
UNITED STATES
SECURITIES AND EXCHANGE COMMISSION
Washington, D.C. 20549
FORM N-CSRS
CERTIFIED SHAREHOLDER REPORT OF REGISTERED
MANAGEMENT INVESTMENT COMPANIES
Investment Company Act file number: 811-09253
Wells Fargo Funds Trust
(Exact name of registrant as specified in charter)
525 Market St., San Francisco, CA 94105
(Address of principal executive offices) (Zip code)
C. David Messman
Wells Fargo Funds Management, LLC
525 Market St., San Francisco, CA 94105
(Name and address of agent for service)
Registrant’s telephone number, including area code: 800-222-8222
Date of fiscal year end: October 31
Registrant is making a filing for 11 of its series:
Wells Fargo Advantage Emerging Markets Local Bond Fund, Wells Fargo Advantage International Bond Fund, Wells Fargo Advantage Strategic Income Fund, Wells Fargo Advantage Asia Pacific Fund, Wells Fargo Advantage Diversified International Fund, Wells Fargo Advantage Emerging Markets Equity Fund, Wells Fargo Advantage Emerging Markets Equity Income Fund, Wells Fargo Advantage Emerging Markets Equity Select Fund, Wells Fargo Advantage Global Opportunities Fund, Wells Fargo Advantage International Equity Fund, and Wells Fargo Advantage Intrinsic World Equity Fund.
Date of reporting period: April 30, 2015
ITEM 1. REPORT TO STOCKHOLDERS

Wells Fargo Advantage
Emerging Markets Local Bond Fund

Semi-Annual Report
April 30, 2015

Reduce clutter. Save trees.
Sign up for electronic delivery of prospectuses and shareholder reports at wellsfargo.com/advantagedelivery
Contents
The views expressed and any forward-looking statements are as of April 30, 2015, unless otherwise noted, and are those of the Fund managers and/or Wells Fargo Funds Management, LLC. Discussions of individual securities, or the markets generally, or any Wells Fargo Advantage Fund are not intended as individual recommendations. Future events or results may vary significantly from those expressed in any forward-looking statements; the views expressed are subject to change at any time in response to changing circumstances in the market. Wells Fargo Funds Management, LLC and the Fund disclaim any obligation to publicly update or revise any views expressed or forward-looking statements.
NOT FDIC INSURED ¡ NO BANK GUARANTEE ¡ MAY LOSE VALUE
| | | | |
| 2 | | Wells Fargo Advantage Emerging Markets Local Bond Fund | | Letter to shareholders (unaudited) |

Karla M. Rabusch
President
Wells Fargo Advantage Funds
A worldwide trend toward looser monetary policy tended to support global bond markets.
European bond markets were boosted by the anticipation and then the reality of the ECB’s asset purchases.
Dear Valued Shareholder:
We are pleased to offer you this semi-annual report for the Wells Fargo Advantage Emerging Markets Local Bond Fund for the six-month period that ended April 30, 2015. The period was marked by low global interest rates as major central banks initiated or increased their quantitative easing programs. At the end of the reporting period, some European sovereign debt issues were selling at negative yields. Low interest rates presented a favorable background for global bonds, including high yield.
Major central banks continued to provide liquidity to the markets.
A worldwide trend toward looser monetary policy tended to support global bond markets. The European Central Bank (ECB) maintained a variety of measures aimed at encouraging lending, including making funds available to banks at low interest rates and imposing a negative interest rate on bank deposits held at the central bank. In January 2015, the ECB announced quantitative easing via significant bond purchases in an attempt to raise the eurozone’s inflation to just under its target of 2%. In Japan, the Bank of Japan (BOJ) also maintained an aggressive monetary program aimed at combating deflation. Later in the period, the BOJ widened its program by purchasing Japanese shares as well as bonds.
Throughout the reporting period, the Federal Open Market Committee (FOMC), which is the U.S. Federal Reserve’s (Fed’s) monetary policymaking body, kept its key interest rate effectively at zero. Even though the FOMC ended its bond-buying program in October 2014 and guided investors to expect an interest-rate hike in mid- to late 2015, the Fed remained accommodative. However, the fact that investors expected the Fed to eventually raise its key rate, even as other central banks lowered their benchmark rates, caused the U.S. dollar to appreciate against most major currencies during the period.
The U.S. outperformed other developed market economies, and a stronger U.S. dollar dampened returns on international assets for dollar-based investors.
Reported U.S. gross domestic product (GDP) growth came in at a solid 2.2% annualized rate in the fourth quarter of 2014. Although the initial estimate for annualized GDP growth came in at a modest 0.2% in the first quarter of 2015, the slowdown was attributed to short-term factors such as harsh winter weather and a long-lived strike at West Coast ports. Core U.S. bonds ended the period with a 2.06% return, as measured by the Barclays U.S. Aggregate Bond Index1.
High-yield bonds also benefited from the stronger economy, as well as continued demand from investors seeking more generous yields in a historically low-yielding environment. As measured by the BofA Merrill Lynch High Yield Master II Index2, high-yield bonds ended the period with a 1.51% gain.
European annualized GDP growth was 1.3% in the fourth quarter of 2014 and 1.4% in the first quarter of 2015. European bond markets were boosted by the anticipation and then the reality of the ECB’s asset purchases. The two-year German bond sold at a negative yield toward the latter half of the period. The flood of ECB-provided liquidity caused high-rated European sovereign bonds to sell at negative yields even in countries outside of the eurozone, such as Switzerland and Denmark. Japanese sovereign bonds also continued to trade at
| 1 | The Barclays U.S. Aggregate Bond Index is a broad-based benchmark that measures the investment-grade, U.S. dollar–denominated, fixed-rate taxable bond market, including Treasuries, government-related and corporate securities, MBS (agency fixed-rate and hybrid ARM pass-throughs), ABS, and CMBS. You cannot invest directly in an index. |
| 2 | The BofA Merrill Lynch High Yield Master II Index is a market-capitalization-weighted index of domestic and Yankee high-yield bonds. The index tracks the performance of high-yield securities traded in the U.S. bond market. You cannot invest directly in an index. |
| | | | | | |
| Letter to shareholders (unaudited) | | Wells Fargo Advantage Emerging Markets Local Bond Fund | | | 3 | |
ultralow yields because of ongoing purchases by the BOJ and major pension funds. Despite the favorable backdrop for international bonds, the appreciation in the U.S. dollar resulted in losses on international assets for dollar-based investors. The BofA Merrill Lynch Global Broad Market ex U.S. Index3, which tracks developed non-U.S. bond markets, returned -5.04% for the six-month period.
Don’t let short-term uncertainty derail long-term investment goals.
Periods of uncertainty can present challenges, but experience has taught us that maintaining long-term investment goals can be an effective way to plan for the future. To help you create a sound strategy based on your personal goals and risk tolerance, Wells Fargo Advantage Funds offers more than 100 mutual funds and other investments spanning a wide range of asset classes and investment styles. Although diversification cannot guarantee an investment profit or prevent losses, we believe it can be an effective way to manage investment risk and potentially smooth out overall portfolio performance. We encourage investors to know their investments and to understand that appropriate levels of risk-taking may unlock opportunities.
Thank you for choosing to invest with Wells Fargo Advantage Funds. We appreciate your confidence in us and remain committed to helping you meet your financial needs.
Sincerely,

Karla M. Rabusch
President
Wells Fargo Advantage Funds
Notice to shareholders
At a telephonic meeting held on June 15, 2015, the Board of Trustees of Wells Fargo Funds Trust unanimously approved the liquidation of the Fund. The Fund was closed to new direct investors and additional investments from existing shareholders effective at the close of business on June 19, 2015. Existing retirement plans, benefit plans and retirement plan platforms may continue to add new participants and make additional purchases until the Fund’s liquidation date. The liquidation of the Fund is expected to occur after close of business on or about July 17, 2015. Shareholders of the Fund on the date of liquidation will receive a distribution of their account proceeds, including any accrued dividends, in complete redemption of their shares.
For current information about your fund investments, contact your investment professional, visit our website at wellsfargoadvantagefunds.com, or call us directly at 1-800-222-8222. We are available 24 hours a day, 7 days a week.
| 3 | The BofA Merrill Lynch Global Broad Market ex U.S. Index tracks the performance of investment-grade debt publicly issued in the major domestic and euro bond markets, including sovereign, quasi-government, corporate, securitized, and collateralized securities, and excludes all securities denominated in U.S. dollars. |
| | | | |
| 4 | | Wells Fargo Advantage Emerging Markets Local Bond Fund | | Performance highlights (unaudited) |
Investment objective
The Fund seeks total return, consisting of income and capital appreciation.
Adviser
Wells Fargo Funds Management, LLC
Subadviser
First International Advisers, LLC
Portfolio managers
Michael Lee
Tony Norris
Alex Perrin
Christopher Wightman
Peter Wilson
Average annual total returns (%) as of April 30, 2015
| | | | | | | | | | | | | | | | | | | | | | | | | | |
| | | | | Including sales charge | | | Excluding sales charge | | | Expense ratios1 (%) | |
| | | Inception date | | 1 year | | | Since inception | | | 1 year | | | Since inception | | | Gross | | | Net2 | |
| Class A (WLBAX) | | 5-31-2012 | | | (13.60 | ) | | | (3.59 | ) | | | (9.50 | ) | | | (2.05 | ) | | | 1.69 | | | | 1.23 | |
| Class C (WLBEX) | | 5-31-2012 | | | (10.98 | ) | | | (2.79 | ) | | | (10.08 | ) | | | (2.79 | ) | | | 2.44 | | | | 1.98 | |
| Administrator Class (WLBDX) | | 5-31-2012 | | | – | | | | – | | | | (9.37 | ) | | | (1.94 | ) | | | 1.63 | | | | 1.10 | |
| Institutional Class (WLBIX) | | 5-31-2012 | | | – | | | | – | | | | (9.12 | ) | | | (1.74 | ) | | | 1.36 | | | | 0.90 | |
| JPMorgan GBI EM Global Diversified Composite Index3 | | – | | | – | | | | – | | | | (9.35 | ) | | | (0.78 | ) | | | – | | | | – | |
Figures quoted represent past performance, which is no guarantee of future results, and do not reflect taxes that a shareholder may pay on fund distributions or the redemption of fund shares. Investment return and principal value of an investment will fluctuate so that an investor’s shares, when redeemed, may be worth more or less than their original cost. Performance shown without sales charges would be lower if sales charges were reflected. Current performance may be lower or higher than the performance data quoted, which assumes the reinvestment of dividends and capital gains. Current month-end performance is available on the Fund’s website, wellsfargoadvantagefunds.com.
Index returns do not include transaction costs associated with buying and selling securities, any mutual fund fees or expenses, or any taxes. It is not possible to invest directly in an index.
For Class A shares, the maximum front-end sales charge is 4.50%. For Class C shares, the maximum contingent deferred sales charge is 1.00%. Performance including a contingent deferred sales charge assumes the sales charge for the corresponding time period. Administrator Class and Institutional Class shares are sold without a front-end sales charge or contingent deferred sales charge.
Bond values fluctuate in response to the financial condition of individual issuers, general market and economic conditions, and changes in interest rates. Changes in market conditions and government policies may lead to periods of heightened volatility in the bond market and reduced liquidity for certain bonds held by the Fund. In general, when interest rates rise, bond values fall and investors may lose principal value. Interest-rate changes and their impact on the fund and its share price can be sudden and unpredictable. Foreign investments are especially volatile and can rise or fall dramatically due to differences in the political and economic conditions of the host country. These risks are generally intensified in emerging markets. The use of derivatives may reduce returns and/or increase volatility. Securities issued by U.S. government agencies or government-sponsored entities may not be guaranteed by the U.S. Treasury. Certain investment strategies tend to increase the total risk of an investment (relative to the broader market). The Fund is exposed to high-yield securities risk and geographic risk. Consult the Fund’s prospectus for additional information on these and other risks.
Please see footnotes on page 5.
| | | | | | |
| Performance highlights (unaudited) | | Wells Fargo Advantage Emerging Markets Local Bond Fund | | | 5 | |
| | | | |
| Ten largest holdings4 (%) as of April 30, 2015 | |
Poland, 3.25%, 7-25-2025 | | | 7.87 | |
Mexico, 4.75%, 6-14-2018 | | | 6.68 | |
Colombia, 7.00%, 5-4-2022 | | | 5.13 | |
Brazil, 10.00%, 1-1-2025 | | | 5.06 | |
Republic of South Africa, 8.00%, 12-21-2018 | | | 4.65 | |
Thailand, 3.25%, 6-16-2017 | | | 4.60 | |
Malaysia, 3.26%, 3-1-2018 | | | 4.50 | |
Brazil, 10.00%, 1-1-2019 | | | 4.38 | |
Romania, 5.85%, 4-26-2023 | | | 4.37 | |
Indonesia, 8.38%, 3-15-2024 | | | 3.78 | |
|
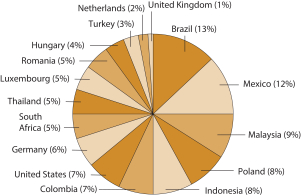
| Country allocation5 as of April 30, 2015 |
|
 |
|
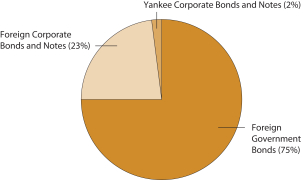
| Portfolio allocation5 as of April 30, 2015 |
|
 |
| 1 | Reflects the expense ratios as stated in the most recent prospectuses. The expense ratios shown are subject to change and may differ from the annualized expense ratios shown in the financial highlights of this report. |
| 2 | The Adviser has committed through February 29, 2016 to waive fees and/or reimburse expenses to the extent necessary to cap the Fund’s Total Annual Fund Operating Expenses After Fee Waiver at the amounts shown. Brokerage commissions, stamp duty fees, interest, taxes, acquired fund fees and expenses and extraordinary expenses are excluded from the cap. After this time, the cap may be increased or the commitment to maintain the cap may be terminated only with the approval of the Board of Trustees. |
| 3 | The JPMorgan Government Bond Index Emerging Markets (GBI EM) Global Diversified Composite Index is an unmanaged index of debt instruments of 16 emerging countries. You cannot invest directly in an index. |
| 4 | The ten largest holdings, excluding cash and cash equivalents, are calculated based on the value of the investments divided by total net assets of the Fund. Holdings are subject to change and may have changed since the date specified. |
| 5 | Amounts are calculated based on the total long-term investments of the Fund. These percentages are subject to change and may have changed since the date specified. |
| | | | |
| 6 | | Wells Fargo Advantage Emerging Markets Local Bond Fund | | Fund expenses (unaudited) |
As a shareholder of the Fund, you incur two types of costs: (1) transaction costs, including sales charges (loads) on purchase payments and contingent deferred sales charges (if any) on redemptions and (2) ongoing costs, including management fees, distribution (12b-1) and/or shareholder service fees, and other Fund expenses. This example is intended to help you understand your ongoing costs (in dollars) of investing in the Fund and to compare these costs with the ongoing costs of investing in other mutual funds.
The example is based on an investment of $1,000 invested at the beginning of the six-month period and held for the entire period from November 1, 2014 to April 30, 2015.
Actual expenses
The “Actual” line of the table below provides information about actual account values and actual expenses. You may use the information in this line, together with the amount you invested, to estimate the expenses that you paid over the period. Simply divide your account value by $1,000 (for example, an $8,600 account value divided by $1,000 = 8.6), then multiply the result by the number in the “Actual” line under the heading entitled “Expenses paid during period” for your applicable class of shares to estimate the expenses you paid on your account during this period.
Hypothetical example for comparison purposes
The “Hypothetical” line of the table below provides information about hypothetical account values and hypothetical expenses based on the Fund’s actual expense ratio and an assumed rate of return of 5% per year before expenses, which is not the Fund’s actual return. The hypothetical account values and expenses may not be used to estimate the actual ending account balance or expenses you paid for the period. You may use this information to compare the ongoing costs of investing in the Fund and other funds. To do so, compare this 5% hypothetical example with the 5% hypothetical examples that appear in the shareholder reports of the other funds.
Please note that the expenses shown in the table are meant to highlight your ongoing costs only and do not reflect any transactional costs, such as sales charges (loads) and contingent deferred sales charges. Therefore, the “Hypothetical” line of the table is useful in comparing ongoing costs only and will not help you determine the relative total costs of owning different funds. In addition, if these transactional costs were included, your costs would have been higher.
| | | | | | | | | | | | | | | | |
| | | Beginning
account value
11-1-2014 | | | Ending
account value
4-30-2015 | | | Expenses
paid during
the period¹ | | | Net annualized
expense ratio | |
Class A | | | | | | | | | | | | | | | | |
Actual | | $ | 1,000.00 | | | $ | 925.39 | | | $ | 5.87 | | | | 1.23 | % |
Hypothetical (5% return before expenses) | | $ | 1,000.00 | | | $ | 1,018.70 | | | $ | 6.16 | | | | 1.23 | % |
Class C | | | | | | | | | | | | | | | | |
Actual | | $ | 1,000.00 | | | $ | 922.67 | | | $ | 9.44 | | | | 1.98 | % |
Hypothetical (5% return before expenses) | | $ | 1,000.00 | | | $ | 1,014.98 | | | $ | 9.89 | | | | 1.98 | % |
Administrator Class | | | | | | | | | | | | | | | | |
Actual | | $ | 1,000.00 | | | $ | 926.68 | | | $ | 5.25 | | | | 1.10 | % |
Hypothetical (5% return before expenses) | | $ | 1,000.00 | | | $ | 1,019.34 | | | $ | 5.51 | | | | 1.10 | % |
Institutional Class | | | | | | | | | | | | | | | | |
Actual | | $ | 1,000.00 | | | $ | 927.15 | | | $ | 4.30 | | | | 0.90 | % |
Hypothetical (5% return before expenses) | | $ | 1,000.00 | | | $ | 1,020.33 | | | $ | 4.51 | | | | 0.90 | % |
| 1 | Expenses paid is equal to the annualized expense ratio of each class multiplied by the average account value over the period, multiplied by the number of days in the most recent fiscal half-year divided by the number of days in the fiscal year (to reflect the one-half-year period). |
| | | | | | |
| Portfolio of investments—April 30, 2015 (unaudited) | | Wells Fargo Advantage Emerging Markets Local Bond Fund | | | 7 | |
| | | | | | | | | | | | | | | | |
| Security name | | Interest rate | | | Maturity date | | | Principal | | | Value | |
| | | | |
Foreign Corporate Bonds and Notes @: 21.83% | | | | | | | | | | | | | | | | |
| | | | |
| Brazil: 0.53% | | | | | | | | | | | | | | | | |
BRF SA (Consumer Staples, Food Products, BRL) 144A | | | 7.75 | % | | | 5-22-2018 | | | | 460,000 | | | $ | 125,956 | |
| | | | | | | | | | | | | | | | |
| | | | |
| Germany: 5.47% | | | | | | | | | | | | | | | | |
KfW (Financials, Banks, TRY) | | | 5.00 | | | | 1-16-2017 | | | | 1,025,000 | | | | 355,716 | |
KfW (Financials, Banks, TRY) | | | 7.75 | | | | 2-3-2016 | | | | 600,000 | | | | 220,530 | |
Landwirtschaftliche Rentenbank (Financials, Banks, ZAR) | | | 8.25 | | | | 5-23-2022 | | | | 6,400,000 | | | | 536,263 | |
Landwirtschaftliche Rentenbank (Financials, Banks, TRY) | | | 9.50 | | | | 5-23-2022 | | | | 500,000 | | | | 189,254 | |
| | | | |
| | | | | | | | | | | | | | | 1,301,763 | |
| | | | | | | | | | | | | | | | |
| | | | |
| Luxembourg: 4.50% | | | | | | | | | | | | | | | | |
European Investment Bank (Financials, Banks, PLN) | | | 4.25 | | | | 10-25-2022 | | | | 1,800,000 | | | | 571,124 | |
European Investment Bank (Financials, Banks, HUF) | | | 6.25 | | | | 10-27-2016 | | | | 22,000,000 | | | | 86,552 | |
European Investment Bank (Financials, Banks, ZAR) | | | 9.00 | | | | 3-31-2021 | | | | 2,600,000 | | | | 227,124 | |
European Investment Bank (Financials, Banks, TRY) | | | 9.25 | | | | 7-20-2018 | | | | 500,000 | | | | 186,017 | |
| | | | |
| | | | | | | | | | | | | | | 1,070,817 | |
| | | | | | | | | | | | | | | | |
| | | | |
| Mexico: 2.85% | | | | | | | | | | | | | | | | |
America Movil SAB de CV (Telecommunication Services, Wireless Telecommunication Services, MXN) | | | 6.45 | | | | 12-5-2022 | | | | 3,000,000 | | | | 189,558 | |
America Movil SAB de CV (Telecommunication Services, Wireless Telecommunication Services, MXN) | | | 7.13 | | | | 12-9-2024 | | | | 2,750,000 | | | | 177,562 | |
Petroleos Mexicanos (Energy, Oil, Gas & Consumable Fuels, MXN) 144A | | | 7.19 | | | | 9-12-2024 | | | | 2,500,000 | | | | 158,063 | |
Petroleos Mexicanos (Energy, Oil, Gas & Consumable Fuels, MXN) | | | 7.65 | | | | 11-24-2021 | | | | 2,300,000 | | | | 154,011 | |
| | | | |
| | | | | | | | | | | | | | | 679,194 | |
| | | | | | | | | | | | | | | | |
| | | | |
| Netherlands: 1.92% | | | | | | | | | | | | | | | | |
Rabobank Nederland (Financials, Banks, TRY) | | | 6.13 | | | | 5-2-2017 | | | | 460,000 | | | | 159,466 | |
Rabobank Nederland (Financials, Banks, ZAR) | | | 7.50 | | | | 3-24-2021 | | | | 3,600,000 | | | | 298,780 | |
| | | | |
| | | | | | | | | | | | | | | 458,246 | |
| | | | | | | | | | | | | | | | |
| | | | |
| United States: 6.56% | | | | | | | | | | | | | | | | |
Inter-American Development Bank (Financials, Banks, IDR) | | | 7.25 | | | | 7-17-2017 | | | | 8,500,000,000 | | | | 640,531 | |
International Bank for Reconstruction & Development (Financials, Banks, ZAR) | | | 7.00 | | | | 6-7-2023 | | | | 5,600,000 | | | | 432,249 | |
International Bank for Reconstruction & Development (Financials, Banks, MXN) | | | 7.50 | | | | 3-5-2020 | | | | 6,600,000 | | | | 487,622 | |
| | | | |
| | | | | | | | | | | | | | | 1,560,402 | |
| | | | | | | | | | | | | | | | |
| | | |
Total Foreign Corporate Bonds and Notes (Cost $6,274,090) | | | | | | | | | | | | 5,196,378 | |
| | | | | | | | | | | | | | | | |
| | | | |
Foreign Government Bonds @: 69.62% | | | | | | | | | | | | | | | | |
Brazil (BRL) | | | 10.00 | | | | 1-1-2017 | | | | 1,100,000 | | | | 359,323 | |
Brazil (BRL) | | | 10.00 | | | | 1-1-2019 | | | | 3,300,000 | | | | 1,042,943 | |
Brazil (BRL) | | | 10.00 | | | | 1-1-2025 | | | | 4,085,000 | | | | 1,204,056 | |
Colombia (COP) | | | 7.00 | | | | 5-4-2022 | | | | 2,810,000,000 | | | | 1,219,981 | |
Colombia (COP) | | | 7.75 | | | | 4-14-2021 | | | | 975,000,000 | | | | 460,076 | |
Hungary (HUF) | | | 6.75 | | | | 11-24-2017 | | | | 189,500,000 | | | | 785,196 | |
Indonesia (IDR) | | | 7.38 | | | | 9-15-2016 | | | | 11,000,000,000 | | | | 850,681 | |
Indonesia (IDR) | | | 8.38 | | | | 3-15-2024 | | | | 11,180,000,000 | | | | 899,144 | |
Malaysia (MYR) | | | 3.26 | | | | 3-1-2018 | | | | 3,835,000 | | | | 1,072,101 | |
The accompanying notes are an integral part of these financial statements.
| | | | |
| 8 | | Wells Fargo Advantage Emerging Markets Local Bond Fund | | Portfolio of investments—April 30, 2015 (unaudited) |
| | | | | | | | | | | | | | | | |
| Security name | | Interest rate | | | Maturity date | | | Principal | | | Value | |
| | | | |
Foreign Government Bonds @ (continued) | | | | | | | | | | | | | | | | |
Malaysia (MYR) | | | 4.18 | % | | | 7-15-2024 | | | | 3,000,000 | | | $ | 861,901 | |
Mexico (MXN) | | | 4.75 | | | | 6-14-2018 | | | | 24,400,000 | | | | 1,590,329 | |
Mexico (MXN) | | | 10.00 | | | | 12-5-2024 | | | | 4,500,000 | | | | 379,875 | |
Poland (PLN) | | | 3.25 | | | | 7-25-2025 | | | | 6,405,000 | | | | 1,873,010 | |
Republic of South Africa (ZAR) | | | 8.00 | | | | 12-21-2018 | | | | 12,850,000 | | | | 1,106,096 | |
Romania (RON) | | | 5.85 | | | | 4-26-2023 | | | | 3,450,000 | | | | 1,039,315 | |
Thailand (THB) | | | 3.25 | | | | 6-16-2017 | | | | 34,850,000 | | | | 1,093,739 | |
Turkey (TRY) | | | 6.30 | | | | 2-14-2018 | | | | 2,125,000 | | | | 733,485 | |
| | | | |
Total Foreign Government Bonds (Cost $18,878,817) | | | | | | | | | | | | | | | 16,571,251 | |
| | | | | | | | | | | | | | | | |
| | | | |
Yankee Corporate Bonds and Notes: 1.65% | | | | | | | | | | | | | | | | |
| | | | |
| Brazil: 0.85% | | | | | | | | | | | | | | | | |
ITAU Unibanco Holding SA (Financials, Banks) | | | 5.13 | | | | 5-13-2023 | | | $ | 200,000 | | | | 203,500 | |
| | | | | | | | | | | | | | | | |
| | | | |
| United Kingdom: 0.80% | | | | | | | | | | | | | | | | |
Vedanta Resources plc (Materials, Metals & Mining) 144A | | | 6.00 | | | | 1-31-2019 | | | | 200,000 | | | | 190,000 | |
| | | | | | | | | | | | | | | | |
| | | | |
Total Yankee Corporate Bonds and Notes (Cost $401,458) | | | | | | | | | | | | | | | 393,500 | |
| | | | | | | | | | | | | | | | |
| | | | |
| | | Yield | | | | | | Shares | | | | |
| Short-Term Investments: 4.83% | | | | | | | | | | | | | | | | |
| | | | |
| Investment Companies: 4.83% | | | | | | | | | | | | | | | | |
Wells Fargo Advantage Cash Investment Money Market Fund, Select Class (l)(u) | | | 0.11 | | | | | | | | 1,149,022 | | | | 1,149,022 | |
| | | | | | | | | | | | | | | | |
| | | | |
Total Short-Term Investments (Cost $1,149,022) | | | | | | | | | | | | | | | 1,149,022 | |
| | | | | | | | | | | | | | | | |
| | | | | | | | |
| Total investments in securities (Cost $26,703,387) * | | | 97.93 | % | | | 23,310,151 | |
Other assets and liabilities, net | | | 2.07 | | | | 491,535 | |
| | | | | | | | |
| Total net assets | | | 100.00 | % | | $ | 23,801,686 | |
| | | | | | | | |
| @ | Foreign bond principal is denominated in the local currency of the issuer. |
| 144A | The security may be resold in transactions exempt from registration, normally to qualified institutional buyers, pursuant to Rule 144A under the Securities Act of 1933. |
| (l) | The security represents an affiliate of the Fund as defined in the Investment Company Act of 1940. |
| (u) | The rate represents the 7-day annualized yield at period end. |
| * | Cost for federal income tax purposes is $26,709,278 and unrealized gains (losses) consists of: |
| | | | |
Gross unrealized gains | | $ | 71,373 | |
Gross unrealized losses | | | (3,470,500 | ) |
| | | | |
Net unrealized losses | | | (3,399,127 | ) |
The accompanying notes are an integral part of these financial statements.
| | | | | | |
| Statement of assets and liabilities—April 30, 2015 (unaudited) | | Wells Fargo Advantage Emerging Markets Local Bond Fund | | | 9 | |
| | | | |
| | | | |
| |
Assets | | | | |
Investments | | | | |
In unaffiliated securities, at value (cost $25,554,365) | | $ | 22,161,129 | |
In affiliated securities, at value (cost $1,149,022) | | | 1,149,022 | |
| | | | |
Total investments, at value (cost $26,703,387) | | | 23,310,151 | |
Foreign currency, at value (cost $51,521) | | | 53,142 | |
Receivable for interest | | | 503,456 | |
Unrealized gains on forward foreign currency contracts | | | 137,235 | |
Prepaid expenses and other assets | | | 18,831 | |
| | | | |
Total assets | | | 24,022,815 | |
| | | | |
| |
Liabilities | | | | |
Unrealized losses on forward foreign currency contracts | | | 193,142 | |
Advisory fee payable | | | 502 | |
Distribution fee payable | | | 282 | |
Administration fees payable | | | 2,779 | |
Professional fees payable | | | 19,190 | |
Accrued expenses and other liabilities | | | 5,234 | |
| | | | |
Total liabilities | | | 221,129 | |
| | | | |
Total net assets | | $ | 23,801,686 | |
| | | | |
| |
NET ASSETS CONSIST OF | | | | |
Paid-in capital | | $ | 29,279,373 | |
Undistributed net investment income | | | 464,275 | |
Accumulated net realized losses on investments | | | (2,466,311 | ) |
Net unrealized losses on investments | | | (3,475,651 | ) |
| | | | |
Total net assets | | $ | 23,801,686 | |
| | | | |
| |
COMPUTATION OF NET ASSET VALUE AND OFFERING PRICE PER SHARE | | | | |
Net assets – Class A | | $ | 594,563 | |
Shares outstanding – Class A1 | | | 73,289 | |
Net asset value per share – Class A | | | $8.11 | |
Maximum offering price per share – Class A2 | | | $8.49 | |
Net assets – Class C | | $ | 460,544 | |
Shares outstanding – Class C1 | | | 56,917 | |
Net asset value per share – Class C | | | $8.09 | |
Net assets – Administrator Class | | $ | 11,339,722 | |
Shares outstanding – Administrator Class1 | | | 1,395,922 | |
Net asset value per share – Administrator Class | | | $8.12 | |
Net assets – Institutional Class | | $ | 11,406,857 | |
Shares outstanding – Institutional Class1 | | | 1,405,962 | |
Net asset value per share – Institutional Class | | | $8.11 | |
| 1 | The Fund has an unlimited number of authorized shares. |
| 2 | Maximum offering price is computed as 100/95.50 of net asset value. On investments of $50,000 or more, the offering price is reduced. |
The accompanying notes are an integral part of these financial statements.
| | | | |
| 10 | | Wells Fargo Advantage Emerging Markets Local Bond Fund | | Statement of operations—six months ended April 30, 2015 (unaudited) |
| | | | |
| | | | |
| |
Investment income | | | | |
Interest (net of foreign interest withholding taxes of $14,772) | | $ | 807,870 | |
Income from affiliated securities | | | 353 | |
| | | | |
Total investment income | | | 808,223 | |
| | | | |
| |
Expenses | | | | |
Advisory fee | | | 77,740 | |
Administration fees | | | | |
Fund level | | | 5,980 | |
Class A | | | 472 | |
Class C | | | 371 | |
Administrator Class | | | 5,699 | |
Institutional Class | | | 4,587 | |
Shareholder servicing fees | | | | |
Class A | | | 738 | |
Class C | | | 580 | |
Administrator Class | | | 14,247 | |
Distribution fee | | | | |
Class C | | | 1,740 | |
Custody and accounting fees | | | 15,083 | |
Professional fees | | | 24,077 | |
Registration fees | | | 30,812 | |
Shareholder report expenses | | | 5,419 | |
Trustees’ fees and expenses | | | 6,674 | |
Other fees and expenses | | | 3,237 | |
| | | | |
Total expenses | | | 197,456 | |
Less: Fee waivers and/or expense reimbursements | | | (74,938 | ) |
| | | | |
Net expenses | | | 122,518 | |
| | | | |
Net investment income | | | 685,705 | |
| | | | |
| |
REALIZED AND UNREALIZED GAINS (LOSSES) ON INVESTMENTS | | | | |
| |
Net realized losses on: | | | | |
Unaffiliated securities | | | (2,113,835 | ) |
Forward foreign currency contract transactions | | | (1,005 | ) |
| | | | |
Net realized losses on investments | | | (2,114,840 | ) |
| | | | |
| |
Net change in unrealized gains (losses) on: | | | | |
Unaffiliated securities | | | (411,719 | ) |
Forward foreign currency contract transactions | | | (27,789 | ) |
| | | | |
Net change in unrealized gains (losses) on investments | | | (439,508 | ) |
| | | | |
Net realized and unrealized gains (losses) on investments | | | (2,554,348 | ) |
| | | | |
Net decrease in net assets resulting from operations | | $ | (1,868,643 | ) |
| | | | |
The accompanying notes are an integral part of these financial statements.
| | | | | | |
| Statement of changes in net assets | | Wells Fargo Advantage Emerging Markets Local Bond Fund | | | 11 | |
| | | | | | | | | | | | | | | | |
| | | Six months ended
April 30, 2015 (unaudited) | | | Year ended
October 31, 2014 | |
| | | | |
Operations | | | | | | | | | | | | | | | | |
Net investment income | | | | | | $ | 685,705 | | | | | | | $ | 1,449,158 | |
Net realized losses on investments | | | | | | | (2,114,840 | ) | | | | | | | (1,367,651 | ) |
Net change in unrealized gains (losses) on investments | | | | | | | (439,508 | ) | | | | | | | (1,154,401 | ) |
| | | | |
Net decrease in net assets resulting from operations | | | | | | | (1,868,643 | ) | | | | | | | (1,072,894 | ) |
| | | | |
| | | | |
Distributions to shareholders from | | | | | | | | | | | | | | | | |
Net investment income | | | | | | | | | | | | | | | | |
Class A | | | | | | | (7,323 | ) | | | | | | | (23,586 | ) |
Class C | | | | | | | (2,268 | ) | | | | | | | (14,343 | ) |
Administrator Class | | | | | | | (154,605 | ) | | | | | | | (370,005 | ) |
Institutional Class | | | | | | | (189,005 | ) | | | | | | | (378,646 | ) |
Net realized gains | | | | | | | | | | | | | | | | |
Class A | | | | | | | 0 | | | | | | | | (10,670 | ) |
Class C | | | | | | | 0 | | | | | | | | (7,606 | ) |
Administrator Class | | | | | | | 0 | | | | | | | | (184,754 | ) |
Institutional Class | | | | | | | 0 | | | | | | | | (185,459 | ) |
| | | | |
Total distributions to shareholders | | | | | | | (353,201 | ) | | | | | | | (1,175,069 | ) |
| | | | |
| | | | |
Capital share transactions | | | Shares | | | | | | | | Shares | | | | | |
Proceeds from shares sold | | | | | | | | | | | | | | | | |
Class A | | | 4,383 | | | | 37,000 | | | | 15,981 | | | | 146,922 | |
Class C | | | 0 | | | | 0 | | | | 421 | | | | 3,600 | |
Institutional Class | | | 1,632 | | | | 14,157 | | | | 156 | | | | 1,446 | |
| | | | |
| | | | | | | 51,157 | | | | | | | | 151,968 | |
| | | | |
Reinvestment of distributions | | | | | | | | | | | | | | | | |
Class A | | | 876 | | | | 7,323 | | | | 3,790 | | | | 34,256 | |
Class C | | | 272 | | | | 2,268 | | | | 2,424 | | | | 21,949 | |
Administrator Class | | | 18,472 | | | | 154,605 | | | | 61,225 | | | | 554,759 | |
Institutional Class | | | 22,608 | | | | 189,005 | | | | 62,321 | | | | 564,105 | |
| | | | |
| | | | | | | 353,201 | | | | | | | | 1,175,069 | |
| | | | |
Payment for shares redeemed | | | | | | | | | | | | | | | | |
Class A | | | (1,327 | ) | | | (11,135 | ) | | | (26,442 | ) | | | (236,163 | ) |
Class C | | | 0 | | | | 0 | | | | (421 | ) | | | (3,714 | ) |
Institutional Class | | | (1,708 | ) | | | (13,567 | ) | | | 0 | | | | 0 | |
| | | | |
| | | | | | | (24,702 | ) | | | | | | | (239,877 | ) |
| | | | |
Net increase in net assets resulting from capital share transactions | | | | | | | 379,656 | | | | | | | | 1,087,160 | |
| | | | |
Total decrease in net assets | | | | | | | (1,842,188 | ) | | | | | | | (1,160,803 | ) |
| | | | |
| | | | |
Net assets | | | | | | | | | | | | | | | | |
Beginning of period | | | | | | | 25,643,874 | | | | | | | | 26,804,677 | |
| | | | |
End of period | | | | | | $ | 23,801,686 | | | | | | | $ | 25,643,874 | |
| | | | |
Undistributed net investment income | | | | | | $ | 464,275 | | | | | | | $ | 131,771 | |
| | | | |
The accompanying notes are an integral part of these financial statements.
| | | | |
| 12 | | Wells Fargo Advantage Emerging Markets Local Bond Fund | | Financial highlights |
(For a share outstanding throughout each period)
| | | | | | | | | | | | | | | | |
| | | Six months ended
April 30, 2015
(unaudited) | | | Year ended October 31 | |
| CLASS A | | | 2014 | | | 2013 | | | 20121 | |
Net asset value, beginning of period | | | $8.86 | | | | $9.68 | | | | $10.85 | | | | $10.00 | |
Net investment income | | | 0.22 | | | | 0.48 | 2 | | | 0.44 | | | | 0.11 | |
Net realized and unrealized gains (losses) on investments | | | (0.87 | ) | | | (0.89 | ) | | | (0.76 | ) | | | 0.85 | |
| | | | | | | | | | | | | | | | |
Total from investment operations | | | (0.65 | ) | | | (0.41 | ) | | | (0.32 | ) | | | 0.96 | |
Distributions to shareholders from | | | | | | | | | | | | | | | | |
Net investment income | | | (0.10 | ) | | | (0.30 | ) | | | (0.65 | ) | | | (0.11 | ) |
Net realized gains | | | 0.00 | | | | (0.11 | ) | | | (0.20 | ) | | | 0.00 | |
| | | | | | | | | | | | | | | | |
Total distributions to shareholders | | | (0.10 | ) | | | (0.41 | ) | | | (0.85 | ) | | | (0.11 | ) |
Net asset value, end of period | | | $8.11 | | | | $8.86 | | | | $9.68 | | | | $10.85 | |
Total return3 | | | (7.46 | )% | | | (4.11 | )% | | | (3.28 | )% | | | 9.67 | % |
Ratios to average net assets (annualized) | | | | | | | | | | | | | | | | |
Gross expenses | | | 1.82 | % | | | 1.69 | % | | | 1.84 | % | | | 2.20 | % |
Net expenses | | | 1.23 | % | | | 1.23 | % | | | 1.23 | % | | | 1.23 | % |
Net investment income | | | 5.48 | % | | | 5.31 | % | | | 4.41 | % | | | 2.62 | % |
Supplemental data | | | | | | | | | | | | | | | | |
Portfolio turnover rate | | | 51 | % | | | 99 | % | | | 85 | % | | | 120 | % |
Net assets, end of period (000s omitted) | | | $595 | | | | $615 | | | | $736 | | | | $581 | |
| 1 | For the period from May 31, 2012 (commencement of class operations) to October 31, 2012 |
| 2 | Calculated based upon average shares outstanding |
| 3 | Total return calculations do not include any sales charges. Returns for periods of less than one year are not annualized. |
The accompanying notes are an integral part of these financial statements.
| | | | | | |
| Financial highlights | | Wells Fargo Advantage Emerging Markets Local Bond Fund | | | 13 | |
(For a share outstanding throughout each period)
| | | | | | | | | | | | | | | | |
| | | Six months ended
April 30, 2015 (unaudited) | | | Year ended October 31 | |
| CLASS C | | | 2014 | | | 2013 | | | 20121 | |
Net asset value, beginning of period | | | $8.81 | | | | $9.68 | | | | $10.85 | | | | $10.00 | |
Net investment income | | | 0.19 | | | | 0.41 | | | | 0.36 | | | | 0.08 | |
Net realized and unrealized gains (losses) on investments | | | (0.87 | ) | | | (0.88 | ) | | | (0.75 | ) | | | 0.85 | |
| | | | | | | | | | | | | | | | |
Total from investment operations | | | (0.68 | ) | | | (0.47 | ) | | | (0.39 | ) | | | 0.93 | |
Distributions to shareholders from | | | | | | | | | | | | | | | | |
Net investment income | | | (0.04 | ) | | | (0.29 | ) | | | (0.58 | ) | | | (0.08 | ) |
Net realized gains | | | 0.00 | | | | (0.11 | ) | | | (0.20 | ) | | | 0.00 | |
| | | | | | | | | | | | | | | | |
Total distributions to shareholders | | | (0.04 | ) | | | (0.40 | ) | | | (0.78 | ) | | | (0.08 | ) |
Net asset value, end of period | | | $8.09 | | | | $8.81 | | | | $9.68 | | | | $10.85 | |
Total return2 | | | (7.73 | )% | | | (4.92 | )% | | | (4.00 | )% | | | 9.35 | % |
Ratios to average net assets (annualized) | | | | | | | | | | | | | | | | |
Gross expenses | | | 2.57 | % | | | 2.44 | % | | | 2.60 | % | | | 2.95 | % |
Net expenses | | | 1.98 | % | | | 1.98 | % | | | 1.98 | % | | | 1.98 | % |
Net investment income | | | 4.72 | % | | | 4.55 | % | | | 3.59 | % | | | 1.89 | % |
Supplemental data | | | | | | | | | | | | | | | | |
Portfolio turnover rate | | | 51 | % | | | 99 | % | | | 85 | % | | | 120 | % |
Net assets, end of period (000s omitted) | | | $461 | | | | $499 | | | | $525 | | | | $547 | |
| 1 | For the period from May 31, 2012 (commencement of class operations) to October 31, 2012 |
| 2 | Total return calculations do not include any sales charges. Returns for periods of less than one year are not annualized. |
The accompanying notes are an integral part of these financial statements.
| | | | |
| 14 | | Wells Fargo Advantage Emerging Markets Local Bond Fund | | Financial highlights |
(For a share outstanding throughout each period)
| | | | | | | | | | | | | | | | |
| | | Six months ended
April 30, 2015 (unaudited) | | | Year ended October 31 | |
| ADMINISTRATOR CLASS | | | 2014 | | | 2013 | | | 20121 | |
Net asset value, beginning of period | | | $8.88 | | | | $9.69 | | | | $10.85 | | | | $10.00 | |
Net investment income | | | 0.23 | | | | 0.49 | | | | 0.46 | | | | 0.12 | |
Net realized and unrealized gains (losses) on investments | | | (0.88 | ) | | | (0.89 | ) | | | (0.76 | ) | | | 0.85 | |
| | | | | | | | | | | | | | | | |
Total from investment operations | | | (0.65 | ) | | | (0.40 | ) | | | (0.30 | ) | | | 0.97 | |
Distributions to shareholders from | | | | | | | | | | | | | | | | |
Net investment income | | | (0.11 | ) | | | (0.30 | ) | | | (0.66 | ) | | | (0.12 | ) |
Net realized gains | | | 0.00 | | | | (0.11 | ) | | | (0.20 | ) | | | 0.00 | |
| | | | | | | | | | | | | | | | |
Total distributions to shareholders | | | (0.11 | ) | | | (0.41 | ) | | | (0.86 | ) | | | (0.12 | ) |
Net asset value, end of period | | | $8.12 | | | | $8.88 | | | | $9.69 | | | | $10.85 | |
Total return2 | | | (7.33 | )% | | | (4.10 | )% | | | (3.13 | )% | | | 9.72 | % |
Ratios to average net assets (annualized) | | | | | | | | | | | | | | | | |
Gross expenses | | | 1.76 | % | | | 1.63 | % | | | 1.79 | % | | | 2.16 | % |
Net expenses | | | 1.10 | % | | | 1.10 | % | | | 1.10 | % | | | 1.10 | % |
Net investment income | | | 5.60 | % | | | 5.43 | % | | | 4.48 | % | | | 2.77 | % |
Supplemental data | | | | | | | | | | | | | | | | |
Portfolio turnover rate | | | 51 | % | | | 99 | % | | | 85 | % | | | 120 | % |
Net assets, end of period (000s omitted) | | | $11,340 | | | | $12,235 | | | | $12,754 | | | | $13,166 | |
| 1 | For the period from May 31, 2012 (commencement of class operations) to October 31, 2012 |
| 2 | Returns for periods of less than one year are not annualized. |
The accompanying notes are an integral part of these financial statements.
| | | | | | |
| Financial highlights | | Wells Fargo Advantage Emerging Markets Local Bond Fund | | | 15 | |
(For a share outstanding throughout each period)
| | | | | | | | | | | | | | | | |
| | | Six months ended
April 30, 2015 (unaudited) | | | Year ended October 31 | |
| INSTITUTIONAL CLASS | | | 2014 | | | 2013 | | | 20121 | |
Net asset value, beginning of period | | | $8.89 | | | | $9.68 | | | | $10.85 | | | | $10.00 | |
Net investment income | | | 0.24 | | | | 0.51 | | | | 0.48 | | | | 0.13 | |
Net realized and unrealized gains (losses) on investments | | | (0.88 | ) | | | (0.88 | ) | | | (0.76 | ) | | | 0.85 | |
| | | | | | | | | | | | | | | | |
Total from investment operations | | | (0.64 | ) | | | (0.37 | ) | | | (0.28 | ) | | | 0.98 | |
Distributions to shareholders from | | | | | | | | | | | | | | | | |
Net investment income | | | (0.14 | ) | | | (0.31 | ) | | | (0.69 | ) | | | (0.13 | ) |
Net realized gains | | | 0.00 | | | | (0.11 | ) | | | (0.20 | ) | | | 0.00 | |
| | | | | | | | | | | | | | | | |
Total distributions to shareholders | | | (0.14 | ) | | | (0.42 | ) | | | (0.89 | ) | | | (0.13 | ) |
Net asset value, end of period | | | $8.11 | | | | $8.89 | | | | $9.68 | | | | $10.85 | |
Total return2 | | | (7.28 | )% | | | (3.83 | )% | | | (2.97 | )% | | | 9.82 | % |
Ratios to average net assets (annualized) | | | | | | | | | | | | | | | | |
Gross expenses | | | 1.49 | % | | | 1.36 | % | | | 1.52 | % | | | 1.94 | % |
Net expenses | | | 0.90 | % | | | 0.90 | % | | | 0.90 | % | | | 0.90 | % |
Net investment income | | | 5.80 | % | | | 5.63 | % | | | 4.68 | % | | | 2.97 | % |
Supplemental data | | | | | | | | | | | | | | | | |
Portfolio turnover rate | | | 51 | % | | | 99 | % | | | 85 | % | | | 120 | % |
Net assets, end of period (000s omitted) | | | $11,407 | | | | $12,295 | | | | $12,790 | | | | $13,177 | |
| 1 | For the period from May 31, 2012 (commencement of class operations) to October 31, 2012 |
| 2 | Returns for periods of less than one year are not annualized. |
The accompanying notes are an integral part of these financial statements.
| | | | |
| 16 | | Wells Fargo Advantage Emerging Markets Local Bond Fund | | Notes to financial statements (unaudited) |
1. ORGANIZATION
Wells Fargo Funds Trust (the “Trust”), a Delaware statutory trust organized on March 10, 1999, is an open-end management investment company registered under the Investment Company Act of 1940, as amended (the “1940 Act”). As an investment company, the Trust follows the accounting and reporting guidance in Financial Accounting Standards Board (“FASB”) Accounting Standards Codification Topic 946, Financial Services – Investment Companies. These financial statements report on the Wells Fargo Advantage Emerging Markets Local Bond Fund (the “Fund”) which is a diversified series of the Trust.
2. SIGNIFICANT ACCOUNTING POLICIES
The following significant accounting policies, which are consistently followed in the preparation of the financial statements of the Fund, are in conformity with U.S. generally accepted accounting principles which require management to make estimates and assumptions that affect the reported amounts of assets and liabilities, disclosure of contingent assets and liabilities at the date of the financial statements, and the reported amounts of revenues and expenses during the reporting period. Actual results could differ from those estimates.
Securities valuation
All investments are valued each business day as of the close of regular trading on the New York Stock Exchange (generally 4 p.m. Eastern Time).
Debt securities are valued at the evaluated bid price provided by an independent pricing service or, if a reliable price is not available, the quoted bid price from an independent broker-dealer.
The values of securities denominated in foreign currencies are translated into U.S. dollars at rates provided by an independent foreign currency pricing source at a time each business day specified by the Management Valuation Team of Wells Fargo Funds Management, LLC (“Funds Management”).
Investments in registered open-end investment companies are valued at net asset value.
Investments which are not valued using any of the methods discussed above are valued at their fair value, as determined in good faith by the Board of Trustees of the Fund. The Board of Trustees has established a Valuation Committee comprised of the Trustees and has delegated to it the authority to take any actions regarding the valuation of portfolio securities that the Valuation Committee deems necessary or appropriate, including determining the fair value of portfolio securities, unless the determination has been delegated to the Management Valuation Team. The Board of Trustees retains the authority to make or ratify any valuation decisions or approve any changes to the Valuation Procedures as it deems appropriate. On a quarterly basis, the Board of Trustees receives reports on any valuation actions taken by the Valuation Committee or the Management Valuation Team which may include items for ratification.
Valuations of fair valued securities are compared to the next actual sales price when available, or other appropriate market values, to assess the continued appropriateness of the fair valuation methodologies used. These securities are fair valued on a day-to-day basis, taking into consideration changes to appropriate market information and any significant changes to the inputs considered in the valuation process until there is a readily available price provided on an exchange or by an independent pricing service. Valuations received from an independent pricing service or independent broker-dealer quotes are periodically validated by comparisons to most recent trades and valuations provided by other independent pricing services in addition to the review of prices by the adviser and/or subadviser. Unobservable inputs used in determining fair valuations are identified based on the type of security, taking into consideration factors utilized by market participants in valuing the investment, knowledge about the issuer and the current market environment.
Foreign currency translation
The accounting records of the Fund are maintained in U.S. dollars. The values of other assets and liabilities denominated in foreign currencies are translated into U.S. dollars at rates provided by an independent foreign currency pricing source at a time each business day specified by the Management Valuation Team. Purchases and sales of securities, and income and expenses are converted at the rate of exchange on the respective dates of such transactions. Net realized foreign exchange gains or losses arise from sales of foreign currencies, currency gains or losses realized between the trade and settlement dates on securities transactions, and the difference between the amounts of dividends, interest and foreign withholding taxes recorded and the U.S. dollar equivalent of the amounts actually paid or received. Net unrealized foreign exchange gains and losses arise from changes in the fair value of assets and liabilities other than investments in securities resulting from changes in exchange rates. The changes in net assets arising from changes in exchange rates and the changes in net assets resulting from changes in market prices of securities are not separately presented. Such changes are included in net realized and unrealized gains or losses from investments.
| | | | | | |
| Notes to financial statements (unaudited) | | Wells Fargo Advantage Emerging Markets Local Bond Fund | | | 17 | |
Forward foreign currency contracts
The Fund is subject to foreign currency exchange rate risk in the normal course of pursuing its investment objectives. A forward foreign currency contract is an agreement between two parties to purchase or sell a specific currency for an agreed-upon price at a future date. The Fund enters into forward foreign currency contracts to facilitate transactions in foreign-denominated securities and to attempt to minimize the risk to the Fund from adverse changes in the relationship between currencies. Forward foreign currency contracts are recorded at the forward rate and marked-to-market daily. When the contracts are closed, realized gains and losses arising from such transactions are recorded as realized gains or losses on forward foreign currency contract transactions. The Fund could be exposed to risks if the counterparties to the contracts are unable to meet the terms of their contracts or if the value of the foreign currency changes unfavorably. The Fund’s maximum risk of loss from counterparty credit risk is the unrealized gains on the contracts. This risk may be mitigated if there is a master netting arrangement between the Fund and the counterparty.
Security transactions and income recognition
Securities transactions are recorded on a trade date basis. Realized gains or losses are recorded on the basis of identified cost.
Interest income is accrued daily and bond discounts are accreted and premiums are amortized daily based on the effective interest method. To the extent debt obligations are placed on non-accrual status, any related interest income may be reduced by writing off interest receivables when the collection of all or a portion of interest has become doubtful based on consistently applied procedures. If the issuer subsequently resumes interest payments or when the collectability of interest is reasonably assured, the debt obligation is removed from non-accrual status.
Income from foreign securities is recorded net of foreign taxes withheld where recovery of such taxes is not assured.
Distributions to shareholders
Distributions to shareholders from net investment income and net realized gains, if any, are recorded on the ex-dividend date. Such distributions are determined in conformity with federal income tax regulations, which may differ in amount or character from net investment income and realized gains recognized for purposes of U.S. generally accepted accounting principles.
Federal and other taxes
The Fund intends to continue to qualify as a regulated investment company by distributing substantially all of its investment company taxable income and any net realized capital gains (after reduction for capital loss carryforwards) sufficient to relieve it from all, or substantially all, federal income taxes. Accordingly, no provision for federal income taxes was required.
The Fund’s income and federal excise tax returns and all financial records supporting those returns for the prior three fiscal years are subject to examination by the federal and Delaware revenue authorities. Management has analyzed the Fund’s tax positions taken on federal, state, and foreign tax returns for all open tax years and does not believe that there are any uncertain tax positions that require recognition of a tax liability.
As of October 31, 2014, the Fund had capital loss carryforwards which consist of $45,848 in short-term capital losses and $305,623 in long-term capital losses.
Class allocations
The separate classes of shares offered by the Fund differ principally in applicable sales charges, distribution, shareholder servicing, and administration fees. Class specific expenses are charged directly to that share class. Investment income, common expenses, and realized and unrealized gains (losses) on investments are allocated daily to each class of shares based on the relative proportion of net assets of each class.
3. FAIR VALUATION MEASUREMENTS
Fair value measurements of investments are determined within a framework that has established a fair value hierarchy based upon the various data inputs utilized in determining the value of the Fund’s investments. The three-level hierarchy gives the highest priority to unadjusted quoted prices in active markets for identical assets or liabilities (Level 1) and the lowest priority to significant unobservable inputs (Level 3). The Fund’s investments are classified within the fair value hierarchy based on the lowest level of input that is significant to the fair value measurement. The inputs are summarized into three broad levels as follows:
| | | | |
| 18 | | Wells Fargo Advantage Emerging Markets Local Bond Fund | | Notes to financial statements (unaudited) |
| n | | Level 1 – quoted prices in active markets for identical securities |
| n | | Level 2 – other significant observable inputs (including quoted prices for similar securities, interest rates, prepayment speeds, credit risk, use of amortized cost, etc.) |
| n | | Level 3 – significant unobservable inputs (including the Fund’s own assumptions in determining the fair value of investments) |
The inputs or methodologies used for valuing investments in securities are not necessarily an indication of the risk associated with investing in those securities.
The following is a summary of the inputs used in valuing the Fund’s assets and liabilities as of April 30, 2015:
| | | | | | | | | | | | | | | | |
| | | Quoted prices
(Level 1) | | | Other significant
observable inputs
(Level 2) | | | Significant
unobservable inputs
(Level 3) | | | Total | |
Assets | | | | | | | | | | | | | | | | |
Investments in: | | | | | | | | | | | | | | | | |
| | | | |
Foreign corporate bonds and notes | | $ | 0 | | | $ | 5,196,378 | | | $ | 0 | | | $ | 5,196,378 | |
| | | | |
Foreign government bonds | | | 0 | | | | 16,571,251 | | | | 0 | | | | 16,571,251 | |
| | | | |
Yankee corporate bonds and notes | | | 0 | | | | 393,500 | | | | 0 | | | | 393,500 | |
| | | | |
Short-term investments | | | | | | | | | | | | | | | | |
Investment companies | | | 1,149,022 | | | | 0 | | | | 0 | | | | 1,149,022 | |
| | | 1,149,022 | | | | 22,161,129 | | | | 0 | | | | 23,310,151 | |
| | | | |
Forward foreign currency contracts | | | 0 | | | | 137,235 | | | | 0 | | | | 137,235 | |
Total assets | | $ | 1,149,022 | | | $ | 22,298,364 | | | $ | 0 | | | $ | 23,447,386 | |
Liabilities | | | | | | | | | | | | | | | | |
| | | | |
Forward foreign currency contracts | | $ | 0 | | | $ | 193,142 | | | $ | 0 | | | $ | 193,142 | |
Total liabilities | | $ | 0 | | | $ | 193,142 | | | $ | 0 | | | $ | 193,142 | |
Forward foreign currency contracts are reported at their unrealized gains (losses) at measurement date, which represents the change in the contract’s value from trade date. All other assets and liabilities are reported at their market value at measurement date.
The Fund recognizes transfers between levels within the fair value hierarchy at the end of the reporting period. At April 30, 2015, the Fund did not have any transfers into/out of Level 1, Level 2, or Level 3.
4. TRANSACTIONS WITH AFFILIATES
Advisory fee
The Trust has entered into an advisory contract with Funds Management, an indirect wholly owned subsidiary of Wells Fargo & Company (“Wells Fargo”). The adviser is responsible for implementing investment policies and guidelines and for supervising the subadviser, who is responsible for day-to-day portfolio management of the Fund.
Pursuant to the contract, Funds Management is entitled to receive an annual advisory fee starting at 0.65% and declining to 0.55% as the average daily net assets of the Fund increase. For the six months ended April 30, 2015, the advisory fee was equivalent to an annual rate of 0.65% of the Fund’s average daily net assets.
Funds Management has retained the services of a subadviser to provide daily portfolio management to the Fund. The fee for subadvisory services is borne by Funds Management. First International Advisors, LLC, an affiliate of Funds Management and an indirect wholly owned subsidiary of Wells Fargo, is the subadviser to the Fund and is entitled to receive a fee from Funds Management at an annual rate starting at 0.45% and declining to 0.30% as the average daily net assets of the Fund increase.
Administration fees
The Trust has entered into an administration agreement with Funds Management. Under this agreement, for providing administrative services, which includes paying fees and expenses for services provided by the transfer agent, sub-transfer agents, omnibus account servicers and record-keepers, Funds Management is entitled to receive from the Fund an
| | | | | | |
| Notes to financial statements (unaudited) | | Wells Fargo Advantage Emerging Markets Local Bond Fund | | | 19 | |
annual fund level administration fee starting at 0.05% and declining to 0.03% as the average daily net assets of the Fund increase and a class level administration fee which is calculated based on the average daily net assets of each class as follows:
| | | | |
| | | Class level
administration fee | |
Class A, Class C | | | 0.16 | % |
Administrator Class | | | 0.10 | |
Institutional Class | | | 0.08 | |
Funds Management has contractually waived and/or reimbursed advisory and administration fees to the extent necessary to maintain certain net operating expense ratios for the Fund. Waiver of fees and/or reimbursement of expenses by Funds Management were made first from fund level expenses on a proportionate basis and then from class specific expenses. Funds Management has committed through February 29, 2016 to waive fees and/or reimburse expenses to the extent necessary to cap the Fund’s expenses at 1.23% for Class A shares, 1.98% for Class C shares, 1.10% for Administrator Class shares, and 0.90% for Institutional Class shares. After this time, the cap may be increased or the commitment to maintain the cap may be terminated only with the approval of the Board of Trustees.
Distribution fee
The Trust has adopted a Distribution Plan for Class C shares of the Fund pursuant to Rule 12b-1 under the 1940 Act. A distribution fee is charged to Class C shares and paid to Wells Fargo Funds Distributor, LLC, the principal underwriter, at an annual rate of 0.75% of the average daily net assets of Class C shares.
In addition, Funds Distributor is entitled to receive the front-end sales charge from the purchase of Class A shares and a contingent deferred sales charge on the redemption of certain Class A shares. Funds Distributor is also entitled to receive the contingent deferred sales charges from redemptions of Class C shares.
Shareholder servicing fees
The Trust has entered into contracts with one or more shareholder servicing agents, whereby Class A, Class C, and Administrator Class of the Fund is charged a fee at an annual rate of 0.25% of the average daily net assets of each respective class.
A portion of these total shareholder servicing fees were paid to affiliates of Wells Fargo.
5. INVESTMENT PORTFOLIO TRANSACTIONS
Purchases and sales of investments, excluding U.S. government obligations (if any) and short-term securities, for the six months ended April 30, 2015 were $12,199,094 and $11,702,564, respectively.
6. DERIVATIVE TRANSACTIONS
During the six months ended April 30, 2015, the Fund entered into forward foreign currency contracts for economic hedging purposes.
At April 30, 2015, the Fund had forward foreign currency contracts outstanding as follows:
Forward foreign currency contracts to buy:
| | | | | | | | | | | | | | | | | | |
| Exchange date | | Counterparty | | Contracts
to receive | | | U.S. value at
April 30, 2015 | | | In exchange
for U.S. $ | | | Unrealized
gains
(losses) | |
| 5-4-2015 | | State Street Bank | | | 14,550,000 | MXN | | $ | 948,377 | | | $ | 971,716 | | | $ | (23,339 | ) |
| 5-4-2015 | | State Street Bank | | | 450,000 | MXN | | | 29,331 | | | | 30,003 | | | | (672 | ) |
| 5-12-2015 | | State Street Bank | | | 3,500,000 | MYR | | | 982,112 | | | | 972,709 | | | | 9,403 | |
| 5-12-2015 | | State Street Bank | | | 1,650,000 | MYR | | | 462,995 | | | | 454,545 | | | | 8,450 | |
| 6-9-2015 | | State Street Bank | | | 5,200,000 | PLN | | | 1,442,793 | | | | 1,402,113 | | | | 40,680 | |
| 6-9-2015 | | State Street Bank | | | 1,750,000 | PLN | | | 485,555 | | | | 471,450 | | | | 14,105 | |
| 6-9-2015 | | State Street Bank | | | 4,350,000 | RON | | | 1,103,463 | | | | 1,102,718 | | | | 745 | |
| 6-12-2015 | | State Street Bank | | | 500,000 | ZAR | | | 41,769 | | | | 41,400 | | | | 369 | |
| | | | |
| 20 | | Wells Fargo Advantage Emerging Markets Local Bond Fund | | Notes to financial statements (unaudited) |
| | | | | | | | | | | | | | | | | | |
| Exchange date | | Counterparty | | Contracts
to receive | | | U.S. value at
April 30, 2015 | | | In exchange
for U.S. $ | | | Unrealized
gains
(losses) | |
| 6-12-2015 | | State Street Bank | | | 1,150,000 | BRL | | $ | 376,689 | | | $ | 352,555 | | | $ | 24,134 | |
| 6-12-2015 | | State Street Bank | | | 4,000,000 | ZAR | | | 334,150 | | | | 333,097 | | | | 1,053 | |
| 6-12-2015 | | State Street Bank | | | 665,000 | BRL | | | 217,825 | | | | 214,668 | | | | 3,157 | |
| 6-12-2015 | | State Street Bank | | | 1,750,000 | TRY | | | 647,367 | | | | 639,547 | | | | 7,820 | |
| 6-22-2015 | | State Street Bank | | | 24,500,000 | THB | | | 742,163 | | | | 750,544 | | | | (8,381 | ) |
Forward foreign currency contracts to sell:
| | | | | | | | | | | | | | | | | | |
| Exchange Date | | Counterparty | | Contracts
to deliver | | | U.S. value at
April 30, 2015 | | | In exchange
for U.S. $ | | | Unrealized
gains
(losses) | |
| 6-9-2015 | | State Street Bank | | | 2,150,000 | PLN | | $ | 596,540 | | | $ | 577,922 | | | $ | (18,618 | ) |
| 6-9-2015 | | State Street Bank | | | 35,25,000 | PLN | | | 978,047 | | | | 938,900 | | | | (39,147 | ) |
| 6-12-2015 | | State Street Bank | | | 45,00,000 | ZAR | | | 375,918 | | | | 363,152 | | | | (12,766 | ) |
| 6-12-2015 | | State Street Bank | | | 1,815,000 | BRL | | | 594,514 | | | | 558,204 | | | | (36,310 | ) |
| 6-12-2015 | | State Street Bank | | | 165,000 | TRY | | | 61,037 | | | | 62,188 | | | | 1,151 | |
| 6-12-2015 | | State Street Bank | | | 2,425,000 | TRY | | | 897,065 | | | | 905,368 | | | | 8,303 | |
| 6-9-2015 | | State Street Bank | | | 240,000,000 | HUF | | | 886,273 | | | | 862,735 | | | | (23,538 | ) |
| 6-9-2015 | | State Street Bank | | | 4,350,000 | RON | | | 1,103,463 | | | | 1,076,440 | | | | (27,023 | ) |
| 5-12-2015 | | State Street Bank | | | 710,000,000 | COP | | | 297,856 | | | | 294,508 | | | | (3,348 | ) |
| 5-4-2015 | | State Street Bank | | | 15,000,000 | MXN | | | 977,708 | | | | 995,573 | | | | 17,865 | |
The Fund had average contract amounts of $4,246,272 and $7,751,230 in forward foreign currency contracts to buy and forward foreign currency contracts to sell, respectively, during the six months ended April 30, 2015.
The fair value, realized gains or losses and change in unrealized gains or losses, if any, on derivative instruments are reflected in the appropriate financial statements.
For certain types of derivative transactions, the Fund has entered into International Swaps and Derivatives Association, Inc. master agreements (“ISDA Master Agreements”) or similar agreements with approved counterparties. The ISDA Master Agreements or similar agreements may have requirements to deliver/deposit securities or cash to/with an exchange or broker-dealer as collateral and allows the Fund to offset, with each counterparty, certain derivative financial instrument’s assets and/or liabilities with collateral held or pledged. Collateral requirements differ by type of derivative. Collateral or margin requirements are set by the broker or exchange clearing house for exchange traded derivatives while collateral terms are contract specific for over-the-counter traded derivatives. Cash collateral that has been pledged to cover obligations of the Fund under ISDA Master Agreements or similar agreements, if any, will be reported separately in the Statement of Assets and Liabilities. Securities pledged as collateral, if any, for the same purpose are noted in the Portfolio of Investments. With respect to balance sheet offsetting, absent an event of default by the counterparty or a termination of the agreement, the reported amounts of financial assets and financial liabilities in the Statement of Assets and Liabilities are not offset across transactions between the Fund and the applicable counterparty. A reconciliation of the gross amounts on the Statement of Assets and Liabilities to the net amounts by derivative type, including any collateral exposure, is as follows:
| | | | | | | | | | | | | | | | |
| Derivative type | | Counterparty | | Gross amounts
of assets in the
Statement of
Assets and
Liabilities | | Amounts
subject to
netting
agreements | | | Collateral
received | | | Net amount
of assets | |
Forward foreign currency contracts | | State Street Bank | | $137,235* | | $ | (137,235 | ) | | $ | 0 | | | $ | 0 | |
| * | Amount represents net unrealized gains. |
| | | | | | |
| Notes to financial statements (unaudited) | | Wells Fargo Advantage Emerging Markets Local Bond Fund | | | 21 | |
| | | | | | | | | | | | | | | | |
| Derivative type | | Counterparty | | Gross amounts
of liabilities in the
Statement of
Assets and
Liabilities | | Amounts
subject to
netting
agreements | | | Collateral
pledged | | | Net amount
of liabilities | |
Forward foreign currency contracts | | State Street Bank | | $193,142** | | $ | (137,235 | ) | | $ | 0 | | | $ | 55,907 | |
| ** | Amount represents net unrealized losses. |
7. BANK BORROWINGS
The Trust (excluding the money market funds and certain other funds in the Trust) and Wells Fargo Variable Trust are parties to a $150,000,000 revolving credit agreement whereby the Fund is permitted to use bank borrowings for temporary or emergency purposes, such as to fund shareholder redemption requests. Interest under the credit agreement is charged to the Fund based on a borrowing rate equal to the higher of the Federal Funds rate in effect on that day plus 1.25% or the overnight LIBOR rate in effect on that day plus 1.25%. In addition, an annual commitment fee equal to 0.10% of the unused balance is allocated to each participating fund. For the six months ended April 30, 2015, the Fund paid $23 in commitment fees.
For the six months ended April 30, 2015, there were no borrowings by the Fund under the agreement.
8. INDEMNIFICATION
Under the Trust’s organizational documents, the officers and Trustees have been granted certain indemnification rights against certain liabilities that may arise out of performance of their duties to the Trust. Additionally, in the normal course of business, the Trust may enter into contracts with service providers that contain a variety of indemnification clauses. The Trust’s maximum exposure under these arrangements is dependent on future claims that may be made against the Fund and, therefore, cannot be estimated.
9. FUND LIQUIDATION
At a meeting of the Board of Trustees held on June 15, 2015, the Trustees approved the liquidation of the Fund. The Fund is currently closed to new direct investors and additional investments from existing shareholders. Existing retirement plans, benefit plans and retirement plan platforms may continue to add new participants and make additional purchases until the Fund’s liquidation date. The liquidation of the Fund is expected to occur after close of business on or about July 17, 2015. Shareholders of the Fund on the date of liquidation will receive a distribution of their account proceeds, including any accrued dividends, in complete redemption of their shares.
| | | | |
| 22 | | Wells Fargo Advantage Emerging Markets Local Bond Fund | | Other information (unaudited) |
PROXY VOTING INFORMATION
A description of the policies and procedures that the Fund uses to determine how to vote proxies relating to portfolio securities is available, upon request, by calling 1-800-222-8222, visiting our website at wellsfargoadvantagefunds.com, or visiting the SEC website at sec.gov. Information regarding how the Fund voted proxies relating to portfolio securities during the most recent 12-month period ended June 30 is available on the Fund’s website at wellsfargoadvantagefunds.com or by visiting the SEC website at sec.gov.
PORTFOLIO HOLDINGS INFORMATION
The complete portfolio holdings for the Fund are publicly available monthly on the Fund’s website (wellsfargoadvantagefunds.com), on a one-month delayed basis. In addition, top ten holdings information (excluding derivative positions) for the Fund is publicly available on the Fund’s website on a monthly, seven-day or more delayed basis. The Fund files its complete schedule of portfolio holdings with the SEC for the first and third quarters of each fiscal year on Form N-Q, which is available by visiting the SEC website at sec.gov. In addition, the Fund’s Form N-Q may be reviewed and copied at the SEC’s Public Reference Room in Washington, DC, and at regional offices in New York City, at 233 Broadway, and in Chicago, at 175 West Jackson Boulevard, Suite 900. Information about the Public Reference Room may be obtained by calling 1-800-SEC-0330.
| | | | | | |
| Other information (unaudited) | | Wells Fargo Advantage Emerging Markets Local Bond Fund | | | 23 | |
BOARD OF TRUSTEES AND OFFICERS
Each of the Trustees and Officers1 listed in the table below acts in identical capacities for each fund in the Wells Fargo Advantage family of funds, which consists of 134 mutual funds comprising the Wells Fargo Funds Trust, Wells Fargo Variable Trust, Wells Fargo Master Trust and four closed-end funds (collectively the “Fund Complex”). This table should be read in conjunction with the Prospectus and the Statement of Additional Information2. The mailing address of each Trustee and Officer is 525 Market Street, 12th Floor, San Francisco, CA 94105. Each Trustee and Officer serves an indefinite term, however, each Trustee serves such term until reaching the mandatory retirement age established by the Trustees.
Independent Trustees
| | | | | | |
Name and year of birth | | Position held and length of service* | | Principal occupations during past five years or longer | | Other directorships during
past five years |
| William R. Ebsworth (Born 1957) | | Trustee, since 2015** | | Retired. From 1984 to 2013, equities analyst, portfolio manager, research director at Fidelity Management and Research Company and retired in 2013 as Chief Investment Officer of Fidelity Strategic Advisers, Inc. in Boston, Tokyo, and Hong Kong where he led a team of investment professionals managing client assets. Prior thereto, Board member of Hong Kong Securities Clearing Co., Hong Kong Options Clearing Corp., the Thailand International Fund, Ltd., Fidelity Investments Life Insurance Company, and Empire Fidelity Investments Life Insurance Company. Mr. Ebsworth is an Adjunct Lecturer, Finance, at Babson College and a Chartered Financial Analyst. | | Asset Allocation Trust |
| Jane A. Freeman (Born 1953) | | Trustee, since 2015** | | Retired. From 2012 to 2014 and 1999 to 2008, Chief Financial Officer of Scientific Learning Corporation. From 2008 to 2012, Ms. Freeman provided consulting services related to strategic business projects. Prior to 1999, Portfolio Manager at Rockefeller & Co. and Scudder, Stevens & Clark. Board member of the Harding Loevner Funds from 1996 to 2014, serving as both Lead Independent Director and chair of the Audit Committee. Board member of the Russell Exchange Traded Funds Trust from 2011 to 2012 and the chair of the Audit Committee. Ms. Freeman is a Chartered Financial Analyst (inactive), Chair of Taproot Foundation (non-profit organization) and a Board Member of Ruth Bancroft Garden (non-profit organization). | | Asset Allocation Trust |
| Peter G. Gordon (Born 1942) | | Trustee, since 1998; Chairman, since 2005 | | Co-Founder, Retired Chairman, President and CEO of Crystal Geyser Water Company. Trustee Emeritus, Colby College. | | Asset Allocation Trust |
| Isaiah Harris, Jr. (Born 1952) | | Trustee, since 2009 | | Retired. Chairman of the Board of CIGNA Corporation since 2009, and Director since 2005. From 2003 to 2011, Director of Deluxe Corporation. Prior thereto, President and CEO of BellSouth Advertising and Publishing Corp. from 2005 to 2007, President and CEO of BellSouth Enterprises from 2004 to 2005 and President of BellSouth Consumer Services from 2000 to 2003. Emeritus member of the Iowa State University Foundation Board of Governors. Emeritus Member of the Advisory Board of Iowa State University School of Business. Advisory Board Member, Palm Harbor Academy. Mr. Harris is a certified public accountant. | | CIGNA Corporation; Asset Allocation Trust |
| Judith M. Johnson (Born 1949) | | Trustee, since 2008;
Audit Committee Chairman, since 2008 | | Retired. Prior thereto, Chief Executive Officer and Chief Investment Officer of Minneapolis Employees Retirement Fund from 1996 to 2008. Ms. Johnson is an attorney, certified public accountant and a certified managerial accountant. | | Asset Allocation Trust |
| David F. Larcker (Born 1950) | | Trustee, since 2009 | | James Irvin Miller Professor of Accounting at the Graduate School of Business, Stanford University, Morgan Stanley Director of the Center for Leadership Development and Research and Senior Faculty of The Rock Center for Corporate Governance since 2006. From 2005 to 2008, Professor of Accounting at the Graduate School of Business, Stanford University. Prior thereto, Ernst & Young Professor of Accounting at The Wharton School, University of Pennsylvania from 1985 to 2005. | | Asset Allocation Trust |
| Olivia S. Mitchell (Born 1953) | | Trustee, since 2006 | | International Foundation of Employee Benefit Plans Professor, Wharton School of the University of Pennsylvania since 1993. Director of Wharton’s Pension Research Council and Boettner Center on Pensions & Retirement Research, and Research Associate at the National Bureau of Economic Research. Previously, Cornell University Professor from 1978 to 1993. | | Asset Allocation Trust |
| | | | |
| 24 | | Wells Fargo Advantage Emerging Markets Local Bond Fund | | Other information (unaudited) |
| | | | | | |
Name and year of birth | | Position held and length of service* | | Principal occupations during past five years or longer | | Other directorships during
past five years |
| Timothy J. Penny (Born 1951) | | Trustee, since 1996 | | President and Chief Executive Officer of Southern Minnesota Initiative Foundation, a non-profit organization, since 2007 and Senior Fellow at the Humphrey Institute Policy Forum at the University of Minnesota since 1995. Member of the Board of Trustees of NorthStar Education Finance, Inc., a non-profit organization, since 2007. | | Asset Allocation Trust |
| Michael S. Scofield (Born 1943) | | Trustee, since 2010 | | Served on the Investment Company Institute’s Board of Governors and Executive Committee from 2008-2011 as well the Governing Council of the Independent Directors Council from 2006-2011 and the Independent Directors Council Executive Committee from 2008-2011. Chairman of the IDC from 2008-2010. Institutional Investor (Fund Directions) Trustee of Year in 2007. Trustee of the Evergreen Funds complex (and its predecessors) from 1984 to 2010. Chairman of the Evergreen Funds from 2000-2010. Former Trustee of the Mentor Funds. Retired Attorney, Law Offices of Michael S. Scofield. | | Asset Allocation Trust |
| Donald C. Willeke (Born 1940) | | Trustee, since 1996 | | Principal of the law firm of Willeke & Daniels. General Counsel of the Minneapolis Employees Retirement Fund from 1984 until its consolidation into the Minnesota Public Employees Retirement Association on June 30, 2010. Director and Vice Chair of The Tree Trust (non-profit corporation). Director of the American Chestnut Foundation (non-profit corporation). | | Asset Allocation Trust |
| * | Length of service dates reflect the Trustee’s commencement of service with the Trust’s predecessor entities, where applicable. |
| ** | William R. Ebsworth and Jane A. Freeman each became a Trustee effective January 1, 2015. |
Officers
| | | | | | |
Name and year of birth | | Position held and
length of service | | Principal occupations during past five years or longer | | |
| Karla M. Rabusch (Born 1959) | | President, since 2003 | | Executive Vice President of Wells Fargo Bank, N.A. and President of Wells Fargo Funds Management, LLC since 2003. | | |
Nancy Wiser1
(Born 1967) | | Treasurer, since 2012 | | Executive Vice President of Wells Fargo Funds Management, LLC since 2011. Chief Operating Officer and Chief Compliance Officer at LightBox Capital Management LLC, from 2008 to 2011. Owned and operated a consulting business providing services to various hedge funds including acting as Chief Operating Officer and Chief Compliance Officer for a hedge fund from 2007 to 2008. Chief Operating Officer and Chief Compliance Officer of GMN Capital LLC from 2006 to 2007. | | |
| C. David Messman (Born 1960) | | Secretary, since 2000; Chief Legal Officer, since 2003 | | Senior Vice President and Secretary of Wells Fargo Funds Management, LLC since 2001. Assistant General Counsel of Wells Fargo Bank, N.A. since 2013 and Vice President and Managing Counsel of Wells Fargo Bank N.A. from 1996 to 2013. | | |
Debra Ann Early
(Born 1964) | | Chief Compliance Officer, since 2007 | | Senior Vice President of Wells Fargo Funds Management, LLC since 2007 and Chief Compliance Officer from 2007 to 2014. Chief Compliance Officer of Parnassus Investments from 2005 to 2007. Chief Financial Officer of Parnassus Investments from 2004 to 2007 and Senior Audit Manager of PricewaterhouseCoopers LLP from 1998 to 2004. | | |
David Berardi
(Born 1975) | | Assistant Treasurer, since 2009 | | Vice President of Wells Fargo Funds Management, LLC since 2009. Vice President of Evergreen Investment Management Company, LLC from 2008 to 2010. Assistant Vice President of Evergreen Investment Services, Inc. from 2004 to 2008. Manager of Fund Reporting and Control for Evergreen Investment Management Company, LLC from 2004 to 2010. | | |
| Jeremy DePalma1 (Born 1974) | | Assistant Treasurer, since 2009 | | Senior Vice President of Wells Fargo Funds Management, LLC since 2009. Senior Vice President of Evergreen Investment Management Company, LLC from 2008 to 2010. Vice President, Evergreen Investment Services, Inc. from 2004 to 2007. Head of the Fund Reporting and Control Team within Fund Administration from 2005 to 2010. | | |
| 1 | Nancy Wiser acts as Treasurer of 73 funds in the Fund Complex. Jeremy DePalma acts as Treasurer of 61 funds and Assistant Treasurer of 73 funds in the Fund Complex. |
| 2 | The Statement of Additional Information includes additional information about the Trustees and is available, without charge, upon request, by calling 1-800-222-8222 or by visiting the website at wellsfargoadvantagefunds.com. |
| | | | | | |
| List of abbreviations | | Wells Fargo Advantage Emerging Markets Local Bond Fund | | | 25 | |
The following is a list of common abbreviations for terms and entities that may have appeared in this report.
| ACA | — ACA Financial Guaranty Corporation |
| ADR | — American depositary receipt |
| ADS | — American depositary shares |
| AGC | — Assured Guaranty Corporation |
| AGM | — Assured Guaranty Municipal |
| Ambac | — Ambac Financial Group Incorporated |
| AMT | — Alternative minimum tax |
| BAN | — Bond anticipation notes |
| BHAC | — Berkshire Hathaway Assurance Corporation |
| CAB | — Capital appreciation bond |
| CCAB | — Convertible capital appreciation bond |
| CDA | — Community Development Authority |
| CDO | — Collateralized debt obligation |
| DRIVER | — Derivative inverse tax-exempt receipts |
| DW&P | — Department of Water & Power |
| DWR | — Department of Water Resources |
| ECFA | — Educational & Cultural Facilities Authority |
| EDA | — Economic Development Authority |
| EDFA | — Economic Development Finance Authority |
| ETF | — Exchange-traded fund |
| FDIC | — Federal Deposit Insurance Corporation |
| FFCB | — Federal Farm Credit Banks |
| FGIC | — Financial Guaranty Insurance Corporation |
| FHA | — Federal Housing Administration |
| FHLB | — Federal Home Loan Bank |
| FHLMC | — Federal Home Loan Mortgage Corporation |
| FICO | — The Financing Corporation |
| FNMA | — Federal National Mortgage Association |
| GDR | — Global depositary receipt |
| GNMA | — Government National Mortgage Association |
| HCFR | — Healthcare facilities revenue |
| HEFA | — Health & Educational Facilities Authority |
| HEFAR | — Higher education facilities authority revenue |
| HFA | — Housing Finance Authority |
| HFFA | — Health Facilities Financing Authority |
| HUD | — Department of Housing and Urban Development |
| IDA | — Industrial Development Authority |
| IDAG | — Industrial Development Agency |
| KRW | — Republic of Korea won |
| LIBOR | — London Interbank Offered Rate |
| LIFER | — Long Inverse Floating Exempt Receipts |
| LLC | — Limited liability company |
| LLLP | — Limited liability limited partnership |
| LLP | — Limited liability partnership |
| MBIA | — Municipal Bond Insurance Association |
| MFHR | — Multifamily housing revenue |
| MSTR | — Municipal securities trust receipts |
| MUD | — Municipal Utility District |
| National | — National Public Finance Guarantee Corporation |
| PCFA | — Pollution Control Financing Authority |
| PCL | — Public Company Limited |
| PCR | — Pollution control revenue |
| PFA | — Public Finance Authority |
| PFFA | — Public Facilities Financing Authority |
| PFOTER | — Puttable floating option tax-exempt receipts |
| plc | — Public limited company |
| PUTTER | — Puttable tax-exempt receipts |
| R&D | — Research & development |
| Radian | — Radian Asset Assurance |
| RAN | — Revenue anticipation notes |
| RDA | — Redevelopment Authority |
| RDFA | — Redevelopment Finance Authority |
| REIT | — Real estate investment trust |
| ROC | — Reset option certificates |
| SAVRS | — Select auction variable rate securities |
| SBA | — Small Business Authority |
| SDR | — Swedish depositary receipt |
| SFHR | — Single-family housing revenue |
| SFMR | — Single-family mortgage revenue |
| SPA | — Standby purchase agreement |
| SPDR | — Standard & Poor’s Depositary Receipts |
| SPEAR | — Short Puttable Exempt Adjustable Receipts |
| STRIPS | — Separate trading of registered interest and |
| TAN | — Tax anticipation notes |
| TIPS | — Treasury inflation-protected securities |
| TRAN | — Tax revenue anticipation notes |
| TTFA | — Transportation Trust Fund Authority |
| TVA | — Tennessee Valley Authority |
This page is intentionally left blank.
This page is intentionally left blank.
This page is intentionally left blank.


For more information
More information about Wells Fargo Advantage Funds is available free upon request. To obtain literature, please write, email, visit the Fund’s website, or call:
Wells Fargo Advantage Funds
P.O. Box 8266
Boston, MA 02266-8266
Email: wfaf@wellsfargo.com
Website: wellsfargoadvantagefunds.com
Individual investors: 1-800-222-8222
Retail investment professionals: 1-888-877-9275
Institutional investment professionals: 1-866-765-0778
This report and the financial statements contained herein are submitted for the general information of the shareholders of Wells Fargo Advantage Funds. If this report is used for promotional purposes, distribution of the report must be accompanied or preceded by a current prospectus. Before investing, please consider the investment objectives, risks, charges, and expenses of the investment. For a current prospectus and, if available, a summary prospectus, containing this information, call 1-800-222-8222 or visit the Fund’s website at wellsfargoadvantagefunds.com. Read the prospectus carefully before you invest or send money.
Wells Fargo Funds Management, LLC, a wholly owned subsidiary of Wells Fargo & Company, provides investment advisory and administrative services for Wells Fargo Advantage Funds. Other affiliates of Wells Fargo & Company provide subadvisory and other services for the Funds. The Funds are distributed by Wells Fargo Funds Distributor, LLC, Member FINRA/SIPC, an affiliate of Wells Fargo & Company.
NOT FDIC INSURED ¡ NO BANK GUARANTEE ¡ MAY LOSE VALUE
© 2015 Wells Fargo Funds Management, LLC. All rights reserved.
| | |
 | | 233647 06-15 SA261/SAR261 04-15 |

Wells Fargo Advantage International Bond Fund

Semi-Annual Report
April 30, 2015

Reduce clutter. Save trees.
Sign up for electronic delivery of prospectuses and shareholder reports at wellsfargo.com/advantagedelivery
Contents
The views expressed and any forward-looking statements are as of April 30, 2015, unless otherwise noted, and are those of the Fund managers and/or Wells Fargo Funds Management, LLC. Discussions of individual securities, or the markets generally, or any Wells Fargo Advantage Fund are not intended as individual recommendations. Future events or results may vary significantly from those expressed in any forward-looking statements; the views expressed are subject to change at any time in response to changing circumstances in the market. Wells Fargo Funds Management, LLC and the Fund disclaim any obligation to publicly update or revise any views expressed or forward-looking statements.
NOT FDIC INSURED ¡ NO BANK GUARANTEE ¡ MAY LOSE VALUE
| | | | |
| 2 | | Wells Fargo Advantage International Bond Fund | | Letter to shareholders (unaudited) |

Karla M. Rabusch
President
Wells Fargo Advantage Funds
A worldwide trend toward looser monetary policy tended to support global bond markets.
European bond markets were boosted by the anticipation and then the reality of the ECB’s asset purchases.
Dear Valued Shareholder:
We are pleased to offer you this semi-annual report for the Wells Fargo Advantage International Bond Fund for the six-month period that ended April 30, 2015. The period was marked by low global interest rates as major central banks initiated or increased their quantitative easing programs. At the end of the reporting period, some European sovereign debt issues were selling at negative yields. Low interest rates presented a favorable background for global bonds, including high yield.
Major central banks continued to provide liquidity to the markets.
A worldwide trend toward looser monetary policy tended to support global bond markets. The European Central Bank (ECB) maintained a variety of measures aimed at encouraging lending, including making funds available to banks at low interest rates and imposing a negative interest rate on bank deposits held at the central bank. In January 2015, the bank announced quantitative easing via significant bond purchases in an attempt to raise the eurozone’s inflation to just under its target of 2%. In Japan, the Bank of Japan (BOJ) also maintained an aggressive monetary program aimed at combating deflation. Later in the period, the BOJ widened its program by purchasing Japanese shares as well as bonds.
Throughout the reporting period, the Federal Open Market Committee (FOMC), which is the U.S. Federal Reserve’s (Fed’s) monetary policymaking body, kept its key interest rate effectively at zero. Even though the FOMC ended its bond-buying program in October 2014 and guided investors to expect an interest-rate hike in mid- to late 2015, the Fed remained accommodative. However, the fact that investors expected the Fed to eventually raise its key rate, even as other central banks lowered their benchmark rates, caused the U.S. dollar to appreciate against most major currencies during the period.
The U.S. outperformed other developed market economies, but a stronger U.S. dollar dampened returns on international assets for dollar-based investors.
Reported U.S. gross domestic product (GDP) growth came in at a solid 2.2% annualized rate in the fourth quarter of 2014. Although the initial estimate for annualized GDP growth came in at a modest 0.2% in the first quarter of 2015, the slowdown was attributed to short-term factors such as harsh winter weather and a long-lived strike at West Coast ports. Core U.S. bonds ended the period with a 2.06% return, as measured by the Barclays U.S. Aggregate Bond Index1.
High-yield bonds also benefited from the stronger economy, as well as continued demand from investors seeking more generous yields in a historically low-yielding environment. As measured by the BofA Merrill Lynch High Yield Master II Index2, high-yield bonds ended the period with a 1.51% gain.
European annualized GDP growth was 1.3% in the fourth quarter of 2014 and 1.4% in the first quarter of 2015. European bond markets were boosted by the anticipation and then the reality of the ECB’s asset purchases. The two-year German bond sold at a negative yield toward the latter half of the period. The flood of ECB-provided liquidity caused high-rated European sovereign bonds to sell at negative yields even in countries outside of the eurozone, such as Switzerland and Denmark. Japanese sovereign bonds also continued to trade at
| 1 | The Barclays U.S. Aggregate Bond Index is a broad-based benchmark that measures the investment-grade, U.S. dollar–denominated, fixed-rate taxable bond market, including Treasuries, government-related and corporate securities, MBS (agency fixed-rate and hybrid ARM pass-throughs), ABS, and CMBS. You cannot invest directly in an index. |
| 2 | The BofA Merrill Lynch High Yield Master II Index is a market-capitalization-weighted index of domestic and Yankee high-yield bonds. The index tracks the performance of high-yield securities traded in the U.S. bond market. You cannot invest directly in an index. |
| | | | | | |
| Letter to shareholders (unaudited) | | Wells Fargo Advantage International Bond Fund | | | 3 | |
ultralow yields because of ongoing purchases by the BOJ and major pension funds. Despite the favorable backdrop for international bonds, the appreciation in the U.S. dollar resulted in losses on international assets for dollar-based investors. The BofA Merrill Lynch Global Broad Market Ex. U.S. Index3, which tracks developed non-U.S. bond markets, returned -5.04% for the six-month period.
Don’t let short-term uncertainty derail long-term investment goals.
Periods of uncertainty can present challenges, but experience has taught us that maintaining long-term investment goals can be an effective way to plan for the future. To help you create a sound strategy based on your personal goals and risk tolerance, Wells Fargo Advantage Funds offers more than 100 mutual funds and other investments spanning a wide range of asset classes and investment styles. Although diversification cannot guarantee an investment profit or prevent losses, we believe it can be an effective way to manage investment risk and potentially smooth out overall portfolio performance. We encourage investors to know their investments and to understand that appropriate levels of risk-taking may unlock opportunities.
Thank you for choosing to invest with Wells Fargo Advantage Funds. We appreciate your confidence in us and remain committed to helping you meet your financial needs.
Sincerely,

Karla M. Rabusch
President
Wells Fargo Advantage Funds
For current information about your fund investments, contact your investment professional, visit our website at wellsfargoadvantagefunds.com, or call us directly at 1-800-222-8222. We are available 24 hours a day, 7 days a week.
| 3 | The BofA Merrill Lynch Global Broad Market Ex. U.S. Index tracks the performance of investment-grade debt publicly issued in the major domestic and euro bond markets, including sovereign, quasi-government, corporate, securitized, and collateralized securities, and excludes all securities denominated in U.S. dollars. You cannot invest directly in an index. |
| | | | |
| 4 | | Wells Fargo Advantage International Bond Fund | | Performance highlights (unaudited) |
Investment objective
The Fund seeks total return, consisting of income and capital appreciation.
Adviser
Wells Fargo Funds Management, LLC
Subadviser
First International Advisers, LLC
Portfolio managers
Michael Lee
Tony Norris
Alex Perrin
Christopher Wightman
Peter Wilson
Average annual total returns1 (%) as of April 30, 2015
| | | | | | | | | | | | | | | | | | | | | | | | | | | | | | | | | | |
| | | | | Including sales charge | | | Excluding sales charge | | | Expense ratios2 (%) | |
| | | Inception date | | 1 year | | | 5 year | | | 10 year | | | 1 year | | | 5 year | | | 10 year | | | Gross | | | Net3 | |
| Class A (ESIYX) | | 9-30-2003 | | | (11.07 | ) | | | 0.72 | | | | 2.94 | | | | (6.86 | ) | | | 1.65 | | | | 3.41 | | | | 1.05 | | | | 1.03 | |
| Class B (ESIUX)* | | 9-30-2003 | | | (12.15 | ) | | | 0.53 | | | | 2.89 | | | | (7.54 | ) | | | 0.89 | | | | 2.89 | | | | 1.80 | | | | 1.78 | |
| Class C (ESIVX) | | 9-30-2003 | | | (8.44 | ) | | | 0.90 | | | | 2.66 | | | | (7.44 | ) | | | 0.90 | | | | 2.66 | | | | 1.80 | | | | 1.78 | |
| Class R6 (ESIRX) | | 11-30-2012 | | | – | | | | – | | | | – | | | | (6.47 | ) | | | 2.01 | | | | 3.74 | | | | 0.67 | | | | 0.65 | |
| Administrator Class (ESIDX) | | 7-30-2010 | | | – | | | | – | | | | – | | | | (6.69 | ) | | | 1.82 | | | | 3.58 | | | | 0.99 | | | | 0.85 | |
| Institutional Class (ESICX) | | 12-15-1993 | | | – | | | | – | | | | – | | | | (6.44 | ) | | | 1.98 | | | | 3.72 | | | | 0.72 | | | | 0.70 | |
| BofA Merrill Lynch Global Broad Market Ex. U.S. Index4 | | – | | | – | | | | – | | | | – | | | | (9.72 | ) | | | 1.30 | | | | 2.76 | | | | – | | | | – | |
| * | | Class B shares are closed to investment, except in connection with the reinvestment of any distributions and permitted exchanges. |
Figures quoted represent past performance, which is no guarantee of future results, and do not reflect taxes that a shareholder may pay on fund distributions or the redemption of fund shares. Investment return and principal value of an investment will fluctuate so that an investor’s shares, when redeemed, may be worth more or less than their original cost. Performance shown without sales charges would be lower if sales charges were reflected. Current performance may be lower or higher than the performance data quoted, which assumes the reinvestment of dividends and capital gains. Current month-end performance is available on the Fund’s website, wellsfargoadvantagefunds.com.
Index returns do not include transaction costs associated with buying and selling securities, any mutual fund fees or expenses, or any taxes. It is not possible to invest directly in an index.
For Class A shares, the maximum front-end sales charge is 4.50%. For Class B shares, the maximum contingent deferred sales charge is 5.00%. For Class C shares, the maximum contingent deferred sales charge is 1.00%. Performance including a contingent deferred sales charge assumes the sales charge for the corresponding time period. Class R6, Administrator Class, and Institutional Class shares are sold without a front-end sales charge or contingent deferred sales charge.
Bond values fluctuate in response to the financial condition of individual issuers, general market and economic conditions, and changes in interest rates. Changes in market conditions and government policies may lead to periods of heightened volatility in the bond market and reduced liquidity for certain bonds held by the Fund. In general, when interest rates rise, bond values fall and investors may lose principal value. Interest-rate changes and their impact on the fund and its share price can be sudden and unpredictable. Foreign investments are especially volatile and can rise or fall dramatically due to differences in the political and economic conditions of the host country. These risks are generally intensified in emerging markets. The use of derivatives may reduce returns and/or increase volatility. Securities issued by U.S. government agencies or government-sponsored entities may not be guaranteed by the U.S. Treasury. Certain investment strategies tend to increase the total risk of an investment (relative to the broader market). The Fund is exposed to high-yield securities risk and geographic risk. Consult the Fund’s prospectus for additional information on these and other risks.
Please see footnotes on page 5.
| | | | | | |
| Performance highlights (unaudited) | | Wells Fargo Advantage International Bond Fund | | | 5 | |
| | | | |
| Ten largest holdings5 (%) as of April 30, 2015 | |
Bonos y Obligaciones del Estado, 1.60%, 4-30-2025 | | | 8.26 | |
Poland, 4.00%, 10-25-2023 | | | 4.61 | |
Mexico, 4.75%, 6-14-2018 | | | 4.38 | |
U.S. Treasury Note , 1.50%, 1-31-2022 | | | 4.17 | |
United Kingdom Gilt, 2.75%, 9-7-2024 | | | 4.02 | |
New Zealand, 5.50%, 4-15-2023 | | | 3.93 | |
Italy Buoni Poliennali del Tesoro, 2.50%, 12-1-2024 | | | 3.46 | |
Brazil, 10.00%, 1-1-2017 | | | 3.16 | |
Australia, 3.25%, 10-21-2018 | | | 2.97 | |
Malaysia, 3.80%, 9-30-2022 | | | 2.82 | |
|
| Portfolio allocation6 as of April 30, 2015 |
|
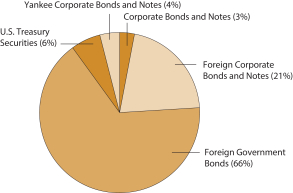 |
| 1 | Historical performance shown for Administrator Class shares prior to their inception reflects the performance of Institutional Class shares and has been adjusted to reflect the higher expenses applicable to Administrator Class shares. Historical performance shown for Class R6 shares prior to their inception reflects the performance of Institutional Class shares and includes the higher expenses applicable to Institutional Class shares. If these expenses had not been included, returns would be higher. Historical performance shown for all classes of the Fund prior to July 12, 2010, is based on the performance of the Fund’s predecessor, Evergreen International Bond Fund. |
| 2 | Reflects the expense ratios as stated in the most recent prospectuses. The expense ratios shown are subject to change and may differ from the annualized expense ratios shown in the financial highlights of this report. |
| 3 | The Adviser has committed through February 29, 2016, to waive fees and/or reimburse expenses to the extent necessary to cap the Fund’s Total Annual Fund Operating Expenses After Fee Waiver, excluding certain expenses, at the amounts shown. After this time, the cap may be increased or the commitment to maintain the cap may be terminated only with the approval of the Board of Trustees. Brokerage commissions, stamp duty fees, interest, taxes, acquired fund fees and expenses, and extraordinary expenses are excluded from the cap. Without this cap, the Fund’s returns would have been lower. |
| 4 | The BofA Merrill Lynch Global Broad Market Ex. U.S. Index tracks the performance of investment-grade debt publicly issued in the major domestic and euro bond markets, including sovereign, quasi-government, corporate, securitized, and collateralized securities, and excludes all securities denominated in U.S. dollars. You cannot invest directly in an index. |
| 5 | The ten largest holdings, excluding cash and cash equivalents, are calculated based on the value of the investments divided by total net assets of the Fund. Holdings are subject to change and may have changed since the date specified. |
| 6 | Amounts are calculated based on the total long-term investments of the Fund. These percentages are subject to change and may have changed since the date specified. |
| | | | |
| 6 | | Wells Fargo Advantage International Bond Fund | | Fund expenses (unaudited) |
As a shareholder of the Fund, you incur two types of costs: (1) transaction costs, including sales charges (loads) on purchase payments and contingent deferred sales charges (if any) on redemptions and (2) ongoing costs, including management fees, distribution (12b-1) and/or shareholder service fees, and other Fund expenses. This example is intended to help you understand your ongoing costs (in dollars) of investing in the Fund and to compare these costs with the ongoing costs of investing in other mutual funds.
The example is based on an investment of $1,000 invested at the beginning of the six-month period and held for the entire period from November 1, 2014 to April 30, 2015.
Actual expenses
The “Actual” line of the table below provides information about actual account values and actual expenses. You may use the information in this line, together with the amount you invested, to estimate the expenses that you paid over the period. Simply divide your account value by $1,000 (for example, an $8,600 account value divided by $1,000 = 8.6), then multiply the result by the number in the “Actual” line under the heading entitled “Expenses paid during period” for your applicable class of shares to estimate the expenses you paid on your account during this period.
Hypothetical example for comparison purposes
The “Hypothetical” line of the table below provides information about hypothetical account values and hypothetical expenses based on the Fund’s actual expense ratio and an assumed rate of return of 5% per year before expenses, which is not the Fund’s actual return. The hypothetical account values and expenses may not be used to estimate the actual ending account balance or expenses you paid for the period. You may use this information to compare the ongoing costs of investing in the Fund and other funds. To do so, compare this 5% hypothetical example with the 5% hypothetical examples that appear in the shareholder reports of the other funds.
Please note that the expenses shown in the table are meant to highlight your ongoing costs only and do not reflect any transactional costs, such as sales charges (loads) and contingent deferred sales charges. Therefore, the “Hypothetical” line of the table is useful in comparing ongoing costs only and will not help you determine the relative total costs of owning different funds. In addition, if these transactional costs were included, your costs would have been higher.
| | | | | | | | | | | | | | | | |
| | | Beginning
account value
11-1-2014 | | | Ending
account value
4-30-2015 | | | Expenses
paid during
the period¹ | | | Net annualized
expense ratio | |
Class A | | | | | | | | | | | | | | | | |
Actual | | $ | 1,000.00 | | | $ | 957.02 | | | $ | 5.00 | | | | 1.03 | % |
Hypothetical (5% return before expenses) | | $ | 1,000.00 | | | $ | 1,019.69 | | | $ | 5.16 | | | | 1.03 | % |
Class B | | | | | | | | | | | | | | | | |
Actual | | $ | 1,000.00 | | | $ | 952.80 | | | $ | 8.57 | | | | 1.77 | % |
Hypothetical (5% return before expenses) | | $ | 1,000.00 | | | $ | 1,016.02 | | | $ | 8.85 | | | | 1.77 | % |
Class C | | | | | | | | | | | | | | | | |
Actual | | $ | 1,000.00 | | | $ | 954.18 | | | $ | 8.62 | | | | 1.78 | % |
Hypothetical (5% return before expenses) | | $ | 1,000.00 | | | $ | 1,015.97 | | | $ | 8.90 | | | | 1.78 | % |
Class R6 | | | | | | | | | | | | | | | | |
Actual | | $ | 1,000.00 | | | $ | 959.21 | | | $ | 3.16 | | | | 0.65 | % |
Hypothetical (5% return before expenses) | | $ | 1,000.00 | | | $ | 1,021.57 | | | $ | 3.26 | | | | 0.65 | % |
Administrator Class | | | | | | | | | | | | | | | | |
Actual | | $ | 1,000.00 | | | $ | 957.53 | | | $ | 4.13 | | | | 0.85 | % |
Hypothetical (5% return before expenses) | | $ | 1,000.00 | | | $ | 1,020.58 | | | $ | 4.26 | | | | 0.85 | % |
Institutional Class | | | | | | | | | | | | | | | | |
Actual | | $ | 1,000.00 | | | $ | 959.04 | | | $ | 3.40 | | | | 0.70 | % |
Hypothetical (5% return before expenses) | | $ | 1,000.00 | | | $ | 1,021.32 | | | $ | 3.51 | | | | 0.70 | % |
| 1 | Expenses paid is equal to the annualized expense ratio of each class multiplied by the average account value over the period, multiplied by the number of days in the most recent fiscal half-year divided by the number of days in the fiscal year (to reflect the one-half-year period). |
| | | | | | |
| Portfolio of investments—April 30, 2015 (unaudited) | | Wells Fargo Advantage International Bond Fund | | | 7 | |
| | | | | | | | | | | | | | | | |
| | | | |
| Security name | | Interest rate | | | Maturity date | | | Principal | | | Value | |
| | | | | | | | | | | | | | | | |
| | | | |
Corporate Bonds and Notes: 2.66% | | | | | | | | | | | | | | | | |
| | | | |
| United States: 2.66% | | | | | | | | | | | | | | | | |
Amazon.com Incorporated (Consumer Discretionary, Internet & Catalog Retail) | | | 3.80 | % | | | 12-5-2024 | | | $ | 5,800,000 | | | $ | 6,035,851 | |
Arrow Electronics Incorporated (Information Technology, Electronic Equipment, Instruments & Components) | | | 3.50 | | | | 4-1-2022 | | | | 5,775,000 | | | | 5,773,464 | |
AT&T Incorporated (Telecommunication Services, Diversified Telecommunication Services) %% | | | 3.00 | | | | 6-30-2022 | | | | 5,950,000 | | | | 5,914,032 | |
Ford Motor Credit Company LLC (Consumer Discretionary, Automobiles) | | | 2.46 | | | | 3-27-2020 | | | | 2,600,000 | | | | 2,596,745 | |
Glencore Funding LLC (Materials, Metals & Mining) 144A | | | 4.00 | | | | 4-16-2025 | | | | 5,625,000 | | | | 5,520,488 | |
Lam Research Corporation (Information Technology, Semiconductors & Semiconductor Equipment) | | | 3.80 | | | | 3-15-2025 | | | | 6,000,000 | | | | 5,979,948 | |
NBCUniversal Media LLC (Consumer Discretionary, Media) | | | 2.88 | | | | 1-15-2023 | | | | 1,265,000 | | | | 1,278,894 | |
| | | | |
Total Corporate Bonds and Notes (Cost $33,265,565) | | | | | | | | | | | | | | | 33,099,422 | |
| | | | | | | | | | | | | | | | |
| | | | |
Foreign Corporate Bonds and Notes @: 20.68% | | | | | | | | | | | | | | | | |
| | | | |
| Australia: 0.78% | | | | | | | | | | | | | | | | |
General Electric Capital Corporation (Financials, Diversified Financial Services, AUD) | | | 6.00 | | | | 3-15-2019 | | | | 1,367,000 | | | | 1,197,493 | |
Telstra Corporation Limited (Telecommunication Services, Diversified Telecommunication Services, EUR) | | | 3.75 | | | | 5-16-2022 | | | | 2,782,000 | | | | 3,727,858 | |
Transurban Finance Company Limited (Financials, Diversified Financial Services, EUR) | | | 1.88 | | | | 9-16-2024 | | | | 4,090,000 | | | | 4,787,461 | |
| | | | |
| | | | | | | | | | | | | | | 9,712,812 | |
| | | | | | | | | | | | | | | | |
| | | | |
| Bermuda: 0.52% | | | | | | | | | | | | | | | | |
Bacardi Limited (Consumer Staples, Beverages, EUR) | | | 2.75 | | | | 7-3-2023 | | | | 5,204,000 | | | | 6,453,732 | |
| | | | | | | | | | | | | | | | |
| | | | |
| Brazil: 0.29% | | | | | | | | | | | | | | | | |
BRF SA (Consumer Staples, Food Products, BRL) 144A | | | 7.75 | | | | 5-22-2018 | | | | 13,137,000 | | | | 3,597,147 | |
| | | | | | | | | | | | | | | | |
| | | | |
| Cayman Islands: 0.35% | | | | | | | | | | | | | | | | |
Brakes Capital (Consumer Discretionary, Diversified Consumer Services, GBP) | | | 7.13 | | | | 12-15-2018 | | | | 1,950,000 | | | | 3,053,354 | |
Brakes Capital (Consumer Discretionary, Diversified Consumer Services, GBP) 144A | | | 7.13 | | | | 12-15-2018 | | | | 825,000 | | | | 1,291,803 | |
| | | | |
| | | | | | | | | | | | | | | 4,345,157 | |
| | | | | | | | | | | | | | | | |
| | | | |
| Czech Republic: 0.75% | | | | | | | | | | | | | | | | |
EP Energy LLC (Energy, Oil, Gas & Consumable Fuels, EUR) | | | 5.88 | | | | 11-1-2019 | | | | 7,295,000 | | | | 9,392,534 | |
| | | | | | | | | | | | | | | | |
| | | | |
| France: 0.73% | | | | | | | | | | | | | | | | |
Autoroutes Du Sud de la France SA (Industrials, Transportation Infrastructure, EUR) | | | 2.95 | | | | 1-17-2024 | | | | 7,100,000 | | | | 9,105,344 | |
| | | | | | | | | | | | | | | | |
| | | | |
| Germany: 2.48% | | | | | | | | | | | | | | | | |
HP Pelzer Holdings GmbH (Consumer Discretionary, Auto Components, EUR) 144A | | | 7.50 | | | | 7-15-2021 | | | | 2,665,000 | | | | 3,231,787 | |
KfW (Financials, Banks, TRY) | | | 5.00 | | | | 1-16-2017 | | | | 3,745,000 | | | | 1,299,666 | |
KfW (Financials, Banks, AUD) | | | 5.00 | | | | 3-19-2024 | | | | 16,755,000 | | | | 15,199,260 | |
KfW (Financials, Banks, AUD) | | | 5.50 | | | | 2-9-2022 | | | | 4,000,000 | | | | 3,665,819 | |
Landwirtschaftliche Rentenbank (Financials, Banks, ZAR) | | | 8.25 | | | | 5-23-2022 | | | | 5,400,000 | | | | 452,472 | |
Rapid Holding GmbH (Energy, Energy Equipment & Services, EUR) 144A | | | 6.63 | | | | 11-15-2020 | | | | 2,100,000 | | | | 2,329,689 | |
Volkswagen Leasing GmbH Company (Financials, Consumer Finance, EUR) | | | 2.63 | | | | 1-15-2024 | | | | 3,726,000 | | | | 4,716,203 | |
| | | | |
| | | | | | | | | | | | | | | 30,894,896 | |
| | | | | | | | | | | | | | | | |
The accompanying notes are an integral part of these financial statements.
| | | | |
| 8 | | Wells Fargo Advantage International Bond Fund | | Portfolio of investments—April 30, 2015 (unaudited) |
| | | | | | | | | | | | | | | | |
| | | | |
| Security name | | Interest rate | | | Maturity date | | | Principal | | | Value | |
| | | | | | | | | | | | | | | | |
| | | | |
| Ireland: 0.79% | | | | | | | | | | | | | | | | |
GE Capital UK Funding Company (Financials, Capital Markets GBP) | | | 5.13 | % | | | 5-24-2023 | | | | 1,000,000 | | | $ | 1,815,412 | |
GE Capital UK Funding Company (Financials, Capital Markets, GBP) | | | 4.13 | | | | 9-13-2023 | | | | 4,700,000 | | | | 8,029,375 | |
| | | | |
| | | | | | | | | | | | | | | 9,844,787 | |
| | | | | | | | | | | | | | | | |
| | | | |
| Luxembourg: 1.25% | | | | | | | | | | | | | | | | |
Befesa Zinc Aser SA (Utilities, Water Utilities, EUR) | | | 8.88 | | | | 5-15-2018 | | | | 2,925,000 | | | | 3,432,131 | |
European Investment Bank (Financials, Banks, NZD) | | | 4.75 | | | | 1-22-2019 | | | | 10,116,000 | | | | 8,005,779 | |
European Investment Bank (Financials, Banks, ZAR) | | | 9.00 | | | | 3-31-2021 | | | | 5,790,000 | | | | 505,787 | |
Gestamp Funding Luxembourg SA (Consumer Discretionary, Auto Components, EUR) | | | 5.88 | | | | 5-31-2020 | | | | 1,485,000 | | | | 1,759,141 | |
Play Finance 2 SA (Telecommunication Services, Wireless Telecommunication Services, EUR) 144A | | | 5.25 | | | | 2-1-2019 | | | | 1,600,000 | | | | 1,860,877 | |
| | | | |
| | | | | | | | | | | | | | | 15,563,715 | |
| | | | | | | | | | | | | | | | |
| | | | |
| Mexico: 0.69% | | | | | | | | | | | | | | | | |
America Movil SAB de CV (Telecommunication Services, Wireless Telecommunication Services, EUR) | | | 3.00 | | | | 7-12-2021 | | | | 5,836,000 | | | | 7,327,970 | |
America Movil SAB de CV (Telecommunication Services, Wireless Telecommunication Services, MXN) | | | 7.13 | | | | 12-9-2024 | | | | 9,750,000 | | | | 629,537 | |
Petroleos Mexicanos (Energy, Oil, Gas & Consumable Fuels, MXN) 144A | | | 7.19 | | | | 9-12-2024 | | | | 9,532,000 | | | | 602,662 | |
| | | | |
| | | | | | | | | | | | | | | 8,560,169 | |
| | | | | | | | | | | | | | | | |
| | | | |
| Netherlands: 0.91% | | | | | | | | | | | | | | | | |
ASML Holding NV (Information Technology, Semiconductors & Semiconductor Equipment, EUR) | | | 3.38 | | | | 9-19-2023 | | | | 400,000 | | | | 524,892 | |
Grupo Isolux Corsan Finance BV (Industrials, Construction & Engineering, EUR) 144A | | | 6.63 | | | | 4-15-2021 | | | | 2,400,000 | | | | 2,307,457 | |
Heineken NV (Consumer Staples, Beverages, EUR) | | | 2.13 | | | | 8-4-2020 | | | | 2,236,000 | | | | 2,689,255 | |
Samvardhana Motherson Automotive Systems Group (Consumer Discretionary, Auto Components, EUR) 144A | | | 4.13 | | | | 7-15-2021 | | | | 1,800,000 | | | | 2,066,813 | |
Schaeffler Finance BV (Financials, Diversified Financial Services, EUR) | | | 3.50 | | | | 5-15-2022 | | | | 3,200,000 | | | | 3,700,913 | |
| | | | |
| | | | | | | | | | | | | | | 11,289,330 | |
| | | | | | | | | | | | | | | | |
| | | | |
| Norway: 0.99% | | | | | | | | | | | | | | | | |
Kommunalbanken AS (Financials, Banks, AUD) | | | 5.25 | | | | 7-15-2024 | | | | 12,650,000 | | | | 11,621,223 | |
Lock AS (Financials, Diversified Financial Services, EUR) 144A | | | 7.00 | | | | 8-15-2021 | | | | 600,000 | | | | 731,730 | |
| | | | |
| | | | | | | | | | | | | | | 12,352,953 | |
| | | | | | | | | | | | | | | | |
| | | | |
| Philippines: 0.65% | | | | | | | | | | | | | | | | |
Asian Development Bank (Financials, Banks, AUD) | | | 3.75 | | | | 3-12-2025 | | | | 9,731,000 | | | | 8,082,103 | |
| | | | | | | | | | | | | | | | |
| | | | |
| Spain: 1.41% | | | | | | | | | | | | | | | | |
Gas Natural Fenosa (Energy, Oil, Gas & Consumable Fuels, EUR) | | | 2.88 | | | | 3-11-2024 | | | | 1,000,000 | | | | 1,269,138 | |
Gas Natural Fenosa (Energy, Oil, Gas & Consumable Fuels, EUR) | | | 3.88 | | | | 4-11-2022 | | | | 2,200,000 | | | | 2,919,318 | |
Isolux Corsan BV (Industrials, Construction & Engineering, EUR) | | | 6.63 | | | | 4-15-2021 | | | | 1,200,000 | | | | 1,153,728 | |
Portaventura Entertainment Barcelona BV (Consumer Discretionary, Hotels, Restaurants & Leisure, EUR) 144A | | | 7.25 | | | | 12-1-2020 | | | | 750,000 | | | | 886,404 | |
Portaventura Entertainment Barcelona BV (Consumer Discretionary, Hotels, Restaurants & Leisure, EUR) | | | 7.25 | | | | 12-1-2020 | | | | 2,000,000 | | | | 2,363,743 | |
Telefonica Emisiones S.A.U. (Telecommunication Services, Diversified Telecommunication Services, GBP) | | | 5.29 | | | | 12-9-2022 | | | | 5,100,000 | | | | 9,017,177 | |
| | | | |
| | | | | | | | | | | | | | | 17,609,508 | |
| | | | | | | | | | | | | | | | |
The accompanying notes are an integral part of these financial statements.
| | | | | | |
| Portfolio of investments—April 30, 2015 (unaudited) | | Wells Fargo Advantage International Bond Fund | | | 9 | |
| | | | | | | | | | | | | | | | |
| | | | |
| Security name | | Interest rate | | | Maturity date | | | Principal | | | Value | |
| | | | | | | | | | | | | | | | |
| | | | |
| United Kingdom: 4.54% | | | | | | | | | | | | | | | | |
AA Bond Company Limited (Financials, Diversified Financial Services, GBP) | | | 4.25 | % | | | 7-31-2043 | | | | 3,495,000 | | | $ | 5,668,741 | |
Brighthouse Group plc (Consumer Discretionary, Specialty Retail, GBP) « | | | 7.88 | | | | 5-15-2018 | | | | 2,300,000 | | | | 3,340,735 | |
Delphi Automotive plc (Consumer Discretionary, Auto Components, EUR) | | | 1.50 | | | | 3-10-2025 | | | | 3,100,000 | | | | 3,487,553 | |
FirstGroup plc (Industrials, Road & Rail, GBP) | | | 5.25 | | | | 11-29-2022 | | | | 3,020,000 | | | | 5,079,242 | |
GHD Bondco plc (Consumer Discretionary, Distributors, GBP) | | | 7.00 | | | | 4-15-2020 | | | | 1,975,000 | | | | 2,728,462 | |
Heathrow Funding Limited (Industrials, Transportation Infrastructure, EUR) | | | 1.88 | | | | 5-23-2024 | | | | 2,561,000 | | | | 3,036,636 | |
Heathrow Funding Limited (Industrials, Transportation Infrastructure, GBP) | | | 7.13 | | | | 2-14-2024 | | | | 1,900,000 | | | | 3,706,106 | |
Imperial Tobacco Finance Company (Consumer Staples, Tobacco, EUR) | | | 2.25 | | | | 2-26-2021 | | | | 4,669,000 | | | | 5,546,803 | |
Ineos Finance plc (Financials, Diversified Financial Services, EUR) 144A%% | | | 4.00 | | | | 5-1-2023 | | | | 3,150,000 | | | | 3,497,186 | |
Jaguar Land Rover plc (Consumer Discretionary, Automobiles, GBP) 144A | | | 3.88 | | | | 3-1-2023 | | | | 400,000 | | | | 612,170 | |
Jaguar Land Rover plc (Consumer Discretionary, Automobiles, GBP) | | | 5.00 | | | | 2-15-2022 | | | | 1,000,000 | | | | 1,644,955 | |
R&R Ice Cream plc (Consumer Staples, Food & Staples Retailing, GBP) | | | 5.50 | | | | 5-15-2020 | | | | 1,810,000 | | | | 2,858,227 | |
TES Finance plc (Financials, Diversified Financial Services, GBP) | | | 6.75 | | | | 7-15-2020 | | | | 1,750,000 | | | | 2,713,112 | |
Tesco plc (Consumer Staples, Food & Staples Retailing, GBP) | | | 6.13 | | | | 2-24-2022 | | | | 3,400,000 | | | | 5,795,666 | |
Twinkle Pizza plc (Consumer Discretionary, Hotels, Restaurants & Leisure, GBP) | | | 6.63 | | | | 8-1-2021 | | | | 2,450,000 | | | | 3,957,940 | |
United Utilities Water plc (Utilities, Water Utilities, GBP) | | | 5.75 | | | | 3-25-2022 | | | | 1,200,000 | | | | 2,208,128 | |
Wagamama Finance plc (Financials, Diversified Financial Services, GBP) 144A | | | 7.88 | | | | 2-1-2020 | | | | 450,000 | | | | 718,380 | |
| | | | |
| | | | | | | | | | | | | | | 56,600,042 | |
| | | | | | | | | | | | | | | | |
| | | | |
| United States: 3.55% | | | | | | | | | | | | | | | | |
Albemarle Corporation (Materials, Chemicals, EUR) | | | 1.88 | | | | 12-8-2021 | | | | 3,910,000 | | | | 4,467,156 | |
Amgen Incorporated (Health Care, Biotechnology, EUR) | | | 4.00 | | | | 9-13-2029 | | | | 3,500,000 | | | | 5,690,378 | |
Discovery Communications Company (Consumer Discretionary, Media, EUR) | | | 1.90 | | | | 3-19-2027 | | | | 4,800,000 | | | | 5,216,703 | |
Iron Mountain Incorporated (Industrials, Commercial Services & Supplies, EUR) | | | 6.75 | | | | 10-15-2018 | | | | 1,868,000 | | | | 2,100,001 | |
Morgan Stanley (Financials, Capital Markets, EUR) | | | 1.75 | | | | 1-30-2025 | | | | 5,750,000 | | | | 6,571,691 | |
Priceline Group Incorporated (Consumer Discretionary, Internet & Catalog Retail, EUR) | | | 1.80 | | | | 3-3-2027 | | | | 1,970,000 | | | | 2,148,251 | |
Priceline Group Incorporated (Consumer Discretionary, Internet & Catalog Retail, EUR) | | | 2.38 | | | | 9-23-2024 | | | | 5,659,000 | | | | 6,692,760 | |
Verizon Communications Incorporated (Telecommunication Services, Diversified Telecommunication Services, EUR) | | | 3.25 | | | | 2-17-2026 | | | | 5,864,000 | | | | 7,748,525 | |
Walgreens Boots Alliance Incorporated (Consumer Staples, Food & Staples Retailing, EUR) | | | 3.60 | | | | 11-20-2025 | | | | 2,250,000 | | | | 3,531,838 | |
| | | | |
| | | | | | | | | | | | | | | 44,167,303 | |
| | | | | | | | | | | | | | | | |
| | | | |
Total Foreign Corporate Bonds and Notes (Cost $275,274,254) | | | | | | | | | | | | | | | 257,571,532 | |
| | | | | | | | | | | | | | | | |
| | | | |
Foreign Government Bonds @: 65.38% | | | | | | | | | | | | | | | | |
Australia (AUD) | | | 3.25 | | | | 10-21-2018 | | | | 44,815,000 | | | | 36,984,717 | |
Australia (AUD) | | | 3.25 | | | | 4-21-2025 | | | | 20,700,000 | | | | 17,230,138 | |
Australia (AUD) | | | 5.50 | | | | 4-21-2023 | | | | 500,000 | | | | 480,963 | |
Bonos y Obligaciones del Estado 144A (EUR) | | | 1.60 | | | | 4-30-2025 | | | | 90,625,000 | | | | 102,908,546 | |
Brazil (BRL) | | | 10.00 | | | | 1-1-2017 | | | | 120,550,000 | | | | 39,378,533 | |
Brazil (BRL) | | | 10.00 | | | | 1-1-2019 | | | | 73,100,000 | | | | 23,102,773 | |
Canada 144A (CAD) | | | 2.90 | | | | 6-15-2024 | | | | 33,300,000 | | | | 29,701,447 | |
Colombia (COP) | | | 7.00 | | | | 5-4-2022 | | | | 6,650,000,000 | | | | 2,887,144 | |
Colombia (COP) | | | 7.75 | | | | 4-14-2021 | | | | 1,630,000,000 | | | | 769,152 | |
Hungary (HUF) | | | 6.75 | | | | 11-24-2017 | | | | 462,450,000 | | | | 1,916,169 | |
Indonesia (IDR) | | | 7.88 | | | | 4-15-2019 | | | | 25,000,000,000 | | | | 1,945,998 | |
Indonesia (IDR) | | | 8.38 | | | | 3-15-2024 | | | | 23,650,000,000 | | | | 1,902,035 | |
The accompanying notes are an integral part of these financial statements.
| | | | |
| 10 | | Wells Fargo Advantage International Bond Fund | | Portfolio of investments—April 30, 2015 (unaudited) |
| | | | | | | | | | | | | | | | |
| | | | |
| Security name | | Interest rate | | | Maturity date | | | Principal | | | Value | |
| | | | | | | | | | | | | | | | |
| | | | |
Foreign Government Bonds @ (continued) | | | | | | | | | | | | | | | | |
Indonesia (IDR) | | | 10.00 | % | | | 7-15-2017 | | | | 17,700,000,000 | | | $ | 1,433,109 | |
Italy Buoni Poliennali del Tesoro (EUR) | | | 2.15 | | | | 12-15-2021 | | | | 3,300,000 | | | | 3,974,932 | |
Italy Buoni Poliennali del Tesoro (EUR) | | | 2.50 | | | | 12-1-2024 | | | | 35,200,000 | | | | 43,151,581 | |
Italy Buoni Poliennali del Tesoro (EUR) | | | 3.75 | | | | 9-1-2024 | | | | 18,190,000 | | | | 24,478,072 | |
Korea (KRW) | | | 3.00 | | | | 9-10-2024 | | | | 28,650,000,000 | | | | 28,023,976 | |
Korea (KRW) | | | 3.13 | | | | 3-10-2019 | | | | 32,550,000,000 | | | | 31,672,304 | |
Malaysia (MYR) | | | 3.26 | | | | 3-1-2018 | | | | 8,002,000 | | | | 2,237,015 | |
Malaysia (MYR) | | | 3.80 | | | | 9-30-2022 | | | | 124,600,000 | | | | 35,093,993 | |
Malaysia (MYR) | | | 4.18 | | | | 7-15-2024 | | | | 6,400,000 | | | | 1,838,722 | |
Mexico (MXN) | | | 4.75 | | | | 6-14-2018 | | | | 836,400,000 | | | | 54,514,395 | |
Mexico (MXN) | | | 10.00 | | | | 12-5-2024 | | | | 26,950,000 | | | | 2,275,034 | |
New Zealand (NZD) | | | 5.50 | | | | 4-15-2023 | | | | 55,764,000 | | | | 49,004,027 | |
Poland (PLN) | | | 3.25 | | | | 7-25-2025 | | | | 21,250,000 | | | | 6,214,113 | |
Poland (PLN) | | | 4.00 | | | | 10-25-2023 | | | | 186,500,000 | | | | 57,418,490 | |
Province of British Columbia (AUD) | | | 4.25 | | | | 11-27-2024 | | | | 14,090,000 | | | | 11,983,663 | |
Province of Ontario (AUD) | | | 6.25 | | | | 9-29-2020 | | | �� | 13,230,000 | | | | 12,130,999 | |
Queensland Treasury (AUD) | | | 5.75 | | | | 7-22-2024 | | | | 26,855,000 | | | | 25,696,293 | |
Republic of South Africa (ZAR) | | | 7.75 | | | | 2-28-2023 | | | | 407,881,000 | | | | 34,238,518 | |
Republic of South Africa (ZAR) | | | 8.00 | | | | 12-21-2018 | | | | 34,500,000 | | | | 2,969,675 | |
Romania (RON) | | | 5.85 | | | | 4-26-2023 | | | | 8,110,000 | | | | 2,443,143 | |
Singapore (SGD) | | | 3.00 | | | | 9-1-2024 | | | | 37,125,000 | | | | 29,889,581 | |
State of New South Wales Australia (AUD) | | | 5.00 | | | | 8-20-2024 | | | | 31,136,000 | | | | 28,811,536 | |
Thailand (THB) | | | 3.25 | | | | 6-16-2017 | | | | 91,207,000 | | | | 2,862,458 | |
Turkey (TRY) | | | 6.30 | | | | 2-14-2018 | | | | 2,750,000 | | | | 949,216 | |
Turkey (TRY) | | | 9.00 | | | | 3-8-2017 | | | | 5,019,000 | | | | 1,863,862 | |
United Kingdom Gilt (GBP) | | | 2.75 | | | | 9-7-2024 | | | | 30,325,000 | | | | 50,072,609 | |
United Kingdom Gilt (GBP) | | | 4.75 | | | | 12-7-2030 | | | | 4,850,000 | | | | 9,955,666 | |
| | | | |
Total Foreign Government Bonds (Cost $847,491,999) | | | | | | | | | | | | | | | 814,404,597 | |
| | | | | | | | | | | | | | | | |
| | | | |
U.S. Treasury Securities: 6.01% | | | | | | | | | | | | | | | | |
U.S. Treasury Note | | | 1.50 | | | | 1-31-2022 | | | $ | 52,900,000 | | | | 51,953,566 | |
U.S. Treasury Note | | | 1.38 | | | | 2-28-2019 | | | | 22,725,000 | | | | 22,879,462 | |
| | | | |
Total U.S. Treasury Securities (Cost $74,283,835) | | | | | | | | | | | | | | | 74,833,028 | |
| | | | | | | | | | | | | | | | |
| | | | |
Yankee Corporate Bonds and Notes: 3.61% | | | | | | | | | | | | | | | | |
| | | | |
| Bermuda: 0.27% | | | | | | | | | | | | | | | | |
Qtel International Finance Limited (Telecommunication Services, Diversified Telecommunication Services) | | | 4.75 | | | | 2-16-2021 | | | | 525,000 | | | | 577,862 | |
Qtel International Finance Limited (Telecommunication Services, Diversified Telecommunication Services) | | | 5.00 | | | | 10-19-2025 | | | | 2,500,000 | | | | 2,780,000 | |
| | | | |
| | | | | | | | | | | | | | | 3,357,862 | |
| | | | | | | | | | | | | | | | |
| | | | |
| Brazil: 0.04% | | | | | | | | | | | | | | | | |
ITAU Unibanco Holding SA (Financials, Banks) | | | 5.13 | | | | 5-13-2023 | | | | 450,000 | | | | 457,875 | |
| | | | | | | | | | | | | | | | |
| | | | |
| Cayman Islands: 0.50% | | | | | | | | | | | | | | | | |
HPHT Finance Limited (Financials, Diversified Financial Services) 144A | | | 2.88 | | | | 3-17-2020 | | | | 1,650,000 | | | | 1,672,019 | |
International Petroleum Investment Company Limited (Energy, Oil, Gas & Consumable Fuels) | | | 5.00 | | | | 11-15-2020 | | | | 2,950,000 | | | | 3,322,438 | |
The accompanying notes are an integral part of these financial statements.
| | | | | | |
| Portfolio of investments—April 30, 2015 (unaudited) | | Wells Fargo Advantage International Bond Fund | | | 11 | |
| | | | | | | | | | | | | | | | |
| | | | |
| Security name | | Interest rate | | | Maturity date | | | Principal | | | Value | |
| | | | | | | | | | | | | | | | |
| | | | |
| Cayman Islands (continued) | | | | | | | | | | | | | | | | |
UPCB Finance IV Limited (Financials, Diversified Financial Services) 144A | | | 5.38 | % | | | 1-15-2025 | | | $ | 1,200,000 | | | $ | 1,219,500 | |
| | | | |
| | | | | | | | | | | | | | | 6,213,957 | |
| | | | | | | | | | | | | | | | |
| | | | |
| China: 0.23% | | | | | | | | | | | | | | | | |
Alibaba Group Holding Limited (Information Technology, Internet Software & Services) | | | 3.60 | | | | 11-28-2024 | | | | 2,000,000 | | | | 1,991,866 | |
Alibaba Group Holding Limited (Information Technology, Internet Software & Services) 144A | | | 3.60 | | | | 11-28-2024 | | | | 950,000 | | | | 946,136 | |
| | | | |
| | | | | | | | | | | | | | | 2,938,002 | |
| | | | | | | | | | | | | | | | |
| | | | |
| Israel: 0.27% | | | | | | | | | | | | | | | | |
B Communications Limited (Telecommunication Services, Diversified Telecommunication Services) 144A | | | 7.38 | | | | 2-15-2021 | | | | 3,162,000 | | | | 3,377,648 | |
| | | | | | | | | | | | | | | | |
| | | | |
| Luxembourg: 0.69% | | | | | | | | | | | | | | | | |
Actavis Funding SCS (Health Care, Pharmaceuticals) | | | 3.45 | | | | 3-15-2022 | | | | 8,475,000 | | | | 8,614,922 | |
| | | | | | | | | | | | | | | | |
| | | | |
| Netherlands: 0.74% | | | | | | | | | | | | | | | | |
Fiat Chrysler Automobiles (Consumer Discretionary, Automobiles) 144A | | | 5.25 | | | | 4-15-2023 | | | | 2,150,000 | | | | 2,168,813 | |
Mubadala Development Company (Energy, Oil, Gas & Consumable Fuels) | | | 5.50 | | | | 4-20-2021 | | | | 3,200,000 | | | | 3,727,584 | |
Myriad International Holdings BV (Consumer Discretionary, Media) | | | 6.00 | | | | 7-18-2020 | | | | 2,950,000 | | | | 3,259,750 | |
| | | | |
| | | | | | | | | | | | | | | 9,156,147 | |
| | | | | | | | | | | | | | | | |
| | | | |
| Peru: 0.30% | | | | | | | | | | | | | | | | |
Banco De Credito Del Peru (Financials, Banks) 144A | | | 4.25 | | | | 4-1-2023 | | | | 3,634,000 | | | | 3,733,935 | |
| | | | | | | | | | | | | | | | |
| | | | |
| United Kingdom: 0.57% | | | | | | | | | | | | | | | | |
British Sky Broadcasting Group plc (Consumer Discretionary, Media) 144A | | | 3.13 | | | | 11-26-2022 | | | | 1,362,000 | | | | 1,348,804 | |
British Sky Broadcasting Group plc (Consumer Discretionary, Media) 144A | | | 3.75 | | | | 9-16-2024 | | | | 4,100,000 | | | | 4,180,930 | |
Jaguar Land Rover Automobiles plc (Consumer Discretionary, Automobiles) 144A | | | 3.50 | | | | 3-15-2020 | | | | 1,200,000 | | | | 1,197,000 | |
Vedanta Resources plc (Materials, Metals & Mining) 144A | | | 6.00 | | | | 1-31-2019 | | | | 400,000 | | | | 380,000 | |
| | | | |
| | | | | | | | | | | | | | | 7,106,734 | |
| | | | | | | | | | | | | | | | |
| | | | |
Total Yankee Corporate Bonds and Notes (Cost $43,451,135) | | | | | | | | | | | | | | | 44,957,082 | |
| | | | | | | | | | | | | | | | |
| | | | |
| | | Yield | | | | | | Shares | | | | |
| Short-Term Investments: 1.19% | | | | | | | | | | | | | | | | |
| | | | |
| Investment Companies: 1.19% | | | | | | | | | | | | | | | | |
Securities Lending Cash Investments, LLC (r)(l)(u) | | | 0.12 | | | | | | | | 3,518,943 | | | | 3,518,943 | |
Wells Fargo Advantage Cash Investment Money Market Fund, Select Class (l)(u)## | | | 0.11 | | | | | | | | 11,368,159 | | | | 11,368,159 | |
| | | | |
Total Short-Term Investments (Cost $14,887,102) | | | | | | | | | | | | | | | 14,887,102 | |
| | | | | | | | | | | | | | | | |
| | | | | | | | |
| Total investments in securities (Cost $1,288,653,890) * | | | 99.53 | % | | | 1,239,752,763 | |
Other assets and liabilities, net | | | 0.47 | | | | 5,820,287 | |
| | | | | | | | |
| Total net assets | | | 100.00 | % | | $ | 1,245,573,050 | |
| | | | | | | | |
The accompanying notes are an integral part of these financial statements.
| | | | |
| 12 | | Wells Fargo Advantage International Bond Fund | | Portfolio of investments—April 30, 2015 (unaudited) |
| %% | The security is issued on a when-issued basis. |
| 144A | The security may be resold in transactions exempt from registration, normally to qualified institutional buyers, pursuant to Rule 144A under the Securities Act of 1933. |
| @ | Foreign bond principal is denominated in the local currency of the issuer. |
| « | All or a portion of this security is on loan. |
| (r) | The investment is a non-registered investment vehicle purchased with cash collateral received from securities on loan. |
| (l) | The security represents an affiliate of the Fund as defined in the Investment Company Act of 1940. |
| (u) | The rate represents the 7-day annualized yield at period end. |
| ## | All or a portion of this security is segregated for when-issued securities. |
| * | Cost for federal income tax purposes is $1,290,319,898 and unrealized gains (losses) consists of: |
| | | | |
Gross unrealized gains | | $ | 7,717,864 | |
Gross unrealized losses | | | (58,284,999 | ) |
| | | | |
Net unrealized losses | | $ | (50,567,135 | ) |
The accompanying notes are an integral part of these financial statements.
| | | | | | |
| Statement of assets and liabilities—April 30, 2015 (unaudited) | | Wells Fargo Advantage International Bond Fund | | | 13 | |
| | | | |
| | | | |
| |
Assets | | | | |
Investments | | | | |
In unaffiliated securities (including $3,350,953 of securities loaned), at value (cost $1,273,766,788) | | $ | 1,224,865,661 | |
In affiliated securities, at value (cost $14,887,102) | | | 14,887,102 | |
| | | | |
Total investments, at value (cost $1,288,653,890) | | | 1,239,752,763 | |
Foreign currency, at value (cost $16,581,233) | | | 17,118,847 | |
Receivable for Fund shares sold | | | 2,825,851 | |
Receivable for interest | | | 10,246,550 | |
Receivable for securities lending income | | | 8,039 | |
Unrealized gains on forward foreign currency contracts | | | 17,291,809 | |
Prepaid expenses and other assets | | | 51,311 | |
| | | | |
Total assets | | | 1,287,295,170 | |
| | | | |
| |
Liabilities | | | | |
Payable for investments purchased | | | 9,500,747 | |
Payable for Fund shares redeemed | | | 1,580,191 | |
Unrealized losses on forward foreign currency contracts | | | 26,206,593 | |
Payable upon receipt of securities loaned | | | 3,518,943 | |
Advisory fee payable | | | 490,442 | |
Distribution fees payable | | | 6,173 | |
Administration fees payable | | | 143,465 | |
Accrued expenses and other liabilities | | | 275,566 | |
| | | | |
Total liabilities | | | 41,722,120 | |
| | | | |
Total net assets | | $ | 1,245,573,050 | |
| | | | |
| |
NET ASSETS CONSIST OF | | | | |
Paid-in capital | | $ | 1,341,840,071 | |
Undistributed net investment income | | | 17,218,312 | |
Accumulated net realized losses on investments | | | (55,994,099 | ) |
Net unrealized losses on investments | | | (57,491,234 | ) |
| | | | |
Total net assets | | $ | 1,245,573,050 | |
| | | | |
| |
COMPUTATION OF NET ASSET VALUE AND OFFERING PRICE PER SHARE | | | | |
Net assets – Class A | | $ | 102,798,521 | |
Shares outstanding – Class A1 | | | 9,977,656 | |
Net asset value per share – Class A | | | $10.30 | |
Maximum offering price per share – Class A | | | $10.79 | |
Net assets – Class B | | $ | 581,562 | |
Shares outstanding – Class B1 | | | 56,608 | |
Net asset value per share – Class B | | | $10.27 | |
Net assets – Class C | | $ | 9,229,476 | |
Shares outstanding – Class C1 | | | 907,070 | |
Net asset value per share – Class C | | | $10.18 | |
Net assets – Class R6 | | $ | 12,270,960 | |
Shares outstanding – Class R61 | | | 1,185,764 | |
Net asset value per share – Class R6 | | | $10.35 | |
Net assets – Administrator Class | | $ | 300,307,354 | |
Shares outstanding – Administrator Class1 | | | 29,148,223 | |
Net asset value per share – Administrator Class | | | $10.30 | |
Net assets – Institutional Class | | $ | 820,385,177 | |
Shares outstanding – Institutional Class1 | | | 79,375,318 | |
Net asset value per share – Institutional Class | | | $10.34 | |
| 1 | The Fund has an unlimited number of authorized shares. |
| 2 | Maximum offering price is computed as 100/95.50 of net asset value. On investments of $50,000 or more, the offering price is reduced. |
The accompanying notes are an integral part of these financial statements.
| | | | |
| 14 | | Wells Fargo Advantage International Bond Fund | | Statement of operations—six months ended April 30, 2015 (unaudited) |
| | | | |
| | | | |
| |
Investment income | | | | |
Interest (net of foreign interest withholding taxes of $144,759) | | $ | 25,757,548 | |
Securities lending income, net | | | 17,098 | |
Income from affiliated securities | | | 10,170 | |
| | | | |
Total investment income | | | 25,784,816 | |
| | | | |
| |
Expenses | | | | |
Advisory fee | | | 3,281,639 | |
Administration fees | | | | |
Fund level | | | 309,773 | |
Class A | | | 77,655 | |
Class B | | | 578 | |
Class C | | | 8,027 | |
Class R6 | | | 1,327 | |
Administrator Class | | | 163,488 | |
Institutional Class | | | 318,180 | |
Shareholder servicing fees | | | | |
Class A | | | 121,336 | |
Class B | | | 847 | |
Class C | | | 12,542 | |
Administrator Class | | | 405,970 | |
Distribution fees | | | | |
Class B | | | 2,710 | |
Class C | | | 37,626 | |
Custody and accounting fees | | | 252,171 | |
Professional fees | | | 27,546 | |
Registration fees | | | 45,358 | |
Shareholder report expenses | | | 70,809 | |
Trustees’ fees and expenses | | | 5,797 | |
Other fees and expenses | | | 16,940 | |
| | | | |
Total expenses | | | 5,160,319 | |
Less: Fee waivers and/or expense reimbursements | | | (362,276 | ) |
| | | | |
Net expenses | | | 4,798,043 | |
| | | | |
Net investment income | | | 20,986,773 | |
| | | | |
| |
REALIZED AND UNREALIZED GAINS (LOSSES) ON INVESTMENTS | | | | |
| |
Net realized gains (losses) on: | | | | |
Unaffiliated securities | | | (74,386,840 | ) |
Forward foreign currency contract transactions | | | 10,731,332 | |
| | | | |
Net realized losses on investments | | | (63,655,508 | ) |
| | | | |
| |
Net change in unrealized gains (losses) on: | | | | |
Unaffiliated securities | | | (12,832,262 | ) |
Forward foreign currency contract transactions | | | (87,758 | ) |
| | | | |
Net change in unrealized gains (losses) on investments | | | (12,920,020 | ) |
| | | | |
Net realized and unrealized gains (losses) on investments | | | (76,575,528 | ) |
| | | | |
Net decrease in net assets resulting from operations | | $ | (55,588,755 | ) |
| | | | |
The accompanying notes are an integral part of these financial statements.
| | | | | | |
| Statement of changes in net assets | | Wells Fargo Advantage International Bond Fund | | | 15 | |
| | | | | | | | | | | | | | | | |
| | | Six months ended April 30, 2015 (unaudited) | | | Year ended October 31, 2014 | |
| | | | |
Operations | | | | | | | | | | | | | | | | |
Net investment income | | | | | | $ | 20,986,773 | | | | | | | $ | 51,017,278 | |
Net realized losses on investments | | | | | | | (63,655,508 | ) | | | | | | | (19,851,675 | ) |
Net change in unrealized gains (losses) on investments | | | | | | | (12,920,020 | ) | | | | | | | (23,841,553 | ) |
| | | | |
Net increase (decrease) in net assets resulting from operations | | | | | | | (55,588,755 | ) | | | | | | | 7,324,050 | |
| | | | |
| | | | |
Distributions to shareholders from | | | | | | | | | | | | | | | | |
Net investment income | | | | | | | | | | | | | | | | |
Class A | | | | | | | (423,572 | ) | | | | | | | (1,131,543 | ) |
Class B | | | | | | | 0 | | | | | | | | (3,281 | ) |
Class C | | | | | | | 0 | | | | | | | | (58,435 | ) |
Class R6 | | | | | | | (48,140 | ) | | | | | | | (51,175 | ) |
Administrator Class | | | | | | | (1,661,619 | ) | | | | | | | (4,290,193 | ) |
Institutional Class | | | | | | | (4,268,266 | ) | | | | | | | (13,007,391 | ) |
Net realized gains | | | | | | | | | | | | | | | | |
Class A | | | | | | | (287,937 | ) | | | | | | | (3,719,413 | ) |
Class B | | | | | | | (2,272 | ) | | | | | | | (57,769 | ) |
Class C | | | | | | | (31,156 | ) | | | | | | | (526,829 | ) |
Class R6 | | | | | | | (18,411 | ) | | | | | | | (83,684 | ) |
Administrator Class | | | | | | | (1,004,296 | ) | | | | | | | (11,543,115 | ) |
Institutional Class | | | | | | | (2,298,056 | ) | | | | | | | (36,033,594 | ) |
| | | | |
Total distributions to shareholders | | | | | | | (10,043,725 | ) | | | | | | | (70,506,422 | ) |
| | | | |
| | | | |
Capital share transactions | | | Shares | | | | | | | | Shares | | | | | |
Proceeds from shares sold | | | | | | | | | | | | | | | | |
Class A | | | 2,437,950 | | | | 25,210,284 | | | | 2,749,646 | | | | 30,368,557 | |
Class B | | | 2 | | | | 19 | | | | 891 | | | | 9,492 | |
Class C | | | 21,989 | | | | 227,046 | | | | 72,519 | | | | 795,278 | |
Class R6 | | | 677,441 | | | | 7,004,290 | | | | 408,110 | | | | 4,564,894 | |
Administrator Class | | | 4,446,324 | | | | 46,222,125 | | | | 10,060,042 | | | | 111,082,502 | |
Institutional Class | | | 15,674,600 | | | | 163,864,048 | | | | 17,799,377 | | | | 196,135,780 | |
| | | | |
| | | | | | | 242,527,812 | | | | | | | | 342,956,503 | |
| | | | |
Reinvestment of distributions | | | | | | | | | | | | | | | | |
Class A | | | 66,631 | | | | 705,372 | | | | 437,747 | | | | 4,731,956 | |
Class B | | | 186 | | | | 1,968 | | | | 5,011 | | | | 53,798 | |
Class C | | | 2,403 | | | | 25,233 | | | | 43,996 | | | | 468,648 | |
Class R6 | | | 6,273 | | | | 66,551 | | | | 12,385 | | | | 134,859 | |
Administrator Class | | | 250,106 | | | | 2,645,484 | | | | 1,432,764 | | | | 15,504,058 | |
Institutional Class | | | 440,841 | | | | 4,675,573 | | | | 3,278,437 | | | | 35,575,623 | |
| | | | |
| | | | | | | 8,120,181 | | | | | | | | 56,468,942 | |
| | | | |
Payment for shares redeemed | | | | | | | | | | | | | | | | |
Class A | | | (1,989,719 | ) | | | (20,680,564 | ) | | | (3,778,957 | ) | | | (41,860,001 | ) |
Class B | | | (26,349 | ) | | | (273,782 | ) | | | (100,427 | ) | | | (1,099,942 | ) |
Class C | | | (200,738 | ) | | | (2,078,149 | ) | | | (471,593 | ) | | | (5,113,839 | ) |
Class R6 | | | (24,301 | ) | | | (254,934 | ) | | | (108,372 | ) | | | (1,209,097 | ) |
Administrator Class | | | (8,696,209 | ) | | | (89,402,891 | ) | | | (7,924,711 | ) | | | (87,207,416 | ) |
Institutional Class | | | (13,268,288 | ) | | | (139,052,510 | ) | | | (42,834,796 | ) | | | (471,768,358 | ) |
| | | | |
| | | | | | | (251,742,830 | ) | | | | | | | (608,258,653 | ) |
| | | | |
Net decrease in net assets resulting from capital share transactions | | | | | | | (1,094,837 | ) | | | | | | | (208,833,208 | ) |
| | | | |
Total decrease in net assets | | | | | | | (66,727,317 | ) | | | | | | | (272,015,580 | ) |
| | | | |
| | | | |
Net assets | | | | | | | | | | | | | | | | |
Beginning of period | | | | | | | 1,312,300,367 | | | | | | | | 1,584,315,947 | |
| | | | |
End of period | | | | | | $ | 1,245,573,050 | | | | | | | $ | 1,312,300,367 | |
| | | | |
Undistributed net investment income | | | | | | $ | 17,218,312 | | | | | | | $ | 2,633,136 | |
| | | | |
The accompanying notes are an integral part of these financial statements.
| | | | |
| 16 | | Wells Fargo Advantage International Bond Fund | | Financial highlights |
(For a share outstanding throughout each period)
| | | | | | | | | | | | | | | | | | | | | | | | |
| | | Six months ended
April 30, 2015
(unaudited) | | | Year ended October 31 | |
| CLASS A | | | 2014 | | | 2013 | | | 2012 | | | 2011 | | | 20101 | |
Net asset value, beginning of period | | | $10.84 | | | | $11.32 | | | | $11.83 | | | | $11.85 | | | | $12.23 | | | | $11.59 | |
Net investment income | | | 0.16 | 2 | | | 0.37 | 2 | | | 0.36 | 2 | | | 0.33 | 2 | | | 0.39 | 2 | | | 0.40 | |
Net realized and unrealized gains (losses) on investments | | | (0.62 | ) | | | (0.34 | ) | | | (0.73 | ) | | | 0.08 | | | | (0.18 | ) | | | 0.65 | |
| | | | | | | | | | | | | | | | | | | | | | | | |
Total from investment operations | | | (0.46 | ) | | | 0.03 | | | | (0.37 | ) | | | 0.41 | | | | 0.21 | | | | 1.05 | |
Distributions to shareholders from | | | | | | | | | | | | | | | | | | | | | | | | |
Net investment income | | | (0.05 | ) | | | (0.12 | ) | | | (0.02 | ) | | | (0.29 | ) | | | (0.51 | ) | | | (0.41 | ) |
Net realized gains | | | (0.03 | ) | | | (0.39 | ) | | | (0.12 | ) | | | (0.14 | ) | | | (0.08 | ) | | | 0.00 | |
| | | | | | | | | | | | | | | | | | | | | | | | |
Total distributions to shareholders | | | (0.08 | ) | | | (0.51 | ) | | | (0.14 | ) | | | (0.43 | ) | | | (0.59 | ) | | | (0.41 | ) |
Net asset value, end of period | | | $10.30 | | | | $10.84 | | | | $11.32 | | | | $11.83 | | | | $11.85 | | | | $12.23 | |
Total return3 | | | (4.30 | )% | | | 0.26 | % | | | (3.18 | )% | | | 3.66 | % | | | 1.93 | % | | | 9.35 | % |
Ratios to average net assets (annualized) | | | | | | | | | | | | | | | | | | | | | | | | |
Gross expenses | | | 1.06 | % | | | 1.05 | % | | | 1.05 | % | | | 1.04 | % | | | 1.02 | % | | | 1.10 | % |
Net expenses | | | 1.03 | % | | | 1.03 | % | | | 1.03 | % | | | 1.03 | % | | | 1.02 | % | | | 1.08 | % |
Net investment income | | | 3.13 | % | | | 3.29 | % | | | 2.93 | % | | | 2.88 | % | | | 3.26 | % | | | 3.53 | % |
Supplemental data | | | | | | | | | | | | | | | | | | | | | | | | |
Portfolio turnover rate | | | 87 | % | | | 103 | % | | | 129 | % | | | 79 | % | | | 88 | % | | | 89 | % |
Net assets, end of period (000s omitted) | | | $102,799 | | | | $102,624 | | | | $113,846 | | | | $139,600 | | | | $286,577 | | | | $255,134 | |
| 1 | After the close of business on July 9, 2010, the Fund acquired the net assets of Evergreen International Bond Fund which became the accounting and performance survivor in the transaction. The information for the period prior to July 12, 2010 is that of Class A of Evergreen International Bond Fund. |
| 2 | Calculated based upon average shares outstanding |
| 3 | Total return calculations do not include any sales charges. Returns for periods of less than one year are not annualized. |
The accompanying notes are an integral part of these financial statements.
| | | | | | |
| Financial highlights | | Wells Fargo Advantage International Bond Fund | | | 17 | |
(For a share outstanding throughout each period)
| | | | | | | | | | | | | | | | | | | | | | | | |
| | | Six months ended
April 30, 2015
(unaudited) | | | Year ended October 31 | |
| CLASS B | | | 2014 | | | 2013 | | | 2012 | | | 2011 | | | 20101 | |
Net asset value, beginning of period | | | $10.81 | | | | $11.27 | | | | $11.85 | | | | $11.88 | | | | $12.25 | | | | $11.54 | |
Net investment income | | | 0.15 | 2 | | | 0.29 | 2 | | | 0.27 | 2 | | | 0.24 | 2 | | | 0.31 | | | | 0.29 | |
Net realized and unrealized gains (losses) on investments | | | (0.66 | ) | | | (0.34 | ) | | | (0.73 | ) | | | 0.09 | | | | (0.19 | ) | | | 0.67 | |
| | | | | | | | | | | | | | | | | | | | | | | | |
Total from investment operations | | | (0.51 | ) | | | (0.05 | ) | | | (0.46 | ) | | | 0.33 | | | | 0.12 | | | | 0.96 | |
Distributions to shareholders from | | | | | | | | | | | | | | | | | | | | | | | | |
Net investment income | | | 0.00 | | | | (0.02 | ) | | | 0.00 | | | | (0.22 | ) | | | (0.41 | ) | | | (0.25 | ) |
Net realized gains | | | (0.03 | ) | | | (0.39 | ) | | | (0.12 | ) | | | (0.14 | ) | | | (0.08 | ) | | | 0.00 | |
| | | | | | | | | | | | | | | | | | | | | | | | |
Total distributions to shareholders | | | (0.03 | ) | | | (0.41 | ) | | | (0.12 | ) | | | (0.36 | ) | | | (0.49 | ) | | | (0.25 | ) |
Net asset value, end of period | | | $10.27 | | | | $10.81 | | | | $11.27 | | | | $11.85 | | | | $11.88 | | | | $12.25 | |
Total return3 | | | (4.72 | )% | | | (0.44 | )% | | | (3.90 | )% | | | 2.90 | % | | | 1.15 | % | | | 8.55 | % |
Ratios to average net assets (annualized) | | | | | | | | | | | | | | | | | | | | | | | | |
Gross expenses | | | 1.79 | % | | | 1.78 | % | | | 1.80 | % | | | 1.79 | % | | | 1.77 | % | | | 1.85 | % |
Net expenses | | | 1.77 | % | | | 1.77 | % | | | 1.78 | % | | | 1.78 | % | | | 1.77 | % | | | 1.82 | % |
Net investment income | | | 2.37 | % | | | 2.57 | % | | | 2.13 | % | | | 2.12 | % | | | 2.53 | % | | | 2.77 | % |
Supplemental data | | | | | | | | | | | | | | | | | | | | | | | | |
Portfolio turnover rate | | | 87 | % | | | 103 | % | | | 129 | % | | | 79 | % | | | 88 | % | | | 89 | % |
Net assets, end of period (000s omitted) | | | $582 | | | | $895 | | | | $1,998 | | | | $4,008 | | | | $6,925 | | | | $10,060 | |
| 1 | After the close of business on July 9, 2010, the Fund acquired the net assets of Evergreen International Bond Fund which became the accounting and performance survivor in the transaction. The information for the period prior to July 12, 2010 is that of Class B of Evergreen International Bond Fund. |
| 2 | Calculated based upon average shares outstanding |
| 3 | Total return calculations do not include any sales charges. Returns for periods of less than one year are not annualized. |
The accompanying notes are an integral part of these financial statements.
| | | | |
| 18 | | Wells Fargo Advantage International Bond Fund | | Financial highlights |
(For a share outstanding throughout each period)
| | | | | | | | | | | | | | | | | | | | | | | | |
| | | Six months ended
April 30, 2015
(unaudited) | | | Year ended October 31 | |
| CLASS C | | | 2014 | | | 2013 | | | 2012 | | | 2011 | | | 20101 | |
Net asset value, beginning of period | | | $10.70 | | | | $11.19 | | | | $11.76 | | | | $11.81 | | | | $12.20 | | | | $11.51 | |
Net investment income | | | 0.15 | 2 | | | 0.28 | 2 | | | 0.26 | 2 | | | 0.24 | 2 | | | 0.31 | | | | 0.33 | |
Net realized and unrealized gains (losses) on investments | | | (0.64 | ) | | | (0.34 | ) | | | (0.71 | ) | | | 0.08 | | | | (0.19 | ) | | | 0.64 | |
| | | | | | | | | | | | | | | | | | | | | | | | |
Total from investment operations | | | (0.49 | ) | | | (0.06 | ) | | | (0.45 | ) | | | 0.32 | | | | 0.12 | | | | 0.97 | |
Distributions to shareholders from | | | | | | | | | | | | | | | | | | | | | | | | |
Net investment income | | | 0.00 | | | | (0.04 | ) | | | (0.00 | )3 | | | (0.23 | ) | | | (0.43 | ) | | | (0.28 | ) |
Net realized gains | | | (0.03 | ) | | | (0.39 | ) | | | (0.12 | ) | | | (0.14 | ) | | | (0.08 | ) | | | 0.00 | |
| | | | | | | | | | | | | | | | | | | | | | | | |
Total distributions to shareholders | | | (0.03 | ) | | | (0.43 | ) | | | (0.12 | ) | | | (0.37 | ) | | | (0.51 | ) | | | (0.28 | ) |
Net asset value, end of period | | | $10.18 | | | | $10.70 | | | | $11.19 | | | | $11.76 | | | | $11.81 | | | | $12.20 | |
Total return4 | | | (4.58 | )% | | | (0.52 | )% | | | (3.84 | )% | | | 2.86 | % | | | 1.11 | % | | | 8.61 | % |
Ratios to average net assets (annualized) | | | | | | | | | | | | | | | | | | | | | | | | |
Gross expenses | | | 1.81 | % | | | 1.80 | % | | | 1.80 | % | | | 1.79 | % | | | 1.77 | % | | | 1.85 | % |
Net expenses | | | 1.78 | % | | | 1.78 | % | | | 1.78 | % | | | 1.78 | % | | | 1.77 | % | | | 1.82 | % |
Net investment income | | | 2.37 | % | | | 2.54 | % | | | 2.15 | % | | | 2.12 | % | | | 2.50 | % | | | 2.77 | % |
Supplemental data | | | | | | | | | | | | | | | | | | | | | | | | |
Portfolio turnover rate | | | 87 | % | | | 103 | % | | | 129 | % | | | 79 | % | | | 88 | % | | | 89 | % |
Net assets, end of period (000s omitted) | | | $9,229 | | | | $11,597 | | | | $16,097 | | | | $23,448 | | | | $27,861 | | | | $30,974 | |
| 1 | After the close of business on July 9, 2010, the Fund acquired the net assets of Evergreen International Bond Fund which became the accounting and performance survivor in the transaction. The information for the period prior to July 12, 2010 is that of Class C of Evergreen International Bond Fund. |
| 2 | Calculated based upon average shares outstanding |
| 3 | Amount is less than $0.005 per share. |
| 4 | Total return calculations do not include any sales charges. Returns for periods of less than one year are not annualized. |
The accompanying notes are an integral part of these financial statements.
| | | | | | |
| Financial highlights | | Wells Fargo Advantage International Bond Fund | | | 19 | |
(For a share outstanding throughout each period)
| | | | | | | | | | | | |
| | | Six months ended
April 30, 2015
(unaudited) | | | Year ended October 31 | |
| CLASS R6 | | | 2014 | | | 20131 | |
Net asset value, beginning of period | | | $10.88 | | | | $11.36 | | | | $11.80 | |
Net investment income | | | 0.21 | 2 | | | 0.42 | 2 | | | 0.39 | 2 |
Net realized and unrealized gains (losses) on investments | | | (0.65 | ) | | | (0.35 | ) | | | (0.69 | ) |
| | | | | | | | | | | | |
Total from investment operations | | | (0.44 | ) | | | 0.07 | | | | (0.30 | ) |
Distributions to shareholders from | | | | | | | | | | | | |
Net investment income | | | (0.06 | ) | | | (0.16 | ) | | | (0.02 | ) |
Net realized gains | | | (0.03 | ) | | | (0.39 | ) | | | (0.12 | ) |
| | | | | | | | | | | | |
Total distributions to shareholders | | | (0.09 | ) | | | (0.55 | ) | | | (0.14 | ) |
Net asset value, end of period | | | $10.35 | | | | $10.88 | | | | $11.36 | |
Total return3 | | | (4.08 | )% | | | 0.60 | % | | | (2.52 | )% |
Ratios to average net assets (annualized) | | | | | | | | | | | | |
Gross expenses | | | 0.68 | % | | | 0.67 | % | | | 0.68 | % |
Net expenses | | | 0.65 | % | | | 0.65 | % | | | 0.65 | % |
Net investment income | | | 3.53 | % | | | 3.64 | % | | | 3.70 | % |
Supplemental data | | | | | | | | | | | | |
Portfolio turnover rate | | | 87 | % | | | 103 | % | | | 129 | % |
Net assets, end of period (000s omitted) | | | $12,271 | | | | $5,729 | | | | $2,433 | |
| 1 | For the period from November 30, 2012 (commencement of class operations) to October 31, 2013 |
| 2 | Calculated based upon average shares outstanding |
| 3 | Returns for periods of less than one year are not annualized. |
The accompanying notes are an integral part of these financial statements.
| | | | |
| 20 | | Wells Fargo Advantage International Bond Fund | | Financial highlights |
(For a share outstanding throughout each period)
| | | | | | | | | | | | | | | | | | | | | | | | |
| | | Six months ended
April 30, 2015
(unaudited) | | | Year ended October 31 | |
| ADMINISTRATOR CLASS | | | 2014 | | | 2013 | | | 2012 | | | 2011 | | | 20101 | |
Net asset value, beginning of period | | | $10.84 | | | | $11.32 | | | | $11.81 | | | | $11.83 | | | | $12.23 | | | | $11.39 | |
Net investment income | | | 0.20 | 2 | | | 0.39 | 2 | | | 0.36 | 2 | | | 0.35 | 2 | | | 0.38 | 2 | | | 0.11 | 2 |
Net realized and unrealized gains (losses) on investments | | | (0.66 | ) | | | (0.34 | ) | | | (0.71 | ) | | | 0.08 | | | | (0.16 | ) | | | 0.82 | |
| | | | | | | | | | | | | | | | | | | | | | | | |
Total from investment operations | | | (0.46 | ) | | | 0.05 | | | | (0.35 | ) | | | 0.43 | | | | 0.22 | | | | 0.93 | |
Distributions to shareholders from | | | | | | | | | | | | | | | | | | | | | | | | |
Net investment income | | | (0.05 | ) | | | (0.14 | ) | | | (0.02 | ) | | | (0.31 | ) | | | (0.54 | ) | | | (0.09 | ) |
Net realized gains | | | (0.03 | ) | | | (0.39 | ) | | | (0.12 | ) | | | (0.14 | ) | | | (0.08 | ) | | | 0.00 | |
| | | | | | | | | | | | | | | | | | | | | | | | |
Total distributions to shareholders | | | (0.08 | ) | | | (0.52 | ) | | | (0.14 | ) | | | (0.45 | ) | | | (0.62 | ) | | | (0.09 | ) |
Net asset value, end of period | | | $10.30 | | | | $10.84 | | | | $11.32 | | | | $11.81 | | | | $11.83 | | | | $12.23 | |
Total return3 | | | (4.25 | )% | | | 0.43 | % | | | (2.98 | )% | | | 3.89 | % | | | 2.03 | % | | | 8.21 | % |
Ratios to average net assets (annualized) | | | | | | | | | | | | | | | | | | | | | | | | |
Gross expenses | | | 1.00 | % | | | 0.99 | % | | | 0.99 | % | | | 0.97 | % | | | 0.95 | % | | | 1.05 | % |
Net expenses | | | 0.85 | % | | | 0.85 | % | | | 0.85 | % | | | 0.85 | % | | | 0.85 | % | | | 0.85 | % |
Net investment income | | | 3.31 | % | | | 3.47 | % | | | 3.15 | % | | | 3.04 | % | | | 3.21 | % | | | 3.63 | % |
Supplemental data | | | | | | | | | | | | | | | | | | | | | | | | |
Portfolio turnover rate | | | 87 | % | | | 103 | % | | | 129 | % | | | 79 | % | | | 88 | % | | | 89 | % |
Net assets, end of period (000s omitted) | | | $300,307 | | | | $359,383 | | | | $334,778 | | | | $294,330 | | | | $170,836 | | | | $4,866 | |
| 1 | For the period from July 30, 2010 (commencement of class operations) to October 31, 2010 |
| 2 | Calculated based upon average shares outstanding |
| 3 | Returns for periods of less than one year are not annualized. |
The accompanying notes are an integral part of these financial statements.
| | | | | | |
| Financial highlights | | Wells Fargo Advantage International Bond Fund | | | 21 | |
(For a share outstanding throughout each period)
| | | | | | | | | | | | | | | | | | | | | | | | |
| | | Six months ended
April 30, 2015
(unaudited) | | | Year ended October 31 | |
| INSTITUTIONAL CLASS | | | 2014 | | | 2013 | | | 2012 | | | 2011 | | | 20101 | |
Net asset value, beginning of period | | | $10.87 | | | | $11.35 | | | | $11.82 | | | | $11.84 | | | | $12.23 | | | | $11.59 | |
Net investment income | | | 0.20 | 2 | | | 0.41 | 2 | | | 0.37 | | | | 0.36 | | | | 0.44 | | | | 0.44 | |
Net realized and unrealized gains (losses) on investments | | | (0.64 | ) | | | (0.35 | ) | | | (0.70 | ) | | | 0.09 | | | | (0.20 | ) | | | 0.65 | |
| | | | | | | | | | | | | | | | | | | | | | | | |
Total from investment operations | | | (0.44 | ) | | | 0.06 | | | | (0.33 | ) | | | 0.45 | | | | 0.24 | | | | 1.09 | |
Distributions to shareholders from | | | | | | | | | | | | | | | | | | | | | | | | |
Net investment income | | | (0.06 | ) | | | (0.15 | ) | | | (0.02 | ) | | | (0.33 | ) | | | (0.55 | ) | | | (0.45 | ) |
Net realized gains | | | (0.03 | ) | | | (0.39 | ) | | | (0.12 | ) | | | (0.14 | ) | | | (0.08 | ) | | | 0.00 | |
| | | | | | | | | | | | | | | | | | | | | | | | |
Total distributions to shareholders | | | (0.09 | ) | | | (0.54 | ) | | | (0.14 | ) | | | (0.47 | ) | | | (0.63 | ) | | | (0.45 | ) |
Net asset value, end of period | | | $10.34 | | | | $10.87 | | | | $11.35 | | | | $11.82 | | | | $11.84 | | | | $12.23 | |
Total return3 | | | (4.10 | )% | | | 0.55 | % | | | (2.78 | )% | | | 3.99 | % | | | 2.19 | % | | | 9.73 | % |
Ratios to average net assets (annualized) | | | | | | | | | | | | | | | | | | | | | | | | |
Gross expenses | | | 0.73 | % | | | 0.72 | % | | | 0.72 | % | | | 0.71 | % | | | 0.69 | % | | | 0.82 | % |
Net expenses | | | 0.70 | % | | | 0.70 | % | | | 0.70 | % | | | 0.71 | % | | | 0.69 | % | | | 0.80 | % |
Net investment income | | | 3.46 | % | | | 3.62 | % | | | 3.26 | % | | | 3.19 | % | | | 3.60 | % | | | 3.79 | % |
Supplemental data | | | | | | | | | | | | | | | | | | | | | | | | |
Portfolio turnover rate | | | 87 | % | | | 103 | % | | | 129 | % | | | 79 | % | | | 88 | % | | | 89 | % |
Net assets, end of period (000s omitted) | | | $820,385 | | | | $832,072 | | | | $1,115,163 | | | | $1,270,164 | | | | $1,228,793 | | | | $1,276,184 | |
| 1 | After the close of business on July 9, 2010, the Fund acquired the net assets of Evergreen International Bond Fund which became the accounting and performance survivor in the transaction. The information for the period prior to July 12, 2010 is that of Class I of Evergreen International Bond Fund. |
| 2 | Calculated based upon average shares outstanding |
| 3 | Returns for periods of less than one year are not annualized. |
The accompanying notes are an integral part of these financial statements.
| | | | |
| 22 | | Wells Fargo Advantage International Bond Fund | | Notes to financial statements (unaudited) |
1. ORGANIZATION
Wells Fargo Funds Trust (the “Trust”), a Delaware statutory trust organized on March 10, 1999, is an open-end management investment company registered under the Investment Company Act of 1940, as amended (the “1940 Act”). As an investment company, the Trust follows the accounting and reporting guidance in Financial Accounting Standards Board (“FASB”) Accounting Standards Codification Topic 946, Financial Services – Investment Companies. These financial statements report on the Wells Fargo Advantage International Bond Fund (the “Fund”) which is a diversified series of the Trust.
2. SIGNIFICANT ACCOUNTING POLICIES
The following significant accounting policies, which are consistently followed in the preparation of the financial statements of the Fund, are in conformity with U.S. generally accepted accounting principles which require management to make estimates and assumptions that affect the reported amounts of assets and liabilities, disclosure of contingent assets and liabilities at the date of the financial statements, and the reported amounts of revenues and expenses during the reporting period. Actual results could differ from those estimates.
Securities valuation
All investments are valued each business day as of the close of regular trading on the New York Stock Exchange (generally 4 p.m. Eastern Time).
Debt securities are valued at the evaluated bid price provided by an independent pricing service or, if a reliable price is not available, the quoted bid price from an independent broker-dealer.
The values of securities denominated in foreign currencies are translated into U.S. dollars at rates provided by an independent foreign currency pricing source at a time each business day specified by the Management Valuation Team of Wells Fargo Funds Management, LLC (“Funds Management”).
Investments in registered open-end investment companies are valued at net asset value. Interests in non-registered investment vehicles that are redeemable at net asset value are fair valued at net asset value when available.
Investments which are not valued using any of the methods discussed above are valued at their fair value, as determined in good faith by the Board of Trustees of the Fund. The Board of Trustees has established a Valuation Committee comprised of the Trustees and has delegated to it the authority to take any actions regarding the valuation of portfolio securities that the Valuation Committee deems necessary or appropriate, including determining the fair value of portfolio securities, unless the determination has been delegated to the Management Valuation Team. The Board of Trustees retains the authority to make or ratify any valuation decisions or approve any changes to the Valuation Procedures as it deems appropriate. On a quarterly basis, the Board of Trustees receives reports on any valuation actions taken by the Valuation Committee or the Management Valuation Team which may include items for ratification.
Valuations of fair valued securities are compared to the next actual sales price when available, or other appropriate market values, to assess the continued appropriateness of the fair valuation methodologies used. These securities are fair valued on a day-to-day basis, taking into consideration changes to appropriate market information and any significant changes to the inputs considered in the valuation process until there is a readily available price provided on an exchange or by an independent pricing service. Valuations received from an independent pricing service or independent broker-dealer quotes are periodically validated by comparisons to most recent trades and valuations provided by other independent pricing services in addition to the review of prices by the adviser and/or subadviser. Unobservable inputs used in determining fair valuations are identified based on the type of security, taking into consideration factors utilized by market participants in valuing the investment, knowledge about the issuer and the current market environment.
Foreign currency translation
The accounting records of the Fund are maintained in U.S. dollars. The values of other assets and liabilities denominated in foreign currencies are translated into U.S. dollars at rates provided by an independent foreign currency pricing source at a time each business day specified by the Management Valuation Team. Purchases and sales of securities, and income and expenses are converted at the rate of exchange on the respective dates of such transactions. Net realized foreign exchange gains or losses arise from sales of foreign currencies, currency gains or losses realized between the trade and settlement dates on securities transactions, and the difference between the amounts of dividends, interest and foreign withholding taxes recorded and the U.S. dollar equivalent of the amounts actually paid or received. Net unrealized foreign exchange gains and losses arise from changes in the fair value of assets and liabilities other than investments in securities resulting from changes in exchange rates. The changes in net assets arising from changes in exchange rates and the changes in net assets resulting from changes in market prices of securities are not separately presented. Such changes are included in net realized and unrealized gains or losses from investments.
| | | | | | |
| Notes to financial statements (unaudited) | | Wells Fargo Advantage International Bond Fund | | | 23 | |
Forward foreign currency contracts
The Fund is subject to foreign currency exchange rate risk in the normal course of pursuing its investment objectives. A forward foreign currency contract is an agreement between two parties to purchase or sell a specific currency for an agreed-upon price at a future date. The Fund enters into forward foreign currency contracts to facilitate transactions in foreign-denominated securities and to attempt to minimize the risk to the Fund from adverse changes in the relationship between currencies. Forward foreign currency contracts are recorded at the forward rate and marked-to-market daily. When the contracts are closed, realized gains and losses arising from such transactions are recorded as realized gains or losses on forward foreign currency contract transactions. The Fund could be exposed to risks if the counterparties to the contracts are unable to meet the terms of their contracts or if the value of the foreign currency changes unfavorably. The Fund’s maximum risk of loss from counterparty credit risk is the unrealized gains on the contracts. This risk may be mitigated if there is a master netting arrangement between the Fund and the counterparty.
Security loans
The Fund may lend its securities from time to time in order to earn additional income in the form of fees or interest on securities received as collateral or the investment of any cash received as collateral. The Fund continues to receive interest or dividends on the securities loaned. The Fund receives collateral in the form of cash or securities with a value at least equal to the value of the securities on loan. The value of the loaned securities is determined at the close of each business day and any additional required collateral is delivered to the Fund on the next business day. In a securities lending transaction, the net asset value of the Fund will be affected by an increase or decrease in the value of the securities loaned and by an increase or decrease in the value of the instrument in which collateral is invested. The amount of securities lending activity undertaken by the Fund fluctuates from time to time. In the event of default or bankruptcy by the borrower, the Fund may be prevented from recovering the loaned securities or gaining access to the collateral or may experience delays or costs in doing so. In addition, the investment of any cash collateral received may lose all or part of its value. The Fund has the right under the lending agreement to recover the securities from the borrower on demand.
The Fund lends its securities through an unaffiliated securities lending agent. Cash collateral received in connection with its securities lending transactions is invested in Securities Lending Cash Investments, LLC (the “Securities Lending Fund”). The Securities Lending Fund is exempt from registration under Section 3(c)(7) of the 1940 Act and is managed by Funds Management and is subadvised by Wells Capital Management Incorporated (“WellsCap”). Funds Management receives an advisory fee starting at 0.05% and declining to 0.01% as the average daily net assets of the Securities Lending Fund increase. All of the fees received by Funds Management are paid to WellsCap for its services as subadviser. The Securities Lending Fund seeks to provide a positive return compared to the daily Fed Funds Open rate by investing in high-quality, U.S. dollar-denominated short-term money market instruments. Securities Lending Fund investments are fair valued based upon the amortized cost valuation technique. Income earned from investment in the Securities Lending Fund is included in securities lending income on the Statement of Operations.
When-issued transactions
The Fund may purchase securities on a forward commitment or when-issued basis. The Fund records a when-issued transaction on the trade date and will segregate assets in an amount at least equal in value to the Fund’s commitment to purchase when-issued securities. Securities purchased on a when-issued basis are marked-to-market daily and the Fund begins earning interest on the settlement date. Losses may arise due to changes in the market value of the underlying securities or if the counterparty does not perform under the contract.
Security transactions and income recognition
Securities transactions are recorded on a trade date basis. Realized gains or losses are recorded on the basis of identified cost.
Interest income is accrued daily and bond discounts are accreted and premiums are amortized daily based on the effective interest method. To the extent debt obligations are placed on non-accrual status, any related interest income may be reduced by writing off interest receivables when the collection of all or a portion of interest has become doubtful based on consistently applied procedures. If the issuer subsequently resumes interest payments or when the collectability of interest is reasonably assured, the debt obligation is removed from non-accrual status.
Income from foreign securities is recorded net of foreign taxes withheld where recovery of such taxes is not assured.
Distributions to shareholders
Distributions to shareholders from net investment income and net realized gains, if any, are recorded on the ex-dividend date. Such distributions are determined in conformity with federal income tax regulations, which may differ in amount or character from net investment income and realized gains recognized for purposes of U.S. generally accepted accounting principles.
| | | | |
| 24 | | Wells Fargo Advantage International Bond Fund | | Notes to financial statements (unaudited) |
Federal and other taxes
The Fund intends to continue to qualify as a regulated investment company by distributing substantially all of its investment company taxable income and any net realized capital gains (after reduction for capital loss carryforwards) sufficient to relieve it from all, or substantially all, federal income taxes. Accordingly, no provision for federal income taxes was required.
The Fund’s income and federal excise tax returns and all financial records supporting those returns for the prior three fiscal years are subject to examination by the federal and Delaware revenue authorities. Management has analyzed the Fund’s tax positions taken on federal, state, and foreign tax returns for all open tax years and does not believe that there are any uncertain tax positions that require recognition of a tax liability.
Class allocations
The separate classes of shares offered by the Fund differ principally in applicable sales charges, distribution, shareholder servicing, and administration fees. Class specific expenses are charged directly to that share class. Investment income, common expenses, and realized and unrealized gains (losses) on investments are allocated daily to each class of shares based on the relative proportion of net assets of each class.
3. FAIR VALUATION MEASUREMENTS
Fair value measurements of investments are determined within a framework that has established a fair value hierarchy based upon the various data inputs utilized in determining the value of the Fund’s investments. The three-level hierarchy gives the highest priority to unadjusted quoted prices in active markets for identical assets or liabilities (Level 1) and the lowest priority to significant unobservable inputs (Level 3). The Fund’s investments are classified within the fair value hierarchy based on the lowest level of input that is significant to the fair value measurement. The inputs are summarized into three broad levels as follows:
| n | | Level 1 – quoted prices in active markets for identical securities |
| n | | Level 2 – other significant observable inputs (including quoted prices for similar securities, interest rates, prepayment speeds, credit risk, use of amortized cost, etc.) |
| n | | Level 3 – significant unobservable inputs (including the Fund’s own assumptions in determining the fair value of investments) |
The inputs or methodologies used for valuing investments in securities are not necessarily an indication of the risk associated with investing in those securities.
The following is a summary of the inputs used in valuing the Fund’s assets and liabilities as of April 30, 2015:
| | | | | | | | | | | | | | | | |
| | | Quoted prices
(Level 1) | | | Other significant
observable inputs
(Level 2) | | | Significant
unobservable inputs
(Level 3) | | | Total | |
Assets | | | | | | | | | | | | | | | | |
Investments in : | | | | | | | | | | | | | | | | |
| | | | |
Corporate bonds and notes | | $ | 0 | | | $ | 33,099,422 | | | $ | 0 | | | $ | 33,099,422 | |
| | | | |
Foreign corporate bonds and notes | | | 0 | | | | 257,571,532 | | | | 0 | | | | 257,571,532 | |
| | | | |
Foreign government bonds | | | 0 | | | | 814,404,597 | | | | 0 | | | | 814,404,597 | |
| | | | |
U.S. Treasury securities | | | 74,833,028 | | | | 0 | | | | 0 | | | | 74,833,028 | |
| | | | |
Yankee corporate bonds and notes | | | 0 | | | | 44,957,082 | | | | 0 | | | | 44,957,082 | |
| | | | |
Short-term investments | | | | | | | | | | | | | | | | |
Investment companies | | | 11,368,159 | | | | 3,518,943 | | | | 0 | | | | 14,887,102 | |
| | | 86,201,187 | | | | 1,153,551,576 | | | | 0 | | | | 1,239,752,763 | |
Forward foreign currency contracts | | | 0 | | | | 17,291,809 | | | | 0 | | | | 17,291,809 | |
Total assets | | $ | 86,201,187 | | | $ | 1,170,843,385 | | | $ | 0 | | | $ | 1,257,044,572 | |
Liabilities | | | | | | | | | | | | | | | | |
Forward foreign currency contracts | | $ | 0 | | | $ | 26,206,593 | | | $ | 0 | | | $ | 26,206,593 | |
Total liabilities | | $ | 0 | | | $ | 26,206,593 | | | $ | 0 | | | $ | 26,206,593 | |
| | | | | | |
| Notes to financial statements (unaudited) | | Wells Fargo Advantage International Bond Fund | | | 25 | |
Forward foreign currency contracts are reported at their unrealized gains (losses) at measurement date, which represents the change in the contract’s value from trade date. All other assets and liabilities are reported at their market value at measurement date.
The Fund recognizes transfers between levels within the fair value hierarchy at the end of the reporting period. At April 30, 2015, the Fund did not have any transfers into/out of Level 1, Level 2, or Level 3.
4. TRANSACTIONS WITH AFFILIATES
Advisory fee
The Trust has entered into an advisory contract with Funds Management, an indirect wholly owned subsidiary of Wells Fargo & Company (“Wells Fargo”). The adviser is responsible for implementing investment policies and guidelines and for supervising the subadviser, who is responsible for day-to-day portfolio management of the Fund.
Pursuant to the contract, Funds Management is entitled to receive an annual advisory fee starting at 0.55% and declining to 0.45% as the average daily net assets of the Fund increase. For the six months ended April 30, 2015, the advisory fee was equivalent to an annual rate of 0.53% of the Fund’s average daily net assets.
Funds Management has retained the services of a subadviser to provide daily portfolio management to the Fund. The fee for subadvisory services is borne by Funds Management. First International Advisors, LLC, an affiliate of Funds Management and an indirect wholly owned subsidiary of Wells Fargo, is the subadviser to the Fund and is entitled to receive a fee from Funds Management at an annual rate starting at 0.35% and declining to 0.20% as the average daily net assets of the Fund increase.
Administration fees
The Trust has entered into an administration agreement with Funds Management. Under this agreement, for providing administrative services, which includes paying fees and expenses for services provided by the transfer agent, sub-transfer agents, omnibus account servicers and record-keepers, Funds Management is entitled to receive from the Fund an annual fund level administration fee starting at 0.05% and declining to 0.03% as the average daily net assets of the Fund increase and a class level administration fee which is calculated based on the average daily net assets of each class as follows:
| | | | |
| | | Class level
administration fee | |
Class A, Class B, Class C | | | 0.16 | % |
Class R6 | | | 0.03 | |
Administrator Class | | | 0.10 | |
Institutional Class | | | 0.08 | |
Funds Management has contractually waived and/or reimbursed advisory and administration fees to the extent necessary to maintain certain net operating expense ratios for the Fund. Waiver of fees and/or reimbursement of expenses by Funds Management were made first from fund level expenses on a proportionate basis and then from class specific expenses. Funds Management has committed through February 29, 2016 to waive fees and/or reimburse expenses to the extent necessary to cap the Fund’s expenses at 1.03% for Class A shares, 1.78% for Class B shares, 1.78% for Class C shares, 0.65% for Class R6 shares, 0.85% for Administrator Class shares, and 0.70% for Institutional Class shares. After this time, the cap may be increased or the commitment to maintain the cap may be terminated only with the approval of the Board of Trustees.
Distribution fees
The Trust has adopted a Distribution Plan for Class B and Class C shares of the Fund pursuant to Rule 12b-1 under the 1940 Act. Distribution fees are charged to Class B and Class C shares and paid to Wells Fargo Funds Distributor, LLC (“Funds Distributor”), the principal underwriter, at an annual rate of 0.75% of the average daily net assets of Class B and Class C shares.
In addition, Funds Distributor is entitled to receive the front-end sales charge from the purchase of Class A shares and a contingent deferred sales charge on the redemption of certain Class A shares. Funds Distributor is also entitled to receive the contingent deferred sales charges from redemptions of Class B and Class C shares. For the six months ended April 30, 2015, Funds Distributor received $447 from the sale of Class A shares and $11 in contingent deferred sales charges from redemptions of Class C shares.
| | | | |
| 26 | | Wells Fargo Advantage International Bond Fund | | Notes to financial statements (unaudited) |
Shareholder servicing fees
The Trust has entered into contracts with one or more shareholder servicing agents, whereby Class A, Class B, Class C, and Administrator Class of the Fund is charged a fee at an annual rate of 0.25% of the average daily net assets of each respective class.
A portion of these total shareholder servicing fees were paid to affiliates of Wells Fargo.
5. INVESTMENT PORTFOLIO TRANSACTIONS
Purchases and sales of investments, excluding short-term securities, for the six months ended April 30, 2015 were as follows:
| | | | | | |
Purchases at cost | | Sales proceeds |
U.S.
government | | Non-U.S.
government | | U.S.
government | | Non-U.S.
government |
| $139,853,152 | | $959,848,758 | | $65,766,632 | | $1,004,446,127 |
6. DERIVATIVE TRANSACTIONS
During the six months ended April 30, 2015, the Fund entered into forward foreign currency contracts for economic hedging purposes.
At April 30, 2015, the Fund had forward foreign currency contracts outstanding as follows:
Forward foreign currency contracts to buy:
| | | | | | | | | | | | | | | | | | |
| Exchange date | | Counterparty | | Contracts to
receive | | | U.S. value at
April 30, 2015 | | | In exchange for U.S. $ | | | Unrealized
gains (losses) | |
| 5-4-2015 | | State Street Bank | | | 33,350,000 | MXN | | $ | 2,173,771 | | | $ | 2,227,267 | | | $ | (53,496 | ) |
| 5-11-2015 | | State Street Bank | | | 20,995,000,000 | JPY | | | 175,841,897 | | | | 179,157,945 | | | | (3,316,048 | ) |
| 5-11-2015 | | State Street Bank | | | 7,770,000,000 | JPY | | | 65,076,996 | | | | 65,150,677 | | | | (73,681 | ) |
| 5-12-2015 | | State Street Bank | | | 7,950,000 | MYR | | | 2,230,796 | | | | 2,209,438 | | | | 21,358 | |
| 5-12-2015 | | State Street Bank | | | 4,650,000 | MYR | | | 1,304,805 | | | | 1,280,992 | | | | 23,813 | |
| 5-18-2015 | | State Street Bank | | | 39,300,000 | TRY | | | 14,644,485 | | | | 14,538,567 | | | | 105,918 | |
| 5-18-2015 | | State Street Bank | | | 38,700,000 | TRY | | | 14,420,905 | | | | 14,244,149 | | | | 176,756 | |
| 5-29-2015 | | State Street Bank | | | 211,769,478 | ZAR | | | 17,731,354 | | | | 17,675,000 | | | | 56,354 | |
| 5-29-2015 | | State Street Bank | | | 14,700,000 | ZAR | | | 1,230,824 | | | | 1,219,974 | | | | 10,850 | |
| 6-9-2015 | | State Street Bank | | | 87,900,000 | BRL | | | 28,819,931 | | | | 29,143,596 | | | | (323,665 | ) |
| 6-9-2015 | | State Street Bank | | | 89,700,000 | BRL | | | 29,410,100 | | | | 28,993,471 | | | | 416,629 | |
| 6-9-2015 | | State Street Bank | | | 11,500,000 | PLN | | | 3,190,793 | | | | 3,100,827 | | | | 89,966 | |
| 6-9-2015 | | State Street Bank | | | 4,150,000 | PLN | | | 1,151,460 | | | | 1,118,011 | | | | 33,449 | |
| 6-9-2015 | | State Street Bank | | | 10,250,000 | RON | | | 2,600,115 | | | | 2,598,357 | | | | 1,758 | |
| 6-12-2015 | | State Street Bank | | | 4,700,000 | TRY | | | 1,738,641 | | | | 1,717,640 | | | | 21,001 | |
| 6-12-2015 | | State Street Bank | | | 14,400,000 | ZAR | | | 1,202,939 | | | | 1,199,151 | | | | 3,788 | |
| 6-12-2015 | | State Street Bank | | | 3,915,000 | BRL | | | 1,282,381 | | | | 1,263,800 | | | | 18,581 | |
| 6-12-2015 | | State Street Bank | | | 1,500,000 | ZAR | | | 125,306 | | | | 124,199 | | | | 1,107 | |
| 6-12-2015 | | State Street Bank | | | 7,000,000 | NZD | | | 5,322,579 | | | | 5,237,043 | | | | 85,536 | |
| 6-16-2015 | | State Street Bank | | | 18,000,000 | EUR | | | 20,222,335 | | | | 19,137,348 | | | | 1,084,987 | |
| 6-16-2015 | | State Street Bank | | | 117,400,000 | EUR | | | 131,894,564 | | | | 124,640,293 | | | | 7,254,271 | |
| 6-16-2015 | | State Street Bank | | | 20,000,000 | EUR | | | 22,469,261 | | | | 21,104,160 | | | | 1,365,101 | |
| 6-16-2015 | | State Street Bank | | | 6,500,000 | EUR | | | 7,302,510 | | | | 7,177,612 | | | | 124,898 | |
| 6-17-2015 | | State Street Bank | | | 10,700,000 | AUD | | | 8,446,998 | | | | 8,194,595 | | | | 252,403 | |
| 6-17-2015 | | State Street Bank | | | 41,519,033 | AUD | | | 32,776,744 | | | | 32,400,000 | | | | 376,744 | |
| 6-22-2015 | | State Street Bank | | | 45,000,000 | THB | | | 1,363,156 | | | | 1,378,550 | | | | (15,394 | ) |
| | | | | | |
| Notes to financial statements (unaudited) | | Wells Fargo Advantage International Bond Fund | | | 27 | |
Forward foreign currency contracts to buy (continued)
| | | | | | | | | | | | | | | | | | |
| Exchange date | | Counterparty | | Contracts to
receive | | | U.S. value at
April 30, 2015 | | | In exchange for U.S. $ | | | Unrealized
gains (losses) | |
| 6-23-2015 | | State Street Bank | | | 213,000,000 | PLN | | $ | 59,071,496 | | | $ | 57,407,370 | | | $ | 1,664,126 | |
| 7-24-2015 | | State Street Bank | | | 86,300,000 | CAD | | | 71,447,100 | | | | 70,448,405 | | | | 998,695 | |
| | | | | | | | | | | | | | | | | | | | | | |
| Exchange date | | Counterparty | | Contracts to
receive | | | U.S. value at
April 30, 2015 | | | In exchange
for | | | U.S. value at
April 30,
2015 | | | Unrealized
losses | |
| 6-23-2015 | | State Street Bank | | | 51,443,062 | EUR | | $ | 57,799,724 | | | | 213,000,000 | PLN | | $ | 59,071,496 | | | $ | (1,271,772 | ) |
| 7-21-2015 | | State Street Bank | | | 12,560,000,000 | JPY | | | 105,287,859 | | | | 98,219,613 | EUR | | | 110,398,829 | | | | (5,110,970 | ) |
Forward foreign currency contracts to sell:
| | | | | | | | | | | | | | | | | | |
| Exchange date | | Counterparty | | Contracts to
deliver | | | U.S. value at
April 30, 2015 | | | In exchange for U.S. $ | | | Unrealized
gains
(losses) | |
| 5-4-2015 | | State Street Bank | | | 33,350,000 | MXN | | $ | 2,173,771 | | | $ | 2,213,491 | | | $ | 39,720 | |
| 5-12-2015 | | State Street Bank | | | 1,295,000,000 | COP | | | 543,273 | | | | 537,166 | | | | (6,107 | ) |
| 5-18-2015 | | State Street Bank | | | 78,000,000 | TRY | | | 29,065,389 | | | | 31,187,650 | | | | 2,122,261 | |
| 5-29-2015 | | State Street Bank | | | 401,250,000 | ZAR | | | 33,596,465 | | | | 34,512,270 | | | | 915,805 | |
| 6-9-2015 | | State Street Bank | | | 7,350,000 | PLN | | | 2,039,333 | | | | 1,975,687 | | | | (63,646 | ) |
| 6-9-2015 | | State Street Bank | | | 177,600,000 | BRL | | | 58,230,032 | | | | 55,880,687 | | | | (2,349,345 | ) |
| 6-9-2015 | | State Street Bank | | | 10,250,000 | RON | | | 2,600,115 | | | | 2,536,438 | | | | (63,677 | ) |
| 6-9-2015 | | State Street Bank | | | 8,300,000 | PLN | | | 2,302,920 | | | | 2,210,742 | | | | (92,178 | ) |
| 6-9-2015 | | State Street Bank | | | 532,250,000 | HUF | | | 1,965,496 | | | | 1,913,295 | | | | (52,201 | ) |
| 6-11-2015 | | State Street Bank | | | 15,600,000 | GBP | | | 23,939,722 | | | | 23,630,022 | | | | (309,700 | ) |
| 6-11-2015 | | State Street Bank | | | 76,650,000 | GBP | | | 117,626,904 | | | | 115,744,719 | | | | (1,882,185 | ) |
| 6-12-2015 | | State Street Bank | | | 3,915,000 | BRL | | | 1,282,381 | | | | 1,204,060 | | | | (78,321 | ) |
| 6-12-2015 | | State Street Bank | | | 81,700,000 | NZD | | | 62,122,106 | | | | 58,927,759 | | | | (3,194,347 | ) |
| 6-12-2015 | | State Street Bank | | | 1,190,000 | TRY | | | 440,209 | | | | 448,507 | | | | 8,298 | |
| 6-12-2015 | | State Street Bank | | | 15,900,000 | ZAR | | | 1,328,245 | | | | 1,283,138 | | | | (45,107 | ) |
| 6-12-2015 | | State Street Bank | | | 5,150,000 | TRY | | | 1,905,107 | | | | 1,922,743 | | | | 17,636 | |
| 6-16-2015 | | State Street Bank | | | 8,300,000 | EUR | | | 9,324,743 | | | | 8,859,628 | | | | (465,115 | ) |
| 6-16-2015 | | State Street Bank | | | 5,500,000 | EUR | | | 6,179,047 | | | | 5,970,641 | | | | (208,406 | ) |
| 6-17-2015 | | State Street Bank | | | 232,200,000 | AUD | | | 183,307,740 | | | | 177,196,696 | | | | (6,111,044 | ) |
| 7-15-2015 | | State Street Bank | | | 40,180,000 | SGD | | | 30,328,305 | | | | 29,208,117 | | | | (1,120,188 | ) |
The Fund had average contract amounts of $641,646,833 and $664,561,210 in forward foreign currency contracts to buy and forward foreign currency contracts to sell, respectively, during the six months ended April 30, 2015.
The fair value, realized gains or losses and change in unrealized gains or losses, if any, on derivative instruments are reflected in the appropriate financial statements.
For certain types of derivative transactions, the Fund has entered into International Swaps and Derivatives Association, Inc. master agreements (“ISDA Master Agreements”) or similar agreements with approved counterparties. The ISDA Master Agreements or similar agreements may have requirements to deliver/deposit securities or cash to/with an exchange or broker-dealer as collateral and allows the Fund to offset, with each counterparty, certain derivative financial instrument’s assets and/or liabilities with collateral held or pledged. Collateral requirements differ by type of derivative. Collateral or margin requirements are set by the broker or exchange clearing house for exchange traded derivatives while collateral terms are contract specific for over-the-counter traded derivatives. Cash collateral that has been pledged to cover obligations of the Fund under ISDA Master Agreements or similar agreements, if any, will be reported separately in the Statement of Assets and Liabilities. Securities pledged as collateral, if any, for the same purpose are noted in the
| | | | |
| 28 | | Wells Fargo Advantage International Bond Fund | | Notes to financial statements (unaudited) |
Portfolio of Investments. With respect to balance sheet offsetting, absent an event of default by the counterparty or a termination of the agreement, the reported amounts of financial assets and financial liabilities in the Statement of Assets and Liabilities are not offset across transactions between the Fund and the applicable counterparty. A reconciliation of the gross amounts on the Statement of Assets and Liabilities to the net amounts by derivative type, including any collateral exposure, is as follows:
| | | | | | | | | | | | | | | | |
| Derivative type | | Counterparty | | Gross amounts
of assets in the
Statement of
Assets and
Liabilities | | Amounts
subject to
netting
agreements | | | Collateral
received | | | Net amount
of assets | |
Forward foreign currency contracts | | State Street Bank | | $17,291,809* | | $ | (17,291,809 | ) | | $ | 0 | | | $ | 0 | |
| * | Amount represents net unrealized gains. |
| | | | | | | | | | | | | | | | |
| Derivative type | | Counterparty | | Gross amounts
of liabilities in the
Statement of
Assets and
Liabilities | | Amounts
subject to
netting
agreements | | | Collateral
pledged | | | Net amount
of liabilities | |
Forward foreign currency contracts | | State Street Bank | | $26,206,593** | | $ | (17,291,809 | ) | | $ | 0 | | | $ | 8,914,784 | |
| ** | Amount represents net unrealized losses. |
7. BANK BORROWINGS
The Trust (excluding the money market funds and certain other funds in the Trust) and Wells Fargo Variable Trust are parties to a $150,000,000 revolving credit agreement, whereby the Fund is permitted to use bank borrowings for temporary or emergency purposes, such as to fund shareholder redemption requests. Interest under the credit agreement is charged to the Fund based on a borrowing rate equal to the higher of the Federal Funds rate in effect on that day plus 1.25% or the overnight LIBOR rate in effect on that day plus 1.25%. In addition, an annual commitment fee equal to 0.10% of the unused balance is allocated to each participating fund. For the six months ended April 30, 2015, the Fund paid $1,172 in commitment fees.
For the six months ended April 30, 2015, there were no borrowings by the Fund under the agreement.
8. INDEMNIFICATION
Under the Trust’s organizational documents, the officers and Trustees have been granted certain indemnification rights against certain liabilities that may arise out of performance of their duties to the Trust. Additionally, in the normal course of business, the Trust may enter into contracts with service providers that contain a variety of indemnification clauses. The Trust’s maximum exposure under these arrangements is dependent on future claims that may be made against the Fund and, therefore, cannot be estimated.
| | | | | | |
| Other information (unaudited) | | Wells Fargo Advantage International Bond Fund | | | 29 | |
PROXY VOTING INFORMATION
A description of the policies and procedures that the Fund uses to determine how to vote proxies relating to portfolio securities is available, upon request, by calling 1-800-222-8222, visiting our website at wellsfargoadvantagefunds.com, or visiting the SEC website at sec.gov. Information regarding how the Fund voted proxies relating to portfolio securities during the most recent 12-month period ended June 30 is available on the Fund’s website at wellsfargoadvantagefunds.com or by visiting the SEC website at sec.gov.
PORTFOLIO HOLDINGS INFORMATION
The complete portfolio holdings for the Fund are publicly available monthly on the Fund’s website (wellsfargoadvantagefunds.com), on a one-month delayed basis. In addition, top ten holdings information (excluding derivative positions) for the Fund is publicly available on the Fund’s website on a monthly, seven-day or more delayed basis. The Fund files its complete schedule of portfolio holdings with the SEC for the first and third quarters of each fiscal year on Form N-Q, which is available by visiting the SEC website at sec.gov. In addition, the Fund’s Form N-Q may be reviewed and copied at the SEC’s Public Reference Room in Washington, DC, and at regional offices in New York City, at 233 Broadway, and in Chicago, at 175 West Jackson Boulevard, Suite 900. Information about the Public Reference Room may be obtained by calling 1-800-SEC-0330.
| | | | |
| 30 | | Wells Fargo Advantage International Bond Fund | | Other information (unaudited) |
BOARD OF TRUSTEES AND OFFICERS
Each of the Trustees and Officers1 listed in the table below acts in identical capacities for each fund in the Wells Fargo Advantage family of funds, which consists of 134 mutual funds comprising the Wells Fargo Funds Trust, Wells Fargo Variable Trust, Wells Fargo Master Trust and four closed-end funds (collectively the “Fund Complex”). This table should be read in conjunction with the Prospectus and the Statement of Additional Information2. The mailing address of each Trustee and Officer is 525 Market Street, 12th Floor, San Francisco, CA 94105. Each Trustee and Officer serves an indefinite term, however, each Trustee serves such term until reaching the mandatory retirement age established by the Trustees.
Independent Trustees
| | | | | | |
Name and year of birth | | Position held and length of service* | | Principal occupations during past five years or longer | | Other directorships during
past five years |
William R. Ebsworth
(Born 1957) | | Trustee, since 2015** | | Retired. From 1984 to 2013, equities analyst, portfolio manager, research director at Fidelity Management and Research Company and retired in 2013 as Chief Investment Officer of Fidelity Strategic Advisers, Inc. in Boston, Tokyo, and Hong Kong where he led a team of investment professionals managing client assets. Prior thereto, Board member of Hong Kong Securities Clearing Co., Hong Kong Options Clearing Corp., the Thailand International Fund, Ltd., Fidelity Investments Life Insurance Company, and Empire Fidelity Investments Life Insurance Company. Mr. Ebsworth is an Adjunct Lecturer, Finance, at Babson College and a Chartered Financial Analyst. | | Asset Allocation Trust |
| Jane A. Freeman (Born 1953) | | Trustee, since 2015** | | Retired. From 2012 to 2014 and 1999 to 2008, Chief Financial Officer of Scientific Learning Corporation. From 2008 to 2012, Ms. Freeman provided consulting services related to strategic business projects. Prior to 1999, Portfolio Manager at Rockefeller & Co. and Scudder, Stevens & Clark. Board member of the Harding Loevner Funds from 1996 to 2014, serving as both Lead Independent Director and chair of the Audit Committee. Board member of the Russell Exchange Traded Funds Trust from 2011 to 2012 and the chair of the Audit Committee. Ms. Freeman is a Chartered Financial Analyst (inactive), Chair of Taproot Foundation (non-profit organization) and a Board Member of Ruth Bancroft Garden (non-profit organization). | | Asset Allocation Trust |
| Peter G. Gordon (Born 1942) | | Trustee, since 1998; Chairman, since 2005 | | Co-Founder, Retired Chairman, President and CEO of Crystal Geyser Water Company. Trustee Emeritus, Colby College. | | Asset Allocation Trust |
| Isaiah Harris, Jr. (Born 1952) | | Trustee, since 2009 | | Retired. Chairman of the Board of CIGNA Corporation since 2009, and Director since 2005. From 2003 to 2011, Director of Deluxe Corporation. Prior thereto, President and CEO of BellSouth Advertising and Publishing Corp. from 2005 to 2007, President and CEO of BellSouth Enterprises from 2004 to 2005 and President of BellSouth Consumer Services from 2000 to 2003. Emeritus member of the Iowa State University Foundation Board of Governors. Emeritus Member of the Advisory Board of Iowa State University School of Business. Advisory Board Member, Palm Harbor Academy. Mr. Harris is a certified public accountant. | | CIGNA Corporation; Asset Allocation Trust |
| Judith M. Johnson (Born 1949) | | Trustee, since 2008;
Audit Committee Chairman, since 2008 | | Retired. Prior thereto, Chief Executive Officer and Chief Investment Officer of Minneapolis Employees Retirement Fund from 1996 to 2008. Ms. Johnson is an attorney, certified public accountant and a certified managerial accountant. | | Asset Allocation Trust |
| David F. Larcker (Born 1950) | | Trustee, since 2009 | | James Irvin Miller Professor of Accounting at the Graduate School of Business, Stanford University, Morgan Stanley Director of the Center for Leadership Development and Research and Senior Faculty of The Rock Center for Corporate Governance since 2006. From 2005 to 2008, Professor of Accounting at the Graduate School of Business, Stanford University. Prior thereto, Ernst & Young Professor of Accounting at The Wharton School, University of Pennsylvania from 1985 to 2005. | | Asset Allocation Trust |
| Olivia S. Mitchell (Born 1953) | | Trustee, since 2006 | | International Foundation of Employee Benefit Plans Professor, Wharton School of the University of Pennsylvania since 1993. Director of Wharton’s Pension Research Council and Boettner Center on Pensions & Retirement Research, and Research Associate at the National Bureau of Economic Research. Previously, Cornell University Professor from 1978 to 1993. | | Asset Allocation Trust |
| | | | | | |
| Other information (unaudited) | | Wells Fargo Advantage International Bond Fund | | | 31 | |
| | | | | | |
Name and year of birth | | Position held and length of service* | | Principal occupations during past five years or longer | | Other directorships during
past five years |
| Timothy J. Penny (Born 1951) | | Trustee, since 1996 | | President and Chief Executive Officer of Southern Minnesota Initiative Foundation, a non-profit organization, since 2007 and Senior Fellow at the Humphrey Institute Policy Forum at the University of Minnesota since 1995. Member of the Board of Trustees of NorthStar Education Finance, Inc., a non-profit organization, since 2007. | | Asset Allocation Trust |
| Michael S. Scofield (Born 1943) | | Trustee, since 2010 | | Served on the Investment Company Institute’s Board of Governors and Executive Committee from 2008-2011 as well the Governing Council of the Independent Directors Council from 2006-2011 and the Independent Directors Council Executive Committee from 2008-2011. Chairman of the IDC from 2008-2010. Institutional Investor (Fund Directions) Trustee of Year in 2007. Trustee of the Evergreen Funds complex (and its predecessors) from 1984 to 2010. Chairman of the Evergreen Funds from 2000-2010. Former Trustee of the Mentor Funds. Retired Attorney, Law Offices of Michael S. Scofield. | | Asset Allocation Trust |
| Donald C. Willeke (Born 1940) | | Trustee, since 1996 | | Principal of the law firm of Willeke & Daniels. General Counsel of the Minneapolis Employees Retirement Fund from 1984 until its consolidation into the Minnesota Public Employees Retirement Association on June 30, 2010. Director and Vice Chair of The Tree Trust (non-profit corporation). Director of the American Chestnut Foundation (non-profit corporation). | | Asset Allocation Trust |
| * | Length of service dates reflect the Trustee’s commencement of service with the Trust’s predecessor entities, where applicable. |
| ** | William R. Ebsworth and Jane A. Freeman each became a Trustee effective January 1, 2015. |
Officers
| | | | | | |
Name and year of birth | | Position held and length of service | | Principal occupations during past five years or longer | | |
| Karla M. Rabusch (Born 1959) | | President, since 2003 | | Executive Vice President of Wells Fargo Bank, N.A. and President of Wells Fargo Funds Management, LLC since 2003. | | |
Nancy Wiser1
(Born 1967) | | Treasurer, since 2012 | | Executive Vice President of Wells Fargo Funds Management, LLC since 2011. Chief Operating Officer and Chief Compliance Officer at LightBox Capital Management LLC, from 2008 to 2011. Owned and operated a consulting business providing services to various hedge funds including acting as Chief Operating Officer and Chief Compliance Officer for a hedge fund from 2007 to 2008. Chief Operating Officer and Chief Compliance Officer of GMN Capital LLC from 2006 to 2007. | | |
| C. David Messman (Born 1960) | | Secretary, since 2000; Chief Legal Officer, since 2003 | | Senior Vice President and Secretary of Wells Fargo Funds Management, LLC since 2001. Assistant General Counsel of Wells Fargo Bank, N.A. since 2013 and Vice President and Managing Counsel of Wells Fargo Bank N.A. from 1996 to 2013. | | |
| Debra Ann Early (Born 1964) | | Chief Compliance Officer, since 2007 | | Senior Vice President of Wells Fargo Funds Management, LLC since 2007 and Chief Compliance Officer from 2007 to 2014. Chief Compliance Officer of Parnassus Investments from 2005 to 2007. Chief Financial Officer of Parnassus Investments from 2004 to 2007 and Senior Audit Manager of PricewaterhouseCoopers LLP from 1998 to 2004. | | |
David Berardi
(Born 1975) | | Assistant Treasurer, since 2009 | | Vice President of Wells Fargo Funds Management, LLC since 2009. Vice President of Evergreen Investment Management Company, LLC from 2008 to 2010. Assistant Vice President of Evergreen Investment Services, Inc. from 2004 to 2008. Manager of Fund Reporting and Control for Evergreen Investment Management Company, LLC from 2004 to 2010. | | |
| Jeremy DePalma1 (Born 1974) | | Assistant Treasurer, since 2009 | | Senior Vice President of Wells Fargo Funds Management, LLC since 2009. Senior Vice President of Evergreen Investment Management Company, LLC from 2008 to 2010. Vice President, Evergreen Investment Services, Inc. from 2004 to 2007. Head of the Fund Reporting and Control Team within Fund Administration from 2005 to 2010. | | |
| 1 | Nancy Wiser acts as Treasurer of 73 funds in the Fund Complex. Jeremy DePalma acts as Treasurer of 61 funds and Assistant Treasurer of 73 funds in the Fund Complex. |
| 2 | The Statement of Additional Information includes additional information about the Trustees and is available, without charge, upon request, by calling 1-800-222-8222 or by visiting the website at wellsfargoadvantagefunds.com. |
| | | | |
| 32 | | Wells Fargo Advantage International Bond Fund | | List of abbreviations |
The following is a list of common abbreviations for terms and entities that may have appeared in this report.
| ACA | — ACA Financial Guaranty Corporation |
| ADR | — American depositary receipt |
| ADS | — American depositary shares |
| AGC | — Assured Guaranty Corporation |
| AGM | — Assured Guaranty Municipal |
| Ambac | — Ambac Financial Group Incorporated |
| AMT | — Alternative minimum tax |
| BAN | — Bond anticipation notes |
| BHAC | — Berkshire Hathaway Assurance Corporation |
| CAB | — Capital appreciation bond |
| CCAB | — Convertible capital appreciation bond |
| CDA | — Community Development Authority |
| CDO | — Collateralized debt obligation |
| DRIVER | — Derivative inverse tax-exempt receipts |
| DW&P | — Department of Water & Power |
| DWR | — Department of Water Resources |
| ECFA | — Educational & Cultural Facilities Authority |
| EDA | — Economic Development Authority |
| EDFA | — Economic Development Finance Authority |
| ETF | — Exchange-traded fund |
| FDIC | — Federal Deposit Insurance Corporation |
| FFCB | — Federal Farm Credit Banks |
| FGIC | — Financial Guaranty Insurance Corporation |
| FHA | — Federal Housing Administration |
| FHLB | — Federal Home Loan Bank |
| FHLMC | — Federal Home Loan Mortgage Corporation |
| FICO | — The Financing Corporation |
| FNMA | — Federal National Mortgage Association |
| GDR | — Global depositary receipt |
| GNMA | — Government National Mortgage Association |
| HCFR | — Healthcare facilities revenue |
| HEFA | — Health & Educational Facilities Authority |
| HEFAR | — Higher education facilities authority revenue |
| HFA | — Housing Finance Authority |
| HFFA | — Health Facilities Financing Authority |
| HUD | — Department of Housing and Urban Development |
| IDA | — Industrial Development Authority |
| IDAG | — Industrial Development Agency |
| KRW | — Republic of Korea won |
| LIBOR | — London Interbank Offered Rate |
| LIFER | — Long Inverse Floating Exempt Receipts |
| LLC | — Limited liability company |
| LLLP | — Limited liability limited partnership |
| LLP | — Limited liability partnership |
| MBIA | — Municipal Bond Insurance Association |
| MFHR | — Multifamily housing revenue |
| MSTR | — Municipal securities trust receipts |
| MUD | — Municipal Utility District |
| National | — National Public Finance Guarantee Corporation |
| PCFA | — Pollution Control Financing Authority |
| PCL | — Public Company Limited |
| PCR | — Pollution control revenue |
| PFA | — Public Finance Authority |
| PFFA | — Public Facilities Financing Authority |
| PFOTER | — Puttable floating option tax-exempt receipts |
| plc | — Public limited company |
| PUTTER | — Puttable tax-exempt receipts |
| R&D | — Research & development |
| Radian | — Radian Asset Assurance |
| RAN | — Revenue anticipation notes |
| RDA | — Redevelopment Authority |
| RDFA | — Redevelopment Finance Authority |
| REIT | — Real estate investment trust |
| ROC | — Reset option certificates |
| SAVRS | — Select auction variable rate securities |
| SBA | — Small Business Authority |
| SDR | — Swedish depositary receipt |
| SFHR | — Single-family housing revenue |
| SFMR | — Single-family mortgage revenue |
| SPA | — Standby purchase agreement |
| SPDR | — Standard & Poor’s Depositary Receipts |
| SPEAR | — Short Puttable Exempt Adjustable Receipts |
| STRIPS | — Separate trading of registered interest and |
| TAN | — Tax anticipation notes |
| TIPS | — Treasury inflation-protected securities |
| TRAN | — Tax revenue anticipation notes |
| TTFA | — Transportation Trust Fund Authority |
| TVA | — Tennessee Valley Authority |


For more information
More information about Wells Fargo Advantage Funds is available free upon request. To obtain literature, please write, email, visit the Fund’s website, or call:
Wells Fargo Advantage Funds
P.O. Box 8266
Boston, MA 02266-8266
Email: wfaf@wellsfargo.com
Website: wellsfargoadvantagefunds.com
Individual investors: 1-800-222-8222
Retail investment professionals: 1-888-877-9275
Institutional investment professionals: 1-866-765-0778
This report and the financial statements contained herein are submitted for the general information of the shareholders of Wells Fargo Advantage Funds. If this report is used for promotional purposes, distribution of the report must be accompanied or preceded by a current prospectus. Before investing, please consider the investment objectives, risks, charges, and expenses of the investment. For a current prospectus and, if available, a summary prospectus, containing this information, call 1-800-222-8222 or visit the Fund’s website at wellsfargoadvantagefunds.com. Read the prospectus carefully before you invest or send money.
Wells Fargo Funds Management, LLC, a wholly owned subsidiary of Wells Fargo & Company, provides investment advisory and administrative services for Wells Fargo Advantage Funds. Other affiliates of Wells Fargo & Company provide subadvisory and other services for the Funds. The Funds are distributed by Wells Fargo Funds Distributor, LLC, Member FINRA/SIPC, an affiliate of Wells Fargo & Company.
NOT FDIC INSURED ¡ NO BANK GUARANTEE ¡ MAY LOSE VALUE
© 2015 Wells Fargo Funds Management, LLC. All rights reserved.
| | |
 | | 233648 06-15 SA235/SAR235 04-15 |

Wells Fargo Advantage Strategic Income Fund

Semi-Annual Report
April 30, 2015

Reduce clutter. Save trees.
Sign up for electronic delivery of prospectuses and shareholder reports at wellsfargo.com/advantagedelivery
Contents
The views expressed and any forward-looking statements are as of April 30, 2015, unless otherwise noted, and are those of the Fund managers and/or Wells Fargo Funds Management, LLC. Discussions of individual securities, or the markets generally, or any Wells Fargo Advantage Fund are not intended as individual recommendations. Future events or results may vary significantly from those expressed in any forward-looking statements; the views expressed are subject to change at any time in response to changing circumstances in the market. Wells Fargo Funds Management, LLC and the Fund disclaim any obligation to publicly update or revise any views expressed or forward-looking statements.
NOT FDIC INSURED ¡ NO BANK GUARANTEE ¡ MAY LOSE VALUE
| | | | |
| 2 | | Wells Fargo Advantage Strategic Income Fund | | Letter to shareholders (unaudited) |

Karla M. Rabusch
President
Wells Fargo Advantage Funds
A worldwide trend toward looser monetary policy tended to support global bond markets.
European bond markets were boosted by the anticipation and then the reality of the ECB’s asset purchases.
Dear Valued Shareholder:
We are pleased to offer you this semi-annual report for the Wells Fargo Advantage Strategic Income Fund for the six-month period that ended April 30, 2015. The period was marked by low global interest rates as major central banks initiated or increased their quantitative easing programs. At the end of the reporting period, some European sovereign debt issues were selling at negative yields. Low interest rates presented a favorable background for global bonds, including high yield.
Major central banks continued to provide liquidity to the markets.
A worldwide trend toward looser monetary policy tended to support global bond markets. The European Central Bank (ECB) maintained a variety of measures aimed at encouraging lending, including making funds available to banks at low interest rates and imposing a negative interest rate on bank deposits held at the central bank. In January 2015, the ECB announced quantitative easing via significant bond purchases in an attempt to raise the eurozone’s inflation to just under its target of 2%. In Japan, the Bank of Japan (BOJ) also maintained an aggressive monetary program aimed at combating deflation. Later in the period, the BOJ widened its program by purchasing Japanese shares as well as bonds.
Throughout the reporting period, the Federal Open Market Committee (FOMC), which is the U.S. Federal Reserve’s (Fed’s) monetary policymaking body, kept its key interest rate effectively at zero. Even though the FOMC ended its bond-buying program in October 2014 and guided investors to expect an interest-rate hike in mid- to late 2015, the Fed remained accommodative. However, the fact that investors expected the Fed to eventually raise its key rate, even as other central banks lowered their benchmark rates, caused the U.S. dollar to appreciate against most major currencies during the period.
The U.S. outperformed other developed market economies, and a stronger U.S. dollar dampened returns on international assets for dollar-based investors.
Reported U.S. gross domestic product (GDP) growth came in at a solid 2.2% annualized rate in the fourth quarter of 2014. Although the initial estimate for annualized GDP growth came in at a modest 0.2% in the first quarter of 2015, the slowdown was attributed to short-term factors such as harsh winter weather and a long-lived strike at West Coast ports. Core U.S. bonds ended the period with a 2.06% return, as measured by the Barclays U.S. Aggregate Bond Index1.
High-yield bonds also benefited from the stronger economy, as well as continued demand from investors seeking more generous yields in a historically low-yielding environment. As measured by the BofA Merrill Lynch High Yield Master II Index2, high-yield bonds ended the period with a 1.51% gain.
European annualized GDP growth was 1.3% in the fourth quarter of 2014 and 1.4% in the first quarter of 2015. European bond markets were boosted by the anticipation and then the reality of the ECB’s asset purchases. The two-year German bond sold at a negative yield toward the latter half of the period. The flood of ECB-provided liquidity caused high-rated European sovereign bonds to sell at negative yields even in countries outside of the eurozone, such as Switzerland and Denmark. Japanese sovereign bonds also continued to trade at
| 1 | The Barclays U.S. Aggregate Bond Index is a broad-based benchmark that measures the investment-grade, U.S. dollar–denominated, fixed-rate taxable bond market, including Treasuries, government-related and corporate securities, MBS (agency fixed-rate and hybrid ARM pass-throughs), ABS, and CMBS. You cannot invest directly in an index. |
| 2 | The BofA Merrill Lynch High Yield Master II Index is a market-capitalization-weighted index of domestic and Yankee high-yield bonds. The index tracks the performance of high-yield securities traded in the U.S. bond market. You cannot invest directly in an index. |
| | | | | | |
| Letter to shareholders (unaudited) | | Wells Fargo Advantage Strategic Income Fund | | | 3 | |
ultralow yields because of ongoing purchases by the BOJ and major pension funds. Despite the favorable backdrop for international bonds, the appreciation in the U.S. dollar resulted in losses on international assets for dollar-based investors. The BofA Merrill Lynch Global Broad Market ex U.S. Index3, which tracks developed non-U.S. bond markets, returned -5.04% for the six-month period.
Don’t let short-term uncertainty derail long-term investment goals.
Periods of uncertainty can present challenges, but experience has taught us that maintaining long-term investment goals can be an effective way to plan for the future. To help you create a sound strategy based on your personal goals and risk tolerance, Wells Fargo Advantage Funds offers more than 100 mutual funds and other investments spanning a wide range of asset classes and investment styles. Although diversification cannot guarantee an investment profit or prevent losses, we believe it can be an effective way to manage investment risk and potentially smooth out overall portfolio performance. We encourage investors to know their investments and to understand that appropriate levels of risk-taking may unlock opportunities.
Thank you for choosing to invest with Wells Fargo Advantage Funds. We appreciate your confidence in us and remain committed to helping you meet your financial needs.
Sincerely,

Karla M. Rabusch
President
Wells Fargo Advantage Funds
For current information about your fund investments, contact your investment professional, visit our website at wellsfargoadvantagefunds.com, or call us directly at 1-800-222-8222. We are available 24 hours a day, 7 days a week.
| 3 | The BofA Merrill Lynch Global Broad Market Ex. U.S. Index tracks the performance of investment-grade debt publicly issued in the major domestic and euro bond markets, including sovereign, quasi-government, corporate, securitized, and collateralized securities, and excludes all securities denominated in U.S. dollars. You cannot invest directly in an index. |
| | | | |
| 4 | | Wells Fargo Advantage Strategic Income Fund | | Performance highlights (unaudited) |
Investment objective
The Fund seeks total return, consisting of income and capital appreciation.
Adviser
Wells Fargo Funds Management, LLC
Subadvisers
First International Advisers, LLC
Wells Capital Management Incorporated
Portfolio managers
Ashok Bhatia, CFA1
David Germany, Ph.D
Niklas Nordenfelt, CFA
Tony Norris
Margaret D. Patel
Alex Perrin
Thomas M. Price, CFA
Scott M. Smith, CFA
Noah Wise, CFA
Average annual total returns (%) as of April 30, 2015
| | | | | | | | | | | | | | | | | | | | | | | | | | |
| | | | | Including sales charge | | | Excluding sales charge | | | Expense ratios2 (%) | |
| | | Inception date | | 1 year | | | Since
inception | | | 1 year | | | Since
inception | | | Gross | | | Net3 | |
| Class A (WSIAX) | | 1-31-2013 | | | (3.86 | ) | | | (0.99 | ) | | | 0.68 | | | | 1.06 | | | | 1.49 | | | | 0.91 | |
| Class C (WSICX) | | 1-31-2013 | | | (1.03 | ) | | | 0.31 | | | | (0.06 | ) | | | 0.31 | | | | 2.24 | | | | 1.66 | |
| Administrator Class (WSIDX) | | 1-31-2013 | | | – | | | | – | | | | 0.84 | | | | 1.25 | | | | 1.43 | | | | 0.76 | |
| Institutional Class (WSINX) | | 1-31-2013 | | | – | | | | – | | | | 0.93 | | | | 1.38 | | | | 1.16 | | | | 0.61 | |
| Barclays U.S. Universal Bond Index4 | | – | | | – | | | | – | | | | 4.34 | | | | 2.79 | | | | – | | | | – | |
| BofA Merrill Lynch 3 Month U.S. Dollar LIBOR Constant Maturity Index5 | | – | | | – | | | | – | | | | 0.23 | | | | 0.26 | | | | – | | | | – | |
Figures quoted represent past performance, which is no guarantee of future results, and do not reflect taxes that a shareholder may pay on fund distributions or the redemption of fund shares. Investment return and principal value of an investment will fluctuate so that an investor’s shares, when redeemed, may be worth more or less than their original cost. Performance shown without sales charges would be lower if sales charges were reflected. Current performance may be lower or higher than the performance data quoted, which assumes the reinvestment of dividends and capital gains. Current month-end performance is available on the Fund’s website, wellsfargoadvantagefunds.com.
Index returns do not include transaction costs associated with buying and selling securities, any mutual fund fees or expenses, or any taxes. It is not possible to invest directly in an index.
For Class A shares, the maximum front-end sales charge is 4.50%. For Class C shares, the maximum contingent deferred sales charge is 1.00%. Performance including a contingent deferred sales charge assumes the sales charge for the corresponding time period. Administrator Class and Institutional Class shares are sold without a front end sales charge or contingent deferred sales charge.
Bond values fluctuate in response to the financial condition of individual issuers, general market and economic conditions, and changes in interest rates. Changes in market conditions and government policies may lead to periods of heightened volatility in the bond market and reduced liquidity for certain bonds held by the Fund. In general, when interest rates rise, bond values fall and investors may lose principal value. Interest-rate changes and their impact on the fund and its share price can be sudden and unpredictable. High-yield securities have a greater risk of default and tend to be more volatile than higher-rated debt securities. Loans are subject to risks similar to those associated with other below-investment-grade bond investments, such as credit risk (for example, risk of issuer default), below-investment-grade bond risk (for example, risk of greater volatility in value), and risk that the loan may become illiquid or difficult to price. Foreign investments are especially volatile and can rise or fall dramatically due to differences in the political and economic conditions of the host country. These risks are generally intensified in emerging markets. The use of derivatives may reduce returns and/or increase volatility. Certain investment strategies tend to increase the total risk of an investment (relative to the broader market). The Fund is exposed to mortgage- and asset-backed securities risk and geographic risk. Consult the Fund’s prospectus for additional information on these and other risks.
Please see footnotes on page 5.
| | | | | | |
| Performance highlights (unaudited) | | Wells Fargo Advantage Strategic Income Fund | | | 5 | |
| | | | |
| Ten largest holdings6 (%) as of April 30, 2015 | |
Indonesia, 7.88%, 4-15-2019 | | | 1.95 | |
Mexico, 4.75%, 6-14-2018 | | | 1.89 | |
Brazil, 10.00%, 1-1-2017 | | | 1.87 | |
Romania, 4.75%, 6-24-2019 | | | 1.66 | |
Republic of South Africa, 7.75%, 2-28-2023 | | | 1.31 | |
ACAS CLO Limited Trust Series 2015-1A Class B, 2.28%, 4-18-2027 | | | 1.23 | |
JPMBB Commercial Mortgage Securities Trust Series 2014-C19 Class D, 4.83%, 4-15-2047 | | | 1.14 | |
FHLMC Series 2012-K706 Class C, 4.17%, 11-25-2044 | | | 1.13 | |
GS Mortgage Securities Trust Series 2014-GC24 Class D, 4.66%, 9-10-2047 | | | 1.13 | |
Republic of South Africa, 8.00%, 12-21-2018 | | | 1.03 | |
| | |
| Portfolio allocation7 as of April 30, 2015 |
|
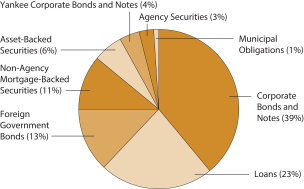 |
| 1 | Effective June 19, 2015, Ashok Bhatia became a portfolio manager of the Fund. |
| 2 | Reflects the expense ratios as stated in the most recent prospectuses, which include the impact of 0.01% in acquired fund fees and expenses. The expense ratios shown are subject to change and may differ from the annualized expense ratios shown in the financial highlights of this report, which do not include acquired fund fees and expenses. |
| 3 | The Adviser has committed through February 29, 2016, to waive fees and/or reimburse expenses to the extent necessary to cap the Fund’s Total Annual Fund Operating Expenses After Fee Waiver, excluding certain expenses, at 0.90% for Class A, 1.65% for Class C, 0.75% for Administrator Class, and 0.60% for Institutional Class. After this time, the cap may be increased or the commitment to maintain the cap may be terminated only with the approval of the Board of Trustees. Brokerage commissions, stamp duty fees, interest, taxes, acquired fund fees and expenses, and extraordinary expenses are excluded from the cap. Without this cap, the Fund’s returns would have been lower. |
| 4 | The Barclays U.S. Universal Bond Index is an unmanaged market value-weighted performance benchmark for the U.S. dollar-denominated bond market, which includes investment-grade, high yield, and emerging market debt securities with maturities of one year or more. You cannot invest directly in an index. |
| 5 | The BofA Merrill Lynch 3 Month U.S. Dollar LIBOR Constant Maturity Index is based on the assumed purchase of a synthetic instrument having 3 months to maturity and with a coupon equal to the closing quote for 3-Month LIBOR. That issue is sold the following day (priced at a yield equal to the current day closing 3-Month LIBOR rate) and is rolled into a new 3-Month instrument. The index, therefore, will always have a constant maturity equal to exactly 3 months. You cannot invest directly in an index. |
| 6 | The ten largest holdings, excluding cash and cash equivalents, are calculated based on the value of the investments divided by total net assets of the Fund. Holdings are subject to change and may have changed since the date specified. |
| 7 | Amounts are calculated based on the total long-term investments of the Fund. These percentages are subject to change and may have changed since the date specified. |
| | | | |
| 6 | | Wells Fargo Advantage Strategic Income Fund | | Fund expenses (unaudited) |
As a shareholder of the Fund, you incur two types of costs: (1) transaction costs, including sales charges (loads) on purchase payments and contingent deferred sales charges (if any) on redemptions and (2) ongoing costs, including management fees, distribution (12b-1) and/or shareholder service fees, and other Fund expenses. This example is intended to help you understand your ongoing costs (in dollars) of investing in the Fund and to compare these costs with the ongoing costs of investing in other mutual funds.
The example is based on an investment of $1,000 invested at the beginning of the six-month period and held for the entire period from November 1, 2014 to April 30, 2015.
Actual expenses
The “Actual” line of the table below provides information about actual account values and actual expenses. You may use the information in this line, together with the amount you invested, to estimate the expenses that you paid over the period. Simply divide your account value by $1,000 (for example, an $8,600 account value divided by $1,000 = 8.6), then multiply the result by the number in the “Actual” line under the heading entitled “Expenses paid during period” for your applicable class of shares to estimate the expenses you paid on your account during this period.
Hypothetical example for comparison purposes
The “Hypothetical” line of the table below provides information about hypothetical account values and hypothetical expenses based on the Fund’s actual expense ratio and an assumed rate of return of 5% per year before expenses, which is not the Fund’s actual return. The hypothetical account values and expenses may not be used to estimate the actual ending account balance or expenses you paid for the period. You may use this information to compare the ongoing costs of investing in the Fund and other funds. To do so, compare this 5% hypothetical example with the 5% hypothetical examples that appear in the shareholder reports of the other funds.
Please note that the expenses shown in the table are meant to highlight your ongoing costs only and do not reflect any transactional costs, such as sales charges (loads) and contingent deferred sales charges. Therefore, the “Hypothetical” line of the table is useful in comparing ongoing costs only and will not help you determine the relative total costs of owning different funds. In addition, if these transactional costs were included, your costs would have been higher.
| | | | | | | | | | | | | | | | |
| | | Beginning account value 11-1-2014 | | | Ending account value 4-30-2015 | | | Expenses paid during the period¹ | | | Net annualized expense ratio | |
Class A | | | | | | | | | | | | | | | | |
Actual | | $ | 1,000.00 | | | $ | 999.53 | | | $ | 4.46 | | | | 0.90 | % |
Hypothetical (5% return before expenses) | | $ | 1,000.00 | | | $ | 1,020.33 | | | $ | 4.51 | | | | 0.90 | % |
Class C | | | | | | | | | | | | | | | | |
Actual | | $ | 1,000.00 | | | $ | 996.53 | | | $ | 8.17 | | | | 1.65 | % |
Hypothetical (5% return before expenses) | | $ | 1,000.00 | | | $ | 1,016.61 | | | $ | 8.25 | | | | 1.65 | % |
Administrator Class | | | | | | | | | | | | | | | | |
Actual | | $ | 1,000.00 | | | $ | 1,000.71 | | | $ | 3.72 | | | | 0.75 | % |
Hypothetical (5% return before expenses) | | $ | 1,000.00 | | | $ | 1,021.08 | | | $ | 3.76 | | | | 0.75 | % |
Institutional Class | | | | | | | | | | | | | | | | |
Actual | | $ | 1,000.00 | | | $ | 1,002.11 | | | $ | 2.98 | | | | 0.60 | % |
Hypothetical (5% return before expenses) | | $ | 1,000.00 | | | $ | 1,021.82 | | | $ | 3.01 | | | | 0.60 | % |
| 1 | Expenses paid is equal to the annualized expense ratio of each class multiplied by the average account value over the period, multiplied by the number of days in the most recent fiscal half-year divided by the number of days in the fiscal year (to reflect the one-half-year period). |
| | | | | | |
| Portfolio of investments—April 30, 2015 (unaudited) | | Wells Fargo Advantage Strategic Income Fund | | | 7 | |
| | | | | | | | | | | | | | | | |
| Security name | | Interest rate | | | Maturity date | | | Principal | | | Value | |
| | | | |
Agency Securities: 2.73% | | | | | | | | | | | | | | | | |
FHLMC Series 2012-K706 Class C ±144A | | | 4.17 | % | | | 11-25-2044 | | | $ | 446,000 | | | $ | 460,298 | |
FHLMC Series 2013-K713 Class B ±144A | | | 3.27 | | | | 4-25-2046 | | | | 125,000 | | | | 127,194 | |
FREMF Mortgage Trust Series 2011-K703 Class B ±144A | | | 5.05 | | | | 7-25-2044 | | | | 250,000 | | | | 269,449 | |
FREMF Mortgage Trust Series 2013-K502 Class B ±144A | | | 2.83 | | | | 3-25-2045 | | | | 250,000 | | | | 253,749 | |
| | | | |
Total Agency Securities (Cost $1,106,932) | | | | | | | | | | | | | | | 1,110,690 | |
| | | | | | | | | | | | | | | | |
| | | | |
Asset-Backed Securities: 5.45% | | | | | | | | | | | | | | | | |
AmeriCredit Automobile Receivables Trust Series 2012-4 Class E 144A | | | 3.82 | | | | 2-10-2020 | | | | 250,000 | | | | 256,077 | |
Avis Budget Rental Car Funding (AESOP) LLC Series 2014-1A Class C 144A | | | 3.75 | | | | 7-20-2020 | | | | 400,000 | | | | 400,565 | |
CAL Funding II Limited Series 2012-1A Class A 144A | | | 3.47 | | | | 10-25-2027 | | | | 187,500 | | | | 188,557 | |
CLI Funding LLC Trust Series 2014-1A Class A 144A | | | 3.29 | | | | 6-18-2029 | | | | 365,870 | | | | 369,086 | |
Dell Equipment Finance Trust Series 2014-1 Class D 144A | | | 2.68 | | | | 6-22-2020 | | | | 300,000 | | | | 301,238 | |
OneMain Financial Issuance Trust Series 2014-1A Class B 144A | | | 3.24 | | | | 6-18-2024 | | | | 250,000 | | | | 251,044 | |
Santander Drive Auto Receivables Trust Series 2012-5 Class D | | | 3.30 | | | | 9-17-2018 | | | | 95,000 | | | | 97,148 | |
Social Professional Loan Program LLC Series 2014-A Class A2 144A | | | 3.02 | | | | 10-25-2027 | | | | 229,206 | | | | 234,689 | |
TAL Advantage LLC Series 2013-1A Class A 144A | | | 2.83 | | | | 2-22-2038 | | | | 117,500 | | | | 117,405 | |
| | | | |
Total Asset-Backed Securities (Cost $2,218,044) | | | | | | | | | | | | | | | 2,215,809 | |
| | | | | | | | | | | | | | | | |
| | | | |
Corporate Bonds and Notes: 35.52% | | | | | | | | | | | | | | | | |
| | | | |
Consumer Discretionary: 6.75% | | | | | | | | | | | | | | | | |
| | | | |
| Automobiles: 0.67% | | | | | | | | | | | | | | | | |
Ford Motor Company | | | 7.45 | | | | 7-16-2031 | | | | 200,000 | | | | 270,847 | |
| | | | | | | | | | | | | | | | |
| | | | |
| Distributors: 0.04% | | | | | | | | | | | | | | | | |
LKQ Corporation | | | 4.75 | | | | 5-15-2023 | | | | 15,000 | | | | 14,775 | |
| | | | | | | | | | | | | | | | |
| | | | |
| Diversified Consumer Services: 0.36% | | | | | | | | | | | | | | | | |
Service Corporation International | | | 8.00 | | | | 11-15-2021 | | | | 124,000 | | | | 147,560 | |
| | | | | | | | | | | | | | | | |
| | | | |
| Hotels, Restaurants & Leisure: 1.08% | | | | | | | | | | | | | | | | |
CCM Merger Incorporated 144A | | | 9.13 | | | | 5-1-2019 | | | | 100,000 | | | | 108,625 | |
Greektown Holdings LLC 144A | | | 8.88 | | | | 3-15-2019 | | | | 125,000 | | | | 132,188 | |
Hilton Worldwide Finance LLC | | | 5.63 | | | | 10-15-2021 | | | | 5,000 | | | | 5,275 | |
NAI Entertainment Holdings LLC 144A | | | 5.00 | | | | 8-1-2018 | | | | 25,000 | | | | 25,813 | |
Pinnacle Entertainment Incorporated | | | 7.50 | | | | 4-15-2021 | | | | 160,000 | | | | 169,200 | |
| | | | |
| | | | | | | | | | | | | | | 441,101 | |
| | | | | | | | | | | | | | | | |
| | | | |
| Household Durables: 1.92% | | | | | | | | | | | | | | | | |
DR Horton Incorporated | | | 4.75 | | | | 5-15-2017 | | | | 375,000 | | | | 391,406 | |
Pulte Group Incorporated | | | 7.63 | | | | 10-15-2017 | | | | 350,000 | | | | 390,250 | |
| | | | |
| | | | | | | | | | | | | | | 781,656 | |
| | | | | | | | | | | | | | | | |
| | | | |
| Media: 1.55% | | | | | | | | | | | | | | | | |
CCO Holdings LLC 144A | | | 5.13 | | | | 5-1-2023 | | | | 5,000 | | | | 4,950 | |
CCO Holdings LLC 144A | | | 5.38 | | | | 5-1-2025 | | | | 5,000 | | | | 4,913 | |
CCO Holdings LLC 144A | | | 5.88 | | | | 5-1-2027 | | | | 5,000 | | | | 4,956 | |
CCO Holdings LLC | | | 5.13 | | | | 2-15-2023 | | | | 15,000 | | | | 14,827 | |
Cequel Communications Holdings I LLC 144A | | | 5.13 | | | | 12-15-2021 | | | | 5,000 | | | | 5,007 | |
Cequel Communications Holdings I LLC 144A | | | 5.13 | | | | 12-15-2021 | | | | 25,000 | | | | 25,094 | |
The accompanying notes are an integral part of these financial statements.
| | | | |
| 8 | | Wells Fargo Advantage Strategic Income Fund | | Portfolio of investments—April 30, 2015 (unaudited) |
| | | | | | | | | | | | | | | | |
| Security name | | Interest rate | | | Maturity date | | | Principal | | | Value | |
| | | | |
| Media (continued) | | | | | | | | | | | | | | | | |
Cinemark USA Incorporated | | | 5.13 | % | | | 12-15-2022 | | | $ | 200,000 | | | $ | 206,740 | |
Gray Television Incorporated | | | 7.50 | | | | 10-1-2020 | | | | 105,000 | | | | 111,563 | |
Lamar Media Corporation | | | 5.38 | | | | 1-15-2024 | | | | 5,000 | | | | 5,220 | |
Lamar Media Corporation | | | 5.88 | | | | 2-1-2022 | | | | 150,000 | | | | 158,625 | |
Live Nation Entertainment Incorporated 144A | | | 7.00 | | | | 9-1-2020 | | | | 5,000 | | | | 5,325 | |
Nexstar Broadcasting Group Incorporated | | | 6.88 | | | | 11-15-2020 | | | | 25,000 | | | | 26,380 | |
Nielsen Finance LLC 144A | | | 5.00 | | | | 4-15-2022 | | | | 35,000 | | | | 35,193 | |
Outfront Media Capital Corporation | | | 5.25 | | | | 2-15-2022 | | | | 5,000 | | | | 5,175 | |
Outfront Media Capital Corporation | | | 5.88 | | | | 3-15-2025 | | | | 15,000 | | | | 16,013 | |
| | | | |
| | | | | | | | | | | | | | | 629,981 | |
| | | | | | | | | | | | | | | | |
| | | | |
| Specialty Retail: 1.12% | | | | | | | | | | | | | | | | |
Century Intermediate Holding Company (PIK at 10.50%) ¥144A | | | 9.75 | | | | 2-15-2019 | | | | 5,000 | | | | 5,300 | |
Penske Auto Group Incorporated | | | 5.75 | | | | 10-1-2022 | | | | 50,000 | | | | 52,500 | |
Sally Holdings Incorporated | | | 6.88 | | | | 11-15-2019 | | | | 360,000 | | | | 380,700 | |
Sonic Automotive Incorporated | | | 5.00 | | | | 5-15-2023 | | | | 15,000 | | | | 14,963 | |
| | | | |
| | | | | | | | | | | | | | | 453,463 | |
| | | | | | | | | | | | | | | | |
| | | | |
| Textiles, Apparel & Luxury Goods: 0.01% | | | | | | | | | | | | | | | | |
The William Carter Company | | | 5.25 | | | | 8-15-2021 | | | | 5,000 | | | | 5,188 | |
| | | | | | | | | | | | | | | | |
| | | | |
Consumer Staples: 1.31% | | | | | | | | | | | | | | | | |
| | | | |
| Beverages: 0.95% | | | | | | | | | | | | | | | | |
Constellation Brands Incorporated | | | 7.25 | | | | 9-1-2016 | | | | 350,000 | | | | 375,340 | |
Cott Beverages Incorporated 144A | | | 6.75 | | | | 1-1-2020 | | | | 10,000 | | | | 10,475 | |
| | | | |
| | | | | | | | | | | | | | | 385,815 | |
| | | | | | | | | | | | | | | | |
| | | | |
| Food Products: 0.36% | | | | | | | | | | | | | | | | |
B&G Foods Incorporated | | | 4.63 | | | | 6-1-2021 | | | | 25,000 | | | | 25,063 | |
Darling Ingredients Incorporated | | | 5.38 | | | | 1-15-2022 | | | | 5,000 | | | | 5,088 | |
Pilgrim’s Pride Corporation 144A | | | 5.75 | | | | 3-15-2025 | | | | 20,000 | | | | 20,500 | |
Simmons Foods Incorporated 144A | | | 7.88 | | | | 10-1-2021 | | | | 50,000 | | | | 48,625 | |
WhiteWave Foods Company | | | 5.38 | | | | 10-1-2022 | | | | 45,000 | | | | 48,375 | |
| | | | |
| | | | | | | | | | | | | | | 147,651 | |
| | | | | | | | | | | | | | | | |
| | | | |
Energy: 7.73% | | | | | | | | | | | | | | | | |
| | | | |
| Energy Equipment & Services: 2.09% | | | | | | | | | | | | | | | | |
Bristow Group Incorporated | | | 6.25 | | | | 10-15-2022 | | | | 150,000 | | | | 147,000 | |
Compressco Partners LP 144A | | | 7.25 | | | | 8-15-2022 | | | | 30,000 | | | | 27,300 | |
Era Group Incorporated | | | 7.75 | | | | 12-15-2022 | | | | 130,000 | | | | 127,400 | |
Forum Energy Technologies Incorporated | | | 6.25 | | | | 10-1-2021 | | | | 5,000 | | | | 4,725 | |
Hilcorp Energy Company 144A | | | 5.00 | | | | 12-1-2024 | | | | 10,000 | | | | 9,700 | |
NGPL PipeCo LLC 144A | | | 7.12 | | | | 12-15-2017 | | | | 75,000 | | | | 76,500 | |
NGPL PipeCo LLC 144A | | | 7.77 | | | | 12-15-2037 | | | | 245,000 | | | | 270,725 | |
PHI Incorporated | | | 5.25 | | | | 3-15-2019 | | | | 85,000 | | | | 82,025 | |
Targa Resources Partners 144A | | | 5.00 | | | | 1-15-2018 | | | | 100,000 | | | | 103,750 | |
| | | | |
| | | | | | | | | | | | | | | 849,125 | |
| | | | | | | | | | | | | | | | |
The accompanying notes are an integral part of these financial statements.
| | | | | | |
| Portfolio of investments—April 30, 2015 (unaudited) | | Wells Fargo Advantage Strategic Income Fund | | | 9 | |
| | | | | | | | | | | | | | | | |
| Security name | | Interest rate | | | Maturity date | | | Principal | | | Value | |
| | | | |
| Oil, Gas & Consumable Fuels: 5.64% | | | | | | | | | | | | | | | | |
Buckeye Partners LP | | | 4.35 | % | | | 10-15-2024 | | | $ | 100,000 | | | $ | 100,147 | |
Chesapeake Energy Corporation Company ± | | | 3.53 | | | | 4-15-2019 | | | | 280,000 | | | | 268,800 | |
Continental Resources Incorporated | | | 3.80 | | | | 6-1-2024 | | | | 100,000 | | | | 96,125 | |
Denbury Resources Incorporated | | | 6.38 | | | | 8-15-2021 | | | | 150,000 | | | | 147,750 | |
Energy Transfer Partners LP | | | 4.05 | | | | 3-15-2025 | | | | 200,000 | | | | 200,144 | |
Energy XXI Gulf Coast Incorporated 144A | | | 6.88 | | | | 3-15-2024 | | | | 25,000 | | | | 9,938 | |
Exterran Partners LP | | | 6.00 | | | | 4-1-2021 | | | | 50,000 | | | | 49,000 | |
Northern Tier Energy LLC | | | 7.13 | | | | 11-15-2020 | | | | 25,000 | | | | 26,000 | |
Rockies Express Pipeline LLC 144A | | | 5.63 | | | | 4-15-2020 | | | | 50,000 | | | | 52,875 | |
Sabine Pass Liquefaction LLC | | | 5.63 | | | | 4-15-2023 | | | | 120,000 | | | | 121,200 | |
Sabine Pass Liquefaction LLC | | | 5.75 | | | | 5-15-2024 | | | | 25,000 | | | | 25,250 | |
Sabine Pass Liquefaction LLC | | | 6.25 | | | | 3-15-2022 | | | | 50,000 | | | | 52,500 | |
Sabine Pass LNG LP | | | 6.50 | | | | 11-1-2020 | | | | 175,000 | | | | 182,875 | |
Sabine Pass LNG LP | | | 7.50 | | | | 11-30-2016 | | | | 250,000 | | | | 266,275 | |
SemGroup Corporation | | | 7.50 | | | | 6-15-2021 | | | | 20,000 | | | | 21,000 | |
Suburban Propane Partners LP | | | 5.50 | | | | 6-1-2024 | | | | 15,000 | | | | 15,413 | |
TC Pipelines LP | | | 4.38 | | | | 3-13-2025 | | | | 100,000 | | | | 100,894 | |
Ultra Petroleum Corporation 144A | | | 6.13 | | | | 10-1-2024 | | | | 30,000 | | | | 26,475 | |
Williams Companies Incorporated | | | 4.55 | | | | 6-24-2024 | | | | 150,000 | | | | 147,511 | |
WPX Energy Incorporated | | | 5.25 | | | | 1-15-2017 | | | | 375,000 | | | | 384,375 | |
| | | | |
| | | | | | | | | | | | | | | 2,294,547 | |
| | | | | | | | | | | | | | | | |
| | | | |
Financials: 8.47% | | | | | | | | | | | | | | | | |
| | | | |
| Banks: 1.81% | | | | | | | | | | | | | | | | |
Bank of America Corporation | | | 4.20 | | | | 8-26-2024 | | | | 150,000 | | | | 151,601 | |
CIT Group Incorporated | | | 3.88 | | | | 2-19-2019 | | | | 5,000 | | | | 4,956 | |
CIT Group Incorporated | | | 4.25 | | | | 8-15-2017 | | | | 375,000 | | | | 381,563 | |
CIT Group Incorporated | | | 5.38 | | | | 5-15-2020 | | | | 50,000 | | | | 52,938 | |
CIT Group Incorporated 144A | | | 6.63 | | | | 4-1-2018 | | | | 5,000 | | | | 5,363 | |
JPMorgan Chase & Company ± | | | 6.00 | | | | 12-31-2049 | | | | 135,000 | | | | 138,713 | |
| | | | |
| | | | | | | | | | | | | | | 735,134 | |
| | | | | | | | | | | | | | | | |
| | | | |
| Capital Markets: 1.34% | | | | | | | | | | | | | | | | |
E*TRADE Financial Corporation | | | 4.63 | | | | 9-15-2023 | | | | 5,000 | | | | 5,106 | |
Jefferies Finance LLC 144A | | | 6.88 | | | | 4-15-2022 | | | | 55,000 | | | | 52,525 | |
Jefferies Finance LLC 144A | | | 7.38 | | | | 4-1-2020 | | | | 25,000 | | | | 24,688 | |
Jefferies Finance LLC 144A | | | 7.50 | | | | 4-15-2021 | | | | 25,000 | | | | 24,581 | |
Lazard Group LLC | | | 3.75 | | | | 2-13-2025 | | | | 270,000 | | | | 223,103 | |
Morgan Stanley | | | 4.10 | | | | 5-22-2023 | | | | 210,000 | | | | 215,495 | |
| | | | |
| | | | | | | | | | | | | | | 545,498 | |
| | | | | | | | | | | | | | | | |
| | | | |
| Consumer Finance: 2.22% | | | | | | | | | | | | | | | | |
Ally Financial Incorporated | | | 4.13 | | | | 3-30-2020 | | | | 25,000 | | | | 25,125 | |
Ally Financial Incorporated | | | 4.63 | | | | 3-30-2025 | | | | 25,000 | | | | 24,805 | |
Ally Financial Incorporated | | | 5.13 | | | | 9-30-2024 | | | | 75,000 | | | | 77,813 | |
General Motors Financial Company Incorporated | | | 2.75 | | | | 5-15-2016 | | | | 200,000 | | | | 202,525 | |
Navient Corporation | | | 5.88 | | | | 3-25-2021 | | | | 15,000 | | | | 14,925 | |
Navient Corporation | | | 6.00 | | | | 1-25-2017 | | | | 350,000 | | | | 367,938 | |
Navient Corporation | | | 8.00 | | | | 3-25-2020 | | | | 30,000 | | | | 33,412 | |
The accompanying notes are an integral part of these financial statements.
| | | | |
| 10 | | Wells Fargo Advantage Strategic Income Fund | | Portfolio of investments—April 30, 2015 (unaudited) |
| | | | | | | | | | | | | | | | |
| Security name | | Interest rate | | | Maturity date | | | Principal | | | Value | |
| | | | |
| Consumer Finance (continued) | | | | | | | | | | | | | | | | |
SLM Corporation | | | 6.13 | % | | | 3-25-2024 | | | $ | 30,000 | | | $ | 29,175 | |
SLM Corporation | | | 8.45 | | | | 6-15-2018 | | | | 75,000 | | | | 83,678 | |
Springleaf Finance Corporation | | | 8.25 | | | | 10-1-2023 | | | | 40,000 | | | | 45,600 | |
| | | | |
| | | | | | | | | | | | | | | 904,996 | |
| | | | | | | | | | | | | | | | |
| | | | |
| Diversified Financial Services: 0.85% | | | | | | | | | | | | | | | | |
Denali Borrower LLC 144A | | | 5.63 | | | | 10-15-2020 | | | | 80,000 | | | | 85,500 | |
Infinity Acquisition LLC 144A | | | 7.25 | | | | 8-1-2022 | | | | 65,000 | | | | 61,263 | |
Moody’s Corporation | | | 4.88 | | | | 2-15-2024 | | | | 180,000 | | | | 198,591 | |
| | | | |
| | | | | | | | | | | | | | | 345,354 | |
| | | | | | | | | | | | | | | | |
| | | | |
| Insurance: 0.57% | | | | | | | | | | | | | | | | |
Fairfax US Incorporated 144A | | | 4.88 | | | | 8-13-2024 | | | | 200,000 | | | | 195,746 | |
Hub Holdings LLC (PIK at 8.88%) ¥144A | | | 8.13 | | | | 7-15-2019 | | | | 35,000 | | | | 34,956 | |
| | | | |
| | | | | | | | | | | | | | | 230,702 | |
| | | | | | | | | | | | | | | | |
| | | | |
| Real Estate Management & Development: 0.10% | | | | | | | | | | | | | | | | |
Hockey Merger Sub 2 Incorporated 144A | | | 7.88 | | | | 10-1-2021 | | | | 40,000 | | | | 41,200 | |
| | | | | | | | | | | | | | | | |
| | | | |
| REITs: 1.58% | | | | | | | | | | | | | | | | |
American Tower Corporation | | | 3.50 | | | | 1-31-2023 | | | | 200,000 | | | | 196,522 | |
Crown Castle International Corporation | | | 4.88 | | | | 4-15-2022 | | | | 25,000 | | | | 26,078 | |
DuPont Fabros Technology Incorporated LP | | | 5.88 | | | | 9-15-2021 | | | | 85,000 | | | | 88,081 | |
Iron Mountain Incorporated | | | 5.75 | | | | 8-15-2024 | | | | 66,000 | | | | 68,228 | |
Iron Mountain Incorporated | | | 6.00 | | | | 8-15-2023 | | | | 75,000 | | | | 79,875 | |
Omega Healthcare Investors Incorporated 144A | | | 4.50 | | | | 1-15-2025 | | | | 175,000 | | | | 177,601 | |
The Geo Group Incorporated | | | 5.88 | | | | 10-15-2024 | | | | 5,000 | | | | 5,313 | |
| | | | |
| | | | | | | | | | | | | | | 641,698 | |
| | | | | | | | | | | | | | | | |
| | | | |
Health Care: 1.67% | | | | | | | | | | | | | | | | |
| | | | |
| Health Care Equipment & Supplies: 0.15% | | | | | | | | | | | | | | | | |
Crimson Merger Sub Incorporated 144A | | | 6.63 | | | | 5-15-2022 | | | | 70,000 | | | | 62,213 | |
| | | | | | | | | | | | | | | | |
| | | | |
| Health Care Providers & Services: 0.93% | | | | | | | | | | | | | | | | |
Acadia Healthcare Company Incorporated 144A | | | 5.63 | | | | 2-15-2023 | | | | 5,000 | | | | 5,113 | |
Aviv Healthcare Properties LP | | | 6.00 | | | | 10-15-2021 | | | | 10,000 | | | | 11,454 | |
Capella Healthcare Incorporated | | | 9.25 | | | | 7-1-2017 | | | | 25,000 | | | | 25,750 | |
Centene Corporation | | | 4.75 | | | | 5-15-2022 | | | | 20,000 | | | | 21,050 | |
Community Health Systems Incorporated | | | 6.88 | | | | 2-1-2022 | | | | 15,000 | | | | 15,919 | |
DaVita HealthCare Partners Incorporated | | | 5.00 | | | | 5-1-2025 | | | | 5,000 | | | | 5,000 | |
HCA Incorporated | | | 4.25 | | | | 10-15-2019 | | | | 15,000 | | | | 15,675 | |
HCA Incorporated | | | 5.25 | | | | 4-15-2025 | | | | 5,000 | | | | 5,419 | |
HealthSouth Corporation | | | 5.13 | | | | 3-15-2023 | | | | 10,000 | | | | 10,300 | |
HealthSouth Corporation | | | 5.75 | | | | 11-1-2024 | | | | 15,000 | | | | 15,825 | |
Lifepoint Hospitals Incorporated | | | 5.50 | | | | 12-1-2021 | | | | 25,000 | | | | 26,278 | |
MPH Acquisition Holdings LLC 144A | | | 6.63 | | | | 4-1-2022 | | | | 100,000 | | | | 105,001 | |
Select Medical Corporation | | | 6.38 | | | | 6-1-2021 | | | | 55,000 | | | | 54,588 | |
Tenet Healthcare Corporation | | | 6.00 | | | | 10-1-2020 | | | | 55,000 | | | | 58,713 | |
| | | | |
| | | | | | | | | | | | | | | 376,085 | |
| | | | | | | | | | | | | | | | |
The accompanying notes are an integral part of these financial statements.
| | | | | | |
| Portfolio of investments—April 30, 2015 (unaudited) | | Wells Fargo Advantage Strategic Income Fund | | | 11 | |
| | | | | | | | | | | | | | | | |
| Security name | | Interest rate | | | Maturity date | | | Principal | | | Value | |
| | | | |
| Health Care Technology: 0.20% | | | | | | | | | | | | | | | | |
Emdeon Incorporated | | | 11.00 | % | | | 12-31-2019 | | | $ | 75,000 | | | $ | 82,125 | |
| | | | | | | | | | | | | | | | |
| | | | |
| Pharmaceuticals: 0.39% | | | | | | | | | | | | | | | | |
Endo Finance LLC 144A | | | 5.38 | | | | 1-15-2023 | | | | 25,000 | | | | 24,672 | |
Endo Finance LLC 144A | | | 6.00 | | | | 2-1-2025 | | | | 25,000 | | | | 25,594 | |
Endo Finance LLC 144A | | | 7.25 | | | | 1-15-2022 | | | | 90,000 | | | | 95,175 | |
Pinnacle Incorporated 144A | | | 9.50 | | | | 10-1-2023 | | | | 10,000 | | | | 11,288 | |
| | | | |
| | | | | | | | | | | | | | | 156,729 | |
| | | | | | | | | | | | | | | | |
| | | | |
Industrials: 2.94% | | | | | | | | | | | | | | | | |
| | | | |
| Airlines: 0.30% | | | | | | | | | | | | | | | | |
American Airlines Incorporated | | | 4.38 | | | | 4-1-2024 | | | | 119,238 | | | | 123,709 | |
| | | | | | | | | | | | | | | | |
| | | | |
| Commercial Services & Supplies: 0.33% | | | | | | | | | | | | | | | | |
ADT Corporation | | | 4.13 | | | | 4-15-2019 | | | | 5,000 | | | | 5,078 | |
ADT Corporation | | | 4.13 | | | | 6-15-2023 | | | | 10,000 | | | | 9,525 | |
ADT Corporation | | | 6.25 | | | | 10-15-2021 | | | | 45,000 | | | | 48,375 | |
Covanta Holding Corporation | | | 5.88 | | | | 3-1-2024 | | | | 45,000 | | | | 46,575 | |
Covanta Holding Corporation | | | 7.25 | | | | 12-1-2020 | | | | 25,000 | | | | 26,500 | |
| | | | |
| | | | | | | | | | | | | | | 136,053 | |
| | | | | | | | | | | | | | | | |
| | | | |
| Construction & Engineering: 0.17% | | | | | | | | | | | | | | | | |
AECOM 144A | | | 5.75 | | | | 10-15-2022 | | | | 5,000 | | | | 5,175 | |
AECOM 144A | | | 5.88 | | | | 10-15-2024 | | | | 60,000 | | | | 62,153 | |
| | | | |
| | | | | | | | | | | | | | | 67,328 | |
| | | | | | | | | | | | | | | | |
| | | | |
| Electrical Equipment: 0.03% | | | | | | | | | | | | | | | | |
EnerSys 144A | | | 5.00 | | | | 4-30-2023 | | | | 10,000 | | | | 10,125 | |
| | | | | | | | | | | | | | | | |
| | | | |
| Machinery: 0.95% | | | | | | | | | | | | | | | | |
Case New Holland Industrial Incorporated | | | 7.88 | | | | 12-1-2017 | | | | 330,000 | | | | 363,287 | |
EnPro Industries Incorporated 144A | | | 5.88 | | | | 9-15-2022 | | | | 20,000 | | | | 20,900 | |
| | | | |
| | | | | | | | | | | | | | | 384,187 | |
| | | | | | | | | | | | | | | | |
| | | | |
| Trading Companies & Distributors: 1.16% | | | | | | | | | | | | | | | | |
H&E Equipment Services Incorporated | | | 7.00 | | | | 9-1-2022 | | | | 50,000 | | | | 52,375 | |
Light Tower Rentals Incorporated 144A | | | 8.13 | | | | 8-1-2019 | | | | 15,000 | | | | 12,413 | |
United Rentals North America Incorporated | | | 4.63 | | | | 7-15-2023 | | | | 15,000 | | | | 15,188 | |
United Rentals North America Incorporated | | | 5.50 | | | | 7-15-2025 | | | | 5,000 | | | | 5,065 | |
United Rentals North America Incorporated | | | 7.38 | | | | 5-15-2020 | | | | 360,000 | | | | 388,184 | |
| | | | |
| | | | | | | | | | | | | | | 473,225 | |
| | | | | | | | | | | | | | | | |
| | | | |
Information Technology: 2.77% | | | | | | | | | | | | | | | | |
| | | | |
| Electronic Equipment, Instruments & Components: 0.61% | | | | | | | | | | | | | | | | |
Arrow Electronics Incorporated | | | 3.50 | | | | 4-1-2022 | | | | 200,000 | | | | 199,947 | |
Zebra Technologies Corporation 144A | | | 7.25 | | | | 10-15-2022 | | | | 45,000 | | | | 48,600 | |
| | | | |
| | | | | | | | | | | | | | | 248,547 | |
| | | | | | | | | | | | | | | | |
The accompanying notes are an integral part of these financial statements.
| | | | |
| 12 | | Wells Fargo Advantage Strategic Income Fund | | Portfolio of investments—April 30, 2015 (unaudited) |
| | | | | | | | | | | | | | | | |
| Security name | | Interest rate | | | Maturity date | | | Principal | | | Value | |
| | | | |
| Internet Software & Services: 0.15% | | | | | | | | | | | | | | | | |
Infor (US) Incorporated 144A | | | 6.50 | % | | | 5-15-2022 | | | $ | 10,000 | | | $ | 10,275 | |
Sophia Holding Finance LP (PIK at 10.38%) 144A¥ | | | 9.63 | | | | 12-1-2018 | | | | 50,000 | | | | 50,750 | |
| | | | |
| | | | | | | | | | | | | | | 61,025 | |
| | | | | | | | | | | | | | | | |
| | | | |
| IT Services: 0.43% | | | | | | | | | | | | | | | | |
Audatex North America Incorporated 144A | | | 6.00 | | | | 6-15-2021 | | | | 40,000 | | | | 41,312 | |
Audatex North America Incorporated 144A | | | 6.13 | | | | 11-1-2023 | | | | 10,000 | | | | 10,425 | |
Cardtronics Incorporated 144A | | | 5.13 | | | | 8-1-2022 | | | | 80,000 | | | | 79,400 | |
First Data Corporation 144A | | | 7.38 | | | | 6-15-2019 | | | | 30,000 | | | | 31,178 | |
First Data Corporation | | | 11.75 | | | | 8-15-2021 | | | | 3,000 | | | | 3,443 | |
SunGard Data Systems Incorporated | | | 6.63 | | | | 11-1-2019 | | | | 10,000 | | | | 10,425 | |
| | | | |
| | | | | | | | | | | | | | | 176,183 | |
| | | | | | | | | | | | | | | | |
| | | | |
| Semiconductors & Semiconductor Equipment: 0.44% | | | | | | | | | | | | | | | | |
KLA-Tencor Corporation | | | 4.65 | | | | 11-1-2024 | | | | 175,000 | | | | 179,629 | |
| | | | | | | | | | | | | | | | |
| | | | |
| Software: 0.66% | | | | | | | | | | | | | | | | |
Activision Blizzard Incorporated 144A | | | 5.63 | | | | 9-15-2021 | | | | 15,000 | | | | 16,031 | |
Activision Blizzard Incorporated 144A | | | 6.13 | | | | 9-15-2023 | | | | 5,000 | | | | 5,509 | |
Boxer Parent Company Incorporated (PIK at 9.75%) ¥144A | | | 9.00 | | | | 10-15-2019 | | | | 50,000 | | | | 41,000 | |
CDK Global Incorporated 144A | | | 4.50 | | | | 10-15-2024 | | | | 200,000 | | | | 206,227 | |
| | | | |
| | | | | | | | | | | | | | | 268,767 | |
| | | | | | | | | | | | | | | | |
| | | | |
| Technology Hardware, Storage & Peripherals: 0.48% | | | | | | | | | | | | | | | | |
NCR Corporation | | | 5.00 | | | | 7-15-2022 | | | | 175,000 | | | | 172,813 | |
NCR Corporation | | | 5.88 | | | | 12-15-2021 | | | | 10,000 | | | | 10,250 | |
NCR Corporation | | | 6.38 | | | | 12-15-2023 | | | | 10,000 | | | | 10,525 | |
| | | | |
| | | | | | | | | | | | | | | 193,588 | |
| | | | | | | | | | | | | | | | |
| | | | |
Materials: 1.08% | | | | | | | | | | | | | | | | |
| | | | |
| Containers & Packaging: 0.10% | | | | | | | | | | | | | | | | |
Owens-Brockway Glass Container Incorporated 144A | | | 5.00 | | | | 1-15-2022 | | | | 5,000 | | | | 5,131 | |
Owens-Brockway Glass Container Incorporated 144A | | | 5.38 | | | | 1-15-2025 | | | | 5,000 | | | | 5,175 | |
Sealed Air Corporation 144A | | | 8.38 | | | | 9-15-2021 | | | | 25,000 | | | | 28,188 | |
| | | | |
| | | | | | | | | | | | | | | 38,494 | |
| | | | | | | | | | | | | | | | |
| | | | |
| Metals & Mining: 0.98% | | | | | | | | | | | | | | | | |
Alcoa Incorporated | | | 5.13 | | | | 10-1-2024 | | | | 10,000 | | | | 10,783 | |
Cliffs Natural Resources Incorporated 144A | | | 8.25 | | | | 3-31-2020 | | | | 10,000 | | | | 9,800 | |
Commercial Metals Company | | | 7.35 | | | | 8-15-2018 | | | | 350,000 | | | | 379,750 | |
| | | | |
| | | | | | | | | | | | | | | 400,333 | |
| | | | | | | | | | | | | | | | |
| | | | |
Telecommunication Services: 2.41% | | | | | | | | | | | | | | | | |
| | | | |
| Diversified Telecommunication Services: 0.96% | | | | | | | | | | | | | | | | |
Frontier Communications Corporation | | | 6.25 | | | | 9-15-2021 | | | | 30,000 | | | | 29,775 | |
GCI Incorporated | | | 6.75 | | | | 6-1-2021 | | | | 115,000 | | | | 117,300 | |
Level 3 Financing Incorporated 144A | | | 5.13 | | | | 5-1-2023 | | | | 10,000 | | | | 9,975 | |
Level 3 Financing Incorporated | | | 5.38 | | | | 8-15-2022 | | | | 25,000 | | | | 25,531 | |
Level 3 Financing Incorporated 144A | | | 5.38 | | | | 5-1-2025 | | | | 10,000 | | | | 9,988 | |
The accompanying notes are an integral part of these financial statements.
| | | | | | |
| Portfolio of investments—April 30, 2015 (unaudited) | | Wells Fargo Advantage Strategic Income Fund | | | 13 | |
| | | | | | | | | | | | | | | | |
| Security name | | Interest rate | | | Maturity date | | | Principal | | | Value | |
| | | | |
| Diversified Telecommunication Services (continued) | | | | | | | | | | | | | | | | |
Level 3 Financing Incorporated 144A | | | 5.63 | % | | | 2-1-2023 | | | $ | 5,000 | | | $ | 5,125 | |
Level 3 Financing Incorporated | | | 6.13 | | | | 1-15-2021 | | | | 5,000 | | | | 5,294 | |
Verizon Communications Incorporated | | | 6.55 | | | | 9-15-2043 | | | | 150,000 | | | | 187,622 | |
| | | | |
| | | | | | | | | | | | | | | 390,610 | |
| | | | | | | | | | | | | | | | |
| | | | |
| Wireless Telecommunication Services: 1.45% | | | | | | | | | | | | | | | | |
CC Holdings GS V LLC | | | 3.85 | | | | 4-15-2023 | | | | 200,000 | | | | 201,476 | |
MetroPCS Wireless Incorporated | | | 6.63 | | | | 11-15-2020 | | | | 150,000 | | | | 156,563 | |
Sprint Capital Corporation | | | 6.88 | | | | 11-15-2028 | | | | 25,000 | | | | 22,625 | |
Sprint Communications Incorporated | | | 7.00 | | | | 8-15-2020 | | | | 10,000 | | | | 10,150 | |
Sprint Corporation | | | 7.25 | | | | 9-15-2021 | | | | 10,000 | | | | 10,038 | |
Sprint Corporation | | | 7.88 | | | | 9-15-2023 | | | | 90,000 | | | | 90,338 | |
T-Mobile USA Incorporated | | | 5.25 | | | | 9-1-2018 | | | | 10,000 | | | | 10,350 | |
T-Mobile USA Incorporated | | | 6.38 | | | | 3-1-2025 | | | | 20,000 | | | | 20,540 | |
T-Mobile USA Incorporated | | | 6.46 | | | | 4-28-2019 | | | | 5,000 | | | | 5,163 | |
T-Mobile USA Incorporated | | | 6.50 | | | | 1-15-2024 | | | | 5,000 | | | | 5,219 | |
T-Mobile USA Incorporated | | | 6.54 | | | | 4-28-2020 | | | | 5,000 | | | | 5,275 | |
T-Mobile USA Incorporated | | | 6.63 | | | | 4-1-2023 | | | | 5,000 | | | | 5,191 | |
T-Mobile USA Incorporated | | | 6.63 | | | | 4-28-2021 | | | | 5,000 | | | | 5,275 | |
T-Mobile USA Incorporated | | | 6.73 | | | | 4-28-2022 | | | | 15,000 | | | | 15,806 | |
T-Mobile USA Incorporated | | | 6.84 | | | | 4-28-2023 | | | | 25,000 | | | | 26,438 | |
| | | | |
| | | | | | | | | | | | | | | 590,447 | |
| | | | | | | | | | | | | | | | |
| | | | |
Utilities: 0.39% | | | | | | | | | | | | | | | | |
| | | |
| Independent Power & Renewable Electricity Producers: 0.39% | | | | | | | | | | | | | |
Calpine Corporation 144A | | | 6.00 | | | | 1-15-2022 | | | | 35,000 | | | | 37,275 | |
NSG Holdings LLC 144A | | | 7.75 | | | | 12-15-2025 | | | | 105,571 | | | | 115,601 | |
TerraForm Power Operating LLC 144A | | | 5.88 | | | | 2-1-2023 | | | | 5,000 | | | | 5,213 | |
| | | | |
| | | | | | | | | | | | | | | 158,089 | |
| | | | | | | | | | | | | | | | |
| | | | |
Total Corporate Bonds and Notes (Cost $14,478,832) | | | | | | | | | | | | | | | 14,443,782 | |
| | | | | | | | | | | | | | | | |
| | | | |
Foreign Government Bonds @: 12.07% | | | | | | | | | | | | | | | | |
Brazil (BRL) | | | 10.00 | | | | 1-1-2017 | | | | 2,330,000 | | | | 761,111 | |
Brazil (BRL) | | | 10.00 | | | | 1-1-2019 | | | | 1,300,000 | | | | 410,856 | |
Indonesia (IDR) | | | 7.38 | | | | 9-15-2016 | | | | 2,000,000,000 | | | | 154,669 | |
Indonesia (IDR) | | | 7.88 | | | | 4-15-2019 | | | | 10,200,000,000 | | | | 793,967 | |
Mexico (MXN) | | | 4.75 | | | | 6-14-2018 | | | | 11,800,000 | | | | 769,094 | |
Republic of South Africa (ZAR) | | | 7.75 | | | | 2-28-2023 | | | | 6,350,000 | | | | 533,034 | |
Republic of South Africa (ZAR) | | | 8.00 | | | | 12-21-2018 | | | | 4,850,000 | | | | 417,476 | |
Romania (RON) | | | 4.75 | | | | 6-24-2019 | | | | 2,430,000 | | | | 675,568 | |
Romania (RON) | | | 6.00 | | | | 4-30-2016 | | | | 1,470,000 | | | | 389,655 | |
| | | | |
Total Foreign Government Bonds (Cost $5,514,980) | | | | | | | | | | | | | | | 4,905,430 | |
| | | | | | | | | | | | | | | | |
| | | | |
Loans: 20.87% | | | | | | | | | | | | | | | | |
| | | | |
Consumer Discretionary: 5.41% | | | | | | | | | | | | | | | | |
| | | | |
| Auto Components: 1.19% | | | | | | | | | | | | | | | | |
Allison Transmission Incorporated ± | | | 3.50 | | | | 8-23-2019 | | | | 151,474 | | | | 152,270 | |
Federal Mogul Corporation ± | | | 4.75 | | | | 4-15-2021 | | | | 332,488 | | | | 331,952 | |
| | | | |
| | | | | | | | | | | | | | | 484,222 | |
| | | | | | | | | | | | | | | | |
The accompanying notes are an integral part of these financial statements.
| | | | |
| 14 | | Wells Fargo Advantage Strategic Income Fund | | Portfolio of investments—April 30, 2015 (unaudited) |
| | | | | | | | | | | | | | | | |
| Security name | | Interest rate | | | Maturity date | | | Principal | | | Value | |
| | | | |
| Distributors: 0.77% | | | | | | | | | | | | | | | | |
Spin Holdco Incorporated ± | | | 4.25 | % | | | 11-14-2019 | | | $ | 312,633 | | | $ | 312,892 | |
| | | | | | | | | | | | | | | | |
| | | | |
| Diversified Consumer Services: 0.08% | | | | | | | | | | | | | | | | |
CCM Merger Incorporated ± | | | 4.50 | | | | 8-8-2021 | | | | 33,127 | | | | 33,334 | |
| | | | | | | | | | | | | | | | |
| | | | |
| Hotels, Restaurants & Leisure: 0.41% | | | | | | | | | | | | | | | | |
Belmond Interfin Limited ± | | | 4.00 | | | | 3-21-2021 | | | | 103,950 | | | | 104,124 | |
Dave & Buster’s Incorporated ± | | | 4.25 | | | | 7-25-2020 | | | | 28,396 | | | | 28,556 | |
Hilton Worldwide Finance LLC ± | | | 3.50 | | | | 10-26-2020 | | | | 20,583 | | | | 20,653 | |
TGI Friday’s Incorporated ± | | | 5.25 | | | | 7-15-2020 | | | | 13,069 | | | | 13,086 | |
| | | | |
| | | | | | | | | | | | | | | 166,419 | |
| | | | | | | | | | | | | | | | |
| | | | |
| Leisure Products: 0.06% | | | | | | | | | | | | | | | | |
AMF Bowling Centers Incorporated ± | | | 7.25 | | | | 9-18-2021 | | | | 24,937 | | | | 25,062 | |
| | | | | | | | | | | | | | | | |
| | | | |
| Media: 1.45% | | | | | | | | | | | | | | | | |
Advantage Sales & Marketing LLC ± | | | 4.25 | | | | 7-25-2021 | | | | 44,775 | | | | 44,909 | |
CBS Outdoor Americas Capital LLC ± | | | 3.00 | | | | 1-31-2021 | | | | 65,000 | | | | 64,908 | |
EMI Music Publishing ± | | | 3.75 | | | | 6-29-2018 | | | | 55,675 | | | | 55,753 | |
Hubbard Broadcasting Incorporated ± | | | 4.50 | | | | 4-29-2019 | | | | 38,269 | | | | 38,317 | |
Learfield Communications Incorporated ± | | | 4.50 | | | | 10-9-2020 | | | | 153,515 | | | | 154,571 | |
Live Nation Entertainment Incorporated ± | | | 3.50 | | | | 8-17-2020 | | | | 148,492 | | | | 148,926 | |
Regal Cinemas Corporation ± | | | 3.75 | | | | 4-1-2022 | | | | 25,000 | | | | 25,112 | |
Salem Communications Corporation ± | | | 4.50 | | | | 3-16-2020 | | | | 27,400 | | | | 27,412 | |
TWCC Holdings Corporation ± | | | 3.50 | | | | 2-11-2017 | | | | 29,402 | | | | 29,112 | |
| | | | |
| | | | | | | | | | | | | | | 589,020 | |
| | | | | | | | | | | | | | | | |
| | | | |
| Multiline Retail: 0.41% | | | | | | | | | | | | | | | | |
Doosan Infracore International Incorporated ± | | | 4.50 | | | | 5-27-2021 | | | | 123,603 | | | | 124,608 | |
New Albertson’s Incorporated ± | | | 4.75 | | | | 6-27-2021 | | | | 39,800 | | | | 39,933 | |
| | | | |
| | | | | | | | | | | | | | | 164,541 | |
| | | | | | | | | | | | | | | | |
| | | | |
| Specialty Retail: 1.04% | | | | | | | | | | | | | | | | |
Focus Brands Incorporated ± | | | 4.25 | | | | 2-21-2018 | | | | 162,830 | | | | 163,196 | |
Pep Boys-Manny, Moe & Jack ± | | | 4.25 | | | | 10-11-2018 | | | | 195,500 | | | | 195,744 | |
Rent-A-Center Incorporated ± | | | 3.75 | | | | 3-19-2021 | | | | 64,275 | | | | 64,115 | |
| | | | |
| | | | | | | | | | | | | | | 423,055 | |
| | | | | | | | | | | | | | | | |
| | | | |
Consumer Staples: 0.24% | | | | | | | | | | | | | | | | |
| | | | |
| Food & Staples Retailing: 0.23% | | | | | | | | | | | | | | | | |
Albertson’s Holdings LLC ± | | | 5.38 | | | | 3-21-2019 | | | | 17,949 | | | | 18,088 | |
Albertson’s Holdings LLC ± | | | 5.50 | | | | 8-25-2021 | | | | 66,112 | | | | 66,782 | |
Stater Brothers Markets ± | | | 4.75 | | | | 5-12-2021 | | | | 9,786 | | | | 9,798 | |
| | | | |
| | | | | | | | | | | | | | | 94,668 | |
| | | | | | | | | | | | | | | | |
| | | | |
| Food Products: 0.01% | | | | | | | | | | | | | | | | |
Darling Ingredients Incorporated ± | | | 3.25 | | | | 1-3-2021 | | | | 4,950 | | | | 4,944 | |
| | | | | | | | | | | | | | | | |
| | | | |
Energy: 0.09% | | | | | | | | | | | | | | | | |
| | | | |
| Energy Equipment & Services: 0.05% | | | | | | | | | | | | | | | | |
ExGen Renewables I LLC ± | | | 5.25 | | | | 2-14-2021 | | | | 17,849 | | | | 18,028 | |
Tallgrass Operations LLC ± | | | 4.25 | | | | 11-13-2018 | | | | 4,376 | | | | 4,349 | |
| | | | |
| | | | | | | | | | | | | | | 22,377 | |
| | | | | | | | | | | | | | | | |
The accompanying notes are an integral part of these financial statements.
| | | | | | |
| Portfolio of investments—April 30, 2015 (unaudited) | | Wells Fargo Advantage Strategic Income Fund | | | 15 | |
| | | | | | | | | | | | | | | | |
| Security name | | Interest rate | | | Maturity date | | | Principal | | | Value | |
| | | | |
| Oil, Gas & Consumable Fuels: 0.04% | | | | | | | | | | | | | | | | |
Western Refining Incorporated ± | | | 4.25 | % | | | 11-12-2020 | | | $ | 14,962 | | | $ | 15,000 | |
| | | | | | | | | | | | | | | | |
| | | | |
Financials: 1.65% | | | | | | | | | | | | | | | | |
| | | | |
| Diversified Financial Services: 0.32% | | | | | | | | | | | | | | | | |
American Beacon Advisors Incorporated ±<%% | | | 0.00 | | | | 4-30-2022 | | | | 10,000 | | | | 10,100 | |
Ipreo Holdings LLC ± | | | 4.00 | | | | 8-6-2021 | | | | 69,650 | | | | 69,546 | |
TMFS Holdings LLC ± | | | 5.50 | | | | 7-30-2021 | | | | 49,750 | | | | 49,501 | |
| | | | |
| | | | | | | | | | | | | | | 129,147 | |
| | | | | | | | | | | | | | | | |
| | | | |
| Insurance: 0.72% | | | | | | | | | | | | | | | | |
Hub International Limited ± | | | 4.00 | | | | 10-2-2020 | | | | 252,450 | | | | 251,662 | |
USI Incorporated ± | | | 4.25 | | | | 12-27-2019 | | | | 39,524 | | | | 39,507 | |
| | | | |
| | | | | | | | | | | | | | | 291,169 | |
| | | | | | | | | | | | | | | | |
| | | | |
| Real Estate Management & Development: 0.31% | | | | | | | | | | | | | | | | |
Capital Automotive LP ± | | | 4.00 | | | | 4-10-2019 | | | | 125,591 | | | | 126,180 | |
| | | | | | | | | | | | | | | | |
| | | | |
| REITs: 0.30% | | | | | | | | | | | | | | | | |
Crown Castle Operating Company ± | | | 3.00 | | | | 1-31-2021 | | | | 84,810 | | | | 84,839 | |
The Geo Group Incorporated ± | | | 3.25 | | | | 4-3-2020 | | | | 37,578 | | | | 37,516 | |
| | | | |
| | | | | | | | | | | | | | | 122,355 | |
| | | | | | | | | | | | | | | | |
| | | | |
Health Care: 2.19% | | | | | | | | | | | | | | | | |
| | | | |
| Health Care Equipment & Supplies: 0.40% | | | | | | | | | | | | | | | | |
Accellent Incorporated ± | | | 4.50 | | | | 3-12-2021 | | | | 94,237 | | | | 94,443 | |
Ortho-Clinical Diagnostics Incorporated ± | | | 4.75 | | | | 6-30-2021 | | | | 69,475 | | | | 69,232 | |
| | | | |
| | | | | | | | | | | | | | | 163,675 | |
| | | | | | | | | | | | | | | | |
| | | | |
| Health Care Providers & Services: 1.01% | | | | | | | | | | | | | | | | |
Acadia Healthcare Company Incorporated ± | | | 4.25 | | | | 2-11-2022 | | | | 19,950 | | | | 20,158 | |
Capella Healthcare Incorporated ± | | | 5.25 | | | | 12-31-2021 | | | | 24,938 | | | | 25,062 | |
Community Health Systems Incorporated ± | | | 4.25 | | | | 1-27-2021 | | | | 107,713 | | | | 108,351 | |
MPH Acquisition Holdings LLC ± | | | 3.75 | | | | 3-31-2021 | | | | 175,149 | | | | 175,002 | |
Surgery Center Holdings Incorporated ± | | | 5.25 | | | | 11-3-2020 | | | | 49,875 | | | | 50,249 | |
Surgical Care Affiliates LLC ± | | | 4.25 | | | | 3-17-2022 | | | | 20,000 | | | | 20,048 | |
United Surgical Partners International Incorporated ± | | | 4.75 | | | | 4-3-2019 | | | | 9,800 | | | | 9,800 | |
| | | | |
| | | | | | | | | | | | | | | 408,670 | |
| | | | | | | | | | | | | | | | |
| | | | |
| Health Care Technology: 0.22% | | | | | | | | | | | | | | | | |
IMS Health Incorporated ± | | | 3.50 | | | | 3-17-2021 | | | | 54,450 | | | | 54,423 | |
MedAssets Incorporated ± | | | 4.00 | | | | 12-12-2019 | | | | 36,412 | | | | 36,367 | |
| | | | |
| | | | | | | | | | | | | | | 90,790 | |
| | | | | | | | | | | | | | | | |
| | | | |
| Pharmaceuticals: 0.56% | | | | | | | | | | | | | | | | |
Par Pharmaceutical Companies Incorporated ± | | | 4.25 | | | | 9-30-2019 | | | | 14,963 | | | | 14,998 | |
Valeant Pharmaceuticals International Incorporated ± | | | 3.50 | | | | 12-11-2019 | | | | 170,559 | | | | 171,009 | |
Valeant Pharmaceuticals International Incorporated ± | | | 3.50 | | | | 8-5-2020 | | | | 7,962 | | | | 7,984 | |
Valeant Pharmaceuticals International Incorporated ± | | | 4.00 | | | | 4-1-2022 | | | | 35,000 | | | | 35,227 | |
| | | | |
| | | | | | | | | | | | | | | 229,218 | |
| | | | | | | | | | | | | | | | |
The accompanying notes are an integral part of these financial statements.
| | | | |
| 16 | | Wells Fargo Advantage Strategic Income Fund | | Portfolio of investments—April 30, 2015 (unaudited) |
| | | | | | | | | | | | | | | | |
| Security name | | Interest rate | | | Maturity date | | | Principal | | | Value | |
| | | | |
Industrials: 3.73% | | | | | | | | | | | | | | | | |
| | | | |
| Aerospace & Defense: 0.73% | | | | | | | | | | | | | | | | |
TransDigm Incorporated ± | | | 3.75 | % | | | 2-28-2020 | | | $ | 296,962 | | | $ | 297,672 | |
| | | | | | | | | | | | | | | | |
| | | | |
| Commercial Services & Supplies: 1.72% | | | | | | | | | | | | | | | | |
Access CIG LLC ±<%% | | | 6.00 | | | | 10-17-2021 | | | | 24,950 | | | | 25,044 | |
ADS Waste Holdings Incorporated ± | | | 3.75 | | | | 10-9-2019 | | | | 59,846 | | | | 59,666 | |
Anchor Glass Container Corporation ± | | | 4.25 | | | | 6-30-2021 | | | | 62,313 | | | | 62,609 | |
Gates Global LLC ± | | | 4.25 | | | | 7-3-2021 | | | | 74,625 | | | | 74,625 | |
Interactive Data Corporation ± | | | 4.75 | | | | 5-2-2021 | | | | 148,875 | | | | 149,759 | |
KAR Auction Services Incorporated ± | | | 3.50 | | | | 3-7-2021 | | | | 136,423 | | | | 136,423 | |
Sedgwick Claims Management Services Incorporated ± | | | 3.75 | | | | 3-1-2021 | | | | 74,437 | | | | 73,945 | |
WASH Multifamily Laundry Systems LLC ± | | | 4.50 | | | | 2-21-2019 | | | | 118,491 | | | | 118,343 | |
| | | | |
| | | | | | | | | | | | | | | 700,414 | |
| | | | | | | | | | | | | | | | |
| | | | |
| Construction & Engineering: 0.20% | | | | | | | | | | | | | | | | |
Mannington Mills Incorporated ± | | | 4.75 | | | | 10-1-2021 | | | | 44,775 | | | | 44,980 | |
USIC Holdings Incorporated ± | | | 4.00 | | | | 7-10-2020 | | | | 34,623 | | | | 34,515 | |
| | | | |
| | | | | | | | | | | | | | | 79,495 | |
| | | | | | | | | | | | | | | | |
| | | | |
| Electrical Equipment: 0.01% | | | | | | | | | | | | | | | | |
Nusil Technology LLC ± | | | 5.25 | | | | 4-7-2017 | | | | 4,850 | | | | 4,815 | |
| | | | | | | | | | | | | | | | |
| | | | |
| Machinery: 0.32% | | | | | | | | | | | | | | | | |
Alliance Laundry Systems LLC ± | | | 4.25 | | | | 12-10-2018 | | | | 72,179 | | | | 72,360 | |
Onex Wizard Acquisition Company ± | | | 5.25 | | | | 3-13-2022 | | | | 45,000 | | | | 45,487 | |
Rexnord LLC ± | | | 4.00 | | | | 8-21-2020 | | | | 9,975 | | | | 10,005 | |
| | | | |
| | | | | | | | | | | | | | | 127,852 | |
| | | | | | | | | | | | | | | | |
| | | | |
| Transportation Infrastructure: 0.75% | | | | | | | | | | | | | | | | |
HGIM Corporation ± | | | 5.50 | | | | 6-18-2020 | | | | 217,269 | | | | 170,324 | |
OSG Bulk Ships Incorporated ± | | | 5.25 | | | | 8-5-2019 | | | | 14,888 | | | | 14,925 | |
OSG International Incorporated ± | | | 5.75 | | | | 8-5-2019 | | | | 119,100 | | | | 119,844 | |
| | | | |
| | | | | | | | | | | | | | | 305,093 | |
| | | | | | | | | | | | | | | | |
| | | | |
Information Technology: 4.01% | | | | | | | | | | | | | | | | |
| | | | |
| Internet Software & Services: 0.69% | | | | | | | | | | | | | | | | |
Applied Systems Incorporated ± | | | 4.27 | | | | 1-25-2021 | | | | 99,023 | | | | 99,235 | |
CCC Information Services Incorporated ± | | | 4.00 | | | | 12-20-2019 | | | | 59,435 | | | | 59,509 | |
Vertafore Incorporated ± | | | 4.25 | | | | 10-3-2019 | | | | 73,340 | | | | 73,508 | |
Vertafore Incorporated ± | | | 9.75 | | | | 10-29-2017 | | | | 10,000 | | | | 10,053 | |
Zayo Group LLC ± | | | 4.00 | | | | 7-2-2019 | | | | 39,745 | | | | 39,745 | |
| | | | |
| | | | | | | | | | | | | | | 282,050 | |
| | | | | | | | | | | | | | | | |
| | | | |
| IT Services: 1.00% | | | | | | | | | | | | | | | | |
First Data Corporation ± | | | 3.68 | | | | 3-24-2018 | | | | 55,000 | | | | 55,103 | |
First Data Corporation ± | | | 3.68 | | | | 9-24-2018 | | | | 350,000 | | | | 350,438 | |
| | | | |
| | | | | | | | | | | | | | | 405,541 | |
| | | | | | | | | | | | | | | | |
| | | | |
| Semiconductors & Semiconductor Equipment: 0.06% | | | | | | | | | | | | | | | | |
Freescale Semiconductor Incorporated ± | | | 4.25 | | | | 3-1-2020 | | | | 24,937 | | | | 25,030 | |
| | | | | | | | | | | | | | | | |
The accompanying notes are an integral part of these financial statements.
| | | | | | |
| Portfolio of investments—April 30, 2015 (unaudited) | | Wells Fargo Advantage Strategic Income Fund | | | 17 | |
| | | | | | | | | | | | | | | | |
| Security name | | Interest rate | | | Maturity date | | | Principal | | | Value | |
| | | | |
| Software: 1.32% | | | | | | | | | | | | | | | | |
BMC Software Finance Incorporated ± | | | 5.00 | % | | | 9-10-2020 | | | $ | 133,628 | | | $ | 131,389 | |
Emdeon Business Services LLC ± | | | 3.75 | | | | 11-2-2018 | | | | 247,440 | | | | 248,111 | |
Sophia LP ± | | | 4.00 | | | | 7-19-2018 | | | | 157,560 | | | | 157,993 | |
| | | | |
| | | | | | | | | | | | | | | 537,493 | |
| | | | | | | | | | | | | | | | |
| | | | |
| Technology Hardware, Storage & Peripherals: 0.94% | | | | | | | | | | | | | | | | |
CDW LLC ± | | | 3.25 | | | | 4-29-2020 | | | | 58,800 | | | | 58,720 | |
Dell Incorporated ± | | | 4.50 | | | | 4-29-2020 | | | | 267,244 | | | | 268,185 | |
Peak 10 Incorporated ± | | | 5.00 | | | | 6-17-2021 | | | | 4,963 | | | | 4,973 | |
Peak 10 Incorporated ± | | | 8.25 | | | | 6-17-2022 | | | | 10,000 | | | | 9,717 | |
Riverbed Technology Incorporated ±<%% | | | 0.00 | | | | 4-24-2022 | | | | 40,000 | | | | 40,420 | |
| | | | |
| | | | | | | | | | | | | | | 382,015 | |
| | | | | | | | | | | | | | | | |
| | | | |
Materials: 0.09% | | | | | | | | | | | | | | | | |
| | | | |
| Containers & Packaging: 0.09% | | | | | | | | | | | | | | | | |
Ardagh Holdings USA Incorporated ± | | | 4.00 | | | | 12-17-2019 | | | | 24,750 | | | | 24,855 | |
Crown Americas LLC ± | | | 5.50 | | | | 10-22-2021 | | | | 9,975 | | | | 9,973 | |
| | | | |
| | | | | | | | | | | | | | | 34,828 | |
| | | | | | | | | | | | | | | | |
| | | | |
Telecommunication Services: 2.52% | | | | | | | | | | | | | | | | |
| | | | |
| Diversified Telecommunication Services: 1.36% | | | | | | | | | | | | | | | | |
Avaya Incorporated ± | | | 4.68 | | | | 10-26-2017 | | | | 24,926 | | | | 24,807 | |
Intelsat Jackson Holdings SA ± | | | 3.75 | | | | 6-30-2019 | | | | 240,332 | | | | 240,032 | |
Level 3 Financing Incorporated ± | | | 4.00 | | | | 8-1-2019 | | | | 288,205 | | | | 288,744 | |
| | | | |
| | | | | | | | | | | | | | | 553,583 | |
| | | | | | | | | | | | | | | | |
| | | | |
| Wireless Telecommunication Services: 1.16% | | | | | | | | | | | | | | | | |
LTS Buyer LLC ± | | | 4.00 | | | | 4-11-2020 | | | | 39,597 | | | | 39,548 | |
SBA Communications Corporation ± | | | 3.25 | | | | 3-24-2021 | | | | 198,500 | | | | 198,335 | |
Syniverse Holdings Incorporated ± | | | 4.00 | | | | 4-23-2019 | | | | 242,380 | | | | 233,216 | |
| | | | |
| | | | | | | | | | | | | | | 471,099 | |
| | | | | | | | | | | | | | | | |
| | | | |
Utilities: 0.94% | | | | | | | | | | | | | | | | |
| | | | |
| Electric Utilities: 0.84% | | | | | | | | | | | | | | | | |
Granite Acquisition Incorporated ± | | | 5.00 | | | | 12-19-2021 | | | | 49,880 | | | | 50,503 | |
Green Energy Partners ± | | | 6.50 | | | | 11-13-2021 | | | | 45,000 | | | | 45,375 | |
Texas Competitive Electric Holdings Company LLC ±(s) | | | 4.66 | | | | 10-10-2015 | | | | 400,000 | | | | 244,224 | |
| | | | |
| | | | | | | | | | | | | | | 340,102 | |
| | | | | | | | | | | | | | | | |
| | | | |
| Independent Power & Renewable Electricity Producers: 0.10% | | | | | | | | | | | | | | | | |
Calpine Corporation ±<%% | | | 0.00 | | | | 10-9-2019 | | | | 40,000 | | | | 40,167 | |
| | | | | | | | | | | | | | | | |
| | | | |
Total Loans (Cost $8,679,613) | | | | | | | | | | | | | | | 8,483,987 | |
| | | | | | | | | | | | | | | | |
| | | | |
Municipal Obligations: 1.34% | | | | | | | | | | | | | | | | |
| | | | |
| Idaho: 0.22% | | | | | | | | | | | | | | | | |
Idaho Housing & Finance Association Legacy Public Charter School (Education Revenue) | | | 7.00 | | | | 5-1-2017 | | | | 90,000 | | | | 90,066 | |
| | | | | | | | | | | | | | | | |
| | | | |
| Illinois: 0.50% | | | | | | | | | | | | | | | | |
Chicago IL Refunding Taxable Project Series E (GO) | | | 6.05 | | | | 1-1-2029 | | | | 200,000 | | | | 200,720 | |
| | | | | | | | | | | | | | | | |
The accompanying notes are an integral part of these financial statements.
| | | | |
| 18 | | Wells Fargo Advantage Strategic Income Fund | | Portfolio of investments—April 30, 2015 (unaudited) |
| | | | | | | | | | | | | | | | |
| Security name | | Interest rate | | | Maturity date | | | Principal | | | Value | |
| | | | |
| Texas: 0.62% | | | | | | | | | | | | | | | | |
North Texas Tollway Authority Build America Bonds Sub Lien Series B-2 (Transportation Revenue) | | | 8.91 | % | | | 2-1-2030 | | | $ | 210,000 | | | $ | 252,092 | |
| | | | | | | | | | | | | | | | |
| | | | |
Total Municipal Obligations (Cost $547,953) | | | | | | | | | | | | | | | 542,878 | |
| | | | | | | | | | | | | | | | |
| | | | |
Non-Agency Mortgage-Backed Securities: 9.87% | | | | | | | | | | | | | | | | |
ACAS CLO Limited Trust Series 2015-1A Class B %%(a)144A± | | | 2.28 | | | | 4-18-2027 | | | | 500,000 | | | | 500,000 | |
Americold LLC Trust Series 2010-ART Class B 144A | | | 6.03 | | | | 1-14-2029 | | | | 200,000 | | | | 228,664 | |
Banc of America Merrill Lynch Trust Series 2014-ICTS Class D ±144A | | | 2.08 | | | | 6-15-2028 | | | | 230,000 | | | | 229,127 | |
BB-UBS Trust Series 2012-TFT Class C ±144A | | | 3.58 | | | | 6-5-2030 | | | | 150,000 | | | | 146,232 | |
Commercial Mortgage Trust Series 2012-LC4 Class B ± | | | 4.93 | | | | 12-10-2044 | | | | 175,000 | | | | 195,797 | |
DB Master Finance LLC Dunkin Trust Series 2015-1A Class A2II 144A | | | 3.98 | | | | 2-20-2045 | | | | 400,000 | | | | 409,861 | |
GS Mortgage Securities Trust Series 2012 Class B 144A | | | 3.41 | | | | 12-10-2030 | | | | 250,000 | | | | 256,446 | |
GS Mortgage Securities Trust Series 2014-GC24 Class D ±144A | | | 4.66 | | | | 9-10-2047 | | | | 500,000 | | | | 458,750 | |
JPMBB Commercial Mortgage Securities Trust Series 2014-C19 Class D ±144A | | | 4.83 | | | | 4-15-2047 | | | | 493,000 | | | | 464,410 | |
JPMorgan Chase Commercial Mortgage Securities Trust Series 2011-C5 Class B ±144A | | | 5.50 | | | | 8-15-2046 | | | | 250,000 | | | | 285,587 | |
JPMorgan Chase Commercial Mortgage Securities Trust Series 2012-LC9 Class D ±144A | | | 4.57 | | | | 12-15-2047 | | | | 329,000 | | | | 340,165 | |
Morgan Stanley Capital I Trust Series 2007-HQ11 Class AM ± | | | 5.48 | | | | 2-12-2044 | | | | 25,000 | | | | 26,595 | |
Morgan Stanley Trust Series 2012-C5 Class B ± | | | 4.44 | | | | 8-15-2045 | | | | 250,000 | | | | 270,829 | |
Winwater Mortgage Loan Trust Series 2014-1 Class A4 ±144A | | | 3.50 | | | | 6-20-2044 | | | | 196,108 | | | | 200,544 | |
| | | | |
Total Non-Agency Mortgage-Backed Securities (Cost $3,992,776) | | | | | | | | | | | | | | | 4,013,007 | |
| | | | | | | | | | | | | | | | |
| | | | |
Yankee Corporate Bonds and Notes: 4.10% | | | | | | | | | | | | | | | | |
| | | | |
Energy: 0.74% | | | | | | | | | | | | | | | | |
| | | | |
| Energy Equipment & Services: 0.25% | | | | | | | | | | | | | | | | |
Ensco plc | | | 5.20 | | | | 3-15-2025 | | | | 100,000 | | | | 103,123 | |
| | | | | | | | | | | | | | | | |
| | | | |
| Oil, Gas & Consumable Fuels: 0.49% | | | | | | | | | | | | | | | | |
Noble Holdings International Limited Corporation | | | 5.95 | | | | 4-1-2025 | | | | 200,000 | | | | 196,741 | |
| | | | | | | | | | | | | | | | |
| | | | |
Financials: 1.21% | | | | | | | | | | | | | | | | |
| | | | |
| Banks: 1.21% | | | | | | | | | | | | | | | | |
BPCE SA 144A | | | 5.15 | | | | 7-21-2024 | | | | 230,000 | | | | 241,678 | |
Credit Agricole SA 144A | | | 4.38 | | | | 3-17-2025 | | | | 200,000 | | | | 197,826 | |
Nielsen Holding and Finance BV 144A | | | 5.50 | | | | 10-1-2021 | | | | 50,000 | | | | 51,250 | |
| | | | |
| | | | | | | | | | | | | | | 490,754 | |
| | | | | | | | | | | | | | | | |
| | | | |
Health Care: 0.65% | | | | | | | | | | | | | | | | |
| | | | |
| Pharmaceuticals: 0.65% | | | | | | | | | | | | | | | | |
Actavis Funding SCS | | | 3.45 | | | | 3-15-2022 | | | | 200,000 | | | | 203,302 | |
Mallinckrodt plc 144A | | | 4.88 | | | | 4-15-2020 | | | | 5,000 | | | | 5,081 | |
Mallinckrodt plc 144A | | | 5.50 | | | | 4-15-2025 | | | | 5,000 | | | | 5,100 | |
Valeant Pharmaceuticals International Incorporated 144A | | | 5.88 | | | | 5-15-2023 | | | | 10,000 | | | | 10,238 | |
Valeant Pharmaceuticals International Incorporated 144A | | | 6.13 | | | | 4-15-2025 | | | | 5,000 | | | | 5,175 | |
Valeant Pharmaceuticals International Incorporated 144A | | | 6.75 | | | | 8-15-2018 | | | | 10,000 | | | | 10,588 | |
Valeant Pharmaceuticals International Incorporated 144A | | | 7.50 | | | | 7-15-2021 | | | | 25,000 | | | | 27,094 | |
| | | | |
| | | | | | | | | | | | | | | 266,578 | |
| | | | | | | | | | | | | | | | |
| | | | |
Industrials: 0.21% | | | | | | | | | | | | | | | | |
| | | | |
| Aerospace & Defense: 0.01% | | | | | | | | | | | | | | | | |
Bombardier Incorporated 144A | | | 7.50 | | | | 3-15-2025 | | | | 5,000 | | | | 4,956 | |
| | | | | | | | | | | | | | | | |
The accompanying notes are an integral part of these financial statements.
| | | | | | |
| Portfolio of investments—April 30, 2015 (unaudited) | | Wells Fargo Advantage Strategic Income Fund | | | 19 | |
| | | | | | | | | | | | | | | | |
| Security name | | Interest rate | | | Maturity date | | | Principal | | | Value | |
| | | | |
| Commercial Services & Supplies: 0.07% | | | | | | | | | | | | | | | | |
GFL Environmental Incorporated 144A | | | 7.88 | % | | | 4-1-2020 | | | $ | 25,000 | | | $ | 25,438 | |
| | | | | | | | | | | | | | | | |
| | | | |
| Machinery: 0.13% | | | | | | | | | | | | | | | | |
Sensata Technologies BV 144A | | | 5.00 | | | | 10-1-2025 | | | | 5,000 | | | | 5,150 | |
Sensata Technologies BV 144A | | | 5.63 | | | | 11-1-2024 | | | | 45,000 | | | | 48,038 | |
| | | | |
| | | | | | | | | | | | | | | 53,188 | |
| | | | | | | | | | | | | | | | |
| | | | |
Information Technology: 0.44% | | | | | | | | | | | | | | | | |
| | | | |
| Technology Hardware, Storage & Peripherals: 0.44% | | | | | | | | | | | | | | | | |
Seagate HDD (Cayman) 144A | | | 4.75 | | | | 1-1-2025 | | | | 175,000 | | | | 179,551 | |
| | | | | | | | | | | | | | | | |
| | | | |
Materials: 0.04% | | | | | | | | | | | | | | | | |
| | | | |
| Metals & Mining: 0.04% | | | | | | | | | | | | | | | | |
FMG Resources (August 2006) Proprietary Limited 144A | | | 6.88 | | | | 4-1-2022 | | | | 20,000 | | | | 15,025 | |
| | | | | | | | | | | | | | | | |
| | | | |
Telecommunication Services: 0.51% | | | | | | | | | | | | | | | | |
| | | | |
| Diversified Telecommunication Services: 0.51% | | | | | | | | | | | | | | | | |
Intelsat Jackson Holdings SA | | | 5.50 | | | | 8-1-2023 | | | | 125,000 | | | | 117,656 | |
Intelsat Luxembourg SA | | | 7.75 | | | | 6-1-2021 | | | | 5,000 | | | | 4,600 | |
Intelsat Luxembourg SA | | | 8.13 | | | | 6-1-2023 | | | | 85,000 | | | | 76,659 | |
Virgin Media Finance plc 144A | | | 5.38 | | | | 4-15-2021 | | | | 4,500 | | | | 4,708 | |
Virgin Media Finance plc 144A | | | 6.38 | | | | 4-15-2023 | | | | 5,000 | | | | 5,263 | |
| | | | |
| | | | | | | | | | | | | | | 208,886 | |
| | | | | | | | | | | | | | | | |
| | | | |
Utilities: 0.30% | | | | | | | | | | | | | | | | |
| | | | |
| Electric Utilities: 0.30% | | | | | | | | | | | | | | | | |
Comision Federal de Electricidad 144A | | | 4.88 | | | | 1-15-2024 | | | | 115,000 | | | | 123,855 | |
| | | | | | | | | | | | | | | | |
| | | | |
Total Yankee Corporate Bonds and Notes (Cost $1,660,100) | | | | | | | | | | | | | | | 1,668,095 | |
| | | | | | | | | | | | | | | | |
| | | | |
| | | Yield | | | | | | Shares | | | | |
| Short-Term Investments: 8.78% | | | | | | | | | | | | | | | | |
| | | | |
| Investment Companies: 8.26% | | | | | | | | | | | | | | | | |
Wells Fargo Advantage Cash Investment Money Market Fund, Select Class (l)(u)## | | | 0.11 | | | | | | | | 3,360,191 | | | | 3,360,191 | |
| | | | | | | | | | | | | | | | |
| | | | |
| | | | | | | | | Principal | | | | |
| U.S. Treasury Securities: 0.52% | | | | | | | | | | | | | | | | |
U.S. Treasury Bill #(z) | | | 0.00 | | | | 6-18-2015 | | | $ | 210,000 | | | | 210,003 | |
| | | | | | | | | | | | | | | | |
| | | | |
Total Short-Term Investments (Cost $3,570,181) | | | | | | | | | | | | | | | 3,570,194 | |
| | | | | | | | | | | | | | | | |
| | | | | | | | |
| Total investments in securities (Cost $41,769,411) * | | | 100.73 | % | | | 40,953,872 | |
Other assets and liabilities, net | | | (0.73 | ) | | | (294,960 | ) |
| | | | | | | | |
| Total net assets | | | 100.00 | % | | $ | 40,658,912 | |
| | | | | | | | |
The accompanying notes are an integral part of these financial statements.
| | | | |
| 20 | | Wells Fargo Advantage Strategic Income Fund | | Portfolio of investments—April 30, 2015 (unaudited) |
| ± | Variable rate investment. The rate shown is the rate in effect at period end. |
| 144A | The security may be resold in transactions exempt from registration, normally to qualified institutional buyers, pursuant to Rule 144A under the Securities Act of 1933. |
| ¥ | A payment-in-kind (PIK) security is a security in which the issuer may make interest or dividend payments in cash or additional securities. These additional securities generally have the same terms as the original holdings. |
| @ | Foreign bond principal is denominated in the local currency of the issuer. |
| < | All or a portion of the position represents an unfunded loan commitment. |
| %% | The security is issued on a when-issued basis. |
| (s) | The security is currently in default with regards to scheduled interest and/or principal payments. The Fund has stopped accruing interest on the security. |
| (a) | The security is fair valued in accordance with procedures approved by the Board of Trustees. |
| (l) | The security represents an affiliate of the Fund as defined in the Investment Company Act of 1940. |
| (u) | The rate represents the 7-day annualized yield at period end. |
| ## | All or a portion of this security is segregated for when-issued securities and unfunded loans. |
| # | All or a portion of this security is segregated as collateral for investments in derivative instruments. |
| (z) | Zero coupon security. The rate represents the current yield to maturity. |
| * | Cost for federal income tax purposes is $42,051,071 and unrealized gains (losses) consists of: |
| | | | |
Gross unrealized gains | | $ | 294,250 | |
Gross unrealized losses | | | (1,391,449 | ) |
| | | | |
Net unrealized losses | | $ | (1,097,199 | ) |
The accompanying notes are an integral part of these financial statements.
| | | | | | |
| Statement of assets and liabilities—April 30, 2015 (unaudited) | | Wells Fargo Advantage Strategic Income Fund | | | 21 | |
| | | | |
| | | | |
| |
Assets | | | | |
Investments | | | | |
In unaffiliated securities, at value (cost $38,409,220) | | $ | 37,593,681 | |
In affiliated securities, at value (cost $3,360,191) | | | 3,360,191 | |
| | | | |
Total investments, at value (cost $41,769,411) | | | 40,953,872 | |
Foreign currency, at value (cost $28,768) | | | 27,885 | |
Receivable for investments sold | | | 112,080 | |
Receivable for interest | | | 428,334 | |
Receivable for daily variation margin on open futures contracts | | | 20,219 | |
Unrealized gains on forward foreign currency contracts | | | 29,815 | |
Prepaid expenses and other assets | | | 38,744 | |
| | | | |
Total assets | | | 41,610,949 | |
| | | | |
| |
Liabilities | | | | |
Payable for investments purchased | | | 594,638 | |
Payable for Fund shares redeemed | | | 39,624 | |
Unrealized losses on forward foreign currency contracts | | | 291,556 | |
Advisory fee payable | | | 328 | |
Distribution fee payable | | | 469 | |
Administration fees payable | | | 4,474 | |
Accrued expenses and other liabilities | | | 20,948 | |
| | | | |
Total liabilities | | | 952,037 | |
| | | | |
Total net assets | | $ | 40,658,912 | |
| | | | |
| |
NET ASSETS CONSIST OF | | | | |
Paid-in capital | | $ | 42,562,039 | |
Overdistributed net investment income | | | (118,302 | ) |
Accumulated net realized losses on investments | | | (557,736 | ) |
Net unrealized losses on investments | | | (1,227,089 | ) |
| | | | |
Total net assets | | $ | 40,658,912 | |
| | | | |
| |
COMPUTATION OF NET ASSET VALUE AND OFFERING PRICE PER SHARE | | | | |
Net assets – Class A | | $ | 982,708 | |
Shares outstanding – Class A1 | | | 103,752 | |
Net asset value per share – Class A | | | $9.47 | |
Maximum offering price per share – Class A2 | | | $9.92 | |
Net assets – Class C | | $ | 708,763 | |
Shares outstanding – Class C1 | | | 74,838 | |
Net asset value per share – Class C | | | $9.47 | |
Net assets – Administrator Class | | $ | 514,017 | |
Shares outstanding – Administrator Class1 | | | 54,116 | |
Net asset value per share – Administrator Class | | | $9.50 | |
Net assets – Institutional Class | | $ | 38,453,424 | |
Shares outstanding – Institutional Class1 | | | 4,060,644 | |
Net asset value per share – Institutional Class | | | $9.47 | |
| 1 | The Fund has an unlimited number of authorized shares. |
| 2 | Maximum offering price is computed as 100/95.50 of net asset value. On investments of $50,000 or more, the offering price is reduced. |
The accompanying notes are an integral part of these financial statements.
| | | | |
| 22 | | Wells Fargo Advantage Strategic Income Fund | | Statement of operations—six months ended April 30, 2015 (unaudited) |
| | | | |
| | | | |
| |
Investment income | | | | |
Interest (net of foreign interest withholding taxes of $1,765) | | $ | 937,084 | |
Income from affiliated securities | | | 642 | |
Securities lending income, net | | | 171 | |
| | | | |
Total investment income | | | 937,897 | |
| | | | |
| |
Expenses | | | | |
Advisory fee | | | 94,681 | |
Administration fees | | | | |
Fund level | | | 9,966 | |
Class A | | | 711 | |
Class C | | | 605 | |
Administrator Class | | | 266 | |
Institutional Class | | | 15,076 | |
Shareholder servicing fees | | | | |
Class A | | | 1,112 | |
Class C | | | 945 | |
Administrator Class | | | 664 | |
Distribution fee | | | | |
Class C | | | 2,836 | |
Custody and accounting fees | | | 15,737 | |
Professional fees | | | 25,592 | |
Registration fees | | | 27,445 | |
Shareholder report expenses | | | 7,198 | |
Trustees’ fees and expenses | | | 7,645 | |
Other fees and expenses | | | 3,774 | |
| | | | |
Total expenses | | | 214,253 | |
Less: Fee waivers and/or expense reimbursements | | | (88,953 | ) |
| | | | |
Net expenses | | | 125,300 | |
| | | | |
Net investment income | | | 812,597 | |
| | | | |
| |
REALIZED AND UNREALIZED GAINS (LOSSES) ON INVESTMENTS | | | | |
| |
Net realized gains (losses) on: | | | | |
Unaffiliated securities | | | (888,739 | ) |
Futures transactions | | | (431,020 | ) |
Forward foreign currency contract transactions | | | 1,152,303 | |
| | | | |
Net realized losses on investments | | | (167,456 | ) |
| | | | |
| |
Net change in unrealized gains (losses) on: | | | | |
Unaffiliated securities | | | (99,366 | ) |
Futures transactions | | | (33,682 | ) |
Forward foreign currency contract transactions | | | (448,674 | ) |
| | | | |
Net change in unrealized gains (losses) on investments | | | (581,722 | ) |
| | | | |
Net realized and unrealized gains (losses) on investments | | | (749,178 | ) |
| | | | |
Net increase in net assets resulting from operations | | $ | 63,419 | |
| | | | |
The accompanying notes are an integral part of these financial statements.
| | | | | | |
| Statement of changes in net assets | | Wells Fargo Advantage Strategic Income Fund | | | 23 | |
| | | | | | | | | | | | | | | | |
| | | Six months ended April 30, 2015 (unaudited) | | | Year ended October 31, 2014 | |
| | | |
Operations | | | | | | | | | | | | |
Net investment income | | | | | | $ | 812,597 | | | | | | | $ | 1,331,266 | |
Net realized losses on investments | | | | | | | (167,456 | ) | | | | | | | (982,908 | ) |
Net change in unrealized gains (losses) on investments | | | | | | | (581,722 | ) | | | | | | | 537,097 | |
| | | | |
Net increase in net assets resulting from operations | | | | | | | 63,419 | | | | | | | | 885,455 | |
| | | | |
| | | |
Distributions to shareholders from | | | | | | | | | | | | |
Net investment income | | | | | | | | | | | | | | | | |
Class A | | | | | | | (23,750 | ) | | | | | | | (15,762 | ) |
Class C | | | | | | | (16,606 | ) | | | | | | | (13,400 | ) |
Administrator Class | | | | | | | (13,803 | ) | | | | | | | (13,793 | ) |
Institutional Class | | | | | | | (1,041,437 | ) | | | | | | | (852,736 | ) |
| | | | |
Total distributions to shareholders | | | | | | | (1,095,596 | ) | | | | | | | (895,691 | ) |
| | | | |
| | | | |
Capital share transactions | | | Shares | | | | | | | | Shares | | | | | |
Proceeds from shares sold | | | | | | | | | | | | | | | | |
Class A | | | 36,061 | | | | 344,528 | | | | 22,517 | | | | 217,023 | |
Class C | | | 2,587 | | | | 24,655 | | | | 46,130 | | | | 444,536 | |
Administrator Class | | | 0 | | | | 0 | | | | 4,115 | | | | 40,000 | |
Institutional Class | | | 2,898 | | | | 26,962 | | | | 1,475,076 | | | | 14,500,000 | |
| | | | |
| | | | | | | 396,145 | | | | | | | | 15,201,559 | |
| | | | |
Reinvestment of distributions | | | | | | | | | | | | | | | | |
Class A | | | 2,260 | | | | 21,553 | | | | 1,619 | | | | 15,592 | |
Class C | | | 1,740 | | | | 16,606 | | | | 1,394 | | | | 13,400 | |
Administrator Class | | | 1,443 | | | | 13,803 | | | | 1,431 | | | | 13,793 | |
Institutional Class | | | 109,213 | | | | 1,041,437 | | | | 88,370 | | | | 852,736 | |
| | | | |
| | | | | | | 1,093,399 | | | | | | | | 895,521 | |
| | | | |
Payment for shares redeemed | | | | | | | | | | | | | | | | |
Class A | | | (8,005 | ) | | | (75,939 | ) | | | (4,382 | ) | | | (42,882 | ) |
Class C | | | (15,520 | ) | | | (148,738 | ) | | | (15,103 | ) | | | (147,854 | ) |
Administrator Class | | | (4,192 | ) | | | (39,997 | ) | | | 0 | | | | 0 | |
Institutional Class | | | (31,505 | ) | | | (300,242 | ) | | | 0 | | | | 0 | |
| | | | |
| | | | | | | (564,916 | ) | | | | | | | (190,736 | ) |
| | | | |
Net increase in net assets resulting from capital share transactions | | | | | | | 924,628 | | | | | | | | 15,906,344 | |
| | | | |
Total increase (decrease) in net assets | | | | | | | (107,549 | ) | | | | | | | 15,896,108 | |
| | | | |
| | |
Net assets | | | | | | | | |
Beginning of period | | | | | | | 40,766,461 | | | | | | | | 24,870,353 | |
| | | | |
End of period | | | | | | $ | 40,658,912 | | | | | | | $ | 40,766,461 | |
| | | | |
Undistributed (overdistributed) net investment income | | | | | | $ | (118,302 | ) | | | | | | $ | 164,697 | |
| | | | |
The accompanying notes are an integral part of these financial statements.
| | | | |
| 24 | | Wells Fargo Advantage Strategic Income Fund | | Financial highlights |
(For a share outstanding throughout each period)
| | | | | | | | | | | | |
| | | Six months ended
April 30, 2015
(unaudited) | | | Year ended October 31 | |
| CLASS A | | | 2014 | | | 20131 | |
Net asset value, beginning of period | | | $9.72 | | | | $9.66 | | | | $10.00 | |
Net investment income | | | 0.16 | | | | 0.37 | | | | 0.27 | |
Net realized and unrealized gains (losses) on investments | | | (0.17 | ) | | | (0.05 | ) | | | (0.36 | ) |
| | | | | | | | | | | | |
Total from investment operations | | | (0.01 | ) | | | 0.32 | | | | (0.09 | ) |
Distributions to shareholders from | | | | | | | | | | | | |
Net investment income | | | (0.24 | ) | | | (0.26 | ) | | | (0.25 | ) |
Net asset value, end of period | | | $9.47 | | | | $9.72 | | | | $9.66 | |
Total return2 | | | (0.05 | )% | | | 3.36 | % | | | (0.89 | )% |
Ratios to average net assets (annualized) | | | | | | | | | | | | |
Gross expenses | | | 1.38 | % | | | 1.51 | % | | | 1.85 | % |
Net expenses | | | 0.90 | % | | | 0.90 | % | | | 0.90 | % |
Net investment income | | | 3.81 | % | | | 4.02 | % | | | 3.76 | % |
Supplemental data | | | | | | | | | | | | |
Portfolio turnover rate | | | 33 | % | | | 51 | % | | | 39 | % |
Net assets, end of period (000s omitted) | | | $983 | | | | $714 | | | | $518 | |
| 1 | For the period from January 31, 2013 (commencement of class operations) to October 31, 2013 |
| 2 | Total return calculations do not include any sales charges. Returns for periods of less than one year are not annualized. |
The accompanying notes are an integral part of these financial statements.
| | | | | | |
| Financial highlights | | Wells Fargo Advantage Strategic Income Fund | | | 25 | |
(For a share outstanding throughout each period)
| | | | | | | | | | | | |
| | | Six months ended
April 30, 2015
(unaudited) | | | Year ended October 31 | |
| CLASS C | | | 2014 | | | 20131 | |
Net asset value, beginning of period | | | $9.71 | | | | $9.65 | | | | $10.00 | |
Net investment income | | | 0.15 | | | | 0.31 | | | | 0.21 | |
Net realized and unrealized gains (losses) on investments | | | (0.18 | ) | | | (0.06 | ) | | | (0.37 | ) |
| | | | | | | | | | | | |
Total from investment operations | | | (0.03 | ) | | | 0.25 | | | | (0.16 | ) |
Distributions to shareholders from | | | | | | | | | | | | |
Net investment income | | | (0.21 | ) | | | (0.19 | ) | | | (0.19 | ) |
Net asset value, end of period | | | $9.47 | | | | $9.71 | | | | $9.65 | |
Total return2 | | | (0.35 | )% | | | 2.61 | % | | | (1.51 | )% |
Ratios to average net assets (annualized) | | | | | | | | | | | | |
Gross expenses | | | 2.12 | % | | | 2.25 | % | | | 2.60 | % |
Net expenses | | | 1.65 | % | | | 1.65 | % | | | 1.65 | % |
Net investment income | | | 3.05 | % | | | 3.25 | % | | | 3.01 | % |
Supplemental data | | | | | | | | | | | | |
Portfolio turnover rate | | | 33 | % | | | 51 | % | | | 39 | % |
Net assets, end of period (000s omitted) | | | $709 | | | | $835 | | | | $518 | |
| 1 | For the period from January 31, 2013 (commencement of class operations) to October 31, 2013 |
| 2 | Total return calculations do not include any sales charges. Returns for periods of less than one year are not annualized. |
The accompanying notes are an integral part of these financial statements.
| | | | |
| 26 | | Wells Fargo Advantage Strategic Income Fund | | Financial highlights |
(For a share outstanding throughout each period)
| | | | | | | | | | | | |
| | | Six months ended
April 30, 2015
(unaudited) | | | Year ended October 31 | |
| ADMINISTRATOR CLASS | | | 2014 | | | 20131 | |
Net asset value, beginning of period | | | $9.74 | | | | $9.66 | | | | $10.00 | |
Net investment income | | | 0.19 | | | | 0.39 | | | | 0.28 | |
Net realized and unrealized gains (losses) on investments | | | (0.18 | ) | | | (0.05 | ) | | | (0.37 | ) |
| | | | | | | | | | | | |
Total from investment operations | | | 0.01 | | | | 0.34 | | | | (0.09 | ) |
Distributions to shareholders from | | | | | | | | | | | | |
Net investment income | | | (0.25 | ) | | | (0.26 | ) | | | (0.25 | ) |
Net asset value, end of period | | | $9.50 | | | | $9.74 | | | | $9.66 | |
Total return2 | | | 0.07 | % | | | 3.63 | % | | | (0.85 | )% |
Ratios to average net assets (annualized) | | | | | | | | | | | | |
Gross expenses | | | 1.31 | % | | | 1.46 | % | | | 1.79 | % |
Net expenses | | | 0.75 | % | | | 0.75 | % | | | 0.75 | % |
Net investment income | | | 3.95 | % | | | 4.18 | % | | | 3.90 | % |
Supplemental data | | | | | | | | | | | | |
Portfolio turnover rate | | | 33 | % | | | 51 | % | | | 39 | % |
Net assets, end of period (000s omitted) | | | $514 | | | | $554 | | | | $496 | |
| 1 | For the period from January 31, 2013 (commencement of class operations) to October 31, 2013 |
| 2 | Returns for periods of less than one year are not annualized. |
The accompanying notes are an integral part of these financial statements.
| | | | | | |
| Financial highlights | | Wells Fargo Advantage Strategic Income Fund | | | 27 | |
(For a share outstanding throughout each period)
| | | | | | | | | | | | |
| | | Six months ended
April 30, 2015
(unaudited) | | | Year ended October 31 | |
| INSTITUTIONAL CLASS | | | 2014 | | | 20131 | |
Net asset value, beginning of period | | | $9.71 | | | | $9.66 | | | | $10.00 | |
Net investment income | | | 0.19 | | | | 0.41 | 2 | | | 0.29 | |
Net realized and unrealized gains (losses) on investments | | | (0.17 | ) | | | (0.07 | ) | | | (0.36 | ) |
| | | | | | | | | | | | |
Total from investment operations | | | 0.02 | | | | 0.34 | | | | (0.07 | ) |
Distributions to shareholders from | | | | | | | | | | | | |
Net investment income | | | (0.26 | ) | | | (0.29 | ) | | | (0.27 | ) |
Net asset value, end of period | | | $9.47 | | | | $9.71 | | | | $9.66 | |
Total return3 | | | 0.21 | % | | | 3.60 | % | | | (0.66 | )% |
Ratios to average net assets (annualized) | | | | | | | | | | | | |
Gross expenses | | | 1.04 | % | | | 1.14 | % | | | 1.52 | % |
Net expenses | | | 0.60 | % | | | 0.60 | % | | | 0.60 | % |
Net investment income | | | 4.11 | % | | | 4.25 | % | | | 4.05 | % |
Supplemental data | | | | | | | | | | | | |
Portfolio turnover rate | | | 33 | % | | | 51 | % | | | 39 | % |
Net assets, end of period (000s omitted) | | | $38,453 | | | | $38,664 | | | | $23,338 | |
| 1 | For the period from January 31, 2013 (commencement of class operations) to October 31, 2013 |
| 2 | Calculated based upon average shares outstanding |
| 3 | Returns for periods of less than one year are not annualized. |
The accompanying notes are an integral part of these financial statements.
| | | | |
| 28 | | Wells Fargo Advantage Strategic Income Fund | | Notes to financial statements (unaudited) |
1. ORGANIZATION
Wells Fargo Funds Trust (the “Trust”), a Delaware statutory trust organized on March 10, 1999, is an open-end management investment company registered under the Investment Company Act of 1940, as amended (the “1940 Act”). As an investment company, the Trust follows the accounting and reporting guidance in Financial Accounting Standards Board (“FASB”) Accounting Standards Codification Topic 946, Financial Services – Investment Companies. These financial statements report on the Wells Fargo Advantage Strategic Income Fund (the “Fund”) which is a diversified series of the Trust.
2. SIGNIFICANT ACCOUNTING POLICIES
The following significant accounting policies, which are consistently followed in the preparation of the financial statements of the Fund, are in conformity with U.S. generally accepted accounting principles which require management to make estimates and assumptions that affect the reported amounts of assets and liabilities, disclosure of contingent assets and liabilities at the date of the financial statements, and the reported amounts of revenues and expenses during the reporting period. Actual results could differ from those estimates.
Securities valuation
All investments are valued each business day as of the close of regular trading on the New York Stock Exchange (generally 4 p.m. Eastern Time).
Debt securities are valued at the evaluated bid price provided by an independent pricing service or, if a reliable price is not available, the quoted bid price from an independent broker-dealer.
Futures that are listed on a foreign or domestic exchange or market are valued at the official closing price or, if none, the last sales price.
The values of securities denominated in foreign currencies are translated into U.S. dollars at rates provided by an independent foreign currency pricing source at a time each business day specified by the Management Valuation Team of Wells Fargo Funds Management, LLC (“Funds Management”).
Investments in registered open-end investment companies are valued at net asset value. Interests in non-registered investment vehicles that are redeemable at net asset value are fair valued at net asset value when available.
Investments which are not valued using any of the methods discussed above are valued at their fair value, as determined in good faith by the Board of Trustees of the Fund. The Board of Trustees has established a Valuation Committee comprised of the Trustees and has delegated to it the authority to take any actions regarding the valuation of portfolio securities that the Valuation Committee deems necessary or appropriate, including determining the fair value of portfolio securities, unless the determination has been delegated to the Management Valuation Team. The Board of Trustees retains the authority to make or ratify any valuation decisions or approve any changes to the Valuation Procedures as it deems appropriate. On a quarterly basis, the Board of Trustees receives reports on any valuation actions taken by the Valuation Committee or the Management Valuation Team which may include items for ratification.
Valuations of fair valued securities are compared to the next actual sales price when available, or other appropriate market values, to assess the continued appropriateness of the fair valuation methodologies used. These securities are fair valued on a day-to-day basis, taking into consideration changes to appropriate market information and any significant changes to the inputs considered in the valuation process until there is a readily available price provided on an exchange or by an independent pricing service. Valuations received from an independent pricing service or independent broker-dealer quotes are periodically validated by comparisons to most recent trades and valuations provided by other independent pricing services in addition to the review of prices by the adviser and/or subadviser. Unobservable inputs used in determining fair valuations are identified based on the type of security, taking into consideration factors utilized by market participants in valuing the investment, knowledge about the issuer and the current market environment.
Foreign currency translation
The accounting records of the Fund are maintained in U.S. dollars. The values of other assets and liabilities denominated in foreign currencies are translated into U.S. dollars at rates provided by an independent foreign currency pricing source at a time each business day specified by the Management Valuation Team. Purchases and sales of securities, and income and expenses are converted at the rate of exchange on the respective dates of such transactions. Net realized foreign exchange gains or losses arise from sales of foreign currencies, currency gains or losses realized between the trade and settlement dates on securities transactions, and the difference between the amounts of dividends, interest and foreign withholding taxes recorded and the U.S. dollar equivalent of the amounts actually paid or received. Net unrealized foreign exchange gains and losses arise from changes in the fair value of assets and liabilities other than investments in securities resulting from changes in exchange rates. The changes in net assets arising from changes in exchange rates
| | | | | | |
| Notes to financial statements (unaudited) | | Wells Fargo Advantage Strategic Income Fund | | | 29 | |
and the changes in net assets resulting from changes in market prices of securities are not separately presented. Such changes are included in net realized and unrealized gains or losses from investments.
Forward foreign currency contracts
The Fund is subject to foreign currency exchange rate risk in the normal course of pursuing its investment objectives. A forward foreign currency contract is an agreement between two parties to purchase or sell a specific currency for an agreed-upon price at a future date. The Fund enters into forward foreign currency contracts to facilitate transactions in foreign-denominated securities and to attempt to minimize the risk to the Fund from adverse changes in the relationship between currencies. Forward foreign currency contracts are recorded at the forward rate and marked-to-market daily. When the contracts are closed, realized gains and losses arising from such transactions are recorded as realized gains or losses on forward foreign currency contract transactions. The Fund could be exposed to risks if the counterparties to the contracts are unable to meet the terms of their contracts or if the value of the foreign currency changes unfavorably. The Fund’s maximum risk of loss from counterparty credit risk is the unrealized gains on the contracts. This risk may be mitigated if there is a master netting arrangement between the Fund and the counterparty.
Security loans
The Fund may lend its securities from time to time in order to earn additional income in the form of fees or interest on securities received as collateral or the investment of any cash received as collateral. The Fund continues to receive interest or dividends on the securities loaned. The Fund receives collateral in the form of cash or securities with a value at least equal to the value of the securities on loan. The value of the loaned securities is determined at the close of each business day and any additional required collateral is delivered to the Fund on the next business day. In a securities lending transaction, the net asset value of the Fund will be affected by an increase or decrease in the value of the securities loaned and by an increase or decrease in the value of the instrument in which collateral is invested. The amount of securities lending activity undertaken by the Fund fluctuates from time to time. In the event of default or bankruptcy by the borrower, the Fund may be prevented from recovering the loaned securities or gaining access to the collateral or may experience delays or costs in doing so. In addition, the investment of any cash collateral received may lose all or part of its value. The Fund has the right under the lending agreement to recover the securities from the borrower on demand.
The Fund lends its securities through an unaffiliated securities lending agent. Cash collateral received in connection with its securities lending transactions is invested in Securities Lending Cash Investments, LLC (the “Securities Lending Fund”). The Securities Lending Fund is exempt from registration under Section 3(c)(7) of the 1940 Act and is managed by Funds Management and is subadvised by Wells Capital Management Incorporated (“WellsCap”). Funds Management receives an advisory fee starting at 0.05% and declining to 0.01% as the average daily net assets of the Securities Lending Fund increase. All of the fees received by Funds Management are paid to WellsCap for its services as subadviser. The Securities Lending Fund seeks to provide a positive return compared to the daily Fed Funds Open rate by investing in high-quality, U.S. dollar-denominated short-term money market instruments. Securities Lending Fund investments are fair valued based upon the amortized cost valuation technique. Income earned from investment in the Securities Lending Fund is included in securities lending income on the Statement of Operations.
When-issued transactions
The Fund may purchase securities on a forward commitment or when-issued basis. The Fund records a when-issued transaction on the trade date and will segregate assets in an amount at least equal in value to the Fund’s commitment to purchase when-issued securities. Securities purchased on a when-issued basis are marked-to-market daily and the Fund begins earning interest on the settlement date. Losses may arise due to changes in the market value of the underlying securities or if the counterparty does not perform under the contract.
Loans
The Fund may invest in direct debt instruments which are interests in amounts owed to lenders by corporate or other borrowers. The loans pay interest at rates which are periodically reset by reference to a base lending rate plus a spread. Investments in loans may be in the form of participations in loans or assignments of all or a portion of loans from third parties. When the Fund purchases participations, it generally has no rights to enforce compliance with terms of the loan agreement with the borrower. As a result, the Fund assumes the credit risk of both the borrower and the lender that is selling the participation. When the Fund purchases assignments from lenders, it acquires direct rights against the borrower on the loan and may enforce compliance by the borrower with the terms of the loan agreement. Loans may include fully funded term loans or unfunded loan commitments, which are contractual obligations for future funding.
Futures contracts
The Fund is subject to interest rate risk in the normal course of pursuing its investment objectives. The Fund may buy and sell futures contracts in order to gain exposure to, or protect against, changes in security values and interest rates. The
| | | | |
| 30 | | Wells Fargo Advantage Strategic Income Fund | | Notes to financial statements (unaudited) |
primary risks associated with the use of futures contracts are the imperfect correlation between changes in market values of securities held by the Fund and the prices of futures contracts, and the possibility of an illiquid market.
The aggregate principal amounts of the contracts are not recorded in the financial statements. Fluctuations in the value of the contracts are recorded in the Statement of Assets and Liabilities as an asset or liability and in the Statement of Operations as unrealized gains or losses until the contracts are closed, at which point they are recorded as net realized gains or losses on futures contracts. With futures contracts, there is minimal counterparty risk to the Fund since futures are exchange traded and the exchange’s clearinghouse, as counterparty to all exchange traded futures, guarantees the futures against default.
Security transactions and income recognition
Securities transactions are recorded on a trade date basis. Realized gains or losses are recorded on the basis of identified cost.
Interest income is accrued daily and bond discounts are accreted and premiums are amortized daily based on the effective interest method. To the extent debt obligations are placed on non-accrual status, any related interest income may be reduced by writing off interest receivables when the collection of all or a portion of interest has become doubtful based on consistently applied procedures. If the issuer subsequently resumes interest payments or when the collectability of interest is reasonably assured, the debt obligation is removed from non-accrual status.
Income from foreign securities is recorded net of foreign taxes withheld where recovery of such taxes is not assured.
Distributions to shareholders
Distributions to shareholders from net investment income and net realized gains, if any, are recorded on the ex-dividend date. Such distributions are determined in conformity with federal income tax regulations, which may differ in amount or character from net investment income and realized gains recognized for purposes of U.S. generally accepted accounting principles.
Federal and other taxes
The Fund intends to continue to qualify as a regulated investment company by distributing substantially all of its investment company taxable income and any net realized capital gains (after reduction for capital loss carryforwards) sufficient to relieve it from all, or substantially all, federal income taxes. Accordingly, no provision for federal income taxes was required.
The Fund’s income and federal excise tax returns and all financial records supporting those returns for the prior three fiscal years are subject to examination by the federal and Delaware revenue authorities. Management has analyzed the Fund’s tax positions taken on federal, state, and foreign tax returns for all open tax years and does not believe that there are any uncertain tax positions that require recognition of a tax liability.
As of October 31, 2014, the Fund had capital loss carryforwards which consisted of $207,810 in short-term capital losses and $200,021 in long-term capital losses.
Class allocations
The separate classes of shares offered by the Fund differ principally in applicable sales charges, distribution, shareholder servicing, and administration fees. Class specific expenses are charged directly to that share class. Investment income, common expenses, and realized and unrealized gains (losses) on investments are allocated daily to each class of shares based on the relative proportion of net assets of each class.
3. FAIR VALUATION MEASUREMENTS
Fair value measurements of investments are determined within a framework that has established a fair value hierarchy based upon the various data inputs utilized in determining the value of the Fund’s investments. The three-level hierarchy gives the highest priority to unadjusted quoted prices in active markets for identical assets or liabilities (Level 1) and the lowest priority to significant unobservable inputs (Level 3). The Fund’s investments are classified within the fair value hierarchy based on the lowest level of input that is significant to the fair value measurement. The inputs are summarized into three broad levels as follows:
| n | | Level 1 – quoted prices in active markets for identical securities |
| n | | Level 2 – other significant observable inputs (including quoted prices for similar securities, interest rates, prepayment speeds, credit risk, use of amortized cost, etc.) |
| n | | Level 3 – significant unobservable inputs (including the Fund’s own assumptions in determining the fair value of investments) |
The inputs or methodologies used for valuing investments in securities are not necessarily an indication of the risk associated with investing in those securities.
| | | | | | |
| Notes to financial statements (unaudited) | | Wells Fargo Advantage Strategic Income Fund | | | 31 | |
The following is a summary of the inputs used in valuing the Fund’s assets and liabilities as of April 30, 2015:
| | | | | | | | | | | | | | | | |
| | | Quoted prices (Level 1) | | | Other significant observable inputs (Level 2) | | | Significant unobservable inputs (Level 3) | | | Total | |
Assets | | | | | | | | | | | | | | | | |
Investments in: | | | | | | | | | | | | | | | | |
| | | | |
Agency securities | | $ | 0 | | | $ | 1,110,690 | | | $ | 0 | | | $ | 1,110,690 | |
| | | | |
Asset-backed securities | | | 0 | | | | 2,215,809 | | | | 0 | | | | 2,215,809 | |
| | | | |
Corporate bonds and notes | | | 0 | | | | 14,443,782 | | | | 0 | | | | 14,443,782 | |
| | | | |
Foreign government bonds | | | 0 | | | | 4,905,430 | | | | 0 | | | | 4,905,430 | |
| | | | |
Loans | | | 0 | | | | 7,533,102 | | | | 950,885 | | | | 8,483,987 | |
| | | | |
Municipal obligations | | | 0 | | | | 542,878 | | | | 0 | | | | 542,878 | |
| | | | |
Non-agency mortgage-backed securities | | | 0 | | | | 4,013,007 | | | | 0 | | | | 4,013,007 | |
| | | | |
Yankee corporate bonds and notes | | | 0 | | | | 1,668,095 | | | | 0 | | | | 1,668,095 | |
| | | | |
Short-term investments | | | | | | | | | | | | | | | | |
Investment companies | | | 3,360,191 | | | | 0 | | | | 0 | | | | 3,360,191 | |
U.S. Treasury securities | | | 210,003 | | | | 0 | | | | 0 | | | | 210,003 | |
| | | | 3,570,194 | | | | 36,432,793 | | | | 950,885 | | | | 40,953,872 | |
| | | | |
Forward foreign currency contracts | | | 0 | | | | 29,815 | | | | 0 | | | | 29,815 | |
| | | | |
Futures contracts | | | 20,219 | | | | 0 | | | | 0 | | | | 20,219 | |
Total assets | | $ | 3,590,413 | | | $ | 36,462,608 | | | $ | 950,885 | | | $ | 41,003,906 | |
Liabilities | | | | | | | | | | | | | | | | |
Forward foreign currency contracts | | $ | 0 | | | $ | 291,556 | | | $ | 0 | | | $ | 291,556 | |
Total liabilities | | $ | 0 | | | $ | 291,556 | | | $ | 0 | | | $ | 291,556 | |
Forward foreign currency contracts are reported at their unrealized gains (losses) at measurement date, which represents the change in the contract’s value from trade date. Futures contracts are reported at their variation margin at measurement date, which represents the amount due to the Fund at that date. All other assets and liabilities are reported at their market value at measurement date.
The Fund recognizes transfers between levels within the fair value hierarchy at the end of the reporting period. At April 30, 2015, the Fund did not have any transfers into/out of Level 1 or Level 2.
The following is a reconciliation of assets in which significant unobservable inputs (Level 3) were used in determining fair value:
| | | | |
| | | Loans | |
Balance as of October 31, 2014 | | $ | 1,127,246 | |
Accrued discounts (premiums) | | | (182 | ) |
Realized gains (losses) | | | 555 | |
Change in unrealized gains (losses) | | | 12,571 | |
Purchases | | | 64,625 | |
Sales | | | (184,864 | ) |
Transfers into Level 3 | | | 367,795 | |
Transfers out of Level 3 | | | (436,861 | ) |
Balance as of April 30, 2015 | | $ | 950,885 | |
Change in unrealized gains (losses) relating to securities still held at April 30, 2015 | | $ | 7,473 | |
The investment type categorized above was valued using indicative broker quotes. These indicative broker quotes are considered Level 3 inputs. Quantitative unobservable inputs used by the brokers are often proprietary and not provided to the Fund and therefore the disclosure that would address these inputs is not included above.
| | | | |
| 32 | | Wells Fargo Advantage Strategic Income Fund | | Notes to financial statements (unaudited) |
4. TRANSACTIONS WITH AFFILIATES
Advisory fee
The Trust has entered into an advisory contract with Funds Management, an indirect wholly owned subsidiary of Wells Fargo & Company (“Wells Fargo”). The adviser is responsible for implementing investment policies and guidelines and for supervising the subadvisers, who are responsible for day-to-day portfolio management of the Fund.
Pursuant to the contract, Funds Management is entitled to receive an annual advisory fee starting at 0.475% and declining to 0.375% as the average daily net assets of the Fund increase. For the six months ended April 30, 2015, the advisory fee was equivalent to an annual rate of 0.475% of the Fund’s average daily net assets.
Funds Management has retained the services of certain subadvisers to provide daily portfolio management to the Fund. The fee for subadvisory services is borne by Funds Management. WellsCap, an affiliate of Funds Management and an indirect wholly owned subsidiary of Wells Fargo, is a subadviser to the Fund and is entitled to receive a fee from Funds Management at an annual rate starting at 0.30% and declining to 0.15% as the average daily net assets of the Fund increase. First International Advisors, LLC, an affiliate of Funds Management and an indirect wholly owned subsidiary of Wells Fargo, is also a subadviser to the Fund and is entitled to receive a fee from Funds Management at an annual rate starting at 0.35% and declining to 0.20% as the average daily net assets of the Fund increase.
Administration fees
The Trust has entered into an administration agreement with Funds Management. Under this agreement, for providing administrative services, which includes paying fees and expenses for services provided by the transfer agent, sub-transfer agents, omnibus account servicers and record-keepers, Funds Management is entitled to receive from the Fund an annual fund level administration fee starting at 0.05% and declining to 0.03% as the average daily net assets of the Fund increase and a class level administration fee which is calculated based on the average daily net assets of each class as follows:
| | | | |
| | | Class level administration fee | |
Class A, Class C | | | 0.16 | % |
Administrator Class | | | 0.10 | |
Institutional Class | | | 0.08 | |
Funds Management has contractually waived and/or reimbursed advisory and administration fees to the extent necessary to maintain certain net operating expense ratios for the Fund. Waiver of fees and/or reimbursement of expenses by Funds Management were made first from fund level expenses on a proportionate basis and then from class specific expenses. Funds Management has committed through February 29, 2016 to waive fees and/or reimburse expenses to the extent necessary to cap the Fund’s expenses at 0.90% for Class A shares, 1.65% for Class C shares, 0.75% for Administrator Class shares, and 0.60% for Institutional Class shares. After this time, the cap may be increased or the commitment to maintain the cap may be terminated only with the approval of the Board of Trustees.
Distribution fee
The Trust has adopted a Distribution Plan for Class C shares of the Fund pursuant to Rule 12b-1 under the 1940 Act. A distribution fee is charged to Class C shares and paid to Wells Fargo Funds Distributor, LLC (“Funds Distributor”), the principal underwriter, at an annual rate of 0.75% of the average daily net assets of Class C shares.
In addition, Funds Distributor is entitled to receive the front-end sales charge from the purchase of Class A shares and a contingent deferred sales charge on the redemption of certain Class A shares. Funds Distributor is also entitled to receive the contingent deferred sales charges from redemptions of Class C shares. For the six months ended April 30, 2015, Funds Distributor received $14 from the sale of Class A shares.
Shareholder servicing fees
The Trust has entered into contracts with one or more shareholder servicing agents, whereby Class A, Class C, and Administrator Class of the Fund is charged a fee at an annual rate of 0.25% of the average daily net assets of each respective class.
A portion of these total shareholder servicing fees were paid to affiliates of Wells Fargo.
| | | | | | |
| Notes to financial statements (unaudited) | | Wells Fargo Advantage Strategic Income Fund | | | 33 | |
5. INVESTMENT PORTFOLIO TRANSACTIONS
Purchases and sales of investments, excluding U.S. government obligations (if any) and short-term securities, for the six months ended April 30, 2015 were $13,042,772 and $12,570,524, respectively.
As of April 30, 2015, the Fund had unfunded term loan commitments of $94,638.
6. DERIVATIVE TRANSACTIONS
During the six months ended April 30, 2015, the Fund entered into futures contracts to manage duration exposure.
At April 30, 2015, the Fund had short futures contracts outstanding as follows:
| | | | | | | | | | | | | | | | | | |
| Expiration date | | Counterparty | | Contracts | | | Type | | | Contract
value at April 30, 2015 | | | Unrealized
gains
(losses) | |
| 6-19-2015 | | JPMorgan | | | 119 Short | | | | 10-Year U.S. Treasury Notes | | | $ | 15,276,625 | | | $ | (126,945 | ) |
| 6-19-2015 | | JPMorgan | | | 5 Short | | | | U.S. Treasury Bonds | | | | 822,500 | | | | 5,624 | |
| 6-30-2015 | | JPMorgan | | | 22 Short | | | | 5-Year U.S. Treasury Notes | | | | 2,642,922 | | | | (24,620 | ) |
The Fund had an average notional amount of $17,770,486 in short futures contracts during the six months ended April 30, 2015.
During the six months ended April 30, 2015, the Fund entered into forward foreign currency contracts for economic hedging purposes.
At April 30, 2015, the Fund had forward foreign currency contracts outstanding as follows:
Forward foreign currency contracts to buy:
| | | | | | | | | | | | | | | | | | |
| Exchange date | | Counterparty | | Contracts to receive | | | U.S. value at April 30, 2015 | | | In exchange for U.S. $ | | | Unrealized
gains | |
| 6-16-2015 | | State Street Bank | | | 700,000 GBP | | | $ | 1,074,182 | | | $ | 1,044,367 | | | $ | 29,815 | |
Forward foreign currency contracts to sell:
| | | | | | | | | | | | | | | | | | |
| Exchange date | | Counterparty | | Contracts to deliver | | | U.S. value at April 30, 2015 | | | In exchange for U.S. $ | | | Unrealized
losses | |
| 6-16-2015 | | State Street Bank | | | 200,000 EUR | | | $ | 224,693 | | | $ | 210,773 | | | $ | (13,920 | ) |
| 6-16-2015 | | State Street Bank | | | 1,000,000 GBP | | | | 1,534,546 | | | | 1,498,190 | | | | (36,356 | ) |
| 6-16-2015 | | State Street Bank | | | 3,850,000 EUR | | | | 4,325,333 | | | | 4,087,437 | | | | (237,896 | ) |
| 6-16-2015 | | State Street Bank | | | 90,000 EUR | | | | 101,111 | | | | 97,727 | | | | (3,384 | ) |
The Fund had average contract amounts of $1,583,533 and $7,138,944 in forward foreign currency contracts to buy and forward foreign currency contracts to sell, respectively, during the six months ended April 30, 2015.
A summary of derivative instruments by primary risk exposure is outlined in the following tables.
The fair value of derivative instruments as of April 30, 2015 was as follows for the Fund:
| | | | | | | | | | | | |
| | | Asset derivatives | | | Liability derivatives | |
| | | Statement of Assets and Liabilities location | | Fair value | | | Statement of Assets and
Liabilities location | | Fair value | |
Interest rate contracts | | Receivable for daily variation margin on open futures contracts | | $ | 20,219 | * | | Payable for daily variation margin on open futures contracts | | $ | 0 | |
Forward foreign currency contracts | | Unrealized gains on forward foreign currency contracts | | | 29,815 | | | Unrealized losses on forward foreign currency contracts | | | 291,556 | |
| | | | | $ | 50,034 | | | | | $ | 291,556 | |
| * | Only the current day’s variation margin as of April 30, 2015 is reported separately on the Statement of Assets and Liabilities. |
| | | | |
| 34 | | Wells Fargo Advantage Strategic Income Fund | | Notes to financial statements (unaudited) |
The effect of derivative instruments on the Statement of Operations for the six months ended April 30, 2015 was as follows for the Fund:
| | | | | | | | | | | | |
| | | Amount of realized gains (losses) on derivatives | | | Change in unrealized gains (losses) on derivatives | |
| | | Futures contracts | | Forward currency contracts | | | Futures contracts | | Forward currency contracts | |
Interest rate contracts | | $(431,020) | | $ | 0 | | | $(33,682) | | $ | 0 | |
Forward foreign currency contracts | | 0 | | | 1,152,303 | | | 0 | | | (448,674 | ) |
| | | $(431,020) | | $ | 1,152,303 | | | $(33,682) | | $ | (448,674 | ) |
For certain types of derivative transactions, the Fund has entered into International Swaps and Derivatives Association, Inc. master agreements (“ISDA Master Agreements”) or similar agreements with approved counterparties. The ISDA Master Agreements or similar agreements may have requirements to deliver/deposit securities or cash to/with an exchange or broker-dealer as collateral and allows the Fund to offset, with each counterparty, certain derivative financial instrument’s assets and/or liabilities with collateral held or pledged. Collateral requirements differ by type of derivative. Collateral or margin requirements are set by the broker or exchange clearing house for exchange traded derivatives while collateral terms are contract specific for over-the-counter traded derivatives. Cash collateral that has been pledged to cover obligations of the Fund under ISDA Master Agreements or similar agreements, if any, will be reported separately in the Statement of Assets and Liabilities. Securities pledged as collateral, if any, for the same purpose are noted in the Portfolio of Investments. With respect to balance sheet offsetting, absent an event of default by the counterparty or a termination of the agreement, the reported amounts of financial assets and financial liabilities in the Statement of Assets and Liabilities are not offset across transactions between the Fund and the applicable counterparty. A reconciliation of the gross amounts on the Statement of Assets and Liabilities to the net amounts by derivative type, including any collateral exposure, is as follows:
| | | | | | | | | | | | | | | | |
| Derivative type | | Counterparty | | Gross amounts
of assets in the
Statement of
Assets and Liabilities | | Amounts
subject to
netting agreements | | | Collateral
received | | | Net amount
of assets | |
Futures – variation margin | | JPMorgan | | $20,219 | | $ | 0 | | | $ | 0 | | | $ | 20,219 | |
Forward foreign currency contracts | | State Street Bank | | 29,815* | | | (29,815 | ) | | | 0 | | | | 0 | |
| | * | Amount represents net unrealized gains. | |
| | | | | | | | | | | | | | | | |
| Derivative type | | Counterparty | | Gross amounts
of liabilities in the
Statement of
Assets and
Liabilities | | Amounts
subject to
netting
agreements | | | Collateral
pledged | | | Net amount
of liabilities | |
Forward foreign currency contracts | | State Street Bank | | $291,556** | | $ | (29,815 | ) | | $ | 0 | | | $ | 261,741 | |
| | ** | Amount represents net realized losses. | |
7. BANK BORROWINGS
The Trust (excluding the money market funds and certain other funds in the Trust) and Wells Fargo Variable Trust are parties to a $150,000,000 revolving credit agreement whereby the Fund is permitted to use bank borrowings for temporary or emergency purposes, such as to fund shareholder redemption requests. Interest under the credit agreement is charged to the Fund based on a borrowing rate equal to the higher of the Federal Funds rate in effect on that day plus 1.25% or the overnight LIBOR rate in effect on that day plus 1.25%. In addition, an annual commitment fee equal to 0.10% of the unused balance is allocated to each participating fund. For the six months ended April 30, 2015, the Fund paid $37 in commitment fees.
For the six months ended April 30, 2015, there were no borrowings by the Fund under the agreement.
| | | | | | |
| Notes to financial statements (unaudited) | | Wells Fargo Advantage Strategic Income Fund | | | 35 | |
8. INDEMNIFICATION
Under the Trust’s organizational documents, the officers and Trustees have been granted certain indemnification rights against certain liabilities that may arise out of performance of their duties to the Trust. Additionally, in the normal course of business, the Trust may enter into contracts with service providers that contain a variety of indemnification clauses. The Trust’s maximum exposure under these arrangements is dependent on future claims that may be made against the Fund and, therefore, cannot be estimated.
| | | | |
| 36 | | Wells Fargo Advantage Strategic Income Fund | | Other information (unaudited) |
PROXY VOTING INFORMATION
A description of the policies and procedures that the Fund uses to determine how to vote proxies relating to portfolio securities is available, upon request, by calling 1-800-222-8222, visiting our website at wellsfargoadvantagefunds.com, or visiting the SEC website at sec.gov. Information regarding how the Fund voted proxies relating to portfolio securities during the most recent 12-month period ended June 30 is available on the Fund’s website at wellsfargoadvantagefunds.com or by visiting the SEC website at sec.gov.
PORTFOLIO HOLDINGS INFORMATION
The complete portfolio holdings for the Fund are publicly available monthly on the Fund’s website (wellsfargoadvantagefunds.com), on a one-month delayed basis. In addition, top ten holdings information (excluding derivative positions) for the Fund is publicly available on the Fund’s website on a monthly, seven-day or more delayed basis. The Fund files its complete schedule of portfolio holdings with the SEC for the first and third quarters of each fiscal year on Form N-Q, which is available by visiting the SEC website at sec.gov. In addition, the Fund’s Form N-Q may be reviewed and copied at the SEC’s Public Reference Room in Washington, DC, and at regional offices in New York City, at 233 Broadway, and in Chicago, at 175 West Jackson Boulevard, Suite 900. Information about the Public Reference Room may be obtained by calling 1-800-SEC-0330.
| | | | | | |
| Other information (unaudited) | | Wells Fargo Advantage Strategic Income Fund | | | 37 | |
BOARD OF TRUSTEES AND OFFICERS
Each of the Trustees and Officers1 listed in the table below acts in identical capacities for each fund in the Wells Fargo Advantage family of funds, which consists of 134 mutual funds comprising the Wells Fargo Funds Trust, Wells Fargo Variable Trust, Wells Fargo Master Trust and four closed-end funds (collectively the “Fund Complex”). This table should be read in conjunction with the Prospectus and the Statement of Additional Information2. The mailing address of each Trustee and Officer is 525 Market Street, 12th Floor, San Francisco, CA 94105. Each Trustee and Officer serves an indefinite term, however, each Trustee serves such term until reaching the mandatory retirement age established by the Trustees.
Independent Trustees
| | | | | | |
Name and year of birth | | Position held and length of service* | | Principal occupations during past five years or longer | | Other directorships during past five years |
William R. Ebsworth (Born 1957) | | Trustee, since 2015** | | Retired. From 1984 to 2013, equities analyst, portfolio manager, research director at Fidelity Management and Research Company and retired in 2013 as Chief Investment Officer of Fidelity Strategic Advisers, Inc. in Boston, Tokyo, and Hong Kong where he led a team of investment professionals managing client assets. Prior thereto, Board member of Hong Kong Securities Clearing Co., Hong Kong Options Clearing Corp., the Thailand International Fund, Ltd., Fidelity Investments Life Insurance Company, and Empire Fidelity Investments Life Insurance Company. Mr. Ebsworth is an Adjunct Lecturer, Finance, at Babson College and a Chartered Financial Analyst. | | Asset Allocation Trust |
Jane A. Freeman (Born 1953) | | Trustee, since 2015** | | Retired. From 2012 to 2014 and 1999 to 2008, Chief Financial Officer of Scientific Learning Corporation. From 2008 to 2012, Ms. Freeman provided consulting services related to strategic business projects. Prior to 1999, Portfolio Manager at Rockefeller & Co. and Scudder, Stevens & Clark. Board member of the Harding Loevner Funds from 1996 to 2014, serving as both Lead Independent Director and chair of the Audit Committee. Board member of the Russell Exchange Traded Funds Trust from 2011 to 2012 and the chair of the Audit Committee. Ms. Freeman is a Chartered Financial Analyst (inactive), Chair of Taproot Foundation (non-profit organization) and a Board Member of Ruth Bancroft Garden (non-profit organization). | | Asset Allocation Trust |
Peter G. Gordon (Born 1942) | | Trustee, since 1998; Chairman, since 2005 | | Co-Founder, Retired Chairman, President and CEO of Crystal Geyser Water Company. Trustee Emeritus, Colby College. | | Asset Allocation Trust |
Isaiah Harris, Jr. (Born 1952) | | Trustee, since 2009 | | Retired. Chairman of the Board of CIGNA Corporation since 2009, and Director since 2005. From 2003 to 2011, Director of Deluxe Corporation. Prior thereto, President and CEO of BellSouth Advertising and Publishing Corp. from 2005 to 2007, President and CEO of BellSouth Enterprises from 2004 to 2005 and President of BellSouth Consumer Services from 2000 to 2003. Emeritus member of the Iowa State University Foundation Board of Governors. Emeritus Member of the Advisory Board of Iowa State University School of Business. Advisory Board Member, Palm Harbor Academy. Mr. Harris is a certified public accountant. | | CIGNA Corporation; Asset Allocation Trust |
Judith M. Johnson (Born 1949) | | Trustee, since 2008;
Audit Committee Chairman, since 2008 | | Retired. Prior thereto, Chief Executive Officer and Chief Investment Officer of Minneapolis Employees Retirement Fund from 1996 to 2008. Ms. Johnson is an attorney, certified public accountant and a certified managerial accountant. | | Asset Allocation Trust |
David F. Larcker (Born 1950) | | Trustee, since 2009 | | James Irvin Miller Professor of Accounting at the Graduate School of Business, Stanford University, Morgan Stanley Director of the Center for Leadership Development and Research and Senior Faculty of The Rock Center for Corporate Governance since 2006. From 2005 to 2008, Professor of Accounting at the Graduate School of Business, Stanford University. Prior thereto, Ernst & Young Professor of Accounting at The Wharton School, University of Pennsylvania from 1985 to 2005. | | Asset Allocation Trust |
Olivia S. Mitchell (Born 1953) | | Trustee, since 2006 | | International Foundation of Employee Benefit Plans Professor, Wharton School of the University of Pennsylvania since 1993. Director of Wharton’s Pension Research Council and Boettner Center on Pensions & Retirement Research, and Research Associate at the National Bureau of Economic Research. Previously, Cornell University Professor from 1978 to 1993. | | Asset Allocation Trust |
| | | | |
| 38 | | Wells Fargo Advantage Strategic Income Fund | | Other information (unaudited) |
| | | | | | |
Name and year of birth | | Position held and length of service* | | Principal occupations during past five years or longer | | Other directorships during past five years |
Timothy J. Penny (Born 1951) | | Trustee, since 1996 | | President and Chief Executive Officer of Southern Minnesota Initiative Foundation, a non-profit organization, since 2007 and Senior Fellow at the Humphrey Institute Policy Forum at the University of Minnesota since 1995. Member of the Board of Trustees of NorthStar Education Finance, Inc., a non-profit organization, since 2007. | | Asset Allocation Trust |
Michael S. Scofield (Born 1943) | | Trustee, since 2010 | | Served on the Investment Company Institute’s Board of Governors and Executive Committee from 2008-2011 as well the Governing Council of the Independent Directors Council from 2006-2011 and the Independent Directors Council Executive Committee from 2008-2011. Chairman of the IDC from 2008-2010. Institutional Investor (Fund Directions) Trustee of Year in 2007. Trustee of the Evergreen Funds complex (and its predecessors) from 1984 to 2010. Chairman of the Evergreen Funds from 2000-2010. Former Trustee of the Mentor Funds. Retired Attorney, Law Offices of Michael S. Scofield. | | Asset Allocation Trust |
Donald C. Willeke (Born 1940) | | Trustee, since 1996 | | Principal of the law firm of Willeke & Daniels. General Counsel of the Minneapolis Employees Retirement Fund from 1984 until its consolidation into the Minnesota Public Employees Retirement Association on June 30, 2010. Director and Vice Chair of The Tree Trust (non-profit corporation). Director of the American Chestnut Foundation (non-profit corporation). | | Asset Allocation Trust |
| * | Length of service dates reflect the Trustee’s commencement of service with the Trust’s predecessor entities, where applicable. |
| ** | William R. Ebsworth and Jane A. Freeman each became a Trustee effective January 1, 2015. |
Officers
| | | | | | |
Name and
year of birth | | Position held and
length of service | | Principal occupations during past five years or longer | | |
Karla M. Rabusch (Born 1959) | | President, since 2003 | | Executive Vice President of Wells Fargo Bank, N.A. and President of Wells Fargo Funds Management, LLC since 2003. | | |
Nancy Wiser1 (Born 1967) | | Treasurer, since 2012 | | Executive Vice President of Wells Fargo Funds Management, LLC since 2011. Chief Operating Officer and Chief Compliance Officer at LightBox Capital Management LLC, from 2008 to 2011. Owned and operated a consulting business providing services to various hedge funds including acting as Chief Operating Officer and Chief Compliance Officer for a hedge fund from 2007 to 2008. Chief Operating Officer and Chief Compliance Officer of GMN Capital LLC from 2006 to 2007. | | |
C. David Messman (Born 1960) | | Secretary, since 2000; Chief Legal Officer, since 2003 | | Senior Vice President and Secretary of Wells Fargo Funds Management, LLC since 2001. Assistant General Counsel of Wells Fargo Bank, N.A. since 2013 and Vice President and Managing Counsel of Wells Fargo Bank N.A. from 1996 to 2013. | | |
Debra Ann Early (Born 1964) | | Chief Compliance Officer, since 2007 | | Senior Vice President of Wells Fargo Funds Management, LLC since 2007 and Chief Compliance Officer from 2007 to 2014. Chief Compliance Officer of Parnassus Investments from 2005 to 2007. Chief Financial Officer of Parnassus Investments from 2004 to 2007 and Senior Audit Manager of PricewaterhouseCoopers LLP from 1998 to 2004. | | |
David Berardi (Born 1975) | | Assistant Treasurer, since 2009 | | Vice President of Wells Fargo Funds Management, LLC since 2009. Vice President of Evergreen Investment Management Company, LLC from 2008 to 2010. Assistant Vice President of Evergreen Investment Services, Inc. from 2004 to 2008. Manager of Fund Reporting and Control for Evergreen Investment Management Company, LLC from 2004 to 2010. | | |
Jeremy DePalma1 (Born 1974) | | Assistant Treasurer, since 2009 | | Senior Vice President of Wells Fargo Funds Management, LLC since 2009. Senior Vice President of Evergreen Investment Management Company, LLC from 2008 to 2010. Vice President, Evergreen Investment Services, Inc. from 2004 to 2007. Head of the Fund Reporting and Control Team within Fund Administration from 2005 to 2010. | | |
| 1 | Nancy Wiser acts as Treasurer of 73 funds in the Fund Complex. Jeremy DePalma acts as Treasurer of 61 funds and Assistant Treasurer of 73 funds in the Fund Complex. |
| 2 | The Statement of Additional Information includes additional information about the Trustees and is available, without charge, upon request, by calling 1-800-222-8222 or by visiting the website at wellsfargoadvantagefunds.com. |
| | | | | | |
| List of abbreviations | | Wells Fargo Advantage Strategic Income Fund | | | 39 | |
The following is a list of common abbreviations for terms and entities that may have appeared in this report.
| ACA | — ACA Financial Guaranty Corporation |
| ADR | — American depositary receipt |
| ADS | — American depositary shares |
| AGC | — Assured Guaranty Corporation |
| AGM | — Assured Guaranty Municipal |
| Ambac | — Ambac Financial Group Incorporated |
| AMT | — Alternative minimum tax |
| BAN | — Bond anticipation notes |
| BHAC | — Berkshire Hathaway Assurance Corporation |
| CAB | — Capital appreciation bond |
| CCAB | — Convertible capital appreciation bond |
| CDA | — Community Development Authority |
| CDO | — Collateralized debt obligation |
| DRIVER | — Derivative inverse tax-exempt receipts |
| DW&P | — Department of Water & Power |
| DWR | — Department of Water Resources |
| ECFA | — Educational & Cultural Facilities Authority |
| EDA | — Economic Development Authority |
| EDFA | — Economic Development Finance Authority |
| ETF | — Exchange-traded fund |
| FDIC | — Federal Deposit Insurance Corporation |
| FFCB | — Federal Farm Credit Banks |
| FGIC | — Financial Guaranty Insurance Corporation |
| FHA | — Federal Housing Administration |
| FHLB | — Federal Home Loan Bank |
| FHLMC | — Federal Home Loan Mortgage Corporation |
| FICO | — The Financing Corporation |
| FNMA | — Federal National Mortgage Association |
| GDR | — Global depositary receipt |
| GNMA | — Government National Mortgage Association |
| HCFR | — Healthcare facilities revenue |
| HEFA | — Health & Educational Facilities Authority |
| HEFAR | — Higher education facilities authority revenue |
| HFA | — Housing Finance Authority |
| HFFA | — Health Facilities Financing Authority |
| HUD | — Department of Housing and Urban Development |
| IDA | — Industrial Development Authority |
| IDAG | — Industrial Development Agency |
| KRW | — Republic of Korea won |
| LIBOR | — London Interbank Offered Rate |
| LIFER | — Long Inverse Floating Exempt Receipts |
| LLC | — Limited liability company |
| LLLP | — Limited liability limited partnership |
| LLP | — Limited liability partnership |
| MBIA | — Municipal Bond Insurance Association |
| MFHR | — Multifamily housing revenue |
| MSTR | — Municipal securities trust receipts |
| MUD | — Municipal Utility District |
| National | — National Public Finance Guarantee Corporation |
| PCFA | — Pollution Control Financing Authority |
| PCL | — Public Company Limited |
| PCR | — Pollution control revenue |
| PFA | — Public Finance Authority |
| PFFA | — Public Facilities Financing Authority |
| PFOTER | — Puttable floating option tax-exempt receipts |
| plc | — Public limited company |
| PUTTER | — Puttable tax-exempt receipts |
| R&D | — Research & development |
| Radian | — Radian Asset Assurance |
| RAN | — Revenue anticipation notes |
| RDA | — Redevelopment Authority |
| RDFA | — Redevelopment Finance Authority |
| REIT | — Real estate investment trust |
| ROC | — Reset option certificates |
| SAVRS | — Select auction variable rate securities |
| SBA | — Small Business Authority |
| SDR | — Swedish depositary receipt |
| SFHR | — Single-family housing revenue |
| SFMR | — Single-family mortgage revenue |
| SPA | — Standby purchase agreement |
| SPDR | — Standard & Poor’s Depositary Receipts |
| SPEAR | — Short Puttable Exempt Adjustable Receipts |
| STRIPS | — Separate trading of registered interest and |
| TAN | — Tax anticipation notes |
| TIPS | — Treasury inflation-protected securities |
| TRAN | — Tax revenue anticipation notes |
| TTFA | — Transportation Trust Fund Authority |
| TVA | — Tennessee Valley Authority |
This page is intentionally left blank.


For more information
More information about Wells Fargo Advantage Funds is available free upon request. To obtain literature, please write, email, visit the Fund’s website, or call:
Wells Fargo Advantage Funds
P.O. Box 8266
Boston, MA 02266-8266
Email: wfaf@wellsfargo.com
Website: wellsfargoadvantagefunds.com
Individual investors: 1-800-222-8222
Retail investment professionals: 1-888-877-9275
Institutional investment professionals: 1-866-765-0778
This report and the financial statements contained herein are submitted for the general information of the shareholders of Wells Fargo Advantage Funds. If this report is used for promotional purposes, distribution of the report must be accompanied or preceded by a current prospectus. Before investing, please consider the investment objectives, risks, charges, and expenses of the investment. For a current prospectus and, if available, a summary prospectus, containing this information, call 1-800-222-8222 or visit the Fund’s website at wellsfargoadvantagefunds.com. Read the prospectus carefully before you invest or send money.
Wells Fargo Funds Management, LLC, a wholly owned subsidiary of Wells Fargo & Company, provides investment advisory and administrative services for Wells Fargo Advantage Funds. Other affiliates of Wells Fargo & Company provide subadvisory and other services for the Funds. The Funds are distributed by Wells Fargo Funds Distributor, LLC, Member FINRA/SIPC, an affiliate of Wells Fargo & Company.
NOT FDIC INSURED ¡ NO BANK GUARANTEE ¡ MAY LOSE VALUE
© 2015 Wells Fargo Funds Management, LLC. All rights reserved.
| | |
 | | 233649 06-15 SA263/SAR263 04-15 |

Wells Fargo Advantage Asia Pacific Fund

Semi-Annual Report
April 30, 2015

Reduce clutter. Save trees.
Sign up for electronic delivery of prospectuses and shareholder reports at wellsfargo.com/advantagedelivery
Contents
The views expressed and any forward-looking statements are as of April 30, 2015, unless otherwise noted, and are those of the Fund managers and/or Wells Fargo Funds Management, LLC. Discussions of individual securities, or the markets generally, or any Wells Fargo Advantage Fund are not intended as individual recommendations. Future events or results may vary significantly from those expressed in any forward-looking statements; the views expressed are subject to change at any time in response to changing circumstances in the market. Wells Fargo Funds Management, LLC and the Fund disclaim any obligation to publicly update or revise any views expressed or forward-looking statements.
NOT FDIC INSURED ¡ NO BANK GUARANTEE ¡ MAY LOSE VALUE
| | | | |
| 2 | | Wells Fargo Advantage Asia Pacific Fund | | Letter to shareholders (unaudited) |

Karla M. Rabusch
President
Wells Fargo Advantage Funds
A worldwide trend toward looser monetary policy tended to support stock and bond markets in both developed and emerging economies.
Dear Valued Shareholder:
We are pleased to offer you this semi-annual report for the Wells Fargo Advantage Asia Pacific Fund for the six-month period that ended April 30, 2015. The period was marked by low global interest rates as major central banks initiated or increased their quantitative easing programs, supporting stock markets worldwide. Asian markets ended the reporting period with a 9.15% gain, as measured by the MSCI All Country Asia Pacific Index (Net)1, supported by strength in China and Japan.
Major central banks continued to provide liquidity to the markets.
A worldwide trend toward looser monetary policy tended to support stock and bond markets in both developed and emerging economies. Throughout the reporting period, the Federal Open Market Committee (FOMC), which is the U.S. Federal Reserve’s (Fed’s) monetary policymaking body, kept its key interest rate effectively at zero. Even though the FOMC ended its bond-buying program in October 2014 and guided investors to expect an interest-rate hike in mid- to late 2015, the Fed remained accommodative. Likewise, the European Central Bank maintained a variety of measures aimed at encouraging lending, including making funds available to banks at low interest rates and imposing a negative interest rate on bank deposits held at the central bank.
In China, the People’s Bank of China (PBOC) cut its benchmark interest rate twice during the reporting period in order to support a slowing economy. The PBOC also twice lowered the reserve requirement ratio, which mandates the amount that banks must set aside in reserves, in an attempt to encourage bank lending and support economic growth. In Japan, the Bank of Japan (BOJ) also maintained an aggressive monetary program aimed at combating deflation. Later in the period, the BOJ widened its program by purchasing Japanese stocks as well as bonds.
China and Japan both appreciated.
In China, government data showed a slowdown in fixed-asset investment, which includes property investment, and modest growth in manufacturing and housing sales. However, China’s growth rates still contrasted favorably with stagnant growth in most developed economies. Chinese markets also benefited from the Shanghai-Hong Kong Stock Connect program, launched in November 2014, which made it easier for mainland investors to purchase stocks on the Hong Kong exchange and for international investors to purchase stocks on the Shanghai exchange. The resulting surge in demand helped the MSCI China Index2 end the period with a 29.61% gain.
Japanese stocks benefited from the country’s improving economic data, which showed signs of recovering from a mid-2014 trough, and a weaker yen that helped encourage Japanese exports. Money managers were also attracted by the
| 1 | The Morgan Stanley Capital International (MSCI) All Country Asia Pacific Index (Net) is a free-float-adjusted market-capitalization-weighted index that is designed to measure the equity market performance of the developed and emerging markets in the Pacific region. The MSCI AC Asia Pacific Index consists of the following 12 developed and emerging markets countries: Australia, China, Hong Kong, Indonesia, Japan, Korea, Malaysia, New Zealand, the Philippines, Singapore, Taiwan, and Thailand. You cannot invest directly in an index. Source: MSCI. MSCI makes no express or implied warranties or representations and shall have no liability whatsoever with respect to any MSCI data contained herein. The MSCI data may not be further redistributed or used as a basis for other indexes or any securities or financial products. This report is not approved, reviewed, or produced by MSCI. |
| 2 | The Morgan Stanley Capital International (MSCI) China Index is a free-float-adjusted market-capitalization-weighted index that is designed to measure equity market performance in China. You cannot invest directly in an index. |
| | | | | | |
| Letter to shareholders (unaudited) | | Wells Fargo Advantage Asia Pacific Fund | | | 3 | |
fact that Japanese stocks remained reasonably valued compared with other developed markets stocks, even as large Japanese companies showed a greater willingness to increase dividends and repurchase shares. A quantitative easing program that pushed pension funds into equities also increased demand for Japanese stocks, as did the BOJ purchasing stocks via exchange-traded funds. The MSCI Japan Index3 ended the period with a 12.82% gain.
Among smaller markets, South Korea ended with a modest gain for the period as the stronger U.S. dollar tended to support exporters such as Korea. India’s stock market benefited from lower inflation and signs of improving economic growth, but delays in key reforms caused the Indian market to underperform the benchmark.
Don’t let short-term uncertainty derail long-term investment goals.
Periods of uncertainty can present challenges, but experience has taught us that maintaining long-term investment goals can be an effective way to plan for the future. To help you create a sound strategy based on your personal goals and risk tolerance, Wells Fargo Advantage Funds offers more than 100 mutual funds and other investments spanning a wide range of asset classes and investment styles. Although diversification cannot guarantee an investment profit or prevent losses, we believe it can be an effective way to manage investment risk and potentially smooth out overall portfolio performance. We encourage investors to know their investments and to understand that appropriate levels of risk-taking may unlock opportunities.
Thank you for choosing to invest with Wells Fargo Advantage Funds. We appreciate your confidence in us and remain committed to helping you meet your financial needs.
Sincerely,

Karla M. Rabusch
President
Wells Fargo Advantage Funds
Among smaller markets, South Korea ended with a modest gain for the period as the stronger U.S. dollar tended to support exporters such as Korea.
For current information about your fund investments, contact your investment professional, visit our website at wellsfargoadvantagefunds.com, or call us directly at 1-800-222-8222. We are available 24 hours a day, 7 days a week.
| 3 | The MSCI Japan Index is a free-float-adjusted market-capitalization-weighted index that is designed to measure the performance of the large and mid cap segments of the Japanese market. You cannot invest directly in an index. |
| | | | |
| 4 | | Wells Fargo Advantage Asia Pacific Fund | | Performance highlights (unaudited) |
Investment objective
The Fund seeks long-term capital appreciation.
Adviser
Wells Fargo Funds Management, LLC
Subadviser
Wells Capital Management Incorporated
Portfolio managers
Anthony L.T. Cragg
Alison Shimada
Average annual total returns1 (%) as of April 30, 2015
| | | | | | | | | | | | | | | | | | | | | | | | | | | | | | | | | | |
| | | | | Including sales charge | | | Excluding sales charge | | | Expense ratios2 (%) | |
| | | Inception date | | 1 year | | | 5 year | | | 10 year | | | 1 year | | | 5 year | | | 10 year | | | Gross | | | Net3 | |
| Class A (WFAAX) | | 7-31-2007 | | | 13.65 | | | | 8.38 | | | | 7.64 | | | | 20.61 | | | | 9.67 | | | | 8.27 | | | | 1.72 | | | | 1.61 | |
| Class C (WFCAX) | | 7-31-2007 | | | 18.77 | | | | 8.84 | | | | 7.46 | | | | 19.77 | | | | 8.84 | | | | 7.46 | | | | 2.47 | | | | 2.36 | |
| Administrator Class (WFADX) | | 7-30-2010 | | | – | | | | – | | | | – | | | | 20.98 | | | | 9.89 | | | | 8.38 | | | | 1.56 | | | | 1.41 | |
| Institutional Class (WFPIX) | | 7-30-2010 | | | – | | | | – | | | | – | | | | 21.09 | | | | 10.04 | | | | 8.46 | | | | 1.29 | | | | 1.26 | |
| Investor Class (SASPX) | | 12-31-1993 | | | – | | | | – | | | | – | | | | 20.56 | | | | 9.62 | | | | 8.22 | | | | 1.78 | | | | 1.66 | |
| MSCI All Country Asia Pacific Index (Net)4 | | – | | | – | | | | – | | | | – | | | | 14.38 | | | | 6.68 | | | | 7.00 | | | | – | | | | – | |
Figures quoted represent past performance, which is no guarantee of future results, and do not reflect taxes that a shareholder may pay on fund distributions or the redemption of fund shares. Investment return and principal value of an investment will fluctuate so that an investor’s shares, when redeemed, may be worth more or less than their original cost. Performance shown without sales charges would be lower if sales charges were reflected. Current performance may be lower or higher than the performance data quoted, which assumes the reinvestment of dividends and capital gains. Current month-end performance is available on the Fund’s website, wellsfargoadvantagefunds.com.
Index returns do not include transaction costs associated with buying and selling securities, any mutual fund fees or expenses, or any taxes. It is not possible to invest directly in an index.
For Class A shares, the maximum front-end sales charge is 5.75%. For Class C shares, the maximum contingent deferred sales charge is 1.00%. Performance including a contingent deferred sales charge assumes the sales charge for the corresponding time period. Administrator Class, Institutional Class, and Investor Class shares are sold without a front-end sales charge or contingent deferred sales charge.
Stock values fluctuate in response to the activities of individual companies and general market and economic conditions. Foreign investments are especially volatile and can rise or fall dramatically due to differences in the political and economic conditions of the host country. These risks are generally intensified in emerging markets. The use of derivatives may reduce returns and/or increase volatility. Certain investment strategies tend to increase the total risk of an investment (relative to the broader market). The Fund is exposed to geographic risk and smaller-company securities risk. Consult the Fund’s prospectus for additional information on these and other risks.
Please see footnotes on page 5.
| | | | | | |
| Performance highlights (unaudited) | | Wells Fargo Advantage Asia Pacific Fund | | | 5 | |
| | | | |
| Ten largest holdings5 (%) as of April 30, 2015 | |
Bank of China Limited H Shares | | | 2.91 | |
Industrial & Commercial Bank of China Limited H Shares | | | 2.85 | |
Mitsui Fudosan Company Limited | | | 1.94 | |
Resona Holdings Incorporated | | | 1.90 | |
China Overseas Land & Investment Limited | | | 1.84 | |
Sumitomo Mitsui Trust Holdings Incorporated | | | 1.84 | |
Japan Airlines Company Limited | | | 1.66 | |
China Mobile Limited | | | 1.63 | |
Ping An Insurance (Group) Company of China Limited H Shares | | | 1.40 | |
China Construction Bank Corporation H Shares | | | 1.38 | |
| | |
| Sector destribution6 as of April 30, 2015 |
|
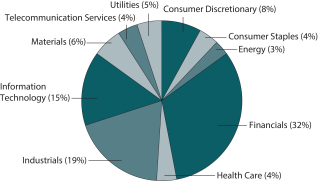 |
| | |
| Country allocation6 as of April 30, 2015 |
|
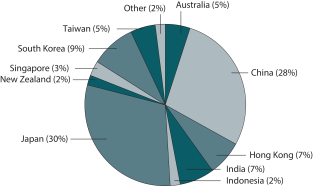 |
| 1 | Historical performance shown for Class A shares prior to their inception reflects the performance of Investor Class shares, and includes the higher expenses applicable to Investor Class shares. If these expenses had not been included, returns would be higher. Historical performance shown for Class C shares prior to their inception reflects the performance of Investor Class shares, and has been adjusted to reflect the higher expenses applicable to Class C shares. Historical performance shown for Administrator and Institutional Class shares prior to their inception reflects the performance of Class A shares, and includes the higher expenses applicable to Class A shares. If these expenses had not been included, returns would be higher. |
| 2 | Reflects the expense ratios as stated in the most recent prospectuses, which include the impact of 0.01% in acquired fund fees and expenses. The expense ratios shown are subject to change and may differ from the annualized expense ratios shown in the financial highlights of this report, which do not include acquired fund fees and expenses. |
| 3 | The Adviser has committed through February 29, 2016, to waive fees and/or reimburse expenses to the extent necessary to cap the Fund’s Total Annual Fund Operating Expenses After Fee Waiver, excluding certain expenses, at 1.60% for Class A, 2.35% for Class C, 1.40% for Administrator Class, 1.25% for Institutional Class, and 1.65% for Investor Class. After this time, the cap may be increased or the commitment to maintain the cap may be terminated only with the approval of the Board of Trustees. Brokerage commissions, stamp duty fees, interest, taxes, acquired fund fees and expenses, and extraordinary expenses are excluded from the cap. Without this cap, the Fund’s returns would have been lower. |
| 4 | The Morgan Stanley Capital International (MSCI) All Country Asia Pacific Index (Net) is a free-float-adjusted market-capitalization-weighted index that is designed to measure the equity market performance of the developed and emerging markets in the Pacific region. The MSCI All Country Pacific Index (Net) consists of the following 12 developed and emerging markets countries: Australia, China, Hong Kong, Indonesia, Japan, Korea, Malaysia, New Zealand, the Philippines, Singapore, Taiwan, and Thailand. You cannot invest directly in an index. Source: MSCI. MSCI makes no express or implied warranties or representations and shall have no liability whatsoever with respect to any MSCI data contained herein. The MSCI data may not be further redistributed or used as a basis for other indexes or any securities or financial products. This report is not approved, reviewed, or produced by MSCI. |
| 5 | The ten largest holdings, excluding cash and cash equivalents, are calculated based on the value of the investments divided by total net assets of the Fund. Holdings are subject to change and may have changed since the date specified. |
| 6 | Amounts are calculated based on the total long-term investments of the Fund. These percentages are subject to change and may have changed since the date specified. |
| | | | |
| 6 | | Wells Fargo Advantage Asia Pacific Fund | | Fund expenses (unaudited) |
As a shareholder of the Fund, you incur two types of costs: (1) transaction costs, including sales charges (loads) on purchase payments and contingent deferred sales charges (if any) on redemptions and (2) ongoing costs, including management fees, distribution (12b-1) and/or shareholder service fees, and other Fund expenses. This example is intended to help you understand your ongoing costs (in dollars) of investing in the Fund and to compare these costs with the ongoing costs of investing in other mutual funds.
The example is based on an investment of $1,000 invested at the beginning of the six-month period and held for the entire period from November 1, 2014 to April 30, 2015.
Actual expenses
The “Actual” line of the table below provides information about actual account values and actual expenses. You may use the information in this line, together with the amount you invested, to estimate the expenses that you paid over the period. Simply divide your account value by $1,000 (for example, an $8,600 account value divided by $1,000 = 8.6), then multiply the result by the number in the “Actual” line under the heading entitled “Expenses paid during period” for your applicable class of shares to estimate the expenses you paid on your account during this period.
Hypothetical example for comparison purposes
The “Hypothetical” line of the table below provides information about hypothetical account values and hypothetical expenses based on the Fund’s actual expense ratio and an assumed rate of return of 5% per year before expenses, which is not the Fund’s actual return. The hypothetical account values and expenses may not be used to estimate the actual ending account balance or expenses you paid for the period. You may use this information to compare the ongoing costs of investing in the Fund and other funds. To do so, compare this 5% hypothetical example with the 5% hypothetical examples that appear in the shareholder reports of the other funds.
Please note that the expenses shown in the table are meant to highlight your ongoing costs only and do not reflect any transactional costs, such as sales charges (loads) and contingent deferred sales charges. Therefore, the “Hypothetical” line of the table is useful in comparing ongoing costs only and will not help you determine the relative total costs of owning different funds. In addition, if these transactional costs were included, your costs would have been higher.
| | | | | | | | | | | | | | | | |
| | | Beginning account value 11-1-2014 | | | Ending account value 4-30-2015 | | | Expenses paid during the period¹ | | | Net annualized expense ratio | |
Class A | | | | | | | | | | | | | | | | |
Actual | | $ | 1,000.00 | | | $ | 1,115.96 | | | $ | 8.39 | | | | 1.60 | % |
Hypothetical (5% return before expenses) | | $ | 1,000.00 | | | $ | 1,016.86 | | | $ | 8.00 | | | | 1.60 | % |
Class C | | | | | | | | | | | | | | | | |
Actual | | $ | 1,000.00 | | | $ | 1,111.76 | | | $ | 12.30 | | | | 2.35 | % |
Hypothetical (5% return before expenses) | | $ | 1,000.00 | | | $ | 1,013.14 | | | $ | 11.73 | | | | 2.35 | % |
Administrator Class | | | | | | | | | | | | | | | | |
Actual | | $ | 1,000.00 | | | $ | 1,116.93 | | | $ | 7.35 | | | | 1.40 | % |
Hypothetical (5% return before expenses) | | $ | 1,000.00 | | | $ | 1,017.85 | | | $ | 7.00 | | | | 1.40 | % |
Institutional Class | | | | | | | | | | | | | | | | |
Actual | | $ | 1,000.00 | | | $ | 1,118.05 | | | $ | 6.56 | | | | 1.25 | % |
Hypothetical (5% return before expenses) | | $ | 1,000.00 | | | $ | 1,018.60 | | | $ | 6.26 | | | | 1.25 | % |
Investor Class | | | | | | | | | | | | | | | | |
Actual | | $ | 1,000.00 | | | $ | 1,115.16 | | | $ | 8.65 | | | | 1.65 | % |
Hypothetical (5% return before expenses) | | $ | 1,000.00 | | | $ | 1,016.61 | | | $ | 8.25 | | | | 1.65 | % |
| 1 | Expenses paid is equal to the annualized expense ratio of each class multiplied by the average account value over the period, multiplied by the number of days in the most recent fiscal half-year divided by the number of days in the fiscal year (to reflect the one-half-year period). |
| | | | | | |
| Portfolio of investments—April 30, 2015 (unaudited) | | Wells Fargo Advantage Asia Pacific Fund | | | 7 | |
| | | | | | | | | | | | |
| Security name | | | | | | Shares | | | Value | |
| | | | |
Common Stocks: 91.38% | | | | | | | | | | | | |
| | | | |
| Australia: 4.30% | | | | | | | | | | | | |
AMP Limited (Financials, Insurance) | | | | | | | 348,157 | | | $ | 1,763,580 | |
BHP Billiton Limited (Materials, Metals & Mining) | | | | | | | 57,000 | | | | 1,455,573 | |
Healthscope Limited (Health Care, Health Care Providers & Services) | | | | | | | 681,600 | | | | 1,527,511 | |
Insurance Australia Group Limited (Financials, Insurance) | | | | | | | 244,300 | | | | 1,119,634 | |
Medibank Private Limited (Financials, Insurance) † | | | | | | | 511,627 | | | | 893,271 | |
Rio Tinto Limited (Materials, Metals & Mining) | | | | | | | 18,300 | | | | 824,914 | |
Suncorp Group Limited (Financials, Insurance) | | | | | | | 69,300 | | | | 716,657 | |
| | | | |
| | | | | | | | | | | 8,301,140 | |
| | | | | | | | | | | | |
| | | | |
| China: 24.02% | | | | | | | | | | | | |
Agricultural Bank of China Limited H Shares (Financials, Banks) | | | | | | | 1,786,000 | | | | 1,005,482 | |
Alibaba Group Holding Limited ADR (Information Technology, Internet Software & Services) † | | | | | | | 27,900 | | | | 2,267,991 | |
AviChina Industry & Technology Company Limited H Shares (Industrials, Aerospace & Defense) | | | | | | | 1,720,000 | | | | 1,948,675 | |
Baidu Incorporated ADR (Information Technology, Internet Software & Services) † | | | | | | | 8,960 | | | | 1,794,509 | |
Bank of China Limited H Shares (Financials, Banks) | | | | | | | 8,193,000 | | | | 5,613,868 | |
Beijing Enterprises Water Group Limited (Utilities, Water Utilities) | | | | | | | 1,806,000 | | | | 1,557,567 | |
China Auto Rental Incorporated (Consumer Discretionary, Automobiles) †« | | | | | | | 619,000 | | | | 1,463,048 | |
China BlueChemical Limited H Shares (Materials, Chemicals) | | | | | | | 2,262,000 | | | | 1,007,437 | |
China Cinda Asset Management Company Limited H Shares (Financials, Capital Markets) † | | | | | | | 1,814,000 | | | | 1,076,496 | |
China Construction Bank Corporation H Shares (Financials, Banks) | | | | | | | 2,739,000 | | | | 2,658,842 | |
China Hongqiao Group Limited (Materials, Metals & Mining) | | | | | | | 1,130,500 | | | | 1,052,495 | |
China Longyuan Power Group Corporation H Shares (Utilities, Independent Power & Renewable Electricity Producers) | | | | | | | 1,563,000 | | | | 1,937,014 | |
China Mobile Limited (Telecommunication Services, Wireless Telecommunication Services) | | | | | | | 220,500 | | | | 3,149,465 | |
China Petroleum & Chemical Corporation H Shares (Energy, Oil, Gas & Consumable Fuels) | | | | | | | 1,624,000 | | | | 1,532,676 | |
China State Construction International Holdings Limited (Industrials, Construction & Engineering) | | | | | | | 666,000 | | | | 1,283,599 | |
Dalian Wanda Commercial Properties Company Limited H Shares (Financials, Real Estate Management & Development) † | | | | | | | 230,600 | | | | 1,890,862 | |
Huaneng Renewables Corporation Limited H Shares (Utilities, Independent Power & Renewable Electricity Producers) | | | | | | | 4,424,000 | | | | 1,931,515 | |
Industrial & Commercial Bank of China Limited H Shares (Financials, Banks) | | | | | | | 6,336,000 | | | | 5,496,231 | |
Kingdee International Software Group Company Limited (Information Technology, Software) †« | | | | | | | 1,874,000 | | | | 1,111,872 | |
PetroChina Company Limited H Shares (Energy, Oil, Gas & Consumable Fuels) | | | | | | | 1,412,000 | | | | 1,821,145 | |
Ping An Insurance (Group) Company of China Limited H Shares (Financials, Insurance) | | | | | | | 189,500 | | | | 2,710,084 | |
Tencent Holdings Limited (Information Technology, Internet Software & Services) | | | | | | | 54,500 | | | | 1,124,818 | |
Tianjin ZhongXin Pharmaceutical Group Corporation Limited Class S (Health Care, Pharmaceuticals) | | | | | | | 659,400 | | | | 923,401 | |
| | | | |
| | | | | | | | | | | 46,359,092 | |
| | | | | | | | | | | | |
| | | | |
| Hong Kong: 7.03% | | | | | | | | | | | | |
China Everbright International Limited (Industrials, Commercial Services & Supplies) | | | | | | | 579,000 | | | | 1,079,693 | |
China Merchants Holdings International Company Limited (Industrials, Transportation Infrastructure) | | | | | | | 360,000 | | | | 1,633,200 | |
China Overseas Land & Investment Limited (Financials, Real Estate Management & Development) | | | | | | | 854,000 | | | | 3,557,234 | |
China Power International Development Limited (Utilities, Independent Power & Renewable Electricity Producers) « | | | | | | | 2,327,000 | | | | 1,500,137 | |
COSCO Pacific Limited (Industrials, Transportation Infrastructure) | | | | | | | 992,241 | | | | 1,556,001 | |
Far East Horizon Limited (Financials, Diversified Financial Services) | | | | | | | 2,247,000 | | | | 2,372,996 | |
GCL-Poly Energy Holdings Limited (Information Technology, Semiconductors & Semiconductor Equipment) † | | | | | | | 3,341,000 | | | | 1,010,425 | |
Orient Overseas International Limited (Industrials, Marine) | | | | | | | 139,000 | | | | 853,110 | |
| | | | |
| | | | | | | | | | | 13,562,796 | |
| | | | | | | | | | | | |
The accompanying notes are an integral part of these financial statements.
| | | | |
| 8 | | Wells Fargo Advantage Asia Pacific Fund | | Portfolio of investments—April 30, 2015 (unaudited) |
| | | | | | | | | | | | |
| Security name | | | | | | Shares | | | Value | |
| | | | |
| India: 6.55% | | | | | | | | | | | | |
Astra Microwave Products Limited (Information Technology, Communications Equipment) | | | | | | | 315,900 | | | $ | 603,385 | |
Coal India Limited (Energy, Oil, Gas & Consumable Fuels) | | | | | | | 149,700 | | | | 852,557 | |
HDFC Bank Limited (Financials, Banks) | | | | | | | 66,800 | | | | 1,040,513 | |
Hindalco Industries Limited (Materials, Metals & Mining) | | | | | | | 645,200 | | | | 1,302,393 | |
Hindustan Zinc Limited (Materials, Metals & Mining) | | | | | | | 348,500 | | | | 928,858 | |
Just Dial Limited (Information Technology, Internet Software & Services) | | | | | | | 69,100 | | | | 1,161,644 | |
Kaveri Seed Company Limited (Consumer Staples, Food Products) | | | | | | | 75,083 | | | | 988,838 | |
Reliance Industries Limited (Energy, Oil, Gas & Consumable Fuels) | | | | | | | 64,300 | | | | 872,082 | |
SKS Microfinance Limited (Financials, Consumer Finance) † | | | | | | | 134,500 | | | | 993,849 | |
State Bank of India (Financials, Banks) | | | | | | | 308,900 | | | | 1,309,316 | |
Suzlon Energy Limited (Industrials, Electrical Equipment) † | | | | | | | 3,504,400 | | | | 1,308,587 | |
Voltas Limited (Industrials, Construction & Engineering) | | | | | | | 291,400 | | | | 1,286,147 | |
| | | | |
| | | | | | | | | | | 12,648,169 | |
| | | | | | | | | | | | |
| | | | |
| Indonesia: 2.03% | | | | | | | | | | | | |
PT Bank Tabungan Negara Persero Tbk (Financials, Banks) | | | | | | | 7,384,700 | | | | 632,720 | |
PT Bekasi Fajar Industrial Estate Tbk (Financials, Real Estate Management & Development) | | | | | | | 19,973,600 | | | | 917,884 | |
PT Blue Bird Tbk (Industrials, Road & Rail) † | | | | | | | 1,205,700 | | | | 760,296 | |
PT Gudang Garam Tbk (Consumer Staples, Tobacco) | | | | | | | 197,800 | | | | 760,220 | |
PT Multipolar Tbk (Consumer Discretionary, Multiline Retail) | | | | | | | 13,634,700 | | | | 844,234 | |
| | | | |
| | | | | | | | | | | 3,915,354 | |
| | | | | | | | | | | | |
| | | | |
| Japan: 28.27% | | | | | | | | | | | | |
ASICS Corporation (Consumer Discretionary, Textiles, Apparel & Luxury Goods) | | | | | | | 49,100 | | | | 1,259,920 | |
Avex Group Holdings Incorporated (Consumer Discretionary, Media) | | | | | | | 58,000 | | | | 895,154 | |
Credit Saison Company Limited (Financials, Consumer Finance) | | | | | | | 73,900 | | | | 1,397,439 | |
FANUC Corporation (Industrials, Machinery) | | | | | | | 6,500 | | | | 1,429,757 | |
FUJIFILM Holdings Corporation (Information Technology, Technology Hardware, Storage & Peripherals) | | | | | | | 54,800 | | | | 2,064,152 | |
Hitachi Limited (Information Technology, Electronic Equipment, Instruments & Components) | | | | | | | 259,000 | | | | 1,767,132 | |
Isuzu Motors Limited (Consumer Discretionary, Automobiles) | | | | | | | 135,700 | | | | 1,798,542 | |
Japan Airlines Company Limited (Industrials, Airlines) | | | | | | | 96,100 | | | | 3,204,183 | |
Japan Hotel REIT Investment Corporation (Financials, REITs) | | | | | | | 2,000 | | | | 1,473,799 | |
Kawasaki Heavy Industries Limited (Industrials, Machinery) | | | | | | | 406,000 | | | | 2,092,466 | |
Kubota Corporation (Industrials, Machinery) | | | | | | | 86,000 | | | | 1,345,987 | |
M3 Incorporated (Health Care, Health Care Technology) | | | | | | | 94,600 | | | | 1,787,512 | |
Matsumotokiyoshi Holdings Company Limited (Consumer Staples, Food & Staples Retailing) | | | | | | | 36,700 | | | | 1,336,283 | |
Mitsubishi Electric Corporation (Industrials, Electrical Equipment) | | | | | | | 137,000 | | | | 1,789,179 | |
Mitsubishi Heavy Industries Limited (Industrials, Machinery) | | | | | | | 161,000 | | | | 892,056 | |
Mitsubishi UFJ Financial Group Incorporated (Financials, Banks) | | | | | | | 271,600 | | | | 1,929,541 | |
Mitsui Fudosan Company Limited (Financials, Real Estate Management & Development) | | | | | | | 126,000 | | | | 3,735,181 | |
Nagoya Railroad Company Limited (Industrials, Road & Rail) | | | | | | | 504,000 | | | | 1,990,788 | |
Nippon Telegraph & Telephone Corporation (Telecommunication Services, Diversified Telecommunication Services) | | | | | | | 17,100 | | | | 1,154,677 | |
ORIX Corporation (Financials, Diversified Financial Services) | | | | | | | 62,400 | | | | 959,611 | |
Otsuka Corporation (Information Technology, IT Services) | | | | | | | 49,100 | | | | 2,261,496 | |
Panasonic Corporation (Consumer Discretionary, Household Durables) | | | | | | | 139,700 | | | | 2,001,045 | |
Resona Holdings Incorporated (Financials, Banks) | | | | | | | 688,000 | | | | 3,668,461 | |
Sekisui House Limited (Consumer Discretionary, Household Durables) | | | | | | | 93,000 | | | | 1,441,561 | |
SoftBank Corporation (Telecommunication Services, Wireless Telecommunication Services) | | | | | | | 29,600 | | | | 1,850,305 | |
Sumitomo Metal Mining Company Limited (Materials, Metals & Mining) | | | | | | | 87,000 | | | | 1,275,176 | |
Sumitomo Mitsui Trust Holdings Incorporated (Financials, Banks) | | | | | | | 808,000 | | | | 3,556,766 | |
The accompanying notes are an integral part of these financial statements.
| | | | | | |
| Portfolio of investments—April 30, 2015 (unaudited) | | Wells Fargo Advantage Asia Pacific Fund | | | 9 | |
| | | | | | | | | | | | |
| Security name | | | | | | Shares | | | Value | |
| | | | |
| Japan (continued) | | | | | | | | | | | | |
Toshiba Corporation (Industrials, Industrial Conglomerates) | | | | | | | 298,000 | | | $ | 1,193,954 | |
Toyota Motor Corporation (Consumer Discretionary, Automobiles) | | | | | | | 31,500 | | | | 2,192,687 | |
Tsukui Corporation (Health Care, Health Care Providers & Services) | | | | | | | 107,500 | | | | 812,383 | |
| | | | |
| | | | | | | | | | | 54,557,193 | |
| | | | | | | | | | | | |
| | | | |
| Malaysia: 0.70% | | | | | | | | | | | | |
IHH Healthcare Bhd (Health Care, Health Care Providers & Services) | | | | | | | 635,000 | | | | 1,055,510 | |
Malakoff Corporation Bhd (Utilities, Electric Utilities) (a) | | | | | | | 591,800 | | | | 302,090 | |
| | | | |
| | | | | | | | | | | 1,357,600 | |
| | | | | | | | | | | | |
| | | | |
| New Zealand: 1.56% | | | | | | | | | | | | |
Air New Zealand Limited (Industrials, Airlines) | | | | | | | 983,900 | | | | 2,021,949 | |
SKYCITY Entertainment Group Limited (Consumer Discretionary, Hotels, Restaurants & Leisure) | | | | | | | 307,100 | | | | 983,749 | |
| | | | |
| | | | | | | | | | | 3,005,698 | |
| | | | | | | | | | | | |
| | | | |
| Philippines: 0.49% | | | | | | | | | | | | |
ABS-CBN Holdings Corporation (Consumer Discretionary, Media) | | | | | | | 656,550 | | | | 915,602 | |
Premium Leisure Corporation (Financials, Diversified Financial Services) | | | | | | | 906,900 | | | | 33,122 | |
| | | | |
| | | | | | | | | | | 948,724 | |
| | | | | | | | | | | | |
| | | | |
| Singapore: 2.95% | | | | | | | | | | | | |
Keppel DC REIT (Financials, REITs) †« | | | | | | | 2,456,400 | | | | 1,912,101 | |
Raffles Medical Group Limited (Health Care, Health Care Providers & Services) | | | | | | | 313,000 | | | | 953,287 | |
Singapore Post Limited (Industrials, Air Freight & Logistics) | | | | | | | 661,000 | | | | 953,044 | |
Singapore Technologies Engineering Limited (Industrials, Aerospace & Defense) | | | | | | | 322,000 | | | | 879,051 | |
Super Group Limited (Consumer Staples, Food Products) | | | | | | | 881,000 | | | | 989,761 | |
| | | | |
| | | | | | | | | | | 5,687,244 | |
| | | | | | | | | | | | |
| | | | |
| South Korea: 7.86% | | | | | | | | | | | | |
Daelim Industrial Company Limited (Industrials, Construction & Engineering) | | | | | | | 13,300 | | | | 1,024,272 | |
Hana Financial Group Incorporated (Financials, Banks) | | | | | | | 51,790 | | | | 1,524,484 | |
Hyundai Motor Company (Consumer Discretionary, Automobiles) | | | | | | | 5,600 | | | | 878,870 | |
KB Financial Group Incorporated (Financials, Banks) | | | | | | | 39,500 | | | | 1,506,305 | |
Korea Aerospace Industries Limited (Industrials, Aerospace & Defense) | | | | | | | 22,510 | | | | 1,375,074 | |
Korea Electric Power Corporation (Utilities, Electric Utilities) | | | | | | | 35,190 | | | | 1,530,199 | |
LG Chem Limited (Materials, Chemicals) | | | | | | | 7,500 | | | | 1,894,562 | |
POSCO (Materials, Metals & Mining) | | | | | | | 8,200 | | | | 1,931,621 | |
Samsung Electronics Company Limited (Information Technology, Technology Hardware, Storage & Peripherals) | | | | | | | 1,963 | | | | 2,575,169 | |
Suprema Incorporated (Information Technology, Electronic Equipment, Instruments & Components) † | | | | | | | 42,600 | | | | 923,574 | |
| | | | |
| | | | | | | | | | | 15,164,130 | |
| | | | | | | | | | | | |
| | | | |
| Taiwan: 4.68% | | | | | | | | | | | | |
Advanced Semiconductor Engineering Incorporated (Information Technology, Semiconductors & Semiconductor Equipment) | | | | | | | 718,000 | | | | 1,018,214 | |
Chicony Electronics Company Limited (Information Technology, Technology Hardware, Storage & Peripherals) | | | | | | | 360,795 | | | | 1,037,458 | |
China Trust Financial Holding Company Limited (Financials, Banks) | | | | | | | 1,323,000 | | | | 1,029,788 | |
CTCI Corporation (Industrials, Construction & Engineering) | | | | | | | 490,000 | | | | 861,552 | |
King Yuan Electronics Company Limited (Information Technology, Semiconductors & Semiconductor Equipment) | | | | | | | 1,047,000 | | | | 951,742 | |
Media Tek Incorporated (Information Technology, Semiconductors & Semiconductor Equipment) | | | | | | | 58,000 | | | | 745,543 | |
The accompanying notes are an integral part of these financial statements.
| | | | |
| 10 | | Wells Fargo Advantage Asia Pacific Fund | | Portfolio of investments—April 30, 2015 (unaudited) |
| | | | | | | | | | | | | | | | |
| Security name | | | | | | | | Shares | | | Value | |
| | | | |
| Taiwan (continued) | | | | | | | | | | | | | | | | |
Namchow Chemical Industrial Company Limited (Consumer Staples, Food Products) | | | | | | | | | | | 496,000 | | | $ | 1,100,190 | |
Taiwan Semiconductor Manufacturing Company Limited (Information Technology, Semiconductors & Semiconductor Equipment) | | | | | | | | | | | 205,000 | | | | 986,926 | |
WPG Holdings Company Limited (Information Technology, Electronic Equipment, Instruments & Components) | | | | | | | | | | | 1,036,000 | | | | 1,296,122 | |
| | | | |
| | | | | | | | | | | | | | | 9,027,535 | |
| | | | | | | | | | | | | | | | |
| | | | |
| Thailand: 0.94% | | | | | | | | | | | | | | | | |
BTS Group Holdings PCL (Industrials, Road & Rail) | | | | | | | | | | | 3,185,400 | | | | 893,825 | |
Dynasty Ceramic PCL (Industrials, Building Products) | | | | | | | | | | | 225,440 | | | | 27,629 | |
Intouch Holding PCL (Telecommunication Services, Wireless Telecommunication Services) | | | | | | | | 380,800 | | | | 887,716 | |
| | | | |
| | | | | | | | | | | | | | | 1,809,170 | |
| | | | | | | | | | | | | | | | |
| | | | |
Total Common Stocks (Cost $153,684,643) | | | | | | | | | | | | | | | 176,343,845 | |
| | | | | | | | | | | | | | | | |
| | | | |
| | | | | | Expiration date | | | | | | | |
| Participation Notes: 2.02% | | | | | | | | | | | | | | | | |
| | | | |
| China: 2.02% | | | | | | | | | | | | | | | | |
HSBC Bank plc (Shanghai International Airport Company Limited Class A) (Industrials, Transportation Infrastructure) † | | | | | | | 8-20-2020 | | | | 223,492 | | | | 995,965 | |
Standard Chartered Bank (Inner Mongolia Yili Industrial Group Company Limited Class A) (Consumer Staples, Food Products) † | | | | | | | 11-5-2015 | | | | 175,000 | | | | 1,029,096 | |
Standard Chartered Bank (Kweichow Moutai Company Limited Class A) (Consumer Staples, Beverages) † | | | | | | | 4-18-2016 | | | | 26,000 | | | | 1,057,722 | |
Standard Chartered Bank (SAIC Motor Corporation Limited Class A) (Consumer Discretionary, Automobiles) † | | | | | | | 4-29-2016 | | | | 187,000 | | | | 814,342 | |
| | | | |
Total Participation Notes (Cost $3,227,403) | | | | | | | | | | | | | | | 3,897,125 | |
| | | | | | | | | | | | | | | | |
| | | | |
| | | Dividend yield | | | | | | | | | | |
| Preferred Stocks: 1.11% | | | | | | | | | | | | | | | | |
| | | | |
| South Korea: 1.11% | | | | | | | | | | | | | | | | |
Samsung Electronics Company Limited (Information Technology, Semiconductors & Semiconductor Equipment) ± | | | 1.80 | % | | | | | | | 2,100 | | | | 2,130,852 | |
| | | | | | | | | | | | | | | | |
| | | | |
Total Preferred Stocks (Cost $1,559,325) | | | | | | | | | | | | | | | 2,130,852 | |
| | | | | | | | | | | | | | | | |
| | | | |
| | | Yield | | | | | | | | | | |
| Short-Term Investments: 4.86% | | | | | | | | | | | | | | | | |
| | | | |
| Investment Companies: 4.86% | | | | | | | | | | | | | | | | |
Securities Lending Cash Investments, LLC (l)(r)(u) | | | 0.12 | | | | | | | | 2,504,107 | | | | 2,504,107 | |
Wells Fargo Advantage Cash Investment Money Market Fund, Select Class (l)(u) | | | 0.11 | | | | | | | | 6,875,792 | | | | 6,875,792 | |
| | | | |
Total Short-Term Investments (Cost $9,379,899) | | | | | | | | | | | | | | | 9,379,899 | |
| | | | | | | | | | | | | | | | |
| | | | | | | | |
| | |
| Total investments in securities (Cost $167,851,270) * | | | 99.37 | % | | | 191,751,721 | |
Other assets and liabilities, net | | | 0.63 | | | | 1,221,536 | |
| | | | | | | | |
| Total net assets | | | 100.00 | % | | $ | 192,973,257 | |
| | | | | | | | |
The accompanying notes are an integral part of these financial statements.
| | | | | | |
| Portfolio of investments—April 30, 2015 (unaudited) | | Wells Fargo Advantage Asia Pacific Fund | | | 11 | |
| † | Non-income-earning security |
| « | All or a portion of this security is on loan. |
| (a) | The security is fair valued in accordance with procedures approved by the Board of Trustees. |
| ± | Variable rate investment. The rate shown is the rate in effect at period end. |
| (l) | The security represents an affiliate of the Fund as defined in the Investment Company Act of 1940. |
| (r) | The investment is a non-registered investment vehicle purchased with cash collateral received from securities on loan. |
| (u) | The rate represents the 7-day annualized yield at period end. |
| * | Cost for federal income tax purposes is $169,291,548 and unrealized gains (losses) consists of: |
| | | | |
Gross unrealized gains | | $ | 28,180,401 | |
Gross unrealized losses | | | (5,720,228 | ) |
| | | | |
Net unrealized gains | | $ | 22,460,173 | |
The accompanying notes are an integral part of these financial statements.
| | | | |
| 12 | | Wells Fargo Advantage Asia Pacific Fund | | Statement of assets and liabilities—April 30, 2015 (unaudited) |
| | | | |
| | | | |
| |
Assets | | | | |
Investments | | | | |
In unaffiliated securities (including $2,325,800 of securities loaned), at value (cost $158,471,371) | | $ | 182,371,822 | |
In affiliated securities, at value (cost $9,379,899) | | | 9,379,899 | |
| | | | |
Total investments, at value (cost $167,851,270) | | | 191,751,721 | |
Foreign currency, at value (cost $505,123) | | | 510,704 | |
Receivable for investments sold | | | 4,559,466 | |
Receivable for Fund shares sold | | | 844,774 | |
Receivable for dividends | | | 526,994 | |
Receivable for securities lending income | | | 6,153 | |
Prepaid expenses and other assets | | | 37,198 | |
| | | | |
Total assets | | | 198,237,010 | |
| | | | |
| |
Liabilities | | | | |
Payable for investments purchased | | | 2,307,100 | |
Payable for Fund shares redeemed | | | 180,948 | |
Payable upon receipt of securities loaned | | | 2,504,107 | |
Advisory fee payable | | | 132,358 | |
Distribution fee payable | | | 1,953 | |
Administration fees payable | | | 53,714 | |
Accrued expenses and other liabilities | | | 83,573 | |
| | | | |
Total liabilities | | | 5,263,753 | |
| | | | |
Total net assets | | $ | 192,973,257 | |
| | | | |
| |
NET ASSETS CONSIST OF | | | | |
Paid-in capital | | $ | 280,048,192 | |
Accumulated net investment loss | | | (1,192,914 | ) |
Accumulated net realized losses on investments | | | (109,789,673 | ) |
Net unrealized gains on investments | | | 23,907,652 | |
| | | | |
Total net assets | | $ | 192,973,257 | |
| | | | |
| |
COMPUTATION OF NET ASSET VALUE AND OFFERING PRICE PER SHARE | | | | |
Net assets – Class A | | $ | 8,372,271 | |
Shares outstanding – Class A1 | | | 623,222 | |
Net asset value per share – Class A | | | $13.43 | |
Maximum offering price per share – Class A2 | | | $14.25 | |
Net assets – Class C | | $ | 3,389,279 | |
Shares outstanding – Class C1 | | | 265,351 | |
Net asset value per share – Class C | | | $12.77 | |
Net assets – Administrator Class | | $ | 16,556,005 | |
Shares outstanding – Administrator Class1 | | | 1,254,472 | |
Net asset value per share – Administrator Class | | | $13.20 | |
Net assets – Institutional Class | | $ | 1,946,291 | |
Shares outstanding – Institutional Class1 | | | 147,467 | |
Net asset value per share – Institutional Class | | | $13.20 | |
Net assets – Investor Class | | $ | 162,709,411 | |
Shares outstanding – Investor Class1 | | | 12,296,560 | |
Net asset value per share – Investor Class | | | $13.23 | |
| 1 | The Fund has an unlimited number of authorized shares. |
| 2 | Maximum offering price is computed as 100/94.25 of net asset value. On investments of $50,000 or more, the offering price is reduced. |
The accompanying notes are an integral part of these financial statements.
| | | | | | |
| Statement of operations—six months ended April 30, 2015 (unaudited) | | Wells Fargo Advantage Asia Pacific Fund | | | 13 | |
| | | | |
| | | | |
| |
Investment income | | | | |
Dividends (net of foreign withholding taxes of $134,731) | | $ | 1,093,631 | |
Securities lending income, net | | | 18,300 | |
Income from affiliated securities | | | 1,581 | |
| | | | |
Total investment income | | | 1,113,512 | |
| | | | |
| |
Expenses | | | | |
Advisory fee | | | 817,522 | |
Administration fees | | | | |
Fund level | | | 43,028 | |
Class A | | | 9,033 | |
Class C | | | 3,441 | |
Administrator Class | | | 6,983 | |
Institutional Class | | | 542 | |
Investor Class | | | 235,508 | |
Shareholder servicing fees | | | | |
Class A | | | 8,685 | |
Class C | | | 3,309 | |
Administrator Class | | | 16,309 | |
Investor Class | | | 183,991 | |
Distribution fee | | | | |
Class C | | | 9,927 | |
Custody and accounting fees | | | 69,548 | |
Professional fees | | | 26,005 | |
Registration fees | | | 33,450 | |
Shareholder report expenses | | | 24,466 | |
Trustees’ fees and expenses | | | 6,305 | |
Other fees and expenses | | | 14,497 | |
| | | | |
Total expenses | | | 1,512,549 | |
Less: Fee waivers and/or expense reimbursements | | | (105,284 | ) |
| | | | |
Net expenses | | | 1,407,265 | |
| | | | |
Net investment loss | | | (293,753 | ) |
| | | | |
| |
REALIZED AND UNREALIZED GAINS ON INVESTMENTS | | | | |
| |
Net realized gains on: | | | | |
Unaffiliated securities | | | 7,733,790 | |
Forward foreign currency contract transactions | | | 99,765 | |
| | | | |
Net realized gains on investments | | | 7,833,555 | |
| | | | |
Net change in unrealized gains on investments | | | 12,208,731 | |
| | | | |
Net realized and unrealized gains on investments | | | 20,042,286 | |
| | | | |
Net increase in net assets resulting from operations | | $ | 19,748,533 | |
| | | | |
The accompanying notes are an integral part of these financial statements.
| | | | |
| 14 | | Wells Fargo Advantage Asia Pacific Fund | | Statement of changes in net assets |
| | | | | | | | | | | | | | | | |
| | | Six months ended
April 30, 2015
(unaudited) | | | Year ended
October 31, 2014 | |
| | | | |
Operations | | | | | | | | | | | | | | | | |
Net investment income (loss) | | | | | | $ | (293,753 | ) | | | | | | $ | 1,447,027 | |
Net realized gains on investments | | | | | | | 7,833,555 | | | | | | | | 14,500,418 | |
Net change in unrealized gains (losses) on investments | | | | | | | 12,208,731 | | | | | | | | (4,886,948 | ) |
| | | | |
Net increase in net assets resulting from operations | | | | | | | 19,748,533 | | | | | | | | 11,060,497 | |
| | | | |
| | | | |
Distributions to shareholders from | | | | | | | | | | | | | | | | |
Net investment income | | | | | | | | | | | | | | | | |
Class A | | | | | | | (82,320 | ) | | | | | | | (174,427 | ) |
Class C | | | | | | | (18,378 | ) | | | | | | | (39,188 | ) |
Administrator Class | | | | | | | (197,300 | ) | | | | | | | (357,092 | ) |
Institutional Class | | | | | | | (18,960 | ) | | | | | | | (3,952 | ) |
Investor Class | | | | | | | (1,661,776 | ) | | | | | | | (4,117,147 | ) |
| | | | |
Total distributions to shareholders | | | | | | | (1,978,734 | ) | | | | | | | (4,691,806 | ) |
| | | | |
| | | | |
Capital share transactions | | | Shares | | | | | | | | Shares | | | | | |
Proceeds from shares sold | | | | | | | | | | | | | | | | |
Class A | | | 110,737 | | | | 1,415,308 | | | | 213,375 | | | | 2,569,331 | |
Class C | | | 73,671 | | | | 880,267 | | | | 91,389 | | | | 1,033,884 | |
Administrator Class | | | 288,864 | | | | 3,548,363 | | | | 515,591 | | | | 6,073,555 | |
Institutional Class | | | 110,664 | | | | 1,343,622 | | | | 32,247 | | | | 390,907 | |
Investor Class | | | 1,135,721 | | | | 14,002,178 | | | | 2,513,982 | | | | 29,455,819 | |
| | | | |
| | | | | | | 21,189,738 | | | | | | | | 39,523,496 | |
| | | | |
Reinvestment of distributions | | | | | | | | | | | | | | | | |
Class A | | | 6,243 | | | | 74,538 | | | | 14,068 | | | | 162,768 | |
Class C | | | 1,201 | | | | 13,666 | | | | 2,369 | | | | 26,174 | |
Administrator Class | | | 16,773 | | | | 196,572 | | | | 29,465 | | | | 334,721 | |
Institutional Class | | | 687 | | | | 8,043 | | | | 348 | | | | 3,952 | |
Investor Class | | | 138,609 | | | | 1,630,057 | | | | 353,802 | | | | 4,029,801 | |
| | | | |
| | | | | | | 1,922,876 | | | | | | | | 4,557,416 | |
| | | | |
Payment for shares redeemed | | | | | | | | | | | | | | | | |
Class A | | | (48,102 | ) | | | (596,302 | ) | | | (417,097 | ) | | | (4,930,591 | ) |
Class C | | | (19,277 | ) | | | (225,319 | ) | | | (61,548 | ) | | | (667,173 | ) |
Administrator Class | | | (215,412 | ) | | | (2,618,515 | ) | | | (470,899 | ) | | | (5,405,459 | ) |
Institutional Class | | | (5,717 | ) | | | (69,503 | ) | | | (1,888 | ) | | | (22,609 | ) |
Investor Class | | | (1,539,311 | ) | | | (18,748,329 | ) | | | (4,536,103 | ) | | | (52,779,516 | ) |
| | | | |
| | | | | | | (22,257,968 | ) | | | | | | | (63,805,348 | ) |
| | | | |
Net increase (decrease) in net assets resulting from capital share transactions | | | | | | | 854,646 | | | | | | | | (19,724,436 | ) |
| | | | |
Total increase (decrease) in net assets | | | | | | | 18,624,445 | | | | | | | | (13,355,745 | ) |
| | | | |
| | | | |
Net assets | | | | | | | | | | | | | | | | |
Beginning of period | | | | | | | 174,348,812 | | | | | | | | 187,704,557 | |
| | | | |
End of period | | | | | | $ | 192,973,257 | | | | | | | $ | 174,348,812 | |
| | | | |
Undistributed (accumulated) net investment income (loss) | | | | | | $ | (1,192,914 | ) | | | | | | $ | 1,079,573 | |
| | | | |
The accompanying notes are an integral part of these financial statements.
| | | | | | |
| Financial highlights | | Wells Fargo Advantage Asia Pacific Fund | | | 15 | |
(For a share outstanding throughout each period)
| | | | | | | | | | | | | | | | | | | | | | | | | | | | |
| | | Six months ended
April 30, 2015
(unaudited) | | | Year ended October 31 | | | Year ended
September 30, 2010 | |
| CLASS A | | | 2014 | | | 2013 | | | 2012 | | | 2011 | | | 20101 | | |
Net asset value, beginning of period | | | $12.18 | | | | $11.72 | | | | $10.19 | | | | $9.30 | | | | $10.15 | | | | $9.77 | | | | $8.82 | |
Net investment income (loss) | | | (0.02 | ) | | | 0.09 | 2 | | | 0.12 | 2 | | | 0.10 | 2 | | | 0.08 | 2 | | | (0.01 | )2 | | | 0.04 | 2 |
Net realized and unrealized gains (losses) on investments | | | 1.41 | | | | 0.67 | | | | 1.79 | | | | 0.79 | | | | (0.89 | ) | | | 0.39 | | | | 1.05 | |
| | | | | | | | | | | | | | | | | | | | | | | | | | | | |
Total from investment operations | | | 1.39 | | | | 0.76 | | | | 1.91 | | | | 0.89 | | | | (0.81 | ) | | | 0.38 | | | | 1.09 | |
Distributions to shareholders from | | | | | | | | | | | | | | | | | | | | | | | | | | | | |
Net investment income | | | (0.14 | ) | | | (0.30 | ) | | | (0.38 | ) | | | 0.00 | | | | (0.04 | ) | | | 0.00 | | | | (0.14 | ) |
Net asset value, end of period | | | $13.43 | | | | $12.18 | | | | $11.72 | | | | $10.19 | | | | $9.30 | | | | $10.15 | | | | $9.77 | |
Total return3 | | | 11.60 | % | | | 6.61 | % | | | 19.24 | % | | | 9.57 | % | | | (7.97 | )% | | | 3.89 | % | | | 12.58 | % |
Ratios to average net assets (annualized) | | | | | | | | | | | | | | | | | | | | | | | | | | | | |
Gross expenses | | | 1.71 | % | | | 1.71 | % | | | 1.79 | % | | | 1.86 | % | | | 1.73 | % | | | 1.90 | % | | | 1.90 | % |
Net expenses | | | 1.60 | % | | | 1.60 | % | | | 1.60 | % | | | 1.60 | % | | | 1.60 | % | | | 1.60 | % | | | 1.59 | % |
Net investment income (loss) | | | (0.30 | )% | | | 0.80 | % | | | 1.08 | % | | | 1.04 | % | | | 0.83 | % | | | (0.91 | )% | | | 0.49 | % |
Supplemental data | | | | | | | | | | | | | | | | | | | | | | | | | | | | |
Portfolio turnover rate | | | 59 | % | | | 113 | % | | | 187 | % | | | 163 | % | | | 196 | % | | | 11 | % | | | 137 | % |
Net assets, end of period (000s omitted) | | | $8,372 | | | | $6,755 | | | | $8,720 | | | | $5,699 | | | | $31,000 | | | | $63,741 | | | | $62,700 | |
| 1 | For the one month ended October 31, 2010. The Fund changed its fiscal year end from September 30 to October 31, effective October 31, 2010. |
| 2 | Calculated based upon average shares outstanding |
| 3 | Total return calculations do not include any sales charges. Returns for periods of less than one year are not annualized. |
The accompanying notes are an integral part of these financial statements.
| | | | |
| 16 | | Wells Fargo Advantage Asia Pacific Fund | | Financial highlights |
(For a share outstanding throughout each period)
| | | | | | | | | | | | | | | | | | | | | | | | | | | | |
| | | Six months ended
April 30, 2015
(unaudited) | | | Year ended October 31 | | | Year ended
September 30, 2010 | |
| CLASS C | | | 2014 | | | 2013 | | | 2012 | | | 2011 | | | 20101 | | |
Net asset value, beginning of period | | | $11.57 | | | | $11.15 | | | | $9.73 | | | | $8.98 | | | | $9.96 | | | | $9.59 | | | | $8.67 | |
Net investment income (loss) | | | (0.06 | )2 | | | 0.01 | 2 | | | 0.05 | | | | 0.09 | 2 | | | 0.01 | | | | (0.01 | )2 | | | (0.01 | )2 |
Net realized and unrealized gains (losses) on investments | | | 1.34 | | | | 0.63 | | | | 1.69 | | | | 0.69 | | | | (0.86 | ) | | | 0.38 | | | | 1.03 | |
| | | | | | | | | | | | | | | | | | | | | | | | | | | | |
Total from investment operations | | | 1.28 | | | | 0.64 | | | | 1.74 | | | | 0.78 | | | | (0.85 | ) | | | 0.37 | | | | 1.02 | |
Distributions to shareholders from | | | | | | | | | | | | | | | | | | | | | | | | | | | | |
Net investment income | | | (0.08 | ) | | | (0.22 | ) | | | (0.32 | ) | | | (0.03 | ) | | | (0.13 | ) | | | 0.00 | | | | (0.10 | ) |
Net asset value, end of period | | | $12.77 | | | | $11.57 | | | | $11.15 | | | | $9.73 | | | | $8.98 | | | | $9.96 | | | | $9.59 | |
Total return3 | | | 11.18 | % | | | 5.76 | % | | | 18.44 | % | | | 8.78 | % | | | (8.67 | )% | | | 3.86 | % | | | 11.84 | % |
Ratios to average net assets (annualized) | | | | | | | | | | | | | | | | | | | | | | | | | | | | |
Gross expenses | | | 2.46 | % | | | 2.46 | % | | | 2.54 | % | | | 2.62 | % | | | 2.48 | % | | | 2.65 | % | | | 2.65 | % |
Net expenses | | | 2.35 | % | | | 2.35 | % | | | 2.35 | % | | | 2.35 | % | | | 2.35 | % | | | 2.35 | % | | | 2.34 | % |
Net investment income (loss) | | | (1.02 | )% | | | 0.12 | % | | | 0.37 | % | | | 0.92 | % | | | 0.18 | % | | | (1.66 | )% | | | (0.13 | )% |
Supplemental data | | | | | | | | | | | | | | | | | | | | | | | | | | | | |
Portfolio turnover rate | | | 59 | % | | | 113 | % | | | 187 | % | | | 163 | % | | | 196 | % | | | 11 | % | | | 137 | % |
Net assets, end of period (000s omitted) | | | $3,389 | | | | $2,427 | | | | $1,980 | | | | $1,673 | | | | $1,274 | | | | $1,507 | | | | $1,450 | |
| 1 | For the one month ended October 31, 2010. The Fund changed its fiscal year end from September 30 to October 31, effective October 31, 2010. |
| 2 | Calculated based upon average shares outstanding |
| 3 | Total return calculations do not include any sales charges. Returns for periods of less than one year are not annualized. |
The accompanying notes are an integral part of these financial statements.
| | | | | | |
| Financial highlights | | Wells Fargo Advantage Asia Pacific Fund | | | 17 | |
(For a share outstanding throughout each period)
| | | | | | | | | | | | | | | | | | | | | | | | | | | | |
| | | Six months ended
April 30, 2015
(unaudited) | | | Year ended October 31 | | | Year ended
September 30, 20102 | |
| ADMINISTRATOR CLASS | | | 2014 | | | 2013 | | | 2012 | | | 2011 | | | 20101 | | |
Net asset value, beginning of period | | | $11.99 | | | | $11.54 | | | | $10.04 | | | | $9.29 | | | | $10.15 | | | | $9.77 | | | | $8.84 | |
Net investment income (loss) | | | (0.01 | )3 | | | 0.12 | 3 | | | 0.14 | 3 | | | 0.17 | | | | 0.12 | 3 | | | (0.00 | )3,4 | | | 0.03 | 3 |
Net realized and unrealized gains (losses) on investments | | | 1.39 | | | | 0.65 | | | | 1.77 | | | | 0.71 | | | | (0.89 | ) | | | 0.38 | | | | 0.90 | |
| | | | | | | | | | | | | | | | | | | | | | | | | | | | |
Total from investment operations | | | 1.38 | | | | 0.77 | | | | 1.91 | | | | 0.88 | | | | (0.77 | ) | | | 0.38 | | | | 0.93 | |
Distributions to shareholders from | | | | | | | | | | | | | | | | | | | | | | | | | | | | |
Net investment income | | | (0.17 | ) | | | (0.32 | ) | | | (0.41 | ) | | | (0.13 | ) | | | (0.09 | ) | | | 0.00 | | | | 0.00 | |
Net asset value, end of period | | | $13.20 | | | | $11.99 | | | | $11.54 | | | | $10.04 | | | | $9.29 | | | | $10.15 | | | | $9.77 | |
Total return5 | | | 11.69 | % | | | 6.86 | % | | | 19.57 | % | | | 9.66 | % | | | (7.68 | )% | | | 3.89 | % | | | 10.52 | % |
Ratios to average net assets (annualized) | | | | | | | | | | | | | | | | | | | | | | | | | | | | |
Gross expenses | | | 1.54 | % | | | 1.52 | % | | | 1.61 | % | | | 1.67 | % | | | 1.52 | % | | | 1.74 | % | | | 1.80 | % |
Net expenses | | | 1.40 | % | | | 1.40 | % | | | 1.40 | % | | | 1.40 | % | | | 1.39 | % | | | 1.40 | % | | | 1.40 | % |
Net investment income (loss) | | | (0.09 | )% | | | 1.04 | % | | | 1.26 | % | | | 1.74 | % | | | 1.14 | % | | | (0.70 | )% | | | 1.98 | % |
Supplemental data | | | | | | | | | | | | | | | | | | | | | | | | | | | | |
Portfolio turnover rate | | | 59 | % | | | 113 | % | | | 187 | % | | | 163 | % | | | 196 | % | | | 11 | % | | | 137 | % |
Net assets, end of period (000s omitted) | | | $16,556 | | | | $13,956 | | | | $12,577 | | | | $12,860 | | | | $13,959 | | | | $11 | | | | $11 | |
| 1 | For the one month ended October 31, 2010. The Fund changed its fiscal year end from September 30 to October 31, effective October 31, 2010. |
| 2 | For the period from July 30, 2010 (commencement of class operations) to September 30, 2010 |
| 3 | Calculated based upon average shares outstanding |
| 4 | Amount is less than $0.005. |
| 5 | Returns for periods of less than one year are not annualized. |
The accompanying notes are an integral part of these financial statements.
| | | | |
| 18 | | Wells Fargo Advantage Asia Pacific Fund | | Financial highlights |
(For a share outstanding throughout each period)
| | | | | | | | | | | | | | | | | | | | | | | | | | | | |
| | | Six months ended
April 30, 2015
(unaudited) | | | Year ended October 31 | | | Year ended
September 30, 20102 | |
| INSTITUTIONAL CLASS | | | 2014 | | | 2013 | | | 2012 | | | 2011 | | | 20101 | | |
Net asset value, beginning of period | | | $12.00 | | | | $11.55 | | | | $10.05 | | | | $9.30 | | | | $10.15 | | | | $9.77 | | | | $8.84 | |
Net investment income (loss) | | | 0.01 | 3 | | | 0.14 | 3 | | | 0.18 | 3 | | | 0.18 | | | | 0.13 | | | | (0.01 | )3 | | | 0.03 | 3 |
Net realized and unrealized gains (losses) on investments | | | 1.38 | | | | 0.65 | | | | 1.74 | | | | 0.71 | | | | (0.89 | ) | | | 0.39 | | | | 0.90 | |
| | | | | | | | | | | | | | | | | | | | | | | | | | | | |
Total from investment operations | | | 1.39 | | | | 0.79 | | | | 1.92 | | | | 0.89 | | | | (0.76 | ) | | | 0.38 | | | | 0.93 | |
Distributions to shareholders from | | | | | | | | | | | | | | | | | | | | | | | | | | | | |
Net investment income | | | (0.19 | ) | | | (0.34 | ) | | | (0.42 | ) | | | (0.14 | ) | | | (0.09 | ) | | | 0.00 | | | | 0.00 | |
Net asset value, end of period | | | $13.20 | | | | $12.00 | | | | $11.55 | | | | $10.05 | | | | $9.30 | | | | $10.15 | | | | $9.77 | |
Total return4 | | | 11.80 | % | | | 6.99 | % | | | 19.70 | % | | | 9.90 | % | | | (7.55 | )% | | | 3.89 | % | | | 10.52 | % |
Ratios to average net assets (annualized) | | | | | | | | | | | | | | | | | | | | | | | | | | | | |
Gross expenses | | | 1.28 | % | | | 1.27 | % | | | 1.33 | % | | | 1.42 | % | | | 1.29 | % | | | 1.47 | % | | | 1.47 | % |
Net expenses | | | 1.25 | % | | | 1.25 | % | | | 1.25 | % | | | 1.25 | % | | | 1.24 | % | | | 1.25 | % | | | 1.25 | % |
Net investment income (loss) | | | 0.23 | % | | | 1.15 | % | | | 1.62 | % | | | 1.86 | % | | | 1.30 | % | | | (0.57 | )% | | | 2.11 | % |
Supplemental data | | | | | | | | | | | | | | | | | | | | | | | | | | | | |
Portfolio turnover rate | | | 59 | % | | | 113 | % | | | 187 | % | | | 163 | % | | | 196 | % | | | 11 | % | | | 137 | % |
Net assets, end of period (000s omitted) | | | $1,946 | | | | $502 | | | | $129 | | | | $12 | | | | $11 | | | | $11 | | | | $11 | |
| 1 | For the one month ended October 31, 2010. The Fund changed its fiscal year end from September 30 to October 31, effective October 31, 2010. |
| 2 | For the period from July 30, 2010 (commencement of class operations) to September 30, 2010 |
| 3 | Calculated based upon average shares outstanding |
| 4 | Returns for periods of less than one year are not annualized. |
The accompanying notes are an integral part of these financial statements.
| | | | | | |
| Financial highlights | | Wells Fargo Advantage Asia Pacific Fund | | | 19 | |
(For a share outstanding throughout each period)
| | | | | | | | | | | | | | | | | | | | | | | | | | | | |
| | | Six months ended
April 30, 2015
(unaudited) | | | Year ended October 31 | | | Year ended
September 30, 2010 | |
| INVESTOR CLASS | | | 2014 | | | 2013 | | | 2012 | | | 2011 | | | 20101 | | |
Net asset value, beginning of period | | | $12.00 | | | | $11.55 | | | | $10.05 | | | | $9.28 | | | | $10.14 | | | | $9.76 | | | | $8.81 | |
Net investment income (loss) | | | (0.02 | ) | | | 0.09 | | | | 0.10 | | | | 0.15 | | | | 0.08 | 2 | | | (0.01 | )2 | | | 0.04 | 2 |
Net realized and unrealized gains (losses) on investments | | | 1.39 | | | | 0.65 | | | | 1.78 | | | | 0.72 | | | | (0.88 | ) | | | 0.39 | | | | 1.05 | |
| | | | | | | | | | | | | | | | | | | | | | | | | | | | |
Total from investment operations | | | 1.37 | | | | 0.74 | | | | 1.88 | | | | 0.87 | | | | (0.80 | ) | | | 0.38 | | | | 1.09 | |
Distributions to shareholders from | | | | | | | | | | | | | | | | | | | | | | | | | | | | |
Net investment income | | | (0.14 | ) | | | (0.29 | ) | | | (0.38 | ) | | | (0.10 | ) | | | (0.06 | ) | | | 0.00 | | | | (0.14 | ) |
Net asset value, end of period | | | $13.23 | | | | $12.00 | | | | $11.55 | | | | $10.05 | | | | $9.28 | | | | $10.14 | | | | $9.76 | |
Total return3 | | | 11.52 | % | | | 6.58 | % | | | 19.25 | % | | | 9.51 | % | | | (7.97 | )% | | | 3.89 | % | | | 12.51 | % |
Ratios to average net assets (annualized) | | | | | | | | | | | | | | | | | | | | | | | | | | | | |
Gross expenses | | | 1.77 | % | | | 1.77 | % | | | 1.85 | % | | | 1.94 | % | | | 1.80 | % | | | 1.97 | % | | | 1.99 | % |
Net expenses | | | 1.65 | % | | | 1.65 | % | | | 1.65 | % | | | 1.65 | % | | | 1.65 | % | | | 1.65 | % | | | 1.64 | % |
Net investment income (loss) | | | (0.36 | )% | | | 0.79 | % | | | 1.04 | % | | | 1.47 | % | | | 0.82 | % | | | (0.96 | )% | | | 0.41 | % |
Supplemental data | | | | | | | | | | | | | | | | | | | | | | | | | | | | |
Portfolio turnover rate | | | 59 | % | | | 113 | % | | | 187 | % | | | 163 | % | | | 196 | % | | | 11 | % | | | 137 | % |
Net assets, end of period (000s omitted) | | | $162,709 | | | | $150,708 | | | | $164,299 | | | | $154,999 | | | | $169,895 | | | | $252,214 | | | | $241,892 | |
| 1 | For the one month ended October 31, 2010. The Fund changed its fiscal year end from September 30 to October 31, effective October 31, 2010. |
| 2 | Calculated based upon average shares outstanding |
| 3 | Returns for periods of less than one year are not annualized. |
The accompanying notes are an integral part of these financial statements.
| | | | |
| 20 | | Wells Fargo Advantage Asia Pacific Fund | | Notes to financial statements (unaudited) |
1. ORGANIZATION
Wells Fargo Funds Trust (the “Trust”), a Delaware statutory trust organized on March 10, 1999, is an open-end management investment company registered under the Investment Company Act of 1940, as amended (the “1940 Act”). As an investment company, the Trust follows the accounting and reporting guidance in Financial Accounting Standards Board (“FASB”) Accounting Standards Codification Topic 946, Financial Services – Investment Companies. These financial statements report on the Wells Fargo Advantage Asia Pacific Fund (the “Fund”) which is a diversified series of the Trust.
2. SIGNIFICANT ACCOUNTING POLICIES
The following significant accounting policies, which are consistently followed in the preparation of the financial statements of the Fund, are in conformity with U.S. generally accepted accounting principles which require management to make estimates and assumptions that affect the reported amounts of assets and liabilities, disclosure of contingent assets and liabilities at the date of the financial statements, and the reported amounts of revenues and expenses during the reporting period. Actual results could differ from those estimates.
Securities valuation
All investments are valued each business day as of the close of regular trading on the New York Stock Exchange (generally 4 p.m. Eastern Time).
Equity securities that are listed on a foreign or domestic exchange or market are valued at the official closing price or, if none, the last sales price. If no sale occurs on the primary exchange or market that day, the prior day’s price will be deemed “stale” and a fair value price will be determined in accordance with the Fund’s Valuation Procedures.
Equity securities that are not listed on a foreign or domestic exchange or market, but have a public trading market, are valued at the quoted bid price from an independent broker-dealer that the Management Valuation Team of Wells Fargo Funds Management, LLC (“Funds Management”) has determined is an acceptable source.
The values of securities denominated in foreign currencies are translated into U.S. dollars at rates provided by an independent foreign currency pricing source at a time each business day specified by the Management Valuation Team.
Many securities markets and exchanges outside the U.S. close prior to the close of the New York Stock Exchange and therefore may not fully reflect trading or events that occur after the close of the principal exchange in which the foreign securities are traded, but before the close of the New York Stock Exchange. If such trading or events are expected to materially affect the value of such securities, then fair value pricing procedures approved by the Board of Trustees of the Fund are applied. These procedures take into account multiple factors including movements in U.S. securities markets after foreign exchanges close. Foreign securities that are fair valued under these procedures are categorized as Level 2 and the application of these procedures may result in transfers between Level 1 and Level 2. Depending on market activity, such fair valuations may be frequent. Such fair value pricing may result in net asset values that are higher or lower than net asset values based on the last reported sales price or latest quoted bid price. On April 30, 2015, such fair value pricing was used in pricing foreign securities.
Investments in registered open-end investment companies are valued at net asset value. Interests in non-registered investment vehicles that are redeemable at net asset value are fair valued at net asset value when available.
Investments which are not valued using any of the methods discussed above are valued at their fair value, as determined in good faith by the Board of Trustees. The Board of Trustees has established a Valuation Committee comprised of the Trustees and has delegated to it the authority to take any actions regarding the valuation of portfolio securities that the Valuation Committee deems necessary or appropriate, including determining the fair value of portfolio securities, unless the determination has been delegated to the Management Valuation Team. The Board of Trustees retains the authority to make or ratify any valuation decisions or approve any changes to the Valuation Procedures as it deems appropriate. On a quarterly basis, the Board of Trustees receives reports on any valuation actions taken by the Valuation Committee or the Management Valuation Team which may include items for ratification.
Valuations of fair valued securities are compared to the next actual sales price when available, or other appropriate market values, to assess the continued appropriateness of the fair valuation methodologies used. These securities are fair valued on a day-to-day basis, taking into consideration changes to appropriate market information and any significant changes to the inputs considered in the valuation process until there is a readily available price provided on an exchange or by an independent pricing service. Valuations received from an independent pricing service or independent broker-dealer quotes are periodically validated by comparisons to most recent trades and valuations provided by other independent pricing services in addition to the review of prices by the adviser and/or subadviser. Unobservable inputs
| | | | | | |
| Notes to financial statements (unaudited) | | Wells Fargo Advantage Asia Pacific Fund | | | 21 | |
used in determining fair valuations are identified based on the type of security, taking into consideration factors utilized by market participants in valuing the investment, knowledge about the issuer and the current market environment.
Foreign currency translation
The accounting records of the Fund are maintained in U.S. dollars. The values of other assets and liabilities denominated in foreign currencies are translated into U.S. dollars at rates provided by an independent foreign currency pricing source at a time each business day specified by the Management Valuation Team. Purchases and sales of securities, and income and expenses are converted at the rate of exchange on the respective dates of such transactions. Net realized foreign exchange gains or losses arise from sales of foreign currencies, currency gains or losses realized between the trade and settlement dates on securities transactions, and the difference between the amounts of dividends, interest and foreign withholding taxes recorded and the U.S. dollar equivalent of the amounts actually paid or received. Net unrealized foreign exchange gains and losses arise from changes in the fair value of assets and liabilities other than investments in securities resulting from changes in exchange rates. The changes in net assets arising from changes in exchange rates and the changes in net assets resulting from changes in market prices of securities are not separately presented. Such changes are included in net realized and unrealized gains or losses from investments.
Forward foreign currency contracts
The Fund is subject to foreign currency exchange rate risk in the normal course of pursuing its investment objectives. A forward foreign currency contract is an agreement between two parties to purchase or sell a specific currency for an agreed-upon price at a future date. The Fund enters into forward foreign currency contracts to facilitate transactions in foreign-denominated securities and to attempt to minimize the risk to the Fund from adverse changes in the relationship between currencies. Forward foreign currency contracts are recorded at the forward rate and marked-to-market daily. When the contracts are closed, realized gains and losses arising from such transactions are recorded as realized gains or losses on forward foreign currency contract transactions. The Fund could be exposed to risks if the counterparties to the contracts are unable to meet the terms of their contracts or if the value of the foreign currency changes unfavorably. The Fund’s maximum risk of loss from counterparty credit risk is the unrealized gains on the contracts. This risk may be mitigated if there is a master netting arrangement between the Fund and the counterparty.
Security loans
The Fund may lend its securities from time to time in order to earn additional income in the form of fees or interest on securities received as collateral or the investment of any cash received as collateral. The Fund continues to receive interest or dividends on the securities loaned. The Fund receives collateral in the form of cash or securities with a value at least equal to the value of the securities on loan. The value of the loaned securities is determined at the close of each business day and any additional required collateral is delivered to the Fund on the next business day. In a securities lending transaction, the net asset value of the Fund will be affected by an increase or decrease in the value of the securities loaned and by an increase or decrease in the value of the instrument in which collateral is invested. The amount of securities lending activity undertaken by the Fund fluctuates from time to time. In the event of default or bankruptcy by the borrower, the Fund may be prevented from recovering the loaned securities or gaining access to the collateral or may experience delays or costs in doing so. In addition, the investment of any cash collateral received may lose all or part of its value. The Fund has the right under the lending agreement to recover the securities from the borrower on demand.
The Fund lends its securities through an unaffiliated securities lending agent. Cash collateral received in connection with its securities lending transactions is invested in Securities Lending Cash Investments, LLC (the “Securities Lending Fund”). The Securities Lending Fund is exempt from registration under Section 3(c)(7) of the 1940 Act and is managed by Funds Management and is subadvised by Wells Capital Management Incorporated (“WellsCap”). Funds Management receives an advisory fee starting at 0.05% and declining to 0.01% as the average daily net assets of the Securities Lending Fund increase. All of the fees received by Funds Management are paid to WellsCap for its services as subadviser. The Securities Lending Fund seeks to provide a positive return compared to the daily Fed Funds Open rate by investing in high-quality, U.S. dollar-denominated short-term money market instruments. Securities Lending Fund investments are fair valued based upon the amortized cost valuation technique. Income earned from investment in the Securities Lending Fund is included in securities lending income on the Statement of Operations.
Security transactions and income recognition
Securities transactions are recorded on a trade date basis. Realized gains or losses are recorded on the basis of identified cost.
Dividend income is recognized on the ex-dividend date, except for certain dividends from foreign securities, which are recorded as soon as the custodian verifies the ex-dividend date. Dividend income from foreign securities is recorded net of foreign taxes withheld where recovery of such taxes is not assured.
| | | | |
| 22 | | Wells Fargo Advantage Asia Pacific Fund | | Notes to financial statements (unaudited) |
Distributions to shareholders
Distributions to shareholders from net investment income and net realized gains, if any, are recorded on the ex-dividend date. Such distributions are determined in conformity with federal income tax regulations, which may differ in amount or character from net investment income and realized gains recognized for purposes of U.S. generally accepted accounting principles.
Federal and other taxes
The Fund intends to continue to qualify as a regulated investment company by distributing substantially all of its investment company taxable income and any net realized capital gains (after reduction for capital loss carryforwards) sufficient to relieve it from all, or substantially all, federal income taxes. Accordingly, no provision for federal income taxes was required.
The Fund’s income and federal excise tax returns and all financial records supporting those returns for the prior three fiscal years are subject to examination by the federal and Delaware revenue authorities. Management has analyzed the Fund’s tax positions taken on federal, state, and foreign tax returns for all open tax years and does not believe that there are any uncertain tax positions that require recognition of a tax liability.
As of October 31, 2014, the Fund had capital loss carryforwards available to offset future net realized capital gains in the amount of $117,451,338 with $36,634,134 expiring in 2016 and $80,817,204 expiring in 2017.
Class allocations
The separate classes of shares offered by the Fund differ principally in applicable sales charges, distribution, shareholder servicing, and administration fees. Class specific expenses are charged directly to that share class. Investment income, common expenses, and realized and unrealized gains (losses) on investments are allocated daily to each class of shares based on the relative proportion of net assets of each class.
3. FAIR VALUATION MEASUREMENTS
Fair value measurements of investments are determined within a framework that has established a fair value hierarchy based upon the various data inputs utilized in determining the value of the Fund’s investments. The three-level hierarchy gives the highest priority to unadjusted quoted prices in active markets for identical assets or liabilities (Level 1) and the lowest priority to significant unobservable inputs (Level 3). The Fund’s investments are classified within the fair value hierarchy based on the lowest level of input that is significant to the fair value measurement. The inputs are summarized into three broad levels as follows:
| n | | Level 1 – quoted prices in active markets for identical securities |
| n | | Level 2 – other significant observable inputs (including quoted prices for similar securities, interest rates, prepayment speeds, credit risk, use of amortized cost, etc.) |
| n | | Level 3 – significant unobservable inputs (including the Fund’s own assumptions in determining the fair value of investments) |
The inputs or methodologies used for valuing investments in securities are not necessarily an indication of the risk associated with investing in those securities.
| | | | | | |
| Notes to financial statements (unaudited) | | Wells Fargo Advantage Asia Pacific Fund | | | 23 | |
The following is a summary of the inputs used in valuing the Fund’s assets and liabilities as of April 30, 2015:
| | | | | | | | | | | | | | | | |
| | | Quoted prices (Level 1) | | | Other significant
observable inputs (Level 2) | | | Significant
unobservable inputs (Level 3) | | | Total | |
Assets | | | | | | | | | | | | | | | | |
Investments in: | | | | | | | | | | | | | | | | |
| | | | |
Common stocks | | | | | | | | | | | | | | | | |
Australia | | $ | 0 | | | $ | 8,301,140 | | | $ | 0 | | | $ | 8,301,140 | |
China | | | 4,062,500 | | | | 42,296,592 | | | | 0 | | | | 46,359,092 | |
Hong Kong | | | 0 | | | | 13,562,796 | | | | 0 | | | | 13,562,796 | |
India | | | 0 | | | | 12,648,169 | | | | 0 | | | | 12,648,169 | |
Indonesia | | | 0 | | | | 3,915,354 | | | | 0 | | | | 3,915,354 | |
Japan | | | 0 | | | | 54,557,193 | | | | 0 | | | | 54,557,193 | |
Malaysia | | | 1,055,510 | | | | 302,090 | | | | 0 | | | | 1,357,600 | |
New Zealand | | | 0 | | | | 3,005,698 | | | | 0 | | | | 3,005,698 | |
Philippines | | | 915,602 | | | | 33,122 | | | | 0 | | | | 948,724 | |
Singapore | | | 2,865,388 | | | | 2,821,856 | | | | 0 | | | | 5,687,244 | |
South Korea | | | 0 | | | | 15,164,130 | | | | 0 | | | | 15,164,130 | |
Taiwan | | | 0 | | | | 9,027,535 | | | | 0 | | | | 9,027,535 | |
Thailand | | | 921,454 | | | | 887,716 | | | | 0 | | | | 1,809,170 | |
| | | | |
Participation notes | | | | | | | | | | | | | | | | |
China | | | 0 | | | | 3,897,125 | | | | 0 | | | | 3,897,125 | |
| | | | |
Preferred stocks | | | | | | | | | | | | | | | | |
South Korea | | | 0 | | | | 2,130,852 | | | | 0 | | | | 2,130,852 | |
| | | | |
Short-term investments | | | | | | | | | | | | | | | | |
Investment companies | | | 6,875,792 | | | | 2,504,107 | | | | 0 | | | | 9,379,899 | |
Total assets | | $ | 16,696,246 | | | $ | 175,055,475 | | | $ | 0 | | | $ | 191,751,721 | |
The Fund recognizes transfers between levels within the fair value hierarchy at the end of the reporting period. At April 30, 2015, fair value pricing was used in pricing certain foreign securities and securities valued at $119,522,517 were transferred from Level 1 to Level 2. The Fund did not have any transfers into/out of Level 3.
4. TRANSACTIONS WITH AFFILIATES
Advisory fee
The Trust has entered into an advisory contract with Funds Management, an indirect wholly owned subsidiary of Wells Fargo & Company (“Wells Fargo”). The adviser is responsible for implementing investment policies and guidelines and for supervising the subadviser, who is responsible for day-to-day portfolio management of the Fund.
Pursuant to the contract, Funds Management is entitled to receive an annual advisory fee starting at 0.95% and declining to 0.80% as the average daily net assets of the Fund increase. For the six months ended April 30, 2015, the advisory fee was equivalent to an annual rate of 0.95% of the Fund’s average daily net assets.
Funds Management has retained the services of a subadviser to provide daily portfolio management to the Fund. The fee for subadvisory services is borne by Funds Management. WellsCap, an affiliate of Funds Management and an indirect wholly owned subsidiary of Wells Fargo, is the subadviser to the Fund and is entitled to receive a fee from Funds Management at an annual rate starting at 0.65% and declining to 0.45% as the average daily net assets of the Fund increase.
Administration fees
The Trust has entered into an administration agreement with Funds Management. Under this agreement, for providing administrative services, which includes paying fees and expenses for services provided by the transfer agent, sub-transfer agents, omnibus account servicers and record-keepers, Funds Management is entitled to receive from the Fund an annual
| | | | |
| 24 | | Wells Fargo Advantage Asia Pacific Fund | | Notes to financial statements (unaudited) |
fund level administration fee starting at 0.05% and declining to 0.03% as the average daily net assets of the Fund increase and a class level administration fee which is calculated based on the average daily net assets of each class as follows:
| | | | |
| | | Class level
administration fee | |
Class A, Class C | | | 0.26 | % |
Administrator Class | | | 0.10 | |
Institutional Class | | | 0.08 | |
Investor Class | | | 0.32 | |
Funds Management has contractually waived and/or reimbursed advisory and administration fees to the extent necessary to maintain certain net operating expense ratios for the Fund. Waiver of fees and/or reimbursement of expenses by Funds Management were made first from fund level expenses on a proportionate basis and then from class specific expenses. Funds Management has committed through February 29, 2016 to waive fees and/or reimburse expenses to the extent necessary to cap the Fund’s expenses at 1.60% for Class A shares, 2.35% for Class C shares, 1.40% for Administrator Class shares, 1.25% for Institutional Class shares, and 1.65% for Investor Class shares. After this time, the cap may be increased or the commitment to maintain the cap may be terminated only with the approval of the Board of Trustees.
Distribution fee
The Trust has adopted a Distribution Plan for Class C shares of the Fund pursuant to Rule 12b-1 under the 1940 Act. A distribution fee is charged to Class C shares and paid to Wells Fargo Funds Distributor, LLC (“Funds Distributor”), the principal underwriter, at an annual rate of 0.75% of the average daily net assets of Class C shares.
In addition, Funds Distributor is entitled to receive the front-end sales charge from the purchase of Class A shares and a contingent deferred sales charge on the redemption of certain Class A shares. Funds Distributor is also entitled to receive the contingent deferred sales charges from redemptions of Class C shares. For the six months ended April 30, 2015, Funds Distributor received $4,097 from the sale of Class A shares.
Shareholder servicing fees
The Trust has entered into contracts with one or more shareholder servicing agents, whereby Class A, Class C, Administrator Class, and Investor Class of the Fund is charged a fee at an annual rate of 0.25% of the average daily net assets of each respective class.
A portion of these total shareholder servicing fees were paid to affiliates of Wells Fargo.
5. INVESTMENT PORTFOLIO TRANSACTIONS
Purchases and sales of investments, excluding U.S. government obligations (if any) and short-term securities, for the six months ended April 30, 2015 were $100,141,869 and $111,798,346, respectively.
6. DERIVATIVE TRANSACTIONS
During the six months ended April 30, 2015, the Fund entered into forward foreign currency contracts for economic hedging purposes.
As of April 30, 2015, the Fund did not have any open forward foreign currency contracts. The Fund had average contract amounts of $251,183 and $285,547 in forward foreign currency contracts to buy and forward foreign currency contracts to sell, respectively, during the six months ended April 30, 2015.
The fair value, realized gains or losses and change in unrealized gains or losses, if any, on derivative instruments are reflected in the appropriate financial statements.
7. BANK BORROWINGS
The Trust (excluding the money market funds and certain other funds in the Trust) and Wells Fargo Variable Trust are parties to a $150,000,000 revolving credit agreement, whereby the Fund is permitted to use bank borrowings for temporary or emergency purposes, such as to fund shareholder redemption requests. Interest under the credit agreement is charged to the Fund based on a borrowing rate equal to the higher of the Federal Funds rate in effect on that day plus 1.25% or the overnight LIBOR rate in effect on that day plus 1.25%. In addition, an annual commitment fee equal to 0.10% of the unused balance is allocated to each participating fund. For the six months ended April 30, 2015, the Fund paid $157 in commitment fees.
| | | | | | |
| Notes to financial statements (unaudited) | | Wells Fargo Advantage Asia Pacific Fund | | | 25 | |
For the six months ended April 30, 2015, there were no borrowings by the Fund under the agreement.
8. CONCENTRATION RISK
Concentration risks result from exposure to a limited number of sectors or geographic region. A fund that invest a substantial portion of their assets in any sector or geographic region may be more affected by changes in that sector or geographic region than would be a fund whose investments are not heavily weighted in any sector or geographic region.
9. INDEMNIFICATION
Under the Trust’s organizational documents, the officers and Trustees have been granted certain indemnification rights against certain liabilities that may arise out of performance of their duties to the Trust. Additionally, in the normal course of business, the Trust may enter into contracts with service providers that contain a variety of indemnification clauses. The Trust’s maximum exposure under these arrangements is dependent on future claims that may be made against the Fund and, therefore, cannot be estimated.
| | | | |
| 26 | | Wells Fargo Advantage Asia Pacific Fund | | Other information (unaudited) |
TAX INFORMATION
Pursuant to Section 853 of the Internal Revenue Code, the following amounts were designated as foreign taxes paid for the fiscal year ended October 31, 2014. These amounts may be less than the actual foreign taxes paid for financial statement purposes. Foreign taxes paid or withheld should be included in taxable income with an offsetting deduction from gross income or as a credit for taxes paid to foreign governments. None of the income was derived from ineligible foreign sources as defined under Section 901(j) of the Internal Revenue Code.
| | | | |
Creditable foreign taxes paid | | Per share amount | | Foreign income as % of ordinary income distributions |
| $367,859 | | $0.0253 | | 88.89% |
PROXY VOTING INFORMATION
A description of the policies and procedures that the Fund uses to determine how to vote proxies relating to portfolio securities is available, upon request, by calling 1-800-222-8222, visiting our website at wellsfargoadvantagefunds.com, or visiting the SEC website at sec.gov. Information regarding how the Fund voted proxies relating to portfolio securities during the most recent 12-month period ended June 30 is available on the Fund’s website at wellsfargoadvantagefunds.com or by visiting the SEC website at sec.gov.
PORTFOLIO HOLDINGS INFORMATION
The complete portfolio holdings for the Fund are publicly available monthly on the Fund’s website (wellsfargoadvantagefunds.com), on a one-month delayed basis. In addition, top ten holdings information (excluding derivative positions) for the Fund is publicly available on the Fund’s website on a monthly, seven-day or more delayed basis. The Fund files its complete schedule of portfolio holdings with the SEC for the first and third quarters of each fiscal year on Form N-Q, which is available by visiting the SEC website at sec.gov. In addition, the Fund’s Form N-Q may be reviewed and copied at the SEC’s Public Reference Room in Washington, DC, and at regional offices in New York City, at 233 Broadway, and in Chicago, at 175 West Jackson Boulevard, Suite 900. Information about the Public Reference Room may be obtained by calling 1-800-SEC-0330.
| | | | | | |
| Other information (unaudited) | | Wells Fargo Advantage Asia Pacific Fund | | | 27 | |
BOARD OF TRUSTEES AND OFFICERS
Each of the Trustees and Officers1 listed in the table below acts in identical capacities for each fund in the Wells Fargo Advantage family of funds, which consists of 134 mutual funds comprising the Wells Fargo Funds Trust, Wells Fargo Variable Trust, Wells Fargo Master Trust and four closed-end funds (collectively the “Fund Complex”). This table should be read in conjunction with the Prospectus and the Statement of Additional Information2. The mailing address of each Trustee and Officer is 525 Market Street, 12th Floor, San Francisco, CA 94105. Each Trustee and Officer serves an indefinite term, however, each Trustee serves such term until reaching the mandatory retirement age established by the Trustees.
Independent Trustees
| | | | | | |
Name and year of birth | | Position held and length of service* | | Principal occupations during past five years or longer | | Other directorships during past five years |
| William R. Ebsworth (Born 1957) | | Trustee, since 2015** | | Retired. From 1984 to 2013, equities analyst, portfolio manager, research director at Fidelity Management and Research Company and retired in 2013 as Chief Investment Officer of Fidelity Strategic Advisers, Inc. in Boston, Tokyo, and Hong Kong where he led a team of investment professionals managing client assets. Prior thereto, Board member of Hong Kong Securities Clearing Co., Hong Kong Options Clearing Corp., the Thailand International Fund, Ltd., Fidelity Investments Life Insurance Company, and Empire Fidelity Investments Life Insurance Company. Mr. Ebsworth is an Adjunct Lecturer, Finance, at Babson College and a Chartered Financial Analyst. | | Asset Allocation Trust |
| Jane A. Freeman (Born 1953) | | Trustee, since 2015** | | Retired. From 2012 to 2014 and 1999 to 2008, Chief Financial Officer of Scientific Learning Corporation. From 2008 to 2012, Ms. Freeman provided consulting services related to strategic business projects. Prior to 1999, Portfolio Manager at Rockefeller & Co. and Scudder, Stevens & Clark. Board member of the Harding Loevner Funds from 1996 to 2014, serving as both Lead Independent Director and chair of the Audit Committee. Board member of the Russell Exchange Traded Funds Trust from 2011 to 2012 and the chair of the Audit Committee. Ms. Freeman is a Chartered Financial Analyst (inactive), Chair of Taproot Foundation (non-profit organization) and a Board Member of Ruth Bancroft Garden (non-profit organization). | | Asset Allocation Trust |
| Peter G. Gordon (Born 1942) | | Trustee, since 1998; Chairman, since 2005 | | Co-Founder, Retired Chairman, President and CEO of Crystal Geyser Water Company. Trustee Emeritus, Colby College. | | Asset Allocation Trust |
| Isaiah Harris, Jr. (Born 1952) | | Trustee, since 2009 | | Retired. Chairman of the Board of CIGNA Corporation since 2009, and Director since 2005. From 2003 to 2011, Director of Deluxe Corporation. Prior thereto, President and CEO of BellSouth Advertising and Publishing Corp. from 2005 to 2007, President and CEO of BellSouth Enterprises from 2004 to 2005 and President of BellSouth Consumer Services from 2000 to 2003. Emeritus member of the Iowa State University Foundation Board of Governors. Emeritus Member of the Advisory Board of Iowa State University School of Business. Advisory Board Member, Palm Harbor Academy. Mr. Harris is a certified public accountant. | | CIGNA Corporation; Asset Allocation Trust |
| Judith M. Johnson (Born 1949) | | Trustee, since 2008; Audit Committee Chairman, since 2008 | | Retired. Prior thereto, Chief Executive Officer and Chief Investment Officer of Minneapolis Employees Retirement Fund from 1996 to 2008. Ms. Johnson is an attorney, certified public accountant and a certified managerial accountant. | | Asset Allocation Trust |
| David F. Larcker (Born 1950) | | Trustee, since 2009 | | James Irvin Miller Professor of Accounting at the Graduate School of Business, Stanford University, Morgan Stanley Director of the Center for Leadership Development and Research and Senior Faculty of The Rock Center for Corporate Governance since 2006. From 2005 to 2008, Professor of Accounting at the Graduate School of Business, Stanford University. Prior thereto, Ernst & Young Professor of Accounting at The Wharton School, University of Pennsylvania from 1985 to 2005. | | Asset Allocation Trust |
| Olivia S. Mitchell (Born 1953) | | Trustee, since 2006 | | International Foundation of Employee Benefit Plans Professor, Wharton School of the University of Pennsylvania since 1993. Director of Wharton’s Pension Research Council and Boettner Center on Pensions & Retirement Research, and Research Associate at the National Bureau of Economic Research. Previously, Cornell University Professor from 1978 to 1993. | | Asset Allocation Trust |
| | | | |
| 28 | | Wells Fargo Advantage Asia Pacific Fund | | Other information (unaudited) |
| | | | | | |
Name and year of birth | | Position held and length of service* | | Principal occupations during past five years or longer | | Other directorships during past five years |
| Timothy J. Penny (Born 1951) | | Trustee, since 1996 | | President and Chief Executive Officer of Southern Minnesota Initiative Foundation, a non-profit organization, since 2007 and Senior Fellow at the Humphrey Institute Policy Forum at the University of Minnesota since 1995. Member of the Board of Trustees of NorthStar Education Finance, Inc., a non-profit organization, since 2007. | | Asset Allocation Trust |
| Michael S. Scofield (Born 1943) | | Trustee, since 2010 | | Served on the Investment Company Institute’s Board of Governors and Executive Committee from 2008-2011 as well the Governing Council of the Independent Directors Council from 2006-2011 and the Independent Directors Council Executive Committee from 2008-2011. Chairman of the IDC from 2008-2010. Institutional Investor (Fund Directions) Trustee of Year in 2007. Trustee of the Evergreen Funds complex (and its predecessors) from 1984 to 2010. Chairman of the Evergreen Funds from 2000-2010. Former Trustee of the Mentor Funds. Retired Attorney, Law Offices of Michael S. Scofield. | | Asset Allocation Trust |
| Donald C. Willeke (Born 1940) | | Trustee, since 1996 | | Principal of the law firm of Willeke & Daniels. General Counsel of the Minneapolis Employees Retirement Fund from 1984 until its consolidation into the Minnesota Public Employees Retirement Association on June 30, 2010. Director and Vice Chair of The Tree Trust (non-profit corporation). Director of the American Chestnut Foundation (non-profit corporation). | | Asset Allocation Trust |
| * | Length of service dates reflect the Trustee’s commencement of service with the Trust’s predecessor entities, where applicable. |
| ** | William R. Ebsworth and Jane A. Freeman each became a Trustee effective January 1, 2015. |
Officers
| | | | | | |
Name and year of birth | | Position held and
length of service | | Principal occupations during past five years or longer | | |
| Karla M. Rabusch (Born 1959) | | President, since 2003 | | Executive Vice President of Wells Fargo Bank, N.A. and President of Wells Fargo Funds Management, LLC since 2003. | | |
| Jeremy DePalma1 (Born 1974) | | Treasurer, since 2012 | | Senior Vice President of Wells Fargo Funds Management, LLC since 2009. Senior Vice President of Evergreen Investment Management Company, LLC from 2008 to 2010. Vice President, Evergreen Investment Services, Inc. from 2004 to 2007. Head of the Fund Reporting and Control Team within Fund Administration from 2005 to 2010. | | |
| C. David Messman (Born 1960) | | Secretary, since 2000; Chief Legal Officer, since 2003 | | Senior Vice President and Secretary of Wells Fargo Funds Management, LLC since 2001. Assistant General Counsel of Wells Fargo Bank, N.A. since 2013 and Vice President and Managing Counsel of Wells Fargo Bank N.A. from 1996 to 2013. | | |
| Debra Ann Early (Born 1964) | | Chief Compliance Officer, since 2007 | | Senior Vice President of Wells Fargo Funds Management, LLC since 2007 and Chief Compliance Officer from 2007 to 2014. Chief Compliance Officer of Parnassus Investments from 2005 to 2007. Chief Financial Officer of Parnassus Investments from 2004 to 2007 and Senior Audit Manager of PricewaterhouseCoopers LLP from 1998 to 2004. | | |
| David Berardi (Born 1975) | | Assistant Treasurer, since 2009 | | Vice President of Wells Fargo Funds Management, LLC since 2009. Vice President of Evergreen Investment Management Company, LLC from 2008 to 2010. Assistant Vice President of Evergreen Investment Services, Inc. from 2004 to 2008. Manager of Fund Reporting and Control for Evergreen Investment Management Company, LLC from 2004 to 2010. | | |
| 1 | Jeremy DePalma acts as Treasurer of 61 funds and Assistant Treasurer of 73 funds in the Fund Complex. |
| 2 | The Statement of Additional Information includes additional information about the Trustees and is available, without charge, upon request, by calling 1-800-222-8222 or by visiting the website at wellsfargoadvantagefunds.com. |
| | | | | | |
| List of abbreviations | | Wells Fargo Advantage Asia Pacific Fund | | | 29 | |
The following is a list of common abbreviations for terms and entities that may have appeared in this report.
| ACA | — ACA Financial Guaranty Corporation |
| ADR | — American depositary receipt |
| ADS | — American depositary shares |
| AGC | — Assured Guaranty Corporation |
| AGM | — Assured Guaranty Municipal |
| Ambac | — Ambac Financial Group Incorporated |
| AMT | — Alternative minimum tax |
| BAN | — Bond anticipation notes |
| BHAC | — Berkshire Hathaway Assurance Corporation |
| CAB | — Capital appreciation bond |
| CCAB | — Convertible capital appreciation bond |
| CDA | — Community Development Authority |
| CDO | — Collateralized debt obligation |
| DRIVER | — Derivative inverse tax-exempt receipts |
| DW&P | — Department of Water & Power |
| DWR | — Department of Water Resources |
| ECFA | — Educational & Cultural Facilities Authority |
| EDA | — Economic Development Authority |
| EDFA | — Economic Development Finance Authority |
| ETF | — Exchange-traded fund |
| FDIC | — Federal Deposit Insurance Corporation |
| FFCB | — Federal Farm Credit Banks |
| FGIC | — Financial Guaranty Insurance Corporation |
| FHA | — Federal Housing Administration |
| FHLB | — Federal Home Loan Bank |
| FHLMC | — Federal Home Loan Mortgage Corporation |
| FICO | — The Financing Corporation |
| FNMA | — Federal National Mortgage Association |
| GDR | — Global depositary receipt |
| GNMA | — Government National Mortgage Association |
| HCFR | — Healthcare facilities revenue |
| HEFA | — Health & Educational Facilities Authority |
| HEFAR | — Higher education facilities authority revenue |
| HFA | — Housing Finance Authority |
| HFFA | — Health Facilities Financing Authority |
| HUD | — Department of Housing and Urban Development |
| IDA | — Industrial Development Authority |
| IDAG | — Industrial Development Agency |
| KRW | — Republic of Korea won |
| LIBOR | — London Interbank Offered Rate |
| LIFER | — Long Inverse Floating Exempt Receipts |
| LLC | — Limited liability company |
| LLLP | — Limited liability limited partnership |
| LLP | — Limited liability partnership |
| MBIA | — Municipal Bond Insurance Association |
| MFHR | — Multifamily housing revenue |
| MSTR | — Municipal securities trust receipts |
| MUD | — Municipal Utility District |
| National | — National Public Finance Guarantee Corporation |
| PCFA | — Pollution Control Financing Authority |
| PCL | — Public Company Limited |
| PCR | — Pollution control revenue |
| PFA | — Public Finance Authority |
| PFFA | — Public Facilities Financing Authority |
| PFOTER | — Puttable floating option tax-exempt receipts |
| plc | — Public limited company |
| PUTTER | — Puttable tax-exempt receipts |
| R&D | — Research & development |
| Radian | — Radian Asset Assurance |
| RAN | — Revenue anticipation notes |
| RDA | — Redevelopment Authority |
| RDFA | — Redevelopment Finance Authority |
| REIT | — Real estate investment trust |
| ROC | — Reset option certificates |
| SAVRS | — Select auction variable rate securities |
| SBA | — Small Business Authority |
| SDR | — Swedish depositary receipt |
| SFHR | — Single-family housing revenue |
| SFMR | — Single-family mortgage revenue |
| SPA | — Standby purchase agreement |
| SPDR | — Standard & Poor’s Depositary Receipts |
| SPEAR | — Short Puttable Exempt Adjustable Receipts |
| STRIPS | — Separate trading of registered interest and |
| TAN | — Tax anticipation notes |
| TIPS | — Treasury inflation-protected securities |
| TRAN | — Tax revenue anticipation notes |
| TTFA | — Transportation Trust Fund Authority |
| TVA | — Tennessee Valley Authority |
This page is intentionally left blank.
This page is intentionally left blank.
This page is intentionally left blank.


For more information
More information about Wells Fargo Advantage Funds is available free upon request. To obtain literature, please write, email, visit the Fund’s website, or call:
Wells Fargo Advantage Funds
P.O. Box 8266
Boston, MA 02266-8266
Email: wfaf@wellsfargo.com
Website: wellsfargoadvantagefunds.com
Individual investors: 1-800-222-8222
Retail investment professionals: 1-888-877-9275
Institutional investment professionals: 1-866-765-0778
This report and the financial statements contained herein are submitted for the general information of the shareholders of Wells Fargo Advantage Funds. If this report is used for promotional purposes, distribution of the report must be accompanied or preceded by a current prospectus. Before investing, please consider the investment objectives, risks, charges, and expenses of the investment. For a current prospectus and, if available, a summary prospectus, containing this information, call 1-800-222-8222 or visit the Fund’s website at wellsfargoadvantagefunds.com. Read the prospectus carefully before you invest or send money.
Wells Fargo Funds Management, LLC, a wholly owned subsidiary of Wells Fargo & Company, provides investment advisory and administrative services for Wells Fargo Advantage Funds. Other affiliates of Wells Fargo & Company provide subadvisory and other services for the Funds. The Funds are distributed by Wells Fargo Funds Distributor, LLC, Member FINRA/SIPC, an affiliate of Wells Fargo & Company.
NOT FDIC INSURED ¡ NO BANK GUARANTEE ¡ MAY LOSE VALUE
© 2015 Wells Fargo Funds Management, LLC. All rights reserved.
| | |
 | | 233650 06-15 SA236/SAR236 04-15 |

Wells Fargo Advantage Diversified International Fund

Semi-Annual Report
April 30, 2015

Reduce clutter. Save trees.
Sign up for electronic delivery of prospectuses and shareholder reports at wellsfargo.com/advantagedelivery
Contents
The views expressed and any forward-looking statements are as of April 30, 2015, unless otherwise noted, and are those of the Fund managers and/or Wells Fargo Funds Management, LLC. Discussions of individual securities, or the markets generally, or any Wells Fargo Advantage Fund are not intended as individual recommendations. Future events or results may vary significantly from those expressed in any forward-looking statements; the views expressed are subject to change at any time in response to changing circumstances in the market. Wells Fargo Funds Management, LLC and the Fund disclaim any obligation to publicly update or revise any views expressed or forward-looking statements.
NOT FDIC INSURED ¡ NO BANK GUARANTEE ¡ MAY LOSE VALUE
| | | | |
| 2 | | Wells Fargo Advantage Diversified International Fund | | Letter to shareholders (unaudited) |

Karla M. Rabusch
President
Wells Fargo Advantage Funds
A worldwide trend toward looser monetary policy tended to support stock and bond markets in both developed and emerging economies.
European stocks were boosted by the anticipation and then the reality of the ECB’s asset purchases.
Dear Valued Shareholder:
We are pleased to offer you this semi-annual report for the Wells Fargo Advantage Diversified International Fund for the six-month period that ended April 30, 2015. The period was marked by low global interest rates as major central banks initiated or increased their quantitative easing programs. By the end of the period, some European sovereign debt issues were selling at negative yields. In the U.S., large-cap stocks, as measured by the S&P 500 Index1, gained 7.22%, boosted by stronger economic data in the U.S. Although non-U.S. economic growth was more restrained, developed international stocks, as measured by the MSCI EAFE Index (Net)2, gained 6.81%, appreciating, in part, because of quantitative easing in Europe and Japan.
Major central banks continued to provide liquidity to the markets.
A worldwide trend toward looser monetary policy tended to support stock and bond markets in both developed and emerging economies. Throughout the reporting period, the Federal Open Market Committee (FOMC), which is the U.S. Federal Reserve’s (Fed’s) monetary policymaking body, kept its key interest rate effectively at zero. Even though the FOMC ended its bond-buying program in October 2014 and guided investors to expect an interest-rate hike in mid- to late-2015, the Fed remained accommodative.
The European Central Bank (ECB) maintained a variety of measures aimed at encouraging lending, including making funds available to banks at low interest rates and imposing a negative interest rate on bank deposits held at the central bank. In January 2015, the bank announced quantitative easing via significant bond purchases in an attempt to raise the eurozone’s inflation to just under its target of 2%. In Japan, the Bank of Japan (BOJ) also maintained an aggressive monetary program aimed at combating deflation.
The U.S. outperformed other developed markets economies, while major emerging economies grappled with slower growth.
Reported U.S. gross domestic product (GDP) growth came in at a solid 2.2% annualized rate in the fourth quarter of 2014. Although the initial estimate for annualized GDP growth came in at a modest 0.2% in the first quarter of 2015, the slowdown was attributed to short-term factors such as a harsh winter and a long-lived strike at West Coast ports.
European annualized GDP growth was 1.3% in the fourth quarter of 2014 and 1.4% in the first quarter of 2015. European stocks were boosted by the anticipation and then the reality of the ECB’s asset purchases. As also occurred in the U.S., the central bank’s purchase of fixed-income assets provided liquidity that investors poured into riskier assets, including stocks. A similar dynamic played out in Japan, although Japanese shares received the benefit of direct purchases from the BOJ and major pension funds.
| 1 | The S&P 500 Index consists of 500 shares chosen for market size, liquidity, and industry group representation. It is a market-value-weighted index with each share’s weight in the index proportionate to its market value. You cannot invest directly in an index. |
| 2 | The Morgan Stanley Capital International Europe, Australasia, and Far East (MSCI EAFE) Index (Net) is a free-float-adjusted market-capitalization-weighted index that is designed to measure the equity market performance of developed markets, excluding the U.S. and Canada. The MSCI EAFE Index (Net) consists of the following 21 developed markets country indexes: Australia, Austria, Belgium, Denmark, Finland, France, Germany, Hong Kong, Ireland, Israel, Italy, Japan, the Netherlands, New Zealand, Norway, Portugal, Singapore, Spain, Sweden, Switzerland, and the United Kingdom. You cannot invest directly in an index. Source: MSCI. MSCI makes no express or implied warranties or representations and shall have no liability whatsoever with respect to any MSCI data contained herein. The MSCI data may not be further redistributed or used as a basis for other indexes or any securities or financial products. This report is not approved, reviewed, or produced by MSCI. |
| | | | | | |
| Letter to shareholders (unaudited) | | Wells Fargo Advantage Diversified International Fund | | | 3 | |
Among major emerging markets, Chinese government data showed a slowdown in fixed-asset investment, which includes property investment, and modest growth in manufacturing and housing sales. However, China’s growth rates still contrasted favorably with stagnant growth in most developed economies. Brazil faced a challenging situation with a growing corruption scandal affecting the state-controlled oil company, a struggling economy, and a severe drought affecting the city of São Paulo. The MSCI Emerging Markets Index (Net)3 ended the period with a 3.92% return.
Don’t let short-term uncertainty derail long-term investment goals.
Periods of uncertainty can present challenges, but experience has taught us that maintaining long-term investment goals can be an effective way to plan for the future. To help you create a sound strategy based on your personal goals and risk tolerance, Wells Fargo Advantage Funds offers more than 100 mutual funds and other investments spanning a wide range of asset classes and investment styles. Although diversification cannot guarantee an investment profit or prevent losses, we believe it can be an effective way to manage investment risk and potentially smooth out overall portfolio performance. We encourage investors to know their investments and to understand that appropriate levels of risk-taking may unlock opportunities.
Thank you for choosing to invest with Wells Fargo Advantage Funds. We appreciate your confidence in us and remain committed to helping you meet your financial needs.
Sincerely,

Karla M. Rabusch
President
Wells Fargo Advantage Funds
For current information about your fund investments, contact your investment professional, visit our website at wellsfargoadvantagefunds.com, or call us directly at 1-800-222-8222. We are available 24 hours a day, 7 days a week.
| 3 | The Morgan Stanley Capital International (MSCI) Emerging Markets Index (Net) is a free-float-adjusted market-capitalization-weighted index that is designed to measure the equity market performance of emerging markets. The MSCI Emerging Markets Index (Net) consists of the following 23 emerging markets country indexes: Brazil, Chile, China, Colombia, Czech Republic, Egypt, Greece, Hungary, India, Indonesia, Korea, Malaysia, Mexico, Peru, the Philippines, Poland, Qatar, Russia, South Africa, Taiwan, Thailand, Turkey, and United Arab Emirates. You cannot invest directly in an index. |
| | | | |
| 4 | | Wells Fargo Advantage Diversified International Fund | | Performance highlights (unaudited) |
Investment objective
The Fund seeks long-term capital appreciation.
Adviser
Wells Fargo Funds Management, LLC
Subadvisers
Artisan Partners Limited Partnership
LSV Asset Management
Wells Capital Management Incorporated
Portfolio managers
Jeffrey Everett, CFA
Josef Lakonishok
Puneet Mansharamani, CFA
Menno Vermeulen, CFA
Dale Winner, CFA
Mark L. Yockey, CFA
Average annual total returns1 (%) as of April 30, 2015
| | | | | | | | | | | | | | | | | | | | | | | | | | | | | | | | | | |
| | | | | Including sales charge | | | Excluding sales charge | | | Expense ratios2 (%) | |
| | | Inception date | | 1 year | | | 5 year | | | 10 year | | | 1 year | | | 5 year | | | 10 year | | | Gross | | | Net3 | |
| Class A (SILAX) | | 9-24-1997 | | | (0.26 | ) | | | 7.20 | | | | 4.47 | | | | 5.83 | | | | 8.47 | | | | 5.09 | | | | 1.76 | | | | 1.41 | |
| Class B (SILBX)* | | 9-24-1997 | | | 0.08 | | | | 7.36 | | | | 4.55 | | | | 5.08 | | | | 7.66 | | | | 4.55 | | | | 2.51 | | | | 2.16 | |
| Class C (WFECX) | | 4-1-1998 | | | 3.99 | | | | 7.64 | | | | 4.32 | | | | 4.99 | | | | 7.64 | | | | 4.32 | | | | 2.51 | | | | 2.16 | |
| Administrator Class (WFIEX) | | 11-8-1999 | | | – | | | | – | | | | – | | | | 6.00 | | | | 8.66 | | | | 5.30 | | | | 1.60 | | | | 1.25 | |
| Institutional Class (WFISX) | | 8-31-2006 | | | – | | | | – | | | | – | | | | 6.24 | | | | 8.84 | | | | 5.47 | | | | 1.33 | | | | 0.99 | |
| Investor Class (WIEVX) | | 7-18-2008 | | | – | | | | – | | | | – | | | | 5.74 | | | | 8.40 | | | | 5.06 | | | | 1.82 | | | | 1.46 | |
| MSCI EAFE Index (Net)4 | | – | | | – | | | | – | | | | – | | | | 1.66 | | | | 7.40 | | | | 5.62 | | | | – | | | | – | |
| * | | Class B shares are closed to investment, except in connection with the reinvestment of any distributions and permitted exchanges. |
Figures quoted represent past performance, which is no guarantee of future results, and do not reflect taxes that a shareholder may pay on fund distributions or the redemption of fund shares. Investment return and principal value of an investment will fluctuate so that an investor’s shares, when redeemed, may be worth more or less than their original cost. Performance shown without sales charges would be lower if sales charges were reflected. Current performance may be lower or higher than the performance data quoted, which assumes the reinvestment of dividends and capital gains. Current month-end performance is available on the Fund’s website, wellsfargoadvantagefunds.com.
Index returns do not include transaction costs associated with buying and selling securities, any mutual fund fees or expenses, or any taxes. It is not possible to invest directly in an index.
For Class A shares, the maximum front-end sales charge is 5.75%. For Class B shares, the maximum contingent deferred sales charge is 5.00%. For Class C shares, the maximum contingent deferred sales charge is 1.00%. Performance including a contingent deferred sales charge assumes the sales charge for the corresponding time period. Administrator Class, Institutional Class, and Investor Class shares are sold without a front-end sales charge or contingent deferred sales charge.
Stock values fluctuate in response to the activities of individual companies and general market and economic conditions. Foreign investments are especially volatile and can rise or fall dramatically due to differences in the political and economic conditions of the host country. These risks are generally intensified in emerging markets. The use of derivatives may reduce returns and/or increase volatility. Certain investment strategies tend to increase the total risk of an investment (relative to the broader market). The Fund is exposed to smaller-company securities risk. Consult the Fund’s prospectus for additional information on these and other risks.
Please see footnotes on page 5.
| | | | | | |
| Performance highlights (unaudited) | | Wells Fargo Advantage Diversified International Fund | | | 5 | |
| | | | |
| Ten largest holdings5 (%) as of April 30, 2015 | |
Bayer AG | | | 1.96 | |
Toyota Motor Corporation | | | 1.84 | |
Zurich Financial Services AG | | | 1.64 | |
Baidu Incorporated ADR | | | 1.62 | |
Mitsubishi UFJ Financial Group Incorporated | | | 1.35 | |
AIA Group Limited | | | 1.29 | |
BP plc | | | 1.22 | |
Medtronic plc | | | 1.14 | |
Anima Holding SpA | | | 1.12 | |
Man Group plc | | | 1.09 | |
|
| Sector distribution6 as of April 30, 2015 |
|
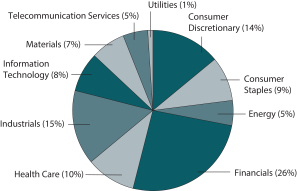 |
|
| Country allocation6 as of April 30, 2015 |
|
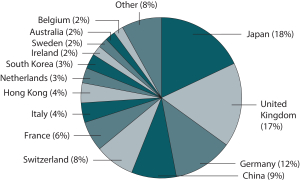 |
| 1 | Historical performance shown for Investor Class shares prior to their inception reflects the performance of Class A shares and has been adjusted to reflect the higher expenses applicable to Investor Class shares. Historical performance shown for Institutional Class shares prior to their inception reflects the performance of Administrator Class shares, and includes the higher expenses applicable to Administrator Class shares. If these expenses had not been included, returns would be higher. |
| 2 | Reflects the expense ratios as stated in the most recent prospectuses. The expense ratios shown are subject to change and may differ from the annualized expense ratios shown in the financial highlights of this report. |
| 3 | The Adviser has committed through February 29, 2016, to waive fees and/or reimburse expenses to the extent necessary to cap the Fund’s Total Annual Fund Operating Expenses After Fee Waiver, excluding certain expenses, at the amounts shown. After this time, the cap may be increased or the commitment to maintain the cap may be terminated only with the approval of the Board of Trustees. Brokerage commissions, stamp duty fees, interest, taxes, acquired fund fees and expenses, and extraordinary expenses are excluded from the cap. Without this cap, the Fund’s returns would have been lower. |
| 4 | The Morgan Stanley Capital International Europe, Australasia, and Far East (MSCI EAFE) Index (Net) is a free-float-adjusted market-capitalization-weighted index that is designed to measure the equity market performance of developed markets, excluding the U.S. and Canada. The MSCI EAFE Index (Net) consists of the following 21 developed markets country indexes: Australia, Austria, Belgium, Denmark, Finland, France, Germany, Hong Kong, Ireland, Israel, Italy, Japan, the Netherlands, New Zealand, Norway, Portugal, Singapore, Spain, Sweden, Switzerland, and the United Kingdom. You cannot invest directly in an index. Source: MSCI. MSCI makes no express or implied warranties or representations and shall have no liability whatsoever with respect to any MSCI data contained herein. The MSCI data may not be further redistributed or used as a basis for other indexes or any securities or financial products. This report is not approved, reviewed, or produced by MSCI. |
| 5 | The ten largest holdings, excluding cash and cash equivalents, are calculated based on the value of the investments divided by total net assets of the Fund. Holdings are subject to change and may have changed since the date specified. |
| 6 | Amounts are calculated based on the total long-term investments of the Fund. These percentages are subject to change and may have changed since the date specified. |
| | | | |
| 6 | | Wells Fargo Advantage Diversified International Fund | | Fund expenses (unaudited) |
As a shareholder of the Fund, you incur two types of costs: (1) transaction costs, including sales charges (loads) on purchase payments and contingent deferred sales charges (if any) on redemptions and (2) ongoing costs, including management fees, distribution (12b-1) and/or shareholder service fees, and other Fund expenses. This example is intended to help you understand your ongoing costs (in dollars) of investing in the Fund and to compare these costs with the ongoing costs of investing in other mutual funds.
The example is based on an investment of $1,000 invested at the beginning of the six-month period and held for the entire period from November 1, 2014 to April 30, 2015.
Actual expenses
The “Actual” line of the table below provides information about actual account values and actual expenses. You may use the information in this line, together with the amount you invested, to estimate the expenses that you paid over the period. Simply divide your account value by $1,000 (for example, an $8,600 account value divided by $1,000 = 8.6), then multiply the result by the number in the “Actual” line under the heading entitled “Expenses paid during period” for your applicable class of shares to estimate the expenses you paid on your account during this period.
Hypothetical example for comparison purposes
The “Hypothetical” line of the table below provides information about hypothetical account values and hypothetical expenses based on the Fund’s actual expense ratio and an assumed rate of return of 5% per year before expenses, which is not the Fund’s actual return. The hypothetical account values and expenses may not be used to estimate the actual ending account balance or expenses you paid for the period. You may use this information to compare the ongoing costs of investing in the Fund and other funds. To do so, compare this 5% hypothetical example with the 5% hypothetical examples that appear in the shareholder reports of the other funds.
Please note that the expenses shown in the table are meant to highlight your ongoing costs only and do not reflect any transactional costs, such as sales charges (loads) and contingent deferred sales charges. Therefore, the “Hypothetical” line of the table is useful in comparing ongoing costs only and will not help you determine the relative total costs of owning different funds. In addition, if these transactional costs were included, your costs would have been higher.
| | | | | | | | | | | | | | | | |
| | | Beginning
account value
11-1-2014 | | | Ending
account value
4-30-2015 | | | Expenses
paid during
the period¹ | | | Net annualized
expense ratio | |
Class A | | | | | | | | | | | | | | | | |
Actual | | $ | 1,000.00 | | | $ | 1,082.97 | | | $ | 7.28 | | | | 1.41 | % |
Hypothetical (5% return before expenses) | | $ | 1,000.00 | | | $ | 1,017.80 | | | $ | 7.05 | | | | 1.41 | % |
Class B | | | | | | | | | | | | | | | | |
Actual | | $ | 1,000.00 | | | $ | 1,079.13 | | | $ | 11.08 | | | | 2.15 | % |
Hypothetical (5% return before expenses) | | $ | 1,000.00 | | | $ | 1,014.13 | | | $ | 10.74 | | | | 2.15 | % |
Class C | | | | | | | | | | | | | | | | |
Actual | | $ | 1,000.00 | | | $ | 1,078.29 | | | $ | 11.13 | | | | 2.16 | % |
Hypothetical (5% return before expenses) | | $ | 1,000.00 | | | $ | 1,014.08 | | | $ | 10.79 | | | | 2.16 | % |
Administrator Class | | | | | | | | | | | | | | | | |
Actual | | $ | 1,000.00 | | | $ | 1,084.31 | | | $ | 6.46 | | | | 1.25 | % |
Hypothetical (5% return before expenses) | | $ | 1,000.00 | | | $ | 1,018.60 | | | $ | 6.26 | | | | 1.25 | % |
Institutional Class | | | | | | | | | | | | | | | | |
Actual | | $ | 1,000.00 | | | $ | 1,085.47 | | | $ | 5.12 | | | | 0.99 | % |
Hypothetical (5% return before expenses) | | $ | 1,000.00 | | | $ | 1,019.89 | | | $ | 4.96 | | | | 0.99 | % |
Investor Class | | | | | | | | | | | | | | | | |
Actual | | $ | 1,000.00 | | | $ | 1,082.11 | | | $ | 7.54 | | | | 1.46 | % |
Hypothetical (5% return before expenses) | | $ | 1,000.00 | | | $ | 1,017.55 | | | $ | 7.30 | | | | 1.46 | % |
| 1 | Expenses paid is equal to the annualized expense ratio of each class multiplied by the average account value over the period, multiplied by the number of days in the most recent fiscal half-year divided by the number of days in the fiscal year (to reflect the one-half-year period). |
| | | | | | |
| Portfolio of investments—April 30, 2015 (unaudited) | | Wells Fargo Advantage Diversified International Fund | | | 7 | |
| | | | | | | | | | | | |
| Security name | | | | | | Shares | | | Value | |
| | | | |
Common Stocks: 92.00% | | | | | | | | | | | | |
| | | | |
| Australia: 1.60% | | | | | | | | | | | | |
Arrium Limited (Materials, Metals & Mining) | | | | | | | 397,400 | | | $ | 54,204 | |
Bendigo Bank Limited (Financials, Banks) | | | | | | | 26,100 | | | | 248,447 | |
Challenger Financial Services Group Limited (Financials, Diversified Financial Services) | | | | | | | 36,300 | | | | 201,565 | |
Downer EDI Limited (Industrials, Commercial Services & Supplies) | | | | | | | 42,300 | | | | 147,091 | |
Fortescue Metals Group Limited (Materials, Metals & Mining) « | | | | | | | 29,600 | | | | 50,004 | |
Lend Lease Corporation Limited (Financials, Real Estate Management & Development) | | | | | | | 20,800 | | | | 262,814 | |
Metcash Limited (Consumer Staples, Food & Staples Retailing) | | | | | | | 28,500 | | | | 29,750 | |
Mineral Resources Limited (Materials, Metals & Mining) | | | | | | | 14,900 | | | | 75,749 | |
Primary Health Care Limited (Health Care, Health Care Providers & Services) | | | | | | | 34,700 | | | | 135,815 | |
Seven Network Limited (Industrials, Trading Companies & Distributors) | | | | | | | 15,300 | | | | 88,569 | |
Toll Holdings Limited (Industrials, Air Freight & Logistics) | | | | | | | 26,100 | | | | 184,729 | |
United Construction Group Limited (Industrials, Construction & Engineering) | | | | | | | 14,100 | | | | 19,374 | |
| | | | |
| | | | | | | | | | | 1,498,111 | |
| | | | | | | | | | | | |
| | | | |
| Austria: 0.34% | | | | | | | | | | | | |
OMV AG (Energy, Oil, Gas & Consumable Fuels) | | | | | | | 5,300 | | | | 176,403 | |
Voestalpine AG (Materials, Metals & Mining) | | | | | | | 3,400 | | | | 142,351 | |
| | | | |
| | | | | | | | | | | 318,754 | |
| | | | | | | | | | | | |
| | | | |
| Belgium: 1.54% | | | | | | | | | | | | |
Anheuser-Busch InBev NV (Consumer Staples, Beverages) « | | | | | | | 5,323 | | | | 648,066 | |
Delhaize Group SA (Consumer Staples, Food & Staples Retailing) | | | | | | | 3,600 | | | | 289,801 | |
Telenet Group Holding NV (Consumer Discretionary, Media) † | | | | | | | 4,300 | | | | 258,410 | |
UCB SA (Health Care, Pharmaceuticals) | | | | | | | 3,333 | | | | 240,085 | |
| | | | |
| | | | | | | | | | | 1,436,362 | |
| | | | | | | | | | | | |
| | | | |
| Brazil: 0.46% | | | | | | | | | | | | |
Ambev SA ADR (Consumer Staples, Beverages) | | | | | | | 7,778 | | | | 49,235 | |
Banco do Brasil SA (Financials, Banks) | | | | | | | 12,100 | | | | 106,906 | |
Companhia de Saneamento Basico do Estado de Sao Paulo SA (Utilities, Water Utilities) | | | | | | | 17,700 | | | | 104,569 | |
Companhia de Saneamento de Minas Gerais SA (Utilities, Water Utilities) | | | | | | | 5,300 | | | | 31,927 | |
JBS SA (Consumer Staples, Food Products) | | | | | | | 26,100 | | | | 134,617 | |
| | | | |
| | | | | | | | | | | 427,254 | |
| | | | | | | | | | | | |
| | | | |
| Canada: 1.36% | | | | | | | | | | | | |
Magna International Incorporated Class A (Consumer Discretionary, Auto Components) | | | | | | | 8,000 | | | | 403,150 | |
Metro Incorporated (Consumer Staples, Food & Staples Retailing) | | | | | | | 6,700 | | | | 193,697 | |
Valeant Pharmaceuticals International Incorporated (Health Care, Pharmaceuticals) † | | | | | | | 2,150 | | | | 466,400 | |
WestJet Airlines Limited (Industrials, Airlines) | | | | | | | 9,200 | | | | 207,944 | |
| | | | |
| | | | | | | | | | | 1,271,191 | |
| | | | | | | | | | | | |
| | | | |
| China: 7.67% | | | | | | | | | | | | |
Alibaba Group Holding Limited ADR (Information Technology, Internet Software & Services) † | | | | | | | 2,270 | | | | 184,528 | |
Baidu Incorporated ADR (Information Technology, Internet Software & Services) † | | | | | | | 7,534 | | | | 1,508,910 | |
Biostime International Holdings Limited (Consumer Staples, Food Products) | | | | | | | 59,500 | | | | 272,708 | |
China Cinda Asset Management Company Limited H Shares (Financials, Capital Markets) † | | | | | | | 470,705 | | | | 279,334 | |
The accompanying notes are an integral part of these financial statements.
| | | | |
| 8 | | Wells Fargo Advantage Diversified International Fund | | Portfolio of investments—April 30, 2015 (unaudited) |
| | | | | | | | | | | | |
| Security name | | | | | | Shares | | | Value | |
| | | | |
| China (continued) | | | | | | | | | | | | |
China Communications Services Corporation Limited (Telecommunication Services, Diversified Telecommunication Services) | | | | | | | 220,000 | | | $ | 123,980 | |
China Mobile Limited (Telecommunication Services, Wireless Telecommunication Services) | | | | | | | 59,000 | | | | 842,714 | |
China Petroleum & Chemical Corporation H Shares (Energy, Oil, Gas & Consumable Fuels) | | | | | | | 369,200 | | | | 348,438 | |
China Railway Construction Corporation Limited (Industrials, Construction & Engineering) | | | | | | | 141,500 | | | | 282,537 | |
China Resources Cement Holdings Limited (Materials, Construction Materials) | | | | | | | 236,000 | | | | 149,989 | |
Dongfeng Motor Group Company Limited H Shares (Consumer Discretionary, Automobiles) | | | | | | | 414,000 | | | | 687,802 | |
Industrial & Commercial Bank of China Limited H Shares (Financials, Banks) | | | | | | | 687,000 | | | | 595,946 | |
JD.com Incorporated ADR (Consumer Discretionary, Internet & Catalog Retail) † | | | | | | | 954 | | | | 32,016 | |
Kingboard Laminates Holdings Limited (Information Technology, Electronic Equipment, Instruments & Components) | | | | | | | 226,500 | | | | 116,130 | |
Ping An Insurance (Group) Company of China Limited H Shares (Financials, Insurance) | | | | | | | 27,435 | | | | 392,354 | |
Shanghai Pharmaceuticals Holding Company Limited (Health Care, Pharmaceuticals) | | | | | | | 59,900 | | | | 186,448 | |
Shenzhen International Holdings Limited (Industrials, Transportation Infrastructure) | | | | | | | 102,500 | | | | 192,662 | |
Tencent Holdings Limited (Information Technology, Internet Software & Services) | | | | | | | 38,400 | | | | 792,533 | |
Xtep International Holdings Limited (Consumer Discretionary, Textiles, Apparel & Luxury Goods) | | | | | | | 486,241 | | | | 176,916 | |
| | | | |
| | | | | | | | | | | 7,165,945 | |
| | | | | | | | | | | | |
| | | | |
| Czech Republic: 0.09% | | | | | | | | | | | | |
CEZ AS (Utilities, Electric Utilities) | | | | | | | 3,200 | | | | 83,137 | |
| | | | | | | | | | | | |
| | | | |
| Finland: 0.15% | | | | | | | | | | | | |
TietoEnator Oyj (Information Technology, IT Services) | | | | | | | 5,800 | | | | 139,086 | |
| | | | | | | | | | | | |
| | | | |
| France: 5.96% | | | | | | | | | | | | |
Alstom SA (Industrials, Machinery) † | | | | | | | 5,100 | | | | 160,213 | |
Arkema SA (Materials, Chemicals) | | | | | | | 910 | | | | 73,231 | |
AXA SA (Financials, Insurance) | | | | | | | 9,900 | | | | 250,330 | |
BNP Paribas SA (Financials, Banks) | | | | | | | 3,600 | | | | 227,345 | |
Compagnie de Saint-Gobain SA (Industrials, Building Products) | | | | | | | 18,426 | | | | 837,408 | |
Compagnie Generale des Etablissements Michelin SCA Class B (Consumer Discretionary, Auto Components) | | | | | | | 1,400 | | | | 156,122 | |
Credit Agricole SA (Financials, Banks) | | | | | | | 10,900 | | | | 169,586 | |
Electricite de France SA (Utilities, Electric Utilities) | | | | | | | 7,800 | | | | 198,470 | |
L’Oreal SA (Consumer Staples, Personal Products) | | | | | | | 1,261 | | | | 240,650 | |
LVMH Moet Hennessy Louis Vuitton SA (Consumer Discretionary, Textiles, Apparel & Luxury Goods) | | | | | | | 1,273 | | | | 222,605 | |
Orange SA (Telecommunication Services, Diversified Telecommunication Services) | | | | | | | 16,980 | | | | 279,683 | |
Pernod-Ricard SA (Consumer Staples, Beverages) | | | | | | | 1,803 | | | | 224,084 | |
Renault SA (Consumer Discretionary, Automobiles) | | | | | | | 2,500 | | | | 263,044 | |
Sanofi-Aventis SA (Health Care, Pharmaceuticals) | | | | | | | 4,200 | | | | 427,523 | |
Schneider Electric SA (Industrials, Electrical Equipment) | | | | | | | 4,668 | | | | 348,925 | |
SCOR SE (Financials, Insurance) « | | | | | | | 7,700 | | | | 277,136 | |
Societe Generale SA (Financials, Banks) | | | | | | | 3,700 | | | | 184,980 | |
Thales SA (Industrials, Aerospace & Defense) | | | | | | | 4,200 | | | | 255,678 | |
Total SA (Energy, Oil, Gas & Consumable Fuels) | | | | | | | 6,000 | | | | 324,900 | |
Zodiac Aerospace SA (Industrials, Aerospace & Defense) | | | | | | | 12,301 | | | | 451,733 | |
| | | | |
| | | | | | | | | | | 5,573,646 | |
| | | | | | | | | | | | |
| | | | |
| Germany: 10.29% | | | | | | | | | | | | |
Allianz AG (Financials, Insurance) « | | | | | | | 3,977 | | | | 676,944 | |
BASF SE (Materials, Chemicals) « | | | | | | | 2,900 | | | | 288,109 | |
Bayer AG (Health Care, Pharmaceuticals) | | | | | | | 12,703 | | | | 1,828,376 | |
The accompanying notes are an integral part of these financial statements.
| | | | | | |
| Portfolio of investments—April 30, 2015 (unaudited) | | Wells Fargo Advantage Diversified International Fund | | | 9 | |
| | | | | | | | | | | | |
| Security name | | | | | | Shares | | | Value | |
| | | | |
| Germany (continued) | | | | | | | | | | | | |
Bayerische Motoren Werke AG (Consumer Discretionary, Automobiles) | | | | | | | 4,558 | | | $ | 537,683 | |
Beiersdorf AG (Consumer Staples, Personal Products) | | | | | | | 4,371 | | | | 380,214 | |
Daimler AG (Consumer Discretionary, Automobiles) | | | | | | | 4,800 | | | | 461,504 | |
Deutsche Bank AG (Financials, Capital Markets) | | | | | | | 6,300 | | | | 201,486 | |
Deutsche Post AG (Industrials, Air Freight & Logistics) | | | | | | | 9,015 | | | | 296,848 | |
E.ON SE (Utilities, Multi-Utilities) « | | | | | | | 8,100 | | | | 126,101 | |
Hannover Rueckversicherung AG (Financials, Insurance) « | | | | | | | 2,200 | | | | 223,631 | |
Hugo Boss AG (Consumer Discretionary, Textiles, Apparel & Luxury Goods) | | | | | | | 2,218 | | | | 272,926 | |
Linde AG (Materials, Chemicals) | | | | | | | 4,000 | | | | 781,638 | |
Merck KGaA (Health Care, Pharmaceuticals) | | | | | | | 381 | | | | 41,074 | |
Metro AG (Consumer Staples, Food & Staples Retailing) | | | | | | | 18,444 | | | | 668,500 | |
Muenchener Rueckversicherungs Gesellschaft AG (Financials, Insurance) | | | | | | | 1,400 | | | | 273,277 | |
Norddeutsche Affinerie AG (Materials, Metals & Mining) | | | | | | | 1,800 | | | | 113,740 | |
Rheinmetall AG (Industrials, Industrial Conglomerates) | | | | | | | 13,285 | | | | 680,163 | |
SAP AG (Information Technology, Software) | | | | | | | 6,787 | | | | 512,860 | |
Siemens AG (Industrials, Industrial Conglomerates) | | | | | | | 6,756 | | | | 734,931 | |
Stada Arzneimittel AG (Health Care, Pharmaceuticals) | | | | | | | 2,900 | | | | 106,079 | |
Volkswagen AG (Consumer Discretionary, Automobiles) « | | | | | | | 1,600 | | | | 405,302 | |
| | | | |
| | | | | | | | | | | 9,611,386 | |
| | | | | | | | | | | | |
| | | | |
| Hong Kong: 3.57% | | | | | | | | | | | | |
AIA Group Limited (Financials, Insurance) | | | | | | | 180,800 | | | | 1,202,406 | |
Beijing Enterprises Holdings Limited (Industrials, Industrial Conglomerates) | | | | | | | 27,500 | | | | 251,315 | |
China Everbright Limited (Financials, Capital Markets) | | | | | | | 306,000 | | | | 1,011,588 | |
Television Broadcasts Limited (Consumer Discretionary, Media) | | | | | | | 26,800 | | | | 174,597 | |
Value Partners Group Limited (Financials, Capital Markets) | | | | | | | 221,000 | | | | 408,600 | |
Wheelock & Company Limited (Financials, Real Estate Management & Development) | | | | | | | 22,000 | | | | 123,880 | |
Yue Yuen Industrial Holdings Limited (Consumer Discretionary, Textiles, Apparel & Luxury Goods) | | | | | | | 42,000 | | | | 159,587 | |
| | | | |
| | | | | | | | | | | 3,331,973 | |
| | | | | | | | | | | | |
| | | | |
| India: 0.99% | | | | | | | | | | | | |
Adani Enterprises Limited (Industrials, Trading Companies & Distributors) | | | | | | | 4,650 | | | | 49,230 | |
Gail Limited (Utilities, Gas Utilities) | | | | | | | 1,800 | | | | 61,200 | |
Housing Development Finance Corporation Limited (Financials, Thrifts & Mortgage Finance) | | | | | | | 18,441 | | | | 339,187 | |
Infosys Technologies Limited ADR (Information Technology, IT Services) | | | | | | | 3,558 | | | | 110,227 | |
Tata Motors Limited ADR (Consumer Discretionary, Automobiles) | | | | | | | 6,600 | | | | 271,854 | |
Tata Steel Limited GDR (Industrials, Machinery) | | | | | | | 17,100 | | | | 97,970 | |
| | | | |
| | | | | | | | | | | 929,668 | |
| | | | | | | | | | | | |
| | | | |
| Ireland: 1.39% | | | | | | | | | | | | |
Medtronic plc (Health Care, Health Care Equipment & Supplies) | | | | | | | 14,321 | | | | 1,066,198 | |
Smurfit Kappa Group plc (Materials, Containers & Packaging) | | | | | | | 7,500 | | | | 229,624 | |
| | | | |
| | | | | | | | | | | 1,295,822 | |
| | | | | | | | | | | | |
| | | | |
| Israel: 0.50% | | | | | | | | | | | | |
Bank Hapoalim Limited (Financials, Banks) | | | | | | | 38,000 | | | | 190,074 | |
Teva Pharmaceutical Industries Limited (Health Care, Pharmaceuticals) | | | | | | | 4,600 | | | | 279,516 | |
| | | | |
| | | | | | | | | | | 469,590 | |
| | | | | | | | | | | | |
The accompanying notes are an integral part of these financial statements.
| | | | |
| 10 | | Wells Fargo Advantage Diversified International Fund | | Portfolio of investments—April 30, 2015 (unaudited) |
| | | | | | | | | | | | |
| Security name | | | | | | Shares | | | Value | |
| | | | |
| Italy: 4.07% | | | | | | | | | | | | |
Anima Holding SpA (Financials, Capital Markets) † | | | | | | | 117,398 | | | $ | 1,045,262 | |
Enel SpA (Utilities, Electric Utilities) | | | | | | | 48,100 | | | | 227,991 | |
ENI SpA (Energy, Oil, Gas & Consumable Fuels) | | | | | | | 40,469 | | | | 776,433 | |
Intesa Sanpaolo SpA (Financials, Banks) | | | | | | | 197,711 | | | | 664,210 | |
Mediaset SpA (Consumer Discretionary, Media) † | | | | | | | 15,555 | | | | 79,947 | |
Prysmian SpA (Industrials, Electrical Equipment) | | | | | | | 39,328 | | | | 802,017 | |
Telecom Italia SpA (Telecommunication Services, Diversified Telecommunication Services) † | | | | | | | 178,742 | | | | 210,963 | |
| | | | |
| | | | | | | | | | | 3,806,823 | |
| | | | | | | | | | | | |
| | | | |
| Japan: 16.56% | | | | | | | | | | | | |
Adeka Corporation (Materials, Chemicals) | | | | | | | 20,600 | | | | 290,558 | |
Aisin Seiki Company Limited (Consumer Discretionary, Auto Components) | | | | | | | 3,300 | | | | 150,902 | |
Alpine Electronics Incorporated (Consumer Discretionary, Household Durables) | | | | | | | 11,600 | | | | 235,727 | |
Aozora Bank Limited (Financials, Banks) | | | | | | | 41,000 | | | | 153,358 | |
Coca-Cola East Japan Company Limited (Consumer Staples, Beverages) | | | | | | | 15,600 | | | | 291,518 | |
Daiwa House Industry Company Limited (Financials, Real Estate Management & Development) | | | | | | | 42,800 | | | | 955,510 | |
Daiwa Securities Group Incorporated (Financials, Capital Markets) | | | | | | | 37,000 | | | | 306,945 | |
Eizo Nanao Corporation (Information Technology, Technology Hardware, Storage & Peripherals) | | | | | | | 7,300 | | | | 161,930 | |
Fuji Oil Company Limited (Consumer Staples, Food Products) | | | | | | | 8,800 | | | | 127,952 | |
Hitachi Limited (Information Technology, Electronic Equipment, Instruments & Components) | | | | | | | 130,000 | | | | 886,977 | |
Ishikawajima-Harima Heavy Industries Company Limited (Industrials, Machinery) | | | | | | | 104,000 | | | | 476,801 | |
Isuzu Motors Limited (Consumer Discretionary, Automobiles) | | | | | | | 8,800 | | | | 116,634 | |
Itochu Corporation (Industrials, Trading Companies & Distributors) | | | | | | | 14,600 | | | | 179,771 | |
JS Group Corporation (Industrials, Building Products) | | | | | | | 6,800 | | | | 141,736 | |
JX Holdings Incorporated (Energy, Oil, Gas & Consumable Fuels) | | | | | | | 28,500 | | | | 124,108 | |
KDDI Corporation (Telecommunication Services, Wireless Telecommunication Services) | | | | | | | 10,500 | | | | 248,455 | |
Kyorin Company Limited (Health Care, Pharmaceuticals) | | | | | | | 7,900 | | | | 181,714 | |
Maeda Road Construction Company Limited (Industrials, Construction & Engineering) | | | | | | | 11,000 | | | | 181,287 | |
Marubeni Corporation (Industrials, Trading Companies & Distributors) | | | | | | | 30,000 | | | | 185,762 | |
Miraca Holdings Incorporated (Health Care, Health Care Providers & Services) | | | | | | | 1,800 | | | | 90,557 | |
Mitsubishi Corporation (Industrials, Trading Companies & Distributors) | | | | | | | 8,800 | | | | 189,875 | |
Mitsubishi UFJ Financial Group Incorporated (Financials, Banks) | | | | | | | 177,500 | | | | 1,261,022 | |
Mitsui & Company Limited (Industrials, Trading Companies & Distributors) | | | | | | | 14,400 | | | | 201,400 | |
Mitsui Fudosan Company Limited (Financials, Real Estate Management & Development) | | | | | | | 21,000 | | | | 622,530 | |
Mizuho Financial Group Incorporated (Financials, Banks) | | | | | | | 154,300 | | | | 294,139 | |
NGK Insulators Limited (Industrials, Machinery) | | | | | | | 22,000 | | | | 494,202 | |
Nippon Telegraph & Telephone Corporation (Telecommunication Services, Diversified Telecommunication Services) | | | | | | | 7,900 | | | | 533,447 | |
Nissan Motor Company Limited (Consumer Discretionary, Automobiles) | | | | | | | 15,800 | | | | 164,015 | |
Nitto Denko Corporation (Materials, Chemicals) | | | | | | | 6,600 | | | | 422,964 | |
Nomura Holdings Incorporated (Financials, Capital Markets) | | | | | | | 128,700 | | | | 834,930 | |
NTT DoCoMo Incorporated (Telecommunication Services, Wireless Telecommunication Services) | | | | | | | 11,700 | | | | 207,236 | |
Olympus Corporation (Health Care, Health Care Equipment & Supplies) † | | | | | | | 21,300 | | | | 767,012 | |
Ono Pharmaceutical Company Limited (Health Care, Pharmaceuticals) | | | | | | | 200 | | | | 21,676 | |
Otsuka Holdings Company Limited (Health Care, Pharmaceuticals) | | | | | | | 2,600 | | | | 82,068 | |
Resona Holdings Incorporated (Financials, Banks) | | | | | | | 43,800 | | | | 233,544 | |
Sankyu Incorporated (Industrials, Road & Rail) | | | | | | | 28,000 | | | | 131,318 | |
SEINO Holdings Company Limited (Industrials, Road & Rail) | | | | | | | 3,000 | | | | 34,437 | |
Sojitz Corporation (Industrials, Trading Companies & Distributors) | | | | | | | 77,400 | | | | 151,347 | |
Sumitomo Corporation (Industrials, Trading Companies & Distributors) | | | | | | | 19,900 | | | | 234,974 | |
Sumitomo Metal Mining Company Limited (Materials, Metals & Mining) | | | | | | | 11,000 | | | | 161,229 | |
The accompanying notes are an integral part of these financial statements.
| | | | | | |
| Portfolio of investments—April 30, 2015 (unaudited) | | Wells Fargo Advantage Diversified International Fund | | | 11 | |
| | | | | | | | | | | | |
| Security name | | | | | | Shares | | | Value | |
| | | | |
| Japan (continued) | | | | | | | | | | | | |
Sumitomo Mitsui Financial Group Incorporated (Financials, Banks) | | | | | | | 8,000 | | | $ | 349,317 | |
Toshiba TEC Corporation (Information Technology, Technology Hardware, Storage & Peripherals) | | | | | | | 22,000 | | | | 122,006 | |
Toyo Tire & Rubber Company Limited (Consumer Discretionary, Auto Components) | | | | | | | 9,500 | | | | 181,974 | |
Toyota Motor Corporation (Consumer Discretionary, Automobiles) | | | | | | | 24,700 | | | | 1,719,345 | |
Tsumura & Company (Health Care, Pharmaceuticals) | | | | | | | 5,600 | | | | 131,226 | |
West Holdings Corporation (Consumer Discretionary, Household Durables) | | | | | | | 21,500 | | | | 155,895 | |
Yaskawa Electric Corporation (Information Technology, Electronic Equipment, Instruments & Components) | | | | | | | 3,700 | | | | 50,836 | |
Yokohama Rubber Company Limited (Consumer Discretionary, Auto Components) | | | | | | | 21,000 | | | | 225,972 | |
| | | | |
| | | | | | | | | | | 15,468,138 | |
| | | | | | | | | | | | |
| | | | |
| Liechtenstein: 0.13% | | | | | | | | | | | | |
Verwaltungs-und Privat-Bank AG (Financials, Capital Markets) | | | | | | | 1,400 | | | | 117,798 | |
| | | | | | | | | | | | |
| | | | |
| Mexico: 1.03% | | | | | | | | | | | | |
Grupo Televisa SAB ADR (Consumer Discretionary, Media) † | | | | | | | 26,529 | | | | 965,921 | |
| | | | | | | | | | | | |
| | | | |
| Netherlands: 2.64% | | | | | | | | | | | | |
Aegon NV (Financials, Insurance) | | | | | | | 17,300 | | | | 136,495 | |
Akzo Nobel NV (Materials, Chemicals) « | | | | | | | 10,576 | | | | 809,209 | |
ASML Holdings NV (Information Technology, Semiconductors & Semiconductor Equipment) | | | | | | | 8,939 | | | | 961,952 | |
ING Groep NV (Financials, Banks) † | | | | | | | 16,600 | | | | 254,670 | |
Koninklijke Ahold NV (Consumer Staples, Food & Staples Retailing) | | | | | | | 15,600 | | | | 302,236 | |
| | | | |
| | | | | | | | | | | 2,464,562 | |
| | | | | | | | | | | | |
| | | | |
| Norway: 1.08% | | | | | | | | | | | | |
DnB Nor ASA (Financials, Banks) | | | | | | | 12,100 | | | | 214,959 | |
Frontline 2012 Limited (Energy, Oil, Gas & Consumable Fuels) 144A | | | | | | | 25,569 | | | | 156,205 | |
Marine Harvest ASA (Consumer Staples, Food Products) | | | | | | | 33,138 | | | | 403,908 | |
Yara International ASA (Materials, Chemicals) « | | | | | | | 4,600 | | | | 235,692 | |
| | | | |
| | | | | | | | | | | 1,010,764 | |
| | | | | | | | | | | | |
| | | | |
| Poland: 0.11% | | | | | | | | | | | | |
Asseco Poland SA (Information Technology, Software) | | | | | | | 5,900 | | | | 99,395 | |
| | | | | | | | | | | | |
| | | | |
| Russia: 0.38% | | | | | | | | | | | | |
Gazprom Neft Sponsored ADR (Energy, Oil, Gas & Consumable Fuels) | | | | | | | 10,500 | | | | 144,143 | |
LUKOIL OAO ADR (Energy, Oil, Gas & Consumable Fuels) | | | | | | | 4,200 | | | | 215,250 | |
| | | | |
| | | | | | | | | | | 359,393 | |
| | | | | | | | | | | | |
| | | | |
| Singapore: 0.29% | | | | | | | | | | | | |
DBS Group Holdings Limited (Financials, Banks) | | | | | | | 17,000 | | | | 270,136 | |
| | | | | | | | | | | | |
| | | | |
| South Africa: 0.26% | | | | | | | | | | | | |
Barclays Africa Group Limited (Financials, Banks) | | | | | | | 9,300 | | | | 148,968 | |
Imperial Holdings Limited (Consumer Discretionary, Distributors) | | | | | | | 5,700 | | | | 95,454 | |
| | | | |
| | | | | | | | | | | 244,422 | |
| | | | | | | | | | | | |
The accompanying notes are an integral part of these financial statements.
| | | | |
| 12 | | Wells Fargo Advantage Diversified International Fund | | Portfolio of investments—April 30, 2015 (unaudited) |
| | | | | | | | | | | | |
| Security name | | | | | | Shares | | | Value | |
| | | | |
| South Korea: 2.41% | | | | | | | | | | | | |
GS Retail Company Limited (Consumer Staples, Food & Staples Retailing) | | | | | | | 5,900 | | | $ | 213,356 | |
Hana Financial Group Incorporated (Financials, Banks) | | | | | | | 19,939 | | | | 586,922 | |
Industrial Bank of Korea (Financials, Banks) | | | | | | | 13,500 | | | | 185,489 | |
KJB Financial Group Company Limited (Financials, Banks) † | | | | | | | 1,044 | | | | 7,791 | |
KNB Financial Group Company Limited (Financials, Banks) † | | | | | | | 1,595 | | | | 15,102 | |
Orion Corporation (Consumer Staples, Food Products) | | | | | | | 3 | | | | 3,504 | |
Samsung Electronics Company Limited GDR (Information Technology, Semiconductors & Semiconductor Equipment) 144A | | | | | | | 837 | | | | 548,894 | |
SK Telecom Company Limited (Telecommunication Services, Wireless Telecommunication Services) | | | | | | | 2,061 | | | | 552,292 | |
Woori Bank (Financials, Banks) | | | | | | | 13,760 | | | | 137,458 | |
| | | | |
| | | | | | | | | | | 2,250,808 | |
| | | | | | | | | | | | |
| | | | |
| Spain: 0.91% | | | | | | | | | | | | |
Banco Santander Central Hispano SA (Financials, Banks) | | | | | | | 22,800 | | | | 172,381 | |
Grifols SA (Health Care, Biotechnology) | | | | | | | 4,024 | | | | 170,745 | |
Grifols SA ADR (Health Care, Biotechnology) | | | | | | | 3,918 | | | | 124,632 | |
International Consolidated Airlines Group SA (Industrials, Airlines) † | | | | | | | 46,252 | | | | 383,598 | |
| | | | |
| | | | | | | | | | | 851,356 | |
| | | | | | | | | | | | |
| | | | |
| Sweden: 1.66% | | | | | | | | | | | | |
Autoliv Incorporated SDR (Consumer Discretionary, Auto Components) | | | | | | | 1,486 | | | | 177,261 | |
Boliden AB (Materials, Metals & Mining) | | | | | | | 9,400 | | | | 204,221 | |
Nordea Bank AB (Financials, Banks) | | | | | | | 15,000 | | | | 190,577 | |
Saab AB (Industrials, Aerospace & Defense) | | | | | | | 5,200 | | | | 134,226 | |
Swedbank AB (Financials, Banks) | | | | | | | 11,917 | | | | 277,102 | |
TeliaSonera AB (Telecommunication Services, Diversified Telecommunication Services) | | | | | | | 17,700 | | | | 110,043 | |
Volvo AB Class B (Industrials, Machinery) | | | | | | | 33,135 | | | | 457,766 | |
| | | | |
| | | | | | | | | | | 1,551,196 | |
| | | | | | | | | | | | |
| | | | |
| Switzerland: 7.21% | | | | | | | | | | | | |
ABB Limited (Industrials, Electrical Equipment) | | | | | | | 27,464 | | | | 601,803 | |
Actelion Pharmaceuticals Limited (Health Care, Biotechnology) | | | | | | | 3,298 | | | | 433,953 | |
Adecco SA (Industrials, Professional Services) | | | | | | | 3,511 | | | | 286,135 | |
Baloise Holding AG (Financials, Insurance) | | | | | | | 2,000 | | | | 260,272 | |
Credit Suisse Group AG (Financials, Capital Markets) | | | | | | | 10,100 | | | | 267,317 | |
Georg Fischer AG (Industrials, Machinery) | | | | | | | 300 | | | | 212,191 | |
Nestle SA (Consumer Staples, Food Products) | | | | | | | 10,811 | | | | 838,763 | |
Novartis AG (Health Care, Pharmaceuticals) | | | | | | | 9,156 | | | | 934,572 | |
Roche Holding AG (Health Care, Pharmaceuticals) | | | | | | | 2,445 | | | | 699,649 | |
Swiss Life Holding AG (Financials, Insurance) | | | | | | | 600 | | | | 142,381 | |
Swiss Reinsurance AG (Financials, Insurance) | | | | | | | 3,900 | | | | 345,959 | |
Syngenta AG (Materials, Chemicals) | | | | | | | 553 | | | | 185,050 | |
Zurich Financial Services AG (Financials, Insurance) | | | | | | | 4,951 | | | | 1,528,141 | |
| | | | |
| | | | | | | | | | | 6,736,186 | |
| | | | | | | | | | | | |
| | | | |
| Taiwan: 0.14% | | | | | | | | | | | | |
Pegatron Corporation (Information Technology, Technology Hardware, Storage & Peripherals) | | | | | | | 46,000 | | | | 136,273 | |
| | | | | | | | | | | | |
| | | | |
| Thailand: 0.16% | | | | | | | | | | | | |
Bangchak Petroleum PCL (Energy, Oil, Gas & Consumable Fuels) | | | | | | | 135,400 | | | | 145,812 | |
| | | | | | | | | | | | |
The accompanying notes are an integral part of these financial statements.
| | | | | | |
| Portfolio of investments—April 30, 2015 (unaudited) | | Wells Fargo Advantage Diversified International Fund | | | 13 | |
| | | | | | | | | | | | |
| Security name | | | | | | Shares | | | Value | |
| | | | |
| United Kingdom: 15.70% | | | | | | | | | | | | |
3i Group plc (Financials, Capital Markets) | | | | | | | 17,300 | | | $ | 134,019 | |
Amlin plc (Financials, Insurance) | | | | | | | 19,500 | | | | 136,656 | |
Anglo American plc (Materials, Metals & Mining) | | | | | | | 9,600 | | | | 162,648 | |
AstraZeneca plc (Health Care, Pharmaceuticals) | | | | | | | 3,900 | | | | 267,644 | |
Aviva plc (Financials, Insurance) | | | | | | | 22,000 | | | | 177,000 | |
Babcock International Group plc (Industrials, Commercial Services & Supplies) | | | | | | | 9,232 | | | | 142,412 | |
BAE Systems plc (Industrials, Aerospace & Defense) | | | | | | | 49,700 | | | | 385,036 | |
Barclays plc (Financials, Banks) | | | | | | | 50,000 | | | | 195,622 | |
Bellway plc (Consumer Discretionary, Household Durables) | | | | | | | 4,200 | | | | 127,689 | |
BP plc (Energy, Oil, Gas & Consumable Fuels) | | | | | | | 157,560 | | | | 1,136,385 | |
BT Group plc (Telecommunication Services, Diversified Telecommunication Services) | | | | | | | 77,315 | | | | 539,240 | |
Capita plc (Industrials, Professional Services) | | | | | | | 15,775 | | | | 276,113 | |
Centrica plc (Utilities, Multi-Utilities) | | | | | | | 41,800 | | | | 163,208 | |
Croda International plc (Materials, Chemicals) | | | | | | | 9,957 | | | | 432,101 | |
Delphi Automotive plc (Consumer Discretionary, Auto Components) | | | | | | | 5,475 | | | | 454,425 | |
Diageo plc (Consumer Staples, Beverages) | | | | | | | 322 | | | | 8,939 | |
Firstgroup plc (Industrials, Road & Rail) † | | | | | | | 32,500 | | | | 49,365 | |
GlaxoSmithKline plc (Health Care, Pharmaceuticals) | | | | | | | 8,800 | | | | 203,251 | |
Intercontinental Hotels Group plc (Consumer Discretionary, Hotels, Restaurants & Leisure) | | | | | | | 6,939 | | | | 296,750 | |
J Sainsbury plc (Consumer Staples, Food & Staples Retailing) | | | | | | | 54,000 | | | | 224,536 | |
Johnson Matthey plc (Materials, Chemicals) | | | | | | | 14,931 | | | | 763,404 | |
Liberty Global plc Class A (Consumer Discretionary, Media) † | | | | | | | 10,591 | | | | 552,215 | |
Liberty Global plc Class C (Consumer Discretionary, Media) † | | | | | | | 17,279 | | | | 871,726 | |
Lloyds Banking Group plc (Financials, Banks) | | | | | | | 390,041 | | | | 461,916 | |
Man Group plc (Financials, Capital Markets) | | | | | | | 344,854 | | | | 1,016,806 | |
Mondi plc (Materials, Paper & Forest Products) | | | | | | | 8,700 | | | | 176,159 | |
Old Mutual plc (Financials, Insurance) | | | | | | | 59,600 | | | | 213,792 | |
Pace plc (Consumer Discretionary, Household Durables) | | | | | | | 19,300 | | | | 122,365 | |
Petrofac Limited (Energy, Energy Equipment & Services) | | | | | | | 5,600 | | | | 74,745 | |
Prudential plc (Financials, Insurance) | | | | | | | 14,878 | | | | 370,425 | |
Reckitt Benckiser Group plc (Consumer Staples, Household Products) | | | | | | | 5,780 | | | | 514,445 | |
Rolls-Royce Holdings plc (Industrials, Aerospace & Defense) (a)† | | | | | | | 1,311,300 | | | | 2,013 | |
Rolls-Royce Holdings plc (Industrials, Aerospace & Defense) | | | | | | | 9,300 | | | | 148,269 | |
Royal Dutch Shell plc Class B (Energy, Oil, Gas & Consumable Fuels) | | | | | | | 15,800 | | | | 505,849 | |
SABMiller plc (Consumer Staples, Beverages) | | | | | | | 11,189 | | | | 592,266 | |
Smiths Group plc (Industrials, Industrial Conglomerates) | | | | | | | 26,424 | | | | 462,590 | |
Tesco plc (Consumer Staples, Food & Staples Retailing) | | | | | | | 18,300 | | | | 61,683 | |
Tullett Prebon plc (Financials, Capital Markets) | | | | | | | 20,600 | | | | 112,804 | |
Vodafone Group plc (Telecommunication Services, Wireless Telecommunication Services) | | | | | | | 209,724 | | | | 738,901 | |
William Morrison Supermarkets plc (Consumer Staples, Food & Staples Retailing) | | | | | | | 48,700 | | | | 138,857 | |
Wolseley plc (Industrials, Trading Companies & Distributors) | | | | | | | 12,268 | | | | 725,583 | |
WPP plc (Consumer Discretionary, Media) | | | | | | | 22,581 | | | | 526,622 | |
| | | | |
| | | | | | | | | | | 14,666,474 | |
| | | | | | | | | | | | |
| | | | |
| United States: 1.35% | | | | | | | | | | | | |
Cognizant Technology Solutions Corporation Class A (Information Technology, IT Services) † | | | | | | | 7,277 | | | | 425,996 | |
QUALCOMM Incorporated (Information Technology, Communications Equipment) | | | | | | | 7,896 | | | | 536,928 | |
Schlumberger Limited (Energy, Energy Equipment & Services) | | | | | | | 1,994 | | | | 188,652 | |
The accompanying notes are an integral part of these financial statements.
| | | | |
| 14 | | Wells Fargo Advantage Diversified International Fund | | Portfolio of investments—April 30, 2015 (unaudited) |
| | | | | | | | | | | | | | | | |
| Security name | | | | | | | | Shares | | | Value | |
| | | | |
| United States (continued) | | | | | | | | | | | | | | | | |
WABCO Holdings Incorporated (Consumer Discretionary, Auto Components) † | | | | | | | | | | | 852 | | | $ | 106,031 | |
| | | | |
| | | | | | | | | | | | | | | 1,257,607 | |
| | | | | | | | | | | | | | | | |
| | | | |
Total Common Stocks (Cost $71,353,839) | | | | | | | | | | | | | | | 85,954,989 | |
| | | | | | | | | | | | | | | | |
| | | | |
| | | | | | Expiration date | | | | | | | |
| Participation Notes: 0.84% | | | | | | | | | | | | | | | | |
| | | | |
| China: 0.56% | | | | | | | | | | | | | | | | |
HSBC Bank plc (Kweichow Moutai Company Limited Class A) (Consumer Staples, Beverages) † | | | | | | | 2-19-2019 | | | | 3,100 | | | | 126,113 | |
HSBC Bank plc (Kweichow Moutai Company Limited Class A) (Consumer Staples, Beverages) † | | | | | | | 12-4-2024 | | | | 996 | | | | 40,519 | |
Standard Chartered Bank (Kweichow Moutai Company Limited Class A) (Consumer Staples, Beverages) † | | | | | | | 4-18-2016 | | | | 8,730 | | | | 355,150 | |
| | | | |
| | | | | | | | | | | | | | | 521,782 | |
| | | | | | | | | | | | | | | | |
| | | | |
| Ireland: 0.28% | | | | | | | | | | | | | | | | |
HSBC Bank plc (Ryanair Holdings plc) (Industrials, Airlines) † | | | | | | | 11-17-2016 | | | | 22,400 | | | | 264,648 | |
| | | | | | | | | | | | | | | | |
| | | | |
Total Participation Notes (Cost $620,436) | | | | | | | | | | | | | | | 786,430 | |
| | | | | | | | | | | | | | | | |
| | | | |
| | | Dividend yield | | | | | | | | | | |
| Preferred Stocks: 1.60% | | | | | | | | | | | | | | | | |
| | | | |
| Brazil: 0.14% | | | | | | | | | | | | | | | | |
Companhia Energetica de Minas Gerais SA (Utilities, Electric Utilities) ± | | | 7.10 | % | | | | | | | 13,600 | | | | 65,677 | |
Companhia Vale Do Rio Doce Class A (Materials, Metals & Mining) ± | | | 2.31 | | | | | | | | 11,100 | | | | 66,866 | |
| | | | |
| | | | | | | | | | | | | | | 132,543 | |
| | | | | | | | | | | | | | | | |
| | | | |
| Germany: 1.46% | | | | | | | | | | | | | | | | |
Henkel AG & Company KGaA (Consumer Staples, Household Products) ± | | | 1.20 | | | | | | | | 2,280 | | | | 264,839 | |
Porsche Automobil Holding SE (Consumer Discretionary, Automobiles) ± | | | 2.88 | | | | | | | | 5,154 | | | | 489,028 | |
Volkswagen AG (Consumer Discretionary, Automobiles) «± | | | 2.16 | | | | | | | | 2,359 | | | | 607,315 | |
| | | | |
| | | | | | | | | | | | | | | 1,361,182 | |
| | | | | | | | | | | | | | | | |
| | | | |
Total Preferred Stocks (Cost $1,569,046) | | | | | | | | | | | | | | | 1,493,725 | |
| | | | | | | | | | | | | | | | |
| | | | |
| | | Yield | | | | | | | | | | |
| Short-Term Investments: 8.20% | | | | | | | | | | | | | | | | |
| | | | |
| Investment Companies: 8.20% | | | | | | | | | | | | | | | | |
Securities Lending Cash Investments, LLC (l)(r)(u) | | | 0.12 | | | | | | | | 3,731,148 | | | | 3,731,148 | |
Wells Fargo Advantage Cash Investment Money Market Fund, Select Class (l)(u) | | | 0.11 | | | | | | | | 3,924,473 | | | | 3,924,473 | |
| | | | |
Total Short-Term Investments (Cost $7,655,621) | | | | | | | | | | | | | | | 7,655,621 | |
| | | | | | | | | | | | | | | | |
| | | | | | | | |
| Total investments in securities (Cost $81,198,942) * | | | 102.64 | % | | | 95,890,765 | |
Other assets and liabilities, net | | | (2.64 | ) | | | (2,463,830 | ) |
| | | | | | | | |
| Total net assets | | | 100.00 | % | | $ | 93,426,935 | |
| | | | | | | | |
The accompanying notes are an integral part of these financial statements.
| | | | | | |
| Portfolio of investments—April 30, 2015 (unaudited) | | Wells Fargo Advantage Diversified International Fund | | | 15 | |
| « | All or a portion of this security is on loan. |
| † | Non-income-earning security |
| 144A | The security may be resold in transactions exempt from registration, normally to qualified institutional buyers, pursuant to Rule 144A under the Securities Act of 1933. |
| (a) | The security is fair valued in accordance with procedures approved by the Board of Trustees. |
| ± | Variable rate investment. The rate shown is the rate in effect at period end. |
| (r) | The investment is a non-registered investment vehicle purchased with cash collateral received from securities on loan. |
| (l) | The security represents an affiliate of the Fund as defined in the Investment Company Act of 1940. |
| (u) | The rate represents the 7-day annualized yield at period end. |
| * | Cost for federal income tax purposes is $82,950,188 and unrealized gains (losses) consists of: |
| | | | |
Gross unrealized gains | | $ | 19,026,775 | |
Gross unrealized losses | | | (6,086,198 | ) |
| | | | |
Net unrealized gains | | $ | 12,940,577 | |
The accompanying notes are an integral part of these financial statements.
| | | | |
| 16 | | Wells Fargo Advantage Diversified International Fund | | Statement of assets and liabilities—April 30, 2015 (unaudited) |
| | | | |
| | | | |
| |
Assets | | | | |
Investments | | | | |
In unaffiliated securities (including $3,552,410 of securities loaned), at value (cost $73,543,321) | | $ | 88,235,144 | |
In affiliated securities, at value (cost $7,655,621) | | | 7,655,621 | |
| | | | |
Total investments, at value (cost $81,198,942) | | | 95,890,765 | |
Foreign currency, at value (cost $895,145) | | | 883,036 | |
Receivable for investments sold | | | 334,241 | |
Receivable for Fund shares sold | | | 175,840 | |
Receivable for dividends | | | 368,649 | |
Receivable for securities lending income | | | 5,472 | |
Prepaid expenses and other assets | | | 31,262 | |
| | | | |
Total assets | | | 97,689,265 | |
| | | | |
| |
Liabilities | | | | |
Payable for investments purchased | | | 268,117 | |
Payable for Fund shares redeemed | | | 62,970 | |
Unrealized losses on forward foreign currency contracts | | | 95,758 | |
Payable upon receipt of securities loaned | | | 3,731,148 | |
Advisory fee payable | | | 30,334 | |
Distribution fees payable | | | 1,211 | |
Administration fees payable | | | 24,250 | |
Accrued expenses and other liabilities | | | 48,542 | |
| | | | |
Total liabilities | | | 4,262,330 | |
| | | | |
Total net assets | | $ | 93,426,935 | |
| | | | |
| |
NET ASSETS CONSIST OF | | | | |
Paid-in capital | | $ | 180,780,759 | |
Undistributed net investment income | | | 315,690 | |
Accumulated net realized losses on investments | | | (102,256,715 | ) |
Net unrealized gains on investments | | | 14,587,201 | |
| | | | |
Total net assets | | $ | 93,426,935 | |
| | | | |
| |
COMPUTATION OF NET ASSET VALUE AND OFFERING PRICE PER SHARE | | | | |
Net assets – Class A | | $ | 26,501,067 | |
Shares outstanding – Class A1 | | | 2,086,838 | |
Net asset value per share – Class A | | | $12.70 | |
Maximum offering price per share – Class A2 | | | $13.47 | |
Net assets – Class B | | $ | 22,900 | |
Shares outstanding – Class B1 | | | 1,846 | |
Net asset value per share – Class B | | | $12.41 | |
Net assets – Class C | | $ | 2,049,447 | |
Shares outstanding – Class C1 | | | 174,350 | |
Net asset value per share – Class C | | | $11.75 | |
Net assets – Administrator Class | | $ | 9,180,784 | |
Shares outstanding – Administrator Class1 | | | 710,055 | |
Net asset value per share – Administrator Class | | | $12.93 | |
Net assets – Institutional Class | | $ | 3,077,266 | |
Shares outstanding – Institutional Class1 | | | 253,849 | |
Net asset value per share – Institutional Class | | | $12.12 | |
Net assets – Investor Class | | $ | 52,595,471 | |
Shares outstanding – Investor Class1 | | | 4,159,802 | |
Net asset value per share – Investor Class | | | $12.64 | |
| 1 | The Fund has an unlimited number of authorized shares. |
| 2 | Maximum offering price is computed as 100/94.25 of net asset value. On investments of $50,000 or more, the offering price is reduced. |
The accompanying notes are an integral part of these financial statements.
| | | | | | |
| Statement of operations—six months ended April 30, 2015 (unaudited) | | Wells Fargo Advantage Diversified International Fund | | | 17 | |
| | | | |
| | | | |
| |
Investment income | | | | |
Dividends (net of foreign withholding taxes of $81,550) | | $ | 976,855 | |
Securities lending income, net | | | 15,653 | |
Income from affiliated securities | | | 1,081 | |
Interest | | | 15 | |
| | | | |
Total investment income | | | 993,604 | |
| | | | |
| |
Expenses | | | | |
Advisory fee | | | 357,884 | |
Administration fees | | | | |
Fund level | | | 21,052 | |
Class A | | | 31,445 | |
Class B | | | 26 | |
Class C | | | 2,144 | |
Administrator Class | | | 3,715 | |
Institutional Class | | | 1,104 | |
Investor Class | | | 77,057 | |
Shareholder servicing fees | | | | |
Class A | | | 30,235 | |
Class B | | | 26 | |
Class C | | | 2,061 | |
Administrator Class | | | 9,287 | |
Investor Class | | | 59,621 | |
Distribution fees | | | | |
Class B | | | 77 | |
Class C | | | 6,184 | |
Custody and accounting fees | | | 78,784 | |
Professional fees | | | 23,339 | |
Registration fees | | | 34,315 | |
Shareholder report expenses | | | 18,973 | |
Trustees’ fees and expenses | | | 6,989 | |
Other fees and expenses | | | 28,356 | |
| | | | |
Total expenses | | | 792,674 | |
Less: Fee waivers and/or expense reimbursements | | | (192,446 | ) |
| | | | |
Net expenses | | | 600,228 | |
| | | | |
Net investment income | | | 393,376 | |
| | | | |
| |
REALIZED AND UNREALIZED GAINS (LOSSES) ON INVESTMENTS | | | | |
| |
Net realized gains on: | | | | |
Unaffiliated securities | | | 2,207,709 | |
Forward foreign currency contract transactions | | | 334,702 | |
| | | | |
Net realized gains on investments | | | 2,542,411 | |
| | | | |
| |
Net change in unrealized gains (losses) on: | | | | |
Unaffiliated securities | | | 4,187,006 | |
Forward foreign currency contract transactions | | | (157,661 | ) |
| | | | |
Net change in unrealized gains (losses) on investments | | | 4,029,345 | |
| | | | |
Net realized and unrealized gains (losses) on investments | | | 6,571,756 | |
| | | | |
Net increase in net assets resulting from operations | | $ | 6,965,132 | |
| | | | |
The accompanying notes are an integral part of these financial statements.
| | | | |
| 18 | | Wells Fargo Advantage Diversified International Fund | | Statement of changes in net assets |
| | | | | | | | | | | | | | | | |
| | | Six months ended
April 30, 2015
(unaudited) | | | Year ended
October 31, 2014 | |
| | | |
Operations | | | | | | | | | | | | |
Net investment income | | | | | | $ | 393,376 | | | | | | | $ | 1,716,255 | |
Net realized gains on investments | | | | | | | 2,542,411 | | | | | | | | 1,412,567 | |
Net change in unrealized gains (losses) on investments | | | | | | | 4,029,345 | | | | | | | | (3,468,155 | ) |
| | | | |
Net increase (decrease) in net assets resulting from operations | | | | | | | 6,965,132 | | | | | | | | (339,333 | ) |
| | | | |
| | | |
Distributions to shareholders from | | | | | | | | | | | | |
Net investment income | | | | | | | | | | | | | | | | |
Class A | | | | | | | (567,395 | ) | | | | | | | (435,361 | ) |
Class B | | | | | | | 0 | | | | | | | | (908 | ) |
Class C | | | | | | | (25,962 | ) | | | | | | | (22,476 | ) |
Administrator Class | | | | | | | (172,327 | ) | | | | | | | (131,295 | ) |
Institutional Class | | | | | | | (79,049 | ) | | | | | | | (53,962 | ) |
Investor Class | | | | | | | (1,116,769 | ) | | | | | | | (713,363 | ) |
| | | | |
Total distributions to shareholders | | | | | | | (1,961,502 | ) | | | | | | | (1,357,365 | ) |
| | | | |
| | | | |
Capital share transactions | | | Shares | | | | | | | | Shares | | | | | |
Proceeds from shares sold | | | | | | | | | | | | | | | | |
Class A | | | 117,395 | | | | 1,449,633 | | | | 219,116 | | | | 2,676,314 | |
Class B | | | 870 | | | | 10,348 | | | | 825 | | | | 9,731 | |
Class C | | | 47,414 | | | | 535,877 | | | | 58,503 | | | | 663,191 | |
Administrator Class | | | 200,708 | | | | 2,474,629 | | | | 394,241 | | | | 4,991,123 | |
Institutional Class | | | 67,950 | | | | 789,106 | | | | 220,008 | | | | 2,622,722 | |
Investor Class | | | 320,358 | | | | 3,900,806 | | | | 651,354 | | | | 7,987,677 | |
| | | | |
| | | | | | | 9,160,399 | | | | | | | | 18,950,758 | |
| | | | |
Reinvestment of distributions | | | | | | | | | | | | | | | | |
Class A | | | 45,755 | | | | 531,212 | | | | 32,439 | | | | 401,923 | |
Class B | | | 0 | | | | 0 | | | | 76 | | | | 908 | |
Class C | | | 2,080 | | | | 22,425 | | | | 1,848 | | | | 21,270 | |
Administrator Class | | | 14,509 | | | | 171,495 | | | | 10,249 | | | | 129,239 | |
Institutional Class | | | 5,648 | | | | 62,524 | | | | 3,024 | | | | 35,774 | |
Investor Class | | | 94,956 | | | | 1,098,641 | | | | 56,897 | | | | 702,683 | |
| | | | |
| | | | | | | 1,886,297 | | | | | | | | 1,291,797 | |
| | | | |
Payment for shares redeemed | | | | | | | | | | | | | | | | |
Class A | | | (151,703 | ) | | | (1,818,783 | ) | | | (536,727 | ) | | | (6,662,045 | ) |
Class B | | | (2,271 | ) | | | (26,219 | ) | | | (12,466 | ) | | | (146,566 | ) |
Class C | | | (21,093 | ) | | | (234,947 | ) | | | (68,203 | ) | | | (768,688 | ) |
Administrator Class | | | (100,516 | ) | | | (1,238,250 | ) | | | (466,124 | ) | | | (5,945,695 | ) |
Institutional Class | | | (52,994 | ) | | | (611,971 | ) | | | (193,900 | ) | | | (2,280,030 | ) |
Investor Class | | | (368,774 | ) | | | (4,411,713 | ) | | | (562,951 | ) | | | (6,893,625 | ) |
| | | | |
| | | | | | | (8,341,883 | ) | | | | | | | (22,696,649 | ) |
| | | | |
Net increase (decrease) in net assets resulting from capital share transactions | | | | | | | 2,704,813 | | | | | | | | (2,454,094 | ) |
| | | | |
Total increase (decrease) in net assets | | | | | | | 7,708,443 | | | | | | | | (4,150,792 | ) |
| | | | |
| | |
Net assets | | | | | | | | |
Beginning of period | | | | | | | 85,718,492 | | | | | | | | 89,869,284 | |
| | | | |
End of period | | | | | | $ | 93,426,935 | | | | | | | $ | 85,718,492 | |
| | | | |
Undistributed net investment income | | | | | | $ | 315,690 | | | | | | | $ | 1,883,816 | |
| | | | |
The accompanying notes are an integral part of these financial statements.
| | | | | | |
| Financial highlights | | Wells Fargo Advantage Diversified International Fund | | | 19 | |
(For a share outstanding throughout each period)
| | | | | | | | | | | | | | | | | | | | | | | | | | | | |
| | | Six months ended
April 30, 2015
(unaudited) | | | Year ended October 31 | | | Year ended
September 30, 2010 | |
| CLASS A | | | 2014 | | | 2013 | | | 2012 | | | 2011 | | | 20101 | | |
Net asset value, beginning of period | | | $12.01 | | | | $12.25 | | | | $10.25 | | | | $9.69 | | | | $10.29 | | | | $9.84 | | | | $9.62 | |
Net investment income | | | 0.06 | | | | 0.24 | 2 | | | 0.19 | 2 | | | 0.19 | 2 | | | 0.16 | | | | 0.00 | 2,3 | | | 0.09 | 2 |
Net realized and unrealized gains (losses) on investments | | | 0.91 | | | | (0.29 | ) | | | 2.41 | | | | 0.51 | | | | (0.65 | ) | | | 0.45 | | | | 0.26 | |
| | | | | | | | | | | | | | | | | | | | | | | | | | | | |
Total from investment operations | | | 0.97 | | | | (0.05 | ) | | | 2.60 | | | | 0.70 | | | | (0.49 | ) | | | 0.45 | | | | 0.35 | |
Distributions to shareholders from | | | | | | | | | | | | | | | | | | | | | | | | | | | | |
Net investment income | | | (0.28 | ) | | | (0.19 | ) | | | (0.60 | ) | | | (0.14 | ) | | | (0.11 | ) | | | 0.00 | | | | (0.13 | ) |
Net asset value, end of period | | | $12.70 | | | | $12.01 | | | | $12.25 | | | | $10.25 | | | | $9.69 | | | | $10.29 | | | | $9.84 | |
Total return4 | | | 8.30 | % | | | (0.49 | )% | | | 26.59 | % | | | 7.45 | % | | | (4.83 | )% | | | 4.57 | % | | | 3.64 | % |
Ratios to average net assets (annualized) | | | | | | | | | | | | | | | | | | | | | | | | | | | | |
Gross expenses | | | 1.86 | % | | | 1.76 | % | | | 1.92 | % | | | 1.68 | % | | | 1.47 | % | | | 1.54 | % | | | 1.64 | % |
Net expenses | | | 1.41 | % | | | 1.41 | % | | | 1.41 | % | | | 1.41 | % | | | 1.41 | % | | | 1.41 | % | | | 1.38 | % |
Net investment income | | | 0.93 | % | | | 1.93 | % | | | 1.75 | % | | | 1.96 | % | | | 1.47 | % | | | 0.59 | % | | | 0.99 | % |
Supplemental data | | | | | | | | | | | | | | | | | | | | | | | | | | | | |
Portfolio turnover rate | | | 17 | % | | | 33 | % | | | 40 | % | | | 57 | % | | | 53 | % | | | 5 | % | | | 64 | % |
Net assets, end of period (000s omitted) | | | $26,501 | | | | $24,921 | | | | $28,928 | | | | $22,434 | | | | $23,862 | | | | $29,804 | | | | $28,926 | |
| 1 | For the one month ended October 31, 2010. The Fund changed its fiscal year end from September 30 to October 31, effective October 31, 2010. |
| 2 | Calculated based upon average shares outstanding |
| 3 | Amount is less than $0.005. |
| 4 | Total return calculations do not include any sales charges. Returns for periods of less than one year are not annualized. |
The accompanying notes are an integral part of these financial statements.
| | | | |
| 20 | | Wells Fargo Advantage Diversified International Fund | | Financial highlights |
(For a share outstanding throughout each period)
| | | | | | | | | | | | | | | | | | | | | | | | | | | | |
| | | Six months ended
April 30, 2015
(unaudited) | | | Year ended October 31 | | | Year ended
September 30, 2010 | |
| CLASS B | | | 2014 | | | 2013 | | | 2012 | | | 2011 | | | 20101 | | |
Net asset value, beginning of period | | | $11.50 | | | | $11.71 | | | | $9.80 | | | | $9.19 | | | | $9.74 | | | | $9.32 | | | | $9.12 | |
Net investment income (loss) | | | 0.01 | 2 | | | 0.13 | 2 | | | 0.09 | 2 | | | 0.10 | 2 | | | 0.06 | 2 | | | (0.00 | )2,3 | | | (0.05 | )2 |
Net realized and unrealized gains (losses) on investments | | | 0.90 | | | | (0.27 | ) | | | 2.32 | | | | 0.51 | | | | (0.61 | ) | | | 0.42 | | | | 0.32 | |
| | | | | | | | | | | | | | | | | | | | | | | | | | | | |
Total from investment operations | | | 0.91 | | | | (0.14 | ) | | | 2.41 | | | | 0.61 | | | | (0.55 | ) | | | 0.42 | | | | 0.27 | |
Distributions to shareholders from | | | | | | | | | | | | | | | | | | | | | | | | | | | | |
Net investment income | | | 0.00 | | | | (0.07 | ) | | | (0.50 | ) | | | (0.00 | )3 | | | 0.00 | | | | 0.00 | | | | (0.07 | ) |
Net asset value, end of period | | | $12.41 | | | | $11.50 | | | | $11.71 | | | | $9.80 | | | | $9.19 | | | | $9.74 | | | | $9.32 | |
Total return4 | | | 7.91 | % | | | (1.25 | )% | | | 25.70 | % | | | 6.69 | % | | | (5.65 | )% | | | 4.51 | % | | | 3.00 | % |
Ratios to average net assets (annualized) | | | | | | | | | | | | | | | | | | | | | | | | | | | | |
Gross expenses | | | 2.60 | % | | | 2.52 | % | | | 2.68 | % | | | 2.35 | % | | | 2.23 | % | | | 2.28 | % | | | 2.39 | % |
Net expenses | | | 2.15 | % | | | 2.16 | % | | | 2.16 | % | | | 2.12 | % | | | 2.16 | % | | | 2.16 | % | | | 2.13 | % |
Net investment income (loss) | | | 0.22 | % | | | 1.10 | % | | | 0.88 | % | | | 1.11 | % | | | 0.64 | % | | | (0.16 | )% | | | (0.59 | )% |
Supplemental data | | | | | | | | | | | | | | | | | | | | | | | | | | | | |
Portfolio turnover rate | | | 17 | % | | | 33 | % | | | 40 | % | | | 57 | % | | | 53 | % | | | 5 | % | | | 64 | % |
Net assets, end of period (000s omitted) | | | $23 | | | | $37 | | | | $174 | | | | $299 | | | | $482 | | | | $1,084 | | | | $1,046 | |
| 1 | For the one month ended October 31, 2010. The Fund changed its fiscal year end from September 30 to October 31, effective October 31, 2010. |
| 2 | Calculated based upon average shares outstanding |
| 3 | Amount is less than $0.005. |
| 4 | Total return calculations do not include any sales charges. Returns for periods of less than one year are not annualized. |
The accompanying notes are an integral part of these financial statements.
| | | | | | |
| Financial highlights | | Wells Fargo Advantage Diversified International Fund | | | 21 | |
(For a share outstanding throughout each period)
| | | | | | | | | | | | | | | | | | | | | | | | | | | | |
| | | Six months ended
April 30, 2015
(unaudited) | | | Year ended October 31 | | | Year ended
September 30, 2010 | |
| CLASS C | | | 2014 | | | 2013 | | | 2012 | | | 2011 | | | 20101 | | |
Net asset value, beginning of period | | | $11.08 | | | | $11.35 | | | | $9.54 | | | | $9.01 | | | | $9.59 | | | | $9.17 | | | | $8.98 | |
Net investment income (loss) | | | 0.02 | 2 | | | 0.13 | 2 | | | 0.09 | 2 | | | 0.11 | 2 | | | 0.07 | 2 | | | (0.00 | )2,3 | | | 0.02 | 2 |
Net realized and unrealized gains (losses) on investments | | | 0.83 | | | | (0.27 | ) | | | 2.25 | | | | 0.48 | | | | (0.61 | ) | | | 0.42 | | | | 0.25 | |
| | | | | | | | | | | | | | | | | | | | | | | | | | | | |
Total from investment operations | | | 0.85 | | | | (0.14 | ) | | | 2.34 | | | | 0.59 | | | | (0.54 | ) | | | 0.42 | | | | 0.27 | |
Distributions to shareholders from | | | | | | | | | | | | | | | | | | | | | | | | | | | | |
Net investment income | | | (0.18 | ) | | | (0.13 | ) | | | (0.53 | ) | | | (0.06 | ) | | | (0.04 | ) | | | 0.00 | | | | (0.08 | ) |
Net asset value, end of period | | | $11.75 | | | | $11.08 | | | | $11.35 | | | | $9.54 | | | | $9.01 | | | | $9.59 | | | | $9.17 | |
Total return4 | | | 7.83 | % | | | (1.24 | )% | | | 25.67 | % | | | 6.67 | % | | | (5.65 | )% | | | 4.58 | % | | | 3.07 | % |
Ratios to average net assets (annualized) | | | | | | | | | | | | | | | | | | | | | | | | | | | | |
Gross expenses | | | 2.61 | % | | | 2.51 | % | | | 2.66 | % | | | 2.43 | % | | | 2.22 | % | | | 2.28 | % | | | 2.39 | % |
Net expenses | | | 2.16 | % | | | 2.16 | % | | | 2.16 | % | | | 2.16 | % | | | 2.16 | % | | | 2.16 | % | | | 2.12 | % |
Net investment income (loss) | | | 0.29 | % | | | 1.15 | % | | | 0.84 | % | | | 1.21 | % | | | 0.72 | % | | | (0.16 | )% | | | 0.20 | % |
Supplemental data | | | | | | | | | | | | | | | | | | | | | | | | | | | | |
Portfolio turnover rate | | | 17 | % | | | 33 | % | | | 40 | % | | | 57 | % | | | 53 | % | | | 5 | % | | | 64 | % |
Net assets, end of period (000s omitted) | | | $2,049 | | | | $1,616 | | | | $1,746 | | | | $628 | | | | $625 | | | | $744 | | | | $718 | |
| 1 | For the one month ended October 31, 2010. The Fund changed its fiscal year end from September 30 to October 31, effective October 31, 2010. |
| 2 | Calculated based upon average shares outstanding |
| 3 | Amount is less than $0.005. |
| 4 | Total return calculations do not include any sales charges. Returns for periods of less than one year are not annualized. |
The accompanying notes are an integral part of these financial statements.
| | | | |
| 22 | | Wells Fargo Advantage Diversified International Fund | | Financial highlights |
(For a share outstanding throughout each period)
| | | | | | | | | | | | | | | | | | | | | | | | | | | | |
| | | Six months ended
April 30, 2015
(unaudited) | | | Year ended October 31 | | | Year ended
September 30, 2010 | |
| ADMINISTRATOR CLASS | | | 2014 | | | 2013 | | | 2012 | | | 2011 | | | 20101 | | |
Net asset value, beginning of period | | | $12.23 | | | | $12.47 | | | | $10.42 | | | | $9.68 | | | | $10.28 | | | | $9.83 | | | | $9.59 | |
Net investment income | | | 0.07 | 2 | | | 0.26 | 2 | | | 0.19 | 2 | | | 0.21 | 2 | | | 0.05 | 2 | | | 0.00 | 2,3 | | | 0.12 | 2 |
Net realized and unrealized gains (losses) on investments | | | 0.93 | | | | (0.30 | ) | | | 2.47 | | | | 0.53 | | | | (0.52 | ) | | | 0.45 | | | | 0.26 | |
| | | | | | | | | | | | | | | | | | | | | | | | | | | | |
Total from investment operations | | | 1.00 | | | | (0.04 | ) | | | 2.66 | | | | 0.74 | | | | (0.47 | ) | | | 0.45 | | | | 0.38 | |
Distributions to shareholders from | | | | | | | | | | | | | | | | | | | | | | | | | | | | |
Net investment income | | | (0.30 | ) | | | (0.20 | ) | | | (0.61 | ) | | | 0.00 | | | | (0.13 | ) | | | 0.00 | | | | (0.14 | ) |
Net asset value, end of period | | | $12.93 | | | | $12.23 | | | | $12.47 | | | | $10.42 | | | | $9.68 | | | | $10.28 | | | | $9.83 | |
Total return4 | | | 8.43 | % | | | (0.39 | )% | | | 26.85 | % | | | 7.64 | % | | | (4.69 | )% | | | 4.58 | % | | | 3.87 | % |
Ratios to average net assets (annualized) | | | | | | | | | | | | | | | | | | | | | | | | | | | | |
Gross expenses | | | 1.70 | % | | | 1.60 | % | | | 1.74 | % | | | 1.52 | % | | | 1.35 | % | | | 1.38 | % | | | 1.46 | % |
Net expenses | | | 1.25 | % | | | 1.25 | % | | | 1.25 | % | | | 1.25 | % | | | 1.24 | % | | | 1.25 | % | | | 1.22 | % |
Net investment income | | | 1.22 | % | | | 2.10 | % | | | 1.72 | % | | | 2.11 | % | | | 0.44 | % | | | 0.75 | % | | | 1.31 | % |
Supplemental data | | | | | | | | | | | | | | | | | | | | | | | | | | | | |
Portfolio turnover rate | | | 17 | % | | | 33 | % | | | 40 | % | | | 57 | % | | | 53 | % | | | 5 | % | | | 64 | % |
Net assets, end of period (000s omitted) | | | $9,181 | | | | $7,283 | | | | $8,195 | | | | $3,504 | | | | $3,421 | | | | $202,247 | | | | $193,626 | |
| 1 | For the one month ended October 31, 2010. The Fund changed its fiscal year end from September 30 to October 31, effective October 31, 2010. |
| 2 | Calculated based upon average shares outstanding |
| 3 | Amount is less than $0.005. |
| 4 | Returns for periods of less than one year are not annualized. |
The accompanying notes are an integral part of these financial statements.
| | | | | | |
| Financial highlights | | Wells Fargo Advantage Diversified International Fund | | | 23 | |
(For a share outstanding throughout each period)
| | | | | | | | | | | | | | | | | | | | | | | | | | | | |
| | | Six months ended
April 30, 2015
(unaudited) | | | Year ended October 31 | | | Year ended
September 30, 2010 | |
| INSTITUTIONAL CLASS | | | 2014 | | | 2013 | | | 2012 | | | 2011 | | | 20101 | | |
Net asset value, beginning of period | | | $11.50 | | | | $11.79 | | | | $10.20 | | | | $9.69 | | | | $10.29 | | | | $9.84 | | | | $9.60 | |
Net investment income | | | 0.08 | 2 | | | 0.26 | 2 | | | 0.20 | 2 | | | 0.19 | 2 | | | 0.23 | | | | 0.00 | 2,3 | | | 0.15 | 2 |
Net realized and unrealized gains (losses) on investments | | | 0.87 | | | | (0.27 | ) | | | 2.37 | | | | 0.51 | | | | (0.68 | ) | | | 0.45 | | | | 0.24 | |
| | | | | | | | | | | | | | | | | | | | | | | | | | | | |
Total from investment operations | | | 0.95 | | | | (0.01 | ) | | | 2.57 | | | | 0.70 | | | | (0.45 | ) | | | 0.45 | | | | 0.39 | |
Distributions to shareholders from | | | | | | | | | | | | | | | | | | | | | | | | | | | | |
Net investment income | | | (0.33 | ) | | | (0.28 | ) | | | (0.98 | ) | | | (0.19 | ) | | | (0.15 | ) | | | 0.00 | | | | (0.15 | ) |
Net asset value, end of period | | | $12.12 | | | | $11.50 | | | | $11.79 | | | | $10.20 | | | | $9.69 | | | | $10.29 | | | | $9.84 | |
Total return4 | | | 8.55 | % | | | (0.18 | )% | | | 27.28 | % | | | 7.51 | % | | | (4.48 | )% | | | 4.57 | % | | | 4.13 | % |
Ratios to average net assets (annualized) | | | | | | | | | | | | | | | | | | | | | | | | | | | | |
Gross expenses | | | 1.43 | % | | | 1.33 | % | | | 1.50 | % | | | 1.20 | % | | | 1.03 | % | | | 1.11 | % | | | 1.19 | % |
Net expenses | | | 0.99 | % | | | 0.99 | % | | | 0.99 | % | | | 0.99 | % | | | 0.99 | % | | | 0.99 | % | | | 0.96 | % |
Net investment income | | | 1.40 | % | | | 2.23 | % | | | 1.94 | % | | | 1.96 | % | | | 2.17 | % | | | 1.00 | % | | | 1.63 | % |
Supplemental data | | | | | | | | | | | | | | | | | | | | | | | | | | | | |
Portfolio turnover rate | | | 17 | % | | | 33 | % | | | 40 | % | | | 57 | % | | | 53 | % | | | 5 | % | | | 64 | % |
Net assets, end of period (000s omitted) | | | $3,077 | | | | $2,683 | | | | $2,406 | | | | $7,367 | | | | $419,925 | | | | $199,081 | | | | $194,651 | |
| 1 | For the one month ended October 31, 2010. The Fund changed its fiscal year end from September 30 to October 31, effective October 31, 2010. |
| 2 | Calculated based upon average shares outstanding |
| 3 | Amount is less than $0.005. |
| 4 | Returns for periods of less than one year are not annualized. |
The accompanying notes are an integral part of these financial statements.
| | | | |
| 24 | | Wells Fargo Advantage Diversified International Fund | | Financial highlights |
(For a share outstanding throughout each period)
| | | | | | | | | | | | | | | | | | | | | | | | | | | | |
| | | Six months ended
April 30, 2015
(unaudited) | | | Year ended October 31 | | | Year ended
September 30, 2010 | |
| INVESTOR CLASS | | | 2014 | | | 2013 | | | 2012 | | | 2011 | | | 20101 | | |
Net asset value, beginning of period | | | $11.96 | | | | $12.20 | | | | $10.21 | | | | $9.65 | | | | $10.26 | | | | $9.81 | | | | $9.58 | |
Net investment income | | | 0.06 | | | | 0.23 | 2 | | | 0.18 | 2 | | | 0.18 | | | | 0.13 | | | | 0.00 | 2,3 | | | 0.11 | 2 |
Net realized and unrealized gains (losses) on investments | | | 0.90 | | | | (0.29 | ) | | | 2.40 | | | | 0.52 | | | | (0.63 | ) | | | 0.45 | | | | 0.24 | |
| | | | | | | | | | | | | | | | | | | | | | | | | | | | |
Total from investment operations | | | 0.96 | | | | (0.06 | ) | | | 2.58 | | | | 0.70 | | | | (0.50 | ) | | | 0.45 | | | | 0.35 | |
Distributions to shareholders from | | | | | | | | | | | | | | | | | | | | | | | | | | | | |
Net investment income | | | (0.28 | ) | | | (0.18 | ) | | | (0.59 | ) | | | (0.14 | ) | | | (0.11 | ) | | | 0.00 | | | | (0.12 | ) |
Net asset value, end of period | | | $12.64 | | | | $11.96 | | | | $12.20 | | | | $10.21 | | | | $9.65 | | | | $10.26 | | | | $9.81 | |
Total return4 | | | 8.21 | % | | | (0.54 | )% | | | 26.54 | % | | | 7.43 | % | | | 4.97 | % | | | 4.59 | % | | | 3.74 | % |
Ratios to average net assets (annualized) | | | | | | | | | | | | | | | | | | | | | | | | | | | | |
Gross expenses | | | 1.92 | % | | | 1.82 | % | | | 1.97 | % | | | 1.74 | % | | | 1.54 | % | | | 1.61 | % | | | 1.73 | % |
Net expenses | | | 1.46 | % | | | 1.46 | % | | | 1.46 | % | | | 1.46 | % | | | 1.46 | % | | | 1.46 | % | | | 1.43 | % |
Net investment income | | | 0.89 | % | | | 1.84 | % | | | 1.67 | % | | | 1.91 | % | | | 1.43 | % | | | 0.54 | % | | | 1.18 | % |
Supplemental data | | | | | | | | | | | | | | | | | | | | | | | | | | | | |
Portfolio turnover rate | | | 17 | % | | | 33 | % | | | 40 | % | | | 57 | % | | | 53 | % | | | 5 | % | | | 64 | % |
Net assets, end of period (000s omitted) | | | $52,595 | | | | $49,177 | | | | $48,421 | | | | $39,152 | | | | $40,456 | | | | $48,070 | | | | $46,282 | |
| 1 | For the one month ended October 31, 2010. The Fund changed its fiscal year end from September 30 to October 31, effective October 31, 2010. |
| 2 | Calculated based upon average shares outstanding |
| 3 | Amount is less than $0.005. |
| 4 | Returns for periods of less than one year are not annualized. |
The accompanying notes are an integral part of these financial statements.
| | | | | | |
| Notes to financial statements (unaudited) | | Wells Fargo Advantage Diversified International Fund | | | 25 | |
1. ORGANIZATION
Wells Fargo Funds Trust (the “Trust”), a Delaware statutory trust organized on March 10, 1999, is an open-end management investment company registered under the Investment Company Act of 1940, as amended (the “1940 Act”). As an investment company, the Trust follows the accounting and reporting guidance in Financial Accounting Standards Board (“FASB”) Accounting Standards Codification Topic 946, Financial Services – Investment Companies. These financial statements report on the Wells Fargo Advantage Diversified International Fund (the “Fund”) which is a diversified series of the Trust.
2. SIGNIFICANT ACCOUNTING POLICIES
The following significant accounting policies, which are consistently followed in the preparation of the financial statements of the Fund, are in conformity with U.S. generally accepted accounting principles which require management to make estimates and assumptions that affect the reported amounts of assets and liabilities, disclosure of contingent assets and liabilities at the date of the financial statements, and the reported amounts of revenues and expenses during the reporting period. Actual results could differ from those estimates.
Securities valuation
All investments are valued each business day as of the close of regular trading on the New York Stock Exchange (generally 4 p.m. Eastern Time).
Equity securities that are listed on a foreign or domestic exchange or market are valued at the official closing price or, if none, the last sales price. If no sale occurs on the primary exchange or market that day, the prior day’s price will be deemed “stale” and a fair value price will be determined in accordance with the Fund’s Valuation Procedures.
Equity securities that are not listed on a foreign or domestic exchange or market, but have a public trading market, are valued at the quoted bid price from an independent broker-dealer that the Management Valuation Team of Wells Fargo Funds Management, LLC (“Funds Management”) has determined is an acceptable source.
The values of securities denominated in foreign currencies are translated into U.S. dollars at rates provided by an independent foreign currency pricing source at a time each business day specified by the Management Valuation Team.
Many securities markets and exchanges outside the U.S. close prior to the close of the New York Stock Exchange and therefore may not fully reflect trading or events that occur after the close of the principal exchange in which the foreign securities are traded, but before the close of the New York Stock Exchange. If such trading or events are expected to materially affect the value of such securities, then fair value pricing procedures approved by the Board of Trustees of the Fund are applied. These procedures take into account multiple factors including movements in U.S. securities markets after foreign exchanges close. Foreign securities that are fair valued under these procedures are categorized as Level 2 and the application of these procedures may result in transfers between Level 1 and Level 2. Depending on market activity, such fair valuations may be frequent. Such fair value pricing may result in net asset values that are higher or lower than net asset values based on the last reported sales price or latest quoted bid price. On April 30, 2015, such fair value pricing was used in pricing foreign securities.
Investments in registered open-end investment companies are valued at net asset value. Interests in non-registered investment vehicles that are redeemable at net asset value are fair valued at net asset value when available.
Investments which are not valued using any of the methods discussed above are valued at their fair value, as determined in good faith by the Board of Trustees. The Board of Trustees has established a Valuation Committee comprised of the Trustees and has delegated to it the authority to take any actions regarding the valuation of portfolio securities that the Valuation Committee deems necessary or appropriate, including determining the fair value of portfolio securities, unless the determination has been delegated to the Management Valuation Team. The Board of Trustees retains the authority to make or ratify any valuation decisions or approve any changes to the Valuation Procedures as it deems appropriate. On a quarterly basis, the Board of Trustees receives reports on any valuation actions taken by the Valuation Committee or the Management Valuation Team which may include items for ratification.
Valuations of fair valued securities are compared to the next actual sales price when available, or other appropriate market values, to assess the continued appropriateness of the fair valuation methodologies used. These securities are fair valued on a day-to-day basis, taking into consideration changes to appropriate market information and any significant changes to the inputs considered in the valuation process until there is a readily available price provided on an exchange or by an independent pricing service. Valuations received from an independent pricing service or independent broker-dealer quotes are periodically validated by comparisons to most recent trades and valuations provided by other
| | | | |
| 26 | | Wells Fargo Advantage Diversified International Fund | | Notes to financial statements (unaudited) |
independent pricing services in addition to the review of prices by the adviser and/or subadviser. Unobservable inputs used in determining fair valuations are identified based on the type of security, taking into consideration factors utilized by market participants in valuing the investment, knowledge about the issuer and the current market environment.
Foreign currency translation
The accounting records of the Fund are maintained in U.S. dollars. The values of other assets and liabilities denominated in foreign currencies are translated into U.S. dollars at rates provided by an independent foreign currency pricing source at a time each business day specified by the Management Valuation Team. Purchases and sales of securities, and income and expenses are converted at the rate of exchange on the respective dates of such transactions. Net realized foreign exchange gains or losses arise from sales of foreign currencies, currency gains or losses realized between the trade and settlement dates on securities transactions, and the difference between the amounts of dividends, interest and foreign withholding taxes recorded and the U.S. dollar equivalent of the amounts actually paid or received. Net unrealized foreign exchange gains and losses arise from changes in the fair value of assets and liabilities other than investments in securities resulting from changes in exchange rates. The changes in net assets arising from changes in exchange rates and the changes in net assets resulting from changes in market prices of securities are not separately presented. Such changes are included in net realized and unrealized gains or losses from investments.
Forward foreign currency contracts
The Fund is subject to foreign currency exchange rate risk in the normal course of pursuing its investment objectives. A forward foreign currency contract is an agreement between two parties to purchase or sell a specific currency for an agreed-upon price at a future date. The Fund enters into forward foreign currency contracts to facilitate transactions in foreign-denominated securities and to attempt to minimize the risk to the Fund from adverse changes in the relationship between currencies. Forward foreign currency contracts are recorded at the forward rate and marked-to-market daily. When the contracts are closed, realized gains and losses arising from such transactions are recorded as realized gains or losses on forward foreign currency contract transactions. The Fund could be exposed to risks if the counterparties to the contracts are unable to meet the terms of their contracts or if the value of the foreign currency changes unfavorably. The Fund’s maximum risk of loss from counterparty credit risk is the unrealized gains on the contracts. This risk may be mitigated if there is a master netting arrangement between the Fund and the counterparty.
Security loans
The Fund may lend its securities from time to time in order to earn additional income in the form of fees or interest on securities received as collateral or the investment of any cash received as collateral. The Fund continues to receive interest or dividends on the securities loaned. The Fund receives collateral in the form of cash or securities with a value at least equal to the value of the securities on loan. The value of the loaned securities is determined at the close of each business day and any additional required collateral is delivered to the Fund on the next business day. In a securities lending transaction, the net asset value of the Fund will be affected by an increase or decrease in the value of the securities loaned and by an increase or decrease in the value of the instrument in which collateral is invested. The amount of securities lending activity undertaken by the Fund fluctuates from time to time. In the event of default or bankruptcy by the borrower, the Fund may be prevented from recovering the loaned securities or gaining access to the collateral or may experience delays or costs in doing so. In addition, the investment of any cash collateral received may lose all or part of its value. The Fund has the right under the lending agreement to recover the securities from the borrower on demand.
The Fund lends its securities through an unaffiliated securities lending agent. Cash collateral received in connection with its securities lending transactions is invested in Securities Lending Cash Investments, LLC (the “Securities Lending Fund”). The Securities Lending Fund is exempt from registration under Section 3(c)(7) of the 1940 Act and is managed by Funds Management and is subadvised by Wells Capital Management Incorporated (“WellsCap”). Funds Management receives an advisory fee starting at 0.05% and declining to 0.01% as the average daily net assets of the Securities Lending Fund increase. All of the fees received by Funds Management are paid to WellsCap for its services as subadviser. The Securities Lending Fund seeks to provide a positive return compared to the daily Fed Funds Open rate by investing in high-quality, U.S. dollar-denominated short-term money market instruments. Securities Lending Fund investments are fair valued based upon the amortized cost valuation technique. Income earned from investment in the Securities Lending Fund is included in securities lending income on the Statement of Operations.
Security transactions and income recognition
Securities transactions are recorded on a trade date basis. Realized gains or losses are recorded on the basis of identified cost.
Dividend income is recognized on the ex-dividend date, except for certain dividends from foreign securities, which are recorded as soon as the custodian verifies the ex-dividend date. Dividend income from foreign securities is recorded net of foreign taxes withheld where recovery of such taxes is not assured.
| | | | | | |
| Notes to financial statements (unaudited) | | Wells Fargo Advantage Diversified International Fund | | | 27 | |
Distributions to shareholders
Distributions to shareholders from net investment income and net realized gains, if any, are recorded on the ex-dividend date. Such distributions are determined in conformity with federal income tax regulations, which may differ in amount or character from net investment income and realized gains recognized for purposes of U.S. generally accepted accounting principles.
Federal and other taxes
The Fund intends to continue to qualify as a regulated investment company by distributing substantially all of its investment company taxable income and any net realized capital gains (after reduction for capital loss carryforwards) sufficient to relieve it from all, or substantially all, federal income taxes. Accordingly, no provision for federal income taxes was required.
The Fund’s income and federal excise tax returns and all financial records supporting those returns for the prior three fiscal years are subject to examination by the federal and Delaware revenue authorities. Management has analyzed the Fund’s tax positions taken on federal, state, and foreign tax returns for all open tax years and does not believe that there are any uncertain tax positions that require recognition of a tax liability.
Capital loss carryforwards that do not expire are required to be utilized prior to capital loss carryforwards that expire. As of October 31, 2014, capital loss carryforwards available to offset future net realized capital gains were as follows through the indicated expiration dates:
| | | | |
| | | No expiration |
| 2017 | | Short-term | | Long-term |
| $89,306,475 | | $8,336,592 | | $5,102,624 |
Class allocations
The separate classes of shares offered by the Fund differ principally in applicable sales charges, distribution, shareholder servicing, and administration fees. Class specific expenses are charged directly to that share class. Investment income, common expenses, and realized and unrealized gains (losses) on investments are allocated daily to each class of shares based on the relative proportion of net assets of each class.
3. FAIR VALUATION MEASUREMENTS
Fair value measurements of investments are determined within a framework that has established a fair value hierarchy based upon the various data inputs utilized in determining the value of the Fund’s investments. The three-level hierarchy gives the highest priority to unadjusted quoted prices in active markets for identical assets or liabilities (Level 1) and the lowest priority to significant unobservable inputs (Level 3). The Fund’s investments are classified within the fair value hierarchy based on the lowest level of input that is significant to the fair value measurement. The inputs are summarized into three broad levels as follows:
| n | | Level 1 – quoted prices in active markets for identical securities |
| n | | Level 2 – other significant observable inputs (including quoted prices for similar securities, interest rates, prepayment speeds, credit risk, use of amortized cost, etc.) |
| n | | Level 3 – significant unobservable inputs (including the Fund’s own assumptions in determining the fair value of investments) |
The inputs or methodologies used for valuing investments in securities are not necessarily an indication of the risk associated with investing in those securities.
| | | | |
| 28 | | Wells Fargo Advantage Diversified International Fund | | Notes to financial statements (unaudited) |
The following is a summary of the inputs used in valuing the Fund’s assets and liabilities as of April 30, 2015:
| | | | | | | | | | | | | | | | |
| | | Quoted prices
(Level 1) | | | Other significant
observable inputs
(Level 2) | | | Significant
unobservable inputs
(Level 3) | | | Total | |
Assets | | | | | | | | | | | | | | | | |
Investments in: | | | | | | | | | | | | | | | | |
| | | | |
Common stocks | | | | | | | | | | | | | | | | |
Australia | | $ | 0 | | | $ | 1,498,111 | | | $ | 0 | | | $ | 1,498,111 | |
Austria | | | 0 | | | | 318,754 | | | | 0 | | | | 318,754 | |
Belgium | | | 0 | | | | 1,436,362 | | | | 0 | | | | 1,436,362 | |
Brazil | | | 427,254 | | | | 0 | | | | 0 | | | | 427,254 | |
Canada | | | 1,271,191 | | | | 0 | | | | 0 | | | | 1,271,191 | |
China | | | 1,902,370 | | | | 5,263,575 | | | | 0 | | | | 7,165,945 | |
Czech Republic | | | 0 | | | | 83,137 | | | | 0 | | | | 83,137 | |
Finland | | | 0 | | | | 139,086 | | | | 0 | | | | 139,086 | |
France | | | 0 | | | | 5,573,646 | | | | 0 | | | | 5,573,646 | |
Germany | | | 0 | | | | 9,611,386 | | | | 0 | | | | 9,611,386 | |
Hong Kong | | | 0 | | | | 3,331,973 | | | | 0 | | | | 3,331,973 | |
India | | | 443,281 | | | | 486,387 | | | | 0 | | | | 929,668 | |
Ireland | | | 1,066,198 | | | | 229,624 | | | | 0 | | | | 1,295,822 | |
Israel | | | 0 | | | | 469,590 | | | | 0 | | | | 469,590 | |
Italy | | | 0 | | | | 3,806,823 | | | | 0 | | | | 3,806,823 | |
Japan | | | 0 | | | | 15,468,138 | | | | 0 | | | | 15,468,138 | |
Liechtenstein | | | 117,798 | | | | 0 | | | | 0 | | | | 117,798 | |
Mexico | | | 965,921 | | | | 0 | | | | 0 | | | | 965,921 | |
Netherlands | | | 0 | | | | 2,464,562 | | | | 0 | | | | 2,464,562 | |
Norway | | | 156,205 | | | | 854,559 | | | | 0 | | | | 1,010,764 | |
Poland | | | 0 | | | | 99,395 | | | | 0 | | | | 99,395 | |
Russia | | | 215,250 | | | | 144,143 | | | | 0 | | | | 359,393 | |
Singapore | | | 0 | | | | 270,136 | | | | 0 | | | | 270,136 | |
South Africa | | | 0 | | | | 244,422 | | | | 0 | | | | 244,422 | |
South Korea | | | 22,893 | | | | 2,227,915 | | | | 0 | | | | 2,250,808 | |
Spain | | | 124,632 | | | | 726,724 | | | | 0 | | | | 851,356 | |
Sweden | | | 0 | | | | 1,551,196 | | | | 0 | | | | 1,551,196 | |
Switzerland | | | 0 | | | | 6,736,186 | | | | 0 | | | | 6,736,186 | |
Taiwan | | | 0 | | | | 136,273 | | | | 0 | | | | 136,273 | |
Thailand | | | 145,812 | | | | 0 | | | | 0 | | | | 145,812 | |
United Kingdom | | | 1,878,366 | | | | 12,788,108 | | | | 0 | | | | 14,666,474 | |
United States | | | 1,257,607 | | | | 0 | | | | 0 | | | | 1,257,607 | |
| | | | |
Participation notes | | | 0 | | | | 786,430 | | | | 0 | | | | 786,430 | |
| | | | |
Preferred stocks | | | | | | | | | | | | | | | | |
Brazil | | | 132,543 | | | | 0 | | | | 0 | | | | 132,543 | |
Germany | | | 0 | | | | 1,361,182 | | | | 0 | | | | 1,361,182 | |
| | | | |
Short-term investments | | | | | | | | | | | | | | | | |
Investment companies | | | 3,924,473 | | | | 3,731,148 | | | | 0 | | | | 7,655,621 | |
Total assets | | $ | 14,051,794 | | | $ | 81,838,971 | | | $ | 0 | | | $ | 95,890,765 | |
Liabilities | | | | | | | | | | | | | | | | |
Forward foreign currency contracts | | $ | 0 | | | $ | 95,758 | | | $ | 0 | | | $ | 95,758 | |
Total liabilities | | $ | 0 | | | $ | 95,758 | | | $ | 0 | | | $ | 95,758 | |
Forward foreign currency contracts are reported at their unrealized gains (losses) at measurement date, which represents the change in the contract’s value from trade date. All other assets and liabilities are reported at their market value at measurement date.
| | | | | | |
| Notes to financial statements (unaudited) | | Wells Fargo Advantage Diversified International Fund | | | 29 | |
The Fund recognizes transfers between levels within the fair value hierarchy at the end of the reporting period. At April 30, 2015, fair value pricing was used in pricing certain foreign securities and securities valued at $69,494,093 were transferred from Level 1 to Level 2. The Fund did not have any transfers into/out of Level 3.
4. TRANSACTIONS WITH AFFILIATES AND OTHER EXPENSES
Advisory fee
The Trust has entered into an advisory contract with Funds Management, an indirect wholly owned subsidiary of
Wells Fargo & Company (“Wells Fargo”). The adviser is responsible for implementing investment policies and guidelines and for supervising the subadvisers, who are responsible for day-to-day portfolio management of the Fund.
Pursuant to the contract, Funds Management is entitled to receive an annual advisory fee starting at 0.85% and declining to 0.70% as the average daily net assets of the Fund increase. For the six months ended April 30, 2015, the advisory fee was equivalent to an annual rate of 0.85% of the Fund’s average daily net assets.
Funds Management has retained the services of certain subadvisers to provide daily portfolio management to the Fund. The fee for subadvisory services is borne by Funds Management. Artisan Partners Limited Partnership, LSV Asset Management, and WellsCap (an affiliate of Funds Management and an indirect wholly owned subsidiary of Wells Fargo) are the subadvisers to the Fund and are entitled to receive a fee from Funds Management which is calculated based on the daily average net assets of the subadviser’s portion of the Fund as follows:
| | | | | | | | |
| | | Annual subadvisory fee | |
| | | starting at | | | declining to | |
Artisan Partners Limited Partnership | | | 0.80 | % | | | 0.50 | % |
LSV Asset Management | | | 0.35 | | | | 0.30 | |
WellsCap | | | 0.45 | | | | 0.40 | |
Administration fees
The Trust has entered into an administration agreement with Funds Management. Under this agreement, for providing administrative services, which includes paying fees and expenses for services provided by the transfer agent, sub-transfer agents, omnibus account servicers and record-keepers, Funds Management is entitled to receive from the Fund an annual fund level administration fee starting at 0.05% and declining to 0.03% as the average daily net assets of the Fund increase and a class level administration fee which is calculated based on the average daily net assets of each class as follows:
| | | | |
| | | Class level
administration fee | |
Class A, Class B, Class C | | | 0.26 | % |
Administrator Class | | | 0.10 | |
Institutional Class | | | 0.08 | |
Investor Class | | | 0.32 | |
Funds Management has contractually waived and/or reimbursed advisory and administration fees to the extent necessary to maintain certain net operating expense ratios for the Fund. Waiver of fees and/or reimbursement of expenses by Funds Management were made first from fund level expenses on a proportionate basis and then from class specific expenses. Funds Management has committed through February 29, 2016 to waive fees and/or reimburse expenses to the extent necessary to cap the Fund’s expenses at 1.41% for Class A shares, 2.16% for Class B shares, 2.16% for Class C shares, 1.25% for Administrator Class shares, 0.99% for Institutional Class shares, and 1.46% for Investor Class shares. After this time, the cap may be increased or the commitment to maintain the cap may be terminated only with the approval of the Board of Trustees.
Distribution fees
The Trust has adopted a Distribution Plan for Class B and Class C shares of the Fund pursuant to Rule 12b-1 under the 1940 Act. Distribution fees are charged to Class B and Class C shares and paid to Wells Fargo Funds Distributor, LLC (“Funds Distributor”), the principal underwriter, at an annual rate of 0.75% of the average daily net assets of Class B and Class C shares.
| | | | |
| 30 | | Wells Fargo Advantage Diversified International Fund | | Notes to financial statements (unaudited) |
In addition, Funds Distributor is entitled to receive the front-end sales charge from the purchase of Class A shares and a contingent deferred sales charge on the redemption of certain Class A shares. Funds Distributor is also entitled to receive the contingent deferred sales charges from redemptions of Class B and Class C shares. For the six months ended April 30, 2015, Funds Distributor received $932 from the sale of Class A shares and $131 in contingent deferred sales charges from redemptions of Class B shares.
Shareholder servicing fees
The Trust has entered into contracts with one or more shareholder servicing agents, whereby Class A, Class B, Class C, Administrator Class, and Investor Class of the Fund is charged a fee at an annual rate of 0.25% of the average daily net assets of each respective class
A portion of these total shareholder servicing fees were paid to affiliates of Wells Fargo.
5. INVESTMENT PORTFOLIO TRANSACTIONS
Purchases and sales of investments, excluding U.S. government obligations (if any) and short-term securities, for the six months ended April 30, 2015 were $14,165,096 and $14,786,186, respectively.
6. DERIVATIVE TRANSACTIONS
During the six months ended April 30, 2015, the Fund entered into forward foreign currency contracts for economic hedging purposes.
At April 30, 2015, the Fund had forward foreign currency contracts outstanding as follows:
Forward foreign currency contracts to sell:
| | | | | | | | | | | | | | | | | | |
| Exchange date | | Counterparty | | Contracts to
deliver | | | U.S. value at April 30, 2015 | | | In exchange for U.S. $ | | | Unrealized
losses | |
| 6-26-2015 | | State Street Bank | | | 669,400 | EUR | | $ | 752,146 | | | $ | 737,224 | | | $ | (14,922 | ) |
| 7-9-2015 | | State Street Bank | | | 782,375 | GBP | | | 1,200,404 | | | | 1,165,578 | | | | (34,826 | ) |
| 7-9-2015 | | State Street Bank | | | 150,013,000 | JPY | | | 1,257,342 | | | | 1,249,973 | | | | (7,369 | ) |
| 7-9-2015 | | State Street Bank | | | 1,116,551 | EUR | | | 1,254,789 | | | | 1,216,148 | | | | (38,641 | ) |
The Fund had average contract amounts of $65,102 and $2,647,009 in forward foreign currency contracts to buy and forward foreign currency contracts to sell, respectively, during the six months ended April 30, 2015.
The fair value, realized gains or losses and change in unrealized gains or losses, if any, on derivative instruments are reflected in the appropriate financial statements.
For certain types of derivative transactions, the Fund has entered into International Swaps and Derivatives Association, Inc. master agreements (“ISDA Master Agreements”) or similar agreements with approved counterparties. The ISDA Master Agreements or similar agreements may have requirements to deliver/deposit securities or cash to/with an exchange or broker-dealer as collateral and allows the Fund to offset, with each counterparty, certain derivative financial instrument’s assets and/or liabilities with collateral held or pledged. Collateral requirements differ by type of derivative. Collateral or margin requirements are set by the broker or exchange clearing house for exchange traded derivatives while collateral terms are contract specific for over-the-counter traded derivatives. Cash collateral that has been pledged to cover obligations of the Fund under ISDA Master Agreements or similar agreements, if any, will be reported separately in the Statement of Assets and Liabilities. Securities pledged as collateral, if any, for the same purpose are noted in the Portfolio of Investments. With respect to balance sheet offsetting, absent an event of default by the counterparty or a termination of the agreement, the reported amounts of financial assets and financial liabilities in the Statement of Assets and Liabilities are not offset across transactions between the Fund and the applicable counterparty. A reconciliation of the gross amounts on the Statement of Assets and Liabilities to the net amounts by derivative type, including any collateral exposure, is as follows:
| | | | | | | | | | | | | | | | |
| Derivative type | | Counterparty | | Gross amounts of
liabilities in the
Statement of
Assets and
Liabilities | | Amounts
subject to netting
agreements | | | Collateral
pledged | | | Net amount
of liabilities | |
Forward foreign currency contracts | | State Street Bank | | $95,758* | | $ | 0 | | | $ | 0 | | | $ | 95,758 | |
| * | Amount represents net unrealized losses. |
| | | | | | |
| Notes to financial statements (unaudited) | | Wells Fargo Advantage Diversified International Fund | | | 31 | |
7. BANK BORROWINGS
The Trust (excluding the money market funds and certain other funds in the Trust) and Wells Fargo Variable Trust are parties to a $150,000,000 revolving credit agreement, whereby the Fund is permitted to use bank borrowings for temporary or emergency purposes, such as to fund shareholder redemption requests. Interest under the credit agreement is charged to the Fund based on a borrowing rate equal to the higher of the Federal Funds rate in effect on that day plus 1.25% or the overnight LIBOR rate in effect on that day plus 1.25%. In addition, an annual commitment fee equal to 0.10% of the unused balance is allocated to each participating fund. For the six months ended April 30, 2015, the Fund paid $77 in commitment fees.
For the six months ended April 30, 2015, there were no borrowings by the Fund under the agreement.
8. CONCENTRATION RISK
Concentration risks result from exposure to a limited number of sectors. A fund that invests a substantial portion of its assets in any sector may be more affected by changes in that sector than would be a fund whose investments are not heavily weighted in any sector.
9. INDEMNIFICATION
Under the Trust’s organizational documents, the officers and Trustees have been granted certain indemnification rights against certain liabilities that may arise out of performance of their duties to the Trust. Additionally, in the normal course of business, the Trust may enter into contracts with service providers that contain a variety of indemnification clauses. The Trust’s maximum exposure under these arrangements is dependent on future claims that may be made against the Fund and, therefore, cannot be estimated.
| | | | |
| 32 | | Wells Fargo Advantage Diversified International Fund | | Other information (unaudited) |
TAX INFORMATION
Pursuant to Section 853 of the Internal Revenue Code, the following amounts were designated as foreign taxes paid for the fiscal year ended April 30, 2015. These amounts may be less than the actual foreign taxes paid for financial statement purposes. Foreign taxes paid or withheld should be included in taxable income with an offsetting deduction from gross income or as a credit for taxes paid to foreign governments. None of the income was derived from ineligible foreign sources as defined under Section 901(j) of the Internal Revenue Code.
| | | | |
Creditable foreign taxes paid | | Per share amount | | Foreign income as % of ordinary income distributions |
| $140,968 | | $0.0197 | | 88.69% |
PROXY VOTING INFORMATION
A description of the policies and procedures that the Fund uses to determine how to vote proxies relating to portfolio securities is available, upon request, by calling 1-800-222-8222, visiting our website at wellsfargoadvantagefunds.com, or visiting the SEC website at sec.gov. Information regarding how the Fund voted proxies relating to portfolio securities during the most recent 12-month period ended June 30 is available on the Fund’s website at wellsfargoadvantagefunds.com or by visiting the SEC website at sec.gov.
PORTFOLIO HOLDINGS INFORMATION
The complete portfolio holdings for the Fund are publicly available monthly on the Fund’s website (wellsfargoadvantagefunds.com), on a one-month delayed basis. In addition, top ten holdings information (excluding derivative positions) for the Fund is publicly available on the Fund’s website on a monthly, seven-day or more delayed basis. The Fund files its complete schedule of portfolio holdings with the SEC for the first and third quarters of each fiscal year on Form N-Q, which is available by visiting the SEC website at sec.gov. In addition, the Fund’s Form N-Q may be reviewed and copied at the SEC’s Public Reference Room in Washington, DC, and at regional offices in New York City, at 233 Broadway, and in Chicago, at 175 West Jackson Boulevard, Suite 900. Information about the Public Reference Room may be obtained by calling 1-800-SEC-0330.
| | | | | | |
| Other information (unaudited) | | Wells Fargo Advantage Diversified International Fund | | | 33 | |
BOARD OF TRUSTEES AND OFFICERS
Each of the Trustees and Officers1 listed in the table below acts in identical capacities for each fund in the Wells Fargo Advantage family of funds, which consists of 134 mutual funds comprising the Wells Fargo Funds Trust, Wells Fargo Variable Trust, Wells Fargo Master Trust and four closed-end funds (collectively the “Fund Complex”). This table should be read in conjunction with the Prospectus and the Statement of Additional Information2. The mailing address of each Trustee and Officer is 525 Market Street, 12th Floor, San Francisco, CA 94105. Each Trustee and Officer serves an indefinite term, however, each Trustee serves such term until reaching the mandatory retirement age established by the Trustees.
Independent Trustees
| | | | | | |
Name and year of birth | | Position held and length of service* | | Principal occupations during past five years or longer | | Other directorships during
past five years |
| William R. Ebsworth (Born 1957) | | Trustee, since 2015** | | Retired. From 1984 to 2013, equities analyst, portfolio manager, research director at Fidelity Management and Research Company and retired in 2013 as Chief Investment Officer of Fidelity Strategic Advisers, Inc. in Boston, Tokyo, and Hong Kong where he led a team of investment professionals managing client assets. Prior thereto, Board member of Hong Kong Securities Clearing Co., Hong Kong Options Clearing Corp., the Thailand International Fund, Ltd., Fidelity Investments Life Insurance Company, and Empire Fidelity Investments Life Insurance Company. Mr. Ebsworth is an Adjunct Lecturer, Finance, at Babson College and a Chartered Financial Analyst. | | Asset Allocation Trust |
| Jane A. Freeman (Born 1953) | | Trustee, since 2015** | | Retired. From 2012 to 2014 and 1999 to 2008, Chief Financial Officer of Scientific Learning Corporation. From 2008 to 2012, Ms. Freeman provided consulting services related to strategic business projects. Prior to 1999, Portfolio Manager at Rockefeller & Co. and Scudder, Stevens & Clark. Board member of the Harding Loevner Funds from 1996 to 2014, serving as both Lead Independent Director and chair of the Audit Committee. Board member of the Russell Exchange Traded Funds Trust from 2011 to 2012 and the chair of the Audit Committee. Ms. Freeman is a Chartered Financial Analyst (inactive), Chair of Taproot Foundation (non-profit organization) and a Board Member of Ruth Bancroft Garden (non-profit organization). | | Asset Allocation Trust |
| Peter G. Gordon (Born 1942) | | Trustee, since 1998; Chairman, since 2005 | | Co-Founder, Retired Chairman, President and CEO of Crystal Geyser Water Company. Trustee Emeritus, Colby College. | | Asset Allocation Trust |
| Isaiah Harris, Jr. (Born 1952) | | Trustee, since 2009 | | Retired. Chairman of the Board of CIGNA Corporation since 2009, and Director since 2005. From 2003 to 2011, Director of Deluxe Corporation. Prior thereto, President and CEO of BellSouth Advertising and Publishing Corp. from 2005 to 2007, President and CEO of BellSouth Enterprises from 2004 to 2005 and President of BellSouth Consumer Services from 2000 to 2003. Emeritus member of the Iowa State University Foundation Board of Governors. Emeritus Member of the Advisory Board of Iowa State University School of Business. Advisory Board Member, Palm Harbor Academy. Mr. Harris is a certified public accountant. | | CIGNA Corporation; Asset Allocation Trust |
| Judith M. Johnson (Born 1949) | | Trustee, since 2008; Audit Committee Chairman, since 2008 | | Retired. Prior thereto, Chief Executive Officer and Chief Investment Officer of Minneapolis Employees Retirement Fund from 1996 to 2008. Ms. Johnson is an attorney, certified public accountant and a certified managerial accountant. | | Asset Allocation Trust |
| David F. Larcker (Born 1950) | | Trustee, since 2009 | | James Irvin Miller Professor of Accounting at the Graduate School of Business, Stanford University, Morgan Stanley Director of the Center for Leadership Development and Research and Senior Faculty of The Rock Center for Corporate Governance since 2006. From 2005 to 2008, Professor of Accounting at the Graduate School of Business, Stanford University. Prior thereto, Ernst & Young Professor of Accounting at The Wharton School, University of Pennsylvania from 1985 to 2005. | | Asset Allocation Trust |
| Olivia S. Mitchell (Born 1953) | | Trustee, since 2006 | | International Foundation of Employee Benefit Plans Professor, Wharton School of the University of Pennsylvania since 1993. Director of Wharton’s Pension Research Council and Boettner Center on Pensions & Retirement Research, and Research Associate at the National Bureau of Economic Research. Previously, Cornell University Professor from 1978 to 1993. | | Asset Allocation Trust |
| | | | |
| 34 | | Wells Fargo Advantage Diversified International Fund | | Other information (unaudited) |
| | | | | | |
Name and year of birth | | Position held and length of service* | | Principal occupations during past five years or longer | | Other directorships during
past five years |
| Timothy J. Penny (Born 1951) | | Trustee, since 1996 | | President and Chief Executive Officer of Southern Minnesota Initiative Foundation, a non-profit organization, since 2007 and Senior Fellow at the Humphrey Institute Policy Forum at the University of Minnesota since 1995. Member of the Board of Trustees of NorthStar Education Finance, Inc., a non-profit organization, since 2007. | | Asset Allocation Trust |
| Michael S. Scofield (Born 1943) | | Trustee, since 2010 | | Served on the Investment Company Institute’s Board of Governors and Executive Committee from 2008-2011 as well the Governing Council of the Independent Directors Council from 2006-2011 and the Independent Directors Council Executive Committee from 2008-2011. Chairman of the IDC from 2008-2010. Institutional Investor (Fund Directions) Trustee of Year in 2007. Trustee of the Evergreen Funds complex (and its predecessors) from 1984 to 2010. Chairman of the Evergreen Funds from 2000-2010. Former Trustee of the Mentor Funds. Retired Attorney, Law Offices of Michael S. Scofield. | | Asset Allocation Trust |
| Donald C. Willeke (Born 1940) | | Trustee, since 1996 | | Principal of the law firm of Willeke & Daniels. General Counsel of the Minneapolis Employees Retirement Fund from 1984 until its consolidation into the Minnesota Public Employees Retirement Association on June 30, 2010. Director and Vice Chair of The Tree Trust (non-profit corporation). Director of the American Chestnut Foundation (non-profit corporation). | | Asset Allocation Trust |
| * | Length of service dates reflect the Trustee’s commencement of service with the Trust’s predecessor entities, where applicable. |
| ** | William R. Ebsworth and Jane A. Freeman each became a Trustee effective January 1, 2015. |
Officers
| | | | | | |
Name and year of birth | | Position held and length of service | | Principal occupations during past five years or longer | | |
Karla M. Rabusch
(Born 1959) | | President, since 2003 | | Executive Vice President of Wells Fargo Bank, N.A. and President of Wells Fargo Funds Management, LLC since 2003. | | |
Jeremy DePalma1
(Born 1974) | | Treasurer, since 2012 | | Senior Vice President of Wells Fargo Funds Management, LLC since 2009. Senior Vice President of Evergreen Investment Management Company, LLC from 2008 to 2010. Vice President, Evergreen Investment Services, Inc. from 2004 to 2007. Head of the Fund Reporting and Control Team within Fund Administration from 2005 to 2010. | | |
C. David Messman
(Born 1960) | | Secretary, since 2000; Chief Legal Officer, since 2003 | | Senior Vice President and Secretary of Wells Fargo Funds Management, LLC since 2001. Assistant General Counsel of Wells Fargo Bank, N.A. since 2013 and Vice President and Managing Counsel of Wells Fargo Bank N.A. from 1996 to 2013. | | |
Debra Ann Early
(Born 1964) | | Chief Compliance Officer, since 2007 | | Senior Vice President of Wells Fargo Funds Management, LLC since 2007 and Chief Compliance Officer from 2007 to 2014. Chief Compliance Officer of Parnassus Investments from 2005 to 2007. Chief Financial Officer of Parnassus Investments from 2004 to 2007 and Senior Audit Manager of PricewaterhouseCoopers LLP from 1998 to 2004. | | |
David Berardi
(Born 1975) | | Assistant Treasurer, since 2009 | | Vice President of Wells Fargo Funds Management, LLC since 2009. Vice President of Evergreen Investment Management Company, LLC from 2008 to 2010. Assistant Vice President of Evergreen Investment Services, Inc. from 2004 to 2008. Manager of Fund Reporting and Control for Evergreen Investment Management Company, LLC from 2004 to 2010. | | |
| 1 | Jeremy DePalma acts as Treasurer of 61 funds and Assistant Treasurer of 73 funds in the Fund Complex. |
| 2 | The Statement of Additional Information includes additional information about the Trustees and is available, without charge, upon request, by calling 1-800-222-8222 or by visiting the website at wellsfargoadvantagefunds.com. |
| | | | | | |
| List of abbreviations | | Wells Fargo Advantage Diversified International Fund | | | 35 | |
The following is a list of common abbreviations for terms and entities that may have appeared in this report.
| ACA | — ACA Financial Guaranty Corporation |
| ADR | — American depositary receipt |
| ADS | — American depositary shares |
| AGC | — Assured Guaranty Corporation |
| AGM | — Assured Guaranty Municipal |
| Ambac | — Ambac Financial Group Incorporated |
| AMT | — Alternative minimum tax |
| BAN | — Bond anticipation notes |
| BHAC | — Berkshire Hathaway Assurance Corporation |
| CAB | — Capital appreciation bond |
| CCAB | — Convertible capital appreciation bond |
| CDA | — Community Development Authority |
| CDO | — Collateralized debt obligation |
| DRIVER | — Derivative inverse tax-exempt receipts |
| DW&P | — Department of Water & Power |
| DWR | — Department of Water Resources |
| ECFA | — Educational & Cultural Facilities Authority |
| EDA | — Economic Development Authority |
| EDFA | — Economic Development Finance Authority |
| ETF | — Exchange-traded fund |
| FDIC | — Federal Deposit Insurance Corporation |
| FFCB | — Federal Farm Credit Banks |
| FGIC | — Financial Guaranty Insurance Corporation |
| FHA | — Federal Housing Administration |
| FHLB | — Federal Home Loan Bank |
| FHLMC | — Federal Home Loan Mortgage Corporation |
| FICO | — The Financing Corporation |
| FNMA | — Federal National Mortgage Association |
| GDR | — Global depositary receipt |
| GNMA | — Government National Mortgage Association |
| HCFR | — Healthcare facilities revenue |
| HEFA | — Health & Educational Facilities Authority |
| HEFAR | — Higher education facilities authority revenue |
| HFA | — Housing Finance Authority |
| HFFA | — Health Facilities Financing Authority |
| HUD | — Department of Housing and Urban Development |
| IDA | — Industrial Development Authority |
| IDAG | — Industrial Development Agency |
| KRW | — Republic of Korea won |
| LIBOR | — London Interbank Offered Rate |
| LIFER | — Long Inverse Floating Exempt Receipts |
| LLC | — Limited liability company |
| LLLP | — Limited liability limited partnership |
| LLP | — Limited liability partnership |
| MBIA | — Municipal Bond Insurance Association |
| MFHR | — Multifamily housing revenue |
| MSTR | — Municipal securities trust receipts |
| MUD | — Municipal Utility District |
| National | — National Public Finance Guarantee Corporation |
| PCFA | — Pollution Control Financing Authority |
| PCL | — Public Company Limited |
| PCR | — Pollution control revenue |
| PFA | — Public Finance Authority |
| PFFA | — Public Facilities Financing Authority |
| PFOTER | — Puttable floating option tax-exempt receipts |
| plc | — Public limited company |
| PUTTER | — Puttable tax-exempt receipts |
| R&D | — Research & development |
| Radian | — Radian Asset Assurance |
| RAN | — Revenue anticipation notes |
| RDA | — Redevelopment Authority |
| RDFA | — Redevelopment Finance Authority |
| REIT | — Real estate investment trust |
| ROC | — Reset option certificates |
| SAVRS | — Select auction variable rate securities |
| SBA | — Small Business Authority |
| SDR | — Swedish depositary receipt |
| SFHR | — Single-family housing revenue |
| SFMR | — Single-family mortgage revenue |
| SPA | — Standby purchase agreement |
| SPDR | — Standard & Poor’s Depositary Receipts |
| SPEAR | — Short Puttable Exempt Adjustable Receipts |
| STRIPS | — Separate trading of registered interest and |
| TAN | — Tax anticipation notes |
| TIPS | — Treasury inflation-protected securities |
| TRAN | — Tax revenue anticipation notes |
| TTFA | — Transportation Trust Fund Authority |
| TVA | — Tennessee Valley Authority |
This page is intentionally left blank.


For more information
More information about Wells Fargo Advantage Funds is available free upon request. To obtain literature, please write, email, visit the Fund’s website, or call:
Wells Fargo Advantage Funds
P.O. Box 8266
Boston, MA 02266-8266
Email: wfaf@wellsfargo.com
Website: wellsfargoadvantagefunds.com
Individual investors: 1-800-222-8222
Retail investment professionals: 1-888-877-9275
Institutional investment professionals: 1-866-765-0778
This report and the financial statements contained herein are submitted for the general information of the shareholders of Wells Fargo Advantage Funds. If this report is used for promotional purposes, distribution of the report must be accompanied or preceded by a current prospectus. Before investing, please consider the investment objectives, risks, charges, and expenses of the investment. For a current prospectus and, if available, a summary prospectus, containing this information, call 1-800-222-8222 or visit the Fund’s website at wellsfargoadvantagefunds.com. Read the prospectus carefully before you invest or send money.
Wells Fargo Funds Management, LLC, a wholly owned subsidiary of Wells Fargo & Company, provides investment advisory and administrative services for Wells Fargo Advantage Funds. Other affiliates of Wells Fargo & Company provide subadvisory and other services for the Funds. The Funds are distributed by Wells Fargo Funds Distributor, LLC, Member FINRA/SIPC, an affiliate of Wells Fargo & Company.
NOT FDIC INSURED ¡ NO BANK GUARANTEE ¡ MAY LOSE VALUE
© 2015 Wells Fargo Funds Management, LLC. All rights reserved.
| | |
 | | 233651 06-15 SA237/SAR237 04-15 |

Wells Fargo Advantage
Emerging Markets Equity Fund

Semi-Annual Report
April 30, 2015

Reduce clutter. Save trees.
Sign up for electronic delivery of prospectuses and shareholder reports at wellsfargo.com/advantagedelivery
Contents
The views expressed and any forward-looking statements are as of April 30, 2015, unless otherwise noted, and are those of the Fund managers and/or Wells Fargo Funds Management, LLC. Discussions of individual securities, or the markets generally, or any Wells Fargo Advantage Fund are not intended as individual recommendations. Future events or results may vary significantly from those expressed in any forward-looking statements; the views expressed are subject to change at any time in response to changing circumstances in the market. Wells Fargo Funds Management, LLC and the Fund disclaim any obligation to publicly update or revise any views expressed or forward-looking statements.
NOT FDIC INSURED ¡ NO BANK GUARANTEE ¡ MAY LOSE VALUE
| | | | |
| 2 | | Wells Fargo Advantage Emerging Markets Equity Fund | | Letter to shareholders (unaudited) |

Karla M. Rabusch
President
Wells Fargo Advantage Funds
A worldwide trend toward looser monetary policy tended to support stock and bond markets in both developed and emerging economies.
Dear Valued Shareholder:
We are pleased to offer you this semi-annual report for the Wells Fargo Advantage Emerging Markets Equity Fund for the six-month period that ended April 30, 2015. The period was marked by low global interest rates as major central banks initiated or increased their quantitative easing programs. Emerging markets stocks, as measured by the MSCI Emerging Markets Index (Net)1, displayed considerable volatility because investors worried about slower economic growth in major economies such as China and Brazil. Even so, the index ended the period with a 3.92% gain.
Major central banks continued to provide liquidity to the markets.
A worldwide trend toward looser monetary policy tended to support stock and bond markets in both developed and emerging economies. Throughout the reporting period, the Federal Open Market Committee (FOMC), which is the U.S. Federal Reserve’s (Fed’s) monetary policymaking body, kept its key interest rate effectively at zero. Even though the FOMC ended its bond-buying program in October 2014 and guided investors to expect an interest-rate hike in mid- to late-2015, the Fed remained accommodative.
The European Central Bank maintained a variety of measures aimed at encouraging lending, including making funds available to banks at low interest rates and imposing a negative interest rate on bank deposits held at the central bank. In January 2015, the bank announced quantitative easing via significant bond purchases in an attempt to raise the eurozone’s inflation to just under its target of 2%. In China, the People’s Bank of China cut its benchmark interest rate twice during the reporting period in order to support a slowing economy.
The Central Bank of Brazil bucked the trend by raising its key rate to 13.25% on April 29, 2015, in an attempt to combat the country’s high rate of inflation.
Currency movements and worries about economic growth dominated the emerging markets landscape.
The projected actions of the Fed—whether it would raise interest rates and when—heavily influenced the emerging markets landscape throughout much of the reporting period. Many emerging markets governments and companies have U.S. dollar–denominated debt outstanding; a rise in U.S. interest rates could make it more expensive to refinance that debt. In addition, near-zero U.S. rates supported capital inflows into emerging markets because investors became more willing to accept higher risk in exchange for potentially higher returns. In the past, even the prospect of higher U.S. rates caused such flows to reverse. Currency swings thus had a large effect on the emerging markets landscape, with notable weakness in the Brazilian real.
Country-specific factors also played a role in the real’s decline; Brazil faces a challenging situation with a growing corruption scandal affecting the state-controlled oil company, a struggling economy, and a severe drought afflicting the city of São Paulo.
| 1 | The Morgan Stanley Capital International (MSCI) Emerging Markets Index (Net) is a free-float-adjusted market-capitalization-weighted index that is designed to measure the equity market performance of emerging markets. The MSCI Emerging Markets Index (Net) consists of the following 23 emerging markets country indexes: Brazil, Chile, China, Colombia, Czech Republic, Egypt, Greece, Hungary, India, Indonesia, Korea, Malaysia, Mexico, Peru, the Philippines, Poland, Qatar, Russia, South Africa, Taiwan, Thailand, Turkey, and United Arab Emirates. You cannot invest directly in an index. Source: MSCI. MSCI makes no express or implied warranties or representations and shall have no liability whatsoever with respect to any MSCI data contained herein. The MSCI data may not be further redistributed or used as a basis for other indexes or any securities or financial products. This report is not approved, reviewed, or produced by MSCI. |
| | | | | | |
| Letter to shareholders (unaudited) | | Wells Fargo Advantage Emerging Markets Equity Fund | | | 3 | |
In China, government data showed a slowdown in fixed-asset investment, which includes property investment, and modest growth in manufacturing and housing sales. However, China’s growth rates still contrasted favorably with stagnant growth in most developed economies. Chinese markets also benefited from the Shanghai-Hong Kong Stock Connect program, launched in November 2014, which made it easier for mainland investors to purchase stocks on the Hong Kong exchange and for international investors to purchase stocks on the Shanghai exchange. The resulting surge in demand helped the MSCI China Index (Net)2 end the period with a 29.61% gain.
Among smaller markets, South Korea outperformed for the period as the stronger U.S. dollar tended to support exporters such as South Korea. India’s stock market benefited from lower inflation and signs of improving economic growth, but delays in key reforms caused the Indian market to underperform the benchmark.
Don’t let short-term uncertainty derail long-term investment goals.
Periods of uncertainty can present challenges, but experience has taught us that maintaining long-term investment goals can be an effective way to plan for the future. To help you create a sound strategy based on your personal goals and risk tolerance, Wells Fargo Advantage Funds offers more than 100 mutual funds and other investments spanning a wide range of asset classes and investment styles. Although diversification cannot guarantee an investment profit or prevent losses, we believe it can be an effective way to manage investment risk and potentially smooth out overall portfolio performance. We encourage investors to know their investments and to understand that appropriate levels of risk-taking may unlock opportunities.
Thank you for choosing to invest with Wells Fargo Advantage Funds. We appreciate your confidence in us and remain committed to helping you meet your financial needs.
Sincerely,

Karla M. Rabusch
President
Wells Fargo Advantage Funds
Among smaller markets, South Korea outperformed for the period as the stronger U.S. dollar tended to support exporters such as South Korea.
For current information about your fund investments, contact your investment professional, visit our website at wellsfargoadvantagefunds.com, or call us directly at 1-800-222-8222. We are available 24 hours a day, 7 days a week.
| 2 | The Morgan Stanley Capital International (MSCI) China Index (Net) is a free-float-adjusted market-capitalization-weighted index that is designed to measure equity market performance in China. You cannot invest directly in an index. |
| | | | |
| 4 | | Wells Fargo Advantage Emerging Markets Equity Fund | | Performance highlights (unaudited) |
This Fund is closed to most new investors1.
Investment objective
The Fund seeks long-term capital appreciation.
Adviser
Wells Fargo Funds Management, LLC
Subadviser
Wells Capital Management Incorporated
Portfolio managers
Derrick Irwin, CFA
Richard Peck, CFA
Yi (Jerry) Zhang, Ph.D, CFA
Average annual total returns2 (%) as of April 30, 2015
| | | | | | | | | | | | | | | | | | | | | | | | | | | | | | | | | | |
| | | | | Including sales charge | | | Excluding sales charge | | | Expense ratios3 (%) | |
| | | Inception date | | 1 year | | | 5 year | | | 10 year | | | 1 year | | | 5 year | | | 10 year | | | Gross | | | Net4 | |
| Class A (EMGAX) | | 9-6-1994 | | | (4.60 | ) | | | 1.19 | | | | 10.01 | | | | 1.20 | | | | 2.39 | | | | 10.67 | | | | 1.65 | | | | 1.65 | |
| Class B (EMGBX)* | | 9-6-1994 | | | (4.61 | ) | | | 1.26 | | | | 10.12 | | | | 0.39 | | | | 1.63 | | | | 10.12 | | | | 2.40 | | | | 2.40 | |
| Class C (EMGCX) | | 9-6-1994 | | | (0.60 | ) | | | 1.62 | | | | 9.85 | | | | 0.40 | | | | 1.62 | | | | 9.85 | | | | 2.40 | | | | 2.40 | |
| Class R6 (EMGDX) | | 6-28-2013 | | | – | | | | – | | | | – | | | | 1.62 | | | | 2.86 | | | | 11.08 | | | | 1.17 | | | | 1.17 | |
| Administrator Class (EMGYX) | | 9-6-1994 | | | – | | | | – | | | | – | | | | 1.33 | | | | 2.57 | | | | 10.92 | | | | 1.49 | | | | 1.49 | |
| Institutional Class (EMGNX) | | 7-30-2010 | | | – | | | | – | | | | – | | | | 1.62 | | | | 2.84 | | | | 11.07 | | | | 1.22 | | | | 1.22 | |
| MSCI Emerging Markets Index (Net)5 | | – | | | – | | | | – | | | | – | | | | 7.80 | | | | 3.02 | | | | 9.58 | | | | – | | | | – | |
| * | | Class B shares are closed to investment, except in connection with the reinvestment of any distributions and permitted exchanges. |
Figures quoted represent past performance, which is no guarantee of future results, and do not reflect taxes that a shareholder may pay on fund distributions or the redemption of fund shares. Investment return and principal value of an investment will fluctuate so that an investor’s shares, when redeemed, may be worth more or less than their original cost. Performance shown without sales charges would be lower if sales charges were reflected. Current performance may be lower or higher than the performance data quoted, which assumes the reinvestment of dividends and capital gains. Current month-end performance is available on the Fund’s website, wellsfargoadvantagefunds.com.
Index returns do not include transaction costs associated with buying and selling securities, any mutual fund fees or expenses, or any taxes. It is not possible to invest directly in an index.
For Class A shares, the maximum front-end sales charge is 5.75%. For Class B shares, the maximum contingent deferred sales charge is 5.00%. For Class C shares, the maximum contingent deferred sales charge is 1.00%. Performance including a contingent deferred sales charge assumes the sales charge for the corresponding time period. Class R6, Administrator Class, and Institutional Class shares are sold without a front-end sales charge or contingent deferred sales charge.
Stock values fluctuate in response to the activities of individual companies and general market and economic conditions. Foreign investments are especially volatile and can rise or fall dramatically due to differences in the political and economic conditions of the host country. These risks are generally intensified in emerging markets. The use of derivatives may reduce returns and/or increase volatility. Certain investment strategies tend to increase the total risk of an investment (relative to the broader market). The Fund is exposed to smaller-company securities risk. Consult the Fund’s prospectus for additional information on these and other risks.
Please see footnotes on page 5.
| | | | | | |
| Performance highlights (unaudited) | | Wells Fargo Advantage Emerging Markets Equity Fund | | | 5 | |
| | | | |
| Ten largest holdings6 (%) as of April 30, 2015 | |
Samsung Electronics Company Limited | | | 4.79 | |
Taiwan Semiconductor Manufacturing Company Limited ADR | | | 3.80 | |
China Life Insurance Company Limited H Shares | | | 3.34 | |
China Mobile Limited | | | 3.21 | |
Fomento Economico Mexicano SAB de CV ADR | | | 2.34 | |
AIA Group Limited | | | 1.98 | |
Belle International Holdings Limited | | | 1.77 | |
America Movil SAB de CV ADR | | | 1.76 | |
ICICI Bank Limited ADR | | | 1.74 | |
Lojas Americanas SA | | | 1.71 | |
|
| Sector distribution7 as of April 30, 2015 |
|
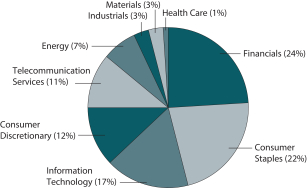 |
|
| Country allocation7 as of April 30, 2015 |
|
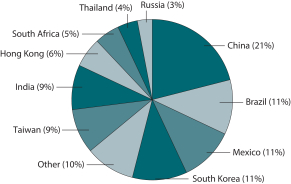 |
| 1 | Please see the Fund’s current Statement of Additional Information for further details. |
| 2 | Historical performance shown for Class R6 shares prior to their inception reflects the performance of Institutional Class shares and includes the higher expenses applicable to Institutional Class shares. If these expenses had not been included, returns would have been higher. Historical performance shown for Institutional Class shares prior to their inception reflects the performance of Administrator Class shares and includes the higher expenses applicable to Administrator Class shares. If these expenses had not been included, returns would be higher. Historical performance shown for all classes of the Fund prior to July 19, 2010, is based on the performance of the Fund’s predecessor, Evergreen Emerging Markets Growth Fund. |
| 3 | Reflects the expense ratios as stated in the most recent prospectuses, which include the impact of 0.01% in acquired fund fees and expenses. The expense ratios shown are subject to change and may differ from the annualized expense ratios shown in the financial highlights of this report, which do not include acquired fund fees and expenses. |
| 4 | The Adviser has committed through February 29, 2016, to waive fees and/or reimburse expenses to the extent necessary to cap the Fund’s Total Annual Fund Operating Expenses After Fee Waiver, excluding certain expenses, at 1.67% for Class A, 2.42% for Class B, 2.42% for Class C, 1.18% for Class R6, 1.50% for Administrator Class, and 1.23% for Institutional Class. After this time, the cap may be increased or the commitment to maintain the cap may be terminated only with the approval of the Board of Trustees. Brokerage commissions, stamp duty fees, interest, taxes, acquired fund fees and expenses, and extraordinary expenses are excluded from the cap. Without this cap, the Fund’s returns would have been lower. |
| 5 | The Morgan Stanley Capital International (MSCI) Emerging Markets Index (Net) is a free-float-adjusted market-capitalization-weighted index that is designed to measure the equity market performance of emerging markets. The MSCI Emerging Markets Index (Net) consists of the following 23 emerging markets country indexes: Brazil, Chile, China, Colombia, Czech Republic, Egypt, Greece, Hungary, India, Indonesia, Korea, Malaysia, Mexico, Peru, the Philippines, Poland, Qatar, Russia, South Africa, Taiwan, Thailand, Turkey,* and United Arab Emirates. You cannot invest directly in an index. Source: MSCI. MSCI makes no express or implied warranties or representations and shall have no liability whatsoever with respect to any MSCI data contained herein. The MSCI data may not be further redistributed or used as a basis for other indexes or any securities or financial products. This report is not approved, reviewed, or produced by MSCI. |
| 6 | The ten largest holdings, excluding cash and cash equivalents, are calculated based on the value of the investments divided by total net assets of the Fund. Holdings are subject to change and may have changed since the date specified. |
| 7 | Amounts are calculated based on the total long-term investments of the Fund. These percentages are subject to change and may have changed since the date specified. |
| | | | |
| 6 | | Wells Fargo Advantage Emerging Markets Equity Fund | | Fund expenses (unaudited) |
As a shareholder of the Fund, you incur two types of costs: (1) transaction costs, including sales charges (loads) on purchase payments and contingent deferred sales charges (if any) on redemptions and (2) ongoing costs, including management fees, distribution (12b-1) and/or shareholder service fees, and other Fund expenses. This example is intended to help you understand your ongoing costs (in dollars) of investing in the Fund and to compare these costs with the ongoing costs of investing in other mutual funds.
The example is based on an investment of $1,000 invested at the beginning of the six-month period and held for the entire period from November 1, 2014 to April 30, 2015.
Actual expenses
The “Actual” line of the table below provides information about actual account values and actual expenses. You may use the information in this line, together with the amount you invested, to estimate the expenses that you paid over the period. Simply divide your account value by $1,000 (for example, an $8,600 account value divided by $1,000 = 8.6), then multiply the result by the number in the “Actual” line under the heading entitled “Expenses paid during period” for your applicable class of shares to estimate the expenses you paid on your account during this period.
Hypothetical example for comparison purposes
The “Hypothetical” line of the table below provides information about hypothetical account values and hypothetical expenses based on the Fund’s actual expense ratio and an assumed rate of return of 5% per year before expenses, which is not the Fund’s actual return. The hypothetical account values and expenses may not be used to estimate the actual ending account balance or expenses you paid for the period. You may use this information to compare the ongoing costs of investing in the Fund and other funds. To do so, compare this 5% hypothetical example with the 5% hypothetical examples that appear in the shareholder reports of the other funds.
Please note that the expenses shown in the table are meant to highlight your ongoing costs only and do not reflect any transactional costs, such as sales charges (loads) and contingent deferred sales charges. Therefore, the “Hypothetical” line of the table is useful in comparing ongoing costs only and will not help you determine the relative total costs of owning different funds. In addition, if these transactional costs were included, your costs would have been higher.
| | | | | | | | | | | | | | | | |
| | | Beginning
account value
11-1-2014 | | | Ending
account value
4-30-2015 | | | Expenses
paid during
the period¹ | | | Net annualized
expense ratio | |
Class A | | | | | | | | | | | | | | | | |
Actual | | $ | 1,000.00 | | | $ | 985.59 | | | $ | 8.12 | | | | 1.65 | % |
Hypothetical (5% return before expenses) | | $ | 1,000.00 | | | $ | 1,016.61 | | | $ | 8.25 | | | | 1.65 | % |
Class B | | | | | | | | | | | | | | | | |
Actual | | $ | 1,000.00 | | | $ | 981.92 | | | $ | 11.70 | | | | 2.38 | % |
Hypothetical (5% return before expenses) | | $ | 1,000.00 | | | $ | 1,012.99 | | | $ | 11.88 | | | | 2.38 | % |
Class C | | | | | | | | | | | | | | | | |
Actual | | $ | 1,000.00 | | | $ | 981.78 | | | $ | 11.79 | | | | 2.40 | % |
Hypothetical (5% return before expenses) | | $ | 1,000.00 | | | $ | 1,012.89 | | | $ | 11.98 | | | | 2.40 | % |
Class R6 | | | | | | | | | | | | | | | | |
Actual | | $ | 1,000.00 | | | $ | 987.79 | | | $ | 5.77 | | | | 1.17 | % |
Hypothetical (5% return before expenses) | | $ | 1,000.00 | | | $ | 1,018.99 | | | $ | 5.86 | | | | 1.17 | % |
Administrator Class | | | | | | | | | | | | | | | | |
Actual | | $ | 1,000.00 | | | $ | 986.23 | | | $ | 7.29 | | | | 1.48 | % |
Hypothetical (5% return before expenses) | | $ | 1,000.00 | | | $ | 1,017.46 | | | $ | 7.40 | | | | 1.48 | % |
Institutional Class | | | | | | | | | | | | | | | | |
Actual | | $ | 1,000.00 | | | $ | 987.73 | | | $ | 6.01 | | | | 1.22 | % |
Hypothetical (5% return before expenses) | | $ | 1,000.00 | | | $ | 1,018.74 | | | $ | 6.11 | | | | 1.22 | % |
| 1 | Expenses paid is equal to the annualized expense ratio of each class multiplied by the average account value over the period, multiplied by the number of days in the most recent fiscal half-year divided by the number of days in the fiscal year (to reflect the one-half-year period). |
| | | | | | |
| Portfolio of investments—April 30, 2015 (unaudited) | | Wells Fargo Advantage Emerging Markets Equity Fund | | | 7 | |
| | | | | | | | | | | | |
| Security name | | | | | | Shares | | | Value | |
| | | | |
Common Stocks: 95.50% | | | | | | | | | | | | |
| | | | |
| Argentina: 0.60% | | | | | | | | | | | | |
MercadoLibre Incorporated (Information Technology, Internet Software & Services) « | | | | | | | 204,300 | | | $ | 29,078,019 | |
| | | | | | | | | | | | |
| | | | |
| Brazil: 8.96% | | | | | | | | | | | | |
Ambev SA ADR (Consumer Staples, Beverages) | | | | | | | 11,447,000 | | | | 72,459,510 | |
B2W Cia Digital (Consumer Discretionary, Internet & Catalog Retail) † | | | | | | | 3,301,424 | | | | 29,990,532 | |
Banco Bradesco SA ADR (Financials, Banks) | | | | | | | 6,285,249 | | | | 67,189,312 | |
BM&F Bovespa SA (Financials, Diversified Financial Services) | | | | | | | 11,954,000 | | | | 49,237,173 | |
BRF Brasil Foods SA ADR (Consumer Staples, Food Products) | | | | | | | 1,119,078 | | | | 24,026,605 | |
CETIP SA (Financials, Capital Markets) | | | | | | | 4,147,437 | | | | 47,559,352 | |
Lojas Renner SA (Consumer Discretionary, Multiline Retail) | | | | | | | 986,600 | | | | 34,398,955 | |
Multiplan Empreendimentos Imobiliarios SA (Financials, Real Estate Management & Development) | | | | | | | 1,361,200 | | | | 23,944,506 | |
Petroleo Brasileiro SA ADR (Energy, Oil, Gas & Consumable Fuels) Ǡ | | | | | | | 1,033,200 | | | | 9,815,400 | |
Petroleo Brasileiro SA ADR Class A (Energy, Oil, Gas & Consumable Fuels) † | | | | | | | 2,422,953 | | | | 21,031,232 | |
Raia Drogasil SA (Consumer Staples, Food & Staples Retailing) | | | | | | | 2,292,600 | | | | 26,023,306 | |
Rumo Logistica Operadora Multimodal SA (Industrials, Road & Rail) | | | | | | | 37,813,513 | | | | 16,315,427 | |
Vale SA ADR (Materials, Metals & Mining) « | | | | | | | 1,221,636 | | | | 9,382,164 | |
| | | | |
| | | | | | | | | | | 431,373,474 | |
| | | | | | | | | | | | |
| | | | |
| Chile: 1.72% | | | | | | | | | | | | |
Banco Santander Chile SA ADR (Financials, Banks) | | | | | | | 1,831,200 | | | | 39,938,472 | |
SACI Falabella (Consumer Discretionary, Multiline Retail) | | | | | | | 5,472,942 | | | | 42,858,330 | |
| | | | |
| | | | | | | | | | | 82,796,802 | |
| | | | | | | | | | | | |
| | | | |
| China: 20.68% | | | | | | | | | | | | |
51Job Incorporated ADR (Industrials, Professional Services) Ǡ | | | | | | | 1,288,382 | | | | 46,381,752 | |
Alibaba Group Holding Limited ADR (Information Technology, Internet Software & Services) † | | | | | | | 291,037 | | | | 23,658,398 | |
Baidu Incorporated ADR (Information Technology, Internet Software & Services) † | | | | | | | 205,540 | | | | 41,165,551 | |
China Auto Rental Incorporated (Consumer Discretionary, Automobiles) † | | | | | | | 1,256,469 | | | | 2,969,749 | |
China Life Insurance Company Limited H Shares (Financials, Insurance) | | | | | | | 33,127,290 | | | | 160,776,102 | |
China Mobile Limited (Telecommunication Services, Wireless Telecommunication Services) | | | | | | | 10,805,165 | | | | 154,333,260 | |
CNOOC Limited (Energy, Oil, Gas & Consumable Fuels) | | | | | | | 47,278,000 | | | | 80,619,008 | |
Ctrip.com International Limited ADR (Consumer Discretionary, Internet & Catalog Retail) † | | | | | | | 860,816 | | | | 54,816,763 | |
Hengan International Group Company Limited (Consumer Staples, Personal Products) | | | | | | | 6,110,000 | | | | 75,378,632 | |
Mindray Medical International Limited ADR (Health Care, Health Care Equipment & Supplies) | | | | | | | 1,134,148 | | | | 35,022,490 | |
New Oriental Education & Technology Group Incorporated ADR (Consumer Discretionary, Diversified Consumer Services) † | | | | | | | 2,296,182 | | | | 58,759,297 | |
PetroChina Company Limited H Shares (Energy, Oil, Gas & Consumable Fuels) | | | | | | | 27,870,000 | | | | 35,945,696 | |
Shandong Weigao Group Medical Polymer Company Limited H Shares (Health Care, Health Care Equipment & Supplies) | | | | | | | 14,324,000 | | | | 13,237,717 | |
SINA Corporation (Information Technology, Internet Software & Services) Ǡ | | | | | | | 1,730,907 | | | | 76,151,253 | |
Tingyi Holding Corporation (Consumer Staples, Food Products) | | | | | | | 25,878,000 | | | | 54,648,357 | |
Tsingtao Brewery Company Limited H Shares (Consumer Staples, Beverages) | | | | | | | 8,112,000 | | | | 51,537,048 | |
Vipshop Holdings Limited ADR (Consumer Discretionary, Internet & Catalog Retail) † | | | | | | | 351,760 | | | | 9,951,290 | |
Weibo Corporation ADR (Information Technology, Internet Software & Services) Ǡ | | | | | | | 1,193,046 | | | | 19,900,007 | |
| | | | |
| | | | | | | | | | | 995,252,370 | |
| | | | | | | | | | | | |
| | | | |
| Colombia: 0.62% | | | | | | | | | | | | |
Bancolombia SA ADR (Financials, Banks) « | | | | | | | 660,400 | | | | 29,896,308 | |
| | | | | | | | | | | | |
The accompanying notes are an integral part of these financial statements.
| | | | |
| 8 | | Wells Fargo Advantage Emerging Markets Equity Fund | | Portfolio of investments—April 30, 2015 (unaudited) |
| | | | | | | | | | | | |
| Security name | | | | | | Shares | | | Value | |
| | | | |
| Hong Kong: 6.34% | | | | | | | | | | | | |
AIA Group Limited (Financials, Insurance) | | | | | | | 14,311,400 | | | $ | 95,177,597 | |
Belle International Holdings Limited (Consumer Discretionary, Textiles, Apparel & Luxury Goods) | | | | | | | 66,516,000 | | | | 85,371,364 | |
Johnson Electric Holdings Limited (Industrials, Electrical Equipment) | | | | | | | 4,164,250 | | | | 15,470,414 | |
Li Ning Company Limited (Consumer Discretionary, Textiles, Apparel & Luxury Goods) † | | | | | | | 20,484,207 | | | | 11,330,200 | |
Sun Art Retail Group Limited (Consumer Staples, Food & Staples Retailing) « | | | | | | | 33,290,500 | | | | 34,318,996 | |
Texwinca Holdings Limited (Consumer Discretionary, Textiles, Apparel & Luxury Goods) | | | | | | | 248,000 | | | | 240,494 | |
WH Group Limited (Consumer Staples, Food Products) † | | | | | | | 90,522,500 | | | | 63,183,585 | |
| | | | |
| | | | | | | | | | | 305,092,650 | |
| | | | | | | | | | | | |
| | | | |
| India: 8.49% | | | | | | | | | | | | |
Bharti Airtel Limited (Telecommunication Services, Wireless Telecommunication Services) | | | | | | | 4,888,728 | | | | 29,273,327 | |
Bharti Infratel Limited (Telecommunication Services, Wireless Telecommunication Services) | | | | | | | 5,348,464 | | | | 33,792,625 | |
HDFC Bank Limited ADR (Financials, Banks) | | | | | | | 123,826 | | | | 7,038,270 | |
Housing Development Finance Corporation Limited (Financials, Thrifts & Mortgage Finance) | | | | | | | 2,250,700 | | | | 41,397,358 | |
ICICI Bank Limited ADR (Financials, Banks) | | | | | | | 7,641,775 | | | | 83,524,601 | |
Infosys Technologies Limited ADR (Information Technology, IT Services) | | | | | | | 2,071,230 | | | | 64,166,705 | |
ITC Limited (Consumer Staples, Tobacco) | | | | | | | 11,762,640 | | | | 59,697,505 | |
Reliance Industries Limited (Energy, Oil, Gas & Consumable Fuels) | | | | | | | 3,244,200 | | | | 44,000,119 | |
Reliance Industries Limited GDR (Energy, Oil, Gas & Consumable Fuels) 144A | | | | | | | 1,246,587 | | | | 33,533,190 | |
Ultra Tech Cement Limited (Materials, Construction Materials) | | | | | | | 286,000 | | | | 12,018,471 | |
| | | | |
| | | | | | | | | | | 408,442,171 | |
| | | | | | | | | | | | |
| | | | |
| Indonesia: 1.90% | | | | | | | | | | | | |
PT Astra International Tbk (Consumer Discretionary, Automobiles) | | | | | | | 14,651,000 | | | | 7,709,820 | |
PT Bank Central Asia Tbk (Financials, Banks) | | | | | | | 9,549,500 | | | | 9,887,620 | |
PT Blue Bird Tbk (Industrials, Road & Rail) † | | | | | | | 13,605,309 | | | | 8,579,302 | |
PT Link Net Tbk (Telecommunication Services, Diversified Telecommunication Services) † | | | | | | | 44,178,161 | | | | 19,170,851 | |
PT Matahari Department Store Tbk (Consumer Discretionary, Multiline Retail) | | | | | | | 10,474,600 | | | | 14,087,379 | |
PT Telekomunikasi Indonesia Persero Tbk ADR (Telecommunication Services, Diversified Telecommunication Services) | | | | | | | 768,877 | | | | 31,816,130 | |
PT Telekomunikasi Indonesia Persero Tbk (Telecommunication Services, Diversified Telecommunication Services) | | | | | | | 2,000,000 | | | | 402,243 | |
| | | | |
| | | | | | | | | | | 91,653,345 | |
| | | | | | | | | | | | |
| | | | |
| Malaysia: 1.33% | | | | | | | | | | | | |
Genting Bhd (Consumer Discretionary, Hotels, Restaurants & Leisure) | | | | | | | 8,480,900 | | | | 20,818,563 | |
Genting Malaysia Bhd (Consumer Discretionary, Hotels, Restaurants & Leisure) | | | | | | | 18,396,300 | | | | 22,173,753 | |
KLCC Property Holdings Bhd (Financials, REITs) | | | | | | | 3,437,900 | | | | 6,814,986 | |
Sime Darby Bhd (Industrials, Industrial Conglomerates) | | | | | | | 5,565,937 | | | | 14,142,125 | |
| | | | |
| | | | | | | | | | | 63,949,427 | |
| | | | | | | | | | | | |
| | | | |
| Mexico: 10.78% | | | | | | | | | | | | |
America Movil SAB de CV ADR (Telecommunication Services, Wireless Telecommunication Services) | | | | | | | 4,047,320 | | | | 84,548,515 | |
Cemex SAB de CV ADR (Materials, Construction Materials) † | | | | | | | 5,573,745 | | | | 53,619,425 | |
Fibra Uno Administracion SAB de CV (Financials, REITs) | | | | | | | 23,927,493 | | | | 59,670,570 | |
Fomento Economico Mexicano SAB de CV ADR (Consumer Staples, Beverages) † | | | | | | | 1,242,100 | | | | 112,397,629 | |
Grupo Financiero Banorte SAB de CV (Financials, Banks) | | | | | | | 12,648,611 | | | | 71,751,311 | |
Grupo Financiero Santander SAB de CV ADR (Financials, Banks) | | | | | | | 2,248,441 | | | | 22,866,645 | |
Grupo Sanborns SA de CV (Consumer Discretionary, Multiline Retail) | | | | | | | 4,264,153 | | | | 6,406,513 | |
The accompanying notes are an integral part of these financial statements.
| | | | | | |
| Portfolio of investments—April 30, 2015 (unaudited) | | Wells Fargo Advantage Emerging Markets Equity Fund | | | 9 | |
| | | | | | | | | | | | |
| Security name | | | | | | Shares | | | Value | |
| | | | |
| Mexico (continued) | | | | | | | | | | | | |
Grupo Televisa SAB ADR (Consumer Discretionary, Media) † | | | | | | | 1,434,000 | | | $ | 52,211,940 | |
Wal-Mart de Mexico SAB de CV (Consumer Staples, Food & Staples Retailing) | | | | | | | 23,477,100 | | | | 55,242,036 | |
| | | | |
| | | | | | | | | | | 518,714,584 | |
| | | | | | | | | | | | |
| | | | |
| Peru: 0.41% | | | | | | | | | | | | |
Compania de Minas Buenaventura SA ADR (Materials, Metals & Mining) | | | | | | | 1,753,600 | | | | 19,605,248 | |
| | | | | | | | | | | | |
| | | | |
| Philippines: 0.63% | | | | | | | | | | | | |
Ayala Corporation (Financials, Diversified Financial Services) | | | | | | | 647,624 | | | | 11,324,543 | |
Metropolitan Bank & Trust Company (Financials, Banks) | | | | | | | 4,287,486 | | | | 8,937,699 | |
SM Investments Corporation (Industrials, Industrial Conglomerates) | | | | | | | 488,582 | | | | 9,870,649 | |
| | | | |
| | | | | | | | | | | 30,132,891 | |
| | | | | | | | | | | | |
| | | | |
| Russia : 2.88% | | | | | | | | | | | | |
LUKOIL ADR - London Exchange (Energy, Oil, Gas & Consumable Fuels) | | | | | | | 881,249 | | | | 45,080,739 | |
Magnit (Consumer Staples, Food & Staples Retailing) (a) | | | | | | | 99,300 | | | | 21,708,549 | |
Mobile Telesystems ADR (Telecommunication Services, Wireless Telecommunication Services) | | | | | | | 2,017,800 | | | | 24,375,024 | |
Sberbank of Russia (Financials, Banks) (a) | | | | | | | 5,517,377 | | | | 8,223,021 | |
Sberbank of Russia ADR (Financials, Banks) | | | | | | | 2,181,195 | | | | 12,945,979 | |
Yandex NV Class A (Information Technology, Internet Software & Services) † | | | | | | | 1,375,106 | | | | 26,457,039 | |
| | | | |
| | | | | | | | | | | 138,790,351 | |
| | | | | | | | | | | | |
| | | | |
| South Africa: 5.04% | | | | | | | | | | | | |
Anglo American Platinum Limited (Materials, Metals & Mining) † | | | | | | | 106,832 | | | | 2,950,676 | |
AngloGold Ashanti Limited ADR (Materials, Metals & Mining) † | | | | | | | 1,077,592 | | | | 12,209,117 | |
Clicks Group Limited (Consumer Staples, Food & Staples Retailing) | | | | | | | 1,020,000 | | | | 7,816,937 | |
Gold Fields Limited ADR (Materials, Metals & Mining) | | | | | | | 660,700 | | | | 3,019,399 | |
Impala Platinum Holdings Limited (Materials, Metals & Mining) † | | | | | | | 1,290,758 | | | | 7,183,704 | |
MTN Group Limited (Telecommunication Services, Wireless Telecommunication Services) | | | | | | | 2,292,643 | | | | 46,033,780 | |
Sasol Limited (Energy, Oil, Gas & Consumable Fuels) | | | | | | | 470,000 | | | | 18,923,832 | |
Shoprite Holdings Limited (Consumer Staples, Food & Staples Retailing) | | | | | | | 4,088,100 | | | | 58,492,252 | |
Standard Bank Group Limited (Financials, Banks) | | | | | | | 2,295,190 | | | | 33,642,737 | |
Tiger Brands Limited (Consumer Staples, Food Products) | | | | | | | 2,015,333 | | | | 52,453,486 | |
| | | | |
| | | | | | | | | | | 242,725,920 | |
| | | | | | | | | | | | |
| | | | |
| South Korea: 10.62% | | | | | | | | | | | | |
Amorepacific Corporation (Consumer Staples, Personal Products) (a) | | | | | | | 7,790 | | | | 28,224,216 | |
KB Financial Group Incorporated (Financials, Banks) | | | | | | | 315,000 | | | | 12,012,306 | |
KB Financial Group Incorporated ADR (Financials, Banks) | | | | | | | 93,117 | | | | 3,550,551 | |
KT Corporation (Telecommunication Services, Diversified Telecommunication Services) † | | | | | | | 40,000 | | | | 1,182,398 | |
KT Corporation ADR (Telecommunication Services, Diversified Telecommunication Services) | | | | | | | 4,334,813 | | | | 63,158,225 | |
KT&G Corporation (Consumer Staples, Tobacco) | | | | | | | 624,091 | | | | 55,364,789 | |
Samsung Electronics Company Limited (Information Technology, Technology Hardware, Storage & Peripherals) | | | | | | | 175,836 | | | | 230,671,114 | |
Samsung Life Insurance Company Limited (Financials, Insurance) | | | | | | | 677,337 | | | | 66,251,889 | |
Shinhan Financial Group Company Limited (Financials, Banks) | | | | | | | 315,945 | | | | 13,076,378 | |
SK Hynix Incorporated (Information Technology, Semiconductors & Semiconductor Equipment) | | | | | | | 875,000 | | | | 37,436,922 | |
| | | | |
| | | | | | | | | | | 510,928,788 | |
| | | | | | | | | | | | |
The accompanying notes are an integral part of these financial statements.
| | | | |
| 10 | | Wells Fargo Advantage Emerging Markets Equity Fund | | Portfolio of investments—April 30, 2015 (unaudited) |
| | | | | | | | | | | | | | | | |
| Security name | | | | | | | | Shares | | | Value | |
| | | | |
| Taiwan: 8.78% | | | | | | | | | | | | | | | | |
104 Corporation (Industrials, Commercial Services &
Supplies) (l)† | | | | | | | | | | | 1,655,000 | | | $ | 9,042,028 | |
Far Eastern New Century Corporation (Industrials, Industrial Conglomerates) | | | | | | | | | | | 21,988,675 | | | | 24,152,586 | |
Fuhwa Financial Holdings Company Limited (Financials, Capital Markets) | | | | | | | | | | | 39,252,018 | | | | 22,814,498 | |
Media Tek Incorporated (Information Technology, Semiconductors & Semiconductor Equipment) | | | | | | | | | | | 2,939,881 | | | | 37,789,787 | |
President Chain Store Corporation (Consumer Staples, Food & Staples Retailing) | | | | | | | | | | | 3,955,000 | | | | 29,267,656 | |
Taiwan Semiconductor Manufacturing Company Limited (Information Technology, Semiconductors & Semiconductor Equipment) | | | | | | | | | | | 8,585,224 | | | | 41,331,600 | |
Taiwan Semiconductor Manufacturing Company Limited ADR (Information Technology, Semiconductors & Semiconductor Equipment) | | | | | | | | | | | 7,477,852 | | | | 182,758,703 | |
Uni-President Enterprises Corporation (Consumer Staples, Food Products) | | | | | | | | | | | 45,996,508 | | | | 75,275,815 | |
| | | | |
| | | | | | | | | | | | | | | 422,432,673 | |
| | | | | | | | | | | | | | | | |
| | | | |
| Thailand: 3.64% | | | | | | | | | | | | | | | | |
Bangkok Bank PCL (Financials, Banks) | | | | | | | | | | | 3,729,800 | | | | 20,935,871 | |
PTT Exploration & Production PCL (Energy, Oil, Gas & Consumable Fuels) | | | | | | | | | | | 6,378,139 | | | | 22,637,411 | |
PTT PCL (Energy, Oil, Gas & Consumable Fuels) | | | | | | | | | | | 3,475,900 | | | | 37,537,400 | |
Siam Commercial Bank PCL (Financials, Banks) | | | | | | | | | | | 9,505,100 | | | | 45,845,924 | |
Thai Beverage PCL (Consumer Staples, Beverages) | | | | | | | | | | | 89,027,000 | | | | 48,106,337 | |
| | | | |
| | | | | | | | | | | | | | | 175,062,943 | |
| | | | | | | | | | | | | | | | |
| | | | |
| Turkey: 0.83% | | | | | | | | | | | | | | | | |
Anadolu Efes Biracilik Ve Malt Sanayii AS (Consumer Staples, Beverages) † | | | | | | | | | | | 2,920,453 | | | | 24,585,830 | |
Avivasa Emeklilik Ve Hayat AS (Financials, Insurance) « | | | | | | | | | | | 378,063 | | | | 7,075,311 | |
Turkcell Iletisim Hizmetleri AS ADR (Telecommunication Services, Wireless Telecommunication Services) « | | | | | | | | | | | 741,462 | | | | 8,200,570 | |
| | | | |
| | | | | | | | | | | | | | | 39,861,711 | |
| | | | | | | | | | | | | | | | |
| | | | |
| United Arab Emirates: 0.07% | | | | | | | | | | | | | | | | |
Emaar Malls Group (Financials, Real Estate Management & Development) † | | | | | | | | | | | 3,773,147 | | | | 3,294,986 | |
| | | | | | | | | | | | | | | | |
| | | | |
| United Kingdom: 1.18% | | | | | | | | | | | | | | | | |
African Barrick Gold Limited (Materials, Metals & Mining) | | | | | | | | | | | 1,068,500 | | | | 4,738,811 | |
Standard Chartered plc (Financials, Banks) | | | | | | | | | | | 3,181,301 | | | | 52,084,903 | |
| | | | |
| | | | | | | | | | | | | | | 56,823,714 | |
| | | | | | | | | | | | | | | | |
| | | | |
Total Common Stocks (Cost $4,222,555,538) | | | | | | | | | | | | | | | 4,595,908,375 | |
| | | | | | | | | | | | | | | | |
| | | | |
| | | Interest rate | | | Maturity date | | | Principal | | | | |
| Convertible Debentures: 0.00% | | | | | | | | | | | | | | | | |
| | | | |
| Brazil: 0.00% | | | | | | | | | | | | | | | | |
Lupatech SA (Energy, Energy Equipment & Services) (a)(i)(s) | | | 6.50 | % | | | 4-15-2018 | | | $ | 303,000 | | | | 1,612 | |
| | | | | | | | | | | | | | | | |
| | | | |
Total Convertible Debentures (Cost $160,691) | | | | | | | | | | | | | | | 1,612 | |
| | | | | | | | | | | | | | | | |
The accompanying notes are an integral part of these financial statements.
| | | | | | |
| Portfolio of investments—April 30, 2015 (unaudited) | | Wells Fargo Advantage Emerging Markets Equity Fund | | | 11 | |
| | | | | | | | | | | | | | | | |
| Security name | | Dividend yield | | | | | | Shares | | | Value | |
| | | | |
| Preferred Stocks: 1.86% | | | | | | | | | | | | | | | | |
| | | | |
| Brazil: 1.86% | | | | | | | | | | | | | | | | |
Lojas Americanas SA (Consumer Discretionary, Multiline Retail) ± | | | 0.13 | % | | | | | | | 14,769,628 | | | $ | 82,207,359 | |
Vale SA ADR (Materials, Metals & Mining) ± | | | 3.30 | | | | | | | | 1,203,500 | | | | 7,281,175 | |
| | | | |
Total Preferred Stocks (Cost $99,573,278) | | | | | | | | | | | | | | | 89,488,534 | |
| | | | | | | | | | | | | | | | |
| | | | |
| | | | | | Expiration date | | | | | | | |
| Warrants: 0.01% | | | | | | | | | | | | | | | | |
| | | | |
| Malaysia: 0.01% | | | | | | | | | | | | | | | | |
Genting Bhd (Consumer Discretionary, Hotels, Restaurants & Leisure) † | | | | | | | 12-18-2018 | | | | 620,325 | | | | 322,224 | |
| | | | | | | | | | | | | | | | |
| | | | |
Total Warrants (Cost $292,284) | | | | | | | | | | | | | | | 322,224 | |
| | | | | | | | | | | | | | | | |
| | | | |
| | | Yield | | | | | | | | | | |
| Short-Term Investments: 4.37% | | | | | | | | | | | | | | | | |
| | | | |
| Investment Companies: 4.37% | | | | | | | | | | | | | | | | |
Securities Lending Cash Investments, LLC (l)(r)(u) | | | 0.12 | | | | | | | | 113,453,863 | | | | 113,453,863 | |
Wells Fargo Advantage Cash Investment Money Market Fund, Select Class (l)(u) | | | 0.11 | | | | | | | | 96,749,081 | | | | 96,749,081 | |
| | | | |
Total Short-Term Investments (Cost $210,202,944) | | | | | | | | | | | | | | | 210,202,944 | |
| | | | | | | | | | | | | | | | |
| | | | | | | | |
| Total investments in securities (Cost $4,532,784,735) * | | | 101.74 | % | | | 4,895,923,689 | |
Other assets and liabilities, net | | | (1.74 | ) | | | (83,731,729 | ) |
| | | | | | | | |
| Total net assets | | | 100.00 | % | | $ | 4,812,191,960 | |
| | | | | | | | |
| « | All or a portion of this security is on loan. |
| † | Non-income-earning security |
| 144A | The security may be resold in transactions exempt from registration, normally to qualified institutional buyers, pursuant to Rule 144A under the Securities Act of 1933. |
| (a) | The security is fair valued in accordance with procedures approved by the Board of Trustees. |
| (l) | The security represents an affiliate of the Fund as defined in the Investment Company Act of 1940. |
| (s) | The security is currently in default with regards to scheduled interest and/or principal payments. The Fund has stopped accruing interest on the security. |
| ± | Variable rate investment. The rate shown is the rate in effect at period end. |
| (r) | The investment is a non-registered investment vehicle purchased with cash collateral received from securities on loan. |
| (u) | The rate represents the 7-day annualized yield at period end. |
| * | Cost for federal income tax purposes is $4,555,692,985 and unrealized gains (losses) consists of: |
| | | | |
Gross unrealized gains | | $ | 813,976,210 | |
Gross unrealized losses | | | (473,745,506 | ) |
| | | | |
Net unrealized gains | | $ | 340,230,704 | |
The accompanying notes are an integral part of these financial statements.
| | | | |
| 12 | | Wells Fargo Advantage Emerging Markets Equity Fund | | Statement of assets and liabilities—April 30, 2015 (unaudited) |
| | | | |
| | | | |
| |
Assets | | | | |
Investments | | | | |
In unaffiliated securities (including $110,108,524 of securities loaned), at value (cost $4,316,905,855) | | $ | 4,676,678,717 | |
In affiliated securities, at value (cost $215,878,880) | | | 219,244,972 | |
| | | | |
Total investments, at value (cost $4,532,784,735) | | | 4,895,923,689 | |
Foreign currency, at value (cost $24,850,831) | | | 24,199,671 | |
Receivable for investments sold | | | 7,617,883 | |
Receivable for Fund shares sold | | | 12,461,141 | |
Receivable for dividends | | | 8,864,048 | |
Receivable for securities lending income | | | 113,060 | |
Prepaid expenses and other assets | | | 219,533 | |
| | | | |
Total assets | | | 4,949,399,025 | |
| | | | |
| |
Liabilities | | | | |
Payable for investments purchased | | | 2,020,884 | |
Payable for Fund shares redeemed | | | 15,973,221 | |
Payable upon receipt of securities loaned | | | 113,453,863 | |
Advisory fee payable | | | 4,006,308 | |
Distribution fees payable | | | 73,685 | |
Administration fees payable | | | 764,497 | |
Accrued expenses and other liabilities | | | 914,607 | |
| | | | |
Total liabilities | | | 137,207,065 | |
| | | | |
Total net assets | | $ | 4,812,191,960 | |
| | | | |
| |
NET ASSETS CONSIST OF | | | | |
Paid-in capital | | $ | 4,555,198,684 | |
Overdistributed net investment income | | | (16,302,674 | ) |
Accumulated net realized losses on investments | | | (89,106,369 | ) |
Net unrealized gains on investments | | | 362,402,319 | |
| | | | |
Total net assets | | $ | 4,812,191,960 | |
| | | | |
| |
COMPUTATION OF NET ASSET VALUE AND OFFERING PRICE PER SHARE | | | | |
Net assets – Class A | | $ | 1,355,151,176 | |
Shares outstanding – Class A1 | | | 64,602,545 | |
Net asset value per share – Class A | | | $20.98 | |
Maximum offering price per share – Class A2 | | | $22.26 | |
Net assets – Class B | | $ | 2,820,997 | |
Shares outstanding – Class B1 | | | 157,433 | |
Net asset value per share – Class B | | | $17.92 | |
Net assets – Class C | | $ | 115,340,393 | |
Shares outstanding – Class C1 | | | 6,485,848 | |
Net asset value per share – Class C | | | $17.78 | |
Net assets – Class R6 | | $ | 41,385,272 | |
Shares outstanding – Class R61 | | | 1,882,715 | |
Net asset value per share – Class R6 | | | $21.98 | |
Net assets – Administrator Class | | $ | 426,582,428 | |
Shares outstanding – Administrator Class1 | | | 19,382,536 | |
Net asset value per share – Administrator Class | | | $22.01 | |
Net assets – Institutional Class | | $ | 2,870,911,694 | |
Shares outstanding – Institutional Class1 | | | 130,623,258 | |
Net asset value per share – Institutional Class | | | $21.98 | |
| 1 | The Fund has an unlimited number of authorized shares. |
| 2 | Maximum offering price is computed as 100/94.25 of net asset value. On investments of $50,000 or more, the offering price is reduced. |
The accompanying notes are an integral part of these financial statements.
| | | | | | |
| Statement of operations—six months ended April 30, 2015 (unaudited) | | Wells Fargo Advantage Emerging Markets Equity Fund | | | 13 | |
| | | | |
| | | | |
| |
Investment income | | | | |
Dividends (net of foreign withholding taxes of $4,590,970) | | $ | 36,796,478 | |
Securities lending income, net | | | 813,948 | |
Income from affiliated securities | | | 79,332 | |
| | | | |
Total investment income | | | 37,689,758 | |
| | | | |
| |
Expenses | | | | |
Advisory fee | | | 23,411,413 | |
Administration fees | | | | |
Fund level | | | 1,174,001 | |
Class A | | | 1,863,044 | |
Class B | | | 4,825 | |
Class C | | | 154,766 | |
Class R6 | | | 5,450 | |
Administrator Class | | | 193,875 | |
Institutional Class | | | 1,086,585 | |
Shareholder servicing fees | | | | |
Class A | | | 1,791,389 | |
Class B | | | 4,438 | |
Class C | | | 148,813 | |
Administrator Class | | | 466,921 | |
Distribution fees | | | | |
Class B | | | 13,919 | |
Class C | | | 446,440 | |
Custody and accounting fees | | | 1,581,248 | |
Professional fees | | | 32,096 | |
Registration fees | | | 161,020 | |
Shareholder report expenses | | | 337,923 | |
Trustees’ fees and expenses | | | 5,662 | |
Other fees and expenses | | | 77,889 | |
| | | | |
Total expenses | | | 32,961,717 | |
Less: Fee waivers and/or expense reimbursements | | | (1,317 | ) |
| | | | |
Net expenses | | | 32,960,400 | |
| | | | |
Net investment income | | | 4,729,358 | |
| | | | |
| |
REALIZED AND UNREALIZED GAINS (LOSSES) ON INVESTMENTS | | | | |
| |
Net realized losses on: | | | | |
Unaffiliated securities | | | (75,168,590 | ) |
Forward foreign currency contract transactions | | | (7,744 | ) |
| | | | |
Net realized losses on investments | | | (75,176,334 | ) |
| | | | |
| |
Net change in unrealized gains (losses) on: | | | | |
Unaffiliated securities | | | 2,262,684 | |
Affiliated securities | | | 2,403,855 | |
| | | | |
Net change in unrealized gains (losses) on investments | | | 4,666,539 | |
| | | | |
Net realized and unrealized gains (losses) on investments | | | (70,509,795 | ) |
| | | | |
Net decrease in net assets resulting from operations | | $ | (65,780,437 | ) |
| | | | |
The accompanying notes are an integral part of these financial statements.
| | | | |
| 14 | | Wells Fargo Advantage Emerging Markets Equity Fund | | Statement of changes in net assets |
| | | | | | | | | | | | | | | | |
| | | Six months ended
April 30, 2015 (unaudited) | | | Year ended
October 31, 2014 | |
| | | | |
Operations | | | | | | | | | | | | | | | | |
Net investment income | | | | | | $ | 4,729,358 | | | | | | | $ | 29,047,921 | |
Net realized gains (losses) on investments | | | | | | | (75,176,334 | ) | | | | | | | 21,339,971 | |
Net change in unrealized gains (losses) on investments | | | | | | | 4,666,539 | | | | | | | | (75,469,857 | ) |
| | | | |
Net decrease in net assets resulting from operations | | | | | | | (65,780,437 | ) | | | | | | | (25,081,965 | ) |
| | | | |
| | | | |
Distributions to shareholders from | | | | | | | | | | | | | | | | |
Net investment income | | | | | | | | | | | | | | | | |
Class A | | | | | | | (9,924,129 | ) | | | | | | | 0 | |
Class R6 | | | | | | | (428,978 | ) | | | | | | | (45,340 | ) |
Administrator Class | | | | | | | (2,112,578 | ) | | | | | | | (1,783,180 | ) |
Institutional Class | | | | | | | (32,080,756 | ) | | | | | | | (8,965,400 | ) |
| | | | |
Total distributions to shareholders | | | | | | | (44,546,441 | ) | | | | | | | (10,793,920 | ) |
| | | | |
| | | | |
Capital share transactions | | | Shares | | | | | | | | Shares | | | | | |
Proceeds from shares sold | | | | | | | | | | | | | | | | |
Class A | | | 10,515,460 | | | | 209,909,893 | | | | 32,727,297 | | | | 667,582,307 | |
Class B | | | 228 | | | | 3,989 | | | | 783 | | | | 13,808 | |
Class C | | | 114,303 | | | | 1,947,773 | | | | 586,118 | | | | 10,456,764 | |
Class R6 | | | 313,343 | | | | 6,629,723 | | | | 1,873,283 | | | | 41,555,780 | |
Administrator Class | | | 3,567,415 | | | | 76,598,937 | | | | 13,152,480 | | | | 287,170,895 | |
Institutional Class | | | 19,543,060 | | | | 415,344,250 | | | | 62,516,706 | | | | 1,409,003,391 | |
| | | | |
| | | | | | | 710,434,565 | | | | | | | | 2,415,782,945 | |
| | | | |
Reinvestment of distributions | | | | | | | | | | | | | | | | |
Class A | | | 489,710 | | | | 9,691,371 | | | | 0 | | | | 0 | |
Class R6 | | | 20,724 | | | | 428,978 | | | | 2,064 | | | | 45,340 | |
Administrator Class | | | 97,421 | | | | 2,021,483 | | | | 75,992 | | | | 1,668,033 | |
Institutional Class | | | 1,420,577 | | | | 29,405,954 | | | | 367,774 | | | | 8,083,670 | |
| | | | |
| | | | | | | 41,547,786 | | | | | | | | 9,797,043 | |
| | | | |
Payment for shares redeemed | | | | | | | | | | | | | | | | |
Class A | | | (16,491,400 | ) | | | (340,412,457 | ) | | | (22,649,849 | ) | | | (476,947,718 | ) |
Class B | | | (137,617 | ) | | | (2,379,038 | ) | | | (298,920 | ) | | | (5,386,850 | ) |
Class C | | | (1,257,131 | ) | | | (21,547,766 | ) | | | (2,319,143 | ) | | | (41,212,489 | ) |
Class R6 | | | (47,744 | ) | | | (1,020,765 | ) | | | (489,299 | ) | | | (10,990,607 | ) |
Administrator Class | | | (4,968,579 | ) | | | (106,471,585 | ) | | | (38,648,549 | ) | | | (875,255,756 | ) |
Institutional Class | | | (19,122,007 | ) | | | (404,233,429 | ) | | | (29,608,625 | ) | | | (662,852,447 | ) |
| | | | |
| | | | | | | (876,065,040 | ) | | | | | | | (2,072,645,867 | ) |
| | | | |
Net increase (decrease) in net assets resulting from capital share transactions | | | | | | | (124,082,689 | ) | | | | | | | 352,934,121 | |
| | | | |
Total increase (decrease) in net assets | | | | | | | (234,409,567 | ) | | | | | | | 317,058,236 | |
| | | | |
| | | | |
Net assets | | | | | | | | | | | | | | | | |
Beginning of period | | | | | | | 5,046,601,527 | | | | | | | | 4,729,543,291 | |
| | | | |
End of period | | | | | | $ | 4,812,191,960 | | | | | | | $ | 5,046,601,527 | |
| | | | |
Undistributed (overdistributed) net investment income | | | | | | $ | (16,302,674 | ) | | | | | | $ | 23,514,409 | |
| | | | |
The accompanying notes are an integral part of these financial statements.
| | | | | | |
| Financial highlights | | Wells Fargo Advantage Emerging Markets Equity Fund | | | 15 | |
(For a share outstanding throughout each period)
| | | | | | | | | | | | | | | | | | | | | | | | |
| | | Six months ended
April 30, 2015 (unaudited) | | | Year ended October 31 | |
| CLASS A | | | 2014 | | | 2013 | | | 2012 | | | 2011 | | | 20101 | |
Net asset value, beginning of period | | | $21.44 | | | | $21.77 | | | | $20.48 | | | | $20.93 | | | | $21.65 | | | | $16.99 | |
Net investment income (loss) | | | (0.01 | ) | | | 0.07 | | | | 0.02 | | | | 0.10 | | | | 0.08 | | | | 0.04 | 2 |
Net realized and unrealized gains (losses) on investments | | | (0.31 | ) | | | (0.40 | ) | | | 1.33 | | | | (0.19 | ) | | | (0.80 | ) | | | 4.63 | |
| | | | | | | | | | | | | | | | | | | | | | | | |
Total from investment operations | | | (0.32 | ) | | | (0.33 | ) | | | 1.35 | | | | (0.09 | ) | | | (0.72 | ) | | | 4.67 | |
Distributions to shareholders from | | | | | | | | | | | | | | | | | | | | | | | | |
Net investment income | | | (0.14 | ) | | | 0.00 | | | | (0.06 | ) | | | (0.14 | ) | | | (0.00 | )3 | | | (0.01 | ) |
Net realized gains | | | 0.00 | | | | 0.00 | | | | 0.00 | | | | (0.22 | ) | | | 0.00 | | | | 0.00 | |
| | | | | | | | | | | | | | | | | | | | | | | | |
Total distributions to shareholders | | | (0.14 | ) | | | 0.00 | | | | (0.06 | ) | | | (0.36 | ) | | | (0.00 | )3 | | | (0.01 | ) |
Net asset value, end of period | | | $20.98 | | | | $21.44 | | | | $21.77 | | | | $20.48 | | | | $20.93 | | | | $21.65 | |
Total return4 | | | (1.44 | )% | | | (1.52 | )% | | | 6.62 | % | | | (0.31 | )% | | | (3.32 | )% | | | 27.51 | % |
Ratios to average net assets (annualized) | | | | | | | | | | | | | | | | | | | | | | | | |
Gross expenses | | | 1.65 | % | | | 1.64 | % | | | 1.65 | % | | | 1.67 | % | | | 1.68 | % | | | 1.91 | % |
Net expenses | | | 1.65 | % | | | 1.64 | % | | | 1.65 | % | | | 1.67 | % | | | 1.68 | % | | | 1.89 | % |
Net investment income (loss) | | | (0.06 | )% | | | 0.36 | % | | | 0.15 | % | | | 0.51 | % | | | 0.44 | % | | | 0.27 | % |
Supplemental data | | | | | | | | | | | | | | | | | | | | | | | | |
Portfolio turnover rate | | | 5 | % | | | 7 | % | | | 13 | % | | | 7 | % | | | 5 | % | | | 6 | % |
Net assets, end of period (000s omitted) | | | $1,355,151 | | | | $1,502,597 | | | | $1,306,269 | | | | $920,709 | | | | $917,633 | | | | $820,716 | |
| 1 | After the close of business on July 16, 2010, the Fund acquired the net assets of Evergreen Emerging Markets Growth Fund and Wells Fargo Advantage Emerging Markets Equity Fund. Evergreen Emerging Markets Growth Fund became the accounting and performance survivor in the transaction. The information for the period prior to July 19, 2010, is that of Class A of Evergreen Emerging Markets Growth Fund. |
| 2 | Calculated based upon average shares outstanding |
| 3 | Amount is less than $0.005. |
| 4 | Total return calculations do not include any sales charges. Return for periods of less than one year are not annualized. |
The accompanying notes are an integral part of these financial statements.
| | | | |
| 16 | | Wells Fargo Advantage Emerging Markets Equity Fund | | Financial highlights |
(For a share outstanding throughout each period)
| | | | | | | | | | | | | | | | | | | | | | | | |
| | | Six months ended
April 30, 2015 (unaudited) | | | Year ended October 31 | |
| CLASS B | | | 2014 | | | 2013 | | | 2012 | | | 2011 | | | 20101 | |
Net asset value, beginning of period | | | $18.25 | | | | $18.67 | | | | $17.64 | | | | $18.06 | | | | $18.82 | | | | $14.87 | |
Net investment loss | | | (0.07 | )2 | | | (0.08 | )2 | | | (0.12 | )2 | | | (0.05 | )2 | | | (0.08 | )2 | | | (0.09 | )2 |
Net realized and unrealized gains (losses) on investments | | | (0.26 | ) | | | (0.34 | ) | | | 1.15 | | | | (0.15 | ) | | | (0.68 | ) | | | 4.04 | |
| | | | | | | | | | | | | | | | | | | | | | | | |
Total from investment operations | | | (0.33 | ) | | | (0.42 | ) | | | 1.03 | | | | (0.20 | ) | | | (0.76 | ) | | | 3.95 | |
Distributions to shareholders from | | | | | | | | | | | | | | | | | | | | | | | | |
Net realized gains | | | 0.00 | | | | 0.00 | | | | 0.00 | | | | (0.22 | ) | | | 0.00 | | | | 0.00 | |
Net asset value, end of period | | | $17.92 | | | | $18.25 | | | | $18.67 | | | | $17.64 | | | | $18.06 | | | | $18.82 | |
Total return3 | | | (1.81 | )% | | | (2.25 | )% | | | 5.84 | % | | | (1.06 | )% | | | (4.04 | )% | | | 26.56 | % |
Ratios to average net assets (annualized) | | | | | | | | | | | | | | | | | | | | | | | | |
Gross expenses | | | 2.38 | % | | | 2.39 | % | | | 2.39 | % | | | 2.41 | % | | | 2.43 | % | | | 2.66 | % |
Net expenses | | | 2.38 | % | | | 2.39 | % | | | 2.39 | % | | | 2.41 | % | | | 2.43 | % | | | 2.64 | % |
Net investment loss | | | (0.81 | )% | | | (0.46 | )% | | | (0.64 | )% | | | (0.28 | )% | | | (0.39 | )% | | | (0.54 | )% |
Supplemental data | | | | | | | | | | | | | | | | | | | | | | | | |
Portfolio turnover rate | | | 5 | % | | | 7 | % | | | 13 | % | | | 7 | % | | | 5 | % | | | 6 | % |
Net assets, end of period (000s omitted) | | | $2,821 | | | | $5,380 | | | | $11,071 | | | | $15,408 | | | | $21,652 | | | | $30,989 | |
| 1 | After the close of business on July 16, 2010, the Fund acquired the net assets of Evergreen Emerging Markets Growth Fund and Wells Fargo Advantage Emerging Markets Equity Fund. Evergreen Emerging Markets Growth Fund became the accounting and performance survivor in the transaction. The information for the period prior to July 19, 2010, is that of Class B of Evergreen Emerging Markets Growth Fund. |
| 2 | Calculated based upon average shares outstanding |
| 3 | Total return calculations do not include any sales charges. Return for periods of less than one year are not annualized. |
The accompanying notes are an integral part of these financial statements.
| | | | | | |
| Financial highlights | | Wells Fargo Advantage Emerging Markets Equity Fund | | | 17 | |
(For a share outstanding throughout each period)
| | | | | | | | | | | | | | | | | | | | | | | | |
| | | Six months ended
April 30, 2015 (unaudited) | | | Year ended October 31 | |
| CLASS C | | | 2014 | | | 2013 | | | 2012 | | | 2011 | | | 20101 | |
Net asset value, beginning of period | | | $18.11 | | | | $18.53 | | | | $17.51 | | | | $17.92 | | | | $18.68 | | | | $14.77 | |
Net investment loss | | | (0.07 | )2 | | | (0.08 | )2 | | | (0.11 | )2 | | | (0.06 | ) | | | (0.06 | )2 | | | (0.08 | )2 |
Net realized and unrealized gains (losses) on investments | | | (0.26 | ) | | | (0.34 | ) | | | 1.13 | | | | (0.13 | ) | | | (0.70 | ) | | | 3.99 | |
| | | | | | | | | | | | | | | | | | | | | | | | |
Total from investment operations | | | (0.33 | ) | | | (0.42 | ) | | | 1.02 | | | | (0.19 | ) | | | (0.76 | ) | | | 3.91 | |
Distributions to shareholders from | | | | | | | | | | | | | | | | | | | | | | | | |
Net realized gains | | | 0.00 | | | | 0.00 | | | | 0.00 | | | | (0.22 | ) | | | 0.00 | | | | 0.00 | |
Net asset value, end of period | | | $17.78 | | | | $18.11 | | | | $18.53 | | | | $17.51 | | | | $17.92 | | | | $18.68 | |
Total return3 | | | (1.82 | )% | | | (2.27 | )% | | | 5.83 | % | | | (1.01 | )% | | | (4.07 | )% | | | 26.47 | % |
Ratios to average net assets (annualized) | | | | | | | | | | | | | | | | | | | | | | | | |
Gross expenses | | | 2.40 | % | | | 2.39 | % | | | 2.39 | % | | | 2.42 | % | | | 2.43 | % | | | 2.66 | % |
Net expenses | | | 2.40 | % | | | 2.39 | % | | | 2.39 | % | | | 2.42 | % | | | 2.43 | % | | | 2.64 | % |
Net investment loss | | | (0.80 | )% | | | (0.42 | )% | | | (0.62 | )% | | | (0.24 | )% | | | (0.32 | )% | | | (0.50 | )% |
Supplemental data | | | | | | | | | | | | | | | | | | | | | | | | |
Portfolio turnover rate | | | 5 | % | | | 7 | % | | | 13 | % | | | 7 | % | | | 5 | % | | | 6 | % |
Net assets, end of period (000s omitted) | | | $115,340 | | | | $138,169 | | | | $173,454 | | | | $183,471 | | | | $200,796 | | | | $193,300 | |
| 1 | After the close of business on July 16, 2010, the Fund acquired the net assets of Evergreen Emerging Markets Growth Fund and Wells Fargo Advantage Emerging Markets Equity Fund. Evergreen Emerging Markets Growth Fund became the accounting and performance survivor in the transaction. The information for the period prior to July 19, 2010, is that of Class C of Evergreen Emerging Markets Growth Fund. |
| 2 | Calculated based upon average shares outstanding |
| 3 | Total return calculations do not include any sales charges. Return for periods of less than one year are not annualized. |
The accompanying notes are an integral part of these financial statements.
| | | | |
| 18 | | Wells Fargo Advantage Emerging Markets Equity Fund | | Financial highlights |
(For a share outstanding throughout each period)
| | | | | | | | | | | | |
| | | Six months ended
April 30, 2015 (unaudited) | | | Year ended October 31 | |
| CLASS R6 | | | 2014 | | | 20131 | |
Net asset value, beginning of period | | | $22.53 | | | | $22.86 | | | | $20.89 | |
Net investment income | | | 0.06 | | | | 0.21 | | | | 0.01 | 2 |
Net realized and unrealized gains (losses) on investments | | | (0.35 | ) | | | (0.44 | ) | | | 1.96 | |
| | | | | | | | | | | | |
Total from investment operations | | | (0.29 | ) | | | (0.23 | ) | | | 1.97 | |
Distributions to shareholders from | | | | | | | | | | | | |
Net investment income | | | (0.26 | ) | | | (0.10 | ) | | | 0.00 | |
Net asset value, end of period | | | $21.98 | | | | $22.53 | | | | $22.86 | |
Total return3 | | | (1.22 | )% | | | (1.01 | )% | | | 9.43 | % |
Ratios to average net assets (annualized) | | | | | | | | | | | | |
Gross expenses | | | 1.17 | % | | | 1.17 | % | | | 1.17 | % |
Net expenses | | | 1.17 | % | | | 1.17 | % | | | 1.17 | % |
Net investment income | | | 0.45 | % | | | 0.88 | % | | | 0.15 | % |
Supplemental data | | | | | | | | | | | | |
Portfolio turnover rate | | | 5 | % | | | 7 | % | | | 13 | % |
Net assets, end of period (000s omitted) | | | $41,385 | | | | $35,967 | | | | $4,809 | |
| 1 | For the period from June 28, 2013 (commencement of class operations) to October 31, 2013 |
| 2 | Calculated based upon average shares outstanding |
| 3 | Returns for periods of less than one year are not annualized. |
The accompanying notes are an integral part of these financial statements.
| | | | | | |
| Financial highlights | | Wells Fargo Advantage Emerging Markets Equity Fund | | | 19 | |
(For a share outstanding throughout each period)
| | | | | | | | | | | | | | | | | | | | | | | | |
| | | Six months ended
April 30, 2015 (unaudited) | | | Year ended October 31 | |
| ADMINISTRATOR CLASS | | | 2014 | | | 2013 | | | 2012 | | | 2011 | | | 20101 | |
Net asset value, beginning of period | | | $22.44 | | | | $22.79 | | | | $21.44 | | | | $21.90 | | | | $22.63 | | | | $17.75 | |
Net investment income | | | 0.01 | 2 | | | 0.13 | 2 | | | 0.05 | | | | 0.14 | | | | 0.02 | | | | 0.09 | 2 |
Net realized and unrealized gains (losses) on investments | | | (0.33 | ) | | | 0.44 | | | | 1.40 | | | | (0.18 | ) | | | (0.73 | ) | | | 4.83 | |
| | | | | | | | | | | | | | | | | | | | | | | | |
Total from investment operations | | | (0.32 | ) | | | (0.31 | ) | | | 1.45 | | | | (0.04 | ) | | | (0.71 | ) | | | 4.92 | |
Distributions to shareholders from | | | | | | | | | | | | | | | | | | | | | | | | |
Net investment income | | | (0.11 | ) | | | (0.04 | ) | | | (0.10 | ) | | | (0.20 | ) | | | (0.02 | ) | | | (0.04 | ) |
Net realized gains | | | 0.00 | | | | 0.00 | | | | 0.00 | | | | (0.22 | ) | | | 0.00 | | | | 0.00 | |
| | | | | | | | | | | | | | | | | | | | | | | | |
Total distributions to shareholders | | | (0.11 | ) | | | (0.04 | ) | | | (0.10 | ) | | | (0.42 | ) | | | (0.02 | ) | | | (0.04 | ) |
Net asset value, end of period | | | $22.01 | | | | $22.44 | | | | $22.79 | | | | $21.44 | | | | $21.90 | | | | $22.63 | |
Total return3 | | | (1.38 | )% | | | (1.36 | )% | | | 6.83 | % | | | (0.13 | )% | | | (3.14 | )% | | | 27.78 | % |
Ratios to average net assets (annualized) | | | | | | | | | | | | | | | | | | | | | | | | |
Gross expenses | | | 1.48 | % | | | 1.48 | % | | | 1.48 | % | | | 1.47 | % | | | 1.47 | % | | | 1.69 | % |
Net expenses | | | 1.48 | % | | | 1.48 | % | | | 1.48 | % | | | 1.47 | % | | | 1.47 | % | | | 1.65 | % |
Net investment income | | | 0.14 | % | | | 0.57 | % | | | 0.35 | % | | | 0.72 | % | | | 0.70 | % | | | 0.50 | % |
Supplemental data | | | | | | | | | | | | | | | | | | | | | | | | |
Portfolio turnover rate | | | 5 | % | | | 7 | % | | | 13 | % | | | 7 | % | | | 5 | % | | | 6 | % |
Net assets, end of period (000s omitted) | | | $426,582 | | | | $464,135 | | | | $1,050,660 | | | | $634,428 | | | | $529,083 | | | | $248,493 | |
| 1 | After the close of business on July 16, 2010, the Fund acquired the net assets of Evergreen Emerging Markets Growth Fund and Wells Fargo Advantage Emerging Markets Equity Fund. Evergreen Emerging Markets Growth Fund became the accounting and performance survivor in the transaction. The information for the period prior to July 19, 2010, is that of Class I of Evergreen Emerging Markets Growth Fund. |
| 2 | Calculated based upon average shares outstanding |
| 3 | Returns for periods of less than one year are not annualized. |
The accompanying notes are an integral part of these financial statements.
| | | | |
| 20 | | Wells Fargo Advantage Emerging Markets Equity Fund | | Financial highlights |
(For a share outstanding throughout each period)
| | | | | | | | | | | | | | | | | | | | | | | | |
| | | Six months ended
April 30, 2015 (unaudited) | | | Year ended October 31 | |
| INSTITUTIONAL CLASS | | | 2014 | | | 2013 | | | 2012 | | | 2011 | | | 20101 | |
Net asset value, beginning of period | | | $22.52 | | | | $22.86 | | | | $21.50 | | | | $21.96 | | | | $22.66 | | | | $20.11 | |
Net investment income | | | 0.04 | | | | 0.15 | | | | 0.11 | | | | 0.22 | | | | 0.16 | | | | 0.00 | 2,3 |
Net realized and unrealized gains (losses) on investments | | | (0.33 | ) | | | (0.40 | ) | | | 1.40 | | | | (0.22 | ) | | | (0.81 | ) | | | 2.55 | |
| | | | | | | | | | | | | | | | | | | | | | | | |
Total from investment operations | | | (0.29 | ) | | | (0.25 | ) | | | 1.51 | | | | 0.00 | | | | (0.65 | ) | | | 2.55 | |
Distributions to shareholders from | | | | | | | | | | | | | | | | | | | | | | | | |
Net investment income | | | (0.25 | ) | | | (0.09 | ) | | | (0.15 | ) | | | (0.24 | ) | | | (0.05 | ) | | | 0.00 | |
Net realized gains | | | 0.00 | | | | 0.00 | | | | 0.00 | | | | (0.22 | ) | | | 0.00 | | | | 0.00 | |
| | | | | | | | | | | | | | | | | | | | | | | | |
Total distributions to shareholders | | | (0.25 | ) | | | (0.09 | ) | | | (0.15 | ) | | | (0.46 | ) | | | (0.05 | ) | | | 0.00 | |
Net asset value, end of period | | | $21.98 | | | | $22.52 | | | | $22.86 | | | | $21.50 | | | | $21.96 | | | | $22.66 | |
Total return4 | | | (1.23 | )% | | | (1.09 | )% | | | 7.07 | % | | | 0.13 | % | | | (2.89 | )% | | | 12.68 | % |
Ratios to average net assets (annualized) | | | | | | | | | | | | | | | | | | | | | | | | |
Gross expenses | | | 1.22 | % | | | 1.21 | % | | | 1.22 | % | | | 1.24 | % | | | 1.24 | % | | | 1.48 | % |
Net expenses | | | 1.22 | % | | | 1.21 | % | | | 1.22 | % | | | 1.24 | % | | | 1.23 | % | | | 1.30 | % |
Net investment income | | | 0.39 | % | | | 0.77 | % | | | 0.57 | % | | | 1.04 | % | | | 0.93 | % | | | 0.02 | % |
Supplemental data | | | | | | | | | | | | | | | | | | | | | | | | |
Portfolio turnover rate | | | 5 | % | | | 7 | % | | | 13 | % | | | 7 | % | | | 5 | % | | | 6 | % |
Net assets, end of period (000s omitted) | | | $2,870,912 | | | | $2,900,353 | | | | $2,183,281 | | | | $1,176,567 | | | | $541,644 | | | | $197,823 | |
| 1 | For the period from July 30, 2010 (commencement of class operations), to October 31, 2010 |
| 2 | Calculated based upon average shares outstanding |
| 3 | Amount is less than $0.005. |
| 4 | Returns for periods of less than one year are not annualized. |
The accompanying notes are an integral part of these financial statements.
| | | | | | |
| Notes to financial statements (unaudited) | | Wells Fargo Advantage Emerging Markets Equity Fund | | | 21 | |
1. ORGANIZATION
Wells Fargo Funds Trust (the “Trust”), a Delaware statutory trust organized on March 10, 1999, is an open-end management investment company registered under the Investment Company Act of 1940, as amended (the “1940 Act”). As an investment company, the Trust follows the accounting and reporting guidance in Financial Accounting Standards Board (“FASB”) Accounting Standards Codification Topic 946, Financial Services—Investment Companies. These financial statements report on the Wells Fargo Advantage Emerging Markets Equity Fund (the “Fund”) which is a diversified series of the Trust.
2. SIGNIFICANT ACCOUNTING POLICIES
The following significant accounting policies, which are consistently followed in the preparation of the financial statements of the Fund, are in conformity with U.S. generally accepted accounting principles which require management to make estimates and assumptions that affect the reported amounts of assets and liabilities, disclosure of contingent assets and liabilities at the date of the financial statements, and the reported amounts of revenues and expenses during the reporting period. Actual results could differ from those estimates.
Securities valuation
All investments are valued each business day as of the close of regular trading on the New York Stock Exchange (generally 4 p.m. Eastern Time).
Equity securities that are listed on a foreign or domestic exchange or market are valued at the official closing price or, if none, the last sales price. If no sale occurs on the primary exchange or market that day, the prior day’s price will be deemed “stale” and a fair value price will be determined in accordance with the Fund’s Valuation Procedures.
Equity securities that are not listed on a foreign or domestic exchange or market, but have a public trading market, are valued at the quoted bid price from an independent broker-dealer that the Management Valuation Team of Wells Fargo Funds Management, LLC (“Funds Management”) has determined is an acceptable source.
The values of securities denominated in foreign currencies are translated into U.S. dollars at rates provided by an independent foreign currency pricing source at a time each business day specified by the Management Valuation Team.
Many securities markets and exchanges outside the U.S. close prior to the close of the New York Stock Exchange and therefore may not fully reflect trading or events that occur after the close of the principal exchange in which the foreign securities are traded, but before the close of the New York Stock Exchange. If such trading or events are expected to materially affect the value of such securities, then fair value pricing procedures approved by the Board of Trustees of the Fund are applied. These procedures take into account multiple factors including movements in U.S. securities markets after foreign exchanges close. Foreign securities that are fair valued under these procedures are categorized as Level 2 and the application of these procedures may result in transfers between Level 1 and Level 2. Depending on market activity, such fair valuations may be frequent. Such fair value pricing may result in net asset values that are higher or lower than net asset values based on the last reported sales price or latest quoted bid price. On April 30, 2015, such fair value pricing was used in pricing foreign securities.
Debt securities are valued at the evaluated bid price provided by an independent pricing service or, if a reliable price is not available, the quoted bid price from an independent broker-dealer.
Investments in registered open-end investment companies are valued at net asset value. Interests in non-registered investment vehicles that are redeemable at net asset value are fair valued at net asset value when available.
Investments which are not valued using any of the methods discussed above are valued at their fair value, as determined in good faith by the Board of Trustees. The Board of Trustees has established a Valuation Committee comprised of the Trustees and has delegated to it the authority to take any actions regarding the valuation of portfolio securities that the Valuation Committee deems necessary or appropriate, including determining the fair value of portfolio securities, unless the determination has been delegated to the Management Valuation Team. The Board of Trustees retains the authority to make or ratify any valuation decisions or approve any changes to the Valuation Procedures as it deems appropriate. On a quarterly basis, the Board of Trustees receives reports on any valuation actions taken by the Valuation Committee or the Management Valuation Team which may include items for ratification.
Valuations of fair valued securities are compared to the next actual sales price when available, or other appropriate market values, to assess the continued appropriateness of the fair valuation methodologies used. These securities are fair valued on a day-to-day basis, taking into consideration changes to appropriate market information and any significant changes to the inputs considered in the valuation process until there is a readily available price provided on an exchange
| | | | |
| 22 | | Wells Fargo Advantage Emerging Markets Equity Fund | | Notes to financial statements (unaudited) |
or by an independent pricing service. Valuations received from an independent pricing service or independent broker-dealer quotes are periodically validated by comparisons to most recent trades and valuations provided by other independent pricing services in addition to the review of prices by the adviser and/or subadviser. Unobservable inputs used in determining fair valuations are identified based on the type of security, taking into consideration factors utilized by market participants in valuing the investment, knowledge about the issuer and the current market environment.
Foreign currency translation
The accounting records of the Fund are maintained in U.S. dollars. The values of other assets and liabilities denominated in foreign currencies are translated into U.S. dollars at rates provided by an independent foreign currency pricing source at a time each business day specified by the Management Valuation Team. Purchases and sales of securities, and income and expenses are converted at the rate of exchange on the respective dates of such transactions. Net realized foreign exchange gains or losses arise from sales of foreign currencies, currency gains or losses realized between the trade and settlement dates on securities transactions, and the difference between the amounts of dividends, interest and foreign withholding taxes recorded and the U.S. dollar equivalent of the amounts actually paid or received. Net unrealized foreign exchange gains and losses arise from changes in the fair value of assets and liabilities other than investments in securities resulting from changes in exchange rates. The changes in net assets arising from changes in exchange rates and the changes in net assets resulting from changes in market prices of securities are not separately presented. Such changes are included in net realized and unrealized gains or losses from investments.
Forward foreign currency contracts
The Fund is subject to foreign currency exchange rate risk in the normal course of pursuing its investment objectives. A forward foreign currency contract is an agreement between two parties to purchase or sell a specific currency for an agreed-upon price at a future date. The Fund enters into forward foreign currency contracts to facilitate transactions in foreign-denominated securities and to attempt to minimize the risk to the Fund from adverse changes in the relationship between currencies. Forward foreign currency contracts are recorded at the forward rate and marked-to-market daily. When the contracts are closed, realized gains and losses arising from such transactions are recorded as realized gains or losses on forward foreign currency contract transactions. The Fund could be exposed to risks if the counterparties to the contracts are unable to meet the terms of their contracts or if the value of the foreign currency changes unfavorably. The Fund’s maximum risk of loss from counterparty credit risk is the unrealized gains on the contracts. This risk may be mitigated if there is a master netting arrangement between the Fund and the counterparty.
Security loans
The Fund may lend its securities from time to time in order to earn additional income in the form of fees or interest on securities received as collateral or the investment of any cash received as collateral. The Fund continues to receive interest or dividends on the securities loaned. The Fund receives collateral in the form of cash or securities with a value at least equal to the value of the securities on loan. The value of the loaned securities is determined at the close of each business day and any additional required collateral is delivered to the Fund on the next business day. In a securities lending transaction, the net asset value of the Fund will be affected by an increase or decrease in the value of the securities loaned and by an increase or decrease in the value of the instrument in which collateral is invested. The amount of securities lending activity undertaken by the Fund fluctuates from time to time. In the event of default or bankruptcy by the borrower, the Fund may be prevented from recovering the loaned securities or gaining access to the collateral or may experience delays or costs in doing so. In addition, the investment of any cash collateral received may lose all or part of its value. The Fund has the right under the lending agreement to recover the securities from the borrower on demand.
The Fund lends its securities through an unaffiliated securities lending agent. Cash collateral received in connection with its securities lending transactions is invested in Securities Lending Cash Investments, LLC (the “Securities Lending Fund”). The Securities Lending Fund is exempt from registration under Section 3(c)(7) of the 1940 Act and is managed by Funds Management and is subadvised by Wells Capital Management Incorporated (“WellsCap”). Funds Management receives an advisory fee starting at 0.05% and declining to 0.01% as the average daily net assets of the Securities Lending Fund increase. All of the fees received by Funds Management are paid to WellsCap for its services as subadviser. The Securities Lending Fund seeks to provide a positive return compared to the daily Fed Funds Open rate by investing in high-quality, U.S. dollar-denominated short-term money market instruments. Securities Lending Fund investments are fair valued based upon the amortized cost valuation technique. Income earned from investment in the Securities Lending Fund is included in securities lending income on the Statement of Operations.
Security transactions and income recognition
Securities transactions are recorded on a trade date basis. Realized gains or losses are recorded on the basis of identified cost.
| | | | | | |
| Notes to financial statements (unaudited) | | Wells Fargo Advantage Emerging Markets Equity Fund | | | 23 | |
Dividend income is recognized on the ex-dividend date, except for certain dividends from foreign securities, which are recorded as soon as the custodian verifies the ex-dividend date. Dividend income from foreign securities is recorded net of foreign taxes withheld where recovery of such taxes is not assured.
Distributions to shareholders
Distributions to shareholders from net investment income and net realized gains, if any, are recorded on the ex-dividend date. Such distributions are determined in conformity with federal income tax regulations, which may differ in amount or character from net investment income and realized gains recognized for purposes of U.S. generally accepted accounting principles.
Federal and other taxes
The Fund intends to continue to qualify as a regulated investment company by distributing substantially all of its investment company taxable income and any net realized capital gains (after reduction for capital loss carryforwards) sufficient to relieve it from all, or substantially all, federal income taxes. Accordingly, no provision for federal income taxes was required.
The Fund’s income and federal excise tax returns and all financial records supporting those returns for the prior three fiscal years are subject to examination by the federal and Delaware revenue authorities. Management has analyzed the Fund’s tax positions taken on federal, state, and foreign tax returns for all open tax years and does not believe that there are any uncertain tax positions that require recognition of a tax liability.
As of October 31, 2014, the Fund had capital loss carryforwards available to offset future net realized capital gains in the amount of $10,889,490 expiring in 2017.
Class allocations
The separate classes of shares offered by the Fund differ principally in applicable sales charges, distribution, shareholder servicing, and administration fees. Class specific expenses are charged directly to that share class. Investment income, common expenses, and realized and unrealized gains (losses) on investments are allocated daily to each class of shares based on the relative proportion of net assets of each class.
3. FAIR VALUATION MEASUREMENTS
Fair value measurements of investments are determined within a framework that has established a fair value hierarchy based upon the various data inputs utilized in determining the value of the Fund’s investments. The three-level hierarchy gives the highest priority to unadjusted quoted prices in active markets for identical assets or liabilities (Level 1) and the lowest priority to significant unobservable inputs (Level 3). The Fund’s investments are classified within the fair value hierarchy based on the lowest level of input that is significant to the fair value measurement. The inputs are summarized into three broad levels as follows:
| n | | Level 1 – quoted prices in active markets for identical securities |
| n | | Level 2 – other significant observable inputs (including quoted prices for similar securities, interest rates, prepayment speeds, credit risk, use of amortized cost, etc.) |
| n | | Level 3 – significant unobservable inputs (including the Fund’s own assumptions in determining the fair value of investments) |
The inputs or methodologies used for valuing investments in securities are not necessarily an indication of the risk associated with investing in those securities.
| | | | |
| 24 | | Wells Fargo Advantage Emerging Markets Equity Fund | | Notes to financial statements (unaudited) |
The following is a summary of the inputs used in valuing the Fund’s assets and liabilities as of April 30, 2015:
| | | | | | | | | | | | | | | | |
| | | Quoted prices
(Level 1) | | | Other significant
observable inputs
(Level 2) | | | Significant
unobservable inputs
(Level 3) | | | Total | |
Assets | | | | | | | | | | | | | | | | |
Investments in: | | | | | | | | | | | | | | | | |
| | | | |
Common stocks | | | | | | | | | | | | | | | | |
Argentina | | $ | 29,078,019 | | | $ | 0 | | | $ | 0 | | | $ | 29,078,019 | |
Brazil | | | 431,373,474 | | | | 0 | | | | 0 | | | | 431,373,474 | |
Chile | | | 82,796,802 | | | | 0 | | | | 0 | | | | 82,796,802 | |
China | | | 365,806,801 | | | | 629,445,569 | | | | 0 | | | | 995,252,370 | |
Colombia | | | 29,896,308 | | | | 0 | | | | 0 | | | | 29,896,308 | |
Hong Kong | | | 34,318,996 | | | | 270,773,654 | | | | 0 | | | | 305,092,650 | |
India | | | 281,752,896 | | | | 126,689,275 | | | | 0 | | | | 408,442,171 | |
Indonesia | | | 50,986,981 | | | | 40,666,364 | | | | 0 | | | | 91,653,345 | |
Malaysia | | | 6,814,986 | | | | 57,134,441 | | | | 0 | | | | 63,949,427 | |
Mexico | | | 518,714,584 | | | | 0 | | | | 0 | | | | 518,714,584 | |
Peru | | | 19,605,248 | | | | 0 | | | | 0 | | | | 19,605,248 | |
Philippines | | | 0 | | | | 30,132,891 | | | | 0 | | | | 30,132,891 | |
Russia | | | 50,832,063 | | | | 87,958,288 | | | | 0 | | | | 138,790,351 | |
South Africa | | | 15,228,516 | | | | 227,497,404 | | | | 0 | | | | 242,725,920 | |
South Korea | | | 122,073,565 | | | | 388,855,223 | | | | 0 | | | | 510,928,788 | |
Taiwan | | | 182,758,703 | | | | 239,673,970 | | | | 0 | | | | 422,432,673 | |
Thailand | | | 154,127,072 | | | | 20,935,871 | | | | 0 | | | | 175,062,943 | |
Turkey | | | 8,200,570 | | | | 31,661,141 | | | | 0 | | | | 39,861,711 | |
United Arab Emirates | | | 0 | | | | 3,294,986 | | | | 0 | | | | 3,294,986 | |
United Kingdom | | | 0 | | | | 56,823,714 | | | | 0 | | | | 56,823,714 | |
| | | | |
Convertible debentures | | | 0 | | | | 0 | | | | 1,612 | | | | 1,612 | |
| | | | |
Preferred stocks | | | | | | | | | | | | | | | | |
Brazil | | | 89,488,534 | | | | 0 | | | | 0 | | | | 89,488,534 | |
| | | | |
Warrants | | | | | | | | | | | | | | | | |
Malaysia | | | 0 | | | | 322,224 | | | | 0 | | | | 322,224 | |
| | | | |
Short-term investments | | | | | | | | | | | | | | | | |
Investment companies | | | 96,749,081 | | | | 113,453,863 | | | | 0 | | | | 210,202,944 | |
Total assets | | $ | 2,570,603,199 | | | $ | 2,325,318,878 | | | $ | 1,612 | | | $ | 4,895,923,689 | |
The Fund recognizes transfers between levels within the fair value hierarchy at the end of the reporting period. At April 30, 2015, fair value pricing was used in pricing certain foreign securities and securities valued at $2,098,710,824 were transferred from Level 1 to Level 2. The Fund did not have any transfers into/out of Level 3.
4. TRANSACTIONS WITH AFFILIATES
Advisory fee
The Trust has entered into an advisory contract with Funds Management, an indirect wholly owned subsidiary of Wells Fargo & Company (“Wells Fargo”). The adviser is responsible for implementing investment policies and guidelines and for supervising the subadviser, who is responsible for day-to-day portfolio management of the Fund.
Pursuant to the contract, Funds Management is entitled to receive an annual advisory fee starting at 1.10% and declining to 0.925% as the average daily net assets of the Fund increase. Prior to March 1,2015, Funds Management received an annual advisory fee which started at 1.10% and declined to 0.95% as the average daily net assets of the Fund increased. For the six months ended April 30, 2015, the advisory fee was equivalent to an annual rate of 1.00% of the Fund’s average daily net assets.
Funds Management has retained the services of a subadviser to provide daily portfolio management to the Fund. The fee for subadvisory services is borne by Funds Management. WellsCap, an affiliate of Funds Management and an indirect wholly owned subsidiary of Wells Fargo, is the subadviser to the Fund and is entitled to receive a fee from Funds Management at an annual rate starting at 0.65% and declining to 0.45% as the average daily net assets of the Fund increase.
| | | | | | |
| Notes to financial statements (unaudited) | | Wells Fargo Advantage Emerging Markets Equity Fund | | | 25 | |
Administration fees
The Trust has entered into an administration agreement with Funds Management. Under this agreement, for providing administrative services, which includes paying fees and expenses for services provided by the transfer agent, sub-transfer agents, omnibus account servicers and record-keepers, Funds Management is entitled to receive from the Fund an annual fund level administration fee starting at 0.05% and declining to 0.03% as the average daily net assets of the Fund increase and a class level administration fee which is calculated based on the average daily net assets of each class as follows:
| | | | |
| | | Class level
administration fee | |
Class A, Class B, Class C | | | 0.26 | % |
Class R6 | | | 0.03 | |
Administrator Class | | | 0.10 | |
Institutional Class | | | 0.08 | |
Funds Management has contractually waived and/or reimbursed advisory and administration fees to the extent necessary to maintain certain net operating expense ratios for the Fund. Waiver of fees and/or reimbursement of expenses by Funds Management were made first from fund level expenses on a proportionate basis and then from class specific expenses. Funds Management has committed through February 29, 2016 to waive fees and/or reimburse expenses to the extent necessary to cap the Fund’s expenses at 1.67% for Class A shares, 2.42% for Class B shares, 2.42% for Class C shares, 1.18% for Class R6 shares, 1.50% for Administrator Class shares and 1.23% for Institutional Class shares. After this time, the cap may be increased or the commitment to maintain the cap may be terminated only with the approval of the Board of Trustees.
Distribution fees
The Trust has adopted a Distribution Plan for Class B and Class C shares of the Fund pursuant to Rule 12b-1 under the 1940 Act. Distribution fees are charged to Class B and Class C shares and paid to Wells Fargo Funds Distributor, LLC (“Funds Distributor”), the principal underwriter, at an annual rate of 0.75% of the average daily net assets of Class B and Class C shares.
In addition, Funds Distributor is entitled to receive the front-end sales charge from the purchase of Class A shares and a contingent deferred sales charge on the redemption of certain Class A shares. Funds Distributor is also entitled to receive the contingent deferred sales charges from redemptions of Class B and Class C shares. For the six months ended April 30, 2015, Funds Distributor received $3,114 from the sale of Class A shares and $41 in contingent deferred sales charges from redemptions of Class C shares.
Shareholder servicing fees
The Trust has entered into contracts with one or more shareholder servicing agents, whereby Class A, Class B, Class C and Administrator Class of the Fund is charged a fee at an annual rate of 0.25% of the average daily net assets of each respective class.
A portion of these total shareholder servicing fees were paid to affiliates of Wells Fargo.
5. INVESTMENT PORTFOLIO TRANSACTIONS
Purchases and sales of investments, excluding U.S. government obligations (if any) and short-term securities, for the six months ended April 30, 2015 were $208,611,489 and $303,406,261, respectively.
6. INVESTMENTS IN AFFILIATES
An affiliated investment is a company which is under common ownership or control of the Fund or which the Fund has ownership of at least 5% of the outstanding voting shares. The following is a summary of transactions for the long-term holdings of issuers that were either affiliates of the Fund at the beginning of the period or the end of the period.
| | | | | | | | | | | | | | | | | | | | | | | | | | | | |
| | | Shares,
beginning of
period | | | Shares
purchased | | | Shares
sold | | | Shares, end
of period | | | Value, end
of period | | | Income
from
affiliated
securities | | | Realized
gains
(losses) | |
104 Corporation | | | 1,655,000 | | | | 0 | | | | 0 | | | | 1,655,000 | | | $ | 9,042,028 | | | $ | 0 | | | $ | 0 | |
| | | | |
| 26 | | Wells Fargo Advantage Emerging Markets Equity Fund | | Notes to financial statements (unaudited) |
7. DERIVATIVE TRANSACTIONS
During the six months ended April 30, 2015, the Fund entered into forward foreign currency contracts for economic hedging purposes.
As of April 30, 2015, the Fund did not have any open forward foreign currency contracts. The Fund had average contract amounts of $224,906 and $628,246 in forward foreign currency contracts to buy and forward foreign currency contracts to sell, respectively, during the six months ended April 30, 2015.
The fair value, realized gains or losses and change in unrealized gains or losses, if any, on derivative instruments are reflected in the appropriate financials statements.
8. BANK BORROWINGS
The Trust (excluding the money market funds and certain other funds in the Trust) and Wells Fargo Variable Trust are parties to a $150,000,000 revolving credit agreement, whereby the Fund is permitted to use bank borrowings for temporary or emergency purposes, such as to fund shareholder redemption requests. Interest under the credit agreement is charged to the Fund based on a borrowing rate equal to the higher of the Federal Funds rate in effect on that day plus 1.25% or the overnight LIBOR rate in effect on that day plus 1.25%. In addition, an annual commitment fee equal to 0.10% of the unused balance is allocated to each participating fund. For the six months ended April 30, 2015, the Fund paid $4,389 in commitment fees.
For the six months ended April 30, 2015, there were no borrowings by the Fund under the agreement.
9. INDEMNIFICATION
Under the Trust’s organizational documents, the officers and Trustees have been granted certain indemnification rights against certain liabilities that may arise out of performance of their duties to the Trust. Additionally, in the normal course of business, the Trust may enter into contracts with service providers that contain a variety of indemnification clauses. The Trust’s maximum exposure under these arrangements is dependent on future claims that may be made against the Fund and, therefore, cannot be estimated.
| | | | | | |
| Other information (unaudited) | | Wells Fargo Advantage Emerging Markets Equity Fund | | | 27 | |
TAX INFORMATION
Pursuant to Section 853 of the Internal Revenue Code, the following amounts were designated as foreign taxes paid for the fiscal year ended October 31, 2014. These amounts may be less than the actual foreign taxes paid for financial statement purposes. Foreign taxes paid or withheld should be included in taxable income with an offsetting deduction from gross income or as a credit for taxes paid to foreign governments. None of the income was derived from ineligible foreign sources as defined under Section 901(j) of the Internal Revenue Code.
| | | | |
Creditable
foreign taxes paid | | Per share
amount | | Foreign income as % of ordinary
income distributions |
| $7,862,864 | | $0.0343 | | 87.00% |
PROXY VOTING INFORMATION
A description of the policies and procedures that the Fund uses to determine how to vote proxies relating to portfolio securities is available, upon request, by calling 1-800-222-8222, visiting our website at wellsfargoadvantagefunds.com, or visiting the SEC website at sec.gov. Information regarding how the Fund voted proxies relating to portfolio securities during the most recent 12-month period ended June 30 is available on the Fund’s website at wellsfargoadvantagefunds.com or by visiting the SEC website at sec.gov.
PORTFOLIO HOLDINGS INFORMATION
The complete portfolio holdings for the Fund are publicly available monthly on the Fund’s website (wellsfargoadvantagefunds.com), on a one-month delayed basis. In addition, top ten holdings information (excluding derivative positions) for the Fund is publicly available on the Fund’s website on a monthly, seven-day or more delayed basis. The Fund files its complete schedule of portfolio holdings with the SEC for the first and third quarters of each fiscal year on Form N-Q, which is available by visiting the SEC website at sec.gov. In addition, the Fund’s Form N-Q may be reviewed and copied at the SEC’s Public Reference Room in Washington, DC, and at regional offices in New York City, at 233 Broadway, and in Chicago, at 175 West Jackson Boulevard, Suite 900. Information about the Public Reference Room may be obtained by calling 1-800-SEC-0330.
| | | | |
| 28 | | Wells Fargo Advantage Emerging Markets Equity Fund | | Other information (unaudited) |
BOARD OF TRUSTEES AND OFFICERS
Each of the Trustees and Officers1 listed in the table below acts in identical capacities for each fund in the Wells Fargo Advantage family of funds, which consists of 134 mutual funds comprising the Wells Fargo Funds Trust, Wells Fargo Variable Trust, Wells Fargo Master Trust and four closed-end funds (collectively the “Fund Complex”). This table should be read in conjunction with the Prospectus and the Statement of Additional Information2. The mailing address of each Trustee and Officer is 525 Market Street, 12th Floor, San Francisco, CA 94105. Each Trustee and Officer serves an indefinite term, however, each Trustee serves such term until reaching the mandatory retirement age established by the Trustees.
Independent Trustees
| | | | | | |
Name and year of birth | | Position held and length of service* | | Principal occupations during past five years or longer | | Other directorships during
past five years |
| William R. Ebsworth (Born 1957) | | Trustee, since 2015** | | Retired. From 1984 to 2013, equities analyst, portfolio manager, research director at Fidelity Management and Research Company and retired in 2013 as Chief Investment Officer of Fidelity Strategic Advisers, Inc. in Boston, Tokyo, and Hong Kong where he led a team of investment professionals managing client assets. Prior thereto, Board member of Hong Kong Securities Clearing Co., Hong Kong Options Clearing Corp., the Thailand International Fund, Ltd., Fidelity Investments Life Insurance Company, and Empire Fidelity Investments Life Insurance Company. Mr. Ebsworth is an Adjunct Lecturer, Finance, at Babson College and a Chartered Financial Analyst. | | Asset Allocation Trust |
| Jane A. Freeman (Born 1953) | | Trustee, since 2015** | | Retired. From 2012 to 2014 and 1999 to 2008, Chief Financial Officer of Scientific Learning Corporation. From 2008 to 2012, Ms. Freeman provided consulting services related to strategic business projects. Prior to 1999, Portfolio Manager at Rockefeller & Co. and Scudder, Stevens & Clark. Board member of the Harding Loevner Funds from 1996 to 2014, serving as both Lead Independent Director and chair of the Audit Committee. Board member of the Russell Exchange Traded Funds Trust from 2011 to 2012 and the chair of the Audit Committee. Ms. Freeman is a Chartered Financial Analyst (inactive), Chair of Taproot Foundation (non-profit organization) and a Board Member of Ruth Bancroft Garden (non-profit organization). | | Asset Allocation Trust |
| Peter G. Gordon (Born 1942) | | Trustee, since 1998; Chairman, since 2005 | | Co-Founder, Retired Chairman, President and CEO of Crystal Geyser Water Company. Trustee Emeritus, Colby College. | | Asset Allocation Trust |
| Isaiah Harris, Jr. (Born 1952) | | Trustee, since 2009 | | Retired. Chairman of the Board of CIGNA Corporation since 2009, and Director since 2005. From 2003 to 2011, Director of Deluxe Corporation. Prior thereto, President and CEO of BellSouth Advertising and Publishing Corp. from 2005 to 2007, President and CEO of BellSouth Enterprises from 2004 to 2005 and President of BellSouth Consumer Services from 2000 to 2003. Emeritus member of the Iowa State University Foundation Board of Governors. Emeritus Member of the Advisory Board of Iowa State University School of Business. Advisory Board Member, Palm Harbor Academy. Mr. Harris is a certified public accountant. | | CIGNA Corporation; Asset Allocation Trust |
| Judith M. Johnson (Born 1949) | | Trustee, since 2008; Audit Committee Chairman, since 2008 | | Retired. Prior thereto, Chief Executive Officer and Chief Investment Officer of Minneapolis Employees Retirement Fund from 1996 to 2008. Ms. Johnson is an attorney, certified public accountant and a certified managerial accountant. | | Asset Allocation Trust |
| David F. Larcker (Born 1950) | | Trustee, since 2009 | | James Irvin Miller Professor of Accounting at the Graduate School of Business, Stanford University, Morgan Stanley Director of the Center for Leadership Development and Research and Senior Faculty of The Rock Center for Corporate Governance since 2006. From 2005 to 2008, Professor of Accounting at the Graduate School of Business, Stanford University. Prior thereto, Ernst & Young Professor of Accounting at The Wharton School, University of Pennsylvania from 1985 to 2005. | | Asset Allocation Trust |
| Olivia S. Mitchell (Born 1953) | | Trustee, since 2006 | | International Foundation of Employee Benefit Plans Professor, Wharton School of the University of Pennsylvania since 1993. Director of Wharton’s Pension Research Council and Boettner Center on Pensions & Retirement Research, and Research Associate at the National Bureau of Economic Research. Previously, Cornell University Professor from 1978 to 1993. | | Asset Allocation Trust |
| | | | | | |
| Other information (unaudited) | | Wells Fargo Advantage Emerging Markets Equity Fund | | | 29 | |
| | | | | | |
Name and year of birth | | Position held and length of service* | | Principal occupations during past five years or longer | | Other directorships during
past five years |
| Timothy J. Penny (Born 1951) | | Trustee, since 1996 | | President and Chief Executive Officer of Southern Minnesota Initiative Foundation, a non-profit organization, since 2007 and Senior Fellow at the Humphrey Institute Policy Forum at the University of Minnesota since 1995. Member of the Board of Trustees of NorthStar Education Finance, Inc., a non-profit organization, since 2007. | | Asset Allocation Trust |
| Michael S. Scofield (Born 1943) | | Trustee, since 2010 | | Served on the Investment Company Institute’s Board of Governors and Executive Committee from 2008-2011 as well the Governing Council of the Independent Directors Council from 2006-2011 and the Independent Directors Council Executive Committee from 2008-2011. Chairman of the IDC from 2008-2010. Institutional Investor (Fund Directions) Trustee of Year in 2007. Trustee of the Evergreen Funds complex (and its predecessors) from 1984 to 2010. Chairman of the Evergreen Funds from 2000-2010. Former Trustee of the Mentor Funds. Retired Attorney, Law Offices of Michael S. Scofield. | | Asset Allocation Trust |
| Donald C. Willeke (Born 1940) | | Trustee, since 1996 | | Principal of the law firm of Willeke & Daniels. General Counsel of the Minneapolis Employees Retirement Fund from 1984 until its consolidation into the Minnesota Public Employees Retirement Association on June 30, 2010. Director and Vice Chair of The Tree Trust (non-profit corporation). Director of the American Chestnut Foundation (non-profit corporation). | | Asset Allocation Trust |
| * | Length of service dates reflect the Trustee’s commencement of service with the Trust’s predecessor entities, where applicable. |
| ** | William R. Ebsworth and Jane A. Freeman each became a Trustee effective January 1, 2015. |
Officers
| | | | | | |
Name and year of birth | | Position held and
length of service | | Principal occupations during past five years or longer | | |
Karla M. Rabusch (Born 1959) | | President, since 2003 | | Executive Vice President of Wells Fargo Bank, N.A. and President of Wells Fargo Funds Management, LLC since 2003. | | |
Jeremy DePalma1 (Born 1974) | | Treasurer, since 2012 | | Senior Vice President of Wells Fargo Funds Management, LLC since 2009. Senior Vice President of Evergreen Investment Management Company, LLC from 2008 to 2010. Vice President, Evergreen Investment Services, Inc. from 2004 to 2007. Head of the Fund Reporting and Control Team within Fund Administration from 2005 to 2010. | | |
C. David Messman (Born 1960) | | Secretary, since 2000; Chief Legal Officer, since 2003 | | Senior Vice President and Secretary of Wells Fargo Funds Management, LLC since 2001. Assistant General Counsel of Wells Fargo Bank, N.A. since 2013 and Vice President and Managing Counsel of Wells Fargo Bank N.A. from 1996 to 2013. | | |
Debra Ann Early
(Born 1964) | | Chief Compliance Officer, since 2007 | | Senior Vice President of Wells Fargo Funds Management, LLC since 2007 and Chief Compliance Officer from 2007 to 2014. Chief Compliance Officer of Parnassus Investments from 2005 to 2007. Chief Financial Officer of Parnassus Investments from 2004 to 2007 and Senior Audit Manager of PricewaterhouseCoopers LLP from 1998 to 2004. | | |
David Berardi
(Born 1975) | | Assistant Treasurer, since 2009 | | Vice President of Wells Fargo Funds Management, LLC since 2009. Vice President of Evergreen Investment Management Company, LLC from 2008 to 2010. Assistant Vice President of Evergreen Investment Services, Inc. from 2004 to 2008. Manager of Fund Reporting and Control for Evergreen Investment Management Company, LLC from 2004 to 2010. | | |
| 1 | Jeremy DePalma acts as Treasurer of 61 funds and Assistant Treasurer of 73 funds in the Fund Complex. |
| 2 | The Statement of Additional Information includes additional information about the Trustees and is available, without charge, upon request, by calling 1-800-222-8222 or by visiting the website at wellsfargoadvantagefunds.com. |
| | | | |
| 30 | | Wells Fargo Advantage Emerging Markets Equity Fund | | List of abbreviations |
The following is a list of common abbreviations for terms and entities that may have appeared in this report.
| ACA | — ACA Financial Guaranty Corporation |
| ADR | — American depositary receipt |
| ADS | — American depositary shares |
| AGC | — Assured Guaranty Corporation |
| AGM | — Assured Guaranty Municipal |
| Ambac | — Ambac Financial Group Incorporated |
| AMT | — Alternative minimum tax |
| BAN | — Bond anticipation notes |
| BHAC | — Berkshire Hathaway Assurance Corporation |
| CAB | — Capital appreciation bond |
| CCAB | — Convertible capital appreciation bond |
| CDA | — Community Development Authority |
| CDO | — Collateralized debt obligation |
| DRIVER | — Derivative inverse tax-exempt receipts |
| DW&P | — Department of Water & Power |
| DWR | — Department of Water Resources |
| ECFA | — Educational & Cultural Facilities Authority |
| EDA | — Economic Development Authority |
| EDFA | — Economic Development Finance Authority |
| ETF | — Exchange-traded fund |
| FDIC | — Federal Deposit Insurance Corporation |
| FFCB | — Federal Farm Credit Banks |
| FGIC | — Financial Guaranty Insurance Corporation |
| FHA | — Federal Housing Administration |
| FHLB | — Federal Home Loan Bank |
| FHLMC | — Federal Home Loan Mortgage Corporation |
| FICO | — The Financing Corporation |
| FNMA | — Federal National Mortgage Association |
| GDR | — Global depositary receipt |
| GNMA | — Government National Mortgage Association |
| HCFR | — Healthcare facilities revenue |
| HEFA | — Health & Educational Facilities Authority |
| HEFAR | — Higher education facilities authority revenue |
| HFA | — Housing Finance Authority |
| HFFA | — Health Facilities Financing Authority |
| HUD | — Department of Housing and Urban Development |
| IDA | — Industrial Development Authority |
| IDAG | — Industrial Development Agency |
| KRW | — Republic of Korea won |
| LIBOR | — London Interbank Offered Rate |
| LIFER | — Long Inverse Floating Exempt Receipts |
| LLC | — Limited liability company |
| LLLP | — Limited liability limited partnership |
| LLP | — Limited liability partnership |
| MBIA | — Municipal Bond Insurance Association |
| MFHR | — Multifamily housing revenue |
| MSTR | — Municipal securities trust receipts |
| MUD | — Municipal Utility District |
| National | — National Public Finance Guarantee Corporation |
| PCFA | — Pollution Control Financing Authority |
| PCL | — Public Company Limited |
| PCR | — Pollution control revenue |
| PFA | — Public Finance Authority |
| PFFA | — Public Facilities Financing Authority |
| PFOTER | — Puttable floating option tax-exempt receipts |
| plc | — Public limited company |
| PUTTER | — Puttable tax-exempt receipts |
| R&D | — Research & development |
| Radian | — Radian Asset Assurance |
| RAN | — Revenue anticipation notes |
| RDA | — Redevelopment Authority |
| RDFA | — Redevelopment Finance Authority |
| REIT | — Real estate investment trust |
| ROC | — Reset option certificates |
| SAVRS | — Select auction variable rate securities |
| SBA | — Small Business Authority |
| SDR | — Swedish depositary receipt |
| SFHR | — Single-family housing revenue |
| SFMR | — Single-family mortgage revenue |
| SPA | — Standby purchase agreement |
| SPDR | — Standard & Poor’s Depositary Receipts |
| SPEAR | — Short Puttable Exempt Adjustable Receipts |
| STRIPS | — Separate trading of registered interest and |
| TAN | — Tax anticipation notes |
| TIPS | — Treasury inflation-protected securities |
| TRAN | — Tax revenue anticipation notes |
| TTFA | — Transportation Trust Fund Authority |
| TVA | — Tennessee Valley Authority |
This page is intentionally left blank.
This page is intentionally left blank.


For more information
More information about Wells Fargo Advantage Funds is available free upon request. To obtain literature, please write, email, visit the Fund’s website, or call:
Wells Fargo Advantage Funds
P.O. Box 8266
Boston, MA 02266-8266
Email: wfaf@wellsfargo.com
Website: wellsfargoadvantagefunds.com
Individual investors: 1-800-222-8222
Retail investment professionals: 1-888-877-9275
Institutional investment professionals: 1-866-765-0778
This report and the financial statements contained herein are submitted for the general information of the shareholders of Wells Fargo Advantage Funds. If this report is used for promotional purposes, distribution of the report must be accompanied or preceded by a current prospectus. Before investing, please consider the investment objectives, risks, charges, and expenses of the investment. For a current prospectus and, if available, a summary prospectus, containing this information, call 1-800-222-8222 or visit the Fund’s website at wellsfargoadvantagefunds.com. Read the prospectus carefully before you invest or send money.
Wells Fargo Funds Management, LLC, a wholly owned subsidiary of Wells Fargo & Company, provides investment advisory and administrative services for Wells Fargo Advantage Funds. Other affiliates of Wells Fargo & Company provide subadvisory and other services for the Funds. The Funds are distributed by Wells Fargo Funds Distributor, LLC, Member FINRA/SIPC, an affiliate of Wells Fargo & Company.
NOT FDIC INSURED ¡ NO BANK GUARANTEE ¡ MAY LOSE VALUE
© 2015 Wells Fargo Funds Management, LLC. All rights reserved.
| | |
 | | 233652 06-15 SA238/SAR238 04-15 |

Wells Fargo Advantage
Emerging Markets Equity Income Fund

Semi-Annual Report
April 30, 2015

Reduce clutter. Save trees.
Sign up for electronic delivery of prospectuses and shareholder reports at wellsfargo.com/advantagedelivery
Contents
The views expressed and any forward-looking statements are as of April 30, 2015, unless otherwise noted, and are those of the Fund managers and/or Wells Fargo Funds Management, LLC. Discussions of individual securities, or the markets generally, or any Wells Fargo Advantage Fund are not intended as individual recommendations. Future events or results may vary significantly from those expressed in any forward-looking statements; the views expressed are subject to change at any time in response to changing circumstances in the market. Wells Fargo Funds Management, LLC and the Fund disclaim any obligation to publicly update or revise any views expressed or forward-looking statements.
NOT FDIC INSURED ¡ NO BANK GUARANTEE ¡ MAY LOSE VALUE
| | | | |
| 2 | | Wells Fargo Advantage Emerging Markets Equity Income Fund | | Letter to shareholders (unaudited) |

Karla M. Rabusch
President
Wells Fargo Advantage Funds
A worldwide trend toward looser monetary policy tended to support stock and bond markets in both developed and emerging economies.
Dear Valued Shareholder:
We are pleased to offer you this semi-annual report for the Wells Fargo Advantage Emerging Markets Equity Income Fund for the six-month period that ended April 30, 2015. The period was marked by low global interest rates as major central banks initiated or increased their quantitative easing programs. Emerging markets stocks, as measured by the MSCI Emerging Markets Index (Net)1, displayed considerable volatility because investors worried about slower economic growth in major economies such as China and Brazil. Even so, the index ended the period with a 3.92% gain.
Major central banks continued to provide liquidity to the markets.
A worldwide trend toward looser monetary policy tended to support stock and bond markets in both developed and emerging economies. Throughout the reporting period, the Federal Open Market Committee (FOMC), which is the U.S. Federal Reserve’s (Fed’s) monetary policymaking body, kept its key interest rate effectively at zero. Even though the FOMC ended its bond-buying program in October 2014 and guided investors to expect an interest-rate hike in mid- to late-2015, the Fed remained accommodative.
The European Central Bank maintained a variety of measures aimed at encouraging lending, including making funds available to banks at low interest rates and imposing a negative interest rate on bank deposits held at the central bank. In January 2015, the bank announced quantitative easing via significant bond purchases in an attempt to raise the eurozone’s inflation to just under its target of 2%. In China, the People’s Bank of China cut its benchmark interest rate twice during the reporting period in order to support a slowing economy.
The Central Bank of Brazil bucked the trend by raising its key rate to 13.25% on April 29, 2015, in an attempt to combat the country’s high rate of inflation.
Currency movements and worries about economic growth dominated the emerging markets landscape.
The projected actions of the Fed—whether it would raise interest rates and when—dominated the emerging markets landscape throughout much of the reporting period. Many emerging markets governments and companies have U.S. dollar-denominated debt outstanding; a rise in U.S. interest rates could make it more expensive to refinance that debt. In addition, near-zero U.S. rates supported capital inflows into emerging markets because investors became more willing to accept higher risk in exchange for potentially higher returns. In the past, even the prospect of higher U.S. rates caused such flows to reverse. Currency swings thus had a large effect on the emerging markets landscape, with notable weakness in the Brazilian real.
Country-specific factors also played a role in the real’s decline; Brazil faces a challenging situation with a growing corruption scandal affecting the state-controlled oil company, a struggling economy, and a severe drought affecting the city of São Paulo.
In China, government data showed a slowdown in fixed-asset investment, which includes property investment, and modest growth in manufacturing and housing
| 1 | The Morgan Stanley Capital International (MSCI) Emerging Markets Index (Net) is a free-float-adjusted market-capitalization-weighted index that is designed to measure the equity market performance of emerging markets. The MSCI Emerging Markets Index (Net) consists of the following 23 emerging markets country indexes: Brazil, Chile, China, Colombia, Czech Republic, Egypt, Greece, Hungary, India, Indonesia, Korea, Malaysia, Mexico, Peru, the Philippines, Poland, Qatar, Russia, South Africa, Taiwan, Thailand, Turkey, and United Arab Emirates. You cannot invest directly in an index. Source: MSCI. MSCI makes no express or implied warranties or representations and shall have no liability whatsoever with respect to any MSCI data contained herein. The MSCI data may not be further redistributed or used as a basis for other indexes or any securities or financial products. This report is not approved, reviewed, or produced by MSCI. |
| | | | | | |
| Letter to shareholders (unaudited) | | Wells Fargo Advantage Emerging Markets Equity Income Fund | | | 3 | |
sales. However, China’s growth rates still contrasted favorably with stagnant growth in most developed economies. Chinese markets also benefited from the Shanghai-Hong Kong Stock Connect program, launched in November 2014, which made it easier for mainland investors to purchase stocks on the Hong Kong exchange and for international investors to purchase stocks on the Shanghai exchange. The resulting surge in demand helped the MSCI China Index (Net)2 end the period with a 29.61% gain.
Among smaller markets, South Korea ended with a modest gain for the period as the stronger U.S. dollar tended to support exporters such as South Korea. India’s stock market benefited from lower inflation and signs of improving economic growth, but delays in key reforms caused the Indian market to underperform the benchmark.
Don’t let short-term uncertainty derail long-term investment goals.
Periods of uncertainty can present challenges, but experience has taught us that maintaining long-term investment goals can be an effective way to plan for the future. To help you create a sound strategy based on your personal goals and risk tolerance, Wells Fargo Advantage Funds offers more than 100 mutual funds and other investments spanning a wide range of asset classes and investment styles. Although diversification cannot guarantee an investment profit or prevent losses, we believe it can be an effective way to manage investment risk and potentially smooth out overall portfolio performance. We encourage investors to know their investments and to understand that appropriate levels of risk-taking may unlock opportunities.
Thank you for choosing to invest with Wells Fargo Advantage Funds. We appreciate your confidence in us and remain committed to helping you meet your financial needs.
Sincerely,

Karla M. Rabusch
President
Wells Fargo Advantage Funds
Among smaller markets, South Korea ended with a modest gain for the period as the stronger U.S. dollar tended to support exporters such as South Korea.
For current information about your fund investments, contact your investment professional, visit our website at wellsfargoadvantagefunds.com, or call us directly at 1-800-222-8222. We are available 24 hours a day, 7 days a week.
| 2 | The Morgan Stanley Capital International (MSCI) China Index (Net) is a free-float-adjusted market-capitalization-weighted index that is designed to measure equity market performance in China. You cannot invest directly in an index. |
| | | | |
| 4 | | Wells Fargo Advantage Emerging Markets Equity Income Fund | | Performance highlights (unaudited) |
Investment objective
The Fund seeks to achieve long-term capital appreciation and current income.
Adviser
Wells Fargo Funds Management, LLC
Subadviser
Wells Capital Management Incorporated
Portfolio managers
Anthony L.T. Cragg
Alison Shimada
Average annual total returns (%) as of April 30, 2015
| | | | | | | | | | | | | | | | | | | | | | | | | | |
| | | | | Including sales charge | | | Excluding sales charge | | | Expense ratios1 (%) | |
| | | Inception date | | 1 year | | | Since
inception | | | 1 year | | | Since
inception | | | Gross | | | Net2 | |
| Class A (EQIAX) | | 5-31-2012 | | | 3.52 | | | | 7.93 | | | | 9.79 | | | | 10.14 | | | | 2.08 | | | | 1.66 | |
| Class C (EQICX) | | 5-31-2012 | | | 8.06 | | | | 9.35 | | | | 9.06 | | | | 9.35 | | | | 2.83 | | | | 2.41 | |
| Administrator Class (EQIDX) | | 5-31-2012 | | | – | | | | – | | | | 10.15 | | | | 10.39 | | | | 1.92 | | | | 1.46 | |
| Institutional Class (EQIIX) | | 5-31-2012 | | | – | | | | – | | | | 10.23 | | | | 10.59 | | | | 1.65 | | | | 1.26 | |
| MSCI Emerging Markets Index (Net)3 | | – | | | – | | | | – | | | | 7.80 | | | | 7.63 | | | | – | | | | – | |
Figures quoted represent past performance, which is no guarantee of future results, and do not reflect taxes that a shareholder may pay on fund distributions or the redemption of fund shares. Investment return and principal value of an investment will fluctuate so that an investor’s shares, when redeemed, may be worth more or less than their original cost. Performance shown without sales charges would be lower if sales charges were reflected. Current performance may be lower or higher than the performance data quoted, which assumes the reinvestment of dividends and capital gains. Current month-end performance is available on the Fund’s website, wellsfargoadvantagefunds.com.
Index returns do not include transaction costs associated with buying and selling securities, any mutual fund fees or expenses, or any taxes. It is not possible to invest directly in an index.
For Class A shares, the maximum front-end sales charge is 5.75%. For Class C shares, the maximum contingent deferred sales charge is 1.00%. Performance including a contingent deferred sales charge assumes the sales charge for the corresponding time period. Administrator Class and Institutional Class shares are sold without a front-end sales charge or contingent deferred sales charge.
Stock values fluctuate in response to the activities of individual companies and general market and economic conditions. Foreign investments are especially volatile and can rise or fall dramatically due to differences in the political and economic conditions of the host country. These risks are generally intensified in emerging markets. The use of derivatives may reduce returns and/or increase volatility. Certain investment strategies tend to increase the total risk of an investment (relative to the broader market). The Fund is exposed to smaller-company securities risk. Consult the Fund’s prospectus for additional information on these and other risks.
Please see footnotes on page 5.
| | | | | | |
| Performance highlights (unaudited) | | Wells Fargo Advantage Emerging Markets Equity Income Fund | | | 5 | |
| | | | |
| Ten largest holdings4 (%) as of April 30, 2015 | |
Bank of China Limited H Shares | | | 3.39 | |
Industrial & Commercial Bank of China Limited H Shares | | | 2.83 | |
China Mobile Limited | | | 2.47 | |
Cosco Pacific Limited | | | 1.94 | |
Grupo Aeroportuario del Centro Norte SAB de CV | | | 1.92 | |
China Construction Bank Corporation H Shares | | | 1.85 | |
Chicony Electronics Company Limited | | | 1.63 | |
China Power International Development Limited | | | 1.52 | |
Kangwon Land Incorporated | | | 1.43 | |
Agricultural Bank of China Limited H Shares | | | 1.35 | |
|
| Country allocation5 as of April 30, 2015 |
|
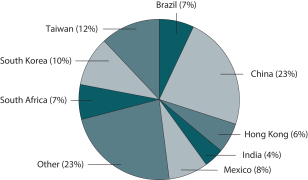 |
|
| Sector distribution5 as of April 30, 2015 |
|
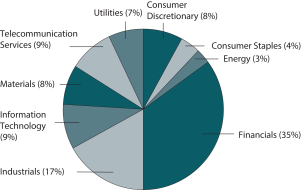 |
| 1 | Reflects the expense ratios as stated in the most recent prospectuses, which include the impact of 0.01% in acquired fund fees and expenses. The expense ratios shown are subject to change and may differ from the annualized expense ratios shown in the financial highlights of this report, which do not include acquired fund fees and expenses. |
| 2 | The Adviser has committed through February 29, 2016, to waive fees and/or reimburse expenses to the extent necessary to cap the Fund’s Total Annual Fund Operating Expenses After Fee Waiver, excluding certain expenses, at 1.65% for Class A, 2.40% for Class C, 1.45% for Administrator Class, and 1.25% for Institutional Class. After this time, the cap may be increased or the commitment to maintain the cap may be terminated only with the approval of the Board of Trustees. Brokerage commissions, stamp duty fees, interest, taxes, acquired fund fees and expenses, and extraordinary expenses are excluded from the cap. Without this cap, the Fund’s returns would have been lower. |
| 3 | The Morgan Stanley Capital International (MSCI) Emerging Markets Index (Net) is a free-float-adjusted market-capitalization-weighted index that is designed to measure the equity market performance of emerging markets. The MSCI Emerging Markets Index (Net) consists of the following 23 emerging markets country indexes: Brazil, Chile, China, Colombia, Czech Republic, Egypt, Greece, Hungary, India, Indonesia, Korea, Malaysia, Mexico, Peru, the Philippines, Poland, Qatar, Russia, South Africa, Taiwan, Thailand, Turkey,* and United Arab Emirates. You cannot invest directly in an index. Source: MSCI. MSCI makes no express or implied warranties or representations and shall have no liability whatsoever with respect to any MSCI data contained herein. The MSCI data may not be further redistributed or used as a basis for other indexes or any securities or financial products. This report is not approved, reviewed, or produced by MSCI. |
| 4 | The ten largest holdings, excluding cash and cash equivalents, are calculated based on the value of the investments divided by total net assets of the Fund. Holdings are subject to change and may have changed since the date specified. |
| 5 | Amounts are calculated based on the total long-term investments of the Fund. These percentages are subject to change and may have changed since the date specified. |
| | | | |
| 6 | | Wells Fargo Advantage Emerging Markets Equity Income Fund | | Fund expenses (unaudited) |
As a shareholder of the Fund, you incur two types of costs: (1) transaction costs, including sales charges (loads) on purchase payments and contingent deferred sales charges (if any) on redemptions and (2) ongoing costs, including management fees, distribution (12b-1) and/or shareholder service fees, and other Fund expenses. This example is intended to help you understand your ongoing costs (in dollars) of investing in the Fund and to compare these costs with the ongoing costs of investing in other mutual funds.
The example is based on an investment of $1,000 invested at the beginning of the six-month period and held for the entire period from November 1, 2014 to April 30, 2015.
Actual expenses
The “Actual” line of the table below provides information about actual account values and actual expenses. You may use the information in this line, together with the amount you invested, to estimate the expenses that you paid over the period. Simply divide your account value by $1,000 (for example, an $8,600 account value divided by $1,000 = 8.6), then multiply the result by the number in the “Actual” line under the heading entitled “Expenses paid during period” for your applicable class of shares to estimate the expenses you paid on your account during this period.
Hypothetical example for comparison purposes
The “Hypothetical” line of the table below provides information about hypothetical account values and hypothetical expenses based on the Fund’s actual expense ratio and an assumed rate of return of 5% per year before expenses, which is not the Fund’s actual return. The hypothetical account values and expenses may not be used to estimate the actual ending account balance or expenses you paid for the period. You may use this information to compare the ongoing costs of investing in the Fund and other funds. To do so, compare this 5% hypothetical example with the 5% hypothetical examples that appear in the shareholder reports of the other funds.
Please note that the expenses shown in the table are meant to highlight your ongoing costs only and do not reflect any transactional costs, such as sales charges (loads) and contingent deferred sales charges. Therefore, the “Hypothetical” line of the table is useful in comparing ongoing costs only and will not help you determine the relative total costs of owning different funds. In addition, if these transactional costs were included, your costs would have been higher.
| | | | | | | | | | | | | | | | |
| | | Beginning
account value
11-1-2014 | | | Ending
account value
4-30-2015 | | | Expenses
paid during
the period¹ | | | Net annualized
expense ratio | |
Class A | | | | | | | | | | | | | | | | |
Actual | | $ | 1,000.00 | | | $ | 1,037.75 | | | $ | 8.34 | | | | 1.65 | % |
Hypothetical (5% return before expenses) | | $ | 1,000.00 | | | $ | 1,016.61 | | | $ | 8.25 | | | | 1.65 | % |
Class C | | | | | | | | | | | | | | | | |
Actual | | $ | 1,000.00 | | | $ | 1,034.63 | | | $ | 12.11 | | | | 2.40 | % |
Hypothetical (5% return before expenses) | | $ | 1,000.00 | | | $ | 1,012.89 | | | $ | 11.98 | | | | 2.40 | % |
Administrator Class | | | | | | | | | | | | | | | | |
Actual | | $ | 1,000.00 | | | $ | 1,039.36 | | | $ | 7.33 | | | | 1.45 | % |
Hypothetical (5% return before expenses) | | $ | 1,000.00 | | | $ | 1,017.60 | | | $ | 7.25 | | | | 1.45 | % |
Institutional Class | | | | | | | | | | | | | | | | |
Actual | | $ | 1,000.00 | | | $ | 1,040.07 | | | $ | 6.32 | | | | 1.25 | % |
Hypothetical (5% return before expenses) | | $ | 1,000.00 | | | $ | 1,018.60 | | | $ | 6.26 | | | | 1.25 | % |
| 1 | Expenses paid is equal to the annualized expense ratio of each class multiplied by the average account value over the period, multiplied by the number of days in the most recent fiscal half-year divided by the number of days in the fiscal year (to reflect the one-half-year period). |
| | | | | | |
| Portfolio of investments—April 30, 2015 (unaudited) | | Wells Fargo Advantage Emerging Markets Equity Income Fund | | | 7 | |
| | | | | | | | | | | | |
| Security name | | | | | | Shares | | | Value | |
| | | | |
Common Stocks: 82.97% | | | | | | | | | | | | |
| | | | |
| Australia: 0.53% | | | | | | | | | | | | |
BHP Billiton Limited (Materials, Metals & Mining) | | | | | | | 26,536 | | | $ | 677,638 | |
| | | | | | | | | | | | |
| | | | |
| Brazil: 5.81% | | | | | | | | | | | | |
Alupar Investimento SA (Utilities, Electric Utilities) | | | | | | | 131,160 | | | | 804,908 | |
Ambev SA (Consumer Staples, Beverages) | | | | | | | 236,600 | | | | 1,487,314 | |
BM&F Bovespa SA (Financials, Diversified Financial Services) | | | | | | | 120,300 | | | | 495,502 | |
Cielo SA (Information Technology, IT Services) | | | | | | | 112,100 | | | | 1,560,422 | |
Itau Unibanco Holding SA ADR (Financials, Banks) | | | | | | | 121,848 | | | | 1,562,091 | |
Telefonica Brasil ADR (Telecommunication Services, Diversified Telecommunication Services) | | | | | | | 36,093 | | | | 592,647 | |
Valid Solucoes SA (Industrials, Commercial Services & Supplies) | | | | | | | 64,300 | | | | 999,836 | |
| | | | |
| | | | | | | | | | | 7,502,720 | |
| | | | | | | | | | | | |
| | | | |
| Cayman Islands: 2.48% | | | | | | | | | | | | |
ANTA Sports Products Limited (Consumer Discretionary, Textiles, Apparel & Luxury Goods) | | | | | | | 754,000 | | | | 1,661,601 | |
KWG Property Holding Limited (Financials, Real Estate Management & Development) | | | | | | | 1,525,000 | | | | 1,540,853 | |
| | | | |
| | | | | | | | | | | 3,202,454 | |
| | | | | | | | | | | | |
| | | | |
| Chile: 0.80% | | | | | | | | | | | | |
Aguas Andinas SA Class A (Utilities, Water Utilities) | | | | | | | 1,740,072 | | | | 1,025,544 | |
| | | | | | | | | | | | |
| | | | |
| China: 18.67% | | | | | | | | | | | | |
Agricultural Bank of China Limited H Shares (Financials, Banks) | | | | | | | 3,096,000 | | | | 1,742,986 | |
Bank of China Limited H Shares (Financials, Banks) | | | | | | | 6,390,000 | | | | 4,378,447 | |
Beijing Capital International Airport Company Limited H Shares (Industrials, Transportation Infrastructure) | | | | | | | 514,000 | | | | 546,318 | |
China BlueChemical Limited H Shares (Materials, Chemicals) | | | | | | | 2,464,000 | | | | 1,097,402 | |
China Communications Construction Company Limited H Shares (Industrials, Construction & Engineering) | | | | | | | 447,000 | | | | 813,028 | |
China Construction Bank H Shares (Financials, Banks) | | | | | | | 2,467,000 | | | | 2,394,802 | |
China Hongqiao Group Limited (Materials, Metals & Mining) | | | | | | | 1,405,000 | | | | 1,308,054 | |
China Mobile Limited (Telecommunication Services, Wireless Telecommunication Services) | | | | | | | 223,500 | | | | 3,192,314 | |
China Petroleum & Chemical Corporation H Shares (Energy, Oil, Gas & Consumable Fuels) | | | | | | | 1,705,600 | | | | 1,609,687 | |
Datang International Power Generation Company Limited H Shares (Utilities, Independent Power & Renewable Electricity Producers) | | | | | | | 1,518,000 | | | | 887,976 | |
Industrial & Commercial Bank of China Limited H Shares (Financials, Banks) | | | | | | | 4,206,000 | | | | 3,648,540 | |
PetroChina Company Limited H Shares (Energy, Oil, Gas & Consumable Fuels) | | | | | | | 1,252,000 | | | | 1,614,783 | |
Qinhuangdao Port Company Limited H Shares (Industrials, Transportation Infrastructure) | | | | | | | 1,283,000 | | | | 869,067 | |
| | | | |
| | | | | | | | | | | 24,103,404 | |
| | | | | | | | | | | | |
| | | | |
| Czech Republic: 0.37% | | | | | | | | | | | | |
Komercni Banka AS (Financials, Banks) | | | | | | | 2,150 | | | | 479,465 | |
| | | | | | | | | | | | |
| | | | |
| Hong Kong: 6.00% | | | | | | | | | | | | |
China Power International Development Limited (Utilities, Independent Power & Renewable Electricity Producers) | | | | | | | 3,053,000 | | | | 1,968,164 | |
COSCO Pacific Limited (Industrials, Transportation Infrastructure) | | | | | | | 1,595,517 | | | | 2,502,039 | |
Far East Horizon Limited (Financials, Diversified Financial Services) | | | | | | | 1,447,000 | | | | 1,528,138 | |
Franshion Properties China Limited (Financials, Real Estate Management & Development) | | | | | | | 2,834,000 | | | | 1,144,994 | |
Texwinca Holdings Limited (Consumer Discretionary, Textiles, Apparel & Luxury Goods) | | | | | | | 624,000 | | | | 605,115 | |
| | | | |
| | | | | | | | | | | 7,748,450 | |
| | | | | | | | | | | | |
The accompanying notes are an integral part of these financial statements.
| | | | |
| 8 | | Wells Fargo Advantage Emerging Markets Equity Income Fund | | Portfolio of investments—April 30, 2015 (unaudited) |
| | | | | | | | | | | | |
| Security name | | | | | | Shares | | | Value | |
| | | | |
| Indonesia: 1.56% | | | | | | | | | | | | |
PT Bank Tabungan Negara Persero Tbk (Financials, Banks) | | | | | | | 6,594,300 | | | $ | 564,998 | |
PT Indo Tambangraya Megah Tbk (Energy, Oil, Gas & Consumable Fuels) | | | | | | | 311,800 | | | | 302,750 | |
PT Telekomunikasi Indonesia Persero Tbk (Telecommunication Services, Diversified Telecommunication Services) | | | | | | | 5,700,300 | | | | 1,146,452 | |
| | | | |
| | | | | | | | | | | 2,014,200 | |
| | | | | | | | | | | | |
| | | | |
| Malaysia: 2.70% | | | | | | | | | | | | |
Berjaya Sports Toto Bhd (Consumer Discretionary, Hotels, Restaurants & Leisure) | | | | | | | 455,700 | | | | 417,123 | |
Malakoff Corporation Bhd (Utilities, Independent Power & Renewable Electricity Producers) (a) | | | | | | | 943,575 | | | | 481,656 | |
Sunway Real Estate Investment Trust (Financials, REITs) | | | | | | | 1,028,400 | | | | 493,771 | |
Telecom Malaysia Bhd (Telecommunication Services, Diversified Telecommunication Services) | | | | | | | 507,081 | | | | 1,052,936 | |
Tenaga Nasional Bhd (Utilities, Electric Utilities) | | | | | | | 131,700 | | | | 530,058 | |
Westports Holdings Bhd (Industrials, Transportation Infrastructure) | | | | | | | 401,963 | | | | 507,885 | |
| | | | |
| | | | | | | | | | | 3,483,429 | |
| | | | | | | | | | | | |
| | | | |
| Mexico: 7.30% | | | | | | | | | | | | |
Bolsa Mexicana de Valores SA (Financials, Diversified Financial Services) | | | | | | | 482,201 | | | | 928,132 | |
Grupo Aeroportuario del Centro Norte SAB de CV (Industrials, Transportation Infrastructure) | | | | | | | 496,935 | | | | 2,481,112 | |
Grupo Aeroportuario del Pacifico SAB de CV (Industrials, Transportation Infrastructure) | | | | | | | 244,435 | | | | 1,737,110 | |
Grupo Financiero Santander SAB de CV (Financials, Banks) | | | | | | | 749,858 | | | | 1,527,380 | |
Macquarie Mexico Real Estate Management SA de CV (Financials, REITs) 144A | | | | | | | 1,045,294 | | | | 1,582,045 | |
Wal-Mart de Mexico SAB de CV (Consumer Staples, Food & Staples Retailing) | | | | | | | 499,040 | | | | 1,174,250 | |
| | | | |
| | | | | | | | | | | 9,430,029 | |
| | | | | | | | | | | | |
| | | | |
| Panama: 0.92% | | | | | | | | | | | | |
Banco Latinoamericano de Comercio Exterior SA (Financials, Banks) | | | | | | | 37,374 | | | | 1,187,372 | |
| | | | | | | | | | | | |
| | | | |
| Philippines: 0.74% | | | | | | | | | | | | |
Philippine Long Distance Telephone Company (Telecommunication Services, Wireless Telecommunication Services) | | | | | | | 7,245 | | | | 454,611 | |
Premium Leisure Corporation (Financials, Diversified Financial Services) | | | | | | | 13,847,000 | | | | 505,724 | |
| | | | |
| | | | | | | | | | | 960,335 | |
| | | | | | | | | | | | |
| | | | |
| Poland: 0.97% | | | | | | | | | | | | |
Bank Pekao SA (Financials, Banks) | | | | | | | 11,933 | | | | 620,262 | |
Powszechny Zaklad Ubezpieczen SA (Financials, Insurance) | | | | | | | 4,794 | | | | 625,256 | |
| | | | |
| | | | | | | | | | | 1,245,518 | |
| | | | | | | | | | | | |
| | | | |
| Qatar: 0.91% | | | | | | | | | | | | |
Industries Qatar (Industrials, Industrial Conglomerates) | | | | | | | 29,708 | | | | 1,178,823 | |
| | | | | | | | | | | | |
| | | | |
| Russia: 0.44% | | | | | | | | | | | | |
Moscow Exchange MICEX-RTS OAO (Financials, Diversified Financial Services) (a) | | | | | | | 381,079 | | | | 568,693 | |
| | | | | | | | | | | | |
| | | | |
| Singapore: 1.71% | | | | | | | | | | | | |
Asian Pay Television Trust (Consumer Discretionary, Media) | | | | | | | 1,757,300 | | | | 1,195,261 | |
Hutchison Port Holdings Trust (Industrials, Transportation Infrastructure) | | | | | | | 1,498,000 | | | | 1,009,292 | |
| | | | |
| | | | | | | | | | | 2,204,553 | |
| | | | | | | | | | | | |
The accompanying notes are an integral part of these financial statements.
| | | | | | |
| Portfolio of investments—April 30, 2015 (unaudited) | | Wells Fargo Advantage Emerging Markets Equity Income Fund | | | 9 | |
| | | | | | | | | | | | |
| Security name | | | | | | Shares | | | Value | |
| | | | |
| South Africa: 6.33% | | | | | | | | | | | | |
Barclays Africa Group Limited (Financials, Banks) | | | | | | | 83,198 | | | $ | 1,332,671 | |
FirstRand Limited (Financials, Diversified Financial Services) | | | | | | | 211,801 | | | | 1,011,793 | |
Imperial Holdings Limited (Consumer Discretionary, Distributors) | | | | | | | 33,160 | | | | 555,308 | |
MMI Holdings Limited (Financials, Insurance) | | | | | | | 498,513 | | | | 1,418,486 | |
MTN Group Limited (Telecommunication Services, Wireless Telecommunication Services) | | | | | | | 46,529 | | | | 934,252 | |
Reunert Limited (Industrials, Industrial Conglomerates) | | | | | | | 241,157 | | | | 1,229,478 | |
Sanlam Limited (Financials, Insurance) | | | | | | | 176,215 | | | | 1,139,691 | |
Woolworths Holdings Limited (Consumer Discretionary, Multiline Retail) | | | | | | | 73,932 | | | | 556,172 | |
| | | | |
| | | | | | | | | | | 8,177,851 | |
| | | | | | | | | | | | |
| | | | |
| South Korea: 9.19% | | | | | | | | | | | | |
Grand Korea Leisure Company Limited (Consumer Discretionary, Hotels, Restaurants & Leisure) | | | | | | | 36,730 | | | | 1,314,477 | |
Hite Jinro Company Limited (Consumer Staples, Beverages) | | | | | | | 34,320 | | | | 726,556 | |
Kangwon Land Incorporated (Consumer Discretionary, Hotels, Restaurants & Leisure) | | | | | | | 54,196 | | | | 1,847,451 | |
Korea Electric Power Corporation (Utilities, Electric Utilities) | | | | | | | 38,131 | | | | 1,658,085 | |
Korea Reinsurance Company (Financials, Insurance) | | | | | | | 59,100 | | | | 653,570 | |
KT&G Corporation (Consumer Staples, Tobacco) | | | | | | | 12,357 | | | | 1,096,223 | |
Macquarie Korea Infrastructure Fund (Financials, Capital Markets) | | | | | | | 209,503 | | | | 1,545,866 | |
POSCO (Materials, Metals & Mining) | | | | | | | 5,484 | | | | 1,291,831 | |
SK Telecom Company Limited ADR (Telecommunication Services, Wireless Telecommunication Services) | | | | | | | 58,172 | | | | 1,724,800 | |
| | | | |
| | | | | | | | | | | 11,858,859 | |
| | | | | | | | | | | | |
| | | | |
| Taiwan: 10.98% | | | | | | | | | | | | |
Advanced Semiconductor Engineering Incorporated (Information Technology, Semiconductors & Semiconductor Equipment) | | | | | | | 809,000 | | | | 1,147,263 | |
Chicony Electronics Company Limited (Information Technology, Technology Hardware, Storage & Peripherals) | | | | | | | 733,465 | | | | 2,109,063 | |
China Trust Financial Holding Company Limited (Financials, Banks) | | | | | | | 770,000 | | | | 599,347 | |
Chroma ATE Incorporated (Information Technology, Electronic Equipment, Instruments & Components) | | | | | | | 174,000 | | | | 419,086 | |
Chunghwa Telecom Company Limited (Telecommunication Services, Diversified Telecommunication Services) | | | | | | | 159,000 | | | | 513,139 | |
Cleanaway Company Limited (Industrials, Commercial Services & Supplies) | | | | | | | 145,000 | | | | 898,455 | |
CTCI Corporation (Industrials, Construction & Engineering) | | | | | | | 613,000 | | | | 1,077,819 | |
Delta Electronics Incorporated (Information Technology, Electronic Equipment, Instruments & Components) | | | | | | | 78,000 | | | | 469,362 | |
King Yuan Electronics Company Limited (Information Technology, Semiconductors & Semiconductor Equipment) | | | | | | | 1,050,000 | | | | 954,469 | |
Media Tek Incorporated (Information Technology, Semiconductors & Semiconductor Equipment) | | | | | | | 47,000 | | | | 604,147 | |
Mega Financial Holding Company Limited (Financials, Banks) | | | | | | | 580,065 | | | | 515,945 | |
Namchow Chemical Industrial Company Limited (Consumer Staples, Food Products) | | | | | | | 298,000 | | | | 661,001 | |
Nan Ya Plastics Corporation (Materials, Chemicals) | | | | | | | 399,000 | | | | 980,661 | |
Siliconware Precision Industries Company (Information Technology, Semiconductors & Semiconductor Equipment) | | | | | | | 331,000 | | | | 543,768 | |
Teco Electric & Machinery Company Limited (Industrials, Electrical Equipment) | | | | | | | 893,000 | | | | 867,023 | |
United Microelectronics Corporation ADR (Information Technology, Semiconductors & Semiconductor Equipment) | | | | | | | 358,309 | | | | 867,108 | |
WPG Holdings Company Limited (Information Technology, Electronic Equipment, Instruments & Components) | | | | | | | 762,000 | | | | 953,325 | |
| | | | |
| | | | | | | | | | | 14,180,981 | |
| | | | | | | | | | | | |
| | | | |
| Thailand: 3.05% | | | | | | | | | | | | |
BTS Group Holdings PCL (Industrials, Road & Rail) | | | | | | | 4,250,700 | | | | 1,192,749 | |
Dynasty Ceramic PCL (Industrials, Building Products) | | | | | | | 6,618,560 | | | | 811,132 | |
Intouch Holding PCL (Telecommunication Services, Wireless Telecommunication Services) | | | | | | | 418,300 | | | | 622,660 | |
Land & Houses PCL (Financials, Real Estate Management & Development) | | | | | | | 2,406,100 | | | | 695,473 | |
Major Cineplex Group PCL (Consumer Discretionary, Media) | | | | | | | 608,800 | | | | 618,680 | |
| | | | |
| | | | | | | | | | | 3,940,694 | |
| | | | | | | | | | | | |
The accompanying notes are an integral part of these financial statements.
| | | | |
| 10 | | Wells Fargo Advantage Emerging Markets Equity Income Fund | | Portfolio of investments—April 30, 2015 (unaudited) |
| | | | | | | | | | | | | | | | |
| Security name | | | | | | | | Shares | | | Value | |
| | | | |
| Turkey: 1.51% | | | | | | | | | | | | | | | | |
Cimsa Cimento Sanayi ve Ticaret AS (Materials, Construction Materials) | | | | | | | | | | | 199,228 | | | $ | 1,222,424 | |
Dogus Otomotiv Servis ve Ticaret AS (Consumer Discretionary, Distributors) | | | | | | | | | | | 149,059 | | | | 724,853 | |
| | | | |
| | | | | | | | | | | | | | | 1,947,277 | |
| | | | | | | | | | | | | | | | |
| | | | |
Total Common Stocks (Cost $96,155,994) | | | | | | | | | | | | | | | 107,118,289 | |
| | | | | | | | | | | | | | | | |
| | | | |
| | | | | | Expiration date | | | | | | | |
| Participation Notes: 7.32% | | | | | | | | | | | | | | | | |
| | | | |
| China: 2.36% | | | | | | | | | | | | | | | | |
HSBC Bank plc (China Vanke Company Limited Class A) (Financials, Real Estate Management & Development) † | | | | | | | 2-11-2019 | | | | 597,000 | | | | 1,405,816 | |
HSBC Bank PLC (Daqin Railway Company Limited Class A) (Industrials, Road & Rail) † | | | | | | | 10-28-2020 | | | | 138,622 | | | | 312,342 | |
Standard Chartered Bank (Daqin Railway Company Limited Class A) (Industrials, Road & Rail) † | | | | | | | 3-30-2016 | | | | 316,000 | | | | 712,008 | |
Standard Chartered Bank (SAIC Motor Corporation Limited Class A) (Consumer Discretionary, Automobiles) † | | | | | | | 4-29-2016 | | | | 140,000 | | | | 609,668 | |
| | | | |
| | | | | | | | | | | | | | | 3,039,834 | |
| | | | | | | | | | | | | | | | |
| | | | |
| India: 4.36% | | | | | | | | | | | | | | | | |
HSBC Bank plc (Akzo Nobel India) (Materials, Construction Materials) | | | | | | | 1-9-2025 | | | | 30,986 | | | | 683,429 | |
HSBC Bank plc (Coal India Limited) (Materials, Metals & Mining) † | | | | | | | 11-2-2020 | | | | 192,998 | | | | 1,102,017 | |
HSBC Bank plc (Indiabulls Housing Finance) (Financials, Diversified Financial Services) † | | | | | | | 6-18-2024 | | | | 148,613 | | | | 1,388,722 | |
HSBC Bank plc (Mphasis Limted) (Information Technology, Semiconductors & Semiconductor Equipment) † | | | | | | | 6-1-2020 | | | | 82,000 | | | | 509,781 | |
HSBC Bank plc (NTPC Limited) (Utilities, Electric Utilities) † | | | | | | | 5-6-2024 | | | | 200,375 | | | | 474,057 | |
HSBC Bank plc (Oil & Natural Gas Corporation Limited) (Energy, Oil, Gas & Consumable Fuels) † | | | | | | | 1-10-2024 | | | | 139,072 | | | | 665,490 | |
HSBC Bank plc (Power Finance Corporation) (Financials, Diversified Financial Services) † | | | | | | | 11-21-2023 | | | | 192,487 | | | | 804,895 | |
| | | | |
| | | | | | | | | | | | | | | 5,628,391 | |
| | | | | | | | | | | | | | | | |
| | | | |
| Qatar: 0.60% | | | | | | | | | | | | | | | | |
HSBC Bank plc (Qatar National Bank) (Financials, Banks) † | | | | | | | 8-1-2023 | | | | 385,518 | | | | 778,269 | |
| | | | | | | | | | | | | | | | |
| | | | |
Total Participation Notes (Cost $9,375,690) | | | | | | | | | | | | | | | 9,446,494 | |
| | | | | | | | | | | | | | | | |
| | | | |
| | | Dividend yield | | | | | | | | | | |
| Preferred Stocks: 1.14% | | | | | | | | | | | | | | | | |
| | | | |
| Brazil: 1.14% | | | | | | | | | | | | | | | | |
Banco Bradesco SA (Financials, Banks) ± | | | 3.43 | % | | | | | | | 138,560 | | | | 1,478,979 | |
| | | | | | | | | | | | | | | | |
| | | | |
Total Preferred Stocks (Cost $1,345,867) | | | | | | | | | | | | | | | 1,478,979 | |
| | | | | | | | | | | | | | | | |
| | | | |
Exchange-Traded Funds: 0.71% | | | | | | | | | | | | | | | | |
| | | | |
| Russia: 0.71% | | | | | | | | | | | | | | | | |
Market Vectors Russia ETF | | | | | | | | | | | 46,741 | | | | 920,798 | |
| | | | | | | | | | | | | | | | |
| | | | |
Total Exchange-Traded Funds (Cost $828,259) | | | | | | | | | | | | | | | 920,798 | |
| | | | | | | | | | | | | | | | |
The accompanying notes are an integral part of these financial statements.
| | | | | | |
| Portfolio of investments—April 30, 2015 (unaudited) | | Wells Fargo Advantage Emerging Markets Equity Income Fund | | | 11 | |
| | | | | | | | | | | | | | |
| Security name | | Yield | | | | | Shares | | | Value | |
| | | | |
Short-Term Investments: 5.37% | | | | | | | | | | | | | | |
| | | | |
| Investment Companies: 5.37% | | | | | | | | | | | | | | |
Wells Fargo Advantage Cash Investment Money Market Fund, Select Class (u)(l) | | | 0.11 | % | | | | | 6,930,129 | | | $ | 6,930,129 | |
| | | | | | | | | | | | | | |
| | | | |
Total Short-Term Investments (Cost $6,930,129) | | | | | | | | | | | | | 6,930,129 | |
| | | | | | | | | | | | | | |
| | | | | | | | |
| Total investments in securities (Cost $114,635,939) * | | | 97.51 | % | | | 125,894,689 | |
Other assets and liabilities, net | | | 2.49 | | | | 3,211,983 | |
| | | | | | | | |
| Total net assets | | | 100.00 | % | | $ | 129,106,672 | |
| | | | | | | | |
| ± | Variable rate investment. The rate shown is the rate in effect at period end. |
| † | Non-income-earning security |
| (u) | The rate represents the 7-day annualized yield at period end. |
| (l) | The security represents an affiliate of the Fund as defined in the Investment Company Act of 1940. |
| 144A | The security may be resold in transactions exempt from registration, normally to qualified institutional buyers, pursuant to Rule 144A under the Securities Act of 1933. |
| (a) | The security is fair valued in accordance with procedures approved by the Board of Trustees. |
| * | Cost for federal income tax purposes is $116,040,701 and unrealized gains (losses) consists of: |
| | | | |
Gross unrealized gains | | $ | 13,474,069 | |
Gross unrealized losses | | | (3,620,081 | ) |
| | | | |
Net unrealized gains | | $ | 9,853,988 | |
The accompanying notes are an integral part of these financial statements.
| | | | |
| 12 | | Wells Fargo Advantage Emerging Markets Equity Income Fund | | Statement of assets and liabilities—April 30, 2015 (unaudited) |
| | | | |
| | | | |
| |
Assets | | | | |
Investments | | | | |
In unaffiliated securities, at value (cost $107,705,810) | | $ | 118,964,560 | |
In affiliated securities, at value (cost $6,930,129) | | | 6,930,129 | |
| | | | |
Total investments, at value (cost $114,635,939) | | | 125,894,689 | |
Foreign currency, at value (cost $274,648) | | | 276,441 | |
Receivable for investments sold | | | 2,670,111 | |
Receivable for Fund shares sold | | | 2,133,825 | |
Receivable for dividends | | | 263,514 | |
Prepaid expenses and other assets | | | 30,966 | |
| | | | |
Total assets | | | 131,269,546 | |
| | | | |
| |
Liabilities | | | | |
Payable for investments purchased | | | 1,869,057 | |
Payable for Fund shares redeemed | | | 131,616 | |
Advisory fee payable | | | 84,304 | |
Distribution fee payable | | | 5,132 | |
Administration fees payable | | | 17,841 | |
Accrued expenses and other liabilities | | | 54,924 | |
| | | | |
Total liabilities | | | 2,162,874 | |
| | | | |
Total net assets | | $ | 129,106,672 | |
| | | | |
| |
NET ASSETS CONSIST OF | | | | |
Paid-in capital | | $ | 121,600,522 | |
Undistributed net investment income | | | 287,167 | |
Accumulated net realized losses on investments | | | (4,034,743 | ) |
Net unrealized gains on investments | | | 11,253,726 | |
| | | | |
Total net assets | | $ | 129,106,672 | |
| | | | |
| |
COMPUTATION OF NET ASSET VALUE AND OFFERING PRICE PER SHARE | | | | |
Net assets – Class A | | $ | 20,500,500 | |
Shares outstanding – Class A1 | | | 1,749,198 | |
Net asset value per share – Class A | | | $11.72 | |
Maximum offering price per share – Class A2 | | | $12.44 | |
Net assets – Class C | | $ | 8,826,317 | |
Shares outstanding – Class C1 | | | 755,185 | |
Net asset value per share – Class C | | | $11.69 | |
Net assets – Administrator Class | | $ | 47,634,196 | |
Shares outstanding – Administrator Class1 | | | 4,056,524 | |
Net asset value per share – Administrator Class | | | $11.74 | |
Net assets – Institutional Class | | $ | 52,145,659 | |
Shares outstanding – Institutional Class1 | | | 4,445,357 | |
Net asset value per share – Institutional Class | | | $11.73 | |
| 1 | The Fund has an unlimited number of authorized shares. |
| 2 | Maximum offering price is computed as 100/94.25 of net asset value. On investments of $50,000 or more, the offering price is reduced. |
The accompanying notes are an integral part of these financial statements.
| | | | | | |
| Statement of operations—six months ended April 30, 2015 (unaudited) | | Wells Fargo Advantage Emerging Markets Equity Income Fund | | | 13 | |
| | | | |
| | | | |
| |
Investment income | | | | |
Dividends (net of foreign withholding taxes of $130,806) | | $ | 1,210,221 | |
Income from affiliated securities | | | 2,819 | |
| | | | |
Total investment income | | | 1,213,040 | |
| | | | |
| |
Expenses | | | | |
Advisory fee | | | 545,679 | |
Administration fees | | | | |
Fund level | | | 24,804 | |
Class A | | | 20,192 | |
Class C | | | 9,124 | |
Administrator Class | | | 19,305 | |
Institutional Class | | | 15,221 | |
Shareholder servicing fees | | | | |
Class A | | | 19,416 | |
Class C | | | 8,773 | |
Administrator Class | | | 48,262 | |
Distribution fee | | | | |
Class C | | | 26,318 | |
Custody and accounting fees | | | 61,888 | |
Professional fees | | | 22,947 | |
Registration fees | | | 30,534 | |
Shareholder report expenses | | | 9,650 | |
Trustees’ fees and expenses | | | 7,156 | |
Interest expense | | | 1,472 | |
Other fees and expenses | | | 12,392 | |
| | | | |
Total expenses | | | 883,133 | |
Less: Fee waivers and/or expense reimbursements | | | (151,540 | ) |
| | | | |
Net expenses | | | 731,593 | |
| | | | |
Net investment income | | | 481,447 | |
| | | | |
| |
REALIZED AND UNREALIZED GAINS (LOSSES) ON INVESTMENTS | | | | |
Net realized losses on investments | | | (2,073,197 | ) |
Net change in unrealized gains (losses) on investments | | | 6,767,705 | |
| | | | |
Net realized and unrealized gains (losses) on investments | | | 4,694,508 | |
| | | | |
Net increase in net assets resulting from operations | | $ | 5,175,955 | |
| | | | |
The accompanying notes are an integral part of these financial statements.
| | | | |
| 14 | | Wells Fargo Advantage Emerging Markets Equity Income Fund | | Statement of changes in net assets |
| | | | | | | | | | | | | | | | |
| | | Six months ended April 30, 2015 (unaudited) | | | Year ended October 31, 2014 | |
| | | | |
Operations | | | | | | | | | | | | | | | | |
Net investment income | | | | | | $ | 481,447 | | | | | | | $ | 2,263,545 | |
Net realized losses on investments | | | | | | | (2,073,197 | ) | | | | | | | (1,885,047 | ) |
Net change in unrealized gains (losses) on investments | | | | | | | 6,767,705 | | | | | | | | 3,323,488 | |
| | | | |
Net increase in net assets resulting from operations | | | | | | | 5,175,955 | | | | | | | | 3,701,986 | |
| | | | |
| | | | |
Distributions to shareholders from | | | | | | | | | | | | | | | | |
Net investment income | | | | | | | | | | | | | | | | |
Class A | | | | | | | (44,825 | ) | | | | | | | (365,935 | ) |
Class C | | | | | | | (6,415 | ) | | | | | | | (99,761 | ) |
Administrator Class | | | | | | | (162,965 | ) | | | | | | | (734,156 | ) |
Institutional Class | | | | | | | (213,116 | ) | | | | | | | (960,146 | ) |
Net realized gains | | | | | | | | | | | | | | | | |
Class A | | | | | | | 0 | | | | | | | | (297,936 | ) |
Class C | | | | | | | 0 | | | | | | | | (99,039 | ) |
Administrator Class | | | | | | | 0 | | | | | | | | (465,603 | ) |
Institutional Class | | | | | | | 0 | | | | | | | | (190,076 | ) |
| | | | |
Total distributions to shareholders | | | | | | | (427,321 | ) | | | | | | | (3,212,652 | ) |
| | | | |
| | | | |
Capital share transactions | | | Shares | | | | | | | | Shares | | | | | |
Proceeds from shares sold | | | | | | | | | | | | | | | | |
Class A | | | 792,738 | | | | 8,786,992 | | | | 1,137,117 | | | | 12,671,376 | |
Class C | | | 284,661 | | | | 3,168,097 | | | | 413,136 | | | | 4,655,213 | |
Administrator Class | | | 1,789,779 | | | | 20,110,326 | | | | 4,410,592 | | | | 50,555,968 | |
Institutional Class | | | 1,599,372 | | | | 17,768,139 | | | | 5,192,856 | | | | 56,567,470 | |
| | | | |
| | | | | | | 49,833,554 | | | | | | | | 124,450,027 | |
| | | | |
Reinvestment of distributions | | | | | | | | | | | | | | | | |
Class A | | | 4,012 | | | | 44,288 | | | | 58,552 | | | | 659,941 | |
Class C | | | 588 | | | | 6,415 | | | | 17,625 | | | | 198,800 | |
Administrator Class | | | 13,448 | | | | 150,146 | | | | 102,116 | | | | 1,157,719 | |
Institutional Class | | | 8,145 | | | | 91,218 | | | | 76,117 | | | | 868,402 | |
| | | | |
| | | | | | | 292,067 | | | | | | | | 2,884,862 | |
| | | | |
Payment for shares redeemed | | | | | | | | | | | | | | | | |
Class A | | | (284,054 | ) | | | (3,128,726 | ) | | | (693,777 | ) | | | (8,135,229 | ) |
Class C | | | (94,724 | ) | | | (1,066,859 | ) | | | (38,131 | ) | | | (422,208 | ) |
Administrator Class | | | (2,406,768 | ) | | | (27,120,506 | ) | | | (999,004 | ) | | | (11,045,099 | ) |
Institutional Class | | | (257,522 | ) | | | (2,861,853 | ) | | | (2,688,911 | ) | | | (30,101,322 | ) |
| | | | |
| | | | | | | (34,177,944 | ) | | | | | | | (49,703,858 | ) |
| | | | |
Net increase in net assets resulting from capital share transactions | | | | | | | 15,947,677 | | | | | | | | 77,631,031 | |
| | | | |
Total increase in net assets | | | | | | | 20,696,311 | | | | | | | | 78,120,365 | |
| | | | |
| | | | |
Net assets | | | | | | | | | | | | | | | | |
Beginning of period | | | | | | | 108,410,361 | | | | | | | | 30,289,996 | |
| | | | |
End of period | | | | | | $ | 129,106,672 | | | | | | | $ | 108,410,361 | |
| | | | |
Undistributed net investment income | | | | | | $ | 287,167 | | | | | | | $ | 233,041 | |
| | | | |
The accompanying notes are an integral part of these financial statements.
| | | | | | |
| Financial highlights | | Wells Fargo Advantage Emerging Markets Equity Income Fund | | | 15 | |
(For a share outstanding throughout each period)
| | | | | | | | | | | | | | | | |
| | | Six months ended
April 30, 2015 (unaudited) | | | Year ended October 31 | |
| CLASS A | | | 2014 | | | 2013 | | | 20121 | |
Net asset value, beginning of period | | | $11.33 | | | | $11.79 | | | | $11.17 | | | | $10.00 | |
Net investment income | | | 0.04 | | | | 0.33 | | | | 0.31 | | | | 0.13 | |
Net realized and unrealized gains (losses) on investments | | | 0.39 | | | | (0.11 | ) | | | 0.88 | | | | 1.15 | |
| | | | | | | | | | | | | | | | |
Total from investment operations | | | 0.43 | | | | 0.22 | | | | 1.19 | | | | 1.28 | |
Distributions to shareholders from | | | | | | | | | | | | | | | | |
Net investment income | | | (0.04 | ) | | | (0.31 | ) | | | (0.34 | ) | | | (0.11 | ) |
Net realized gains | | | 0.00 | | | | (0.37 | ) | | | (0.23 | ) | | | 0.00 | |
| | | | | | | | | | | | | | | | |
Total distributions to shareholders | | | (0.04 | ) | | | (0.68 | ) | | | (0.57 | ) | | | (0.11 | ) |
Net asset value, end of period | | | $11.72 | | | | $11.33 | | | | $11.79 | | | | $11.17 | |
Total return2 | | | 3.77 | % | | | 2.05 | % | | | 10.94 | % | | | 12.80 | % |
Ratios to average net assets (annualized) | | | | | | | | | | | | | | | | |
Gross expenses | | | 1.96 | % | | | 2.09 | % | | | 2.88 | % | | | 4.29 | % |
Net expenses | | | 1.65 | % | | | 1.65 | % | | | 1.65 | % | | | 1.65 | % |
Net investment income | | | 0.84 | % | | | 3.12 | % | | | 2.64 | % | | | 2.94 | % |
Supplemental data | | | | | | | | | | | | | | | | |
Portfolio turnover rate | | | 53 | % | | | 91 | % | | | 85 | % | | | 39 | % |
Net assets, end of period (000s omitted) | | | $20,501 | | | | $14,010 | | | | $8,658 | | | | $628 | |
| 1 | For the period from May 31, 2012 (commencement of class operations) to October 31, 2012 |
| 2 | Total return calculations do not include any sales charges. Returns for periods of less than one year are not annualized. |
The accompanying notes are an integral part of these financial statements.
| | | | |
| 16 | | Wells Fargo Advantage Emerging Markets Equity Income Fund | | Financial highlights |
(For a share outstanding throughout each period)
| | | | | | | | | | | | | | | | |
| | | Six months ended
April 30, 2015 (unaudited) | | | Year ended October 31 | |
| CLASS C | | | 2014 | | | 2013 | | | 20121 | |
Net asset value, beginning of period | | | $11.32 | | | | $11.79 | | | | $11.16 | | | | $10.00 | |
Net investment income | | | 0.00 | 2 | | | 0.23 | | | | 0.22 | | | | 0.10 | |
Net realized and unrealized gains (losses) on investments | | | 0.38 | | | | (0.08 | ) | | | 0.89 | | | | 1.13 | |
| | | | | | | | | | | | | | | | |
Total from investment operations | | | 0.38 | | | | 0.15 | | | | 1.11 | | | | 1.23 | |
Distributions to shareholders from | | | | | | | | | | | | | | | | |
Net investment income | | | (0.01 | ) | | | (0.25 | ) | | | (0.25 | ) | | | (0.07 | ) |
Net realized gains | | | 0.00 | | | | (0.37 | ) | | | (0.23 | ) | | | 0.00 | |
| | | | | | | | | | | | | | | | |
Total distributions to shareholders | | | (0.01 | ) | | | (0.62 | ) | | | (0.48 | ) | | | (0.07 | ) |
Net asset value, end of period | | | $11.69 | | | | $11.32 | | | | $11.79 | | | | $11.16 | |
Total return3 | | | 3.46 | % | | | 1.27 | % | | | 10.11 | % | | | 12.49 | % |
Ratios to average net assets (annualized) | | | | | | | | | | | | | | | | |
Gross expenses | | | 2.71 | % | | | 2.83 | % | | | 3.81 | % | | | 5.03 | % |
Net expenses | | | 2.40 | % | | | 2.40 | % | | | 2.40 | % | | | 2.41 | % |
Net investment income | | | 0.05 | % | | | 2.17 | % | | | 1.80 | % | | | 2.24 | % |
Supplemental data | | | | | | | | | | | | | | | | |
Portfolio turnover rate | | | 53 | % | | | 91 | % | | | 85 | % | | | 39 | % |
Net assets, end of period (000s omitted) | | | $8,826 | | | | $6,390 | | | | $2,028 | | | | $562 | |
| 1 | For the period from May 31, 2012 (commencement of class operations) to October 31, 2012 |
| 2 | Amount less than $0.005 per share |
| 3 | Total return calculations do not include any sales charges. Returns for periods of less than one year are not annualized. |
The accompanying notes are an integral part of these financial statements.
| | | | | | |
| Financial highlights | | Wells Fargo Advantage Emerging Markets Equity Income Fund | | | 17 | |
(For a share outstanding throughout each period)
| | | | | | | | | | | | | | | | |
| | | Six months ended
April 30, 2015 (unaudited) | | | Year ended October 31 | |
| ADMINISTRATOR CLASS | | | 2014 | | | 2013 | | | 20121 | |
Net asset value, beginning of period | | | $11.35 | | | | $11.80 | | | | $11.17 | | | | $10.00 | |
Net investment income | | | 0.05 | | | | 0.33 | 2 | | | 0.32 | | | | 0.14 | |
Net realized and unrealized gains (losses) on investments | | | 0.38 | | | | (0.08 | ) | | | 0.89 | | | | 1.14 | |
| | | | | | | | | | | | | | | | |
Total from investment operations | | | 0.43 | | | | 0.25 | | | | 1.21 | | | | 1.28 | |
Distributions to shareholders from | | | | | | | | | | | | | | | | |
Net investment income | | | (0.04 | ) | | | (0.33 | ) | | | (0.35 | ) | | | (0.11 | ) |
Net realized gains | | | 0.00 | | | | (0.37 | ) | | | (0.23 | ) | | | 0.00 | |
| | | | | | | | | | | | | | | | |
Total distributions to shareholders | | | (0.04 | ) | | | (0.70 | ) | | | (0.58 | ) | | | (0.11 | ) |
Net asset value, end of period | | | $11.74 | | | | $11.35 | | | | $11.80 | | | | $11.17 | |
Total return3 | | | 3.94 | % | | | 2.30 | % | | | 11.13 | % | | | 12.89 | % |
Ratios to average net assets (annualized) | | | | | | | | | | | | | | | | |
Gross expenses | | | 1.79 | % | | | 1.91 | % | | | 2.94 | % | | | 4.14 | % |
Net expenses | | | 1.45 | % | | | 1.45 | % | | | 1.45 | % | | | 1.45 | % |
Net investment income | | | 0.93 | % | | | 2.89 | % | | | 2.70 | % | | | 3.17 | % |
Supplemental data | | | | | | | | | | | | | | | | |
Portfolio turnover rate | | | 53 | % | | | 91 | % | | | 85 | % | | | 39 | % |
Net assets, end of period (000s omitted) | | | $47,634 | | | | $52,896 | | | | $13,527 | | | | $5,285 | |
| 1 | For the period from May 31, 2012 (commencement of class operations) to October 31, 2012 |
| 2 | Calculated based upon average shares outstanding |
| 3 | Returns for periods of less than one year are not annualized. |
The accompanying notes are an integral part of these financial statements.
| | | | |
| 18 | | Wells Fargo Advantage Emerging Markets Equity Income Fund | | Financial highlights |
(For a share outstanding throughout each period)
| | | | | | | | | | | | | | | | |
| | | Six months ended
April 30, 2015 (unaudited) | | | Year ended October 31 | |
| INSTITUTIONAL CLASS | | | 2014 | | | 2013 | | | 20121 | |
Net asset value, beginning of period | | | $11.34 | | | | $11.79 | | | | $11.17 | | | | $10.00 | |
Net investment income | | | 0.07 | | | | 0.35 | | | | 0.34 | | | | 0.15 | |
Net realized and unrealized gains (losses) on investments | | | 0.38 | | | | (0.07 | ) | | | 0.89 | | | | 1.14 | |
| | | | | | | | | | | | | | | | |
Total from investment operations | | | 0.45 | | | | 0.28 | | | | 1.23 | | | | 1.29 | |
Distributions to shareholders from | | | | | | | | | | | | | | | | |
Net investment income | | | (0.06 | ) | | | (0.36 | ) | | | (0.38 | ) | | | (0.12 | ) |
Net realized gains | | | 0.00 | | | | (0.37 | ) | | | (0.23 | ) | | | 0.00 | |
| | | | | | �� | | | | | | | | | | |
Total distributions to shareholders | | | (0.06 | ) | | | (0.73 | ) | | | (0.61 | ) | | | (0.12 | ) |
Net asset value, end of period | | | $11.73 | | | | $11.34 | | | | $11.79 | | | | $11.17 | |
Total return2 | | | 4.01 | % | | | 2.52 | % | | | 11.32 | % | | | 12.98 | % |
Ratios to average net assets (annualized) | | | | | | | | | | | | | | | | |
Gross expenses | | | 1.53 | % | | | 1.62 | % | | | 2.74 | % | | | 3.92 | % |
Net expenses | | | 1.25 | % | | | 1.25 | % | | | 1.25 | % | | | 1.25 | % |
Net investment income | | | 1.24 | % | | | 3.69 | % | | | 2.88 | % | | | 3.39 | % |
Supplemental data | | | | | | | | | | | | | | | | |
Portfolio turnover rate | | | 53 | % | | | 91 | % | | | 85 | % | | | 39 | % |
Net assets, end of period (000s omitted) | | | $52,146 | | | | $35,114 | | | | $6,077 | | | | $5,082 | |
| 1 | For the period from May 31, 2012 (commencement of class operations) to October 31, 2012 |
| 2 | Returns for periods of less than one year are not annualized. |
The accompanying notes are an integral part of these financial statements.
| | | | | | |
| Notes to financial statements (unaudited) | | Wells Fargo Advantage Emerging Markets Equity Income Fund | | | 19 | |
1. ORGANIZATION
Wells Fargo Funds Trust (the “Trust”), a Delaware statutory trust organized on March 10, 1999, is an open-end management investment company registered under the Investment Company Act of 1940, as amended (the “1940 Act”). As an investment company, the Trust follows the accounting and reporting guidance in Financial Accounting Standards Board (“FASB”) Accounting Standards Codification Topic 946, Financial Services – Investment Companies. These financial statements report on the Wells Fargo Advantage Emerging Markets Equity Income Fund (the “Fund”) which is a diversified series of the Trust.
2. SIGNIFICANT ACCOUNTING POLICIES
The following significant accounting policies, which are consistently followed in the preparation of the financial statements of the Fund, are in conformity with U.S. generally accepted accounting principles which require management to make estimates and assumptions that affect the reported amounts of assets and liabilities, disclosure of contingent assets and liabilities at the date of the financial statements, and the reported amounts of revenues and expenses during the reporting period. Actual results could differ from those estimates.
Securities valuation
All investments are valued each business day as of the close of regular trading on the New York Stock Exchange (generally 4 p.m. Eastern Time).
Equity securities that are listed on a foreign or domestic exchange or market are valued at the official closing price or, if none, the last sales price. If no sale occurs on the primary exchange or market that day, the prior day’s price will be deemed “stale” and a fair value price will be determined in accordance with the Fund’s Valuation Procedures.
Equity securities that are not listed on a foreign or domestic exchange or market, but have a public trading market, are valued at the quoted bid price from an independent broker-dealer that the Management Valuation Team of Wells Fargo Funds Management, LLC (“Funds Management”) has determined is an acceptable source.
The values of securities denominated in foreign currencies are translated into U.S. dollars at rates provided by an independent foreign currency pricing source at a time each business day specified by the Management Valuation Team.
Many securities markets and exchanges outside the U.S. close prior to the close of the New York Stock Exchange and therefore may not fully reflect trading or events that occur after the close of the principal exchange in which the foreign securities are traded, but before the close of the New York Stock Exchange. If such trading or events are expected to materially affect the value of such securities, then fair value pricing procedures approved by the Board of Trustees of the Fund are applied. These procedures take into account multiple factors including movements in U.S. securities markets after foreign exchanges close. Foreign securities that are fair valued under these procedures are categorized as Level 2 and the application of these procedures may result in transfers between Level 1 and Level 2. Depending on market activity, such fair valuations may be frequent. Such fair value pricing may result in net asset values that are higher or lower than net asset values based on the last reported sales price or latest quoted bid price. On April 30, 2015, such fair value pricing was used in pricing foreign securities.
Investments in registered open-end investment companies are valued at net asset value.
Investments which are not valued using any of the methods discussed above are valued at their fair value, as determined in good faith by the Board of Trustees. The Board of Trustees has established a Valuation Committee comprised of the Trustees and has delegated to it the authority to take any actions regarding the valuation of portfolio securities that the Valuation Committee deems necessary or appropriate, including determining the fair value of portfolio securities, unless the determination has been delegated to the Management Valuation Team. The Board of Trustees retains the authority to make or ratify any valuation decisions or approve any changes to the Valuation Procedures as it deems appropriate. On a quarterly basis, the Board of Trustees receives reports on any valuation actions taken by the Valuation Committee or the Management Valuation Team which may include items for ratification.
Valuations of fair valued securities are compared to the next actual sales price when available, or other appropriate market values, to assess the continued appropriateness of the fair valuation methodologies used. These securities are fair valued on a day-to-day basis, taking into consideration changes to appropriate market information and any significant changes to the inputs considered in the valuation process until there is a readily available price provided on an exchange or by an independent pricing service. Valuations received from an independent pricing service or independent broker-dealer quotes are periodically validated by comparisons to most recent trades and valuations provided by other independent pricing services in addition to the review of prices by the adviser and/or subadviser. Unobservable inputs used in determining fair valuations are identified based on the type of security, taking into consideration factors utilized by market participants in valuing the investment, knowledge about the issuer and the current market environment.
| | | | |
| 20 | | Wells Fargo Advantage Emerging Markets Equity Income Fund | | Notes to financial statements (unaudited) |
Foreign currency translation
The accounting records of the Fund are maintained in U.S. dollars. The values of other assets and liabilities denominated in foreign currencies are translated into U.S. dollars at rates provided by an independent foreign currency pricing source at a time each business day specified by the Management Valuation Team. Purchases and sales of securities, and income and expenses are converted at the rate of exchange on the respective dates of such transactions. Net realized foreign exchange gains or losses arise from sales of foreign currencies, currency gains or losses realized between the trade and settlement dates on securities transactions, and the difference between the amounts of dividends, interest and foreign withholding taxes recorded and the U.S. dollar equivalent of the amounts actually paid or received. Net unrealized foreign exchange gains and losses arise from changes in the fair value of assets and liabilities other than investments in securities resulting from changes in exchange rates. The changes in net assets arising from changes in exchange rates and the changes in net assets resulting from changes in market prices of securities are not separately presented. Such changes are included in net realized and unrealized gains or losses from investments.
Security transactions and income recognition
Securities transactions are recorded on a trade date basis. Realized gains or losses are recorded on the basis of identified cost.
Dividend income is recognized on the ex-dividend date, except for certain dividends from foreign securities, which are recorded as soon as the custodian verifies the ex-dividend date. Dividend income from foreign securities is recorded net of foreign taxes withheld where recovery of such taxes is not assured.
Distributions to shareholders
Distributions to shareholders from net investment income and net realized gains, if any, are recorded on the ex-dividend date. Such distributions are determined in conformity with federal income tax regulations, which may differ in amount or character from net investment income and realized gains recognized for purposes of U.S. generally accepted accounting principles.
Federal and other taxes
The Fund intends to continue to qualify as a regulated investment company by distributing substantially all of its investment company taxable income and any net realized capital gains (after reduction for capital loss carryforwards) sufficient to relieve it from all, or substantially all, federal income taxes. Accordingly, no provision for federal income taxes was required.
The Fund’s income and federal excise tax returns and all financial records supporting those returns for the prior three fiscal years are subject to examination by the federal and Delaware revenue authorities. Management has analyzed the Fund’s tax positions taken on federal, state, and foreign tax returns for all open tax years and does not believe that there are any uncertain tax positions that require recognition of a tax liability.
As of October 31, 2014, the Fund had capital loss carryforwards which consist of $1,412,277 in short-term capital losses.
Class allocations
The separate classes of shares offered by the Fund differ principally in applicable sales charges, distribution, shareholder servicing, and administration fees. Class specific expenses are charged directly to that share class. Investment income, common expenses, and realized and unrealized gains (losses) on investments are allocated daily to each class of shares based on the relative proportion of net assets of each class.
3. FAIR VALUATION MEASUREMENTS
Fair value measurements of investments are determined within a framework that has established a fair value hierarchy based upon the various data inputs utilized in determining the value of the Fund’s investments. The three-level hierarchy gives the highest priority to unadjusted quoted prices in active markets for identical assets or liabilities (Level 1) and the lowest priority to significant unobservable inputs (Level 3). The Fund’s investments are classified within the fair value hierarchy based on the lowest level of input that is significant to the fair value measurement. The inputs are summarized into three broad levels as follows:
| n | | Level 1 – quoted prices in active markets for identical securities |
| n | | Level 2 – other significant observable inputs (including quoted prices for similar securities, interest rates, prepayment speeds, credit risk, use of amortized cost, etc.) |
| n | | Level 3 – significant unobservable inputs (including the Fund’s own assumptions in determining the fair value of investments) |
| | | | | | |
| Notes to financial statements (unaudited) | | Wells Fargo Advantage Emerging Markets Equity Income Fund | | | 21 | |
The inputs or methodologies used for valuing investments in securities are not necessarily an indication of the risk associated with investing in those securities.
The following is a summary of the inputs used in valuing the Fund’s assets and liabilities as of April 30, 2015:
| | | | | | | | | | | | | | | | |
| | | Quoted prices
(Level 1) | | | Other significant
observable inputs
(Level 2) | | | Significant
unobservable inputs
(Level 3) | | | Total | |
Assets | | | | | | | | | | | | | | | | |
Investments in : | | | | | | | | | | | | | | | | |
| | | | |
Common stocks | | | | | | | | | | | | | | | | |
Australia | | $ | 0 | | | $ | 677,638 | | | $ | 0 | | | $ | 677,638 | |
Brazil | | | 7,502,720 | | | | 0 | | | | 0 | | | | 7,502,720 | |
Cayman Islands | | | 1,661,601 | | | | 1,540,853 | | | | 0 | | | | 3,202,454 | |
Chile | | | 0 | | | | 1,025,544 | | | | 0 | | | | 1,025,544 | |
China | | | 869,067 | | | | 23,234,337 | | | | 0 | | | | 24,103,404 | |
Czech Republic | | | 479,465 | | | | 0 | | | | 0 | | | | 479,465 | |
Hong Kong | | | 0 | | | | 7,748,450 | | | | 0 | | | | 7,748,450 | |
Indonesia | | | 0 | | | | 2,014,200 | | | | 0 | | | | 2,014,200 | |
Malaysia | | | 1,418,779 | | | | 2,064,650 | | | | 0 | | | | 3,483,429 | |
Mexico | | | 9,430,029 | | | | 0 | | | | 0 | | | | 9,430,029 | |
Panama | | | 1,187,372 | | | | 0 | | | | 0 | | | | 1,187,372 | |
Philippines | | | 0 | | | | 960,335 | | | | 0 | | | | 960,335 | |
Poland | | | 0 | | | | 1,245,518 | | | | 0 | | | | 1,245,518 | |
Qatar | | | 0 | | | | 1,178,823 | | | | 0 | | | | 1,178,823 | |
Russia | | | 0 | | | | 568,693 | | | | 0 | | | | 568,693 | |
Singapore | | | 1,195,261 | | | | 1,009,292 | | | | 0 | | | | 2,204,553 | |
South Africa | | | 2,647,964 | | | | 5,529,887 | | | | 0 | | | | 8,177,851 | |
South Korea | | | 5,020,459 | | | | 6,838,400 | | | | 0 | | | | 11,858,859 | |
Taiwan | | | 867,108 | | | | 13,313,873 | | | | 0 | | | | 14,180,981 | |
Thailand | | | 2,622,561 | | | | 1,318,133 | | | | 0 | | | | 3,940,694 | |
Turkey | | | 0 | | | | 1,947,277 | | | | 0 | | | | 1,947,277 | |
| | | | |
Participation notes | | | | | | | | | | | | | | | | |
China | | | 0 | | | | 3,039,834 | | | | 0 | | | | 3,039,834 | |
India | | | 0 | | | | 5,628,391 | | | | 0 | | | | 5,628,391 | |
Qatar | | | 0 | | | | 778,269 | | | | 0 | | | | 778,269 | |
| | | | |
Preferred stocks | | | | | | | | | | | | | | | | |
Brazil | | | 1,478,979 | | | | 0 | | | | 0 | | | | 1,478,979 | |
| | | | |
Exchange-traded funds | | | | | | | | | | | | | | | | |
Russia | | | 920,798 | | | | 0 | | | | 0 | | | | 920,798 | |
| | | | |
Short-term investments | | | | | | | | | | | | | | | | |
Investment companies | | | 6,930,129 | | | | 0 | | | | 0 | | | | 6,930,129 | |
Total assets | | $ | 44,232,292 | | | $ | 81,662,397 | | | $ | 0 | | | $ | 125,894,689 | |
The Fund recognizes transfers between levels within the fair value hierarchy at the end of the reporting period. At April 30, 2015, fair value pricing was used in pricing certain foreign securities and securities valued at $44,928,410 were transferred from Level 1 to Level 2. The Fund did not have any transfers into/out of Level 3.
4. TRANSACTIONS WITH AFFILIATES
Advisory fee
The Trust has entered into an advisory contract with Funds Management, an indirect wholly owned subsidiary of Wells Fargo & Company (“Wells Fargo”). The adviser is responsible for implementing investment policies and guidelines and for supervising the subadviser, who is responsible for day-to-day portfolio management of the Fund.
| | | | |
| 22 | | Wells Fargo Advantage Emerging Markets Equity Income Fund | | Notes to financial statements (unaudited) |
Pursuant to the contract, Funds Management is entitled to receive an annual advisory fee starting at 1.10% and declining to 0.925% as the average daily net assets of the Fund increase. Prior to March 1, 2015, Funds Management received an annual advisory fee which started at 1.10% and declined to 0.95% as the average daily net assets of the Fund increased. For the six months ended April 30, 2015, the advisory fee was equivalent to an annual rate of 1.10% of the Fund’s average daily net assets.
Funds Management has retained the services of a subadviser to provide daily portfolio management to the Fund. The fee for subadvisory services is borne by Funds Management. Wells Capital Management Incorporated, an affiliate of Funds Management and an indirect wholly owned subsidiary of Wells Fargo, is the subadviser to the Fund and is entitled to receive a fee from Funds Management at an annual rate starting at 0.65% and declining to 0.45% as the average daily net assets of the Fund increase.
Administration fees
The Trust has entered into an administration agreement with Funds Management. Under this agreement, for providing administrative services, which includes paying fees and expenses for services provided by the transfer agent, sub-transfer agents, omnibus account servicers and record-keepers, Funds Management is entitled to receive from the Fund an annual fund level administration fee starting at 0.05% and declining to 0.03% as the average daily net assets of the Fund increase and a class level administration fee which is calculated based on the average daily net assets of each class as follows:
| | | | |
| | | Class level
administration fee | |
Class A, Class C | | | 0.26 | % |
Administrator Class | | | 0.10 | |
Institutional Class | | | 0.08 | |
Funds Management has contractually waived and/or reimbursed advisory and administration fees to the extent necessary to maintain certain net operating expense ratios for the Fund. Waiver of fees and/or reimbursement of expenses by Funds Management were made first from fund level expenses on a proportionate basis and then from class specific expenses. Funds Management has committed through February 29, 2016 to waive fees and/or reimburse expenses to the extent necessary to cap the Fund’s expenses at 1.65% for Class A shares, 2.40% for Class C shares, 1.45% for Administrator Class shares and 1.25% for Institutional Class shares. After this time, the cap may be increased or the commitment to maintain the cap may be terminated only with the approval of the Board of Trustees.
Distribution fee
The Trust has adopted a Distribution Plan for Class C shares of the Fund pursuant to Rule 12b-1 under the 1940 Act. A distribution fee is charged to Class C shares and paid to Wells Fargo Funds Distributor, LLC (“Funds Distributor”), the principal underwriter, at an annual rate of 0.75% of the average daily net assets of Class C shares.
In addition, Funds Distributor is entitled to receive the front-end sales charge from the purchase of Class A shares and a contingent deferred sales charge on the redemption of certain Class A shares. Funds Distributor is also entitled to receive the contingent deferred sales charges from redemptions of Class C shares. For the six months ended April 30, 2015, Funds Distributor received $11,349 from the sale of Class A shares.
Shareholder servicing fees
The Trust has entered into contracts with one or more shareholder servicing agents, whereby Class A, Class C and Administrator Class of the Fund is charged a fee at an annual rate of 0.25% of the average daily net assets of each respective class.
A portion of these total shareholder servicing fees were paid to affiliates of Wells Fargo.
5. INVESTMENT PORTFOLIO TRANSACTIONS
Purchases and sales of investments, excluding U.S. government obligations (if any) and short-term securities, for the six months ended April 30, 2015 were $64,350,738 and $50,784,365, respectively.
6. BANK BORROWINGS
The Trust (excluding the money market funds and certain other funds in the Trust) and Wells Fargo Variable Trust are parties to a $150,000,000 revolving credit agreement, whereby the Fund is permitted to use bank borrowings for
temporary or emergency purposes, such as to fund shareholder redemption requests. Interest under the credit
| | | | | | |
| Notes to financial statements (unaudited) | | Wells Fargo Advantage Emerging Markets Equity Income Fund | | | 23 | |
agreement is charged to the Fund based on a borrowing rate equal to the higher of the Federal Funds rate in effect on that day plus 1.25% or the overnight LIBOR rate in effect on that day plus 1.25%. In addition, an annual commitment fee equal to 0.10% of the unused balance is allocated to each participating fund. For the six months ended April 30, 2015, the Fund paid $90 in commitment fees.
During the six months ended April 30, 2015, the Fund had average borrowings outstanding of $107,445 (on an annualized basis) at an average rate of 1.37% and paid interest in the amount of $1,472.
7. CONCENTRATION RISK
Concentration risks result from exposure to a limited number of sectors. A fund that invests a substantial portion of its assets in any sector may be more affected by changes in that sector than would be a fund whose investments are not heavily weighted in any sector.
8. INDEMNIFICATION
Under the Trust’s organizational documents, the officers and Trustees have been granted certain indemnification rights against certain liabilities that may arise out of performance of their duties to the Trust. Additionally, in the normal course of business, the Trust may enter into contracts with service providers that contain a variety of indemnification clauses. The Trust’s maximum exposure under these arrangements is dependent on future claims that may be made against the Fund and, therefore, cannot be estimated.
9. SUBSEQUENT DISTRIBUTIONS
On May 22, 2015, the Fund declared distributions from net investment income to shareholders of record on May 21, 2015. The per share amounts payable on May 26, 2015 were as follows:
| | | | |
| | | Net investment
income | |
Class A | | $ | 0.02390 | |
Class C | | $ | 0.01810 | |
Administrator Class | | $ | 0.02533 | |
Institutional Class | | $ | 0.02748 | |
On June 24, 2015, the Fund declared distributions from net investment income to shareholders of record on June 23, 2015. The per share amounts payable on June 25, 2015 were as follows:
| | | | |
| | | Net investment
income | |
Class A | | $ | 0.04763 | |
Class C | | $ | 0.04088 | |
Administrator Class | | $ | 0.04893 | |
Institutional Class | | $ | 0.05157 | |
These distributions are not reflected in the accompanying financial statements. The final determination of the source of all distributions is subject to change and made after the Fund’s tax year-end.
| | | | |
| 24 | | Wells Fargo Advantage Emerging Markets Equity Income Fund | | Other information (unaudited) |
TAX INFORMATION
Pursuant to Section 853 of the Internal Revenue Code, the following amounts were designated as foreign taxes paid for the fiscal year ended October 31, 2014. These amounts may be less than the actual foreign taxes paid for financial statement purposes. Foreign taxes paid or withheld should be included in taxable income with an offsetting deduction from gross income or as a credit for taxes paid to foreign governments. None of the income was derived from ineligible foreign sources as defined under Section 901(j) of the Internal Revenue Code.
| | | | |
Creditable foreign taxes paid | | Per share amount | | Foreign income as % of ordinary
income distributions |
| $303,444 | | $0.0318 | | 95.88% |
PROXY VOTING INFORMATION
A description of the policies and procedures that the Fund uses to determine how to vote proxies relating to portfolio securities is available, upon request, by calling 1-800-222-8222, visiting our website at wellsfargoadvantagefunds.com, or visiting the SEC website at sec.gov. Information regarding how the Fund voted proxies relating to portfolio securities during the most recent 12-month period ended June 30 is available on the Fund’s website at wellsfargoadvantagefunds.com or by visiting the SEC website at sec.gov.
PORTFOLIO HOLDINGS INFORMATION
The complete portfolio holdings for the Fund are publicly available monthly on the Fund’s website (wellsfargoadvantagefunds.com), on a one-month delayed basis. In addition, top ten holdings information (excluding derivative positions) for the Fund is publicly available on the Fund’s website on a monthly, seven-day or more delayed basis. The Fund files its complete schedule of portfolio holdings with the SEC for the first and third quarters of each fiscal year on Form N-Q, which is available by visiting the SEC website at sec.gov. In addition, the Fund’s Form N-Q may be reviewed and copied at the SEC’s Public Reference Room in Washington, DC, and at regional offices in New York City, at 233 Broadway, and in Chicago, at 175 West Jackson Boulevard, Suite 900. Information about the Public Reference Room may be obtained by calling 1-800-SEC-0330.
| | | | | | |
| Other information (unaudited) | | Wells Fargo Advantage Emerging Markets Equity Income Fund | | | 25 | |
BOARD OF TRUSTEES AND OFFICERS
Each of the Trustees and Officers1 listed in the table below acts in identical capacities for each fund in the Wells Fargo Advantage family of funds, which consists of 134 mutual funds comprising the Wells Fargo Funds Trust, Wells Fargo Variable Trust, Wells Fargo Master Trust and four closed-end funds (collectively the “Fund Complex”). This table should be read in conjunction with the Prospectus and the Statement of Additional Information2. The mailing address of each Trustee and Officer is 525 Market Street, 12th Floor, San Francisco, CA 94105. Each Trustee and Officer serves an indefinite term, however, each Trustee serves such term until reaching the mandatory retirement age established by the Trustees.
Independent Trustees
| | | | | | |
Name and year of birth | | Position held and length of service* | | Principal occupations during past five years or longer | | Other
directorships during past five years |
William R. Ebsworth (Born 1957) | | Trustee, since 2015** | | Retired. From 1984 to 2013, equities analyst, portfolio manager, research director at Fidelity Management and Research Company and retired in 2013 as Chief Investment Officer of Fidelity Strategic Advisers, Inc. in Boston, Tokyo, and Hong Kong where he led a team of investment professionals managing client assets. Prior thereto, Board member of Hong Kong Securities Clearing Co., Hong Kong Options Clearing Corp., the Thailand International Fund, Ltd., Fidelity Investments Life Insurance Company, and Empire Fidelity Investments Life Insurance Company. Mr. Ebsworth is an Adjunct Lecturer, Finance, at Babson College and a Chartered Financial Analyst. | | Asset Allocation Trust |
Jane A. Freeman (Born 1953) | | Trustee, since 2015** | | Retired. From 2012 to 2014 and 1999 to 2008, Chief Financial Officer of Scientific Learning Corporation. From 2008 to 2012, Ms. Freeman provided consulting services related to strategic business projects. Prior to 1999, Portfolio Manager at Rockefeller & Co. and Scudder, Stevens & Clark. Board member of the Harding Loevner Funds from 1996 to 2014, serving as both Lead Independent Director and chair of the Audit Committee. Board member of the Russell Exchange Traded Funds Trust from 2011 to 2012 and the chair of the Audit Committee. Ms. Freeman is a Chartered Financial Analyst (inactive), Chair of Taproot Foundation (non-profit organization) and a Board Member of Ruth Bancroft Garden (non-profit organization). | | Asset Allocation Trust |
Peter G. Gordon (Born 1942) | | Trustee, since 1998; Chairman, since 2005 | | Co-Founder, Retired Chairman, President and CEO of Crystal Geyser Water Company. Trustee Emeritus, Colby College. | | Asset Allocation Trust |
Isaiah Harris, Jr. (Born 1952) | | Trustee, since 2009 | | Retired. Chairman of the Board of CIGNA Corporation since 2009, and Director since 2005. From 2003 to 2011, Director of Deluxe Corporation. Prior thereto, President and CEO of BellSouth Advertising and Publishing Corp. from 2005 to 2007, President and CEO of BellSouth Enterprises from 2004 to 2005 and President of BellSouth Consumer Services from 2000 to 2003. Emeritus member of the Iowa State University Foundation Board of Governors. Emeritus Member of the Advisory Board of Iowa State University School of Business. Advisory Board Member, Palm Harbor Academy. Mr. Harris is a certified public accountant. | | CIGNA Corporation; Asset Allocation Trust |
Judith M. Johnson (Born 1949) | | Trustee, since 2008; Audit Committee Chairman, since 2008 | | Retired. Prior thereto, Chief Executive Officer and Chief Investment Officer of Minneapolis Employees Retirement Fund from 1996 to 2008. Ms. Johnson is an attorney, certified public accountant and a certified managerial accountant. | | Asset Allocation Trust |
David F. Larcker (Born 1950) | | Trustee, since 2009 | | James Irvin Miller Professor of Accounting at the Graduate School of Business, Stanford University, Morgan Stanley Director of the Center for Leadership Development and Research and Senior Faculty of The Rock Center for Corporate Governance since 2006. From 2005 to 2008, Professor of Accounting at the Graduate School of Business, Stanford University. Prior thereto, Ernst & Young Professor of Accounting at The Wharton School, University of Pennsylvania from 1985 to 2005. | | Asset Allocation Trust |
Olivia S. Mitchell (Born 1953) | | Trustee, since 2006 | | International Foundation of Employee Benefit Plans Professor, Wharton School of the University of Pennsylvania since 1993. Director of Wharton’s Pension Research Council and Boettner Center on Pensions & Retirement Research, and Research Associate at the National Bureau of Economic Research. Previously, Cornell University Professor from 1978 to 1993. | | Asset Allocation Trust |
| | | | |
| 26 | | Wells Fargo Advantage Emerging Markets Equity Income Fund | | Other information (unaudited) |
| | | | | | |
Name and year of birth | | Position held and length of service* | | Principal occupations during past five years or longer | | Other
directorships during past five years |
Timothy J. Penny (Born 1951) | | Trustee, since 1996 | | President and Chief Executive Officer of Southern Minnesota Initiative Foundation, a non-profit organization, since 2007 and Senior Fellow at the Humphrey Institute Policy Forum at the University of Minnesota since 1995. Member of the Board of Trustees of NorthStar Education Finance, Inc., a non-profit organization, since 2007. | | Asset Allocation Trust |
Michael S. Scofield (Born 1943) | | Trustee, since 2010 | | Served on the Investment Company Institute’s Board of Governors and Executive Committee from 2008-2011 as well the Governing Council of the Independent Directors Council from 2006-2011 and the Independent Directors Council Executive Committee from 2008-2011. Chairman of the IDC from 2008-2010. Institutional Investor (Fund Directions) Trustee of Year in 2007. Trustee of the Evergreen Funds complex (and its predecessors) from 1984 to 2010. Chairman of the Evergreen Funds from 2000-2010. Former Trustee of the Mentor Funds. Retired Attorney, Law Offices of Michael S. Scofield. | | Asset Allocation Trust |
Donald C. Willeke (Born 1940) | | Trustee, since 1996 | | Principal of the law firm of Willeke & Daniels. General Counsel of the Minneapolis Employees Retirement Fund from 1984 until its consolidation into the Minnesota Public Employees Retirement Association on June 30, 2010. Director and Vice Chair of The Tree Trust (non-profit corporation). Director of the American Chestnut Foundation (non-profit corporation). | | Asset Allocation Trust |
| * | Length of service dates reflect the Trustee’s commencement of service with the Trust’s predecessor entities, where applicable. |
| ** | William R. Ebsworth and Jane A. Freeman each became a Trustee effective January 1, 2015. |
Officers
| | | | | | |
Name and year of birth | | Position held and length of service | | Principal occupations during past five years or longer | | |
Karla M. Rabusch (Born 1959) | | President, since 2003 | | Executive Vice President of Wells Fargo Bank, N.A. and President of Wells Fargo Funds Management, LLC since 2003. | | |
Jeremy DePalma1 (Born 1974) | | Treasurer, since 2012 | | Senior Vice President of Wells Fargo Funds Management, LLC since 2009. Senior Vice President of Evergreen Investment Management Company, LLC from 2008 to 2010. Vice President, Evergreen Investment Services, Inc. from 2004 to 2007. Head of the Fund Reporting and Control Team within Fund Administration from 2005 to 2010. | | |
C. David Messman (Born 1960) | | Secretary, since 2000; Chief Legal Officer, since 2003 | | Senior Vice President and Secretary of Wells Fargo Funds Management, LLC since 2001. Assistant General Counsel of Wells Fargo Bank, N.A. since 2013 and Vice President and Managing Counsel of Wells Fargo Bank N.A. from 1996 to 2013. | | |
Debra Ann Early (Born 1964) | | Chief Compliance Officer, since 2007 | | Senior Vice President of Wells Fargo Funds Management, LLC since 2007 and Chief Compliance Officer from 2007 to 2014. Chief Compliance Officer of Parnassus Investments from 2005 to 2007. Chief Financial Officer of Parnassus Investments from 2004 to 2007 and Senior Audit Manager of PricewaterhouseCoopers LLP from 1998 to 2004. | | |
David Berardi (Born 1975) | | Assistant Treasurer, since 2009 | | Vice President of Wells Fargo Funds Management, LLC since 2009. Vice President of Evergreen Investment Management Company, LLC from 2008 to 2010. Assistant Vice President of Evergreen Investment Services, Inc. from 2004 to 2008. Manager of Fund Reporting and Control for Evergreen Investment Management Company, LLC from 2004 to 2010. | | |
| 1 | Jeremy DePalma acts as Treasurer of 61 funds and Assistant Treasurer of 73 funds in the Fund Complex. |
| 2 | The Statement of Additional Information includes additional information about the Trustees and is available, without charge, upon request, by calling 1-800-222-8222 or by visiting the website at wellsfargoadvantagefunds.com. |
| | | | | | |
| List of abbreviations | | Wells Fargo Advantage Emerging Markets Equity Income Fund | | | 27 | |
The following is a list of common abbreviations for terms and entities that may have appeared in this report.
| ACA | — ACA Financial Guaranty Corporation |
| ADR | — American depositary receipt |
| ADS | — American depositary shares |
| AGC | — Assured Guaranty Corporation |
| AGM | — Assured Guaranty Municipal |
| Ambac | — Ambac Financial Group Incorporated |
| AMT | — Alternative minimum tax |
| BAN | — Bond anticipation notes |
| BHAC | — Berkshire Hathaway Assurance Corporation |
| CAB | — Capital appreciation bond |
| CCAB | — Convertible capital appreciation bond |
| CDA | — Community Development Authority |
| CDO | — Collateralized debt obligation |
| DRIVER | — Derivative inverse tax-exempt receipts |
| DW&P | — Department of Water & Power |
| DWR | — Department of Water Resources |
| ECFA | — Educational & Cultural Facilities Authority |
| EDA | — Economic Development Authority |
| EDFA | — Economic Development Finance Authority |
| ETF | — Exchange-traded fund |
| FDIC | — Federal Deposit Insurance Corporation |
| FFCB | — Federal Farm Credit Banks |
| FGIC | — Financial Guaranty Insurance Corporation |
| FHA | — Federal Housing Administration |
| FHLB | — Federal Home Loan Bank |
| FHLMC | — Federal Home Loan Mortgage Corporation |
| FICO | — The Financing Corporation |
| FNMA | — Federal National Mortgage Association |
| GDR | — Global depositary receipt |
| GNMA | — Government National Mortgage Association |
| HCFR | — Healthcare facilities revenue |
| HEFA | — Health & Educational Facilities Authority |
| HEFAR | — Higher education facilities authority revenue |
| HFA | — Housing Finance Authority |
| HFFA | — Health Facilities Financing Authority |
| HUD | — Department of Housing and Urban Development |
| IDA | — Industrial Development Authority |
| IDAG | — Industrial Development Agency |
| KRW | — Republic of Korea won |
| LIBOR | — London Interbank Offered Rate |
| LIFER | — Long Inverse Floating Exempt Receipts |
| LLC | — Limited liability company |
| LLLP | — Limited liability limited partnership |
| LLP | — Limited liability partnership |
| MBIA | — Municipal Bond Insurance Association |
| MFHR | — Multifamily housing revenue |
| MSTR | — Municipal securities trust receipts |
| MUD | — Municipal Utility District |
| National | — National Public Finance Guarantee Corporation |
| PCFA | — Pollution Control Financing Authority |
| PCL | — Public Company Limited |
| PCR | — Pollution control revenue |
| PFA | — Public Finance Authority |
| PFFA | — Public Facilities Financing Authority |
| PFOTER | — Puttable floating option tax-exempt receipts |
| plc | — Public limited company |
| PUTTER | — Puttable tax-exempt receipts |
| R&D | — Research & development |
| Radian | — Radian Asset Assurance |
| RAN | — Revenue anticipation notes |
| RDA | — Redevelopment Authority |
| RDFA | — Redevelopment Finance Authority |
| REIT | — Real estate investment trust |
| ROC | — Reset option certificates |
| SAVRS | — Select auction variable rate securities |
| SBA | — Small Business Authority |
| SDR | — Swedish depositary receipt |
| SFHR | — Single-family housing revenue |
| SFMR | — Single-family mortgage revenue |
| SPA | — Standby purchase agreement |
| SPDR | — Standard & Poor’s Depositary Receipts |
| SPEAR | — Short Puttable Exempt Adjustable Receipts |
| STRIPS | — Separate trading of registered interest and |
| TAN | — Tax anticipation notes |
| TIPS | — Treasury inflation-protected securities |
| TRAN | — Tax revenue anticipation notes |
| TTFA | — Transportation Trust Fund Authority |
| TVA | — Tennessee Valley Authority |
This page is intentionally left blank.


For more information
More information about Wells Fargo Advantage Funds is available free upon request. To obtain literature, please write, email, visit the Fund’s website, or call:
Wells Fargo Advantage Funds
P.O. Box 8266
Boston, MA 02266-8266
Email: wfaf@wellsfargo.com
Website: wellsfargoadvantagefunds.com
Individual investors: 1-800-222-8222
Retail investment professionals: 1-888-877-9275
Institutional investment professionals: 1-866-765-0778
This report and the financial statements contained herein are submitted for the general information of the shareholders of Wells Fargo Advantage Funds. If this report is used for promotional purposes, distribution of the report must be accompanied or preceded by a current prospectus. Before investing, please consider the investment objectives, risks, charges, and expenses of the investment. For a current prospectus and, if available, a summary prospectus, containing this information, call 1-800-222-8222 or visit the Fund’s website at wellsfargoadvantagefunds.com. Read the prospectus carefully before you invest or send money.
Wells Fargo Funds Management, LLC, a wholly owned subsidiary of Wells Fargo & Company, provides investment advisory and administrative services for Wells Fargo Advantage Funds. Other affiliates of Wells Fargo & Company provide subadvisory and other services for the Funds. The Funds are distributed by Wells Fargo Funds Distributor, LLC, Member FINRA/SIPC, an affiliate of Wells Fargo & Company.
NOT FDIC INSURED ¡ NO BANK GUARANTEE ¡ MAY LOSE VALUE
© 2015 Wells Fargo Funds Management, LLC. All rights reserved.
| | |
 | | 233653 06-15 SA262/SAR262 04-15 |

Wells Fargo Advantage
Emerging Markets Equity Select Fund

Semi-Annual Report
April 30, 2015

Reduce clutter. Save trees.
Sign up for electronic delivery of prospectuses and shareholder reports at wellsfargo.com/advantagedelivery
Contents
The views expressed and any forward-looking statements are as of April 30, 2015, unless otherwise noted, and are those of the Fund managers and/or Wells Fargo Funds Management, LLC. Discussions of individual securities, or the markets generally, or any Wells Fargo Advantage Fund are not intended as individual recommendations. Future events or results may vary significantly from those expressed in any forward-looking statements; the views expressed are subject to change at any time in response to changing circumstances in the market. Wells Fargo Funds Management, LLC and the Fund disclaim any obligation to publicly update or revise any views expressed or forward-looking statements.
NOT FDIC INSURED ¡ NO BANK GUARANTEE ¡ MAY LOSE VALUE
| | | | |
| 2 | | Wells Fargo Advantage Emerging Markets Equity Select Fund | | Letter to shareholders (unaudited) |

Karla M. Rabusch
President
Wells Fargo Advantage Funds
A worldwide trend toward looser monetary policy tended to support stock and bond markets in both developed and emerging economies.
Dear Valued Shareholder:
We are pleased to offer you this semi-annual report for the Wells Fargo Advantage Emerging Markets Equity Select Fund for the six-month period that ended April 30, 2015. The period was marked by low global interest rates as major central banks initiated or increased their quantitative easing programs. Emerging markets stocks, as measured by the MSCI Emerging Markets Index (Net)1, displayed considerable volatility because investors worried about slower economic growth in major economies such as China and Brazil. Even so, the index ended the period with a 3.92% gain.
Major central banks continued to provide liquidity to the markets.
A worldwide trend toward looser monetary policy tended to support stock and bond markets in both developed and emerging economies. Throughout the reporting period, the Federal Open Market Committee (FOMC), which is the U.S. Federal Reserve’s (Fed’s) monetary policymaking body, kept its key interest rate effectively at zero. Even though the FOMC ended its bond-buying program in October 2014 and guided investors to expect an interest-rate hike in mid- to late-2015, the Fed remained accommodative.
The European Central Bank maintained a variety of measures aimed at encouraging lending, including making funds available to banks at low interest rates and imposing a negative interest rate on bank deposits held at the central bank. In January 2015, the bank announced quantitative easing via significant bond purchases in an attempt to raise the eurozone’s inflation to just under its target of 2%. In China, the People’s Bank of China cut its benchmark interest rate twice during the reporting period in order to support a slowing economy.
The Central Bank of Brazil bucked the trend by raising its key rate to 13.25% on April 29, 2015, in an attempt to combat the country’s high rate of inflation.
Currency movements and worries about economic growth dominated the emerging markets landscape.
The projected actions of the Fed—whether it would raise interest rates and when—heavily influenced the emerging markets landscape throughout much of the reporting period. Many emerging markets governments and companies have U.S. dollar-denominated debt outstanding; a rise in U.S. interest rates could make it more expensive to refinance that debt. In addition, near-zero U.S. rates supported capital inflows into emerging markets because investors became more willing to accept higher risk in exchange for potentially higher returns. In the past, even the prospect of higher U.S. rates caused such flows to reverse. Currency swings thus had a large effect on the emerging markets landscape, with notable weakness in the Brazilian real.
Country-specific factors also played a role in the real’s decline; Brazil faces a challenging situation with a growing corruption scandal affecting the state-controlled oil company, a struggling economy, and a severe drought afflicting the city of São Paulo.
| 1 | The Morgan Stanley Capital International (MSCI) Emerging Markets Index (Net) is a free-float-adjusted market-capitalization-weighted index that is designed to measure the equity market performance of emerging markets. The MSCI Emerging Markets Index (Net) consists of the following 23 emerging markets country indexes: Brazil, Chile, China, Colombia, Czech Republic, Egypt, Greece, Hungary, India, Indonesia, Korea, Malaysia, Mexico, Peru, the Philippines, Poland, Qatar, Russia, South Africa, Taiwan, Thailand, Turkey, and United Arab Emirates. You cannot invest directly in an index. Source: MSCI. MSCI makes no express or implied warranties or representations and shall have no liability whatsoever with respect to any MSCI data contained herein. The MSCI data may not be further redistributed or used as a basis for other indexes or any securities or financial products. This report is not approved, reviewed, or produced by MSCI. |
| | | | | | |
| Letter to shareholders (unaudited) | | Wells Fargo Advantage Emerging Markets Equity Select Fund | | | 3 | |
In China, government data showed a slowdown in fixed-asset investment, which includes property investment, and modest growth in manufacturing and housing sales. However, China’s growth rates still contrasted favorably with stagnant growth in most developed economies. Chinese markets also benefited from the Shanghai-Hong Kong Stock Connect program, launched in November 2014, which made it easier for mainland investors to purchase stocks on the Hong Kong exchange and for international investors to purchase stocks on the Shanghai exchange. The resulting surge in demand helped the MSCI China Index (Net)2 end the period with a 29.61% gain.
Among smaller markets, South Korea outperformed for the period as the stronger U.S. dollar tended to support exporters such as South Korea. India’s stock market benefited from lower inflation and signs of improving economic growth, but delays in key reforms caused the Indian market to underperform the benchmark.
Don’t let short-term uncertainty derail long-term investment goals.
Periods of uncertainty can present challenges, but experience has taught us that maintaining long-term investment goals can be an effective way to plan for the future. To help you create a sound strategy based on your personal goals and risk tolerance, Wells Fargo Advantage Funds offers more than 100 mutual funds and other investments spanning a wide range of asset classes and investment styles. Although diversification cannot guarantee an investment profit or prevent losses, we believe it can be an effective way to manage investment risk and potentially smooth out overall portfolio performance. We encourage investors to know their investments and to understand that appropriate levels of risk-taking may unlock opportunities.
Thank you for choosing to invest with Wells Fargo Advantage Funds. We appreciate your confidence in us and remain committed to helping you meet your financial needs.
Sincerely,

Karla M. Rabusch
President
Wells Fargo Advantage Funds
Among smaller markets, South Korea outperformed for the period as the stronger U.S. dollar tended to support exporters such as South Korea.
Notice to shareholders
At a telephonic meeting held on June 15, 2015, the Board of Trustees of Wells Fargo Funds Trust unanimously approved the liquidation of the Fund. The Fund was closed to new direct investors and additional investments from existing shareholders effective at the close of business on June 19, 2015. Existing retirement plans, benefit plans and retirement plan platforms may continue to add new participants and make additional purchases until the Fund’s liquidation date. The liquidation of the Fund is expected to occur after close of business on or about July 17, 2015. Shareholders of the Fund on the date of liquidation will receive a distribution of their account proceeds, including any accrued dividends, in complete redemption of their shares.
For current information about your fund investments, contact your investment professional, visit our website at wellsfargoadvantagefunds.com, or call us directly at 1-800-222-8222. We are available 24 hours a day, 7 days a week.
| 2 | The Morgan Stanley Capital International (MSCI) China Index (Net) is a free-float-adjusted market-capitalization-weighted index that is designed to measure equity market performance in China. You cannot invest directly in an index. |
| | | | |
| 4 | | Wells Fargo Advantage Emerging Markets Equity Select Fund | | Performance highlights (unaudited) |
Investment objective
The Fund seeks long-term capital appreciation.
Adviser
Wells Fargo Funds Management, LLC
Subadviser
Wells Capital Management Incorporated
Portfolio managers
Derrick Irwin, CFA
Richard Peck, CFA
Yi (Jerry) Zhang, Ph.D, CFA
Average annual total returns (%) as of April 30, 2015
| | | | | | | | | | | | | | | | | | | | | | | | | | |
| | | | | Including sales charge | | | Excluding sales charge | | | Expense ratios1 (%) | |
| | | Inception date | | 1 year | | | Since
inception | | | 1 year | | | Since
inception | | | Gross | | | Net2 | |
| Class A (WEMSX) | | 11-29-2013 | | | (5.04 | ) | | | (4.59 | ) | | | 0.76 | | | | (0.52 | ) | | | 5.44 | | | | 1.67 | |
| Class C (WEMQX) | | 11-29-2013 | | | (1.12 | ) | | | (2.01 | ) | | | (0.12 | ) | | | (1.31 | ) | | | 6.19 | | | | 2.42 | |
| Class R6 (WEMRX) | | 11-29-2013 | | | – | | | | – | | | | 1.14 | | | | (0.07 | ) | | | 4.96 | | | | 1.17 | |
| Administrator Class (WEMEX) | | 11-29-2013 | | | – | | | | – | | | | 0.89 | | | | (0.34 | ) | | | 5.28 | | | | 1.47 | |
| Institutional Class (WEMTX) | | 11-29-2013 | | | – | | | | – | | | | 1.18 | | | | (0.12 | ) | | | 5.01 | | | | 1.22 | |
| MSCI Emerging Markets Index (Net)3 | | – | | | – | | | | – | | | | 7.80 | | | | 4.29 | | | | – | | | | – | |
Figures quoted represent past performance, which is no guarantee of future results, and do not reflect taxes that a shareholder may pay on fund distributions or the redemption of fund shares. Investment return and principal value of an investment will fluctuate so that an investor’s shares, when redeemed, may be worth more or less than their original cost. Performance shown without sales charges would be lower if sales charges were reflected. Current performance may be lower or higher than the performance data quoted, which assumes the reinvestment of dividends and capital gains. Current month-end performance is available on the Fund’s website, wellsfargoadvantagefunds.com.
Index returns do not include transaction costs associated with buying and selling securities, any mutual fund fees or expenses, or any taxes. It is not possible to invest directly in an index.
For Class A shares, the maximum front-end sales charge is 5.75%. For Class C shares, the maximum contingent deferred sales charge is 1.00%. Performance including a contingent deferred sales charge assumes the sales charge for the corresponding time period. Class R6, Administrator Class, and Institutional Class shares are sold without a front-end sales charge or contingent deferred sales charge.
Stock values fluctuate in response to the activities of individual companies and general market and economic conditions. Foreign investments are especially volatile and can rise or fall dramatically due to differences in the political and economic conditions of the host country. These risks are generally intensified in emerging markets. Certain investment strategies tend to increase the total risk of an investment (relative to the broader market). Consult the Fund’s prospectus for additional information on these and other risks.
Please see footnotes on page 5.
| | | | | | |
| Performance highlights (unaudited) | | Wells Fargo Advantage Emerging Markets Equity Select Fund | | | 5 | |
| | | | |
| Ten largest holdings4 (%) as of April 30, 2015 | |
Samsung Electronics Company Limited | | | 4.68 | |
Taiwan Semiconductor Manufacturing Company Limited ADR | | | 4.64 | |
China Life Insurance Company Limited H Shares | | | 3.30 | |
China Mobile Limited | | | 3.21 | |
Fomento Economico Mexicano SAB de CV ADR | | | 2.29 | |
AIA Group Limited | | | 1.93 | |
America Movil SAB de CV ADR | | | 1.78 | |
Belle International Holdings Limited | | | 1.71 | |
CNOOC Limited | | | 1.71 | |
Lojas Americanas SA | | | 1.64 | |
|
| Sector distribution5 as of April 30, 2015 |
|
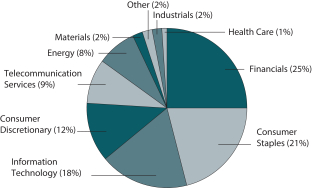 |
|
| Country allocation5 as of April 30, 2015 |
|
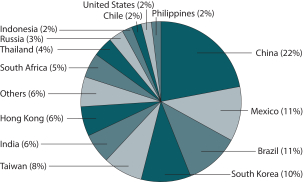 |
| 1 | Reflects the expense ratios as stated in the most recent prospectuses, which include the impact of 0.02% in acquired fund fees and expenses. The expense ratios shown are subject to change and may differ from the annualized expense ratios shown in the financial highlights of this report, which do not include acquired fund fees and expenses. |
| 2 | The Adviser has committed through February 29, 2016, to waive fees and/or reimburse expenses to the extent necessary to cap the Fund’s Total Annual Fund Operating Expenses After Fee Waiver, excluding certain expenses, at 1.65% for Class A, 2.40% for Class C, 1.15% for Class R6, 1.45% for Administrator Class, and 1.20% for Institutional Class. After this time, the cap may be increased or the commitment to maintain the cap may be terminated only with the approval of the Board of Trustees. Brokerage commissions, stamp duty fees, interest, taxes, acquired fund fees and expenses, and extraordinary expenses are excluded from the cap. Without this cap, the Fund’s returns would have been lower. |
| 3 | The Morgan Stanley Capital International (MSCI) Emerging Markets Index (Net) is a free-float-adjusted market-capitalization-weighted index that is designed to measure the equity market performance of emerging markets. The MSCI Emerging Markets Index (Net) consists of the following 23 emerging markets country indexes: Brazil, Chile, China, Colombia, Czech Republic, Egypt, Greece, Hungary, India, Indonesia, Korea, Malaysia, Mexico, Peru, the Philippines, Poland, Qatar, Russia, South Africa, Taiwan, Thailand, Turkey, and United Arab Emirates. You cannot invest directly in an index. Source: MSCI. MSCI makes no express or implied warranties or representations and shall have no liability whatsoever with respect to any MSCI data contained herein. The MSCI data may not be further redistributed or used as a basis for other indexes or any securities or financial products. This report is not approved, reviewed, or produced by MSCI. |
| 4 | The ten largest holdings, excluding cash and cash equivalents, are calculated based on the value of the investments divided by total net assets of the Fund. Holdings are subject to change and may have changed since the date specified. |
| 5 | Amounts are calculated based on the total long-term investments of the Fund. These percentages are subject to change and may have changed since the date specified. |
| | | | |
| 6 | | Wells Fargo Advantage Emerging Markets Equity Select Fund | | Fund expenses (unaudited) |
As a shareholder of the Fund, you incur two types of costs: (1) transaction costs, including sales charges (loads) on purchase payments and contingent deferred sales charges (if any) on redemptions and (2) ongoing costs, including management fees, distribution (12b-1) and/or shareholder service fees, and other Fund expenses. This example is intended to help you understand your ongoing costs (in dollars) of investing in the Fund and to compare these costs with the ongoing costs of investing in other mutual funds.
The example is based on an investment of $1,000 invested at the beginning of the six-month period and held for the entire period from November 1, 2014 to April 30, 2015.
Actual expenses
The “Actual” line of the table below provides information about actual account values and actual expenses. You may use the information in this line, together with the amount you invested, to estimate the expenses that you paid over the period. Simply divide your account value by $1,000 (for example, an $8,600 account value divided by $1,000 = 8.6), then multiply the result by the number in the “Actual” line under the heading entitled “Expenses paid during period” for your applicable class of shares to estimate the expenses you paid on your account during this period.
Hypothetical example for comparison purposes
The “Hypothetical” line of the table below provides information about hypothetical account values and hypothetical expenses based on the Fund’s actual expense ratio and an assumed rate of return of 5% per year before expenses, which is not the Fund’s actual return. The hypothetical account values and expenses may not be used to estimate the actual ending account balance or expenses you paid for the period. You may use this information to compare the ongoing costs of investing in the Fund and other funds. To do so, compare this 5% hypothetical example with the 5% hypothetical examples that appear in the shareholder reports of the other funds.
Please note that the expenses shown in the table are meant to highlight your ongoing costs only and do not reflect any transactional costs, such as sales charges (loads) and contingent deferred sales charges. Therefore, the “Hypothetical” line of the table is useful in comparing ongoing costs only and will not help you determine the relative total costs of owning different funds. In addition, if these transactional costs were included, your costs would have been higher.
| | | | | | | | | | | | | | | | |
| | | Beginning
account value
11-1-2014 | | | Ending
account value
4-30-2015 | | | Expenses
paid during
the period¹ | | | Net annualized
expense ratio | |
Class A | | | | | | | | | | | | | | | | |
Actual | | $ | 1,000.00 | | | $ | 985.50 | | | $ | 8.12 | | | | 1.65 | % |
Hypothetical (5% return before expenses) | | $ | 1,000.00 | | | $ | 1,016.61 | | | $ | 8.25 | | | | 1.65 | % |
Class C | | | | | | | | | | | | | | | | |
Actual | | $ | 1,000.00 | | | $ | 980.78 | | | $ | 11.79 | | | | 2.40 | % |
Hypothetical (5% return before expenses) | | $ | 1,000.00 | | | $ | 1,012.89 | | | $ | 11.98 | | | | 2.40 | % |
Class R6 | | | | | | | | | | | | | | | | |
Actual | | $ | 1,000.00 | | | $ | 987.35 | | | $ | 5.67 | | | | 1.15 | % |
Hypothetical (5% return before expenses) | | $ | 1,000.00 | | | $ | 1,019.09 | | | $ | 5.76 | | | | 1.15 | % |
Administrator Class | | | | | | | | | | | | | | | | |
Actual | | $ | 1,000.00 | | | $ | 985.84 | | | $ | 7.14 | | | | 1.45 | % |
Hypothetical (5% return before expenses) | | $ | 1,000.00 | | | $ | 1,017.60 | | | $ | 7.25 | | | | 1.45 | % |
Institutional Class | | | | | | | | | | | | | | | | |
Actual | | $ | 1,000.00 | | | $ | 986.69 | | | $ | 5.91 | | | | 1.20 | % |
Hypothetical (5% return before expenses) | | $ | 1,000.00 | | | $ | 1,018.84 | | | $ | 6.01 | | | | 1.20 | % |
| 1 | Expenses paid is equal to the annualized expense ratio of each class multiplied by the average account value over the period, multiplied by the number of days in the most recent fiscal half-year divided by the number of days in the fiscal year (to reflect the one-half-year period). |
| | | | | | |
| Portfolio of investments—April 30, 2015 (unaudited) | | Wells Fargo Advantage Emerging Markets Equity Select Fund | | | 7 | |
| | | | | | | | | | | | |
| Security name | | | | | | Shares | | | Value | |
| | | |
Common Stocks: 91.24% | | | | | | | | | | |
| | | | |
| Argentina: 0.69% | | | | | | | | | | | | |
MercadoLibre Incorporated (Information Technology, Internet Software & Services) « | | | | | | | 420 | | | $ | 59,779 | |
| | | | | | | | | | | | |
| | | |
| Brazil: 8.93% | | | | | | | | | | |
Ambev SA ADR (Consumer Staples, Beverages) | | | | | | | 21,500 | | | | 136,095 | |
B2W Cia Digital (Consumer Discretionary, Internet & Catalog Retail) † | | | | | | | 5,400 | | | | 49,054 | |
Banco Bradesco SA ADR (Financials, Banks) | | | | | | | 12,240 | | | | 130,846 | |
BM&F Bovespa SA (Financials, Diversified Financial Services) | | | | | | | 23,500 | | | | 96,794 | |
BRF Brasil Foods SA ADR (Consumer Staples, Food Products) | | | | | | | 2,300 | | | | 49,381 | |
CETIP SA (Financials, Capital Markets) | | | | | | | 7,700 | | | | 88,297 | |
Lojas Renner SA (Consumer Discretionary, Multiline Retail) | | | | | | | 1,800 | | | | 62,759 | |
Multiplan Empreendimentos Imobiliarios SA (Financials, Real Estate Management & Development) | | | | | | | 2,300 | | | | 40,459 | |
Petroleo Brasileiro SA ADR (Energy, Oil, Gas & Consumable Fuels) Ǡ | | | | | | | 6,200 | | | | 58,900 | |
Rumo Logistica Operadora Multimodal SA (Industrials, Road & Rail) | | | | | | | 76,014 | | | | 32,798 | |
Vale SA ADR (Materials, Metals & Mining) « | | | | | | | 3,900 | | | | 29,952 | |
| | | | |
| | | | | | | | | | | 775,335 | |
| | | | | | | | | | | | |
| | | |
| Chile: 1.97% | | | | | | | | | | |
Banco Santander Chile SA ADR (Financials, Banks) | | | | | | | 4,000 | | | | 87,240 | |
SACI Falabella (Consumer Discretionary, Multiline Retail) | | | | | | | 10,714 | | | | 83,901 | |
| | | | |
| | | | | | | | | | | 171,141 | |
| | | | | | | | | | | | |
| | | |
| China: 20.56% | | | | | | | | | | |
Alibaba Group Holding Limited ADR (Information Technology, Internet Software & Services) † | | | | | | | 534 | | | | 43,409 | |
Baidu Incorporated ADR (Information Technology, Internet Software & Services) † | | | | | | | 390 | | | | 78,109 | |
China Auto Rental Incorporated (Consumer Discretionary, Automobiles) † | | | | | | | 1,705 | | | | 4,030 | |
China Life Insurance Company Limited H Shares (Financials, Insurance) | | | | | | | 59,000 | | | | 286,344 | |
China Mobile Limited (Telecommunication Services, Wireless Telecommunication Services) | | | | | | | 19,500 | | | | 278,524 | |
CNOOC Limited (Energy, Oil, Gas & Consumable Fuels) | | | | | | | 87,000 | | | | 148,353 | |
Ctrip.com International Limited ADR (Consumer Discretionary, Internet & Catalog Retail) † | | | | | | | 1,600 | | | | 101,888 | |
Hengan International Group Company Limited (Consumer Staples, Personal Products) | | | | | | | 11,500 | | | | 141,875 | |
Mindray Medical International Limited ADR (Health Care, Health Care Equipment & Supplies) | | | | | | | 2,750 | | | | 84,920 | |
New Oriental Education & Technology Group Incorporated (Consumer Discretionary, Diversified Consumer Services) † | | | | | | | 4,450 | | | | 113,875 | |
PetroChina Company Limited H Shares (Energy, Oil, Gas & Consumable Fuels) | | | | | | | 54,000 | | | | 69,647 | |
Shandong Weigao Group Medical Polymer Company Limited H Shares (Health Care, Health Care Equipment & Supplies) | | | | | | | 36,000 | | | | 33,270 | |
SINA Corporation (Information Technology, Internet Software & Services) Ǡ | | | | | | | 3,060 | | | | 134,625 | |
Tingyi Holding Corporation (Consumer Staples, Food Products) | | | | | | | 48,000 | | | | 101,365 | |
Tsingtao Brewery Company Limited H Shares (Consumer Staples, Beverages) | | | | | | | 16,000 | | | | 101,651 | |
Vipshop Holdings Limited ADR (Consumer Discretionary, Internet & Catalog Retail) † | | | | | | | 1,000 | | | | 28,290 | |
Weibo Corporation ADR (Information Technology, Internet Software & Services) † | | | | | | | 2,149 | | | | 35,845 | |
| | | | |
| | | | | | | | | | | 1,786,020 | |
| | | | | | | | | | | | |
| | | |
| Colombia: 0.68% | | | | | | | | | | |
Bancolombia SA ADR (Financials, Banks) « | | | | | | | 1,300 | | | | 58,851 | |
| | | | | | | | | | | | |
| | | |
| Hong Kong: 5.67% | | | | | | | | | | |
AIA Group Limited (Financials, Insurance) | | | | | | | 25,200 | | | | 167,592 | |
Belle International Holdings Limited (Consumer Discretionary, Textiles, Apparel & Luxury Goods) | | | | | | | 116,000 | | | | 148,883 | |
Sun Art Retail Group Limited (Consumer Staples, Food & Staples Retailing) | | | | | | | 57,000 | | | | 58,761 | |
The accompanying notes are an integral part of these financial statements.
| | | | |
| 8 | | Wells Fargo Advantage Emerging Markets Equity Select Fund | | Portfolio of investments—April 30, 2015 (unaudited) |
| | | | | | | | | | | | |
| Security name | | | | | | Shares | | | Value | |
| | | |
| Hong Kong (continued) | | | | | | | | | | |
WH Group Limited (Consumer Staples, Food Products) † | | | | | | | 168,500 | | | $ | 117,611 | |
| | | | |
| | | | | | | | | | | 492,847 | |
| | | | | | | | | | | | |
| | | |
| India: 5.83% | | | | | | | | | | |
HDFC Bank Limited ADR (Financials, Banks) | | | | | | | 2,404 | | | | 136,643 | |
ICICI Bank Limited ADR (Financials, Banks) | | | | | | | 10,500 | | | | 114,765 | |
Infosys Technologies Limited ADR (Information Technology, IT Services) | | | | | | | 3,900 | | | | 120,822 | |
Reliance Industries Limited GDR (Energy, Oil, Gas & Consumable Fuels) 144A | | | | | | | 5,000 | | | | 134,500 | |
| | | | |
| | | | | | | | | | | 506,730 | |
| | | | | | | | | | | | |
| | | | |
| Indonesia: 2.05% | | | | | | | | | | | | |
PT Astra International Tbk (Consumer Discretionary, Automobiles) | | | | | | | 76,000 | | | | 39,994 | |
PT Bank Central Asia Tbk (Financials, Banks) | | | | | | | 48,000 | | | | 49,699 | |
PT Matahari Department Store Tbk (Consumer Discretionary, Multiline Retail) | | | | | | | 18,100 | | | | 24,343 | |
PT Telekomunikasi Indonesia Persero Tbk (Telecommunication Services, Diversified Telecommunication Services) | | | | | | | 320,000 | | | | 64,359 | |
| | | | |
| | | | | | | | | | | 178,395 | |
| | | | | | | | | | | | |
| | | | |
| Malaysia: 1.42% | | | | | | | | | | | | |
Genting Bhd (Consumer Discretionary, Hotels, Restaurants & Leisure) | | | | | | | 20,700 | | | | 50,813 | |
Genting Malaysia Bhd (Consumer Discretionary, Hotels, Restaurants & Leisure) | | | | | | | 41,000 | | | | 49,419 | |
Sime Darby Bhd (Industrials, Industrial Conglomerates) | | | | | | | 9,000 | | | | 22,867 | |
| | | | |
| | | | | | | | | | | 123,099 | |
| | | | | | | | | | | | |
| | | | |
| Mexico: 10.75% | | | | | | | | | | | | |
America Movil SAB de CV ADR (Telecommunication Services, Wireless Telecommunication Services) | | | | | | | 7,400 | | | | 154,586 | |
Cemex SAB de CV ADR (Materials, Construction Materials) † | | | | | | | 10,088 | | | | 97,046 | |
Fibra Uno Administracion SAB de CV (Financials, REITs) | | | | | | | 43,250 | | | | 107,857 | |
Fomento Economico Mexicano SAB de CV ADR (Consumer Staples, Beverages) † | | | | | | | 2,200 | | | | 199,078 | |
Grupo Financiero Banorte SAB de CV (Financials, Banks) | | | | | | | 23,100 | | | | 131,038 | |
Grupo Financiero Santander SAB de CV ADR (Financials, Banks) | | | | | | | 4,250 | | | | 43,222 | |
Grupo Sanborns SA de CV (Consumer Discretionary, Multiline Retail) | | | | | | | 5,000 | | | | 7,512 | |
Grupo Televisa SAB ADR (Consumer Discretionary, Media) † | | | | | | | 2,600 | | | | 94,666 | |
Wal-Mart de Mexico SAB de CV (Consumer Staples, Food & Staples Retailing) | | | | | | | 42,000 | | | | 98,827 | |
| | | | |
| | | | | | | | | | | 933,832 | |
| | | | | | | | | | | | |
| | | | |
| Peru: 0.40% | | | | | | | | | | | | |
Compania de Minas Buenaventura SA ADR (Materials, Metals & Mining) | | | | | | | 3,100 | | | | 34,658 | |
| | | | | | | | | | | | |
| | | | |
| Philippines: 1.48% | | | | | | | | | | | | |
Ayala Corporation (Financials, Diversified Financial Services) | | | | | | | 2,800 | | | | 48,962 | |
Metropolitan Bank & Trust Company (Financials, Banks) | | | | | | | 13,903 | | | | 28,982 | |
SM Investments Corporation (Industrials, Industrial Conglomerates) | | | | | | | 2,500 | | | | 50,507 | |
| | | | |
| | | | | | | | | | | 128,451 | |
| | | | | | | | | | | | |
| | | | |
| Russia: 2.88% | | | | | | | | | | | | |
LUKOIL ADR (Energy, Oil, Gas & Consumable Fuels) | | | | | | | 1,500 | | | | 76,733 | |
Magnit (Consumer Staples, Food & Staples Retailing) (a) | | | | | | | 200 | | | | 43,723 | |
Mobile Telesystems ADR (Telecommunication Services, Wireless Telecommunication Services) | | | | | | | 4,000 | | | | 48,320 | |
The accompanying notes are an integral part of these financial statements.
| | | | | | |
| Portfolio of investments—April 30, 2015 (unaudited) | | Wells Fargo Advantage Emerging Markets Equity Select Fund | | | 9 | |
| | | | | | | | | | | | |
| Security name | | | | | | Shares | | | Value | |
| | | | |
| Russia (continued) | | | | | | | | | | | | |
Sberbank of Russia ADR (Financials, Banks) | | | | | | | 6,000 | | | $ | 35,612 | |
Yandex NV Class A (Information Technology, Internet Software & Services) † | | | | | | | 2,400 | | | | 46,176 | |
| | | | |
| | | | | | | | | | | 250,564 | |
| | | | | | | | | | | | |
| | | | |
| South Africa: 4.89% | | | | | | | | | | | | |
AngloGold Ashanti Limited ADR (Materials, Metals & Mining) † | | | | | | | 2,200 | | | | 24,926 | |
Impala Platinum Holdings Limited (Materials, Metals & Mining) † | | | | | | | 1,300 | | | | 7,235 | |
MTN Group Limited (Telecommunication Services, Wireless Telecommunication Services) | | | | | | | 5,100 | | | | 102,402 | |
Sasol Limited (Energy, Oil, Gas & Consumable Fuels) | | | | | | | 600 | | | | 24,158 | |
Shoprite Holdings Limited (Consumer Staples, Food & Staples Retailing) | | | | | | | 7,200 | | | | 103,017 | |
Standard Bank Group Limited (Financials, Banks) | | | | | | | 5,000 | | | | 73,290 | |
Tiger Brands Limited (Consumer Staples, Food Products) | | | | | | | 3,450 | | | | 89,794 | |
| | | | |
| | | | | | | | | | | 424,822 | |
| | | | | | | | | | | | |
| | | | |
| South Korea: 9.95% | | | | | | | | | | | | |
Amorepacific Corporation (Consumer Staples, Personal Products) (a) | | | | | | | 10 | | | | 36,231 | |
KT Corporation ADR (Telecommunication Services, Diversified Telecommunication Services) | | | | | | | 8,500 | | | | 123,845 | |
KT&G Corporation (Consumer Staples, Tobacco) | | | | | | | 1,100 | | | | 97,584 | |
Samsung Electronics Company Limited (Information Technology, Technology Hardware, Storage & Peripherals) | | | | | | | 310 | | | | 406,675 | |
Samsung Life Insurance Company Limited (Financials, Insurance) | | | | | | | 1,300 | | | | 127,156 | |
SK Hynix Incorporated (Information Technology, Semiconductors & Semiconductor Equipment) | | | | | | | 1,700 | | | | 72,735 | |
| | | | |
| | | | | | | | | | | 864,226 | |
| | | | | | | | | | | | |
| | | | |
| Taiwan: 7.85% | | | | | | | | | | | | |
Far Eastern New Century Corporation (Industrials, Industrial Conglomerates) | | | | | | | 21,420 | | | | 23,528 | |
Media Tek Incorporated (Information Technology, Semiconductors & Semiconductor Equipment) | | | | | | | 6,000 | | | | 77,125 | |
President Chain Store Corporation (Consumer Staples, Food & Staples Retailing) | | | | | | | 6,000 | | | | 44,401 | |
Taiwan Semiconductor Manufacturing Company Limited ADR (Information Technology, Semiconductors & Semiconductor Equipment) | | | 16,500 | | | | 403,260 | |
Uni-President Enterprises Corporation (Consumer Staples, Food Products) | | | | | | | 81,360 | | | | 133,150 | |
| | | | |
| | | | | | | | | | | 681,464 | |
| | | | | | | | | | | | |
| | | | |
| Thailand: 3.69% | | | | | | | | | | | | |
Bangkok Bank PCL (Financials, Banks) | | | | | | | 6,500 | | | | 36,485 | |
PTT Exploration & Production PCL (Energy, Oil, Gas & Consumable Fuels) | | | | | | | 12,000 | | | | 42,591 | |
PTT PCL (Energy, Oil, Gas & Consumable Fuels) | | | | | | | 6,000 | | | | 64,796 | |
Siam Commercial Bank PCL (Financials, Banks) | | | | | | | 18,000 | | | | 86,819 | |
Thai Beverage PCL (Consumer Staples, Beverages) | | | | | | | 167,000 | | | | 90,240 | |
| | | | |
| | | | | | | | | | | 320,931 | |
| | | | | | | | | | | | |
| | | | |
| Turkey: 0.58% | | | | | | | | | | | | |
Anadolu Efes Biracilik Ve Malt Sanayii AS (Consumer Staples, Beverages) † | | | | | | | 6,000 | | | | 50,511 | |
| | | | | | | | | | | | |
| | | | |
| United Kingdom: 0.97% | | | | | | | | | | | | |
Standard Chartered plc (Financials, Banks) | | | | | | | 5,162 | | | | 84,513 | |
| | | | | | | | | | | | |
| | | | |
Total Common Stocks (Cost $7,959,713) | | | | | | | | | | | 7,926,169 | |
| | | | | | | | | | | | |
The accompanying notes are an integral part of these financial statements.
| | | | |
| 10 | | Wells Fargo Advantage Emerging Markets Equity Select Fund | | Portfolio of investments—April 30, 2015 (unaudited) |
| | | | | | | | | | | | | | |
| Security name | | Dividend yield | | | | | Shares | | | Value | |
| | | | |
Preferred Stocks: 1.64% | | | | | | | | | | | | | | |
| | | | |
| Brazil: 1.64% | | | | | | | | | | | | | | |
Lojas Americanas SA (Consumer Discretionary, Multiline Retail) ± | | | 0.72 | % | | | | | 25,550 | | | $ | 142,211 | |
| | | | | | | | | | | | | | |
| | | | |
Total Preferred Stocks (Cost $148,568) | | | | | | | | | | | | | 142,211 | |
| | | | | | | | | | | | | | |
| | | | |
Exchange-Traded Funds: 1.93% | | | | | | | | | | | | | | |
| | | | |
| United States: 1.93% | | | | | | | | | | | | | | |
iShares MSCI South Korea Capped ETF | | | | | | | | | 1,400 | | | | 85,638 | |
iShares MSCI Taiwan ETF | | | | | | | | | 5,000 | | | | 82,200 | |
| | | | |
Total Exchange-Traded Funds (Cost $157,672) | | | | | | | | | | | | | 167,838 | |
| | | | | | | | | | | | | | |
| | | | |
| | | Yield | | | | | | | | | |
| Short-Term Investments: 7.56% | | | | | | | | | | | | | | |
| | | | |
| Investment Companies: 7.56% | | | | | | | | | | | | | | |
Securities Lending Cash Investments, LLC (l)(r)(u) | | | 0.12 | | | | | | 310,678 | | | | 310,678 | |
Wells Fargo Advantage Cash Investment Money Market Fund, Select Class (l)(u) | | | 0.11 | | | | | | 346,401 | | | | 346,401 | |
| | | | |
Total Short-Term Investments (Cost $657,079) | | | | | | | | | | | | | 657,079 | |
| | | | | | | | | | | | | | |
| | | | | | | | |
| Total investments in securities (Cost $8,923,032) * | | | 102.37 | % | | | 8,893,297 | |
Other assets and liabilities, net | | | (2.37 | ) | | | (206,178 | ) |
| | | | | | | | |
| Total net assets | | | 100.00 | % | | $ | 8,687,119 | |
| | | | | | | | |
| « | All or a portion of this security is on loan. |
| † | Non-income-earning security |
| 144A | The security may be resold in transactions exempt from registration, normally to qualified institutional buyers, pursuant to Rule 144A under the Securities Act of 1933. |
| (a) | The security is fair valued in accordance with procedures approved by the Board of Trustees. |
| ± | Variable rate investment. The rate shown is the rate in effect at period end. |
| (l) | The security represents an affiliate of the Fund as defined in the Investment Company Act of 1940. |
| (r) | The investment is a non-registered investment vehicle purchased with cash collateral received from securities on loan. |
| (u) | The rate represents the 7-day annualized yield at period end. |
| * | Cost for federal income tax purposes is $8,979,514 and unrealized gains (losses) consists of: |
| | | | |
Gross unrealized gains | | $ | 626,324 | |
Gross unrealized losses | | | (712,541 | ) |
| | | | |
Net unrealized losses | | $ | (86,217 | ) |
The accompanying notes are an integral part of these financial statements.
| | | | | | |
| Statement of assets and liabilities—April 30, 2015 (unaudited) | | Wells Fargo Advantage Emerging Markets Equity Select Fund | | | 11 | |
| | | | |
| | | | |
| |
Assets | | | | |
Investments | | | | |
In unaffiliated securities (including $302,698 of securities loaned), at value (cost $8,265,953) | | $ | 8,236,218 | |
In affiliated securities, at value (cost $657,079) | | | 657,079 | |
| | | | |
Total investments, at value (cost $8,923,032) | | | 8,893,297 | |
Foreign currency, at value (cost $73,276) | | | 73,194 | |
Receivable for dividends | | | 16,273 | |
Receivable for securities lending income | | | 112 | |
Receivable from adviser | | | 8,901 | |
Prepaid expenses and other assets | | | 41,533 | |
| | | | |
Total assets | | | 9,033,310 | |
| | | | |
| |
Liabilities | | | | |
Payable upon receipt of securities loaned | | | 310,678 | |
Distribution fee payable | | | 168 | |
Administration fees payable | | | 825 | |
Professional fees payable | | | 24,573 | |
Accrued expenses and other liabilities | | | 9,947 | |
| | | | |
Total liabilities | | | 346,191 | |
| | | | |
Total net assets | | $ | 8,687,119 | |
| | | | |
| |
NET ASSETS CONSIST OF | | | | |
Paid-in capital | | $ | 8,783,341 | |
Undistributed net investment income | | | 8,525 | |
Accumulated net realized losses on investments | | | (74,825 | ) |
Net unrealized losses on investments | | | (29,922 | ) |
| | | | |
Total net assets | | $ | 8,687,119 | |
| | | | |
| |
COMPUTATION OF NET ASSET VALUE AND OFFERING PRICE PER SHARE | | | | |
Net assets – Class A | | $ | 316,174 | |
Shares outstanding – Class A1 | | | 32,044 | |
Net asset value per share – Class A | | | $9.87 | |
Maximum offering price per share – Class A2 | | | $10.47 | |
Net assets – Class C | | $ | 273,967 | |
Shares outstanding – Class C1 | | | 28,037 | |
Net asset value per share – Class C | | | $9.77 | |
Net assets – Class R6 | | $ | 5,095,857 | |
Shares outstanding – Class R61 | | | 515,779 | |
Net asset value per share – Class R6 | | | $9.88 | |
Net assets – Administrator Class | | $ | 1,503,556 | |
Shares outstanding – Administrator Class1 | | | 152,234 | |
Net asset value per share – Administrator Class | | | $9.88 | |
Net assets – Institutional Class | | $ | 1,497,565 | |
Shares outstanding – Institutional Class1 | | | 151,556 | |
Net asset value per share – Institutional Class | | | $9.88 | |
| 1 | The Fund has an unlimited number of authorized shares. |
| 2 | Maximum offering price is computed as 100/94.25 of net asset value. On investments of $50,000 or more, the offering price is reduced. |
The accompanying notes are an integral part of these financial statements.
| | | | |
| 12 | | Wells Fargo Advantage Emerging Markets Equity Select Fund | | Statement of operations—six months ended April 30, 2015 (unaudited) |
| | | | |
| | | | |
| |
Investment income | | | | |
Dividends (net of foreign withholding taxes of $7,965) | | $ | 62,519 | |
Securities lending income, net | | | 736 | |
Income from affiliated securities | | | 195 | |
| | | | |
Total investment income | | | 63,450 | |
| | | | |
| |
Expenses | | | | |
Advisory fee | | | 39,886 | |
Administration fees | | | | |
Fund level | | | 1,994 | |
Class A | | | 386 | |
Class C | | | 337 | |
Class R6 | | | 688 | |
Administrator Class | | | 710 | |
Institutional Class | | | 566 | |
Shareholder servicing fees | | | | |
Class A | | | 371 | |
Class C | | | 324 | |
Administrator Class | | | 1,776 | |
Distribution fee | | | | |
Class C | | | 971 | |
Custody and accounting fees | | | 7,383 | |
Professional fees | | | 28,672 | |
Registration fees | | | 46,839 | |
Shareholder report expenses | | | 17,129 | |
Trustees’ fees and expenses | | | 7,753 | |
Other fees and expenses | | | 4,576 | |
| | | | |
Total expenses | | | 160,361 | |
Less: Fee waivers and/or expense reimbursements | | | (109,646 | ) |
| | | | |
Net expenses | | | 50,715 | |
| | | | |
Net investment income | | | 12,735 | |
| | | | |
| |
REALIZED AND UNREALIZED GAINS (LOSSES) ON INVESTMENTS | | | | |
| |
Net realized losses on: | | | | |
Unaffiliated securities | | | (74,577 | ) |
Forward foreign currency contract transactions | | | (245 | ) |
| | | | |
Net realized losses on investments | | | (74,822 | ) |
Net change in unrealized gains (losses) on investments | | | (49,210 | ) |
| | | | |
Net realized and unrealized gains (losses) on investments | | | (124,032 | ) |
| | | | |
Net decrease in net assets resulting from operations | | $ | (111,297 | ) |
| | | | |
The accompanying notes are an integral part of these financial statements.
| | | | | | |
| Statement of changes in net assets | | Wells Fargo Advantage Emerging Markets Equity Select Fund | | | 13 | |
| | | | | | | | | | | | | | | | |
| | | Six months ended
April 30, 2015
(unaudited) | | | Year ended
October 31, 20141 | |
| | | | |
Operations | | | | | | | | | | | | | | | | |
Net investment income | | | | | | $ | 12,735 | | | | | | | $ | 44,964 | |
Net realized gains (losses) on investments | | | | | | | (74,822 | ) | | | | | | | 21,610 | |
Net change in unrealized gains (losses) on investments | | | | | | | (49,210 | ) | | | | | | | 19,288 | |
| | | | |
Net increase (decrease) in net assets resulting from operations | | | | | | | (111,297 | ) | | | | | | | 85,862 | |
| | | | |
| | | | |
Distributions to shareholders from | | | | | | | | | | | | | | | | |
Net investment income | | | | | | | | | | | | | | | | |
Class A | | | | | | | (181 | ) | | | | | | | (570 | ) |
Class C | | | | | | | 0 | | | | | | | | (414 | ) |
Class R6 | | | | | | | (26,084 | ) | | | | | | | (4,056 | ) |
Administrator Class | | | | | | | (2,747 | ) | | | | | | | (3,679 | ) |
Institutional Class | | | | | | | (6,731 | ) | | | | | | | (3,993 | ) |
Net realized gains | | | | | | | | | | | | | | | | |
Class A | | | | | | | (851 | ) | | | | | | | 0 | |
Class C | | | | | | | (732 | ) | | | | | | | 0 | |
Class R6 | | | | | | | (13,417 | ) | | | | | | | 0 | |
Administrator Class | | | | | | | (3,974 | ) | | | | | | | 0 | |
Institutional Class | | | | | | | (3,945 | ) | | | | | | | 0 | |
| | | | |
Total distributions to shareholders | | | | | | | (58,662 | ) | | | | | | | (12,712 | ) |
| | | | |
| | | | |
Capital share transactions | | | Shares | | | | | | | | Shares | | | | | |
Proceeds from shares sold | | | | | | | | | | | | | | | | |
Class A | | | 2,774 | | | | 26,396 | | | | 33,596 | | | | 336,929 | |
Class C | | | 62 | | | | 600 | | | | 28,476 | | | | 285,482 | |
Class R6 | | | 179,104 | | | | 1,800,000 | | | | 332,002 | | | | 3,300,000 | |
Administrator Class | | | 0 | | | | 0 | | | | 151,135 | | | | 1,511,750 | |
Institutional Class | | | 0 | | | | 0 | | | | 150,000 | | | | 1,500,000 | |
| | | | |
| | | | | | | 1,826,996 | | | | | | | | 6,934,161 | |
| | | | |
Reinvestment of distributions | | | | | | | | | | | | | | | | |
Class A | | | 113 | | | | 1,032 | | | | 58 | | | | 570 | |
Class C | | | 80 | | | | 732 | | | | 42 | | | | 414 | |
Class R6 | | | 4,263 | | | | 39,501 | | | | 410 | | | | 4,056 | |
Administrator Class | | | 727 | | | | 6,721 | | | | 372 | | | | 3,679 | |
Institutional Class | | | 1,153 | | | | 10,676 | | | | 403 | | | | 3,993 | |
| | | | |
| | | | | | | 58,662 | | | | | | | | 12,712 | |
| | | | |
Payment for shares redeemed | | | | | | | | | | | | | | | | |
Class A | | | (2,841 | ) | | | (25,674 | ) | | | (1,656 | ) | | | (16,912 | ) |
Class C | | | (1 | ) | | | (10 | ) | | | (622 | ) | | | (6,007 | ) |
| | | | |
| | | | | | | (25,684 | ) | | | | | | | (22,919 | ) |
| | | | |
Net increase in net assets resulting from capital share transactions | | | | | | | 1,859,974 | | | | | | | | 6,923,954 | |
| | | | |
Total increase in net assets | | | | | | | 1,690,015 | | | | | | | | 6,997,104 | |
| | | | |
| | | | |
Net assets | | | | | | | | | | | | | | | | |
Beginning of period | | | | | | | 6,997,104 | | | | | | | | 0 | |
| | | | |
End of period | | | | | | $ | 8,687,119 | | | | | | | $ | 6,997,104 | |
| | | | |
Undistributed net investment income | | | | | | $ | 8,525 | | | | | | | $ | 31,533 | |
| | | | |
| 1 | For the period from November 29, 2013 (commencement of operations) to October 31, 2014 |
The accompanying notes are an integral part of these financial statements.
| | | | |
| 14 | | Wells Fargo Advantage Emerging Markets Equity Select Fund | | Financial highlights |
(For a share outstanding throughout each period)
| | | | | | | | |
| CLASS A | | Six months ended
April 30, 2015
(unaudited) | | | Year ended October 31, 20141 | |
Net asset value, beginning of period | | | $10.05 | | | | $10.00 | |
Net investment income (loss) | | | (0.00 | )2 | | | 0.04 | |
Net realized and unrealized gains (losses) on investments | | | (0.14 | ) | | | 0.03 | |
| | | | | | | | |
Total from investment operations | | | (0.14 | ) | | | 0.07 | |
Distributions to shareholders from | | | | | | | | |
Net investment income | | | (0.01 | ) | | | (0.02 | ) |
Net realized gains | | | (0.03 | ) | | | 0.00 | |
| | | | | | | | |
Total distributions to shareholders | | | (0.04 | ) | | | (0.02 | ) |
Net asset value, end of period | | | $9.87 | | | | $10.05 | |
Total return3 | | | (1.45 | )% | | | 0.73 | % |
Ratios to average net assets (annualized) | | | | | | | | |
Gross expenses | | | 4.40 | % | | | 5.49 | % |
Net expenses | | | 1.65 | % | | | 1.65 | % |
Net investment income (loss) | | | (0.08 | )% | | | 0.46 | % |
Supplemental data | | | | | | | | |
Portfolio turnover rate | | | 5 | % | | | 12 | % |
Net assets, end of period (000s omitted) | | | $316 | | | | $322 | |
| 1 | For the period from November 29, 2013 (commencement of class operations) to October 31, 2014 |
| 2 | Amount is less than $0.005. |
| 3 | Total return calculations do not include any sales charges. Returns for periods of less than one year are not annualized. |
The accompanying notes are an integral part of these financial statements.
| | | | | | |
| Financial highlights | | Wells Fargo Advantage Emerging Markets Equity Select Fund | | | 15 | |
(For a share outstanding throughout each period)
| | | | | | | | |
| CLASS C | | Six months ended
April 30, 2015
(unaudited) | | | Year ended October 31, 20141 | |
Net asset value, beginning of period | | | $9.99 | | | | $10.00 | |
Net investment loss | | | (0.04 | ) | | | (0.02 | ) |
Net realized and unrealized gains (losses) on investments | | | (0.15 | ) | | | 0.03 | |
| | | | | | | | |
Total from investment operations | | | (0.19 | ) | | | 0.01 | |
Distributions to shareholders from | | | | | | | | |
Net investment income | | | 0.00 | | | | (0.02 | ) |
Net realized gains | | | (0.03 | ) | | | 0.00 | |
| | | | | | | | |
Total distributions to shareholders | | | (0.03 | ) | | | (0.02 | ) |
Net asset value, end of period | | | $9.77 | | | | $9.99 | |
Total return2 | | | (1.92 | )% | | | 0.07 | % |
Ratios to average net assets (annualized) | | | | | | | | |
Gross expenses | | | 5.15 | % | | | 6.25 | % |
Net expenses | | | 2.40 | % | | | 2.40 | % |
Net investment loss | | | (0.83 | )% | | | (0.30 | )% |
Supplemental data | | | | | | | | |
Portfolio turnover rate | | | 5 | % | | | 12 | % |
Net assets, end of period (000s omitted) | | | $274 | | | | $279 | |
| 1 | For the period from November 29, 2013 (commencement of class operations) to October 31, 2014 |
| 2 | Total return calculations do not include any sales charges. Returns for periods of less than one year are not annualized. |
The accompanying notes are an integral part of these financial statements.
| | | | |
| 16 | | Wells Fargo Advantage Emerging Markets Equity Select Fund | | Financial highlights |
(For a share outstanding throughout each period)
| | | | | | | | |
| CLASS R6 | | Six months ended
April 30, 2015
(unaudited) | | | Year ended October 31, 20141 | |
Net asset value, beginning of period | | | $10.09 | | | | $10.00 | |
Net investment income | | | 0.02 | 2 | | | 0.09 | 2 |
Net realized and unrealized gains (losses) on investments | | | (0.15 | ) | | | 0.03 | |
| | | | | | | | |
Total from investment operations | | | (0.13 | ) | | | 0.12 | |
Distributions to shareholders from | | | | | | | | |
Net investment income | | | (0.05 | ) | | | (0.03 | ) |
Net realized gains | | | (0.03 | ) | | | 0.00 | |
| | | | | | | | |
Total distributions to shareholders | | | (0.08 | ) | | | (0.03 | ) |
Net asset value, end of period | | | $9.88 | | | | $10.09 | |
Total return3 | | | (1.27 | )% | | | 1.18 | % |
Ratios to average net assets (annualized) | | | | | | | | |
Gross expenses | | | 3.88 | % | | | 4.81 | % |
Net expenses | | | 1.15 | % | | | 1.15 | % |
Net investment income | | | 0.45 | % | | | 0.99 | % |
Supplemental data | | | | | | | | |
Portfolio turnover rate | | | 5 | % | | | 12 | % |
Net assets, end of period (000s omitted) | | | $5,096 | | | | $3,354 | |
| 1 | For the period from November 29, 2013 (commencement of class operations) to October 31, 2014 |
| 2 | Calculated based upon average shares outstanding. |
| 3 | Returns for periods of less than one year are not annualized. |
The accompanying notes are an integral part of these financial statements.
| | | | | | |
| Financial highlights | | Wells Fargo Advantage Emerging Markets Equity Select Fund | | | 17 | |
(For a share outstanding throughout each period)
| | | | | | | | |
| ADMINISTRATOR CLASS | | Six months ended
April 30, 2015
(unaudited) | | | Year ended October 31, 20141 | |
Net asset value, beginning of period | | | $10.07 | | | | $10.00 | |
Net investment income | | | 0.01 | | | | 0.06 | |
Net realized and unrealized gains (losses) on investments | | | (0.15 | ) | | | 0.03 | |
| | | | | | | | |
Total from investment operations | | | (0.14 | ) | | | 0.09 | |
Distributions to shareholders from | | | | | | | | |
Net investment income | | | (0.02 | ) | | | (0.02 | ) |
Net realized gains | | | (0.03 | ) | | | 0.00 | |
| | | | | | | | |
Total distributions to shareholders | | | (0.05 | ) | | | (0.02 | ) |
Net asset value, end of period | | | $9.88 | | | | $10.07 | |
Total return2 | | | (1.42 | )% | | | 0.95 | % |
Ratios to average net assets (annualized) | | | | | | | | |
Gross expenses | | | 4.24 | % | | | 5.36 | % |
Net expenses | | | 1.45 | % | | | 1.45 | % |
Net investment income | | | 0.12 | % | | | 0.66 | % |
Supplemental data | | | | | | | | |
Portfolio turnover rate | | | 5 | % | | | 12 | % |
Net assets, end of period (000s omitted) | | | $1,504 | | | | $1,525 | |
| 1 | For the period from November 29, 2013 (commencement of class operations) to October 31, 2014 |
| 2 | Returns for periods of less than one year are not annualized. |
The accompanying notes are an integral part of these financial statements.
| | | | |
| 18 | | Wells Fargo Advantage Emerging Markets Equity Select Fund | | Financial highlights |
(For a share outstanding throughout each period)
| | | | | | | | |
| INSTITUTIONAL CLASS | | Six months ended April 30, 2015
(unaudited) | | | Year ended October 31, 20141 | |
Net asset value, beginning of period | | | $10.09 | | | | $10.00 | |
Net investment income | | | 0.02 | | | | 0.08 | |
Net realized and unrealized gains (losses) on investments | | | (0.16 | ) | | | 0.04 | |
| | | | | | | | |
Total from investment operations | | | (0.14 | ) | | | 0.12 | |
Distributions to shareholders from | | | | | | | | |
Net investment income | | | (0.04 | ) | | | (0.03 | ) |
Net realized gains | | | (0.03 | ) | | | 0.00 | |
| | | | | | | | |
Total distributions to shareholders | | | (0.07 | ) | | | (0.03 | ) |
Net asset value, end of period | | | $9.88 | | | | $10.09 | |
Total return2 | | | (1.33 | )% | | | 1.17 | % |
Ratios to average net assets (annualized) | | | | | | | | |
Gross expenses | | | 3.97 | % | | | 5.09 | % |
Net expenses | | | 1.20 | % | | | 1.20 | % |
Net investment income | | | 0.37 | % | | | 0.91 | % |
Supplemental data | | | | | | | | |
Portfolio turnover rate | | | 5 | % | | | 12 | % |
Net assets, end of period (000s omitted) | | | $1,498 | | | | $1,517 | |
| 1 | For the period from November 29, 2013 (commencement of class operations) to October 31, 2014 |
| 2 | Returns for periods of less than one year are not annualized. |
The accompanying notes are an integral part of these financial statements.
| | | | | | |
| Notes to financial statements (unaudited) | | Wells Fargo Advantage Emerging Markets Equity Select Fund | | | 19 | |
1. ORGANIZATION
Wells Fargo Funds Trust (the “Trust”), a Delaware statutory trust organized on March 10, 1999, is an open-end management investment company registered under the Investment Company Act of 1940, as amended (the “1940 Act”). As an investment company, the Trust follows the accounting and reporting guidance in Financial Accounting Standards Board (“FASB”) Accounting Standards Codification Topic 946, Financial Services – Investment Companies. These financial statements report on the Wells Fargo Advantage Emerging Markets Equity Select Fund (the “Fund”) which is a diversified series of the Trust.
2. SIGNIFICANT ACCOUNTING POLICIES
The following significant accounting policies, which are consistently followed in the preparation of the financial statements of the Fund, are in conformity with U.S. generally accepted accounting principles which require management to make estimates and assumptions that affect the reported amounts of assets and liabilities, disclosure of contingent assets and liabilities at the date of the financial statements, and the reported amounts of revenues and expenses during the reporting period. Actual results could differ from those estimates.
Securities valuation
All investments are valued each business day as of the close of regular trading on the New York Stock Exchange (generally 4 p.m. Eastern Time).
Equity securities that are listed on a foreign or domestic exchange or market are valued at the official closing price or, if none, the last sales price. If no sale occurs on the primary exchange or market that day, the prior day’s price will be deemed “stale” and a fair value price will be determined in accordance with the Fund’s Valuation Procedures.
Equity securities that are not listed on a foreign or domestic exchange or market, but have a public trading market, are valued at the quoted bid price from an independent broker-dealer that the Management Valuation Team of Wells Fargo Funds Management, LLC (“Funds Management”) has determined is an acceptable source.
The values of securities denominated in foreign currencies are translated into U.S. dollars at rates provided by an independent foreign currency pricing source at a time each business day specified by the Management Valuation Team.
Many securities markets and exchanges outside the U.S. close prior to the close of the New York Stock Exchange and therefore may not fully reflect trading or events that occur after the close of the principal exchange in which the foreign securities are traded, but before the close of the New York Stock Exchange. If such trading or events are expected to materially affect the value of such securities, then fair value pricing procedures approved by the Board of Trustees of the Fund are applied. These procedures take into account multiple factors including movements in U.S. securities markets after foreign exchanges close. Foreign securities that are fair valued under these procedures are categorized as Level 2 and the application of these procedures may result in transfers between Level 1 and Level 2. Depending on market activity, such fair valuations may be frequent. Such fair value pricing may result in net asset values that are higher or lower than net asset values based on the last reported sales price or latest quoted bid price. On April 31, 2015, such fair value pricing was used in pricing foreign securities.
Investments in registered open-end investment companies are valued at net asset value. Interests in non-registered investment vehicles that are redeemable at net asset value are fair valued at net asset value when available.
Investments which are not valued using any of the methods discussed above are valued at their fair value, as determined in good faith by the Board of Trustees. The Board of Trustees has established a Valuation Committee comprised of the Trustees and has delegated to it the authority to take any actions regarding the valuation of portfolio securities that the Valuation Committee deems necessary or appropriate, including determining the fair value of portfolio securities, unless the determination has been delegated to the Management Valuation Team. The Board of Trustees retains the authority to make or ratify any valuation decisions or approve any changes to the Valuation Procedures as it deems appropriate. On a quarterly basis, the Board of Trustees receives reports on any valuation actions taken by the Valuation Committee or the Management Valuation Team which may include items for ratification.
Valuations of fair valued securities are compared to the next actual sales price when available, or other appropriate market values, to assess the continued appropriateness of the fair valuation methodologies used. These securities are fair valued on a day-to-day basis, taking into consideration changes to appropriate market information and any significant changes to the inputs considered in the valuation process until there is a readily available price provided on an exchange or by an independent pricing service. Valuations received from an independent pricing service or independent broker-dealer quotes are periodically validated by comparisons to most recent trades and valuations provided by other
| | | | |
| 20 | | Wells Fargo Advantage Emerging Markets Equity Select Fund | | Notes to financial statements (unaudited) |
independent pricing services in addition to the review of prices by the adviser and/or subadviser. Unobservable inputs used in determining fair valuations are identified based on the type of security, taking into consideration factors utilized by market participants in valuing the investment, knowledge about the issuer and the current market environment.
Foreign currency translation
The accounting records of the Fund are maintained in U.S. dollars. The values of other assets and liabilities denominated in foreign currencies are translated into U.S. dollars at rates provided by an independent foreign currency pricing source at a time each business day specified by the Management Valuation Team. Purchases and sales of securities, and income and expenses are converted at the rate of exchange on the respective dates of such transactions. Net realized foreign exchange gains or losses arise from sales of foreign currencies, currency gains or losses realized between the trade and settlement dates on securities transactions, and the difference between the amounts of dividends, interest and foreign withholding taxes recorded and the U.S. dollar equivalent of the amounts actually paid or received. Net unrealized foreign exchange gains and losses arise from changes in the fair value of assets and liabilities other than investments in securities resulting from changes in exchange rates. The changes in net assets arising from changes in exchange rates and the changes in net assets resulting from changes in market prices of securities are not separately presented. Such changes are included in net realized and unrealized gains or losses from investments.
Forward foreign currency contracts
The Fund is subject to foreign currency exchange rate risk in the normal course of pursuing its investment objectives. A forward foreign currency contract is an agreement between two parties to purchase or sell a specific currency for an agreed-upon price at a future date. The Fund enters into forward foreign currency contracts to facilitate transactions in foreign-denominated securities and to attempt to minimize the risk to the Fund from adverse changes in the relationship between currencies. Forward foreign currency contracts are recorded at the forward rate and marked-to-market daily. When the contracts are closed, realized gains and losses arising from such transactions are recorded as realized gains or losses on forward foreign currency contract transactions. The Fund could be exposed to risks if the counterparties to the contracts are unable to meet the terms of their contracts or if the value of the foreign currency changes unfavorably. The Fund’s maximum risk of loss from counterparty credit risk is the unrealized gains on the contracts. This risk may be mitigated if there is a master netting arrangement between the Fund and the counterparty.
Security loans
The Fund may lend its securities from time to time in order to earn additional income in the form of fees or interest on securities received as collateral or the investment of any cash received as collateral. The Fund continues to receive interest or dividends on the securities loaned. The Fund receives collateral in the form of cash or securities with a value at least equal to the value of the securities on loan. The value of the loaned securities is determined at the close of each business day and any additional required collateral is delivered to the Fund on the next business day. In a securities lending transaction, the net asset value of the Fund will be affected by an increase or decrease in the value of the securities loaned and by an increase or decrease in the value of the instrument in which collateral is invested. The amount of securities lending activity undertaken by the Fund fluctuates from time to time. In the event of default or bankruptcy by the borrower, the Fund may be prevented from recovering the loaned securities or gaining access to the collateral or may experience delays or costs in doing so. In addition, the investment of any cash collateral received may lose all or part of its value. The Fund has the right under the lending agreement to recover the securities from the borrower on demand.
The Fund lends its securities through an unaffiliated securities lending agent. Cash collateral received in connection with its securities lending transactions is invested in Securities Lending Cash Investments, LLC (the “Securities Lending Fund”). The Securities Lending Fund is exempt from registration under Section 3(c)(7) of the 1940 Act and is managed by Funds Management and is subadvised by Wells Capital Management Incorporated (“WellsCap”). Funds Management receives an advisory fee starting at 0.05% and declining to 0.01% as the average daily net assets of the Securities Lending Fund increase. All of the fees received by Funds Management are paid to WellsCap for its services as subadviser. The Securities Lending Fund seeks to provide a positive return compared to the daily Fed Funds Open rate by investing in high-quality, U.S. dollar-denominated short-term money market instruments. Securities Lending Fund investments are fair valued based upon the amortized cost valuation technique. Income earned from investment in the Securities Lending Fund is included in securities lending income on the Statement of Operations.
Security transactions and income recognition
Securities transactions are recorded on a trade date basis. Realized gains or losses are recorded on the basis of identified cost.
Dividend income is recognized on the ex-dividend date, except for certain dividends from foreign securities, which are recorded as soon as the custodian verifies the ex-dividend date. Dividend income from foreign securities is recorded net of foreign taxes withheld where recovery of such taxes is not assured.
| | | | | | |
| Notes to financial statements (unaudited) | | Wells Fargo Advantage Emerging Markets Equity Select Fund | | | 21 | |
Distributions to shareholders
Distributions to shareholders from net investment income and net realized gains, if any, are recorded on the ex-dividend date. Such distributions are determined in conformity with federal income tax regulations, which may differ in amount or character from net investment income and realized gains recognized for purposes of U.S. generally accepted accounting principles.
Federal and other taxes
The Fund intends to continue to qualify as a regulated investment company by distributing substantially all of its investment company taxable income and any net realized capital gains (after reduction for capital loss carryforwards) sufficient to relieve it from all, or substantially all, federal income taxes. Accordingly, no provision for federal income taxes was required.
The Fund’s income and federal excise tax returns and all financial records supporting those returns for the fiscal years since commencement of operations are subject to examination by the federal and Delaware revenue authorities. Management has analyzed the Fund’s tax positions taken on federal, state, and foreign tax returns for all open tax years and does not believe that there are any uncertain tax positions that require recognition of a tax liability.
Class allocations
The separate classes of shares offered by the Fund differ principally in applicable sales charges, distribution, shareholder servicing, and administration fees. Class specific expenses are charged directly to that share class. Investment income, common expenses, and realized and unrealized gains (losses) on investments are allocated daily to each class of shares based on the relative proportion of net assets of each class.
3. FAIR VALUATION MEASUREMENTS
Fair value measurements of investments are determined within a framework that has established a fair value hierarchy based upon the various data inputs utilized in determining the value of the Fund’s investments. The three-level hierarchy gives the highest priority to unadjusted quoted prices in active markets for identical assets or liabilities (Level 1) and the lowest priority to significant unobservable inputs (Level 3). The Fund’s investments are classified within the fair value hierarchy based on the lowest level of input that is significant to the fair value measurement. The inputs are summarized into three broad levels as follows:
| n | | Level 1 – quoted prices in active markets for identical securities |
| n | | Level 2 – other significant observable inputs (including quoted prices for similar securities, interest rates, prepayment speeds, credit risk, use of amortized cost, etc.) |
| n | | Level 3 – significant unobservable inputs (including the Fund’s own assumptions in determining the fair value of investments) |
The inputs or methodologies used for valuing investments in securities are not necessarily an indication of the risk associated with investing in those securities.
| | | | |
| 22 | | Wells Fargo Advantage Emerging Markets Equity Select Fund | | Notes to financial statements (unaudited) |
The following is a summary of the inputs used in valuing the Fund’s assets and liabilities as of April 30, 2015:
| | | | | | | | | | | | | | | | |
| | | Quoted prices
(Level 1) | | | Other significant
observable inputs
(Level 2) | | | Significant
unobservable inputs
(Level 3) | | | Total | |
Assets | | | | | | | | | | | | | | | | |
Investments in: | | | | | | | | | | | | | | | | |
| | | | |
Common stocks | | | | | | | | | | | | | | | | |
Argentina | | $ | 59,779 | | | $ | 0 | | | $ | 0 | | | $ | 59,779 | |
Brazil | | | 775,335 | | | | 0 | | | | 0 | | | | 775,335 | |
Chile | | | 171,141 | | | | 0 | | | | 0 | | | | 171,141 | |
China | | | 620,961 | | | | 1,165,059 | | | | 0 | | | | 1,786,020 | |
Colombia | | | 58,851 | | | | 0 | | | | 0 | | | | 58,851 | |
Hong Kong | | | 58,761 | | | | 434,086 | | | | 0 | | | | 492,847 | |
India | | | 506,730 | | | | 0 | | | | 0 | | | | 506,730 | |
Indonesia | | | 0 | | | | 178,395 | | | | 0 | | | | 178,395 | |
Malaysia | | | 0 | | | | 123,099 | | | | 0 | | | | 123,099 | |
Mexico | | | 933,832 | | | | 0 | | | | 0 | | | | 933,832 | |
Peru | | | 34,658 | | | | 0 | | | | 0 | | | | 34,658 | |
Philippines | | | 0 | | | | 128,451 | | | | 0 | | | | 128,451 | |
Russia | | | 94,496 | | | | 156,068 | | | | 0 | | | | 250,564 | |
South Africa | | | 24,926 | | | | 399,896 | | | | 0 | | | | 424,822 | |
South Korea | | | 221,429 | | | | 642,797 | | | | 0 | | | | 864,226 | |
Taiwan | | | 403,260 | | | | 278,204 | | | | 0 | | | | 681,464 | |
Thailand | | | 284,446 | | | | 36,485 | | | | 0 | | | | 320,931 | |
Turkey | | | 0 | | | | 50,511 | | | | 0 | | | | 50,511 | |
United Kingdom | | | 0 | | | | 84,513 | | | | 0 | | | | 84,513 | |
| | | | |
Preferred stocks | | | | | | | | | | | | | | | | |
Brazil | | | 142,211 | | | | 0 | | | | 0 | | | | 142,211 | |
| | | | |
Exchange-traded funds | | | | | | | | | | | | | | | | |
United States | | | 167,838 | | | | 0 | | | | 0 | | | | 167,838 | |
| | | | |
Short-term investments | | | | | | | | | | | | | | | | |
Investment companies | | | 346,401 | | | | 310,678 | | | | 0 | | | | 657,079 | |
Total assets | | $ | 4,905,055 | | | $ | 3,988,242 | | | $ | 0 | | | $ | 8,893,297 | |
The Fund recognizes transfers between levels within the fair value hierarchy at the end of the reporting period. At April 30, 2015, fair value pricing was used in pricing certain foreign securities and securities valued at $3,941,605 were transferred from Level 1 to Level 2. The Fund did not have any transfers into/out of Level 3.
4. TRANSACTIONS WITH AFFILIATES
Advisory fee
The Trust has entered into an advisory contract with Funds Management, an indirect wholly owned subsidiary of Wells Fargo & Company (“Wells Fargo”). The adviser is responsible for implementing investment policies and guidelines and for supervising the subadviser, who is responsible for day-to-day portfolio management of the Fund.
Pursuant to the contract, Funds Management is entitled to receive an annual advisory fee starting at 1.00% and declining to 0.90% as the average daily net assets of the Fund increase. For the six months ended April 30, 2015, the advisory fee was equivalent to an annual rate of 1.00% of the Fund’s average daily net assets.
Funds Management has retained the services of a subadviser to provide daily portfolio management to the Fund. The fee for subadvisory services is borne by Funds Management. WellsCap, an affiliate of Funds Management and an indirect wholly owned subsidiary of Wells Fargo, is the subadviser to the Fund and is entitled to receive a fee from Funds Management at an annual rate starting at 0.60% and declining to 0.425% as the average daily net assets of the Fund increase.
| | | | | | |
| Notes to financial statements (unaudited) | | Wells Fargo Advantage Emerging Markets Equity Select Fund | | | 23 | |
Administration fees
The Trust has entered into an administration agreement with Funds Management. Under this agreement, for providing administrative services, which includes paying fees and expenses for services provided by the transfer agent, sub-transfer agents, omnibus account servicers and record-keepers, Funds Management is entitled to receive from the Fund an annual fund level administration fee starting at 0.05% and declining to 0.03% as the average daily net assets of the Fund increase and a class level administration fee which is calculated based on the average daily net assets of each class as follows:
| | | | |
| | | Class level
administration fee | |
Class A, Class C | | | 0.26 | % |
Class R6 | | | 0.03 | |
Administrator Class | | | 0.10 | |
Institutional Class | | | 0.08 | |
Funds Management has contractually waived and/or reimbursed advisory and administration fees to the extent necessary to maintain certain net operating expense ratios for the Fund. Waiver of fees and/or reimbursement of expenses by Funds Management were made first from fund level expenses on a proportionate basis and then from class specific expenses. Funds Management has committed through February 29, 2016 to waive fees and/or reimburse expenses to the extent necessary to cap the Fund’s expenses at 1.65% for Class A shares, 2.40% for Class C shares, 1.15% for Class R6 shares, 1.45% for Administrator Class shares, and 1.20% for Institutional Class shares. After this time, the cap may be increased or the commitment to maintain the cap may be terminated only with the approval of the Board of Trustees.
Distribution fee
The Trust has adopted a Distribution Plan for Class C shares of the Fund pursuant to Rule 12b-1 under the 1940 Act. A distribution fee is charged to Class C shares and paid to Wells Fargo Funds Distributor, LLC (“Funds Distributor”), the principal underwriter, at an annual rate of 0.75% of the average daily net assets of Class C shares.
In addition, Funds Distributor is entitled to receive the front-end sales charge from the purchase of Class A shares and a contingent deferred sales charge on the redemption of certain Class A shares. Funds Distributor is also entitled to receive the contingent deferred sales charges from redemptions of Class C shares. For the six months ended April 30, 2015, Funds Distributor received $81 from the sale of Class A shares.
Shareholder servicing fees
The Trust has entered into contracts with one or more shareholder servicing agents, whereby Class A, Class C, and Administrator Class of the Fund is charged a fee at an annual rate of 0.25% of the average daily net assets of each respective class.
A portion of these total shareholder servicing fees were paid to affiliates of Wells Fargo.
5. INVESTMENT PORTFOLIO TRANSACTIONS
Purchases and sales of investments, excluding U.S. government obligations (if any) and short-term securities, for the six months ended April 30, 2015 were $2,169,596 and $413,137, respectively.
6. DERIVATIVE TRANSACTIONS
During the six months ended April 30, 2015, the Fund entered into forward foreign currency contracts for economic hedging purposes.
As of April 30, 2015, the Fund did not have any open forward foreign currency contracts. The Fund had an average contract amount of $589 in forward foreign currency contracts to sell during the six months ended April 30, 2015.
7. BANK BORROWINGS
The Trust (excluding the money market funds and certain other funds in the Trust) and Wells Fargo Variable Trust are parties to a $150,000,000 revolving credit agreement, whereby the Fund is permitted to use bank borrowings for temporary or emergency purposes, such as to fund shareholder redemption requests. Interest under the credit agreement is charged to the Fund based on a borrowing rate equal to the higher of the Federal Funds rate in effect on that day plus 1.25% or the overnight LIBOR rate in effect on that day plus 1.25%. In addition, an annual commitment fee equal to 0.10% of the unused balance is allocated to each participating fund. For the six months ended April 30, 2015, the Fund paid $7 in commitment fees.
| | | | |
| 24 | | Wells Fargo Advantage Emerging Markets Equity Select Fund | | Notes to financial statements (unaudited) |
For the six months ended April 30, 2015, there were no borrowings by the Fund under the agreement.
8. INDEMNIFICATION
Under the Trust’s organizational documents, the officers and Trustees have been granted certain indemnification rights against certain liabilities that may arise out of performance of their duties to the Trust. Additionally, in the normal course of business, the Trust may enter into contracts with service providers that contain a variety of indemnification clauses. The Trust’s maximum exposure under these arrangements is dependent on future claims that may be made against the Fund and, therefore, cannot be estimated.
9. FUND LIQUIDATION
At a meeting of the Board of Trustees held on June 15, 2015, the Trustees approved the liquidation of the Fund. The Fund is currently closed to new direct investors and additional investments from existing shareholders. Existing retirement plans, benefit plans and retirement plan platforms may continue to add new participants and make additional purchases until the Fund’s liquidation date. The liquidation of the Fund is expected to occur after close of business on or about July 17, 2015. Shareholders of the Fund on the date of liquidation will receive a distribution of their account proceeds, including any accrued dividends, in complete redemption of their shares.
| | | | | | |
| Other information (unaudited) | | Wells Fargo Advantage Emerging Markets Equity Select Fund | | | 25 | |
TAX INFORMATION
Pursuant to Section 853 of the Internal Revenue Code, the following amounts were designated as foreign taxes paid for the fiscal year ended October 31, 2014. These amounts may be less than the actual foreign taxes paid for financial statement purposes. Foreign taxes paid or withheld should be included in taxable income with an offsetting deduction from gross income or as a credit for taxes paid to foreign governments. None of the income was derived from ineligible foreign sources as defined under Section 901(j) of the Internal Revenue Code.
| | | | |
Creditable
foreign taxes
paid | | Per share amount | | Foreign
income as % of ordinary income
distributions |
| $8,911 | | $0.0128 | | 82.01% |
PROXY VOTING INFORMATION
A description of the policies and procedures that the Fund uses to determine how to vote proxies relating to portfolio securities is available, upon request, by calling 1-800-222-8222, visiting our website at wellsfargoadvantagefunds.com, or visiting the SEC website at sec.gov. Information regarding how the Fund voted proxies relating to portfolio securities during the most recent 12-month period ended June 30 is available on the Fund’s website at wellsfargoadvantagefunds.com or by visiting the SEC website at sec.gov.
PORTFOLIO HOLDINGS INFORMATION
The complete portfolio holdings for the Fund are publicly available monthly on the Fund’s website (wellsfargoadvantagefunds.com), on a one-month delayed basis. In addition, top ten holdings information (excluding derivative positions) for the Fund is publicly available on the Fund’s website on a monthly, seven-day or more delayed basis. The Fund files its complete schedule of portfolio holdings with the SEC for the first and third quarters of each fiscal year on Form N-Q, which is available by visiting the SEC website at sec.gov. In addition, the Fund’s Form N-Q may be reviewed and copied at the SEC’s Public Reference Room in Washington, DC, and at regional offices in New York City, at 233 Broadway, and in Chicago, at 175 West Jackson Boulevard, Suite 900. Information about the Public Reference Room may be obtained by calling 1-800-SEC-0330.
| | | | |
| 26 | | Wells Fargo Advantage Emerging Markets Equity Select Fund | | Other information (unaudited) |
BOARD OF TRUSTEES AND OFFICERS
Each of the Trustees and Officers1 listed in the table below acts in identical capacities for each fund in the Wells Fargo Advantage family of funds, which consists of 134 mutual funds comprising the Wells Fargo Funds Trust, Wells Fargo Variable Trust, Wells Fargo Master Trust and four closed-end funds (collectively the “Fund Complex”). This table should be read in conjunction with the Prospectus and the Statement of Additional Information2. The mailing address of each Trustee and Officer is 525 Market Street, 12th Floor, San Francisco, CA 94105. Each Trustee and Officer serves an indefinite term, however, each Trustee serves such term until reaching the mandatory retirement age established by the Trustees.
Independent Trustees
| | | | | | |
Name and year of birth | | Position held and length of service* | | Principal occupations during past five years or longer | | Other directorships during
past five years |
William R. Ebsworth
(Born 1957) | | Trustee, since 2015** | | Retired. From 1984 to 2013, equities analyst, portfolio manager, research director at Fidelity Management and Research Company and retired in 2013 as Chief Investment Officer of Fidelity Strategic Advisers, Inc. in Boston, Tokyo, and Hong Kong where he led a team of investment professionals managing client assets. Prior thereto, Board member of Hong Kong Securities Clearing Co., Hong Kong Options Clearing Corp., the Thailand International Fund, Ltd., Fidelity Investments Life Insurance Company, and Empire Fidelity Investments Life Insurance Company. Mr. Ebsworth is an Adjunct Lecturer, Finance, at Babson College and a Chartered Financial Analyst. | | Asset Allocation Trust |
Jane A. Freeman
(Born 1953) | | Trustee, since 2015** | | Retired. From 2012 to 2014 and 1999 to 2008, Chief Financial Officer of Scientific Learning Corporation. From 2008 to 2012, Ms. Freeman provided consulting services related to strategic business projects. Prior to 1999, Portfolio Manager at Rockefeller & Co. and Scudder, Stevens & Clark. Board member of the Harding Loevner Funds from 1996 to 2014, serving as both Lead Independent Director and chair of the Audit Committee. Board member of the Russell Exchange Traded Funds Trust from 2011 to 2012 and the chair of the Audit Committee. Ms. Freeman is a Chartered Financial Analyst (inactive), Chair of Taproot Foundation (non-profit organization) and a Board Member of Ruth Bancroft Garden (non-profit organization). | | Asset Allocation Trust |
Peter G. Gordon
(Born 1942) | | Trustee, since 1998; Chairman, since 2005 | | Co-Founder, Retired Chairman, President and CEO of Crystal Geyser Water Company. Trustee Emeritus, Colby College. | | Asset Allocation Trust |
Isaiah Harris, Jr.
(Born 1952) | | Trustee, since 2009 | | Retired. Chairman of the Board of CIGNA Corporation since 2009, and Director since 2005. From 2003 to 2011, Director of Deluxe Corporation. Prior thereto, President and CEO of BellSouth Advertising and Publishing Corp. from 2005 to 2007, President and CEO of BellSouth Enterprises from 2004 to 2005 and President of BellSouth Consumer Services from 2000 to 2003. Emeritus member of the Iowa State University Foundation Board of Governors. Emeritus Member of the Advisory Board of Iowa State University School of Business. Advisory Board Member, Palm Harbor Academy. Mr. Harris is a certified public accountant. | | CIGNA Corporation; Asset Allocation Trust |
Judith M. Johnson
(Born 1949) | | Trustee, since 2008; Audit Committee Chairman, since 2008 | | Retired. Prior thereto, Chief Executive Officer and Chief Investment Officer of Minneapolis Employees Retirement Fund from 1996 to 2008. Ms. Johnson is an attorney, certified public accountant and a certified managerial accountant. | | Asset Allocation Trust |
David F. Larcker
(Born 1950) | | Trustee, since 2009 | | James Irvin Miller Professor of Accounting at the Graduate School of Business, Stanford University, Morgan Stanley Director of the Center for Leadership Development and Research and Senior Faculty of The Rock Center for Corporate Governance since 2006. From 2005 to 2008, Professor of Accounting at the Graduate School of Business, Stanford University. Prior thereto, Ernst & Young Professor of Accounting at The Wharton School, University of Pennsylvania from 1985 to 2005. | | Asset Allocation Trust |
Olivia S. Mitchell
(Born 1953) | | Trustee, since 2006 | | International Foundation of Employee Benefit Plans Professor, Wharton School of the University of Pennsylvania since 1993. Director of Wharton’s Pension Research Council and Boettner Center on Pensions & Retirement Research, and Research Associate at the National Bureau of Economic Research. Previously, Cornell University Professor from 1978 to 1993. | | Asset Allocation Trust |
| | | | | | |
| Other information (unaudited) | | Wells Fargo Advantage Emerging Markets Equity Select Fund | | | 27 | |
| | | | | | |
Name and year of birth | | Position held and length of service* | | Principal occupations during past five years or longer | | Other directorships during
past five years |
Timothy J. Penny
(Born 1951) | | Trustee, since 1996 | | President and Chief Executive Officer of Southern Minnesota Initiative Foundation, a non-profit organization, since 2007 and Senior Fellow at the Humphrey Institute Policy Forum at the University of Minnesota since 1995. Member of the Board of Trustees of NorthStar Education Finance, Inc., a non-profit organization, since 2007. | | Asset Allocation Trust |
| Michael S. Scofield (Born 1943) | | Trustee, since 2010 | | Served on the Investment Company Institute’s Board of Governors and Executive Committee from 2008-2011 as well the Governing Council of the Independent Directors Council from 2006-2011 and the Independent Directors Council Executive Committee from 2008-2011. Chairman of the IDC from 2008-2010. Institutional Investor (Fund Directions) Trustee of Year in 2007. Trustee of the Evergreen Funds complex (and its predecessors) from 1984 to 2010. Chairman of the Evergreen Funds from 2000-2010. Former Trustee of the Mentor Funds. Retired Attorney, Law Offices of Michael S. Scofield. | | Asset Allocation Trust |
| Donald C. Willeke (Born 1940) | | Trustee, since 1996 | | Principal of the law firm of Willeke & Daniels. General Counsel of the Minneapolis Employees Retirement Fund from 1984 until its consolidation into the Minnesota Public Employees Retirement Association on June 30, 2010. Director and Vice Chair of The Tree Trust (non-profit corporation). Director of the American Chestnut Foundation (non-profit corporation). | | Asset Allocation Trust |
| * | Length of service dates reflect the Trustee’s commencement of service with the Trust’s predecessor entities, where applicable. |
| ** | William R. Ebsworth and Jane A. Freeman each became a Trustee effective January 1, 2015. |
Officers
| | | | | | |
Name and
year of birth | | Position held and
length of service | | Principal occupations during past five years or longer | | |
| Karla M. Rabusch (Born 1959) | | President, since 2003 | | Executive Vice President of Wells Fargo Bank, N.A. and President of Wells Fargo Funds Management, LLC since 2003. | | |
| Jeremy DePalma1 (Born 1974) | | Treasurer, since 2012 | | Senior Vice President of Wells Fargo Funds Management, LLC since 2009. Senior Vice President of Evergreen Investment Management Company, LLC from 2008 to 2010. Vice President, Evergreen Investment Services, Inc. from 2004 to 2007. Head of the Fund Reporting and Control Team within Fund Administration from 2005 to 2010. | | |
| C. David Messman (Born 1960) | | Secretary, since 2000; Chief Legal Officer, since 2003 | | Senior Vice President and Secretary of Wells Fargo Funds Management, LLC since 2001. Assistant General Counsel of Wells Fargo Bank, N.A. since 2013 and Vice President and Managing Counsel of Wells Fargo Bank N.A. from 1996 to 2013. | | |
Debra Ann Early
(Born 1964) | | Chief Compliance Officer, since 2007 | | Senior Vice President of Wells Fargo Funds Management, LLC since 2007 and Chief Compliance Officer from 2007 to 2014. Chief Compliance Officer of Parnassus Investments from 2005 to 2007. Chief Financial Officer of Parnassus Investments from 2004 to 2007 and Senior Audit Manager of PricewaterhouseCoopers LLP from 1998 to 2004. | | |
David Berardi
(Born 1975) | | Assistant Treasurer, since 2009 | | Vice President of Wells Fargo Funds Management, LLC since 2009. Vice President of Evergreen Investment Management Company, LLC from 2008 to 2010. Assistant Vice President of Evergreen Investment Services, Inc. from 2004 to 2008. Manager of Fund Reporting and Control for Evergreen Investment Management Company, LLC from 2004 to 2010. | | |
| 1 | Jeremy DePalma acts as Treasurer of 61 funds and Assistant Treasurer of 73 funds in the Fund Complex. |
| 2 | The Statement of Additional Information includes additional information about the Trustees and is available, without charge, upon request, by calling 1-800-222-8222 or by visiting the website at wellsfargoadvantagefunds.com. |
| | | | |
| 28 | | Wells Fargo Advantage Emerging Markets Equity Select Fund | | List of abbreviations |
The following is a list of common abbreviations for terms and entities that may have appeared in this report.
| ACA | — ACA Financial Guaranty Corporation |
| ADR | — American depositary receipt |
| ADS | — American depositary shares |
| AGC | — Assured Guaranty Corporation |
| AGM | — Assured Guaranty Municipal |
| Ambac | — Ambac Financial Group Incorporated |
| AMT | — Alternative minimum tax |
| BAN | — Bond anticipation notes |
| BHAC | — Berkshire Hathaway Assurance Corporation |
| CAB | — Capital appreciation bond |
| CCAB | — Convertible capital appreciation bond |
| CDA | — Community Development Authority |
| CDO | — Collateralized debt obligation |
| DRIVER | — Derivative inverse tax-exempt receipts |
| DW&P | — Department of Water & Power |
| DWR | — Department of Water Resources |
| ECFA | — Educational & Cultural Facilities Authority |
| EDA | — Economic Development Authority |
| EDFA | — Economic Development Finance Authority |
| ETF | — Exchange-traded fund |
| FDIC | — Federal Deposit Insurance Corporation |
| FFCB | — Federal Farm Credit Banks |
| FGIC | — Financial Guaranty Insurance Corporation |
| FHA | — Federal Housing Administration |
| FHLB | — Federal Home Loan Bank |
| FHLMC | — Federal Home Loan Mortgage Corporation |
| FICO | — The Financing Corporation |
| FNMA | — Federal National Mortgage Association |
| GDR | — Global depositary receipt |
| GNMA | — Government National Mortgage Association |
| HCFR | — Healthcare facilities revenue |
| HEFA | — Health & Educational Facilities Authority |
| HEFAR | — Higher education facilities authority revenue |
| HFA | — Housing Finance Authority |
| HFFA | — Health Facilities Financing Authority |
| HUD | — Department of Housing and Urban Development |
| IDA | — Industrial Development Authority |
| IDAG | — Industrial Development Agency |
| KRW | — Republic of Korea won |
| LIBOR | — London Interbank Offered Rate |
| LIFER | — Long Inverse Floating Exempt Receipts |
| LLC | — Limited liability company |
| LLLP | — Limited liability limited partnership |
| LLP | — Limited liability partnership |
| MBIA | — Municipal Bond Insurance Association |
| MFHR | — Multifamily housing revenue |
| MSTR | — Municipal securities trust receipts |
| MUD | — Municipal Utility District |
| National | — National Public Finance Guarantee Corporation |
| PCFA | — Pollution Control Financing Authority |
| PCL | — Public Company Limited |
| PCR | — Pollution control revenue |
| PFA | — Public Finance Authority |
| PFFA | — Public Facilities Financing Authority |
| PFOTER | — Puttable floating option tax-exempt receipts |
| plc | — Public limited company |
| PUTTER | — Puttable tax-exempt receipts |
| R&D | — Research & development |
| Radian | — Radian Asset Assurance |
| RAN | — Revenue anticipation notes |
| RDA | — Redevelopment Authority |
| RDFA | — Redevelopment Finance Authority |
| REIT | — Real estate investment trust |
| ROC | — Reset option certificates |
| SAVRS | — Select auction variable rate securities |
| SBA | — Small Business Authority |
| SDR | — Swedish depositary receipt |
| SFHR | — Single-family housing revenue |
| SFMR | — Single-family mortgage revenue |
| SPA | — Standby purchase agreement |
| SPDR | — Standard & Poor’s Depositary Receipts |
| SPEAR | — Short Puttable Exempt Adjustable Receipts |
| STRIPS | — Separate trading of registered interest and |
| TAN | — Tax anticipation notes |
| TIPS | — Treasury inflation-protected securities |
| TRAN | — Tax revenue anticipation notes |
| TTFA | — Transportation Trust Fund Authority |
| TVA | — Tennessee Valley Authority |


For more information
More information about Wells Fargo Advantage Funds is available free upon request. To obtain literature, please write, email, visit the Fund’s website, or call:
Wells Fargo Advantage Funds
P.O. Box 8266
Boston, MA 02266-8266
Email: wfaf@wellsfargo.com
Website: wellsfargoadvantagefunds.com
Individual investors: 1-800-222-8222
Retail investment professionals: 1-888-877-9275
Institutional investment professionals: 1-866-765-0778
This report and the financial statements contained herein are submitted for the general information of the shareholders of Wells Fargo Advantage Funds. If this report is used for promotional purposes, distribution of the report must be accompanied or preceded by a current prospectus. Before investing, please consider the investment objectives, risks, charges, and expenses of the investment. For a current prospectus and, if available, a summary prospectus, containing this information, call 1-800-222-8222 or visit the Fund’s website at wellsfargoadvantagefunds.com. Read the prospectus carefully before you invest or send money.
Wells Fargo Funds Management, LLC, a wholly owned subsidiary of Wells Fargo & Company, provides investment advisory and administrative services for Wells Fargo Advantage Funds. Other affiliates of Wells Fargo & Company provide subadvisory and other services for the Funds. The Funds are distributed by Wells Fargo Funds Distributor, LLC, Member FINRA/SIPC, an affiliate of Wells Fargo & Company.
NOT FDIC INSURED ¡ NO BANK GUARANTEE ¡ MAY LOSE VALUE
© 2015 Wells Fargo Funds Management, LLC. All rights reserved.
| | |
 | | 233654 06-15 SA266/SAR266 04-15 |

Wells Fargo Advantage
Global Opportunities Fund

Semi-Annual Report
April 30, 2015

Reduce clutter. Save trees.
Sign up for electronic delivery of prospectuses and shareholder reports at wellsfargo.com/advantagedelivery
Contents
The views expressed and any forward-looking statements are as of April 30, 2015, unless otherwise noted, and are those of the Fund managers and/or Wells Fargo Funds Management, LLC. Discussions of individual securities, or the markets generally, or any Wells Fargo Advantage Fund are not intended as individual recommendations. Future events or results may vary significantly from those expressed in any forward-looking statements; the views expressed are subject to change at any time in response to changing circumstances in the market. Wells Fargo Funds Management, LLC and the Fund disclaim any obligation to publicly update or revise any views expressed or forward-looking statements.
NOT FDIC INSURED ¡ NO BANK GUARANTEE ¡ MAY LOSE VALUE
| | | | |
| 2 | | Wells Fargo Advantage Global Opportunities Fund | | Letter to shareholders (unaudited) |

Karla M. Rabusch
President
Wells Fargo Advantage Funds
A worldwide trend toward looser monetary policy tended to support stock and bond markets in both developed and emerging economies.
European stocks were boosted by the anticipation and then the reality of the ECB’s asset purchases.
Dear Valued Shareholder:
We are pleased to offer you this semi-annual report for the Wells Fargo Advantage Global Opportunities Fund for the six-month period that ended April 30, 2015. The period was marked by low global interest rates as major central banks initiated or increased their quantitative easing programs. By the end of the period, some European sovereign debt issues were selling at negative yields. In the U.S., large-cap stocks, as measured by the S&P 500 Index1, gained 7.22%, boosted by stronger economic data in the U.S. Although non-U.S. economic growth was more restrained, developed international stocks, as measured by the MSCI EAFE Index (Net)2, gained 6.81%, appreciating, in part, because of quantitative easing in Europe and Japan.
Major central banks continued to provide liquidity to the markets.
A worldwide trend toward looser monetary policy tended to support stock and bond markets in both developed and emerging economies. Throughout the reporting period, the Federal Open Market Committee (FOMC), which is the U.S. Federal Reserve’s (Fed’s) monetary policymaking body, kept its key interest rate effectively at zero. Even though the FOMC ended its bond-buying program in October 2014 and guided investors to expect an interest-rate hike in mid- to late-2015, the Fed remained accommodative.
The European Central Bank (ECB) maintained a variety of measures aimed at encouraging lending, including making funds available to banks at low interest rates and imposing a negative interest rate on bank deposits held at the central bank. In January 2015, the bank announced quantitative easing via significant bond purchases in an attempt to raise the eurozone’s inflation to just under its target of 2%. In Japan, the Bank of Japan (BOJ) also maintained an aggressive monetary program aimed at combating deflation.
The U.S. outperformed other developed markets economies, while major emerging economies grappled with slower growth.
Reported U.S. gross domestic product (GDP) growth came in at a solid 2.2% annualized rate in the fourth quarter of 2014. Although the initial estimate for annualized GDP growth came in at a modest 0.2% in the first quarter of 2015, the slowdown was attributed to short-term factors such as a harsh winter and a long-lived strike at West Coast ports.
European annualized GDP growth was 1.3% in the fourth quarter of 2014 and 1.4% in the first quarter of 2015. European stocks were boosted by the anticipation and then the reality of the ECB’s asset purchases. As also occurred in the U.S., the central bank’s purchase of fixed-income assets provided liquidity that investors poured into riskier assets, including stocks. A similar dynamic played out in Japan, although Japanese shares received the benefit of direct purchases from the BOJ and major pension funds.
Among major emerging markets, Chinese government data showed a slowdown in fixed-asset investment, which includes property investment, and modest growth in manufacturing and housing sales. However, China’s growth rates still
| 1 | The S&P 500 Index consists of 500 shares chosen for market size, liquidity, and industry group representation. It is a market-value-weighted index with each share’s weight in the index proportionate to its market value. You cannot invest directly in an index. |
| 2 | The Morgan Stanley Capital International Europe, Australasia, and Far East (MSCI EAFE) Index (Net) is a free-float-adjusted market-capitalization-weighted index that is designed to measure the equity market performance of developed markets, excluding the U.S. and Canada. You cannot invest directly in an index. Source: MSCI. MSCI makes no express or implied warranties or representations and shall have no liability whatsoever with respect to any MSCI data contained herein. The MSCI data may not be further redistributed or used as a basis for other indexes or any securities or financial products. This report is not approved, reviewed, or produced by MSCI. |
| | | | | | |
| Letter to shareholders (unaudited) | | Wells Fargo Advantage Global Opportunities Fund | | | 3 | |
contrasted favorably with stagnant growth in most developed economies. Brazil faced a challenging situation with a growing corruption scandal affecting the state-controlled oil company, a struggling economy, and a severe drought affecting the city of São Paulo. The MSCI Emerging Markets Index (Net)3 ended the period with a 3.92% return.
Don’t let short-term uncertainty derail long-term investment goals.
Periods of uncertainty can present challenges, but experience has taught us that maintaining long-term investment goals can be an effective way to plan for the future. To help you create a sound strategy based on your personal goals and risk tolerance, Wells Fargo Advantage Funds offers more than 100 mutual funds and other investments spanning a wide range of asset classes and investment styles. Although diversification cannot guarantee an investment profit or prevent losses, we believe it can be an effective way to manage investment risk and potentially smooth out overall portfolio performance. We encourage investors to know their investments and to understand that appropriate levels of risk-taking may unlock opportunities.
Thank you for choosing to invest with Wells Fargo Advantage Funds. We appreciate your confidence in us and remain committed to helping you meet your financial needs.
Sincerely,

Karla M. Rabusch
President
Wells Fargo Advantage Funds
For current information about your fund investments, contact your investment professional, visit our website at wellsfargoadvantagefunds.com, or call us directly at 1-800-222-8222. We are available 24 hours a day, 7 days a week.
| 3 | The Morgan Stanley Capital International (MSCI) Emerging Markets Index (Net) is a free-float-adjusted market-capitalization-weighted index that is designed to measure the equity market performance of emerging markets. The MSCI Emerging Markets Index (Net) consists of the following 23 emerging markets country indexes: Brazil, Chile, China, Colombia, Czech Republic, Egypt, Greece, Hungary, India, Indonesia, Korea, Malaysia, Mexico, Peru, the Philippines, Poland, Qatar, Russia, South Africa, Taiwan, Thailand, Turkey, and United Arab Emirates. You cannot invest directly in an index. |
| | | | |
| 4 | | Wells Fargo Advantage Global Opportunities Fund | | Performance highlights (unaudited) |
Investment objective
The Fund seeks long-term capital appreciation.
Adviser
Wells Fargo Funds Management, LLC
Subadviser
Wells Capital Management Incorporated
Portfolio managers
Oleg Makhorine
Robert Rifkin, CFA
James M. Tringas, CFA
Bryant VanCronkhite, CFA, CPA
Average annual total returns1 (%) as of April 30, 2015
| | | | | | | | | | | | | | | | | | | | | | | | | | | | | | | | | | |
| | | | | Including sales charge | | | Excluding sales charge | | | Expense ratios2 (%) | |
| | | Inception date | | 1 year | | | 5 year | | | 10 year | | | 1 year | | | 5 year | | | 10 year | | | Gross | | | Net3 | |
| Class A (EKGAX) | | 3-16-1988 | | | (2.22 | ) | | | 8.00 | | | | 8.42 | | | | 3.75 | | | | 9.29 | | | | 9.06 | | | | 1.58 | | | | 1.56 | |
| Class B (EKGBX)* | | 2-1-1993 | | | (1.17 | ) | | | 8.18 | | | | 8.51 | | | | 2.97 | | | | 8.47 | | | | 8.51 | | | | 2.33 | | | | 2.31 | |
| Class C (EKGCX) | | 2-1-1993 | | | 1.98 | | | | 8.47 | | | | 8.26 | | | | 2.98 | | | | 8.47 | | | | 8.26 | | | | 2.33 | | | | 2.31 | |
| Administrator Class (EKGYX) | | 1-13-1997 | | | – | | | | – | | | | – | | | | 3.93 | | | | 9.48 | | | | 9.31 | | | | 1.42 | | | | 1.41 | |
| Institutional Class (EKGIX) | | 7-30-2010 | | | – | | | | – | | | | – | | | | 4.21 | | | | 9.75 | | | | 9.44 | | | | 1.15 | | | | 1.15 | |
| S&P Developed SmallCap Index4 | | – | | | – | | | | – | | | | – | | | | 6.72 | | | | 11.87 | | | | 8.94 | | | | – | | | | – | |
| * | | Class B shares are closed to investment, except in connection with the reinvestment of any distributions and permitted exchanges. |
Figures quoted represent past performance, which is no guarantee of future results, and do not reflect taxes that a shareholder may pay on fund distributions or the redemption of fund shares. Investment return and principal value of an investment will fluctuate so that an investor’s shares, when redeemed, may be worth more or less than their original cost. Performance shown without sales charges would be lower if sales charges were reflected. Current performance may be lower or higher than the performance data quoted, which assumes the reinvestment of dividends and capital gains. Current month-end performance is available on the Fund’s website, wellsfargoadvantagefunds.com.
Index returns do not include transaction costs associated with buying and selling securities, any mutual fund fees or expenses, or any taxes. It is not possible to invest directly in an index.
For Class A shares, the maximum front-end sales charge is 5.75%. For Class B shares, the maximum contingent deferred sales charge is 5.00%. For Class C shares, the maximum contingent deferred sales charge is 1.00%. Performance including a contingent deferred sales charge assumes the sales charge for the corresponding time period. Administrator Class and Institutional Class shares are sold without a front-end sales charge or contingent deferred sales charge.
Stock values fluctuate in response to the activities of individual companies and general market and economic conditions. Foreign investments are especially volatile and can rise or fall dramatically due to differences in the political and economic conditions of the host country. These risks are generally intensified in emerging markets. The use of derivatives may reduce returns and/or increase volatility. Certain investment strategies tend to increase the total risk of an investment (relative to the broader market). The Fund is exposed to geographic risk and smaller-company securities risk. Consult the Fund’s prospectus for additional information on these and other risks.
Please see footnotes on page 5.
| | | | | | |
| Performance highlights (unaudited) | | Wells Fargo Advantage Global Opportunities Fund | | | 5 | |
| | | | |
| Ten largest holdings5 (%) as of April 30, 2015 | |
ACI Worldwide Incorporated | | | 1.76 | |
Krispy Kreme Doughnuts Incorporated | | | 1.76 | |
GSI Group Incorporated | | | 1.74 | |
Innospec Incorporated | | | 1.67 | |
Kadant Incorporated | | | 1.54 | |
Mueller Industries Incorporated | | | 1.53 | |
Franklin Electric Company Incorporated | | | 1.51 | |
Simpson Manufacturing Company Incorporated | | | 1.51 | |
Brown & Brown Incorporated | | | 1.50 | |
Schweitzer-Mauduit International Incorporated | | | 1.48 | |
|
| Sector distribution6 as of April 30, 2015 |
|
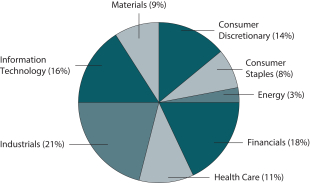 |
|
| Country allocation6 as of April 30, 2015 |
|
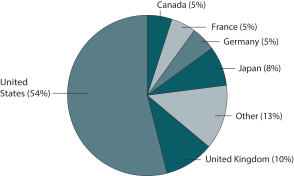 |
| 1 | Historical performance shown for Institutional Class shares prior to their inception reflects the performance of Administrator Class shares, and includes the higher expenses applicable to Administrator Class shares. If these expenses had not been included, returns would be higher. Historical performance shown for all classes of the Fund prior to July 19, 2010, is based on the performance of the Fund’s predecessor, Evergreen Global Opportunities Fund. |
| 2 | Reflects the expense ratios as stated in the most recent prospectuses, which include the impact of 0.01% in acquired fund fees and expenses. The expense ratios shown are subject to change and may differ from the annualized expense ratios shown in the financial highlights of this report, which do not include acquired fund fees and expenses. |
| 3 | The Adviser has committed through February 29, 2016, to waive fees and/or reimburse expenses to the extent necessary to cap the Fund’s Total Annual Fund Operating Expenses After Fee Waiver, excluding certain expenses, at 1.55% for Class A, 2.30% for Class B, 2.30% for Class C, 1.40% for Administrator Class, and 1.15% for Institutional Class. After this time, the cap may be increased or the commitment to maintain the cap may be terminated only with the approval of the Board of Trustees. Brokerage commissions, stamp duty fees, interest, taxes, acquired fund fees and expenses, and extraordinary expenses are excluded from the cap. Without this cap, the Fund’s returns would have been lower. |
| 4 | The S&P Developed SmallCap Index is a float-adjusted market capitalization index designed to measure the equity market performance of small capitalization companies located in developed markets. The index is comprised of companies within the bottom 15% of the cumulative market capitalization in developed markets. The index covers all publicly listed equities with float-adjusted market values of U.S. $100 million or more and annual dollar value traded of at least U.S. $50 million in all included countries. You cannot invest directly in an index. |
| 5 | The ten largest holdings, excluding cash and cash equivalents, are calculated based on the value of the investments divided by total net assets of the Fund. Holdings are subject to change and may have changed since the date specified. |
| 6 | Amounts are calculated based on the total long-term investments of the Fund. These percentages are subject to change and may have changed since the date specified. |
| | | | |
| 6 | | Wells Fargo Advantage Global Opportunities Fund | | Fund expenses (unaudited) |
As a shareholder of the Fund, you incur two types of costs: (1) transaction costs, including sales charges (loads) on purchase payments and contingent deferred sales charges (if any) on redemptions and (2) ongoing costs, including management fees, distribution (12b-1) and/or shareholder service fees, and other Fund expenses. This example is intended to help you understand your ongoing costs (in dollars) of investing in the Fund and to compare these costs with the ongoing costs of investing in other mutual funds.
The example is based on an investment of $1,000 invested at the beginning of the six-month period and held for the entire period from November 1, 2014 to April 30, 2015.
Actual expenses
The “Actual” line of the table below provides information about actual account values and actual expenses. You may use the information in this line, together with the amount you invested, to estimate the expenses that you paid over the period. Simply divide your account value by $1,000 (for example, an $8,600 account value divided by $1,000 = 8.6), then multiply the result by the number in the “Actual” line under the heading entitled “Expenses paid during period” for your applicable class of shares to estimate the expenses you paid on your account during this period.
Hypothetical example for comparison purposes
The “Hypothetical” line of the table below provides information about hypothetical account values and hypothetical expenses based on the Fund’s actual expense ratio and an assumed rate of return of 5% per year before expenses, which is not the Fund’s actual return. The hypothetical account values and expenses may not be used to estimate the actual ending account balance or expenses you paid for the period. You may use this information to compare the ongoing costs of investing in the Fund and other funds. To do so, compare this 5% hypothetical example with the 5% hypothetical examples that appear in the shareholder reports of the other funds.
Please note that the expenses shown in the table are meant to highlight your ongoing costs only and do not reflect any transactional costs, such as sales charges (loads) and contingent deferred sales charges. Therefore, the “Hypothetical” line of the table is useful in comparing ongoing costs only and will not help you determine the relative total costs of owning different funds. In addition, if these transactional costs were included, your costs would have been higher.
| | | | | | | | | | | | | | | | |
| | | Beginning
account value
11-1-2014 | | | Ending
account value
4-30-2015 | | | Expenses
paid during
the period1 | | | Net annualized
expense ratio | |
Class A | | | | | | | | | | | | | | | | |
Actual | | $ | 1,000.00 | | | $ | 1,066.98 | | | $ | 7.94 | | | | 1.55 | % |
Hypothetical (5% return before expenses) | | $ | 1,000.00 | | | $ | 1,017.11 | | | $ | 7.75 | | | | 1.55 | % |
Class B | | | | | | | | | | | | | | | | |
Actual | | $ | 1,000.00 | | | $ | 1,062.97 | | | $ | 11.76 | | | | 2.30 | % |
Hypothetical (5% return before expenses) | | $ | 1,000.00 | | | $ | 1,013.39 | | | $ | 11.48 | | | | 2.30 | % |
Class C | | | | | | | | | | | | | | | | |
Actual | | $ | 1,000.00 | | | $ | 1,062.99 | | | $ | 11.76 | | | | 2.30 | % |
Hypothetical (5% return before expenses) | | $ | 1,000.00 | | | $ | 1,013.39 | | | $ | 11.48 | | | | 2.30 | % |
Administrator Class | | | | | | | | | | | | | | | | |
Actual | | $ | 1,000.00 | | | $ | 1,067.98 | | | $ | 7.18 | | | | 1.40 | % |
Hypothetical (5% return before expenses) | | $ | 1,000.00 | | | $ | 1,017.85 | | | $ | 7.00 | | | | 1.40 | % |
Institutional Class | | | | | | | | | | | | | | | | |
Actual | | $ | 1,000.00 | | | $ | 1,069.37 | | | $ | 5.90 | | | | 1.15 | % |
Hypothetical (5% return before expenses) | | $ | 1,000.00 | | | $ | 1,019.09 | | | $ | 5.76 | | | | 1.15 | % |
| 1 | Expenses paid is equal to the annualized expense ratio of each class multiplied by the average account value over the period, multiplied by the number of days in the most recent fiscal half-year divided by the number of days in the fiscal year (to reflect the one-half-year period). |
| | | | | | |
| Portfolio of investments—April 30, 2015 (unaudited) | | Wells Fargo Advantage Global Opportunities Fund | | | 7 | |
| | | | | | | | | | | | |
| Security name | | | | | | Shares | | | Value | |
| | | | |
Common Stocks: 94.14% | | | | | | | | | | | | |
| | | | |
| Australia: 0.22% | | | | | | | | | | | | |
Super Cheap Auto Group Limited (Consumer Discretionary, Specialty Retail) « | | | | | | | 75,078 | | | $ | 584,439 | |
| | | | | | | | | | | | |
| | | | |
| Austria: 0.32% | | | | | | | | | | | | |
UNIQA Insurance Group AG (Financials, Insurance) | | | | | | | 84,451 | | | | 829,579 | |
| | | | | | | | | | | | |
| | | | |
| Belgium: 0.15% | | | | | | | | | | | | |
Barco NV (Information Technology, Electronic Equipment, Instruments & Components) « | | | | | | | 5,743 | | | | 388,216 | |
| | | | | | | | | | | | |
| | | | |
| Canada: 4.85% | | | | | | | | | | | | |
Canadian Western Bank (Financials, Banks) | | | | | | | 67,475 | | | | 1,754,406 | |
Capstone Mining Corporation (Materials, Metals & Mining) † | | | | | | | 183,636 | | | | 255,705 | |
Cott Corporation (Consumer Staples, Beverages) | | | | | | | 187,800 | | | | 1,635,738 | |
Cott Corporation - Canadian Exchange (Consumer Staples, Beverages) | | | | | | | 139,045 | | | | 1,212,394 | |
GSI Group Incorporated (Information Technology, Electronic Equipment, Instruments & Components) † | | | | | | | 341,271 | | | | 4,532,079 | |
Maple Leaf Foods Incorporated (Consumer Staples, Food Products) | | | | | | | 68,974 | | | | 1,323,455 | |
MBAC Fertilizer Corporation - Legend Shares (Materials, Chemicals) (i) | | | | | | | 84,000 | | | | 7,310 | |
Parex Resources Incorporated (Energy, Oil, Gas & Consumable Fuels) † | | | | | | | 94,897 | | | | 761,378 | |
Transglobe Energy Corporation (Energy, Oil, Gas & Consumable Fuels) | | | | | | | 132,059 | | | | 602,010 | |
Western Forest Products Incorporated (Materials, Paper & Forest Products) | | | | | | | 348,677 | | | | 528,868 | |
| | | | |
| | | | | | | | | | | 12,613,343 | |
| | | | | | | | | | | | |
| | | | |
| Denmark: 0.62% | | | | | | | | | | | | |
Jyske Bank AS (Financials, Banks) † | | | | | | | 32,767 | | | | 1,604,562 | |
| | | | | | | | | | | | |
| | | | |
| France: 4.51% | | | | | | | | | | | | |
ALTEN SA (Information Technology, IT Services) | | | | | | | 72,494 | | | | 3,538,625 | |
Eutelsat Communications SA (Consumer Discretionary, Media) | | | | | | | 46,897 | | | | 1,635,037 | |
M6 Metropole Television SA (Consumer Discretionary, Media) | | | | | | | 71,729 | | | | 1,497,043 | |
Mersen SA (Industrials, Electrical Equipment) | | | | | | | 61,675 | | | | 1,686,281 | |
Teleperformance SA (Industrials, Professional Services) | | | | | | | 44,778 | | | | 3,366,177 | |
| | | | |
| | | | | | | | | | | 11,723,163 | |
| | | | | | | | | | | | |
| | | | |
| Germany: 4.11% | | | | | | | | | | | | |
Amadeus Fire AG (Industrials, Professional Services) | | | | | | | 9,573 | | | | 775,898 | |
Bilfinger SE (Industrials, Commercial Services & Supplies) « | | | | | | | 8,136 | | | | 408,723 | |
Cancom SE (Information Technology, IT Services) « | | | | | | | 31,806 | | | | 1,315,639 | |
Gerresheimer AG (Health Care, Life Sciences Tools & Services) « | | | | | | | 40,158 | | | | 2,272,810 | |
Hochtief AG (Industrials, Construction & Engineering) « | | | | | | | 24,093 | | | | 1,861,589 | |
Kion Group AG (Industrials, Machinery) | | | | | | | 37,774 | | | | 1,675,839 | |
TLG Immobilien AG (Financials, REITs) † | | | | | | | 110,927 | | | | 1,862,088 | |
TOM TAILOR Holding AG (Consumer Discretionary, Textiles, Apparel & Luxury Goods) † | | | | | | | 40,907 | | | | 505,645 | |
| | | | |
| | | | | | | | | | | 10,678,231 | |
| | | | | | | | | | | | |
| | | | |
| Hong Kong: 0.92% | | | | | | | | | | | | |
Sunlight REIT (Financials, REITs) | | | | | | | 4,734,000 | | | | 2,390,903 | |
| | | | | | | | | | | | |
| | | | |
| Israel: 0.65% | | | | | | | | | | | | |
Orbotech Limited (Information Technology, Electronic Equipment, Instruments & Components) † | | | | | | | 93,700 | | | | 1,681,915 | |
| | | | | | | | | | | | |
The accompanying notes are an integral part of these financial statements.
| | | | |
| 8 | | Wells Fargo Advantage Global Opportunities Fund | | Portfolio of investments—April 30, 2015 (unaudited) |
| | | | | | | | | | | | |
| Security name | | | | | | Shares | | | Value | |
| | | | |
| Italy: 1.28% | | | | | | | | | | | | |
Beni Stabili SpA (Financials, REITs) | | | | | | | 1,892,024 | | | $ | 1,560,111 | |
Davide Campari-Milano SpA (Consumer Staples, Beverages) | | | | | | | 227,003 | | | | 1,755,592 | |
| | | | |
| | | | | | | | | | | 3,315,703 | |
| | | | | | | | | | | | |
| | | | |
| Japan: 7.58% | | | | | | | | | | | | |
Aeon Delight Company Limited (Industrials, Commercial Services & Supplies) | | | | | | | 84,700 | | | | 2,243,068 | |
Chiba Bank Limited (Financials, Banks) | | | | | | | 177,000 | | | | 1,454,659 | |
DTS Corporation (Information Technology, IT Services) | | | | | | | 76,100 | | | | 1,548,843 | |
FamilyMart Company Limited (Consumer Staples, Food & Staples Retailing) | | | | | | | 46,200 | | | | 1,989,511 | |
Hitachi Chemical Company Limited (Materials, Chemicals) | | | | | | | 85,600 | | | | 1,656,868 | |
Musashi Seimitsu Industry Company Limited (Consumer Discretionary, Auto Components) | | | | | | | 66,400 | | | | 1,405,448 | |
Nissin Kogyo Company Limited (Consumer Discretionary, Auto Components) | | | | | | | 99,830 | | | | 1,645,429 | |
ORIX JREIT Incorporated (Financials, REITs) | | | | | | | 1,381 | | | | 2,041,336 | |
Sumitomo Warehouse Company Limited (Industrials, Transportation Infrastructure) | | | | | | | 380,000 | | | | 2,144,008 | |
Taikisha Limited (Industrials, Construction & Engineering) | | | | | | | 52,500 | | | | 1,409,333 | |
Tokyo Ohka Kogyo Company Limited (Materials, Chemicals) | | | | | | | 35,955 | | | | 1,119,106 | |
Toshiba Machine Company Limited (Industrials, Machinery) | | | | | | | 233,263 | | | | 1,035,829 | |
| | | | |
| | | | | | | | | | | 19,693,438 | |
| | | | | | | | | | | | |
| | | | |
| Netherlands: 1.77% | | | | | | | | | | | | |
Arcadis NV (Industrials, Construction & Engineering) | | | | | | | 54,464 | | | | 1,724,004 | |
BinckBank NV (Financials, Capital Markets) | | | | | | | 147,653 | | | | 1,479,892 | |
USG People NV (Industrials, Professional Services) | | | | | | | 103,495 | | | | 1,405,466 | |
| | | | |
| | | | | | | | | | | 4,609,362 | |
| | | | | | | | | | | | |
| | | | |
| Norway: 1.46% | | | | | | | | | | | | |
Atea ASA (Information Technology, IT Services) « | | | | | | | 198,319 | | | | 2,212,412 | |
SpareBank 1 SR Bank ASA (Financials, Banks) « | | | | | | | 215,103 | | | | 1,595,291 | |
| | | | |
| | | | | | | | | | | 3,807,703 | |
| | | | | | | | | | | | |
| | | | |
| Russia: 0.17% | | | | | | | | | | | | |
Sollers OJSC (Consumer Discretionary, Automobiles) (a) | | | | | | | 53,955 | | | | 430,826 | |
| | | | | | | | | | | | |
| | | | |
| South Korea: 0.93% | | | | | | | | | | | | |
BS Financial Group Incorporated (Financials, Banks) | | | | | | | 119,424 | | | | 1,785,345 | |
Hy-Lok Corporation (Industrials, Machinery) | | | | | | | 19,851 | | | | 629,603 | |
| | | | |
| | | | | | | | | | | 2,414,948 | |
| | | | | | | | | | | | |
| | | | |
| Spain: 1.43% | | | | | | | | | | | | |
Almirall SA (Health Care, Pharmaceuticals) † | | | | | | | 77,762 | | | | 1,466,176 | |
Merlin Properties Socimi SA (Financials, REITs) Ǡ | | | | | | | 106,487 | | | | 1,455,752 | |
Prosegur Compania de Seguridad SA (Industrials, Commercial Services & Supplies) | | | | | | | 135,886 | | | | 783,322 | |
| | | | |
| | | | | | | | | | | 3,705,250 | |
| | | | | | | | | | | | |
| | | | |
| Sweden: 0.31% | | | | | | | | | | | | |
Rezidor Hotel Group AB (Consumer Discretionary, Hotels, Restaurants & Leisure) | | | | | | | 189,238 | | | | 806,152 | |
| | | | | | | | | | | | |
| | | | |
| Switzerland: 2.22% | | | | | | | | | | | | |
Aryzta AG (Consumer Staples, Food Products) | | | | | | | 21,635 | | | | 1,459,866 | |
The accompanying notes are an integral part of these financial statements.
| | | | | | |
| Portfolio of investments—April 30, 2015 (unaudited) | | Wells Fargo Advantage Global Opportunities Fund | | | 9 | |
| | | | | | | | | | | | |
| Security name | | | | | | Shares | | | Value | |
| | | | |
| Switzerland (continued) | | | | | | | | | | | | |
Dufry AG (Consumer Discretionary, Specialty Retail) † | | | | | | | 11,195 | | | $ | 1,646,078 | |
Kuoni Reisen Holding AG (Consumer Discretionary, Hotels, Restaurants & Leisure) | | | | | | | 5,190 | | | | 1,746,782 | |
OC Oerlikon Corporation AG (Information Technology, Electronic Equipment, Instruments & Components) | | | | | | | 69,936 | | | | 914,869 | |
| | | | |
| | | | | | | | | | | 5,767,595 | |
| | | | | | | | | | | | |
| | | | |
| Taiwan: 0.29% | | | | | | | | | | | | |
Siliconware Precision Industries Company (Information Technology, Semiconductors & Semiconductor Equipment) | | | | | | | 466,000 | | | | 765,547 | |
| | | | | | | | | | | | |
| | | | |
| United Kingdom: 9.52% | | | | | | | | | | | | |
Bovis Homes Group plc (Consumer Discretionary, Household Durables) | | | | | | | 153,578 | | | | 2,186,704 | |
Cambian Group plc (Health Care, Health Care Providers & Services) | | | | | | | 466,837 | | | | 1,857,771 | |
Catlin Group Limited (Financials, Insurance) (a) | | | | | | | 211,358 | | | | 2,277,536 | |
Consort Medical plc (Health Care, Health Care Equipment & Supplies) | | | | | | | 148,305 | | | | 2,139,892 | |
Debenhams plc (Consumer Discretionary, Multiline Retail) | | | | | | | 865,225 | | | | 1,188,564 | |
Hunting plc (Energy, Energy Equipment & Services) | | | | | | | 115,066 | | | | 1,034,147 | |
IMI plc (Industrials, Machinery) | | | | | | | 56,940 | | | | 1,091,117 | |
John Wood Group plc (Energy, Energy Equipment & Services) | | | | | | | 24,827 | | | | 261,588 | |
Jupiter Fund Management plc (Financials, Capital Markets) | | | | | | | 296,987 | | | | 1,955,433 | |
Keller Group plc (Industrials, Construction & Engineering) | | | | | | | 78,060 | | | | 1,194,002 | |
Mears Group plc (Industrials, Commercial Services & Supplies) | | | | | | | 271,251 | | | | 1,782,064 | |
Morgan Advanced Materials plc (Industrials, Machinery) | | | | | | | 333,093 | | | | 1,718,471 | |
Pace plc (Consumer Discretionary, Household Durables) | | | | | | | 185,986 | | | | 1,179,183 | |
Savills plc (Financials, Real Estate Management & Development) | | | | | | | 153,645 | | | | 1,945,845 | |
Shawbrook Group plc (Financials, Banks) † | | | | | | | 95,085 | | | | 451,002 | |
SIG plc (Industrials, Trading Companies & Distributors) | | | | | | | 540,088 | | | | 1,605,035 | |
Stock Spirits Group plc (Consumer Staples, Beverages) | | | | | | | 296,450 | | | | 866,525 | |
| | | | |
| | | | | | | | | | | 24,734,879 | |
| | | | | | | | | | | | |
| | | | |
| United States: 50.83% | | | | | | | | | | | | |
A. Schulman Incorporated (Materials, Chemicals) | | | | | | | 77,611 | | | | 3,294,587 | |
ACI Worldwide Incorporated (Information Technology, Software) † | | | | | | | 199,000 | | | | 4,582,970 | |
Acxiom Corporation (Information Technology, IT Services) † | | | | | | | 74,000 | | | | 1,292,040 | |
Analogic Corporation (Health Care, Health Care Equipment & Supplies) | | | | | | | 41,524 | | | | 3,508,778 | |
Atwood Oceanics Incorporated (Energy, Energy Equipment & Services) | | | | | | | 38,100 | | | | 1,271,778 | |
Bio-Rad Laboratories Incorporated Class A (Health Care, Life Sciences Tools & Services) † | | | | | | | 14,361 | | | | 1,930,836 | |
Blyth Incorporated (Consumer Discretionary, Household Durables) † | | | | | | | 93,500 | | | | 718,080 | |
Brown & Brown Incorporated (Financials, Insurance) | | | | | | | 121,722 | | | | 3,889,018 | |
CARBO Ceramics Incorporated (Energy, Energy Equipment & Services) « | | | | | | | 35,500 | | | | 1,570,165 | |
Christopher & Banks Corporation (Consumer Discretionary, Specialty Retail) † | | | | | | | 172,028 | | | | 1,021,846 | |
Coherent Incorporated (Information Technology, Electronic Equipment, Instruments & Components) † | | | | | | | 25,200 | | | | 1,512,000 | |
Delta Apparel Incorporated (Consumer Discretionary, Textiles, Apparel & Luxury Goods) † | | | | | | | 72,800 | | | | 893,256 | |
Denny’s Corporation (Consumer Discretionary, Hotels, Restaurants & Leisure) † | | | | | | | 126,260 | | | | 1,314,367 | |
Dixie Group Incorporated (Consumer Discretionary, Household Durables) Ǡ | | | | | | | 178,671 | | | | 1,756,336 | |
Domino’s Pizza Group plc (Consumer Discretionary, Hotels, Restaurants & Leisure) | | | | | | | 120,183 | | | | 1,456,476 | |
Douglas Dynamics Incorporated (Industrials, Machinery) | | | | | | | 147,702 | | | | 3,212,519 | |
DST Systems Incorporated (Information Technology, IT Services) | | | | | | | 25,256 | | | | 2,906,460 | |
Eagle Materials Incorporated (Materials, Construction Materials) | | | | | | | 45,900 | | | | 3,827,601 | |
First Citizens BancShares Corporation Class A (Financials, Banks) | | | | | | | 14,096 | | | | 3,387,833 | |
Franklin Electric Company Incorporated (Industrials, Electrical Equipment) | | | | | | | 108,362 | | | | 3,918,370 | |
The accompanying notes are an integral part of these financial statements.
| | | | |
| 10 | | Wells Fargo Advantage Global Opportunities Fund | | Portfolio of investments—April 30, 2015 (unaudited) |
| | | | | | | | | | | | | | | | |
| Security name | | | | | | | | Shares | | | Value | |
| | | | |
| United States (continued) | | | | | | | | | | | | | | | | |
Guess? Incorporated (Consumer Discretionary, Specialty Retail) | | | | | | | | | | | 125,100 | | | $ | 2,290,581 | |
Haemonetics Corporation (Health Care, Health Care Equipment & Supplies) † | | | | | | | | | | | 50,176 | | | | 2,033,633 | |
ICU Medical Incorporated (Health Care, Health Care Equipment & Supplies) † | | | | | | | | | | | 28,169 | | | | 2,376,619 | |
Imation Corporation (Information Technology, Technology Hardware, Storage & Peripherals) † | | | | 494,388 | | | | 2,022,047 | |
Innospec Incorporated (Materials, Chemicals) | | | | | | | | | | | 99,205 | | | | 4,335,259 | |
Kadant Incorporated (Industrials, Machinery) | | | | | | | | | | | 78,276 | | | | 3,988,945 | |
Knowles Corporation (Information Technology, Electronic Equipment, Instruments & Components) Ǡ | | | | 71,500 | | | | 1,370,655 | |
Krispy Kreme Doughnuts Incorporated (Consumer Discretionary, Hotels, Restaurants & Leisure) † | | | | 257,300 | | | | 4,579,940 | |
Liberty Tax Incorporated (Consumer Discretionary, Diversified Consumer Services) « | | | | | | | | 109,300 | | | | 3,027,610 | |
Matthews International Corporation Class A (Industrials, Commercial Services & Supplies) | | | | | | | | 66,740 | | | | 3,238,892 | |
Mueller Industries Incorporated (Industrials, Machinery) | | | | | | | | | | | 113,200 | | | | 3,966,528 | |
Neenah Paper Incorporated (Materials, Paper & Forest Products) | | | | | | | | | | | 42,850 | | | | 2,591,140 | |
NETGEAR Incorporated (Information Technology, Communications Equipment) † | | | | | | | | 63,193 | | | | 1,912,852 | |
Pier 1 Imports Incorporated (Consumer Discretionary, Specialty Retail) | | | | | | | | | | | 107,700 | | | | 1,362,405 | |
ProAssurance Corporation (Financials, Insurance) | | | | | | | | | | | 56,900 | | | | 2,557,655 | |
Progress Software Corporation (Information Technology, Software) † | | | | | | | | | | | 83,400 | | | | 2,201,760 | |
Schweitzer-Mauduit International Incorporated (Materials, Paper & Forest Products) | | | | | | | | 87,200 | | | | 3,855,112 | |
Simpson Manufacturing Company Incorporated (Industrials, Building Products) | | | | | | | | | | | 119,416 | | | | 3,914,456 | |
Spectrum Brands Holdings Incorporated (Consumer Staples, Household Products) | | | | | | | | | | | 16,700 | | | | 1,526,881 | |
Steel Excel Incorporated (Energy, Energy Equipment & Services) † | | | | | | | | | | | 103,534 | | | | 2,075,857 | |
Steris Corporation (Health Care, Health Care Equipment & Supplies) | | | | | | | | | | | 43,600 | | | | 2,899,400 | |
Stone Energy Corporation (Energy, Oil, Gas & Consumable Fuels) † | | | | | | | | | | | 53,864 | | | | 919,458 | |
Teradata Corporation (Information Technology, IT Services) † | | | | | | | | | | | 60,300 | | | | 2,652,597 | |
Theravance Incorporated (Health Care, Pharmaceuticals) « | | | | | | | | | | | 99,908 | | | | 1,623,505 | |
TreeHouse Foods Incorporated (Consumer Staples, Food Products) † | | | | | | | | | | | 45,900 | | | | 3,729,834 | |
UMB Financial Corporation (Financials, Banks) | | | | | | | | | | | 76,900 | | | | 3,828,851 | |
Validus Holdings Limited (Financials, Insurance) | | | | | | | | | | | 35,500 | | | | 1,484,965 | |
Vishay Intertechnology Incorporated (Information Technology, Electronic Equipment, Instruments & Components) | | | | 246,890 | | | | 3,130,565 | |
WD-40 Company (Consumer Staples, Household Products) | | | | | | | | | | | 36,716 | | | | 2,972,527 | |
WellCare Health Plans Incorporated (Health Care, Health Care Providers & Services) † | | | | | | | | 31,700 | | | | 2,454,531 | |
West Pharmaceutical Services Incorporated (Health Care, Health Care Equipment & Supplies) | | | | 19,100 | | | | 1,017,648 | |
Westwood Holdings Group Incorporated (Financials, Capital Markets) | | | | | | | | | | | 49,050 | | | | 2,873,841 | |
| | | | |
| | | | | | | | | | | | | | | 132,081,865 | |
| | | | | | | | | | | | | | | | |
| | | | |
Total Common Stocks (Cost $209,513,300) | | | | | | | | | | | | | | | 244,627,619 | |
| | | | | | | | | | | | | | | | |
| | | | |
| | | Dividend yield | | | | | | | | | | |
| | | | |
Preferred Stocks: 0.64% | | | | | | | | | | | | | | | | |
| | | | |
| Germany: 0.64% | | | | | | | | | | | | | | | | |
Draegerwerk AG & Company KGAA (Health Care, Health Care Equipment & Supplies) « | | | 1.34 | % | | | | | | | 14,232 | | | | 1,651,574 | |
| | | | | | | | | | | | | | | | |
| | | | |
Total Preferred Stocks (Cost $1,439,559) | | | | | | | | | | | | | | | 1,651,574 | |
| | | | | | | | | | | | | | | | |
| | | | |
| | | | | | Expiration date | | | | | | | |
| Rights: 0.06% | | | | | | | | | | | | | | | | |
| | | | |
| Spain: 0.06% | | | | | | | | | | | | | | | | |
Merlin Properties Socimi SA (Financials, REITs) † | | | | | | | 5-2-2015 | | | | 106,487 | | | | 162,614 | |
| | | | | | | | | | | | | | | | |
| | | | |
Total Rights (Cost $0) | | | | | | | | | | | | | | | 162,614 | |
| | | | | | | | | | | | | | | | |
The accompanying notes are an integral part of these financial statements.
| | | | | | |
| Portfolio of investments—April 30, 2015 (unaudited) | | Wells Fargo Advantage Global Opportunities Fund | | | 11 | |
| | | | | | | | | | | | | | |
| Security name | | Yield | | | | | Shares | | | Value | |
| | | | |
Short-Term Investments: 9.52% | | | | | | | | | | | | | | |
| | | | |
| Investment Companies: 9.52% | | | | | | | | | | | | | | |
Securities Lending Cash Investments, LLC (l)(r)(u) | | | 0.12 | % | | | | | 16,489,624 | | | $ | 16,489,624 | |
Wells Fargo Advantage Cash Investment Money Market Fund, Select Class (l)(u) | | | 0.11 | | | | | | 8,261,818 | | | | 8,261,818 | |
| | | | |
Total Short-Term Investments (Cost $24,751,442) | | | | | | | | | | | | | 24,751,442 | |
| | | | | | | | | | | | | | |
| | | | | | | | |
| Total investments in securities (Cost $235,704,301)* | | | 104.36 | % | | | 271,193,249 | |
Other assets and liabilities, net | | | (4.36 | ) | | | (11,334,192 | ) |
| | | | | | | | |
| Total net assets | | | 100.00 | % | | $ | 259,859,057 | |
| | | | | | | | |
| « | All or a portion of this security is on loan. |
| † | Non-income-earning security |
| (a) | The security is fair valued in accordance with procedures approved by the Board of Trustees. |
| (l) | The security represents an affiliate of the Fund as defined in the Investment Company Act of 1940. |
| (u) | The rate represents the 7-day annualized yield at period end. |
| (r) | The investment is a non-registered investment vehicle purchased with cash collateral received from securities on loan. |
| * | Cost for federal income tax purposes is $237,290,131 and unrealized gains (losses) consists of: |
| | | | |
Gross unrealized gains | | $ | 45,749,652 | |
Gross unrealized losses | | | (11,846,534 | ) |
| | | | |
Net unrealized gains | | $ | 33,903,118 | |
The accompanying notes are an integral part of these financial statements.
| | | | |
| 12 | | Wells Fargo Advantage Global Opportunities Fund | | Statement of assets and liabilities—April 30, 2015 (unaudited) |
| | | | |
| | | | |
| |
Assets | | | | |
Investments | | | | |
In unaffiliated securities (including $15,831,687 of securities loaned), at value (cost $210,952,859) | | $ | 246,441,807 | |
In affiliated securities, at value (cost $24,751,442) | | | 24,751,442 | |
| | | | |
Total investments, at value (cost $235,704,301) | | | 271,193,249 | |
Foreign currency, at value (cost $3,670,311) | | | 3,812,401 | |
Receivable for investments sold | | | 2,788,898 | |
Receivable for Fund shares sold | | | 98,205 | |
Receivable for dividends | | | 596,543 | |
Receivable for securities lending income | | | 33,433 | |
Prepaid expenses and other assets | | | 39,919 | |
| | | | |
Total assets | | | 278,562,648 | |
| | | | |
| |
Liabilities | | | | |
Payable for investments purchased | | | 1,621,361 | |
Payable for Fund shares redeemed | | | 183,569 | |
Payable upon receipt of securities loaned | | | 16,489,624 | |
Advisory fee payable | | | 187,418 | |
Distribution fees payable | | | 30,613 | |
Administration fees payable | | | 60,764 | |
Accrued expenses and other liabilities | | | 130,242 | |
| | | | |
Total liabilities | | | 18,703,591 | |
| | | | |
Total net assets | | $ | 259,859,057 | |
| | | | |
| |
NET ASSETS CONSIST OF | | | | |
Paid-in capital | | $ | 220,564,107 | |
Overdistributed net investment income | | | (89,471 | ) |
Accumulated net realized gains on investments | | | 3,728,496 | |
Net unrealized gains on investments | | | 35,655,925 | |
| | | | |
Total net assets | | $ | 259,859,057 | |
| | | | |
| |
COMPUTATION OF NET ASSET VALUE AND OFFERING PRICE PER SHARE | | | | |
Net assets – Class A | | $ | 165,555,328 | |
Shares outstanding – Class A1 | | | 4,255,398 | |
Net asset value per share – Class A | | | $38.90 | |
Maximum offering price per share – Class A2 | | | $41.27 | |
Net assets – Class B | | $ | 8,309,728 | |
Shares outstanding – Class B1 | | | 280,784 | |
Net asset value per share – Class B | | | $29.59 | |
Net assets – Class C | | $ | 40,469,650 | |
Shares outstanding – Class C1 | | | 1,358,860 | |
Net asset value per share – Class C | | | $29.78 | |
Net assets – Administrator Class | | $ | 37,931,533 | |
Shares outstanding – Administrator Class1 | | | 939,863 | |
Net asset value per share – Administrator Class | | | $40.36 | |
Net assets – Institutional Class | | $ | 7,592,818 | |
Shares outstanding – Institutional Class1 | | | 188,476 | |
Net asset value per share – Institutional Class | | | $40.29 | |
| 1 | The Fund has an unlimited number of authorized shares. |
| 2 | Maximum offering price is computed as 100/94.25 of net asset value. On investments of $50,000 or more, the offering price is reduced. |
The accompanying notes are an integral part of these financial statements.
| | | | | | |
| Statement of operations—six months ended April 30, 2015 (unaudited) | | Wells Fargo Advantage Global Opportunities Fund | | | 13 | |
| | | | |
| | | | |
| |
Investment income | | | | |
Dividends (net of foreign withholding taxes of $68,375) | | $ | 2,182,644 | |
Securities lending income, net | | | 100,688 | |
Income from affiliated securities | | | 5,619 | |
| | | | |
Total investment income | | | 2,288,951 | |
| | | | |
| |
Expenses | | | | |
Advisory fee | | | 1,154,974 | |
Administration fees | | | | |
Fund level | | | 64,165 | |
Class A | | | 208,826 | |
Class B | | | 12,699 | |
Class C | | | 51,843 | |
Administrator Class | | | 19,380 | |
Institutional Class | | | 3,047 | |
Shareholder servicing fees | | | | |
Class A | | | 200,794 | |
Class B | | | 12,211 | |
Class C | | | 49,849 | |
Administrator Class | | | 48,215 | |
Distribution fees | | | | |
Class B | | | 36,633 | |
Class C | | | 149,547 | |
Custody and accounting fees | | | 66,145 | |
Professional fees | | | 24,843 | |
Registration fees | | | 25,019 | |
Shareholder report expenses | | | 24,496 | |
Trustees’ fees and expenses | | | 5,708 | |
Other fees and expenses | | | 14,089 | |
| | | | |
Total expenses | | | 2,172,483 | |
Less: Fee waivers and/or expense reimbursements | | | (41,586 | ) |
| | | | |
Net expenses | | | 2,130,897 | |
| | | | |
Net investment income | | | 158,054 | |
| | | | |
| |
REALIZED AND UNREALIZED GAINS (LOSSES) ON INVESTMENTS | | | | |
| |
Net realized gains on: | | | | |
Unaffiliated securities | | | 4,732,085 | |
Forward foreign currency contract transactions | | | 227,108 | |
| | | | |
Net realized gains on investments | | | 4,959,193 | |
| | | | |
| |
Net change in unrealized gains (losses) on: | | | | |
Unaffiliated securities | | | 11,705,726 | |
Forward foreign currency contract transactions | | | (224,896 | ) |
| | | | |
Net change in unrealized gains (losses) on investments | | | 11,480,830 | |
| | | | |
Net realized and unrealized gains (losses) on investments | | | 16,440,023 | |
| | | | |
Net increase in net assets resulting from operations | | $ | 16,598,077 | |
| | | | |
The accompanying notes are an integral part of these financial statements.
| | | | |
| 14 | | Wells Fargo Advantage Global Opportunities Fund | | Statement of changes in net assets |
| | | | | | | | | | | | | | | | |
| | | Six months ended April 30, 2015 (unaudited) | | | Year ended October 31, 2014 | |
| | | | |
Operations | | | | | | | | | | | | | | | | |
Net investment income (loss) | | | | | | $ | 158,054 | | | | | | | $ | (166,255 | ) |
Net realized gains on investments | | | | | | | 4,959,193 | | | | | | | | 43,058,242 | |
Net change in unrealized gains (losses) on investments | | | | | | | 11,480,830 | | | | | | | | (36,690,231 | ) |
| | | | |
Net increase in net assets resulting from operations | | | | | | | 16,598,077 | | | | | | | | 6,201,756 | |
| | | | |
| | | | |
Distributions to shareholders from | | | | | | | | | | | | | | | | |
Net investment income | | | | | | | | | | | | | | | | |
Class A | | | | | | | (112,091 | ) | | | | | | | (1,289,731 | ) |
Class C | | | | | | | 0 | | | | | | | | (17,006 | ) |
Administrator Class | | | | | | | (31,925 | ) | | | | | | | (475,665 | ) |
Institutional Class | | | | | | | (45,625 | ) | | | | | | | (23,151 | ) |
Net realized gains | | | | | | | | | | | | | | | | |
Class A | | | | | | | (25,688,232 | ) | | | | | | | 0 | |
Class B | | | | | | | (2,100,714 | ) | | | | | | | 0 | |
Class C | | | | | | | (7,981,435 | ) | | | | | | | 0 | |
Administrator Class | | | | | | | (5,573,313 | ) | | | | | | | 0 | |
Institutional Class | | | | | | | (1,170,657 | ) | | | | | | | 0 | |
| | | | |
Total distributions to shareholders | | | | | | | (42,703,992 | ) | | | | | | | (1,805,553 | ) |
| | | | |
| | | | |
| | | Shares | | | | | | | | Shares | | | | | |
| | | | |
Capital share transactions | | | | | | | | | | | | | | | | |
Proceeds from shares sold | | | | | | | | | | | | | | | | |
Class A | | | 227,391 | | | | 8,764,038 | | | | 339,559 | | | | 14,931,283 | |
Class B | | | 2,168 | | | | 62,186 | | | | 4,025 | | | | 140,530 | |
Class C | | | 61,360 | | | | 1,771,541 | | | | 55,031 | | | | 1,941,771 | |
Administrator Class | | | 119,864 | | | | 4,760,342 | | | | 300,922 | | | | 13,658,466 | |
Institutional Class | | | 103,519 | | | | 4,354,130 | | | | 87,544 | | | | 4,024,855 | |
| | | | |
| | | | | | | 19,712,237 | | | | | | | | 34,696,905 | |
| | | | |
Reinvestment of distributions | | | | | | | | | | | | | | | | |
Class A | | | 656,362 | | | | 23,808,617 | | | | 27,164 | | | | 1,188,435 | |
Class B | | | 73,234 | | | | 2,024,915 | | | | 0 | | | | 0 | |
Class C | | | 236,312 | | | | 6,574,187 | | | | 392 | | | | 13,875 | |
Administrator Class | | | 146,011 | | | | 5,492,203 | | | | 9,728 | | | | 438,256 | |
Institutional Class | | | 21,540 | | | | 812,381 | | | | 514 | | | | 23,151 | |
| | | | |
| | | | | | | 38,712,303 | | | | | | | | 1,663,717 | |
| | | | |
Payment for shares redeemed | | | | | | | | | | | | | | | | |
Class A | | | (492,443 | ) | | | (18,874,061 | ) | | | (761,396 | ) | | | (33,410,938 | ) |
Class B | | | (135,424 | ) | | | (4,067,490 | ) | | | (232,231 | ) | | | (8,230,660 | ) |
Class C | | | (139,829 | ) | | | (4,154,067 | ) | | | (152,969 | ) | | | (5,417,774 | ) |
Administrator Class | | | (535,939 | ) | | | (23,182,203 | ) | | | (292,897 | ) | | | (13,293,051 | ) |
Institutional Class | | | (54,858 | ) | | | (2,188,499 | ) | | | (18,605 | ) | | | (837,713 | ) |
| | | | |
| | | | | | | (52,466,320 | ) | | | | | | | (61,190,136 | ) |
| | | | |
Net increase (decrease) in net assets resulting from capital share transactions | | | | | | | 5,958,220 | | | | | | | | (24,829,514 | ) |
| | | | |
Total decrease in net assets | | | | | | | (20,147,695 | ) | | | | | | | (20,433,311 | ) |
| | | | |
| | | | |
Net assets | | | | | | | | | | | | | | | | |
Beginning of period | | | | | | | 280,006,752 | | | | | | | | 300,440,063 | |
| | | | |
End of period | | | | | | $ | 259,859,057 | | | | | | | $ | 280,006,752 | |
| | | | |
Overdistributed/accumulated net investment income (loss) | | | | | | $ | (89,471 | ) | | | | | | $ | (57,884 | ) |
| | | | |
The accompanying notes are an integral part of these financial statements.
| | | | | | |
| Financial highlights | | Wells Fargo Advantage Global Opportunities Fund | | | 15 | |
(For a share outstanding throughout each period)
| | | | | | | | | | | | | | | | | | | | | | | | |
| | | Six months ended
April 30, 2015
(unaudited) | | | Year ended October 31 | |
| CLASS A | | | 2014 | | | 2013 | | | 2012 | | | 2011 | | | 20101 | |
Net asset value, beginning of period | | | $43.26 | | | | $42.68 | | | | $33.17 | | | | $30.14 | | | | $31.91 | | | | $24.96 | |
Net investment income | | | 0.05 | 2 | | | 0.03 | 2 | | | 0.16 | 2 | | | 0.20 | 2 | | | 0.12 | 2 | | | 0.07 | 2 |
Net realized and unrealized gains (losses) on investments | | | 2.36 | | | | 0.86 | | | | 9.58 | | | | 2.87 | | | | (1.89 | ) | | | 6.99 | |
| | | | | | | | | | | | | | | | | | | | | | | | |
Total from investment operations | | | 2.41 | | | | 0.89 | | | | 9.74 | | | | 3.07 | | | | (1.77 | ) | | | 7.06 | |
Distributions to shareholders from | | | | | | | | | | | | | | | | | | | | | | | | |
Net investment income | | | (0.03 | ) | | | (0.31 | ) | | | (0.23 | ) | | | (0.04 | ) | | | 0.00 | | | | (0.11 | ) |
Net realized gains | | | (6.74 | ) | | | 0.00 | | | | 0.00 | | | | 0.00 | | | | 0.00 | | | | 0.00 | |
| | | | | | | | | | | | | | | | | | | | | | | | |
Total distributions to shareholders | | | (6.77 | ) | | | (0.31 | ) | | | (0.23 | ) | | | (0.04 | ) | | | 0.00 | | | | (0.11 | ) |
Net asset value, end of period | | | $38.90 | | | | $43.26 | | | | $42.68 | | | | $33.17 | | | | $30.14 | | | | $31.91 | |
Total return3 | | | 6.70 | % | | | 2.07 | % | | | 29.50 | % | | | 10.24 | % | | | (5.55 | )% | | | 28.41 | % |
Ratios to average net assets (annualized) | | | | | | | | | | | | | | | | | | | | | | | | |
Gross expenses | | | 1.59 | % | | | 1.57 | % | | | 1.59 | % | | | 1.55 | % | | | 1.55 | % | | | 1.66 | % |
Net expenses | | | 1.55 | % | | | 1.55 | % | | | 1.55 | % | | | 1.54 | % | | | 1.53 | % | | | 1.63 | % |
Net investment income | | | 0.24 | % | | | 0.06 | % | | | 0.43 | % | | | 0.65 | % | | | 0.34 | % | | | 0.25 | % |
Supplemental data | | | | | | | | | | | | | | | | | | | | | | | | |
Portfolio turnover rate | | | 18 | % | | | 66 | % | | | 59 | % | | | 85 | % | | | 76 | % | | | 104 | % |
Net assets, end of period (000s omitted) | | | $165,555 | | | | $167,166 | | | | $181,764 | | | | $156,433 | | | | $174,937 | | | | $212,729 | |
| 1 | After the close of business on July 16, 2010, the Fund acquired the net assets of Evergreen Global Opportunities Fund which became the accounting and performance survivor in the transaction. The information for the periods prior to July 19, 2010 is that of Class A of Evergreen Global Opportunities Fund. |
| 2 | Calculated based upon average shares outstanding |
| 3 | Total return calculations do not include any sales charges. Returns for periods of less than one year are not annualized |
The accompanying notes are an integral part of these financial statements.
| | | | |
| 16 | | Wells Fargo Advantage Global Opportunities Fund | | Financial highlights |
(For a share outstanding throughout each period)
| | | | | | | | | | | | | | | | | | | | | | | | |
| | | Six months ended
April 30, 2015
(unaudited) | | | Year ended October 31 | |
| CLASS B | | | 2014 | | | 2013 | | | 2012 | | | 2011 | | | 20101 | |
Net asset value, beginning of period | | | $34.62 | | | | $34.18 | | | | $26.58 | | | | $24.30 | | | | $25.92 | | | | $20.33 | |
Net investment loss | | | (0.08 | )2 | | | (0.25 | )2 | | | (0.09 | )2 | | | (0.03 | )2 | | | (0.12 | )2 | | | (0.11 | )2 |
Net realized and unrealized gains (losses) on investments | | | 1.79 | | | | 0.69 | | | | 7.69 | | | | 2.31 | | | | (1.50 | ) | | | 5.70 | |
| | | | | | | | | | | | | | | | | | | | | | | | |
Total from investment operations | | | 1.71 | | | | 0.44 | | | | 7.60 | | | | 2.28 | | | | (1.62 | ) | | | 5.59 | |
Distributions to shareholders from | | | | | | | | | | | | | | | | | | | | | | | | |
Net realized gains | | | (6.74 | ) | | | 0.00 | | | | 0.00 | | | | 0.00 | | | | 0.00 | | | | 0.00 | |
Net asset value, end of period | | | $29.59 | | | | $34.62 | | | | $34.18 | | | | $26.58 | | | | $24.30 | | | | $25.92 | |
Total return3 | | | 6.30 | % | | | 1.29 | % | | | 28.54 | % | | | 9.42 | % | | | (6.25 | )% | | | 27.43 | % |
Ratios to average net assets (annualized) | | | | | | | | | | | | | | | | | | | | | | | | |
Gross expenses | | | 2.33 | % | | | 2.32 | % | | | 2.34 | % | | | 2.30 | % | | | 2.30 | % | | | 2.41 | % |
Net expenses | | | 2.30 | % | | | 2.30 | % | | | 2.30 | % | | | 2.29 | % | | | 2.28 | % | | | 2.38 | % |
Net investment loss | | | (0.56 | )% | | | (0.71 | )% | | | (0.32 | )% | | | (0.10 | )% | | | (0.43 | )% | | | (0.49 | )% |
Supplemental data | | | | | | | | | | | | | | | | | | | | | | | | |
Portfolio turnover rate | | | 18 | % | | | 66 | % | | | 59 | % | | | 85 | % | | | 76 | % | | | 104 | % |
Net assets, end of period (000s omitted) | | | $8,310 | | | | $11,799 | | | | $19,446 | | | | $21,181 | | | | $26,598 | | | | $37,752 | |
| 1 | After the close of business on July 16, 2010, the Fund acquired the net assets of Evergreen Global Opportunities Fund which became the accounting and performance survivor in the transaction. The information for the periods prior to July 19, 2010 is that of Class B of Evergreen Global Opportunities Fund. |
| 2 | Calculated based upon average shares outstanding |
| 3 | Total return calculations do not include any sales charges. Returns for periods of less than one year are not annualized |
The accompanying notes are an integral part of these financial statements.
| | | | | | |
| Financial highlights | | Wells Fargo Advantage Global Opportunities Fund | | | 17 | |
(For a share outstanding throughout each period)
| | | | | | | | | | | | | | | | | | | | | | | | |
| | | Six months ended
April 30, 2015
(unaudited) | | | Year ended October 31 | |
| CLASS C | | | 2014 | | | 2013 | | | 2012 | | | 2011 | | | 20101 | |
Net asset value, beginning of period | | | $34.80 | | | | $34.36 | | | | $26.73 | | | | $24.43 | | | | $26.05 | | | | $20.44 | |
Net investment loss | | | (0.08 | )2 | | | (0.24 | )2 | | | (0.09 | )2 | | | (0.03 | )2 | | | (0.11 | )2 | | | (0.11 | )2 |
Net realized and unrealized gains (losses) on investments | | | 1.80 | | | | 0.69 | | | | 7.72 | | | | 2.33 | | | | (1.51 | ) | | | 5.72 | |
| | | | | | | | | | | | | | | | | | | | | | | | |
Total from investment operations | | | 1.72 | | | | 0.45 | | | | 7.63 | | | | 2.30 | | | | (1.62 | ) | | | 5.61 | |
Distributions to shareholders from | | | | | | | | | | | | | | | | | | | | | | | | |
Net investment income | | | 0.00 | | | | (0.01 | ) | | | 0.00 | | | | 0.00 | | | | 0.00 | | | | 0.00 | |
Net realized gains | | | (6.74 | ) | | | 0.00 | | | | 0.00 | | | | 0.00 | | | | 0.00 | | | | 0.00 | |
| | | | | | | | | | | | | | | | | | | | | | | | |
Total distributions to shareholders | | | (6.74 | ) | | | (0.01 | ) | | | 0.00 | | | | 0.00 | | | | 0.00 | | | | 0.00 | |
Net asset value, end of period | | | $29.78 | | | | $34.80 | | | | $34.36 | | | | $26.73 | | | | $24.43 | | | | $26.05 | |
Total return3 | | | 6.30 | % | | | 1.32 | % | | | 28.54 | % | | | 9.41 | % | | | (6.25 | )% | | | 27.43 | % |
Ratios to average net assets (annualized) | | | | | | | | | | | | | | | | | | | | | | | | |
Gross expenses | | | 2.34 | % | | | 2.32 | % | | | 2.34 | % | | | 2.30 | % | | | 2.30 | % | | | 2.41 | % |
Net expenses | | | 2.30 | % | | | 2.30 | % | | | 2.30 | % | | | 2.29 | % | | | 2.28 | % | | | 2.38 | % |
Net investment loss | | | (0.52 | )% | | | (0.69 | )% | | | (0.31 | )% | | | (0.11 | )% | | | (0.41 | )% | | | (0.50 | )% |
Supplemental data | | | | | | | | | | | | | | | | | | | | | | | | |
Portfolio turnover rate | | | 18 | % | | | 66 | % | | | 59 | % | | | 85 | % | | | 76 | % | | | 104 | % |
Net assets, end of period (000s omitted) | | | $40,470 | | | | $41,792 | | | | $44,618 | | | | $37,753 | | | | $45,135 | | | | $52,866 | |
| 1 | After the close of business on July 16, 2010, the Fund acquired the net assets of Evergreen Global Opportunities Fund which became the accounting and performance survivor in the transaction. The information for the periods prior to July 19, 2010 is that of Class C of Evergreen Global Opportunities Fund. |
| 2 | Calculated based upon average shares outstanding |
| 3 | Total return calculations do not include any sales charges. Returns for periods of less than one year are not annualized |
The accompanying notes are an integral part of these financial statements.
| | | | |
| 18 | | Wells Fargo Advantage Global Opportunities Fund | | Financial highlights |
(For a share outstanding throughout each period)
| | | | | | | | | | | | | | | | | | | | | | | | |
| | | Six months ended
April 30, 2015
(unaudited) | | | Year ended October 31 | |
| ADMINISTRATOR CLASS | | | 2014 | | | 2013 | | | 2012 | | | 2011 | | | 20101 | |
Net asset value, beginning of period | | | $44.60 | | | | $44.00 | | | | $34.21 | | | | $31.10 | | | | $32.92 | | | | $25.73 | |
Net investment income | | | 0.07 | 2 | | | 0.09 | | | | 0.22 | 2 | | | 0.26 | 2 | | | 0.15 | | | | 0.14 | 2 |
Net realized and unrealized gains (losses) on investments | | | 2.46 | | | | 0.90 | | | | 9.86 | | | | 2.96 | | | | (1.93 | ) | | | 7.23 | |
| | | | | | | | | | | | | | | | | | | | | | | | |
Total from investment operations | | | 2.53 | | | | 0.99 | | | | 10.08 | | | | 3.22 | | | | (1.78 | ) | | | 7.37 | |
Distributions to shareholders from | | | | | | | | | | | | | | | | | | | | | | | | |
Net investment income | | | (0.03 | ) | | | (0.39 | ) | | | (0.29 | ) | | | (0.11 | ) | | | (0.04 | ) | | | (0.18 | ) |
Net realized gains | | | (6.74 | ) | | | 0.00 | | | | 0.00 | | | | 0.00 | | | | 0.00 | | | | 0.00 | |
| | | | | | | | | | | | | | | | | | | | | | | | |
Total distributions to shareholders | | | (6.77 | ) | | | (0.39 | ) | | | (0.29 | ) | | | (0.11 | ) | | | (0.04 | ) | | | (0.18 | ) |
Net asset value, end of period | | | $40.36 | | | | $44.60 | | | | $44.00 | | | | $34.21 | | | | $31.10 | | | | $32.92 | |
Total return3 | | | 6.80 | % | | | 2.22 | % | | | 29.73 | % | | | 10.44 | % | | | (5.39 | )% | | | 28.77 | % |
Ratios to average net assets (annualized) | | | | | | | | | | | | | | | | | | | | | | | | |
Gross expenses | | | 1.42 | % | | | 1.41 | % | | | 1.42 | % | | | 1.38 | % | | | 1.37 | % | | | 1.43 | % |
Net expenses | | | 1.40 | % | | | 1.40 | % | | | 1.40 | % | | | 1.38 | % | | | 1.36 | % | | | 1.40 | % |
Net investment income | | | 0.37 | % | | | 0.22 | % | | | 0.58 | % | | | 0.81 | % | | | 0.53 | % | | | 0.49 | % |
Supplemental data | | | | | | | | | | | | | | | | | | | | | | | | |
Portfolio turnover rate | | | 18 | % | | | 66 | % | | | 59 | % | | | 85 | % | | | 76 | % | | | 104 | % |
Net assets, end of period (000s omitted) | | | $37,932 | | | | $53,966 | | | | $52,461 | | | | $44,360 | | | | $49,860 | | | | $46,106 | |
| 1 | After the close of business on July 16, 2010, the Fund acquired the net assets of Evergreen Global Opportunities Fund which became the accounting and performance survivor in the transaction. The information for the periods prior to July 19, 2010 is that of Class I of Evergreen Global Opportunities Fund. |
| 2 | Calculated based upon average shares outstanding |
| 3 | Returns for periods of less than one year are not annualized. |
The accompanying notes are an integral part of these financial statements.
| | | | | | |
| Financial highlights | | Wells Fargo Advantage Global Opportunities Fund | | | 19 | |
(For a share outstanding throughout each period)
| | | | | | | | | | | | | | | | | | | | | | | | |
| | | Six months ended
April 30, 2015
(unaudited) | | | Year ended October 31 | |
| INSTITUTIONAL CLASS | | | 2014 | | | 2013 | | | 2012 | | | 2011 | | | 20101 | |
Net asset value, beginning of period | | | $44.67 | | | | $44.05 | | | | $34.25 | | | | $31.18 | | | | $32.94 | | | | $28.37 | |
Net investment income | | | 0.13 | 2 | | | 0.15 | | | | 0.32 | 2 | | | 0.36 | 2 | | | 0.25 | | | | 0.04 | 2 |
Net realized and unrealized gains (losses) on investments | | | 2.45 | | | | 0.96 | | | | 9.86 | | | | 2.93 | | | | (1.94 | ) | | | 4.53 | |
| | | | | | | | | | | | | | | | | | | | | | | | |
Total from investment operations | | | 2.58 | | | | 1.11 | | | | 10.18 | | | | 3.29 | | | | (1.69 | ) | | | 4.57 | |
Distributions to shareholders from | | | | | | | | | | | | | | | | | | | | | | | | |
Net investment income | | | (0.22 | ) | | | (0.49 | ) | | | (0.38 | ) | | | (0.22 | ) | | | (0.07 | ) | | | 0.00 | |
Net realized gains | | | (6.74 | ) | | | 0.00 | | | | 0.00 | | | | 0.00 | | | | 0.00 | | | | 0.00 | |
| | | | | | | | | | | | | | | | | | | | | | | | |
Total distributions to shareholders | | | (6.96 | ) | | | (0.49 | ) | | | (0.38 | ) | | | (0.22 | ) | | | (0.07 | ) | | | 0.00 | |
Net asset value, end of period | | | $40.29 | | | | $44.67 | | | | $44.05 | | | | $34.25 | | | | $31.18 | | | | $32.94 | |
Total return3 | | | 6.94 | % | | | 2.48 | % | | | 30.06 | % | | | 10.70 | % | | | (5.15 | )% | | | 16.11 | % |
Ratios to average net assets (annualized) | | | | | | | | | | | | | | | | | | | | | | | | |
Gross expenses | | | 1.16 | % | | | 1.14 | % | | | 1.16 | % | | | 1.12 | % | | | 1.08 | % | | | 1.22 | % |
Net expenses | | | 1.15 | % | | | 1.14 | % | | | 1.15 | % | | | 1.12 | % | | | 1.08 | % | | | 1.15 | % |
Net investment income | | | 0.64 | % | | | 0.47 | % | | | 0.83 | % | | | 1.13 | % | | | 1.18 | % | | | 0.53 | % |
Supplemental data | | | | | | | | | | | | | | | | | | | | | | | | |
Portfolio turnover rate | | | 18 | % | | | 66 | % | | | 59 | % | | | 85 | % | | | 76 | % | | | 104 | % |
Net assets, end of period (000s omitted) | | | $7,593 | | | | $5,284 | | | | $2,151 | | | | $1,263 | | | | $1,486 | | | | $12 | |
| 1 | For the period from July 30, 2010 (commencement of class operations) to October 31, 2010 |
| 2 | Calculated based upon average shares outstanding |
| 3 | Returns for periods of less than one year are not annualized. |
The accompanying notes are an integral part of these financial statements.
| | | | |
| 20 | | Wells Fargo Advantage Global Opportunities Fund | | Notes to financial statements (unaudited) |
1. ORGANIZATION
Wells Fargo Funds Trust (the “Trust”), a Delaware statutory trust organized on March 10, 1999, is an open-end management investment company registered under the Investment Company Act of 1940, as amended (the “1940 Act”). As an investment company, the Trust follows the accounting and reporting guidance in Financial Accounting Standards Board (“FASB”) Accounting Standards Codification Topic 946, Financial Services – Investment Companies. These financial statements report on the Wells Fargo Advantage Global Opportunities Fund (the “Fund”) which is a diversified series of the Trust.
2. SIGNIFICANT ACCOUNTING POLICIES
The following significant accounting policies, which are consistently followed in the preparation of the financial statements of the Fund, are in conformity with U.S. generally accepted accounting principles which require management to make estimates and assumptions that affect the reported amounts of assets and liabilities, disclosure of contingent assets and liabilities at the date of the financial statements, and the reported amounts of revenues and expenses during the reporting period. Actual results could differ from those estimates.
Securities valuation
All investments are valued each business day as of the close of regular trading on the New York Stock Exchange (generally 4 p.m. Eastern Time).
Equity securities that are listed on a foreign or domestic exchange or market are valued at the official closing price or, if none, the last sales price. If no sale occurs on the primary exchange or market that day, the prior day’s price will be deemed “stale” and a fair value price will be determined in accordance with the Fund’s Valuation Procedures.
Equity securities that are not listed on a foreign or domestic exchange or market, but have a public trading market, are valued at the quoted bid price from an independent broker-dealer that the Management Valuation Team of Wells Fargo Funds Management, LLC (“Funds Management”) has determined is an acceptable source.
The values of securities denominated in foreign currencies are translated into U.S. dollars at rates provided by an independent foreign currency pricing source at a time each business day specified by the Management Valuation Team.
Many securities markets and exchanges outside the U.S. close prior to the close of the New York Stock Exchange and therefore may not fully reflect trading or events that occur after the close of the principal exchange in which the foreign securities are traded, but before the close of the New York Stock Exchange. If such trading or events are expected to materially affect the value of such securities, then fair value pricing procedures approved by the Board of Trustees of the Fund are applied. These procedures take into account multiple factors including movements in U.S. securities markets after foreign exchanges close. Foreign securities that are fair valued under these procedures are categorized as Level 2 and the application of these procedures may result in transfers between Level 1 and Level 2. Depending on market activity, such fair valuations may be frequent. Such fair value pricing may result in net asset values that are higher or lower than net asset values based on the last reported sales price or latest quoted bid price. On April 30, 2015, such fair value pricing was used in pricing foreign securities.
Investments in registered open-end investment companies are valued at net asset value. Interests in non-registered investment vehicles that are redeemable at net asset value are fair valued at net asset value when available.
Investments which are not valued using any of the methods discussed above are valued at their fair value, as determined in good faith by the Board of Trustees. The Board of Trustees has established a Valuation Committee comprised of the Trustees and has delegated to it the authority to take any actions regarding the valuation of portfolio securities that the Valuation Committee deems necessary or appropriate, including determining the fair value of portfolio securities, unless the determination has been delegated to the Management Valuation Team. The Board of Trustees retains the authority to make or ratify any valuation decisions or approve any changes to the Valuation Procedures as it deems appropriate. On a quarterly basis, the Board of Trustees receives reports on any valuation actions taken by the Valuation Committee or the Management Valuation Team which may include items for ratification.
Valuations of fair valued securities are compared to the next actual sales price when available, or other appropriate market values, to assess the continued appropriateness of the fair valuation methodologies used. These securities are fair valued on a day-to-day basis, taking into consideration changes to appropriate market information and any significant changes to the inputs considered in the valuation process until there is a readily available price provided on an exchange or by an independent pricing service. Valuations received from an independent pricing service or independent broker-dealer quotes are periodically validated by comparisons to most recent trades and valuations provided by other
| | | | | | |
| Notes to financial statements (unaudited) | | Wells Fargo Advantage Global Opportunities Fund | | | 21 | |
independent pricing services in addition to the review of prices by the adviser and/or subadviser. Unobservable inputs used in determining fair valuations are identified based on the type of security, taking into consideration factors utilized by market participants in valuing the investment, knowledge about the issuer and the current market environment.
Foreign currency translation
The accounting records of the Fund are maintained in U.S. dollars. The values of other assets and liabilities denominated in foreign currencies are translated into U.S. dollars at rates provided by an independent foreign currency pricing source at a time each business day specified by the Management Valuation Team. Purchases and sales of securities, and income and expenses are converted at the rate of exchange on the respective dates of such transactions. Net realized foreign exchange gains or losses arise from sales of foreign currencies, currency gains or losses realized between the trade and settlement dates on securities transactions, and the difference between the amounts of dividends, interest and foreign withholding taxes recorded and the U.S. dollar equivalent of the amounts actually paid or received. Net unrealized foreign exchange gains and losses arise from changes in the fair value of assets and liabilities other than investments in securities resulting from changes in exchange rates. The changes in net assets arising from changes in exchange rates and the changes in net assets resulting from changes in market prices of securities are not separately presented. Such changes are included in net realized and unrealized gains or losses from investments.
Forward foreign currency contracts
The Fund is subject to foreign currency exchange rate risk in the normal course of pursuing its investment objectives. A forward foreign currency contract is an agreement between two parties to purchase or sell a specific currency for an agreed-upon price at a future date. The Fund enters into forward foreign currency contracts to facilitate transactions in foreign-denominated securities and to attempt to minimize the risk to the Fund from adverse changes in the relationship between currencies. Forward foreign currency contracts are recorded at the forward rate and marked-to-market daily. When the contracts are closed, realized gains and losses arising from such transactions are recorded as realized gains or losses on forward foreign currency contract transactions. The Fund could be exposed to risks if the counterparties to the contracts are unable to meet the terms of their contracts or if the value of the foreign currency changes unfavorably. The Fund’s maximum risk of loss from counterparty credit risk is the unrealized gains on the contracts. This risk may be mitigated if there is a master netting arrangement between the Fund and the counterparty.
Security loans
The Fund may lend its securities from time to time in order to earn additional income in the form of fees or interest on securities received as collateral or the investment of any cash received as collateral. The Fund continues to receive interest or dividends on the securities loaned. The Fund receives collateral in the form of cash or securities with a value at least equal to the value of the securities on loan. The value of the loaned securities is determined at the close of each business day and any additional required collateral is delivered to the Fund on the next business day. In a securities lending transaction, the net asset value of the Fund will be affected by an increase or decrease in the value of the securities loaned and by an increase or decrease in the value of the instrument in which collateral is invested. The amount of securities lending activity undertaken by the Fund fluctuates from time to time. In the event of default or bankruptcy by the borrower, the Fund may be prevented from recovering the loaned securities or gaining access to the collateral or may experience delays or costs in doing so. In addition, the investment of any cash collateral received may lose all or part of its value. The Fund has the right under the lending agreement to recover the securities from the borrower on demand.
The Fund lends its securities through an unaffiliated securities lending agent. Cash collateral received in connection with its securities lending transactions is invested in Securities Lending Cash Investments, LLC (the “Securities Lending Fund”). The Securities Lending Fund is exempt from registration under Section 3(c)(7) of the 1940 Act and is managed by Funds Management and is subadvised by Wells Capital Management Incorporated (“WellsCap”). Funds Management receives an advisory fee starting at 0.05% and declining to 0.01% as the average daily net assets of the Securities Lending Fund increase. All of the fees received by Funds Management are paid to WellsCap for its services as subadviser. The Securities Lending Fund seeks to provide a positive return compared to the daily Fed Funds Open rate by investing in high-quality, U.S. dollar-denominated short-term money market instruments. Securities Lending Fund investments are fair valued based upon the amortized cost valuation technique. Income earned from investment in the Securities Lending Fund is included in securities lending income on the Statement of Operations.
Security transactions and income recognition
Securities transactions are recorded on a trade date basis. Realized gains or losses are recorded on the basis of identified cost.
Dividend income is recognized on the ex-dividend date, except for certain dividends from foreign securities, which are recorded as soon as the custodian verifies the ex-dividend date. Dividend income from foreign securities is recorded net of foreign taxes withheld where recovery of such taxes is not assured.
| | | | |
| 22 | | Wells Fargo Advantage Global Opportunities Fund | | Notes to financial statements (unaudited) |
Distributions to shareholders
Distributions to shareholders from net investment income and net realized gains, if any, are recorded on the ex-dividend date. Such distributions are determined in conformity with federal income tax regulations, which may differ in amount or character from net investment income and realized gains recognized for purposes of U.S. generally accepted accounting principles.
Federal and other taxes
The Fund intends to continue to qualify as a regulated investment company by distributing substantially all of its investment company taxable income and any net realized capital gains (after reduction for capital loss carryforwards) sufficient to relieve it from all, or substantially all, federal income taxes. Accordingly, no provision for federal income taxes was required.
The Fund’s income and federal excise tax returns and all financial records supporting those returns for the prior three fiscal years are subject to examination by the federal and Delaware revenue authorities. Management has analyzed the Fund’s tax positions taken on federal, state, and foreign tax returns for all open tax years and does not believe that there are any uncertain tax positions that require recognition of a tax liability.
Class allocations
The separate classes of shares offered by the Fund differ principally in applicable sales charges, distribution, shareholder servicing, and administration fees. Class specific expenses are charged directly to that share class. Investment income, common expenses, and realized and unrealized gains (losses) on investments are allocated daily to each class of shares based on the relative proportion of net assets of each class.
3. FAIR VALUATION MEASUREMENTS
Fair value measurements of investments are determined within a framework that has established a fair value hierarchy based upon the various data inputs utilized in determining the value of the Fund’s investments. The three-level hierarchy gives the highest priority to unadjusted quoted prices in active markets for identical assets or liabilities (Level 1) and the lowest priority to significant unobservable inputs (Level 3). The Fund’s investments are classified within the fair value hierarchy based on the lowest level of input that is significant to the fair value measurement. The inputs are summarized into three broad levels as follows:
| n | | Level 1 – quoted prices in active markets for identical securities |
| n | | Level 2 – other significant observable inputs (including quoted prices for similar securities, interest rates, prepayment speeds, credit risk, use of amortized cost, etc.) |
| n | | Level 3 – significant unobservable inputs (including the Fund’s own assumptions in determining the fair value of investments) |
The inputs or methodologies used for valuing investments in securities are not necessarily an indication of the risk associated with investing in those securities.
| | | | | | |
| Notes to financial statements (unaudited) | | Wells Fargo Advantage Global Opportunities Fund | | | 23 | |
The following is a summary of the inputs used in valuing the Fund’s assets and liabilities as of April 30, 2015:
| | | | | | | | | | | | | | | | |
| | | Quoted prices
(Level 1) | | | Other significant
observable inputs
(Level 2) | | | Significant
unobservable inputs
(Level 3) | | | Total | |
Assets | | | | | | | | | | | | | | | | |
Investments in : | | | | | | | | | | | | | | | | |
| | | | |
Common stocks | | | | | | | | | | | | | | | | |
Australia | | $ | 0 | | | $ | 584,439 | | | $ | 0 | | | $ | 584,439 | |
Austria | | | 0 | | | | 829,579 | | | | 0 | | | | 829,579 | |
Belgium | | | 0 | | | | 388,216 | | | | 0 | | | | 388,216 | |
Canada | | | 12,606,033 | | | | 7,310 | | | | 0 | | | | 12,613,343 | |
Denmark | | | 0 | | | | 1,604,562 | | | | 0 | | | | 1,604,562 | |
France | | | 5,052,458 | | | | 6,670,705 | | | | 0 | | | | 11,723,163 | |
Germany | | | 2,270,811 | | | | 8,407,420 | | | | 0 | | | | 10,678,231 | |
Hong Kong | | | 0 | | | | 2,390,903 | | | | 0 | | | | 2,390,903 | |
Israel | | | 1,681,915 | | | | 0 | | | | 0 | | | | 1,681,915 | |
Italy | | | 0 | | | | 3,315,703 | | | | 0 | | | | 3,315,703 | |
Japan | | | 0 | | | | 19,693,438 | | | | 0 | | | | 19,693,438 | |
Netherlands | | | 0 | | | | 4,609,362 | | | | 0 | | | | 4,609,362 | |
Norway | | | 2,212,412 | | | | 1,595,291 | | | | 0 | | | | 3,807,703 | |
Russia | | | 0 | | | | 430,826 | | | | 0 | | | | 430,826 | |
South Korea | | | 629,603 | | | | 1,785,345 | | | | 0 | | | | 2,414,948 | |
Spain | | | 1,455,752 | | | | 2,249,498 | | | | 0 | | | | 3,705,250 | |
Sweden | | | 806,152 | | | | 0 | | | | 0 | | | | 806,152 | |
Switzerland | | | 1,746,782 | | | | 4,020,813 | | | | 0 | | | | 5,767,595 | |
Taiwan | | | 0 | | | | 765,547 | | | | 0 | | | | 765,547 | |
United Kingdom | | | 8,983,347 | | | | 15,751,532 | | | | 0 | | | | 24,734,879 | |
United States | | | 130,006,008 | | | | 2,075,857 | | | | 0 | | | | 132,081,865 | |
| | | | |
Preferred stocks | | | | | | | | | | | | | | | | |
Germany | | | 1,651,574 | | | | 0 | | | | 0 | | | | 1,651,574 | |
| | | | |
Rights | | | | | | | | | | | | | | | | |
Spain | | | 0 | | | | 162,614 | | | | 0 | | | | 162,614 | |
| | | | |
Short-term investments | | | | | | | | | | | | | | | | |
Investment companies | | | 8,261,818 | | | | 16,489,624 | | | | 0 | | | | 24,751,442 | |
Total assets | | $ | 177,364,665 | | | $ | 93,828,584 | | | $ | 0 | | | $ | 271,193,249 | |
The Fund recognizes transfers between levels within the fair value hierarchy at the end of the reporting period. At April 30, 2015, fair value pricing was used in pricing certain foreign securities and securities valued at $67,126,086 were transferred from Level 1 to Level 2. The Fund did not have any transfers into/out of Level 3.
4. TRANSACTIONS WITH AFFILIATES
Advisory fee
The Trust has entered into an advisory contract with Funds Management, an indirect wholly owned subsidiary of Wells Fargo & Company (“Wells Fargo”). The adviser is responsible for implementing investment policies and guidelines and for supervising the subadviser, who is responsible for day-to-day portfolio management of the Fund.
Pursuant to the contract, Funds Management is entitled to receive an annual advisory fee starting at 0.90% and declining to 0.80% as the average daily net assets of the Fund increase. For the six months ended April 30, 2015, the advisory fee was equivalent to an annual rate of 0.90% of the Fund’s average daily net assets.
Funds Management has retained the services of a subadviser to provide daily portfolio management to the Fund. The fee for subadvisory services is borne by Funds Management. WellsCap, an affiliate of Funds Management and an indirect wholly owned subsidiary of Wells Fargo, is the subadviser to the Fund and is entitled to receive a fee from Funds Management at an annual rate starting at 0.55% and declining to 0.40% as the average daily net assets of the Fund increase.
| | | | |
| 24 | | Wells Fargo Advantage Global Opportunities Fund | | Notes to financial statements (unaudited) |
Administration fees
The Trust has entered into an administration agreement with Funds Management. Under this agreement, for providing administrative services, which includes paying fees and expenses for services provided by the transfer agent, sub-transfer agents, omnibus account servicers and record-keepers, Funds Management is entitled to receive from the Fund an annual fund level administration fee starting at 0.05% and declining to 0.03% as the average daily net assets of the Fund increase and a class level administration fee which is calculated based on the average daily net assets of each class as follows:
| | | | |
| | | Class level
administration fee | |
Class A, Class B, Class C | | | 0.26 | % |
Administrator Class | | | 0.10 | |
Institutional Class | | | 0.08 | |
Funds Management has contractually waived and/or reimbursed advisory and administration fees to the extent necessary to maintain certain net operating expense ratios for the Fund. Waiver of fees and/or reimbursement of expenses by Funds Management were made first from fund level expenses on a proportionate basis and then from class specific expenses. Funds Management has committed through February 29, 2016 to waive fees and/or reimburse expenses to the extent necessary to cap the Fund’s expenses at 1.55% for Class A shares, 2.30% for Class B shares, 2.30% for Class C shares, 1.40% for Administrator Class shares, and 1.15% for Institutional Class shares. After this time, the cap may be increased or the commitment to maintain the cap may be terminated only with the approval of the Board of Trustees.
Distribution fees
The Trust has adopted a Distribution Plan for Class B and Class C shares of the Fund pursuant to Rule 12b-1 under the 1940 Act. Distribution fees are charged to Class B and Class C shares and paid to Wells Fargo Funds Distributor, LLC (“Funds Distributor”), the principal underwriter, at an annual rate of 0.75% of the average daily net assets of Class B and Class C shares.
In addition, Funds Distributor is entitled to receive the front-end sales charge from the purchase of Class A shares and a contingent deferred sales charge on the redemption of certain Class A shares. Funds Distributor is also entitled to receive the contingent deferred sales charges from redemptions of Class B and Class C shares. For the six months ended April 30, 2015, Funds Distributor received $2,389 from the sale of Class A shares and $320 and $152 in contingent deferred sales charges from redemptions of Class B and Class C shares, respectively.
Shareholder servicing fees
The Trust has entered into contracts with one or more shareholder servicing agents, whereby Class A, Class B, Class C, and Administrator Class of the Fund is charged a fee at an annual rate of 0.25% of the average daily net assets of each respective class.
A portion of these total shareholder servicing fees were paid to affiliates of Wells Fargo.
5. INVESTMENT PORTFOLIO TRANSACTIONS
Purchases and sales of investments, excluding U.S. government obligations (if any) and short-term securities, for the six months ended April 30, 2015 were $44,543,209 and $79,489,831, respectively.
6. DERIVATIVE TRANSACTIONS
During the six months ended April 30, 2015, the Fund entered into forward foreign currency contracts for economic hedging purposes.
As of April 30, 2015, the Fund did not have any open forward foreign currency contracts. The Fund had average contract amounts of $30,573 and $113,770 in forward foreign currency contracts to buy and forward foreign currency contracts to sell, respectively, during the six months ended April 30, 2015.
The fair value, realized gains or losses and change in unrealized gains or losses, if any, on derivative instruments are reflected in the appropriate financial statements.
| | | | | | |
| Notes to financial statements (unaudited) | | Wells Fargo Advantage Global Opportunities Fund | | | 25 | |
7. BANK BORROWINGS
The Trust (excluding the money market funds and certain other funds in the Trust) and Wells Fargo Variable Trust are parties to a $150,000,000 revolving credit agreement, whereby the Fund is permitted to use bank borrowings for temporary or emergency purposes, such as to fund shareholder redemption requests. Interest under the credit agreement is charged to the Fund based on a borrowing rate equal to the higher of the Federal Funds rate in effect on that day plus 1.25% or the overnight LIBOR rate in effect on that day plus 1.25%. In addition, an annual commitment fee equal to 0.10% of the unused balance is allocated to each participating fund. For the six months ended April 30, 2015, the Fund paid $242 in commitment fees.
For the six months ended April 30, 2015, there were no borrowings by the Fund under the agreement.
8. INDEMNIFICATION
Under the Trust’s organizational documents, the officers and Trustees have been granted certain indemnification rights against certain liabilities that may arise out of performance of their duties to the Trust. Additionally, in the normal course of business, the Trust may enter into contracts with service providers that contain a variety of indemnification clauses. The Trust’s maximum exposure under these arrangements is dependent on future claims that may be made against the Fund and, therefore, cannot be estimated.
| | | | |
| 26 | | Wells Fargo Advantage Global Opportunities Fund | | Other information (unaudited) |
PROXY VOTING INFORMATION
A description of the policies and procedures that the Fund uses to determine how to vote proxies relating to portfolio securities is available, upon request, by calling 1-800-222-8222, visiting our website at wellsfargoadvantagefunds.com, or visiting the SEC website at sec.gov. Information regarding how the Fund voted proxies relating to portfolio securities during the most recent 12-month period ended June 30 is available on the Fund’s website at wellsfargoadvantagefunds.com or by visiting the SEC website at sec.gov.
PORTFOLIO HOLDINGS INFORMATION
The complete portfolio holdings for the Fund are publicly available monthly on the Fund’s website (wellsfargoadvantagefunds.com), on a one-month delayed basis. In addition, top ten holdings information (excluding derivative positions) for the Fund is publicly available on the Fund’s website on a monthly, seven-day or more delayed basis. The Fund files its complete schedule of portfolio holdings with the SEC for the first and third quarters of each fiscal year on Form N-Q, which is available by visiting the SEC website at sec.gov. In addition, the Fund’s Form N-Q may be reviewed and copied at the SEC’s Public Reference Room in Washington, DC, and at regional offices in New York City, at 233 Broadway, and in Chicago, at 175 West Jackson Boulevard, Suite 900. Information about the Public Reference Room may be obtained by calling 1-800-SEC-0330.
| | | | | | |
| Other information (unaudited) | | Wells Fargo Advantage Global Opportunities Fund | | | 27 | |
BOARD OF TRUSTEES AND OFFICERS
Each of the Trustees and Officers1 listed in the table below acts in identical capacities for each fund in the Wells Fargo Advantage family of funds, which consists of 134 mutual funds comprising the Wells Fargo Funds Trust, Wells Fargo Variable Trust, Wells Fargo Master Trust and four closed-end funds (collectively the “Fund Complex”). This table should be read in conjunction with the Prospectus and the Statement of Additional Information2. The mailing address of each Trustee and Officer is 525 Market Street, 12th Floor, San Francisco, CA 94105. Each Trustee and Officer serves an indefinite term, however, each Trustee serves such term until reaching the mandatory retirement age established by the Trustees.
Independent Trustees
| | | | | | |
Name and year of birth | | Position held and length of service* | | Principal occupations during past five years or longer | | Other directorships during
past five years |
William R. Ebsworth
(Born 1957) | | Trustee, since 2015** | | Retired. From 1984 to 2013, equities analyst, portfolio manager, research director at Fidelity Management and Research Company and retired in 2013 as Chief Investment Officer of Fidelity Strategic Advisers, Inc. in Boston, Tokyo, and Hong Kong where he led a team of investment professionals managing client assets. Prior thereto, Board member of Hong Kong Securities Clearing Co., Hong Kong Options Clearing Corp., the Thailand International Fund, Ltd., Fidelity Investments Life Insurance Company, and Empire Fidelity Investments Life Insurance Company. Mr. Ebsworth is an Adjunct Lecturer, Finance, at Babson College and a Chartered Financial Analyst. | | Asset Allocation Trust |
Jane A. Freeman
(Born 1953) | | Trustee, since 2015** | | Retired. From 2012 to 2014 and 1999 to 2008, Chief Financial Officer of Scientific Learning Corporation. From 2008 to 2012, Ms. Freeman provided consulting services related to strategic business projects. Prior to 1999, Portfolio Manager at Rockefeller & Co. and Scudder, Stevens & Clark. Board member of the Harding Loevner Funds from 1996 to 2014, serving as both Lead Independent Director and chair of the Audit Committee. Board member of the Russell Exchange Traded Funds Trust from 2011 to 2012 and the chair of the Audit Committee. Ms. Freeman is a Chartered Financial Analyst (inactive), Chair of Taproot Foundation (non-profit organization) and a Board Member of Ruth Bancroft Garden (non-profit organization). | | Asset Allocation Trust |
Peter G. Gordon
(Born 1942) | | Trustee, since 1998; Chairman, since 2005 | | Co-Founder, Retired Chairman, President and CEO of Crystal Geyser Water Company. Trustee Emeritus, Colby College. | | Asset Allocation Trust |
Isaiah Harris, Jr.
(Born 1952) | | Trustee, since 2009 | | Retired. Chairman of the Board of CIGNA Corporation since 2009, and Director since 2005. From 2003 to 2011, Director of Deluxe Corporation. Prior thereto, President and CEO of BellSouth Advertising and Publishing Corp. from 2005 to 2007, President and CEO of BellSouth Enterprises from 2004 to 2005 and President of BellSouth Consumer Services from 2000 to 2003. Emeritus member of the Iowa State University Foundation Board of Governors. Emeritus Member of the Advisory Board of Iowa State University School of Business. Advisory Board Member, Palm Harbor Academy. Mr. Harris is a certified public accountant. | | CIGNA Corporation; Asset Allocation Trust |
Judith M. Johnson
(Born 1949) | | Trustee, since 2008;
Audit Committee Chairman, since 2008 | | Retired. Prior thereto, Chief Executive Officer and Chief Investment Officer of Minneapolis Employees Retirement Fund from 1996 to 2008. Ms. Johnson is an attorney, certified public accountant and a certified managerial accountant. | | Asset Allocation Trust |
David F. Larcker
(Born 1950) | | Trustee, since 2009 | | James Irvin Miller Professor of Accounting at the Graduate School of Business, Stanford University, Morgan Stanley Director of the Center for Leadership Development and Research and Senior Faculty of The Rock Center for Corporate Governance since 2006. From 2005 to 2008, Professor of Accounting at the Graduate School of Business, Stanford University. Prior thereto, Ernst & Young Professor of Accounting at The Wharton School, University of Pennsylvania from 1985 to 2005. | | Asset Allocation Trust |
Olivia S. Mitchell
(Born 1953) | | Trustee, since 2006 | | International Foundation of Employee Benefit Plans Professor, Wharton School of the University of Pennsylvania since 1993. Director of Wharton’s Pension Research Council and Boettner Center on Pensions & Retirement Research, and Research Associate at the National Bureau of Economic Research. Previously, Cornell University Professor from 1978 to 1993. | | Asset Allocation Trust |
| | | | |
| 28 | | Wells Fargo Advantage Global Opportunities Fund | | Other information (unaudited) |
| | | | | | |
Name and year of birth | | Position held and length of service* | | Principal occupations during past five years or longer | | Other directorships during
past five years |
Timothy J. Penny
(Born 1951) | | Trustee, since 1996 | | President and Chief Executive Officer of Southern Minnesota Initiative Foundation, a non-profit organization, since 2007 and Senior Fellow at the Humphrey Institute Policy Forum at the University of Minnesota since 1995. Member of the Board of Trustees of NorthStar Education Finance, Inc., a non-profit organization, since 2007. | | Asset Allocation Trust |
Michael S. Scofield
(Born 1943) | | Trustee, since 2010 | | Served on the Investment Company Institute’s Board of Governors and Executive Committee from 2008-2011 as well the Governing Council of the Independent Directors Council from 2006-2011 and the Independent Directors Council Executive Committee from 2008-2011. Chairman of the IDC from 2008-2010. Institutional Investor (Fund Directions) Trustee of Year in 2007. Trustee of the Evergreen Funds complex (and its predecessors) from 1984 to 2010. Chairman of the Evergreen Funds from 2000-2010. Former Trustee of the Mentor Funds. Retired Attorney, Law Offices of Michael S. Scofield. | | Asset Allocation Trust |
Donald C. Willeke
(Born 1940) | | Trustee, since 1996 | | Principal of the law firm of Willeke & Daniels. General Counsel of the Minneapolis Employees Retirement Fund from 1984 until its consolidation into the Minnesota Public Employees Retirement Association on June 30, 2010. Director and Vice Chair of The Tree Trust (non-profit corporation). Director of the American Chestnut Foundation (non-profit corporation). | | Asset Allocation Trust |
| * | Length of service dates reflect the Trustee’s commencement of service with the Trust’s predecessor entities, where applicable. |
| ** | William R. Ebsworth and Jane A. Freeman each became a Trustee effective January 1, 2015. |
Officers
| | | | | | |
Name and
year of birth | | Position held and
length of service | | Principal occupations during past five years or longer | | |
Karla M. Rabusch
(Born 1959) | | President, since 2003 | | Executive Vice President of Wells Fargo Bank, N.A. and President of Wells Fargo Funds Management, LLC since 2003. | | |
Jeremy DePalma1
(Born 1974) | | Treasurer, since 2012 | | Senior Vice President of Wells Fargo Funds Management, LLC since 2009. Senior Vice President of Evergreen Investment Management Company, LLC from 2008 to 2010. Vice President, Evergreen Investment Services, Inc. from 2004 to 2007. Head of the Fund Reporting and Control Team within Fund Administration from 2005 to 2010. | | |
C. David Messman
(Born 1960) | | Secretary, since 2000; Chief Legal Officer, since 2003 | | Senior Vice President and Secretary of Wells Fargo Funds Management, LLC since 2001. Assistant General Counsel of Wells Fargo Bank, N.A. since 2013 and Vice President and Managing Counsel of Wells Fargo Bank N.A. from 1996 to 2013. | | |
Debra Ann Early
(Born 1964) | | Chief Compliance Officer, since 2007 | | Senior Vice President of Wells Fargo Funds Management, LLC since 2007 and Chief Compliance Officer from 2007 to 2014. Chief Compliance Officer of Parnassus Investments from 2005 to 2007. Chief Financial Officer of Parnassus Investments from 2004 to 2007 and Senior Audit Manager of PricewaterhouseCoopers LLP from 1998 to 2004. | | |
David Berardi
(Born 1975) | | Assistant Treasurer, since 2009 | | Vice President of Wells Fargo Funds Management, LLC since 2009. Vice President of Evergreen Investment Management Company, LLC from 2008 to 2010. Assistant Vice President of Evergreen Investment Services, Inc. from 2004 to 2008. Manager of Fund Reporting and Control for Evergreen Investment Management Company, LLC from 2004 to 2010. | | |
| 1 | Jeremy DePalma acts as Treasurer of 61 funds and Assistant Treasurer of 73 funds in the Fund Complex. |
| 2 | The Statement of Additional Information includes additional information about the Trustees and is available, without charge, upon request, by calling 1-800-222-8222 or by visiting the website at wellsfargoadvantagefunds.com. |
| | | | | | |
| List of abbreviations | | Wells Fargo Advantage Global Opportunities Fund | | | 29 | |
The following is a list of common abbreviations for terms and entities that may have appeared in this report.
| ACA | — ACA Financial Guaranty Corporation |
| ADR | — American depositary receipt |
| ADS | — American depositary shares |
| AGC | — Assured Guaranty Corporation |
| AGM | — Assured Guaranty Municipal |
| Ambac | — Ambac Financial Group Incorporated |
| AMT | — Alternative minimum tax |
| BAN | — Bond anticipation notes |
| BHAC | — Berkshire Hathaway Assurance Corporation |
| CAB | — Capital appreciation bond |
| CCAB | — Convertible capital appreciation bond |
| CDA | — Community Development Authority |
| CDO | — Collateralized debt obligation |
| DRIVER | — Derivative inverse tax-exempt receipts |
| DW&P | — Department of Water & Power |
| DWR | — Department of Water Resources |
| ECFA | — Educational & Cultural Facilities Authority |
| EDA | — Economic Development Authority |
| EDFA | — Economic Development Finance Authority |
| ETF | — Exchange-traded fund |
| FDIC | — Federal Deposit Insurance Corporation |
| FFCB | — Federal Farm Credit Banks |
| FGIC | — Financial Guaranty Insurance Corporation |
| FHA | — Federal Housing Administration |
| FHLB | — Federal Home Loan Bank |
| FHLMC | — Federal Home Loan Mortgage Corporation |
| FICO | — The Financing Corporation |
| FNMA | — Federal National Mortgage Association |
| GDR | — Global depositary receipt |
| GNMA | — Government National Mortgage Association |
| HCFR | — Healthcare facilities revenue |
| HEFA | — Health & Educational Facilities Authority |
| HEFAR | — Higher education facilities authority revenue |
| HFA | — Housing Finance Authority |
| HFFA | — Health Facilities Financing Authority |
| HUD | — Department of Housing and Urban Development |
| IDA | — Industrial Development Authority |
| IDAG | — Industrial Development Agency |
| KRW | — Republic of Korea won |
| LIBOR | — London Interbank Offered Rate |
| LIFER | — Long Inverse Floating Exempt Receipts |
| LLC | — Limited liability company |
| LLLP | — Limited liability limited partnership |
| LLP | — Limited liability partnership |
| MBIA | — Municipal Bond Insurance Association |
| MFHR | — Multifamily housing revenue |
| MSTR | — Municipal securities trust receipts |
| MUD | — Municipal Utility District |
| National | — National Public Finance Guarantee Corporation |
| PCFA | — Pollution Control Financing Authority |
| PCL | — Public Company Limited |
| PCR | — Pollution control revenue |
| PFA | — Public Finance Authority |
| PFFA | — Public Facilities Financing Authority |
| PFOTER | — Puttable floating option tax-exempt receipts |
| plc | — Public limited company |
| PUTTER | — Puttable tax-exempt receipts |
| R&D | — Research & development |
| Radian | — Radian Asset Assurance |
| RAN | — Revenue anticipation notes |
| RDA | — Redevelopment Authority |
| RDFA | — Redevelopment Finance Authority |
| REIT | — Real estate investment trust |
| ROC | — Reset option certificates |
| SAVRS | — Select auction variable rate securities |
| SBA | — Small Business Authority |
| SDR | — Swedish depositary receipt |
| SFHR | — Single-family housing revenue |
| SFMR | — Single-family mortgage revenue |
| SPA | — Standby purchase agreement |
| SPDR | — Standard & Poor’s Depositary Receipts |
| SPEAR | — Short Puttable Exempt Adjustable Receipts |
| STRIPS | — Separate trading of registered interest and |
| TAN | — Tax anticipation notes |
| TIPS | — Treasury inflation-protected securities |
| TRAN | — Tax revenue anticipation notes |
| TTFA | — Transportation Trust Fund Authority |
| TVA | — Tennessee Valley Authority |
This page is intentionally left blank.
This page is intentionally left blank.
This page is intentionally left blank.


For more information
More information about Wells Fargo Advantage Funds is available free upon request. To obtain literature, please write, email, visit the Fund’s website, or call:
Wells Fargo Advantage Funds
P.O. Box 8266
Boston, MA 02266-8266
Email: wfaf@wellsfargo.com
Website: wellsfargoadvantagefunds.com
Individual investors: 1-800-222-8222
Retail investment professionals: 1-888-877-9275
Institutional investment professionals: 1-866-765-0778
This report and the financial statements contained herein are submitted for the general information of the shareholders of Wells Fargo Advantage Funds. If this report is used for promotional purposes, distribution of the report must be accompanied or preceded by a current prospectus. Before investing, please consider the investment objectives, risks, charges, and expenses of the investment. For a current prospectus and, if available, a summary prospectus, containing this information, call 1-800-222-8222 or visit the Fund’s website at wellsfargoadvantagefunds.com. Read the prospectus carefully before you invest or send money.
Wells Fargo Funds Management, LLC, a wholly owned subsidiary of Wells Fargo & Company, provides investment advisory and administrative services for Wells Fargo Advantage Funds. Other affiliates of Wells Fargo & Company provide subadvisory and other services for the Funds. The Funds are distributed by Wells Fargo Funds Distributor, LLC, Member FINRA/SIPC, an affiliate of Wells Fargo & Company.
NOT FDIC INSURED ¡ NO BANK GUARANTEE ¡ MAY LOSE VALUE
© 2015 Wells Fargo Funds Management, LLC. All rights reserved.
| | |
 | | 233655 06-15 SA239/SAR239 04-15 |

Wells Fargo Advantage
International Equity Fund

Semi-Annual Report
April 30, 2015

Reduce clutter. Save trees.
Sign up for electronic delivery of prospectuses and shareholder reports at wellsfargo.com/advantagedelivery
Contents
The views expressed and any forward-looking statements are as of April 30, 2015, unless otherwise noted, and are those of the Fund managers and/or Wells Fargo Funds Management, LLC. Discussions of individual securities, or the markets generally, or any Wells Fargo Advantage Fund are not intended as individual recommendations. Future events or results may vary significantly from those expressed in any forward-looking statements; the views expressed are subject to change at any time in response to changing circumstances in the market. Wells Fargo Funds Management, LLC and the Fund disclaim any obligation to publicly update or revise any views expressed or forward-looking statements.
NOT FDIC INSURED ¡ NO BANK GUARANTEE ¡ MAY LOSE VALUE
| | | | |
| 2 | | Wells Fargo Advantage International Equity Fund | | Letter to shareholders (unaudited) |

Karla M. Rabusch
President
Wells Fargo Advantage Funds
A worldwide trend toward looser monetary policy tended to support stock and bond markets in both developed and emerging economies.
European stocks were boosted by the anticipation and then the reality of the ECB’s asset purchases.
Dear Valued Shareholder:
We are pleased to offer you this semi-annual report for the Wells Fargo Advantage International Equity Fund for the six-month period that ended April 30, 2015. The period was marked by low global interest rates as major central banks initiated or increased their quantitative easing programs. By the end of the period, some European sovereign debt issues were selling at negative yields. In the U.S., large-cap stocks, as measured by the S&P 500 Index1, gained 7.22%, boosted by stronger economic data in the U.S. Although non-U.S. economic growth was more restrained, developed international stocks, as measured by the MSCI EAFE Index (Net)2, gained 6.81%, appreciating, in part, because of quantitative easing in Europe and Japan.
Major central banks continued to provide liquidity to the markets.
A worldwide trend toward looser monetary policy tended to support stock and bond markets in both developed and emerging economies. Throughout the reporting period, the Federal Open Market Committee (FOMC), which is the U.S. Federal Reserve’s (Fed’s) monetary policymaking body, kept its key interest rate effectively at zero. Even though the FOMC ended its bond-buying program in October 2014 and guided investors to expect an interest-rate hike in mid- to late-2015, the Fed remained accommodative.
The European Central Bank (ECB) maintained a variety of measures aimed at encouraging lending, including making funds available to banks at low interest rates and imposing a negative interest rate on bank deposits held at the central bank. In January 2015, the bank announced quantitative easing via significant bond purchases in an attempt to raise the eurozone’s inflation to just under its target of 2%. In Japan, the Bank of Japan (BOJ) also maintained an aggressive monetary program aimed at combating deflation.
The U.S. outperformed other developed markets economies, while major emerging economies grappled with slower growth.
Reported U.S. gross domestic product (GDP) growth came in at a solid 2.2% annualized rate in the fourth quarter of 2014. Although the initial estimate for annualized GDP growth came in at a modest 0.2% in the first quarter of 2015, the slowdown was attributed to short-term factors such as a harsh winter and a long-lived strike at West Coast ports.
European annualized GDP growth was 1.3% in the fourth quarter of 2014 and 1.4% in the first quarter of 2015. European stocks were boosted by the anticipation and then the reality of the ECB’s asset purchases. As also occurred in the U.S., the central bank’s purchase of fixed-income assets provided liquidity that investors poured into riskier assets, including stocks. A similar dynamic played out in Japan, although Japanese shares received the benefit of direct purchases from the BOJ and major pension funds.
Among major emerging markets, Chinese government data showed a slowdown in fixed-asset investment, which includes property investment, and modest growth in manufacturing and housing sales. However, China’s growth rates still
| 1 | The S&P 500 Index consists of 500 shares chosen for market size, liquidity, and industry group representation. It is a market-value-weighted index with each share’s weight in the index proportionate to its market value. You cannot invest directly in an index. |
| 2 | The Morgan Stanley Capital International Europe, Australasia, and Far East (MSCI EAFE) Index (Net) is a free-float-adjusted market-capitalization-weighted index that is designed to measure the equity market performance of developed markets, excluding the U.S. and Canada. You cannot invest directly in an index. Source: MSCI. MSCI makes no express or implied warranties or representations and shall have no liability whatsoever with respect to any MSCI data contained herein. The MSCI data may not be further redistributed or used as a basis for other indexes or any securities or financial products. This report is not approved, reviewed, or produced by MSCI. |
| | | | | | |
| Letter to shareholders (unaudited) | | Wells Fargo Advantage International Equity Fund | | | 3 | |
contrasted favorably with stagnant growth in most developed economies. Brazil faced a challenging situation with a growing corruption scandal affecting the state-controlled oil company, a struggling economy, and a severe drought affecting the city of São Paulo. The MSCI Emerging Markets Index (Net)3 ended the period with a 3.92% return.
Don’t let short-term uncertainty derail long-term investment goals.
Periods of uncertainty can present challenges, but experience has taught us that maintaining long-term investment goals can be an effective way to plan for the future. To help you create a sound strategy based on your personal goals and risk tolerance, Wells Fargo Advantage Funds offers more than 100 mutual funds and other investments spanning a wide range of asset classes and investment styles. Although diversification cannot guarantee an investment profit or prevent losses, we believe it can be an effective way to manage investment risk and potentially smooth out overall portfolio performance. We encourage investors to know their investments and to understand that appropriate levels of risk-taking may unlock opportunities.
Thank you for choosing to invest with Wells Fargo Advantage Funds. We appreciate your confidence in us and remain committed to helping you meet your financial needs.
Sincerely,

Karla M. Rabusch
President
Wells Fargo Advantage Funds
For current information about your fund investments, contact your investment professional, visit our website at wellsfargoadvantagefunds.com, or call us directly at 1-800-222-8222. We are available 24 hours a day, 7 days a week.
| 3 | The Morgan Stanley Capital International (MSCI) Emerging Markets Index (Net) is a free-float-adjusted market-capitalization-weighted index that is designed to measure the equity market performance of emerging markets. The MSCI Emerging Markets Index (Net) consists of the following 23 emerging markets country indexes: Brazil, Chile, China, Colombia, Czech Republic, Egypt, Greece, Hungary, India, Indonesia, Korea, Malaysia, Mexico, Peru, the Philippines, Poland, Qatar, Russia, South Africa, Taiwan, Thailand, Turkey, and United Arab Emirates. You cannot invest directly in an index. |
| | | | |
| 4 | | Wells Fargo Advantage International Equity Fund | | Performance highlights (unaudited) |
Investment objective
The Fund seeks long-term capital appreciation.
Adviser
Wells Fargo Funds Management, LLC
Subadviser
Wells Capital Management Incorporated
Portfolio managers
Jeffrey Everett, CFA
Dale Winner, CFA
Average annual total returns1 (%) as of April 30, 2015
| | | | | | | | | | | | | | | | | | | | | | | | | | | | | | | | | | |
| | | | | Including sales charge | | | Excluding sales charge | | | Expense ratios2 (%) | |
| | | Inception date | | 1 year | | | 5 year | | | 10 year | | | 1 year | | | 5 year | | | 10 year | | | Gross | | | Net3 | |
| Class A (WFEAX) | | 1-20-1998 | | | 7.36 | | | | 6.43 | | | | 4.60 | | | | 13.87 | | | | 7.70 | | | | 5.22 | | | | 1.53 | | | | 1.09 | |
| Class B (WFEBX)* | | 9-6-1979 | | | 8.03 | | | | 6.58 | | | | 4.67 | | | | 13.03 | | | | 6.89 | | | | 4.67 | | | | 2.28 | | | | 1.84 | |
| Class C (WFEFX) | | 3-6-1998 | | | 12.10 | | | | 6.89 | | | | 4.44 | | | | 13.10 | | | | 6.89 | | | | 4.44 | | | | 2.28 | | | | 1.84 | |
| Class R (WFERX) | | 10-10-2003 | | | – | | | | – | | | | – | | | | 13.62 | | | | 7.43 | | | | 4.95 | | | | 1.78 | | | | 1.34 | |
| Administrator Class (WFEDX) | | 7-16-2010 | | | – | | | | – | | | | – | | | | 13.95 | | | | 7.71 | | | | 5.37 | | | | 1.37 | | | | 1.09 | |
| Institutional Class (WFENX) | | 3-9-1998 | | | – | | | | – | | | | – | | | | 14.14 | | | | 7.96 | | | | 5.49 | | | | 1.10 | | | | 0.84 | |
| MSCI ACWI ex USA (Net)4 | | – | | | – | | | | – | | | | – | | | | 2.63 | | | | 6.04 | | | | 6.26 | | | | – | | | | – | |
| * | | Class B shares are closed to investment, except in connection with the reinvestment of any distributions and permitted exchanges. |
Figures quoted represent past performance, which is no guarantee of future results, and do not reflect taxes that a shareholder may pay on fund distributions or the redemption of fund shares. Investment return and principal value of an investment will fluctuate so that an investor’s shares, when redeemed, may be worth more or less than their original cost. Performance shown without sales charges would be lower if sales charges were reflected. Current performance may be lower or higher than the performance data quoted, which assumes the reinvestment of dividends and capital gains. Current month-end performance is available on the Fund’s website, wellsfargoadvantagefunds.com.
Index returns do not include transaction costs associated with buying and selling securities, any mutual fund fees or expenses, or any taxes. It is not possible to invest directly in an index.
For Class A shares, the maximum front-end sales charge is 5.75%. For Class B shares, the maximum contingent deferred sales charge is 5.00%. For Class C shares, the maximum contingent deferred sales charge is 1.00%. Performance including a contingent deferred sales charge assumes the sales charge for the corresponding time period. Class R, Administrator Class, and Institutional Class shares are sold without a front-end sales charge or contingent deferred sales charge.
Stock values fluctuate in response to the activities of individual companies and general market and economic conditions. Foreign investments are especially volatile and can rise or fall dramatically due to differences in the political and economic conditions of the host country. These risks are generally intensified in emerging markets. The use of derivatives may reduce returns and/or increase volatility. Certain investment strategies tend to increase the total risk of an investment (relative to the broader market). The Fund is exposed to smaller-company securities risk. Consult the Fund’s prospectus for additional information on these and other risks.
Please see footnotes on page 5.
| | | | | | |
| Performance highlights (unaudited) | | Wells Fargo Advantage International Equity Fund | | | 5 | |
| | | | |
| Ten largest holdings5 (%) as of April 30, 2015 | |
Mitsubishi UFJ Financial Group Incorporated | | | 3.29 | |
Anima Holding SpA | | | 3.14 | |
China Everbright Limited | | | 3.02 | |
Daiwa House Industry Company Limited | | | 2.99 | |
Man Group plc | | | 2.84 | |
Hitachi Limited | | | 2.73 | |
China Mobile Limited | | | 2.63 | |
Nomura Holdings Incorporated | | | 2.59 | |
Akzo Nobel NV | | | 2.56 | |
Compagnie de Saint-Gobain | | | 2.49 | |
|
| Sector distribution6 as of April 30, 2015 |
|
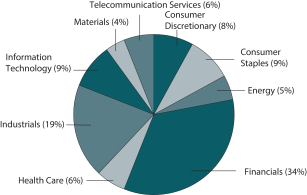 |
|
| Country allocation6 as of April 30, 2015 |
|
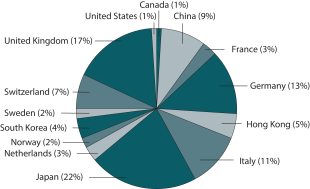 |
| 1 | Historical performance shown for Administrator Class shares prior to their inception reflects the performance of Institutional Class shares and has been adjusted to reflect the higher expenses applicable to Administrator Class shares. Historical performance shown for all classes of the Fund prior to July 19, 2010, is based on the performance of the Fund’s predecessor, Evergreen International Equity Fund. |
| 2 | Reflects the expense ratios as stated in the most recent prospectuses. The expense ratios shown are subject to change and may differ from the annualized expense ratios shown in the financial highlights of this report. |
| 3 | The Adviser has committed through February 29, 2016, to waive fees and/or reimburse expenses to the extent necessary to cap the Fund’s Total Annual Fund Operating Expenses After Fee Waiver, excluding certain expenses, at the amounts shown. After this time, the cap may be increased or the commitment to maintain the cap may be terminated only with the approval of the Board of Trustees. Brokerage commissions, stamp duty fees, interest, taxes, acquired fund fees and expenses, and extraordinary expenses are excluded from the cap. Without this cap, the Fund’s returns would have been lower. |
| 4 | The Morgan Stanley Capital International All Country World Index ex USA (Net) (MSCI ACWI ex USA (Net)) is a free float-adjusted market-capitalization weighted index that is designed to measure the equity market performance of developed and emerging markets. You cannot invest directly in an index. Source: MSCI. MSCI makes no express or implied warranties or representations and shall have no liability whatsoever with respect to any MSCI data contained herein. The MSCI data may not be further redistributed or used as a basis for other indexes or any securities or financial products. This report is not approved, reviewed, or produced by MSCI. |
| 5 | The ten largest holdings, excluding cash and cash equivalents, are calculated based on the value of the investments divided by total net assets of the Fund. Holdings are subject to change and may have changed since the date specified. |
| 6 | Amounts are calculated based on the total long-term investments of the Fund. These percentages are subject to change and may have changed since the date specified. |
| | | | |
| 6 | | Wells Fargo Advantage International Equity Fund | | Fund expenses (unaudited) |
As a shareholder of the Fund, you incur two types of costs: (1) transaction costs, including sales charges (loads) on purchase payments and contingent deferred sales charges (if any) on redemptions and (2) ongoing costs, including management fees, distribution (12b-1) and/or shareholder service fees, and other Fund expenses. This example is intended to help you understand your ongoing costs (in dollars) of investing in the Fund and to compare these costs with the ongoing costs of investing in other mutual funds.
The example is based on an investment of $1,000 invested at the beginning of the six-month period and held for the
entire period from November 1, 2014 to April 30, 2015.
Actual expenses
The “Actual” line of the table below provides information about actual account values and actual expenses. You may use the information in this line, together with the amount you invested, to estimate the expenses that you paid over the period. Simply divide your account value by $1,000 (for example, an $8,600 account value divided by $1,000 = 8.6), then multiply the result by the number in the “Actual” line under the heading entitled “Expenses paid during period” for your applicable class of shares to estimate the expenses you paid on your account during this period.
Hypothetical example for comparison purposes
The “Hypothetical” line of the table below provides information about hypothetical account values and hypothetical expenses based on the Fund’s actual expense ratio and an assumed rate of return of 5% per year before expenses, which is not the Fund’s actual return. The hypothetical account values and expenses may not be used to estimate the actual ending account balance or expenses you paid for the period. You may use this information to compare the ongoing costs of investing in the Fund and other funds. To do so, compare this 5% hypothetical example with the 5% hypothetical examples that appear in the shareholder reports of the other funds.
Please note that the expenses shown in the table are meant to highlight your ongoing costs only and do not reflect any
transactional costs, such as sales charges (loads) and contingent deferred sales charges. Therefore, the “Hypothetical” line
of the table is useful in comparing ongoing costs only and will not help you determine the relative total costs of owning
different funds. In addition, if these transactional costs were included, your costs would have been higher.
| | | | | | | | | | | | | | | | |
| | | Beginning account value 11-1-2014 | | | Ending account value 4-30-2015 | | | Expenses paid during the period¹ | | | Net annualized expense ratio | |
Class A | | | | | | | | | | | | | | | | |
Actual | | $ | 1,000.00 | | | $ | 1,164.93 | | | $ | 5.85 | | | | 1.09 | % |
Hypothetical (5% return before expenses) | | $ | 1,000.00 | | | $ | 1,019.39 | | | $ | 5.46 | | | | 1.09 | % |
Class B | | | | | | | | | | | | | | | | |
Actual | | $ | 1,000.00 | | | $ | 1,160.24 | | | $ | 9.86 | | | | 1.84 | % |
Hypothetical (5% return before expenses) | | $ | 1,000.00 | | | $ | 1,015.67 | | | $ | 9.20 | | | | 1.84 | % |
Class C | | | | | | | | | | | | | | | | |
Actual | | $ | 1,000.00 | | | $ | 1,160.67 | | | $ | 9.86 | | | | 1.84 | % |
Hypothetical (5% return before expenses) | | $ | 1,000.00 | | | $ | 1,015.67 | | | $ | 9.20 | | | | 1.84 | % |
Class R | | | | | | | | | | | | | | | | |
Actual | | $ | 1,000.00 | | | $ | 1,163.09 | | | $ | 7.19 | | | | 1.34 | % |
Hypothetical (5% return before expenses) | | $ | 1,000.00 | | | $ | 1,018.15 | | | $ | 6.71 | | | | 1.34 | % |
Administrator Class | | | | | | | | | | | | | | | | |
Actual | | $ | 1,000.00 | | | $ | 1,165.15 | | | $ | 5.85 | | | | 1.09 | % |
Hypothetical (5% return before expenses) | | $ | 1,000.00 | | | $ | 1,019.39 | | | $ | 5.46 | | | | 1.09 | % |
Institutional Class | | | | | | | | | | | | | | | | |
Actual | | $ | 1,000.00 | | | $ | 1,165.80 | | | $ | 4.51 | | | | 0.84 | % |
Hypothetical (5% return before expenses) | | $ | 1,000.00 | | | $ | 1,020.63 | | | $ | 4.21 | | | | 0.84 | % |
| 1 | Expenses paid is equal to the annualized expense ratio of each class multiplied by the average account value over the period, multiplied by the number of days in the most recent fiscal half-year divided by the number of days in the fiscal year (to reflect the one-half-year period). |
| | | | | | |
| Portfolio of investments—April 30, 2015 (unaudited) | | Wells Fargo Advantage International Equity Fund | | | 7 | |
| | | | | | | | | | | | |
| Security name | | | | | | Shares | | | Value | |
| | | | |
Common Stocks: 85.79% | | | | | | | | | | | | |
| | | | |
| Canada: 1.44% | | | | | | | | | | | | |
Valeant Pharmaceuticals International Incorporated (Health Care, Pharmaceuticals) † | | | | | | | 15,267 | | | $ | 3,311,870 | |
| | | | | | | | | | | | |
| | | | |
| China: 7.76% | | | | | | | | | | | | |
Biostime International Holdings Limited (Consumer Staples, Food Products) | | | | | | | 322,500 | | | | 1,478,123 | |
China Mobile Limited (Telecommunication Services, Wireless Telecommunication Services) | | | | | | | 424,500 | | | | 6,063,255 | |
Dongfeng Motor Group Company Limited (Consumer Discretionary, Automobiles) | | | | | | | 3,006,000 | | | | 4,994,037 | |
Industrial & Commercial Bank of China Limited H Shares (Financials, Banks) | | | | | | | 4,800,000 | | | | 4,163,812 | |
Xtep International Holdings Limited (Consumer Discretionary, Textiles, Apparel & Luxury Goods) | | | | | | | 3,317,715 | | | | 1,207,135 | |
| | | | |
| | | | | | | | | | | 17,906,362 | |
| | | | | | | | | | | | |
| | | | |
| France: 2.49% | | | | | | | | | | | | |
Compagnie de Saint-Gobain (Industrials, Building Products) | | | | | | | 126,646 | | | | 5,755,692 | |
| | | | | | | | | | | | |
| | | | |
| Germany: 10.65% | | | | | | | | | | | | |
Bayer AG (Health Care, Pharmaceuticals) | | | | | | | 30,127 | | | | 4,336,257 | |
Hugo Boss AG (Consumer Discretionary, Textiles, Apparel & Luxury Goods) | | | | | | | 15,289 | | | | 1,881,318 | |
Metro AG (Consumer Staples, Food & Staples Retailing) | | | | | | | 130,400 | | | | 4,726,331 | |
Rheinmetall AG (Industrials, Industrial Conglomerates) | | | | | | | 91,889 | | | | 4,704,516 | |
SAP AG (Information Technology, Software) | | | | | | | 51,197 | | | | 3,868,701 | |
Siemens AG (Industrials, Industrial Conglomerates) | | | | | | | 46,664 | | | | 5,076,199 | |
| | | | |
| | | | | | | | | | | 24,593,322 | |
| | | | | | | | | | | | |
| | | | |
| Hong Kong: 4.31% | | | | | | | | | | | | |
China Everbright Limited (Financials, Capital Markets) | | | | | | | 2,110,000 | | | | 6,975,328 | |
Value Partners Group Limited (Financials, Capital Markets) | | | | | | | 1,602,000 | | | | 2,961,889 | |
| | | | |
| | | | | | | | | | | 9,937,217 | |
| | | | | | | | | | | | |
| | | | |
| Italy: 9.53% | | | | | | | | | | | | |
Anima Holding SpA (Financials, Capital Markets) † | | | | | | | 813,887 | | | | 7,246,508 | |
ENI SpA (Energy, Oil, Gas & Consumable Fuels) | | | | | | | 230,235 | | | | 4,417,254 | |
Intesa Sanpaolo SpA (Financials, Banks) | | | | | | | 1,365,870 | | | | 4,588,641 | |
Prysmian SpA (Industrials, Electrical Equipment) | | | | | | | 281,424 | | | | 5,739,089 | |
| | | | |
| | | | | | | | | | | 21,991,492 | |
| | | | | | | | | | | | |
| | | | |
| Japan: 19.25% | | | | | | | | | | | | |
Coca-Cola East Japan Company Limited (Consumer Staples, Beverages) | | | | | | | 108,200 | | | | 2,021,941 | |
Daiwa House Industry Company Limited (Financials, Real Estate Management & Development) | | | | | | | 308,900 | | | | 6,896,196 | |
Daiwa Securities Group Incorporated (Financials, Capital Markets) | | | | | | | 265,000 | | | | 2,198,390 | |
Hitachi Limited (Information Technology, Electronic Equipment, Instruments & Components) | | | | | | | 925,000 | | | | 6,311,185 | |
Mitsubishi UFJ Financial Group Incorporated (Financials, Banks) | | | | | | | 1,070,000 | | | | 7,601,654 | |
Mitsui Fudosan Company Limited (Financials, Real Estate Management & Development) | | | | | | | 147,000 | | | | 4,357,712 | |
Nitto Denko Corporation (Materials, Chemicals) | | | | | | | 49,888 | | | | 3,197,098 | |
Nomura Holdings Incorporated (Financials, Capital Markets) | | | | | | | 920,600 | | | | 5,972,313 | |
Toyota Motor Corporation (Consumer Discretionary, Automobiles) | | | | | | | 63,800 | | | | 4,441,062 | |
West Holdings Corporation (Consumer Discretionary, Household Durables) | | | | | | | 151,200 | | | | 1,096,340 | |
Yaskawa Electric Corporation (Information Technology, Electronic Equipment, Instruments & Components) | | | | | | | 25,500 | | | | 350,357 | |
| | | | |
| | | | | | | | | | | 44,444,248 | |
| | | | | | | | | | | | |
The accompanying notes are an integral part of these financial statements.
| | | | |
| 8 | | Wells Fargo Advantage International Equity Fund | | Portfolio of investments—April 30, 2015 (unaudited) |
| | | | | | | | | | | | | | |
| Security name | | | | | | | Shares | | | Value | |
| | | | |
| Netherlands: 2.56% | | | | | | | | | | | | | | |
Akzo Nobel NV (Materials, Chemicals) « | | | | | | | | | 77,098 | | | $ | 5,899,054 | |
| | | | | | | | | | | | | | |
| | | | |
| Norway: 1.42% | | | | | | | | | | | | | | |
Frontline 2012 Limited (Energy, Oil, Gas & Consumable Fuels) 144A | | | | | | | | | 189,513 | | | | 1,157,762 | |
Marine Harvest ASA (Consumer Staples, Food Products) | | | | | | | | | 173,624 | | | | 2,116,242 | |
| | | | |
| | | | | | | | | | | | | 3,274,004 | |
| | | | | | | | | | | | | | |
| | | | |
| South Korea: 4.05% | | | | | | | | | | | | | | |
Hana Financial Group Incorporated (Financials, Banks) | | | | | | | | | 138,230 | | | | 4,068,921 | |
Samsung Electronics Company Limited GDR (Information Technology, Semiconductors & Semiconductor Equipment) 144A | | | | | | | | | 7,232 | | | | 4,742,656 | |
SK Telecom Company Limited (Telecommunication Services, Wireless Telecommunication Services) | | | | | | | | | 1,983 | | | | 531,390 | |
| | | | |
| | | | | | | | | | | | | 9,342,967 | |
| | | | | | | | | | | | | | |
| | | | |
| Sweden: 1.65% | | | | | | | | | | | | | | |
Volvo AB Class B (Industrials, Machinery) | | | | | | | | | 275,740 | | | | 3,809,401 | |
| | | | | | | | | | | | | | |
| | | | |
| Switzerland: 6.03% | | | | | | | | | | | | | | |
ABB Limited (Industrials, Electrical Equipment) | | | | | | | | | 208,709 | | | | 4,573,322 | |
Novartis AG (Health Care, Pharmaceuticals) | | | | | | | | | 47,737 | | | | 4,872,617 | |
Zurich Financial Services AG (Financials, Insurance) | | | | | | | | | 14,503 | | | | 4,476,397 | |
| | | | |
| | | | | | | | | | | | | 13,922,336 | |
| | | | | | | | | | | | | | |
| | | | |
| United Kingdom: 13.52% | | | | | | | | | | | | | | |
BP plc (Energy, Oil, Gas & Consumable Fuels) | | | | | | | | | 764,873 | | | | 5,516,566 | |
Capita plc (Industrials, Professional Services) | | | | | | | | | 113,451 | | | | 1,985,754 | |
Man Group plc (Financials, Capital Markets) | | | | | | | | | 2,219,944 | | | | 6,545,527 | |
Reckitt Benckiser Group plc (Consumer Staples, Household Products) | | | | | | | | | 42,649 | | | | 3,795,948 | |
Smiths Group plc (Industrials, Industrial Conglomerates) | | | | | | | | | 150,535 | | | | 2,635,330 | |
Vodafone Group plc (Telecommunication Services, Wireless Telecommunication Services) | | | | | | | | | 1,508,811 | | | | 5,315,852 | |
Wolseley plc (Industrials, Trading Companies & Distributors) | | | | | | | | | 91,639 | | | | 5,419,929 | |
| | | | |
| | | | | | | | | | | | | 31,214,906 | |
| | | | | | | | | | | | | | |
| | | | |
| United States: 1.13% | | | | | | | | | | | | | | |
QUALCOMM Incorporated (Information Technology, Communications Equipment) | | | | | | | | | 38,479 | | | | 2,616,572 | |
| | | | | | | | | | | | | | |
| | | | |
Total Common Stocks (Cost $148,628,692) | | | | | | | | | | | | | 198,019,443 | |
| | | | | | | | | | | | | | |
| | | | |
| | | | | Expiration date | | | | | | | |
| Participation Notes: 1.59% | | | | | | | | | | | | | | |
| | | | |
| United Kingdom: 1.59% | | | | | | | | | | | | | | |
HSBC Bank plc (Kweichow Moutai Company Limited Class A) (Consumer Staples, Beverages) † | | | | | 2-19-2019 | | | | 21,100 | | | | 858,382 | |
HSBC Bank plc (Kweichow Moutai Company Limited Class A) (Consumer Staples, Beverages) † | | | | | 12-4-2024 | | | | 7,469 | | | | 303,851 | |
Standard Chartered Bank (Kweichow Moutai Company Limited Class A) (Consumer Staples, Beverages) † | | | | | 4-18-2016 | | | | 61,639 | | | | 2,507,573 | |
| | | | |
Total Participation Notes (Cost $3,069,004) | | | | | | | | | | | | | 3,669,806 | |
| | | | | | | | | | | | | | |
The accompanying notes are an integral part of these financial statements.
| | | | | | |
| Portfolio of investments—April 30, 2015 (unaudited) | | Wells Fargo Advantage International Equity Fund | | | 9 | |
| | | | | | | | | | | | | | |
| Security name | | Dividend yield | | | | | Shares | | | Value | |
| | | | |
Preferred Stocks: 0.95% | | | | | | | | | | | | | | |
| | | | |
| Germany: 0.95% | | | | | | | | | | | | | | |
Volkswagen AG (Consumer Discretionary, Automobiles) «± | | | 2.14 | % | | | | | 8,574 | | | $ | 2,207,339 | |
| | | | | | | | | | | | | | |
| | | | |
Total Preferred Stocks (Cost $1,988,951) | | | | | | | | | | | | | 2,207,339 | |
| | | | | | | | | | | | | | |
| | | | |
| | | Yield | | | | | | | | | |
| Short-Term Investments: 12.09% | | | | | | | | | | | | | | |
| | | | |
| Investment Companies: 12.09% | | | | | | | | | | | | | | |
Securities Lending Cash Investments, LLC (l)(r)(u) | | | 0.12 | | | | | | 2,200,453 | | | | 2,200,453 | |
Wells Fargo Advantage Cash Investment Money Market Fund, Select Class (l)(u) | | | 0.11 | | | | | | 25,699,509 | | | | 25,699,509 | |
| | | | |
Total Short-Term Investments (Cost $27,899,962) | | | | | | | | | | | | | 27,899,962 | |
| | | | | | | | | | | | | | |
| | | | | | | | |
| Total investments in securities (Cost $181,586,609) * | | | 100.42 | % | | | 231,796,550 | |
Other assets and liabilities, net | | | (0.42 | ) | | | (969,019 | ) |
| | | | | | | | |
| Total net assets | | | 100.00 | % | | $ | 230,827,531 | |
| | | | | | | | |
| † | Non-income-earning security |
| « | All or a portion of this security is on loan. |
| 144A | The security may be resold in transactions exempt from registration, normally to qualified institutional buyers, pursuant to Rule 144A under the Securities Act of 1933. |
| ± | Variable rate investment. The rate shown is the rate in effect at period end. |
| (l) | The security represents an affiliate of the Fund as defined in the Investment Company Act of 1940. |
| (u) | The rate represents the 7-day annualized yield at period end. |
| (r) | The investment is a non-registered investment vehicle purchased with cash collateral received from securities on loan. |
| * | Cost for federal income tax purposes is $183,182,623 and unrealized gains (losses) consists of: |
| | | | |
Gross unrealized gains | | $ | 52,651,039 | |
Gross unrealized losses | | | (4,037,112 | ) |
| | | | |
Net unrealized gains | | $ | 48,613,927 | |
The accompanying notes are an integral part of these financial statements.
| | | | |
| 10 | | Wells Fargo Advantage International Equity Fund | | Statement of assets and liabilities—April 30, 2015 (unaudited) |
| | | | |
| | | | |
| |
Assets | | | | |
Investments | | | | |
In unaffiliated securities (including $2,096,410 of securities loaned), at value (cost $153,686,647) | | $ | 203,896,588 | |
In affiliated securities, at value (cost $27,899,962) | | | 27,899,962 | |
| | | | |
Total investments, at value (cost $181,586,609) | | | 231,796,550 | |
Foreign currency, at value (cost $232,480) | | | 233,953 | |
Receivable for investments sold | | | 199,596 | |
Receivable for Fund shares sold | | | 2,477,000 | |
Receivable for dividends | | | 793,103 | |
Receivable for securities lending income | | | 13,323 | |
Prepaid expenses and other assets | | | 45,449 | |
| | | | |
Total assets | | | 235,558,974 | |
| | | | |
| |
Liabilities | | | | |
Payable for investments purchased | | | 1,452,376 | |
Payable for Fund shares redeemed | | | 119,048 | |
Unrealized losses on forward foreign currency contracts | | | 711,568 | |
Payable upon receipt of securities loaned | | | 2,200,453 | |
Advisory fee payable | | | 75,467 | |
Distribution fees payable | | | 13,410 | |
Administration fees payable | | | 41,861 | |
Accrued expenses and other liabilities | | | 117,260 | |
| | | | |
Total liabilities | | | 4,731,443 | |
| | | | |
Total net assets | | $ | 230,827,531 | |
| | | | |
| |
NET ASSETS CONSIST OF | | | | |
Paid-in capital | | $ | 222,477,174 | |
Undistributed net investment income | | | 482,187 | |
Accumulated net realized losses on investments | | | (41,639,229 | ) |
Net unrealized gains on investments | | | 49,507,399 | |
| | | | |
Total net assets | | $ | 230,827,531 | |
| | | | |
| |
COMPUTATION OF NET ASSET VALUE AND OFFERING PRICE PER SHARE | | | | |
Net assets – Class A | | $ | 111,435,518 | |
Shares outstanding – Class A1 | | | 8,866,600 | |
Net asset value per share – Class A | | | $12.57 | |
Maximum offering price per share – Class A2 | | | $13.34 | |
Net assets – Class B | | $ | 3,648,537 | |
Shares outstanding – Class B1 | | | 297,353 | |
Net asset value per share – Class B | | | $12.27 | |
Net assets – Class C | | $ | 18,312,640 | |
Shares outstanding – Class C1 | | | 1,480,823 | |
Net asset value per share – Class C | | | $12.37 | |
Net assets – Class R | | $ | 1,612,864 | |
Shares outstanding – Class R1 | | | 126,720 | |
Net asset value per share – Class R | | | $12.73 | |
Net assets – Administrator Class | | $ | 19,800,146 | |
Shares outstanding – Administrator Class1 | | | 1,603,373 | |
Net asset value per share – Administrator Class | | | $12.35 | |
Net assets – Institutional Class | | $ | 76,017,826 | |
Shares outstanding – Institutional Class1 | | | 6,075,210 | |
Net asset value per share – Institutional Class | | | $12.51 | |
| 1 | The Fund has an unlimited number of authorized shares. |
| 2 | Maximum offering price is computed as 100/94.25 of net asset value. On investments of $50,000 or more, the offering price is reduced. |
The accompanying notes are an integral part of these financial statements.
| | | | | | |
| Statement of operations—six months ended April 30, 2015 (unaudited) | | Wells Fargo Advantage International Equity Fund | | | 11 | |
| | | | |
| | | | |
| |
Investment income | | | | |
Dividends (net of foreign withholding taxes of $179,084) | | $ | 2,064,255 | |
Securities lending income, net | | | 44,068 | |
Income from affiliated securities | | | 4,247 | |
Interest | | | 19 | |
| | | | |
Total investment income | | | 2,112,589 | |
| | | | |
| |
Expenses | | | | |
Advisory fee | | | 819,825 | |
Administration fees | | | | |
Fund level | | | 48,225 | |
Class A | | | 125,251 | |
Class B | | | 4,800 | |
Class C | | | 20,902 | |
Class R | | | 1,953 | |
Administrator Class | | | 5,520 | |
Institutional Class | | | 25,696 | |
Shareholder servicing fees | | | | |
Class A | | | 120,433 | |
Class B | | | 4,616 | |
Class C | | | 20,098 | |
Class R | | | 1,877 | |
Administrator Class | | | 13,801 | |
Distribution fees | | | | |
Class B | | | 13,847 | |
Class C | | | 60,294 | |
Class R | | | 1,877 | |
Custody and accounting fees | | | 45,284 | |
Professional fees | | | 35,011 | |
Registration fees | | | 30,221 | |
Shareholder report expenses | | | 27,122 | |
Trustees’ fees and expenses | | | 8,290 | |
Other fees and expenses | | | 11,560 | |
| | | | |
Total expenses | | | 1,446,503 | |
Less: Fee waivers and/or expense reimbursements | | | (399,479 | ) |
| | | | |
Net expenses | | | 1,047,024 | |
| | | | |
Net investment income | | | 1,065,565 | |
| | | | |
| |
REALIZED AND UNREALIZED GAINS (LOSSES) ON INVESTMENTS | | | | |
| |
Net realized gains on: | | | | |
Unaffiliated securities | | | 7,231,468 | |
Forward foreign currency contract transactions | | | 2,520,742 | |
| | | | |
Net realized gains on investments | | | 9,752,210 | |
| | | | |
| |
Net change in unrealized gains (losses) on: | | | | |
Unaffiliated securities | | | 20,383,036 | |
Forward foreign currency contract transactions | | | (1,152,478 | ) |
| | | | |
Net change in unrealized gains (losses) on investments | | | 19,230,558 | |
| | | | |
Net realized and unrealized gains (losses) on investments | | | 28,982,768 | |
| | | | |
Net increase in net assets resulting from operations | | $ | 30,048,333 | |
| | | | |
The accompanying notes are an integral part of these financial statements.
| | | | |
| 12 | | Wells Fargo Advantage International Equity Fund | | Statement of changes in net assets |
| | | | | | | | | | | | | | | | |
| | | Six months ended April 30, 2015 (unaudited) | | | Year ended October 31, 2014 | |
| | | | |
Operations | | | | | | | | | | | | | | | | |
Net investment income | | | | | | $ | 1,065,565 | | | | | | | $ | 6,499,158 | |
Net realized gains on investments | | | | | | | 9,752,210 | | | | | | | | 2,939,425 | |
Net change in unrealized gains (losses) on investments | | | | | | | 19,230,558 | | | | | | | | (17,267,991 | ) |
| | | | |
Net increase (decrease) in net assets resulting from operations | | | | | | | 30,048,333 | | | | | | | | (7,829,408 | ) |
| | | | |
| | | | |
Distributions to shareholders from | | | | | | | | | | | | | | | | |
Net investment income | | | | | | | | | | | | | | | | |
Class A | | | | | | | (4,144,449 | ) | | | | | | | (2,501,560 | ) |
Class B | | | | | | | (133,491 | ) | | | | | | | (86,510 | ) |
Class C | | | | | | | (589,249 | ) | | | | | | | (245,790 | ) |
Class R | | | | | | | (58,692 | ) | | | | | | | (13,985 | ) |
Administrator Class | | | | | | | (444,265 | ) | | | | | | | (102,289 | ) |
Institutional Class | | | | | | | (3,012,972 | ) | | | | | | | (1,898,103 | ) |
| | | | |
Total distributions to shareholders | | | | | | | (8,383,118 | ) | | | | | | | (4,848,237 | ) |
| | | | |
| | | | |
Capital share transactions | | | Shares | | | | | | | | Shares | | | | | |
Proceeds from shares sold | | | | | | | | | | | | | | | | |
Class A | | | 928,405 | | | | 11,148,845 | | | | 1,770,644 | | | | 20,755,971 | |
Class B | | | 2,011 | | | | 24,346 | | | | 2,057 | | | | 23,111 | |
Class C | | | 125,459 | | | | 1,488,699 | | | | 286,544 | | | | 3,296,726 | |
Class R | | | 20,567 | | | | 237,031 | | | | 34,731 | | | | 411,910 | |
Administrator Class | | | 838,756 | | | | 10,064,904 | | | | 1,087,000 | | | | 12,536,509 | |
Institutional Class | | | 1,804,105 | | | | 21,467,188 | | | | 1,478,849 | | | | 17,423,599 | |
| | | | |
| | | | | | | 44,431,013 | | | | | | | | 54,447,826 | |
| | | | |
Reinvestment of distributions | | | | | | | | | | | | | | | | |
Class A | | | 350,957 | | | | 3,835,959 | | | | 183,571 | | | | 2,204,689 | |
Class B | | | 12,086 | | | | 129,201 | | | | 7,028 | | | | 82,440 | |
Class C | | | 47,129 | | | | 508,047 | | | | 18,292 | | | | 216,764 | |
Class R | | | 2,725 | | | | 30,167 | | | | 467 | | | | 5,680 | |
Administrator Class | | | 41,287 | | | | 443,423 | | | | 6,202 | | | | 73,240 | |
Institutional Class | | | 220,501 | | | | 2,396,847 | | | | 100,489 | | | | 1,200,840 | |
| | | | |
| | | | | | | 7,343,644 | | | | | | | | 3,783,653 | |
| | | | |
Payment for shares redeemed | | | | | | | | | | | | | | | | |
Class A | | | (1,069,134 | ) | | | (12,207,233 | ) | | | (2,964,305 | ) | | | (34,898,761 | ) |
Class B | | | (93,755 | ) | | | (1,040,579 | ) | | | (218,071 | ) | | | (2,489,646 | ) |
Class C | | | (169,964 | ) | | | (1,902,446 | ) | | | (273,075 | ) | | | (3,147,560 | ) |
Class R | | | (34,897 | ) | | | (411,177 | ) | | | (83,667 | ) | | | (995,507 | ) |
Administrator Class | | | (445,408 | ) | | | (4,952,316 | ) | | | (259,973 | ) | | | (2,909,657 | ) |
Institutional Class | | | (1,618,086 | ) | | | (18,516,352 | ) | | | (2,848,720 | ) | | | (33,494,543 | ) |
| | | | |
| | | | | | | (39,030,103 | ) | | | | | | | (77,935,674 | ) |
| | | | |
Net increase (decrease) in net assets resulting from capital share transactions | | | | | | | 12,744,554 | | | | | | | | (19,704,195 | ) |
| | | | |
Total increase (decrease) in net assets | | | | | | | 34,409,769 | | | | | | | | (32,381,840 | ) |
| | | | |
| | | | |
Net assets | | | | | | | | | | | | | | | | |
Beginning of period | | | | | | | 196,417,762 | | | | | | | | 228,799,602 | |
| | | | |
End of period | | | | | | $ | 230,827,531 | | | | | | | $ | 196,417,762 | |
| | | | |
Undistributed net investment income | | | | | | $ | 482,187 | | | | | | | $ | 7,799,740 | |
| | | | |
The accompanying notes are an integral part of these financial statements.
| | | | | | |
| Financial highlights | | Wells Fargo Advantage International Equity Fund | | | 13 | |
(For a share outstanding throughout each period)
| | | | | | | | | | | | | | | | | | | | | | | | |
| | | Six months ended
April 30, 2015
(unaudited) | | | Year ended October 31 | |
| CLASS A | | | 2014 | | | 2013 | | | 2012 | | | 2011 | | | 20101 | |
Net asset value, beginning of period | | | $11.28 | | | | $11.98 | | | | $9.77 | | | | $9.82 | | | | $10.41 | | | | $9.14 | |
Net investment income | | | 0.06 | 2 | | | 0.37 | 2 | | | 0.21 | | | | 0.25 | | | | 0.17 | | | | 0.09 | 2 |
Net realized and unrealized gains (losses) on investments | | | 1.73 | | | | (0.81 | ) | | | 2.27 | | | | (0.09 | ) | | | (0.75 | ) | | | 1.42 | |
| | | | | | | | | | | | | | | | | | | | | | | | |
Total from investment operations | | | 1.79 | | | | (0.44 | ) | | | 2.48 | | | | 0.16 | | | | (0.58 | ) | | | 1.51 | |
Distributions to shareholders from | | | | | | | | | | | | | | | | | | | | | | | | |
Net investment income | | | (0.50 | ) | | | (0.26 | ) | | | (0.27 | ) | | | (0.21 | ) | | | (0.01 | ) | | | (0.24 | ) |
Net asset value, end of period | | | $12.57 | | | | $11.28 | | | | $11.98 | | | | $9.77 | | | | $9.82 | | | | $10.41 | |
Total return3 | | | 16.49 | % | | | (3.77 | )% | | | 25.99 | % | | | 1.83 | % | | | (5.62 | )% | | | 16.90 | % |
Ratios to average net assets (annualized) | | | | | | | | | | | | | | | | | | | | | | | | |
Gross expenses | | | 1.57 | % | | | 1.53 | % | | | 1.56 | % | | | 1.53 | % | | | 1.46 | % | | | 1.19 | % |
Net expenses | | | 1.09 | % | | | 1.09 | % | | | 1.09 | % | | | 1.09 | % | | | 1.09 | % | | | 1.07 | % |
Net investment income | | | 1.11 | % | | | 3.14 | % | | | 2.03 | % | | | 2.49 | % | | | 1.55 | % | | | 0.91 | % |
Supplemental data | | | | | | | | | | | | | | | | | | | | | | | | |
Portfolio turnover rate | | | 16 | % | | | 32 | % | | | 38 | % | | | 115 | % | | | 44 | % | | | 42 | % |
Net assets, end of period (000s omitted) | | | $111,436 | | | | $97,640 | | | | $115,821 | | | | $114,219 | | | | $162,954 | | | | $216,096 | |
| 1 | After the close of business on July 16, 2010, the Fund acquired the net assets of Evergreen International Equity Fund which became the accounting and performance survivor in the transaction. The information for the period prior to July 19, 2010 is that of Class A of Evergreen International Equity Fund. |
| 2 | Calculated based upon average shares outstanding |
| 3 | Total return calculations do not include any sales charges. Returns for periods of less than one year are not annualized. |
The accompanying notes are an integral part of these financial statements.
| | | | |
| 14 | | Wells Fargo Advantage International Equity Fund | | Financial highlights |
(For a share outstanding throughout each period)
| | | | | | | | | | | | | | | | | | | | | | | | |
| | | Six months ended
April 30, 2015 (unaudited) | | | Year ended October 31 | |
| CLASS B | | | 2014 | | | 2013 | | | 2012 | | | 2011 | | | 20101 | |
Net asset value, beginning of period | | | $10.95 | | | | $11.62 | | | | $9.47 | | | | $9.48 | | | | $10.12 | | | | $8.81 | |
Net investment income | | | 0.01 | 2 | | | 0.28 | 2 | | | 0.13 | 2 | | | 0.16 | 2 | | | 0.08 | 2 | | | 0.01 | 2 |
Net realized and unrealized gains (losses) on investments | | | 1.69 | | | | (0.79 | ) | | | 2.21 | | | | (0.07 | ) | | | (0.72 | ) | | | 1.41 | |
| | | | | | | | | | | | | | | | | | | | | | | | |
Total from investment operations | | | 1.70 | | | | (0.51 | ) | | | 2.34 | | | | 0.09 | | | | (0.64 | ) | | | 1.42 | |
Distributions to shareholders from | | | | | | | | | | | | | | | | | | | | | | | | |
Net investment income | | | (0.38 | ) | | | (0.16 | ) | | | (0.19 | ) | | | (0.10 | ) | | | 0.00 | | | | (0.11 | ) |
Net asset value, end of period | | | $12.27 | | | | $10.95 | | | | $11.62 | | | | $9.47 | | | | $9.48 | | | | $10.12 | |
Total return3 | | | 16.02 | % | | | (4.48 | )% | | | 25.07 | % | | | 0.99 | % | | | (6.32 | )% | | | 16.15 | % |
Ratios to average net assets (annualized) | | | | | | | | | | | | | | | | | | | | | | | | |
Gross expenses | | | 2.32 | % | | | 2.28 | % | | | 2.31 | % | | | 2.28 | % | | | 2.21 | % | | | 1.94 | % |
Net expenses | | | 1.84 | % | | | 1.84 | % | | | 1.84 | % | | | 1.84 | % | | | 1.84 | % | | | 1.82 | % |
Net investment income | | | 0.24 | % | | | 2.40 | % | | | 1.27 | % | | | 1.67 | % | | | 0.77 | % | | | 0.15 | % |
Supplemental data | | | | | | | | | | | | | | | | | | | | | | | | |
Portfolio turnover rate | | | 16 | % | | | 32 | % | | | 38 | % | | | 115 | % | | | 44 | % | | | 42 | % |
Net assets, end of period (000s omitted) | | | $3,649 | | | | $4,127 | | | | $6,810 | | | | $8,303 | | | | $12,873 | | | | $20,450 | |
| 1 | After the close of business on July 16, 2010, the Fund acquired the net assets of Evergreen International Equity Fund which became the accounting and performance survivor in the transaction. The information for the period prior to July 19, 2010 is that of Class B of Evergreen International Equity Fund. |
| 2 | Calculated based upon average shares outstanding |
| 3 | Total return calculations do not include any sales charges. Returns for periods of less than one year are not annualized. |
The accompanying notes are an integral part of these financial statements.
| | | | | | |
| Financial highlights | | Wells Fargo Advantage International Equity Fund | | | 15 | |
(For a share outstanding throughout each period)
| | | | | | | | | | | | | | | | | | | | | | | | |
| | | Six months ended April 30, 2015 (unaudited) | | | Year ended October 31 | |
| CLASS C | | | 2014 | | | 2013 | | | 2012 | | | 2011 | | | 20101 | |
Net asset value, beginning of period | | | $11.06 | | | | $11.75 | | | | $9.58 | | | | $9.59 | | | | $10.24 | | | | $8.93 | |
Net investment income | | | 0.03 | | | | 0.27 | 2 | | | 0.14 | 2 | | | 0.16 | 2 | | | 0.06 | | | | 0.01 | 2 |
Net realized and unrealized gains (losses) on investments | | | 1.69 | | | | (0.79 | ) | | | 2.22 | | | | (0.07 | ) | | | (0.71 | ) | | | 1.41 | |
| | | | | | | | | | | | | | | | | | | | | | | | |
Total from investment operations | | | 1.72 | | | | (0.52 | ) | | | 2.36 | | | | 0.09 | | | | (0.65 | ) | | | 1.42 | |
Distributions to shareholders from | | | | | | | | | | | | | | | | | | | | | | | | |
Net investment income | | | (0.41 | ) | | | (0.17 | ) | | | (0.19 | ) | | | (0.10 | ) | | | 0.00 | | | | (0.11 | ) |
Net asset value, end of period | | | $12.37 | | | | $11.06 | | | | $11.75 | | | | $9.58 | | | | $9.59 | | | | $10.24 | |
Total return3 | | | 16.07 | % | | | (4.49 | )% | | | 25.05 | % | | | 1.08 | % | | | (6.35 | )% | | | 16.13 | % |
Ratios to average net assets (annualized) | | | | | | | | | | | | | | | | | | | | | | | | |
Gross expenses | | | 2.32 | % | | | 2.28 | % | | | 2.31 | % | | | 2.28 | % | | | 2.21 | % | | | 1.94 | % |
Net expenses | | | 1.84 | % | | | 1.84 | % | | | 1.84 | % | | | 1.84 | % | | | 1.84 | % | | | 1.82 | % |
Net investment income | | | 0.34 | % | | | 2.37 | % | | | 1.30 | % | | | 1.72 | % | | | 0.79 | % | | | 0.16 | % |
Supplemental data | | | | | | | | | | | | | | | | | | | | | | | | |
Portfolio turnover rate | | | 16 | % | | | 32 | % | | | 38 | % | | | 115 | % | | | 44 | % | | | 42 | % |
Net assets, end of period (000s omitted) | | | $18,313 | | | | $16,346 | | | | $16,997 | | | | $16,760 | | | | $22,578 | | | | $30,439 | |
| 1 | After the close of business on July 16, 2010, the Fund acquired the net assets of Evergreen International Equity Fund which became the accounting and performance survivor in the transaction. The information for the period prior to July 19, 2010 is that of Class C of Evergreen International Equity Fund. |
| 2 | Calculated based upon average shares outstanding |
| 3 | Total return calculations do not include any sales charges. Returns for periods of less than one year are not annualized. |
The accompanying notes are an integral part of these financial statements.
| | | | |
| 16 | | Wells Fargo Advantage International Equity Fund | | Financial highlights |
(For a share outstanding throughout each period)
| | | | | | | | | | | | | | | | | | | | | | | | |
| | | Six months ended April 30, 2015 (unaudited) | | | Year ended October 31 | |
| CLASS R | | | 2014 | | | 2013 | | | 2012 | | | 2011 | | | 20101 | |
Net asset value, beginning of period | | | $11.40 | | | | $11.96 | | | | $9.75 | | | | $9.79 | | | | $10.40 | | | | $9.13 | |
Net investment income | | | 0.05 | 2 | | | 0.32 | 2 | | | 0.18 | 2 | | | 0.20 | 2 | | | 0.14 | 2 | | | 0.06 | 2 |
Net realized and unrealized gains (losses) on investments | | | 1.74 | | | | (0.79 | ) | | | 2.27 | | | | (0.06 | ) | | | (0.75 | ) | | | 1.42 | |
| | | | | | | | | | | | | | | | | | | | | | | | |
Total from investment operations | | | 1.79 | | | | (0.47 | ) | | | 2.45 | | | | 0.14 | | | | (0.61 | ) | | | 1.48 | |
Distributions to shareholders from | | | | | | | | | | | | | | | | | | | | | | | | |
Net investment income | | | (0.46 | ) | | | (0.09 | ) | | | (0.24 | ) | | | (0.18 | ) | | | 0.00 | | | | (0.21 | ) |
Net asset value, end of period | | | $12.73 | | | | $11.40 | | | | $11.96 | | | | $9.75 | | | | $9.79 | | | | $10.40 | |
Total return3 | | | 16.31 | % | | | (4.00 | )% | | | 25.68 | % | | | 1.58 | % | | | (5.87 | )% | | | 16.58 | % |
Ratios to average net assets (annualized) | | | | | | | | | | | | | | | | | | | | | | | | |
Gross expenses | | | 1.82 | % | | | 1.78 | % | | | 1.81 | % | | | 1.78 | % | | | 1.71 | % | | | 1.45 | % |
Net expenses | | | 1.34 | % | | | 1.34 | % | | | 1.34 | % | | | 1.34 | % | | | 1.34 | % | | | 1.33 | % |
Net investment income | | | 0.86 | % | | | 2.71 | % | | | 1.72 | % | | | 2.11 | % | | | 1.31 | % | | | 0.66 | % |
Supplemental data | | | | | | | | | | | | | | | | | | | | | | | | |
Portfolio turnover rate | | | 16 | % | | | 32 | % | | | 38 | % | | | 115 | % | | | 44 | % | | | 42 | % |
Net assets, end of period (000s omitted) | | | $1,613 | | | | $1,576 | | | | $2,234 | | | | $2,196 | | | | $3,050 | | | | $4,066 | |
| 1 | After the close of business on July 16, 2010, the Fund acquired the net assets of Evergreen International Equity Fund which became the accounting and performance survivor in the transaction. The information for the period prior to July 19, 2010 is that of Class R of Evergreen International Equity Fund. |
| 2 | Calculated based upon average shares outstanding |
| 3 | Returns for periods of less than one year are not annualized. |
The accompanying notes are an integral part of these financial statements.
| | | | | | |
| Financial highlights | | Wells Fargo Advantage International Equity Fund | | | 17 | |
(For a share outstanding throughout each period)
| | | | | | | | | | | | | | | | | | | | | | | | |
| | | Six months ended April 30, 2015 (unaudited) | | | Year ended October 31 | |
| ADMINISTRATOR CLASS | | | 2014 | | | 2013 | | | 2012 | | | 2011 | | | 20101 | |
Net asset value, beginning of period | | | $11.09 | | | | $11.79 | | | | $9.62 | | | | $9.67 | | | | $10.28 | | | | $8.82 | |
Net investment income | | | 0.07 | 2 | | | 0.37 | 2 | | | 0.22 | | | | 0.25 | | | | 0.16 | | | | 0.01 | |
Net realized and unrealized gains (losses) on investments | | | 1.69 | | | | (0.80 | ) | | | 2.22 | | | | (0.09 | ) | | | (0.74 | ) | | | 1.45 | |
| | | | | | | | | | | | | | | | | | | | | | | | |
Total from investment operations | | | 1.76 | | | | (0.43 | ) | | | 2.44 | | | | 0.16 | | | | (0.58 | ) | | | 1.46 | |
Distributions to shareholders from | | | | | | | | | | | | | | | | | | | | | | | | |
Net investment income | | | (0.50 | ) | | | (0.27 | ) | | | (0.27 | ) | | | (0.21 | ) | | | (0.03 | ) | | | 0.00 | |
Net asset value, end of period | | | $12.35 | | | | $11.09 | | | | $11.79 | | | | $9.62 | | | | $9.67 | | | | $10.28 | |
Total return3 | | | 16.51 | % | | | (3.82 | )% | | | 26.00 | % | | | 1.88 | % | | | (5.68 | )% | | | 16.55 | % |
Ratios to average net assets (annualized) | | | | | | | | | | | | | | | | | | | | | | | | |
Gross expenses | | | 1.42 | % | | | 1.37 | % | | | 1.37 | % | | | 1.36 | % | | | 1.25 | % | | | 1.36 | % |
Net expenses | | | 1.09 | % | | | 1.09 | % | | | 1.09 | % | | | 1.09 | % | | | 1.09 | % | | | 1.09 | % |
Net investment income | | | 1.21 | % | | | 3.21 | % | | | 2.08 | % | | | 2.52 | % | | | 1.58 | % | | | 0.32 | % |
Supplemental data | | | | | | | | | | | | | | | | | | | | | | | | |
Portfolio turnover rate | | | 16 | % | | | 32 | % | | | 38 | % | | | 115 | % | | | 44 | % | | | 42 | % |
Net assets, end of period (000s omitted) | | | $19,800 | | | | $12,962 | | | | $3,955 | | | | $3,505 | | | | $3,436 | | | | $89 | |
| 1 | For the period from July 16, 2010 (commencement of class operations) to October 31, 2010 |
| 2 | Calculated based upon average shares outstanding |
| 3 | Returns for periods of less than one year are not annualized. |
The accompanying notes are an integral part of these financial statements.
| | | | |
| 18 | | Wells Fargo Advantage International Equity Fund | | Financial highlights |
(For a share outstanding throughout each period)
| | | | | | | | | | | | | | | | | | | | | | | | |
| | | Six months ended April 30, 2015 (unaudited) | | | Year ended October 31 | |
| INSTITUTIONAL CLASS | | | 2014 | | | 2013 | | | 2012 | | | 2011 | | | 20101 | |
Net asset value, beginning of period | | | $11.25 | | | | $11.96 | | | | $9.76 | | | | $9.83 | | | | $10.42 | | | | $9.17 | |
Net investment income | | | 0.07 | 2 | | | 0.37 | 2 | | | 0.24 | 2 | | | 0.37 | | | | 0.19 | 2 | | | 0.11 | 2 |
Net realized and unrealized gains (losses) on investments | | | 1.72 | | | | (0.77 | ) | | | 2.26 | | | | (0.19 | ) | | | (0.75 | ) | | | 1.43 | |
| | | | | | | | | | | | | | | | | | | | | | | | |
Total from investment operations | | | 1.79 | | | | (0.40 | ) | | | 2.50 | | | | 0.18 | | | | (0.56 | ) | | | 1.54 | |
Distributions to shareholders from | | | | | | | | | | | | | | | | | | | | | | | | |
Net investment income | | | (0.53 | ) | | | (0.31 | ) | | | (0.30 | ) | | | (0.25 | ) | | | (0.03 | ) | | | (0.29 | ) |
Net asset value, end of period | | | $12.51 | | | | $11.25 | | | | $11.96 | | | | $9.76 | | | | $9.83 | | | | $10.42 | |
Total return3 | | | 16.58 | % | | | (3.53 | )% | | | 26.31 | % | | | 2.05 | % | | | (5.38 | )% | | | 17.17 | % |
Ratios to average net assets (annualized) | | | | | | | | | | | | | | | | | | | | | | | | |
Gross expenses | | | 1.14 | % | | | 1.10 | % | | | 1.13 | % | | | 1.10 | % | | | 1.03 | % | | | 0.87 | % |
Net expenses | | | 0.84 | % | | | 0.84 | % | | | 0.84 | % | | | 0.84 | % | | | 0.84 | % | | | 0.82 | % |
Net investment income | | | 1.33 | % | | | 3.18 | % | | | 2.29 | % | | | 2.67 | % | | | 1.78 | % | | | 1.15 | % |
Supplemental data | | | | | | | | | | | | | | | | | | | | | | | | |
Portfolio turnover rate | | | 16 | % | | | 32 | % | | | 38 | % | | | 115 | % | | | 44 | % | | | 42 | % |
Net assets, end of period (000s omitted) | | | $76,018 | | | | $63,766 | | | | $82,982 | | | | $138,245 | | | | $227,158 | | | | $373,200 | |
| 1 | After the close of business on July 16, 2010, the Fund acquired the net assets of Evergreen International Equity Fund which became the accounting and performance survivor in the transaction. The information for the period prior to July 19, 2010 is that of Class I of Evergreen International Equity Fund. |
| 2 | Calculated based upon average shares outstanding |
| 3 | Returns for periods of less than one year are not annualized. |
The accompanying notes are an integral part of these financial statements.
| | | | | | |
| Notes to financial statements (unaudited) | | Wells Fargo Advantage International Equity Fund | | | 19 | |
1. ORGANIZATION
Wells Fargo Funds Trust (the “Trust”), a Delaware statutory trust organized on March 10, 1999, is an open-end management investment company registered under the Investment Company Act of 1940, as amended (the “1940 Act”). As an investment company, the Trust follows the accounting and reporting guidance in Financial Accounting Standards Board (“FASB”) Accounting Standards Codification Topic 946, Financial Services – Investment Companies. These financial statements report on the Wells Fargo Advantage International Equity Fund (the “Fund”) which is a diversified series of the Trust.
2. SIGNIFICANT ACCOUNTING POLICIES
The following significant accounting policies, which are consistently followed in the preparation of the financial statements of the Fund, are in conformity with U.S. generally accepted accounting principles which require management to make estimates and assumptions that affect the reported amounts of assets and liabilities, disclosure of contingent assets and liabilities at the date of the financial statements, and the reported amounts of revenues and expenses during the reporting period. Actual results could differ from those estimates.
Securities valuation
All investments are valued each business day as of the close of regular trading on the New York Stock Exchange (generally 4 p.m. Eastern Time).
Equity securities that are listed on a foreign or domestic exchange or market are valued at the official closing price or, if none, the last sales price. If no sale occurs on the primary exchange or market that day, the prior day’s price will be deemed “stale” and a fair value price will be determined in accordance with the Fund’s Valuation Procedures.
Equity securities that are not listed on a foreign or domestic exchange or market, but have a public trading market, are valued at the quoted bid price from an independent broker-dealer that the Management Valuation Team of Wells Fargo Funds Management, LLC (“Funds Management”) has determined is an acceptable source.
The values of securities denominated in foreign currencies are translated into U.S. dollars at rates provided by an independent foreign currency pricing source at a time each business day specified by the Management Valuation Team.
Many securities markets and exchanges outside the U.S. close prior to the close of the New York Stock Exchange and therefore may not fully reflect trading or events that occur after the close of the principal exchange in which the foreign securities are traded, but before the close of the New York Stock Exchange. If such trading or events are expected to materially affect the value of such securities, then fair value pricing procedures approved by the Board of Trustees of the Fund are applied. These procedures take into account multiple factors including movements in U.S. securities markets after foreign exchanges close. Foreign securities that are fair valued under these procedures are categorized as Level 2 and the application of these procedures may result in transfers between Level 1 and Level 2. Depending on market activity, such fair valuations may be frequent. Such fair value pricing may result in net asset values that are higher or lower than net asset values based on the last reported sales price or latest quoted bid price. On April 30, 2015, such fair value pricing was used in pricing foreign securities.
Investments in registered open-end investment companies are valued at net asset value. Interests in non-registered investment vehicles that are redeemable at net asset value are fair valued at net asset value when available.
Investments which are not valued using any of the methods discussed above are valued at their fair value, as determined in good faith by the Board of Trustees. The Board of Trustees has established a Valuation Committee comprised of the Trustees and has delegated to it the authority to take any actions regarding the valuation of portfolio securities that the Valuation Committee deems necessary or appropriate, including determining the fair value of portfolio securities, unless the determination has been delegated to the Management Valuation Team. The Board of Trustees retains the authority to make or ratify any valuation decisions or approve any changes to the Valuation Procedures as it deems appropriate. On a quarterly basis, the Board of Trustees receives reports on any valuation actions taken by the Valuation Committee or the Management Valuation Team which may include items for ratification.
Valuations of fair valued securities are compared to the next actual sales price when available, or other appropriate market values, to assess the continued appropriateness of the fair valuation methodologies used. These securities are fair valued on a day-to-day basis, taking into consideration changes to appropriate market information and any significant changes to the inputs considered in the valuation process until there is a readily available price provided on an exchange or by an independent pricing service. Valuations received from an independent pricing service or independent broker-dealer quotes are periodically validated by comparisons to most recent trades and valuations provided by other
| | | | |
| 20 | | Wells Fargo Advantage International Equity Fund | | Notes to financial statements (unaudited) |
independent pricing services in addition to the review of prices by the adviser and/or subadviser. Unobservable inputs used in determining fair valuations are identified based on the type of security, taking into consideration factors utilized by market participants in valuing the investment, knowledge about the issuer and the current market environment.
Foreign currency translation
The accounting records of the Fund are maintained in U.S. dollars. The values of other assets and liabilities denominated in foreign currencies are translated into U.S. dollars at rates provided by an independent foreign currency pricing source at a time each business day specified by the Management Valuation Team. Purchases and sales of securities, and income and expenses are converted at the rate of exchange on the respective dates of such transactions. Net realized foreign exchange gains or losses arise from sales of foreign currencies, currency gains or losses realized between the trade and settlement dates on securities transactions, and the difference between the amounts of dividends, interest and foreign withholding taxes recorded and the U.S. dollar equivalent of the amounts actually paid or received. Net unrealized foreign exchange gains and losses arise from changes in the fair value of assets and liabilities other than investments in securities resulting from changes in exchange rates. The changes in net assets arising from changes in exchange rates and the changes in net assets resulting from changes in market prices of securities are not separately presented. Such changes are included in net realized and unrealized gains or losses from investments.
Forward foreign currency contracts
The Fund is subject to foreign currency exchange rate risk in the normal course of pursuing its investment objectives. A forward foreign currency contract is an agreement between two parties to purchase or sell a specific currency for an agreed-upon price at a future date. The Fund enters into forward foreign currency contracts to facilitate transactions in foreign-denominated securities and to attempt to minimize the risk to the Fund from adverse changes in the relationship between currencies. Forward foreign currency contracts are recorded at the forward rate and marked-to-market daily. When the contracts are closed, realized gains and losses arising from such transactions are recorded as realized gains or losses on forward foreign currency contract transactions. The Fund could be exposed to risks if the counterparties to the contracts are unable to meet the terms of their contracts or if the value of the foreign currency changes unfavorably. The Fund’s maximum risk of loss from counterparty credit risk is the unrealized gains on the contracts. This risk may be mitigated if there is a master netting arrangement between the Fund and the counterparty.
Security loans
The Fund may lend its securities from time to time in order to earn additional income in the form of fees or interest on securities received as collateral or the investment of any cash received as collateral. The Fund continues to receive interest or dividends on the securities loaned. The Fund receives collateral in the form of cash or securities with a value at least equal to the value of the securities on loan. The value of the loaned securities is determined at the close of each business day and any additional required collateral is delivered to the Fund on the next business day. In a securities lending transaction, the net asset value of the Fund will be affected by an increase or decrease in the value of the securities loaned and by an increase or decrease in the value of the instrument in which collateral is invested. The amount of securities lending activity undertaken by the Fund fluctuates from time to time. In the event of default or bankruptcy by the borrower, the Fund may be prevented from recovering the loaned securities or gaining access to the collateral or may experience delays or costs in doing so. In addition, the investment of any cash collateral received may lose all or part of its value. The Fund has the right under the lending agreement to recover the securities from the borrower on demand.
The Fund lends its securities through an unaffiliated securities lending agent. Cash collateral received in connection with its securities lending transactions is invested in Securities Lending Cash Investments, LLC (the “Securities Lending Fund”). The Securities Lending Fund is exempt from registration under Section 3(c)(7) of the 1940 Act and is managed by Funds Management and is subadvised by Wells Capital Management Incorporated (“WellsCap”). Funds Management receives an advisory fee starting at 0.05% and declining to 0.01% as the average daily net assets of the Securities Lending Fund increase. All of the fees received by Funds Management are paid to WellsCap for its services as subadviser. The Securities Lending Fund seeks to provide a positive return compared to the daily Fed Funds Open rate by investing in high-quality, U.S. dollar-denominated short-term money market instruments. Securities Lending Fund investments are fair valued based upon the amortized cost valuation technique. Income earned from investment in the Securities Lending Fund is included in securities lending income on the Statement of Operations.
Security transactions and income recognition
Securities transactions are recorded on a trade date basis. Realized gains or losses are recorded on the basis of identified cost.
| | | | | | |
| Notes to financial statements (unaudited) | | Wells Fargo Advantage International Equity Fund | | | 21 | |
Dividend income is recognized on the ex-dividend date, except for certain dividends from foreign securities, which are recorded as soon as the custodian verifies the ex-dividend date. Dividend income from foreign securities is recorded net of foreign taxes withheld where recovery of such taxes is not assured.
Distributions to shareholders
Distributions to shareholders from net investment income and net realized gains, if any, are recorded on the ex-dividend date. Such distributions are determined in conformity with federal income tax regulations, which may differ in amount or character from net investment income and realized gains recognized for purposes of U.S. generally accepted accounting principles.
Federal and other taxes
The Fund intends to continue to qualify as a regulated investment company by distributing substantially all of its investment company taxable income and any net realized capital gains (after reduction for capital loss carryforwards) sufficient to relieve it from all, or substantially all, federal income taxes. Accordingly, no provision for federal income taxes was required.
The Fund’s income and federal excise tax returns and all financial records supporting those returns for the prior three fiscal years are subject to examination by the federal and Delaware revenue authorities. Management has analyzed the Fund’s tax positions taken on federal, state, and foreign tax returns for all open tax years and does not believe that there are any uncertain tax positions that require recognition of a tax liability.
As of October 31, 2014, the Fund had capital loss carryforwards available to offset future net realized capital gains in the amount of $49,301,219 expiring in 2016.
Class allocations
The separate classes of shares offered by the Fund differ principally in applicable sales charges, distribution, shareholder servicing, and administration fees. Class specific expenses are charged directly to that share class. Investment income, common expenses, and realized and unrealized gains (losses) on investments are allocated daily to each class of shares based on the relative proportion of net assets of each class.
3. FAIR VALUATION MEASUREMENTS
Fair value measurements of investments are determined within a framework that has established a fair value hierarchy based upon the various data inputs utilized in determining the value of the Fund’s investments. The three-level hierarchy gives the highest priority to unadjusted quoted prices in active markets for identical assets or liabilities (Level 1) and the lowest priority to significant unobservable inputs (Level 3). The Fund’s investments are classified within the fair value hierarchy based on the lowest level of input that is significant to the fair value measurement. The inputs are summarized into three broad levels as follows:
| n | | Level 1 – quoted prices in active markets for identical securities |
| n | | Level 2 – other significant observable inputs (including quoted prices for similar securities, interest rates, prepayment speeds, credit risk, use of amortized cost, etc.) |
| n | | Level 3 – significant unobservable inputs (including the Fund’s own assumptions in determining the fair value of investments) |
The inputs or methodologies used for valuing investments in securities are not necessarily an indication of the risk associated with investing in those securities.
| | | | |
| 22 | | Wells Fargo Advantage International Equity Fund | | Notes to financial statements (unaudited) |
The following is a summary of the inputs used in valuing the Fund’s assets and liabilities as of April 30, 2015:
| | | | | | | | | | | | | | | | |
| | | Quoted prices (Level 1) | | | Other significant observable inputs (Level 2) | | | Significant unobservable inputs (Level 3) | | | Total | |
Assets | | | | | | | | | | | | | | | | |
Investments in : | | | | | | | | | | | | | | | | |
| | | | |
Common stocks | | | | | | | | | | | | | | | | |
Canada | | $ | 3,311,870 | | | $ | 0 | | | $ | 0 | | | $ | 3,311,870 | |
China | | | 1,207,135 | | | | 16,699,227 | | | | 0 | | | | 17,906,362 | |
France | | | 0 | | | | 5,755,692 | | | | 0 | | | | 5,755,692 | |
Germany | | | 0 | | | | 24,593,322 | | | | 0 | | | | 24,593,322 | |
Hong Kong | | | 0 | | | | 9,937,217 | | | | 0 | | | | 9,937,217 | |
Italy | | | 0 | | | | 21,991,492 | | | | 0 | | | | 21,991,492 | |
Japan | | | 0 | | | | 44,444,248 | | | | 0 | | | | 44,444,248 | |
Netherlands | | | 0 | | | | 5,899,054 | | | | 0 | | | | 5,899,054 | |
Norway | | | 1,157,762 | | | | 2,116,242 | | | | 0 | | | | 3,274,004 | |
South Korea | | | 0 | | | | 9,342,967 | | | | 0 | | | | 9,342,967 | |
Sweden | | | 0 | | | | 3,809,401 | | | | 0 | | | | 3,809,401 | |
Switzerland | | | 0 | | | | 13,922,336 | | | | 0 | | | | 13,922,336 | |
United Kingdom | | | 0 | | | | 31,214,906 | | | | 0 | | | | 31,214,906 | |
United States | | | 2,616,572 | | | | 0 | | | | 0 | | | | 2,616,572 | |
| | | | |
Participation notes | | | | | | | | | | | | | | | | |
United Kingdom | | | 0 | | | | 3,669,806 | | | | 0 | | | | 3,669,806 | |
| | | | |
Preferred stocks | | | | | | | | | | | | | | | | |
Germany | | | 0 | | | | 2,207,339 | | | | 0 | | | | 2,207,339 | |
| | | | |
Short-term investments | | | | | | | | | | | | | | | | |
Investment companies | | | 25,699,509 | | | | 2,200,453 | | | | 0 | | | | 27,899,962 | |
Total assets | | $ | 33,992,848 | | | $ | 197,803,702 | | | $ | 0 | | | $ | 231,796,550 | |
Liabilities | | | | | | | | | | | | | | | | |
| | | | |
Forward foreign currency contracts | | | 0 | | | $ | 711,568 | | | | 0 | | | $ | 711,568 | |
Total liabilities | | $ | 0 | | | $ | 711,568 | | | $ | 0 | | | $ | 711,568 | |
Forward foreign currency contracts are reported at their unrealized gains (losses) at measurement date, which represents the change in the contract’s value from trade date. All other assets and liabilities are reported at their market value at measurement date.
The Fund recognizes transfers between levels within the fair value hierarchy at the end of the reporting period. At April 30, 2015, fair value pricing was used in pricing certain foreign securities and securities valued at $172,813,890 were transferred from Level 1 to Level 2. The Fund did not have any transfers into/out of Level 3.
4. TRANSACTIONS WITH AFFILIATES
Advisory fee
The Trust has entered into an advisory contract with Funds Management, an indirect wholly owned subsidiary of Wells Fargo & Company (“Wells Fargo”). The adviser is responsible for implementing investment policies and guidelines and for supervising the subadviser, who is responsible for day-to-day portfolio management of the Fund.
Pursuant to the contract, Funds Management is entitled to receive an annual advisory fee starting at 0.85% and declining to 0.70% as the average daily net assets of the Fund increase. For the six months ended April 30, 2015, the advisory fee was equivalent to an annual rate of 0.85% of the Fund’s average daily net assets.
Funds Management has retained the services of a subadviser to provide daily portfolio management to the Fund. The fee for subadvisory services is borne by Funds Management. WellsCap, an affiliate of Funds Management and an indirect wholly owned subsidiary of Wells Fargo, is the subadviser to the Fund and is entitled to receive a fee from Funds Management at an annual rate starting at 0.45% and declining to 0.40% as the average daily net assets of the Fund increase.
| | | | | | |
| Notes to financial statements (unaudited) | | Wells Fargo Advantage International Equity Fund | | | 23 | |
Administration fees
The Trust has entered into an administration agreement with Funds Management. Under this agreement, for providing administrative services, which includes paying fees and expenses for services provided by the transfer agent, sub-transfer agents, omnibus account servicers and record-keepers, Funds Management is entitled to receive from the Fund an annual fund level administration fee starting at 0.05% and declining to 0.03% as the average daily net assets of the Fund increase and a class level administration fee which is calculated based on the average daily net assets of each class as follows:
| | | | |
| | | Class level administration fee | |
Class A, Class B, Class C, Class R | | | 0.26 | % |
Administrator Class | | | 0.10 | |
Institutional Class | | | 0.08 | |
Funds Management has contractually waived and/or reimbursed advisory and administration fees to the extent necessary to maintain certain net operating expense ratios for the Fund. Waiver of fees and/or reimbursement of expenses by Funds Management were made first from fund level expenses on a proportionate basis and then from class specific expenses. Funds Management has committed through February 29, 2016 to waive fees and/or reimburse expenses to the extent necessary to cap the Fund’s expenses at 1.09% for Class A shares, 1.84% for Class B shares, 1.84% for Class C shares, 1.34% for Class R shares, 1.09% for Administrator Class shares, and 0.84% for Institutional Class shares. After this time, the cap may be increased or the commitment to maintain the cap may be terminated only with the approval of the Board of Trustees.
Distribution fees
The Trust has adopted a Distribution Plan for Class B, Class C, and Class R shares of the Fund pursuant to Rule 12b-1 under the 1940 Act. Distribution fees are charged to Class B, Class C, and Class R shares and paid to Wells Fargo Funds Distributor, LLC (“Funds Distributor”), the principal underwriter, at an annual rate of 0.75% of the average daily net assets of Class B and Class C shares and 0.25% of the average daily net assets of Class R shares.
In addition, Funds Distributor is entitled to receive the front-end sales charge from the purchase of Class A shares and a contingent deferred sales charge on the redemption of certain Class A shares. Funds Distributor is also entitled to receive the contingent deferred sales charges from redemptions of Class B and Class C shares. For the six months ended April 30, 2015, Funds Distributor received $5,553 from the sale of Class A shares and $110 in contingent deferred sales charges from redemptions of Class C shares.
Shareholder servicing fees
The Trust has entered into contracts with one or more shareholder servicing agents, whereby Class A, Class B, Class C, Class R, and Administrator Class of the Fund is charged a fee at an annual rate of 0.25% of the average daily net assets of each respective class.
A portion of these total shareholder servicing fees were paid to affiliates of Wells Fargo.
5. INVESTMENT PORTFOLIO TRANSACTIONS
Purchases and sales of investments, excluding U.S. government obligations (if any) and short-term securities, for the six months ended April 30, 2015 were $30,813,979 and $32,853,037, respectively.
6. DERIVATIVE TRANSACTIONS
During the six months ended April 30, 2015, the Fund entered into forward foreign currency contracts for economic hedging purposes.
At April 30, 2015, the Fund had forward foreign currency contracts outstanding as follows:
Forward foreign currency contracts to sell:
| | | | | | | | | | | | | | | | | | |
| Exchange date | | Counterparty | | Contracts to deliver | | | U.S. value at April 30, 2015 | | | In exchange for U.S. $ | | | Unrealized losses | |
| 6-26-2015 | | State Street Bank | | | 5,449,300 EUR | | | $ | 6,122,896 | | | $ | 6,001,423 | | | $ | (121,473 | ) |
| 7-9-2015 | | State Street Bank | | | 1,086,102,000 JPY | | | | 9,103,220 | | | | 9,049,870 | | | | (53,350 | ) |
| 7-9-2015 | | State Street Bank | | | 5,555,450 GBP | | | | 8,523,774 | | | | 8,276,481 | | | | (247,293 | ) |
| 7-9-2015 | | State Street Bank | | | 8,363,784 EUR | | | | 9,399,286 | | | | 9,109,834 | | | | (289,452 | ) |
The Fund had average contract amounts of $555,794 and $24,910,550 in forward foreign currency contracts to buy and forward foreign currency contracts to sell, respectively, during the six months ended April 30, 2015.
| | | | |
| 24 | | Wells Fargo Advantage International Equity Fund | | Notes to financial statements (unaudited) |
The fair value, realized gains or losses and change in unrealized gains or losses, if any, on derivative instruments are reflected in the appropriate financial statements.
For certain types of derivative transactions, the Fund has entered into International Swaps and Derivatives Association, Inc. master agreements (“ISDA Master Agreements”) or similar agreements with approved counterparties. The ISDA Master Agreements or similar agreements may have requirements to deliver/deposit securities or cash to/with an exchange or broker-dealer as collateral and allows the Fund to offset, with each counterparty, certain derivative financial instrument’s assets and/or liabilities with collateral held or pledged. Collateral requirements differ by type of derivative. Collateral or margin requirements are set by the broker or exchange clearing house for exchange traded derivatives while collateral terms are contract specific for over-the-counter traded derivatives. Cash collateral that has been pledged to cover obligations of the Fund under ISDA Master Agreements or similar agreements, if any, will be reported separately in the Statement of Assets and Liabilities. Securities pledged as collateral, if any, for the same purpose are noted in the Portfolio of Investments. With respect to balance sheet offsetting, absent an event of default by the counterparty or a termination of the agreement, the reported amounts of financial assets and financial liabilities in the Statement of Assets and Liabilities are not offset across transactions between the Fund and the applicable counterparty. A reconciliation of the gross amounts on the Statement of Assets and Liabilities to the net amounts by derivative type, including any collateral exposure, is as follows:
| | | | | | | | | | | | | | | | | | |
| Derivative type | | Counterparty | | Gross amounts of liabilities in the Statement of Assets and Liabilities | | | Amounts subject to netting agreements | | | Collateral
pledged | | | Net amount of liabilities | |
Forward foreign currency contracts | | State Street Bank | | $ | 711,568 | * | | $ | 0 | | | $ | 0 | | | $ | 711,568 | |
| * | Amount represents net unrealized loss. |
7. BANK BORROWINGS
The Trust (excluding the money market funds and certain other funds in the Trust) and Wells Fargo Variable Trust are parties to a $150,000,000 revolving credit agreement, whereby the Fund is permitted to use bank borrowings for temporary or emergency purposes, such as to fund shareholder redemption requests. Interest under the credit agreement is charged to the Fund based on a borrowing rate equal to the higher of the Federal Funds rate in effect on that day plus 1.25% or the overnight LIBOR rate in effect on that day plus 1.25%. In addition, an annual commitment fee equal to 0.10% of the unused balance is allocated to each participating fund. For the six months ended April 30, 2015, the Fund paid $176 in commitment fees.
For the six months ended April 30, 2015, there were no borrowings by the Fund under the agreement.
8. CONCENTRATION RISK
Concentration risks result from exposure to a limited number of sectors. A fund that invests a substantial portion of its assets in any sector may be more affected by changes in that sector than would be a fund whose investments are not heavily weighted in any sector.
9. INDEMNIFICATION
Under the Trust’s organizational documents, the officers and Trustees have been granted certain indemnification rights against certain liabilities that may arise out of performance of their duties to the Trust. Additionally, in the normal course of business, the Trust may enter into contracts with service providers that contain a variety of indemnification clauses. The Trust’s maximum exposure under these arrangements is dependent on future claims that may be made against the Fund and, therefore, cannot be estimated.
| | | | | | |
| Other information (unaudited) | | Wells Fargo Advantage International Equity Fund | | | 25 | |
TAX INFORMATION
Pursuant to Section 853 of the Internal Revenue Code, the following amounts were designated as foreign taxes paid for the fiscal year ended October 31, 2014. These amounts may be less than the actual foreign taxes paid for financial statement purposes. Foreign taxes paid or withheld should be included in taxable income with an offsetting deduction from gross income or as a credit for taxes paid to foreign governments. None of the income was derived from ineligible foreign sources as defined under Section 901(j) of the Internal Revenue Code.
| | | | |
Creditable foreign taxes paid | | Per share amount | | Foreign income as % of ordinary income distributions |
| $340,784 | | $0.0195 | | 79.59% |
PROXY VOTING INFORMATION
A description of the policies and procedures that the Fund uses to determine how to vote proxies relating to portfolio securities is available, upon request, by calling 1-800-222-8222, visiting our website at wellsfargoadvantagefunds.com, or visiting the SEC website at sec.gov. Information regarding how the Fund voted proxies relating to portfolio securities during the most recent 12-month period ended June 30 is available on the Fund’s website at wellsfargoadvantagefunds.com or by visiting the SEC website at sec.gov.
PORTFOLIO HOLDINGS INFORMATION
The complete portfolio holdings for the Fund are publicly available monthly on the Fund’s website (wellsfargoadvantagefunds.com), on a one-month delayed basis. In addition, top ten holdings information (excluding derivative positions) for the Fund is publicly available on the Fund’s website on a monthly, seven-day or more delayed basis. The Fund files its complete schedule of portfolio holdings with the SEC for the first and third quarters of each fiscal year on Form N-Q, which is available by visiting the SEC website at sec.gov. In addition, the Fund’s Form N-Q may be reviewed and copied at the SEC’s Public Reference Room in Washington, DC, and at regional offices in New York City, at 233 Broadway, and in Chicago, at 175 West Jackson Boulevard, Suite 900. Information about the Public Reference Room may be obtained by calling 1-800-SEC-0330.
| | | | |
| 26 | | Wells Fargo Advantage International Equity Fund | | Other information (unaudited) |
BOARD OF TRUSTEES AND OFFICERS
Each of the Trustees and Officers1 listed in the table below acts in identical capacities for each fund in the Wells Fargo Advantage family of funds, which consists of 134 mutual funds comprising the Wells Fargo Funds Trust, Wells Fargo Variable Trust, Wells Fargo Master Trust and four closed-end funds (collectively the “Fund Complex”). This table should be read in conjunction with the Prospectus and the Statement of Additional Information2. The mailing address of each Trustee and Officer is 525 Market Street, 12th Floor, San Francisco, CA 94105. Each Trustee and Officer serves an indefinite term, however, each Trustee serves such term until reaching the mandatory retirement age established by the Trustees.
Independent Trustees
| | | | | | |
Name and year of birth | | Position held and length of service* | | Principal occupations during past five years or longer | | Other directorships during past five years |
William R. Ebsworth (Born 1957) | | Trustee, since 2015** | | Retired. From 1984 to 2013, equities analyst, portfolio manager, research director at Fidelity Management and Research Company and retired in 2013 as Chief Investment Officer of Fidelity Strategic Advisers, Inc. in Boston, Tokyo, and Hong Kong where he led a team of investment professionals managing client assets. Prior thereto, Board member of Hong Kong Securities Clearing Co., Hong Kong Options Clearing Corp., the Thailand International Fund, Ltd., Fidelity Investments Life Insurance Company, and Empire Fidelity Investments Life Insurance Company. Mr. Ebsworth is an Adjunct Lecturer, Finance, at Babson College and a Chartered Financial Analyst. | | Asset Allocation Trust |
Jane A. Freeman (Born 1953) | | Trustee, since 2015** | | Retired. From 2012 to 2014 and 1999 to 2008, Chief Financial Officer of Scientific Learning Corporation. From 2008 to 2012, Ms. Freeman provided consulting services related to strategic business projects. Prior to 1999, Portfolio Manager at Rockefeller & Co. and Scudder, Stevens & Clark. Board member of the Harding Loevner Funds from 1996 to 2014, serving as both Lead Independent Director and chair of the Audit Committee. Board member of the Russell Exchange Traded Funds Trust from 2011 to 2012 and the chair of the Audit Committee. Ms. Freeman is a Chartered Financial Analyst (inactive), Chair of Taproot Foundation (non-profit organization) and a Board Member of Ruth Bancroft Garden (non-profit organization). | | Asset Allocation Trust |
Peter G. Gordon (Born 1942) | | Trustee, since 1998; Chairman, since 2005 | | Co-Founder, Retired Chairman, President and CEO of Crystal Geyser Water Company. Trustee Emeritus, Colby College. | | Asset Allocation Trust |
Isaiah Harris, Jr. (Born 1952) | | Trustee, since 2009 | | Retired. Chairman of the Board of CIGNA Corporation since 2009, and Director since 2005. From 2003 to 2011, Director of Deluxe Corporation. Prior thereto, President and CEO of BellSouth Advertising and Publishing Corp. from 2005 to 2007, President and CEO of BellSouth Enterprises from 2004 to 2005 and President of BellSouth Consumer Services from 2000 to 2003. Emeritus member of the Iowa State University Foundation Board of Governors. Emeritus Member of the Advisory Board of Iowa State University School of Business. Advisory Board Member, Palm Harbor Academy. Mr. Harris is a certified public accountant. | | CIGNA Corporation; Asset Allocation Trust |
Judith M. Johnson (Born 1949) | | Trustee, since 2008; Audit Committee Chairman, since 2008 | | Retired. Prior thereto, Chief Executive Officer and Chief Investment Officer of Minneapolis Employees Retirement Fund from 1996 to 2008. Ms. Johnson is an attorney, certified public accountant and a certified managerial accountant. | | Asset Allocation Trust |
David F. Larcker (Born 1950) | | Trustee, since 2009 | | James Irvin Miller Professor of Accounting at the Graduate School of Business, Stanford University, Morgan Stanley Director of the Center for Leadership Development and Research and Senior Faculty of The Rock Center for Corporate Governance since 2006. From 2005 to 2008, Professor of Accounting at the Graduate School of Business, Stanford University. Prior thereto, Ernst & Young Professor of Accounting at The Wharton School, University of Pennsylvania from 1985 to 2005. | | Asset Allocation Trust |
Olivia S. Mitchell (Born 1953) | | Trustee, since 2006 | | International Foundation of Employee Benefit Plans Professor, Wharton School of the University of Pennsylvania since 1993. Director of Wharton’s Pension Research Council and Boettner Center on Pensions & Retirement Research, and Research Associate at the National Bureau of Economic Research. Previously, Cornell University Professor from 1978 to 1993. | | Asset Allocation Trust |
| | | | | | |
| Other information (unaudited) | | Wells Fargo Advantage International Equity Fund | | | 27 | |
| | | | | | |
Name and year of birth | | Position held and length of service* | | Principal occupations during past five years or longer | | Other directorships during past five years |
Timothy J. Penny (Born 1951) | | Trustee, since 1996 | | President and Chief Executive Officer of Southern Minnesota Initiative Foundation, a non-profit organization, since 2007 and Senior Fellow at the Humphrey Institute Policy Forum at the University of Minnesota since 1995. Member of the Board of Trustees of NorthStar Education Finance, Inc., a non-profit organization, since 2007. | | Asset Allocation Trust |
Michael S. Scofield (Born 1943) | | Trustee, since 2010 | | Served on the Investment Company Institute’s Board of Governors and Executive Committee from 2008-2011 as well the Governing Council of the Independent Directors Council from 2006-2011 and the Independent Directors Council Executive Committee from 2008-2011. Chairman of the IDC from 2008-2010. Institutional Investor (Fund Directions) Trustee of Year in 2007. Trustee of the Evergreen Funds complex (and its predecessors) from 1984 to 2010. Chairman of the Evergreen Funds from 2000-2010. Former Trustee of the Mentor Funds. Retired Attorney, Law Offices of Michael S. Scofield. | | Asset Allocation Trust |
Donald C. Willeke (Born 1940) | | Trustee, since 1996 | | Principal of the law firm of Willeke & Daniels. General Counsel of the Minneapolis Employees Retirement Fund from 1984 until its consolidation into the Minnesota Public Employees Retirement Association on June 30, 2010. Director and Vice Chair of The Tree Trust (non-profit corporation). Director of the American Chestnut Foundation (non-profit corporation). | | Asset Allocation Trust |
| * | Length of service dates reflect the Trustee’s commencement of service with the Trust’s predecessor entities, where applicable. |
| ** | William R. Ebsworth and Jane A. Freeman each became a Trustee effective January 1, 2015. |
Officers
| | | | | | |
Name and year of birth | | Position held and length of service | | Principal occupations during past five years or longer | | |
Karla M. Rabusch (Born 1959) | | President, since 2003 | | Executive Vice President of Wells Fargo Bank, N.A. and President of Wells Fargo Funds Management, LLC since 2003. | | |
Jeremy DePalma1 (Born 1974) | | Treasurer, since 2012 | | Senior Vice President of Wells Fargo Funds Management, LLC since 2009. Senior Vice President of Evergreen Investment Management Company, LLC from 2008 to 2010. Vice President, Evergreen Investment Services, Inc. from 2004 to 2007. Head of the Fund Reporting and Control Team within Fund Administration from 2005 to 2010. | | |
C. David Messman (Born 1960) | | Secretary, since 2000; Chief Legal Officer, since 2003 | | Senior Vice President and Secretary of Wells Fargo Funds Management, LLC since 2001. Assistant General Counsel of Wells Fargo Bank, N.A. since 2013 and Vice President and Managing Counsel of Wells Fargo Bank N.A. from 1996 to 2013. | | |
Debra Ann Early (Born 1964) | | Chief Compliance Officer, since 2007 | | Senior Vice President of Wells Fargo Funds Management, LLC since 2007 and Chief Compliance Officer from 2007 to 2014. Chief Compliance Officer of Parnassus Investments from 2005 to 2007. Chief Financial Officer of Parnassus Investments from 2004 to 2007 and Senior Audit Manager of PricewaterhouseCoopers LLP from 1998 to 2004. | | |
David Berardi (Born 1975) | | Assistant Treasurer, since 2009 | | Vice President of Wells Fargo Funds Management, LLC since 2009. Vice President of Evergreen Investment Management Company, LLC from 2008 to 2010. Assistant Vice President of Evergreen Investment Services, Inc. from 2004 to 2008. Manager of Fund Reporting and Control for Evergreen Investment Management Company, LLC from 2004 to 2010. | | |
| 1 | Jeremy DePalma acts as Treasurer of 61 funds and Assistant Treasurer of 73 funds in the Fund Complex. |
| 2 | The Statement of Additional Information includes additional information about the Trustees and is available, without charge, upon request, by calling 1-800-222-8222 or by visiting the website at wellsfargoadvantagefunds.com. |
| | | | |
| 28 | | Wells Fargo Advantage International Equity Fund | | List of abbreviations |
The following is a list of common abbreviations for terms and entities that may have appeared in this report.
| ACA | — ACA Financial Guaranty Corporation |
| ADR | — American depositary receipt |
| ADS | — American depositary shares |
| AGC | — Assured Guaranty Corporation |
| AGM | — Assured Guaranty Municipal |
| Ambac | — Ambac Financial Group Incorporated |
| AMT | — Alternative minimum tax |
| BAN | — Bond anticipation notes |
| BHAC | — Berkshire Hathaway Assurance Corporation |
| CAB | — Capital appreciation bond |
| CCAB | — Convertible capital appreciation bond |
| CDA | — Community Development Authority |
| CDO | — Collateralized debt obligation |
| DRIVER | — Derivative inverse tax-exempt receipts |
| DW&P | — Department of Water & Power |
| DWR | — Department of Water Resources |
| ECFA | — Educational & Cultural Facilities Authority |
| EDA | — Economic Development Authority |
| EDFA | — Economic Development Finance Authority |
| ETF | — Exchange-traded fund |
| FDIC | — Federal Deposit Insurance Corporation |
| FFCB | — Federal Farm Credit Banks |
| FGIC | — Financial Guaranty Insurance Corporation |
| FHA | — Federal Housing Administration |
| FHLB | — Federal Home Loan Bank |
| FHLMC | — Federal Home Loan Mortgage Corporation |
| FICO | — The Financing Corporation |
| FNMA | — Federal National Mortgage Association |
| GDR | — Global depositary receipt |
| GNMA | — Government National Mortgage Association |
| HCFR | — Healthcare facilities revenue |
| HEFA | — Health & Educational Facilities Authority |
| HEFAR | — Higher education facilities authority revenue |
| HFA | — Housing Finance Authority |
| HFFA | — Health Facilities Financing Authority |
| HUD | — Department of Housing and Urban Development |
| IDA | — Industrial Development Authority |
| IDAG | — Industrial Development Agency |
| KRW | — Republic of Korea won |
| LIBOR | — London Interbank Offered Rate |
| LIFER | — Long Inverse Floating Exempt Receipts |
| LLC | — Limited liability company |
| LLLP | — Limited liability limited partnership |
| LLP | — Limited liability partnership |
| MBIA | — Municipal Bond Insurance Association |
| MFHR | — Multifamily housing revenue |
| MSTR | — Municipal securities trust receipts |
| MUD | — Municipal Utility District |
| National | — National Public Finance Guarantee Corporation |
| PCFA | — Pollution Control Financing Authority |
| PCL | — Public Company Limited |
| PCR | — Pollution control revenue |
| PFA | — Public Finance Authority |
| PFFA | — Public Facilities Financing Authority |
| PFOTER | — Puttable floating option tax-exempt receipts |
| plc | — Public limited company |
| PUTTER | — Puttable tax-exempt receipts |
| R&D | — Research & development |
| Radian | — Radian Asset Assurance |
| RAN | — Revenue anticipation notes |
| RDA | — Redevelopment Authority |
| RDFA | — Redevelopment Finance Authority |
| REIT | — Real estate investment trust |
| ROC | — Reset option certificates |
| SAVRS | — Select auction variable rate securities |
| SBA | — Small Business Authority |
| SDR | — Swedish depositary receipt |
| SFHR | — Single-family housing revenue |
| SFMR | — Single-family mortgage revenue |
| SPA | — Standby purchase agreement |
| SPDR | — Standard & Poor’s Depositary Receipts |
| SPEAR | — Short Puttable Exempt Adjustable Receipts |
| STRIPS | — Separate trading of registered interest and |
| TAN | — Tax anticipation notes |
| TIPS | — Treasury inflation-protected securities |
| TRAN | — Tax revenue anticipation notes |
| TTFA | — Transportation Trust Fund Authority |
| TVA | — Tennessee Valley Authority |


For more information
More information about Wells Fargo Advantage Funds is available free upon request. To obtain literature, please write, email, visit the Fund’s website, or call:
Wells Fargo Advantage Funds
P.O. Box 8266
Boston, MA 02266-8266
Email: wfaf@wellsfargo.com
Website: wellsfargoadvantagefunds.com
Individual investors: 1-800-222-8222
Retail investment professionals: 1-888-877-9275
Institutional investment professionals: 1-866-765-0778
This report and the financial statements contained herein are submitted for the general information of the shareholders of Wells Fargo Advantage Funds. If this report is used for promotional purposes, distribution of the report must be accompanied or preceded by a current prospectus. Before investing, please consider the investment objectives, risks, charges, and expenses of the investment. For a current prospectus and, if available, a summary prospectus, containing this information, call 1-800-222-8222 or visit the Fund’s website at wellsfargoadvantagefunds.com. Read the prospectus carefully before you invest or send money.
Wells Fargo Funds Management, LLC, a wholly owned subsidiary of Wells Fargo & Company, provides investment advisory and administrative services for Wells Fargo Advantage Funds. Other affiliates of Wells Fargo & Company provide subadvisory and other services for the Funds. The Funds are distributed by Wells Fargo Funds Distributor, LLC, Member FINRA/SIPC, an affiliate of Wells Fargo & Company.
NOT FDIC INSURED ¡ NO BANK GUARANTEE ¡ MAY LOSE VALUE
© 2015 Wells Fargo Funds Management, LLC. All rights reserved.
| | |
 | | 233656 06-15 SA240/SAR240 04-15 |

Wells Fargo Advantage
Intrinsic World Equity Fund

Semi-Annual Report
April 30, 2015

Reduce clutter. Save trees.
Sign up for electronic delivery of prospectuses and shareholder reports at wellsfargo.com/advantagedelivery
Contents
The views expressed and any forward-looking statements are as of April 30, 2015, unless otherwise noted, and are those of the Fund managers and/or Wells Fargo Funds Management, LLC. Discussions of individual securities, or the markets generally, or any Wells Fargo Advantage Fund are not intended as individual recommendations. Future events or results may vary significantly from those expressed in any forward-looking statements; the views expressed are subject to change at any time in response to changing circumstances in the market. Wells Fargo Funds Management, LLC and the Fund disclaim any obligation to publicly update or revise any views expressed or forward-looking statements.
NOT FDIC INSURED ¡ NO BANK GUARANTEE ¡ MAY LOSE VALUE
| | | | |
| 2 | | Wells Fargo Advantage Intrinsic World Equity Fund | | Letter to shareholders (unaudited) |

Karla M. Rabusch
President
Wells Fargo Advantage Funds
A worldwide trend toward looser monetary policy tended to support stock and bond markets in both developed and emerging economies.
European stocks were boosted by the anticipation and then the reality of the ECB’s asset purchases.
Dear Valued Shareholder:
We are pleased to offer you this semi-annual report for the Wells Fargo Advantage Intrinsic World Equity Fund for the six-month period that ended April 30, 2015. The period was marked by low global interest rates as major central banks initiated or increased their quantitative easing programs. By the end of the period, some European sovereign debt issues were selling at negative yields. In the U.S., large-cap stocks, as measured by the S&P 500 Index1, gained 7.22%, boosted by stronger economic data in the U.S. Although non-U.S. economic growth was more restrained, developed international stocks, as measured by the MSCI EAFE Index (Net)2, gained 6.81%, appreciating, in part, because of quantitative easing in Europe and Japan.
Major central banks continued to provide liquidity to the markets.
A worldwide trend toward looser monetary policy tended to support stock and bond markets in both developed and emerging economies. Throughout the reporting period, the Federal Open Market Committee (FOMC), which is the U.S. Federal Reserve’s (Fed’s) monetary policymaking body, kept its key interest rate effectively at zero. Even though the FOMC ended its bond-buying program in October 2014 and guided investors to expect an interest-rate hike in mid- to late-2015, the Fed remained accommodative.
The European Central Bank (ECB) maintained a variety of measures aimed at encouraging lending, including making funds available to banks at low interest rates and imposing a negative interest rate on bank deposits held at the central bank. In January 2015, the bank announced quantitative easing via significant bond purchases in an attempt to raise the eurozone’s inflation to just under its target of 2%. In Japan, the Bank of Japan (BOJ) also maintained an aggressive monetary program aimed at combating deflation.
The U.S. outperformed other developed markets economies, while major emerging economies grappled with slower growth.
Reported U.S. gross domestic product (GDP) growth came in at a solid 2.2% annualized rate in the fourth quarter of 2014. Although the initial estimate for annualized GDP growth came in at a modest 0.2% in the first quarter of 2015, the slowdown was attributed to short-term factors such as a harsh winter and a long-lived strike at West Coast ports.
European annualized GDP growth was 1.3% in the fourth quarter of 2014 and 1.4% in the first quarter of 2015. European stocks were boosted by the anticipation and then the reality of the ECB’s asset purchases. As also occurred in the U.S., the central bank’s purchase of fixed-income assets provided liquidity that investors poured into riskier assets, including stocks. A similar dynamic played out in Japan, although Japanese shares received the benefit of direct purchases from the BOJ and major pension funds.
| 1 | The S&P 500 Index consists of 500 shares chosen for market size, liquidity, and industry group representation. It is a market-value-weighted index with each share’s weight in the index proportionate to its market value. You cannot invest directly in an index. |
| 2 | The Morgan Stanley Capital International Europe, Australasia, and Far East (MSCI EAFE) Index (Net) is a free-float-adjusted market-capitalization-weighted index that is designed to measure the equity market performance of developed markets, excluding the U.S. and Canada. You cannot invest directly in an index. Source: MSCI. MSCI makes no express or implied warranties or representations and shall have no liability whatsoever with respect to any MSCI data contained herein. The MSCI data may not be further redistributed or used as a basis for other indexes or any securities or financial products. This report is not approved, reviewed, or produced by MSCI. |
| | | | | | |
| Letter to shareholders (unaudited) | | Wells Fargo Advantage Intrinsic World Equity Fund | | | 3 | |
Among major emerging markets, Chinese government data showed a slowdown in fixed-asset investment, which includes property investment, and modest growth in manufacturing and housing sales. However, China’s growth rates still contrasted favorably with stagnant growth in most developed economies. Brazil faced a challenging situation with a growing corruption scandal affecting the state-controlled oil company, a struggling economy, and a severe drought affecting the city of São Paulo. The MSCI Emerging Markets Index (Net)3 ended the period with a 3.92% return.
Don’t let short-term uncertainty derail long-term investment goals.
Periods of uncertainty can present challenges, but experience has taught us that maintaining long-term investment goals can be an effective way to plan for the future. To help you create a sound strategy based on your personal goals and risk tolerance, Wells Fargo Advantage Funds offers more than 100 mutual funds and other investments spanning a wide range of asset classes and investment styles. Although diversification cannot guarantee an investment profit or prevent losses, we believe it can be an effective way to manage investment risk and potentially smooth out overall portfolio performance. We encourage investors to know their investments and to understand that appropriate levels of risk-taking may unlock opportunities.
Thank you for choosing to invest with Wells Fargo Advantage Funds. We appreciate your confidence in us and remain committed to helping you meet your financial needs.
Sincerely,

Karla M. Rabusch
President
Wells Fargo Advantage Funds
For current information about your fund investments, contact your investment professional, visit our website at wellsfargoadvantagefunds.com, or call us directly at 1-800-222-8222. We are available 24 hours a day, 7 days a week.
| 3 | The Morgan Stanley Capital International (MSCI) Emerging Markets Index (Net) is a free-float-adjusted market-capitalization-weighted index that is designed to measure the equity market performance of emerging markets. The MSCI Emerging Markets Index (Net) consists of the following 23 emerging markets country indexes: Brazil, Chile, China, Colombia, Czech Republic, Egypt, Greece, Hungary, India, Indonesia, Korea, Malaysia, Mexico, Peru, the Philippines, Poland, Qatar, Russia, South Africa, Taiwan, Thailand, Turkey, and United Arab Emirates. You cannot invest directly in an index. |
| | | | |
| 4 | | Wells Fargo Advantage Intrinsic World Equity Fund | | Performance highlights (unaudited) |
Investment objective
The Fund seeks long-term capital appreciation.
Adviser
Wells Fargo Funds Management, LLC
Subadviser
Metropolitan West Capital Management, LLC
Portfolio managers
Jean-Baptiste Nadal, CFA
Jeffrey Peck
Average annual total returns1 (%) as of April 30, 2015
| | | | | | | | | | | | | | | | | | | | | | | | | | | | | | | | | | |
| | | | | Including sales charge | | | Excluding sales charge | | | Expense ratios2 (%) | |
| | | Inception date | | 1 year | | | 5 year | | | 10 year | | | 1 year | | | 5 year | | | 10 year | | | Gross | | | Net3 | |
| Class A (EWEAX) | | 4-30-1996 | | | (0.03 | ) | | | 10.41 | | | | 7.06 | | | | 6.09 | | | | 11.73 | | | | 7.70 | | | | 1.47 | | | | 1.40 | |
| Class C (EWECX) | | 5-18-2007 | | | 4.28 | | | | 10.90 | | | | 6.90 | | | | 5.28 | | | | 10.90 | | | | 6.90 | | | | 2.22 | | | | 2.15 | |
| Administrator Class (EWEIX) | | 5-18-2007 | | | – | | | | – | | | | – | | | | 6.39 | | | | 12.01 | | | | 7.90 | | | | 1.31 | | | | 1.15 | |
| Institutional Class (EWENX) | | 7-30-2010 | | | – | | | | – | | | | – | | | | 6.55 | | | | 12.22 | | | | 8.00 | | | | 1.04 | | | | 0.95 | |
| MSCI World Index (Net)4 | | – | | | – | | | | – | | | | – | | | | 7.41 | | | | 10.51 | | | | 6.87 | | | | – | | | | – | |
Figures quoted represent past performance, which is no guarantee of future results, and do not reflect taxes that a shareholder may pay on fund distributions or the redemption of fund shares. Investment return and principal value of an investment will fluctuate so that an investor’s shares, when redeemed, may be worth more or less than their original cost. Performance shown without sales charges would be lower if sales charges were reflected. Current performance may be lower or higher than the performance data quoted, which assumes the reinvestment of dividends and capital gains. Current month-end performance is available on the Fund’s website, wellsfargoadvantagefunds.com.
Index returns do not include transaction costs associated with buying and selling securities, any mutual fund fees or expenses, or any taxes. It is not possible to invest directly in an index.
For Class A shares, the maximum front-end sales charge is 5.75%. For Class C shares, the maximum contingent deferred sales charge is 1.00%. Performance including a contingent deferred sales charge assumes the sales charge for the corresponding time period. Administrator Class and Institutional Class shares are sold without a front-end sales charge or contingent deferred sales charge.
Stock values fluctuate in response to the activities of individual companies and general market and economic conditions. Foreign investments are especially volatile and can rise or fall dramatically due to differences in the political and economic conditions of the host country. These risks are generally intensified in emerging markets. The use of derivatives may reduce returns and/or increase volatility. Certain investment strategies tend to increase the total risk of an investment (relative to the broader market). The Fund is exposed to focused portfolio risk, geographic risk, and smaller-company securities risk. Consult the Fund’s prospectus for additional information on these and other risks.
Please see footnotes on page 5.
| | | | | | |
| Performance highlights (unaudited) | | Wells Fargo Advantage Intrinsic World Equity Fund | | | 5 | |
| | | | |
| Ten largest holdings5 (%) as of April 30, 2015 | |
Samsonite International SA | | | 2.56 | |
Oracle Corporation | | | 2.52 | |
Express Scripts Holding Company | | | 2.52 | |
The Walt Disney Company | | | 2.51 | |
Sensata Technologies Holding NV | | | 2.40 | |
Novartis AG ADR | | | 2.36 | |
Visa Incorporated Class A | | | 2.29 | |
Samsung Electronics Company Limited | | | 2.28 | |
Apple Incorporated | | | 2.27 | |
Unilever NV | | | 2.27 | |
|
| Sector distribution6 as of April 30, 2015 |
|
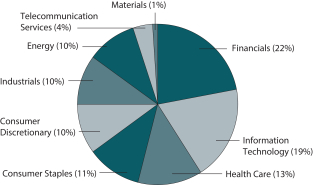 |
|
| Country allocation6 as of April 30, 2015 |
|
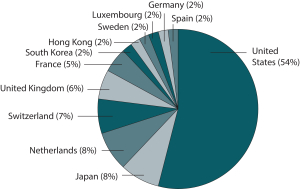 |
| 1 | Historical performance shown for Class C shares prior to their inception reflects the performance of Class A shares, and has been adjusted to reflect the higher expenses applicable to Class C shares. Historical performance shown for Institutional Class shares prior to their inception reflects the performance of Administrator Class shares, and includes the higher expenses applicable to Administrator Class shares. If these expenses had not been included, returns would be higher. Historical performance shown for Administrator Class shares prior to their inception reflects the performance of Class A shares, and includes the higher expenses applicable to Class A shares. If these expenses had not been included, returns would be higher. Historical performance shown for all classes of the Fund prior to July 19, 2010, is based on the performance of the Fund’s predecessor, Evergreen Intrinsic World Equity Fund. |
| 2 | Reflects the expense ratios as stated in the most recent prospectuses. The expense ratios shown are subject to change and may differ from the annualized expense ratios shown in the financial highlights of this report. |
| 3 | The Adviser has committed through February 29, 2016, to waive fees and/or reimburse expenses to the extent necessary to cap the Fund’s Total Annual Fund Operating Expenses After Fee Waiver, excluding certain expenses, at the amounts shown. After this time, the cap may be increased or the commitment to maintain the cap may be terminated only with the approval of the Board of Trustees. Brokerage commissions, stamp duty fees, interest, taxes, acquired fund fees and expenses, and extraordinary expenses are excluded from the cap. Without this cap, the Fund’s returns would have been lower. |
| 4 | The Morgan Stanley Capital International World Index (Net) (MSCI World Index (Net)) is a free float-adjusted market-capitalization-weighted index that is designed to measure the equity market performance of developed markets. You cannot invest directly in an index. Source: MSCI. MSCI makes no express or implied warranties or representations and shall have no liability whatsoever with respect to any MSCI data contained herein. The MSCI data may not be further redistributed or used as a basis for other indexes or any securities or financial products. This report is not approved, reviewed, or produced by MSCI. |
| 5 | The ten largest holdings, excluding cash and cash equivalents, are calculated based on the value of the investments divided by total net assets of the Fund. Holdings are subject to change and may have changed since the date specified. |
| 6 | Amounts are calculated based on the total long-term investments of the Fund. These percentages are subject to change and may have changed since the date specified. |
| | | | |
| 6 | | Wells Fargo Advantage Intrinsic World Equity Fund | | Fund expenses (unaudited) |
As a shareholder of the Fund, you incur two types of costs: (1) transaction costs, including sales charges (loads) on purchase payments and contingent deferred sales charges (if any) on redemptions and (2) ongoing costs, including management fees, distribution (12b-1) and/or shareholder service fees, and other Fund expenses. This example is intended to help you understand your ongoing costs (in dollars) of investing in the Fund and to compare these costs with the ongoing costs of investing in other mutual funds.
The example is based on an investment of $1,000 invested at the beginning of the six-month period and held for the entire period from November 1, 2014 to April 30, 2015.
Actual expenses
The “Actual” line of the table below provides information about actual account values and actual expenses. You may use the information in this line, together with the amount you invested, to estimate the expenses that you paid over the period. Simply divide your account value by $1,000 (for example, an $8,600 account value divided by $1,000 = 8.6), then multiply the result by the number in the “Actual” line under the heading entitled “Expenses paid during period” for your applicable class of shares to estimate the expenses you paid on your account during this period.
Hypothetical example for comparison purposes
The “Hypothetical” line of the table below provides information about hypothetical account values and hypothetical expenses based on the Fund’s actual expense ratio and an assumed rate of return of 5% per year before expenses, which is not the Fund’s actual return. The hypothetical account values and expenses may not be used to estimate the actual ending account balance or expenses you paid for the period. You may use this information to compare the ongoing costs of investing in the Fund and other funds. To do so, compare this 5% hypothetical example with the 5% hypothetical examples that appear in the shareholder reports of the other funds.
Please note that the expenses shown in the table are meant to highlight your ongoing costs only and do not reflect any transactional costs, such as sales charges (loads) and contingent deferred sales charges. Therefore, the “Hypothetical” line of the table is useful in comparing ongoing costs only and will not help you determine the relative total costs of owning different funds. In addition, if these transactional costs were included, your costs would have been higher.
| | | | | | | | | | | | | | | | |
| | | Beginning account value 11-1-2014 | | | Ending account value 4-30-2015 | | | Expenses paid during the period1 | | | Net annualized expense ratio | |
Class A | | | | | | | | | | | | | | | | |
Actual | | $ | 1,000.00 | | | $ | 1,076.54 | | | $ | 7.21 | | | | 1.40 | % |
Hypothetical (5% return before expenses) | | $ | 1,000.00 | | | $ | 1,017.85 | | | $ | 7.00 | | | | 1.40 | % |
Class C | | | | | | | | | | | | | | | | |
Actual | | $ | 1,000.00 | | | $ | 1,072.70 | | | $ | 11.05 | | | | 2.15 | % |
Hypothetical (5% return before expenses) | | $ | 1,000.00 | | | $ | 1,014.13 | | | $ | 10.74 | | | | 2.15 | % |
Administrator Class | | | | | | | | | | | | | | | | |
Actual | | $ | 1,000.00 | | | $ | 1,078.15 | | | $ | 5.93 | | | | 1.15 | % |
Hypothetical (5% return before expenses) | | $ | 1,000.00 | | | $ | 1,019.09 | | | $ | 5.76 | | | | 1.15 | % |
Institutional Class | | | | | | | | | | | | | | | | |
Actual | | $ | 1,000.00 | | | $ | 1,079.33 | | | $ | 4.90 | | | | 0.95 | % |
Hypothetical (5% return before expenses) | | $ | 1,000.00 | | | $ | 1,020.08 | | | $ | 4.76 | | | | 0.95 | % |
| 1 | Expenses paid is equal to the annualized expense ratio of each class multiplied by the average account value over the period, multiplied by the number of days in the most recent fiscal half-year divided by the number of days in the fiscal year (to reflect the one-half-year period). |
| | | | | | |
| Portfolio of investments—April 30, 2015 (unaudited) | | Wells Fargo Advantage Intrinsic World Equity Fund | | | 7 | |
| | | | | | | | | | | | |
| Security name | | | | | | Shares | | | Value | |
| | | | |
Common Stocks: 99.14% | | | | | | | | | | | | |
| | | | |
| France: 5.30% | | | | | | | | | | | | |
Kering (Consumer Discretionary, Textiles, Apparel & Luxury Goods) « | | | | | | | 14,765 | | | $ | 2,730,589 | |
Sanofi-Aventis SA (Health Care, Pharmaceuticals) | | | | | | | 30,313 | | | | 3,085,573 | |
Societe Generale SA (Financials, Banks) | | | | | | | 77,502 | | | | 3,874,686 | |
| | | | |
| | | | | | | | | | | 9,690,848 | |
| | | | | | | | | | | | |
| | | | |
| Germany: 1.81% | | | | | | | | | | | | |
Siemens AG (Industrials, Industrial Conglomerates) | | | | | | | 30,444 | | | | 3,311,756 | |
| | | | | | | | | | | | |
| | | | |
| Hong Kong: 2.19% | | | | | | | | | | | | |
AIA Group Limited (Financials, Insurance) | | | | | | | 600,530 | | | | 3,993,809 | |
| | | | | | | | | | | | |
| | | | |
| Japan: 8.39% | | | | | | | | | | | | |
Honda Motor Company Limited (Consumer Discretionary, Automobiles) | | | | | | | 101,220 | | | | 3,393,437 | |
Kao Corporation (Consumer Staples, Personal Products) | | | | | | | 82,700 | | | | 3,960,418 | |
Nidec Corporation (Industrials, Electrical Equipment) | | | | | | | 26,610 | | | | 1,990,554 | |
ORIX Corporation (Financials, Diversified Financial Services) | | | | | | | 257,500 | | | | 3,959,935 | |
ORIX Corporation ADR (Financials, Diversified Financial Services) « | | | | | | | 10,410 | | | | 802,091 | |
TOTO Limited (Industrials, Building Products) | | | | | | | 87,000 | | | | 1,230,810 | |
| | | | |
| | | | | | | | | | | 15,337,245 | |
| | | | | | | | | | | | |
| | | | |
| Luxembourg: 1.83% | | | | | | | | | | | | |
Millicom International Cellular SA (Telecommunication Services, Wireless Telecommunication Services) | | | | | | | 42,850 | | | | 3,343,020 | |
| | | | | | | | | | | | |
| | | | |
| Netherlands: 7.67% | | | | | | | | | | | | |
Airbus Group NV (Industrials, Aerospace & Defense) | | | | | | | 32,380 | | | | 2,244,002 | |
Heineken NV (Consumer Staples, Beverages) « | | | | | | | 41,232 | | | | 3,248,175 | |
Sensata Technologies Holding NV (Industrials, Electrical Equipment) † | | | | | | | 79,392 | | | | 4,383,232 | |
Unilever NV (Consumer Staples, Food Products) | | | | | | | 95,341 | | | | 4,145,427 | |
| | | | |
| | | | | | | | | | | 14,020,836 | |
| | | | | | | | | | | | |
| | | | |
| South Korea: 2.28% | | | | | | | | | | | | |
Samsung Electronics Company Limited (Information Technology, Technology Hardware, Storage & Peripherals) | | | | | | | 3,183 | | | | 4,175,630 | |
| | | | | | | | | | | | |
| | | | |
| Spain: 1.68% | | | | | | | | | | | | |
CaixaBank SA (Financials, Banks) | | | | | | | 611,213 | | | | 3,065,570 | |
| | | | | | | | | | | | |
| | | | |
| Sweden: 1.95% | | | | | | | | | | | | |
Autoliv Incorporated SDR (Consumer Discretionary, Auto Components) | | | | | | | 29,852 | | | | 3,560,965 | |
| | | | | | | | | | | | |
| | | | |
| Switzerland: 6.59% | | | | | | | | | | | | |
Novartis AG ADR (Health Care, Pharmaceuticals) | | | | | | | 42,381 | | | | 4,314,386 | |
Roche Holding AG (Health Care, Pharmaceuticals) | | | | | | | 12,847 | | | | 3,676,234 | |
UBS Group AG (Financials, Capital Markets) | | | | | | | 203,410 | | | | 4,063,588 | |
| | | | |
| | | | | | | | | | | 12,054,208 | |
| | | | | | | | | | | | |
| | | | |
| United Kingdom: 6.39% | | | | | | | | | | | | |
Barclays plc (Financials, Banks) | | | | | | | 1,016,508 | | | | 3,977,036 | |
BG Group plc (Energy, Oil, Gas & Consumable Fuels) | | | | | | | 165,246 | | | | 2,993,190 | |
The accompanying notes are an integral part of these financial statements.
| | | | |
| 8 | | Wells Fargo Advantage Intrinsic World Equity Fund | | Portfolio of investments—April 30, 2015 (unaudited) |
| | | | | | | | | | | | | | |
| Security name | | | | | | | Shares | | | Value | |
| | | | |
| United Kingdom (continued) | | | | | | | | | | | | | | |
Diageo plc (Consumer Staples, Beverages) | | | | | | 78,476 | | | $ | 2,178,679 | |
Royal Dutch Shell plc Class A (Energy, Oil, Gas & Consumable Fuels) | | | | | | 79,857 | | | | 2,532,041 | |
| | | | |
| | | | | | | | | | | | | 11,680,946 | |
| | | | | | | | | | | | | | |
| | | | |
| United States: 53.06% | | | | | | | | | | | | | | |
Abbott Laboratories (Health Care, Health Care Equipment & Supplies) | | | 86,908 | | | | 4,034,269 | |
Apple Incorporated (Information Technology, Technology Hardware, Storage & Peripherals) | | | 33,164 | | | | 4,150,475 | |
Baxter International Incorporated (Health Care, Health Care Equipment & Supplies) | | | 4,102 | | | | 281,971 | |
BB&T Corporation (Financials, Banks) | | | 86,910 | | | | 3,327,784 | |
Charles Schwab Corporation (Financials, Capital Markets) | | | 124,295 | | | | 3,790,998 | |
Chevron Corporation (Energy, Oil, Gas & Consumable Fuels) | | | 31,731 | | | | 3,524,045 | |
CIT Group Incorporated (Financials, Banks) | | | 38,697 | | | | 1,742,526 | |
EMC Corporation (Information Technology, Technology Hardware, Storage & Peripherals) | | | 146,237 | | | | 3,935,238 | |
EOG Resources Incorporated (Energy, Oil, Gas & Consumable Fuels) | | | 18,845 | | | | 1,864,713 | |
Express Scripts Holding Company (Health Care, Health Care Providers & Services) † | | | 53,224 | | | | 4,598,554 | |
FMC Corporation (Materials, Chemicals) | | | 31,826 | | | | 1,887,600 | |
Franklin Resources Incorporated (Financials, Capital Markets) | | | 6,353 | | | | 327,561 | |
Gilead Sciences Incorporated (Health Care, Biotechnology) † | | | 26,791 | | | | 2,692,763 | |
Goldman Sachs Group Incorporated (Financials, Capital Markets) | | | 20,129 | | | | 3,953,738 | |
Honeywell International Incorporated (Industrials, Aerospace & Defense) | | | 17,400 | | | | 1,756,008 | |
Microsoft Corporation (Information Technology, Software) | | | 80,190 | | | | 3,900,442 | |
Motorola Solutions Incorporated (Information Technology, Communications Equipment) | | | 59,270 | | | | 3,541,383 | |
Occidental Petroleum Corporation (Energy, Oil, Gas & Consumable Fuels) | | | 36,916 | | | | 2,956,972 | |
Oracle Corporation (Information Technology, Software) | | | 105,753 | | | | 4,612,946 | |
PepsiCo Incorporated (Consumer Staples, Beverages) | | | 40,518 | | | | 3,854,072 | |
QUALCOMM Incorporated (Information Technology, Communications Equipment) | | | 38,926 | | | | 2,646,968 | |
Samsonite International SA (Consumer Discretionary, Textiles, Apparel & Luxury Goods) | | | 1,280,970 | | | | 4,671,911 | |
Schlumberger Limited (Energy, Energy Equipment & Services) | | | 40,620 | | | | 3,843,058 | |
SunTrust Banks Incorporated (Financials, Banks) | | | 85,674 | | | | 3,555,471 | |
Texas Instruments Incorporated (Information Technology, Semiconductors & Semiconductor Equipment) | | | 66,653 | | | | 3,613,259 | |
The Procter & Gamble Company (Consumer Staples, Household Products) | | | 31,805 | | | | 2,528,816 | |
The Walt Disney Company (Consumer Discretionary, Media) | | | 42,226 | | | | 4,590,811 | |
United Parcel Service Incorporated Class B (Industrials, Air Freight & Logistics) | | | 36,104 | | | | 3,629,535 | |
Verizon Communications Incorporated (Telecommunication Services, Diversified Telecommunication Services) | | | 59,890 | | | | 3,020,852 | |
Visa Incorporated Class A (Information Technology, IT Services) | | | 63,292 | | | | 4,180,437 | |
| | | | |
| | | | | | | | | | | | | 97,015,176 | |
| | | | | | | | | | | | | | |
| | | | |
Total Common Stocks (Cost $139,270,644) | | | | | | | | | | | | | 181,250,009 | |
| | | | | | | | | | | | | | |
| | | | |
| | | Yield | | | | | | | | | |
| Short-Term Investments: 4.12% | | | | | | | | | | | | | | |
| | | | |
| Investment Companies: 4.12% | | | | | | | | | | | | | | |
Securities Lending Cash Investments, LLC (l)(r)(u) | | | 0.12 | % | | | | | 6,478,230 | | | | 6,478,230 | |
Wells Fargo Advantage Cash Investment Money Market Fund, Select Class (l)(u) | | | 0.11 | | | | | | 1,063,333 | | | | 1,063,333 | |
| | | | |
Total Short-Term Investments (Cost $7,541,563) | | | | | | | | | | | | | 7,541,563 | |
| | | | | | | | | | | | | | |
| | | | | | | | |
| Total investments in securities (Cost $146,812,207) * | | | 103.26 | % | | | 188,791,572 | |
Other assets and liabilities, net | | | (3.26 | ) | | | (5,965,366 | ) |
| | | | | | | | |
| Total net assets | | | 100.00 | % | | $ | 182,826,206 | |
| | | | | | | | |
The accompanying notes are an integral part of these financial statements.
| | | | | | |
| Portfolio of investments—April 30, 2015 (unaudited) | | Wells Fargo Advantage Intrinsic World Equity Fund | | | 9 | |
| « | All or a portion of this security is on loan. |
| † | Non-income-earning security |
| (l) | The security represents an affiliate of the Fund as defined in the Investment Company Act of 1940. |
| (r) | The investment is a non-registered investment vehicle purchased with cash collateral received from securities on loan. |
| (u) | The rate represents the 7-day annualized yield at period end. |
| * | Cost for federal income tax purposes is $147,285,642 and unrealized gains (losses) consists of: |
| | | | |
Gross unrealized gains | | $ | 46,411,302 | |
Gross unrealized losses | | | (4,905,372 | ) |
| | | | |
Net unrealized gains | | $ | 41,505,930 | |
The accompanying notes are an integral part of these financial statements.
| | | | |
| 10 | | Wells Fargo Advantage Intrinsic World Equity Fund | | Statement of assets and liabilities—April 30, 2015 (unaudited) |
| | | | |
| | | | |
| |
Assets | | | | |
Investments | | | | |
In unaffiliated securities (including $6,177,686 of securities loaned), at value (cost $139,270,644) | | $ | 181,250,009 | |
In affiliated securities, at value (cost $7,541,563) | | | 7,541,563 | |
| | | | |
Total investments, at value (cost $146,812,207) | | | 188,791,572 | |
Foreign currency, at value (cost $1,906) | | | 1,904 | |
Receivable for investments sold | | | 2,435,338 | |
Receivable for Fund shares sold | | | 44,891 | |
Receivable for dividends | | | 374,963 | |
Receivable for securities lending income | | | 3,124 | |
Prepaid expenses and other assets | | | 39,965 | |
| | | | |
Total assets | | | 191,691,757 | |
| | | | |
| |
Liabilities | | | | |
Payable for investments purchased | | | 1,730,496 | |
Payable for Fund shares redeemed | | | 416,952 | |
Payable upon receipt of securities loaned | | | 6,478,230 | |
Advisory fee payable | | | 106,657 | |
Distribution fee payable | | | 6,333 | |
Administration fees payable | | | 45,132 | |
Accrued expenses and other liabilities | | | 81,751 | |
| | | | |
Total liabilities | | | 8,865,551 | |
| | | | |
Total net assets | | $ | 182,826,206 | |
| | | | |
| |
NET ASSETS CONSIST OF | | | | |
Paid-in capital | | $ | 128,181,204 | |
Undistributed net investment income | | | 152,186 | |
Accumulated net realized gains on investments | | | 12,513,569 | |
Net unrealized gains on investments | | | 41,979,247 | |
| | | | |
Total net assets | | $ | 182,826,206 | |
| | | | |
| |
COMPUTATION OF NET ASSET VALUE AND OFFERING PRICE PER SHARE | | | | |
Net assets – Class A | | $ | 162,043,077 | |
Shares outstanding – Class A1 | | | 6,874,458 | |
Net asset value per share – Class A | | | $23.57 | |
Maximum offering price per share – Class A2 | | | $25.01 | |
Net assets – Class C | | $ | 10,304,975 | |
Shares outstanding – Class C1 | | | 451,824 | |
Net asset value per share – Class C | | | $22.81 | |
Net assets – Administrator Class | | $ | 5,875,751 | |
Shares outstanding – Administrator Class1 | | | 250,249 | |
Net asset value per share – Administrator Class | | | $23.48 | |
Net assets – Institutional Class | | $ | 4,602,403 | |
Shares outstanding – Institutional Class1 | | | 195,599 | |
Net asset value per share – Institutional Class | | | $23.53 | |
| 1 | The Fund has an unlimited number of authorized shares. |
| 2 | Maximum offering price is computed as 100/94.25 of net asset value. On investments of $50,000 or more, the offering price is reduced. |
The accompanying notes are an integral part of these financial statements.
| | | | | | |
| Statement of operations—six months ended April 30, 2015 (unaudited) | | Wells Fargo Advantage Intrinsic World Equity Fund | | | 11 | |
| | | | |
| | | | |
| |
Investment income | | | | |
Dividends (net of foreign withholding taxes of $117,858) | | $ | 1,795,169 | |
Securities lending income, net | | | 17,482 | |
Income from affiliated securities | | | 796 | |
| | | | |
Total investment income | | | 1,813,447 | |
| | | | |
| |
Expenses | | | | |
Advisory fee | | | 698,636 | |
Administration fees | | | | |
Fund level | | | 43,665 | |
Class A | | | 200,659 | |
Class C | | | 12,717 | |
Administrator Class | | | 3,011 | |
Institutional Class | | | 1,800 | |
Shareholder servicing fees | | | | |
Class A | | | 192,942 | |
Class C | | | 12,228 | |
Administrator Class | | | 7,157 | |
Distribution fee | | | | |
Class C | | | 36,685 | |
Custody and accounting fees | | | 17,476 | |
Professional fees | | | 26,446 | |
Registration fees | | | 30,260 | |
Shareholder report expenses | | | 21,025 | |
Trustees’ fees and expenses | | | 6,747 | |
Other fees and expenses | | | 6,175 | |
| | | | |
Total expenses | | | 1,317,629 | |
Less: Fee waivers and/or expense reimbursements | | | (75,985 | ) |
| | | | |
Net expenses | | | 1,241,644 | |
| | | | |
Net investment income | | | 571,803 | |
| | | | |
| |
REALIZED AND UNREALIZED GAINS (LOSSES) ON INVESTMENTS | | | | |
Net realized gains on investments | | | 13,051,454 | |
Net change in unrealized gains (losses) on investments | | | (430,319 | ) |
| | | | |
Net realized and unrealized gains (losses) on investments | | | 12,621,135 | |
| | | | |
Net increase in net assets resulting from operations | | $ | 13,192,938 | |
| | | | |
The accompanying notes are an integral part of these financial statements.
| | | | |
| 12 | | Wells Fargo Advantage Intrinsic World Equity Fund | | Statement of changes in net assets |
| | | | | | | | | | | | | | | | |
| | | Six months ended April 30, 2015 (unaudited) | | | Year ended October 31, 2014 | |
| | | | |
Operations | | | | | | | | | | | | | | | | |
Net investment income | | | | | | $ | 571,803 | | | | | | | $ | 1,272,982 | |
Net realized gains on investments | | | | | | | 13,051,454 | | | | | | | | 14,277,155 | |
Net change in unrealized gains (losses) on investments | | | | | | | (430,319 | ) | | | | | | | (9,175,909 | ) |
| | | | |
Net increase in net assets resulting from operations | | | | | | | 13,192,938 | | | | | | | | 6,374,228 | |
| | | | |
| | | | |
Distributions to shareholders from | | | | | | | | | | | | | | | | |
Net investment income | | | | | | | | | | | | | | | | |
Class A | | | | | | | (856,992 | ) | | | | | | | (1,863,591 | ) |
Class C | | | | | | | 0 | | | | | | | | (51,916 | ) |
Administrator Class | | | | | | | (51,944 | ) | | | | | | | (64,491 | ) |
Institutional Class | | | | | | | (48,847 | ) | | | | | | | (34,571 | ) |
Net realized gains | | | | | | | | | | | | | | | | |
Class A | | | | | | | (2,600,451 | ) | | | | | | | 0 | |
Class C | | | | | | | (169,828 | ) | | | | | | | 0 | |
Administrator Class | | | | | | | (108,609 | ) | | | | | | | 0 | |
Institutional Class | | | | | | | (77,473 | ) | | | | | | | 0 | |
| | | | |
Total distributions to shareholders | | | | | | | (3,914,144 | ) | | | | | | | (2,014,569 | ) |
| | | | |
| | | | |
Capital share transactions | | | Shares | | | | | | | | Shares | | | | | |
Proceeds from shares sold | | | | | | | | | | | | | | | | |
Class A | | | 127,873 | | | | 2,908,836 | | | | 233,908 | | | | 5,271,086 | |
Class C | | | 21,303 | | | | 466,361 | | | | 50,986 | | | | 1,125,201 | |
Administrator Class | | | 25,364 | | | | 570,272 | | | | 311,050 | | | | 6,906,837 | |
Institutional Class | | | 107,967 | | | | 2,447,708 | | | | 77,064 | | | | 1,740,401 | |
| | | | |
| | | | | | | 6,393,177 | | | | | | | | 15,043,525 | |
| | | | |
Reinvestment of distributions | | | | | | | | | | | | | | | | |
Class A | | | 152,110 | | | | 3,351,854 | | | | 80,375 | | | | 1,805,214 | |
Class C | | | 7,388 | | | | 156,548 | | | | 2,231 | | | | 48,726 | |
Administrator Class | | | 7,067 | | | | 155,486 | | | | 2,592 | | | | 57,936 | |
Institutional Class | | | 3,982 | | | | 87,906 | | | | 1,542 | | | | 34,536 | |
| | | | |
| | | | | | | 3,751,794 | | | | | | | | 1,946,412 | |
| | | | |
Payment for shares redeemed | | | | | | | | | | | | | | | | |
Class A | | | (420,917 | ) | | | (9,510,028 | ) | | | (1,004,696 | ) | | | (22,616,282 | ) |
Class C | | | (29,234 | ) | | | (644,871 | ) | | | (70,464 | ) | | | (1,532,097 | ) |
Administrator Class | | | (110,350 | ) | | | (2,456,676 | ) | | | (228,770 | ) | | | (5,076,626 | ) |
Institutional Class | | | (58,247 | ) | | | (1,340,819 | ) | | | (44,254 | ) | | | (998,282 | ) |
| | | | |
| | | | | | | (13,952,394 | ) | | | | | | | (30,223,287 | ) |
| | | | |
Net decrease in net assets resulting from capital share transactions | | | | | | | (3,807,423 | ) | | | | | | | (13,233,350 | ) |
| | | | |
Total increase (decrease) in net assets | | | | | | | 5,471,371 | | | | | | | | (8,873,691 | ) |
| | | | |
| | | | |
Net assets | | | | | | | | | | | | | | | | |
Beginning of period | | | | | | | 177,354,835 | | | | | | | | 186,228,526 | |
| | | | |
End of period | | | | | | $ | 182,826,206 | | | | | | | $ | 177,354,835 | |
| | | | |
Undistributed net investment income | | | | | | $ | 152,186 | | | | | | | $ | 538,166 | |
| | | | |
The accompanying notes are an integral part of these financial statements.
| | | | | | |
| Financial highlights | | Wells Fargo Advantage Intrinsic World Equity Fund | | | 13 | |
(For a share outstanding throughout each period)
| | | | | | | | | | | | | | | | | | | | | | | | |
| | | Six months ended April 30, 2015 (unaudited) | | | Year ended October 31 | |
| CLASS A | | | 2014 | | | 2013 | | | 2012 | | | 2011 | | | 20101 | |
Net asset value, beginning of period | | | $22.39 | | | | $21.88 | | | | $17.94 | | | | $15.55 | | | | $15.06 | | | | $13.27 | |
Net investment income | | | 0.08 | | | | 0.17 | | | | 0.20 | | | | 0.16 | | | | 0.12 | 2 | | | 0.12 | |
Net realized and unrealized gains (losses) on investments | | | 1.59 | | | | 0.59 | | | | 4.00 | | | | 1.87 | | | | 0.48 | | | | 1.78 | |
| | | | | | | | | | | | | | | | | | | | | | | | |
Total from investment operations | | | 1.67 | | | | 0.76 | | | | 4.20 | | | | 2.03 | | | | 0.60 | | | | 1.90 | |
Distributions to shareholders from | | | | | | | | | | | | | | | | | | | | | | | | |
Net investment income | | | (0.12 | ) | | | (0.25 | ) | | | (0.26 | ) | | | (0.11 | ) | | | (0.11 | ) | | | (0.11 | ) |
Net realized gains | | | (0.37 | ) | | | 0.00 | | | | 0.00 | | | | 0.00 | | | | 0.00 | | | | 0.00 | |
| | | | | | | | | | | | | | | | | | | | | | | | |
Total distributions to shareholders | | | (0.49 | ) | | | (0.25 | ) | | | (0.26 | ) | | | (0.11 | ) | | | (0.11 | ) | | | (0.11 | ) |
Regulatory settlement proceeds | | | 0.00 | | | | 0.00 | | | | 0.00 | | | | 0.47 | | | | 0.00 | | | | 0.00 | |
Net asset value, end of period | | | $23.57 | | | | $22.39 | | | | $21.88 | | | | $17.94 | | | | $15.55 | | | | $15.06 | |
Total return3 | | | 7.65 | % | | | 3.45 | % | | | 23.74 | % | | | 16.25 | %4 | | | 4.00 | % | | | 14.43 | % |
Ratios to average net assets (annualized) | | | | | | | | | | | | | | | | | | | | | | | | |
Gross expenses | | | 1.48 | % | | | 1.47 | % | | | 1.49 | % | | | 1.51 | % | | | 1.50 | % | | | 1.53 | % |
Net expenses | | | 1.40 | % | | | 1.40 | % | | | 1.40 | % | | | 1.40 | % | | | 1.40 | % | | | 1.46 | % |
Net investment income | | | 0.68 | % | | | 0.70 | % | | | 0.95 | % | | | 0.91 | % | | | 0.79 | % | | | 0.75 | % |
Supplemental data | | | | | | | | | | | | | | | | | | | | | | | | |
Portfolio turnover rate | | | 22 | % | | | 23 | % | | | 22 | % | | | 27 | % | | | 12 | % | | | 11 | % |
Net assets, end of period (000s omitted) | | | $162,043 | | | | $157,061 | | | | $168,621 | | | | $146,930 | | | | $139,100 | | | | $100,460 | |
| 1 | After the close of business on July 16, 2010, the Fund acquired the net assets of Evergreen Intrinsic World Equity Fund which became the accounting and performance survivor in the transaction. The information for the period prior to July 19, 2010 is that of Class A of Evergreen Intrinsic World Equity Fund. |
| 2 | Calculated based upon average shares outstanding |
| 3 | Total return calculations do not include any sales charges. Returns for periods of less than one year are not annualized. |
| 4 | During the year ended October 31, 2012, the Fund received a regulatory settlement from an unaffiliated third party which had an impact of 2.92% on the total return. |
The accompanying notes are an integral part of these financial statements.
| | | | |
| 14 | | Wells Fargo Advantage Intrinsic World Equity Fund | | Financial highlights |
(For a share outstanding throughout each period)
| | | | | | | | | | | | | | | | | | | | | | | | |
| | | Six months ended
April 30, 2015 (unaudited) | | | Year ended October 31 | |
| CLASS C | | | 2014 | | | 2013 | | | 2012 | | | 2011 | | | 20101 | |
Net asset value, beginning of period | | | $21.64 | | | | $21.19 | | | | $17.37 | | | | $15.15 | | | | $14.68 | | | | $12.96 | |
Net investment income (loss) | | | (0.01 | ) | | | (0.02 | ) | | | 0.05 | | | | 0.02 | | | | (0.01 | )2 | | | 0.07 | |
Net realized and unrealized gains (losses) on investments | | | 1.55 | | | | 0.58 | | | | 3.89 | | | | 1.82 | | | | 0.49 | | | | 1.69 | |
| | | | | | | | | | | | | | | | | | | | | | | | |
Total from investment operations | | | 1.54 | | | | 0.56 | | | | 3.94 | | | | 1.84 | | | | 0.48 | | | | 1.76 | |
Distributions to shareholders from | | | | | | | | | | | | | | | | | | | | | | | | |
Net investment income | | | 0.00 | | | | (0.11 | ) | | | (0.12 | ) | | | (0.09 | ) | | | (0.01 | ) | | | (0.04 | ) |
Net realized gains | | | (0.37 | ) | | | 0.00 | | | | 0.00 | | | | 0.00 | | | | 0.00 | | | | 0.00 | |
| | | | | | | | | | | | | | | | | | | | | | | | |
Total distributions to shareholders | | | (0.37 | ) | | | (0.11 | ) | | | (0.12 | ) | | | (0.09 | ) | | | (0.01 | ) | | | (0.04 | ) |
Regulatory settlement proceeds | | | 0.00 | | | | 0.00 | | | | 0.00 | | | | 0.47 | | | | 0.00 | | | | 0.00 | |
Net asset value, end of period | | | $22.81 | | | | $21.64 | | | | $21.19 | | | | $17.37 | | | | $15.15 | | | | $14.68 | |
Total return3 | | | 7.27 | % | | | 2.65 | % | | | 22.82 | % | | | 15.39 | %4 | | | 3.27 | % | | | 13.58 | % |
Ratios to average net assets (annualized) | | | | | | | | | | | | | | | | |
Gross expenses | | | 2.23 | % | | | 2.22 | % | | | 2.24 | % | | | 2.26 | % | | | 2.20 | % | | | 2.28 | % |
Net expenses | | | 2.15 | % | | | 2.15 | % | | | 2.15 | % | | | 2.15 | % | | | 2.15 | % | | | 2.21 | % |
Net investment income (loss) | | | (0.07 | )% | | | (0.06 | )% | | | 0.20 | % | | | 0.16 | % | | | (0.05 | )% | | | 0.04 | % |
Supplemental data | | | | | | | | | | | | | | | | |
Portfolio turnover rate | | | 22 | % | | | 23 | % | | | 22 | % | | | 27 | % | | | 12 | % | | | 11 | % |
Net assets, end of period (000s omitted) | | | $10,305 | | | | $9,788 | | | | $9,949 | | | | $7,341 | | | | $6,817 | | | | $588 | |
| 1 | After the close of business on July 16, 2010, the Fund acquired the net assets of Evergreen Intrinsic World Equity Fund which became the accounting and performance survivor in the transaction. The information for the period prior to July 19, 2010 is that of Class C of Evergreen Intrinsic World Equity Fund. |
| 2 | Calculated based upon average shares outstanding |
| 3 | Total return calculations do not include any sales charges. Returns for periods of less than one year are not annualized. |
| 4 | During the year ended October 31, 2012, the Fund received a regulatory settlement from an unaffiliated third party which had an impact of 2.92% on the total return. |
The accompanying notes are an integral part of these financial statements.
| | | | | | |
| Financial highlights | | Wells Fargo Advantage Intrinsic World Equity Fund | | | 15 | |
(For a share outstanding throughout each period)
| | | | | | | | | | | | | | | | | | | | | | | | |
| | | Six months ended
April 30, 2015 (unaudited) | | | Year ended October 31 | |
| ADMINISTRATOR CLASS | | | 2014 | | | 2013 | | | 2012 | | | 2011 | | | 20101 | |
Net asset value, beginning of period | | | $22.33 | | | | $21.81 | | | | $17.89 | | | | $15.52 | | | | $15.02 | | | | $13.23 | |
Net investment income | | | 0.10 | 2 | | | 0.22 | 2 | | | 0.24 | 2 | | | 0.19 | 2 | | | 0.15 | 2 | | | 0.15 | 2 |
Net realized and unrealized gains (losses) on investments | | | 1.60 | | | | 0.59 | | | | 3.99 | | | | 1.87 | | | | 0.49 | | | | 1.78 | |
| | | | | | | | | | | | | | | | | | | | | | | | |
Total from investment operations | | | 1.70 | | | | 0.81 | | | | 4.23 | | | | 2.06 | | | | 0.64 | | | | 1.93 | |
Distributions to shareholders from | | | | | | | | | | | | | | | | | | | | | | | | |
Net investment income | | | (0.18 | ) | | | (0.29 | ) | | | (0.31 | ) | | | (0.16 | ) | | | (0.14 | ) | | | (0.14 | ) |
Net realized gains | | | (0.37 | ) | | | 0.00 | | | | 0.00 | | | | 0.00 | | | | 0.00 | | | | 0.00 | |
| | | | | | | | | | | | | | | | | | | | | | | | |
Total distributions to shareholders | | | (0.55 | ) | | | (0.29 | ) | | | (0.31 | ) | | | (0.16 | ) | | | (0.14 | ) | | | (0.14 | ) |
Regulatory settlement proceeds | | | 0.00 | | | | 0.00 | | | | 0.00 | | | | 0.47 | | | | 0.00 | | | | 0.00 | |
Net asset value, end of period | | | $23.48 | | | | $22.33 | | | | $21.81 | | | | $17.89 | | | | $15.52 | | | | $15.02 | |
Total return3 | | | 7.81 | % | | | 3.70 | % | | | 24.03 | % | | | 16.52 | %4 | | | 4.27 | % | | | 14.72 | % |
Ratios to average net assets (annualized) | | | | | | | | | | | | | | | | | | | | | | | | |
Gross expenses | | | 1.31 | % | | | 1.29 | % | | | 1.31 | % | | | 1.34 | % | | | 1.30 | % | | | 1.29 | % |
Net expenses | | | 1.15 | % | | | 1.15 | % | | | 1.15 | % | | | 1.15 | % | | | 1.15 | % | | | 1.21 | % |
Net investment income | | | 0.91 | % | | | 0.96 | % | | | 1.18 | % | | | 1.14 | % | | | 0.99 | % | | | 1.06 | % |
Supplemental data | | | | | | | | | | | | | | | | | | | | | | | | |
Portfolio turnover rate | | | 22 | % | | | 23 | % | | | 22 | % | | | 27 | % | | | 12 | % | | | 11 | % |
Net assets, end of period (000s omitted) | | | $5,876 | | | | $7,327 | | | | $5,306 | | | | $2,001 | | | | $1,986 | | | | $144 | |
| 1 | After the close of business on July 16, 2010, the Fund acquired the net assets of Evergreen Intrinsic World Equity Fund which became the accounting and performance survivor in the transaction. The information for the period prior to July 19, 2010 is that of Class I of Evergreen Intrinsic World Equity Fund. |
| 2 | Calculated based upon average shares outstanding |
| 3 | Returns for periods of less than one year are not annualized. |
| 4 | During the year ended October 31, 2012, the Fund received a regulatory settlement from an unaffiliated third party which had an impact of 2.93% on the total return. |
The accompanying notes are an integral part of these financial statements.
| | | | |
| 16 | | Wells Fargo Advantage Intrinsic World Equity Fund | | Financial highlights |
(For a share outstanding throughout each period)
| | | | | | | | | | | | | | | | | | | | | | | | |
| | | Six months ended April 30, 2015 (unaudited) | | | Year ended October 31 | |
| INSTITUTIONAL CLASS | | | 2014 | | | 2013 | | | 2012 | | | 2011 | | | 20101 | |
Net asset value, beginning of period | | | $22.40 | | | | $21.87 | | | | $17.93 | | | | $15.54 | | | | $15.02 | | | | $13.80 | |
Net investment income | | | 0.12 | | | | 0.25 | 2 | | | 0.26 | 2 | | | 0.17 | 2 | | | 0.16 | | | | 0.03 | 2 |
Net realized and unrealized gains (losses) on investments | | | 1.61 | | | | 0.60 | | | | 4.02 | | | | 1.92 | | | | 0.51 | | | | 1.19 | |
| | | | | | | | | | | | | | | | | | | | | | | | |
Total from investment operations | | | 1.73 | | | | 0.85 | | | | 4.28 | | | | 2.09 | | | | 0.67 | | | | 1.22 | |
Distributions to shareholders from | | | | | | | | | | | | | | | | | | | | | | | | |
Net investment income | | | (0.23 | ) | | | (0.32 | ) | | | (0.34 | ) | | | (0.17 | ) | | | (0.15 | ) | | | 0.00 | |
Net realized gains | | | (0.37 | ) | | | 0.00 | | | | 0.00 | | | | 0.00 | | | | 0.00 | | | | 0.00 | |
| | | | | | | | | | | | | | | | | | | | | | | | |
Total distributions to shareholders | | | (0.60 | ) | | | (0.32 | ) | | | (0.34 | ) | | | (0.17 | ) | | | (0.15 | ) | | | 0.00 | |
Regulatory settlement proceeds | | | 0.00 | | | | 0.00 | | | | 0.00 | | | | 0.47 | | | | 0.00 | | | | 0.00 | |
Net asset value, end of period | | | $23.53 | | | | $22.40 | | | | $21.87 | | | | $17.93 | | | | $15.54 | | | | $15.02 | |
Total return3 | | | 7.93 | % | | | 3.90 | % | | | 24.28 | % | | | 16.74 | %4 | | | 4.50 | % | | | 8.84 | % |
Ratios to average net assets (annualized) | | | | | | | | | | | | | | | | | | | | | | | | |
Gross expenses | | | 1.05 | % | | | 1.04 | % | | | 1.06 | % | | | 1.10 | % | | | 1.00 | % | | | 1.23 | % |
Net expenses | | | 0.95 | % | | | 0.95 | % | | | 0.95 | % | | | 0.95 | % | | | 0.95 | % | | | 0.95 | % |
Net investment income | | | 1.14 | % | | | 1.11 | % | | | 1.32 | % | | | 1.03 | % | | | 1.12 | % | | | 0.91 | % |
Supplemental data | | | | | | | | | | | | | | | | | | | | | | | | |
Portfolio turnover rate | | | 22 | % | | | 23 | % | | | 22 | % | | | 27 | % | | | 12 | % | | | 11 | % |
Net assets, end of period (000s omitted) | | | $4,602 | | | | $3,179 | | | | $2,352 | | | | $561 | | | | $573 | | | | $11 | |
| 1 | For the period from July 30, 2010 (commencement of class operations), to October 31, 2010. |
| 2 | Calculated based upon average shares outstanding |
| 3 | Returns for periods of less than one year are not annualized. |
| 4 | During the year ended October 31, 2012, the Fund received a regulatory settlement from an unaffiliated third party which had an impact of 2.93% on the total return. |
The accompanying notes are an integral part of these financial statements.
| | | | | | |
| Notes to financial statements (unaudited) | | Wells Fargo Advantage Intrinsic World Equity Fund | | | 17 | |
1. ORGANIZATION
Wells Fargo Funds Trust (the “Trust”), a Delaware statutory trust organized on March 10, 1999, is an open-end management investment company registered under the Investment Company Act of 1940, as amended (the “1940 Act”). As an investment company, the Trust follows the accounting and reporting guidance in Financial Accounting Standards Board (“FASB”) Accounting Standards Codification Topic 946, Financial Services – Investment Companies. These financial statements report on the Wells Fargo Advantage Intrinsic World Equity Fund (the “Fund”) which is a diversified series of the Trust.
2. SIGNIFICANT ACCOUNTING POLICIES
The following significant accounting policies, which are consistently followed in the preparation of the financial statements of the Fund, are in conformity with U.S. generally accepted accounting principles which require management to make estimates and assumptions that affect the reported amounts of assets and liabilities, disclosure of contingent assets and liabilities at the date of the financial statements, and the reported amounts of revenues and expenses during the reporting period. Actual results could differ from those estimates.
Securities valuation
All investments are valued each business day as of the close of regular trading on the New York Stock Exchange (generally 4 p.m. Eastern Time).
Equity securities that are listed on a foreign or domestic exchange or market are valued at the official closing price or, if none, the last sales price. If no sale occurs on the primary exchange or market that day, the prior day’s price will be deemed “stale” and a fair value price will be determined in accordance with the Fund’s Valuation Procedures.
Equity securities that are not listed on a foreign or domestic exchange or market, but have a public trading market, are valued at the quoted bid price from an independent broker-dealer that the Management Valuation Team of Wells Fargo Funds Management, LLC (“Funds Management”) has determined is an acceptable source.
The values of securities denominated in foreign currencies are translated into U.S. dollars at rates provided by an independent foreign currency pricing source at a time each business day specified by the Management Valuation Team.
Many securities markets and exchanges outside the U.S. close prior to the close of the New York Stock Exchange and therefore may not fully reflect trading or events that occur after the close of the principal exchange in which the foreign securities are traded, but before the close of the New York Stock Exchange. If such trading or events are expected to materially affect the value of such securities, then fair value pricing procedures approved by the Board of Trustees of the Fund are applied. These procedures take into account multiple factors including movements in U.S. securities markets after foreign exchanges close. Foreign securities that are fair valued under these procedures are categorized as Level 2 and the application of these procedures may result in transfers between Level 1 and Level 2. Depending on market activity, such fair valuations may be frequent. Such fair value pricing may result in net asset values that are higher or lower than net asset values based on the last reported sales price or latest quoted bid price. On April 30, 2015, such fair value pricing was used in pricing foreign securities.
Investments in registered open-end investment companies are valued at net asset value. Interests in non-registered investment vehicles that are redeemable at net asset value are fair valued at net asset value when available.
Investments which are not valued using any of the methods discussed above are valued at their fair value, as determined in good faith by the Board of Trustees. The Board of Trustees has established a Valuation Committee comprised of the Trustees and has delegated to it the authority to take any actions regarding the valuation of portfolio securities that the Valuation Committee deems necessary or appropriate, including determining the fair value of portfolio securities, unless the determination has been delegated to the Management Valuation Team. The Board of Trustees retains the authority to make or ratify any valuation decisions or approve any changes to the Valuation Procedures as it deems appropriate. On a quarterly basis, the Board of Trustees receives reports on any valuation actions taken by the Valuation Committee or the Management Valuation Team which may include items for ratification.
Valuations of fair valued securities are compared to the next actual sales price when available, or other appropriate market values, to assess the continued appropriateness of the fair valuation methodologies used. These securities are fair valued on a day-to-day basis, taking into consideration changes to appropriate market information and any significant changes to the inputs considered in the valuation process until there is a readily available price provided on an exchange or by an independent pricing service. Valuations received from an independent pricing service or independent broker-dealer quotes are periodically validated by comparisons to most recent trades and valuations provided by other
| | | | |
| 18 | | Wells Fargo Advantage Intrinsic World Equity Fund | | Notes to financial statements (unaudited) |
independent pricing services in addition to the review of prices by the adviser and/or subadviser. Unobservable inputs used in determining fair valuations are identified based on the type of security, taking into consideration factors utilized by market participants in valuing the investment, knowledge about the issuer and the current market environment.
Foreign currency translation
The accounting records of the Fund are maintained in U.S. dollars. The values of other assets and liabilities denominated in foreign currencies will be converted to U.S. dollars at rates provided by an independent foreign currency pricing source at a time each business day specified by the Management Valuation Team. Purchases and sales of securities, and income and expenses are converted at the rate of exchange on the respective dates of such transactions. Reported net realized foreign exchange gains or losses arise from sales of foreign currencies, currency gains or losses realized between the trade and settlement dates on securities transactions, and the difference between the amounts of dividends, interest and foreign withholding taxes recorded and the U.S. dollar equivalent of the amounts actually paid or received. Net unrealized foreign exchange gains and losses arise from changes in the fair value of assets and liabilities other than investments in securities resulting from changes in exchange rates. The changes in net assets arising from changes in exchange rates and the changes in net assets resulting from changes in market prices of securities are not separately presented. Such changes are recorded with net realized and unrealized gains or losses from investments. Gains and losses from certain foreign currency transactions are treated as ordinary income for U.S. federal income tax purposes.
Security loans
The Fund may lend its securities from time to time in order to earn additional income in the form of fees or interest on securities received as collateral or the investment of any cash received as collateral. The Fund continues to receive interest or dividends on the securities loaned. The Fund receives collateral in the form of cash or securities with a value at least equal to the value of the securities on loan. The value of the loaned securities is determined at the close of each business day and any additional required collateral is delivered to the Fund on the next business day. In a securities lending transaction, the net asset value of the Fund will be affected by an increase or decrease in the value of the securities loaned and by an increase or decrease in the value of the instrument in which collateral is invested. The amount of securities lending activity undertaken by the Fund fluctuates from time to time. In the event of default or bankruptcy by the borrower, the Fund may be prevented from recovering the loaned securities or gaining access to the collateral or may experience delays or costs in doing so. In addition, the investment of any cash collateral received may lose all or part of its value. The Fund has the right under the lending agreement to recover the securities from the borrower on demand.
The Fund lends its securities through an unaffiliated securities lending agent. Cash collateral received in connection with its securities lending transactions is invested in Securities Lending Cash Investments, LLC (the “Securities Lending Fund”). The Securities Lending Fund is exempt from registration under Section 3(c)(7) of the 1940 Act and is managed by Funds Management and is subadvised by Wells Capital Management Incorporated (“WellsCap”). Funds Management receives an advisory fee starting at 0.05% and declining to 0.01% as the average daily net assets of the Securities Lending Fund increase. All of the fees received by Funds Management are paid to WellsCap for its services as subadviser. The Securities Lending Fund seeks to provide a positive return compared to the daily Fed Funds Open rate by investing in high-quality, U.S. dollar-denominated short-term money market instruments. Securities Lending Fund investments are fair valued based upon the amortized cost valuation technique. Income earned from investment in the Securities Lending Fund is included in securities lending income on the Statement of Operations.
Security transactions and income recognition
Securities transactions are recorded on a trade date basis. Realized gains or losses are recorded on the basis of identified cost.
Dividend income is recognized on the ex-dividend date, except for certain dividends from foreign securities, which are recorded as soon as the custodian verifies the ex-dividend date. Dividend income from foreign securities is recorded net of foreign taxes withheld where recovery of such taxes is not assured.
Distributions to shareholders
Distributions to shareholders from net investment income and net realized gains, if any, are recorded on the ex-dividend date. Such distributions are determined in conformity with federal income tax regulations, which may differ in amount or character from net investment income and realized gains recognized for purposes of U.S. generally accepted accounting principles.
Federal and other taxes
The Fund intends to continue to qualify as a regulated investment company by distributing substantially all of its investment company taxable income and any net realized capital gains (after reduction for capital loss carryforwards) sufficient to relieve it from all, or substantially all, federal income taxes. Accordingly, no provision for federal income taxes was required.
| | | | | | |
| Notes to financial statements (unaudited) | | Wells Fargo Advantage Intrinsic World Equity Fund | | | 19 | |
The Fund’s income and federal excise tax returns and all financial records supporting those returns for the prior three fiscal years are subject to examination by the federal and Delaware revenue authorities. Management has analyzed the Fund’s tax positions taken on federal, state, and foreign tax returns for all open tax years and does not believe that there are any uncertain tax positions that require recognition of a tax liability.
As of October 31, 2014, the Fund had capital loss carryforwards available to offset future net realized capital gains in the amount of $152,261 expiring in 2017.
Class allocations
The separate classes of shares offered by the Fund differ principally in applicable sales charges, distribution, shareholder servicing, and administration fees. Class specific expenses are charged directly to that share class. Investment income, common expenses, and realized and unrealized gains (losses) on investments are allocated daily to each class of shares based on the relative proportion of net assets of each class.
3. FAIR VALUATION MEASUREMENTS
Fair value measurements of investments are determined within a framework that has established a fair value hierarchy based upon the various data inputs utilized in determining the value of the Fund’s investments. The three-level hierarchy gives the highest priority to unadjusted quoted prices in active markets for identical assets or liabilities (Level 1) and the lowest priority to significant unobservable inputs (Level 3). The Fund’s investments are classified within the fair value hierarchy based on the lowest level of input that is significant to the fair value measurement. The inputs are summarized into three broad levels as follows:
| n | | Level 1 – quoted prices in active markets for identical securities |
| n | | Level 2 – other significant observable inputs (including quoted prices for similar securities, interest rates, prepayment speeds, credit risk, use of amortized cost, etc.) |
| n | | Level 3 – significant unobservable inputs (including the Fund’s own assumptions in determining the fair value of investments) |
The inputs or methodologies used for valuing investments in securities are not necessarily an indication of the risk associated with investing in those securities.
The following is a summary of the inputs used in valuing the Fund’s assets and liabilities as of April 30, 2015:
| | | | | | | | | | | | | | | | |
| | | Quoted prices (Level 1) | | | Other significant observable inputs (Level 2) | | | Significant unobservable inputs (Level 3) | | | Total | |
Assets | | | | | | | | | | | | | | | | |
Investments in: | | | | | | | | | | | | | | | | |
| | | | |
Common stocks | | | | | | | | | | | | | | | | |
France | | $ | 0 | | | $ | 9,690,848 | | | $ | 0 | | | $ | 9,690,848 | |
Germany | | | 0 | | | | 3,311,756 | | | | 0 | | | | 3,311,756 | |
Hong Kong | | | 0 | | | | 3,993,809 | | | | 0 | | | | 3,993,809 | |
Japan | | | 802,091 | | | | 14,535,154 | | | | 0 | | | | 15,337,245 | |
Luxembourg | | | 0 | | | | 3,343,020 | | | | 0 | | | | 3,343,020 | |
Netherlands | | | 8,528,659 | | | | 5,492,177 | | | | 0 | | | | 14,020,836 | |
South Korea | | | 0 | | | | 4,175,630 | | | | 0 | | | | 4,175,630 | |
Spain | | | 0 | | | | 3,065,570 | | | | 0 | | | | 3,065,570 | |
Sweden | | | 0 | | | | 3,560,965 | | | | 0 | | | | 3,560,965 | |
Switzerland | | | 4,314,386 | | | | 7,739,822 | | | | 0 | | | | 12,054,208 | |
United Kingdom | | | 0 | | | | 11,680,946 | | | | 0 | | | | 11,680,946 | |
United States | | | 92,343,265 | | | | 4,671,911 | | | | 0 | | | | 97,015,176 | |
| | | | |
Short-term investments | | | | | | | | | | | | | | | | |
Investment companies | | | 1,063,333 | | | | 6,478,230 | | | | 0 | | | | 7,541,563 | |
Total assets | | $ | 107,051,734 | | | $ | 81,739,838 | | | $ | 0 | | | $ | 188,791,572 | |
The Fund recognizes transfers between levels within the fair value hierarchy at the end of the reporting period. At April 30, 2015, fair value pricing was used in pricing certain foreign securities and securities valued at $62,465,665 were transferred from Level 1 to Level 2. The Fund did not have any transfers into/out of Level 3.
| | | | |
| 20 | | Wells Fargo Advantage Intrinsic World Equity Fund | | Notes to financial statements (unaudited) |
4. TRANSACTIONS WITH AFFILIATES
The Trust has entered into an advisory contract with Funds Management, an indirect wholly owned subsidiary of Wells Fargo & Company (“Wells Fargo”). The adviser is responsible for implementing investment policies and guidelines and for supervising the subadviser, who is responsible for day-to-day portfolio management of the Fund.
Pursuant to the contract, Funds Management is entitled to receive an annual advisory fee starting at 0.80% and declining to 0.65% as the average daily net assets of the Fund increase. For the six months ended April 30, 2015, the advisory fee was equivalent to an annual rate of 0.80% of the Fund’s average daily net assets.
Funds Management has retained the services of a subadviser to provide daily portfolio management to the Fund. The fee for subadvisory services is borne by Funds Management. Metropolitan West Capital Management, LLC, an affiliate of Funds Management and an indirect wholly owned subsidiary of Wells Fargo, is the subadviser to the Fund and is entitled to receive a fee from Funds Management at an annual rate starting at 0.35% and declining to 0.20% as the average daily net assets of the Fund increase.
Administration fees
The Trust has entered into an administration agreement with Funds Management. Under this agreement, for providing administrative services, which includes paying fees and expenses for services provided by the transfer agent, sub-transfer agents, omnibus account servicers and record-keepers, Funds Management is entitled to receive from the Fund an annual fund level administration fee starting at 0.05% and declining to 0.03% as the average daily net assets of the Fund increase and a class level administration fee which is calculated based on the average daily net assets of each class as follows:
| | | | |
| | | Class level
administration fee | |
Class A, Class C | | | 0.26 | % |
Administrator Class | | | 0.10 | |
Institutional Class | | | 0.08 | |
Funds Management has contractually waived and/or reimbursed advisory and administration fees to the extent necessary to maintain certain net operating expense ratios for the Fund. Waiver of fees and/or reimbursement of expenses by Funds Management were made first from fund level expenses on a proportionate basis and then from class specific expenses. Funds Management has committed through February 29, 2016 to waive fees and/or reimburse expenses to the extent necessary to cap the Fund’s expenses at 1.40% for Class A shares, 2.15% for Class C shares, 1.15% for Administrator Class shares, and 0.95% for Institutional Class shares. After this time, the cap may be increased or the commitment to maintain the cap may be terminated only with the approval of the Board of Trustees.
Distribution fee
The Trust has adopted a Distribution Plan for Class C shares of the Fund pursuant to Rule 12b-1 under the 1940 Act. A distribution fee is charged to Class C shares and paid to Wells Fargo Funds Distributor, LLC (“Funds Distributor”), the principal underwriter, at an annual rate of 0.75% of the average daily net assets of Class C shares.
In addition, Funds Distributor is entitled to receive the front-end sales charge from the purchase of Class A shares and a contingent deferred sales charge on the redemption of certain Class A shares. Funds Distributor is also entitled to receive the contingent deferred sales charges from redemptions of Class C shares. For the six months ended April 30, 2015, Funds Distributor received $1,352 from the sale of Class A shares.
Shareholder servicing fees
The Trust has entered into contracts with one or more shareholder servicing agents, whereby Class A, Class C, and Administrator Class of the Fund is charged a fee at an annual rate of 0.25% of the average daily net assets of each respective class.
A portion of these total shareholder servicing fees were paid to affiliates of Wells Fargo.
5. INVESTMENT PORTFOLIO TRANSACTIONS
Purchases and sales of investments, excluding U.S. government obligations (if any) and short-term securities, for the six months ended April 30, 2015 were $38,002,576 and $43,839,014 respectively.
| | | | | | |
| Notes to financial statements (unaudited) | | Wells Fargo Advantage Intrinsic World Equity Fund | | | 21 | |
6. BANK BORROWINGS
The Trust (excluding the money market funds and certain other funds in the Trust) and Wells Fargo Variable Trust are parties to a $150,000,000 revolving credit agreement, whereby the Fund is permitted to use bank borrowings for temporary or emergency purposes, such as to fund shareholder redemption requests. Interest under the credit agreement is charged to the Fund based on a borrowing rate equal to the higher of the Federal Funds rate in effect on that day plus 1.25% or the overnight LIBOR rate in effect on that day plus 1.25%. In addition, an annual commitment fee equal to 0.10% of the unused balance is allocated to each participating fund. For the six months ended April 30, 2015, the Fund paid $160 in commitment fees.
For the six months ended April 30, 2015, there were no borrowings by the Fund under the agreement.
7. INDEMNIFICATION
Under the Trust’s organizational documents, the officers and Trustees have been granted certain indemnification rights against certain liabilities that may arise out of performance of their duties to the Trust. Additionally, in the normal course of business, the Trust may enter into contracts with service providers that contain a variety of indemnification clauses. The Trust’s maximum exposure under these arrangements is dependent on future claims that may be made against the Fund and, therefore, cannot be estimated.
| | | | |
| 22 | | Wells Fargo Advantage Intrinsic World Equity Fund | | Other information (unaudited) |
PROXY VOTING INFORMATION
A description of the policies and procedures that the Fund uses to determine how to vote proxies relating to portfolio securities is available, upon request, by calling 1-800-222-8222, visiting our website at wellsfargoadvantagefunds.com, or visiting the SEC website at sec.gov. Information regarding how the Fund voted proxies relating to portfolio securities during the most recent 12-month period ended June 30 is available on the Fund’s website at wellsfargoadvantagefunds.com or by visiting the SEC website at sec.gov.
PORTFOLIO HOLDINGS INFORMATION
The complete portfolio holdings for the Fund are publicly available monthly on the Fund’s website (wellsfargoadvantagefunds.com), on a one-month delayed basis. In addition, top ten holdings information (excluding derivative positions) for the Fund is publicly available on the Fund’s website on a monthly, seven-day or more delayed basis. The Fund files its complete schedule of portfolio holdings with the SEC for the first and third quarters of each fiscal year on Form N-Q, which is available by visiting the SEC website at sec.gov. In addition, the Fund’s Form N-Q may be reviewed and copied at the SEC’s Public Reference Room in Washington, DC, and at regional offices in New York City, at 233 Broadway, and in Chicago, at 175 West Jackson Boulevard, Suite 900. Information about the Public Reference Room may be obtained by calling 1-800-SEC-0330.
| | | | | | |
| Other information (unaudited) | | Wells Fargo Advantage Intrinsic World Equity Fund | | | 23 | |
BOARD OF TRUSTEES AND OFFICERS
Each of the Trustees and Officers1 listed in the table below acts in identical capacities for each fund in the Wells Fargo Advantage family of funds, which consists of 134 mutual funds comprising the Wells Fargo Funds Trust, Wells Fargo Variable Trust, Wells Fargo Master Trust and four closed-end funds (collectively the “Fund Complex”). This table should be read in conjunction with the Prospectus and the Statement of Additional Information2. The mailing address of each Trustee and Officer is 525 Market Street, 12th Floor, San Francisco, CA 94105. Each Trustee and Officer serves an indefinite term, however, each Trustee serves such term until reaching the mandatory retirement age established by the Trustees.
Independent Trustees
| | | | | | |
Name and year of birth | | Position held and length of service* | | Principal occupations during past five years or longer | | Other directorships during past five years |
William R. Ebsworth (Born 1957) | | Trustee, since 2015** | | Retired. From 1984 to 2013, equities analyst, portfolio manager, research director at Fidelity Management and Research Company and retired in 2013 as Chief Investment Officer of Fidelity Strategic Advisers, Inc. in Boston, Tokyo, and Hong Kong where he led a team of investment professionals managing client assets. Prior thereto, Board member of Hong Kong Securities Clearing Co., Hong Kong Options Clearing Corp., the Thailand International Fund, Ltd., Fidelity Investments Life Insurance Company, and Empire Fidelity Investments Life Insurance Company. Mr. Ebsworth is an Adjunct Lecturer, Finance, at Babson College and a Chartered Financial Analyst. | | Asset Allocation Trust |
| Jane A. Freeman (Born 1953) | | Trustee, since 2015** | | Retired. From 2012 to 2014 and 1999 to 2008, Chief Financial Officer of Scientific Learning Corporation. From 2008 to 2012, Ms. Freeman provided consulting services related to strategic business projects. Prior to 1999, Portfolio Manager at Rockefeller & Co. and Scudder, Stevens & Clark. Board member of the Harding Loevner Funds from 1996 to 2014, serving as both Lead Independent Director and chair of the Audit Committee. Board member of the Russell Exchange Traded Funds Trust from 2011 to 2012 and the chair of the Audit Committee. Ms. Freeman is a Chartered Financial Analyst (inactive), Chair of Taproot Foundation (non-profit organization) and a Board Member of Ruth Bancroft Garden (non-profit organization). | | Asset Allocation Trust |
| Peter G. Gordon (Born 1942) | | Trustee, since 1998; Chairman, since 2005 | | Co-Founder, Retired Chairman, President and CEO of Crystal Geyser Water Company. Trustee Emeritus, Colby College. | | Asset Allocation Trust |
| Isaiah Harris, Jr. (Born 1952) | | Trustee, since 2009 | | Retired. Chairman of the Board of CIGNA Corporation since 2009, and Director since 2005. From 2003 to 2011, Director of Deluxe Corporation. Prior thereto, President and CEO of BellSouth Advertising and Publishing Corp. from 2005 to 2007, President and CEO of BellSouth Enterprises from 2004 to 2005 and President of BellSouth Consumer Services from 2000 to 2003. Emeritus member of the Iowa State University Foundation Board of Governors. Emeritus Member of the Advisory Board of Iowa State University School of Business. Advisory Board Member, Palm Harbor Academy. Mr. Harris is a certified public accountant. | | CIGNA Corporation; Asset Allocation Trust |
| Judith M. Johnson (Born 1949) | | Trustee, since 2008; Audit Committee Chairman, since 2008 | | Retired. Prior thereto, Chief Executive Officer and Chief Investment Officer of Minneapolis Employees Retirement Fund from 1996 to 2008. Ms. Johnson is an attorney, certified public accountant and a certified managerial accountant. | | Asset Allocation Trust |
David F. Larcker (Born 1950) | | Trustee, since 2009 | | James Irvin Miller Professor of Accounting at the Graduate School of Business, Stanford University, Morgan Stanley Director of the Center for Leadership Development and Research and Senior Faculty of The Rock Center for Corporate Governance since 2006. From 2005 to 2008, Professor of Accounting at the Graduate School of Business, Stanford University. Prior thereto, Ernst & Young Professor of Accounting at The Wharton School, University of Pennsylvania from 1985 to 2005. | | Asset Allocation Trust |
| Olivia S. Mitchell (Born 1953) | | Trustee, since 2006 | | International Foundation of Employee Benefit Plans Professor, Wharton School of the University of Pennsylvania since 1993. Director of Wharton’s Pension Research Council and Boettner Center on Pensions & Retirement Research, and Research Associate at the National Bureau of Economic Research. Previously, Cornell University Professor from 1978 to 1993. | | Asset Allocation Trust |
| | | | |
| 24 | | Wells Fargo Advantage Intrinsic World Equity Fund | | Other information (unaudited) |
| | | | | | |
Name and year of birth | | Position held and length of service* | | Principal occupations during past five years or longer | | Other directorships during past five years |
Timothy J. Penny (Born 1951) | | Trustee, since 1996 | | President and Chief Executive Officer of Southern Minnesota Initiative Foundation, a non-profit organization, since 2007 and Senior Fellow at the Humphrey Institute Policy Forum at the University of Minnesota since 1995. Member of the Board of Trustees of NorthStar Education Finance, Inc., a non-profit organization, since 2007. | | Asset Allocation Trust |
Michael S. Scofield (Born 1943) | | Trustee, since 2010 | | Served on the Investment Company Institute’s Board of Governors and Executive Committee from 2008-2011 as well the Governing Council of the Independent Directors Council from 2006-2011 and the Independent Directors Council Executive Committee from 2008-2011. Chairman of the IDC from 2008-2010. Institutional Investor (Fund Directions) Trustee of Year in 2007. Trustee of the Evergreen Funds complex (and its predecessors) from 1984 to 2010. Chairman of the Evergreen Funds from 2000-2010. Former Trustee of the Mentor Funds. Retired Attorney, Law Offices of Michael S. Scofield. | | Asset Allocation Trust |
Donald C. Willeke (Born 1940) | | Trustee, since 1996 | | Principal of the law firm of Willeke & Daniels. General Counsel of the Minneapolis Employees Retirement Fund from 1984 until its consolidation into the Minnesota Public Employees Retirement Association on June 30, 2010. Director and Vice Chair of The Tree Trust (non-profit corporation). Director of the American Chestnut Foundation (non-profit corporation). | | Asset Allocation Trust |
| * | Length of service dates reflect the Trustee’s commencement of service with the Trust’s predecessor entities, where applicable. |
| ** | William R. Ebsworth and Jane A. Freeman each became a Trustee effective January 1, 2015. |
Officers
| | | | | | |
Name and year of birth | | Position held and length of service | | Principal occupations during past five years or longer | | |
Karla M. Rabusch (Born 1959) | | President, since 2003 | | Executive Vice President of Wells Fargo Bank, N.A. and President of Wells Fargo Funds Management, LLC since 2003. | | |
Jeremy DePalma1 (Born 1974) | | Treasurer, since 2012 | | Senior Vice President of Wells Fargo Funds Management, LLC since 2009. Senior Vice President of Evergreen Investment Management Company, LLC from 2008 to 2010. Vice President, Evergreen Investment Services, Inc. from 2004 to 2007. Head of the Fund Reporting and Control Team within Fund Administration from 2005 to 2010. | | |
C. David Messman (Born 1960) | | Secretary, since 2000; Chief Legal Officer, since 2003 | | Senior Vice President and Secretary of Wells Fargo Funds Management, LLC since 2001. Assistant General Counsel of Wells Fargo Bank, N.A. since 2013 and Vice President and Managing Counsel of Wells Fargo Bank N.A. from 1996 to 2013. | | |
Debra Ann Early (Born 1964) | | Chief Compliance Officer, since 2007 | | Senior Vice President of Wells Fargo Funds Management, LLC since 2007 and Chief Compliance Officer from 2007 to 2014. Chief Compliance Officer of Parnassus Investments from 2005 to 2007. Chief Financial Officer of Parnassus Investments from 2004 to 2007 and Senior Audit Manager of PricewaterhouseCoopers LLP from 1998 to 2004. | | |
David Berardi (Born 1975) | | Assistant Treasurer, since 2009 | | Vice President of Wells Fargo Funds Management, LLC since 2009. Vice President of Evergreen Investment Management Company, LLC from 2008 to 2010. Assistant Vice President of Evergreen Investment Services, Inc. from 2004 to 2008. Manager of Fund Reporting and Control for Evergreen Investment Management Company, LLC from 2004 to 2010. | | |
| 1 | Jeremy DePalma acts as Treasurer of 61 funds and Assistant Treasurer of 73 funds in the Fund Complex. |
| 2 | The Statement of Additional Information includes additional information about the Trustees and is available, without charge, upon request, by calling 1-800-222-8222 or by visiting the website at wellsfargoadvantagefunds.com. |
| | | | | | |
| List of abbreviations | | Wells Fargo Advantage Intrinsic World Equity Fund | | | 25 | |
The following is a list of common abbreviations for terms and entities that may have appeared in this report.
| ACA | — ACA Financial Guaranty Corporation |
| ADR | — American depositary receipt |
| ADS | — American depositary shares |
| AGC | — Assured Guaranty Corporation |
| AGM | — Assured Guaranty Municipal |
| Ambac | — Ambac Financial Group Incorporated |
| AMT | — Alternative minimum tax |
| BAN | — Bond anticipation notes |
| BHAC | — Berkshire Hathaway Assurance Corporation |
| CAB | — Capital appreciation bond |
| CCAB | — Convertible capital appreciation bond |
| CDA | — Community Development Authority |
| CDO | — Collateralized debt obligation |
| DRIVER | — Derivative inverse tax-exempt receipts |
| DW&P | — Department of Water & Power |
| DWR | — Department of Water Resources |
| ECFA | — Educational & Cultural Facilities Authority |
| EDA | — Economic Development Authority |
| EDFA | — Economic Development Finance Authority |
| ETF | — Exchange-traded fund |
| FDIC | — Federal Deposit Insurance Corporation |
| FFCB | — Federal Farm Credit Banks |
| FGIC | — Financial Guaranty Insurance Corporation |
| FHA | — Federal Housing Administration |
| FHLB | — Federal Home Loan Bank |
| FHLMC | — Federal Home Loan Mortgage Corporation |
| FICO | — The Financing Corporation |
| FNMA | — Federal National Mortgage Association |
| GDR | — Global depositary receipt |
| GNMA | — Government National Mortgage Association |
| HCFR | — Healthcare facilities revenue |
| HEFA | — Health & Educational Facilities Authority |
| HEFAR | — Higher education facilities authority revenue |
| HFA | — Housing Finance Authority |
| HFFA | — Health Facilities Financing Authority |
| HUD | — Department of Housing and Urban Development |
| IDA | — Industrial Development Authority |
| IDAG | — Industrial Development Agency |
| KRW | — Republic of Korea won |
| LIBOR | — London Interbank Offered Rate |
| LIFER | — Long Inverse Floating Exempt Receipts |
| LLC | — Limited liability company |
| LLLP | — Limited liability limited partnership |
| LLP | — Limited liability partnership |
| MBIA | — Municipal Bond Insurance Association |
| MFHR | — Multifamily housing revenue |
| MSTR | — Municipal securities trust receipts |
| MUD | — Municipal Utility District |
| National | — National Public Finance Guarantee Corporation |
| PCFA | — Pollution Control Financing Authority |
| PCL | — Public Company Limited |
| PCR | — Pollution control revenue |
| PFA | — Public Finance Authority |
| PFFA | — Public Facilities Financing Authority |
| PFOTER | — Puttable floating option tax-exempt receipts |
| plc | — Public limited company |
| PUTTER | — Puttable tax-exempt receipts |
| R&D | — Research & development |
| Radian | — Radian Asset Assurance |
| RAN | — Revenue anticipation notes |
| RDA | — Redevelopment Authority |
| RDFA | — Redevelopment Finance Authority |
| REIT | — Real estate investment trust |
| ROC | — Reset option certificates |
| SAVRS | — Select auction variable rate securities |
| SBA | — Small Business Authority |
| SDR | — Swedish depositary receipt |
| SFHR | — Single-family housing revenue |
| SFMR | — Single-family mortgage revenue |
| SPA | — Standby purchase agreement |
| SPDR | — Standard & Poor’s Depositary Receipts |
| SPEAR | — Short Puttable Exempt Adjustable Receipts |
| STRIPS | — Separate trading of registered interest and |
| TAN | — Tax anticipation notes |
| TIPS | — Treasury inflation-protected securities |
| TRAN | — Tax revenue anticipation notes |
| TTFA | — Transportation Trust Fund Authority |
| TVA | — Tennessee Valley Authority |
This page is intentionally left blank.
This page is intentionally left blank.
This page is intentionally left blank.


For more information
More information about Wells Fargo Advantage Funds is available free upon request. To obtain literature, please write, email, visit the Fund’s website, or call:
Wells Fargo Advantage Funds
P.O. Box 8266
Boston, MA 02266-8266
Email: wfaf@wellsfargo.com
Website: wellsfargoadvantagefunds.com
Individual investors: 1-800-222-8222
Retail investment professionals: 1-888-877-9275
Institutional investment professionals: 1-866-765-0778
This report and the financial statements contained herein are submitted for the general information of the shareholders of Wells Fargo Advantage Funds. If this report is used for promotional purposes, distribution of the report must be accompanied or preceded by a current prospectus. Before investing, please consider the investment objectives, risks, charges, and expenses of the investment. For a current prospectus and, if available, a summary prospectus, containing this information, call 1-800-222-8222 or visit the Fund’s website at wellsfargoadvantagefunds.com. Read the prospectus carefully before you invest or send money.
Wells Fargo Funds Management, LLC, a wholly owned subsidiary of Wells Fargo & Company, provides investment advisory and administrative services for Wells Fargo Advantage Funds. Other affiliates of Wells Fargo & Company provide subadvisory and other services for the Funds. The Funds are distributed by Wells Fargo Funds Distributor, LLC, Member FINRA/SIPC, an affiliate of Wells Fargo & Company.
NOT FDIC INSURED ¡ NO BANK GUARANTEE ¡ MAY LOSE VALUE
© 2015 Wells Fargo Funds Management, LLC. All rights reserved.
| | |
 | | 233657 06-15 SA241/SAR241 04-15 |
ITEM 2. CODE OF ETHICS
Not applicable.
ITEM 3. AUDIT COMMITTEE FINANCIAL EXPERT
Not applicable.
ITEM 4. PRINCIPAL ACCOUNTANT FEES AND SERVICES
Not applicable.
ITEM 5. AUDIT COMMITTEE OF LISTED REGISTRANTS
Not applicable.
ITEM 6. INVESTMENTS
A Portfolio of Investments for each series of Wells Fargo Funds Trust is included as part of the report to shareholders filed under Item 1 of this Form.
ITEM 7. DISCLOSURE OF PROXY VOTING POLICIES AND PROCEDURES FOR CLOSED-END MANAGEMENT INVESTMENT COMPANIES
Not applicable.
ITEM 8. PORTFOLIO MANAGERS OF CLOSED-END MANAGEMENT INVESTMENT COMPANIES
Not applicable.
ITEM 9. PURCHASES OF EQUITY SECURITIES BY CLOSED-END MANAGEMEENT INVESTMENT COMPANY AND AFFILIATED PURCHASERS
Not applicable.
ITEM 10. SUBMISSION OF MATTERS TO A VOTE OF SECURITY HOLDERS
There have been no material changes to the procedures by which shareholders may recommend nominees to the registrant’s Board of Trustees that have been implemented since the registrant’s last provided disclosure in response to the requirements of this Item.
ITEM 11. CONTROLS AND PROCEDURES
(a) The President and Treasurer have concluded that the Wells Fargo Funds Trust (the “Trust”) disclosure controls and procedures (as defined in Rule 30a-3(c) under the Investment Company Act of 1940) provide reasonable assurances that material information relating to the Trust is made known to them by the appropriate persons, based on their evaluation of these controls and procedures as of a date within 90 days of the filing of this report.
(b) There were no significant changes in the Trust’s internal controls over financial reporting (as defined in Rule 30a-3(d) under the Investment Company Act of 1940) that occurred during the second fiscal quarter of the period covered by this report that materially affected, or is reasonably likely to materially affect, the registrant’s internal control over financial reporting.
ITEM 12. EXHIBITS
(a)(1) Not applicable.
(a)(2) Certification pursuant to Rule 30a-2(a) under the Investment Company Act of 1940 (17 CFR 270.30a-2(a)) is filed and attached hereto as Exhibit 99.CERT.
(a)(3) Not applicable.
(b) Certification pursuant to Rule 30a-2(b) under the Investment Company Act of 1940 (17 CFR 270.30a-2(b)) is filed and attached hereto as Exhibit 99.906CERT.
SIGNATURES
Pursuant to the requirements of the Securities Exchange Act of 1934 and the Investment Company Act of 1940, the registrant has duly caused this report to be signed on its behalf by the undersigned, thereunto duly authorized.
| | |
| Wells Fargo Funds Trust |
| |
By: | | /s/ Karla M. Rabusch |
| |
| | Karla M. Rabusch |
| | President |
| |
| Date: | | June 25, 2015 |
Pursuant to the requirements of the Securities Exchange Act of 1934 and the Investment Company Act of 1940, this report has been signed below by the following persons on behalf of the registrant and in the capacities and on the date indicated.
| | |
| Wells Fargo Funds Trust |
| |
By: | | /s/ Karla M. Rabusch |
| |
| | Karla M. Rabusch |
| | President |
| |
| Date: | | June 25, 2015 |
| |
By: | | /s/ Nancy Wiser |
| |
| | Nancy Wiser |
| | Treasurer |
| |
| Date: | | June 25, 2015 |
| |
By: | | /s/ Jeremy DePalma |
| |
| | Jeremy DePalma |
| | Treasurer |
| |
| Date: | | June 25, 2015 |