
UNITED STATES
SECURITIES AND EXCHANGE COMMISSION
Washington, D.C. 20549
FORM N-CSRS
CERTIFIED SHAREHOLDER REPORT OF REGISTERED
MANAGEMENT INVESTMENT COMPANIES
Investment Company Act file number: 811-09253
Wells Fargo Funds Trust
(Exact name of registrant as specified in charter)
525 Market St., San Francisco, CA 94105
(Address of principal executive offices) (Zip code)
C. David Messman
Wells Fargo Funds Management, LLC
525 Market St., San Francisco, CA 94105
(Name and address of agent for service)
Registrant’s telephone number, including area code: 800-222-8222
Date of fiscal year end: March 31
Registrant is making a filing for 9 of its series:
Wells Fargo Advantage Intrinsic Small Cap Value Fund, Wells Fargo Advantage Small Cap Opportunities Fund, Wells Fargo Advantage Small Cap Value Fund, Wells Fargo Advantage Small/Mid Cap Value Fund, Wells Fargo Advantage Special Small Cap Value Fund, Wells Fargo Advantage Traditional Small Cap Growth Fund, Wells Fargo Advantage Precious Metals Fund, Wells Fargo Advantage Specialized Technology Fund, and Wells Fargo Advantage Utility and Telecommunications Fund.
Date of reporting period: September 30, 2015
ITEM 1. REPORT TO STOCKHOLDERS

Wells Fargo Advantage
Intrinsic Small Cap Value Fund

Semi-Annual Report
September 30, 2015

Reduce clutter. Save trees.
Sign up for electronic delivery of prospectuses and shareholder reports at wellsfargo.com/advantagedelivery
Contents
The views expressed and any forward-looking statements are as of September 30, 2015, unless otherwise noted, and are those of the Fund managers and/or Wells Fargo Funds Management, LLC. Discussions of individual securities, or the markets generally, or any Wells Fargo Advantage Fund are not intended as individual recommendations. Future events or results may vary significantly from those expressed in any forward-looking statements; the views expressed are subject to change at any time in response to changing circumstances in the market. Wells Fargo Funds Management, LLC and the Fund disclaim any obligation to publicly update or revise any views expressed or forward-looking statements.
NOT FDIC INSURED ¡ NO BANK GUARANTEE ¡ MAY LOSE VALUE
| | | | |
| 2 | | Wells Fargo Advantage Intrinsic Small Cap Value Fund | | Letter to shareholders (unaudited) |

Karla M. Rabusch
President
Wells Fargo Advantage Funds
Despite generally improving U.S. economic data, the broad U.S. stock market experienced heightened volatility that led to negative results overall for U.S. stocks for the period.
Periods of uncertainty can present challenges, but experience has taught us that maintaining long-term investment goals can be an effective way to plan for the future.
Dear Valued Shareholder:
We are pleased to offer you this semi-annual report for the Wells Fargo Advantage Intrinsic Small Cap Value Fund for the six-month period that ended September 30, 2015. Despite generally improving U.S. economic data, the broad U.S. stock market experienced heightened volatility that led to negative results overall for U.S. stocks for the period. Large-cap stocks performed best, followed by mid caps and small caps. Markets outside the U.S. faced deeper ongoing challenges and generally delivered weaker results.
U.S. stocks experienced challenges during the second quarter of 2015.
The broad U.S. stock market fluctuated widely, eventually eking out a small quarterly gain. Mid- and large-cap stocks at times were pressured by investor concerns over the potentially negative effects of financially troubled overseas economies and of a strengthening U.S. dollar on the profits of U.S. multinational firms. The U.S. economy picked up traction during the quarter; consumer spending improved, and positive trends were evident in construction and new-home sales. Jobs growth remained a bright spot as well. U.S. Federal Reserve (Fed) officials, who have kept interest rates low while waiting for the U.S. jobs market to sufficiently improve and for inflation to approach their 2% target, made clear they could take action soon. Throughout the quarter, non-U.S. markets also experienced volatility, triggered by uncertainty over the potential impact of financial challenges in other locations—most notably in Greece and Puerto Rico. Questions over slower growth in China caused investor concern as well.
In the third quarter of 2015, China’s slowdown took a toll on economies and markets worldwide.
U.S. stocks sagged during the quarter, experiencing the most volatility since 2011. Larger-cap stocks generally declined the least and smaller caps the most. Economic data released during the quarter suggested the U.S. economy remains solid but has lost some steam, burdened by the drag of the strong U.S. dollar coupled with global economic turmoil. The fact that the Fed left the federal funds interest rate unchanged at its September meeting surprised investors and fueled increased uncertainty about the U.S. economy’s stamina to remain healthy while facing the challenges of slowing in China and troubles elsewhere in the world. Outside the U.S., markets were even more volatile and delivered generally weaker quarterly results, also largely due to investors’ increasing anxiety over China’s weakened economy. Because China is the world’s largest importer of many commodities, a number of emerging markets—key commodities exporters—are struggling under the dual strains of reduced demand for commodities and, because of weaker demand, lower prices for the commodities they do sell. In the eurozone, however, where only about 3% of exports are sent to China, household spending and business investment appeared relatively unaffected by troubles elsewhere. However, the European Central Bank warned in September that slowing growth in China could lead to slower growth and lower inflation rates in the eurozone than previously forecast and indicated additional stimulus could be provided should this occur.
Don’t let short-term uncertainty derail long-term investment goals.
Periods of uncertainty can present challenges, but experience has taught us that maintaining long-term investment goals can be an effective way to plan for the future. To help you create a sound strategy based on your personal goals and risk tolerance, Wells Fargo Advantage Funds offers more than 100 mutual funds spanning a wide range of asset classes and investment styles. Although
| | | | | | |
| Letter to shareholders (unaudited) | | Wells Fargo Advantage Intrinsic Small Cap Value Fund | | | 3 | |
diversification cannot guarantee an investment profit or prevent losses, we believe it can be an effective way to manage investment risk and potentially smooth out overall portfolio performance. We encourage investors to know their investments and to understand that appropriate levels of risk-taking may unlock opportunities.
Thank you for choosing to invest in Wells Fargo Advantage Funds. We appreciate your confidence in us and remain committed to helping you meet your financial needs.
Sincerely,

Karla M. Rabusch
President
Wells Fargo Advantage Funds
Notice to shareholders
At a meeting held August 11-12, 2015, the Board of Trustees of the Fund approved a change in the name of the Fund whereby the word “Advantage” was removed from its name, effective December 15, 2015.
For current information about your fund investments, contact your investment professional, visit our website at wellsfargoadvantagefunds.com, or call us directly at 1-800-222-8222. We are available 24 hours a day, 7 days a week.
| | | | |
| 4 | | Wells Fargo Advantage Intrinsic Small Cap Value Fund | | Performance highlights (unaudited) |
Investment objective
The Fund seeks long-term capital appreciation.
Manager
Wells Fargo Funds Management, LLC
Subadviser
Metropolitan West Capital Management, LLC
Portfolio managers
Alex Alvarez, CFA
Samir Sikka
Average annual total returns1 (%) as of September 30, 2015
| | | | | | | | | | | | | | | | | | | | | | | | | | | | | | | | | | |
| | | | | Including sales charge | | | Excluding sales charge | | | Expense ratios2 (%) | |
| | | Inception date | | 1 year | | | 5 year | | | 10 year | | | 1 year | | | 5 year | | | 10 year | | | Gross | | | Net3 | |
| Class A (WFSMX) | | 3-31-2008 | | | (6.25 | ) | | | 10.62 | | | | 4.30 | | | | (0.52 | ) | | | 11.94 | | | | 4.92 | | | | 1.42 | | | | 1.36 | |
| Class C (WSCDX) | | 3-31-2008 | | | (2.33 | ) | | | 11.11 | | | | 4.16 | | | | (1.33 | ) | | | 11.11 | | | | 4.16 | | | | 2.17 | | | | 2.11 | |
| Administrator Class (WFSDX) | | 4-8-2005 | | | – | | | | – | | | | – | | | | (0.34 | ) | | | 12.21 | | | | 5.20 | | | | 1.34 | | | | 1.21 | |
| Institutional Class (WFSSX) | | 4-8-2005 | | | – | | | | – | | | | – | | | | (0.19 | ) | | | 12.44 | | | | 5.41 | | | | 1.09 | | | | 1.01 | |
| Investor Class (SCOVX)+ | | 3-28-2002 | | | | | | | | | | | | | | | (0.61 | ) | | | 11.89 | | | | 4.88 | | | | 1.53 | | | | 1.47 | |
| Russell 2000® Value Index4 | | – | | | – | | | | – | | | | – | | | | (1.60 | ) | | | 10.17 | | | | 5.35 | | | | – | | | | – | |
| + | | Effective at the close of business on October 23, 2015, Investor Class shares of the Fund were converted to Class A shares and Investor Class shares are no longer offered. |
Figures quoted represent past performance, which is no guarantee of future results, and do not reflect taxes that a shareholder may pay on fund distributions or the redemption of fund shares. Investment return and principal value of an investment will fluctuate so that an investor’s shares, when redeemed, may be worth more or less than their original cost. Performance shown without sales charges would be lower if sales charges were reflected. Current performance may be lower or higher than the performance data quoted, which assumes the reinvestment of dividends and capital gains. Current month-end performance is available on the Fund’s website, wellsfargoadvantagefunds.com.
Index returns do not include transaction costs associated with buying and selling securities, any mutual fund fees or expenses, or any taxes. It is not possible to invest directly in an index.
For Class A shares, the maximum front-end sales charge is 5.75%. For Class C shares, the maximum contingent deferred sales charge is 1.00%. Performance including a contingent deferred sales charge assumes the sales charge for the corresponding time period. Administrator Class, Institutional Class, and Investor Class shares are sold without a front-end sales charge or contingent deferred sales charge.
Stock values fluctuate in response to the activities of individual companies and general market and economic conditions. Smaller-company stocks tend to be more volatile and less liquid than those of larger companies. Certain investment strategies tend to increase the total risk of an investment (relative to the broader market). Consult the Fund’s prospectus for additional information on these and other risks.
Please see footnotes on page 5.
| | | | | | |
| Performance highlights (unaudited) | | Wells Fargo Advantage Intrinsic Small Cap Value Fund | | | 5 | |
| | | | |
| Ten largest holdings5 (%) as of September 30, 2015 | |
KAR Auction Services Incorporated | | | 2.67 | |
Dean Foods Company | | | 2.24 | |
EVERTEC Incorporated | | | 2.17 | |
Zions Bancorporation | | | 2.15 | |
Treasury Wine Estates ADR | | | 2.15 | |
SeaWorld Entertainment Incorporated | | | 2.03 | |
Parkway Properties Incorporated | | | 1.98 | |
Steris Corporation | | | 1.96 | |
Essent Group Limited | | | 1.94 | |
Westar Energy Incorporated | | | 1.92 | |
|
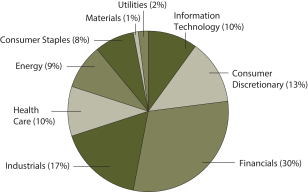
| Portfolio allocation6 as of September 30, 2015 |
|
 |
| 1 | Prior to June 1, 2010, the Fund was named Wells Fargo Advantage Small Cap Disciplined Fund. Metropolitan West Capital Management, LLC replaced Wells Capital Management as a subadviser for the Fund effective June 1, 2010. Accordingly, performance figures shown prior to June 1, 2010, do not reflect the principal investment strategies or performance of Metropolitan West Capital Management, LLC. Historical performance shown for Class A shares prior to their inception reflects the performance of Investor Class shares, and includes the higher expenses applicable to Investor Class shares. If these expenses had not been included, returns would be higher. Historical performance shown for Class C shares prior to their inception reflects the performance of Investor Class shares and has been adjusted to reflect the higher expenses applicable to Class C shares. |
| 2 | Reflects the expense ratios as stated in the most recent prospectuses, which include the impact of 0.01% in acquired fund fees and expenses. The expense ratios shown are subject to change and may differ from the annualized expense ratios shown in the financial highlights of this report, which do not include acquired fund fees and expenses. |
| 3 | The manager has committed through July 31, 2016, to waive fees and/or reimburse expenses to the extent necessary to cap the Fund’s Total Annual Fund Operating Expenses After Fee Waiver at 1.35% for Class A, 2.10% for Class C, 1.20% for Administrator Class, 1.00% for Institutional Class, and 1.46% for Investor Class. After this time, the cap may be increased or the commitment to maintain the cap may be terminated only with the approval of the Board of Trustees. Brokerage commissions, stamp duty fees, interest, taxes, acquired fund fees and expenses, and extraordinary expenses are excluded from the cap. Without this cap, the Fund’s returns would have been lower. |
| 4 | The Russell 2000® Value Index measures the performance of those Russell 2000 companies with lower price/book ratios and lower forecasted growth values. You cannot invest directly in an index. |
| 5 | The ten largest holdings, excluding cash and cash equivalents, are calculated based on the value of the investments divided by total net assets of the Fund. Holdings are subject to change and may have changed since the date specified. |
| 6 | Amounts are calculated based on the total long-term investments of the Fund. These amounts are subject to change and may have changed since the date specified. |
| | | | |
| 6 | | Wells Fargo Advantage Intrinsic Small Cap Value Fund | | Fund expenses (unaudited) |
As a shareholder of the Fund, you incur two types of costs: (1) transaction costs, including sales charges (loads) on purchase payments and contingent deferred sales charges (if any) on redemptions and (2) ongoing costs, including management fees, distribution (12b-1) and/or shareholder servicing fees, and other Fund expenses. This example is intended to help you understand your ongoing costs (in dollars) of investing in the Fund and to compare these costs with the ongoing costs of investing in other mutual funds.
The example is based on an investment of $1,000 invested at the beginning of the six-month period and held for the entire period from April 1, 2015 to September 30, 2015.
Actual expenses
The “Actual” line of the table below provides information about actual account values and actual expenses. You may use the information in this line, together with the amount you invested, to estimate the expenses that you paid over the period. Simply divide your account value by $1,000 (for example, an $8,600 account value divided by $1,000 = 8.6), then multiply the result by the number in the “Actual” line under the heading entitled “Expenses paid during period” for your applicable class of shares to estimate the expenses you paid on your account during this period.
Hypothetical example for comparison purposes
The “Hypothetical” line of the table below provides information about hypothetical account values and hypothetical expenses based on the Fund’s actual expense ratio and an assumed rate of return of 5% per year before expenses, which is not the Fund’s actual return. The hypothetical account values and expenses may not be used to estimate the actual ending account balance or expenses you paid for the period. You may use this information to compare the ongoing costs of investing in the Fund and other funds. To do so, compare this 5% hypothetical example with the 5% hypothetical examples that appear in the shareholder reports of the other funds.
Please note that the expenses shown in the table are meant to highlight your ongoing costs only and do not reflect any transactional costs, such as sales charges (loads) and contingent deferred sales charges. Therefore, the “Hypothetical” line of the table is useful in comparing ongoing costs only and will not help you determine the relative total costs of owning different funds. In addition, if these transactional costs were included, your costs would have been higher.
| | | | | | | | | | | | | | | | |
| | | Beginning
account value
4-1-2015 | | | Ending
account value
9-30-2015 | | | Expenses
paid during
the period1 | | | Net annualized
expense ratio | |
Class A | | | | | | | | | | | | | | | | |
Actual | | $ | 1,000.00 | | | $ | 899.61 | | | $ | 6.57 | | | | 1.38 | % |
Hypothetical (5% return before expenses) | | $ | 1,000.00 | | | $ | 1,018.15 | | | $ | 6.98 | | | | 1.38 | % |
Class C | | | | | | | | | | | | | | | | |
Actual | | $ | 1,000.00 | | | $ | 896.01 | | | $ | 10.17 | | | | 2.14 | % |
Hypothetical (5% return before expenses) | | $ | 1,000.00 | | | $ | 1,014.34 | | | $ | 10.81 | | | | 2.14 | % |
Administrator Class | | | | | | | | | | | | | | | | |
Actual | | $ | 1,000.00 | | | $ | 900.58 | | | $ | 5.72 | | | | 1.20 | % |
Hypothetical (5% return before expenses) | | $ | 1,000.00 | | | $ | 1,019.05 | | | $ | 6.07 | | | | 1.20 | % |
Institutional Class | | | | | | | | | | | | | | | | |
Actual | | $ | 1,000.00 | | | $ | 901.22 | | | $ | 4.77 | | | | 1.00 | % |
Hypothetical (5% return before expenses) | | $ | 1,000.00 | | | $ | 1,020.05 | | | $ | 5.06 | | | | 1.00 | % |
Investor Class | | | | | | | | | | | | | | | | |
Actual | | $ | 1,000.00 | | | $ | 899.33 | | | $ | 6.95 | | | | 1.46 | % |
Hypothetical (5% return before expenses) | | $ | 1,000.00 | | | $ | 1,017.75 | | | $ | 7.38 | | | | 1.46 | % |
| 1 | Expenses paid is equal to the annualized expense ratio of each class multiplied by the average account value over the period, multiplied by the number of days in the most recent fiscal half-year divided by the number of days in the fiscal year (to reflect the one-half-year period). |
| | | | | | |
| Portfolio of investments—September 30, 2015 (unaudited) | | Wells Fargo Advantage Intrinsic Small Cap Value Fund | | | 7 | |
| | | | | | | | | | | | |
| Security name | | | | | | Shares | | | Value | |
| | | | |
Common Stocks: 96.40% | | | | | | | | | | | | |
| | | | |
Consumer Discretionary: 12.48% | | | | | | | | | | | | |
| | | | |
| Hotels, Restaurants & Leisure: 4.51% | | | | | | | | | | | | |
Interval Leisure Group Incorporated | | | | | | | 119,840 | | | $ | 2,200,261 | |
SeaWorld Entertainment Incorporated « | | | | | | | 150,770 | | | | 2,685,214 | |
Six Flags Entertainment Corporation | | | | | | | 23,530 | | | | 1,077,203 | |
| | | | |
| | | | | | | | | | | 5,962,678 | |
| | | | | | | | | | | | |
| | | | |
| Household Durables: 1.49% | | | | | | | | | | | | |
Tupperware Brands Corporation « | | | | | | | 39,908 | | | | 1,975,047 | |
| | | | | | | | | | | | |
| | | | |
| Specialty Retail: 6.48% | | | | | | | | | | | | |
Abercrombie & Fitch Company Class A « | | | | | | | 57,510 | | | | 1,218,637 | |
Ascena Retail Group Incorporated † | | | | | | | 156,485 | | | | 2,176,706 | |
DSW Incorporated Class A | | | | | | | 96,290 | | | | 2,437,100 | |
Party City Holdco Incorporated † | | | | | | | 81,421 | | | | 1,300,293 | |
Pier 1 Imports Incorporated « | | | | | | | 208,660 | | | | 1,439,754 | |
| | | | |
| | | | | | | | | | | 8,572,490 | |
| | | | | | | | | | | | |
| | | | |
Consumer Staples: 7.38% | | | | | | | | | | | | |
| | | | |
| Beverages: 2.15% | | | | | | | | | | | | |
Treasury Wine Estates ADR « | | | | | | | 612,018 | | | | 2,839,764 | |
| | | | | | | | | | | | |
| | | | |
| Food Products: 5.23% | | | | | | | | | | | | |
Dean Foods Company | | | | | | | 179,226 | | | | 2,960,814 | |
Flowers Foods Incorporated | | | | | | | 13,438 | | | | 332,456 | |
J & J Snack Foods Corporation | | | | | | | 12,690 | | | | 1,442,345 | |
Post Holdings Incorporated † | | | | | | | 36,862 | | | | 2,178,544 | |
| | | | |
| | | | | | | | | | | 6,914,159 | |
| | | | | | | | | | | | |
| | | | |
Energy: 9.05% | | | | | | | | | | | | |
| | | | |
| Energy Equipment & Services: 2.28% | | | | | | | | | | | | |
Dril-Quip Incorporated † | | | | | | | 29,821 | | | | 1,736,179 | |
Forum Energy Technologies Incorporated † | | | | | | | 104,400 | | | | 1,274,724 | |
| | | | |
| | | | | | | | | | | 3,010,903 | |
| | | | | | | | | | | | |
| | | | |
| Oil, Gas & Consumable Fuels: 6.77% | | | | | | | | | | | | |
Cobalt International Energy Incorporated † | | | | | | | 192,223 | | | | 1,360,939 | |
Diamondback Energy Incorporated † | | | | | | | 39,070 | | | | 2,523,922 | |
Laredo Petroleum Incorporated Ǡ | | | | | | | 178,650 | | | | 1,684,670 | |
Oasis Petroleum Incorporated Ǡ | | | | | | | 173,903 | | | | 1,509,478 | |
RSP Permian Incorporated † | | | | | | | 92,520 | | | | 1,873,530 | |
| | | | |
| | | | | | | | | | | 8,952,539 | |
| | | | | | | | | | | | |
| | | | |
Financials: 28.65% | | | | | | | | | | | | |
| | | | |
| Banks: 6.63% | | | | | | | | | | | | |
FirstMerit Corporation | | | | | | | 114,280 | | | | 2,019,328 | |
Hancock Holding Company | | | | | | | 81,225 | | | | 2,197,136 | |
The accompanying notes are an integral part of these financial statements.
| | | | |
| 8 | | Wells Fargo Advantage Intrinsic Small Cap Value Fund | | Portfolio of investments—September 30, 2015 (unaudited) |
| | | | | | | | | | | | |
| Security name | | | | | | Shares | | | Value | |
| | | | |
| Banks (continued) | | | | | | | | | | | | |
Umpqua Holdings Corporation | | | | | | | 104,120 | | | $ | 1,697,156 | |
Zions Bancorporation | | | | | | | 103,395 | | | | 2,847,498 | |
| | | | |
| | | | | | | | | | | 8,761,118 | |
| | | | | | | | | | | | |
| | | | |
| Capital Markets: 2.76% | | | | | | | | | | | | |
Artisan Partners Asset Management Incorporated | | | | | | | 48,875 | | | | 1,721,866 | |
Virtus Investment Partners Incorporated | | | | | | | 19,240 | | | | 1,933,620 | |
| | | | |
| | | | | | | | | | | 3,655,486 | |
| | | | | | | | | | | | |
| | | | |
| Consumer Finance: 1.30% | | | | | | | | | | | | |
Encore Capital Group Incorporated Ǡ | | | | | | | 46,446 | | | | 1,718,502 | |
| | | | | | | | | | | | |
| | | | |
| Insurance: 1.66% | | | | | | | | | | | | |
Endurance Specialty Holdings Limited | | | | | | | 36,000 | | | | 2,197,080 | |
| | | | | | | | | | | | |
| | | | |
| REITs: 12.54% | | | | | | | | | | | | |
Chesapeake Lodging Trust | | | | | | | 69,008 | | | | 1,798,348 | |
Equity Commonwealth † | | | | | | | 64,009 | | | | 1,743,605 | |
Ladder Capital Corporation | | | | | | | 109,350 | | | | 1,565,892 | |
Mack-Cali Realty Corporation | | | | | | | 108,930 | | | | 2,056,598 | |
New Residential Investment Corporation | | | | | | | 144,185 | | | | 1,888,824 | |
Parkway Properties Incorporated | | | | | | | 168,015 | | | | 2,614,313 | |
PennyMac Mortgage Investment Trust | | | | | | | 157,835 | | | | 2,441,707 | |
Redwood Trust Incorporated | | | | | | | 178,690 | | | | 2,473,070 | |
| | | | |
| | | | | | | | | | | 16,582,357 | |
| | | | | | | | | | | | |
| | | | |
| Thrifts & Mortgage Finance: 3.76% | | | | | | | | | | | | |
Essent Group Limited † | | | | | | | 103,480 | | | | 2,571,478 | |
Ocwen Financial Corporation Ǡ | | | | | | | 357,640 | | | | 2,399,764 | |
| | | | |
| | | | | | | | | | | 4,971,242 | |
| | | | | | | | | | | | |
| | | | |
Health Care: 9.80% | | | | | | | | | | | | |
| | | | |
| Health Care Equipment & Supplies: 5.12% | | | | | | | | | | | | |
Haemonetics Corporation † | | | | | | | 65,235 | | | | 2,108,395 | |
Integra LifeSciences Holdings † | | | | | | | 34,680 | | | | 2,065,194 | |
Steris Corporation | | | | | | | 39,955 | | | | 2,595,876 | |
| | | | |
| | | | | | | | | | | 6,769,465 | |
| | | | | | | | | | | | |
| | | | |
| Health Care Providers & Services: 3.01% | | | | | | | | | | | | |
AMN Healthcare Services Incorporated † | | | | | | | 63,976 | | | | 1,919,920 | |
AmSurg Corporation † | | | | | | | 26,600 | | | | 2,067,086 | |
| | | | |
| | | | | | | | | | | 3,987,006 | |
| | | | | | | | | | | | |
| | | | |
| Life Sciences Tools & Services: 1.67% | | | | | | | | | | | | |
Bio-Rad Laboratories Incorporated Class A † | | | | | | | 8,755 | | | | 1,175,884 | |
Charles River Laboratories International Incorporated † | | | | | | | 16,278 | | | | 1,033,979 | |
| | | | |
| | | | | | | | | | | 2,209,863 | |
| | | | | | | | | | | | |
The accompanying notes are an integral part of these financial statements.
| | | | | | |
| Portfolio of investments—September 30, 2015 (unaudited) | | Wells Fargo Advantage Intrinsic Small Cap Value Fund | | | 9 | |
| | | | | | | | | | | | |
| Security name | | | | | | Shares | | | Value | |
| | | | |
Industrials: 16.37% | | | | | | | | | | | | |
| | | | |
| Commercial Services & Supplies: 5.44% | | | | | | | | | | | | |
Essendant Incorporated | | | | | | | 64,090 | | | $ | 2,078,439 | |
KAR Auction Services Incorporated | | | | | | | 99,470 | | | | 3,531,185 | |
Tetra Tech Incorporated | | | | | | | 65,255 | | | | 1,586,349 | |
| | | | |
| | | | | | | | | | | 7,195,973 | |
| | | | | | | | | | | | |
| | | | |
| Construction & Engineering: 0.95% | | | | | | | | | | | | |
EMCOR Group Incorporated | | | | | | | 28,526 | | | | 1,262,276 | |
| | | | | | | | | | | | |
| | | | |
| Machinery: 4.66% | | | | | | | | | | | | |
Actuant Corporation Class A | | | | | | | 89,325 | | | | 1,642,687 | |
IDEX Corporation | | | | | | | 28,635 | | | | 2,041,676 | |
Manitowoc Company Incorporated « | | | | | | | 165,490 | | | | 2,482,350 | |
| | | | |
| | | | | | | | | | | 6,166,713 | |
| | | | | | | | | | | | |
| | | | |
| Professional Services: 2.66% | | | | | | | | | | | | |
Korn/Ferry International | | | | | | | 44,210 | | | | 1,462,025 | |
Resources Connection Incorporated | | | | | | | 136,147 | | | | 2,051,735 | |
| | | | |
| | | | | | | | | | | 3,513,760 | |
| | | | | | | | | | | | |
| | | | |
| Road & Rail: 1.52% | | | | | | | | | | | | |
Landstar System Incorporated | | | | | | | 31,680 | | | | 2,010,730 | |
| | | | | | | | | | | | |
| | | | |
| Trading Companies & Distributors: 1.14% | | | | | | | | | | | | |
Beacon Roofing Supply Incorporated † | | | | | | | 46,400 | | | | 1,507,536 | |
| | | | | | | | | | | | |
| | | | |
Information Technology: 9.26% | | | | | | | | | | | | |
| | | | |
| Electronic Equipment, Instruments & Components: 1.79% | | | | | | | | | | | | |
Jabil Circuit Incorporated | | | | | | | 105,715 | | | | 2,364,845 | |
| | | | | | | | | | | | |
| | | | |
| Internet Software & Services: 1.21% | | | | | | | | | | | | |
Endurance International Group Holdings † | | | | | | | 120,207 | | | | 1,605,966 | |
| | | | | | | | | | | | |
| | | | |
| IT Services: 4.00% | | | | | | | | | | | | |
CoreLogic Incorporated † | | | | | | | 64,910 | | | | 2,416,599 | |
EVERTEC Incorporated | | | | | | | 158,777 | | | | 2,869,100 | |
| | | | |
| | | | | | | | | | | 5,285,699 | |
| | | | | | | | | | | | |
| | | | |
| Technology Hardware, Storage & Peripherals: 2.26% | | | | | | | | | | | | |
Avid Technology Incorporated † | | | | | | | 188,660 | | | | 1,501,734 | |
Wincor Nixdorf AG ADR | | | | | | | 190,500 | | | | 1,492,758 | |
| | | | |
| | | | | | | | | | | 2,994,492 | |
| | | | | | | | | | | | |
| | | | |
Materials: 1.49% | | | | | | | | | | | | |
| | | | |
| Containers & Packaging: 1.49% | | | | | | | | | | | | |
Silgan Holdings Incorporated | | | | | | | 37,920 | | | | 1,973,357 | |
| | | | | | | | | | | | |
The accompanying notes are an integral part of these financial statements.
| | | | |
| 10 | | Wells Fargo Advantage Intrinsic Small Cap Value Fund | | Portfolio of investments—September 30, 2015 (unaudited) |
| | | | | | | | | | | | | | |
| Security name | | | | | | | Shares | | | Value | |
| | | | |
Utilities: 1.92% | | | | | | | | | | | | | | |
| | | | |
| Electric Utilities: 1.92% | | | | | | | | | | | | | | |
Westar Energy Incorporated | | | | | | | | | 66,005 | | | $ | 2,537,232 | |
| | | | | | | | | | | | | | |
| | | | |
Total Common Stocks (Cost $130,589,461) | | | | | | | | | | | | | 127,498,278 | |
| | | | | | | | | | | | | | |
| | | | |
| | | Yield | | | | | | | | | |
| Short-Term Investments: 15.50% | | | | | | | | | | | | | | |
| | | | |
| Investment Companies: 15.50% | | | | | | | | | | | | | | |
Securities Lending Cash Investments, LLC (l)(r)(u) | | | 0.15 | % | | | | | 16,158,925 | | | | 16,158,925 | |
Wells Fargo Advantage Cash Investment Money Market Fund, Select Class (l)(u) | | | 0.16 | | | | | | 4,342,704 | | | | 4,342,704 | |
| | | | |
Total Short-Term Investments (Cost $20,501,629) | | | | | | | | | | | | | 20,501,629 | |
| | | | | | | | | | | | | | |
| | | | | | | | |
| Total investments in securities (Cost $151,091,090) * | | | 111.90 | % | | | 147,999,907 | |
Other assets and liabilities, net | | | (11.90 | ) | | | (15,734,998 | ) |
| | | | | | | | |
| Total net assets | | | 100.00 | % | | $ | 132,264,909 | |
| | | | | | | | |
| « | All or a portion of this security is on loan. |
| † | Non-income-earning security |
| (l) | The security represents an affiliate of the Fund as defined in the Investment Company Act of 1940. |
| (r) | The investment is a non-registered investment vehicle purchased with cash collateral received from securities on loan. |
| (u) | The rate represents the 7-day annualized yield at period end. |
| * | Cost for federal income tax purposes is $152,003,956 and unrealized gains (losses) consists of: |
| | | | |
Gross unrealized gains | | $ | 15,843,736 | |
Gross unrealized losses | | | (19,847,785 | ) |
| | | | |
Net unrealized losses | | $ | (4,004,049 | ) |
The accompanying notes are an integral part of these financial statements.
| | | | | | |
| Statement of assets and liabilities—September 30, 2015 (unaudited) | | Wells Fargo Advantage Intrinsic Small Cap Value Fund | | | 11 | |
| | | | |
| | | | |
| |
Assets | | | | |
Investments | | | | |
In unaffiliated securities (including $15,650,277 of securities loaned), at value (cost $130,589,461) | | $ | 127,498,278 | |
In affiliated securities, at value (cost $20,501,629) | | | 20,501,629 | |
| | | | |
Total investments, at value (cost $151,091,090) | | | 147,999,907 | |
Receivable for investments sold | | | 1,244,729 | |
Receivable for Fund shares sold | | | 93,679 | |
Receivable for dividends | | | 237,800 | |
Receivable for securities lending income | | | 30,192 | |
Prepaid expenses and other assets | | | 53,014 | |
| | | | |
Total assets | | | 149,659,321 | |
| | | | |
| |
Liabilities | | | | |
Payable for investments purchased | | | 850,861 | |
Payable for Fund shares redeemed | | | 227,583 | |
Payable upon receipt of securities loaned | | | 16,158,925 | |
Management fee payable | | | 79,899 | |
Distribution fee payable | | | 185 | |
Administration fees payable | | | 22,876 | |
Accrued expenses and other liabilities | | | 54,083 | |
| | | | |
Total liabilities | | | 17,394,412 | |
| | | | |
Total net assets | | $ | 132,264,909 | |
| | | | |
| |
NET ASSETS CONSIST OF | | | | |
Paid-in capital | | $ | 181,270,704 | |
Undistributed net investment income | | | 791,153 | |
Accumulated net realized losses on investments | | | (46,705,765 | ) |
Net unrealized losses on investments | | | (3,091,183 | ) |
| | | | |
Total net assets | | $ | 132,264,909 | |
| | | | |
| |
COMPUTATION OF NET ASSET VALUE AND OFFERING PRICE PER SHARE | | | | |
Net assets – Class A | | $ | 793,115 | |
Shares outstanding – Class A1 | | | 34,576 | |
Net asset value per share – Class A | | | $22.94 | |
Maximum offering price per share – Class A2 | | | $24.34 | |
Net assets – Class C | | $ | 289,082 | |
Shares outstanding – Class C1 | | | 13,419 | |
Net asset value per share – Class C | | | $21.54 | |
Net assets – Administrator Class | | $ | 4,579,078 | |
Shares outstanding – Administrator Class1 | | | 195,926 | |
Net asset value per share – Administrator Class | | | $23.37 | |
Net assets – Institutional Class | | $ | 76,354,542 | |
Shares outstanding – Institutional Class1 | | | 3,230,637 | |
Net asset value per share – Institutional Class | | | $23.63 | |
Net assets – Investor Class | | $ | 50,249,092 | |
Shares outstanding – Investor Class1 | | | 2,214,316 | |
Net asset value per share – Investor Class | | | $22.69 | |
| 1 | The Fund has an unlimited number of authorized shares. |
| 2 | Maximum offering price is computed as 100/94.25 of net asset value. On investments of $50,000 or more, the offering price is reduced. |
The accompanying notes are an integral part of these financial statements.
| | | | |
| 12 | | Wells Fargo Advantage Intrinsic Small Cap Value Fund | | Statement of operations—six months ended September 30, 2015 (unaudited) |
| | | | |
| | | | |
| |
Investment income | | | | |
Dividends (net of foreign withholding taxes of $5,049) | | $ | 1,308,791 | |
Securities lending income, net | | | 116,323 | |
Income from affiliated securities | | | 3,986 | |
| | | | |
Total investment income | | | 1,429,100 | |
| | | | |
| |
Expenses | | | | |
Management fee | | | 625,968 | |
Administration fees | | | | |
Class A | | | 984 | |
Class C | | | 368 | |
Administrator Class | | | 3,004 | |
Institutional Class | | | 43,854 | |
Investor Class | | | 91,074 | |
Shareholder servicing fees | | | | |
Class A | | | 1,047 | |
Class C | | | 391 | |
Administrator Class | | | 6,543 | |
Investor Class | | | 71,151 | |
Distribution fee | | | | |
Class C | | | 1,174 | |
Custody and accounting fees | | | 12,245 | |
Professional fees | | | 21,183 | |
Registration fees | | | 41,183 | |
Shareholder report expenses | | | 18,793 | |
Trustees’ fees and expenses | | | 7,188 | |
Other fees and expenses | | | 5,671 | |
| | | | |
Total expenses | | | 951,821 | |
Less: Fee waivers and/or expense reimbursements | | | (75,848 | ) |
| | | | |
Net expenses | | | 875,973 | |
| | | | |
Net investment income | | | 553,127 | |
| | | | |
| |
REALIZED AND UNREALIZED GAINS (LOSSES) ON INVESTMENTS | | | | |
Net realized gains on investments | | | 6,237,095 | |
Net change in unrealized gains (losses) on investments | | | (21,465,133 | ) |
| | | | |
Net realized and unrealized gains (losses) on investments | | | (15,228,038 | ) |
| | | | |
Net decrease in net assets resulting from operations | | $ | (14,674,911 | ) |
| | | | |
The accompanying notes are an integral part of these financial statements.
| | | | | | |
| Statement of changes in net assets | | Wells Fargo Advantage Intrinsic Small Cap Value Fund | | | 13 | |
| | | | | | | | | | | | | | | | |
| | | Six months ended
September 30, 2015
(unaudited) | | | Year ended
March 31, 2015 | |
| | | | |
Operations | | | | | | | | | | | | | | | | |
Net investment income | | | | | | $ | 553,127 | | | | | | | $ | 537,231 | |
Net realized gains on investments | | | | | | | 6,237,095 | | | | | | | | 18,094,620 | |
Net change in unrealized gains (losses) on investments | | | | | | | (21,465,133 | ) | | | | | | | (6,365,605 | ) |
| | | | |
Net increase (decrease) in net assets resulting from operations | | | | | | | (14,674,911 | ) | | | | | | | 12,266,246 | |
| | | | |
| | | | |
Distributions to shareholders from | | | | | | | | | | | | | | | | |
Net investment income | | | | | | | | | | | | | | | | |
Institutional Class | | | | | | | 0 | | | | | | | | (328,545 | ) |
| | | | |
| | | | |
Capital share transactions | | | Shares | | | | | | | | Shares | | | | | |
Proceeds from shares sold | | | | | | | | | | | | | | | | |
Class A | | | 5,212 | | | | 130,848 | | | | 9,617 | | | | 235,725 | |
Class C | | | 2,353 | | | | 56,218 | | | | 3,365 | | | | 77,441 | |
Administrator Class | | | 26,205 | | | | 691,303 | | | | 25,631 | | | | 625,437 | |
Institutional Class | | | 83,690 | | | | 2,156,071 | | | | 303,417 | | | | 7,622,405 | |
Investor Class | | | 39,440 | | | | 997,369 | | | | 128,639 | | | | 3,066,856 | |
| | | | |
| | | | | | | 4,031,809 | | | | | | | | 11,627,864 | |
| | | | |
Reinvestment of distributions | | | | | | | | | | | | | | | | |
Institutional Class | | | 0 | | | | 0 | | | | 10,900 | | | | 263,886 | |
| | | | |
Payment for shares redeemed | | | | | | | | | | | | | | | | |
Class A | | | (2,680 | ) | | | (66,714 | ) | | | (16,182 | ) | | | (388,997 | ) |
Class C | | | (1,570 | ) | | | (37,162 | ) | | | (9,910 | ) | | | (221,282 | ) |
Administrator Class | | | (27,162 | ) | | | (682,782 | ) | | | (268,033 | ) | | | (6,673,609 | ) |
Institutional Class | | | (78,107 | ) | | | (2,019,479 | ) | | | (367,323 | ) | | | (9,277,448 | ) |
Investor Class | | | (150,557 | ) | | | (3,759,178 | ) | | | (486,009 | ) | | | (11,447,508 | ) |
| | | | |
| | | | | | | (6,565,315 | ) | | | | | | | (28,008,844 | ) |
| | | | |
Net decrease in net assets resulting from capital share transactions | | | | | | | (2,533,506 | ) | | | | | | | (16,117,094 | ) |
| | | | |
Total decrease in net assets | | | | | | | (17,208,417 | ) | | | | | | | (4,179,393 | ) |
| | | | |
| | | | |
Net assets | | | | | | | | | | | | | | | | |
Beginning of period | | | | | | | 149,473,326 | | | | | | | | 153,652,719 | |
| | | | |
End of period | | | | | | $ | 132,264,909 | | | | | | | $ | 149,473,326 | |
| | | | |
Undistributed net investment income | | | | | | $ | 791,153 | | | | | | | $ | 238,026 | |
| | | | |
The accompanying notes are an integral part of these financial statements.
| | | | |
| 14 | | Wells Fargo Advantage Intrinsic Small Cap Value Fund | | Financial highlights |
(For a share outstanding throughout each period)
| | | | | | | | | | | | | | | | | | | | | | | | | | | | |
| | | Six months ended
September 30, 2015 (unaudited) | | | Year ended March 31 | | | Year ended October 31 | |
| CLASS A | | | 2015 | | | 20141 | | | 2013 | | | 2012 | | | 2011 | | | 2010 | |
Net asset value, beginning of period | | | $25.50 | | | | $23.53 | | | | $22.16 | | | | $15.96 | | | | $14.06 | | | | $13.81 | | | | $11.52 | |
Net investment income (loss) | | | 0.07 | | | | 0.04 | | | | 0.02 | | | | 0.03 | | | | (0.06 | )2 | | | (0.06 | )2 | | | (0.06 | ) |
Net realized and unrealized gains (losses) on investments | | | (2.63 | ) | | | 1.93 | | | | 1.35 | | | | 6.17 | | | | 1.96 | | | | 0.31 | | | | 2.35 | |
| | | | | | | | | | | | | | | | | | | | | | | | | | | | |
Total from investment operations | | | (2.56 | ) | | | 1.97 | | | | 1.37 | | | | 6.20 | | | | 1.90 | | | | 0.25 | | | | 2.29 | |
Net asset value, end of period | | | $22.94 | | | | $25.50 | | | | $23.53 | | | | $22.16 | | | | $15.96 | | | | $14.06 | | | | $13.81 | |
Total return3 | | | (10.04 | )% | | | 8.37 | % | | | 6.33 | % | | | 38.66 | % | | | 13.51 | % | | | 1.81 | % | | | 19.88 | % |
Ratios to average net assets (annualized) | | | | | | | | | | | | | | | | | | | | | | | | | | | | |
Gross expenses | | | 1.48 | % | | | 1.46 | % | | | 1.57 | % | | | 1.56 | % | | | 1.48 | % | | | 1.44 | % | | | 1.54 | % |
Net expenses | | | 1.38 | % | | | 1.40 | % | | | 1.44 | % | | | 1.45 | % | | | 1.45 | % | | | 1.42 | % | | | 1.45 | % |
Net investment income (loss) | | | 0.56 | % | | | 0.15 | % | | | 0.19 | % | | | 0.11 | % | | | (0.38 | )% | | | (0.41 | )% | | | (0.49 | )% |
Supplemental data | | | | | | | | | | | | | | | | | | | | | | | | | | | | |
Portfolio turnover rate | | | 27 | % | | | 60 | % | | | 22 | % | | | 75 | % | | | 33 | % | | | 54 | % | | | 147 | % |
Net assets, end of period (000s omitted) | | | $793 | | | | $817 | | | | $908 | | | | $967 | | | | $357 | | | | $189 | | | | $354 | |
| 1 | For the five months ended March 31, 2014. The Fund changed its fiscal year end from October 31 to March 31, effective March 31, 2014. |
| 2 | Calculated based upon average shares outstanding |
| 3 | Total return calculations do not include any sales charges. Returns for periods of less than one year are not annualized. |
The accompanying notes are an integral part of these financial statements.
| | | | | | |
| Financial highlights | | Wells Fargo Advantage Intrinsic Small Cap Value Fund | | | 15 | |
(For a share outstanding throughout each period)
| | | | | | | | | | | | | | | | | | | | | | | | | | | | |
| | | Six months ended
September 30, 2015 (unaudited) | | | Year ended March 31 | | | Year ended October 31 | |
| CLASS C | | | 2015 | | | 20141 | | | 2013 | | | 2012 | | | 2011 | | | 2010 | |
Net asset value, beginning of period | | | $24.04 | | | | $22.35 | | | | $21.12 | | | | $15.32 | | | | $13.60 | | | | $13.45 | | | | $11.31 | |
Net investment loss | | | (0.02 | )2 | | | (0.14 | )2 | | | (0.05 | ) | | | (0.13 | )2 | | | (0.16 | )2 | | | (0.17 | )2 | | | (0.18 | ) |
Net realized and unrealized gains (losses) on investments | | | (2.48 | ) | | | 1.83 | | | | 1.28 | | | | 5.93 | | | | 1.88 | | | | 0.32 | | | | 2.32 | |
| | | | | | | | | | | | | | | | | | | | | | | | | | | | |
Total from investment operations | | | (2.50 | ) | | | 1.69 | | | | 1.23 | | | | 5.80 | | | | 1.72 | | | | 0.15 | | | | 2.14 | |
Net asset value, end of period | | | $21.54 | | | | $24.04 | | | | $22.35 | | | | $21.12 | | | | $15.32 | | | | $13.60 | | | | $13.45 | |
Total return3 | | | (10.40 | )% | | | 7.56 | % | | | 6.02 | % | | | 37.60 | % | | | 12.65 | % | | | 1.12 | % | | | 18.92 | % |
Ratios to average net assets (annualized) | | | | | | | | | | | | | | | | | | | | | | | | | | | | |
Gross expenses | | | 2.23 | % | | | 2.21 | % | | | 2.33 | % | | | 2.30 | % | | | 2.22 | % | | | 2.19 | % | | | 2.30 | % |
Net expenses | | | 2.14 | % | | | 2.15 | % | | | 2.19 | % | | | 2.20 | % | | | 2.20 | % | | | 2.17 | % | | | 2.20 | % |
Net investment loss | | | (0.18 | )% | | | (0.62 | )% | | | (0.54 | )% | | | (0.66 | )% | | | (1.12 | )% | | | (1.19 | )% | | | (1.24 | )% |
Supplemental data | | | | | | | | | | | | | | | | | | | | | | | | | | | | |
Portfolio turnover rate | | | 27 | % | | | 60 | % | | | 22 | % | | | 75 | % | | | 33 | % | | | 54 | % | | | 147 | % |
Net assets, end of period (000s omitted) | | | $289 | | | | $304 | | | | $429 | | | | $418 | | | | $89 | | | | $108 | | | | $142 | |
| 1 | For the five months ended March 31, 2014. The Fund changed its fiscal year end from October 31 to March 31, effective March 31, 2014. |
| 2 | Calculated based upon average shares outstanding |
| 3 | Total return calculations do not include any sales charges. Returns for periods of less than one year are not annualized. |
The accompanying notes are an integral part of these financial statements.
| | | | |
| 16 | | Wells Fargo Advantage Intrinsic Small Cap Value Fund | | Financial highlights |
(For a share outstanding throughout each period)
| | | | | | | | | | | | | | | | | | | | | | | | | | | | |
| | | Six months ended
September 30, 2015 (unaudited) | | | Year ended March 31 | | | Year ended October 31 | |
| ADMINISTRATOR CLASS | | | 2015 | | | 20141 | | | 2013 | | | 2012 | | | 2011 | | | 2010 | |
Net asset value, beginning of period | | | $25.95 | | | | $23.90 | | | | $22.49 | | | | $16.16 | | | | $14.20 | | | | $13.91 | | | | $11.58 | |
Net investment income (loss) | | | 0.09 | 2 | | | 0.07 | 2 | | | 0.04 | 2 | | | 0.09 | | | | (0.02 | )2 | | | (0.05 | )2 | | | (0.02 | ) |
Net realized and unrealized gains (losses) on investments | | | (2.67 | ) | | | 1.98 | | | | 1.37 | | | | 6.24 | | | | 1.98 | | | | 0.34 | | | | 2.35 | |
| | | | | | | | | | | | | | | | | | | | | | | | | | | | |
Total from investment operations | | | (2.58 | ) | | | 2.05 | | | | 1.41 | | | | 6.33 | | | | 1.96 | | | | 0.29 | | | | 2.33 | |
Distributions to shareholders from | | | | | | | | | | | | | | | | | | | | | | | | | | | | |
Net investment income | | | 0.00 | | | | 0.00 | | | | (0.00 | )3 | | | 0.00 | | | | 0.00 | | | | 0.00 | | | | 0.00 | |
Net asset value, end of period | | | $23.37 | | | | $25.95 | | | | $23.90 | | | | $22.49 | | | | $16.16 | | | | $14.20 | | | | $13.91 | |
Total return4 | | | (9.94 | )% | | | 8.58 | % | | | 6.43 | % | | | 38.99 | % | | | 13.80 | % | | | 2.08 | % | | | 20.12 | % |
Ratios to average net assets (annualized) | | | | | | | | | | | | | | | | | | | | | | | | | | | | |
Gross expenses | | | 1.36 | % | | | 1.30 | % | | | 1.42 | % | | | 1.40 | % | | | 1.30 | % | | | 1.22 | % | | | 1.37 | % |
Net expenses | | | 1.20 | % | | | 1.20 | % | | | 1.20 | % | | | 1.20 | % | | | 1.20 | % | | | 1.19 | % | | | 1.20 | % |
Net investment income (loss) | | | 0.73 | % | | | 0.27 | % | | | 0.45 | % | | | 0.52 | % | | | (0.12 | )% | | | (0.30 | )% | | | (0.23 | )% |
Supplemental data | | | | | | | | | | | | | | | | | | | | | | | | | | | | |
Portfolio turnover rate | | | 27 | % | | | 60 | % | | | 22 | % | | | 75 | % | | | 33 | % | | | 54 | % | | | 147 | % |
Net assets, end of period (000s omitted) | | | $4,579 | | | | $5,110 | | | | $10,498 | | | | $11,182 | | | | $6,801 | | | | $9,722 | | | | $5,774 | |
| 1 | For the five months ended March 31, 2014. The Fund changed its fiscal year end from October 31 to March 31, effective March 31, 2014. |
| 2 | Calculated based upon average shares outstanding |
| 3 | Amount is less than $0.005. |
| 4 | Returns for periods of less than one year are not annualized. |
The accompanying notes are an integral part of these financial statements.
| | | | | | |
| Financial highlights | | Wells Fargo Advantage Intrinsic Small Cap Value Fund | | | 17 | |
(For a share outstanding throughout each period)
| | | | | | | | | | | | | | | | | | | | | | | | | | | | |
| | | Six months ended
September 30, 2015 (unaudited) | | | Year ended March 31 | | | Year ended October 31 | |
| INSTITUTIONAL CLASS | | | 2015 | | | 20141 | | | 2013 | | | 2012 | | | 2011 | | | 2010 | |
Net asset value, beginning of period | | | $26.22 | | | | $24.19 | | | | $22.78 | | | | $16.32 | | | | $14.32 | | | | $14.00 | | | | $11.63 | |
Net investment income (loss) | | | 0.12 | | | | 0.14 | 2 | | | 0.06 | 2 | | | 0.12 | 2 | | | 0.01 | 2 | | | 0.00 | 2,3 | | | (0.00 | )2,3 |
Net realized and unrealized gains (losses) on investments | | | (2.71 | ) | | | 1.99 | | | | 1.39 | | | | 6.34 | | | | 1.99 | | | | 0.32 | | | | 2.37 | |
| | | | | | | | | | | | | | | | | | | | | | | | | | | | |
Total from investment operations | | | (2.59 | ) | | | 2.13 | | | | 1.45 | | | | 6.46 | | | | 2.00 | | | | 0.32 | | | | 2.37 | |
Distributions to shareholders from | | | | | | | | | | | | | | | | | | | | | | | | | | | | |
Net investment income | | | 0.00 | | | | (0.10 | ) | | | (0.04 | ) | | | 0.00 | | | | 0.00 | | | | 0.00 | | | | 0.00 | |
Net asset value, end of period | | | $23.63 | | | | $26.22 | | | | $24.19 | | | | $22.78 | | | | $16.32 | | | | $14.32 | | | | $14.00 | |
Total return4 | | | (9.88 | )% | | | 8.83 | % | | | 6.50 | % | | | 39.40 | % | | | 13.97 | % | | | 2.29 | % | | | 20.38 | % |
Ratios to average net assets (annualized) | | | | | | | | | | | | | | | | | | | | | | | | | | | | |
Gross expenses | | | 1.10 | % | | | 1.03 | % | | | 1.15 | % | | | 1.10 | % | | | 1.05 | % | | | 1.01 | % | | | 1.10 | % |
Net expenses | | | 1.00 | % | | | 1.00 | % | | | 1.00 | % | | | 1.00 | % | | | 1.00 | % | | | 0.98 | % | | | 1.00 | % |
Net investment income (loss) | | | 0.94 | % | | | 0.57 | % | | | 0.64 | % | | | 0.58 | % | | | 0.07 | % | | | 0.02 | % | | | (0.03 | )% |
Supplemental data | | | | | | | | | | | | | | | | | | | | | | | | | | | | |
Portfolio turnover rate | | | 27 | % | | | 60 | % | | | 22 | % | | | 75 | % | | | 33 | % | | | 54 | % | | | 147 | % |
Net assets, end of period (000s omitted) | | | $76,355 | | | | $84,563 | | | | $79,312 | | | | $71,934 | | | | $40,073 | | | | $41,861 | | | | $72,200 | |
| 1 | For the five months ended March 31, 2014. The Fund changed its fiscal year end from October 31 to March 31, effective March 31, 2014. |
| 2 | Calculated based upon average shares outstanding |
| 3 | Amount is less than $0.005. |
| 4 | Returns for periods of less than one year are not annualized. |
The accompanying notes are an integral part of these financial statements.
| | | | |
| 18 | | Wells Fargo Advantage Intrinsic Small Cap Value Fund | | Financial highlights |
(For a share outstanding throughout each period)
| | | | | | | | | | | | | | | | | | | | | | | | | | | | |
| | | Six months ended
September 30, 2015 (unaudited) | | | Year ended March 31 | | | Year ended October 31 | |
| INVESTOR CLASS | | | 2015 | | | 20141 | | | 2013 | | | 2012 | | | 2011 | | | 2010 | |
Net asset value, beginning of period | | | $25.23 | | | | $23.30 | | | | $21.95 | | | | $15.81 | | | | $13.94 | | | | $13.70 | | | | $11.43 | |
Net investment income (loss) | | | 0.06 | 2 | | | 0.02 | 2 | | | 0.01 | 2 | | | 0.04 | 2 | | | (0.06 | )2 | | | (0.07 | )2 | | | (0.06 | )2 |
Net realized and unrealized gains (losses) on investments | | | (2.60 | ) | | | 1.91 | | | | 1.34 | | | | 6.10 | | | | 1.93 | | | | 0.31 | | | | 2.33 | |
| | | | | | | | | | | | | | | | | | | | | | | | | | | | |
Total from investment operations | | | (2.54 | ) | | | 1.93 | | | | 1.35 | | | | 6.14 | | | | 1.87 | | | | 0.24 | | | | 2.27 | |
Net asset value, end of period | | | $22.69 | | | | $25.23 | | | | $23.30 | | | | $21.95 | | | | $15.81 | | | | $13.94 | | | | $13.70 | |
Total return3 | | | (10.07 | )% | | | 8.28 | % | | | 6.30 | % | | | 38.56 | % | | | 13.49 | % | | | 1.75 | % | | | 19.86 | % |
Ratios to average net assets (annualized) | | | | | | | | | | | | | | | | | | | | | | | | | | | | |
Gross expenses | | | 1.56 | % | | | 1.52 | % | | | 1.64 | % | | | 1.62 | % | | | 1.54 | % | | | 1.50 | % | | | 1.63 | % |
Net expenses | | | 1.46 | % | | | 1.46 | % | | | 1.48 | % | | | 1.49 | % | | | 1.49 | % | | | 1.48 | % | | | 1.49 | % |
Net investment income (loss) | | | 0.48 | % | | | 0.09 | % | | | 0.16 | % | | | 0.19 | % | | | (0.42 | )% | | | (0.48 | )% | | | (0.47 | )% |
Supplemental data | | | | | | | | | | | | | | | | | | | | | | | | | | | | |
Portfolio turnover rate | | | 27 | % | | | 60 | % | | | 22 | % | | | 75 | % | | | 33 | % | | | 54 | % | | | 147 | % |
Net assets, end of period (000s omitted) | | | $50,249 | | | | $58,680 | | | | $62,505 | | | | $61,302 | | | | $46,977 | | | | $51,927 | | | | $79,132 | |
| 1 | For the five months ended March 31, 2014. The Fund changed its fiscal year end from October 31 to March 31, effective March 31, 2014. |
| 2 | Calculated based upon average shares outstanding |
| 3 | Returns for periods of less than one year are not annualized. |
The accompanying notes are an integral part of these financial statements.
| | | | | | |
| Notes to financial statements (unaudited) | | Wells Fargo Advantage Intrinsic Small Cap Value Fund | | | 19 | |
1. ORGANIZATION
Wells Fargo Funds Trust (the “Trust”), a Delaware statutory trust organized on March 10, 1999, is an open-end management investment company registered under the Investment Company Act of 1940, as amended (the “1940 Act”). As an investment company, the Trust follows the accounting and reporting guidance in Financial Accounting Standards Board (“FASB”) Accounting Standards Codification Topic 946, Financial Services – Investment Companies. These financial statements report on the Wells Fargo Advantage Intrinsic Small Cap Value Fund (the “Fund”) which is a diversified series of the Trust.
2. SIGNIFICANT ACCOUNTING POLICIES
The following significant accounting policies, which are consistently followed in the preparation of the financial statements of the Fund, are in conformity with U.S. generally accepted accounting principles which require management to make estimates and assumptions that affect the reported amounts of assets and liabilities, disclosure of contingent assets and liabilities at the date of the financial statements, and the reported amounts of revenues and expenses during the reporting period. Actual results could differ from those estimates.
Securities valuation
All investments are valued each business day as of the close of regular trading on the New York Stock Exchange (generally 4 p.m. Eastern Time).
Equity securities that are listed on a foreign or domestic exchange or market are valued at the official closing price or, if none, the last sales price. If no sale occurs on the primary exchange or market that day, the prior day’s price will be deemed “stale” and a fair value price will be determined in accordance with the Fund’s Valuation Procedures.
Equity securities that are not listed on a foreign or domestic exchange or market, but have a public trading market, are valued at the quoted bid price from an independent broker-dealer that the Management Valuation Team of Wells Fargo Funds Management, LLC (“Funds Management”) has determined is an acceptable source.
Investments in registered open-end investment companies are valued at net asset value. Interests in non-registered investment vehicles that are redeemable at net asset value are fair valued at net asset value when available.
Investments which are not valued using any of the methods discussed above are valued at their fair value, as determined in good faith by the Board of Trustees of the Fund. The Board of Trustees has established a Valuation Committee comprised of the Trustees and has delegated to it the authority to take any actions regarding the valuation of portfolio securities that the Valuation Committee deems necessary or appropriate, including determining the fair value of portfolio securities, unless the determination has been delegated to the Management Valuation Team. The Board of Trustees retains the authority to make or ratify any valuation decisions or approve any changes to the Valuation Procedures as it deems appropriate. On a quarterly basis, the Board of Trustees receives reports on any valuation actions taken by the Valuation Committee or the Management Valuation Team which may include items for ratification.
Valuations of fair valued securities are compared to the next actual sales price when available, or other appropriate market values, to assess the continued appropriateness of the fair valuation methodologies used. These securities are fair valued on a day-to-day basis, taking into consideration changes to appropriate market information and any significant changes to the inputs considered in the valuation process until there is a readily available price provided on an exchange or by an independent pricing service. Valuations received from an independent pricing service or independent broker-dealer quotes are periodically validated by comparisons to most recent trades and valuations provided by other independent pricing services in addition to the review of prices by the manager and/or subadviser. Unobservable inputs used in determining fair valuations are identified based on the type of security, taking into consideration factors utilized by market participants in valuing the investment, knowledge about the issuer and the current market environment.
Security loans
The Fund may lend its securities from time to time in order to earn additional income in the form of fees or interest on securities received as collateral or the investment of any cash received as collateral. The Fund continues to receive interest or dividends on the securities loaned. The Fund receives collateral in the form of cash or securities with a value at least equal to the value of the securities on loan. The value of the loaned securities is determined at the close of each business day and any additional required collateral is delivered to the Fund on the next business day. In a securities lending transaction, the net asset value of the Fund will be affected by an increase or decrease in the value of the securities loaned and by an increase or decrease in the value of the instrument in which collateral is invested. The amount of securities lending activity undertaken by the Fund fluctuates from time to time. In the event of default or bankruptcy
| | | | |
| 20 | | Wells Fargo Advantage Intrinsic Small Cap Value Fund | | Notes to financial statements (unaudited) |
by the borrower, the Fund may be prevented from recovering the loaned securities or gaining access to the collateral or may experience delays or costs in doing so. In addition, the investment of any cash collateral received may lose all or part of its value. The Fund has the right under the lending agreement to recover the securities from the borrower on demand.
The Fund lends its securities through an unaffiliated securities lending agent. Cash collateral received in connection with its securities lending transactions is invested in Securities Lending Cash Investments, LLC (the “Securities Lending Fund”). The Securities Lending Fund is exempt from registration under Section 3(c)(7) of the 1940 Act and is managed by Funds Management and is subadvised by Wells Capital Management Incorporated (“WellsCap”). Funds Management receives an advisory fee starting at 0.05% and declining to 0.01% as the average daily net assets of the Securities Lending Fund increase. All of the fees received by Funds Management are paid to WellsCap for its services as subadviser. The Securities Lending Fund seeks to provide a positive return compared to the daily Fed Funds Open rate by investing in high-quality, U.S. dollar-denominated short-term money market instruments. Securities Lending Fund investments are fair valued based upon the amortized cost valuation technique. Income earned from investment in the Securities Lending Fund is included in securities lending income on the Statement of Operations.
Security transactions and income recognition
Securities transactions are recorded on a trade date basis. Realized gains or losses are recorded on the basis of identified cost.
Dividend income is recognized on the ex-dividend date. Dividend income from foreign securities is recorded net of foreign taxes withheld where recovery of such taxes is not assured.
Distributions to shareholders
Distributions to shareholders from net investment income and net realized gains, if any, are recorded on the ex-dividend date. Such distributions are determined in conformity with federal income tax regulations, which may differ in amount or character from net investment income and realized gains recognized for purposes of U.S. generally accepted accounting principles.
Federal and other taxes
The Fund intends to continue to qualify as a regulated investment company by distributing substantially all of its investment company taxable income and any net realized capital gains (after reduction for capital loss carryforwards) sufficient to relieve it from all, or substantially all, federal income taxes. Accordingly, no provision for federal income taxes was required.
The Fund’s income and federal excise tax returns and all financial records supporting those returns for the prior three fiscal years are subject to examination by the federal and Delaware revenue authorities. Management has analyzed the Fund’s tax positions taken on federal, state, and foreign tax returns for all open tax years and does not believe that there are any uncertain tax positions that require recognition of a tax liability.
As of March 31, 2015, the Fund had capital loss carryforwards available to offset future net realized capital gains in the amount of $52,594,336 with $44,904,626 expiring in 2017 and $7,689,710 expiring in 2018.
Class allocations
The separate classes of shares offered by the Fund differ principally in applicable sales charges, distribution, shareholder servicing, and administration fees. Class specific expenses are charged directly to that share class. Investment income, common expenses, and realized and unrealized gains (losses) on investments are allocated daily to each class of shares based on the relative proportion of net assets of each class.
3. FAIR VALUATION MEASUREMENTS
Fair value measurements of investments are determined within a framework that has established a fair value hierarchy based upon the various data inputs utilized in determining the value of the Fund’s investments. The three-level hierarchy gives the highest priority to unadjusted quoted prices in active markets for identical assets or liabilities (Level 1) and the lowest priority to significant unobservable inputs (Level 3). The Fund’s investments are classified within the fair value hierarchy based on the lowest level of input that is significant to the fair value measurement. The inputs are summarized into three broad levels as follows:
| n | | Level 1 – quoted prices in active markets for identical securities |
| n | | Level 2 – other significant observable inputs (including quoted prices for similar securities, interest rates, prepayment speeds, credit risk, use of amortized cost, etc.) |
| n | | Level 3 – significant unobservable inputs (including the Fund’s own assumptions in determining the fair value of investments) |
| | | | | | |
| Notes to financial statements (unaudited) | | Wells Fargo Advantage Intrinsic Small Cap Value Fund | | | 21 | |
The inputs or methodologies used for valuing investments in securities are not necessarily an indication of the risk associated with investing in those securities.
The following is a summary of the inputs used in valuing the Fund’s assets and liabilities as of September 30, 2015:
| | | | | | | | | | | | | | | | |
| | | Quoted prices
(Level 1) | | | Other significant observable inputs (Level 2) | | | Significant
unobservable inputs
(Level 3) | | | Total | |
Assets | | | | | | | | | | | | | | | | |
Investments in: | | | | | | | | | | | | | | | | |
| | | | |
Common stocks | | | | | | | | | | | | | | | | |
Consumer discretionary | | $ | 16,510,215 | | | $ | 0 | | | $ | 0 | | | $ | 16,510,215 | |
Consumer staples | | | 9,753,923 | | | | 0 | | | | 0 | | | | 9,753,923 | |
Energy | | | 11,963,442 | | | | 0 | | | | 0 | | | | 11,963,442 | |
Financials | | | 37,885,785 | | | | 0 | | | | 0 | | | | 37,885,785 | |
Health care | | | 12,966,334 | | | | 0 | | | | 0 | | | | 12,966,334 | |
Industrials | | | 21,656,988 | | | | 0 | | | | 0 | | | | 21,656,988 | |
Information technology | | | 10,758,244 | | | | 1,492,758 | | | | 0 | | | | 12,251,002 | |
Materials | | | 1,973,357 | | | | 0 | | | | 0 | | | | 1,973,357 | |
Utilities | | | 2,537,232 | | | | 0 | | | | 0 | | | | 2,537,232 | |
| | | | |
Short-term investments | | | | | | | | | | | | | | | | |
Investment companies | | | 4,342,704 | | | | 16,158,925 | | | | 0 | | | | 20,501,629 | |
Total assets | | $ | 130,348,224 | | | $ | 17,651,683 | | | $ | 0 | | | $ | 147,999,907 | |
The Fund recognizes transfers between levels within the fair value hierarchy at the end of the reporting period. At September 30, 2015, the Fund did not have any transfers into/out of Level 1, Level 2, or Level 3.
4. TRANSACTIONS WITH AFFILIATES
Management fee
Funds Management, an indirect wholly owned subsidiary of Wells Fargo & Company (“Wells Fargo”), is the manager of the Fund and provides advisory and fund-level administrative services under an investment management agreement. Under the investment management agreement, Funds Management is responsible for, among other services, implementing the investment objectives and strategies of the Fund, supervising the applicable subadviser, providing fund-level administrative services in connection with the Fund’s operations, and providing any other fund-level administrative services reasonably necessary for the operation of the Fund. As compensation for its services under the investment management agreement, Funds Management is entitled to receive an annual management fee starting at 0.85% and declining to 0.71% as the average daily net assets of the Fund increase.
Prior to July 1, 2015, Funds Management provided advisory services pursuant to an investment advisory agreement and was entitled to receive an annual fee which started at 0.80% and declined to 0.68% as the average daily net assets of the Fund increased. In addition, fund-level administrative services were provided by Funds Management under a separate administration agreement at an annual fee which started at 0.05% and declined to 0.03% as the average daily net assets of the Fund increased. For financial statement purposes, the advisory fee and fund-level administration fee for the six months ended September 30, 2015 have been included in management fee on the Statement of Operations.
For the six months ended September 30, 2015, the management fee was equivalent to an annual rate of 0.85% of the Fund’s average daily net assets.
Funds Management has retained the services of a subadviser to provide daily portfolio management to the Fund. The fee for subadvisory services is borne by Funds Management. Metropolitan West Capital Management, LLC, an affiliate of Funds Management and an indirect wholly owned subsidiary of Wells Fargo, is the subadviser to the Fund and is entitled to receive a fee from Funds Management at an annual rate starting at 0.55% and declining to 0.40% as the average daily net assets of the Fund increase.
Administration fees
Under a class-level administration agreement, Funds Management provides class-level administrative services to the Fund, which includes paying fees and expenses for services provided by the transfer agent, sub-transfer agents, omnibus
| | | | |
| 22 | | Wells Fargo Advantage Intrinsic Small Cap Value Fund | | Notes to financial statements (unaudited) |
account servicers and record-keepers. As compensation for its services under the class-level administration agreement, Funds Management receives an annual fee which is calculated based on the average daily net assets of each class as follows:
| | | | | | | | |
| | | Class-level administration fee | |
| | | Current rate | | | Rate prior to
July 1, 2015 | |
Class A, Class C | | | 0.21 | % | | | 0.26 | % |
Administrator Class | | | 0.13 | | | | 0.10 | |
Institutional Class | | | 0.13 | | | | 0.08 | |
Investor Class | | | 0.32 | | | | 0.32 | |
Funds Management has contractually waived and/or reimbursed management and administration fees to the extent necessary to maintain certain net operating expense ratios for the Fund. Waiver of fees and/or reimbursement of expenses by Funds Management were made first from fund level expenses on a proportionate basis and then from class specific expenses. Funds Management has committed through July 31, 2016 to waive fees and/or reimburse expenses to the extent necessary to cap the Fund’s expenses at 1.35% for Class A shares, 2.10% for Class C shares, 1.20% for Class Administrator shares, 1.00% for Institutional Class shares, and 1.46% for Investor Class shares. After this time, the cap may be increased or the commitment to maintain the cap may be terminated only with the approval of the Board of Trustees.
Distribution fee
The Trust has adopted a distribution plan for Class C shares of the Fund pursuant to Rule 12b-1 under the 1940 Act. A distribution fee is charged to Class C shares and paid to Wells Fargo Funds Distributor, LLC (“Funds Distributor”), the principal underwriter, at an annual rate of 0.75% of the average daily net assets of Class C shares.
In addition, Funds Distributor is entitled to receive the front-end sales charge from the purchase of Class A shares and a contingent deferred sales charge on the redemption of certain Class A shares. Funds Distributor is also entitled to receive the contingent deferred sales charges from redemptions of Class C shares. For the six months ended September 30, 2015, Funds Distributor received $315 from the sale of Class A shares.
Shareholder servicing fees
The Trust has entered into contracts with one or more shareholder servicing agents, whereby Class A, Class C, Administrator Class, and Investor Class of the Fund is charged a fee at an annual rate of 0.25% of the average daily net assets of each respective class.
A portion of these total shareholder servicing fees were paid to affiliates of Wells Fargo.
5. INVESTMENT PORTFOLIO TRANSACTIONS
Purchases and sales of investments, excluding U.S. government obligations (if any) and short-term securities, for the six months ended September 30, 2015 were $40,560,215 and $37,477,225, respectively.
6. BANK BORROWINGS
The Trust (excluding the money market funds) and Wells Fargo Variable Trust are parties to a $200,000,000 revolving credit agreement whereby the Fund is permitted to use bank borrowings for temporary or emergency purposes, such as to fund shareholder redemption requests. Interest under the credit agreement is charged to the Fund based on a borrowing rate equal to the higher of the Federal Funds rate in effect on that day plus 1.25% or the overnight LIBOR rate in effect on that day plus 1.25%. In addition, an annual commitment fee equal to 0.20% of the unused balance is allocated to each participating fund. Prior to September 1, 2015, the revolving credit agreement amount was $150,000,000 and the annual commitment fee was equal to 0.10% of the unused balance is allocated to each participating fund. For the six months ended September 30, 2015, the Fund paid $136 in commitment fees.
For the six months ended September 30, 2015, there were no borrowings by the Fund under the agreement.
7. CONCENTRATION RISK
Concentration risks result from exposure to a limited number of sectors. A fund that invests a substantial portion of its assets in any sector may be more affected by changes in that sector than would be a fund whose investments are not heavily weighted in any sector.
| | | | | | |
| Notes to financial statements (unaudited) | | Wells Fargo Advantage Intrinsic Small Cap Value Fund | | | 23 | |
8. INDEMNIFICATION
Under the Trust’s organizational documents, the officers and Trustees have been granted certain indemnification rights against certain liabilities that may arise out of performance of their duties to the Trust. Additionally, in the normal course of business, the Trust may enter into contracts with service providers that contain a variety of indemnification clauses. The Trust’s maximum exposure under these arrangements is dependent on future claims that may be made against the Fund and, therefore, cannot be estimated.
9. SUBSEQUENT EVENT
After the close of business on October 23, 2015, Investor Class shares of the Fund became Class A shares in a tax-free conversion. Shareholders of Investor Class of the Fund received Class A shares at a value equal to the value of their Investor Class shares immediately prior to the conversion.
| | | | |
| 24 | | Wells Fargo Advantage Intrinsic Small Cap Value Fund | | Other information (unaudited) |
PROXY VOTING INFORMATION
A description of the policies and procedures that the Fund uses to determine how to vote proxies relating to portfolio securities is available, upon request, by calling 1-800-222-8222, visiting our website at wellsfargoadvantagefunds.com, or visiting the SEC website at sec.gov. Information regarding how the Fund voted proxies relating to portfolio securities during the most recent 12-month period ended June 30 is available on the Fund’s website at wellsfargoadvantagefunds.com or by visiting the SEC website at sec.gov.
PORTFOLIO HOLDINGS INFORMATION
The complete portfolio holdings for the Fund are publicly available monthly on the Fund’s website (wellsfargoadvantagefunds.com), on a one-month delayed basis. In addition, top ten holdings information (excluding derivative positions) for the Fund is publicly available on the Fund’s website on a monthly, seven-day or more delayed basis. The Fund files its complete schedule of portfolio holdings with the SEC for the first and third quarters of each fiscal year on Form N-Q, which is available by visiting the SEC website at sec.gov. In addition, the Fund’s Form N-Q may be reviewed and copied at the SEC’s Public Reference Room in Washington, DC, and at regional offices in New York City, at 233 Broadway, and in Chicago, at 175 West Jackson Boulevard, Suite 900. Information about the Public Reference Room may be obtained by calling 1-800-SEC-0330.
| | | | | | |
| Other information (unaudited) | | Wells Fargo Advantage Intrinsic Small Cap Value Fund | | | 25 | |
BOARD OF TRUSTEES AND OFFICERS
Each of the Trustees and Officers1 listed in the table below acts in identical capacities for each fund in the Wells Fargo Advantage family of funds, which consists of 144 mutual funds comprising the Wells Fargo Funds Trust, Wells Fargo Variable Trust, Wells Fargo Master Trust and four closed-end funds (collectively the “Fund Complex”). This table should be read in conjunction with the Prospectus and the Statement of Additional Information2. The mailing address of each Trustee and Officer is 525 Market Street, 12th Floor, San Francisco, CA 94105. Each Trustee and Officer serves an indefinite term, however, each Trustee serves such term until reaching the mandatory retirement age established by the Trustees.
Independent Trustees
| | | | | | |
Name and
year of birth | | Position held and
length of service* | | Principal occupations during past five years or longer | | Other
public company or
investment company directorships during
past 5 years |
| William R. Ebsworth (Born 1957) | | Trustee, since 2015** | | Retired. From 1984 to 2013, equities analyst, portfolio manager, research director at Fidelity Management and Research Company and retired in 2013 as Chief Investment Officer of Fidelity Strategic Advisers, Inc. in Boston, Tokyo, and Hong Kong where he led a team of investment professionals managing client assets. Prior thereto, Board member of Hong Kong Securities Clearing Co., Hong Kong Options Clearing Corp., the Thailand International Fund, Ltd., Fidelity Investments Life Insurance Company, and Empire Fidelity Investments Life Insurance Company. Mr. Ebsworth is a CFA® charterholder and an Adjunct Adjunct Lecturer, Finance, at Babson College. | | Asset Allocation Trust |
| Jane A. Freeman (Born 1953) | | Trustee, since 2015** | | Retired. From 2012 to 2014 and 1999 to 2008, Chief Financial Officer of Scientific Learning Corporation. From 2008 to 2012, Ms. Freeman provided consulting services related to strategic business projects. Prior to 1999, Portfolio Manager at Rockefeller & Co. and Scudder, Stevens & Clark. Board member of the Harding Loevner Funds from 1996 to 2014, serving as both Lead Independent Director and chair of the Audit Committee. Board member of the Russell Exchange Traded Funds Trust from 2011 to 2012 and the chair of the Audit Committee. Ms. Freeman is Chair of Taproot Foundation (non-profit organization), a Board Member of Ruth Bancroft Garden (non-profit organization) and an inactive chartered financial analyst. | | Asset Allocation Trust; Harding Loevner Funds; Russell Exchange Traded Funds Trust |
| Peter G. Gordon (Born 1942) | | Trustee, since 1998; Chairman, since 2005 | | Co-Founder, Retired Chairman, President and CEO of Crystal Geyser Water Company. Trustee Emeritus, Colby College. | | Asset Allocation Trust |
| Isaiah Harris, Jr. (Born 1952) | | Trustee, since 2009 | | Retired. Chairman of the Board of CIGNA Corporation since 2009, and Director since 2005. From 2003 to 2011, Director of Deluxe Corporation. Prior thereto, President and CEO of BellSouth Advertising and Publishing Corp. from 2005 to 2007, President and CEO of BellSouth Enterprises from 2004 to 2005 and President of BellSouth Consumer Services from 2000 to 2003. Emeritus member of the Iowa State University Foundation Board of Governors. Emeritus Member of the Advisory Board of Iowa State University School of Business. Advisory Board Member, Palm Harbor Academy (charter school). Mr. Harris is a certified public accountant. | | CIGNA Corporation; Asset Allocation Trust |
| Judith M. Johnson (Born 1949) | | Trustee, since 2008; Audit Committee Chairman, since 2008 | | Retired. Prior thereto, Chief Executive Officer and Chief Investment Officer of Minneapolis Employees Retirement Fund from 1996 to 2008. Ms. Johnson is an attorney, certified public accountant and a certified managerial accountant. | | Asset Allocation Trust |
| David F. Larcker (Born 1950) | | Trustee, since 2009 | | James Irvin Miller Professor of Accounting at the Graduate School of Business, Stanford University, Morgan Stanley Director of the Center for Leadership Development and Research and Senior Faculty of The Rock Center for Corporate Governance since 2006. From 2005 to 2008, Professor of Accounting at the Graduate School of Business, Stanford University. Prior thereto, Ernst & Young Professor of Accounting at The Wharton School, University of Pennsylvania from 1985 to 2005. | | Asset Allocation Trust |
| | | | |
| 26 | | Wells Fargo Advantage Intrinsic Small Cap Value Fund | | Other information (unaudited) |
| | | | | | |
Name and
year of birth | | Position held and
length of service* | | Principal occupations during past five years or longer | | Other
public company or
investment company directorships during
past 5 years |
| Olivia S. Mitchell (Born 1953) | | Trustee, since 2006 | | International Foundation of Employee Benefit Plans Professor, Wharton School of the University of Pennsylvania since 1993. Director of Wharton’s Pension Research Council and Boettner Center on Pensions & Retirement Research, and Research Associate at the National Bureau of Economic Research. Previously, Cornell University Professor from 1978 to 1993. | | Asset Allocation Trust |
| Timothy J. Penny (Born 1951) | | Trustee, since 1996 | | President and Chief Executive Officer of Southern Minnesota Initiative Foundation, a non-profit organization, since 2007 and Senior Fellow at the Humphrey Institute Policy Forum at the University of Minnesota since 1995. Member of the Board of Trustees of NorthStar Education Finance, Inc., a non-profit organization, since 2007. | | Asset Allocation Trust |
| Michael S. Scofield (Born 1943) | | Trustee, since 2010 | | Served on the Investment Company Institute’s Board of Governors and Executive Committee from 2008-2011 as well the Governing Council of the Independent Directors Council from 2006-2011 and the Independent Directors Council Executive Committee from 2008-2011. Chairman of the IDC from 2008-2010. Institutional Investor (Fund Directions) Trustee of Year in 2007. Trustee of the Evergreen Funds complex (and its predecessors) from 1984 to 2010. Chairman of the Evergreen Funds from 2000-2010. Former Trustee of the Mentor Funds. Retired Attorney, Law Offices of Michael S. Scofield. | | Asset Allocation Trust |
| Donald C. Willeke (Born 1940) | | Trustee, since 1996 | | Principal of the law firm of Willeke & Daniels. General Counsel of the Minneapolis Employees Retirement Fund from 1984 until its consolidation into the Minnesota Public Employees Retirement Association on June 30, 2010. Director and Vice Chair of The Tree Trust (non-profit corporation). Director of the American Chestnut Foundation (non-profit corporation). | | Asset Allocation Trust |
| * | Length of service dates reflect the Trustee’s commencement of service with the Trust’s predecessor entities, where applicable. |
| ** | William R. Ebsworth and Jane A. Freeman each became a Trustee effective January 1, 2015. |
Officers
| | | | | | |
Name and year of birth | | Position held and
length of service | | Principal occupations during past five years or longer | | |
| Karla M. Rabusch (Born 1959) | | President, since 2003 | | Executive Vice President of Wells Fargo Bank, N.A. and President of Wells Fargo Funds Management, LLC since 2003. | | |
Nancy Wiser1 (Born 1967) | | Treasurer, since 2012 | | Executive Vice President of Wells Fargo Funds Management, LLC since 2011. Chief Operating Officer and Chief Compliance Officer at LightBox Capital Management LLC, from 2008 to 2011. | | |
| C. David Messman (Born 1960) | | Secretary, since 2000; Chief Legal Officer, since 2003 | | Senior Vice President and Secretary of Wells Fargo Funds Management, LLC since 2001. Assistant General Counsel of Wells Fargo Bank, N.A. since 2013 and Vice President and Managing Counsel of Wells Fargo Bank N.A. from 1996 to 2013. | | |
Debra Ann Early (Born 1964) | | Chief Compliance Officer, since 2007 | | Executive Vice President of Wells Fargo Funds Management, LLC since 2014, Senior Vice President and Chief Compliance Officer from 2007 to 2014. | | |
David Berardi (Born 1975) | | Assistant Treasurer, since 2009 | | Vice President of Wells Fargo Funds Management, LLC since 2009. Vice President of Evergreen Investment Management Company, LLC from 2008 to 2010. Manager of Fund Reporting and Control for Evergreen Investment Management Company, LLC from 2004 to 2010. | | |
| Jeremy DePalma1 (Born 1974) | | Assistant Treasurer, since 2009 | | Senior Vice President of Wells Fargo Funds Management, LLC since 2009. Senior Vice President of Evergreen Investment Management Company, LLC from 2008 to 2010 and head of the Fund Reporting and Control Team within Fund Administration from 2005 to 2010. | | |
| 1 | Nancy Wiser acts as Treasurer of 72 funds in the Fund Complex. Jeremy DePalma acts as Treasurer of 72 funds and Assistant Treasurer of 72 funds in the Fund Complex. |
| 2 | The Statement of Additional Information includes additional information about the Trustees and is available, without charge, upon request, by calling 1-800-222-8222 or by visiting the website at wellsfargoadvantagefunds.com. |
| | | | | | |
| Other information (unaudited) | | Wells Fargo Advantage Intrinsic Small Cap Value Fund | | | 27 | |
BOARD CONSIDERATION OF INVESTMENT ADVISORY, INVESTMENT MANAGEMENT AND SUB-ADVISORY AGREEMENTS:
Under the Investment Company Act of 1940 (the “1940 Act”), the Board of Trustees (the “Board”) of Wells Fargo Funds Trust (the “Trust”) must determine annually whether to approve the continuation of the Trust’s investment advisory and sub-advisory agreements. In this regard, at an in-person meeting held on May 19-20, 2015 (the “Meeting”), the Board, all the members of which have no direct or indirect interest in the investment advisory and sub-advisory agreements and are not “interested persons” of the Trust, as defined in the 1940 Act (the “Independent Trustees”), reviewed and approved for Wells Fargo Advantage Intrinsic Small Cap Value Fund (the “Fund”): (i) an investment advisory agreement (the “Advisory Agreement”) with Wells Fargo Funds Management, LLC (“Funds Management”); (ii) an investment management agreement (the “Management Agreement”) with Funds Management; and (iii) an investment sub-advisory agreement (the “Sub-Advisory Agreement”) with Metropolitan West Capital Management, LLC (the “Sub-Adviser”), an affiliate of Funds Management. The Management Agreement combines the terms of the Advisory Agreement with the terms of the Fund’s Amended and Restated Administration Agreement (the “Administration Agreement”) applicable to Fund-level administrative services. The Advisory Agreement, the Management Agreement and the Sub-Advisory Agreement are collectively referred to as the “Advisory Agreements.”
At the Meeting, the Board considered the factors and reached the conclusions described below relating to the selection of Funds Management and the Sub-Adviser and the approval of the Advisory Agreements. Prior to the Meeting, including at an in-person meeting in March 2015, the Trustees conferred extensively among themselves and with representatives of Funds Management about these matters. Also, the Board has adopted a team-based approach, with each team consisting of a sub-set of Trustees, to assist the full Board in the discharge of its duties in reviewing performance and other matters throughout the year. The Independent Trustees were assisted in their evaluation of the Advisory Agreements by independent legal counsel, from whom they received separate legal advice and with whom they met separately.
In providing information to the Board, Funds Management and the Sub-Adviser were guided by a detailed set of requests for information submitted to them by independent legal counsel on behalf of the Independent Trustees at the start of the Board’s annual contract renewal process earlier in 2015. In considering and approving the Advisory Agreements, the Trustees considered the information they believed relevant, including but not limited to the information discussed below. The Board considered not only the specific information presented in connection with the Meeting, but also the knowledge gained over time through interaction with Funds Management and the Sub-Adviser about various topics. In this regard, the Board reviewed reports of Funds Management at each of its quarterly meetings, which included, among other things, portfolio reviews and performance reports. In addition, the Board and the teams mentioned above confer with portfolio managers at various times throughout the year. The Board did not identify any particular information or consideration that was all-important or controlling, and each individual Trustee may have attributed different weights to various factors.
After its deliberations, the Board unanimously approved the continuation of the Advisory Agreement for the period from June 1, 2015 through June 30, 2015, approved the Management Agreement for the period from July 1, 2015 through May 31, 2016, and approved the continuation of the Sub-Advisory Agreement for a one-year term through May 31, 2016. The Board also determined that the compensation payable to Funds Management and the Sub-Adviser under each of the Advisory Agreements was reasonable. The Board considered the approval of the Advisory Agreements for the Fund as part of its consideration of agreements for funds across the complex, but its approvals were made on a fund-by-fund basis. The following summarizes a number of important, but not necessarily all, factors considered by the Board in support of its approvals.
Nature, extent and quality of services
The Board received and considered various information regarding the nature, extent and quality of services provided to the Fund by Funds Management and the Sub-Adviser under the Advisory Agreements. This information included, among other things, a summary of the background and experience of senior management of Funds Management, and the qualifications, background, tenure and responsibilities of each of the portfolio managers primarily responsible for the day-to-day portfolio management of the Fund. The Board noted that the services to be provided to the Fund pursuant to the Management Agreement combined the advisory services previously provided to the Fund pursuant to the Fund’s Advisory Agreement with the Fund-level administrative services previously provided to the Fund pursuant to the Fund’s Administration Agreement. The Board received a representation from Funds Management that combining these services would not result in any change to the nature or level of services provided by Funds Management to the Fund.
| | | | |
| 28 | | Wells Fargo Advantage Intrinsic Small Cap Value Fund | | Other information (unaudited) |
The Board evaluated the ability of Funds Management and the Sub-Adviser to attract and retain qualified investment professionals, including research, advisory and supervisory personnel. The Board further considered the compliance programs and compliance records of Funds Management and the Sub-Adviser. In addition, the Board took into account the full range of services provided to the Fund by Funds Management and its affiliates.
Fund performance and expenses
The Board considered the performance results for the Fund over various time periods ended March 31, 2015. The Board considered these results in comparison to the performance of funds in a universe that was determined by Lipper Inc. (“Lipper”) to be similar to the Fund (the “Universe”), and in comparison to the Fund’s benchmark index and to other comparative data. Lipper is an independent provider of investment company data. The Board received a description of the methodology used by Lipper to select the mutual funds in the performance Universe. The Board noted that the performance of the Fund (Administrator Class) was higher than or in range of the average performance of the Universe for all periods under review except the first quarter of 2015 and the ten-year period. The Board also noted that the performance of the Fund was higher than its benchmark, the Russell 2000® Value Index, for all periods under review except the ten-year period.
The Board also received and considered information regarding the Fund’s net operating expense ratios and their various components, including actual management fees (which reflect fee waivers, if any, and include advisory, administration and transfer agent fees), custodian and other non-management fees, and Rule 12b-1 and non-Rule 12b-1 service fees. The Board considered these ratios in comparison to the median ratios of funds in class-specific expense groups that were determined by Lipper to be similar to the Fund (the “Groups”). The Board received a description of the methodology used by Lipper to select the mutual funds in the expense Groups and an explanation of how funds comprising expense groups and their expense ratios may vary from year-to-year. Based on the Lipper reports, the Board noted that the net operating expense ratios of the Fund were lower than or in the range of the median net operating expense ratios of the expense Groups. The Board discussed and accepted Funds Management’s proposal to convert the Investor Class shares into Class A shares. The Board also discussed and accepted Funds Management’s proposal to reduce the net operating expense ratio caps for Class A and Class C shares.
The Board took into account the Fund performance and expense information provided to it among the factors considered in deciding to re-approve the Advisory Agreement and Sub-Advisory Agreement and approve the Management Agreement.
Investment advisory and sub-advisory fee rates
The Board reviewed and considered the contractual investment advisory fee rates that are payable by the Fund to Funds Management for investment advisory services (the “Advisory Agreement Rates”), both on a stand-alone basis and on a combined basis with the Fund’s fund-level and class-level contractual administration fee rates (the “Management Rates”). The Board noted that the Management Rates include transfer agency and sub-transfer agency costs. The Board also noted that the fee rate to be paid by the Fund under the Management Agreement will incorporate the advisory fee and Fund-level administration fee previously payable separately by the Fund under the Fund’s Advisory Agreement and Administration Agreement with Funds Management. The Board also reviewed and considered the contractual investment sub-advisory fee rates that are payable by Funds Management to the Sub-Adviser for investment sub-advisory services (the “Sub-Advisory Agreement Rates”).
Among other information reviewed by the Board was a comparison of the Management Rates of the Fund with those of other funds in the expense Groups at a common asset level. The Board noted that the Management Rate for the Investor Class was higher than the average rate of the Investor Class’s expense Group, while the Management Rates for all other share classes of the Fund were lower than or in the range of their respective expense Groups. The Board discussed and accepted Funds Management’s proposal to convert the Investor Class shares into Class A shares.
The Board also received and considered information about the portion of the total advisory fee that was retained by Funds Management after payment of the fee to the Sub-Adviser for sub-advisory services. In assessing the reasonableness of this amount, the Board received and evaluated information about the nature and extent of responsibilities retained and risks assumed by Funds Management and not delegated to or assumed by the Sub-Adviser, and about Funds Management’s on-going oversight services. However, given the affiliation between Funds Management and the Sub-Adviser, the Board ascribed limited relevance to the allocation of the advisory fee between them.
The Board also received and considered information about the nature and extent of services offered and fee rates charged by Funds Management and the Sub-Adviser to other types of clients with investment strategies similar to those of the Fund. In this regard, the Board received information about the significantly greater scope of services, and
| | | | | | |
| Other information (unaudited) | | Wells Fargo Advantage Intrinsic Small Cap Value Fund | | | 29 | |
compliance, reporting and other legal burdens and risks of managing mutual funds compared with those associated with managing assets of non-mutual fund clients such as collective funds or institutional separate accounts.
Based on its consideration of the factors and information it deemed relevant, including those described here, the Board determined that the compensation payable to Funds Management under the Management Agreement and Advisory Agreement and to the Sub-Adviser under the Sub-Advisory Agreement was reasonable, in light of the services covered by the Advisory Agreements.
Profitability
The Board received and considered information concerning the profitability of Funds Management, as well as the profitability of Wells Fargo as a whole, from providing services to the Fund and the fund family as a whole. The Board also received and considered information concerning the profitability of the Sub-Adviser from providing services to the fund family as a whole, noting that the Sub-Adviser’s profitability information with respect to providing services to the Fund was subsumed in the Wells Fargo profitability analysis.
Funds Management reported on the methodologies and estimates used in calculating profitability. Among other things, the Board noted that the levels of profitability reported on a fund-by-fund basis varied widely, depending on factors such as the size and type of fund. Based on its review, the Board did not deem the profits reported by Funds Management or Wells Fargo from its services to the Fund to be at a level that would prevent it from approving the continuation of the Advisory Agreements.
Economies of scale
With respect to possible economies of scale, the Board noted the existence of breakpoints in the Fund’s advisory and management fee structures, and the Fund’s administration fee structure, which operate generally to reduce the Fund’s expense ratios as the Fund grows in size. It considered that, for a small fund or a fund that shrinks in size, breakpoints conversely can result in higher fee levels. The Board also considered that fee waiver and expense reimbursement arrangements and competitive fee rates at the outset are means of sharing potential economies of scale with shareholders of the Fund and the fund family as a whole. The Board considered Funds Management’s view that any analyses of potential economies of scale in managing a particular fund are inherently limited in light of the joint and common costs and investments that Funds Management incurs across the fund family as a whole.
The Board concluded that the Fund’s fee and expense arrangements, including contractual breakpoints, constituted a reasonable approach to sharing potential economies of scale with the Fund and its shareholders.
Other benefits to Funds Management and the Sub-Adviser
The Board received and considered information regarding potential “fall-out” or ancillary benefits received by Funds Management and its affiliates, including the Sub-Adviser, as a result of their relationships with the Fund. Ancillary benefits could include, among others, benefits directly attributable to other relationships with the Fund and benefits potentially derived from an increase in Funds Management’s and the Sub-Adviser’s business as a result of their relationships with the Fund. The Board noted that various affiliates of Funds Management may receive distribution-related fees, shareholder servicing payments and sub-transfer agency fees in respect of shares sold or held through them and services provided.
The Board also reviewed information about soft dollar credits earned and utilized by the Sub-Adviser, fees earned by Funds Management from managing a private investment vehicle for the fund family’s securities lending collateral and commissions earned by an affiliated broker from portfolio transactions.
Based on its consideration of the factors and information it deemed relevant, including those described here, the Board did not find that any ancillary benefits received by Funds Management and its affiliates, including the Sub-Adviser, were unreasonable.
Conclusion
At the Meeting, after considering the above-described factors and based on its deliberations and its evaluation of the information described above, the Board unanimously approved the continuation of the Advisory Agreement for the period from June 1, 2015 through June 30, 2015, approved the Management Agreement for the period from July 1, 2015 through May 31, 2016, and approved the continuation of the Sub-Advisory Agreement for a one-year term through May 31, 2016. The Board also determined that the compensation payable to Funds Management and the Sub-Adviser under each of the Advisory Agreements was reasonable.
| | | | |
| 30 | | Wells Fargo Advantage Intrinsic Small Cap Value Fund | | List of abbreviations |
The following is a list of common abbreviations for terms and entities that may have appeared in this report.
| ACA | — ACA Financial Guaranty Corporation |
| ADR | — American depositary receipt |
| ADS | — American depositary shares |
| AGC | — Assured Guaranty Corporation |
| AGM | — Assured Guaranty Municipal |
| Ambac | — Ambac Financial Group Incorporated |
| AMT | — Alternative minimum tax |
| BAN | — Bond anticipation notes |
| BHAC | — Berkshire Hathaway Assurance Corporation |
| CAB | — Capital appreciation bond |
| CCAB | — Convertible capital appreciation bond |
| CDA | — Community Development Authority |
| CDO | — Collateralized debt obligation |
| DRIVER | — Derivative inverse tax-exempt receipts |
| DW&P | — Department of Water & Power |
| DWR | — Department of Water Resources |
| ECFA | — Educational & Cultural Facilities Authority |
| EDA | — Economic Development Authority |
| EDFA | — Economic Development Finance Authority |
| ETF | — Exchange-traded fund |
| FDIC | — Federal Deposit Insurance Corporation |
| FFCB | — Federal Farm Credit Banks |
| FGIC | — Financial Guaranty Insurance Corporation |
| FHA | — Federal Housing Administration |
| FHLB | — Federal Home Loan Bank |
| FHLMC | — Federal Home Loan Mortgage Corporation |
| FICO | — The Financing Corporation |
| FNMA | — Federal National Mortgage Association |
| GDR | — Global depositary receipt |
| GNMA | — Government National Mortgage Association |
| HCFR | — Healthcare facilities revenue |
| HEFA | — Health & Educational Facilities Authority |
| HEFAR | — Higher education facilities authority revenue |
| HFA | — Housing Finance Authority |
| HFFA | — Health Facilities Financing Authority |
| HUD | — Department of Housing and Urban Development |
| IDA | — Industrial Development Authority |
| IDAG | — Industrial Development Agency |
| KRW | — Republic of Korea won |
| LIBOR | — London Interbank Offered Rate |
| LIFER | — Long Inverse Floating Exempt Receipts |
| LLC | — Limited liability company |
| LLLP | — Limited liability limited partnership |
| LLP | — Limited liability partnership |
| MBIA | — Municipal Bond Insurance Association |
| MFHR | — Multifamily housing revenue |
| MSTR | — Municipal securities trust receipts |
| MUD | — Municipal Utility District |
| National | — National Public Finance Guarantee Corporation |
| PCFA | — Pollution Control Financing Authority |
| PCL | — Public Company Limited |
| PCR | — Pollution control revenue |
| PFA | — Public Finance Authority |
| PFFA | — Public Facilities Financing Authority |
| PFOTER | — Puttable floating option tax-exempt receipts |
| plc | — Public limited company |
| PUTTER | — Puttable tax-exempt receipts |
| R&D | — Research & development |
| Radian | — Radian Asset Assurance |
| RAN | — Revenue anticipation notes |
| RDA | — Redevelopment Authority |
| RDFA | — Redevelopment Finance Authority |
| REIT | — Real estate investment trust |
| ROC | — Reset option certificates |
| SAVRS | — Select auction variable rate securities |
| SBA | — Small Business Authority |
| SDR | — Swedish depositary receipt |
| SFHR | — Single-family housing revenue |
| SFMR | — Single-family mortgage revenue |
| SPA | — Standby purchase agreement |
| SPDR | — Standard & Poor’s Depositary Receipts |
| SPEAR | — Short Puttable Exempt Adjustable Receipts |
| STRIPS | — Separate trading of registered interest and |
| TAN | — Tax anticipation notes |
| TIPS | — Treasury inflation-protected securities |
| TRAN | — Tax revenue anticipation notes |
| TTFA | — Transportation Trust Fund Authority |
| TVA | — Tennessee Valley Authority |
This page is intentionally left blank.
This page is intentionally left blank.


For more information
More information about Wells Fargo Advantage Funds is available free upon request. To obtain literature, please write, email, visit the Fund’s website, or call:
Wells Fargo Advantage Funds
P.O. Box 8266
Boston, MA 02266-8266
Email: wfaf@wellsfargo.com
Website: wellsfargoadvantagefunds.com
Individual investors: 1-800-222-8222
Retail investment professionals: 1-888-877-9275
Institutional investment professionals: 1-866-765-0778
This report and the financial statements contained herein are submitted for the general information of the shareholders of Wells Fargo Advantage Funds. If this report is used for promotional purposes, distribution of the report must be accompanied or preceded by a current prospectus. Before investing, please consider the investment objectives, risks, charges, and expenses of the investment. For a current prospectus and, if available, a summary prospectus, containing this information, call 1-800-222-8222 or visit the Fund’s website at wellsfargoadvantagefunds.com. Read the prospectus carefully before you invest or send money.
Wells Fargo Funds Management, LLC, a wholly owned subsidiary of Wells Fargo & Company, provides investment advisory and administrative services for Wells Fargo Advantage Funds. Other affiliates of Wells Fargo & Company provide subadvisory and other services for the Funds. The Funds are distributed by Wells Fargo Funds Distributor, LLC, Member FINRA, an affiliate of Wells Fargo & Company.
NOT FDIC INSURED ¡ NO BANK GUARANTEE ¡ MAY LOSE VALUE
© 2015 Wells Fargo Funds Management, LLC. All rights reserved.
| | |
 | | 237480 11-15 SA242/SAR242 09-15 |

Wells Fargo Advantage
Small Cap Opportunities Fund

Semi-Annual Report
September 30, 2015

Reduce clutter. Save trees.
Sign up for electronic delivery of prospectuses and shareholder reports at wellsfargo.com/advantagedelivery
Contents
The views expressed and any forward-looking statements are as of September 30, 2015, unless otherwise noted, and are those of the Fund managers and/or Wells Fargo Funds Management, LLC. Discussions of individual securities, or the markets generally, or any Wells Fargo Advantage Fund are not intended as individual recommendations. Future events or results may vary significantly from those expressed in any forward-looking statements; the views expressed are subject to change at any time in response to changing circumstances in the market. Wells Fargo Funds Management, LLC and the Fund disclaim any obligation to publicly update or revise any views expressed or forward-looking statements.
NOT FDIC INSURED ¡ NO BANK GUARANTEE ¡ MAY LOSE VALUE
| | | | |
| 2 | | Wells Fargo Advantage Small Cap Opportunities Fund | | Letter to shareholders (unaudited) |

Karla M. Rabusch
President
Wells Fargo Advantage Funds
Despite generally improving U.S. economic data, the broad U.S. stock market experienced heightened volatility that led to negative results overall for U.S. stocks for the period.
Periods of uncertainty can present challenges, but experience has taught us that maintaining long-term investment goals can be an effective way to plan for the future.
Dear Valued Shareholder:
We are pleased to offer you this semi-annual report for the Wells Fargo Advantage Small Cap Opportunities Fund for the six-month period that ended September 30, 2015. Despite generally improving U.S. economic data, the broad U.S. stock market experienced heightened volatility that led to negative results overall for U.S. stocks for the period. Large-cap stocks performed best, followed by mid caps and small caps. Markets outside the U.S. faced deeper ongoing challenges and generally delivered weaker results.
U.S. stocks experienced challenges during the second quarter of 2015.
The broad U.S. stock market fluctuated widely, eventually eking out a small quarterly gain. Mid- and large-cap stocks at times were pressured by investor concerns over the potentially negative effects of financially troubled overseas economies and of a strengthening U.S. dollar on the profits of U.S. multinational firms. The U.S. economy picked up traction during the quarter; consumer spending improved, and positive trends were evident in construction and new-home sales. Jobs growth remained a bright spot as well. U.S. Federal Reserve (Fed) officials, who have kept interest rates low while waiting for the U.S. jobs market to sufficiently improve and for inflation to approach their 2% target, made clear they could take action soon. Throughout the quarter, non-U.S. markets also experienced volatility, triggered by uncertainty over the potential impact of financial challenges in other locations—most notably in Greece and Puerto Rico. Questions over slower growth in China caused investor concern as well.
In the third quarter of 2015, China’s slowdown took a toll on economies and markets worldwide.
U.S. stocks sagged during the quarter, experiencing the most volatility since 2011. Larger-cap stocks generally declined the least and smaller caps the most. Economic data released during the quarter suggested the U.S. economy remains solid but has lost some steam, burdened by the drag of the strong U.S. dollar coupled with global economic turmoil. The fact that the Fed left the federal funds interest rate unchanged at its September meeting surprised investors and fueled increased uncertainty about the U.S. economy’s stamina to remain healthy while facing the challenges of slowing in China and troubles elsewhere in the world. Outside the U.S., markets were even more volatile and delivered generally weaker quarterly results, also largely due to investors’ increasing anxiety over China’s weakened economy. Because China is the world’s largest importer of many commodities, a number of emerging markets—key commodities exporters—are struggling under the dual strains of reduced demand for commodities and, because of weaker demand, lower prices for the commodities they do sell. In the eurozone, however, where only about 3% of exports are sent to China, household spending and business investment appeared relatively unaffected by troubles elsewhere. However, the European Central Bank warned in September that slowing growth in China could lead to slower growth and lower inflation rates in the eurozone than previously forecast and indicated additional stimulus could be provided should this occur.
Don’t let short-term uncertainty derail long-term investment goals.
Periods of uncertainty can present challenges, but experience has taught us that maintaining long-term investment goals can be an effective way to plan for the future. To help you create a sound strategy based on your personal goals and risk tolerance, Wells Fargo Advantage Funds offers more than 100 mutual funds spanning a wide range of asset classes and investment styles. Although diversification cannot guarantee an investment profit or prevent losses, we believe it can be an effective way to manage investment risk and potentially smooth out overall portfolio performance. We encourage investors to know their investments and to understand that appropriate levels of risk-taking may unlock opportunities.
| | | | | | |
| Letter to shareholders (unaudited) | | Wells Fargo Advantage Small Cap Opportunities Fund | | | 3 | |
Thank you for choosing to invest in Wells Fargo Advantage Funds. We appreciate your confidence in us and remain committed to helping you meet your financial needs.
Sincerely,

Karla M. Rabusch
President
Wells Fargo Advantage Funds
Notice to shareholders
At a meeting held on August 11–12, 2015, the Board of Trustees of the Fund approved a change in the name of the Fund whereby the word “Advantage” was removed from its name, effective December 15, 2015.
For current information about your fund investments, contact your investment professional, visit our website at wellsfargoadvantagefunds.com, or call us directly at 1-800-222-8222. We are available 24 hours a day, 7 days a week.
| | | | |
| 4 | | Wells Fargo Advantage Small Cap Opportunities Fund | | Performance highlights (unaudited) |
Investment objective
The Fund seeks long-term capital appreciation.
Manager
Wells Fargo Funds Management, LLC
Subadviser
Schroder Investment Management North America Inc.
Portfolio manager
Jenny B. Jones
Average annual total returns1 (%) as of September 30, 2015
| | | | | | | | | | | | | | | | | | | | | | |
| | | | | | | | Expense ratios2 (%) | |
| | | Inception date | | 1 year | | | 5 year | | | 10 year | | | Gross | | | Net3 | |
| Administrator Class (NVSOX) | | 8-1-1993 | | | 4.52 | | | | 11.20 | | | | 8.56 | | | | 1.28 | | | | 1.21 | |
| Institutional Class (WSCOX) | | 10-31-2014 | | | 4.77 | | | | 11.26 | | | | 8.59 | | | | 1.03 | | | | 0.96 | |
| Russell 2000® Index4 | | – | | | 1.25 | | | | 11.73 | | | | 6.55 | | | | – | | | | – | |
Figures quoted represent past performance, which is no guarantee of future results, and do not reflect taxes that a shareholder may pay on fund distributions or the redemption of fund shares. Investment return and principal value of an investment will fluctuate so that an investor’s shares, when redeemed, may be worth more or less than their original cost. Current performance may be lower or higher than the performance data quoted, which assumes the reinvestment of dividends and capital gains. Current month-end performance is available on the Fund’s website, wellsfargoadvantagefunds.com.
Index returns do not include transaction costs associated with buying and selling securities, any mutual fund fees or expenses, or any taxes. It is not possible to invest directly in an index.
Administrator Class and Institutional Class shares are sold without a front-end sales charge or contingent deferred sales charge.
Stock values fluctuate in response to the activities of individual companies and general market and economic conditions. Smaller-company stocks tend to be more volatile and less liquid than those of larger companies. The use of derivatives may reduce returns and/or increase volatility. Consult the Fund’s prospectus for additional information on these and other risks.
Please see footnotes on page 5.
| | | | | | |
| Performance highlights (unaudited) | | Wells Fargo Advantage Small Cap Opportunities Fund | | | 5 | |
| | | | |
| Ten largest holdings5 (%) as of September 30, 2015 | |
iShares Russell 2000 Index ETF | | | 2.53 | |
Brown & Brown Incorporated | | | 1.72 | |
CoreLogic Incorporated | | | 1.67 | |
Mid-America Apartment Communities Incorporated | | | 1.61 | |
Equity Lifestyle Properties Incorporated | | | 1.46 | |
VWR Corporation | | | 1.43 | |
Kennedy Wilson Holdings Incorporated | | | 1.39 | |
Cleco Corporation | | | 1.39 | |
IDEX Corporation | | | 1.38 | |
Steven Madden Limited | | | 1.35 | |
| | |
| Sector distribution6 as of September 30, 2015 |
|
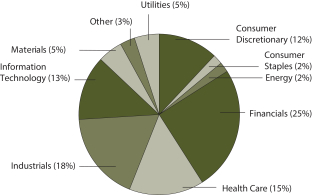 |
| 1 | Historical performance shown for the Institutional Class shares prior to their inception reflects the performance of the Administrator Class shares, and is not adjusted to reflect the Institutional Class expenses. If these expenses had been included, returns for the Institutional Class would be higher. |
| 2 | Reflects the expense ratios as stated in the most recent prospectuses, which include the impact of 0.01% in acquired fund fees and expenses. The expense ratios shown are subject to change and may differ from the annualized expense ratios shown in the financial highlights of this report, which do not include acquired fund fees and expenses. |
| 3 | The manager has contractually committed through July 31, 2016, to waive fees and/or reimburse expenses to the extent necessary to cap the Fund’s Total Annual Fund Operating Expenses After Fee Waiver at 1.20% for Administrator Class and 0.95% for Institutional Class. After this time, the cap may be increased or the commitment to maintain the cap may be terminated only with the approval of the Board of Trustees. Brokerage commissions, stamp duty fees, interest, taxes, acquired fund fees and expenses, and extraordinary expenses are excluded from the cap. Without this cap, the Fund’s returns would have been lower. |
| 4 | The Russell 2000® Index measures the performance of the 2,000 smallest companies in the Russell 3000® Index, which represents approximately 8% of the total market capitalization of the Russell 3000 Index. You cannot invest directly in an index. |
| 5 | The ten largest holdings, excluding cash and cash equivalents, are calculated based on the value of the investments divided by total net assets of the Fund. Holdings are subject to change and may have changed since the date specified. |
| 6 | Amounts are calculated based on the total long-term investments of the Fund. These amounts are subject to change and may have changed since the date specified. |
| | | | |
| 6 | | Wells Fargo Advantage Small Cap Opportunities Fund | | Fund expenses (unaudited) |
As a shareholder of the Fund, you incur ongoing costs and other Fund expenses. This example is intended to help you understand your ongoing costs (in dollars) of investing in the Fund and to compare these costs with the ongoing costs of investing in other mutual funds.
The example is based on an investment of $1,000 invested at the beginning of the six-month period and held for the entire period from April 1, 2015 to September 30, 2015.
Actual expenses
The “Actual” line of the table below provides information about actual account values and actual expenses. You may use the information in this line, together with the amount you invested, to estimate the expenses that you paid over the period. Simply divide your account value by $1,000 (for example, an $8,600 account value divided by $1,000 = 8.6), then multiply the result by the number in the “Actual” line under the heading entitled “Expenses paid during period” for your applicable class of shares to estimate the expenses you paid on your account during this period.
Hypothetical example for comparison purposes
The “Hypothetical” line of the table below provides information about hypothetical account values and hypothetical expenses based on the Fund’s actual expense ratio and an assumed rate of return of 5% per year before expenses, which is not the Fund’s actual return. The hypothetical account values and expenses may not be used to estimate the actual ending account balance or expenses you paid for the period. You may use this information to compare the ongoing costs of investing in the Fund and other funds. To do so, compare this 5% hypothetical example with the 5% hypothetical examples that appear in the shareholder reports of the other funds.
Please note that the expenses shown in the table are meant to highlight your ongoing costs. Therefore, the “Hypothetical” line of the table is useful in comparing ongoing costs only and will not help you determine the relative total costs of owning different funds.
| | | | | | | | | | | | | | | | |
| | | Beginning
account value 4-1-2015 | | | Ending
account value
09-30-2015 | | | Expenses
paid during
the period1 | | | Net annualized
expense ratio | |
Administrator Class | | | | | | | | | | | | | | | | |
Actual | | $ | 1,000.00 | | | $ | 913.85 | | | $ | 5.76 | | | | 1.20 | % |
Hypothetical (5% return before expenses) | | $ | 1,000.00 | | | $ | 1,019.05 | | | $ | 6.07 | | | | 1.20 | % |
Institutional Class | | | | | | | | | | | | | | | | |
Actual | | $ | 1,000.00 | | | $ | 915.15 | | | $ | 4.56 | | | | 0.95 | % |
Hypothetical (5% return before expenses) | | $ | 1,000.00 | | | $ | 1,020.31 | | | $ | 4.81 | | | | 0.95 | % |
| 1 | Expenses paid is equal to the annualized expense ratio of each class multiplied by the average account value over the period, multiplied by the number of days in the most recent fiscal half-year divided by the number of days in the fiscal year (to reflect the one-half-year period). |
| | | | | | |
| Portfolio of investments—September 30, 2015 (unaudited) | | Wells Fargo Advantage Small Cap Opportunities Fund | | | 7 | |
| | | | | | | | | | | | |
| Security name | | | | | | Shares | | | Value | |
| | | | | | | | | | | | |
| | | | |
Common Stocks: 89.29% | | | | | | | | | | | | |
| | | | |
Consumer Discretionary: 10.75% | | | | | | | | | | | | |
| | | | |
| Auto Components: 0.29% | | | | | | | | | | | | |
Fox Factory Holding Corporation † | | | | | | | 44,953 | | | $ | 757,908 | |
| | | | | | | | | | | | |
| | | | |
| Diversified Consumer Services: 1.28% | | | | | | | | | | | | |
Chegg Incorporated †« | | | | | | | 184,257 | | | | 1,328,493 | |
Graham Holdings Company Class B | | | | | | | 1,685 | | | | 972,245 | |
ServiceMaster Global Holdings Incorporated † | | | | | | | 32,777 | | | | 1,099,668 | |
| | | | |
| | | | | | | | | | | 3,400,406 | |
| | | | | | | | | | | | |
| | | | |
| Hotels, Restaurants & Leisure: 2.78% | | | | | | | | | | | | |
ClubCorp Holdings Incorporated | | | | | | | 110,300 | | | | 2,367,038 | |
Domino’s Pizza Incorporated | | | | | | | 16,200 | | | | 1,748,142 | |
Homeinns Hotel Group ADR †« | | | | | | | 37,700 | | | | 1,083,498 | |
Interval Leisure Group Incorporated | | | | | | | 117,300 | | | | 2,153,628 | |
| | | | |
| | | | | | | | | | | 7,352,306 | |
| | | | | | | | | | | | |
| | | | |
| Household Durables: 0.80% | | | | | | | | | | | | |
Cavco Industries Incorporated † | | | | | | | 3,390 | | | | 230,825 | |
Helen of Troy Limited † | | | | | | | 21,200 | | | | 1,893,161 | |
| | | | |
| | | | | | | | | | | 2,123,986 | |
| | | | | | | | | | | | |
| | | | |
| Leisure Products: 1.34% | | | | | | | | | | | | |
Brunswick Corporation | | | | | | | 74,300 | | | | 3,558,227 | |
| | | | | | | | | | | | |
| | | | |
| Media: 1.57% | | | | | | | | | | | | |
AMC Entertainment Holdings Class A | | | | | | | 41,400 | | | | 1,042,866 | |
Global Eagle Entertainment Incorporated †« | | | | | | | 177,400 | | | | 2,036,552 | |
Hemisphere Media Group Incorporated †« | | | | | | | 78,534 | | | | 1,068,062 | |
| | | | |
| | | | | | | | | | | 4,147,480 | |
| | | | | | | | | | | | |
| | | | |
| Specialty Retail: 1.34% | | | | | | | | | | | | |
American Eagle Outfitters Incorporated « | | | | | | | 227,900 | | | | 3,562,077 | |
| | | | | | | | | | | | |
| | | | |
| Textiles, Apparel & Luxury Goods: 1.35% | | | | | | | | | | | | |
Steven Madden Limited † | | | | | | | 97,900 | | | | 3,585,098 | |
| | | | | | | | | | | | |
| | | | |
Consumer Staples: 1.41% | | | | | | | | | | | | |
| | | | |
| Food Products: 1.41% | | | | | | | | | | | | |
Darling Ingredients Incorporated † | | | | | | | 156,000 | | | | 1,753,440 | |
Dean Foods Company | | | | | | | 119,350 | | | | 1,971,662 | |
| | | | |
| | | | | | | | | | | 3,725,102 | |
| | | | | | | | | | | | |
| | | | |
Energy: 1.92% | | | | | | | | | | | | |
| | | | |
| Energy Equipment & Services: 0.53% | | | | | | | | | | | | |
RigNet Incorporated †« | | | | | | | 32,600 | | | | 831,300 | |
RPC Incorporated « | | | | | | | 65,200 | | | | 577,020 | |
| | | | |
| | | | | | | | | | | 1,408,320 | |
| | | | | | | | | | | | |
The accompanying notes are an integral part of these financial statements.
| | | | |
| 8 | | Wells Fargo Advantage Small Cap Opportunities Fund | | Portfolio of investments—September 30, 2015 (unaudited) |
| | | | | | | | | | | | |
| Security name | | | | | | Shares | | | Value | |
| | | | | | | | | | | | |
| | | | |
| Oil, Gas & Consumable Fuels: 1.39% | | | | | | | | | | | | |
Carrizo Oil & Gas Incorporated † | | | | | | | 30,000 | | | $ | 916,200 | |
Synergy Resources Corporation † | | | | | | | 281,600 | | | | 2,759,680 | |
| | | | |
| | | | | | | | | | | 3,675,880 | |
| | | | | | | | | | | | |
| | | | |
Financials: 22.62% | | | | | | | | | | | | |
| | | | |
| Banks: 6.48% | | | | | | | | | | | | |
First Citizens BancShares Corporation Class A | | | | | | | 8,491 | | | | 1,918,966 | |
First Horizon National Corporation | | | | | | | 38,900 | | | | 551,602 | |
Heritage Financial Corporation | | | | | | | 107,500 | | | | 2,023,150 | |
Lakeland Financial Corporation | | | | | | | 34,500 | | | | 1,557,675 | |
Old National Bancorp | | | | | | | 71,272 | | | | 992,819 | |
PacWest Bancorp | | | | | | | 43,900 | | | | 1,879,359 | |
PrivateBancorp Incorporated | | | | | | | 57,900 | | | | 2,219,307 | |
Simmons First National Corporation Class A | | | | | | | 38,300 | | | | 1,835,719 | |
South State Corporation | | | | | | | 28,900 | | | | 2,221,543 | |
Wintrust Financial Corporation | | | | | | | 36,700 | | | | 1,960,881 | |
| | | | |
| | | | | | | | | | | 17,161,021 | |
| | | | | | | | | | | | |
| | | | |
| Capital Markets: 2.65% | | | | | | | | | | | | |
Golub Capital BDC Incorporated | | | | | | | 159,786 | | | | 2,553,380 | |
HFF Incorporated Class A † | | | | | | | 56,200 | | | | 1,897,312 | |
Stifel Financial Corporation † | | | | | | | 61,131 | | | | 2,573,615 | |
| | | | |
| | | | | | | | | | | 7,024,307 | |
| | | | | | | | | | | | |
| | | | |
| Diversified Financial Services: 0.57% | | | | | | | | | | | | |
Compass Diversified Holdings | | | | | | | 93,900 | | | | 1,513,668 | |
| | | | | | | | | | | | |
| | | | |
| Insurance: 4.91% | | | | | | | | | | | | |
Amerisafe Incorporated | | | | | | | 50,300 | | | | 2,501,419 | |
Brown & Brown Incorporated | | | | | | | 147,300 | | | | 4,561,881 | |
ProAssurance Corporation | | | | | | | 68,729 | | | | 3,372,532 | |
Reinsurance Group of America Incorporated | | | | | | | 28,300 | | | | 2,563,697 | |
| | | | |
| | | | | | | | | | | 12,999,529 | |
| | | | | | | | | | | | |
| | | | |
| Real Estate Management & Development: 1.39% | | | | | | | | | | | | |
Kennedy Wilson Holdings Incorporated | | | | | | | 166,600 | | | | 3,693,522 | |
| | | | | | | | | | | | |
| | | | |
| REITs: 5.46% | | | | | | | | | | | | |
Douglas Emmett Incorporated | | | | | | | 87,800 | | | | 2,521,616 | |
Equity Lifestyle Properties Incorporated | | | | | | | 66,232 | | | | 3,879,208 | |
Mid-America Apartment Communities Incorporated | | | | | | | 52,103 | | | | 4,265,673 | |
Parkway Properties Incorporated | | | | | | | 59,862 | | | | 931,453 | |
Terreno Realty Corporation | | | | | | | 145,775 | | | | 2,863,021 | |
| | | | |
| | | | | | | | | | | 14,460,971 | |
| | | | | | | | | | | | |
| | | | |
| Thrifts & Mortgage Finance: 1.16% | | | | | | | | | | | | |
Meridian Bancorp Incorporated | | | | | | | 79,178 | | | | 1,082,363 | |
Radian Group Incorporated | | | | | | | 124,200 | | | | 1,976,022 | |
| | | | |
| | | | | | | | | | | 3,058,385 | |
| | | | | | | | | | | | |
The accompanying notes are an integral part of these financial statements.
| | | | | | |
| Portfolio of investments—September 30, 2015 (unaudited) | | Wells Fargo Advantage Small Cap Opportunities Fund | | | 9 | |
| | | | | | | | | | | | |
| Security name | | | | | | Shares | | | Value | |
| | | | | | | | | | | | |
| | | | |
Health Care: 14.07% | | | | | | | | | | | | |
| | | | |
| Biotechnology: 1.09% | | | | | | | | | | | | |
Cepheid Incorporated † | | | | | | | 48,400 | | | $ | 2,187,680 | |
Flexion Therapeutics Incorporated † | | | | | | | 46,065 | | | | 684,526 | |
| | | | |
| | | | | | | | | | | 2,872,206 | |
| | | | | | | | | | | | |
| | | | |
| Health Care Equipment & Supplies: 4.31% | | | | | | | | | | | | |
K2M Group Holdings Incorporated † | | | | | | | 72,591 | | | | 1,350,193 | |
Masimo Corporation † | | | | | | | 44,300 | | | | 1,708,208 | |
Sientra Incorporated † | | | | | | | 65,619 | | | | 666,033 | |
Sirona Dental Systems Incorporated † | | | | | | | 37,200 | | | | 3,472,248 | |
The Cooper Companies Incorporated | | | | | | | 13,300 | | | | 1,979,838 | |
West Pharmaceutical Services Incorporated | | | | | | | 41,400 | | | | 2,240,568 | |
| | | | |
| | | | | | | | | | | 11,417,088 | |
| | | | | | | | | | | | |
| | | | |
| Health Care Providers & Services: 3.34% | | | | | | | | | | | | |
Centene Corporation † | | | | | | | 42,700 | | | | 2,315,621 | |
HealthSouth Corporation | | | | | | | 59,182 | | | | 2,270,813 | |
LifePoint Hospitals Incorporated † | | | | | | | 33,300 | | | | 2,360,970 | |
Surgical Care Affiliates Incorporated † | | | | | | | 58,000 | | | | 1,896,020 | |
| | | | |
| | | | | | | | | | | 8,843,424 | |
| | | | | | | | | | | | |
| | | | |
| Health Care Technology: 0.41% | | | | | | | | | | | | |
Evolent Health Incorporated Class A † | | | | | | | 26,900 | | | | 429,324 | |
Inovalon Holdings Incorporated Class A † | | | | | | | 31,600 | | | | 658,228 | |
| | | | |
| | | | | | | | | | | 1,087,552 | |
| | | | | | | | | | | | |
| | | | |
| Life Sciences Tools & Services: 3.48% | | | | | | | | | | | | |
INC Research Holdings Incorporated Class A † | | | | | | | 62,304 | | | | 2,492,160 | |
PAREXEL International Corporation † | | | | | | | 47,500 | | | | 2,941,200 | |
VWR Corporation † | | | | | | | 147,480 | | | | 3,788,761 | |
| | | | |
| | | | | | | | | | | 9,222,121 | |
| | | | | | | | | | | | |
| | | | |
| Pharmaceuticals: 1.44% | | | | | | | | | | | | |
Aerie Pharmaceuticals Incorporated †« | | | | | | | 20,000 | | | | 354,800 | |
Catalent Incorporated † | | | | | | | 104,790 | | | | 2,546,397 | |
KemPharm Incorportated † | | | | | | | 47,600 | | | | 922,488 | |
| | | | |
| | | | | | | | | | | 3,823,685 | |
| | | | | | | | | | | | |
| | | | |
Industrials: 16.97% | | | | | | | | | | | | |
| | | | |
| Aerospace & Defense: 1.43% | | | | | | | | | | | | |
DigitalGlobe Incorporated † | | | | | | | 35,700 | | | | 679,014 | |
Hexcel Corporation | | | | | | | 69,200 | | | | 3,104,312 | |
| | | | |
| | | | | | | | | | | 3,783,326 | |
| | | | | | | | | | | | |
| | | | |
| Airlines: 1.05% | | | | | | | | | | | | |
Allegiant Travel Company | | | | | | | 12,892 | | | | 2,787,895 | |
| | | | | | | | | | | | |
The accompanying notes are an integral part of these financial statements.
| | | | |
| 10 | | Wells Fargo Advantage Small Cap Opportunities Fund | | Portfolio of investments—September 30, 2015 (unaudited) |
| | | | | | | | | | | | |
| Security name | | | | | | Shares | | | Value | |
| | | | | | | | | | | | |
| | | | |
| Building Products: 3.02% | | | | | | | | | | | | |
Fortune Brands Home & Security Incorporated | | | | | | | 73,800 | | | $ | 3,503,286 | |
Simpson Manufacturing Company Incorporated | | | | | | | 92,000 | | | | 3,081,080 | |
Universal Forest Products Incorporated | | | | | | | 24,600 | | | | 1,418,928 | |
| | | | |
| | | | | | | | | | | 8,003,294 | |
| | | | | | | | | | | | |
| | | | |
| Commercial Services & Supplies: 3.95% | | | | | | | | | | | | |
Herman Miller Incorporated | | | | | | | 67,511 | | | | 1,947,017 | |
Matthews International Corporation Class A | | | | | | | 61,400 | | | | 3,006,758 | |
Multi-Color Corporation | | | | | | | 10,400 | | | | 795,496 | |
Tetra Tech Incorporated | | | | | | | 54,600 | | | | 1,327,326 | |
US Ecology Incorporated | | | | | | | 15,400 | | | | 672,210 | |
Waste Connections Incorporated | | | | | | | 55,790 | | | | 2,710,278 | |
| | | | |
| | | | | | | | | | | 10,459,085 | |
| | | | | | | | | | | | |
| | | | |
| Construction & Engineering: 0.51% | | | | | | | | | | | | |
Dycom Industries Incorporated † | | | | | | | 18,800 | | | | 1,360,368 | |
| | | | | | | | | | | | |
| | | | |
| Electrical Equipment: 1.12% | | | | | | | | | | | | |
Generac Holdings Incorporated † | | | | | | | 77,000 | | | | 2,316,930 | |
Powell Industries Incorporated | | | | | | | 700 | | | | 21,070 | |
Regal-Beloit Corporation | | | | | | | 10,900 | | | | 615,305 | |
| | | | |
| | | | | | | | | | | 2,953,305 | |
| | | | | | | | | | | | |
| | | | |
| Machinery: 3.26% | | | | | | | | | | | | |
CLARCOR Incorporated | | | | | | | 31,800 | | | | 1,516,224 | |
ESCO Technologies Incorporated | | | | | | | 64,000 | | | | 2,297,600 | |
IDEX Corporation | | | | | | | 51,173 | | | | 3,648,635 | |
Kornit Digital Limited †« | | | | | | | 92,000 | | | | 1,161,960 | |
| | | | |
| | | | | | | | | | | 8,624,419 | |
| | | | | | | | | | | | |
| | | | |
| Professional Services: 1.09% | | | | | | | | | | | | |
On Assignment Incorporated † | | | | | | | 32,100 | | | | 1,184,490 | |
Towers Watson & Company Class A | | | | | | | 14,500 | | | | 1,702,010 | |
| | | | |
| | | | | | | | | | | 2,886,500 | |
| | | | | | | | | | | | |
| | | | |
| Trading Companies & Distributors: 1.54% | | | | | | | | | | | | |
Beacon Roofing Supply Incorporated † | | | | | | | 58,500 | | | | 1,900,665 | |
MSC Industrial Direct Company Class A | | | | | | | 35,900 | | | | 2,190,977 | |
| | | | |
| | | | | | | | | | | 4,091,642 | |
| | | | | | | | | | | | |
| | | | |
Information Technology: 12.19% | | | | | | | | | | | | |
| | | | |
| Communications Equipment: 1.02% | | | | | | | | | | | | |
Ciena Corporation † | | | | | | | 129,800 | | | | 2,689,456 | |
Lumentum Holdings Incorporated † | | | | | | | 20 | | | | 339 | |
| | | | |
| | | | | | | | | | | 2,689,795 | |
| | | | | | | | | | | | |
| | | | |
| Electronic Equipment, Instruments & Components: 1.22% | | | | | | | | | | | | |
Fabrinet † | | | | | | | 71,200 | | | | 1,305,096 | |
OSI Systems Incorporated † | | | | | | | 25,000 | | | | 1,924,000 | |
| | | | |
| | | | | | | | | | | 3,229,096 | |
| | | | | | | | | | | | |
The accompanying notes are an integral part of these financial statements.
| | | | | | |
| Portfolio of investments—September 30, 2015 (unaudited) | | Wells Fargo Advantage Small Cap Opportunities Fund | | | 11 | |
| | | | | | | | | | | | |
| Security name | | | | | | Shares | | | Value | |
| | | | | | | | | | | | |
| | | | |
| IT Services: 2.71% | | | | | | | | | | | | |
CoreLogic Incorporated † | | | | | | | 118,800 | | | $ | 4,422,924 | |
EPAM Systems Incorporated † | | | | | | | 18,600 | | | | 1,386,072 | |
Leidos Holdings Incorporated | | | | | | | 33,400 | | | | 1,379,754 | |
| | | | |
| | | | | | | | | | | 7,188,750 | |
| | | | | | | | | | | | |
| | | | |
| Semiconductors & Semiconductor Equipment: 3.15% | | | | | | | | | | | | |
Entegris Incorporated † | | | | | | | 218,700 | | | | 2,884,653 | |
Fairchild Semiconductor International Incorporated † | | | | | | | 92,700 | | | | 1,301,508 | |
Integrated Device Technology Incorporated † | | | | | | | 97,200 | | | | 1,973,160 | |
MA-COM Technology Solutions Holdings Incorporated † | | | | | | | 75,654 | | | | 2,193,209 | |
| | | | |
| | | | | | | | | | | 8,352,530 | |
| | | | | | | | | | | | |
| | | | |
| Software: 4.09% | | | | | | | | | | | | |
Cadence Design Systems Incorporated † | | | | | | | 161,000 | | | | 3,329,480 | |
Fortinet Incorporated † | | | | | | | 74,800 | | | | 3,177,504 | |
PTC Incorporated † | | | | | | | 57,000 | | | | 1,809,180 | |
Verint Systems Incorporated † | | | | | | | 58,525 | | | | 2,525,354 | |
| | | | |
| | | | | | | | | | | 10,841,518 | |
| | | | | | | | | | | | |
| | | | |
Materials: 5.01% | | | | | | | | | | | | |
| | | | |
| Chemicals: 1.51% | | | | | | | | | | | | |
Balchem Corporation | | | | | | | 30,300 | | | | 1,841,331 | |
Minerals Technologies Incorporated | | | | | | | 44,500 | | | | 2,143,120 | |
| | | | |
| | | | | | | | | | | 3,984,451 | |
| | | | | | | | | | | | |
| | | | |
| Containers & Packaging: 1.10% | | | | | | | | | | | | |
Packaging Corporation of America | | | | | | | 48,500 | | | | 2,917,760 | |
| | | | | | | | | | | | |
| | | | |
| Metals & Mining: 1.96% | | | | | | | | | | | | |
Compass Minerals International Incorporated | | | | | | | 37,900 | | | | 2,970,223 | |
Steel Dynamics Incorporated | | | | | | | 129,800 | | | | 2,229,964 | |
| | | | |
| | | | | | | | | | | 5,200,187 | |
| | | | | | | | | | | | |
| | | | |
| Paper & Forest Products: 0.44% | | | | | | | | | | | | |
Louisiana-Pacific Corporation † | | | | | | | 81,200 | | | | 1,156,288 | |
| | | | | | | | | | | | |
| | | | |
Utilities: 4.35% | | | | | | | | | | | | |
| | | | |
| Electric Utilities: 2.76% | | | | | | | | | | | | |
Cleco Corporation | | | | | | | 69,000 | | | | 3,673,560 | |
IDACORP Incorporated | | | | | | | 39,600 | | | | 2,562,516 | |
Portland General Electric Company | | | | | | | 29,400 | | | | 1,086,918 | |
| | | | |
| | | | | | | | | | | 7,322,994 | |
| | | | | | | | | | | | |
| | | | |
| Multi-Utilities: 1.34% | | | | | | | | | | | | |
Northwestern Corporation | | | | | | | 65,781 | | | | 3,540,991 | |
| | | | | | | | | | | | |
| | | | |
| Water Utilities: 0.25% | | | | | | | | | | | | |
SJW Corporation | | | | | | | 21,100 | | | | 648,825 | |
| | | | | | | | | | | | |
| | | | |
Total Common Stocks (Cost $199,469,324) | | | | | | | | | | | 236,497,288 | |
| | | | | | | | | | | | |
The accompanying notes are an integral part of these financial statements.
| | | | |
| 12 | | Wells Fargo Advantage Small Cap Opportunities Fund | | Portfolio of investments—September 30, 2015 (unaudited) |
| | | | | | | | | | | | | | |
| Security name | | | | | | | Shares | | | Value | |
| | | | | | | | | | | | | | |
| | | | |
Exchange-Traded Funds: 2.53% | | | | | | | | | | | | | | |
iShares Russell 2000 Index ETF « | | | | | | | | | 61,400 | | | $ | 6,704,880 | |
| | | | | | | | | | | | | | |
| | | | |
Total Exchange-Traded Funds (Cost $7,555,671) | | | | | | | | | | | | | 6,704,880 | |
| | | | | | | | | | | | | | |
| | | | |
| | | Yield | | | | | | | | | |
| | | | |
Short-Term Investments: 15.42% | | | | | | | | | | | | | | |
| | | | |
| Investment Companies: 15.42% | | | | | | | | | | | | | | |
Securities Lending Cash Investments, LLC (l)(r)(u) | | | 0.15 | % | | | | | 15,856,450 | | | | 15,856,450 | |
Wells Fargo Advantage Cash Investment Money Market Fund, Select Class (l)(u) | | | 0.16 | | | | | | 24,970,973 | | | | 24,970,973 | |
| | | | |
Total Short-Term Investments (Cost $40,827,423) | | | | | | | | | | | | | 40,827,423 | |
| | | | | | | | | | | | | | |
| | | | | | | | |
| Total investments in securities (Cost $247,852,418) * | | | 107.24 | % | | | 284,029,591 | |
Other assets and liabilities, net | | | (7.24 | ) | | | (19,171,843 | ) |
| | | | | | | | |
| Total net assets | | | 100.00 | % | | $ | 264,857,748 | |
| | | | | | | | |
| † | Non-income-earning security |
| « | All or a portion of this security is on loan. |
| (l) | The security represents an affiliate of the Fund as defined in the Investment Company Act of 1940. |
| (r) | The investment is a non-registered investment vehicle purchased with cash collateral received from securities on loan. |
| (u) | The rate represents the 7-day annualized yield at period end. |
| * | Cost for federal income tax purposes is $248,769,788 and unrealized gains (losses) consists of: |
| | | | |
Gross unrealized gains | | $ | 42,881,357 | |
Gross unrealized losses | | | (7,621,554 | ) |
| | | | |
Net unrealized gains | | $ | 35,259,803 | |
The accompanying notes are an integral part of these financial statements.
| | | | | | |
| Statement of assets and liabilities—September 30, 2015 (unaudited) | | Wells Fargo Advantage Small Cap Opportunities Fund | | | 13 | |
| | | | |
| | | | |
| |
Assets | | | | |
Investments | | | | |
In unaffiliated securities (including $15,420,865 of securities loaned), at value (cost $207,024,995) | | $ | 243,202,168 | |
In affiliated securities, at value (cost $40,827,423) | | | 40,827,423 | |
| | | | |
Total investments, at value (cost $247,852,418) | | | 284,029,591 | |
Receivable for investments sold | | | 819,412 | |
Receivable for Fund shares sold | | | 344,987 | |
Receivable for dividends | | | 244,840 | |
Receivable for securities lending income | | | 14,889 | |
Prepaid expenses and other assets | | | 30,384 | |
| | | | |
Total assets | | | 285,484,103 | |
| | | | |
| |
Liabilities | | | | |
Payable for investments purchased | | | 4,420,702 | |
Payable for Fund shares redeemed | | | 74,201 | |
Payable upon receipt of securities loaned | | | 15,856,450 | |
Management fee payable | | | 168,373 | |
Administration fees payable | | | 29,253 | |
Accrued expenses and other liabilities | | | 77,376 | |
| | | | |
Total liabilities | | | 20,626,355 | |
| | | | |
Total net assets | | $ | 264,857,748 | |
| | | | |
| |
NET ASSETS CONSIST OF | | | | |
Paid-in capital | | $ | 195,434,738 | |
Undistributed net investment income | | | 4,480 | |
Accumulated net realized gains on investments | | | 33,241,357 | |
Net unrealized gains on investments | | | 36,177,173 | |
| | | | |
Total net assets | | $ | 264,857,748 | |
| | | | |
| |
COMPUTATION OF NET ASSET VALUE | | | | |
Net assets – Administrator Class | | $ | 264,609,830 | |
Shares outstanding – Administrator Class1 | | | 11,495,188 | |
Net asset value per share – Administrator Class | | | $23.02 | |
Net assets – Institutional Class | | $ | 247,918 | |
Shares outstanding – Institutional Class1 | | | 10,742 | |
Net asset value per share – Institutional Class | | | $23.08 | |
| 1 | The Fund has an unlimited number of authorized shares. |
The accompanying notes are an integral part of these financial statements.
| | | | |
| 14 | | Wells Fargo Advantage Small Cap Opportunities Fund | | Statement of operations—six months ended september 30, 2015 (unaudited) |
| | | | |
| | | | |
| |
Investment income | | | | |
Dividends | | $ | 1,652,530 | |
Securities lending income, net | | | 113,616 | |
Income from affiliated securities | | | 14,173 | |
| | | | |
Total investment income | | | 1,780,319 | |
| | | | |
| |
Expenses | | | | |
Management fee | | | 1,257,966 | |
Administration fees | | | | |
Administrator Class | | | 169,637 | |
Institutional Class | | | 57 | |
Shareholder servicing fees | | | | |
Administrator Class | | | 369,877 | |
Custody and accounting fees | | | 15,301 | |
Professional fees | | | 21,223 | |
Registration fees | | | 24,902 | |
Shareholder report expenses | | | 12,634 | |
Trustees’ fees and expenses | | | 7,777 | |
Other fees and expenses | | | 6,308 | |
| | | | |
Total expenses | | | 1,885,682 | |
Less: Fee waivers and/or expense reimbursements | | | (109,843 | ) |
| | | | |
Net expenses | | | 1,775,839 | |
| | | | |
Net investment income | | | 4,480 | |
| | | | |
| |
REALIZED AND UNREALIZED GAINS (LOSSES) ON INVESTMENTS | | | | |
| |
Net realized gains (losses) on: | | | | |
Unaffiliated securities | | | 9,293,909 | |
Futures transactions | | | (79,563 | ) |
| | | | |
Net realized gains on investments | | | 9,214,346 | |
| | | | |
| |
Net change in unrealized gains (losses) on: | | | | |
Unaffiliated securities | | | (34,540,268 | ) |
Futures transactions | | | 326 | |
| | | | |
Net change in unrealized gains (losses) on investments | | | (34,539,942 | ) |
| | | | |
Net realized and unrealized gains (losses) on investments | | | (25,325,596 | ) |
| | | | |
Net decrease in net assets resulting from operations | | $ | (25,321,116 | ) |
| | | | |
The accompanying notes are an integral part of these financial statements.
| | | | | | |
| Statement of changes in net assets | | Wells Fargo Advantage Small Cap Opportunities Fund | | | 15 | |
| | | | | | | | | | | | | | | | |
| | | Six months ended
September 30, 2015
(unaudited) | | | Year ended March 31, 2015 | |
| | | | |
Operations | | | | | | | | | | | | | | | | |
Net investment income | | | | | | $ | 4,480 | | | | | | | $ | 202,195 | |
Net realized gains on investments | | | | | | | 9,214,346 | | | | | | | | 74,856,998 | |
Net change in unrealized gains (losses) on investments | | | | | | | (34,539,942 | ) | | | | | | | (39,409,715 | ) |
| | | | |
Net increase (decrease) in net assets resulting from operations | | | | | | | (25,321,116 | ) | | | | | | | 35,649,478 | |
| | | | |
| | | | |
Distributions to shareholders from | | | | | | | | | | | | | | | | |
Net realized gains | | | | | | | | | | | | | | | | |
Administrator Class | | | | | | | 0 | | | | | | | | (132,976,135 | ) |
Institutional Class | | | | | | | 0 | | | | | | | | (4,069 | )1 |
| | | | |
Total distributions to shareholders | | | | | | | 0 | | | | | | | | (132,980,204 | ) |
| | | | |
| | | | |
Capital share transactions | | | Shares | | | | | | | | Shares | | | | | |
Proceeds from shares sold | | | | | | | | | | | | | | | | |
Administrator Class | | | 677,854 | | | | 16,871,793 | | | | 2,307,138 | | | | 64,652,442 | |
Institutional Class | | | 10,311 | | | | 260,096 | | | | 256 | 1 | | | 10,000 | 1 |
| | | | |
| | | | | | | 17,131,889 | | | | | | | | 64,662,442 | |
| | | | |
Reinvestment of distributions | | | | | | | | | | | | | | | | |
Administrator Class | | | 0 | | | | 0 | | | | 5,627,220 | | | | 130,945,409 | |
Institutional Class | | | 0 | | | | 0 | | | | 175 | 1 | | | 4,069 | 1 |
| | | | |
| | | | | | | 0 | | | | | | | | 130,949,478 | |
| | | | |
Payment for shares redeemed | | | | | | | | | | | | | | | | |
Administrator Class | | | (1,355,302 | ) | | | (33,592,054 | ) | | | (8,188,457 | ) | | | (262,972,511 | ) |
| | | | |
Net decrease in net assets resulting from capital share transactions | | | | | | | (16,460,165 | ) | | | | | | | (67,360,591 | ) |
| | | | |
Total decrease in net assets | | | | | | | (41,781,281 | ) | | | | | | | (164,691,317 | ) |
| | | | |
| | | | |
Net assets | | | | | | | | | | | | | | | | |
Beginning of period | | | | | | | 306,639,029 | | | | | | | | 471,330,346 | |
| | | | |
End of period | | | | | | $ | 264,857,748 | | | | | | | $ | 306,639,029 | |
| | | | |
Undistributed net investment income | | | | | | $ | 4,480 | | | | | | | $ | 0 | |
| | | | |
| 1 | For the period from October 31, 2014 (commencement of class operations) to March 31, 2015 |
The accompanying notes are an integral part of these financial statements.
| | | | |
| 16 | | Wells Fargo Advantage Small Cap Opportunities Fund | | Financial highlights |
(For a share outstanding throughout each period)
| | | | | | | | | | | | | | | | | | | | | | | | | | | | |
| | | Six months ended
September 30, 2015 (unaudited) | | | Year ended March 31 | | | Year ended October 31 | |
| ADMINISTRATOR CLASS | | | 2015 | | | 20141 | | | 2013 | | | 2012 | | | 2011 | | | 2010 | |
Net asset value, beginning of period | | | $25.19 | | | | $37.93 | | | | $42.43 | | | | $34.45 | | | | $32.50 | | | | $31.33 | | | | $25.88 | |
Net investment income (loss) | | | 0.00 | 2 | | | 0.02 | | | | 0.02 | | | | 0.11 | | | | 0.05 | | | | 0.00 | 2 | | | (0.06 | ) |
Net realized and unrealized gains (losses) on investments | | | (2.17 | ) | | | 3.13 | | | | 2.33 | | | | 10.48 | | | | 3.13 | | | | 1.17 | | | | 5.51 | |
| | | | | | | | | | | | | | | | | | | | | | | | | | | | |
Total from investment operations | | | (2.17 | ) | | | 3.15 | | | | 2.35 | | | | 10.59 | | | | 3.18 | | | | 1.17 | | | | 5.45 | |
Distributions to shareholders from | | | | | | | | | | | | | | | | | | | | | | | | | | | | |
Net investment income | | | 0.00 | | | | 0.00 | | | | (0.02 | ) | | | (0.08 | ) | | | 0.00 | | | | 0.00 | | | | 0.00 | |
Net realized gains | | | 0.00 | | | | (15.89 | ) | | | (6.83 | ) | | | (2.53 | ) | | | (1.23 | ) | | | 0.00 | | | | 0.00 | |
| | | | | | | | | | | | | | | | | | | | | | | | | | | | |
Total distributions to shareholders | | | 0.00 | | | | (15.89 | ) | | | (6.85 | ) | | | (2.61 | ) | | | (1.23 | ) | | | 0.00 | | | | 0.00 | |
Net asset value, end of period | | | $23.02 | | | | $25.19 | | | | $37.93 | | | | $42.43 | | | | $34.45 | | | | $32.50 | | | | $31.33 | |
Total return3 | | | (8.61 | )% | | | 11.75 | % | | | 6.26 | % | | | 33.19 | % | | | 10.12 | % | | | 3.73 | % | | | 21.06 | % |
Ratios to average net assets (annualized) | | | | | | | | | | | | | | | | | | | | | | | | | | | | |
Gross expenses | | | 1.27 | % | | | 1.24 | % | | | 1.24 | % | | | 1.22 | % | | | 1.22 | % | | | 1.22 | % | | | 1.25 | % |
Net expenses | | | 1.20 | % | | | 1.20 | % | | | 1.20 | % | | | 1.20 | % | | | 1.20 | % | | | 1.20 | % | | | 1.20 | % |
Net investment income (loss) | | | 0.00 | % | | | 0.06 | % | | | 0.11 | % | | | 0.31 | % | | | 0.13 | % | | | 0.00 | % | | | (0.20 | )% |
Supplemental data | | | | | | | | | | | | | | | | | | | | | | | | | | | | |
Portfolio turnover rate | | | 26 | % | | | 60 | % | | | 26 | % | | | 76 | % | | | 78 | % | | | 100 | % | | | 66 | % |
Net assets, end of period (000s omitted) | | | $264,610 | | | | $306,628 | | | | $471,330 | | | | $705,671 | | | | $624,844 | | | | $656,720 | | | | $707,958 | |
| 1 | For the five months ended March 31, 2014. The Fund changed its fiscal year end from October 31 to March 31, effective March 31, 2014. |
| 2 | Amount is less than $0.005. |
| 3 | Returns for periods of less than one year are not annualized. |
The accompanying notes are an integral part of these financial statements.
| | | | | | |
| Financial highlights | | Wells Fargo Advantage Small Cap Opportunities Fund | | | 17 | |
(For a share outstanding throughout each period)
| | | | | | | | |
| INSTITUTIONAL CLASS | | Six months ended
September 30, 2015
(unaudited) | | | Year ended
March 31, 20151 | |
Net asset value, beginning of period | | | $25.22 | | | | $39.04 | |
Net investment income | | | 0.06 | 2 | | | 0.06 | |
Net realized and unrealized gains (losses) on investments | | | (2.20 | ) | | | 2.01 | |
| | | | | | | | |
Total from investment operations | | | (2.14 | ) | | | 2.07 | |
Distributions to shareholders from | | | | | | | | |
Net realized gains | | | 0.00 | | | | (15.89 | ) |
Net asset value, end of period | | | $23.08 | | | | $25.22 | |
Total return3 | | | (8.49 | )% | | | 8.68 | % |
Ratios to average net assets (annualized) | | | | | | | | |
Gross expenses | | | 1.04 | % | | | 0.92 | % |
Net expenses | | | 0.95 | % | | | 0.92 | % |
Net investment income | | | 0.49 | % | | | 0.59 | % |
Supplemental data | | | | | | | | |
Portfolio turnover rate | | | 26 | % | | | 60 | % |
Net assets, end of period (000s omitted) | | | $248 | | | | $11 | |
| 1 | For the period from October 31, 2014 (commencement of class operations) to March 31, 2015 |
| 2 | Calculated based upon average shares outstanding |
| 3 | Returns for periods of less than one year are not annualized. |
The accompanying notes are an integral part of these financial statements.
| | | | |
| 18 | | Wells Fargo Advantage Small Cap Opportunities Fund | | Notes to financial statements (unaudited) |
1. ORGANIZATION
Wells Fargo Funds Trust (the “Trust”), a Delaware statutory trust organized on March 10, 1999, is an open-end management investment company registered under the Investment Company Act of 1940, as amended (the “1940 Act”). As an investment company, the Trust follows the accounting and reporting guidance in Financial Accounting Standards Board (“FASB”) Accounting Standards Codification Topic 946, Financial Services – Investment Companies. These financial statements report on the Wells Fargo Advantage Small Cap Opportunities Fund (the “Fund”) which is a diversified series of the Trust.
2. SIGNIFICANT ACCOUNTING POLICIES
The following significant accounting policies, which are consistently followed in the preparation of the financial statements of the Fund, are in conformity with U.S. generally accepted accounting principles which require management to make estimates and assumptions that affect the reported amounts of assets and liabilities, disclosure of contingent assets and liabilities at the date of the financial statements, and the reported amounts of revenues and expenses during the reporting period. Actual results could differ from those estimates.
Securities valuation
All investments are valued each business day as of the close of regular trading on the New York Stock Exchange (generally 4 p.m. Eastern Time).
Equity securities and futures that are listed on a foreign or domestic exchange or market are valued at the official closing price or, if none, the last sales price. If no sale occurs on the primary exchange or market that day, the prior day’s price will be deemed “stale” and a fair value price will be determined in accordance with the Fund’s Valuation Procedures.
Equity securities that are not listed on a foreign or domestic exchange or market, but have a public trading market, are valued at the quoted bid price from an independent broker-dealer that the Management Valuation Team of Wells Fargo Funds Management, LLC (“Funds Management”) has determined is an acceptable source.
Investments in registered open-end investment companies are valued at net asset value. Interests in non-registered investment vehicles that are redeemable at net asset value are fair valued at net asset value when available.
Investments which are not valued using any of the methods discussed above are valued at their fair value, as determined in good faith by the Board of Trustees. The Board of Trustees has established a Valuation Committee comprised of the Trustees and has delegated to it the authority to take any actions regarding the valuation of portfolio securities that the Valuation Committee deems necessary or appropriate, including determining the fair value of portfolio securities, unless the determination has been delegated to the Management Valuation Team. The Board of Trustees retains the authority to make or ratify any valuation decisions or approve any changes to the Valuation Procedures as it deems appropriate. On a quarterly basis, the Board of Trustees receives reports on any valuation actions taken by the Valuation Committee or the Management Valuation Team which may include items for ratification.
Valuations of fair valued securities are compared to the next actual sales price when available, or other appropriate market values, to assess the continued appropriateness of the fair valuation methodologies used. These securities are fair valued on a day-to-day basis, taking into consideration changes to appropriate market information and any significant changes to the inputs considered in the valuation process until there is a readily available price provided on an exchange or by an independent pricing service. Valuations received from an independent pricing service or independent broker-dealer quotes are periodically validated by comparisons to most recent trades and valuations provided by other independent pricing services in addition to the review of prices by the manager and/or subadviser. Unobservable inputs used in determining fair valuations are identified based on the type of security, taking into consideration factors utilized by market participants in valuing the investment, knowledge about the issuer and the current market environment.
Security loans
The Fund may lend its securities from time to time in order to earn additional income in the form of fees or interest on securities received as collateral or the investment of any cash received as collateral. The Fund continues to receive interest or dividends on the securities loaned. The Fund receives collateral in the form of cash or securities with a value at least equal to the value of the securities on loan. The value of the loaned securities is determined at the close of each business day and any additional required collateral is delivered to the Fund on the next business day. In a securities lending transaction, the net asset value of the Fund will be affected by an increase or decrease in the value of the securities loaned and by an increase or decrease in the value of the instrument in which collateral is invested. The amount of securities lending activity undertaken by the Fund fluctuates from time to time. In the event of default or bankruptcy by the borrower, the Fund may be prevented from recovering the loaned securities or gaining access to the collateral or
| | | | | | |
| Notes to financial statements (unaudited) | | Wells Fargo Advantage Small Cap Opportunities Fund | | | 19 | |
may experience delays or costs in doing so. In addition, the investment of any cash collateral received may lose all or part of its value. The Fund has the right under the lending agreement to recover the securities from the borrower on demand.
The Fund lends its securities through an unaffiliated securities lending agent. Cash collateral received in connection with its securities lending transactions is invested in Securities Lending Cash Investments, LLC (the “Securities Lending Fund”). The Securities Lending Fund is exempt from registration under Section 3(c)(7) of the 1940 Act and is managed by Funds Management and is subadvised by Wells Capital Management Incorporated (“WellsCap”). Funds Management receives an advisory fee starting at 0.05% and declining to 0.01% as the average daily net assets of the Securities Lending Fund increase. All of the fees received by Funds Management are paid to WellsCap for its services as subadviser. The Securities Lending Fund seeks to provide a positive return compared to the daily Fed Funds Open rate by investing in high-quality, U.S. dollar-denominated short-term money market instruments. Securities Lending Fund investments are fair valued based upon the amortized cost valuation technique. Income earned from investment in the Securities Lending Fund is included in securities lending income on the Statement of Operations.
Futures contracts
The Fund is subject to equity price risk in the normal course of pursuing its investment objectives. The Fund may buy and sell futures contracts in order to gain exposure to, or protect against, changes in security values and interest rates. The primary risks associated with the use of futures contracts are the imperfect correlation between changes in market values of securities held by the Fund and the prices of futures contracts, and the possibility of an illiquid market.
The aggregate principal amounts of the contracts are not recorded in the financial statements. Fluctuations in the value of the contracts are recorded in the Statement of Assets and Liabilities as an asset or liability and in the Statement of Operations as unrealized gains or losses until the contracts are closed, at which point they are recorded as net realized gains or losses on futures contracts. With futures contracts, there is minimal counterparty risk to the Fund since futures are exchange traded and the exchange’s clearinghouse, as counterparty to all exchange traded futures, guarantees the futures against default.
Security transactions and income recognition
Securities transactions are recorded on a trade date basis. Realized gains or losses are recorded on the basis of identified cost.
Dividend income is recognized on the ex-dividend date.
Distributions to shareholders
Distributions to shareholders from net investment income and net realized gains, if any, are recorded on the ex-dividend date. Such distributions are determined in conformity with federal income tax regulations, which may differ in amount or character from net investment income and realized gains recognized for purposes of U.S. generally accepted accounting principles.
Federal and other taxes
The Fund intends to continue to qualify as a regulated investment company by distributing substantially all of its investment company taxable income and any net realized capital gains (after reduction for capital loss carryforwards) sufficient to relieve it from all, or substantially all, federal income taxes. Accordingly, no provision for federal income taxes was required.
The Fund’s income and federal excise tax returns and all financial records supporting those returns for the prior three fiscal years are subject to examination by the federal and Delaware revenue authorities. Management has analyzed the Fund’s tax positions taken on federal, state, and foreign tax returns for all open tax years and does not believe that there are any uncertain tax positions that require recognition of a tax liability.
Class allocations
The separate classes of shares offered by the Fund differ principally in applicable sales charges, distribution, shareholder servicing, and administration fees. Class specific expenses are charged directly to that share class. Investment income, common expenses, and realized and unrealized gains (losses) on investments are allocated daily to each class of shares based on the relative proportion of net assets of each class.
3. FAIR VALUATION MEASUREMENTS
Fair value measurements of investments are determined within a framework that has established a fair value hierarchy based upon the various data inputs utilized in determining the value of the Fund’s investments. The three-level hierarchy gives the highest priority to unadjusted quoted prices in active markets for identical assets or liabilities (Level 1) and the lowest priority to
| | | | |
| 20 | | Wells Fargo Advantage Small Cap Opportunities Fund | | Notes to financial statements (unaudited) |
significant unobservable inputs (Level 3). The Fund’s investments are classified within the fair value hierarchy based on the lowest level of input that is significant to the fair value measurement. The inputs are summarized into three broad levels as follows:
| n | | Level 1 – quoted prices in active markets for identical securities |
| n | | Level 2 – other significant observable inputs (including quoted prices for similar securities, interest rates, prepayment speeds, credit risk, use of amortized cost, etc.) |
| n | | Level 3 – significant unobservable inputs (including the Fund’s own assumptions in determining the fair value of investments) |
The inputs or methodologies used for valuing investments in securities are not necessarily an indication of the risk associated with investing in those securities.
The following is a summary of the inputs used in valuing the Fund’s assets and liabilities as of September 30, 2015:
| | | | | | | | | | | | | | | | |
| | | Quoted prices
(Level 1) | | | Other significant
observable inputs
(Level 2) | | | Significant
unobservable inputs
(Level 3) | | | Total | |
Assets | | | | | | | | | | | | | | | | |
Investments in: | | | | | | | | | | | | | | | | |
| | | | |
Common stocks | | | | | | | | | | | | | | | | |
Consumer discretionary | | $ | 28,487,488 | | | $ | 0 | | | $ | 0 | | | $ | 28,487,488 | |
Consumer staples | | | 3,725,102 | | | | 0 | | | | 0 | | | | 3,725,102 | |
Energy | | | 5,084,200 | | | | 0 | | | | 0 | | | | 5,084,200 | |
Financials | | | 59,911,403 | | | | 0 | | | | 0 | | | | 59,911,403 | |
Health care | | | 37,266,076 | | | | 0 | | | | 0 | | | | 37,266,076 | |
Industrials | | | 44,949,834 | | | | 0 | | | | 0 | | | | 44,949,834 | |
Information technology | | | 32,301,689 | | | | 0 | | | | 0 | | | | 32,301,689 | |
Materials | | | 13,258,686 | | | | 0 | | | | 0 | | | | 13,258,686 | |
Utilities | | | 11,512,810 | | | | 0 | | | | 0 | | | | 11,512,810 | |
| | | | |
Exchange-traded funds | | | 6,704,880 | | | | 0 | | | | 0 | | | | 6,704,880 | |
| | | | |
Short-term investments | | | | | | | | | | | | | | | | |
Investment companies | | | 24,970,973 | | | | 15,856,450 | | | | 0 | | | | 40,827,423 | |
Total assets | | $ | 268,173,141 | | | $ | 15,856,450 | | | $ | 0 | | | $ | 284,029,591 | |
The Fund recognizes transfers between levels within the fair value hierarchy at the end of the reporting period. At September 30, 2015, the Fund did not have any transfers into/out of Level 1, Level 2, or Level 3.
4. TRANSACTIONS WITH AFFILIATES AND OTHER EXPENSES
Management fee
Funds Management, an indirect wholly owned subsidiary of Wells Fargo & Company (“Wells Fargo”), is the manager of the Fund and provides advisory and fund-level administrative services under an investment management agreement. Under the investment management agreement, Funds Management is responsible for, among other services, implementing the investment objectives and strategies of the Fund, supervising the applicable subadviser, providing fund-level administrative services in connection with the Fund’s operations, and providing any other fund-level administrative services reasonably necessary for the operation of the Fund. As compensation for its services under the investment management agreement, Funds Management is entitled to receive an annual management fee starting at 0.85% and declining to 0.71% as the average daily net assets of the Fund increase.
Prior to July 1, 2015, Funds Management provided advisory services pursuant to an investment advisory agreement and was entitled to receive an annual fee which started at 0.80% and declined to 0.68% as the average daily net assets of the Fund increased. In addition, fund-level administrative services were provided by Funds Management under a separate administration agreement at an annual fee which started at 0.05% and declined to 0.03% as the average daily net assets of the Fund increased. For financial statement purposes, the advisory fee and fund-level administration fee for the six months ended September 30, 2015 have been included in management fee on the Statement of Operations.
For the six months ended September 30, 2015, the management fee was equivalent to an annual rate of 0.85% of the Fund’s average daily net assets.
| | | | | | |
| Notes to financial statements (unaudited) | | Wells Fargo Advantage Small Cap Opportunities Fund | | | 21 | |
Funds Management has retained the services of a subadviser to provide daily portfolio management to the Fund. The fee for subadvisory services is borne by Funds Management. Schroder Investment Management North America Inc. is the subadviser to the Fund and is entitled to receive a fee from Funds Management at an annual rate starting at 0.50% and declining to 0.45% as the average daily net assets of the Fund increase.
Administration fees
Under a class-level administration agreement, Funds Management provides class-level administrative services to the Fund, which includes paying fees and expenses for services provided by the transfer agent, sub-transfer agents, omnibus account servicers and record-keepers. As compensation for its services under the class-level administration agreement, Funds Management receives an annual fee which is calculated based on the average daily net assets of each class as follows:
| | | | | | | | |
| | | Class-level administration fee | |
| | | Current rate | | | Rate prior to
July 1, 2015 | |
Administrator Class | | | 0.13 | % | | | 0.10 | % |
Institutional Class | | | 0.13 | | | | 0.08 | |
Funds Management has contractually waived and/or reimbursed management and administration fees to the extent necessary to maintain certain net operating expense ratios for the Fund. Waiver of fees and/or reimbursement of expenses by Funds Management were made first from fund level expenses on a proportionate basis and then from class specific expenses. Funds Management has committed through July 31, 2016 to waive fees and/or reimburse expenses to the extent necessary to cap the Fund’s expenses at 1.20 % for Administrator Class shares, and 0.95 % for Institutional Class shares. After this time, the cap may be increased or the commitment to maintain the cap may be terminated only with the approval of the Board of Trustees.
Shareholder servicing fees
The Trust has entered into contracts with one or more shareholder servicing agents, whereby Administrator Class of the Fund is charged a fee at an annual rate of 0.25% of its average daily net assets.
A portion of these total shareholder servicing fees were paid to affiliates of Wells Fargo.
5. INVESTMENT PORTFOLIO TRANSACTIONS
Purchases and sales of investments, excluding U.S. government obligations (if any) and short-term securities, for the six months ended September 30, 2015 were $71,112,637 and $95,724,283, respectively.
6. DERIVATIVE TRANSACTIONS
During the six months ended September 30, 2015, the Fund entered into futures contracts to gain market exposure.
As of September 30, 2015, the Fund did not have any open futures contracts. The Fund had an average notional amount of $75,072 in long futures contracts during the six months ended September 30, 2015.
The fair value, realized gains or losses and change in unrealized gains or losses, if any, on derivative instruments are reflected in the appropriate financial statements.
7. BANK BORROWINGS
The Trust (excluding the money market funds) and Wells Fargo Variable Trust are parties to a $200,000,000 revolving credit agreement whereby the Fund is permitted to use bank borrowings for temporary or emergency purposes, such as to fund shareholder redemption requests. Interest under the credit agreement is charged to the Fund based on a borrowing rate equal to the higher of the Federal Funds rate in effect on that day plus 1.25% or the overnight LIBOR rate in effect on that day plus 1.25%. In addition, an annual commitment fee equal to 0.20% of the unused balance is allocated to each participating fund. Prior to September 1, 2015, the revolving credit agreement amount was $150,000,000 and the annual commitment fee was equal to 0.10% of the unused balance which was allocated to each participating fund. For the six months ended September 30, 2015, the Fund paid $285 in commitment fees.
For the six months ended September 30, 2015, there were no borrowings by the Fund under the agreement.
| | | | |
| 22 | | Wells Fargo Advantage Small Cap Opportunities Fund | | Notes to financial statements (unaudited) |
8. INDEMNIFICATION
Under the Trust’s organizational documents, the officers and Trustees have been granted certain indemnification rights against certain liabilities that may arise out of performance of their duties to the Trust. Additionally, in the normal course of business, the Trust may enter into contracts with service providers that contain a variety of indemnification clauses. The Trust’s maximum exposure under these arrangements is dependent on future claims that may be made against the Fund and, therefore, cannot be estimated.
| | | | | | |
| Other information (unaudited) | | Wells Fargo Advantage Small Cap Opportunities Fund | | | 23 | |
PROXY VOTING INFORMATION
A description of the policies and procedures that the Fund uses to determine how to vote proxies relating to portfolio securities is available, upon request, by calling 1-800-222-8222, visiting our website at wellsfargoadvantagefunds.com, or visiting the SEC website at sec.gov. Information regarding how the Fund voted proxies relating to portfolio securities during the most recent 12-month period ended June 30 is available on the Fund’s website at wellsfargoadvantagefunds.com or by visiting the SEC website at sec.gov.
PORTFOLIO HOLDINGS INFORMATION
The complete portfolio holdings for the Fund are publicly available monthly on the Fund’s website (wellsfargoadvantagefunds.com), on a one-month delayed basis. In addition, top ten holdings information (excluding derivative positions) for the Fund is publicly available on the Fund’s website on a monthly, seven-day or more delayed basis. The Fund files its complete schedule of portfolio holdings with the SEC for the first and third quarters of each fiscal year on Form N-Q, which is available by visiting the SEC website at sec.gov. In addition, the Fund’s Form N-Q may be reviewed and copied at the SEC’s Public Reference Room in Washington, DC, and at regional offices in New York City, at 233 Broadway, and in Chicago, at 175 West Jackson Boulevard, Suite 900. Information about the Public Reference Room may be obtained by calling 1-800-SEC-0330.
| | | | |
| 24 | | Wells Fargo Advantage Small Cap Opportunities Fund | | Other information (unaudited) |
BOARD OF TRUSTEES AND OFFICERS
Each of the Trustees and Officers1 listed in the table below acts in identical capacities for each fund in the Wells Fargo Advantage family of funds, which consists of 144 mutual funds comprising the Wells Fargo Funds Trust, Wells Fargo Variable Trust, Wells Fargo Master Trust and four closed-end funds (collectively the “Fund Complex”). This table should be read in conjunction with the Prospectus and the Statement of Additional Information2. The mailing address of each Trustee and Officer is 525 Market Street, 12th Floor, San Francisco, CA 94105. Each Trustee and Officer serves an indefinite term, however, each Trustee serves such term until reaching the mandatory retirement age established by the Trustees.
Independent Trustees
| | | | | | |
Name and year of birth | | Position held and length of service* | | Principal occupations during past five years or longer | | Other public company or investment company directorships during past 5 years |
William R. Ebsworth
(Born 1957) | | Trustee, since 2015** | | Retired. From 1984 to 2013, equities analyst, portfolio manager, research director at Fidelity Management and Research Company and retired in 2013 as Chief Investment Officer of Fidelity Strategic Advisers, Inc. in Boston, Tokyo, and Hong Kong where he led a team of investment professionals managing client assets. Prior thereto, Board member of Hong Kong Securities Clearing Co., Hong Kong Options Clearing Corp., the Thailand International Fund, Ltd., Fidelity Investments Life Insurance Company, and Empire Fidelity Investments Life Insurance Company. Mr. Ebsworth is a CFA ® charterholder and an Adjunct Lecturer, Finance, at Babson College. | | Asset Allocation Trust |
Jane A. Freeman (Born 1953) | | Trustee, since 2015** | | Retired. From 2012 to 2014 and 1999 to 2008, Chief Financial Officer of Scientific Learning Corporation. From 2008 to 2012, Ms. Freeman provided consulting services related to strategic business projects. Prior to 1999, Portfolio Manager at Rockefeller & Co. and Scudder, Stevens & Clark. Board member of the Harding Loevner Funds from 1996 to 2014, serving as both Lead Independent Director and chair of the Audit Committee. Board member of the Russell Exchange Traded Funds Trust from 2011 to 2012 and the chair of the Audit Committee. Ms. Freeman is Chair of Taproot Foundation (non-profit organization), a Board Member of Ruth Bancroft Garden (non-profit organization) and an inactive chartered financial analyst. | | Asset Allocation Trust; Harding Loevner Funds; Russell Exchange Traded Funds Trust |
Peter G. Gordon (Born 1942) | | Trustee, since 1998; Chairman, since 2005 | | Co-Founder, Retired Chairman, President and CEO of Crystal Geyser Water Company. Trustee Emeritus, Colby College. | | Asset Allocation Trust |
Isaiah Harris, Jr. (Born 1952) | | Trustee, since 2009 | | Retired. Chairman of the Board of CIGNA Corporation since 2009, and Director since 2005. From 2003 to 2011, Director of Deluxe Corporation. Prior thereto, President and CEO of BellSouth Advertising and Publishing Corp. from 2005 to 2007, President and CEO of BellSouth Enterprises from 2004 to 2005 and President of BellSouth Consumer Services from 2000 to 2003. Emeritus member of the Iowa State University Foundation Board of Governors. Emeritus Member of the Advisory Board of Iowa State University School of Business. Advisory Board Member, Palm Harbor Academy (charter school). Mr. Harris is a certified public accountant. | | CIGNA Corporation; Asset Allocation Trust |
Judith M. Johnson (Born 1949) | | Trustee, since 2008; Audit Committee Chairman, since 2008 | | Retired. Prior thereto, Chief Executive Officer and Chief Investment Officer of Minneapolis Employees Retirement Fund from 1996 to 2008. Ms. Johnson is an attorney, certified public accountant and a certified managerial accountant. | | Asset Allocation Trust |
David F. Larcker (Born 1950) | | Trustee, since 2009 | | James Irvin Miller Professor of Accounting at the Graduate School of Business, Stanford University, Morgan Stanley Director of the Center for Leadership Development and Research and Senior Faculty of The Rock Center for Corporate Governance since 2006. From 2005 to 2008, Professor of Accounting at the Graduate School of Business, Stanford University. Prior thereto, Ernst & Young Professor of Accounting at The Wharton School, University of Pennsylvania from 1985 to 2005. | | Asset Allocation Trust |
| | | | | | |
| Other information (unaudited) | | Wells Fargo Advantage Small Cap Opportunities Fund | | | 25 | |
| | | | | | |
Name and year of birth | | Position held and length of service* | | Principal occupations during past five years or longer | | Other public company or investment company directorships during past 5 years |
Olivia S. Mitchell (Born 1953) | | Trustee, since 2006 | | International Foundation of Employee Benefit Plans Professor, Wharton School of the University of Pennsylvania since 1993. Director of Wharton’s Pension Research Council and Boettner Center on Pensions & Retirement Research, and Research Associate at the National Bureau of Economic Research. Previously, Cornell University Professor from 1978 to 1993. | | Asset Allocation Trust |
Timothy J. Penny (Born 1951) | | Trustee, since 1996 | | President and Chief Executive Officer of Southern Minnesota Initiative Foundation, a non-profit organization, since 2007 and Senior Fellow at the Humphrey Institute Policy Forum at the University of Minnesota since 1995. Member of the Board of Trustees of NorthStar Education Finance, Inc., a non-profit organization, since 2007. | | Asset Allocation Trust |
Michael S. Scofield (Born 1943) | | Trustee, since 2010 | | Served on the Investment Company Institute’s Board of Governors and Executive Committee from 2008-2011 as well the Governing Council of the Independent Directors Council from 2006-2011 and the Independent Directors Council Executive Committee from 2008-2011. Chairman of the IDC from 2008-2010. Institutional Investor (Fund Directions) Trustee of Year in 2007. Trustee of the Evergreen Funds complex (and its predecessors) from 1984 to 2010. Chairman of the Evergreen Funds from 2000-2010. Former Trustee of the Mentor Funds. Retired Attorney, Law Offices of Michael S. Scofield. | | Asset Allocation Trust |
Donald C. Willeke (Born 1940) | | Trustee, since 1996 | | Principal of the law firm of Willeke & Daniels. General Counsel of the Minneapolis Employees Retirement Fund from 1984 until its consolidation into the Minnesota Public Employees Retirement Association on June 30, 2010. Director and Vice Chair of The Tree Trust (non-profit corporation). Director of the American Chestnut Foundation (non-profit corporation). | | Asset Allocation Trust |
| * | Length of service dates reflect the Trustee’s commencement of service with the Trust’s predecessor entities, where applicable. |
| ** | William R. Ebsworth and Jane A. Freeman each became a Trustee effective January 1, 2015. |
Officers
| | | | | | |
Name and year of birth | | Position held and length of service | | Principal occupations during past five years or longer | | |
Karla M. Rabusch (Born 1959) | | President, since 2003 | | Executive Vice President of Wells Fargo Bank, N.A. and President of Wells Fargo Funds Management, LLC since 2003. | | |
Nancy Wiser1 (Born 1967) | | Treasurer, since 2012 | | Executive Vice President of Wells Fargo Funds Management, LLC since 2011. Chief Operating Officer and Chief Compliance Officer at LightBox Capital Management LLC, from 2008 to 2011. | | |
C. David Messman (Born 1960) | | Secretary, since 2000; Chief Legal Officer, since 2003 | | Senior Vice President and Secretary of Wells Fargo Funds Management, LLC since 2001. Assistant General Counsel of Wells Fargo Bank, N.A. since 2013 and Vice President and Managing Counsel of Wells Fargo Bank N.A. from 1996 to 2013. | | |
Debra Ann Early (Born 1964) | | Chief Compliance Officer, since 2007 | | Executive Vice President of Wells Fargo Funds Management, LLC since 2014, Senior Vice President and Chief Compliance Officer from 2007 to 2014. | | |
David Berardi (Born 1975) | | Assistant Treasurer, since 2009 | | Vice President of Wells Fargo Funds Management, LLC since 2009. Vice President of Evergreen Investment Management Company, LLC from 2008 to 2010. Manager of Fund Reporting and Control for Evergreen Investment Management Company, LLC from 2004 to 2010. | | |
Jeremy DePalma1 (Born 1974) | | Assistant Treasurer, since 2009 | | Senior Vice President of Wells Fargo Funds Management, LLC since 2009. Senior Vice President of Evergreen Investment Management Company, LLC from 2008 to 2010 and head of the Fund Reporting and Control Team within Fund Administration from 2005 to 2010. | | |
| 1 | Nancy Wiser acts as Treasurer of 72 funds in the Fund Complex. Jeremy DePalma acts as Treasurer of 72 funds and Assistant Treasurer of 72 funds in the Fund Complex. |
| 2 | The Statement of Additional Information includes additional information about the Trustees and is available, without charge, upon request, by calling 1-800-222-8222 or by visiting the website at wellsfargoadvantagefunds.com. |
| | | | |
| 26 | | Wells Fargo Advantage Small Cap Opportunities Fund | | Other information (unaudited) |
BOARD CONSIDERATION OF INVESTMENT ADVISORY, INVESTMENT MANAGEMENT AND SUB-ADVISORY AGREEMENTS:
Under the Investment Company Act of 1940 (the “1940 Act”), the Board of Trustees (the “Board”) of Wells Fargo Funds Trust (the “Trust”) must determine annually whether to approve the continuation of the Trust’s investment advisory and sub-advisory agreements. In this regard, at an in-person meeting held on May 19-20, 2015 (the “Meeting”), the Board, all the members of which have no direct or indirect interest in the investment advisory and sub-advisory agreements and are not “interested persons” of the Trust, as defined in the 1940 Act (the “Independent Trustees”), reviewed and approved for Wells Fargo Advantage Small Cap Opportunities Fund (the “Fund”): (i) an investment advisory agreement (the “Advisory Agreement”) with Wells Fargo Funds Management, LLC (“Funds Management”); (ii) an investment management agreement (the “Management Agreement”) with Funds Management; and (iii) an investment sub-advisory agreement (the “Sub-Advisory Agreement”) with Schroder Investment Management North America Inc. (the “Sub-Adviser”). The Management Agreement combines the terms of the Advisory Agreement with the terms of the Fund’s Amended and Restated Administration Agreement (the “Administration Agreement”) applicable to Fund-level administrative services. The Advisory Agreement, the Management Agreement and the Sub-Advisory Agreement are collectively referred to as the “Advisory Agreements.”
At the Meeting, the Board considered the factors and reached the conclusions described below relating to the selection of Funds Management and the Sub-Adviser and the approval of the Advisory Agreements. Prior to the Meeting, including at an in-person meeting in March 2015, the Trustees conferred extensively among themselves and with representatives of Funds Management about these matters. Also, the Board has adopted a team-based approach, with each team consisting of a sub-set of Trustees, to assist the full Board in the discharge of its duties in reviewing performance and other matters throughout the year. The Independent Trustees were assisted in their evaluation of the Advisory Agreements by independent legal counsel, from whom they received separate legal advice and with whom they met separately.
In providing information to the Board, Funds Management and the Sub-Adviser were guided by a detailed set of requests for information submitted to them by independent legal counsel on behalf of the Independent Trustees at the start of the Board’s annual contract renewal process earlier in 2015. In considering and approving the Advisory Agreements, the Trustees considered the information they believed relevant, including but not limited to the information discussed below. The Board considered not only the specific information presented in connection with the Meeting, but also the knowledge gained over time through interaction with Funds Management and the Sub-Adviser about various topics. In this regard, the Board reviewed reports of Funds Management at each of its quarterly meetings, which included, among other things, portfolio reviews and performance reports. In addition, the Board and the teams mentioned above confer with portfolio managers at various times throughout the year. The Board did not identify any particular information or consideration that was all-important or controlling, and each individual Trustee may have attributed different weights to various factors.
After its deliberations, the Board unanimously approved the continuation of the Advisory Agreement for the period from June 1, 2015 through June 30, 2015, approved the Management Agreement for the period from July 1, 2015 through May 31, 2016, and approved the continuation of the Sub-Advisory Agreement for a one-year term through May 31, 2016. The Board also determined that the compensation payable to Funds Management and the Sub-Adviser under each of the Advisory Agreements was reasonable. The Board considered the approval of the Advisory Agreements for the Fund as part of its consideration of agreements for funds across the complex, but its approvals were made on a fund-by-fund basis. The following summarizes a number of important, but not necessarily all, factors considered by the Board in support of its approvals.
Nature, extent and quality of services
The Board received and considered various information regarding the nature, extent and quality of services provided to the Fund by Funds Management and the Sub-Adviser under the Advisory Agreements. This information included, among other things, a summary of the background and experience of senior management of Funds Management, and the qualifications, background, tenure and responsibilities of each of the portfolio managers primarily responsible for the day-to-day portfolio management of the Fund. The Board noted that the services to be provided to the Fund pursuant to the Management Agreement combined the advisory services previously provided to the Fund pursuant to the Fund’s Advisory Agreement with the Fund-level administrative services previously provided to the Fund pursuant to the Fund’s Administration Agreement. The Board received a representation from Funds Management that combining these services would not result in any change to the nature or level of services provided by Funds Management to the Fund.
The Board evaluated the ability of Funds Management and the Sub-Adviser to attract and retain qualified investment professionals, including research, advisory and supervisory personnel. The Board further considered the compliance programs and compliance records of Funds Management and the Sub-Adviser. In addition, the Board took into account the full range of services provided to the Fund by Funds Management and its affiliates.
| | | | | | |
| Other information (unaudited) | | Wells Fargo Advantage Small Cap Opportunities Fund | | | 27 | |
Fund performance and expenses
The Board considered the performance results for the Fund over various time periods ended March 31, 2015. The Board considered these results in comparison to the performance of funds in a universe that was determined by Lipper Inc. (“Lipper”) to be similar to the Fund (the “Universe”), and in comparison to the Fund’s benchmark index and to other comparative data. Lipper is an independent provider of investment company data. The Board received a description of the methodology used by Lipper to select the mutual funds in the performance Universe. The Board noted that the performance of the Fund (Administrator Class) was higher than the average performance of the Universe for all periods under review. The Board also noted that the performance of the Fund was higher than its benchmark, the Russell 2000® Index, for the first quarter of 2015 and the one- and ten-year periods under review, was in range of its benchmark for the three-year period under review and lower than its benchmark for the 5-year period under review.
The Board also received and considered information regarding the Fund’s net operating expense ratios and their various components, including actual management fees (which reflect fee waivers, if any, and include advisory, administration and transfer agent fees), custodian and other non-management fees, and Rule 12b-1 and non-Rule 12b-1 service fees. The Board considered these ratios in comparison to the median ratios of funds in class-specific expense groups that were determined by Lipper to be similar to the Fund (the “Groups”). The Board received a description of the methodology used by Lipper to select the mutual funds in the expense Groups and an explanation of how funds comprising expense groups and their expense ratios may vary from year-to-year. Based on the Lipper reports, the Board noted that the net operating expense ratios of the Fund were equal to or in the range of the median net operating expense ratios of the expense Groups.
The Board took into account the Fund performance and expense information provided to it among the factors considered in deciding to re-approve the Advisory Agreement and Sub-Advisory Agreement and approve the Management Agreement.
Investment advisory and sub-advisory fee rates
The Board reviewed and considered the contractual investment advisory fee rates that are payable by the Fund to Funds Management for investment advisory services (the “Advisory Agreement Rates”), both on a stand-alone basis and on a combined basis with the Fund’s fund-level and class-level contractual administration fee rates (the “Management Rates”). The Board noted that the Management Rates include transfer agency and sub-transfer agency costs. The Board also noted that the fee rate to be paid by the Fund under the Management Agreement will incorporate the advisory fee and Fund-level administration fee previously payable separately by the Fund under the Fund’s Advisory Agreement and Administration Agreement with Funds Management. The Board also reviewed and considered the contractual investment sub-advisory fee rates that are payable by Funds Management to the Sub-Adviser for investment sub-advisory services (the “Sub-Advisory Agreement Rates”).
Among other information reviewed by the Board was a comparison of the Management Rates of the Fund with those of other funds in the expense Groups at a common asset level. The Board noted that the Management Rates of the Fund lower than or in the range of the average rates for the Fund’s expense Groups for all share classes.
The Board also received and considered information about the portion of the total advisory fee that was retained by Funds Management after payment of the fee to the Sub-Adviser for sub-advisory services. The Board considered this amount in comparison to the median amount retained by advisers to funds in a sub-advised expense universe that was determined by Lipper to be similar to the Fund. In assessing the reasonableness of this amount, the Board received and evaluated information about the nature and extent of responsibilities retained and risks assumed by Funds Management and not delegated to or assumed by the Sub-Adviser, and about Funds Management’s on-going oversight services. The Board also considered that the sub-advisory fees paid to the Sub-Adviser had been negotiated by Funds Management on an arm’s length basis.
The Board also received and considered information about the nature and extent of services offered and fee rates charged by Funds Management and the Sub-Adviser to other types of clients with investment strategies similar to those of the Fund. In this regard, the Board received information about the significantly greater scope of services, and compliance, reporting and other legal burdens and risks of managing mutual funds compared with those associated with managing assets of non-mutual fund clients such as collective funds or institutional separate accounts.
Based on its consideration of the factors and information it deemed relevant, including those described here, the Board determined that the compensation payable to Funds Management under the Management Agreement and Advisory Agreement and to the Sub-Adviser under the Sub-Advisory Agreement was reasonable, in light of the services covered by the Advisory Agreements.
| | | | |
| 28 | | Wells Fargo Advantage Small Cap Opportunities Fund | | Other information (unaudited) |
Profitability
The Board received and considered information concerning the profitability of Funds Management, as well as the profitability of Wells Fargo as a whole, from providing services to the Fund and the fund family as a whole. Funds Management reported on the methodologies and estimates used in calculating profitability. Among other things, the Board noted that the levels of profitability reported on a fund-by-fund basis varied widely, depending on factors such as the size and type of fund. The Board did not consider profitability with respect to the Sub-Adviser, as the sub-advisory fees paid to the Sub-Adviser had been negotiated by Funds Management on an arm’s-length basis.
Based on its review, the Board did not deem the profits reported by Funds Management to be at a level that would prevent it from approving the continuation of the Advisory Agreements.
Economies of scale
With respect to possible economies of scale, the Board noted the existence of breakpoints in the Fund’s advisory and management fee structures, and the Fund’s administration fee structure, which operate generally to reduce the Fund’s expense ratios as the Fund grows in size. It considered that, for a small fund or a fund that shrinks in size, breakpoints conversely can result in higher fee levels. The Board also considered that fee waiver and expense reimbursement arrangements and competitive fee rates at the outset are means of sharing potential economies of scale with shareholders of the Fund and the fund family as a whole. The Board considered Funds Management’s view that any analyses of potential economies of scale in managing a particular fund are inherently limited in light of the joint and common costs and investments that Funds Management incurs across the fund family as a whole.
The Board concluded that the Fund’s fee and expense arrangements, including contractual breakpoints, constituted a reasonable approach to sharing potential economies of scale with the Fund and its shareholders.
Other benefits to funds management and the sub-adviser
The Board received and considered information regarding potential “fall-out” or ancillary benefits received by Funds Management, the Sub-Adviser, and their affiliates as a result of their relationships with the Fund. Ancillary benefits could include, among others, benefits directly attributable to other relationships with the Fund and benefits potentially derived from an increase in Funds Management’s and the Sub-Adviser’s business as a result of their relationships with the Fund. The Board noted that various affiliates of Funds Management may receive distribution-related fees, shareholder servicing payments and sub-transfer agency fees in respect of shares sold or held through them and services provided.
The Board also reviewed information about soft dollar credits earned and utilized by the Sub-Adviser, fees earned by Funds Management from managing a private investment vehicle for the fund family’s securities lending collateral and commissions earned by an affiliated broker from portfolio transactions.
Based on its consideration of the factors and information it deemed relevant, including those described here, the Board did not find that any ancillary benefits received by Funds Management, the Sub-Adviser, and their affiliates were unreasonable.
Conclusion
At the Meeting, after considering the above-described factors and based on its deliberations and its evaluation of the information described above, the Board unanimously approved the continuation of the Advisory Agreement for the period from June 1, 2015 through June 30, 2015, approved the Management Agreement for the period from July 1, 2015 through May 31, 2016, and approved the continuation of the Sub-Advisory Agreement for a one-year term through May 31, 2016. The Board also determined that the compensation payable to Funds Management and the Sub-Adviser under each of the Advisory Agreements was reasonable.
| | | | | | |
| List of abbreviations | | Wells Fargo Advantage Small Cap Opportunities Fund | | | 29 | |
The following is a list of common abbreviations for terms and entities that may have appeared in this report.
| ACA | — ACA Financial Guaranty Corporation |
| ADR | — American depositary receipt |
| ADS | — American depositary shares |
| AGC | — Assured Guaranty Corporation |
| AGM | — Assured Guaranty Municipal |
| Ambac | — Ambac Financial Group Incorporated |
| AMT | — Alternative minimum tax |
| BAN | — Bond anticipation notes |
| BHAC | — Berkshire Hathaway Assurance Corporation |
| CAB | — Capital appreciation bond |
| CCAB | — Convertible capital appreciation bond |
| CDA | — Community Development Authority |
| CDO | — Collateralized debt obligation |
| DRIVER | — Derivative inverse tax-exempt receipts |
| DW&P | — Department of Water & Power |
| DWR | — Department of Water Resources |
| ECFA | — Educational & Cultural Facilities Authority |
| EDA | — Economic Development Authority |
| EDFA | — Economic Development Finance Authority |
| ETF | — Exchange-traded fund |
| FDIC | — Federal Deposit Insurance Corporation |
| FFCB | — Federal Farm Credit Banks |
| FGIC | — Financial Guaranty Insurance Corporation |
| FHA | — Federal Housing Administration |
| FHLB | — Federal Home Loan Bank |
| FHLMC | — Federal Home Loan Mortgage Corporation |
| FICO | — The Financing Corporation |
| FNMA | — Federal National Mortgage Association |
| GDR | — Global depositary receipt |
| GNMA | — Government National Mortgage Association |
| HCFR | — Healthcare facilities revenue |
| HEFA | — Health & Educational Facilities Authority |
| HEFAR | — Higher education facilities authority revenue |
| HFA | — Housing Finance Authority |
| HFFA | — Health Facilities Financing Authority |
| HUD | — Department of Housing and Urban Development |
| IDA | — Industrial Development Authority |
| IDAG | — Industrial Development Agency |
| KRW | — Republic of Korea won |
| LIBOR | — London Interbank Offered Rate |
| LIFER | — Long Inverse Floating Exempt Receipts |
| LLC | — Limited liability company |
| LLLP | — Limited liability limited partnership |
| LLP | — Limited liability partnership |
| MBIA | — Municipal Bond Insurance Association |
| MFHR | — Multifamily housing revenue |
| MSTR | — Municipal securities trust receipts |
| MUD | — Municipal Utility District |
| National | — National Public Finance Guarantee Corporation |
| PCFA | — Pollution Control Financing Authority |
| PCL | — Public Company Limited |
| PCR | — Pollution control revenue |
| PFA | — Public Finance Authority |
| PFFA | — Public Facilities Financing Authority |
| PFOTER | — Puttable floating option tax-exempt receipts |
| plc | — Public limited company |
| PUTTER | — Puttable tax-exempt receipts |
| R&D | — Research & development |
| Radian | — Radian Asset Assurance |
| RAN | — Revenue anticipation notes |
| RDA | — Redevelopment Authority |
| RDFA | — Redevelopment Finance Authority |
| REIT | — Real estate investment trust |
| ROC | — Reset option certificates |
| SAVRS | — Select auction variable rate securities |
| SBA | — Small Business Authority |
| SDR | — Swedish depositary receipt |
| SFHR | — Single-family housing revenue |
| SFMR | — Single-family mortgage revenue |
| SPA | — Standby purchase agreement |
| SPDR | — Standard & Poor’s Depositary Receipts |
| SPEAR | — Short Puttable Exempt Adjustable Receipts |
| STRIPS | — Separate trading of registered interest and |
| TAN | — Tax anticipation notes |
| TIPS | — Treasury inflation-protected securities |
| TRAN | — Tax revenue anticipation notes |
| TTFA | — Transportation Trust Fund Authority |
| TVA | — Tennessee Valley Authority |
This page is intentionally left blank.
This page is intentionally left blank.
This page is intentionally left blank.


For more information
More information about Wells Fargo Advantage Funds is available free upon request. To obtain literature, please write, email, visit the Fund’s website, or call:
Wells Fargo Advantage Funds
P.O. Box 8266
Boston, MA 02266-8266
Email: wfaf@wellsfargo.com
Website: wellsfargoadvantagefunds.com
Individual investors: 1-800-222-8222
Retail investment professionals: 1-888-877-9275
Institutional investment professionals: 1-866-765-0778
This report and the financial statements contained herein are submitted for the general information of the shareholders of Wells Fargo Advantage Funds. If this report is used for promotional purposes, distribution of the report must be accompanied or preceded by a current prospectus. Before investing, please consider the investment objectives, risks, charges, and expenses of the investment. For a current prospectus and, if available, a summary prospectus, containing this information, call 1-800-222-8222 or visit the Fund’s website at wellsfargoadvantagefunds.com. Read the prospectus carefully before you invest or send money.
Wells Fargo Funds Management, LLC, a wholly owned subsidiary of Wells Fargo & Company, provides investment advisory and administrative services for Wells Fargo Advantage Funds. Other affiliates of Wells Fargo & Company provide subadvisory and other services for the Funds. The Funds are distributed by Wells Fargo Funds Distributor, LLC, Member FINRA, an affiliate of Wells Fargo & Company.
NOT FDIC INSURED ¡ NO BANK GUARANTEE ¡ MAY LOSE VALUE
© 2015 Wells Fargo Funds Management, LLC. All rights reserved.
| | |
 | | 237482 11-15 SA243/SAR243 09-15 |

Wells Fargo Advantage Small Cap Value Fund

Semi-Annual Report
September 30, 2015

Reduce clutter. Save trees.
Sign up for electronic delivery of prospectuses and shareholder reports at wellsfargo.com/advantagedelivery
Contents
The views expressed and any forward-looking statements are as of September 30, 2015, unless otherwise noted, and are those of the Fund managers and/or Wells Fargo Funds Management, LLC. Discussions of individual securities, or the markets generally, or any Wells Fargo Advantage Fund are not intended as individual recommendations. Future events or results may vary significantly from those expressed in any forward-looking statements; the views expressed are subject to change at any time in response to changing circumstances in the market. Wells Fargo Funds Management, LLC and the Fund disclaim any obligation to publicly update or revise any views expressed or forward-looking statements.
NOT FDIC INSURED ¡ NO BANK GUARANTEE ¡ MAY LOSE VALUE
| | | | |
| 2 | | Wells Fargo Advantage Small Cap Value Fund | | Letter to shareholders (unaudited) |

Karla M. Rabusch
President
Wells Fargo Advantage Funds
Despite generally improving U.S. economic data, the broad U.S. stock market experienced heightened volatility that led to negative results overall for U.S. stocks for the period.
Periods of uncertainty can present challenges, but experience has taught us that maintaining long-term investment goals can be an effective way to plan for the future.
Dear Valued Shareholder:
We are pleased to offer you this semi-annual report for the Wells Fargo Advantage Small Cap Value Fund for the six-month period that ended September 30, 2015. Despite generally improving U.S. economic data, the broad U.S. stock market experienced heightened volatility that led to negative results overall for U.S. stocks for the period. Large-cap stocks performed best, followed by mid caps and small caps. Markets outside the U.S. faced deeper ongoing challenges and generally delivered weaker results.
U.S. stocks experienced challenges during the second quarter of 2015.
The broad U.S. stock market fluctuated widely, eventually eking out a small quarterly gain. Mid- and large-cap stocks at times were pressured by investor concerns over the potentially negative effects of financially troubled overseas economies and of a strengthening U.S. dollar on the profits of U.S. multinational firms. The U.S. economy picked up traction during the quarter; consumer spending improved, and positive trends were evident in construction and new-home sales. Jobs growth remained a bright spot as well. U.S. Federal Reserve (Fed) officials, who have kept interest rates low while waiting for the U.S. jobs market to sufficiently improve and for inflation to approach their 2% target, made clear they could take action soon. Throughout the quarter, non-U.S. markets also experienced volatility, triggered by uncertainty over the potential impact of financial challenges in other locations—most notably in Greece and Puerto Rico. Questions over slower growth in China caused investor concern as well.
In the third quarter of 2015, China’s slowdown took a toll on economies and markets worldwide.
U.S. stocks sagged during the quarter, experiencing the most volatility since 2011. Larger-cap stocks generally declined the least and smaller caps the most. Economic data released during the quarter suggested the U.S. economy remains solid but has lost some steam, burdened by the drag of the strong U.S. dollar coupled with global economic turmoil. The fact that the Fed left the federal funds interest rate unchanged at its September meeting surprised investors and fueled increased uncertainty about the U.S. economy’s stamina to remain healthy while facing the challenges of slowing in China and troubles elsewhere in the world. Outside the U.S., markets were even more volatile and delivered generally weaker quarterly results, also largely due to investors’ increasing anxiety over China’s weakened economy. Because China is the world’s largest importer of many commodities, a number of emerging markets—key commodities exporters—are struggling under the dual strains of reduced demand for commodities and, because of weaker demand, lower prices for the commodities they do sell. In the eurozone, however, where only about 3% of exports are sent to China, household spending and business investment appeared relatively unaffected by troubles elsewhere. However, the European Central Bank warned in September that slowing growth in China could lead to slower growth and lower inflation rates in the eurozone than previously forecast and indicated additional stimulus could be provided should this occur.
Don’t let short-term uncertainty derail long-term investment goals.
Periods of uncertainty can present challenges, but experience has taught us that maintaining long-term investment goals can be an effective way to plan for the future. To help you create a sound strategy based on your personal goals and risk tolerance, Wells Fargo Advantage Funds offers more than 100 mutual funds spanning a wide range of asset classes and investment styles. Although diversification cannot
| | | | | | |
| Letter to shareholders (unaudited) | | Wells Fargo Advantage Small Cap Value Fund | | | 3 | |
guarantee an investment profit or prevent losses, we believe it can be an effective way to manage investment risk and potentially smooth out overall portfolio performance. We encourage investors to know their investments and to understand that appropriate levels of risk-taking may unlock opportunities.
Thank you for choosing to invest in Wells Fargo Advantage Funds. We appreciate your confidence in us and remain committed to helping you meet your financial needs.
Sincerely,

Karla M. Rabusch
President
Wells Fargo Advantage Funds
Notice to shareholders
At a meeting held August 11-12, 2015, the Board of Trustees of the Fund approved a change in the name of the Fund whereby the word “Advantage” was removed from its name, effective December 15, 2015.
For current information about your fund investments, contact your investment professional, visit our website at wellsfargoadvantagefunds.com, or call us directly at 1-800-222-8222. We are available 24 hours a day, 7 days a week.
| | | | |
| 4 | | Wells Fargo Advantage Small Cap Value Fund | | Performance highlights (unaudited) |
Investment objective
The Fund seeks long-term capital appreciation.
Manager
Wells Fargo Funds Management, LLC
Subadviser
Wells Capital Management Incorporated
Portfolio managers
Erik C. Astheimer
I. Charles Rinaldi
Michael Schneider, CFA
Average annual total returns1 (%) as of September 30, 2015
| | | | | | | | | | | | | | | | | | | | | | | | | | | | | | | | | | |
| | | | | Including sales charge | | | Excluding sales charge | | | Expense ratios2 (%) | |
| | | Inception date | | 1 year | | | 5 year | | | 10 year | | | 1 year | | | 5 year | | | 10 year | | | Gross | | | Net3 | |
| Class A (SMVAX) | | 11-30-2000 | | | (18.99 | ) | | | 1.65 | | | | 3.18 | | | | (14.05 | ) | | | 2.86 | | | | 3.80 | | | | 1.32 | | | | 1.30 | |
| Class B (SMVBX)* | | 11-30-2000 | | | (19.71 | ) | | | 1.71 | | | | 3.25 | | | | (14.71 | ) | | | 2.08 | | | | 3.25 | | | | 2.07 | | | | 2.05 | |
| Class C (SMVCX) | | 11-30-2000 | | | (15.72 | ) | | | 2.09 | | | | 3.02 | | | | (14.72 | ) | | | 2.09 | | | | 3.02 | | | | 2.07 | | | | 2.05 | |
| Class R6 (SMVRX) | | 6-28-2013 | | | – | | | | – | | | | – | | | | (13.67 | ) | | | 3.29 | | | | 4.19 | | | | 0.89 | | | | 0.85 | |
| Administrator Class (SMVDX) | | 7-30-2010 | | | – | | | | – | | | | – | | | | (13.91 | ) | | | 3.05 | | | | 3.98 | | | | 1.24 | | | | 1.10 | |
| Institutional Class (WFSVX) | | 7-31-2007 | | | – | | | | – | | | | – | | | | (13.70 | ) | | | 3.28 | | | | 4.18 | | | | 0.99 | | | | 0.90 | |
| Investor Class (SSMVX)+ | | 12-31-1997 | | | – | | | | – | | | | – | | | | (14.08 | ) | | | 2.83 | | | | 3.82 | | | | 1.43 | | | | 1.31 | |
| Russell 2000® Value Index4 | | – | | | – | | | | – | | | | – | | | | (1.60 | ) | | | 10.17 | | | | 5.35 | | | | – | | | | – | |
| * | | Class B shares are closed to investment, except in connection with the reinvestment of any distributions and permitted exchanges. |
| + | | Effective at the close of business on October 23, 2015, Investor Class shares of the Fund were converted to Class A shares and Investor Class shares are no longer offered. |
Figures quoted represent past performance, which is no guarantee of future results, and do not reflect taxes that a shareholder may pay on fund distributions or the redemption of fund shares. Investment return and principal value of an investment will fluctuate so that an investor’s shares, when redeemed, may be worth more or less than their original cost. Performance shown without sales charges would be lower if sales charges were reflected. Current performance may be lower or higher than the performance data quoted, which assumes the reinvestment of dividends and capital gains. Current month-end performance is available on the Fund’s website, wellsfargoadvantagefunds.com.
Index returns do not include transaction costs associated with buying and selling securities, any mutual fund fees or expenses, or any taxes. It is not possible to invest directly in an index.
For Class A shares, the maximum front-end sales charge is 5.75%. For Class B shares, the maximum contingent deferred sales charge is 5.00%. For Class C shares, the maximum contingent deferred sales charge is 1.00%. Performance including a contingent deferred sales charge assumes the sales charge for the corresponding time period. Administrator Class, Institutional Class, and Investor Class shares are sold without a front-end sales charge or contingent deferred sales charge.
Stock values fluctuate in response to the activities of individual companies and general market and economic conditions. Smaller-company stocks tend to be more volatile and less liquid than those of larger companies. The use of derivatives may reduce returns and/or increase volatility. Certain investment strategies tend to increase the total risk of an investment (relative to the broader market). The Fund is exposed to foreign investment risk. Consult the Fund’s prospectus for additional information on these and other risks.
Please see footnotes on page 5.
| | | | | | |
| Performance highlights (unaudited) | | Wells Fargo Advantage Small Cap Value Fund | | | 5 | |
| | | | |
| Ten largest holdings5 (%) as of September 30, 2015 | |
Randgold Resources Limited ADR | | | 6.93 | |
InterOil Corporation | | | 6.27 | |
OSI Systems Incorporated | | | 4.29 | |
Cavco Industries Incorporated | | | 4.06 | |
Argo Group International Holdings Limited | | | 3.16 | |
Delta Air Lines Incorporated | | | 3.08 | |
Cray Incorporated | | | 2.71 | |
Coherent Incorporated | | | 2.11 | |
Cincinnati Bell Incorporated | | | 2.05 | |
United Continental Holdings Incorporated | | | 2.00 | |
|
| Sector distribution6 as of September 30, 2015 |
|
 |
| 1 | Historical performance shown for Administrator Class shares prior to their inception reflects the performance of Institutional Class shares and has been adjusted to reflect the higher expenses applicable to Administrator Class shares. Historical performance shown for Institutional Class shares prior to their inception reflects the performance of Investor Class shares, and includes the higher expenses applicable to Investor Class shares. Historical performance shown for Class R6 shares prior to their inception reflects the performance of Institutional Class shares and includes the higher expenses applicable to Institutional Class shares. If these expenses had not been included, returns would be higher. |
| 2 | Reflects the expense ratios as stated in the most recent prospectuses, which include the impact of 0.02% in acquired fund fees and expenses. The expense ratios shown are subject to change and may differ from the annualized expense ratios shown in the financial highlights of this report, which do not include acquired fund fees and expenses. |
| 3 | The manager has contracutally committed through July 31, 2016, to waive fees and/or reimburse expenses to the extent necessary to cap the Fund’s Total Annual Fund Operating Expenses After Fee Waiver at 1.28% for Class A, 2.03% for Class B, 2.03% for Class C, 0.83% for Class R6, 1.08% for Administrator Class, 0.88% for Institutional Class, and 1.29% for Investor Class. After this time, the cap may be increased or the commitment to maintain the cap may be terminated only with the approval of the Board of Trustees. Brokerage commissions, stamp duty fees, interest, taxes, acquired fund fees and expenses, and extraordinary expenses are excluded from the cap. Without this cap, the Fund’s returns would have been lower. |
| 4 | The Russell 2000® Value Index measures the performance of those Russell 2000 companies with lower price-to-book ratios and lower forecasted growth values. You cannot invest directly in an index. |
| 5 | The ten largest holdings, excluding cash and cash equivalents, are calculated based on the value of the investments divided by total net assets of the Fund. Holdings are subject to change and may have changed since the date specified. |
| 6 | Amounts are calculated based on the total long-term investments of the Fund. These amounts are subject to change and may have changed since the date specified. |
| | | | |
| 6 | | Wells Fargo Advantage Small Cap Value Fund | | Fund expenses (unaudited) |
As a shareholder of the Fund, you incur two types of costs: (1) transaction costs, including sales charges (loads) on purchase payments and contingent deferred sales charges (if any) on redemptions and (2) ongoing costs, including management fees, distribution (12b-1) and/or shareholder servicing fees, and other Fund expenses. This example is intended to help you understand your ongoing costs (in dollars) of investing in the Fund and to compare these costs with the ongoing costs of investing in other mutual funds.
The example is based on an investment of $1,000 invested at the beginning of the six-month period and held for the entire period from April 1, 2015 to September 30, 2015.
Actual expenses
The “Actual” line of the table below provides information about actual account values and actual expenses. You may use the information in this line, together with the amount you invested, to estimate the expenses that you paid over the period. Simply divide your account value by $1,000 (for example, an $8,600 account value divided by $1,000 = 8.6), then multiply the result by the number in the “Actual” line under the heading entitled “Expenses paid during period” for your applicable class of shares to estimate the expenses you paid on your account during this period.
Hypothetical example for comparison purposes
The “Hypothetical” line of the table below provides information about hypothetical account values and hypothetical expenses based on the Fund’s actual expense ratio and an assumed rate of return of 5% per year before expenses, which is not the Fund’s actual return. The hypothetical account values and expenses may not be used to estimate the actual ending account balance or expenses you paid for the period. You may use this information to compare the ongoing costs of investing in the Fund and other funds. To do so, compare this 5% hypothetical example with the 5% hypothetical examples that appear in the shareholder reports of the other funds.
Please note that the expenses shown in the table are meant to highlight your ongoing costs only and do not reflect any transactional costs, such as sales charges (loads) and contingent deferred sales charges. Therefore, the “Hypothetical” line of the table is useful in comparing ongoing costs only and will not help you determine the relative total costs of owning different funds. In addition, if these transactional costs were included, your costs would have been higher.
| | | | | | | | | | | | | | | | |
| | | Beginning
account value
4-1-2015 | | | Ending
account value
9-30-2015 | | | Expenses
paid during
the period¹ | | | Net annualized
expense ratio | |
Class A | | | | | | | | | | | | | | | | |
Actual | | $ | 1,000.00 | | | $ | 863.32 | | | $ | 5.98 | | | | 1.28 | % |
Hypothetical (5% return before expenses) | | $ | 1,000.00 | | | $ | 1,018.65 | | | $ | 6.48 | | | | 1.28 | % |
Class B | | | | | | | | | | | | | | | | |
Actual | | $ | 1,000.00 | | | $ | 859.90 | | | $ | 9.46 | | | | 2.03 | % |
Hypothetical (5% return before expenses) | | $ | 1,000.00 | | | $ | 1,014.89 | | | $ | 10.25 | | | | 2.03 | % |
Class C | | | | | | | | | | | | | | | | |
Actual | | $ | 1,000.00 | | | $ | 860.08 | | | $ | 9.47 | | | | 2.03 | % |
Hypothetical (5% return before expenses) | | $ | 1,000.00 | | | $ | 1,014.89 | | | $ | 10.25 | | | | 2.03 | % |
Class R6 | | | | | | | | | | | | | | | | |
Actual | | $ | 1,000.00 | | | $ | 865.32 | | | $ | 3.88 | | | | 0.83 | % |
Hypothetical (5% return before expenses) | | $ | 1,000.00 | | | $ | 1,020.91 | | | $ | 4.20 | | | | 0.83 | % |
Administrator Class | | | | | | | | | | | | | | | | |
Actual | | $ | 1,000.00 | | | $ | 864.31 | | | $ | 5.05 | | | | 1.08 | % |
Hypothetical (5% return before expenses) | | $ | 1,000.00 | | | $ | 1,019.65 | | | $ | 5.47 | | | | 1.08 | % |
Institutional Class | | | | | | | | | | | | | | | | |
Actual | | $ | 1,000.00 | | | $ | 865.32 | | | $ | 4.11 | | | | 0.88 | % |
Hypothetical (5% return before expenses) | | $ | 1,000.00 | | | $ | 1,020.66 | | | $ | 4.46 | | | | 0.88 | % |
Investor Class | | | | | | | | | | | | | | | | |
Actual | | $ | 1,000.00 | | | $ | 863.17 | | | $ | 6.03 | | | | 1.29 | % |
Hypothetical (5% return before expenses) | | $ | 1,000.00 | | | $ | 1,018.60 | | | $ | 6.53 | | | | 1.29 | % |
| 1 | Expenses paid is equal to the annualized expense ratio of each class multiplied by the average account value over the period, multiplied by the number of days in the most recent fiscal half-year divided by the number of days in the fiscal year (to reflect the one-half-year period). |
| | | | | | |
| Portfolio of investments—September 30, 2015 (unaudited) | | Wells Fargo Advantage Small Cap Value Fund | | | 7 | |
| | | | | | | | | | | | |
| Security name | | | | | | Shares | | | Value | |
| | | | | | | | | | | | |
| | | | |
Common Stocks: 91.81% | | | | | | | | | | | | |
| | | | |
Consumer Discretionary: 14.96% | | | | | | | | | | | | |
| | | | |
| Auto Components: 1.73% | | | | | | | | | | | | |
Fox Factory Holding Corporation † | | | | | | | 625,500 | | | $ | 10,545,930 | |
Gentex Corporation | | | | | | | 502,300 | | | | 7,785,650 | |
| | | | |
| | | | | | | | | | | 18,331,580 | |
| | | | | | | | | | | | |
| | | | |
| Hotels, Restaurants & Leisure: 5.29% | | | | | | | | | | | | |
Century Casinos Incorporated †(l) | | | | | | | 1,511,100 | | | | 9,293,265 | |
Denny’s Corporation † | | | | | | | 1,682,000 | | | | 18,552,460 | |
Peak Resorts Incorporated | | | | | | | 552,500 | | | | 3,806,725 | |
Scientific Games Corporation Class A † | | | | | | | 981,600 | | | | 10,257,720 | |
The Wendy’s Company | | | | | | | 1,627,300 | | | | 14,076,145 | |
| | | | |
| | | | | | | | | | | 55,986,315 | |
| | | | | | | | | | | | |
| | | | |
| Household Durables: 6.88% | | | | | | | | | | | | |
Cavco Industries Incorporated †(l) | | | | | | | 631,400 | | | | 42,992,026 | |
Harman International Industries Incorporated | | | | | | | 57,900 | | | | 5,557,821 | |
KB Home Incorporated | | | | | | | 556,000 | | | | 7,533,800 | |
Skyline Corporation †(l) | | | | | | | 621,200 | | | | 1,789,056 | |
Taylor Morrison Home Corporation Class A † | | | | | | | 382,600 | | | | 7,139,316 | |
The New Home Company Incorporated † | | | | | | | 599,600 | | | | 7,764,820 | |
| | | | |
| | | | | | | | | | | 72,776,839 | |
| | | | | | | | | | | | |
| | | | |
| Media: 0.49% | | | | | | | | | | | | |
Starz Incorporated Class A † | | | | | | | 138,000 | | | | 5,152,920 | |
| | | | | | | | | | | | |
| | | | |
| Multiline Retail: 0.23% | | | | | | | | | | | | |
Fred’s Incorporated Class A | | | | | | | 206,000 | | | | 2,441,100 | |
| | | | | | | | | | | | |
| | | | |
| Specialty Retail: 0.34% | | | | | | | | | | | | |
Vitamin Shoppe Incorporated † | | | | | | | 111,000 | | | | 3,623,040 | |
| | | | | | | | | | | | |
| | | | |
Energy: 8.90% | | | | | | | | | | | | |
| | | | |
| Energy Equipment & Services: 1.74% | | | | | | | | | | | | |
Glori Energy Incorporated † | | | | | | | 491,800 | | | | 363,932 | |
ION Geophysical Corporation † | | | | | | | 3,025,100 | | | | 1,179,789 | |
Key Energy Services Incorporated † | | | | | | | 465,000 | | | | 218,550 | |
Newpark Resources Incorporated † | | | | | | | 1,577,200 | | | | 8,075,264 | |
Parker Drilling Company † | | | | | | | 1,421,900 | | | | 3,739,597 | |
PHI Incorporated (non-voting) † | | | | | | | 239,400 | | | | 4,519,872 | |
Willbros Group Incorporated † | | | | | | | 270,800 | | | | 341,208 | |
| | | | |
| | | | | | | | | | | 18,438,212 | |
| | | | | | | | | | | | |
| | | | |
| Oil, Gas & Consumable Fuels: 7.16% | | | | | | | | | | | | |
Clean Energy Fuels Corporation † | | | | | | | 123,800 | | | | 557,100 | |
InterOil Corporation † | | | | | | | 1,968,900 | | | | 66,371,619 | |
Range Resources Corporation | | | | | | | 110,800 | | | | 3,558,896 | |
Sanchez Energy Corporation † | | | | | | | 321,200 | | | | 1,975,380 | |
Trilogy Energy Corporation | | | | | | | 1,278,300 | | | | 3,259,665 | |
| | | | |
| | | | | | | | | | | 75,722,660 | |
| | | | | | | | | | | | |
The accompanying notes are an integral part of these financial statements.
| | | | |
| 8 | | Wells Fargo Advantage Small Cap Value Fund | | Portfolio of investments—September 30, 2015 (unaudited) |
| | | | | | | | | | | | |
| Security name | | | | | | Shares | | | Value | |
| | | | | | | | | | | | |
| | | | |
Financials: 20.13% | | | | | | | | | | | | |
| | | | |
| Banks: 10.15% | | | | | | | | | | | | |
Ameris Bancorp | | | | | | | 348,100 | | | $ | 10,007,875 | |
BBCN Bancorp Incorporated | | | | | | | 648,700 | | | | 9,743,474 | |
CenterState Banks Incorporated | | | | | | | 859,700 | | | | 12,637,590 | |
First Horizon National Corporation | | | | | | | 974,900 | | | | 13,824,082 | |
First Niagara Financial Group Incorporated | | | | | | | 1,169,600 | | | | 11,941,616 | |
Hilltop Holdings Incorporated † | | | | | | | 434,900 | | | | 8,615,369 | |
IBERIABANK Corporation | | | | | | | 199,100 | | | | 11,589,611 | |
Park Sterling Corporation | | | | | | | 838,100 | | | | 5,699,080 | |
Sterling BanCorp | | | | | | | 203,700 | | | | 3,029,019 | |
The Bancorp Incorporated † | | | | | | | 1,256,200 | | | | 9,572,244 | |
Valley National Bancorp | | | | | | | 299,600 | | | | 2,948,064 | |
Wilshire Bancorp Incorporated | | | | | | | 745,400 | | | | 7,834,154 | |
| | | | |
| | | | | | | | | | | 107,442,178 | |
| | | | | | | | | | | | |
| | | | |
| Capital Markets: 0.45% | | | | | | | | | | | | |
Medley Management Incorporated Class A (l) | | | | | | | 714,200 | | | | 4,728,004 | |
| | | | | | | | | | | | |
| | | | |
| Consumer Finance: 0.41% | | | | | | | | | | | | |
Cash America International Incorporated | | | | | | | 34,500 | | | | 964,965 | |
Enova International Incorporated † | | | | | | | 327,900 | | | | 3,351,138 | |
| | | | |
| | | | | | | | | | | 4,316,103 | |
| | | | | | | | | | | | |
| | | | |
| Insurance: 5.42% | | | | | | | | | | | | |
Argo Group International Holdings Limited | | | | | | | 590,884 | | | | 33,438,126 | |
James River Group Holdings Limited | | | | | | | 144,600 | | | | 3,888,294 | |
National General Holdings Corporation | | | | | | | 497,300 | | | | 9,592,917 | |
OneBeacon Insurance Group Limited Class A | | | | | | | 741,700 | | | | 10,413,468 | |
| | | | |
| | | | | | | | | | | 57,332,805 | |
| | | | | | | | | | | | |
| | | | |
| REITs: 3.06% | | | | | | | | | | | | |
Potlatch Corporation | | | | | | | 224,300 | | | | 6,457,597 | |
Redwood Trust Incorporated | | | | | | | 1,345,300 | | | | 18,618,952 | |
UMH Properties Incorporated | | | | | | | 785,400 | | | | 7,304,220 | |
| | | | |
| | | | | | | | | | | 32,380,769 | |
| | | | | | | | | | | | |
| | | | |
| Thrifts & Mortgage Finance: 0.64% | | | | | | | | | | | | |
Northwest Bancshares Incorporated | | | | | | | 518,700 | | | | 6,743,100 | |
| | | | | | | | | | | | |
| | | | |
Health Care: 6.30% | | | | | | | | | | | | |
| | | | |
| Health Care Equipment & Supplies: 2.16% | | | | | | | | | | | | |
Allied Healthcare Products Incorporated †(l) | | | | | | | 804,500 | | | | 925,175 | |
Hologic Incorporated † | | | | | | | 198,500 | | | | 7,767,305 | |
OraSure Technologies Incorporated †(l) | | | | | | | 3,196,800 | | | | 14,193,792 | |
| | | | |
| | | | | | | | | | | 22,886,272 | |
| | | | | | | | | | | | |
| | | | |
| Health Care Providers & Services: 2.89% | | | | | | | | | | | | |
Air Methods Corporation † | | | | | | | 158,800 | | | | 5,413,492 | |
The accompanying notes are an integral part of these financial statements.
| | | | | | |
| Portfolio of investments—September 30, 2015 (unaudited) | | Wells Fargo Advantage Small Cap Value Fund | | | 9 | |
| | | | | | | | | | | | |
| Security name | | | | | | Shares | | | Value | |
| | | | | | | | | | | | |
| | | | |
| Health Care Providers & Services (continued) | | | | | | | | | | | | |
Cross Country Healthcare Incorporated † | | | | | | | 1,426,100 | | | $ | 19,409,221 | |
Healthways Incorporated † | | | | | | | 518,100 | | | | 5,761,272 | |
| | | | |
| | | | | | | | | | | 30,583,985 | |
| | | | | | | | | | | | |
| | | | |
| Health Care Technology: 0.74% | | | | | | | | | | | | |
Allscripts Healthcare Solutions Incorporated † | | | | | | | 628,500 | | | | 7,793,400 | |
| | | | | | | | | | | | |
| | | | |
| Life Sciences Tools & Services: 0.31% | | | | | | | | | | | | |
PAREXEL International Corporation † | | | | | | | 52,400 | | | | 3,244,608 | |
| | | | | | | | | | | | |
| | | | |
| Pharmaceuticals: 0.20% | | | | | | | | | | | | |
Prestige Brands Holdings Incorporated † | | | | | | | 46,500 | | | | 2,099,940 | |
| | | | | | | | | | | | |
| | | | |
Industrials: 11.14% | | | | | | | | | | | | |
| | | | |
| Airlines: 6.29% | | | | | | | | | | | | |
American Airlines Group Incorporated | | | | | | | 240,500 | | | | 9,338,615 | |
Delta Air Lines Incorporated | | | | | | | 725,200 | | | | 32,539,724 | |
Latam Airlines Group SP ADR † | | | | | | | 726,700 | | | | 3,546,296 | |
United Continental Holdings Incorporated † | | | | | | | 399,000 | | | | 21,166,950 | |
| | | | |
| | | | | | | | | | | 66,591,585 | |
| | | | | | | | | | | | |
| | | | |
| Commercial Services & Supplies: 2.40% | | | | | | | | | | | | |
ABM Industries Incorporated | | | | | | | 94,900 | | | | 2,591,719 | |
ACCO Brands Corporation † | | | | | | | 2,413,486 | | | | 17,063,346 | |
Healthcare Services Group Incorporated | | | | | | | 171,700 | | | | 5,786,290 | |
| | | | |
| | | | | | | | | | | 25,441,355 | |
| | | | | | | | | | | | |
| | | | |
| Construction & Engineering: 0.57% | | | | | | | | | | | | |
Tutor Perini Corporation † | | | | | | | 363,000 | | | | 5,974,980 | |
| | | | | | | | | | | | |
| | | | |
| Machinery: 0.32% | | | | | | | | | | | | |
Actuant Corporation Class A | | | | | | | 184,600 | | | | 3,394,794 | |
| | | | | | | | | | | | |
| | | | |
| Professional Services: 0.55% | | | | | | | | | | | | |
Hill International Incorporated † | | | | | | | 1,768,700 | | | | 5,801,336 | |
| | | | | | | | | | | | |
| | | | |
| Road & Rail: 0.21% | | | | | | | | | | | | |
Covenant Transport Incorporated Class A † | | | | | | | 121,000 | | | | 2,174,370 | |
| | | | | | | | | | | | |
| | | | |
| Trading Companies & Distributors: 0.80% | | | | | | | | | | | | |
Applied Industrial Technologies Incorporated | | | | | | | 221,400 | | | | 8,446,410 | |
| | | | | | | | | | | | |
| | | | |
Information Technology: 13.69% | | | | | | | | | | | | |
| | | | |
| Communications Equipment: 1.27% | | | | | | | | | | | | |
Brocade Communications Systems Incorporated | | | | | | | 208,500 | | | | 2,164,230 | |
Harmonic Incorporated † | | | | | | | 1,014,200 | | | | 5,882,360 | |
Ruckus Wireless Incorporated † | | | | | | | 450,700 | | | | 5,354,316 | |
| | | | |
| | | | | | | | | | | 13,400,906 | |
| | | | | | | | | | | | |
The accompanying notes are an integral part of these financial statements.
| | | | |
| 10 | | Wells Fargo Advantage Small Cap Value Fund | | Portfolio of investments—September 30, 2015 (unaudited) |
| | | | | | | | | | | | |
| Security name | | | | | | Shares | | | Value | |
| | | | | | | | | | | | |
| | | | |
| Electronic Equipment, Instruments & Components: 8.00% | | | | | | | | | | | | |
Checkpoint Systems Incorporated | | | | | | | 985,900 | | | $ | 7,147,775 | |
Cognex Corporation | | | | | | | 284,800 | | | | 9,788,576 | |
Coherent Incorporated † | | | | | | | 408,100 | | | | 22,323,070 | |
OSI Systems Incorporated † | | | | | | | 590,200 | | | | 45,421,792 | |
| | | | |
| | | | | | | | | | | 84,681,213 | |
| | | | | | | | | | | | |
| | | | |
| IT Services: 0.25% | | | | | | | | | | | | |
TeleTech Holdings Incorporated | | | | | | | 100,300 | | | | 2,687,037 | |
| | | | | | | | | | | | |
| | | | |
| Semiconductors & Semiconductor Equipment: 0.40% | | | | | | | | | | | | |
Kulicke & Soffa Industries Incorporated † | | | | | | | 463,300 | | | | 4,253,094 | |
| | | | | | | | | | | | |
| | | | |
| Software: 0.18% | | | | | | | | | | | | |
Tangoe Incorporated † | | | | | | | 257,000 | | | | 1,850,400 | |
| | | | | | | | | | | | |
| | | | |
| Technology Hardware, Storage & Peripherals: 3.59% | | | | | | | | | | | | |
Cray Incorporated † | | | | | | | 1,447,400 | | | | 28,672,994 | |
Diebold Incorporated | | | | | | | 210,200 | | | | 6,257,654 | |
Quantum Corporation † | | | | | | | 4,288,300 | | | | 2,990,232 | |
| | | | |
| | | | | | | | | | | 37,920,880 | |
| | | | | | | | | | | | |
| | | | |
Materials: 14.65% | | | | | | | | | | | | |
| | | | |
| Chemicals: 0.34% | | | | | | | | | | | | |
Calgon Carbon Corporation | | | | | | | 229,800 | | | | 3,580,284 | |
| | | | | | | | | | | | |
| | | | |
| Containers & Packaging: 0.22% | | | | | | | | | | | | |
Intertape Polymer Group Incorporated | | | | | | | 219,200 | | | | 2,338,864 | |
| | | | | | | | | | | | |
| | | | |
| Metals & Mining: 13.03% | | | | | | | | | | | | |
Agnico-Eagle Mines Limited | | | | | | | 359,600 | | | | 9,105,072 | |
Carpenter Technology Corporation | | | | | | | 228,900 | | | | 6,814,353 | |
NovaGold Resources Incorporated † | | | | | | | 1,243,300 | | | | 4,488,313 | |
Randgold Resources Limited ADR | | | | | | | 1,240,700 | | | | 73,312,963 | |
Royal Gold Incorporated | | | | | | | 240,700 | | | | 11,308,086 | |
Sandstorm Gold Limited † | | | | | | | 1,488,800 | | | | 3,975,096 | |
Silver Standard Resources Incorporated † | | | | | | | 1,183,500 | | | | 7,716,420 | |
Steel Dynamics Incorporated | | | | | | | 978,600 | | | | 16,812,348 | |
Webco Industries Incorporated †(a)(i)(l) | | | | | | | 77,500 | | | | 4,340,000 | |
| | | | |
| | | | | | | | | | | 137,872,651 | |
| | | | | | | | | | | | |
| | | | |
| Paper & Forest Products: 1.06% | | | | | | | | | | | | |
Deltic Timber Corporation | | | | | | | 121,600 | | | | 7,272,896 | |
Wausau Paper Corporation | | | | | | | 622,500 | | | | 3,984,000 | |
| | | | |
| | | | | | | | | | | 11,256,896 | |
| | | | | | | | | | | | |
| | | | |
Telecommunication Services: 2.04% | | | | | | | | | | | | |
| | | | |
| Diversified Telecommunication Services: 2.04% | | | | | | | | | | | | |
Cincinnati Bell Incorporated † | | | | | | | 6,934,900 | | | | 21,636,888 | |
| | | | | | | | | | | | |
| | | | |
Total Common Stocks (Cost $724,911,020) | | | | | | | | | | | 971,327,773 | |
| | | | | | | | | | | | |
The accompanying notes are an integral part of these financial statements.
| | | | | | |
| Portfolio of investments—September 30, 2015 (unaudited) | | Wells Fargo Advantage Small Cap Value Fund | | | 11 | |
| | | | | | | | | | | | | | | | |
| Security name | | | | | | | | Shares | | | Value | |
| | | | | | | | | | | | | | | | |
| | | | |
Exchange-Traded Funds: 1.83% | | | | | | | | | | | | | | | | |
Market Vectors Gold Miners ETF | | | | | | | | | | | 503,724 | | | $ | 6,921,168 | |
Market Vectors Junior Gold Miners ETF | | | | | | | | | | | 159,616 | | | | 3,126,877 | |
SPDR S&P Regional Banking ETF | | | | | | | | | | | 226,878 | | | | 9,342,836 | |
| | | | |
Total Exchange-Traded Funds (Cost $28,249,819) | | | | | | | | | | | | | | | 19,390,881 | |
| | | | | | | | | | | | | | | | |
| | | | |
| | | | | | Expiration date | | | | | | | |
| Warrants: 0.00% | | | | | | | | | | | | | | | | |
| | | | |
Materials: 0.00% | | | | | | | | | | | | | | | | |
| | | | |
| Metals & Mining: 0.00% | | | | | | | | | | | | | | | | |
Sandstorm Gold Limited †(i) | | | | | | | 10-19-2015 | | | | 470,263 | | | | 295 | |
| | | | | | | | | | | | | | | | |
| | | | |
Total Warrants (Cost $0) | | | | | | | | | | | | | | | 295 | |
| | | | | | | | | | | | | | | | |
| | | | |
| | | Yield | | | | | | | | | | |
| Short-Term Investments: 6.24% | | | | | | | | | | | | | | | | |
| | | | |
| Investment Companies: 6.24% | | | | | | | | | | | | | | | | |
Wells Fargo Advantage Cash Investment Money Market Fund, Select Class (l)(u) | | | 0.15 | % | | | | | | | 65,981,591 | | | | 65,981,591 | |
| | | | | | | | | | | | | | | | |
| | | | |
Total Short-Term Investments (Cost $65,981,591) | | | | | | | | | | | | | | | 65,981,591 | |
| | | | | | | | | | | | | | | | |
| | | | | | | | |
| Total investments in securities (Cost $819,142,430) * | | | 99.88 | % | | | 1,056,700,540 | |
Other assets and liabilities, net | | | 0.12 | | | | 1,308,705 | |
| | | | | | | | |
| Total net assets | | | 100.00 | % | | $ | 1,058,009,245 | |
| | | | | | | | |
| † | Non-income-earning security |
| (l) | The security represents an affiliate of the Fund as defined in the Investment Company Act of 1940. |
| (a) | The security is fair valued in accordance with procedures approved by the Board of Trustees. |
| (u) | The rate represents the 7-day annualized yield at period end. |
| * | Cost for federal income tax purposes is $810,893,494 and unrealized gains (losses) consists of: |
| | | | |
Gross unrealized gains | | $ | 372,698,046 | |
Gross unrealized losses | | | (126,891,000 | ) |
| | | | |
Net unrealized gains | | $ | 245,807,046 | |
The accompanying notes are an integral part of these financial statements.
| | | | |
| 12 | | Wells Fargo Advantage Small Cap Value Fund | | Statement of assets and liabilities—September 30, 2015 (unaudited) |
| | | | |
| | | | |
| |
Assets | | | | |
Investments | | | | |
In unaffiliated securities, at value (cost $675,525,192) | | $ | 912,457,631 | |
In affiliated securities, at value (cost $143,617,238) | | | 144,242,909 | |
| | | | |
Total investments, at value (cost $819,142,430) | | | 1,056,700,540 | |
Foreign currency, at value (cost $44) | | | 38 | |
Receivable for investments sold | | | 5,883,219 | |
Receivable for Fund shares sold | | | 326,131 | |
Receivable for dividends | | | 480,075 | |
Prepaid expenses and other assets | | | 69,009 | |
| | | | |
Total assets | | | 1,063,459,012 | |
| | | | |
| |
Liabilities | | | | |
Payable for investments purchased | | | 505,269 | |
Payable for Fund shares redeemed | | | 3,647,163 | |
Management fee payable | | | 641,789 | |
Distribution fees payable | | | 31,295 | |
Administration fee payable | | | 178,265 | |
Accrued expenses and other liabilities | | | 445,986 | |
| | | | |
Total liabilities | | | 5,449,767 | |
| | | | |
Total net assets | | $ | 1,058,009,245 | |
| | | | |
| |
NET ASSETS CONSIST OF | | | | |
Paid-in capital | | $ | 566,213,643 | |
Accumulated net investment loss | | | (3,117,537 | ) |
Accumulated net realized gains on investments | | | 257,355,035 | |
Net unrealized gains on investments | | | 237,558,104 | |
| | | | |
Total net assets | | $ | 1,058,009,245 | |
| | | | |
| |
COMPUTATION OF NET ASSET VALUE AND OFFERING PRICE PER SHARE | | | | |
Net assets – Class A | | $ | 186,149,766 | |
Shares outstanding – Class A1 | | | 7,839,063 | |
Net asset value per share – Class A | | | $23.75 | |
Maximum offering price per share – Class A2 | | | $25.20 | |
Net assets – Class B | | $ | 107,262 | |
Shares outstanding – Class B1 | | | 5,232 | |
Net asset value per share – Class B | | | $20.50 | |
Net assets – Class C | | $ | 47,718,046 | |
Shares outstanding – Class C1 | | | 2,331,349 | |
Net asset value per share – Class C | | | $20.47 | |
Net assets – Class R6 | | $ | 130,873,594 | |
Shares outstanding – Class R61 | | | 5,346,703 | |
Net asset value per share – Class R6 | | | $24.48 | |
Net assets – Administrator Class | | $ | 36,624,322 | |
Shares outstanding – Administrator Class1 | | | 1,497,493 | |
Net asset value per share – Administrator Class | | | $24.46 | |
Net assets – Institutional Class | | $ | 325,039,744 | |
Shares outstanding – Institutional Class1 | | | 13,280,677 | |
Net asset value per share – Institutional Class | | | $24.47 | |
Net assets – Investor Class | | $ | 331,496,511 | |
Shares outstanding – Investor Class1 | | | 13,613,971 | |
Net asset value per share – Investor Class | | | $24.35 | |
| 1 | The Fund has an unlimited number of authorized shares. |
| 2 | Maximum offering price is computed as 100/94.25 of net asset value. On investments of $50,000 or more, the offering price is reduced. |
The accompanying notes are an integral part of these financial statements.
| | | | | | |
| Statement of operations—six months ended September 30, 2015 (unaudited) | | Wells Fargo Advantage Small Cap Value Fund | | | 13 | |
| | | | |
| | | | |
| |
Investment income | | | | |
Dividends (net of foreign withholding taxes of $16,675) | | $ | 4,887,820 | |
Income from affiliated securities | | | 362,246 | |
| | | | |
Total investment income | | | 5,250,066 | |
| | | | |
| |
Expenses | | | | |
Management fee | | | 5,750,891 | |
Administration fees | | | | |
Class A | | | 295,994 | |
Class B | | | 148 | |
Class C | | | 81,569 | |
Class R6 | | | 12,769 | |
Administrator Class | | | 33,564 | |
Institutional Class | | | 250,567 | |
Investor Class | | | 673,147 | |
Shareholder servicing fees | | | | |
Class A | | | 311,220 | |
Class B | | | 157 | |
Class C | | | 85,487 | |
Administrator Class | | | 74,090 | |
Investor Class | | | 521,917 | |
Distribution fees | | | | |
Class B | | | 470 | |
Class C | | | 256,462 | |
Custody and accounting fees | | | 59,481 | |
Professional fees | | | 26,901 | |
Registration fees | | | 46,883 | |
Shareholder report expenses | | | 177,435 | |
Trustees’ fees and expenses | | | 5,761 | |
Other fees and expenses | | | 14,021 | |
| | | | |
Total expenses | | | 8,678,934 | |
Less: Fee waivers and/or expense reimbursements | | | (766,659 | ) |
| | | | |
Net expenses | | | 7,912,275 | |
| | | | |
Net investment loss | | | (2,662,209 | ) |
| | | | |
| |
REALIZED AND UNREALIZED GAINS (LOSSES) ON INVESTMENTS | | | | |
| |
Net realized gains (losses) on: | | | | |
Unaffiliated securities | | | 60,832,479 | |
Affiliated securities | | | 26,982,975 | |
| | | | |
Net realized gains on investments | | | 87,815,454 | |
| | | | |
| |
Net change in unrealized gains (losses) on: | | | | |
Unaffiliated securities | | | (173,291,304 | ) |
Affiliated securities | | | (78,619,256 | ) |
| | | | |
Net change in unrealized gains (losses) on investments | | | (251,910,560 | ) |
| | | | |
Net realized and unrealized gains (losses) on investments | | | (164,095,106 | ) |
| | | | |
Net decrease in net assets resulting from operations | | $ | (166,757,315 | ) |
| | | | |
The accompanying notes are an integral part of these financial statements.
| | | | |
| 14 | | Wells Fargo Advantage Small Cap Value Fund | | Statement of changes in net assets |
| | | | | | | | | | | | | | | | |
| | | Six months ended
September 30, 2015
(unaudited) | | | Year ended
March 31, 2015 | |
| | | | |
Operations | | | | | | | | | | | | | | | | |
Net investment income (loss) | | | | | | $ | (2,662,209 | ) | | | | | | $ | 4,712,137 | |
Net realized gains on investments | | | | | | | 87,815,454 | | | | | | | | 297,123,395 | |
Net change in unrealized gains (losses) on investments | | | | | | | (251,910,560 | ) | | | | | | | (486,933,435 | ) |
| | | | |
Net decrease in net assets resulting from operations | | | | | | | (166,757,315 | ) | | | | | | | (185,097,903 | ) |
| | | | |
| | | | |
Distributions to shareholders from | | | | | | | | | | | | | | | | |
Net investment income | | | | | | | | | | | | | | | | |
Class A | | | | | | | 0 | | | | | | | | (1,523,233 | ) |
Class C | | | | | | | 0 | | | | | | | | (221,005 | ) |
Class R6 | | | | | | | 0 | | | | | | | | (333,505 | ) |
Institutional Class | | | | | | | 0 | | | | | | | | (8,076,528 | ) |
Investor Class | | | | | | | 0 | | | | | | | | (2,166,037 | ) |
Net realized gains | | | | | | | | | | | | | | | | |
Class A | | | | | | | 0 | | | | | | | | (55,676,351 | ) |
Class B | | | | | | | 0 | | | | | | | | (47,217 | ) |
Class C | | | | | | | 0 | | | | | | | | (16,838,250 | ) |
Class R6 | | | | | | | 0 | | | | | | | | (7,568,540 | ) |
Administrator Class | | | | | | | 0 | | | | | | | | (15,392,983 | ) |
Institutional Class | | | | | | | 0 | | | | | | | | (192,333,937 | ) |
Investor Class | | | | | | | 0 | | | | | | | | (90,968,444 | ) |
| | | | |
Total distributions to shareholders | | | | | | | 0 | | | | | | | | (391,146,030 | ) |
| | | | |
| | | | |
Capital share transactions | | | Shares | | | | | | | | Shares | | | | | |
Proceeds from shares sold | | | | | | | | | | | | | | | | |
Class A | | | 237,154 | | | | 6,365,953 | | | | 1,004,915 | | | | 32,650,378 | |
Class C | | | 45,230 | | | | 1,045,433 | | | | 208,610 | | | | 5,701,764 | |
Class R6 | | | 4,647,332 | | | | 130,687,037 | | | | 1,795,825 | | | | 62,081,868 | |
Administrator Class | | | 125,257 | | | | 3,507,245 | | | | 2,670,173 | | | | 93,659,025 | |
Institutional Class | | | 1,144,209 | | | | 31,818,150 | | | | 22,555,891 | | | | 768,995,626 | |
Investor Class | | | 295,502 | | | | 8,062,610 | | | | 1,134,358 | | | | 38,165,162 | |
| | | | |
| | | | | | | 181,486,428 | | | | | | | | 1,001,253,823 | |
| | | | |
Reinvestment of distributions | | | | | | | | | | | | | | | | |
Class A | | | 0 | | | | 0 | | | | 1,960,105 | | | | 54,762,197 | |
Class B | | | 0 | | | | 0 | | | | 1,945 | | | | 47,030 | |
Class C | | | 0 | | | | 0 | | | | 619,555 | | | | 14,985,444 | |
Class R6 | | | 0 | | | | 0 | | | | 274,897 | | | | 7,902,046 | |
Administrator Class | | | 0 | | | | 0 | | | | 510,536 | | | | 14,611,549 | |
Institutional Class | | | 0 | | | | 0 | | | | 3,727,964 | | | | 107,172,323 | |
Investor Class | | | 0 | | | | 0 | | | | 3,198,137 | | | | 91,570,270 | |
| | | | |
| | | | | | | 0 | | | | | | | | 291,050,859 | |
| | | | |
Payment for shares redeemed | | | | | | | | | | | | | | | | |
Class A | | | (2,928,191 | ) | | | (78,236,096 | ) | | | (4,847,855 | ) | | | (156,671,667 | ) |
Class B | | | (1,314 | ) | | | (31,577 | ) | | | (12,058 | ) | | | (350,936 | ) |
Class C | | | (1,115,891 | ) | | | (25,576,538 | ) | | | (728,251 | ) | | | (20,122,577 | ) |
Class R6 | | | (1,160,304 | ) | | | (32,328,626 | ) | | | (221,939 | ) | | | (7,157,233 | ) |
Administrator Class | | | (1,271,202 | ) | | | (34,508,740 | ) | | | (20,096,449 | ) | | | (705,338,775 | ) |
Institutional Class | | | (23,811,439 | ) | | | (679,507,251 | ) | | | (17,298,268 | ) | | | (567,191,934 | ) |
Investor Class | | | (3,694,358 | ) | | | (101,785,459 | ) | | | (8,864,914 | ) | | | (296,658,045 | ) |
| | | | |
| | | | | | | (951,974,287 | ) | | | | | | | (1,753,491,167 | ) |
| | | | |
Net decrease in net assets resulting from capital share transactions | | | | | | | (770,487,859 | ) | | | | | | | (461,186,485 | ) |
| | | | |
Total decrease in net assets | | | | | | | (937,245,174 | ) | | | | | | | (1,037,430,418 | ) |
| | | | |
| | | | |
Net assets | | | | | | | | | | | | | | | | |
Beginning of period | | | | | | | 1,995,254,419 | | | | | | | | 3,032,684,837 | |
| | | | |
End of period | | | | | | $ | 1,058,009,245 | | | | | | | $ | 1,995,254,419 | |
| | | | |
Overdistributed/accumulated net investment income (loss) | | | | | | $ | (3,117,537 | ) | | | | | | $ | (455,328 | ) |
| | | | |
The accompanying notes are an integral part of these financial statements.
| | | | | | |
| Financial highlights | | Wells Fargo Advantage Small Cap Value Fund | | | 15 | |
(For a share outstanding throughout each period)
| | | | | | | | | | | | | | | | | | | | | | | | | | | | |
| | | Six months ended
September 30, 2015 (unaudited) | | | Year ended March 31 | | | Year ended October 31 | |
| CLASS A | | | 2015 | | | 20141 | | | 2013 | | | 2012 | | | 2011 | | | 2010 | |
Net asset value, beginning of period | | | $27.51 | | | | $35.74 | | | | $36.33 | | | | $32.87 | | | | $29.56 | | | | $29.71 | | | | $23.32 | |
Net investment income (loss) | | | (0.07 | )2 | | | 0.01 | 2 | | | 0.18 | | | | 0.23 | | | | 0.19 | | | | 0.16 | | | | 0.22 | 2 |
Net realized and unrealized gains (losses) on
investments | | | (3.69 | ) | | | (2.55 | ) | | | 2.71 | | | | 4.68 | | | | 3.39 | | | | (0.11 | ) | | | 6.29 | |
| | | | | | | | | | | | | | | | | | | | | | | | | | | | |
Total from investment operations | | | (3.76 | ) | | | (2.54 | ) | | | 2.89 | | | | 4.91 | | | | 3.58 | | | | 0.05 | | | | 6.51 | |
Distributions to shareholders from | | | | | | | | | | | | | | | | | | | | | | | | | | | | |
Net investment income | | | 0.00 | | | | (0.13 | ) | | | (0.11 | ) | | | (0.24 | ) | | | (0.12 | ) | | | (0.20 | ) | | | (0.12 | ) |
Net realized gains | | | 0.00 | | | | (5.56 | ) | | | (3.37 | ) | | | (1.21 | ) | | | (0.15 | ) | | | 0.00 | | | | 0.00 | |
| | | | | | | | | | | | | | | | | | | | | | | | | | | | |
Total distributions to shareholders | | | 0.00 | | | | (5.69 | ) | | | (3.48 | ) | | | (1.45 | ) | | | (0.27 | ) | | | (0.20 | ) | | | (0.12 | ) |
Net asset value, end of period | | | $23.75 | | | | $27.51 | | | | $35.74 | | | | $36.33 | | | | $32.87 | | | | $29.56 | | | | $29.71 | |
Total return3 | | | (13.67 | )% | | | (7.29 | )% | | | 8.87 | % | | | 15.67 | % | | | 12.22 | % | | | 0.11 | % | | | 28.01 | % |
Ratios to average net assets (annualized) | | | | | | | | | | | | | | | | | | | | | | | | | | | | |
Gross expenses | | | 1.36 | % | | | 1.35 | % | | | 1.33 | % | | | 1.33 | % | | | 1.34 | % | | | 1.32 | % | | | 1.38 | % |
Net expenses | | | 1.28 | % | | | 1.29 | % | | | 1.30 | % | | | 1.30 | % | | | 1.30 | % | | | 1.30 | % | | | 1.37 | % |
Net investment income (loss) | | | (0.52 | )% | | | 0.02 | % | | | 1.26 | % | | | 0.72 | % | | | 0.61 | % | | | 0.50 | % | | | 0.79 | % |
Supplemental data | | | | | | | | | | | | | | | | | | | | | | | | | | | | |
Portfolio turnover rate | | | 10 | % | | | 9 | % | | | 7 | % | | | 18 | % | | | 16 | % | | | 17 | % | | | 21 | % |
Net assets, end of period (000s omitted) | | | $186,150 | | | | $289,669 | | | | $443,671 | | | | $482,677 | | | | $603,622 | | | | $596,741 | | | | $645,371 | |
| 1 | For the five months ended March 31, 2014. The Fund changed its fiscal year end from October 31 to March 31, effective March 31, 2014. |
| 2 | Calculated based upon average shares outstanding |
| 3 | Total return calculations do not include any sales charges. Returns for periods of less than one year are not annualized. |
The accompanying notes are an integral part of these financial statements.
| | | | |
| 16 | | Wells Fargo Advantage Small Cap Value Fund | | Financial highlights |
(For a share outstanding throughout each period)
| | | | | | | | | | | | | | | | | | | | | | | | | | | | |
| | | Six months ended
September 30, 2015 (unaudited) | | | Year ended March 31 | | | Year ended October 31 | |
| CLASS B | | | 2015 | | | 20141 | | | 2013 | | | 2012 | | | 2011 | | | 2010 | |
Net asset value, beginning of period | | | $23.84 | | | | $31.87 | | | | $32.75 | | | | $29.74 | | | | $26.85 | | | | $27.02 | | | | $21.28 | |
Net investment income (loss) | | | (0.15 | )2 | | | (0.25 | )2 | | | 0.06 | 2 | | | 0.01 | 2 | | | (0.03 | )2 | | | (0.16 | )2 | | | 0.00 | 2,3 |
Net realized and unrealized gains (losses) on investments | | | (3.19 | ) | | | (2.22 | ) | | | 2.43 | | | | 4.21 | | | | 3.07 | | | | (0.01 | ) | | | 5.74 | |
| | | | | | | | | | | | | | | | | | | | | | | | | | | | |
Total from investment operations | | | (3.34 | ) | | | (2.47 | ) | | | 2.49 | | | | 4.22 | | | | 3.04 | | | | (0.17 | ) | | | 5.74 | |
Distributions to shareholders from | | | | | | | | | | | | | | | | | | | | | | | | | | | | |
Net realized gains | | | 0.00 | | | | (5.56 | ) | | | (3.37 | ) | | | (1.21 | ) | | | (0.15 | ) | | | 0.00 | | | | 0.00 | |
Net asset value, end of period | | | $20.50 | | | | $23.84 | | | | $31.87 | | | | $32.75 | | | | $29.74 | | | | $26.85 | | | | $27.02 | |
Total return4 | | | (14.01 | )% | | | (8.01 | )% | | | 8.53 | % | | | 14.86 | % | | | 11.37 | % | | | (0.63 | )% | | | 26.97 | % |
Ratios to average net assets (annualized) | | | | | | | | | | | | | | | | | | | | | | | | | | | | |
Gross expenses | | | 2.11 | % | | | 2.10 | % | | | 2.08 | % | | | 2.06 | % | | | 2.08 | % | | | 2.06 | % | | | 2.13 | % |
Net expenses | | | 2.03 | % | | | 2.04 | % | | | 2.05 | % | | | 2.03 | % | | | 2.05 | % | | | 2.04 | % | | | 2.13 | % |
Net investment income (loss) | | | (1.25 | )% | | | (0.83 | )% | | | 0.50 | % | | | 0.02 | % | | | (0.12 | )% | | | (0.57 | )% | | | 0.00 | % |
Supplemental data | | | | | | | | | | | | | | | | | | | | | | | | | | | | |
Portfolio turnover rate | | | 10 | % | | | 9 | % | | | 7 | % | | | 18 | % | | | 16 | % | | | 17 | % | | | 21 | % |
Net assets, end of period (000s omitted) | | | $107 | | | | $156 | | | | $531 | | | | $647 | | | | $1,310 | | | | $3,928 | | | | $36,436 | |
| 1 | For the five months ended March 31, 2014. The Fund changed its fiscal year end from October 31 to March 31, effective March 31, 2014. |
| 2 | Calculated based upon average shares outstanding |
| 3 | Amount is less than $0.005. |
| 4 | Total return calculations do not include any sales charges. Returns for periods of less than one year are not annualized. |
The accompanying notes are an integral part of these financial statements.
| | | | | | |
| Financial highlights | | Wells Fargo Advantage Small Cap Value Fund | | | 17 | |
(For a share outstanding throughout each period)
| | | | | | | | | | | | | | | | | | | | | | | | | | | | |
| | | Six months ended
September 30, 2015 (unaudited) | | | Year ended March 31 | | | Year ended October 31 | |
| CLASS C | | | 2015 | | | 20141 | | | 2013 | | | 2012 | | | 2011 | | | 2010 | |
Net asset value, beginning of period | | | $23.80 | | | | $31.89 | | | | $32.77 | | | | $29.82 | | | | $26.92 | | | | $27.11 | | | | $21.34 | |
Net investment income (loss) | | | (0.15 | )2 | | | (0.20 | )2 | | | 0.07 | 2 | | | (0.02 | )2 | | | (0.04 | )2 | | | (0.07 | )2 | | | 0.01 | 2 |
Net realized and unrealized gains (losses) on investments | | | (3.18 | ) | | | (2.27 | ) | | | 2.42 | | | | 4.23 | | | | 3.09 | | | | (0.10 | ) | | | 5.76 | |
| | | | | | | | | | | | | | | | | | | | | | | | | | | | |
Total from investment operations | | | (3.33 | ) | | | (2.47 | ) | | | 2.49 | | | | 4.21 | | | | 3.05 | | | | (0.17 | ) | | | 5.77 | |
Distributions to shareholders from | | | | | | | | | | | | | | | | | | | | | | | | | | | | |
Net investment income | | | 0.00 | | | | (0.06 | ) | | | 0.00 | | | | (0.05 | ) | | | 0.00 | | | | (0.02 | ) | | | 0.00 | |
Net realized gains | | | 0.00 | | | | (5.56 | ) | | | (3.37 | ) | | | (1.21 | ) | | | (0.15 | ) | | | 0.00 | | | | 0.00 | |
| | | | | | | | | | | | | | | | | | | | | | | | | | | | |
Total distributions to shareholders | | | 0.00 | | | | (5.62 | ) | | | (3.37 | ) | | | (1.26 | ) | | | (0.15 | ) | | | (0.02 | ) | | | 0.00 | |
Net asset value, end of period | | | $20.47 | | | | $23.80 | | | | $31.89 | | | | $32.77 | | | | $29.82 | | | | $26.92 | | | | $27.11 | |
Total return3 | | | (13.99 | )% | | | (8.00 | )% | | | 8.53 | % | | | 14.80 | % | | | 11.38 | % | | | (0.62 | )% | | | 27.04 | % |
Ratios to average net assets (annualized) | | | | | | | | | | | | | | | | | | | | | | | | | | | | |
Gross expenses | | | 2.11 | % | | | 2.10 | % | | | 2.08 | % | | | 2.08 | % | | | 2.09 | % | | | 2.07 | % | | | 2.13 | % |
Net expenses | | | 2.03 | % | | | 2.04 | % | | | 2.05 | % | | | 2.05 | % | | | 2.05 | % | | | 2.05 | % | | | 2.12 | % |
Net investment income (loss) | | | (1.28 | )% | | | (0.70 | )% | | | 0.52 | % | | | (0.06 | )% | | | (0.14 | )% | | | (0.24 | )% | | | 0.04 | % |
Supplemental data | | | | | | | | | | | | | | | | | | | | | | | | | | | | |
Portfolio turnover rate | | | 10 | % | | | 9 | % | | | 7 | % | | | 18 | % | | | 16 | % | | | 17 | % | | | 21 | % |
Net assets, end of period (000s omitted) | | | $47,718 | | | | $80,969 | | | | $105,309 | | | | $105,491 | | | | $102,663 | | | | $100,032 | | | | $97,675 | |
| 1 | For the five months ended March 31, 2014. The Fund changed its fiscal year end from October 31 to March 31, effective March 31, 2014. |
| 2 | Calculated based upon average shares outstanding |
| 3 | Total return calculations do not include any sales charges. Returns for periods of less than one year are not annualized. |
The accompanying notes are an integral part of these financial statements.
| | | | |
| 18 | | Wells Fargo Advantage Small Cap Value Fund | | Financial highlights |
(For a share outstanding throughout each period)
| | | | | | | | | | | | | | | | |
| | | Six months ended
September 30, 2015 (unaudited) | | | Year ended March 31 | | | Year ended October 31, 20132 | |
| CLASS R6 | | | 2015 | | | 20141 | | |
Net asset value, beginning of period | | | $28.29 | | | | $36.52 | | | | $37.13 | | | | $33.69 | |
Net investment income | | | 0.00 | 3,4 | | | 0.23 | 3 | | | 0.35 | | | | 0.07 | 3 |
Net realized and unrealized gains (losses) on investments | | | (3.81 | ) | | | (2.69 | ) | | | 2.67 | | | | 3.37 | |
| | | | | | | | | | | | | | | | |
Total from investment operations | | | (3.81 | ) | | | (2.46 | ) | | | 3.02 | | | | 3.44 | |
Distributions to shareholders from | | | | | | | | | | | | | | | | |
Net investment income | | | 0.00 | | | | (0.21 | ) | | | (0.26 | ) | | | 0.00 | |
Net realized gains | | | 0.00 | | | | (5.56 | ) | | | (3.37 | ) | | | 0.00 | |
| | | | | | | | | | | | | | | | |
Total distributions to shareholders | | | 0.00 | | | | (5.77 | ) | | | (3.63 | ) | | | 0.00 | |
Net asset value, end of period | | | $24.48 | | | | $28.29 | | | | $36.52 | | | | $37.13 | |
Total return5 | | | (13.47 | )% | | | (6.90 | )% | | | 9.07 | % | | | 10.21 | % |
Ratios to average net assets (annualized) | | | | | | | | | | | | | | | | |
Gross expenses | | | 0.91 | % | | | 0.87 | % | | | 0.85 | % | | | 0.85 | % |
Net expenses | | | 0.83 | % | | | 0.83 | % | | | 0.85 | % | | | 0.85 | % |
Net investment income | | | 0.03 | % | | | 0.72 | % | | | 2.82 | % | | | 0.60 | % |
Supplemental data | | | | | | | | | | | | | | | | |
Portfolio turnover rate | | | 10 | % | | | 9 | % | | | 7 | % | | | 18 | % |
Net assets, end of period (000s omitted) | | | $130,874 | | | | $52,613 | | | | $398 | | | | $28 | |
| 1 | For the five months ended March 31, 2014. The Fund changed its fiscal year end from October 31 to March 31, effective March 31, 2014. |
| 2 | For the period from June 28, 2013 (commencement of class operations) to October 31, 2013. |
| 3 | Calculated based upon average shares outstanding |
| 4 | Amount is less than $0.005. |
| 5 | Total return calculations do not include any sales charges. |
The accompanying notes are an integral part of these financial statements.
| | | | | | |
| Financial highlights | | Wells Fargo Advantage Small Cap Value Fund | | | 19 | |
(For a share outstanding throughout each period)
| | | | | | | | | | | | | | | | | | | | | | | | | | | | |
| | | Six months ended
September 30, 2015 (unaudited) | | | Year ended March 31 | | | Year ended October 31 | |
| ADMINISTRATOR CLASS | | | 2015 | | | 20141 | | | 2013 | | | 2012 | | | 2011 | | | 20102 | |
Net asset value, beginning of period | | | $28.30 | | | | $36.40 | | | | $36.98 | | | | $33.45 | | | | $30.12 | | | | $30.32 | | | | $28.12 | |
Net investment income (loss) | | | (0.05 | )3 | | | 0.01 | 3 | | | 0.21 | | | | 0.31 | | | | 0.25 | 3 | | | 0.29 | 3 | | | 0.05 | 3 |
Net realized and unrealized gains (losses) on investments | | | (3.79 | ) | | | (2.55 | ) | | | 2.77 | | | | 4.75 | | | | 3.44 | | | | (0.17 | ) | | | 2.15 | |
| | | | | | | | | | | | | | | | | | | | | | | | | | | | |
Total from investment operations | | | (3.84 | ) | | | (2.54 | ) | | | 2.98 | | | | 5.06 | | | | 3.69 | | | | 0.12 | �� | | | 2.20 | |
Distributions to shareholders from | | | | | | | | | | | | | | | | | | | | | | | | | | | | |
Net investment income | | | 0.00 | | | | 0.00 | | | | (0.19 | ) | | | (0.32 | ) | | | (0.21 | ) | | | (0.32 | ) | | | 0.00 | |
Net realized gains | | | 0.00 | | | | (5.56 | ) | | | (3.37 | ) | | | (1.21 | ) | | | (0.15 | ) | | | 0.00 | | | | 0.00 | |
| | | | | | | | | | | | | | | | | | | | | | | | | | | | |
Total distributions to shareholders | | | 0.00 | | | | (5.56 | ) | | | (3.56 | ) | | | (1.53 | ) | | | (0.36 | ) | | | (0.32 | ) | | | 0.00 | |
Net asset value, end of period | | | $24.46 | | | | $28.30 | | | | $36.40 | | | | $36.98 | | | | $33.45 | | | | $30.12 | | | | $30.32 | |
Total return4 | | | (13.57 | )% | | | (7.16 | )% | | | 8.97 | % | | | 15.92 | % | | | 12.42 | % | | | 0.32 | % | | | 7.82 | % |
Ratios to average net assets (annualized) | | | | | | | | | | | | | | | | | | | | | | | | | | | | |
Gross expenses | | | 1.24 | % | | | 1.19 | % | | | 1.17 | % | | | 1.17 | % | | | 1.17 | % | | | 1.15 | % | | | 1.28 | % |
Net expenses | | | 1.08 | % | | | 1.09 | % | | | 1.10 | % | | | 1.10 | % | | | 1.10 | % | | | 1.10 | % | | | 1.10 | % |
Net investment income (loss) | | | (0.33 | )% | | | 0.03 | % | | | 1.48 | % | | | 0.87 | % | | | 0.80 | % | | | 0.91 | % | | | 0.79 | % |
Supplemental data | | | | | | | | | | | | | | | | | | | | | | | | | | | | |
Portfolio turnover rate | | | 10 | % | | | 9 | % | | | 7 | % | | | 18 | % | | | 16 | % | | | 17 | % | | | 21 | % |
Net assets, end of period (000s omitted) | | | $36,624 | | | | $74,820 | | | | $711,869 | | | | $666,812 | | | | $543,683 | | | | $390,266 | | | | $8,841 | |
| 1 | For the five months ended March 31, 2014. The Fund changed its fiscal year end from October 31 to March 31, effective March 31, 2014. |
| 2 | For the period from July 30, 2010 (commencement of class operations), to October 31, 2010. |
| 3 | Calculated based upon average shares outstanding |
| 4 | Returns for periods of less than one year are not annualized. |
The accompanying notes are an integral part of these financial statements.
| | | | |
| 20 | | Wells Fargo Advantage Small Cap Value Fund | | Financial highlights |
(For a share outstanding throughout each period)
| | | | | | | | | | | | | | | | | | | | | | | | | | | | |
| | | Six months ended
September 30, 2015 (unaudited) | | | Year ended March 31 | | | Year ended October 31 | |
| INSTITUTIONAL CLASS | | | 2015 | | | 20141 | | | 2013 | | | 2012 | | | 2011 | | | 2010 | |
Net asset value, beginning of period | | | $28.29 | | | | $36.53 | | | | $37.12 | | | | $33.56 | | | | $30.21 | | | | $30.33 | | | | $23.80 | |
Net investment income (loss) | | | (0.02 | )2 | | | 0.17 | 2 | | | 0.26 | | | | 0.38 | 2 | | | 0.34 | | | | 0.31 | | | | 0.34 | 2 |
Net realized and unrealized gains (losses) on investments | | | (3.80 | ) | | | (2.65 | ) | | | 2.76 | | | | 4.76 | | | | 3.42 | | | | (0.12 | ) | | | 6.42 | |
| | | | | | | | | | | | | | | | | | | | | | | | | | | | |
Total from investment operations | | | (3.82 | ) | | | (2.48 | ) | | | 3.02 | | | | 5.14 | | | | 3.76 | | | | 0.19 | | | | 6.76 | |
Distributions to shareholders from | | | | | | | | | | | | | | | | | | | | | | | | | | | | |
Net investment income | | | 0.00 | | | | (0.20 | ) | | | (0.24 | ) | | | (0.37 | ) | | | (0.26 | ) | | | (0.31 | ) | | | (0.23 | ) |
Net realized gains | | | 0.00 | | | | (5.56 | ) | | | (3.37 | ) | | | (1.21 | ) | | | (0.15 | ) | | | 0.00 | | | | 0.00 | |
| | | | | | | | | | | | | | | | | | | | | | | | | | | | |
Total distributions to shareholders | | | 0.00 | | | | (5.75 | ) | | | (3.61 | ) | | | (1.58 | ) | | | (0.41 | ) | | | (0.31 | ) | | | (0.23 | ) |
Net asset value, end of period | | | $24.47 | | | | $28.29 | | | | $36.53 | | | | $37.12 | | | | $33.56 | | | | $30.21 | | | | $30.33 | |
Total return3 | | | (13.47 | )% | | | (6.95 | )% | | | 9.05 | % | | | 16.15 | % | | | 12.68 | % | | | 0.52 | % | | | 28.53 | % |
Ratios to average net assets (annualized) | | | | | | | | | | | | | | | | | | | | | | | | | | | | |
Gross expenses | | | 0.97 | % | | | 0.92 | % | | | 0.90 | % | | | 0.90 | % | | | 0.91 | % | | | 0.89 | % | | | 0.94 | % |
Net expenses | | | 0.88 | % | | | 0.89 | % | | | 0.90 | % | | | 0.90 | % | | | 0.90 | % | | | 0.89 | % | | | 0.93 | % |
Net investment income (loss) | | | (0.16 | )% | | | 0.52 | % | | | 1.66 | % | | | 1.08 | % | | | 1.01 | % | | | 0.97 | % | | | 1.23 | % |
Supplemental data | | | | | | | | | | | | | | | | | | | | | | | | | | | | |
Portfolio turnover rate | | | 10 | % | | | 9 | % | | | 7 | % | | | 18 | % | | | 16 | % | | | 17 | % | | | 21 | % |
Net assets, end of period (000s omitted) | | | $325,040 | | | | $1,017,115 | | | | $984,881 | | | | $1,081,869 | | | | $1,143,730 | | | | $1,073,943 | | | | $1,279,201 | |
| 1 | For the five months ended March 31, 2014. The Fund changed its fiscal year end from October 31 to March 31, effective March 31, 2014. |
| 2 | Calculated based upon average shares outstanding |
| 3 | Returns for periods of less than one year are not annualized. |
The accompanying notes are an integral part of these financial statements.
| | | | | | |
| Financial highlights | | Wells Fargo Advantage Small Cap Value Fund | | | 21 | |
(For a share outstanding throughout each period)
| | | | | | | | | | | | | | | | | | | | | | | | | | | | |
| | | Six months ended
September 30, 2015 (unaudited) | | | Year ended March 31 | | | Year ended October 31 | |
| INVESTOR CLASS | | | 2015 | | | 20141 | | | 2013 | | | 2012 | | | 2011 | | | 2010 | |
Net asset value, beginning of period | | | $28.21 | | | | $36.48 | | | | $36.98 | | | | $33.43 | | | | $30.04 | | | | $30.18 | | | | $23.70 | |
Net investment income (loss) | | | (0.07 | )2 | | | 0.00 | 2,3 | | | 0.18 | 2 | | | 0.23 | 2 | | | 0.19 | 2 | | | 0.14 | 2 | | | 0.22 | 2 |
Net realized and unrealized gains (losses) on investments | | | (3.79 | ) | | | (2.60 | ) | | | 2.77 | | | | 4.75 | | | | 3.44 | | | | (0.10 | ) | | | 6.39 | |
| | | | | | | | | | | | | | | | | | | | | | | | | | | | |
Total from investment operations | | | (3.86 | ) | | | (2.60 | ) | | | 2.95 | | | | 4.98 | | | | 3.63 | | | | 0.04 | | | | 6.61 | |
Distributions to shareholders from | | | | | | | | | | | | | | | | | | | | | | | | | | | | |
Net investment income | | | 0.00 | | | | (0.11 | ) | | | (0.08 | ) | | | (0.22 | ) | | | (0.09 | ) | | | (0.18 | ) | | | (0.13 | ) |
Net realized gains | | | 0.00 | | | | (5.56 | ) | | | (3.37 | ) | | | (1.21 | ) | | | (0.15 | ) | | | 0.00 | | | | 0.00 | |
| | | | | | | | | | | | | | | | | | | | | | | | | | | | |
Total distributions to shareholders | | | 0.00 | | | | (5.67 | ) | | | (3.45 | ) | | | (1.43 | ) | | | (0.24 | ) | | | (0.18 | ) | | | (0.13 | ) |
Net asset value, end of period | | | $24.35 | | | | $28.21 | | | | $36.48 | | | | $36.98 | | | | $33.43 | | | | $30.04 | | | | $30.18 | |
Total return4 | | | (13.68 | )% | | | (7.30 | )% | | | 8.85 | % | | | 15.64 | % | | | 12.18 | % | | | 0.09 | % | | | 27.99 | % |
Ratios to average net assets (annualized) | | | | | | | | | | | | | | | | | | | | | | | | | | | | |
Gross expenses | | | 1.44 | % | | | 1.41 | % | | | 1.39 | % | | | 1.39 | % | | | 1.40 | % | | | 1.39 | % | | | 1.47 | % |
Net expenses | | | 1.29 | % | | | 1.30 | % | | | 1.33 | % | | | 1.33 | % | | | 1.33 | % | | | 1.33 | % | | | 1.35 | % |
Net investment income (loss) | | | (0.52 | )% | | | 0.00 | % | | | 1.21 | % | | | 0.68 | % | | | 0.58 | % | | | 0.45 | % | | | 0.80 | % |
Supplemental data | | | | | | | | | | | | | | | | | | | | | | | | | | | | |
Portfolio turnover rate | | | 10 | % | | | 9 | % | | | 7 | % | | | 18 | % | | | 16 | % | | | 17 | % | | | 21 | % |
Net assets, end of period (000s omitted) | | | $331,497 | | | | $479,913 | | | | $786,027 | | | | $985,639 | | | | $1,282,510 | | | | $1,448,429 | | | | $1,968,601 | |
| 1 | For the five months ended March 31, 2014. The Fund changed its fiscal year end from October 31 to March 31, effective March 31, 2014. |
| 2 | Calculated based upon average shares outstanding |
| 3 | Amount is less than $0.005. |
| 4 | Returns for periods of less than one year are not annualized. |
The accompanying notes are an integral part of these financial statements.
| | | | |
| 22 | | Wells Fargo Advantage Small Cap Value Fund | | Notes to financial statements (unaudited) |
1. ORGANIZATION
Wells Fargo Funds Trust (the “Trust”), a Delaware statutory trust organized on March 10, 1999, is an open-end management investment company registered under the Investment Company Act of 1940, as amended (the “1940 Act”). As an investment company, the Trust follows the accounting and reporting guidance in Financial Accounting Standards Board (“FASB”) Accounting Standards Codification Topic 946, Financial Services – Investment Companies. These financial statements report on the Wells Fargo Advantage Small Cap Value Fund (the “Fund”) which is a diversified series of the Trust.
2. SIGNIFICANT ACCOUNTING POLICIES
The following significant accounting policies, which are consistently followed in the preparation of the financial statements of the Fund, are in conformity with U.S. generally accepted accounting principles which require management to make estimates and assumptions that affect the reported amounts of assets and liabilities, disclosure of contingent assets and liabilities at the date of the financial statements, and the reported amounts of revenues and expenses during the reporting period. Actual results could differ from those estimates.
Securities valuation
All investments are valued each business day as of the close of regular trading on the New York Stock Exchange (generally 4 p.m. Eastern Time).
Equity securities and options that are listed on a foreign or domestic exchange or market are valued at the official closing price or, if none, the last sales price. If no sale occurs on the primary exchange or market that day, the prior day’s price will be deemed “stale” and a fair value price will be determined in accordance with the Fund’s Valuation Procedures.
Equity securities that are not listed on a foreign or domestic exchange or market, but have a public trading market, are valued at the quoted bid price from an independent broker-dealer that the Management Valuation Team of Wells Fargo Funds Management, LLC (“Funds Management”) has determined is an acceptable source.
Non-listed OTC options are valued at the evaluated price provided by an independent pricing service or, if a reliable price is not available, the quoted bid price from an independent broker-dealer.
The values of securities denominated in foreign currencies are translated into U.S. dollars at rates provided by an independent foreign currency pricing source at a time each business day specified by the Management Valuation Team.
Many securities markets and exchanges outside the U.S. close prior to the close of the New York Stock Exchange and therefore may not fully reflect trading or events that occur after the close of the principal exchange in which the foreign securities are traded, but before the close of the New York Stock Exchange. If such trading or events are expected to materially affect the value of such securities, then fair value pricing procedures approved by the Board of Trustees of the Fund are applied. These procedures take into account multiple factors including movements in U.S. securities markets after foreign exchanges close. Foreign securities that are fair valued under these procedures are categorized as Level 2 and the application of these procedures may result in transfers between Level 1 and Level 2. Depending on market activity, such fair valuations may be frequent. Such fair value pricing may result in net asset values that are higher or lower than net asset values based on the last reported sales price or latest quoted bid price. On September 30, 2015, such fair value pricing was not used in pricing foreign securities.
Investments in registered open-end investment companies are valued at net asset value.
Investments which are not valued using any of the methods discussed above are valued at their fair value, as determined in good faith by the Board of Trustees. The Board of Trustees has established a Valuation Committee comprised of the Trustees and has delegated to it the authority to take any actions regarding the valuation of portfolio securities that the Valuation Committee deems necessary or appropriate, including determining the fair value of portfolio securities, unless the determination has been delegated to the Management Valuation Team. The Board of Trustees retains the authority to make or ratify any valuation decisions or approve any changes to the Valuation Procedures as it deems appropriate. On a quarterly basis, the Board of Trustees receives reports on any valuation actions taken by the Valuation Committee or the Management Valuation Team which may include items for ratification.
Valuations of fair valued securities are compared to the next actual sales price when available, or other appropriate market values, to assess the continued appropriateness of the fair valuation methodologies used. These securities are fair valued on a day-to-day basis, taking into consideration changes to appropriate market information and any significant changes to the inputs considered in the valuation process until there is a readily available price provided on an exchange or by an independent pricing service. Valuations received from an independent pricing service or independent
| | | | | | |
| Notes to financial statements (unaudited) | | Wells Fargo Advantage Small Cap Value Fund | | | 23 | |
broker-dealer quotes are periodically validated by comparisons to most recent trades and valuations provided by other independent pricing services in addition to the review of prices by the manager and/or subadviser. Unobservable inputs used in determining fair valuations are identified based on the type of security, taking into consideration factors utilized by market participants in valuing the investment, knowledge about the issuer and the current market environment.
Foreign currency translation
The accounting records of the Fund are maintained in U.S. dollars. The values of other assets and liabilities denominated in foreign currencies are translated into U.S. dollars at rates provided by an independent foreign currency pricing source at a time each business day specified by the Management Valuation Team. Purchases and sales of securities, and income and expenses are converted at the rate of exchange on the respective dates of such transactions. Net realized foreign exchange gains or losses arise from sales of foreign currencies, currency gains or losses realized between the trade and settlement dates on securities transactions, and the difference between the amounts of dividends, interest and foreign withholding taxes recorded and the U.S. dollar equivalent of the amounts actually paid or received. Net unrealized foreign exchange gains and losses arise from changes in the fair value of assets and liabilities other than investments in securities resulting from changes in exchange rates. The changes in net assets arising from changes in exchange rates and the changes in net assets resulting from changes in market prices of securities are not separately presented. Such changes are included in net realized and unrealized gains or losses from investments.
Options
The Fund is subject to equity price risk in the normal course of pursuing its investment objectives. The Fund may write covered call options or secured put options on individual securities and/or indexes. When the Fund writes an option, an amount equal to the premium received is recorded as a liability and is subsequently adjusted to the current market value of the written option. Premiums received from written options that expire unexercised are recognized as realized gains on the expiration date. For exercised options, the difference between the premium received and the amount paid on effecting a closing purchase transaction, including brokerage commissions, is treated as a realized gain or loss. If a call option is exercised, the premium is added to the proceeds from the sale of the underlying security in calculating the realized gain or loss on the sale. If a put option is exercised, the premium reduces the cost of the security purchased. The Fund, as a writer of an option, bears the market risk of an unfavorable change in the price of the security and/or index underlying the written option.
The Fund may also purchase call or put options. The premium is included in the Statement of Assets and Liabilities as an investment, the value of which is subsequently adjusted based on the current market value of the option. Premiums paid for purchased options that expire are recognized as realized losses on the expiration date. Premiums paid for purchased options that are exercised or closed are added to the amount paid or offset against the proceeds received for the underlying security to determine the realized gain or loss. The risk of loss associated with purchased options is limited to the premium paid.
Options traded on an exchange are regulated and terms of the options are standardized. Purchased options traded over-the-counter expose the Fund to counterparty risk in the event the counterparty does not perform. This risk can be mitigated by having a master netting arrangement between the Fund and the counterparty and by having the counterparty post collateral to cover the Fund’s exposure to the counterparty.
Security transactions and income recognition
Securities transactions are recorded on a trade date basis. Realized gains or losses are recorded on the basis of identified cost.
Dividend income is recognized on the ex-dividend date, except for certain dividends from foreign securities, which are recorded as soon as the custodian verifies the ex-dividend date. Dividend income from foreign securities is recorded net of foreign taxes withheld where recovery of such taxes is not assured.
Distributions to shareholders
Distributions to shareholders from net investment income and net realized gains, if any, are recorded on the ex-dividend date. Such distributions are determined in conformity with federal income tax regulations, which may differ in amount or character from net investment income and realized gains recognized for purposes of U.S. generally accepted accounting principles.
Federal and other taxes
The Fund intends to continue to qualify as a regulated investment company by distributing substantially all of its investment company taxable income and any net realized capital gains (after reduction for capital loss carryforwards) sufficient to relieve it from all, or substantially all, federal income taxes. Accordingly, no provision for federal income taxes was required.
| | | | |
| 24 | | Wells Fargo Advantage Small Cap Value Fund | | Notes to financial statements (unaudited) |
The Fund’s income and federal excise tax returns and all financial records supporting those returns for the prior three fiscal years are subject to examination by the federal and Delaware revenue authorities. Management has analyzed the Fund’s tax positions taken on federal, state, and foreign tax returns for all open tax years and does not believe that there are any uncertain tax positions that require recognition of a tax liability.
As of March 31, 2015, the Fund had $4,243,961 of current year deferred post-October capital losses which was recognized on the first day of the current fiscal year.
Class allocations
The separate classes of shares offered by the Fund differ principally in applicable sales charges, distribution, shareholder servicing, and administration fees. Class specific expenses are charged directly to that share class. Investment income, common expenses, and realized and unrealized gains (losses) on investments are allocated daily to each class of shares based on the relative proportion of net assets of each class.
3. FAIR VALUATION MEASUREMENTS
Fair value measurements of investments are determined within a framework that has established a fair value hierarchy based upon the various data inputs utilized in determining the value of the Fund’s investments. The three-level hierarchy gives the highest priority to unadjusted quoted prices in active markets for identical assets or liabilities (Level 1) and the lowest priority to significant unobservable inputs (Level 3). The Fund’s investments are classified within the fair value hierarchy based on the lowest level of input that is significant to the fair value measurement. The inputs are summarized into three broad levels as follows:
| n | | Level 1 – quoted prices in active markets for identical securities |
| n | | Level 2 – other significant observable inputs (including quoted prices for similar securities, interest rates, prepayment speeds, credit risk, use of amortized cost, etc.) |
| n | | Level 3 – significant unobservable inputs (including the Fund’s own assumptions in determining the fair value of investments) |
The inputs or methodologies used for valuing investments in securities are not necessarily an indication of the risk associated with investing in those securities.
The following is a summary of the inputs used in valuing the Fund’s assets and liabilities as of September 30, 2015:
| | | | | | | | | | | | | | | | |
| | | Quoted prices
(Level 1) | | | Other significant
observable inputs
(Level 2) | | | Significant
unobservable inputs
(Level 3) | | | Total | |
Assets | | | | | | | | | | | | | | | | |
Investments in: | | | | | | | | | | | | | | | | |
| | | | |
Common stocks | | | | | | | | | | | | | | | | |
Consumer discretionary | | $ | 158,311,794 | | | $ | 0 | | | $ | 0 | | | $ | 158,311,794 | |
Energy | | | 90,901,207 | | | | 3,259,665 | | | | 0 | | | | 94,160,872 | |
Financials | | | 212,942,959 | | | | 0 | | | | 0 | | | | 212,942,959 | |
Health care | | | 66,608,205 | | | | 0 | | | | 0 | | | | 66,608,205 | |
Industrials | | | 117,824,830 | | | | 0 | | | | 0 | | | | 117,824,830 | |
Information technology | | | 144,793,530 | | | | 0 | | | | 0 | | | | 144,793,530 | |
Materials | | | 148,369,831 | | | | 6,678,864 | | | | 0 | | | | 155,048,695 | |
Telecommunication services | | | 21,636,888 | | | | 0 | | | | 0 | | | | 21,636,888 | |
| | | | |
Exchange-traded funds | | | 19,390,881 | | | | 0 | | | | 0 | | | | 19,390,881 | |
| | | | |
Warrants | | | | | | | | | | | | | | | | |
Materials | | | 0 | | | | 295 | | | | 0 | | | | 295 | |
| | | | |
Short-term investments | | | | | | | | | | | | | | | | |
Investment companies | | | 65,981,591 | | | | 0 | | | | 0 | | | | 65,981,591 | |
Total assets | | $ | 1,046,761,716 | | | $ | 9,938,824 | | | $ | 0 | | | $ | 1,056,700,540 | |
The Fund recognizes transfers between levels within the fair value hierarchy at the end of the reporting period. At September 30, 2015, the Fund did not have any transfers into/out of Level 1, Level 2, or Level 3.
| | | | | | |
| Notes to financial statements (unaudited) | | Wells Fargo Advantage Small Cap Value Fund | | | 25 | |
4. TRANSACTIONS WITH AFFILIATES
Management fee
Funds Management, an indirect wholly owned subsidiary of Wells Fargo & Company (“Wells Fargo”), is the manager of the Fund and provides advisory and fund-level administrative services under an investment management agreement. Under the investment management agreement, Funds Management is responsible for, among other services, implementing the investment objectives and strategies of the Fund, supervising the applicable subadviser, providing fund-level administrative services in connection with the Fund’s operations, and providing any other fund-level administrative services reasonably necessary for the operation of the Fund. As compensation for its services under the investment management agreement, Funds Management is entitled to receive an annual management fee starting at 0.85% and declining to 0.71% as the average daily net assets of the Fund increase.
Prior to July 1, 2015, Funds Management provided advisory services pursuant to an investment advisory agreement and was entitled to receive an annual fee which started at 0.80% and declined to 0.68% as the average daily net assets of the Fund increased. In addition, fund-level administrative services were provided by Funds Management under a separate administration agreement at an annual fee which started at 0.05% and declined to 0.03% as the average daily net assets of the Fund increased. For financial statement purposes, the advisory fee and fund-level administration fee for the six months ended September 30, 2015 have been included in management fee on the Statement of Operations.
For the six months ended September 30, 2015, the management fee was equivalent to an annual rate of 0.82% of the Fund’s average daily net assets.
Funds Management has retained the services of a subadviser to provide daily portfolio management to the Fund. The fee for subadvisory services is borne by Funds Management. Wells Capital Management Incorporated, an affiliate of Funds Management and an indirect wholly owned subsidiary of Wells Fargo, is the subadviser to the Fund and is entitled to receive a fee from Funds Management at an annual rate starting at 0.55% and declining to 0.40% as the average daily net assets of the Fund increase.
Administration fees
Under a class-level administration agreement, Funds Management provides class-level administrative services to the Fund, which includes paying fees and expenses for services provided by the transfer agent, sub-transfer agents, omnibus account servicers and record-keepers. As compensation for its services under the class-level administration agreement, Funds Management receives an annual fee which is calculated based on the average daily net assets of each class as follows:
| | | | | | | | |
| | | Class-level administration fee | |
| | | Current rate | | | Rate prior to
July 1, 2015 | |
Class A, Class B, Class C | | | 0.21 | % | | | 0.26 | % |
Class R6 | | | 0.03 | | | | 0.03 | |
Administrator Class | | | 0.13 | | | | 0.10 | |
Institutional Class | | | 0.13 | | | | 0.08 | |
Investor Class | | | 0.32 | | | | 0.32 | |
Funds Management has contractually waived and/or reimbursed management and administration fees to the extent necessary to maintain certain net operating expense ratios for the Fund. Waiver of fees and/or reimbursement of expenses by Funds Management were made first from fund level expenses on a proportionate basis and then from class specific expenses. Funds Management has committed through July 31, 2016 to waive fees and/or reimburse expenses to the extent necessary to cap the Fund’s expenses at 1.28% for Class A shares, 2.03% for Class B shares, 2.03% for Class C shares, 0.83% for Class R6 shares, 1.08% for Administrator Class shares, 0.88% for Institutional Class shares, and 1.29% for Investor Class shares. After this time, the cap may be increased or the commitment to maintain the cap may be terminated only with the approval of the Board of Trustees.
Distribution fees
The Trust has adopted a distribution plan for Class B and Class C shares of the Fund pursuant to Rule 12b-1 under the 1940 Act. Distribution fees are charged to Class B and Class C shares and paid to Wells Fargo Funds Distributor, LLC (“Funds Distributor”), the principal underwriter, at an annual rate of 0.75% of the average daily net assets of Class B and Class C shares.
| | | | |
| 26 | | Wells Fargo Advantage Small Cap Value Fund | | Notes to financial statements (unaudited) |
In addition, Funds Distributor is entitled to receive the front-end sales charge from the purchase of Class A shares and a contingent deferred sales charge on the redemption of certain Class A shares. Funds Distributor is also entitled to receive the contingent deferred sales charges from redemptions of Class B and Class C shares. For the six months ended September 30, 2015, Funds Distributor received $1,189 from the sale of Class A shares and $178 in contingent deferred sales charges from redemptions of Class C shares.
Shareholder servicing fees
The Trust has entered into contracts with one or more shareholder servicing agents, whereby Class A, Class B, Class C, Administrator Class, and Investor Class of the Fund is charged a fee at an annual rate of 0.25% of the average daily net assets of each respective class.
A portion of these total shareholder servicing fees were paid to affiliates of Wells Fargo.
5. INVESTMENT PORTFOLIO TRANSACTIONS
Purchases and sales of investments, excluding U.S. government obligations (if any) and short-term securities, for the six months ended September 30, 2015 were $129,774,555 and $535,036,043, respectively.
6. INVESTMENTS IN AFFILIATES
An affiliated investment is a company in which the Fund has ownership of at least 5% of the outstanding voting shares. The following is a summary of transactions in issuers that were either affiliates of the Fund at the beginning of the period or the end of the period.
| | | | | | | | | | | | | | | | | | | | | | | | | | | | |
| | | Shares, beginning
of period | | | Shares
purchased | | | Shares
sold | | | Shares, end of
period | | | Value, end of
period | | | Income from
affiliated securities | | | Realized gains (losses) | |
Allied Healthcare Products Incorporated | | | 780,500 | | | | 24,000 | | | | 0 | | | | 804,500 | | | $ | 925,175 | | | $ | 0 | | | $ | 0 | |
Cavco Industries Incorporated | | | 635,300 | | | | 31,900 | | | | 35,800 | | | | 631,400 | | | | 42,992,026 | | | | 0 | | | | 249,591 | |
Century Casinos Incorporated | | | 1,220,300 | | | | 290,800 | | | | 0 | | | | 1,511,100 | | | | 9,293,265 | | | | 0 | | | | 0 | |
Cross Country Healthcare Incorporated* | | | 1,640,500 | | | | 7,100 | | | | 221,500 | | | | 1,426,100 | | | | 19,409,221 | | | | 0 | | | | (1,016,010 | ) |
lnterOil Corporation* | | | 3,601,700 | | | | 183,600 | | | | 1,816,400 | | | | 1,968,900 | | | | 66,371,619 | | | | 0 | | | | 30,927,203 | |
Medley Management Incorporated Class A | | | 753,200 | | | | 14,000 | | | | 53,000 | | | | 714,200 | | | | 4,728,004 | | | | 297,240 | | | | (424,874 | ) |
OraSure Technoloies Incorporated | | | 4,218,600 | | | | 0 | | | | 1,021,800 | | | | 3,196,800 | | | | 14,193,792 | | | | 0 | | | | (2,567,505 | ) |
Skyline Corporation | | | 550,900 | | | | 70,300 | | | | 0 | | | | 621,200 | | | | 1,789,056 | | | | 0 | | | | 0 | |
Webco Industries Incorporated | | | 81,000 | | | | 0 | | | | 3,500 | | | | 77,500 | | | | 4,340,000 | | | | 0 | | | | (185,430 | ) |
| | | | | | | | | | | | | | | | | | | | | | | $ | 297,240 | | | $ | 26,982,975 | |
| * | No longer an affiliate of the Fund at the end of the period. |
7. BANK BORROWINGS
The Trust (excluding the money market funds) and Wells Fargo Variable Trust are parties to a $200,000,000 revolving credit agreement whereby the Fund is permitted to use bank borrowings for temporary or emergency purposes, such as to fund shareholder redemption requests. Interest under the credit agreement is charged to the Fund based on a borrowing rate equal to the higher of the Federal Funds rate in effect on that day plus 1.25% or the overnight LIBOR rate in effect on that day plus 1.25%. In addition, an annual commitment fee equal to 0.20% of the unused balance is allocated to each participating fund. Prior to September 1, 2015, the revolving credit agreement amount was $150,000,000 and the annual commitment fee was equal to 0.10% of the unused balance which was allocated to each participating fund. For the six months ended September 30, 2015, the Fund paid $1,762 in commitment fees.
For the six months ended September 30, 2015, there were no borrowings by the Fund under the agreement.
| | | | | | |
| Notes to financial statements (unaudited) | | Wells Fargo Advantage Small Cap Value Fund | | | 27 | |
8. INDEMNIFICATION
Under the Trust’s organizational documents, the officers and Trustees have been granted certain indemnification rights against certain liabilities that may arise out of performance of their duties to the Trust. Additionally, in the normal course of business, the Trust may enter into contracts with service providers that contain a variety of indemnification clauses. The Trust’s maximum exposure under these arrangements is dependent on future claims that may be made against the Fund and, therefore, cannot be estimated.
9. SUBSEQUENT EVENT
After the close of business on October 23, 2015, Investor Class shares of the Fund became Class A shares in a tax-free conversion. Shareholders of Investor Class of the Fund received Class A shares at a value equal to the value of their Investor Class shares immediately prior to the conversion.
| | | | |
| 28 | | Wells Fargo Advantage Small Cap Value Fund | | Other information (unaudited) |
PROXY VOTING INFORMATION
A description of the policies and procedures that the Fund uses to determine how to vote proxies relating to portfolio securities is available, upon request, by calling 1-800-222-8222, visiting our website at wellsfargoadvantagefunds.com, or visiting the SEC website at sec.gov. Information regarding how the Fund voted proxies relating to portfolio securities during the most recent 12-month period ended June 30 is available on the Fund’s website at wellsfargoadvantagefunds.com or by visiting the SEC website at sec.gov.
PORTFOLIO HOLDINGS INFORMATION
The complete portfolio holdings for the Fund are publicly available monthly on the Fund’s website (wellsfargoadvantagefunds.com), on a one-month delayed basis. In addition, top ten holdings information (excluding derivative positions) for the Fund is publicly available on the Fund’s website on a monthly, seven-day or more delayed basis. The Fund files its complete schedule of portfolio holdings with the SEC for the first and third quarters of each fiscal year on Form N-Q, which is available by visiting the SEC website at sec.gov. In addition, the Fund’s Form N-Q may be reviewed and copied at the SEC’s Public Reference Room in Washington, DC, and at regional offices in New York City, at 233 Broadway, and in Chicago, at 175 West Jackson Boulevard, Suite 900. Information about the Public Reference Room may be obtained by calling 1-800-SEC-0330.
| | | | | | |
| Other information (unaudited) | | Wells Fargo Advantage Small Cap Value Fund | | | 29 | |
BOARD OF TRUSTEES AND OFFICERS
Each of the Trustees and Officers1 listed in the table below acts in identical capacities for each fund in the Wells Fargo Advantage family of funds, which consists of 144 mutual funds comprising the Wells Fargo Funds Trust, Wells Fargo Variable Trust, Wells Fargo Master Trust and four closed-end funds (collectively the “Fund Complex”). This table should be read in conjunction with the Prospectus and the Statement of Additional Information2. The mailing address of each Trustee and Officer is 525 Market Street, 12th Floor, San Francisco, CA 94105. Each Trustee and Officer serves an indefinite term, however, each Trustee serves such term until reaching the mandatory retirement age established by the Trustees.
Independent Trustees
| | | | | | |
Name and year of birth | | Position held and length of service* | | Principal occupations during past five years or longer | | Other public company or
investment company
directorships during past 5 years |
William R. Ebsworth (Born 1957) | | Trustee, since 2015** | | Retired. From 1984 to 2013, equities analyst, portfolio manager, research director at Fidelity Management and Research Company and retired in 2013 as Chief Investment Officer of Fidelity Strategic Advisers, Inc. in Boston, Tokyo, and Hong Kong where he led a team of investment professionals managing client assets. Prior thereto, Board member of Hong Kong Securities Clearing Co., Hong Kong Options Clearing Corp., the Thailand International Fund, Ltd., Fidelity Investments Life Insurance Company, and Empire Fidelity Investments Life Insurance Company. Mr. Ebsworth is a CFA ® charterholder and an Adjunct Lecturer, Finance, at Babson College. | | Asset Allocation Trust |
Jane A. Freeman (Born 1953) | | Trustee, since 2015** | | Retired. From 2012 to 2014 and 1999 to 2008, Chief Financial Officer of Scientific Learning Corporation. From 2008 to 2012, Ms. Freeman provided consulting services related to strategic business projects. Prior to 1999, Portfolio Manager at Rockefeller & Co. and Scudder, Stevens & Clark. Board member of the Harding Loevner Funds from 1996 to 2014, serving as both Lead Independent Director and chair of the Audit Committee. Board member of the Russell Exchange Traded Funds Trust from 2011 to 2012 and the chair of the Audit Committee. Ms. Freeman is Chair of Taproot Foundation (non-profit organization), a Board Member of Ruth Bancroft Garden (non-profit organization) and an inactive chartered financial analyst. | | Asset Allocation Trust; Harding Loevner Funds; Russell Exchange Traded Funds Trust |
Peter G. Gordon (Born 1942) | | Trustee, since 1998; Chairman, since 2005 | | Co-Founder, Retired Chairman, President and CEO of Crystal Geyser Water Company. Trustee Emeritus, Colby College. | | Asset Allocation Trust |
Isaiah Harris, Jr. (Born 1952) | | Trustee, since 2009 | | Retired. Chairman of the Board of CIGNA Corporation since 2009, and Director since 2005. From 2003 to 2011, Director of Deluxe Corporation. Prior thereto, President and CEO of BellSouth Advertising and Publishing Corp. from 2005 to 2007, President and CEO of BellSouth Enterprises from 2004 to 2005 and President of BellSouth Consumer Services from 2000 to 2003. Emeritus member of the Iowa State University Foundation Board of Governors. Emeritus Member of the Advisory Board of Iowa State University School of Business. Advisory Board Member, Palm Harbor Academy (charter school). Mr. Harris is a certified public accountant. | | CIGNA Corporation; Asset Allocation Trust |
Judith M. Johnson (Born 1949) | | Trustee, since 2008; Audit Committee Chairman, since 2008 | | Retired. Prior thereto, Chief Executive Officer and Chief Investment Officer of Minneapolis Employees Retirement Fund from 1996 to 2008. Ms. Johnson is an attorney, certified public accountant and a certified managerial accountant. | | Asset Allocation Trust |
David F. Larcker (Born 1950) | | Trustee, since 2009 | | James Irvin Miller Professor of Accounting at the Graduate School of Business, Stanford University, Morgan Stanley Director of the Center for Leadership Development and Research and Senior Faculty of The Rock Center for Corporate Governance since 2006. From 2005 to 2008, Professor of Accounting at the Graduate School of Business, Stanford University. Prior thereto, Ernst & Young Professor of Accounting at The Wharton School, University of Pennsylvania from 1985 to 2005. | | Asset Allocation Trust |
| | | | |
| 30 | | Wells Fargo Advantage Small Cap Value Fund | | Other information (unaudited) |
| | | | | | |
Name and year of birth | | Position held and length of service* | | Principal occupations during past five years or longer | | Other public company or
investment company
directorships during past 5 years |
Olivia S. Mitchell (Born 1953) | | Trustee, since 2006 | | International Foundation of Employee Benefit Plans Professor, Wharton School of the University of Pennsylvania since 1993. Director of Wharton’s Pension Research Council and Boettner Center on Pensions & Retirement Research, and Research Associate at the National Bureau of Economic Research. Previously, Cornell University Professor from 1978 to 1993. | | Asset Allocation Trust |
Timothy J. Penny (Born 1951) | | Trustee, since 1996 | | President and Chief Executive Officer of Southern Minnesota Initiative Foundation, a non-profit organization, since 2007 and Senior Fellow at the Humphrey Institute Policy Forum at the University of Minnesota since 1995. Member of the Board of Trustees of NorthStar Education Finance, Inc., a non-profit organization, since 2007. | | Asset Allocation Trust |
Michael S. Scofield (Born 1943) | | Trustee, since 2010 | | Served on the Investment Company Institute’s Board of Governors and Executive Committee from 2008-2011 as well the Governing Council of the Independent Directors Council from 2006-2011 and the Independent Directors Council Executive Committee from 2008-2011. Chairman of the IDC from 2008-2010. Institutional Investor (Fund Directions) Trustee of Year in 2007. Trustee of the Evergreen Funds complex (and its predecessors) from 1984 to 2010. Chairman of the Evergreen Funds from 2000-2010. Former Trustee of the Mentor Funds. Retired Attorney, Law Offices of Michael S. Scofield. | | Asset Allocation Trust |
Donald C. Willeke (Born 1940) | | Trustee, since 1996 | | Principal of the law firm of Willeke & Daniels. General Counsel of the Minneapolis Employees Retirement Fund from 1984 until its consolidation into the Minnesota Public Employees Retirement Association on June 30, 2010. Director and Vice Chair of The Tree Trust (non-profit corporation). Director of the American Chestnut Foundation (non-profit corporation). | | Asset Allocation Trust |
| * | Length of service dates reflect the Trustee’s commencement of service with the Trust’s predecessor entities, where applicable. |
| ** | William R. Ebsworth and Jane A. Freeman each became a Trustee effective January 1, 2015. |
Officers
| | | | | | |
Name and year of birth | | Position held and length of service | | Principal occupations during past five years or longer | | |
Karla M. Rabusch (Born 1959) | | President, since 2003 | | Executive Vice President of Wells Fargo Bank, N.A. and President of Wells Fargo Funds Management, LLC since 2003. | | |
Nancy Wiser1 (Born 1967) | | Treasurer, since 2012 | | Executive Vice President of Wells Fargo Funds Management, LLC since 2011. Chief Operating Officer and Chief Compliance Officer at LightBox Capital Management LLC, from 2008 to 2011. | | |
C. David Messman (Born 1960) | | Secretary, since 2000; Chief Legal Officer, since 2003 | | Senior Vice President and Secretary of Wells Fargo Funds Management, LLC since 2001. Assistant General Counsel of Wells Fargo Bank, N.A. since 2013 and Vice President and Managing Counsel of Wells Fargo Bank N.A. from 1996 to 2013. | | |
Debra Ann Early (Born 1964) | | Chief Compliance Officer, since 2007 | | Executive Vice President of Wells Fargo Funds Management, LLC since 2014, Senior Vice President and Chief Compliance Officer from 2007 to 2014. | | |
David Berardi (Born 1975) | | Assistant Treasurer, since 2009 | | Vice President of Wells Fargo Funds Management, LLC since 2009. Vice President of Evergreen Investment Management Company, LLC from 2008 to 2010. Manager of Fund Reporting and Control for Evergreen Investment Management Company, LLC from 2004 to 2010. | | |
Jeremy DePalma1 (Born 1974) | | Assistant Treasurer, since 2009 | | Senior Vice President of Wells Fargo Funds Management, LLC since 2009. Senior Vice President of Evergreen Investment Management Company, LLC from 2008 to 2010 and head of the Fund Reporting and Control Team within Fund Fund Administration from 2005 to 2010. | | |
| 1 | Nancy Wiser acts as Treasurer of 72 funds in the Fund Complex. Jeremy DePalma acts as Treasurer of 72 funds and Assistant Treasurer of 72 funds in the Fund Complex. |
| 2 | The Statement of Additional Information includes additional information about the Trustees and is available, without charge, upon request, by calling 1-800-222-8222 or by visiting the website at wellsfargoadvantagefunds.com. |
| | | | | | |
| Other information (unaudited) | | Wells Fargo Advantage Small Cap Value Fund | | | 31 | |
BOARD CONSIDERATION OF INVESTMENT ADVISORY, INVESTMENT MANAGEMENT AND SUB-ADVISORY AGREEMENTS:
Under the Investment Company Act of 1940 (the “1940 Act”), the Board of Trustees (the “Board”) of Wells Fargo Funds Trust (the “Trust”) must determine annually whether to approve the continuation of the Trust’s investment advisory and sub-advisory agreements. In this regard, at an in-person meeting held on May 19-20, 2015 (the “Meeting”), the Board, all the members of which have no direct or indirect interest in the investment advisory and sub-advisory agreements and are not “interested persons” of the Trust, as defined in the 1940 Act (the “Independent Trustees”), reviewed and approved for Wells Fargo Advantage Small Cap Value Fund (the “Fund”): (i) an investment advisory agreement (the “Advisory Agreement”) with Wells Fargo Funds Management, LLC (“Funds Management”); (ii) an investment management agreement (the “Management Agreement”) with Funds Management; and (iii) an investment sub-advisory agreement (the “Sub-Advisory Agreement”) with Wells Capital Management Incorporated (the “Sub-Adviser”), an affiliate of Funds Management. The Management Agreement combines the terms of the Advisory Agreement with the terms of the Fund’s Amended and Restated Administration Agreement (the “Administration Agreement”) applicable to Fund-level administrative services. The Advisory Agreement, the Management Agreement and the Sub-Advisory Agreement are collectively referred to as the “Advisory Agreements.”
At the Meeting, the Board considered the factors and reached the conclusions described below relating to the selection of Funds Management and the Sub-Adviser and the approval of the Advisory Agreements. Prior to the Meeting, including at an in-person meeting in March 2015, the Trustees conferred extensively among themselves and with representatives of Funds Management about these matters. Also, the Board has adopted a team-based approach, with each team consisting of a sub-set of Trustees, to assist the full Board in the discharge of its duties in reviewing performance and other matters throughout the year. The Independent Trustees were assisted in their evaluation of the Advisory Agreements by independent legal counsel, from whom they received separate legal advice and with whom they met separately.
In providing information to the Board, Funds Management and the Sub-Adviser were guided by a detailed set of requests for information submitted to them by independent legal counsel on behalf of the Independent Trustees at the start of the Board’s annual contract renewal process earlier in 2015. In considering and approving the Advisory Agreements, the Trustees considered the information they believed relevant, including but not limited to the information discussed below. The Board considered not only the specific information presented in connection with the Meeting, but also the knowledge gained over time through interaction with Funds Management and the Sub-Adviser about various topics. In this regard, the Board reviewed reports of Funds Management at each of its quarterly meetings, which included, among other things, portfolio reviews and performance reports. In addition, the Board and the teams mentioned above confer with portfolio managers at various times throughout the year. The Board did not identify any particular information or consideration that was all-important or controlling, and each individual Trustee may have attributed different weights to various factors.
After its deliberations, the Board unanimously approved the continuation of the Advisory Agreement for the period from June 1, 2015 through June 30, 2015, approved the Management Agreement for the period from July 1, 2015 through May 31, 2016, and approved the continuation of the Sub-Advisory Agreement for a one-year term through May 31, 2016. The Board also determined that the compensation payable to Funds Management and the Sub-Adviser under each of the Advisory Agreements was reasonable. The Board considered the approval of the Advisory Agreements for the Fund as part of its consideration of agreements for funds across the complex, but its approvals were made on a fund-by-fund basis. The following summarizes a number of important, but not necessarily all, factors considered by the Board in support of its approvals.
Nature, extent and quality of services
The Board received and considered various information regarding the nature, extent and quality of services provided to the Fund by Funds Management and the Sub-Adviser under the Advisory Agreements. This information included, among other things, a summary of the background and experience of senior management of Funds Management, and the qualifications, background, tenure and responsibilities of each of the portfolio managers primarily responsible for the day-to-day portfolio management of the Fund. The Board noted that the services to be provided to the Fund pursuant to the Management Agreement combined the advisory services previously provided to the Fund pursuant to the Fund’s Advisory Agreement with the Fund-level administrative services previously provided to the Fund pursuant to the Fund’s Administration Agreement. The Board received a representation from Funds Management that combining these services would not result in any change to the nature or level of services provided by Funds Management to the Fund.
The Board evaluated the ability of Funds Management and the Sub-Adviser to attract and retain qualified investment professionals, including research, advisory and supervisory personnel. The Board further considered the compliance
| | | | |
| 32 | | Wells Fargo Advantage Small Cap Value Fund | | Other information (unaudited) |
programs and compliance records of Funds Management and the Sub-Adviser. In addition, the Board took into account the full range of services provided to the Fund by Funds Management and its affiliates.
Fund performance and expenses
The Board considered the performance results for the Fund over various time periods ended March 31, 2015. The Board considered these results in comparison to the performance of funds in a universe that was determined by Lipper Inc. (“Lipper”) to be similar to the Fund (the “Universe”), and in comparison to the Fund’s benchmark index and to other comparative data. Lipper is an independent provider of investment company data. The Board received a description of the methodology used by Lipper to select the mutual funds in the performance Universe. The Board noted that the performance of the Fund (Class A) was lower than the average performance of the Universe for all periods under review. The Board also noted that the performance of the Fund was lower than its benchmark, the Russell 2000® Value Index, for all periods under review.
The Board received information concerning, and discussed factors contributing to, the underperformance of the Fund relative to the Universe and benchmark for all periods. The Board took note of the explanations for the relative underperformance, including with respect to overall investment approach, sector allocations and investment decisions that affected the Fund’s performance.
The Board also received and considered information regarding the Fund’s net operating expense ratios and their various components, including actual management fees (which reflect fee waivers, if any, and include advisory, administration and transfer agent fees), custodian and other non-management fees, and Rule 12b-1 and non-Rule 12b-1 service fees. The Board considered these ratios in comparison to the median ratios of funds in class-specific expense groups that were determined by Lipper to be similar to the Fund (the “Groups”). The Board received a description of the methodology used by Lipper to select the mutual funds in the expense Groups and an explanation of how funds comprising expense groups and their expense ratios may vary from year-to-year. Based on the Lipper reports, the Board noted that the net operating expense ratios of the Fund were lower than or in range of the median net operating expense ratios of the expense Groups. The Board discussed and accepted Funds Management’s proposal to convert the Investor Class shares into Class A shares.
The Board took into account the Fund performance and expense information provided to it among the factors considered in deciding to re-approve the Advisory Agreement and Sub-Advisory Agreement and approve the Management Agreement.
Investment advisory and sub-advisory fee rates
The Board reviewed and considered the contractual investment advisory fee rates that are payable by the Fund to Funds Management for investment advisory services (the “Advisory Agreement Rates”), both on a stand-alone basis and on a combined basis with the Fund’s fund-level and class-level contractual administration fee rates (the “Management Rates”). The Board noted that the Management Rates include transfer agency and sub-transfer agency costs. The Board also noted that the fee rate to be paid by the Fund under the Management Agreement will incorporate the advisory fee and Fund-level administration fee previously payable separately by the Fund under the Fund’s Advisory Agreement and Administration Agreement with Funds Management. The Board also reviewed and considered the contractual investment sub-advisory fee rates that are payable by Funds Management to the Sub-Adviser for investment sub-advisory services (the “Sub-Advisory Agreement Rates”).
Among other information reviewed by the Board was a comparison of the Management Rates of the Fund with those of other funds in the expense Groups at a common asset level. The Board noted that the Management Rate for the Investor Class was higher than the average rate of the Investor Class’s expense Group, while the Management Rates for all other share classes of the Fund were lower than, equal to or in range of their respective expense Groups. The Board discussed and accepted Funds Management’s proposal to convert the Investor Class shares into Class A shares.
The Board also received and considered information about the portion of the total advisory fee that was retained by Funds Management after payment of the fee to the Sub-Adviser for sub-advisory services. In assessing the reasonableness of this amount, the Board received and evaluated information about the nature and extent of responsibilities retained and risks assumed by Funds Management and not delegated to or assumed by the Sub-Adviser, and about Funds Management’s on-going oversight services. However, given the affiliation between Funds Management and the Sub-Adviser, the Board ascribed limited relevance to the allocation of the advisory fee between them.
The Board also received and considered information about the nature and extent of services offered and fee rates charged by Funds Management and the Sub-Adviser to other types of clients with investment strategies similar to those
| | | | | | |
| Other information (unaudited) | | Wells Fargo Advantage Small Cap Value Fund | | | 33 | |
of the Fund. In this regard, the Board received information about the significantly greater scope of services, and compliance, reporting and other legal burdens and risks of managing mutual funds compared with those associated with managing assets of non-mutual fund clients such as collective funds or institutional separate accounts.
Based on its consideration of the factors and information it deemed relevant, including those described here, the Board determined that the compensation payable to Funds Management under the Management Agreement and Advisory Agreement and to the Sub-Adviser under the Sub-Advisory Agreement was reasonable, in light of the services covered by the Advisory Agreements.
Profitability
The Board received and considered information concerning the profitability of Funds Management, as well as the profitability of Wells Fargo as a whole, from providing services to the Fund and the fund family as a whole. The Board also received and considered information concerning the profitability of the Sub-Adviser from providing services to the fund family as a whole, noting that the Sub-Adviser’s profitability information with respect to providing services to the Fund was subsumed in the Wells Fargo profitability analysis.
Funds Management reported on the methodologies and estimates used in calculating profitability. Among other things, the Board noted that the levels of profitability reported on a fund-by-fund basis varied widely, depending on factors such as the size and type of fund. Based on its review, the Board did not deem the profits reported by Funds Management or Wells Fargo from its services to the Fund to be at a level that would prevent it from approving the continuation of the Advisory Agreements.
Economies of scale
With respect to possible economies of scale, the Board noted the existence of breakpoints in the Fund’s advisory and management fee structures, and the Fund’s administration fee structure, which operate generally to reduce the Fund’s expense ratios as the Fund grows in size. It considered that, for a small fund or a fund that shrinks in size, breakpoints conversely can result in higher fee levels. The Board also considered that fee waiver and expense reimbursement arrangements and competitive fee rates at the outset are means of sharing potential economies of scale with shareholders of the Fund and the fund family as a whole. The Board considered Funds Management’s view that any analyses of potential economies of scale in managing a particular fund are inherently limited in light of the joint and common costs and investments that Funds Management incurs across the fund family as a whole.
The Board concluded that the Fund’s fee and expense arrangements, including contractual breakpoints, constituted a reasonable approach to sharing potential economies of scale with the Fund and its shareholders.
Other benefits to Funds Management and the Sub-Adviser
The Board received and considered information regarding potential “fall-out” or ancillary benefits received by Funds Management and its affiliates, including the Sub-Adviser, as a result of their relationships with the Fund. Ancillary benefits could include, among others, benefits directly attributable to other relationships with the Fund and benefits potentially derived from an increase in Funds Management’s and the Sub-Adviser’s business as a result of their relationships with the Fund. The Board noted that various affiliates of Funds Management may receive distribution-related fees, shareholder servicing payments and sub-transfer agency fees in respect of shares sold or held through them and services provided.
The Board also reviewed information about soft dollar credits earned and utilized by the Sub-Adviser, fees earned by Funds Management and the Sub-Adviser from managing a private investment vehicle for the fund family’s securities lending collateral and commissions earned by an affiliated broker from portfolio transactions.
Based on its consideration of the factors and information it deemed relevant, including those described here, the Board did not find that any ancillary benefits received by Funds Management and its affiliates, including the Sub-Adviser, were unreasonable.
Conclusion
At the Meeting, after considering the above-described factors and based on its deliberations and its evaluation of the information described above, the Board unanimously approved the continuation of the Advisory Agreement for the period from June 1, 2015 through June 30, 2015, approved the Management Agreement for the period from July 1, 2015 through May 31, 2016, and approved the continuation of the Sub-Advisory Agreement for a one-year term through May 31, 2016. The Board also determined that the compensation payable to Funds Management and the Sub-Adviser under each of the Advisory Agreements was reasonable.
| | | | |
| 34 | | Wells Fargo Advantage Small Cap Value Fund | | List of abbreviations |
The following is a list of common abbreviations for terms and entities that may have appeared in this report.
| ACA | — ACA Financial Guaranty Corporation |
| ADR | — American depositary receipt |
| ADS | — American depositary shares |
| AGC | — Assured Guaranty Corporation |
| AGM | — Assured Guaranty Municipal |
| Ambac | — Ambac Financial Group Incorporated |
| AMT | — Alternative minimum tax |
| BAN | — Bond anticipation notes |
| BHAC | — Berkshire Hathaway Assurance Corporation |
| CAB | — Capital appreciation bond |
| CCAB | — Convertible capital appreciation bond |
| CDA | — Community Development Authority |
| CDO | — Collateralized debt obligation |
| DRIVER | — Derivative inverse tax-exempt receipts |
| DW&P | — Department of Water & Power |
| DWR | — Department of Water Resources |
| ECFA | — Educational & Cultural Facilities Authority |
| EDA | — Economic Development Authority |
| EDFA | — Economic Development Finance Authority |
| ETF | — Exchange-traded fund |
| FDIC | — Federal Deposit Insurance Corporation |
| FFCB | — Federal Farm Credit Banks |
| FGIC | — Financial Guaranty Insurance Corporation |
| FHA | — Federal Housing Administration |
| FHLB | — Federal Home Loan Bank |
| FHLMC | — Federal Home Loan Mortgage Corporation |
| FICO | — The Financing Corporation |
| FNMA | — Federal National Mortgage Association |
| GDR | — Global depositary receipt |
| GNMA | — Government National Mortgage Association |
| HCFR | — Healthcare facilities revenue |
| HEFA | — Health & Educational Facilities Authority |
| HEFAR | — Higher education facilities authority revenue |
| HFA | — Housing Finance Authority |
| HFFA | — Health Facilities Financing Authority |
| HUD | — Department of Housing and Urban Development |
| IDA | — Industrial Development Authority |
| IDAG | — Industrial Development Agency |
| KRW | — Republic of Korea won |
| LIBOR | — London Interbank Offered Rate |
| LIFER | — Long Inverse Floating Exempt Receipts |
| LLC | — Limited liability company |
| LLLP | — Limited liability limited partnership |
| LLP | — Limited liability partnership |
| MBIA | — Municipal Bond Insurance Association |
| MFHR | — Multifamily housing revenue |
| MSTR | — Municipal securities trust receipts |
| MUD | — Municipal Utility District |
| National | — National Public Finance Guarantee Corporation |
| PCFA | — Pollution Control Financing Authority |
| PCL | — Public Company Limited |
| PCR | — Pollution control revenue |
| PFA | — Public Finance Authority |
| PFFA | — Public Facilities Financing Authority |
| PFOTER | — Puttable floating option tax-exempt receipts |
| plc | — Public limited company |
| PUTTER | — Puttable tax-exempt receipts |
| R&D | — Research & development |
| Radian | — Radian Asset Assurance |
| RAN | — Revenue anticipation notes |
| RDA | — Redevelopment Authority |
| RDFA | — Redevelopment Finance Authority |
| REIT | — Real estate investment trust |
| ROC | — Reset option certificates |
| SAVRS | — Select auction variable rate securities |
| SBA | — Small Business Authority |
| SDR | — Swedish depositary receipt |
| SFHR | — Single-family housing revenue |
| SFMR | — Single-family mortgage revenue |
| SPA | — Standby purchase agreement |
| SPDR | — Standard & Poor’s Depositary Receipts |
| SPEAR | — Short Puttable Exempt Adjustable Receipts |
| STRIPS | — Separate trading of registered interest and |
| TAN | — Tax anticipation notes |
| TIPS | — Treasury inflation-protected securities |
| TRAN | — Tax revenue anticipation notes |
| TTFA | — Transportation Trust Fund Authority |
| TVA | — Tennessee Valley Authority |
This page is intentionally left blank.
This page is intentionally left blank.


For more information
More information about Wells Fargo Advantage Funds is available free upon request. To obtain literature, please write, email, visit the Fund’s website, or call:
Wells Fargo Advantage Funds
P.O. Box 8266
Boston, MA 02266-8266
Email: wfaf@wellsfargo.com
Website: wellsfargoadvantagefunds.com
Individual investors: 1-800-222-8222
Retail investment professionals: 1-888-877-9275
Institutional investment professionals: 1-866-765-0778
This report and the financial statements contained herein are submitted for the general information of the shareholders of Wells Fargo Advantage Funds. If this report is used for promotional purposes, distribution of the report must be accompanied or preceded by a current prospectus. Before investing, please consider the investment objectives, risks, charges, and expenses of the investment. For a current prospectus and, if available, a summary prospectus, containing this information, call 1-800-222-8222 or visit the Fund’s website at wellsfargoadvantagefunds.com. Read the prospectus carefully before you invest or send money.
Wells Fargo Funds Management, LLC, a wholly owned subsidiary of Wells Fargo & Company, provides investment advisory and administrative services for Wells Fargo Advantage Funds. Other affiliates of Wells Fargo & Company provide subadvisory and other services for the Funds. The Funds are distributed by Wells Fargo Funds Distributor, LLC, Member FINRA, an affiliate of Wells Fargo & Company.
NOT FDIC INSURED ¡ NO BANK GUARANTEE ¡ MAY LOSE VALUE
© 2015 Wells Fargo Funds Management, LLC. All rights reserved.
| | |
 | | 237483 11-15 SA244/SAR244 09-15 |

Wells Fargo Advantage Small/Mid Cap Value Fund

Semi-Annual Report
September 30, 2015

Reduce clutter. Save trees.
Sign up for electronic delivery of prospectuses and shareholder reports at wellsfargo.com/advantagedelivery
Contents
The views expressed and any forward-looking statements are as of September 30, 2015, unless otherwise noted, and are those of the Fund managers and/or Wells Fargo Funds Management, LLC. Discussions of individual securities, or the markets generally, or any Wells Fargo Advantage Fund are not intended as individual recommendations. Future events or results may vary significantly from those expressed in any forward-looking statements; the views expressed are subject to change at any time in response to changing circumstances in the market. Wells Fargo Funds Management, LLC and the Fund disclaim any obligation to publicly update or revise any views expressed or forward-looking statements.
NOT FDIC INSURED ¡ NO BANK GUARANTEE ¡ MAY LOSE VALUE
| | | | |
| 2 | | Wells Fargo Advantage Small/Mid Cap Value Fund | | Letter to shareholders (unaudited) |

Karla M. Rabusch
President
Wells Fargo Advantage Funds
Despite generally improving U.S. economic data, the broad U.S. stock market experienced heightened volatility that led to negative results overall for U.S. stocks for the period.
Dear Valued Shareholder:
We are pleased to offer you this semi-annual report for the Wells Fargo Advantage Small/Mid Cap Value Fund for the six-month period that ended September 30, 2015. Despite generally improving U.S. economic data, the broad U.S. stock market experienced heightened volatility that led to negative results overall for U.S. stocks for the period. Large-cap stocks performed best, followed by mid caps and small caps. Markets outside the U.S. faced deeper ongoing challenges and generally delivered weaker results.
U.S. stocks experienced challenges during the second quarter of 2015.
The broad U.S. stock market fluctuated widely, eventually eking out a small quarterly gain. Mid- and large-cap stocks at times were pressured by investor concerns over the potentially negative effects of financially troubled overseas economies and of a strengthening U.S. dollar on the profits of U.S. multinational firms. The U.S. economy picked up traction during the quarter; consumer spending improved, and positive trends were evident in construction and new-home sales. Jobs growth remained a bright spot as well. U.S. Federal Reserve (Fed) officials, who have kept interest rates low while waiting for the U.S. jobs market to sufficiently improve and for inflation to approach their 2% target, made clear they could take action soon. Throughout the quarter, non-U.S. markets also experienced volatility, triggered by uncertainty over the potential impact of financial challenges in other locations—most notably in Greece and Puerto Rico. Questions over slower growth in China caused investor concern as well.
In the third quarter of 2015, China’s slowdown took a toll on economies and markets worldwide.
U.S. stocks sagged during the quarter, experiencing the most volatility since 2011. Larger-cap stocks generally declined the least and smaller caps the most. Economic data released during the quarter suggested the U.S. economy remains solid but has lost some steam, burdened by the drag of the strong U.S. dollar coupled with global economic turmoil. The fact that the Fed left the federal funds interest rate unchanged at its September meeting surprised investors and fueled increased uncertainty about the U.S. economy’s stamina to remain healthy while facing the challenges of slowing in China and troubles elsewhere in the world. Outside the U.S., markets were even more volatile and delivered generally weaker quarterly results, also largely due to investors’ increasing anxiety over China’s weakened economy. Because China is the world’s largest importer of many commodities, a number of emerging markets—key commodities exporters—are struggling under the dual strains of reduced demand for commodities and, because of weaker demand, lower prices for the commodities they do sell. In the eurozone, however, where only about 3% of exports are sent to China, household spending and business investment appeared relatively unaffected by troubles elsewhere. However, the European Central Bank warned in September that slowing growth in China could lead to slower growth and lower inflation rates in the eurozone than previously forecast and indicated additional stimulus could be provided should this occur.
| | | | | | |
| Letter to shareholders (unaudited) | | Wells Fargo Advantage Small/Mid Cap Value Fund | | | 3 | |
Don’t let short-term uncertainty derail long-term investment goals.
Periods of uncertainty can present challenges, but experience has taught us that maintaining long-term investment goals can be an effective way to plan for the future. To help you create a sound strategy based on your personal goals and risk tolerance, Wells Fargo Advantage Funds offers more than 100 mutual funds spanning a wide range of asset classes and investment styles. Although diversification cannot guarantee an investment profit or prevent losses, we believe it can be an effective way to manage investment risk and potentially smooth out overall portfolio performance. We encourage investors to know their investments and to understand that appropriate levels of risk-taking may unlock opportunities.
Thank you for choosing to invest in Wells Fargo Advantage Funds. We appreciate your confidence in us and remain committed to helping you meet your financial needs.
Sincerely,

Karla M. Rabusch
President
Wells Fargo Advantage Funds
Periods of uncertainty can present challenges, but experience has taught us that maintaining long-term investment goals can be an effective way to plan for the future.
Notice to shareholders
At a meeting held August 11-12, 2015, the Board of Trustees of the Fund approved a change in the name of the Fund whereby the word “Advantage” was removed from its name, effective December 15, 2015.
For current information about your fund investments, contact your investment professional, visit our website at wellsfargoadvantagefunds.com, or call us directly at 1-800-222-8222. We are available 24 hours a day, 7 days a week.
| | | | |
| 4 | | Wells Fargo Advantage Small/Mid Cap Value Fund | | Performance highlights (unaudited) |
Investment objective
The Fund seeks long-term capital appreciation.
Manager
Wells Fargo Funds Management, LLC
Subadviser
Wells Capital Management Incorporated
Portfolio managers
Erik C. Astheimer
I. Charles Rinaldi
Michael Schneider, CFA
Average annual total returns1 (%) as of September 30, 2015
| | | | | | | | | | | | | | | | | | | | | | | | | | | | | | | | | | |
| | | | | Including sales charge | | | Excluding sales charge | | | Expense ratios2 (%) | |
| | | Inception date | | 1 year | | | 5 year | | | 10 year | | | 1 year | | | 5 year | | | 10 year | | | Gross | | | Net3 | |
| Class A (WFVAX) | | 7-31-2007 | | | (20.32 | ) | | | 0.39 | | | | 0.89 | | | | (15.47 | ) | | | 1.58 | | | | 1.49 | | | | 1.43 | | | | 1.36 | |
| Class C (WFCVX) | | 7-31-2007 | | | (17.07 | ) | | | 0.82 | | | | 0.77 | | | | (16.07 | ) | | | 0.82 | | | | 0.77 | | | | 2.18 | | | | 2.11 | |
| Administrator Class (WWMDX) | | 4-8-2005 | | | – | | | | – | | | | – | | | | (15.29 | ) | | | 1.82 | | | | 1.77 | | | | 1.35 | | | | 1.16 | |
| Institutional Class (WWMSX) | | 8-31-2006 | | | – | | | | – | | | | – | | | | (15.17 | ) | | | 2.01 | | | | 1.94 | | | | 1.10 | | | | 0.96 | |
| Investor Class (SMMVX)+ | | 3-28-2002 | | | – | | | | – | | | | – | | | | (15.53 | ) | | | 1.51 | | | | 1.43 | | | | 1.54 | | | | 1.42 | |
| Russell 2500TM Value Index4 | | – | | | – | | | | – | | | | – | | | | (2.44 | ) | | | 11.49 | | | | 6.31 | | | | – | | | | – | |
| + | | Effective at the close of business on October 23, 2015, Investor Class shares of the Fund were converted to Class A shares and Investor Class shares are no longer offered. |
Figures quoted represent past performance, which is no guarantee of future results, and do not reflect taxes that a shareholder may pay on fund distributions or the redemption of fund shares. Investment return and principal value of an investment will fluctuate so that an investor’s shares, when redeemed, may be worth more or less than their original cost. Performance shown without sales charges would be lower if sales charges were reflected. Current performance may be lower or higher than the performance data quoted, which assumes the reinvestment of dividends and capital gains. Current month-end performance is available on the Fund’s website, wellsfargoadvantagefunds.com.
Index returns do not include transaction costs associated with buying and selling securities, any mutual fund fees or expenses, or any taxes. It is not possible to invest directly in an index.
For Class A shares, the maximum front-end sales charge is 5.75%. For Class C shares, the maximum contingent deferred sales charge is 1.00%. Performance including a contingent deferred sales charge assumes the sales charge for the corresponding time period. Administrator Class, Institutional Class, and Investor Class shares are sold without a front-end sales charge or contingent deferred sales charge.
Stock values fluctuate in response to the activities of individual companies and general market and economic conditions. Smaller-company stocks tend to be more volatile and less liquid than those of larger companies. The use of derivatives may reduce returns and/or increase volatility. Certain investment strategies tend to increase the total risk of an investment (relative to the broader market). The Fund is exposed to foreign investment risk. Consult the Fund’s prospectus for additional information on these and other risks.
Please see footnotes on page 5.
| | | | | | |
| Performance highlights (unaudited) | | Wells Fargo Advantage Small/Mid Cap Value Fund | | | 5 | |
| | | | |
| Ten largest holdings5 (%) as of September 30, 2015 | |
InterOil Corporation | | | 5.61 | |
UMH Properties Incorporated | | | 5.51 | |
Century Casinos Incorporated | | | 5.25 | |
Integrated Electrical Services Incorporated | | | 4.75 | |
Randgold Resources Limited ADR | | | 4.72 | |
Cavco Industries Incorporated | | | 3.98 | |
Pacific Premier Bancorp Incorporated | | | 2.42 | |
Sierra Bancorp | | | 2.03 | |
WCI Communities Incorporated | | | 1.96 | |
Redwood Trust Incorporated | | | 1.80 | |
|
| Sector distribution6 as of September 30, 2015 |
|
 |
| 1 | Historical performance shown for Class A shares prior to their inception reflects the performance of Investor Class shares, and includes the higher expenses applicable to Investor Class shares. If these expenses had not been included, returns would be higher. Historical performance shown for Class C shares prior to their inception reflects the performance of Investor Class shares, and has been adjusted to reflect the higher expenses applicable to Class C shares. Historical performance shown for Institutional Class shares prior to their inception reflects the performance of Administrator Class shares, and includes the higher expenses applicable to Administrator Class shares. If these expenses had not been included, returns would be higher. |
| 2 | Reflects the expense ratio as stated in the most recent prospectuses, which include the impact of 0.01% in acquired fund fees and expenses. The expense ratios shown are subject to change and may differ from the annualized expense ratios shown in the financial highlights of this report, which do not include acquired fund fees and expenses. |
| 3 | The manager has committed through July 31, 2016, to waive fees and/or reimburse expenses to the extent necessary to cap the Fund’s Total Annual Fund Operating Expenses After Fee Waiver at 1.35% for Class A, 2.10% for Class C, 1.15% for Administrator Class, 0.95% for Institutional Class, and 1.41% for Investor Class. After this time, the cap may be increased or the commitment to maintain the cap may be terminated only with the approval of the Board of Trustees. Brokerage commissions, stamp duty fees, interest, taxes, acquired fund fees and expenses, and extraordinary expenses are excluded from the cap. Without this cap, the Fund’s returns would have been lower. |
| 4 | The Russell 2500TM Value Index measures the performance of those Russell 2500TM companies with lower price-to-book ratios and lower forecasted growth values. You cannot invest directly in an index. |
| 5 | The ten largest holdings, excluding cash and cash equivalents, are calculated based on the value of the investments divided by total net assets of the Fund. Holdings are subject to change and may have changed since the date specified. |
| 6 | Amounts are calculated based on the total long-term investments of the Fund. These amounts are subject to change and may have changed since the date specified. |
| | | | |
| 6 | | Wells Fargo Advantage Small/Mid Cap Value Fund | | Fund expenses (unaudited) |
As a shareholder of the Fund, you incur two types of costs: (1) transaction costs, including sales charges (loads) on purchase payments and contingent deferred sales charges (if any) on redemptions and (2) ongoing costs, including management fees, distribution (12b-1) and/or shareholder servicing fees, and other Fund expenses. This example is intended to help you understand your ongoing costs (in dollars) of investing in the Fund and to compare these costs with the ongoing costs of investing in other mutual funds.
The example is based on an investment of $1,000 invested at the beginning of the six-month period and held for the entire period from April 1, 2015 to September 30, 2015.
Actual expenses
The “Actual” line of the table below provides information about actual account values and actual expenses. You may use the information in this line, together with the amount you invested, to estimate the expenses that you paid over the period. Simply divide your account value by $1,000 (for example, an $8,600 account value divided by $1,000 = 8.6), then multiply the result by the number in the “Actual” line under the heading entitled “Expenses paid during period” for your applicable class of shares to estimate the expenses you paid on your account during this period.
Hypothetical example for comparison purposes
The “Hypothetical” line of the table below provides information about hypothetical account values and hypothetical expenses based on the Fund’s actual expense ratio and an assumed rate of return of 5% per year before expenses, which is not the Fund’s actual return. The hypothetical account values and expenses may not be used to estimate the actual ending account balance or expenses you paid for the period. You may use this information to compare the ongoing costs of investing in the Fund and other funds. To do so, compare this 5% hypothetical example with the 5% hypothetical examples that appear in the shareholder reports of the other funds.
Please note that the expenses shown in the table are meant to highlight your ongoing costs only and do not reflect any transactional costs, such as sales charges (loads) and contingent deferred sales charges. Therefore, the “Hypothetical” line of the table is useful in comparing ongoing costs only and will not help you determine the relative total costs of owning different funds. In addition, if these transactional costs were included, your costs would have been higher.
| | | | | | | | | | | | | | | | |
| | | Beginning
account value
4-1-2015 | | | Ending
account value
9-30-2015 | | | Expenses
paid during
the period¹ | | | Net annualized
expense ratio | |
Class A | | | | | | | | | | | | | | | | |
Actual | | $ | 1,000.00 | | | $ | 903.17 | | | $ | 6.44 | | | | 1.35 | % |
Hypothetical (5% return before expenses) | | $ | 1,000.00 | | | $ | 1,018.30 | | | $ | 6.83 | | | | 1.35 | % |
Class C | | | | | | | | | | | | | | | | |
Actual | | $ | 1,000.00 | | | $ | 899.91 | | | $ | 10.00 | | | | 2.10 | % |
Hypothetical (5% return before expenses) | | $ | 1,000.00 | | | $ | 1,014.54 | | | $ | 10.61 | | | | 2.10 | % |
Administrator Class | | | | | | | | | | | | | | | | |
Actual | | $ | 1,000.00 | | | $ | 904.27 | | | $ | 5.49 | | | | 1.15 | % |
Hypothetical (5% return before expenses) | | $ | 1,000.00 | | | $ | 1,019.30 | | | $ | 5.82 | | | | 1.15 | % |
Institutional Class | | | | | | | | | | | | | | | | |
Actual | | $ | 1,000.00 | | | $ | 905.00 | | | $ | 4.54 | | | | 0.95 | % |
Hypothetical (5% return before expenses) | | $ | 1,000.00 | | | $ | 1,020.31 | | | $ | 4.81 | | | | 0.95 | % |
Investor Class | | | | | | | | | | | | | | | | |
Actual | | $ | 1,000.00 | | | $ | 903.51 | | | $ | 6.73 | | | | 1.41 | % |
Hypothetical (5% return before expenses) | | $ | 1,000.00 | | | $ | 1,018.00 | | | $ | 7.13 | | | | 1.41 | % |
| 1 | Expenses paid is equal to the annualized expense ratio of each class multiplied by the average account value over the period, multiplied by the number of days in the most recent fiscal half-year divided by the number of days in the fiscal year (to reflect the one-half-year period). |
| | | | | | |
| Portfolio of investments—September 30, 2015 (unaudited) | | Wells Fargo Advantage Small/Mid Cap Value Fund | | | 7 | |
| | | | | | | | | | | | |
| Security name | | | | | | Shares | | | Value | |
| | | | |
Common Stocks: 97.51% | | | | | | | | | | | | |
| | | | |
Consumer Discretionary: 22.63% | | | | | | | | | | | | |
| | | | |
| Auto Components: 1.74% | | | | | | | | | | | | |
Fox Factory Holding Corporation † | | | | | | | 49,070 | | | $ | 827,320 | |
| | | | | | | | | | | | |
| | | | |
| Hotels, Restaurants & Leisure: 6.09% | | | | | | | | | | | | |
Century Casinos Incorporated † | | | | | | | 406,200 | | | | 2,498,130 | |
Peak Resorts Incorporated | | | | | | | 57,600 | | | | 396,864 | |
| | | | |
| | | | | | | | | | | 2,894,994 | |
| | | | | | | | | | | | |
| | | | |
| Household Durables: 9.86% | | | | | | | | | | | | |
Cavco Industries Incorporated † | | | | | | | 27,813 | | | | 1,893,787 | |
D.R. Horton Incorporated | | | | | | | 23,200 | | | | 681,152 | |
Skyline Corporation † | | | | | | | 141,300 | | | | 406,944 | |
Taylor Morrison Home Corporation Class A † | | | | | | | 41,509 | | | | 774,558 | |
WCI Communities Incorporated † | | | | | | | 41,102 | | | | 930,138 | |
| | | | |
| | | | | | | | | | | 4,686,579 | |
| | | | | | | | | | | | |
| | | | |
| Media: 4.94% | | | | | | | | | | | | |
Cinemark Holdings Incorporated | | | | | | | 10,700 | | | | 347,643 | |
Entravision Communications Corporation Class A | | | | | | | 96,475 | | | | 640,594 | |
Interpublic Group of Companies Incorporated | | | | | | | 28,768 | | | | 550,332 | |
News Corporation Class A | | | | | | | 64,387 | | | | 812,564 | |
| | | | |
| | | | | | | | | | | 2,351,133 | |
| | | | | | | | | | | | |
| | | | |
Energy: 7.02% | | | | | | | | | | | | |
| | | | |
| Oil, Gas & Consumable Fuels: 7.02% | | | | | | | | | | | | |
Canadian Natural Resources Limited | | | | | | | 14,600 | | | | 283,970 | |
InterOil Corporation † | | | | | | | 79,189 | | | | 2,669,461 | |
Raging River Exploration Incorporated † | | | | | | | 29,400 | | | | 162,366 | |
Range Resources Corporation | | | | | | | 2,800 | | | | 89,936 | |
Sanchez Energy Corporation † | | | | | | | 21,800 | | | | 134,070 | |
| | | | |
| | | | | | | | | | | 3,339,803 | |
| | | | | | | | | | | | |
| | | | |
Financials: 28.47% | | | | | | | | | | | | |
| | | | |
| Banks: 16.35% | | | | | | | | | | | | |
American River Bankshares † | | | | | | | 61,100 | | | | 589,615 | |
Ameris Bancorp | | | | | | | 19,156 | | | | 550,735 | |
BBCN Bancorp Incorporated | | | | | | | 49,506 | | | | 743,580 | |
First Niagara Financial Group Incorporated | | | | | | | 39,549 | | | | 403,795 | |
Hilltop Holdings Incorporated † | | | | | | | 26,144 | | | | 517,913 | |
IBERIABANK Corporation | | | | | | | 7,785 | | | | 453,165 | |
Midsouth Bancorp Incorporated | | | | | | | 37,500 | | | | 438,750 | |
Pacific Premier Bancorp Incorporated † | | | | | | | 56,719 | | | | 1,152,530 | |
Sierra Bancorp | | | | | | | 60,400 | | | | 963,984 | |
The Bancorp Incorporated † | | | | | | | 84,745 | | | | 645,757 | |
Valley National Bancorp | | | | | | | 57,638 | | | | 567,158 | |
Wilshire Bancorp Incorporated | | | | | | | 71,300 | | | | 749,363 | |
| | | | |
| | | | | | | | | | | 7,776,345 | |
| | | | | | | | | | | | |
The accompanying notes are an integral part of these financial statements.
| | | | |
| 8 | | Wells Fargo Advantage Small/Mid Cap Value Fund | | Portfolio of investments—September 30, 2015 (unaudited) |
| | | | | | | | | | | | |
| Security name | | | | | | Shares | | | Value | |
| | | | |
| Capital Markets: 0.33% | | | | | | | | | | | | |
Safeguard Scientifics Incorporated † | | | | | | | 10,200 | | | $ | 158,508 | |
| | | | | | | | | | | | |
| | | | |
| Consumer Finance: 0.31% | | | | | | | | | | | | |
Enova International Incorporated † | | | | | | | 14,233 | | | | 145,461 | |
| | | | | | | | | | | | |
| | | | |
| Insurance: 1.57% | | | | | | | | | | | | |
First Acceptance Corporation † | | | | | | | 159,800 | | | | 431,460 | |
Health Insurance Innovations Incorporated Class A † | | | | | | | 26,780 | | | | 133,900 | |
James River Group Holdings Limited | | | | | | | 6,800 | | | | 182,852 | |
| | | | |
| | | | | | | | | | | 748,212 | |
| | | | | | | | | | | | |
| | | | |
| REITs: 8.75% | | | | | | | | | | | | |
Owens Realty Mortgage Incorporated | | | | | | | 25,100 | | | | 345,627 | |
Potlatch Corporation | | | | | | | 11,600 | | | | 333,964 | |
Redwood Trust Incorporated | | | | | | | 62,000 | | | | 858,080 | |
UMH Properties Incorporated | | | | | | | 281,800 | | | | 2,620,740 | |
| | | | |
| | | | | | | | | | | 4,158,411 | |
| | | | | | | | | | | | |
| | | | |
| Thrifts & Mortgage Finance: 1.16% | | | | | | | | | | | | |
Northwest Bancshares Incorporated | | | | | | | 42,483 | | | | 552,279 | |
| | | | | | | | | | | | |
| | | | |
Health Care: 4.41% | | | | | | | | | | | | |
| | | | |
| Health Care Equipment & Supplies: 1.22% | | | | | | | | | | | | |
Allied Healthcare Products Incorporated † | | | | | | | 76,400 | | | | 87,860 | |
EnteroMedics Incorporated † | | | | | | | 1,067,900 | | | | 277,654 | |
Stryker Corporation | | | | | | | 2,300 | | | | 216,430 | |
| | | | |
| | | | | | | | | | | 581,944 | |
| | | | | | | | | | | | |
| | | | |
| Health Care Providers & Services: 1.38% | | | | | | | | | | | | |
Cross Country Healthcare Incorporated † | | | | | | | 48,079 | | | | 654,355 | |
| | | | | | | | | | | | |
| | | | |
| Health Care Technology: 1.81% | | | | | | | | | | | | |
Allscripts Healthcare Solutions Incorporated † | | | | | | | 20,900 | | | | 259,160 | |
Merge Healthcare Incorporated † | | | | | | | 56,200 | | | | 399,020 | |
Omnicell Incorporated † | | | | | | | 6,500 | | | | 202,150 | |
| | | | |
| | | | | | | | | | | 860,330 | |
| | | | | | | | | | | | |
| | | | |
Industrials: 15.44% | | | | | | | | | | | | |
| | | | |
| Airlines: 3.84% | | | | | | | | | | | | |
American Airlines Group Incorporated | | | | | | | 11,700 | | | | 454,311 | |
JetBlue Airways Corporation † | | | | | | | 18,402 | | | | 474,220 | |
LATAM Airlines Group ADR † | | | | | | | 59,692 | | | | 291,297 | |
United Continental Holdings Incorporated † | | | | | | | 11,400 | | | | 604,770 | |
| | | | |
| | | | | | | | | | | 1,824,598 | |
| | | | | | | | | | | | |
| | | | |
| Commercial Services & Supplies: 1.99% | | | | | | | | | | | | |
ACCO Brands Corporation † | | | | | | | 44,530 | | | | 314,827 | |
Healthcare Services Group Incorporated | | | | | | | 10,643 | | | | 358,669 | |
SP Plus Corporation † | | | | | | | 11,900 | | | | 275,485 | |
| | | | |
| | | | | | | | | | | 948,981 | |
| | | | | | | | | | | | |
The accompanying notes are an integral part of these financial statements.
| | | | | | |
| Portfolio of investments—September 30, 2015 (unaudited) | | Wells Fargo Advantage Small/Mid Cap Value Fund | | | 9 | |
| | | | | | | | | | | | |
| Security name | | | | | | Shares | | | Value | |
| | | | |
| Construction & Engineering: 5.46% | | | | | | | | | | | | |
Integrated Electrical Services Incorporated † | | | | | | | 292,700 | | | $ | 2,259,644 | |
Sterling Construction Company Incorporated † | | | | | | | 82,100 | | | | 337,431 | |
| | | | |
| | | | | | | | | | | 2,597,075 | |
| | | | | | | | | | | | |
| | | | |
| Machinery: 2.89% | | | | | | | | | | | | |
Actuant Corporation Class A | | | | | | | 10,687 | | | | 196,534 | |
Graco Incorporated | | | | | | | 5,700 | | | | 382,071 | |
Kennametal Incorporated | | | | | | | 9,600 | | | | 238,944 | |
Xylem Incorporated | | | | | | | 16,955 | | | | 556,972 | |
| | | | |
| | | | | | | | | | | 1,374,521 | |
| | | | | | | | | | | | |
| | | | |
| Trading Companies & Distributors: 1.26% | | | | | | | | | | | | |
Applied Industrial Technologies Incorporated | | | | | | | 15,700 | | | | 598,955 | |
| | | | | | | | | | | | |
| | | | |
Information Technology: 8.24% | | | | | | | | | | | | |
| | | | |
| Communications Equipment: 3.72% | | | | | | | | | | | | |
Applied Optoelectronics Incorporated † | | | | | | | 33,883 | | | | 636,323 | |
Ruckus Wireless Incorporated † | | | | | | | 32,000 | | | | 380,160 | |
Sandvine Corporation † | | | | | | | 438,211 | | | | 751,488 | |
| | | | |
| | | | | | | | | | | 1,767,971 | |
| | | | | | | | | | | | |
| | | | |
| Electronic Equipment, Instruments & Components: 2.09% | | | | | | | | | | | | |
Knowles Corporation † | | | | | | | 27,881 | | | | 513,847 | |
Mercury Computer Systems Incorporated † | | | | | | | 30,350 | | | | 482,869 | |
| | | | |
| | | | | | | | | | | 996,716 | |
| | | | | | | | | | | | |
| | | | |
| Semiconductors & Semiconductor Equipment: 1.04% | | | | | | | | | | | | |
FormFactor Incorporated † | | | | | | | 72,720 | | | | 493,042 | |
| | | | | | | | | | | | |
| | | | |
| Technology Hardware, Storage & Peripherals: 1.39% | | | | | | | | | | | | |
Cray Incorporated † | | | | | | | 33,427 | | | | 662,189 | |
| | | | | | | | | | | | |
| | | | |
Materials: 10.75% | | | | | | | | | | | | |
| | | | |
| Metals & Mining: 10.75% | | | | | | | | | | | | |
Agnico-Eagle Mines Limited – U.S. Exchange Traded Shares | | | | | | | 14,200 | | | | 359,544 | |
Endeavour Mining Corporation † | | | | | | | 827,000 | | | | 340,839 | |
Goldcorp Incorporated – U.S. Exchange Traded Shares | | | | | | | 9,200 | | | | 115,184 | |
Lucara Diamond Corporation – U.S. Exchange Traded Shares (a) | | | | | | | 408,600 | | | | 460,256 | |
Randgold Resources Limited ADR | | | | | | | 37,975 | | | | 2,243,943 | |
Rockwell Diamonds Incorporated †(a)(i) | | | | | | | 728,200 | | | | 109,368 | |
Rockwell Diamonds Incorporated – Legend Shares (i) | | | | | | | 1,172,000 | | | | 175,646 | |
Royal Gold Incorporated | | | | | | | 10,800 | | | | 507,384 | |
Sandstorm Gold Limited † | | | | | | | 189,600 | | | | 506,232 | |
Silver Wheaton Corporation – U.S. Exchange Traded Shares | | | | | | | 24,300 | | | | 291,842 | |
| | | | |
| | | | | | | | | | | 5,110,238 | |
| | | | | | | | | | | | |
| | | | |
Telecommunication Services: 0.55% | | | | | | | | | | | | |
| | | | |
| Diversified Telecommunication Services: 0.55% | | | | | | | | | | | | |
Cincinnati Bell Incorporated † | | | | | | | 82,973 | | | | 258,876 | |
| | | | | | | | | | | | |
| | | | |
Total Common Stocks (Cost $36,504,781) | | | | | | | | | | | 46,368,836 | |
| | | | | | | | | | | | |
The accompanying notes are an integral part of these financial statements.
| | | | |
| 10 | | Wells Fargo Advantage Small/Mid Cap Value Fund | | Portfolio of investments—September 30, 2015 (unaudited) |
| | | | | | | | | | | | | | | | |
| Security name | | | | | | | | Shares | | | Value | |
| | | | |
Exchange-Traded Funds: 0.67% | | | | | | | | | | | | | | | | |
Market Vectors Junior Gold Miners ETF | | | | | | | | | | | 16,103 | | | $ | 315,458 | |
| | | | | | | | | | | | | | | | |
| | | | |
Total Exchange-Traded Funds (Cost $528,998) | | | | | | | | | | | | | | | 315,458 | |
| | | | | | | | | | | | | | | | |
| | | | |
| | | | | | Expiration date | | | | | | | |
| Warrants: 0.00% | | | | | | | | | | | | | | | | |
| | | | |
Health Care: 0.00% | | | | | | | | | | | | | | | | |
| | | | |
| Health Care Equipment & Supplies: 0.00% | | | | | | | | | | | | | | | | |
EnteroMedics Incorporated †(a)(i) | | | | | | | 5-14-2016 | | | | 270,908 | | | | 107 | |
EnteroMedics Incorporated †(a)(i) | | | | | | | 9-28-2016 | | | | 13,680 | | | | 32 | |
EnteroMedics Incorporated †(a)(i) | | | | | | | 2-27-2018 | | | | 48,280 | | | | 836 | |
| | | | |
Total Warrants (Cost $0) | | | | | | | | | | | | | | | 975 | |
| | | | | | | | | | | | | | | | |
| | | | |
| | | Yield | | | | | | | | | | |
| Short-Term Investments: 0.27% | | | | | | | | | | | | | | | | |
| | | | |
| Investment Companies: 0.27% | | | | | | | | | | | | | | | | |
Wells Fargo Advantage Cash Investment Money Market Fund, Select Class (l)(u) | | | 0.15 | % | | | | | | | 129,227 | | | | 129,227 | |
| | | | | | | | | | | | | | | | |
| | | | |
Total Short-Term Investments (Cost $129,227) | | | | | | | | | | | | | | | 129,227 | |
| | | | | | | | | | | | | | | | |
| | | | | | | | |
| Total investments in securities (Cost $37,163,006) * | | | 98.45 | % | | | 46,814,496 | |
Other assets and liabilities, net | | | 1.55 | | | | 738,616 | |
| | | | | | | | |
| Total net assets | | | 100.00 | % | | $ | 47,553,112 | |
| | | | | | | | |
| † | Non-income-earning security |
| (a) | The security is fair valued in accordance with procedures approved by the Board of Trustees. |
| (l) | The security represents an affiliate of the Fund as defined in the Investment Company Act of 1940. |
| (u) | The rate represents the 7-day annualized yield at period end. |
| * | Cost for federal income tax purposes is $39,309,139 and unrealized gains (losses) consists of: |
| | | | |
Gross unrealized gains | | $ | 15,766,531 | |
Gross unrealized losses | | | (8,261,174 | ) |
| | | | |
Net unrealized gains | | $ | 7,505,357 | |
The accompanying notes are an integral part of these financial statements.
| | | | | | |
| Statement of assets and liabilities—September 30, 2015 (unaudited) | | Wells Fargo Advantage Small/Mid Cap Value Fund | | | 11 | |
| | | | |
| | | | |
| |
Assets | | | | |
Investments | | | | |
In unaffiliated securities, at value (cost $37,033,779) | | $ | 46,685,269 | |
In affiliated securities, at value (cost $129,227) | | | 129,227 | |
| | | | |
Total investments, at value (cost $37,163,006) | | | 46,814,496 | |
Receivable for investments sold | | | 1,213,261 | |
Receivable for Fund shares sold | | | 12,328 | |
Receivable for dividends | | | 33,980 | |
Prepaid expenses and other assets | | | 51,416 | |
| | | | |
Total assets | | | 48,125,481 | |
| | | | |
| |
Liabilities | | | | |
Payable for investments purchased | | | 339,314 | |
Payable for Fund shares redeemed | | | 163,374 | |
Management fee payable | | | 15,928 | |
Distribution fee payable | | | 1,960 | |
Administration fees payable | | | 11,159 | |
Accrued expenses and other liabilities | | | 40,634 | |
| | | | |
Total liabilities | | | 572,369 | |
| | | | |
Total net assets | | $ | 47,553,112 | |
| | | | |
| |
NET ASSETS CONSIST OF | | | | |
Paid-in capital | | $ | 39,248,691 | |
Accumulated net investment loss | | | (78,172 | ) |
Accumulated net realized losses on investments | | | (1,268,823 | ) |
Net unrealized gains on investments | | | 9,651,416 | |
| | | | |
Total net assets | | $ | 47,553,112 | |
| | | | |
| |
COMPUTATION OF NET ASSET VALUE AND OFFERING PRICE PER SHARE | | | | |
Net assets – Class A | | $ | 7,115,580 | |
Shares outstanding – Class A1 | | | 693,473 | |
Net asset value per share – Class A | | | $10.26 | |
Maximum offering price per share – Class A2 | | | $10.89 | |
Net assets – Class C | | $ | 3,104,753 | |
Shares outstanding – Class C1 | | | 319,866 | |
Net asset value per share – Class C | | | $9.71 | |
Net assets – Administrator Class | | $ | 2,338,671 | |
Shares outstanding – Administrator Class1 | | | 220,980 | |
Net asset value per share – Administrator Class | | | $10.58 | |
Net assets – Institutional Class | | $ | 2,233,498 | |
Shares outstanding – Institutional Class1 | | | 209,238 | |
Net asset value per share – Institutional Class | | | $10.67 | |
Net assets – Investor Class | | $ | 32,760,610 | |
Shares outstanding – Investor Class1 | | | 3,181,581 | |
Net asset value per share – Investor Class | | | $10.30 | |
| 1 | The Fund has an unlimited number of authorized shares. |
| 2 | Maximum offering price is computed as 100/94.25 of net asset value. On investments of $50,000 or more, the offering price is reduced. |
The accompanying notes are an integral part of these financial statements.
| | | | |
| 12 | | Wells Fargo Advantage Small/Mid Cap Value Fund | | Statement of operations—six months ended September 30, 2015 (unaudited) |
| | | | |
| | | | |
| |
Investment income | | | | |
Dividends (net of foreign withholding taxes of $3,096) | | $ | 336,184 | |
Income from affiliated securities | | | 1,035 | |
| | | | |
Total investment income | | | 337,219 | |
| | | | |
| |
Expenses | | | | |
Management fee | | | 231,895 | |
Administration fees | | | | |
Class A | | | 11,249 | |
Class C | | | 4,425 | |
Administrator Class | | | 1,835 | |
Institutional Class | | | 1,810 | |
Investor Class | | | 60,670 | |
Shareholder servicing fees | | | | |
Class A | | | 11,809 | |
Class C | | | 4,668 | |
Administrator Class | | | 4,090 | |
Investor Class | | | 47,398 | |
Distribution fee | | | | |
Class C | | | 14,004 | |
Custody and accounting fees | | | 10,358 | |
Professional fees | | | 21,394 | |
Registration fees | | | 36,269 | |
Shareholder report expenses | | | 19,335 | |
Trustees’ fees and expenses | | | 7,824 | |
Other fees and expenses | | | 4,785 | |
| | | | |
Total expenses | | | 493,818 | |
Less: Fee waivers and/or expense reimbursements | | | (87,591 | ) |
| | | | |
Net expenses | | | 406,227 | |
| | | | |
Net investment loss | | | (69,008 | ) |
| | | | |
| |
REALIZED AND UNREALIZED GAINS (LOSSES) ON INVESTMENTS | | | | |
Net realized gains on investments | | | 487,589 | |
Net change in unrealized gains (losses) on investments | | | (5,580,826 | ) |
| | | | |
Net realized and unrealized gains (losses) on investments | | | (5,093,237 | ) |
| | | | |
Net decrease in net assets resulting from operations | | $ | (5,162,245 | ) |
| | | | |
The accompanying notes are an integral part of these financial statements.
| | | | | | |
| Statement of changes in net assets | | Wells Fargo Advantage Small/Mid Cap Value Fund | | | 13 | |
| | | | | | | | | | | | | | | | |
| | | Six months ended
September 30, 2015
(unaudited) | | | Year ended
March 31, 2015 | |
| | | |
Operations | | | | | | | | | | | | |
Net investment loss | | | | | | $ | (69,008 | ) | | | | | | $ | (154,084 | ) |
Net realized gains on investments | | | | | | | 487,589 | | | | | | | | 10,733,260 | |
Net change in unrealized gains (losses) on investments | | | | | | | (5,580,826 | ) | | | | | | | (29,960,089 | ) |
| | | | |
Net decrease in net assets resulting from operations | | | | | | | (5,162,245 | ) | | | | | | | (19,380,913 | ) |
| | | | |
| | | |
Distributions to shareholders from | | | | | | | | | | | | |
Net realized gains | | | | | | | | | | | | | | | | |
Class A | | | | | | | 0 | | | | | | | | (3,859,460 | ) |
Class C | | | | | | | 0 | | | | | | | | (2,021,715 | ) |
Administrator Class | | | | | | | 0 | | | | | | | | (1,576,683 | ) |
Institutional Class | | | | | | | 0 | | | | | | | | (1,605,351 | ) |
Investor Class | | | | | | | 0 | | | | | | | | (12,209,745 | ) |
| | | | |
Total distributions to shareholders | | | | | | | 0 | | | | | | | | (21,272,954 | ) |
| | | | |
| | | | |
Capital share transactions | | | Shares | | | | | | | | Shares | | | | | |
Proceeds from shares sold | | | | | | | | | | | | | | | | |
Class A | | | 23,893 | | | | 271,380 | | | | 273,650 | | | | 4,672,524 | |
Class C | | | 19,537 | | | | 201,819 | | | | 113,449 | | | | 1,504,201 | |
Administrator Class | | | 14,072 | | | | 163,134 | | | | 115,653 | | | | 2,005,080 | |
Institutional Class | | | 51,006 | | | | 589,987 | | | | 506,801 | | | | 8,494,369 | |
Investor Class | | | 121,787 | | | | 1,368,784 | | | | 607,478 | | | | 10,486,522 | |
| | | | |
| | | | | | | 2,595,104 | | | | | | | | 27,162,696 | |
| | | | |
Reinvestment of distributions | | | | | | | | | | | | | | | | |
Class A | | | 0 | | | | 0 | | | | 339,370 | | | | 3,824,702 | |
Class C | | | 0 | | | | 0 | | | | 108,994 | | | | 1,168,410 | |
Administrator Class | | | 0 | | | | 0 | | | | 128,628 | | | | 1,492,081 | |
Institutional Class | | | 0 | | | | 0 | | | | 72,544 | | | | 847,311 | |
Investor Class | | | 0 | | | | 0 | | | | 1,069,774 | | | | 12,099,144 | |
| | | | |
| | | | | | | 0 | | | | | | | | 19,431,648 | |
| | | | |
Payment for shares redeemed | | | | | | | | | | | | | | | | |
Class A | | | (324,199 | ) | | | (3,668,658 | ) | | | (725,009 | ) | | | (10,498,924 | ) |
Class C | | | (114,705 | ) | | | (1,235,808 | ) | | | (360,815 | ) | | | (4,563,950 | ) |
Administrator Class | | | (144,134 | ) | | | (1,703,863 | ) | | | (1,127,021 | ) | | | (19,233,321 | ) |
Institutional Class | | | (221,046 | ) | | | (2,549,166 | ) | | | (977,958 | ) | | | (15,827,735 | ) |
Investor Class | | | (477,413 | ) | | | (5,395,273 | ) | | | (1,533,274 | ) | | | (23,460,698 | ) |
| | | | |
| | | | | | | (14,552,768 | ) | | | | | | | (73,584,628 | ) |
| | | | |
Net decrease in net assets resulting from capital share transactions | | | | | | | (11,957,664 | ) | | | | | | | (26,990,284 | ) |
| | | | |
Total decrease in net assets | | | | | | | (17,119,909 | ) | | | | | | | (67,644,151 | ) |
| | | | |
| | | | |
Net assets | | | | | | | | | | | | | | | | |
Beginning of period | | | | | | | 64,673,021 | | | | | | | | 132,317,172 | |
| | | | |
End of period | | | | | | $ | 47,553,112 | | | | | | | $ | 64,673,021 | |
| | | | |
Accumulated net investment loss | | | | | | $ | (78,172 | ) | | | | | | $ | (9,164 | ) |
| | | | |
The accompanying notes are an integral part of these financial statements.
| | | | |
| 14 | | Wells Fargo Advantage Small/Mid Cap Value Fund | | Financial highlights |
(For a share outstanding throughout each period)
| | | | | | | | | | | | | | | | | | | | | | | | | | | | |
| | | Six months ended
September 30, 2015
(unaudited) | | | Year ended March 31 | | | Year ended October 31 | |
| CLASS A | | | 2015 | | | 20141 | | | 2013 | | | 2012 | | | 2011 | | | 2010 | |
Net asset value, beginning of period | | | $11.36 | | | | $18.63 | | | | $17.66 | | | | $16.17 | | | | $14.61 | | | | $14.33 | | | | $11.78 | |
Net investment income (loss) | | | (0.01 | )2 | | | (0.01 | ) | | | 0.09 | 2 | | | 0.11 | 2 | | | 0.07 | | | | 0.06 | | | | 0.08 | |
Net realized and unrealized gains (losses) on investments | | | (1.09 | ) | | | (3.13 | ) | | | 1.93 | | | | 1.42 | | | | 1.55 | | | | 0.35 | | | | 2.56 | |
| | | | | | | | | | | | | | | | | | | | | | | | | | | | |
Total from investment operations | | | (1.10 | ) | | | (3.14 | ) | | | 2.02 | | | | 1.53 | | | | 1.62 | | | | 0.41 | | | | 2.64 | |
Distributions to shareholders from | | | | | | | | | | | | | | | | | | | | |
Net investment income | | | 0.00 | | | | 0.00 | | | | 0.00 | | | | (0.04 | ) | | | (0.06 | ) | | | (0.13 | ) | | | (0.09 | ) |
Net realized gains | | | 0.00 | | | | (4.13 | ) | | | (1.05 | ) | | | 0.00 | | | | 0.00 | | | | 0.00 | | | | 0.00 | |
| | | | | | | | | | | | | | | | | | | | | | | | | | | | |
Total distributions to shareholders | | | 0.00 | | | | (4.13 | ) | | | (1.05 | ) | | | (0.04 | ) | | | (0.06 | ) | | | (0.13 | ) | | | (0.09 | ) |
Net asset value, end of period | | | $10.26 | | | | $11.36 | | | | $18.63 | | | | $17.66 | | | | $16.17 | | | | $14.61 | | | | $14.33 | |
Total return3 | | | (9.68 | )% | | | (16.66 | )% | | | 12.22 | % | | | 9.47 | % | | | 11.13 | % | | | 2.76 | % | | | 22.63 | % |
Ratios to average net assets (annualized) | | | | | | | | | | | | | | | | | | | | |
Gross expenses | | | 1.63 | % | | | 1.47 | % | | | 1.57 | % | | | 1.41 | % | | | 1.41 | % | | | 1.40 | % | | | 1.47 | % |
Net expenses | | | 1.35 | % | | | 1.35 | % | | | 1.39 | % | | | 1.40 | % | | | 1.40 | % | | | 1.40 | % | | | 1.40 | % |
Net investment income (loss) | | | (0.20 | )% | | | (0.11 | )% | | | 1.20 | % | | | 0.68 | % | | | 0.37 | % | | | 0.37 | % | | | 0.77 | % |
Supplemental data | | | | | | | | | | | | | | | | | | | | |
Portfolio turnover rate | | | 19 | % | | | 33 | % | | | 24 | % | | | 29 | % | | | 32 | % | | | 34 | % | | | 41 | % |
Net assets, end of period (000s omitted) | | | $7,116 | | | | $11,288 | | | | $20,599 | | | | $19,659 | | | | $25,612 | | | | $34,642 | | | | $41,491 | |
| 1 | For the five months ended March 31, 2014. The Fund changed its fiscal year end from October 31 to March 31, effective March 31, 2014. |
| 2 | Calculated based upon average shares outstanding |
| 3 | Total return calculations do not include any sales charges. Returns for periods of less than one year are not annualized. |
The accompanying notes are an integral part of these financial statements.
| | | | | | |
| Financial highlights | | Wells Fargo Advantage Small/Mid Cap Value Fund | | | 15 | |
(For a share outstanding throughout each period)
| | | | | | | | | | | | | | | | | | | | | | | | | | | | |
| | | Six months ended
September 30, 2015
(unaudited) | | | Year ended March 31 | | | Year ended October 31 | |
| CLASS C | | | 2015 | | | 20141 | | | 2013 | | | 2012 | | | 2011 | | | 2010 | |
Net asset value, beginning of period | | | $10.79 | | | | $18.07 | | | | $17.21 | | | | $15.84 | | | | $14.36 | | | | $14.10 | | | | $11.62 | |
Net investment income (loss) | | | (0.05 | )2 | | | (0.13 | )2 | | | 0.03 | 2 | | | (0.01 | )2 | | | (0.08 | ) | | | (0.06 | ) | | | 0.00 | 3 |
Net realized and unrealized gains (losses) on investments | | | (1.03 | ) | | | (3.02 | ) | | | 1.88 | | | | 1.38 | | | | 1.56 | | | | 0.35 | | | | 2.51 | |
| | | | | | | | | | | | | | | | | | | | | | | | | | | | |
Total from investment operations | | | (1.08 | ) | | | (3.15 | ) | | | 1.91 | | | | 1.37 | | | | 1.48 | | | | 0.29 | | | | 2.51 | |
Distributions to shareholders from | | | | | | | | | | | | | | | | | | | | |
Net investment income | | | 0.00 | | | | 0.00 | | | | 0.00 | | | | 0.00 | | | | 0.00 | | | | (0.03 | ) | | | (0.03 | ) |
Net realized gains | | | 0.00 | | | | (4.13 | ) | | | (1.05 | ) | | | 0.00 | | | | 0.00 | | | | 0.00 | | | | 0.00 | |
| | | | | | | | | | | | | | | | | | | | | | | | | | | | |
Total distributions to shareholders | | | 0.00 | | | | (4.13 | ) | | | (1.05 | ) | | | 0.00 | | | | 0.00 | | | | (0.03 | ) | | | (0.03 | ) |
Net asset value, end of period | | | $9.71 | | | | $10.79 | | | | $18.07 | | | | $17.21 | | | | $15.84 | | | | $14.36 | | | | $14.10 | |
Total return4 | | | (10.01 | )% | | | (17.26 | )% | | | 11.88 | % | | | 8.65 | % | | | 10.31 | % | | | 2.05 | % | | | 21.62 | % |
Ratios to average net assets (annualized) | | | | | | | | | | | | | | | | | | | | |
Gross expenses | | | 2.38 | % | | | 2.22 | % | | | 2.32 | % | | | 2.17 | % | | | 2.16 | % | | | 2.15 | % | | | 2.22 | % |
Net expenses | | | 2.10 | % | | | 2.10 | % | | | 2.14 | % | | | 2.15 | % | | | 2.15 | % | | | 2.15 | % | | | 2.15 | % |
Net investment income (loss) | | | (0.94 | )% | | | (0.87 | )% | | | 0.46 | % | | | (0.07 | )% | | | (0.40 | )% | | | (0.38 | )% | | | 0.00 | % |
Supplemental data | | | | | | | | | | | | | | | | | | | | |
Portfolio turnover rate | | | 19 | % | | | 33 | % | | | 24 | % | | | 29 | % | | | 32 | % | | | 34 | % | | | 41 | % |
Net assets, end of period (000s omitted) | | | $3,105 | | | | $4,476 | | | | $9,999 | | | | $9,347 | | | | $10,763 | | | | $12,204 | | | | $12,379 | |
| 1 | For the five months ended March 31, 2014. The Fund changed its fiscal year end from October 31 to March 31, effective March 31, 2014. |
| 2 | Calculated based upon average shares outstanding |
| 3 | Amount is less than $0.005. |
| 4 | Total return calculations do not include any sales charges. Returns for periods of less than one year are not annualized. |
The accompanying notes are an integral part of these financial statements.
| | | | |
| 16 | | Wells Fargo Advantage Small/Mid Cap Value Fund | | Financial highlights |
(For a share outstanding throughout each period)
| | | | | | | | | | | | | | | | | | | | | | | | | | | | |
| | | Six months ended
September 30, 2015
(unaudited) | | | Year ended March 31 | | | Year ended October 31 | |
| ADMINISTRATOR CLASS | | | 2015 | | | 20141 | | | 2013 | | | 2012 | | | 2011 | | | 2010 | |
Net asset value, beginning of period | | | $11.70 | | | | $19.00 | | | | $17.97 | | | | $16.46 | | | | $14.89 | | | | $14.60 | | | | $11.99 | |
Net investment income (loss) | | | 0.00 | 2,3 | | | (0.00 | )2,3 | | | 0.11 | 2 | | | 0.15 | 2 | | | 0.10 | | | | 0.09 | | | | 0.13 | |
Net realized and unrealized gains (losses) on investments | | | (1.12 | ) | | | (3.17 | ) | | | 1.97 | | | | 1.44 | | | | 1.58 | | | | 0.36 | | | | 2.59 | |
| | | | | | | | | | | | | | | | | | | | | | | | | | | | |
Total from investment operations | | | (1.12 | ) | | | (3.17 | ) | | | 2.08 | | | | 1.59 | | | | 1.68 | | | | 0.45 | | | | 2.72 | |
Distributions to shareholders from | | | | | | | | | | | | | | | | | | | | |
Net investment income | | | 0.00 | | | | 0.00 | | | | 0.00 | | | | (0.08 | ) | | | (0.11 | ) | | | (0.16 | ) | | | (0.11 | ) |
Net realized gains | | | 0.00 | | | | (4.13 | ) | | | (1.05 | ) | | | 0.00 | | | | 0.00 | | | | 0.00 | | | | 0.00 | |
| | | | | | | | | | | | | | | | | | | | | | | | | | | | |
Total distributions to shareholders | | | 0.00 | | | | (4.13 | ) | | | (1.05 | ) | | | (0.08 | ) | | | (0.11 | ) | | | (0.16 | ) | | | (0.11 | ) |
Net asset value, end of period | | | $10.58 | | | | $11.70 | | | | $19.00 | | | | $17.97 | | | | $16.46 | | | | $14.89 | | | | $14.60 | |
Total return4 | | | (9.57 | )% | | | (16.48 | )% | | | 12.34 | % | | | 9.75 | % | | | 11.33 | % | | | 3.13 | % | | | 22.82 | % |
Ratios to average net assets (annualized) | | | | | | | | | | | | | | | | | | | | |
Gross expenses | | | 1.50 | % | | | 1.28 | % | | | 1.39 | % | | | 1.24 | % | | | 1.24 | % | | | 1.24 | % | | | 1.29 | % |
Net expenses | | | 1.15 | % | | | 1.14 | % | | | 1.15 | % | | | 1.15 | % | | | 1.15 | % | | | 1.15 | % | | | 1.15 | % |
Net investment income (loss) | | | 0.02 | % | | | (0.02 | )% | | | 1.44 | % | | | 0.91 | % | | | 0.59 | % | | | 0.61 | % | | | 1.00 | % |
Supplemental data | | | | | | | | | | | | | | | | | | | | |
Portfolio turnover rate | | | 19 | % | | | 33 | % | | | 24 | % | | | 29 | % | | | 32 | % | | | 34 | % | | | 41 | % |
Net assets, end of period (000s omitted) | | | $2,339 | | | | $4,107 | | | | $23,445 | | | | $24,127 | | | | $68,857 | | | | $76,668 | | | | $71,246 | |
| 1 | For the five months ended March 31, 2014. The Fund changed its fiscal year end from October 31 to March 31, effective March 31, 2014. |
| 2 | Calculated based upon average shares outstanding |
| 3 | Amount is less than $0.005. |
| 4 | Returns for periods of less than one year are not annualized. |
The accompanying notes are an integral part of these financial statements.
| | | | | | |
| Financial highlights | | Wells Fargo Advantage Small/Mid Cap Value Fund | | | 17 | |
(For a share outstanding throughout each period)
| | | | | | | | | | | | | | | | | | | | | | | | | | | | |
| | | Six months ended
September 30, 2015
(unaudited) | | | Year ended March 31 | | | Year ended October 31 | |
| INSTITUTIONAL CLASS | | | 2015 | | | 20141 | | | 2013 | | | 2012 | | | 2011 | | | 2010 | |
Net asset value, beginning of period | | | $11.79 | | | | $19.08 | | | | $18.06 | | | | $16.54 | | | | $14.97 | | | | $14.67 | | | | $12.04 | |
Net investment income | | | 0.01 | 2 | | | 0.04 | 2 | | | 0.12 | 2 | | | 0.18 | 2 | | | 0.11 | | | | 0.11 | | | | 0.17 | 2 |
Net realized and unrealized gains (losses) on investments | | | (1.13 | ) | | | (3.20 | ) | | | 1.98 | | | | 1.46 | | | | 1.60 | | | | 0.38 | | | | 2.59 | |
| | | | | | | | | | | | | | | | | | | | | | | | | | | | |
Total from investment operations | | | (1.12 | ) | | | (3.16 | ) | | | 2.10 | | | | 1.64 | | | | 1.71 | | | | 0.49 | | | | 2.76 | |
Distributions to shareholders from | | | | | | | | | | | | | | | | | | | | |
Net investment income | | | 0.00 | | | | 0.00 | | | | (0.03 | ) | | | (0.12 | ) | | | (0.14 | ) | | | (0.19 | ) | | | (0.13 | ) |
Net realized gains | | | 0.00 | | | | (4.13 | ) | | | (1.05 | ) | | | 0.00 | | | | 0.00 | | | | 0.00 | | | | 0.00 | |
| | | | | | | | | | | | | | | | | | | | | | | | | | | | |
Total distributions to shareholders | | | 0.00 | | | | (4.13 | ) | | | (1.08 | ) | | | (0.12 | ) | | | (0.14 | ) | | | (0.19 | ) | | | (0.13 | ) |
Net asset value, end of period | | | $10.67 | | | | $11.79 | | | | $19.08 | | | | $18.06 | | | | $16.54 | | | | $14.97 | | | | $14.67 | |
Total return3 | | | (9.50 | )% | | | (16.34 | )% | | | 12.46 | % | | | 9.94 | % | | | 11.61 | % | | | 3.28 | % | | | 23.08 | % |
Ratios to average net assets (annualized) | | | | | | | | | | | | | | | | | | | | |
Gross expenses | | | 1.24 | % | | | 1.03 | % | | | 1.12 | % | | | 0.99 | % | | | 0.98 | % | | | 0.97 | % | | | 1.02 | % |
Net expenses | | | 0.95 | % | | | 0.95 | % | | | 0.95 | % | | | 0.95 | % | | | 0.95 | % | | | 0.95 | % | | | 0.95 | % |
Net investment income | | | 0.16 | % | | | 0.24 | % | | | 1.65 | % | | | 1.10 | % | | | 0.74 | % | | | 0.79 | % | | | 1.22 | % |
Supplemental data | | | | | | | | | | | | | | | | | | | | |
Portfolio turnover rate | | | 19 | % | | | 33 | % | | | 24 | % | | | 29 | % | | | 32 | % | | | 34 | % | | | 41 | % |
Net assets, end of period (000s omitted) | | | $2,233 | | | | $4,473 | | | | $14,842 | | | | $37,671 | | | | $47,737 | | | | $29,881 | | | | $19,005 | |
| 1 | For the five months ended March 31, 2014. The Fund changed its fiscal year end from October 31 to March 31, effective March 31, 2014. |
| 2 | Calculated based upon average shares outstanding |
| 3 | Returns for periods of less than one year are not annualized. |
The accompanying notes are an integral part of these financial statements.
| | | | |
| 18 | | Wells Fargo Advantage Small/Mid Cap Value Fund | | Financial highlights |
(For a share outstanding throughout each period)
| | | | | | | | | | | | | | | | | | | | | | | | | | | | |
| | | Six months ended
September 30, 2015
(unaudited) | | | Year ended March 31 | | | Year ended October 31 | |
| INVESTOR CLASS | | | 2015 | | | 20141 | | | 2013 | | | 2012 | | | 2011 | | | 2010 | |
Net asset value, beginning of period | | | $11.40 | | | | $18.69 | | | | $17.72 | | | | $16.22 | | | | $14.67 | | | | $14.38 | | | | $11.81 | |
Net investment income (loss) | | | (0.01 | )2 | | | (0.02 | ) | | | 0.08 | 2 | | | 0.10 | 2 | | | 0.03 | | | | 0.05 | 2 | | | 0.09 | |
Net realized and unrealized gains (losses) on investments | | | (1.09 | ) | | | (3.14 | ) | | | 1.94 | | | | 1.43 | | | | 1.57 | | | | 0.35 | | | | 2.56 | |
| | | | | | | | | | | | | | | | | | | | | | | | | | | | |
Total from investment operations | | | (1.10 | ) | | | (3.16 | ) | | | 2.02 | | | | 1.53 | | | | 1.60 | | | | 0.40 | | | | 2.65 | |
Distributions to shareholders from | | | | | | | | | | | | | | | | | | | | |
Net investment income | | | 0.00 | | | | 0.00 | | | | 0.00 | | | | (0.03 | ) | | | (0.05 | ) | | | (0.11 | ) | | | (0.08 | ) |
Net realized gains | | | 0.00 | | | | (4.13 | ) | | | (1.05 | ) | | | 0.00 | | | | 0.00 | | | | 0.00 | | | | 0.00 | |
| | | | | | | | | | | | | | | | | | | | | | | | | | | | |
Total distributions to shareholders | | | 0.00 | | | | (4.13 | ) | | | (1.05 | ) | | | (0.03 | ) | | | (0.05 | ) | | | (0.11 | ) | | | (0.08 | ) |
Net asset value, end of period | | | $10.30 | | | | $11.40 | | | | $18.69 | | | | $17.72 | | | | $16.22 | | | | $14.67 | | | | $14.38 | |
Total return3 | | | (9.65 | )% | | | (16.71 | )% | | | 12.17 | % | | | 9.44 | % | | | 10.97 | % | | | 2.73 | % | | | 22.49 | % |
Ratios to average net assets (annualized) | | | | | | | | | | | | | | | | | | | | |
Gross expenses | | | 1.72 | % | | | 1.53 | % | | | 1.63 | % | | | 1.47 | % | | | 1.47 | % | | | 1.47 | % | | | 1.56 | % |
Net expenses | | | 1.41 | % | | | 1.41 | % | | | 1.45 | % | | | 1.46 | % | | | 1.47 | % | | | 1.47 | % | | | 1.48 | % |
Net investment income (loss) | | | (0.24 | )% | | | (0.16 | )% | | | 1.15 | % | | | 0.62 | % | | | 0.27 | % | | | 0.30 | % | | | 0.67 | % |
Supplemental data | | | | | | | | | | | | | | | | | | | | |
Portfolio turnover rate | | | 19 | % | | | 33 | % | | | 24 | % | | | 29 | % | | | 32 | % | | | 34 | % | | | 41 | % |
Net assets, end of period (000s omitted) | | | $32,761 | | | | $40,330 | | | | $63,432 | | | | $57,625 | | | | $73,138 | | | | $79,099 | | | | $99,424 | |
| 1 | For the five months ended March 31, 2014. The Fund changed its fiscal year end from October 31 to March 31, effective March 31, 2014. |
| 2 | Calculated based upon average shares outstanding |
| 3 | Returns for periods of less than one year are not annualized. |
The accompanying notes are an integral part of these financial statements.
| | | | | | |
| Notes to financial statements (unaudited) | | Wells Fargo Advantage Small/Mid Cap Value Fund | | | 19 | |
1. ORGANIZATION
Wells Fargo Funds Trust (the “Trust”), a Delaware statutory trust organized on March 10, 1999, is an open-end management investment company registered under the Investment Company Act of 1940, as amended (the “1940 Act”). As an investment company, the Trust follows the accounting and reporting guidance in Financial Accounting Standards Board (“FASB”) Accounting Standards Codification Topic 946, Financial Services – Investment Companies. These financial statements report on the Wells Fargo Advantage Small/Mid Cap Value Fund (the “Fund”) which is a diversified series of the Trust.
2. SIGNIFICANT ACCOUNTING POLICIES
The following significant accounting policies, which are consistently followed in the preparation of the financial statements of the Fund, are in conformity with U.S. generally accepted accounting principles which require management to make estimates and assumptions that affect the reported amounts of assets and liabilities, disclosure of contingent assets and liabilities at the date of the financial statements, and the reported amounts of revenues and expenses during the reporting period. Actual results could differ from those estimates.
Securities valuation
All investments are valued each business day as of the close of regular trading on the New York Stock Exchange (generally 4 p.m. Eastern Time).
Equity securities that are listed on a foreign or domestic exchange or market are valued at the official closing price or, if none, the last sales price. If no sale occurs on the primary exchange or market that day, the prior day’s price will be deemed “stale” and a fair value price will be determined in accordance with the Fund’s Valuation Procedures.
Equity securities that are not listed on a foreign or domestic exchange or market, but have a public trading market, are valued at the quoted bid price from an independent broker-dealer that the Management Valuation Team of Wells Fargo Funds Management, LLC (“Funds Management”) has determined is an acceptable source.
The values of securities denominated in foreign currencies are translated into U.S. dollars at rates provided by an independent foreign currency pricing source at a time each business day specified by the Management Valuation Team.
Many securities markets and exchanges outside the U.S. close prior to the close of the New York Stock Exchange and therefore may not fully reflect trading or events that occur after the close of the principal exchange in which the foreign securities are traded, but before the close of the New York Stock Exchange. If such trading or events are expected to materially affect the value of such securities, then fair value pricing procedures approved by the Board of Trustees of the Fund are applied. These procedures take into account multiple factors including movements in U.S. securities markets after foreign exchanges close. Foreign securities that are fair valued under these procedures are categorized as Level 2 and the application of these procedures may result in transfers between Level 1 and Level 2. Depending on market activity, such fair valuations may be frequent. Such fair value pricing may result in net asset values that are higher or lower than net asset values based on the last reported sales price or latest quoted bid price. On September 30, 2015, such fair value pricing was used in pricing foreign securities.
Investments in registered open-end investment companies are valued at net asset value.
Investments which are not valued using any of the methods discussed above are valued at their fair value, as determined in good faith by the Board of Trustees. The Board of Trustees has established a Valuation Committee comprised of the Trustees and has delegated to it the authority to take any actions regarding the valuation of portfolio securities that the Valuation Committee deems necessary or appropriate, including determining the fair value of portfolio securities, unless the determination has been delegated to the Management Valuation Team. The Board of Trustees retains the authority to make or ratify any valuation decisions or approve any changes to the Valuation Procedures as it deems appropriate. On a quarterly basis, the Board of Trustees receives reports on any valuation actions taken by the Valuation Committee or the Management Valuation Team which may include items for ratification.
Valuations of fair valued securities are compared to the next actual sales price when available, or other appropriate market values, to assess the continued appropriateness of the fair valuation methodologies used. These securities are fair valued on a day-to-day basis, taking into consideration changes to appropriate market information and any significant changes to the inputs considered in the valuation process until there is a readily available price provided on an exchange or by an independent pricing service. Valuations received from an independent pricing service or independent broker-dealer quotes are periodically validated by comparisons to most recent trades and valuations provided by other independent pricing services in addition to the review of prices by the manager and/or subadviser. Unobservable inputs
| | | | |
| 20 | | Wells Fargo Advantage Small/Mid Cap Value Fund | | Notes to financial statements (unaudited) |
used in determining fair valuations are identified based on the type of security, taking into consideration factors utilized by market participants in valuing the investment, knowledge about the issuer and the current market environment.
Foreign currency translation
The accounting records of the Fund are maintained in U.S. dollars. The values of other assets and liabilities denominated in foreign currencies are translated into U.S. dollars at rates provided by an independent foreign currency pricing source at a time each business day specified by the Management Valuation Team. Purchases and sales of securities, and income and expenses are converted at the rate of exchange on the respective dates of such transactions. Net realized foreign exchange gains or losses arise from sales of foreign currencies, currency gains or losses realized between the trade and settlement dates on securities transactions, and the difference between the amounts of dividends, interest and foreign withholding taxes recorded and the U.S. dollar equivalent of the amounts actually paid or received. Net unrealized foreign exchange gains and losses arise from changes in the fair value of assets and liabilities other than investments in securities resulting from changes in exchange rates. The changes in net assets arising from changes in exchange rates and the changes in net assets resulting from changes in market prices of securities are not separately presented. Such changes are included in net realized and unrealized gains or losses from investments.
Security transactions and income recognition
Securities transactions are recorded on a trade date basis. Realized gains or losses are recorded on the basis of identified cost.
Dividend income is recognized on the ex-dividend date, except for certain dividends from foreign securities, which are recorded as soon as the custodian verifies the ex-dividend date. Dividend income from foreign securities is recorded net of foreign taxes withheld where recovery of such taxes is not assured.
Distributions to shareholders
Distributions to shareholders from net investment income and net realized gains, if any, are recorded on the ex-dividend date. Such distributions are determined in conformity with federal income tax regulations, which may differ in amount or character from net investment income and realized gains recognized for purposes of U.S. generally accepted accounting principles.
Federal and other taxes
The Fund intends to continue to qualify as a regulated investment company by distributing substantially all of its investment company taxable income and any net realized capital gains (after reduction for capital loss carryforwards) sufficient to relieve it from all, or substantially all, federal income taxes. Accordingly, no provision for federal income taxes was required.
The Fund’s income and federal excise tax returns and all financial records supporting those returns for the prior three fiscal years are subject to examination by the federal and Delaware revenue authorities. Management has analyzed the Fund’s tax positions taken on federal, state, and foreign tax returns for all open tax years and does not believe that there are any uncertain tax positions that require recognition of a tax liability.
As of March 31, 2015, the Fund had a qualified late-year ordinary loss of $9,164 which was recognized on the first day of the current fiscal year.
Class allocations
The separate classes of shares offered by the Fund differ principally in applicable sales charges, distribution, shareholder servicing, and administration fees. Class specific expenses are charged directly to that share class. Investment income, common expenses, and realized and unrealized gains (losses) on investments are allocated daily to each class of shares based on the relative proportion of net assets of each class.
3. FAIR VALUATION MEASUREMENTS
Fair value measurements of investments are determined within a framework that has established a fair value hierarchy based upon the various data inputs utilized in determining the value of the Fund’s investments. The three-level hierarchy gives the highest priority to unadjusted quoted prices in active markets for identical assets or liabilities (Level 1) and the lowest priority to significant unobservable inputs (Level 3). The Fund’s investments are classified within the fair value hierarchy based on the lowest level of input that is significant to the fair value measurement. The inputs are summarized into three broad levels as follows:
| | | | | | |
| Notes to financial statements (unaudited) | | Wells Fargo Advantage Small/Mid Cap Value Fund | | | 21 | |
| n | | Level 1 – quoted prices in active markets for identical securities |
| n | | Level 2 – other significant observable inputs (including quoted prices for similar securities, interest rates, prepayment speeds, credit risk, use of amortized cost, etc.) |
| n | | Level 3 – significant unobservable inputs (including the Fund’s own assumptions in determining the fair value of investments) |
The inputs or methodologies used for valuing investments in securities are not necessarily an indication of the risk associated with investing in those securities.
The following is a summary of the inputs used in valuing the Fund’s assets and liabilities as of September 30, 2015:
| | | | | | | | | | | | | | | | |
| | | Quoted prices
(Level 1) | | | Other significant
observable inputs
(Level 2) | | | Significant
unobservable inputs
(Level 3) | | | Total | |
Assets | | | | | | | | | | | | | | | | |
Investments in: | | | | | | | | | | | | | | | | |
| | | | |
Common stocks | | | | | | | | | | | | | | | | |
Consumer discretionary | | $ | 10,760,026 | | | $ | 0 | | | $ | 0 | | | $ | 10,760,026 | |
Energy | | | 3,339,803 | | | | 0 | | | | 0 | | | | 3,339,803 | |
Financials | | | 13,539,216 | | | | 0 | | | | 0 | | | | 13,539,216 | |
Health care | | | 2,096,629 | | | | 0 | | | | 0 | | | | 2,096,629 | |
Industrials | | | 7,344,130 | | | | 0 | | | | 0 | | | | 7,344,130 | |
Information technology | | | 3,168,430 | | | | 751,488 | | | | 0 | | | | 3,919,918 | |
Materials | | | 4,364,968 | | | | 745,270 | | | | 0 | | | | 5,110,238 | |
Telecommunication services | | | 258,876 | | | | 0 | | | | 0 | | | | 258,876 | |
| | | | |
Exchange-traded funds | | | 315,458 | | | | 0 | | | | 0 | | | | 315,458 | |
| | | | |
Warrants | | | | | | | | | | | | | | | | |
Health care | | | 0 | | | | 975 | | | | 0 | | | | 975 | |
| | | | |
Short-term investments | | | | | | | | | | | | | | | | |
Investment companies | | | 129,227 | | | | 0 | | | | 0 | | | | 129,227 | |
Total assets | | $ | 45,316,763 | | | $ | 1,497,733 | | | $ | 0 | | | $ | 46,814,496 | |
The Fund recognizes transfers between levels within the fair value hierarchy at the end of the reporting period. At September 30, 2015, the Fund did not have any transfers into/out of Level 1, Level 2, or Level 3.
4. TRANSACTIONS WITH AFFILIATES
Management fee
Funds Management, an indirect wholly owned subsidiary of Wells Fargo & Company (“Wells Fargo”), is the manager of the Fund and provides advisory and fund-level administrative services under an investment management agreement. Under the investment management agreement, Funds Management is responsible for, among other services, implementing the investment objectives and strategies of the Fund, supervising the applicable subadviser, providing fund-level administrative services in connection with the Fund’s operations, and providing any other fund-level administrative services reasonably necessary for the operation of the Fund. As compensation for its services under the investment management agreement, Funds Management is entitled to receive an annual management fee starting at 0.80% and declining to 0.63% as the average daily net assets of the Fund increase.
Prior to July 1, 2015, Funds Management provided advisory services pursuant to an investment advisory agreement and was entitled to receive an annual fee which started at 0.75% and declined to 0.60% as the average daily net assets of the Fund increased. In addition, fund-level administrative services were provided by Funds Management under a separate administration agreement at an annual fee which started at 0.05% and declined to 0.03% as the average daily net assets of the Fund increased. For financial statement purposes, the advisory fee and fund-level administration fee for the six months ended September 30, 2015 have been included in management fee on the Statement of Operations.
For the six months ended September 30, 2015, the management fee was equivalent to an annual rate of 0.80% of the Fund’s average daily net assets.
| | | | |
| 22 | | Wells Fargo Advantage Small/Mid Cap Value Fund | | Notes to financial statements (unaudited) |
Funds Management has retained the services of a subadviser to provide daily portfolio management to the Fund. The fee for subadvisory services is borne by Funds Management. Wells Capital Management Incorporated, an affiliate of Funds Management and an indirect wholly owned subsidiary of Wells Fargo, is the subadviser to the Fund and is entitled to receive a fee from Funds Management at an annual rate starting at 0.45% and declining to 0.35% as the average daily net assets of the Fund increase.
Administration fees
Under a class-level administration agreement, Funds Management provides class-level administrative services to the Fund, which includes paying fees and expenses for services provided by the transfer agent, sub-transfer agents, omnibus account servicers and record-keepers. As compensation for its services under the class-level administration agreement, Funds Management receives an annual fee which is calculated based on the average daily net assets of each class as follows:
| | | | | | | | |
| | | Class-level administration fee | |
| | | Current rate | | | Rate prior to
April 1, 2015 | |
Class A, Class C | | | 0.21 | % | | | 0.26 | % |
Administrator Class | | | 0.13 | | | | 0.10 | |
Institutional Class | | | 0.13 | | | | 0.08 | |
Investor Class | | | 0.32 | | | | 0.32 | |
Funds Management has contractually waived and/or reimbursed management and administration fees to the extent necessary to maintain certain net operating expense ratios for the Fund. Waiver of fees and/or reimbursement of expenses by Funds Management were made first from fund level expenses on a proportionate basis and then from class specific expenses. Funds Management has committed through July 31, 2016 to waive fees and/or reimburse expenses to the extent necessary to cap the Fund’s expenses at 1.35% for Class A shares, 2.10% for Class C shares, 1.15% for Administrator Class shares, 0.95% for Institutional Class shares, and 1.41% for Investor Class shares. After this time, the cap may be increased or the commitment to maintain the cap may be terminated only with the approval of the Board of Trustees.
Distribution fee
The Trust has adopted a distribution plan for Class C shares of the Fund pursuant to Rule 12b-1 under the 1940 Act. A distribution fee is charged to Class C shares and paid to Wells Fargo Funds Distributor, LLC, the principal underwriter, at an annual rate of 0.75% of the average daily net assets of Class C shares.
In addition, Funds Distributor is entitled to receive the front-end sales charge from the purchase of Class A shares and a contingent deferred sales charge on the redemption of certain Class A shares. Funds Distributor is also entitled to receive the contingent deferred sales charges from redemptions of Class C shares. For the six months ended September 30, 2015, Funds Distributor received $415 from the sale of Class A shares and $14 in contingent deferred sales charges from redemptions of Class C shares.
Shareholder servicing fees
The Trust has entered into contracts with one or more shareholder servicing agents, whereby Class A, Class C, Administrator Class, and Investor Class of the Fund is charged a fee at an annual rate of 0.25% of the average daily net assets of each respective class.
A portion of these total shareholder servicing fees were paid to affiliates of Wells Fargo.
5. INVESTMENT PORTFOLIO TRANSACTIONS
Purchases and sales of investments, excluding U.S. government obligations (if any) and short-term securities, for the six months ended September 30, 2015 were $10,782,802 and $20,489,159, respectively.
6. BANK BORROWINGS
The Trust (excluding the money market funds) and Wells Fargo Variable Trust are parties to a $200,000,000 revolving credit agreement whereby the Fund is permitted to use bank borrowings for temporary or emergency purposes, such as to fund shareholder redemption requests. Interest under the credit agreement is charged to the Fund based on a borrowing rate equal to the higher of the Federal Funds rate in effect on that day plus 1.25% or the overnight LIBOR rate in effect on that day plus 1.25%. In addition, an annual commitment fee equal to 0.20% of the unused balance is allocated
| | | | | | |
| Notes to financial statements (unaudited) | | Wells Fargo Advantage Small/Mid Cap Value Fund | | | 23 | |
to each participating fund. Prior to September 1, 2015, the revolving credit agreement amount was $150,000,000 and the annual commitment fee was equal to 0.10% of the unused balance which was allocated to each participating fund. For the six months ended September 30, 2015, the Fund paid $50 in commitment fees.
For the six months ended September 30, 2015, there were no borrowings by the Fund under the agreement.
7. CONCENTRATION RISK
Concentration risks result from exposure to a limited number of sectors. A fund that invests a substantial portion of its assets in any sector may be more affected by changes in that sector than would be a fund whose investments are not heavily weighted in any sector.
8. INDEMNIFICATION
Under the Trust’s organizational documents, the officers and Trustees have been granted certain indemnification rights against certain liabilities that may arise out of performance of their duties to the Trust. Additionally, in the normal course of business, the Trust may enter into contracts with service providers that contain a variety of indemnification clauses. The Trust’s maximum exposure under these arrangements is dependent on future claims that may be made against the Fund and, therefore, cannot be estimated.
9. SUBSEQUENT EVENT
After the close of business on October 23, 2015, Investor Class shares of the Fund became Class A shares in a tax-free conversion. Shareholders of Investor Class of the Fund received Class A shares at a value equal to the value of their Investor Class shares immediately prior to the conversion.
| | | | |
| 24 | | Wells Fargo Advantage Small/Mid Cap Value Fund | | Other information (unaudited) |
PROXY VOTING INFORMATION
A description of the policies and procedures that the Fund uses to determine how to vote proxies relating to portfolio securities is available, upon request, by calling 1-800-222-8222, visiting our website at wellsfargoadvantagefunds.com, or visiting the SEC website at sec.gov. Information regarding how the Fund voted proxies relating to portfolio securities during the most recent 12-month period ended June 30 is available on the Fund’s website at wellsfargoadvantagefunds.com or by visiting the SEC website at sec.gov.
PORTFOLIO HOLDINGS INFORMATION
The complete portfolio holdings for the Fund are publicly available monthly on the Fund’s website (wellsfargoadvantagefunds.com), on a one-month delayed basis. In addition, top ten holdings information (excluding derivative positions) for the Fund is publicly available on the Fund’s website on a monthly, seven-day or more delayed basis. The Fund files its complete schedule of portfolio holdings with the SEC for the first and third quarters of each fiscal year on Form N-Q, which is available by visiting the SEC website at sec.gov. In addition, the Fund’s Form N-Q may be reviewed and copied at the SEC’s Public Reference Room in Washington, DC, and at regional offices in New York City, at 233 Broadway, and in Chicago, at 175 West Jackson Boulevard, Suite 900. Information about the Public Reference Room may be obtained by calling 1-800-SEC-0330.
| | | | | | |
| Other information (unaudited) | | Wells Fargo Advantage Small/Mid Cap Value Fund | | | 25 | |
BOARD OF TRUSTEES AND OFFICERS
Each of the Trustees and Officers1 listed in the table below acts in identical capacities for each fund in the Wells Fargo Advantage family of funds, which consists of 144 mutual funds comprising the Wells Fargo Funds Trust, Wells Fargo Variable Trust, Wells Fargo Master Trust and four closed-end funds (collectively the “Fund Complex”). This table should be read in conjunction with the Prospectus and the Statement of Additional Information2. The mailing address of each Trustee and Officer is 525 Market Street, 12th Floor, San Francisco, CA 94105. Each Trustee and Officer serves an indefinite term, however, each Trustee serves such term until reaching the mandatory retirement age established by the Trustees.
Independent Trustees
| | | | | | |
Name and
year of birth | | Position held and
length of service* | | Principal occupations during past five years or longer | | Other public
company or
investment company
directorships during
past 5 years |
| William R. Ebsworth (Born 1957) | | Trustee, since 2015** | | Retired. From 1984 to 2013, equities analyst, portfolio manager, research director at Fidelity Management and Research Company and retired in 2013 as Chief Investment Officer of Fidelity Strategic Advisers, Inc. in Boston, Tokyo, and Hong Kong where he led a team of investment professionals managing client assets. Prior thereto, Board member of Hong Kong Securities Clearing Co., Hong Kong Options Clearing Corp., the Thailand International Fund, Ltd., Fidelity Investments Life Insurance Company, and Empire Fidelity Investments Life Insurance Company. Mr. Ebsworth is a CFA ® charterholder and an Adjunct Lecturer, Finance, at Babson College. | | Asset Allocation Trust |
Jane A. Freeman (Born 1953) | | Trustee, since 2015** | | Retired. From 2012 to 2014 and 1999 to 2008, Chief Financial Officer of Scientific Learning Corporation. From 2008 to 2012, Ms. Freeman provided consulting services related to strategic business projects. Prior to 1999, Portfolio Manager at Rockefeller & Co. and Scudder, Stevens & Clark. Board member of the Harding Loevner Funds from 1996 to 2014, serving as both Lead Independent Director and chair of the Audit Committee. Board member of the Russell Exchange Traded Funds Trust from 2011 to 2012 and the chair of the Audit Committee. Ms. Freeman is Chair of Taproot Foundation (non-profit organization), a Board Member of Ruth Bancroft Garden (non-profit organization) and an inactive chartered financial analyst. | | Asset Allocation Trust, Harding Loevner Funds; Russell Exchange Traded Funds Trust |
Peter G. Gordon (Born 1942) | | Trustee, since 1998; Chairman, since 2005 | | Co-Founder, Retired Chairman, President and CEO of Crystal Geyser Water Company. Trustee Emeritus, Colby College. | | Asset Allocation Trust |
Isaiah Harris, Jr. (Born 1952) | | Trustee, since 2009 | | Retired. Chairman of the Board of CIGNA Corporation since 2009, and Director since 2005. From 2003 to 2011, Director of Deluxe Corporation. Prior thereto, President and CEO of BellSouth Advertising and Publishing Corp. from 2005 to 2007, President and CEO of BellSouth Enterprises from 2004 to 2005 and President of BellSouth Consumer Services from 2000 to 2003. Emeritus member of the Iowa State University Foundation Board of Governors. Emeritus Member of the Advisory Board of Iowa State University School of Business. Advisory Board Member, Palm Harbor Academy (charter school). Mr. Harris is a certified public accountant. | | CIGNA Corporation; Asset Allocation Trust |
Judith M. Johnson (Born 1949) | | Trustee, since 2008; Audit Committee Chairman, since 2008 | | Retired. Prior thereto, Chief Executive Officer and Chief Investment Officer of Minneapolis Employees Retirement Fund from 1996 to 2008. Ms. Johnson is an attorney, certified public accountant and a certified managerial accountant. | | Asset Allocation Trust |
David F. Larcker (Born 1950) | | Trustee, since 2009 | | James Irvin Miller Professor of Accounting at the Graduate School of Business, Stanford University, Morgan Stanley Director of the Center for Leadership Development and Research and Senior Faculty of The Rock Center for Corporate Governance since 2006. From 2005 to 2008, Professor of Accounting at the Graduate School of Business, Stanford University. Prior thereto, Ernst & Young Professor of Accounting at The Wharton School, University of Pennsylvania from 1985 to 2005. | | Asset Allocation Trust |
Olivia S. Mitchell (Born 1953) | | Trustee, since 2006 | | International Foundation of Employee Benefit Plans Professor, Wharton School of the University of Pennsylvania since 1993. Director of Wharton’s Pension Research Council and Boettner Center on Pensions & Retirement Research, and Research Associate at the National Bureau of Economic Research. Previously, Cornell University Professor from 1978 to 1993. | | Asset Allocation Trust |
| | | | |
| 26 | | Wells Fargo Advantage Small/Mid Cap Value Fund | | Other information (unaudited) |
| | | | | | |
Name and
year of birth | | Position held and
length of service* | | Principal occupations during past five years or longer | | Other public
company or
investment company
directorships during
past 5 years |
Timothy J. Penny (Born 1951) | | Trustee, since 1996 | | President and Chief Executive Officer of Southern Minnesota Initiative Foundation, a non-profit organization, since 2007 and Senior Fellow at the Humphrey Institute Policy Forum at the University of Minnesota since 1995. Member of the Board of Trustees of NorthStar Education Finance, Inc., a non-profit organization, since 2007. | | Asset Allocation Trust |
Michael S. Scofield (Born 1943) | | Trustee, since 2010 | | Served on the Investment Company Institute’s Board of Governors and Executive Committee from 2008-2011 as well the Governing Council of the Independent Directors Council from 2006-2011 and the Independent Directors Council Executive Committee from 2008-2011. Chairman of the IDC from 2008-2010. Institutional Investor (Fund Directions) Trustee of Year in 2007. Trustee of the Evergreen Funds complex (and its predecessors) from 1984 to 2010. Chairman of the Evergreen Funds from 2000-2010. Former Trustee of the Mentor Funds. Retired Attorney, Law Offices of Michael S. Scofield. | | Asset Allocation Trust |
Donald C. Willeke (Born 1940) | | Trustee, since 1996 | | Principal of the law firm of Willeke & Daniels. General Counsel of the Minneapolis Employees Retirement Fund from 1984 until its consolidation into the Minnesota Public Employees Retirement Association on June 30, 2010. Director and Vice Chair of The Tree Trust (non-profit corporation). Director of the American Chestnut Foundation (non-profit corporation). | | Asset Allocation Trust |
| * | Length of service dates reflect the Trustee’s commencement of service with the Trust’s predecessor entities, where applicable. |
| ** | William R. Ebsworth and Jane A. Freeman each became a Trustee effective January 1, 2015. |
Officers
| | | | | | |
Name and
year of birth | | Position held and
length of service | | Principal occupations during past five years or longer | | |
Karla M. Rabusch (Born 1959) | | President, since 2003 | | Executive Vice President of Wells Fargo Bank, N.A. and President of Wells Fargo Funds Management, LLC since 2003. | | |
Nancy Wiser1 (Born 1967) | | Treasurer, since 2012 | | Executive Vice President of Wells Fargo Funds Management, LLC since 2011. Chief Operating Officer and Chief Compliance Officer at LightBox Capital Management LLC, from 2008 to 2011. | | |
C. David Messman (Born 1960) | | Secretary, since 2000; Chief Legal Officer, since 2003 | | Senior Vice President and Secretary of Wells Fargo Funds Management, LLC since 2001. Assistant General Counsel of Wells Fargo Bank, N.A. since 2013 and Vice President and Managing Counsel of Wells Fargo Bank N.A. from 1996 to 2013. | | |
Debra Ann Early (Born 1964) | | Chief Compliance Officer, since 2007 | | Executive Vice President of Wells Fargo Funds Management, LLC since 2014, Senior Vice President and Chief Compliance Officer from 2007 to 2014. | | |
David Berardi (Born 1975) | | Assistant Treasurer, since 2009 | | Vice President of Wells Fargo Funds Management, LLC since 2009. Vice President of Evergreen Investment Management Company, LLC from 2008 to 2010. Manager of Fund Reporting and Control for Evergreen Investment Management Company, LLC from 2004 to 2010. | | |
Jeremy DePalma1 (Born 1974) | | Assistant Treasurer, since 2009 | | Senior Vice President of Wells Fargo Funds Management, LLC since 2009. Senior Vice President of Evergreen Investment Management Company, LLC from 2008 to 2010 and head of the Fund Reporting and Control Team within Fund Fund Administration from 2005 to 2010. | | |
| 1 | Nancy Wiser acts as Treasurer of 72 funds in the Fund Complex. Jeremy DePalma acts as Treasurer of 72 funds and Assistant Treasurer of 72 funds in the Fund Complex. |
| 2 | The Statement of Additional Information includes additional information about the Trustees and is available, without charge, upon request, by calling 1-800-222-8222 or by visiting the website at wellsfargoadvantagefunds.com. |
| | | | | | |
| Other information (unaudited) | | Wells Fargo Advantage Small/Mid Cap Value Fund | | | 27 | |
BOARD CONSIDERATION OF INVESTMENT ADVISORY, INVESTMENT MANAGEMENT AND SUB-ADVISORY AGREEMENTS:
Under the Investment Company Act of 1940 (the “1940 Act”), the Board of Trustees (the “Board”) of Wells Fargo Funds Trust (the “Trust”) must determine annually whether to approve the continuation of the Trust’s investment advisory and sub-advisory agreements. In this regard, at an in-person meeting held on May 19-20, 2015 (the “Meeting”), the Board, all the members of which have no direct or indirect interest in the investment advisory and sub-advisory agreements and are not “interested persons” of the Trust, as defined in the 1940 Act (the “Independent Trustees”), reviewed and approved for Wells Fargo Advantage Small/Mid Cap Value Fund (the “Fund”): (i) an investment advisory agreement (the “Advisory Agreement”) with Wells Fargo Funds Management, LLC (“Funds Management”); (ii) an investment management agreement (the “Management Agreement”) with Funds Management; and (iii) an investment sub-advisory agreement (the “Sub-Advisory Agreement”) with Wells Capital Management Incorporated (the “Sub-Adviser”), an affiliate of Funds Management. The Management Agreement combines the terms of the Advisory Agreement with the terms of the Fund’s Amended and Restated Administration Agreement (the “Administration Agreement”) applicable to Fund-level administrative services. The Advisory Agreement, the Management Agreement and the Sub-Advisory Agreement are collectively referred to as the “Advisory Agreements.”
At the Meeting, the Board considered the factors and reached the conclusions described below relating to the selection of Funds Management and the Sub-Adviser and the approval of the Advisory Agreements. Prior to the Meeting, including at an in-person meeting in March 2015, the Trustees conferred extensively among themselves and with representatives of Funds Management about these matters. Also, the Board has adopted a team-based approach, with each team consisting of a sub-set of Trustees, to assist the full Board in the discharge of its duties in reviewing performance and other matters throughout the year. The Independent Trustees were assisted in their evaluation of the Advisory Agreements by independent legal counsel, from whom they received separate legal advice and with whom they met separately.
In providing information to the Board, Funds Management and the Sub-Adviser were guided by a detailed set of requests for information submitted to them by independent legal counsel on behalf of the Independent Trustees at the start of the Board’s annual contract renewal process earlier in 2015. In considering and approving the Advisory Agreements, the Trustees considered the information they believed relevant, including but not limited to the information discussed below. The Board considered not only the specific information presented in connection with the Meeting, but also the knowledge gained over time through interaction with Funds Management and the Sub-Adviser about various topics. In this regard, the Board reviewed reports of Funds Management at each of its quarterly meetings, which included, among other things, portfolio reviews and performance reports. In addition, the Board and the teams mentioned above confer with portfolio managers at various times throughout the year. The Board did not identify any particular information or consideration that was all-important or controlling, and each individual Trustee may have attributed different weights to various factors.
After its deliberations, the Board unanimously approved the continuation of the Advisory Agreement for the period from June 1, 2015 through June 30, 2015, approved the Management Agreement for the period from July 1, 2015 through May 31, 2016, and approved the continuation of the Sub-Advisory Agreement for a one-year term through May 31, 2016. The Board also determined that the compensation payable to Funds Management and the Sub-Adviser under each of the Advisory Agreements was reasonable. The Board considered the approval of the Advisory Agreements for the Fund as part of its consideration of agreements for funds across the complex, but its approvals were made on a fund-by-fund basis. The following summarizes a number of important, but not necessarily all, factors considered by the Board in support of its approvals.
Nature, extent and quality of services
The Board received and considered various information regarding the nature, extent and quality of services provided to the Fund by Funds Management and the Sub-Adviser under the Advisory Agreements. This information included, among other things, a summary of the background and experience of senior management of Funds Management, and the qualifications, background, tenure and responsibilities of each of the portfolio managers primarily responsible for the day-to-day portfolio management of the Fund. The Board noted that the services to be provided to the Fund pursuant to the Management Agreement combined the advisory services previously provided to the Fund pursuant to the Fund’s Advisory Agreement with the Fund-level administrative services previously provided to the Fund pursuant to the Fund’s Administration Agreement. The Board received a representation from Funds Management that combining these services would not result in any change to the nature or level of services provided by Funds Management to the Fund.
| | | | |
| 28 | | Wells Fargo Advantage Small/Mid Cap Value Fund | | Other information (unaudited) |
The Board evaluated the ability of Funds Management and the Sub-Adviser to attract and retain qualified investment professionals, including research, advisory and supervisory personnel. The Board further considered the compliance programs and compliance records of Funds Management and the Sub-Adviser. In addition, the Board took into account the full range of services provided to the Fund by Funds Management and its affiliates.
Fund performance and expenses
The Board considered the performance results for the Fund over various time periods ended March 31, 2015. The Board considered these results in comparison to the performance of funds in a universe that was determined by Lipper Inc. (“Lipper”) to be similar to the Fund (the “Universe”), and in comparison to the Fund’s benchmark index and to other comparative data. Lipper is an independent provider of investment company data. The Board received a description of the methodology used by Lipper to select the mutual funds in the performance Universe. The Board noted that the performance of the Fund (Administrator Class) was lower than the average performance of the Universe for all periods under review. The Board also noted that the performance of the Fund was lower than its benchmark, the Russell 2500TM Value Index, for all periods under review.
The Board received information concerning, and discussed factors contributing to, the underperformance of the Fund relative to the Universe and benchmark for all periods. The Board took note of the explanations for the relative underperformance, including with respect to overall investment approach, sector allocations and investment decisions that affected the Fund’s performance.
The Board also received and considered information regarding the Fund’s net operating expense ratios and their various components, including actual management fees (which reflect fee waivers, if any, and include advisory, administration and transfer agent fees), custodian and other non-management fees, and Rule 12b-1 and non-Rule 12b-1 service fees. The Board considered these ratios in comparison to the median ratios of funds in class-specific expense groups that were determined by Lipper to be similar to the Fund (the “Groups”). The Board received a description of the methodology used by Lipper to select the mutual funds in the expense Groups and an explanation of how funds comprising expense groups and their expense ratios may vary from year-to-year. Based on the Lipper reports, the Board noted that the net operating expense ratios of the Fund were lower than or in range of the median net operating expense ratios of the expense Groups for all share classes except the Investor Class. The Board discussed and accepted Funds Management’s proposal to convert the Investor Class shares into Class A shares.
The Board took into account the Fund performance and expense information provided to it among the factors considered in deciding to re-approve the Advisory Agreement and Sub-Advisory Agreement and approve the Management Agreement.
Investment advisory and sub-advisory fee rates
The Board reviewed and considered the contractual investment advisory fee rates that are payable by the Fund to Funds Management for investment advisory services (the “Advisory Agreement Rates”), both on a stand-alone basis and on a combined basis with the Fund’s fund-level and class-level contractual administration fee rates (the “Management Rates”). The Board noted that the Management Rates include transfer agency and sub-transfer agency costs. The Board also noted that the fee rate to be paid by the Fund under the Management Agreement will incorporate the advisory fee and Fund-level administration fee previously payable separately by the Fund under the Fund’s Advisory Agreement and Administration Agreement with Funds Management. The Board also reviewed and considered the contractual investment sub-advisory fee rates that are payable by Funds Management to the Sub-Adviser for investment sub-advisory services (the “Sub-Advisory Agreement Rates”).
Among other information reviewed by the Board was a comparison of the Management Rates of the Fund with those of other funds in the expense Groups at a common asset level. The Board noted that the Management Rates for all share classes of the Fund were lower than, equal to or in range of their respective expense Groups.
The Board also received and considered information about the portion of the total advisory fee that was retained by Funds Management after payment of the fee to the Sub-Adviser for sub-advisory services. In assessing the reasonableness of this amount, the Board received and evaluated information about the nature and extent of responsibilities retained and risks assumed by Funds Management and not delegated to or assumed by the Sub-Adviser, and about Funds Management’s on-going oversight services. However, given the affiliation between Funds Management and the Sub-Adviser, the Board ascribed limited relevance to the allocation of the advisory fee between them.
The Board also received and considered information about the nature and extent of services offered and fee rates charged by Funds Management and the Sub-Adviser to other types of clients with investment strategies similar to those
| | | | | | |
| Other information (unaudited) | | Wells Fargo Advantage Small/Mid Cap Value Fund | | | 29 | |
of the Fund. In this regard, the Board received information about the significantly greater scope of services, and compliance, reporting and other legal burdens and risks of managing mutual funds compared with those associated with managing assets of non-mutual fund clients such as collective funds or institutional separate accounts.
Based on its consideration of the factors and information it deemed relevant, including those described here, the Board determined that the compensation payable to Funds Management under the Management Agreement and Advisory Agreement and to the Sub-Adviser under the Sub-Advisory Agreement was reasonable, in light of the services covered by the Advisory Agreements.
Profitability
The Board received and considered information concerning the profitability of Funds Management, as well as the profitability of Wells Fargo as a whole, from providing services to the Fund and the fund family as a whole. The Board also received and considered information concerning the profitability of the Sub-Adviser from providing services to the fund family as a whole, noting that the Sub-Adviser’s profitability information with respect to providing services to the Fund was subsumed in the Wells Fargo profitability analysis.
Funds Management reported on the methodologies and estimates used in calculating profitability. Among other things, the Board noted that the levels of profitability reported on a fund-by-fund basis varied widely, depending on factors such as the size and type of fund. Based on its review, the Board did not deem the profits reported by Funds Management or Wells Fargo from its services to the Fund to be at a level that would prevent it from approving the continuation of the Advisory Agreements.
Economies of scale
With respect to possible economies of scale, the Board noted the existence of breakpoints in the Fund’s advisory and management fee structures, and the Fund’s administration fee structure, which operate generally to reduce the Fund’s expense ratios as the Fund grows in size. It considered that, for a small fund or a fund that shrinks in size, breakpoints conversely can result in higher fee levels. The Board also considered that fee waiver and expense reimbursement arrangements and competitive fee rates at the outset are means of sharing potential economies of scale with shareholders of the Fund and the fund family as a whole. The Board considered Funds Management’s view that any analyses of potential economies of scale in managing a particular fund are inherently limited in light of the joint and common costs and investments that Funds Management incurs across the fund family as a whole.
The Board concluded that the Fund’s fee and expense arrangements, including contractual breakpoints, constituted a reasonable approach to sharing potential economies of scale with the Fund and its shareholders.
Other benefits to Funds Management and the Sub-Adviser
The Board received and considered information regarding potential “fall-out” or ancillary benefits received by Funds Management and its affiliates, including the Sub-Adviser, as a result of their relationships with the Fund. Ancillary benefits could include, among others, benefits directly attributable to other relationships with the Fund and benefits potentially derived from an increase in Funds Management’s and the Sub-Adviser’s business as a result of their relationships with the Fund. The Board noted that various affiliates of Funds Management may receive distribution-related fees, shareholder servicing payments and sub-transfer agency fees in respect of shares sold or held through them and services provided.
The Board also reviewed information about soft dollar credits earned and utilized by the Sub-Adviser, fees earned by Funds Management and the Sub-Adviser from managing a private investment vehicle for the fund family’s securities lending collateral and commissions earned by an affiliated broker from portfolio transactions.
Based on its consideration of the factors and information it deemed relevant, including those described here, the Board did not find that any ancillary benefits received by Funds Management and its affiliates, including the Sub-Adviser, were unreasonable.
Conclusion
At the Meeting, after considering the above-described factors and based on its deliberations and its evaluation of the information described above, the Board unanimously approved the continuation of the Advisory Agreement for the period from June 1, 2015 through June 30, 2015, approved the Management Agreement for the period from July 1, 2015 through May 31, 2016, and approved the continuation of the Sub-Advisory Agreement for a one-year term through May 31, 2016. The Board also determined that the compensation payable to Funds Management and the Sub-Adviser under each of the Advisory Agreements was reasonable.
| | | | |
| 30 | | Wells Fargo Advantage Small/Mid Cap Value Fund | | List of abbreviations |
The following is a list of common abbreviations for terms and entities that may have appeared in this report.
| ACA | — ACA Financial Guaranty Corporation |
| ADR | — American depositary receipt |
| ADS | — American depositary shares |
| AGC | — Assured Guaranty Corporation |
| AGM | — Assured Guaranty Municipal |
| Ambac | — Ambac Financial Group Incorporated |
| AMT | — Alternative minimum tax |
| BAN | — Bond anticipation notes |
| BHAC | — Berkshire Hathaway Assurance Corporation |
| CAB | — Capital appreciation bond |
| CCAB | — Convertible capital appreciation bond |
| CDA | — Community Development Authority |
| CDO | — Collateralized debt obligation |
| DRIVER | — Derivative inverse tax-exempt receipts |
| DW&P | — Department of Water & Power |
| DWR | — Department of Water Resources |
| ECFA | — Educational & Cultural Facilities Authority |
| EDA | — Economic Development Authority |
| EDFA | — Economic Development Finance Authority |
| ETF | — Exchange-traded fund |
| FDIC | — Federal Deposit Insurance Corporation |
| FFCB | — Federal Farm Credit Banks |
| FGIC | — Financial Guaranty Insurance Corporation |
| FHA | — Federal Housing Administration |
| FHLB | — Federal Home Loan Bank |
| FHLMC | — Federal Home Loan Mortgage Corporation |
| FICO | — The Financing Corporation |
| FNMA | — Federal National Mortgage Association |
| GDR | — Global depositary receipt |
| GNMA | — Government National Mortgage Association |
| HCFR | — Healthcare facilities revenue |
| HEFA | — Health & Educational Facilities Authority |
| HEFAR | — Higher education facilities authority revenue |
| HFA | — Housing Finance Authority |
| HFFA | — Health Facilities Financing Authority |
| HUD | — Department of Housing and Urban Development |
| IDA | — Industrial Development Authority |
| IDAG | — Industrial Development Agency |
| KRW | — Republic of Korea won |
| LIBOR | — London Interbank Offered Rate |
| LIFER | — Long Inverse Floating Exempt Receipts |
| LLC | — Limited liability company |
| LLLP | — Limited liability limited partnership |
| LLP | — Limited liability partnership |
| MBIA | — Municipal Bond Insurance Association |
| MFHR | — Multifamily housing revenue |
| MSTR | — Municipal securities trust receipts |
| MUD | — Municipal Utility District |
| National | — National Public Finance Guarantee Corporation |
| PCFA | — Pollution Control Financing Authority |
| PCL | — Public Company Limited |
| PCR | — Pollution control revenue |
| PFA | — Public Finance Authority |
| PFFA | — Public Facilities Financing Authority |
| PFOTER | — Puttable floating option tax-exempt receipts |
| plc | — Public limited company |
| PUTTER | — Puttable tax-exempt receipts |
| R&D | — Research & development |
| Radian | — Radian Asset Assurance |
| RAN | — Revenue anticipation notes |
| RDA | — Redevelopment Authority |
| RDFA | — Redevelopment Finance Authority |
| REIT | — Real estate investment trust |
| ROC | — Reset option certificates |
| SAVRS | — Select auction variable rate securities |
| SBA | — Small Business Authority |
| SDR | — Swedish depositary receipt |
| SFHR | — Single-family housing revenue |
| SFMR | — Single-family mortgage revenue |
| SPA | — Standby purchase agreement |
| SPDR | — Standard & Poor’s Depositary Receipts |
| SPEAR | — Short Puttable Exempt Adjustable Receipts |
| STRIPS | — Separate trading of registered interest and |
| TAN | — Tax anticipation notes |
| TIPS | — Treasury inflation-protected securities |
| TRAN | — Tax revenue anticipation notes |
| TTFA | — Transportation Trust Fund Authority |
| TVA | — Tennessee Valley Authority |
This page is intentionally left blank.
This page is intentionally left blank.


For more information
More information about Wells Fargo Advantage Funds is available free upon request. To obtain literature, please write, email, visit the Fund’s website, or call:
Wells Fargo Advantage Funds
P.O. Box 8266
Boston, MA 02266-8266
Email: wfaf@wellsfargo.com
Website: wellsfargoadvantagefunds.com
Individual investors: 1-800-222-8222
Retail investment professionals: 1-888-877-9275
Institutional investment professionals: 1-866-765-0778
This report and the financial statements contained herein are submitted for the general information of the shareholders of Wells Fargo Advantage Funds. If this report is used for promotional purposes, distribution of the report must be accompanied or preceded by a current prospectus. Before investing, please consider the investment objectives, risks, charges, and expenses of the investment. For a current prospectus and, if available, a summary prospectus, containing this information, call 1-800-222-8222 or visit the Fund’s website at wellsfargoadvantagefunds.com. Read the prospectus carefully before you invest or send money.
Wells Fargo Funds Management, LLC, a wholly owned subsidiary of Wells Fargo & Company, provides investment advisory and administrative services for Wells Fargo Advantage Funds. Other affiliates of Wells Fargo & Company provide subadvisory and other services for the Funds. The Funds are distributed by Wells Fargo Funds Distributor, LLC, Member FINRA, an affiliate of Wells Fargo & Company.
NOT FDIC INSURED ¡ NO BANK GUARANTEE ¡ MAY LOSE VALUE
© 2015 Wells Fargo Funds Management, LLC. All rights reserved.
| | |
 | | 237484 11-15 SA245/SAR245 09-15 |

Wells Fargo Advantage
Special Small Cap Value Fund

Semi-Annual Report
September 30, 2015

Reduce clutter. Save trees.
Sign up for electronic delivery of prospectuses and shareholder reports at wellsfargo.com/advantagedelivery
Contents
The views expressed and any forward-looking statements are as of September 30, 2015, unless otherwise noted, and are those of the Fund managers and/or Wells Fargo Funds Management, LLC. Discussions of individual securities, or the markets generally, or any Wells Fargo Advantage Fund are not intended as individual recommendations. Future events or results may vary significantly from those expressed in any forward-looking statements; the views expressed are subject to change at any time in response to changing circumstances in the market. Wells Fargo Funds Management, LLC and the Fund disclaim any obligation to publicly update or revise any views expressed or forward-looking statements.
NOT FDIC INSURED ¡ NO BANK GUARANTEE ¡ MAY LOSE VALUE
| | | | |
| 2 | | Wells Fargo Advantage Special Small Cap Value Fund | | Letter to shareholders (unaudited) |

Karla M. Rabusch
President
Wells Fargo Advantage Funds
Despite generally improving U.S. economic data, the broad U.S. stock market experienced heightened volatility that led to negative results overall for U.S. stocks for the period.
Periods of uncertainty can present challenges, but experience has taught us that maintaining long-term investment goals can be an effective way to plan for the future.
Dear Valued Shareholder:
We are pleased to offer you this semi-annual report for the Wells Fargo Advantage Special Small Cap Value Fund for the six-month period that ended September 30, 2015. Despite generally improving U.S. economic data, the broad U.S. stock market experienced heightened volatility that led to negative results overall for U.S. stocks for the period. Large-cap stocks performed best, followed by mid caps and small caps. Markets outside the U.S. faced deeper ongoing challenges and generally delivered weaker results.
U.S. stocks experienced challenges during the second quarter of 2015.
The broad U.S. stock market fluctuated widely, eventually eking out a small quarterly gain. Mid- and large-cap stocks at times were pressured by investor concerns over the potentially negative effects of financially troubled overseas economies and of a strengthening U.S. dollar on the profits of U.S. multinational firms. The U.S. economy picked up traction during the quarter; consumer spending improved, and positive trends were evident in construction and new-home sales. Jobs growth remained a bright spot as well. U.S. Federal Reserve (Fed) officials, who have kept interest rates low while waiting for the U.S. jobs market to sufficiently improve and for inflation to approach their 2% target, made clear they could take action soon. Throughout the quarter, non-U.S. markets also experienced volatility, triggered by uncertainty over the potential impact of financial challenges in other locations—most notably in Greece and Puerto Rico. Questions over slower growth in China caused investor concern as well.
In the third quarter of 2015, China’s slowdown took a toll on economies and markets worldwide.
U.S. stocks sagged during the quarter, experiencing the most volatility since 2011. Larger-cap stocks generally declined the least and smaller caps the most. Economic data released during the quarter suggested the U.S. economy remains solid but has lost some steam, burdened by the drag of the strong U.S. dollar coupled with global economic turmoil. The fact that the Fed left the federal funds interest rate unchanged at its September meeting surprised investors and fueled increased uncertainty about the U.S. economy’s stamina to remain healthy while facing the challenges of slowing in China and troubles elsewhere in the world. Outside the U.S., markets were even more volatile and delivered generally weaker quarterly results, also largely due to investors’ increasing anxiety over China’s weakened economy. Because China is the world’s largest importer of many commodities, a number of emerging markets—key commodities exporters—are struggling under the dual strains of reduced demand for commodities and, because of weaker demand, lower prices for the commodities they do sell. In the eurozone, however, where only about 3% of exports are sent to China, household spending and business investment appeared relatively unaffected by troubles elsewhere. However, the European Central Bank warned in September that slowing growth in China could lead to slower growth and lower inflation rates in the eurozone than previously forecast and indicated additional stimulus could be provided should this occur.
Don’t let short-term uncertainty derail long-term investment goals.
Periods of uncertainty can present challenges, but experience has taught us that maintaining long-term investment goals can be an effective way to plan for the future. To help you create a sound strategy based on your personal goals and risk tolerance, Wells Fargo Advantage Funds offers more than 100 mutual funds spanning a wide range of asset classes and investment styles. Although diversification cannot guarantee an investment profit or prevent losses, we believe it can be an effective way to manage investment risk and potentially smooth out overall portfolio performance. We encourage investors to know their investments and to understand that appropriate levels of risk-taking may unlock opportunities.
| | | | | | |
| Letter to shareholders (unaudited) | | Wells Fargo Advantage Special Small Cap Value Fund | | | 3 | |
Thank you for choosing to invest in Wells Fargo Advantage Funds. We appreciate your confidence in us and remain committed to helping you meet your financial needs.
Sincerely,

Karla M. Rabusch
President
Wells Fargo Advantage Funds
Notice to shareholders
At a meeting held August 11–12, 2015, the Board of Trustees of the Fund approved a change in the name of the Fund whereby the word “Advantage” was removed from its name, effective December 15, 2015.
For current information about your fund investments, contact your investment professional, visit our website at wellsfargoadvantagefunds.com, or call us directly at 1-800-222-8222. We are available 24 hours a day, 7 days a week.
| | | | |
| 4 | | Wells Fargo Advantage Special Small Cap Value Fund | | Performance highlights (unaudited) |
Investment objective
The Fund seeks long-term capital appreciation.
Manager
Wells Fargo Funds Management, LLC
Subadviser
Wells Capital Management Incorporated
Portfolio managers
Robert Rifkin, CFA
James M. Tringas, CFA, CPA
Bryant VanCronkhite, CFA, CPA
Average annual total returns1 (%) as of September 30, 2015
| | | | | | | | | | | | | | | | | | | | | | | | | | | | | | | | | | |
| | | | | Including sales charge | | | Excluding sales charge | | | Expense ratios2 (%) | |
| | | Inception date | | 1 year | | | 5 year | | | 10 year | | | 1 year | | | 5 year | | | 10 year | | | Gross | | | Net3 | |
| Class A (ESPAX) | | 5-7-1993 | | | (5.32 | ) | | | 10.55 | | | | 5.84 | | | | 0.46 | | | | 11.87 | | | | 6.47 | | | | 1.35 | | | | 1.35 | |
| Class B (ESPBX)* | | 3-26-1999 | | | (4.42 | ) | | | 10.77 | | | | 5.91 | | | | (0.29 | ) | | | 11.04 | | | | 5.91 | | | | 2.10 | | | | 2.10 | |
| Class C (ESPCX) | | 12-12-2000 | | | (1.26 | ) | | | 11.04 | | | | 5.67 | | | | (0.26 | ) | | | 11.04 | | | | 5.67 | | | | 2.10 | | | | 2.10 | |
| Class R (ESPHX) | | 9-30-2015 | | | – | | | | – | | | | – | | | | 0.19 | | | | 11.37 | | | | 6.06 | | | | 1.60 | | | | 1.60 | |
| Class R6 (ESPRX) | | 10-31-2014 | | | – | | | | – | | | | – | | | | 0.89 | | | | 12.33 | | | | 6.82 | | | | 0.92 | | | | 0.90 | |
| Administrator Class (ESPIX) | | 7-23-1996 | | | – | | | | – | | | | – | | | | 0.67 | | | | 12.15 | | | | 6.73 | | | | 1.27 | | | | 1.21 | |
| Institutional Class (ESPNX) | | 7-30-2010 | | | – | | | | – | | | | – | | | | 0.85 | | | | 12.32 | | | | 6.81 | | | | 1.02 | | | | 0.95 | |
| Russell 2000® Value Index4 | | – | | | – | | | | – | | | | – | | | | (1.60 | ) | | | 10.17 | | | | 5.35 | | | | – | | | | – | |
| * | | Class B shares are closed to investment, except in connection with the reinvestment of any distributions and permitted exchanges. |
Figures quoted represent past performance, which is no guarantee of future results, and do not reflect taxes that a shareholder may pay on fund distributions or the redemption of fund shares. Investment return and principal value of an investment will fluctuate so that an investor’s shares, when redeemed, may be worth more or less than their original cost. Performance shown without sales charges would be lower if sales charges were reflected. Current performance may be lower or higher than the performance data quoted, which assumes the reinvestment of dividends and capital gains. Current month-end performance is available on the Fund’s website, wellsfargoadvantagefunds.com.
Index returns do not include transaction costs associated with buying and selling securities, any mutual fund fees or expenses, or any taxes. It is not possible to invest directly in an index.
For Class A shares, the maximum front-end sales charge is 5.75%. For Class B shares, the maximum contingent deferred sales charge is 5.00%. For Class C shares, the maximum contingent deferred sales charge is 1.00%. Performance including a contingent deferred sales charge assumes the sales charge for the corresponding time period. Class R, Class R6, Administrator Class, and Institutional Class shares are sold without a front-end sales charge or contingent deferred sales charge.
Stock values fluctuate in response to the activities of individual companies and general market and economic conditions. Smaller-company stocks tend to be more volatile and less liquid than those of larger companies. Consult the Fund’s prospectus for additional information on these and other risks.
Please see footnotes on page 5.
| | | | | | |
| Performance highlights (unaudited) | | Wells Fargo Advantage Special Small Cap Value Fund | | | 5 | |
| | | | |
| Ten largest holdings5 (%) as of September 30, 2015 | |
First Citizens BancShares Corporation Class A | | | 2.43 | |
Brown & Brown Incorporated | | | 1.80 | |
TreeHouse Foods Incorporated | | | 1.71 | |
UMB Financial Corporation | | | 1.71 | |
Eagle Materials Incorporated | | | 1.69 | |
Mueller Industries Incorporated | | | 1.68 | |
Simpson Manufacturing Company Incorporated | | | 1.68 | |
Franklin Electric Company Incorporated | | | 1.65 | |
GSI Group Incorporated | | | 1.62 | |
ProAssurance Corporation | | | 1.57 | |
|
| Sector distribution6 as of September 30, 2015 |
|
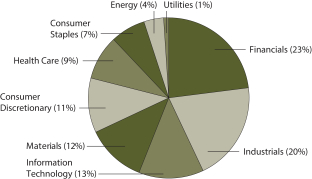 |
| 1 | Historical performance shown for Class R shares prior to their inception reflects the performance of the Institutional Class shares adjusted to reflect the higher expenses applicable to Class R. Historical performance for Class R6 shares prior to their inception reflects the performance of the Institutional Class shares, and includes the higher expenses applicable to Institutional Class shares. If these expenses had not been included, returns would be higher. Historical performance shown for Institutional Class shares prior to their inception reflects the performance of Administrator Class shares, and includes the higher expenses applicable to Administrator Class shares. If these expenses had not been included, returns would be higher. Historical performance shown for all classes of the Fund prior to July 19, 2010, is based on the performance of the Fund’s predecessor, Evergreen Special Values Fund. |
| 2 | Reflects the expense ratios as stated in the most recent prospectuses, which include the impact of 0.01% in acquired fund fees and expenses. The expense ratios shown are subject to change and may differ from the annualized expense ratios shown in the financial highlights of this report, which do not include acquired fund fees and expenses. |
| 3 | The manager has contractually committed through July 31, 2016 (July 31, 2017 for Class R), to waive fees and/or reimburse expenses to the extent necessary to cap the Fund’s Total Annual Fund Operating Expenses After Fee Waiver at 1.34% for Class A, 2.09% for Class B, 2.09% for Class C, 1.59% for Class R, 0.89% for Class R6, 1.20% for Administrator Class, and 0.94% for Institutional Class. After this time, the cap may be increased or the commitment to maintain the cap may be terminated only with the approval of the Board of Trustees. Brokerage commissions, stamp duty fees, interest, taxes, acquired fund fees and expenses, and extraordinary expenses are excluded from the cap. Without this cap, the Fund’s returns would have been lower. |
| 4 | The Russell 2000® Value Index measures the performance of those Russell 2000 companies with lower price-to-book ratios and lower forecasted growth values. You cannot invest directly in an index. |
| 5 | The ten largest holdings, excluding cash and cash equivalents, are calculated based on the value of the investments divided by total net assets of the Fund. Holdings are subject to change and may have changed since the date specified. |
| 6 | Amounts are calculated based on the total long-term investments of the Fund. These amounts are subject to change and may have changed since the date specified. |
| | | | |
| 6 | | Wells Fargo Advantage Special Small Cap Value Fund | | Fund expenses (unaudited) |
As a shareholder of the Fund, you incur two types of costs: (1) transaction costs, including sales charges (loads) on purchase payments and contingent deferred sales charges (if any) on redemptions and (2) ongoing costs, including management fees, distribution (12b-1) and/or shareholder servicing fees, and other Fund expenses. This example is intended to help you understand your ongoing costs (in dollars) of investing in the Fund and to compare these costs with the ongoing costs of investing in other mutual funds.
The example is based on an investment of $1,000 invested at the beginning of the six-month period and held for the entire period from April 1, 2015 to September 30, 2015.
Actual expenses
The “Actual” line of the table below provides information about actual account values and actual expenses. You may use the information in this line, together with the amount you invested, to estimate the expenses that you paid over the period. Simply divide your account value by $1,000 (for example, an $8,600 account value divided by $1,000 = 8.6), then multiply the result by the number in the “Actual” line under the heading entitled “Expenses paid during period” for your applicable class of shares to estimate the expenses you paid on your account during this period.
Hypothetical example for comparison purposes
The “Hypothetical” line of the table below provides information about hypothetical account values and hypothetical expenses based on the Fund’s actual expense ratio and an assumed rate of return of 5% per year before expenses, which is not the Fund’s actual return. The hypothetical account values and expenses may not be used to estimate the actual ending account balance or expenses you paid for the period. You may use this information to compare the ongoing costs of investing in the Fund and other funds. To do so, compare this 5% hypothetical example with the 5% hypothetical examples that appear in the shareholder reports of the other funds.
Please note that the expenses shown in the table are meant to highlight your ongoing costs only and do not reflect any transactional costs, such as sales charges (loads) and contingent deferred sales charges. Therefore, the “Hypothetical” line of the table is useful in comparing ongoing costs only and will not help you determine the relative total costs of owning different funds. In addition, if these transactional costs were included, your costs would have been higher.
| | | | | | | | | | | | | | | | |
| | | Beginning
account value
4-1-2015 | | | Ending
account value
9-30-2015 | | | Expenses
paid during
the period¹ | | | Net annualized
expense ratio | |
Class A | | | | | | | | | | | | | | | | |
Actual | | $ | 1,000.00 | | | $ | 891.01 | | | $ | 6.35 | | | | 1.34 | % |
Hypothetical (5% return before expenses) | | $ | 1,000.00 | | | $ | 1,018.35 | | | $ | 6.78 | | | | 1.34 | % |
Class B | | | | | | | | | | | | | | | | |
Actual | | $ | 1,000.00 | | | $ | 887.60 | | | $ | 9.89 | | | | 2.09 | % |
Hypothetical (5% return before expenses) | | $ | 1,000.00 | | | $ | 1,014.59 | | | $ | 10.56 | | | | 2.09 | % |
Class C | | | | | | | | | | | | | | | | |
Actual | | $ | 1,000.00 | | | $ | 887.73 | | | $ | 9.89 | | | | 2.09 | % |
Hypothetical (5% return before expenses) | | $ | 1,000.00 | | | $ | 1,014.59 | | | $ | 10.56 | | | | 2.09 | % |
Class R | | | | | | | | | | | | | | | | |
Actual | | $ | 1,000.00 | | | $ | 889.80 | | | $ | 7.53 | | | | 1.59 | % |
Hypothetical (5% return before expenses) | | $ | 1,000.00 | | | $ | 1,017.10 | | | $ | 8.04 | | | | 1.59 | % |
Class R6 | | | | | | | | | | | | | | | | |
Actual | | $ | 1,000.00 | | | $ | 893.05 | | | $ | 4.22 | | | | 0.89 | % |
Hypothetical (5% return before expenses) | | $ | 1,000.00 | | | $ | 1,020.61 | | | $ | 4.51 | | | | 0.89 | % |
Administrator Class | | | | | | | | | | | | | | | | |
Actual | | $ | 1,000.00 | | | $ | 891.82 | | | $ | 5.31 | | | | 1.12 | % |
Hypothetical (5% return before expenses) | | $ | 1,000.00 | | | $ | 1,019.45 | | | $ | 5.67 | | | | 1.12 | % |
Institutional Class | | | | | | | | | | | | | | | | |
Actual | | $ | 1,000.00 | | | $ | 892.75 | | | $ | 4.46 | | | | 0.94 | % |
Hypothetical (5% return before expenses) | | $ | 1,000.00 | | | $ | 1,020.36 | | | $ | 4.76 | | | | 0.94 | % |
| 1 | Expenses paid is equal to the annualized expense ratio of each class multiplied by the average account value over the period, multiplied by the number of days in the most recent fiscal half-year divided by the number of days in the fiscal year (to reflect the one-half-year period). |
| | | | | | |
| Portfolio of investments—September 30, 2015 (unaudited) | | Wells Fargo Advantage Special Small Cap Value Fund | | | 7 | |
| | | | | | | | | | | | |
| Security name | | | | | | Shares | | | Value | |
| | | | |
Common Stocks: 95.89% | | | | | | | | | | | | |
| | | | |
Consumer Discretionary: 11.01% | | | | | | | | | | | | |
| | | | |
| Diversified Consumer Services: 0.65% | | | | | | | | | | | | |
Liberty Tax Incorporated | | | | | | | 195,147 | | | $ | 4,544,974 | |
| | | | | | | | | | | | |
| | | | |
| Hotels, Restaurants & Leisure: 4.56% | | | | | | | | | | | | |
Denny’s Corporation † | | | | | | | 362,896 | | | | 4,002,743 | |
DineEquity Incorporated | | | | | | | 98,050 | | | | 8,987,265 | |
Krispy Kreme Doughnuts Incorporated † | | | | | | | 557,700 | | | | 8,159,151 | |
Ruby Tuesday Incorporated † | | | | | | | 555,100 | | | | 3,447,171 | |
The Wendy’s Company | | | | | | | 838,100 | | | | 7,249,565 | |
| | | | |
| | | | | | | | | | | 31,845,895 | |
| | | | | | | | | | | | |
| | | | |
| Household Durables: 2.50% | | | | | | | | | | | | |
Blyth Incorporated † | | | | | | | 149,500 | | | | 892,515 | |
Dixie Group Incorporated Ǡ | | | | | | | 419,346 | | | | 3,505,733 | |
Helen of Troy Limited † | | | | | | | 81,700 | | | | 7,295,810 | |
Tupperware Brands Corporation « | | | | | | | 116,400 | | | | 5,760,636 | |
| | | | |
| | | | | | | | | | | 17,454,694 | |
| | | | | | | | | | | | |
| | | | |
| Media: 1.18% | | | | | | | | | | | | |
A.H. Belo Corporation Class A | | | | | | | 902,039 | | | | 4,447,052 | |
New Media Investment Group Incorporated | | | | | | | 242,943 | | | | 3,755,899 | |
| | | | |
| | | | | | | | | | | 8,202,951 | |
| | | | | | | | | | | | |
| | | | |
| Specialty Retail: 1.49% | | | | | | | | | | | | |
Ascena Retail Group Incorporated † | | | | | | | 137,100 | | | | 1,907,061 | |
Christopher & Banks Corporation † | | | | | | | 519,120 | | | | 576,223 | |
Guess? Incorporated | | | | | | | 193,900 | | | | 4,141,704 | |
The Buckle Incorporated « | | | | | | | 101,400 | | | | 3,748,758 | |
| | | | |
| | | | | | | | | | | 10,373,746 | |
| | | | | | | | | | | | |
| | | | |
| Textiles, Apparel & Luxury Goods: 0.63% | | | | | | | | | | | | |
Delta Apparel Incorporated † | | | | | | | 247,739 | | | | 4,367,639 | |
| | | | | | | | | | | | |
| | | | |
Consumer Staples: 6.49% | | | | | | | | | | | | |
| | | | |
| Beverages: 0.92% | | | | | | | | | | | | |
Cott Corporation | | | | | | | 595,200 | | | | 6,446,016 | |
| | | | | | | | | | | | |
| | | | |
| Food & Staples Retailing: 0.68% | | | | | | | | | | | | |
SUPERVALU Incorporated † | | | | | | | 382,700 | | | | 2,747,786 | |
The Fresh Market Incorporated † | | | | | | | 88,800 | | | | 2,005,992 | |
| | | | |
| | | | | | | | | | | 4,753,778 | |
| | | | | | | | | | | | |
| | | | |
| Food Products: 1.74% | | | | | | | | | | | | |
SunOpta Incorporated † | | | | | | | 42,400 | | | | 206,064 | |
TreeHouse Foods Incorporated † | | | | | | | 153,285 | | | | 11,924,040 | |
| | | | |
| | | | | | | | | | | 12,130,104 | |
| | | | | | | | | | | | |
The accompanying notes are an integral part of these financial statements.
| | | | |
| 8 | | Wells Fargo Advantage Special Small Cap Value Fund | | Portfolio of investments—September 30, 2015 (unaudited) |
| | | | | | | | | | | | |
| Security name | | | | | | Shares | | | Value | |
| | | | |
| Household Products: 3.15% | | | | | | | | | | | | |
Central Garden & Pet Company † | | | | | | | 351,892 | | | $ | 5,443,769 | |
Spectrum Brands Holdings Incorporated | | | | | | | 69,800 | | | | 6,387,398 | |
WD-40 Company | | | | | | | 113,822 | | | | 10,138,126 | |
| | | | |
| | | | | | | | | | | 21,969,293 | |
| | | | | | | | | | | | |
| | | | |
Energy: 3.71% | | | | | | | | | | | | |
| | | | |
| Energy Equipment & Services: 2.18% | | | | | | | | | | | | |
Atwood Oceanics Incorporated « | | | | | | | 222,700 | | | | 3,298,187 | |
CARBO Ceramics Incorporated « | | | | | | | 154,300 | | | | 2,930,157 | |
Patterson-UTI Energy Incorporated | | | | | | | 259,100 | | | | 3,404,574 | |
Steel Excel Incorporated † | | | | | | | 280,613 | | | | 5,598,229 | |
| | | | |
| | | | | | | | | | | 15,231,147 | |
| | | | | | | | | | | | |
| | | | |
| Oil, Gas & Consumable Fuels: 1.53% | | | | | | | | | | | | |
Energen Corporation | | | | | | | 65,500 | | | | 3,265,830 | |
Gulfport Energy Corporation † | | | | | | | 115,823 | | | | 3,437,627 | |
PDC Energy Incorporated † | | | | | | | 74,600 | | | | 3,954,546 | |
| | | | |
| | | | | | | | | | | 10,658,003 | |
| | | | | | | | | | | | |
| | | | |
Financials: 21.33% | | | | | | | | | | | | |
| | | | |
| Banks: 8.26% | | | | | | | | | | | | |
Associated Banc-Corp | | | | | | | 371,500 | | | | 6,675,855 | |
BBCN Bancorp Incorporated | | | | | | | 234,400 | | | | 3,520,688 | |
First Citizens BancShares Corporation Class A | | | | | | | 74,900 | | | | 16,927,400 | |
First Niagara Financial Group Incorporated | | | | | | | 410,000 | | | | 4,186,100 | |
Hancock Holding Company | | | | | | | 190,900 | | | | 5,163,845 | |
TCF Financial Corporation | | | | | | | 607,336 | | | | 9,207,214 | |
UMB Financial Corporation | | | | | | | 234,663 | | | | 11,923,227 | |
| | | | |
| | | | | | | | | | | 57,604,329 | |
| | | | | | | | | | | | |
| | | | |
| Capital Markets: 2.57% | | | | | | | | | | | | |
Apollo Investment Corporation « | | | | | | | 607,900 | | | | 3,331,292 | |
CIFC Corporation | | | | | | | 179,685 | | | | 1,284,748 | |
New Mountain Finance Corporation « | | | | | | | 236,700 | | | | 3,216,753 | |
Westwood Holdings Group Incorporated | | | | | | | 186,412 | | | | 10,131,492 | |
| | | | |
| | | | | | | | | | | 17,964,285 | |
| | | | | | | | | | | | |
| | | | |
| Insurance: 7.57% | | | | | | | | | | | | |
Brown & Brown Incorporated | | | | | | | 404,400 | | | | 12,524,268 | |
Endurance Specialty Holdings Limited | | | | | | | 97,300 | | | | 5,938,219 | |
Fidelity & Guaranty Life | | | | | | | 114,497 | | | | 2,809,756 | |
ProAssurance Corporation | | | | | | | 223,800 | | | | 10,981,866 | |
RenaissanceRe Holdings Limited | | | | | | | 42,500 | | | | 4,518,600 | |
Stewart Information Services Corporation | | | | | | | 138,700 | | | | 5,674,217 | |
Validus Holdings Limited | | | | | | | 230,300 | | | | 10,379,621 | |
| | | | |
| | | | | | | | | | | 52,826,547 | |
| | | | | | | | | | | | |
The accompanying notes are an integral part of these financial statements.
| | | | | | |
| Portfolio of investments—September 30, 2015 (unaudited) | | Wells Fargo Advantage Special Small Cap Value Fund | | | 9 | |
| | | | | | | | | | | | |
| Security name | | | | | | Shares | | | Value | |
| | | | |
| REITs: 2.93% | | | | | | | | | | | | |
Apollo Commercial Real Estate Finance Incorporated | | | | | | | 177,400 | | | $ | 2,786,954 | |
Gramercy Property Trust Incorporated | | | | | | | 245,600 | | | | 5,101,112 | |
Hatteras Financial Corporation | | | | | | | 570,408 | | | | 8,641,681 | |
LaSalle Hotel Properties | | | | | | | 138,200 | | | | 3,923,498 | |
| | | | |
| | | | | | | | | | | 20,453,245 | |
| | | | | | | | | | | | |
| | | | |
Health Care: 8.89% | | | | | | | | | | | | |
| | | | |
| Biotechnology: 0.53% | | | | | | | | | | | | |
Myriad Genetics Incorporated Ǡ | | | | | | | 98,000 | | | | 3,673,040 | |
| | | | | | | | | | | | |
| | | | |
| Health Care Equipment & Supplies: 4.14% | | | | | | | | | | | | |
Analogic Corporation | | | | | | | 103,583 | | | | 8,497,949 | |
CryoLife Incorporated | | | | | | | 225,900 | | | | 2,198,007 | |
Haemonetics Corporation † | | | | | | | 169,100 | | | | 5,465,312 | |
Halyard Health Incorporated † | | | | | | | 138,500 | | | | 3,938,940 | |
Meridian Diagnostics Incorporated | | | | | | | 219,500 | | | | 3,753,450 | |
Steris Corporation | | | | | | | 78,100 | | | | 5,074,157 | |
| | | | |
| | | | | | | | | | | 28,927,815 | |
| | | | | | | | | | | | |
| | | | |
| Health Care Providers & Services: 2.49% | | | | | | | | | | | | |
Owens & Minor Incorporated | | | | | | | 138,100 | | | | 4,410,914 | |
Patterson Companies Incorporated | | | | | | | 171,900 | | | | 7,434,675 | |
WellCare Health Plans Incorporated † | | | | | | | 63,900 | | | | 5,506,902 | |
| | | | |
| | | | | | | | | | | 17,352,491 | |
| | | | | | | | | | | | |
| | | | |
| Health Care Technology: 0.53% | | | | | | | | | | | | |
HMS Holdings Corporation † | | | | | | | 418,600 | | | | 3,671,122 | |
| | | | | | | | | | | | |
| | | | |
| Life Sciences Tools & Services: 0.81% | | | | | | | | | | | | |
Bio-Rad Laboratories Incorporated Class A † | | | | | | | 42,200 | | | | 5,667,882 | |
| | | | | | | | | | | | |
| | | | |
| Pharmaceuticals: 0.39% | | | | | | | | | | | | |
Theravance Incorporated « | | | | | | | 381,200 | | | | 2,737,016 | |
| | | | | | | | | | | | |
| | | | |
Industrials: 19.42% | | | | | | | | | | | | |
| | | | |
| Building Products: 1.69% | | | | | | | | | | | | |
Simpson Manufacturing Company Incorporated | | | | | | | 350,818 | | | | 11,748,895 | |
| | | | | | | | | | | | |
| | | | |
| Commercial Services & Supplies: 4.78% | | | | | | | | | | | | |
ACCO Brands Corporation † | | | | | | | 1,099,869 | | | | 7,776,074 | |
Brady Corporation Class A | | | | | | | 333,400 | | | | 6,554,644 | |
Matthews International Corporation Class A | | | | | | | 141,298 | | | | 6,919,363 | |
Quad Graphics Incorporated | | | | | | | 209,300 | | | | 2,532,530 | |
Viad Corporation | | | | | | | 330,553 | | | | 9,582,731 | |
| | | | |
| | | | | | | | | | | 33,365,342 | |
| | | | | | | | | | | | |
| | | | |
| Construction & Engineering: 1.18% | | | | | | | | | | | | |
EMCOR Group Incorporated | | | | | | | 185,900 | | | | 8,226,075 | |
| | | | | | | | | | | | |
The accompanying notes are an integral part of these financial statements.
| | | | |
| 10 | | Wells Fargo Advantage Special Small Cap Value Fund | | Portfolio of investments—September 30, 2015 (unaudited) |
| | | | | | | | | | | | |
| Security name | | | | | | Shares | | | Value | |
| | | | |
| Electrical Equipment: 3.35% | | | | | | | | | | | | |
Babcock & Wilcox Enterprises Incorporated † | | | | | | | 63,400 | | | $ | 1,065,120 | |
EnerSys | | | | | | | 128,800 | | | | 6,901,104 | |
Franklin Electric Company Incorporated | | | | | | | 422,087 | | | | 11,493,429 | |
Regal-Beloit Corporation | | | | | | | 69,700 | | | | 3,934,565 | |
| | | | |
| | | | | | | | | | | 23,394,218 | |
| | | | | | | | | | | | |
| | | | |
| Machinery: 7.29% | | | | | | | | | | | | |
Briggs & Stratton Corporation | | | | | | | 219,300 | | | | 4,234,683 | |
Circor International Incorporated | | | | | | | 34,500 | | | | 1,384,140 | |
Douglas Dynamics Incorporated | | | | | | | 475,147 | | | | 9,436,419 | |
ESCO Technologies Incorporated | | | | | | | 216,700 | | | | 7,779,530 | |
Hillenbrand Incorporated | | | | | | | 258,902 | | | | 6,734,041 | |
Kadant Incorporated | | | | | | | 245,044 | | | | 9,559,166 | |
Mueller Industries Incorporated | | | | | | | 397,340 | | | | 11,753,317 | |
| | | | |
| | | | | | | | | | | 50,881,296 | |
| | | | | | | | | | | | |
| | | | |
| Professional Services: 1.13% | | | | | | | | | | | | |
Korn/Ferry International | | | | | | | 239,146 | | | | 7,908,558 | |
| | | | | | | | | | | | |
| | | | |
Information Technology: 12.57% | | | | | | | | | | | | |
| | | | |
| Communications Equipment: 0.97% | | | | | | | | | | | | |
Aviat Networks Incorporated † | | | | | | | 807,647 | | | | 839,953 | |
NETGEAR Incorporated † | | | | | | | 201,900 | | | | 5,889,423 | |
| | | | |
| | | | | | | | | | | 6,729,376 | |
| | | | | | | | | | | | |
| | | | |
| Electronic Equipment, Instruments & Components: 5.13% | | | | | | | | | | | | |
AVX Corporation | | | | | | | 408,998 | | | | 5,353,784 | |
Coherent Incorporated † | | | | | | | 92,300 | | | | 5,048,810 | |
GSI Group Incorporated † | | | | | | | 888,505 | | | | 11,310,669 | |
Orbotech Limited † | | | | | | | 314,697 | | | | 4,862,069 | |
Vishay Intertechnology Incorporated | | | | | | | 950,521 | | | | 9,210,548 | |
| | | | |
| | | | | | | | | | | 35,785,880 | |
| | | | | | | | | | | | |
| | | | |
| IT Services: 3.46% | | | | | | | | | | | | |
Acxiom Corporation † | | | | | | | 119,554 | | | | 2,362,387 | |
DST Systems Incorporated | | | | | | | 70,900 | | | | 7,454,426 | |
Sykes Enterprises Incorporated † | | | | | | | 337,800 | | | | 8,613,900 | |
Teradata Corporation † | | | | | | | 198,200 | | | | 5,739,872 | |
| | | | |
| | | | | | | | | | | 24,170,585 | |
| | | | | | | | | | | | |
| | | | |
| Semiconductors & Semiconductor Equipment: 0.68% | | | | | | | | | | | | |
DSP Group Incorporated † | | | | | | | 354,715 | | | | 3,231,454 | |
Exar Corporation † | | | | | | | 249,652 | | | | 1,485,429 | |
| | | | |
| | | | | | | | | | | 4,716,883 | |
| | | | | | | | | | | | |
| | | | |
| Software: 1.74% | | | | | | | | | | | | |
ACI Worldwide Incorporated † | | | | | | | 269,552 | | | | 5,692,938 | |
Progress Software Corporation † | | | | | | | 249,951 | | | | 6,456,234 | |
| | | | |
| | | | | | | | | | | 12,149,172 | |
| | | | | | | | | | | | |
The accompanying notes are an integral part of these financial statements.
| | | | | | |
| Portfolio of investments—September 30, 2015 (unaudited) | | Wells Fargo Advantage Special Small Cap Value Fund | | | 11 | |
| | | | | | | | | | | | | | |
| Security name | | | | | | | Shares | | | Value | |
| | | | |
| Technology Hardware, Storage & Peripherals: 0.59% | | | | | | | | | | | | | | |
Imation Corporation † | | | | | | | | | 1,929,730 | | | $ | 4,110,325 | |
| | | | | | | | | | | | | | |
| | | | |
Materials: 11.36% | | | | | | | | | | | | | | |
| | | | |
| Chemicals: 5.70% | | | | | | | | | | | | | | |
A. Schulman Incorporated | | | | | | | | | 127,758 | | | | 4,148,302 | |
HB Fuller Company | | | | | | | | | 171,900 | | | | 5,834,286 | |
Innospec Incorporated | | | | | | | | | 188,412 | | | | 8,763,042 | |
Quaker Chemical Corporation | | | | | | | | | 95,900 | | | | 7,391,972 | |
Scotts Miracle-Gro Company Class A | | | | | | | | | 96,400 | | | | 5,863,048 | |
Sensient Technologies Corporation | | | | | | | | | 126,200 | | | | 7,736,060 | |
| | | | |
| | | | | | | | | | | | | 39,736,710 | |
| | | | | | | | | | | | | | |
| | | | |
| Construction Materials: 1.69% | | | | | | | | | | | | | | |
Eagle Materials Incorporated | | | | | | | | | 172,700 | | | | 11,816,134 | |
| | | | | | | | | | | | | | |
| | | | |
| Containers & Packaging: 0.71% | | | | | | | | | | | | | | |
Silgan Holdings Incorporated | | | | | | | | | 95,200 | | | | 4,954,208 | |
| | | | | | | | | | | | | | |
| | | | | | | | | | | | | | |
| | | | |
| Metals & Mining: 0.86% | | | | | | | | | | | | | | |
Royal Gold Incorporated | | | | | | | | | 87,300 | | | | 4,101,354 | |
TimkenSteel Corporation | | | | | | | | | 190,500 | | | | 1,927,860 | |
| | | | |
| | | | | | | | | | | | | 6,029,214 | |
| | | | | | | | | | | | | | |
| | | | | | | | | | | | | | |
| | | | |
| Paper & Forest Products: 2.40% | | | | | | | | | | | | | | |
Neenah Paper Incorporated | | | | | | | | | 150,914 | | | | 8,795,268 | |
Schweitzer-Mauduit International Incorporated | | | | | | | | | 230,287 | | | | 7,917,267 | |
| | | | |
| | | | | | | | | | | | | 16,712,535 | |
| | | | | | | | | | | | | | |
| | | | | | | | | | | | | | |
| | | | |
Utilities: 1.11% | | | | | | | | | | | | | | |
| | | | |
| Electric Utilities: 1.11% | | | | | | | | | | | | | | |
Hawaiian Electric Industries Incorporated | | | | | | | | | 270,600 | | | | 7,763,514 | |
| | | | | | | | | | | | | | |
| | | | |
Total Common Stocks (Cost $646,232,977) | | | | | | | | | | | | | 669,054,932 | |
| | | | | | | | | | | | | | |
| | | | |
| | | Yield | | | | | | | | | |
| Short-Term Investments: 7.59% | | | | | | | | | | | | | | |
| | | | |
| Investment Companies: 7.59% | | | | | | | | | | | | | | |
Securities Lending Cash Investments, LLC (l)(r)(u) | | | 0.15 | % | | | | | 21,253,444 | | | | 21,253,444 | |
Wells Fargo Advantage Cash Investment Money Market Fund, Select Class (l)(u) | | | 0.16 | | | | | | 31,696,041 | | | | 31,696,041 | |
| | | | |
Total Short-Term Investments (Cost $52,949,485) | | | | | | | | | | | | | 52,949,485 | |
| | | | | | | | | | | | | | |
| | | | | | | | |
| Total investments in securities (Cost $699,182,462) * | | | 103.48 | % | | | 722,004,417 | |
Other assets and liabilities, net | | | (3.48 | ) | | | (24,299,021 | ) |
| | | | | | | | |
| Total net assets | | | 100.00 | % | | $ | 697,705,396 | |
| | | | | | | | |
The accompanying notes are an integral part of these financial statements.
| | | | |
| 12 | | Wells Fargo Advantage Special Small Cap Value Fund | | Portfolio of investments—September 30, 2015 (unaudited) |
| † | Non-income-earning security |
| « | All or a portion of this security is on loan. |
| (l) | The security represents an affiliate of the Fund as defined in the Investment Company Act of 1940. |
| (r) | The investment is a non-registered investment vehicle purchased with cash collateral received from securities on loan. |
| (u) | The rate represents the 7-day annualized yield at period end. |
| * | Cost for federal income tax purposes is $706,684,197 and unrealized gains (losses) consists of: |
| | | | |
Gross unrealized gains | | $ | 103,798,413 | |
Gross unrealized losses | | | (88,478,193 | ) |
| | | | |
Net unrealized gains | | $ | 15,320,220 | |
The accompanying notes are an integral part of these financial statements.
| | | | | | |
| Statement of assets and liabilities—September 30, 2015 (unaudited) | | Wells Fargo Advantage Special Small Cap Value Fund | | | 13 | |
| | | | |
| | | | |
| |
Assets | | | | |
Investments | | | | |
In unaffiliated securities (including $20,657,521 of securities loaned), at value (cost $646,232,977) | | $ | 669,054,932 | |
In affiliated securities, at value (cost $52,949,485) | | | 52,949,485 | |
| | | | |
Total investments, at value (cost $699,182,462) | | | 722,004,417 | |
Cash | | | 4,078 | |
Receivable for investments sold | | | 1,038,111 | |
Receivable for Fund shares sold | | | 1,109,722 | |
Receivable for dividends | | | 1,209,268 | |
Receivable for securities lending income | | | 45,694 | |
Prepaid expenses and other assets | | | 69,093 | |
| | | | |
Total assets | | | 725,480,383 | |
| | | | |
| |
Liabilities | | | | |
Payable for investments purchased | | | 4,917,724 | |
Payable for Fund shares redeemed | | | 790,265 | |
Payable upon receipt of securities loaned | | | 21,253,444 | |
Management fee payable | | | 477,292 | |
Distribution fees payable | | | 25,870 | |
Administration fees payable | | | 105,153 | |
Accrued expenses and other liabilities | | | 205,239 | |
| | | | |
Total liabilities | | | 27,774,987 | |
| | | | |
Total net assets | | $ | 697,705,396 | |
| | | | |
| |
NET ASSETS CONSIST OF | | | | |
Paid-in capital | | $ | 671,575,170 | |
Undistributed net investment income | | | 4,928,753 | |
Accumulated net realized losses on investments | | | (1,620,482 | ) |
Net unrealized gains on investments | | | 22,821,955 | |
| | | | |
Total net assets | | $ | 697,705,396 | |
| | | | |
| |
COMPUTATION OF NET ASSET VALUE AND OFFERING PRICE PER SHARE | | | | |
Net assets – Class A | | $ | 393,440,636 | |
Shares outstanding – Class A1 | | | 15,086,140 | |
Net asset value per share – Class A | | | $26.08 | |
Maximum offering price per share – Class A2 | | | $27.67 | |
Net assets – Class B | | $ | 1,822,914 | |
Shares outstanding – Class B1 | | | 76,953 | |
Net asset value per share – Class B | | | $23.69 | |
Net assets – Class C | | $ | 39,146,174 | |
Shares outstanding – Class C1 | | | 1,645,123 | |
Net asset value per share – Class C | | | $23.80 | |
Net assets – Class R | | $ | 25,000 | |
Shares outstanding – Class R1 | | | 936 | |
Net asset value per share – Class R | | | $26.72 | |
Net assets – Class R6 | | $ | 129,349 | |
Shares outstanding – Class R61 | | | 4,841 | |
Net asset value per share – Class R6 | | | $26.72 | |
Net assets – Administrator Class | | $ | 65,862,760 | |
Shares outstanding – Administrator Class1 | | | 2,465,821 | |
Net asset value per share – Administrator Class | | | $26.71 | |
Net assets – Institutional Class | | $ | 197,278,563 | |
Shares outstanding – Institutional Class1 | | | 7,382,564 | |
Net asset value per share – Institutional Class | | | $26.72 | |
| 1 | The Fund has an unlimited number of authorized shares. |
| 2 | Maximum offering price is computed as 100/94.25 of net asset value. On investments of $50,000 or more, the offering price is reduced. |
The accompanying notes are an integral part of these financial statements.
| | | | |
| 14 | | Wells Fargo Advantage Special Small Cap Value Fund | | Statement of operations—six months ended September 30, 2015 (unaudited) |
| | | | |
| | | | |
| |
Investment income | | | | |
Dividends (net of foreign withholding taxes of $11,759) | | $ | 7,008,163 | |
Securities lending income, net | | | 508,440 | |
Income from affiliated securities | | | 19,984 | |
| | | | |
Total investment income | | | 7,536,587 | |
| | | | |
| |
Expenses | | | | |
Management fee | | | 3,131,154 | |
Administration fees | | | | |
Class A | | | 510,219 | |
Class B | | | 2,673 | |
Class C | | | 50,545 | |
Class R6 | | | 9 | |
Administrator Class | | | 38,500 | |
Institutional Class | | | 104,847 | |
Shareholder servicing fees | | | | |
Class A | | | 541,428 | |
Class B | | | 2,819 | |
Class C | | | 53,633 | |
Administrator Class | | | 83,694 | |
Distribution fees | | | | |
Class B | | | 8,457 | |
Class C | | | 160,897 | |
Custody and accounting fees | | | 39,456 | |
Professional fees | | | 25,575 | |
Registration fees | | | 45,243 | |
Shareholder report expenses | | | 40,505 | |
Trustees’ fees and expenses | | | 3,545 | |
Other fees and expenses | | | 8,489 | |
| | | | |
Total expenses | | | 4,851,688 | |
Less: Fee waivers and/or expense reimbursements | | | (167,149 | ) |
| | | | |
Net expenses | | | 4,684,539 | |
| | | | |
Net investment income | | | 2,852,048 | |
| | | | �� |
| |
REALIZED AND UNREALIZED GAINS (LOSSES) ON INVESTMENTS | | | | |
Net realized gains on investments | | | 17,425,481 | |
Net change in unrealized gains (losses) on investments | | | (104,157,611 | ) |
| | | | |
Net realized and unrealized gains (losses) on investments | | | (86,732,130 | ) |
| | | | |
Net decrease in net assets resulting from operations | | $ | (83,880,082 | ) |
| | | | |
The accompanying notes are an integral part of these financial statements.
| | | | | | |
| Statement of changes in net assets | | Wells Fargo Advantage Special Small Cap Value Fund | | | 15 | |
| | | | | | | | | | | | | | | | |
| | | Six months ended September 30, 2015 (unaudited) | | | Year ended March 31, 2015 | |
| | | | |
Operations | | | | | | | | | | | | | | | | |
Net investment income | | | | | | $ | 2,852,048 | | | | | | | $ | 6,802,567 | |
Net realized gains on investments | | | | | | | 17,425,481 | | | | | | | | 45,004,416 | |
Net change in unrealized gains (losses) on investments | | | | | | | (104,157,611 | ) | | | | | | | 1,853,024 | |
| | | | |
Net increase (decrease) in net assets resulting from operations | | | | | | | (83,880,082 | ) | | | | | | | 53,660,007 | |
| | | | |
| | | | |
Distributions to shareholders from | | | | | | | | | | | | | | | | |
Net investment income | | | | | | | | | | | | | | | | |
Class A | | | | | | | 0 | | | | | | | | (3,226,001 | ) |
Class C | | | | | | | 0 | | | | | | | | (11,114 | ) |
Class R6 | | | | | | | 0 | | | | | | | | (306 | )2 |
Administrator Class | | | | | | | 0 | | | | | | | | (558,514 | ) |
Institutional Class | | | | | | | 0 | | | | | | | | (2,040,765 | ) |
Net realized gains | | | | | | | | | | | | | | | | |
Class A | | | | | | | 0 | | | | | | | | (66,808,530 | ) |
Class B | | | | | | | 0 | | | | | | | | (508,991 | ) |
Class C | | | | | | | 0 | | | | | | | | (7,206,152 | ) |
Class R6 | | | | | | | 0 | | | | | | | | (3,880 | )2 |
Administrator Class | | | | | | | 0 | | | | | | | | (9,100,902 | ) |
Institutional Class | | | | | | | 0 | | | | | | | | (27,568,111 | ) |
| | | | |
Total distributions to shareholders | | | | | | | 0 | | | | | | | | (117,033,266 | ) |
| | | | |
| | | | |
Capital share transactions | | | Shares | | | | | | | | Shares | | | | | |
Proceeds from shares sold | | | | | | | | | | | | | | | | |
Class A | | | 870,100 | | | | 24,717,015 | | | | 2,415,533 | | | | 73,079,829 | |
Class B | | | 31 | | | | 808 | | | | 831 | | | | 22,261 | |
Class C | | | 74,916 | | | | 1,934,581 | | | | 146,593 | | | | 4,105,094 | |
Class R | | | 936 | 1 | | | 25,000 | 1 | | | N/A | | | | N/A | |
Class R6 | | | 4,060 | | | | 115,072 | | | | 749 | 2 | | | 25,000 | 2 |
Administrator Class | | | 937,252 | | | | 26,906,761 | | | | 1,104,188 | | | | 34,033,327 | |
Institutional Class | | | 1,658,203 | | | | 48,353,921 | | | | 2,320,193 | | | | 73,297,899 | |
| | | | |
| | | | | | | 102,053,158 | | | | | | | | 184,563,410 | |
| | | | |
Reinvestment of distributions | | | | | | | | | | | | | | | | |
Class A | | | 0 | | | | 0 | | | | 2,471,872 | | | | 67,960,767 | |
Class B | | | 0 | | | | 0 | | | | 19,500 | | | | 486,712 | |
Class C | | | 0 | | | | 0 | | | | 256,095 | | | | 6,422,643 | |
Class R6 | | | 0 | | | | 0 | | | | 149 | 2 | | | 4,186 | 2 |
Administrator Class | | | 0 | | | | 0 | | | | 331,510 | | | | 9,331,809 | |
Institutional Class | | | 0 | | | | 0 | | | | 795,610 | | | | 22,416,688 | |
| | | | |
| | | | | | | 0 | | | | | | | | 106,622,805 | |
| | | | |
Payment for shares redeemed | | | | | | | | | | | | | | | | |
Class A | | | (1,123,304 | ) | | | (31,743,438 | ) | | | (2,712,534 | ) | | | (83,101,895 | ) |
Class B | | | (25,332 | ) | | | (659,687 | ) | | | (57,981 | ) | | | (1,660,897 | ) |
Class C | | | (83,379 | ) | | | (2,157,272 | ) | | | (161,778 | ) | | | (4,569,660 | ) |
Class R6 | | | (117 | ) | | | (3,509 | ) | | | 0 | 2 | | | 0 | 2 |
Administrator Class | | | (812,398 | ) | | | (24,020,939 | ) | | | (1,460,618 | ) | | | (46,782,017 | ) |
Institutional Class | | | (622,413 | ) | | | (18,010,355 | ) | | | (1,170,774 | ) | | | (36,425,234 | ) |
| | | | |
| | | | | | | (76,595,200 | ) | | | | | | | (172,539,703 | ) |
| | | | |
Net increase in net assets resulting from capital share transactions | | | | | | | 25,457,958 | | | | | | | | 118,646,512 | |
| | | | |
Total increase (decrease) in net assets | | | | | | | (58,422,124 | ) | | | | | | | 55,273,253 | |
| | | | |
| | | | |
Net assets | | | | | | | | | | | | | | | | |
Beginning of period | | | | | | | 756,127,520 | | | | | | | | 700,854,267 | |
| | | | |
End of period | | | | | | $ | 697,705,396 | | | | | | | $ | 756,127,520 | |
| | | | |
Undistributed net investment income | | | | | | $ | 4,928,753 | | | | | | | $ | 2,076,705 | |
| | | | |
| 1 | The class commenced operations on September 30, 2015. Information represents activity for the one day of operation. |
| 2 | For the period from October 31, 2014 (commencement of class operations) to March 31, 2015 |
The accompanying notes are an integral part of these financial statements.
| | | | |
| 16 | | Wells Fargo Advantage Special Small Cap Value Fund | | Financial highlights |
(For a share outstanding throughout each period)
| | | | | | | | | | | | | | | | | | | | | | | | | | | | | | | | |
| | | Six months ended
September 30, 2015
(unaudited) | | | Year ended March 31 | | | Year ended October 31 | | | Year ended
July 31, 20103 | |
| CLASS A | | | 2015 | | | 20141 | | | 2013 | | | 2012 | | | 2011 | | | 20102 | | |
Net asset value, beginning of period | | | $29.27 | | | | $32.59 | | | | $31.35 | | | | $22.97 | | | | $20.97 | | | | $19.78 | | | | $18.50 | | | | $15.51 | |
Net investment income (loss) | | | 0.10 | | | | 0.26 | | | | 0.10 | | | | (0.01 | )4 | | | (0.05 | ) | | | (0.05 | ) | | | (0.01 | ) | | | (0.02 | ) |
Net realized and unrealized gains (losses) on investments | | | (3.29 | ) | | | 1.81 | | | | 3.14 | | | | 8.37 | | | | 2.05 | | | | 1.24 | | | | 1.29 | | | | 3.07 | |
| | | | | | | | | | | | | | | | | | | | | | | | | | | | | | | | |
Total from investment operations | | | (3.19 | ) | | | 2.07 | | | | 3.24 | | | | 8.38 | | | | 2.00 | | | | 1.19 | | | | 1.28 | | | | 3.05 | |
Distributions to shareholders from | | | | | | | | | | | | | | | | | | | | | | | | | | | | | | | | |
Net investment income | | | 0.00 | | | | (0.21 | ) | | | (0.03 | ) | | | 0.00 | | | | 0.00 | | | | 0.00 | | | | 0.00 | | | | (0.01 | ) |
Net realized gains | | | 0.00 | | | | (5.18 | ) | | | (1.97 | ) | | | 0.00 | | | | 0.00 | | | | 0.00 | | | | 0.00 | | | | 0.00 | |
Tax basis return of capital | | | 0.00 | | | | 0.00 | | | | 0.00 | | | | 0.00 | | | | 0.00 | | | | 0.00 | | | | 0.00 | | | | (0.05 | )4 |
| | | | | | | | | | | | | | | | | | | | | | | | | | | | | | | | |
Total distributions to shareholders | | | 0.00 | | | | (5.39 | ) | | | (2.00 | ) | | | 0.00 | | | | 0.00 | | | | 0.00 | | | | 0.00 | | | | (0.06 | ) |
Net asset value, end of period | | | $26.08 | | | | $29.27 | | | | $32.59 | | | | $31.35 | | | | $22.97 | | | | $20.97 | | | | $19.78 | | | | $18.50 | |
Total return5 | | | (10.90 | )% | | | 7.56 | % | | | 10.74 | % | | | 36.48 | % | | | 9.54 | % | | | 6.02 | % | | | 6.92 | % | | | 19.72 | % |
Ratios to average net assets (annualized) | | | | | | | | | | | | | | | | | | | | | | | | | | | | | | | | |
Gross expenses | | | 1.37 | % | | | 1.39 | % | | | 1.41 | % | | | 1.40 | % | | | 1.38 | % | | | 1.37 | % | | | 1.46 | % | | | 1.43 | % |
Net expenses | | | 1.34 | % | | | 1.34 | % | | | 1.34 | % | | | 1.34 | % | | | 1.34 | % | | | 1.34 | % | | | 1.34 | % | | | 1.39 | % |
Net investment income (loss) | | | 0.68 | % | | | 0.90 | % | | | 0.75 | % | | | 0.04 | % | | | (0.16 | )% | | | (0.14 | )% | | | (0.19 | )% | | | (0.07 | )% |
Supplemental data | | | | | | | | | | | | | | | | | | | | | | | | | | | | | | | | |
Portfolio turnover rate | | | 24 | % | | | 79 | % | | | 37 | % | | | 65 | % | | | 69 | % | | | 54 | % | | | 7 | % | | | 45 | % |
Net assets, end of period (000s omitted) | | | $393,441 | | | | $448,980 | | | | $429,089 | | | | $409,557 | | | | $366,320 | | | | $387,767 | | | | $477,079 | | | | $472,903 | |
| 1 | For the five months ended March 31, 2014. The Fund changed its fiscal year end from October 31 to March 31, effective March 31, 2014. |
| 2 | For the three months ended October 31, 2010. The Fund changed its fiscal year end from July 31 to October 31, effective October 31, 2010. |
| 3 | After the close of business on July 16, 2010, the Fund acquired the net assets of Evergreen Special Values Fund and Evergreen Small Cap Value Fund. Evergreen Special Values Fund became the accounting and performance survivor in the transaction. The information for the period prior to July 19, 2010 is that of Class A of Evergreen Special Values Fund. |
| 4 | Calculated based upon average shares outstanding |
| 5 | Total return calculations do not include any sales charges. Returns for periods of less than one year are not annualized. |
The accompanying notes are an integral part of these financial statements.
| | | | | | |
| Financial highlights | | Wells Fargo Advantage Special Small Cap Value Fund | | | 17 | |
(For a share outstanding throughout each period)
| | | | | | | | | | | | | | | | | | | | | | | | | | | | | | | | |
| | | Six months ended
September 30, 2015
(unaudited) | | | Year ended March 31 | | | Year ended October 31 | | | Year ended
July 31, 20103 | |
| CLASS B | | | 2015 | | | 20141 | | | 2013 | | | 2012 | | | 2011 | | | 20102 | | |
Net asset value, beginning of period | | | $26.69 | | | | $30.19 | | | | $29.23 | | | | $21.58 | | | | $19.85 | | | | $18.87 | | | | $17.68 | | | | $14.88 | |
Net investment income (loss) | | | (0.01 | )4 | | | 0.03 | 4 | | | 0.00 | 4,5 | | | (0.16 | )4 | | | (0.19 | )4 | | | (0.18 | )4 | | | (0.08 | ) | | | (0.14 | )4 |
Net realized and unrealized gains (losses) on investments | | | (2.99 | ) | | | 1.65 | | | | 2.93 | | | | 7.81 | | | | 1.92 | | | | 1.16 | | | | 1.27 | | | | 2.94 | |
| | | | | | | | | | | | | | | | | | | | | | | | | | | | | | | | |
Total from investment operations | | | (3.00 | ) | | | 1.68 | | | | 2.93 | | | | 7.65 | | | | 1.73 | | | | 0.98 | | | | 1.19 | | | | 2.80 | |
Distributions to shareholders from | | | | | | | | | | | | | | | | | | | | | | | | | | | | | | | | |
Net realized gains | | | 0.00 | | | | (5.18 | ) | | | (1.97 | ) | | | 0.00 | | | | 0.00 | | | | 0.00 | | | | 0.00 | | | | 0.00 | |
Net asset value, end of period | | | $23.69 | | | | $26.69 | | | | $30.19 | | | | $29.23 | | | | $21.58 | | | | $19.85 | | | | $18.87 | | | | $17.68 | |
Total return4 | | | (11.24 | )% | | | 6.76 | % | | | 10.42 | % | | | 35.45 | % | | | 8.72 | % | | | 5.19 | % | | | 6.73 | % | | | 18.82 | % |
Ratios to average net assets (annualized) | | | | | | | | | | | | | | | | | | | | | | | | | | | | | | | | |
Gross expenses | | | 2.12 | % | | | 2.14 | % | | | 2.16 | % | | | 2.14 | % | | | 2.12 | % | | | 2.13 | % | | | 2.21 | % | | | 2.18 | % |
Net expenses | | | 2.09 | % | | | 2.09 | % | | | 2.09 | % | | | 2.09 | % | | | 2.09 | % | | | 2.09 | % | | | 2.09 | % | | | 2.15 | % |
Net investment income (loss) | | | (0.11 | )% | | | 0.09 | % | | | 0.02 | % | | | (0.64 | )% | | | (0.89 | )% | | | (0.88 | )% | | | (0.93 | )% | | | (0.82 | )% |
Supplemental data | | | | | | | | | | | | | | | | | | | | | | | | | | | | | | | | |
Portfolio turnover rate | | | 24 | % | | | 79 | % | | | 37 | % | | | 65 | % | | | 69 | % | | | 54 | % | | | 7 | % | | | 45 | % |
Net assets, end of period (000s omitted) | | | $1,823 | | | | $2,729 | | | | $4,224 | | | | $4,770 | | | | $9,171 | | | | $22,053 | | | | $36,922 | | | | $36,654 | |
| 1 | For the five months ended March 31, 2014. The Fund changed its fiscal year end from October 31 to March 31, effective March 31, 2014. |
| 2 | For the three months ended October 31, 2010. The Fund changed its fiscal year end from July 31 to October 31, effective October 31, 2010. |
| 3 | After the close of business on July 16, 2010, the Fund acquired the net assets of Evergreen Special Values Fund and Evergreen Small Cap Value Fund. Evergreen Special Values Fund became the accounting and performance survivor in the transaction. The information for the period prior to July 19, 2010 is that of Class B of Evergreen Special Values Fund. |
| 4 | Calculated based upon average shares outstanding |
| 5 | Amount is less than $0.005. |
| 6 | Total return calculations do not include any sales charges. Returns for periods of less than one year are not annualized. |
The accompanying notes are an integral part of these financial statements.
| | | | |
| 18 | | Wells Fargo Advantage Special Small Cap Value Fund | | Financial highlights |
(For a share outstanding throughout each period)
| | | | | | | | | | | | | | | | | | | | | | | | | | | | | | | | |
| | | Six months ended
September 30, 2015
(unaudited) | | | Year ended March 31 | | | Year ended October 31 | | | Year ended
July 31, 20103 | |
| CLASS C | | | 2015 | | | 20141 | | | 2013 | | | 2012 | | | 2011 | | | 20102 | | |
Net asset value, beginning of period | | | $26.81 | | | | $30.31 | | | | $29.34 | | | | $21.66 | | | | $19.92 | | | | $18.94 | | | | $17.74 | | | | $14.93 | |
Net investment income (loss) | | | (0.01 | ) | | | 0.04 | 4 | | | 0.00 | 4,5 | | | (0.18 | )4 | | | (0.19 | )4 | | | (0.18 | )4 | | | (0.07 | ) | | | (0.18 | ) |
Net realized and unrealized gains (losses) on investments | | | (3.00 | ) | | | 1.65 | | | | 2.94 | | | | 7.86 | | | | 1.93 | | | | 1.16 | | | | 1.27 | | | | 2.99 | |
| | | | | | | | | | | | | | | | | | | | | | | | | | | | | | | | |
Total from investment operations | | | (3.01 | ) | | | 1.69 | | | | 2.94 | | | | 7.68 | | | | 1.74 | | | | 0.98 | | | | 1.20 | | | | 2.81 | |
Distributions to shareholders from | | | | | | | | | | | | | | | | | | | | | | | | | | | | | | | | |
Net investment income | | | 0.00 | | | | (0.01 | ) | | | 0.00 | | | | 0.00 | | | | 0.00 | | | | 0.00 | | | | 0.00 | | | | 0.00 | |
Net realized gains | | | 0.00 | | | | (5.18 | ) | | | (1.97 | ) | | | 0.00 | | | | 0.00 | | | | 0.00 | | | | 0.00 | | | | 0.00 | |
| | | | | | | | | | | | | | | | | | | | | | | | | | | | | | | | |
Total distributions to shareholders | | | 0.00 | | | | (5.19 | ) | | | (1.97 | ) | | | 0.00 | | | | 0.00 | | | | 0.00 | | | | 0.00 | | | | 0.00 | |
Net asset value, end of period | | | $23.80 | | | | $26.81 | | | | $30.31 | | | | $29.34 | | | | $21.66 | | | | $19.92 | | | | $18.94 | | | | $17.74 | |
Total return6 | | | (11.23 | )% | | | 6.75 | % | | | 10.42 | % | | | 35.46 | % | | | 8.73 | % | | | 5.17 | % | | | 6.76 | % | | | 18.82 | % |
Ratios to average net assets (annualized) | | | | | | | | | | | | | | | | | | | | | | | | | | | | | | | | |
Gross expenses | | | 2.12 | % | | | 2.14 | % | | | 2.16 | % | | | 2.15 | % | | | 2.13 | % | | | 2.13 | % | | | 2.21 | % | | | 2.18 | % |
Net expenses | | | 2.09 | % | | | 2.09 | % | | | 2.09 | % | | | 2.09 | % | | | 2.09 | % | | | 2.09 | % | | | 2.09 | % | | | 2.12 | % |
Net investment income (loss) | | | (0.07 | )% | | | 0.15 | % | | | 0.00 | % | | | (0.71 | )% | | | (0.91 | )% | | | (0.89 | )% | | | (0.93 | )% | | | (0.80 | )% |
Supplemental data | | | | | | | | | | | | | | | | | | | | | | | | | | | | | | | | |
Portfolio turnover rate | | | 24 | % | | | 79 | % | | | 37 | % | | | 65 | % | | | 69 | % | | | 54 | % | | | 7 | % | | | 45 | % |
Net assets, end of period (000s omitted) | | | $39,146 | | | | $44,327 | | | | $42,816 | | | | $39,620 | | | | $33,478 | | | | $34,270 | | | | $40,850 | | | | $40,968 | |
| 1 | For the five months ended March 31, 2014. The Fund changed its fiscal year end from October 31 to March 31, effective March 31, 2014. |
| 2 | For the three months ended October 31, 2010. The Fund changed its fiscal year end from July 31 to October 31, effective October 31, 2010. |
| 3 | After the close of business on July 16, 2010, the Fund acquired the net assets of Evergreen Special Values Fund and Evergreen Small Cap Value Fund. Evergreen Special Values Fund became the accounting and performance survivor in the transaction. The information for the period prior to July 19, 2010 is that of Class C of Evergreen Special Values Fund. |
| 4 | Calculated based upon average shares outstanding. |
| 5 | Amount is less than $0.005. |
| 6 | Total return calculations do not include any sales charges. Returns for periods of less than one year are not annualized. |
The accompanying notes are an integral part of these financial statements.
| | | | | | |
| Financial highlights | | Wells Fargo Advantage Special Small Cap Value Fund | | | 19 | |
(For a share outstanding throughout the period)
| | | | |
| CLASS R | | Period ended September 30, 20151 (unaudited) | |
Net asset value, beginning of period | | | $26.72 | |
Net investment income | | | 0.00 | |
Net realized and unrealized gains (losses) on investments | | | 0.00 | |
| | | | |
Total from investment operations | | | 0.00 | |
Net asset value, end of period | | | $26.72 | |
Total return2 | | | 0.00 | % |
Ratios to average net assets (annualized) | | | | |
Gross expenses | | | 0.00 | % |
Net expenses | | | 0.00 | % |
Net investment income | | | 0.00 | % |
Supplemental data | | | | |
Portfolio turnover rate | | | 24 | % |
Net assets, end of period (000s omitted) | | | $25 | |
| 1 | The class commenced operations on September 30, 2015. Information represents activity for the one day of operation. |
| 2 | Returns for periods of less than one year are not annualized. |
The accompanying notes are an integral part of these financial statements.
| | | | |
| 20 | | Wells Fargo Advantage Special Small Cap Value Fund | | Financial highlights |
(For a share outstanding throughout each period)
| | | | | | | | |
| CLASS R6 | | Six months ended September 30, 2015 (unaudited) | | | Year ended March 31, 20151 | |
Net asset value, beginning of period | | | $29.91 | | | | $33.38 | |
Net investment income | | | 0.22 | 2 | | | 0.26 | 2 |
Net realized and unrealized gains (losses) on investments | | | (3.41 | ) | | | 1.80 | |
| | | | | | | | |
Total from investment operations | | | (3.19 | ) | | | 2.06 | |
Distributions to shareholders from | | | | | | | | |
Net investment income | | | 0.00 | | | | (0.35 | ) |
Net realized gains | | | 0.00 | | | | (5.18 | ) |
| | | | | | | | |
Total distributions to shareholders | | | 0.00 | | | | (5.53 | ) |
Net asset value, end of period | | | $26.72 | | | | $29.91 | |
Total return3 | | | (10.70 | )% | | | 7.42 | % |
Ratios to average net assets (annualized) | | | | | | | | |
Gross expenses | | | 0.92 | % | | | 0.89 | % |
Net expenses | | | 0.89 | % | | | 0.89 | % |
Net investment income | | | 1.56 | % | | | 2.16 | % |
Supplemental data | | | | | | | | |
Portfolio turnover rate | | | 24 | % | | | 79 | % |
Net assets, end of period (000s omitted) | | | $129 | | | | $27 | |
| 1 | For the period from October 31, 2014 (commencement of class operations) to March 31, 2015 |
| 2 | Calculated based upon average shares outstanding |
| 3 | Returns for periods of less than one year are not annualized. |
The accompanying notes are an integral part of these financial statements.
| | | | | | |
| Financial highlights | | Wells Fargo Advantage Special Small Cap Value Fund | | | 21 | |
(For a share outstanding throughout each period)
| | | | | | | | | | | | | | | | | | | | | | | | | | | | | | | | |
| | | Six months ended
September 30, 2015
(unaudited) | | | Year ended March 31 | | | Year ended October 31 | | | Year ended
July 31, 20103 | |
| ADMINISTRATOR CLASS | | | 2015 | | | 20141 | | | 2013 | | | 2012 | | | 2011 | | | 20102 | | |
Net asset value, beginning of period | | | $29.94 | | | | $33.21 | | | | $31.85 | | | | $23.28 | | | | $21.21 | | | | $19.96 | | | | $18.65 | | | | $15.63 | |
Net investment income | | | 0.13 | 4 | | | 0.35 | 4 | | | 0.14 | 4 | | | 0.08 | 4 | | | 0.02 | 4 | | | 0.02 | 4 | | | 0.01 | | | | 0.04 | 4 |
Net realized and unrealized gains (losses) on investments | | | (3.36 | ) | | | 1.83 | | | | 3.21 | | | | 8.49 | | | | 2.05 | | | | 1.23 | | | | 1.30 | | | | 3.04 | |
| | | | | | | | | | | | | | | | | | | | | | | | | | | | | | | | |
Total from investment operations | | | (3.23 | ) | | | 2.18 | | | | 3.35 | | | | 8.57 | | | | 2.07 | | | | 1.25 | | | | 1.31 | | | | 3.08 | |
Distributions to shareholders from | | | | | | | | | | | | | | | | | | | | | | | | | | | | | | | | |
Net investment income | | | 0.00 | | | | (0.27 | ) | | | (0.02 | ) | | | (0.00 | )5 | | | 0.00 | | | | 0.00 | | | | 0.00 | | | | (0.01 | ) |
Net realized gains | | | 0.00 | | | | (5.18 | ) | | | (1.97 | ) | | | 0.00 | | | | 0.00 | | | | 0.00 | | | | 0.00 | | | | 0.00 | |
Tax basis return of capital | | | 0.00 | | | | 0.00 | | | | 0.00 | | | | 0.00 | | | | 0.00 | | | | 0.00 | | | | 0.00 | | | | (0.05 | )4 |
| | | | | | | | | | | | | | | | | | | | | | | | | | | | | | | | |
Total distributions to shareholders | | | 0.00 | | | | (5.45 | ) | | | (1.99 | ) | | | (0.00 | )5 | | | 0.00 | | | | 0.00 | | | | 0.00 | | | | (0.06 | ) |
Net asset value, end of period | | | $26.71 | | | | $29.94 | | | | $33.21 | | | | $31.85 | | | | $23.28 | | | | $21.21 | | | | $19.96 | | | | $18.65 | |
Total return6 | | | (10.82 | )% | | | 7.78 | %7 | | | 10.91 | % | | | 36.82 | % | | | 9.76 | % | | | 6.26 | % | | | 7.02 | % | | | 20.02 | % |
Ratios to average net assets (annualized) | | | | | | | | | | | | | | | | | | | | | | | | | | | | | | | | |
Gross expenses | | | 1.25 | % | | | 1.23 | % | | | 1.24 | % | | | 1.23 | % | | | 1.22 | % | | | 1.22 | % | | | 1.30 | % | | | 1.17 | % |
Net expenses | | | 1.12 | % | | | 1.09 | % | | | 1.09 | % | | | 1.09 | % | | | 1.09 | % | | | 1.09 | % | | | 1.09 | % | | | 1.13 | % |
Net investment income | | | 0.91 | % | | | 1.10 | % | | | 1.04 | % | | | 0.30 | % | | | 0.10 | % | | | 0.12 | % | | | 0.05 | % | | | 0.21 | % |
Supplemental data | | | | | | | | | | | | | | | | | | | | | | | | | | | | | | | | |
Portfolio turnover rate | | | 24 | % | | | 79 | % | | | 37 | % | | | 65 | % | | | 69 | % | | | 54 | % | | | 7 | % | | | 45 | % |
Net assets, end of period (000s omitted) | | | $65,863 | | | | $70,100 | | | | $78,563 | | | | $96,940 | | | | $232,283 | | | | $273,510 | | | | $335,766 | | | | $320,814 | |
| 1 | For the five months ended March 31, 2014. The Fund changed its fiscal year end from October 31 to March 31, effective March 31, 2014. |
| 2 | For the three months ended October 31, 2010. The Fund changed its fiscal year end from July 31 to October 31, effective October 31, 2010. |
| 3 | After the close of business on July 16, 2010, the Fund acquired the net assets of Evergreen Special Values Fund and Evergreen Small Cap Value Fund. Evergreen Special Values Fund became the accounting and performance survivor in the transaction. The information for the period prior to July 19, 2010 is that of Class I of Evergreen Special Values Fund. |
| 4 | Calculated based upon average shares outstanding |
| 5 | Amount is less than $0.005. |
| 6 | Returns for periods of less than one year are not annualized. |
| 7 | Total return reflects adjustments to conform with generally accepted accounting principles. |
The accompanying notes are an integral part of these financial statements.
| | | | |
| 22 | | Wells Fargo Advantage Special Small Cap Value Fund | | Financial highlights |
(For a share outstanding throughout each period)
| | | | | | | | | | | | | | | | | | | | | | | | | | | | | | | | |
| | | Six months ended
September 30, 2015
(unaudited) | | | Year ended March 31 | | | Year ended October 31 | | | Year ended
July 31, 20103 | |
| INSTITUTIONAL CLASS | | | 2015 | | | 20141 | | | 2013 | | | 2012 | | | 2011 | | | 20102 | | |
Net asset value, beginning of period | | | $29.93 | | | | $33.21 | | | | $31.94 | | | | $23.36 | | | | $21.24 | | | | $19.96 | | | | $18.66 | | | | $18.66 | |
Net investment income (loss) | | | 0.16 | 3 | | | 0.43 | 4 | | | 0.15 | | | | 0.10 | | | | 0.05 | 4 | | | 0.04 | | | | (0.02 | )4 | | | 0.00 | 4,5 |
Net realized and unrealized gains (losses) on investments | | | (3.37 | ) | | | 1.80 | | | | 3.22 | | | | 8.53 | | | | 2.07 | | | | 1.24 | | | | 1.32 | | | | 0.00 | 5 |
| | | | | | | | | | | | | | | | | | | | | | | | | | | | | | | | |
Total from investment operations | | | (3.21 | ) | | | 2.23 | | | | 3.37 | | | | 8.63 | | | | 2.12 | | | | 1.28 | | | | 1.30 | | | | 0.00 | 5 |
Distributions to shareholders from | | | | | | | | | | | | | | | | | | | | | | | | | | | | | | | | |
Net investment income | | | 0.00 | | | | (0.33 | ) | | | (0.13 | ) | | | (0.05 | ) | | | 0.00 | | | | 0.00 | | | | 0.00 | | | | 0.00 | |
Net realized gains | | | 0.00 | | | | (5.18 | ) | | | (1.97 | ) | | | 0.00 | | | | 0.00 | | | | 0.00 | | | | 0.00 | | | | 0.00 | |
| | | | | | | | | | | | | | | | | | | | | | | | | | | | | | | | |
Total distributions to shareholders | | | 0.00 | | | | (5.51 | ) | | | (2.10 | ) | | | (0.05 | ) | | | 0.00 | | | | 0.00 | | | | 0.00 | | | | 0.00 | |
Net asset value, end of period | | | $26.72 | | | | $29.93 | | | | $33.21 | | | | $31.94 | | | | $23.36 | | | | $21.24 | | | | $19.96 | | | | $18.66 | |
Total return5 | | | (10.73 | )% | | | 7.96 | % | | | 10.97 | % | | | 37.02 | % | | | 9.98 | % | | | 6.41 | % | | | 7.02 | % | | | 0.00 | % |
Ratios to average net assets (annualized) | | | | | | | | | | | | | | | | | | | | | | | | | | | | | | | | |
Gross expenses | | | 0.99 | % | | | 0.96 | % | | | 0.98 | % | | | 0.97 | % | | | 0.95 | % | | | 0.94 | % | | | 1.10 | % | | | 0.00 | % |
Net expenses | | | 0.94 | % | | | 0.94 | % | | | 0.94 | % | | | 0.94 | % | | | 0.94 | % | | | 0.93 | % | | | 0.94 | % | | | 0.00 | % |
Net investment income (loss) | | | 1.10 | % | | | 1.36 | % | | | 1.15 | % | | | 0.42 | % | | | 0.21 | % | | | 0.19 | % | | | (0.38 | )% | | | 0.00 | % |
Supplemental data | | | | | | | | | | | | | | | | | | | | | | | | | | | | | | | | |
Portfolio turnover rate | | | 24 | % | | | 79 | % | | | 37 | % | | | 65 | % | | | 69 | % | | | 54 | % | | | 7 | % | | | 45 | % |
Net assets, end of period (000s omitted) | | | $197,279 | | | | $189,965 | | | | $146,162 | | | | $138,638 | | | | $88,067 | | | | $27,217 | | | | $3,106 | | | | $10 | |
| 1 | For the five months ended March 31, 2014. The Fund changed its fiscal year end from October 31 to March 31, effective March 31, 2014. |
| 2 | For the three months ended October 31, 2010. The Fund changed its fiscal year end from July 31 to October 31, effective October 31, 2010. |
| 3 | For the period from July 30, 2010 (commencement of class operations) to July 31, 2010 |
| 4 | Calculated based upon average shares outstanding |
| 5 | Amount is less than $0.005. |
| 5 | Returns for periods of less than one year are not annualized. |
The accompanying notes are an integral part of these financial statements.
| | | | | | |
| Notes to financial statements (unaudited) | | Wells Fargo Advantage Special Small Cap Value Fund | | | 23 | |
1. ORGANIZATION
Wells Fargo Funds Trust (the “Trust”), a Delaware statutory trust organized on March 10, 1999, is an open-end management investment company registered under the Investment Company Act of 1940, as amended (the “1940 Act”). As an investment company, the Trust follows the accounting and reporting guidance in Financial Accounting Standards Board (“FASB”) Accounting Standards Codification Topic 946, Financial Services – Investment Companies. These financial statements report on the Wells Fargo Advantage Special Small Cap Value Fund (the “Fund”) which is a diversified series of the Trust.
2. SIGNIFICANT ACCOUNTING POLICIES
The following significant accounting policies, which are consistently followed in the preparation of the financial statements of the Fund, are in conformity with U.S. generally accepted accounting principles which require management to make estimates and assumptions that affect the reported amounts of assets and liabilities, disclosure of contingent assets and liabilities at the date of the financial statements, and the reported amounts of revenues and expenses during the reporting period. Actual results could differ from those estimates.
Securities valuation
All investments are valued each business day as of the close of regular trading on the New York Stock Exchange (generally 4 p.m. Eastern Time).
Equity securities that are listed on a foreign or domestic exchange or market are valued at the official closing price or, if none, the last sales price. If no sale occurs on the primary exchange or market that day, the prior day’s price will be deemed “stale” and a fair value price will be determined in accordance with the Fund’s Valuation Procedures.
Equity securities that are not listed on a foreign or domestic exchange or market, but have a public trading market, are valued at the quoted bid price from an independent broker-dealer that the Management Valuation Team of Wells Fargo Funds Management, LLC (“Funds Management”) has determined is an acceptable source.
Investments in registered open-end investment companies are valued at net asset value. Interests in non-registered investment vehicles that are redeemable at net asset value are fair valued at net asset value when available.
Investments which are not valued using any of the methods discussed above are valued at their fair value, as determined in good faith by the Board of Trustees of the Fund. The Board of Trustees has established a Valuation Committee comprised of the Trustees and has delegated to it the authority to take any actions regarding the valuation of portfolio securities that the Valuation Committee deems necessary or appropriate, including determining the fair value of portfolio securities, unless the determination has been delegated to the Management Valuation Team. The Board of Trustees retains the authority to make or ratify any valuation decisions or approve any changes to the Valuation Procedures as it deems appropriate. On a quarterly basis, the Board of Trustees receives reports on any valuation actions taken by the Valuation Committee or the Management Valuation Team which may include items for ratification.
Valuations of fair valued securities are compared to the next actual sales price when available, or other appropriate market values, to assess the continued appropriateness of the fair valuation methodologies used. These securities are fair valued on a day-to-day basis, taking into consideration changes to appropriate market information and any significant changes to the inputs considered in the valuation process until there is a readily available price provided on an exchange or by an independent pricing service. Valuations received from an independent pricing service or independent broker-dealer quotes are periodically validated by comparisons to most recent trades and valuations provided by other independent pricing services in addition to the review of prices by the manager and/or subadviser. Unobservable inputs used in determining fair valuations are identified based on the type of security, taking into consideration factors utilized by market participants in valuing the investment, knowledge about the issuer and the current market environment.
Security loans
The Fund may lend its securities from time to time in order to earn additional income in the form of fees or interest on securities received as collateral or the investment of any cash received as collateral. The Fund continues to receive interest or dividends on the securities loaned. The Fund receives collateral in the form of cash or securities with a value at least equal to the value of the securities on loan. The value of the loaned securities is determined at the close of each business day and any additional required collateral is delivered to the Fund on the next business day. In a securities lending transaction, the net asset value of the Fund will be affected by an increase or decrease in the value of the securities loaned and by an increase or decrease in the value of the instrument in which collateral is invested. The amount of securities lending activity undertaken by the Fund fluctuates from time to time. In the event of default or bankruptcy by the borrower, the Fund may be prevented from recovering the loaned securities or gaining access to the collateral or
| | | | |
| 24 | | Wells Fargo Advantage Special Small Cap Value Fund | | Notes to financial statements (unaudited) |
may experience delays or costs in doing so. In addition, the investment of any cash collateral received may lose all or part of its value. The Fund has the right under the lending agreement to recover the securities from the borrower on demand.
The Fund lends its securities through an unaffiliated securities lending agent. Cash collateral received in connection with its securities lending transactions is invested in Securities Lending Cash Investments, LLC (the “Securities Lending Fund”). The Securities Lending Fund is exempt from registration under Section 3(c)(7) of the 1940 Act and is managed by Funds Management and is subadvised by Wells Capital Management Incorporated (“WellsCap”). Funds Management receives an advisory fee starting at 0.05% and declining to 0.01% as the average daily net assets of the Securities Lending Fund increase. All of the fees received by Funds Management are paid to WellsCap for its services as subadviser. The Securities Lending Fund seeks to provide a positive return compared to the daily Fed Funds Open rate by investing in high-quality, U.S. dollar-denominated short-term money market instruments. Securities Lending Fund investments are fair valued based upon the amortized cost valuation technique. Income earned from investment in the Securities Lending Fund is included in securities lending income on the Statement of Operations.
Security transactions and income recognition
Securities transactions are recorded on a trade date basis. Realized gains or losses are recorded on the basis of identified cost.
Dividend income is recognized on the ex-dividend date. Dividend income is recorded net of foreign taxes withheld where recovery of such taxes is not assured.
Distributions to shareholders
Distributions to shareholders from net investment income and net realized gains, if any, are recorded on the ex-dividend date. Such distributions are determined in conformity with federal income tax regulations, which may differ in amount or character from net investment income and realized gains recognized for purposes of U.S. generally accepted accounting principles.
Federal and other taxes
The Fund intends to continue to qualify as a regulated investment company by distributing substantially all of its investment company taxable income and any net realized capital gains (after reduction for capital loss carryforwards) sufficient to relieve it from all, or substantially all, federal income taxes. Accordingly, no provision for federal income taxes was required.
The Fund’s income and federal excise tax returns and all financial records supporting those returns for the prior three fiscal years are subject to examination by the federal and Delaware revenue authorities. Management has analyzed the Fund’s tax positions taken on federal, state, and foreign tax returns for all open tax years and does not believe that there are any uncertain tax positions that require recognition of a tax liability.
As of March 31, 2015, the Fund had capital loss carryforwards available to offset future net realized capital gains in the amount of $2,837,924 expiring in 2017.
As of March 31, 2015, the Fund had $7,289,000 of current year deferred post-October capital losses which was recognized on the first day of the current fiscal year.
Class allocations
The separate classes of shares offered by the Fund differ principally in applicable sales charges, distribution, shareholder servicing, and administration fees. Class specific expenses are charged directly to that share class. Investment income, common expenses, and realized and unrealized gains (losses) on investments are allocated daily to each class of shares based on the relative proportion of net assets of each class.
3. FAIR VALUATION MEASUREMENTS
Fair value measurements of investments are determined within a framework that has established a fair value hierarchy based upon the various data inputs utilized in determining the value of the Fund’s investments. The three-level hierarchy gives the highest priority to unadjusted quoted prices in active markets for identical assets or liabilities (Level 1) and the lowest priority to significant unobservable inputs (Level 3). The Fund’s investments are classified within the fair value hierarchy based on the lowest level of input that is significant to the fair value measurement. The inputs are summarized into three broad levels as follows:
| | | | | | |
| Notes to financial statements (unaudited) | | Wells Fargo Advantage Special Small Cap Value Fund | | | 25 | |
| n | | Level 1 – quoted prices in active markets for identical securities |
| n | | Level 2 – other significant observable inputs (including quoted prices for similar securities, interest rates, prepayment speeds, credit risk, use of amortized cost, etc.) |
| n | | Level 3 – significant unobservable inputs (including the Fund’s own assumptions in determining the fair value of investments) |
The inputs or methodologies used for valuing investments in securities are not necessarily an indication of the risk associated with investing in those securities.
The following is a summary of the inputs used in valuing the Fund’s assets and liabilities as of September 30, 2015:
| | | | | | | | | | | | | | | | |
| | | Quoted prices (Level 1) | | | Other significant observable inputs (Level 2) | | | Significant unobservable inputs (Level 3) | | | Total | |
Assets | | | | | | | | | | | | | | | | |
Investments in : | | | | | | | | | | | | | | | | |
| | | | |
Common stocks | | | | | | | | | | | | | | | | |
Consumer discretionary | | $ | 76,789,899 | | | $ | 0 | | | $ | 0 | | | $ | 76,789,899 | |
Consumer staples | | | 45,299,191 | | | | 0 | | | | 0 | | | | 45,299,191 | |
Energy | | | 20,290,921 | | | | 5,598,229 | | | | 0 | | | | 25,889,150 | |
Financials | | | 148,848,406 | | | | 0 | | | | 0 | | | | 148,848,406 | |
Health care | | | 62,029,366 | | | | 0 | | | | 0 | | | | 62,029,366 | |
Industrials | | | 135,524,384 | | | | 0 | | | | 0 | | | | 135,524,384 | |
Information technology | | | 87,662,221 | | | | 0 | | | | 0 | | | | 87,662,221 | |
Materials | | | 79,248,801 | | | | 0 | | | | 0 | | | | 79,248,801 | |
Utilities | | | 7,763,514 | | | | 0 | | | | 0 | | | | 7,763,514 | |
| | | | |
Short-term investments | | | | | | | | | | | | | | | | |
Investment companies | | | 31,696,041 | | | | 21,253,444 | | | | 0 | | | | 52,949,485 | |
Total assets | | $ | 695,152,744 | | | $ | 26,851,673 | | | $ | 0 | | | $ | 722,004,417 | |
The Fund recognizes transfers between levels within the fair value hierarchy at the end of the reporting period. At September 30, 2015, the Fund did not have any transfers into/out of Level 1, Level 2, or Level 3.
4. TRANSACTIONS WITH AFFILIATES
Management fee
Funds Management, an indirect wholly owned subsidiary of Wells Fargo & Company (“Wells Fargo”), is the manager of the Fund and provides advisory and fund-level administrative services under an investment management agreement. Under the investment management agreement, Funds Management is responsible for, among other services, implementing the investment objectives and strategies of the Fund, supervising the applicable subadviser, providing fund-level administrative services in connection with the Fund’s operations, and providing any other fund-level administrative services reasonably necessary for the operation of the Fund. As compensation for its services under the investment management agreement, Funds Management is entitled to receive an annual management fee starting at 0.85% and declining to 0.71% as the average daily net assets of the Fund increase.
Prior to July 1, 2015, Funds Management provided advisory services pursuant to an investment advisory agreement and was entitled to receive an annual fee which started at 0.80% and declined to 0.68% as the average daily net assets of the Fund increased. In addition, fund-level administrative services were provided by Funds Management under a separate administration agreement at an annual fee which started at 0.05% and declined to 0.03% as the average daily net assets of the Fund increased. For financial statement purposes, the advisory fee and fund-level administration fee for the six months ended September 30, 2015 have been included in management fee on the Statement of Operations.
For the six months ended September 30, 2015, the management fee was equivalent to an annual rate of 0.84% of the Fund’s average daily net assets.
| | | | |
| 26 | | Wells Fargo Advantage Special Small Cap Value Fund | | Notes to financial statements (unaudited) |
Funds Management has retained the services of a subadviser to provide daily portfolio management to the Fund. The fee for subadvisory services is borne by Funds Management. WellsCap, an affiliate of Funds Management and an indirect wholly owned subsidiary of Wells Fargo, is the subadviser to the Fund and is entitled to receive a fee from Funds Management at an annual rate starting at 0.55% and declining to 0.40% as the average daily net assets of the Fund increase.
Administration fees
Under a class-level administration agreement, Funds Management provides class-level administrative services to the Fund, which includes paying fees and expenses for services provided by the transfer agent, sub-transfer agents, omnibus account servicers and record-keepers. As compensation for its services under the class-level administration agreement, Funds Management receives an annual fee which is calculated based on the average daily net assets of each class as follows:
| | | | | | | | |
| | | Class-level administration fee | |
| | | Current rate | | | Rate prior to July 1, 2015 | |
Class A, Class B, Class C | | | 0.21 | % | | | 0.26 | % |
Class R | | | 0.21 | | | | N/A | |
Class R6 | | | 0.03 | | | | 0.03 | |
Administrator Class | | | 0.13 | | | | 0.10 | |
Institutional Class | | | 0.13 | | | | 0.08 | |
Funds Management has contractually waived and/or reimbursed management and administration fees to the extent necessary to maintain certain net operating expense ratios for the Fund. Waiver of fees and/or reimbursement of expenses by Funds Management were made first from fund level expenses on a proportionate basis and then from class specific expenses. Funds Management has committed to waive fees and/or reimburse expenses to the extent necessary to cap expenses as follows:
| | | | | | | | |
| | | Expense ratio cap | | | Expiration date | |
Class A | | | 1.34 | % | | | July 31, 2016 | |
Class B | | | 2.09 | % | | | July 31, 2016 | |
Class C | | | 2.09 | % | | | July 31, 2016 | |
Class R | | | 1.59 | % | | | July 31, 2017 | |
Class R6 | | | 0.89 | % | | | July 31, 2016 | |
Administrator Class | | | 1.20 | %* | | | July 31, 2016 | * |
Institutional Class | | | 0.94 | % | | | July 31, 2016 | |
| * | Prior to August 1, 2015, the Fund’s expenses were capped at 1.09% for Administrator Class shares. |
After this time, the cap may be increased or the commitment to maintain the cap may be terminated only with the approval of the Board of Trustees.
Distribution fees
The Trust has adopted a distribution plan for Class B and Class C shares of the Fund pursuant to Rule 12b-1 under the 1940 Act. Distribution fees are charged to Class B and Class C shares and paid to Wells Fargo Funds Distributor, LLC (“Funds Distributor”), the principal underwriter, at an annual rate of 0.75% of the average daily net assets of Class B and Class C shares.
In addition, Funds Distributor is entitled to receive the front-end sales charge from the purchase of Class A shares and a contingent deferred sales charge on the redemption of certain Class A shares. Funds Distributor is also entitled to receive the contingent deferred sales charges from redemptions of Class B and Class C shares. For the six months ended September 30, 2015, Funds Distributor received $4,622 from the sale of Class A shares and $32 in contingent deferred sales charges from redemptions of Class C shares.
| | | | | | |
| Notes to financial statements (unaudited) | | Wells Fargo Advantage Special Small Cap Value Fund | | | 27 | |
Shareholder servicing fees
The Trust has entered into contracts with one or more shareholder servicing agents, whereby Class A, Class B, Class C, and Administrator Class of the Fund is charged a fee at an annual rate of 0.25% of the average daily net assets of each respective class.
A portion of these total shareholder servicing fees were paid to affiliates of Wells Fargo.
5. INVESTMENT PORTFOLIO TRANSACTIONS
Purchases and sales of investments, excluding U.S. government obligations (if any) and short-term securities, for the six months ended September 30, 2015 were $214,173,109 and $166,940,925, respectively.
6. BANK BORROWINGS
The Trust (excluding the money market funds) and Wells Fargo Variable Trust are parties to a $200,000,000 revolving credit agreement whereby the Fund is permitted to use bank borrowings for temporary or emergency purposes, such as to fund shareholder redemption requests. Interest under the credit agreement is charged to the Fund based on a borrowing rate equal to the higher of the Federal Funds rate in effect on that day plus 1.25% or the overnight LIBOR rate in effect on that day plus 1.25%. In addition, an annual commitment fee equal to 0.20% of the unused balance is allocated to each participating fund. Prior to September 1, 2015, the revolving credit agreement amount was $150,000,000 and the annual commitment fee was equal to 0.10% of the unused balance which was allocated to each participating fund. For the six months ended September 30, 2015, the Fund paid $666 in commitment fees.
For the six months ended September 30, 2015, there were no borrowings by the Fund under the agreement.
7. INDEMNIFICATION
Under the Trust’s organizational documents, the officers and Trustees have been granted certain indemnification rights against certain liabilities that may arise out of performance of their duties to the Trust. Additionally, in the normal course of business, the Trust may enter into contracts with service providers that contain a variety of indemnification clauses. The Trust’s maximum exposure under these arrangements is dependent on future claims that may be made against the Fund and, therefore, cannot be estimated.
| | | | |
| 28 | | Wells Fargo Advantage Special Small Cap Value Fund | | Other information (unaudited) |
PROXY VOTING INFORMATION
A description of the policies and procedures that the Fund uses to determine how to vote proxies relating to portfolio securities is available, upon request, by calling 1-800-222-8222, visiting our website at wellsfargoadvantagefunds.com, or visiting the SEC website at sec.gov. Information regarding how the Fund voted proxies relating to portfolio securities during the most recent 12-month period ended June 30 is available on the Fund’s website at wellsfargoadvantagefunds.com or by visiting the SEC website at sec.gov.
PORTFOLIO HOLDINGS INFORMATION
The complete portfolio holdings for the Fund are publicly available monthly on the Fund’s website (wellsfargoadvantagefunds.com), on a one-month delayed basis. In addition, top ten holdings information (excluding derivative positions) for the Fund is publicly available on the Fund’s website on a monthly, seven-day or more delayed basis. The Fund files its complete schedule of portfolio holdings with the SEC for the first and third quarters of each fiscal year on Form N-Q, which is available by visiting the SEC website at sec.gov. In addition, the Fund’s Form N-Q may be reviewed and copied at the SEC’s Public Reference Room in Washington, DC, and at regional offices in New York City, at 233 Broadway, and in Chicago, at 175 West Jackson Boulevard, Suite 900. Information about the Public Reference Room may be obtained by calling 1-800-SEC-0330.
| | | | | | |
| Other information (unaudited) | | Wells Fargo Advantage Special Small Cap Value Fund | | | 29 | |
BOARD OF TRUSTEES AND OFFICERS
Each of the Trustees and Officers1 listed in the table below acts in identical capacities for each fund in the Wells Fargo Advantage family of funds, which consists of 144 mutual funds comprising the Wells Fargo Funds Trust, Wells Fargo Variable Trust, Wells Fargo Master Trust and four closed-end funds (collectively the “Fund Complex”). This table should be read in conjunction with the Prospectus and the Statement of Additional Information2. The mailing address of each Trustee and Officer is 525 Market Street, 12th Floor, San Francisco, CA 94105. Each Trustee and Officer serves an indefinite term, however, each Trustee serves such term until reaching the mandatory retirement age established by the Trustees.
Independent Trustees
| | | | | | |
Name and
year of birth | | Position held and
length of service* | | Principal occupations during past five years or longer | | Other
public company or
investment company
directorships during
past 5 years |
William R. Ebsworth (Born 1957) | | Trustee, since 2015** | | Retired. From 1984 to 2013, equities analyst, portfolio manager, research director at Fidelity Management and Research Company and retired in 2013 as Chief Investment Officer of Fidelity Strategic Advisers, Inc. in Boston, Tokyo, and Hong Kong where he led a team of investment professionals managing client assets. Prior thereto, Board member of Hong Kong Securities Clearing Co., Hong Kong Options Clearing Corp., the Thailand International Fund, Ltd., Fidelity Investments Life Insurance Company, and Empire Fidelity Investments Life Insurance Company. Mr. Ebsworth is a CFA ® charterholder and an Adjunct Lecturer, Finance, at Babson College. | | Asset Allocation Trust |
Jane A. Freeman (Born 1953) | | Trustee, since 2015** | | Retired. From 2012 to 2014 and 1999 to 2008, Chief Financial Officer of Scientific Learning Corporation. From 2008 to 2012, Ms. Freeman provided consulting services related to strategic business projects. Prior to 1999, Portfolio Manager at Rockefeller & Co. and Scudder, Stevens & Clark. Board member of the Harding Loevner Funds from 1996 to 2014, serving as both Lead Independent Director and chair of the Audit Committee. Board member of the Russell Exchange Traded Funds Trust from 2011 to 2012 and the chair of the Audit Committee. Ms. Freeman is Chair of Taproot Foundation (non-profit organization), a Board Member of Ruth Bancroft Garden (non-profit organization) and an inactive chartered financial analyst. | | Asset Allocation Trust; Harding Loevner Funds; Russell Exchange Traded Funds Trust |
Peter G. Gordon (Born 1942) | | Trustee, since 1998; Chairman, since 2005 | | Co-Founder, Retired Chairman, President and CEO of Crystal Geyser Water Company. Trustee Emeritus, Colby College. | | Asset Allocation Trust |
Isaiah Harris, Jr. (Born 1952) | | Trustee, since 2009 | | Retired. Chairman of the Board of CIGNA Corporation since 2009, and Director since 2005. From 2003 to 2011, Director of Deluxe Corporation. Prior thereto, President and CEO of BellSouth Advertising and Publishing Corp. from 2005 to 2007, President and CEO of BellSouth Enterprises from 2004 to 2005 and President of BellSouth Consumer Services from 2000 to 2003. Emeritus member of the Iowa State University Foundation Board of Governors. Emeritus Member of the Advisory Board of Iowa State University School of Business. Advisory Board Member, Palm Harbor Academy (charter school). Mr. Harris is a certified public accountant. | | CIGNA Corporation; Asset Allocation Trust |
Judith M. Johnson (Born 1949) | | Trustee, since 2008; Audit Committee Chairman, since 2008 | | Retired. Prior thereto, Chief Executive Officer and Chief Investment Officer of Minneapolis Employees Retirement Fund from 1996 to 2008. Ms. Johnson is an attorney, certified public accountant and a certified managerial accountant. | | Asset Allocation Trust |
David F. Larcker (Born 1950) | | Trustee, since 2009 | | James Irvin Miller Professor of Accounting at the Graduate School of Business, Stanford University, Morgan Stanley Director of the Center for Leadership Development and Research and Senior Faculty of The Rock Center for Corporate Governance since 2006. From 2005 to 2008, Professor of Accounting at the Graduate School of Business, Stanford University. Prior thereto, Ernst & Young Professor of Accounting at The Wharton School, University of Pennsylvania from 1985 to 2005. | | Asset Allocation Trust |
| | | | |
| 30 | | Wells Fargo Advantage Special Small Cap Value Fund | | Other information (unaudited) |
| | | | | | |
Name and
year of birth | | Position held and
length of service* | | Principal occupations during past five years or longer | | Other
public company or
investment company
directorships during
past 5 years |
| Olivia S. Mitchell (Born 1953) | | Trustee, since 2006 | | International Foundation of Employee Benefit Plans Professor, Wharton School of the University of Pennsylvania since 1993. Director of Wharton’s Pension Research Council and Boettner Center on Pensions & Retirement Research, and Research Associate at the National Bureau of Economic Research. Previously, Cornell University Professor from 1978 to 1993. | | Asset Allocation Trust |
| Timothy J. Penny (Born 1951) | | Trustee, since 1996 | | President and Chief Executive Officer of Southern Minnesota Initiative Foundation, a non-profit organization, since 2007 and Senior Fellow at the Humphrey Institute Policy Forum at the University of Minnesota since 1995. Member of the Board of Trustees of NorthStar Education Finance, Inc., a non-profit organization, since 2007. | | Asset Allocation Trust |
| Michael S. Scofield (Born 1943) | | Trustee, since 2010 | | Served on the Investment Company Institute’s Board of Governors and Executive Committee from 2008-2011 as well the Governing Council of the Independent Directors Council from 2006-2011 and the Independent Directors Council Executive Committee from 2008-2011. Chairman of the IDC from 2008-2010. Institutional Investor (Fund Directions) Trustee of Year in 2007. Trustee of the Evergreen Funds complex (and its predecessors) from 1984 to 2010. Chairman of the Evergreen Funds from 2000-2010. Former Trustee of the Mentor Funds. Retired Attorney, Law Offices of Michael S. Scofield. | | Asset Allocation Trust |
| Donald C. Willeke (Born 1940) | | Trustee, since 1996 | | Principal of the law firm of Willeke & Daniels. General Counsel of the Minneapolis Employees Retirement Fund from 1984 until its consolidation into the Minnesota Public Employees Retirement Association on June 30, 2010. Director and Vice Chair of The Tree Trust (non-profit corporation). Director of the American Chestnut Foundation (non-profit corporation). | | Asset Allocation Trust |
| * | Length of service dates reflect the Trustee’s commencement of service with the Trust’s predecessor entities, where applicable. |
| ** | William R. Ebsworth and Jane A. Freeman each became a Trustee effective January 1, 2015. |
Officers
| | | | | | |
Name and year of birth | | Position held and length of service | | Principal occupations during past five years or longer | | |
| Karla M. Rabusch (Born 1959) | | President, since 2003 | | Executive Vice President of Wells Fargo Bank, N.A. and President of Wells Fargo Funds Management, LLC since 2003. | | |
Nancy Wiser1 (Born 1967) | | Treasurer, since 2012 | | Executive Vice President of Wells Fargo Funds Management, LLC since 2011. Chief Operating Officer and Chief Compliance Officer at LightBox Capital Management LLC, from 2008 to 2011. | | |
| C. David Messman (Born 1960) | | Secretary, since 2000; Chief Legal Officer, since 2003 | | Senior Vice President and Secretary of Wells Fargo Funds Management, LLC since 2001. Assistant General Counsel of Wells Fargo Bank, N.A. since 2013 and Vice President and Managing Counsel of Wells Fargo Bank N.A. from 1996 to 2013. | | |
Debra Ann Early (Born 1964) | | Chief Compliance Officer, since 2007 | | Executive Vice President of Wells Fargo Funds Management, LLC since 2014, Senior Vice President and Chief Compliance Officer from 2007 to 2014. | | |
David Berardi (Born 1975) | | Assistant Treasurer, since 2009 | | Vice President of Wells Fargo Funds Management, LLC since 2009. Vice President of Evergreen Investment Management Company, LLC from 2008 to 2010. Manager of Fund Reporting and Control for Evergreen Investment Management Company, LLC from 2004 to 2010. | | |
| Jeremy DePalma1 (Born 1974) | | Assistant Treasurer, since 2009 | | Senior Vice President of Wells Fargo Funds Management, LLC since 2009. Senior Vice President of Evergreen Investment Management Company, LLC from 2008 to 2010 and head of the Fund Reporting and Control Team within Fund Fund Administration from 2005 to 2010. | | |
| 1 | Nancy Wiser acts as Treasurer of 72 funds in the Fund Complex. Jeremy DePalma acts as Treasurer of 72 funds and Assistant Treasurer of 72 funds in the Fund Complex. |
| 2 | The Statement of Additional Information includes additional information about the Trustees and is available, without charge, upon request, by calling 1-800-222-8222 or by visiting the website at wellsfargoadvantagefunds.com. |
| | | | | | |
| Other information (unaudited) | | Wells Fargo Advantage Special Small Cap Value Fund | | | 31 | |
BOARD CONSIDERATION OF INVESTMENT ADVISORY, INVESTMENT MANAGEMENT AND SUB-ADVISORY AGREEMENTS:
Under the Investment Company Act of 1940 (the “1940 Act”), the Board of Trustees (the “Board”) of Wells Fargo Funds Trust (the “Trust”) must determine annually whether to approve the continuation of the Trust’s investment advisory and sub-advisory agreements. In this regard, at an in-person meeting held on May 19-20, 2015 (the “Meeting”), the Board, all the members of which have no direct or indirect interest in the investment advisory and sub-advisory agreements and are not “interested persons” of the Trust, as defined in the 1940 Act (the “Independent Trustees”), reviewed and approved for Wells Fargo Advantage Special Small Cap Value Fund (the “Fund”): (i) an investment advisory agreement (the “Advisory Agreement”) with Wells Fargo Funds Management, LLC (“Funds Management”); (ii) an investment management agreement (the “Management Agreement”) with Funds Management; and (iii) an investment sub-advisory agreement (the “Sub-Advisory Agreement”) with Wells Capital Management Incorporated (the “Sub-Adviser”), an affiliate of Funds Management. The Management Agreement combines the terms of the Advisory Agreement with the terms of the Fund’s Amended and Restated Administration Agreement (the “Administration Agreement”) applicable to Fund-level administrative services. The Advisory Agreement, the Management Agreement and the Sub-Advisory Agreement are collectively referred to as the “Advisory Agreements.”
At the Meeting, the Board considered the factors and reached the conclusions described below relating to the selection of Funds Management and the Sub-Adviser and the approval of the Advisory Agreements. Prior to the Meeting, including at an in-person meeting in March 2015, the Trustees conferred extensively among themselves and with representatives of Funds Management about these matters. Also, the Board has adopted a team-based approach, with each team consisting of a sub-set of Trustees, to assist the full Board in the discharge of its duties in reviewing performance and other matters throughout the year. The Independent Trustees were assisted in their evaluation of the Advisory Agreements by independent legal counsel, from whom they received separate legal advice and with whom they met separately.
In providing information to the Board, Funds Management and the Sub-Adviser were guided by a detailed set of requests for information submitted to them by independent legal counsel on behalf of the Independent Trustees at the start of the Board’s annual contract renewal process earlier in 2015. In considering and approving the Advisory Agreements, the Trustees considered the information they believed relevant, including but not limited to the information discussed below. The Board considered not only the specific information presented in connection with the Meeting, but also the knowledge gained over time through interaction with Funds Management and the Sub-Adviser about various topics. In this regard, the Board reviewed reports of Funds Management at each of its quarterly meetings, which included, among other things, portfolio reviews and performance reports. In addition, the Board and the teams mentioned above confer with portfolio managers at various times throughout the year. The Board did not identify any particular information or consideration that was all-important or controlling, and each individual Trustee may have attributed different weights to various factors.
After its deliberations, the Board unanimously approved the continuation of the Advisory Agreement for the period from June 1, 2015 through June 30, 2015, approved the Management Agreement for the period from July 1, 2015 through May 31, 2016, and approved the continuation of the Sub-Advisory Agreement for a one-year term through May 31, 2016. The Board also determined that the compensation payable to Funds Management and the Sub-Adviser under each of the Advisory Agreements was reasonable. The Board considered the approval of the Advisory Agreements for the Fund as part of its consideration of agreements for funds across the complex, but its approvals were made on a fund-by-fund basis. The following summarizes a number of important, but not necessarily all, factors considered by the Board in support of its approvals.
Nature, extent and quality of services
The Board received and considered various information regarding the nature, extent and quality of services provided to the Fund by Funds Management and the Sub-Adviser under the Advisory Agreements. This information included, among other things, a summary of the background and experience of senior management of Funds Management, and the qualifications, background, tenure and responsibilities of each of the portfolio managers primarily responsible for the day-to-day portfolio management of the Fund. The Board noted that the services to be provided to the Fund pursuant to the Management Agreement combined the advisory services previously provided to the Fund pursuant to the Fund’s Advisory Agreement with the Fund-level administrative services previously provided to the Fund pursuant to the Fund’s Administration Agreement. The Board received a representation from Funds Management that combining these services would not result in any change to the nature or level of services provided by Funds Management to the Fund.
| | | | |
| 32 | | Wells Fargo Advantage Special Small Cap Value Fund | | Other information (unaudited) |
The Board evaluated the ability of Funds Management and the Sub-Adviser to attract and retain qualified investment professionals, including research, advisory and supervisory personnel. The Board further considered the compliance programs and compliance records of Funds Management and the Sub-Adviser. In addition, the Board took into account the full range of services provided to the Fund by Funds Management and its affiliates.
Fund performance and expenses
The Board considered the performance results for the Fund over various time periods ended March 31, 2015. The Board considered these results in comparison to the performance of funds in a universe that was determined by Lipper Inc. (“Lipper”) to be similar to the Fund (the “Universe”), and in comparison to the Fund’s benchmark index and to other comparative data. Lipper is an independent provider of investment company data. The Board received a description of the methodology used by Lipper to select the mutual funds in the performance Universe. The Board noted that the performance of the Fund (Administrator Class) was higher than the average performance of the Universe for all periods under review. The Board also noted that the performance of the Fund was higher than its benchmark, the Russell 2000® Value Index, for all periods under review.
The Board also received and considered information regarding the Fund’s net operating expense ratios and their various components, including actual management fees (which reflect fee waivers, if any, and include advisory, administration and transfer agent fees), custodian and other non-management fees, and Rule 12b-1 and non-Rule 12b-1 service fees. The Board considered these ratios in comparison to the median ratios of funds in class-specific expense groups that were determined by Lipper to be similar to the Fund (the “Groups”). The Board received a description of the methodology used by Lipper to select the mutual funds in the expense Groups and an explanation of how funds comprising expense groups and their expense ratios may vary from year-to-year. Based on the Lipper reports, the Board noted that the net operating expense ratios of the Fund were lower than or in range of the median net operating expense ratios of the expense Groups. The Board discussed and accepted Funds Management’s proposal to increase the net operating expense ratio cap for the Administrator Class. In accepting such proposed new net expense ratio cap, the Board noted that the Fund’s new net operating expense ratios would still be lower than or in range of the median net operating expense ratios of the expense Groups.
The Board took into account the Fund performance and expense information provided to it among the factors considered in deciding to re-approve the Advisory Agreement and Sub-Advisory Agreement and approve the Management Agreement.
Investment advisory and sub-advisory fee rates
The Board reviewed and considered the contractual investment advisory fee rates that are payable by the Fund to Funds Management for investment advisory services (the “Advisory Agreement Rates”), both on a stand-alone basis and on a combined basis with the Fund’s fund-level and class-level contractual administration fee rates (the “Management Rates”). The Board noted that the Management Rates include transfer agency and sub-transfer agency costs. The Board also noted that the fee rate to be paid by the Fund under the Management Agreement will incorporate the advisory fee and Fund-level administration fee previously payable separately by the Fund under the Fund’s Advisory Agreement and Administration Agreement with Funds Management. The Board also reviewed and considered the contractual investment sub-advisory fee rates that are payable by Funds Management to the Sub-Adviser for investment sub-advisory services (the “Sub-Advisory Agreement Rates”).
Among other information reviewed by the Board was a comparison of the Management Rates of the Fund with those of other funds in the expense Groups at a common asset level. The Board noted that the Management Rates of the Fund were lower than or in range of the average rates for the Fund’s expense Groups for all share classes.
The Board also received and considered information about the portion of the total advisory fee that was retained by Funds Management after payment of the fee to the Sub-Adviser for sub-advisory services. In assessing the reasonableness of this amount, the Board received and evaluated information about the nature and extent of responsibilities retained and risks assumed by Funds Management and not delegated to or assumed by the Sub-Adviser, and about Funds Management’s on-going oversight services. However, given the affiliation between Funds Management and the Sub-Adviser, the Board ascribed limited relevance to the allocation of the advisory fee between them.
The Board also received and considered information about the nature and extent of services offered and fee rates charged by Funds Management and the Sub-Adviser to other types of clients with investment strategies similar to those of the Fund. In this regard, the Board received information about the significantly greater scope of services, and compliance, reporting and other legal burdens and risks of managing mutual funds compared with those associated with managing assets of non-mutual fund clients such as collective funds or institutional separate accounts.
| | | | | | |
| Other information (unaudited) | | Wells Fargo Advantage Special Small Cap Value Fund | | | 33 | |
Based on its consideration of the factors and information it deemed relevant, including those described here, the Board determined that the compensation payable to Funds Management under the Management Agreement and Advisory Agreement and to the Sub-Adviser under the Sub-Advisory Agreement was reasonable, in light of the services covered by the Advisory Agreements.
Profitability
The Board received and considered information concerning the profitability of Funds Management, as well as the profitability of Wells Fargo as a whole, from providing services to the Fund and the fund family as a whole. The Board also received and considered information concerning the profitability of the Sub-Adviser from providing services to the fund family as a whole, noting that the Sub-Adviser’s profitability information with respect to providing services to the Fund was subsumed in the Wells Fargo profitability analysis.
Funds Management reported on the methodologies and estimates used in calculating profitability. Among other things, the Board noted that the levels of profitability reported on a fund-by-fund basis varied widely, depending on factors such as the size and type of fund. Based on its review, the Board did not deem the profits reported by Funds Management or Wells Fargo from its services to the Fund to be at a level that would prevent it from approving the continuation of the Advisory Agreements.
Economies of scale
With respect to possible economies of scale, the Board noted the existence of breakpoints in the Fund’s advisory and management fee structures, and the Fund’s administration fee structure, which operate generally to reduce the Fund’s expense ratios as the Fund grows in size. It considered that, for a small fund or a fund that shrinks in size, breakpoints conversely can result in higher fee levels. The Board also considered that fee waiver and expense reimbursement arrangements and competitive fee rates at the outset are means of sharing potential economies of scale with shareholders of the Fund and the fund family as a whole. The Board considered Funds Management’s view that any analyses of potential economies of scale in managing a particular fund are inherently limited in light of the joint and common costs and investments that Funds Management incurs across the fund family as a whole.
The Board concluded that the Fund’s fee and expense arrangements, including contractual breakpoints, constituted a reasonable approach to sharing potential economies of scale with the Fund and its shareholders.
Other benefits to Funds Management and the Sub-Adviser
The Board received and considered information regarding potential “fall-out” or ancillary benefits received by Funds Management and its affiliates, including the Sub-Adviser, as a result of their relationships with the Fund. Ancillary benefits could include, among others, benefits directly attributable to other relationships with the Fund and benefits potentially derived from an increase in Funds Management’s and the Sub-Adviser’s business as a result of their relationships with the Fund. The Board noted that various affiliates of Funds Management may receive distribution-related fees, shareholder servicing payments and sub-transfer agency fees in respect of shares sold or held through them and services provided.
The Board also reviewed information about soft dollar credits earned and utilized by the Sub-Adviser, fees earned by Funds Management and the Sub-Adviser from managing a private investment vehicle for the fund family’s securities lending collateral and commissions earned by an affiliated broker from portfolio transactions.
Based on its consideration of the factors and information it deemed relevant, including those described here, the Board did not find that any ancillary benefits received by Funds Management and its affiliates, including the Sub-Adviser, were unreasonable.
Conclusion
At the Meeting, after considering the above-described factors and based on its deliberations and its evaluation of the information described above, the Board unanimously approved the continuation of the Advisory Agreement for the period from June 1, 2015 through June 30, 2015, approved the Management Agreement for the period from July 1, 2015 through May 31, 2016, and approved the continuation of the Sub-Advisory Agreement for a one-year term through May 31, 2016. The Board also determined that the compensation payable to Funds Management and the Sub-Adviser under each of the Advisory Agreements was reasonable.
| | | | |
| 34 | | Wells Fargo Advantage Special Small Cap Value Fund | | List of abbreviations |
The following is a list of common abbreviations for terms and entities that may have appeared in this report.
| ACA | — ACA Financial Guaranty Corporation |
| ADR | — American depositary receipt |
| ADS | — American depositary shares |
| AGC | — Assured Guaranty Corporation |
| AGM | — Assured Guaranty Municipal |
| Ambac | — Ambac Financial Group Incorporated |
| AMT | — Alternative minimum tax |
| BAN | — Bond anticipation notes |
| BHAC | — Berkshire Hathaway Assurance Corporation |
| CAB | — Capital appreciation bond |
| CCAB | — Convertible capital appreciation bond |
| CDA | — Community Development Authority |
| CDO | — Collateralized debt obligation |
| DRIVER | — Derivative inverse tax-exempt receipts |
| DW&P | — Department of Water & Power |
| DWR | — Department of Water Resources |
| ECFA | — Educational & Cultural Facilities Authority |
| EDA | — Economic Development Authority |
| EDFA | — Economic Development Finance Authority |
| ETF | — Exchange-traded fund |
| FDIC | — Federal Deposit Insurance Corporation |
| FFCB | — Federal Farm Credit Banks |
| FGIC | — Financial Guaranty Insurance Corporation |
| FHA | — Federal Housing Administration |
| FHLB | — Federal Home Loan Bank |
| FHLMC | — Federal Home Loan Mortgage Corporation |
| FICO | — The Financing Corporation |
| FNMA | — Federal National Mortgage Association |
| GDR | — Global depositary receipt |
| GNMA | — Government National Mortgage Association |
| HCFR | — Healthcare facilities revenue |
| HEFA | — Health & Educational Facilities Authority |
| HEFAR | — Higher education facilities authority revenue |
| HFA | — Housing Finance Authority |
| HFFA | — Health Facilities Financing Authority |
| HUD | — Department of Housing and Urban Development |
| IDA | — Industrial Development Authority |
| IDAG | — Industrial Development Agency |
| KRW | — Republic of Korea won |
| LIBOR | — London Interbank Offered Rate |
| LIFER | — Long Inverse Floating Exempt Receipts |
| LLC | — Limited liability company |
| LLLP | — Limited liability limited partnership |
| LLP | — Limited liability partnership |
| MBIA | — Municipal Bond Insurance Association |
| MFHR | — Multifamily housing revenue |
| MSTR | — Municipal securities trust receipts |
| MUD | — Municipal Utility District |
| National | — National Public Finance Guarantee Corporation |
| PCFA | — Pollution Control Financing Authority |
| PCL | — Public Company Limited |
| PCR | — Pollution control revenue |
| PFA | — Public Finance Authority |
| PFFA | — Public Facilities Financing Authority |
| PFOTER | — Puttable floating option tax-exempt receipts |
| plc | — Public limited company |
| PUTTER | — Puttable tax-exempt receipts |
| R&D | — Research & development |
| Radian | — Radian Asset Assurance |
| RAN | — Revenue anticipation notes |
| RDA | — Redevelopment Authority |
| RDFA | — Redevelopment Finance Authority |
| REIT | — Real estate investment trust |
| ROC | — Reset option certificates |
| SAVRS | — Select auction variable rate securities |
| SBA | — Small Business Authority |
| SDR | — Swedish depositary receipt |
| SFHR | — Single-family housing revenue |
| SFMR | — Single-family mortgage revenue |
| SPA | — Standby purchase agreement |
| SPDR | — Standard & Poor’s Depositary Receipts |
| SPEAR | — Short Puttable Exempt Adjustable Receipts |
| STRIPS | — Separate trading of registered interest and |
| TAN | — Tax anticipation notes |
| TIPS | — Treasury inflation-protected securities |
| TRAN | — Tax revenue anticipation notes |
| TTFA | — Transportation Trust Fund Authority |
| TVA | — Tennessee Valley Authority |
This page is intentionally left blank.
This page is intentionally left blank.


For more information
More information about Wells Fargo Advantage Funds is available free upon request. To obtain literature, please write, email, visit the Fund’s website, or call:
Wells Fargo Advantage Funds
P.O. Box 8266
Boston, MA 02266-8266
Email: wfaf@wellsfargo.com
Website: wellsfargoadvantagefunds.com
Individual investors: 1-800-222-8222
Retail investment professionals: 1-888-877-9275
Institutional investment professionals: 1-866-765-0778
This report and the financial statements contained herein are submitted for the general information of the shareholders of Wells Fargo Advantage Funds. If this report is used for promotional purposes, distribution of the report must be accompanied or preceded by a current prospectus. Before investing, please consider the investment objectives, risks, charges, and expenses of the investment. For a current prospectus and, if available, a summary prospectus, containing this information, call 1-800-222-8222 or visit the Fund’s website at wellsfargoadvantagefunds.com. Read the prospectus carefully before you invest or send money.
Wells Fargo Funds Management, LLC, a wholly owned subsidiary of Wells Fargo & Company, provides investment advisory and administrative services for Wells Fargo Advantage Funds. Other affiliates of Wells Fargo & Company provide subadvisory and other services for the Funds. The Funds are distributed by Wells Fargo Funds Distributor, LLC, Member FINRA, an affiliate of Wells Fargo & Company.
NOT FDIC INSURED ¡ NO BANK GUARANTEE ¡ MAY LOSE VALUE
© 2015 Wells Fargo Funds Management, LLC. All rights reserved.
| | |
 | | 237485 11-15 SA246/SAR246 09-15 |

Wells Fargo Advantage
Traditional Small Cap Growth Fund

Semi-Annual Report
September 30, 2015

Reduce clutter. Save trees.
Sign up for electronic delivery of prospectuses and shareholder reports at wellsfargo.com/advantagedelivery
Contents
The views expressed and any forward-looking statements are as of September 30, 2015, unless otherwise noted, and are those of the Fund managers and/or Wells Fargo Funds Management, LLC. Discussions of individual securities, or the markets generally, or any Wells Fargo Advantage Fund are not intended as individual recommendations. Future events or results may vary significantly from those expressed in any forward-looking statements; the views expressed are subject to change at any time in response to changing circumstances in the market. Wells Fargo Funds Management, LLC and the Fund disclaim any obligation to publicly update or revise any views expressed or forward-looking statements.
NOT FDIC INSURED ¡ NO BANK GUARANTEE ¡ MAY LOSE VALUE
| | | | |
| 2 | | Wells Fargo Advantage Traditional Small Cap Growth Fund | | Letter to shareholders (unaudited) |

Karla M. Rabusch
President
Wells Fargo Advantage Funds
Despite generally improving U.S. economic data, the broad U.S. stock market experienced heightened volatility that led to negative results overall for U.S. stocks for the period.
Dear Valued Shareholder:
We are pleased to offer you this semi-annual report for the Wells Fargo Advantage Traditional Small Cap Growth Fund for the six-month period that ended September 30, 2015. Despite generally improving U.S. economic data, the broad U.S. stock market experienced heightened volatility that led to negative results overall for U.S. stocks for the period. Large-cap stocks performed best, followed by mid caps and small caps. Markets outside the U.S. faced deeper ongoing challenges and generally delivered weaker results.
U.S. stocks experienced challenges during the second quarter of 2015.
The broad U.S. stock market fluctuated widely, eventually eking out a small quarterly gain. Mid- and large-cap stocks at times were pressured by investor concerns over the potentially negative effects of financially troubled overseas economies and of a strengthening U.S. dollar on the profits of U.S. multinational firms. The U.S. economy picked up traction during the quarter; consumer spending improved, and positive trends were evident in construction and new-home sales. Jobs growth remained a bright spot as well. U.S. Federal Reserve (Fed) officials, who have kept interest rates low while waiting for the U.S. jobs market to sufficiently improve and for inflation to approach their 2% target, made clear they could take action soon. Throughout the quarter, non-U.S. markets also experienced volatility, triggered by uncertainty over the potential impact of financial challenges in other locations—most notably in Greece and Puerto Rico. Questions over slower growth in China caused investor concern as well.
In the third quarter of 2015, China’s slowdown took a toll on economies and markets worldwide.
U.S. stocks sagged during the quarter, experiencing the most volatility since 2011. Larger-cap stocks generally declined the least and smaller caps the most. Economic data released during the quarter suggested the U.S. economy remains solid but has lost some steam, burdened by the drag of the strong U.S. dollar coupled with global economic turmoil. The fact that the Fed left the federal funds interest rate unchanged at its September meeting surprised investors and fueled increased uncertainty about the U.S. economy’s stamina to remain healthy while facing the challenges of slowing in China and troubles elsewhere in the world. Outside the U.S., markets were even more volatile and delivered generally weaker quarterly results, also largely due to investors’ increasing anxiety over China’s weakened economy. Because China is the world’s largest importer of many commodities, a number of emerging markets—key commodities exporters—are struggling under the dual strains of reduced demand for commodities and, because of weaker demand, lower prices for the commodities they do sell. In the eurozone, however, where only about 3% of exports are sent to China, household spending and business investment appeared relatively unaffected by troubles elsewhere. However, the European Central Bank warned in September that slowing growth in China could lead to slower growth and lower inflation rates in the eurozone than previously forecast and indicated additional stimulus could be provided should this occur.
| | | | | | |
| Letter to shareholders (unaudited) | | Wells Fargo Advantage Traditional Small Cap Growth Fund | | | 3 | |
Don’t let short-term uncertainty derail long-term investment goals.
Periods of uncertainty can present challenges, but experience has taught us that maintaining long-term investment goals can be an effective way to plan for the future. To help you create a sound strategy based on your personal goals and risk tolerance, Wells Fargo Advantage Funds offers more than 100 mutual funds spanning a wide range of asset classes and investment styles. Although diversification cannot guarantee an investment profit or prevent losses, we believe it can be an effective way to manage investment risk and potentially smooth out overall portfolio performance. We encourage investors to know their investments and to understand that appropriate levels of risk-taking may unlock opportunities.
Thank you for choosing to invest in Wells Fargo Advantage Funds. We appreciate your confidence in us and remain committed to helping you meet your financial needs.
Sincerely,

Karla M. Rabusch
President
Wells Fargo Advantage Funds
Periods of uncertainty can present challenges, but experience has taught us that maintaining long-term investment goals can be an effective way to plan for the future.
Notice to shareholders
At a meeting held August 11-12, 2015, the Board of Trustees of the Fund approved a change in the name of the Fund whereby the word “Advantage” was removed from its name, effective December 15, 2015.
For current information about your fund investments, contact your investment professional, visit our website at wellsfargoadvantagefunds.com, or call us directly at 1-800-222-8222. We are available 24 hours a day, 7 days a week.
| | | | |
| 4 | | Wells Fargo Advantage Traditional Small Cap Growth Fund | | Performance highlights (unaudited) |
Investment objective
The Fund seeks long-term capital appreciation.
Manager
Wells Fargo Funds Management, LLC
Subadviser
Wells Capital Management Incorporated
Portfolio manager
Alexi Makkas
Average annual total returns1 (%) as of September 30, 2015
| | | | | | | | | | | | | | | | | | | | | | | | | | | | | | | | | | |
| | | | | Including sales charge | | | Excluding sales charge | | | Expense ratios2 (%) | |
| | | Inception date | | 1 year | | | 5 year | | | 10 year | | | 1 year | | | 5 year | | | 10 year | | | Gross | | | Net3 | |
| Class A (EGWAX) | | 6-5-1995 | | | (4.79 | ) | | | 9.77 | | | | 5.71 | | | | 1.04 | | | | 11.08 | | | | 6.34 | | | | 1.42 | | | | 1.33 | |
| Class C (EGWCX) | | 7-30-2010 | | | (0.68 | ) | | | 10.27 | | | | 5.55 | | | | 0.32 | | | | 10.27 | | | | 5.55 | | | | 2.17 | | | | 2.08 | |
| Administrator Class (EGWDX) | | 7-30-2010 | | | – | | | | – | | | | – | | | | 1.19 | | | | 11.25 | | | | 6.44 | | | | 1.34 | | | | 1.20 | |
| Institutional Class (EGRYX) | | 11-19-1997 | | | – | | | | – | | | | – | | | | 1.40 | | | | 11.47 | | | | 6.67 | | | | 1.09 | | | | 0.98 | |
| Russell 2000® Growth Index4 | | – | | | – | | | | – | | | | – | | | | 4.04 | | | | 13.26 | | | | 7.67 | | | | – | | | | – | |
Figures quoted represent past performance, which is no guarantee of future results, and do not reflect taxes that a shareholder may pay on fund distributions or the redemption of fund shares. Investment return and principal value of an investment will fluctuate so that an investor’s shares, when redeemed, may be worth more or less than their original cost. Performance shown without sales charges would be lower if sales charges were reflected. Current performance may be lower or higher than the performance data quoted, which assumes the reinvestment of dividends and capital gains. Current month-end performance is available on the Fund’s website, wellsfargoadvantagefunds.com.
Index returns do not include transaction costs associated with buying and selling securities, any mutual fund fees or expenses, or any taxes. It is not possible to invest directly in an index.
For Class A shares, the maximum front-end sales charge is 5.75%. For Class C shares, the maximum contingent deferred sales charge is 1.00%. Performance including a contingent deferred sales charge assumes the sales charge for the corresponding time period. Administrator Class and Institutional Class shares are sold without a front-end sales charge or contingent deferred sales charge.
Stock values fluctuate in response to the activities of individual companies and general market and economic conditions. Smaller-company stocks tend to be more volatile and less liquid than those of larger companies. Consult the Fund’s prospectus for additional information on these and other risks.
Please see footnotes on page 5.
| | | | | | |
| Performance highlights (unaudited) | | Wells Fargo Advantage Traditional Small Cap Growth Fund | | | 5 | |
| | | | |
| Ten largest holdings5 (%) as of September 30, 2015 | |
Fleetmatics Group plc | | | 4.06 | |
Portfolio Recovery Associates Incorporated | | | 3.34 | |
ClubCorp Holdings Incorporated | | | 3.34 | |
LogMeIn Incorporated | | | 2.95 | |
Pool Corporation | | | 2.92 | |
Sonic Corporation | | | 2.78 | |
Qlik Technologies Incorporated | | | 2.77 | |
Stewart Information Services Corporation | | | 2.65 | |
Motorcar Parts of America Incorporated | | | 2.61 | |
Ultimate Software Group Incorporated | | | 2.49 | |
|
| Sector distribution6 as of September 30, 2015 |
|
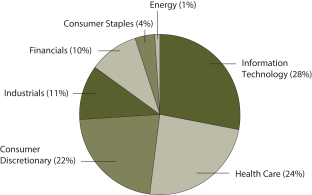 |
| 1 | Historical performance shown for Class C shares prior to their inception reflects the performance of Class A shares and has been adjusted to reflect the higher expenses applicable to Class C shares. Historical performance shown for Administrator Class shares prior to their inception reflects the performance of Institutional Class shares and has been adjusted to reflect the higher expenses applicable to Administrator Class shares. Historical performance shown for all classes of the Fund prior to July 19, 2010, is based on the performance of the Fund’s predecessor, Evergreen Growth Fund. |
| 2 | Reflects the expense ratios as stated in the most recent prospectuses. The expense ratios shown are subject to change and may differ from the annualized expense ratios shown in the financial highlights of this report. |
| 3 | The manager has contractually committed through July 31, 2016, to waive fees and/or reimburse expenses to the extent necessary to cap the Fund’s Total Annual Fund Operating Expenses After Fee Waiver at the amounts shown. After this time, the cap may be increased or the commitment to maintain the cap may be terminated only with the approval of the Board of Trustees. Brokerage commissions, stamp duty fees, interest, taxes, acquired fund fees and expenses, and extraordinary expenses are excluded from the cap. Without this cap, the Fund’s returns would have been lower. |
| 4 | The Russell 2000® Growth Index measures the performance of those Russell 2000 companies with higher price-to-book ratios and higher forecasted growth values. You cannot invest directly in an index. |
| 5 | The ten largest holdings, excluding cash and cash equivalents, are calculated based on the value of the investments divided by total net assets of the Fund. Holdings are subject to change and may have changed since the date specified. |
| 6 | Amounts are calculated based on the total long-term investments of the Fund. These amounts are subject to change and may have changed since the date specified. |
| | | | |
| 6 | | Wells Fargo Advantage Traditional Small Cap Growth Fund | | Fund expenses (unaudited) |
As a shareholder of the Fund, you incur two types of costs: (1) transaction costs, including sales charges (loads) on purchase payments and contingent deferred sales charges (if any) on redemptions and (2) ongoing costs, including management fees, distribution (12b-1) and/or shareholder servicing fees, and other Fund expenses. This example is intended to help you understand your ongoing costs (in dollars) of investing in the Fund and to compare these costs with the ongoing costs of investing in other mutual funds.
The example is based on an investment of $1,000 invested at the beginning of the six-month period and held for the entire period from April 1, 2015 to September 30, 2015.
Actual expenses
The “Actual” line of the table below provides information about actual account values and actual expenses. You may use the information in this line, together with the amount you invested, to estimate the expenses that you paid over the period. Simply divide your account value by $1,000 (for example, an $8,600 account value divided by $1,000 = 8.6), then multiply the result by the number in the “Actual” line under the heading entitled “Expenses paid during period” for your applicable class of shares to estimate the expenses you paid on your account during this period.
Hypothetical example for comparison purposes
The “Hypothetical” line of the table below provides information about hypothetical account values and hypothetical expenses based on the Fund’s actual expense ratio and an assumed rate of return of 5% per year before expenses, which is not the Fund’s actual return. The hypothetical account values and expenses may not be used to estimate the actual ending account balance or expenses you paid for the period. You may use this information to compare the ongoing costs of investing in the Fund and other funds. To do so, compare this 5% hypothetical example with the 5% hypothetical examples that appear in the shareholder reports of the other funds.
Please note that the expenses shown in the table are meant to highlight your ongoing costs only and do not reflect any transactional costs, such as sales charges (loads) and contingent deferred sales charges. Therefore, the “Hypothetical” line of the table is useful in comparing ongoing costs only and will not help you determine the relative total costs of owning different funds. In addition, if these transactional costs were included, your costs would have been higher.
| | | | | | | | | | | | | | | | |
| | | Beginning
account value
4-1-2015 | | | Ending
account value
9-30-2015 | | | Expenses
paid during
the period¹ | | | Net annualized
expense ratio | |
Class A | | | | | | | | | | | | | | | | |
Actual | | $ | 1,000.00 | | | $ | 895.23 | | | $ | 6.32 | | | | 1.33 | % |
Hypothetical (5% return before expenses) | | $ | 1,000.00 | | | $ | 1,018.40 | | | $ | 6.73 | | | | 1.33 | % |
Class C | | | | | | | | | | | | | | | | |
Actual | | $ | 1,000.00 | | | $ | 891.92 | | | $ | 9.86 | | | | 2.08 | % |
Hypothetical (5% return before expenses) | | $ | 1,000.00 | | | $ | 1,014.64 | | | $ | 10.50 | | | | 2.08 | % |
Administrator Class | | | | | | | | | | | | | | | | |
Actual | | $ | 1,000.00 | | | $ | 896.09 | | | $ | 5.70 | | | | 1.20 | % |
Hypothetical (5% return before expenses) | | $ | 1,000.00 | | | $ | 1,019.05 | | | $ | 6.07 | | | | 1.20 | % |
Institutional Class | | | | | | | | | | | | | | | | |
Actual | | $ | 1,000.00 | | | $ | 896.90 | | | $ | 4.66 | | | | 0.98 | % |
Hypothetical (5% return before expenses) | | $ | 1,000.00 | | | $ | 1,020.16 | | | $ | 4.96 | | | | 0.98 | % |
| 1 | Expenses paid is equal to the annualized expense ratio of each class multiplied by the average account value over the period, multiplied by the number of days in the most recent fiscal half-year divided by the number of days in the fiscal year (to reflect the one-half-year period). |
| | | | | | |
| Portfolio of investments—September 30, 2015 (unaudited) | | Wells Fargo Advantage Traditional Small Cap Growth Fund | | | 7 | |
| | | | | | | | | | | | |
| Security name | | | | | | Shares | | | Value | |
| | | | |
Common Stocks: 97.18% | | | | | | | | | | | | |
| | | | |
Consumer Discretionary: 21.43% | | | | | | | | | | | | |
| | | | |
| Auto Components: 4.56% | | | | | | | | | | | | |
Cooper-Standard Holdings Incorporated † | | | | | | | 39,000 | | | $ | 2,262,000 | |
Motorcar Parts of America Incorporated † | | | | | | | 96,200 | | | | 3,014,908 | |
| | | | |
| | | | | | | | | | | 5,276,908 | |
| | | | | | | | | | | | |
| | | | |
| Diversified Consumer Services: 0.73% | | | | | | | | | | | | |
Bright Horizons Family Solutions Incorporated † | | | | | | | 13,200 | | | | 847,968 | |
| | | | | | | | | | | | |
| | | | |
| Hotels, Restaurants & Leisure: 10.12% | | | | | | | | | | | | |
ClubCorp Holdings Incorporated | | | | | | | 180,000 | | | | 3,862,800 | |
Krispy Kreme Doughnuts Incorporated † | | | | | | | 170,000 | | | | 2,487,100 | |
Sonic Corporation | | | | | | | 140,000 | | | | 3,213,000 | |
Zoe’s Kitchen Incorporated «† | | | | | | | 54,200 | | | | 2,140,358 | |
| | | | |
| | | | | | | | | | | 11,703,258 | |
| | | | | | | | | | | | |
| | | | |
| Internet & Catalog Retail: 2.32% | | | | | | | | | | | | |
Shutterfly Incorporated † | | | | | | | 75,000 | | | | 2,681,250 | |
| | | | | | | | | | | | |
| | | | |
| Leisure Products: 3.70% | | | | | | | | | | | | |
Nautilus Group Incorporated † | | | | | | | 60,000 | | | | 900,000 | |
Pool Corporation | | | | | | | 46,700 | | | | 3,376,410 | |
| | | | |
| | | | | | | | | | | 4,276,410 | |
| | | | | | | | | | | | |
| | | | |
Consumer Staples: 3.44% | | | | | | | | | | | | |
| | | | |
| Food & Staples Retailing: 0.89% | | | | | | | | | | | | |
Casey’s General Stores Incorporated | | | | | | | 10,000 | | | | 1,029,200 | |
| | | | | | | | | | | | |
| | | | |
| Food Products: 1.14% | | | | | | | | | | | | |
Freshpet Incorporated Ǡ | | | | | | | 126,000 | | | | 1,323,000 | |
| | | | | | | | | | | | |
| | | | |
| Household Products: 1.41% | | | | | | | | | | | | |
WD-40 Company | | | | | | | 18,300 | | | | 1,629,981 | |
| | | | | | | | | | | | |
| | | | |
Energy: 0.56% | | | | | | | | | | | | |
| | | | |
| Energy Equipment & Services: 0.56% | | | | | | | | | | | | |
Aspen Aerogels Incorporated † | | | | | | | 86,400 | | | | 648,000 | |
| | | | | | | | | | | | |
| | | | |
Financials: 9.53% | | | | | | | | | | | | |
| | | | |
| Banks: 0.54% | | | | | | | | | | | | |
PrivateBancorp Incorporated | | | | | | | 16,200 | | | | 620,946 | |
| | | | | | | | | | | | |
| | | | |
| Consumer Finance: 3.34% | | | | | | | | | | | | |
Portfolio Recovery Associates Incorporated Ǡ | | | | | | | 73,000 | | | | 3,863,160 | |
| | | | | | | | | | | | |
| | | | |
| Insurance: 2.65% | | | | | | | | | | | | |
Stewart Information Services Corporation | | | | | | | 75,000 | | | | 3,068,250 | |
| | | | | | | | | | | | |
| | | | |
| Real Estate Management & Development: 1.99% | | | | | | | | | | | | |
Marcus & Millichap Incorporated † | | | | | | | 50,000 | | | | 2,299,500 | |
| | | | | | | | | | | | |
The accompanying notes are an integral part of these financial statements.
| | | | |
| 8 | | Wells Fargo Advantage Traditional Small Cap Growth Fund | | Portfolio of investments—September 30, 2015 (unaudited) |
| | | | | | | | | | | | |
| Security name | | | | | | Shares | | | Value | |
| | | | |
| Thrifts & Mortgage Finance: 1.01% | | | | | | | | | | | | |
Bofi Holding Incorporated † | | | | | | | 9,100 | | | $ | 1,172,353 | |
| | | | | | | | | | | | |
| | | | |
Health Care: 23.69% | | | | | | | | | | | | |
| | | | |
| Biotechnology: 5.79% | | | | | | | | | | | | |
AMAG Pharmaceuticals Incorporated † | | | | | | | 49,900 | | | | 1,982,527 | |
Emergent BioSolutions Incorporated † | | | | | | | 38,300 | | | | 1,091,167 | |
Exact Sciences Corporation Ǡ | | | | | | | 78,700 | | | | 1,415,813 | |
Novavax Incorporated † | | | | | | | 105,000 | | | | 742,350 | |
Repligen Corporation † | | | | | | | 52,400 | | | | 1,459,340 | |
| | | | |
| | | | | | | | | | | 6,691,197 | |
| | | | | | | | | | | | |
| | | | |
| Health Care Equipment & Supplies: 6.54% | | | | | | | | | | | | |
Cardiovascular Systems Incorporated † | | | | | | | 41,684 | | | | 660,275 | |
DexCom Incorporated † | | | | | | | 6,837 | | | | 587,025 | |
Globus Medical Incorporated † | | | | | | | 120,000 | | | | 2,479,200 | |
Inogen Incorporated † | | | | | | | 45,000 | | | | 2,184,750 | |
LDR Holding Corporation † | | | | | | | 48,000 | | | | 1,657,440 | |
| | | | |
| | | | | | | | | | | 7,568,690 | |
| | | | | | | | | | | | |
| | | | |
| Health Care Providers & Services: 4.21% | | | | | | | | | | | | |
Capital Senior Living Corporation † | | | | | | | 95,600 | | | | 1,916,780 | |
Ensign Group Incorporated | | | | | | | 27,100 | | | | 1,155,273 | |
Surgical Care Affiliates Incorporated † | | | | | | | 55,000 | | | | 1,797,950 | |
| | | | |
| | | | | | | | | | | 4,870,003 | |
| | | | | | | | | | | | |
| | | | |
| Health Care Technology: 3.74% | | | | | | | | | | | | |
Imprivata Incorporated † | | | | | | | 125,000 | | | | 2,221,250 | |
Medidata Solutions Incorporated † | | | | | | | 50,000 | | | | 2,105,500 | |
| | | | |
| | | | | | | | | | | 4,326,750 | |
| | | | | | | | | | | | |
| | | | |
| Pharmaceuticals: 3.41% | | | | | | | | | | | | |
Akorn Incorporated † | | | | | | | 52,000 | | | | 1,482,260 | |
Intersect ENT Incorporated † | | | | | | | 85,000 | | | | 1,989,000 | |
TherapeuticsMD Incorporated † | | | | | | | 80,000 | | | | 468,800 | |
| | | | |
| | | | | | | | | | | 3,940,060 | |
| | | | | | | | | | | | |
| | | | |
Industrials: 11.07% | | | | | | | | | | | | |
| | | | |
| Air Freight & Logistics: 1.53% | | | | | | | | | | | | |
Echo Global Logistics Incorporated † | | | | | | | 90,000 | | | | 1,764,000 | |
| | | | | | | | | | | | |
| | | | |
| Building Products: 1.85% | | | | | | | | | | | | |
Apogee Enterprises Incorporated | | | | | | | 48,000 | | | | 2,143,200 | |
| | | | | | | | | | | | |
| | | | |
| Commercial Services & Supplies: 1.86% | | | | | | | | | | | | |
Mobile Mini Incorporated | | | | | | | 70,000 | | | | 2,155,300 | |
| | | | | | | | | | | | |
| | | | |
| Electrical Equipment: 0.57% | | | | | | | | | | | | |
Generac Holdings Incorporated † | | | | | | | 22,000 | | | | 661,980 | |
| | | | | | | | | | | | |
The accompanying notes are an integral part of these financial statements.
| | | | | | |
| Portfolio of investments—September 30, 2015 (unaudited) | | Wells Fargo Advantage Traditional Small Cap Growth Fund | | | 9 | |
| | | | | | | | | | | | | | |
| Security name | | | | | | | Shares | | | Value | |
| | | | |
| Professional Services: 3.81% | | | | | | | | | | | | | | |
The Advisory Board Company † | | | | | | | | | 51,100 | | | $ | 2,327,094 | |
Wageworks Incorporated † | | | | | | | | | 46,020 | | | | 2,074,582 | |
| | | | |
| | | | | | | | | | | | | 4,401,676 | |
| | | | | | | | | | | | | | |
| | | | |
| Trading Companies & Distributors: 1.45% | | | | | | | | | | | | | | |
H&E Equipment Services Incorporated | | | | | | | | | 100,000 | | | | 1,672,000 | |
| | | | | | | | | | | | | | |
| | | | |
Information Technology: 27.46% | | | | | | | | | | | | | | |
| | | | |
| Electronic Equipment, Instruments & Components: 1.72% | | | | | | | | | | | | | | |
Littelfuse Incorporated | | | | | | | | | 21,800 | | | | 1,987,070 | |
| | | | | | | | | | | | | | |
| | | | |
| Internet Software & Services: 4.42% | | | | | | | | | | | | | | |
Demandware Incorporated † | | | | | | | | | 33,000 | | | | 1,705,440 | |
LogMeIn Incorporated † | | | | | | | | | 50,000 | | | | 3,408,000 | |
| | | | |
| | | | | | | | | | | | | 5,113,440 | |
| | | | | | | | | | | | | | |
| | | | |
| IT Services: 4.62% | | | | | | | | | | | | | | |
Euronet Worldwide Incorporated † | | | | | | | | | 38,000 | | | | 2,815,420 | |
Heartland Payment Systems Incorporated | | | | | | | | | 40,000 | | | | 2,520,400 | |
| | | | |
| | | | | | | | | | | | | 5,335,820 | |
| | | | | | | | | | | | | | |
| | | | |
| Semiconductors & Semiconductor Equipment: 2.53% | | | | | | | | | | | | | | |
Cavium Incorporated † | | | | | | | | | 8,500 | | | | 521,645 | |
Exar Corporation † | | | | | | | | | 165,000 | | | | 981,750 | |
Integrated Device Technology Incorporated † | | | | | | | | | 70,000 | | | | 1,421,000 | |
| | | | |
| | | | | | | | | | | | | 2,924,395 | |
| | | | | | | | | | | | | | |
| | | | |
| Software: 14.17% | | | | | | | | | | | | | | |
Bottomline Technologies Incorporated † | | | | | | | | | 100,000 | | | | 2,501,000 | |
Ellie Mae Incorporated † | | | | | | | | | 25,000 | | | | 1,664,250 | |
Fleetmatics Group plc † | | | | | | | | | 95,712 | | | | 4,698,501 | |
Guidewire Software Incorporated † | | | | | | | | | 27,400 | | | | 1,440,692 | |
Qlik Technologies Incorporated † | | | | | | | | | 88,000 | | | | 3,207,600 | |
Ultimate Software Group Incorporated † | | | | | | | | | 16,074 | | | | 2,877,407 | |
| | | | |
| | | | | | | | | | | | | 16,389,450 | |
| | | | | | | | | | | | | | |
| | | | |
Total Common Stocks (Cost $107,574,325) | | | | | | | | | | | | | 112,385,215 | |
| | | | | | | | | | | | | | |
| | | | |
| | | Yield | | | | | | | | | |
| Short-Term Investments: 6.98% | | | | | | | | | | | | | | |
| | | | |
| Investment Companies: 6.98% | | | | | | | | | | | | | | |
Securities Lending Cash Investments, LLC (l)(r)(u) | | | 0.15 | % | | | | | 5,109,850 | | | | 5,109,850 | |
Wells Fargo Advantage Cash Investment Money Market Fund, Select Class (l)(u) | | | 0.16 | | | | | | 2,964,108 | | | | 2,964,108 | |
| | | | |
Total Short-Term Investments (Cost $8,073,958) | | | | | | | | | | | | | 8,073,958 | |
| | | | | | | | | | | | | | |
| | | | | | | | |
| Total investments in securities (Cost $115,648,283) * | | | 104.16 | % | | | 120,459,173 | |
Other assets and liabilities, net | | | (4.16 | ) | | | (4,811,373 | ) |
| | | | | | | | |
| Total net assets | | | 100.00 | % | | $ | 115,647,800 | |
| | | | | | | | |
The accompanying notes are an integral part of these financial statements.
| | | | |
| 10 | | Wells Fargo Advantage Traditional Small Cap Growth Fund | | Portfolio of investments—September 30, 2015 (unaudited) |
| † | Non-income-earning security |
| « | All or a portion of this security is on loan. |
| (l) | The security represents an affiliate of the Fund as defined in the Investment Company Act of 1940. |
| (r) | The investment is a non-registered investment vehicle purchased with cash collateral received from securities on loan. |
| (u) | The rate represents the 7-day annualized yield at period end. |
| * | Cost for federal income tax purposes is $115,946,138 and unrealized gains (losses) consists of: |
| | | | |
Gross unrealized gains | | $ | 14,049,231 | |
Gross unrealized losses | | | (9,536,196 | ) |
| | | | |
Net unrealized gains | | $ | 4,513,035 | |
The accompanying notes are an integral part of these financial statements.
| | | | | | |
| Statement of assets and liabilities—September 30, 2015 (unaudited) | | Wells Fargo Advantage Traditional Small Cap Growth Fund | | | 11 | |
| | | | |
| | | | |
| |
Assets | | | | |
Investments | | | | |
In unaffiliated securities (including $4,977,797 of securities loaned), at value (cost $107,574,325) | | $ | 112,385,215 | |
In affiliated securities, at value (cost $8,073,958) | | | 8,073,958 | |
| | | | |
Total investments, at value (cost $115,648,283) | | | 120,459,173 | |
Receivable for investments sold | | | 1,200,359 | |
Receivable for Fund shares sold | | | 15,447 | |
Receivable for dividends | | | 25,736 | |
Receivable for securities lending income | | | 9,138 | |
Prepaid expenses and other assets | | | 49,910 | |
| | | | |
Total assets | | | 121,759,763 | |
| | | | |
| |
Liabilities | | | | |
Payable for investments purchased | | | 767,956 | |
Payable for Fund shares redeemed | | | 81,749 | |
Payable upon receipt of securities loaned | | | 5,109,850 | |
Management fee payable | | | 69,806 | |
Distribution fee payable | | | 141 | |
Administration fees payable | | | 20,168 | |
Accrued expenses and other liabilities | | | 62,293 | |
| | | | |
Total liabilities | | | 6,111,963 | |
| | | | |
Total net assets | | $ | 115,647,800 | |
| | | | |
| |
NET ASSETS CONSIST OF | | | | |
Paid-in capital | | $ | 86,642,728 | |
Accumulated net investment loss | | | (865,494 | ) |
Accumulated net realized gains on investments | | | 25,059,676 | |
Net unrealized gains on investments | | | 4,810,890 | |
| | | | |
Total net assets | | $ | 115,647,800 | |
| | | | |
| |
COMPUTATION OF NET ASSET VALUE AND OFFERING PRICE PER SHARE | | | | |
Net assets – Class A | | $ | 103,027,005 | |
Shares outstanding – Class A1 | | | 6,377,191 | |
Net asset value per share – Class A | | | $16.16 | |
Maximum offering price per share – Class A2 | | | $17.15 | |
Net assets – Class C | | $ | 215,205 | |
Shares outstanding – Class C1 | | | 14,016 | |
Net asset value per share – Class C | | | $15.35 | |
Net assets – Administrator Class | | $ | 3,007,564 | |
Shares outstanding – Administrator Class1 | | | 172,612 | |
Net asset value per share – Administrator Class | | | $17.42 | |
Net assets – Institutional Class | | $ | 9,398,026 | |
Shares outstanding – Institutional Class1 | | | 532,013 | |
Net asset value per share – Institutional Class | | | $17.67 | |
| 1 | The Fund has an unlimited number of authorized shares. |
| 2 | Maximum offering price is computed as 100/94.25 of net asset value. On investments of $50,000 or more, the offering price is reduced. |
The accompanying notes are an integral part of these financial statements.
| | | | |
| 12 | | Wells Fargo Advantage Traditional Small Cap Growth Fund | | Statement of operations—six months ended September 30, 2015 (unaudited) |
| | | | |
| | | | |
| |
Investment income | | | | |
Dividends | | $ | 270,929 | |
Securities lending income, net | | | 46,165 | |
Income from affiliated securities | | | 2,729 | |
| | | | |
Total investment income | | | 319,823 | |
| | | | |
| |
Expenses | | | | |
Management fee | | | 565,806 | |
Administration fees | | | | |
Class A | | | 139,090 | |
Class C | | | 273 | |
Administrator Class | | | 2,002 | |
Institutional Class | | | 5,917 | |
Shareholder servicing fees | | | | |
Class A | | | 147,563 | |
Class C | | | 291 | |
Administrator Class | | | 4,349 | |
Distribution fee | | | | |
Class C | | | 873 | |
Custody and accounting fees | | | 9,526 | |
Professional fees | | | 24,297 | |
Registration fees | | | 31,772 | |
Shareholder report expenses | | | 15,485 | |
Trustees’ fees and expenses | | | 8,005 | |
Other fees and expenses | | | 3,704 | |
| | | | |
Total expenses | | | 958,953 | |
Less: Fee waivers and/or expense reimbursements | | | (94,916 | ) |
| | | | |
Net expenses | | | 864,037 | |
| | | | |
Net investment loss | | | (544,214 | ) |
| | | | |
| |
REALIZED AND UNREALIZED GAINS (LOSSES) ON INVESTMENTS | | | | |
Net realized gains on investments | | | 18,588,279 | |
Net change in unrealized gains (losses) on investments | | | (31,541,187 | ) |
| | | | |
Net realized and unrealized gains (losses) on investments | | | (12,952,908 | ) |
| | | | |
Net decrease in net assets resulting from operations | | $ | (13,497,122 | ) |
| | | | |
The accompanying notes are an integral part of these financial statements.
| | | | | | |
| Statement of changes in net assets | | Wells Fargo Advantage Traditional Small Cap Growth Fund | | | 13 | |
| | | | | | | | | | | | | | | | |
| | | Six months ended
September 30, 2015
(unaudited) | | | Year ended
March 31, 2015 | |
| | | |
Operations | | | | | | | | | | | | |
Net investment loss | | | | | | $ | (544,214 | ) | | | | | | $ | (1,186,546 | ) |
Net realized gains on investments | | | | | | | 18,588,279 | | | | | | | | 16,249,777 | |
Net change in unrealized gains (losses) on investments | | | | | | | (31,541,187 | ) | | | | | | | (6,954,098 | ) |
| | | | |
Net increase (decrease) in net assets resulting from operations | | | | | | | (13,497,122 | ) | | | | | | | 8,109,133 | |
| | | | |
| | | |
Distributions to shareholders from | | | | | | | | | | | | |
Net realized gains | | | | | | | | | | | | | | | | |
Class A | | | | | | | 0 | | | | | | | | (20,918,267 | ) |
Class C | | | | | | | 0 | | | | | | | | (64,164 | ) |
Administrator Class | | | | | | | 0 | | | | | | | | (489,047 | ) |
Institutional Class | | | | | | | 0 | | | | | | | | (2,109,310 | ) |
| | | | |
Total distributions to shareholders | | | | | | | 0 | | | | | | | | (23,580,788 | ) |
| | | | |
| | | | |
Capital share transactions | | | Shares | | | | | | | | Shares | | | | | |
Proceeds from shares sold | | | | | | | | | | | | | | | | |
Class A | | | 75,368 | | | | 1,360,422 | | | | 166,240 | | | | 3,105,325 | |
Class C | | | 1,996 | | | | 34,675 | | | | 4,689 | | | | 87,580 | |
Administrator Class | | | 37,517 | | | | 736,870 | | | | 18,974 | | | | 376,286 | |
Institutional Class | | | 36,616 | | | | 701,590 | | | | 145,847 | | | | 2,948,534 | |
| | | | |
| | | | | | | 2,833,557 | | | | | | | | 6,517,725 | |
| | | | |
Reinvestment of distributions | | | | | | | | | | | | | | | | |
Class A | | | 0 | | | | 0 | | | | 1,187,647 | | | | 20,118,743 | |
Class C | | | 0 | | | | 0 | | | | 3,495 | | | | 56,625 | |
Administrator Class | | | 0 | | | | 0 | | | | 26,596 | | | | 485,372 | |
Institutional Class | | | 0 | | | | 0 | | | | 93,024 | | | | 1,718,153 | |
| | | | |
| | | | | | | 0 | | | | | | | | 22,378,893 | |
| | | | |
Payment for shares redeemed | | | | | | | | | | | | | | | | |
Class A | | | (557,288 | ) | | | (10,064,956 | ) | | | (1,439,029 | ) | | | (27,107,396 | ) |
Class C | | | (1,479 | ) | | | (25,555 | ) | | | (15,128 | ) | | | (267,013 | ) |
Administrator Class | | | (25,820 | ) | | | (481,356 | ) | | | (64,575 | ) | | | (1,331,123 | ) |
Institutional Class | | | (104,583 | ) | | | (2,001,230 | ) | | | (421,031 | ) | | | (8,665,650 | ) |
| | | | |
| | | | | | | (12,573,097 | ) | | | | | | | (37,371,182 | ) |
| | | | |
Net decrease in net assets resulting from capital share transactions | | | | | | | (9,739,540 | ) | | | | | | | (8,474,564 | ) |
| | | | |
Total decrease in net assets | | | | | | | (23,236,662 | ) | | | | | | | (23,946,219 | ) |
| | | | |
| | |
Net assets | | | | | | | | |
Beginning of period | | | | | | | 138,884,462 | | | | | | | | 162,830,681 | |
| | | | |
End of period | | | | | | $ | 115,647,800 | | | | | | | $ | 138,884,462 | |
| | | | |
Accumulated net investment loss | | | | | | $ | (865,494 | ) | | | | | | $ | (321,280 | ) |
| | | | |
The accompanying notes are an integral part of these financial statements.
| | | | |
| 14 | | Wells Fargo Advantage Traditional Small Cap Growth Fund | | Financial highlights |
(For a share outstanding throughout each period)
| | | | | | | | | | | | | | | | | | | | | | | | | | | | | | | | |
| | | Six months ended
September 30, 2015
(unaudited) | | | Year ended March 31 | | | Year ended October 31 | | | Year ended
September 30, 20103 | |
| CLASS A | | | 2015 | | | 20141 | | | 2013 | | | 2012 | | | 2011 | | | 20102 | | |
Net asset value, beginning of period | | | $18.04 | | | | $20.37 | | | | $23.11 | | | | $17.08 | | | | $15.31 | | | | $14.31 | | | | $13.77 | | | | $12.24 | |
Net investment loss | | | (0.08 | )4 | | | (0.18 | ) | | | (0.09 | )4 | | | (0.11 | )4 | | | (0.11 | )4 | | | (0.16 | )4 | | | (0.02 | )4 | | | (0.12 | )4 |
Net realized and unrealized gains (losses) on investments | | | (1.80 | ) | | | 1.33 | | | | 0.96 | | | | 6.34 | | | | 1.88 | | | | 1.16 | | | | 0.56 | | | | 1.65 | |
| | | | | | | | | | | | | | | | | | | | | | | | | | | | | | | | |
Total from investment operations | | | (1.88 | ) | | | 1.15 | | | | 0.87 | | | | 6.23 | | | | 1.77 | | | | 1.00 | | | | 0.54 | | | | 1.53 | |
Distributions to shareholders from | | | | | | | | | | | | | | | | | | | | | |
Net realized gains | | | 0.00 | | | | (3.48 | ) | | | (3.61 | ) | | | (0.20 | ) | | | 0.00 | | | | 0.00 | | | | 0.00 | | | | 0.00 | |
Net asset value, end of period | | | $16.16 | | | | $18.04 | | | | $20.37 | | | | $23.11 | | | | $17.08 | | | | $15.31 | | | | $14.31 | | | | $13.77 | |
Total return5 | | | (10.48 | )% | | | 6.77 | % | | | 4.14 | % | | | 36.98 | % | | | 11.56 | % | | | 6.99 | % | | | 3.92 | % | | | 12.50 | % |
Ratios to average net assets (annualized) | | | | | | | | | | | | | | | | | | | | | |
Gross expenses | | | 1.48 | % | | | 1.47 | % | | | 1.54 | % | | | 1.48 | % | | | 1.48 | % | | | 1.43 | % | | | 1.47 | % | | | 1.39 | % |
Net expenses | | | 1.33 | % | | | 1.33 | % | | | 1.33 | % | | | 1.33 | % | | | 1.33 | % | | | 1.33 | % | | | 1.33 | % | | | 1.33 | % |
Net investment loss | | | (0.85 | )% | | | (0.87 | )% | | | (1.04 | )% | | | (0.58 | )% | | | (0.69 | )% | | | (0.96 | )% | | | (0.64 | )% | | | (0.92 | )% |
Supplemental data | | | | | | | | | | | | | | | | | | | | | | | | |
Portfolio turnover rate | | | 80 | % | | | 73 | % | | | 36 | % | | | 77 | % | | | 57 | % | | | 123 | % | | | 9 | % | | | 80 | % |
Net assets, end of period (000s omitted) | | | $103,027 | | | | $123,712 | | | | $141,446 | | | | $141,933 | | | | $119,490 | | | | $123,063 | | | | $136,332 | | | | $133,166 | |
| 1 | For the five months ended March 31, 2014. The Fund changed its fiscal year end from October 31 to March 31, effective March 31, 2014. |
| 2 | For the one month ended October 31, 2010. The Fund changed its fiscal year end from September 30 to October 31, effective October 31, 2010. |
| 3 | After the close of business on July 16, 2010, the Fund acquired the net assets of Evergreen Growth Fund which became the accounting and performance survivor in the transaction. The information for the period prior to July 19, 2010 is that of Class A of Evergreen Growth Fund. |
| 4 | Calculated based upon average shares outstanding |
| 5 | Total return calculations do not include any sales charges. Returns for periods of less than one year are not annualized. |
The accompanying notes are an integral part of these financial statements.
| | | | | | |
| Financial highlights | | Wells Fargo Advantage Traditional Small Cap Growth Fund | | | 15 | |
(For a share outstanding throughout each period)
| | | | | | | | | | | | | | | | | | | | | | | | | | | | | | | | |
| | | Six months ended
September 30, 2015
(unaudited) | | | Year ended March 31 | | | Year ended October 31 | | | Year ended
September 30, 20103 | |
| CLASS C | | | 2015 | | | 20141 | | | 2013 | | | 2012 | | | 2011 | | | 20102 | | |
Net asset value, beginning of period | | | $17.21 | | | | $19.73 | | | | $22.56 | | | | $16.80 | | | | $15.18 | | | | $14.29 | | | | $13.66 | | | | $13.18 | |
Net investment loss | | | (0.12 | ) | | | (0.29 | )4 | | | (0.15 | )4 | | | (0.26 | ) | | | (0.25 | ) | | | (0.27 | )4 | | | (0.02 | )4 | | | (0.04 | )4 |
Net realized and unrealized gains (losses) on investments | | | (1.74 | ) | | | 1.25 | | | | 0.93 | | | | 6.22 | | | | 1.87 | | | | 1.16 | | | | 0.65 | | | | 0.52 | |
| | | | | | | | | | | | | | | | | | | | | | | | | | | | | | | | |
Total from investment operations | | | (1.86 | ) | | | 0.96 | | | | 0.78 | | | | 5.96 | | | | 1.62 | | | | 0.89 | | | | 0.63 | | | | 0.48 | |
Distributions to shareholders from | | | | | | | | | | | | | | | | | | | | | |
Net realized gains | | | 0.00 | | | | (3.48 | ) | | | (3.61 | ) | | | (0.20 | ) | | | 0.00 | | | | 0.00 | | | | 0.00 | | | | 0.00 | |
Net asset value, end of period | | | $15.35 | | | | $17.21 | | | | $19.73 | | | | $22.56 | | | | $16.80 | | | | $15.18 | | | | $14.29 | | | | $13.66 | |
Total return5 | | | (10.81 | )% | | | 5.98 | % | | | 3.85 | % | | | 35.92 | % | | | 10.74 | % | | | 6.16 | % | | | 3.93 | % | | | 4.32 | % |
Ratios to average net assets (annualized) | | | | | | | | | | | | | | | | | | | | | |
Gross expenses | | | 2.23 | % | | | 2.22 | % | | | 2.30 | % | | | 2.23 | % | | | 2.23 | % | | | 2.18 | % | | | 2.25 | % | | | 2.19 | % |
Net expenses | | | 2.08 | % | | | 2.08 | % | | | 2.08 | % | | | 2.08 | % | | | 2.08 | % | | | 2.08 | % | | | 2.08 | % | | | 2.08 | % |
Net investment loss | | | (1.59 | )% | | | (1.61 | )% | | | (1.81 | )% | | | (1.36 | )% | | | (1.44 | )% | | | (1.72 | )% | | | (1.31 | )% | | | (1.67 | )% |
Supplemental data | | | | | | | | | | | | | | | | | | | | | | | | |
Portfolio turnover rate | | | 80 | % | | | 73 | % | | | 36 | % | | | 77 | % | | | 57 | % | | | 123 | % | | | 9 | % | | | 80 | % |
Net assets, end of period (000s omitted) | | | $215 | | | | $232 | | | | $403 | | | | $150 | | | | $116 | | | | $115 | | | | $99 | | | | $10 | |
| 1 | For the five months ended March 31, 2014. The Fund changed its fiscal year end from October 31 to March 31, effective March 31, 2014. |
| 2 | For the one month ended October 31, 2010. The Fund changed its fiscal year end from September 30 to October 31, effective October 31, 2010. |
| 3 | For the period from July 30, 2010 (commencement of class operations) to September 30, 2010 |
| 4 | Calculated based upon average shares outstanding |
| 5 | Total return calculations do not include any sales charges. Returns for periods of less than one year are not annualized. |
The accompanying notes are an integral part of these financial statements.
| | | | |
| 16 | | Wells Fargo Advantage Traditional Small Cap Growth Fund | | Financial highlights |
(For a share outstanding throughout each period)
| | | | | | | | | | | | | | | | | | | | | | | | | | | | | | | | |
| | | Six months ended
September 30, 2015
(unaudited) | | | Year ended March 31 | | | Year ended October 31 | | | Year ended
September 30, 20103 | |
| ADMINISTRATOR CLASS | | | 2015 | | | 20141 | | | 2013 | | | 2012 | | | 2011 | | | 20102 | | |
Net asset value, beginning of period | | | $19.44 | | | | $21.65 | | | | $24.33 | | | | $17.94 | | | | $16.06 | | | | $14.99 | | | | $14.43 | | | | $13.80 | |
Net investment loss | | | (0.07 | )4 | | | (0.15 | )4 | | | (0.08 | )4 | | | (0.09 | )4 | | | (0.09 | )4 | | | (0.14 | )4 | | | (0.01 | )4 | | | (0.02 | )4 |
Net realized and unrealized gains (losses) on investments | | | (1.95 | ) | | | 1.42 | | | | 1.01 | | | | 6.68 | | | | 1.97 | | | | 1.21 | | | | 0.57 | | | | 0.65 | |
| | | | | | | | | | | | | | | | | | | | | | | | | | | | | | | | |
Total from investment operations | | | (2.02 | ) | | | 1.27 | | | | 0.93 | | | | 6.59 | | | | 1.88 | | | | 1.07 | | | | 0.56 | | | | 0.63 | |
Distributions to shareholders from | | | | | | | | | | | | | | | | | | | | | |
Net realized gains | | | 0.00 | | | | (3.48 | ) | | | (3.61 | ) | | | (0.20 | ) | | | 0.00 | | | | 0.00 | | | | 0.00 | | | | 0.00 | |
Net asset value, end of period | | | $17.42 | | | | $19.44 | | | | $21.65 | | | | $24.33 | | | | $17.94 | | | | $16.06 | | | | $14.99 | | | | $14.43 | |
Total return5 | | | (10.39 | )% | | | 6.93 | % | | | 4.18 | % | | | 37.21 | % | | | 11.71 | % | | | 7.14 | % | | | 3.95 | % | | | 4.49 | % |
Ratios to average net assets (annualized) | | | | | | | | | | | | | | | | | | | | | |
Gross expenses | | | 1.36 | % | | | 1.29 | % | | | 1.32 | % | | | 1.26 | % | | | 1.26 | % | | | 1.23 | % | | | 1.31 | % | | | 1.37 | % |
Net expenses | | | 1.20 | % | | | 1.19 | % | | | 1.19 | % | | | 1.17 | % | | | 1.17 | % | | | 1.19 | % | | | 1.20 | % | | | 1.20 | % |
Net investment loss | | | (0.71 | )% | | | (0.73 | )% | | | (0.90 | )% | | | (0.43 | )% | | | (0.54 | )% | | | (0.83 | )% | | | (0.55 | )% | | | (0.77 | )% |
Supplemental data | | | | | | | | | | | | | | | | | | | | | | | | |
Portfolio turnover rate | | | 80 | % | | | 73 | % | | | 36 | % | | | 77 | % | | | 57 | % | | | 123 | % | | | 9 | % | | | 80 | % |
Net assets, end of period (000s omitted) | | | $3,008 | | | | $3,128 | | | | $3,896 | | | | $3,882 | | | | $3,063 | | | | $3,413 | | | | $11 | | | | $10 | |
| 1 | For the five months ended March 31, 2014. The Fund changed its fiscal year end from October 31 to March 31, effective March 31, 2014. |
| 2 | For the one month ended October 31, 2010. The Fund changed its fiscal year end from September 30 to October 31, effective October 31, 2010. |
| 3 | For the period from July 30, 2010 (commencement of class operations) to September 30, 2010 |
| 4 | Calculated based upon average shares outstanding |
| 5 | Returns for periods of less than one year are not annualized. |
The accompanying notes are an integral part of these financial statements.
| | | | | | |
| Financial highlights | | Wells Fargo Advantage Traditional Small Cap Growth Fund | | | 17 | |
(For a share outstanding throughout each period)
| | | | | | | | | | | | | | | | | | | | | | | | | | | | | | | | |
| | | Six months ended
September 30, 2015
(unaudited) | | | Year ended March 31 | | | Year ended October 31 | | | Year ended
September 30, 20103 | |
| INSTITUTIONAL CLASS | | | 2015 | | | 20141 | | | 2013 | | | 2012 | | | 2011 | | | 20102 | | |
Net asset value, beginning of period | | | $19.69 | | | | $21.84 | | | | $24.50 | | | | $18.03 | | | | $16.11 | | | | $15.01 | | | | $14.43 | | | | $12.79 | |
Net investment income (loss) | | | (0.05 | )4 | | | (0.11 | )4 | | | (0.07 | )4 | | | 0.00 | 4,5 | | | (0.06 | )4 | | | (0.10 | ) | | | (0.00 | )4,5 | | | (0.10 | )4 |
Net realized and unrealized gains (losses) on investments | | | (1.97 | ) | | | 1.44 | | | | 1.02 | | | | 6.67 | | | | 1.98 | | | | 1.20 | | | | 0.58 | | | | 1.74 | |
| | | | | | | | | | | | | | | | | | | | | | | | | | | | | | | | |
Total from investment operations | | | (2.02 | ) | | | 1.33 | | | | 0.95 | | | | 6.67 | | | | 1.92 | | | | 1.10 | | | | 0.58 | | | | 1.64 | |
Distributions to shareholders from | | | | | | | | | | | | | | | | | | | | | |
Net investment income | | | 0.00 | | | | 0.00 | | | | 0.00 | | | | 0.00 | | | | 0.00 | | | | 0.00 | | | | 0.00 | | | | (0.00 | )5 |
Net realized gains | | | 0.00 | | | | (3.48 | ) | | | (3.61 | ) | | | (0.20 | ) | | | 0.00 | | | | 0.00 | | | | 0.00 | | | | 0.00 | |
| | | | | | | | | | | | | | | | | | | | | | | | | | | | | | | | |
Total distributions to shareholders | | | 0.00 | | | | (3.48 | ) | | | (3.61 | ) | | | (0.20 | ) | | | 0.00 | | | | 0.00 | | | | 0.00 | | | | (0.00 | )5 |
Net asset value, end of period | | | $17.67 | | | | $19.69 | | | | $21.84 | | | | $24.50 | | | | $18.03 | | | | $16.11 | | | | $15.01 | | | | $14.43 | |
Total return6 | | | (10.31 | )% | | | 7.16 | % | | | 4.29 | % | | | 37.42 | % | | | 11.92 | % | | | 7.33 | % | | | 4.02 | % | | | 12.87 | % |
Ratios to average net assets (annualized) | | | | | | | | | | | | | | | | | | | | | |
Gross expenses | | | 1.09 | % | | | 1.04 | % | | | 1.10 | % | | | 1.04 | % | | | 1.05 | % | | | 1.00 | % | | | 1.04 | % | | | 1.06 | % |
Net expenses | | | 0.98 | % | | | 0.98 | % | | | 0.98 | % | | | 0.98 | % | | | 0.98 | % | | | 0.98 | % | | | 0.98 | % | | | 1.05 | % |
Net investment income (loss) | | | (0.50 | )% | | | (0.52 | )% | | | (0.69 | )% | | | 0.01 | % | | | (0.35 | )% | | | (0.61 | )% | | | (0.29 | )% | | | (0.78 | )% |
Supplemental data | | | | | | | | | | | | | | | | | | | | | | | | |
Portfolio turnover rate | | | 80 | % | | | 73 | % | | | 36 | % | | | 77 | % | | | 57 | % | | | 123 | % | | | 9 | % | | | 80 | % |
Net assets, end of period (000s omitted) | | | $9,398 | | | | $11,812 | | | | $17,086 | | | | $17,997 | | | | $43,160 | | | | $71,493 | | | | $105,475 | | | | $102,499 | |
| 1 | For the five months ended March 31, 2014. The Fund changed its fiscal year end from October 31 to March 31, effective March 31, 2014. |
| 2 | For the one month ended October 31, 2010. The Fund changed its fiscal year end from September 30 to October 31, effective October 31, 2010. |
| 3 | After the close of business on July 16, 2010, the Fund acquired the net assets of Evergreen Growth Fund which became the accounting and performance survivor in the transaction. The information for the period prior to July 19, 2010 is that of Class I of Evergreen Growth Fund. |
| 4 | Calculated based upon average shares outstanding |
| 5 | Amount is less than $0.005. |
| 6 | Returns for periods of less than one year are not annualized. |
The accompanying notes are an integral part of these financial statements.
| | | | |
| 18 | | Wells Fargo Advantage Traditional Small Cap Growth Fund | | Notes to financial statements (unaudited) |
1. ORGANIZATION
Wells Fargo Funds Trust (the “Trust”), a Delaware statutory trust organized on March 10, 1999, is an open-end management investment company registered under the Investment Company Act of 1940, as amended (the “1940 Act”). As an investment company, the Trust follows the accounting and reporting guidance in Financial Accounting Standards Board (“FASB”) Accounting Standards Codification Topic 946, Financial Services – Investment Companies. These financial statements report on the Wells Fargo Advantage Traditional Small Cap Growth Fund (the “Fund”) which is a diversified series of the Trust.
2. SIGNIFICANT ACCOUNTING POLICIES
The following significant accounting policies, which are consistently followed in the preparation of the financial statements of the Fund, are in conformity with U.S. generally accepted accounting principles which require management to make estimates and assumptions that affect the reported amounts of assets and liabilities, disclosure of contingent assets and liabilities at the date of the financial statements, and the reported amounts of revenues and expenses during the reporting period. Actual results could differ from those estimates.
Securities valuation
All investments are valued each business day as of the close of regular trading on the New York Stock Exchange (generally 4 p.m. Eastern Time).
Equity securities that are listed on a foreign or domestic exchange or market are valued at the official closing price or, if none, the last sales price. If no sale occurs on the primary exchange or market that day, the prior day’s price will be deemed “stale” and a fair value price will be determined in accordance with the Fund’s Valuation Procedures.
Equity securities that are not listed on a foreign or domestic exchange or market, but have a public trading market, are valued at the quoted bid price from an independent broker-dealer that the Management Valuation Team of Wells Fargo Funds Management, LLC (“Funds Management”) has determined is an acceptable source.
Investments in registered open-end investment companies are valued at net asset value. Interests in non-registered investment vehicles that are redeemable at net asset value are fair valued at net asset value when available.
Investments which are not valued using any of the methods discussed above are valued at their fair value, as determined in good faith by the Board of Trustees of the Fund. The Board of Trustees has established a Valuation Committee comprised of the Trustees and has delegated to it the authority to take any actions regarding the valuation of portfolio securities that the Valuation Committee deems necessary or appropriate, including determining the fair value of portfolio securities, unless the determination has been delegated to the Management Valuation Team. The Board of Trustees retains the authority to make or ratify any valuation decisions or approve any changes to the Valuation Procedures as it deems appropriate. On a quarterly basis, the Board of Trustees receives reports on any valuation actions taken by the Valuation Committee or the Management Valuation Team which may include items for ratification.
Valuations of fair valued securities are compared to the next actual sales price when available, or other appropriate market values, to assess the continued appropriateness of the fair valuation methodologies used. These securities are fair valued on a day-to-day basis, taking into consideration changes to appropriate market information and any significant changes to the inputs considered in the valuation process until there is a readily available price provided on an exchange or by an independent pricing service. Valuations received from an independent pricing service or independent broker-dealer quotes are periodically validated by comparisons to most recent trades and valuations provided by other independent pricing services in addition to the review of prices by the manager and/or subadviser. Unobservable inputs used in determining fair valuations are identified based on the type of security, taking into consideration factors utilized by market participants in valuing the investment, knowledge about the issuer and the current market environment.
Security loans
The Fund may lend its securities from time to time in order to earn additional income in the form of fees or interest on securities received as collateral or the investment of any cash received as collateral. The Fund continues to receive interest or dividends on the securities loaned. The Fund receives collateral in the form of cash or securities with a value at least equal to the value of the securities on loan. The value of the loaned securities is determined at the close of each business day and any additional required collateral is delivered to the Fund on the next business day. In a securities lending transaction, the net asset value of the Fund will be affected by an increase or decrease in the value of the securities loaned and by an increase or decrease in the value of the instrument in which collateral is invested. The amount of securities lending activity undertaken by the Fund fluctuates from time to time. In the event of default or bankruptcy by the borrower, the Fund may be prevented from recovering the loaned securities or gaining access to the collateral or
| | | | | | |
| Notes to financial statements (unaudited) | | Wells Fargo Advantage Traditional Small Cap Growth Fund | | | 19 | |
may experience delays or costs in doing so. In addition, the investment of any cash collateral received may lose all or part of its value. The Fund has the right under the lending agreement to recover the securities from the borrower on demand.
The Fund lends its securities through an unaffiliated securities lending agent. Cash collateral received in connection with its securities lending transactions is invested in Securities Lending Cash Investments, LLC (the “Securities Lending Fund”). The Securities Lending Fund is exempt from registration under Section 3(c)(7) of the 1940 Act and is managed by Funds Management and is subadvised by Wells Capital Management Incorporated (“WellsCap”). Funds Management receives an advisory fee starting at 0.05% and declining to 0.01% as the average daily net assets of the Securities Lending Fund increase. All of the fees received by Funds Management are paid to WellsCap for its services as subadviser. The Securities Lending Fund seeks to provide a positive return compared to the daily Fed Funds Open rate by investing in high-quality, U.S. dollar-denominated short-term money market instruments. Securities Lending Fund investments are fair valued based upon the amortized cost valuation technique. Income earned from investment in the Securities Lending Fund is included in securities lending income on the Statement of Operations.
Security transactions and income recognition
Securities transactions are recorded on a trade date basis. Realized gains or losses are recorded on the basis of identified cost.
Dividend income is recognized on the ex-dividend date.
Distributions to shareholders
Distributions to shareholders from net investment income and net realized gains, if any, are recorded on the ex-dividend date. Such distributions are determined in conformity with federal income tax regulations, which may differ in amount or character from net investment income and realized gains recognized for purposes of U.S. generally accepted accounting principles.
Federal and other taxes
The Fund intends to continue to qualify as a regulated investment company by distributing substantially all of its investment company taxable income and any net realized capital gains (after reduction for capital loss carryforwards) sufficient to relieve it from all, or substantially all, federal income taxes. Accordingly, no provision for federal income taxes was required.
The Fund’s income and federal excise tax returns and all financial records supporting those returns for the prior three fiscal years are subject to examination by the federal and Delaware revenue authorities. Management has analyzed the Fund’s tax positions taken on federal, state, and foreign tax returns for all open tax years and does not believe that there are any uncertain tax positions that require recognition of a tax liability.
As of March 31, 2015, the Fund had a qualified late-year ordinary loss of $306,018 which was recognized on the first day of the current fiscal year.
Class allocations
The separate classes of shares offered by the Fund differ principally in applicable sales charges, distribution, shareholder servicing, and administration fees. Class specific expenses are charged directly to that share class. Investment income, common expenses, and realized and unrealized gains (losses) on investments are allocated daily to each class of shares based on the relative proportion of net assets of each class.
3. FAIR VALUATION MEASUREMENTS
Fair value measurements of investments are determined within a framework that has established a fair value hierarchy based upon the various data inputs utilized in determining the value of the Fund’s investments. The three-level hierarchy gives the highest priority to unadjusted quoted prices in active markets for identical assets or liabilities (Level 1) and the lowest priority to significant unobservable inputs (Level 3). The Fund’s investments are classified within the fair value hierarchy based on the lowest level of input that is significant to the fair value measurement. The inputs are summarized into three broad levels as follows:
| n | | Level 1 – quoted prices in active markets for identical securities |
| n | | Level 2 – other significant observable inputs (including quoted prices for similar securities, interest rates, prepayment speeds, credit risk, use of amortized cost, etc.) |
| n | | Level 3 – significant unobservable inputs (including the Fund’s own assumptions in determining the fair value of investments) |
| | | | |
| 20 | | Wells Fargo Advantage Traditional Small Cap Growth Fund | | Notes to financial statements (unaudited) |
The inputs or methodologies used for valuing investments in securities are not necessarily an indication of the risk associated with investing in those securities.
The following is a summary of the inputs used in valuing the Fund’s assets and liabilities as of September 30, 2015:
| | | | | | | | | | | | | | | | |
| | | Quoted prices
(Level 1) | | | Other significant
observable inputs
(Level 2) | | | Significant
unobservable inputs
(Level 3) | | | Total | |
Assets | | | | | | | | | | | | | | | | |
Investments in: | | | | | | | | | | | | | | | | |
| | | | |
Common stocks | | | | | | | | | | | | | | | | |
Consumer discretionary | | $ | 24,785,794 | | | $ | 0 | | | $ | 0 | | | $ | 24,785,794 | |
Consumer staples | | | 3,982,181 | | | | 0 | | | | 0 | | | | 3,982,181 | |
Energy | | | 648,000 | | | | 0 | | | | 0 | | | | 648,000 | |
Financials | | | 11,024,209 | | | | 0 | | | | 0 | | | | 11,024,209 | |
Health care | | | 27,396,700 | | | | 0 | | | | 0 | | | | 27,396,700 | |
Industrials | | | 12,798,156 | | | | 0 | | | | 0 | | | | 12,798,156 | |
Information technology | | | 31,750,175 | | | | 0 | | | | 0 | | | | 31,750,175 | |
| | | | |
Short-term investments | | | | | | | | | | | | | | | | |
Investment companies | | | 2,964,108 | | | | 5,109,850 | | | | 0 | | | | 8,073,958 | |
Total assets | | $ | 115,349,323 | | | $ | 5,109,850 | | | $ | 0 | | | $ | 120,459,173 | |
The Fund recognizes transfers between levels within the fair value hierarchy at the end of the reporting period. At September 30, 2015, the Fund did not have any transfers into/out of Level 1, Level 2, or Level 3.
4. TRANSACTIONS WITH AFFILIATES
Management fee
Funds Management, an indirect wholly owned subsidiary of Wells Fargo & Company (“Wells Fargo”), is the manager of the Fund and provides advisory and fund-level administrative services under an investment management agreement. Under the investment management agreement, Funds Management is responsible for, among other services, implementing the investment objectives and strategies of the Fund, supervising the applicable subadviser, providing fund-level administrative services in connection with the Fund’s operations, and providing any other fund-level administrative services reasonably necessary for the operation of the Fund. As compensation for its services under the investment management agreement, Funds Management is entitled to receive an annual management fee starting at 0.85% and declining to 0.71% as the average daily net assets of the Fund increase.
Prior to July 1, 2015, Funds Management provided advisory services pursuant to an investment advisory agreement and was entitled to receive an annual fee which started at 0.80% and declined to 0.68% as the average daily net assets of the Fund increased. In addition, fund-level administrative services were provided by Funds Management under a separate administration agreement at an annual fee which started at 0.05% and declined to 0.03% as the average daily net assets of the Fund increased. For financial statement purposes, the advisory fee and fund-level administration fee for the six months ended September 30, 2015 have been included in management fee on the Statement of Operations.
For the six months ended September 30, 2015, the management fee was equivalent to an annual rate of 0.85% of the Fund’s average daily net assets.
Funds Management has retained the services of a subadviser to provide daily portfolio management to the Fund. The fee for subadvisory services is borne by Funds Management. WellsCap, an affiliate of Funds Management and an indirect wholly owned subsidiary of Wells Fargo, is the subadviser to the Fund and is entitled to receive a fee from Funds Management at an annual rate starting at 0.55% and declining to 0.40% as the average daily net assets of the Fund increase.
Administration fees
Under a class-level administration agreement, Funds Management provides class-level administrative services to the Fund, which includes paying fees and expenses for services provided by the transfer agent, sub-transfer agents, omnibus
| | | | | | |
| Notes to financial statements (unaudited) | | Wells Fargo Advantage Traditional Small Cap Growth Fund | | | 21 | |
account servicers and record-keepers. As compensation for its services under the class-level administration agreement, Funds Management receives an annual fee which is calculated based on the average daily net assets of each class as follows:
| | | | | | | | |
| | | Class-level administration fee | |
| | | Current rate | | | Rate prior to
July 1, 2015 | |
Class A, Class C | | | 0.21 | % | | | 0.26 | % |
Administrator Class | | | 0.13 | | | | 0.10 | |
Institutional Class | | | 0.13 | | | | 0.08 | |
Funds Management has contractually waived and/or reimbursed management and administration fees to the extent necessary to maintain certain net operating expense ratios for the Fund. Waiver of fees and/or reimbursement of expenses by Funds Management were made first from fund level expenses on a proportionate basis and then from class specific expenses. Funds Management has committed through July 31, 2016 to waive fees and/or reimburse expenses to the extent necessary to cap the Fund’s expenses at 1.33% for Class A shares, 2.08% for Class C shares, 1.20% for Administrator Class shares, and 0.98% for Institutional Class shares. After this time, the cap may be increased or the commitment to maintain the cap may be terminated only with the approval of the Board of Trustees.
Distribution fee
The Trust has adopted a distribution plan for Class C shares of the Fund pursuant to Rule 12b-1 under the 1940 Act. A distribution fee is charged to Class C shares and paid to Wells Fargo Funds Distributor, LLC (“Funds Distributor”), the principal underwriter, at an annual rate of 0.75% of the average daily net assets of Class C shares.
In addition, Funds Distributor is entitled to receive the front-end sales charge from the purchase of Class A shares and a contingent deferred sales charge on the redemption of certain Class A shares. Funds Distributor is also entitled to receive the contingent deferred sales charges from redemptions of Class C shares. For the six months ended September 30, 2015, Funds Distributor received $954 from the sale of Class A shares.
Shareholder servicing fees
The Trust has entered into contracts with one or more shareholder servicing agents, whereby Class A, Class C, and Administrator Class of the Fund is charged a fee at an annual rate of 0.25% of the average daily net assets of each respective class.
A portion of these total shareholder servicing fees were paid to affiliates of Wells Fargo.
5. INVESTMENT PORTFOLIO TRANSACTIONS
Purchases and sales of investments, excluding U.S. government obligations (if any) and short-term securities, for the six months ended September 30, 2015 were $101,381,935 and $111,219,244, respectively.
6. BANK BORROWINGS
The Trust (excluding the money market funds) and Wells Fargo Variable Trust are parties to a $200,000,000 revolving credit agreement whereby the Fund is permitted to use bank borrowings for temporary or emergency purposes, such as to fund shareholder redemption requests. Interest under the credit agreement is charged to the Fund based on a borrowing rate equal to the higher of the Federal Funds rate in effect on that day plus 1.25% or the overnight LIBOR rate in effect on that day plus 1.25%. In addition, an annual commitment fee equal to 0.20% of the unused balance is allocated to each participating fund. Prior to September 1, 2015, the revolving credit agreement was $150,000,000 and the annual commitment fee was equal to 0.10% of the unused balance which was allocated to each participating fund. For the six months ended September 30, 2015, the Fund paid $126 in commitment fees.
For the six months ended September 30, 2015, there were no borrowings by the Fund under the agreement.
7. CONCENTRATION RISK
Concentration risks result from exposure to a limited number of sectors. A fund that invests a substantial portion of its assets in any sector may be more affected by changes in that sector than would be a fund whose investments are not heavily weighted in any sector.
| | | | |
| 22 | | Wells Fargo Advantage Traditional Small Cap Growth Fund | | Notes to financial statements (unaudited) |
8. INDEMNIFICATION
Under the Trust’s organizational documents, the officers and Trustees have been granted certain indemnification rights against certain liabilities that may arise out of performance of their duties to the Trust. Additionally, in the normal course of business, the Trust may enter into contracts with service providers that contain a variety of indemnification clauses. The Trust’s maximum exposure under these arrangements is dependent on future claims that may be made against the Fund and, therefore, cannot be estimated.
| | | | | | |
| Other information (unaudited) | | Wells Fargo Advantage Traditional Small Cap Growth Fund | | | 23 | |
PROXY VOTING INFORMATION
A description of the policies and procedures that the Fund uses to determine how to vote proxies relating to portfolio securities is available, upon request, by calling 1-800-222-8222, visiting our website at wellsfargoadvantagefunds.com, or visiting the SEC website at sec.gov. Information regarding how the Fund voted proxies relating to portfolio securities during the most recent 12-month period ended June 30 is available on the Fund’s website at wellsfargoadvantagefunds.com or by visiting the SEC website at sec.gov.
PORTFOLIO HOLDINGS INFORMATION
The complete portfolio holdings for the Fund are publicly available monthly on the Fund’s website (wellsfargoadvantagefunds.com), on a one-month delayed basis. In addition, top ten holdings information (excluding derivative positions) for the Fund is publicly available on the Fund’s website on a monthly, seven-day or more delayed basis. The Fund files its complete schedule of portfolio holdings with the SEC for the first and third quarters of each fiscal year on Form N-Q, which is available by visiting the SEC website at sec.gov. In addition, the Fund’s Form N-Q may be reviewed and copied at the SEC’s Public Reference Room in Washington, DC, and at regional offices in New York City, at 233 Broadway, and in Chicago, at 175 West Jackson Boulevard, Suite 900. Information about the Public Reference Room may be obtained by calling 1-800-SEC-0330.
| | | | |
| 24 | | Wells Fargo Advantage Traditional Small Cap Growth Fund | | Other information (unaudited) |
BOARD OF TRUSTEES AND OFFICERS
Each of the Trustees and Officers1 listed in the table below acts in identical capacities for each fund in the Wells Fargo Advantage family of funds, which consists of 144 mutual funds comprising the Wells Fargo Funds Trust, Wells Fargo Variable Trust, Wells Fargo Master Trust and four closed-end funds (collectively the “Fund Complex”). This table should be read in conjunction with the Prospectus and the Statement of Additional Information2. The mailing address of each Trustee and Officer is 525 Market Street, 12th Floor, San Francisco, CA 94105. Each Trustee and Officer serves an indefinite term, however, each Trustee serves such term until reaching the mandatory retirement age established by the Trustees.
Independent Trustees
| | | | | | |
Name and
year of birth | | Position held and
length of service* | | Principal occupations during past five years or longer | | Other public
company or
investment company
directorships during
past 5 years |
| William R. Ebsworth (Born 1957) | | Trustee, since 2015** | | Retired. From 1984 to 2013, equities analyst, portfolio manager, research director at Fidelity Management and Research Company and retired in 2013 as Chief Investment Officer of Fidelity Strategic Advisers, Inc. in Boston, Tokyo, and Hong Kong where he led a team of investment professionals managing client assets. Prior thereto, Board member of Hong Kong Securities Clearing Co., Hong Kong Options Clearing Corp., the Thailand International Fund, Ltd., Fidelity Investments Life Insurance Company, and Empire Fidelity Investments Life Insurance Company. Mr. Ebsworth is a CFA ® charterholder and an Adjunct Lecturer, Finance, at Babson College. | | Asset Allocation Trust |
Jane A. Freeman (Born 1953) | | Trustee, since 2015** | | Retired. From 2012 to 2014 and 1999 to 2008, Chief Financial Officer of Scientific Learning Corporation. From 2008 to 2012, Ms. Freeman provided consulting services related to strategic business projects. Prior to 1999, Portfolio Manager at Rockefeller & Co. and Scudder, Stevens & Clark. Board member of the Harding Loevner Funds from 1996 to 2014, serving as both Lead Independent Director and chair of the Audit Committee. Board member of the Russell Exchange Traded Funds Trust from 2011 to 2012 and the chair of the Audit Committee. Ms. Freeman is Chair of Taproot Foundation (non-profit organization), a Board Member of Ruth Bancroft Garden (non-profit organization) and an inactive chartered financial analyst. | | Asset Allocation Trust; Harding Loevner Funds; Russell Exchange Traded Funds Trust |
Peter G. Gordon (Born 1942) | | Trustee, since 1998; Chairman, since 2005 | | Co-Founder, Retired Chairman, President and CEO of Crystal Geyser Water Company. Trustee Emeritus, Colby College. | | Asset Allocation Trust |
Isaiah Harris, Jr. (Born 1952) | | Trustee, since 2009 | | Retired. Chairman of the Board of CIGNA Corporation since 2009, and Director since 2005. From 2003 to 2011, Director of Deluxe Corporation. Prior thereto, President and CEO of BellSouth Advertising and Publishing Corp. from 2005 to 2007, President and CEO of BellSouth Enterprises from 2004 to 2005 and President of BellSouth Consumer Services from 2000 to 2003. Emeritus member of the Iowa State University Foundation Board of Governors. Emeritus Member of the Advisory Board of Iowa State University School of Business. Advisory Board Member, Palm Harbor Academy (charter school). Mr. Harris is a certified public accountant. | | CIGNA Corporation; Asset Allocation Trust |
Judith M. Johnson (Born 1949) | | Trustee, since 2008; Audit Committee Chairman, since 2008 | | Retired. Prior thereto, Chief Executive Officer and Chief Investment Officer of Minneapolis Employees Retirement Fund from 1996 to 2008. Ms. Johnson is an attorney, certified public accountant and a certified managerial accountant. | | Asset Allocation Trust |
David F. Larcker (Born 1950) | | Trustee, since 2009 | | James Irvin Miller Professor of Accounting at the Graduate School of Business, Stanford University, Morgan Stanley Director of the Center for Leadership Development and Research and Senior Faculty of The Rock Center for Corporate Governance since 2006. From 2005 to 2008, Professor of Accounting at the Graduate School of Business, Stanford University. Prior thereto, Ernst & Young Professor of Accounting at The Wharton School, University of Pennsylvania from 1985 to 2005. | | Asset Allocation Trust |
| | | | | | |
| Other information (unaudited) | | Wells Fargo Advantage Traditional Small Cap Growth Fund | | | 25 | |
| | | | | | |
Name and
year of birth | | Position held and
length of service* | | Principal occupations during past five years or longer | | Other public
company or
investment company
directorships during
past 5 years |
Olivia S. Mitchell (Born 1953) | | Trustee, since 2006 | | International Foundation of Employee Benefit Plans Professor, Wharton School of the University of Pennsylvania since 1993. Director of Wharton’s Pension Research Council and Boettner Center on Pensions & Retirement Research, and Research Associate at the National Bureau of Economic Research. Previously, Cornell University Professor from 1978 to 1993. | | Asset Allocation Trust |
Timothy J. Penny (Born 1951) | | Trustee, since 1996 | | President and Chief Executive Officer of Southern Minnesota Initiative Foundation, a non-profit organization, since 2007 and Senior Fellow at the Humphrey Institute Policy Forum at the University of Minnesota since 1995. Member of the Board of Trustees of NorthStar Education Finance, Inc., a non-profit organization, since 2007. | | Asset Allocation Trust |
Michael S. Scofield (Born 1943) | | Trustee, since 2010 | | Served on the Investment Company Institute’s Board of Governors and Executive Committee from 2008-2011 as well the Governing Council of the Independent Directors Council from 2006-2011 and the Independent Directors Council Executive Committee from 2008-2011. Chairman of the IDC from 2008-2010. Institutional Investor (Fund Directions) Trustee of Year in 2007. Trustee of the Evergreen Funds complex (and its predecessors) from 1984 to 2010. Chairman of the Evergreen Funds from 2000-2010. Former Trustee of the Mentor Funds. Retired Attorney, Law Offices of Michael S. Scofield. | | Asset Allocation Trust |
Donald C. Willeke (Born 1940) | | Trustee, since 1996 | | Principal of the law firm of Willeke & Daniels. General Counsel of the Minneapolis Employees Retirement Fund from 1984 until its consolidation into the Minnesota Public Employees Retirement Association on June 30, 2010. Director and Vice Chair of The Tree Trust (non-profit corporation). Director of the American Chestnut Foundation (non-profit corporation). | | Asset Allocation Trust |
| * | Length of service dates reflect the Trustee’s commencement of service with the Trust’s predecessor entities, where applicable. |
| ** | William R. Ebsworth and Jane A. Freeman each became a Trustee effective January 1, 2015. |
Officers
| | | | | | |
Name and
year of birth | | Position held and
length of service | | Principal occupations during past five years or longer | | |
Karla M. Rabusch
(Born 1959) | | President, since 2003 | | Executive Vice President of Wells Fargo Bank, N.A. and President of Wells Fargo Funds Management, LLC since 2003. | | |
Nancy Wiser1
(Born 1967) | | Treasurer, since 2012 | | Executive Vice President of Wells Fargo Funds Management, LLC since 2011. Chief Operating Officer and Chief Compliance Officer at LightBox Capital Management LLC, from 2008 to 2011. | | |
C. David Messman (Born 1960) | | Secretary, since 2000; Chief Legal Officer, since 2003 | | Senior Vice President and Secretary of Wells Fargo Funds Management, LLC since 2001. Assistant General Counsel of Wells Fargo Bank, N.A. since 2013 and Vice President and Managing Counsel of Wells Fargo Bank N.A. from 1996 to 2013. | | |
Debra Ann Early (Born 1964) | | Chief Compliance Officer, since 2007 | | Executive Vice President of Wells Fargo Funds Management, LLC since 2014, Senior Vice President and Chief Compliance Officer from 2007 to 2014. | | |
David Berardi (Born 1975) | | Assistant Treasurer, since 2009 | | Vice President of Wells Fargo Funds Management, LLC since 2009. Vice President of Evergreen Investment Management Company, LLC from 2008 to 2010. Manager of Fund Reporting and Control for Evergreen Investment Management Company, LLC from 2004 to 2010. | | |
Jeremy DePalma1 (Born 1974) | | Assistant Treasurer, since 2009 | | Senior Vice President of Wells Fargo Funds Management, LLC since 2009. Senior Vice President of Evergreen Investment Management Company, LLC from 2008 to 2010 and head of the Fund Reporting and Control Team within Fund Administration from 2005 to 2010. | | |
| 1 | Nancy Wiser acts as Treasurer of 72 funds in the Fund Complex. Jeremy DePalma acts as Treasurer of 72 funds and Assistant Treasurer of 72 funds in the Fund Complex. |
| 2 | The Statement of Additional Information includes additional information about the Trustees and is available, without charge, upon request, by calling 1-800-222-8222 or by visiting the website at wellsfargoadvantagefunds.com. |
| | | | |
| 26 | | Wells Fargo Advantage Traditional Small Cap Growth Fund | | Other information (unaudited) |
BOARD CONSIDERATION OF INVESTMENT ADVISORY, INVESTMENT MANAGEMENT AND SUB-ADVISORY AGREEMENTS:
Under the Investment Company Act of 1940 (the “1940 Act”), the Board of Trustees (the “Board”) of Wells Fargo Funds Trust (the “Trust”) must determine annually whether to approve the continuation of the Trust’s investment advisory and sub-advisory agreements. In this regard, at an in-person meeting held on May 19-20, 2015 (the “Meeting”), the Board, all the members of which have no direct or indirect interest in the investment advisory and sub-advisory agreements and are not “interested persons” of the Trust, as defined in the 1940 Act (the “Independent Trustees”), reviewed and approved for Wells Fargo Advantage Traditional Small Cap Growth Fund (the “Fund”): (i) an investment advisory agreement (the “Advisory Agreement”) with Wells Fargo Funds Management, LLC (“Funds Management”); (ii) an investment management agreement (the “Management Agreement”) with Funds Management; and (iii) an investment sub-advisory agreement (the “Sub-Advisory Agreement”) with Wells Capital Management Incorporated (the “Sub-Adviser”), an affiliate of Funds Management. The Management Agreement combines the terms of the Advisory Agreement with the terms of the Fund’s Amended and Restated Administration Agreement (the “Administration Agreement”) applicable to Fund-level administrative services. The Advisory Agreement, the Management Agreement and the Sub-Advisory Agreement are collectively referred to as the “Advisory Agreements.”
At the Meeting, the Board considered the factors and reached the conclusions described below relating to the selection of Funds Management and the Sub-Adviser and the approval of the Advisory Agreements. Prior to the Meeting, including at an in-person meeting in March 2015, the Trustees conferred extensively among themselves and with representatives of Funds Management about these matters. Also, the Board has adopted a team-based approach, with each team consisting of a sub-set of Trustees, to assist the full Board in the discharge of its duties in reviewing performance and other matters throughout the year. The Independent Trustees were assisted in their evaluation of the Advisory Agreements by independent legal counsel, from whom they received separate legal advice and with whom they met separately.
In providing information to the Board, Funds Management and the Sub-Adviser were guided by a detailed set of requests for information submitted to them by independent legal counsel on behalf of the Independent Trustees at the start of the Board’s annual contract renewal process earlier in 2015. In considering and approving the Advisory Agreements, the Trustees considered the information they believed relevant, including but not limited to the information discussed below. The Board considered not only the specific information presented in connection with the Meeting, but also the knowledge gained over time through interaction with Funds Management and the Sub-Adviser about various topics. In this regard, the Board reviewed reports of Funds Management at each of its quarterly meetings, which included, among other things, portfolio reviews and performance reports. In addition, the Board and the teams mentioned above confer with portfolio managers at various times throughout the year. The Board did not identify any particular information or consideration that was all-important or controlling, and each individual Trustee may have attributed different weights to various factors.
After its deliberations, the Board unanimously approved the continuation of the Advisory Agreement for the period from June 1, 2015 through June 30, 2015, approved the Management Agreement for the period from July 1, 2015 through May 31, 2016, and approved the continuation of the Sub-Advisory Agreement for a one-year term through May 31, 2016. The Board also determined that the compensation payable to Funds Management and the Sub-Adviser under each of the Advisory Agreements was reasonable. The Board considered the approval of the Advisory Agreements for the Fund as part of its consideration of agreements for funds across the complex, but its approvals were made on a fund-by-fund basis. The following summarizes a number of important, but not necessarily all, factors considered by the Board in support of its approvals.
Nature, extent and quality of services
The Board received and considered various information regarding the nature, extent and quality of services provided to the Fund by Funds Management and the Sub-Adviser under the Advisory Agreements. This information included, among other things, a summary of the background and experience of senior management of Funds Management, and the qualifications, background, tenure and responsibilities of each of the portfolio managers primarily responsible for the day-to-day portfolio management of the Fund. The Board noted that the services to be provided to the Fund pursuant to the Management Agreement combined the advisory services previously provided to the Fund pursuant to the Fund’s Advisory Agreement with the Fund-level administrative services previously provided to the Fund pursuant to the Fund’s Administration Agreement. The Board received a representation from Funds Management that combining these services would not result in any change to the nature or level of services provided by Funds Management to the Fund.
The Board evaluated the ability of Funds Management and the Sub-Adviser to attract and retain qualified investment professionals, including research, advisory and supervisory personnel. The Board further considered the compliance
| | | | | | |
| Other information (unaudited) | | Wells Fargo Advantage Traditional Small Cap Growth Fund | | | 27 | |
programs and compliance records of Funds Management and the Sub-Adviser. In addition, the Board took into account the full range of services provided to the Fund by Funds Management and its affiliates.
Fund performance and expenses
The Board considered the performance results for the Fund over various time periods ended March 31, 2015. The Board considered these results in comparison to the performance of funds in a universe that was determined by Lipper Inc. (“Lipper”) to be similar to the Fund (the “Universe”), and in comparison to the Fund’s benchmark index and to other comparative data. Lipper is an independent provider of investment company data. The Board received a description of the methodology used by Lipper to select the mutual funds in the performance Universe. The Board noted that the performance of the Fund (Class A) was lower than the average performance of the Universe for all periods under review except for the ten-year period. The Board also noted that the performance of the Fund was lower than its benchmark, the Russell 2000® Growth Index, for all periods under review.
The Board received information concerning, and discussed factors contributing to, the underperformance of the Fund relative to the Universe and benchmark for the periods noted above. The Board took note of the explanations for the relative underperformance in these periods, including with respect to overall investment approach, market factors, sector allocations and investment decisions that affected the Fund’s performance. The Board also noted that the Fund experienced a portfolio manager changes in 2014 and 2015.
The Board also received and considered information regarding the Fund’s net operating expense ratios and their various components, including actual management fees (which reflect fee waivers, if any, and include advisory, administration and transfer agent fees), custodian and other non-management fees, and Rule 12b-1 and non-Rule 12b-1 service fees. The Board considered these ratios in comparison to the median ratios of funds in class-specific expense groups that were determined by Lipper to be similar to the Fund (the “Groups”). The Board received a description of the methodology used by Lipper to select the mutual funds in the expense Groups and an explanation of how funds comprising expense groups and their expense ratios may vary from year-to-year. Based on the Lipper reports, the Board noted that the net operating expense ratios of the Fund were lower than the median net operating expense ratios of the expense Groups.
The Board took into account the Fund performance and expense information provided to it among the factors considered in deciding to re-approve the Advisory Agreement and Sub-Advisory Agreement and approve the Management Agreement.
Investment advisory and sub-advisory fee rates
The Board reviewed and considered the contractual investment advisory fee rates that are payable by the Fund to Funds Management for investment advisory services (the “Advisory Agreement Rates”), both on a stand-alone basis and on a combined basis with the Fund’s fund-level and class-level contractual administration fee rates (the “Management Rates”). The Board noted that the Management Rates include transfer agency and sub-transfer agency costs. The Board also noted that the fee rate to be paid by the Fund under the Management Agreement will incorporate the advisory fee and Fund-level administration fee previously payable separately by the Fund under the Fund’s Advisory Agreement and Administration Agreement with Funds Management. The Board also reviewed and considered the contractual investment sub-advisory fee rates that are payable by Funds Management to the Sub-Adviser for investment sub-advisory services (the “Sub-Advisory Agreement Rates”).
Among other information reviewed by the Board was a comparison of the Management Rates of the Fund with those of other funds in the expense Groups at a common asset level. The Board noted that the Management Rates of the Fund were lower than, in range of or equal to the average rates for the Fund’s expense Groups for all share classes.
The Board also received and considered information about the portion of the total advisory fee that was retained by Funds Management after payment of the fee to the Sub-Adviser for sub-advisory services. In assessing the reasonableness of this amount, the Board received and evaluated information about the nature and extent of responsibilities retained and risks assumed by Funds Management and not delegated to or assumed by the Sub-Adviser, and about Funds Management’s on-going oversight services. However, given the affiliation between Funds Management and the Sub-Adviser, the Board ascribed limited relevance to the allocation of the advisory fee between them.
The Board also received and considered information about the nature and extent of services offered and fee rates charged by Funds Management and the Sub-Adviser to other types of clients with investment strategies similar to those of the Fund. In this regard, the Board received information about the significantly greater scope of services, and compliance, reporting and other legal burdens and risks of managing mutual funds compared with those associated with managing assets of non-mutual fund clients such as collective funds or institutional separate accounts.
| | | | |
| 28 | | Wells Fargo Advantage Traditional Small Cap Growth Fund | | Other information (unaudited) |
Based on its consideration of the factors and information it deemed relevant, including those described here, the Board determined that the compensation payable to Funds Management under the Management Agreement and Advisory Agreement and to the Sub-Adviser under the Sub-Advisory Agreement was reasonable, in light of the services covered by the Advisory Agreements.
Profitability
The Board received and considered information concerning the profitability of Funds Management, as well as the profitability of Wells Fargo as a whole, from providing services to the Fund and the fund family as a whole. The Board also received and considered information concerning the profitability of the Sub-Adviser from providing services to the fund family as a whole, noting that the Sub-Adviser’s profitability information with respect to providing services to the Fund was subsumed in the Wells Fargo profitability analysis.
Funds Management reported on the methodologies and estimates used in calculating profitability. Among other things, the Board noted that the levels of profitability reported on a fund-by-fund basis varied widely, depending on factors such as the size and type of fund. Based on its review, the Board did not deem the profits reported by Funds Management or Wells Fargo from its services to the Fund to be at a level that would prevent it from approving the continuation of the Advisory Agreements.
Economies of scale
With respect to possible economies of scale, the Board noted the existence of breakpoints in the Fund’s advisory and management fee structures, and the Fund’s administration fee structure, which operate generally to reduce the Fund’s expense ratios as the Fund grows in size. It considered that, for a small fund or a fund that shrinks in size, breakpoints conversely can result in higher fee levels. The Board also considered that fee waiver and expense reimbursement arrangements and competitive fee rates at the outset are means of sharing potential economies of scale with shareholders of the Fund and the fund family as a whole. The Board considered Funds Management’s view that any analyses of potential economies of scale in managing a particular fund are inherently limited in light of the joint and common costs and investments that Funds Management incurs across the fund family as a whole.
The Board concluded that the Fund’s fee and expense arrangements, including contractual breakpoints, constituted a reasonable approach to sharing potential economies of scale with the Fund and its shareholders.
Other benefits to Funds Management and the Sub-Adviser
The Board received and considered information regarding potential “fall-out” or ancillary benefits received by Funds Management and its affiliates, including the Sub-Adviser, as a result of their relationships with the Fund. Ancillary benefits could include, among others, benefits directly attributable to other relationships with the Fund and benefits potentially derived from an increase in Funds Management’s and the Sub-Adviser’s business as a result of their relationships with the Fund. The Board noted that various affiliates of Funds Management may receive distribution-related fees, shareholder servicing payments and sub-transfer agency fees in respect of shares sold or held through them and services provided.
The Board also reviewed information about soft dollar credits earned and utilized by the Sub-Adviser, fees earned by Funds Management and the Sub-Adviser from managing a private investment vehicle for the fund family’s securities lending collateral and commissions earned by an affiliated broker from portfolio transactions.
Based on its consideration of the factors and information it deemed relevant, including those described here, the Board did not find that any ancillary benefits received by Funds Management and its affiliates, including the Sub-Adviser, were unreasonable.
Conclusion
At the Meeting, after considering the above-described factors and based on its deliberations and its evaluation of the information described above, the Board unanimously approved the continuation of the Advisory Agreement for the period from June 1, 2015 through June 30, 2015, approved the Management Agreement for the period from July 1, 2015 through May 31, 2016, and approved the continuation of the Sub-Advisory Agreement for a one-year term through May 31, 2016. The Board also determined that the compensation payable to Funds Management and the Sub-Adviser under each of the Advisory Agreements was reasonable.
| | | | | | |
| List of abbreviations | | Wells Fargo Advantage Traditional Small Cap Growth Fund | | | 29 | |
The following is a list of common abbreviations for terms and entities that may have appeared in this report.
| ACA | — ACA Financial Guaranty Corporation |
| ADR | — American depositary receipt |
| ADS | — American depositary shares |
| AGC | — Assured Guaranty Corporation |
| AGM | — Assured Guaranty Municipal |
| Ambac | — Ambac Financial Group Incorporated |
| AMT | — Alternative minimum tax |
| BAN | — Bond anticipation notes |
| BHAC | — Berkshire Hathaway Assurance Corporation |
| CAB | — Capital appreciation bond |
| CCAB | — Convertible capital appreciation bond |
| CDA | — Community Development Authority |
| CDO | — Collateralized debt obligation |
| DRIVER | — Derivative inverse tax-exempt receipts |
| DW&P | — Department of Water & Power |
| DWR | — Department of Water Resources |
| ECFA | — Educational & Cultural Facilities Authority |
| EDA | — Economic Development Authority |
| EDFA | — Economic Development Finance Authority |
| ETF | — Exchange-traded fund |
| FDIC | — Federal Deposit Insurance Corporation |
| FFCB | — Federal Farm Credit Banks |
| FGIC | — Financial Guaranty Insurance Corporation |
| FHA | — Federal Housing Administration |
| FHLB | — Federal Home Loan Bank |
| FHLMC | — Federal Home Loan Mortgage Corporation |
| FICO | — The Financing Corporation |
| FNMA | — Federal National Mortgage Association |
| GDR | — Global depositary receipt |
| GNMA | — Government National Mortgage Association |
| HCFR | — Healthcare facilities revenue |
| HEFA | — Health & Educational Facilities Authority |
| HEFAR | — Higher education facilities authority revenue |
| HFA | — Housing Finance Authority |
| HFFA | — Health Facilities Financing Authority |
| HUD | — Department of Housing and Urban Development |
| IDA | — Industrial Development Authority |
| IDAG | — Industrial Development Agency |
| KRW | — Republic of Korea won |
| LIBOR | — London Interbank Offered Rate |
| LIFER | — Long Inverse Floating Exempt Receipts |
| LLC | — Limited liability company |
| LLLP | — Limited liability limited partnership |
| LLP | — Limited liability partnership |
| MBIA | — Municipal Bond Insurance Association |
| MFHR | — Multifamily housing revenue |
| MSTR | — Municipal securities trust receipts |
| MUD | — Municipal Utility District |
| National | — National Public Finance Guarantee Corporation |
| PCFA | — Pollution Control Financing Authority |
| PCL | — Public Company Limited |
| PCR | — Pollution control revenue |
| PFA | — Public Finance Authority |
| PFFA | — Public Facilities Financing Authority |
| PFOTER | — Puttable floating option tax-exempt receipts |
| plc | — Public limited company |
| PUTTER | — Puttable tax-exempt receipts |
| R&D | — Research & development |
| Radian | — Radian Asset Assurance |
| RAN | — Revenue anticipation notes |
| RDA | — Redevelopment Authority |
| RDFA | — Redevelopment Finance Authority |
| REIT | — Real estate investment trust |
| ROC | — Reset option certificates |
| SAVRS | — Select auction variable rate securities |
| SBA | — Small Business Authority |
| SDR | — Swedish depositary receipt |
| SFHR | — Single-family housing revenue |
| SFMR | — Single-family mortgage revenue |
| SPA | — Standby purchase agreement |
| SPDR | — Standard & Poor’s Depositary Receipts |
| SPEAR | — Short Puttable Exempt Adjustable Receipts |
| STRIPS | — Separate trading of registered interest and |
| TAN | — Tax anticipation notes |
| TIPS | — Treasury inflation-protected securities |
| TRAN | — Tax revenue anticipation notes |
| TTFA | — Transportation Trust Fund Authority |
| TVA | — Tennessee Valley Authority |
This page is intentionally left blank.
This page is intentionally left blank.
This page is intentionally left blank.


For more information
More information about Wells Fargo Advantage Funds is available free upon request. To obtain literature, please write, email, visit the Fund’s website, or call:
Wells Fargo Advantage Funds
P.O. Box 8266
Boston, MA 02266-8266
Email: wfaf@wellsfargo.com
Website: wellsfargoadvantagefunds.com
Individual investors: 1-800-222-8222
Retail investment professionals: 1-888-877-9275
Institutional investment professionals: 1-866-765-0778
This report and the financial statements contained herein are submitted for the general information of the shareholders of Wells Fargo Advantage Funds. If this report is used for promotional purposes, distribution of the report must be accompanied or preceded by a current prospectus. Before investing, please consider the investment objectives, risks, charges, and expenses of the investment. For a current prospectus and, if available, a summary prospectus, containing this information, call 1-800-222-8222 or visit the Fund’s website at wellsfargoadvantagefunds.com. Read the prospectus carefully before you invest or send money.
Wells Fargo Funds Management, LLC, a wholly owned subsidiary of Wells Fargo & Company, provides investment advisory and administrative services for Wells Fargo Advantage Funds. Other affiliates of Wells Fargo & Company provide subadvisory and other services for the Funds. The Funds are distributed by Wells Fargo Funds Distributor, LLC, Member FINRA, an affiliate of Wells Fargo & Company.
NOT FDIC INSURED ¡ NO BANK GUARANTEE ¡ MAY LOSE VALUE
© 2015 Wells Fargo Funds Management, LLC. All rights reserved.
| | |
 | | 237486 11-15 SA247/SAR247 09-15 |

Wells Fargo Advantage Precious Metals Fund

Semi-Annual Report
September 30, 2015

Reduce clutter. Save trees.
Sign up for electronic delivery of prospectuses and shareholder reports at wellsfargo.com/advantagedelivery
Contents
The views expressed and any forward-looking statements are as of September 30, 2015, unless otherwise noted, and are those of the Fund managers and/or Wells Fargo Funds Management, LLC. Discussions of individual securities, or the markets generally, or any Wells Fargo Advantage Fund are not intended as individual recommendations. Future events or results may vary significantly from those expressed in any forward-looking statements; the views expressed are subject to change at any time in response to changing circumstances in the market. Wells Fargo Funds Management, LLC and the Fund disclaim any obligation to publicly update or revise any views expressed or forward-looking statements.
NOT FDIC INSURED ¡ NO BANK GUARANTEE ¡ MAY LOSE VALUE
| | | | |
| 2 | | Wells Fargo Advantage Precious Metals Fund | | Letter to shareholders (unaudited) |

Karla M. Rabusch
President
Wells Fargo Advantage Funds
Gold prices fluctuated widely and ultimately fell nearly 6% during the six-month period.
Dear Valued Shareholder:
We are pleased to offer you this semi-annual report for the Wells Fargo Advantage Precious Metals Fund for the six-month period that ended September 30, 2015. Despite generally improving U.S. economic data, the broad U.S. stock market experienced heightened volatility that led to negative results overall for U.S. stocks for the period. Large-cap stocks performed best, followed by mid caps and small caps. Markets outside the U.S. faced deeper ongoing challenges and generally delivered weaker results.
U.S. stocks experienced challenges during the second quarter of 2015.
The broad U.S. stock market fluctuated widely, eventually eking out a small quarterly gain. Mid- and large-cap stocks at times were pressured by investor concerns over the potentially negative effects of financially troubled overseas economies and of a strengthening U.S. dollar on the profits of U.S. multinational firms. The U.S. economy picked up traction during the quarter; consumer spending improved, and positive trends were evident in construction and new-home sales. Jobs growth remained a bright spot as well. U.S. Federal Reserve (Fed) officials, who have kept interest rates low while waiting for the U.S. jobs market to sufficiently improve and for inflation to approach their 2% target, made clear they could take action soon. Throughout the quarter, non-U.S. markets also experienced volatility, triggered by uncertainty over the potential impact of financial challenges in other locations—most notably in Greece and Puerto Rico. Questions over slower growth in China caused investor concern as well.
In the third quarter of 2015, China’s slowdown took a toll on economies and markets worldwide.
U.S. stocks sagged during the quarter, experiencing the most volatility since 2011. Larger-cap stocks generally declined the least and smaller caps the most. Economic data released during the quarter suggested the U.S. economy remains solid but has lost some steam, burdened by the drag of the strong U.S. dollar coupled with global economic turmoil. The fact that the Fed left the federal funds interest rate unchanged at its September meeting surprised investors and fueled increased uncertainty about the U.S. economy’s stamina to remain healthy while facing the challenges of slowing in China and troubles elsewhere in the world. Outside the U.S., markets were even more volatile and delivered generally weaker quarterly results, also largely due to investors’ increasing anxiety over China’s weakened economy. Because China is the world’s largest importer of many commodities, a number of emerging markets—key commodities exporters—are struggling under the dual strains of reduced demand for commodities and, because of weaker demand, lower prices for the commodities they do sell. In the eurozone, however, where only about 3% of exports are sent to China, household spending and business investment appeared relatively unaffected by troubles elsewhere. However, the European Central Bank warned in September that slowing growth in China could lead to slower growth and lower inflation rates in the eurozone than previously forecast and indicated additional stimulus could be provided should this occur.
Gold prices fluctuated widely and ultimately fell nearly 6% during the six-month period.
During the second quarter of 2015, gold and gold-related stocks delivered relatively flat results, with minor price changes. The U.S. dollar declined slightly relative to the euro following the report of weak first-quarter 2015 U.S. gross domestic product. All else being equal, the price of gold tends to rise as the dollar
| | | | | | |
| Letter to shareholders (unaudited) | | Wells Fargo Advantage Precious Metals Fund | | | 3 | |
weakens partly because it takes more dollars to buy an equivalent amount of gold. However, despite the positive influence of the modestly weaker dollar, strengthening U.S. Treasury yields pressured gold prices because as Treasury yields rise, some investors move toward Treasuries and away from gold. From July 1, 2015, through the end of the reporting period, gold prices fluctuated within a narrow trading range, falling nearly 5% during those three months; gold-related stocks declined significantly more. The metal’s most pronounced decline occurred during July when the U.S. dollar strengthened and a weaker-than-expected update about China’s gold holdings disappointed the market. Historically, gold-related stocks often have surpassed movement in underlying gold prices, both up or down, which is an unfavorable characteristic when investors expect the price of gold to decline. Throughout the reporting period, Fed announcements influenced trends in gold and other precious metals prices.
Don’t let short-term uncertainty derail long-term investment goals.
Periods of uncertainty can present challenges, but experience has taught us that maintaining long-term investment goals can be an effective way to plan for the future. To help you create a sound strategy based on your personal goals and risk tolerance, Wells Fargo Advantage Funds offers more than 100 mutual funds spanning a wide range of asset classes and investment styles. Although diversification cannot guarantee an investment profit or prevent losses, we believe it can be an effective way to manage investment risk and potentially smooth out overall portfolio performance. We encourage investors to know their investments and to understand that appropriate levels of risk-taking may unlock opportunities.
Thank you for choosing to invest in Wells Fargo Advantage Funds. We appreciate your confidence in us and remain committed to helping you meet your financial needs.
Sincerely,

Karla M. Rabusch
President
Wells Fargo Advantage Funds
Periods of uncertainty can present challenges, but experience has taught us that maintaining long-term investment goals can be an effective way to plan for the future.
Notice to shareholders
At a meeting held August 11-12, 2015, the Board of Trustees of the Fund approved a change in the name of the Fund whereby the word “Advantage” was removed from its name, effective December 15, 2015.
For current information about your fund investments, contact your investment professional, visit our website at wellsfargoadvantagefunds.com, or call us directly at 1-800-222-8222. We are available 24 hours a day, 7 days a week.
| | | | |
| 4 | | Wells Fargo Advantage Precious Metals Fund | | Performance highlights (unaudited) |
Investment objective
The Fund seeks long-term capital appreciation.
Manager
Wells Fargo Funds Management, LLC
Subadviser
Wells Capital Management Incorporated
Portfolio managers
Michael Bradshaw, CFA
Oleg Makhorine
Average annual total returns1 (%) as of September 30, 2015
| | | | | | | | | | | | | | | | | | | | | | | | | | | | | | | | | | |
| | | | | Including sales charge | | | Excluding sales charge | | | Expense ratios2 (%) | |
| | | Inception date | | 1 year | | | 5 year | | | 10 year | | | 1 year | | | 5 year | | | 10 year | | | Gross | | | Net3 | |
| Class A (EKWAX) | | 1-20-1998 | | | (35.82 | ) | | | (22.10 | ) | | | (2.07 | ) | | | (31.90 | ) | | | (21.17 | ) | | | (1.49 | ) | | | 1.17 | | | | 1.09 | |
| Class B (EKWBX)* | | 1-30-1978 | | | (35.81 | ) | | | (22.03 | ) | | | (2.00 | ) | | | (32.43 | ) | | | (21.76 | ) | | | (2.00 | ) | | | 1.92 | | | | 1.84 | |
| Class C (EKWCX) | | 1-29-1998 | | | (33.40 | ) | | | (21.75 | ) | | | (2.22 | ) | | | (32.40 | ) | | | (21.75 | ) | | | (2.22 | ) | | | 1.92 | | | | 1.84 | |
| Administrator Class (EKWDX) | | 7-30-2010 | | | – | | | | – | | | | – | | | | (31.80 | ) | | | (21.05 | ) | | | (1.36 | ) | | | 1.09 | | | | 0.95 | |
| Institutional Class (EKWYX) | | 2-29-2000 | | | – | | | | – | | | | – | | | | (31.70 | ) | | | (20.90 | ) | | | (1.19 | ) | | | 0.84 | | | | 0.79 | |
| FTSE Gold Mines Index4 | | – | | | – | | | | – | | | | – | | | | (34.39 | ) | | | (24.36 | ) | | | (6.95 | ) | | | – | | | | – | |
| S&P 500 Index5 | | – | | | – | | | | – | | | | – | | | | (0.61 | ) | | | 13.34 | | | | 6.80 | | | | – | | | | – | |
| * | | Class B shares are closed to investment, except in connection with the reinvestment of any distributions and permitted exchanges. |
Figures quoted represent past performance, which is no guarantee of future results, and do not reflect taxes that a shareholder may pay on fund distributions or the redemption of fund shares. Investment return and principal value of an investment will fluctuate so that an investor’s shares, when redeemed, may be worth more or less than their original cost. Performance shown without sales charges would be lower if sales charges were reflected. Current performance may be lower or higher than the performance data quoted, which assumes the reinvestment of dividends and capital gains. Current month-end performance is available on the Fund’s website, wellsfargoadvantagefunds.com.
Index returns do not include transaction costs associated with buying and selling securities, any mutual fund fees or expenses, or any taxes. It is not possible to invest directly in an index.
For Class A shares, the maximum front-end sales charge is 5.75%. For Class B shares, the maximum contingent deferred sales charge is 5.00%. For Class C shares, the maximum contingent deferred sales charge is 1.00%. Performance including a contingent deferred sales charge assumes the sales charge for the corresponding time period. Administrator Class and Institutional Class shares are sold without a front-end sales charge or contingent deferred sales charge.
Stock values fluctuate in response to the activities of individual companies and general market and economic conditions. Bond values fluctuate in response to the financial condition of individual issuers, general market and economic conditions, and changes in interest rates. Changes in market conditions and government policies may lead to periods of heightened volatility in the bond market and reduced liquidity for certain bonds held by the Fund. In general, when interest rates rise, bond values fall and investors may lose principal value. Interest-rate changes and their impact on the Fund and its share price can be sudden and unpredictable. Funds that concentrate their investments in limited sectors, such as gold-related investments, are more vulnerable to adverse market, economic, regulatory, political, or other developments affecting those sectors. Certain investment strategies tend to increase the total risk of an investment (relative to the broader market). The Fund is exposed to foreign investment risk, geographic, nondiversification risk, smaller-company securities risk, and subsidiary risk. Consult the Fund’s prospectus for additional information on these and other risks.
Please see footnotes on page 5.
| | | | | | |
| Performance highlights (unaudited) | | Wells Fargo Advantage Precious Metals Fund | | | 5 | |
| | | | |
| Ten largest holdings6 (%) as of September 30, 2015 | |
Randgold Resources Limited ADR | | | 10.36 | |
Gold Bullion | | | 7.27 | |
Agnico-Eagle Mines Limited-U.S. Exchange Traded Shares | | | 6.68 | |
Royal Gold Incorporated | | | 6.19 | |
Newmont Mining Corporation | | | 4.11 | |
Fresnillo plc | | | 3.83 | |
Goldcorp Incorporated | | | 3.81 | |
AngloGold Ashanti Limited ADR | | | 3.31 | |
Franco-Nevada Corporation | | | 3.02 | |
Goldcorp Incorporated-U.S. Exchange Traded Shares | | | 2.91 | |
|
| Country allocation7 as of September 30, 2015 |
|
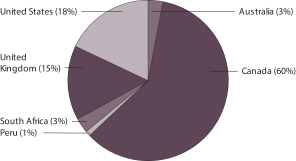 |
| 1 | Historical performance shown for Administrator Class shares prior to their inception reflects the performance of Institutional Class shares and has been adjusted to reflect the higher expenses applicable to Administrator Class shares. Historical performance shown for all classes of the Fund prior July 19, 2010, is based on the Fund’s predecessor Evergreen Precious Metals Fund. |
| 2 | Reflect the expense ratios as stated in the most recent prospectuses. The expense ratios are subject to change and may differ from the annualized expense ratio shown in the financial highlights of this report. |
| 3 | The manager has contractually committed through July 31, 2016, to waive fees and/or reimburse expenses to the extent necessary to cap the Fund’s Total Annual Fund Operating Expenses After Fee Waiver at the amounts shown. After this time, the cap may be increased or the commitment to maintain the cap may be terminated only with the approval of the Board of Trustees. Brokerage commissions, stamp duty fees, interest, taxes, acquired fund fees and expenses, and extraordinary expenses are excluded from the cap. Without this cap, the Fund’s returns would have been lower. |
| 4 | FTSE Gold Mines Index is an unmanaged, open-ended index designed to reflect the performance of the worldwide market in the shares of companies whose principal activity is the mining of gold. You cannot invest directly in an index. |
| 5 | The S&P 500 Index consists of 500 stocks chosen for market size, liquidity, and industry group representation. It is a market-value weighted index with each stock’s weight in the index proportionate to its market value. You cannot invest directly in an index. |
| 6 | The ten largest holdings, excluding cash and cash equivalents, are calculated based on the value of the investments divided by total net assets of the Fund. Holdings are subject to change and may have changed since the date specified. |
| 7 | Amounts are calculated based on the total long-term investments of the Fund. These amounts are subject to change and may have changed since the date specified. |
| | | | |
| 6 | | Wells Fargo Advantage Precious Metals Fund | | Fund expenses (unaudited) |
As a shareholder of the Fund, you incur two types of costs: (1) transaction costs, including sales charges (loads) on purchase payments and contingent deferred sales charges (if any) on redemptions and (2) ongoing costs, including management fees, distribution (12b-1) and/or shareholder servicing fees, and other Fund expenses. This example is intended to help you understand your ongoing costs (in dollars) of investing in the Fund and to compare these costs with the ongoing costs of investing in other mutual funds.
The example is based on an investment of $1,000 invested at the beginning of the six-month period and held for the entire period from April 1, 2015 to September 30, 2015.
Actual expenses
The “Actual” line of the table below provides information about actual account values and actual expenses. You may use the information in this line, together with the amount you invested, to estimate the expenses that you paid over the period. Simply divide your account value by $1,000 (for example, an $8,600 account value divided by $1,000 = 8.6), then multiply the result by the number in the “Actual” line under the heading entitled “Expenses paid during period” for your applicable class of shares to estimate the expenses you paid on your account during this period.
Hypothetical example for comparison purposes
The “Hypothetical” line of the table below provides information about hypothetical account values and hypothetical expenses based on the Fund’s actual expense ratio and an assumed rate of return of 5% per year before expenses, which is not the Fund’s actual return. The hypothetical account values and expenses may not be used to estimate the actual ending account balance or expenses you paid for the period. You may use this information to compare the ongoing costs of investing in the Fund and other funds. To do so, compare this 5% hypothetical example with the 5% hypothetical examples that appear in the shareholder reports of the other funds.
Please note that the expenses shown in the table are meant to highlight your ongoing costs only and do not reflect any transactional costs, such as sales charges (loads) and contingent deferred sales charges. Therefore, the “Hypothetical” line of the table is useful in comparing ongoing costs only and will not help you determine the relative total costs of owning different funds. In addition, if these transactional costs were included, your costs would have been higher.
| | | | | | | | | | | | | | | | |
| | | Beginning
account value
4-1-2015 | | | Ending
account value
9-30-2015 | | | Expenses
paid during
the period¹ | | | Net annualized
expense ratio | |
Class A | | | | | | | | | | | | | | | | |
Actual | | $ | 1,000.00 | | | $ | 805.45 | | | $ | 4.93 | | | | 1.09 | % |
Hypothetical (5% return before expenses) | | $ | 1,000.00 | | | $ | 1,019.60 | | | $ | 5.52 | | | | 1.09 | % |
Class B | | | | | | | | | | | | | | | | |
Actual | | $ | 1,000.00 | | | $ | 802.51 | | | $ | 8.31 | | | | 1.84 | % |
Hypothetical (5% return before expenses) | | $ | 1,000.00 | | | $ | 1,015.84 | | | $ | 9.30 | | | | 1.84 | % |
Class C | | | | | | | | | | | | | | | | |
Actual | | $ | 1,000.00 | | | $ | 802.46 | | | $ | 8.31 | | | | 1.84 | % |
Hypothetical (5% return before expenses) | | $ | 1,000.00 | | | $ | 1,015.84 | | | $ | 9.30 | | | | 1.84 | % |
Administrator Class | | | | | | | | | | | | | | | | |
Actual | | $ | 1,000.00 | | | $ | 805.97 | | | $ | 4.30 | | | | 0.95 | % |
Hypothetical (5% return before expenses) | | $ | 1,000.00 | | | $ | 1,020.31 | | | $ | 4.81 | | | | 0.95 | % |
Institutional Class | | | | | | | | | | | | | | | | |
Actual | | $ | 1,000.00 | | | $ | 806.68 | | | $ | 3.58 | | | | 0.79 | % |
Hypothetical (5% return before expenses) | | $ | 1,000.00 | | | $ | 1,021.11 | | | $ | 4.00 | | | | 0.79 | % |
| 1 | Expenses paid is equal to the annualized expense ratio of each class multiplied by the average account value over the period, multiplied by the number of days in the most recent fiscal half-year divided by the number of days in the fiscal year (to reflect the one-half-year period). |
| | | | | | |
| Consolidated portfolio of investments—September 30, 2015 (unaudited) | | Wells Fargo Advantage Precious Metals Fund | | | 7 | |
| | | | | | | | | | | | |
| Security name | | | | | | Shares | | | Value | |
| | | | | | | | | | | | |
| | | |
Common Stocks: 89.23% | | | | | | | | | | |
| | | |
| Australia: 2.67% | | | | | | | | | | |
Newcrest Mining Limited (Materials, Metals & Mining) † | | | | | | | 788,440 | | | $ | 7,094,992 | |
| | | | | | | | | | | | |
| | | |
| Canada: 57.81% | | | | | | | | | | |
Agnico-Eagle Mines Limited (Materials, Metals & Mining) | | | | | | | 266,370 | | | | 6,752,565 | |
Agnico-Eagle Mines Limited-Legend Shares (Materials, Metals & Mining) | | | | | | | 35,000 | | | | 886,200 | |
Agnico-Eagle Mines Limited-U.S. Exchange Traded Shares (Materials, Metals & Mining) | | | | | | | 700,164 | | | | 17,728,152 | |
Alamos Gold Incorporated Class A (Materials, Metals & Mining) | | | | | | | 1,388,980 | | | | 5,141,672 | |
Aureus Mining Incorporated (Materials, Metals & Mining) † | | | | | | | 7,703,000 | | | | 2,040,657 | |
AuRico Metals Incorporated (Materials, Metals & Mining) † | | | | | | | 610,742 | | | | 302,053 | |
B2Gold Corporation (Materials, Metals & Mining) † | | | | | | | 5,590,000 | | | | 5,906,257 | |
Barrick Gold Corporation (Materials, Metals & Mining) | | | | | | | 984,083 | | | | 6,258,768 | |
Centerra Gold Incorporated (Materials, Metals & Mining) | | | | | | | 260,000 | | | | 1,469,015 | |
Centerra Gold Incorporated (Materials, Metals & Mining) 144A | | | | | | | 350,000 | | | | 1,977,520 | |
Detour Gold Corporation (Materials, Metals & Mining) † | | | | | | | 441,057 | | | | 4,703,066 | |
Detour Gold Corporation (Materials, Metals & Mining) 144A† | | | | | | | 525,000 | | | | 5,602,098 | |
Detour Gold Corporation-Legend Shares (Materials, Metals & Mining) † | | | | | | | 90,000 | | | | 960,360 | |
Eldorado Gold Corporation (Materials, Metals & Mining) | | | | | | | 2,026,044 | | | | 6,497,916 | |
Entree Gold Incorporated-Legend Shares (Materials, Metals & Mining) | | | | | | | 1,275,000 | | | | 363,057 | |
Exeter Resource Corporation-Legend Shares (Materials, Metals & Mining) | | | | | | | 585,000 | | | | 184,114 | |
Franco-Nevada Corporation (Materials, Metals & Mining) 144A | | | | | | | 142,500 | | | | 6,295,841 | |
Franco-Nevada Corporation (Materials, Metals & Mining) | | | | | | | 182,000 | | | | 8,020,547 | |
Goldcorp Incorporated (Materials, Metals & Mining) | | | | | | | 807,254 | | | | 10,120,164 | |
Goldcorp Incorporated-U.S. Exchange Traded Shares (Materials, Metals & Mining) | | | | | | | 616,694 | | | | 7,721,009 | |
Kinross Gold Corporation (Materials, Metals & Mining) † | | | | | | | 4,150,553 | | | | 7,215,649 | |
Lake Shore Gold Corporation (Materials, Metals & Mining) † | | | | | | | 3,800,000 | | | | 3,189,209 | |
Mag Silver Corporation (Materials, Metals & Mining) † | | | | | | | 720,000 | | | | 5,125,515 | |
Mag Silver Corporation-Legend Shares (Materials, Metals & Mining) † | | | | | | | 100,000 | | | | 711,877 | |
New Gold Incorporated (Materials, Metals & Mining) † | | | | | | | 300,000 | | | | 676,658 | |
Osisko Gold Royalties Limited (Materials, Metals & Mining) | | | | | | | 366,700 | | | | 3,874,462 | |
Platinum Group Metals Limited (Materials, Metals & Mining) † | | | | | | | 3,450,000 | | | | 775,571 | |
Platinum Group Metals Limited-Legend Shares (Materials, Metals & Mining) † | | | | | | | 800,000 | | | | 179,843 | |
Platinum Group Metals Limited-U.S. Exchange Traded Shares (Materials, Metals & Mining) † | | | | | | | 1,440,000 | | | | 331,200 | |
Primero Mining Corporation (Materials, Metals & Mining) † | | | | | | | 325,100 | | | | 760,069 | |
Semafo Incorporated (Materials, Metals & Mining) † | | | | | | | 3,160,400 | | | | 6,844,178 | |
Silver Wheaton Corporation (Materials, Metals & Mining) | | | | | | | 12,950 | | | | 155,652 | |
Silver Wheaton Corporation-U.S. Exchange Traded Shares (Materials, Metals & Mining) | | | | | | | 605,000 | | | | 7,266,050 | |
Tahoe Resources Incorporated (Materials, Metals & Mining) | | | | | | | 670,000 | | | | 5,176,246 | |
Tahoe Resources Incorporated-Legend Shares (Materials, Metals & Mining) | | | | | | | 280,000 | | | | 2,163,207 | |
Torex Gold Resources Incorporated (Materials, Metals & Mining) †(i) | | | | | | | 2,200,000 | | | | 2,060,697 | |
Torex Gold Resources Incorporated (Materials, Metals & Mining) 144A† | | | | | | | 1,850,000 | | | | 1,718,996 | |
Torex Gold Resources Incorporated-Legend Shares (Materials, Metals & Mining) † | | | | | | | 2,662,500 | | | | 2,473,960 | |
Yamana Gold Incorporated (Materials, Metals & Mining) | | | | | | | 1,562,731 | | | | 2,634,803 | |
Yamana Gold Incorporated-U.S. Exchange Traded Shares (Materials, Metals & Mining) | | | | | | | 640,537 | | | | 1,088,913 | |
| | | | |
| | | | | | | | | | | 153,353,786 | |
| | | | | | | | | | | | |
| | | | |
| Peru: 0.75% | | | | | | | | | | | | |
Compania de Minas Buenaventura SA ADR (Materials, Metals & Mining) | | | | | | | 334,644 | | | | 1,994,478 | |
| | | | | | | | | | | | |
The accompanying notes are an integral part of these financial statements.
| | | | |
| 8 | | Wells Fargo Advantage Precious Metals Fund | | Consolidated portfolio of investments—September 30, 2015 (unaudited) |
| | | | | | | | | | | | | | |
| Security name | | | | | | | Shares | | | Value | |
| | | | | | | | | | | | | | |
| | | |
| South Africa: 3.31% | | | | | | | | | | | |
AngloGold Ashanti Limited ADR (Materials, Metals & Mining) † | | | | | | | | | 1,070,591 | | | $ | 8,768,140 | |
| | | | | | | | | | | | | | |
| | | |
| United Kingdom: 14.39% | | | | | | | | | | | |
Fresnillo plc (Materials, Metals & Mining) | | | | | | | | | 1,135,000 | | | | 10,167,428 | |
Hochschild Mining plc (Materials, Metals & Mining) † | | | | | | | | | 499,251 | | | | 528,669 | |
Randgold Resources Limited ADR (Materials, Metals & Mining) | | | | | | | | | 465,000 | | | | 27,476,850 | |
| | | | |
| | | | | | | | | | | | | 38,172,947 | |
| | | | | | | | | | | | | | |
| | | |
| United States: 10.30% | | | | | | | | | | | |
Newmont Mining Corporation (Materials, Metals & Mining) | | | | | | | | | 678,455 | | | | 10,902,772 | |
Royal Gold Incorporated (Materials, Metals & Mining) | | | | | | | | | 349,436 | | | | 16,416,503 | |
| | | | |
| | | | | | | | | | | | | 27,319,275 | |
| | | | | | | | | | | | | | |
| | | | |
Total Common Stocks (Cost $312,000,301) | | | | | | | | | | | | | 236,703,618 | |
| | | | | | | | | | | | | | |
| | | | |
| | | | | | | | Troy ounces | | | | |
| | | | |
Commodities: 7.27% | | | | | | | | | | | | | | |
Gold Bullion †** | | | | | | | | | 9,558 | | | | 19,299,494 | |
| | | | |
Total Commodities (Cost $10,593,806) | | | | | | | | | | | | | 19,299,494 | |
| | | | | | | | | | | | | | |
| | | | |
| | | Yield | | | | | Shares | | | | |
| Short-Term Investments: 3.15% | | | | | | | | | | | | | | |
| | | | |
| Investment Companies: 3.15% | | | | | | | | | | | | | | |
Wells Fargo Advantage Cash Investment Money Market Fund, Select Class (l)(u) | | | 0.16 | % | | | | | 8,354,747 | | | | 8,354,747 | |
| | | | | | | | | | | | | | |
| | | | |
Total Short-Term Investments (Cost $8,354,747) | | | | | | | | | | | | | 8,354,747 | |
| | | | | | | | | | | | | | |
| | | | | | | | |
| Total investments in securities (Cost $330,948,854) * | | | 99.65 | % | | | 264,357,859 | |
Other assets and liabilities, net | | | 0.35 | | | | 927,908 | |
| | | | | | | | |
| Total net assets | | | 100.00 | % | | $ | 265,285,767 | |
| | | | | | | | |
| † | Non-income-earning security |
| 144A | The security may be resold in transactions exempt from registration, normally to qualified institutional buyers, pursuant to Rule 144A under the Securities Act of 1933. |
| ** | Represents an investment held in Wells Fargo Special Investments (Cayman) SPC, the consolidated entity. |
| (l) | The security represents an affiliate of the Fund as defined in the Investment Company Act of 1940. |
| (u) | The rate represents the 7-day annualized yield at period end. |
| * | Cost for federal income tax purposes is $353,763,800 and unrealized gains (losses) consists of: |
| | | | |
Gross unrealized gains | | $ | 64,735,177 | |
Gross unrealized losses | | | (154,141,118 | ) |
| | | | |
Net unrealized losses | | | (89,405,941 | ) |
The accompanying notes are an integral part of these financial statements.
| | | | | | |
| Consolidated statement of assets and liabilities—September 30, 2015 (unaudited) | | Wells Fargo Advantage Precious Metals Fund | | | 9 | |
| | | | |
| |
Assets | | | | |
Investments | | | | |
In unaffiliated securities, at value (cost $312,000,301) | | $ | 236,703,618 | |
In commodities, at value (cost $10,593,806) | | | 19,299,494 | |
In affiliated securities, at value (cost $8,354,747) | | | 8,354,747 | |
| | | | |
Total investments, at value (cost $330,948,854) | | | 264,357,859 | |
Cash | | | 33,386 | |
Foreign currency, at value (cost $586,486) | | | 579,964 | |
Receivable for investments sold | | | 127,122 | |
Receivable for Fund shares sold | | | 1,462,878 | |
Receivable for dividends | | | 113,618 | |
Prepaid expenses and other assets | | | 64,443 | |
| | | | |
Total assets | | | 266,739,270 | |
| | | | |
| |
Liabilities | | | | |
Payable for Fund shares redeemed | | | 1,136,795 | |
Management fee payable | | | 108,854 | |
Distribution fees payable | | | 26,752 | |
Administration fees payable | | | 42,199 | |
Accrued expenses and other liabilities | | | 138,903 | |
| | | | |
Total liabilities | | | 1,453,503 | |
| | | | |
Total net assets | | $ | 265,285,767 | |
| | | | |
| |
NET ASSETS CONSIST OF | | | | |
Paid-in capital | | $ | 490,657,493 | |
Accumulated net investment loss | | | (951,574 | ) |
Accumulated net realized losses on investments | | | (157,822,521 | ) |
Net unrealized losses on investments | | | (66,597,631 | ) |
| | | | |
Total net assets | | $ | 265,285,767 | |
| | | | |
| |
COMPUTATION OF NET ASSET VALUE AND OFFERING PRICE PER SHARE | | | | |
Net assets – Class A | | $ | 172,804,570 | |
Shares outstanding – Class A1 | | | 7,399,891 | |
Net asset value per share – Class A | | | $23.35 | |
Maximum offering price per share – Class A2 | | | $24.77 | |
Net assets – Class B | | $ | 1,677,040 | |
Shares outstanding – Class B1 | | | 79,366 | |
Net asset value per share – Class B | | | $21.13 | |
Net assets – Class C | | $ | 41,117,561 | |
Shares outstanding – Class C1 | | | 1,972,885 | |
Net asset value per share – Class C | | | $20.84 | |
Net assets – Administrator Class | | $ | 14,880,844 | |
Shares outstanding – Administrator Class1 | | | 632,919 | |
Net asset value per share – Administrator Class | | | $23.51 | |
Net assets – Institutional Class | | $ | 34,805,752 | |
Shares outstanding – Institutional Class1 | | | 1,471,314 | |
Net asset value per share – Institutional Class | | | $23.66 | |
| 1 | The Fund has an unlimited number of authorized shares. |
| 2 | Maximum offering price is computed as 100/94.25 of net asset value. On investments of $50,000 or more, the offering price is reduced. |
The accompanying notes are an integral part of these financial statements.
| | | | |
| 10 | | Wells Fargo Advantage Precious Metals Fund | | Consolidated statement of operations—six months ended September 30, 2015 (unaudited) |
| | | | |
| | | | |
| |
Investment income | | | | |
Dividends (net of foreign withholding taxes of $158,685) | | $ | 1,495,871 | |
Income from affiliated securities | | | 3,877 | |
Interest | | | 157 | |
| | | | |
Total investment income | | | 1,499,905 | |
| | | | |
| |
Expenses | | | | |
Management fee | | | 1,019,045 | |
Administration fees | | | | |
Class A | | | 235,846 | |
Class B | | | 2,683 | |
Class C | | | 63,154 | |
Administrator Class | | | 11,457 | |
Institutional Class | | | 20,219 | |
Shareholder servicing fees | | | | |
Class A | | | 247,992 | |
Class B | | | 2,802 | |
Class C | | | 66,182 | |
Administrator Class | | | 25,337 | |
Distribution fees | | | | |
Class B | | | 8,407 | |
Class C | | | 198,547 | |
Custody and accounting fees | | | 25,514 | |
Professional fees | | | 30,753 | |
Registration fees | | | 38,104 | |
Shareholder report expenses | | | 49,487 | |
Trustees’ fees and expenses | | | 7,362 | |
Other fees and expenses | | | 21,504 | |
| | | | |
Total expenses | | | 2,074,395 | |
Less: Fee waivers and/or expense reimbursements | | | (217,158 | ) |
| | | | |
Net expenses | | | 1,857,237 | |
| | | | |
Net investment loss | | | (357,332 | ) |
| | | | |
| |
REALIZED AND UNREALIZED GAINS (LOSSES) ON INVESTMENTS | | | | |
| |
Net realized gains (losses) on: | | | | |
Unaffiliated securities | | | (9,436,375 | ) |
Commodities | | | (19,816 | ) |
| | | | |
Net realized losses on investments | | | (9,456,191 | ) |
| | | | |
| |
Net change in unrealized gains (losses) on: | | | | |
Unaffiliated securities | | | (52,527,529 | ) |
Commodities | | | (1,083,372 | ) |
| | | | |
Net change in unrealized gains (losses) on investments | | | (53,610,901 | ) |
| | | | |
Net realized and unrealized gains (losses) on investments | | | (63,067,092 | ) |
| | | | |
Net decrease in net assets resulting from operations | | $ | (63,424,424 | ) |
| | | | |
The accompanying notes are an integral part of these financial statements.
| | | | | | |
| Consolidated statement of changes in net assets | | Wells Fargo Advantage Precious Metals Fund | | | 11 | |
| | | | | | | | | | | | | | | | |
| | | Six months ended September 30, 2015 (unaudited) | | | Year ended March 31, 2015 | |
| | | | |
Operations | | | | | | | | | | | | | | | | |
Net investment loss | | | | | | $ | (357,332 | ) | | | | | | $ | (1,850,832 | ) |
Net realized losses on investments | | | | | | | (9,456,191 | ) | | | | | | | (8,544,605 | ) |
Net change in unrealized gains (losses) on investments | | | | | | | (53,610,901 | ) | | | | | | | (84,220,889 | ) |
| | | | |
Net decrease in net assets resulting from operations | | | | | | | (63,424,424 | ) | | | | | | | (94,616,326 | ) |
| | | | |
| | | | |
Capital share transactions | | | Shares | | | | | | | | Shares | | | | | |
Proceeds from shares sold | | | | | | | | | | | | | | | | |
Class A | | | 1,149,347 | | | | 30,282,261 | | | | 2,090,045 | | | | 74,515,784 | |
Class B | | | 564 | | | | 12,571 | | | | 1,003 | | | | 31,925 | |
Class C | | | 58,712 | | | | 1,421,409 | | | | 216,694 | | | | 6,828,594 | |
Administrator Class | | | 161,274 | | | | 4,455,694 | | | | 759,290 | | | | 28,093,290 | |
Institutional Class | | | 457,662 | | | | 12,208,186 | | | | 1,064,094 | | | | 38,355,131 | |
| | | | |
| | | | | | | 48,380,121 | | | | | | | | 147,824,724 | |
| | | | |
Payment for shares redeemed | | | | | | | | | | | | | | | | |
Class A | | | (1,043,081 | ) | | | (28,642,708 | ) | | | (3,006,178 | ) | | | (108,551,283 | ) |
Class B | | | (27,951 | ) | | | (731,523 | ) | | | (111,993 | ) | | | (3,694,954 | ) |
Class C | | | (360,131 | ) | | | (8,715,132 | ) | | | (810,107 | ) | | | (24,887,063 | ) |
Administrator Class | | | (279,686 | ) | | | (7,075,087 | ) | | | (883,304 | ) | | | (29,469,517 | ) |
Institutional Class | | | (452,978 | ) | | | (12,797,290 | ) | | | (733,544 | ) | | | (25,611,256 | ) |
| | | | |
| | | | | | | (57,961,740 | ) | | | | | | | (192,214,073 | ) |
| | | | |
Net decrease in net assets resulting from capital share transactions | | | | | | | (9,581,619 | ) | | | | | | | (44,389,349 | ) |
| | | | |
Total decrease in net assets | | | | | | | (73,006,043 | ) | | | | | | | (139,005,675 | ) |
| | | | |
| | | | |
Net assets | | | | | | | | | | | | | | | | |
Beginning of period | | | | | | | 338,291,810 | | | | | | | | 477,297,485 | |
| | | | |
End of period | | | | | | $ | 265,285,767 | | | | | | | $ | 338,291,810 | |
| | | | |
Accumulated net investment loss | | | | | | $ | (951,574 | ) | | | | | | $ | (594,242 | ) |
| | | | |
The accompanying notes are an integral part of these financial statements.
| | | | |
| 12 | | Wells Fargo Advantage Precious Metals Fund | | Consolidated financial highlights |
(For a share outstanding throughout each period)
| | | | | | | | | | | | | | | | | | | | | | | | | | | | |
| | | Six months ended
September 30, 2015 (unaudited) | | | Year ended March 31 | | | Year ended
October 31 20101,3 | |
| CLASS A | | | 2015 | | | 20141 | | | 20131 | | | 20121 | | | 20111,2 | | |
Net asset value, beginning of period | | | $28.99 | | | | $36.65 | | | | $53.59 | | | | $70.30 | | | | $85.64 | | | | $93.43 | | | | $64.40 | |
Net investment income (loss) | | | (0.04 | ) | | | (0.11 | )4 | | | 0.05 | 4 | | | (0.01 | )4 | | | (0.19 | )4 | | | (0.21 | )4 | | | (0.35 | )4 |
Net realized and unrealized gains (losses) on investments | | | (5.60 | ) | | | (7.55 | ) | | | (16.78 | ) | | | (14.47 | ) | | | (13.39 | ) | | | 3.24 | | | | 29.38 | |
| | | | | | | | | | | | | | | | | | | | | | | | | | | | |
Total from investment operations | | | (5.64 | ) | | | (7.66 | ) | | | (16.73 | ) | | | (14.48 | ) | | | (13.58 | ) | | | 3.03 | | | | 29.03 | |
Distributions to shareholders from | | | | | | | | | | | | | | | | | | | | | | | | | | | | |
Net investment income | | | 0.00 | | | | 0.00 | | | | 0.00 | | | | 0.00 | | | | (1.27 | ) | | | (4.06 | ) | | | 0.00 | |
Net realized gains | | | 0.00 | | | | 0.00 | | | | (0.21 | ) | | | (2.23 | ) | | | (0.49 | ) | | | (6.76 | ) | | | 0.00 | |
| | | | | | | | | | | | | | | | | | | | | | | | | | | | |
Total distributions to shareholders | | | 0.00 | | | | 0.00 | | | | (0.21 | ) | | | (2.23 | ) | | | (1.76 | ) | | | (10.82 | ) | | | 0.00 | |
Net asset value, end of period | | | $23.35 | | | | $28.99 | | | | $36.65 | | | | $53.59 | | | | $70.30 | | | | $85.64 | | | | $93.43 | |
Total return5 | | | (19.45 | )% | | | (20.90 | )% | | | (31.17 | )% | | | (21.14 | )% | | | (15.95 | )% | | | 3.14 | % | | | 45.10 | % |
Ratios to average net assets (annualized) | | | | | | | | | | | | | | | | | | | | | | | | | | | | |
Gross expenses | | | 1.25 | % | | | 1.23 | % | | | 1.22 | % | | | 1.18 | % | | | 1.14 | % | | | 1.15 | % | | | 1.09 | % |
Net expenses | | | 1.10 | % | | | 1.10 | % | | | 1.09 | % | | | 1.09 | % | | | 1.09 | % | | | 1.09 | % | | | 1.05 | % |
Net investment income (loss) | | | (0.13 | )% | | | (0.30 | )% | | | 0.12 | % | | | (0.02 | )% | | | (0.24 | )% | | | (0.57 | )% | | | (0.45 | )% |
Supplemental data | | | | | | | | | | | | | | | | | | | | | | | | | | | | |
Portfolio turnover rate | | | 11 | %6 | | | 9 | %6 | | | 16 | % | | | 6 | % | | | 4 | % | | | 5 | % | | | 14 | % |
Net assets, end of period (000s omitted) | | | $172,805 | | | | $211,477 | | | | $300,906 | | | | $498,874 | | | | $699,773 | | | | $873,142 | | | | $954,220 | |
| 1 | Amounts do not reflect the consolidated financial results of its wholly-owned subsidiary. |
| 2 | For the five months ended March 31, 2011. The Fund changed its fiscal year end from October 31 to March 31, effective March 31, 2011. |
| 3 | After the close of business on July 16, 2010, the Fund acquired the net assets of Evergreen Precious Metals Fund which became the accounting and performance survivor in the transaction. The information for the period prior to July 19, 2010 is that of Class A of Evergreen Precious Metals Fund. |
| 4 | Calculated based upon average shares outstanding |
| 5 | Total return calculations do not include any sales charges. Returns for periods of less than one year are not annualized. |
| 6 | Portfolio turnover rate includes the purchases and sales transactions of its wholly-owned subsidiary. |
The accompanying notes are an integral part of these financial statements.
| | | | | | |
| Consolidated financial highlights | | Wells Fargo Advantage Precious Metals Fund | | | 13 | |
(For a share outstanding throughout each period)
| | | | | | | | | | | | | | | | | | | | | | | | | | | | |
| | | Six months ended
September 30, 2015 (unaudited) | | | Year ended March 31 | | | Year ended
October 31 20101,3 | |
| CLASS B | | | 2015 | | | 20141 | | | 20131 | | | 20121 | | | 20111,2 | | |
Net asset value, beginning of period | | | $26.33 | | | | $33.54 | | | | $49.44 | | | | $65.53 | | | | $79.20 | | | | $86.53 | | | | $60.10 | |
Net investment loss | | | (0.11 | )4 | | | (0.36 | )4 | | | (0.22 | )4 | | | (0.47 | )4 | | | (0.77 | )4 | | | (0.44 | )4 | | | (0.86 | )4 |
Net realized and unrealized gains (losses) on investments | | | (5.09 | ) | | | (6.85 | ) | | | (15.47 | ) | | | (13.39 | ) | | | (12.29 | ) | | | 3.01 | | | | 27.29 | |
| | | | | | | | | | | | | | | | | | | | | | | | | | | | |
Total from investment operations | | | (5.20 | ) | | | (7.21 | ) | | | (15.69 | ) | | | (13.86 | ) | | | (13.06 | ) | | | 2.57 | | | | 26.43 | |
Distributions to shareholders from | | | | | | | | | | | | | | | | | | | | | | | | | | | | |
Net investment income | | | 0.00 | | | | 0.00 | | | | 0.00 | | | | 0.00 | | | | (0.12 | ) | | | (3.14 | ) | | | 0.00 | |
Net realized gains | | | 0.00 | | | | 0.00 | | | | (0.21 | ) | | | (2.23 | ) | | | (0.49 | ) | | | (6.76 | ) | | | 0.00 | |
| | | | | | | | | | | | | | | | | | | | | | | | | | | | |
Total distributions to shareholders | | | 0.00 | | | | 0.00 | | | | (0.21 | ) | | | (2.23 | ) | | | (0.61 | ) | | | (9.90 | ) | | | 0.00 | |
Net asset value, end of period | | | $21.13 | | | | $26.33 | | | | $33.54 | | | | $49.44 | | | | $65.53 | | | | $79.20 | | | | $86.53 | |
Total return5 | | | (19.75 | )% | | | (21.50 | )% | | | (31.68 | )% | | | (21.74 | )% | | | (16.58 | )% | | | 2.82 | % | | | 44.00 | % |
Ratios to average net assets (annualized) | | | | | | | | | | | | | | | | | | | | | | | | | | | | |
Gross expenses | | | 1.98 | % | | | 1.98 | % | | | 1.96 | % | | | 1.93 | % | | | 1.89 | % | | | 1.90 | % | | | 1.83 | % |
Net expenses | | | 1.83 | % | | | 1.85 | % | | | 1.84 | % | | | 1.84 | % | | | 1.84 | % | | | 1.84 | % | | | 1.80 | % |
Net investment loss | | | (0.90 | )% | | | (1.08 | )% | | | (0.60 | )% | | | (0.78 | )% | | | (1.01 | )% | | | (1.32 | )% | | | (1.19 | )% |
Supplemental data | | | | | | | | | | | | | | | | | | | | | | | | | | | | |
Portfolio turnover rate | | | 11 | %6 | | | 9 | %6 | | | 16 | % | | | 6 | % | | | 4 | % | | | 5 | % | | | 14 | % |
Net assets, end of period (000s omitted) | | | $1,677 | | | | $2,811 | | | | $7,304 | | | | $20,570 | | | | $39,046 | | | | $71,761 | | | | $82,984 | |
| 1 | Amounts do not reflect the consolidated financial results of its wholly-owned subsidiary. |
| 2 | For the five months ended March 31, 2011. The Fund changed its fiscal year end from October 31 to March 31, effective March 31, 2011. |
| 3 | After the close of business on July 16, 2010, the Fund acquired the net assets of Evergreen Precious Metals Fund which became the accounting and performance survivor in the transaction. The information for the period prior to July 19, 2010 is that of Class B of Evergreen Precious Metals Fund. |
| 4 | Calculated based upon average shares outstanding |
| 5 | Total return calculations do not include any sales charges. Returns for periods of less than one year are not annualized. |
| 6 | Portfolio turnover rate includes the purchases and sales transactions of its wholly-owned subsidiary. |
The accompanying notes are an integral part of these financial statements.
| | | | |
| 14 | | Wells Fargo Advantage Precious Metals Fund | | Consolidated financial highlights |
(For a share outstanding throughout each period)
| | | | | | | | | | | | | | | | | | | | | | | | | | | | |
| | | Six months ended
September 30, 2015 (unaudited) | | | Year ended March 31 | | | Year ended
October 31 20101,3 | |
| CLASS C | | | 2015 | | | 20141 | | | 20131 | | | 20121 | | | 20111,2 | | |
Net asset value, beginning of period | | | $25.97 | | | | $33.08 | | | | $48.76 | | | | $64.66 | | | | $78.43 | | | | $85.86 | | | | $59.63 | |
Net investment loss | | | (0.11 | )4 | | | (0.35 | )4 | | | (0.22 | )4 | | | (0.46 | )4 | | | (0.75 | )4 | | | (0.43 | )4 | | | (0.86 | )4 |
Net realized and unrealized gains (losses) on investments | | | (5.02 | ) | | | (6.76 | ) | | | (15.25 | ) | | | (13.21 | ) | | | (12.18 | ) | | | 2.98 | | | | 27.09 | |
| | | | | | | | | | | | | | | | | | | | | | | | | | | | |
Total from investment operations | | | (5.13 | ) | | | (7.11 | ) | | | (15.47 | ) | | | (13.67 | ) | | | (12.93 | ) | | | 2.55 | | | | 26.23 | |
Distributions to shareholders from | | | | | | | | | | | | | | | | | | | | | | | | | | | | |
Net investment income | | | 0.00 | | | | 0.00 | | | | 0.00 | | | | 0.00 | | | | (0.35 | ) | | | (3.22 | ) | | | 0.00 | |
Net realized gains | | | 0.00 | | | | 0.00 | | | | (0.21 | ) | | | (2.23 | ) | | | (0.49 | ) | | | (6.76 | ) | | | 0.00 | |
| | | | | | | | | | | | | | | | | | | | | | | | | | | | |
Total distributions to shareholders | | | 0.00 | | | | 0.00 | | | | (0.21 | ) | | | (2.23 | ) | | | (0.84 | ) | | | (9.98 | ) | | | 0.00 | |
Net asset value, end of period | | | $20.84 | | | | $25.97 | | | | $33.08 | | | | $48.76 | | | | $64.66 | | | | $78.43 | | | | $85.86 | |
Total return5 | | | (19.75 | )% | | | (21.49 | )% | | | (31.67 | )% | | | (21.74 | )% | | | (16.58 | )% | | | 2.82 | % | | | 44.01 | % |
Ratios to average net assets (annualized) | | | | | | | | | | | | | | | | | | | | | | | | | | | | |
Gross expenses | | | 2.00 | % | | | 1.98 | % | | | 1.97 | % | | | 1.93 | % | | | 1.89 | % | | | 1.90 | % | | | 1.84 | % |
Net expenses | | | 1.85 | % | | | 1.85 | % | | | 1.84 | % | | | 1.84 | % | | | 1.84 | % | | | 1.84 | % | | | 1.80 | % |
Net investment loss | | | (0.89 | )% | | | (1.06 | )% | | | (0.62 | )% | | | (0.77 | )% | | | (0.99 | )% | | | (1.31 | )% | | | (1.19 | )% |
Supplemental data | | | | | | | | | | | | | | | | | | | | | | | | | | | | |
Portfolio turnover rate | | | 11 | %6 | | | 9 | %6 | | | 16 | % | | | 6 | % | | | 4 | % | | | 5 | % | | | 14 | % |
Net assets, end of period (000s omitted) | | | $41,118 | | | | $59,074 | | | | $94,865 | | | | $191,782 | | | | $290,513 | | | | $398,047 | | | | $396,590 | |
| 1 | Amounts do not reflect the consolidated financial results of its wholly-owned subsidiary. |
| 2 | For the five months ended March 31, 2011. The Fund changed its fiscal year end from October 31 to March 31, effective March 31, 2011. |
| 3 | After the close of business on July 16, 2010, the Fund acquired the net assets of Evergreen Precious Metals Fund which became the accounting and performance survivor in the transaction. The information for the period prior to July 19, 2010 is that of Class C of Evergreen Precious Metals Fund. |
| 4 | Calculated based upon average shares outstanding |
| 5 | Total return calculations do not include any sales charges. Returns for periods of less than one year are not annualized. |
| 6 | Portfolio turnover rate includes the purchases and sales transactions of its wholly-owned subsidiary. |
The accompanying notes are an integral part of these financial statements.
| | | | | | |
| Consolidated financial highlights | | Wells Fargo Advantage Precious Metals Fund | | | 15 | |
(For a share outstanding throughout each period)
| | | | | | | | | | | | | | | | | | | | | | | | | | | | |
| | | Six months ended
September 30, 2015 (unaudited) | | | Year ended March 31 | | | Year ended
October 31 20101,3 | |
| ADMINISTRATOR CLASS | | | 2015 | | | 20141 | | | 20131 | | | 20121 | | | 20111,2 | | |
Net asset value, beginning of period | | | $29.17 | | | | $36.82 | | | | $53.75 | | | | $70.42 | | | | $85.70 | | | | $93.65 | | | | $77.73 | |
Net investment income (loss) | | | (0.00 | )4,5 | | | (0.06 | )4 | | | 0.10 | 4 | | | 0.08 | 4 | | | (0.06 | )4 | | | (0.11 | )4 | | | (0.12 | )4 |
Net realized and unrealized gains (losses) on investments | | | (5.66 | ) | | | (7.59 | ) | | | (16.82 | ) | | | (14.52 | ) | | | (13.41 | ) | | | 3.22 | | | | 16.04 | |
| | | | | | | | | | | | | | | | | | | | | | | | | | | | |
Total from investment operations | | | (5.66 | ) | | | (7.65 | ) | | | (16.72 | ) | | | (14.44 | ) | | | (13.47 | ) | | | 3.11 | | | | 15.92 | |
Distributions to shareholders from | | | | | | | | | | | | | | | | | | | | | | | | | | | | |
Net investment income | | | 0.00 | | | | 0.00 | | | | 0.00 | | | | 0.00 | | | | (1.32 | ) | | | (4.30 | ) | | | 0.00 | |
Net realized gains | | | 0.00 | | | | 0.00 | | | | (0.21 | ) | | | (2.23 | ) | | | (0.49 | ) | | | (6.76 | ) | | | 0.00 | |
| | | | | | | | | | | | | | | | | | | | | | | | | | | | |
Total distributions to shareholders | | | 0.00 | | | | 0.00 | | | | (0.21 | ) | | | (2.23 | ) | | | (1.81 | ) | | | (11.06 | ) | | | 0.00 | |
Net asset value, end of period | | | $23.51 | | | | $29.17 | | | | $36.82 | | | | $53.75 | | | | $70.42 | | | | $85.70 | | | | $93.65 | |
Total return6 | | | (19.40 | )% | | | (20.78 | )% | | | (31.06 | )% | | | (21.05 | )% | | | (15.81 | )% | | | 3.20 | % | | | 20.48 | % |
Ratios to average net assets (annualized) | | | | | | | | | | | | | | | | | | | | | | | | | | | | |
Gross expenses | | | 1.12 | % | | | 1.07 | % | | | 1.04 | % | | | 1.01 | % | | | 0.94 | % | | | 0.91 | % | | | 1.06 | % |
Net expenses | | | 0.96 | % | | | 0.96 | % | | | 0.95 | % | | | 0.95 | % | | | 0.92 | % | | | 0.91 | % | | | 0.95 | % |
Net investment income (loss) | | | (0.01 | )% | | | (0.17 | )% | | | 0.26 | % | | | 0.13 | % | | | (0.08 | )% | | | (0.30 | )% | | | (0.54 | )% |
Supplemental data | | | | | | | | | | | | | | | | | | | | | | | | | | | | |
Portfolio turnover rate | | | 11 | %7 | | | 9 | %7 | | | 16 | % | | | 6 | % | | | 4 | % | | | 5 | % | | | 14 | % |
Net assets, end of period (000s omitted) | | | $14,881 | | | | $21,917 | | | | $32,230 | | | | $53,142 | | | | $53,497 | | | | $94,103 | | | | $127 | |
| 1 | Amounts do not reflect the consolidated financial results of its wholly-owned subsidiary. |
| 2 | For the five months ended March 31, 2011. The Fund changed its fiscal year end from October 31 to March 31, effective March 31, 2011. |
| 3 | For the period from July 30, 2010 (commencement of class operations) to October 31, 2010 |
| 4 | Calculated based upon average shares outstanding |
| 5 | Amount is less than $0.005 |
| 6 | Returns for periods of less than one year are not annualized. |
| 7 | Portfolio turnover rate includes the purchases and sales transactions of its wholly-owned subsidiary. |
The accompanying notes are an integral part of these financial statements.
| | | | |
| 16 | | Wells Fargo Advantage Precious Metals Fund | | Consolidated financial highlights |
(For a share outstanding throughout each period)
| | | | | | | | | | | | | | | | | | | | | | | | | | | | |
| | | Six months ended
September 30, 2015 (unaudited) | | | Year ended March 31 | | | Year ended
October 31 20101,3 | |
| INSTITUTIONAL CLASS | | | 2015 | | | 20141 | | | 20131 | | | 20121 | | | 20111,2 | | |
Net asset value, beginning of period | | | $29.33 | | | | $36.96 | | | | $53.87 | | | | $70.43 | | | | $85.84 | | | | $93.68 | | | | $64.41 | |
Net investment income (loss) | | | 0.02 | | | | 0.01 | 4 | | | 0.16 | 4 | | | 0.19 | | | | 0.12 | | | | (0.06 | )4 | | | (0.14 | )4 |
Net realized and unrealized gains (losses) on investments | | | (5.69 | ) | | | (7.64 | ) | | | (16.86 | ) | | | (14.52 | ) | | | (13.45 | ) | | | 3.26 | | | | 29.41 | |
| | | | | | | | | | | | | | | | | | | | | | | | | | | | |
Total from investment operations | | | (5.67 | ) | | | (7.63 | ) | | | (16.70 | ) | | | (14.33 | ) | | | (13.33 | ) | | | 3.20 | | | | 29.27 | |
Distributions to shareholders from | | | | | | | | | | | | | | | | | | | | | | | | | | | | |
Net investment income | | | 0.00 | | | | 0.00 | | | | 0.00 | | | | 0.00 | | | | (1.59 | ) | | | (4.28 | ) | | | 0.00 | |
Net realized gains | | | 0.00 | | | | 0.00 | | | | (0.21 | ) | | | (2.23 | ) | | | (0.49 | ) | | | (6.76 | ) | | | 0.00 | |
| | | | | | | | | | | | | | | | | | | | | | | | | | | | |
Total distributions to shareholders | | | 0.00 | | | | 0.00 | | | | (0.21 | ) | | | (2.23 | ) | | | (2.08 | ) | | | (11.04 | ) | | | 0.00 | |
Net asset value, end of period | | | $23.66 | | | | $29.33 | | | | $36.96 | | | | $53.87 | | | | $70.43 | | | | $85.84 | | | | $93.68 | |
Total return5 | | | (19.33 | )% | | | (20.64 | )% | | | (30.95 | )% | | | (20.89 | )% | | | (15.64 | )% | | | 3.32 | % | | | 45.47 | % |
Ratios to average net assets (annualized) | | | | | | | | | | | | | | | | | | | | | | | | | | | | |
Gross expenses | | | 0.85 | % | | | 0.80 | % | | | 0.79 | % | | | 0.75 | % | | | 0.71 | % | | | 0.72 | % | | | 0.78 | % |
Net expenses | | | 0.79 | % | | | 0.79 | % | | | 0.78 | % | | | 0.75 | % | | | 0.71 | % | | | 0.69 | % | | | 0.78 | % |
Net investment income (loss) | | | 0.18 | % | | | 0.03 | % | | | 0.41 | % | | | 0.32 | % | | | 0.14 | % | | | (0.15 | )% | | | (0.18 | )% |
Supplemental data | | | | | | | | | | | | | | | | | | | | | | | | | | | | |
Portfolio turnover rate | | | 11 | %6 | | | 9 | %6 | | | 16 | % | | | 6 | % | | | 4 | % | | | 5 | % | | | 14 | % |
Net assets, end of period (000s omitted) | | | $34,806 | | | | $43,014 | | | | $41,993 | | | | $59,349 | | | | $78,846 | | | | $96,798 | | | | $84,087 | |
| 1 | Amounts do not reflect the consolidated financial results of its wholly-owned subsidiary. |
| 2 | For the five months ended March 31, 2011. The Fund changed its fiscal year end from October 31 to March 31, effective March 31, 2011. |
| 3 | After the close of business on July 16, 2010, the Fund acquired the net assets of Evergreen Precious Metals Fund which became the accounting and performance survivor in the transaction. The information for the period prior to July 19, 2010 is that of Class I of Evergreen Precious Metals Fund. |
| 4 | Calculated based upon average shares outstanding |
| 5 | Returns for periods of less than one year are not annualized. |
| 6 | Portfolio turnover rate includes the purchases and sales transactions of its wholly-owned subsidiary. |
The accompanying notes are an integral part of these financial statements.
| | | | | | |
| Notes to consolidated financial statements (unaudited) | | Wells Fargo Advantage Precious Metals Fund | | | 17 | |
1. ORGANIZATION
Wells Fargo Funds Trust (the “Trust”), a Delaware statutory trust organized on March 10, 1999, is an open-end management investment company registered under the Investment Company Act of 1940, as amended (the “1940 Act”). As an investment company, the Trust follows the accounting and reporting guidance in Financial Accounting Standards Board (“FASB”) Accounting Standards Codification Topic 946, Financial Services – Investment Companies. These financial statements report on the Wells Fargo Advantage Precious Metals Fund (the “Fund”) which is a non-diversified series of the Trust.
2. INVESTMENT IN SUBSIDIARY
The Fund invests in precious metals and minerals through Wells Fargo Special Investments (Cayman) SPC (the “Subsidiary”), a wholly owned subsidiary incorporated on May 3, 2005 under the laws of the Cayman Islands as an exempted segregated portfolio company with limited liability. As of September 30, 2015, the Subsidiary held $19,299,494 in gold bullion representing 99.88% of its net assets. The Fund is the sole shareholder of the Subsidiary. As of September 30, 2015, the Fund held $19,323,163 in the Subsidiary, representing 7.28% of the Fund’s net assets.
The consolidated financial statements of the Fund include the financial results of its wholly-owned subsidiary. The Consolidated Portfolio of Investments includes positions of the Fund and the Subsidiary and the consolidated financial statements include the accounts of the Fund and the Subsidiary. Accordingly, all interfund balances and transactions between the Fund and the Subsidiary have been eliminated in consolidation.
3. SIGNIFICANT ACCOUNTING POLICIES
The following significant accounting policies, which are consistently followed in the preparation of the consolidated financial statements, are in conformity with U.S. generally accepted accounting principles which require management to make estimates and assumptions that affect the reported amounts of assets and liabilities, disclosure of contingent assets and liabilities at the date of the financial statements, and the reported amounts of revenues and expenses during the reporting period. Actual results could differ from those estimates.
Securities valuation
All investments are valued each business day as of the close of regular trading on the New York Stock Exchange (generally 4 p.m. Eastern Time).
Equity securities that are listed on a foreign or domestic exchange or market are valued at the official closing price or, if none, the last sales price. If no sale occurs on the primary exchange or market for the security that day, the prior day’s price will be deemed “stale” and fair values will be determined in accordance with the Fund’s Valuation Procedures.
Equity securities that are not listed on a foreign or domestic exchange or market, but have a public trading market, are valued at the quoted bid price from an independent broker-dealer that the Management Valuation Team of Funds Management has determined is an acceptable source.
Investments in commodities are valued at their last traded price.
The values of securities denominated in foreign currencies are translated into U.S. dollars at rates provided by an independent foreign currency pricing source at a time each business day specified by the Management Valuation Team.
Many securities markets and exchanges outside the U.S. close prior to the close of the New York Stock Exchange and therefore may not fully reflect trading or events that occur after the close of the principal exchange in which the foreign securities are traded, but before the close of the New York Stock Exchange. If such trading or events are expected to materially affect the value of such securities, then fair value pricing procedures approved by the Board of Trustees of the Fund are applied. These procedures take into account multiple factors including movements in U.S. securities markets after foreign exchanges close. Foreign securities that are fair valued under these procedures are categorized as Level 2 and the application of these procedures may result in transfers between Level 1 and Level 2. Depending on market activity, such fair valuations may be frequent. Such fair value pricing may result in NAVs that are higher or lower than NAVs based on the last reported sales price or latest quoted bid price. On September 30, 2015, such fair value pricing was used in pricing foreign securities.
Investments in registered open-end investment companies are valued at net asset value.
Investments which are not valued using any of the methods discussed above are valued at their fair value, as determined in good faith by the Board of Trustees. The Board of Trustees has established a Valuation Committee comprised of the Trustees and has delegated to it the authority to take any actions regarding the valuation of portfolio securities that the Valuation Committee deems necessary or appropriate, including determining the fair value of portfolio securities, unless
| | | | |
| 18 | | Wells Fargo Advantage Precious Metals Fund | | Notes to consolidated financial statements (unaudited) |
the determination has been delegated to the Management Valuation Team. The Board of Trustees retains the authority to make or ratify any valuation decisions or approve any changes to the Valuation Procedures as it deems appropriate. On a quarterly basis, the Board of Trustees receives reports on any valuation actions taken by the Valuation Committee or the Management Valuation Team which may include items for ratification.
Valuations of fair valued securities are compared to the next actual sales price when available, or other appropriate market values, to assess the continued appropriateness of the fair valuation methodologies used. These securities are fair valued on a day-to-day basis, taking into consideration changes to appropriate market information and any significant changes to the inputs considered in the valuation process until there is a readily available price provided on an exchange or by an independent pricing service. Valuations received from an independent pricing service or independent broker-dealer quotes are periodically validated by comparisons to most recent trades and valuations provided by other independent pricing services in addition to the review of prices by the manager and/or subadviser. Unobservable inputs used in determining fair valuations are identified based on the type of security, taking into consideration factors utilized by market participants in valuing the investment, knowledge about the issuer and the current market environment.
Foreign currency translation
The accounting records of the Fund are maintained in U.S. dollars. The values of other assets and liabilities denominated in foreign currencies are translated into U.S. dollars at rates provided by an independent foreign currency pricing source at a time each business day specified by the Management Valuation Team. Purchases and sales of securities, and income and expenses are converted at the rate of exchange on the respective dates of such transactions. Net realized foreign exchange gains or losses arise from sales of foreign currencies, currency gains or losses realized between the trade and settlement dates on securities transactions, and the difference between the amounts of dividends, interest and foreign withholding taxes recorded and the U.S. dollar equivalent of the amounts actually paid or received. Net unrealized foreign exchange gains and losses arise from changes in the fair value of assets and liabilities other than investments in securities resulting from changes in exchange rates. The changes in net assets arising from changes in exchange rates and the changes in net assets resulting from changes in market prices of securities are not separately presented. Such changes are included in net realized and unrealized gains or losses from investments.
Security transactions and income recognition
Securities transactions are recorded on a trade date basis. Realized gains or losses are recorded on the basis of identified cost.
Dividend income is recognized on the ex-dividend date, except for certain dividends from foreign securities, which are recorded as soon as the custodian verifies the ex-dividend date. Dividend income from foreign securities is recorded net of foreign taxes withheld where recovery of such taxes is not assured.
Distributions to shareholders
Distributions to shareholders from net investment income and net realized gains, if any, are recorded on the ex-dividend date. Such distributions are determined in conformity with federal income tax regulations, which may differ in amount or character from net investment income and realized gains recognized for purposes of U.S. generally accepted accounting principles.
Federal and other taxes
The Fund intends to continue to qualify as a regulated investment company by distributing substantially all of its investment company taxable income and any net realized capital gains (after reduction for capital loss carryforwards) sufficient to relieve it from all, or substantially all, federal income taxes. Accordingly, no provision for federal income taxes was required.
The Subsidiary is classified as a controlled foreign corporation under Subchapter N of the Internal Revenue Code. Therefore, the Fund is required to increase its taxable income by its share of the Subsidiary’s income. Net investment losses of the Subsidiary cannot be deducted by the Fund in the current period nor carried forward to offset taxable income in future periods.
The Fund’s income and federal excise tax returns and all financial records supporting those returns for the prior three fiscal years are subject to examination by the federal and Delaware revenue authorities. Management has analyzed the Fund’s tax positions taken on federal, state, and foreign tax returns for all open tax years and does not believe that there are any uncertain tax positions that require recognition of a tax liability.
As of March 31, 2015, the Fund had capital loss carryforwards which consist of $3,179,254 in short-term capital losses and $106,504,357 in long-term capital losses.
| | | | | | |
| Notes to consolidated financial statements (unaudited) | | Wells Fargo Advantage Precious Metals Fund | | | 19 | |
As of March 31, 2015, the Fund had $15,459,347 of current year deferred post-October capital losses and a qualified late-year ordinary loss of $578,346 which were both recognized on the first day of the current fiscal year.
Class allocations
The separate classes of shares offered by the Fund differ principally in applicable sales charges, distribution, shareholder servicing, and administration fees. Class specific expenses are charged directly to that share class. Investment income, common expenses, and realized and unrealized gains (losses) on investments are allocated daily to each class of shares based on the relative proportion of net assets of each class.
4. FAIR VALUATION MEASUREMENTS
Fair value measurements of investments are determined within a framework that has established a fair value hierarchy based upon the various data inputs utilized in determining the value of the Fund’s investments. The three-level hierarchy gives the highest priority to unadjusted quoted prices in active markets for identical assets or liabilities (Level 1) and the lowest priority to significant unobservable inputs (Level 3). The Fund’s investments are classified within the fair value hierarchy based on the lowest level of input that is significant to the fair value measurement. The inputs are summarized into three broad levels as follows:
| n | | Level 1 – quoted prices in active markets for identical securities |
| n | | Level 2 – other significant observable inputs (including quoted prices for similar securities, interest rates, prepayment speeds, credit risk, use of amortized cost, etc.) |
| n | | Level 3 – significant unobservable inputs (including the Fund’s own assumptions in determining the fair value of investments) |
The inputs or methodologies used for valuing investments in securities are not necessarily an indication of the risk associated with investing in those securities.
The following is a summary of the inputs used in valuing the Fund’s assets and liabilities as of September 30, 2015:
| | | | | | | | | | | | | | | | |
| | | Quoted prices
(Level 1) | | | Other significant
observable inputs
(Level 2) | | | Significant
unobservable inputs
(Level 3) | | | Total | |
Assets | | | | | | | | | | | | | | | | |
Investments in: | | | | | | | | | | | | | | | | |
| | | | |
Common stocks | | | | | | | | | | | | | | | | |
Australia | | $ | 0 | | | $ | 7,094,992 | | | $ | 0 | | | $ | 7,094,992 | |
Canada | | | 127,796,056 | | | | 25,557,730 | | | | 0 | | | | 153,353,786 | |
Peru | | | 1,994,478 | | | | 0 | | | | 0 | | | | 1,994,478 | |
South Africa | | | 8,768,140 | | | | 0 | | | | 0 | | | | 8,768,140 | |
United Kingdom | | | 28,005,519 | | | | 10,167,428 | | | | 0 | | | | 38,172,947 | |
United States | | | 27,319,275 | | | | 0 | | | | 0 | | | | 27,319,275 | |
| | | | |
Commodities | | | 19,299,494 | | | | 0 | | | | 0 | | | | 19,299,494 | |
| | | | |
Short-term investments | | | | | | | | | | | | | | | | |
Investment companies | | | 8,354,747 | | | | 0 | | | | 0 | | | | 8,354,747 | |
Total assets | | $ | 221,537,709 | | | $ | 42,820,150 | | | $ | 0 | | | $ | 264,357,859 | |
The Fund recognizes transfers between levels within the fair value hierarchy at the end of the reporting period. At September 30, 2015, fair value pricing was used in pricing certain foreign securities and securities valued at $19,303,077 were transferred from Level 1 to Level 2 within the fair value hierarchy. The Fund did not have any transfers into/out of Level 3.
| | | | |
| 20 | | Wells Fargo Advantage Precious Metals Fund | | Notes to consolidated financial statements (unaudited) |
5. TRANSACTIONS WITH AFFILIATES
Management fee
Funds Management, an indirect wholly owned subsidiary of Wells Fargo & Company (“Wells Fargo”), is the manager of the Fund and provides advisory and fund-level administrative services under an investment management agreement. Under the investment management agreement, Funds Management is responsible for, among other services, implementing the investment objectives and strategies of the Fund, supervising the applicable subadviser, providing fund-level administrative services in connection with the Fund’s operations, and providing any other fund-level administrative services reasonably necessary for the operation of the Fund. As compensation for its services under the investment management agreement, Funds Management is entitled to receive an annual management fee starting at 0.65% and declining to 0.48% as the average daily net assets of the Fund increase.
Prior to July 1, 2015, Funds Management provided advisory services pursuant to an investment advisory agreement and was entitled to receive an annual fee which started at 0.60% and declined to 0.45% as the average daily net assets of the Fund increased. In addition, fund-level administrative services were provided by Funds Management under a separate administration agreement at an annual fee which started at 0.05% and declined to 0.03% as the average daily net assets of the Fund increased. For financial statement purposes, the advisory fee and fund-level administration fee for the six months ended September 30, 2015 have been included in management fee on the Statement of Operations.
For the six months ended September 30, 2015, the management fee was equivalent to an annual rate of 0.65% of the Fund’s average daily net assets.
The Subsidiary has entered into separate advisory contract with Funds Management to manage the investment and reinvestment of its assets in conformity with its investment objectives and restrictions. Under this agreement, the Subsidiary does not pay Funds Management a fee for its services.
Funds Management has retained the services of a subadviser to provide daily portfolio management to the Fund. The fee for subadvisory services is borne by Funds Management. Wells Capital Management Incorporated, an affiliate of Funds Management and an indirect wholly owned subsidiary of Wells Fargo, is the subadviser to the Fund and is entitled to receive a fee from Funds Management at an annual rate starting at 0.40% and declining to 0.30% as the average daily net assets of the Fund increase.
Administration fees
Under a class-level administration agreement, Funds Management provides class-level administrative services to the Fund, which includes paying fees and expenses for services provided by the transfer agent, sub-transfer agents, omnibus account servicers and record-keepers. As compensation for its services under the class-level administration agreement, Funds Management receives an annual fee which is calculated based on the average daily net assets of each class as follows
| | | | | | | | |
| | | Class-level administration fee | |
| | | Current rate | | | Rate prior to July 1, 2015 | |
Class A, Class B, Class C | | | 0.21 | % | | | 0.26 | % |
Administrator Class | | | 0.13 | | | | 0.10 | |
Institutional Class | | | 0.13 | | | | 0.08 | |
Funds Management has contractually waived and/or reimbursed advisory and administration fees to the extent necessary to maintain certain net operating expense ratios for the Fund. Waiver of fees and/or reimbursement of expenses by Funds Management were made first from fund level expenses on a proportionate basis and then from class specific expenses. Funds Management has committed through July 31, 2016 to waive fees and/or reimburse expenses to the extent necessary to cap the Fund’s expenses at 1.09% for Class A shares, 1.84% for Class B shares, 1.84% for Class C shares, 0.95% for Administrator Class shares, and 0.79% for Institutional Class shares. After this time, the cap may be increased or the commitment to maintain the cap may be terminated only with the approval of the Board of Trustees.
Distribution fees
The Trust has adopted a Distribution Plan for Class B and Class C shares of the Fund pursuant to Rule 12b-1 under the 1940 Act. Distribution fees are charged to Class B and Class C shares and paid to Wells Fargo Funds Distributor, LLC (“Funds Distributor”), the principal underwriter, at an annual rate of 0.75% of the average daily net assets of Class B and Class C shares.
| | | | | | |
| Notes to consolidated financial statements (unaudited) | | Wells Fargo Advantage Precious Metals Fund | | | 21 | |
In addition, Funds Distributor is entitled to receive the front-end sales charge from the purchase of Class A shares and a contingent deferred sales charges on the redemptions of certain Class A shares. Funds Distributor is also entitled to receive the contingent deferred sales charges from redemptions of Class B and Class C shares. For the six months ended September 30, 2015, Funds Distributor received $8,703 from the sale of Class A shares and $981 in contingent deferred sales charges from redemptions of Class C shares.
Shareholder servicing fees
The Trust has entered into contracts with one or more shareholder servicing agents, whereby Class A, Class B, Class C, and Administrator Class of the Fund is charged a fee at an annual rate of 0.25% of the average daily net assets of each respective class.
A portion of these total shareholder servicing fees were paid to affiliates of Wells Fargo.
6. INVESTMENT PORTFOLIO TRANSACTIONS
Purchases and sales of investments, excluding U.S. government obligations (if any) and short-term securities, for the six months ended September 30, 2015 were $33,666,167 and $45,789,132, respectively. These amounts include purchases and sales transactions of the Subsidiary.
7. BANK BORROWINGS
The Trust (excluding the money market funds) and Wells Fargo Variable Trust are parties to a $200,000,000 revolving credit agreement whereby the Fund is permitted to use bank borrowings for temporary or emergency purposes, such as to fund shareholder redemption requests. Interest under the credit agreement is charged to the Fund based on a borrowing rate equal to the higher of the Federal Funds rate in effect on that day plus 1.25% or the overnight LIBOR rate in effect on that day plus 1.25%. In addition, an annual commitment fee equal to 0.20% of the unused balance is allocated to each participating fund. Prior to September 1, 2015, the revolving credit agreement amount was $150,000,000 and the annual commitment fee was equal to 0.10% of the unused balance which was allocated to each participating fund. For the six months ended September 30, 2015, the Fund paid $332 in commitment fees.
For the six months ended September 30, 2015, there were no borrowings by the Fund under the agreement.
8. CONCENTRATION RISK
Concentration risks result from exposure to a limited number of sectors or geographic region. A fund that invests a substantial portion of their assets in any sector or geographic region may be more affected by changes in that sector or geographic region than would be a fund whose investments are not heavily weighted in any sector or geographic region.
9. INDEMNIFICATION
Under the Trust’s organizational documents, the officers and Trustees have been granted certain indemnification rights against certain liabilities that may arise out of performance of their duties to the Trust. Additionally, in the normal course of business, the Trust may enter into contracts with service providers that contain a variety of indemnification clauses. The Trust’s maximum exposure under these arrangements is dependent on future claims that may be made against the Fund and, therefore, cannot be estimated.
| | | | |
| 22 | | Wells Fargo Advantage Precious Metals Fund | | Other information (unaudited) |
TAX INFORMATION
Pursuant to Section 853 of the Internal Revenue Code, the following amounts were designated as foreign taxes paid for the fiscal year ended April 30, 2015. These amounts may be less than the actual foreign taxes paid for financial statement purposes. Foreign taxes paid or withheld should be included in taxable income with an offsetting deduction from gross income or as a credit for taxes paid to foreign governments. None of the income was derived from ineligible foreign sources as defined under Section 901(j) of the Internal Revenue Code.
| | | | |
Creditable foreign taxes paid | | Per share amount | | Foreign income as % of ordinary income distributions |
| $454,620 | | $0.03823 | | 100.00% |
PROXY VOTING INFORMATION
A description of the policies and procedures that the Fund uses to determine how to vote proxies relating to portfolio securities is available, upon request, by calling 1-800-222-8222, visiting our website at wellsfargoadvantagefunds.com, or visiting the SEC website at sec.gov. Information regarding how the Fund voted proxies relating to portfolio securities during the most recent 12-month period ended June 30 is available on the Fund’s website at wellsfargoadvantagefunds.com or by visiting the SEC website at sec.gov.
PORTFOLIO HOLDINGS INFORMATION
The complete portfolio holdings for the Fund are publicly available monthly on the Fund’s website (wellsfargoadvantagefunds.com), on a one-month delayed basis. In addition, top ten holdings information (excluding derivative positions) for the Fund is publicly available on the Fund’s website on a monthly, seven-day or more delayed basis. The Fund files its complete schedule of portfolio holdings with the SEC for the first and third quarters of each fiscal year on Form N-Q, which is available by visiting the SEC website at sec.gov. In addition, the Fund’s Form N-Q may be reviewed and copied at the SEC’s Public Reference Room in Washington, DC, and at regional offices in New York City, at 233 Broadway, and in Chicago, at 175 West Jackson Boulevard, Suite 900. Information about the Public Reference Room may be obtained by calling 1-800-SEC-0330.
| | | | | | |
| Other information (unaudited) | | Wells Fargo Advantage Precious Metals Fund | | | 23 | |
BOARD OF TRUSTEES AND OFFICERS
Each of the Trustees and Officers1 listed in the table below acts in identical capacities for each fund in the Wells Fargo Advantage family of funds, which consists of 144 mutual funds comprising the Wells Fargo Funds Trust, Wells Fargo Variable Trust, Wells Fargo Master Trust and four closed-end funds (collectively the “Fund Complex”). This table should be read in conjunction with the Prospectus and the Statement of Additional Information2. The mailing address of each Trustee and Officer is 525 Market Street, 12th Floor, San Francisco, CA 94105. Each Trustee and Officer serves an indefinite term, however, each Trustee serves such term until reaching the mandatory retirement age established by the Trustees.
Independent Trustees
| | | | | | |
Name and
year of birth | | Position held and
length of service* | | Principal occupations during past five years or longer | | Other
public company or
investment company
dictorships during
past 5 years |
William R. Ebsworth (Born 1957) | | Trustee, since 2015** | | Retired. From 1984 to 2013, equities analyst, portfolio manager, research director at Fidelity Management and Research Company and retired in 2013 as Chief Investment Officer of Fidelity Strategic Advisers, Inc. in Boston, Tokyo, and Hong Kong where he led a team of investment professionals managing client assets. Prior thereto, Board member of Hong Kong Securities Clearing Co., Hong Kong Options Clearing Corp., the Thailand International Fund, Ltd., Fidelity Investments Life Insurance Company, and Empire Fidelity Investments Life Insurance Company. Mr. Ebsworth is a CFA ® charterholder and an Adjunct Lecturer, Finance, at Babson College. | | Asset Allocation Trust |
| Jane A. Freeman (Born 1953) | | Trustee, since 2015** | | Retired. From 2012 to 2014 and 1999 to 2008, Chief Financial Officer of Scientific Learning Corporation. From 2008 to 2012, Ms. Freeman provided consulting services related to strategic business projects. Prior to 1999, Portfolio Manager at Rockefeller & Co. and Scudder, Stevens & Clark. Board member of the Harding Loevner Funds from 1996 to 2014, serving as both Lead Independent Director and chair of the Audit Committee. Board member of the Russell Exchange Traded Funds Trust from 2011 to 2012 and the chair of the Audit Committee. Ms. Freeman is Chair of Taproot Foundation (non-profit organization) (non-profit organization), a Board Member of Ruth Bancroft Garden (non-profit organization) and an inactive chartered financial analyst. | | Asset Allocation Trust; Harding Loevner Funds; Russell Exchange Traded Funds Trust |
| Peter G. Gordon (Born 1942) | | Trustee, since 1998; Chairman, since 2005 | | Co-Founder, Retired Chairman, President and CEO of Crystal Geyser Water Company. Trustee Emeritus, Colby College. | | Asset Allocation Trust |
| Isaiah Harris, Jr. (Born 1952) | | Trustee, since 2009 | | Retired. Chairman of the Board of CIGNA Corporation since 2009, and Director since 2005. From 2003 to 2011, Director of Deluxe Corporation. Prior thereto, President and CEO of BellSouth Advertising and Publishing Corp. from 2005 to 2007, President and CEO of BellSouth Enterprises from 2004 to 2005 and President of BellSouth Consumer Services from 2000 to 2003. Emeritus member of the Iowa State University Foundation Board of Governors. Emeritus Member of the Advisory Board of Iowa State University School of Business. Advisory Board Member, Palm Harbor Academy (charter school). Mr. Harris is a certified public accountant. | | CIGNA Corporation; Asset Allocation Trust |
| Judith M. Johnson (Born 1949) | | Trustee, since 2008; Audit Committee Chairman, since 2008 | | Retired. Prior thereto, Chief Executive Officer and Chief Investment Officer of Minneapolis Employees Retirement Fund from 1996 to 2008. Ms. Johnson is an attorney, certified public accountant and a certified managerial accountant. | | Asset Allocation Trust |
| David F. Larcker (Born 1950) | | Trustee, since 2009 | | James Irvin Miller Professor of Accounting at the Graduate School of Business, Stanford University, Morgan Stanley Director of the Center for Leadership Development and Research and Senior Faculty of The Rock Center for Corporate Governance since 2006. From 2005 to 2008, Professor of Accounting at the Graduate School of Business, Stanford University. Prior thereto, Ernst & Young Professor of Accounting at The Wharton School, University of Pennsylvania from 1985 to 2005. | | Asset Allocation Trust |
| Olivia S. Mitchell (Born 1953) | | Trustee, since 2006 | | International Foundation of Employee Benefit Plans Professor, Wharton School of the University of Pennsylvania since 1993. Director of Wharton’s Pension Research Council and Boettner Center on Pensions & Retirement Research, and Research Associate at the National Bureau of Economic Research. Previously, Cornell University Professor from 1978 to 1993. | | Asset Allocation Trust |
| | | | |
| 24 | | Wells Fargo Advantage Precious Metals Fund | | Other information (unaudited) |
| | | | | | |
Name and
year of birth | | Position held and
length of service* | | Principal occupations during past five years or longer | | Other
public company or
investment company
dictorships during
past 5 years |
| Timothy J. Penny (Born 1951) | | Trustee, since 1996 | | President and Chief Executive Officer of Southern Minnesota Initiative Foundation, a non-profit organization, since 2007 and Senior Fellow at the Humphrey Institute Policy Forum at the University of Minnesota since 1995. Member of the Board of Trustees of NorthStar Education Finance, Inc., a non-profit organization, since 2007. | | Asset Allocation Trust |
| Michael S. Scofield (Born 1943) | | Trustee, since 2010 | | Served on the Investment Company Institute’s Board of Governors and Executive Committee from 2008-2011 as well the Governing Council of the Independent Directors Council from 2006-2011 and the Independent Directors Council Executive Committee from 2008-2011. Chairman of the IDC from 2008-2010. Institutional Investor (Fund Directions) Trustee of Year in 2007. Trustee of the Evergreen Funds complex (and its predecessors) from 1984 to 2010. Chairman of the Evergreen Funds from 2000-2010. Former Trustee of the Mentor Funds. Retired Attorney, Law Offices of Michael S. Scofield. | | Asset Allocation Trust |
| Donald C. Willeke (Born 1940) | | Trustee, since 1996 | | Principal of the law firm of Willeke & Daniels. General Counsel of the Minneapolis Employees Retirement Fund from 1984 until its consolidation into the Minnesota Public Employees Retirement Association on June 30, 2010. Director and Vice Chair of The Tree Trust (non-profit corporation). Director of the American Chestnut Foundation (non-profit corporation). | | Asset Allocation Trust |
| * | Length of service dates reflect the Trustee’s commencement of service with the Trust’s predecessor entities, where applicable. |
| ** | William R. Ebsworth and Jane A. Freeman each became a Trustee effective January 1, 2015. |
Officers
| | | | | | |
Name and year of birth | | Position held and
length of service | | Principal occupations during past five years or longer | | |
| Karla M. Rabusch (Born 1959) | | President, since 2003 | | Executive Vice President of Wells Fargo Bank, N.A. and President of Wells Fargo Funds Management, LLC since 2003. | | |
Nancy Wiser1 (Born 1967) | | Treasurer, since 2012 | | Executive Vice President of Wells Fargo Funds Management, LLC since 2011. Chief Operating Officer and Chief Compliance Officer at LightBox Capital Management LLC, from 2008 to 2011. | | |
| C. David Messman (Born 1960) | | Secretary, since 2000; Chief Legal Officer, since 2003 | | Senior Vice President and Secretary of Wells Fargo Funds Management, LLC since 2001. Assistant General Counsel of Wells Fargo Bank, N.A. since 2013 and Vice President and Managing Counsel of Wells Fargo Bank N.A. from 1996 to 2013. | | |
Debra Ann Early (Born 1964) | | Chief Compliance Officer, since 2007 | | Executive Vice President of Wells Fargo Funds Management, LLC since 2014, Senior Vice President and Chief Compliance Officer from 2007 to 2014. | | |
David Berardi (Born 1975) | | Assistant Treasurer, since 2009 | | Vice President of Wells Fargo Funds Management, LLC since 2009. Vice President of Evergreen Investment Management Company, LLC from 2008 to 2010. Manager of Fund Reporting and Control for Evergreen Investment Management Company, LLC from 2004 to 2010. | | |
| Jeremy DePalma1 (Born 1974) | | Assistant Treasurer, since 2009 | | Senior Vice President of Wells Fargo Funds Management, LLC since 2009. Senior Vice President of Evergreen Investment Management Company, LLC from 2008 to 2010 and head of the Fund Reporting and Control Team within Fund Administration from 2005 to 2010. | | |
| 1 | Nancy Wiser acts as Treasurer of 72 funds in the Fund Complex. Jeremy DePalma acts as Treasurer of 72 funds and Assistant Treasurer of 72 funds in the Fund Complex. |
| 2 | The Statement of Additional Information includes additional information about the Trustees and is available, without charge, upon request, by calling 1-800-222-8222 or by visiting the website at wellsfargoadvantagefunds.com. |
| | | | | | |
| Other information (unaudited) | | Wells Fargo Advantage Precious Metals Fund | | | 25 | |
BOARD CONSIDERATION OF INVESTMENT ADVISORY, INVESTMENT MANAGEMENT AND SUB-ADVISORY AGREEMENTS:
Under the Investment Company Act of 1940 (the “1940 Act”), the Board of Trustees (the “Board”) of Wells Fargo Funds Trust (the “Trust”) must determine annually whether to approve the continuation of the Trust’s investment advisory and sub-advisory agreements. In this regard, at an in-person meeting held on May 19-20, 2015 (the “Meeting”), the Board, all the members of which have no direct or indirect interest in the investment advisory and sub-advisory agreements and are not “interested persons” of the Trust, as defined in the 1940 Act (the “Independent Trustees”), reviewed and approved for Wells Fargo Advantage Precious Metals Fund (the “Fund”): (i) an investment advisory agreement (the “Advisory Agreement”) with Wells Fargo Funds Management, LLC (“Funds Management”); (ii) an investment management agreement (the “Management Agreement”) with Funds Management; and (iii) an investment sub-advisory agreement (the “Sub-Advisory Agreement”) with Wells Capital Management Incorporated (the “Sub-Adviser”), an affiliate of Funds Management. The Management Agreement combines the terms of the Advisory Agreement with the terms of the Fund’s Amended and Restated Administration Agreement (the “Administration Agreement”) applicable to Fund-level administrative services. The Advisory Agreement, the Management Agreement and the Sub-Advisory Agreement are collectively referred to as the “Advisory Agreements.”
At the Meeting, the Board considered the factors and reached the conclusions described below relating to the selection of Funds Management and the Sub-Adviser and the approval of the Advisory Agreements. Prior to the Meeting, including at an in-person meeting in March 2015, the Trustees conferred extensively among themselves and with representatives of Funds Management about these matters. Also, the Board has adopted a team-based approach, with each team consisting of a sub-set of Trustees, to assist the full Board in the discharge of its duties in reviewing performance and other matters throughout the year. The Independent Trustees were assisted in their evaluation of the Advisory Agreements by independent legal counsel, from whom they received separate legal advice and with whom they met separately.
In providing information to the Board, Funds Management and the Sub-Adviser were guided by a detailed set of requests for information submitted to them by independent legal counsel on behalf of the Independent Trustees at the start of the Board’s annual contract renewal process earlier in 2015. In considering and approving the Advisory Agreements, the Trustees considered the information they believed relevant, including but not limited to the information discussed below. The Board considered not only the specific information presented in connection with the Meeting, but also the knowledge gained over time through interaction with Funds Management and the Sub-Adviser about various topics. In this regard, the Board reviewed reports of Funds Management at each of its quarterly meetings, which included, among other things, portfolio reviews and performance reports. In addition, the Board and the teams mentioned above confer with portfolio managers at various times throughout the year. The Board did not identify any particular information or consideration that was all-important or controlling, and each individual Trustee may have attributed different weights to various factors.
After its deliberations, the Board unanimously approved the continuation of the Advisory Agreement for the period from June 1, 2015 through June 30, 2015, approved the Management Agreement for the period from July 1, 2015 through May 31, 2016, and approved the continuation of the Sub-Advisory Agreement for a one-year term through May 31, 2016. The Board also determined that the compensation payable to Funds Management and the Sub-Adviser under each of the Advisory Agreements was reasonable. The Board considered the approval of the Advisory Agreements for the Fund as part of its consideration of agreements for funds across the complex, but its approvals were made on a fund-by-fund basis. The following summarizes a number of important, but not necessarily all, factors considered by the Board in support of its approvals.
Nature, extent and quality of services
The Board received and considered various information regarding the nature, extent and quality of services provided to the Fund by Funds Management and the Sub-Adviser under the Advisory Agreements. This information included, among other things, a summary of the background and experience of senior management of Funds Management, and the qualifications, background, tenure and responsibilities of each of the portfolio managers primarily responsible for the day-to-day portfolio management of the Fund. The Board noted that the services to be provided to the Fund pursuant to the Management Agreement combined the advisory services previously provided to the Fund pursuant to the Fund’s Advisory Agreement with the Fund-level administrative services previously provided to the Fund pursuant to the Fund’s Administration Agreement. The Board received a representation from Funds Management that combining these services would not result in any change to the nature or level of services provided by Funds Management to the Fund.
| | | | |
| 26 | | Wells Fargo Advantage Precious Metals Fund | | Other information (unaudited) |
The Board evaluated the ability of Funds Management and the Sub-Adviser to attract and retain qualified investment professionals, including research, advisory and supervisory personnel. The Board further considered the compliance programs and compliance records of Funds Management and the Sub-Adviser. In addition, the Board took into account the full range of services provided to the Fund by Funds Management and its affiliates.
Fund performance and expenses
The Board considered the performance results for the Fund over various time periods ended March 31, 2015. The Board considered these results in comparison to the performance of funds in a universe that was determined by Lipper Inc. (“Lipper”) to be similar to the Fund (the “Universe”), and in comparison to the Fund’s benchmark index and to other comparative data. Lipper is an independent provider of investment company data. The Board received a description of the methodology used by Lipper to select the mutual funds in the performance Universe. The Board noted that the performance of the Fund (Class A) was higher than the average performance of the Universe for all periods under review except the first quarter of 2015. The Board also noted that the performance of the Fund was higher than its benchmark, the FTSE Gold Mines Index, for all periods under review except the first quarter of 2015.
The Board also received and considered information regarding the Fund’s net operating expense ratios and their various components, including actual management fees (which reflect fee waivers, if any, and include advisory, administration and transfer agent fees), custodian and other non-management fees, and Rule 12b-1 and non-Rule 12b-1 service fees. The Board considered these ratios in comparison to the median ratios of funds in class-specific expense groups that were determined by Lipper to be similar to the Fund (the “Groups”). The Board received a description of the methodology used by Lipper to select the mutual funds in the expense Groups and an explanation of how funds comprising expense groups and their expense ratios may vary from year-to-year. Based on the Lipper reports, the Board noted that the net operating expense ratios of the Fund were lower than the median net operating expense ratios of the expense Groups.
The Board took into account the Fund performance and expense information provided to it among the factors considered in deciding to re-approve the Advisory Agreement and Sub-Advisory Agreement and approve the Management Agreement.
Investment advisory and sub-advisory fee rates
The Board reviewed and considered the contractual investment advisory fee rates that are payable by the Fund to Funds Management for investment advisory services (the “Advisory Agreement Rates”), both on a stand-alone basis and on a combined basis with the Fund’s fund-level and class-level contractual administration fee rates (the “Management Rates”). The Board noted that the Management Rates include transfer agency and sub-transfer agency costs. The Board also noted that the fee rate to be paid by the Fund under the Management Agreement will incorporate the advisory fee and Fund-level administration fee previously payable separately by the Fund under the Fund’s Advisory Agreement and Administration Agreement with Funds Management. The Board also reviewed and considered the contractual investment sub-advisory fee rates that are payable by Funds Management to the Sub-Adviser for investment sub-advisory services (the “Sub-Advisory Agreement Rates”).
Among other information reviewed by the Board was a comparison of the Management Rates of the Fund with those of other funds in the expense Groups at a common asset level. The Board noted that the Management Rates of the Fund were lower than the average rates for the Fund’s expense Groups for all share classes.
The Board also received and considered information about the portion of the total advisory fee that was retained by Funds Management after payment of the fee to the Sub-Adviser for sub-advisory services. In assessing the reasonableness of this amount, the Board received and evaluated information about the nature and extent of responsibilities retained and risks assumed by Funds Management and not delegated to or assumed by the Sub-Adviser, and about Funds Management’s on-going oversight services. However, given the affiliation between Funds Management and the Sub-Adviser, the Board ascribed limited relevance to the allocation of the advisory fee between them.
The Board also received and considered information about the nature and extent of services offered and fee rates charged by Funds Management and the Sub-Adviser to other types of clients with investment strategies similar to those of the Fund. In this regard, the Board received information about the significantly greater scope of services, and compliance, reporting and other legal burdens and risks of managing mutual funds compared with those associated with managing assets of non-mutual fund clients such as collective funds or institutional separate accounts.
Based on its consideration of the factors and information it deemed relevant, including those described here, the Board determined that the compensation payable to Funds Management under the Management Agreement and Advisory Agreement and to the Sub-Adviser under the Sub-Advisory Agreement was reasonable, in light of the services covered by the Advisory Agreements.
| | | | | | |
| Other information (unaudited) | | Wells Fargo Advantage Precious Metals Fund | | | 27 | |
Profitability
The Board received and considered information concerning the profitability of Funds Management, as well as the profitability of Wells Fargo as a whole, from providing services to the Fund and the fund family as a whole. The Board also received and considered information concerning the profitability of the Sub-Adviser from providing services to the fund family as a whole, noting that the Sub-Adviser’s profitability information with respect to providing services to the Fund was subsumed in the Wells Fargo profitability analysis.
Funds Management reported on the methodologies and estimates used in calculating profitability. Among other things, the Board noted that the levels of profitability reported on a fund-by-fund basis varied widely, depending on factors such as the size and type of fund. Based on its review, the Board did not deem the profits reported by Funds Management or Wells Fargo from its services to the Fund to be at a level that would prevent it from approving the continuation of the Advisory Agreements.
Economies of scale
With respect to possible economies of scale, the Board noted the existence of breakpoints in the Fund’s advisory and management fee structures, and the Fund’s administration fee structure, which operate generally to reduce the Fund’s expense ratios as the Fund grows in size. It considered that, for a small fund or a fund that shrinks in size, breakpoints conversely can result in higher fee levels. The Board also considered that fee waiver and expense reimbursement arrangements and competitive fee rates at the outset are means of sharing potential economies of scale with shareholders of the Fund and the fund family as a whole. The Board considered Funds Management’s view that any analyses of potential economies of scale in managing a particular fund are inherently limited in light of the joint and common costs and investments that Funds Management incurs across the fund family as a whole.
The Board concluded that the Fund’s fee and expense arrangements, including contractual breakpoints, constituted a reasonable approach to sharing potential economies of scale with the Fund and its shareholders.
Other benefits to Funds Management and the Sub-Adviser
The Board received and considered information regarding potential “fall-out” or ancillary benefits received by Funds Management and its affiliates, including the Sub-Adviser, as a result of their relationships with the Fund. Ancillary benefits could include, among others, benefits directly attributable to other relationships with the Fund and benefits potentially derived from an increase in Funds Management’s and the Sub-Adviser’s business as a result of their relationships with the Fund. The Board noted that various affiliates of Funds Management may receive distribution-related fees, shareholder servicing payments and sub-transfer agency fees in respect of shares sold or held through them and services provided.
The Board also reviewed information about soft dollar credits earned and utilized by the Sub-Adviser, fees earned by Funds Management and the Sub-Adviser from managing a private investment vehicle for the fund family’s securities lending collateral and commissions earned by an affiliated broker from portfolio transactions.
Based on its consideration of the factors and information it deemed relevant, including those described here, the Board did not find that any ancillary benefits received by Funds Management and its affiliates, including the Sub-Adviser, were unreasonable.
Conclusion
At the Meeting, after considering the above-described factors and based on its deliberations and its evaluation of the information described above, the Board unanimously approved the continuation of the Advisory Agreement for the period from June 1, 2015 through June 30, 2015, approved the Management Agreement for the period from July 1, 2015 through May 31, 2016, and approved the continuation of the Sub-Advisory Agreement for a one-year term through May 31, 2016. The Board also determined that the compensation payable to Funds Management and the Sub-Adviser under each of the Advisory Agreements was reasonable.
| | | | |
| 28 | | Wells Fargo Advantage Precious Metals Fund | | List of abbreviations |
The following is a list of common abbreviations for terms and entities that may have appeared in this report.
| ACA | — ACA Financial Guaranty Corporation |
| ADR | — American depositary receipt |
| ADS | — American depositary shares |
| AGC | — Assured Guaranty Corporation |
| AGM | — Assured Guaranty Municipal |
| Ambac | — Ambac Financial Group Incorporated |
| AMT | — Alternative minimum tax |
| BAN | — Bond anticipation notes |
| BHAC | — Berkshire Hathaway Assurance Corporation |
| CAB | — Capital appreciation bond |
| CCAB | — Convertible capital appreciation bond |
| CDA | — Community Development Authority |
| CDO | — Collateralized debt obligation |
| DRIVER | — Derivative inverse tax-exempt receipts |
| DW&P | — Department of Water & Power |
| DWR | — Department of Water Resources |
| ECFA | — Educational & Cultural Facilities Authority |
| EDA | — Economic Development Authority |
| EDFA | — Economic Development Finance Authority |
| ETF | — Exchange-traded fund |
| FDIC | — Federal Deposit Insurance Corporation |
| FFCB | — Federal Farm Credit Banks |
| FGIC | — Financial Guaranty Insurance Corporation |
| FHA | — Federal Housing Administration |
| FHLB | — Federal Home Loan Bank |
| FHLMC | — Federal Home Loan Mortgage Corporation |
| FICO | — The Financing Corporation |
| FNMA | — Federal National Mortgage Association |
| GDR | — Global depositary receipt |
| GNMA | — Government National Mortgage Association |
| HCFR | — Healthcare facilities revenue |
| HEFA | — Health & Educational Facilities Authority |
| HEFAR | — Higher education facilities authority revenue |
| HFA | — Housing Finance Authority |
| HFFA | — Health Facilities Financing Authority |
| HUD | — Department of Housing and Urban Development |
| IDA | — Industrial Development Authority |
| IDAG | — Industrial Development Agency |
| KRW | — Republic of Korea won |
| LIBOR | — London Interbank Offered Rate |
| LIFER | — Long Inverse Floating Exempt Receipts |
| LLC | — Limited liability company |
| LLLP | — Limited liability limited partnership |
| LLP | — Limited liability partnership |
| MBIA | — Municipal Bond Insurance Association |
| MFHR | — Multifamily housing revenue |
| MSTR | — Municipal securities trust receipts |
| MUD | — Municipal Utility District |
| National | — National Public Finance Guarantee Corporation |
| PCFA | — Pollution Control Financing Authority |
| PCL | — Public Company Limited |
| PCR | — Pollution control revenue |
| PFA | — Public Finance Authority |
| PFFA | — Public Facilities Financing Authority |
| PFOTER | — Puttable floating option tax-exempt receipts |
| plc | — Public limited company |
| PUTTER | — Puttable tax-exempt receipts |
| R&D | — Research & development |
| Radian | — Radian Asset Assurance |
| RAN | — Revenue anticipation notes |
| RDA | — Redevelopment Authority |
| RDFA | — Redevelopment Finance Authority |
| REIT | — Real estate investment trust |
| ROC | — Reset option certificates |
| SAVRS | — Select auction variable rate securities |
| SBA | — Small Business Authority |
| SDR | — Swedish depositary receipt |
| SFHR | — Single-family housing revenue |
| SFMR | — Single-family mortgage revenue |
| SPA | — Standby purchase agreement |
| SPDR | — Standard & Poor’s Depositary Receipts |
| SPEAR | — Short Puttable Exempt Adjustable Receipts |
| STRIPS | — Separate trading of registered interest and |
| TAN | — Tax anticipation notes |
| TIPS | — Treasury inflation-protected securities |
| TRAN | — Tax revenue anticipation notes |
| TTFA | — Transportation Trust Fund Authority |
| TVA | — Tennessee Valley Authority |


For more information
More information about Wells Fargo Advantage Funds is available free upon request. To obtain literature, please write, email, visit the Fund’s website, or call:
Wells Fargo Advantage Funds
P.O. Box 8266
Boston, MA 02266-8266
Email: wfaf@wellsfargo.com
Website: wellsfargoadvantagefunds.com
Individual investors: 1-800-222-8222
Retail investment professionals: 1-888-877-9275
Institutional investment professionals: 1-866-765-0778
This report and the financial statements contained herein are submitted for the general information of the shareholders of Wells Fargo Advantage Funds. If this report is used for promotional purposes, distribution of the report must be accompanied or preceded by a current prospectus. Before investing, please consider the investment objectives, risks, charges, and expenses of the investment. For a current prospectus and, if available, a summary prospectus, containing this information, call 1-800-222-8222 or visit the Fund’s website at wellsfargoadvantagefunds.com. Read the prospectus carefully before you invest or send money.
Wells Fargo Funds Management, LLC, a wholly owned subsidiary of Wells Fargo & Company, provides investment advisory and administrative services for Wells Fargo Advantage Funds. Other affiliates of Wells Fargo & Company provide subadvisory and other services for the Funds. The Funds are distributed by Wells Fargo Funds Distributor, LLC, Member FINRA, an affiliate of Wells Fargo & Company.
NOT FDIC INSURED ¡ NO BANK GUARANTEE ¡ MAY LOSE VALUE
© 2015 Wells Fargo Funds Management, LLC. All rights reserved.
| | |
 | | 237487 11-15 SA316/SAR316 09-15 |

Wells Fargo Advantage
Specialized Technology Fund

Semi-Annual Report
September 30, 2015

Reduce clutter. Save trees.
Sign up for electronic delivery of prospectuses and shareholder reports at wellsfargo.com/advantagedelivery
Contents
The views expressed and any forward-looking statements are as of September 30, 2015, unless otherwise noted, and are those of the Fund managers and/or Wells Fargo Funds Management, LLC. Discussions of individual securities, or the markets generally, or any Wells Fargo Advantage Fund are not intended as individual recommendations. Future events or results may vary significantly from those expressed in any forward-looking statements; the views expressed are subject to change at any time in response to changing circumstances in the market. Wells Fargo Funds Management, LLC and the Fund disclaim any obligation to publicly update or revise any views expressed or forward-looking statements.
NOT FDIC INSURED ¡ NO BANK GUARANTEE ¡ MAY LOSE VALUE
| | | | |
| 2 | | Wells Fargo Advantage Specialized Technology Fund | | Letter to shareholders (unaudited) |

Karla M. Rabusch
President
Wells Fargo Advantage Funds
Dear Valued Shareholder:
We are pleased to offer you this semi-annual report for the Wells Fargo Advantage Specialized Technology Fund for the six-month period that ended September 30, 2015. Despite generally improving U.S. economic data, the broad U.S. stock market experienced heightened volatility that led to negative results overall for U.S. stocks for the period. Large-cap stocks performed best, followed by mid caps and small caps. Markets outside the U.S. faced deeper ongoing challenges and generally delivered weaker results.
U.S. stocks experienced challenges during the second quarter of 2015.
The broad U.S. stock market fluctuated widely, eventually eking out a small quarterly gain. Mid-and large-cap stocks at times were pressured by investor concerns over the potentially negative effects of financially troubled overseas economies and of a strengthening U.S. dollar on the profits of U.S. multinational firms. The U.S. economy picked up traction during the quarter; consumer spending improved, and positive trends were evident in construction and new-home sales. Jobs growth remained a bright spot as well. U.S. Federal Reserve (Fed) officials, who have kept interest rates low while waiting for the U.S. jobs market to sufficiently improve and for inflation to approach their 2% target, made clear they could take action soon. Throughout the quarter, non-U.S. markets also experienced volatility, triggered by uncertainty over the potential impact of financial challenges in other locations—most notably in Greece and Puerto Rico. Questions over slower growth in China caused investor concern as well.
In the third quarter of 2015, China’s slowdown took a toll on economies and markets worldwide.
U.S. stocks sagged during the quarter, experiencing the most volatility since 2011. Larger-cap stocks generally declined the least and smaller caps the most. Economic data released during the quarter suggested the U.S. economy remains solid but has lost some steam, burdened by the drag of the strong U.S. dollar coupled with global economic turmoil. The fact that the Fed left the federal funds interest rate unchanged at its September meeting surprised investors and fueled increased uncertainty about the U.S. economy’s stamina to remain healthy while facing the challenges of slowing in China and troubles elsewhere in the world. Outside the U.S., markets were even more volatile and delivered generally weaker quarterly results, also largely due to investors’ increasing anxiety over China’s weakened economy. Because China is the world’s largest importer of many commodities, a number of emerging markets—key commodities exporters—are struggling under the dual strains of reduced demand for commodities and, because of weaker demand, lower prices for the commodities they do sell. In the eurozone, however, where only about 3% of exports are sent to China, household spending and business investment appeared relatively unaffected by troubles elsewhere. However, the European Central Bank warned in September that slowing growth in China could lead to slower growth and lower inflation rates in the eurozone than previously forecast and indicated additional stimulus could be provided should this occur.
| | | | | | |
| Letter to shareholders (unaudited) | | Wells Fargo Advantage Specialized Technology Fund | | | 3 | |
Information technology (IT) stocks delivered negative results overall for the six-month reporting period.
During the second quarter of 2015, the IT sector performed roughly in line with the broad U.S. stock market, pressured by the same investor concerns that held results to a slight gain. During the third quarter, IT stocks declined overall, although less than the broader market; worried investors gravitated toward more defensive sectors as commodity prices weakened, the timing of a Fed interest-rate increase became less certain, and economies in emerging markets continued to struggle. Despite delivering a negative return for the six-month period overall, IT stocks tended to outperform the broader U.S. stock market.
Don’t let short-term uncertainty derail long-term investment goals.
Periods of uncertainty can present challenges, but experience has taught us that maintaining long-term investment goals can be an effective way to plan for the future. To help you create a sound strategy based on your personal goals and risk tolerance, Wells Fargo Advantage Funds offers more than 100 mutual funds spanning a wide range of asset classes and investment styles. Although diversification cannot guarantee an investment profit or prevent losses, we believe it can be an effective way to manage investment risk and potentially smooth out overall portfolio performance. We encourage investors to know their investments and to understand that appropriate levels of risk-taking may unlock opportunities.
Thank you for choosing to invest in Wells Fargo Advantage Funds. We appreciate your confidence in us and remain committed to helping you meet your financial needs.
Sincerely,

Karla M. Rabusch
President
Wells Fargo Advantage Funds
Despite delivering a negative return for the six-month period overall, IT stocks tended to outperform the broader U.S. stock market.
Periods of uncertainty can present challenges, but experience has taught us that maintaining long-term investment goals can be an effective way to plan for the future.
Notice to shareholders
At a meeting held August 11-12, 2015, the Board of Trustees of the Fund approved a change in the name of the Fund whereby the word “Advantage” was removed from its name, effective December 15, 2015.
For current information about your fund investments, contact your investment professional, visit our website at wellsfargoadvantagefunds.com, or call us directly at 1-800-222-8222. We are available 24 hours a day, 7 days a week.
| | | | |
| 4 | | Wells Fargo Advantage Specialized Technology Fund | | Performance highlights (unaudited) |
Investment objective
The Fund seeks long-term capital appreciation.
Manager
Wells Fargo Funds Management, LLC
Subadviser
Allianz Global Investors U.S. LLC
Portfolio managers
Huachen Chen, CFA
Walter C. Price, Jr., CFA
Average annual total returns1 (%) as of September 30, 2015
| | | | | | | | | | | | | | | | | | | | | | | | | | | | | | | | | | |
| | | | | Including sales charge | | | Excluding sales charge | | | Expense ratios2 (%) | |
| | | Inception date | | 1 year | | | 5 year | | | 10 year | | | 1 year | | | 5 year | | | 10 year | | | Gross | | | Net3 | |
| Class A (WFSTX) | | 9-18-2000 | | | (6.39 | ) | | | 10.32 | | | | 8.76 | | | | (0.72 | ) | | | 11.63 | | | | 9.41 | | | | 1.45 | | | | 1.45 | |
| Class B (WFTBX)* | | 9-18-2000 | | | (6.48 | ) | | | 10.51 | | | | 8.82 | | | | (1.48 | ) | | | 10.77 | | | | 8.82 | | | | 2.20 | | | | 2.20 | |
| Class C (WFTCX) | | 9-18-2000 | | | (2.49 | ) | | | 10.78 | | | | 8.58 | | | | (1.49 | ) | | | 10.78 | | | | 8.58 | | | | 2.20 | | | | 2.20 | |
| Administrator Class (WFTDX) | | 7-30-2010 | | | – | | | | – | | | | – | | | | (0.62 | ) | | | 11.84 | | | | 9.51 | | | | 1.37 | | | | 1.34 | |
| Investor Class (WFTZX)+ | | 4-8-2005 | | | – | | | | – | | | | – | | | | (0.83 | ) | | | 11.54 | | | | 9.31 | | | | 1.56 | | | | 1.54 | |
| S&P North American Technology Sector Index4 | | – | | | – | | | | – | | | | – | | | | 4.07 | | | | 14.38 | | | | 9.18 | | | | – | | | | – | |
| S&P 500 Index5 | | – | | | – | | | | – | | | | – | | | | (0.61 | ) | | | 13.34 | | | | 6.80 | | | | – | | | | – | |
| * | | Class B shares are closed to investment, except in connection with the reinvestment of any distributions and permitted exchanges. |
| + | | Effective at the close of business on October 23, 2015, Investor Class shares of the Fund were converted to Class A shares and Investor Class shares are no longer offered. |
Figures quoted represent past performance, which is no guarantee of future results, and do not reflect taxes that a shareholder may pay on fund distributions or the redemption of fund shares. Investment return and principal value of an investment will fluctuate so that an investor’s shares, when redeemed, may be worth more or less than their original cost. Performance shown without sales charges would be lower if sales charges were reflected. Current performance may be lower or higher than the performance data quoted, which assumes the reinvestment of dividends and capital gains. Current month-end performance is available on the Fund’s website, wellsfargoadvantagefunds.com.
Index returns do not include transaction costs associated with buying and selling securities, any mutual fund fees or expenses, or any taxes. It is not possible to invest directly in an index.
For Class A shares, the maximum front-end sales charge is 5.75%. For Class B shares, the maximum contingent deferred sales charge is 5.00%. For Class C shares, the maximum contingent deferred sales charge is 1.00%. Performance including a contingent deferred sales charge assumes the sales charge for the corresponding time period. Administrator Class and Investor Class shares are sold without a front-end sales charge or contingent deferred sales charge.
Stock values fluctuate in response to the activities of individual companies and general market and economic conditions. Funds that concentrate their investments in limited sectors, such as technology, may be susceptible to financial, economic, or market events affecting those sectors. Certain investment strategies tend to increase the total risk of an investment (relative to the broader market). The Fund is exposed to convertible securities risk, foreign investment risk, non-diversification risk, and smaller-company securities risk. Consult the Fund’s prospectus for additional information on these and other risks.
Please see footnotes on page 5.
| | | | | | |
| Performance highlights (unaudited) | | Wells Fargo Advantage Specialized Technology Fund | | | 5 | |
| | | | |
| Ten largest holdings6 (%) as of September 30, 2015 | |
Microsoft Corporation | | | 7.62 | |
Amazon.com Incorporated | | | 6.64 | |
Facebook Incorporated Class A | | | 6.60 | |
Apple Incorporated | | | 6.28 | |
Intel Corporation | | | 5.49 | |
Skyworks Solutions Incorporated | | | 4.79 | |
Visa Incorporated Class A | | | 4.34 | |
Palo Alto Networks Incorporated | | | 3.18 | |
Alphabet Incorporated Class A | | | 2.93 | |
Alphabet Incorporated Class C | | | 2.87 | |
| | |
| Industry distribution7 as of September 30, 2015 |
|
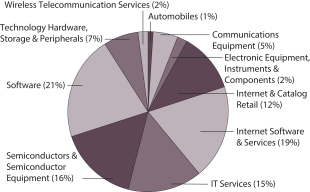 |
| 1 | Historical performance shown for Administrator Class shares prior to their inception reflects the performance of Class A shares, and includes the higher expenses applicable to Class A shares. If these expenses had not been included, returns would be higher. |
| 2 | Reflects the expense ratios as stated in the most recent prospectuses, which include the impact of 0.01% in acquired fund fees and expenses. The expense ratios shown are subject to change and may differ from the annualized expense ratios shown in the financial highlights of this report, which do not include acquired fund fees and expenses. |
| 3 | The manager has committed through July 31, 2016, to waive fees and/or reimburse expenses to the extent necessary to cap the Fund’s Total Annual Fund Operating Expenses After Fee Waiver at 1.50% for Class A, 2.25% for Class B, 2.25% for Class C, 1.33% for Administrator Class, and 1.53% for Investor Class. After this time, the cap may be increased or the commitment to maintain the cap may be terminated only with the approval of the Board of Trustees. Brokerage commissions, stamp duty fees, interest, taxes, acquired fund fees and expenses, and extraordinary expenses are excluded from the cap. Without this cap, the Fund’s returns would have been lower. |
| 4 | The S&P North American Technology Sector Index is a modified capitalization-weighted index of selected technology stocks. You cannot invest directly in an index. |
| 5 | The S&P 500 Index consists of 500 stocks chosen for market size, liquidity, and industry group representation. It is a market-value weighted index with each stock’s weight in the index proportionate to its market value. You cannot invest directly in an index. |
| 6 | The ten largest holdings, excluding cash and cash equivalents, are calculated based on the value of the investments divided by total net assets of the Fund. Holdings are subject to change and may have changed since the date specified. |
| 7 | Amounts are calculated based on the total long-term investments of the Fund. These amounts are subject to change and may have changed since the date specified. |
| | | | |
| 6 | | Wells Fargo Advantage Specialized Technology Fund | | Fund expenses (unaudited) |
As a shareholder of the Fund, you incur two types of costs: (1) transaction costs, including sales charges (loads) on purchase payments and contingent deferred sales charges (if any) on redemptions and (2) ongoing costs, including management fees, distribution (12b-1) and/or shareholder servicing fees, and other Fund expenses. This example is intended to help you understand your ongoing costs (in dollars) of investing in the Fund and to compare these costs with the ongoing costs of investing in other mutual funds.
The example is based on an investment of $1,000 invested at the beginning of the six-month period and held for the entire period from April 1, 2015 to September 30, 2015.
Actual expenses
The “Actual” line of the table below provides information about actual account values and actual expenses. You may use the information in this line, together with the amount you invested, to estimate the expenses that you paid over the period. Simply divide your account value by $1,000 (for example, an $8,600 account value divided by $1,000 = 8.6), then multiply the result by the number in the “Actual” line under the heading entitled “Expenses paid during period” for your applicable class of shares to estimate the expenses you paid on your account during this period.
Hypothetical example for comparison purposes
The “Hypothetical” line of the table below provides information about hypothetical account values and hypothetical expenses based on the Fund’s actual expense ratio and an assumed rate of return of 5% per year before expenses, which is not the Fund’s actual return. The hypothetical account values and expenses may not be used to estimate the actual ending account balance or expenses you paid for the period. You may use this information to compare the ongoing costs of investing in the Fund and other funds. To do so, compare this 5% hypothetical example with the 5% hypothetical examples that appear in the shareholder reports of the other funds.
Please note that the expenses shown in the table are meant to highlight your ongoing costs only and do not reflect any transactional costs, such as sales charges (loads) and contingent deferred sales charges. Therefore, the “Hypothetical” line of the table is useful in comparing ongoing costs only and will not help you determine the relative total costs of owning different funds. In addition, if these transactional costs were included, your costs would have been higher.
| | | | | | | | | | | | | | | | |
| | | Beginning
account value
4-1-2015 | | | Ending
account value
9-30-2015 | | | Expenses
paid during
the period¹ | | | Net annualized
expense ratio | |
Class A | | | | | | | | | | | | | | | | |
Actual | | $ | 1,000.00 | | | $ | 937.62 | | | $ | 7.09 | | | | 1.46 | % |
Hypothetical (5% return before expenses) | | $ | 1,000.00 | | | $ | 1,017.75 | | | $ | 7.38 | | | | 1.46 | % |
Class B | | | | | | | | | | | | | | | | |
Actual | | $ | 1,000.00 | | | $ | 933.76 | | | $ | 10.71 | | | | 2.21 | % |
Hypothetical (5% return before expenses) | | $ | 1,000.00 | | | $ | 1,013.99 | | | $ | 11.16 | | | | 2.21 | % |
Class C | | | | | | | | | | | | | | | | |
Actual | | $ | 1,000.00 | | | $ | 933.55 | | | $ | 10.71 | | | | 2.21 | % |
Hypothetical (5% return before expenses) | | $ | 1,000.00 | | | $ | 1,013.99 | | | $ | 11.16 | | | | 2.21 | % |
Administrator Class | | | | | | | | | | | | | | | | |
Actual | | $ | 1,000.00 | | | $ | 937.38 | | | $ | 6.46 | | | | 1.33 | % |
Hypothetical (5% return before expenses) | | $ | 1,000.00 | | | $ | 1,018.40 | | | $ | 6.73 | | | | 1.33 | % |
Investor Class | | | | | | | | | | | | | | | | |
Actual | | $ | 1,000.00 | | | $ | 936.91 | | | $ | 7.43 | | | | 1.53 | % |
Hypothetical (5% return before expenses) | | $ | 1,000.00 | | | $ | 1,017.40 | | | $ | 7.74 | | | | 1.53 | % |
| 1 | Expenses paid is equal to the annualized expense ratio of each class multiplied by the average account value over the period, multiplied by the number of days in the most recent fiscal half-year divided by the number of days in the fiscal year (to reflect the one-half-year period). |
| | | | | | |
| Portfolio of investments—September 30, 2015 (unaudited) | | Wells Fargo Advantage Specialized Technology Fund | | | 7 | |
| | | | | | | | | | | | |
| Security name | | | | | | Shares | | | Value | |
| | | | | | | | | | | | |
| | | | |
Common Stocks: 91.78% | | | | | | | | | | | | |
| | | | |
Consumer Discretionary: 12.46% | | | | | | | | | | | | |
| | | | |
| Automobiles: 0.89% | | | | | | | | | | | | |
Tesla Motors Incorporated † | | | | | | | 11,010 | | | $ | 2,734,884 | |
| | | | | | | | | | | | |
| | | | |
| Internet & Catalog Retail: 11.24% | | | | | | | | | | | | |
Amazon.com Incorporated † | | | | | | | 39,890 | | | | 20,419,292 | |
Expedia Incorporated | | | | | | | 35,355 | | | | 4,160,576 | |
Netflix Incorporated † | | | | | | | 41,450 | | | | 4,280,127 | |
The Priceline Group Incorporated † | | | | | | | 4,610 | | | | 5,701,925 | |
| | | | |
| | | | | | | | | | | 34,561,920 | |
| | | | | | | | | | | | |
| | | | |
| Media: 0.33% | | | | | | | | | | | | |
Comcast Corporation Class A | | | | | | | 17,730 | | | | 1,008,482 | |
| | | | | | | | | | | | |
| | | | |
Industrials: 0.28% | | | | | | | | | | | | |
| | | | |
| Electrical Equipment: 0.18% | | | | | | | | | | | | |
Nidec Corporation | | | | | | | 8,000 | | | | 550,128 | |
| | | | | | | | | | | | |
| | | | |
| Professional Services: 0.10% | | | | | | | | | | | | |
Verisk Analytics Incorporated Class A † | | | | | | | 4,225 | | | | 312,270 | |
| | | | | | | | | | | | |
| | | | |
Information Technology: 77.62% | | | | | | | | | | | | |
| | | | |
| Communications Equipment: 4.47% | | | | | | | | | | | | |
Cisco Systems Incorporated | | | | | | | 150,745 | | | | 3,957,056 | |
Palo Alto Networks Incorporated † | | | | | | | 56,900 | | | | 9,786,800 | |
| | | | |
| | | | | | | | | | | 13,743,856 | |
| | | | | | | | | | | | |
| | | | |
| Electronic Equipment, Instruments & Components: 1.78% | | | | | | | | | | | | |
CDW Corporation of Delaware | | | | | | | 47,575 | | | | 1,943,915 | |
Corning Incorporated | | | | | | | 34,375 | | | | 588,500 | |
Fitbit Incorporated Class A †« | | | | | | | 10,162 | | | | 383,006 | |
Ingram Micro Incorporated Class A | | | | | | | 46,095 | | | | 1,255,628 | |
Tech Data Corporation † | | | | | | | 19,150 | | | | 1,311,775 | |
| | | | |
| | | | | | | | | | | 5,482,824 | |
| | | | | | | | | | | | |
| | | | |
| Internet Software & Services: 17.42% | | | | | | | | | | | | |
Alphabet Incorporated Class A † | | | | | | | 14,105 | | | | 9,004,209 | |
Alphabet Incorporated Class C † | | | | | | | 14,500 | | | | 8,822,090 | |
Criteo SA ADR † | | | | | | | 203,075 | | | | 7,623,436 | |
eBay Incorporated | | | | | | | 47,750 | | | | 1,167,010 | |
Facebook Incorporated Class A † | | | | | | | 225,760 | | | | 20,295,824 | |
NetEase Incorporated ADR | | | | | | | 55,200 | | | | 6,630,624 | |
| | | | |
| | | | | | | | | | | 53,543,193 | |
| | | | | | | | | | | | |
| | | | |
| IT Services: 13.51% | | | | | | | | | | | | |
Accenture plc Class A | | | | | | | 26,345 | | | | 2,588,660 | |
Automatic Data Processing Incorporated | | | | | | | 1,375 | | | | 110,361 | |
Cognizant Technology Solutions Corporation Class A † | | | | | | | 125,100 | | | | 7,832,511 | |
Computer Sciences Corporation | | | | | | | 5,150 | | | | 316,107 | |
The accompanying notes are an integral part of these financial statements.
| | | | |
| 8 | | Wells Fargo Advantage Specialized Technology Fund | | Portfolio of investments—September 30, 2015 (unaudited) |
| | | | | | | | | | | | | | |
| Security name | | | | | | | Shares | | | Value | |
| | | | | | | | | | | | | | |
| | | | |
| IT Services (continued) | | | | | | | | | | | | | | |
Fidelity National Information Services Incorporated | | | | | | | | | 62,995 | | | $ | 4,225,705 | |
Fiserv Incorporated † | | | | | | | | | 40,015 | | | | 3,465,699 | |
Global Payments Incorporated | | | | | | | | | 5,410 | | | | 620,689 | |
MasterCard Incorporated Class A | | | | | | | | | 86,515 | | | | 7,796,732 | |
Total System Services Incorporated | | | | | | | | | 13,535 | | | | 614,895 | |
Vantiv Incorporated Class A † | | | | | | | | | 13,615 | | | | 611,586 | |
Visa Incorporated Class A | | | | | | | | | 191,640 | | | | 13,349,642 | |
| | | | |
| | | | | | | | | | | | | 41,532,587 | |
| | | | | | | | | | | | | | |
| | | | |
| Semiconductors & Semiconductor Equipment: 14.58% | | | | | | | | | | | | | | |
Avago Technologies Limited | | | | | | | | | 48,725 | | | | 6,091,112 | |
Intel Corporation | | | | | | | | | 560,029 | | | | 16,879,274 | |
Lam Research Corporation | | | | | | | | | 78,450 | | | | 5,125,139 | |
Micron Technology Incorporated † | | | | | | | | | 133,450 | | | | 1,999,081 | |
Skyworks Solutions Incorporated | | | | | | | | | 174,973 | | | | 14,734,476 | |
| | | | |
| | | | | | | | | | | | | 44,829,082 | |
| | | | | | | | | | | | | | |
| | | | |
| Software: 19.58% | | | | | | | | | | | | | | |
Adobe Systems Incorporated † | | | | | | | | | 70,015 | | | | 5,756,633 | |
Electronic Arts Incorporated † | | | | | | | | | 38,790 | | | | 2,628,023 | |
Fortinet Incorporated † | | | | | | | | | 114,525 | | | | 4,865,022 | |
Imperva Incorporated † | | | | | | | | | 84,355 | | | | 5,523,565 | |
Intuit Incorporated | | | | | | | | | 69,245 | | | | 6,145,494 | |
Microsoft Corporation | | | | | | | | | 529,565 | | | | 23,438,546 | |
Oracle Corporation | | | | | | | | | 31,475 | | | | 1,136,877 | |
Proofpoint Incorporated † | | | | | | | | | 86,475 | | | | 5,216,172 | |
ServiceNow Incorporated † | | | | | | | | | 78,965 | | | | 5,484,119 | |
| | | | |
| | | | | | | | | | | | | 60,194,451 | |
| | | | | | | | | | | | | | |
| | | | |
| Technology Hardware, Storage & Peripherals: 6.28% | | | | | | | | | | | | | | |
Apple Incorporated | | | | | | | | | 175,045 | | | | 19,307,464 | |
| | | | | | | | | | | | | | |
| | | | |
Telecommunication Services: 1.42% | | | | | | | | | | | | | | |
| | | | |
| Wireless Telecommunication Services: 1.42% | | | | | | | | | | | | | | |
T-Mobile USA Incorporated † | | | | | | | | | 109,520 | | | | 4,359,991 | |
| | | | | | | | | | | | | | |
| | | | |
Total Common Stocks (Cost $233,559,565) | | | | | | | | | | | | | 282,161,132 | |
| | | | | | | | | | | | | | |
| | | | |
| | | Yield | | | | | | | | | |
| Short-Term Investments: 4.48% | | | | | | | | | | | | | | |
| | | | |
| Investment Companies: 4.48% | | | | | | | | | | | | | | |
Securities Lending Cash Investments, LLC (l)(r)(u) | | | 0.15 | % | | | | | 1,394,400 | | | | 1,394,400 | |
Wells Fargo Advantage Cash Investment Money Market Fund, Select Class (l)(u) | | | 0.16 | | | | | | 12,390,771 | | | | 12,390,771 | |
| | | | |
Total Short-Term Investments (Cost $13,785,171) | | | | | | | | | | | | | 13,785,171 | |
| | | | | | | | | | | | | | |
| | | | | | | | |
| Total investments in securities (Cost $247,344,736) * | | | 96.26 | % | | | 295,946,303 | |
Other assets and liabilities, net | | | 3.74 | | | | 11,501,792 | |
| | | | | | | | |
| Total net assets | | | 100.00 | % | | $ | 307,448,095 | |
| | | | | | | | |
The accompanying notes are an integral part of these financial statements.
| | | | | | |
| Portfolio of investments—September 30, 2015 (unaudited) | | Wells Fargo Advantage Specialized Technology Fund | | | 9 | |
| † | Non-income-earning security |
| « | All or a portion of this security is on loan. |
| (l) | The security represents an affiliate of the Fund as defined in the Investment Company Act of 1940. |
| (r) | The investment is a non-registered investment vehicle purchased with cash collateral received from securities on loan. |
| (u) | The rate represents the 7-day annualized yield at period end. |
| * | Cost for federal income tax purposes is $248,908,845 and unrealized gains (losses) consists of: |
| | | | |
Gross unrealized gains | | $ | 50,881,515 | |
Gross unrealized losses | | | (3,844,057 | ) |
| | | | |
Net unrealized gains | | $ | 47,037,458 | |
The accompanying notes are an integral part of these financial statements.
| | | | |
| 10 | | Wells Fargo Advantage Specialized Technology Fund | | Statement of assets and liabilities—September 30, 2015 (unaudited) |
| | | | |
| | | | |
| |
Assets | | | | |
Investments | | | | |
In unaffiliated securities (including $1,360,101 of securities loaned), at value (cost $233,559,565) | | $ | 282,161,132 | |
In affiliated securities, at value (cost $13,785,171) | | | 13,785,171 | |
| | | | |
Total investments, at value (cost $247,344,736) | | | 295,946,303 | |
Foreign currency, at value (cost $14) | | | 13 | |
Receivable for investments sold | | | 18,164,872 | |
Receivable for Fund shares sold | | | 161,768 | |
Receivable for dividends | | | 5,632 | |
Receivable for securities lending income | | | 6,258 | |
Prepaid expenses and other assets | | | 45,112 | |
| | | | |
Total assets | | | 314,329,958 | |
| | | | |
| |
Liabilities | | | | |
Payable for investments purchased | | | 4,903,420 | |
Payable for Fund shares redeemed | | | 205,735 | |
Payable upon receipt of securities loaned | | | 1,394,400 | |
Management fee payable | | | 229,366 | |
Distribution fees payable | | | 8,700 | |
Administration fees payable | | | 62,111 | |
Accrued expenses and other liabilities | | | 78,131 | |
| | | | |
Total liabilities | | | 6,881,863 | |
| | | | |
Total net assets | | $ | 307,448,095 | |
| | | | |
| |
NET ASSETS CONSIST OF | | | | |
Paid-in capital | | $ | 208,630,951 | |
Accumulated net investment loss | | | (1,960,976 | ) |
Accumulated net realized gains on investments | | | 52,176,557 | |
Net unrealized gains on investments | | | 48,601,563 | |
| | | | |
Total net assets | | $ | 307,448,095 | |
| | | | |
| |
COMPUTATION OF NET ASSET VALUE AND OFFERING PRICE PER SHARE | | | | |
Net assets – Class A | | $ | 153,105,074 | |
Shares outstanding – Class A1 | | | 15,209,671 | |
Net asset value per share – Class A | | | $10.07 | |
Maximum offering price per share – Class A2 | | | $10.68 | |
Net assets – Class B | | $ | 125,521 | |
Shares outstanding – Class B1 | | | 14,366 | |
Net asset value per share – Class B | | | $8.74 | |
Net assets – Class C | | $ | 13,859,016 | |
Shares outstanding – Class C1 | | | 1,590,745 | |
Net asset value per share – Class C | | | $8.71 | |
Net assets – Administrator Class | | $ | 30,430,802 | |
Shares outstanding – Administrator Class1 | | | 2,988,710 | |
Net asset value per share – Administrator Class | | | $10.18 | |
Net assets – Investor Class | | $ | 109,927,682 | |
Shares outstanding – Investor Class1 | | | 11,048,113 | |
Net asset value per share – Investor Class | | | $9.95 | |
| 1 | The Fund has an unlimited number of authorized shares. |
| 2 | Maximum offering price is computed as 100/94.25 of net asset value. On investments of $50,000 or more, the offering price is reduced. |
The accompanying notes are an integral part of these financial statements.
| | | | | | |
| Statement of operations—six months ended September 30, 2015 (unaudited) | | Wells Fargo Advantage Specialized Technology Fund | | | 11 | |
| | | | |
| | | | |
| |
Investment income | | | | |
Dividends (net of foreign withholding taxes of $10,462) | | $ | 1,070,473 | |
Securities lending income, net | | | 31,107 | |
Income from affiliated securities | | | 8,237 | |
| | | | |
Total investment income | | | 1,109,817 | |
| | | | |
| |
Expenses | | | | |
Management fee | | | 1,515,962 | |
Administration fees | | | | |
Class A | | | 198,319 | |
Class B | | | 203 | |
Class C | | | 17,152 | |
Administrator Class | | | 18,849 | |
Investor Class | | | 193,429 | |
Shareholder servicing fees | | | | |
Class A | | | 210,581 | |
Class B | | | 214 | |
Class C | | | 18,235 | |
Administrator Class | | | 40,954 | |
Investor Class | | | 151,116 | |
Distribution fees | | | | |
Class B | | | 641 | |
Class C | | | 54,706 | |
Custody and accounting fees | | | 19,072 | |
Professional fees | | | 21,620 | |
Registration fees | | | 32,343 | |
Shareholder report expenses | | | 31,948 | |
Trustees’ fees and expenses | | | 7,452 | |
Other fees and expenses | | | 7,554 | |
| | | | |
Total expenses | | | 2,540,350 | |
Less: Fee waivers and/or expense reimbursements | | | (8,587 | ) |
| | | | |
Net expenses | | | 2,531,763 | |
| | | | |
Net investment loss | | | (1,421,946 | ) |
| | | | |
| |
REALIZED AND UNREALIZED GAINS (LOSSES) ON INVESTMENTS | | | | |
Net realized gains on investments | | | 13,678,836 | |
Net change in unrealized gains (losses) on investments | | | (33,195,846 | ) |
| | | | |
Net realized and unrealized gains (losses) on investments | | | (19,517,010 | ) |
| | | | |
Net decrease in net assets resulting from operations | | $ | (20,938,956 | ) |
| | | | |
The accompanying notes are an integral part of these financial statements.
| | | | |
| 12 | | Wells Fargo Advantage Specialized Technology Fund | | Statement of changes in net assets |
| | | | | | | | | | | | | | | | |
| | | Six months ended
September 30, 2015
(unaudited) | | | Year ended
March 31, 2015 | |
| | | | |
Operations | | | | | | | | | | | | | | | | |
Net investment loss | | | | | | $ | (1,421,946 | ) | | | | | | $ | (1,928,741 | ) |
Net realized gains on investments | | | | | | | 13,678,836 | | | | | | | | 39,950,258 | |
Net change in unrealized gains (losses) on investments | | | | | | | (33,195,846 | ) | | | | | | | 1,502,311 | |
| | | | |
Net increase (decrease) in net assets resulting from operations | | | | | | | (20,938,956 | ) | | | | | | | 39,523,828 | |
| | | | |
| | | | |
Distributions to shareholders from | | | | | | | | | | | | | | | | |
Net realized gains | | | | | | | | | | | | | | | | |
Class A | | | | | | | 0 | | | | | | | | (18,125,259 | ) |
Class B | | | | | | | 0 | | | | | | | | (22,156 | ) |
Class C | | | | | | | 0 | | | | | | | | (1,636,338 | ) |
Administrator Class | | | | | | | 0 | | | | | | | | (3,932,263 | ) |
Investor Class | | | | | | | 0 | | | | | | | | (12,824,710 | ) |
| | | | |
Total distributions to shareholders | | | | | | | 0 | | | | | | | | (36,540,726 | ) |
| | | | |
| | | | |
Capital share transactions | | | Shares | | | | | | | | Shares | | | | | |
Proceeds from shares sold | | | | | | | | | | | | | | | | |
Class A | | | 615,335 | | | | 6,703,435 | | | | 1,762,029 | | | | 19,362,721 | |
Class B | | | 2,502 | | | | 23,834 | | | | 2,720 | | | | 25,600 | |
Class C | | | 199,887 | | | | 1,888,021 | | | | 408,438 | | | | 3,904,420 | |
Administrator Class | | | 425,875 | | | | 4,745,935 | | | | 967,647 | | | | 10,482,691 | |
Investor Class | | | 785,806 | | | | 8,486,810 | | | | 1,543,345 | | | | 16,797,703 | |
| | | | |
| | | | | | | 21,848,035 | | | | | | | | 50,573,135 | |
| | | | |
Reinvestment of distributions | | | | | | | | | | | | | | | | |
Class A | | | 0 | | | | 0 | | | | 1,669,631 | | | | 17,397,551 | |
Class B | | | 0 | | | | 0 | | | | 2,371 | | | | 21,580 | |
Class C | | | 0 | | | | 0 | | | | 156,108 | | | | 1,415,903 | |
Administrator Class | | | 0 | | | | 0 | | | | 336,308 | | | | 3,541,324 | |
Investor Class | | | 0 | | | | 0 | | | | 1,223,851 | | | | 12,617,907 | |
| | | | |
| | | | | | | 0 | | | | | | | | 34,994,265 | |
| | | | |
Payment for shares redeemed | | | | | | | | | | | | | | | | |
Class A | | | (1,052,436 | ) | | | (11,383,074 | ) | | | (2,321,229 | ) | | | (25,436,134 | ) |
Class B | | | (7,876 | ) | | | (71,973 | ) | | | (22,695 | ) | | | (223,733 | ) |
Class C | | | (124,575 | ) | | | (1,181,131 | ) | | | (200,360 | ) | | | (1,924,869 | ) |
Administrator Class | | | (369,172 | ) | | | (4,039,432 | ) | | | (1,322,475 | ) | | | (14,127,800 | ) |
Investor Class | | | (943,481 | ) | | | (10,111,345 | ) | | | (1,422,163 | ) | | | (15,304,661 | ) |
| | | | |
| | | | | | | (26,786,955 | ) | | | | | | | (57,017,197 | ) |
| | | | |
Net increase (decrease) in net assets resulting from capital share transactions | | | | | | | (4,938,920 | ) | | | | | | | 28,550,203 | |
| | | | |
Total increase (decrease) in net assets | | | | | | | (25,877,876 | ) | | | | | | | 31,533,305 | |
| | | | |
| | | | |
Net assets | | | | | | | | | | | | | | | | |
Beginning of period | | | | | | | 333,325,971 | | | | | | | | 301,792,666 | |
| | | | |
End of period | | | | | | $ | 307,448,095 | | | | | | | $ | 333,325,971 | |
| | | | |
Accumulated net investment loss | | | | | | $ | (1,960,976 | ) | | | | | | $ | (539,030 | ) |
| | | | |
The accompanying notes are an integral part of these financial statements.
| | | | | | |
| Financial highlights | | Wells Fargo Advantage Specialized Technology Fund | | | 13 | |
(For a share outstanding throughout each period)
| | | | | | | | | | | | | | | | | | | | | | | | | | | | |
| | | Six months ended
September 30, 2015 (unaudited) | | | Year ended March 31 | | | Year ended
October 31, 2010 | |
| CLASS A | | | 2015 | | | 2014 | | | 2013 | | | 2012 | | | 20111 | | |
Net asset value, beginning of period | | | $10.74 | | | | $10.65 | | | | $8.15 | | | | $8.40 | | | | $8.88 | | | | $7.74 | | | | $5.81 | |
Net investment loss | | | (0.04 | ) | | | (0.06 | ) | | | (0.06 | ) | | | (0.03 | )2 | | | (0.07 | ) | | | (0.04 | ) | | | (0.08 | ) |
Net realized and unrealized gains (losses) on investments | | | (0.63 | ) | | | 1.43 | | | | 3.07 | | | | (0.00 | )3 | | | (0.05 | ) | | | 1.18 | | | | 2.01 | |
| | | | | | | | | | | | | | | | | | | | | | | | | | | | |
Total from investment operations | | | (0.67 | ) | | | 1.37 | | | | 3.01 | | | | (0.03 | ) | | | (0.12 | ) | | | 1.14 | | | | 1.93 | |
Distributions to shareholders from | | | | | | | | | | | | | | | | | | | | | | | | | | | | |
Net realized gains | | | 0.00 | | | | (1.28 | ) | | | (0.51 | ) | | | (0.22 | ) | | | (0.36 | ) | | | 0.00 | | | | 0.00 | |
Net asset value, end of period | | | $10.07 | | | | $10.74 | | | | $10.65 | | | | $8.15 | | | | $8.40 | | | | $8.88 | | | | $7.74 | |
Total return4 | | | (6.24 | )% | | | 13.24 | % | | | 37.27 | % | | | (0.17 | )% | | | (0.74 | )% | | | 14.60 | % | | | 33.22 | % |
Ratios to average net assets (annualized) | | | | | | | | | | | | | | | | | | | | | | | | | | | | |
Gross expenses | | | 1.46 | % | | | 1.52 | % | | | 1.60 | % | | | 1.64 | % | | | 1.70 | % | | | 1.67 | % | | | 1.73 | % |
Net expenses | | | 1.46 | % | | | 1.51 | % | | | 1.56 | % | | | 1.63 | % | | | 1.70 | % | | | 1.67 | % | | | 1.73 | % |
Net investment loss | | | (0.80 | )% | | | (0.58 | )% | | | (0.63 | )% | | | (0.34 | )% | | | (0.92 | )% | | | (1.20 | )% | | | (1.23 | )% |
Supplemental data | | | | | | | | | | | | | | | | | | | | | | | | | | | | |
Portfolio turnover rate | | | 78 | % | | | 119 | % | | | 132 | % | | | 127 | % | | | 169 | % | | | 43 | % | | | 164 | % |
Net assets, end of period (000s omitted) | | | $153,105 | | | | $168,108 | | | | $154,833 | | | | $115,145 | | | | $144,308 | | | | $167,298 | | | | $147,945 | |
| 1 | For the five months ended March 31, 2011. The Fund changed its fiscal year end from October 31 to March 31, effective March 31, 2011. |
| 2 | Calculated based upon average shares outstanding |
| 3 | Amount is less than $0.005. |
| 4 | Total return calculations do not include any sales charges. Returns for periods of less than one year are not annualized. |
The accompanying notes are an integral part of these financial statements.
| | | | |
| 14 | | Wells Fargo Advantage Specialized Technology Fund | | Financial highlights |
(For a share outstanding throughout each period)
| | | | | | | | | | | | | | | | | | | | | | | | | | | | |
| | | Six months ended
September 30, 2015 (unaudited) | | | Year ended March 31 | | | Year ended
October 31, 2010 | |
| CLASS B | | | 2015 | | | 2014 | | | 2013 | | | 2012 | | | 20111 | | |
Net asset value, beginning of period | | | $9.36 | | | | $9.50 | | | | $7.37 | | | | $7.67 | | | | $8.20 | | | | $7.18 | | | | $5.42 | |
Net investment loss | | | (0.07 | )2 | | | (0.13 | )2 | | | (0.12 | )2 | | | (0.08 | )2 | | | (0.13 | )2 | | | (0.06 | )2 | | | (0.12 | )2 |
Net realized and unrealized gains (losses) on investments | | | (0.55 | ) | | | 1.27 | | | | 2.76 | | | | (0.00 | )3 | | | (0.04 | ) | | | 1.08 | | | | 1.88 | |
| | | | | | | | | | | | | | | | | | | | | | | | | | | | |
Total from investment operations | | | (0.62 | ) | | | 1.14 | | | | 2.64 | | | | (0.08 | ) | | | (0.17 | ) | | | 1.02 | | | | 1.76 | |
Distributions to shareholders from | | | | | | | | | | | | | | | | | | | | | | | | | | | | |
Net realized gains | | | 0.00 | | | | (1.28 | ) | | | (0.51 | ) | | | (0.22 | ) | | | (0.36 | ) | | | 0.00 | | | | 0.00 | |
Net asset value, end of period | | | $8.74 | | | | $9.36 | | | | $9.50 | | | | $7.37 | | | | $7.67 | | | | $8.20 | | | | $7.18 | |
Total return4 | | | (6.62 | )% | | | 12.40 | % | | | 36.18 | % | | | (0.84 | )% | | | (1.54 | )% | | | 14.21 | % | | | 32.47 | % |
Ratios to average net assets (annualized) | | | | | | | | | | | | | | | | | | | | | | | | | | | | |
Gross expenses | | | 2.21 | % | | | 2.28 | % | | | 2.35 | % | | | 2.39 | % | | | 2.45 | % | | | 2.42 | % | | | 2.48 | % |
Net expenses | | | 2.21 | % | | | 2.27 | % | | | 2.32 | % | | | 2.38 | % | | | 2.45 | % | | | 2.42 | % | | | 2.48 | % |
Net investment loss | | | (1.54 | )% | | | (1.34 | )% | | | (1.36 | )% | | | (1.09 | )% | | | (1.69 | )% | | | (1.95 | )% | | | (1.97 | )% |
Supplemental data | | | | | | | | | | | | | | | | | | | | | | | | | | | | |
Portfolio turnover rate | | | 78 | % | | | 119 | % | | | 132 | % | | | 127 | % | | | 169 | % | | | 43 | % | | | 164 | % |
Net assets, end of period (000s omitted) | | | $126 | | | | $185 | | | | $355 | | | | $473 | | | | $851 | | | | $1,629 | | | | $1,888 | |
| 1 | For the five months ended March 31, 2011. The Fund changed its fiscal year end from October 31 to March 31, effective March 31, 2011. |
| 2 | Calculated based upon average shares outstanding |
| 3 | Amount is less than $0.005. |
| 4 | Total return calculations do not include any sales charges. Returns for periods of less than one year are not annualized. |
The accompanying notes are an integral part of these financial statements.
| | | | | | |
| Financial highlights | | Wells Fargo Advantage Specialized Technology Fund | | | 15 | |
(For a share outstanding throughout each period)
| | | | | | | | | | | | | | | | | | | | | | | | | | | | |
| | | Six months ended
September 30, 2015 (unaudited) | | | Year ended March 31 | | | Year ended
October 31, 2010 | |
| CLASS C | | | 2015 | | | 2014 | | | 2013 | | | 2012 | | | 20111 | | |
Net asset value, beginning of period | | | $9.33 | | | | $9.47 | | | | $7.35 | | | | $7.65 | | | | $8.18 | | | | $7.16 | | | | $5.41 | |
Net investment loss | | | (0.07 | )2 | | | (0.13 | )2 | | | (0.12 | )2 | | | (0.08 | )2 | | | (0.12 | )2 | | | (0.06 | )2 | | | (0.12 | )2 |
Net realized and unrealized gains (losses) on investments | | | (0.55 | ) | | | 1.27 | | | | 2.75 | | | | (0.00 | )3 | | | (0.05 | ) | | | 1.08 | | | | 1.87 | |
| | | | | | | | | | | | | | | | | | | | | | | | | | | | |
Total from investment operations | | | (0.62 | ) | | | 1.14 | | | | 2.63 | | | | (0.08 | ) | | | (0.17 | ) | | | 1.02 | | | | 1.75 | |
Distributions to shareholders from | | | | | | | | | | | | | | | | | | | | | | | | | | | | |
Net realized gains | | | 0.00 | | | | (1.28 | ) | | | (0.51 | ) | | | (0.22 | ) | | | (0.36 | ) | | | 0.00 | | | | 0.00 | |
Net asset value, end of period | | | $8.71 | | | | $9.33 | | | | $9.47 | | | | $7.35 | | | | $7.65 | | | | $8.18 | | | | $7.16 | |
Total return4 | | | (6.65 | )% | | | 12.44 | % | | | 36.14 | % | | | (0.84 | )% | | | (1.55 | )% | | | 14.25 | % | | | 32.35 | % |
Ratios to average net assets (annualized) | | | | | | | | | | | | | | | | | | | | | | | | | | | | |
Gross expenses | | | 2.21 | % | | | 2.27 | % | | | 2.35 | % | | | 2.39 | % | | | 2.45 | % | | | 2.43 | % | | | 2.48 | % |
Net expenses | | | 2.21 | % | | | 2.26 | % | | | 2.31 | % | | | 2.38 | % | | | 2.45 | % | | | 2.43 | % | | | 2.48 | % |
Net investment loss | | | (1.55 | )% | | | (1.33 | )% | | | (1.38 | )% | | | (1.09 | )% | | | (1.66 | )% | | | (1.95 | )% | | | (1.98 | )% |
Supplemental data | | | | | | | | | | | | | | | | | | | | | | | | | | | | |
Portfolio turnover rate | | | 78 | % | | | 119 | % | | | 132 | % | | | 127 | % | | | 169 | % | | | 43 | % | | | 164 | % |
Net assets, end of period (000s omitted) | | | $13,859 | | | | $14,143 | | | | $10,907 | | | | $6,563 | | | | $7,194 | | | | $6,742 | | | | $5,566 | |
| 1 | For the five months ended March 31, 2011. The Fund changed its fiscal year end from October 31 to March 31, effective March 31, 2011. |
| 2 | Calculated based upon average shares outstanding |
| 3 | Amount is less than $0.005. |
| 4 | Total return calculations do not include any sales charges. Returns for periods of less than one year are not annualized. |
The accompanying notes are an integral part of these financial statements.
| | | | |
| 16 | | Wells Fargo Advantage Specialized Technology Fund | | Financial highlights |
(For a share outstanding throughout each period)
| | | | | | | | | | | | | | | | | | | | | | | | | | | | |
| | | Six months ended
September 30, 2015 (unaudited) | | | Year ended March 31 | | | Year ended
October 31, 20102 | |
| ADMINISTRATOR CLASS | | | 2015 | | | 2014 | | | 2013 | | | 2012 | | | 20111 | | |
Net asset value, beginning of period | | | $10.86 | | | | $10.74 | | | | $8.20 | | | | $8.43 | | | | $8.88 | | | | $7.74 | | | | $6.63 | |
Net investment loss | | | (0.04 | ) | | | (0.05 | ) | | | (0.05 | ) | | | (0.01 | )3 | | | (0.06 | ) | | | (0.04 | )3 | | | (0.02 | )3 |
Net realized and unrealized gains (losses) on investments | | | (0.64 | ) | | | 1.45 | | | | 3.10 | | | | (0.00 | )4 | | | (0.03 | ) | | | 1.18 | | | | 1.13 | |
| | | | | | | | | | | | | | | | | | | | | | | | | | | | |
Total from investment operations | | | (0.68 | ) | | | 1.40 | | | | 3.05 | | | | (0.01 | ) | | | (0.09 | ) | | | 1.14 | | | | 1.11 | |
Distributions to shareholders from | | | | | | | | | | | | | | | | | | | | | | | | | | | | |
Net realized gains | | | 0.00 | | | | (1.28 | ) | | | (0.51 | ) | | | (0.22 | ) | | | (0.36 | ) | | | 0.00 | | | | 0.00 | |
Net asset value, end of period | | | $10.18 | | | | $10.86 | | | | $10.74 | | | | $8.20 | | | | $8.43 | | | | $8.88 | | | | $7.74 | |
Total return5 | | | (6.26 | )% | | | 13.42 | % | | | 37.54 | % | | | 0.07 | % | | | (0.51 | )% | | | 14.73 | % | | | 16.74 | % |
Ratios to average net assets (annualized) | | | | | | | | | | | | | | | | | | | | | | | | | | | | |
Gross expenses | | | 1.34 | % | | | 1.36 | % | | | 1.44 | % | | | 1.48 | % | | | 1.53 | % | | | 1.48 | % | | | 1.58 | % |
Net expenses | | | 1.33 | % | | | 1.35 | % | | | 1.40 | % | | | 1.42 | % | | | 1.50 | % | | | 1.48 | % | | | 1.50 | % |
Net investment loss | | | (0.67 | )% | | | (0.42 | )% | | | (0.48 | )% | | | (0.14 | )% | | | (0.64 | )% | | | (1.03 | )% | | | (0.97 | )% |
Supplemental data | | | | | | | | | | | | | | | | | | | | | | | | | | | | |
Portfolio turnover rate | | | 78 | % | | | 119 | % | | | 132 | % | | | 127 | % | | | 169 | % | | | 43 | % | | | 164 | % |
Net assets, end of period (000s omitted) | | | $30,431 | | | | $31,842 | | | | $31,681 | | | | $17,008 | | | | $7,546 | | | | $3,879 | | | | $108 | |
| 1 | For the five months ended March 31, 2011. The Fund changed its fiscal year end from October 31 to March 31, effective March 31, 2011. |
| 2 | For the period from July 30, 2010 (commencement of class operations) to October 31, 2010 |
| 3 | Calculated based upon average shares outstanding |
| 4 | Amount is less than $0.005. |
| 5 | Returns for periods of less than one year are not annualized. |
The accompanying notes are an integral part of these financial statements.
| | | | | | |
| Financial highlights | | Wells Fargo Advantage Specialized Technology Fund | | | 17 | |
(For a share outstanding throughout each period)
| | | | | | | | | | | | | | | | | | | | | | | | | | | | |
| | | Six months ended
September 30, 2015 (unaudited) | | | Year ended March 31 | | | Year ended
October 31, 2010 | |
| INVESTOR CLASS | | | 2015 | | | 2014 | | | 2013 | | | 2012 | | | 20111 | | |
Net asset value, beginning of period | | | $10.62 | | | | $10.55 | | | | $8.08 | | | | $8.34 | | | | $8.81 | | | | $7.69 | | | | $5.78 | |
Net investment loss | | | (0.05 | ) | | | (0.07 | ) | | | (0.06 | ) | | | (0.03 | ) | | | (0.08 | ) | | | (0.05 | ) | | | (0.09 | )2 |
Net realized and unrealized gains (losses) on investments | | | (0.62 | ) | | | 1.42 | | | | 3.04 | | | | (0.01 | ) | | | (0.03 | ) | | | 1.17 | | | | 2.00 | |
| | | | | | | | | | | | | | | | | | | | | | | | | | | | |
Total from investment operations | | | (0.67 | ) | | | 1.35 | | | | 2.98 | | | | (0.04 | ) | | | (0.11 | ) | | | 1.12 | | | | 1.91 | |
Distributions to shareholders from | | | | | | | | | | | | | | | | | | | | | | | | | | | | |
Net realized gains | | | 0.00 | | | | (1.28 | ) | | | (0.51 | ) | | | (0.22 | ) | | | (0.36 | ) | | | 0.00 | | | | 0.00 | |
Net asset value, end of period | | | $9.95 | | | | $10.62 | | | | $10.55 | | | | $8.08 | | | | $8.34 | | | | $8.81 | | | | $7.69 | |
Total return3 | | | (6.31 | )% | | | 13.17 | % | | | 37.23 | % | | | (0.29 | )% | | | (0.74 | )% | | | 14.56 | % | | | 33.04 | % |
Ratios to average net assets (annualized) | | | | | | | | | | | | | | | | | | | | | | | | | | | | |
Gross expenses | | | 1.54 | % | | | 1.58 | % | | | 1.66 | % | | | 1.70 | % | | | 1.77 | % | | | 1.74 | % | | | 1.82 | % |
Net expenses | | | 1.53 | % | | | 1.55 | % | | | 1.60 | % | | | 1.69 | % | | | 1.77 | % | | | 1.74 | % | | | 1.82 | % |
Net investment loss | | | (0.87 | )% | | | (0.62 | )% | | | (0.67 | )% | | | (0.40 | )% | | | (0.98 | )% | | | (1.27 | )% | | | (1.32 | )% |
Supplemental data | | | | | | | | | | | | | | | | | | | | | | | | | | | | |
Portfolio turnover rate | | | 78 | % | | | 119 | % | | | 132 | % | | | 127 | % | | | 169 | % | | | 43 | % | | | 164 | % |
Net assets, end of period (000s omitted) | | | $109,928 | | | | $119,048 | | | | $104,016 | | | | $78,931 | | | | $87,706 | | | | $94,139 | | | | $81,544 | |
| 1 | For the five months ended March 31, 2011. The Fund changed its fiscal year end from October 31 to March 31, effective March 31, 2011. |
| 2 | Calculated based upon average shares outstanding |
| 3 | Returns for periods of less than one year are not annualized. |
The accompanying notes are an integral part of these financial statements.
| | | | |
| 18 | | Wells Fargo Advantage Specialized Technology Fund | | Notes to financial statements (unaudited) |
1. ORGANIZATION
Wells Fargo Funds Trust (the “Trust”), a Delaware statutory trust organized on March 10, 1999, is an open-end management investment company registered under the Investment Company Act of 1940, as amended (the “1940 Act”). As an investment company, the Trust follows the accounting and reporting guidance in Financial Accounting Standards Board (“FASB”) Accounting Standards Codification Topic 946, Financial Services – Investment Companies. These financial statements report on the Wells Fargo Advantage Specialized Technology Fund (the “Fund”) which is a non-diversified series of the Trust.
2. SIGNIFICANT ACCOUNTING POLICIES
The following significant accounting policies, which are consistently followed in the preparation of the financial statements of the Fund, are in conformity with U.S. generally accepted accounting principles which require management to make estimates and assumptions that affect the reported amounts of assets and liabilities, disclosure of contingent assets and liabilities at the date of the financial statements, and the reported amounts of revenues and expenses during the reporting period. Actual results could differ from those estimates.
Securities valuation
All investments are valued each business day as of the close of regular trading on the New York Stock Exchange (generally 4 p.m. Eastern Time).
Equity securities that are listed on a foreign or domestic exchange or market are valued at the official closing price or, if none, the last sales price. If no sale occurs on the primary exchange or market that day, the prior day’s price will be deemed “stale” and a fair value price will be determined in accordance with the Fund’s Valuation Procedures.
Equity securities that are not listed on a foreign or domestic exchange or market, but have a public trading market, are valued at the quoted bid price from an independent broker-dealer that the Management Valuation Team of Wells Fargo Funds Management, LLC (“Funds Management”) has determined is an acceptable source.
The values of securities denominated in foreign currencies are translated into U.S. dollars at rates provided by an independent foreign currency pricing source at a time each business day specified by the Management Valuation Team.
Many securities markets and exchanges outside the U.S. close prior to the close of the New York Stock Exchange and therefore may not fully reflect trading or events that occur after the close of the principal exchange in which the foreign securities are traded, but before the close of the New York Stock Exchange. If such trading or events are expected to materially affect the value of such securities, then fair value pricing procedures approved by the Board of Trustees of the Fund are applied. These procedures take into account multiple factors including movements in U.S. securities markets after foreign exchanges close. Foreign securities that are fair valued under these procedures are categorized as Level 2 and the application of these procedures may result in transfers between Level 1 and Level 2. Depending on market activity, such fair valuations may be frequent. Such fair value pricing may result in net asset values that are higher or lower than net asset values based on the last reported sales price or latest quoted bid price. On September 30, 2015, such fair value pricing was used in pricing foreign securities.
Investments in registered open-end investment companies are valued at net asset value. Interests in non-registered investment vehicles that are redeemable at net asset value are fair valued at net asset value when available.
Investments which are not valued using any of the methods discussed above are valued at their fair value, as determined in good faith by the Board of Trustees. The Board of Trustees has established a Valuation Committee comprised of the Trustees and has delegated to it the authority to take any actions regarding the valuation of portfolio securities that the Valuation Committee deems necessary or appropriate, including determining the fair value of portfolio securities, unless the determination has been delegated to the Management Valuation Team. The Board of Trustees retains the authority to make or ratify any valuation decisions or approve any changes to the Valuation Procedures as it deems appropriate. On a quarterly basis, the Board of Trustees receives reports on any valuation actions taken by the Valuation Committee or the Management Valuation Team which may include items for ratification.
Valuations of fair valued securities are compared to the next actual sales price when available, or other appropriate market values, to assess the continued appropriateness of the fair valuation methodologies used. These securities are fair valued on a day-to-day basis, taking into consideration changes to appropriate market information and any significant changes to the inputs considered in the valuation process until there is a readily available price provided on an exchange or by an independent pricing service. Valuations received from an independent pricing service or independent broker-dealer quotes are periodically validated by comparisons to most recent trades and valuations provided by other
| | | | | | |
| Notes to financial statements (unaudited) | | Wells Fargo Advantage Specialized Technology Fund | | | 19 | |
independent pricing services in addition to the review of prices by the manager and/or subadviser. Unobservable inputs used in determining fair valuations are identified based on the type of security, taking into consideration factors utilized by market participants in valuing the investment, knowledge about the issuer and the current market environment.
Foreign currency translation
The accounting records of the Fund are maintained in U.S. dollars. The values of other assets and liabilities denominated in foreign currencies are translated into U.S. dollars at rates provided by an independent foreign currency pricing source at a time each business day specified by the Management Valuation Team. Purchases and sales of securities, and income and expenses are converted at the rate of exchange on the respective dates of such transactions. Net realized foreign exchange gains or losses arise from sales of foreign currencies, currency gains or losses realized between the trade and settlement dates on securities transactions, and the difference between the amounts of dividends, interest and foreign withholding taxes recorded and the U.S. dollar equivalent of the amounts actually paid or received. Net unrealized foreign exchange gains and losses arise from changes in the fair value of assets and liabilities other than investments in securities resulting from changes in exchange rates. The changes in net assets arising from changes in exchange rates and the changes in net assets resulting from changes in market prices of securities are not separately presented. Such changes are included in net realized and unrealized gains or losses from investments.
Security loans
The Fund may lend its securities from time to time in order to earn additional income in the form of fees or interest on securities received as collateral or the investment of any cash received as collateral. The Fund continues to receive interest or dividends on the securities loaned. The Fund receives collateral in the form of cash or securities with a value at least equal to the value of the securities on loan. The value of the loaned securities is determined at the close of each business day and any additional required collateral is delivered to the Fund on the next business day. In a securities lending transaction, the net asset value of the Fund will be affected by an increase or decrease in the value of the securities loaned and by an increase or decrease in the value of the instrument in which collateral is invested. The amount of securities lending activity undertaken by the Fund fluctuates from time to time. In the event of default or bankruptcy by the borrower, the Fund may be prevented from recovering the loaned securities or gaining access to the collateral or may experience delays or costs in doing so. In addition, the investment of any cash collateral received may lose all or part of its value. The Fund has the right under the lending agreement to recover the securities from the borrower on demand.
The Fund lends its securities through an unaffiliated securities lending agent. Cash collateral received in connection with its securities lending transactions is invested in Securities Lending Cash Investments, LLC (the “Securities Lending Fund”). The Securities Lending Fund is exempt from registration under Section 3(c)(7) of the 1940 Act and is managed by Funds Management and is subadvised by Wells Capital Management Incorporated (“WellsCap”). Funds Management receives an advisory fee starting at 0.05% and declining to 0.01% as the average daily net assets of the Securities Lending Fund increase. All of the fees received by Funds Management are paid to WellsCap for its services as subadviser. The Securities Lending Fund seeks to provide a positive return compared to the daily Fed Funds Open rate by investing in high-quality, U.S. dollar-denominated short-term money market instruments. Securities Lending Fund investments are fair valued based upon the amortized cost valuation technique. Income earned from investment in the Securities Lending Fund is included in securities lending income on the Statement of Operations.
Security transactions and income recognition
Securities transactions are recorded on a trade date basis. Realized gains or losses are recorded on the basis of identified cost.
Dividend income is recognized on the ex-dividend date, except for certain dividends from foreign securities, which are recorded as soon as the custodian verifies the ex-dividend date. Dividend income from foreign securities is recorded net of foreign taxes withheld where recovery of such taxes is not assured.
Distributions to shareholders
Distributions to shareholders from net investment income and net realized gains, if any, are recorded on the ex-dividend date. Such distributions are determined in conformity with federal income tax regulations, which may differ in amount or character from net investment income and realized gains recognized for purposes of U.S. generally accepted accounting principles.
Federal and other taxes
The Fund intends to continue to qualify as a regulated investment company by distributing substantially all of its investment company taxable income and any net realized capital gains (after reduction for capital loss carryforwards) sufficient to relieve it from all, or substantially all, federal income taxes. Accordingly, no provision for federal income taxes was required.
| | | | |
| 20 | | Wells Fargo Advantage Specialized Technology Fund | | Notes to financial statements (unaudited) |
The Fund’s income and federal excise tax returns and all financial records supporting those returns for the prior three fiscal years are subject to examination by the federal and Delaware revenue authorities. Management has analyzed the Fund’s tax positions taken on federal, state, and foreign tax returns for all open tax years and does not believe that there are any uncertain tax positions that require recognition of a tax liability.
As of March 31, 2015, the Fund had a qualified late-year ordinary loss of $539,030 which was recognized on the first day of the current fiscal year.
Class allocations
The separate classes of shares offered by the Fund differ principally in applicable sales charges, distribution, shareholder servicing, and administration fees. Class specific expenses are charged directly to that share class. Investment income, common expenses, and realized and unrealized gains (losses) on investments are allocated daily to each class of shares based on the relative proportion of net assets of each class.
3. FAIR VALUATION MEASUREMENTS
Fair value measurements of investments are determined within a framework that has established a fair value hierarchy based upon the various data inputs utilized in determining the value of the Fund’s investments. The three-level hierarchy gives the highest priority to unadjusted quoted prices in active markets for identical assets or liabilities (Level 1) and the lowest priority to significant unobservable inputs (Level 3). The Fund’s investments are classified within the fair value hierarchy based on the lowest level of input that is significant to the fair value measurement. The inputs are summarized into three broad levels as follows:
| n | | Level 1 – quoted prices in active markets for identical securities |
| n | | Level 2 – other significant observable inputs (including quoted prices for similar securities, interest rates, prepayment speeds, credit risk, use of amortized cost, etc.) |
| n | | Level 3 – significant unobservable inputs (including the Fund’s own assumptions in determining the fair value of investments) |
The inputs or methodologies used for valuing investments in securities are not necessarily an indication of the risk associated with investing in those securities.
The following is a summary of the inputs used in valuing the Fund’s assets and liabilities as of September 30, 2015:
| | | | | | | | | | | | | | | | |
| | | Quoted prices
(Level 1) | | | Other significant
observable inputs
(Level 2) | | | Significant
unobservable inputs
(Level 3) | | | Total | |
Assets | | | | | | | | | | | | | | | | |
Investments in: | | | | | | | | | | | | | | | | |
| | | | |
Common stocks | | | | | | | | | | | | | | | | |
Consumer discretionary | | $ | 38,305,286 | | | $ | 0 | | | $ | 0 | | | $ | 38,305,286 | |
Industrials | | | 312,270 | | | | 550,128 | | | | 0 | | | | 862,398 | |
Information technology | | | 238,633,457 | | | | 0 | | | | 0 | | | | 238,633,457 | |
Telecommunications services | | | 4,359,991 | | | | 0 | | | | 0 | | | | 4,359,991 | |
| | | | |
Short-term investments | | | | | | | | | | | | | | | | |
Investment companies | | | 12,390,771 | | | | 1,394,400 | | | | 0 | | | | 13,785,171 | |
Total assets | | $ | 294,001,775 | | | $ | 1,944,528 | | | $ | 0 | | | $ | 295,946,303 | |
The Fund recognizes transfers between levels within the fair value hierarchy at the end of the reporting period. At September 30, 2015, fair value pricing was used in pricing certain foreign securities and securities valued at $550,128 were transferred from Level 1 to Level 2 within the fair value hierarchy. The Fund did not have any transfers into/out of Level 3.
4. TRANSACTIONS WITH AFFILIATES AND OTHER EXPENSES
Management fee
Funds Management, an indirect wholly owned subsidiary of Wells Fargo & Company (“Wells Fargo”), is the manager of the Fund and provides advisory and fund-level administrative services under an investment management agreement. Under the investment management agreement, Funds Management is responsible for, among other services,
| | | | | | |
| Notes to financial statements (unaudited) | | Wells Fargo Advantage Specialized Technology Fund | | | 21 | |
implementing the investment objectives and strategies of the Fund, supervising the applicable subadviser, providing fund-level administrative services in connection with the Fund’s operations, and providing any other fund-level administrative services reasonably necessary for the operation of the Fund. As compensation for its services under the investment management agreement, Funds Management is entitled to receive an annual management fee starting at 0.90% and declining to 0.78% as the average daily net assets of the Fund increase.
Prior to July 1, 2015, Funds Management provided advisory services pursuant to an investment advisory agreement and was entitled to receive an annual fee which started at 0.85% and declined to 0.75% as the average daily net assets of the Fund increased. In addition, fund-level administrative services were provided by Funds Management under a separate administration agreement at an annual fee which started at 0.05% and declined to 0.03% as the average daily net assets of the Fund increased. For financial statement purposes, the advisory fee and fund-level administration fee for the six months ended September 30, 2015 have been included in management fee on the Statement of Operations.
For the six months ended September 30, 2015, the management fee was equivalent to an annual rate of 0.90% of the Fund’s average daily net assets.
Funds Management has retained the services of a subadviser to provide daily portfolio management to the Fund. The fee for subadvisory services is borne by Funds Management. Allianz Global Investors U.S. LLC, is the subadviser to the Fund and is entitled to receive a fee from Funds Management at an annual rate starting at 0.80% and declining to 0.55% as the average daily net assets of the Fund increase. Prior to July 1, 2015, the subadviser received a fee at an annual rate which started at 0.90% and declined to 0.55% as the average daily net assets of the Fund increased.
Administration fees
Under a class-level administration agreement, Funds Management provides class-level administrative services to the Fund, which includes paying fees and expenses for services provided by the transfer agent, sub-transfer agents, omnibus account servicers and record-keepers. As compensation for its services under the class-level administration agreement, Funds Management receives an annual fee which is calculated based on the average daily net assets of each class as follows:
| | | | | | | | |
| | | Class-level administration fee | |
| | | Current rate | | | Rate prior to
July 1, 2015 | |
Class A, Class B, Class C | | | 0.21 | % | | | 0.26 | % |
Administrator Class | | | 0.13 | | | | 0.10 | |
Investor Class | | | 0.32 | | | | 0.32 | |
Funds Management has contractually waived and/or reimbursed management and administration fees to the extent necessary to maintain certain net operating expense ratios for the Fund. Waiver of fees and/or reimbursement of expenses by Funds Management were made first from fund level expenses on a proportionate basis and then from class specific expenses. Funds Management has committed through July 31, 2016 to waive fees and/or reimburse expenses to the extent necessary to cap the Fund’s expenses at 1.50% for Class A shares, 2.25% for Class B shares, 2.25% for Class C shares, and 1.33% for Administrator Class shares and 1.53% for Investor Class shares. After this time, the cap may be increased or the commitment to maintain the cap may be terminated only with the approval of the Board of Trustees. Prior to July 1, 2015, the Fund’s expenses were capped at 1.35% for Administrator Class shares.
Distribution fees
The Trust has adopted a distribution plan for Class B and Class C shares of the Fund pursuant to Rule 12b-1 under the 1940 Act. Distribution fees are charged to Class B and Class C shares and paid to Wells Fargo Funds Distributor, LLC (“Funds Distributor”), the principal underwriter, at an annual rate of 0.75% of the average daily net assets of Class B and Class C shares.
In addition, Funds Distributor is entitled to receive the front-end sales charge from the purchase of Class A shares and a contingent deferred sales charge on the redemption of certain Class A shares. Funds Distributor is also entitled to receive the contingent deferred sales charges from redemptions of Class B and Class C shares. For the six months ended September 30, 2015, Funds Distributor received $8,268 from the sale of Class A shares and $40 in contingent deferred sales charges from redemptions of Class C shares.
Shareholder servicing fees
The Trust has entered into contracts with one or more shareholder servicing agents, whereby each class of the Fund is charged a fee at an annual rate of 0.25% of the average daily net assets of each respective class.
| | | | |
| 22 | | Wells Fargo Advantage Specialized Technology Fund | | Notes to financial statements (unaudited) |
A portion of these total shareholder servicing fees were paid to affiliates of Wells Fargo.
5. INVESTMENT PORTFOLIO TRANSACTIONS
Purchases and sales of investments, excluding U.S. government obligations (if any) and short-term securities, for the six months ended September 30, 2015 were $249,473,511 and $272,491,925, respectively.
6. BANK BORROWINGS
The Trust (excluding the money market funds) and Wells Fargo Variable Trust are parties to a $200,000,000 revolving credit agreement whereby the Fund is permitted to use bank borrowings for temporary or emergency purposes, such as to fund shareholder redemption requests. Interest under the credit agreement is charged to the Fund based on a borrowing rate equal to the higher of the Federal Funds rate in effect on that day plus 1.25% or the overnight LIBOR rate in effect on that day plus 1.25%. In addition, an annual commitment fee equal to 0.20% of the unused balance is allocated to each participating fund. Prior to September 1, 2015, the revolving credit agreement amount was $150,000,000 and the annual commitment fee was equal to 0.10% of the unused balance which was allocated to each participating fund. For the six months ended September 30, 2015, the Fund paid $244 in commitment fees.
For the six months ended September 30, 2015, there were no borrowings by the Fund under the agreement.
7. CONCENTRATION RISK
The Fund invests a substantial portion of its assets in technology companies and, therefore, would be more affected by changes in the technology sector than would be a fund whose investments are not heavily weighted in the sector.
8. INDEMNIFICATION
Under the Trust’s organizational documents, the officers and Trustees have been granted certain indemnification rights against certain liabilities that may arise out of performance of their duties to the Trust. Additionally, in the normal course of business, the Trust may enter into contracts with service providers that contain a variety of indemnification clauses. The Trust’s maximum exposure under these arrangements is dependent on future claims that may be made against the Fund and, therefore, cannot be estimated.
9. SUBSEQUENT EVENT
After the close of business on October 23, 2015, Investor Class shares of the Fund became Class A shares in a tax-free conversion. Shareholders of Investor Class of the Fund received Class A shares at a value equal to the value of their Investor Class shares immediately prior to the conversion.
| | | | | | |
| Other information (unaudited) | | Wells Fargo Advantage Specialized Technology Fund | | | 23 | |
PROXY VOTING INFORMATION
A description of the policies and procedures that the Fund uses to determine how to vote proxies relating to portfolio securities is available, upon request, by calling 1-800-222-8222, visiting our website at wellsfargoadvantagefunds.com, or visiting the SEC website at sec.gov. Information regarding how the Fund voted proxies relating to portfolio securities during the most recent 12-month period ended June 30 is available on the Fund’s website at wellsfargoadvantagefunds.com or by visiting the SEC website at sec.gov.
PORTFOLIO HOLDINGS INFORMATION
The complete portfolio holdings for the Fund are publicly available monthly on the Fund’s website (wellsfargoadvantagefunds.com), on a one-month delayed basis. In addition, top ten holdings information (excluding derivative positions) for the Fund is publicly available on the Fund’s website on a monthly, seven-day or more delayed basis. The Fund files its complete schedule of portfolio holdings with the SEC for the first and third quarters of each fiscal year on Form N-Q, which is available by visiting the SEC website at sec.gov. In addition, the Fund’s Form N-Q may be reviewed and copied at the SEC’s Public Reference Room in Washington, DC, and at regional offices in New York City, at 233 Broadway, and in Chicago, at 175 West Jackson Boulevard, Suite 900. Information about the Public Reference Room may be obtained by calling 1-800-SEC-0330.
| | | | |
| 24 | | Wells Fargo Advantage Specialized Technology Fund | | Other information (unaudited) |
BOARD OF TRUSTEES AND OFFICERS
Each of the Trustees and Officers1 listed in the table below acts in identical capacities for each fund in the Wells Fargo Advantage family of funds, which consists of 144 mutual funds comprising the Wells Fargo Funds Trust, Wells Fargo Variable Trust, Wells Fargo Master Trust and four closed-end funds (collectively the “Fund Complex”). This table should be read in conjunction with the Prospectus and the Statement of Additional Information2. The mailing address of each Trustee and Officer is 525 Market Street, 12th Floor, San Francisco, CA 94105. Each Trustee and Officer serves an indefinite term, however, each Trustee serves such term until reaching the mandatory retirement age established by the Trustees.
Independent Trustees
| | | | | | |
Name and year of birth | | Position held and length of service* | | Principal occupations during past five years or longer | | Other public
company or
investment company
directorships during
past 5 years |
| William R. Ebsworth (Born 1957) | | Trustee, since 2015** | | Retired. From 1984 to 2013, equities analyst, portfolio manager, research director at Fidelity Management and Research Company and retired in 2013 as Chief Investment Officer of Fidelity Strategic Advisers, Inc. in Boston, Tokyo, and Hong Kong where he led a team of investment professionals managing client assets. Prior thereto, Board member of Hong Kong Securities Clearing Co., Hong Kong Options Clearing Corp., the Thailand International Fund, Ltd., Fidelity Investments Life Insurance Company, and Empire Fidelity Investments Life Insurance Company. Mr. Ebsworth is a CFA® charterholder and an Adjunct Lecturer, Finance, at Babson College. | | Asset Allocation Trust |
| Jane A. Freeman (Born 1953) | | Trustee, since 2015** | | Retired. From 2012 to 2014 and 1999 to 2008, Chief Financial Officer of Scientific Learning Corporation. From 2008 to 2012, Ms. Freeman provided consulting services related to strategic business projects. Prior to 1999, Portfolio Manager at Rockefeller & Co. and Scudder, Stevens & Clark. Board member of the Harding Loevner Funds from 1996 to 2014, serving as both Lead Independent Director and chair of the Audit Committee. Board member of the Russell Exchange Traded Funds Trust from 2011 to 2012 and the chair of the Audit Committee. Ms. Freeman is Chair of Taproot Foundation (non-profit organization), a Board Member of Ruth Bancroft Garden (non-profit organization) and an inactive chartered financial analyst. | | Asset Allocation Trust; Harding Loevner Funds; Russell Exchange Traded Funds Trust |
| Peter G. Gordon (Born 1942) | | Trustee, since 1998; Chairman, since 2005 | | Co-Founder, Retired Chairman, President and CEO of Crystal Geyser Water Company. Trustee Emeritus, Colby College. | | Asset Allocation Trust |
| Isaiah Harris, Jr. (Born 1952) | | Trustee, since 2009 | | Retired. Chairman of the Board of CIGNA Corporation since 2009, and Director since 2005. From 2003 to 2011, Director of Deluxe Corporation. Prior thereto, President and CEO of BellSouth Advertising and Publishing Corp. from 2005 to 2007, President and CEO of BellSouth Enterprises from 2004 to 2005 and President of BellSouth Consumer Services from 2000 to 2003. Emeritus member of the Iowa State University Foundation Board of Governors. Emeritus Member of the Advisory Board of Iowa State University School of Business. Advisory Board Member, Palm Harbor Academy (charter school). Mr. Harris is a certified public accountant. | | CIGNA Corporation; Asset Allocation Trust |
| Judith M. Johnson (Born 1949) | | Trustee, since 2008; Audit Committee Chairman, since 2008 | | Retired. Prior thereto, Chief Executive Officer and Chief Investment Officer of Minneapolis Employees Retirement Fund from 1996 to 2008. Ms. Johnson is an attorney, certified public accountant and a certified managerial accountant. | | Asset Allocation Trust |
| David F. Larcker (Born 1950) | | Trustee, since 2009 | | James Irvin Miller Professor of Accounting at the Graduate School of Business, Stanford University, Morgan Stanley Director of the Center for Leadership Development and Research and Senior Faculty of The Rock Center for Corporate Governance since 2006. From 2005 to 2008, Professor of Accounting at the Graduate School of Business, Stanford University. Prior thereto, Ernst & Young Professor of Accounting at The Wharton School, University of Pennsylvania from 1985 to 2005. | | Asset Allocation Trust |
| | | | | | |
| Other information (unaudited) | | Wells Fargo Advantage Specialized Technology Fund | | | 25 | |
| | | | | | |
Name and year of birth | | Position held and length of service* | | Principal occupations during past five years or longer | | Other public
company or
investment company
directorships during
past 5 years |
| Olivia S. Mitchell (Born 1953) | | Trustee, since 2006 | | International Foundation of Employee Benefit Plans Professor, Wharton School of the University of Pennsylvania since 1993. Director of Wharton’s Pension Research Council and Boettner Center on Pensions & Retirement Research, and Research Associate at the National Bureau of Economic Research. Previously, Cornell University Professor from 1978 to 1993. | | Asset Allocation Trust |
| Timothy J. Penny (Born 1951) | | Trustee, since 1996 | | President and Chief Executive Officer of Southern Minnesota Initiative Foundation, a non-profit organization, since 2007 and Senior Fellow at the Humphrey Institute Policy Forum at the University of Minnesota since 1995. Member of the Board of Trustees of NorthStar Education Finance, Inc., a non-profit organization, since 2007. | | Asset Allocation Trust |
| Michael S. Scofield (Born 1943) | | Trustee, since 2010 | | Served on the Investment Company Institute’s Board of Governors and Executive Committee from 2008-2011 as well the Governing Council of the Independent Directors Council from 2006-2011 and the Independent Directors Council Executive Committee from 2008-2011. Chairman of the IDC from 2008-2010. Institutional Investor (Fund Directions) Trustee of Year in 2007. Trustee of the Evergreen Funds complex (and its predecessors) from 1984 to 2010. Chairman of the Evergreen Funds from 2000-2010. Former Trustee of the Mentor Funds. Retired Attorney, Law Offices of Michael S. Scofield. | | Asset Allocation Trust |
| Donald C. Willeke (Born 1940) | | Trustee, since 1996 | | Principal of the law firm of Willeke & Daniels. General Counsel of the Minneapolis Employees Retirement Fund from 1984 until its consolidation into the Minnesota Public Employees Retirement Association on June 30, 2010. Director and Vice Chair of The Tree Trust (non-profit corporation). Director of the American Chestnut Foundation (non-profit corporation). | | Asset Allocation Trust |
| * | Length of service dates reflect the Trustee’s commencement of service with the Trust’s predecessor entities, where applicable. |
| ** | William R. Ebsworth and Jane A. Freeman each became a Trustee effective January 1, 2015. |
Officers
| | | | | | |
Name and year of birth | | Position held and
length of service | | Principal occupations during past five years or longer | | |
| Karla M. Rabusch (Born 1959) | | President, since 2003 | | Executive Vice President of Wells Fargo Bank, N.A. and President of Wells Fargo Funds Management, LLC since 2003. | | |
| Nancy Wiser1 (Born 1967) | | Treasurer, since 2012 | | Executive Vice President of Wells Fargo Funds Management, LLC since 2011. Chief Operating Officer and Chief Compliance Officer at LightBox Capital Management LLC, from 2008 to 2011. | | |
| C. David Messman (Born 1960) | | Secretary, since 2000; Chief Legal Officer, since 2003 | | Senior Vice President and Secretary of Wells Fargo Funds Management, LLC since 2001. Assistant General Counsel of Wells Fargo Bank, N.A. since 2013 and Vice President and Managing Counsel of Wells Fargo Bank N.A. from 1996 to 2013. | | |
| Debra Ann Early (Born 1964) | | Chief Compliance Officer, since 2007 | | Executive Vice President of Wells Fargo Funds Management, LLC since 2014, Senior Vice President and Chief Compliance Officer from 2007 to 2014. | | |
| David Berardi (Born 1975) | | Assistant Treasurer, since 2009 | | Vice President of Wells Fargo Funds Management, LLC since 2009. Vice President of Evergreen Investment Management Company, LLC from 2008 to 2010. Manager of Fund Reporting and Control for Evergreen Investment Management Company, LLC from 2004 to 2010. | | |
| Jeremy DePalma1 (Born 1974) | | Assistant Treasurer, since 2009 | | Senior Vice President of Wells Fargo Funds Management, LLC since 2009. Senior Vice President of Evergreen Investment Management Company, LLC from 2008 to 2010 and head of the Fund Reporting and Control Team within Fund Fund Administration from 2005 to 2010. | | |
| 1 | Nancy Wiser acts as Treasurer of 72 funds in the Fund Complex. Jeremy DePalma acts as Treasurer of 72 funds and Assistant Treasurer of 72 funds in the Fund Complex. |
| 2 | The Statement of Additional Information includes additional information about the Trustees and is available, without charge, upon request, by calling 1-800-222-8222 or by visiting the website at wellsfargoadvantagefunds.com. |
| | | | |
| 26 | | Wells Fargo Advantage Specialized Technology Fund | | Other information (unaudited) |
BOARD CONSIDERATION OF INVESTMENT ADVISORY, INVESTMENT MANAGEMENT AND SUB-ADVISORY AGREEMENTS:
Under the Investment Company Act of 1940 (the “1940 Act”), the Board of Trustees (the “Board”) of Wells Fargo Funds Trust (the “Trust”) must determine annually whether to approve the continuation of the Trust’s investment advisory and sub-advisory agreements. In this regard, at an in-person meeting held on May 19-20, 2015 (the “Meeting”), the Board, all the members of which have no direct or indirect interest in the investment advisory and sub-advisory agreements and are not “interested persons” of the Trust, as defined in the 1940 Act (the “Independent Trustees”), reviewed and approved for Wells Fargo Advantage Specialized Technology Fund (the “Fund”): (i) an investment advisory agreement (the “Advisory Agreement”) with Wells Fargo Funds Management, LLC (“Funds Management”); (ii) an investment management agreement (the “Management Agreement”) with Funds Management; and (iii) an investment sub-advisory agreement (the “Sub-Advisory Agreement”) with Allianz Global Investors U.S. LLC (the “Sub-Adviser”). The Management Agreement combines the terms of the Advisory Agreement with the terms of the Fund’s Amended and Restated Administration Agreement (the “Administration Agreement”) applicable to Fund-level administrative services. The Advisory Agreement, the Management Agreement and the Sub-Advisory Agreement are collectively referred to as the “Advisory Agreements.”
At the Meeting, the Board considered the factors and reached the conclusions described below relating to the selection of Funds Management and the Sub-Adviser and the approval of the Advisory Agreements. Prior to the Meeting, including at an in-person meeting in March 2015, the Trustees conferred extensively among themselves and with representatives of Funds Management about these matters. Also, the Board has adopted a team-based approach, with each team consisting of a sub-set of Trustees, to assist the full Board in the discharge of its duties in reviewing performance and other matters throughout the year. The Independent Trustees were assisted in their evaluation of the Advisory Agreements by independent legal counsel, from whom they received separate legal advice and with whom they met separately.
In providing information to the Board, Funds Management and the Sub-Adviser were guided by a detailed set of requests for information submitted to them by independent legal counsel on behalf of the Independent Trustees at the start of the Board’s annual contract renewal process earlier in 2015. In considering and approving the Advisory Agreements, the Trustees considered the information they believed relevant, including but not limited to the information discussed below. The Board considered not only the specific information presented in connection with the Meeting, but also the knowledge gained over time through interaction with Funds Management and the Sub-Adviser about various topics. In this regard, the Board reviewed reports of Funds Management at each of its quarterly meetings, which included, among other things, portfolio reviews and performance reports. In addition, the Board and the teams mentioned above confer with portfolio managers at various times throughout the year. The Board did not identify any particular information or consideration that was all-important or controlling, and each individual Trustee may have attributed different weights to various factors.
After its deliberations, the Board unanimously approved the continuation of the Advisory Agreement for the period from June 1, 2015 through June 30, 2015, approved the Management Agreement for the period from July 1, 2015 through May 31, 2016, and approved the continuation of the Sub-Advisory Agreement for a one-year term through May 31, 2016. The Board also determined that the compensation payable to Funds Management and the Sub-Adviser under each of the Advisory Agreements was reasonable. The Board considered the approval of the Advisory Agreements for the Fund as part of its consideration of agreements for funds across the complex, but its approvals were made on a fund-by-fund basis. The following summarizes a number of important, but not necessarily all, factors considered by the Board in support of its approvals.
Nature, extent and quality of services
The Board received and considered various information regarding the nature, extent and quality of services provided to the Fund by Funds Management and the Sub-Adviser under the Advisory Agreements. This information included, among other things, a summary of the background and experience of senior management of Funds Management, and the qualifications, background, tenure and responsibilities of each of the portfolio managers primarily responsible for the day-to-day portfolio management of the Fund. The Board noted that the services to be provided to the Fund pursuant to the Management Agreement combined the advisory services previously provided to the Fund pursuant to the Fund’s Advisory Agreement with the Fund-level administrative services previously provided to the Fund pursuant to the Fund’s Administration Agreement. The Board received a representation from Funds Management that combining these services would not result in any change to the nature or level of services provided by Funds Management to the Fund.
The Board evaluated the ability of Funds Management and the Sub-Adviser to attract and retain qualified investment professionals, including research, advisory and supervisory personnel. The Board further considered the compliance programs and compliance records of Funds Management and the Sub-Adviser. In addition, the Board took into account the full range of services provided to the Fund by Funds Management and its affiliates.
| | | | | | |
| Other information (unaudited) | | Wells Fargo Advantage Specialized Technology Fund | | | 27 | |
Fund performance and expenses
The Board considered the performance results for the Fund over various time periods ended March 31, 2015. The Board considered these results in comparison to the performance of funds in a universe that was determined by Lipper Inc. (“Lipper”) to be similar to the Fund (the “Universe”), and in comparison to the Fund’s benchmark index and to other comparative data. Lipper is an independent provider of investment company data. The Board received a description of the methodology used by Lipper to select the mutual funds in the performance Universe. The Board noted that the performance of the Fund (Class A) was higher than or in range of the average performance of the Universe for all periods under review except the first quarter of 2015. The Board also noted that the performance of the Fund was higher than its benchmark, the S&P North American Technology TR Index, for all periods under review except the one-year period.
The Board also received and considered information regarding the Fund’s net operating expense ratios and their various components, including actual management fees (which reflect fee waivers, if any, and include advisory, administration and transfer agent fees), custodian and other non-management fees, and Rule 12b-1 and non-Rule 12b-1 service fees. The Board considered these ratios in comparison to the median ratios of funds in class-specific expense groups that were determined by Lipper to be similar to the Fund (the “Groups”). The Board received a description of the methodology used by Lipper to select the mutual funds in the expense Groups and an explanation of how funds comprising expense groups and their expense ratios may vary from year-to-year. Based on the Lipper reports, the Board noted that the net operating expense ratios of the Fund were equal to or in range of the median net operating expense ratios of the expense Groups. The Board discussed and accepted Funds Management’s proposal to reduce the net operating expense ratio caps for the Administrator Class and Class A, and to convert the Investor Class shares into Class A shares.
The Board took into account the Fund performance and expense information provided to it among the factors considered in deciding to re-approve the Advisory Agreement and Sub-Advisory Agreement and approve the Management Agreement.
Investment advisory and sub-advisory fee rates
The Board reviewed and considered the contractual investment advisory fee rates that are payable by the Fund to Funds Management for investment advisory services (the “Advisory Agreement Rates”), both on a stand-alone basis and on a combined basis with the Fund’s fund-level and class-level contractual administration fee rates (the “Management Rates”). The Board noted that the Management Rates include transfer agency and sub-transfer agency costs. The Board also noted that the fee rate to be paid by the Fund under the Management Agreement will incorporate the advisory fee and Fund-level administration fee previously payable separately by the Fund under the Fund’s Advisory Agreement and Administration Agreement with Funds Management. The Board also reviewed and considered the contractual investment sub-advisory fee rates that are payable by Funds Management to the Sub-Adviser for investment sub-advisory services (the “Sub-Advisory Agreement Rates”).
Among other information reviewed by the Board was a comparison of the Management Rates of the Fund with those of other funds in the expense Groups at a common asset level. The Board noted that the Management Rate for the Investor Class was higher than the average rate of the Investor Class’s expense Group, while the Management Rates for Class A and the Administrator Class were in range of their respective expense Groups. The Board discussed and accepted Funds Management’s proposal to convert the Investor Class shares into Class A shares.
The Board also received and considered information about the portion of the total advisory fee that was retained by Funds Management after payment of the fee to the Sub-Adviser for sub-advisory services. The Board considered this amount in comparison to the median amount retained by advisers to funds in a sub-advised expense universe that was determined by Lipper to be similar to the Fund. In assessing the reasonableness of this amount, the Board received and evaluated information about the nature and extent of responsibilities retained and risks assumed by Funds Management and not delegated to or assumed by the Sub-Adviser, and about Funds Management’s on-going oversight services. The Board also considered that the sub-advisory fees paid to the Sub-Adviser had been negotiated by Funds Management on an arm’s length basis. The Board approved a reduction in the sub-advisory fee rate payable by Funds Management to the Sub-Adviser, noting that it had approved a revised advisory fee schedule for the Fund in 2014, reducing the Advisory Agreement Rates for the Fund as of August 1, 2014.
The Board also received and considered information about the nature and extent of services offered and fee rates charged by Funds Management and the Sub-Adviser to other types of clients with investment strategies similar to those of the Fund. In this regard, the Board received information about the significantly greater scope of services, and compliance, reporting and other legal burdens and risks of managing mutual funds compared with those associated with managing assets of non-mutual fund clients such as collective funds or institutional separate accounts.
| | | | |
| 28 | | Wells Fargo Advantage Specialized Technology Fund | | Other information (unaudited) |
Based on its consideration of the factors and information it deemed relevant, including those described here, the Board determined that the compensation payable to Funds Management under the Management Agreement and Advisory Agreement and to the Sub-Adviser under the Sub-Advisory Agreement was reasonable, in light of the services covered by the Advisory Agreements.
Profitability
The Board received and considered information concerning the profitability of Funds Management, as well as the profitability of Wells Fargo as a whole, from providing services to the Fund and the fund family as a whole. Funds Management reported on the methodologies and estimates used in calculating profitability. Among other things, the Board noted that the levels of profitability reported on a fund-by-fund basis varied widely, depending on factors such as the size and type of fund. The Board did not consider profitability with respect to the Sub-Adviser, as the sub-advisory fees paid to the Sub-Adviser had been negotiated by Funds Management on an arm’s-length basis.
Based on its review, the Board did not deem the profits reported by Funds Management to be at a level that would prevent it from approving the continuation of the Advisory Agreements.
Economies of scale
With respect to possible economies of scale, the Board noted the existence of breakpoints in the Fund’s advisory and management fee structures, and the Fund’s administration fee structure, which operate generally to reduce the Fund’s expense ratios as the Fund grows in size. It considered that, for a small fund or a fund that shrinks in size, breakpoints conversely can result in higher fee levels. The Board also considered that fee waiver and expense reimbursement arrangements and competitive fee rates at the outset are means of sharing potential economies of scale with shareholders of the Fund and the fund family as a whole. The Board considered Funds Management’s view that any analyses of potential economies of scale in managing a particular fund are inherently limited in light of the joint and common costs and investments that Funds Management incurs across the fund family as a whole.
The Board concluded that the Fund’s fee and expense arrangements, including contractual breakpoints, constituted a reasonable approach to sharing potential economies of scale with the Fund and its shareholders.
Other benefits to Funds Management and the Sub-Adviser
The Board received and considered information regarding potential “fall-out” or ancillary benefits received by Funds Management, the Sub-Adviser, and their affiliates as a result of their relationships with the Fund. Ancillary benefits could include, among others, benefits directly attributable to other relationships with the Fund and benefits potentially derived from an increase in Funds Management’s and the Sub-Adviser’s business as a result of their relationships with the Fund. The Board noted that various affiliates of Funds Management may receive distribution-related fees, shareholder servicing payments and sub-transfer agency fees in respect of shares sold or held through them and services provided.
The Board also reviewed information about soft dollar credits earned and utilized by the Sub-Adviser, fees earned by Funds Management from managing a private investment vehicle for the fund family’s securities lending collateral and commissions earned by an affiliated broker from portfolio transactions.
Based on its consideration of the factors and information it deemed relevant, including those described here, the Board did not find that any ancillary benefits received by Funds Management, the Sub-Adviser, and their affiliates were unreasonable.
Conclusion
At the Meeting, after considering the above-described factors and based on its deliberations and its evaluation of the information described above, the Board unanimously approved the continuation of the Advisory Agreement for the period from June 1, 2015 through June 30, 2015, approved the Management Agreement for the period from July 1, 2015 through May 31, 2016, and approved the continuation of the Sub-Advisory Agreement for a one-year term through May 31, 2016. The Board also determined that the compensation payable to Funds Management and the Sub-Adviser under each of the Advisory Agreements was reasonable.
| | | | | | |
| List of abbreviations | | Wells Fargo Advantage Specialized Technology Fund | | | 29 | |
The following is a list of common abbreviations for terms and entities that may have appeared in this report.
| ACA | — ACA Financial Guaranty Corporation |
| ADR | — American depositary receipt |
| ADS | — American depositary shares |
| AGC | — Assured Guaranty Corporation |
| AGM | — Assured Guaranty Municipal |
| Ambac | — Ambac Financial Group Incorporated |
| AMT | — Alternative minimum tax |
| BAN | — Bond anticipation notes |
| BHAC | — Berkshire Hathaway Assurance Corporation |
| CAB | — Capital appreciation bond |
| CCAB | — Convertible capital appreciation bond |
| CDA | — Community Development Authority |
| CDO | — Collateralized debt obligation |
| DRIVER | — Derivative inverse tax-exempt receipts |
| DW&P | — Department of Water & Power |
| DWR | — Department of Water Resources |
| ECFA | — Educational & Cultural Facilities Authority |
| EDA | — Economic Development Authority |
| EDFA | — Economic Development Finance Authority |
| ETF | — Exchange-traded fund |
| FDIC | — Federal Deposit Insurance Corporation |
| FFCB | — Federal Farm Credit Banks |
| FGIC | — Financial Guaranty Insurance Corporation |
| FHA | — Federal Housing Administration |
| FHLB | — Federal Home Loan Bank |
| FHLMC | — Federal Home Loan Mortgage Corporation |
| FICO | — The Financing Corporation |
| FNMA | — Federal National Mortgage Association |
| GDR | — Global depositary receipt |
| GNMA | — Government National Mortgage Association |
| HCFR | — Healthcare facilities revenue |
| HEFA | — Health & Educational Facilities Authority |
| HEFAR | — Higher education facilities authority revenue |
| HFA | — Housing Finance Authority |
| HFFA | — Health Facilities Financing Authority |
| HUD | — Department of Housing and Urban Development |
| IDA | — Industrial Development Authority |
| IDAG | — Industrial Development Agency |
| KRW | — Republic of Korea won |
| LIBOR | — London Interbank Offered Rate |
| LIFER | — Long Inverse Floating Exempt Receipts |
| LLC | — Limited liability company |
| LLLP | — Limited liability limited partnership |
| LLP | — Limited liability partnership |
| MBIA | — Municipal Bond Insurance Association |
| MFHR | — Multifamily housing revenue |
| MSTR | — Municipal securities trust receipts |
| MUD | — Municipal Utility District |
| National | — National Public Finance Guarantee Corporation |
| PCFA | — Pollution Control Financing Authority |
| PCL | — Public Company Limited |
| PCR | — Pollution control revenue |
| PFA | — Public Finance Authority |
| PFFA | — Public Facilities Financing Authority |
| PFOTER | — Puttable floating option tax-exempt receipts |
| plc | — Public limited company |
| PUTTER | — Puttable tax-exempt receipts |
| R&D | — Research & development |
| Radian | — Radian Asset Assurance |
| RAN | — Revenue anticipation notes |
| RDA | — Redevelopment Authority |
| RDFA | — Redevelopment Finance Authority |
| REIT | — Real estate investment trust |
| ROC | — Reset option certificates |
| SAVRS | — Select auction variable rate securities |
| SBA | — Small Business Authority |
| SDR | — Swedish depositary receipt |
| SFHR | — Single-family housing revenue |
| SFMR | — Single-family mortgage revenue |
| SPA | — Standby purchase agreement |
| SPDR | — Standard & Poor’s Depositary Receipts |
| SPEAR | — Short Puttable Exempt Adjustable Receipts |
| STRIPS | — Separate trading of registered interest and |
| TAN | — Tax anticipation notes |
| TIPS | — Treasury inflation-protected securities |
| TRAN | — Tax revenue anticipation notes |
| TTFA | — Transportation Trust Fund Authority |
| TVA | — Tennessee Valley Authority |
This page is intentionally left blank.
This page is intentionally left blank.
This page is intentionally left blank.


For more information
More information about Wells Fargo Advantage Funds is available free upon request. To obtain literature, please write, email, visit the Fund’s website, or call:
Wells Fargo Advantage Funds
P.O. Box 8266
Boston, MA 02266-8266
Email: wfaf@wellsfargo.com
Website: wellsfargoadvantagefunds.com
Individual investors: 1-800-222-8222
Retail investment professionals: 1-888-877-9275
Institutional investment professionals: 1-866-765-0778
This report and the financial statements contained herein are submitted for the general information of the shareholders of Wells Fargo Advantage Funds. If this report is used for promotional purposes, distribution of the report must be accompanied or preceded by a current prospectus. Before investing, please consider the investment objectives, risks, charges, and expenses of the investment. For a current prospectus and, if available, a summary prospectus, containing this information, call 1-800-222-8222 or visit the Fund’s website at wellsfargoadvantagefunds.com. Read the prospectus carefully before you invest or send money.
Wells Fargo Funds Management, LLC, a wholly owned subsidiary of Wells Fargo & Company, provides investment advisory and administrative services for Wells Fargo Advantage Funds. Other affiliates of Wells Fargo & Company provide subadvisory and other services for the Funds. The Funds are distributed by Wells Fargo Funds Distributor, LLC, Member FINRA, an affiliate of Wells Fargo & Company.
NOT FDIC INSURED ¡ NO BANK GUARANTEE ¡ MAY LOSE VALUE
© 2015 Wells Fargo Funds Management, LLC. All rights reserved.
| | |
 | | 237488 11-15 SA317/SAR317 09-15 |

Wells Fargo Advantage
Utility and Telecommunications Fund

Semi-Annual Report
September 30, 2015

Reduce clutter. Save trees.
Sign up for electronic delivery of prospectuses and shareholder reports at wellsfargo.com/advantagedelivery
Contents
The views expressed and any forward-looking statements are as of September 30, 2015, unless otherwise noted, and are those of the Fund managers and/or Wells Fargo Funds Management, LLC. Discussions of individual securities, or the markets generally, or any Wells Fargo Advantage Fund are not intended as individual recommendations. Future events or results may vary significantly from those expressed in any forward-looking statements; the views expressed are subject to change at any time in response to changing circumstances in the market. Wells Fargo Funds Management, LLC and the Fund disclaim any obligation to publicly update or revise any views expressed or forward-looking statements.
NOT FDIC INSURED ¡ NO BANK GUARANTEE ¡ MAY LOSE VALUE
| | | | |
| 2 | | Wells Fargo Advantage Utility and Telecommunications Fund | | Letter to shareholders (unaudited) |

Karla M. Rabusch
President
Wells Fargo Advantage Funds
Utilities and telecommunication services stocks posted negative results for the six-month reporting period.
Dear Valued Shareholder:
We are pleased to offer you this semi-annual report for the Wells Fargo Advantage Utility and Telecommunications Fund for the six-month period that ended September 30, 2015. Despite generally improving U.S. economic data, the broad U.S. stock market experienced heightened volatility that led to negative results overall for U.S. stocks for the period. Large-cap stocks performed best, followed by mid caps and small caps. Markets outside the U.S. faced deeper ongoing challenges and generally delivered weaker results.
U.S. stocks experienced challenges during the second quarter of 2015.
The broad U.S. stock market fluctuated widely, eventually eking out a small quarterly gain. Mid- and large-cap stocks at times were pressured by investor concerns over the potentially negative effects of financially troubled overseas economies and of a strengthening U.S. dollar on the profits of U.S. multinational firms. The U.S. economy picked up traction during the quarter; consumer spending improved, and positive trends were evident in construction and new-home sales. Jobs growth remained a bright spot as well. U.S. Federal Reserve (Fed) officials, who have kept interest rates low while waiting for the U.S. jobs market to sufficiently improve and for inflation to approach their 2% target, made clear they could take action soon. Throughout the quarter, non-U.S. markets also experienced volatility, triggered by uncertainty over the potential impact of financial challenges in other locations—most notably in Greece and Puerto Rico. Questions over slower growth in China caused investor concern as well.
In the third quarter of 2015, China’s slowdown took a toll on economies and markets worldwide.
U.S. stocks sagged during the quarter, experiencing the most volatility since 2011. Larger-cap stocks generally declined the least and smaller caps the most. Economic data released during the quarter suggested the U.S. economy remains solid but has lost some steam, burdened by the drag of the strong U.S. dollar coupled with global economic turmoil. The fact that the Fed left the federal funds interest rate unchanged at its September meeting surprised investors and fueled increased uncertainty about the U.S. economy’s stamina to remain healthy while facing the challenges of slowing in China and troubles elsewhere in the world. Outside the U.S., markets were even more volatile and delivered generally weaker quarterly results, also largely due to investors’ increasing anxiety over China’s weakened economy. Because China is the world’s largest importer of many commodities, a number of emerging markets—key commodities exporters—are struggling under the dual strains of reduced demand for commodities and, because of weaker demand, lower prices for the commodities they do sell. In the eurozone, however, where only about 3% of exports are sent to China, household spending and business investment appeared relatively unaffected by troubles elsewhere. However, the European Central Bank warned in September that slowing growth in China could lead to slower growth and lower inflation rates in the eurozone than previously forecast and indicated additional stimulus could be provided should this occur.
Utilities and telecommunication services stocks posted negative results for the six-month reporting period.
During the second quarter of 2015, utilities stocks underperformed the broad U.S. stock market while telecommunication services stocks delivered slightly better results than the broader market. Similar to bonds, utilities stocks are desired for the income they provide and thus are sensitive to interest-rate movements; as a result, they can underperform the broader stock market when investors believe interest rates will be rising soon. During the third quarter, utilities delivered
| | | | | | |
| Letter to shareholders (unaudited) | | Wells Fargo Advantage Utility and Telecommunications Fund | | | 3 | |
positive results, significantly outperforming the broad stock market; telecommunication services stocks declined with the broader market, though with slightly better results. Utilities benefited as investors’ growing anxiety caused them to move toward investments perceived to have greater stability. Utilities are especially desirable in a defensive environment because many tend to deliver steady revenues and profits as a result of their regulated businesses. Despite delivering negative returns for the six-month period overall, utilities and telecommunication services stocks generally outperformed the broader U.S. stock market.
Don’t let short-term uncertainty derail long-term investment goals.
Periods of uncertainty can present challenges, but experience has taught us that maintaining long-term investment goals can be an effective way to plan for the future. To help you create a sound strategy based on your personal goals and risk tolerance, Wells Fargo Advantage Funds offers more than 100 mutual funds spanning a wide range of asset classes and investment styles. Although diversification cannot guarantee an investment profit or prevent losses, we believe it can be an effective way to manage investment risk and potentially smooth out overall portfolio performance. We encourage investors to know their investments and to understand that appropriate levels of risk-taking may unlock opportunities.
Thank you for choosing to invest in Wells Fargo Advantage Funds. We appreciate your confidence in us and remain committed to helping you meet your financial needs.
Sincerely,

Karla M. Rabusch
President
Wells Fargo Advantage Funds
Periods of uncertainty can present challenges, but experience has taught us that maintaining long-term investment goals can be an effective way to plan for the future.
Notice to shareholders
At a meeting held August 11-12, 2015, the Board of Trustees of the Fund approved a change in the name of the Fund whereby the word “Advantage” was removed from its name, effective December 15, 2015.
For current information about your fund investments, contact your investment professional, visit our website at wellsfargoadvantagefunds.com, or call us directly at 1-800-222-8222. We are available 24 hours a day, 7 days a week.
| | | | |
| 4 | | Wells Fargo Advantage Utility and Telecommunications Fund | | Performance highlights (unaudited) |
Investment objective
The Fund seeks total return, consisting of current income and capital appreciation.
Manager
Wells Fargo Funds Management, LLC
Subadviser
Crow Point Partners, LLC
Portfolio manager
Timothy P. O’Brien, CFA
Average annual total returns1 (%) as of September 30, 2015
| | | | | | | | | | | | | | | | | | | | | | | | | | | | | | | | | | |
| | | | | Including sales charge | | | Excluding sales charge | | | Expense ratios2 (%) | |
| | | Inception date | | 1 year | | | 5 year | | | 10 year | | | 1 year | | | 5 year | | | 10 year | | | Gross | | | Net3 | |
| Class A (EVUAX) | | 1-4-1994 | | | (5.96 | ) | | | 9.33 | | | | 6.23 | | | | (0.22 | ) | | | 10.63 | | | | 6.86 | | | | 1.18 | | | | 1.15 | |
| Class B (EVUBX)* | | 1-4-1994 | | | (5.89 | ) | | | 9.53 | | | | 6.30 | | | | (1.01 | ) | | | 9.80 | | | | 6.30 | | | | 1.93 | | | | 1.90 | |
| Class C (EVUCX) | | 9-2-1994 | | | (1.98 | ) | | | 9.81 | | | | 6.05 | | | | (0.98 | ) | | | 9.81 | | | | 6.05 | | | | 1.93 | | | | 1.90 | |
| Administrator Class (EVUDX) | | 7-30-2010 | | | – | | | | – | | | | – | | | | (0.10 | ) | | | 10.86 | | | | 6.99 | | | | 1.10 | �� | | | 0.96 | |
| Institutional Class (EVUYX) | | 2-28-1994 | | | – | | | | – | | | | – | | | | 0.09 | | | | 10.98 | | | | 7.15 | | | | 0.85 | | | | 0.79 | |
| S&P Utilities Index4 | | – | | | – | | | | – | | | | – | | | | 6.57 | | | | 11.04 | | | | 6.69 | | | | – | | | | – | |
| S&P 500 Index5 | | – | | | – | | | | – | | | | – | | | | (0.61 | ) | | | 13.34 | | | | 6.80 | | | | – | | | | – | |
| * | | Class B shares are closed to investment, except in connection with the reinvestment of any distributions and permitted exchanges. |
Figures quoted represent past performance, which is no guarantee of future results, and do not reflect taxes that a shareholder may pay on fund distributions or the redemption of fund shares. Investment return and principal value of an investment will fluctuate so that an investor’s shares, when redeemed, may be worth more or less than their original cost. Performance shown without sales charges would be lower if sales charges were reflected. Current performance may be lower or higher than the performance data quoted, which assumes the reinvestment of dividends and capital gains. Current month-end performance is available on the Fund’s website, wellsfargoadvantagefunds.com.
Index returns do not include transaction costs associated with buying and selling securities, any mutual fund fees or expenses, or any taxes. It is not possible to invest directly in an index.
For Class A shares, the maximum front-end sales charge is 5.75%. For Class B shares, the maximum contingent deferred sales charge is 5.00%. For Class C shares, the maximum contingent deferred sales charge is 1.00%. Performance including a contingent deferred sales charge assumes the sales charge for the corresponding time period. Administrator Class and Institutional Class shares are sold without a front-end sales charge or contingent deferred sales charge.
Stock values fluctuate in response to the activities of individual companies and general market and economic conditions. Bond values fluctuate in response to the financial condition of individual issuers, general market and economic conditions, and changes in interest rates. Changes in market conditions and government policies may lead to periods of heightened volatility in the bond market and reduced liquidity for certain bonds held by the fund. In general, when interest rates rise, bond values fall and investors may lose principal value. Interest-rate changes and their impact on the fund and its share price can be sudden and unpredictable. The use of derivatives may reduce returns and/or increase volatility. Funds that concentrate their investments in limited sectors, such as utilities and telecommunication services, are more vulnerable to adverse market, economic, regulatory, political, or other developments affecting those sectors. Certain investment strategies tend to increase the total risk of an investment (relative to the broader market). The Fund is exposed to convertible securities risk, foreign investment risk, high-yield securities risk, non-diversification risk, and smaller-company securities risk. Consult the Fund’s prospectus for additional information on these and other risks.
Please see footnotes on page 5.
| | | | | | |
| Performance highlights (unaudited) | | Wells Fargo Advantage Utility and Telecommunications Fund | | | 5 | |
| | | | |
| Ten largest holdings6 (%) as of September 30, 2015 | |
CMS Energy Corporation | | | 5.90 | |
Eversource Energy | | | 5.71 | |
Edison International | | | 5.61 | |
NextEra Energy Incorporated | | | 5.43 | |
Sempra Energy | | | 5.13 | |
Visa Incorporated Class A | | | 5.08 | |
Alliant Energy Corporation | | | 4.65 | |
PNM Resources Incorporated | | | 4.46 | |
Chatham Lodging Trust | | | 3.70 | |
Shenandoah Telecommunications Company | | | 3.69 | |
|
| Industry distribution7 as of September 30, 2015 |
|
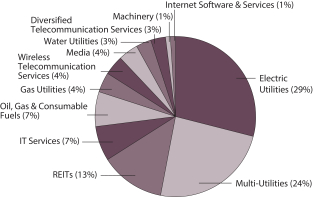 |
| 1 | Historical performance shown for Administrator Class shares prior to their inception reflects the performance of Institutional Class shares and has been adjusted to reflect the higher expenses applicable to Administrator Class shares. Historical performance shown for all classes of the Fund prior to July 19, 2010, is based on the performance of the Fund’s predecessor, Evergreen Utility and Telecommunications Fund. |
| 2 | Reflects the expense ratios as stated in the most recent prospectuses, which include the impact of 0.01% in acquired fund fees and expenses. The expense ratios shown are subject to change and may differ from the annualized expense ratios shown in the financial highlights of this report, which do not include acquired fund fees and expenses. |
| 3 | The manager has contractually committed through July 31, 2016, to waive fees and/or reimburse expenses to the extent necessary to cap the Fund’s Total Annual Fund Operating Expenses After Fee Waiver at 1.14% for Class A, 1.89% for Class B, 1.89% for Class C, 0.95% for Administrator Class, and 0.78% for Institutional Class. After this time, the cap may be increased or the commitment to maintain the cap may be terminated only with the approval of the Board of Trustees. Brokerage commissions, stamp duty fees, interest, taxes, acquired fund fees and expenses, and extraordinary expenses are excluded from the cap. Without this cap, the Fund’s returns would have been lower. |
| 4 | The S&P Utilities Index is a market-value-weighted index, measuring the performance of all stocks within the utility sector of the S&P 500 Index. You cannot invest directly in an index. |
| 5 | The S&P 500 Index consists of 500 stocks chosen for market size, liquidity, and industry group representation. It is a market-value weighted index with each stock’s weight in the index proportionate to its market value. You cannot invest directly in an index. |
| 6 | The ten largest holdings, excluding cash and cash equivalents, are calculated based on the value of the investments divided by total net assets of the Fund. Holdings are subject to change and may have changed since the date specified. |
| 7 | Amounts are calculated based on the total long-term investments of the Fund. These amounts are subject to change and may have changed since the date specified. |
| | | | |
| 6 | | Wells Fargo Advantage Utility and Telecommunications Fund | | Fund expenses (unaudited) |
As a shareholder of the Fund, you incur two types of costs: (1) transaction costs, including sales charges (loads) on purchase payments and contingent deferred sales charges (if any) on redemptions and (2) ongoing costs, including management fees, distribution (12b-1) and/or shareholder servicing fees, and other Fund expenses. This example is intended to help you understand your ongoing costs (in dollars) of investing in the Fund and to compare these costs with the ongoing costs of investing in other mutual funds.
The example is based on an investment of $1,000 invested at the beginning of the six-month period and held for the entire period from April 1, 2015 to September 30, 2015.
Actual expenses
The “Actual” line of the table below provides information about actual account values and actual expenses. You may use the information in this line, together with the amount you invested, to estimate the expenses that you paid over the period. Simply divide your account value by $1,000 (for example, an $8,600 account value divided by $1,000 = 8.6), then multiply the result by the number in the “Actual” line under the heading entitled “Expenses paid during period” for your applicable class of shares to estimate the expenses you paid on your account during this period.
Hypothetical example for comparison purposes
The “Hypothetical” line of the table below provides information about hypothetical account values and hypothetical expenses based on the Fund’s actual expense ratio and an assumed rate of return of 5% per year before expenses, which is not the Fund’s actual return. The hypothetical account values and expenses may not be used to estimate the actual ending account balance or expenses you paid for the period. You may use this information to compare the ongoing costs of investing in the Fund and other funds. To do so, compare this 5% hypothetical example with the 5% hypothetical examples that appear in the shareholder reports of the other funds.
Please note that the expenses shown in the table are meant to highlight your ongoing costs only and do not reflect any transactional costs, such as sales charges (loads) and contingent deferred sales charges. Therefore, the “Hypothetical” line of the table is useful in comparing ongoing costs only and will not help you determine the relative total costs of owning different funds. In addition, if these transactional costs were included, your costs would have been higher.
| | | | | | | | | | | | | | | | |
| | | Beginning
account value
4-1-2015 | | | Ending
account value
9-30-2015 | | | Expenses
paid during
the period1 | | | Net annualized
expense ratio | |
Class A | | | | | | | | | | | | | | | | |
Actual | | $ | 1,000.00 | | | $ | 944.55 | | | $ | 5.56 | | | | 1.14 | % |
Hypothetical (5% return before expenses) | | $ | 1,000.00 | | | $ | 1,019.35 | | | $ | 5.77 | | | | 1.14 | % |
Class B | | | | | | | | | | | | | | | | |
Actual | | $ | 1,000.00 | | | $ | 940.83 | | | $ | 9.20 | | | | 1.89 | % |
Hypothetical (5% return before expenses) | | $ | 1,000.00 | | | $ | 1,015.59 | | | $ | 9.55 | | | | 1.89 | % |
Class C | | | | | | | | | | | | | | | | |
Actual | | $ | 1,000.00 | | | $ | 940.89 | | | $ | 9.20 | | | | 1.89 | % |
Hypothetical (5% return before expenses) | | $ | 1,000.00 | | | $ | 1,015.59 | | | $ | 9.55 | | | | 1.89 | % |
Administrator Class | | | | | | | | | | | | | | | | |
Actual | | $ | 1,000.00 | | | $ | 944.91 | | | $ | 4.63 | | | | 0.95 | % |
Hypothetical (5% return before expenses) | | $ | 1,000.00 | | | $ | 1,020.31 | | | $ | 4.81 | | | | 0.95 | % |
Institutional Class | | | | | | | | | | | | | | | | |
Actual | | $ | 1,000.00 | | | $ | 945.80 | | | $ | 3.80 | | | | 0.78 | % |
Hypothetical (5% return before expenses) | | $ | 1,000.00 | | | $ | 1,021.16 | | | $ | 3.95 | | | | 0.78 | % |
| 1 | Expenses paid is equal to the annualized expense ratio of each class multiplied by the average account value over the period, multiplied by the number of days in the most recent fiscal half-year divided by the number of days in the fiscal year (to reflect the one-half-year period). |
| | | | | | |
| Portfolio of investments—September 30, 2015 (unaudited) | | Wells Fargo Advantage Utility and Telecommunications Fund | | | 7 | |
| | | | | | | | | | | | |
| Security name | | | | | | Shares | | | Value | |
| | | | | | | | | | | | |
| | | | |
Common Stocks: 93.95% | | | | | | | | | | | | |
| | | | |
Consumer Discretionary: 3.40% | | | | | | | | | | | | |
| | | | |
| Media: 3.40% | | | | | | | | | | | | |
Comcast Corporation Class A | | | | | | | 225,100 | | | $ | 12,803,688 | |
| | | | | | | | | | | | |
| | | | |
Energy: 6.57% | | | | | | | | | | | | |
| | | | |
| Oil, Gas & Consumable Fuels: 6.57% | | | | | | | | | | | | |
EQT Corporation | | | | | | | 58,600 | | | | 3,795,522 | |
EQT Midstream Partners LP | | | | | | | 100,000 | | | | 6,633,000 | |
The Williams Companies Incorporated | | | | | | | 270,000 | | | | 9,949,500 | |
Veresen Incorporated « | | | | | | | 575,000 | | | | 4,394,904 | |
| | | | |
| | | | | | | | | | | 24,772,926 | |
| | | | | | | | | | | | |
| | | | |
Financials: 9.62% | | | | | | | | | | | | |
| | | | |
| REITs: 9.62% | | | | | | | | | | | | |
Ashford Hospitality Prime Incorporated | | | | | | | 49,117 | | | | 689,112 | |
Ashford Hospitality Trust | | | | | | | 1,200,000 | | | | 7,320,000 | |
CareTrust REIT Incorporated | | | | | | | 200,000 | | | | 2,270,000 | |
Chatham Lodging Trust | | | | | | | 650,000 | | | | 13,962,000 | |
Preferred Apartment Communities Incorporated | | | | | | | 600,000 | | | | 6,528,000 | |
Strategic Hotel & Resorts Incorporated † | | | | | | | 400,000 | | | | 5,516,000 | |
| | | | |
| | | | | | | | | | | 36,285,112 | |
| | | | | | | | | | | | |
| | | | |
Industrials: 0.91% | | | | | | | | | | | | |
| | | | |
| Construction & Engineering: 0.05% | | | | | | | | | | | | |
Ameresco Incorporated Class A † | | | | | | | 35,000 | | | | 205,800 | |
| | | | | | | | | | | | |
| | | | |
| Machinery: 0.86% | | | | | | | | | | | | |
NN Incorporated | | | | | | | 175,000 | | | | 3,237,500 | |
| | | | | | | | | | | | |
| | | | |
Information Technology: 8.06% | | | | | | | | | | | | |
| | | | |
| Internet Software & Services: 0.86% | | | | | | | | | | | | |
Rocket Internet AG «144A† | | | | | | | 100,000 | | | | 3,219,441 | |
| | | | | | | | | | | | |
| | | | |
| IT Services: 7.20% | | | | | | | | | | | | |
Convergys Corporation | | | | | | | 34,081 | | | | 787,612 | |
MasterCard Incorporated Class A | | | | | | | 80,000 | | | | 7,209,600 | |
Visa Incorporated Class A | | | | | | | 275,000 | | | | 19,156,500 | |
| | | | |
| | | | | | | | | | | 27,153,712 | |
| | | | | | | | | | | | |
| | | | |
Telecommunication Services: 6.14% | | | | | | | | | | | | |
| | | | |
| Diversified Telecommunication Services: 2.45% | | | | | | | | | | | | |
AT&T Incorporated | | | | | | | 150,000 | | | | 4,887,000 | |
Verizon Communications Incorporated | | | | | | | 100,000 | | | | 4,351,000 | |
| | | | |
| | | | | | | | | | | 9,238,000 | |
| | | | | | | | | | | | |
| | | | |
| Wireless Telecommunication Services: 3.69% | | | | | | | | | | | | |
Shenandoah Telecommunications Company | | | | | | | 325,000 | | | | 13,913,250 | |
| | | | | | | | | | | | |
The accompanying notes are an integral part of these financial statements.
| | | | |
| 8 | | Wells Fargo Advantage Utility and Telecommunications Fund | | Portfolio of investments—September 30, 2015 (unaudited) |
| | | | | | | | | | | | | | | | |
| Security name | | | | | | | | Shares | | | Value | |
| | | | | | | | | | | | | | | | |
| | | | |
Utilities: 59.25% | | | | | | | | | | | | | | | | |
| | | | |
| Electric Utilities: 28.48% | | | | | | | | | | | | | | | | |
ALLETE Incorporated | | | | | | | | | | | 10,000 | | | $ | 504,900 | |
American Electric Power Company Incorporated | | | | | | | | | | | 175,000 | | | | 9,950,500 | |
Edison International | | | | | | | | | | | 335,000 | | | | 21,128,450 | |
Eversource Energy | | | | | | | | | | | 425,000 | | | | 21,513,500 | |
Great Plains Energy Incorporated | | | | | | | | | | | 200,000 | | | | 5,404,000 | |
IDACORP Incorporated | | | | | | | | | | | 75,000 | | | | 4,853,250 | |
ITC Holdings Corporation | | | | | | | | | | | 200,000 | | | | 6,668,000 | |
NextEra Energy Incorporated | | | | | | | | | | | 210,000 | | | | 20,485,500 | |
PNM Resources Incorporated | | | | | | | | | | | 600,000 | | | | 16,830,000 | |
| | | | |
| | | | | | | | | | | | | | | 107,338,100 | |
| | | | | | | | | | | | | | | | |
| | | | |
| Gas Utilities: 4.00% | | | | | | | | | | | | | | | | |
National Fuel Gas Company | | | | | | | | | | | 250,000 | | | | 12,495,000 | |
Snam SpA | | | | | | | | | | | 500,000 | | | | 2,567,940 | |
| | | | |
| | | | | | | | | | | | | | | 15,062,940 | |
| | | | | | | | | | | | | | | | |
| | | | |
| Multi-Utilities: 23.85% | | | | | | | | | | | | | | | | |
Alliant Energy Corporation | | | | | | | | | | | 300,000 | | | | 17,547,000 | |
CenterPoint Energy Incorporated | | | | | | | | | | | 250,000 | | | | 4,510,000 | |
CMS Energy Corporation | | | | | | | | | | | 630,000 | | | | 22,251,600 | |
Dominion Resources Incorporated | | | | | | | | | | | 175,000 | | | | 12,316,500 | |
Northwestern Corporation | | | | | | | | | | | 102,411 | | | | 5,512,784 | |
Public Service Enterprise Group Incorporated | | | | | | | | | | | 200,000 | | | | 8,432,000 | |
Sempra Energy | | | | | | | | | | | 200,000 | | | | 19,344,000 | |
| | | | |
| | | | | | | | | | | | | | | 89,913,884 | |
| | | | | | | | | | | | | | | | |
| | | | |
| Water Utilities: 2.92% | | | | | | | | | | | | | | | | |
American Water Works Company Incorporated | | | | | | | | | | | 200,000 | | | | 11,016,000 | |
| | | | | | | | | | | | | | | | |
| | | | |
Total Common Stocks (Cost $225,308,616) | | | | | | | | | | | | | | | 354,160,353 | |
| | | | | | | | | | | | | | | | |
| | | | |
| | | Interest rate | | | Maturity date | | | Principal | | | | |
| Convertible Debentures: 0.20% | | | | | | | | | | | | | | | | |
| | | | |
Energy: 0.20% | | | | | | | | | | | | | | | | |
| | | | |
| Oil, Gas & Consumable Fuels: 0.20% | | | | | | | | | | | | | | | | |
Energy and Exploration Partners Incorporated (i) | | | 8.00 | % | | | 7-1-2019 | | | $ | 5,000,000 | | | | 762,500 | |
| | | | | | | | | | | | | | | | |
| | | | |
Total Convertible Debentures (Cost $5,000,000) | | | | | | | | | | | | | | | 762,500 | |
| | | | | | | | | | | | | | | | |
| | | | |
| | | | | | | | | Shares | | | | |
| Exchange-Traded Funds: 0.13% | | | | | | | | | | | | | | | | |
Recon Capital NASDAQ 100 Covered Call ETF | | | | | | | | | | | 21,500 | | | | 470,205 | |
| | | | | | | | | | | | | | | | |
| | | | |
Total Exchange-Traded Funds (Cost $512,990) | | | | | | | | | | | | | | | 470,205 | |
| | | | | | | | | | | | | | | | |
The accompanying notes are an integral part of these financial statements.
| | | | | | |
| Portfolio of investments—September 30, 2015 (unaudited) | | Wells Fargo Advantage Utility and Telecommunications Fund | | | 9 | |
| | | | | | | | | | | | | | | | |
| Security name | | Dividend yield | | | | | | Shares | | | Value | |
| | | | | | | | | | | | | | | | |
| | | | |
Preferred Stocks: 2.52% | | | | | | | | | | | | | | | | |
| | | | |
Financials: 2.52% | | | | | | | | | | | | | | | | |
| | | | |
| REITs: 2.52% | | | | | | | | | | | | | | | | |
Wheeler Real Estate Investment Trusts Incorporated (a) | | | 8.68 | % | | | | | | | 10,000 | | | $ | 9,500,000 | |
| | | | | | | | | | | | | | | | |
| | | | |
Total Preferred Stocks (Cost $10,000,000) | | | | | | | | | | | | | | | 9,500,000 | |
| | | | | | | | | | | | | | | | |
| | | Strike price | | | Expiration date | | | Contracts | | | | |
| | | | |
Purchased Put Options: 0.70% | | | | | | | | | | | | | | | | |
The Williams Companies Incorporated (a) | | $ | 50.00 | | | | 11-20-2015 | | | | 2,000 | | | | 2,643,079 | |
| | | | | | | | | | | | | | | | |
| | | | |
Total Purchased Put Options (Cost $390,356) | | | | | | | | | | | | | | | 2,643,079 | |
| | | | | | | | | | | | | | | | |
| | | | |
| | | | | | | | | Shares | | | | |
| Warrants: 0.12% | | | | | | | | | | | | | | | | |
| | | | |
Energy: 0.12% | | | | | | | | | | | | | | | | |
| | | | |
| Oil, Gas & Consumable Fuels: 0.12% | | | | | | | | | | | | | | | | |
Kinder Morgan Incorporated † | | | | | | | 5-27-2017 | | | | 496,000 | | | | 456,320 | |
Magnum Hunter Resources Corporation Ǡ(a) | | | | | | | 4-15-2016 | | | | 140,000 | | | | 0 | |
| | | | |
Total Warrants (Cost $553,300) | | | | | | | | | | | | | | | 456,320 | |
| | | | | | | | | | | | | | | | |
| | | | |
| | | Yield | | | | | | | | | | |
| Short-Term Investments: 3.96% | | | | | | | | | | | | | | | | |
| | | | |
| Investment Companies: 3.96% | | | | | | | | | | | | | | | | |
Securities Lending Cash Investments, LLC (l)(r)(u) | | | 0.15 | % | | | | | | | 7,021,603 | | | | 7,021,603 | |
Wells Fargo Advantage Cash Investment Money Market Fund, Select Class #(l)(u) | | | 0.16 | | | | | | | | 7,887,500 | | | | 7,887,500 | |
| | | | |
Total Short-Term Investments (Cost $14,909,103) | | | | | | | | | | | | | | | 14,909,103 | |
| | | | | | | | | | | | | | | | |
| | | | | | | | |
| Total investments in securities (Cost $256,674,365) * | | | 101.58 | % | | | 382,901,560 | |
Other assets and liabilities, net | | | (1.58 | ) | | | (5,946,046 | ) |
| | | | | | | | |
| Total net assets | | | 100.00 | % | | $ | 376,955,514 | |
| | | | | | | | |
| « | All or a portion of this security is on loan. |
| # | All or a portion of this security is segregated as collateral for investments in derivative instruments. |
| † | Non-income-earning security |
| 144A | The security may be resold in transactions exempt from registration, normally to qualified institutional buyers, pursuant to Rule 144A under the Securities Act of 1933. |
| (a) | The security is fair valued in accordance with procedures approved by the Board of Trustees. |
| (l) | The security represents an affiliate of the Fund as defined in the Investment Company Act of 1940. |
| (r) | The investment is a non-registered investment vehicle purchased with cash collateral received from securities on loan. |
| (u) | The rate represents the 7-day annualized yield at period end. |
| * | Cost for federal income tax purposes is $256,586,259 and unrealized gains (losses) consists of: |
| | | | |
Gross unrealized gains | | $ | 145,367,156 | |
Gross unrealized losses | | | (19,051,855 | ) |
| | | | |
Net unrealized gains | | $ | 126,315,301 | |
The accompanying notes are an integral part of these financial statements.
| | | | |
| 10 | | Wells Fargo Advantage Utility and Telecommunications Fund | | Statement of assets and liabilities—September 30, 2015 (unaudited) |
| | | | |
| | | | |
| |
Assets | | | | |
Investments | | | | |
In unaffiliated securities (including $6,663,792 of securities loaned), at value (cost $241,765,262) | | $ | 367,992,457 | |
In affiliated securities, at value (cost $14,909,103) | | | 14,909,103 | |
| | | | |
Total investments, at value (cost $256,674,365) | | | 382,901,560 | |
Foreign currency, at value (cost $70,591) | | | 70,192 | |
Receivable for investments sold | | | 918,183 | |
Receivable for Fund shares sold | | | 175,636 | |
Receivable for dividends and interest | | | 884,096 | |
Receivable for securities lending income | | | 1,784 | |
Prepaid expenses and other assets | | | 47,894 | |
| | | | |
Total assets | | | 384,999,345 | |
| | | | |
| |
Liabilities | | | | |
Payable for Fund shares redeemed | | | 619,827 | |
Payable upon receipt of securities loaned | | | 7,021,603 | |
Written options, at value (premiums received $322,818) | | | 611 | |
Management fee payable | | | 184,703 | |
Distribution fees payable | | | 36,530 | |
Administration fees payable | | | 63,202 | |
Accrued expenses and other liabilities | | | 117,355 | |
| | | | |
Total liabilities | | | 8,043,831 | |
| | | | |
Total net assets | | $ | 376,955,514 | |
| | | | |
| |
NET ASSETS CONSIST OF | | | | |
Paid-in capital | | $ | 266,654,664 | |
Undistributed net investment income | | | 660,699 | |
Accumulated net realized losses on investments | | | (16,908,891 | ) |
Net unrealized gains on investments | | | 126,549,042 | |
| | | | |
Total net assets | | $ | 376,955,514 | |
| | | | |
| |
COMPUTATION OF NET ASSET VALUE AND OFFERING PRICE PER SHARE | | | | |
Net assets – Class A | | $ | 298,984,613 | |
Shares outstanding – Class A1 | | | 17,567,625 | |
Net asset value per share – Class A | | | $17.02 | |
Maximum offering price per share – Class A2 | | | $18.06 | |
Net assets – Class B | | $ | 4,261,932 | |
Shares outstanding – Class B1 | | | 249,492 | |
Net asset value per share – Class B | | | $17.08 | |
Net assets – Class C | | $ | 55,399,821 | |
Shares outstanding – Class C1 | | | 3,251,828 | |
Net asset value per share – Class C | | | $17.04 | |
Net assets – Administrator Class | | $ | 5,923,657 | |
Shares outstanding – Administrator Class1 | | | 347,748 | |
Net asset value per share – Administrator Class | | | $17.03 | |
Net assets – Institutional Class | | $ | 12,385,491 | |
Shares outstanding – Institutional Class1 | | | 728,046 | |
Net asset value per share – Institutional Class | | | $17.01 | |
| 1 | The Fund has an unlimited number of authorized shares. |
| 2 | Maximum offering price is computed as 100/94.25 of net asset value. On investments of $50,000 or more, the offering price is reduced. |
The accompanying notes are an integral part of these financial statements.
| | | | | | |
| Statement of operations—six months ended September 30, 2015 (unaudited) | | Wells Fargo Advantage Utility and Telecommunications Fund | | | 11 | |
| | | | |
| | | | |
| |
Investment income | | | | |
Dividends (net of foreign withholding taxes of $109,802) | | $ | 7,229,808 | |
Interest | | | 198,926 | |
Securities lending income, net | | | 20,644 | |
Income from affiliated securities | | | 5,983 | |
| | | | |
Total investment income | | | 7,455,361 | |
| | | | |
| |
Expenses | | | | |
Management fee | | | 1,319,553 | |
Administration fees | | | | |
Class A | | | 376,779 | |
Class B | | | 6,464 | |
Class C | | | 70,332 | |
Administrator Class | | | 4,238 | |
Institutional Class | | | 7,254 | |
Shareholder servicing fees | | | | |
Class A | | | 399,523 | |
Class B | | | 6,781 | |
Class C | | | 74,588 | |
Administrator Class | | | 9,293 | |
Distribution fees | | | | |
Class B | | | 20,343 | |
Class C | | | 223,765 | |
Custody and accounting fees | | | 23,115 | |
Professional fees | | | 26,153 | |
Registration fees | | | 38,278 | |
Shareholder report expenses | | | 40,555 | |
Trustees’ fees and expenses | | | 7,170 | |
Other fees and expenses | | | 6,859 | |
| | | | |
Total expenses | | | 2,661,043 | |
Less: Fee waivers and/or expense reimbursements | | | (134,668 | ) |
| | | | |
Net expenses | | | 2,526,375 | |
| | | | |
Net investment income | | | 4,928,986 | |
| | | | |
| |
REALIZED AND UNREALIZED GAINS (LOSSES) ON INVESTMENTS | | | | |
| |
Net realized gains on: | | | | |
Unaffiliated securities | | | 7,514,304 | |
Written options | | | 145,253 | |
| | | | |
Net realized gains on investments | | | 7,659,557 | |
| | | | |
| |
Net change in unrealized gains (losses) on: | | | | |
Unaffiliated securities | | | (36,290,962 | ) |
Written options | | | 322,207 | |
| | | | |
Net change in unrealized gains (losses) on investments | | | (35,968,755 | ) |
| | | | |
Net realized and unrealized gains (losses) on investments | | | (28,309,198 | ) |
| | | | |
Net decrease in net assets resulting from operations | | $ | (23,380,212 | ) |
| | | | |
The accompanying notes are an integral part of these financial statements.
| | | | |
| 12 | | Wells Fargo Advantage Utility and Telecommunications Fund | | Statement of changes in net assets |
| | | | | | | | | | | | | | | | |
| | | Six months ended
September 30, 2015
(unaudited) | | | Year ended
March 31, 2015 | |
| | | | |
Operations | | | | | | | | | | | | | | | | |
Net investment income | | | | | | $ | 4,928,986 | | | | | | | $ | 6,560,533 | |
Net realized gains on investments | | | | | | | 7,659,557 | | | | | | | | 23,373,912 | |
Net change in unrealized gains (losses) on investments | | | | | | | (35,968,755 | ) | | | | | | | (9,639,771 | ) |
| | | | |
Net increase (decrease) in net assets resulting from operations | | | | | | | (23,380,212 | ) | | | | | | | 20,294,674 | |
| | | | |
| | | | |
Distributions to shareholders from | | | | | | | | | | | | | | | | |
Net investment income | | | | | | | | | | | | | | | | |
Class A | | | | | | | (3,530,828 | ) | | | | | | | (6,403,863 | ) |
Class B | | | | | | | (31,010 | ) | | | | | | | (104,423 | ) |
Class C | | | | | | | (431,154 | ) | | | | | | | (693,137 | ) |
Administrator Class | | | | | | | (80,539 | ) | | | | | | | (183,512 | ) |
Institutional Class | | | | | | | (184,984 | ) | | | | | | | (306,091 | ) |
| | | | |
Total distributions to shareholders | | | | | | | (4,258,515 | ) | | | | | | | (7,691,026 | ) |
| | | | |
| | | | |
Capital share transactions | | | Shares | | | | | | | | Shares | | | | | |
Proceeds from shares sold | | | | | | | | | | | | | | | | |
Class A | | | 449,435 | | | | 8,028,831 | | | | 2,072,323 | | | | 37,834,688 | |
Class B | | | 511 | | | | 8,939 | | | | 1,562 | | | | 29,964 | |
Class C | | | 54,510 | | | | 964,629 | | | | 382,365 | | | | 6,988,536 | |
Administrator Class | | | 24,527 | | | | 438,967 | | | | 260,834 | | | | 4,786,634 | |
Institutional Class | | | 142,970 | | | | 2,489,591 | | | | 453,039 | | | | 8,303,139 | |
| | | | |
| | | | | | | 11,930,957 | | | | | | | | 57,942,961 | |
| | | | |
Reinvestment of distributions | | | | | | | | | | | | | | | | |
Class A | | | 193,929 | | | | 3,312,328 | | | | 325,162 | | | | 6,016,355 | |
Class B | | | 1,483 | | | | 25,332 | | | | 4,647 | | | | 86,670 | |
Class C | | | 22,462 | | | | 383,073 | | | | 32,978 | | | | 614,675 | |
Administrator Class | | | 4,440 | | | | 76,036 | | | | 8,290 | | | | 153,428 | |
Institutional Class | | | 8,475 | | | | 144,661 | | | | 14,526 | | | | 267,923 | |
| | | | |
| | | | | | | 3,941,430 | | | | | | | | 7,139,051 | |
| | | | |
Payment for shares redeemed | | | | | | | | | | | | | | | | |
Class A | | | (1,795,892 | ) | | | (31,961,268 | ) | | | (3,436,374 | ) | | | (62,486,613 | ) |
Class B | | | (166,717 | ) | | | (2,984,811 | ) | | | (363,882 | ) | | | (6,686,336 | ) |
Class C | | | (312,053 | ) | | | (5,515,766 | ) | | | (387,363 | ) | | | (7,054,107 | ) |
Administrator Class | | | (139,590 | ) | | | (2,420,503 | ) | | | (339,970 | ) | | | (6,214,019 | ) |
Institutional Class | | | (200,005 | ) | | | (3,463,767 | ) | | | (273,028 | ) | | | (4,941,344 | ) |
| | | | |
| | | | | | | (46,346,115 | ) | | | | | | | (87,382,419 | ) |
| | | | |
Net decrease in net assets resulting from capital share transactions | | | | | | | (30,473,728 | ) | | | | | | | (22,300,407 | ) |
| | | | |
Total decrease in net assets | | | | | | | (58,112,455 | ) | | | | | | | (9,696,759 | ) |
| | | | |
| | | | |
Net assets | | | | | | | | | | | | | | | | |
Beginning of period | | | | | | | 435,067,969 | | | | | | | | 444,764,728 | |
| | | | |
End of period | | | | | | $ | 376,955,514 | | | | | | | $ | 435,067,969 | |
| | | | |
Undistributed (overdistributed) net investment income | | | | | | $ | 660,699 | | | | | | | $ | (9,772 | ) |
| | | | |
The accompanying notes are an integral part of these financial statements.
| | | | | | |
| Financial highlights | | Wells Fargo Advantage Utility and Telecommunications Fund | | | 13 | |
(For a share outstanding throughout each period)
| | | | | | | | | | | | | | | | | | | | | | | | | | | | |
| | | Six months ended
September 30, 2015
(unaudited) | | | Year ended March 31 | | | Year ended
October 31, 20102 | |
| CLASS A | | | 2015 | | | 2014 | | | 2013 | | | 2012 | | | 20111 | | |
Net asset value, beginning of period | | | $18.23 | | | | $17.71 | | | | $15.85 | | | | $13.78 | | | | $12.59 | | | | $11.73 | | | | $10.77 | |
Net investment income | | | 0.23 | | | | 0.29 | | | | 0.36 | | | | 0.36 | | | | 0.28 | | | | 0.14 | | | | 0.29 | |
Net realized and unrealized gains (losses) on investments | | | (1.24 | ) | | | 0.57 | | | | 1.84 | | | | 2.07 | | | | 1.21 | | | | 0.87 | | | | 0.94 | |
| | | | | | | | | | | | | | | | | | | | | | | | | | | | |
Total from investment operations | | | (1.01 | ) | | | 0.86 | | | | 2.20 | | | | 2.43 | | | | 1.49 | | | | 1.01 | | | | 1.23 | |
Distributions to shareholders from | | | | | | | | | | | | | | | | | | | | | | | | | | | | |
Net investment income | | | (0.20 | ) | | | (0.34 | ) | | | (0.34 | ) | | | (0.36 | ) | | | (0.30 | ) | | | (0.15 | ) | | | (0.27 | ) |
Net asset value, end of period | | | $17.02 | | | | $18.23 | | | | $17.71 | | | | $15.85 | | | | $13.78 | | | | $12.59 | | | | $11.73 | |
Total return3 | | | (5.54 | )% | | | 4.82 | % | | | 14.12 | % | | | 17.94 | % | | | 12.01 | % | | | 8.66 | % | | | 11.55 | % |
Ratios to average net assets (annualized) | | | | | | | | | | | | | | | | | | | | | | | | | | | | |
Gross expenses | | | 1.21 | % | | | 1.22 | % | | | 1.22 | % | | | 1.23 | % | | | 1.20 | % | | | 1.24 | % | | | 1.16 | % |
Net expenses | | | 1.14 | % | | | 1.14 | % | | | 1.14 | % | | | 1.14 | % | | | 1.14 | % | | | 1.14 | % | | | 1.12 | % |
Net investment income | | | 2.53 | % | | | 1.57 | % | | | 2.21 | % | | | 2.47 | % | | | 2.11 | % | | | 2.85 | % | | | 2.56 | % |
Supplemental data | | | | | | | | | | | | | | | | | | | | | | | | | | | | |
Portfolio turnover rate | | | 3 | % | | | 29 | % | | | 20 | % | | | 21 | % | | | 36 | % | | | 8 | % | | | 51 | % |
Net assets, end of period (000s omitted) | | | $298,985 | | | | $341,342 | | | | $350,029 | | | | $316,551 | | | | $288,228 | | | | $283,716 | | | | $281,501 | |
| 1 | For the five months ended March 31, 2011. The Fund changed its fiscal year end from October 31 to March 31, effective March 31, 2011. |
| 2 | After the close of business on July 16, 2010, the Fund acquired the net assets of Evergreen Utility and Telecommunications Fund which became the accounting and performance survivor in the transaction. The information for the period prior to July 19, 2010 is that of Class A of Evergreen Utility and Telecommunications Fund. |
| 3 | Total return calculations do not include any sales charges. Returns for periods of less than one year are not annualized. |
The accompanying notes are an integral part of these financial statements.
| | | | |
| 14 | | Wells Fargo Advantage Utility and Telecommunications Fund | | Financial highlights |
(For a share outstanding throughout each period)
| | | | | | | | | | | | | | | | | | | | | | | | | | | | |
| | | Six months ended
September 30, 2015
(unaudited) | | | Year ended March 31 | | | Year ended
October 31, 20102 | |
| CLASS B | | | 2015 | | | 2014 | | | 2013 | | | 2012 | | | 20111 | | |
Net asset value, beginning of period | | | $18.28 | | | | $17.75 | | | | $15.87 | | | | $13.79 | | | | $12.59 | | | | $11.72 | | | | $10.77 | |
Net investment income | | | 0.15 | 3 | | | 0.16 | 3 | | | 0.24 | 3 | | | 0.24 | 3 | | | 0.18 | 3 | | | 0.10 | 3 | | | 0.21 | 3 |
Net realized and unrealized gains (losses) on investments | | | (1.23 | ) | | | 0.55 | | | | 1.85 | | | | 2.09 | | | | 1.22 | | | | 0.87 | | | | 0.93 | |
| | | | | | | | | | | | | | | | | | | | | | | | | | | | |
Total from investment operations | | | (1.08 | ) | | | 0.71 | | | | 2.09 | | | | 2.33 | | | | 1.40 | | | | 0.97 | | | | 1.14 | |
Distributions to shareholders from | | | | | | | | | | | | | | | | | | | | | | | | | | | | |
Net investment income | | | (0.12 | ) | | | (0.18 | ) | | | (0.21 | ) | | | (0.25 | ) | | | (0.20 | ) | | | (0.10 | ) | | | (0.19 | ) |
Net asset value, end of period | | | $17.08 | | | | $18.28 | | | | $17.75 | | | | $15.87 | | | | $13.79 | | | | $12.59 | | | | $11.72 | |
Total return4 | | | (5.92 | )% | | | 3.98 | % | | | 13.32 | % | | | 17.08 | % | | | 11.21 | % | | | 8.32 | % | | | 10.64 | % |
Ratios to average net assets (annualized) | | | | | | | | | | | | | | | | | | | | | | | | | | | | |
Gross expenses | | | 1.96 | % | | | 1.97 | % | | | 1.97 | % | | | 1.97 | % | | | 1.95 | % | | | 1.99 | % | | | 1.91 | % |
Net expenses | | | 1.89 | % | | | 1.89 | % | | | 1.89 | % | | | 1.89 | % | | | 1.89 | % | | | 1.89 | % | | | 1.87 | % |
Net investment income | | | 1.70 | % | | | 0.86 | % | | | 1.46 | % | | | 1.70 | % | | | 1.35 | % | | | 2.09 | % | | | 1.82 | % |
Supplemental data | | | | | | | | | | | | | | | | | | | | | | | | | | | | |
Portfolio turnover rate | | | 3 | % | | | 29 | % | | | 20 | % | | | 21 | % | | | 36 | % | | | 8 | % | | | 51 | % |
Net assets, end of period (000s omitted) | | | $4,262 | | | | $7,573 | | | | $13,698 | | | | $17,240 | | | | $20,613 | | | | $24,461 | | | | $27,042 | |
| 1 | For the five months ended March 31, 2011. The Fund changed its fiscal year end from October 31 to March 31, effective March 31, 2011. |
| 2 | After the close of business on July 16, 2010, the Fund acquired the net assets of Evergreen Utility and Telecommunications Fund which became the accounting and performance survivor in the transaction. The information for the period prior to July 19, 2010 is that of Class B of Evergreen Utility and Telecommunications Fund. |
| 3 | Calculated based upon average shares outstanding |
| 4 | Total return calculations do not include any sales charges. Returns for periods of less than one year are not annualized. |
The accompanying notes are an integral part of these financial statements.
| | | | | | |
| Financial highlights | | Wells Fargo Advantage Utility and Telecommunications Fund | | | 15 | |
(For a share outstanding throughout each period)
| | | | | | | | | | | | | | | | | | | | | | | | | | | | |
| | | Six months ended
September 30, 2015
(unaudited) | | | Year ended March 31 | | | Year ended October 31, 20102 | |
| CLASS C | | | 2015 | | | 2014 | | | 2013 | | | 2012 | | | 20111 | | |
Net asset value, beginning of period | | | $18.25 | | | | $17.73 | | | | $15.86 | | | | $13.79 | | | | $12.59 | | | | $11.72 | | | | $10.77 | |
Net investment income | | | 0.15 | | | | 0.15 | | | | 0.24 | 3 | | | 0.23 | | | | 0.18 | 3 | | | 0.11 | 3 | | | 0.21 | 3 |
Net realized and unrealized gains (losses) on investments | | | (1.23 | ) | | | 0.57 | | | | 1.85 | | | | 2.09 | | | | 1.22 | | | | 0.86 | | | | 0.93 | |
| | | | | | | | | | | | | | | | | | | | | | | | | | | | |
Total from investment operations | | | (1.08 | ) | | | 0.72 | | | | 2.09 | | | | 2.32 | | | | 1.40 | | | | 0.97 | | | | 1.14 | |
Distributions to shareholders from | | | | | | | | | | | | | | | | | | | | | | | | | | | | |
Net investment income | | | (0.13 | ) | | | (0.20 | ) | | | (0.22 | ) | | | (0.25 | ) | | | (0.20 | ) | | | (0.10 | ) | | | (0.19 | ) |
Net asset value, end of period | | | $17.04 | | | | $18.25 | | | | $17.73 | | | | $15.86 | | | | $13.79 | | | | $12.59 | | | | $11.72 | |
Total return4 | | | (5.91 | )% | | | 4.04 | % | | | 13.31 | % | | | 17.03 | % | | | 11.23 | % | | | 8.32 | % | | | 10.62 | % |
Ratios to average net assets (annualized) | | | | | | | | | | | | | | | | | | | | | | | | | | | | |
Gross expenses | | | 1.96 | % | | | 1.97 | % | | | 1.97 | % | | | 1.98 | % | | | 1.95 | % | | | 1.99 | % | | | 1.91 | % |
Net expenses | | | 1.89 | % | | | 1.89 | % | | | 1.89 | % | | | 1.89 | % | | | 1.89 | % | | | 1.89 | % | | | 1.87 | % |
Net investment income | | | 1.78 | % | | | 0.82 | % | | | 1.46 | % | | | 1.71 | % | | | 1.36 | % | | | 2.10 | % | | | 1.83 | % |
Supplemental data | | | | | | | | | | | | | | | | | | | | | | | | | | | | |
Portfolio turnover rate | | | 3 | % | | | 29 | % | | | 20 | % | | | 21 | % | | | 36 | % | | | 8 | % | | | 51 | % |
Net assets, end of period (000s omitted) | | | $55,400 | | | | $63,632 | | | | $61,329 | | | | $57,431 | | | | $58,555 | | | | $60,655 | | | | $64,942 | |
| 1 | For the five months ended March 31, 2011. The Fund changed its fiscal year end from October 31 to March 31, effective March 31, 2011. |
| 2 | After the close of business on July 16, 2010, the Fund acquired the net assets of Evergreen Utility and Telecommunications Fund which became the accounting and performance survivor in the transaction. The information for the period prior to July 19, 2010 is that of Class C of Evergreen Utility and Telecommunications Fund. |
| 3 | Calculated based upon average shares outstanding |
| 4 | Total return calculations do not include any sales charges. Returns for periods of less than one year are not annualized. |
The accompanying notes are an integral part of these financial statements.
| | | | |
| 16 | | Wells Fargo Advantage Utility and Telecommunications Fund | | Financial highlights |
(For a share outstanding throughout each period)
| | | | | | | | | | | | | | | | | | | | | | | | | | | | |
| | | Six months ended
September 30, 2015 (unaudited) | | | Year ended March 31 | | | Year ended
October 31, 20102 | |
| ADMINISTRATOR CLASS | | | 2015 | | | 2014 | | | 2013 | | | 2012 | | | 20111 | | |
Net asset value, beginning of period | | | $18.25 | | | | $17.73 | | | | $15.86 | | | | $13.79 | | | | $12.59 | | | | $11.74 | | | | $11.10 | |
Net investment income | | | 0.25 | | | | 0.33 | | | | 0.40 | | | | 0.39 | | | | 0.30 | 3 | | | 0.12 | 3 | | | 0.06 | |
Net realized and unrealized gains (losses) on investments | | | (1.26 | ) | | | 0.56 | | | | 1.84 | | | | 2.07 | | | | 1.23 | | | | 0.89 | | | | 0.63 | |
| | | | | | | | | | | | | | | | | | | | | | | | | | | | |
Total from investment operations | | | (1.01 | ) | | | 0.89 | | | | 2.24 | | | | 2.46 | | | | 1.53 | | | | 1.01 | | | | 0.69 | |
Distributions to shareholders from | | | | | | | | | | | | | | | | | | | | | | | | | | | | |
Net investment income | | | (0.21 | ) | | | (0.37 | ) | | | (0.37 | ) | | | (0.39 | ) | | | (0.33 | ) | | | (0.16 | ) | | | (0.05 | ) |
Net asset value, end of period | | | $17.03 | | | | $18.25 | | | | $17.73 | | | | $15.86 | | | | $13.79 | | | | $12.59 | | | | $11.74 | |
Total return4 | | | (5.51 | )% | | | 5.01 | % | | | 14.41 | % | | | 18.16 | % | | | 12.32 | % | | | 8.70 | % | | | 6.22 | % |
Ratios to average net assets (annualized) | | | | | | | | | | | | | | | | | | | | | | | | | | | | |
Gross expenses | | | 1.08 | % | | | 1.06 | % | | | 1.04 | % | | | 1.04 | % | | | 1.01 | % | | | 1.04 | % | | | 1.14 | % |
Net expenses | | | 0.95 | % | | | 0.95 | % | | | 0.95 | % | | | 0.95 | % | | | 0.94 | % | | | 0.95 | % | | | 0.95 | % |
Net investment income | | | 2.68 | % | | | 1.79 | % | | | 2.38 | % | | | 2.66 | % | | | 2.32 | % | | | 2.37 | % | | | 2.23 | % |
Supplemental data | | | | | | | | | | | | | | | | | | | | | | | | | | | | |
Portfolio turnover rate | | | 3 | % | | | 29 | % | | | 20 | % | | | 21 | % | | | 36 | % | | | 8 | % | | | 51 | % |
Net assets, end of period (000s omitted) | | | $5,924 | | | | $8,365 | | | | $9,383 | | | | $5,803 | | | | $4,945 | | | | $3,904 | | | | $11 | |
| 1 | For the five months ended March 31, 2011. The Fund changed its fiscal year end from October 31 to March 31, effective March 31, 2011. |
| 2 | For the period from July 30, 2010 (commencement of class operations) to October 31, 2010 |
| 3 | Calculated based upon average shares outstanding |
| 4 | Returns for periods of less than one year are not annualized. |
The accompanying notes are an integral part of these financial statements.
| | | | | | |
| Financial highlights | | Wells Fargo Advantage Utility and Telecommunications Fund | | | 17 | |
(For a share outstanding throughout each period)
| | | | | | | | | | | | | | | | | | | | | | | | | | | | |
| | | Six months ended
September 30, 2015 (unaudited) | | | Year ended March 31 | | | Year ended
October 31, 20102 | |
| INSTITUTIONAL CLASS | | | 2015 | | | 2014 | | | 2013 | | | 2012 | | | 20111 | | |
Net asset value, beginning of period | | | $18.23 | | | | $17.74 | | | | $15.87 | | | | $13.80 | | | | $12.61 | | | | $11.74 | | | | $10.78 | |
Net investment income | | | 0.26 | 3 | | | 0.35 | 3 | | | 0.42 | | | | 0.46 | | | | 0.33 | | | | 0.16 | | | | 0.31 | 3 |
Net realized and unrealized gains (losses) on investments | | | (1.25 | ) | | | 0.54 | | | | 1.85 | | | | 2.03 | | | | 1.21 | | | | 0.87 | | | | 0.95 | |
| | | | | | | | | | | | | | | | | | | | | | | | | | | | |
Total from investment operations | | | (0.99 | ) | | | 0.89 | | | | 2.27 | | | | 2.49 | | | | 1.54 | | | | 1.03 | | | | 1.26 | |
Distributions to shareholders from | | | | | | | | | | | | | | | | | | | | | | | | | | | | |
Net investment income | | | (0.23 | ) | | | (0.40 | ) | | | (0.40 | ) | | | (0.42 | ) | | | (0.35 | ) | | | (0.16 | ) | | | (0.30 | ) |
Net asset value, end of period | | | $17.01 | | | | $18.23 | | | | $17.74 | | | | $15.87 | | | | $13.80 | | | | $12.61 | | | | $11.74 | |
Total return4 | | | (5.42 | )% | | | 5.02 | % | | | 14.58 | % | | | 18.34 | % | | | 12.42 | % | | | 8.85 | % | | | 11.75 | % |
Ratios to average net assets (annualized) | | | | | | | | | | | | | | | | | | | | | | | | | | | | |
Gross expenses | | | 0.82 | % | | | 0.79 | % | | | 0.79 | % | | | 0.80 | % | | | 0.77 | % | | | 0.81 | % | | | 0.86 | % |
Net expenses | | | 0.78 | % | | | 0.78 | % | | | 0.78 | % | | | 0.78 | % | | | 0.77 | % | | | 0.78 | % | | | 0.84 | % |
Net investment income | | | 2.89 | % | | | 1.89 | % | | | 2.56 | % | | | 2.97 | % | | | 2.50 | % | | | 3.22 | % | | | 2.73 | % |
Supplemental data | | | | | | | | | | | | | | | | | | | | | | | | | | | | |
Portfolio turnover rate | | | 3 | % | | | 29 | % | | | 20 | % | | | 21 | % | | | 36 | % | | | 8 | % | | | 51 | % |
Net assets, end of period (000s omitted) | | | $12,385 | | | | $14,156 | | | | $10,325 | | | | $8,317 | | | | $6,918 | | | | $6,909 | | | | $7,123 | |
| 1 | For the five months ended March 31, 2011. The Fund changed its fiscal year end from October 31 to March 31, effective March 31, 2011. |
| 2 | After the close of business on July 16, 2010, the Fund acquired the net assets of Evergreen Utility and Telecommunications Fund which became the accounting and performance survivor in the transaction. The information for the period prior to July 19, 2010 is that of Class I of Evergreen Utility and Telecommunications Fund. |
| 3 | Calculated based upon average shares outstanding |
| 4 | Returns for periods of less than one year are not annualized. |
The accompanying notes are an integral part of these financial statements.
| | | | |
| 18 | | Wells Fargo Advantage Utility and Telecommunications Fund | | Notes to financial statements (unaudited) |
1. ORGANIZATION
Wells Fargo Funds Trust (the “Trust”), a Delaware statutory trust organized on March 10, 1999, is an open-end management investment company registered under the Investment Company Act of 1940, as amended (the “1940 Act”). As an investment company, the Trust follows the accounting and reporting guidance in Financial Accounting Standards Board (“FASB”) Accounting Standards Codification Topic 946, Financial Services – Investment Companies. These financial statements report on the Wells Fargo Advantage Utility and Telecommunications Fund (the “Fund”) which is a non-diversified series of the Trust.
2. SIGNIFICANT ACCOUNTING POLICIES
The following significant accounting policies, which are consistently followed in the preparation of the financial statements of the Fund, are in conformity with U.S. generally accepted accounting principles which require management to make estimates and assumptions that affect the reported amounts of assets and liabilities, disclosure of contingent assets and liabilities at the date of the financial statements, and the reported amounts of revenues and expenses during the reporting period. Actual results could differ from those estimates.
Securities valuation
All investments are valued each business day as of the close of regular trading on the New York Stock Exchange (generally 4 p.m. Eastern Time).
Equity securities and options that are listed on a foreign or domestic exchange or market are valued at the official closing price or, if none, the last sales price. If no sale occurs on the primary exchange or market that day, the prior day’s price will be deemed “stale” and a fair value price will be determined in accordance with the Fund’s Valuation Procedures.
Equity securities that are not listed on a foreign or domestic exchange or market, but have a public trading market, are valued at the quoted bid price from an independent broker-dealer that the Management Valuation Team of Wells Fargo Funds Management, LLC (“Funds Management”) has determined is an acceptable source.
Non-listed OTC options are valued at the evaluated price provided by an independent pricing service or, if a reliable price is not available, the quoted bid price from an independent broker-dealer.
The values of securities denominated in foreign currencies are translated into U.S. dollars at rates provided by an independent foreign currency pricing source at a time each business day specified by the Management Valuation Team.
Many securities markets and exchanges outside the U.S. close prior to the close of the New York Stock Exchange and therefore may not fully reflect trading or events that occur after the close of the principal exchange in which the foreign securities are traded, but before the close of the New York Stock Exchange. If such trading or events are expected to materially affect the value of such securities, then fair value pricing procedures approved by the Board of Trustees of the Fund are applied. These procedures take into account multiple factors including movements in U.S. securities markets after foreign exchanges close. Foreign securities that are fair valued under these procedures are categorized as Level 2 and the application of these procedures may result in transfers between Level 1 and Level 2. Depending on market activity, such fair valuations may be frequent. Such fair value pricing may result in net asset values that are higher or lower than net asset values based on the last reported sales price or latest quoted bid price. On September 30, 2015, such fair value pricing was used in pricing foreign securities.
Debt securities are valued at the evaluated bid price provided by an independent pricing service or, if a reliable price is not available, the quoted bid price from an independent broker-dealer.
Investments in registered open-end investment companies are valued at net asset value. Interests in non-registered investment vehicles that are redeemable at net asset value are fair valued at net asset value when available.
Investments which are not valued using any of the methods discussed above are valued at their fair value, as determined in good faith by the Board of Trustees. The Board of Trustees has established a Valuation Committee comprised of the Trustees and has delegated to it the authority to take any actions regarding the valuation of portfolio securities that the Valuation Committee deems necessary or appropriate, including determining the fair value of portfolio securities, unless the determination has been delegated to the Management Valuation Team. The Board of Trustees retains the authority to make or ratify any valuation decisions or approve any changes to the Valuation Procedures as it deems appropriate. On a quarterly basis, the Board of Trustees receives reports on any valuation actions taken by the Valuation Committee or the Management Valuation Team which may include items for ratification.
Valuations of fair valued securities are compared to the next actual sales price when available, or other appropriate market values, to assess the continued appropriateness of the fair valuation methodologies used. These securities are fair
| | | | | | |
| Notes to financial statements (unaudited) | | Wells Fargo Advantage Utility and Telecommunications Fund | | | 19 | |
valued on a day-to-day basis, taking into consideration changes to appropriate market information and any significant changes to the inputs considered in the valuation process until there is a readily available price provided on an exchange or by an independent pricing service. Valuations received from an independent pricing service or independent broker-dealer quotes are periodically validated by comparisons to most recent trades and valuations provided by other independent pricing services in addition to the review of prices by the manager and/or subadviser. Unobservable inputs used in determining fair valuations are identified based on the type of security, taking into consideration factors utilized by market participants in valuing the investment, knowledge about the issuer and the current market environment.
Foreign currency translation
The accounting records of the Fund are maintained in U.S. dollars. The values of other assets and liabilities denominated in foreign currencies are translated into U.S. dollars at rates provided by an independent foreign currency pricing source at a time each business day specified by the Management Valuation Team. Purchases and sales of securities, and income and expenses are converted at the rate of exchange on the respective dates of such transactions. Net realized foreign exchange gains or losses arise from sales of foreign currencies, currency gains or losses realized between the trade and settlement dates on securities transactions, and the difference between the amounts of dividends, interest and foreign withholding taxes recorded and the U.S. dollar equivalent of the amounts actually paid or received. Net unrealized foreign exchange gains and losses arise from changes in the fair value of assets and liabilities other than investments in securities resulting from changes in exchange rates. The changes in net assets arising from changes in exchange rates and the changes in net assets resulting from changes in market prices of securities are not separately presented. Such changes are included in net realized and unrealized gains or losses from investments.
Security loans
The Fund may lend its securities from time to time in order to earn additional income in the form of fees or interest on securities received as collateral or the investment of any cash received as collateral. The Fund continues to receive interest or dividends on the securities loaned. The Fund receives collateral in the form of cash or securities with a value at least equal to the value of the securities on loan. The value of the loaned securities is determined at the close of each business day and any additional required collateral is delivered to the Fund on the next business day. In a securities lending transaction, the net asset value of the Fund will be affected by an increase or decrease in the value of the securities loaned and by an increase or decrease in the value of the instrument in which collateral is invested. The amount of securities lending activity undertaken by the Fund fluctuates from time to time. In the event of default or bankruptcy by the borrower, the Fund may be prevented from recovering the loaned securities or gaining access to the collateral or may experience delays or costs in doing so. In addition, the investment of any cash collateral received may lose all or part of its value. The Fund has the right under the lending agreement to recover the securities from the borrower on demand.
The Fund lends its securities through an unaffiliated securities lending agent. Cash collateral received in connection with its securities lending transactions is invested in Securities Lending Cash Investments, LLC (the “Securities Lending Fund”). The Securities Lending Fund is exempt from registration under Section 3(c)(7) of the 1940 Act and is managed by Funds Management and is subadvised by Wells Capital Management Incorporated (“WellsCap”). Funds Management receives an advisory fee starting at 0.05% and declining to 0.01% as the average daily net assets of the Securities Lending Fund increase. All of the fees received by Funds Management are paid to WellsCap for its services as subadviser. The Securities Lending Fund seeks to provide a positive return compared to the daily Fed Funds Open rate by investing in high-quality, U.S. dollar-denominated short-term money market instruments. Securities Lending Fund investments are fair valued based upon the amortized cost valuation technique. Income earned from investment in the Securities Lending Fund is included in securities lending income on the Statement of Operations.
Options
The Fund is subject to equity price risk in the normal course of pursuing its investment objectives. The Fund may write covered call options or secured put options on individual securities and/or indexes. When the Fund writes an option, an amount equal to the premium received is recorded as a liability and is subsequently adjusted to the current market value of the written option. Premiums received from written options that expire unexercised are recognized as realized gains on the expiration date. For exercised options, the difference between the premium received and the amount paid on effecting a closing purchase transaction, including brokerage commissions, is treated as a realized gain or loss. If a call option is exercised, the premium is added to the proceeds from the sale of the underlying security in calculating the realized gain or loss on the sale. If a put option is exercised, the premium reduces the cost of the security purchased. The Fund, as a writer of an option, bears the market risk of an unfavorable change in the price of the security and/or index underlying the written option.
| | | | |
| 20 | | Wells Fargo Advantage Utility and Telecommunications Fund | | Notes to financial statements (unaudited) |
The Fund may also purchase call or put options. The premium is included in the Statement of Assets and Liabilities as an investment, the value of which is subsequently adjusted based on the current market value of the option. Premiums paid for purchased options that expire are recognized as realized losses on the expiration date. Premiums paid for purchased options that are exercised or closed are added to the amount paid or offset against the proceeds received for the underlying security to determine the realized gain or loss. The risk of loss associated with purchased options is limited to the premium paid.
Options traded on an exchange are regulated and terms of the options are standardized. Purchased options traded over-the-counter expose the Fund to counterparty risk in the event the counterparty does not perform. This risk can be mitigated by having a master netting arrangement between the Fund and the counterparty and by having the counterparty post collateral to cover the Fund’s exposure to the counterparty.
Security transactions and income recognition
Securities transactions are recorded on a trade date basis. Realized gains or losses are recorded on the basis of identified cost.
Dividend income is recognized on the ex-dividend date, except for certain dividends from foreign securities, which are recorded as soon as the custodian verifies the ex-dividend date. Dividend income from foreign securities is recorded net of foreign taxes withheld where recovery of such taxes is not assured.
Interest income is accrued daily and bond discounts are accreted and premiums are amortized daily based on the effective interest method. To the extent debt obligations are placed on non-accrual status, any related interest income may be reduced by writing off interest receivables when the collection of all or a portion of interest has become doubtful based on consistently applied procedures. If the issuer subsequently resumes interest payments or when the collectability of interest is reasonably assured, the debt obligation is removed from non-accrual status.
Distributions to shareholders
Distributions to shareholders from net investment income and net realized gains, if any, are recorded on the ex-dividend date. Such distributions are determined in conformity with federal income tax regulations, which may differ in amount or character from net investment income and realized gains recognized for purposes of U.S. generally accepted accounting principles.
Federal and other taxes
The Fund intends to continue to qualify as a regulated investment company by distributing substantially all of its investment company taxable income and any net realized capital gains (after reduction for capital loss carryforwards) sufficient to relieve it from all, or substantially all, federal income taxes. Accordingly, no provision for federal income taxes was required.
The Fund’s income and federal excise tax returns and all financial records supporting those returns for the prior three fiscal years are subject to examination by the federal and Delaware revenue authorities. Management has analyzed the Fund’s tax positions taken on federal, state, and foreign tax returns for all open tax years and does not believe that there are any uncertain tax positions that require recognition of a tax liability.
As of March 31, 2015, the Fund had capital loss carryforwards available to offset future net realized capital gains in the amount of $23,415,460 expiring in 2017.
As of March 31, 2015, the Fund had $1,241,098 of current year deferred post-October capital losses which was recognized on the first day of the current fiscal year.
Class allocations
The separate classes of shares offered by the Fund differ principally in applicable sales charges, distribution, shareholder servicing, and administration fees. Class specific expenses are charged directly to that share class. Investment income, common expenses, and realized and unrealized gains (losses) on investments are allocated daily to each class of shares based on the relative proportion of net assets of each class.
3. FAIR VALUATION MEASUREMENTS
Fair value measurements of investments are determined within a framework that has established a fair value hierarchy based upon the various data inputs utilized in determining the value of the Fund’s investments. The three-level hierarchy gives the highest priority to unadjusted quoted prices in active markets for identical assets or liabilities (Level 1) and the lowest priority to significant unobservable inputs (Level 3). The Fund’s investments are classified within the fair value hierarchy based on the lowest level of input that is significant to the fair value measurement. The inputs are summarized into three broad levels as follows:
| | | | | | |
| Notes to financial statements (unaudited) | | Wells Fargo Advantage Utility and Telecommunications Fund | | | 21 | |
| n | | Level 1 – quoted prices in active markets for identical securities |
| n | | Level 2 – other significant observable inputs (including quoted prices for similar securities, interest rates, prepayment speeds, credit risk, use of amortized cost, etc.) |
| n | | Level 3 – significant unobservable inputs (including the Fund’s own assumptions in determining the fair value of investments) |
The inputs or methodologies used for valuing investments in securities are not necessarily an indication of the risk associated with investing in those securities.
The following is a summary of the inputs used in valuing the Fund’s assets and liabilities as of September 30, 2015:
| | | | | | | | | | | | | | | | |
| | | Quoted prices
(Level 1) | | | Other significant
observable inputs (Level 2) | | | Significant
unobservable inputs
(Level 3) | | | Total | |
Assets | | | | | | | | | | | | | | | | |
Investments in : | | | | | | | | | | | | | | | | |
| | | | |
Common stocks | | | | | | | | | | | | | | | | |
Consumer discretionary | | $ | 12,803,688 | | | $ | 0 | | | $ | 0 | | | $ | 12,803,688 | |
Energy | | | 24,772,926 | | | | 0 | | | | 0 | | | | 24,772,926 | |
Financials | | | 36,285,112 | | | | 0 | | | | 0 | | | | 36,285,112 | |
Industrials | | | 3,443,300 | | | | 0 | | | | 0 | | | | 3,443,300 | |
Information technology | | | 27,153,712 | | | | 3,219,441 | | | | 0 | | | | 30,373,153 | |
Telecommunications services | | | 23,151,250 | | | | 0 | | | | 0 | | | | 23,151,250 | |
Utilities | | | 220,762,984 | | | | 2,567,940 | | | | 0 | | | | 223,330,924 | |
| | | | |
Convertible debentures | | | 0 | | | | 762,500 | | | | 0 | | | | 762,500 | |
| | | | |
Exchange-traded funds | | | 470,205 | | | | 0 | | | | 0 | | | | 470,205 | |
| | | | |
Preferred stocks | | | | | | | | | | | | | | | | |
Financials | | | 0 | | | | 9,500,000 | | | | 0 | | | | 9,500,000 | |
| | | | |
Purchased put options | | | 0 | | | | 2,643,079 | | | | 0 | | | | 2,643,079 | |
| | | | |
Warrants | | | | | | | | | | | | | | | | |
Energy | | | 0 | | | | 456,320 | | | | 0 | | | | 456,320 | |
| | | | |
Short-term investments | | | | | | | | | | | | | | | | |
Investment companies | | | 7,887,500 | | | | 7,021,603 | | | | 0 | | | | 14,909,103 | |
Total assets | | $ | 356,730,677 | | | $ | 26,170,883 | | | $ | 0 | | | $ | 382,901,560 | |
Liabilities | | | | | | | | | | | | | | | | |
| | | | |
Written options | | $ | 0 | | | $ | 611 | | | $ | 0 | | | $ | 611 | |
Total liabilities | | $ | 0 | | | $ | 611 | | | $ | 0 | | | $ | 611 | |
The Fund recognizes transfers between levels within the fair value hierarchy at the end of the reporting period. At September 30, 2015, fair value pricing was used in pricing certain foreign securities and securities valued at $5,787,381 were transferred from Level 1 to Level 2 within the fair value hierarchy. In addition, previously broker quoted preferred stocks with a market value of $9,500,000 were transferred from Level 3 to Level 2 due to a change in valuation which is based on the underlying common stock.
4. TRANSACTIONS WITH AFFILIATES AND OTHER EXPENSES
Management fee
Funds Management, an indirect wholly owned subsidiary of Wells Fargo & Company (“Wells Fargo”), is the manager of the Fund and provides advisory and fund-level administrative services under an investment management agreement. Under the investment management agreement, Funds Management is responsible for, among other services, implementing the investment objectives and strategies of the Fund, supervising the applicable subadviser, providing fund-level administrative services in connection with the Fund’s operations, and providing any other fund-level administrative services reasonably necessary for the operation of the Fund. As compensation for its services under the investment management agreement, Funds Management is entitled to receive an annual management fee starting at 0.65% and declining to 0.48% as the average daily net assets of the Fund increase.
| | | | |
| 22 | | Wells Fargo Advantage Utility and Telecommunications Fund | | Notes to financial statements (unaudited) |
Prior to July 1, 2015, Funds Management provided advisory services pursuant to an investment advisory agreement and was entitled to receive an annual fee which started at 0.60% and declined to 0.45% as the average daily net assets of the Fund increased. In addition, fund-level administrative services were provided by Funds Management under a separate administration agreement at an annual fee which started at 0.05% and declined to 0.03% as the average daily net assets of the Fund increased. For financial statement purposes, the advisory fee and fund-level administration fee for the six months ended September 30, 2015 have been included in management fee on the Statement of Operations.
For the six months ended September 30, 2015, the management fee was equivalent to an annual rate of 0.65% of the Fund’s average daily net assets.
Funds Management has retained the services of a subadviser to provide daily portfolio management to the Fund. The fee for subadvisory services is borne by Funds Management. Crow Point Partners, LLC is the subadviser of the Fund and is entitled to receive a fee from Funds Management at an annual rate starting at 0.20% and declining to 0.10% as the average daily net assets of the Fund increase.
Administration fees
Under a class-level administration agreement, Funds Management provides class-level administrative services to the Fund, which includes paying fees and expenses for services provided by the transfer agent, sub-transfer agents, omnibus account servicers and record-keepers. As compensation for its services under the class-level administration agreement, Funds Management receives an annual fee which is calculated based on the average daily net assets of each class as follows:
| | | | | | | | |
| | | Class-level administration fee | |
| | | Current rate | | | Rate prior to
July 1, 2015 | |
Class A, Class B, Class C | | | 0.21 | % | | | 0.26 | % |
Administrator Class | | | 0.13 | | | | 0.10 | |
Institutional Class | | | 0.13 | | | | 0.08 | |
Funds Management has contractually waived and/or reimbursed management and administration fees to the extent necessary to maintain certain net operating expense ratios for the Fund. Waiver of fees and/or reimbursement of expenses by Funds Management were made first from fund level expenses on a proportionate basis and then from class specific expenses. Funds Management has committed through July 31, 2016 to waive fees and/or reimburse expenses to the extent necessary to cap the Fund’s expenses at 1.14% for Class A shares, 1.89% for Class B shares, 1.89% for Class C shares, 0.95% for Administrator Class shares, and 0.78% for Institutional Class shares. After this time, the cap may be increased or the commitment to maintain the cap may be terminated only with the approval of the Board of Trustees.
Distribution fees
The Trust has adopted a distribution plan for Class B and Class C shares of the Fund pursuant to Rule 12b-1 under the 1940 Act. Distribution fees are charged to Class B and Class C shares and paid to Wells Fargo Funds Distributor, LLC (“Funds Distributor”), the principal underwriter, at an annual rate of 0.75% of the average daily net assets of Class B and Class C shares.
In addition, Funds Distributor is entitled to receive the front-end sales charge from the purchase of Class A shares and a contingent deferred sales charge on the redemption of certain Class A shares. Funds Distributor is also entitled to receive the contingent deferred sales charges from redemptions of Class B and Class C shares. For the six months ended September 30, 2015, Funds Distributor received $5,592 from the sale of Class A shares and $271 in contingent deferred sales charges from redemptions of Class C shares.
Shareholder servicing fees
The Trust has entered into contracts with one or more shareholder servicing agents, whereby Class A, Class B, Class C, and Administrator Class of the Fund is charged a fee at an annual rate of 0.25% of the average daily net assets of each respective class.
A portion of these total shareholder servicing fees were paid to affiliates of Wells Fargo.
5. INVESTMENT PORTFOLIO TRANSACTIONS
Purchases and sales of investments, excluding U.S. government obligations (if any) and short-term securities, for the six months ended September 30, 2015 were $11,762,391 and $45,063,889, respectively
| | | | | | |
| Notes to financial statements (unaudited) | | Wells Fargo Advantage Utility and Telecommunications Fund | | | 23 | |
6. DERIVATIVE TRANSACTIONS
During the six months ended September 30, 2015, the Fund entered into written options for economic hedging purposes.
During the six months ended September 30, 2015, the Fund had written option activities as follows:
| | | | | | | | | | | | | | | | |
| | | Call options | | | Put options | |
| | | Number of contracts | | | Premiums
received | | | Number of
contracts | | | Premiums
received | |
Options outstanding at March 31, 2015 | | | 0 | | | $ | 0 | | | | 0 | | | $ | 0 | |
Options written | | | 2,000 | | | | 430,424 | | | | 369 | | | | 49,238 | |
Options expired | | | 0 | | | | 0 | | | | (369 | ) | | | (49,238 | ) |
Options closed | | | (500 | ) | | | (107,606 | ) | | | 0 | | | | 0 | |
Options exercised | | | 0 | | | | 0 | | | | 0 | | | | 0 | |
Options outstanding at September 30, 2015 | | | 1,500 | | | $ | 322,818 | | | | 0 | | | $ | 0 | |
Open call options written at September 30, 2015 were as follows:
| | | | | | | | | | | | |
| Expiration date | | Counterparty | | Number of contracts | | Strike price | | | Value | |
| 11-20-2015 | | The William Companies Incorporated | | 1,500 | | $ | 62.50 | | | $ | (611 | ) |
The Fund had an average of 1,074 written option contracts during the six months ended September 30, 2015. During the six months ended September 30, 2015, the Fund had an average of 1,082 purchased options contracts.
A summary of derivative instruments by primary risk exposure is outlined in the following tables.
The fair value of derivative instruments as of September 30, 2015 was as follows for the Fund:
| | | | | | | | | | | | |
| | | Asset derivatives | | | Liability derivatives | |
| | | Statement of Assets and
Liabilities location | | Fair value | | | Statement of Assets and
Liabilities location | | Fair value | |
Equity contracts | | Investments in unaffiliated securities, at value | | $ | 2,643,079 | * | | Payable for written options | | $ | 611 | |
| * | Amount relates to purchased options |
The effect of derivative instruments on the Statement of Operations for the six months ended September 30, 2015 was as follows for the Fund:
| | | | | | | | | | | | | | | | |
| | |
| | | Amount of realized gains (losses) on derivatives | | | Change in unrealized gains (losses) on derivatives | |
| | | Unaffiliated
securities | | | Written
options | | | Unaffiliated
securities | | | Written
options | |
Equity contracts | | $ | 0 | ** | | $ | 145,253 | | | $ | 2,252,723 | ** | | $ | 322,207 | |
| ** | Amount relates to purchased options |
For certain types of derivative transactions, the Fund has entered into International Swaps and Derivatives Association, Inc. master agreements (“ISDA Master Agreements”) or similar agreements with approved counterparties. The ISDA Master Agreements or similar agreements may have requirements to deliver/deposit securities or cash to/with an exchange or broker-dealer as collateral and allows the Fund to offset, with each counterparty, certain derivative financial instrument’s assets and/or liabilities with collateral held or pledged. Collateral requirements differ by type of derivative. Collateral or margin requirements are set by the broker or exchange clearing house for exchange traded derivatives while collateral terms are contract specific for over-the-counter traded derivatives. Cash collateral that has been pledged to cover obligations of the Fund under ISDA Master Agreements or similar agreements, if any, will be reported separately in the Statement of Assets and Liabilities. Securities pledged as collateral, if any, for the same purpose are noted in the Portfolio of Investments. With respect to balance sheet offsetting, absent an event of default by the counterparty or a termination of the agreement, the reported amounts of financial assets and financial liabilities in the Statement of Assets
| | | | |
| 24 | | Wells Fargo Advantage Utility and Telecommunications Fund | | Notes to financial statements (unaudited) |
and Liabilities are not offset across transactions between the Fund and the applicable counterparty. A reconciliation of the gross amounts on the Statement of Assets and Liabilities to the net amounts by derivative type, including any collateral exposure, is as follows:
| | | | | | | | | | | | | | | | |
| Derivative type | | Counterparty | | Gross amounts
of liabilities in the
Statement of
Assets and
Liabilities | | Amounts
subject to
netting
agreements | | | Collateral
pledged1 | | | Net amount
of liabilities | |
Written options | | The Williams Companies Incorporated | | $611 | | $ | 0 | | | $ | (611 | ) | | $ | 0 | |
| | 1 | Collateral pledged within this table is limited to the collateral for the net transaction with the counterparty. | |
7. BANK BORROWINGS
The Trust (excluding the money market funds) and Wells Fargo Variable Trust are parties to a $200,000,000 revolving credit agreement whereby the Fund is permitted to use bank borrowings for temporary or emergency purposes, such as to fund shareholder redemption requests. Interest under the credit agreement is charged to the Fund based on a borrowing rate equal to the higher of the Federal Funds rate in effect on that day plus 1.25% or the overnight LIBOR rate in effect on that day plus 1.25%. In addition, an annual commitment fee equal to 0.20% of the unused balance is allocated to each participating fund. Prior to September 1, 2015, the revolving credit agreement amount was $150,000,000 and the annual commitment fee was equal to 0.10% of the unused balance which was allocated to each participating fund. For the six months ended September 30, 2015, the Fund paid $322 in commitment fees.
For the six months ended September 30, 2015, there were no borrowings by the Fund under the agreement.
8. CONCENTRATION RISK
The Fund invests a substantial portion of its assets in utility and telecommunications companies and, therefore, may be more affected by changes in the utility and telecommunications sectors than would be a fund whose investments are not heavily weighted in any sector.
9. INDEMNIFICATION
Under the Trust’s organizational documents, the officers and Trustees have been granted certain indemnification rights against certain liabilities that may arise out of performance of their duties to the Trust. Additionally, in the normal course of business, the Trust may enter into contracts with service providers that contain a variety of indemnification clauses. The Trust’s maximum exposure under these arrangements is dependent on future claims that may be made against the Fund and, therefore, cannot be estimated.
| | | | | | |
| Other information (unaudited) | | Wells Fargo Advantage Utility and Telecommunications Fund | | | 25 | |
PROXY VOTING INFORMATION
A description of the policies and procedures that the Fund uses to determine how to vote proxies relating to portfolio securities is available, upon request, by calling 1-800-222-8222, visiting our website at wellsfargoadvantagefunds.com, or visiting the SEC website at sec.gov. Information regarding how the Fund voted proxies relating to portfolio securities during the most recent 12-month period ended June 30 is available on the Fund’s website at wellsfargoadvantagefunds.com or by visiting the SEC website at sec.gov.
PORTFOLIO HOLDINGS INFORMATION
The complete portfolio holdings for the Fund are publicly available monthly on the Fund’s website (wellsfargoadvantagefunds.com), on a one-month delayed basis. In addition, top ten holdings information (excluding derivative positions) for the Fund is publicly available on the Fund’s website on a monthly, seven-day or more delayed basis. The Fund files its complete schedule of portfolio holdings with the SEC for the first and third quarters of each fiscal year on Form N-Q, which is available by visiting the SEC website at sec.gov. In addition, the Fund’s Form N-Q may be reviewed and copied at the SEC’s Public Reference Room in Washington, DC, and at regional offices in New York City, at 233 Broadway, and in Chicago, at 175 West Jackson Boulevard, Suite 900. Information about the Public Reference Room may be obtained by calling 1-800-SEC-0330.
| | | | |
| 26 | | Wells Fargo Advantage Utility and Telecommunications Fund | | Other information (unaudited) |
BOARD OF TRUSTEES AND OFFICERS
Each of the Trustees and Officers1 listed in the table below acts in identical capacities for each fund in the Wells Fargo Advantage family of funds, which consists of 144 mutual funds comprising the Wells Fargo Funds Trust, Wells Fargo Variable Trust, Wells Fargo Master Trust and four closed-end funds (collectively the “Fund Complex”). This table should be read in conjunction with the Prospectus and the Statement of Additional Information2. The mailing address of each Trustee and Officer is 525 Market Street, 12th Floor, San Francisco, CA 94105. Each Trustee and Officer serves an indefinite term, however, each Trustee serves such term until reaching the mandatory retirement age established by the Trustees.
Independent Trustees
| | | | | | |
Name and year of birth | | Position held and length of service* | | Principal occupations during past five years or longer | | Other public company or
investment company
directorships during
past 5 years |
William R. Ebsworth
(Born 1957) | | Trustee, since 2015** | | Retired. From 1984 to 2013, equities analyst, portfolio manager, research director at Fidelity Management and Research Company and retired in 2013 as Chief Investment Officer of Fidelity Strategic Advisers, Inc. in Boston, Tokyo, and Hong Kong where he led a team of investment professionals managing client assets. Prior thereto, Board member of Hong Kong Securities Clearing Co., Hong Kong Options Clearing Corp., the Thailand International Fund, Ltd., Fidelity Investments Life Insurance Company, and Empire Fidelity Investments Life Insurance Company. Mr. Ebsworth is a CFA® charterholder and an Adjunct Lecturer, Finance, at Babson College. | | Asset Allocation Trust |
Jane A. Freeman
(Born 1953) | | Trustee, since 2015** | | Retired. From 2012 to 2014 and 1999 to 2008, Chief Financial Officer of Scientific Learning Corporation. From 2008 to 2012, Ms. Freeman provided consulting services related to strategic business projects. Prior to 1999, Portfolio Manager at Rockefeller & Co. and Scudder, Stevens & Clark. Board member of the Harding Loevner Funds from 1996 to 2014, serving as both Lead Independent Director and chair of the Audit Committee. Board member of the Russell Exchange Traded Funds Trust from 2011 to 2012 and the chair of the Audit Committee. Ms. Freeman is Chair of Taproot Foundation (non-profit organization), a Board Member of Ruth Bancroft Garden (non-profit organization) and an inactive chartered financial analyst. | | Asset Allocation Trust; Harding Harding Loevner Funds; Russell Exchange Traded Funds Trust |
Peter G. Gordon
(Born 1942) | | Trustee, since 1998; Chairman, since 2005 | | Co-Founder, Retired Chairman, President and CEO of Crystal Geyser Water Company. Trustee Emeritus, Colby College. | | Asset Allocation Trust |
Isaiah Harris, Jr.
(Born 1952) | | Trustee, since 2009 | | Retired. Chairman of the Board of CIGNA Corporation since 2009, and Director since 2005. From 2003 to 2011, Director of Deluxe Corporation. Prior thereto, President and CEO of BellSouth Advertising and Publishing Corp. from 2005 to 2007, President and CEO of BellSouth Enterprises from 2004 to 2005 and President of BellSouth Consumer Services from 2000 to 2003. Emeritus member of the Iowa State University Foundation Board of Governors. Emeritus Member of the Advisory Board of Iowa State University School of Business. Advisory Board Member, Palm Harbor Academy (charter school). Mr. Harris is a certified public accountant. | | CIGNA Corporation; Asset Allocation Trust |
Judith M. Johnson
(Born 1949) | | Trustee, since 2008; Audit Committee Chairman, since 2008 | | Retired. Prior thereto, Chief Executive Officer and Chief Investment Officer of Minneapolis Employees Retirement Fund from 1996 to 2008. Ms. Johnson is an attorney, certified public accountant and a certified managerial accountant. | | Asset Allocation Trust |
David F. Larcker
(Born 1950) | | Trustee, since 2009 | | James Irvin Miller Professor of Accounting at the Graduate School of Business, Stanford University, Morgan Stanley Director of the Center for Leadership Development and Research and Senior Faculty of The Rock Center for Corporate Governance since 2006. From 2005 to 2008, Professor of Accounting at the Graduate School of Business, Stanford University. Prior thereto, Ernst & Young Professor of Accounting at The Wharton School, University of Pennsylvania from 1985 to 2005. | | Asset Allocation Trust |
| | | | | | |
| Other information (unaudited) | | Wells Fargo Advantage Utility and Telecommunications Fund | | | 27 | |
| | | | | | |
Name and year of birth | | Position held and length of service* | | Principal occupations during past five years or longer | | Other public company or
investment company
directorships during
past 5 years |
Olivia S. Mitchell
(Born 1953) | | Trustee, since 2006 | | International Foundation of Employee Benefit Plans Professor, Wharton School of the University of Pennsylvania since 1993. Director of Wharton’s Pension Research Council and Boettner Center on Pensions & Retirement Research, and Research Associate at the National Bureau of Economic Research. Previously, Cornell University Professor from 1978 to 1993. | | Asset Allocation Trust |
Timothy J. Penny
(Born 1951) | | Trustee, since 1996 | | President and Chief Executive Officer of Southern Minnesota Initiative Foundation, a non-profit organization, since 2007 and Senior Fellow at the Humphrey Institute Policy Forum at the University of Minnesota since 1995. Member of the Board of Trustees of NorthStar Education Finance, Inc., a non-profit organization, since 2007. | | Asset Allocation Trust |
Michael S. Scofield
(Born 1943) | | Trustee, since 2010 | | Served on the Investment Company Institute’s Board of Governors and Executive Committee from 2008-2011 as well the Governing Council of the Independent Directors Council from 2006-2011 and the Independent Directors Council Executive Committee from 2008-2011. Chairman of the IDC from 2008-2010. Institutional Investor (Fund Directions) Trustee of Year in 2007. Trustee of the Evergreen Funds complex (and its predecessors) from 1984 to 2010. Chairman of the Evergreen Funds from 2000-2010. Former Trustee of the Mentor Funds. Retired Attorney, Law Offices of Michael S. Scofield. | | Asset Allocation Trust |
Donald C. Willeke
(Born 1940) | | Trustee, since 1996 | | Principal of the law firm of Willeke & Daniels. General Counsel of the Minneapolis Employees Retirement Fund from 1984 until its consolidation into the Minnesota Public Employees Retirement Association on June 30, 2010. Director and Vice Chair of The Tree Trust (non-profit corporation). Director of the American Chestnut Foundation (non-profit corporation). | | Asset Allocation Trust |
| * | Length of service dates reflect the Trustee’s commencement of service with the Trust’s predecessor entities, where applicable. |
| ** | William R. Ebsworth and Jane A. Freeman each became a Trustee effective January 1, 2015. |
Officers
| | | | | | |
Name and year of birth | | Position held and
length of service | | Principal occupations during past five years or longer | | |
Karla M. Rabusch
(Born 1959) | | President, since 2003 | | Executive Vice President of Wells Fargo Bank, N.A. and President of Wells Fargo Funds Management, LLC since 2003. | | |
Nancy Wiser1
(Born 1967) | | Treasurer, since 2012 | | Executive Vice President of Wells Fargo Funds Management, LLC since 2011. Chief Operating Officer and Chief Compliance Officer at LightBox Capital Management LLC, from 2008 to 2011. | | |
| C. David Messman (Born 1960) | | Secretary, since 2000; Chief Legal Officer, since 2003 | | Senior Vice President and Secretary of Wells Fargo Funds Management, LLC since 2001. Assistant General Counsel of Wells Fargo Bank, N.A. since 2013 and Vice President and Managing Counsel of Wells Fargo Bank N.A. from 1996 to 2013. | | |
Debra Ann Early
(Born 1964) | | Chief Compliance Officer, since 2007 | | Executive Vice President of Wells Fargo Funds Management, LLC since 2014, Senior Vice President and Chief Compliance Officer from 2007 to 2014. | | |
David Berardi
(Born 1975) | | Assistant Treasurer, since 2009 | | Vice President of Wells Fargo Funds Management, LLC since 2009. Vice President of Evergreen Investment Management Company, LLC from 2008 to 2010. Manager of Fund Reporting and Control for Evergreen Investment Management Company, LLC from 2004 to 2010. | | |
Jeremy DePalma1
(Born 1974) | | Assistant Treasurer, since 2009 | | Senior Vice President of Wells Fargo Funds Management, LLC since 2009. Senior Vice President of Evergreen Investment Management Company, LLC from 2008 to 2010 and head of the Fund Reporting and Control Team within Fund Administration from 2005 to 2010. | | |
| 1 | Nancy Wiser acts as Treasurer of 72 funds in the Fund Complex. Jeremy DePalma acts as Treasurer of 72 funds and Assistant Treasurer of 72 funds in the Fund Complex. |
| 2 | The Statement of Additional Information includes additional information about the Trustees and is available, without charge, upon request, by calling 1-800-222-8222 or by visiting the website at wellsfargoadvantagefunds.com. |
| | | | |
| 28 | | Wells Fargo Advantage Utility and Telecommunications Fund | | Other information (unaudited) |
BOARD CONSIDERATION OF INVESTMENT ADVISORY, INVESTMENT MANAGEMENT AND SUB-ADVISORY AGREEMENTS:
Under the Investment Company Act of 1940 (the “1940 Act”), the Board of Trustees (the “Board”) of Wells Fargo Funds Trust (the “Trust”) must determine annually whether to approve the continuation of the Trust’s investment advisory and sub-advisory agreements. In this regard, at an in-person meeting held on May 19-20, 2015 (the “Meeting”), the Board, all the members of which have no direct or indirect interest in the investment advisory and sub-advisory agreements and are not “interested persons” of the Trust, as defined in the 1940 Act (the “Independent Trustees”), reviewed and approved for Wells Fargo Advantage Utility and Telecommunications Fund (the “Fund”): (i) an investment advisory agreement (the “Advisory Agreement”) with Wells Fargo Funds Management, LLC (“Funds Management”); (ii) an investment management agreement (the “Management Agreement”) with Funds Management; and (iii) an investment sub-advisory agreement (the “Sub-Advisory Agreement”) with Crow Point Partners, LLC (the “Sub-Adviser”). The Management Agreement combines the terms of the Advisory Agreement with the terms of the Fund’s Amended and Restated Administration Agreement (the “Administration Agreement”) applicable to Fund-level administrative services. The Advisory Agreement, the Management Agreement and the Sub-Advisory Agreement are collectively referred to as the “Advisory Agreements.”
At the Meeting, the Board considered the factors and reached the conclusions described below relating to the selection of Funds Management and the Sub-Adviser and the approval of the Advisory Agreements. Prior to the Meeting, including at an in-person meeting in March 2015, the Trustees conferred extensively among themselves and with representatives of Funds Management about these matters. Also, the Board has adopted a team-based approach, with each team consisting of a sub-set of Trustees, to assist the full Board in the discharge of its duties in reviewing performance and other matters throughout the year. The Independent Trustees were assisted in their evaluation of the Advisory Agreements by independent legal counsel, from whom they received separate legal advice and with whom they met separately.
In providing information to the Board, Funds Management and the Sub-Adviser were guided by a detailed set of requests for information submitted to them by independent legal counsel on behalf of the Independent Trustees at the start of the Board’s annual contract renewal process earlier in 2015. In considering and approving the Advisory Agreements, the Trustees considered the information they believed relevant, including but not limited to the information discussed below. The Board considered not only the specific information presented in connection with the Meeting, but also the knowledge gained over time through interaction with Funds Management and the Sub-Adviser about various topics. In this regard, the Board reviewed reports of Funds Management at each of its quarterly meetings, which included, among other things, portfolio reviews and performance reports. In addition, the Board and the teams mentioned above confer with portfolio managers at various times throughout the year. The Board did not identify any particular information or consideration that was all-important or controlling, and each individual Trustee may have attributed different weights to various factors.
After its deliberations, the Board unanimously approved the continuation of the Advisory Agreement for the period from June 1, 2015 through June 30, 2015, approved the Management Agreement for the period from July 1, 2015 through May 31, 2016, and approved the continuation of the Sub-Advisory Agreement for a one-year term through May 31, 2016. The Board also determined that the compensation payable to Funds Management and the Sub-Adviser under each of the Advisory Agreements was reasonable. The Board considered the approval of the Advisory Agreements for the Fund as part of its consideration of agreements for funds across the complex, but its approvals were made on a fund-by-fund basis. The following summarizes a number of important, but not necessarily all, factors considered by the Board in support of its approvals.
Nature, extent and quality of services
The Board received and considered various information regarding the nature, extent and quality of services provided to the Fund by Funds Management and the Sub-Adviser under the Advisory Agreements. This information included, among other things, a summary of the background and experience of senior management of Funds Management, and the qualifications, background, tenure and responsibilities of each of the portfolio managers primarily responsible for the day-to-day portfolio management of the Fund. The Board noted that the services to be provided to the Fund pursuant to the Management Agreement combined the advisory services previously provided to the Fund pursuant to the Fund’s Advisory Agreement with the Fund-level administrative services previously provided to the Fund pursuant to the Fund’s Administration Agreement. The Board received a representation from Funds Management that combining these services would not result in any change to the nature or level of services provided by Funds Management to the Fund.
| | | | | | |
| Other information (unaudited) | | Wells Fargo Advantage Utility and Telecommunications Fund | | | 29 | |
The Board evaluated the ability of Funds Management and the Sub-Adviser to attract and retain qualified investment professionals, including research, advisory and supervisory personnel. The Board further considered the compliance programs and compliance records of Funds Management and the Sub-Adviser. In addition, the Board took into account the full range of services provided to the Fund by Funds Management and its affiliates.
Fund performance and expenses
The Board considered the performance results for the Fund over various time periods ended March 31, 2015. The Board considered these results in comparison to the performance of funds in a universe that was determined by Lipper Inc. (“Lipper”) to be similar to the Fund (the “Universe”), and in comparison to the Fund’s benchmark index and to other comparative data. Lipper is an independent provider of investment company data. The Board received a description of the methodology used by Lipper to select the mutual funds in the performance Universe. The Board noted that the performance of the Fund (Class A) was higher than or in range of the average performance of the Universe for all periods under review except the first quarter of 2015 and the one-year period. The Board also noted that the performance of the Fund was higher than or in range of its benchmark, the S&P Utilities Index, for all periods under review except the one- and five-year periods.
The Board received information concerning, and discussed factors contributing to, the underperformance of the Fund relative to the Universe and benchmark for the periods noted above. The Board took note of the explanations for the relative underperformance in these periods, including with respect to investment decisions and market factors that affected the Fund’s performance, and of longer term outperformance.
The Board also received and considered information regarding the Fund’s net operating expense ratios and their various components, including actual management fees (which reflect fee waivers, if any, and include advisory, administration and transfer agent fees), custodian and other non-management fees, and Rule 12b-1 and non-Rule 12b-1 service fees. The Board considered these ratios in comparison to the median ratios of funds in class-specific expense groups that were determined by Lipper to be similar to the Fund (the “Groups”). The Board received a description of the methodology used by Lipper to select the mutual funds in the expense Groups and an explanation of how funds comprising expense groups and their expense ratios may vary from year-to-year. Based on the Lipper reports, the Board noted that the net operating expense ratios of the Fund were lower than or equal to the median net operating expense ratios of the expense Groups.
The Board took into account the Fund performance and expense information provided to it among the factors considered in deciding to re-approve the Advisory Agreement and Sub-Advisory Agreement and approve the Management Agreement.
Investment advisory and sub-advisory fee rates
The Board reviewed and considered the contractual investment advisory fee rates that are payable by the Fund to Funds Management for investment advisory services (the “Advisory Agreement Rates”), both on a stand-alone basis and on a combined basis with the Fund’s fund-level and class-level contractual administration fee rates (the “Management Rates”). The Board noted that the Management Rates include transfer agency and sub-transfer agency costs. The Board also noted that the fee rate to be paid by the Fund under the Management Agreement will incorporate the advisory fee and Fund-level administration fee previously payable separately by the Fund under the Fund’s Advisory Agreement and Administration Agreement with Funds Management. The Board also reviewed and considered the contractual investment sub-advisory fee rates that are payable by Funds Management to the Sub-Adviser for investment sub-advisory services (the “Sub-Advisory Agreement Rates”).
Among other information reviewed by the Board was a comparison of the Management Rates of the Fund with those of other funds in the expense Groups at a common asset level. The Board noted that the Management Rates for the Fund were lower than or in range of the Fund’s expense Groups for all share classes.
The Board also received and considered information about the portion of the total advisory fee that was retained by Funds Management after payment of the fee to the Sub-Adviser for sub-advisory services. The Board considered this amount in comparison to the median amount retained by advisers to funds in a sub-advised expense universe that was determined by Lipper to be similar to the Fund. In assessing the reasonableness of this amount, the Board received and evaluated information about the nature and extent of responsibilities retained and risks assumed by Funds Management and not delegated to or assumed by the Sub-Adviser, and about Funds Management’s on-going oversight services. The Board also considered that the sub-advisory fees paid to the Sub-Adviser had been negotiated by Funds Management on an arm’s length basis.
The Board also received and considered information about the nature and extent of services offered and fee rates charged by Funds Management and the Sub-Adviser to other types of clients with investment strategies similar to those
| | | | |
| 30 | | Wells Fargo Advantage Utility and Telecommunications Fund | | Other information (unaudited) |
of the Fund. In this regard, the Board received information about the significantly greater scope of services, and compliance, reporting and other legal burdens and risks of managing mutual funds compared with those associated with managing assets of non-mutual fund clients such as collective funds or institutional separate accounts.
Based on its consideration of the factors and information it deemed relevant, including those described here, the Board determined that the compensation payable to Funds Management under the Management Agreement and Advisory Agreement and to the Sub-Adviser under the Sub-Advisory Agreement was reasonable, in light of the services covered by the Advisory Agreements.
Profitability
The Board received and considered information concerning the profitability of Funds Management, as well as the profitability of Wells Fargo as a whole, from providing services to the Fund and the fund family as a whole. Funds Management reported on the methodologies and estimates used in calculating profitability. Among other things, the Board noted that the levels of profitability reported on a fund-by-fund basis varied widely, depending on factors such as the size and type of fund. The Board did not consider profitability with respect to the Sub-Adviser, as the sub-advisory fees paid to the Sub-Adviser had been negotiated by Funds Management on an arm’s-length basis.
Based on its review, the Board did not deem the profits reported by Funds Management to be at a level that would prevent it from approving the continuation of the Advisory Agreements.
Economies of scale
With respect to possible economies of scale, the Board noted the existence of breakpoints in the Fund’s advisory and management fee structures, and the Fund’s administration fee structure, which operate generally to reduce the Fund’s expense ratios as the Fund grows in size. It considered that, for a small fund or a fund that shrinks in size, breakpoints conversely can result in higher fee levels. The Board also considered that fee waiver and expense reimbursement arrangements and competitive fee rates at the outset are means of sharing potential economies of scale with shareholders of the Fund and the fund family as a whole. The Board considered Funds Management’s view that any analyses of potential economies of scale in managing a particular fund are inherently limited in light of the joint and common costs and investments that Funds Management incurs across the fund family as a whole.
The Board concluded that the Fund’s fee and expense arrangements, including contractual breakpoints, constituted a reasonable approach to sharing potential economies of scale with the Fund and its shareholders.
Other benefits to Funds Management and the Sub-Adviser
The Board received and considered information regarding potential “fall-out” or ancillary benefits received by Funds Management, the Sub-Adviser, and their affiliates as a result of their relationships with the Fund. Ancillary benefits could include, among others, benefits directly attributable to other relationships with the Fund and benefits potentially derived from an increase in Funds Management’s and the Sub-Adviser’s business as a result of their relationships with the Fund. The Board noted that various affiliates of Funds Management may receive distribution-related fees, shareholder servicing payments and sub-transfer agency fees in respect of shares sold or held through them and services provided.
The Board also reviewed information about soft dollar credits earned and utilized by the Sub-Adviser, fees earned by Funds Management from managing a private investment vehicle for the fund family’s securities lending collateral and commissions earned by an affiliated broker from portfolio transactions.
Based on its consideration of the factors and information it deemed relevant, including those described here, the Board did not find that any ancillary benefits received by Funds Management, the Sub-Adviser, and their affiliates were unreasonable.
Conclusion
At the Meeting, after considering the above-described factors and based on its deliberations and its evaluation of the information described above, the Board unanimously approved the continuation of the Advisory Agreement for the period from June 1, 2015 through June 30, 2015, approved the Management Agreement for the period from July 1, 2015 through May 31, 2016, and approved the continuation of the Sub-Advisory Agreement for a one-year term through May 31, 2016. The Board also determined that the compensation payable to Funds Management and the Sub-Adviser under each of the Advisory Agreements was reasonable.
| | | | | | |
| List of abbreviations | | Wells Fargo Advantage Utility and Telecommunications Fund | | | 31 | |
The following is a list of common abbreviations for terms and entities that may have appeared in this report.
| ACA | — ACA Financial Guaranty Corporation |
| ADR | — American depositary receipt |
| ADS | — American depositary shares |
| AGC | — Assured Guaranty Corporation |
| AGM | — Assured Guaranty Municipal |
| Ambac | — Ambac Financial Group Incorporated |
| AMT | — Alternative minimum tax |
| BAN | — Bond anticipation notes |
| BHAC | — Berkshire Hathaway Assurance Corporation |
| CAB | — Capital appreciation bond |
| CCAB | — Convertible capital appreciation bond |
| CDA | — Community Development Authority |
| CDO | — Collateralized debt obligation |
| DRIVER | — Derivative inverse tax-exempt receipts |
| DW&P | — Department of Water & Power |
| DWR | — Department of Water Resources |
| ECFA | — Educational & Cultural Facilities Authority |
| EDA | — Economic Development Authority |
| EDFA | — Economic Development Finance Authority |
| ETF | — Exchange-traded fund |
| FDIC | — Federal Deposit Insurance Corporation |
| FFCB | — Federal Farm Credit Banks |
| FGIC | — Financial Guaranty Insurance Corporation |
| FHA | — Federal Housing Administration |
| FHLB | — Federal Home Loan Bank |
| FHLMC | — Federal Home Loan Mortgage Corporation |
| FICO | — The Financing Corporation |
| FNMA | — Federal National Mortgage Association |
| GDR | — Global depositary receipt |
| GNMA | — Government National Mortgage Association |
| HCFR | — Healthcare facilities revenue |
| HEFA | — Health & Educational Facilities Authority |
| HEFAR | — Higher education facilities authority revenue |
| HFA | — Housing Finance Authority |
| HFFA | — Health Facilities Financing Authority |
| HUD | — Department of Housing and Urban Development |
| IDA | — Industrial Development Authority |
| IDAG | — Industrial Development Agency |
| KRW | — Republic of Korea won |
| LIBOR | — London Interbank Offered Rate |
| LIFER | — Long Inverse Floating Exempt Receipts |
| LLC | — Limited liability company |
| LLLP | — Limited liability limited partnership |
| LLP | — Limited liability partnership |
| MBIA | — Municipal Bond Insurance Association |
| MFHR | — Multifamily housing revenue |
| MSTR | — Municipal securities trust receipts |
| MUD | — Municipal Utility District |
| National | — National Public Finance Guarantee Corporation |
| PCFA | — Pollution Control Financing Authority |
| PCL | — Public Company Limited |
| PCR | — Pollution control revenue |
| PFA | — Public Finance Authority |
| PFFA | — Public Facilities Financing Authority |
| PFOTER | — Puttable floating option tax-exempt receipts |
| plc | — Public limited company |
| PUTTER | — Puttable tax-exempt receipts |
| R&D | — Research & development |
| Radian | — Radian Asset Assurance |
| RAN | — Revenue anticipation notes |
| RDA | — Redevelopment Authority |
| RDFA | — Redevelopment Finance Authority |
| REIT | — Real estate investment trust |
| ROC | — Reset option certificates |
| SAVRS | — Select auction variable rate securities |
| SBA | — Small Business Authority |
| SDR | — Swedish depositary receipt |
| SFHR | — Single-family housing revenue |
| SFMR | — Single-family mortgage revenue |
| SPA | — Standby purchase agreement |
| SPDR | — Standard & Poor’s Depositary Receipts |
| SPEAR | — Short Puttable Exempt Adjustable Receipts |
| STRIPS | — Separate trading of registered interest and |
| TAN | — Tax anticipation notes |
| TIPS | — Treasury inflation-protected securities |
| TRAN | — Tax revenue anticipation notes |
| TTFA | — Transportation Trust Fund Authority |
| TVA | — Tennessee Valley Authority |
This page is intentionally left blank.


For more information
More information about Wells Fargo Advantage Funds is available free upon request. To obtain literature, please write, email, visit the Fund’s website, or call:
Wells Fargo Advantage Funds
P.O. Box 8266
Boston, MA 02266-8266
Email: wfaf@wellsfargo.com
Website: wellsfargoadvantagefunds.com
Individual investors: 1-800-222-8222
Retail investment professionals: 1-888-877-9275
Institutional investment professionals: 1-866-765-0778
This report and the financial statements contained herein are submitted for the general information of the shareholders of Wells Fargo Advantage Funds. If this report is used for promotional purposes, distribution of the report must be accompanied or preceded by a current prospectus. Before investing, please consider the investment objectives, risks, charges, and expenses of the investment. For a current prospectus and, if available, a summary prospectus, containing this information, call 1-800-222-8222 or visit the Fund’s website at wellsfargoadvantagefunds.com. Read the prospectus carefully before you invest or send money.
Wells Fargo Funds Management, LLC, a wholly owned subsidiary of Wells Fargo & Company, provides investment advisory and administrative services for Wells Fargo Advantage Funds. Other affiliates of Wells Fargo & Company provide subadvisory and other services for the Funds. The Funds are distributed by Wells Fargo Funds Distributor, LLC, Member FINRA, an affiliate of Wells Fargo & Company.
NOT FDIC INSURED ¡ NO BANK GUARANTEE ¡ MAY LOSE VALUE
© 2015 Wells Fargo Funds Management, LLC. All rights reserved.
| | |
 | | 237489 11-15 SA318/SAR318 09-15 |
ITEM 2. CODE OF ETHICS
Not applicable.
ITEM 3. AUDIT COMMITTEE FINANCIAL EXPERT
Not applicable.
ITEM 4. PRINCIPAL ACCOUNTANT FEES AND SERVICES
Not applicable.
ITEM 5. AUDIT COMMITTEE OF LISTED REGISTRANTS
Not applicable.
ITEM 6. INVESTMENTS
A Portfolio of investments for each series is included as part of the report to shareholders filed under Item 1 of this Form.
ITEM 7. DISCLOSURE OF PROXY VOTING POLICIES AND PROCEDURES FOR CLOSED-END MANAGEMENT INVESTMENT COMPANIES
Not applicable.
ITEM 8. PORTFOLIO MANAGERS OF CLOSED-END MANAGEMENT INVESTMENT COMPANIES
Not applicable.
ITEM 9. PURCHASES OF EQUITY SECURITIES BY CLOSED-END MANAGEMEENT INVESTMENT COMPANY AND AFFILIATED PURCHASERS
Not applicable.
ITEM 10. SUBMISSION OF MATTERS TO A VOTE OF SECURITY HOLDERS
There have been no material changes to the procedures by which shareholders may recommend nominees to the registrant’s Board of Trustees that have been implemented since the registrant’s last provided disclosure in response to the requirements of this Item.
ITEM 11. CONTROLS AND PROCEDURES
(a) The President and Treasurer have concluded that the Wells Fargo Funds Trust (the “Trust”) disclosure controls and procedures (as defined in Rule 30a-3(c) under the Investment Company Act of 1940) provide reasonable assurances that material information relating to the Trust is made known to them by the appropriate persons, based on their evaluation of these controls and procedures as of a date within 90 days of the filing of this report.
(b) There were no significant changes in the Trust’s internal controls over financial reporting (as defined in Rule 30a-3(d) under the Investment Company Act of 1940) that occurred during the second fiscal quarter of the period covered by this report that materially affected, or is reasonably likely to materially affect, the registrant’s internal control over financial reporting.
ITEM 12. EXHIBITS
(a) (1) Not applicable.
(a) (2) Certification pursuant to Rule 30a-2(a) under the Investment Company Act of 1940 (17 CFR 270.30a-2(a)) is filed and attached hereto as Exhibit 99.CERT.
(a) (3) Not applicable.
(b) Certification pursuant to Rule 30a-2(b) under the Investment Company Act of 1940 (17 CFR 270.30a-2(b)) is filed and attached hereto as Exhibit 99.906CERT.
SIGNATURES
Pursuant to the requirements of the Securities Exchange Act of 1934 and the Investment Company Act of 1940, the registrant has duly caused this report to be signed on its behalf by the undersigned, thereunto duly authorized.
| | |
| Wells Fargo Funds Trust |
| |
| By: | | /s/ Karla M. Rabusch |
| |
| | Karla M. Rabusch |
| | President |
| |
| Date: | | November 24, 2015 |
Pursuant to the requirements of the Securities Exchange Act of 1934 and the Investment Company Act of 1940, this report has been signed below by the following persons on behalf of the registrant and in the capacities and on the date indicated.
| | |
| Wells Fargo Funds Trust |
| |
| By: | | /s/ Karla M. Rabusch |
| |
| | Karla M. Rabusch |
| | President |
| |
| Date: | | November 24, 2015 |
| |
| By: | | /s/ Nancy Wiser |
| |
| | Nancy Wiser |
| | Treasurer |
| |
| Date: | | November 24, 2015 |