
UNITED STATES
SECURITIES AND EXCHANGE COMMISSION
Washington, D.C. 20549
FORM N-CSRS
CERTIFIED SHAREHOLDER REPORT OF REGISTERED
MANAGEMENT INVESTMENT COMPANIES
Investment Company Act file number: 811-09253
Wells Fargo Funds Trust
(Exact name of registrant as specified in charter)
525 Market St., San Francisco, CA 94105
(Address of principal executive offices) (Zip code)
C. David Messman
Wells Fargo Funds Management, LLC
525 Market St., San Francisco, CA 94105
(Name and address of agent for service)
Registrant’s telephone number, including area code: 800-222-8222
Date of fiscal year end: May 31 Registrant is making a filing for 28 of its series:
Wells Fargo Dynamic Target Today, Wells Fargo Dynamic Target 2015, Wells Fargo Dynamic Target 2020, Wells Fargo Dynamic Target 2025, Wells Fargo Dynamic Target 2030, Wells Fargo Dynamic Target 2035, Wells Fargo Dynamic Target 2040, Wells Fargo Dynamic Target 2045, Wells Fargo Dynamic Target 2050, Wells Fargo Dynamic Target 2055, Wells Fargo Dynamic Target 2060, Wells Fargo Growth Balanced Fund, Wells Fargo Moderate Balanced Fund, Wells Fargo C&B Large Cap Value Fund, Wells Fargo Diversified Equity Fund, Wells Fargo Emerging Growth Fund, Wells Fargo Index Fund, Wells Fargo International Value Fund, Wells Fargo Small Company Growth Fund, Wells Fargo Small Company Value Fund, Wells Fargo Core Bond Fund, Wells Fargo Real Return Fund, Wells Fargo WealthBuilder Conservative Allocation Portfolio, Wells Fargo WealthBuilder Equity Portfolio, Wells Fargo WealthBuilder Growth Allocation Portfolio, Wells Fargo WealthBuilder Growth Balanced Portfolio, Wells Fargo WealthBuilder Moderate Balanced Portfolio and Wells Fargo WealthBuilder Tactical Equity Portfolio.
Date of reporting period: November 30, 2015
| ITEM 1. | REPORT TO STOCKHOLDERS |
Semi-Annual Report
November 30, 2015

Allocation Funds

| n | | Wells Fargo Growth Balanced Fund |
| n | | Wells Fargo Moderate Balanced Fund |

Reduce clutter. Save trees.
Sign up for electronic delivery of prospectuses and shareholder reports at wellsfargo.com/advantagedelivery
Contents
| * | A complete schedule of portfolio holdings as of the report date may be obtained, free of charge, by accessing the following website: https://www.wellsfargofunds.com/assets/edocs/regulatory/holdings/index-semi.pdf or by calling Wells Fargo Funds at 1-800-222-8222. This complete schedule, filed on Form N-CSRS, is also available on the SEC’s website at sec.gov. |
| ** | A complete schedule of portfolio holdings as of the report date may be obtained, free of charge, by accessing the following website: https://www.wellsfargofunds.com/assets/edocs/regulatory/holdings/core-bond-semi.pdf or by calling Wells Fargo Funds at 1-800-222-8222. This complete schedule, filed on Form N-CSRS, is also available on the SEC’s website at sec.gov. |
The views expressed and any forward-looking statements are as of November 30, 2015, unless otherwise noted, and are those of the Fund managers and/or Wells Fargo Funds Management, LLC. Discussions of individual securities, or the markets generally, or any Wells Fargo Fund are not intended as individual recommendations. Future events or results may vary significantly from those expressed in any forward-looking statements. The views expressed are subject to change at any time in response to changing circumstances in the market. Wells Fargo Funds Management, LLC and the Fund disclaim any obligation to publicly update or revise any views expressed or forward-looking statements.
NOT FDIC INSURED ¡ NO BANK GUARANTEE ¡ MAY LOSE VALUE
| | | | |
| 2 | | Wells Fargo Allocation Funds | | Letter to shareholders (unaudited) |

Karla M. Rabusch
President
Wells Fargo Funds
Central bank actions abroad diverged during the period to be more accommodative when compared with the U.S. Federal Reserve.
Dear Valued Shareholder:
We are pleased to offer you this semi-annual report for the Wells Fargo Allocation Funds for the six-month period that ended November 30, 2015. Among the most significant influences on investment markets during the period were low interest rates; low prices for oil, natural gas, and other commodities; a strong U.S. dollar; and shifting investor sentiment, which sparked volatility in equity and bond markets at higher levels than during recent years, pushing markets generally lower.
U.S. economic growth remained slow and uneven.
U.S. annualized gross domestic product (GDP) growth was 2.1% for the three-month period ended September 30, 2015, a slower pace than the prior quarter that restrained investor activity during the third and fourth quarters of 2015. Investor concerns about economic growth in the U.S. were compounded by data on retail sales and industrial production. Retail sales increased in August but at a slightly slower pace than expected, and the overall trend remained constrained. Industrial production declined in August, and the trend remained fairly flat overall with the periodic exception of automobile manufacturing.
On a more positive note, unemployment eased to 5.0% in October 2015 and consumer spending was solid as housing demand improved, although corporate results, as measured by profits from current production, decreased in the third quarter after a second-quarter increase, according to the U.S. Bureau of Economic Analysis. Despite sometimes conflicting data, expectations grew throughout the period that the Federal Open Market Committee would announce the first increase in the federal funds rate since June 2006 after its December 2015 meeting. The S&P 500 Index1 was essentially flat for the period, recording a -0.21% return.
Overseas, central banks diverged from Federal Reserve policy due to economic concerns.
Central bank actions abroad diverged during the period to be more accommodative when compared with the U.S. Federal Reserve. Contentious negotiations between Greece and its debtors to refinance the country’s sovereign debt concerned investors in mid-2015 before the Greek government accepted additional reforms in order to secure new loan agreements with the European Central Bank (ECB). The ECB continued to encourage lending and investing in the region by making funds available to banks at low interest rates, imposing a negative interest rate on bank deposits it held, and purchasing bonds through its quantitative easing program.
During the summer of 2015, the Hang Seng Index2 in Hong Kong experienced a dramatic decline. The People’s Bank of China sought to spur growth by cutting interest rates six times in less than a year through October 2015; lowering bank reserve requirements to encourage lending; and allowing the renminbi to depreciate in support of exports and to advance government efforts to transition to a more market-driven economy. Slowing economic growth in China reduced its importing activity, which, combined with continued low prices for many commodities, negatively affected China’s trading partners, particularly emerging markets countries.
Although Japan’s third-quarter 2015 GDP was positive after contracting in the second quarter, the Bank of Japan expanded its economic stimulus programs to increase injections of liquidity into the economy through additional bond purchases. The Government Pension Investment Fund continued to reduce government bond investments and direct those assets to investments in the Japanese stock market.
| 1 | The S&P 500 Index consists of 500 stocks chosen for market size, liquidity, and industry group representation. It is a market-value-weighted index with each stock’s weight in the index proportionate to its market value. You cannot invest directly in an index. |
| 2 | The Hang Seng Index is a free-float-adjusted market-capitalization-weighted stock market index in Hong Kong. It is used to record and monitor daily changes of the largest companies of the Hong Kong stock market and is the main indicator of the overall market performance in Hong Kong. You cannot invest directly in an index. |
| | | | | | |
| Letter to shareholders (unaudited) | | Wells Fargo Allocation Funds | | | 3 | |
Developed European and Asian equity markets returned -7.42%, as measured by the Morgan Stanley Capital International (MSCI) Europe, Australasia, Far East (EAFE) Index (Net),3 for the six-month period that ended November 30, 2015. U.S. investors in overseas markets saw the values of their investments fall as the U.S. dollar strengthened in comparison with other currencies.
Bond performance stumbled as investor concerns increased.
Bond investors were not spared the negative effects that stemmed from uncertain investor sentiment. While low interest rates restrained yields, periodic flights to the perceived quality of U.S. government bonds in the face of equity market volatility helped support domestic bond prices. As a result, U.S. bonds tended to fare better than bonds issued overseas. During the period, the Barclays U.S. Aggregate Bond Index4 was essentially flat, recording a -0.12% return, while the Barclays Global Aggregate ex U.S. Dollar Bond Index5 recorded a -1.76% return.
Don’t let short-term uncertainty derail long-term investment goals.
Periods of uncertainty can present challenges, but experience has taught us that maintaining long-term investment goals can be an effective way to plan for the future. To help you create a sound strategy based on your personal goals and risk tolerance, Wells Fargo Funds offers more than 100 mutual funds and other investments spanning a wide range of asset classes and investment styles. Although diversification cannot guarantee an investment profit or prevent losses, we believe it can be an effective way to manage investment risk and potentially smooth out overall portfolio performance. We encourage investors to know their investments and to understand that appropriate levels of risk-taking may unlock opportunities.
Thank you for choosing to invest with Wells Fargo Funds. We appreciate your confidence in us and remain committed to helping you meet your financial needs.
Sincerely,

Karla M. Rabusch
President
Wells Fargo Funds
Bond investors were not spared the negative effects that stemmed from uncertain investor sentiment.
Notice to shareholders
At a meeting held August 11-12, 2015, the Board of Trustees of the Funds and the underlying Master Portfolios approved a change in the name of each Fund and underlying Master Portfolio whereby the word “Advantage” was removed from its name, effective December 15, 2015.
For current information about your fund investments, contact your investment professional, visit our website at wellsfargofunds.com, or call us directly at 1-800-222-8222. 24 hours a day, 7 days a week.
| 3 | The Morgan Stanley Capital International (MSCI) Europe, Australasia, Far East (EAFE) Index (Net) is a free-float-adjusted market-capitalization-weighted index that is designed to measure the equity market performance of developed markets, excluding the U.S. and Canada. The MSCI EAFE Index (Net) consists of the following 21 developed markets country indexes: Australia, Austria, Belgium, Denmark, Finland, France, Germany, Hong Kong, Ireland, Israel, Italy, Japan, the Netherlands, New Zealand, Norway, Portugal, Singapore, Spain, Sweden, Switzerland, and the United Kingdom. You cannot invest directly in an index. Source: MSCI. MSCI makes norepresentations and shall have no liability whatsoever with respect to any MSCI data contained herein. The MSCI data may not be further redistributed or used as a basis for other indexes or any securities or financial products. This report is not approved, reviewed, or produced by MSCI. |
| 4 | The Barclays U.S. Aggregate Bond Index is composed of the Barclays U.S. Government/Credit Index and the Barclays U.S. Mortgage-Backed Securities Index, and includes Treasury issues, agency issues, corporate bond issues, and mortgage-backed securities. You cannot invest directly in an index. |
| 5 | The Barclays Global Aggregate ex U.S. Dollar Bond Index tracks an international basket of government, corporate, agency, and mortgage-related bonds. You cannot invest directly in an index. |
| | | | |
| 4 | | Wells Fargo Allocation Funds | | Performance highlights (unaudited) |
Wells Fargo Growth Balanced Fund1
Investment objective
The Fund seeks total return, consisting of capital appreciation and current income.
Manager
Wells Fargo Funds Management, LLC
Subadviser
Wells Capital Management Incorporated
Subadvisers for the master portfolios
Artisan Partners Limited Partnership
Cooke & Bieler, L.P.
Galliard Capital Management, Inc.
Golden Capital Management, LLC
LSV Asset Management
Peregrine Capital Management, INC.
Phocas Financial Corportation
Wells Capital Management Incorporated
Portfolio managers
Kandarp Acharya, CFA®, FRM
Thomas C. Biwer, CFA®
Aldo Ceccarelli, CFA®
Christian Chan, CFA®
Erik Sens, CFA®
Average annual total returns (%) as of November 30, 2015
| | | | | | | | | | | | | | | | | | | | | | | | | | | | | | | | | | |
| | | | | Including sales charge | | | Excluding sales charge | | | Expense ratios2 (%) | |
| | | Inception date | | 1 year | | | 5 year | | | 10 year | | | 1 year | | | 5 year | | | 10 year | | | Gross | | | Net3 | |
| Class A (WFGBX) | | 10-14-1998 | | | (4.23 | ) | | | 8.61 | | | | 4.95 | | | | 1.61 | | | | 9.91 | | | | 5.57 | | | | 1.35 | | | | 1.20 | |
| Class B (NVGRX)* | | 10-1-1998 | | | (4.15 | ) | | | 8.79 | | | | 5.02 | | | | 0.85 | | | | 9.08 | | | | 5.02 | | | | 2.10 | | | | 1.95 | |
| Class C (WFGWX) | | 10-1-1998 | | | (0.15 | ) | | | 9.09 | | | | 4.79 | | | | 0.85 | | | | 9.09 | | | | 4.79 | | | | 2.10 | | | | 1.95 | |
| Administrator Class (NVGBX) | | 11-11-1994 | | | – | | | | – | | | | – | | | | 1.86 | | | | 10.18 | | | | 5.84 | | | | 1.27 | | | | 0.95 | |
| Growth Balanced Composite Index4 | | – | | | – | | | | – | | | | – | | | | 1.77 | | | | 9.53 | | | | 6.50 | | | | – | | | | – | |
| Barclays U.S. Aggregate Bond Index5 | | – | | | – | | | | – | | | | – | | | | 0.97 | | | | 3.09 | | | | 4.65 | | | | – | | | | – | |
| MSCI EAFE Index (Net)6 | | – | | | – | | | | – | | | | – | | | | (2.94 | ) | | | 5.52 | | | | 3.64 | | | | – | | | | – | |
| Russell 1000® Growth Index7 | | – | | | – | | | | – | | | | – | | | | 6.12 | | | | 15.10 | | | | 8.66 | | | | – | | | | – | |
| Russell 1000® Value Index8 | | – | | | – | | | | – | | | | – | | | | (1.11 | ) | | | 13.47 | | | | 6.45 | | | | – | | | | – | |
| Russell 2000® Index9 | | – | | | – | | | | – | | | | – | | | | 3.51 | | | | 12.02 | | | | 7.31 | | | | – | | | | – | |
| S&P 500 Index10 | | – | | | – | | | | – | | | | – | | | | 2.75 | | | | 14.40 | | | | 7.48 | | | | – | | | | – | |
| * | | Class B shares are closed to investment, except in connection with the reinvestment of any distributions and permitted exchanges. |
Figures quoted represent past performance, which is no guarantee of future results, and do not reflect taxes that a shareholder may pay on fund distributions or the redemption of fund shares. Investment return and principal value of an investment will fluctuate so that an investor’s shares, when redeemed, may be worth more or less than their original cost. Performance shown without sales charges would be lower if sales charges were reflected. Current performance may be lower or higher than the performance data quoted, which assumes the reinvestment of dividends and capital gains. Current month-end performance is available on the Fund’s website, wellsfargofunds.com.
Index returns do not include transaction costs associated with buying and selling securities, any mutual fund fees or expenses, or any taxes. It is not possible to invest directly in an index.
For Class A shares, the maximum front-end sales charge is 5.75%. For Class B shares, the maximum contingent deferred sales charge is 5.00%. For Class C shares, the maximum contingent deferred sales charge is 1.00%. Performance including a contingent deferred sales charge assumes the sales charge for the corresponding time period. Administrator Class shares are sold without a front-end sales charge or contingent deferred sales charge.
Please see footnotes on pages 5-6.
| | | | | | |
| Performance highlights (unaudited) | | Wells Fargo Allocation Funds | | | 5 | |
Wells Fargo Growth Balanced Fund (continued)
| | | | |
| Ten largest holdings (%) as of November 30, 201511 | |
Apple Incorporated | | | 1.38 | |
Facebook Incorporated | | | 0.86 | |
Amazon.com Incorporated | | | 0.82 | |
Alphabet Incorporated Class A | | | 0.76 | |
Exxon Mobil Corporation | | | 0.70 | |
JPMorgan Chase & Company | | | 0.69 | |
Alphabet Incorporated Class C | | | 0.65 | |
U.S. Treasury Bonds, 2.87% 8-15-2045 | | | 0.64 | |
Visa Incorporated | | | 0.61 | |
Medtronic Plc | | | 0.59 | |
|
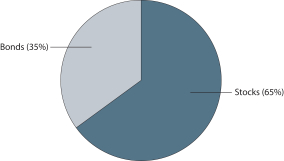
| Current target allocation as of November 30, 201512 |
|
 |
|
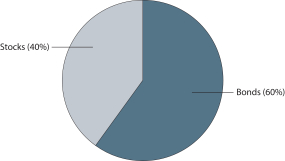
| Neutral target allocation as of November 30, 201512 |
|
 |
Balanced funds may invest in stocks and bonds. Stock values fluctuate in response to the activities of individual companies and general market and economic conditions. Bond values fluctuate in response to the financial condition of individual issuers, general market and economic conditions, and changes in interest rates. Changes in market conditions and government policies may lead to periods of heightened volatility in the bond market and reduced liquidity for certain bonds held by the Fund. In general, when interest rates rise, bond values fall and investors may lose principal value. Interest-rate changes and their impact on the Fund and its share price can be sudden and unpredictable. The use of derivatives may reduce returns and/or increase volatility. Certain investment strategies tend to increase the total risk of an investment (relative to the broader market). The Fund is exposed to foreign investment risk, mortgage- and asset-backed securities risk, and smaller-company securities risk. Consult the Fund’s prospectus for additional information on these and other risks.
| 1 | The Fund is a gateway blended fund that invests all of its assets in two or more affiliated master portfolios of Wells Fargo Master Trust in varying proportions. References to the investment activities of the Fund are intended to refer to the investment activities of the affiliated master portfolios in which it invests. |
| 2 | Reflects the expense ratios as stated in the most recent prospectuses. The expense ratios shown are subject to change and may differ from the annualized expense ratios shown in the financial highlights of this report. |
| 3 | The manager has contractually committed through September 30, 2016, to waive fees and/or reimburse expenses to the extent necessary to cap the Fund’s Total Annual Fund Operating Expenses After Fee Waiver at the amounts shown. After this time, the cap may be increased or the commitment to maintain the cap may be terminated only with the approval of the Board of Trustees. Brokerage commissions, stamp duty fees, interest, taxes, acquired fund fees and expenses, and extraordinary expenses are excluded from the cap. Expenses allocated from the affiliated master portfolios are included in the cap. Without this cap, the Fund’s returns would have been lower. |
| | | | |
| 6 | | Wells Fargo Allocation Funds | | Performance highlights (unaudited) |
Wells Fargo Growth Balanced Fund (continued)
| 4 | Source: Wells Fargo Funds Management, LLC. The Growth Balanced Composite Index is weighted 35% in the Barclays U.S. Aggregate Bond Index, 16.25% in the Russell 1000® Value Index, 16.25% in the S&P 500 Index, 16.25% in the Russell 1000® Growth Index, 9.75% in the MSCI EAFE Index (Net), 6.50% in the Russell 2000® Index. You cannot invest directly in an index. |
| 5 | The Barclays U.S. Aggregate Bond Index is composed of the Barclays U.S. Government/Credit Index and the Barclays U.S. Mortgage-Backed Securities Index, and includes Treasury issues, agency issues, corporate bond issues, and mortgage-backed securities. You cannot invest directly in an index. |
| 6 | The Morgan Stanley Capital International (MSCI) Europe, Australasia, Far East (EAFE) Index (Net) is a free-float-adjusted market-capitalization-weighted index that is designed to measure the equity market performance of developed markets, excluding the U.S. and Canada. The MSCI EAFE Index (Net) consists of the following 21 developed markets country indexes: Australia, Austria, Belgium, Denmark, Finland, France, Germany, Hong Kong, Ireland, Israel, Italy, Japan, the Netherlands, New Zealand, Norway, Portugal, Singapore, Spain, Sweden, Switzerland, and the United Kingdom. You cannot invest directly in an index. Source: MSCI. MSCI makes no representations and shall have no liability whatsoever with respect to any MSCI data contained herein. The MSCI data may not be further redistributed or used as a basis for other indexes or any securities or financial products. This report is not approved, reviewed, or produced by MSCI. |
| 7 | The Russell 1000® Growth Index measures the performance of those Russell 1000 companies with higher price-to-book ratios and higher forecasted growth values. You cannot invest directly in an index. |
| 8 | The Russell 1000® Value Index measures the performance of those Russell 1000 companies with lower price-to-book ratios and lower forecasted growth values. You cannot invest directly in an index. |
| 9 | The Russell 2000® Index measures the performance of the 2,000 smallest companies in the Russell 3000® Index, which represents approximately 8% of the total market capitalization of the Russell 3000® Index. You cannot invest directly in an index. |
| 10 | The S&P 500 Index consists of 500 stocks chosen for market size, liquidity, and industry group representation. It is a market-value-weighted index with each stock’s weight in the index proportionate to its market value. You cannot invest directly in an index. |
| 11 | The ten largest holdings, excluding cash and cash equivalents, are calculated based on the value of the securities of the affiliated master portfolios allocable to the Fund divided by the total net assets of the Fund. Holdings are subject to change and may have changed since the date specified. |
| 12 | Cash and cash equivalents are not reflected in the calculations of target allocations. Neutral target allocation is the target allocation of the Fund as stated in the Fund’s prospectus. Current target allocation is the current allocation of the Fund based on the Tactical Asset Allocation (TAA) Model as of the date specified. Current target allocation is subject to change and may have changed since the date specified. |
| | | | | | |
| Performance highlights (unaudited) | | Wells Fargo Allocation Funds | | | 7 | |
Wells Fargo Moderate Balanced Fund1
Investment objective
The Fund seeks total return, consisting of current income and capital appreciation.
Manager
Wells Capital Management Incorporated
Subadviser
Wells Capital Management Incorporated
Subadvisers for the master portfolios
Artisan Partners Limited Partnership
Cooke & Bieler, L.P.
Galliard Capital Management, Inc.
Golden Capital Management, LLC
LSV Asset Management
Peregrine Capital Management, INC.
Phocas Financial Corportation
Wells Capital Management Incorporated
Portfolio managers
Kandarp Acharya, CFA®, FRM
Thomas C. Biwer, CFA®
Aldo Ceccarelli, CFA®
Christian Chan, CFA®
Erik Sens, CFA®
Average annual total returns (%) as of November 30, 2015
| | | | | | | | | | | | | | | | | | | | | | | | | | | | | | | | | | |
| | | | | Including sales charge | | | Excluding sales charge | | | Expense ratios2 (%) | |
| | | Inception date | | 1 year | | | 5 year | | | 10 year | | | 1 year | | | 5 year | | | 10 year | | | Gross | | | Net3 | |
| Class A (WFMAX) | | 1-30-2004 | | | (4.36 | ) | | | 6.12 | | | | 4.36 | | | | 1.47 | | | | 7.38 | | | | 4.98 | | | | 1.32 | | | | 1.15 | |
| Class B (WMOBX)* | | 1-30-2004 | | | (4.29 | ) | | | 6.27 | | | | 4.43 | | | | 0.71 | | | | 6.58 | | | | 4.43 | | | | 2.07 | | | | 1.90 | |
| Class C (WFBCX) | | 1-30-2004 | | | (0.26 | ) | | | 6.58 | | | | 4.19 | | | | 0.74 | | | | 6.58 | | | | 4.19 | | | | 2.07 | | | | 1.90 | |
| Administrator Class (NVMBX) | | 11-11-1994 | | | – | | | | – | | | | – | | | | 1.71 | | | | 7.64 | | | | 5.23 | | | | 1.24 | | | | 0.90 | |
| Moderate Balanced Composite Index4 | | – | | | – | | | | – | | | | – | | | | 1.43 | | | | 6.66 | | | | 5.48 | | | | – | | | | – | |
| Barclays U.S. Short Treasury 9-12 Months Index5 | | – | | | – | | | | – | | | | – | | | | 0.13 | | | | 0.28 | | | | 1.79 | | | | – | | | | – | |
| Barclays U.S. Aggregate Bond Index6 | | – | | | – | | | | – | | | | – | | | | 0.97 | | | | 3.09 | | | | 4.65 | | | | – | | | | – | |
| MSCI EAFE Index (Net)7 | | – | | | – | | | | – | | | | – | | | | (2.94 | ) | | | 5.52 | | | | 3.64 | | | | – | | | | – | |
| Russell 1000® Growth Index8 | | – | | | – | | | | – | | | | – | | | | 6.12 | | | | 15.10 | | | | 8.66 | | | | – | | | | – | |
| Russell 1000® Value Index9 | | – | | | – | | | | – | | | | – | | | | (1.11 | ) | | | 13.47 | | | | 6.45 | | | | – | | | | – | |
| Russell 2000® Index10 | | – | | | – | | | | – | | | | – | | | | 3.51 | | | | 12.02 | | | | 7.31 | | | | – | | | | – | |
| S&P 500 Index11 | | – | | | – | | | | – | | | | – | | | | 2.75 | | | | 14.40 | | | | 7.48 | | | | – | | | | – | |
| * | | Class B shares are closed to investment, except in connection with the reinvestment of any distributions and permitted exchanges. |
Figures quoted represent past performance, which is no guarantee of future results, and do not reflect taxes that a shareholder may pay on fund distributions or the redemption of fund shares. Investment return and principal value of an investment will fluctuate so that an investor’s shares, when redeemed, may be worth more or less than their original cost. Performance shown without sales charges would be lower if sales charges were reflected. Current performance may be lower or higher than the performance data quoted, which assumes the reinvestment of dividends and capital gains. Current month-end performance is available on the Fund’s website, wellsfargofunds.com.
Index returns do not include transaction costs associated with buying and selling securities, any mutual fund fees or expenses, or any taxes. It is not possible to invest directly in an index.
For Class A shares, the maximum front-end sales charge is 5.75%. For Class B shares, the maximum contingent deferred sales charge is 5.00%. For Class C shares, the maximum contingent deferred sales charge is 1.00%. Performance including a contingent deferred sales charge assumes the sales charge for the corresponding time period. Administrator Class shares are sold without a front-end sales charge or contingent deferred sales charge.
Please see footnotes on pages 8-9.
| | | | |
| 8 | | Wells Fargo Allocation Funds | | Performance highlights (unaudited) |
Wells Fargo Moderate Balanced Fund (continued)
| | | | |
| Ten largest holdings (%) as of November 30, 201512 | |
Apple Incorporated | | | 0.84 | |
U.S. Treasury Bond, 2.88%, 8-15-2045 | | | 0.83 | |
FHLMC Structured Pass-Through Securities Series T-58 Class 4A, 7.50%, 9-25-2043 | | | 0.77 | |
U.S. Treasury Note, 0.63%, 9-30-2017 | | | 0.74 | |
FNMA Series 2002-W4 Class A4, 6.25%, 5-25-2042 | | | 0.58 | |
FNMA, 3.50%, 9-1-2032 | | | 0.56 | |
Facebook Incorporated Class A | | | 0.52 | |
Amazon.com Incorporated | | | 0.50 | |
FHLMC, 3.50%, 4-1-2043 | | | 0.48 | |
Alphabet Incorporated Class A | | | 0.46 | |
|
| Current target allocation as of November 30, 201513 |
|
 |
|
| Neutral target allocation as of November 30, 201513 |
|
 |
Balanced funds may invest in stocks and bonds. Stock values fluctuate in response to the activities of individual companies and general market and economic conditions. Bond values fluctuate in response to the financial condition of individual issuers, general market and economic conditions, and changes in interest rates. Changes in market conditions and government policies may lead to periods of heightened volatility in the bond market and reduced liquidity for certain bonds held by the Fund. In general, when interest rates rise, bond values fall and investors may lose principal value. Interest-rate changes and their impact on the Fund and its share price can be sudden and unpredictable. The use of derivatives may reduce returns and/or increase volatility. Certain investment strategies tend to increase the total risk of an investment (relative to the broader market). The Fund is exposed to mortgage- and asset-backed securities risk. Consult the Fund’s prospectus for additional information on these and other risks.
| 1 | The Fund is a gateway blended fund that invests all of its assets in two or more affiliated master portfolios of the Wells Fargo Master Trust in varying proportions. References to the investment activities of the Fund are intended to refer to the investment activities of the affiliated master portfolios in which it invests. |
| 2 | Reflects the expense ratios as stated in the most recent prospectuses. The expense ratios shown are subject to change and may differ from the annualized expense ratios shown in the financial highlights of this report. |
| 3 | The manager has contractually committed through September 30, 2016, to waive fees and/or reimburse expenses to the extent necessary to cap the Fund’s Total Annual Fund Operating Expenses After Fee Waiver at the amounts shown. After this time, the cap may be increased or the commitment to maintain the cap may be terminated only with the approval of the Board of Trustees. Brokerage commissions, stamp duty fees, interest, taxes, acquired fund fees and expenses, and extraordinary expenses are excluded from the cap. Expenses allocated from the affiliated master portfolios are included in the cap. Without this cap, the Fund’s returns would have been lower. |
| 4 | Source: Wells Fargo Funds Management, LLC. The Moderate Balanced Composite Index is weighted 45% in the Barclays U.S. Aggregate Bond Index, 15% in the Barclays U.S. Short Treasury 9-12 Months Index, 10% in the Russell 1000® Index, 10% in the S&P 500 Index, 10% in the Russell 1000® Growth Index, 6% in the MSCI EAFE Index (Net) and 4% in the Russell 2000® Index. You cannot invest directly in an index. |
| | | | | | |
| Performance highlights (unaudited) | | Wells Fargo Allocation Funds | | | 9 | |
Wells Fargo Moderate Balanced Fund (continued)
| 5 | The Barclays U.S. Short Treasury 9–12 Months Index is an unmanaged index that includes aged U.S. Treasury bills, notes, and bonds with a remaining maturity from 9 up to (but not including) 12 months. It excludes zero-coupon STRIPS. You cannot invest directly in an index. |
| 6 | The Barclays U.S. Aggregate Bond Index is composed of the Barclays U.S. Government/Credit Index and the Barclays U.S. Mortgage-Backed Securities Index, and includes Treasury issues, agency issues, corporate bond issues, and mortgage-backed securities. You cannot invest directly in an index. |
| 7 | The Morgan Stanley Capital International (MSCI) Europe, Australasia, Far East (EAFE) Index (Net) is a free-float-adjusted market-capitalization-weighted index that is designed to measure the equity market performance of developed markets, excluding the U.S. and Canada. The MSCI EAFE Index (Net) consists of the following 21 developed markets country indexes: Australia, Austria, Belgium, Denmark, Finland, France, Germany, Hong Kong, Ireland, Israel, Italy, Japan, the Netherlands, New Zealand, Norway, Portugal, Singapore, Spain, Sweden, Switzerland, and the United Kingdom. You cannot invest directly in an index. Source: MSCI. MSCI makes no representations and shall have no liability whatsoever with respect to any MSCI data contained herein. The MSCI data may not be further redistributed or used as a basis for other indexes or any securities or financial products. This report is not approved, reviewed, or produced by MSCI. |
| 8 | The Russell 1000® Growth Index measures the performance of those Russell 1000 companies with higher price-to-book ratios and higher forecasted growth values. You cannot invest directly in an index. |
| 9 | The Russell 1000® Value Index measures the performance of those Russell 1000 companies with lower price-to-book ratios and lower forecasted growth values. You cannot invest directly in an index. |
| 10 | The Russell 2000® Index measures the performance of the 2,000 smallest companies in the Russell 3000® Index, which represents approximately 8% of the total market capitalization of the Russell 3000® Index. You cannot invest directly in an index. |
| 11 | The S&P 500 Index consists of 500 stocks chosen for market size, liquidity, and industry group representation. It is a market-value-weighted index with each stock’s weight in the index proportionate to its market value. You cannot invest directly in an index. |
| 12 | The ten largest holdings, excluding cash and cash equivalents, are calculated based on the value of the securities of the affiliated master portfolios allocable to the Fund divided by the total net assets of the Fund. Holdings are subject to change and may have changed since the date specified. |
| 13 | Cash and cash equivalents are not reflected in the calculations of target allocations. Neutral target allocation is the target allocation of the Fund as stated in the Fund’s prospectus. Current target allocation is the current allocation of the Fund based on the Tactical Asset Allocation (TAA) Model as of the date specified. Current target allocation is subject to change and may have changed since the date specified. |
| | | | |
| 10 | | Wells Fargo Allocation Funds | | Fund expenses (unaudited) |
As a shareholder of the Fund, you incur two types of costs: (1) transaction costs, including sales charges (loads) on purchase payments and contingent deferred sales charges (if any) on redemptions and (2) ongoing costs, including management fees, distribution (12b-1) and/or shareholder servicing fees, and other Fund expenses. This example is intended to help you understand your ongoing costs (in dollars) of investing in the Fund and to compare these costs with the ongoing costs of investing in other mutual funds.
The example is based on an investment of $1,000 invested at the beginning of the six-month period and held for the entire period from June 1, 2015 to November 30, 2015.
Actual expenses
The “Actual” line of the table below provides information about actual account values and actual expenses. You may use the information in this line, together with the amount you invested, to estimate the expenses that you paid over the period. Simply divide your account value by $1,000 (for example, an $8,600 account value divided by $1,000 = 8.6), then multiply the result by the number in the “Actual” line under the heading entitled “Expenses paid during period” for your applicable class of shares to estimate the expenses you paid on your account during this period.
Hypothetical example for comparison purposes
The “Hypothetical” line of the table below provides information about hypothetical account values and hypothetical expenses based on the Fund’s actual expense ratio and an assumed rate of return of 5% per year before expenses, which is not the Fund’s actual return. The hypothetical account values and expenses may not be used to estimate the actual ending account balance or expenses you paid for the period. You may use this information to compare the ongoing costs of investing in the Fund and other funds. To do so, compare this 5% hypothetical example with the 5% hypothetical examples that appear in the shareholder reports of the other funds.
Please note that the expenses shown in the table are meant to highlight your ongoing costs only and do not reflect any transactional costs, such as sales charges (loads) and contingent deferred sales charges. Therefore, the “Hypothetical” line of the table is useful in comparing ongoing costs only and will not help you determine the relative total costs of owning different funds. In addition, if these transactional costs were included, your costs would have been higher.
| | | | | | | | | | | | | | | | |
| Wells Fargo Growth Balanced Fund | | Beginning
account value
6-1-2015 | | | Ending
account value
11-30-2015 | | | Expenses
paid during
the period¹ | | | Net annualized
expense ratio | |
Class A | | | | | | | | | | | | | | | | |
Actual | | $ | 1,000.00 | | | $ | 984.56 | | | $ | 5.95 | | | | 1.20 | % |
Hypothetical (5% return before expenses) | | $ | 1,000.00 | | | $ | 1,019.00 | | | $ | 6.06 | | | | 1.20 | % |
Class B | | | | | | | | | | | | | | | | |
Actual | | $ | 1,000.00 | | | $ | 980.76 | | | $ | 9.66 | | | | 1.95 | % |
Hypothetical (5% return before expenses) | | $ | 1,000.00 | | | $ | 1,015.25 | | | $ | 9.82 | | | | 1.95 | % |
Class C | | | | | | | | | | | | | | | | |
Actual | | $ | 1,000.00 | | | $ | 980.91 | | | $ | 9.66 | | | | 1.95 | % |
Hypothetical (5% return before expenses) | | $ | 1,000.00 | | | $ | 1,015.25 | | | $ | 9.82 | | | | 1.95 | % |
Administrator Class | | | | | | | | | | | | | | | | |
Actual | | $ | 1,000.00 | | | $ | 985.77 | | | $ | 4.72 | | | | 0.95 | % |
Hypothetical (5% return before expenses) | | $ | 1,000.00 | | | $ | 1,020.25 | | | $ | 4.80 | | | | 0.95 | % |
| Wells Fargo Moderate Balanced Fund | | | | | | | | | | | | |
Class A | | | | | | | | | | | | | | | | |
Actual | | $ | 1,000.00 | | | $ | 991.09 | | | $ | 5.72 | | | | 1.15 | % |
Hypothetical (5% return before expenses) | | $ | 1,000.00 | | | $ | 1,019.25 | | | $ | 5.81 | | | | 1.15 | % |
Class B | | | | | | | | | | | | | | | | |
Actual | | $ | 1,000.00 | | | $ | 987.40 | | | $ | 9.44 | | | | 1.90 | % |
Hypothetical (5% return before expenses) | | $ | 1,000.00 | | | $ | 1,015.50 | | | $ | 9.57 | | | | 1.90 | % |
Class C | | | | | | | | | | | | | | | | |
Actual | | $ | 1,000.00 | | | $ | 987.49 | | | $ | 9.44 | | | | 1.90 | % |
Hypothetical (5% return before expenses) | | $ | 1,000.00 | | | $ | 1,015.50 | | | $ | 9.57 | | | | 1.90 | % |
Administrator Class | | | | | | | | | | | | | | | | |
Actual | | $ | 1,000.00 | | | $ | 992.42 | | | $ | 4.48 | | | | 0.90 | % |
Hypothetical (5% return before expenses) | | $ | 1,000.00 | | | $ | 1,020.50 | | | $ | 4.55 | | | | 0.90 | % |
| 1 | Expenses paid is equal to the annualized expense ratio of each class multiplied by the average account value over the period, multiplied by the number of days in the most recent fiscal half-year divided by the number of days in the fiscal year (to reflect the one-half-year period). |
| | | | | | |
| Portfolio of investments—November 30, 2015 (unaudited) | | Wells Fargo Allocation Funds | | | 11 | |
GROWTH BALANCED FUND
| | | | | | | | | | |
| Security name | | | �� | | | | | Value | |
| | | | |
Investment Companies: 100.70% | | | | | | | | | | |
| | | | |
| Affiliated Master Portfolios: 100.70% | | | | | | | | | | |
Wells Fargo C&B Large Cap Value Portfolio | | | | | | | | $ | 14,068,190 | |
Wells Fargo Core Bond Portfolio | | | | | | | | | 17,933,473 | |
Wells Fargo Diversified Large Cap Growth Portfolio | | | | | | | | | 42,163,363 | |
Wells Fargo Emerging Growth Portfolio | | | | | | | | | 4,271,258 | |
Wells Fargo Index Portfolio | | | | | | | | | 42,125,819 | |
Wells Fargo International Growth Portfolio | | | | | | | | | 12,667,643 | |
Wells Fargo International Value Portfolio | | | | | | | | | 12,205,285 | |
Wells Fargo Large Company Value Portfolio | | | | | | | | | 28,118,616 | |
Wells Fargo Managed Fixed Income Portfolio | | | | | | | | | 62,777,646 | |
Wells Fargo Real Return Portfolio | | | | | | | | | 8,992,991 | |
Wells Fargo Small Company Growth Portfolio | | | | | | | | | 4,214,717 | |
Wells Fargo Small Company Value Portfolio | | | | | | | | | 8,417,459 | |
| | | | |
Total Investment Companies (Cost $230,303,176) | | | | | | | | | 257,956,460 | |
| | | | | | | | | | |
| | | | | | | | |
| Total investments in securities (Cost $230,303,176) * | | | 100.70 | % | | | 257,956,460 | |
Other assets and liabilities, net | | | (0.70 | ) | | | (1,800,197 | ) |
| | | | | | | | |
| Total net assets | | | 100.00 | % | | $ | 256,156,263 | |
| | | | | | | | |
| * | Cost for federal income tax purposes is $231,007,235 and unrealized gains (losses) consists of: |
| | | | | | | | |
| | Gross unrealized gains | | $ | 26,949,225 | | | |
| | Gross unrealized losses | | | 0 | | | |
| | | | | | | | |
| | Net unrealized gains | | $ | 26,949,225 | | | |
MODERATE BALANCED FUND
| | | | | | | | | | |
| Security name | | | | | | | | Value | |
| | | | |
Investment Companies: 100.48% | | | | | | | | | | |
| | | | |
| Affiliated Master Portfolios: 100.48% | | | | | | | | | | |
Wells Fargo C&B Large Cap Value Portfolio | | | | | | | | $ | 6,191,299 | |
Wells Fargo Core Bond Portfolio | | | | | | | | | 16,732,636 | |
Wells Fargo Diversified Large Cap Growth Portfolio | | | | | | | | | 18,562,160 | |
Wells Fargo Emerging Growth Portfolio | | | | | | | | | 1,888,286 | |
Wells Fargo Index Portfolio | | | | | | | | | 18,585,864 | |
Wells Fargo International Growth Portfolio | | | | | | | | | 5,596,364 | |
Wells Fargo International Value Portfolio | | | | | | | | | 5,513,038 | |
Wells Fargo Large Company Value Portfolio | | | | | | | | | 12,450,016 | |
Wells Fargo Managed Fixed Income Portfolio | | | | | | | | | 58,578,908 | |
Wells Fargo Real Return Portfolio | | | | | | | | | 8,388,576 | |
Wells Fargo Small Company Growth Portfolio | | | | | | | | | 1,893,295 | |
Wells Fargo Small Company Value Portfolio | | | | | | | | | 3,788,758 | |
Wells Fargo Stable Income Portfolio | | | | | | | | | 27,871,083 | |
| | | | |
Total Investment Companies (Cost $175,575,274) | | | | | | | | | 186,040,283 | |
| | | | | | | | | | |
| | | | | | | | |
| Total investments in securities (Cost $175,575,274) * | | | 100.48 | % | | | 186,040,283 | |
Other assets and liabilities, net | | | (0.48 | ) | | | (897,499 | ) |
| | | | | | | | |
| Total net assets | | | 100.00 | % | | $ | 185,142,784 | |
| | | | | | | | |
| * | Cost for federal income tax purposes is $174,611,774 and unrealized gains (losses) consists of: |
| | | | | | | | |
| | Gross unrealized gains | | $ | 11,428,509 | | | |
| | Gross unrealized losses | | | 0 | | | |
| | | | | | | | |
| | Net unrealized gains | | $ | 11,428,509 | | | |
The accompanying notes are an integral part of these financial statements.
| | | | |
| 12 | | Wells Fargo Allocation Funds | | Statements of assets and liabilities—November 30, 2015 (unaudited) |
| | | | | | | | |
| | | Growth
Balanced Fund | | | Moderate
Balanced Fund | |
| | |
Assets | | | | | | | | |
Investments in affiliated Master Portfolios, at value (see cost below) | | $ | 257,956,460 | | | $ | 186,040,283 | |
Receivable for Fund shares sold | | | 335,532 | | | | 385,695 | |
Receivable from manager | | | 0 | | | | 572 | |
Prepaid expenses and other assets | | | 47,166 | | | | 34,148 | |
| | | | |
Total assets | | | 258,339,158 | | | | 186,460,698 | |
| | | | |
| | |
Liabilities | | | | | | | | |
Payable for Fund shares redeemed | | | 2,053,195 | | | | 1,242,033 | |
Management fee payable | | | 6,308 | | | | 0 | |
Distribution fees payable | | | 9,465 | | | | 5,077 | |
Administration fees payable | | | 32,586 | | | | 21,735 | |
Accrued expenses and other liabilities | | | 81,341 | | | | 49,069 | |
| | | | |
Total liabilities | | | 2,182,895 | | | | 1,317,914 | |
| | | | |
Total net assets | | $ | 256,156,263 | | | $ | 185,142,784 | |
| | | | |
| | |
NET ASSETS CONSIST OF | | | | | | | | |
Paid-in capital | | $ | 365,138,629 | | | $ | 165,249,634 | |
Undistributed net investment income | | | 3,909,644 | | | | 2,141,841 | |
Accumulated net realized gains (losses) on investments | | | (140,545,294 | ) | | | 7,286,300 | |
Net unrealized gains on investments | | | 27,653,284 | | | | 10,465,009 | |
| | | | |
Total net assets | | $ | 256,156,263 | | | $ | 185,142,784 | |
| | | | |
| | |
COMPUTATION OF NET ASSET VALUE AND OFFERING PRICE PER SHARE | | | | | | | | |
Net assets – Class A | | $ | 63,962,672 | | | $ | 25,143,518 | |
Shares outstanding – Class A1 | | | 1,592,472 | | | | 1,076,308 | |
Net asset value per share – Class A | | | $40.17 | | | | $23.36 | |
Maximum offering price per share – Class A2 | | | $42.62 | | | | $24.79 | |
Net assets – Class B | | $ | 162,137 | | | $ | 160,345 | |
Shares outstanding – Class B1 | | | 4,543 | | | | 6,821 | |
Net asset value per share – Class B | | | $35.69 | | | | $23.51 | |
Net assets – Class C | | $ | 15,439,998 | | | $ | 8,554,713 | |
Shares outstanding – Class C1 | | | 441,824 | | | | 373,786 | |
Net asset value per share – Class C | | | $34.95 | | | | $22.89 | |
Net assets – Administrator Class | | $ | 176,591,456 | | | $ | 151,284,208 | |
Shares outstanding – Administrator Class1 | | | 4,902,009 | | | | 6,417,875 | |
Net asset value per share – Administrator Class | | | $36.02 | | | | $23.57 | |
| | |
Investments in affiliated Master Portfolios, at cost | | $ | 230,303,176 | | | $ | 175,575,274 | |
| | | | |
| 1 | Each Fund has an unlimited number of authorized shares. |
| 2 | Maximum offering price is computed as 100/94.25 of net asset value. On investments of $50,000 or more, the offering price is reduced. |
The accompanying notes are an integral part of these financial statements.
| | | | | | |
| Statements of operations—six months ended November 30, 2015 (unaudited) | | Wells Fargo Allocation Funds | | | 13 | |
| | | | | | | | |
| | | Growth
Balanced Fund | | | Moderate
Balanced Fund | |
| | |
Investment income | | | | | | | | |
Interest allocated from affiliated Master Portfolios | | $ | 1,420,786 | | | $ | 1,494,559 | |
Dividends allocated from affiliated Master Portfolios* | | | 1,353,775 | | | | 595,820 | |
Securities lending income allocated from affiliated Master Portfolios | | | 22,046 | | | | 10,476 | |
Interest | | | 106 | | | | 74 | |
Expenses allocated from affiliated Master Portfolios | | | (721,589 | ) | | | (494,050 | ) |
Waivers allocated from affiliated Master Portfolios | | | 61,574 | | | | 71,209 | |
| | | | |
Total investment income | | | 2,136,698 | | | | 1,678,088 | |
| | | | |
| | |
Expenses | | | | | | | | |
Management fee | | | 384,620 | | | | 270,992 | |
Administration fees | | | | | | | | |
Class A | | | 69,330 | | | | 23,784 | |
Class B | | | 207 | | | | 181 | |
Class C | | | 15,931 | | | | 7,335 | |
Administrator Class | | | 111,302 | | | | 94,975 | |
Shareholder servicing fees | | | | | | | | |
Class A | | | 79,361 | | | | 27,290 | |
Class B | | | 239 | | | | 206 | |
Class C | | | 18,255 | | | | 8,433 | |
Administrator Class | | | 222,662 | | | | 189,897 | |
Distribution fees | | | | | | | | |
Class B | | | 716 | | | | 618 | |
Class C | | | 54,767 | | | | 25,299 | |
Custody and accounting fees | | | 5,547 | | | | 4,107 | |
Professional fees | | | 15,930 | | | | 16,057 | |
Registration fees | | | 27,502 | | | | 22,480 | |
Shareholder report expenses | | | 31,032 | | | | 15,311 | |
Trustees’ fees and expenses | | | 6,430 | | | | 6,553 | |
Other fees and expenses | | | 5,318 | | | | 5,776 | |
| | | | |
Total expenses | | | 1,049,149 | | | | 719,294 | |
Less: Fee waivers and/or expense reimbursements | | | (337,860 | ) | | | (267,313 | ) |
| | | | |
Net expenses | | | 711,289 | | | | 451,981 | |
| | | | |
Net investment income | | | 1,425,409 | | | | 1,226,107 | |
| | | | |
| | |
REALIZED AND UNREALIZED GAINS (LOSSES) ON INVESTMENTS | | | | | | | | |
| | |
Net realized gains on: | | | | | | | | |
Securities transactions allocated from affiliated Master Portfolios | | | 3,821,382 | | | | 1,814,995 | |
Futures transactions | | | 631,982 | | | | 471,956 | |
| | | | |
Net realized gains on investments | | | 4,453,364 | | | | 2,286,951 | |
| | | | |
| | |
Net change in unrealized gains (losses) on: | | | | | | | | |
Securities transactions allocated from affiliated Master Portfolios | | | (9,909,620 | ) | | | (5,088,864 | ) |
Unaffiliated securities | | | (73 | ) | | | (53 | ) |
Futures transactions | | | 132,495 | | | | 92,148 | |
| | | | |
Net change in unrealized gains (losses) on investments | | | (9,777,198 | ) | | | (4,996,769 | ) |
| | | | |
Net realized and unrealized gains (losses) on investments | | | (5,323,834 | ) | | | (2,709,818 | ) |
| | | | |
Net decrease in net assets resulting from operations | | $ | (3,898,425 | ) | | $ | (1,483,711 | ) |
| | | | |
| | |
* Net of foreign dividend withholding taxes allocated from affiliated Master Portfolios in the amount of | | | $19,313 | | | | $8,892 | |
The accompanying notes are an integral part of these financial statements.
| | | | |
| 14 | | Wells Fargo Allocation Funds | | Statements of changes in net assets |
| | | | | | | | | | | | | | | | |
| | | Growth Balanced Fund | |
| | | Six months ended
November 30, 2015
(unaudited) | | | Year ended
May 31, 2015 | |
| | | | |
Operations | | | | | | | | | | | | | | | | |
Net investment income | | | | | | $ | 1,425,409 | | | | | | | $ | 2,789,281 | |
Net realized gains on investments | | | | | | | 4,453,364 | | | | | | | | 15,701,271 | |
Net change in unrealized gains (losses) on investments | | | | | | | (9,777,198 | ) | | | | | | | 1,114,605 | |
| | | | |
Net increase (decrease) in net assets resulting from operations | | | | | | | (3,898,425 | ) | | | | | | | 19,605,157 | |
| | | | |
| | | | |
Distributions to shareholders from | | | | | | | | | | | | | | | | |
Net investment income | | | | | | | | | | | | | | | | |
Class A | | | | | | | 0 | | | | | | | | (268,805 | ) |
Class C | | | | | | | 0 | | | | | | | | (29,178 | ) |
Administrator Class | | | | | | | 0 | | | | | | | | (1,028,262 | ) |
| | | | |
Total distributions to shareholders | | | | | | | 0 | | | | | | | | (1,326,245 | ) |
| | | | |
| | | | |
Capital share transactions | | | Shares | | | | | | | | Shares | | | | | |
Proceeds from shares sold | | | | | | | | | | | | | | | | |
Class A | | | 146,862 | | | | 5,900,015 | | | | 185,450 | | | | 7,274,394 | |
Class B | | | 2,165 | | | | 78,159 | | | | 1,558 | | | | 53,483 | |
Class C | | | 70,893 | | | | 2,467,172 | | | | 72,213 | | | | 2,489,920 | |
Administrator Class | | | 327,507 | | | | 11,697,535 | | | | 635,039 | | | | 22,455,940 | |
| | | | |
| | | | | | | 20,142,881 | | | | | | | | 32,273,737 | |
| | | | |
Reinvestment of distributions | | | | | | | | | | | | | | | | |
Class A | | | 0 | | | | 0 | | | | 6,633 | | | | 261,859 | |
Class C | | | 0 | | | | 0 | | | | 788 | | | | 27,266 | |
Administrator Class | | | 0 | | | | 0 | | | | 28,932 | | | | 1,022,158 | |
| | | | |
| | | | | | | 0 | | | | | | | | 1,311,283 | |
| | | | |
Payment for shares redeemed | | | | | | | | | | | | | | | | |
Class A | | | (128,624 | ) | | | (5,168,709 | ) | | | (227,744 | ) | | | (8,991,283 | ) |
Class B | | | (2,132 | ) | | | (76,248 | ) | | | (11,057 | ) | | | (384,245 | ) |
Class C | | | (31,808 | ) | | | (1,108,199 | ) | | | (49,378 | ) | | | (1,697,172 | ) |
Administrator Class | | | (415,990 | ) | | | (14,844,101 | ) | | | (826,937 | ) | | | (29,006,446 | ) |
| | | | |
| | | | | | | (21,197,257 | ) | | | | | | | (40,079,146 | ) |
| | | | |
Net decrease in net assets resulting from capital share transactions | | | | | | | (1,054,376 | ) | | | | | | | (6,494,126 | ) |
| | | | |
Total increase (decrease) in net assets | | | | | | | (4,952,801 | ) | | | | | | | 11,784,786 | |
| | | | |
| | | | |
Net assets | | | | | | | | | | | | | | | | |
Beginning of period | | | | | | | 261,109,064 | | | | | | | | 249,324,278 | |
| | | | |
End of period | | | | | | $ | 256,156,263 | | | | | | | $ | 261,109,064 | |
| | | | |
Undistributed net investment income | | | | | | $ | 3,909,644 | | | | | | | $ | 2,484,235 | |
| | | | |
The accompanying notes are an integral part of these financial statements.
| | | | | | |
| Statements of changes in net assets | | Wells Fargo Allocation Funds | | | 15 | |
| | | | | | | | | | | | | | | | |
| | | Moderate Balanced Fund | |
| | | Six months ended November 30, 2015 (unaudited) | | | Year ended May 31, 2015 | |
| | | | |
Operations | | | | | | | | | | | | | | | | |
Net investment income | | | | | | $ | 1,226,107 | | | | | | | $ | 2,299,319 | |
Net realized gains on investments | | | | | | | 2,286,951 | | | | | | | | 7,901,060 | |
Net change in unrealized losses on investments | | | | | | | (4,996,769 | ) | | | | | | | (22,765 | ) |
| | | | |
Net increase (decrease) in net assets resulting from operations | | | | | | | (1,483,711 | ) | | | | | | | 10,177,614 | |
| | | | |
| | | | |
Distributions to shareholders from | | | | | | | | | | | | | | | | |
Net investment income | | | | | | | | | | | | | | | | |
Class A | | | | | | | 0 | | | | | | | | (376,425 | ) |
Class C | | | | | | | 0 | | | | | | | | (52,862 | ) |
Administrator Class | | | | | | | 0 | | | | | | | | (3,267,946 | ) |
Net realized gains | | | | | | | | | | | | | | | | |
Class A | | | | | | | 0 | | | | | | | | (415,324 | ) |
Class B | | | | | | | 0 | | | | | | | | (4,805 | ) |
Class C | | | | | | | 0 | | | | | | | | (111,625 | ) |
Administrator Class | | | | | | | 0 | | | | | | | | (3,128,190 | ) |
| | | | |
Total distributions to shareholders | | | | | | | 0 | | | | | | | | (7,357,177 | ) |
| | | | |
| | | | |
Capital share transactions | | | Shares | | | | | | | | Shares | | | | | |
Proceeds from shares sold | | | | | | | | | | | | | | | | |
Class A | | | 336,361 | | | | 7,818,549 | | | | 255,117 | | | | 5,957,581 | |
Class B | | | 1,822 | | | | 43,159 | | | | 1,624 | | | | 38,050 | |
Class C | | | 151,215 | | | | 3,447,311 | | | | 97,255 | | | | 2,232,984 | |
Administrator Class | | | 567,978 | | | | 13,329,438 | | | | 731,005 | | | | 17,208,011 | |
| | | | |
| | | | | | | 24,638,457 | | | | | | | | 25,436,626 | |
| | | | |
Reinvestment of distributions | | | | | | | | | | | | | | | | |
Class A | | | 0 | | | | 0 | | | | 32,909 | | | | 762,939 | |
Class B | | | 0 | | | | 0 | | | | 156 | | | | 3,620 | |
Class C | | | 0 | | | | 0 | | | | 6,451 | | | | 147,103 | |
Administrator Class | | | 0 | | | | 0 | | | | 270,522 | | | | 6,320,119 | |
| | | | |
| | | | | | | 0 | | | | | | | | 7,233,781 | |
| | | | |
Payment for shares redeemed | | | | | | | | | | | | | | | | |
Class A | | | (141,826 | ) | | | (3,305,610 | ) | | | (189,830 | ) | | | (4,466,077 | ) |
Class B | | | (3,739 | ) | | | (88,210 | ) | | | (9,450 | ) | | | (221,598 | ) |
Class C | | | (38,139 | ) | | | (871,589 | ) | | | (39,148 | ) | | | (899,068 | ) |
Administrator Class | | | (610,871 | ) | | | (14,236,402 | ) | | | (709,375 | ) | | | (16,680,708 | ) |
| | | | |
| | | | | | | (18,501,811 | ) | | | | | | | (22,267,451 | ) |
| | | | |
Net increase in net assets resulting from capital share transactions | | | | | | | 6,136,646 | | | | | | | | 10,402,956 | |
| | | | |
Total increase in net assets | | | | | | | 4,652,935 | | | | | | | | 13,223,393 | |
| | | | |
| | | | |
Net assets | | | | | | | | | | | | | | | | |
Beginning of period | | | | | | | 180,489,849 | | | | | | | | 167,266,456 | |
| | | | |
End of period | | | | | | $ | 185,142,784 | | | | | | | $ | 180,489,849 | |
| | | | |
Undistributed net investment income | | | | | | $ | 2,141,841 | | | | | | | $ | 915,734 | |
| | | | |
The accompanying notes are an integral part of these financial statements.
| | | | |
| 16 | | Wells Fargo Allocation Funds | | Financial highlights |
| | | | | | | | | | | | | | | | | | | | |
| Growth Balanced Fund | | Beginning net asset value per share | | | Net investment income1 | | | Net realized and unrealized gains (losses) on investments | | | Distributions from net investment income | | | Ending net asset value per share | |
Class A | | | | | | | | | | | | | | | | | | | | |
Six months ended November 30, 2015 (unaudited) | | $ | 40.80 | | | | 0.20 | | | | (0.83 | ) | | | 0.00 | | | $ | 40.17 | |
Year ended May 31, 2015 | | $ | 37.96 | | | | 0.36 | | | | 2.65 | | | | (0.17 | ) | | $ | 40.80 | |
Year ended May 31, 2014 | | $ | 33.35 | | | | 0.35 | | | | 4.60 | | | | (0.34 | ) | | $ | 37.96 | |
Year ended May 31, 2013 | | $ | 27.77 | | | | 0.32 | | | | 5.70 | | | | (0.44 | ) | | $ | 33.35 | |
Year ended May 31, 2012 | | $ | 29.34 | | | | 0.39 | 4 | | | (1.73 | ) | | | (0.23 | ) | | $ | 27.77 | |
Year ended May 31, 20115 | | $ | 25.89 | | | | 0.23 | | | | 4.11 | | | | (0.89 | ) | | $ | 29.34 | |
Year ended September 30, 2010 | | $ | 24.12 | | | | 0.40 | 4 | | | 1.75 | | | | (0.38 | ) | | $ | 25.89 | |
Class B | | | | | | | | | | | | | | | | | | | | |
Six months ended November 30, 2015 (unaudited) | | $ | 36.39 | | | | 0.04 | 4 | | | (0.74 | ) | | | 0.00 | | | $ | 35.69 | |
Year ended May 31, 2015 | | $ | 33.97 | | | | 0.06 | 4 | | | 2.36 | | | | 0.00 | | | $ | 36.39 | |
Year ended May 31, 2014 | | $ | 29.84 | | | | 0.08 | 4 | | | 4.10 | | | | (0.05 | ) | | $ | 33.97 | |
Year ended May 31, 2013 | | $ | 24.80 | | | | 0.12 | 4 | | | 5.05 | | | | (0.13 | ) | | $ | 29.84 | |
Year ended May 31, 2012 | | $ | 26.17 | | | | 0.15 | 4 | | | (1.52 | ) | | | 0.00 | | | $ | 24.80 | |
Year ended May 31, 20115 | | $ | 23.07 | | | | 0.12 | 4 | | | 3.62 | | | | (0.64 | ) | | $ | 26.17 | |
Year ended September 30, 2010 | | $ | 21.46 | | | | 0.22 | 4 | | | 1.53 | | | | (0.14 | ) | | $ | 23.07 | |
Class C | | | | | | | | | | | | | | | | | | | | |
Six months ended November 30, 2015 (unaudited) | | $ | 35.63 | | | | 0.04 | 4 | | | (0.72 | ) | | | 0.00 | | | $ | 34.95 | |
Year ended May 31, 2015 | | $ | 33.33 | | | | 0.08 | 4 | | | 2.30 | | | | (0.08 | ) | | $ | 35.63 | |
Year ended May 31, 2014 | | $ | 29.38 | | | | 0.10 | 4 | | | 4.00 | | | | (0.15 | ) | | $ | 33.33 | |
Year ended May 31, 2013 | | $ | 24.52 | | | | 0.13 | 4 | | | 4.98 | | | | (0.25 | ) | | $ | 29.38 | |
Year ended May 31, 2012 | | $ | 25.94 | | | | 0.16 | 4 | | | (1.53 | ) | | | (0.05 | ) | | $ | 24.52 | |
Year ended May 31, 20115 | | $ | 22.93 | | | | 0.12 | 4 | | | 3.60 | | | | (0.71 | ) | | $ | 25.94 | |
Year ended September 30, 2010 | | $ | 21.42 | | | | 0.19 | 4 | | | 1.56 | | | | (0.24 | ) | | $ | 22.93 | |
Administrator Class | | | | | | | | | | | | | | | | | | | | |
Six months ended November 30, 2015 (unaudited) | | $ | 36.54 | | | | 0.24 | | | | (0.76 | ) | | | 0.00 | | | $ | 36.02 | |
Year ended May 31, 2015 | | $ | 33.98 | | | | 0.45 | 4 | | | 2.32 | | | | (0.21 | ) | | $ | 36.54 | |
Year ended May 31, 2014 | | $ | 29.89 | | | | 0.41 | 4 | | | 4.10 | | | | (0.42 | ) | | $ | 33.98 | |
Year ended May 31, 2013 | | $ | 24.93 | | | | 0.65 | 4 | | | 4.82 | | | | (0.51 | ) | | $ | 29.89 | |
Year ended May 31, 2012 | | $ | 26.39 | | | | 0.41 | 4 | | | (1.57 | ) | | | (0.30 | ) | | $ | 24.93 | |
Year ended May 31, 20115 | | $ | 23.39 | | | | 0.31 | 4 | | | 3.64 | | | | (0.95 | ) | | $ | 26.39 | |
Year ended September 30, 2010 | | $ | 21.81 | | | | 0.46 | 4 | | | 1.55 | | | | (0.43 | ) | | $ | 23.39 | |
| 1 | Includes net expenses allocated from the affiliated Master Portfolios in which the Fund invests. |
| 2 | Total return calculations do not include any sales charges. Returns for periods of less than one year are not annualized. |
| 3 | Portfolio turnover rate is calculated by multiplying the Fund’s investment percentage in the respective affiliated Master Portfolios by the corresponding affiliated Master Portfolio’s portfolio turnover rate and then aggregating the results. |
| 4 | Calculated based upon average shares outstanding |
| 5 | For the eight months ended May 31, 2011. The Fund changed its fiscal year end from September 30 to May 31, effective May 31, 2011. |
The accompanying notes are an integral part of these financial statements.
| | | | | | |
| Financial highlights | | Wells Fargo Allocation Funds | | | 17 | |
| | | | | | | | | | | | | | | | | | | | | | |
| Ratio to average net assets (annualized) | | | Total return2 | | | Portfolio turnover rate3 | | | Net assets at end of period (000s omitted) | |
Net investment income1 | | | Gross expenses1 | | | Net expenses1 | | | | |
| | | | | | | | | | | | | | | | | | | | | | |
| | 0.98 | % | | | 1.35 | % | | | 1.20 | % | | | (1.54 | )% | | | 37 | % | | $ | 63,963 | |
| | 0.97 | % | | | 1.40 | % | | | 1.20 | % | | | 7.94 | % | | | 75 | % | | $ | 64,223 | |
| | 1.05 | % | | | 1.39 | % | | | 1.20 | % | | | 14.87 | % | | | 77 | % | | $ | 61,117 | |
| | 1.23 | % | | | 1.39 | % | | | 1.20 | % | | | 21.85 | % | | | 80 | % | | $ | 55,777 | |
| | 1.40 | % | | | 1.36 | % | | | 1.20 | % | | | (4.53 | )% | | | 107 | % | | $ | 49,403 | |
| | 1.43 | % | | | 1.35 | % | | | 1.20 | % | | | 17.02 | % | | | 70 | % | | $ | 60,055 | |
| | 1.61 | % | | | 1.38 | % | | | 1.20 | % | | | 9.00 | % | | | 94 | % | | $ | 55,284 | |
| | | | | | | | | | | | | | | | | | | | | | |
| | 0.24 | % | | | 2.09 | % | | | 1.95 | % | | | (1.92 | )% | | | 37 | % | | $ | 162 | |
| | 0.18 | % | | | 2.14 | % | | | 1.95 | % | | | 7.12 | % | | | 75 | % | | $ | 164 | |
| | 0.25 | % | | | 2.14 | % | | | 1.95 | % | | | 14.00 | % | | | 77 | % | | $ | 476 | |
| | 0.45 | % | | | 2.12 | % | | | 1.95 | % | | | 20.91 | % | | | 80 | % | | $ | 970 | |
| | 0.61 | % | | | 2.10 | % | | | 1.95 | % | | | (5.23 | )% | | | 107 | % | | $ | 1,704 | |
| | 0.62 | % | | | 2.09 | % | | | 1.95 | % | | | 16.43 | % | | | 70 | % | | $ | 4,163 | |
| | 0.96 | % | | | 2.12 | % | | | 1.95 | % | | | 8.19 | % | | | 94 | % | | $ | 6,924 | |
| | | | | | | | | | | | | | | | | | | | | | |
| | 0.23 | % | | | 2.11 | % | | | 1.95 | % | | | (1.91 | )% | | | 37 | % | | $ | 15,440 | |
| | 0.22 | % | | | 2.15 | % | | | 1.95 | % | | | 7.13 | % | | | 75 | % | | $ | 14,349 | |
| | 0.31 | % | | | 2.14 | % | | | 1.95 | % | | | 13.99 | % | | | 77 | % | | $ | 12,637 | |
| | 0.48 | % | | | 2.14 | % | | | 1.95 | % | | | 20.97 | % | | | 80 | % | | $ | 9,326 | |
| | 0.65 | % | | | 2.11 | % | | | 1.95 | % | | | (5.26 | )% | | | 107 | % | | $ | 7,656 | |
| | 0.68 | % | | | 2.10 | % | | | 1.95 | % | | | 16.45 | % | | | 70 | % | | $ | 8,388 | |
| | 0.84 | % | | | 2.12 | % | | | 1.95 | % | | | 8.20 | % | | | 94 | % | | $ | 7,665 | |
| | | | | | | | | | | | | | | | | | | | | | |
| | 1.23 | % | | | 1.26 | % | | | 0.95 | % | | | (1.42 | )% | | | 37 | % | | $ | 176,591 | |
| | 1.22 | % | | | 1.24 | % | | | 0.95 | % | | | 8.16 | % | | | 75 | % | | $ | 182,373 | |
| | 1.29 | % | | | 1.23 | % | | | 0.95 | % | | | 15.16 | % | | | 77 | % | | $ | 175,094 | |
| | 1.47 | % | | | 1.22 | % | | | 0.95 | % | | | 22.18 | % | | | 80 | % | | $ | 175,142 | |
| | 1.64 | % | | | 1.20 | % | | | 0.95 | % | | | (4.30 | )% | | | 107 | % | | $ | 220,021 | |
| | 1.66 | % | | | 1.19 | % | | | 0.95 | % | | | 17.19 | % | | | 70 | % | | $ | 273,174 | |
| | 2.04 | % | | | 1.19 | % | | | 0.95 | % | | | 9.32 | % | | | 94 | % | | $ | 287,073 | |
The accompanying notes are an integral part of these financial statements.
| | | | |
| 18 | | Wells Fargo Allocation Funds | | Financial highlights |
| | | | | | | | | | | | | | | | | | | | | | | | |
| Moderate Balanced Fund | | Beginning
net asset
value per
share | | | Net
investment
income1 | | | Net realized
and unrealized
gains (losses)
on investments | | | Distributions
from net
investment
income | | | Distributions
from net
realized gains | | | Ending
net asset
value per
share | |
Class A | | | | | | | | | | | | | | | | | | | | | | | | |
Six months ended November 30, 2015 (unaudited) | | $ | 23.57 | | | | 0.14 | 4 | | | (0.35 | ) | | | 0.00 | | | | 0.00 | | | $ | 23.36 | |
Year ended May 31, 2015 | | $ | 23.19 | | | | 0.32 | | | | 1.01 | | | | (0.44 | ) | | | (0.51 | ) | | $ | 23.57 | |
Year ended May 31, 2014 | | $ | 21.21 | | | | 0.29 | 4 | | | 1.82 | | | | (0.13 | ) | | | 0.00 | | | $ | 23.19 | |
Year ended May 31, 2013 | | $ | 18.84 | | | | 0.21 | | | | 2.50 | | | | (0.34 | ) | | | 0.00 | | | $ | 21.21 | |
Year ended May 31, 2012 | | $ | 19.64 | | | | 0.32 | | | | (0.54 | ) | | | (0.58 | ) | | | 0.00 | | | $ | 18.84 | |
Year ended May 31, 20115 | | $ | 17.97 | | | | 0.28 | | | | 1.80 | | | | (0.41 | ) | | | 0.00 | | | $ | 19.64 | |
Year ended September 30, 2010 | | $ | 17.12 | | | | 0.38 | 4 | | | 1.03 | | | | (0.56 | ) | | | 0.00 | | | $ | 17.97 | |
Class B | | | | | | | | | | | | | | | | | | | | | | | | |
Six months ended November 30, 2015 (unaudited) | | $ | 23.81 | | | | 0.05 | 4 | | | (0.35 | ) | | | 0.00 | | | | 0.00 | | | $ | 23.51 | |
Year ended May 31, 2015 | | $ | 23.16 | | | | 0.09 | 4 | | | 1.07 | | | | 0.00 | | | | (0.51 | ) | | $ | 23.81 | |
Year ended May 31, 2014 | | $ | 21.25 | | | | 0.11 | 4 | | | 1.83 | | | | (0.03 | ) | | | 0.00 | | | $ | 23.16 | |
Year ended May 31, 2013 | | $ | 18.86 | | | | 0.13 | 4 | | | 2.43 | | | | (0.17 | ) | | | 0.00 | | | $ | 21.25 | |
Year ended May 31, 2012 | | $ | 19.58 | | | | 0.18 | 4 | | | (0.53 | ) | | | (0.37 | ) | | | 0.00 | | | $ | 18.86 | |
Year ended May 31, 20115 | | $ | 17.85 | | | | 0.14 | 4 | | | 1.84 | | | | (0.25 | ) | | | 0.00 | | | $ | 19.58 | |
Year ended September 30, 2010 | | $ | 16.99 | | | | 0.30 | | | | 0.97 | | | | (0.41 | ) | | | 0.00 | | | $ | 17.85 | |
Class C | | | | | | | | | | | | | | | | | | | | | | | | |
Six months ended November 30, 2015 (unaudited) | | $ | 23.18 | | | | 0.05 | 4 | | | (0.34 | ) | | | 0.00 | | | | 0.00 | | | $ | 22.89 | |
Year ended May 31, 2015 | | $ | 22.79 | | | | 0.09 | 4 | | | 1.04 | | | | (0.23 | ) | | | (0.51 | ) | | $ | 23.18 | |
Year ended May 31, 2014 | | $ | 20.96 | | | | 0.12 | 4 | | | 1.80 | | | | (0.09 | ) | | | 0.00 | | | $ | 22.79 | |
Year ended May 31, 2013 | | $ | 18.63 | | | | 0.11 | | | | 2.42 | | | | (0.20 | ) | | | 0.00 | | | $ | 20.96 | |
Year ended May 31, 2012 | | $ | 19.45 | | | | 0.18 | 4 | | | (0.53 | ) | | | (0.47 | ) | | | 0.00 | | | $ | 18.63 | |
Year ended May 31, 20115 | | $ | 17.77 | | | | 0.14 | 4 | | | 1.83 | | | | (0.29 | ) | | | 0.00 | | | $ | 19.45 | |
Year ended September 30, 2010 | | $ | 16.96 | | | | 0.28 | 4 | | | 0.99 | | | | (0.46 | ) | | | 0.00 | | | $ | 17.77 | |
Administrator Class | | | | | | | | | | | | | | | | | | | | | | | | |
Six months ended November 30, 2015 (unaudited) | | $ | 23.75 | | | | 0.17 | | | | (0.35 | ) | | | 0.00 | | | | 0.00 | | | $ | 23.57 | |
Year ended May 31, 2015 | | $ | 23.38 | | | | 0.33 | 4 | | | 1.07 | | | | (0.52 | ) | | | (0.51 | ) | | $ | 23.75 | |
Year ended May 31, 2014 | | $ | 21.36 | | | | 0.38 | | | | 1.79 | | | | (0.15 | ) | | | 0.00 | | | $ | 23.38 | |
Year ended May 31, 2013 | | $ | 18.96 | | | | 0.41 | | | | 2.38 | | | | (0.39 | ) | | | 0.00 | | | $ | 21.36 | |
Year ended May 31, 2012 | | $ | 19.77 | | | | 0.40 | | | | (0.58 | ) | | | (0.63 | ) | | | 0.00 | | | $ | 18.96 | |
Year ended May 31, 20115 | | $ | 18.11 | | | | 0.29 | | | | 1.83 | | | | (0.46 | ) | | | 0.00 | | | $ | 19.77 | |
Year ended September 30, 2010 | | $ | 17.23 | | | | 0.52 | 4 | | | 0.95 | | | | (0.59 | ) | | | 0.00 | | | $ | 18.11 | |
| 1 | Includes net expenses allocated from the affiliated Master Portfolios in which the Fund invests. |
| 2 | Total return calculations do not include any sales charges. Returns for periods of less than one year are not annualized. |
| 3 | Portfolio turnover rate is calculated by multiplying the Fund’s investment percentage in the respective affiliated Master Portfolios by the corresponding affiliated Master Portfolio’s portfolio turnover rate and then aggregating the results. |
| 4 | Calculated based upon average shares outstanding |
| 5 | For the eight months ended May 31, 2011. The Fund changed its fiscal year end from September 30 to May 31, effective May 31, 2011. |
The accompanying notes are an integral part of these financial statements.
| | | | | | |
| Financial highlights | | Wells Fargo Allocation Funds | | | 19 | |
| | | | | | | | | | | | | | | | | | | | | | |
| Ratio to average net assets (annualized) | | | Total
return2 | | | Portfolio
turnover
rate3 | | | Net assets at
end of period
(000s omitted) | |
Net investment
income1 | | | Gross
expenses1 | | | Net
expenses1 | | | | |
| | | | | | | | | | | | | | | | | | | | | | |
| | 1.18 | % | | | 1.32 | % | | | 1.15 | % | | | (0.89 | )% | | | 42 | % | | $ | 25,144 | |
| | 1.14 | % | | | 1.36 | % | | | 1.15 | % | | | 5.87 | % | | | 84 | % | | $ | 20,782 | |
| | 1.29 | % | | | 1.36 | % | | | 1.15 | % | | | 9.94 | % | | | 89 | % | | $ | 18,169 | |
| | 1.41 | % | | | 1.36 | % | | | 1.15 | % | | | 14.57 | % | | | 86 | % | | $ | 10,344 | |
| | 1.68 | % | | | 1.33 | % | | | 1.15 | % | | | (0.93 | )% | | | 115 | % | | $ | 9,935 | |
| | 1.89 | % | | | 1.34 | % | | | 1.15 | % | | | 11.72 | % | | | 70 | % | | $ | 10,702 | |
| | 2.42 | % | | | 1.37 | % | | | 1.15 | % | | | 8.41 | % | | | 103 | % | | $ | 7,992 | |
| | | | | | | | | | | | | | | | | | | | | | |
| | 0.42 | % | | | 2.05 | % | | | 1.90 | % | | | (1.26 | )% | | | 42 | % | | $ | 160 | |
| | 0.38 | % | | | 2.10 | % | | | 1.90 | % | | | 5.07 | % | | | 84 | % | | $ | 208 | |
| | 0.50 | % | | | 2.11 | % | | | 1.90 | % | | | 9.15 | % | | | 89 | % | | $ | 380 | |
| | 0.65 | % | | | 2.11 | % | | | 1.90 | % | | | 13.65 | % | | | 86 | % | | $ | 613 | |
| | 0.94 | % | | | 2.08 | % | | | 1.90 | % | | | (1.66 | )% | | | 115 | % | | $ | 807 | |
| | 1.11 | % | | | 2.09 | % | | | 1.90 | % | | | 11.16 | % | | | 70 | % | | $ | 1,097 | |
| | 1.65 | % | | | 2.12 | % | | | 1.90 | % | | | 7.58 | % | | | 103 | % | | $ | 1,257 | |
| | | | | | | | | | | | | | | | | | | | | | |
| | 0.44 | % | | | 2.07 | % | | | 1.90 | % | | | (1.25 | )% | | | 42 | % | | $ | 8,555 | |
| | 0.40 | % | | | 2.11 | % | | | 1.90 | % | | | 5.06 | % | | | 84 | % | | $ | 6,042 | |
| | 0.54 | % | | | 2.11 | % | | | 1.90 | % | | | 9.15 | % | | | 89 | % | | $ | 4,469 | |
| | 0.66 | % | | | 2.11 | % | | | 1.90 | % | | | 13.65 | % | | | 86 | % | | $ | 2,576 | |
| | 0.92 | % | | | 2.08 | % | | | 1.90 | % | | | (1.67 | )% | | | 115 | % | | $ | 2,319 | |
| | 1.16 | % | | | 2.09 | % | | | 1.90 | % | | | 11.17 | % | | | 70 | % | | $ | 2,364 | |
| | 1.59 | % | | | 2.12 | % | | | 1.90 | % | | | 7.58 | % | | | 103 | % | | $ | 1,726 | |
| | | | | | | | | | | | | | | | | | | | | | |
| | 1.42 | % | | | 1.22 | % | | | 0.90 | % | | | (0.76 | )% | | | 42 | % | | $ | 151,284 | |
| | 1.39 | % | | | 1.20 | % | | | 0.90 | % | | | 6.13 | % | | | 84 | % | | $ | 153,457 | |
| | 1.52 | % | | | 1.20 | % | | | 0.90 | % | | | 10.18 | % | | | 89 | % | | $ | 144,248 | |
| | 1.66 | % | | | 1.20 | % | | | 0.90 | % | | | 14.81 | % | | | 86 | % | | $ | 146,729 | |
| | 1.92 | % | | | 1.17 | % | | | 0.90 | % | | | (0.66 | )% | | | 115 | % | | $ | 172,587 | |
| | 2.14 | % | | | 1.18 | % | | | 0.90 | % | | | 11.93 | % | | | 70 | % | | $ | 192,305 | |
| | 3.06 | % | | | 1.18 | % | | | 0.90 | % | | | 8.65 | % | | | 103 | % | | $ | 176,179 | |
The accompanying notes are an integral part of these financial statements.
| | | | |
| 20 | | Wells Fargo Allocation Funds | | Notes to financial statements (unaudited) |
1. ORGANIZATION
Wells Fargo Funds Trust (the “Trust”), a Delaware statutory trust organized on March 10, 1999, is an open-end management investment company registered under the Investment Company Act of 1940, as amended (the “1940 Act”). As an investment company, the Trust follows the accounting and reporting guidance in Financial Accounting Standards Board (“FASB”) Accounting Standards Codification Topic 946, Financial Services – Investment Companies. These financial statements report on the following funds: Wells Fargo Growth Balanced Fund (“Growth Balanced Fund”) and the Wells Fargo Moderate Balanced Fund (“Moderate Balanced Fund”) (each, a “Fund”, collectively, the “Funds”). Each Fund is a diversified series of the Trust.
Each Fund seeks to achieve its investment objective by investing substantially all of its investable assets in separate diversified portfolios (each, an “affiliated Master Portfolio”, collectively, the “affiliated Master Portfolios”) of Wells Fargo Master Trust, a registered open-end management investment company. Each affiliated Master Portfolio directly acquires portfolio securities, and a Fund investing in an affiliated Master Portfolio acquires an indirect interest in those securities. Each Fund accounts for its investment in the affiliated Master Portfolios as partnership investments and records on a daily basis its share of the affiliated Master Portfolio’s income, expense and realized and unrealized gains and losses. The financial statements of the affiliated Master Portfolios for the six months ended November 30, 2015 are included in this report and should be read in conjunction with each Fund’s financial statements. As of November 30, 2015, the Funds own the following percentages of the affiliated Master Portfolios:
| | | | | | | | |
| | | Growth Balanced Fund | | | Moderate Balanced Fund | |
Wells Fargo C&B Large Cap Value Portfolio | | | 4 | % | | | 2 | % |
Wells Fargo Core Bond Portfolio | | | 0 | * | | | 0 | * |
Wells Fargo Diversified Large Cap Growth Portfolio | | | 36 | | | | 16 | |
Wells Fargo Emerging Growth Portfolio | | | 0 | * | | | 0 | * |
Wells Fargo Index Portfolio | | | 2 | | | | 1 | |
Wells Fargo International Growth Portfolio | | | 8 | | | | 4 | |
Wells Fargo International Value Portfolio | | | 2 | | | | 1 | |
Wells Fargo Large Company Value Portfolio | | | 36 | | | | 16 | |
Wells Fargo Managed Fixed Income Portfolio | | | 52 | | | | 48 | |
Wells Fargo Real Return Portfolio | | | 18 | | | | 16 | |
Wells Fargo Small Company Growth Portfolio | | | 0 | * | | | 0 | * |
Wells Fargo Small Company Value Portfolio | | | 4 | | | | 2 | |
Wells Fargo Stable Income Portfolio | | | N/A | | | | 100 | |
| * | The amount owned is less than 1%. |
2. SIGNIFICANT ACCOUNTING POLICIES
The following significant accounting policies, which are consistently followed in the preparation of the financial statements of each Fund, are in conformity with U.S. generally accepted accounting principles which require management to make estimates and assumptions that affect the reported amounts of assets and liabilities, disclosure of contingent assets and liabilities at the date of the financial statements, and the reported amounts of revenues and expenses during the reporting period. Actual results could differ from those estimates.
Securities valuation
All investments are valued each business day as of the close of regular trading on the New York Stock Exchange (generally 4 p.m. Eastern Time).
Investments in the affiliated Master Portfolios are valued daily based on each Fund’s proportionate share of each affiliated Master Portfolio’s net assets, which are also valued daily. Securities held in the affiliated Master Portfolios are valued as discussed in the Notes to Financial Statements of the affiliated Master Portfolios, which are included elsewhere in this report.
Futures that are listed on a foreign or domestic exchange or market are valued at the official closing price or, if none, the last sales price.
Debt securities are valued at the evaluated bid price provided by an independent pricing service or, if a reliable price is not available, the quoted bid price from an independent broker-dealer.
| | | | | | |
| Notes to financial statements (unaudited) | | Wells Fargo Allocation Funds | | | 21 | |
Investments which are not valued using any of the methods discussed above are valued at their fair value, as determined in good faith by the Board of Trustees of the Funds. The Board of Trustees has established a Valuation Committee comprised of the Trustees and has delegated to it the authority to take any actions regarding the valuation of portfolio securities that the Valuation Committee deems necessary or appropriate, including determining the fair value of portfolio securities, unless the determination has been delegated to the Management Valuation Team of Wells Fargo Funds Management, LLC (“Funds Management”). The Board of Trustees retains the authority to make or ratify any valuation decisions or approve any changes to the Valuation Procedures as it deems appropriate. On a quarterly basis, the Board of Trustees receives reports on any valuation actions taken by the Valuation Committee or the Management Valuation Team which may include items for ratification.
Valuations of fair valued securities are compared to the next actual sales price when available, or other appropriate market values, to assess the continued appropriateness of the fair valuation methodologies used. These securities are fair valued on a day-to-day basis, taking into consideration changes to appropriate market information and any significant changes to the inputs considered in the valuation process until there is a readily available price provided on an exchange or by an independent pricing service. Valuations received from an independent pricing service or independent broker-dealer quotes are periodically validated by comparisons to most recent trades and valuations provided by other independent pricing services in addition to the review of prices by the manager and/or subadviser. Unobservable inputs used in determining fair valuations are identified based on the type of security, taking into consideration factors utilized by market participants in valuing the investment, knowledge about the issuer and the current market environment.
Futures contracts
Each Fund is subject to interest rate risk, equity price risk and foreign currency exchange rate risk in the normal course of pursuing its investment objectives. The Fund may buy and sell futures contracts in order to gain exposure to, or protect against, changes in security values and interest rates. The primary risks associated with the use of futures contracts are the imperfect correlation between changes in market values of securities held by the Fund and the prices of futures contracts, and the possibility of an illiquid market.
The aggregate principal amounts of the contracts are not recorded in the financial statements. Fluctuations in the value of the contracts are recorded in the Statements of Assets and Liabilities as an asset or liability and in the Statements of Operations as unrealized gains or losses until the contracts are closed, at which point they are recorded as net realized gains or losses on futures contracts. With futures contracts, there is minimal counterparty risk to the Fund since futures are exchange traded and the exchange’s clearinghouse, as counterparty to all exchange traded futures, guarantees the futures against default.
Security transactions and income recognition
Securities transactions are recorded on a trade date basis by each Fund and each affiliated Master Portfolio. Realized gains or losses in each Fund and each affiliated Master Portfolio are recorded on the basis of identified cost.
Interest income in each Fund and each affiliated Master Portfolio is accrued daily and bond discounts are accreted and premiums are amortized daily based on the effective interest method. To the extent debt obligations are placed on non-accrual status, any related interest income may be reduced by writing off interest receivables when the collection of all or a portion of interest has become doubtful based on consistently applied procedures. If the issuer subsequently resumes interest payments or when the collectability of interest is reasonably assured, the debt obligation is removed from non-accrual status.
Dividend income in each affiliated Master Portfolio is recognized on the ex-dividend date, except for certain dividends from foreign securities which are recorded as soon as the custodian verifies the ex-dividend date. Dividend income from foreign securities in each affiliated Master Portfolio is recorded net of foreign taxes withheld where recovery of such taxes is not assured.
Each Fund records daily its proportionate share of each affiliated Master Portfolio’s interest and dividend income and realized and unrealized gains or losses.
Distributions to shareholders
Distributions to shareholders from net investment income and net realized gains, if any, are recorded on the ex-dividend date. Such distributions are determined in conformity with federal income tax regulations, which may differ in amount or character from net investment income and realized gains recognized for purposes of U.S. generally accepted accounting principles.
Federal and other taxes
Each Fund is treated as a separate entity for federal income tax purposes. Each Fund intends to continue to qualify as a regulated investment company by distributing substantially all of its investment company taxable and any net realized capital gains (after reduction for capital loss carryforwards) sufficient to relieve it from all, or substantially all, federal income taxes. Accordingly, no provision for federal income taxes was required.
| | | | |
| 22 | | Wells Fargo Allocation Funds | | Notes to financial statements (unaudited) |
Each Fund’s income and federal excise tax returns and all financial records supporting those returns for the prior three fiscal years are subject to examination by the federal and Delaware revenue authorities. Management has analyzed each Fund’s tax positions taken on federal, state, and foreign tax returns for all open tax years and does not believe that there are any uncertain tax positions that require recognition of a tax liability.
As of May 31, 2015, Growth Balanced Fund had capital loss carryforwards that are available to offset future net realized capital gains in the amount of $144,529,745 with $3,749,870 expiring in 2016; $58,201,648 expiring in 2017; and $82,578,227 expiring in 2018.
Class allocations
The separate classes of shares offered by each Fund differ principally in applicable sales charges, distribution, shareholder servicing, and administration fees. Class specific expenses are charged directly to that share class. Investment income, common expenses, and realized and unrealized gains (losses) on investments are allocated daily to each class of shares based on the relative proportion of net assets of each class.
3. FAIR VALUATION MEASUREMENTS
Fair value measurements of investments are determined within a framework that has established a fair value hierarchy based upon the various data inputs utilized in determining the value of each Fund’s investments. The three-level hierarchy gives the highest priority to unadjusted quoted prices in active markets for identical assets or liabilities (Level 1) and the lowest priority to significant unobservable inputs (Level 3). Each Fund’s investments are classified within the fair value hierarchy based on the lowest level of input that is significant to the fair value measurement. The inputs are summarized into three broad levels as follows:
| n | | Level 1 – quoted prices in active markets for identical securities |
| n | | Level 2 – other significant observable inputs (including quoted prices for similar securities, interest rates, prepayment speeds, credit risk, use of amortized cost, etc.) |
| n | | Level 3 – significant unobservable inputs (including the Fund’s own assumptions in determining the fair value of investments) |
The inputs or methodologies used for valuing investments in securities are not necessarily an indication of the risk associated with investing in those securities.
At November 30, 2015, each Fund’s investments in affiliated Master Portfolios carried at fair valued were designated as Level 2 inputs.
The Funds recognize transfers between levels within the fair value hierarchy at the end of the reporting period. At November 30, 2015, the Funds did not have any transfers into/out of Level 1, Level 2, or Level 3.
4. TRANSACTIONS WITH AFFILIATES
Management fee
Funds Management, an indirect wholly owned subsidiary of Wells Fargo & Company (“Wells Fargo”), is the manager of each Fund and provides advisory and fund-level administrative services under an investment management agreement. Under the investment management agreement, Funds Management is responsible for, among other services, implementing the investment objectives and strategies of each Fund, supervising the applicable subadvisers, providing fund-level administrative services in connection with each Fund’s operations, and providing any other fund-level administrative services reasonably necessary for the operation of each Fund. As compensation for its services under the investment management agreement, Funds Management is entitled to receive an annual management fee starting at 0.30% and declining to 0.22% as the average daily net assets of each Fund increase.
Prior to July 1, 2015, Funds Management provided advisory services pursuant to an investment advisory agreement and was entitled to receive an annual fee which started at 0.25% and declined to 0.19% as the average daily net assets of each Fund increased. In addition, fund-level administrative services were provided by Funds Management under a separate administration agreement at an annual fee which started at 0.05% and declined to 0.03% as the average daily net assets of each Fund increased. For financial statement purposes, the advisory fee and fund-level administration fee for the six months ended November 30, 2015 have been included in management fee on the Statement of Operations.
| | | | | | |
| Notes to financial statements (unaudited) | | Wells Fargo Allocation Funds | | | 23 | |
For the six months ended November 30, 2015, the management fee was equivalent to an annual rate of 0.30% of each Fund’s average daily net assets.
Funds Management also serves as the adviser to each affiliated Master Portfolio and is entitled to receive a fee from each affiliated Master Portfolio for those services.
Administration fees
Under a class-level administration agreement, Funds Management provides class-level administrative services to each Fund, which includes paying fees and expenses for services provided by the transfer agent, sub-transfer agents, omnibus account servicers and record-keepers. As compensation for its services under the class-level administration agreement, Funds Management receives an annual fee which is calculated based on the average daily net assets of each class as follows:
| | | | | | | | |
| | | Class-level administration fee | |
| | | Current rate | | | Rate prior to
July 1, 2015 | |
Class A, Class B, Class C | | | 0.21 | % | | | 0.26 | % |
Administrator Class | | | 0.13 | | | | 0.10 | |
Funds Management has contractually waived and/or reimbursed management and administration fees to the extent necessary to maintain certain net operating expense ratios for the Funds. Waiver of fees and/or reimbursement of expenses by Funds Management were made first from fund level expenses on a proportionate basis and then from class specific expenses. Funds Management has committed through September 30, 2016 to waive fees and/or reimburse expenses to the extent necessary to cap each Fund’s expenses as follows:
| | | | | | | | | | | | | | | | |
| | | Class A | | | Class B | | | Class C | | | Administrator Class | |
Growth Balanced Fund | | | 1.20 | % | | | 1.95 | % | | | 1.95 | % | | | 0.95 | % |
Moderate Balanced Fund | | | 1.15 | | | | 1.90 | | | | 1.90 | | | | 0.90 | |
After the expiration date, each expense cap may be increased or the commitment to maintain the cap may be terminated only with the approval of the Board of Trustees.
Distribution fees
The Trust has adopted a Distribution Plan for Class B and Class C shares of the applicable Funds pursuant to Rule 12b-1 under the 1940 Act. Distribution fees are charged to the Class B and Class C shares and paid to Wells Fargo Funds Distributor, LLC (“Funds Distributor”), the principal underwriter of each Fund, at an annual rate of 0.75% of the average daily net assets of Class B and Class C shares.
In addition, Funds Distributor is entitled to receive the front-end sales charge from the purchase of Class A shares and a contingent deferred sales charge on the redemption of certain Class A shares. Funds Distributor is also entitled to receive the contingent deferred sales charges from redemptions of Class B and Class C shares. For the six months ended November 30, 2015, Funds Distributor received the following amounts in front-end sales charges.
| | | | |
| | | Class A | |
| |
Growth Balanced Fund | | $ | 9,444 | |
Moderate Balanced Fund | | | 11,737 | |
Shareholder servicing fees
The Trust has entered into contracts with one or more shareholder servicing agents, whereby Class A, Class B, Class C and Administrator Class of each applicable Fund is charged a fee at an annual rate of 0.25% of the average daily net assets of each respective class.
A portion of these total shareholder servicing fees were paid to affiliates of Wells Fargo.
| | | | |
| 24 | | Wells Fargo Allocation Funds | | Notes to financial statements (unaudited) |
5. INVESTMENT PORTFOLIO TRANSACTIONS
Purchases and sales of investments, excluding short-term securities, for the six months ended November 30, 2015 were as follows:
| | | | | | | | | | | | | | | | |
| | | Purchases at cost* | | | Sales proceeds* | |
| | | U.S.
Government | | | Non-U.S.
Government | | | U.S.
Government | | | Non-U.S.
Government | |
Growth Balanced Fund | | $ | 57,447,267 | | | $ | 49,464,561 | | | $ | 57,349,993 | | | $ | 47,904,200 | |
Moderate Balanced Fund | | | 56,046,520 | | | | 33,912,739 | | | | 54,309,182 | | | | 28,715,730 | |
| * | The Funds seek to achieve their investment objective by investing substantially all of their investable assets in affiliated Master Portfolios. Purchases and sales related to these investments have been calculated by multiplying each Fund’s ownership percentage of the respective affiliated Master Portfolio by the corresponding affiliated Master Portfolio’s purchases and sales. |
6. DERIVATIVE TRANSACTIONS
During the six months ended November 30, 2015, the Funds entered into futures contracts to gain market exposure to certain asset classes consistent with an active asset allocation strategy.
As of November 30, 2015, the Fund did not have any open futures contracts.
The Funds had average notional amounts in futures contracts during the six months ended November 30, 2015 as follows:
| | | | | | | | |
| | | Long contracts | | | Short contracts | |
Growth Balanced Fund | | $ | 2,757,632 | | | $ | 4,311,908 | |
Moderate Balanced Fund | | | 1,942,141 | | | | 3,019,320 | |
A summary of derivative instruments by primary risk exposure is outlined in the following tables, unless the only primary risk exposure category is already reflected in the appropriate financial statements.
The effect of derivative instruments on the Statements of Operations for the six months ended November 30, 2015 was as follows for Growth Balanced Fund:
| | | | | | | | |
| | | Amount of realized
gains (losses) on
derivatives | | | Change in unrealized
gains (losses) on
derivatives | |
Interest rate contracts | | $ | 301,801 | | | $ | 39,148 | |
Equity contracts | | | (253,223 | ) | | | 56,282 | |
Foreign currency exchange contracts | | | 583,404 | | | | 37,065 | |
| | | $ | 631,982 | | | $ | 132,495 | |
The effect of derivative instruments on the Statements of Operations for the six months ended November 30, 2015 was as follows for Moderate Balanced Fund:
| | | | | | | | |
| | | Amount of realized
gains (losses) on
derivatives | | | Change in unrealized
gains (losses) on
derivatives | |
Interest rate contracts | | $ | 208,909 | | | $ | 27,031 | |
Equity contracts | | | 437,127 | | | | 38,815 | |
Foreign currency exchange contracts | | | (174,080 | ) | | | 26,302 | |
| | | $ | 471,956 | | | $ | 92,148 | |
7. BANK BORROWINGS
The Trust (excluding the money market funds and certain other funds) and Wells Fargo Variable Trust are parties to a $200,000,000 revolving credit agreement whereby each Fund is permitted to use bank borrowings for temporary or emergency purposes, such as to fund shareholder redemption requests. Interest under the credit agreement is charged to each Fund based on a borrowing rate equal to the higher of the Federal Funds rate in effect on that day plus 1.25% or
| | | | | | |
| Notes to financial statements (unaudited) | | Wells Fargo Allocation Funds | | | 25 | |
the overnight LIBOR rate in effect on that day plus 1.25%. In addition, an annual commitment fee equal to 0.20% of the unused balance is allocated to each participating fund. Prior to September 1, 2015, the revolving credit agreement amount was $25,000,000 with annual commitment fee of 0.15% of the unused balance which was allocated to each participating fund. For the six months ended November 30, 2015, the Growth Balanced Fund and Moderate Balanced Fund paid $341 and $179, respectively, in commitment fees.
For the six months ended November 30, 2015, there were no borrowings by Funds under the agreement.
8. INDEMNIFICATION
Under the Trust’s organizational documents, the officers and Trustees have been granted certain indemnification rights against certain liabilities that may arise out of performance of their duties to the Trust. Additionally, in the normal course of business, the Trust may enter into contracts with service providers that contain a variety of indemnification clauses. The Trust’s maximum exposure under these arrangements is dependent on future claims that may be made against the Funds and, therefore, cannot be estimated.
9. SUBSEQUENT DISTRIBUTIONS
On December 18, 2015, the Funds declared distributions from net investment income to shareholders of record on December 17, 2015. The per share amounts payable on December 21, 2015 were as follows:
| | | | | | | | |
| | | Growth
Balanced Fund | | | Moderate
Balanced Fund | |
Net investment income | | | | | | | | |
Class A | | $ | 0.33446 | | | $ | 0.26051 | |
Class B | | | 0.00000 | | | | 0.02797 | |
Class C | | | 0.13594 | | | | 0.15602 | |
Administrator Class | | | 0.43175 | | | | 0.30936 | |
These distributions are not reflected in the accompanying financial statements. The final determination of the source of all distributions is subject to change and made after the tax year-end of each Fund.
| | | | |
| 26 | | Wells Fargo Allocation Funds | | Portfolio of investments—November 30, 2015 (unaudited) |
C&B LARGE CAP VALUE PORTFOLIO
| | | | | | | | | | | | |
| Security name | | | | | | Shares | | | Value | |
| | | | |
Common Stocks: 96.68% | | | | | | | | | | | | |
| | | | |
Consumer Discretionary: 13.74% | | | | | | | | | | | | |
| | | | |
| Hotels, Restaurants & Leisure: 3.33% | | | | | | | | | | | | |
Brinker International Incorporated | | | | | | | 67,300 | | | $ | 3,070,226 | |
Carnival Corporation | | | | | | | 148,100 | | | | 7,483,493 | |
| | | | |
| | | | | | | | | | | 10,553,719 | |
| | | | | | | | | | | | |
| | | | |
| Media: 6.18% | | | | | | | | | | | | |
Omnicom Group Incorporated | | | | | | | 133,500 | | | | 9,868,320 | |
Twenty-First Century Fox Incorporated Class A | | | | | | | 329,300 | | | | 9,717,643 | |
| | | | |
| | | | | | | | | | | 19,585,963 | |
| | | | | | | | | | | | |
| | | | |
| Multiline Retail: 1.38% | | | | | | | | | | | | |
Kohl’s Corporation | | | | | | | 92,900 | | | | 4,378,377 | |
| | | | | | | | | | | | |
| | | | |
| Textiles, Apparel & Luxury Goods: 2.85% | | | | | | | | | | | | |
Gildan Activewear Incorporated | | | | | | | 292,100 | | | | 9,052,179 | |
| | | | | | | | | | | | |
| | | | |
Consumer Staples: 8.68% | | | | | | | | | | | | |
| | | | |
| Beverages: 1.83% | | | | | | | | | | | | |
Diageo plc ADR | | | | | | | 50,620 | | | | 5,799,027 | |
| | | | | | | | | | | | |
| | | | |
| Household Products: 2.81% | | | | | | | | | | | | |
Colgate-Palmolive Company | | | | | | | 46,010 | | | | 3,021,937 | |
The Procter & Gamble Company | | | | | | | 78,790 | | | | 5,896,644 | |
| | | | |
| | | | | | | | | | | 8,918,581 | |
| | | | | | | | | | | | |
| | | | |
| Personal Products: 1.46% | | | | | | | | | | | | |
Unilever NV ADR | | | | | | | 105,900 | | | | 4,632,066 | |
| | | | | | | | | | | | |
| | | | |
| Tobacco: 2.58% | | | | | | | | | | | | |
Philip Morris International | | | | | | | 93,600 | | | | 8,179,704 | |
| | | | | | | | | | | | |
| | | | |
Energy: 8.12% | | | | | | | | | | | | |
| | | | |
| Oil, Gas & Consumable Fuels: 8.12% | | | | | | | | | | | | |
Chevron Corporation | | | | | | | 46,540 | | | | 4,250,033 | |
Devon Energy Corporation | | | | | | | 80,900 | | | | 3,722,209 | |
Exxon Mobil Corporation | | | | | | | 100,870 | | | | 8,237,044 | |
Noble Energy Incorporated | | | | | | | 84,100 | | | | 3,083,947 | |
World Fuel Services Corporation | | | | | | | 148,300 | | | | 6,464,397 | |
| | | | |
| | | | | | | | | | | 25,757,630 | |
| | | | | | | | | | | | |
| | | | |
Financials: 25.45% | | | | | | | | | | | | |
| | | | |
| Banks: 9.00% | | | | | | | | | | | | |
Bank of America Corporation | | | | | | | 507,200 | | | | 8,840,496 | |
JPMorgan Chase & Company | | | | | | | 160,770 | | | | 10,720,144 | |
PNC Financial Services Group Incorporated | | | | | | | 93,900 | | | | 8,968,389 | |
| | | | |
| | | | | | | | | | | 28,529,029 | |
| | | | | | | | | | | | |
The accompanying notes are an integral part of these financial statements.
| | | | | | |
| Portfolio of investments—November 30, 2015 (unaudited) | | Wells Fargo Allocation Funds | | | 27 | |
C&B LARGE CAP VALUE PORTFOLIO
| | | | | | | | | | | | |
| Security name | | | | | | Shares | | | Value | |
| | | | |
| Capital Markets: 3.77% | | | | | | | | | | | | |
State Street Corporation | | | | | | | 164,900 | | | $ | 11,968,442 | |
| | | | | | | | | | | | |
| | | | |
| Consumer Finance: 2.35% | | | | | | | | | | | | |
American Express Company | | | | | | | 103,900 | | | | 7,443,396 | |
| | | | | | | | | | | | |
| | | | |
| Diversified Financial Services: 2.27% | | | | | | | | | | | | |
Berkshire Hathaway Incorporated Class B † | | | | | | | 53,700 | | | | 7,200,633 | |
| | | | | | | | | | | | |
| | | | |
| Insurance: 8.06% | | | | | | | | | | | | |
FNF Group | | | | | | | 218,200 | | | | 7,822,470 | |
RenaissanceRe Holdings Limited | | | | | | | 85,600 | | | | 9,481,056 | |
The Progressive Corporation | | | | | | | 267,700 | | | | 8,250,514 | |
| | | | |
| | | | | | | | | | | 25,554,040 | |
| | | | | | | | | | | | |
| | | | |
Health Care: 15.62% | | | | | | | | | | | | |
| | | | |
| Health Care Equipment & Supplies: 4.28% | | | | | | | | | | | | |
Abbott Laboratories | | | | | | | 119,300 | | | | 5,358,956 | |
Becton Dickinson & Company | | | | | | | 54,600 | | | | 8,203,650 | |
| | | | |
| | | | | | | | | | | 13,562,606 | |
| | | | | | | | | | | | |
| | | | |
| Health Care Providers & Services: 8.23% | | | | | | | | | | | | |
Cardinal Health Incorporated | | | | | | | 96,140 | | | | 8,349,759 | |
Laboratory Corporation of America Holdings † | | | | | | | 87,060 | | | | 10,581,272 | |
UnitedHealth Group Incorporated | | | | | | | 63,490 | | | | 7,155,958 | |
| | | | |
| | | | | | | | | | | 26,086,989 | |
| | | | | | | | | | | | |
| | | | |
| Pharmaceuticals: 3.11% | | | | | | | | | | | | |
Johnson & Johnson | | | | | | | 97,400 | | | | 9,860,776 | |
| | | | | | | | | | | | |
| | | | |
Industrials: 18.05% | | | | | | | | | | | | |
| | | | |
| Aerospace & Defense: 1.54% | | | | | | | | | | | | |
Rockwell Collins Incorporated | | | | | | | 52,600 | | | | 4,874,968 | |
| | | | | | | | | | | | |
| | | | |
| Air Freight & Logistics: 2.46% | | | | | | | | | | | | |
United Parcel Service Incorporated Class B | | | | | | | 75,800 | | | | 7,808,158 | |
| | | | | | | | | | | | |
| | | | |
| Electrical Equipment: 2.42% | | | | | | | | | | | | |
Eaton Corporation plc | | | | | | | 132,000 | | | | 7,677,120 | |
| | | | | | | | | | | | |
| | | | |
| Industrial Conglomerates: 1.61% | | | | | | | | | | | | |
3M Company | | | | | | | 32,600 | | | | 5,104,508 | |
| | | | | | | | | | | | |
| | | | |
| Machinery: 4.63% | | | | | | | | | | | | |
Donaldson Company Incorporated | | | | | | | 216,500 | | | | 6,798,100 | |
Parker-Hannifin Corporation | | | | | | | 75,200 | | | | 7,870,432 | |
| | | | |
| | | | | | | | | | | 14,668,532 | |
| | | | | | | | | | | | |
The accompanying notes are an integral part of these financial statements.
| | | | |
| 28 | | Wells Fargo Allocation Funds | | Portfolio of investments—November 30, 2015 (unaudited) |
C&B LARGE CAP VALUE PORTFOLIO
| | | | | | | | | | | | | | | | |
| Security name | | | | | | | | | Shares | | | Value | |
| | | | | |
| Trading Companies & Distributors: 5.39% | | | | | | | | | | | | | | | | |
Aercap Holdings NV † | | | | | | | | | | | 198,300 | | | $ | 9,010,752 | |
W.W. Grainger Incorporated « | | | | | | | | | | | 22,112 | | | | 4,434,340 | |
WESCO International Incorporated † | | | | | | | | | | | 75,900 | | | | 3,646,995 | |
| | | | | |
| | | | | | | | | | | | | | | 17,092,087 | |
| | | | | | | | | | | | | | | | |
| | | | | |
Information Technology: 3.24% | | | | | | | | | | | | | | | | |
| | | | | |
| Communications Equipment: 0.69% | | | | | | | | | | | | | | | | |
QUALCOMM Incorporated | | | | | | | | | | | 44,830 | | | | 2,187,256 | |
| | | | | | | | | | | | | | | | |
| | | | | |
| IT Services: 1.19% | | | | | | | | | | | | | | | | |
The Western Union Company | | | | | | | | | | | 200,400 | | | | 3,779,544 | |
| | | | | | | | | | | | | | | | |
| | | | | |
| Semiconductors & Semiconductor Equipment: 1.36% | | | | | | | | | | | | | | | | |
Linear Technology Corporation | | | | | | | | | | | 94,200 | | | | 4,306,824 | |
| | | | | | | | | | | | | | | | |
| | | | | |
Materials: 3.78% | | | | | | | | | | | | | | | | |
| | | | | |
| Containers & Packaging: 3.78% | | | | | | | | | | | | | | | | |
Ball Corporation | | | | | | | | | | | 45,920 | | | | 3,187,766 | |
Crown Holdings Incorporated † | | | | | | | | | | | 169,300 | | | | 8,788,363 | |
| | | | | |
| | | | | | | | | | | | | | | 11,976,129 | |
| | | | | | | | | | | | | | | | |
| | | | | |
Total Common Stocks (Cost $240,460,541) | | | | | | | | | | | | | | | 306,538,283 | |
| | | | | | | | | | | | | | | | |
| | | | | |
| | | Yield | | | | | | | | | | | |
| | | | | |
Short-Term Investments: 4.54% | | | | | | | | | | | | | | | | |
| | | | | |
| Investment Companies: 4.54% | | | | | | | | | | | | | | | | |
Securities Lending Cash Investments, LLC (l)(r)(u) | | | 0.18 | % | | | | | | | 4,278,750 | | | | 4,278,750 | |
Wells Fargo Cash Investment Money Market Fund, Select Class (l)(u) | | | 0.17 | | | | | | | | 10,128,152 | | | | 10,128,152 | |
| | | | | |
Total Short-Term Investments (Cost $14,406,902) | | | | | | | | | | | | | | | 14,406,902 | |
| | | | | | | | | | | | | | | | |
| | | | | | | | |
| Total investments in securities (Cost $254,867,443) * | | | 101.22 | % | | | 320,945,185 | |
Other assets and liabilities, net | | | (1.22 | ) | | | (3,871,692 | ) |
| | | | | | | | |
| Total net assets | | | 100.00 | % | | $ | 317,073,493 | |
| | | | | | | | |
| † | Non-income-earning security |
| « | All or a portion of this security is on loan. |
| (l) | The issuer of the security is an affiliated person of the Portfolio as defined in the Investment Company Act of 1940. |
| (r) | The investment is a non-registered investment vehicle purchased with cash collateral received from securities on loan. |
| (u) | The rate represents the 7-day annualized yield at period end. |
| * | Cost for federal income tax purposes is $265,027,841 and unrealized gains (losses) consists of: |
| | | | |
Gross unrealized gains | | $ | 71,516,145 | |
Gross unrealized losses | | | (15,598,801 | ) |
| | | | |
Net unrealized gains | | $ | 55,917,344 | |
The accompanying notes are an integral part of these financial statements.
| | | | | | |
| Portfolio of investments—November 30, 2015 (unaudited) | | Wells Fargo Allocation Funds | | | 29 | |
DIVERSIFIED LARGE CAP GROWTH PORTFOLIO
| | | | | | | | | | | | |
| Security name | | | | | | Shares | | | Value | |
| | | | |
Common Stocks: 98.75% | | | | | | | | | | | | |
| | | | |
Consumer Discretionary: 24.23% | | | | | | | | | | | | |
| | | | |
| Auto Components: 1.31% | | | | | | | | | | | | |
Delphi Automotive plc | | | | | | | 17,610 | | | $ | 1,547,567 | |
| | | | | | | | | | | | |
| | | | |
| Distributors: 0.43% | | | | | | | | | | | | |
LKQ Corporation † | | | | | | | 17,140 | | | | 505,459 | |
| | | | | | | | | | | | |
| | | | |
| Hotels, Restaurants & Leisure: 3.80% | | | | | | | | | | | | |
Chipotle Mexican Grill Incorporated † | | | | | | | 1,400 | | | | 811,370 | |
Hilton Worldwide Holdings Incorporated | | | | | | | 54,579 | | | | 1,267,324 | |
Marriott International Incorporated Class A | | | | | | | 8,010 | | | | 567,989 | |
Starbucks Corporation | | | | | | | 29,888 | | | | 1,834,824 | |
| | | | |
| | | | | | | | | | | 4,481,507 | |
| | | | | | | | | | | | |
| | | | |
| Internet & Catalog Retail: 4.40% | | | | | | | | | | | | |
Amazon.com Incorporated † | | | | | | | 6,540 | | | | 4,347,792 | |
Netflix Incorporated † | | | | | | | 4,180 | | | | 515,519 | |
The Priceline Group Incorporated † | | | | | | | 270 | | | | 337,190 | |
| | | | |
| | | | | | | | | | | 5,200,501 | |
| | | | | | | | | | | | |
| | | | |
| Media: 1.67% | | | | | | | | | | | | |
Charter Communication Incorporated Class A Ǡ | | | | | | | 1,740 | | | | 326,006 | |
Comcast Corporation Class A | | | | | | | 5,420 | | | | 329,861 | |
The Walt Disney Company | | | | | | | 11,610 | | | | 1,317,387 | |
| | | | |
| | | | | | | | | | | 1,973,254 | |
| | | | | | | | | | | | |
| | | | |
| Multiline Retail: 2.67% | | | | | | | | | | | | |
Dollar General Corporation | | | | | | | 9,770 | | | | 639,056 | |
Dollar Tree Incorporated † | | | | | | | 28,560 | | | | 2,155,138 | |
Nordstrom Incorporated | | | | | | | 6,390 | | | | 359,821 | |
| | | | |
| | | | | | | | | | | 3,154,015 | |
| | | | | | | | | | | | |
| | | | |
| Specialty Retail: 6.67% | | | | | | | | | | | | |
CarMax Incorporated † | | | | | | | 23,120 | | | | 1,324,776 | |
O’Reilly Automotive Incorporated † | | | | | | | 3,200 | | | | 844,384 | |
The Home Depot Incorporated | | | | | | | 22,660 | | | | 3,033,721 | |
The TJX Companies Incorporated | | | | | | | 17,030 | | | | 1,202,318 | |
Tractor Supply Company | | | | | | | 16,400 | | | | 1,465,340 | |
| | | | |
| | | | | | | | | | | 7,870,539 | |
| | | | | | | | | | | | |
| | | | |
| Textiles, Apparel & Luxury Goods: 3.28% | | | | | | | | | | | | |
Nike Incorporated Class B | | | | | | | 19,780 | | | | 2,616,498 | |
Under Armour Incorporated Class A † | | | | | | | 5,230 | | | | 450,931 | |
VF Corporation | | | | | | | 12,490 | | | | 808,103 | |
| | | | |
| | | | | | | | | | | 3,875,532 | |
| | | | | | | | | | | | |
The accompanying notes are an integral part of these financial statements.
| | | | |
| 30 | | Wells Fargo Allocation Funds | | Portfolio of investments—November 30, 2015 (unaudited) |
DIVERSIFIED LARGE CAP GROWTH PORTFOLIO
| | | | | | | | | | | | |
| Security name | | | | | | Shares | | | Value | |
| | | | |
Consumer Staples: 5.07% | | | | | | | | | | | | |
| | | | |
| Beverages: 1.12% | | | | | | | | | | | | |
Constellation Brands Incorporated Class A | | | | | | | 6,590 | | | $ | 924,313 | |
The Coca-Cola Company | | | | | | | 9,220 | | | | 392,956 | |
| | | | |
| | | | | | | | | | | 1,317,269 | |
| | | | | | | | | | | | |
| | | | |
| Food & Staples Retailing: 2.86% | | | | | | | | | | | | |
Costco Wholesale Corporation | | | | | | | 8,530 | | | | 1,376,913 | |
CVS Health Corporation | | | | | | | 10,300 | | | | 969,127 | |
Sprouts Farmers Market Incorporated † | | | | | | | 12,088 | | | | 291,683 | |
Walgreens Boots Alliance Incorporated | | | | | | | 8,720 | | | | 732,742 | |
| | | | |
| | | | | | | | | | | 3,370,465 | |
| | | | | | | | | | | | |
| | | | |
| Household Products: 0.36% | | | | | | | | | | | | |
Colgate-Palmolive Company | | | | | | | 6,540 | | | | 429,547 | |
| | | | | | | | | | | | |
| | | | |
| Personal Products: 0.73% | | | | | | | | | | | | |
The Estee Lauder Companies Incorporated Class A | | | | | | | 10,300 | | | | 866,436 | |
| | | | | | | | | | | | |
| | | | |
Energy: 0.93% | | | | | | | | | | | | |
| | | | |
| Oil, Gas & Consumable Fuels: 0.93% | | | | | | | | | | | | |
Concho Resources Incorporated † | | | | | | | 8,780 | | | | 960,883 | |
EOG Resources Incorporated | | | | | | | 1,660 | | | | 138,494 | |
| | | | |
| | | | | | | | | | | 1,099,377 | |
| | | | | | | | | | | | |
| | | | |
Financials: 4.07% | | | | | | | | | | | | |
| | | | |
| Capital Markets: 1.77% | | | | | | | | | | | | |
Charles Schwab Corporation | | | | | | | 21,800 | | | | 734,878 | |
TD Ameritrade Holding Corporation | | | | | | | 36,850 | | | | 1,349,816 | |
| | | | |
| | | | | | | | | | | 2,084,694 | |
| | | | | | | | | | | | |
| | | | |
| Consumer Finance: 0.57% | | | | | | | | | | | | |
Discover Financial Services | | | | | | | 11,890 | | | | 674,876 | |
| | | | | | | | | | | | |
| | | | |
| Diversified Financial Services: 1.42% | | | | | | | | | | | | |
Intercontinental Exchange Incorporated | | | | | | | 3,320 | | | | 862,669 | |
McGraw Hill Financial Incorporated | | | | | | | 8,420 | | | | 812,277 | |
| | | | |
| | | | | | | | | | | 1,674,946 | |
| | | | | | | | | | | | |
| | | | |
| REITs: 0.31% | | | | | | | | | | | | |
American Tower Corporation | | | | | | | 3,720 | | | | 369,694 | |
| | | | | | | | | | | | |
| | | | |
Health Care: 16.22% | | | | | | | | | | | | |
| | | | |
| Biotechnology: 9.77% | | | | | | | | | | | | |
Alexion Pharmaceuticals Incorporated † | | | | | | | 18,940 | | | | 3,379,654 | |
Biogen Incorporated † | | | | | | | 930 | | | | 266,780 | |
BioMarin Pharmaceutical Incorporated † | | | | | | | 5,380 | | | | 513,091 | |
Celgene Corporation † | | | | | | | 21,920 | | | | 2,399,144 | |
Gilead Sciences Incorporated | | | | | | | 9,719 | | | | 1,029,825 | |
The accompanying notes are an integral part of these financial statements.
| | | | | | |
| Portfolio of investments—November 30, 2015 (unaudited) | | Wells Fargo Allocation Funds | | | 31 | |
DIVERSIFIED LARGE CAP GROWTH PORTFOLIO
| | | | | | | | | | | | |
| Security name | | | | | | Shares | | | Value | |
| | | | |
| Biotechnology (continued) | | | | | | | | | | | | |
Incyte Corporation † | | | | | | | 3,980 | | | $ | 454,675 | |
Medivation Incorporated † | | | | | | | 11,170 | | | | 472,268 | |
Regeneron Pharmaceuticals Incorporated † | | | | | | | 4,610 | | | | 2,510,145 | |
Vertex Pharmaceuticals Incorporated † | | | | | | | 3,990 | | | | 516,146 | |
| | | | |
| | | | | | | | | | | 11,541,728 | |
| | | | | | | | | | | | |
| | | | |
| Health Care Equipment & Supplies: 1.15% | | | | | | | | | | | | |
Intuitive Surgical Incorporated † | | | | | | | 420 | | | | 218,408 | |
Medtronic plc | | | | | | | 15,155 | | | | 1,141,778 | |
| | | | |
| | | | | | | | | | | 1,360,186 | |
| | | | | | | | | | | | |
| | | | |
| Health Care Providers & Services: 1.96% | | | | | | | | | | | | |
AmerisourceBergen Corporation | | | | | | | 11,763 | | | | 1,160,302 | |
McKesson Corporation | | | | | | | 930 | | | | 176,096 | |
UnitedHealth Group Incorporated | | | | | | | 8,710 | | | | 981,704 | |
| | | | |
| | | | | | | | | | | 2,318,102 | |
| | | | | | | | | | | | |
| | | | |
| Health Care Technology: 0.46% | | | | | | | | | | | | |
Cerner Corporation † | | | | | | | 8,981 | | | | 535,268 | |
| | | | | | | | | | | | |
| | | | |
| Life Sciences Tools & Services: 0.60% | | | | | | | | | | | | |
Mettler-Toledo International Incorporated † | | | | | | | 430 | | | | 147,395 | |
Quintiles Transnational Holdings Incorporated † | | | | | | | 8,164 | | | | 555,070 | |
| | | | |
| | | | | | | | | | | 702,465 | |
| | | | | | | | | | | | |
| | | | |
| Pharmaceuticals: 2.28% | | | | | | | | | | | | |
Allergan plc † | | | | | | | 2,116 | | | | 664,191 | |
Bristol-Myers Squibb Company | | | | | | | 11,390 | | | | 763,244 | |
Perrigo Company plc | | | | | | | 4,170 | | | | 622,956 | |
Zoetis Incorporated | | | | | | | 13,821 | | | | 645,441 | |
| | | | |
| | | | | | | | | | | 2,695,832 | |
| | | | | | | | | | | | |
| | | | |
Industrials: 8.08% | | | | | | | | | | | | |
| | | | |
| Aerospace & Defense: 0.78% | | | | | | | | | | | | |
The Boeing Company | | | | | | | 6,290 | | | | 914,881 | |
| | | | | | | | | | | | |
| | | | |
| Air Freight & Logistics: 0.53% | | | | | | | | | | | | |
United Parcel Service Incorporated Class B | | | | | | | 6,100 | | | | 628,361 | |
| | | | | | | | | | | | |
| | | | |
| Airlines: 1.71% | | | | | | | | | | | | |
Delta Air Lines Incorporated | | | | | | | 18,720 | | | | 869,731 | |
Southwest Airlines Company | | | | | | | 24,980 | | | | 1,146,082 | |
| | | | |
| | | | | | | | | | | 2,015,813 | |
| | | | | | | | | | | | |
| | | | |
| Industrial Conglomerates: 1.43% | | | | | | | | | | | | |
3M Company | | | | | | | 3,090 | | | | 483,832 | |
Carlisle Companies Incorporated | | | | | | | 6,300 | | | | 557,235 | |
Danaher Corporation | | | | | | | 6,730 | | | | 648,705 | |
| | | | |
| | | | | | | | | | | 1,689,772 | |
| | | | | | | | | | | | |
The accompanying notes are an integral part of these financial statements.
| | | | |
| 32 | | Wells Fargo Allocation Funds | | Portfolio of investments—November 30, 2015 (unaudited) |
DIVERSIFIED LARGE CAP GROWTH PORTFOLIO
| | | | | | | | | | | | |
| Security name | | | | | | Shares | | | Value | |
| | | | |
| Professional Services: 0.77% | | | | | | | | | | | | |
Verisk Analytics Incorporated † | | | | | | | 12,200 | | | $ | 914,390 | |
| | | | | | | | | | | | |
| | | | |
| Road & Rail: 2.86% | | | | | | | | | | | | |
Canadian Pacific Railway Limited | | | | | | | 2,420 | | | | 356,877 | |
CSX Corporation | | | | | | | 12,230 | | | | 347,699 | |
Kansas City Southern | | | | | | | 8,710 | | | | 791,913 | |
Norfolk Southern Corporation | | | | | | | 3,060 | | | | 290,884 | |
Union Pacific Corporation | | | | | | | 18,970 | | | | 1,592,532 | |
| | | | |
| | | | | | | | | | | 3,379,905 | |
| | | | | | | | | | | | |
| | | | |
Information Technology: 35.85% | | | | | | | | | | | | |
| | | | |
| Communications Equipment: 0.72% | | | | | | | | | | | | |
Cisco Systems Incorporated | | | | | | | 6,280 | | | | 171,130 | |
Palo Alto Networks Incorporated † | | | | | | | 3,652 | | | | 684,166 | |
| | | | |
| | | | | | | | | | | 855,296 | |
| | | | | | | | | | | | |
| | | | |
| Internet Software & Services: 10.93% | | | | | | | | | | | | |
Akamai Technologies Incorporated † | | | | | | | 20,730 | | | | 1,194,255 | |
Alphabet Incorporated Class A † | | | | | | | 5,384 | | | | 4,107,184 | |
Alphabet Incorporated Class C † | | | | | | | 2,984 | | | | 2,215,918 | |
Facebook Incorporated Class A † | | | | | | | 45,530 | | | | 4,746,047 | |
Tencent Holdings Limited ADR | | | | | | | 32,050 | | | | 637,946 | |
| | | | |
| | | | | | | | | | | 12,901,350 | |
| | | | | | | | | | | | |
| | | | |
| IT Services: 8.45% | | | | | | | | | | | | |
Accenture plc Class A | | | | | | | 9,000 | | | | 964,980 | |
Alliance Data Systems Corporation † | | | | | | | 7,200 | | | | 2,065,320 | |
Cognizant Technology Solutions Corporation Class A † | | | | | | | 22,520 | | | | 1,454,342 | |
MasterCard Incorporated Class A | | | | | | | 20,660 | | | | 2,023,027 | |
Visa Incorporated Class A | | | | | | | 43,990 | | | | 3,475,650 | |
| | | | |
| | | | | | | | | | | 9,983,319 | |
| | | | | | | | | | | | |
| | | | |
| Semiconductors & Semiconductor Equipment: 3.36% | | | | | | | | | | | | |
ARM Holdings plc ADR | | | | | | | 15,490 | | | | 785,343 | |
Avago Technologies Limited | | | | | | | 3,622 | | | | 472,490 | |
Broadcom Corporation Class A | | | | | | | 2,870 | | | | 156,788 | |
Microchip Technology Incorporated « | | | | | | | 33,949 | | | | 1,639,058 | |
Texas Instruments Incorporated | | | | | | | 15,730 | | | | 914,228 | |
| | | | |
| | | | | | | | | | | 3,967,907 | |
| | | | | | | | | | | | |
| | | | |
| Software: 8.17% | | | | | | | | | | | | |
Adobe Systems Incorporated † | | | | | | | 18,750 | | | | 1,714,875 | |
Electronic Arts Incorporated † | | | | | | | 9,910 | | | | 671,799 | |
Fortinet Incorporated † | | | | | | | 18,980 | | | | 683,660 | |
Microsoft Corporation | | | | | | | 24,360 | | | | 1,323,966 | |
NetSuite Incorporated † | | | | | | | 3,230 | | | | 275,842 | |
Red Hat Incorporated † | | | | | | | 4,110 | | | | 334,595 | |
Salesforce.com Incorporated † | | | | | | | 23,264 | | | | 1,853,908 | |
The accompanying notes are an integral part of these financial statements.
| | | | | | |
| Portfolio of investments—November 30, 2015 (unaudited) | | Wells Fargo Allocation Funds | | | 33 | |
DIVERSIFIED LARGE CAP GROWTH PORTFOLIO
| | | | | | | | | | | | | | | | |
| Security name | | | | | | | | | Shares | | | Value | |
| | | | | |
| Software (continued) | | | | | | | | | | | | | | | | |
ServiceNow Incorporated † | | | | | | | | | | | 17,650 | | | $ | 1,535,727 | |
Splunk Incorporated † | | | | | | | | | | | 12,240 | | | | 728,280 | |
Tableau Software Incorporated Class A † | | | | | | | | | | | 5,460 | | | | 529,784 | |
| | | | | |
| | | | | | | | | | | | | | | 9,652,436 | |
| | | | | | | | | | | | | | | | |
| | | | | |
| Technology Hardware, Storage & Peripherals: 4.22% | | | | | | | | | | | | | | | | |
Apple Incorporated | | | | | | | | | | | 42,107 | | | | 4,981,258 | |
| | | | | | | | | | | | | | | | |
| | | | | |
Materials: 3.08% | | | | | | | | | | | | | | | | |
| | | | | |
| Chemicals: 3.08% | | | | | | | | | | | | | | | | |
Airgas Incorporated | | | | | | | | | | | 1,330 | | | | 183,806 | |
Axalta Coating Systems Limited † | | | | | | | | | | | 19,350 | | | | 561,537 | |
Ecolab Incorporated | | | | | | | | | | | 10,490 | | | | 1,249,988 | |
Praxair Incorporated | | | | | | | | | | | 7,340 | | | | 827,952 | |
The Sherwin-Williams Company | | | | | | | | | | | 2,950 | | | | 814,407 | |
| | | | | |
| | | | | | | | | | | | | | | 3,637,690 | |
| | | | | | | | | | | | | | | | |
| | | | | |
Telecommunication Services: 1.22% | | | | | | | | | | | | | | | | |
| | | | | |
| Diversified Telecommunication Services: 0.41% | | | | | | | | | | | | | | | | |
Level 3 Communications Incorporated † | | | | | | | | | | | 9,660 | | | | 491,018 | |
| | | | | | | | | | | | | | | | |
| | | | | |
| Wireless Telecommunication Services: 0.81% | | | | | | | | | | | | | | | | |
SBA Communications Corporation Class A † | | | | | | | | | | | 9,063 | | | | 953,063 | |
| | | | | | | | | | | | | | | | |
| | | | | |
Total Common Stocks (Cost $75,203,099) | | | | | | | | | | | | | | | 116,615,718 | |
| | | | | | | | | | | | | | | | |
| | | Yield | | | | | | | | | | | |
| | | | | |
Short-Term Investments: 2.37% | | | | | | | | | | | | | | | | |
| | | | | |
| Investment Companies: 2.37% | | | | | | | | | | | | | | | | |
Securities Lending Cash Investments, LLC (l)(r)(u) | | | 0.18 | % | | | | | | | 1,326,875 | | | | 1,326,875 | |
Wells Fargo Cash Investment Money Market Fund, Select Class (l)(u) | | | 0.17 | | | | | | | | 1,475,666 | | | | 1,475,666 | |
| | | | | |
Total Short-Term Investments (Cost $2,802,541) | | | | | | | | | | | | | | | 2,802,541 | |
| | | | | | | | | | | | | | | | |
| | | | | | | | |
| Total investments in securities (Cost $78,005,640) * | | | 101.12 | % | | | 119,418,259 | |
Other assets and liabilities, net | | | (1.12 | ) | | | (1,320,509 | ) |
| | | | | | | | |
| Total net assets | | | 100.00 | % | | $ | 118,097,750 | |
| | | | | | | | |
| † | Non-income-earning security |
| « | All or a portion of this security is on loan. |
| (l) | The issuer of the security is an affiliated person of the Portfolio as defined in the Investment Company Act of 1940. |
| (r) | The investment is a non-registered investment vehicle purchased with cash collateral received from securities on loan. |
| (u) | The rate represents the 7-day annualized yield at period end. |
| * | Cost for federal income tax purposes is $78,348,035 and unrealized gains (losses) consists of: |
| | | | |
Gross unrealized gains | | $ | 42,394,703 | |
Gross unrealized losses | | | (1,324,479 | ) |
| | | | |
Net unrealized gains | | $ | 41,070,224 | |
The accompanying notes are an integral part of these financial statements.
| | | | |
| 34 | | Wells Fargo Allocation Funds | | Portfolio of investments—November 30, 2015 (unaudited) |
EMERGING GROWTH PORTFOLIO
| | | | | | | | | | | | |
| Security name | | | | | | Shares | | | Value | |
| | | | |
Common Stocks: 98.92% | | | | | | | | | | | | |
| | | | |
Consumer Discretionary: 15.12% | | | | | | | | | | | | |
| | | | |
| Auto Components: 2.05% | | | | | | | | | | | | |
Gentherm Incorporated † | | | | | | | 116,360 | | | $ | 5,915,742 | |
Motorcar Parts of America Incorporated † | | | | | | | 373,282 | | | | 14,953,677 | |
| | | | |
| | | | | | | | | | | 20,869,419 | |
| | | | | | | | | | | | |
| | | | |
| Diversified Consumer Services: 1.43% | | | | | | | | | | | | |
2U Incorporated †« | | | | | | | 167,160 | | | | 4,031,899 | |
Grand Canyon Education Incorporated † | | | | | | | 264,430 | | | | 10,476,717 | |
| | | | |
| | | | | | | | | | | 14,508,616 | |
| | | | | | | | | | | | |
| | | | |
| Hotels, Restaurants & Leisure: 5.28% | | | | | | | | | | | | |
Fiesta Restaurant Group Incorporated † | | | | | | | 499,465 | | | | 19,194,440 | |
Jack in the Box Incorporated | | | | | | | 130,640 | | | | 9,685,650 | |
La Quinta Holdings Incorporated † | | | | | | | 120,505 | | | | 1,806,370 | |
Planet Fitness Incorporated Class A † | | | | | | | 90,381 | | | | 1,428,924 | |
The Habit Restaurants Incorporated Class A †« | | | | | | | 529,098 | | | | 12,745,971 | |
Wingstop Incorporated †« | | | | | | | 241,070 | | | | 5,195,059 | |
Zoe’s Kitchen Incorporated †« | | | | | | | 107,530 | | | | 3,658,171 | |
| | | | |
| | | | | | | | | | | 53,714,585 | |
| | | | | | | | | | | | |
| | | | |
| Leisure Products: 0.77% | | | | | | | | | | | | |
MCBC Holdings Incorporated † | | | | | | | 258,372 | | | | 3,707,638 | |
Performance Sports Group Limited † | | | | | | | 351,552 | | | | 4,169,407 | |
| | | | |
| | | | | | | | | | | 7,877,045 | |
| | | | | | | | | | | | |
| | | | |
| Media: 1.28% | | | | | | | | | | | | |
IMAX Corporation † | | | | | | | 343,190 | | | | 13,000,037 | |
| | | | | | | | | | | | |
| | | | |
| Specialty Retail: 3.25% | | | | | | | | | | | | |
Boot Barn Holdings Incorporated †« | | | | | | | 486,299 | | | | 5,106,140 | |
Five Below Incorporated † | | | | | | | 116,497 | | | | 3,263,081 | |
Lithia Motors Incorporated Class A | | | | | | | 140,780 | | | | 17,490,507 | |
Sportsman’s Warehouse Incorporated † | | | | | | | 626,403 | | | | 7,172,314 | |
| | | | |
| | | | | | | | | | | 33,032,042 | |
| | | | | | | | | | | | |
| | | | |
| Textiles, Apparel & Luxury Goods: 1.06% | | | | | | | | | | | | |
G-III Apparel Group Limited † | | | | | | | 236,420 | | | | 10,844,585 | |
| | | | | | | | | | | | |
| | | | |
Energy: 2.43% | | | | | | | | | | | | |
| | | | |
| Oil, Gas & Consumable Fuels: 2.43% | | | | | | | | | | | | |
Matador Resources Company † | | | | | | | 255,752 | | | | 6,572,826 | |
PDC Energy Incorporated † | | | | | | | 135,170 | | | | 7,635,753 | |
RSP Permian Incorporated † | | | | | | | 371,028 | | | | 10,529,775 | |
| | | | |
| | | | | | | | | | | 24,738,354 | |
| | | | | | | | | | | | |
The accompanying notes are an integral part of these financial statements.
| | | | | | |
| Portfolio of investments—November 30, 2015 (unaudited) | | Wells Fargo Allocation Funds | | | 35 | |
EMERGING GROWTH PORTFOLIO
| | | | | | | | | | | | |
| Security name | | | | | | Shares | | | Value | |
| | | | |
Financials: 6.80% | | | | | | | | | | | | |
| | | | |
| Capital Markets: 0.76% | | | | | | | | | | | | |
Financial Engines Incorporated « | | | | | | | 213,360 | | | $ | 7,687,361 | |
| | | | | | | | | | | | |
| | | | |
| Consumer Finance: 0.31% | | | | | | | | | | | | |
PRA Group Incorporated †« | | | | | | | 77,280 | | | | 3,192,437 | |
| | | | | | | | | | | | |
| | | | |
| Diversified Financial Services: 4.29% | | | | | | | | | | | | |
MarketAxess Holdings Incorporated | | | | | | | 408,501 | | | | 43,619,737 | |
| | | | | | | | | | | | |
| | | | |
| Thrifts & Mortgage Finance: 1.44% | | | | | | | | | | | | |
LendingTree Incorporated † | | | | | | | 144,203 | | | | 14,691,402 | |
| | | | | | | | | | | | |
| | | | |
Health Care: 30.47% | | | | | | | | | | | | |
| | | | |
| Biotechnology: 5.02% | | | | | | | | | | | | |
Exact Sciences Corporation †« | | | | | | | 102,372 | | | | 930,561 | |
Ligand Pharmaceuticals Incorporated † | | | | | | | 128,930 | | | | 13,805,824 | |
PTC Therapeutics Incorporated †« | | | | | | | 213,250 | | | | 6,406,030 | |
Radius Health Incorporated † | | | | | | | 135,135 | | | | 8,217,559 | |
Repligen Corporation † | | | | | | | 320,150 | | | | 9,101,865 | |
Ultragenyx Pharmaceutical Incorporated † | | | | | | | 128,494 | | | | 12,633,530 | |
| | | | |
| | | | | | | | | | | 51,095,369 | |
| | | | | | | | | | | | |
| | | | |
| Health Care Equipment & Supplies: 12.49% | | | | | | | | | | | | |
Abiomed Incorporated † | | | | | | | 65,660 | | | | 5,355,886 | |
Align Technology Incorporated † | | | | | | | 92,740 | | | | 6,189,468 | |
Cardiovascular Systems Incorporated †« | | | | | | | 255,644 | | | | 4,090,304 | |
Cerus Corporation †« | | | | | | | 1,161,428 | | | | 6,585,297 | |
ConforMIS Incorporated †« | | | | | | | 249,804 | | | | 5,328,319 | |
Cynosure Incorporated Class A † | | | | | | | 443,088 | | | | 18,636,281 | |
DexCom Incorporated † | | | | | | | 20,670 | | | | 1,757,363 | |
Entellus Medical Incorporated † | | | | | | | 248,145 | | | | 4,327,649 | |
Glaukos Corporation † | | | | | | | 301,295 | | | | 7,803,541 | |
Inogen Incorporated † | | | | | | | 258,888 | | | | 9,902,466 | |
Natus Medical Incorporated † | | | | | | | 199,750 | | | | 9,743,805 | |
Nevro Corporation † | | | | | | | 206,935 | | | | 12,494,735 | |
NxStage Medical Incorporated † | | | | | | | 790,180 | | | | 15,416,412 | |
The Spectranetics Corporation † | | | | | | | 1,079,919 | | | | 14,935,280 | |
Zeltiq Aesthetics Incorporated † | | | | | | | 150,200 | | | | 4,563,076 | |
| | | | |
| | | | | | | | | | | 127,129,882 | |
| | | | | | | | | | | | |
| | | | |
| Health Care Providers & Services: 10.12% | | | | | | | | | | | | |
AAC Holdings Incorporated †« | | | | | | | 138,491 | | | | 3,398,569 | |
Acadia Healthcare Company Incorporated † | | | | | | | 517,400 | | | | 35,705,774 | |
Adeptus Health Incorporated Class A †« | | | | | | | 80,365 | | | | 4,829,131 | |
Diplomat Pharmacy Incorporated †« | | | | | | | 339,176 | | | | 11,915,253 | |
ExamWorks Group Incorporated † | | | | | | | 581,658 | | | | 15,367,404 | |
HealthEquity Incorporated † | | | | | | | 608,962 | | | | 20,095,746 | |
Team Health Holdings Incorporated † | | | | | | | 69,110 | | | | 3,810,725 | |
Teladoc Incorporated †« | | | | | | | 371,579 | | | | 7,896,054 | |
| | | | |
| | | | | | | | | | | 103,018,656 | |
| | | | | | | | | | | | |
The accompanying notes are an integral part of these financial statements.
| | | | |
| 36 | | Wells Fargo Allocation Funds | | Portfolio of investments—November 30, 2015 (unaudited) |
EMERGING GROWTH PORTFOLIO
| | | | | | | | | | | | |
| Security name | | | | | | Shares | | | Value | |
| | | | |
| Life Sciences Tools & Services: 2.23% | | | | | | | | | | | | |
ICON plc ADR † | | | | | | | 138,610 | | | $ | 10,302,881 | |
INC Research Holdings Incorporated Class A † | | | | | | | 261,113 | | | | 12,350,645 | |
| | | | |
| | | | | | | | | | | 22,653,526 | |
| | | | | | | | | | | | |
| | | | |
| Pharmaceuticals: 0.61% | | | | | | | | | | | | |
Intersect ENT Incorporated † | | | | | | | 316,450 | | | | 6,237,230 | |
| | | | | | | | | | | | |
| | | | |
Industrials: 6.67% | | | | | | | | | | | | |
| | | | |
| Building Products: 1.16% | | | | | | | | | | | | |
Apogee Enterprises Incorporated | | | | | | | 233,910 | | | | 11,746,960 | |
| | | | | | | | | | | | |
| | | | |
| Commercial Services & Supplies: 0.58% | | | | | | | | | | | | |
Multi-Color Corporation | | | | | | | 95,040 | | | | 5,940,950 | |
| | | | | | | | | | | | |
| | | | |
| Machinery: 0.96% | | | | | | | | | | | | |
John Bean Technologies Corporation | | | | | | | 66,500 | | | | 3,251,850 | |
Milacron Holdings Corporation † | | | | | | | 443,028 | | | | 6,521,372 | |
| | | | |
| | | | | | | | | | | 9,773,222 | |
| | | | | | | | | | | | |
| | | | |
| Professional Services: 3.97% | | | | | | | | | | | | |
CEB Incorporated | | | | | | | 37,556 | | | | 2,901,952 | |
On Assignment Incorporated † | | | | | | | 426,773 | | | | 19,921,764 | |
Wageworks Incorporated † | | | | | | | 412,800 | | | | 17,560,512 | |
| | | | |
| | | | | | | | | | | 40,384,228 | |
| | | | | | | | | | | | |
| | | | |
Information Technology: 37.43% | | | | | | | | | | | | |
| | | | |
| Communications Equipment: 1.08% | | | | | | | | | | | | |
Infinera Corporation † | | | | | | | 489,093 | | | | 11,014,374 | |
| | | | | | | | | | | | |
| | | | |
| Internet Software & Services: 11.95% | | | | | | | | | | | | |
Demandware Incorporated †« | | | | | | | 386,350 | | | | 19,761,803 | |
Envestnet Incorporated † | | | | | | | 717,182 | | | | 23,286,900 | |
HomeAway Incorporated † | | | | | | | 387,825 | | | | 13,713,492 | |
Hortonworks Incorporated †« | | | | | | | 153,897 | | | | 2,614,710 | |
LogMeIn Incorporated † | | | | | | | 76,600 | | | | 5,470,772 | |
Q2 Holdings Incorporated † | | | | | | | 683,763 | | | | 18,789,807 | |
SPS Commerce Incorporated † | | | | | | | 439,982 | | | | 32,699,462 | |
Xactly Corporation † | | | | | | | 539,347 | | | | 5,274,814 | |
| | | | |
| | | | | | | | | | | 121,611,760 | |
| | | | | | | | | | | | |
| | | | |
| IT Services: 2.11% | | | | | | | | | | | | |
InterXion Holding NV † | | | | | | | 600,320 | | | | 18,441,830 | |
MAXIMUS Incorporated | | | | | | | 52,370 | | | | 2,971,998 | |
| | | | |
| | | | | | | | | | | 21,413,828 | |
| | | | | | | | | | | | |
| | | | |
| Semiconductors & Semiconductor Equipment: 1.67% | | | | | | | | | | | | |
Cavium Incorporated † | | | | | | | 134,580 | | | | 9,031,664 | |
Monolithic Power Systems Incorporated | | | | | | | 116,760 | | | | 7,978,211 | |
| | | | |
| | | | | | | | | | | 17,009,875 | |
| | | | | | | | | | | | |
The accompanying notes are an integral part of these financial statements.
| | | | | | |
| Portfolio of investments—November 30, 2015 (unaudited) | | Wells Fargo Allocation Funds | | | 37 | |
EMERGING GROWTH PORTFOLIO
| | | | | | | | | | | | | | |
| Security name | | | | | | | Shares | | | Value | |
| | | | |
| Software: 20.62% | | | | | | | | | | | | | | |
Callidus Software Incorporated † | | | | | | | | | 885,592 | | | $ | 18,376,034 | |
CyberArk Software Limited †« | | | | | | | | | 274,570 | | | | 11,886,135 | |
Fleetmatics Group plc † | | | | | | | | | 246,730 | | | | 14,729,781 | |
Guidewire Software Incorporated † | | | | | | | | | 167,951 | | | | 9,964,533 | |
HubSpot Incorporated † | | | | | | | | | 297,876 | | | | 16,147,858 | |
Paycom Software Incorporated † | | | | | | | | | 259,110 | | | | 11,297,196 | |
Paylocity Holding Corporation † | | | | | | | | | 217,203 | | | | 9,543,900 | |
Proofpoint Incorporated † | | | | | | | | | 549,870 | | | | 40,310,970 | |
Qlik Technologies Incorporated † | | | | | | | | | 434,250 | | | | 13,813,493 | |
Qualys Incorporated † | | | | | | | | | 210,080 | | | | 8,079,677 | |
Rapid7 Incorporated †« | | | | | | | | | 211,879 | | | | 3,629,487 | |
Ringcentral Incorporated Class A † | | | | | | | | | 715,810 | | | | 16,399,207 | |
Synchronoss Technologies Incorporated † | | | | | | | | | 446,651 | | | | 17,584,650 | |
Tyler Technologies Incorporated † | | | | | | | | | 49,735 | | | | 8,874,713 | |
Ultimate Software Group Incorporated † | | | | | | | | | 46,540 | | | | 9,191,650 | |
| | | | |
| | | | | | | | | | | | | 209,829,284 | |
| | | | | | | | | | | | | | |
| | | | |
Total Common Stocks (Cost $760,204,702) | | | | | | | | | | | | | 1,006,634,764 | |
| | | | | | | | | | | | | | |
| | | | |
| | | Yield | | | | | | | | | |
| | | | |
Short-Term Investments: 10.75% | | | | | | | | | | | | | | |
| | | | |
| Investment Companies: 10.75% | | | | | | | | | | | | | | |
Securities Lending Cash Investments, LLC (l)(r)(u) | | | 0.18 | % | | | | | 97,288,111 | | | | 97,288,111 | |
Wells Fargo Cash Investment Money Market Fund, Select Class (l)(u) | | | 0.17 | | | | | | 12,067,245 | | | | 12,067,245 | |
| | | | |
Total Short-Term Investments (Cost $109,355,356) | | | | | | | | | | | | | 109,355,356 | |
| | | | | | | | | | | | | | |
| | | | | | | | |
| Total investments in securities (Cost $869,560,058) * | | | 109.67 | % | | | 1,115,990,120 | |
Other assets and liabilities, net | | | (9.67 | ) | | | (98,394,055 | ) |
| | | | | | | | |
| Total net assets | | | 100.00 | % | | $ | 1,017,596,065 | |
| | | | | | | | |
| † | Non-income-earning security |
| « | All or a portion of this security is on loan. |
| (l) | The issuer of the security is an affiliated person of the Portfolio as defined in the Investment Company Act of 1940. |
| (r) | The investment is a non-registered investment vehicle purchased with cash collateral received from securities on loan. |
| (u) | The rate represents the 7-day annualized yield at period end. |
| * | Cost for federal income tax purposes is $871,132,855 and unrealized gains (losses) consists of: |
| | | | |
Gross unrealized gains | | $ | 285,010,123 | |
Gross unrealized losses | | | (40,152,858 | ) |
| | | | |
Net unrealized gains | | $ | 244,857,265 | |
The accompanying notes are an integral part of these financial statements.
| | | | |
| 38 | | Wells Fargo Allocation Funds | | Summary portfolio of investments—November 30, 2015 (unaudited) |
INDEX PORTFOLIO
The Summary portfolio of investments shows the 50 largest portfolio holdings in unaffiliated issuers and any holdings exceeding 1% of the total net assets as of the report date. The remaining securities held are grouped as “Other securities” in each category.
| | | | | | | | | | | | | | | | |
| Security name | | | | | | Shares | | | Value | | | Percent of
net assets | |
| | | | | |
Common Stocks: 97.62% | | | | | | | | | | | | | | | | |
| | | | | |
Consumer Discretionary: 12.77% | | | | | | | | | | | | | | | | |
| | | | | |
| Auto Components: 0.39% | | | | | | | | | | | | | | | | |
Other securities | | | | | | | | | | $ | 9,998,825 | | | | 0.39 | % |
| | | | | | | | | | | | | | | | |
| | | | | |
| Automobiles: 0.62% | | | | | | | | | | | | | | | | |
Other securities | | | | | | | | | | | 15,835,624 | | | | 0.62 | |
| | | | | | | | | | | | | | | | |
| | | | | |
| Distributors: 0.07% | | | | | | | | | | | | | | | | |
Other securities | | | | | | | | | | | 1,853,112 | | | | 0.07 | |
| | | | | | | | | | | | | | | | |
| | | | | |
| Diversified Consumer Services: 0.05% | | | | | | | | | | | | | | | | |
Other securities | | | | | | | | | | | 1,166,779 | | | | 0.05 | |
| | | | | | | | | | | | | | | | |
| | | | | |
| Hotels, Restaurants & Leisure: 1.78% | | | | | | | | | | | | | | | | |
McDonald’s Corporation | | | | | | | 127,027 | | | | 14,501,402 | | | | 0.57 | |
Starbucks Corporation | | | | | | | 200,181 | | | | 12,289,112 | | | | 0.48 | |
Other securities | | | | | | | | | | | 18,267,723 | | | | 0.73 | |
| | | | | |
| | | | | | | | | | | 45,058,237 | | | | 1.78 | |
| | | | | | | | | | | | | | | | |
| | | | | |
| Household Durables: 0.43% | | | | | | | | | | | | | | | | |
Other securities | | | | | | | | | | | 10,889,139 | | | | 0.43 | |
| | | | | | | | | | | | | | | | |
| | | | | |
| Internet & Catalog Retail: 2.09% | | | | | | | | | | | | | | | | |
Amazon.com Incorporated † | | | | | | | 51,728 | | | | 34,388,774 | | | | 1.36 | |
Other securities | | | | | | | | | | | 18,541,467 | | | | 0.73 | |
| | | | | |
| | | | | | | | | | | 52,930,241 | | | | 2.09 | |
| | | | | | | | | | | | | | | | |
| | | | | |
| Leisure Products: 0.09% | | | | | | | | | | | | | | | | |
Other securities | | | | | | | | | | | 2,243,547 | | | | 0.09 | |
| | | | | | | | | | | | | | | | |
| | | | | |
| Media: 3.14% | | | | | | | | | | | | | | | | |
Comcast Corporation Class A | | | | | | | 285,232 | | | | 17,359,220 | | | | 0.69 | |
The Walt Disney Company | | | | | | | 209,438 | | | | 23,764,930 | | | | 0.94 | |
Other securities | | | | | | | | | | | 38,367,610 | | | | 1.51 | |
| | | | | |
| | | | | | | | | | | 79,491,760 | | | | 3.14 | |
| | | | | | | | | | | | | | | | |
| | | | | |
| Multiline Retail: 0.60% | | | | | | | | | | | | | | | | |
Other securities | | | | | | | | | | | 15,106,401 | | | | 0.60 | |
| | | | | | | | | | | | | | | | |
| | | | | |
| Specialty Retail: 2.59% | | | | | | | | | | | | | | | | |
The Home Depot Incorporated | | | | | | | 173,193 | | | | 23,187,079 | | | | 0.92 | |
Other securities | | | | | | | | | | | 42,391,885 | | | | 1.67 | |
| | | | | |
| | | | | | | | | | | 65,578,964 | | | | 2.59 | |
| | | | | | | | | | | | | | | | |
The accompanying notes are an integral part of these financial statements.
| | | | | | |
| Summary portfolio of investments—November 30, 2015 (unaudited) | | Wells Fargo Allocation Funds | | | 39 | |
INDEX PORTFOLIO
| | | | | | | | | | | | | | | | |
| Security name | | | | | | Shares | | | Value | | | Percent of
net assets | |
| | | | | |
| Textiles, Apparel & Luxury Goods: 0.92% | | | | | | | | | | | | | | | | |
Nike Incorporated Class B | | | | | | | 91,431 | | | $ | 12,094,493 | | | | 0.48 | % |
Other securities | | | | | | | | | | | 11,269,188 | | | | 0.44 | |
| | | | | |
| | | | | | | | | | | 23,363,681 | | | | 0.92 | |
| | | | | | | | | | | | | | | | |
| | | | | |
Consumer Staples: 9.34% | | | | | | | | | | | | | | | | |
| | | | | |
| Beverages: 2.21% | | | | | | | | | | | | | | | | |
PepsiCo Incorporated | | | | | | | 198,130 | | | | 19,844,701 | | | | 0.78 | |
The Coca-Cola Company | | | | | | | 528,036 | | | | 22,504,894 | | | | 0.89 | |
Other securities | | | | | | | | | | | 13,594,355 | | | | 0.54 | |
| | | | | |
| | | | | | | | | | | 55,943,950 | | | | 2.21 | |
| | | | | | | | | | | | | | | | |
| | | | | |
| Food & Staples Retailing: 2.19% | | | | | | | | | | | | | | | | |
CVS Health Corporation | | | | | | | 150,316 | | | | 14,143,232 | | | | 0.56 | |
Wal-Mart Stores Incorporated | | | | | | | 212,842 | | | | 12,523,623 | | | | 0.49 | |
Other securities | | | | | | | | | | | 28,723,311 | | | | 1.14 | |
| | | | | |
| | | | | | | | | | | 55,390,166 | | | | 2.19 | |
| | | | | | | | | | | | | | | | |
| | | | | |
| Food Products: 1.60% | | | | | | | | | | | | | | | | |
Other securities | | | | | | | | | | | 40,537,489 | | | | 1.60 | |
| | | | | | | | | | | | | | | | |
| | | | | |
| Household Products: 1.71% | | | | | | | | | | | | | | | | |
The Procter & Gamble Company | | | | | | | 365,857 | | | | 27,380,738 | | | | 1.08 | |
Other securities | | | | | | | | | | | 15,984,687 | | | | 0.63 | |
| | | | | |
| | | | | | | | | | | 43,365,425 | | | | 1.71 | |
| | | | | | | | | | | | | | | | |
| | | | | |
| Personal Products: 0.10% | | | | | | | | | | | | | | | | |
Other securities | | | | | | | | | | | 2,562,548 | | | | 0.10 | |
| | | | | | | | | | | | | | | | |
| | | | | |
| Tobacco: 1.53% | | | | | | | | | | | | | | | | |
Altria Group Incorporated | | | | | | | 264,449 | | | | 15,232,262 | | | | 0.60 | |
Philip Morris International | | | | | | | 208,946 | | | | 18,259,791 | | | | 0.72 | |
Other securities | | | | | | | | | | | 5,170,519 | | | | 0.21 | |
| | | | | |
| | | | | | | | | | | 38,662,572 | | | | 1.53 | |
| | | | | | | | | | | | | | | | |
| | | | | |
Energy: 6.89% | | | | | | | | | | | | | | | | |
| | | | | |
| Energy Equipment & Services: 1.10% | | | | | | | | | | | | | | | | |
Schlumberger Limited | | | | | | | 170,677 | | | | 13,167,731 | | | | 0.52 | |
Other securities | | | | | | | | | | | 14,772,195 | | | | 0.58 | |
| | | | | |
| | | | | | | | | | | 27,939,926 | | | | 1.10 | |
| | | | | | | | | | | | | | | | |
| | | | | |
| Oil, Gas & Consumable Fuels: 5.79% | | | | | | | | | | | | | | | | |
Chevron Corporation | | | | | | | 253,799 | | | | 23,176,925 | | | | 0.92 | |
Exxon Mobil Corporation | | | | | | | 562,354 | | | | 45,921,828 | | | | 1.81 | |
Other securities | | | | | | | | | | | 77,414,331 | | | | 3.06 | |
| | | | | |
| | | | | | | | | | | 146,513,084 | | | | 5.79 | |
| | | | | | | | | | | | | | | | |
The accompanying notes are an integral part of these financial statements.
| | | | |
| 40 | | Wells Fargo Allocation Funds | | Summary portfolio of investments—November 30, 2015 (unaudited) |
INDEX PORTFOLIO
| | | | | | | | | | | | | | | | |
| Security name | | | | | | Shares | | | Value | | | Percent of
net assets | |
| | | | | |
Financials: 16.19% | | | | | | | | | | | | | | | | |
| | | | | |
| Banks: 5.93% | | | | | | | | | | | | | | | | |
Bank of America Corporation | | | | | | | 1,411,945 | | | $ | 24,610,201 | | | | 0.97 | % |
Citigroup Incorporated | | | | | | | 405,953 | | | | 21,957,998 | | | | 0.87 | |
JPMorgan Chase & Company | | | | | | | 498,777 | | | | 33,258,450 | | | | 1.31 | |
Wells Fargo & Company (l) | | | | | | | 630,049 | | | | 34,715,700 | | | | 1.37 | |
Other securities | | | | | | | | | | | 35,655,337 | | | | 1.41 | |
| | | | | |
| | | | | | | | | | | 150,197,686 | | | | 5.93 | |
| | | | | | | | | | | | | | | | |
| | | | | |
| Capital Markets: 2.15% | | | | | | | | | | | | | | | | |
Other securities | | | | | | | | | | | 54,470,876 | | | | 2.15 | |
| | | | | | | | | | | | | | | | |
| | | | | |
| Consumer Finance: 0.85% | | | | | | | | | | | | | | | | |
Other securities | | | | | | | | | | | 21,480,159 | | | | 0.85 | |
| | | | | | | | | | | | | | | | |
| | | | | |
| Diversified Financial Services: 1.97% | | | | | | | | | | | | | | | | |
Berkshire Hathaway Incorporated Class B † | | | | | | | 252,675 | | | | 33,881,191 | | | | 1.34 | |
Other securities | | | | | | | | | | | 16,028,966 | | | | 0.63 | |
| | | | | |
| | | | | | | | | | | 49,910,157 | | | | 1.97 | |
| | | | | | | | | | | | | | | | |
| | | | | |
| Insurance: 2.71% | | | | | | | | | | | | | | | | |
American International Group Incorporated | | | | | | | 174,513 | | | | 11,095,537 | | | | 0.44 | |
Other securities | | | | | | | | | | | 57,427,615 | | | | 2.27 | |
| | | | | |
| | | | | | | | | | | 68,523,152 | | | | 2.71 | |
| | | | | | | | | | | | | | | | |
| | | | | |
| Real Estate Management & Development: 0.06% | | | | | | | | | | | | | | | | |
Other securities | | | | | | | | | | | 1,464,927 | | | | 0.06 | |
| | | | | | | | | | | | | | | | |
| | | | | |
| REITs: 2.52% | | | | | | | | | | | | | | | | |
Other securities | | | | | | | | | | | 63,944,092 | | | | 2.52 | |
| | | | | | | | | | | | | | | | |
| | | | | |
Health Care: 14.26% | | | | | | | | | | | | | | | | |
| | | | | |
| Biotechnology: 3.50% | | | | | | | | | | | | | | | | |
AbbVie Incorporated | | | | | | | 223,255 | | | | 12,982,278 | | | | 0.51 | |
Amgen Incorporated | | | | | | | 102,269 | | | | 16,475,536 | | | | 0.65 | |
Celgene Corporation † | | | | | | | 106,624 | | | | 11,669,997 | | | | 0.46 | |
Gilead Sciences Incorporated | | | | | | | 197,943 | | | | 20,974,040 | | | | 0.83 | |
Other securities | | | | | | | | | | | 26,525,613 | | | | 1.05 | |
| | | | | |
| | | | | | | | | | | 88,627,464 | | | | 3.50 | |
| | | | | | | | | | | | | | | | |
| | | | | |
| Health Care Equipment & Supplies: 2.04% | | | | | | | | | | | | | | | | |
Medtronic plc | | | | | | | 190,739 | | | | 14,370,276 | | | | 0.57 | |
Other securities | | | | | | | | | | | 37,264,008 | | | | 1.47 | |
| | | | | |
| | | | | | | | | | | 51,634,284 | | | | 2.04 | |
| | | | | | | | | | | | | | | | |
| | | | | |
| Health Care Providers & Services: 2.53% | | | | | | | | | | | | | | | | |
UnitedHealth Group Incorporated | | | | | | | 128,612 | | | | 14,495,859 | | | | 0.57 | |
Other securities | | | | | | | | | | | 49,608,634 | | | | 1.96 | |
| | | | | |
| | | | | | | | | | | 64,104,493 | | | | 2.53 | |
| | | | | | | | | | | | | | | | |
The accompanying notes are an integral part of these financial statements.
| | | | | | |
| Summary portfolio of investments—November 30, 2015 (unaudited) | | Wells Fargo Allocation Funds | | | 41 | |
INDEX PORTFOLIO
| | | | | | | | | | | | | | | | |
| Security name | | | | | | Shares | | | Value | | | Percent of
net assets | |
| | | | | |
| Health Care Technology: 0.10% | | | | | | | | | | | | | | | | |
Other securities | | | | | | | | | | $ | 2,468,751 | | | | 0.10 | % |
| | | | | | | | | | | | | | | | |
| | | | | |
| Life Sciences Tools & Services: 0.60% | | | | | | | | | | | | | | | | |
Other securities | | | | | | | | | | | 15,183,455 | | | | 0.60 | |
| | | | | | | | | | | | | | | | |
| | | | | |
| Pharmaceuticals: 5.49% | | | | | | | | | | | | | | | | |
Allergan plc † | | | | | | | 53,092 | | | | 16,665,048 | | | | 0.66 | |
Bristol-Myers Squibb Company | | | | | | | 224,904 | | | | 15,070,817 | | | | 0.59 | |
Johnson & Johnson | | | | | | | 373,483 | | | | 37,811,419 | | | | 1.49 | |
Merck & Company Incorporated | | | | | | | 379,894 | | | | 20,138,181 | | | | 0.79 | |
Pfizer Incorporated | | | | | | | 831,821 | | | | 27,258,774 | | | | 1.08 | |
Other securities | | | | | | | | | | | 22,291,726 | | | | 0.88 | |
| | | | | |
| | | | | | | | | | | 139,235,965 | | | | 5.49 | |
| | | | | | | | | | | | | | | | |
| | | | | |
Industrials: 9.88% | | | | | | | | | | | | | | | | |
| | | | | |
| Aerospace & Defense: 2.63% | | | | | | | | | | | | | | | | |
The Boeing Company | | | | | | | 86,148 | | | | 12,530,227 | | | | 0.49 | |
Other securities | | | | | | | | | | | 54,223,344 | | | | 2.14 | |
| | | | | |
| | | | | | | | | | | 66,753,571 | | | | 2.63 | |
| | | | | | | | | | | | | | | | |
| | | | | |
| Air Freight & Logistics: 0.70% | | | | | | | | | | | | | | | | |
Other securities | | | | | | | | | | | 17,848,289 | | | | 0.70 | |
| | | | | | | | | | | | | | | | |
| | | | | |
| Airlines: 0.61% | | | | | | | | | | | | | | | | |
Other securities | | | | | | | | | | | 15,411,554 | | | | 0.61 | |
| | | | | | | | | | | | | | | | |
| | | | | |
| Building Products: 0.09% | | | | | | | | | | | | | | | | |
Other securities | | | | | | | | | | | 2,256,080 | | | | 0.09 | |
| | | | | | | | | | | | | | | | |
| | | | | |
| Commercial Services & Supplies: 0.41% | | | | | | | | | | | | | | | | |
Other securities | | | | | | | | | | | 10,369,398 | | | | 0.41 | |
| | | | | | | | | | | | | | | | |
| | | | | |
| Construction & Engineering: 0.09% | | | | | | | | | | | | | | | | |
Other securities | | | | | | | | | | | 2,171,415 | | | | 0.09 | |
| | | | | | | | | | | | | | | | |
| | | | | |
| Electrical Equipment: 0.47% | | | | | | | | | | | | | | | | |
Other securities | | | | | | | | | | | 11,868,205 | | | | 0.47 | |
| | | | | | | | | | | | | | | | |
| | | | | |
| Industrial Conglomerates: 2.43% | | | | | | | | | | | | | | | | |
3M Company | | | | | | | 84,262 | | | | 13,193,744 | | | | 0.52 | |
General Electric Company | | | | | | | 1,271,254 | | | | 38,061,345 | | | | 1.50 | |
Other securities | | | | | | | | | | | 10,357,588 | | | | 0.41 | |
| | | | | |
| | | | | | | | | | | 61,612,677 | | | | 2.43 | |
| | | | | | | | | | | | | | | | |
| | | | | |
| Machinery: 1.20% | | | | | | | | | | | | | | | | |
Other securities | | | | | | | | | | | 30,337,488 | | | | 1.20 | |
| | | | | | | | | | | | | | | | |
| | | | | |
| Professional Services: 0.28% | | | | | | | | | | | | | | | | |
Other securities | | | | | | | | | | | 7,108,301 | | | | 0.28 | |
| | | | | | | | | | | | | | | | |
The accompanying notes are an integral part of these financial statements.
| | | | |
| 42 | | Wells Fargo Allocation Funds | | Summary portfolio of investments—November 30, 2015 (unaudited) |
INDEX PORTFOLIO
| | | | | | | | | | | | | | | | |
| Security name | | | | | | Shares | | | Value | | | Percent of
net assets | |
| | | | | |
| Road & Rail: 0.80% | | | | | | | | | | | | | | | | |
Other securities | | | | | | | | | | $ | 20,258,328 | | | | 0.80 | % |
| | | | | | | | | | | | | | | | |
| | | | | |
| Trading Companies & Distributors: 0.17% | | | | | | | | | | | | | | | | |
Other securities | | | | | | | | | | | 4,241,892 | | | | 0.17 | |
| | | | | | | | | | | | | | | | |
| | | | | |
Information Technology: 20.43% | | | | | | | | | | | | | | | | |
| | | | | |
| Communications Equipment: 1.36% | | | | | | | | | | | | | | | | |
Cisco Systems Incorporated | | | | | | | 685,959 | | | | 18,692,383 | | | | 0.74 | |
Other securities | | | | | | | | | | | 15,710,720 | | | | 0.62 | |
| | | | | |
| | | | | | | | | | | 34,403,103 | | | | 1.36 | |
| | | | | | | | | | | | | | | | |
| | | | | |
| Electronic Equipment, Instruments & Components: 0.38% | | | | | | | | | | | | | | | | |
Other securities | | | | | | | | | | | 9,611,514 | | | | 0.38 | |
| | | | | | | | | | | | | | | | |
| | | | | |
| Internet Software & Services: 4.03% | | | | | | | | | | | | | | | | |
Alphabet Incorporated Class A † | | | | | | | 39,098 | | | | 29,825,909 | | | | 1.18 | |
Alphabet Incorporated Class C † | | | | | | | 39,893 | | | | 29,624,542 | | | | 1.17 | |
Facebook Incorporated Class A † | | | | | | | 304,782 | | | | 31,770,476 | | | | 1.25 | |
Other securities | | | | | | | | | | | 11,014,824 | | | | 0.43 | |
| | | | | |
| | | | | | | | | | | 102,235,751 | | | | 4.03 | |
| | | | | | | | | | | | | | | | |
| | | | | |
| IT Services: 3.60% | | | | | | | | | | | | | | | | |
International Business Machines Corporation | | | | | | | 121,545 | | | | 16,945,804 | | | | 0.67 | |
MasterCard Incorporated Class A | | | | | | | 134,605 | | | | 13,180,522 | | | | 0.52 | |
Visa Incorporated Class A | | | | | | | 263,193 | | | | 20,794,879 | | | | 0.82 | |
Other securities | | | | | | | | | | | 40,272,752 | | | | 1.59 | |
| | | | | |
| | | | | | | | | | | 91,193,957 | | | | 3.60 | |
| | | | | | | | | | | | | | | | |
| | | | | |
| Semiconductors & Semiconductor Equipment: 2.48% | | | | | | | | | | | | | | | | |
Intel Corporation | | | | | | | 641,196 | | | | 22,294,385 | | | | 0.88 | |
Other securities | | | | | | | | | | | 40,527,079 | | | | 1.60 | |
| | | | | |
| | | | | | | | | | | 62,821,464 | | | | 2.48 | |
| | | | | | | | | | | | | | | | |
| | | | | |
| Software: 4.20% | | | | | | | | | | | | | | | | |
Microsoft Corporation | | | | | | | 1,078,727 | | | | 58,628,812 | | | | 2.32 | |
Oracle Corporation | | | | | | | 438,621 | | | | 17,093,060 | | | | 0.67 | |
Other securities | | | | | | | | | | | 30,567,637 | | | | 1.21 | |
| | | | | |
| | | | | | | | | | | 106,289,509 | | | | 4.20 | |
| | | | | | | | | | | | | | | | |
| | | | | |
| Technology Hardware, Storage & Peripherals: 4.38% | | | | | | | | | | | | | | | | |
Apple Incorporated | | | | | | | 769,154 | | | | 90,990,918 | | | | 3.59 | |
Other securities | | | | | | | | | | | 19,935,289 | | | | 0.79 | |
| | | | | |
| | | | | | | | | | | 110,926,207 | | | | 4.38 | |
| | | | | | | | | | | | | | | | |
| | | | | |
Materials: 2.79% | | | | | | | | | | | | | | | | |
| | | | | |
| Chemicals: 2.11% | | | | | | | | | | | | | | | | |
Other securities | | | | | | | | | | | 53,509,505 | | | | 2.11 | |
| | | | | | | | | | | | | | | | |
The accompanying notes are an integral part of these financial statements.
| | | | | | |
| Summary portfolio of investments—November 30, 2015 (unaudited) | | Wells Fargo Allocation Funds | | | 43 | |
INDEX PORTFOLIO
| | | | | | | | | | | | | | | | | | | | |
| Security name | | | | | | | | Shares | | | Value | | | Percent of
net assets | |
| | | | | |
| Construction Materials: 0.13% | | | | | | | | | | | | | | | | | | | | |
Other securities | | | | | | | | | | | | | | $ | 3,266,685 | | | | 0.13 | % |
| | | | | | | | | | | | | | | | | | | | |
| | | | | |
| Containers & Packaging: 0.22% | | | | | | | | | | | | | | | | | | | | |
Other securities | | | | | | | | | | | | | | | 5,572,841 | | | | 0.22 | |
| | | | | | | | | | | | | | | | | | | | |
| | | | | |
| Metals & Mining: 0.24% | | | | | | | | | | | | | | | | | | | | |
Other securities | | | | | | | | | | | | | | | 6,008,282 | | | | 0.24 | |
| | | | | | | | | | | | | | | | | | | | |
| | | | | |
| Paper & Forest Products: 0.09% | | | | | | | | | | | | | | | | | | | | |
Other securities | | | | | | | | | | | | | | | 2,356,828 | | | | 0.09 | |
| | | | | | | | | | | | | | | | | | | | |
| | | | | |
Telecommunication Services: 2.28% | | | | | | | | | | | | | | | | | | | | |
| | | | | |
| Diversified Telecommunication Services: 2.28% | | | | | | | | | | | | | | | | | | | | |
AT&T Incorporated | | | | | | | | | | | 829,616 | | | | 27,933,171 | | | | 1.10 | |
Verizon Communications Incorporated | | | | | | | | | | | 548,360 | | | | 24,922,962 | | | | 0.99 | |
Other securities | | | | | | | | | | | | | | | 4,807,075 | | | | 0.19 | |
| | | | | |
| | | | | | | | | | | | | | | 57,663,208 | | | | 2.28 | |
| | | | | | | | | | | | | | | | | | | | |
| | | | | |
Utilities: 2.79% | | | | | | | | | | | | | | | | | | | | |
| | | | | |
| Electric Utilities: 1.60% | | | | | | | | | | | | | | | | | | | | |
Other securities | | | | | | | | | | | | | | | 40,570,108 | | | | 1.60 | |
| | | | | | | | | | | | | | | | | | | | |
| | | | | |
| Gas Utilities: 0.04% | | | | | | | | | | | | | | | | | | | | |
Other securities | | | | | | | | | | | | | | | 1,013,446 | | | | 0.04 | |
| | | | | | | | | | | | | | | | | | | | |
| | | | | |
| Independent Power & Renewable Electricity Producers: 0.06% | | | | | | | | | | | | | | | | | | | | |
Other securities | | | | | | | | | | | | | | | 1,471,258 | | | | 0.06 | |
| | | | | | | | | | | | | | | | | | | | |
| | | | | |
| Multi-Utilities: 1.09% | | | | | | | | | | | | | | | | | | | | |
Other securities | | | | | | | | | | | | | | | 27,722,609 | | | | 1.09 | |
| | | | | | | | | | | | | | | | | | | | |
| | | | | |
Total Common Stocks (Cost $1,203,617,883) | | | | | | | | | | | | | | | 2,472,550,404 | | | | 97.62 | |
| | | | | | | | | | | | | | | | | | | | |
| | | | | |
| | | Yield | | | | | | | | | | | | | |
| Short-Term Investments: 1.79% | | | | | | | | | | | | | | | | | | | | |
| | | | | |
| Investment Companies: 1.72% | | | | | | | | | | | | | | | | | | | | |
Securities Lending Cash Investments, LLC (l)(r)(u) | | | 0.18 | % | | | | | | | 13,080,495 | | | | 13,080,495 | | | | 0.52 | |
Wells Fargo Cash Investment Money Market Fund, Select Class (l)(u) | | | 0.17 | | | | | | | | 30,518,256 | | | | 30,518,256 | | | | 1.20 | |
| | | | | |
| | | | | | | | | | | | | | | 43,598,751 | | | | 1.72 | |
| | | | | | | | | | | | | | | | | | | | |
| | | | | |
| | | | | | Maturity date | | | Principal | | | | | | | |
| U.S. Treasury Securities: 0.07% | | | | | | | | | | | | | | | | | | | | |
Treasury Bill (z)# | | | 0.05 | | | | 4-7-2016 | | | $ | 1,007,000 | | | | 1,006,239 | | | | 0.04 | |
Treasury Bill (z)# | | | 0.10 | | | | 4-21-2016 | | | | 255,000 | | | | 254,796 | | | | 0.01 | |
Treasury Bill (z)# | | | 0.16 | | | | 2-25-2016 | | | | 76,000 | | | | 75,968 | | | | 0.00 | |
Treasury Bill (z)# | | | 0.28 | | | | 5-5-2016 | | | | 360,000 | | | | 359,507 | | | | 0.02 | |
| | | | | |
| | | | | | | | | | | | | | | 1,696,510 | | | | 0.07 | |
| | | | | | | | | | | | | | | | | | | | |
The accompanying notes are an integral part of these financial statements.
| | | | |
| 44 | | Wells Fargo Allocation Funds | | Summary portfolio of investments—November 30, 2015 (unaudited) |
INDEX PORTFOLIO
| | | | | | | | | | | | | | |
| | | | | | | | | Value | | | Percent of
net assets | |
| | | | |
Total Short-Term Investments (Cost $45,295,990) | | | | | | $ | 45,295,261 | | | | 1.79 | % |
| | | | | | | | | | | | | | |
| | | | | |
| Total investments in securities (Cost $1,248,913,873) * | | | | | | | | | 2,517,845,665 | | | | 99.41 | |
Other assets and liabilities, net | | | | | | | | | 14,857,797 | | | | 0.59 | |
| | | | | | | | | | | | | | |
| Total net assets | | | | | | | | $ | 2,532,703,462 | | | | 100.00 | % |
| | | | | | | | | | | | | | |
| † | Non-income-earning security |
| « | All or a portion of this security is on loan. |
| (l) | The issuer of the security is an affiliated person of the Portfolio as defined in the Investment Company Act of 1940. |
| (r) | The investment is a non-registered investment vehicle purchased with cash collateral received from securities on loan. |
| (u) | The rate represents the 7-day annualized yield at period end. |
| (z) | Zero coupon security. The rate represents the current yield to maturity. |
| # | All or a portion of this security is segregated as collateral for investments in derivative instruments. |
| * | Cost for federal income tax purposes is $1,317,979,628 and unrealized gains (losses) consists of: |
| | | | |
Gross unrealized gains | | $ | 1,301,718,519 | |
Gross unrealized losses | | | (101,852,482 | ) |
| | | | |
Net unrealized gains | | $ | 1,199,866,037 | |
The accompanying notes are an integral part of these financial statements.
| | | | | | |
| Portfolio of investments—November 30, 2015 (unaudited) | | Wells Fargo Allocation Funds | | | 45 | |
INTERNATIONAL GROWTH PORTFOLIO
| | | | | | | | | | | | |
| Security name | | | | | | Shares | | | Value | |
| | | | |
Common Stocks: 94.66% | | | | | | | | | | | | |
| | | | |
| Belgium: 3.51% | | | | | | | | | | | | |
Anheuser-Busch InBev NV (Consumer Staples, Beverages) | | | | | | | 22,037 | | | $ | 2,839,385 | |
Telenet Group Holding NV (Consumer Discretionary, Media) † | | | | | | | 22,809 | | | | 1,245,669 | |
UCB SA (Health Care, Pharmaceuticals) | | | | | | | 15,768 | | | | 1,408,076 | |
| | | | |
| | | | | | | | | | | 5,493,130 | |
| | | | | | | | | | | | |
| | | | |
| China: 8.44% | | | | | | | | | | | | |
Baidu Incorporated ADR (Information Technology, Internet Software & Services) † | | | | | | | 39,497 | | | | 8,609,161 | |
Tencent Holdings Limited (Information Technology, Internet Software & Services) | | | | | | | 230,500 | | | | 4,587,139 | |
| | | | |
| | | | | | | | | | | 13,196,300 | |
| | | | | | | | | | | | |
| | | | |
| France: 5.54% | | | | | | | | | | | | |
L’Oreal SA (Consumer Staples, Personal Products) | | | | | | | 6,888 | | | | 1,219,711 | |
LVMH Moet Hennessy Louis Vuitton SA (Consumer Discretionary, Textiles, Apparel & Luxury Goods) « | | | | | | | 7,971 | | | | 1,336,954 | |
Orange SA (Telecommunication Services, Diversified Telecommunication Services) | | | | | | | 77,130 | | | | 1,333,204 | |
Pernod-Ricard SA (Consumer Staples, Beverages) | | | | | | | 12,640 | | | | 1,438,311 | |
Zodiac Aerospace SA (Industrials, Aerospace & Defense) | | | | | | | 123,250 | | | | 3,337,532 | |
| | | | |
| | | | | | | | | | | 8,665,712 | |
| | | | | | | | | | | | |
| | | | |
| Germany: 11.29% | | | | | | | | | | | | |
Allianz AG (Financials, Insurance) | | | | | | | 8,871 | | | | 1,571,325 | |
Bayer AG (Health Care, Pharmaceuticals) | | | | | | | 53,082 | | | | 7,083,380 | |
Beiersdorf AG (Consumer Staples, Personal Products) | | | | | | | 24,795 | | | | 2,309,017 | |
Linde AG (Materials, Chemicals) | | | | | | | 25,604 | | | | 4,470,326 | |
Vonovia SE (Financials, Real Estate Management & Development) | | | | | | | 36,076 | | | | 1,118,135 | |
Wirecard AG (Information Technology, IT Services) | | | | | | | 22,432 | | | | 1,098,875 | |
| | | | |
| | | | | | | | | | | 17,651,058 | |
| | | | | | | | | | | | |
| | | | |
| Hong Kong: 3.74% | | | | | | | | | | | | |
AIA Group Limited (Financials, Insurance) | | | | | | | 932,400 | | | | 5,567,859 | |
Beijing Enterprises Water Group Limited (Utilities, Water Utilities) | | | | | | | 362,000 | | | | 282,935 | |
| | | | |
| | | | | | | | | | | 5,850,794 | |
| | | | | | | | | | | | |
| | | | |
| India: 2.07% | | | | | | | | | | | | |
Housing Development Finance Corporation Limited (Financials, Thrifts & Mortgage Finance) | | | | | | | 110,747 | | | | 2,012,404 | |
Infosys Limited ADR (Information Technology, IT Services) | | | | | | | 73,799 | | | | 1,230,967 | |
| | | | |
| | | | | | | | | | | 3,243,371 | |
| | | | | | | | | | | | |
| | | | |
| Ireland: 6.04% | | | | | | | | | | | | |
Allegion plc (Industrials, Building Products) | | | | | | | 4,928 | | | | 331,211 | |
Allergan plc (Health Care, Pharmaceuticals) † | | | | | | | 5,099 | | | | 1,600,525 | |
Medtronic plc (Health Care, Health Care Equipment & Supplies) | | | | | | | 99,664 | | | | 7,508,686 | |
| | | | |
| | | | | | | | | | | 9,440,422 | |
| | | | | | | | | | | | |
| | | | |
| Italy: 0.64% | | | | | | | | | | | | |
Mediaset SpA (Consumer Discretionary, Media) | | | | | | | 228,906 | | | | 1,006,582 | |
| | | | | | | | | | | | |
The accompanying notes are an integral part of these financial statements.
| | | | |
| 46 | | Wells Fargo Allocation Funds | | Portfolio of investments—November 30, 2015 (unaudited) |
INTERNATIONAL GROWTH PORTFOLIO
| | | | | | | | | | | | |
| Security name | | | | | | Shares | | | Value | |
| | | | |
| Japan: 9.29% | | | | | | | | | | | | |
Ishikawajima-Harima Heavy Industries Company Limited (Industrials, Machinery) | | | | | | | 247,000 | | | $ | 646,093 | |
Japan Tobacco Incorporated (Consumer Staples, Tobacco) | | | | | | | 67,654 | | | | 2,423,673 | |
NGK Insulators Limited (Industrials, Machinery) | | | | | | | 122,000 | | | | 2,829,488 | |
Olympus Corporation (Health Care, Health Care Equipment & Supplies) | | | | | | | 75,400 | | | | 3,007,425 | |
Ono Pharmaceutical Company Limited (Health Care, Pharmaceuticals) | | | | | | | 8,100 | | | | 1,296,921 | |
Toyota Motor Corporation (Consumer Discretionary, Automobiles) | | | | | | | 69,400 | | | | 4,316,781 | |
| | | | |
| | | | | | | | | | | 14,520,381 | |
| | | | | | | | | | | | |
| | | | |
| Mexico: 1.94% | | | | | | | | | | | | |
Grupo Televisa SAB ADR (Consumer Discretionary, Media) | | | | | | | 107,696 | | | | 3,037,027 | |
| | | | | | | | | | | | |
| | | | |
| Netherlands: 2.28% | | | | | | | | | | | | |
ASML Holdings NV (Information Technology, Semiconductors & Semiconductor Equipment) | | | | | | | 38,503 | | | | 3,558,309 | |
| | | | | | | | | | | | |
| | | | |
| South Korea: 0.01% | | | | | | | | | | | | |
Orion Corporation (Consumer Staples, Food Products) | | | | | | | 18 | | | | 17,735 | |
| | | | | | | | | | | | |
| | | | |
| Spain: 1.48% | | | | | | | | | | | | |
Grifols SA (Health Care, Biotechnology) | | | | | | | 21,620 | | | | 1,026,090 | |
Grifols SA ADR (Health Care, Biotechnology) | | | | | | | 37,018 | | | | 1,286,376 | |
| | | | |
| | | | | | | | | | | 2,312,466 | |
| | | | | | | | | | | | |
| | | | |
| Sweden: 2.15% | | | | | | | | | | | | |
Autoliv Incorporated SDR (Consumer Discretionary, Auto Components) | | | | | | | 15,312 | | | | 1,927,650 | |
Swedbank AB Class A (Financials, Banks) | | | | | | | 65,125 | | | | 1,442,609 | |
| | | | |
| | | | | | | | | | | 3,370,259 | |
| | | | | | | | | | | | |
| | | | |
| Switzerland: 12.33% | | | | | | | | | | | | |
Actelion Limited (Health Care, Biotechnology) | | | | | | | 17,043 | | | | 2,393,657 | |
Adecco SA (Industrials, Professional Services) | | | | | | | 22,326 | | | | 1,527,677 | |
Nestle SA (Consumer Staples, Food Products) | | | | | | | 59,015 | | | | 4,379,448 | |
Novartis AG (Health Care, Pharmaceuticals) | | | | | | | 22,069 | | | | 1,886,542 | |
Roche Holding AG (Health Care, Pharmaceuticals) | | | | | | | 16,045 | | | | 4,296,445 | |
Syngenta AG (Materials, Chemicals) | | | | | | | 10,271 | | | | 3,786,548 | |
TE Connectivity Limited (Information Technology, Electronic Equipment, Instruments & Components) | | | | | | | 15,005 | | | | 1,006,685 | |
| | | | |
| | | | | | | | | | | 19,277,002 | |
| | | | | | | | | | | | |
| | | | |
| United Kingdom: 20.47% | | | | | | | | | | | | |
Aon plc (Financials, Insurance) | | | | | | | 8,124 | | | | 769,668 | |
Babcock International Group plc (Industrials, Commercial Services & Supplies) | | | | | | | 53,879 | | | | 869,086 | |
BT Group plc (Telecommunication Services, Diversified Telecommunication Services) | | | | | | | 201,076 | | | | 1,503,451 | |
Carnival plc (Consumer Discretionary, Hotels, Restaurants & Leisure) | | | | | | | 40,059 | | | | 2,090,532 | |
Croda International plc (Materials, Chemicals) | | | | | | | 35,756 | | | | 1,544,477 | |
Delphi Automotive plc (Consumer Discretionary, Auto Components) | | | | | | | 41,127 | | | | 3,614,241 | |
Diageo plc (Consumer Staples, Beverages) | | | | | | | 1,639 | | | | 47,148 | |
Imperial Tobacco Group plc (Consumer Staples, Tobacco) | | | | | | | 32,109 | | | | 1,735,133 | |
Intercontinental Hotels Group plc (Consumer Discretionary, Hotels, Restaurants & Leisure) | | | | | | | 37,990 | | | | 1,462,459 | |
International Consolidated Airlines Group SA (Industrials, Airlines) † | | | | | | | 299,860 | | | | 2,560,679 | |
Johnson Matthey plc (Materials, Chemicals) | | | | | | | 83,824 | | | | 3,572,797 | |
The accompanying notes are an integral part of these financial statements.
| | | | | | |
| Portfolio of investments—November 30, 2015 (unaudited) | | Wells Fargo Allocation Funds | | | 47 | |
INTERNATIONAL GROWTH PORTFOLIO
| | | | | | | | | | | | | | | | |
| Security name | | | | | | | | Shares | | | Value | |
| | | | |
| United Kingdom (continued) | | | | | | | | | | | | | | | | |
Liberty Global plc Class A (Consumer Discretionary, Media) | | | | | | | | | | | 56,548 | | | $ | 2,398,201 | |
Liberty Global plc Class C (Consumer Discretionary, Media) | | | | | | | | | | | 94,351 | | | | 3,868,391 | |
Lloyds Banking Group plc (Financials, Banks) | | | | | | | | | | | 1,834,497 | | | | 2,015,835 | |
Worldpay Group plc (Information Technology, IT Services) 144A† | | | | | | | | | | | 244,315 | | | | 1,100,208 | |
WPP plc (Consumer Discretionary, Media) | | | | | | | | | | | 123,555 | | | | 2,856,421 | |
| | | | |
| | | | | | | | | | | | | | | 32,008,727 | |
| | | | | | | | | | | | | | | | |
| | | | |
| United States: 3.44% | | | | | | | | | | | | | | | | |
Cognizant Technology Solutions Corporation Class A (Information Technology, IT Services) † | | | | | | | | | | | 43,538 | | | | 2,811,684 | |
Royal Caribbean Cruises Limited (Consumer Discretionary, Hotels, Restaurants & Leisure) | | | | | | | | | | | 16,934 | | | | 1,568,258 | |
WABCO Holdings Incorporated (Industrials, Machinery) † | | | | | | | | | | | 9,256 | | | | 994,835 | |
| | | | |
| | | | | | | | | | | | | | | 5,374,777 | |
| | | | | | | | | | | | | | | | |
| | | | |
Total Common Stocks (Cost $124,324,775) | | | | | | | | | | | | | | | 148,024,052 | |
| | | | | | | | | | | | | | | | |
| | | | |
| | | | | | Expiration date | | | | | | | |
| | | | |
Participation Notes: 1.19% | | | | | | | | | | | | | | | | |
| | | | |
| Ireland: 1.19% | | | | | | | | | | | | | | | | |
HSBC Bank plc (Ryanair Holdings plc) (Industrials, Airlines) | | | | | | | 10-29-2018 | | | | 124,515 | | | | 1,864,418 | |
| | | | | | | | | | | | | | | | |
| | | | |
Total Participation Notes (Cost $1,147,504) | | | | | | | | | | | | | | | 1,864,418 | |
| | | | | | | | | | | | | | | | |
| | | | |
| | | Dividend yield | | | | | | | | | | |
| | | | |
Preferred Stocks: 0.89% | | | | | | | | | | | | | | | | |
| | | | |
| Germany: 0.89% | | | | | | | | | | | | | | | | |
Henkel AG & Company KGaA (Consumer Staples, Household Products) ± | | | 1.23 | % | | | | | | | 12,217 | | | | 1,387,596 | |
| | | | | | | | | | | | | | | | |
| | | | |
Total Preferred Stocks (Cost $874,798) | | | | | | | | | | | | | | | 1,387,596 | |
| | | | | | | | | | | | | | | | |
| | | Yield | | | | | | | | | | |
| Short-Term Investments: 3.60% | | | | | | | | | | | | | | | | |
| | | | |
| Investment Companies: 3.60% | | | | | | | | | | | | | | | | |
Securities Lending Cash Investments, LLC (l)(r)(u) | | | 0.18 | | | | | | | | 1,302,812 | | | | 1,302,812 | |
Wells Fargo Cash Investment Money Market Fund, Select Class (l)(u) | | | 0.17 | | | | | | | | 4,324,287 | | | | 4,324,287 | |
| | | | |
Total Short-Term Investments (Cost $5,627,099) | | | | | | | | | | | | | | | 5,627,099 | |
| | | | | | | | | | | | | | | | |
| | | | | | | | |
| Total investments in securities (Cost $131,974,176) * | | | 100.34 | % | | | 156,903,165 | |
Other assets and liabilities, net | | | (0.34 | ) | | | (532,486 | ) |
| | | | | | | | |
| Total net assets | | | 100.00 | % | | $ | 156,370,679 | |
| | | | | | | | |
The accompanying notes are an integral part of these financial statements.
| | | | |
| 48 | | Wells Fargo Allocation Funds | | Portfolio of investments—November 30, 2015 (unaudited) |
INTERNATIONAL GROWTH PORTFOLIO
| † | Non-income-earning security |
| « | All or a portion of this security is on loan. |
| ± | Variable rate investment. The rate shown is the rate in effect at period end. |
| 144A | The security may be resold in transactions exempt from registration, normally to qualified institutional buyers, pursuant to Rule 144A under the Securities Act of 1933. |
| (l) | The issuer of the security is an affiliated person of the Portfolio as defined in the Investment Company Act of 1940. |
| (r) | The investment is a non-registered investment vehicle purchased with cash collateral received from securities on loan. |
| (u) | The rate represents the 7-day annualized yield at period end. |
| * | Cost for federal income tax purposes is $132,399,036 and unrealized gains (losses) consists of: |
| | | | |
Gross unrealized gains | | $ | 27,616,019 | |
Gross unrealized losses | | | (3,111,890 | ) |
| | | | |
Net unrealized gains | | $ | 24,504,129 | |
The following table shows the percent of total long-term investments by sector as of November 30, 2015:
| | | | |
Health Care | | | 21.67 | % |
Consumer Discretionary | | | 20.31 | |
Information Technology | | | 15.87 | |
Consumer Staples | | | 11.76 | |
Financials | | | 10.82 | |
Materials | | | 8.84 | |
Industrials | | | 8.66 | |
Telecommunication Services | | | 1.88 | |
Utilities | | | 0.19 | |
| | | | |
| | | 100.00 | % |
| | | | |
The accompanying notes are an integral part of these financial statements.
| | | | | | |
| Portfolio of investments—November 30, 2015 (unaudited) | | Wells Fargo Allocation Funds | | | 49 | |
INTERNATIONAL VALUE PORTFOLIO
| | | | | | | | | | | | |
| Security name | | | | | | Shares | | | Value | |
| | | | |
Common Stocks: 96.94% | | | | | | | | | | | | |
| | | | |
| Australia: 5.05% | | | | | | | | | | | | |
AGL Energy Limited (Utilities, Multi-Utilities) | | | | | | | 131,500 | | | $ | 1,573,919 | |
Arrium Limited (Materials, Metals & Mining) | | | | | | | 3,063,400 | | | | 175,021 | |
Automotive Holdings Group (Consumer Discretionary) | | | | | | | 410,016 | | | | 1,254,295 | |
Bendigo Bank Limited (Financials, Banks) | | | | | | | 272,500 | | | | 2,199,324 | |
Boart Longyear Group Limited (Industrials, Construction & Engineering) † | | | | | | | 199,991 | | | | 10,703 | |
Cabcharge Australia Limited (Industrials, Commercial Services & Supplies) « | | | | | | | 207,386 | | | | 410,950 | |
Challenger Financial Services Group Limited (Financials, Diversified Financial Services) | | | | | | | 475,400 | | | | 2,901,751 | |
CSR Limited (Materials, Construction Materials) | | | | | | | 754,900 | | | | 1,665,129 | |
Downer EDI Limited (Industrials, Commercial Services & Supplies) | | | | | | | 518,900 | | | | 1,354,720 | |
Fortescue Metals Group Limited (Materials, Metals & Mining) « | | | | | | | 394,700 | | | | 559,476 | |
Independence Group NL (Materials, Metals & Mining) | | | | | | | 404,400 | | | | 707,758 | |
Lend Lease Corporation Limited (Financials, Real Estate Management & Development) | | | | | | | 350,500 | | | | 3,231,891 | |
McMillan Shakespeare Limited (Industrials, Professional Services) | | | | | | | 158,800 | | | | 1,535,467 | |
Metcash Limited (Consumer Staples, Food & Staples Retailing) « | | | | | | | 785,500 | | | | 840,749 | |
Mincor Resources NL (Materials, Metals & Mining) (i) | | | | | | | 570,994 | | | | 101,171 | |
Mineral Resources Limited (Materials, Metals & Mining) « | | | | | | | 144,300 | | | | 509,266 | |
Myer Holdings Limited (Consumer Discretionary, Multiline Retail) « | | | | | | | 1,059,500 | | | | 850,516 | |
Panoramic Resources Limited (Materials, Metals & Mining) | | | | | | | 368,800 | | | | 58,678 | |
Primary Health Care Limited (Health Care, Health Care Providers & Services) | | | | | | | 339,000 | | | | 786,979 | |
Qantas Airways Limited (Industrials, Airlines) | | | | | | | 580,020 | | | | 1,526,873 | |
Rio Tinto Limited (Materials, Metals & Mining) | | | | | | | 58,300 | | | | 1,935,684 | |
Seven Group Holdings Limited (Industrials, Trading Companies & Distributors) « | | | | | | | 165,800 | | | | 621,116 | |
United Construction Group Limited (Industrials, Construction & Engineering) | | | | | | | 152,800 | | | | 269,632 | |
| | | | |
| | | | | | | | | | | 25,081,068 | |
| | | | | | | | | | | | |
| | | | |
| Austria: 1.07% | | | | | | | | | | | | |
OMV AG (Energy, Oil, Gas & Consumable Fuels) | | | | | | | 41,100 | | | | 1,173,105 | |
Raiffeisen Bank International AG (Financials, Banks) †« | | | | | | | 81,200 | | | | 1,270,577 | |
RHI AG (Materials, Construction Materials) « | | | | | | | 64,721 | | | | 1,298,896 | |
Voestalpine AG (Materials, Metals & Mining) | | | | | | | 47,700 | | | | 1,552,241 | |
| | | | |
| | | | | | | | | | | 5,294,819 | |
| | | | | | | | | | | | |
| | | | |
| Belgium: 0.80% | | | | | | | | | | | | |
Delhaize Group SA (Consumer Staples, Food & Staples Retailing) | | | | | | | 39,400 | | | | 3,947,589 | |
| | | | | | | | | | | | |
| | | | |
| Brazil: 1.10% | | | | | | | | | | | | |
Banco do Brasil SA (Financials, Banks) | | | | | | | 309,500 | | | | 1,303,116 | |
Companhia de Saneamento Basico do Estado de Sao Paulo SA (Utilities, Water Utilities) | | | | | | | 253,200 | | | | 1,238,187 | |
Companhia de Saneamento de Minas Gerais SA (Utilities, Water Utilities) | | | | | | | 72,400 | | | | 305,955 | |
JBS SA (Consumer Staples, Food Products) | | | | | | | 805,600 | | | | 2,586,082 | |
| | | | |
| | | | | | | | | | | 5,433,340 | |
| | | | | | | | | | | | |
| | | | |
| Canada: 2.11% | | | | | | | | | | | | |
Magna International Incorporated Class A (Consumer Discretionary, Auto Components) | | | | | | | 131,600 | | | | 5,985,536 | |
Metro Incorporated (Consumer Staples, Food & Staples Retailing) | | | | | | | 90,100 | | | | 2,594,815 | |
WestJet Airlines Limited (Industrials, Airlines) | | | | | | | 120,000 | | | | 1,908,570 | |
| | | | |
| | | | | | | | | | | 10,488,921 | |
| | | | | | | | | | | | |
The accompanying notes are an integral part of these financial statements.
| | | | |
| 50 | | Wells Fargo Allocation Funds | | Portfolio of investments—November 30, 2015 (unaudited) |
INTERNATIONAL VALUE PORTFOLIO
| | | | | | | | | | | | |
| Security name | | | | | | Shares | | | Value | |
| | | | |
| Cayman Islands: 0.63% | | | | | | | | | | | | |
China Resources Cement Holdings Limited (Materials, Construction Materials) | | | | | | | 3,186,000 | | | $ | 1,039,612 | |
Kingboard Laminates Holdings Limited (Information Technology, Electronic Equipment, Instruments & Components) | | | | | | | 2,204,000 | | | | 932,375 | |
TCL Communication Technology Holdings Limited (Information Technology, Technology Hardware, Storage & Peripherals) « | | | | | | | 1,586,000 | | | | 1,174,141 | |
| | | | |
| | | | | | | | | | | 3,146,128 | |
| | | | | | | | | | | | |
| | | | |
| China: 2.68% | | | | | | | | | | | | |
China BlueChemical Limited H Shares (Materials, Chemicals) | | | | | | | 1,984,000 | | | | 539,920 | |
China Communications Services Corporation Limited H Shares (Telecommunication Services, Diversified Telecommunication Services) | | | | | | | 2,836,000 | | | | 1,093,660 | |
China Petroleum & Chemical Corporation H Shares (Energy, Oil, Gas & Consumable Fuels) | | | | | | | 4,152,000 | | | | 2,543,642 | |
China Railway Construction Corporation Limited H Shares (Industrials, Construction & Engineering) | | | | | | | 1,747,500 | | | | 2,321,450 | |
Dongfeng Motor Group Company Limited H Shares (Consumer Discretionary, Automobiles) | | | | | | | 1,730,000 | | | | 2,351,753 | |
PICC Property & Casualty Company Limited H Shares (Financials, Insurance) | | | | | | | 1,225,000 | | | | 2,657,462 | |
Shanghai Pharmaceuticals Holding Company Limited H Shares (Health Care, Pharmaceuticals) | | | | | | | 823,400 | | | | 1,807,488 | |
| | | | |
| | | | | | | | | | | 13,315,375 | |
| | | | | | | | | | | | |
| | | | |
| Czech Republic: 0.21% | | | | | | | | | | | | |
CEZ AS (Utilities, Electric Utilities) | | | | | | | 57,500 | | | | 1,044,660 | |
| | | | | | | | | | | | |
| | | | |
| Denmark: 0.28% | | | | | | | | | | | | |
Sydbank AG (Financials, Banks) | | | | | | | 43,000 | | | | 1,410,994 | |
| | | | | | | | | | | | |
| | | | |
| Finland: 0.43% | | | | | | | | | | | | |
TietoEnator Oyj (Information Technology, IT Services) | | | | | | | 82,700 | | | | 2,109,273 | |
| | | | | | | | | | | | |
| | | | |
| France: 9.01% | | | | | | | | | | | | |
Alstom SA (Industrials, Machinery) †« | | | | | | | 83,800 | | | | 2,604,371 | |
AXA SA (Financials, Insurance) | | | | | | | 132,200 | | | | 3,577,099 | |
BNP Paribas SA (Financials, Banks) | | | | | | | 49,100 | | | | 2,910,796 | |
Compagnie Generale des Etablissements Michelin SCA Class B (Consumer Discretionary, Auto Components) | | | | | | | 24,000 | | | | 2,406,398 | |
Credit Agricole SA (Financials, Banks) | | | | | | | 219,328 | | | | 2,646,367 | |
Electricite de France SA (Utilities, Electric Utilities) « | | | | | | | 148,600 | | | | 2,214,531 | |
Engie SA (Utilities, Multi-Utilities) | | | | | | | 171,900 | | | | 2,994,929 | |
Renault SA (Consumer Discretionary, Automobiles) | | | | | | | 40,500 | | | | 4,086,898 | |
Sanofi-Aventis SA (Health Care, Pharmaceuticals) | | | | | | | 82,900 | | | | 7,390,673 | |
SCOR SE (Financials, Insurance) | | | | | | | 109,700 | | | | 4,302,338 | |
Societe Generale SA (Financials, Banks) | | | | | | | 39,000 | | | | 1,861,662 | |
Thales SA (Industrials, Aerospace & Defense) | | | | | | | 41,400 | | | | 3,082,439 | |
Total SA (Energy, Oil, Gas & Consumable Fuels) | | | | | | | 93,700 | | | | 4,652,939 | |
| | | | |
| | | | | | | | | | | 44,731,440 | |
| | | | | | | | | | | | |
| | | | |
| Germany: 8.61% | | | | | | | | | | | | |
Allianz AG (Financials, Insurance) | | | | | | | 35,700 | | | | 6,323,561 | |
BASF SE (Materials, Chemicals) | | | | | | | 46,500 | | | | 3,848,810 | |
Bayerische Motoren Werke AG (Consumer Discretionary, Automobiles) | | | | | | | 31,200 | | | | 3,405,217 | |
Daimler AG (Consumer Discretionary, Automobiles) | | | | | | | 75,700 | | | | 6,776,774 | |
Deutsche Bank AG (Financials, Capital Markets) | | | | | | | 130,100 | | | | 3,340,895 | |
E.ON SE (Utilities, Multi-Utilities) | | | | | | | 87,200 | | | | 828,812 | |
Hannover Rueckversicherung AG (Financials, Insurance) | | | | | | | 31,000 | | | | 3,627,399 | |
The accompanying notes are an integral part of these financial statements.
| | | | | | |
| Portfolio of investments—November 30, 2015 (unaudited) | | Wells Fargo Allocation Funds | | | 51 | |
INTERNATIONAL VALUE PORTFOLIO
| | | | | | | | | | | | |
| Security name | | | | | | Shares | | | Value | |
| | | | |
| Germany (continued) | | | | | | | | | | | | |
Muenchener Rueckversicherungs Gesellschaft AG (Financials, Insurance) | | | | | | | 19,700 | | | $ | 3,970,276 | |
Norddeutsche Affinerie AG (Materials, Metals & Mining) | | | | | | | 25,900 | | | | 1,613,693 | |
Rhoen Klinikum AG (Health Care, Health Care Providers & Services) † | | | | | | | 18,500 | | | | 235 | |
Rhoen Klinikum AG (Health Care, Health Care Providers & Services) « | | | | | | | 73,100 | | | | 2,113,116 | |
Stada Arzneimittel AG (Health Care, Pharmaceuticals) | | | | | | | 56,900 | | | | 2,172,653 | |
Volkswagen AG (Consumer Discretionary, Automobiles) « | | | | | | | 22,600 | | | | 3,373,965 | |
Wincor Nixdorf AG (Information Technology, Technology Hardware, Storage & Peripherals) | | | | | | | 26,600 | | | | 1,346,333 | |
| | | | |
| | | | | | | | | | | 42,741,739 | |
| | | | | | | | | | | | |
| | | | |
| Hong Kong: 1.60% | | | | | | | | | | | | |
Shenzhen International Holdings Limited (Industrials, Transportation Infrastructure) | | | | | | | 1,012,500 | | | | 1,666,290 | |
Skyworth Digital Holdings Limited (Consumer Discretionary, Household Durables) | | | | | | | 3,680,000 | | | | 2,425,346 | |
Wheelock & Company Limited (Financials, Real Estate Management & Development) | | | | | | | 379,000 | | | | 1,637,529 | |
Yue Yuen Industrial Holdings Limited (Consumer Discretionary, Textiles, Apparel & Luxury Goods) | | | | | | | 611,500 | | | | 2,220,137 | |
| | | | |
| | | | | | | | | | | 7,949,302 | |
| | | | | | | | | | | | |
| | | | |
| Hungary: 0.23% | | | | | | | | | | | | |
Richter Gedeon (Health Care, Pharmaceuticals) | | | | | | | 59,700 | | | | 1,134,183 | |
| | | | | | | | | | | | |
| | | | |
| India: 0.89% | | | | | | | | | | | | |
Gail Limited (Utilities, Gas Utilities) | | | | | | | 28,100 | | | | 923,085 | |
Tata Motors Limited ADR (Consumer Discretionary, Automobiles) | | | | | | | 83,800 | | | | 2,645,566 | |
Tata Steel Limited GDR (Industrials, Machinery) (i) | | | | | | | 245,900 | | | | 850,814 | |
| | | | |
| | | | | | | | | | | 4,419,465 | |
| | | | | | | | | | | | |
| | | | |
| Ireland: 0.90% | | | | | | | | | | | | |
C&C Group plc (Consumer Staples, Beverages) | | | | | | | 240,000 | | | | 930,609 | |
Smurfit Kappa Group plc (Materials, Containers & Packaging) | | | | | | | 130,200 | | | | 3,557,373 | |
| | | | |
| | | | | | | | | | | 4,487,982 | |
| | | | | | | | | | | | |
| | | | |
| Israel: 1.20% | | | | | | | | | | | | |
Bank Hapoalim Limited (Financials, Banks) | | | | | | | 542,900 | | | | 2,807,366 | |
Teva Pharmaceutical Industries Limited (Health Care, Pharmaceuticals) | | | | | | | 51,404 | | | | 3,148,064 | |
| | | | |
| | | | | | | | | | | 5,955,430 | |
| | | | | | | | | | | | |
| | | | |
| Italy: 1.24% | | | | | | | | | | | | |
Enel SpA (Utilities, Electric Utilities) | | | | | | | 688,400 | | | | 3,035,871 | |
Mediobanca SpA (Financials, Capital Markets) | | | | | | | 324,800 | | | | 3,112,528 | |
| | | | |
| | | | | | | | | | | 6,148,399 | |
| | | | | | | | | | | | |
| | | | |
| Japan: 22.12% | | | | | | | | | | | | |
Adeka Corporation (Materials, Chemicals) | | | | | | | 155,300 | | | | 2,296,068 | |
Aisin Seiki Company Limited (Consumer Discretionary, Auto Components) | | | | | | | 46,400 | | | | 1,858,262 | |
Anritsu Corporation (Information Technology, Electronic Equipment, Instruments & Components) | | | | | | | 206,300 | | | | 1,382,595 | |
Aoyama Trading Company Limited (Consumer Discretionary, Specialty Retail) | | | | | | | 73,100 | | | | 2,713,786 | |
Aozora Bank Limited (Financials, Banks) | | | | | | | 588,000 | | | | 2,073,046 | |
Calsonic Kansei Corporation (Consumer Discretionary, Auto Components) | | | | | | | 326,000 | | | | 2,836,279 | |
Central Glass Company Limited (Industrials, Building Products) | | | | | | | 444,000 | | | | 2,099,171 | |
The accompanying notes are an integral part of these financial statements.
| | | | |
| 52 | | Wells Fargo Allocation Funds | | Portfolio of investments—November 30, 2015 (unaudited) |
INTERNATIONAL VALUE PORTFOLIO
| | | | | | | | | | | | |
| Security name | | | | | | Shares | | | Value | |
| | | | |
| Japan (continued) | | | | | | | | | | | | |
CKD Corporation (Industrials, Machinery) | | | | | | | 171,200 | | | $ | 1,839,948 | |
Dainippon Ink & Chemicals Incorporated (Materials, Chemicals) | | | | | | | 808,700 | | | | 2,332,157 | |
DCM Japan Holdings Company Limited (Consumer Discretionary, Specialty Retail) | | | | | | | 143,100 | | | | 981,124 | |
Denki Kagaku Kogyo Kabushiki Kaisha (Materials, Chemicals) | | | | | | | 682,000 | | | | 3,013,875 | |
Eizo Nanao Corporation (Information Technology, Technology Hardware, Storage & Peripherals) | | | | | | | 63,300 | | | | 1,486,084 | |
Fujikura Limited (Industrials, Electrical Equipment) | | | | | | | 348,000 | | | | 1,970,398 | |
Isuzu Motors Limited (Consumer Discretionary, Automobiles) | | | | | | | 110,300 | | | | 1,240,987 | |
Itochu Corporation (Industrials, Trading Companies & Distributors) | | | | | | | 200,700 | | | | 2,448,833 | |
Japan Airlines Company Limited (Industrials, Airlines) | | | | | | | 80,700 | | | | 2,759,927 | |
JFE Holdings Incorporated (Materials, Metals & Mining) | | | | | | | 70,000 | | | | 1,104,305 | |
JX Holdings Incorporated (Energy, Oil, Gas & Consumable Fuels) | | | | | | | 408,000 | | | | 1,654,869 | |
KDDI Corporation (Telecommunication Services, Wireless Telecommunication Services) | | | | | | | 102,800 | | | | 2,553,716 | |
Kureha Corporation (Materials, Chemicals) | | | | | | | 271,000 | | | | 1,065,508 | |
Kyorin Company Limited (Health Care, Pharmaceuticals) | | | | | | | 99,000 | | | | 1,869,017 | |
Maeda Road Construction Company Limited (Industrials, Construction & Engineering) | | | | | | | 148,000 | | | | 2,459,854 | |
Marubeni Corporation (Industrials, Trading Companies & Distributors) | | | | | | | 516,000 | | | | 2,858,749 | |
Miraca Holdings Incorporated (Health Care, Health Care Providers & Services) | | | | | | | 25,100 | | | | 1,115,329 | |
Mitsubishi Corporation (Industrials, Trading Companies & Distributors) | | | | | | | 35,500 | | | | 597,530 | |
Mitsubishi Gas Chemical Company Incorporated (Materials, Chemicals) | | | | | | | 556,400 | | | | 3,014,775 | |
Mitsubishi UFJ Financial Group Incorporated (Financials, Banks) | | | | | | | 657,100 | | | | 4,216,970 | |
Mitsui & Company Limited (Industrials, Trading Companies & Distributors) | | | | | | | 260,300 | | | | 3,192,957 | |
Mizuho Financial Group Incorporated (Financials, Banks) | | | | | | | 2,244,400 | | | | 4,530,734 | |
Namura Shipbuilding Company Limited (Industrials, Machinery) | | | | | | | 108,800 | | | | 1,001,384 | |
Nichirei Corporation (Consumer Staples, Food Products) | | | | | | | 252,000 | | | | 1,649,976 | |
Nippon Telegraph & Telephone Corporation (Telecommunication Services, Diversified Telecommunication Services) | | | | | | | 234,000 | | | | 8,677,579 | |
Nissan Motor Company Limited (Consumer Discretionary, Automobiles) | | | | | | | 419,800 | | | | 4,482,755 | |
Nisshinbo Industries Incorporated (Industrials, Industrial Conglomerates) | | | | | | | 117,000 | | | | 1,383,851 | |
NTT DOCOMO Incorporated (Telecommunication Services, Wireless Telecommunication Services) | | | | | | | 180,000 | | | | 3,404,062 | |
Resona Holdings Incorporated (Financials, Banks) | | | | | | | 1,013,300 | | | | 4,945,497 | |
Ricoh Company Limited (Information Technology, Technology Hardware, Storage & Peripherals) | | | | | | | 166,000 | | | | 1,701,803 | |
Sankyu Incorporated (Industrials, Road & Rail) | | | | | | | 370,000 | | | | 1,845,491 | |
Sojitz Corporation (Industrials, Trading Companies & Distributors) | | | | | | | 678,000 | | | | 1,487,084 | |
Sumitomo Corporation (Industrials, Trading Companies & Distributors) | | | | | | | 285,000 | | | | 3,027,112 | |
Sumitomo Metal Mining Company Limited (Materials, Metals & Mining) | | | | | | | 149,000 | | | | 1,680,032 | |
Sumitomo Mitsui Financial Group Incorporated (Financials, Banks) | | | | | | | 100,400 | | | | 3,830,859 | |
The Keiyo Bank Limited (Financials, Banks) | | | | | | | 62,000 | | | | 296,653 | |
Toyo Tire & Rubber Company Limited (Consumer Discretionary, Auto Components) | | | | | | | 95,400 | | | | 2,062,996 | |
Tsumura & Company (Health Care, Pharmaceuticals) | | | | | | | 79,300 | | | | 2,180,589 | |
Yokohama Rubber Company Limited (Consumer Discretionary, Auto Components) | | | | | | | 148,500 | | | | 2,553,814 | |
| | | | |
| | | | | | | | | | | 109,778,390 | |
| | | | | | | | | | | | |
| | | | |
| Liechtenstein: 0.11% | | | | | | | | | | | | |
Verwaltungs-und Privat-Bank AG (Financials, Capital Markets) (i) | | | | | | | 6,558 | | | | 522,358 | |
| | | | | | | | | | | | |
| | | | |
| Netherlands: 2.22% | | | | | | | | | | | | |
Aegon NV (Financials, Insurance) | | | | | | | 334,000 | | | | 2,045,337 | |
ING Groep NV (Financials, Banks) | | | | | | | 237,100 | | | | 3,255,351 | |
Koninklijke Ahold NV (Consumer Staples, Food & Staples Retailing) | | | | | | | 263,630 | | | | 5,735,102 | |
| | | | |
| | | | | | | | | | | 11,035,790 | |
| | | | | | | | | | | | |
The accompanying notes are an integral part of these financial statements.
| | | | | | |
| Portfolio of investments—November 30, 2015 (unaudited) | | Wells Fargo Allocation Funds | | | 53 | |
INTERNATIONAL VALUE PORTFOLIO
| | | | | | | | | | | | |
| Security name | | | | | | Shares | | | Value | |
| | | | |
| Norway: 1.31% | | | | | | | | | | | | |
Atea ASA (Information Technology, IT Services) | | | | | | | 84,900 | | | $ | 762,000 | |
DnB Nor ASA (Financials, Banks) | | | | | | | 148,800 | | | | 1,958,762 | |
Marine Harvest ASA (Consumer Staples, Food Products) | | | | | | | 97,500 | | | | 1,318,242 | |
Yara International ASA (Materials, Chemicals) | | | | | | | 53,600 | | | | 2,481,233 | |
| | | | |
| | | | | | | | | | | 6,520,237 | |
| | | | | | | | | | | | |
| | | | |
| Poland: 0.42% | | | | | | | | | | | | |
Asseco Poland SA (Information Technology, Software) | | | | | | | 101,800 | | | | 1,444,731 | |
KGHM Polska Miedz SA (Materials, Metals & Mining) | | | | | | | 36,500 | | | | 653,036 | |
| | | | |
| | | | | | | | | | | 2,097,767 | |
| | | | | | | | | | | | |
| | | | |
| Russia: 0.81% | | | | | | | | | | | | |
Gazprom Neft Sponsored ADR (Energy, Oil, Gas & Consumable Fuels) (i) | | | | | | | 150,014 | | | | 1,680,157 | |
Gazprom Neft Sponsored ADR (Energy, Oil, Gas & Consumable Fuels) | | | | | | | 886 | | | | 9,968 | |
LUKOIL OAO ADR (Energy, Oil, Gas & Consumable Fuels) | | | | | | | 60,400 | | | | 2,312,112 | |
| | | | |
| | | | | | | | | | | 4,002,237 | |
| | | | | | | | | | | | |
| | | | |
| Singapore: 0.85% | | | | | | | | | | | | |
DBS Group Holdings Limited (Financials, Banks) | | | | | | | 227,000 | | | | 2,655,347 | |
United Overseas Bank Limited (Financials, Banks) | | | | | | | 113,000 | | | | 1,553,344 | |
| | | | |
| | | | | | | | | | | 4,208,691 | |
| | | | | | | | | | | | |
| | | | |
| South Africa: 0.44% | | | | | | | | | | | | |
Barclays Africa Group Limited (Financials, Banks) | | | | | | | 200,300 | | | | 2,201,554 | |
| | | | | | | | | | | | |
| | | | |
| South Korea: 2.81% | | | | | | | | | | | | |
BS Financial Group Incorporated (Financials, Banks) | | | | | | | 13,188 | | | | 110,806 | |
E-MART Company Limited (Consumer Staples, Food & Staples Retailing) | | | | | | | 8,500 | | | | 1,570,744 | |
Industrial Bank of Korea (Financials, Banks) | | | | | | | 192,500 | | | | 2,210,829 | |
KT&G Corporation (Consumer Staples, Tobacco) | | | | | | | 43,000 | | | | 3,973,058 | |
Kwangju Bank (Financials, Banks) † | | | | | | | 13,510 | | | | 94,379 | |
SK Telecom Company Limited (Telecommunication Services, Wireless Telecommunication Services) | | | | | | | 22,300 | | | | 4,506,023 | |
Woori Bank (Financials, Banks) | | | | | | | 178,044 | | | | 1,459,037 | |
| | | | |
| | | | | | | | | | | 13,924,876 | |
| | | | | | | | | | | | |
| | | | |
| Spain: 1.03% | | | | | | | | | | | | |
Banco Santander Central Hispano SA (Financials, Banks) | | | | | | | 429,681 | | | | 2,346,165 | |
Gas Natural SDG SA (Utilities, Gas Utilities) | | | | | | | 128,100 | | | | 2,771,169 | |
| | | | |
| | | | | | | | | | | 5,117,334 | |
| | | | | | | | | | | | |
| | | | |
| Sweden: 2.34% | | | | | | | | | | | | |
Boliden AB (Materials, Metals & Mining) | | | | | | | 169,300 | | | | 3,111,604 | |
Nordea Bank AB (Financials, Banks) | | | | | | | 177,300 | | | | 1,964,737 | |
Skandinaviska Enskilda Banken AB Class A (Financials, Banks) | | | | | | | 144,900 | | | | 1,540,906 | |
Telefonaktiebolaget LM Ericsson Class B (Information Technology, Communications Equipment) | | | | | | | 304,500 | | | | 2,965,818 | |
TeliaSonera AB (Telecommunication Services, Diversified Telecommunication Services) | | | | | | | 417,000 | | | | 2,046,799 | |
| | | | |
| | | | | | | | | | | 11,629,864 | |
| | | | | | | | | | | | |
The accompanying notes are an integral part of these financial statements.
| | | | |
| 54 | | Wells Fargo Allocation Funds | | Portfolio of investments—November 30, 2015 (unaudited) |
INTERNATIONAL VALUE PORTFOLIO
| | | | | | | | | | | | |
| Security name | | | | | | Shares | | | Value | |
| | | | |
| Switzerland: 5.30% | | | | | | | | | | | | |
Baloise Holding AG (Financials, Insurance) | | | | | | | 28,800 | | | $ | 3,499,052 | |
Credit Suisse Group AG (Financials, Capital Markets) | | | | | | | 273,395 | | | | 5,877,919 | |
Georg Fischer AG (Industrials, Machinery) | | | | | | | 3,000 | | | | 1,955,095 | |
Swiss Life Holding AG (Financials, Insurance) | | | | | | | 12,600 | | | | 3,178,014 | |
Swiss Reinsurance AG (Financials, Insurance) | | | | | | | 75,700 | | | | 7,214,254 | |
UBS Group AG (Financials, Capital Markets) | | | | | | | 5,400 | | | | 103,659 | |
Zurich Insurance Group AG (Financials, Insurance) | | | | | | | 17,100 | | | | 4,502,493 | |
| | | | |
| | | | | | | | | | | 26,330,486 | |
| | | | | | | | | | | | |
| | | | |
| Taiwan: 0.77% | | | | | | | | | | | | |
Innolux Display Corporation (Information Technology, Electronic Equipment, Instruments & Components) | | | | | | | 3,549,000 | | | | 1,086,162 | |
Pegatron Corporation (Information Technology, Technology Hardware, Storage & Peripherals) | | | | | | | 1,035,000 | | | | 2,730,026 | |
| | | | |
| | | | | | | | | | | 3,816,188 | |
| | | | | | | | | | | | |
| | | | |
| Thailand: 0.72% | | | | | | | | | | | | |
Bangchak Petroleum PCL (Energy, Oil, Gas & Consumable Fuels) | | | | | | | 2,188,900 | | | | 2,122,329 | |
Thanachart Capital PCL (Financials, Banks) | | | | | | | 1,481,500 | | | | 1,457,111 | |
| | | | |
| | | | | | | | | | | 3,579,440 | |
| | | | | | | | | | | | |
| | | | |
| United Kingdom: 17.65% | | | | | | | | | | | | |
3i Group plc (Financials, Capital Markets) | | | | | | | 409,100 | | | | 3,096,129 | |
Alent plc (Materials, Chemicals) (a) | | | | | | | 50,200 | | | | 379,921 | |
AMEC plc (Energy, Energy Equipment & Services) | | | | | | | 83,300 | | | | 546,244 | |
Amlin plc (Financials, Insurance) | | | | | | | 93,700 | | | | 930,696 | |
Anglo American plc (Materials, Metals & Mining) | | | | | | | 107,000 | | | | 658,550 | |
AstraZeneca plc (Health Care, Pharmaceuticals) | | | | | | | 38,500 | | | | 2,610,766 | |
Aviva plc (Financials, Insurance) | | | | | | | 314,900 | | | | 2,425,894 | |
BAE Systems plc (Industrials, Aerospace & Defense) | | | | | | | 939,800 | | | | 7,310,705 | |
Barclays plc (Financials, Banks) | | | | | | | 715,000 | | | | 2,403,553 | |
Barratt Developments plc (Consumer Discretionary, Household Durables) | | | | | | | 318,600 | | | | 2,883,857 | |
Berkeley Group Holdings plc (Consumer Discretionary, Household Durables) | | | | | | | 58,800 | | | | 2,843,617 | |
BP plc (Energy, Oil, Gas & Consumable Fuels) | | | | | | | 844,300 | | | | 4,898,836 | |
BT Group plc (Telecommunication Services, Diversified Telecommunication Services) | | | | | | | 509,700 | | | | 3,811,041 | |
Carillion plc (Industrials, Construction & Engineering) « | | | | | | | 261,500 | | | | 1,241,399 | |
Centrica plc (Utilities, Multi-Utilities) | | | | | | | 898,500 | | | | 2,951,394 | |
Chemring Group plc (Industrials, Aerospace & Defense) | | | | | | | 247,200 | | | | 742,754 | |
Crest Nicholson Holdings plc (Consumer Discretionary, Household Durables) | | | | | | | 264,876 | | | | 2,140,257 | |
Debenhams plc (Consumer Discretionary, Multiline Retail) | | | | | | | 1,238,200 | | | | 1,559,016 | |
easyJet plc (Industrials, Airlines) | | | | | | | 75,100 | | | | 1,869,676 | |
Firstgroup plc (Industrials, Road & Rail) † | | | | | | | 952,400 | | | | 1,510,432 | |
GlaxoSmithKline plc (Health Care, Pharmaceuticals) | | | | | | | 110,500 | | | | 2,255,876 | |
Home Retail Group plc (Consumer Discretionary, Internet & Catalog Retail) | | | | | | | 290,000 | | | | 449,435 | |
J Sainsbury plc (Consumer Staples, Food & Staples Retailing) | | | | | | | 1,211,800 | | | | 4,632,080 | |
Kesa Electricals plc (Consumer Discretionary, Specialty Retail) | | | | | | | 547,900 | | | | 821,066 | |
Lloyds Banking Group plc (Financials, Banks) | | | | | | | 1,749,400 | | | | 1,922,328 | |
Marks & Spencer Group plc (Consumer Discretionary, Multiline Retail) | | | | | | | 379,900 | | | | 2,875,139 | |
Marston’s plc (Consumer Discretionary, Hotels, Restaurants & Leisure) | | | | | | | 558,800 | | | | 1,447,566 | |
Mitchells & Butlers plc (Consumer Discretionary, Hotels, Restaurants & Leisure) † | | | | | | | 236,800 | | | | 1,179,422 | |
The accompanying notes are an integral part of these financial statements.
| | | | | | |
| Portfolio of investments—November 30, 2015 (unaudited) | | Wells Fargo Allocation Funds | | | 55 | |
INTERNATIONAL VALUE PORTFOLIO
| | | | | | | | | | | | | | | | |
| Security name | | | | | | | | Shares | | | Value | |
| | | | |
| United Kingdom (continued) | | | | | | | | | | | | | | | | |
Mitie Group plc (Industrials, Commercial Services & Supplies) | | | | | | | | | | | 283,197 | | | $ | 1,361,034 | |
Mondi plc (Materials, Paper & Forest Products) | | | | | | | | | | | 67,600 | | | | 1,571,982 | |
Old Mutual plc (Financials, Insurance) | | | | | | | | | | | 982,800 | | | | 3,093,606 | |
Pace plc (Consumer Discretionary, Household Durables) | | | | | | | | | | | 308,800 | | | | 1,853,822 | |
Petrofac Limited (Energy, Energy Equipment & Services) | | | | | | | | | | | 149,300 | | | | 1,855,100 | |
Premier Foods plc (Consumer Staples, Food Products) † | | | | | | | | | | | 73,926 | | | | 43,750 | |
Redrow plc (Consumer Discretionary, Household Durables) | | | | | | | | | | | 141,600 | | | | 968,643 | |
Royal Dutch Shell plc Class B (Energy, Oil, Gas & Consumable Fuels) | | | | | | | | | | | 287,900 | | | | 7,163,169 | |
Standard Chartered plc (Financials, Banks) | | | | | | | | | | | 253,000 | | | | 2,123,172 | |
Tate & Lyle plc (Consumer Staples, Food Products) | | | | | | | | | | | 158,800 | | | | 1,411,094 | |
Tullett Prebon plc (Financials, Capital Markets) | | | | | | | | | | | 279,500 | | | | 1,472,920 | |
Vesuvius plc (Industrials, Machinery) | | | | | | | | | | | 145,400 | | | | 745,869 | |
William Morrison Supermarkets plc (Consumer Staples, Food & Staples Retailing) | | | | | | | | | | | 679,700 | | | | 1,561,136 | |
| | | | |
| | | | | | | | | | | | | | | 87,622,946 | |
| | | | | | | | | | | | | | | | |
| | | | |
Total Common Stocks (Cost $515,773,545) | | | | | | | | | | | | | | | 481,228,265 | |
| | | | | | | | | | | | | | | | |
| | | | |
| | | Dividend yield | | | | | | | | | | |
| | | | |
Preferred Stocks: 0.14% | | | | | | | | | | | | | | | | |
| | | | |
| Brazil: 0.14% | | | | | | | | | | | | | | | | |
Banco do Estado do Rio Grande do Sul SA (Financials, Banks) | | | 12.05 | % | | | | | | | 349,800 | | | | 492,740 | |
Companhia Energetica de Minas Gerais SA (Utilities, Electric Utilities) | | | 11.96 | | | | | | | | 109,056 | | | | 186,035 | |
| | | | |
Total Preferred Stocks (Cost $3,545,600) | | | | | | | | | | | | | | | 678,775 | |
| | | | | | | | | | | | | | | | |
| | | | |
| | | | | | Expiration date | | | | | | | |
| Rights: 0.02% | | | | | | | | | | | | | | | | |
| | | | |
| United Kingdom: 0.02% | | | | | | | | | | | | | | | | |
Standard Chartered plc (Financials, Banks) † | | | | | | | 2-23-2016 | | | | 72,286 | | | | 99,071 | |
| | | | | | | | | | | | | | | | |
| | | | |
Total Rights (Cost $0) | | | | | | | | | | | | | | | 99,071 | |
| | | | | | | | | | | | | | | | |
| | | | |
| | | Yield | | | | | | | | | | |
| | | | |
Short-Term Investments: 3.93% | | | | | | | | | | | | | | | | |
| | | | |
| Investment Companies: 3.93% | | | | | | | | | | | | | | | | |
Securities Lending Cash Investments, LLC (l)(r)(u) | | | 0.18 | | | | | | | | 15,597,666 | | | | 15,597,666 | |
Wells Fargo Cash Investment Money Market Fund, Select Class (l)(u) | | | 0.17 | | | | | | | | 3,910,661 | | | | 3,910,661 | |
| | | | |
Total Short-Term Investments (Cost $19,508,327) | | | | | | | | | | | | | | | 19,508,327 | |
| | | | | | | | | | | | | | | | |
| | | | | | | | |
| Total investments in securities (Cost $538,827,472) * | | | 101.03 | % | | | 501,514,438 | |
Other assets and liabilities, net | | | (1.03 | ) | | | (5,103,501 | ) |
| | | | | | | | |
| Total net assets | | | 100.00 | % | | $ | 496,410,937 | |
| | | | | | | | |
The accompanying notes are an integral part of these financial statements.
| | | | |
| 56 | | Wells Fargo Allocation Funds | | Portfolio of investments—November 30, 2015 (unaudited) |
INTERNATIONAL VALUE PORTFOLIO
| † | Non-income-earning security |
| « | All or a portion of this security is on loan. |
| (l) | The issuer of the security is an affiliated person of the Portfolio as defined in the Investment Company Act of 1940. |
| (r) | The investment is a non-registered investment vehicle purchased with cash collateral received from securities on loan. |
| (u) | The rate represents the 7-day annualized yield at period end. |
| (a) | The security is fair valued in accordance with procedures approved by the Board of Trustees. |
| * | Cost for federal income tax purposes is $539,229,701 and unrealized gains (losses) consists of: |
| | | | |
Gross unrealized gains | | $ | 66,608,097 | |
Gross unrealized losses | | | (104,323,360 | |
| | | | |
Net unrealized losses | | $ | (37,715,263 | ) |
The following table shows the percent of total long-term investments by sector as of November 30, 2015:
| | | | |
Financials | | | 29.64 | % |
Consumer Discretionary | | | 15.67 | |
Industrials | | | 13.25 | |
Materials | | | 8.82 | |
Consumer Staples | | | 6.80 | |
Energy | | | 6.35 | |
Health Care | | | 5.93 | |
Telecommunication Services | | | 5.41 | |
Utilities Services | | | 4.16 | |
Information Technology | | | 3.97 | |
| | | | |
| | | 100.00 | % |
| | | | |
The accompanying notes are an integral part of these financial statements.
| | | | | | |
| Portfolio of investments—November 30, 2015 (unaudited) | | Wells Fargo Allocation Funds | | | 57 | |
LARGE COMPANY VALUE PORTFOLIO
| | | | | | | | | | | | |
| Security name | | | | | | Shares | | | Value | |
| | | | |
Common Stocks: 98.13% | | | | | | | | | | | | |
| | | | |
Consumer Discretionary: 7.36% | | | | | | | | | | | | |
| | | | |
| Hotels, Restaurants & Leisure: 1.52% | | | | | | | | | | | | |
Norwegian Cruise Line Holdings Limited † | | | | | | | 20,897 | | | $ | 1,200,324 | |
| | | | | | | | | | | | |
| | | | |
| Household Durables: 1.50% | | | | | | | | | | | | |
Harman International Industries Incorporated | | | | | | | 11,488 | | | | 1,185,102 | |
| | | | | | | | | | | | |
| | | | |
| Leisure Products: 0.98% | | | | | | | | | | | | |
Mattel Incorporated | | | | | | | 31,070 | | | | 772,400 | |
| | | | | | | | | | | | |
| | | | |
| Media: 1.22% | | | | | | | | | | | | |
Omnicom Group Incorporated | | | | | | | 13,026 | | | | 962,882 | |
| | | | | | | | | | | | |
| | | | |
| Multiline Retail: 0.64% | | | | | | | | | | | | |
JCPenny Company Incorporated Ǡ | | | | | | | 63,783 | | | | 508,351 | |
| | | | | | | | | | | | |
| | | | |
| Textiles, Apparel & Luxury Goods: 1.50% | | | | | | | | | | | | |
PVH Corporation | | | | | | | 6,432 | | | | 587,177 | |
Skechers U.S.A. Incorporated Class A † | | | | | | | 19,787 | | | | 597,567 | |
| | | | |
| | | | | | | | | | | 1,184,744 | |
| | | | | | | | | | | | |
| | | | |
Consumer Staples: 6.11% | | | | | | | | | | | | |
| | | | |
| Food & Staples Retailing: 2.60% | | | | | | | | | | | | |
CVS Health Corporation | | | | | | | 21,792 | | | | 2,050,409 | |
| | | | | | | | | | | | |
| | | | |
| Food Products: 1.03% | | | | | | | | | | | | |
TreeHouse Foods Incorporated † | | | | | | | 9,442 | | | | 816,355 | |
| | | | | | | | | | | | |
| | | | |
| Household Products: 1.15% | | | | | | | | | | | | |
The Procter & Gamble Company | | | | | | | 12,169 | | | | 910,728 | |
| | | | | | | | | | | | |
| | | | |
| Personal Products: 1.33% | | | | | | | | | | | | |
Herbalife Limited Ǡ | | | | | | | 18,156 | | | | 1,048,146 | |
| | | | | | | | | | | | |
| | | | |
Energy: 11.56% | | | | | | | | | | | | |
| | | | |
| Energy Equipment & Services: 2.00% | | | | | | | | | | | | |
Baker Hughes Incorporated | | | | | | | 21,820 | | | | 1,179,807 | |
Noble Corporation plc « | | | | | | | 30,051 | | | | 398,777 | |
| | | | |
| | | | | | | | | | | 1,578,584 | |
| | | | | | | | | | | | |
| | | | |
| Oil, Gas & Consumable Fuels: 9.56% | | | | | | | | | | | | |
Chevron Corporation | | | | | | | 8,779 | | | | 801,698 | |
ConocoPhillips | | | | | | | 18,980 | | | | 1,025,869 | |
Exxon Mobil Corporation | | | | | | | 23,864 | | | | 1,948,734 | |
Marathon Oil Corporation | | | | | | | 56,883 | | | | 996,021 | |
Noble Energy Incorporated | | | | | | | 29,050 | | | | 1,065,264 | |
Valero Energy Corporation | | | | | | | 18,325 | | | | 1,316,835 | |
Whiting Petroleum Corporation † | | | | | | | 24,159 | | | | 398,865 | |
| | | | |
| | | | | | | | | | | 7,553,286 | |
| | | | | | | | | | | | |
The accompanying notes are an integral part of these financial statements.
| | | | |
| 58 | | Wells Fargo Allocation Funds | | Portfolio of investments—November 30, 2015 (unaudited) |
LARGE COMPANY VALUE PORTFOLIO
| | | | | | | | | | | | |
| Security name | | | | | | Shares | | | Value | |
| | | | |
Financials: 28.69% | | | | | | | | | | | | |
| | | | |
| Banks: 11.98% | | | | | | | | | | | | |
Bank of America Corporation | | | | | | | 63,481 | | | $ | 1,106,474 | |
BOK Financial Corporation « | | | | | | | 29,357 | | | | 2,021,228 | |
Citigroup Incorporated | | | | | | | 20,562 | | | | 1,112,199 | |
First Republic Bank | | | | | | | 26,169 | | | | 1,801,997 | |
JPMorgan Chase & Company | | | | | | | 31,756 | | | | 2,117,490 | |
KeyCorp | | | | | | | 31,511 | | | | 413,109 | |
SunTrust Banks Incorporated | | | | | | | 20,443 | | | | 887,635 | |
| | | | |
| | | | | | | | | | | 9,460,132 | |
| | | | | | | | | | | | |
| | | | |
| Capital Markets: 3.44% | | | | | | | | | | | | |
Ameriprise Financial Incorporated | | | | | | | 16,299 | | | | 1,840,972 | |
Goldman Sachs Group Incorporated | | | | | | | 4,631 | | | | 879,983 | |
| | | | |
| | | | | | | | | | | 2,720,955 | |
| | | | | | | | | | | | |
| | | | |
| Insurance: 7.42% | | | | | | | | | | | | |
ACE Limited | | | | | | | 7,047 | | | | 809,348 | |
American International Group Incorporated | | | | | | | 28,732 | | | | 1,826,781 | |
Endurance Specialty Holdings Limited | | | | | | | 24,220 | | | | 1,597,551 | |
MetLife Incorporated | | | | | | | 31,892 | | | | 1,629,362 | |
| | | | |
| | | | | | | | | | | 5,863,042 | |
| | | | | | | | | | | | |
| | | | |
| REITs: 5.85% | | | | | | | | | | | | |
Alexandria Real Estate Equities Incorporated | | | | | | | 18,665 | | | | 1,718,860 | |
Equity Residential | | | | | | | 16,508 | | | | 1,317,669 | |
Prologis Incorporated | | | | | | | 18,090 | | | | 773,348 | |
VEREIT Incorporated | | | | | | | 97,729 | | | | 814,083 | |
| | | | |
| | | | | | | | | | | 4,623,960 | |
| | | | | | | | | | | | |
| | | | |
Health Care: 12.87% | | | | | | | | | | | | |
| | | | |
| Biotechnology: 1.89% | | | | | | | | | | | | |
Baxalta Incorporated | | | | | | | 25,511 | | | | 877,068 | |
Gilead Sciences Incorporated | | | | | | | 5,867 | | | | 621,667 | |
| | | | |
| | | | | | | | | | | 1,498,735 | |
| | | | | | | | | | | | |
| | | | |
| Health Care Equipment & Supplies: 0.97% | | | | | | | | | | | | |
Medtronic plc | | | | | | | 10,172 | | | | 766,358 | |
| | | | | | | | | | | | |
| | | | |
| Health Care Providers & Services: 2.61% | | | | | | | | | | | | |
Cigna Corporation | | | | | | | 5,529 | | | | 746,304 | |
HCA Holdings Incorporated † | | | | | | | 9,106 | | | | 619,754 | |
McKesson Corporation | | | | | | | 3,672 | | | | 695,293 | |
| | | | |
| | | | | | | | | | | 2,061,351 | |
| | | | | | | | | | | | |
| | | | |
| Pharmaceuticals: 7.40% | | | | | | | | | | | | |
AbbVie Incorporated | | | | | | | 10,488 | | | | 609,877 | |
Allergan plc † | | | | | | | 4,385 | | | | 1,376,408 | |
Johnson & Johnson | | | | | | | 7,594 | | | | 768,817 | |
The accompanying notes are an integral part of these financial statements.
| | | | | | |
| Portfolio of investments—November 30, 2015 (unaudited) | | Wells Fargo Allocation Funds | | | 59 | |
LARGE COMPANY VALUE PORTFOLIO
| | | | | | | | | | | | |
| Security name | | | | | | Shares | | | Value | |
| | | | |
| Pharmaceuticals (continued) | | | | | | | | | | | | |
Mallinckrodt plc † | | | | | | | 11,924 | | | $ | 798,059 | |
Merck & Company Incorporated | | | | | | | 16,463 | | | | 872,704 | |
Pfizer Incorporated | | | | | | | 43,284 | | | | 1,418,417 | |
| | | | |
| | | | | | | | | | | 5,844,282 | |
| | | | | | | | | | | | |
| | | | |
Industrials: 11.87% | | | | | | | | | | | | |
| | | | |
| Aerospace & Defense: 2.90% | | | | | | | | | | | | |
Curtiss-Wright Corporation | | | | | | | 11,473 | | | | 807,814 | |
Raytheon Company | | | | | | | 11,949 | | | | 1,482,034 | |
| | | | |
| | | | | | | | | | | 2,289,848 | |
| | | | | | | | | | | | |
| | | | |
| Airlines: 0.44% | | | | | | | | | | | | |
United Continental Holdings Incorporated † | | | | | | | 6,218 | | | | 346,529 | |
| | | | | | | | | | | | |
| | | | |
| Commercial Services & Supplies: 1.73% | | | | | | | | | | | | |
Progressive Waste Solutions Limited | | | | | | | 23,414 | | | | 553,039 | |
West Corporation | | | | | | | 31,792 | | | | 810,696 | |
| | | | |
| | | | | | | | | | | 1,363,735 | |
| | | | | | | | | | | | |
| | | | |
| Electrical Equipment: 0.87% | | | | | | | | | | | | |
Eaton Corporation plc | | | | | | | 11,799 | | | | 686,230 | |
| | | | | | | | | | | | |
| | | | |
| Industrial Conglomerates: 1.63% | | | | | | | | | | | | |
General Electric Company | | | | | | | 42,941 | | | | 1,285,654 | |
| | | | | | | | | | | | |
| | | | |
| Machinery: 1.59% | | | | | | | | | | | | |
Stanley Black & Decker Incorporated | | | | | | | 11,540 | | | | 1,259,706 | |
| | | | | | | | | | | | |
| | | | |
| Professional Services: 0.84% | | | | | | | | | | | | |
CEB Incorporated | | | | | | | 8,546 | | | | 660,349 | |
| | | | | | | | | | | | |
| | | | |
| Road & Rail: 1.87% | | | | | | | | | | | | |
AMERCO | | | | | | | 1,434 | | | | 581,344 | |
Norfolk Southern Corporation | | | | | | | 9,471 | | | | 900,313 | |
| | | | |
| | | | | | | | | | | 1,481,657 | |
| | | | | | | | | | | | |
| | | | |
Information Technology: 10.73% | | | | | | | | | | | | |
| | | | |
| Communications Equipment: 0.96% | | | | | | | | | | | | |
Cisco Systems Incorporated | | | | | | | 28,008 | | | | 763,218 | |
| | | | | | | | | | | | |
| | | | |
| Electronic Equipment, Instruments & Components: 2.24% | | | | | | | | | | | | |
Synnex Corporation | | | | | | | 13,907 | | | | 1,311,013 | |
TE Connectivity Limited | | | | | | | 6,811 | | | | 456,950 | |
| | | | |
| | | | | | | | | | | 1,767,963 | |
| | | | | | | | | | | | |
| | | | |
| Internet Software & Services: 1.41% | | | | | | | | | | | | |
Alphabet Incorporated Class C † | | | | | | | 1,496 | | | | 1,110,930 | |
| | | | | | | | | | | | |
The accompanying notes are an integral part of these financial statements.
| | | | |
| 60 | | Wells Fargo Allocation Funds | | Portfolio of investments—November 30, 2015 (unaudited) |
LARGE COMPANY VALUE PORTFOLIO
| | | | | | | | | | | | | | |
| Security name | | | | | | | Shares | | | Value | |
| | | | |
| Semiconductors & Semiconductor Equipment: 2.57% | | | | | | | | | | | | | | |
NXP Semiconductors NV † | | | | | | | | | 8,507 | | | $ | 795,064 | |
Skyworks Solutions Incorporated | | | | | | | | | 14,885 | | | | 1,235,753 | |
| | | | |
| | | | | | | | | | | | | 2,030,817 | |
| | | | | | | | | | | | | | |
| | | | |
| Software: 0.52% | | | | | | | | | | | | | | |
Citrix Systems Incorporated † | | | | | | | | | 5,363 | | | | 411,181 | |
| | | | | | | | | | | | | | |
| | | | |
| Technology Hardware, Storage & Peripherals: 3.03% | | | | | | | | | | | | | | |
Apple Incorporated | | | | | | | | | 7,011 | | | | 829,401 | |
NCR Corporation † | | | | | | | | | 48,898 | | | | 1,325,625 | |
Seagate Technology plc « | | | | | | | | | 6,638 | | | | 238,570 | |
| | | | |
| | | | | | | | | | | | | 2,393,596 | |
| | | | | | | | | | | | | | |
| | | | |
Materials: 3.29% | | | | | | | | | | | | | | |
| | | | |
| Chemicals: 1.72% | | | | | | | | | | | | | | |
Cabot Corporation | | | | | | | | | 11,863 | | | | 516,515 | |
FMC Corporation | | | | | | | | | 19,675 | | | | 845,435 | |
| | | | |
| | | | | | | | | | | | | 1,361,950 | |
| | | | | | | | | | | | | | |
| | | | |
| Containers & Packaging: 1.57% | | | | | | | | | | | | | | |
Crown Holdings Incorporated † | | | | | | | | | 17,021 | | | | 883,560 | |
WestRock Company | | | | | | | | | 7,059 | | | | 357,397 | |
| | | | |
| | | | | | | | | | | | | 1,240,957 | |
| | | | | | | | | | | | | | |
| | | | |
Telecommunication Services: 1.97% | | | | | | | | | | | | | | |
| | | | |
| Diversified Telecommunication Services: 1.97% | | | | | | | | | | | | | | |
AT&T Incorporated | | | | | | | | | 22,528 | | | | 758,518 | |
Verizon Communications Incorporated | | | | | | | | | 17,570 | | | | 798,557 | |
| | | | |
| | | | | | | | | | | | | 1,557,075 | |
| | | | | | | | | | | | | | |
| | | | |
Utilities: 3.68% | | | | | | | | | | | | | | |
| | | | |
| Electric Utilities: 2.75% | | | | | | | | | | | | | | |
Duke Energy Corporation | | | | | | | | | 15,099 | | | | 1,023,108 | |
The Southern Company | | | | | | | | | 25,711 | | | | 1,145,168 | |
| | | | |
| | | | | | | | | | | | | 2,168,276 | |
| | | | | | | | | | | | | | |
| | | | |
| Gas Utilities: 0.93% | | | | | | | | | | | | | | |
Atmos Energy Corporation | | | | | | | | | 11,822 | | | | 736,629 | |
| | | | | | | | | | | | | | |
| | | | |
Total Common Stocks (Cost $67,502,414) | | | | | | | | | | | | | 77,526,426 | |
| | | | | | | | | | | | | | |
| | | | |
| | | Yield | | | | | | | | | |
| Short-Term Investments: 6.19% | | | | | | | | | | | | | | |
| | | | |
| Investment Companies: 6.19% | | | | | | | | | | | | | | |
Securities Lending Cash Investments, LLC (l)(r)(u) | | | 0.18 | % | | | | | 3,413,200 | | | | 3,413,200 | |
Wells Fargo Cash Investment Money Market Fund, Select Class (l)(u) | | | 0.17 | | | | | | 1,477,801 | | | | 1,477,801 | |
| | | | |
Total Short-Term Investments (Cost $4,891,001) | | | | | | | | | | | | | 4,891,001 | |
| | | | | | | | | | | | | | |
The accompanying notes are an integral part of these financial statements.
| | | | | | |
| Portfolio of investments—November 30, 2015 (unaudited) | | Wells Fargo Allocation Funds | | | 61 | |
LARGE COMPANY VALUE PORTFOLIO
| | | | | | | | |
| | | | | | Value | |
| Total investments in securities (Cost $72,393,415) * | | | 104.32 | % | | $ | 82,417,427 | |
Other assets and liabilities, net | | | (4.32 | ) | | | (3,416,112 | ) |
| | | | | | | | |
| Total net assets | | | 100.00 | % | | $ | 79,001,315 | |
| | | | | | | | |
| † | Non-income-earning security |
| « | All or a portion of this security is on loan. |
| (l) | The issuer of the security is an affiliated person of the Portfolio as defined in the Investment Company Act of 1940. |
| (r) | The investment is a non-registered investment vehicle purchased with cash collateral received from securities on loan. |
| (u) | The rate represents the 7-day annualized yield at period end. |
| * | Cost for federal income tax purposes is $73,133,631 and unrealized gains (losses) consists of: |
| | | | |
Gross unrealized gains | | $ | 13,349,290 | |
Gross unrealized losses | | | (4,065,494 | ) |
| | | | |
Net unrealized gains | | $ | 9,283,796 | |
The accompanying notes are an integral part of these financial statements.
| | | | |
| 62 | | Wells Fargo Allocation Funds | | Portfolio of investments—November 30, 2015 (unaudited) |
SMALL COMPANY GROWTH PORTFOLIO
| | | | | | | | | | | | |
| Security name | | | | | | Shares | | | Value | |
| | | | |
Common Stocks: 94.77% | | | | | | | | | | | | |
| | | | |
Consumer Discretionary: 14.44% | | | | | | | | | | | | |
| | | | |
| Auto Components: 1.03% | | | | | | | | | | | | |
Gentherm Incorporated † | | | | | | | 234,165 | | | $ | 11,904,948 | |
| | | | | | | | | | | | |
| | | | |
| Diversified Consumer Services: 1.87% | | | | | | | | | | | | |
2U Incorporated †« | | | | | | | 403,201 | | | | 9,725,208 | |
Houghton Mifflin Harcourt Company † | | | | | | | 605,490 | | | | 11,964,482 | |
| | | | |
| | | | | | | | | | | 21,689,690 | |
| | | | | | | | | | | | |
| | | | |
| Hotels, Restaurants & Leisure: 3.06% | | | | | | | | | | | | |
Brinker International Incorporated | | | | | | | 112,145 | | | | 5,116,055 | |
Del Taco Restaurants Incorporated † | | | | | | | 524,230 | | | | 5,787,499 | |
Extended Stay America Incorporated | | | | | | | 540,270 | | | | 9,244,020 | |
Krispy Kreme Doughnuts Incorporated † | | | | | | | 631,710 | | | | 8,932,379 | |
Zoe’s Kitchen Incorporated †« | | | | | | | 184,820 | | | | 6,287,576 | |
| | | | |
| | | | | | | | | | | 35,367,529 | |
| | | | | | | | | | | | |
| | | | |
| Household Durables: 0.57% | | | | | | | | | | | | |
William Lyon Homes Class A † | | | | | | | 380,729 | | | | 6,651,336 | |
| | | | | | | | | | | | |
| | | | |
| Leisure Products: 0.37% | | | | | | | | | | | | |
Malibu Boats Incorporated † | | | | | | | 272,830 | | | | 4,234,322 | |
| | | | | | | | | | | | |
| | | | |
| Media: 2.54% | | | | | | | | | | | | |
IMAX Corporation † | | | | | | | 352,253 | | | | 13,343,344 | |
Lions Gate Entertainment Corporation | | | | | | | 283,304 | | | | 9,615,338 | |
Media General Incorporated †« | | | | | | | 410,540 | | | | 6,375,686 | |
| | | | |
| | | | | | | | | | | 29,334,368 | |
| | | | | | | | | | | | |
| | | | |
| Multiline Retail: 0.66% | | | | | | | | | | | | |
Burlington Stores Incorporated † | | | | | | | 159,770 | | | | 7,686,535 | |
| | | | | | | | | | | | |
| | | | |
| Specialty Retail: 3.12% | | | | | | | | | | | | |
Chico’s FAS Incorporated | | | | | | | 416,917 | | | | 5,003,004 | |
Dick’s Sporting Goods Incorporated | | | | | | | 191,709 | | | | 7,482,402 | |
Monro Muffler Brake Incorporated | | | | | | | 214,091 | | | | 15,851,298 | |
Party City Holdco Incorporated † | | | | | | | 609,380 | | | | 7,739,126 | |
| | | | |
| | | | | | | | | | | 36,075,830 | |
| | | | | | | | | | | | |
| | | | |
| Textiles, Apparel & Luxury Goods: 1.22% | | | | | | | | | | | | |
Kate Spade & Company † | | | | | | | 399,050 | | | | 7,996,962 | |
Skechers U.S.A. Incorporated Class A † | | | | | | | 202,276 | | | | 6,108,735 | |
| | | | |
| | | | | | | | | | | 14,105,697 | |
| | | | | | | | | | | | |
| | | | |
Consumer Staples: 1.42% | | | | | | | | | | | | |
| | | | |
| Food Products: 1.42% | | | | | | | | | | | | |
Amplify Snack Brands Incorporated †« | | | | | | | 588,819 | | | | 7,389,678 | |
Whitewave Foods Company † | | | | | | | 221,766 | | | | 9,010,353 | |
| | | | |
| | | | | | | | | | | 16,400,031 | |
| | | | | | | | | | | | |
The accompanying notes are an integral part of these financial statements.
| | | | | | |
| Portfolio of investments—November 30, 2015 (unaudited) | | Wells Fargo Allocation Funds | | | 63 | |
SMALL COMPANY GROWTH PORTFOLIO
| | | | | | | | | | | | |
| Security name | | | | | | Shares | | | Value | |
| | | | |
Energy: 2.21% | | | | | | | | | | | | |
| | | | |
| Oil, Gas & Consumable Fuels: 2.21% | | | | | | | | | | | | |
Diamondback Energy Incorporated † | | | | | | | 110,719 | | | $ | 8,638,296 | |
GasLog Limited « | | | | | | | 473,043 | | | | 5,662,325 | |
Memorial Resource Development Corporation † | | | | | | | 487,900 | | | | 7,947,891 | |
Ring Energy Incorporated †« | | | | | | | 333,230 | | | | 3,322,303 | |
| | | | |
| | | | | | | | | | | 25,570,815 | |
| | | | | | | | | | | | |
| | | | |
Financials: 11.31% | | | | | | | | | | | | |
| | | | |
| Banks: 2.74% | | | | | | | | | | | | |
ServisFirst Bancshares Incorporated | | | | | | | 131,250 | | | | 6,460,125 | |
Signature Bank † | | | | | | | 64,395 | | | | 10,184,069 | |
SVB Financial Group † | | | | | | | 113,762 | | | | 15,071,190 | |
| | | | |
| | | | | | | | | | | 31,715,384 | |
| | | | | | | | | | | | |
| | | | |
| Capital Markets: 4.85% | | | | | | | | | | | | |
Evercore Partners Incorporated Class A | | | | | | | 272,124 | | | | 15,111,046 | |
LPL Financial Holdings Incorporated « | | | | | | | 276,707 | | | | 12,722,988 | |
Stifel Financial Corporation † | | | | | | | 241,601 | | | | 10,959,021 | |
Virtu Financial Incorporated | | | | | | | 434,428 | | | | 9,666,023 | |
Virtus Investment Partners Incorporated | | | | | | | 56,048 | | | | 7,635,980 | |
| | | | |
| | | | | | | | | | | 56,095,058 | |
| | | | | | | | | | | | |
| | | | |
| Insurance: 1.58% | | | | | | | | | | | | |
Argo Group International Holdings Limited | | | | | | | 212,801 | | | | 13,519,248 | |
Patriot National Incorporated † | | | | | | | 324,040 | | | | 4,724,503 | |
| | | | |
| | | | | | | | | | | 18,243,751 | |
| | | | | | | | | | | | |
| | | | |
| REITs: 0.98% | | | | | | | | | | | | |
QTS Realty Trust Incorporated Class A | | | | | | | 269,985 | | | | 11,398,767 | |
| | | | | | | | | | | | |
| | | | |
| Thrifts & Mortgage Finance: 1.16% | | | | | | | | | | | | |
Essent Group Limited † | | | | | | | 543,084 | | | | 13,425,036 | |
| | | | | | | | | | | | |
| | | | |
Health Care: 22.45% | | | | | | | | | | | | |
| | | | |
| Biotechnology: 5.13% | | | | | | | | | | | | |
Alder Biopharmaceuticals Inc † | | | | | | | 123,070 | | | | 4,585,588 | |
Alnylam Pharmaceuticals Incorporated † | | | | | | | 74,822 | | | | 7,785,977 | |
Celldex Therapeutics Incorporated †« | | | | | | | 289,876 | | | | 5,220,667 | |
Cepheid Incorporated † | | | | | | | 265,754 | | | | 9,551,199 | |
Flexion Therapeutics Incorporated †« | | | | | | | 318,310 | | | | 6,187,946 | |
Intrexon Corporation « | | | | | | | 118,354 | | | | 4,297,434 | |
Oncomed Pharmaceuticals Incorporated †« | | | | | | | 234,120 | | | | 5,349,642 | |
Portola Pharmaceuticals Incorporated † | | | | | | | 146,645 | | | | 7,275,058 | |
Radius Health Incorporated † | | | | | | | 73,960 | | | | 4,497,508 | |
Tesaro Incorporated † | | | | | | | 90,122 | | | | 4,599,827 | |
| | | | |
| | | | | | | | | �� | | 59,350,846 | |
| | | | | | | | | | | | |
The accompanying notes are an integral part of these financial statements.
| | | | |
| 64 | | Wells Fargo Allocation Funds | | Portfolio of investments—November 30, 2015 (unaudited) |
SMALL COMPANY GROWTH PORTFOLIO
| | | | | | | | | | | | |
| Security name | | | | | | Shares | | | Value | |
| | | | |
| Health Care Equipment & Supplies: 7.12% | | | | | | | | | | | | |
Accuray Incorporated †« | | | | | | | 995,078 | | | $ | 7,005,349 | |
Analogic Corporation | | | | | | | 119,440 | | | | 9,979,212 | |
Atricure Incorporated † | | | | | | | 367,123 | | | | 7,885,802 | |
Cerus Corporation †« | | | | | | | 1,706,248 | | | | 9,674,426 | |
DexCom Incorporated † | | | | | | | 146,206 | | | | 12,430,434 | |
Inogen Incorporated † | | | | | | | 283,515 | | | | 10,844,449 | |
LDR Holding Corporation † | | | | | | | 325,109 | | | | 8,784,445 | |
Nevro Corporation †« | | | | | | | 160,860 | | | | 9,712,727 | |
The Spectranetics Corporation † | | | | | | | 437,994 | | | | 6,057,457 | |
| | | | |
| | | | | | | | | | | 82,374,301 | |
| | | | | | | | | | | | |
| | | | |
| Health Care Providers & Services: 6.50% | | | | | | | | | | | | |
Adeptus Health Incorporated Class A †« | | | | | | | 163,877 | | | | 9,847,369 | |
AMN Healthcare Services Incorporated † | | | | | | | 425,705 | | | | 12,558,298 | |
Capital Senior Living Corporation † | | | | | | | 391,700 | | | | 8,977,764 | |
Ensign Group Incorporated | | | | | | | 189,755 | | | | 9,026,645 | |
HealthEquity Incorporated † | | | | | | | 366,830 | | | | 12,105,390 | |
LifePoint Hospitals Incorporated † | | | | | | | 118,756 | | | | 8,504,117 | |
Surgery Partners Inc †« | | | | | | | 409,094 | | | | 7,817,786 | |
Teladoc Incorporated †« | | | | | | | 298,960 | | | | 6,352,900 | |
| | | | |
| | | | | | | | | | | 75,190,269 | |
| | | | | | | | | | | | |
| | | | |
| Health Care Technology: 1.20% | | | | | | | | | | | | |
Evolent Health Incorporated Class A † | | | | | | | 477,820 | | | | 7,778,910 | |
Medidata Solutions Incorporated † | | | | | | | 132,332 | | | | 6,064,776 | |
| | | | |
| | | | | | | | | | | 13,843,686 | |
| | | | | | | | | | | | |
| | | | |
| Life Sciences Tools & Services: 1.45% | | | | | | | | | | | | |
ICON plc ADR † | | | | | | | 225,962 | | | | 16,795,755 | |
| | | | | | | | | | | | |
| | | | |
| Pharmaceuticals: 1.05% | | | | | | | | | | | | |
Akorn Incorporated † | | | | | | | 195,388 | | | | 6,506,420 | |
Cempra Holdings Incorporated †« | | | | | | | 176,680 | | | | 5,637,859 | |
| | | | |
| | | | | | | | | | | 12,144,279 | |
| | | | | | | | | | | | |
| | | | |
Industrials: 14.99% | | | | | | | | | | | | |
| | | | |
| Aerospace & Defense: 1.40% | | | | | | | | | | | | |
Astronics Corporation | | | | | | | 190,522 | | | | 7,371,296 | |
Esterline Technologies Corporation † | | | | | | | 92,881 | | | | 8,831,125 | |
| | | | |
| | | | | | | | | | | 16,202,421 | |
| | | | | | | | | | | | |
| | | | |
| Air Freight & Logistics: 1.03% | | | | | | | | | | | | |
Hub Group Incorporated Class A † | | | | | | | 307,789 | | | | 11,859,110 | |
| | | | | | | | | | | | |
| | | | |
| Building Products: 2.63% | | | | | | | | | | | | |
A.O. Smith Corporation | | | | | | | 176,464 | | | | 14,074,769 | |
NCI Building Systems Incorporated † | | | | | | | 618,414 | | | | 7,334,390 | |
PGT Incorporated † | | | | | | | 813,650 | | | | 9,047,788 | |
| | | | |
| | | | | | | | | | | 30,456,947 | |
| | | | | | | | | | | | |
The accompanying notes are an integral part of these financial statements.
| | | | | | |
| Portfolio of investments—November 30, 2015 (unaudited) | | Wells Fargo Allocation Funds | | | 65 | |
SMALL COMPANY GROWTH PORTFOLIO
| | | | | | | | | | | | |
| Security name | | | | | | Shares | | | Value | |
| | | | |
| Commercial Services & Supplies: 5.03% | | | | | | | | | | | | |
Copart Incorporated † | | | | | | | 326,873 | | | $ | 12,901,677 | |
KAR Auction Services Incorporated | | | | | | | 296,190 | | | | 11,234,487 | |
Mobile Mini Incorporated | | | | | | | 277,490 | | | | 9,837,021 | |
TrueBlue Incorporated † | | | | | | | 490,276 | | | | 14,360,184 | |
West Corporation | | | | | | | 386,200 | | | | 9,848,100 | |
| | | | |
| | | | | | | | | | | 58,181,469 | |
| | | | | | | | | | | | |
| | | | |
| Construction & Engineering: 1.19% | | | | | | | | | | | | |
Comfort Systems USA Incorporated | | | | | | | 236,422 | | | | 7,504,034 | |
Granite Construction Incorporated | | | | | | | 152,780 | | | | 6,228,841 | |
| | | | |
| | | | | | | | | | | 13,732,875 | |
| | | | | | | | | | | | |
| | | | |
| Machinery: 0.88% | | | | | | | | | | | | |
Wabash National Corporation † | | | | | | | 787,273 | | | | 10,210,931 | |
| | | | | | | | | | | | |
| | | | |
| Professional Services: 1.42% | | | | | | | | | | | | |
On Assignment Incorporated † | | | | | | | 245,704 | | | | 11,469,463 | |
RPX Corporation † | | | | | | | 356,064 | | | | 4,938,608 | |
| | | | |
| | | | | | | | | | | 16,408,071 | |
| | | | | | | | | | | | |
| | | | |
| Road & Rail: 1.41% | | | | | | | | | | | | |
Genesee & Wyoming Incorporated Class A † | | | | | | | 131,797 | | | | 9,129,578 | |
Swift Transportation Company †« | | | | | | | 453,346 | | | | 7,239,936 | |
| | | | |
| | | | | | | | | | | 16,369,514 | |
| | | | | | | | | | | | |
| | | | |
Information Technology: 24.60% | | | | | | | | | | | | |
| | | | |
| Communications Equipment: 2.68% | | | | | | | | | | | | |
Infinera Corporation † | | | | | | | 485,952 | | | | 10,943,639 | |
Radware Limited † | | | | | | | 572,960 | | | | 9,419,462 | |
Ruckus Wireless Incorporated † | | | | | | | 933,810 | | | | 10,692,125 | |
| | | | |
| | | | | | | | | | | 31,055,226 | |
| | | | | | | | | | | | |
| | | | |
| Electronic Equipment, Instruments & Components: 1.18% | | | | | | | | | | | | |
OSI Systems Incorporated † | | | | | | | 145,776 | | | | 13,649,007 | |
| | | | | | | | | | | | |
| | | | |
| Internet Software & Services: 3.58% | | | | | | | | | | | | |
Benefitfocus Incorporated †« | | | | | | | 245,410 | | | | 9,944,013 | |
Cornerstone OnDemand Incorporated † | | | | | | | 323,120 | | | | 11,603,239 | |
Marketo Incorporated † | | | | | | | 301,040 | | | | 9,112,481 | |
Pandora Media Incorporated † | | | | | | | 419,090 | | | | 5,783,442 | |
Zillow Group Incorporated Class A « | | | | | | | 46,841 | | | | 1,219,271 | |
Zillow Group Incorporated Class C †« | | | | | | | 150,822 | | | | 3,717,762 | |
| | | | |
| | | | | | | | | | | 41,380,208 | |
| | | | | | | | | | | | |
| | | | |
| IT Services: 2.95% | | | | | | | | | | | | |
Acxiom Corporation † | | | | | | | 539,610 | | | | 12,357,069 | |
MAXIMUS Incorporated | | | | | | | 184,690 | | | | 10,481,158 | |
Vantiv Incorporated Class A † | | | | | | | 214,420 | | | | 11,302,078 | |
| | | | |
| | | | | | | | | | | 34,140,305 | |
| | | | | | | | | | | | |
The accompanying notes are an integral part of these financial statements.
| | | | |
| 66 | | Wells Fargo Allocation Funds | | Portfolio of investments—November 30, 2015 (unaudited) |
SMALL COMPANY GROWTH PORTFOLIO
| | | | | | | | | | | | | | |
| Security name | | | | | | | Shares | | | Value | |
| | | | |
| Semiconductors & Semiconductor Equipment: 5.72% | | | | | | | | | | | | | | |
Applied Micro Circuits Corporation † | | | | | | | | | 957,597 | | | $ | 7,009,610 | |
Cypress Semiconductor Corporation | | | | | | | | | 1,138,464 | | | | 12,318,180 | |
FormFactor Incorporated † | | | | | | | | | 1,013,475 | | | | 8,827,367 | |
Microsemi Corporation † | | | | | | | | | 347,420 | | | | 12,510,594 | |
Nanometrics Incorporated † | | | | | | | | | 294,549 | | | | 4,642,092 | |
Silicon Motion Technology Corporation | | | | | | | | | 241,644 | | | | 8,039,496 | |
Teradyne Incorporated | | | | | | | | | 619,377 | | | | 12,870,654 | |
| | | | |
| | | | | | | | | | | | | 66,217,993 | |
| | | | | | | | | | | | | | |
| | | | |
| Software: 8.49% | | | | | | | | | | | | | | |
Bottomline Technologies Incorporated † | | | | | | | | | 311,740 | | | | 9,635,883 | |
Cadence Design Systems Incorporated † | | | | | | | | | 675,612 | | | | 15,066,148 | |
PTC Incorporated † | | | | | | | | | 328,825 | | | | 11,850,853 | |
Qlik Technologies Incorporated † | | | | | | | | | 347,723 | | | | 11,061,069 | |
Rubicon Project Incorporated † | | | | | | | | | 580,644 | | | | 8,564,499 | |
SS&C Technologies Holdings | | | | | | | | | 252,358 | | | | 18,144,540 | |
Synchronoss Technologies Incorporated † | | | | | | | | | 180,230 | | | | 7,095,655 | |
Ultimate Software Group Incorporated † | | | | | | | | | 40,441 | | | | 7,987,098 | |
Zendesk Incorporated † | | | | | | | | | 342,773 | | | | 8,778,417 | |
| | | | |
| | | | | | | | | | | | | 98,184,162 | |
| | | | | | | | | | | | | | |
| | | | |
Materials: 3.03% | | | | | | | | | | | | | | |
| | | | |
| Chemicals: 1.40% | | | | | | | | | | | | | | |
Calgon Carbon Corporation | | | | | | | | | 514,099 | | | | 8,693,414 | |
Flotek Industries Incorporated †« | | | | | | | | | 657,247 | | | | 7,505,761 | |
| | | | |
| | | | | | | | | | | | | 16,199,175 | |
| | | | | | | | | | | | | | |
| | | | |
| Metals & Mining: 0.64% | | | | | | | | | | | | | | |
Steel Dynamics Incorporated | | | | | | | | | 424,593 | | | | 7,383,672 | |
| | | | | | | | | | | | | | |
| | | | |
| Paper & Forest Products: 0.99% | | | | | | | | | | | | | | |
Boise Cascade Company † | | | | | | | | | 366,107 | | | | 11,459,149 | |
| | | | | | | | | | | | | | |
| | | | |
Utilities: 0.32% | | | | | | | | | | | | | | |
| | | | |
| Independent Power & Renewable Electricity Producers: 0.32% | | | | | | | | | | | | | | |
Dynegy Incorporated † | | | | | | | | | 230,660 | | | | 3,718,239 | |
| | | | | | | | | | | | | | |
| | | | |
Total Common Stocks (Cost $995,453,082) | | | | | | | | | | | | | 1,096,406,707 | |
| | | | | | | | | | | | | | |
| | | | |
| | | Yield | | | | | | | | | |
| Short-Term Investments: 15.24% | | | | | | | | | | | | | | |
| | | | |
| Investment Companies: 15.24% | | | | | | | | | | | | | | |
Securities Lending Cash Investments, LLC (l)(r)(u) | | | 0.18 | % | | | | | 118,989,418 | | | | 118,989,418 | |
Wells Fargo Cash Investment Money Market Fund, Select Class (l)(u) | | | 0.17 | | | | | | 57,304,768 | | | | 57,304,768 | |
| | | | |
Total Short-Term Investments (Cost $176,294,186) | | | | | | | | | | | | | 176,294,186 | |
| | | | | | | | | | | | | | |
| | | | | | | | |
| Total investments in securities (Cost $1,171,747,268) * | | | 110.01 | % | | | 1,272,700,893 | |
Other assets and liabilities, net | | | (10.01 | ) | | | (115,825,971 | ) |
| | | | | | | | |
| Total net assets | | | 100.00 | % | | $ | 1,156,874,922 | |
| | | | | | | | |
The accompanying notes are an integral part of these financial statements.
| | | | | | |
| Portfolio of investments—November 30, 2015 (unaudited) | | Wells Fargo Allocation Funds | | | 67 | |
SMALL COMPANY GROWTH PORTFOLIO
| † | Non-income-earning security |
| « | All or a portion of this security is on loan. |
| (l) | The issuer of the security is an affiliated person of the Portfolio as defined in the Investment Company Act of 1940. |
| (r) | The investment is a non-registered investment vehicle purchased with cash collateral received from securities on loan. |
| (u) | The rate represents the 7-day annualized yield at period end. |
| * | Cost for federal income tax purposes is $1,183,487,190 and unrealized gains (losses) consists of: |
| | | | |
Gross unrealized gains | | $ | 153,725,982 | |
Gross unrealized losses | | | (64,512,279 | ) |
| | | | |
Net unrealized gains | | $ | 89,213,703 | |
The accompanying notes are an integral part of these financial statements.
| | | | |
| 68 | | Wells Fargo Allocation Funds | | Portfolio of investments—November 30, 2015 (unaudited) |
SMALL COMPANY VALUE PORTFOLIO
| | | | | | | | | | | | |
| Security name | | | | | | Shares | | | Value | |
| | | | |
Common Stocks: 95.47% | | | | | | | | | | | | |
| | | | |
Consumer Discretionary: 11.61% | | | | | | | | | | | | |
| | | | |
| Auto Components: 2.42% | | | | | | | | | | | | |
American Axle & Manufacturing Holdings Incorporated † | | | | | | | 127,519 | | | $ | 2,902,332 | |
Metaldyne Performance Group Incorporated | | | | | | | 94,700 | | | | 2,132,644 | |
| | | | |
| | | | | | | | | | | 5,034,976 | |
| | | | | | | | | | | | |
| | | | |
| Automobiles: 1.02% | | | | | | | | | | | | |
Thor Industries Incorporated | | | | | | | 36,550 | | | | 2,116,976 | |
| | | | | | | | | | | | |
| | | | |
| Hotels, Restaurants & Leisure: 0.97% | | | | | | | | | | | | |
ClubCorp Holdings Incorporated | | | | | | | 112,094 | | | | 2,012,087 | |
| | | | | | | | | | | | |
| | | | |
| Media: 2.59% | | | | | | | | | | | | |
National CineMedia Incorporated | | | | | | | 167,800 | | | | 2,662,986 | |
Scholastic Corporation | | | | | | | 63,693 | | | | 2,720,965 | |
| | | | |
| | | | | | | | | | | 5,383,951 | |
| | | | | | | | | | | | |
| | | | |
| Specialty Retail: 4.61% | | | | | | | | | | | | |
Asbury Automotive Group Incorporated † | | | | | | | 24,109 | | | | 1,810,586 | |
Ascena Retail Group Incorporated † | | | | | | | 121,820 | | | | 1,380,221 | |
DSW Incorporated Class A | | | | | | | 80,188 | | | | 1,841,116 | |
Outerwall Incorporated « | | | | | | | 38,790 | | | | 2,401,101 | |
The Men’s Wearhouse Incorporated | | | | | | | 43,000 | | | | 859,570 | |
Urban Outfitters Incorporated † | | | | | | | 57,550 | | | | 1,289,120 | |
| | | | |
| | | | | | | | | | | 9,581,714 | |
| | | | | | | | | | | | |
| | | | |
Consumer Staples: 1.62% | | | | | | | | | | | | |
| | | | |
| Food & Staples Retailing: 0.75% | | | | | | | | | | | | |
SUPERVALU Incorporated † | | | | | | | 231,850 | | | | 1,558,032 | |
| | | | | | | | | | | | |
| | | | |
| Food Products: 0.87% | | | | | | | | | | | | |
Darling Ingredients Incorporated † | | | | | | | 165,910 | | | | 1,816,715 | |
| | | | | | | | | | | | |
| | | | |
Energy: 5.41% | | | | | | | | | | | | |
| | | | |
| Energy Equipment & Services: 0.96% | | | | | | | | | | | | |
RPC Incorporated « | | | | | | | 150,400 | | | | 1,992,800 | |
| | | | | | | | | | | | |
| | | | |
| Oil, Gas & Consumable Fuels: 4.45% | | | | | | | | | | | | |
Carrizo Oil & Gas Incorporated † | | | | | | | 48,800 | | | | 1,970,544 | |
Parsley Energy Incorporated Class A † | | | | | | | 112,300 | | | | 2,206,695 | |
PDC Energy Incorporated † | | | | | | | 31,300 | | | | 1,768,137 | |
Rice Energy Incorporated † | | | | | | | 91,500 | | | | 1,233,420 | |
WPX Energy Incorporated † | | | | | | | 241,330 | | | | 2,070,611 | |
| | | | |
| | | | | | | | | | | 9,249,407 | |
| | | | | | | | | | | | |
The accompanying notes are an integral part of these financial statements.
| | | | | | |
| Portfolio of investments—November 30, 2015 (unaudited) | | Wells Fargo Allocation Funds | | | 69 | |
SMALL COMPANY VALUE PORTFOLIO
| | | | | | | | | | | | |
| Security name | | | | | | Shares | | | Value | |
| | | | |
Financials: 40.79% | | | | | | | | | | | | |
| | | | |
| Banks: 21.24% | | | | | | | | | | | | |
Associated Banc-Corp | | | | | | | 110,800 | | | $ | 2,272,508 | |
BancorpSouth Incorporated | | | | | | | 97,092 | | | | 2,611,775 | |
BankUnited Incorporated | | | | | | | 67,650 | | | | 2,557,170 | |
Columbia Banking System Incorporated | | | | | | | 54,235 | | | | 1,927,512 | |
ConnectOne Bancorp Incorporated | | | | | | | 76,220 | | | | 1,487,052 | |
FirstMerit Corporation | | | | | | | 96,500 | | | | 1,952,195 | |
Great Western Bancorp Incorporated | | | | | | | 94,640 | | | | 2,860,021 | |
IBERIABANK Corporation | | | | | | | 38,117 | | | | 2,415,474 | |
Investors Bancorp Incorporated | | | | | | | 184,894 | | | | 2,370,341 | |
National Bank Holdings Corporation Class A | | | | | | | 108,825 | | | | 2,470,328 | |
Pinnacle Financial Partners Incorporated | | | | | | | 42,160 | | | | 2,290,553 | |
PrivateBancorp Incorporated | | | | | | | 63,397 | | | | 2,796,442 | |
Renasant Corporation | | | | | | | 71,000 | | | | 2,593,630 | |
Sterling BanCorp | | | | | | | 153,700 | | | | 2,695,898 | |
Talmer Bancorp Incorporated Class A | | | | | | | 145,900 | | | | 2,665,593 | |
Webster Financial Corporation | | | | | | | 66,037 | | | | 2,655,348 | |
Western Alliance Bancorp † | | | | | | | 84,378 | | | | 3,273,023 | |
Wintrust Financial Corporation | | | | | | | 43,077 | | | | 2,267,143 | |
| | | | |
| | | | | | | | | | | 44,162,006 | |
| | | | | | | | | | | | |
| | | | |
| Capital Markets: 0.94% | | | | | | | | | | | | |
Stifel Financial Corporation † | | | | | | | 42,993 | | | | 1,950,162 | |
| | | | | | | | | | | | |
| | | | |
| Insurance: 6.18% | | | | | | | | | | | | |
American Equity Investment Life Holding Company | | | | | | | 72,108 | | | | 1,933,215 | |
Employers Holdings Incorporated | | | | | | | 91,224 | | | | 2,500,450 | |
Horace Mann Educators Corporation | | | | | | | 67,210 | | | | 2,347,645 | |
Kemper Corporation | | | | | | | 47,210 | | | | 1,940,803 | |
OneBeacon Insurance Group Limited Class A | | | | | | | 97,056 | | | | 1,345,196 | |
Primerica Incorporated | | | | | | | 54,463 | | | | 2,790,684 | |
| | | | |
| | | | | | | | | | | 12,857,993 | |
| | | | | | | | | | | | |
| | | | |
| Real Estate Management & Development: 1.78% | | | | | | | | | | | | |
Alexander & Baldwin Incorporated | | | | | | | 40,981 | | | | 1,553,590 | |
Kennedy Wilson Holdings Incorporated | | | | | | | 81,900 | | | | 2,137,590 | |
| | | | |
| | | | | | | | | | | 3,691,180 | |
| | | | | | | | | | | | |
| | | | |
| REITs: 10.65% | | | | | | | | | | | | |
Columbia Property Trust Incorporated | | | | | | | 97,400 | | | | 2,440,844 | |
Corporate Office Properties Trust | | | | | | | 94,300 | | | | 2,101,947 | |
Education Realty Trust Incorporated | | | | | | | 57,200 | | | | 2,107,820 | |
Equity Commonwealth † | | | | | | | 99,600 | | | | 2,750,952 | |
Gramercy Property Trust Incorporated | | | | | | | 100,450 | | | | 2,399,751 | |
Highwoods Properties Incorporated | | | | | | | 50,800 | | | | 2,212,848 | |
Parkway Properties Incorporated | | | | | | | 122,297 | | | | 2,088,833 | |
Physicians Realty Trust | | | | | | | 130,900 | | | | 2,095,709 | |
Ramco-Gershenson Properties Trust | | | | | | | 141,021 | | | | 2,379,024 | |
Sunstone Hotel Investors Incorporated | | | | | | | 106,156 | | | | 1,558,370 | |
| | | | |
| | | | | | | | | | | 22,136,098 | |
| | | | | | | | | | | | |
The accompanying notes are an integral part of these financial statements.
| | | | |
| 70 | | Wells Fargo Allocation Funds | | Portfolio of investments—November 30, 2015 (unaudited) |
SMALL COMPANY VALUE PORTFOLIO
| | | | | | | | | | | | |
| Security name | | | | | | Shares | | | Value | |
| | | | |
Health Care: 5.82% | | | | | | | | | | | | |
| | | | |
| Health Care Equipment & Supplies: 2.06% | | | | | | | | | | | | |
Alere Incorporated † | | | | | | | 66,697 | | | $ | 2,752,585 | |
Halyard Health Incorporated † | | | | | | | 47,780 | | | | 1,528,482 | |
| | | | |
| | | | | | | | | | | 4,281,067 | |
| | | | | | | | | | | | |
| | | | |
| Health Care Providers & Services: 3.48% | | | | | | | | | | | | |
Kindred Healthcare Incorporated | | | | | | | 169,300 | | | | 2,260,155 | |
Select Medical Holdings Corporation | | | | | | | 188,360 | | | | 2,273,505 | |
WellCare Health Plans Incorporated † | | | | | | | 32,743 | | | | 2,700,643 | |
| | | | |
| | | | | | | | | | | 7,234,303 | |
| | | | | | | | | | | | |
| | | | |
| Health Care Technology: 0.28% | | | | | | | | | | | | |
Computer Programs & Systems Incorporated « | | | | | | | 12,100 | | | | 589,512 | |
| | | | | | | | | | | | |
| | | | |
Industrials: 7.76% | | | | | | | | | | | | |
| | | | |
| Air Freight & Logistics: 0.88% | | | | | | | | | | | | |
Atlas Air Worldwide Holdings Incorporated † | | | | | | | 44,005 | | | | 1,818,287 | |
| | | | | | | | | | | | |
| | | | |
| Commercial Services & Supplies: 1.62% | | | | | | | | | | | | |
Essendant Incorporated | | | | | | | 47,819 | | | | 1,732,004 | |
Quad Graphics Incorporated | | | | | | | 158,600 | | | | 1,636,752 | |
| | | | |
| | | | | | | | | | | 3,368,756 | |
| | | | | | | | | | | | |
| | | | |
| Construction & Engineering: 1.88% | | | | | | | | | | | | |
KBR Incorporated | | | | | | | 109,190 | | | | 2,122,654 | |
Tutor Perini Corporation † | | | | | | | 94,495 | | | | 1,780,286 | |
| | | | |
| | | | | | | | | | | 3,902,940 | |
| | | | | | | | | | | | |
| | | | |
| Electrical Equipment: 1.08% | | | | | | | | | | | | |
Generac Holdings Incorporated † | | | | | | | 69,560 | | | | 2,232,876 | |
| | | | | | | | | | | | |
| | | | |
| Machinery: 0.80% | | | | | | | | | | | | |
NN Incorporated | | | | | | | 63,190 | | | | 1,077,390 | |
Titan International Incorporated | | | | | | | 136,820 | | | | 593,799 | |
| | | | |
| | | | | | | | | | | 1,671,189 | |
| | | | | | | | | | | | |
| | | | |
| Professional Services: 0.28% | | | | | | | | | | | | |
Hill International Incorporated † | | | | | | | 170,166 | | | | 587,073 | |
| | | | | | | | | | | | |
| | | | |
| Road & Rail: 0.15% | | | | | | | | | | | | |
Universal Truckload Services | | | | | | | 19,636 | | | | 318,889 | |
| | | | | | | | | | | | |
| | | | |
| Trading Companies & Distributors: 1.07% | | | | | | | | | | | | |
Air Lease Corporation | | | | | | | 66,100 | | | | 2,222,943 | |
| | | | | | | | | | | | |
| | | | |
Information Technology: 12.55% | | | | | | | | | | | | |
| | | | |
| Communications Equipment: 0.98% | | | | | | | | | | | | |
ARRIS Group Incorporated † | | | | | | | 66,983 | | | | 2,047,670 | |
| | | | | | | | | | | | |
The accompanying notes are an integral part of these financial statements.
| | | | | | |
| Portfolio of investments—November 30, 2015 (unaudited) | | Wells Fargo Allocation Funds | | | 71 | |
SMALL COMPANY VALUE PORTFOLIO
| | | | | | | | | | | | |
| Security name | | | | | | Shares | | | Value | |
| | | | |
| Electronic Equipment, Instruments & Components: 4.04% | | | | | | | | | | | | |
Belden Incorporated | | | | | | | 50,350 | | | $ | 3,160,470 | |
Celestica Incorporated † | | | | | | | 180,136 | | | | 2,031,934 | |
Plexus Corporation † | | | | | | | 51,321 | | | | 1,909,141 | |
Tech Data Corporation † | | | | | | | 19,028 | | | | 1,287,244 | |
| | | | |
| | | | | | | | | | | 8,388,789 | |
| | | | | | | | | | | | |
| | | | |
| IT Services: 1.79% | | | | | | | | | | | | |
Cardtronics Incorporated † | | | | | | | 43,840 | | | | 1,648,822 | |
VeriFone Systems Incorporated † | | | | | | | 72,100 | | | | 2,067,828 | |
| | | | |
| | | | | | | | | | | 3,716,650 | |
| | | | | | | | | | | | |
| | | | |
| Semiconductors & Semiconductor Equipment: 4.02% | | | | | | | | | | | | |
Advanced Energy Industries Incorporated † | | | | | | | 86,845 | | | | 2,533,269 | |
Diodes Incorporated † | | | | | | | 113,040 | | | | 2,632,702 | |
Veeco Instruments Incorporated † | | | | | | | 55,250 | | | | 1,129,863 | |
Xcerra Corporation † | | | | | | | 340,471 | | | | 2,059,850 | |
| | | | |
| | | | | | | | | | | 8,355,684 | |
| | | | | | | | | | | | |
| | | | |
| Software: 1.13% | | | | | | | | | | | | |
Mentor Graphics Corporation | | | | | | | 125,417 | | | | 2,349,060 | |
| | | | | | | | | | | | |
| | | | |
| Technology Hardware, Storage & Peripherals: 0.59% | | | | | | | | | | | | |
Avid Technology Incorporated † | | | | | | | 162,200 | | | | 1,231,098 | |
| | | | | | | | | | | | |
| | | | |
Materials: 5.14% | | | | | | | | | | | | |
| | | | |
| Chemicals: 4.29% | | | | | | | | | | | | |
A. Schulman Incorporated | | | | | | | 68,900 | | | | 2,384,629 | |
Axiall Corporation | | | | | | | 69,300 | | | | 1,444,212 | |
Cabot Corporation | | | | | | | 58,600 | | | | 2,551,444 | |
Chemtura Corporation † | | | | | | | 83,013 | | | | 2,550,159 | |
| | | | |
| | | | | | | | | | | 8,930,444 | |
| | | | | | | | | | | | |
| | | | |
| Metals & Mining: 0.85% | | | | | | | | | | | | |
Globe Specialty Metals Incorporated | | | | | | | 173,500 | | | | 1,764,495 | |
| | | | | | | | | | | | |
| | | | |
Utilities: 4.77% | | | | | | | | | | | | |
| | | | |
| Electric Utilities: 3.52% | | | | | | | | | | | | |
El Paso Electric Company | | | | | | | 64,371 | | | | 2,487,939 | |
PNM Resources Incorporated | | | | | | | 101,017 | | | | 2,929,493 | |
Portland General Electric Company | | | | | | | 51,724 | | | | 1,909,650 | |
| | | | |
| | | | | | | | | | | 7,327,082 | |
| | | | | | | | | | | | |
| | | | |
| Multi-Utilities: 1.25% | | | | | | | | | | | | |
Avista Corporation | | | | | | | 74,910 | | | | 2,592,632 | |
| | | | | | | | | | | | |
| | | | |
Total Common Stocks (Cost $174,801,497) | | | | | | | | | | | 198,475,536 | |
| | | | | | | | | | | | |
The accompanying notes are an integral part of these financial statements.
| | | | |
| 72 | | Wells Fargo Allocation Funds | | Portfolio of investments—November 30, 2015 (unaudited) |
SMALL COMPANY VALUE PORTFOLIO
| | | | | | | | | | | | | | | | |
| Security name | | | | | Expiration date | | | Shares | | | Value | |
| Warrants: 0.00% | | | | | | | | | | | | | | | | |
| | | | |
Health Care: 0.00% | | | | | | | | | | | | | | | | |
| | | | |
| Health Care Equipment & Supplies: 0.00% | | | | | | | | | | | | | | | | |
EnteroMedics Incorporated †(a) | | | | | | | 5-14-2016 | | | | 9,104 | | | $ | 2 | |
| | | | | | | | | | | | | | | | |
| | | | |
Total Warrants (Cost $0) | | | | | | | | | | | | | | | 2 | |
| | | | | | | | | | | | | | | | |
| | | | |
| | | Yield | | | | | | | | | | |
| Short-Term Investments: 6.15% | | | | | | | | | | | | | | | | |
| | | | |
| Investment Companies: 6.15% | | | | | | | | | | | | | | | | |
Securities Lending Cash Investments, LLC (l)(r)(u) | | | 0.18 | % | | | | | | | 4,795,850 | | | | 4,795,850 | |
Wells Fargo Cash Investment Money Market Fund, Select Class (l)(u) | | | 0.17 | | | | | | | | 7,987,779 | | | | 7,987,779 | |
| | | | |
Total Short-Term Investments (Cost $12,783,629) | | | | | | | | | | | | | | | 12,783,629 | |
| | | | | | | | | | | | | | | | |
| | | | | | | | |
| Total investments in securities (Cost $187,585,126) * | | | 101.62 | % | | | 211,259,167 | |
Other assets and liabilities, net | | | (1.62 | ) | | | (3,373,120 | ) |
| | | | | | | | |
| Total net assets | | | 100.00 | % | | $ | 207,886,047 | |
| | | | | | | | |
| † | Non-income-earning security |
| « | All or a portion of this security is on loan. |
| (a) | The security is fair valued in accordance with procedures approved by the Board of Trustees. |
| (l) | The issuer of the security is an affiliated person of the Portfolio as defined in the Investment Company Act of 1940. |
| (r) | The investment is a non-registered investment vehicle purchased with cash collateral received from securities on loan. |
| (u) | The rate represents the 7-day annualized yield at period end. |
| * | Cost for federal income tax purposes is $188,083,132 and unrealized gains (losses) consists of: |
| | | | |
Gross unrealized gains | | $ | 35,807,002 | |
Gross unrealized losses | | | (12,630,967 | ) |
| | | | |
Net unrealized gains | | $ | 23,176,035 | |
The accompanying notes are an integral part of these financial statements.
| | | | | | |
| Summary portfolio of investments—November 30, 2015 (unaudited) | | Wells Fargo Allocation Funds | | | 73 | |
CORE BOND PORTFOLIO
The Summary portfolio of investments shows the 50 largest portfolio holdings in unaffiliated issuers and any holdings exceeding 1% of the total net assets as of the report date. The remaining securities held are grouped as “Other securities” in each category.
| | | | | | | | | | | | | | | | | | | | |
| Security name | | Interest rate | | | Maturity date | | | Principal | | | Value | | | Percent of
net assets | |
| | | | | |
Agency Securities: 31.34% | | | | | | | | | | | | | | | | | | | | |
FHLMC | | | 0.90-7.00 | % | | | 8-1-2017 to 12-10-2045 | | | $ | 188,381,872 | | | $ | 197,942,749 | | | | 5.42 | % |
FHLMC | | | 3.00 | | | | 2-15-2045 | | | | 20,186,411 | | | | 20,432,393 | | | | 0.56 | |
FHLMC | | | 3.50 | | | | 12-1-2043 | | | | 23,375,730 | | | | 24,264,399 | | | | 0.66 | |
FHLMC %% | | | 3.50 | | | | 1-14-2046 | | | | 31,900,000 | | | | 32,901,858 | | | | 0.90 | |
FHLMC | | | 4.00 | | | | 8-1-2044 | | | | 15,390,799 | | | | 16,470,560 | | | | 0.45 | |
FHLMC | | | 4.50 | | | | 8-1-2020 | | | | 13,649,699 | | | | 14,164,647 | | | | 0.39 | |
FHLMC | | | 5.00 | | | | 8-1-2039 | | | | 11,904,846 | | | | 13,373,077 | | | | 0.37 | |
FHLMC Series 300 Class 300 | | | 3.00 | | | | 1-15-2043 | | | | 19,758,962 | | | | 19,895,089 | | | | 0.54 | |
FHLMC Series 4483 Class PA | | | 2.50 | | | | 6-15-2045 | | | | 19,188,169 | | | | 19,455,398 | | | | 0.53 | |
FNMA | | | 0.00-8.19 | | | | 4-1-2017 to 12-10-2045 | | | | 347,881,570 | | | | 366,292,589 | | | | 9.98 | |
FNMA | | | 3.00 | | | | 10-25-2042 | | | | 17,545,991 | | | | 17,668,882 | | | | 0.48 | |
FNMA | | | 3.00 | | | | 4-1-2043 | | | | 13,319,454 | | | | 13,413,363 | | | | 0.37 | |
FNMA | | | 3.50 | | | | 6-1-2045 | | | | 18,521,741 | | | | 19,232,513 | | | | 0.53 | |
FNMA %% | | | 3.50 | | | | 1-14-2046 | | | | 38,300,000 | | | | 39,582,152 | | | | 1.08 | |
FNMA | | | 4.00 | | | | 7-1-2029 | | | | 16,926,160 | | | | 18,118,228 | | | | 0.50 | |
FNMA | | | 4.00 | | | | 2-1-2041 | | | | 13,768,411 | | | | 14,683,620 | | | | 0.40 | |
FNMA | | | 4.00 | | | | 12-1-2044 | | | | 13,461,521 | | | | 14,433,272 | | | | 0.39 | |
FNMA | | | 4.00 | | | | 10-1-2045 | | | | 14,357,970 | | | | 15,312,521 | | | | 0.42 | |
FNMA | | | 4.50 | | | | 2-1-2044 | | | | 15,370,157 | | | | 16,895,119 | | | | 0.46 | |
GNMA %% | | | 3.50 | | | | 12-17-2045 | | | | 58,500,000 | | | | 61,108,503 | | | | 1.67 | |
GNMA ± | | | 2.50 | | | | 5-20-2045 | | | | 14,494,986 | | | | 14,741,940 | | | | 0.40 | |
GNMA | | | 2.50-4.50 | | | | 4-15-2045 to 12-20-2045 | | | | 35,819,634 | | | | 38,272,470 | | | | 1.07 | |
GNMA %% | | | 3.00 | | | | 12-17-2045 | | | | 49,600,000 | | | | 50,433,131 | | | | 1.38 | |
GNMA %% | | | 3.50 | | | | 1-21-2046 | | | | 52,700,000 | | | | 54,911,957 | | | | 1.50 | |
GNMA %% | | | 4.00 | | | | 12-17-2045 | | | | 14,800,000 | | | | 15,722,978 | | | | 0.43 | |
Other securities | | | | | | | | | | | | | | | 16,881,810 | | | | 0.46 | |
| | | | | |
Total Agency Securities (Cost $1,146,474,469) | | | | | | | | | | | | | | | 1,146,605,218 | | | | 31.34 | |
| | | | | | | | | | | | | | | | | | | | |
| | | | | |
Asset-Backed Securities: 10.69% | | | | | | | | | | | | | | | | | | | | |
Capital Auto Receivables Asset Trust | | | 1.09-2.01 | | | | 3-20-2018 to 7-20-2020 | | | | 79,419,000 | | | | 79,311,438 | | | | 2.15 | |
SLM Student Loan Trust | | | 0.36-4.37 | | | | 1-25-2018 to 2-15-2046 | | | | 118,260,379 | | | | 114,446,453 | | | | 3.13 | |
Other securities | | | | | | | | | | | | | | | 197,416,052 | | | | 5.41 | |
| | | | | |
Total Asset-Backed Securities (Cost $394,809,590) | | | | | | | | | | | | | | | 391,173,943 | | | | 10.69 | |
| | | | | | | | | | | | | | | | | | | | |
| | | | | |
Corporate Bonds and Notes: 17.09% | | | | | | | | | | | | | | | | | | | | |
| | | | | |
Consumer Discretionary: 1.56% | | | | | | | | | | | | | | | | | | | | |
| | | | | |
| Automobiles: 0.38% | | | | | | | | | | | | | | | | | | | | |
Other securities | | | | | | | | | | | | | | | 13,803,360 | | | | 0.38 | |
| | | | | | | | | | | | | | | | | | | | |
| | | | | |
| Internet & Catalog Retail: 0.03% | | | | | | | | | | | | | | | | | | | | |
Other securities | | | | | | | | | | | | | | | 904,402 | | | | 0.03 | |
| | | | | | | | | | | | | | | | | | | | |
| | | | | |
| Media: 1.01% | | | | | | | | | | | | | | | | | | | | |
Other securities | | | | | | | | | | | | | | | 37,108,689 | | | | 1.01 | |
| | | | | | | | | | | | | | | | | | | | |
The accompanying notes are an integral part of these financial statements.
| | | | |
| 74 | | Wells Fargo Allocation Funds | | Summary portfolio of investments—November 30, 2015 (unaudited) |
CORE BOND PORTFOLIO
| | | | | | | | | | | | | | | | | | | | |
| Security name | | Interest rate | | | Maturity date | | | Principal | | | Value | | | Percent of
net assets | |
| | | | | |
| Multiline Retail: 0.04% | | | | | | | | | | | | | | | | | | | | |
Other securities | | | | | | | | | | | | | | $ | 1,490,024 | | | | 0.04 | % |
| | | | | | | | | | | | | | | | | | | | |
| | | | | |
| Specialty Retail: 0.05% | | | | | | | | | | | | | | | | | | | | |
Other securities | | | | | | | | | | | | | | | 1,871,533 | | | | 0.05 | |
| | | | | | | | | | | | | | | | | | | | |
| | | | | |
| Textiles, Apparel & Luxury Goods: 0.05% | | | | | | | | | | | | | | | | | | | | |
Other securities | | | | | | | | | | | | | | | 1,923,346 | | | | 0.05 | |
| | | | | | | | | | | | | | | | | | | | |
| | | | | |
Consumer Staples: 1.01% | | | | | | | | | | | | | | | | | | | | |
| | | | | |
| Beverages: 0.05% | | | | | | | | | | | | | | | | | | | | |
Other securities | | | | | | | | | | | | | | | 1,894,207 | | | | 0.05 | |
| | | | | | | | | | | | | | | | | | | | |
| | | | | |
| Food & Staples Retailing: 0.07% | | | | | | | | | | | | | | | | | | | | |
Other securities | | | | | | | | | | | | | | | 2,509,956 | | | | 0.07 | |
| | | | | | | | | | | | | | | | | | | | |
| | | | | |
| Food Products: 0.75% | | | | | | | | | | | | | | | | | | | | |
Other securities | | | | | | | | | | | | | | | 27,602,973 | | | | 0.75 | |
| | | | | | | | | | | | | | | | | | | | |
| | | | | |
| Tobacco: 0.14% | | | | | | | | | | | | | | | | | | | | |
Other securities | | | | | | | | | | | | | | | 4,986,445 | | | | 0.14 | |
| | | | | | | | | | | | | | | | | | | | |
| | | | | |
Energy: 1.81% | | | | | | | | | | | | | | | | | | | | |
| | | | | |
| Energy Equipment & Services: 0.10% | | | | | | | | | | | | | | | | | | | | |
Other securities | | | | | | | | | | | | | | | 3,773,695 | | | | 0.10 | |
| | | | | | | | | | | | | | | | | | | | |
| | | | | |
| Oil, Gas & Consumable Fuels: 1.71% | | | | | | | | | | | | | | | | | | | | |
Other securities | | | | | | | | | | | | | | | 62,432,630 | | | | 1.71 | |
| | | | | | | | | | | | | | | | | | | | |
| | | | | |
Financials: 6.34% | | | | | | | | | | | | | | | | | | | | |
| | | | | |
| Banks: 2.16% | | | | | | | | | | | | | | | | | | | | |
Other securities | | | | | | | | | | | | | | | 78,863,259 | | | | 2.16 | |
| | | | | | | | | | | | | | | | | | | | |
| | | | | |
| Capital Markets: 1.24% | | | | | | | | | | | | | | | | | | | | |
Morgan Stanley | | | 4.00 | % | | | 7-23-2025 | | | $ | 13,454,000 | | | | 13,976,096 | | | | 0.38 | |
Other securities | | | | | | | | | | | | | | | 31,302,504 | | | | 0.86 | |
| | | | | |
| | | | | | | | | | | | | | | 45,278,600 | | | | 1.24 | |
| | | | | | | | | | | | | | | | | | | | |
| | | | | |
| Consumer Finance: 0.79% | | | | | | | | | | | | | | | | | | | | |
Other securities | | | | | | | | | | | | | | | 28,902,001 | | | | 0.79 | |
| | | | | | | | | | | | | | | | | | | | |
| | | | | |
| Diversified Financial Services: 0.23% | | | | | | | | | | | | | | | | | | | | |
Other securities | | | | | | | | | | | | | | | 8,535,009 | | | | 0.23 | �� |
| | | | | | | | | | | | | | | | | | | | |
| | | | | |
| Insurance: 0.91% | | | | | | | | | | | | | | | | | | | | |
Other securities | | | | | | | | | | | | | | | 33,263,028 | | | | 0.91 | |
| | | | | | | | | | | | | | | | | | | | |
| | | | | |
| REITs: 1.01% | | | | | | | | | | | | | | | | | | | | |
Other securities | | | | | | | | | | | | | | | 37,137,541 | | | | 1.01 | |
| | | | | | | | | | | | | | | | | | | | |
The accompanying notes are an integral part of these financial statements.
| | | | | | |
| Summary portfolio of investments—November 30, 2015 (unaudited) | | Wells Fargo Allocation Funds | | | 75 | |
CORE BOND PORTFOLIO
| | | | | | | | | | | | | | |
| Security name | | | | | | | | Value | | | Percent of
net assets | |
| | | | | |
Health Care: 1.25% | | | | | | | | | | | | | | |
| | | | | |
| Biotechnology: 0.91% | | | | | | | | | | | | | | |
Other securities | | | | | | | | $ | 33,306,145 | | | | 0.91 | % |
| | | | | | | | | | | | | | |
| | | | | |
| Health Care Providers & Services: 0.04% | | | | | | | | | | | | | | |
Other securities | | | | | | | | | 1,429,515 | | | | 0.04 | |
| | | | | | | | | | | | | | |
| | | | | |
| Pharmaceuticals: 0.30% | | | | | | | | | | | | | | |
Other securities | | | | | | | | | 11,082,776 | | | | 0.30 | |
| | | | | | | | | | | | | | |
| | | | | |
Industrials: 1.02% | | | | | | | | | | | | | | |
| | | | | |
| Aerospace & Defense: 0.61% | | | | | | | | | | | | | | |
Other securities | | | | | | | | | 22,258,727 | | | | 0.61 | |
| | | | | | | | | | | | | | |
| | | | | |
| Machinery: 0.05% | | | | | | | | | | | | | | |
Other securities | | | | | | | | | 1,759,143 | | | | 0.05 | |
| | | | | | | | | | | | | | |
| | | | | |
| Professional Services: 0.01% | | | | | | | | | | | | | | |
Other securities | | | | | | | | | 533,651 | | | | 0.01 | |
| | | | | | | | | | | | | | |
| | | | | |
| Road & Rail: 0.29% | | | | | | | | | | | | | | |
Other securities | | | | | | | | | 10,521,512 | | | | 0.29 | |
| | | | | | | | | | | | | | |
| | | | | |
| Transportation Infrastructure: 0.06% | | | | | | | | | | | | | | |
Other securities | | | | | | | | | 2,264,467 | | | | 0.06 | |
| | | | | | | | | | | | | | |
| | | | | |
Information Technology: 1.49% | | | | | | | | | | | | | | |
| | | | | |
| Electronic Equipment, Instruments & Components: 0.04% | | | | | | | | | | | | | | |
Other securities | | | | | | | | | 1,461,020 | | | | 0.04 | |
| | | | | | | | | | | | | | |
| | | | | |
| IT Services: 0.50% | | | | | | | | | | | | | | |
Other securities | | | | | | | | | 18,223,030 | | | | 0.50 | |
| | | | | | | | | | | | | | |
| | | | | |
| Semiconductors & Semiconductor Equipment: 0.05% | | | | | | | | | | | | | | |
Other securities | | | | | | | | | 1,802,665 | | | | 0.05 | |
| | | | | | | | | | | | | | |
| | | | | |
| Software: 0.60% | | | | | | | | | | | | | | |
Other securities | | | | | | | | | 21,998,934 | | | | 0.60 | |
| | | | | | | | | | | | | | |
| | | | | |
| Technology Hardware, Storage & Peripherals: 0.30% | | | | | | | | | | | | | | |
Other securities | | | | | | | | | 11,029,267 | | | | 0.30 | |
| | | | | | | | | | | | | | |
| | | | | |
Materials: 0.21% | | | | | | | | | | | | | | |
| | | | | |
| Chemicals: 0.10% | | | | | | | | | | | | | | |
Other securities | | | | | | | | | 3,461,538 | | | | 0.10 | |
| | | | | | | | | | | | | | |
| | | | | |
| Metals & Mining: 0.02% | | | | | | | | | | | | | | |
Other securities | | | | | | | | | 850,298 | | | | 0.02 | |
| | | | | | | | | | | | | | |
The accompanying notes are an integral part of these financial statements.
| | | | |
| 76 | | Wells Fargo Allocation Funds | | Summary portfolio of investments—November 30, 2015 (unaudited) |
CORE BOND PORTFOLIO
| | | | | | | | | | | | | | | | | | | | |
| Security name | | Interest rate | | | Maturity date | | | Principal | | | Value | | | Percent of
net assets | |
| | | | | |
| Paper & Forest Products: 0.09% | | | | | | | | | | | | | | | | | | | | |
Other securities | | | | | | | | | | | | | | $ | 3,191,221 | | | | 0.09 | % |
| | | | | | | | | | | | | | | | | | | | |
| | | | | |
Telecommunication Services: 0.92% | | | | | | | | | | | | | | | | | | | | |
| | | | | |
| Diversified Telecommunication Services: 0.92% | | | | | | | | | | | | | | | | | | | | |
Other securities | | | | | | | | | | | | | | | 33,506,725 | | | | 0.92 | |
| | | | | | | | | | | | | | | | | | | | |
| | | | | |
Utilities: 1.48% | | | | | | | | | | | | | | | | | | | | |
| | | | | |
| Electric Utilities: 0.83% | | | | | | | | | | | | | | | | | | | | |
Other securities | | | | | | | | | | | | | | | 30,444,217 | | | | 0.83 | |
| | | | | | | | | | | | | | | | | | | | |
| | | | | |
| Multi-Utilities: 0.65% | | | | | | | | | | | | | | | | | | | | |
Other securities | | | | | | | | | | | | | | | 23,695,295 | | | | 0.65 | |
| | | | | | | | | | | | | | | | | | | | |
| | | | | |
Total Corporate Bonds and Notes (Cost $630,838,447) | | | | | | | | | | | | | | | 625,100,844 | | | | 17.09 | |
| | | | | | | | | | | | | | | | | | | | |
| | | | | |
Municipal Obligations: 0.94% | | | | | | | | | | | | | | | | | | | | |
| | | | | |
| California: 0.26% | | | | | | | | | | | | | | | | | | | | |
Other securities | | | | | | | | | | | | | | | 9,548,468 | | | | 0.26 | |
| | | | | | | | | | | | | | | | | | | | |
| | | | | |
| Nevada: 0.19% | | | | | | | | | | | | | | | | | | | | |
Other securities | | | | | | | | | | | | | | | 7,067,845 | | | | 0.19 | |
| | | | | | | | | | | | | | | | | | | | |
| | | | | |
| New Jersey: 0.17% | | | | | | | | | | | | | | | | | | | | |
Other securities | | | | | | | | | | | | | | | 6,299,380 | | | | 0.17 | |
| | | | | | | | | | | | | | | | | | | | |
| | | | | |
| New York: 0.13% | | | | | | | | | | | | | | | | | | | | |
Other securities | | | | | | | | | | | | | | | 4,519,967 | | | | 0.13 | |
| | | | | | | | | | | | | | | | | | | | |
| | | | | |
| Ohio: 0.04% | | | | | | | | | | | | | | | | | | | | |
Other securities | | | | | | | | | | | | | | | 1,313,630 | | | | 0.04 | |
| | | | | | | | | | | | | | | | | | | | |
| | | | | |
| Texas: 0.15% | | | | | | | | | | | | | | | | | | | | |
Other securities | | | | | | | | | | | | | | | 5,583,271 | | | | 0.15 | |
| | | | | | | | | | | | | | | | | | | | |
| | | | | |
Total Municipal Obligations (Cost $29,677,345) | | | | | | | | | | | | | | | 34,332,561 | | | | 0.94 | |
| | | | | | | | | | | | | | | | | | | | |
| | | | | |
Non-Agency Mortgage-Backed Securities: 4.66% | | | | | | | | | | | | | | | | | | | | |
Citigroup Commercial Mortgage Trust Series 2013-GC17 Class A4 | | | 4.13 | % | | | 11-10-2046 | | | $ | 12,758,000 | | | | 13,656,411 | | | | 0.37 | |
Commercial Mortgage Trust | | | 1.80-4.21 | | | | 5-15-2045 to 10-10-2053 | | | | 35,515,821 | | | | 36,806,796 | | | | 1.01 | |
Other securities | | | | | | | | | | | | | | | 120,044,696 | | | | 3.28 | |
| | | |
Total Non-Agency Mortgage-Backed Securities (Cost $170,318,800) | | | | | | | | 170,507,903 | | | | 4.66 | |
| | | | | | | | | | | | | | | | | | | | |
| | | | | |
U.S. Treasury Securities: 31.96% | | | | | | | | | | | | | | | | | | | | |
U.S. Treasury Bond | | | 2.50 | | | | 2-15-2045 | | | | 19,271,000 | | | | 17,384,543 | | | | 0.48 | |
U.S. Treasury Bond ## | | | 2.88 | | | | 8-15-2045 | | | | 32,694,000 | | | | 31,964,760 | | | | 0.87 | |
U.S. Treasury Bond | | | 3.00 | | | | 5-15-2045 | | | | 20,774,000 | | | | 20,802,398 | | | | 0.57 | |
U.S. Treasury Bond | | | 3.00-4.50 | | | | 8-15-2039 to 11-15-2045 | | | | 24,424,000 | | | | 25,717,746 | | | | 0.70 | |
U.S. Treasury Bond | | | 3.13 | | | | 2-15-2043 | | | | 33,657,000 | | | | 34,653,550 | | | | 0.95 | |
The accompanying notes are an integral part of these financial statements.
| | | | | | |
| Summary portfolio of investments—November 30, 2015 (unaudited) | | Wells Fargo Allocation Funds | | | 77 | |
CORE BOND PORTFOLIO
| | | | | | | | | | | | | | | | | | | | |
| Security name | | Interest rate | | | Maturity date | | | Principal | | | Value | | | Percent of
net assets | |
| | | | | |
U.S. Treasury Securities (continued) | | | | | | | | | | | | | | | | | | | | |
U.S. Treasury Note | | | 0.63 | % | | | 5-31-2017 | | | $ | 37,417,000 | | | $ | 37,292,776 | | | | 1.02 | % |
U.S. Treasury Note | | | 0.63 | | | | 8-31-2017 | | | | 16,856,000 | | | | 16,776,979 | | | | 0.46 | |
U.S. Treasury Note | | | 0.63-2.13 | | | | 9-30-2017 to 5-15-2025 | | | | 59,619,000 | | | | 59,439,081 | | | | 1.61 | |
U.S. Treasury Note | | | 0.63 | | | | 11-30-2017 | | | | 18,817,000 | | | | 18,692,036 | | | | 0.51 | |
U.S. Treasury Note | | | 0.75 | | | | 10-31-2017 | | | | 16,200,000 | | | | 16,144,952 | | | | 0.44 | |
U.S. Treasury Note | | | 0.75 | | | | 12-31-2017 | | | | 12,988,000 | | | | 12,924,073 | | | | 0.35 | |
U.S. Treasury Note | | | 0.75 | | | | 4-15-2018 | | | | 47,062,000 | | | | 46,707,200 | | | | 1.28 | |
U.S. Treasury Note | | | 0.88 | | | | 5-15-2017 | | | | 30,929,000 | | | | 30,949,537 | | | | 0.85 | |
U.S. Treasury Note | | | 0.88 | | | | 8-15-2017 | | | | 74,780,000 | | | | 74,768,334 | | | | 2.04 | |
U.S. Treasury Note | | | 0.88 | | | | 11-30-2017 | | | | 29,125,000 | | | | 29,088,594 | | | | 0.80 | |
U.S. Treasury Note | | | 0.88 | | | | 1-15-2018 | | | | 39,731,000 | | | | 39,614,588 | | | | 1.08 | |
U.S. Treasury Note | | | 0.88 | | | | 10-15-2018 | | | | 49,785,000 | | | | 49,308,558 | | | | 1.35 | |
U.S. Treasury Note | | | 1.00 | | | | 9-15-2018 | | | | 39,252,000 | | | | 39,046,555 | | | | 1.07 | |
U.S. Treasury Note | | | 1.25 | | | | 11-15-2018 | | | | 56,808,000 | | | | 56,852,360 | | | | 1.55 | |
U.S. Treasury Note | | | 1.38 | | | | 3-31-2020 | | | | 13,375,000 | | | | 13,261,099 | | | | 0.36 | |
U.S. Treasury Note | | | 1.38 | | | | 9-30-2020 | | | | 114,159,000 | | | | 112,669,568 | | | | 3.08 | |
U.S. Treasury Note « | | | 1.38 | | | | 10-31-2020 | | | | 50,610,000 | | | | 49,929,903 | | | | 1.37 | |
U.S. Treasury Note | | | 1.63 | | | | 3-31-2019 | | | | 95,667,000 | | | | 96,548,954 | | | | 2.64 | |
U.S. Treasury Note | | | 1.63 | | | | 6-30-2020 | | | | 71,619,000 | | | | 71,624,586 | | | | 1.96 | |
U.S. Treasury Note | | | 1.63 | | | | 7-31-2020 | | | | 37,340,000 | | | | 37,319,575 | | | | 1.02 | |
U.S. Treasury Note | | | 1.63 | | | | 11-30-2020 | | | | 46,024,000 | | | | 45,968,265 | | | | 1.26 | |
U.S. Treasury Note | | | 2.00 | | | | 8-15-2025 | | | | 40,732,000 | | | | 39,938,052 | | | | 1.09 | |
U.S. Treasury Note | | | 2.25 | | | | 11-15-2025 | | | | 43,719,000 | | | | 43,862,442 | | | | 1.20 | |
| | | |
Total U.S. Treasury Securities (Cost $1,165,035,704) | | | | | | | | 1,169,251,064 | | | | 31.96 | |
| | | | | | | | | | | | | | | | | | | | |
| | | | | |
Yankee Corporate Bonds and Notes: 5.30% | | | | | | | | | | | | | | | | | | | | |
| | | | | |
Consumer Discretionary: 0.20% | | | | | | | | | | | | | | | | | | | | |
| | | | | |
| Media: 0.20% | | | | | | | | | | | | | | | | | | | | |
Other securities | | | | | | | | | | | | | | | 7,308,961 | | | | 0.20 | |
| | | | | | | | | | | | | | | | | | | | |
| | | | | |
Energy: 0.72% | | | | | | | | | | | | | | | | | | | | |
| | | | | |
| Oil, Gas & Consumable Fuels: 0.72% | | | | | | | | | | | | | | | | | | | | |
Other securities | | | | | | | | | | | | | | | 26,174,223 | | | | 0.72 | |
| | | | | | | | | | | | | | | | | | | | |
| | | | | |
Financials: 2.67% | | | | | | | | | | | | | | | | | | | | |
| | | | | |
| Banks: 2.31% | | | | | | | | | | | | | | | | | | | | |
Other securities | | | | | | | | | | | | | | | 84,348,567 | | | | 2.31 | |
| | | | | | | | | | | | | | | | | | | | |
| | | | | |
| Consumer Finance: 0.16% | | | | | | | | | | | | | | | | | | | | |
Other securities | | | | | | | | | | | | | | | 5,979,104 | | | | 0.16 | |
| | | | | | | | | | | | | | | | | | | | |
| | | | | |
| Diversified Financial Services: 0.11% | | | | | | | | | | | | | | | | | | | | |
Other securities | | | | | | | | | | | | | | | 4,212,606 | | | | 0.11 | |
| | | | | | | | | | | | | | | | | | | | |
| | | | | |
| Insurance: 0.09% | | | | | | | | | | | | | | | | | | | | |
Other securities | | | | | | | | | | | | | | | 3,292,298 | | | | 0.09 | |
| | | | | | | | | | | | | | | | | | | | |
The accompanying notes are an integral part of these financial statements.
| | | | |
| 78 | | Wells Fargo Allocation Funds | | Summary portfolio of investments—November 30, 2015 (unaudited) |
CORE BOND PORTFOLIO
| | | | | | | | | | | | | | | | | | |
| Security name | | | | | | | | | | Value | | | Percent of
net assets | |
| | | | | |
Health Care: 0.50% | | | | | | | | | | | | | | | | | | |
| | | | | |
| Pharmaceuticals: 0.50% | | | | | | | | | | | | | | | | | | |
Other securities | | | | | | | | | | | | $ | 18,240,012 | | | | 0.50 | % |
| | | | | | | | | | | | | | | | | | |
| | | | | |
Industrials: 0.32% | | | | | | | | | | | | | | | | | | |
| | | | | |
| Aerospace & Defense: 0.05% | | | | | | | | | | | | | | | | | | |
Other securities | | | | | | | | | | | | | 1,761,403 | | | | 0.05 | |
| | | | | | | | | | | | | | | | | | |
| | | | | |
| Transportation Infrastructure: 0.27% | | | | | | | | | | | | | | | | | | |
Other securities | | | | | | | | | | | | | 9,775,390 | | | | 0.27 | |
| | | | | | | | | | | | | | | | | | |
| | | | | |
Information Technology: 0.09% | | | | | | | | | | | | | | | | | | |
| | | | | |
| Internet Software & Services: 0.09% | | | | | | | | | | | | | | | | | | |
Other securities | | | | | | | | | | | | | 3,340,177 | | | | 0.09 | |
| | | | | | | | | | | | | | | | | | |
| | | | | |
Materials: 0.35% | | | | | | | | | | | | | | | | | | |
| | | | | |
| Chemicals: 0.08% | | | | | | | | | | | | | | | | | | |
Other securities | | | | | | | | | | | | | 2,799,892 | | | | 0.08 | |
| | | | | | | | | | | | | | | | | | |
| | | | | |
| Metals & Mining: 0.27% | | | | | | | | | | | | | | | | | | |
Other securities | | | | | | | | | | | | | 9,898,008 | | | | 0.27 | |
| | | | | | | | | | | | | | | | | | |
| | | | | |
Telecommunication Services: 0.19% | | | | | | | | | | | | | | | | | | |
| | | | | |
| Wireless Telecommunication Services: 0.19% | | | | | | | | | | | | | | | | | | |
Other securities | | | | | | | | | | | | | 7,117,736 | | | | 0.19 | |
| | | | | | | | | | | | | | | | | | |
| | | | | |
Utilities: 0.26% | | | | | | | | | | | | | | | | | | |
| | | | | |
| Electric Utilities: 0.26% | | | | | | | | | | | | | | | | | | |
Other securities | | | | | | | | | | | | | 9,550,779 | | | | 0.26 | |
| | | | | | | | | | | | | | | | | | |
| | | | | |
Total Yankee Corporate Bonds and Notes (Cost $197,731,012) | | | | | | | | | | | | | 193,799,156 | | | | 5.30 | |
| | | | | | | | | | | | | | | | | | |
| | | | | |
Yankee Government Bonds: 1.32% | | | | | | | | | | | | | | | | | | |
Other securities | | | | | | | | | | | | | 48,344,874 | | | | 1.32 | |
| | | | | | | | | | | | | | | | | | |
| | | | | |
Total Yankee Government Bonds (Cost $47,763,128) | | | | | | | | | | | | | 48,344,874 | | | | 1.32 | |
| | | | | | | | | | | | | | | | | | |
| | | | | |
| | | Yield | | | | | Shares | | | | | | | |
| Short-Term Investments: 9.10% | | | | | | | | | | | | | | | | | | |
| | | | | |
| Investment Companies: 9.10% | | | | | | | | | | | | | | | | | | |
Securities Lending Cash Investments, LLC (l)(r)(u) | | | 0.18 | % | | | | | 60,450,000 | | | | 60,450,000 | | | | 1.65 | |
Wells Fargo Cash Investment Money Market Fund, Select Class (l)(u)## | | | 0.17 | | | | | | 272,482,327 | | | | 272,482,327 | | | | 7.45 | |
| | | | | |
Total Short-Term Investments (Cost $332,932,327) | | | | | | | | | | | | | 332,932,327 | | | | 9.10 | |
| | | | | | | | | | | | | | | | | | |
| | | | | |
| Total investments in securities (Cost $4,115,580,822) * | | | | | | | | | | | | | 4,112,047,890 | | | | 112.40 | |
Other assets and liabilities, net | | | | | | | | | | | | | (453,594,674 | ) | | | (12.40 | ) |
| | | | | | | | | | | | | | | | | | |
| Total net assets | | | | | | | | | | | | $ | 3,658,453,216 | | | | 100.00 | % |
| | | | | | | | | | | | | | | | | | |
The accompanying notes are an integral part of these financial statements.
| | | | | | |
| Summary portfolio of investments—November 30, 2015 (unaudited) | | Wells Fargo Allocation Funds | | | 79 | |
CORE BOND PORTFOLIO
| ± | Variable rate investment. The rate shown is the rate in effect at period end. |
| %% | Security issued on a when-issued basis |
| ## | All or a portion of this security has been segregated for when-issued securities. |
| « | All or a portion of this security is on loan. |
| (l) | The issuer of the security is an affiliated person of the Portfolio as defined in the Investment Company Act of 1940. |
| (r) | The investment is a non-registered investment vehicle purchased with cash collateral received from securities on loan. |
| (u) | The rate represents the 7-day annualized yield at period end. |
| * | Cost for federal income tax purposes is $4,127,741,800 and unrealized gains (losses) consists of: |
| | | | |
Gross unrealized gains | | $ | 23,212,447 | |
Gross unrealized losses | | | (38,906,357 | ) |
| | | | |
Net unrealized losses | | $ | (15,693,910 | ) |
The accompanying notes are an integral part of these financial statements.
| | | | |
| 80 | | Wells Fargo Allocation Funds | | Portfolio of investments—November 30, 2015 (unaudited) |
MANAGED FIXED INCOME PORTFOLIO
| | | | | | | | | | | | | | | | |
| Security name | | Interest rate | | | Maturity date | | | Principal | | | Value | |
| | | | |
Agency Securities: 29.60% | | | | | | | | | | | | | | | | |
FHLMC | | | 3.50 | % | | | 9-1-2032 | | | $ | 1,089,107 | | | $ | 1,140,057 | |
FHLMC | | | 3.50 | | | | 4-1-2043 | | | | 1,789,259 | | | | 1,858,652 | |
FHLMC | | | 3.50 | | | | 5-1-2044 | | | | 775,289 | | | | 804,865 | |
FHLMC | | | 4.00 | | | | 4-1-2044 | | | | 943,793 | | | | 1,009,026 | |
FHLMC | | | 4.00 | | | | 8-1-2044 | | | | 732,508 | | | | 780,795 | |
FHLMC Structured Pass-Through Securities Series T-20 Class A6 | | | 7.99 | | | | 9-25-2029 | | | | 80,833 | | | | 84,932 | |
FHLMC Structured Pass-Through Securities Series T-58 Class 4A | | | 7.50 | | | | 9-25-2043 | | | | 1,142,783 | | | | 1,354,320 | |
FNMA | | | 2.57 | | | | 9-1-2019 | | | | 532,014 | | | | 546,376 | |
FNMA | | | 2.57 | | | | 9-1-2019 | | | | 532,524 | | | | 546,900 | |
FNMA | | | 2.73 | | | | 1-1-2023 | | | | 580,000 | | | | 590,110 | |
FNMA | | | 2.73 | | | | 9-1-2023 | | | | 597,691 | | | | 602,295 | |
FNMA | | | 2.76 | | | | 4-1-2021 | | | | 1,094,164 | | | | 1,127,698 | |
FNMA | | | 2.78 | | | | 10-1-2020 | | | | 550,000 | | | | 567,147 | |
FNMA (a) | | | 2.85 | | | | 1-1-2046 | | | | 590,000 | | | | 592,213 | |
FNMA | | | 2.96 | | | | 6-1-2022 | | | | 523,758 | | | | 542,940 | |
FNMA | | | 3.00 | | | | 12-1-2032 | | | | 72,325 | | | | 74,581 | |
FNMA | | | 3.03 | | | | 11-1-2022 | | | | 589,091 | | | | 610,948 | |
FNMA | | | 3.31 | | | | 6-1-2021 | | | | 550,000 | | | | 576,859 | |
FNMA | | | 3.50 | | | | 9-1-2032 | | | | 2,080,684 | | | | 2,188,167 | |
FNMA | | | 3.50 | | | | 10-1-2032 | | | | 1,026,915 | | | | 1,080,293 | |
FNMA | | | 3.50 | | | | 11-1-2042 | | | | 391,268 | | | | 406,258 | |
FNMA | | | 3.50 | | | | 11-1-2042 | | | | 570,397 | | | | 592,062 | |
FNMA | | | 3.50 | | | | 2-1-2043 | | | | 288,555 | | | | 299,620 | |
FNMA | | | 5.00 | | | | 9-1-2033 | | | | 288,945 | | | | 320,333 | |
FNMA | | | 5.50 | | | | 2-1-2036 | | | | 479,987 | | | | 511,798 | |
FNMA Series 2002-90 Class A2 | | | 6.50 | | | | 11-25-2042 | | | | 481,494 | | | | 542,865 | |
FNMA Series 2002-T4 Class A2 | | | 7.00 | | | | 12-25-2041 | | | | 224,519 | | | | 257,376 | |
FNMA Series 2002-W4 Class A4 | | | 6.25 | | | | 5-25-2042 | | | | 2,066,505 | | | | 2,273,179 | |
FNMA Series 2003-86 Class PT | | | 4.50 | | | | 9-25-2018 | | | | 264,113 | | | | 272,983 | |
FNMA Series 2003-W4 Class 3A ± | | | 6.54 | | | | 10-25-2042 | | | | 301,522 | | | | 342,033 | |
FNMA Series 2004-T2 Class 1A1 | | | 6.00 | | | | 11-25-2043 | | | | 901,816 | | | | 1,004,850 | |
FNMA Series 2004-T3 Class A1 | | | 6.00 | | | | 2-25-2044 | | | | 1,245,898 | | | | 1,418,661 | |
FNMA Series 2004-W1 Class 2A2 | | | 7.00 | | | | 12-25-2033 | | | | 207,262 | | | | 241,871 | |
FNMA Series 2004-W11 Class 1A3 | | | 7.00 | | | | 5-25-2044 | | | | 1,179,876 | | | | 1,387,431 | |
FNMA Series 2004-W8 Class 3A | | | 7.50 | | | | 6-25-2044 | | | | 448,638 | | | | 524,362 | |
FNMA Series 2006-M2 Class A2F ± | | | 5.26 | | | | 5-25-2020 | | | | 445,900 | | | | 465,990 | |
GNMA | | | 6.50 | | | | 10-15-2023 | | | | 29,960 | | | | 34,329 | |
GNMA | | | 6.50 | | | | 11-15-2023 | | | | 17,664 | | | | 20,240 | |
GNMA | | | 6.50 | | | | 11-15-2023 | | | | 8,468 | | | | 9,703 | |
GNMA | | | 6.50 | | | | 12-15-2023 | | | | 22,539 | | | | 25,826 | |
GNMA | | | 6.50 | | | | 1-15-2024 | | | | 38,416 | | | | 44,018 | |
GNMA | | | 7.00 | | | | 8-15-2027 | | | | 107,979 | | | | 124,478 | |
SBA Series 2006-20B Class 1 | | | 5.35 | | | | 2-1-2026 | | | | 648,053 | | | | 707,349 | |
SBA Series 2006-20H Class 1 | | | 5.70 | | | | 8-1-2026 | | | | 351,946 | | | | 391,494 | |
SBA Series 2007-20J Class 1 | | | 5.57 | | | | 10-1-2027 | | | | 764,473 | | | | 857,417 | |
SBA Series 2013-20A Class 1 | | | 2.13 | | | | 1-1-2033 | | | | 517,979 | | | | 508,934 | |
SBA Series 2013-20J Class 1 | | | 3.37 | | | | 10-1-2033 | | | | 541,725 | | | | 565,261 | |
SBA Series 2014-10A Class 1 | | | 3.19 | | | | 3-10-2024 | | | | 737,768 | | | | 768,286 | |
SBA Series 2014-10B Class 1 | | | 3.02 | | | | 9-10-2024 | | | | 1,130,745 | | | | 1,171,878 | |
SBA Series 2014-20A Class 1 | | | 3.46 | | | | 1-1-2034 | | | | 457,566 | | | | 480,403 | |
The accompanying notes are an integral part of these financial statements.
| | | | | | |
| Portfolio of investments—November 30, 2015 (unaudited) | | Wells Fargo Allocation Funds | | | 81 | |
MANAGED FIXED INCOME PORTFOLIO
| | | | | | | | | | | | | | | | |
| Security name | | Interest rate | | | Maturity date | | | Principal | | | Value | |
| | | | |
Agency Securities (continued) | | | | | | | | | | | | | | | | |
SBA Series 2015-10B Class 1 | | | 2.83 | % | | | 9-10-2025 | | | $ | 590,000 | | | $ | 599,517 | |
SBA Series 2015-20C Class 1 | | | 2.72 | | | | 3-1-2035 | | | | 571,686 | | | | 576,359 | |
SBA Series 2015-20E Class 1 | | | 2.77 | | | | 5-1-2035 | | | | 880,926 | | | | 888,076 | |
SBA Series 2015-20F Class 1 | | | 2.98 | | | | 6-1-2035 | | | | 600,000 | | | | 610,567 | |
| | | | |
Total Agency Securities (Cost $34,757,847) | | | | | | | | | | | | | | | 35,924,981 | |
| | | | | | | | | | | | | | | | |
| | | | |
Asset-Backed Securities: 3.74% | | | | | | | | | | | | | | | | |
American Express Credit Accounts Series 2014-2 Class A | | | 1.26 | | | | 1-15-2020 | | | | 570,000 | | | | 570,600 | |
Barclays Dryrock Issuance Trust Series 2014-3 Class A | | | 2.41 | | | | 7-15-2022 | | | | 570,000 | | | | 577,923 | |
Capital Auto Receivables Asset Trust Series 2014-2 Class A3 | | | 1.26 | | | | 5-21-2018 | | | | 550,000 | | | | 549,842 | |
Capital Auto Receivables Asset Trust Series 2014-3 Class A3 | | | 1.48 | | | | 11-20-2018 | | | | 570,000 | | | | 569,965 | |
CNH Equipment Trust Series 2014-A Class A3 | | | 0.84 | | | | 5-15-2019 | | | | 550,000 | | | | 548,771 | |
CNH Equipment Trust Series 2015-A Class A4 | | | 1.85 | | | | 4-15-2021 | | | | 580,000 | | | | 579,199 | |
Green Tree Financial Corporation Series 1997-7 Class A8 ± | | | 6.86 | | | | 7-15-2028 | | | | 21,303 | | | | 21,456 | |
Mississippi Higher Education Assistance Corporation Series 2014-1 Class A1 ± | | | 0.90 | | | | 10-25-2035 | | | | 650,725 | | | | 635,856 | |
South Carolina Student Loan Corporation Series 2014-1 Class B ± | | | 1.74 | | | | 8-1-2035 | | | | 500,000 | | | | 479,860 | |
| | | | |
Total Asset-Backed Securities (Cost $4,535,609) | | | | | | | | | | | | | | | 4,533,472 | |
| | | | | | | | | | | | | | | | |
| | | | |
Corporate Bonds and Notes: 31.82% | | | | | | | | | | | | | | | | |
| | | | |
Consumer Discretionary: 4.17% | | | | | | | | | | | | | | | | |
| | | | |
| Automobiles: 0.34% | | | | | | | | | | | | | | | | |
General Motors Company | | | 4.88 | | | | 10-2-2023 | | | | 400,000 | | | | 414,003 | |
| | | | | | | | | | | | | | | | |
| | | | |
| Diversified Consumer Services: 2.31% | | | | | | | | | | | | | | | | |
Massachusetts Institute of Technology | | | 3.96 | | | | 7-1-2038 | | | | 200,000 | | | | 208,941 | |
Massachusetts Institute of Technology | | | 7.25 | | | | 11-2-2096 | | | | 500,000 | | | | 779,351 | |
Northwestern University | | | 4.64 | | | | 12-1-2044 | | | | 350,000 | | | | 397,498 | |
Service Corporation International | | | 5.38 | | | | 1-15-2022 | | | | 360,000 | | | | 378,000 | |
The President and Fellows of Harvard College | | | 3.53 | | | | 10-1-2031 | | | | 250,000 | | | | 244,168 | |
The President and Fellows of Harvard College | | | 5.63 | | | | 10-1-2038 | | | | 250,000 | | | | 310,912 | |
Trustee of Dartmouth College | | | 4.75 | | | | 6-1-2019 | | | | 440,000 | | | | 480,467 | |
| | | | |
| | | | | | | | | | | | | | | 2,799,337 | |
| | | | | | | | | | | | | | | | |
| | | | |
| Media: 1.20% | | | | | | | | | | | | | | | | |
CCO Safari II LLC 144A | | | 4.91 | | | | 7-23-2025 | | | | 325,000 | | | | 330,067 | |
DIRECTV Holdings LLC | | | 2.40 | | | | 3-15-2017 | | | | 400,000 | | | | 404,750 | |
Lamar Media Corporation | | | 5.88 | | | | 2-1-2022 | | | | 315,000 | | | | 329,963 | |
Time Warner Incorporated | | | 3.40 | | | | 6-15-2022 | | | | 140,000 | | | | 140,326 | |
Time Warner Incorporated | | | 3.60 | | | | 7-15-2025 | | | | 260,000 | | | | 257,380 | |
| | | | |
| | | | | | | | | | | | | | | 1,462,486 | |
| | | | | | | | | | | | | | | | |
| | | | |
| Specialty Retail: 0.11% | | | | | | | | | | | | | | | | |
Home Depot Incorporated | | | 2.63 | | | | 6-1-2022 | | | | 130,000 | | | | 130,134 | |
| | | | | | | | | | | | | | | | |
| | | | |
| Textiles, Apparel & Luxury Goods: 0.21% | | | | | | | | | | | | | | | | |
The William Carter Company | | | 5.25 | | | | 8-15-2021 | | | | 250,000 | | | | 256,875 | |
| | | | | | | | | | | | | | | | |
The accompanying notes are an integral part of these financial statements.
| | | | |
| 82 | | Wells Fargo Allocation Funds | | Portfolio of investments—November 30, 2015 (unaudited) |
MANAGED FIXED INCOME PORTFOLIO
| | | | | | | | | | | | | | | | |
| Security name | | Interest rate | | | Maturity date | | | Principal | | | Value | |
| | | | |
Consumer Staples: 1.21% | | | | | | | | | | | | | | | | |
| | | | |
| Food & Staples Retailing: 0.76% | | | | | | | | | | | | | | | | |
CVS Caremark Corporation | | | 4.00 | % | | | 12-5-2023 | | | $ | 275,000 | | | $ | 289,394 | |
CVS Health Corporation | | | 3.50 | | | | 7-20-2022 | | | | 120,000 | | | | 123,266 | |
SABMiller Holdings Incorporated 144A | | | 3.75 | | | | 1-15-2022 | | | | 500,000 | | | | 514,647 | |
| | | | |
| | | | | | | | | | | | | | | 927,307 | |
| | | | | | | | | | | | | | | | |
| | | | |
| Food Products: 0.25% | | | | | | | | | | | | | | | | |
Kraft Foods Group Incorporated | | | 3.50 | | | | 6-6-2022 | | | | 300,000 | | | | 304,896 | |
| | | | | | | | | | | | | | | | |
| | | | |
| Household Products: 0.20% | | | | | | | | | | | | | | | | |
The Procter & Gamble Company | | | 5.50 | | | | 2-1-2034 | | | | 200,000 | | | | 239,458 | |
| | | | | | | | | | | | | | | | |
| | | | |
Energy: 3.15% | | | | | | | | | | | | | | | | |
| | | | |
| Energy Equipment & Services: 0.13% | | | | | | | | | | | | | | | | |
Halliburton Company | | | 3.80 | | | | 11-15-2025 | | | | 160,000 | | | | 161,159 | |
| | | | | | | | | | | | | | | | |
| | | | |
| Oil, Gas & Consumable Fuels: 3.02% | | | | | | | | | | | | | | | | |
Chevron Corporation | | | 3.19 | | | | 6-24-2023 | | | | 250,000 | | | | 255,526 | |
Cimarex Energy Company | | | 5.88 | | | | 5-1-2022 | | | | 350,000 | | | | 368,429 | |
Columbia Pipeline Group Incorporated 144A | | | 2.45 | | | | 6-1-2018 | | | | 210,000 | | | | 208,889 | |
Concho Resources Incorporated | | | 6.50 | | | | 1-15-2022 | | | | 375,000 | | | | 382,500 | |
ConocoPhillips Company | | | 3.35 | | | | 11-15-2024 | | | | 370,000 | | | | 364,974 | |
EQT Corporation | | | 8.13 | | | | 6-1-2019 | | | | 400,000 | | | | 456,072 | |
Florida Gas Transmission Company 144A | | | 4.35 | | | | 7-15-2025 | | | | 230,000 | | | | 222,548 | |
Marathon Oil Corporation | | | 3.85 | | | | 6-1-2025 | | | | 410,000 | | | | 367,573 | |
Newfield Exploration Company | | | 5.63 | | | | 7-1-2024 | | | | 249,000 | | | | 234,683 | |
Pioneer Natural Resource Company %% | | | 4.45 | | | | 1-15-2026 | | | | 190,000 | | | | 189,789 | |
Plains All American Pipeline LP | | | 4.65 | | | | 10-15-2025 | | | | 400,000 | | | | 373,103 | |
Southwestern Energy Company « | | | 4.95 | | | | 1-23-2025 | | | | 290,000 | | | | 238,941 | |
| | | | |
| | | | | | | | | | | | | | | 3,663,027 | |
| | | | | | | | | | | | | | | | |
| | | | |
Financials: 12.22% | | | | | | | | | | | | | | | | |
| | | | |
| Banks: 4.59% | | | | | | | | | | | | | | | | |
Bank of America Corporation | | | 2.60 | | | | 1-15-2019 | | | | 155,000 | | | | 156,712 | |
Bank of America Corporation | | | 3.95 | | | | 4-21-2025 | | | | 120,000 | | | | 118,700 | |
Bank of America Corporation | | | 4.00 | | | | 4-1-2024 | | | | 700,000 | | | | 723,450 | |
Chase Capital VI ± | | | 0.95 | | | | 8-1-2028 | | | | 1,000,000 | | | | 840,000 | |
Citigroup Incorporated | | | 3.30 | | | | 4-27-2025 | | | | 130,000 | | | | 128,538 | |
Citigroup Incorporated | | | 4.40 | | | | 6-10-2025 | | | | 100,000 | | | | 101,696 | |
Citigroup Incorporated | | | 6.13 | | | | 11-21-2017 | | | | 435,000 | | | | 472,388 | |
CoreStates Capital Trust II ±144A | | | 0.97 | | | | 1-15-2027 | | | | 750,000 | | | | 648,863 | |
Manufacturers & Traders Trust Company ± | | | 5.59 | | | | 12-28-2020 | | | | 758,000 | | | | 752,458 | |
National Capital Commerce Incorporated ±(i) | | | 1.31 | | | | 4-1-2027 | | | | 400,000 | | | | 333,000 | |
NTC Capital Trust Series A ± | | | 0.84 | | | | 1-15-2027 | | | | 450,000 | | | | 378,000 | |
UBS Preferred Funding Trust V Series 1 ± | | | 6.24 | | | | 5-29-2049 | | | | 700,000 | | | | 710,500 | |
US Bancorp | | | 2.95 | | | | 7-15-2022 | | | | 200,000 | | | | 200,368 | |
| | | | |
| | | | | | | | | | | | | | | 5,564,673 | |
| | | | | | | | | | | | | | | | |
The accompanying notes are an integral part of these financial statements.
| | | | | | |
| Portfolio of investments—November 30, 2015 (unaudited) | | Wells Fargo Allocation Funds | | | 83 | |
MANAGED FIXED INCOME PORTFOLIO
| | | | | | | | | | | | | | | | |
| Security name | | Interest rate | | | Maturity date | | | Principal | | | Value | |
| | | | |
| Capital Markets: 1.52% | | | | | | | | | | | | | | | | |
Goldman Sachs Capital II ± | | | 4.00 | % | | | 12-31-2049 | | | $ | 115,000 | | | $ | 82,225 | |
Goldman Sachs Group Incorporated | | | 3.50 | | | | 1-23-2025 | | | | 265,000 | | | | 263,558 | |
Goldman Sachs Group Incorporated | | | 4.25 | | | | 10-21-2025 | | | | 120,000 | | | | 120,353 | |
Goldman Sachs Group Incorporated | | | 5.75 | | | | 1-24-2022 | | | | 200,000 | | | | 229,439 | |
Morgan Stanley | | | 3.70 | | | | 10-23-2024 | | | | 100,000 | | | | 101,734 | |
Morgan Stanley | | | 3.95 | | | | 4-23-2027 | | | | 180,000 | | | | 176,116 | |
Morgan Stanley | | | 5.50 | | | | 7-24-2020 | | | | 350,000 | | | | 393,498 | |
State Street Corporation | | | 3.55 | | | | 8-18-2025 | | | | 220,000 | | | | 226,875 | |
The Bank of New York Mellon Corporation | | | 3.25 | | | | 9-11-2024 | | | | 250,000 | | | | 252,055 | |
| | | | |
| | | | | | | | | | | | | | | 1,845,853 | |
| | | | | | | | | | | | | | | | |
| | | | |
| Consumer Finance: 0.44% | | | | | | | | | | | | | | | | |
American Honda Finance Corporation | | | 2.45 | | | | 9-24-2020 | | | | 120,000 | | | | 120,631 | |
Caterpillar Financial Services Corporation | | | 3.75 | | | | 11-24-2023 | | | | 150,000 | | | | 155,625 | |
Daimler Finance North America LLC 144A | | | 2.38 | | | | 8-1-2018 | | | | 260,000 | | | | 261,510 | |
| | | | |
| | | | | | | | | | | | | | | 537,766 | |
| | | | | | | | | | | | | | | | |
| | | | |
| Diversified Financial Services: 1.19% | | | | | | | | | | | | | | | | |
Abay Leasing 2014 LLC | | | 2.65 | | | | 11-9-2026 | | | | 527,083 | | | | 534,816 | |
ABB Treasury Center USA Incorporated 144A | | | 4.00 | | | | 6-15-2021 | | | | 510,000 | | | | 530,473 | |
CNH Industrial Capital LLC | | | 3.38 | | | | 7-15-2019 | | | | 390,000 | | | | 374,888 | |
| | | | |
| | | | | | | | | | | | | | | 1,440,177 | |
| | | | | | | | | | | | | | | | |
| | | | |
| Insurance: 1.47% | | | | | | | | | | | | | | | | |
ACE INA Holdings Incorporated | | | 2.88 | | | | 11-3-2022 | | | | 110,000 | | | | 109,354 | |
Minnesota Life Insurance Company 144A | | | 8.25 | | | | 9-15-2025 | | | | 650,000 | | | | 804,076 | |
NLV Financial Corporation 144A | | | 7.50 | | | | 8-15-2033 | | | | 565,000 | | | | 645,646 | |
Pacific LifeCorp 144A | | | 6.00 | | | | 2-10-2020 | | | | 200,000 | | | | 223,830 | |
| | | | |
| | | | | | | | | | | | | | | 1,782,906 | |
| | | | | | | | | | | | | | | | |
| | | | |
| REITs: 3.01% | | | | | | | | | | | | | | | | |
AvalonBay Communities Incorporated | | | 2.95 | | | | 9-15-2022 | | | | 190,000 | | | | 187,286 | |
AvalonBay Communities Incorporated | | | 3.63 | | | | 10-1-2020 | | | | 40,000 | | | | 41,703 | |
Boston Properties LP | | | 3.70 | | | | 11-15-2018 | | | | 180,000 | | | | 187,095 | |
Boston Properties LP | | | 5.88 | | | | 10-15-2019 | | | | 200,000 | | | | 224,111 | |
Duke Realty LP | | | 3.88 | | | | 10-15-2022 | | | | 150,000 | | | | 150,890 | |
ERP Operating LP | | | 4.63 | | | | 12-15-2021 | | | | 470,000 | | | | 512,743 | |
Liberty Property LP | | | 3.75 | | | | 4-1-2025 | | | | 100,000 | | | | 96,630 | |
Liberty Property LP | | | 6.63 | | | | 10-1-2017 | | | | 400,000 | | | | 431,410 | |
Potlatch Corporation | | | 7.50 | | | | 11-1-2019 | | | | 310,000 | | | | 345,263 | |
ProLogis LP | | | 3.75 | | | | 11-1-2025 | | | | 170,000 | | | | 170,270 | |
Realty Income Corporation | | | 4.65 | | | | 8-1-2023 | | | | 370,000 | | | | 387,567 | |
Simon Property Group LP | | | 3.38 | | | | 10-1-2024 | | | | 300,000 | | | | 302,432 | |
UDR Incorporated | | | 4.63 | | | | 1-10-2022 | | | | 260,000 | | | | 278,712 | |
Ventas Realty LP | | | 3.50 | | | | 2-1-2025 | | | | 150,000 | | | | 143,725 | |
Vornado Realty LP | | | 2.50 | | | | 6-30-2019 | | | | 200,000 | | | | 198,094 | |
| | | | |
| | | | | | | | | | | | | | | 3,657,931 | |
| | | | | | | | | | | | | | | | |
The accompanying notes are an integral part of these financial statements.
| | | | |
| 84 | | Wells Fargo Allocation Funds | | Portfolio of investments—November 30, 2015 (unaudited) |
MANAGED FIXED INCOME PORTFOLIO
| | | | | | | | | | | | | | | | |
| Security name | | Interest rate | | | Maturity date | | | Principal | | | Value | |
| | | | |
Health Care: 2.23% | | | | | | | | | | | | | | | | |
| | | | |
| Health Care Equipment & Supplies: 0.35% | | | | | | | | | | | | | | | | |
Becton Dickinson & Company | | | 3.73 | % | | | 12-15-2024 | | | $ | 290,000 | | | $ | 295,375 | |
Medtronic Incorporated | | | 3.15 | | | | 3-15-2022 | | | | 130,000 | | | | 132,023 | |
| | | | |
| | | | | | | | | | | | | | | 427,398 | |
| | | | | | | | | | | | | | | | |
| | | | |
| Health Care Providers & Services: 1.35% | | | | | | | | | | | | | | | | |
Allina Health System Incorporated | | | 4.81 | | | | 11-15-2045 | | | | 235,000 | | | | 243,144 | |
Howard Hughes Medical Institute | | | 3.50 | | | | 9-1-2023 | | | | 120,000 | | | | 125,518 | |
Memorial Sloan Kettering Cancer Center | | | 4.20 | | | | 7-1-2055 | | | | 375,000 | | | | 352,761 | |
Texas Health Resources | | | 4.33 | | | | 11-15-2055 | | | | 375,000 | | | | 360,468 | |
The New York and Presbyterian Hospital | | | 4.02 | | | | 8-1-2045 | | | | 175,000 | | | | 165,620 | |
UnitedHealth Group Incorporated | | | 3.75 | | | | 7-15-2025 | | | | 380,000 | | | | 394,114 | |
| | | | |
| | | | | | | | | | | | | | | 1,641,625 | |
| | | | | | | | | | | | | | | | |
| | | | |
| Life Sciences Tools & Services: 0.13% | | | | | | | | | | | | | | | | |
Thermo Fisher Scientific Incorporated | | | 3.30 | | | | 2-15-2022 | | | | 150,000 | | | | 150,310 | |
| | | | | | | | | | | | | | | | |
| | | | |
| Pharmaceuticals: 0.40% | | | | | | | | | | | | | | | | |
Bayer US Finance LLC 144A | | | 3.38 | | | | 10-8-2024 | | | | 240,000 | | | | 241,450 | |
EMD Finance LLC 144A | | | 2.95 | | | | 3-19-2022 | | | | 250,000 | | | | 241,118 | |
| | | | |
| | | | | | | | | | | | | | | 482,568 | |
| | | | | | | | | | | | | | | | |
| | | | |
Industrials: 3.38% | | | | | | | | | | | | | | | | |
| | | | |
| Aerospace & Defense: 0.37% | | | | | | | | | | | | | | | | |
BAE Systems Holdings Incorporated 144A | | | 3.80 | | | | 10-7-2024 | | | | 100,000 | | | | 100,052 | |
Lockheed Martin Corporation | | | 3.55 | | | | 1-15-2026 | | | | 160,000 | | | | 161,550 | |
United Technologies Corporation | | | 3.10 | | | | 6-1-2022 | | | | 180,000 | | | | 183,983 | |
| | | | |
| | | | | | | | | | | | | | | 445,585 | |
| | | | | | | | | | | | | | | | |
| | | | |
| Air Freight & Logistics: 0.19% | | | | | | | | | | | | | | | | |
FedEx Corporation | | | 4.00 | | | | 1-15-2024 | | | | 225,000 | | | | 236,100 | |
| | | | | | | | | | | | | | | | |
| | | | |
| Commercial Services & Supplies: 0.49% | | | | | | | | | | | | | | | | |
Clean Harbors Incorporated | | | 5.25 | | | | 8-1-2020 | | | | 350,000 | | | | 354,865 | |
Waste Management Incorporated | | | 3.13 | | | | 3-1-2025 | | | | 240,000 | | | | 233,751 | |
| | | | |
| | | | | | | | | | | | | | | 588,616 | |
| | | | | | | | | | | | | | | | |
| | | | |
| Machinery: 1.45% | | | | | | | | | | | | | | | | |
Actuant Corporation | | | 5.63 | | | | 6-15-2022 | | | | 425,000 | | | | 430,844 | |
Briggs & Stratton Corporation | | | 6.88 | | | | 12-15-2020 | | | | 350,000 | | | | 380,625 | |
Deere & Company | | | 2.60 | | | | 6-8-2022 | | | | 340,000 | | | | 337,131 | |
Oshkosh Corporation | | | 5.38 | | | | 3-1-2022 | | | | 375,000 | | | | 378,750 | |
Valmont Industries Incorporated | | | 5.00 | | | | 10-1-2044 | | | | 260,000 | | | | 226,259 | |
| | | | |
| | | | | | | | | | | | | | | 1,753,609 | |
| | | | | | | | | | | | | | | | |
| | | | |
| Road & Rail: 0.58% | | | | | | | | | | | | | | | | |
Burlington Northern Santa Fe LLC | | | 3.05 | | | | 9-1-2022 | | | | 100,000 | | | | 100,291 | |
Burlington Northern Santa Fe LLC | | | 3.40 | | | | 9-1-2024 | | | | 150,000 | | | | 150,200 | |
The accompanying notes are an integral part of these financial statements.
| | | | | | |
| Portfolio of investments—November 30, 2015 (unaudited) | | Wells Fargo Allocation Funds | | | 85 | |
MANAGED FIXED INCOME PORTFOLIO
| | | | | | | | | | | | | | | | |
| Security name | | Interest rate | | | Maturity date | | | Principal | | | Value | |
| | | | |
| Road & Rail (continued) | | | | | | | | | | | | | | | | |
Burlington Northern Santa Fe LLC | | | 3.45 | % | | | 9-15-2021 | | | $ | 250,000 | | | $ | 257,592 | |
Union Pacific Corporation | | | 7.88 | | | | 1-15-2019 | | | | 171,000 | | | | 199,137 | |
| | | | |
| | | | | | | | | | | | | | | 707,220 | |
| | | | | | | | | | | | | | | | |
| | | | |
| Transportation Infrastructure: 0.30% | | | | | | | | | | | | | | | | |
Vessel Management Service | | | 3.43 | | | | 8-15-2036 | | | | 356,000 | | | | 362,792 | |
| | | | | | | | | | | | | | | | |
| | | | |
Information Technology: 0.99% | | | | | | | | | | | | | | | | |
| | | | |
| Electronic Equipment, Instruments & Components: 0.23% | | | | | | | | | | | | | | | | |
Jabil Circuit Incorporated | | | 8.25 | | | | 3-15-2018 | | | | 250,000 | | | | 278,750 | |
| | | | | | | | | | | | | | | | |
| | | | |
| IT Services: 0.09% | | | | | | | | | | | | | | | | |
Fiserv Incorporated | | | 4.75 | | | | 6-15-2021 | | | | 100,000 | | | | 107,943 | |
| | | | | | | | | | | | | | | | |
| | | | |
| Software: 0.36% | | | | | | | | | | | | | | | | |
Oracle Corporation | | | 2.50 | | | | 5-15-2022 | | | | 220,000 | | | | 218,150 | |
Oracle Corporation | | | 3.40 | | | | 7-8-2024 | | | | 220,000 | | | | 224,248 | |
| | | | |
| | | | | | | | | | | | | | | 442,398 | |
| | | | | | | | | | | | | | | | |
| | | | |
| Technology Hardware, Storage & Peripherals: 0.31% | | | | | | | | | | | | | | | | |
Hewlett Packard Enterprise Company 144A | | | 4.90 | | | | 10-15-2025 | | | | 375,000 | | | | 370,245 | |
| | | | | | | | | | | | | | | | |
| | | | |
Materials: 1.47% | | | | | | | | | | | | | | | | |
| | | | |
| Chemicals: 0.37% | | | | | | | | | | | | | | | | |
Ecolab Incorporated | | | 4.35 | | | | 12-8-2021 | | | | 330,000 | | | | 354,872 | |
Valspar Corporation | | | 3.30 | | | | 2-1-2025 | | | | 100,000 | | | | 95,719 | |
| | | | |
| | | | | | | | | | | | | | | 450,591 | |
| | | | | | | | | | | | | | | | |
| | | | |
| Containers & Packaging: 0.57% | | | | | | | | | | | | | | | | |
Ball Corporation | | | 5.00 | | | | 3-15-2022 | | | | 350,000 | | | | 354,375 | |
Sealed Air Corporation 144A | | | 6.50 | | | | 12-1-2020 | | | | 300,000 | | | | 333,000 | |
| | | | |
| | | | | | | | | | | | | | | 687,375 | |
| | | | | | | | | | | | | | | | |
| | | | |
| Metals & Mining: 0.25% | | | | | | | | | | | | | | | | |
Alcoa Incorporated | | | 5.40 | | | | 4-15-2021 | | | | 300,000 | | | | 301,875 | |
| | | | | | | | | | | | | | | | |
| | | | |
| Paper & Forest Products: 0.28% | | | | | | | | | | | | | | | | |
Georgia Pacific LLC 144A | | | 3.73 | | | | 7-15-2023 | | | | 340,000 | | | | 343,665 | |
| | | | | | | | | | | | | | | | |
| | | | |
Telecommunication Services: 0.63% | | | | | | | | | | | | | | | | |
| | | | |
| Diversified Telecommunication Services: 0.63% | | | | | | | | | | | | | | | | |
AT&T Incorporated | | | 4.75 | | | | 5-15-2046 | | | | 280,000 | | | | 262,752 | |
Verizon Communications Incorporated | | | 3.50 | | | | 11-1-2024 | | | | 110,000 | | | | 110,391 | |
Verizon Communications Incorporated | | | 5.15 | | | | 9-15-2023 | | | | 350,000 | | | | 391,366 | |
| | | | |
| | | | | | | | | | | | | | | 764,509 | |
| | | | | | | | | | | | | | | | |
The accompanying notes are an integral part of these financial statements.
| | | | |
| 86 | | Wells Fargo Allocation Funds | | Portfolio of investments—November 30, 2015 (unaudited) |
MANAGED FIXED INCOME PORTFOLIO
| | | | | | | | | | | | | | | | |
| Security name | | Interest rate | | | Maturity date | | | Principal | | | Value | |
| | | | |
Utilities: 2.37% | | | | | | | | | | | | | | | | |
| | | | |
| Electric Utilities: 2.05% | | | | | | | | | | | | | | | | |
Entergy Texas Incorporated | | | 7.13 | % | | | 2-1-2019 | | | $ | 250,000 | | | $ | 284,867 | |
Great River Energy 144A | | | 5.83 | | | | 7-1-2017 | | | | 261,811 | | | | 269,417 | |
IPALCO Enterprises Incorporated | | | 3.45 | | | | 7-15-2020 | | | | 350,000 | | | | 344,750 | |
ITC Holdings Corporation | | | 3.65 | | | | 6-15-2024 | | | | 120,000 | | | | 119,028 | |
Monongahela Power Company 144A | | | 4.10 | | | | 4-15-2024 | | | | 380,000 | | | | 391,861 | |
Northern States Power Company of Wisconsin | | | 3.30 | | | | 6-15-2024 | | | | 370,000 | | | | 375,412 | |
Otter Tail Corporation (i) | | | 9.00 | | | | 12-15-2016 | | | | 350,000 | | | | 375,249 | |
PacifiCorp | | | 3.35 | | | | 7-1-2025 | | | | 130,000 | | | | 131,973 | |
Trans-Allegheny Interstate Line Company 144A | | | 3.85 | | | | 6-1-2025 | | | | 200,000 | | | | 200,930 | |
| | | | |
| | | | | | | | | | | | | | | 2,493,487 | |
| | | | | | | | | | | | | | | | |
| | | | |
| Gas Utilities: 0.32% | | | | | | | | | | | | | | | | |
AmeriGas Finance LLC | | | 7.00 | | | | 5-20-2022 | | | | 375,000 | | | | 386,250 | |
| | | | | | | | | | | | | | | | |
| | | | |
Total Corporate Bonds and Notes (Cost $38,171,537) | | | | | | | | | | | | | | | 38,610,899 | |
| | | | | | | | | | | | | | | | |
| | | | |
Municipal Obligations: 8.28% | | | | | | | | | | | | | | | | |
| | | | |
| Arizona: 0.94% | | | | | | | | | | | | | | | | |
Arizona School Facilities Board Refunding Certificates of Participation Series A-3 (Miscellaneous Revenue) | | | 2.38 | | | | 9-1-2019 | | | | 235,000 | | | | 235,872 | |
Maricopa County AZ Elementary School District #28 Kyrene Elementary Build America Bonds Series D (GO Revenue) | | | 5.38 | | | | 7-1-2019 | | | | 800,000 | | | | 904,832 | |
| | | | |
| | | | | | | | | | | | | | | 1,140,704 | |
| | | | | | | | | | | | | | | | |
| | | | |
| Arkansas: 0.30% | | | | | | | | | | | | | | | | |
Arkansas Taxable Bond Amendment 82 Series A (GO Revenue) | | | 2.61 | | | | 7-1-2021 | | | | 350,000 | | | | 362,268 | |
| | | | | | | | | | | | | | | | |
| | | | |
| California: 0.21% | | | | | | | | | | | | | | | | |
California Build America Bonds (GO Revenue) | | | 6.88 | | | | 11-1-2026 | | | | 200,000 | | | | 260,814 | |
| | | | | | | | | | | | | | | | |
| | | | |
| Georgia: 0.49% | | | | | | | | | | | | | | | | |
Cherokee County GA School System Build America Bonds (GO Revenue) | | | 5.87 | | | | 8-1-2028 | | | | 500,000 | | | | 592,395 | |
| | | | | | | | | | | | | | | | |
| | | | |
| Indiana: 0.34% | | | | | | | | | | | | | | | | |
Indiana Housing & CDA Series A-2 (Housing Revenue, GNMA/FNMA/FHLMC Insured) | | | 5.51 | | | | 1-1-2039 | | | | 110,000 | | | | 111,745 | |
Indianapolis In Local Public Improvement Bond Bank Build America Bonds (Miscellaneous Revenue) | | | 5.85 | | | | 1-15-2030 | | | | 250,000 | | | | 297,345 | |
| | | | |
| | | | | | | | | | | | | | | 409,090 | |
| | | | | | | | | | | | | | | | |
| | | | |
| Kentucky: 0.07% | | | | | | | | | | | | | | | | |
Kentucky Housing Corporation Series D (Housing Revenue) | | | 5.75 | | | | 7-1-2037 | | | | 85,000 | | | | 86,184 | |
| | | | | | | | | | | | | | | | |
| | | | |
| Maryland: 0.24% | | | | | | | | | | | | | | | | |
Baltimore County MD (GO Revenue) | | | 3.57 | | | | 8-1-2032 | | | | 300,000 | | | | 295,554 | |
| | | | | | | | | | | | | | | | |
| | | | |
| Massachusetts: 0.80% | | | | | | | | | | | | | | | | |
Boston MA Series C Qualified School Construction Bonds (GO Revenue) | | | 4.40 | | | | 4-1-2026 | | | | 400,000 | | | | 437,476 | |
Massachusetts Build America Bonds Series D (GO Revenue) | | | 4.50 | | | | 8-1-2031 | | | | 500,000 | | | | 539,250 | |
| | | | |
| | | | | | | | | | | | | | | 976,726 | |
| | | | | | | | | | | | | | | | |
The accompanying notes are an integral part of these financial statements.
| | | | | | |
| Portfolio of investments—November 30, 2015 (unaudited) | | Wells Fargo Allocation Funds | | | 87 | |
MANAGED FIXED INCOME PORTFOLIO
| | | | | | | | | | | | | | | | |
| Security name | | Interest rate | | | Maturity date | | | Principal | | | Value | |
| | | | |
| Minnesota: 0.24% | | | | | | | | | | | | | | | | |
Minnetonka MN Independent School District #276 Series E (GO Revenue, South Dakota Credit Program Insured) | | | 2.55 | % | | | 1-1-2024 | | | $ | 290,000 | | | $ | 287,898 | |
| | | | | | | | | | | | | | | | |
| | | | |
| Missouri: 0.30% | | | | | | | | | | | | | | | | |
Missouri Higher Education Loan Authority Notes Class A-1 (Education Revenue) ± | | | 1.24 | | | | 8-27-2029 | | | | 365,367 | | | | 362,444 | |
| | | | | | | | | | | | | | | | |
| | | | |
| New Hampshire: 0.02% | | | | | | | | | | | | | | | | |
New Hampshire HFA SFMR Series D (Housing Revenue) | | | 5.53 | | | | 7-1-2037 | | | | 25,000 | | | | 25,040 | |
| | | | | | | | | | | | | | | | |
| | | | |
| New Jersey: 0.99% | | | | | | | | | | | | | | | | |
Hudson County NJ Improvement Authority Hudson County Lease Project (Miscellaneous Revenue, AGM Insured) | | | 7.40 | | | | 12-1-2025 | | | | 1,030,000 | | | | 1,196,469 | |
| | | | | | | | | | | | | | | | |
| | | | |
| North Carolina: 0.31% | | | | | | | | | | | | | | | | |
Duke University North Carolina Series A (Education Revenue) | | | 5.85 | | | | 4-1-2037 | | | | 300,000 | | | | 371,901 | |
| | | | | | | | | | | | | | | | |
| | | | |
| Ohio: 0.54% | | | | | | | | | | | | | | | | |
Cuyahoga County OH Build America Bonds Series B (GO Revenue) | | | 6.03 | | | | 12-1-2034 | | | | 325,000 | | | | 394,180 | |
Ohio Veterans Compensation (GO Revenue) | | | 3.38 | | | | 10-1-2021 | | | | 250,000 | | | | 263,855 | |
| | | | |
| | | | | | | | | | | | | | | 658,035 | |
| | | | | | | | | | | | | | | | |
| | | | |
| Oklahoma: 0.33% | | | | | | | | | | | | | | | | |
Oklahoma Water Resource Board Revolving Fund Series A (Water & Sewer Revenue) | | | 3.27 | | | | 4-1-2023 | | | | 375,000 | | | | 395,490 | |
| | | | | | | | | | | | | | | | |
| | | | |
| Texas: 0.73% | | | | | | | | | | | | | | | | |
Clear Creek TX Independent School District Taxable Refunding Series B (GO Revenue) | | | 3.40 | | | | 2-15-2022 | | | | 375,000 | | | | 396,585 | |
Harris County TX Taxable Refunding Permanent Improvement Series B (GO Revenue) | | | 2.12 | | | | 10-1-2021 | | | | 500,000 | | | | 493,300 | |
| | | | |
| | | | | | | | | | | | | | | 889,885 | |
| | | | | | | | | | | | | | | | |
| | | | |
| Washington: 0.88% | | | | | | | | | | | | | | | | |
King County WA Build America Bonds Recovery Zone Economic Development Taxable Bond Series C (GO Revenue) | | | 5.03 | | | | 12-1-2023 | | | | 230,000 | | | | 261,597 | |
King County WA School District #210 Federal Way Build America Bonds (GO Revenue, AGM Insured) | | | 4.90 | | | | 12-1-2022 | | | | 400,000 | | | | 435,048 | |
Washington Build America Bonds (GO Revenue) | | | 5.09 | | | | 8-1-2033 | | | | 325,000 | | | | 373,711 | |
| | | | |
| | | | | | | | | | | | | | | 1,070,356 | |
| | | | | | | | | | | | | | | | |
| | | | |
| West Virginia: 0.45% | | | | | | | | | | | | | | | | |
Ohio County WV Special District Excise Tax Series A (Tax Revenue) | | | 8.25 | | | | 3-1-2035 | | | | 500,000 | | | | 546,425 | |
| | | | | | | | | | | | | | | | |
| | | | |
| Wisconsin: 0.10% | | | | | | | | | | | | | | | | |
Milwaukee County WI Taxable Pension Promissory Notes Series A (GO Revenue) | | | 6.84 | | | | 12-1-2028 | | | | 90,000 | | | | 115,988 | |
| | | | | | | | | | | | | | | | |
| | | | |
Total Municipal Obligations (Cost $9,494,402) | | | | | | | | | | | | | | | 10,043,666 | |
| | | | | | | | | | | | | | | | |
| | | | |
Non-Agency Mortgage-Backed Securities: 11.44% | | | | | | | | | | | | | | | | |
Commercial Mortgage Pass-Through Certificate Series 2010-C1 Class A3 144A | | | 4.21 | | | | 7-10-2046 | | | | 700,000 | | | | 752,225 | |
Commercial Mortgage Pass-Through Certificate Series 2012-CR2 Class A4 | | | 3.15 | | | | 8-15-2045 | | | | 550,000 | | | | 561,832 | |
Commercial Mortgage Pass-Through Certificate Series 2012-CR3 Class A3 | | | 2.82 | | | | 10-15-2045 | | | | 620,000 | | | | 620,337 | |
Commercial Mortgage Pass-Through Certificate Series 2013-CR12 Class ASB | | | 3.62 | | | | 10-10-2046 | | | | 550,000 | | | | 580,040 | |
Commercial Mortgage Pass-Through Certificate Series 2013-CR13 Class A4 ± | | | 4.19 | | | | 11-10-2023 | | | | 600,000 | | | | 646,695 | |
The accompanying notes are an integral part of these financial statements.
| | | | |
| 88 | | Wells Fargo Allocation Funds | | Portfolio of investments—November 30, 2015 (unaudited) |
MANAGED FIXED INCOME PORTFOLIO
| | | | | | | | | | | | | | | | |
| Security name | | Interest rate | | | Maturity date | | | Principal | | | Value | |
| | | | |
Non-Agency Mortgage-Backed Securities (continued) | | | | | | | | | | | | | | | | |
Credit Suisse First Boston Commercial Mortgage Trust Series 2004-AR5 Class 10A1 ± | | | 2.66 | % | | | 6-25-2034 | | | $ | 605,187 | | | $ | 614,025 | |
Credit Suisse First Boston Commercial Mortgage Trust Series 2007-C1 Class AAB | | | 5.34 | | | | 2-15-2040 | | | | 152,278 | | | | 153,384 | |
GE Equipment Transportation LLC Series 2015-1 Class A4 | | | 1.77 | | | | 5-23-2023 | | | | 500,000 | | | | 500,000 | |
GS Mortgage Securities Trust Series 2011-GC3 Class A4 144A | | | 4.75 | | | | 3-10-2044 | | | | 500,000 | | | | 547,482 | |
GS Mortgage Securities Trust Series 2011-GC5 Class A4 | | | 3.71 | | | | 8-10-2044 | | | | 545,000 | | | | 575,907 | |
GS Mortgage Securities Trust Series 2012-GCJ7 Class A4 | | | 3.38 | | | | 5-10-2045 | | | | 560,000 | | | | 580,210 | |
GS Mortgage Securities Trust Series 2013-GC10 Class AAB | | | 2.56 | | | | 2-10-2046 | | | | 212,500 | | | | 213,023 | |
GS Mortgage Securities Trust Series 2013-GC12 Class AAB | | | 2.68 | | | | 6-10-2046 | | | | 212,500 | | | | 213,837 | |
GS Mortgage Securities Trust Series 2013-GC14 Class A5 | | | 4.24 | | | | 8-10-2046 | | | | 615,000 | | | | 664,823 | |
GS Mortgage Securities Trust Series 2013-GC16 Class A4 | | | 4.27 | | | | 11-10-2046 | | | | 350,000 | | | | 379,015 | |
JPMorgan Chase Commercial Mortgage Securities Trust Series 2010-C2 Class A3 144A | | | 4.07 | | | | 11-15-2043 | | | | 395,000 | | | | 419,284 | |
JPMorgan Chase Commercial Mortgage Securities Trust Series 2013-C12 Class ASB | | | 3.16 | | | | 7-15-2045 | | | | 550,000 | | | | 565,455 | |
MMAF Equipment Finance LLC Series 2015-AA Class A4 144A | | | 1.93 | | | | 7-16-2021 | | | | 500,000 | | | | 499,862 | |
Morgan Stanley Bank of America Merrill Lynch Trust Series 2014-C15 Class ASB | | | 3.65 | | | | 4-15-2047 | | | | 550,000 | | | | 576,097 | |
Morgan Stanley Capital I Trust Series 2011-C2 Class A4 144A | | | 4.66 | | | | 6-15-2044 | | | | 500,000 | | | | 548,011 | |
Morgan Stanley Capital I Trust Series 2011-C3 Class A4 | | | 4.12 | | | | 7-15-2049 | | | | 530,000 | | | | 568,563 | |
Motel 6 Trust Series 2015-MTL6 Class B 144A | | | 3.30 | | | | 2-5-2030 | | | | 500,000 | | | | 496,972 | |
Nomura Asset Acceptance Corporation Series 2004-R2 Class A1 ±144A | | | 6.50 | | | | 10-25-2034 | | | | 1,040,007 | | | | 1,033,620 | |
Sequoia Mortgage Trust Series 10 Class 1A ± | | | 1.01 | | | | 10-20-2027 | | | | 283,045 | | | | 276,440 | |
Structured Asset Securities Corporation Series 2007-RM1 Class A1 ±144A(i)(a) | | | 0.50 | | | | 5-25-2047 | | | | 1,979,516 | | | | 1,296,583 | |
| | | | |
Total Non-Agency Mortgage-Backed Securities (Cost $14,551,101) | | | | | | | | | | | | | | | 13,883,722 | |
| | | | | | | | | | | | | | | | |
| | | | |
U.S. Treasury Securities: 5.75% | | | | | | | | | | | | | | | | |
TIPS | | | 0.38 | | | | 7-15-2025 | | | | 1,234,219 | | | | 1,207,413 | |
U.S. Treasury Bond | | | 2.50 | | | | 2-15-2045 | | | | 1,370,000 | | | | 1,235,889 | |
U.S. Treasury Bond | | | 2.88 | | | | 8-15-2045 | | | | 3,000,000 | | | | 2,933,085 | |
U.S. Treasury Bond | | | 3.00 | | | | 11-15-2045 | | | | 790,000 | | | | 792,564 | |
U.S. Treasury Note | | | 2.00 | | | | 8-15-2025 | | | | 830,000 | | | | 813,822 | |
| | | | |
Total U.S. Treasury Securities (Cost $7,067,568) | | | | | | | | | | | | | | | 6,982,773 | |
| | | | | | | | | | | | | | | | |
| | | | |
Yankee Corporate Bonds and Notes: 5.58% | | | | | | | | | | | | | | | | |
| | | | |
Consumer Discretionary: 0.29% | | | | | | | | | | | | | | | | |
| | | | |
| Media: 0.29% | | | | | | | | | | | | | | | | |
Pearson Dollar Finance Two plc 144A | | | 6.25 | | | | 5-6-2018 | | | | 325,000 | | | | 353,821 | |
| | | | | | | | | | | | | | | | |
| | | | |
Energy: 2.21% | | | | | | | | | | | | | | | | |
| | | | |
| Energy Equipment & Services: 0.45% | | | | | | | | | | | | | | | | |
Ensco plc | | | 4.70 | | | | 3-15-2021 | | | | 160,000 | | | | 139,872 | |
Schlumberger Norge AS 144A | | | 4.20 | | | | 1-15-2021 | | | | 380,000 | | | | 405,689 | |
| | | | |
| | | | | | | | | | | | | | | 545,561 | |
| | | | | | | | | | | | | | | | |
| | | | |
| Oil, Gas & Consumable Fuels: 1.76% | | | | | | | | | | | | | | | | |
BP Capital Markets plc | | | 3.81 | | | | 2-10-2024 | | | | 110,000 | | | | 113,226 | |
BP Capital Markets plc | | | 4.50 | | | | 10-1-2020 | | | | 350,000 | | | | 382,883 | |
Petroleos Mexicanos | | | 2.29 | | | | 2-15-2024 | | | | 233,750 | | | | 235,575 | |
Petroleos Mexicanos | | | 2.83 | | | | 2-15-2024 | | | | 488,750 | | | | 503,123 | |
Petroleos Mexicanos | | | 6.38 | | | | 1-23-2045 | | | | 250,000 | | | | 231,875 | |
Statoil ASA | | | 3.25 | | | | 11-10-2024 | | | | 310,000 | | | | 310,458 | |
The accompanying notes are an integral part of these financial statements.
| | | | | | |
| Portfolio of investments—November 30, 2015 (unaudited) | | Wells Fargo Allocation Funds | | | 89 | |
MANAGED FIXED INCOME PORTFOLIO
| | | | | | | | | | | | | | | | |
| Security name | | Interest rate | | | Maturity date | | | Principal | | | Value | |
| | | | |
| Oil, Gas & Consumable Fuels (continued) | | | | | | | | | | | | | | | | |
Total Capital International SA | | | 3.70 | % | | | 1-15-2024 | | | $ | 200,000 | | | $ | 207,068 | |
Weatherford International Limited | | | 4.50 | | | | 4-15-2022 | | | | 190,000 | | | | 149,150 | |
| | | | |
| | | | | | | | | | | | | | | 2,133,358 | |
| | | | | | | | | | | | | | | | |
| | | | |
Financials: 1.06% | | | | | | | | | | | | | | | | |
| | | | |
| Banks: 0.21% | | | | | | | | | | | | | | | | |
Credit Suisse AG (New York) | | | 3.63 | | | | 9-9-2024 | | | | 250,000 | | | | 252,148 | |
| | | | | | | | | | | | | | | | |
| | | | |
| Diversified Financial Services: 0.85% | | | | | | | | | | | | | | | | |
Shell International Finance BV | | | 3.25 | | | | 5-11-2025 | | | | 200,000 | | | | 198,938 | |
Shell International Finance BV | | | 3.40 | | | | 8-12-2023 | | | | 370,000 | | | | 377,208 | |
Tyco Electronics Group SA | | | 3.50 | | | | 2-3-2022 | | | | 450,000 | | | | 459,351 | |
| | | | |
| | | | | | | | | | | | | | | 1,035,497 | |
| | | | | | | | | | | | | | | | |
| | | | |
Health Care: 0.19% | | | | | | | | | | | | | | | | |
| | | | |
| Pharmaceuticals: 0.19% | | | | | | | | | | | | | | | | |
Actavis Funding SCS | | | 4.55 | | | | 3-15-2035 | | | | 230,000 | | | | 226,258 | |
| | | | | | | | | | | | | | | | |
| | | | |
Industrials: 0.53% | | | | | | | | | | | | | | | | |
| | | | |
| Aerospace & Defense: 0.41% | | | | | | | | | | | | | | | | |
BAE Systems plc 144A | | | 4.75 | | | | 10-11-2021 | | | | 470,000 | | | | 502,533 | |
| | | | | | | | | | | | | | | | |
| | | | |
| Road & Rail: 0.12% | | | | | | | | | | | | | | | | |
Canadian Pacific Railway Company | | | 2.90 | | | | 2-1-2025 | | | | 150,000 | | | | 141,156 | |
| | | | | | | | | | | | | | | | |
| | | | |
Information Technology: 0.54% | | | | | | | | | | | | | | | | |
| | | | |
| Semiconductors & Semiconductor Equipment: 0.31% | | | | | | | | | | | | | | | | |
TSMC Global Limited 144A | | | 1.63 | | | | 4-3-2018 | | | | 380,000 | | | | 373,134 | |
| | | | | | | | | | | | | | | | |
| | | | |
| Technology Hardware, Storage & Peripherals: 0.23% | | | | | | | | | | | | | | | | |
Seagate HDD (Cayman) | | | 4.75 | | | | 6-1-2023 | | | | 325,000 | | | | 287,064 | |
| | | | | | | | | | | | | | | | |
| | | | |
Materials: 0.44% | | | | | | | | | | | | | | | | |
| | | | |
| Metals & Mining: 0.44% | | | | | | | | | | | | | | | | |
Rio Tinto Finance (USA) Limited | | | 3.75 | | | | 9-20-2021 | | | | 370,000 | | | | 376,794 | |
Teck Resources Limited | | | 3.00 | | | | 3-1-2019 | | | | 240,000 | | | | 161,550 | |
| | | | |
| | | | | | | | | | | | | | | 538,344 | |
| | | | | | | | | | | | | | | | |
| | | | |
Telecommunication Services: 0.32% | | | | | | | | | | | | | | | | |
| | | | |
| Wireless Telecommunication Services: 0.32% | | | | | | | | | | | | | | | | |
Rogers Communications Incorporated | | | 4.10 | | | | 10-1-2023 | | | | 370,000 | | | | 385,614 | |
| | | | | | | | | | | | | | | | |
| | | | |
Total Yankee Corporate Bonds and Notes (Cost $6,817,312) | | | | | | | | | | | | | | | 6,774,488 | |
| | | | | | | | | | | | | | | | |
| | | | |
Yankee Government Bonds: 0.80% | | | | | | | | | | | | | | | | |
Hashemite Kingdom of Jordan | | | 3.00 | | | | 6-30-2025 | | | | 950,000 | | | | 975,693 | |
| | | | | | | | | | | | | | | | |
| | | | |
Total Yankee Government Bonds (Cost $950,000) | | | | | | | | | | | | | | | 975,693 | |
| | | | | | | | | | | | | | | | |
The accompanying notes are an integral part of these financial statements.
| | | | |
| 90 | | Wells Fargo Allocation Funds | | Portfolio of investments—November 30, 2015 (unaudited) |
MANAGED FIXED INCOME PORTFOLIO
| | | | | | | | | | | | | | |
| Security name | | Yield | | | | | Shares | | | Value | |
| Short-Term Investments: 3.67% | | | | | | | | | | | | | | |
| | | | |
| Investment Companies: 3.67% | | | | | | | | | | | | | | |
Securities Lending Cash Investments, LLC (l)(r)(u) | | | 0.18 | % | | | | | 236,500 | | | $ | 236,500 | |
Wells Fargo Cash Investment Money Market Fund, Select Class (l)(u)## | | | 0.17 | | | | | | 4,211,422 | | | | 4,211,422 | |
| | | | |
Total Short-Term Investments (Cost $4,447,922) | | | | | | | | | | | | | 4,447,922 | |
| | | | | | | | | | | | | | |
| | | | | | | | |
| Total investments in securities (Cost $120,793,298) * | | | 100.68 | % | | | 122,177,616 | |
Other assets and liabilities, net | | | (0.68 | ) | | | (821,055 | ) |
| | | | | | | | |
| Total net assets | | | 100.00 | % | | $ | 121,356,561 | |
| | | | | | | | |
| (a) | The security is fair valued in accordance with procedures approved by the Board of Trustees. |
| ± | Variable rate investment. The rate shown is the rate in effect at period end. |
| 144A | The security may be resold in transactions exempt from registration, normally to qualified institutional buyers, pursuant to Rule 144A under the Securities Act of 1933. |
| %% | The security is issued on a when-issued basis. |
| « | All or a portion of this security is on loan. |
| (l) | The issuer of the security is an affiliated person of the Portfolio as defined in the Investment Company Act of 1940. |
| (r) | The investment is a non-registered investment vehicle purchased with cash collateral received from securities on loan. |
| (u) | The rate represents the 7-day annualized yield at period end. |
| ## | All or a portion of this security is segregated for when-issued securities. |
| * | Cost for federal income tax purposes is $120,803,524 and unrealized gains (losses) consists of: |
| | | | |
Gross unrealized gains | | $ | 3,456,556 | |
Gross unrealized losses | | | (2,082,464 | ) |
| | | | |
Net unrealized gains | | $ | 1,374,092 | |
The accompanying notes are an integral part of these financial statements.
| | | | | | |
| Portfolio of investments—November 30, 2015 (unaudited) | | Wells Fargo Allocation Funds | | | 91 | |
REAL RETURN PORTFOLIO
| | | | | | | | | | | | |
| Security name | | | | | | Shares | | | Value | |
| | | | |
Common Stocks: 12.58% | | | | | | | | | | | | |
| | | | |
Consumer Staples: 1.53% | | | | | | | | | | | | |
| | | | |
| Food Products: 0.70% | | | | | | | | | | | | |
Biostime International Holdings Limited | | | | | | | 176,000 | | | $ | 296,456 | |
Marine Harvest ASA | | | | | | | 4,555 | | | | 61,586 | |
| | | | |
| | | | | | | | | | | 358,042 | |
| | | | | | | | | | | | |
| | | | |
| Household Products: 0.83% | | | | | | | | | | | | |
Reckitt Benckiser Group plc | | | | | | | 4,568 | | | | 428,615 | |
| | | | | | | | | | | | |
| | | | |
Energy: 2.16% | | | | | | | | | | | | |
| | | | |
| Oil, Gas & Consumable Fuels: 2.16% | | | | | | | | | | | | |
BP plc | | | | | | | 101,076 | | | | 586,468 | |
Eni SpA | | | | | | | 32,056 | | | | 522,256 | |
| | | | |
| | | | | | | | | | | 1,108,724 | |
| | | | | | | | | | | | |
| | | | |
Financials: 4.48% | | | | | | | | | | | | |
| | | | |
| REITs: 4.48% | | | | | | | | | | | | |
American Tower Corporation | | | | | | | 3,884 | | | | 385,992 | |
AvalonBay Communities Incorporated | | | | | | | 1,488 | | | | 270,504 | |
Boston Properties Incorporated | | | | | | | 1,800 | | | | 224,982 | |
General Growth Properties Incorporated | | | | | | | 9,274 | | | | 236,209 | |
Host Hotels & Resorts Incorporated | | | | | | | 9,905 | | | | 164,423 | |
Mid-America Apartment Communities Incorporated | | | | | | | 1,710 | | | | 151,438 | |
Physicians Realty Trust | | | | | | | 8,414 | | | | 134,708 | |
Prologis Incorporated | | | | | | | 3,676 | | | | 157,149 | |
Public Storage Incorporated | | | | | | | 916 | | | | 219,895 | |
Simon Property Group Incorporated | | | | | | | 1,345 | | | | 250,493 | |
Ventas Incorporated | | | | | | | 1,922 | | | | 102,519 | |
| | | | |
| | | | | | | | | | | 2,298,312 | |
| | | | | | | | | | | | |
| | | | |
| Materials: 4.41% | | | | | | | | | | | | |
| | | | |
| Chemicals: 2.60% | | | | | | | | | | | | |
Akzo Nobel NV | | | | | | | 8,858 | | | | 630,042 | |
Nitto Denko Corporation | | | | | | | 10,400 | | | | 700,881 | |
| | | | |
| | | | | | | | | | | 1,330,923 | |
| | | | | | | | | | | | |
| | | | |
| Metals & Mining: 1.81% | | | | | | | | | | | | |
Agnico-Eagle Mines Limited-U.S. Exchange Traded Shares | | | | | | | 6,000 | | | | 158,700 | |
Detour Gold Corporation † | | | | | | | 4,400 | | | | 45,830 | |
Franco-Nevada Corporation | | | | | | | 2,050 | | | | 98,536 | |
Fresnillo plc | | | | | | | 7,800 | | | | 83,995 | |
Goldcorp Incorporated-U.S. Exchange Traded Shares | | | | | | | 12,000 | | | | 141,720 | |
Newmont Mining Corporation | | | | | | | 6,600 | | | | 121,506 | |
Randgold Resources Limited ADR « | | | | | | | 2,850 | | | | 172,710 | |
The accompanying notes are an integral part of these financial statements.
| | | | |
| 92 | | Wells Fargo Allocation Funds | | Portfolio of investments—November 30, 2015 (unaudited) |
REAL RETURN PORTFOLIO
| | | | | | | | | | | | | | | | |
| Security name | | | | | | | | Shares | | | Value | |
| | | | |
| Metals & Mining (continued) | | | | | | | | | | | | | | | | |
Royal Gold Incorporated | | | | | | | | | | | 1,760 | | | $ | 63,272 | |
Tahoe Resources Incorporated | | | | | | | | | | | 4,800 | | | | 42,233 | |
| | | | |
| | | | | | | | | | | | | | | 928,502 | |
| | | | | | | | | | | | | | | | |
| | | | |
Total Common Stocks (Cost $6,733,020) | | | | | | | | | | | | | | | 6,453,118 | |
| | | | | | | | | | | | | | | | |
| | | | |
| | | Interest rate | | | Maturity date | | | Principal | | | | |
| | | | |
Corporate Bonds and Notes: 10.08% | | | | | | | | | | | | | | | | |
| | | | |
Consumer Discretionary: 3.56% | | | | | | | | | | | | | | | | |
| | | | |
| Auto Components: 0.50% | | | | | | | | | | | | | | | | |
Goodyear Tire & Rubber Company | | | 8.25 | % | | | 8-15-2020 | | | $ | 125,000 | | | | 130,213 | |
Tenneco Incorporated | | | 6.88 | | | | 12-15-2020 | | | | 125,000 | | | | 129,375 | |
| | | | |
| | | | | | | | | | | | | | | 259,588 | |
| | | | | | | | | | | | | | | | |
| | | | |
| Diversified Consumer Services: 0.15% | | | | | | | | | | | | | | | | |
Service Corporation International | | | 7.00 | | | | 6-15-2017 | | | | 70,000 | | | | 75,250 | |
| | | | | | | | | | | | | | | | |
| | | | |
| Hotels, Restaurants & Leisure: 0.32% | | | | | | | | | | | | | | | | |
Hilton Worldwide Finance LLC | | | 5.63 | | | | 10-15-2021 | | | | 50,000 | | | | 52,060 | |
MGM Resorts International | | | 7.63 | | | | 1-15-2017 | | | | 105,000 | | | | 110,775 | |
| | | | |
| | | | | | | | | | | | | | | 162,835 | |
| | | | | | | | | | | | | | | | |
| | | | |
| Household Durables: 0.72% | | | | | | | | | | | | | | | | |
DR Horton Incorporated | | | 3.63 | | | | 2-15-2018 | | | | 135,000 | | | | 136,688 | |
Jarden Corporation | | | 7.50 | | | | 5-1-2017 | | | | 120,000 | | | | 128,100 | |
Tempur Sealy International Incorporated | | | 6.88 | | | | 12-15-2020 | | | | 100,000 | | | | 105,875 | |
| | | | |
| | | | | | | | | | | | | | | 370,663 | |
| | | | | | | | | | | | | | | | |
| | | | |
| Media: 0.91% | | | | | | | | | | | | | | | | |
CCO Holdings LLC | | | 7.38 | | | | 6-1-2020 | | | | 125,000 | | | | 130,313 | |
CSC Holdings LLC | | | 7.63 | | | | 7-15-2018 | | | | 75,000 | | | | 78,375 | |
DISH DBS Corporation | | | 4.25 | | | | 4-1-2018 | | | | 130,000 | | | | 129,350 | |
Gannett Company Incorporated | | | 5.13 | | | | 10-15-2019 | | | | 50,000 | | | | 52,000 | |
Nexstar Broadcasting Group Incorporated | | | 6.88 | | | | 11-15-2020 | | | | 75,000 | | | | 76,406 | |
| | | | |
| | | | | | | | | | | | | | | 466,444 | |
| | | | | | | | | | | | | | | | |
| | | | |
| Specialty Retail: 0.71% | | | | | | | | | | | | | | | | |
Best Buy Company Incorporated | | | 5.00 | | | | 8-1-2018 | | | | 100,000 | | | | 104,000 | |
Limited Brands Incorporated | | | 6.90 | | | | 7-15-2017 | | | | 120,000 | | | | 128,850 | |
Sally Holdings Incorporated | | | 6.88 | | | | 11-15-2019 | | | | 125,000 | | | | 129,525 | |
| | | | |
| | | | | | | | | | | | | | | 362,375 | |
| | | | | | | | | | | | | | | | |
| | | | |
| Textiles, Apparel & Luxury Goods: 0.25% | | | | | | | | | | | | | | | | |
HanesBrands Incorporated | | | 6.38 | | | | 12-15-2020 | | | | 125,000 | | | | 129,219 | |
| | | | | | | | | | | | | | | | |
The accompanying notes are an integral part of these financial statements.
| | | | | | |
| Portfolio of investments—November 30, 2015 (unaudited) | | Wells Fargo Allocation Funds | | | 93 | |
REAL RETURN PORTFOLIO
| | | | | | | | | | | | | | | | |
| Security name | | Interest rate | | | Maturity date | | | Principal | | | Value | |
| | | | |
Consumer Staples: 0.50% | | | | | | | | | | | | | | | | |
| | | | |
| Food Products: 0.25% | | | | | | | | | | | | | | | | |
Smithfield Foods Incorporated | | | 7.75 | % | | | 7-1-2017 | | | $ | 120,000 | | | $ | 128,850 | |
| | | | | | | | | | | | | | | | |
| | | | |
| Household Products: 0.25% | | | | | | | | | | | | | | | | |
Spectrum Brands Incorporated | | | 6.38 | | | | 11-15-2020 | | | | 120,000 | | | | 128,400 | |
| | | | | | | | | | | | | | | | |
| | | | |
Energy: 1.03% | | | | | | | | | | | | | | | | |
| | | | |
| Energy Equipment & Services: 0.38% | | | | | | | | | | | | | | | | |
SESI LLC | | | 6.38 | | | | 5-1-2019 | | | | 70,000 | | | | 68,075 | |
Targa Resources Partners 144A | | | 5.00 | | | | 1-15-2018 | | | | 130,000 | | | | 127,725 | |
| | | | |
| | | | | | | | | | | | | | | 195,800 | |
| | | | | | | | | | | | | | | | |
| | | | |
| Oil, Gas & Consumable Fuels: 0.65% | | | | | | | | | | | | | | | | |
Kinder Morgan Incorporated | | | 7.00 | | | | 6-15-2017 | | | | 60,000 | | | | 62,550 | |
Sabine Pass LNG LP | | | 7.50 | | | | 11-30-2016 | | | | 65,000 | | | | 66,300 | |
Tesoro Corporation | | | 4.25 | | | | 10-1-2017 | | | | 65,000 | | | | 66,463 | |
Tesoro Logistics LP | | | 5.88 | | | | 10-1-2020 | | | | 65,000 | | | | 66,788 | |
WPX Energy Incorporated | | | 5.25 | | | | 1-15-2017 | | | | 70,000 | | | | 69,300 | |
| | | | |
| | | | | | | | | | | | | | | 331,401 | |
| | | | | | | | | | | | | | | | |
| | | | |
Financials: 1.50% | | | | | | | | | | | | | | | | |
| | | | |
| Banks: 0.26% | | | | | | | | | | | | | | | | |
CIT Group Incorporated | | | 4.25 | | | | 8-15-2017 | | | | 130,000 | | | | 132,560 | |
| | | | | | | | | | | | | | | | |
| | | | |
| Consumer Finance: 1.05% | | | | | | | | | | | | | | | | |
Ally Financial Incorporated | | | 6.25 | | | | 12-1-2017 | | | | 125,000 | | | | 131,875 | |
General Motors Financial Company Incorporated | | | 3.25 | | | | 5-15-2018 | | | | 135,000 | | | | 136,279 | |
SLM Corporation | | | 4.63 | | | | 9-25-2017 | | | | 130,000 | | | | 130,000 | |
Toll Brothers Finance Corporation | | | 4.00 | | | | 12-31-2018 | | | | 135,000 | | | | 139,725 | |
| | | | |
| | | | | | | | | | | | | | | 537,879 | |
| | | | | | | | | | | | | | | | |
| | | | |
| REITs: 0.19% | | | | | | | | | | | | | | | | |
ARC Properties Operating Partnership LP | | | 2.00 | | | | 2-6-2017 | | | | 100,000 | | | | 98,750 | |
| | | | | | | | | | | | | | | | |
| | | | |
Health Care: 0.52% | | | | | | | | | | | | | | | | |
| | | | |
| Health Care Providers & Services: 0.52% | | | | | | | | | | | | | | | | |
Fresenius Medical Care Holdings Incorporated | | | 6.88 | | | | 7-15-2017 | | | | 125,000 | | | | 134,375 | |
HCA Incorporated | | | 8.00 | | | | 10-1-2018 | | | | 115,000 | | | | 129,088 | |
| | | | |
| | | | | | | | | | | | | | | 263,463 | |
| | | | | | | | | | | | | | | | |
| | | | |
Industrials: 0.93% | | | | | | | | | | | | | | | | |
| | | | |
| Building Products: 0.18% | | | | | | | | | | | | | | | | |
USG Corporation | | | 9.75 | | | | 1-15-2018 | | | | 80,000 | | | | 89,800 | |
| | | | | | | | | | | | | | | | |
| | | | |
| Diversified Consumer Services: 0.13% | | | | | | | | | | | | | | | | |
ADT Corporation | | | 2.25 | | | | 7-15-2017 | | | | 70,000 | | | | 69,125 | |
| | | | | | | | | | | | | | | | |
The accompanying notes are an integral part of these financial statements.
| | | | |
| 94 | | Wells Fargo Allocation Funds | | Portfolio of investments—November 30, 2015 (unaudited) |
REAL RETURN PORTFOLIO
| | | | | | | | | | | | | | | | |
| Security name | | Interest rate | | | Maturity date | | | Principal | | | Value | |
| | | | |
| Machinery: 0.36% | | | | | | | | | | | | | | | | |
Case New Holland Industrial Incorporated | | | 7.88 | % | | | 12-1-2017 | | | $ | 65,000 | | | $ | 69,540 | |
Manitowoc Company Incorporated | | | 8.50 | | | | 11-1-2020 | | | | 30,000 | | | | 31,200 | |
SPX Flow Incorporated | | | 6.88 | | | | 9-1-2017 | | | | 80,000 | | | | 84,600 | |
| | | | |
| | | | | | | | | | | | | | | 185,340 | |
| | | | | | | | | | | | | | | | |
| | | | |
| Trading Companies & Distributors: 0.26% | | | | | | | | | | | | | | | | |
United Rentals North America Incorporated | | | 7.38 | | | | 5-15-2020 | | | | 125,000 | | | | 132,500 | |
| | | | | | | | | | | | | | | | |
| | | | |
Information Technology: 0.46% | | | | | | | | | | | | | | | | |
| | | | |
| Communications Equipment: 0.20% | | | | | | | | | | | | | | | | |
ViaSat Incorporated | | | 6.88 | | | | 6-15-2020 | | | | 100,000 | | | | 103,761 | |
| | | | | | | | | | | | | | | | |
| | | | |
| Internet Software & Services: 0.26% | | | | | | | | | | | | | | | | |
IAC/InterActiveCorp | | | 4.88 | | | | 11-30-2018 | | | | 130,000 | | | | 133,088 | |
| | | | | | | | | | | | | | | | |
| | | | |
Materials: 0.70% | | | | | | | | | | | | | | | | |
| | | | |
| Chemicals: 0.16% | | | | | | | | | | | | | | | | |
Ashland Incorporated | | | 3.88 | | | | 4-15-2018 | | | | 80,000 | | | | 81,900 | |
| | | | | | | | | | | | | | | | |
| | | | |
| Containers & Packaging: 0.51% | | | | | | | | | | | | | | | | |
Crown Americas LLC | | | 6.25 | | | | 2-1-2021 | | | | 125,000 | | | | 129,214 | |
Owens-Illinois Incorporated | | | 7.80 | | | | 5-15-2018 | | | | 120,000 | | | | 133,200 | |
| | | | |
| | | | | | | | | | | | | | | 262,414 | |
| | | | | | | | | | | | | | | | |
| | | | |
| Metals & Mining: 0.03% | | | | | | | | | | | | | | | | |
US Steel Corporation | | | 7.00 | | | | 2-1-2018 | | | | 25,000 | | | | 15,500 | |
| | | | | | | | | | | | | | | | |
| | | | |
Telecommunication Services: 0.64% | | | | | | | | | | | | | | | | |
| | | | |
| Diversified Telecommunication Services: 0.28% | | | | | | | | | | | | | | | | |
Frontier Communications Corporation | | | 8.13 | | | | 10-1-2018 | | | | 60,000 | | | | 62,775 | |
Hughes Satelite Systems Corporation | | | 6.50 | | | | 6-15-2019 | | | | 75,000 | | | | 81,000 | |
| | | | |
| | | | | | | | | | | | | | | 143,775 | |
| | | | | | | | | | | | | | | | |
| | | | |
| Wireless Telecommunication Services: 0.36% | | | | | | | | | | | | | | | | |
SBA Communications Corporation | | | 5.63 | | | | 10-1-2019 | | | | 80,000 | | | | 83,200 | |
T-Mobile USA Incorporated | | | 6.46 | | | | 4-28-2019 | | | | 100,000 | | | | 102,750 | |
| | | | |
| | | | | | | | | | | | | | | 185,950 | |
| | | | | | | | | | | | | | | | |
| | | | |
Utilities: 0.24% | | | | | | | | | | | | | | | | |
| | | | |
| Independent Power & Renewable Electricity Producers: 0.24% | | | | | | | | | | | | | | | | |
NRG Energy Incorporated | | | 7.63 | | | | 1-15-2018 | | | | 120,000 | | | | 124,800 | |
| | | | | | | | | | | | | | | | |
| | | | |
Total Corporate Bonds and Notes (Cost $5,227,053) | | | | | | | | | | | | | | | 5,171,430 | |
| | | | | | | | | | | | | | | | |
| | | | |
Loans: 4.07% | | | | | | | | | | | | | | | | |
| | | | |
Consumer Discretionary: 0.43% | | | | | | | | | | | | | | | | |
| | | | |
| Media: 0.17% | | | | | | | | | | | | | | | | |
Virgin Media Investment Holdings Limited ± | | | 3.50 | | | | 6-30-2023 | | | | 90,898 | | | | 89,444 | |
| | | | | | | | | | | | | | | | |
The accompanying notes are an integral part of these financial statements.
| | | | | | |
| Portfolio of investments—November 30, 2015 (unaudited) | | Wells Fargo Allocation Funds | | | 95 | |
REAL RETURN PORTFOLIO
| | | | | | | | | | | | | | | | |
| Security name | | Interest rate | | | Maturity date | | | Principal | | | Value | |
| | | | |
| Multiline Retail: 0.26% | | | | | | | | | | | | | | | | |
Michaels Stores Incorporated ± | | | 3.75 | % | | | 1-28-2020 | | | $ | 133,629 | | | $ | 132,245 | |
| | | | | | | | | | | | | | | | |
| | | | |
Financials: 0.26% | | | | | | | | | | | | | | | | |
| | | | |
| Diversified Financial Services: 0.26% | | | | | | | | | | | | | | | | |
Delos Finance SARL ± | | | 3.50 | | | | 3-6-2021 | | | | 135,000 | | | | 134,353 | |
| | | | | | | | | | | | | | | | |
| | | | |
Health Care: 0.51% | | | | | | | | | | | | | | | | |
| | | | |
| Health Care Providers & Services: 0.40% | | | | | | | | | | | | | | | | |
Community Health Systems Incorporated ± | | | 3.66 | | | | 12-31-2018 | | | | 133,987 | | | | 131,441 | |
Iasis Healthcare LLC ± | | | 4.50 | | | | 5-3-2018 | | | | 74,616 | | | | 73,451 | |
| | | | |
| | | | | | | | | | | | | | | 204,892 | |
| | | | | | | | | | | | | | | | |
| | | | |
| Pharmaceuticals: 0.11% | | | | | | | | | | | | | | | | |
Valeant Pharmaceuticals International Incorporated ± | | | 3.50 | | | | 2-13-2019 | | | | 60,000 | | | | 56,475 | |
| | | | | | | | | | | | | | | | |
| | | | |
Industrials: 1.46% | | | | | | | | | | | | | | | | |
| | | | |
| Aerospace & Defense: 0.23% | | | | | | | | | | | | | | | | |
TransDigm Incorporated ± | | | 3.75 | | | | 2-28-2020 | | | | 119,134 | | | | 116,057 | |
| | | | | | | | | | | | | | | | |
| | | | |
| Airlines: 0.26% | | | | | | | | | | | | | | | | |
Delta Air Lines Incorporated ± | | | 3.25 | | | | 8-24-2022 | | | | 135,000 | | | | 134,606 | |
| | | | | | | | | | | | | | | | |
| | | | |
| Commercial Services & Supplies: 0.78% | | | | | | | | | | | | | | | | |
Hertz Corporation ± | | | 3.00 | | | | 3-11-2018 | | | | 133,629 | | | | 131,709 | |
KAR Auction Services Incorporated ± | | | 3.50 | | | | 3-11-2021 | | | | 133,477 | | | | 132,643 | |
ServiceMaster Company ± | | | 4.25 | | | | 7-1-2021 | | | | 133,985 | | | | 133,052 | |
| | | | |
| | | | | | | | | | | | | | | 397,404 | |
| | | | | | | | | | | | | | | | |
| | | | |
| Diversified Consumer Services: 0.19% | | | | | | | | | | | | | | | | |
NXP BV ±< | | | 0.00 | | | | 10-30-2020 | | | | 100,000 | | | | 99,375 | |
| | | | | | | | | | | | | | | | |
| | | | |
Information Technology: 0.38% | | | | | | | | | | | | | | | | |
| | | | |
| Communications Equipment: 0.25% | | | | | | | | | | | | | | | | |
Cequel Communications LLC ± | | | 3.50 | | | | 2-14-2019 | | | | 130,495 | | | | 128,537 | |
| | | | | | | | | | | | | | | | |
| | | | |
| Internet Software & Services: 0.13% | | | | | | | | | | | | | | | | |
Zayo Group LLC ± | | | 3.75 | | | | 5-6-2021 | | | | 69,472 | | | | 68,614 | |
| | | | | | | | | | | | | | | | |
| | | | |
Materials: 0.51% | | | | | | | | | | | | | | | | |
| | | | |
| Chemicals: 0.25% | | | | | | | | | | | | | | | | |
Ineos US Finance LLC ± | | | 3.75 | | | | 12-15-2020 | | | | 133,646 | | | | 129,053 | |
| | | | | | | | | | | | | | | | |
| | | | |
| Containers & Packaging: 0.26% | | | | | | | | | | | | | | | | |
Berry Plastics Group Incorporated ± | | | 3.50 | | | | 2-8-2020 | | | | 133,629 | | | | 131,068 | |
| | | | | | | | | | | | | | | | |
The accompanying notes are an integral part of these financial statements.
| | | | |
| 96 | | Wells Fargo Allocation Funds | | Portfolio of investments—November 30, 2015 (unaudited) |
REAL RETURN PORTFOLIO
| | | | | | | | | | | | | | | | |
| Security name | | Interest rate | | | Maturity date | | | Principal | | | Value | |
| | | | |
Telecommunication Services: 0.52% | | | | | | | | | | | | | | | | |
| | | | |
| Diversified Telecommunication Services: 0.52% | | | | | | | | | | | | | | | | |
Level 3 Financing Incorporated ± | | | 3.50 | % | | | 5-31-2022 | | | $ | 135,000 | | | $ | 133,583 | |
West Corporation ± | | | 3.25 | | | | 6-30-2018 | | | | 135,000 | | | | 132,806 | |
| | | | |
| | | | | | | | | | | | | | | 266,389 | |
| | | | | | | | | | | | | | | | |
| | | | |
Total Loans (Cost $2,112,047) | | | | | | | | | | | | | | | 2,088,512 | |
| | | | | | | | | | | | | | | | |
| | | | |
U.S. Treasury Securities: 65.92% | | | | | | | | | | | | | | | | |
TIPS | | | 0.13 | | | | 4-15-2017 | | | | 670,509 | | | | 669,636 | |
TIPS | | | 0.13 | | | | 4-15-2018 | | | | 1,410,278 | | | | 1,410,260 | |
TIPS | | | 0.13 | | | | 4-15-2019 | | | | 2,142,747 | | | | 2,136,750 | |
TIPS | | | 0.13 | | | | 4-15-2020 | | | | 975,485 | | | | 967,458 | |
TIPS | | | 0.13 | | | | 1-15-2022 | | | | 1,534,971 | | | | 1,499,155 | |
TIPS | | | 0.13 | | | | 7-15-2022 | | | | 1,671,137 | | | | 1,633,580 | |
TIPS | | | 0.13 | | | | 1-15-2023 | | | | 1,448,429 | | | | 1,400,524 | |
TIPS | | | 0.13 | | | | 7-15-2024 | | | | 1,538,300 | | | | 1,475,407 | |
TIPS | | | 0.25 | | | | 1-15-2025 | | | | 1,557,223 | | | | 1,501,219 | |
TIPS | | | 0.38 | | | | 7-15-2023 | | | | 1,451,964 | | | | 1,431,716 | |
TIPS | | | 0.38 | | | | 7-15-2025 | | | | 1,364,665 | | | | 1,335,026 | |
TIPS | | | 0.63 | | | | 7-15-2021 | | | | 1,414,759 | | | | 1,435,538 | |
TIPS | | | 0.63 | | | | 1-15-2024 | | | | 1,499,150 | | | | 1,496,748 | |
TIPS | | | 0.63 | | | | 2-15-2043 | | | | 445,050 | | | | 384,829 | |
TIPS | | | 0.75 | | | | 2-15-2042 | | | | 679,243 | | | | 609,497 | |
TIPS | | | 0.75 | | | | 2-15-2045 | | | | 884,196 | | | | 787,740 | |
TIPS | | | 1.13 | | | | 1-15-2021 | | | | 1,321,665 | | | | 1,372,328 | |
TIPS | | | 1.25 | | | | 7-15-2020 | | | | 976,552 | | | | 1,021,515 | |
TIPS | | | 1.38 | | | | 7-15-2018 | | | | 1,064,868 | | | | 1,105,674 | |
TIPS | | | 1.38 | | | | 1-15-2020 | | | | 632,730 | | | | 661,409 | |
TIPS | | | 1.38 | | | | 2-15-2044 | | | | 755,555 | | | | 785,581 | |
TIPS | | | 1.63 | | | | 1-15-2018 | | | | 613,359 | | | | 634,124 | |
TIPS | | | 1.75 | | | | 1-15-2028 | | | | 675,831 | | | | 749,952 | |
TIPS | | | 1.88 | | | | 7-15-2019 | | | | 523,796 | | | | 558,102 | |
TIPS | | | 2.00 | | | | 1-15-2026 | | | | 719,346 | | | | 809,059 | |
TIPS | | | 2.13 | | | | 1-15-2019 | | | | 459,957 | | | | 488,836 | |
TIPS | | | 2.13 | | | | 2-15-2040 | | | | 269,730 | | | | 324,010 | |
TIPS | | | 2.13 | | | | 2-15-2041 | | | | 347,715 | | | | 419,771 | |
TIPS | | | 2.38 | | | | 1-15-2025 | | | | 871,049 | | | | 1,001,967 | |
TIPS | | | 2.38 | | | | 1-15-2027 | | | | 648,984 | | | | 760,731 | |
TIPS | | | 2.50 | | | | 1-15-2029 | | | | 509,832 | | | | 614,327 | |
TIPS | | | 2.63 | | | | 7-15-2017 | | | | 597,028 | | | | 625,153 | |
TIPS | | | 3.38 | | | | 4-15-2032 | | | | 201,090 | | | | 277,132 | |
TIPS | | | 3.63 | | | | 4-15-2028 | | | | 426,657 | | | | 566,626 | |
TIPS | | | 3.88 | | | | 4-15-2029 | | | | 622,421 | | | | 859,954 | |
| | | | |
Total U.S. Treasury Securities (Cost $33,559,816) | | | | | | | | | | | | | | | 33,811,334 | |
| | | | | | | | | | | | | | | | |
| | | | |
Yankee Corporate Bonds and Notes: 0.77% | | | | | | | | | | | | | | | | |
| | | | |
Consumer Discretionary: 0.20% | | | | | | | | | | | | | | | | |
| | | | |
| Automobiles: 0.20% | | | | | | | | | | | | | | | | |
Jaguar Land Rover Automotive plc 144A | | | 4.13 | | | | 12-15-2018 | | | | 100,000 | | | | 101,625 | |
| | | | | | | | | | | | | | | | |
The accompanying notes are an integral part of these financial statements.
| | | | | | |
| Portfolio of investments—November 30, 2015 (unaudited) | | Wells Fargo Allocation Funds | | | 97 | |
REAL RETURN PORTFOLIO
| | | | | | | | | | | | | | | | |
| Security name | | Interest rate | | | Maturity date | | | Principal | | | Value | |
| | | | |
Financials: 0.16% | | | | | | | | | | | | | | | | |
| | | | |
| Banks: 0.16% | | | | | | | | | | | | | | | | |
Royal Bank of Scotland Group plc | | | 4.70 | % | | | 7-3-2018 | | | $ | 80,000 | | | $ | 82,957 | |
| | | | | | | | | | | | | | | | |
| | | | |
Health Care: 0.13% | | | | | | | | | | | | | | | | |
| | | | |
| Pharmaceuticals: 0.13% | | | | | | | | | | | | | | | | |
Mallinckrodt International Finance SA | | | 3.50 | | | | 4-15-2018 | | | | 70,000 | | | | 64,575 | |
| | | | | | | | | | | | | | | | |
| | | | |
Information Technology: 0.04% | | | | | | | | | | | | | | | | |
| | | | |
| Communications Equipment: 0.04% | | | | | | | | | | | | | | | | |
Nokia Corporation | | | 5.38 | | | | 5-15-2019 | | | | 20,000 | | | | 21,374 | |
| | | | | | | | | | | | | | | | |
| | | | |
Materials: 0.24% | | | | | | | | | | | | | | | | |
| | | | |
| Metals & Mining: 0.24% | | | | | | | | | | | | | | | | |
ArcelorMittal SA | | | 6.13 | | | | 6-1-2018 | | | | 125,000 | | | | 121,563 | |
| | | | | | | | | | | | | | | | |
| | | | |
Total Yankee Corporate Bonds and Notes (Cost $406,389) | | | | | | | | | | | | | | | 392,094 | |
| | | | | | | | | | | | | | | | |
| | | | |
| | | Yield | | | | | | Shares | | | | |
| Short-Term Investments: 6.72% | | | | | | | | | | | | | | | | |
| | | | |
| Investment Companies: 6.67% | | | | | | | | | | | | | | | | |
Securities Lending Cash Investments, LLC (l)(r)(u) | | | 0.18 | | | | | | | | 166,050 | | | | 166,050 | |
Wells Fargo Government Money Market Fund, Select Class (l)(u) | | | 0.04 | | | | | | | | 3,255,779 | | | | 3,255,779 | |
| | | | |
| | | | | | | | | | | | | | | 3,421,829 | |
| | | | | | | | | | | | | | | | |
| | | | |
| | | | | | | | | Principal | | | | |
| U.S. Treasury Securities: 0.05% | | | | | | | | | | | | | | | | |
U.S. Treasury Bill (z)# | | | 0.08 | | | | 12-17-2015 | | | $ | 25,000 | | | | 24,999 | |
| | | | | | | | | | | | | | | | |
| | | | |
Total Short-Term Investments (Cost $3,446,828) | | | | | | | | | | | | | | | 3,446,828 | |
| | | | | | | | | | | | | | | | |
| | | | | | | | |
| Total investments in securities (Cost $51,485,153) * | | | 100.14 | % | | | 51,363,316 | |
Other assets and liabilities, net | | | (0.14 | ) | | | (69,676 | ) |
| | | | | | | | |
| Total net assets | | | 100.00 | % | | $ | 51,293,640 | |
| | | | | | | | |
| † | Non-income-earning security |
| « | All or a portion of this security is on loan. |
| 144A | The security may be resold in transactions exempt from registration, normally to qualified institutional buyers, pursuant to Rule 144A under the Securities Act of 1933. |
| ± | Variable rate investment. The rate shown is the rate in effect at period end. |
| < | All or a portion of the position represents an unfunded loan commitment. |
| (l) | The issuer of the security is an affiliated person of the Portfolio as defined in the Investment Company Act of 1940. |
| (r) | The investment is a non-registered investment vehicle purchased with cash collateral received from securities on loan. |
| (u) | The rate represents the 7-day annualized yield at period end. |
| (z) | Zero coupon security. The rate represents the current yield to maturity. |
| # | All or a portion of this security is segregated as collateral for investments in derivative instruments. |
| * | Cost for federal income tax purposes is $51,526,026 and unrealized gains (losses) consists of: |
| | | | |
Gross unrealized gains | | $ | 1,224,576 | |
Gross unrealized losses | | | (1,387,286 | ) |
| | | | |
Net unrealized losses | | $ | (162,710 | ) |
The accompanying notes are an integral part of these financial statements.
| | | | |
| 98 | | Wells Fargo Allocation Funds | | Portfolio of investments—November 30, 2015 (unaudited) |
STABLE INCOME PORTFOLIO
| | | | | | | | | | | | | | | | |
| Security name | | Interest rate | | | Maturity date | | | Principal | | | Value | |
| | | | |
Agency Securities: 27.91% | | | | | | | | | | | | | | | | |
FHLMC | | | 6.00 | % | | | 7-1-2017 | | | $ | 10,705 | | | $ | 10,978 | |
FHLMC | | | 7.50 | | | | 7-17-2017 | | | | 13,417 | | | | 13,580 | |
FHLMC Series T-54 Class 4A ± | | | 3.07 | | | | 2-25-2043 | | | | 445,625 | | | | 479,468 | |
FHLMC Series T-57 Class 1A2 | | | 7.00 | | | | 7-25-2043 | | | | 549,999 | | | | 662,697 | |
FHLMC Series T-63 Class 1A1 ± | | | 1.42 | | | | 2-25-2045 | | | | 384,879 | | | | 393,433 | |
FHLMC Structured Pass-Through Securities Series T-54 Class 3A | | | 7.00 | | | | 2-25-2043 | | | | 411,991 | | | | 482,477 | |
FHLMC Structured Pass-Through Securities Series T-55 Class 1A2 | | | 7.00 | | | | 3-25-2043 | | | | 606,854 | | | | 672,116 | |
FHLMC Structured Pass-Through Securities Series T-58 Class 4A | | | 7.50 | | | | 9-25-2043 | | | | 671,385 | | | | 795,663 | |
FNMA ± | | | 1.42 | | | | 10-1-2034 | | | | 237,123 | | | | 242,987 | |
FNMA ± | | | 1.42 | | | | 4-1-2044 | | | | 200,456 | | | | 205,437 | |
FNMA ± | | | 1.42 | | | | 10-1-2044 | | | | 226,745 | | | | 232,391 | |
FNMA ± | | | 1.48 | | | | 4-1-2037 | | | | 250,820 | | | | 258,018 | |
FNMA ± | | | 1.59 | | | | 7-1-2017 | | | | 1,310 | | | | 1,309 | |
FNMA ± | | | 1.87 | | | | 9-1-2033 | | | | 147,202 | | | | 153,971 | |
FNMA ± | | | 1.90 | | | | 4-1-2034 | | | | 348,944 | | | | 368,421 | |
FNMA ± | | | 1.93 | | | | 6-1-2033 | | | | 312,226 | | | | 327,597 | |
FNMA ± | | | 1.94 | | | | 10-1-2033 | | | | 361,064 | | | | 377,711 | |
FNMA ± | | | 2.03 | | | | 12-1-2033 | | | | 256,567 | | | | 270,320 | |
FNMA ± | | | 2.03 | | | | 1-1-2036 | | | | 190,740 | | | | 201,391 | |
FNMA ± | | | 2.13 | | | | 6-1-2033 | | | | 205,586 | | | | 211,620 | |
FNMA ± | | | 2.16 | | | | 8-1-2035 | | | | 246,536 | | | | 258,819 | |
FNMA ± | | | 2.33 | | | | 7-1-2035 | | | | 220,765 | | | | 235,117 | |
FNMA | | | 5.50 | | | | 2-1-2017 | | | | 25,998 | | | | 26,374 | |
FNMA Series 2003-W4 Class 3A ± | | | 6.54 | | | | 10-25-2042 | | | | 251,938 | | | | 285,788 | |
FNMA Series 2004-W2 Class 2A2 | | | 7.00 | | | | 2-25-2044 | | | | 194,162 | | | | 225,319 | |
FNMA Series 2007-88 Class HC ± | | | 2.41 | | | | 9-25-2037 | | | | 234,621 | | | | 243,868 | |
HUD | | | 0.83 | | | | 8-1-2016 | | | | 150,000 | | | | 149,874 | |
| | | | |
Total Agency Securities (Cost $7,286,206) | | | | | | | | | | | | | | | 7,786,744 | |
| | | | | | | | | | | | | | | | |
| | | | |
Asset-Backed Securities: 25.21% | | | | | | | | | | | | | | | | |
Ally Auto Receivables Trust Series 2013-2 Class A3 | | | 0.79 | | | | 1-15-2018 | | | | 66,463 | | | | 66,428 | |
Ally Auto Receivables Trust Series 2014-SN1 Class A3 | | | 0.75 | | | | 2-21-2017 | | | | 110,000 | | | | 109,948 | |
Ally Auto Receivables Trust Series 2014-SN2 Class A2B ± | | | 0.51 | | | | 3-20-2017 | | | | 72,321 | | | | 72,297 | |
Ally Auto Receivables Trust Series 2015-1 Class A2 | | | 0.92 | | | | 2-15-2018 | | | | 130,000 | | | | 129,871 | |
American Express Credit Account Master Trust Series 2014-4 Class A | | | 1.43 | | | | 6-15-2020 | | | | 130,000 | | | | 130,236 | |
AmeriCredit Automobile Receivables Trust Series 2013-5 Class A3 | | | 0.90 | | | | 9-10-2018 | | | | 79,007 | | | | 78,941 | |
AmeriCredit Automobile Receivables Trust Series 2014-1 Class A3 | | | 0.90 | | | | 2-8-2019 | | | | 98,668 | | | | 98,534 | |
AmeriCredit Automobile Receivables Trust Series 2014-4 Class A3 | | | 1.27 | | | | 7-8-2019 | | | | 125,000 | | | | 124,734 | |
AmeriCredit Automobile Receivables Trust Series 2015-2 Class A3 | | | 1.27 | | | | 1-8-2020 | | | | 135,000 | | | | 133,923 | |
Bank of the West Auto Trust Series 2014-1 Class A3 144A | | | 1.09 | | | | 3-15-2019 | | | | 125,000 | | | | 124,769 | |
Bank of the West Auto Trust Series 2015-1 Class A2 144A± | | | 0.55 | | | | 4-16-2018 | | | | 100,000 | | | | 99,906 | |
BMW Vehicle Lease Trust Series 2014-1 Class A3 | | | 0.73 | | | | 2-21-2017 | | | | 90,384 | | | | 90,342 | |
Capital Auto Receivables Asset Trust Series 2015-1 Class A2 | | | 1.42 | | | | 6-20-2018 | | | | 130,000 | | | | 129,920 | |
Capital Auto Receivables Asset Trust Series 2015-2 Class A1B ± | | | 0.61 | | | | 10-20-2017 | | | | 150,000 | | | | 149,661 | |
Capital One Multi-Asset Execution Trust Series 2014-A2 Class A2 | | | 1.26 | | | | 1-15-2020 | | | | 100,000 | | | | 100,150 | |
CarMax Auto Owner Trust Series 2014-1 Class A3 | | | 0.79 | | | | 10-15-2018 | | | | 101,980 | | | | 101,735 | |
CarMax Auto Owner Trust Series 2015-1 Class A3 | | | 1.38 | | | | 11-15-2019 | | | | 130,000 | | | | 129,655 | |
CarMax Auto Owner Trust Series 2015-3 Class A2B ± | | | 0.65 | | | | 11-15-2018 | | | | 140,000 | | | | 139,886 | |
Chase Issuance Trust Series 2014-A6 Class A6 | | | 1.26 | | | | 7-15-2019 | | | | 120,000 | | | | 120,083 | |
Chrysler Capital Auto Receivables Trust Series 2014-AA Class A3 144A | | | 0.83 | | | | 9-17-2018 | | | | 68,875 | | | | 68,792 | |
The accompanying notes are an integral part of these financial statements.
| | | | | | |
| Portfolio of investments—November 30, 2015 (unaudited) | | Wells Fargo Allocation Funds | | | 99 | |
STABLE INCOME PORTFOLIO
| | | | | | | | | | | | | | | | |
| Security name | | Interest rate | | | Maturity date | | | Principal | | | Value | |
| | | | |
Asset-Backed Securities (continued) | | | | | | | | | | | | | | | | |
CNH Equipment Trust Series 2014-A Class A3 | | | 0.84 | % | | | 5-15-2019 | | | $ | 100,000 | | | $ | 99,777 | |
College Loan Corporation Trust Series 2004-1 Class A4 ± | | | 0.51 | | | | 4-25-2024 | | | | 110,000 | | | | 109,388 | |
Fifth Third Auto Trust Series 2014-1 Class A3 | | | 0.68 | | | | 4-16-2018 | | | | 70,774 | | | | 70,711 | |
Fifth Third Auto Trust Series 2014-2 Class A3 | | | 0.89 | | | | 11-15-2018 | | | | 130,000 | | | | 129,762 | |
Ford Credit Auto Lease Trust Series 2014-A Class A3 | | | 0.68 | | | | 4-15-2017 | | | | 73,178 | | | | 73,148 | |
Ford Credit Auto Owner Trust Series 2014-A Class A3 | | | 0.79 | | | | 5-15-2018 | | | | 162,165 | | | | 162,080 | |
Ford Credit Auto Owner Trust Series 2014-B Class A3 | | | 0.90 | | | | 10-15-2018 | | | | 120,000 | | | | 119,895 | |
Ford Credit Auto Owner Trust Series 2014-C Class A3 | | | 1.06 | | | | 5-15-2019 | | | | 250,000 | | | | 249,695 | |
GE Equipment LLC Series 2013-2 Class A3 | | | 0.92 | | | | 9-25-2017 | | | | 81,513 | | | | 81,503 | |
GE Equipment Small Ticket LLC Series 2014-1A Class A3 144A | | | 0.95 | | | | 9-25-2017 | | | | 110,000 | | | | 110,003 | |
GM Financial Automobile Lease Series 2014-1A Class A3 144A | | | 1.01 | | | | 5-22-2017 | | | | 120,000 | | | | 119,941 | |
GSAMP Trust Series 2005-SEA2 Class A1 144A± | | | 0.57 | | | | 1-25-2045 | | | | 196,657 | | | | 192,668 | |
Honda Auto Receivables Owner Trust Series 2014-1 Class A3 | | | 0.67 | | | | 11-21-2017 | | | | 100,000 | | | | 99,885 | |
Honda Auto Receivables Owner Trust Series 2014-4 Class A3 | | | 0.99 | | | | 9-17-2018 | | | | 100,000 | | | | 99,808 | |
Honda Auto Receivables Owner Trust Series 2015-3 Class A2 | | | 0.92 | | | | 11-20-2017 | | | | 140,000 | | | | 140,041 | |
Hyundai Auto Lease Securitization Trust Series 2015-A Class A3 144A | | | 1.42 | | | | 9-17-2018 | | | | 130,000 | | | | 130,132 | |
Hyundai Auto Lease Securitization Trust Series 2015-B Class A3 144A | | | 1.40 | | | | 11-15-2018 | | | | 140,000 | | | | 139,536 | |
Hyundai Auto Receivables Trust Series 2014-A Class A3 | | | 0.79 | | | | 7-16-2018 | | | | 88,535 | | | | 88,462 | |
Hyundai Auto Receivables Trust Series 2015-A Class A3 | | | 1.05 | | | | 4-15-2019 | | | | 130,000 | | | | 129,580 | |
John Deere Owner Trust Series 2014-A Class A3 | | | 0.92 | | | | 4-16-2018 | | | | 110,000 | | | | 109,806 | |
John Deere Owner Trust Series 2015-A Class A3 | | | 1.32 | | | | 6-17-2019 | | | | 130,000 | | | | 130,059 | |
Mercedes Benz Auto Receivables Trust 2015-1 Class A2B ± | | | 0.47 | | | | 6-15-2018 | | | | 130,000 | | | | 129,891 | |
Mercedes-Benz Auto Lease Trust Series 2015-A Class A3 | | | 1.10 | | | | 8-15-2017 | | | | 130,000 | | | | 130,015 | |
Nissan Auto Receivables Owner Trust Series 2014-A Class A3 | | | 0.72 | | | | 8-15-2018 | | | | 88,346 | | | | 88,196 | |
Nissan Auto Receivables Owner Trust Series 2014-B Class A3 | | | 1.11 | | | | 5-15-2019 | | | | 130,000 | | | | 129,771 | |
Nissan Auto Receivables Owner Trust Series 2015-A Class A3 | | | 1.05 | | | | 10-15-2019 | | | | 135,000 | | | | 134,395 | |
Nissan Auto Receivables Owner Trust Series 2015-B Class A2B ± | | | 0.48 | | | | 7-16-2018 | | | | 130,000 | | | | 129,938 | |
Santander Drive Auto Receivables Trust Series 2015-3 Class A2A | | | 1.02 | | | | 9-17-2018 | | | | 135,210 | | | | 135,068 | |
Santander Drive Auto Receivables Trust Series 2015-4 Class A2B ± | | | 0.90 | | | | 12-17-2018 | | | | 130,000 | | | | 129,948 | |
SunTrust Auto Receivables Trust Series 2015-1A Class A2 144A | | | 0.99 | | | | 6-15-2018 | | | | 140,000 | | | | 140,066 | |
Toyota Auto Receivables Owner Trust Series 2014-A Class A3 | | | 0.67 | | | | 12-15-2017 | | | | 93,514 | | | | 93,408 | |
Toyota Auto Receivables Owner Trust Series 2014-B Class A3 | | | 0.76 | | | | 3-15-2018 | | | | 110,000 | | | | 109,873 | |
Toyota Auto Receivables Owner Trust Series 2015-B Class A2B ± | | | 0.41 | | | | 11-15-2017 | | | | 135,000 | | | | 134,897 | |
Toyota Auto Receivables Owner Trust Series 2015-C Class A2B ± | | | 0.53 | | | | 2-15-2018 | | | | 120,000 | | | | 119,952 | |
Volkswagen Auto Lease Trust Series 2014-A Class A3 | | | 0.80 | | | | 4-20-2017 | | | | 133,846 | | | | 133,643 | |
Volkswagen Auto Lease Trust Series 2015-A Class A3 | | | 1.25 | | | | 12-20-2017 | | | | 130,000 | | | | 129,003 | |
Volvo Financial Equipment LLC Series 2014-1A Class A3 144A | | | 0.82 | | | | 4-16-2018 | | | | 100,000 | | | | 99,820 | |
Volvo Financial Equipment LLC Series 2015-1A Class A3 144A | | | 1.51 | | | | 6-17-2019 | | | | 150,000 | | | | 150,217 | |
World Omni Auto Receivables Trust 2015-B | | | 0.96 | | | | 7-15-2019 | | | | 130,000 | | | | 129,807 | |
| | | | |
Total Asset-Backed Securities (Cost $7,044,803) | | | | | | | | | | | | | | | 7,033,599 | |
| | | | | | | | | | | | | | | | |
| | | | |
Corporate Bonds and Notes: 22.63% | | | | | | | | | | | | | | | | |
| | | | |
Consumer Discretionary: 0.58% | | | | | | | | | | | | | | | | |
| | | | |
| Specialty Retail: 0.58% | | | | | | | | | | | | | | | | |
Lowe’s Companies Incorporated | | | 1.63 | | | | 4-15-2017 | | | | 160,000 | | | | 161,319 | |
| | | | | | | | | | | | | | | | |
| | | | |
Consumer Staples: 2.47% | | | | | | | | | | | | | | | | |
| | | | |
| Beverages: 0.75% | | | | | | | | | | | | | | | | |
Brown-Forman Corporation | | | 2.50 | | | | 1-15-2016 | | | | 120,000 | | | | 120,236 | |
PepsiCo Incorporated ± | | | 0.57 | | | | 7-17-2017 | | | | 90,000 | | | | 89,986 | |
| | | | |
| | | | | | | | | | | | | | | 210,222 | |
| | | | | | | | | | | | | | | | |
The accompanying notes are an integral part of these financial statements.
| | | | |
| 100 | | Wells Fargo Allocation Funds | | Portfolio of investments—November 30, 2015 (unaudited) |
STABLE INCOME PORTFOLIO
| | | | | | | | | | | | | | | | |
| Security name | | Interest rate | | | Maturity date | | | Principal | | | Value | |
| | | | |
| Food Products: 1.72% | | | | | | | | | | | | | | | | |
Cargill Incorporated 144A | | | 1.90 | % | | | 3-1-2017 | | | $ | 114,000 | | | $ | 114,769 | |
Diageo Capital plc | | | 1.50 | | | | 5-11-2017 | | | | 90,000 | | | | 90,049 | |
General Mills Incorporated | | | 5.70 | | | | 2-15-2017 | | | | 85,000 | | | | 89,487 | |
H.J. Heinz Company 144A | | | 1.60 | | | | 6-30-2017 | | | | 90,000 | | | | 90,089 | |
Kellogg Company | | | 4.45 | | | | 5-30-2016 | | | | 94,000 | | | | 95,592 | |
| | | | |
| | | | | | | | | | | | | | | 479,986 | |
| | | | | | | | | | | | | | | | |
| | | | |
Energy: 0.77% | | | | | | | | | | | | | | | | |
| | | | |
| Oil, Gas & Consumable Fuels: 0.77% | | | | | | | | | | | | | | | | |
Chevron Corporation ± | | | 0.48 | | | | 2-22-2017 | | | | 110,000 | | | | 109,933 | |
Chevron Corporation | | | 1.34 | | | | 11-9-2017 | | | | 30,000 | | | | 30,045 | |
Marathon Oil Corporation | | | 6.00 | | | | 10-1-2017 | | | | 70,000 | | | | 74,249 | |
| | | | |
| | | | | | | | | | | | | | | 214,227 | |
| | | | | | | | | | | | | | | | |
| | | | |
Financials: 9.42% | | | | | | | | | | | | | | | | |
| | | | |
| Banks: 2.93% | | | | | | | | | | | | | | | | |
Bank of America Corporation | | | 1.25 | | | | 1-11-2016 | | | | 70,000 | | | | 70,032 | |
Bank of America Corporation | | | 3.88 | | | | 3-22-2017 | | | | 70,000 | | | | 72,130 | |
Branch Banking & Trust Company ± | | | 0.66 | | | | 9-13-2016 | | | | 250,000 | | | | 249,569 | |
Citigroup Incorporated | | | 1.85 | | | | 11-24-2017 | | | | 40,000 | | | | 40,020 | |
Citigroup Incorporated | | | 4.59 | | | | 12-15-2015 | | | | 90,000 | | | | 90,136 | |
HSBC USA Incorporated ± | | | 1.11 | | | | 8-7-2018 | | | | 110,000 | | | | 109,835 | |
JPMorgan Chase & Company | | | 3.15 | | | | 7-5-2016 | | | | 120,000 | | | | 121,620 | |
JPMorgan Chase & Company | | | 6.00 | | | | 1-15-2018 | | | | 60,000 | | | | 65,211 | |
| | | | |
| | | | | | | | | | | | | | | 818,553 | |
| | | | | | | | | | | | | | | | |
| | | | |
| Capital Markets: 1.64% | | | | | | | | | | | | | | | | |
Bank of New York Mellon Corporation | | | 2.50 | | | | 1-15-2016 | | | | 115,000 | | | | 115,286 | |
Goldman Sachs Group Incorporated | | | 2.38 | | | | 1-22-2018 | | | | 40,000 | | | | 40,511 | |
Goldman Sachs Group Incorporated | | | 5.35 | | | | 1-15-2016 | | | | 90,000 | | | | 90,493 | |
Morgan Stanley | | | 4.75 | | | | 3-22-2017 | | | | 50,000 | | | | 52,075 | |
Morgan Stanley | | | 5.55 | | | | 4-27-2017 | | | | 115,000 | | | | 121,374 | |
State Street Corporation | | | 2.88 | | | | 3-7-2016 | | | | 37,000 | | | | 37,230 | |
| | | | |
| | | | | | | | | | | | | | | 456,969 | |
| | | | | | | | | | | | | | | | |
| | | | |
| Consumer Finance: 2.36% | | | | | | | | | | | | | | | | |
American Honda Finance Corporation | | | 0.95 | | | | 5-5-2017 | | | | 60,000 | | | | 59,761 | |
American Honda Finance Corporation | | | 1.13 | | | | 10-7-2016 | | | | 50,000 | | | | 50,118 | |
American Honda Finance Corporation | | | 1.55 | | | | 12-11-2017 | | | | 30,000 | | | | 30,081 | |
BMW Bank North America | | | 0.70 | | | | 7-18-2016 | | | | 245,000 | | | | 245,476 | |
Daimler Finance North America LLC 144A | | | 2.63 | | | | 9-15-2016 | | | | 150,000 | | | | 151,657 | |
Toyota Motor Credit Corporation | | | 2.05 | | | | 1-12-2017 | | | | 120,000 | | | | 121,345 | |
| | | | |
| | | | | | | | | | | | | | | 658,438 | |
| | | | | | | | | | | | | | | | |
| | | | |
| Diversified Financial Services: 0.67% | | | | | | | | | | | | | | | | |
AIG Global Funding 144A | | | 1.65 | | | | 12-15-2017 | | | | 100,000 | | | | 100,166 | |
General Electric Capital Corporation | | | 5.63 | | | | 9-15-2017 | | | | 80,000 | | | | 86,087 | |
| | | | |
| | | | | | | | | | | | | | | 186,253 | |
| | | | | | | | | | | | | | | | |
The accompanying notes are an integral part of these financial statements.
| | | | | | |
| Portfolio of investments—November 30, 2015 (unaudited) | | Wells Fargo Allocation Funds | | | 101 | |
STABLE INCOME PORTFOLIO
| | | | | | | | | | | | | | | | |
| Security name | | Interest rate | | | Maturity date | | | Principal | | | Value | |
| | | | |
| Insurance: 0.61% | | | | | | | | | | | | | | | | |
MetLife Global Funding 144A | | | 3.13 | % | | | 1-11-2016 | | | $ | 100,000 | | | $ | 100,266 | |
New York Life Global Funding 144A | | | 1.55 | | | | 11-2-2018 | | | | 70,000 | | | | 69,601 | |
| | | | |
| | | | | | | | | | | | | | | 169,867 | |
| | | | | | | | | | | | | | | | |
| | | | |
REITs: 1.21%
| | | | | | | | | | | | | | | | |
AvalonBay Communities Incorporated | | | 5.70 | | | | 3-15-2017 | | | | 80,000 | | | | 84,077 | |
Boston Properties LP | | | 3.70 | | | | 11-15-2018 | | | | 90,000 | | | | 93,548 | |
ERP Operating LP | | | 5.38 | | | | 8-1-2016 | | | | 89,000 | | | | 91,362 | |
ERP Operating LP | | | 5.75 | | | | 6-15-2017 | | | | 66,000 | | | | 70,109 | |
| | | | |
| | | | | | | | | | | | | | | 339,096 | |
| | | | | | | | | | | | | | | | |
| | | | |
Health Care: 0.83% | | | | | | | | | | | | | | | | |
| | | | |
| Health Care Equipment & Supplies: 0.18% | | | | | | | | | | | | | | | | |
Becton Dickinson & Company | | | 1.80 | | | | 12-15-2017 | | | | 50,000 | | | | 50,112 | |
| | | | | | | | | | | | | | | | |
| | | | |
| Health Care Providers & Services: 0.25% | | | | | | | | | | | | | | | | |
UnitedHealth Group Incorporated | | | 1.45 | | | | 7-17-2017 | | | | 70,000 | | | | 70,225 | |
| | | | | | | | | | | | | | | | |
| | | | |
| Pharmaceuticals: 0.40% | | | | | | | | | | | | | | | | |
AbbVie Incorporated | | | 1.80 | | | | 5-14-2018 | | | | 20,000 | | | | 19,977 | |
Merck & Company Incorporated ± | | | 0.47 | | | | 2-10-2017 | | | | 90,000 | | | | 89,946 | |
| | | | |
| | | | | | | | | | | | | | | 109,923 | |
| | | | | | | | | | | | | | | | |
| | | | |
Industrials: 2.51% | | | | | | | | | | | | | | | | |
| | | | |
| Aerospace & Defense: 0.11% | | | | | | | | | | | | | | | | |
Lockheed Martin Corporation | | | 1.85 | | | | 11-23-2018 | | | | 30,000 | | | | 30,041 | |
| | | | | | | | | | | | | | | | |
| | | | |
| Commercial Services & Supplies: 0.72% | | | | | | | | | | | | | | | | |
Cintas Corporation No. 2 | | | 2.85 | | | | 6-1-2016 | | | | 80,000 | | | | 80,691 | |
Cooper US Incorporated | | | 2.38 | | | | 1-15-2016 | | | | 120,000 | | | | 120,236 | |
| | | | |
| | | | | | | | | | | | | | | 200,927 | |
| | | | | | | | | | | | | | | | |
| | | | |
| Electrical Equipment: 0.33% | | | | | | | | | | | | | | | | |
ABB Treasury Center USA Incorporated 144A | | | 2.50 | | | | 6-15-2016 | | | | 90,000 | | | | 90,719 | |
| | | | | | | | | | | | | | | | |
| | | | |
| Machinery: 0.32% | | | | | | | | | | | | | | | | |
Caterpillar Financial Service | | | 1.80 | | | | 11-13-2018 | | | | 90,000 | | | | 90,274 | |
| | | | | | | | | | | | | | | | |
| | | | |
| Road & Rail: 1.03% | | | | | | | | | | | | | | | | |
Burlington Northern Santa Fe LLC | | | 5.65 | | | | 5-1-2017 | | | | 80,000 | | | | 84,766 | |
Norfolk Southern Corporation | | | 5.75 | | | | 1-15-2016 | | | | 106,000 | | | | 106,626 | |
Union Pacific Corporation | | | 5.75 | | | | 11-15-2017 | | | | 90,000 | | | | 97,390 | |
| | | | |
| | | | | | | | | | | | | | | 288,782 | |
| | | | | | | | | | | | | | | | |
| | | | |
Information Technology: 1.33% | | | | | | | | | | | | | | | | |
| | | | |
| Communications Equipment: 0.32% | | | | | | | | | | | | | | | | |
Cisco Systems Incorporated ± | | | 0.65 | | | | 6-15-2018 | | | | 90,000 | | | | 89,928 | |
| | | | | | | | | | | | | | | | |
The accompanying notes are an integral part of these financial statements.
| | | | |
| 102 | | Wells Fargo Allocation Funds | | Portfolio of investments—November 30, 2015 (unaudited) |
STABLE INCOME PORTFOLIO
| | | | | | | | | | | | | | | | |
| Security name | | Interest rate | | | Maturity date | | | Principal | | | Value | |
| | | | |
| Software: 0.33% | | | | | | | | | | | | | | | | |
Oracle Corporation ± | | | 0.52 | % | | | 7-7-2017 | | | $ | 90,000 | | | $ | 89,984 | |
| | | | | | | | | | | | | | | | |
| | | | |
| Technology Hardware, Storage & Peripherals: 0.68% | | | | | | | | | | | | | | | | |
Apple Incorporated | | | 0.90 | | | | 5-12-2017 | | | | 90,000 | | | | 89,967 | |
HP Enterprise Company 144A | | | 2.45 | | | | 10-5-2017 | | | | 100,000 | | | | 100,230 | |
| | | | |
| | | | | | | | | | | | | | | 190,197 | |
| | | | | | | | | | | | | | | | |
| | | | |
Materials: 0.97% | | | | | | | | | | | | | | | | |
| | | | |
| Chemicals: 0.97% | | | | | | | | | | | | | | | | |
Ecolab Incorporated | | | 3.00 | | | | 12-8-2016 | | | | 90,000 | | | | 91,631 | |
Praxair Incorporated | | | 1.05 | | | | 11-7-2017 | | | | 90,000 | | | | 89,251 | |
Sherwin-Williams Company | | | 1.35 | | | | 12-15-2017 | | | | 90,000 | | | | 89,376 | |
| | | | |
| | | | | | | | | | | | | | | 270,258 | |
| | | | | | | | | | | | | | | | |
| | | | |
Telecommunication Services: 0.79% | | | | | | | | | | | | | | | | |
| | | | |
| Diversified Telecommunication Services: 0.79% | | | | | | | | | | | | | | | | |
AT&T Incorporated | | | 1.60 | | | | 2-15-2017 | | | | 90,000 | | | | 90,349 | |
Verizon Communications Incorporated | | | 1.35 | | | | 6-9-2017 | | | | 130,000 | | | | 130,075 | |
| | | | |
| | | | | | | | | | | | | | | 220,424 | |
| | | | | | | | | | | | | | | | |
| | | | |
Utilities: 2.96% | | | | | | | | | | | | | | | | |
| | | | |
| Electric Utilities: 1.66% | | | | | | | | | | | | | | | | |
Commonwealth Edison Company | | | 5.95 | | | | 8-15-2016 | | | | 120,000 | | | | 124,199 | |
Connecticut Light & Power | | | 5.38 | | | | 3-1-2017 | | | | 75,000 | | | | 78,215 | |
Sierra Pacific Power Company | | | 6.00 | | | | 5-15-2016 | | | | 120,000 | | | | 122,715 | |
Southern California Edison Company | | | 1.13 | | | | 5-1-2017 | | | | 90,000 | | | | 89,843 | |
Xcel Energy Incorporated | | | 1.20 | | | | 6-1-2017 | | | | 50,000 | | | | 49,771 | |
| | | | |
| | | | | | | | | | | | | | | 464,743 | |
| | | | | | | | | | | | | | | | |
| | | | |
| Gas Utilities: 0.52% | | | | | | | | | | | | | | | | |
Questar Corporation | | | 2.75 | | | | 2-1-2016 | | | | 144,000 | | | | 144,408 | |
| | | | | | | | | | | | | | | | |
| | | | |
| Multi-Utilities: 0.78% | | | | | | | | | | | | | | | | |
Consumers Energy Company | | | 5.15 | | | | 2-15-2017 | | | | 130,000 | | | | 135,885 | |
Entergy Mississippi Incorporated | | | 3.25 | | | | 6-1-2016 | | | | 80,000 | | | | 80,700 | |
| | | | |
| | | | | | | | | | | | | | | 216,585 | |
| | | | | | | | | | | | | | | | |
| | | | |
Total Corporate Bonds and Notes (Cost $6,314,291) | | | | | | | | | | | | | | | 6,312,460 | |
| | | | | | | | | | | | | | | | |
| | | | |
Municipal Obligations: 1.89% | | | | | | | | | | | | | | | | |
| | | | |
| Arizona: 0.25% | | | | | | | | | | | | | | | | |
Arizona School Facilities Board Certificate of Participation Series A-3 (Miscellaneous Revenue) | | | 0.95 | | | | 9-1-2016 | | | | 70,000 | | | | 69,981 | |
| | | | | | | | | | | | | | | | |
| | | | |
| Michigan: 0.70% | | | | | | | | | | | | | | | | |
Chippewa Valley MI School District (GO Revenue, Qualified School Board Loan Fund Insured) | | | 1.18 | | | | 5-1-2017 | | | | 60,000 | | | | 60,037 | |
Saranac MI School District (GO Revenue, Qualified School Board Loan Fund Insured) | | | 1.03 | | | | 5-1-2016 | | | | 135,000 | | | | 135,050 | |
| | | | |
| | | | | | | | | | | | | | | 195,087 | |
| | | | | | | | | | | | | | | | |
The accompanying notes are an integral part of these financial statements.
| | | | | | |
| Portfolio of investments—November 30, 2015 (unaudited) | | Wells Fargo Allocation Funds | | | 103 | |
STABLE INCOME PORTFOLIO
| | | | | | | | | | | | | | | | |
| Security name | | Interest rate | | | Maturity date | | | Principal | | | Value | |
| | | | |
| Minnesota: 0.11% | | | | | | | | | | | | | | | | |
Saint Paul MN Housing & Redevelopment Authority HealthPartners Obligated Group Series B (Health Revenue) | | | 1.04 | % | | | 7-1-2016 | | | $ | 30,000 | | | $ | 29,969 | |
| | | | | | | | | | | | | | | | |
| | | | |
| North Carolina: 0.55% | | | | | | | | | | | | | | | | |
North Carolina Education Assistance Authority Student Loan Backed notes Series 2011-1 Tranche A-2 (Education Revenue) ± | | | 1.22 | | | | 1-26-2026 | | | | 152,245 | | | | 152,712 | |
| | | | | | | | | | | | | | | | |
| | | | |
| Pennsylvania: 0.28% | | | | | | | | | | | | | | | | |
Chester County PA (GO Revenue) | | | 0.59 | | | | 5-15-2016 | | | | 80,000 | | | | 79,947 | |
| | | | | | | | | | | | | | | | |
| | | | |
Total Municipal Obligations (Cost $527,711) | | | | | | | | | | | | | | | 527,696 | |
| | | | | | | | | | | | | | | | |
| | | | |
Non-Agency Mortgage-Backed Securities: 6.34% | | | | | | | | | | | | | | | | |
Bear Stearns Commercial Mortgage Securities Trust Series 2007 PW16 Class A1A ± | | | 5.91 | | | | 6-11-2040 | | | | 106,814 | | | | 112,383 | |
Bear Stearns Commercial Mortgage Securities Trust Series 2007-PW17 Class A1A ± | | | 5.65 | | | | 6-11-2050 | | | | 129,713 | | | | 136,971 | |
CIT Education Loan Trust Series 2005-1 Class A3 ± | | | 0.46 | | | | 3-15-2026 | | | | 79,047 | | | | 77,906 | |
CNH Equipment Trust Series 2014-B Class A3 | | | 0.91 | | | | 5-15-2019 | | | | 125,000 | | | | 124,611 | |
CNH Equipment Trust Series 2015 Class A2B ± | | | 0.67 | | | | 12-17-2018 | | | | 140,000 | | | | 140,102 | |
Commercial Mortgage Trust Pass-Through Certificates Series 2007-C9 Class A4 ± | | | 5.99 | | | | 12-10-2049 | | | | 140,000 | | | | 147,045 | |
Dell Equipment Finance Trust 2015-1 Class A2 144A | | | 1.01 | | | | 7-24-2017 | | | | 140,000 | | | | 139,856 | |
GAHR Commercial Mortgage Trust Series 2015 144A± | | | 1.50 | | | | 12-15-2016 | | | | 140,000 | | | | 139,911 | |
GE Equipment Transportation LLC Series 2014-1 Class A3 | | | 0.97 | | | | 4-23-2018 | | | | 120,000 | | | | 119,825 | |
JPMorgan Chase Commercial Mortgage Securities Trust Series 2007-LDPX Class A1A | | | 5.44 | | | | 1-15-2049 | | | | 105,598 | | | | 109,715 | |
Morgan Stanley Capital I Series 2007-T27 Class A4 ± | | | 5.82 | | | | 6-11-2042 | | | | 123,072 | | | | 129,381 | |
SLMA Series 2014-1 Class A1 ± | | | 0.50 | | | | 5-28-2019 | | | | 17,706 | | | | 17,684 | |
SLMA Series 2006 1 A5 ± | | | 0.43 | | | | 7-26-2021 | | | | 135,000 | | | | 131,994 | |
Structured Asset Securities Corporation Series 2006-RF3 Class 1A1 144A | | | 6.00 | | | | 10-25-2036 | | | | 138,737 | | | | 139,027 | |
Towd Point Mortgage Trust Series 2015-6-A1 144A±(a) | | | 3.50 | | | | 4-25-2055 | | | | 100,000 | | | | 101,269 | |
| | | | |
Total Non-Agency Mortgage-Backed Securities (Cost $1,788,989) | | | | | | | | | | | | | | | 1,767,680 | |
| | | | | | | | | | | | | | | | |
| | | | |
U.S. Treasury Securities: 5.89% | | | | | | | | | | | | | | | | |
U.S. Treasury Note | | | 0.63 | | | | 7-31-2017 | | | | 300,000 | | | | 298,828 | |
U.S. Treasury Note | | | 0.63 | | | | 9-30-2017 | | | | 1,350,000 | | | | 1,343,250 | |
| | | | |
Total U.S. Treasury Securities (Cost $1,646,147) | | | | | | | | | | | | | | | 1,642,078 | |
| | | | | | | | | | | | | | | | |
| | | | |
Yankee Corporate Bonds and Notes: 3.69% | | | | | | | | | | | | | | | | |
| | | | |
Energy: 1.22% | | | | | | | | | | | | | | | | |
| | | | |
| Oil, Gas & Consumable Fuels: 1.22% | | | | | | | | | | | | | | | | |
Schlumberger SA 144A | | | 2.65 | | | | 1-15-2016 | | | | 100,000 | | | | 100,238 | |
Shell International Finance Company ± | | | 0.66 | | | | 5-10-2017 | | | | 90,000 | | | | 89,975 | |
Total Capital SA | | | 2.30 | | | | 3-15-2016 | | | | 150,000 | | | | 150,725 | |
| | | | |
| | | | | | | | | | | | | | | 340,938 | |
| | | | | | | | | | | | | | | | |
| | | | |
Financials: 1.65% | | | | | | | | | | | | | | | | |
| | | | |
| Banks: 0.92% | | | | | | | | | | | | | | | | |
Bank of Nova Scotia ± | | | 0.80 | | | | 6-11-2018 | | | | 90,000 | | | | 89,819 | |
BNP Paribas | | | 3.60 | | | | 2-23-2016 | | | | 75,000 | | | | 75,477 | |
Toronto Dominion Bank ± | | | 0.86 | | | | 7-23-2018 | | | | 90,000 | | | | 89,891 | |
| | | | |
| | | | | | | | | | | | | | | 255,187 | |
| | | | | | | | | | | | | | | | |
The accompanying notes are an integral part of these financial statements.
| | | | |
| 104 | | Wells Fargo Allocation Funds | | Portfolio of investments—November 30, 2015 (unaudited) |
STABLE INCOME PORTFOLIO
| | | | | | | | | | | | | | | | |
| Security name | | Interest rate | | | Maturity date | | | Principal | | | Value | |
| | | | |
| Diversified Financial Services: 0.73% | | | | | | | | | | | | | | | | |
ConocoPhillips Canada Funding Company | | | 5.63 | % | | | 10-15-2016 | | | $ | 100,000 | | | $ | 103,780 | |
Deutsche Bank AG (London) | | | 3.25 | | | | 1-11-2016 | | | | 100,000 | | | | 100,239 | |
| | | | |
| | | | | | | | | | | | | | | 204,019 | |
| | | | | | | | | | | | | | | | |
| | | | |
Industrials: 0.82% | | | | | | | | | | | | | | | | |
| | | | |
| Machinery: 0.29% | | | | | | | | | | | | | | | | |
Pentair Finance SA | | | 1.35 | | | | 12-1-2015 | | | | 80,000 | | | | 80,000 | |
| | | | | | | | | | | | | | | | |
| | | | |
| Road & Rail: 0.53% | | | | | | | | | | | | | | | | |
Canadian National Railway Company | | | 1.45 | | | | 12-15-2016 | | | | 90,000 | | | | 90,553 | |
Canadian National Railway Company | | | 5.80 | | | | 6-1-2016 | | | | 57,000 | | | | 58,436 | |
| | | | |
| | | | | | | | | | | | | | | 148,989 | |
| | | | | | | | | | | | | | | | |
| | | | |
Total Yankee Corporate Bonds and Notes (Cost $1,029,708) | | | | | | | | | | | | | | | 1,029,133 | |
| | | | | | | | | | | | | | | | |
| | | | |
| | | Yield | | | | | | Shares | | | | |
| Short-Term Investments: 6.17% | | | | | | | | | | | | | | | | |
| | | | |
| Investment Companies: 4.11% | | | | | | | | | | | | | | | | |
Wells Fargo Cash Investment Money Market Fund, Select Class (l)(u) | | | 0.17 | | | | | | | | 1,145,992 | | | | 1,145,992 | |
| | | | | | | | | | | | | | | | |
| | | | |
| | | | | | | | | Principal | | | | |
| U.S. Treasury Securities: 2.06% | | | | | | | | | | | | | | | | |
U.S Treasury Bill (z)# | | | 0.22 | | | | 3-3-2016 | | | $ | 575,000 | | | | 574,678 | |
| | | | | | | | | | | | | | | | |
| | | | |
Total Short-Term Investments (Cost $1,720,647) | | | | | | | | | | | | | | | 1,720,670 | |
| | | | | | | | | | | | | | | | |
| | | | | | | | |
| Total investments in securities (Cost $27,348,502) * | | | 99.73 | % | | | 27,820,060 | |
Other assets and liabilities, net | | | 0.27 | | | | 76,663 | |
| | | | | | | | |
| Total net assets | | | 100.00 | % | | $ | 27,896,723 | |
| | | | | | | | |
| ± | Variable rate investment. The rate shown is the rate in effect at period end. |
| 144A | The security may be resold in transactions exempt from registration, normally to qualified institutional buyers, pursuant to Rule 144A under the Securities Act of 1933. |
| (a) | The security is fair valued in accordance with procedures approved by the Board of Trustees. |
| (l) | The issuer of the security is an affiliated person of the Portfolio as defined in the Investment Company Act of 1940. |
| (u) | The rate represents the 7-day annualized yield at period end. |
| (z) | Zero coupon security. The rate represents the current yield to maturity. |
| # | All or a portion of this security is segregated as collateral for investments in derivative instruments. |
| * | Cost for federal income tax purposes is $26,784,231 and unrealized gains (losses) consists of: |
| | | | |
Gross unrealized gains | | $ | 1,101,788 | |
Gross unrealized losses | | | (65,959 | ) |
| | | | |
Net unrealized gains | | $ | 1,035,829 | |
The accompanying notes are an integral part of these financial statements.
This page is intentionally left blank.
| | | | |
| 106 | | Wells Fargo Allocation Funds | | Statements of assets and liabilities—November 30, 2015 (unaudited) |
| | | | | | | | |
| | | C&B Large
Cap Value
Portfolio | | | Diversified
Large Cap
Growth
Portfolio | |
| | |
Assets | | | | | | | | |
Investments | | | | | | | | |
In unaffiliated securities (including securities on loan), at value (see cost below) | | $ | 306,538,283 | | | $ | 116,615,718 | |
In affiliated securities, at value (see cost below) | | | 14,406,902 | | | | 2,802,541 | |
| | | | |
Total investments, at value (see cost below) | | | 320,945,185 | | | | 119,418,259 | |
Cash | | | 0 | | | | 0 | |
Foreign currency, at value (see cost below) | | | 0 | | | | 0 | |
Receivable for investments sold | | | 0 | | | | 121,450 | |
Receivable for dividends | | | 597,245 | | | | 103,426 | |
Receivable for securities lending income | | | 966 | | | | 641 | |
Prepaid expenses and other assets | | | 4,408 | | | | 5,307 | |
| | | | |
Total assets | | | 321,547,804 | | | | 119,649,083 | |
| | | | |
| | |
Liabilities | | | | | | | | |
Payable for investments purchased | | | 0 | | | | 146,808 | |
Payable upon receipt of securities loaned | | | 4,278,750 | | | | 1,326,875 | |
Payable for daily variation margin on open futures contracts | | | 0 | | | | 0 | |
Advisory fee payable | | | 169,545 | | | | 52,402 | |
Accrued expenses and other liabilities | | | 26,016 | | | | 25,248 | |
| | | | |
Total liabilities | | | 4,474,311 | | | | 1,551,333 | |
| | | | |
Total net assets | | $ | 317,073,493 | | | $ | 118,097,750 | |
| | | | |
| | |
Investments in unaffiliated securities (including securities on loan), at cost | | $ | 240,460,541 | | | $ | 75,203,099 | |
| | | | |
Investments in affiliated securities, at cost | | $ | 14,406,902 | | | $ | 2,802,541 | |
| | | | |
Total investments, at cost | | $ | 254,867,443 | | | $ | 78,005,640 | |
| | | | |
Securities on loan, at value | | $ | 4,192,650 | | | $ | 1,298,417 | |
| | | | |
Foreign currency, at cost | | $ | 0 | | | $ | 0 | |
| | | | |
The accompanying notes are an integral part of these financial statements.
| | | | | | |
| Statements of assets and liabilities—November 30, 2015 (unaudited) | | Wells Fargo Allocation Funds | | | 107 | |
| | | | | | | | | | | | | | | | | | | | | | | | | | |
Emerging
Growth
Portfolio | | | Index
Portfolio | | | International
Growth
Portfolio | | | International
Value
Portfolio | | | Large Company
Value
Portfolio | | | Small Company
Growth
Portfolio | | | Small Company
Value
Portfolio | |
| | | | | | |
| | | | | | | | | | | | | | | | | | | | | | | | | | |
| | | | | | | | | | | | | | | | | | | | | | | | | | |
| $ | 1,006,634,764 | | | $ | 2,439,531,214 | | | $ | 151,276,066 | | | $ | 482,006,111 | | | $ | 77,526,426 | | | $ | 1,096,406,707 | | | $ | 198,475,538 | |
| | 109,355,356 | | | | 78,314,451 | | | | 5,627,099 | | | | 19,508,327 | | | | 4,891,001 | | | | 176,294,186 | | | | 12,783,629 | |
| | |
| | 1,115,990,120 | | | | 2,517,845,665 | | | | 156,903,165 | | | | 501,514,438 | | | | 82,417,427 | | | | 1,272,700,893 | | | | 211,259,167 | |
| | 0 | | | | 0 | | | | 0 | | | | 0 | | | | 0 | | | | 0 | | | | 9,762 | |
| | 0 | | | | 0 | | | | 55,488 | | | | 9,263,631 | | | | 0 | | | | 0 | | | | 0 | |
| | 2,900,476 | | | | 22,479,271 | | | | 684,540 | | | | 0 | | | | 678,828 | | | | 3,235,001 | | | | 2,799,733 | |
| | 6,402 | | | | 5,820,405 | | | | 209,219 | | | | 1,575,575 | | | | 173,142 | | | | 362,879 | | | | 238,835 | |
| | 335,217 | | | | 15,506 | | | | 5,635 | | | | 28,485 | | | | 2,440 | | | | 290,585 | | | | 4,653 | |
| | 3,410 | | | | 21,849 | | | | 18,636 | | | | 11,613 | | | | 6,885 | | | | 17,022 | | | | 3,350 | |
| | |
| | 1,119,235,625 | | | | 2,546,182,696 | | | | 157,876,683 | | | | 512,393,742 | | | | 83,278,722 | | | | 1,276,606,380 | | | | 214,315,500 | |
| | |
| | | | | | |
| | | | | | | | | | | | | | | | | | | | | | | | | | |
| | 3,644,031 | | | | 0 | | | | 53,395 | | | | 0 | | | | 798,059 | | | | 0 | | | | 1,474,888 | |
| | 97,288,111 | | | | 13,080,495 | | | | 1,302,812 | | | | 15,597,666 | | | | 3,413,200 | | | | 118,989,418 | | | | 4,795,850 | |
| | 0 | | | | 181,800 | | | | 0 | | | | 0 | | | | 0 | | | | 0 | | | | 0 | |
| | 666,423 | | | | 176,909 | | | | 108,660 | | | | 346,379 | | | | 40,928 | | | | 717,492 | | | | 134,522 | |
| | 40,995 | | | | 40,030 | | | | 41,137 | | | | 38,760 | | | | 25,220 | | | | 24,548 | | | | 24,193 | |
| | |
| | 101,639,560 | | | | 13,479,234 | | | | 1,506,004 | | | | 15,982,805 | | | | 4,277,407 | | | | 119,731,458 | | | | 6,429,453 | |
| | |
| $ | 1,017,596,065 | | | $ | 2,532,703,462 | | | $ | 156,370,679 | | | $ | 496,410,937 | | | $ | 79,001,315 | | | $ | 1,156,874,922 | | | $ | 207,886,047 | |
| | |
| | | | | | |
| $ | 760,204,702 | | | $ | 1,188,428,645 | | | $ | 126,347,077 | | | $ | 519,319,145 | | | $ | 67,502,414 | | | $ | 995,453,082 | | | $ | 174,801,497 | |
| | |
| $ | 109,355,356 | | | $ | 60,485,228 | | | $ | 5,627,099 | | | $ | 19,508,327 | | | $ | 4,891,001 | | | $ | 176,294,186 | | | $ | 12,783,629 | |
| | |
| $ | 869,560,058 | | | $ | 1,248,913,873 | | | $ | 131,974,176 | | | $ | 538,827,472 | | | $ | 72,393,415 | | | $ | 1,171,747,268 | | | $ | 187,585,126 | |
| | |
| $ | 94,857,530 | | | $ | 12,747,497 | | | $ | 1,240,646 | | | $ | 14,809,795 | | | $ | 3,325,447 | | | $ | 115,718,547 | | | $ | 4,677,670 | |
| | |
| $ | 0 | | | $ | 0 | | | $ | 55,503 | | | $ | 9,665,860 | | | $ | 0 | | | $ | 0 | | | $ | 0 | |
| | |
The accompanying notes are an integral part of these financial statements.
| | | | |
| 108 | | Wells Fargo Allocation Funds | | Statements of assets and liabilities—November 30, 2015 (unaudited) |
| | | | | | | | |
| | | Core Bond
Portfolio | | | Managed
Fixed Income
Portfolio | |
| | |
Assets | | | | | | | | |
Investments | | | | | | | | |
In unaffiliated securities (including securities on loan), at value (see cost below) | | $ | 3,779,115,563 | | | $ | 117,729,694 | |
In affiliated securities, at value (see cost below) | | | 332,932,327 | | | | 4,447,922 | |
| | | | |
Total investments, at value (see cost below) | | | 4,112,047,890 | | | | 122,177,616 | |
Cash | | | 3,585,903 | | | | 0 | |
Segregated cash | | | 0 | | | | 0 | |
Foreign currency, at value (see cost below) | | | 0 | | | | 0 | |
Receivable for investments sold | | | 297,335,015 | | | | 92,075 | |
Receivable for interest | | | 14,859,972 | | | | 951,310 | |
Receivable for daily variation margin on open futures contracts | | | 0 | | | | 0 | |
Receivable for securities lending income | | | 22,100 | | | | 42 | |
Prepaid expenses and other assets | | | 37,966 | | | | 5,652 | |
| | | | |
Total assets | | | 4,427,888,846 | | | | 123,226,695 | |
| | | | |
| | |
Liabilities | | | | | | | | |
Payable for investments purchased | | | 707,879,734 | | | | 1,576,449 | |
Payable upon receipt of securities loaned | | | 60,450,000 | | | | 236,500 | |
Payable for daily variation margin on open futures contracts | | | 0 | | | | 0 | |
Advisory fee payable | | | 1,011,736 | | | | 29,946 | |
Professional fees payable | | | 37,201 | | | | 25,310 | |
Accrued expenses and other liabilities | | | 56,959 | | | | 1,929 | |
| | | | |
Total liabilities | | | 769,435,630 | | | | 1,870,134 | |
| | | | |
Total net assets | | $ | 3,658,453,216 | | | $ | 121,356,561 | |
| | | | |
| | |
Investments in unaffiliated securities (including securities on loan), at cost | | $ | 3,782,648,495 | | | $ | 116,345,376 | |
| | | | |
Investments in affiliated securities, at cost | | $ | 332,932,327 | | | $ | 4,447,922 | |
| | | | |
Total investments, at cost | | $ | 4,115,580,822 | | | $ | 120,793,298 | |
| | | | |
Securities on loan, at value | | $ | 59,259,188 | | | $ | 231,503 | |
| | | | |
Foreign currency, at cost | | $ | 0 | | | $ | 0 | |
| | | | |
The accompanying notes are an integral part of these financial statements.
| | | | | | |
| Statements of assets and liabilities—November 30, 2015 (unaudited) | | Wells Fargo Allocation Funds | | | 109 | |
| | | | | | |
Real Return
Portfolio | | | Stable
Income
Portfolio | |
| |
| | | | | | |
| | | | | | |
| $ | 47,941,487 | | | $ | 26,674,068 | |
| | 3,421,829 | | | | 1,145,992 | |
| | |
| | 51,363,316 | | | | 27,820,060 | |
| | 171 | | | | 0 | |
| | 0 | | | | 13,500 | |
| | 5,124 | | | | 0 | |
| | 5,139 | | | | 0 | |
| | 216,420 | | | | 86,114 | |
| | 0 | | | | 703 | |
| | 87 | | | | 0 | |
| | 3,006 | | | | 2,369 | |
| | |
| | 51,593,263 | | | | 27,922,746 | |
| | |
| |
| | | | | | |
| | 103,035 | | | | 0 | |
| | 166,050 | | | | 0 | |
| | 406 | | | | 0 | |
| | 11,646 | | | | 2,595 | |
| | 17,754 | | | | 22,193 | |
| | 732 | | | | 1,235 | |
| | |
| | 299,623 | | | | 26,023 | |
| | |
| $ | 51,293,640 | | | $ | 27,896,723 | |
| | |
| |
| $ | 48,063,324 | | | $ | 26,202,510 | |
| | |
| $ | 3,421,829 | | | $ | 1,145,992 | |
| | |
| $ | 51,485,153 | | | $ | 27,348,502 | |
| | |
| $ | 162,486 | | | $ | 0 | |
| | |
| $ | 5,147 | | | $ | 0 | |
| | |
The accompanying notes are an integral part of these financial statements.
| | | | |
| 110 | | Wells Fargo Allocation Funds | | Statements of operations—six months ended November 30, 2015 (unaudited) |
| | | | | | | | |
| | | C&B Large
Cap Value
Portfolio | | | Diversified
Large Cap
Growth
Portfolio | |
| | |
Investment income | | | | | | | | |
Dividends* | | $ | 3,185,662 | | | $ | 520,296 | |
Income from affiliated securities | | | 9,012 | | | | 1,195 | |
Securities lending income, net | | | 4,606 | | | | 3,218 | |
Interest | | | 0 | | | | 0 | |
| | | | |
Total investment income | | | 3,199,280 | | | | 524,709 | |
| | | | |
| | |
Expenses | | | | | | | | |
Advisory fee | | | 1,068,535 | | | | 387,876 | |
Custody and accounting fees | | | 12,147 | | | | 11,724 | |
Professional fees | | | 22,130 | | | | 24,088 | |
Shareholder report expenses | | | 531 | | | | 1,025 | |
Trustees’ fees and expenses | | | 6,301 | | | | 6,473 | |
Other fees and expenses | | | 4,550 | | | | 6,702 | |
| | | | |
Total expenses | | | 1,114,194 | | | | 437,888 | |
Less: Fee waivers and/or expense reimbursements | | | 0 | | | | (66,660 | ) |
| | | | |
Net expenses | | | 1,114,194 | | | | 371,228 | |
| | | | |
Net investment income (loss) | | | 2,085,086 | | | | 153,481 | |
| | | | |
| | |
REALIZED AND UNREALIZED GAINS (LOSSES) ON INVESTMENTS | | | | | | | | |
| | |
Net realized gains (losses) on: | | | | | | | | |
Unaffiliated securities | | | 10,230,399 | | | | 4,189,078 | |
Affiliated securities | | | 0 | | | | 0 | |
Futures transactions | | | 0 | | | | 0 | |
| | | | |
Net realized gain (losses) on investments | | | 10,230,399 | | | | 4,189,078 | |
| | | | |
| | |
Net change in unrealized gains (losses) on: | | | | | | | | |
Unaffiliated securities | | | (20,364,413 | ) | | | (2,879,730 | ) |
Affiliated securities | | | 0 | | | | 0 | |
Futures transactions | | | 0 | | | | 0 | |
| | | | |
Net change in unrealized gains (losses) on investments | | | (20,364,413 | ) | | | (2,879,730 | ) |
| | | | |
Net realized and unrealized gains (losses) on investments | | | (10,134,014 | ) | | | 1,309,348 | |
| | | | |
Net increase (decrease) in net assets resulting from operations | | $ | (8,048,928 | ) | | $ | 1,462,829 | |
| | | | |
| | |
* Net of foreign dividend withholding taxes in the amount of | | | $17,263 | | | | $1,173 | |
The accompanying notes are an integral part of these financial statements.
| | | | | | |
| Statements of operations—six months ended November 30, 2015 (unaudited) | | Wells Fargo Allocation Funds | | | 111 | |
| | | | | | | | | | | | | | | | | | | | | | | | | | |
Emerging
Growth
Portfolio | | | Index
Portfolio | | |
International
Growth
Portfolio | | | International
Value
Portfolio | | | Large Company
Value
Portfolio | | | Small Company
Growth
Portfolio | | | Small Company
Value
Portfolio | |
| | | | | | |
| | | | | | | | | | | | | | | | | | | | | | | | | | |
| $ | 446,429 | | | $ | 27,262,952 | | | $ | 785,935 | | | $ | 5,888,648 | | | $ | 828,105 | | | $ | 2,031,225 | | | $ | 1,673,963 | |
| | 18,887 | | | | 505,801 | | | | 3,876 | | | | 4,240 | | | | 1,585 | | | | 38,880 | | | | 4,714 | |
| | 974,921 | | | | 62,626 | | | | 15,220 | | | | 183,620 | | | | 13,516 | | | | 852,443 | | | | 15,804 | |
| | 0 | | | | 264 | | | | 0 | | | | 0 | | | | 0 | | | | 0 | | | | 0 | |
| | |
| | 1,440,237 | | | | 27,831,643 | | | | 805,031 | | | | 6,076,508 | | | | 843,206 | | | | 2,922,548 | | | | 1,694,481 | |
| | |
| | | | | | |
| | | | | | | | | | | | | | | | | | | | | | | | | | |
| | 4,318,734 | | | | 1,090,712 | | | | 652,569 | | | | 2,142,625 | | | | 257,317 | | | | 3,793,458 | | | | 828,526 | |
| | 31,798 | | | | 73,520 | | | | 49,094 | | | | 94,192 | | | | 5,761 | | | | 32,910 | | | | 11,363 | |
| | 23,493 | | | | 30,361 | | | | 26,642 | | | | 30,417 | | | | 23,654 | | | | 24,297 | | | | 23,329 | |
| | 2,262 | | | | 3,562 | | | | 756 | | | | 1,323 | | | | 615 | | | | 992 | | | | 1,394 | |
| | 6,125 | | | | 4,773 | | | | 6,430 | | | | 5,982 | | | | 6,121 | | | | 5,971 | | | | 6,023 | |
| | 17,017 | | | | 193,132 | | | | 24,191 | | | | 26,968 | | | | 7,765 | | | | 12,515 | | | | 4,721 | |
| | |
| | 4,399,429 | | | | 1,396,060 | | | | 759,682 | | | | 2,301,507 | | | | 301,233 | | | | 3,870,143 | | | | 875,356 | |
| | 0 | | | | (11,554 | ) | | | 0 | | | | 0 | | | | (8,922 | ) | | | 0 | | | | 0 | |
| | |
| | 4,399,429 | | | | 1,384,506 | | | | 759,682 | | | | 2,301,507 | | | | 292,311 | | | | 3,870,143 | | | | 875,356 | |
| | |
| | (2,959,192 | ) | | | 26,447,137 | | | | 45,349 | | | | 3,775,001 | | | | 550,895 | | | | (947,595 | ) | | | 819,125 | |
| | |
| | | | | | |
| | | | | | | | | | | | | | | | | | | | | | | | | | |
| | | | | | |
| | | | | | | | | | | | | | | | | | | | | | | | | | |
| | 30,516,698 | | | | 76,603,043 | | | | (2,006,489 | ) | | | 68,474 | | | | 1,589,301 | | | | (33,533,955 | ) | | | 14,137,854 | |
| | 0 | | | | 1,061,279 | | | | 0 | | | | 0 | | | | 0 | | | | 0 | | | | 0 | |
| | 0 | | | | 40,989 | | | | 0 | | | | 0 | | | | 0 | | | | 0 | | | | 0 | |
| | |
| | 30,516,698 | | | | 77,705,311 | | | | (2,006,489 | ) | | | 68,474 | | | | 1,589,301 | | | | (33,533,955 | ) | | | 14,137,854 | |
| | |
| | | | | | |
| | | | | | | | | | | | | | | | | | | | | | | | | | |
| | (115,631,449 | ) | | | (111,490,822 | ) | | | (10,962,419 | ) | | | (53,900,425 | ) | | | (4,975,347 | ) | | | (33,388,318 | ) | | | (23,027,705 | ) |
| | 0 | | | | (1,620,608 | ) | | | 0 | | | | 0 | | | | 0 | | | | 0 | | | | 0 | |
| | 0 | | | | 935 | | | | 0 | | | | 0 | | | | 0 | | | | 0 | | | | 0 | |
| | |
| | (115,631,449 | ) | | | (113,110,495 | ) | | | (10,962,419 | ) | | | (53,900,425 | ) | | | (4,975,347 | ) | | | (33,388,318 | ) | | | (23,027,705 | ) |
| | |
| | (85,114,751 | ) | | | (35,405,184 | ) | | | (12,968,908 | ) | | | (53,831,951 | ) | | | (3,386,046 | ) | | | (66,922,273 | ) | | | (8,889,851 | ) |
| | |
| $ | (88,073,943 | ) | | $ | (8,958,047 | ) | | $ | (12,923,559 | ) | | $ | (50,056,950 | ) | | $ | (2,835,151 | ) | | $ | (67,869,868 | ) | | $ | (8,070,726 | ) |
| | |
| | | | | | |
| | $0 | | | | $3,832 | | | | $10,924 | | | | $657,280 | | | | $784 | | | | $6,205 | | | | $0 | |
The accompanying notes are an integral part of these financial statements.
| | | | |
| 112 | | Wells Fargo Allocation Funds | | Statements of operations—six months ended November 30, 2015 (unaudited) |
| | | | | | | | |
| | | Core Bond
Portfolio | | | Managed
Fixed Income
Portfolio | |
| | |
Investment income | | | | | | | | |
Interest* | | $ | 41,053,852 | | | $ | 2,148,391 | |
Income from affiliated securities | | | 122,031 | | | | 1,312 | |
Securities lending income, net | | | 63,914 | | | | 276 | |
Dividends | | | 0 | | | | 0 | |
| | | | |
Total investment income | | | 41,239,797 | | | | 2,149,979 | |
| | | | |
| | |
Expenses | | | | | | | | |
Advisory fee | | | 6,666,958 | | | | 239,896 | |
Custody and accounting fees | | | 101,992 | | | | 7,613 | |
Professional fees | | | 39,202 | | | | 27,765 | |
Shareholder report expenses | | | 2,033 | | | | 1,318 | |
Trustees’ fees and expenses | | | 5,722 | | | | 6,544 | |
Other fees and expenses | | | 11,526 | | | | 3,669 | |
| | | | |
Total expenses | | | 6,827,433 | | | | 286,805 | |
Less: Fee waivers and/or expense reimbursements | | | (268,428 | ) | | | (53,626 | ) |
| | | | |
Net expenses | | | 6,559,005 | | | | 233,179 | |
| | | | |
Net investment income | | | 34,680,792 | | | | 1,916,800 | |
| | | | |
| | |
REALIZED AND UNREALIZED GAINS (LOSSES) ON INVESTMENTS | | | | | | | | |
| | |
Net realized gains (losses) on: | | | | | | | | |
Unaffiliated securities | | | (1,762,633 | ) | | | 955,253 | |
Futures transactions | | | 0 | | | | 0 | |
TBA sale commitments | | | 305,506 | | | | 0 | |
| | | | |
Net realized gain (losses) on investments | | | (1,457,127 | ) | | | 955,253 | |
| | | | |
| | |
Net change in unrealized gains (losses) on: | | | | | | | | |
Unaffiliated securities | | | (36,347,983 | ) | | | (2,407,955 | ) |
Futures transactions | | | 0 | | | | 0 | |
| | | | |
Net change in unrealized gains (losses) on investments | | | (36,347,983 | ) | | | (2,407,955 | ) |
| | | | |
Net realized and unrealized gains (losses) on investments | | | (37,805,110 | ) | | | (1,452,702 | ) |
| | | | |
Net increase (decrease) in net assets resulting from operations | | $ | (3,124,318 | ) | | $ | 464,098 | |
| | | | |
| | |
* Net of foreign interest withholding taxes in the amount of | | | $0 | | | | $0 | |
The accompanying notes are an integral part of these financial statements.
| | | | | | |
| Statements of operations—six months ended November 30, 2015 (unaudited) | | Wells Fargo Allocation Funds | | | 113 | |
| | | | | | |
Real Return
Portfolio | | | Stable
Income
Portfolio | |
| |
| | | | | | |
| $ | 495,671 | | | $ | 214,645 | |
| | 152 | | | | 512 | |
| | 5,818 | | | | 165 | |
| | 85,388 | | | | 0 | |
| | |
| | 587,029 | | | | 215,322 | |
| | |
| |
| | | | | | |
| | 101,540 | | | | 40,654 | |
| | 6,179 | | | | 4,728 | |
| | 22,216 | | | | 26,399 | |
| | 717 | | | | 862 | |
| | 7,328 | | | | 7,050 | |
| | 4,289 | | | | 3,470 | |
| | |
| | 142,269 | | | | 83,163 | |
| | (30,930 | ) | | | (28,213 | ) |
| | |
| | 111,339 | | | | 54,950 | |
| | |
| | 475,690 | | | | 160,372 | |
| | |
| |
| | | | | | |
| |
| | | | | | |
| | (61,660 | ) | | | (179 | ) |
| | 7,530 | | | | (6,450 | ) |
| | 0 | | | | 0 | |
| | |
| | (54,130 | ) | | | (6,629 | ) |
| | |
| |
| | | | | | |
| | (1,916,517 | ) | | | (92,713 | ) |
| | (2,851 | ) | | | 8,251 | |
| | |
| | (1,919,368 | ) | | | (84,462 | ) |
| | |
| | (1,973,498 | ) | | | (91,091 | ) |
| | |
| $ | (1,497,808 | ) | | $ | 69,281 | |
| | |
| |
| | $5,397 | | | | $0 | |
The accompanying notes are an integral part of these financial statements.
| | | | |
| 114 | | Wells Fargo Allocation Funds | | Statements of changes in net assets |
| | | | | | | | |
| | | C&B Large Cap Value Portfolio | |
| | | Six months ended
November 30, 2015
(unaudited) | | | Year ended May 31, 2015 | |
| | |
Operations | | | | | | | | |
Net investment income | | $ | 2,085,086 | | | $ | 3,962,347 | |
Net realized gains on investments | | | 10,230,399 | | | | 41,880,494 | |
Net change in unrealized gains (losses) on investments | | | (20,364,413 | ) | | | (13,267,776 | ) |
| | | | |
Net increase (decrease) in net assets resulting from operations | | | (8,048,928 | ) | | | 32,575,065 | |
| | | | |
| | |
Capital share transactions | | | | | | | | |
Transactions in investors’ beneficial interests | | | | | | | | |
Contributions | | | 26,534,974 | | | | 32,358,693 | |
Withdrawals | | | (36,947,357 | ) | | | (46,347,409 | ) |
| | | | |
Net decrease in net assets resulting from capital share transactions | | | (10,412,383 | ) | | | (13,988,716 | ) |
| | | | |
Total increase (decrease) in net assets | | | (18,461,311 | ) | | | 18,586,349 | |
| | | | |
| | |
Net assets | | | | | | | | |
Beginning of period | | | 335,534,804 | | | | 316,948,455 | |
| | | | |
End of period | | $ | 317,073,493 | | | $ | 335,534,804 | |
| | | | |
The accompanying notes are an integral part of these financial statements.
| | | | | | |
| Statements of changes in net assets | | Wells Fargo Allocation Funds | | | 115 | |
| | | | | | | | |
| | | Diversified Large Cap Growth Portfolio | |
| | | Six months ended
November 30, 2015
(unaudited) | | | Year ended May 31, 2015 | |
| | |
Operations | | | | | | | | |
Net investment income | | $ | 153,481 | | | $ | 378,418 | |
Net realized gains on investments | | | 4,189,078 | | | | 13,356,513 | |
Net change in unrealized gains (losses) on investments | | | (2,879,730 | ) | | | 2,762,375 | |
| | | | |
Net increase in net assets resulting from operations | | | 1,462,829 | | | | 16,497,306 | |
| | | | |
| | |
Capital share transactions | | | | | | | | |
Transactions in investors’ beneficial interests | | | | | | | | |
Contributions | | | 1,990,449 | | | | 1,385,145 | |
Withdrawals | | | (8,685,389 | ) | | | (38,000,934 | ) |
| | | | |
Net decrease in net assets resulting from capital share transactions | | | (6,694,940 | ) | | | (36,615,789 | ) |
| | | | |
Total decrease in net assets | | | (5,232,111 | ) | | | (20,118,483 | ) |
| | | | |
| | |
Net assets | | | | | | | | |
Beginning of period | | | 123,329,861 | | | | 143,448,344 | |
| | | | |
End of period | | $ | 118,097,750 | | | $ | 123,329,861 | |
| | | | |
The accompanying notes are an integral part of these financial statements.
| | | | |
| 116 | | Wells Fargo Allocation Funds | | Statements of changes in net assets |
| | | | | | | | |
| | | Emerging Growth Portfolio | |
| | | Six months ended
November 30, 2015
(unaudited) | | | Year ended
May 31, 2015 | |
| | |
Operations | | | | | | | | |
Net investment loss | | $ | (2,959,192 | ) | | $ | (7,075,125 | ) |
Net realized gains on investments | | | 30,516,698 | | | | 124,199,895 | |
Net change in unrealized gains (losses) on investments | | | (115,631,449 | ) | | | 125,177,937 | |
| | | | |
Net increase (decrease) in net assets resulting from operations | | | (88,073,943 | ) | | | 242,302,707 | |
| | | | |
| | |
Capital share transactions | | | | | | | | |
Transactions in investors’ beneficial interests | | | | | | | | |
Contributions | | | 70,849,193 | | | | 45,776,720 | |
Withdrawals | | | (112,946,618 | ) | | | (236,510,647 | ) |
| | | | |
Net decrease in net assets resulting from capital share transactions | | | (42,097,425 | ) | | | (190,733,927 | ) |
| | | | |
Total increase (decrease) in net assets | | | (130,171,368 | ) | | | 51,568,780 | |
| | | | |
| | |
Net assets | | | | | | | | |
Beginning of period | | | 1,147,767,433 | | | | 1,096,198,653 | |
| | | | |
End of period | | $ | 1,017,596,065 | | | $ | 1,147,767,433 | |
| | | | |
The accompanying notes are an integral part of these financial statements.
| | | | | | |
| Statements of changes in net assets | | Wells Fargo Allocation Funds | | | 117 | |
| | | | | | | | |
| | | Index Portfolio | |
| | | Six months ended
November 30, 2015
(unaudited) | | | Year ended
May 31, 2015 | |
| | |
Operations | | | | | | | | |
Net investment income | | $ | 26,447,137 | | | $ | 54,937,429 | |
Net realized gains on investments | | | 77,705,311 | | | | 151,694,995 | |
Net change in unrealized gains (losses) on investments | | | (113,110,495 | ) | | | 106,085,589 | |
| | | | |
Net increase (decrease) in net assets resulting from operations | | | (8,958,047 | ) | | | 312,718,013 | |
| | | | |
| | |
Capital share transactions | | | | | | | | |
Transactions in investors’ beneficial interests | | | | | | | | |
Contributions | | | 35,484,942 | | | | 163,917,502 | |
Withdrawals | | | (264,067,367 | ) | | | (543,742,749 | ) |
| | | | |
Net decrease in net assets resulting from capital share transactions | | | (228,582,425 | ) | | | (379,825,247 | ) |
| | | | |
Total decrease in net assets | | | (237,540,472 | ) | | | (67,107,234 | ) |
| | | | |
| | |
Net assets | | | | | | | | |
Beginning of period | | | 2,770,243,934 | | | | 2,837,351,168 | |
| | | | |
End of period | | $ | 2,532,703,462 | | | $ | 2,770,243,934 | |
| | | | |
The accompanying notes are an integral part of these financial statements.
| | | | |
| 118 | | Wells Fargo Allocation Funds | | Statements of changes in net assets |
| | | | | | | | |
| | | International Growth Portfolio | |
| | | Six months ended
November 30, 2015
(unaudited) | | | Year ended May 31, 2015 | |
| | |
Operations | | | | | | | | |
Net investment income | | $ | 45,349 | | | $ | 1,168,188 | |
Net realized gains (losses) on investments | | | (2,006,489 | ) | | | 5,764,586 | |
Net change in unrealized gains (losses) on investments | | | (10,962,419 | ) | | | 1,080,710 | |
| | | | |
Net increase (decrease) in net assets resulting from operations | | | (12,923,559 | ) | | | 8,013,484 | |
| | | | |
| | |
Capital share transactions | | | | | | | | |
Transactions in investors’ beneficial interests | | | | | | | | |
Contributions | | | 13,012,480 | | | | 9,541,797 | |
Withdrawals | | | (2,122,571 | ) | | | (15,259,152 | ) |
| | | | |
Net increase (decrease) in net assets resulting from capital share transactions | | | 10,889,909 | | | | (5,717,355 | ) |
| | | | |
Total increase (decrease) in net assets | | | (2,033,650 | ) | | | 2,296,129 | |
| | | | |
| | |
Net assets | | | | | | | | |
Beginning of period | | | 158,404,329 | | | | 156,108,200 | |
| | | | |
End of period | | $ | 156,370,679 | | | $ | 158,404,329 | |
| | | | |
The accompanying notes are an integral part of these financial statements.
| | | | | | |
| Statements of changes in net assets | | Wells Fargo Allocation Funds | | | 119 | |
| | | | | | | | |
| | | International Value Portfolio | |
| | | Six months ended
November 30, 2015
(unaudited) | | | Year ended May 31, 2015 | |
| | |
Operations | | | | | | | | |
Net investment income | | $ | 3,775,001 | | | $ | 12,375,837 | |
Net realized gains on investments | | | 68,474 | | | | 12,459,307 | |
Net change in unrealized gains (losses) on investments | | | (53,900,425 | ) | | | (27,933,255 | ) |
| | | | |
Net decrease in net assets resulting from operations | | | (50,056,950 | ) | | | (3,098,111 | ) |
| | | | |
| | |
Capital share transactions | | | | | | | | |
Transactions in investors’ beneficial interests | | | | | | | | |
Contributions | | | 16,809,245 | | | | 42,159,536 | |
Withdrawals | | | (4,555,006 | ) | | | (17,083,113 | ) |
| | | | |
Net increase in net assets resulting from capital share transactions | | | 12,254,239 | | | | 25,076,423 | |
| | | | |
Total increase (decrease) in net assets | | | (37,802,711 | ) | | | 21,978,312 | |
| | | | |
| | |
Net assets | | | | | | | | |
Beginning of period | | | 534,213,648 | | | | 512,235,336 | |
| | | | |
End of period | | $ | 496,410,937 | | | $ | 534,213,648 | |
| | | | |
The accompanying notes are an integral part of these financial statements.
| | | | |
| 120 | | Wells Fargo Allocation Funds | | Statements of changes in net assets |
| | | | | | | | |
| | | Large Company Value Portfolio | |
| | | Six months ended
November 30, 2015
(unaudited) | | | Year ended May 31, 2015 | |
| | |
Operations | | | | | | | | |
Net investment income | | $ | 550,895 | | | $ | 964,436 | |
Net realized gains on investments | | | 1,589,301 | | | | 9,724,164 | |
Net change in unrealized gains (losses) on investments | | | (4,975,347 | ) | | | (3,904,014 | ) |
| | | | |
Net increase (decrease) in net assets resulting from operations | | | (2,835,151 | ) | | | 6,784,586 | |
| | | | |
| | |
Capital share transactions | | | | | | | | |
Transactions in investors’ beneficial interests | | | | | | | | |
Contributions | | | 2,593,477 | | | | 1,636,829 | |
Withdrawals | | | (3,253,299 | ) | | | (21,975,522 | ) |
| | | | |
Net decrease in net assets resulting from capital share transactions | | | (659,822 | ) | | | (20,338,693 | ) |
| | | | |
Total decrease in net assets | | | (3,494,973 | ) | | | (13,554,107 | ) |
| | | | |
| | |
Net assets | | | | | | | | |
Beginning of period | | | 82,496,288 | | | | 96,050,395 | |
| | | | |
End of period | | $ | 79,001,315 | | | $ | 82,496,288 | |
| | | | |
The accompanying notes are an integral part of these financial statements.
| | | | | | |
| Statements of changes in net assets | | Wells Fargo Allocation Funds | | | 121 | |
| | | | | | | | |
| | | Small Company Growth Portfolio | |
| | | Six months ended November 30, 2015
(unaudited) | | | Year ended May 31, 2015 | |
| | |
Operations | | | | | | | | |
Net investment loss | | $ | (947,595 | ) | | $ | (1,603,331 | ) |
Net realized gains (losses) on investments | | | (33,533,955 | ) | | | 17,519,892 | |
Net change in unrealized gains (losses) on investments | | | (33,388,318 | ) | | | 73,745,204 | |
| | | | |
Net increase (decrease) in net assets resulting from operations | | | (67,869,868 | ) | | | 89,661,765 | |
| | | | |
| | |
Capital share transactions | | | | | | | | |
Transactions in investors’ beneficial interests | | | | | | | | |
Contributions | | | 502,985,505 | | | | 343,108,775 | |
Withdrawals | | | (29,626,135 | ) | | | (37,300,648 | ) |
| | | | |
Net increase in net assets resulting from capital share transactions | | | 473,359,370 | | | | 305,808,127 | |
| | | | |
Total increase in net assets | | | 405,489,502 | | | | 395,469,892 | |
| | | | |
| | |
Net assets | | | | | | | | |
Beginning of period | | | 751,385,420 | | | | 355,915,528 | |
| | | | |
End of period | | $ | 1,156,874,922 | | | $ | 751,385,420 | |
| | | | |
The accompanying notes are an integral part of these financial statements.
| | | | |
| 122 | | Wells Fargo Allocation Funds | | Statements of changes in net assets |
| | | | | | | | |
| | | Small Company Value Portfolio | |
| | | Six months ended
November 30, 2015
(unaudited) | | | Year ended May 31, 2015 | |
| | |
Operations | | | | | | | | |
Net investment income | | $ | 819,125 | | | $ | 1,850,375 | |
Net realized gains on investments | | | 14,137,854 | | | | 16,879,349 | |
Net change in unrealized gains (losses) on investments | | | (23,027,705 | ) | | | (3,678,556 | ) |
| | | | |
Net increase (decrease) in net assets resulting from operations | | | (8,070,726 | ) | | | 15,051,168 | |
| | | | |
| | |
Capital share transactions | | | | | | | | |
Transactions in investors’ beneficial interests | | | | | | | | |
Contributions | | | 9,367,320 | | | | 22,862,632 | |
Withdrawals | | | (9,106,770 | ) | | | (28,565,086 | ) |
| | | | |
Net increase (decrease) in net assets resulting from capital share transactions | | | 260,550 | | | | (5,702,454 | ) |
| | | | |
Total increase (decrease) in net assets | | | (7,810,176 | ) | | | 9,348,714 | |
| | | | |
| | |
Net assets | | | | | | | | |
Beginning of period | | | 215,696,223 | | | | 206,347,509 | |
| | | | |
End of period | | $ | 207,886,047 | | | $ | 215,696,223 | |
| | | | |
The accompanying notes are an integral part of these financial statements.
| | | | | | |
| Statements of changes in net assets | | Wells Fargo Allocation Funds | | | 123 | |
| | | | | | | | |
| | | Core Bond Portfolio | |
| | | Six months ended
November 30, 2015
(unaudited) | | | Year ended May 31, 2015 | |
| | |
Operations | | | | | | | | |
Net investment income | | $ | 34,680,792 | | | $ | 58,488,996 | |
Net realized gains (losses) on investments | | | (1,457,127 | ) | | | 54,777,871 | |
Net change in unrealized gains (losses) on investments | | | (36,347,983 | ) | | | (15,603,380 | ) |
| | | | |
Net increase (decrease) in net assets resulting from operations | | | (3,124,318 | ) | | | 97,663,487 | |
| | | | |
| | |
Capital share transactions | | | | | | | | |
Transactions in investors’ beneficial interests | | | | | | | | |
Contributions | | | 303,917,312 | | | | 1,275,843,092 | |
Withdrawals | | | (394,886,755 | ) | | | (517,501,361 | ) |
| | | | |
Net increase (decrease) in net assets resulting from capital share transactions | | | (90,969,443 | ) | | | 758,341,731 | |
| | | | |
Total increase (decrease) in net assets | | | (94,093,761 | ) | | | 856,005,218 | |
| | | | |
| | |
Net assets | | | | | | | | |
Beginning of period | | | 3,752,546,977 | | | | 2,896,541,759 | |
| | | | |
End of period | | $ | 3,658,453,216 | | | $ | 3,752,546,977 | |
| | | | |
The accompanying notes are an integral part of these financial statements.
| | | | |
| 124 | | Wells Fargo Allocation Funds | | Statements of changes in net assets |
| | | | | | | | |
| | | Managed Fixed Income Portfolio | |
| | | Six months ended
November 30, 2015
(unaudited) | | | Year ended May 31, 2015 | |
| | |
Operations | | | | | | | | |
Net investment income | | $ | 1,916,800 | | | $ | 3,704,473 | |
Net realized gains on investments | | | 955,253 | | | | 1,635,962 | |
Net change in unrealized gains (losses) on investments | | | (2,407,955 | ) | | | (507,703 | ) |
| | | | |
Net increase in net assets resulting from operations | | | 464,098 | | | | 4,832,732 | |
| | | | |
| | |
Capital share transactions | | | | | | | | |
Transactions in investors’ beneficial interests | | | | | | | | |
Contributions | | | 8,875,167 | | | | 17,767,001 | |
Withdrawals | | | (9,068,438 | ) | | | (14,012,007 | ) |
| | | | |
Net increase (decrease) in net assets resulting from capital share transactions | | | (193,271 | ) | | | 3,754,994 | |
| | | | |
Total increase in net assets | | | 270,827 | | | | 8,587,726 | |
| | | | |
| | |
Net assets | | | | | | | | |
Beginning of period | | | 121,085,734 | | | | 112,498,008 | |
| | | | |
End of period | | $ | 121,356,561 | | | $ | 121,085,734 | |
| | | | |
The accompanying notes are an integral part of these financial statements.
| | | | | | |
| Statements of changes in net assets | | Wells Fargo Allocation Funds | | | 125 | |
| | | | | | | | |
| | | Real Return Portfolio | |
| | | Six months ended
November 30, 2015
(unaudited) | | | Year ended May 31, 2015 | |
| | |
Operations | | | | | | | | |
Net investment income | | $ | 475,690 | | | $ | 400,921 | |
Net realized gains (losses) on investments | | | (54,130 | ) | | | 1,132,514 | |
Net change in unrealized gains (losses) on investments | | | (1,919,368 | ) | | | (896,307 | ) |
| | | | |
Net increase (decrease) in net assets resulting from operations | | | (1,497,808 | ) | | | 637,128 | |
| | | | |
| | |
Capital share transactions | | | | | | | | |
Transactions in investors’ beneficial interests | | | | | | | | |
Contributions | | | 8,862,425 | | | | 12,526,145 | |
Withdrawals | | | (4,467,761 | ) | | | (11,966,906 | ) |
| | | | |
Net increase in net assets resulting from capital share transactions | | | 4,394,664 | | | | 559,239 | |
| | | | |
Total increase in net assets | | | 2,896,856 | | | | 1,196,367 | |
| | | | |
| | |
Net assets | | | | | | | | |
Beginning of period | | | 48,396,784 | | | | 47,200,417 | |
| | | | |
End of period | | $ | 51,293,640 | | | $ | 48,396,784 | |
| | | | |
The accompanying notes are an integral part of these financial statements.
| | | | |
| 126 | | Wells Fargo Allocation Funds | | Statements of changes in net assets |
| | | | | | | | |
| | | Stable Income Portfolio | |
| | | Six months ended
November 30, 2015
(unaudited) | | | Year ended May 31, 2015 | |
| | |
Operations | | | | | | | | |
Net investment income | | $ | 160,372 | | | $ | 308,337 | |
Net realized gains (losses) on investments | | | (6,629 | ) | | | 148 | |
Net change in unrealized gains (losses) on investments | | | (84,462 | ) | | | (79,402 | ) |
| | | | |
Net increase in net assets resulting from operations | | | 69,281 | | | | 229,083 | |
| | | | |
| | |
Capital share transactions | | | | | | | | |
Transactions in investors’ beneficial interests | | | | | | | | |
Contributions | | | 2,484,007 | | | | 3,703,378 | |
Withdrawals | | | (1,732,369 | ) | | | (1,665,191 | ) |
| | | | |
Net increase in net assets resulting from capital share transactions | | | 751,638 | | | | 2,038,187 | |
| | | | |
Total increase in net assets | | | 820,919 | | | | 2,267,270 | |
| | | | |
| | |
Net assets | | | | | | | | |
Beginning of period | | | 27,075,804 | | | | 24,808,534 | |
| | | | |
End of period | | $ | 27,896,723 | | | $ | 27,075,804 | |
| | | | |
The accompanying notes are an integral part of these financial statements.
| | | | | | |
| Financial highlights | | Wells Fargo Allocation Funds | | | 127 | |
| | | | | | | | | | | | | | | | | | | | |
| | | Ratio to average net assets (annualized) | | | | | | Portfolio
turnover
rate | |
| | | Net investment
income (loss) | | | Gross
expenses | | | Net
expenses | | | Total
return1 | | |
| | | | | |
C&B Large Cap Value Portfolio | | | | | | | | | | | | | | | | | | | | |
Six months ended November 30, 2015 (unaudited) | | | 1.27 | % | | | 0.68 | % | | | 0.68 | % | | | (2.13 | )% | | | 18 | % |
Year ended May 31, 2015 | | | 1.20 | % | | | 0.68 | % | | | 0.68 | % | | | 10.29 | % | | | 35 | % |
Year ended May 31, 2014 | | | 1.35 | % | | | 0.68 | % | | | 0.68 | % | | | 17.80 | % | | | 22 | % |
Year ended May 31, 2013 | | | 1.73 | % | | | 0.68 | % | | | 0.68 | % | | | 29.30 | % | | | 18 | % |
Year ended May 31, 2012 | | | 1.81 | % | | | 0.68 | % | | | 0.68 | % | | | (4.61 | )% | | | 21 | % |
Year ended May 31, 20112 | | | 1.27 | % | | | 0.67 | % | | | 0.67 | % | | | 18.08 | % | | | 17 | % |
Year ended September 30, 2010 | | | 1.40 | % | | | 0.70 | % | | | 0.68 | % | | | 7.49 | % | | | 13 | % |
| | | | | |
Diversified Large Cap Growth Portfolio | | | | | | | | | | | | | | | | | | | | |
Six months ended November 30, 2015 (unaudited) | | | 0.26 | % | | | 0.73 | % | | | 0.62 | % | | | 1.28 | % | | | 28 | % |
Year ended May 31, 2015 | | | 0.28 | % | | | 0.72 | % | | | 0.62 | % | | | 13.11 | % | | | 46 | % |
Year ended May 31, 2014 | | | 0.15 | % | | | 0.72 | % | | | 0.62 | % | | | 21.70 | % | | | 54 | % |
Year ended May 31, 2013 | | | 0.51 | % | | | 0.71 | % | | | 0.62 | % | | | 20.30 | % | | | 56 | % |
Year ended May 31, 2012 | | | 0.24 | % | | | 0.71 | % | | | 0.62 | % | | | 1.26 | % | | | 79 | % |
Year ended May 31, 20112,3 | | | 0.40 | % | | | 0.69 | % | | | 0.62 | % | | | 22.78 | % | | | 101 | % |
Year ended September 30, 20103 | | | 0.66 | % | | | 0.70 | % | | | 0.62 | % | | | 7.51 | % | | | 11 | % |
| | | | | |
Emerging Growth Portfolio | | | | | | | | | | | | | | | | | | | | |
Six months ended November 30, 2015 (unaudited) | | | (0.54 | )% | | | 0.80 | % | | | 0.80 | % | | | (7.70 | )% | | | 40 | % |
Year ended May 31, 2015 | | | (0.63 | )% | | | 0.80 | % | | | 0.80 | % | | | 24.02 | % | | | 56 | % |
Year ended May 31, 2014 | | | (0.62 | )% | | | 0.80 | % | | | 0.80 | % | | | 11.92 | % | | | 63 | % |
Year ended May 31, 2013 | | | (0.47 | )% | | | 0.80 | % | | | 0.80 | % | | | 20.53 | % | | | 65 | % |
Year ended May 31, 2012 | | | (0.57 | )% | | | 0.80 | % | | | 0.80 | % | | | (4.83 | )% | | | 75 | % |
Year ended May 31, 20112 | | | (0.77 | )% | | | 0.94 | % | | | 0.91 | % | | | 37.91 | % | | | 59 | % |
Year ended September 30, 2010 | | | (0.66 | )% | | | 1.02 | % | | | 0.94 | % | | | 20.49 | % | | | 97 | % |
| | | | | |
Index Portfolio | | | | | | | | | | | | | | | | | | | | |
Six months ended November 30, 2015 (unaudited) | | | 2.05 | % | | | 0.11 | % | | | 0.11 | % | | | (0.27 | )% | | | 2 | % |
Year ended May 31, 2015 | | | 1.96 | % | | | 0.11 | % | | | 0.11 | % | | | 11.69 | % | | | 4 | % |
Year ended May 31, 2014 | | | 1.99 | % | | | 0.10 | % | | | 0.10 | % | | | 20.33 | % | | | 5 | % |
Year ended May 31, 2013 | | | 2.20 | % | | | 0.09 | % | | | 0.09 | % | | | 27.22 | % | | | 4 | % |
Year ended May 31, 2012 | | | 2.09 | % | | | 0.10 | % | | | 0.10 | % | | | (0.52 | )% | | | 9 | % |
Year ended May 31, 20112 | | | 1.93 | % | | | 0.10 | % | | | 0.10 | % | | | 19.39 | % | | | 3 | % |
Year ended September 30, 2010 | | | 2.01 | % | | | 0.10 | % | | | 0.10 | % | | | 9.97 | % | | | 22 | % |
| | | | | |
International Growth Portfolio | | | | | | | | | | | | | | | | | | | | |
Six months ended November 30, 2015 (unaudited) | | | 0.06 | % | | | 0.99 | % | | | 0.99 | % | | | (8.10 | )% | | | 22 | % |
Year ended May 31, 2015 | | | 0.76 | % | | | 1.00 | % | | | 1.00 | % | | | 5.13 | % | | | 51 | % |
Year ended May 31, 2014 | | | 1.13 | % | | | 1.00 | % | | | 1.00 | % | | | 16.45 | % | | | 46 | % |
Year ended May 31, 2013 | | | 1.63 | % | | | 1.04 | % | | | 1.04 | % | | | 30.34 | % | | | 46 | % |
Year ended May 31, 2012 | | | 2.04 | % | | | 0.97 | % | | | 0.90 | % | | | (9.44 | )% | | | 69 | % |
Year ended May 31, 20112 | | | 1.62 | % | | | 1.10 | % | | | 1.10 | % | | | 14.50 | % | | | 53 | % |
Year ended September 30, 2010 | | | 0.89 | % | | | 1.42 | % | | | 1.20 | % | | | 3.25 | % | | | 89 | % |
| | | | | |
International Value Portfolio | | | | | | | | | | | | | | | | | | | | |
Six months ended November 30, 2015 (unaudited) | | | 1.50 | % | | | 0.91 | % | | | 0.91 | % | | | (9.32 | )% | | | 5 | % |
Year ended May 31, 2015 | | | 2.45 | % | | | 0.91 | % | | | 0.91 | % | | | (1.04 | )% | | | 18 | % |
Year ended May 31, 2014 | | | 3.09 | % | | | 0.91 | % | | | 0.91 | % | | | 18.22 | % | | | 11 | % |
Year ended May 31, 2013 | | | 3.04 | % | | | 0.91 | % | | | 0.91 | % | | | 29.45 | % | | | 16 | % |
Year ended May 31, 2012 | | | 3.44 | % | | | 0.91 | % | | | 0.85 | % | | | (21.07 | )% | | | 9 | % |
Year ended May 31, 20112 | | | 3.14 | % | | | 0.94 | % | | | 0.94 | % | | | 14.00 | % | | | 16 | % |
Year ended September 30, 2010 | | | 2.41 | % | | | 1.20 | % | | | 1.06 | % | | | 0.92 | % | | | 27 | % |
Please see footnotes on page 131.
The accompanying notes are an integral part of these financial statements.
| | | | |
| 128 | | Wells Fargo Allocation Funds | | Financial highlights |
| | | | | | | | | | | | | | | | | | | | |
| | | Ratio to average net assets (annualized) | | | | | | Portfolio
turnover
rate | |
| | | Net investment
income (loss) | | | Gross
expenses | | | Net
expenses | | | Total
return1 | | |
| | | | | |
Large Company Value Portfolio | | | | | | | | | | | | | | | | | | | | |
Six months ended November 30, 2015 (unaudited) | | | 1.39 | % | | | 0.76 | % | | | 0.74 | % | | | (3.40 | )% | | | 30 | % |
Year ended May 31, 2015 | | | 1.09 | % | | | 0.74 | % | | | 0.74 | % | | | 7.90 | % | | | 72 | % |
Year ended May 31, 2014 | | | 0.99 | % | | | 0.73 | % | | | 0.73 | % | | | 20.26 | % | | | 62 | % |
Year ended May 31, 2013 | | | 1.49 | % | | | 0.78 | % | | | 0.74 | % | | | 28.91 | % | | | 95 | % |
Year ended May 31, 2012 | | | 1.67 | % | | | 0.77 | % | | | 0.74 | % | | | (6.06 | )% | | | 104 | % |
Year ended May 31, 20112 | | | 1.58 | % | | | 0.78 | % | | | 0.74 | % | | | 21.46 | % | | | 38 | % |
Year ended September 30, 2010 | | | 1.73 | % | | | 0.73 | % | | | 0.72 | % | | | 7.02 | % | | | 46 | % |
| | | | | |
Small Company Growth Portfolio | | | | | | | | | | | | | | | | | | | | |
Six months ended November 30, 2015 (unaudited) | | | (0.20 | )% | | | 0.80 | % | | | 0.80 | % | | | (6.99 | )% | | | 24 | % |
Year ended May 31, 2015 | | | (0.32 | )% | | | 0.82 | % | | | 0.82 | % | | | 18.07 | % | | | 58 | % |
Year ended May 31, 2014 | | | (0.37 | )% | | | 0.83 | % | | | 0.83 | % | | | 23.47 | % | | | 77 | % |
Year ended May 31, 2013 | | | (0.02 | )% | | | 0.86 | % | | | 0.86 | % | | | 31.39 | % | | | 109 | % |
Year ended May 31, 2012 | | | (0.12 | )% | | | 0.83 | % | | | 0.83 | % | | | (10.75 | )% | | | 107 | % |
Year ended May 31, 20112 | | | (0.42 | )% | | | 0.83 | % | | | 0.83 | % | | | 39.64 | % | | | 70 | % |
Year ended September 30, 2010 | | | (0.48 | )% | | | 0.87 | % | | | 0.86 | % | | | 15.25 | % | | | 129 | % |
| | | | | |
Small Company Value Portfolio | | | | | | | | | | | | | | | | | | | | |
Six months ended November 30, 2015 (unaudited) | | | 0.79 | % | | | 0.85 | % | | | 0.85 | % | | | (3.82 | )% | | | 34 | % |
Year ended May 31, 2015 | | | 0.89 | % | | | 0.84 | % | | | 0.84 | % | | | 7.29 | % | | | 54 | % |
Year ended May 31, 2014 | | | 0.89 | % | | | 0.85 | % | | | 0.85 | % | | | 18.09 | % | | | 47 | % |
Year ended May 31, 2013 | | | 0.58 | % | | | 0.85 | % | | | 0.85 | % | | | 30.76 | % | | | 57 | % |
Year ended May 31, 2012 | | | 0.69 | % | | | 0.84 | % | | | 0.84 | % | | | (7.17 | )% | | | 60 | % |
Year ended May 31, 20112 | | | 1.60 | % | | | 0.84 | % | | | 0.84 | % | | | 26.72 | % | | | 47 | % |
Year ended September 30, 2010 | | | 0.31 | % | | | 0.89 | % | | | 0.89 | % | | | 16.38 | % | | | 60 | % |
| | | | | |
Core Bond Portfolio | | | | | | | | | | | | | | | | | | | | |
Six months ended November 30, 2015 (unaudited) | | | 1.85 | % | | | 0.36 | % | | | 0.35 | % | | | (0.10 | )% | | | 303 | % |
Year ended May 31, 2015 | | | 1.82 | % | | | 0.37 | % | | | 0.35 | % | | | 3.22 | % | | | 586 | % |
Year ended May 31, 2014 | | | 1.94 | % | | | 0.37 | % | | | 0.35 | % | | | 2.90 | % | | | 646 | % |
Year ended May 31, 2013 | | | 1.75 | % | | | 0.37 | % | | | 0.35 | % | | | 2.61 | % | | | 547 | % |
Year ended May 31, 2012 | | | 2.33 | % | | | 0.37 | % | | | 0.35 | % | | | 8.20 | % | | | 803 | % |
Year ended May 31, 2011 | | | 2.99 | % | | | 0.37 | % | | | 0.35 | % | | | 7.02 | % | | | 789 | % |
| | | | | |
Managed Fixed Income Portfolio | | | | | | | | | | | | | | | | | | | | |
Six months ended November 30, 2015 (unaudited) | | | 3.20 | % | | | 0.48 | % | | | 0.39 | % | | | 0.35 | % | | | 14 | % |
Year ended May 31, 2015 | | | 3.20 | % | | | 0.48 | % | | | 0.39 | % | | | 4.23 | % | | | 31 | % |
Year ended May 31, 2014 | | | 3.33 | % | | | 0.48 | % | | | 0.39 | % | | | 3.07 | % | | | 35 | % |
Year ended May 31, 2013 | | | 3.42 | % | | | 0.47 | % | | | 0.39 | % | | | 4.81 | % | | | 49 | % |
Year ended May 31, 2012 | | | 3.83 | % | | | 0.46 | % | | | 0.39 | % | | | 6.97 | % | | | 51 | % |
Year ended May 31, 2011 | | | 3.97 | % | | | 0.45 | % | | | 0.39 | % | | | 8.84 | % | | | 104 | % |
| | | | | |
Real Return Portfolio | | | | | | | | | | | | | | | | | | | | |
Six months ended November 30, 2015 (unaudited) | | | 1.87 | % | | | 0.56 | % | | | 0.44 | % | | | (3.03 | )% | | | 9 | % |
Year ended May 31, 2015 | | | 0.89 | % | | | 0.57 | % | | | 0.44 | % | | | 1.50 | % | | | 57 | % |
Year ended May 31, 2014 | | | 1.45 | % | | | 0.53 | % | | | 0.44 | % | | | (0.26 | )% | | | 9 | % |
Year ended May 31, 2013 | | | 1.52 | % | | | 0.50 | % | | | 0.44 | % | | | (1.86 | )% | | | 15 | % |
Year ended May 31, 2012 | | | 3.00 | % | | | 0.48 | % | | | 0.44 | % | | | 12.62 | % | | | 23 | % |
Year ended May 31, 2011 | | | 3.25 | % | | | 0.44 | % | | | 0.43 | % | | | 8.19 | % | | | 19 | % |
| | | | | |
Stable Income Portfolio | | | | | | | | | | | | | | | | | | | | |
Six months ended November 30, 2015 (unaudited) | | | 1.18 | % | | | 0.61 | % | | | 0.41 | % | | | 0.28 | % | | | 13 | % |
Year ended May 31, 2015 | | | 1.20 | % | | | 0.64 | % | | | 0.41 | % | | | 0.89 | % | | | 26 | % |
Year ended May 31, 2014 | | | 1.41 | % | | | 0.66 | % | | | 0.41 | % | | | 1.52 | % | | | 33 | % |
Year ended May 31, 2013 | | | 1.50 | % | | | 0.58 | % | | | 0.41 | % | | | 2.78 | % | | | 20 | % |
Year ended May 31, 2012 | | | 1.76 | % | | | 0.59 | % | | | 0.41 | % | | | 1.71 | % | | | 11 | % |
Year ended May 31, 2011 | | | 2.02 | % | | | 0.54 | % | | | 0.40 | % | | | 2.97 | % | | | 14 | % |
Please see footnotes on page 131.
The accompanying notes are an integral part of these financial statements.
| | | | | | |
| Financial highlights | | Wells Fargo Allocation Funds | | | 129 | |
| 1 | Returns for periods of less than one year are not annualized. |
| 2 | For the eight months ended May 31, 2011. The Portfolio changed its fiscal year end from September 30 to May 31, effective May 31, 2011. |
| 3 | After the close of business on January 28, 2011, the Diversified Large Cap Growth Portfolio acquired the net assets of Wells Fargo Advantage Disciplined Growth Portfolio, Wells Fargo Advantage Large Cap Appreciation Portfolio, and Wells Fargo Advantage Large Company Growth Portfolio. Wells Fargo Advantage Large Company Growth Portfolio became the accounting and performance survivor in the transaction. The information for the periods prior to January 31, 2011 is that of the Wells Fargo Advantage Large Company Growth Portfolio. |
The accompanying notes are an integral part of these financial statements.
| | | | |
| 130 | | Wells Fargo Allocation Funds | | Notes to financial statements (unaudited) |
1. ORGANIZATION
Wells Fargo Master Trust (the “Trust”), a Delaware statutory trust organized on March 10, 1999, is an open-end management investment company registered under the Investment Company Act of 1940, as amended (the “1940 Act”). As an investment company, the Trust follows the accounting and reporting guidance in Financial Accounting Standards Board (“FASB”) Accounting Standards Codification Topic 946, Financial Services – Investment Companies. These financial statements report on the following portfolios: the Wells Fargo C&B Large Cap Value Portfolio (“C&B Large Cap Value Portfolio”), the Wells Fargo Diversified Large Cap Growth Portfolio (“Diversified Large Cap Growth Portfolio”), the Wells Fargo Emerging Growth Portfolio (“Emerging Growth Portfolio”), the Wells Fargo Index Portfolio (“Index Portfolio”), the Wells Fargo International Growth Portfolio (“International Growth Portfolio”), the Wells Fargo International Value Portfolio (“International Value Portfolio”), the Wells Fargo Large Company Value Portfolio (“Large Company Value Portfolio”), the Wells Fargo Small Company Growth Portfolio (“Small Company Growth Portfolio”), the Wells Fargo Small Company Value Portfolio (“Small Company Value Portfolio”), the Wells Fargo Core Bond Portfolio (“Core Bond Portfolio”), the Wells Fargo Managed Fixed Income Portfolio (“Managed Fixed Income Portfolio”), the Wells Fargo Real Return Portfolio (“Real Return Portfolio”), and the Wells Fargo Stable Income Portfolio (“Stable Income Portfolio”) (each, a “Portfolio”, collectively, the “Portfolios”). Each Portfolio is a diversified series of the Trust.
The Portfolios, which are master portfolios in a master/feeder structure, offer their shares to multiple feeder funds and other affiliated master portfolios rather than directly to the public.
2. SIGNIFICANT ACCOUNTING POLICIES
The following significant accounting policies, which are consistently followed in the preparation of the financial statements of each Portfolio, are in conformity with U.S. generally accepted accounting principles which require management to make estimates and assumptions that affect the reported amounts of assets and liabilities, disclosure of contingent assets and liabilities at the date of the financial statements, and the reported amounts of revenues and expenses during the reporting period. Actual results could differ from those estimates.
Securities valuation
All investments are valued each business day as of the close of regular trading on the New York Stock Exchange (generally 4 p.m. Eastern Time).
Equity securities and futures that are listed on a foreign or domestic exchange or market are valued at the official closing price or, if none, the last sales price. If no sale occurs on the primary exchange or market that day, the prior day’s price will be deemed “stale” and a fair value price will be determined in accordance with the Portfolio’s Valuation Procedures.
Equity securities that are not listed on a foreign or domestic exchange or market, but have a public trading market, are valued at the quoted bid price from an independent broker-dealer that the Management Valuation Team of Wells Fargo Funds Management, LLC (“Funds Management”) has determined is an acceptable source.
The values of securities denominated in foreign currencies are translated into U.S. dollars at rates provided by an independent foreign currency pricing source at a time each business day specified by the Management Valuation Team.
Many securities markets and exchanges outside the U.S. close prior to the close of the New York Stock Exchange and therefore may not fully reflect trading or events that occur after the close of the principal exchange in which the foreign securities are traded, but before the close of the New York Stock Exchange. If such trading or events are expected to materially affect the value of such securities, then fair value pricing procedures approved by the Board of Trustees of the Portfolios are applied. These procedures take into account multiple factors including movements in U.S. securities markets after foreign exchanges close. Foreign securities that are fair valued under these procedures are categorized as Level 2 and the application of these procedures may result in transfers between Level 1 and Level 2. Depending on market activity, such fair valuations may be frequent. Such fair value pricing may result in net asset values that are higher or lower than net asset values based on the last reported sales price or latest quoted bid price. On November 30, 2015, such fair value pricing was not used in pricing foreign securities.
Debt securities are valued at the evaluated bid price provided by an independent pricing service or, if a reliable price is not available, the quoted bid price from an independent broker-dealer.
Investments in registered open-end investment companies are valued at net asset value. Interests in non-registered investment vehicles that are redeemable at net asset value are fair valued at net asset value when available.
Investments which are not valued using any of the methods discussed above are valued at their fair value, as determined in good faith by the Board of Trustees. The Board of Trustees has established a Valuation Committee comprised of the
| | | | | | |
| Notes to financial statements (unaudited) | | Wells Fargo Allocation Funds | | | 131 | |
Trustees and has delegated to it the authority to take any actions regarding the valuation of portfolio securities that the Valuation Committee deems necessary or appropriate, including determining the fair value of portfolio securities, unless the determination has been delegated to the Management Valuation Team. The Board of Trustees retains the authority to make or ratify any valuation decisions or approve any changes to the Valuation Procedures as it deems appropriate. On a quarterly basis, the Board of Trustees receives reports on any valuation actions taken by the Valuation Committee or the Management Valuation Team which may include items for ratification.
Valuations of fair valued securities are compared to the next actual sales price when available, or other appropriate market values, to assess the continued appropriateness of the fair valuation methodologies used. These securities are fair valued on a day-to-day basis, taking into consideration changes to appropriate market information and any significant changes to the inputs considered in the valuation process until there is a readily available price provided on an exchange or by an independent pricing service. Valuations received from an independent pricing service or independent broker-dealer quotes are periodically validated by comparisons to most recent trades and valuations provided by other independent pricing services in addition to the review of prices by the adviser and/or subadviser. Unobservable inputs used in determining fair valuations are identified based on the type of security, taking into consideration factors utilized by market participants in valuing the investment, knowledge about the issuer and the current market environment.
Foreign currency translation
The accounting records of the Portfolios are maintained in U.S. dollars. The value of other assets and liabilities denominated in foreign currencies are translated into U.S. dollars at rates provided by an independent foreign currency pricing source at a time each business day specified by the Management Valuation Team. Purchases and sales of securities, and income and expenses are converted at the rate of exchange on the respective dates of such transactions. Net realized foreign exchange gains or losses arise from sales of foreign currencies, currency gains or losses realized between the trade and settlement dates on securities transactions, and the difference between the amounts of dividends, interest and foreign withholding taxes recorded and the U.S. dollar equivalent of the amounts actually paid or received. Net unrealized foreign exchange gains and losses arise from changes in the fair value of assets and liabilities other than investments in securities resulting from changes in exchange rates. The changes in net assets arising from changes in exchange rates and the changes in net assets resulting from changes in market prices of securities are not separately presented. Such changes are included in net realized and unrealized gains or losses from investments.
Security loans
The Portfolios may lend their securities from time to time in order to earn additional income in the form of fees or interest on securities received as collateral or the investment of any cash received as collateral. The Portfolios continue to receive interest or dividends on the securities loaned. The Portfolios receive collateral in the form of cash or securities with a value at least equal to the value of the securities on loan. The value of the loaned securities is determined at the close of each business day and any additional required collateral is delivered to the Portfolios on the next business day. In a securities lending transaction, the net asset value of the Portfolios will be affected by an increase or decrease in the value of the securities loaned and by an increase or decrease in the value of the instrument in which collateral is invested. The amount of securities lending activity undertaken by the Portfolios fluctuate from time to time, In the event of default or bankruptcy by the borrower, the Portfolios may be prevented from recovering the loaned securities or gaining access to the collateral or may experience delays or costs in doing so. In addition, the investment of any cash collateral received may lose all or part of its value. The Portfolios have the right under the lending agreement to recover the securities from the borrower on demand.
The Portfolios lend their securities through an unaffiliated securities lending agent. Cash collateral received in connection with its securities lending transactions is invested in Securities Lending Cash Investments, LLC (the “Securities Lending Fund”). The Securities Lending Fund is exempt from registration under Section 3(c)(7) of the 1940 Act and is managed by Funds Management and is subadvised by Wells Capital Management Incorporated (“WellsCap”). Funds Management receives an advisory fee starting at 0.05% and declining to 0.01% as the average daily net assets of the Securities Lending Fund increase. All of the fees received by Funds Management are paid to WellsCap for its services as subadviser. The Securities Lending Fund seeks to provide a positive return compared to the daily Fed Funds Open rate by investing in high-quality, U.S. dollar-denominated short-term money market instruments. Securities Lending Fund investments are fair valued based upon the amortized cost valuation technique. Income earned from investment in the Securities Lending Fund is included in securities lending income on the Statements of Operations.
When-issued transactions
The Portfolios may purchase securities on a forward commitment or when-issued basis. A Portfolio records a when-issued transaction on the trade date and will segregate assets in an amount at least equal in value to the Portfolio’s commitment
| | | | |
| 132 | | Wells Fargo Allocation Funds | | Notes to financial statements (unaudited) |
to purchase when-issued securities. Securities purchased on a when-issued basis are marked-to-market daily and the Portfolio begins earning interest on the settlement date. Losses may arise due to changes in the market value of the underlying securities or if the counterparty does not perform under the contract.
Loans
The Portfolios may invest in direct debt instruments which are interests in amounts owed to lenders by corporate or other borrowers. The loans pay interest at rates which are periodically reset by reference to a base lending rate plus a spread. Investments in loans may be in the form of participations in loans or assignments of all or a portion of loans from third parties. When the Portfolio purchases participations, it generally has no rights to enforce compliance with terms of the loan agreement with the borrower. As a result, the Portfolio assumes the credit risk of both the borrower and the lender that is selling the participation. When the Portfolio purchases assignments from lenders, it acquires direct rights against the borrower on the loan and may enforce compliance by the borrower with the terms of the loan agreement. Loans may include fully funded term loans or unfunded loan commitments, which are contractual obligations for future funding.
Futures contracts
The Portfolios are subject to interest rate risk or equity price risk in the normal course of pursuing its investment objectives. A Portfolio may buy and sell futures contracts in order to gain exposure to, or protect against, changes in security values and interest rates. The primary risks associated with the use of futures contracts are the imperfect correlation between changes in market values of securities held by the Portfolio and the prices of futures contracts, and the possibility of an illiquid market.
The aggregate principal amounts of the contracts are not recorded in the financial statements. Fluctuations in the value of the contracts are recorded in the Statements of Assets and Liabilities as an asset or liability and in the Statements of Operations as unrealized gains or losses until the contracts are closed, at which point they are recorded as net realized gains or losses on futures contracts. With futures contracts, there is minimal counterparty risk to the Portfolio since futures are exchange traded and the exchange’s clearinghouse, as counterparty to all exchange traded futures, guarantees the futures against default.
TBA sale commitments
The Portfolios may enter into To Be Announced (“TBA”) sale commitments to hedge its portfolio positions or to sell mortgage-backed securities it owns under delayed delivery arrangements. Proceeds of TBA sale commitments are not received until the contractual settlement date. During the time a TBA sale commitment is outstanding, equivalent deliverable securities or offsetting TBA purchase commitments, which are deliverable on or before the sale commitment date, are held as “cover” for the transaction. Unsettled TBA sale commitments are valued at the current market value of the underlying securities, generally according to the procedures described under “Securities valuation”. The contract is marked-to-market daily and the change in market value is recorded by the Portfolio as an unrealized gain or loss. If the TBA sale commitment is closed through the acquisition of an offsetting purchase commitment, the Portfolio realizes a gain or loss. If the Portfolio delivers securities under the commitment, the Portfolio realizes a gain or a loss from the sale of the securities based upon the unit price established at the date the commitment was entered into.
Inflation-indexed bonds and TIPS
The Portfolios may invest in inflation-indexed bonds, including Treasury inflation-protected securities (TIPS). Inflation-indexed bonds are fixed income securities whose principal value is periodically adjusted according to the rate of inflation. If the index measuring inflation falls, the principal value of inflation-indexed bonds (other than municipal inflation indexed bonds and certain corporate inflation-indexed bonds) will be adjusted downward, and consequently the interest payable on these securities (calculated with respect to a smaller principal amount) will be reduced. Repayment of the original bond principal upon maturity (as adjusted for inflation) is guaranteed in the case of U.S. Treasury inflation-indexed bonds. For bonds that do not provide a similar guarantee, the adjusted principal value of the bond repaid at maturity may be less than the original principal. The value of inflation-indexed bonds is expected to change in response to changes in real interest rates. Real interest rates are tied to the relationship between nominal interest rates and the rate of inflation. If nominal interest rates increase at a faster rate than inflation, real interest rates may rise, leading to a decrease in value of inflation-indexed bonds. Inflation-indexed bonds, including TIPS, decline in value when real interest rates rise. In certain interest rate environments, such as when real interest rates are rising faster than nominal interest rates, inflation-indexed bonds may experience greater losses than other fixed income securities with similar durations.
Mortgage dollar roll transactions
The Portfolios may engage in mortgage dollar roll transactions through TBA mortgage-backed securities issued by Government National Mortgage Association (GNMA), Federal National Mortgage Association (FNMA) and Federal Home
| | | | | | |
| Notes to financial statements (unaudited) | | Wells Fargo Allocation Funds | | | 133 | |
Loan Mortgage Corporation (FHLMC). In a mortgage dollar roll transaction, a Portfolio sells a mortgage-backed security to a financial institution, such as a bank or broker-dealer and simultaneously agrees to repurchase a substantially similar security from the institution at a later date at an agreed upon price. The mortgage-backed securities that are repurchased will bear the same interest rate as those sold, but generally will be collateralized by different pools of mortgages with different pre-payment histories. During the roll period, a Portfolio foregoes principal and interest paid on the securities. A Portfolio is compensated by the difference between the current sales price and the forward price for the future purchase as well as by the earnings on the cash proceeds of the initial sale. Mortgage dollar rolls may be renewed without physical delivery of the securities subject to the contract. The Portfolios account for TBA dollar roll transactions as purchases and sales which, as a result, may increase its portfolio turnover rate.
Security transactions and income recognition
Securities transactions are recorded on a trade date basis. Realized gains or losses are recorded on the basis of identified cost.
Dividend income is recognized on the ex-dividend date, except for certain dividends from foreign securities which are recorded as soon as the custodian verifies the ex-dividend date.
Interest income is accrued daily and bond discounts are accreted and premiums are amortized daily based on the effective interest method. To the extent debt obligations are placed on non-accrual status, any related interest income may be reduced by writing off interest receivables when the collection of all or a portion of interest has become doubtful based on consistently applied procedures. If the issuer subsequently resumes interest payments or when the collectability of interest is reasonably assured, the debt obligation is removed from non-accrual status.
Income from foreign securities is recorded net of foreign taxes withheld where recovery of such taxes is not assured.
Federal and other taxes
Each Portfolio is treated as a separate entity for federal income tax purposes. The Portfolios are not required to pay federal income taxes on their net investment income and net capital gain as they are treated as partnerships for federal income tax purposes. All interest, dividends, gains and losses of a Portfolio are deemed to have been “passed through” to the interestholders in proportion to their holdings of the Portfolio regardless of whether such interest, dividends and gains have been distributed by the Portfolio.
Each Portfolio’s income tax returns and all financial records supporting those returns for the prior three fiscal years are subject to examination by the federal revenue authority. Management has analyzed each Portfolio’s tax positions taken on federal, state, and foreign tax returns for all open tax years and does not believe that there are any uncertain tax positions that require recognition of a tax liability.
3. FAIR VALUATION MEASUREMENTS
Fair value measurements of investments are determined within a framework that has established a fair value hierarchy based upon the various data inputs utilized in determining the value of each Portfolio’s investments. The three-level hierarchy gives the highest priority to unadjusted quoted prices in active markets for identical assets or liabilities (Level 1) and the lowest priority to significant unobservable inputs (Level 3). Each Portfolio’s investments are classified within the fair value hierarchy based on the lowest level of input that is significant to the fair value measurement. The inputs are summarized into three broad levels as follows:
| n | | Level 1 – quoted prices in active markets for identical securities |
| n | | Level 2 – other significant observable inputs (including quoted prices for similar securities, interest rates, prepayment speeds, credit risk, use of amortized cost, etc.) |
| n | | Level 3 – significant unobservable inputs (including the Portfolio’s own assumptions in determining the fair value of investments) |
The inputs or methodologies used for valuing investments in securities are not necessarily an indication of the risk associated with investing in those securities.
| | | | |
| 134 | | Wells Fargo Allocation Funds | | Notes to financial statements (unaudited) |
The following is a summary of the inputs used in valuing each Portfolio’s assets and liabilities as of November 30, 2015:
| | | | | | | | | | | | | | | | |
| | | Quoted prices
(Level 1) | | | Other significant
observable inputs
(Level 2) | | | Significant unobservable inputs (Level 3) | | | Total | |
C&B Large Cap Value Portfolio | | | | | | | | | | | | | | | | |
Assets | | | | | | | | | | | | | | | | |
Investments in: | | | | | | | | | | | | | | | | |
| | | | |
Common stocks | | | | | | | | | | | | | | | | |
Consumer discretionary | | $ | 43,570,238 | | | $ | 0 | | | $ | 0 | | | $ | 43,570,238 | |
Consumer staples | | | 27,529,378 | | | | 0 | | | | 0 | | | | 27,529,378 | |
Energy | | | 25,757,630 | | | | 0 | | | | 0 | | | | 25,757,630 | |
Financials | | | 80,695,540 | | | | 0 | | | | 0 | | | | 80,695,540 | |
Health care | | | 49,510,371 | | | | 0 | | | | 0 | | | | 49,510,371 | |
Industrials | | | 57,225,373 | | | | 0 | | | | 0 | | | | 57,225,373 | |
Information technology | | | 10,273,624 | | | | 0 | | | | 0 | | | | 10,273,624 | |
Materials | | | 11,976,129 | | | | 0 | | | | 0 | | | | 11,976,129 | |
| | | | |
Short-term investments | | | | | | | | | | | | | | | | |
Investment companies | | | 10,128,152 | | | | 4,278,750 | | | | 0 | | | | 14,406,902 | |
Total assets | | $ | 316,666,435 | | | $ | 4,278,750 | | | $ | 0 | | | $ | 320,945,185 | |
Diversified Large Cap Growth Portfolio | | | | | | | | | | | | | | | | |
Assets | | | | | | | | | | | | | | | | |
Investments in: | | | | | | | | | | | | | | | | |
| | | | |
Common stocks | | | | | | | | | | | | | | | | |
Consumer discretionary | | $ | 28,608,374 | | | $ | 0 | | | $ | 0 | | | $ | 28,608,374 | |
Consumer staples | | | 5,983,717 | | | | 0 | | | | 0 | | | | 5,983,717 | |
Energy | | | 1,099,377 | | | | 0 | | | | 0 | | | | 1,099,377 | |
Financials | | | 4,804,210 | | | | 0 | | | | 0 | | | | 4,804,210 | |
Health care | | | 19,153,581 | | | | 0 | | | | 0 | | | | 19,153,581 | |
Industrials | | | 9,543,122 | | | | 0 | | | | 0 | | | | 9,543,122 | |
Information technology | | | 41,703,620 | | | | 637,946 | | | | 0 | | | | 42,341,566 | |
Materials | | | 3,637,690 | | | | 0 | | | | 0 | | | | 3,637,690 | |
Telecommunication services | | | 1,444,081 | | | | 0 | | | | 0 | | | | 1,444,081 | |
| | | | |
Short-term investments | | | | | | | | | | | | | | | | |
Investment companies | | | 1,475,666 | | | | 1,326,875 | | | | 0 | | | | 2,802,541 | |
Total assets | | $ | 117,453,438 | | | $ | 1,964,821 | | | $ | 0 | | | $ | 119,418,259 | |
Emerging Growth Portfolio | | | | | | | | | | | | | | | | |
Assets | | | | | | | | | | | | | | | | |
Investments in: | | | | | | | | | | | | | | | | |
| | | | |
Common stocks | | | | | | | | | | | | | | | | |
Consumer discretionary | | $ | 153,846,329 | | | $ | 0 | | | $ | 0 | | | $ | 153,846,329 | |
Energy | | | 24,738,354 | | | | 0 | | | | 0 | | | | 24,738,354 | |
Financials | | | 69,190,937 | | | | 0 | | | | 0 | | | | 69,190,937 | |
Health care | | | 310,134,663 | | | | 0 | | | | 0 | | | | 310,134,663 | |
Industrials | | | 67,845,360 | | | | 0 | | | | 0 | | | | 67,845,360 | |
Information technology | | | 380,879,121 | | | | 0 | | | | 0 | | | | 380,879,121 | |
| | | | |
Short-term investments | | | | | | | | | | | | | | | | |
Investment companies | | | 12,067,245 | | | | 97,288,111 | | | | 0 | | | | 109,355,356 | |
Total assets | | $ | 1,018,702,009 | | | $ | 97,288,111 | | | $ | 0 | | | $ | 1,115,990,120 | |
| | | | | | |
| Notes to financial statements (unaudited) | | Wells Fargo Allocation Funds | | | 135 | |
| | | | | | | | | | | | | | | | |
| | | Quoted prices
(Level 1) | | | Other significant
observable inputs
(Level 2) | | | Significant unobservable inputs (Level 3) | | | Total | |
Index Portfolio | | | | | | | | | | | | | | | | |
Assets | | | | | | | | | | | | | | | | |
Investments in: | | | | | | | | | | | | | | | | |
| | | | |
Common stocks | | | | | | | | | | | | | | | | |
Consumer discretionary | | $ | 323,516,310 | | | $ | 0 | | | $ | 0 | | | $ | 323,516,310 | |
Consumer staples | | | 236,462,150 | | | | 0 | | | | 0 | | | | 236,462,150 | |
Energy | | | 174,453,010 | | | | 0 | | | | 0 | | | | 174,453,010 | |
Financials | | | 409,991,049 | | | | 0 | | | | 0 | | | | 409,991,049 | |
Health care | | | 361,254,412 | | | | 0 | | | | 0 | | | | 361,254,412 | |
Industrials | | | 250,237,198 | | | | 0 | | | | 0 | | | | 250,237,198 | |
Information technology | | | 517,481,505 | | | | 0 | | | | 0 | | | | 517,481,505 | |
Materials | | | 70,714,141 | | | | 0 | | | | 0 | | | | 70,714,141 | |
Telecommunication services | | | 57,663,208 | | | | 0 | | | | 0 | | | | 57,663,208 | |
Utilities | | | 70,777,421 | | | | 0 | | | | 0 | | | | 70,777,421 | |
| | | | |
Short-term investments | | | | | | | | | | | | | | | | |
Investment companies | | | 30,518,256 | | | | 13,080,495 | | | | 0 | | | | 43,598,751 | |
U.S. Treasury Securities | | | 1,696,510 | | | | 0 | | | | 0 | | | | 1,696,510 | |
Total assets | | $ | 2,504,765,170 | | | $ | 13,080,495 | | | $ | 0 | | | $ | 2,517,845,665 | |
Liabilities | | | | | | | | | | | | | | | | |
| | | | |
Futures contracts | | $ | 181,800 | | | $ | 0 | | | $ | 0 | | | $ | 181,800 | |
Total liabilities | | $ | 181,800 | | | $ | 0 | | | $ | 0 | | | $ | 181,800 | |
International Growth Portfolio | | | | | | | | | | | | | | | | |
Assets | | | | | | | | | | | | | | | | |
Investments in: | | | | | | | | | | | | | | | | |
| | | | |
Common stocks | | | | | | | | | | | | | | | | |
Belgium | | $ | 5,493,130 | | | $ | 0 | | | $ | 0 | | | $ | 5,493,130 | |
China | | | 13,196,300 | | | | 0 | | | | 0 | | | | 13,196,300 | |
France | | | 8,665,712 | | | | 0 | | | | 0 | | | | 8,665,712 | |
Germany | | | 17,651,058 | | | | 0 | | | | 0 | | | | 17,651,058 | |
Hong Kong | | | 5,850,794 | | | | 0 | | | | 0 | | | | 5,850,794 | |
India | | | 3,243,371 | | | | 0 | | | | 0 | | | | 3,243,371 | |
Ireland | | | 9,440,422 | | | | 0 | | | | 0 | | | | 9,440,422 | |
Italy | | | 1,006,582 | | | | 0 | | | | 0 | | | | 1,006,582 | |
Japan | | | 14,520,381 | | | | 0 | | | | 0 | | | | 14,520,381 | |
Mexico | | | 3,037,027 | | | | 0 | | | | 0 | | | | 3,037,027 | |
Netherlands | | | 3,558,309 | | | | 0 | | | | 0 | | | | 3,558,309 | |
South Korea | | | 17,735 | | | | 0 | | | | 0 | | | | 17,735 | |
Spain | | | 2,312,466 | | | | 0 | | | | 0 | | | | 2,312,466 | |
Sweden | | | 3,370,259 | | | | 0 | | | | 0 | | | | 3,370,259 | |
Switzerland | | | 19,277,002 | | | | 0 | | | | 0 | | | | 19,277,002 | |
United Kingdom | | | 32,008,727 | | | | 0 | | | | 0 | | | | 32,008,727 | |
United States | | | 5,374,777 | | | | 0 | | | | 0 | | | | 5,374,777 | |
| | | | |
Participation Notes | | | | | | | | | | | | | | | | |
Ireland | | | 0 | | | | 1,864,418 | | | | 0 | | | | 1,864,418 | |
| | | | |
Preferred stocks | | | | | | | | | | | | | | | | |
Germany | | | 1,387,596 | | | | 0 | | | | 0 | | | | 1,387,596 | |
| | | | |
Short-term investments | | | | | | | | | | | | | | | | |
Investment companies | | | 4,324,287 | | | | 1,302,812 | | | | 0 | | | | 5,627,099 | |
Total assets | | $ | 153,735,935 | | | $ | 3,167,230 | | | $ | 0 | | | $ | 156,903,165 | |
| | | | |
| 136 | | Wells Fargo Allocation Funds | | Notes to financial statements (unaudited) |
| | | | | | | | | | | | | | | | |
| | | Quoted prices
(Level 1) | | | Other significant
observable inputs
(Level 2) | | | Significant unobservable inputs (Level 3) | | | Total | |
International Value Portfolio | | | | | | | | | | | | | | | | |
Assets | | | | | | | | | | | | | | | | |
Investments in: | | | | | | | | | | | | | | | | |
| | | | |
Common stocks | | | | | | | | | | | | | | | | |
Australia | | $ | 25,081,068 | | | $ | 0 | | | $ | 0 | | | $ | 25,081,068 | |
Austria | | | 5,294,819 | | | | 0 | | | | 0 | | | | 5,294,819 | |
Belgium | | | 3,947,589 | | | | 0 | | | | 0 | | | | 3,947,589 | |
Bermuda | | | 6,311,773 | | | | 0 | | | | 0 | | | | 6,311,773 | |
Brazil | | | 5,433,340 | | | | 0 | | | | 0 | | | | 5,433,340 | |
Canada | | | 10,488,921 | | | | 0 | | | | 0 | | | | 10,488,921 | |
Cayman Islands | | | 3,146,128 | | | | 0 | | | | 0 | | | | 3,146,128 | |
China | | | 13,315,375 | | | | 0 | | | | 0 | | | | 13,315,375 | |
Czech Republic | | | 1,044,660 | | | | 0 | | | | 0 | | | | 1,044,660 | |
Denmark | | | 1,410,994 | | | | 0 | | | | 0 | | | | 1,410,994 | |
Finland | | | 2,109,273 | | | | 0 | | | | 0 | | | | 2,109,273 | |
France | | | 44,731,440 | | | | 0 | | | | 0 | | | | 44,731,440 | |
Germany | | | 42,741,504 | | | | 235 | | | | 0 | | | | 42,741,739 | |
Hong Kong | | | 1,637,529 | | | | 0 | | | | 0 | | | | 1,637,529 | |
Hungary | | | 1,134,183 | | | | 0 | | | | 0 | | | | 1,134,183 | |
India | | | 4,419,465 | | | | 0 | | | | 0 | | | | 4,419,465 | |
Ireland | | | 4,487,982 | | | | 0 | | | | 0 | | | | 4,487,982 | |
Israel | | | 5,955,430 | | | | 0 | | | | 0 | | | | 5,955,430 | |
Italy | | | 6,148,399 | | | | 0 | | | | 0 | | | | 6,148,399 | |
Japan | | | 109,778,390 | | | | 0 | | | | 0 | | | | 109,778,390 | |
Liechtenstein | | | 522,358 | | | | 0 | | | | 0 | | | | 522,358 | |
Netherlands | | | 11,035,790 | | | | 0 | | | | 0 | | | | 11,035,790 | |
Norway | | | 6,520,237 | | | | 0 | | | | 0 | | | | 6,520,237 | |
Poland | | | 2,097,767 | | | | 0 | | | | 0 | | | | 2,097,767 | |
Russia | | | 4,002,237 | | | | 0 | | | | 0 | | | | 4,002,237 | |
Singapore | | | 4,208,691 | | | | 0 | | | | 0 | | | | 4,208,691 | |
South Africa | | | 2,201,554 | | | | 0 | | | | 0 | | | | 2,201,554 | |
South Korea | | | 13,924,876 | | | | 0 | | | | 0 | | | | 13,924,876 | |
Spain | | | 5,117,334 | | | | 0 | | | | 0 | | | | 5,117,334 | |
Sweden | | | 11,629,864 | | | | 0 | | | | 0 | | | | 11,629,864 | |
Switzerland | | | 26,330,486 | | | | 0 | | | | 0 | | | | 26,330,486 | |
Taiwan | | | 3,816,188 | | | | 0 | | | | 0 | | | | 3,816,188 | |
Thailand | | | 3,579,440 | | | | 0 | | | | 0 | | | | 3,579,440 | |
United Kingdom | | | 87,143,954 | | | | 478,992 | | | | 0 | | | | 87,622,946 | |
| | | | |
Preferred stocks | | | | | | | | | | | | | | | | |
Brazil | | | 678,775 | | | | 0 | | | | 0 | | | | 678,775 | |
| | | | |
Rights | | | | | | | | | | | | | | | | |
United Kingdom | | | 99,071 | | | | 0 | | | | 0 | | | | 99,071 | |
| | | | |
Short-term investments | | | | | | | | | | | | | | | | |
Investment companies | | | 3,910,661 | | | | 15,597,666 | | | | 0 | | | | 19,508,327 | |
Total assets | | $ | 485,437,545 | | | $ | 16,076,893 | | | $ | 0 | | | $ | 501,514,438 | |
| | | | | | |
| Notes to financial statements (unaudited) | | Wells Fargo Allocation Funds | | | 137 | |
| | | | | | | | | | | | | | | | |
| | | Quoted prices
(Level 1) | | | Other significant
observable inputs
(Level 2) | | | Significant unobservable inputs (Level 3) | | | Total | |
Large Company Value Portfolio | | | | | | | | | | | | | | | | |
Assets | | | | | | | | | | | | | | | | |
Investments in: | | | | | | | | | | | | | | | | |
| | | | |
Common stocks | | | | | | | | | | | | | | | | |
Consumer discretionary | | $ | 5,813,803 | | | $ | 0 | | | $ | 0 | | | $ | 5,813,803 | |
Consumer staples | | | 4,825,638 | | | | 0 | | | | 0 | | | | 4,825,638 | |
Energy | | | 9,131,870 | | | | 0 | | | | 0 | | | | 9,131,870 | |
Financials | | | 22,668,089 | | | | 0 | | | | 0 | | | | 22,668,089 | |
Health care | | | 10,170,726 | | | | 0 | | | | 0 | | | | 10,170,726 | |
Industrials | | | 9,373,708 | | | | 0 | | | | 0 | | | | 9,373,708 | |
Information technology | | | 8,477,705 | | | | 0 | | | | 0 | | | | 8,477,705 | |
Materials | | | 2,602,907 | | | | 0 | | | | 0 | | | | 2,602,907 | |
Telecommunication services | | | 1,557,075 | | | | 0 | | | | 0 | | | | 1,557,075 | |
Utilities | | | 2,904,905 | | | | 0 | | | | 0 | | | | 2,904,905 | |
| | | | |
Short-term investments | | | | | | | | | | | | | | | | |
Investment companies | | | 1,477,801 | | | | 3,413,200 | | | | 0 | | | | 4,891,001 | |
Total assets | | $ | 79,004,227 | | | $ | 3,413,200 | | | $ | 0 | | | $ | 82,417,427 | |
Small Company Growth Portfolio | | | | | | | | | | | | | | | | |
Assets | | | | | | | | | | | | | | | | |
Investments in: | | | | | | | | | | | | | | | | |
| | | | |
Common stocks | | | | | | | | | | | | | | | | |
Consumer discretionary | | $ | 167,050,255 | | | $ | 0 | | | $ | 0 | | | $ | 167,050,255 | |
Consumer staples | | | 16,400,031 | | | | 0 | | | | 0 | | | | 16,400,031 | |
Energy | | | 25,570,815 | | | | 0 | | | | 0 | | | | 25,570,815 | |
Financials | | | 130,877,996 | | | | 0 | | | | 0 | | | | 130,877,996 | |
Health care | | | 259,699,136 | | | | 0 | | | | 0 | | | | 259,699,136 | |
Industrials | | | 173,421,338 | | | | 0 | | | | 0 | | | | 173,421,338 | |
Information technology | | | 284,626,901 | | | | 0 | | | | 0 | | | | 284,626,901 | |
Materials | | | 35,041,996 | | | | 0 | | | | 0 | | | | 35,041,996 | |
Utilities | | | 3,718,239 | | | | 0 | | | | 0 | | | | 3,718,239 | |
| | | | |
Short-term investments | | | | | | | | | | | | | | | | |
Investment companies | | | 57,304,768 | | | | 118,989,418 | | | | 0 | | | | 176,294,186 | |
Total assets | | $ | 1,153,711,475 | | | $ | 118,989,418 | | | $ | 0 | | | $ | 1,272,700,893 | |
Small Company Value Portfolio | | | | | | | | | | | | | | | | |
Assets | | | | | | | | | | | | | | | | |
Investments in: | | | | | | | | | | | | | | | | |
| | | | |
Common stocks | | | | | | | | | | | | | | | | |
Consumer discretionary | | $ | 24,129,704 | | | $ | 0 | | | $ | 0 | | | $ | 24,129,704 | |
Consumer staples | | | 3,374,747 | | | | 0 | | | | 0 | | | | 3,374,747 | |
Energy | | | 11,242,207 | | | | 0 | | | | 0 | | | | 11,242,207 | |
Financials | | | 84,797,439 | | | | 0 | | | | 0 | | | | 84,797,439 | |
Health care | | | 12,104,882 | | | | 0 | | | | 0 | | | | 12,104,882 | |
Industrials | | | 16,122,953 | | | | 0 | | | | 0 | | | | 16,122,953 | |
Information technology | | | 26,088,951 | | | | 0 | | | | 0 | | | | 26,088,951 | |
Materials | | | 10,694,939 | | | | 0 | | | | 0 | | | | 10,694,939 | |
Utilities | | | 9,919,714 | | | | 0 | | | | 0 | | | | 9,919,714 | |
| | | | |
Warrants | | | | | | | | | | | | | | | | |
Health care | | | 0 | | | | 2 | | | | 0 | | | | 2 | |
| | | | |
Short-term investments | | | | | | | | | | | | | | | | |
Investment companies | | | 7,987,779 | | | | 4,795,850 | | | | 0 | | | | 12,783,629 | |
Total assets | | $ | 206,463,315 | | | $ | 4,795,852 | | | $ | 0 | | | $ | 211,259,167 | |
| | | | |
| 138 | | Wells Fargo Allocation Funds | | Notes to financial statements (unaudited) |
| | | | | | | | | | | | | | | | |
| | | Quoted prices
(Level 1) | | | Other significant
observable inputs
(Level 2) | | | Significant unobservable inputs (Level 3) | | | Total | |
Core Bond Portfolio | | | | | | | | | | | | | | | | |
Assets | | | | | | | | | | | | | | | | |
Investments in: | | | | | | | | | | | | | | | | |
| | | | |
Agency securities | | $ | 0 | | | $ | 1,146,605,218 | | | $ | 0 | | | $ | 1,146,605,218 | |
| | | | |
Asset-backed securities | | | 0 | | | | 391,173,943 | | | | 0 | | | | 391,173,943 | |
| | | | |
Corporate bonds and notes | | | 0 | | | | 625,100,844 | | | | 0 | | | | 625,100,844 | |
| | | | |
Municipal obligations | | | 0 | | | | 34,332,561 | | | | 0 | | | | 34,332,561 | |
| | | | |
Non-agency mortgage-backed securities | | | 0 | | | | 170,507,903 | | | | 0 | | | | 170,507,903 | |
| | | | |
U.S. Treasury securities | | | 1,169,251,064 | | | | 0 | | | | 0 | | | | 1,169,251,064 | |
| | | | |
Yankee corporate bonds and notes | | | 0 | | | | 193,799,156 | | | | 0 | | | | 193,799,156 | |
| | | | |
Yankee government bonds | | | 0 | | | | 48,344,874 | | | | 0 | | | | 48,344,874 | |
| | | | |
Short-term investments | | | | | | | | | | | | | | | | |
Investment companies | | | 272,482,327 | | | | 60,450,000 | | | | 0 | | | | 332,932,327 | |
Total assets | | $ | 1,441,733,391 | | | $ | 2,670,314,499 | | | $ | 0 | | | $ | 4,112,047,890 | |
Managed Fixed Income Portfolio | | | | | | | | | | | | | | | | |
Assets | | | | | | | | | | | | | | | | |
Investments in: | | | | | | | | | | | | | | | | |
| | | | |
Agency securities | | $ | 0 | | | $ | 35,924,981 | | | $ | 0 | | | $ | 35,924,981 | |
| | | | |
Asset-backed securities | | | 0 | | | | 4,533,472 | | | | 0 | | | | 4,533,472 | |
| | | | |
Corporate bonds and notes | | | 0 | | | | 38,610,899 | | | | 0 | | | | 38,610,899 | |
| | | | |
Municipal obligations | | | 0 | | | | 10,043,666 | | | | 0 | | | | 10,043,666 | |
| | | | |
Non-agency mortgage-backed securities | | | 0 | | | | 12,587,139 | | | | 1,296,583 | | | | 13,883,722 | |
| | | | |
U.S. Treasury securities | | | 6,982,773 | | | | 0 | | | | 0 | | | | 6,982,773 | |
| | | | |
Yankee corporate bonds and notes | | | 0 | | | | 6,774,488 | | | | 0 | | | | 6,774,488 | |
| | | | |
Yankee government bonds | | | 0 | | | | 975,693 | | | | 0 | | | | 975,693 | |
| | | | |
Short-term investments | | | | | | | | | | | | | | | | |
Investment companies | | | 4,211,422 | | | | 236,500 | | | | 0 | | | | 4,447,922 | |
Total assets | | $ | 11,194,195 | | | $ | 109,686,838 | | | $ | 1,296,583 | | | $ | 122,177,616 | |
Real Return Portfolio | | | | | | | | | | | | | | | | |
Assets | | | | | | | | | | | | | | | | |
Investments in: | | | | | | | | | | | | | | | | |
| | | | |
Common stocks | | | | | | | | | | | | | | | | |
Consumer staples | | $ | 786,657 | | | $ | 0 | | | $ | 0 | | | $ | 786,657 | |
Energy | | | 1,108,724 | | | | 0 | | | | 0 | | | | 1,108,724 | |
Financials | | | 2,298,312 | | | | 0 | | | | 0 | | | | 2,298,312 | |
Materials | | | 2,259,425 | | | | 0 | | | | 0 | | | | 2,259,425 | |
| | | | |
Corporate bonds and notes | | | 0 | | | | 5,171,430 | | | | 0 | | | | 5,171,430 | |
| | | | |
Loans | | | 0 | | | | 2,088,512 | | | | 0 | | | | 2,088,512 | |
| | | | |
U.S. Treasury securities | | | 33,811,334 | | | | 0 | | | | 0 | | | | 33,811,334 | |
| | | | |
Yankee corporate bonds and notes | | | 0 | | | | 392,094 | | | | 0 | | | | 392,094 | |
| | | | |
Short-term investments | | | | | | | | | | | | | | | | |
Investment companies | | | 3,255,779 | | | | 166,050 | | | | 0 | | | | 3,421,829 | |
U. S. Treasury securities | | | 24,999 | | | | 0 | | | | 0 | | | | 24,999 | |
Total assets | | $ | 43,545,230 | | | $ | 7,818,086 | | | $ | 0 | | | $ | 51,363,316 | |
Liabilities | | | | | | | | | | | | | | | | |
| | | | |
Futures contract | | $ | 406 | | | $ | 0 | | | $ | 0 | | | $ | 406 | |
Total liabilities | | $ | 406 | | | $ | 0 | | | $ | 0 | | | $ | 406 | |
| | | | | | |
| Notes to financial statements (unaudited) | | Wells Fargo Allocation Funds | | | 139 | |
| | | | | | | | | | | | | | | | |
| | | Quoted prices
(Level 1) | | | Other significant
observable inputs
(Level 2) | | | Significant unobservable inputs (Level 3) | | | Total | |
Stable Income Portfolio | | | | | | | | | | | | | | | | |
Assets | | | | | | | | | | | | | | | | |
Investments in: | | | | | | | | | | | | | | | | |
| | | | |
Agency securities | | $ | 0 | | | $ | 7,786,744 | | | $ | 0 | | | $ | 7,786,744 | |
| | | | |
Asset-backed securities | | | 0 | | | | 7,033,599 | | | | 0 | | | | 7,033,599 | |
| | | | |
Corporate bonds and notes | | | 0 | | | | 6,312,460 | | | | 0 | | | | 6,312,460 | |
| | | | |
Municipal obligations | | | 0 | | | | 527,696 | | | | 0 | | | | 527,696 | |
| | | | |
Non-agency mortgage-backed securities | | | 0 | | | | 1,767,680 | | | | 0 | | | | 1,767,680 | |
| | | | |
U.S. Treasury securities | | | 1,642,078 | | | | 0 | | | | 0 | | | | 1,642,078 | |
| | | | |
Yankee corporate bonds and notes | | | 0 | | | | 1,029,133 | | | | 0 | | | | 1,029,133 | |
| | | | |
Short-term investments | | | | | | | | | | | | | | | | |
Investment companies | | | 1,145,992 | | | | 0 | | | | 0 | | | | 1,145,992 | |
U.S. Treasury securities | | | 574,678 | | | | 0 | | | | 0 | | | | 574,678 | |
| | | | |
| | | 3,362,748 | | | | 24,457,312 | | | | 0 | | | | 27,820,060 | |
| | | | |
Futures contracts | | | 703 | | | | 0 | | | | 0 | | | | 703 | |
Total assets | | $ | 3,363,451 | | | $ | 24,457,312 | | | $ | 0 | | | $ | 27,820,763 | |
Futures contracts are reported at their variation margin at measurement date, which represents the amount due to/from the Portfolio at that date. All other assets and liabilities are reported at their market value at measurement date.
The Portfolios recognize transfers between levels within the fair value hierarchy at the end of the reporting period. At November 30, 2015, the Portfolios did not have any transfers into/out of Level 1 or Level 2.
The following is a reconciliation of assets in which significant unobservable inputs (Level 3) were used in determining fair value:
| | | | |
| Managed Fixed Income Portfolio | | Non-agency
mortgage-backed
securities | |
Balance as of May 31, 2015 | | $ | 1,351,797 | |
Accrued discounts (premiums) | | | 0 | |
Realized gains (losses) | | | 0 | |
Change in unrealized gains (losses) | | | 61,078 | |
Purchases | | | 0 | |
Sales | | | (116,292 | ) |
Transfers into Level 3 | | | 0 | |
Transfers out of Level 3 | | | 0 | |
Transfers in from acquisition | | | 0 | |
Balance as of November 30, 2015 | | $ | 1,296,583 | |
Change in unrealized gains (losses) relating to securities still held at November 30, 2015 | | $ | 19,795 | |
The investment type categorized above was valued using an indicative broker quote. The indicative broker quote is considered a Level 3 input. Quantitative unobservable inputs used by the brokers are often proprietary and not provided to the Portfolio and therefore the disclosure that would address these inputs is not included above.
4. TRANSACTIONS WITH AFFILIATES AND OTHER EXPENSES
Advisory fee
The Trust has entered into an advisory contract with Funds Management, an indirect wholly owned subsidiary of Wells Fargo & Company (“Wells Fargo”). The adviser is responsible for implementing investment policies and guidelines and for supervising the subadvisers, who are responsible for day-to-day portfolio management of the Portfolios. Pursuant to the contract, Funds Management is entitled to receive an annual advisory fee which is calculated based on the average daily net assets of each Portfolio.
| | | | |
| 140 | | Wells Fargo Allocation Funds | | Notes to financial statements (unaudited) |
Funds Management has retained the services of certain subadvisers to provide daily portfolio management for the Portfolios. Funds Management has engaged WellsCap (an affiliate of Funds Management and an indirect wholly owned subsidiary of Wells Fargo), Peregrine Capital Management, Inc. (an affiliate of Funds Management and a direct wholly owned subsidiary of Wells Fargo), Artisan Partners Limited Partnership, Cooke & Bieler, L.P., Galliard Capital Management, Inc. (an affiliate of Funds Management and an indirect wholly owned subsidiary of Wells Fargo), Golden Capital Management, LLC (an affiliate of Funds Management), LSV Asset Management, and Phocas Financial Corporation as subadvisers.
The fees for subadvisory services are borne by Funds Management. The subadvisers are each entitled to receive from Funds Management an annual subadvisory fee which is calculated based on the average daily net assets of each Portfolio.
The annual advisory and subadvisory fee rates for each Portfolio are as follows:
| | | | | | | | | | | | | | | | | | | | |
| | | Advisory fee | | | Effective rate for
the six months ended November 30, 2015 | | | Subadviser | | Subadvisory fee | |
| | | starting at | | | declining to | | | | | starting at | | declining to | |
C&B Large Cap Value Portfolio | | | 0.65 | % | | | 0.475 | % | | | 0.65 | % | | Cooke & Bieler, L.P. | | 0.38% | | | 0.30 | % |
Diversified Large Cap Growth Portfolio | | | 0.65 | | | | 0.475 | | | | 0.65 | | | WellsCap | | 0.30 | | | 0.20 | |
Emerging Growth Portfolio | | | 0.80 | | | | 0.68 | | | | 0.78 | | | WellsCap | | 0.55 | | | 0.40 | |
Index Portfolio | | | 0.10 | | | | 0.05 | | | | 0.08 | | | Golden Capital Management, LLC | | 0.05 | | | 0.02 | |
International Growth Portfolio | | | 0.85 | | | | 0.70 | | | | 0.85 | | | Artisan Partners Limited Partnership | | 0.80 | | | 0.50 | |
International Value Portfolio | | | 0.85 | | | | 0.70 | | | | 0.85 | | | LSV Asset Management | | 0.35 | | | 0.30 | |
Large Company Value Portfolio | | | 0.65 | | | | 0.475 | | | | 0.65 | | | Phocas Financial Corporation | | 0.29 | | | 0.20 | |
Small Company Growth Portfolio | | | 0.80 | | | | 0.68 | | | | 0.79 | | | Peregrine Capital Management, Inc. | | 0.50 | | | 0.45 | |
Small Company Value Portfolio | | | 0.80 | | | | 0.68 | | | | 0.80 | | | Peregrine Capital Management, Inc. | | 0.45 | | | 0.40 | |
Core Bond Portfolio | | | 0.40 | | | | 0.30 | | | | 0.35 | | | WellsCap | | 0.20 | | | 0.10 | |
Managed Fixed Income Portfolio | | | 0.40 | | | | 0.30 | | | | 0.40 | | | Galliard Capital Management, Inc. | | 0.20 | | | 0.10 | |
Real Return Portfolio | | | 0.40 | | | | 0.30 | | | | 0.40 | | | WellsCap | | 0.28 | | | 0.18 | |
Stable Income Portfolio | | | 0.30 | | | | 0.225 | | | | 0.30 | | | Galliard Capital Management, Inc. | | 0.15 | | | 0.05 | |
Funds Management has voluntarily waived and/or reimbursed advisory fees to the extent necessary to maintain certain net operating expense ratios for the Portfolios.
| | | | | | |
| Notes to financial statements (unaudited) | | Wells Fargo Allocation Funds | | | 141 | |
5. INVESTMENT PORTFOLIO TRANSACTIONS
Purchases and sales of investments, excluding short-term securities, for the six months ended November 30, 2015 were as follows:
| | | | | | | | | | | | | | | | |
| | | Purchases at cost | | | Sales proceeds | |
| | | U.S. Government | | | Non-U.S. Government | | | U.S. Government | | | Non-U.S. Government | |
C&B Large Cap Value Portfolio | | $ | 0 | | | $ | 57,405,351 | | | $ | 0 | | | $ | 62,971,984 | |
Diversified Large Cap Growth Portfolio | | | 0 | | | | 32,564,848 | | | | 0 | | | | 38,940,011 | |
Emerging Growth Portfolio | | | 0 | | | | 426,627,598 | | | | 0 | | | | 463,548,625 | |
Index Portfolio | | | 0 | | | | 51,565,968 | | | | 0 | | | | 219,216,738 | |
International Growth Portfolio | | | 0 | | | | 41,302,536 | | | | 0 | | | | 33,178,491 | |
International Value Portfolio | | | 0 | | | | 42,162,582 | | | | 0 | | | | 25,390,877 | |
Large Company Value Portfolio | | | 0 | | | | 23,533,763 | | | | 0 | | | | 23,142,265 | |
Small Company Growth Portfolio | | | 0 | | | | 696,517,890 | | | | 0 | | | | 220,797,193 | |
Small Company Value Portfolio | | | 0 | | | | 67,171,241 | | | | 0 | | | | 67,655,397 | |
Core Bond Portfolio | | | 10,589,875,023 | | | | 1,491,007,478 | | | | 10,554,847,450 | | | | 1,433,738,469 | |
Managed Fixed Income Portfolio | | | 8,862,470 | | | | 13,187,438 | | | | 9,790,260 | | | | 6,312,513 | |
Real Return Portfolio | | | 5,429,363 | | | | 2,828,542 | | | | 3,116,428 | | | | 1,309,226 | |
Stable Income Portfolio | | | 2,445,838 | | | | 4,836,467 | | | | 799,123 | | | | 2,367,314 | |
As of November 30, 2015, Real Return Portfolio Portfolio had unfunded term loan commitments of $99,750.
6. DERIVATIVE TRANSACTIONS
During the six months ended November 30, 2015, Index Portfolio used uninvested cash to enter into futures contracts to gain market exposure. During the six months ended November 30, 2015, Real Return Portfolio and Stable Income Portfolio entered into futures contracts to speculate on interest rates and to help manage the duration of each portfolio.
At November 30, 2015, the Portfolios had long and short futures contracts outstanding as follows:
| | | | | | | | | | | | | | | | |
| | | Expiration date | | Counterparty | | Contracts | | Type | | Contract value at
November 30,
2015 | | | Unrealized
gains (losses) | |
Index Portfolio | | 12-17-2015 | | Societe Generale | | 72 Long | | S&P 500 Index | | $ | 37,436,400 | | | $ | 168,015 | |
Real Return Portfolio | | 03-21-2016 | | JPMorgan | | 2 Short | | U.S. Treasury Bonds | | | 308,000 | | | | (3,066 | ) |
Real Return Portfolio | | 03-21-2016 | | JPMorgan | | 2 Long | | 5 Year U.S. Treasury Notes | | | 237,359 | | | | 215 | |
Stable Income Portfolio | | 03-03-2016 | | JPMorgan | | 15 Short | | 5 Year U.S. Treasury Notes | | | 1,780,195 | | | | 555 | |
As of November 30, 2015, Stable Income Portfolio had segregated $13,500 as cash collateral for open futures contracts.
The Portfolios had average notional amounts in futures contracts during the six months ended November 30, 2015 as follows:
| | | | | | | | |
| | | Long contracts | | | Short contracts | |
Index Portfolio | | $ | 28,358,824 | | | $ | 0 | |
Real Return Portfolio | | | 143,629 | | | | 454,141 | |
Stable Income Portfolio | | | 0 | | | | 2,132,298 | |
The receivable and payable for daily variation margin on open futures contracts reflected in the Statements of Assets and Liabilities only represents the current day’s variation margin. The realized gains or losses and change in unrealized gains or losses on derivative instruments are reflected in the Statements of Operations.
| | | | |
| 142 | | Wells Fargo Allocation Funds | | Notes to financial statements (unaudited) |
For certain types of derivative transactions, the Portfolios have entered into International Swaps and Derivatives Association, Inc. master agreements (“ISDA Master Agreements”) or similar agreements with approved counterparties. The ISDA Master Agreements or similar agreements may have requirements to deliver/deposit securities or cash to/with an exchange or broker-dealer as collateral and allows the Portfolio to offset, with each counterparty, certain derivative financial instrument’s assets and/or liabilities with collateral held or pledged. Collateral requirements differ by type of derivative. Collateral or margin requirements are set by the broker or exchange clearing house for exchange traded derivatives while collateral terms are contract specific for over-the-counter traded derivatives. Cash collateral that has been pledged to cover obligations of the Portfolios under ISDA Master Agreements or similar agreements, if any, are reported separately in the Statements of Assets and Liabilities. Securities pledged as collateral, if any, are noted in the Portfolio of Investments or Summary Portfolio of Investments. With respect to balance sheet offsetting, absent an event of default by the counterparty or a termination of the agreement, the reported amounts of financial assets and financial liabilities in the Statements of Assets and Liabilities are not offset across transactions between the Portfolio and the applicable counterparty. A reconciliation of the gross amounts on the Statements of Assets and Liabilities to the net amounts by derivative type, including any collateral exposure, is as follows:
| | | | | | | | | | | | | | | | | | | | |
| | | Derivative type | | Counterparty | | Gross amounts
of assets in the
Statements of
Assets and
Liabilities | | | Amounts
subject to
netting
agreements | | | Collateral
received | | | Net amount
of assets | |
Stable Income Portfolio | | Futures – variation margin | | JPMorgan | | $ | 703 | | | $ | 0 | | | $ | 0 | | | $ | 703 | |
| | | | | | | | | | | | | | | | | | | | |
| | | Derivative type | | Counterparty | | Gross amounts
of liabilities in the
Statements of
Assets and
Liabilities | | | Amounts
subject to
netting
agreements | | | Collateral
pledged1 | | | Net amount
of liabilities | |
Index Portfolio | | Futures – variation margin | | Societe Generale | | $ | 181,800 | | | $ | 0 | | | $ | (181,800 | ) | | $ | 0 | |
Real Return Portfolio | | Futures – variation margin | | JPMorgan | | | 406 | | | | 0 | | | | (406 | ) | | | 0 | |
| | 1 | Collateral pledged within this table is limited to the collateral for the net transaction with the counterparty. | |
7. CONCENTRATION RISK
Concentration risks result from exposure to a limited number of sectors. Portfolios that invest a substantial portion of their assets in a sector may be more affected by changes in that sector than would be a portfolio whose investments are not heavily weighted in any sector. The Portfolio of Investments or Summary Portfolio of Investments includes information on each Portfolio’s holdings, including sector composition, country and/or geographical composition as relevant.
8. INDEMNIFICATION
Under the Trust’s organizational documents, the officers and Trustees have been granted certain indemnification rights against certain liabilities that may arise out of performance of their duties to the Trust. Additionally, in the normal course of business, the Trust may enter into contracts with service providers that contain a variety of indemnification clauses. The Trust’s maximum exposure under these arrangements is dependent on future claims that may be made against the Portfolios and, therefore, cannot be estimated.
| | | | | | |
| Other information (unaudited) | | Wells Fargo Allocation Funds | | | 143 | |
PROXY VOTING INFORMATION
A description of the policies and procedures used to determine how to vote proxies relating to portfolio securities is available without charge, upon request, by calling 1-800-222-8222, visiting our website at wellsfargofunds.com, or visiting the SEC website at sec.gov. Information regarding how the proxies related to portfolio securities were voted during the most recent 12-month period ended June 30 is available on the website at wellsfargofunds.com or by visiting the SEC website at sec.gov.
PORTFOLIO HOLDINGS INFORMATION
The complete portfolio holdings are publicly available on the website (wellsfargofunds.com) on a one-month delayed basis. In addition, top ten holdings information (excluding derivative positions) is publicly available on the website on a monthly, seven-day or more delayed basis. Each Fund and Portfolio files its complete schedule of portfolio holdings with the SEC for the first and third quarters of each fiscal year on Form N-Q, which is available by visiting the SEC website at sec.gov. In addition, each Form N-Q may be reviewed and copied at the SEC’s Public Reference Room in Washington, DC, and at regional offices in New York City, at 233 Broadway, and in Chicago, at 175 West Jackson Boulevard, Suite 900. Information about the Public Reference Room may be obtained by calling 1-800-SEC-0330.
| | | | |
| 144 | | Wells Fargo Allocation Funds | | Other information (unaudited) |
BOARD OF TRUSTEES AND OFFICERS
Each of the Trustees and Officers1 listed in the table below acts in identical capacities for each fund in the Wells Fargo family of funds, which consists of 144 mutual funds comprising the Wells Fargo Funds Trust, Wells Fargo Variable Trust, Wells Fargo Master Trust and four closed-end funds (collectively the “Fund Complex”). This table should be read in conjunction with the Prospectus and the Statement of Additional Information2. The mailing address of each Trustee and Officer is 525 Market Street, 12th Floor, San Francisco, CA 94105. Each Trustee and Officer serves an indefinite term, however, each Trustee serves such term until reaching the mandatory retirement age established by the Trustees.
Independent Trustees
| | | | | | |
Name and
year of birth | | Position held and
length of service* | | Principal occupations during past five years or longer | | Current other
public company or
investment company
directorships |
| William R. Ebsworth (Born 1957) | | Trustee, since 2015 | | Retired. From 1984 to 2013, equities analyst, portfolio manager, research director at Fidelity Management and Research Company in Boston, Tokyo, and Hong Kong and retired in 2013 as Chief Investment Officer of Fidelity Strategic Advisers, Inc. where he lead a team of investment professionals managing client assets. Prior thereto, Board member of Hong Kong Securities Clearing Co., Hong Kong Options Clearing Corp., the Thailand International Fund, Ltd., Fidelity Investments Life Insurance Company, and Empire Fidelity Investments Life Insurance Company. Mr. Ebsworth is a CFA® charterholder and an Adjunct Lecturer, Finance, at Babson College. | | Asset Allocation Trust |
| Jane A. Freeman (Born 1953) | | Trustee, since 2015 | | Retired. From 2012 to 2014 and 1999 to 2008, Chief Financial Officer of Scientific Learning Corporation. From 2008 to 2012, Ms. Freeman provided consulting services related to strategic business projects. Prior to 1999, Portfolio Manager at Rockefeller & Co. and Scudder, Stevens & Clark. Board member of the Harding Loevner Funds from 1996 to 2014, serving as both Lead Independent Director and chair of the Audit Committee. Board member of the Russell Exchange Traded Funds Trust from 2011 to 2012 and the chair of the Audit Committee. Ms. Freeman is Chair of Taproot Foundation (non-profit organization), a Board Member of Ruth Bancroft Garden (non-profit organization) and an inactive chartered financial analyst. | | Asset Allocation Trust |
| Peter G. Gordon (Born 1942) | | Trustee, since 1998;
Chairman, since 2005 | | Co-Founder, Retired Chairman, President and CEO of Crystal Geyser Water Company. Trustee Emeritus, Colby College. | | Asset Allocation Trust |
| Isaiah Harris, Jr. (Born 1952) | | Trustee, since 2009 | | Retired. Chairman of the Board of CIGNA Corporation since 2009, and Director since 2005. From 2003 to 2011, Director of Deluxe Corporation. Prior thereto, President and CEO of BellSouth Advertising and Publishing Corp. from 2005 to 2007, President and CEO of BellSouth Enterprises from 2004 to 2005 and President of BellSouth Consumer Services from 2000 to 2003. Emeritus member of the Iowa State University Foundation Board of Governors. Emeritus Member of the Advisory Board of Iowa State University School of Business. Advisory Board Member, Palm Harbor Academy (charter school). Mr. Harris is a certified public accountant. | | CIGNA Corporation; Asset Allocation Trust |
| Judith M. Johnson (Born 1949) | | Trustee, since 2008;
Audit Committee
Chairman, since 2008 | | Retired. Prior thereto, Chief Executive Officer and Chief Investment Officer of Minneapolis Employees Retirement Fund from 1996 to 2008. Ms. Johnson is an attorney, certified public accountant and a certified managerial accountant. | | Asset Allocation Trust |
| David F. Larcker (Born 1950) | | Trustee, since 2009 | | James Irvin Miller Professor of Accounting at the Graduate School of Business, Stanford University, Morgan Stanley Director of the Center for Leadership Development and Research and Senior Faculty of The Rock Center for Corporate Governance since 2006. From 2005 to 2008, Professor of Accounting at the Graduate School of Business, Stanford University. Prior thereto, Ernst & Young Professor of Accounting at The Wharton School, University of Pennsylvania from 1985 to 2005. | | Asset Allocation Trust |
| | | | | | |
| Other information (unaudited) | | Wells Fargo Allocation Funds | | | 145 | |
| | | | | | |
Name and
year of birth | | Position held and
length of service* | | Principal occupations during past five years or longer | | Current other
public company or
investment company
directorships |
| Olivia S. Mitchell (Born 1953) | | Trustee, since 2006 | | International Foundation of Employee Benefit Plans Professor, Wharton School of the University of Pennsylvania since 1993. Director of Wharton’s Pension Research Council and Boettner Center on Pensions & Retirement Research, and Research Associate at the National Bureau of Economic Research. Previously, Cornell University Professor from 1978 to 1993. | | Asset Allocation Trust |
| Timothy J. Penny (Born 1951) | | Trustee, since 1996 | | President and Chief Executive Officer of Southern Minnesota Initiative Foundation, a non-profit organization, since 2007 and Senior Fellow at the Humphrey Institute Policy Forum at the University of Minnesota since 1995. Member of the Board of Trustees of NorthStar Education Finance, Inc., a non-profit organization, since 2007. | | Asset Allocation Trust |
| Michael S. Scofield (Born 1943) | | Trustee, since 2010 | | Served on the Investment Company Institute’s Board of Governors and Executive Committee from 2008-2011 as well the Governing Council of the Independent Directors Council from 2006-2011 and the Independent Directors Council Executive Committee from 2008-2011. Chairman of the IDC from 2008-2010. Institutional Investor (Fund Directions) Trustee of Year in 2007. Trustee of the Evergreen Funds complex (and its predecessors) from 1984 to 2010. Chairman of the Evergreen Funds from 2000-2010. Former Trustee of the Mentor Funds. Retired Attorney, Law Offices of Michael S. Scofield. | | Asset Allocation Trust |
| Donald C. Willeke (Born 1940) | | Trustee, since 1996** | | Principal of the law firm of Willeke & Daniels. General Counsel of the Minneapolis Employees Retirement Fund from 1984 until its consolidation into the Minnesota Public Employees Retirement Association on June 30, 2010. Director and Vice Chair of The Tree Trust (non-profit corporation). Director of the American Chestnut Foundation (non-profit corporation). | | Asset Allocation Trust |
| * | Length of service dates reflect the Trustee’s commencement of service with the Trust’s predecessor entities, where applicable. |
| ** | Donald Willeke retired as a Trustee effective December 31, 2015. |
Officers
| | | | | | |
Name and
year of birth | | Position held and
length of service | | Principal occupations during past five years or longer | | |
| Karla M. Rabusch (Born 1959) | | President, since 2003 | | Executive Vice President of Wells Fargo Bank, N.A. and President of Wells Fargo Funds Management, LLC since 2003. | | |
| Jeremy DePalma1 (Born 1974) | | Treasurer, since 2012; Assistant Treasurer, since 2009 | | Senior Vice President of Wells Fargo Funds Management, LLC since 2009. Senior Vice President of Evergreen Investment Management Company, LLC from 2008 to 2010 and head of the Fund Reporting and Control Team within Fund Administration from 2005 to 2010. | | |
| Nancy Wiser1 (Born 1967) | | Treasurer, since 2012 | | Executive Vice President of Wells Fargo Funds Management, LLC since 2011. Chief Operating Officer and Chief Compliance Officer at LightBox Capital Management LLC, from 2008 to 2011. | | |
| C. David Messman (Born 1960) | | Secretary, since 2000; Chief Legal Officer, since 2003 | | Senior Vice President and Secretary of Wells Fargo Funds Management, LLC since 2001. Assistant General Counsel of Wells Fargo Bank, N.A. since 2013 and Vice President and Managing Counsel of Wells Fargo Bank N.A. from 1996 to 2013. | | |
| Debra Ann Early (Born 1964) | | Chief Compliance Officer, since 2007 | | Executive Vice President of Wells Fargo Funds Management, LLC since 2014, Senior Vice President and Chief Compliance Officer from 2007 to 2014. | | |
| David Berardi (Born 1975) | | Assistant Treasurer, since 2009 | | Vice President of Wells Fargo Funds Management, LLC since 2009. Vice President of Evergreen Investment Management Company, LLC from 2008 to 2010. Manager of Fund Reporting and Control for Evergreen Investment Management Company, LLC from 2004 to 2010. | | |
| 1 | Jeremy DePalma acts as Treasurer of the Growth Balanced Fund, Moderate Balanced Fund, International Growth Portfolio, and International Value Portfolio and Assistant Treasurer of the remaining funds in this shareholder report. In addition, Jeremy DePalma acts as Treasurer of 68 other funds and Assistant Treasurer of 61 other funds in the Fund Complex. Nancy Wiser serves as Treasurer of the remaining funds in this shareholder report as well as 61 other funds in the Fund Complex. |
| 2 | The Statement of Additional Information includes additional information about the Trustees and is available, without charge, upon request, by calling 1-800-222-8222 or by visiting the website at wellsfargofunds.com. |
| | | | |
| 146 | | Wells Fargo Allocation Funds | | List of abbreviations |
The following is a list of common abbreviations for terms and entities that may have appeared in this report.
| ACA | — ACA Financial Guaranty Corporation |
| ADR | — American depositary receipt |
| ADS | — American depositary shares |
| AGC | — Assured Guaranty Corporation |
| AGM | — Assured Guaranty Municipal |
| Ambac | — Ambac Financial Group Incorporated |
| AMT | — Alternative minimum tax |
| BAN | — Bond anticipation notes |
| BHAC | — Berkshire Hathaway Assurance Corporation |
| CAB | — Capital appreciation bond |
| CCAB | — Convertible capital appreciation bond |
| CDA | — Community Development Authority |
| CDO | — Collateralized debt obligation |
| DRIVER | — Derivative inverse tax-exempt receipts |
| DW&P | — Department of Water & Power |
| DWR | — Department of Water Resources |
| ECFA | — Educational & Cultural Facilities Authority |
| EDA | — Economic Development Authority |
| EDFA | — Economic Development Finance Authority |
| ETF | — Exchange-traded fund |
| FDIC | — Federal Deposit Insurance Corporation |
| FFCB | — Federal Farm Credit Banks |
| FGIC | — Financial Guaranty Insurance Corporation |
| FHA | — Federal Housing Administration |
| FHLB | — Federal Home Loan Bank |
| FHLMC | — Federal Home Loan Mortgage Corporation |
| FICO | — The Financing Corporation |
| FNMA | — Federal National Mortgage Association |
| GDR | — Global depositary receipt |
| GNMA | — Government National Mortgage Association |
| HCFR | — Healthcare facilities revenue |
| HEFA | — Health & Educational Facilities Authority |
| HEFAR | — Higher education facilities authority revenue |
| HFA | — Housing Finance Authority |
| HFFA | — Health Facilities Financing Authority |
| HUD | — Department of Housing and Urban Development |
| IDA | — Industrial Development Authority |
| IDAG | — Industrial Development Agency |
| KRW | — Republic of Korea won |
| LIBOR | — London Interbank Offered Rate |
| LIFER | — Long Inverse Floating Exempt Receipts |
| LLC | — Limited liability company |
| LLLP | — Limited liability limited partnership |
| LLP | — Limited liability partnership |
| MBIA | — Municipal Bond Insurance Association |
| MFHR | — Multifamily housing revenue |
| MSTR | — Municipal securities trust receipts |
| MUD | — Municipal Utility District |
| National | — National Public Finance Guarantee Corporation |
| PCFA | — Pollution Control Financing Authority |
| PCL | — Public Company Limited |
| PCR | — Pollution control revenue |
| PFA | — Public Finance Authority |
| PFFA | — Public Facilities Financing Authority |
| PFOTER | — Puttable floating option tax-exempt receipts |
| plc | — Public limited company |
| PUTTER | — Puttable tax-exempt receipts |
| R&D | — Research & development |
| Radian | — Radian Asset Assurance |
| RAN | — Revenue anticipation notes |
| RDA | — Redevelopment Authority |
| RDFA | — Redevelopment Finance Authority |
| REIT | — Real estate investment trust |
| ROC | — Reset option certificates |
| SAVRS | — Select auction variable rate securities |
| SBA | — Small Business Authority |
| SDR | — Swedish depositary receipt |
| SFHR | — Single-family housing revenue |
| SFMR | — Single-family mortgage revenue |
| SPA | — Standby purchase agreement |
| SPDR | — Standard & Poor’s Depositary Receipts |
| SPEAR | — Short Puttable Exempt Adjustable Receipts |
| STRIPS | — Separate trading of registered interest and |
| TAN | — Tax anticipation notes |
| TIPS | — Treasury inflation-protected securities |
| TRAN | — Tax revenue anticipation notes |
| TTFA | — Transportation Trust Fund Authority |
| TVA | — Tennessee Valley Authority |
This page is intentionally left blank.
This page is intentionally left blank.

For more information
More information about Wells Fargo Funds is available free upon request. To obtain literature, please write, email, visit the Fund’s website, or call:
Wells Fargo Funds
P.O. Box 8266
Boston, MA 02266-8266
Email: wfaf@wellsfargo.com
Website: wellsfargofunds.com
Individual investors: 1-800-222-8222
Retail investment professionals: 1-888-877-9275
Institutional investment professionals: 1-866-765-0778
This report and the financial statements contained herein are submitted for the general information of the shareholders of Wells Fargo Funds. If this report is used for promotional purposes, distribution of the report must be accompanied or preceded by a current prospectus. Before investing, please consider the investment objectives, risks, charges, and expenses of the investment. For a current prospectus and, if available, a summary prospectus, containing this information, call 1-800-222-8222 or visit the Fund’s website at wellsfargofunds.com. Read the prospectus carefully before you invest or send money.
Wells Fargo Funds Management, LLC, a wholly owned subsidiary of Wells Fargo & Company, provides investment advisory and administrative services for Wells Fargo Funds. Other affiliates of Wells Fargo & Company provide subadvisory and other services for the Funds. The Funds are distributed by Wells Fargo Funds Distributor, LLC, Member FINRA, an affiliate of Wells Fargo & Company.
NOT FDIC INSURED ¡ NO BANK GUARANTEE ¡ MAY LOSE VALUE
© 2015 Wells Fargo Funds Management, LLC. All rights reserved.
| | |
 | | 239078 01-16 SAAFNLD/SAR109 11-15 |
Semi-Annual Report
November 30, 2015

Equity Gateway Funds

| n | | Wells Fargo C&B Large Cap Value Fund |
| n | | Wells Fargo Diversified Equity Fund |
| n | | Wells Fargo Emerging Growth Fund |
| n | | Wells Fargo International Value Fund |
| n | | Wells Fargo Small Company Growth Fund |
| n | | Wells Fargo Small Company Value Fund |

Reduce clutter. Save trees.
Sign up for electronic delivery of prospectuses and shareholder reports at wellsfargo.com/advantagedelivery
Contents
| * | A complete schedule of portfolio holdings as of the report date may be obtained, free of charge, by accessing the following website: https://www.wellsfargofunds.com/assets/edocs/regulatory/holdings/index-semi.pdf or by calling Wells Fargo Funds at 1-800-222-8222. This complete schedule, filed on Form N-CSRS, is also available on the SEC’s website at sec.gov. |
The views expressed and any forward-looking statements are as of November 30, 2015, unless otherwise noted, and are those of the Fund managers and/or Wells Fargo Funds Management, LLC. Discussions of individual securities, or the markets generally, or any Wells Fargo Fund are not intended as individual recommendations. Future events or results may vary significantly from those expressed in any forward-looking statements. The views expressed are subject to change at any time in response to changing circumstances in the market. Wells Fargo Funds Management, LLC and the Fund disclaim any obligation to publicly update or revise any views expressed or forward-looking statements.
NOT FDIC INSURED ¡ NO BANK GUARANTEE ¡ MAY LOSE VALUE
| | | | |
| 2 | | Wells Fargo Equity Gateway Funds | | Letter to shareholders (unaudited) |

Karla M. Rabusch
President
Wells Fargo Funds
Central bank actions abroad diverged during the period to be more accommodative when compared with the U.S. Federal Reserve.
Dear Valued Shareholder:
We are pleased to offer you this semi-annual report for the Wells Fargo Equity Gateway Funds for the six-month period that ended November 30, 2015. Among the most significant influences on equity markets during the period were low interest rates; low prices for oil, natural gas, and other commodities; a strong U.S. dollar; and shifting investor sentiment, which sparked volatility in equity and bond markets at higher levels than during recent years, pushing markets generally lower for the period.
U.S. economic growth remained slow and uneven.
U.S. annualized gross domestic product (GDP) growth was 2.1% for the three-month period ended September 30, 2015, a slower pace than the prior quarter that restrained investor activity during the third and fourth quarters of 2015. Investor concerns about economic growth in the U.S. were compounded by data on retail sales and industrial production. Retail sales increased in August but at a slightly slower pace than expected, and the overall trend remained constrained. Industrial production declined in August, and the trend remained fairly flat overall with the periodic exception of automobile manufacturing.
On a more positive note, unemployment eased to 5.0% in October 2015 and consumer spending was solid as housing demand improved, although corporate results, as measured by profits from current production, decreased in the third quarter after a second-quarter increase, according to the U.S. Bureau of Economic Analysis. The S&P 500 Index,1 a common gauge of U.S. large-cap stock performance, was essentially flat for the period, recording a -0.21% return. U.S. small-cap stocks, as measured by the Russell 2500TM Index,2 felt the effects of investor uncertainty more severely than large-cap domestic stocks, recording a -4.09% return for the period. Despite sometimes conflicting data, expectations grew throughout the period that the Federal Open Market Committee would announce the first increase in the federal funds rate since June 2006 after its December 2015 meeting.
Overseas, central banks diverged from Federal Reserve policy due to economic concerns.
Central bank actions abroad diverged during the period to be more accommodative when compared with the U.S. Federal Reserve. Contentious negotiations between Greece and its debtors to refinance the country’s sovereign debt concerned investors in mid-2015 before the Greek government accepted additional reforms in order to secure new loan agreements with the European Central Bank (ECB). The ECB continued to encourage lending and investing in the region by making funds available to banks at low interest rates, imposing a negative interest rate on bank deposits it held, and purchasing bonds through its quantitative easing program.
During the summer of 2015, Hong Kong’s Hang Seng Index3 experienced a dramatic decline. The People’s Bank of China sought to spur growth by cutting interest rates six times in less than a year through October 2015; lowering bank reserve requirements to encourage lending; and allowing the renminbi to depreciate in support of exports and to advance government efforts to transition to a more market-driven economy. Slowing economic growth in China reduced its importing activity, which, combined with continued low prices for many commodities, negatively affected China’s trading partners, particularly emerging markets countries.
| 1 | The S&P 500 Index consists of 500 stocks chosen for market size, liquidity, and industry group representation. It is a market-value-weighted index with each stock’s weight in the index proportionate to its market value. You cannot invest directly in an index. |
| 2 | The Russell 2500 Index measures the performance of the 2,500 smallest companies in the Russell 3000® Index, which represents approximately 16% of the total market capitalization of the Russell 3000 Index. You cannot invest directly in an index. |
| 3 | The Hang Seng Index is a free-float-adjusted market-capitalization-weighted stock market index in Hong Kong. It is used to record and monitor daily changes of the largest companies of the Hong Kong stock market and is the main indicator of the overall market performance in Hong Kong. You cannot invest directly in an index. |
| | | | | | |
| Letter to shareholders (unaudited) | | Wells Fargo Equity Gateway Funds | | | 3 | |
Although Japan’s third-quarter 2015 GDP was positive after contracting in the second quarter, the Bank of Japan expanded its economic stimulus programs to increase injections of liquidity into the economy through additional bond purchases. The Government Pension Investment Fund continued to reduce government bond investments and direct those assets to investments in the Japanese stock market.
Developed European and Asian equity markets returned -7.42%, as measured by the Morgan Stanley Capital International (MSCI) Europe, Australasia, Far East (EAFE) Index (Net)4 for the six-month period that ended November 30, 2015. U.S. investors in overseas markets saw the values of their investments fall as the U.S. dollar strengthened in comparison with other currencies. Emerging markets tended to bear the negative effects of investor uncertainty, a strong U.S. dollar, and sustained commodity-price weakness to a greater degree than developed markets. For the period, the MSCI Emerging Markets Index (Net)5 recorded a return of -17.67%.
Don’t let short-term uncertainty derail long-term investment goals.
Periods of uncertainty can present challenges, but experience has taught us that maintaining long-term investment goals can be an effective way to plan for the future. To help you create a sound strategy based on your personal goals and risk tolerance, Wells Fargo Funds offers more than 100 mutual funds and other investments spanning a wide range of asset classes and investment styles. Although diversification cannot guarantee an investment profit or prevent losses, we believe it can be an effective way to manage investment risk and potentially smooth out overall portfolio performance. We encourage investors to know their investments and to understand that appropriate levels of risk-taking may unlock opportunities.
Thank you for choosing to invest with Wells Fargo Funds. We appreciate your confidence in us and remain committed to helping you meet your financial needs.
Sincerely,

Karla M. Rabusch
President
Wells Fargo Funds
U.S. investors in overseas markets saw the values of their investments fall as the U.S. dollar strengthened in comparison with other currencies.
Notice to shareholders
At a meeting held August 11-12, 2015, the Board of Trustees of the Funds and the underlying Master Portfolios approved a change in the name of each Fund and underlying Master Portfolio whereby the word “Advantage” was removed from its name, effective December 15, 2015.
For current information about your fund investments, contact your investment professional, visit our website at wellsfargofunds.com, or call us directly at 1-800-222-8222. We are available 24 hours a day, 7 days a week.
| 4 | The Morgan Stanley Capital International (MSCI) Europe, Australasia, Far East (EAFE) Index (Net) is a free-float-adjusted market-capitalization-weighted index that is designed to measure the equity market performance of developed markets, excluding the U.S. and Canada. The MSCI EAFE Index (Net) consists of the following 21 developed markets country indexes: Australia, Austria, Belgium, Denmark, Finland, France, Germany, Hong Kong, Ireland, Israel, Italy, Japan, the Netherlands, New Zealand, Norway, Portugal, Singapore, Spain, Sweden, Switzerland, and the United Kingdom. You cannot invest directly in an index. Source: MSCI. MSCI makes no representations and shall have no liability whatsoever with respect to any MSCI data contained herein. The MSCI data may not be further redistributed or used as a basis for other indexes or any securities or financial products. This report is not approved, reviewed, or produced by MSCI. |
| 5 | The MSCI Emerging Markets Index (Net) is a free-float-adjusted market-capitalization-weighted index that is designed to measure the equity market performance of emerging markets. The MSCI Emerging Markets Index (Net) consists of the following 23 emerging markets country indexes: Brazil, Chile, China, Colombia, Czech Republic, Egypt, Greece, Hungary, India, Indonesia, Korea, Malaysia, Mexico, Peru, the Philippines, Poland, Qatar, Russia, South Africa, Taiwan, Thailand, Turkey, and United Arab Emirates. You cannot invest directly in an index. |
| | | | |
| 4 | | Wells Fargo Equity Gateway Funds | | Performance highlights (unaudited) |
Wells Fargo C&B Large Cap Value Fund1
Investment objective
The Fund seeks maximum long-term total return (current income and capital appreciation), consistent with minimizing risk to principal.
Manager
Wells Fargo Funds Management, LLC
Subadviser for the affiliated master portfolio
Cooke & Bieler, L.P.
Portfolio managers
| | |
Andrew Armstrong, CFA® Steve Lyons, CFA® Michael M. Meyer, CFA® Edward W. O’Connor, CFA® | | R. James O’Neil, CFA® Mehul Trivedi, CFA® William Weber, CFA® |
Average annual total returns (%) as of November 30, 2015
| | | | | | | | | | | | | | | | | | | | | | | | | | | | | | | | | | |
| | | | | Including sales charge | | | Excluding sales charge | | | Expense ratios2 (%) | |
| | | Inception date | | 1 year | | | 5 year | | | 10 year | | | 1 year | | | 5 year | | | 10 year | | | Gross | | | Net3 | |
| Class A (CBEAX) | | 7-26-2004 | | | (4.95 | ) | | | 10.52 | | | | 5.49 | | | | 0.86 | | | | 11.83 | | | | 6.12 | | | | 1.24 | | | | 1.15 | |
| Class B (CBEBX)* | | 7-26-2004 | | | (4.92 | ) | | | 10.71 | | | | 5.58 | | | | 0.08 | | | | 10.98 | | | | 5.58 | | | | 1.99 | | | | 1.90 | |
| Class C (CBECX) | | 7-26-2004 | | | (0.94 | ) | | | 10.97 | | | | 5.34 | | | | 0.06 | | | | 10.97 | | | | 5.34 | | | | 1.99 | | | | 1.90 | |
| Administrator Class (CBLLX) | | 7-26-2004 | | | – | | | | – | | | | – | | | | 1.01 | | | | 12.02 | | | | 6.34 | | | | 1.16 | | | | 1.00 | |
| Institutional Class (CBLSX) | | 7-26-2004 | | | – | | | | – | | | | – | | | | 1.32 | | | | 12.31 | | | | 6.62 | | | | 0.91 | | | | 0.80 | |
| Russell 1000® Value Index4 | | – | | | – | | | | – | | | | – | | | | (1.11 | ) | | | 13.47 | | | | 6.45 | | | | – | | | | – | |
| * | | Class B shares are closed to investment, except in connection with the reinvestment of any distributions and permitted exchanges. |
Figures quoted represent past performance, which is no guarantee of future results, and do not reflect taxes that a shareholder may pay on fund distributions or the redemption of fund shares. Investment return and principal value of an investment will fluctuate so that an investor’s shares, when redeemed, may be worth more or less than their original cost. Performance shown without sales charges would be lower if sales charges were reflected. Current performance may be lower or higher than the performance data quoted, which assumes the reinvestment of dividends and capital gains. Current month-end performance is available on the Fund’s website, wellsfargofunds.com.
Index returns do not include transaction costs associated with buying and selling securities, any mutual fund fees or expenses, or any taxes. It is not possible to invest directly in an index.
For Class A shares, the maximum front-end sales charge is 5.75%. For Class B shares, the maximum contingent deferred sales charge is 5.00%. For Class C shares, the maximum contingent deferred sales charge is 1.00%. Performance including a contingent deferred sales charge assumes the sales charge for the corresponding time period. Administrator Class and Institutional Class shares are sold without a front-end sales charge or contingent deferred sales charge.
Stock values fluctuate in response to the activities of individual companies and general market and economic conditions. Consult the Fund’s prospectus for additional information on these and other risks.
Please see footnotes on page 5.
| | | | | | |
| Performance highlights (unaudited) | | Wells Fargo Equity Gateway Funds | | | 5 | |
Wells Fargo C&B Large Cap Value Fund (continued)
| | | | |
| Ten largest holdings (%) as of November 30, 20155 | |
State Street Corporation | | | 3.78 | |
JPMorgan Chase & Company | | | 3.38 | |
Laboratory Corporation of America Holdings | | | 3.34 | |
Omnicom Group Incorporated | | | 3.12 | |
Johnson & Johnson | | | 3.11 | |
Twenty-First Century Fox Incorporated Class A | | | 3.07 | |
RenaissanceRe Holdings Limited | | | 2.99 | |
Gildan Activewear Incorporated | | | 2.86 | |
Aercap Holdings NV | | | 2.85 | |
PNC Financial Services Group Incorporated | | | 2.83 | |
|
| Sector distribution as of November 30, 20156 |
|
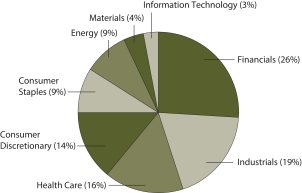 |
| 1 | The Fund is a gateway feeder fund that invests all of its assets in a single affiliated master portfolio of the Wells Fargo Master Trust with a substantially similar investment objective and substantially similar investment strategies. References to the investment activities of the Fund are intended to refer to the investment activities of the affiliated master portfolio in which it invests. |
| 2 | Reflects the expense ratios as stated in the most recent prospectuses. The expense ratios shown are subject to change and may differ from the annualized expense ratios shown in the financial highlights of this report. |
| 3 | The manager has contractually committed through September 30, 2016, to waive fees and/or reimburse expenses to the extent necessary to cap the Fund’s Total Annual Fund Operating Expenses After Fee Waiver at the amounts shown. After this time, the cap may be increased or the commitment to maintain the cap may be terminated only with the approval of the Board of Trustees. Brokerage commissions, stamp duty fees, interest, taxes, acquired fund fees and expenses, and extraordinary expenses are excluded from the cap. Expenses allocated from the affiliated master portfolio are included in the cap. Without this cap, the Fund’s returns would have been lower. |
| 4 | The Russell 1000® Value Index measures the performance of those Russell 1000 companies with lower price-to-book ratios and lower forecasted growth values. You cannot invest directly in an index. |
| 5 | The ten largest holdings, excluding cash and cash equivalents, are calculated based on the value of the securities of the affiliated master portfolio allocable to the Fund divided by the total net assets of the Fund. Holdings are subject to change and may have changed since the date specified. |
| 6 | Amounts represent the sector distribution of the affiliated master portfolio which are calculated based on the total long-term investments of the affiliated master portfolio. These amounts are subject to change and may have changed since the date specified. |
| | | | |
| 6 | | Wells Fargo Equity Gateway Funds | | Performance highlights (unaudited) |
Wells Fargo Diversified Equity Fund1
Investment objective
The Fund seeks long-term total capital appreciation.
Manager
Wells Fargo Funds Management, LLC
Subadvisers for the affiliated master portfolios
| | |
| Artisan Partners Limited Partnership | | Peregrine Capital Management, Inc. |
| Cooke & Bieler, L.P. | | Phocas Financial Corporation |
| Golden Capital Management, LLC | | Wells Capital Management Incorporated |
| LSV Asset Management | | |
Portfolio managers
Thomas C. Biwer CFA®
Aldo Ceccarelli, CFA®
Erik Sens, CFA®
Average annual total returns (%) as of November 30, 2015
| | | | | | | | | | | | | | | | | | | | | | | | | | | | | | | | | | |
| | | | | Including sales charge | | | Excluding sales charge | | | Expense ratios2 (%) | |
| | | Inception date | | 1 year | | | 5 year | | | 10 year | | | 1 year | | | 5 year | | | 10 year | | | Gross | | | Net3 | |
| Class A (NVDAX) | | 5-2-1996 | | | (4.70 | ) | | | 10.21 | | | | 5.05 | | | | 1.11 | | | | 11.52 | | | | 5.67 | | | | 1.39 | | | | 1.25 | |
| Class B (NVDBX)* | | 5-6-1996 | | | (4.69 | ) | | | 10.41 | | | | 5.11 | | | | 0.31 | | | | 10.67 | | | | 5.11 | | | | 2.14 | | | | 2.00 | |
| Class C (WFDEX) | | 10-1-1998 | | | (0.63 | ) | | | 10.70 | | | | 4.88 | | | | 0.37 | | | | 10.70 | | | | 4.88 | | | | 2.14 | | | | 2.00 | |
| Administrator Class (NVDEX) | | 11-11-1994 | | | – | | | | – | | | | – | | | | 1.35 | | | | 11.80 | | | | 5.94 | | | | 1.31 | | | | 1.00 | |
| Diversified Equity Composite Index4 | | – | | | – | | | | – | | | | – | | | | 1.88 | | | | 12.81 | | | | 7.02 | | | | – | | | | – | |
| MSCI EAFE Index (Net)5 | | – | | | – | | | | – | | | | – | | | | (2.94 | ) | | | 5.52 | | | | 3.64 | | | | – | | | | – | |
| Russell 1000® Growth Index6 | | – | | | – | | | | – | | | | – | | | | 6.12 | | | | 15.10 | | | | 8.66 | | | | – | | | | – | |
| Russell 1000® Value Index7 | | – | | | – | | | | – | | | | – | | | | (1.11 | ) | | | 13.47 | | | | 6.45 | | | | – | | | | – | |
| Russell 2000® Index8 | | – | | | – | | | | – | | | | – | | | | 3.51 | | | | 12.02 | | | | 7.31 | | | | – | | | | – | |
| S&P 500 Index9 | | – | | | – | | | | – | | | | – | | | | 2.75 | | | | 14.40 | | | | 7.48 | | | | – | | | | – | |
| * | | Class B shares are closed to investment, except in connection with the reinvestment of any distributions and permitted exchanges. |
Figures quoted represent past performance, which is no guarantee of future results, and do not reflect taxes that a shareholder may pay on fund distributions or the redemption of fund shares. Investment return and principal value of an investment will fluctuate so that an investor’s shares, when redeemed, may be worth more or less than their original cost. Performance shown without sales charges would be lower if sales charges were reflected. Current performance may be lower or higher than the performance data quoted, which assumes the reinvestment of dividends and capital gains. Current month-end performance is available on the Fund’s website, wellsfargofunds.com.
Index returns do not include transaction costs associated with buying and selling securities, any mutual fund fees or expenses, or any taxes. It is not possible to invest directly in an index.
For Class A shares, the maximum front-end sales charge is 5.75%. For Class B shares, the maximum contingent deferred sales charge is 5.00%. For Class C shares, the maximum contingent deferred sales charge is 1.00%. Performance including a contingent deferred sales charge assumes the sales charge for the corresponding time period. Administrator Class shares are sold without a front-end sales charge or contingent deferred sales charge.
Stock values fluctuate in response to the activities of individual companies and general market and economic conditions. Consult the Fund’s prospectus for additional information on these and other risks.
Please see footnotes on page 7.
| | | | | | |
| Performance highlights (unaudited) | | Wells Fargo Equity Gateway Funds | | | 7 | |
Wells Fargo Diversified Equity Fund (continued)
| | | | |
| Ten largest holdings (%) as of November 30, 201510 | |
Apple Incorporated | | | 2.13 | |
Facebook Incorporated | | | 1.32 | |
Amazon.com Incorporated | | | 1.26 | |
Alphabet Incorporated Class A | | | 1.16 | |
Exxon Mobil Corporation | | | 1.08 | |
JPMorgan Chase & Company | | | 1.06 | |
Alphabet Incorporated Class C | | | 1.00 | |
Visa Incorporated | | | 0.94 | |
Medtronic plc | | | 0.91 | |
The Home Depot Incorporated | | | 0.87 | |
|
| Sector distribution as of November 30, 201511 |
|
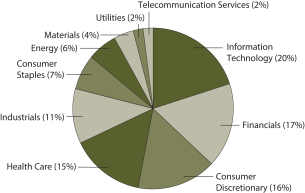 |
| 1 | The Fund is a gateway feeder fund that invests all of its assets in two or more affiliated master portfolios of the Wells Fargo Master Trust in varying proportions. References to the investment activities of the Fund are intended to refer to the investment activities of the affiliated master portfolios in which it invests. |
| 2 | Reflects the expense ratios as stated in the most recent prospectuses. The expense ratios shown are subject to change and may differ from the annualized expense ratios shown in the financial highlights of this report. |
| 3 | The manager has contractually committed through September 30, 2016, to waive fees and/or reimburse expenses to the extent necessary to cap the Fund’s Total Annual Fund Operating Expenses After Fee Waiver at the amounts shown. After this time, the cap may be increased or the commitment to maintain the cap may be terminated only with the approval of the Board of Trustees. Brokerage commissions, stamp duty fees, interest, taxes, acquired fund fees and expenses, and extraordinary expenses are excluded from the cap. Expenses allocated from the affiliated master portfolios are included in the cap. Without this cap, the Fund’s returns would have been lower. |
| 4 | Source: Wells Fargo Funds Management, LLC. The Diversified Equity Composite Index is weighted 25% in the Russell 1000® Value Index, 25% in the S&P 500 Index, 25% in the Russell 1000® Growth Index, 15% in the MSCI EAFE Index (Net) and 10% in the Russell 2000® Index. You cannot invest directly in an index. |
| 5 | The Morgan Stanley Capital International (MSCI) Europe, Australasia, Far East (EAFE) Index (Net) is a free-float-adjusted market-capitalization-weighted index that is designed to measure the equity market performance of developed markets, excluding the U.S. and Canada. The MSCI EAFE Index (Net) consists of the following 21 developed markets country indexes: Australia, Austria, Belgium, Denmark, Finland, France, Germany, Hong Kong, Ireland, Israel, Italy, Japan, the Netherlands, New Zealand, Norway, Portugal, Singapore, Spain, Sweden, Switzerland, and the United Kingdom. You cannot invest directly in an index. Source: MSCI. MSCI makes no express or implied warranties or representations and shall have no liability whatsoever with respect to any MSCI data contained herein. The MSCI data may not be further redistributed or used as a basis for other indexes or any securities or financial products. This report is not approved, reviewed, or produced by MSCI. |
| 6 | The Russell 1000® Growth Index measures the performance of those Russell 1000 companies with higher price-to-book ratios and higher forecasted growth values. You cannot invest directly in an index. |
| 7 | The Russell 1000® Value Index measures the performance of those Russell 1000 companies with lower price-to-book ratios and lower forecasted growth values. You cannot invest directly in an index. |
| 8 | The Russell 2000® Index measures the performance of the 2,000 smallest companies in the Russell 3000® Index, which represents approximately 8% of the total market capitalization of the Russell 3000 Index. You cannot invest directly in an index. |
| 9 | The S&P 500 Index consists of 500 stocks chosen for market size, liquidity, and industry group representation. It is a market-value-weighted index with each stock’s weight in the index proportionate to its market value. You cannot invest directly in an index. |
| 10 | The ten largest holdings, excluding cash and cash equivalents, are calculated based on the value of the securities of the affiliated master portfolios allocable to the Fund divided by the total net assets of the Fund. Holdings are subject to change and may have changed since the date specified. |
| 11 | Amounts represent the sector distribution of the affiliated master portfolios which are calculated based on the total long-term investments of the affiliated master portfolios. These amounts are subject to change and may have changed since the date specified. |
| | | | |
| 8 | | Wells Fargo Equity Gateway Funds | | Performance highlights (unaudited) |
Wells Fargo Emerging Growth Fund1
The Fund is closed to most new investors.2
Investment objective
The Fund seeks long-term capital appreciation.
Manager
Wells Fargo Funds Management, LLC
Subadviser for the affiliated master portfolio
Wells Capital Management Incorporated
Portfolio managers
Joseph M. Eberhardy, CFA®, CPA
Thomas C. Ognar, CFA®
Bruce C. Olson , CFA®
Average annual total returns (%) as of November 30, 20153
| | | | | | | | | | | | | | | | | | | | | | | | | | | | | | | | |
| | | | | Including sales charge | | | Excluding sales charge | | Expense ratios4 (%) | |
| | | Inception date | | 1 year | | | 5 year | | | Since
inception | | | 1 year | | | 5 year | | | Since
inception | | Gross | | | Net5 | |
| Class A (WEMAX) | | 3-31-2008 | | | (4.17 | ) | | | 10.98 | | | | 6.78 | | | | 1.67 | | | | 12.30 | | | 7.50 | | | 1.34 | | | | 1.34 | |
| Class C (WEMCX) | | 3-31-2008 | | | (0.07 | ) | | | 11.48 | | | | 6.71 | | | | 0.93 | | | | 11.48 | | | 6.71 | | | 2.09 | | | | 2.09 | |
| Administrator Class (WFGDX) | | 1-31-2007 | | | – | | | | – | | | | – | | | | 1.84 | | | | 12.48 | | | 7.73 | | | 1.26 | | | | 1.20 | |
| Institutional Class (WEMIX) | | 3-31-2008 | | | – | | | | – | | | | – | | | | 2.11 | | | | 12.83 | | | 7.99 | | | 1.01 | | | | 0.90 | |
| Russell 2000® Growth Index6 | | – | | | – | | | | – | | | | – | | | | 6.63 | | | | 13.41 | | | 7.89 | | | – | | | | – | |
Figures quoted represent past performance, which is no guarantee of future results, and do not reflect taxes that a shareholder may pay on fund distributions or the redemption of fund shares. Investment return and principal value of an investment will fluctuate so that an investor’s shares, when redeemed, may be worth more or less than their original cost. Performance shown without sales charges would be lower if sales charges were reflected. Current performance may be lower or higher than the performance data quoted, which assumes the reinvestment of dividends and capital gains. Current month-end performance is available on the Fund’s website, wellsfargofunds.com.
Index returns do not include transaction costs associated with buying and selling securities, any mutual fund fees or expenses, or any taxes. It is not possible to invest directly in an index.
For Class A shares, the maximum front-end sales charge is 5.75%. For Class C shares, the maximum contingent deferred sales charge is 1.00%. Performance including a contingent deferred sales charge assumes the sales charge for the corresponding time period. Administrator Class and Institutional Class shares are sold without a front-end sales charge or contingent deferred sales charge.
Stock values fluctuate in response to the activities of individual companies and general market and economic conditions. Smaller-company stocks tend to be more volatile and less liquid than those of larger companies. Certain investment strategies tend to increase the total risk of an investment (relative to the broader market). The Fund is exposed to foreign investment risk. Consult the Fund’s prospectus for additional information on these and other risks.
Please see footnotes on page 9.
| | | | | | |
| Performance highlights (unaudited) | | Wells Fargo Equity Gateway Funds | | | 9 | |
Wells Fargo Emerging Growth Fund (continued)
| | | | |
| Ten largest holdings (%) as of November 30, 20157 | |
MarketAxess Holdings Incorporated | | | 4.29 | |
Proofpoint Incorporated | | | 3.96 | |
Acadia Healthcare Company Incorporated | | | 3.51 | |
SPS Commerce Incorporated | | | 3.21 | |
Envestnet Incorporated | | | 2.29 | |
HealthEquity Incorporated | | | 1.97 | |
On Assignment Incorporated | | | 1.96 | |
Demandware Incorporated | | | 1.94 | |
Fiesta Restaurant Group Incorporated | | | 1.89 | |
Q2 Holdings Incorporated | | | 1.85 | |
|
| Sector distribution as of November 30, 20158 |
|
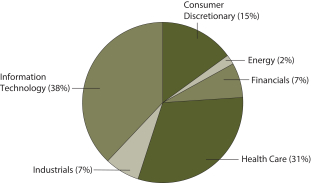 |
| 1 | The Fund is a gateway feeder fund that invests all of its assets in a single affiliated master portfolio of the Wells Fargo Master Trust with a substantially similar investment objective and substantially similar investment strategies. References to the investment activities of the Fund are intended to refer to the investment activities of the affiliated master portfolio in which it invests. |
| 2 | Please see the Fund’s current Statement of Additional Information for further details. |
| 3 | Historical performance shown for Class A shares prior to their inception reflects the performance of the former Investor Class shares, and includes the higher expenses applicable to the former Investor Class shares. If these expenses had not been included, returns would be higher. Historical performance shown for Class C shares prior to their inception reflects the performance of the former Investor Class shares, adjusted to reflect the higher expenses applicable to Class C shares. Historical performance shown for Institutional Class shares prior to their inception reflects the performance of Administrator Class shares, and includes the higher expenses applicable to Administrator Class shares. If these expenses had not been included, returns would be higher. |
| 4 | Reflects the expense ratios as stated in the most recent prospectuses. The expense ratios shown are subject to change and may differ from the annualized expense ratios shown in the financial highlights of this report. |
| 5 | The manager has contractually committed through September 30, 2016, to waive fees and/or reimburse expenses to the extent necessary to cap the Fund’s Total Annual Fund Operating Expenses After Fee Waiver at 1.35% for Class A, 2.10% for Class C, 1.20% for Administrator Class, and 0.90% for Institutional Class. After this time, the cap may be increased or the commitment to maintain the cap may be terminated only with the approval of the Board of Trustees. Brokerage commissions, stamp duty fees, interest, taxes, acquired fund fees and expenses, and extraordinary expenses are excluded from the cap. Expenses allocated from the affiliated master portfolio are included in the cap. Without this cap, the Fund’s returns would have been lower. |
| 6 | The Russell 2000® Growth Index measures the performance of those Russell 2000 companies with higher price-to-book ratios and higher forecasted growth values. You cannot invest directly in an index. |
| 7 | The ten largest holdings, excluding cash and cash equivalents, are calculated based on the value of the securities of the affiliated master portfolio allocable to the Fund divided by the total net assets of the Fund. Holdings are subject to change and may have changed since the date specified. |
| 8 | Amounts represent the sector distribution of the affiliated master portfolio which are calculated based on the total long-term investments of the affiliated master portfolio. These amounts are subject to change and may have changed since the date specified. |
| | | | |
| 10 | | Wells Fargo Equity Gateway Funds | | Performance highlights (unaudited) |
Wells Fargo Index Fund1
Investment objective
The Fund seeks to replicate the total return of S&P 500 Index, before fees and expenses.
Manager
Wells Fargo Funds Management, LLC
Subadviser for the affiliated master portfolio
Golden Capital Management, LLC
Portfolio managers
John R. Campbell, CFA®
Justin Carr, CFA®
David Neal, CFA®
Average annual total returns (%) as of November 30, 20152
| | | | | | | | | | | | | | | | | | | | | | | | | | | | | | | | | | |
| | | | | Including sales charge | | | Excluding sales charge | | | Expense ratios3 (%) | |
| | | Inception date | | 1 year | | | 5 year | | | 10 year | | | 1 year | | | 5 year | | | 10 year | | | Gross | | | Net4 | |
| Class A (WFILX) | | 11-4-1998 | | | (3.64 | ) | | | 12.45 | | | | 6.29 | | | | 2.23 | | | | 13.79 | | | | 6.92 | | | | 0.63 | | | | 0.56 | |
| Class B (WFMIX)* | | 11-3-1998 | | | (3.53 | ) | | | 12.69 | | | | 6.36 | | | | 1.46 | | | | 12.93 | | | | 6.36 | | | | 1.38 | | | | 1.31 | |
| Class C (WFINX) | | 4-30-1999 | | | 0.46 | | | | 12.94 | | | | 6.12 | | | | 1.46 | | | | 12.94 | | | | 6.12 | | | | 1.38 | | | | 1.31 | |
| Administrator Class (WFIOX) | | 2-14-1985 | | | – | | | | – | | | | – | | | | 2.53 | | | | 14.14 | | | | 7.22 | | | | 0.40 | | | | 0.25 | |
| S&P 500 Index5 | | – | | | – | | | | – | | | | – | | | | 2.75 | | | | 14.40 | | | | 7.48 | | | | – | | | | – | |
| * | | Class B shares are closed to investment, except in connection with the reinvestment of any distribution and permitted exchanges. |
Figures quoted represent past performance, which is no guarantee of future results, and do not reflect taxes that a shareholder may pay on fund distributions or the redemption of fund shares. Investment return and principal value of an investment will fluctuate so that an investor’s shares, when redeemed, may be worth more or less than their original cost. Performance shown without sales charges would be lower if sales charges were reflected. Current performance may be lower or higher than the performance data quoted, which assumes the reinvestment of dividends and capital gains. Current month-end performance is available on the Fund’s website, wellsfargofunds.com.
Index returns do not include transaction costs associated with buying and selling securities, any mutual fund fees or expenses, or any taxes. It is not possible to invest directly in an index.
For Class A shares, the maximum front-end sales charge is 5.75%. For Class B shares, the maximum contingent deferred sales charge is 5.00%. For Class C shares, the maximum contingent deferred sales charge is 1.00%. Performance including a contingent deferred sales charge assumes the sales charge for the corresponding time period. Administrator Class shares are sold without a front-end sales charge or contingent deferred sales charge.
Stock values fluctuate in response to the activities of individual companies and general market and economic conditions. The use of derivatives may reduce returns and/or increase volatility. Consult the Fund’s prospectus for additional information on these and other risks.
Please see footnotes on page 11.
| | | | | | |
| Performance highlights (unaudited) | | Wells Fargo Equity Gateway Funds | | | 11 | |
Wells Fargo Index Fund (continued)
| | | | |
| Ten largest holdings (%) as of November 30, 20156 | |
Apple Incorporated | | | 3.82 | |
Microsoft Corporation | | | 2.46 | |
Exxon Mobil Corporation | | | 1.93 | |
General Electric Company | | | 1.60 | |
Johnson & Johnson | | | 1.59 | |
Wells Fargo & Company | | | 1.46 | |
Amazon.com Incorporated | | | 1.44 | |
Berkshire Hathaway Incorporated Class B | | | 1.42 | |
JPMorgan Chase & Company | | | 1.39 | |
Facebook Incorporated Class A | | | 1.33 | |
|
| Sector distribution as of November 30, 20157 |
|
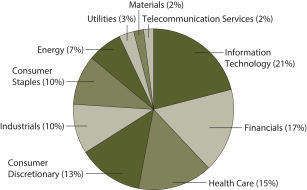 |
| 1 | The Fund is a gateway feeder fund that invests all of its assets in a single affiliated master portfolio of the Wells Fargo Master Trust with a substantially similar investment objective and substantially similar investment strategies. References to the investment activities of the Fund are intended to refer to the investment activities of the affiliated master portfolio in which it invests. |
| 2 | Historical performance shown for all classes of the Fund prior to July 19, 2010, is based on the performance of the Fund’s predecessor, Evergreen Equity Index Fund. |
| 3 | Reflects the expense ratios as stated in the most recent prospectuses. The expense ratios shown are subject to change and may differ from the annualized expense ratios shown in the financial highlights of this report. |
| 4 | The manager has contractually committed through September 30, 2017 (September 30, 2016 for Administrator Class), to waive fees and/or reimburse expenses to the extent necessary to cap the Fund’s Total Annual Fund Operating Expenses After Fee Waiver at 0.45% for Class A, 1.20% for Class B, 1.20% for Class C, and 0.25% for Administrator Class. After this time, the caps may be increased or the commitment to maintain the caps may be terminated only with the approval of the Board of Trustees. Brokerage commissions, stamp duty fees, interest, taxes, acquired fund fees and expenses, and extraordinary expenses are excluded from the cap. Expenses allocated from the affiliated master portfolio are included in the cap. Without this cap, the Fund’s returns would have been lower. |
| 5 | The S&P 500 Index consists of 500 stocks chosen for market size, liquidity, and industry group representation. It is a market-value-weighted index with each stock’s weight in the index proportionate to its market value. You cannot invest directly in an index. |
| 6 | The ten largest holdings, excluding cash and cash equivalents, are calculated based on the value of the securities of the affiliated master portfolio allocable to the Fund divided by the total net assets of the Fund. Holdings are subject to change and may have changed since the date specified. |
| 7 | Amounts represent the sector distribution of the affiliated master portfolio which are calculated based on the total long-term investments of the affiliated master portfolio. These amounts are subject to change and may have changed since the date specified. |
| | | | |
| 12 | | Wells Fargo Equity Gateway Funds | | Performance highlights (unaudited) |
Wells Fargo International Value Fund1
Investment objective
The Fund seeks long-term capital appreciation.
Manager
Wells Fargo Funds Management, LLC
Subadviser for the affiliated master portfolio
LSV Asset Management
Portfolio managers
Josef Lakonishok
Puneed Mansharamani, CFA®
Menno Vermeulen, CFA®
Average annual total returns (%) as of November 30, 20152
| | | | | | | | | | | | | | | | | | | | | | | | | | | | | | | | | | |
| | | | | Including sales charge | | | Excluding sales charge | | | Expense ratios3 (%) | |
| | | Inception date | | 1 year | | | 5 year | | | 10 year | | | 1 year | | | 5 year | | | 10 year | | | Gross | | | Net4 | |
| Class A (WFFAX) | | 10-31-2003 | | | (10.09 | ) | | | 2.88 | | | | 1.39 | | | | (4.61 | ) | | | 4.10 | | | | 1.99 | | | | 1.45 | | | | 1.35 | |
| Class B (WFMIX)* | | 4-8-2005 | | | (10.26 | ) | | | 2.99 | | | | 1.44 | | | | (5.26 | ) | | | 3.34 | | | | 1.44 | | | | 2.20 | | | | 2.10 | |
| Class C (WFINX) | | 4-8-2005 | | | (6.36 | ) | | | 3.32 | | | | 1.21 | | | | (5.36 | ) | | | 3.32 | | | | 1.21 | | | | 2.20 | | | | 2.10 | |
| Administrator Class (WFIOX) | | 4-8-2005 | | | – | | | | – | | | | – | | | | (4.65 | ) | | | 4.28 | | | | 2.19 | | | | 1.37 | | | | 1.25 | |
| Institutional Class (WFVIX) | | 8-31-2006 | | | – | | | | – | | | | – | | | | (4.21 | ) | | | 4.55 | | | | 2.40 | | | | 1.12 | | | | 1.00 | |
| MSCI EAFE Value Index (Net)5 | | – | | | – | | | | – | | | | – | | | | (7.14 | ) | | | 4.61 | | | | 2.56 | | | | – | | | | – | |
| * | | Effective December 9, 2015, Class B shares are no longer offered by the Fund. |
Figures quoted represent past performance, which is no guarantee of future results, and do not reflect taxes that a shareholder may pay on fund distributions or the redemption of fund shares. Investment return and principal value of an investment will fluctuate so that an investor’s shares, when redeemed, may be worth more or less than their original cost. Performance shown without sales charges would be lower if sales charges were reflected. Current performance may be lower or higher than the performance data quoted, which assumes the reinvestment of dividends and capital gains. Current month-end performance is available on the Fund’s website, wellsfargofunds.com.
Index returns do not include transaction costs associated with buying and selling securities, any mutual fund fees or expenses, or any taxes. It is not possible to invest directly in an index.
For Class A shares, the maximum front-end sales charge is 5.75%. For Class B shares, the maximum contingent deferred sales charge is 5.00%. For Class C shares, the maximum contingent deferred sales charge is 1.00%. Performance including a contingent deferred sales charge assumes the sales charge for the corresponding time period. Administrator Class and Institutional Class shares are sold without a front-end sales charge or contingent deferred sales charge.
Stock values fluctuate in response to the activities of individual companies and general market and economic conditions. Foreign investments are especially volatile and can rise or fall dramatically due to differences in the political and economic conditions of the host country. These risks are generally intensified in emerging markets. The use of derivatives may reduce returns and/or increase volatility. Certain investment strategies tend to increase the total risk of an investment (relative to the broader market). The Fund is exposed to smaller company securities risk. Consult the Fund’s prospectus for additional information on these and other risks.
Please see footnotes on page 13.
| | | | | | |
| Performance highlights (unaudited) | | Wells Fargo Equity Gateway Funds | | | 13 | |
Wells Fargo International Value Fund (continued)
| | | | |
| Ten largest holdings (%) as of November 30, 20156 | |
Nippon Telegraph & Telephone Corporation | | | 1.75 | |
Sanofi-Aventis SA | | | 1.49 | |
BAE Systems plc | | | 1.47 | |
Swiss Reinsurance AG | | | 1.45 | |
Royal Dutch Shell plc Class B | | | 1.44 | |
Daimler AG | | | 1.37 | |
Allianz AG | | | 1.27 | |
Magna International Incorporated Class A | | | 1.21 | |
Credit Suisse Group AG | | | 1.18 | |
Koninklijke Ahold NV | | | 1.16 | |
|
| Sector distribution as of November 30, 20157 |
|
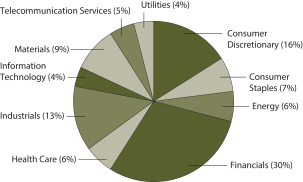 |
|
| Country allocation as of November 30, 20157 |
|
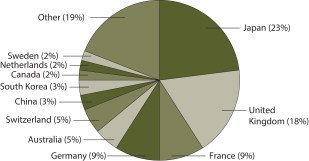 |
| 1 | The Fund is a gateway feeder fund that invests all of its assets in a single affiliated master portfolio of the Wells Fargo Master Trust with a substantially similar investment objective and substantially similar investment strategies. References to the investment activities of the Fund are intended to refer to the investment activities of the affiliated master portfolio in which it invests. |
| 2 | Historical performance shown for Institutional Class shares prior to their inception reflects the performance of Administrator Class shares, and includes the higher expenses applicable to Administrator Class shares. If these expenses had not been included, returns would be higher. |
| 3 | Reflects the expense ratios as stated in the most recent prospectuses. The expense ratios shown are subject to change and may differ from the annualized expense ratios shown in the financial highlights of this report. |
| 4 | The manager has contractually committed through September 30, 2016, to waive fees and/or reimburse expenses to the extent necessary to cap the Fund’s Total Annual Fund Operating Expenses After Fee Waiver at the amounts shown. After this time, the cap may be increased or the commitment to maintain the cap may be terminated only with the approval of the Board of Trustees. Brokerage commissions, stamp duty fees, interest, taxes, acquired fund fees and expenses, and extraordinary expenses are excluded from the cap. Expenses allocated from the affiliated master portfolio are included in the cap. Without this cap, the Fund’s returns would have been lower. |
| 5 | The Morgan Stanley Capital International (MSCI) Europe, Australasia, and Far East (EAFE) Value Index (Net) is a free-float-adjusted market capitalization-weighted index that is designed to measure the equity market performance of value securities within developed equity markets, excluding the U.S. and Canada. The MSCI EAFE Value Index (Net) consists of the following 21 developed markets country indexes: Australia, Austria, Belgium, Denmark, Finland, France, Germany, Hong Kong, Ireland, Israel, Italy, Japan, the Netherlands, New Zealand, Norway, Portugal, Singapore, Spain, Sweden, Switzerland, and the United Kingdom. You cannot invest directly in an index. Source: MSCI. MSCI makes no express or implied warranties or representations and shall have no liability whatsoever with respect to any MSCI data contained herein. The MSCI data may not be further redistributed or used as a basis for other indexes or any securities or financial products. This report is not approved, reviewed, or produced by MSCI. |
| 6 | The ten largest holdings, excluding cash and cash equivalents, are calculated based on the value of the securities of the affiliated master portfolio allocable to the Fund divided by the total net assets of the Fund. Holdings are subject to change and may have changed since the date specified. |
| 7 | Amounts represent the sector distribution of the affiliated master portfolio which are calculated based on the total long-term investments of the affiliated master portfolio. These amounts are subject to change and may have changed since the date specified. |
| | | | |
| 14 | | Wells Fargo Equity Gateway Funds | | Performance highlights (unaudited) |
Wells Fargo Small Company Growth Fund1
Investment objective
The Fund seeks long-term capital appreciation.
Manager
Wells Fargo Funds Management, LLC
Subadviser for the affiliated master portfolio
Peregrine Capital Management, Inc.
Portfolio managers
William A. Grierson, CFA®
Daniel J. Hageni, CFA®
Robert B. Mersky, CFA®
James P. Ross, CFA®
Paul E. von Kuster, CFA®
Average annual total returns (%) as of November 30, 20152
| | | | | | | | | | | | | | | | | | | | | | | | | | | | | | | | | | |
| | | | | Including sales charge | | | Excluding sales charge | | | Expense ratios3 (%) | |
| | | Inception date | | 1 year | | | 5 year | | | 10 year | | | 1 year | | | 5 year | | | 10 year | | | Gross | | | Net4 | |
| Class A (WFSAX) | | 1-30-2004 | | | (2.27 | ) | | | 12.78 | | | | 7.59 | | | | 3.69 | | | | 14.13 | | | | 8.23 | | | | 1.36 | | | | 1.35 | |
| Class B (WFSBX)* | | 1-30-2004 | | | (2.08 | ) | | | 13.02 | | | | 7.66 | | | | 2.92 | | | | 13.27 | | | | 7.66 | | | | 2.11 | | | | 2.10 | |
| Class C (WSMCX) | | 1-30-2004 | | | 1.91 | | | | 13.27 | | | | 7.43 | | | | 2.91 | | | | 13.27 | | | | 7.43 | | | | 2.11 | | | | 2.10 | |
| Class R6 (WBHWJ) | | 10-31-2014 | | | – | | | | – | | | | – | | | | 4.15 | | | | 14.67 | | | | 8.69 | | | | 0.93 | | | | 0.90 | |
| Administrator Class (NVSCX) | | 11-11-1994 | | | – | | | | – | | | | – | | | | 3.89 | | | | 14.38 | | | | 8.49 | | | | 1.28 | | | | 1.20 | |
| Institutional Class (WSCG) | | 3-31-2008 | | | – | | | | – | | | | – | | | | 4.13 | | | | 14.66 | | | | 8.69 | | | | 1.03 | | | | 0.95 | |
| Russell 2000® Growth Index5 | | – | | | – | | | | – | | | | – | | | | 6.63 | | | | 13.41 | | | | 8.46 | | | | – | | | | – | |
| * | | Class B shares are closed to investment, except with the reinvestment of any distributions and permitted exchanges. |
Figures quoted represent past performance, which is no guarantee of future results, and do not reflect taxes that a shareholder may pay on fund distributions or the redemption of fund shares. Investment return and principal value of an investment will fluctuate so that an investor’s shares, when redeemed, may be worth more or less than their original cost. Performance shown without sales charges would be lower if sales charges were reflected. Current performance may be lower or higher than the performance data quoted, which assumes the reinvestment of dividends and capital gains. Current month-end performance is available on the Fund’s website, wellsfargofunds.com.
Index returns do not include transaction costs associated with buying and selling securities, any mutual fund fees or expenses, or any taxes. It is not possible to invest directly in an index.
For Class A shares, the maximum front-end sales charge is 5.75%. For Class B shares, the maximum contingent deferred sales charge is 5.00%. For Class C shares, the maximum contingent deferred sales charge is 1.00%. Performance including a contingent deferred sales charge assumes the sales charge for the corresponding time period. Class R6, Administrator Class and Institutional Class shares are sold without a front-end sales charge or contingent deferred sales charge.
Stock values fluctuate in response to the activities of individual companies and general market and economic conditions. Smaller-company stocks tend to be more volatile and less liquid than those of larger companies. Certain investment strategies tend to increase the total risk of an investment (relative to the broader market). The Fund is exposed to foreign investment risk. Consult the Fund’s prospectus for additional information on these and other risks.
Please see footnotes on page 15.
| | | | | | |
| Performance highlights (unaudited) | | Wells Fargo Equity Gateway Funds | | | 15 | |
Wells Fargo Small Company Growth Fund (continued)
| | | | |
| Ten largest holdings (%) as of November 30, 20156 | |
SS&C Technologies Holdings | | | 1.55 | |
ICON plc ADR | | | 1.44 | |
Monro Muffler Brake Incorporated | | | 1.35 | |
Evercore Partners Incorporated Class A | | | 1.29 | |
SVB Financial Group | | | 1.29 | |
Cadence Design Systems Incorporated | | | 1.29 | |
TrueBlue Incorporated | | | 1.23 | |
A.O. Smith Corporation | | | 1.20 | |
OSI Systems Incorporated | | | 1.17 | |
Argo Group International Holdings Limited | | | 1.16 | |
|
| Sector distribution as of November 30, 20157 |
|
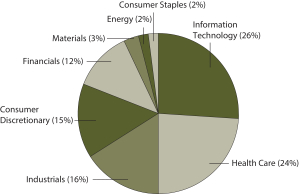 |
| 1 | The Fund is a gateway feeder fund that invests all of its assets in a single affiliated master portfolio of the Wells Fargo Master Trust with a substantially similar investment objective and substantially similar investment strategies. References to the investment activities of the Fund are intended to refer to the investment activities of the affiliated master portfolio in which it invests. |
| 2 | Historical performance shown for Class R6 shares prior to their inception reflects the performance of Institutional Class shares, and includes the higher expenses applicable to Institutional Class shares. If these expenses had not been included, returns would be higher. Historical performance shown for Institutional Class shares prior to their inception reflects the performance of Administrator Class shares, and includes the higher expenses applicable to Administrator Class shares. If these expenses had not been included, returns would be higher. |
| 3 | Reflects the expense ratios as stated in the most recent prospectuses. The expense ratios shown are subject to change and may differ from the annualized expense ratios shown in the financial highlights of this report. |
| 4 | The manager has contractually committed through September 30, 2016, to waive fees and/or reimburse expenses to the extent necessary to cap the Fund’s Total Annual Fund Operating Expenses After Fee Waiver at the amounts shown. After this time, the cap may be increased or the commitment to maintain the cap may be terminated only with the approval of the Board of Trustees. Brokerage commissions, stamp duty fees, interest, taxes, acquired fund fees and expenses, and extraordinary expenses are excluded from the cap. Expenses allocated from the affiliated master portfolio are included in the cap. Without this cap, the Fund’s returns would have been lower. |
| 5 | The Russell 2000® Growth Index measures the performance shown of those Russell 2000 companies with higher price-to-book ratios and higher forecasted growth values. You cannot invest directly in an index. |
| 6 | The ten largest holdings, excluding cash and cash equivalents, are calculated based on the value of the securities of the affiliated master portfolio allocable to the Fund divided by the total net assets of the Fund. Holdings are subject to change and may have changed since the date specified. |
| 7 | Amounts represent the sector distribution of the affiliated master portfolio which are calculated based on the total long-term investments of the affiliated master portfolio. These amounts are subject to change and may have changed since the date specified. |
| | | | |
| 16 | | Wells Fargo Equity Gateway Funds | | Performance highlights (unaudited) |
Wells Fargo Small Company Value Fund1
Investment objective
The Fund seeks long-term capital appreciation.
Manager
Wells Fargo Funds Management, LLC
Subadviser for the affiliated master portfolio
Peregrine Capital Management, Inc.
Portfolio managers
Jason R. Ballsrud, CFA®
Tasso H. Coin, Jr., CFA®
Douglas G. Pugh, CFA®
Average annual total returns (%) as of November 30, 20152
| | | | | | | | | | | | | | | | | | | | | | | | | | | | | | | | | | |
| | | | | Including sales charge | | | Excluding sales charge | | | Expense ratios3 (%) | |
| | | Inception date | | 1 year | | | 5 year | | | 10 year | | | 1 year | | | 5 year | | | 10 year | | | Gross | | | Net4 | |
| Class A SCVAX) | | 1-31-2002 | | | (3.64 | ) | | | 9.89 | | | | 4.87 | | | | 2.24 | | | | 11.20 | | | | 5.49 | | | | 1.45 | | | | 1.35 | |
| Class B (SCVBX)* | | 1-31-2002 | | | (3.53 | ) | | | 10.13 | | | | 4.96 | | | | 1.47 | | | | 10.40 | | | | 4.96 | | | | 2.20 | | | | 2.10 | |
| Class C (SCVFX) | | 8-30-2002 | | | 0.48 | | | | 10.36 | | | | 4.73 | | | | 1.48 | | | | 10.36 | | | | 4.73 | | | | 2.20 | | | | 2.10 | |
| Administrator Class (SCVIX) | | 1-31-2002 | | | – | | | | – | | | | – | | | | 2.44 | | | | 11.43 | | | | 5.76 | | | | 1.37 | | | | 1.20 | |
| Institutional Class (SCVNX) | | 7-30-2010 | | | – | | | | – | | | | – | | | | 2.62 | | | | 11.65 | | | | 5.87 | | | | 1.12 | | | | 1.00 | |
| Russell 2000® Value Index5 | | – | | | – | | | | – | | | | – | | | | 0.35 | | | | 10.60 | | | | 6.07 | | | | – | | | | – | |
| * | | Effective January 8, 2016, Class B shares are no longer offered by the Fund. |
Figures quoted represent past performance, which is no guarantee of future results, and do not reflect taxes that a shareholder may pay on fund distributions or the redemption of fund shares. Investment return and principal value of an investment will fluctuate so that an investor’s shares, when redeemed, may be worth more or less than their original cost. Performance shown without sales charges would be lower if sales charges were reflected. Current performance may be lower or higher than the performance data quoted, which assumes the reinvestment of dividends and capital gains. Current month-end performance is available on the Fund’s website, wellsfargofunds.com.
Index returns do not include transaction costs associated with buying and selling securities, any mutual fund fees or expenses, or any taxes. It is not possible to invest directly in an index.
For Class A shares, the maximum front-end sales charge is 5.75%. For Class B shares, the maximum contingent deferred sales charge is 5.00%. For Class C shares, the maximum contingent deferred sales charge is 1.00%. Performance including a contingent deferred sales charge assumes the sales charge for the corresponding time period. Administrator Class and Institutional Class shares are sold without a front-end sales charge or contingent deferred sales charge.
Stock values fluctuate in response to the activities of individual companies and general market and economic conditions. Smaller-company stocks tend to be more volatile and less liquid than those of larger companies. Certain investment strategies tend to increase the total risk of an investment (relative to the broader market). The Fund is exposed to foreign investment risk. Consult the Fund’s prospectus for additional information on these and other risks.
Please see footnotes on page 17.
| | | | | | |
| Performance highlights (unaudited) | | Wells Fargo Equity Gateway Funds | | | 17 | |
Wells Fargo Small Company Value Fund (continued)
| | | | |
| Ten largest holdings (%) as of November 30, 20156 | |
Western Alliance Bancorp | | | 2.59 | |
Belden Incorporated | | | 2.50 | |
PNM Resources Incorporated | | | 2.32 | |
American Axle & Manufacturing Holdings Incorporated | | | 2.30 | |
Great Western Bancorp Incorporated | | | 2.26 | |
PrivateBancorp Incorporated | | | 2.21 | |
Primerica Incorporated | | | 2.21 | |
Alere Incorporated | | | 2.18 | |
Equity Commonwealth | | | 2.18 | |
Scholastic Corporation | | | 2.15 | |
|
| Sector distribution as of November 30, 20157 |
|
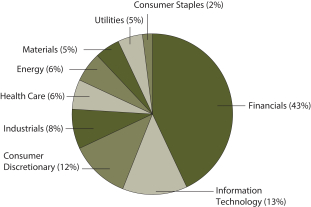 |
| 1 | The Fund is a gateway feeder fund that invests all of its assets in a single affiliated master portfolio of the Wells Fargo Master Trust with a substantially similar investment objective and substantially similar investment strategies. References to the investment activities of the Fund are intended to refer to the investment activities of the affiliated master portfolio in which it invests. |
| 2 | Historical performance shown for Institutional Class shares prior to their inception reflects the performance of Administrator Class shares and includes the higher expenses applicable to Administrator Class shares. If these expenses had not been included, returns would be higher. |
| 3 | Reflects the expense ratios as stated in the most recent prospectuses. The expense ratios shown are subject to change and may differ from the annualized expense ratios shown in the financial highlights of this report. |
| 4 | The manager has contractually committed through September 30, 2016, to waive fees and/or reimburse expenses to the extent necessary to cap the Fund’s Total Annual Fund Operating Expenses After Fee Waiver at the amounts shown. After this time, the cap may be increased or the commitment to maintain the cap may be terminated only with the approval of the Board of Trustees. Brokerage commissions, stamp duty fees, interest, taxes, acquired fund fees and expenses, and extraordinary expenses are excluded from the cap. Expenses allocated from the affiliated master portfolio are included in the cap. Without this cap, the Fund’s returns would have been lower. |
| 5 | The Russell 2000® Value Index measures the performance of those Russell 2000 companies with lower price-to-book ratios and lower forecasted growth values. You cannot invest directly in an index. |
| 6 | The ten largest holdings, excluding cash and cash equivalents, are calculated based on the value of the securities of the affiliated master portfolio allocable to the Fund divided by the total net assets of the Fund. Holdings are subject to change and may have changed since the date specified. |
| 7 | Amounts represent the sector distribution of the affiliated master portfolio which are calculated based on the total long-term investments of the affiliated master portfolio. These amounts are subject to change and may have changed since the date specified. |
| | | | |
| 18 | | Wells Fargo Equity Gateway Funds | | Fund expenses (unaudited) |
As a shareholder of the Fund, you incur two types of costs: (1) transaction costs, including sales charges (loads) on purchase payments and contingent deferred sales charges (if any) on redemptions and (2) ongoing costs, including management fees, distribution (12b-1) and/or shareholder servicing fees, and other Fund expenses. This example is intended to help you understand your ongoing costs (in dollars) of investing in the Fund and to compare these costs with the ongoing costs of investing in other mutual funds.
The example is based on an investment of $1,000 invested at the beginning of the six-month period and held for the entire period from June 1, 2015 to November 30, 2015.
Actual expenses
The “Actual” line of the table below provides information about actual account values and actual expenses. You may use the information in this line, together with the amount you invested, to estimate the expenses that you paid over the period. Simply divide your account value by $1,000 (for example, an $8,600 account value divided by $1,000 = 8.6), then multiply the result by the number in the “Actual” line under the heading entitled “Expenses paid during period” for your applicable class of shares to estimate the expenses you paid on your account during this period.
Hypothetical example for comparison purposes
The “Hypothetical” line of the table below provides information about hypothetical account values and hypothetical expenses based on the Fund’s actual expense ratio and an assumed rate of return of 5% per year before expenses, which is not the Fund’s actual return. The hypothetical account values and expenses may not be used to estimate the actual ending account balance or expenses you paid for the period. You may use this information to compare the ongoing costs of investing in the Fund and other funds. To do so, compare this 5% hypothetical example with the 5% hypothetical examples that appear in the shareholder reports of the other funds.
Please note that the expenses shown in the table are meant to highlight your ongoing costs only and do not reflect any transactional costs, such as sales charges (loads) and contingent deferred sales charges. Therefore, the “Hypothetical” line of the table is useful in comparing ongoing costs only and will not help you determine the relative total costs of owning different funds. In addition, if these transactional costs were included, your costs would have been higher.
| | | | | | | | | | | | | | | | |
| Wells Fargo C&B Large Cap Value Fund | | Beginning
account value
6-1-2015 | | | Ending
account value
11-30-2015 | | | Expenses
paid during
the period¹ | | | Net annualized
expense ratio | |
Class A | | | | | | | | | | | | | | | | |
Actual | | $ | 1,000.00 | | | $ | 977.05 | | | $ | 5.68 | | | | 1.15 | % |
Hypothetical (5% return before expenses) | | $ | 1,000.00 | | | $ | 1,019.25 | | | $ | 5.81 | | | | 1.15 | % |
Class B | | | | | | | | | | | | | | | | |
Actual | | $ | 1,000.00 | | | $ | 973.53 | | | $ | 9.37 | | | | 1.90 | % |
Hypothetical (5% return before expenses) | | $ | 1,000.00 | | | $ | 1,015.50 | | | $ | 9.57 | | | | 1.90 | % |
Class C | | | | | | | | | | | | | | | | |
Actual | | $ | 1,000.00 | | | $ | 973.10 | | | $ | 9.37 | | | | 1.90 | % |
Hypothetical (5% return before expenses) | | $ | 1,000.00 | | | $ | 1,015.50 | | | $ | 9.57 | | | | 1.90 | % |
Administrator Class | | | | | | | | | | | | | | | | |
Actual | | $ | 1,000.00 | | | $ | 977.81 | | | $ | 4.75 | | | | 0.96 | % |
Hypothetical (5% return before expenses) | | $ | 1,000.00 | | | $ | 1,020.20 | | | $ | 4.85 | | | | 0.96 | % |
Institutional Class | | | | | | | | | | | | | | | | |
Actual | | $ | 1,000.00 | | | $ | 979.41 | | | $ | 3.61 | | | | 0.73 | % |
Hypothetical (5% return before expenses) | | $ | 1,000.00 | | | $ | 1,021.35 | | | $ | 3.69 | | | | 0.73 | % |
Please see footnote on page 20.
| | | | | | |
| Fund expenses (unaudited) | | Wells Fargo Equity Gateway Funds | | | 19 | |
| | | | | | | | | | | | | | | | |
| Wells Fargo Diversified Equity Fund | | Beginning
account value
6-1-2015 | | | Ending
account value
11-30-2015 | | | Expenses
paid during
the period¹ | | | Net annualized
expense ratio | |
Class A | | | | | | | | | | | | | | | | |
Actual | | $ | 1,000.00 | | | $ | 973.12 | | | $ | 6.17 | | | | 1.25 | % |
Hypothetical (5% return before expenses) | | $ | 1,000.00 | | | $ | 1,018.75 | | | $ | 6.31 | | | | 1.25 | % |
Class B | | | | | | | | | | | | | | | | |
Actual | | $ | 1,000.00 | | | $ | 969.45 | | | $ | 9.85 | | | | 2.00 | % |
Hypothetical (5% return before expenses) | | $ | 1,000.00 | | | $ | 1,015.00 | | | $ | 10.08 | | | | 2.00 | % |
Class C | | | | | | | | | | | | | | | | |
Actual | | $ | 1,000.00 | | | $ | 969.56 | | | $ | 9.85 | | | | 2.00 | % |
Hypothetical (5% return before expenses) | | $ | 1,000.00 | | | $ | 1,015.00 | | | $ | 10.08 | | | | 2.00 | % |
Administrator Class | | | | | | | | | | | | | | | | |
Actual | | $ | 1,000.00 | | | $ | 974.42 | | | $ | 4.94 | | | | 1.00 | % |
Hypothetical (5% return before expenses) | | $ | 1,000.00 | | | $ | 1,020.00 | | | $ | 5.05 | | | | 1.00 | % |
| Wells Fargo Emerging Growth Fund | | | | | | | | | | | | |
Class A | | | | | | | | | | | | | | | | |
Actual | | $ | 1,000.00 | | | $ | 920.36 | | | $ | 6.43 | | | | 1.34 | % |
Hypothetical (5% return before expenses) | | $ | 1,000.00 | | | $ | 1,018.30 | | | $ | 6.76 | | | | 1.34 | % |
Class C | | | | | | | | | | | | | | | | |
Actual | | $ | 1,000.00 | | | $ | 917.68 | | | $ | 10.02 | | | | 2.09 | % |
Hypothetical (5% return before expenses) | | $ | 1,000.00 | | | $ | 1,014.55 | | | $ | 10.53 | | | | 2.09 | % |
Administrator Class | | | | | | | | | | | | | | | | |
Actual | | $ | 1,000.00 | | | $ | 921.72 | | | $ | 5.72 | | | | 1.19 | % |
Hypothetical (5% return before expenses) | | $ | 1,000.00 | | | $ | 1,019.05 | | | $ | 6.01 | | | | 1.19 | % |
Institutional Class | | | | | | | | | | | | | | | | |
Actual | | $ | 1,000.00 | | | $ | 922.41 | | | $ | 4.33 | | | | 0.90 | % |
Hypothetical (5% return before expenses) | | $ | 1,000.00 | | | $ | 1,020.50 | | | $ | 4.55 | | | | 0.90 | % |
| Wells Fargo Index Fund | | | | | | | | | | | | |
Class A | | | | | | | | | | | | | | | | |
Actual | | $ | 1,000.00 | | | $ | 995.25 | | | $ | 2.64 | | | | 0.53 | % |
Hypothetical (5% return before expenses) | | $ | 1,000.00 | | | $ | 1,022.35 | | | $ | 2.68 | | | | 0.53 | % |
Class B | | | | | | | | | | | | | | | | |
Actual | | $ | 1,000.00 | | | $ | 991.53 | | | $ | 6.42 | | | | 1.29 | % |
Hypothetical (5% return before expenses) | | $ | 1,000.00 | | | $ | 1,018.55 | | | $ | 6.51 | | | | 1.29 | % |
Class C | | | | | | | | | | | | | | | | |
Actual | | $ | 1,000.00 | | | $ | 991.56 | | | $ | 6.42 | | | | 1.29 | % |
Hypothetical (5% return before expenses) | | $ | 1,000.00 | | | $ | 1,018.55 | | | $ | 6.51 | | | | 1.29 | % |
Administrator Class | | | | | | | | | | | | | | | | |
Actual | | $ | 1,000.00 | | | $ | 996.76 | | | $ | 1.25 | | | | 0.25 | % |
Hypothetical (5% return before expenses) | | $ | 1,000.00 | | | $ | 1,023.75 | | | $ | 1.26 | | | | 0.25 | % |
| Wells Fargo International Value Fund | | | | | | | | | | | | |
Class A | | | | | | | | | | | | | | | | |
Actual | | $ | 1,000.00 | | | $ | 904.38 | | | $ | 6.81 | | | | 1.43 | % |
Hypothetical (5% return before expenses) | | $ | 1,000.00 | | | $ | 1,017.85 | | | $ | 7.21 | | | | 1.43 | % |
Class B | | | | | | | | | | | | | | | | |
Actual | | $ | 1,000.00 | | | $ | 902.38 | | | $ | 9.65 | | | | 2.03 | % |
Hypothetical (5% return before expenses) | | $ | 1,000.00 | | | $ | 1,014.85 | | | $ | 10.23 | | | | 2.03 | % |
Class C | | | | | | | | | | | | | | | | |
Actual | | $ | 1,000.00 | | | $ | 900.96 | | | $ | 10.36 | | | | 2.18 | % |
Hypothetical (5% return before expenses) | | $ | 1,000.00 | | | $ | 1,014.10 | | | $ | 10.98 | | | | 2.18 | % |
Administrator Class | | | | | | | | | | | | | | | | |
Actual | | $ | 1,000.00 | | | $ | 902.92 | | | $ | 5.95 | | | | 1.25 | % |
Hypothetical (5% return before expenses) | | $ | 1,000.00 | | | $ | 1,018.75 | | | $ | 6.31 | | | | 1.25 | % |
Institutional Class | | | | | | | | | | | | | | | | |
Actual | | $ | 1,000.00 | | | $ | 906.44 | | | $ | 4.86 | | | | 1.02 | % |
Hypothetical (5% return before expenses) | | $ | 1,000.00 | | | $ | 1,019.90 | | | $ | 5.15 | | | | 1.02 | % |
Please see footnote on page 20.
| | | | |
| 20 | | Wells Fargo Equity Gateway Funds | | Fund expenses (unaudited) |
| | | | | | | | | | | | | | | | |
| Wells Fargo Small Company Growth Fund | | Beginning
account value
6-1-2015 | | | Ending
account value
11-30-2015 | | | Expenses
paid during
the period¹ | | | Net annualized
expense ratio | |
Class A | | | | | | | | | | | | | | | | |
Actual | | $ | 1,000.00 | | | $ | 928.33 | | | $ | 6.46 | | | | 1.34 | % |
Hypothetical (5% return before expenses) | | $ | 1,000.00 | | | $ | 1,018.30 | | | $ | 6.76 | | | | 1.34 | % |
Class B | | | | | | | | | | | | | | | | |
Actual | | $ | 1,000.00 | | | $ | 924.76 | | | $ | 10.01 | | | | 2.08 | % |
Hypothetical (5% return before expenses) | | $ | 1,000.00 | | | $ | 1,014.60 | | | $ | 10.48 | | | | 2.08 | % |
Class C | | | | | | | | | | | | | | | | |
Actual | | $ | 1,000.00 | | | $ | 924.72 | | | $ | 10.06 | | | | 2.09 | % |
Hypothetical (5% return before expenses) | | $ | 1,000.00 | | | $ | 1,014.55 | | | $ | 10.53 | | | | 2.09 | % |
Class R6 | | | | | | | | | | | | | | | | |
Actual | | $ | 1,000.00 | | | $ | 930.25 | | | $ | 4.34 | | | | 0.90 | % |
Hypothetical (5% return before expenses) | | $ | 1,000.00 | | | $ | 1,020.50 | | | $ | 4.55 | | | | 0.90 | % |
Administrator Class | | | | | | | | | | | | | | | | |
Actual | | $ | 1,000.00 | | | $ | 929.15 | | | $ | 5.79 | | | | 1.20 | % |
Hypothetical (5% return before expenses) | | $ | 1,000.00 | | | $ | 1,019.00 | | | $ | 6.06 | | | | 1.20 | % |
Institutional Class | | | | | | | | | | | | | | | | |
Actual | | $ | 1,000.00 | | | $ | 930.23 | | | $ | 4.58 | | | | 0.95 | % |
Hypothetical (5% return before expenses) | | $ | 1,000.00 | | | $ | 1,020.25 | | | $ | 4.80 | | | | 0.95 | % |
| Wells Fargo Small Company Value Fund | | | | | | | | | | | | |
Class A | | | | | | | | | | | | | | | | |
Actual | | $ | 1,000.00 | | | $ | 959.83 | | | $ | 6.76 | | | | 1.38 | % |
Hypothetical (5% return before expenses) | | $ | 1,000.00 | | | $ | 1,018.10 | | | $ | 6.96 | | | | 1.38 | % |
Class B | | | | | | | | | | | | | | | | |
Actual | | $ | 1,000.00 | | | $ | 955.81 | | | $ | 10.41 | | | | 2.13 | % |
Hypothetical (5% return before expenses) | | $ | 1,000.00 | | | $ | 1,014.35 | | | $ | 10.73 | | | | 2.13 | % |
Class C | | | | | | | | | | | | | | | | |
Actual | | $ | 1,000.00 | | | $ | 956.05 | | | $ | 10.42 | | | | 2.13 | % |
Hypothetical (5% return before expenses) | | $ | 1,000.00 | | | $ | 1,014.35 | | | $ | 10.73 | | | | 2.13 | % |
Administrator Class | | | | | | | | | | | | | | | | |
Actual | | $ | 1,000.00 | | | $ | 960.27 | | | $ | 5.88 | | | | 1.20 | % |
Hypothetical (5% return before expenses) | | $ | 1,000.00 | | | $ | 1,019.00 | | | $ | 6.06 | | | | 1.20 | % |
Institutional Class | | | | | | | | | | | | | | | | |
Actual | | $ | 1,000.00 | �� | | $ | 961.40 | | | $ | 4.90 | | | | 1.00 | % |
Hypothetical (5% return before expenses) | | $ | 1,000.00 | | | $ | 1,020.00 | | | $ | 5.05 | | | | 1.00 | % |
| 1 | Expenses paid is equal to the annualized expense ratio of each class multiplied by the average account value over the period, multiplied by the number of days in the most recent fiscal half-year divided by the number of days in the fiscal year (to reflect the one-half-year period). |
| | | | | | |
| Portfolio of investments—November 30, 2015 (unaudited) | | Wells Fargo Equity Gateway Funds | | | 21 | |
C&B LARGE CAP VALUE FUND
| | | | | | | | | | |
| Security name | | | | | | | | Value | |
| | | | |
Investment Companies: 100.13% | | | | | | | | | | |
| | | | |
| Affiliated Master Portfolios: 100.13% | | | | | | | | | | |
Wells Fargo C&B Large Cap Value Portfolio | | | | | | | | $ | 277,595,614 | |
| | | | | | | | | | |
| | | | |
Total Investment Companies (Cost $220,801,135) | | | | | | | | | 277,595,614 | |
| | | | | | | | | | |
| | | | | | | | |
| Total investments in securities (Cost $220,801,135) * | | | 100.13 | % | | | 277,595,614 | |
Other assets and liabilities, net | | | (0.13 | ) | | | (363,219 | ) |
| | | | | | | | |
| Total net assets | | | 100.00 | % | | $ | 277,232,395 | |
| | | | | | | | |
| * | Cost for federal income tax purposes is $227,552,861 and unrealized gains (losses) consists of: |
| | | | |
Gross unrealized gains | | $ | 50,042,753 | |
Gross unrealized losses | | | 0 | |
| | | | |
Net unrealized gains | | $ | 50,042,753 | |
DIVERSIFIED EQUITY FUND
| | | | | | | | | | |
| Security name | | | | | | | | Value | |
| | | | |
Investment Companies: 100.02% | | | | | | | | | | |
| | | | |
| Affiliated Master Portfolios: 100.02% | | | | | | | | | | |
Wells Fargo C&B Large Cap Value Portfolio | | | | | | | | $ | 19,217,623 | |
Wells Fargo Diversified Large Cap Growth Portfolio | | | | | | | | | 57,372,228 | |
Wells Fargo Emerging Growth Portfolio | | | | | | | | | 5,711,359 | |
Wells Fargo Index Portfolio | | | | | | | | | 57,479,562 | |
Wells Fargo International Growth Portfolio | | | | | | | | | 17,334,197 | |
Wells Fargo International Value Portfolio | | | | | | | | | 16,892,228 | |
Wells Fargo Large Company Value Portfolio | | | | | | | | | 38,432,683 | |
Wells Fargo Small Company Growth Portfolio | | | | | | | | | 5,728,626 | |
Wells Fargo Small Company Value Portfolio | | | | | | | | | 11,599,168 | |
| | | | |
Total Investment Companies (Cost $174,927,427) | | | | | | | | | 229,767,674 | |
| | | | | | | | | | |
| | | | | | | | |
| Total investments in securities (Cost $174,927,427) * | | | 100.02 | % | | | 229,767,674 | |
Other assets and liabilities, net | | | (0.02 | ) | | | (35,731 | ) |
| | | | | | | | |
| Total net assets | | | 100.00 | % | | $ | 229,731,943 | |
| | | | | | | | |
| * | Cost for federal income tax purposes is $182,122,044 and unrealized gains (losses) consists of: |
| | | | |
Gross unrealized gains | | $ | 54,840,247 | |
Gross unrealized losses | | | (7,194,617 | ) |
| | | | |
Net unrealized gains | | $ | 47,645,630 | |
The accompanying notes are an integral part of these financial statements.
| | | | |
| 22 | | Wells Fargo Equity Gateway Funds | | Portfolio of investments—November 30, 2015 (unaudited) |
EMERGING GROWTH FUND
| | | | | | | | | | |
| Security name | | | | | | | | Value | |
| | | | |
Investment Companies: 100.25% | | | | | | | | | | |
| | | | |
| Affiliated Master Portfolios: 100.25% | | | | | | | | | | |
Wells Fargo Emerging Growth Portfolio | | | | | | | | $ | 933,853,800 | |
| | | | | | | | | | |
| | | | |
Total Investment Companies (Cost $716,308,529) | | | | | | | | | 933,853,800 | |
| | | | | | | | | | |
| | | | | | | | |
| Total investments in securities (Cost $716,308,529) * | | | 100.25 | % | | | 933,853,800 | |
Other assets and liabilities, net | | | (0.25 | ) | | | (2,350,517 | ) |
| | | | | | | | |
| Total net assets | | | 100.00 | % | | $ | 931,503,283 | |
| | | | | | | | |
| * | Cost for federal income tax purposes is $715,038,541 and unrealized gains (losses) consists of: |
| | | | |
Gross unrealized gains | | $ | 218,815,259 | |
Gross unrealized losses | | | 0 | |
| | | | |
Net unrealized gains | | $ | 218,815,259 | |
INDEX FUND
| | | | | | | | | | |
| Security name | | | | | | | | Value | |
| | | | |
Investment Companies: 101.27% | | | | | | | | | | |
| | | | |
| Affiliated Master Portfolios: 101.27% | | | | | | | | | | |
Wells Fargo Index Portfolio | | | | | | | | $ | 2,414,512,217 | |
| | | | | | | | | | |
| | | | |
Total Investment Companies (Cost $998,282,721) | | | | | | | | | 2,414,512,217 | |
| | | | | | | | | | |
| | | | | | | | |
| Total investments in securities (Cost $998,282,721) * | | | 101.27 | % | | | 2,414,512,217 | |
Other assets and liabilities, net | | | (1.27 | ) | | | (30,338,789 | ) |
| | | | | | | | |
| Total net assets | | | 100.00 | % | | $ | 2,384,173,428 | |
| | | | | | | | |
| * | Cost for federal income tax purposes is $1,057,676,929 and unrealized gains (losses) consists of: |
| | | | |
Gross unrealized gains | | $ | 1,356,835,288 | |
Gross unrealized losses | | | 0 | |
| | | | |
Net unrealized gains | | $ | 1,356,835,288 | |
The accompanying notes are an integral part of these financial statements.
| | | | | | |
| Portfolio of investments—November 30, 2015 (unaudited) | | Wells Fargo Equity Gateway Funds | | | 23 | |
INTERNATIONAL VALUE FUND
| | | | | | | | | | |
| Security name | | | | | | | | Value | |
| | | | |
Investment Companies: 99.82% | | | | | | | | | | |
| | | | |
| Affiliated Master Portfolios: 99.82% | | | | | | | | | | |
Wells Fargo International Value Portfolio | | | | | | | | $ | 461,800,401 | |
| | | | | | | | | | |
| | | | |
Total Investment Companies (Cost $496,785,503) | | | | | | | | | 461,800,401 | |
| | | | | | | | | | |
| | | | | | | | |
| Total investments in securities (Cost $496,785,503) * | | | 99.82 | % | | | 461,800,401 | |
Other assets and liabilities, net | | | 0.18 | | | | 816,699 | |
| | | | | | | | |
| Total net assets | | | 100.00 | % | | $ | 462,617,100 | |
| | | | | | | | |
| * | Cost for federal income tax purposes is $497,901,468 and unrealized gains (losses) consists of: |
| | | | |
Gross unrealized gains | | $ | 0 | |
Gross unrealized losses | | | (36,101,067 | ) |
| | | | |
Net unrealized losses | | $ | (36,101,067 | ) |
SMALL COMPANY GROWTH FUND
| | | | | | | | | | |
| Security name | | | | | | | | Value | |
| | | | |
Investment Companies: 98.87% | | | | | | | | | | |
| | | | |
| Affiliated Master Portfolios: 98.87% | | | | | | | | | | |
Wells Fargo Small Company Growth Portfolio | | | | | | | | $ | 1,145,038,284 | |
| | | | | | | | | | |
| | | | |
Total Investment Companies (Cost $1,090,092,035) | | | | | | | | | 1,145,038,284 | |
| | | | | | | | | | |
| | | | | | | | |
| Total investments in securities (Cost $1,090,092,035) * | | | 98.87 | % | | | 1,145,038,284 | |
Other assets and liabilities, net | | | 1.13 | | | | 13,041,652 | |
| | | | | | | | |
| Total net assets | | | 100.00 | % | | $ | 1,158,079,936 | |
| | | | | | | | |
| * | Cost for federal income tax purposes is $1,090,620,551 and unrealized gains (losses) consists of: |
| | | | |
Gross unrealized gains | | $ | 54,417,733 | |
Gross unrealized losses | | | 0 | |
| | | | |
Net unrealized gains | | $ | 54,417,733 | |
The accompanying notes are an integral part of these financial statements.
| | | | |
| 24 | | Wells Fargo Equity Gateway Funds | | Portfolio of investments—November 30, 2015 (unaudited) |
SMALL COMPANY VALUE FUND
| | | | | | | | | | |
| Security name | | | | | | | | Value | |
| | | | |
Investment Companies: 87.56% | | | | | | | | | | |
| | | | |
| Affiliated Master Portfolios: 87.56% | | | | | | | | | | |
Wells Fargo Small Company Value Portfolio | | | | | | | | $ | 110,577,929 | |
| | | | | | | | | | |
| | | | |
Total Investment Companies (Cost $100,817,730) | | | | | | | | | 110,577,929 | |
| | | | | | | | | | |
| | | | | | | | |
| Total investments in securities (Cost $100,817,730) * | | | 87.56 | % | | | 110,577,929 | |
Other assets and liabilities, net | | | 12.44 | | | | 15,715,533 | |
| | | | | | | | |
| Total net assets | | | 100.00 | % | | $ | 126,293,462 | |
| | | | | | | | |
| * | Cost for federal income tax purposes is $105,903,175 and unrealized gains (losses) consists of: |
| | | | |
Gross unrealized gains | | $ | 4,674,754 | |
Gross unrealized losses | | | 0 | |
| | | | |
Net unrealized gains | | $ | 4,674,754 | |
The accompanying notes are an integral part of these financial statements.
This page is intentionally left blank.
| | | | |
| 26 | | Wells Fargo Equity Gateway Funds | | Statements of assets and liabilities—November 30, 2015 (unaudited) |
| | | | | | | | |
| | | C&B Large Cap
Value Fund | | | Diversified
Equity Fund | |
| | |
Assets | | | | | | | | |
Investments in affiliated Master Portfolio(s), at value (see cost below) | | $ | 277,595,614 | | | $ | 229,767,674 | |
Receivable for Fund shares sold | | | 149,399 | | | | 147,895 | |
Receivable from manager | | | 15,429 | | | | 0 | |
Prepaid expenses and other assets | | | 41,158 | | | | 35,826 | |
| | | | |
Total assets | | | 277,801,600 | | | | 229,951,395 | |
| | | | |
| | |
Liabilities | | | | | | | | |
Payable for Fund shares redeemed | | | 475,453 | | | | 103,402 | |
Management fee payable | | | 0 | | | | 7,485 | |
Distribution fees payable | | | 4,546 | | | | 2,399 | |
Administration fees payable | | | 36,066 | | | | 29,770 | |
Shareholder report expenses payable | | | 11,120 | | | | 16,388 | |
Shareholder servicing fees payable | | | 28,212 | | | | 46,989 | |
Professional fees payable | | | 13,153 | | | | 13,019 | |
Accrued expenses and other liabilities | | | 655 | | | | 0 | |
| | | | |
Total liabilities | | | 569,205 | | | | 219,452 | |
| | | | |
Total net assets | | $ | 277,232,395 | | | $ | 229,731,943 | |
| | | | |
| | |
NET ASSETS CONSIST OF | | | | | | | | |
Paid-in capital | | $ | 218,900,129 | | | $ | 154,095,731 | |
Undistributed (accumulated) net investment income (loss) | | | 2,519,307 | | | | 688,614 | |
Accumulated net realized gains (losses) on investments | | | (981,520 | ) | | | 20,107,351 | |
Net unrealized gains (losses) on investments | | | 56,794,479 | | | | 54,840,247 | |
| | | | |
Total net assets | | $ | 277,232,395 | | | $ | 229,731,943 | |
| | | | |
| | |
COMPUTATION OF NET ASSET VALUE AND OFFERING PRICE PER SHARE | | | | | | | | |
Net assets – Class A | | $ | 89,729,147 | | | $ | 75,528,691 | |
Shares outstanding – Class A1 | | | 7,028,880 | | | | 2,397,451 | |
Net asset value per share – Class A | | | $12.77 | | | | $31.50 | |
Maximum offering price per share – Class A2 | | | $13.55 | | | | $33.42 | |
Net assets – Class B | | $ | 146,067 | | | $ | 41,908 | |
Shares outstanding – Class B1 | | | 11,353 | | | | 1,467 | |
Net asset value per share – Class B | | | $12.87 | | | | $28.57 | |
Net assets – Class C | | $ | 7,262,416 | | | $ | 3,867,316 | |
Shares outstanding – Class C1 | | | 573,649 | | | | 132,002 | |
Net asset value per share – Class C | | | $12.66 | | | | $29.30 | |
Net assets – Class R6 | | | N/A | | | | N/A | |
Shares outstanding – Class R61 | | | N/A | | | | N/A | |
Net asset value per share – Class R6 | | | N/A | | | | N/A | |
Net assets – Administrator Class | | $ | 40,123,747 | | | $ | 150,294,028 | |
Shares outstanding – Administrator Class1 | | | 3,139,586 | | | | 4,752,872 | |
Net asset value per share – Administrator Class | | | $12.78 | | | | $31.62 | |
Net assets – Institutional Class | | $ | 139,971,018 | | | | N/A | |
Shares outstanding – Institutional Class1 | | | 10,904,226 | | | | N/A | |
Net asset value per share – Institutional Class | | | $12.84 | | | | N/A | |
| | |
Investments in affiliated Master Portfolio(s), at cost | | $ | 220,801,135 | | | $ | 174,927,427 | |
| | | | |
| 1 | Each Fund has an unlimited number of authorized shares. |
| 2 | Maximum offering price is computed as 100/94.25 of net asset value. On investments of $50,000 or more, the offering price is reduced. |
The accompanying notes are an integral part of these financial statements.
| | | | | | |
| Statements of assets and liabilities—November 30, 2015 (unaudited) | | Wells Fargo Equity Gateway Funds | | | 27 | |
| | | | | | | | | | | | | | | | | | |
Emerging Growth Fund | | | Index Fund | | | International
Value Fund | | | Small Company
Growth Fund | | | Small Company
Value Fund | |
| | | | |
| | | | | | | | | | | | | | | | | | |
| $ | 933,853,800 | | | $ | 2,414,512,217 | | | $ | 461,800,401 | | | $ | 1,145,038,284 | | | $ | 110,577,929 | |
| | 805,438 | | | | 1,593,288 | | | | 1,261,874 | | | | 14,482,718 | | | | 15,817,631 | |
| | 26,432 | | | | 214,405 | | | | 28,382 | | | | 0 | | | | 10,839 | |
| | 41,544 | | | | 79,312 | | | | 37,052 | | | | 146,494 | | | | 31,628 | |
| | |
| | 934,727,214 | | | | 2,416,399,222 | | | | 463,127,709 | | | | 1,159,667,496 | | | | 126,438,027 | |
| | |
| | | | |
| | | | | | | | | | | | | | | | | | |
| | 2,964,931 | | | | 31,478,631 | | | | 430,075 | | | | 1,348,734 | | | | 94,670 | |
| | 0 | | | | 0 | | | | 0 | | | | 15,546 | | | | 0 | |
| | 2,758 | | | | 50,718 | | | | 494 | | | | 17,383 | | | | 1,371 | |
| | 111,885 | | | | 306,966 | | | | 49,751 | | | | 118,313 | | | | 13,354 | |
| | 67,714 | | | | 44,077 | | | | 12,127 | | | | 3,692 | | | | 4,335 | |
| | 56,257 | | | | 287,641 | | | | 2,883 | | | | 66,285 | | | | 19,134 | |
| | 13,119 | | | | 13,555 | | | | 13,906 | | | | 11,719 | | | | 9,932 | |
| | 7,267 | | | | 44,206 | | | | 1,373 | | | | 5,888 | | | | 1,769 | |
| | |
| | 3,223,931 | | | | 32,225,794 | | | | 510,609 | | | | 1,587,560 | | | | 144,565 | |
| | |
| $ | 931,503,283 | | | $ | 2,384,173,428 | | | $ | 462,617,100 | | | $ | 1,158,079,936 | | | $ | 126,293,462 | |
| | |
| | | | |
| | | | | | | | | | | | | | | | | | |
| $ | 625,349,690 | | | $ | 819,378,552 | | | $ | 525,637,056 | | | $ | 1,133,659,023 | | | $ | 195,047,484 | |
| | (7,670,541 | ) | | | 40,022,824 | | | | 8,901,780 | | | | (3,081,969 | ) | | | 654,791 | |
| | 96,278,863 | | | | 108,542,556 | | | | (36,936,634 | ) | | | (27,443,367 | ) | | | (79,169,012 | ) |
| | 217,545,271 | | | | 1,416,229,496 | | | | (34,985,102 | ) | | | 54,946,249 | | | | 9,760,199 | |
| | |
| $ | 931,503,283 | | | $ | 2,384,173,428 | | | $ | 462,617,100 | | | $ | 1,158,079,936 | | | $ | 126,293,462 | |
| | |
| | | | |
| | | | | | | | | | | | | | | | | | |
| $ | 156,017,393 | | | $ | 654,767,467 | | | $ | 5,104,535 | | | $ | 144,645,763 | | | $ | 24,086,328 | |
| | 10,148,631 | | | | 9,772,786 | | | | 380,149 | | | | 3,523,110 | | | | 1,172,077 | |
| | $15.37 | | | | $67.00 | | | | $13.43 | | | | $41.06 | | | | $20.55 | |
| | $16.31 | | | | $71.09 | | | | $14.25 | | | | $43.56 | | | | $21.80 | |
| | N/A | | | $ | 1,479,419 | | | $ | 1,833 | | | $ | 57,051 | | | $ | 23,521 | |
| | N/A | | | | 21,802 | | | | 134 | | | | 1,552 | | | | 1,264 | |
| | N/A | | | | $67.86 | | | | $13.68 | | | | $36.75 | | | | $18.60 | |
| $ | 4,543,267 | | | $ | 80,717,835 | | | $ | 756,159 | | | $ | 29,477,114 | | | $ | 2,246,202 | |
| | 316,042 | | | | 1,205,165 | | | | 57,708 | | | | 791,888 | | | | 121,483 | |
| | $14.38 | | | | $66.98 | | | | $13.10 | | | | $37.22 | | | | $18.49 | |
| | N/A | | | | N/A | | | | N/A | | | $ | 140,804,413 | | | | N/A | |
| | N/A | | | | N/A | | | | N/A | | | | 3,258,356 | | | | N/A | |
| | N/A | | | | N/A | | | | N/A | | | | $43.21 | | | | N/A | |
| $ | 124,257,788 | | | $ | 1,647,208,707 | | | $ | 15,154,189 | | | $ | 164,463,374 | | | $ | 68,150,919 | |
| | 7,935,861 | | | | 24,374,455 | | | | 1,138,974 | | | | 3,870,252 | | | | 3,240,562 | |
| | $15.66 | | | | $67.58 | | | | $13.31 | | | | $42.49 | | | | $21.03 | |
| $ | 646,684,835 | | | | N/A | | | $ | 441,600,384 | | | $ | 678,632,221 | | | $ | 31,786,492 | |
| | 40,284,575 | | | | N/A | | | | 33,024,706 | | | | 15,710,397 | | | | 1,501,286 | |
| | $16.05 | | | | N/A | | | | $13.37 | | | | $43.20 | | | | $21.17 | |
| | | | |
| $ | 716,308,529 | | | $ | 998,282,721 | | | $ | 496,785,503 | | | $ | 1,090,092,035 | | | $ | 100,817,730 | |
| | |
The accompanying notes are an integral part of these financial statements.
| | | | |
| 28 | | Wells Fargo Equity Gateway Funds | | Statements of operations—six months ended November 30, 2015 (unaudited) |
| | | | | | | | |
| | | C&B Large Cap
Value Fund | | | Diversified
Equity Fund | |
| | |
Investment income | | | | | | | | |
Dividends allocated from affiliated Master Portfolio(s)* | | $ | 2,810,465 | | | $ | 1,916,435 | |
Securities lending income allocated from affiliated Master Portfolio(s) | | | 4,050 | | | | 29,087 | |
Interest allocated from affiliated Master Portfolio(s) | | | 0 | | | | 6 | |
Expenses allocated from affiliated Master Portfolio(s) | | | (979,844 | ) | | | (733,271 | ) |
Waivers allocated from affiliated Master Portfolio(s) | | | 0 | | | | 38,008 | |
| | | | |
Total investment income (loss) | | | 1,834,671 | | | | 1,250,265 | |
| | | | |
| | |
Expenses | | | | | | | | |
Management fee | | | 72,414 | | | | 356,169 | |
Administration fees | | | | | | | | |
Class A | | | 40,856 | | | | 84,233 | |
Class B | | | 210 | | | | 50 | |
Class C | | | 8,061 | | | | 4,304 | |
Class R6 | | | N/A | | | | N/A | |
Administrator Class | | | 31,117 | | | | 97,536 | |
Institutional Class | | | 85,206 | | | | N/A | |
Investor Class | | | 87,078 | 1 | | | N/A | |
Shareholder servicing fees | | | | | | | | |
Class A | | | 47,316 | | | | 96,301 | |
Class B | | | 237 | | | | 57 | |
Class C | | | 9,222 | | | | 4,920 | |
Administrator Class | | | 62,479 | | | | 195,317 | |
Investor Class | | | 68,029 | 1 | | | N/A | |
Distribution fees | | | | | | | | |
Class B | | | 710 | | | | 170 | |
Class C | | | 27,666 | | | | 14,761 | |
Custody and accounting fees | | | 6,128 | | | | 5,213 | |
Professional fees | | | 16,463 | | | | 15,789 | |
Registration fees | | | 33,099 | | | | 18,895 | |
Shareholder report expenses | | | 13,641 | | | | 15,507 | |
Trustees’ fees and expenses | | | 6,129 | | | | 6,509 | |
Interest expense | | | 0 | | | | 0 | |
Other fees and expenses | | | 6,214 | | | | 4,690 | |
| | | | |
Total expenses | | | 622,275 | | | | 920,421 | |
Less: Fee waivers and/or expense reimbursements | | | (233,422 | ) | | | (312,245 | ) |
| | | | |
Net expenses | | | 388,853 | | | | 608,176 | |
| | | | |
Net investment income (loss) | | | 1,445,818 | | | | 642,089 | |
| | | | |
| | |
REALIZED AND UNREALIZED GAINS (LOSSES) ON INVESTMENTS: | | | | | | | | |
Net realized gains (losses) on securities transactions allocated from affiliated Master Portfolio(s) | | | 8,588,889 | | | | 9,278,117 | |
Net change in unrealized gains (losses) on securities transactions allocated from affiliated Master Portfolio(s) | | | (17,557,966 | ) | | | (16,863,433 | ) |
| | | | |
Net realized and unrealized gains (losses) on investments | | | (8,969,077 | ) | | | (7,585,316 | ) |
| | | | |
Net decrease in net assets resulting from operations | | $ | (7,523,259 | ) | | $ | (6,943,227 | ) |
| | | | |
| | |
* Net of foreign dividend withholding taxes allocated from affiliated Master Portfolio(s) in the amount of | | | $15,175 | | | | $26,458 | |
| 1 | For the period from June 1, 2015 to October 23, 2015. Effective at the close of business on October 23, 2015, Investor Class shares were converted to Class A shares and are no longer offered by the Fund. |
The accompanying notes are an integral part of these financial statements.
| | | | | | |
| Statements of operations—six months ended November 30, 2015 (unaudited) | | Wells Fargo Equity Gateway Funds | | | 29 | |
| | | | | | | | | | | | | | | | | | |
Emerging
Growth Fund | | | Index Fund | | | International
Value Fund | | | Small Company
Growth Fund | | | Small Company
Value Fund | |
| | | | |
| | | | | | | | | | | | | | | | | | |
| $ | 430,091 | | | $ | 26,481,290 | | | $ | 5,479,355 | | | $ | 2,044,779 | | | $ | 900,898 | |
| | 899,622 | | | | 59,723 | | | | 170,889 | | | | 842,741 | | | | 8,458 | |
| | 0 | | | | 252 | | | | 0 | | | | 0 | | | | 0 | |
| | (4,066,116 | ) | | | (1,331,426 | ) | | | (2,140,098 | ) | | | (3,822,978 | ) | | | (470,137 | ) |
| | 0 | | | | 11,023 | | | | 0 | | | | 0 | | | | 0 | |
| | |
| | (2,736,403 | ) | | | 25,220,862 | | | | 3,510,146 | | | | (935,458 | ) | | | 439,219 | |
| | |
| | | | |
| | | | | | | | | | | | | | | | | | |
| | 254,718 | | | | 614,399 | | | | 117,498 | | | | 239,484 | | | | 27,828 | |
| | | | | | | | | | | | | | | | | | |
| | 145,271 | | | | 513,950 | | | | 5,701 | | | | 124,021 | | | | 26,854 | |
| | N/A | | | | 1,852 | | | | 2 | | | | 60 | | | | 25 | |
| | 5,342 | | | | 88,191 | | | | 951 | | | | 25,860 | | | | 2,662 | |
| | N/A | | | | N/A | | | | N/A | | | | 12,900 | | | | N/A | |
| | 85,060 | | | | 1,073,463 | | | | 130,886 | | | | 104,921 | | | | 42,456 | |
| | 430,334 | | | | N/A | | | | 158,551 | | | | 347,907 | | | | 9,875 | |
| | 55,252 | 1 | | | 290,084 | 1 | | | N/A | | | | N/A | | | | N/A | |
| | | | | | | | | | | | | | | | | | |
| | 166,291 | | | | 589,271 | | | | 6,511 | | | | 142,989 | | | | 30,670 | |
| | N/A | | | | 2,107 | | | | 2 | | | | 68 | | | | 29 | |
| | 6,100 | | | | 100,914 | | | | 1,088 | | | | 29,861 | | | | 3,041 | |
| | 156,486 | | | | 855,201 | | | | 271,995 | | | | 209,770 | | | | 85,065 | |
| | 43,166 | 1 | | | 223,991 | 1 | | | N/A | | | | N/A | | | | N/A | |
| | | | | | | | | | | | | | | | | | |
| | N/A | | | | 6,322 | | | | 7 | | | | 208 | | | | 88 | |
| | 18,300 | | | | 302,742 | | | | 3,263 | | | | 89,584 | | | | 9,122 | |
| | 19,801 | | | | 46,777 | | | | 9,188 | | | | 18,659 | | | | 2,784 | |
| | 16,464 | | | | 15,963 | | | | 16,928 | | | | 17,879 | | | | 16,695 | |
| | 35,583 | | | | 38,844 | | | | 26,680 | | | | 45,898 | | | | 28,985 | |
| | 56,359 | | | | 56,225 | | | | 16,702 | | | | 14,689 | | | | 6,109 | |
| | 5,973 | | | | 2,767 | | | | 6,024 | | | | 6,394 | | | | 6,171 | |
| | 0 | | | | 510 | | | | 0 | | | | 0 | | | | 0 | |
| | 11,617 | | | | 16,007 | | | | 5,131 | | | | 10,033 | | | | 4,651 | |
| | |
| | 1,512,117 | | | | 4,839,580 | | | | 777,108 | | | | 1,441,185 | | | | 303,110 | |
| | (382,443 | ) | | | (1,823,683 | ) | | | (253,168 | ) | | | (167,855 | ) | | | (87,597 | ) |
| | |
| | 1,129,674 | | | | 3,015,897 | | | | 523,940 | | | | 1,273,330 | | | | 215,513 | |
| | |
| | (3,866,077 | ) | | | 22,204,965 | | | | 2,986,206 | | | | (2,208,788 | ) | | | 223,706 | |
| | |
| | | | |
| | | | | | | | | | | | | | | | | | |
| | 27,376,073 | | | | 73,566,616 | | | | 61,568 | | | | (33,618,771 | ) | | | 6,879,514 | |
| | (106,413,812 | ) | | | (107,025,702 | ) | | | (50,130,376 | ) | | | (32,499,359 | ) | | | (11,666,550 | ) |
| | |
| | (79,037,739 | ) | | | (33,459,086 | ) | | | (50,068,808 | ) | | | (66,118,130 | ) | | | (4,787,036 | ) |
| | |
| $ | (82,903,816 | ) | | $ | (11,254,121 | ) | | $ | (47,082,602 | ) | | $ | (68,326,918 | ) | | $ | (4,563,330 | ) |
| | |
| | | | |
| | $0 | | | | $3,654 | | | | $611,228 | | | | $6,128 | | | | $0 | |
The accompanying notes are an integral part of these financial statements.
| | | | |
| 30 | | Wells Fargo Equity Gateway Funds | | Statements of changes in net assets |
| | | | | | | | | | | | | | | | |
| | | C&B Large Cap Value Fund | |
| | | Six months ended November 30, 2015
(unaudited) | | | Year ended May 31, 2015 | |
| | | |
Operations | | | | | | | | | | | | |
Net investment income | | | | | | $ | 1,445,818 | | | | | | | $ | 2,657,630 | |
Net realized gains on investments | | | | | | | 8,588,889 | | | | | | | | 35,718,120 | |
Net change in unrealized gains (losses) on investments | | | | | | | (17,557,966 | ) | | | | | | | (10,878,572 | ) |
| | | | |
Net increase (decrease) in net assets resulting from operations | | | | | | | (7,523,259 | ) | | | | | | | 27,497,178 | |
| | | | |
| | | |
Distributions to shareholders from | | | | | | | | | | | | |
Net investment income | | | | | | | | | | | | | | | | |
Class A | | | | | | | 0 | | | | | | | | (191,216 | ) |
Class C | | | | | | | 0 | | | | | | | | (4,396 | ) |
Administrator Class | | | | | | | 0 | | | | | | | | (542,158 | ) |
Institutional Class | | | | | | | 0 | | | | | | | | (1,502,171 | ) |
Investor Class | | | | | | | 0 | 1 | | | | | | | (465,119 | ) |
| | | | |
Total distributions to shareholders | | | | | | | 0 | | | | | | | | (2,705,060 | ) |
| | | | |
| | | | |
Capital share transactions | | | Shares | | | | | | | | Shares | | | | | |
Proceeds from shares sold | | | | | | | | | | | | | | | | |
Class A | | | 5,323,734 | | | | 67,070,928 | | | | 130,294 | | | | 1,649,118 | |
Class B | | | 1,042 | | | | 13,731 | | | | 2,800 | | | | 33,928 | |
Class C | | | 25,970 | | | | 332,025 | | | | 79,178 | | | | 996,261 | |
Administrator Class | | | 155,673 | | | | 1,965,412 | | | | 918,168 | | | | 11,427,828 | |
Institutional Class | | | 2,591,237 | | | | 32,995,465 | | | | 3,151,544 | | | | 39,122,654 | |
Investor Class | | | 97,970 | 1 | | | 1,221,665 | 1 | | | 516,799 | | | | 6,496,956 | |
| | | | |
| | | | | | | 103,599,226 | | | | | | | | 59,726,745 | |
| | | | |
Reinvestment of distributions | | | | | | | | | | | | | | | | |
Class A | | | 0 | | | | 0 | | | | 13,941 | | | | 178,728 | |
Class C | | | 0 | | | | 0 | | | | 328 | | | | 4,197 | |
Administrator Class | | | 0 | | | | 0 | | | | 40,849 | | | | 523,278 | |
Institutional Class | | | 0 | | | | 0 | | | | 39,316 | | | | 504,812 | |
Investor Class | | | 0 | 1 | | | 0 | 1 | | | 35,187 | | | | 451,449 | |
| | | | |
| | | | | | | 0 | | | | | | | | 1,662,464 | |
| | | | |
Payment for shares redeemed | | | | | | | | | | | | | | | | |
Class A | | | (367,262 | ) | | | (4,687,065 | ) | | | (534,599 | ) | | | (6,629,667 | ) |
Class B | | | (10,870 | ) | | | (141,667 | ) | | | (20,246 | ) | | | (256,296 | ) |
Class C | | | (40,680 | ) | | | (505,028 | ) | | | (98,840 | ) | | | (1,234,205 | ) |
Administrator Class | | | (1,277,546 | ) | | | (15,971,380 | ) | | | (1,188,416 | ) | | | (14,887,845 | ) |
Institutional Class | | | (1,810,884 | ) | | | (22,392,425 | ) | | | (1,771,504 | ) | | | (22,562,089 | ) |
Investor Class | | | (5,539,205 | )1 | | | (69,791,666 | )1 | | | (1,183,734 | ) | | | (14,758,082 | ) |
| | | | |
| | | | | | | (113,489,231 | ) | | | | | | | (60,328,184 | ) |
| | | | |
Net increase (decrease) in net assets resulting from capital share transactions | | | | | | | (9,890,005 | ) | | | | | | | 1,061,025 | |
| | | | |
Total increase (decrease) in net assets | | | | | | | (17,413,264 | ) | | | | | | | 25,853,143 | |
| | | | |
| | |
Net assets | | | | | | | | |
Beginning of period | | | | | | | 294,645,659 | | | | | | | | 268,792,516 | |
| | | | |
End of period | | | | | | $ | 277,232,395 | | | | | | | $ | 294,645,659 | |
| | | | |
Undistributed net investment income | | | | | | $ | 2,519,307 | | | | | | | $ | 1,073,489 | |
| | | | |
| 1 | For the period from June 1, 2015 to October 23, 2015. Effective at the close of business on October 23, 2015, Investor Class shares were converted to Class A shares and are no longer offered by the Fund. |
The accompanying notes are an integral part of these financial statements.
| | | | | | |
| Statements of changes in net assets | | Wells Fargo Equity Gateway Funds | | | 31 | |
| | | | | | | | | | | | | | | | |
| | | Diversified Equity Fund | |
| | | Six months ended
November 30, 2015
(unaudited) | | | Year ended
May 31, 2015 | |
| | | |
Operations | | | | | | | | | | | | |
Net investment income | | | | | | $ | 642,089 | | | | | | | $ | 1,736,992 | |
Net realized gains on investments | | | | | | | 9,278,117 | | | | | | | | 29,109,484 | |
Net change in unrealized gains (losses) on investments | | | | | | | (16,863,433 | ) | | | | | | | (4,344,945 | ) |
| | | | |
Net increase (decrease) in net assets resulting from operations | | | | | | | (6,943,227 | ) | | | | | | | 26,501,531 | |
| | | | |
| | | |
Distributions to shareholders from | | | | | | | | | | | | |
Net investment income | | | | | | | | | | | | | | | | |
Class A | | | | | | | 0 | | | | | | | | (390,822 | ) |
Administrator Class | | | | | | | 0 | | | | | | | | (1,510,404 | ) |
Net realized gains | | | | | | | | | | | | | | | | |
Class A | | | | | | | 0 | | | | | | | | (7,603,395 | ) |
Class B | | | | | | | 0 | | | | | | | | (21,431 | ) |
Class C | | | | | | | 0 | | | | | | | | (406,484 | ) |
Administrator Class | | | | | | | 0 | | | | | | | | (19,427,983 | ) |
| | | | |
Total distributions to shareholders | | | | | | | 0 | | | | | | | | (29,360,519 | ) |
| | | | |
| | | | |
Capital share transactions | | | Shares | | | | | | | | Shares | | | | | |
Proceeds from shares sold | | | | | | | | | | | | | | | | |
Class A | | | 62,315 | | | | 1,947,128 | | | | 72,592 | | | | 2,360,097 | |
Class B | | | 156 | | | | 4,615 | | | | 1,406 | | | | 41,124 | |
Class C | | | 6,634 | | | | 191,835 | | | | 18,482 | | | | 554,242 | |
Administrator Class | | | 200,635 | | | | 6,364,585 | | | | 481,984 | | | | 15,640,677 | |
| | | | |
| | | | | | | 8,508,163 | | | | | | | | 18,596,140 | |
| | | | |
Reinvestment of distributions | | | | | | | | | | | | | | | | |
Class A | | | 0 | | | | 0 | | | | 255,678 | | | | 7,964,368 | |
Class B | | | 0 | | | | 0 | | | | 757 | | | | 21,428 | |
Class C | | | 0 | | | | 0 | | | | 13,515 | | | | 392,475 | |
Administrator Class | | | 0 | | | | 0 | | | | 663,957 | | | | 20,758,097 | |
| | | | |
| | | | | | | 0 | | | | | | | | 29,136,368 | |
| | | | |
Payment for shares redeemed | | | | | | | | | | | | | | | | |
Class A | | | (182,528 | ) | | | (5,704,874 | ) | | | (318,000 | ) | | | (10,362,321 | ) |
Class B | | | (205 | ) | | | (5,702 | ) | | | (27,329 | ) | | | (827,317 | ) |
Class C | | | (12,455 | ) | | | (359,275 | ) | | | (33,140 | ) | | | (1,009,906 | ) |
Administrator Class | | | (605,159 | ) | | | (18,844,783 | ) | | | (2,856,844 | ) | | | (92,459,859 | ) |
| | | | |
| | | | | | | (24,914,634 | ) | | | | | | | (104,659,403 | ) |
| | | | |
Net decrease in net assets resulting from capital share transactions | | | | | | | (16,406,471 | ) | | | | | | | (56,926,895 | ) |
| | | | |
Total decrease in net assets | | | | | | | (23,349,698 | ) | | | | | | | (59,785,883 | ) |
| | | | |
| | |
Net assets | | | | | | | | |
Beginning of period | | | | | | | 253,081,641 | | | | | | | | 312,867,524 | |
| | | | |
End of period | | | | | | $ | 229,731,943 | | | | | | | $ | 253,081,641 | |
| | | | |
Undistributed net investment income | | | | | | $ | 688,614 | | | | | | | $ | 46,525 | |
| | | | |
The accompanying notes are an integral part of these financial statements.
| | | | |
| 32 | | Wells Fargo Equity Gateway Funds | | Statements of changes in net assets |
| | | | | | | | | | | | | | | | |
| | | Emerging Growth Fund | |
| | | Six months ended
November 30, 2015 (unaudited) | | | Year ended
May 31, 2015 | |
| | | |
Operations | | | | | | | | | | | | |
Net investment loss | | | | | | $ | (3,866,077 | ) | | | | | | $ | (9,024,176 | ) |
Net realized gains on investments | | | | | | | 27,376,073 | | | | | | | | 112,708,948 | |
Net change in unrealized gains (losses) on investments | | | | | | | (106,413,812 | ) | | | | | | | 117,750,083 | |
| | | | |
Net increase (decrease) in net assets resulting from operations | | | | | | | (82,903,816 | ) | | | | | | | 221,434,855 | |
| | | | |
| | | |
Distributions to shareholders from | | | | | | | | | | | | |
Net realized gains | | | | | | | | | | | | | | | | |
Class A | | | | | | | 0 | | | | | | | | (9,447,019 | ) |
Class C | | | | | | | 0 | | | | | | | | (383,862 | ) |
Administrator Class | | | | | | | 0 | | | | | | | | (11,952,978 | ) |
Institutional Class | | | | | | | 0 | | | | | | | | (49,504,949 | ) |
Investor Class | | | | | | | 0 | 1 | | | | | | | (3,083,544 | ) |
| | | | |
Total distributions to shareholders | | | | | | | 0 | | | | | | | | (74,372,352 | ) |
| | | | |
| | | | |
Capital share transactions | | | Shares | | | | | | | | Shares | | | | | |
Proceeds from shares sold | | | | | | | | | | | | | | | | |
Class A | | | 2,936,817 | | | | 43,729,557 | | | | 589,286 | | | | 9,273,753 | |
Class C | | | 6,318 | | | | 98,116 | | | | 4,497 | | | | 66,858 | |
Administrator Class | | | 1,113,232 | | | | 18,629,575 | | | | 2,507,269 | | | | 40,410,865 | |
Institutional Class | | | 6,392,615 | | | | 109,040,085 | | | | 10,077,065 | | | | 166,502,610 | |
Investor Class | | | 89,491 | 1 | | | 1,444,439 | 1 | | | 128,783 | | | | 2,057,466 | |
| | | | |
| | | | | | | 172,941,772 | | | | | | | | 218,311,552 | |
| | | | |
Reinvestment of distributions | | | | | | | | | | | | | | | | |
Class A | | | 0 | | | | 0 | | | | 606,373 | | | | 9,247,183 | |
Class C | | | 0 | | | | 0 | | | | 24,422 | | | | 350,946 | |
Administrator Class | | | 0 | | | | 0 | | | | 665,028 | | | | 10,314,584 | |
Institutional Class | | | 0 | | | | 0 | | | | 2,893,200 | | | | 45,886,151 | |
Investor Class | | | 0 | 1 | | | 0 | 1 | | | 196,696 | | | | 2,981,905 | |
| | | | |
| | | | | | | 0 | | | | | | | | 68,780,769 | |
| | | | |
Payment for shares redeemed | | | | | | | | | | | | | | | | |
Class A | | | (671,703 | ) | | | (10,785,497 | ) | | | (2,238,922 | ) | | | (35,052,130 | ) |
Class C | | | (15,744 | ) | | | (231,585 | ) | | | (50,484 | ) | | | (748,028 | ) |
Administrator Class | | | (2,580,884 | ) | | | (43,937,043 | ) | | | (6,591,370 | ) | | | (106,561,035 | ) |
Institutional Class | | | (7,720,633 | ) | | | (127,912,512 | ) | | | (14,421,358 | ) | | | (236,697,488 | ) |
Investor Class | | | (2,736,791 | )1 | | | (40,078,311 | )1 | | | (409,799 | ) | | | (6,362,087 | ) |
| | | | |
| | | | | | | (222,944,948 | ) | | | | | | | (385,420,768 | ) |
| | | | |
Net decrease in net assets resulting from capital share transactions | | | | | | | (50,003,176 | ) | | | | | | | (98,328,447 | ) |
| | | | |
Total increase (decrease) in net assets | | | | | | | (132,906,992 | ) | | | | | | | 48,734,056 | |
| | | | |
| | |
Net assets | | | | | | | | |
Beginning of period | | | | | | | 1,064,410,275 | | | | | | | | 1,015,676,219 | |
| | | | |
End of period | | | | | | $ | 931,503,283 | | | | | | | $ | 1,064,410,275 | |
| | | | |
Accumulated net investment loss | | | | | | $ | (7,670,541 | ) | | | | | | $ | (3,804,464 | ) |
| | | | |
| 1 | For the period from June 1, 2015 to October 23, 2015. Effective at the close of business on October 23, 2015, Investor Class shares were converted to Class A shares and are no longer offered by the Fund. |
The accompanying notes are an integral part of these financial statements.
| | | | | | |
| Statements of changes in net assets | | Wells Fargo Equity Gateway Funds | | | 33 | |
| | | | | | | | | | | | | | | | |
| | | Index Fund | |
| | | Six months ended
November 30, 2015 (unaudited) | | | Year ended
May 31, 2015 | |
| | | |
Operations | | | | | | | | | | | | |
Net investment income | | | | | | $ | 22,204,965 | | | | | | | $ | 45,846,902 | |
Net realized gains on investments | | | | | | | 73,566,616 | | | | | | | | 143,388,775 | |
Net change in unrealized gains (losses) on investments | | | | | | | (107,025,702 | ) | | | | | | | 102,650,064 | |
| | | | |
Net increase (decrease) in net assets resulting from operations | | | | | | | (11,254,121 | ) | | | | | | | 291,885,741 | |
| | | | |
| | | |
Distributions to shareholders from | | | | | | | | | | | | |
Net investment income | | | | | | | | | | | | | | | | |
Class A | | | | | | | 0 | | | | | | | | (6,566,177 | ) |
Class B | | | | | | | 0 | | | | | | | | (12,077 | ) |
Class C | | | | | | | 0 | | | | | | | | (604,147 | ) |
Administrator Class | | | | | | | 0 | | | | | | | | (34,295,290 | ) |
Investor Class | | | | | | | 0 | 1 | | | | | | | (3,502,692 | ) |
Net realized gains | | | | | | | | | | | | | | | | |
Class A | | | | | | | 0 | | | | | | | | (5,235,617 | ) |
Class B | | | | | | | 0 | | | | | | | | (31,633 | ) |
Class C | | | | | | | 0 | | | | | | | | (945,801 | ) |
Administrator Class | | | | | | | 0 | | | | | | | | (22,741,125 | ) |
Investor Class | | | | | | | 0 | 1 | | | | | | | (2,537,733 | ) |
| | | | |
Total distributions to shareholders | | | | | | | 0 | | | | | | | | (76,472,292 | ) |
| | | | |
| | | | |
Capital share transactions | | | Shares | | | | | | | | Shares | | | | | |
Proceeds from shares sold | | | | | | | | | | | | | | | | |
Class A | | | 3,532,983 | | | | 235,451,063 | | | | 388,150 | | | | 25,178,381 | |
Class B | | | 0 | | | | 0 | | | | 146 | | | | 9,762 | |
Class C | | | 25,900 | | | | 1,699,763 | | | | 86,074 | | | | 5,639,238 | |
Administrator Class | | | 1,812,249 | | | | 118,010,553 | | | | 5,874,897 | | | | 384,950,475 | |
Investor Class | | | 142,837 | 1 | | | 9,251,031 | 1 | | | 810,418 | | | | 52,754,953 | |
| | | | |
| | | | | | | 364,412,410 | | | | | | | | 468,532,809 | |
| | | | |
Reinvestment of distributions | | | | | | | | | | | | | | | | |
Class A | | | 0 | | | | 0 | | | | 174,805 | | | | 11,529,519 | |
Class B | | | 0 | | | | 0 | | | | 614 | | | | 41,109 | |
Class C | | | 0 | | | | 0 | | | | 13,660 | | | | 904,452 | |
Administrator Class | | | 0 | | | | 0 | | | | 829,053 | | | | 55,036,997 | |
Investor Class | | | 0 | 1 | | | 0 | 1 | | | 90,165 | | | | 5,962,586 | |
| | | | |
| | | | | | | 0 | | | | | | | | 73,474,663 | |
| | | | |
Payment for shares redeemed | | | | | | | | | | | | | | | | |
Class A | | | (372,092 | ) | | | (24,533,827 | ) | | | (910,851 | ) | | | (59,490,312 | ) |
Class B | | | (8,848 | ) | | | (593,877 | ) | | | (24,275 | ) | | | (1,605,163 | ) |
Class C | | | (60,142 | ) | | | (3,931,168 | ) | | | (112,909 | ) | | | (7,341,983 | ) |
Administrator Class | | | (4,469,582 | ) | | | (296,547,791 | ) | | | (11,398,138 | ) | | | (748,386,873 | ) |
Investor Class | | | (3,630,262 | )1 | | | (242,534,901 | )1 | | | (480,314 | ) | | | (31,414,981 | ) |
| | | | |
| | | | | | | (568,141,564 | ) | | | | | | | (848,239,312 | ) |
| | | | |
Net decrease in net assets resulting from capital share transactions | | | | | | | (203,729,154 | ) | | | | | | | (306,231,840 | ) |
| | | | |
Total decrease in net assets | | | | | | | (214,983,275 | ) | | | | | | | (90,818,391 | ) |
| | | | |
| | |
Net assets | | | | | | | | |
Beginning of period | | | | | | | 2,599,156,703 | | | | | | | | 2,689,975,094 | |
| | | | |
End of period | | | | | | $ | 2,384,173,428 | | | | | | | $ | 2,599,156,703 | |
| | | | |
Undistributed net investment income | | | | | | $ | 40,022,824 | | | | | | | $ | 17,817,859 | |
| | | | |
| 1 | For the period from June 1, 2015 to October 23, 2015. Effective at the close of business on October 23, 2015, Investor Class shares were converted to Class A shares and are no longer offered by the Fund. |
The accompanying notes are an integral part of these financial statements.
| | | | |
| 34 | | Wells Fargo Equity Gateway Funds | | Statements of changes in net assets |
| | | | | | | | | | | | | | | | |
| | | International Value Fund | |
| | | Six months ended
November 30, 2015 (unaudited) | | | Year ended
May 31, 2015 | |
| | | |
Operations | | | | | | | | | | | | |
Net investment income | | | | | | $ | 2,986,206 | | | | | | | $ | 9,858,076 | |
Net realized gains on investments | | | | | | | 61,568 | | | | | | | | 11,094,516 | |
Net change in unrealized gains (losses) on investments | | | | | | | (50,130,376 | ) | | | | | | | (25,271,313 | ) |
| | | | |
Net decrease in net assets resulting from operations | | | | | | | (47,082,602 | ) | | | | | | | (4,318,721 | ) |
| | | | |
| | | |
Distributions to shareholders from | | | | | | | | | | | | |
Net investment income | | | | | | | | | | | | | | | | |
Class A | | | | | | | 0 | | | | | | | | (124,398 | ) |
Class C | | | | | | | 0 | | | | | | | | (15,574 | ) |
Administrator Class | | | | | | | 0 | | | | | | | | (11,810,387 | ) |
Institutional Class | | | | | | | 0 | | | | | | | | (99,504 | ) |
| | | | |
Total distributions to shareholders | | | | | | | 0 | | | | | | | | (12,049,863 | ) |
| | | | |
| | | | |
Capital share transactions | | | Shares | | | | | | | | Shares | | | | | |
Proceeds from shares sold | | | | | | | | | | | | | | | | |
Class A | | | 42,203 | | | | 585,466 | | | | 96,792 | | | | 1,420,552 | |
Class C | | | 7,550 | | | | 106,001 | | | | 16,755 | | | | 237,604 | |
Administrator Class | | | 1,245,709 | | | | 17,806,172 | | | | 6,638,872 | | | | 95,650,707 | |
Institutional Class | | | 33,924,088 | | | | 462,278,364 | | | | 125,680 | | | | 1,859,946 | |
| | | | |
| | | | | | | 480,776,003 | | | | | | | | 99,168,809 | |
| | | | |
Reinvestment of distributions | | | | | | | | | | | | | | | | |
Class A | | | 0 | | | | 0 | | | | 9,086 | | | | 123,662 | |
Class C | | | 0 | | | | 0 | | | | 1,125 | | | | 15,035 | |
Administrator Class | | | 0 | | | | 0 | | | | 874,917 | | | | 11,802,625 | |
Institutional Class | | | 0 | | | | 0 | | | | 6,675 | | | | 90,113 | |
| | | | |
| | | | | | | 0 | | | | | | | | 12,031,435 | |
| | | | |
Payment for shares redeemed | | | | | | | | | | | | | | | | |
Class A | | | (50,610 | ) | | | (714,864 | ) | | | (152,548 | ) | | | (2,261,304 | ) |
Class B | | | 0 | | | | 0 | | | | (1,476 | ) | | | (21,755 | ) |
Class C | | | (13,111 | ) | | | (172,626 | ) | | | (15,291 | ) | | | (213,669 | ) |
Administrator Class | | | (33,214,972 | ) | | | (452,913,754 | ) | | | (4,339,458 | ) | | | (63,303,960 | ) |
Institutional Class | | | (1,156,455 | ) | | | (15,340,163 | ) | | | (28,692 | ) | | | (410,073 | ) |
| | | | |
| | | | | | | (469,141,407 | ) | | | | | | | (66,210,761 | ) |
| | | | |
Net increase in net assets resulting from capital share transactions | | | | | | | 11,634,596 | | | | | | | | 44,989,483 | |
| | | | |
Total increase (decrease) in net assets | | | | | | | (35,448,006 | ) | | | | | | | 28,620,899 | |
| | | | |
| | |
Net assets | | | | | | | | |
Beginning of period | | | | | | | 498,065,106 | | | | | | | | 469,444,207 | |
| | | | |
End of period | | | | | | $ | 462,617,100 | | | | | | | $ | 498,065,106 | |
| | | | |
Undistributed net investment income | | | | | | $ | 8,901,780 | | | | | | | $ | 5,915,574 | |
| | | | |
The accompanying notes are an integral part of these financial statements.
| | | | | | |
| Statements of changes in net assets | | Wells Fargo Equity Gateway Funds | | | 35 | |
| | | | | | | | | | | | | | | | |
| | | Small Company Growth Fund | |
| | | Six months ended
November 30, 2015 (unaudited) | | | Year ended
May 31, 2015 | |
| | | |
Operations | | | | | | | | | | | | |
Net investment loss | | | | | | $ | (2,208,788 | ) | | | | | | $ | (2,896,434 | ) |
Net realized gains (losses) on investments | | | | | | | (33,618,771 | ) | | | | | | | 16,034,580 | |
Net change in unrealized gains (losses) on investments | | | | | | | (32,499,359 | ) | | | | | | | 73,081,605 | |
| | | | |
Net increase (decrease) in net assets resulting from operations | | | | | | | (68,326,918 | ) | | | | | | | 86,219,751 | |
| | | | |
| | | |
Distributions to shareholders from | | | | | | | | | | | | |
Net realized gains | | | | | | | | | | | | | | | | |
Class A | | | | | | | 0 | | | | | | | | (1,858,139 | ) |
Class B | | | | | | | 0 | | | | | | | | (3,974 | ) |
Class C | | | | | | | 0 | | | | | | | | (460,132 | ) |
Class R6 | | | | | | | 0 | | | | | | | | (1,115 | )1 |
Administrator Class | | | | | | | 0 | | | | | | | | (5,745,406 | ) |
Institutional Class | | | | | | | 0 | | | | | | | | (12,434,827 | ) |
| | | | |
Total distributions to shareholders | | | | | | | 0 | | | | | | | | (20,503,593 | ) |
| | | | |
| | | | |
Capital share transactions | | | Shares | | | | | | | | Shares | | | | | |
Proceeds from shares sold | | | | | | | | | | | | | | | | |
Class A | | | 1,882,370 | | | | 79,981,749 | | | | 1,510,052 | | | | 64,079,862 | |
Class B | | | 549 | | | | 20,518 | | | | 529 | | | | 19,657 | |
Class C | | | 413,050 | | | | 15,987,587 | | | | 290,683 | | | | 11,238,963 | |
Class R6 | | | 3,416,108 | | | | 153,960,206 | | | | 13,839 | 1 | | | 637,602 | 1 |
Administrator Class | | | 1,274,091 | | | | 56,264,655 | | | | 2,449,329 | | | | 104,749,365 | |
Institutional Class | | | 7,851,132 | | | | 350,532,263 | | | | 6,506,083 | | | | 283,139,829 | |
| | | | |
| | | | | | | 656,746,978 | | | | | | | | 463,865,278 | |
| | | | |
Reinvestment of distributions | | | | | | | | | | | | | | | | |
Class A | | | 0 | | | | 0 | | | | 43,783 | | | | 1,755,706 | |
Class B | | | 0 | | | | 0 | | | | 93 | | | | 3,360 | |
Class C | | | 0 | | | | 0 | | | | 9,491 | | | | 347,563 | |
Class R6 | | | 0 | | | | 0 | | | | 27 | 1 | | | 1,115 | 1 |
Administrator Class | | | 0 | | | | 0 | | | | 138,133 | | | | 5,721,481 | |
Institutional Class | | | 0 | | | | 0 | | | | 218,839 | | | | 9,195,633 | |
| | | | |
| | | | | | | 0 | | | | | | | | 17,024,858 | |
| | | | |
Payment for shares redeemed | | | | | | | | | | | | | | | | |
Class A | | | (294,476 | ) | | | (12,331,358 | ) | | | (388,500 | ) | | | (16,048,290 | ) |
Class B | | | (905 | ) | | | (36,072 | ) | | | (1,539 | ) | | | (58,026 | ) |
Class C | | | (51,845 | ) | | | (1,932,695 | ) | | | (49,730 | ) | | | (1,913,997 | ) |
Class R6 | | | (171,605 | ) | | | (7,517,234 | ) | | | (13 | )1 | | | (614 | )1 |
Administrator Class | | | (1,455,187 | ) | | | (65,427,981 | ) | | | (1,451,172 | ) | | | (62,196,609 | ) |
Institutional Class | | | (1,992,848 | ) | | | (89,545,050 | ) | | | (1,407,660 | ) | | | (61,985,956 | ) |
| | | | |
| | | | | | | (176,790,390 | ) | | | | | | | (142,203,492 | ) |
| | | | |
Net increase in net assets resulting from capital share transactions | | | | | | | 479,956,588 | | | | | | | | 338,686,644 | |
| | | | |
Total increase in net assets | | | | | | | 411,629,670 | | | | | | | | 404,402,802 | |
| | | | |
| | |
Net assets | | | | | | | | |
Beginning of period | | | | | | | 746,450,266 | | | | | | | | 342,047,464 | |
| | | | |
End of period | | | | | | $ | 1,158,079,936 | | | | | | | $ | 746,450,266 | |
| | | | |
Accumulated net investment loss | | | | | | $ | (3,081,969 | ) | | | | | | $ | (873,181 | ) |
| | | | |
| 1 | For the period from October 31, 2014 (commencement of class operations) to May 31, 2015 |
The accompanying notes are an integral part of these financial statements.
| | | | |
| 36 | | Wells Fargo Equity Gateway Funds | | Statements of changes in net assets |
| | | | | | | | | | | | | | | | |
| | | Small Company Value Fund | |
| | | Six months ended
November 30, 2015
(unaudited) | | | Year ended
May 31, 2015 | |
| | | | |
Operations | | | | | | | | | | | | | | | | |
Net investment income | | | | | | $ | 223,706 | | | | | | | $ | 542,897 | |
Net realized gains on investments | | | | | | | 6,879,514 | | | | | | | | 7,943,351 | |
Net change in unrealized gains (losses) on investments | | | | | | | (11,666,550 | ) | | | | | | | (915,138 | ) |
| | | | |
Net increase (decrease) in net assets resulting from operations | | | | | | | (4,563,330 | ) | | | | | | | 7,571,110 | |
| | | | |
| | | | |
Capital share transactions | | | Shares | | | | | | | | Shares | | | | | |
Proceeds from shares sold | | | | | | | | | | | | | | | | |
Class A | | | 69,062 | | | | 1,416,643 | | | | 194,148 | | | | 3,976,608 | |
Class B | | | 708 | | | | 13,845 | | | | 179 | | | | 3,340 | |
Class C | | | 14,549 | | | | 275,590 | | | | 31,950 | | | | 594,610 | |
Administrator Class | | | 243,144 | | | | 5,086,733 | | | | 558,083 | | | | 11,639,194 | |
Institutional Class | | | 823,413 | | | | 17,453,417 | | | | 450,222 | | | | 9,191,898 | |
| | | | |
| | | | | | | 24,246,228 | | | | | | | | 25,405,650 | |
| | | | |
Payment for shares redeemed | | | | | | | | | | | | | | | | |
Class A | | | (126,891 | ) | | | (2,633,213 | ) | | | (284,709 | ) | | | (5,834,552 | ) |
Class B | | | 0 | | | | 0 | | | | (2,794 | ) | | | (51,063 | ) |
Class C | | | (27,609 | ) | | | (507,460 | ) | | | (17,350 | ) | | | (318,222 | ) |
Administrator Class | | | (246,794 | ) | | | (5,238,848 | ) | | | (649,811 | ) | | | (13,424,863 | ) |
Institutional Class | | | (87,197 | ) | | | (1,845,628 | ) | | | (266,922 | ) | | | (5,603,780 | ) |
| | | | |
| | | | | | | (10,225,149 | ) | | | | | | | (25,232,480 | ) |
| | | | |
Net increase in net assets resulting from capital share transactions | | | | | | | 14,021,079 | | | | | | | | 173,170 | |
| | | | |
Total increase in net assets | | | | | | | 9,457,749 | | | | | | | | 7,744,280 | |
| | | | |
| | | | |
Net assets | | | | | | | | | | | | | | | | |
Beginning of period | | | | | | | 116,835,713 | | | | | | | | 109,091,433 | |
| | | | |
End of period | | | | | | $ | 126,293,462 | | | | | | | $ | 116,835,713 | |
| | | | |
Undistributed net investment income | | | | | | $ | 654,791 | | | | | | | $ | 431,085 | |
| | | | |
The accompanying notes are an integral part of these financial statements.
This page is intentionally left blank.
| | | | |
| 38 | | Wells Fargo Equity Gateway Funds | | Financial highlights |
| | | | | | | | | | | | | | | | | | | | |
| C&B Large Cap Value Fund | | Beginning
net asset
value per
share | | | Net
investment
income (loss)1 | | | Net realized
and unrealized
gains (losses)
on investments | | | Distributions
from net
investment
income | | | Ending
net asset
value per
share | |
Class A | | | | | | | | | | | | | | | | | | | | |
Six months ended November 30, 2015 (unaudited) | | $ | 13.07 | | | | 0.05 | 5 | | | (0.35 | ) | | | 0.00 | | | $ | 12.77 | |
Year ended May 31, 2015 | | $ | 11.99 | | | | 0.10 | | | | 1.07 | | | | (0.09 | ) | | $ | 13.07 | |
Year ended May 31, 2014 | | $ | 10.32 | | | | 0.09 | | | | 1.68 | | | | (0.10 | ) | | $ | 11.99 | |
Year ended May 31, 2013 | | $ | 8.13 | | | | 0.12 | | | | 2.20 | | | | (0.13 | ) | | $ | 10.32 | |
Year ended May 31, 2012 | | $ | 8.70 | | | | 0.12 | | | | (0.58 | ) | | | (0.11 | ) | | $ | 8.13 | |
Year ended May 31, 20114 | | $ | 7.48 | | | | 0.06 | | | | 1.26 | | | | (0.10 | ) | | $ | 8.70 | |
Year ended September 30, 2010 | | $ | 7.06 | | | | 0.08 | | | | 0.42 | | | | (0.08 | ) | | $ | 7.48 | |
Class B | | | | | | | | | | | | | | | | | | | | |
Six months ended November 30, 2015 (unaudited) | | $ | 13.22 | | | | (0.00 | )5,6 | | | (0.35 | ) | | | 0.00 | | | $ | 12.87 | |
Year ended May 31, 2015 | | $ | 12.14 | | | | (0.01 | )5 | | | 1.09 | | | | 0.00 | | | $ | 13.22 | |
Year ended May 31, 2014 | | $ | 10.43 | | | | 0.02 | 5 | | | 1.69 | | | | 0.00 | | | $ | 12.14 | |
Year ended May 31, 2013 | | $ | 8.16 | | | | 0.05 | 5 | | | 2.22 | | | | 0.00 | | | $ | 10.43 | |
Year ended May 31, 2012 | | $ | 8.68 | | | | 0.05 | 5 | | | (0.56 | ) | | | (0.01 | ) | | $ | 8.16 | |
Year ended May 31, 20114 | | $ | 7.44 | | | | 0.01 | | | | 1.26 | | | | (0.03 | ) | | $ | 8.68 | |
Year ended September 30, 2010 | | $ | 7.02 | | | | 0.03 | | | | 0.42 | | | | (0.03 | ) | | $ | 7.44 | |
Class C | | | | | | | | | | | | | | | | | | | | |
Six months ended November 30, 2015 (unaudited) | | $ | 13.01 | | | | 0.00 | 6 | | | (0.35 | ) | | | 0.00 | | | $ | 12.66 | |
Year ended May 31, 2015 | | $ | 11.95 | | | | (0.00 | )6 | | | 1.07 | | | | (0.01 | ) | | $ | 13.01 | |
Year ended May 31, 2014 | | $ | 10.29 | | | | 0.01 | | | | 1.67 | | | | (0.02 | ) | | $ | 11.95 | |
Year ended May 31, 2013 | | $ | 8.11 | | | | 0.04 | | | | 2.20 | | | | (0.06 | ) | | $ | 10.29 | |
Year ended May 31, 2012 | | $ | 8.66 | | | | 0.05 | | | | (0.56 | ) | | | (0.04 | ) | | $ | 8.11 | |
Year ended May 31, 20114 | | $ | 7.43 | | | | 0.00 | 6 | | | 1.27 | | | | (0.04 | ) | | $ | 8.66 | |
Year ended September 30, 2010 | | $ | 7.02 | | | | 0.02 | | | | 0.42 | | | | (0.03 | ) | | $ | 7.43 | |
Administrator Class | | | | | | | | | | | | | | | | | | | | |
Six months ended November 30, 2015 (unaudited) | | $ | 13.07 | | | | 0.06 | 5 | | | (0.35 | ) | | | 0.00 | | | $ | 12.78 | |
Year ended May 31, 2015 | | $ | 12.00 | | | | 0.13 | | | | 1.06 | | | | (0.12 | ) | | $ | 13.07 | |
Year ended May 31, 2014 | | $ | 10.32 | | | | 0.12 | 5 | | | 1.68 | | | | (0.12 | ) | | $ | 12.00 | |
Year ended May 31, 2013 | | $ | 8.13 | | | | 0.13 | 5 | | | 2.21 | | | | (0.15 | ) | | $ | 10.32 | |
Year ended May 31, 2012 | | $ | 8.69 | | | | 0.13 | 5 | | | (0.56 | ) | | | (0.13 | ) | | $ | 8.13 | |
Year ended May 31, 20114 | | $ | 7.47 | | | | 0.05 | 5 | | | 1.28 | | | | (0.11 | ) | | $ | 8.69 | |
Year ended September 30, 2010 | | $ | 7.06 | | | | 0.08 | 5 | | | 0.42 | | | | (0.09 | ) | | $ | 7.47 | |
Institutional Class | | | | | | | | | | | | | | | | | | | | |
Six months ended November 30, 2015 (unaudited) | | $ | 13.11 | | | | 0.08 | | | | (0.35 | ) | | | 0.00 | | | $ | 12.84 | |
Year ended May 31, 2015 | | $ | 12.03 | | | | 0.15 | | | | 1.08 | | | | (0.15 | ) | | $ | 13.11 | |
Year ended May 31, 2014 | | $ | 10.35 | | | | 0.14 | | | | 1.69 | | | | (0.15 | ) | | $ | 12.03 | |
Year ended May 31, 2013 | | $ | 8.16 | | | | 0.17 | | | | 2.19 | | | | (0.17 | ) | | $ | 10.35 | |
Year ended May 31, 2012 | | $ | 8.73 | | | | 0.14 | | | | (0.56 | ) | | | (0.15 | ) | | $ | 8.16 | |
Year ended May 31, 20114 | | $ | 7.51 | | | | 0.07 | | | | 1.28 | | | | (0.13 | ) | | $ | 8.73 | |
Year ended September 30, 2010 | | $ | 7.09 | | | | 0.11 | 5 | | | 0.42 | | | | (0.11 | ) | | $ | 7.51 | |
| 1 | Includes net expenses allocated from the affiliated Master Portfolio in which the Fund invests. |
| 2 | Total return calculations do not include any sales charges. Returns for periods of less than one year are not annualized. |
| 3 | Portfolio turnover rate is calculated by multiplying the Fund’s investment percentage in the affiliated Master Portfolio by the affiliated Master Portfolio’s portfolio turnover rate. |
| 4 | For the eight months ended May 31, 2011. The Fund changed its fiscal year end from September 30 to May 31, effective May 31, 2011. |
| 5 | Calculated based upon average shares outstanding |
| 6 | Amount is less than $0.005. |
The accompanying notes are an integral part of these financial statements.
| | | | | | |
| Financial highlights | | Wells Fargo Equity Gateway Funds | | | 39 | |
| | | | | | | | | | | | | | | | | | | | | | |
| Ratio to average net assets (annualized) | | | Total
return2 | | | Portfolio
turnover
rate3 | | | Net assets at
end of period
(000s omitted) | |
Net investment
income (loss)1 | | | Gross
expenses1 | | | Net
expenses1 | | | | |
| | | | | | | | | | | | | | | | | | | | | | |
| | 0.80 | % | | | 1.25 | % | | | 1.15 | % | | | (2.30 | )% | | | 18 | % | | $ | 89,729 | |
| | 0.73 | % | | | 1.29 | % | | | 1.15 | % | | | 9.78 | % | | | 35 | % | | $ | 27,085 | |
| | 0.86 | % | | | 1.31 | % | | | 1.15 | % | | | 17.25 | % | | | 22 | % | | $ | 29,537 | |
| | 1.25 | % | | | 1.30 | % | | | 1.15 | % | | | 28.82 | % | | | 18 | % | | $ | 23,571 | |
| | 1.33 | % | | | 1.30 | % | | | 1.15 | % | | | (5.23 | )% | | | 21 | % | | $ | 21,380 | |
| | 0.78 | % | | | 1.31 | % | | | 1.15 | % | | | 17.73 | % | | | 17 | % | | $ | 25,912 | |
| | 0.96 | % | | | 1.32 | % | | | 1.15 | % | | | 7.14 | % | | | 13 | % | | $ | 31,038 | |
| | | | | | | | | | | | | | | | | | | | | | |
| | (0.01 | )% | | | 2.00 | % | | | 1.90 | % | | | (2.65 | )% | | | 18 | % | | $ | 146 | |
| | (0.04 | )% | | | 2.04 | % | | | 1.90 | % | | | 8.90 | % | | | 35 | % | | $ | 280 | |
| | 0.17 | % | | | 2.06 | % | | | 1.90 | % | | | 16.40 | % | | | 22 | % | | $ | 469 | |
| | 0.57 | % | | | 2.03 | % | | | 1.89 | % | | | 27.82 | % | | | 18 | % | | $ | 1,167 | |
| | 0.61 | % | | | 2.05 | % | | | 1.90 | % | | | (5.84 | )% | | | 21 | % | | $ | 2,418 | |
| | 0.04 | % | | | 2.06 | % | | | 1.90 | % | | | 17.15 | % | | | 17 | % | | $ | 6,607 | |
| | 0.20 | % | | | 2.07 | % | | | 1.90 | % | | | 6.36 | % | | | 13 | % | | $ | 6,951 | |
| | | | | | | | | | | | | | | | | | | | | | |
| | 0.04 | % | | | 2.00 | % | | | 1.90 | % | | | (2.69 | )% | | | 18 | % | | $ | 7,262 | |
| | (0.02 | )% | | | 2.04 | % | | | 1.90 | % | | | 8.93 | % | | | 35 | % | | $ | 7,654 | |
| | 0.11 | % | | | 2.06 | % | | | 1.90 | % | | | 16.39 | % | | | 22 | % | | $ | 7,262 | |
| | 0.51 | % | | | 2.05 | % | | | 1.90 | % | | | 27.76 | % | | | 18 | % | | $ | 5,818 | |
| | 0.58 | % | | | 2.05 | % | | | 1.90 | % | | | (5.81 | )% | | | 21 | % | | $ | 5,524 | |
| | 0.05 | % | | | 2.07 | % | | | 1.90 | % | | | 17.15 | % | | | 17 | % | | $ | 7,046 | |
| | 0.21 | % | | | 2.07 | % | | | 1.90 | % | | | 6.29 | % | | | 13 | % | | $ | 6,607 | |
| | | | | | | | | | | | | | | | | | | | | | |
| | 0.98 | % | | | 1.16 | % | | | 0.96 | % | | | (2.22 | )% | | | 18 | % | | $ | 40,124 | |
| | 0.92 | % | | | 1.13 | % | | | 0.95 | % | | | 9.93 | % | | | 35 | % | | $ | 55,705 | |
| | 1.08 | % | | | 1.14 | % | | | 0.95 | % | | | 17.49 | % | | | 22 | % | | $ | 53,884 | |
| | 1.48 | % | | | 1.13 | % | | | 0.95 | % | | | 29.09 | % | | | 18 | % | | $ | 70,727 | |
| | 1.54 | % | | | 1.13 | % | | | 0.95 | % | | | (4.90 | )% | | | 21 | % | | $ | 81,999 | |
| | 1.00 | % | | | 1.15 | % | | | 0.95 | % | | | 17.74 | % | | | 17 | % | | $ | 120,613 | |
| | 1.13 | % | | | 1.13 | % | | | 0.95 | % | | | 7.33 | % | | | 13 | % | | $ | 114,664 | |
| | | | | | | | | | | | | | | | | | | | | | |
| | 1.22 | % | | | 0.91 | % | | | 0.73 | % | | | (2.06 | )% | | | 18 | % | | $ | 139,971 | |
| | 1.18 | % | | | 0.86 | % | | | 0.70 | % | | | 10.15 | % | | | 35 | % | | $ | 132,768 | |
| | 1.34 | % | | | 0.88 | % | | | 0.70 | % | | | 17.86 | % | | | 22 | % | | $ | 104,758 | |
| | 1.68 | % | | | 0.87 | % | | | 0.70 | % | | | 29.32 | % | | | 18 | % | | $ | 130,015 | |
| | 1.78 | % | | | 0.87 | % | | | 0.70 | % | | | (4.72 | )% | | | 21 | % | | $ | 96,653 | |
| | 1.25 | % | | | 0.88 | % | | | 0.70 | % | | | 18.16 | % | | | 17 | % | | $ | 110,061 | |
| | 1.48 | % | | | 0.88 | % | | | 0.70 | % | | | 7.51 | % | | | 13 | % | | $ | 95,466 | |
The accompanying notes are an integral part of these financial statements.
| | | | |
| 40 | | Wells Fargo Equity Gateway Funds | | Financial highlights |
| | | | | | | | | | | | | | | | | | | | | | | | |
| Diversified Equity Fund | | Beginning net asset value per share | | | Net investment income (loss)1 | | | Net realized and unrealized gains (losses) on investments | | | Distributions from net investment income | | | Distributions from net realized gains | | | Ending net asset value per share | |
Class A | | | | | | | | | | | | | | | | | | | | | | | | |
Six months ended November 30, 2015 (unaudited) | | $ | 32.37 | | | | 0.03 | | | | (0.90 | ) | | | 0.00 | | | | 0.00 | | | $ | 31.50 | |
Year ended May 31, 2015 | | $ | 32.78 | | | | 0.14 | | | | 2.79 | | | | (0.15 | ) | | | (3.19 | ) | | $ | 32.37 | |
Year ended May 31, 2014 | | $ | 30.65 | | | | 0.16 | | | | 5.48 | | | | (0.17 | ) | | | (3.34 | ) | | $ | 32.78 | |
Year ended May 31, 2013 | | $ | 26.08 | | | | 0.23 | 4 | | | 6.14 | | | | (0.24 | ) | | | (1.56 | ) | | $ | 30.65 | |
Year ended May 31, 2012 | | $ | 29.71 | | | | 0.15 | | | | (2.01 | ) | | | (0.18 | ) | | | (1.59 | ) | | $ | 26.08 | |
Year ended May 31, 20115 | | $ | 24.89 | | | | 0.12 | | | | 4.85 | | | | (0.15 | ) | | | 0.00 | | | $ | 29.71 | |
Year ended September 30, 2010 | | $ | 23.41 | | | | 0.18 | | | | 1.66 | | | | (0.36 | ) | | | 0.00 | | | $ | 24.89 | |
Class B | | | | | | | | | | | | | | | | | | | | | | | | |
Six months ended November 30, 2015 (unaudited) | | $ | 29.46 | | | | (0.05 | )4 | | | (0.84 | ) | | | 0.00 | | | | 0.00 | | | $ | 28.57 | |
Year ended May 31, 2015 | | $ | 30.20 | | | | (0.14 | )4 | | | 2.59 | | | | 0.00 | | | | (3.19 | ) | | $ | 29.46 | |
Year ended May 31, 2014 | | $ | 28.54 | | | | (0.10 | )4 | | | 5.10 | | | | 0.00 | | | | (3.34 | ) | | $ | 30.20 | |
Year ended May 31, 2013 | | $ | 24.36 | | | | 0.01 | 4 | | | 5.73 | | | | 0.00 | | | | (1.56 | ) | | $ | 28.54 | |
Year ended May 31, 2012 | | $ | 27.87 | | | | (0.01 | )4 | | | (1.91 | ) | | | 0.00 | | | | (1.59 | ) | | $ | 24.36 | |
Year ended May 31, 20115 | | $ | 23.35 | | | | (0.05 | )4 | | | 4.57 | | | | 0.00 | | | | 0.00 | | | $ | 27.87 | |
Year ended September 30, 2010 | | $ | 21.96 | | | | (0.01 | )4 | | | 1.57 | | | | (0.17 | ) | | | 0.00 | | | $ | 23.35 | |
Class C | | | | | | | | | | | | | | | | | | | | | | | | |
Six months ended November 30, 2015 (unaudited) | | $ | 30.22 | | | | (0.05 | )4 | | | (0.87 | ) | | | 0.00 | | | | 0.00 | | | $ | 29.30 | |
Year ended May 31, 2015 | | $ | 30.88 | | | | (0.12 | ) | | | 2.65 | | | | 0.00 | | | | (3.19 | ) | | $ | 30.22 | |
Year ended May 31, 2014 | | $ | 29.13 | | | | (0.08 | )4 | | | 5.18 | | | | (0.01 | ) | | | (3.34 | ) | | $ | 30.88 | |
Year ended May 31, 2013 | | $ | 24.88 | | | | 0.02 | 4 | | | 5.84 | | | | (0.05 | ) | | | (1.56 | ) | | $ | 29.13 | |
Year ended May 31, 2012 | | $ | 28.43 | | | | (0.59 | )4 | | | (1.37 | ) | | | 0.00 | | | | (1.59 | ) | | $ | 24.88 | |
Year ended May 31, 20115 | | $ | 23.81 | | | | (0.04 | )4 | | | 4.66 | | | | 0.00 | | | | 0.00 | | | $ | 28.43 | |
Year ended September 30, 2010 | | $ | 22.43 | | | | (0.01 | )4 | | | 1.60 | | | | (0.21 | ) | | | 0.00 | | | $ | 23.81 | |
Administrator Class | | | | | | | | | | | | | | | | | | | | | | | | |
Six months ended November 30, 2015 (unaudited) | | $ | 32.45 | | | | 0.10 | 4 | | | (0.93 | ) | | | 0.00 | | | | 0.00 | | | $ | 31.62 | |
Year ended May 31, 2015 | | $ | 32.84 | | | | 0.22 | 4 | | | 2.81 | | | | (0.23 | ) | | | (3.19 | ) | | $ | 32.45 | |
Year ended May 31, 2014 | | $ | 30.70 | | | | 0.23 | 4 | | | 5.49 | | | | (0.24 | ) | | | (3.34 | ) | | $ | 32.84 | |
Year ended May 31, 2013 | | $ | 26.12 | | | | 0.30 | 4 | | | 6.15 | | | | (0.31 | ) | | | (1.56 | ) | | $ | 30.70 | |
Year ended May 31, 2012 | | $ | 29.78 | | | | 0.33 | | | | (2.13 | ) | | | (0.27 | ) | | | (1.59 | ) | | $ | 26.12 | |
Year ended May 31, 20115 | | $ | 24.98 | | | | 0.14 | 4 | | | 4.89 | | | | (0.23 | ) | | | 0.00 | | | $ | 29.78 | |
Year ended September 30, 2010 | | $ | 23.47 | | | | 0.20 | 4 | | | 1.70 | | | | (0.39 | ) | | | 0.00 | | | $ | 24.98 | |
| 1 | Includes net expenses allocated from the affiliated Master Portfolios in which the Fund invests. |
| 2 | Total return calculations do not include any sales charges. Returns for periods of less than one year are not annualized. |
| 3 | Portfolio turnover rate is calculated by multiplying the Fund’s investment percentage in the respective affiliated Master Portfolios by the corresponding affiliated Master Portfolio’s portfolio turnover rate and then aggregating the results. |
| 4 | Calculated based upon average shares outstanding |
| 5 | For the eight months ended May 31, 2011. The Fund changed its fiscal year end from September 30 to May 31, effective May 31, 2011. |
The accompanying notes are an integral part of these financial statements.
| | | | | | |
| Financial highlights | | Wells Fargo Equity Gateway Funds | | | 41 | |
| | | | | | | | | | | | | | | | | | | | | | |
| Ratio to average net assets (annualized) | | | Total return2 | | | Portfolio turnover rate3 | | | Net assets at end of period (000s omitted) | |
Net investment income (loss)1 | | | Gross expenses1 | | | Net expenses1 | | | | |
| | | | | | | | | | | | | | | | | | | | | | |
| | 0.39 | % | | | 1.44 | % | | | 1.25 | % | | | (2.69 | )% | | | 19 | % | | $ | 75,529 | |
| | 0.44 | % | | | 1.44 | % | | | 1.25 | % | | | 9.39 | % | | | 38 | % | | $ | 81,502 | |
| | 0.48 | % | | | 1.43 | % | | | 1.25 | % | | | 19.10 | % | | | 37 | % | | $ | 82,186 | |
| | 0.81 | % | | | 1.43 | % | | | 1.25 | % | | | 25.42 | % | | | 44 | % | | $ | 75,640 | |
| | 0.74 | % | | | 1.41 | % | | | 1.25 | % | | | (5.91 | )% | | | 57 | % | | $ | 75,751 | |
| | 0.59 | % | | | 1.40 | % | | | 1.25 | % | | | 20.04 | % | | | 48 | % | | $ | 95,532 | |
| | 0.71 | % | | | 1.48 | % | | | 1.25 | % | | | 7.90 | % | | | 44 | % | | $ | 85,735 | |
| | | | | | | | | | | | | | | | | | | | | | |
| | (0.37 | )% | | | 2.13 | % | | | 2.00 | % | | | (3.06 | )% | | | 19 | % | | $ | 42 | |
| | (0.47 | )% | | | 2.18 | % | | | 2.00 | % | | | 8.54 | % | | | 38 | % | | $ | 45 | |
| | (0.34 | )% | | | 2.18 | % | | | 2.00 | % | | | 18.20 | % | | | 37 | % | | $ | 806 | |
| | 0.04 | % | | | 2.18 | % | | | 2.00 | % | | | 24.48 | % | | | 44 | % | | $ | 2,029 | |
| | (0.05 | )% | | | 2.16 | % | | | 2.00 | % | | | (6.61 | )% | | | 57 | % | | $ | 2,922 | |
| | (0.20 | )% | | | 2.15 | % | | | 2.00 | % | | | 19.36 | % | | | 48 | % | | $ | 5,754 | |
| | (0.04 | )% | | | 2.23 | % | | | 2.00 | % | | | 7.15 | % | | | 44 | % | | $ | 7,825 | |
| | | | | | | | | | | | | | | | | | | | | | |
| | (0.36 | )% | | | 2.16 | % | | | 2.00 | % | | | (3.04 | )% | | | 19 | % | | $ | 3,867 | |
| | (0.31 | )% | | | 2.19 | % | | | 2.00 | % | | | 8.58 | % | | | 38 | % | | $ | 4,165 | |
| | (0.25 | )% | | | 2.19 | % | | | 2.00 | % | | | 18.23 | % | | | 37 | % | | $ | 4,292 | |
| | 0.07 | % | | | 2.18 | % | | | 2.00 | % | | | 24.50 | % | | | 44 | % | | $ | 2,667 | |
| | (0.02 | )% | | | 2.16 | % | | | 2.00 | % | | | (6.62 | )% | | | 57 | % | | $ | 2,499 | |
| | (0.17 | )% | | | 2.15 | % | | | 2.00 | % | | | 19.40 | % | | | 48 | % | | $ | 3,383 | |
| | (0.05 | )% | | | 2.23 | % | | | 2.00 | % | | | 7.10 | % | | | 44 | % | | $ | 3,280 | |
| | | | | | | | | | | | | | | | | | | | | | |
| | 0.64 | % | | | 1.32 | % | | | 1.00 | % | | | (2.56 | )% | | | 19 | % | | $ | 150,294 | |
| | 0.67 | % | | | 1.28 | % | | | 1.00 | % | | | 9.65 | % | | | 38 | % | | $ | 167,371 | |
| | 0.71 | % | | | 1.27 | % | | | 1.00 | % | | | 19.40 | % | | | 37 | % | | $ | 225,584 | |
| | 1.06 | % | | | 1.27 | % | | | 1.00 | % | | | 25.75 | % | | | 44 | % | | $ | 290,011 | |
| | 0.99 | % | | | 1.25 | % | | | 1.00 | % | | | (5.67 | )% | | | 57 | % | | $ | 293,895 | |
| | 0.84 | % | | | 1.24 | % | | | 1.00 | % | | | 20.22 | % | | | 48 | % | | $ | 386,429 | |
| | 0.83 | % | | | 1.29 | % | | | 1.00 | % | | | 8.18 | % | | | 44 | % | | $ | 359,109 | |
The accompanying notes are an integral part of these financial statements.
| | | | |
| 42 | | Wells Fargo Equity Gateway Funds | | Financial highlights |
| | | | | | | | | | | | | | | | | | | | |
| Emerging Growth Fund | | Beginning
net asset
value per
share | | | Net
investment
income (loss)1 | | | Net realized
and unrealized
gains (losses)
on investments | | | Distributions
from net
realized gains | | | Ending
net asset
value per
share | |
Class A | | | | | | | | | | | | | | | | | | | | |
Six months ended November 30, 2015 (unaudited) | | $ | 16.70 | | | | (0.10 | ) | | | (1.23 | ) | | | 0.00 | | | $ | 15.37 | |
Year ended May 31, 2015 | | $ | 14.61 | | | | (0.22 | ) | | | 3.51 | | | | (1.20 | ) | | $ | 16.70 | |
Year ended May 31, 2014 | | $ | 14.10 | | | | (0.19 | ) | | | 1.88 | | | | (1.18 | ) | | $ | 14.61 | |
Year ended May 31, 2013 | | $ | 12.44 | | | | (0.15 | ) | | | 2.49 | | | | (0.68 | ) | | $ | 14.10 | |
Year ended May 31, 2012 | | $ | 13.12 | | | | (0.14 | )4 | | | (0.54 | ) | | | 0.00 | | | $ | 12.44 | |
Year ended May 31, 20115 | | $ | 9.50 | | | | (0.11 | )4 | | | 3.73 | | | | 0.00 | | | $ | 13.12 | |
Year ended September 30, 2010 | | $ | 7.93 | | | | (0.12 | ) | | | 1.69 | | | | 0.00 | | | $ | 9.50 | |
Class C | | | | | | | | | | | | | | | | | | | | |
Six months ended November 30, 2015 (unaudited) | | $ | 15.67 | | | | (0.14 | )4 | | | (1.15 | ) | | | 0.00 | | | $ | 14.38 | |
Year ended May 31, 2015 | | $ | 13.88 | | | | (0.33 | ) | | | 3.32 | | | | (1.20 | ) | | $ | 15.67 | |
Year ended May 31, 2014 | | $ | 13.55 | | | | (0.32 | ) | | | 1.83 | | | | (1.18 | ) | | $ | 13.88 | |
Year ended May 31, 2013 | | $ | 12.06 | | | | (0.27 | ) | | | 2.44 | | | | (0.68 | ) | | $ | 13.55 | |
Year ended May 31, 2012 | | $ | 12.81 | | | | (0.23 | )4 | | | (0.52 | ) | | | 0.00 | | | $ | 12.06 | |
Year ended May 31, 20115 | | $ | 9.32 | | | | (0.16 | )4 | | | 3.65 | | | | 0.00 | | | $ | 12.81 | |
Year ended September 30, 2010 | | $ | 7.85 | | | | (0.16 | )4 | | | 1.63 | | | | 0.00 | | | $ | 9.32 | |
Administrator Class | | | | | | | | | | | | | | | | | | | | |
Six months ended November 30, 2015 (unaudited) | | $ | 17.00 | | | | (0.08 | )4 | | | (1.26 | ) | | | 0.00 | | | $ | 15.66 | |
Year ended May 31, 2015 | | $ | 14.83 | | | | (0.16 | )4 | | | 3.53 | | | | (1.20 | ) | | $ | 17.00 | |
Year ended May 31, 2014 | | $ | 14.28 | | | | (0.17 | )4 | | | 1.90 | | | | (1.18 | ) | | $ | 14.83 | |
Year ended May 31, 2013 | | $ | 12.56 | | | | (0.12 | ) | | | 2.52 | | | | (0.68 | ) | | $ | 14.28 | |
Year ended May 31, 2012 | | $ | 13.22 | | | | (0.12 | )4 | | | (0.54 | ) | | | 0.00 | | | $ | 12.56 | |
Year ended May 31, 20115 | | $ | 9.56 | | | | (0.09 | )4 | | | 3.75 | | | | 0.00 | | | $ | 13.22 | |
Year ended September 30, 2010 | | $ | 8.08 | | | | (0.01 | ) | | | 1.49 | | | | 0.00 | | | $ | 9.56 | |
Institutional Class | | | | | | | | | | | | | | | | | | | | |
Six months ended November 30, 2015 (unaudited) | | $ | 17.40 | | | | (0.05 | )4 | | | (1.30 | ) | | | 0.00 | | | $ | 16.05 | |
Year ended May 31, 2015 | | $ | 15.11 | | | | (0.12 | ) | | | 3.61 | | | | (1.20 | ) | | $ | 17.40 | |
Year ended May 31, 2014 | | $ | 14.49 | | | | (0.11 | ) | | | 1.91 | | | | (1.18 | ) | | $ | 15.11 | |
Year ended May 31, 2013 | | $ | 12.70 | | | | (0.08 | ) | | | 2.55 | | | | (0.68 | ) | | $ | 14.49 | |
Year ended May 31, 2012 | | $ | 13.33 | | | | (0.08 | )4 | | | (0.55 | ) | | | 0.00 | | | $ | 12.70 | |
Year ended May 31, 20115 | | $ | 9.62 | | | | (0.07 | )4 | | | 3.78 | | | | 0.00 | | | $ | 13.33 | |
Year ended September 30, 2010 | | $ | 8.00 | | | | (0.07 | ) | | | 1.69 | | | | 0.00 | | | $ | 9.62 | |
| 1 | Includes net expenses allocated from the affiliated Master Portfolio in which the Fund invests. |
| 2 | Total return calculations do not include any sales charges. Returns for periods of less than one year are not annualized. |
| 3 | Portfolio turnover rate is calculated by multiplying the Fund’s investment percentage in the affiliated Master Portfolio by the affiliated Master Portfolio’s portfolio turnover rate. |
| 4 | Calculated based upon average shares outstanding |
| 5 | For the eight months ended May 31, 2011. The Fund changed its fiscal year end from September 30 to May 31, effective May 31, 2011. |
The accompanying notes are an integral part of these financial statements.
| | | | | | |
| Financial highlights | | Wells Fargo Equity Gateway Funds | | | 43 | |
| | | | | | | | | | | | | | | | | | | | | | |
| Ratio to average net assets (annualized) | | | Total
return2 | | | Portfolio
turnover
rate3 | | | Net assets at
end of period
(000s omitted) | |
Net investment
income (loss)1 | | | Gross
expenses1 | | | Net
expenses1 | | | | |
| | | | | | | | | | | | | | | | | | | | | | |
| | (1.06 | )% | | | 1.35 | % | | | 1.34 | % | | | (7.96 | )% | | | 40 | % | | $ | 156,017 | |
| | (1.20 | )% | | | 1.39 | % | | | 1.37 | % | | | 23.32 | % | | | 56 | % | | $ | 131,638 | |
| | (1.20 | )% | | | 1.39 | % | | | 1.37 | % | | | 11.30 | % | | | 63 | % | | $ | 130,403 | |
| | (1.04 | )% | | | 1.40 | % | | | 1.37 | % | | | 19.89 | % | | | 65 | % | | $ | 125,070 | |
| | (1.13 | )% | | | 1.41 | % | | | 1.37 | % | | | (5.18 | )% | | | 75 | % | | $ | 125,113 | |
| | (1.32 | )% | | | 3.03 | % | | | 1.45 | % | | | 38.11 | % | | | 59 | % | | $ | 3,425 | |
| | (1.17 | )% | | | 4.65 | % | | | 1.46 | % | | | 19.80 | % | | | 97 | % | | $ | 142 | |
| | | | | | | | | | | | | | | | | | | | | | |
| | (1.83 | )% | | | 2.10 | % | | | 2.09 | % | | | (8.23 | )% | | | 40 | % | | $ | 4,543 | |
| | (1.95 | )% | | | 2.14 | % | | | 2.12 | % | | | 22.35 | % | | | 56 | % | | $ | 5,101 | |
| | (1.95 | )% | | | 2.14 | % | | | 2.12 | % | | | 10.40 | % | | | 63 | % | | $ | 4,816 | |
| | (1.79 | )% | | | 2.15 | % | | | 2.12 | % | | | 19.09 | % | | | 65 | % | | $ | 4,878 | |
| | (1.89 | )% | | | 2.17 | % | | | 2.12 | % | | | (5.85 | )% | | | 75 | % | | $ | 5,114 | |
| | (2.05 | )% | | | 3.83 | % | | | 2.20 | % | | | 37.30 | % | | | 59 | % | | $ | 516 | |
| | (1.93 | )% | | | 5.40 | % | | | 2.22 | % | | | 18.85 | % | | | 97 | % | | $ | 58 | |
| | | | | | | | | | | | | | | | | | | | | | |
| | (0.93 | )% | | | 1.23 | % | | | 1.19 | % | | | (7.83 | )% | | | 40 | % | | $ | 124,258 | |
| | (1.03 | )% | | | 1.21 | % | | | 1.20 | % | | | 23.45 | % | | | 56 | % | | $ | 159,813 | |
| | (1.03 | )% | | | 1.22 | % | | | 1.20 | % | | | 11.45 | % | | | 63 | % | | $ | 190,126 | |
| | (0.87 | )% | | | 1.23 | % | | | 1.20 | % | | | 20.19 | % | | | 65 | % | | $ | 200,140 | |
| | (0.95 | )% | | | 1.22 | % | | | 1.19 | % | | | (4.99 | )% | | | 75 | % | | $ | 185,744 | |
| | (1.08 | )% | | | 2.41 | % | | | 1.20 | % | | | 38.28 | % | | | 59 | % | | $ | 1,915 | |
| | (0.78 | )% | | | 4.54 | % | | | 1.20 | % | | | 19.95 | % | | | 97 | % | | $ | 51 | |
| | | | | | | | | | | | | | | | | | | | | | |
| | (0.63 | )% | | | 1.00 | % | | | 0.90 | % | | | (7.76 | )% | | | 40 | % | | $ | 646,685 | |
| | (0.73 | )% | | | 0.96 | % | | | 0.90 | % | | | 23.89 | % | | | 56 | % | | $ | 723,946 | |
| | (0.73 | )% | | | 0.96 | % | | | 0.90 | % | | | 11.77 | % | | | 63 | % | | $ | 650,650 | |
| | (0.57 | )% | | | 0.97 | % | | | 0.90 | % | | | 20.52 | % | | | 65 | % | | $ | 578,841 | |
| | (0.67 | )% | | | 0.98 | % | | | 0.90 | % | | | (4.73 | )% | | | 75 | % | | $ | 526,865 | |
| | (0.82 | )% | | | 1.98 | % | | | 0.95 | % | | | 38.57 | % | | | 59 | % | | $ | 8,170 | |
| | (0.67 | )% | | | 4.32 | % | | | 0.95 | % | | | 20.40 | % | | | 97 | % | | $ | 10 | |
The accompanying notes are an integral part of these financial statements.
| | | | |
| 44 | | Wells Fargo Equity Gateway Funds | | Financial highlights |
| | | | | | | | | | | | | | | | | | | | | | | | |
| Index Fund | | Beginning
net asset
value per
share | | | Net
investment
income1 | | | Net realized
and unrealized
gains (losses)
on investments | | | Distributions
from net
investment
income | | | Distributions
from net
realized gains | | | Ending
net asset
value per
share | |
Class A | | | | | | | | | | | | | | | | | | | | | | | | |
Six months ended November 30, 2015 (unaudited) | | $ | 67.32 | | | | 0.56 | 4 | | | (0.88 | ) | | | 0.00 | | | | 0.00 | | | $ | 67.00 | |
Year ended May 31, 2015 | | $ | 62.14 | | | | 1.00 | | | | 5.91 | | | | (0.96 | ) | | | (0.77 | ) | | $ | 67.32 | |
Year ended May 31, 2014 | | $ | 54.00 | | | | 0.90 | | | | 9.59 | | | | (0.85 | ) | | | (1.50 | ) | | $ | 62.14 | |
Year ended May 31, 2013 | | $ | 44.25 | | | | 0.86 | | | | 10.66 | | | | (0.83 | ) | | | (0.94 | ) | | $ | 54.00 | |
Year ended May 31, 2012 | | $ | 47.17 | | | | 0.73 | | | | (1.35 | ) | | | (0.65 | ) | | | (1.65 | ) | | $ | 44.25 | |
Year ended May 31, 20115 | | $ | 40.42 | | | | 0.56 | | | | 8.77 | | | | (0.70 | ) | | | (1.88 | ) | | $ | 47.17 | |
Year ended July 31, 20106 | | $ | 41.72 | | | | 0.64 | | | | 4.89 | | | | (0.63 | ) | | | (6.20 | ) | | $ | 40.42 | |
Class B | | | | | | | | | | | | | | | | | | | | | | | | |
Six months ended November 30, 2015 (unaudited) | | $ | 68.44 | | | | 0.29 | 4 | | | (0.87 | ) | | | 0.00 | | | | 0.00 | | | $ | 67.86 | |
Year ended May 31, 2015 | | $ | 62.99 | | | | 0.49 | 4 | | | 6.02 | | | | (0.29 | ) | | | (0.77 | ) | | $ | 68.44 | |
Year ended May 31, 2014 | | $ | 54.57 | | | | 0.45 | 4 | | | 9.70 | | | | (0.23 | ) | | | (1.50 | ) | | $ | 62.99 | |
Year ended May 31, 2013 | | $ | 44.53 | | | | 0.47 | 4 | | | 10.78 | | | | (0.27 | ) | | | (0.94 | ) | | $ | 54.57 | |
Year ended May 31, 2012 | | $ | 47.23 | | | | 0.38 | 4 | | | (1.29 | ) | | | (0.14 | ) | | | (1.65 | ) | | $ | 44.53 | |
Year ended May 31, 20115 | | $ | 40.32 | | | | 0.29 | 4 | | | 8.76 | | | | (0.26 | ) | | | (1.88 | ) | | $ | 47.23 | |
Year ended July 31, 20106 | | $ | 41.63 | | | | 0.28 | | | | 4.88 | | | | (0.27 | ) | | | (6.20 | ) | | $ | 40.32 | |
Class C | | | | | | | | | | | | | | | | | | | | | | | | |
Six months ended November 30, 2015 (unaudited) | | $ | 67.55 | | | | 0.29 | 4 | | | (0.86 | ) | | | 0.00 | | | | 0.00 | | | $ | 66.98 | |
Year ended May 31, 2015 | | $ | 62.37 | | | | 0.50 | | | | 5.94 | | | | (0.49 | ) | | | (0.77 | ) | | $ | 67.55 | |
Year ended May 31, 2014 | | $ | 54.22 | | | | 0.47 | | | | 9.62 | | | | (0.44 | ) | | | (1.50 | ) | | $ | 62.37 | |
Year ended May 31, 2013 | | $ | 44.41 | | | | 0.48 | 4 | | | 10.71 | | | | (0.44 | ) | | | (0.94 | ) | | $ | 54.22 | |
Year ended May 31, 2012 | | $ | 47.27 | | | | 0.39 | 4 | | | (1.31 | ) | | | (0.29 | ) | | | (1.65 | ) | | $ | 44.41 | |
Year ended May 31, 20115 | | $ | 40.32 | | | | 0.27 | | | | 8.78 | | | | (0.22 | ) | | | (1.88 | ) | | $ | 47.27 | |
Year ended July 31, 20106 | | $ | 41.62 | | | | 0.30 | | | | 4.88 | | | | (0.28 | ) | | | (6.20 | ) | | $ | 40.32 | |
Administrator Class | | | | | | | | | | | | | | | | | | | | | | | | |
Six months ended November 30, 2015 (unaudited) | | $ | 67.80 | | | | 0.63 | 4 | | | (0.85 | ) | | | 0.00 | | | | 0.00 | | | $ | 67.58 | |
Year ended May 31, 2015 | | $ | 62.56 | | | | 1.27 | | | | 5.90 | | | | (1.16 | ) | | | (0.77 | ) | | $ | 67.80 | |
Year ended May 31, 2014 | | $ | 54.34 | | | | 1.08 | | | | 9.66 | | | | (1.02 | ) | | | (1.50 | ) | | $ | 62.56 | |
Year ended May 31, 2013 | | $ | 44.52 | | | | 1.02 | | | | 10.71 | | | | (0.97 | ) | | | (0.94 | ) | | $ | 54.34 | |
Year ended May 31, 2012 | | $ | 47.45 | | | | 0.83 | | | | (1.32 | ) | | | (0.79 | ) | | | (1.65 | ) | | $ | 44.52 | |
Year ended May 31, 20115 | | $ | 40.56 | | | | 0.67 | | | | 8.82 | | | | (0.72 | ) | | | (1.88 | ) | | $ | 47.45 | |
Year ended July 31, 20106 | | $ | 41.88 | | | | 0.86 | | | | 4.76 | | | | (0.75 | ) | | | (6.20 | ) | | $ | 40.56 | |
| 1 | Includes net expenses allocated from the affiliated Master Portfolio in which the Fund invests. |
| 2 | Total return calculations do not include any sales charges. Returns for periods of less than one year are not annualized. |
| 3 | Portfolio turnover rate is calculated by multiplying the Fund’s investment percentage in the affiliated Master Portfolio by the affiliated Master Portfolio’s portfolio turnover rate. |
| 4 | Calculated based upon average shares outstanding |
| 5 | For the ten months ended May 31, 2011. The Fund changed its fiscal year end from July 31 to May 31, effective May 31, 2011. |
| 6 | At the close of business on July 16, 2010, the Fund acquired the net assets of Evergreen Equity Index Fund which became the accounting and performance survivor in the transaction. The information for the periods prior to July 19, 2010 is that of Evergreen Equity Index Fund. The per share information has been adjusted to give effect to this transaction. |
The accompanying notes are an integral part of these financial statements.
| | | | | | |
| Financial highlights | | Wells Fargo Equity Gateway Funds | | | 45 | |
| | | | | | | | | | | | | | | | | | | | | | |
| Ratio to average net assets (annualized) | | | Total
return2 | | | Portfolio
turnover
rate3 | | | Net assets at
end of period
(000s omitted) | |
Net investment
income1 | | | Gross
expenses1 | | | Net
expenses1 | | | | |
| | | | | | | | | | | | | | | | | | | | | | |
| | 1.70 | % | | | 0.64 | % | | | 0.53 | % | | | (0.48 | )% | | | 2 | % | | $ | 654,767 | |
| | 1.50 | % | | | 0.68 | % | | | 0.56 | % | | | 11.21 | % | | | 4 | % | | $ | 445,088 | |
| | 1.53 | % | | | 0.67 | % | | | 0.56 | % | | | 19.77 | % | | | 5 | % | | $ | 432,448 | |
| | 1.72 | % | | | 0.67 | % | | | 0.56 | % | | | 26.63 | % | | | 4 | % | | $ | 407,533 | |
| | 1.63 | % | | | 0.68 | % | | | 0.56 | % | | | (0.95 | )% | | | 9 | % | | $ | 347,412 | |
| | 1.53 | % | | | 0.67 | % | | | 0.56 | % | | | 23.66 | % | | | 3 | % | | $ | 388,113 | |
| | 1.49 | % | | | 1.00 | % | | | 0.60 | % | | | 13.29 | % | | | 7 | % | | $ | 358,953 | |
| | | | | | | | | | | | | | | | | | | | | | |
| | 0.86 | % | | | 1.39 | % | | | 1.29 | % | | | (0.85 | )% | | | 2 | % | | $ | 1,479 | |
| | 0.74 | % | | | 1.43 | % | | | 1.31 | % | | | 10.39 | % | | | 4 | % | | $ | 2,098 | |
| | 0.77 | % | | | 1.42 | % | | | 1.31 | % | | | 18.86 | % | | | 5 | % | | $ | 3,412 | |
| | 0.95 | % | | | 1.42 | % | | | 1.31 | % | | | 25.66 | % | | | 4 | % | | $ | 5,453 | |
| | 0.85 | % | | | 1.43 | % | | | 1.31 | % | | | (1.68 | )% | | | 9 | % | | $ | 8,869 | |
| | 0.78 | % | | | 1.42 | % | | | 1.31 | % | | | 22.90 | % | | | 3 | % | | $ | 19,894 | |
| | 0.69 | % | | | 1.76 | % | | | 1.35 | % | | | 12.44 | % | | | 7 | % | | $ | 26,295 | |
| | | | | | | | | | | | | | | | | | | | | | |
| | 0.88 | % | | | 1.39 | % | | | 1.29 | % | | | (0.84 | )% | | | 2 | % | | $ | 80,718 | |
| | 0.75 | % | | | 1.43 | % | | | 1.31 | % | | | 10.38 | % | | | 4 | % | | $ | 83,718 | |
| | 0.78 | % | | | 1.42 | % | | | 1.31 | % | | | 18.89 | % | | | 5 | % | | $ | 78,118 | |
| | 0.97 | % | | | 1.42 | % | | | 1.31 | % | | | 25.67 | % | | | 4 | % | | $ | 70,322 | |
| | 0.87 | % | | | 1.43 | % | | | 1.31 | % | | | (1.67 | )% | | | 9 | % | | $ | 65,245 | |
| | 0.78 | % | | | 1.42 | % | | | 1.31 | % | | | 22.89 | % | | | 3 | % | | $ | 80,981 | |
| | 0.68 | % | | | 1.76 | % | | | 1.35 | % | | | 12.44 | % | | | 7 | % | | $ | 81,848 | |
| | | | | | | | | | | | | | | | | | | | | | |
| | 1.91 | % | | | 0.40 | % | | | 0.25 | % | | | (0.32 | )% | | | 2 | % | | $ | 1,647,209 | |
| | 1.81 | % | | | 0.37 | % | | | 0.25 | % | | | 11.56 | % | | | 4 | % | | $ | 1,832,814 | |
| | 1.84 | % | | | 0.36 | % | | | 0.25 | % | | | 20.13 | % | | | 5 | % | | $ | 1,984,845 | |
| | 2.03 | % | | | 0.36 | % | | | 0.25 | % | | | 27.02 | % | | | 4 | % | | $ | 1,832,524 | |
| | 1.94 | % | | | 0.37 | % | | | 0.25 | % | | | (0.63 | )% | | | 9 | % | | $ | 1,682,905 | |
| | 1.84 | % | | | 0.37 | % | | | 0.25 | % | | | 23.98 | % | | | 3 | % | | $ | 1,709,455 | |
| | 1.94 | % | | | 0.63 | % | | | 0.31 | % | | | 13.55 | % | | | 7 | % | | $ | 1,404,098 | |
The accompanying notes are an integral part of these financial statements.
| | | | |
| 46 | | Wells Fargo Equity Gateway Funds | | Financial highlights |
| | | | | | | | | | | | | | | | | | | | |
| International Value Fund | | Beginning
net asset
value per
share | | | Net
investment
income1 | | | Net realized
and unrealized
gains (losses)
on investments | | | Distributions
from net
investment
income | | | Ending
net asset
value per
share | |
Class A | | | | | | | | | | | | | | | | | | | | |
Six months ended November 30, 2015 (unaudited) | | $ | 14.85 | | | | 0.08 | | | | (1.50 | ) | | | 0.00 | | | $ | 13.43 | |
Year ended May 31, 2015 | | $ | 15.45 | | | | 0.26 | 4 | | | (0.53 | ) | | | (0.33 | ) | | $ | 14.85 | |
Year ended May 31, 2014 | | $ | 13.40 | | | | 0.36 | | | | 1.97 | | | | (0.28 | ) | | $ | 15.45 | |
Year ended May 31, 2013 | | $ | 10.64 | | | | 0.31 | | | | 2.71 | | | | (0.26 | ) | | $ | 13.40 | |
Year ended May 31, 2012 | | $ | 14.03 | | | | 0.34 | | | | (3.36 | ) | | | (0.37 | ) | | $ | 10.64 | |
Year ended May 31, 20115 | | $ | 12.58 | | | | 0.22 | 4 | | | 1.46 | | | | (0.23 | ) | | $ | 14.03 | |
Year ended September 30, 2010 | | $ | 12.67 | | | | 0.23 | 4 | | | (0.17 | ) | | | (0.15 | ) | | $ | 12.58 | |
Class B | | | | | | | | | | | | | | | | | | | | |
Six months ended November 30, 2015 (unaudited) | | $ | 15.16 | | | | 0.03 | | | | (1.51 | ) | | | 0.00 | | | $ | 13.68 | |
Year ended May 31, 2015 | | $ | 15.52 | | | | 0.07 | 4 | | | (0.43 | ) | | | 0.00 | | | $ | 15.16 | |
Year ended May 31, 2014 | | $ | 13.43 | | | | 0.13 | 4 | | | 2.09 | | | | (0.13 | ) | | $ | 15.52 | |
Year ended May 31, 2013 | | $ | 10.60 | | | | 0.17 | 4 | | | 2.76 | | | | (0.10 | ) | | $ | 13.43 | |
Year ended May 31, 2012 | | $ | 13.94 | | | | 0.21 | 4 | | | (3.29 | ) | | | (0.26 | ) | | $ | 10.60 | |
Year ended May 31, 20115 | | $ | 12.42 | | | | 0.11 | 4 | | | 1.49 | | | | (0.08 | ) | | $ | 13.94 | |
Year ended September 30, 2010 | | $ | 12.57 | | | | 0.12 | 4 | | | (0.14 | ) | | | (0.13 | ) | | $ | 12.42 | |
Class C | | | | | | | | | | | | | | | | | | | | |
Six months ended November 30, 2015 (unaudited) | | $ | 14.54 | | | | 0.03 | | | | (1.47 | ) | | | 0.00 | | | $ | 13.10 | |
Year ended May 31, 2015 | | $ | 15.16 | | | | 0.13 | | | | (0.51 | ) | | | (0.24 | ) | | $ | 14.54 | |
Year ended May 31, 2014 | | $ | 13.18 | | | | 0.19 | | | | 2.00 | | | | (0.21 | ) | | $ | 15.16 | |
Year ended May 31, 2013 | | $ | 10.47 | | | | 0.19 | | | | 2.70 | | | | (0.18 | ) | | $ | 13.18 | |
Year ended May 31, 2012 | | $ | 13.79 | | | | 0.23 | 4 | | | (3.28 | ) | | | (0.27 | ) | | $ | 10.47 | |
Year ended May 31, 20115 | | $ | 12.33 | | | | 0.15 | 4 | | | 1.44 | | | | (0.13 | ) | | $ | 13.79 | |
Year ended September 30, 2010 | | $ | 12.51 | | | | 0.15 | | | | (0.18 | ) | | | (0.15 | ) | | $ | 12.33 | |
Administrator Class | | | | | | | | | | | | | | | | | | | | |
Six months ended November 30, 2015 (unaudited) | | $ | 14.73 | | | | 0.06 | 4 | | | (1.48 | ) | | | 0.00 | | | $ | 13.31 | |
Year ended May 31, 2015 | | $ | 15.35 | | | | 0.28 | | | | (0.52 | ) | | | (0.38 | ) | | $ | 14.73 | |
Year ended May 31, 2014 | | $ | 13.31 | | | | 0.38 | | | | 1.98 | | | | (0.32 | ) | | $ | 15.35 | |
Year ended May 31, 2013 | | $ | 10.57 | | | | 0.33 | 4 | | | 2.70 | | | | (0.29 | ) | | $ | 13.31 | |
Year ended May 31, 2012 | | $ | 13.95 | | | | 0.35 | | | | (3.33 | ) | | | (0.40 | ) | | $ | 10.57 | |
Year ended May 31, 20115 | | $ | 12.52 | | | | 0.24 | 4 | | | 1.46 | | | | (0.27 | ) | | $ | 13.95 | |
Year ended September 30, 2010 | | $ | 12.68 | | | | 0.25 | | | | (0.15 | ) | | | (0.26 | ) | | $ | 12.52 | |
Institutional Class | | | | | | | | | | | | | | | | | | | | |
Six months ended November 30, 2015 (unaudited) | | $ | 14.75 | | | | 0.13 | | | | (1.51 | ) | | | 0.00 | | | $ | 13.37 | |
Year ended May 31, 2015 | | $ | 15.38 | | | | 0.29 | | | | (0.51 | ) | | | (0.41 | ) | | $ | 14.75 | |
Year ended May 31, 2014 | | $ | 13.34 | | | | 0.41 | | | | 1.98 | | | | (0.35 | ) | | $ | 15.38 | |
Year ended May 31, 2013 | | $ | 10.58 | | | | 0.35 | | | | 2.73 | | | | (0.32 | ) | | $ | 13.34 | |
Year ended May 31, 2012 | | $ | 13.98 | | | | 0.36 | | | | (3.33 | ) | | | (0.43 | ) | | $ | 10.58 | |
Year ended May 31, 20115 | | $ | 12.58 | | | | 0.28 | | | | 1.44 | | | | (0.32 | ) | | $ | 13.98 | |
Year ended September 30, 2010 | | $ | 12.71 | | | | 0.32 | | | | (0.20 | ) | | | (0.25 | ) | | $ | 12.58 | |
| 1 | Includes net expenses allocated from the affiliated Master Portfolio in which the Fund invests. |
| 2 | Total return calculations do not include any sales charges. Returns for periods of less than one year are not annualized. |
| 3 | Portfolio turnover rate is calculated by multiplying the Fund’s investment percentage in the affiliated Master Portfolio by the affiliated Master Portfolio’s portfolio turnover rate. |
| 4 | Calculated based upon average shares outstanding |
| 5 | For the eight months ended May 31, 2011. The Fund changed its fiscal year end from September 30 to May 31, effective May 31, 2011. |
The accompanying notes are an integral part of these financial statements.
| | | | | | |
| Financial highlights | | Wells Fargo Equity Gateway Funds | | | 47 | |
| | | | | | | | | | | | | | | | | | | | | | |
| Ratio to average net assets (annualized) | | | Total
return2 | | | Portfolio
turnover
rate3 | | | Net assets at
end of period
(000s omitted) | |
Net investment
income1 | | | Gross
expenses1 | | | Net
expenses1 | | | | |
| | | | | | | | | | | | | | | | | | | | | | |
| | 0.97 | % | | | 1.46 | % | | | 1.43 | % | | | (9.56 | )% | | | 5 | % | | $ | 5,105 | |
| | 1.80 | % | | | 1.50 | % | | | 1.49 | % | | | (1.55 | )% | | | 18 | % | | $ | 5,768 | |
| | 2.45 | % | | | 1.51 | % | | | 1.50 | % | | | 17.48 | % | | | 11 | % | | $ | 6,725 | |
| | 2.35 | % | | | 1.51 | % | | | 1.50 | % | | | 28.58 | % | | | 16 | % | | $ | 5,922 | |
| | 2.81 | % | | | 1.46 | % | | | 1.46 | % | | | (21.53 | )% | | | 9 | % | | $ | 4,742 | |
| | 2.41 | % | | | 1.55 | % | | | 1.47 | % | | | 13.55 | % | | | 16 | % | | $ | 6,213 | |
| | 1.92 | % | | | 1.69 | % | | | 1.46 | % | | | 0.52 | % | | | 27 | % | | $ | 6,792 | |
| | | | | | | | | | | | | | | | | | | | | | |
| | 0.38 | % | | | 2.03 | % | | | 2.03 | % | | | (9.76 | )% | | | 5 | % | | $ | 2 | |
| | 0.45 | % | | | 2.16 | % | | | 2.16 | % | | | (2.32 | )% | | | 18 | % | | $ | 2 | |
| | 0.94 | % | | | 2.26 | % | | | 2.25 | % | | | 16.57 | % | | | 11 | % | | $ | 25 | |
| | 1.34 | % | | | 2.26 | % | | | 2.25 | % | | | 27.69 | % | | | 16 | % | | $ | 70 | |
| | 1.79 | % | | | 2.21 | % | | | 2.21 | % | | | (22.15 | )% | | | 9 | % | | $ | 110 | |
| | 1.28 | % | | | 2.32 | % | | | 2.22 | % | | | 12.97 | % | | | 16 | % | | $ | 194 | |
| | 0.99 | % | | | 2.44 | % | | | 2.21 | % | | | (0.16 | )% | | | 27 | % | | $ | 339 | |
| | | | | | | | | | | | | | | | | | | | | | |
| | 0.22 | % | | | 2.21 | % | | | 2.18 | % | | | (9.90 | )% | | | 5 | % | | $ | 756 | |
| | 1.07 | % | | | 2.25 | % | | | 2.24 | % | | | (2.37 | )% | | | 18 | % | | $ | 920 | |
| | 1.88 | % | | | 2.26 | % | | | 2.25 | % | | | 16.64 | % | | | 11 | % | | $ | 920 | |
| | 1.67 | % | | | 2.26 | % | | | 2.25 | % | | | 27.67 | % | | | 16 | % | | $ | 595 | |
| | 1.96 | % | | | 2.21 | % | | | 2.21 | % | | | (22.14 | )% | | | 9 | % | | $ | 441 | |
| | 1.75 | % | | | 2.30 | % | | | 2.22 | % | | | 13.00 | % | | | 16 | % | | $ | 665 | |
| | 1.11 | % | | | 2.45 | % | | | 2.21 | % | | | (0.21 | )% | | | 27 | % | | $ | 665 | |
| | | | | | | | | | | | | | | | | | | | | | |
| | 0.87 | % | | | 1.36 | % | | | 1.25 | % | | | (9.71 | )% | | | 5 | % | | $ | 15,154 | |
| | 2.12 | % | | | 1.34 | % | | | 1.25 | % | | | (1.35 | )% | | | 18 | % | | $ | 487,582 | |
| | 2.76 | % | | | 1.34 | % | | | 1.25 | % | | | 17.81 | % | | | 11 | % | | $ | 459,415 | |
| | 2.67 | % | | | 1.34 | % | | | 1.25 | % | | | 28.90 | % | | | 16 | % | | $ | 372,187 | |
| | 3.04 | % | | | 1.29 | % | | | 1.25 | % | | | (21.37 | )% | | | 9 | % | | $ | 259,969 | |
| | 2.84 | % | | | 1.38 | % | | | 1.25 | % | | | 13.73 | % | | | 16 | % | | $ | 313,423 | |
| | 2.26 | % | | | 1.53 | % | | | 1.21 | % | | | 0.80 | % | | | 27 | % | | $ | 259,768 | |
| | | | | | | | | | | | | | | | | | | | | | |
| | 1.64 | % | | | 1.13 | % | | | 1.02 | % | | | (9.36 | )% | | | 5 | % | | $ | 441,600 | |
| | 2.42 | % | | | 1.07 | % | | | 1.05 | % | | | (1.19 | )% | | | 18 | % | | $ | 3,793 | |
| | 2.91 | % | | | 1.08 | % | | | 1.05 | % | | | 18.07 | % | | | 11 | % | | $ | 2,359 | |
| | 2.81 | % | | | 1.08 | % | | | 1.05 | % | | | 29.20 | % | | | 16 | % | | $ | 1,941 | |
| | 3.20 | % | | | 1.03 | % | | | 1.03 | % | | | (21.26 | )% | | | 9 | % | | $ | 1,505 | |
| | 3.04 | % | | | 1.11 | % | | | 1.03 | % | | | 13.92 | % | | | 16 | % | | $ | 1,797 | |
| | 2.51 | % | | | 1.08 | % | | | 1.01 | % | | | 1.01 | % | | | 27 | % | | $ | 1,518 | |
The accompanying notes are an integral part of these financial statements.
| | | | |
| 48 | | Wells Fargo Equity Gateway Funds | | Financial highlights |
| | | | | | | | | | | | | | | | | | | | | | | | |
| Small Company Growth Fund | | Beginning
net asset
value per
share | | | Net
investment
loss1 | | | Net realized
and unrealized
gains (losses)
on investments | | | Distributions
from net
investment
income | | | Distributions
from net
realized gains | | | Ending
net asset
value per
share | |
Class A | | | | | | | | | | | | | | | | | | | | | | | | |
Six months ended November 30, 2015 (unaudited) | | $ | 44.23 | | | | (0.15 | )4 | | | (3.02 | ) | | | 0.00 | | | | 0.00 | | | $ | 41.06 | |
Year ended May 31, 2015 | | $ | 39.44 | | | | (0.37 | )4 | | | 7.08 | | | | 0.00 | | | | (1.92 | ) | | $ | 44.23 | |
Year ended May 31, 2014 | | $ | 34.23 | | | | (0.37 | )4 | | | 7.98 | | | | 0.00 | | | | (2.40 | ) | | $ | 39.44 | |
Year ended May 31, 2013 | | $ | 26.21 | | | | (0.15 | ) | | | 8.17 | | | | 0.00 | | | | 0.00 | | | $ | 34.23 | |
Year ended May 31, 2012 | | $ | 29.53 | | | | (0.18 | )4 | | | (3.14 | ) | | | 0.00 | | | | 0.00 | | | $ | 26.21 | |
Year ended May 31, 20115 | | $ | 21.23 | | | | (0.15 | ) | | | 8.45 | | | | 0.00 | | | | 0.00 | | | $ | 29.53 | |
Year ended September 30, 2010 | | $ | 18.56 | | | | (0.21 | )4 | | | 2.88 | | | | 0.00 | | | | 0.00 | | | $ | 21.23 | |
Class B | | | | | | | | | | | | | | | | | | | | | | | | |
Six months ended November 30, 2015 (unaudited) | | $ | 39.74 | | | | (0.28 | )4 | | | (2.71 | ) | | | 0.00 | | | | 0.00 | | | $ | 36.75 | |
Year ended May 31, 2015 | | $ | 35.88 | | | | (0.62 | )4 | | | 6.40 | | | | 0.00 | | | | (1.92 | ) | | $ | 39.74 | |
Year ended May 31, 2014 | | $ | 31.55 | | | | (0.60 | )4 | | | 7.33 | | | | 0.00 | | | | (2.40 | ) | | $ | 35.88 | |
Year ended May 31, 2013 | | $ | 24.35 | | | | (0.36 | )4 | | | 7.56 | | | | 0.00 | | | | 0.00 | | | $ | 31.55 | |
Year ended May 31, 2012 | | $ | 27.63 | | | | (0.37 | )4 | | | (2.91 | ) | | | 0.00 | | | | 0.00 | | | $ | 24.35 | |
Year ended May 31, 20115 | | $ | 19.97 | | | | (0.29 | )4 | | | 7.95 | | | | 0.00 | | | | 0.00 | | | $ | 27.63 | |
Year ended September 30, 2010 | | $ | 17.58 | | | | (0.34 | )4 | | | 2.73 | | | | 0.00 | | | | 0.00 | | | $ | 19.97 | |
Class C | | | | | | | | | | | | | | | | | | | | | | | | |
Six months ended November 30, 2015 (unaudited) | | $ | 40.25 | | | | (0.28 | )4 | | | (2.75 | ) | | | 0.00 | | | | 0.00 | | | $ | 37.22 | |
Year ended May 31, 2015 | | $ | 36.32 | | | | (0.63 | )4 | | | 6.48 | | | | 0.00 | | | | (1.92 | ) | | $ | 40.25 | |
Year ended May 31, 2014 | | $ | 31.91 | | | | (0.62 | )4 | | | 7.43 | | | | 0.00 | | | | (2.40 | ) | | $ | 36.32 | |
Year ended May 31, 2013 | | $ | 24.62 | | | | (0.37 | )4 | | | 7.66 | | | | 0.00 | | | | 0.00 | | | $ | 31.91 | |
Year ended May 31, 2012 | | $ | 27.95 | | | | (0.36 | )4 | | | (2.97 | ) | | | 0.00 | | | | 0.00 | | | $ | 24.62 | |
Year ended May 31, 20115 | | $ | 20.19 | | | | (0.30 | )4 | | | 8.06 | | | | 0.00 | | | | 0.00 | | | $ | 27.95 | |
Year ended September 30, 2010 | | $ | 17.77 | | | | (0.34 | )4 | | | 2.76 | | | | 0.00 | | | | 0.00 | | | $ | 20.19 | |
Class R6 | | | | | | | | | | | | | | | | | | | | | | | | |
Six months ended November 30, 2015 (unaudited) | | $ | 46.45 | | | | (0.04 | ) | | | (3.20 | ) | | | 0.00 | | | | 0.00 | | | $ | 43.21 | |
Year ended May 31, 20156 | | $ | 42.98 | | | | (0.09 | )4 | | | 5.48 | | | | 0.00 | | | | (1.92 | ) | | $ | 46.45 | |
Administrator Class | | | | | | | | | | | | | | | | | | | | | | | | |
Six months ended November 30, 2015 (unaudited) | | $ | 45.73 | | | | (0.14 | ) | | | (3.10 | ) | | | 0.00 | | | | 0.00 | | | $ | 42.49 | |
Year ended May 31, 2015 | | $ | 40.64 | | | | (0.30 | )4 | | | 7.31 | | | | 0.00 | | | | (1.92 | ) | | $ | 45.73 | |
Year ended May 31, 2014 | | $ | 35.13 | | | | (0.26 | ) | | | 8.17 | | | | 0.00 | | | | (2.40 | ) | | $ | 40.64 | |
Year ended May 31, 2013 | | $ | 26.90 | | | | (0.09 | )4 | | | 8.38 | | | | (0.06 | ) | | | 0.00 | | | $ | 35.13 | |
Year ended May 31, 2012 | | $ | 30.22 | | | | (0.13 | )4 | | | (3.19 | ) | | | 0.00 | | | | 0.00 | | | $ | 26.90 | |
Year ended May 31, 20115 | | $ | 21.70 | | | | (0.14 | )4 | | | 8.66 | | | | 0.00 | | | | 0.00 | | | $ | 30.22 | |
Year ended September 30, 2010 | | $ | 18.90 | | | | (0.16 | )4 | | | 2.96 | | | | 0.00 | | | | 0.00 | | | $ | 21.70 | |
Institutional Class | | | | | | | | | | | | | | | | | | | | | | | | |
Six months ended November 30, 2015 (unaudited) | | $ | 46.44 | | | | (0.09 | ) | | | (3.15 | ) | | | 0.00 | | | | 0.00 | | | $ | 43.20 | |
Year ended May 31, 2015 | | $ | 41.14 | | | | (0.20 | )4 | | | 7.42 | | | | 0.00 | | | | (1.92 | ) | | $ | 46.44 | |
Year ended May 31, 2014 | | $ | 35.46 | | | | (0.20 | )4 | | | 8.28 | | | | 0.00 | | | | (2.40 | ) | | $ | 41.14 | |
Year ended May 31, 2013 | | $ | 27.15 | | | | (0.06 | )4 | | | 8.51 | | | | (0.14 | ) | | | 0.00 | | | $ | 35.46 | |
Year ended May 31, 2012 | | $ | 30.44 | | | | (0.07 | )4 | | | (3.22 | ) | | | 0.00 | | | | 0.00 | | | $ | 27.15 | |
Year ended May 31, 20115 | | $ | 21.81 | | | | (0.12 | )4 | | | 8.75 | | | | 0.00 | | | | 0.00 | | | $ | 30.44 | |
Year ended September 30, 2010 | | $ | 18.94 | | | | (0.05 | )4 | | | 2.92 | | | | 0.00 | | | | 0.00 | | | $ | 21.81 | |
| 1 | Includes net expenses allocated from the affiliated Master Portfolio in which the Fund invests. |
| 2 | Total return calculations do not include any sales charges. Returns for periods of less than one year are not annualized. |
| 3 | Portfolio turnover rate is calculated by multiplying the Fund’s investment percentage in the affiliated Master Portfolio by the affiliated Master Portfolio’s portfolio turnover rate. |
| 4 | Calculated based upon average shares outstanding |
| 5 | For the eight months ended May 31, 2011. The Fund changed its fiscal year end from September 30 to May 31, effective May 31, 2011. |
| 6 | For the period from October 31, 2014 (commencement of class operations) to May 31, 2015 |
The accompanying notes are an integral part of these financial statements.
| | | | | | |
| Financial highlights | | Wells Fargo Equity Gateway Funds | | | 49 | |
| | | | | | | | | | | | | | | | | | | | | | |
| Ratio to average net assets (annualized) | | | Total
return2 | | | Portfolio
turnover
rate3 | | | Net assets at
end of period
(000s omitted) | |
Net investment
loss1 | | | Gross
expenses1 | | | Net
expenses1 | | | | |
| | | | | | | | | | | | | | | | | | | | | | |
| | (0.73 | )% | | | 1.34 | % | | | 1.34 | % | | | (7.17 | )% | | | 24 | % | | $ | 144,646 | |
| | (0.90 | )% | | | 1.41 | % | | | 1.40 | % | | | 17.51 | % | | | 58 | % | | $ | 85,588 | |
| | (0.96 | )% | | | 1.45 | % | | | 1.41 | % | | | 22.63 | % | | | 77 | % | | $ | 30,364 | |
| | (0.58 | )% | | | 1.53 | % | | | 1.45 | % | | | 30.55 | % | | | 109 | % | | $ | 9,357 | |
| | (0.70 | )% | | | 1.46 | % | | | 1.44 | % | | | (11.18 | )% | | | 107 | % | | $ | 6,450 | |
| | (1.04 | )% | | | 1.45 | % | | | 1.44 | % | | | 39.11 | % | | | 70 | % | | $ | 7,201 | |
| | (1.05 | )% | | | 1.50 | % | | | 1.45 | % | | | 14.39 | % | | | 129 | % | | $ | 4,042 | |
| | | | | | | | | | | | | | | | | | | | | | |
| | (1.48 | )% | | | 2.08 | % | | | 2.08 | % | | | (7.52 | )% | | | 24 | % | | $ | 57 | |
| | (1.65 | )% | | | 2.15 | % | | | 2.15 | % | | | 16.63 | % | | | 58 | % | | $ | 76 | |
| | (1.71 | )% | | | 2.20 | % | | | 2.16 | % | | | 21.74 | % | | | 77 | % | | $ | 101 | |
| | (1.33 | )% | | | 2.28 | % | | | 2.20 | % | | | 29.57 | % | | | 109 | % | | $ | 164 | |
| | (1.48 | )% | | | 2.21 | % | | | 2.19 | % | | | (11.87 | )% | | | 107 | % | | $ | 193 | |
| | (1.78 | )% | | | 2.19 | % | | | 2.19 | % | | | 38.43 | % | | | 70 | % | | $ | 380 | |
| | (1.83 | )% | | | 2.24 | % | | | 2.20 | % | | | 13.54 | % | | | 129 | % | | $ | 251 | |
| | | | | | | | | | | | | | | | | | | | | | |
| | (1.48 | )% | | | 2.09 | % | | | 2.09 | % | | | (7.53 | )% | | | 24 | % | | $ | 29,477 | |
| | (1.64 | )% | | | 2.16 | % | | | 2.15 | % | | | 16.62 | % | | | 58 | % | | $ | 17,334 | |
| | (1.71 | )% | | | 2.20 | % | | | 2.16 | % | | | 21.75 | % | | | 77 | % | | $ | 6,546 | |
| | (1.31 | )% | | | 2.28 | % | | | 2.20 | % | | | 29.56 | % | | | 109 | % | | $ | 2,406 | |
| | (1.45 | )% | | | 2.22 | % | | | 2.19 | % | | | (11.85 | )% | | | 107 | % | | $ | 1,628 | |
| | (1.80 | )% | | | 2.20 | % | | | 2.19 | % | | | 38.39 | % | | | 70 | % | | $ | 1,736 | |
| | (1.81 | )% | | | 2.24 | % | | | 2.20 | % | | | 13.62 | % | | | 129 | % | | $ | 820 | |
| | | | | | | | | | | | | | | | | | | | | | |
| | (0.29 | )% | | | 0.90 | % | | | 0.90 | % | | | (6.98 | )% | | | 24 | % | | $ | 140,804 | |
| | (0.34 | )% | | | 0.91 | % | | | 0.90 | % | | | 13.00 | % | | | 58 | % | | $ | 644 | |
| | | | | | | | | | | | | | | | | | | | | | |
| | (0.61 | )% | | | 1.24 | % | | | 1.20 | % | | | (7.08 | )% | | | 24 | % | | $ | 164,463 | |
| | (0.70 | )% | | | 1.24 | % | | | 1.20 | % | | | 17.73 | % | | | 58 | % | | $ | 185,267 | |
| | (0.74 | )% | | | 1.29 | % | | | 1.20 | % | | | 22.92 | % | | | 77 | % | | $ | 118,456 | |
| | (0.30 | )% | | | 1.37 | % | | | 1.20 | % | | | 30.89 | % | | | 109 | % | | $ | 98,445 | |
| | (0.48 | )% | | | 1.30 | % | | | 1.20 | % | | | (10.99 | )% | | | 107 | % | | $ | 97,776 | |
| | (0.78 | )% | | | 1.28 | % | | | 1.20 | % | | | 39.33 | % | | | 70 | % | | $ | 177,938 | |
| | (0.82 | )% | | | 1.32 | % | | | 1.20 | % | | | 14.76 | % | | | 129 | % | | $ | 237,761 | |
| | | | | | | | | | | | | | | | | | | | | | |
| | (0.35 | )% | | | 1.00 | % | | | 0.95 | % | | | (6.98 | )% | | | 24 | % | | $ | 678,632 | |
| | (0.45 | )% | | | 0.98 | % | | | 0.95 | % | | | 18.03 | % | | | 58 | % | | $ | 457,542 | |
| | (0.49 | )% | | | 1.02 | % | | | 0.95 | % | | | 23.19 | % | | | 77 | % | | $ | 186,581 | |
| | (0.19 | )% | | | 1.10 | % | | | 0.95 | % | | | 31.25 | % | | | 109 | % | | $ | 71,336 | |
| | (0.27 | )% | | | 1.03 | % | | | 0.95 | % | | | (10.78 | )% | | | 107 | % | | $ | 9,692 | |
| | (0.61 | )% | | | 1.01 | % | | | 0.95 | % | | | 39.59 | % | | | 70 | % | | $ | 91,704 | |
| | (0.25 | )% | | | 1.05 | % | | | 0.95 | % | | | 14.98 | % | | | 129 | % | | $ | 1,175 | |
The accompanying notes are an integral part of these financial statements.
| | | | |
| 50 | | Wells Fargo Equity Gateway Funds | | Financial highlights |
| | | | | | | | | | | | | | | | | | | | |
| Small Company Value Fund | | Beginning
net asset
value per
share | | | Net
investment
income (loss)1 | | | Net realized
and unrealized
gains (losses)
on investments | | | Distributions
from net
investment
income | | | Ending
net asset
value per
share | |
Class A | | | | | | | | | | | | | | | | | | | | |
Six months ended November 30, 2015 (unaudited) | | $ | 21.42 | | | | 0.03 | | | | (0.90 | ) | | | 0.00 | | | $ | 20.55 | |
Year ended May 31, 2015 | | $ | 20.08 | | | | 0.07 | | | | 1.27 | | | | 0.00 | | | $ | 21.42 | |
Year ended May 31, 2014 | | $ | 17.10 | | | | 0.06 | | | | 2.92 | | | | 0.00 | | | $ | 20.08 | |
Year ended May 31, 2013 | | $ | 13.17 | | | | (0.00 | )4 | | | 3.93 | | | | 0.00 | | | $ | 17.10 | |
Year ended May 31, 2012 | | $ | 14.36 | | | | 0.03 | | | | (1.11 | ) | | | (0.11 | ) | | $ | 13.17 | |
Year ended May 31, 20115 | | $ | 11.38 | | | | 0.11 | | | | 2.87 | | | | 0.00 | | | $ | 14.36 | |
Year ended September 30, 2010 | | $ | 9.84 | | | | (0.02 | ) | | | 1.56 | | | | 0.00 | | | $ | 11.38 | |
Class B | | | | | | | | | | | | | | | | | | | | |
Six months ended November 30, 2015 (unaudited) | | $ | 19.46 | | | | (0.05 | )6 | | | (0.81 | ) | | | 0.00 | | | $ | 18.60 | |
Year ended May 31, 2015 | | $ | 18.38 | | | | (0.08 | )6 | | | 1.16 | | | | 0.00 | | | $ | 19.46 | |
Year ended May 31, 2014 | | $ | 15.74 | | | | (0.05 | )6 | | | 2.69 | | | | 0.00 | | | $ | 18.38 | |
Year ended May 31, 2013 | | $ | 12.21 | | | | (0.10 | )6 | | | 3.63 | | | | 0.00 | | | $ | 15.74 | |
Year ended May 31, 2012 | | $ | 13.30 | | | | (0.08 | )6 | | | (1.01 | ) | | | 0.00 | | | $ | 12.21 | |
Year ended May 31, 20115 | | $ | 10.59 | | | | 0.04 | 6 | | | 2.67 | | | | 0.00 | | | $ | 13.30 | |
Year ended September 30, 2010 | | $ | 9.20 | | | | (0.10 | )6 | | | 1.49 | | | | 0.00 | | | $ | 10.59 | |
Class C | | | | | | | | | | | | | | | | | | | | |
Six months ended November 30, 2015 (unaudited) | | $ | 19.34 | | | | (0.05 | )6 | | | (0.80 | ) | | | 0.00 | | | $ | 18.49 | |
Year ended May 31, 2015 | | $ | 18.27 | | | | (0.08 | )6 | | | 1.15 | | | | 0.00 | | | $ | 19.34 | |
Year ended May 31, 2014 | | $ | 15.68 | | | | (0.07 | )6 | | | 2.66 | | | | 0.00 | | | $ | 18.27 | |
Year ended May 31, 2013 | | $ | 12.16 | | | | (0.10 | )6 | | | 3.62 | | | | 0.00 | | | $ | 15.68 | |
Year ended May 31, 2012 | | $ | 13.30 | | | | (0.08 | )6 | | | (1.02 | ) | | | (0.04 | ) | | $ | 12.16 | |
Year ended May 31, 20115 | | $ | 10.59 | | | | 0.02 | 6 | | | 2.69 | | | | 0.00 | | | $ | 13.30 | |
Year ended September 30, 2010 | | $ | 9.20 | | | | (0.09 | )6 | | | 1.48 | | | | 0.00 | | | $ | 10.59 | |
Administrator Class | | | | | | | | | | | | | | | | | | | | |
Six months ended November 30, 2015 (unaudited) | | $ | 21.90 | | | | 0.05 | | | | (0.92 | ) | | | 0.00 | | | $ | 21.03 | |
Year ended May 31, 2015 | | $ | 20.49 | | | | 0.11 | | | | 1.30 | | | | 0.00 | | | $ | 21.90 | |
Year ended May 31, 2014 | | $ | 17.42 | | | | 0.12 | | | | 2.95 | | | | 0.00 | | | $ | 20.49 | |
Year ended May 31, 2013 | | $ | 13.39 | | | | 0.03 | 6 | | | 4.01 | | | | (0.01 | ) | | $ | 17.42 | |
Year ended May 31, 2012 | | $ | 14.60 | | | | 0.06 | | | | (1.13 | ) | | | (0.14 | ) | | $ | 13.39 | |
Year ended May 31, 20115 | | $ | 11.55 | | | | 0.12 | 6 | | | 2.93 | | | | 0.00 | | | $ | 14.60 | |
Year ended September 30, 2010 | | $ | 9.94 | | | | (0.02 | ) | | | 1.63 | | | | 0.00 | | | $ | 11.55 | |
Institutional Class | | | | | | | | | | | | | | | | | | | | |
Six months ended November 30, 2015 (unaudited) | | $ | 22.02 | | | | 0.07 | 6 | | | (0.92 | ) | | | 0.00 | | | $ | 21.17 | |
Year ended May 31, 2015 | | $ | 20.57 | | | | 0.14 | | | | 1.31 | | | | 0.00 | | | $ | 22.02 | |
Year ended May 31, 2014 | | $ | 17.45 | | | | 0.13 | | | | 2.99 | | | | 0.00 | | | $ | 20.57 | |
Year ended May 31, 2013 | | $ | 13.41 | | | | 0.06 | 6 | | | 4.03 | | | | (0.05 | ) | | $ | 17.45 | |
Year ended May 31, 2012 | | $ | 14.63 | | | | 0.11 | | | | (1.17 | ) | | | (0.16 | ) | | $ | 13.41 | |
Year ended May 31, 20115 | | $ | 11.55 | | | | 0.13 | 6 | | | 2.95 | | | | 0.00 | | | $ | 14.63 | |
Year ended September 30, 20107 | | $ | 11.26 | | | | 0.02 | | | | 0.27 | | | | 0.00 | | | $ | 11.55 | |
| 1 | Includes net expenses allocated from the affiliated Master Portfolio in which the Fund invests. |
| 2 | Total return calculations do not include any sales charges. Returns for periods of less than one year are not annualized. |
| 3 | Portfolio turnover rate is calculated by multiplying the Fund’s investment percentage in the affiliated Master Portfolio by the affiliated Master Portfolio’s portfolio turnover rate. |
| 4 | Amount is less than $0.005. |
| 5 | For the eight months ended May 31, 2011. The Fund changed its fiscal year end from September 30 to May 31, effective May 31, 2011. |
| 6 | Calculated based upon average shares outstanding |
| 7 | For the period from July 30, 2010 (commencement of class operations) to September 30, 2010 |
The accompanying notes are an integral part of these financial statements.
| | | | | | |
| Financial highlights | | Wells Fargo Equity Gateway Funds | | | 51 | |
| | | | | | | | | | | | | | | | | | | | | | |
| Ratio to average net assets (annualized) | | | Total
return2 | | | Portfolio
turnover
rate3 | | | Net assets at
end of period
(000s omitted) | |
Net investment
income (loss)1 | | | Gross
expenses1 | | | Net
expenses1 | | | | |
| | | | | | | | | | | | | | | | | | | | | | |
| | 0.25 | % | | | 1.48 | % | | | 1.38 | % | | | (4.02 | )% | | | 34 | % | | $ | 24,086 | |
| | 0.33 | % | | | 1.50 | % | | | 1.40 | % | | | 6.62 | % | | | 54 | % | | $ | 26,339 | |
| | 0.33 | % | | | 1.56 | % | | | 1.42 | % | | | 17.43 | % | | | 47 | % | | $ | 26,517 | |
| | (0.02 | )% | | | 1.57 | % | | | 1.45 | % | | | 29.84 | % | | | 57 | % | | $ | 21,652 | |
| | 0.08 | % | | | 1.50 | % | | | 1.45 | % | | | (7.44 | )% | | | 60 | % | | $ | 18,605 | |
| | 1.07 | % | | | 1.49 | % | | | 1.42 | % | | | 26.19 | % | | | 47 | % | | $ | 26,222 | |
| | (0.21 | )% | | | 1.65 | % | | | 1.45 | % | | | 15.53 | % | | | 60 | % | | $ | 22,492 | |
| | | | | | | | | | | | | | | | | | | | | | |
| | (0.51 | )% | | | 2.20 | % | | | 2.13 | % | | | (4.42 | )% | | | 34 | % | | $ | 24 | |
| | (0.44 | )% | | | 2.24 | % | | | 2.15 | % | | | 5.88 | % | | | 54 | % | | $ | 11 | |
| | (0.29 | )% | | | 2.15 | % | | | 2.02 | % | | | 16.77 | % | | | 47 | % | | $ | 58 | |
| | (0.75 | )% | | | 2.31 | % | | | 2.20 | % | | | 28.91 | % | | | 57 | % | | $ | 197 | |
| | (0.67 | )% | | | 2.25 | % | | | 2.20 | % | | | (8.20 | )% | | | 60 | % | | $ | 500 | |
| | 0.45 | % | | | 2.25 | % | | | 2.17 | % | | | 25.59 | % | | | 47 | % | | $ | 1,340 | |
| | (0.99 | )% | | | 2.40 | % | | | 2.20 | % | | | 14.98 | % | | | 60 | % | | $ | 2,079 | |
| | | | | | | | | | | | | | | | | | | | | | |
| | (0.50 | )% | | | 2.23 | % | | | 2.13 | % | | | (4.40 | )% | | | 34 | % | | $ | 2,246 | |
| | (0.42 | )% | | | 2.26 | % | | | 2.15 | % | | | 5.86 | % | | | 54 | % | | $ | 2,602 | |
| | (0.42 | )% | | | 2.31 | % | | | 2.17 | % | | | 16.52 | % | | | 47 | % | | $ | 2,192 | |
| | (0.76 | )% | | | 2.32 | % | | | 2.20 | % | | | 28.95 | % | | | 57 | % | | $ | 1,814 | |
| | (0.68 | )% | | | 2.25 | % | | | 2.20 | % | | | (8.20 | )% | | | 60 | % | | $ | 1,557 | |
| | 0.29 | % | | | 2.24 | % | | | 2.17 | % | | | 25.59 | % | | | 47 | % | | $ | 2,150 | |
| | (0.94 | )% | | | 2.40 | % | | | 2.20 | % | | | 14.98 | % | | | 60 | % | | $ | 1,763 | |
| | | | | | | | | | | | | | | | | | | | | | |
| | 0.43 | % | | | 1.39 | % | | | 1.20 | % | | | (3.97 | )% | | | 34 | % | | $ | 68,151 | |
| | 0.52 | % | | | 1.34 | % | | | 1.20 | % | | | 6.88 | % | | | 54 | % | | $ | 71,034 | |
| | 0.55 | % | | | 1.39 | % | | | 1.20 | % | | | 17.62 | % | | | 47 | % | | $ | 68,358 | |
| | 0.23 | % | | | 1.40 | % | | | 1.20 | % | | | 30.21 | % | | | 57 | % | | $ | 60,550 | |
| | 0.32 | % | | | 1.33 | % | | | 1.20 | % | | | (7.24 | )% | | | 60 | % | | $ | 60,333 | |
| | 1.34 | % | | | 1.33 | % | | | 1.20 | % | | | 26.41 | % | | | 47 | % | | $ | 70,022 | |
| | (0.05 | )% | | | 1.47 | % | | | 1.20 | % | | | 16.20 | % | | | 60 | % | | $ | 60,081 | |
| | | | | | | | | | | | | | | | | | | | | | |
| | 0.64 | % | | | 1.13 | % | | | 1.00 | % | | | (3.86 | )% | | | 34 | % | | $ | 31,786 | |
| | 0.75 | % | | | 1.07 | % | | | 1.00 | % | | | 7.05 | % | | | 54 | % | | $ | 16,850 | |
| | 0.75 | % | | | 1.13 | % | | | 1.00 | % | | | 17.88 | % | | | 47 | % | | $ | 11,967 | |
| | 0.40 | % | | | 1.14 | % | | | 1.00 | % | | | 30.54 | % | | | 57 | % | | $ | 8,185 | |
| | 0.59 | % | | | 1.05 | % | | | 1.00 | % | | | (7.14 | )% | | | 60 | % | | $ | 62 | |
| | 1.42 | % | | | 1.02 | % | | | 0.96 | % | | | 26.67 | % | | | 47 | % | | $ | 16 | |
| | 1.02 | % | | | 1.15 | % | | | 1.00 | % | | | 2.58 | % | | | 60 | % | | $ | 10 | |
The accompanying notes are an integral part of these financial statements.
| | | | |
| 52 | | Wells Fargo Equity Gateway Funds | | Notes to financial statements (unaudited) |
1. ORGANIZATION
Wells Fargo Funds Trust (the “Trust”), a Delaware statutory trust organized on March 10, 1999, is an open-end management investment company registered under the Investment Company Act of 1940, as amended (the “1940 Act”). As an investment company, the Trust follows the accounting and reporting guidance in Financial Accounting Standards Board (“FASB”) Accounting Standards Codification Topic 946, Financial Services – Investment Companies. These financial statements report on the following funds: Wells Fargo C&B Large Cap Value Fund (“C&B Large Cap Value Fund”), Wells Fargo Diversified Equity Fund (“Diversified Equity Fund “), Wells Fargo Emerging Growth Fund (“Emerging Growth Fund”), Wells Fargo Index Fund (“Index Fund” ), Wells Fargo International Value Fund (“International Value Fund” ), Wells Fargo Small Company Growth Fund (“Small Company Growth Fund”) and Wells Fargo Small Company Value Fund (“Small Company Value Fund”) (each, a “Fund”, collectively, the “Funds”). Each Fund is a diversified series of the Trust.
After the close of business on October 23, 2015, Investor Class shares became Class A shares in a tax-free conversion. Shareholders of Investor Class in the applicable funds received Class A shares at a value equal to the value of their Investor Class shares immediately prior to the conversion. Investor Class shares are no longer offered by the applicable funds.
Each Fund seeks to achieve its investment objective by investing all investable assets in one or more separate diversified portfolios (each, an “affiliated Master Portfolio”, collectively, the “affiliated Master Portfolios”) of Wells Fargo Master Trust, a registered open-end management investment company. Each affiliated Master Portfolio directly acquires portfolio securities, and a Fund investing in an affiliated Master Portfolio acquires an indirect interest in those securities. Each Fund accounts for its investment in the affiliated Master Portfolios as partnership investments and records on a daily basis its share of the affiliated Master Portfolio’s income, expense and realized and unrealized gains and losses. The financial statements of the affiliated Master Portfolios for the six months ended November 30, 2015 are included in this report and should be read in conjunction with each Fund’s financial statements. As of November 30, 2015, the Funds own the following percentages of the affiliated Master Portfolios:
| | | | | | | | | | | | | | | | | | | | | | | | | | |
| | | C&B
Large Cap
Value
Fund | | | Diversified
Equity
Fund | | | Emerging
Growth
Fund | | | Index
Fund | | | International
Value Fund | | Small
Company
Growth
Fund | | | Small
Company
Value
Fund | |
Wells Fargo C&B Large Cap Value Portfolio | | | 88 | % | | | 6 | % | | | N/A | | | | N/A | | | N/A | | | N/A | | | | N/A | |
Wells Fargo Diversified Large Cap Growth Portfolio | | | N/A | | | | 49 | % | | | N/A | | | | N/A | | | N/A | | | N/A | | | | N/A | |
Wells Fargo Emerging Growth Portfolio | | | N/A | | | | 1 | % | | | 92 | % | | | N/A | | | N/A | | | N/A | | | | N/A | |
Wells Fargo Index Portfolio | | | N/A | | | | 2 | % | | | N/A | | | | 95 | % | | N/A | | | N/A | | | | N/A | |
Wells Fargo International Growth Portfolio | | | N/A | | | | 11 | % | | | N/A | | | | N/A | | | N/A | | | N/A | | | | N/A | |
Wells Fargo International Value Portfolio | | | N/A | | | | 3 | % | | | N/A | | | | N/A | | | 93% | | | N/A | | | | N/A | |
Wells Fargo Large Company Value Portfolio | | | N/A | | | | 49 | % | | | N/A | | | | N/A | | | N/A | | | N/A | | | | N/A | |
Wells Fargo Small Company Growth Portfolio | | | N/A | | | | 1 | % | | | N/A | | | | N/A | | | N/A | | | 99 | % | | | N/A | |
Wells Fargo Small Company Value Portfolio | | | N/A | | | | 6 | % | | | N/A | | | | N/A | | | N/A | | | N/A | | | | 53 | % |
2. SIGNIFICANT ACCOUNTING POLICIES
The following significant accounting policies, which are consistently followed in the preparation of the financial statements of each Fund, are in conformity with U.S. generally accepted accounting principles which require management to make estimates and assumptions that affect the reported amounts of assets and liabilities, disclosure of contingent assets and liabilities at the date of the financial statements, and the reported amounts of revenues and expenses during the reporting period. Actual results could differ from those estimates.
Securities valuation
All investments are valued each business day as of the close of regular trading on the New York Stock Exchange (generally 4 p.m. Eastern Time).
Investments in the affiliated Master Portfolios are valued daily based on each Fund’s proportionate share of each affiliated Master Portfolio’s net assets, which are also valued daily. Securities held in the affiliated Master Portfolios are valued as discussed in the Notes to Financial Statements of the affiliated Master Portfolios, which are included elsewhere in this report.
| | | | | | |
| Notes to financial statements (unaudited) | | Wells Fargo Equity Gateway Funds | | | 53 | |
Security transactions and income recognition
Securities transactions are recorded on a trade date basis in each affiliated Master Portfolio. Realized gains or losses in each affiliated Master Portfolio are recorded on the basis of identified cost.
Interest income is accrued daily and bond discounts are accreted and premiums are amortized daily based on the effective interest method by each affiliated Master Portfolio. To the extent debt obligations are placed on non-accrual status, any related interest income may be reduced by writing off interest receivables when the collection of all or a portion of interest has become doubtful based on consistently applied procedures. If the issuer subsequently resumes interest payments or when the collectability of interest is reasonably assured, the debt obligation is removed from non-accrual status.
Dividend income in each affiliated Master Portfolio is recognized on the ex-dividend date, except for certain dividends from foreign securities which are recorded as soon as the custodian verifies the ex-dividend date. Dividend income from foreign securities in each affiliated Master Portfolio is recorded net of foreign taxes withheld where recovery of such taxes is not assured.
Each Fund records daily its proportionate share of each affiliated Master Portfolio’s interest and dividend income and realized and unrealized gains or losses.
Distributions to shareholders
Distributions to shareholders from net investment income and net realized gains, if any, are recorded on the ex-dividend date. Such distributions are determined in conformity with federal income tax regulations, which may differ in amount or character from net investment income and realized gains recognized for purposes of U.S. generally accepted accounting principles.
Federal and other taxes
Each Fund is treated as a separate entity for federal income tax purposes. Each Fund intends to continue to qualify as a regulated investment company by distributing substantially all of its investment company taxable income and any net realized capital gains (after reduction for capital loss carryforwards) sufficient to relieve it from all, or substantially all, federal income taxes. Accordingly, no provision for federal income taxes was required.
Each Fund’s income and federal excise tax returns and all financial records supporting those returns for the prior three fiscal years are subject to examination by the federal and Delaware revenue authorities. Management has analyzed each Fund’s tax positions taken on federal, state, and foreign tax returns for all open tax years and does not believe that there are any uncertain tax positions that require recognition of a tax liability.
At May 31, 2015, capital loss carryforwards available to offset future net realized capital gains were as follows through the indicated expiration dates:
| | | | | | | | | | | | | | | | |
| | | 2016 | | | 2017 | | | 2018 | | | 2019 | |
C&B Large Cap Value Fund | | $ | 0 | | | $ | 0 | | | $ | 0 | | | $ | 2,818,684 | |
International Value Fund | | | 0 | | | | 0 | | | | 31,783,032 | | | | 4,561,591 | |
Small Company Growth Fund | | | 273,409 | | | | 273,409 | | | | 0 | | | | 0 | |
Small Company Value Fund | | | 0 | | | | 550,192 | | | | 80,412,918 | | | | 0 | |
At May 31, 2015, qualified late-year ordinary losses which were recognized on the first day of the current fiscal year were as follows:
| | | | |
| | | Late-year ordinary loss | |
Emerging Growth Fund | | $ | 3,804,464 | |
Small Company Growth Fund | | | 977,160 | |
Class allocations
The separate classes of shares offered by each Fund differ principally in applicable sales charges, distribution, shareholder servicing, and administration fees. Class specific expenses are charged directly to that share class. Investment income, common expenses, and realized and unrealized gains (losses) on investments are allocated daily to each class of shares based on the relative proportion of net assets of each class.
| | | | |
| 54 | | Wells Fargo Equity Gateway Funds | | Notes to financial statements (unaudited) |
3. FAIR VALUATION MEASUREMENTS
Fair value measurements of investments are determined within a framework that has established a fair value hierarchy based upon the various data inputs utilized in determining the value of each Fund’s investments. The three-level hierarchy gives the highest priority to unadjusted quoted prices in active markets for identical assets or liabilities (Level 1) and the lowest priority to significant unobservable inputs (Level 3). Each Fund’s investments are classified within the fair value hierarchy based on the lowest level of input that is significant to the fair value measurement. The inputs are summarized into three broad levels as follows:
| n | | Level 1 – quoted prices in active markets for identical securities |
| n | | Level 2 – other significant observable inputs (including quoted prices for similar securities, interest rates, prepayment speeds, credit risk, use of amortized cost, etc.) |
| n | | Level 3 – significant unobservable inputs (including the Fund’s own assumptions in determining the fair value of investments) |
The inputs or methodologies used for valuing investments in securities are not necessarily an indication of the risk associated with investing in those securities.
At November 30, 2015, each Fund’s investments in an affiliated Master Portfolio carried at fair value were designated as Level 2 inputs. Further details on the investments of the affiliated Master Portfolios can be found in the Portfolio of Investments or Summary Portfolio of Investments of each affiliated Master Portfolio which is contained elsewhere in this report.
The Funds recognize transfers between levels within the fair value hierarchy at the end of the reporting period. At November 30, 2015, the Funds did not have any transfers into/out of Level 1, Level 2, or Level 3.
4. TRANSACTIONS WITH AFFILIATES
Management fee
Wells Fargo Funds Management, LLC (“Funds Management”), an indirect wholly owned subsidiary of Wells Fargo & Company (“Wells Fargo”), is the manager of each Fund. For each Fund that invests all of its assets in a single affiliated Master Portfolio, Funds Management does not currently receive a management fee. For Diversified Equity Fund which invests in multiple affiliated Master Portfolios, Funds Management is entitled to receive a management fee for providing advisory and fund-level administrative services under an investment management agreement, including the determination of the asset allocations of its investments in the various affiliated Master Portfolios. Under the investment management agreement, Funds Management is responsible for, among other services, implementing the investment objectives and strategies of Diversified Equity Fund, supervising the applicable subadvisers, providing fund-level administrative services in connection with the Fund’s operations, and providing any other fund-level administrative services reasonably necessary for the operation of the Fund. As compensation for its services under the investment management agreement, Funds Management is entitled to receive an annual management fee starting at 0.30% and declining to 0.22% as the average daily net assets of Diversified Equity Fund increase.
Prior to July 1, 2015, Funds Management provided advisory services pursuant to an investment advisory agreement for Diversified Equity Fund and was entitled to receive an annual fee which started at 0.25% and declined to 0.19% as its average daily net assets increased. In addition, fund-level administrative services were provided by Funds Management under a separate administration agreement at an annual fee which started at 0.05% and declined to 0.03% as the average daily net assets of Diversified Equity Fund increased. For each Fund that invested all of its assets in a single affiliated Master Portfolio prior to July 1, 2015, Funds Management did not receive an advisory fee. For financial statement purposes, the advisory fee and fund-level administration fee for the six months ended November 30,2015 have been included in management fee on the Statement of Operations for Diversified Equity Fund.
For the six months ended November 30, 2015, the management fee for Diversified Equity Fund was equivalent to an annual rate of 0.30% of its average daily net assets.
Funds Management also serves as the adviser to each affiliated Master Portfolio and is entitled to receive a fee from each affiliated Master Portfolio for those services.
Administration fees
Under a class-level administration agreement, Funds Management provides class-level administrative services to the Fund, which includes paying fees and expenses for services provided by the transfer agent, sub-transfer agents, omnibus account
| | | | | | |
| Notes to financial statements (unaudited) | | Wells Fargo Equity Gateway Funds | | | 55 | |
servicers and record-keepers. As compensation for its services under the class-level administration agreement, Funds Management receives an annual fee which is calculated based on the average daily net assets of each class as follows:
| | | | | | | | |
| | | Class-level administration fee | |
| | | Current rate | | | Rate prior to
July 1, 2015 | |
Class A, Class B, Class C | | | 0.21 | % | | | 0.26 | % |
Class R6 | | | 0.03 | | | | 0.03 | |
Administrator Class | | | 0.13 | | | | 0.10 | |
Institutional Class | | | 0.13 | | | | 0.08 | |
Investor Class | | | 0.32 | | | | 0.32 | |
Funds Management has contractually waived and/or reimbursed management and administration fees to the extent necessary to maintain certain net operating expense ratios for the Funds. Waiver of fees and/or reimbursement of expenses by Funds Management were made first from fund level expenses on a proportionate basis and then from class specific expenses. Funds Management has committed to waive fees and/or reimburse expenses to the extent necessary to cap each Fund’s expenses as follows:
| | | | | | | | | | | | | | | | | | | | | | | | | | | | |
| | | Expiration date | | | Class A | | | Class B | | | Class C | | | Class R6 | | | Administrator
Class | | | Institutional
Class | |
C&B Large Cap Value Fund | | | September 30, 2016 | | | | 1.15 | % | | | 1.90 | % | | | 1.90 | % | | | N/A | | | | 1.00 | % | | | 0.80 | % |
Diversified Equity Fund | | | September 30, 2016 | | | | 1.25 | | | | 2.00 | | | | 2.00 | | | | N/A | | | | 1.00 | | | | N/A | |
Emerging Growth Fund | | | September 30, 2016 | | | | 1.35 | | | | N/A | | | | 2.10 | | | | N/A | | | | 1.20 | | | | 0.90 | |
Index Fund | | | September 30, 2017 | | | | 0.45 | | | | 1.20 | | | | 1.20 | | | | N/A | | | | 0.25 | * | | | N/A | |
International Value Fund | | | September 30, 2016 | | | | 1.35 | | | | 2.10 | | | | 2.10 | | | | N/A | | | | 1.25 | | | | 1.00 | |
Small Company Growth Fund | | | September 30, 2016 | | | | 1.35 | | | | 2.10 | | | | 2.10 | | | | 0.90 | % | | | 1.20 | | | | 0.95 | |
Small Company Value Fund | | | September 30, 2016 | | | | 1.35 | | | | 2.10 | | | | 2.10 | | | | N/A | | | | 1.20 | | | | 1.00 | |
| * | The expiration date for Administrator Class is September 30, 2016. |
After November 30, 2015, the cap may be increased or the commitment to maintain the cap may be terminated only with the approval of the Board of Trustees.
Prior to the following dates, the expense caps for the following Funds and classes were as follows:
| | | | | | | | | | | | | | | | | | | | | | | | | | | | |
| | | Prior to | | | Class A | | | Class B | | | Class C | | | Class R6 | | | Administrator
Class | | | Institutional
Class | |
C&B Large Cap Value Fund | | | September 30, 2015 | | | | 1.15 | % | | | 1.90 | % | | | 1.90 | % | | | N/A | | | | 0.95 | % | | | 0.70 | % |
Diversified Equity Fund | | | September 30, 2015 | | | | 1.25 | | | | 2.00 | | | | 2.00 | | | | N/A | | | | 1.00 | | | | N/A | |
Emerging Growth Fund | | | September 30, 2015 | | | | 1.37 | | | | N/A | | | | 2.12 | | | | N/A | | | | 1.20 | | | | 0.90 | |
Index Fund | | | September 30, 2015 | | | | 0.56 | | | | 1.31 | | | | 1.31 | | | | N/A | | | | 0.25 | | | | N/A | |
International Value Fund | | | September 30, 2015 | | | | 1.50 | | | | 2.25 | | | | 2.25 | | | | N/A | | | | 1.25 | | | | 1.05 | |
Small Company Growth Fund | | | September 30, 2015 | | | | 1.40 | | | | 2.15 | | | | 2.15 | | | | 0.90 | % | | | 1.20 | | | | 0.95 | |
Small Company Value Fund | | | September 30, 2015 | | | | 1.40 | | | | 2.15 | | | | 2.15 | | | | N/A | | | | 1.20 | | | | 1.00 | |
Distribution fees
The Trust has adopted a Distribution Plan for Class B and Class C shares of the applicable Funds pursuant to Rule 12b-1 under the 1940 Act. Distribution fees are charged to the Class B and Class C shares and paid to Wells Fargo Funds Distributor, LLC (“Funds Distributor”), the principal underwriter of each Fund, at an annual rate of 0.75% of the average daily net assets of Class B and Class C shares.
In addition, Funds Distributor is entitled to receive the front-end sales charge from the purchase of Class A shares and a contingent deferred sales charge on the redemption of certain Class A shares. Funds Distributor is also entitled to receive
| | | | |
| 56 | | Wells Fargo Equity Gateway Funds | | Notes to financial statements (unaudited) |
the contingent deferred sales charges from redemptions of Class B and Class C shares. For the six months ended November 30, 2015, Funds Distributor received the following amounts in front-end sales charges and contingent deferred sales charges.
| | | | | | | | | | | | |
| | | Front-end
sales charges Class A | | | Contingent deferred sales charges | |
| | | | Class B | | | Class C | |
C&B Large Cap Value Fund | | $ | 275 | | | $ | 0 | | | $ | 50 | |
Diversified Equity Fund | | | 7,141 | | | | 0 | | | | 0 | |
Emerging Growth Fund | | | 867 | | | | N/A | | | | 0 | |
Index Fund | | | 4,110 | | | | 1,109 | | | | 11 | |
International Value Fund | | | 1,902 | | | | 0 | | | | 0 | |
Small Company Growth Fund | | | 32,170 | | | | 0 | | | | 499 | |
Small Company Value Fund | | | 435 | | | | 0 | | | | 0 | |
Shareholder servicing fees
The Trust has entered into contracts with one or more shareholder servicing agents, whereby Class A, Class B, Class C, Administrator Class and Investor Class of each applicable Fund is charged a fee at an annual rate of 0.25% of the average daily net assets of each respective class. Administrator Class of the Index Fund is charged a fee at an annual rate of 0.10% of its average daily net assets.
A portion of these total shareholder servicing fees were paid to affiliates of Wells Fargo.
5. INVESTMENT PORTFOLIO TRANSACTIONS
Purchases and sales of investments, excluding U.S. Government obligations (if any) and short-term securities, for the six months ended November 30, 2015 were as follows:
| | | | | | | | |
| | | Purchases at cost* | | | Sales proceeds* | |
C&B Large Cap Value Fund | | $ | 50,258,103 | | | $ | 55,131,663 | |
Diversified Equity Fund | | | 47,523,082 | | | | 50,979,175 | |
Emerging Growth Fund | | | 391,518,616 | | | | 425,401,257 | |
Index Fund | | | 49,159,589 | | | | 208,986,760 | |
International Value Fund | | | 39,222,942 | | | | 23,620,586 | |
Small Company Growth Fund | | | 689,391,434 | | | | 218,538,092 | |
Small Company Value Fund | | | 35,729,463 | | | | 35,986,993 | |
| * | The Funds seek to achieve their investment objective by investing all of their investable assets in affiliated Master Portfolios. Purchases and sales related to these investments have been calculated by multiplying each Fund’s ownership percentage of the respective affiliated Master Portfolio by the corresponding affiliated Master Portfolio’s purchases and sales. The results of these amounts are then aggregated. |
6. BANK BORROWINGS
The Trust (excluding the money market funds and certain other funds) and Wells Fargo Variable Trust are parties to a $200,000,000 revolving credit agreement whereby the Funds are permitted to use bank borrowings for temporary or emergency purposes, such as to fund shareholder redemption requests. Interest under the credit agreement is charged to each Fund based on a borrowing rate equal to the higher of the Federal Funds rate in effect on that day plus 1.25% or the overnight LIBOR rate in effect on that day plus 1.25%. In addition, an annual commitment fee equal to 0.20% of the unused balance is allocated to each participating fund.
Prior to September 1, 2015, the Funds, except Diversified Equity Fund, were are parties to a $150,000,000 revolving credit agreement. Diversified Equity Fund and certain other funds in the Trust were parties to a $25,000,000 revolving credit agreement. Interest under each credit agreement was charged to each Fund based on a borrowing rate equal to the higher of the Federal Funds rate in effect on that day plus 1.25% or the overnight LIBOR rate in effect on that day plus 1.25%. In addition, the applicable Funds paid an annual commitment fee equal to 0.10% under the $150,000,000 credit agreement and an annual commitment fee equal to 0.15% under the $25,000,000 credit agreement. The annual commitment fee applied on the unused balance for each credit agreement was allocated to each participating fund.
| | | | | | |
| Notes to financial statements (unaudited) | | Wells Fargo Equity Gateway Funds | | | 57 | |
For the six months ended November 30, 2015, the Funds paid the following amounts in commitment fees:
| | | | |
| | | Commitment fee | |
C&B Large Cap Value Fund | | $ | 285 | |
Diversified Equity Fund | | | 326 | |
Emerging Growth Fund | | | 1,004 | |
Index Fund | | | 2,425 | |
International Value Fund | | | 573 | |
Small Company Growth Fund | | | 1,018 | |
Small Company Value Fund | | | 135 | |
During the six months ended November 30, 2015, the Index Fund had average borrowings outstanding of $36,187 (on an annualized basis) at an average rate of 1.39% and paid interest in the amount of $510.
7. CONCENTRATION RISK
Concentration risks result from exposure to a limited number of sectors. Through their investments in affiliated Master Portfolio(s), Funds that invest a substantial portion of their assets in a sector may be more affected by changes in that sector than would be a fund whose investments are not heavily weighted in any sector.
8. INDEMNIFICATION
Under the Trust’s organizational documents, the officers and Trustees have been granted certain indemnification rights against certain liabilities that may arise out of performance of their duties to the Trust. Additionally, in the normal course of business, the Trust may enter into contracts with service providers that contain a variety of indemnification clauses. The Trust’s maximum exposure under these arrangements is dependent on future claims that may be made against the Funds and, therefore, cannot be estimated.
9. SUBSEQUENT DISTRIBUTIONS
On December 9, 2015, the following Funds declared distributions from capital gains to shareholders of record on December 8, 2015. The per share amounts payable on December 10, 2015 were as follows:
| | | | | | | | |
| | | Diversified
Equity Fund | | | Index
Fund | |
Short-term capital gains | | | | | | | | |
Class A | | $ | 0.10552 | | | $ | 0.03608 | |
Class B | | | 0.10552 | | | | 0.03608 | |
Class C | | | 0.10552 | | | | 0.03608 | |
Administrator Class | | | 0.10552 | | | | 0.03608 | |
| | | | | | | | | | | | | | | | | | | | |
| | | C&B Large
Cap Value
Fund | | | Diversified
Equity
Fund | | | Emerging
Growth
Fund | | | Index
Fund | | | Small Company
Growth Fund | |
Long-term capital gains | | | | | | | | | | | | | | | | | | | | |
Class A | | $ | 0.39460 | | | $ | 3.48987 | | | $ | 1.74140 | | | $ | 3.99679 | | | $ | 0.26844 | |
Class B | | | 0.39460 | | | | 3.48987 | | | | N/A | | | | 3.99679 | | | | 0.26844 | |
Class C | | | 0.39460 | | | | 3.48987 | | | | 1.74140 | | | | 3.99679 | | | | 0.26844 | |
Classs R6 | | | N/A | | | | N/A | | | | N/A | | | | N/A | | | | 0.26844 | |
Administrator Class | | | 0.39460 | | | | 3.48987 | | | | 1.74140 | | | | 3.99679 | | | | 0.26844 | |
Institutional Class | | | 0.39460 | | | | N/A | | | | 1.74140 | | | | N/A | | | | 0.26844 | |
| | | | |
| 58 | | Wells Fargo Equity Gateway Funds | | Notes to financial statements (unaudited) |
On December 18, 2015, the following Funds declared distributions from net investment income to shareholders of record on December 17, 2015. The per share amounts payable on December 21, 2015 were as follows:
| | | | | | | | | | | | | | | | |
| | | C&B Large Cap Value
Fund | | | Diversified
Equity
Fund | | | Index Fund | | | Small Company
Value Fund | |
Net investment income | | | | | | | | | | | | | | | | |
Class A | | $ | 0.09766 | | | $ | 0.08303 | | | $ | 1.07806 | | | $ | 0.02553 | |
Class B | | | 0.00000 | | | | 0.00000 | | | | 0.29237 | | | | 0.00000 | |
Class C | | | 0.00954 | | | | 0.00000 | | | | 0.57356 | | | | 0.00000 | |
Administrator Class | | | 0.12102 | | | | 0.15643 | | | | 1.23985 | | | | 0.07120 | |
Institutional Class | | | 0.15703 | | | | N/A | | | | N/A | | | | 0.11320 | |
On December 30, 2015, the following Fund declared distributions from net investment income to shareholders of record on December 29, 2015. The per share amounts payable on December 31, 2015 were as follows:
| | | | |
| | | International
Value Fund | |
Net investment income | | | | |
Class A | | $ | 0.19562 | |
Class C | | | 0.09875 | |
Institutional Class | | | 0.25790 | |
These distributions are not reflected in the accompanying financial statements. The final determination of the source of all distributions is subject to change and made after the tax year-end of each Fund.
| | | | | | |
| Portfolio of investments—November 30, 2015 (unaudited) | | Wells Fargo Equity Gateway Funds | | | 59 | |
C&B LARGE CAP VALUE PORTFOLIO
| | | | | | | | | | | | |
| Security name | | | | | | Shares | | | Value | |
| | | | |
Common Stocks: 96.68% | | | | | | | | | | | | |
| | | | |
Consumer Discretionary: 13.74% | | | | | | | | | | | | |
| | | | |
| Hotels, Restaurants & Leisure: 3.33% | | | | | | | | | | | | |
Brinker International Incorporated | | | | | | | 67,300 | | | $ | 3,070,226 | |
Carnival Corporation | | | | | | | 148,100 | | | | 7,483,493 | |
| | | | |
| | | | | | | | | | | 10,553,719 | |
| | | | | | | | | | | | |
| | | | |
| Media: 6.18% | | | | | | | | | | | | |
Omnicom Group Incorporated | | | | | | | 133,500 | | | | 9,868,320 | |
Twenty-First Century Fox Incorporated Class A | | | | | | | 329,300 | | | | 9,717,643 | |
| | | | |
| | | | | | | | | | | 19,585,963 | |
| | | | | | | | | | | | |
| | | | |
| Multiline Retail: 1.38% | | | | | | | | | | | | |
Kohl’s Corporation | | | | | | | 92,900 | | | | 4,378,377 | |
| | | | | | | | | | | | |
| | | | |
| Textiles, Apparel & Luxury Goods: 2.85% | | | | | | | | | | | | |
Gildan Activewear Incorporated | | | | | | | 292,100 | | | | 9,052,179 | |
| | | | | | | | | | | | |
| | | | |
Consumer Staples: 8.68% | | | | | | | | | | | | |
| | | | |
| Beverages: 1.83% | | | | | | | | | | | | |
Diageo plc ADR | | | | | | | 50,620 | | | | 5,799,027 | |
| | | | | | | | | | | | |
| | | | |
| Household Products: 2.81% | | | | | | | | | | | | |
Colgate-Palmolive Company | | | | | | | 46,010 | | | | 3,021,937 | |
The Procter & Gamble Company | | | | | | | 78,790 | | | | 5,896,644 | |
| | | | |
| | | | | | | | | | | 8,918,581 | |
| | | | | | | | | | | | |
| | | | |
| Personal Products: 1.46% | | | | | | | | | | | | |
Unilever NV ADR | | | | | | | 105,900 | | | | 4,632,066 | |
| | | | | | | | | | | | |
| | | | |
| Tobacco: 2.58% | | | | | | | | | | | | |
Philip Morris International | | | | | | | 93,600 | | | | 8,179,704 | |
| | | | | | | | | | | | |
| | | | |
Energy: 8.12% | | | | | | | | | | | | |
| | | | |
| Oil, Gas & Consumable Fuels: 8.12% | | | | | | | | | | | | |
Chevron Corporation | | | | | | | 46,540 | | | | 4,250,033 | |
Devon Energy Corporation | | | | | | | 80,900 | | | | 3,722,209 | |
Exxon Mobil Corporation | | | | | | | 100,870 | | | | 8,237,044 | |
Noble Energy Incorporated | | | | | | | 84,100 | | | | 3,083,947 | |
World Fuel Services Corporation | | | | | | | 148,300 | | | | 6,464,397 | |
| | | | |
| | | | | | | | | | | 25,757,630 | |
| | | | | | | | | | | | |
| | | | |
Financials: 25.45% | | | | | | | | | | | | |
| | | | |
| Banks: 9.00% | | | | | | | | | | | | |
Bank of America Corporation | | | | | | | 507,200 | | | | 8,840,496 | |
JPMorgan Chase & Company | | | | | | | 160,770 | | | | 10,720,144 | |
PNC Financial Services Group Incorporated | | | | | | | 93,900 | | | | 8,968,389 | |
| | | | |
| | | | | | | | | | | 28,529,029 | |
| | | | | | | | | | | | |
The accompanying notes are an integral part of these financial statements.
| | | | |
| 60 | | Wells Fargo Equity Gateway Funds | | Portfolio of investments—November 30, 2015 (unaudited) |
C&B LARGE CAP VALUE PORTFOLIO
| | | | | | | | | | | | |
| Security name | | | | | | Shares | | | Value | |
| | | | |
| Capital Markets: 3.77% | | | | | | | | | | | | |
State Street Corporation | | | | | | | 164,900 | | | $ | 11,968,442 | |
| | | | | | | | | | | | |
| | | | |
| Consumer Finance: 2.35% | | | | | | | | | | | | |
American Express Company | | | | | | | 103,900 | | | | 7,443,396 | |
| | | | | | | | | | | | |
| | | | |
| Diversified Financial Services: 2.27% | | | | | | | | | | | | |
Berkshire Hathaway Incorporated Class B † | | | | | | | 53,700 | | | | 7,200,633 | |
| | | | | | | | | | | | |
| | | | |
| Insurance: 8.06% | | | | | | | | | | | | |
FNF Group | | | | | | | 218,200 | | | | 7,822,470 | |
RenaissanceRe Holdings Limited | | | | | | | 85,600 | | | | 9,481,056 | |
The Progressive Corporation | | | | | | | 267,700 | | | | 8,250,514 | |
| | | | |
| | | | | | | | | | | 25,554,040 | |
| | | | | | | | | | | | |
| | | | |
Health Care: 15.62% | | | | | | | | | | | | |
| | | | |
| Health Care Equipment & Supplies: 4.28% | | | | | | | | | | | | |
Abbott Laboratories | | | | | | | 119,300 | | | | 5,358,956 | |
Becton Dickinson & Company | | | | | | | 54,600 | | | | 8,203,650 | |
| | | | |
| | | | | | | | | | | 13,562,606 | |
| | | | | | | | | | | | |
| | | | |
| Health Care Providers & Services: 8.23% | | | | | | | | | | | | |
Cardinal Health Incorporated | | | | | | | 96,140 | | | | 8,349,759 | |
Laboratory Corporation of America Holdings † | | | | | | | 87,060 | | | | 10,581,272 | |
UnitedHealth Group Incorporated | | | | | | | 63,490 | | | | 7,155,958 | |
| | | | |
| | | | | | | | | | | 26,086,989 | |
| | | | | | | | | | | | |
| | | | |
| Pharmaceuticals: 3.11% | | | | | | | | | | | | |
Johnson & Johnson | | | | | | | 97,400 | | | | 9,860,776 | |
| | | | | | | | | | | | |
| | | | |
Industrials: 18.05% | | | | | | | | | | | | |
| | | | |
| Aerospace & Defense: 1.54% | | | | | | | | | | | | |
Rockwell Collins Incorporated | | | | | | | 52,600 | | | | 4,874,968 | |
| | | | | | | | | | | | |
| | | | |
| Air Freight & Logistics: 2.46% | | | | | | | | | | | | |
United Parcel Service Incorporated Class B | | | | | | | 75,800 | | | | 7,808,158 | |
| | | | | | | | | | | | |
| | | | |
| Electrical Equipment: 2.42% | | | | | | | | | | | | |
Eaton Corporation plc | | | | | | | 132,000 | | | | 7,677,120 | |
| | | | | | | | | | | | |
| | | | |
| Industrial Conglomerates: 1.61% | | | | | | | | | | | | |
3M Company | | | | | | | 32,600 | | | | 5,104,508 | |
| | | | | | | | | | | | |
| | | | |
| Machinery: 4.63% | | | | | | | | | | | | |
Donaldson Company Incorporated | | | | | | | 216,500 | | | | 6,798,100 | |
Parker-Hannifin Corporation | | | | | | | 75,200 | | | | 7,870,432 | |
| | | | |
| | | | | | | | | | | 14,668,532 | |
| | | | | | | | | | | | |
The accompanying notes are an integral part of these financial statements.
| | | | | | |
| Portfolio of investments—November 30, 2015 (unaudited) | | Wells Fargo Equity Gateway Funds | | | 61 | |
C&B LARGE CAP VALUE PORTFOLIO
| | | | | | | | | | | | | | | | |
| Security name | | | | | | | | | Shares | | | Value | |
| | | | | |
| Trading Companies & Distributors: 5.39% | | | | | | | | | | | | | | | | |
Aercap Holdings NV † | | | | | | | | | | | 198,300 | | | $ | 9,010,752 | |
W.W. Grainger Incorporated « | | | | | | | | | | | 22,112 | | | | 4,434,340 | |
WESCO International Incorporated † | | | | | | | | | | | 75,900 | | | | 3,646,995 | |
| | | | | |
| | | | | | | | | | | | | | | 17,092,087 | |
| | | | | | | | | | | | | | | | |
| | | | | |
Information Technology: 3.24% | | | | | | | | | | | | | | | | |
| | | | | |
| Communications Equipment: 0.69% | | | | | | | | | | | | | | | | |
QUALCOMM Incorporated | | | | | | | | | | | 44,830 | | | | 2,187,256 | |
| | | | | | | | | | | | | | | | |
| | | | | |
| IT Services: 1.19% | | | | | | | | | | | | | | | | |
The Western Union Company | | | | | | | | | | | 200,400 | | | | 3,779,544 | |
| | | | | | | | | | | | | | | | |
| | | | | |
| Semiconductors & Semiconductor Equipment: 1.36% | | | | | | | | | | | | | | | | |
Linear Technology Corporation | | | | | | | | | | | 94,200 | | | | 4,306,824 | |
| | | | | | | | | | | | | | | | |
| | | | | |
Materials: 3.78% | | | | | | | | | | | | | | | | |
| | | | | |
| Containers & Packaging: 3.78% | | | | | | | | | | | | | | | | |
Ball Corporation | | | | | | | | | | | 45,920 | | | | 3,187,766 | |
Crown Holdings Incorporated † | | | | | | | | | | | 169,300 | | | | 8,788,363 | |
| | | | | |
| | | | | | | | | | | | | | | 11,976,129 | |
| | | | | | | | | | | | | | | | |
| | | | | |
Total Common Stocks (Cost $240,460,541) | | | | | | | | | | | | | | | 306,538,283 | |
| | | | | | | | | | | | | | | | |
| | | | | |
| | | Yield | | | | | | | | | | | |
| | | | | |
Short-Term Investments: 4.54% | | | | | | | | | | | | | | | | |
| | | | | |
| Investment Companies: 4.54% | | | | | | | | | | | | | | | | |
Securities Lending Cash Investments, LLC (l)(r)(u) | | | 0.18 | % | | | | | | | 4,278,750 | | | | 4,278,750 | |
Wells Fargo Cash Investment Money Market Fund, Select Class (l)(u) | | | 0.17 | | | | | | | | 10,128,152 | | | | 10,128,152 | |
| | | | | |
Total Short-Term Investments (Cost $14,406,902) | | | | | | | | | | | | | | | 14,406,902 | |
| | | | | | | | | | | | | | | | |
| | | | | | | | |
| Total investments in securities (Cost $254,867,443) * | | | 101.22 | % | | | 320,945,185 | |
Other assets and liabilities, net | | | (1.22 | ) | | | (3,871,692 | ) |
| | | | | | | | |
| Total net assets | | | 100.00 | % | | $ | 317,073,493 | |
| | | | | | | | |
| † | Non-income-earning security |
| « | All or a portion of this security is on loan. |
| (l) | The issuer of the security is an affiliated person of the Portfolio as defined in the Investment Company Act of 1940. |
| (r) | The investment is a non-registered investment vehicle purchased with cash collateral received from securities on loan. |
| (u) | The rate represents the 7-day annualized yield at period end. |
| * | Cost for federal income tax purposes is $265,027,841 and unrealized gains (losses) consists of: |
| | | | |
Gross unrealized gains | | $ | 71,516,145 | |
Gross unrealized losses | | | (15,598,801 | ) |
| | | | |
Net unrealized gains | | $ | 55,917,344 | |
The accompanying notes are an integral part of these financial statements.
| | | | |
| 62 | | Wells Fargo Equity Gateway Funds | | Portfolio of investments—November 30, 2015 (unaudited) |
DIVERSIFIED LARGE CAP GROWTH PORTFOLIO
| | | | | | | | | | | | |
| Security name | | | | | | Shares | | | Value | |
| | | | |
Common Stocks: 98.75% | | | | | | | | | | | | |
| | | | |
Consumer Discretionary: 24.23% | | | | | | | | | | | | |
| | | | |
| Auto Components: 1.31% | | | | | | | | | | | | |
Delphi Automotive plc | | | | | | | 17,610 | | | $ | 1,547,567 | |
| | | | | | | | | | | | |
| | | | |
| Distributors: 0.43% | | | | | | | | | | | | |
LKQ Corporation † | | | | | | | 17,140 | | | | 505,459 | |
| | | | | | | | | | | | |
| | | | |
| Hotels, Restaurants & Leisure: 3.80% | | | | | | | | | | | | |
Chipotle Mexican Grill Incorporated † | | | | | | | 1,400 | | | | 811,370 | |
Hilton Worldwide Holdings Incorporated | | | | | | | 54,579 | | | | 1,267,324 | |
Marriott International Incorporated Class A | | | | | | | 8,010 | | | | 567,989 | |
Starbucks Corporation | | | | | | | 29,888 | | | | 1,834,824 | |
| | | | |
| | | | | | | | | | | 4,481,507 | |
| | | | | | | | | | | | |
| | | | |
| Internet & Catalog Retail: 4.40% | | | | | | | | | | | | |
Amazon.com Incorporated † | | | | | | | 6,540 | | | | 4,347,792 | |
Netflix Incorporated † | | | | | | | 4,180 | | | | 515,519 | |
The Priceline Group Incorporated † | | | | | | | 270 | | | | 337,190 | |
| | | | |
| | | | | | | | | | | 5,200,501 | |
| | | | | | | | | | | | |
| | | | |
| Media: 1.67% | | | | | | | | | | | | |
Charter Communication Incorporated Class A Ǡ | | | | | | | 1,740 | | | | 326,006 | |
Comcast Corporation Class A | | | | | | | 5,420 | | | | 329,861 | |
The Walt Disney Company | | | | | | | 11,610 | | | | 1,317,387 | |
| | | | |
| | | | | | | | | | | 1,973,254 | |
| | | | | | | | | | | | |
| | | | |
| Multiline Retail: 2.67% | | | | | | | | | | | | |
Dollar General Corporation | | | | | | | 9,770 | | | | 639,056 | |
Dollar Tree Incorporated † | | | | | | | 28,560 | | | | 2,155,138 | |
Nordstrom Incorporated | | | | | | | 6,390 | | | | 359,821 | |
| | | | |
| | | | | | | | | | | 3,154,015 | |
| | | | | | | | | | | | |
| | | | |
| Specialty Retail: 6.67% | | | | | | | | | | | | |
CarMax Incorporated † | | | | | | | 23,120 | | | | 1,324,776 | |
O’Reilly Automotive Incorporated † | | | | | | | 3,200 | | | | 844,384 | |
The Home Depot Incorporated | | | | | | | 22,660 | | | | 3,033,721 | |
The TJX Companies Incorporated | | | | | | | 17,030 | | | | 1,202,318 | |
Tractor Supply Company | | | | | | | 16,400 | | | | 1,465,340 | |
| | | | |
| | | | | | | | | | | 7,870,539 | |
| | | | | | | | | | | | |
| | | | |
| Textiles, Apparel & Luxury Goods: 3.28% | | | | | | | | | | | | |
Nike Incorporated Class B | | | | | | | 19,780 | | | | 2,616,498 | |
Under Armour Incorporated Class A † | | | | | | | 5,230 | | | | 450,931 | |
VF Corporation | | | | | | | 12,490 | | | | 808,103 | |
| | | | |
| | | | | | | | | | | 3,875,532 | |
| | | | | | | | | | | | |
The accompanying notes are an integral part of these financial statements.
| | | | | | |
| Portfolio of investments—November 30, 2015 (unaudited) | | Wells Fargo Equity Gateway Funds | | | 63 | |
DIVERSIFIED LARGE CAP GROWTH PORTFOLIO
| | | | | | | | | | | | |
| Security name | | | | | | Shares | | | Value | |
| | | | |
Consumer Staples: 5.07% | | | | | | | | | | | | |
| | | | |
| Beverages: 1.12% | | | | | | | | | | | | |
Constellation Brands Incorporated Class A | | | | | | | 6,590 | | | $ | 924,313 | |
The Coca-Cola Company | | | | | | | 9,220 | | | | 392,956 | |
| | | | |
| | | | | | | | | | | 1,317,269 | �� |
| | | | | | | | | | | | |
| | | | |
| Food & Staples Retailing: 2.86% | | | | | | | | | | | | |
Costco Wholesale Corporation | | | | | | | 8,530 | | | | 1,376,913 | |
CVS Health Corporation | | | | | | | 10,300 | | | | 969,127 | |
Sprouts Farmers Market Incorporated † | | | | | | | 12,088 | | | | 291,683 | |
Walgreens Boots Alliance Incorporated | | | | | | | 8,720 | | | | 732,742 | |
| | | | |
| | | | | | | | | | | 3,370,465 | |
| | | | | | | | | | | | |
| | | | |
| Household Products: 0.36% | | | | | | | | | | | | |
Colgate-Palmolive Company | | | | | | | 6,540 | | | | 429,547 | |
| | | | | | | | | | | | |
| | | | |
| Personal Products: 0.73% | | | | | | | | | | | | |
The Estee Lauder Companies Incorporated Class A | | | | | | | 10,300 | | | | 866,436 | |
| | | | | | | | | | | | |
| | | | |
Energy: 0.93% | | | | | | | | | | | | |
| | | | |
| Oil, Gas & Consumable Fuels: 0.93% | | | | | | | | | | | | |
Concho Resources Incorporated † | | | | | | | 8,780 | | | | 960,883 | |
EOG Resources Incorporated | | | | | | | 1,660 | | | | 138,494 | |
| | | | |
| | | | | | | | | | | 1,099,377 | |
| | | | | | | | | | | | |
| | | | |
Financials: 4.07% | | | | | | | | | | | | |
| | | | |
| Capital Markets: 1.77% | | | | | | | | | | | | |
Charles Schwab Corporation | | | | | | | 21,800 | | | | 734,878 | |
TD Ameritrade Holding Corporation | | | | | | | 36,850 | | | | 1,349,816 | |
| | | | |
| | | | | | | | | | | 2,084,694 | |
| | | | | | | | | | | | |
| | | | |
| Consumer Finance: 0.57% | | | | | | | | | | | | |
Discover Financial Services | | | | | | | 11,890 | | | | 674,876 | |
| | | | | | | | | | | | |
| | | | |
| Diversified Financial Services: 1.42% | | | | | | | | | | | | |
Intercontinental Exchange Incorporated | | | | | | | 3,320 | | | | 862,669 | |
McGraw Hill Financial Incorporated | | | | | | | 8,420 | | | | 812,277 | |
| | | | |
| | | | | | | | | | | 1,674,946 | |
| | | | | | | | | | | | |
| | | | |
| REITs: 0.31% | | | | | | | | | | | | |
American Tower Corporation | | | | | | | 3,720 | | | | 369,694 | |
| | | | | | | | | | | | |
| | | | |
Health Care: 16.22% | | | | | | | | | | | | |
| | | | |
| Biotechnology: 9.77% | | | | | | | | | | | | |
Alexion Pharmaceuticals Incorporated † | | | | | | | 18,940 | | | | 3,379,654 | |
Biogen Incorporated † | | | | | | | 930 | | | | 266,780 | |
BioMarin Pharmaceutical Incorporated † | | | | | | | 5,380 | | | | 513,091 | |
Celgene Corporation † | | | | | | | 21,920 | | | | 2,399,144 | |
Gilead Sciences Incorporated | | | | | | | 9,719 | | | | 1,029,825 | |
The accompanying notes are an integral part of these financial statements.
| | | | |
| 64 | | Wells Fargo Equity Gateway Funds | | Portfolio of investments—November 30, 2015 (unaudited) |
DIVERSIFIED LARGE CAP GROWTH PORTFOLIO
| | | | | | | | | | | | |
| Security name | | | | | | Shares | | | Value | |
| | | | |
| Biotechnology (continued) | | | | | | | | | | | | |
Incyte Corporation † | | | | | | | 3,980 | | | $ | 454,675 | |
Medivation Incorporated † | | | | | | | 11,170 | | | | 472,268 | |
Regeneron Pharmaceuticals Incorporated † | | | | | | | 4,610 | | | | 2,510,145 | |
Vertex Pharmaceuticals Incorporated † | | | | | | | 3,990 | | | | 516,146 | |
| | | | |
| | | | | | | | | | | 11,541,728 | |
| | | | | | | | | | | | |
| | | | |
| Health Care Equipment & Supplies: 1.15% | | | | | | | | | | | | |
Intuitive Surgical Incorporated † | | | | | | | 420 | | | | 218,408 | |
Medtronic plc | | | | | | | 15,155 | | | | 1,141,778 | |
| | | | |
| | | | | | | | | | | 1,360,186 | |
| | | | | | | | | | | | |
| | | | |
| Health Care Providers & Services: 1.96% | | | | | | | | | | | | |
AmerisourceBergen Corporation | | | | | | | 11,763 | | | | 1,160,302 | |
McKesson Corporation | | | | | | | 930 | | | | 176,096 | |
UnitedHealth Group Incorporated | | | | | | | 8,710 | | | | 981,704 | |
| | | | |
| | | | | | | | | | | 2,318,102 | |
| | | | | | | | | | | | |
| | | | |
| Health Care Technology: 0.46% | | | | | | | | | | | | |
Cerner Corporation † | | | | | | | 8,981 | | | | 535,268 | |
| | | | | | | | | | | | |
| | | | |
| Life Sciences Tools & Services: 0.60% | | | | | | | | | | | | |
Mettler-Toledo International Incorporated † | | | | | | | 430 | | | | 147,395 | |
Quintiles Transnational Holdings Incorporated † | | | | | | | 8,164 | | | | 555,070 | |
| | | | |
| | | | | | | | | | | 702,465 | |
| | | | | | | | | | | | |
| | | | |
| Pharmaceuticals: 2.28% | | | | | | | | | | | | |
Allergan plc † | | | | | | | 2,116 | | | | 664,191 | |
Bristol-Myers Squibb Company | | | | | | | 11,390 | | | | 763,244 | |
Perrigo Company plc | | | | | | | 4,170 | | | | 622,956 | |
Zoetis Incorporated | | | | | | | 13,821 | | | | 645,441 | |
| | | | |
| | | | | | | | | | | 2,695,832 | |
| | | | | | | | | | | | |
| | | | |
Industrials: 8.08% | | | | | | | | | | | | |
| | | | |
| Aerospace & Defense: 0.78% | | | | | | | | | | | | |
The Boeing Company | | | | | | | 6,290 | | | | 914,881 | |
| | | | | | | | | | | | |
| | | | |
| Air Freight & Logistics: 0.53% | | | | | | | | | | | | |
United Parcel Service Incorporated Class B | | | | | | | 6,100 | | | | 628,361 | |
| | | | | | | | | | | | |
| | | | |
| Airlines: 1.71% | | | | | | | | | | | | |
Delta Air Lines Incorporated | | | | | | | 18,720 | | | | 869,731 | |
Southwest Airlines Company | | | | | | | 24,980 | | | | 1,146,082 | |
| | | | |
| | | | | | | | | | | 2,015,813 | |
| | | | | | | | | | | | |
| | | | |
| Industrial Conglomerates: 1.43% | | | | | | | | | | | | |
3M Company | | | | | | | 3,090 | | | | 483,832 | |
Carlisle Companies Incorporated | | | | | | | 6,300 | | | | 557,235 | |
Danaher Corporation | | | | | | | 6,730 | | | | 648,705 | |
| | | | |
| | | | | | | | | | | 1,689,772 | |
| | | | | | | | | | | | |
The accompanying notes are an integral part of these financial statements.
| | | | | | |
| Portfolio of investments—November 30, 2015 (unaudited) | | Wells Fargo Equity Gateway Funds | | | 65 | |
DIVERSIFIED LARGE CAP GROWTH PORTFOLIO
| | | | | | | | | | | | |
| Security name | | | | | | Shares | | | Value | |
| | | | |
| Professional Services: 0.77% | | | | | | | | | | | | |
Verisk Analytics Incorporated † | | | | | | | 12,200 | | | $ | 914,390 | |
| | | | | | | | | | | | |
| | | | |
| Road & Rail: 2.86% | | | | | | | | | | | | |
Canadian Pacific Railway Limited | | | | | | | 2,420 | | | | 356,877 | |
CSX Corporation | | | | | | | 12,230 | | | | 347,699 | |
Kansas City Southern | | | | | | | 8,710 | | | | 791,913 | |
Norfolk Southern Corporation | | | | | | | 3,060 | | | | 290,884 | |
Union Pacific Corporation | | | | | | | 18,970 | | | | 1,592,532 | |
| | | | |
| | | | | | | | | | | 3,379,905 | |
| | | | | | | | | | | | |
| | | | |
Information Technology: 35.85% | | | | | | | | | | | | |
| | | | |
| Communications Equipment: 0.72% | | | | | | | | | | | | |
Cisco Systems Incorporated | | | | | | | 6,280 | | | | 171,130 | |
Palo Alto Networks Incorporated † | | | | | | | 3,652 | | | | 684,166 | |
| | | | |
| | | | | | | | | | | 855,296 | |
| | | | | | | | | | | | |
| | | | |
| Internet Software & Services: 10.93% | | | | | | | | | | | | |
Akamai Technologies Incorporated † | | | | | | | 20,730 | | | | 1,194,255 | |
Alphabet Incorporated Class A † | | | | | | | 5,384 | | | | 4,107,184 | |
Alphabet Incorporated Class C † | | | | | | | 2,984 | | | | 2,215,918 | |
Facebook Incorporated Class A † | | | | | | | 45,530 | | | | 4,746,047 | |
Tencent Holdings Limited ADR | | | | | | | 32,050 | | | | 637,946 | |
| | | | |
| | | | | | | | | | | 12,901,350 | |
| | | | | | | | | | | | |
| | | | |
| IT Services: 8.45% | | | | | | | | | | | | |
Accenture plc Class A | | | | | | | 9,000 | | | | 964,980 | |
Alliance Data Systems Corporation † | | | | | | | 7,200 | | | | 2,065,320 | |
Cognizant Technology Solutions Corporation Class A † | | | | | | | 22,520 | | | | 1,454,342 | |
MasterCard Incorporated Class A | | | | | | | 20,660 | | | | 2,023,027 | |
Visa Incorporated Class A | | | | | | | 43,990 | | | | 3,475,650 | |
| | | | |
| | | | | | | | | | | 9,983,319 | |
| | | | | | | | | | | | |
| | | | |
| Semiconductors & Semiconductor Equipment: 3.36% | | | | | | | | | | | | |
ARM Holdings plc ADR | | | | | | | 15,490 | | | | 785,343 | |
Avago Technologies Limited | | | | | | | 3,622 | | | | 472,490 | |
Broadcom Corporation Class A | | | | | | | 2,870 | | | | 156,788 | |
Microchip Technology Incorporated « | | | | | | | 33,949 | | | | 1,639,058 | |
Texas Instruments Incorporated | | | | | | | 15,730 | | | | 914,228 | |
| | | | |
| | | | | | | | | | | 3,967,907 | |
| | | | | | | | | | | | |
| | | | |
| Software: 8.17% | | | | | | | | | | | | |
Adobe Systems Incorporated † | | | | | | | 18,750 | | | | 1,714,875 | |
Electronic Arts Incorporated † | | | | | | | 9,910 | | | | 671,799 | |
Fortinet Incorporated † | | | | | | | 18,980 | | | | 683,660 | |
Microsoft Corporation | | | | | | | 24,360 | | | | 1,323,966 | |
NetSuite Incorporated † | | | | | | | 3,230 | | | | 275,842 | |
Red Hat Incorporated † | | | | | | | 4,110 | | | | 334,595 | |
Salesforce.com Incorporated † | | | | | | | 23,264 | | | | 1,853,908 | |
The accompanying notes are an integral part of these financial statements.
| | | | |
| 66 | | Wells Fargo Equity Gateway Funds | | Portfolio of investments—November 30, 2015 (unaudited) |
DIVERSIFIED LARGE CAP GROWTH PORTFOLIO
| | | | | | | | | | | | | | | | |
| Security name | | | | | | | | | Shares | | | Value | |
| | | | | |
| Software (continued) | | | | | | | | | | | | | | | | |
ServiceNow Incorporated † | | | | | | | | | | | 17,650 | | | $ | 1,535,727 | |
Splunk Incorporated † | | | | | | | | | | | 12,240 | | | | 728,280 | |
Tableau Software Incorporated Class A † | | | | | | | | | | | 5,460 | | | | 529,784 | |
| | | | | |
| | | | | | | | | | | | | | | 9,652,436 | |
| | | | | | | | | | | | | | | | |
| | | | | |
| Technology Hardware, Storage & Peripherals: 4.22% | | | | | | | | | | | | | | | | |
Apple Incorporated | | | | | | | | | | | 42,107 | | | | 4,981,258 | |
| | | | | | | | | | | | | | | | |
| | | | | |
Materials: 3.08% | | | | | | | | | | | | | | | | |
| | | | | |
| Chemicals: 3.08% | | | | | | | | | | | | | | | | |
Airgas Incorporated | | | | | | | | | | | 1,330 | | | | 183,806 | |
Axalta Coating Systems Limited † | | | | | | | | | | | 19,350 | | | | 561,537 | |
Ecolab Incorporated | | | | | | | | | | | 10,490 | | | | 1,249,988 | |
Praxair Incorporated | | | | | | | | | | | 7,340 | | | | 827,952 | |
The Sherwin-Williams Company | | | | | | | | | | | 2,950 | | | | 814,407 | |
| | | | | |
| | | | | | | | | | | | | | | 3,637,690 | |
| | | | | | | | | | | | | | | | |
| | | | | |
Telecommunication Services: 1.22% | | | | | | | | | | | | | | | | |
| | | | | |
| Diversified Telecommunication Services: 0.41% | | | | | | | | | | | | | | | | |
Level 3 Communications Incorporated † | | | | | | | | | | | 9,660 | | | | 491,018 | |
| | | | | | | | | | | | | | | | |
| | | | | |
| Wireless Telecommunication Services: 0.81% | | | | | | | | | | | | | | | | |
SBA Communications Corporation Class A † | | | | | | | | | | | 9,063 | | | | 953,063 | |
| | | | | | | | | | | | | | | | |
| | | | | |
Total Common Stocks (Cost $75,203,099) | | | | | | | | | | | | | | | 116,615,718 | |
| | | | | | | | | | | | | | | | |
| | | Yield | | | | | | | | | | | |
| | | | | |
Short-Term Investments: 2.37% | | | | | | | | | | | | | | | | |
| | | | | |
| Investment Companies: 2.37% | | | | | | | | | | | | | | | | |
Securities Lending Cash Investments, LLC (l)(r)(u) | | | 0.18 | % | | | | | | | 1,326,875 | | | | 1,326,875 | |
Wells Fargo Cash Investment Money Market Fund, Select Class (l)(u) | | | 0.17 | | | | | | | | 1,475,666 | | | | 1,475,666 | |
| | | | | |
Total Short-Term Investments (Cost $2,802,541) | | | | | | | | | | | | | | | 2,802,541 | |
| | | | | | | | | | | | | | | | |
| | | | | | | | |
| Total investments in securities (Cost $78,005,640) * | | | 101.12 | % | | | 119,418,259 | |
Other assets and liabilities, net | | | (1.12 | ) | | | (1,320,509 | ) |
| | | | | | | | |
| Total net assets | | | 100.00 | % | | $ | 118,097,750 | |
| | | | | | | | |
| † | Non-income-earning security |
| « | All or a portion of this security is on loan. |
| (l) | The issuer of the security is an affiliated person of the Portfolio as defined in the Investment Company Act of 1940. |
| (r) | The investment is a non-registered investment vehicle purchased with cash collateral received from securities on loan. |
| (u) | The rate represents the 7-day annualized yield at period end. |
| * | Cost for federal income tax purposes is $78,348,035 and unrealized gains (losses) consists of: |
| | | | |
Gross unrealized gains | | $ | 42,394,703 | |
Gross unrealized losses | | | (1,324,479 | ) |
| | | | |
Net unrealized gains | | $ | 41,070,224 | |
The accompanying notes are an integral part of these financial statements.
| | | | | | |
| Portfolio of investments—November 30, 2015 (unaudited) | | Wells Fargo Equity Gateway Funds | | | 67 | |
EMERGING GROWTH PORTFOLIO
| | | | | | | | | | | | |
| Security name | | | | | | Shares | | | Value | |
| | | | |
Common Stocks: 98.92% | | | | | | | | | | | | |
| | | | |
Consumer Discretionary: 15.12% | | | | | | | | | | | | |
| | | | |
| Auto Components: 2.05% | | | | | | | | | | | | |
Gentherm Incorporated † | | | | | | | 116,360 | | | $ | 5,915,742 | |
Motorcar Parts of America Incorporated † | | | | | | | 373,282 | | | | 14,953,677 | |
| | | | |
| | | | | | | | | | | 20,869,419 | |
| | | | | | | | | | | | |
| | | | |
| Diversified Consumer Services: 1.43% | | | | | | | | | | | | |
2U Incorporated †« | | | | | | | 167,160 | | | | 4,031,899 | |
Grand Canyon Education Incorporated † | | | | | | | 264,430 | | | | 10,476,717 | |
| | | | |
| | | | | | | | | | | 14,508,616 | |
| | | | | | | | | | | | |
| | | | |
| Hotels, Restaurants & Leisure: 5.28% | | | | | | | | | | | | |
Fiesta Restaurant Group Incorporated † | | | | | | | 499,465 | | | | 19,194,440 | |
Jack in the Box Incorporated | | | | | | | 130,640 | | | | 9,685,650 | |
La Quinta Holdings Incorporated † | | | | | | | 120,505 | | | | 1,806,370 | |
Planet Fitness Incorporated Class A † | | | | | | | 90,381 | | | | 1,428,924 | |
The Habit Restaurants Incorporated Class A †« | | | | | | | 529,098 | | | | 12,745,971 | |
Wingstop Incorporated †« | | | | | | | 241,070 | | | | 5,195,059 | |
Zoe’s Kitchen Incorporated †« | | | | | | | 107,530 | | | | 3,658,171 | |
| | | | |
| | | | | | | | | | | 53,714,585 | |
| | | | | | | | | | | | |
| | | | |
| Leisure Products: 0.77% | | | | | | | | | | | | |
MCBC Holdings Incorporated † | | | | | | | 258,372 | | | | 3,707,638 | |
Performance Sports Group Limited † | | | | | | | 351,552 | | | | 4,169,407 | |
| | | | |
| | | | | | | | | | | 7,877,045 | |
| | | | | | | | | | | | |
| | | | |
| Media: 1.28% | | | | | | | | | | | | |
IMAX Corporation † | | | | | | | 343,190 | | | | 13,000,037 | |
| | | | | | | | | | | | |
| | | | |
| Specialty Retail: 3.25% | | | | | | | | | | | | |
Boot Barn Holdings Incorporated †« | | | | | | | 486,299 | | | | 5,106,140 | |
Five Below Incorporated † | | | | | | | 116,497 | | | | 3,263,081 | |
Lithia Motors Incorporated Class A | | | | | | | 140,780 | | | | 17,490,507 | |
Sportsman’s Warehouse Incorporated † | | | | | | | 626,403 | | | | 7,172,314 | |
| | | | |
| | | | | | | | | | | 33,032,042 | |
| | | | | | | | | | | | |
| | | | |
| Textiles, Apparel & Luxury Goods: 1.06% | | | | | | | | | | | | |
G-III Apparel Group Limited † | | | | | | | 236,420 | | | | 10,844,585 | |
| | | | | | | | | | | | |
| | | | |
Energy: 2.43% | | | | | | | | | | | | |
| | | | |
| Oil, Gas & Consumable Fuels: 2.43% | | | | | | | | | | | | |
Matador Resources Company † | | | | | | | 255,752 | | | | 6,572,826 | |
PDC Energy Incorporated † | | | | | | | 135,170 | | | | 7,635,753 | |
RSP Permian Incorporated † | | | | | | | 371,028 | | | | 10,529,775 | |
| | | | |
| | | | | | | | | | | 24,738,354 | |
| | | | | | | | | | | | |
The accompanying notes are an integral part of these financial statements.
| | | | |
| 68 | | Wells Fargo Equity Gateway Funds | | Portfolio of investments—November 30, 2015 (unaudited) |
EMERGING GROWTH PORTFOLIO
| | | | | | | | | | | | |
| Security name | | | | | | Shares | | | Value | |
| | | | |
Financials: 6.80% | | | | | | | | | | | | |
| | | | |
| Capital Markets: 0.76% | | | | | | | | | | | | |
Financial Engines Incorporated « | | | | | | | 213,360 | | | $ | 7,687,361 | |
| | | | | | | | | | | | |
| | | | |
| Consumer Finance: 0.31% | | | | | | | | | | | | |
PRA Group Incorporated †« | | | | | | | 77,280 | | | | 3,192,437 | |
| | | | | | | | | | | | |
| | | | |
| Diversified Financial Services: 4.29% | | | | | | | | | | | | |
MarketAxess Holdings Incorporated | | | | | | | 408,501 | | | | 43,619,737 | |
| | | | | | | | | | | | |
| | | | |
| Thrifts & Mortgage Finance: 1.44% | | | | | | | | | | | | |
LendingTree Incorporated † | | | | | | | 144,203 | | | | 14,691,402 | |
| | | | | | | | | | | | |
| | | | |
Health Care: 30.47% | | | | | | | | | | | | |
| | | | |
| Biotechnology: 5.02% | | | | | | | | | | | | |
Exact Sciences Corporation †« | | | | | | | 102,372 | | | | 930,561 | |
Ligand Pharmaceuticals Incorporated † | | | | | | | 128,930 | | | | 13,805,824 | |
PTC Therapeutics Incorporated †« | | | | | | | 213,250 | | | | 6,406,030 | |
Radius Health Incorporated † | | | | | | | 135,135 | | | | 8,217,559 | |
Repligen Corporation † | | | | | | | 320,150 | | | | 9,101,865 | |
Ultragenyx Pharmaceutical Incorporated † | | | | | | | 128,494 | | | | 12,633,530 | |
| | | | |
| | | | | | | | | | | 51,095,369 | |
| | | | | | | | | | | | |
| | | | |
| Health Care Equipment & Supplies: 12.49% | | | | | | | | | | | | |
Abiomed Incorporated † | | | | | | | 65,660 | | | | 5,355,886 | |
Align Technology Incorporated † | | | | | | | 92,740 | | | | 6,189,468 | |
Cardiovascular Systems Incorporated †« | | | | | | | 255,644 | | | | 4,090,304 | |
Cerus Corporation †« | | | | | | | 1,161,428 | | | | 6,585,297 | |
ConforMIS Incorporated †« | | | | | | | 249,804 | | | | 5,328,319 | |
Cynosure Incorporated Class A † | | | | | | | 443,088 | | | | 18,636,281 | |
DexCom Incorporated † | | | | | | | 20,670 | | | | 1,757,363 | |
Entellus Medical Incorporated † | | | | | | | 248,145 | | | | 4,327,649 | |
Glaukos Corporation † | | | | | | | 301,295 | | | | 7,803,541 | |
Inogen Incorporated † | | | | | | | 258,888 | | | | 9,902,466 | |
Natus Medical Incorporated † | | | | | | | 199,750 | | | | 9,743,805 | |
Nevro Corporation † | | | | | | | 206,935 | | | | 12,494,735 | |
NxStage Medical Incorporated † | | | | | | | 790,180 | | | | 15,416,412 | |
The Spectranetics Corporation † | | | | | | | 1,079,919 | | | | 14,935,280 | |
Zeltiq Aesthetics Incorporated † | | | | | | | 150,200 | | | | 4,563,076 | |
| | | | |
| | | | | | | | | | | 127,129,882 | |
| | | | | | | | | | | | |
| | | | |
| Health Care Providers & Services: 10.12% | | | | | | | | | | | | |
AAC Holdings Incorporated †« | | | | | | | 138,491 | | | | 3,398,569 | |
Acadia Healthcare Company Incorporated † | | | | | | | 517,400 | | | | 35,705,774 | |
Adeptus Health Incorporated Class A †« | | | | | | | 80,365 | | | | 4,829,131 | |
Diplomat Pharmacy Incorporated †« | | | | | | | 339,176 | | | | 11,915,253 | |
ExamWorks Group Incorporated † | | | | | | | 581,658 | | | | 15,367,404 | |
HealthEquity Incorporated † | | | | | | | 608,962 | | | | 20,095,746 | |
Team Health Holdings Incorporated † | | | | | | | 69,110 | | | | 3,810,725 | |
Teladoc Incorporated †« | | | | | | | 371,579 | | | | 7,896,054 | |
| | | | |
| | | | | | | | | | | 103,018,656 | |
| | | | | | | | | | | | |
The accompanying notes are an integral part of these financial statements.
| | | | | | |
| Portfolio of investments—November 30, 2015 (unaudited) | | Wells Fargo Equity Gateway Funds | | | 69 | |
EMERGING GROWTH PORTFOLIO
| | | | | | | | | | | | |
| Security name | | | | | | Shares | | | Value | |
| | | | |
| Life Sciences Tools & Services: 2.23% | | | | | | | | | | | | |
ICON plc ADR † | | | | | | | 138,610 | | | $ | 10,302,881 | |
INC Research Holdings Incorporated Class A † | | | | | | | 261,113 | | | | 12,350,645 | |
| | | | |
| | | | | | | | | | | 22,653,526 | |
| | | | | | | | | | | | |
| | | | |
| Pharmaceuticals: 0.61% | | | | | | | | | | | | |
Intersect ENT Incorporated † | | | | | | | 316,450 | | | | 6,237,230 | |
| | | | | | | | | | | | |
| | | | |
Industrials: 6.67% | | | | | | | | | | | | |
| | | | |
| Building Products: 1.16% | | | | | | | | | | | | |
Apogee Enterprises Incorporated | | | | | | | 233,910 | | | | 11,746,960 | |
| | | | | | | | | | | | |
| | | | |
| Commercial Services & Supplies: 0.58% | | | | | | | | | | | | |
Multi-Color Corporation | | | | | | | 95,040 | | | | 5,940,950 | |
| | | | | | | | | | | | |
| | | | |
| Machinery: 0.96% | | | | | | | | | | | | |
John Bean Technologies Corporation | | | | | | | 66,500 | | | | 3,251,850 | |
Milacron Holdings Corporation † | | | | | | | 443,028 | | | | 6,521,372 | |
| | | | |
| | | | | | | | | | | 9,773,222 | |
| | | | | | | | | | | | |
| | | | |
| Professional Services: 3.97% | | | | | | | | | | | | |
CEB Incorporated | | | | | | | 37,556 | | | | 2,901,952 | |
On Assignment Incorporated † | | | | | | | 426,773 | | | | 19,921,764 | |
Wageworks Incorporated † | | | | | | | 412,800 | | | | 17,560,512 | |
| | | | |
| | | | | | | | | | | 40,384,228 | |
| | | | | | | | | | | | |
| | | | |
Information Technology: 37.43% | | | | | | | | | | | | |
| | | | |
| Communications Equipment: 1.08% | | | | | | | | | | | | |
Infinera Corporation † | | | | | | | 489,093 | | | | 11,014,374 | |
| | | | | | | | | | | | |
| | | | |
| Internet Software & Services: 11.95% | | | | | | | | | | | | |
Demandware Incorporated †« | | | | | | | 386,350 | | | | 19,761,803 | |
Envestnet Incorporated † | | | | | | | 717,182 | | | | 23,286,900 | |
HomeAway Incorporated † | | | | | | | 387,825 | | | | 13,713,492 | |
Hortonworks Incorporated †« | | | | | | | 153,897 | | | | 2,614,710 | |
LogMeIn Incorporated † | | | | | | | 76,600 | | | | 5,470,772 | |
Q2 Holdings Incorporated † | | | | | | | 683,763 | | | | 18,789,807 | |
SPS Commerce Incorporated † | | | | | | | 439,982 | | | | 32,699,462 | |
Xactly Corporation † | | | | | | | 539,347 | | | | 5,274,814 | |
| | | | |
| | | | | | | | | | | 121,611,760 | |
| | | | | | | | | | | | |
| | | | |
| IT Services: 2.11% | | | | | | | | | | | | |
InterXion Holding NV † | | | | | | | 600,320 | | | | 18,441,830 | |
MAXIMUS Incorporated | | | | | | | 52,370 | | | | 2,971,998 | |
| | | | |
| | | | | | | | | | | 21,413,828 | |
| | | | | | | | | | | | |
| | | | |
| Semiconductors & Semiconductor Equipment: 1.67% | | | | | | | | | | | | |
Cavium Incorporated † | | | | | | | 134,580 | | | | 9,031,664 | |
Monolithic Power Systems Incorporated | | | | | | | 116,760 | | | | 7,978,211 | |
| | | | |
| | | | | | | | | | | 17,009,875 | |
| | | | | | | | | | | | |
The accompanying notes are an integral part of these financial statements.
| | | | |
| 70 | | Wells Fargo Equity Gateway Funds | | Portfolio of investments—November 30, 2015 (unaudited) |
EMERGING GROWTH PORTFOLIO
| | | | | | | | | | | | | | |
| Security name | | | | | | | Shares | | | Value | |
| | | | |
| Software: 20.62% | | | | | | | | | | | | | | |
Callidus Software Incorporated † | | | | | | | | | 885,592 | | | $ | 18,376,034 | |
CyberArk Software Limited †« | | | | | | | | | 274,570 | | | | 11,886,135 | |
Fleetmatics Group plc † | | | | | | | | | 246,730 | | | | 14,729,781 | |
Guidewire Software Incorporated † | | | | | | | | | 167,951 | | | | 9,964,533 | |
HubSpot Incorporated † | | | | | | | | | 297,876 | | | | 16,147,858 | |
Paycom Software Incorporated † | | | | | | | | | 259,110 | | | | 11,297,196 | |
Paylocity Holding Corporation † | | | | | | | | | 217,203 | | | | 9,543,900 | |
Proofpoint Incorporated † | | | | | | | | | 549,870 | | | | 40,310,970 | |
Qlik Technologies Incorporated † | | | | | | | | | 434,250 | | | | 13,813,493 | |
Qualys Incorporated † | | | | | | | | | 210,080 | | | | 8,079,677 | |
Rapid7 Incorporated †« | | | | | | | | | 211,879 | | | | 3,629,487 | |
Ringcentral Incorporated Class A † | | | | | | | | | 715,810 | | | | 16,399,207 | |
Synchronoss Technologies Incorporated † | | | | | | | | | 446,651 | | | | 17,584,650 | |
Tyler Technologies Incorporated † | | | | | | | | | 49,735 | | | | 8,874,713 | |
Ultimate Software Group Incorporated † | | | | | | | | | 46,540 | | | | 9,191,650 | |
| | | | |
| | | | | | | | | | | | | 209,829,284 | |
| | | | | | | | | | | | | | |
| | | | |
Total Common Stocks (Cost $760,204,702) | | | | | | | | | | | | | 1,006,634,764 | |
| | | | | | | | | | | | | | |
| | | | |
| | | Yield | | | | | | | | | |
| | | | |
Short-Term Investments: 10.75% | | | | | | | | | | | | | | |
| | | | |
| Investment Companies: 10.75% | | | | | | | | | | | | | | |
Securities Lending Cash Investments, LLC (l)(r)(u) | | | 0.18 | % | | | | | 97,288,111 | | | | 97,288,111 | |
Wells Fargo Cash Investment Money Market Fund, Select Class (l)(u) | | | 0.17 | | | | | | 12,067,245 | | | | 12,067,245 | |
| | | | |
Total Short-Term Investments (Cost $109,355,356) | | | | | | | | | | | | | 109,355,356 | |
| | | | | | | | | | | | | | |
| | | | | | | | |
| Total investments in securities (Cost $869,560,058) * | | | 109.67 | % | | | 1,115,990,120 | |
Other assets and liabilities, net | | | (9.67 | ) | | | (98,394,055 | ) |
| | | | | | | | |
| Total net assets | | | 100.00 | % | | $ | 1,017,596,065 | |
| | | | | | | | |
| † | Non-income-earning security |
| « | All or a portion of this security is on loan. |
| (l) | The issuer of the security is an affiliated person of the Portfolio as defined in the Investment Company Act of 1940. |
| (r) | The investment is a non-registered investment vehicle purchased with cash collateral received from securities on loan. |
| (u) | The rate represents the 7-day annualized yield at period end. |
| * | Cost for federal income tax purposes is $871,132,855 and unrealized gains (losses) consists of: |
| | | | |
Gross unrealized gains | | $ | 285,010,123 | |
Gross unrealized losses | | | (40,152,858 | ) |
| | | | |
Net unrealized gains | | $ | 244,857,265 | |
The accompanying notes are an integral part of these financial statements.
| | | | | | |
| Summary portfolio of investments—November 30, 2015 (unaudited) | | Wells Fargo Equity Gateway Funds | | | 71 | |
INDEX PORTFOLIO
The Summary portfolio of investments shows the 50 largest portfolio holdings in unaffiliated issuers and any holdings exceeding 1% of the total net assets as of the report date. The remaining securities held are grouped as “Other securities” in each category.
| | | | | | | | | | | | | | | | |
| Security name | | | | | | Shares | | | Value | | | Percent of
net assets | |
| | | | | |
Common Stocks: 97.62% | | | | | | | | | | | | | | | | |
| | | | | |
Consumer Discretionary: 12.77% | | | | | | | | | | | | | | | | |
| | | | | |
| Auto Components: 0.39% | | | | | | | | | | | | | | | | |
Other securities | | | | | | | | | | $ | 9,998,825 | | | | 0.39 | % |
| | | | | | | | | | | | | | | | |
| | | | | |
| Automobiles: 0.62% | | | | | | | | | | | | | | | | |
Other securities | | | | | | | | | | | 15,835,624 | | | | 0.62 | |
| | | | | | | | | | | | | | | | |
| | | | | |
| Distributors: 0.07% | | | | | | | | | | | | | | | | |
Other securities | | | | | | | | | | | 1,853,112 | | | | 0.07 | |
| | | | | | | | | | | | | | | | |
| | | | | |
| Diversified Consumer Services: 0.05% | | | | | | | | | | | | | | | | |
Other securities | | | | | | | | | | | 1,166,779 | | | | 0.05 | |
| | | | | | | | | | | | | | | | |
| | | | | |
| Hotels, Restaurants & Leisure: 1.78% | | | | | | | | | | | | | | | | |
McDonald’s Corporation | | | | | | | 127,027 | | | | 14,501,402 | | | | 0.57 | |
Starbucks Corporation | | | | | | | 200,181 | | | | 12,289,112 | | | | 0.48 | |
Other securities | | | | | | | | | | | 18,267,723 | | | | 0.73 | |
| | | | | |
| | | | | | | | | | | 45,058,237 | | | | 1.78 | |
| | | | | | | | | | | | | | | | |
| | | | | |
| Household Durables: 0.43% | | | | | | | | | | | | | | | | |
Other securities | | | | | | | | | | | 10,889,139 | | | | 0.43 | |
| | | | | | | | | | | | | | | | |
| | | | | |
| Internet & Catalog Retail: 2.09% | | | | | | | | | | | | | | | | |
Amazon.com Incorporated † | | | | | | | 51,728 | | | | 34,388,774 | | | | 1.36 | |
Other securities | | | | | | | | | | | 18,541,467 | | | | 0.73 | |
| | | | | |
| | | | | | | | | | | 52,930,241 | | | | 2.09 | |
| | | | | | | | | | | | | | | | |
| | | | | |
| Leisure Products: 0.09% | | | | | | | | | | | | | | | | |
Other securities | | | | | | | | | | | 2,243,547 | | | | 0.09 | |
| | | | | | | | | | | | | | | | |
| | | | | |
| Media: 3.14% | | | | | | | | | | | | | | | | |
Comcast Corporation Class A | | | | | | | 285,232 | | | | 17,359,220 | | | | 0.69 | |
The Walt Disney Company | | | | | | | 209,438 | | | | 23,764,930 | | | | 0.94 | |
Other securities | | | | | | | | | | | 38,367,610 | | | | 1.51 | |
| | | | | |
| | | | | | | | | | | 79,491,760 | | | | 3.14 | |
| | | | | | | | | | | | | | | | |
| | | | | |
| Multiline Retail: 0.60% | | | | | | | | | | | | | | | | |
Other securities | | | | | | | | | | | 15,106,401 | | | | 0.60 | |
| | | | | | | | | | | | | | | | |
| | | | | |
| Specialty Retail: 2.59% | | | | | | | | | | | | | | | | |
The Home Depot Incorporated | | | | | | | 173,193 | | | | 23,187,079 | | | | 0.92 | |
Other securities | | | | | | | | | | | 42,391,885 | | | | 1.67 | |
| | | | | |
| | | | | | | | | | | 65,578,964 | | | | 2.59 | |
| | | | | | | | | | | | | | | | |
The accompanying notes are an integral part of these financial statements.
| | | | |
| 72 | | Wells Fargo Equity Gateway Funds | | Summary portfolio of investments—November 30, 2015 (unaudited) |
INDEX PORTFOLIO
| | | | | | | | | | | | | | | | |
| Security name | | | | | | Shares | | | Value | | | Percent of
net assets | |
| | | | | |
| Textiles, Apparel & Luxury Goods: 0.92% | | | | | | | | | | | | | | | | |
Nike Incorporated Class B | | | | | | | 91,431 | | | $ | 12,094,493 | | | | 0.48 | % |
Other securities | | | | | | | | | | | 11,269,188 | | | | 0.44 | |
| | | | | |
| | | | | | | | | | | 23,363,681 | | | | 0.92 | |
| | | | | | | | | | | | | | | | |
| | | | | |
Consumer Staples: 9.34% | | | | | | | | | | | | | | | | |
| | | | | |
| Beverages: 2.21% | | | | | | | | | | | | | | | | |
PepsiCo Incorporated | | | | | | | 198,130 | | | | 19,844,701 | | | | 0.78 | |
The Coca-Cola Company | | | | | | | 528,036 | | | | 22,504,894 | | | | 0.89 | |
Other securities | | | | | | | | | | | 13,594,355 | | | | 0.54 | |
| | | | | |
| | | | | | | | | | | 55,943,950 | | | | 2.21 | |
| | | | | | | | | | | | | | | | |
| | | | | |
| Food & Staples Retailing: 2.19% | | | | | | | | | | | | | | | | |
CVS Health Corporation | | | | | | | 150,316 | | | | 14,143,232 | | | | 0.56 | |
Wal-Mart Stores Incorporated | | | | | | | 212,842 | | | | 12,523,623 | | | | 0.49 | |
Other securities | | | | | | | | | | | 28,723,311 | | | | 1.14 | |
| | | | | |
| | | | | | | | | | | 55,390,166 | | | | 2.19 | |
| | | | | | | | | | | | | | | | |
| | | | | |
| Food Products: 1.60% | | | | | | | | | | | | | | | | |
Other securities | | | | | | | | | | | 40,537,489 | | | | 1.60 | |
| | | | | | | | | | | | | | | | |
| | | | | |
| Household Products: 1.71% | | | | | | | | | | | | | | | | |
The Procter & Gamble Company | | | | | | | 365,857 | | | | 27,380,738 | | | | 1.08 | |
Other securities | | | | | | | | | | | 15,984,687 | | | | 0.63 | |
| | | | | |
| | | | | | | | | | | 43,365,425 | | | | 1.71 | |
| | | | | | | | | | | | | | | | |
| | | | | |
| Personal Products: 0.10% | | | | | | | | | | | | | | | | |
Other securities | | | | | | | | | | | 2,562,548 | | | | 0.10 | |
| | | | | | | | | | | | | | | | |
| | | | | |
| Tobacco: 1.53% | | | | | | | | | | | | | | | | |
Altria Group Incorporated | | | | | | | 264,449 | | | | 15,232,262 | | | | 0.60 | |
Philip Morris International | | | | | | | 208,946 | | | | 18,259,791 | | | | 0.72 | |
Other securities | | | | | | | | | | | 5,170,519 | | | | 0.21 | |
| | | | | |
| | | | | | | | | | | 38,662,572 | | | | 1.53 | |
| | | | | | | | | | | | | | | | |
| | | | | |
Energy: 6.89% | | | | | | | | | | | | | | | | |
| | | | | |
| Energy Equipment & Services: 1.10% | | | | | | | | | | | | | | | | |
Schlumberger Limited | | | | | | | 170,677 | | | | 13,167,731 | | | | 0.52 | |
Other securities | | | | | | | | | | | 14,772,195 | | | | 0.58 | |
| | | | | |
| | | | | | | | | | | 27,939,926 | | | | 1.10 | |
| | | | | | | | | | | | | | | | |
| | | | | |
| Oil, Gas & Consumable Fuels: 5.79% | | | | | | | | | | | | | | | | |
Chevron Corporation | | | | | | | 253,799 | | | | 23,176,925 | | | | 0.92 | |
Exxon Mobil Corporation | | | | | | | 562,354 | | | | 45,921,828 | | | | 1.81 | |
Other securities | | | | | | | | | | | 77,414,331 | | | | 3.06 | |
| | | | | |
| | | | | | | | | | | 146,513,084 | | | | 5.79 | |
| | | | | | | | | | | | | | | | |
The accompanying notes are an integral part of these financial statements.
| | | | | | |
| Summary portfolio of investments—November 30, 2015 (unaudited) | | Wells Fargo Equity Gateway Funds | | | 73 | |
INDEX PORTFOLIO
| | | | | | | | | | | | | | | | |
| Security name | | | | | | Shares | | | Value | | | Percent of
net assets | |
| | | | | |
Financials: 16.19% | | | | | | | | | | | | | | | | |
| | | | | |
| Banks: 5.93% | | | | | | | | | | | | | | | | |
Bank of America Corporation | | | | | | | 1,411,945 | | | $ | 24,610,201 | | | | 0.97 | % |
Citigroup Incorporated | | | | | | | 405,953 | | | | 21,957,998 | | | | 0.87 | |
JPMorgan Chase & Company | | | | | | | 498,777 | | | | 33,258,450 | | | | 1.31 | |
Wells Fargo & Company (l) | | | | | | | 630,049 | | | | 34,715,700 | | | | 1.37 | |
Other securities | | | | | | | | | | | 35,655,337 | | | | 1.41 | |
| | | | | |
| | | | | | | | | | | 150,197,686 | | | | 5.93 | |
| | | | | | | | | | | | | | | | |
| | | | | |
| Capital Markets: 2.15% | | | | | | | | | | | | | | | | |
Other securities | | | | | | | | | | | 54,470,876 | | | | 2.15 | |
| | | | | | | | | | | | | | | | |
| | | | | |
| Consumer Finance: 0.85% | | | | | | | | | | | | | | | | |
Other securities | | | | | | | | | | | 21,480,159 | | | | 0.85 | |
| | | | | | | | | | | | | | | | |
| | | | | |
| Diversified Financial Services: 1.97% | | | | | | | | | | | | | | | | |
Berkshire Hathaway Incorporated Class B † | | | | | | | 252,675 | | | | 33,881,191 | | | | 1.34 | |
Other securities | | | | | | | | | | | 16,028,966 | | | | 0.63 | |
| | | | | |
| | | | | | | | | | | 49,910,157 | | | | 1.97 | |
| | | | | | | | | | | | | | | | |
| | | | | |
| Insurance: 2.71% | | | | | | | | | | | | | | | | |
American International Group Incorporated | | | | | | | 174,513 | | | | 11,095,537 | | | | 0.44 | |
Other securities | | | | | | | | | | | 57,427,615 | | | | 2.27 | |
| | | | | |
| | | | | | | | | | | 68,523,152 | | | | 2.71 | |
| | | | | | | | | | | | | | | | |
| | | | | |
| Real Estate Management & Development: 0.06% | | | | | | | | | | | | | | | | |
Other securities | | | | | | | | | | | 1,464,927 | | | | 0.06 | |
| | | | | | | | | | | | | | | | |
| | | | | |
| REITs: 2.52% | | | | | | | | | | | | | | | | |
Other securities | | | | | | | | | | | 63,944,092 | | | | 2.52 | |
| | | | | | | | | | | | | | | | |
| | | | | |
Health Care: 14.26% | | | | | | | | | | | | | | | | |
| | | | | |
| Biotechnology: 3.50% | | | | | | | | | | | | | | | | |
AbbVie Incorporated | | | | | | | 223,255 | | | | 12,982,278 | | | | 0.51 | |
Amgen Incorporated | | | | | | | 102,269 | | | | 16,475,536 | | | | 0.65 | |
Celgene Corporation † | | | | | | | 106,624 | | | | 11,669,997 | | | | 0.46 | |
Gilead Sciences Incorporated | | | | | | | 197,943 | | | | 20,974,040 | | | | 0.83 | |
Other securities | | | | | | | | | | | 26,525,613 | | | | 1.05 | |
| | | | | |
| | | | | | | | | | | 88,627,464 | | | | 3.50 | |
| | | | | | | | | | | | | | | | |
| | | | | |
| Health Care Equipment & Supplies: 2.04% | | | | | | | | | | | | | | | | |
Medtronic plc | | | | | | | 190,739 | | | | 14,370,276 | | | | 0.57 | |
Other securities | | | | | | | | | | | 37,264,008 | | | | 1.47 | |
| | | | | |
| | | | | | | | | | | 51,634,284 | | | | 2.04 | |
| | | | | | | | | | | | | | | | |
| | | | | |
| Health Care Providers & Services: 2.53% | | | | | | | | | | | | | | | | |
UnitedHealth Group Incorporated | | | | | | | 128,612 | | | | 14,495,859 | | | | 0.57 | |
Other securities | | | | | | | | | | | 49,608,634 | | | | 1.96 | |
| | | | | |
| | | | | | | | | | | 64,104,493 | | | | 2.53 | |
| | | | | | | | | | | | | | | | |
The accompanying notes are an integral part of these financial statements.
| | | | |
| 74 | | Wells Fargo Equity Gateway Funds | | Summary portfolio of investments—November 30, 2015 (unaudited) |
INDEX PORTFOLIO
| | | | | | | | | | | | | | | | |
| Security name | | | | | | Shares | | | Value | | | Percent of
net assets | |
| | | | | |
| Health Care Technology: 0.10% | | | | | | | | | | | | | | | | |
Other securities | | | | | | | | | | $ | 2,468,751 | | | | 0.10 | % |
| | | | | | | | | | | | | | | | |
| | | | | |
| Life Sciences Tools & Services: 0.60% | | | | | | | | | | | | | | | | |
Other securities | | | | | | | | | | | 15,183,455 | | | | 0.60 | |
| | | | | | | | | | | | | | | | |
| | | | | |
| Pharmaceuticals: 5.49% | | | | | | | | | | | | | | | | |
Allergan plc † | | | | | | | 53,092 | | | | 16,665,048 | | | | 0.66 | |
Bristol-Myers Squibb Company | | | | | | | 224,904 | | | | 15,070,817 | | | | 0.59 | |
Johnson & Johnson | | | | | | | 373,483 | | | | 37,811,419 | | | | 1.49 | |
Merck & Company Incorporated | | | | | | | 379,894 | | | | 20,138,181 | | | | 0.79 | |
Pfizer Incorporated | | | | | | | 831,821 | | | | 27,258,774 | | | | 1.08 | |
Other securities | | | | | | | | | | | 22,291,726 | | | | 0.88 | |
| | | | | |
| | | | | | | | | | | 139,235,965 | | | | 5.49 | |
| | | | | | | | | | | | | | | | |
| | | | | |
Industrials: 9.88% | | | | | | | | | | | | | | | | |
| | | | | |
| Aerospace & Defense: 2.63% | | | | | | | | | | | | | | | | |
The Boeing Company | | | | | | | 86,148 | | | | 12,530,227 | | | | 0.49 | |
Other securities | | | | | | | | | | | 54,223,344 | | | | 2.14 | |
| | | | | |
| | | | | | | | | | | 66,753,571 | | | | 2.63 | |
| | | | | | | | | | | | | | | | |
| | | | | |
| Air Freight & Logistics: 0.70% | | | | | | | | | | | | | | | | |
Other securities | | | | | | | | | | | 17,848,289 | | | | 0.70 | |
| | | | | | | | | | | | | | | | |
| | | | | |
| Airlines: 0.61% | | | | | | | | | | | | | | | | |
Other securities | | | | | | | | | | | 15,411,554 | | | | 0.61 | |
| | | | | | | | | | | | | | | | |
| | | | | |
| Building Products: 0.09% | | | | | | | | | | | | | | | | |
Other securities | | | | | | | | | | | 2,256,080 | | | | 0.09 | |
| | | | | | | | | | | | | | | | |
| | | | | |
| Commercial Services & Supplies: 0.41% | | | | | | | | | | | | | | | | |
Other securities | | | | | | | | | | | 10,369,398 | | | | 0.41 | |
| | | | | | | | | | | | | | | | |
| | | | | |
| Construction & Engineering: 0.09% | | | | | | | | | | | | | | | | |
Other securities | | | | | | | | | | | 2,171,415 | | | | 0.09 | |
| | | | | | | | | | | | | | | | |
| | | | | |
| Electrical Equipment: 0.47% | | | | | | | | | | | | | | | | |
Other securities | | | | | | | | | | | 11,868,205 | | | | 0.47 | |
| | | | | | | | | | | | | | | | |
| | | | | |
| Industrial Conglomerates: 2.43% | | | | | | | | | | | | | | | | |
3M Company | | | | | | | 84,262 | | | | 13,193,744 | | | | 0.52 | |
General Electric Company | | | | | | | 1,271,254 | | | | 38,061,345 | | | | 1.50 | |
Other securities | | | | | | | | | | | 10,357,588 | | | | 0.41 | |
| | | | | |
| | | | | | | | | | | 61,612,677 | | | | 2.43 | |
| | | | | | | | | | | | | | | | |
| | | | | |
| Machinery: 1.20% | | | | | | | | | | | | | | | | |
Other securities | | | | | | | | | | | 30,337,488 | | | | 1.20 | |
| | | | | | | | | | | | | | | | |
| | | | | |
| Professional Services: 0.28% | | | | | | | | | | | | | | | | |
Other securities | | | | | | | | | | | 7,108,301 | | | | 0.28 | |
| | | | | | | | | | | | | | | | |
The accompanying notes are an integral part of these financial statements.
| | | | | | |
| Summary portfolio of investments—November 30, 2015 (unaudited) | | Wells Fargo Equity Gateway Funds | | | 75 | |
INDEX PORTFOLIO
| | | | | | | | | | | | | | | | |
| Security name | | | | | | Shares | | | Value | | | Percent of
net assets | |
| | | | | |
| Road & Rail: 0.80% | | | | | | | | | | | | | | | | |
Other securities | | | | | | | | | | $ | 20,258,328 | | | | 0.80 | % |
| | | | | | | | | | | | | | | | |
| | | | | |
| Trading Companies & Distributors: 0.17% | | | | | | | | | | | | | | | | |
Other securities | | | | | | | | | | | 4,241,892 | | | | 0.17 | |
| | | | | | | | | | | | | | | | |
| | | | | |
Information Technology: 20.43% | | | | | | | | | | | | | | | | |
| | | | | |
| Communications Equipment: 1.36% | | | | | | | | | | | | | | | | |
Cisco Systems Incorporated | | | | | | | 685,959 | | | | 18,692,383 | | | | 0.74 | |
Other securities | | | | | | | | | | | 15,710,720 | | | | 0.62 | |
| | | | | |
| | | | | | | | | | | 34,403,103 | | | | 1.36 | |
| | | | | | | | | | | | | | | | |
| | | | | |
| Electronic Equipment, Instruments & Components: 0.38% | | | | | | | | | | | | | | | | |
Other securities | | | | | | | | | | | 9,611,514 | | | | 0.38 | |
| | | | | | | | | | | | | | | | |
| | | | | |
| Internet Software & Services: 4.03% | | | | | | | | | | | | | | | | |
Alphabet Incorporated Class A † | | | | | | | 39,098 | | | | 29,825,909 | | | | 1.18 | |
Alphabet Incorporated Class C † | | | | | | | 39,893 | | | | 29,624,542 | | | | 1.17 | |
Facebook Incorporated Class A † | | | | | | | 304,782 | | | | 31,770,476 | | | | 1.25 | |
Other securities | | | | | | | | | | | 11,014,824 | | | | 0.43 | |
| | | | | |
| | | | | | | | | | | 102,235,751 | | | | 4.03 | |
| | | | | | | | | | | | | | | | |
| | | | | |
| IT Services: 3.60% | | | | | | | | | | | | | | | | |
International Business Machines Corporation | | | | | | | 121,545 | | | | 16,945,804 | | | | 0.67 | |
MasterCard Incorporated Class A | | | | | | | 134,605 | | | | 13,180,522 | | | | 0.52 | |
Visa Incorporated Class A | | | | | | | 263,193 | | | | 20,794,879 | | | | 0.82 | |
Other securities | | | | | | | | | | | 40,272,752 | | | | 1.59 | |
| | | | | |
| | | | | | | | | | | 91,193,957 | | | | 3.60 | |
| | | | | | | | | | | | | | | | |
| | | | | |
| Semiconductors & Semiconductor Equipment: 2.48% | | | | | | | | | | | | | | | | |
Intel Corporation | | | | | | | 641,196 | | | | 22,294,385 | | | | 0.88 | |
Other securities | | | | | | | | | | | 40,527,079 | | | | 1.60 | |
| | | | | |
| | | | | | | | | | | 62,821,464 | | | | 2.48 | |
| | | | | | | | | | | | | | | | |
| | | | | |
| Software: 4.20% | | | | | | | | | | | | | | | | |
Microsoft Corporation | | | | | | | 1,078,727 | | | | 58,628,812 | | | | 2.32 | |
Oracle Corporation | | | | | | | 438,621 | | | | 17,093,060 | | | | 0.67 | |
Other securities | | | | | | | | | | | 30,567,637 | | | | 1.21 | |
| | | | | |
| | | | | | | | | | | 106,289,509 | | | | 4.20 | |
| | | | | | | | | | | | | | | | |
| | | | | |
| Technology Hardware, Storage & Peripherals: 4.38% | | | | | | | | | | | | | | | | |
Apple Incorporated | | | | | | | 769,154 | | | | 90,990,918 | | | | 3.59 | |
Other securities | | | | | | | | | | | 19,935,289 | | | | 0.79 | |
| | | | | |
| | | | | | | | | | | 110,926,207 | | | | 4.38 | |
| | | | | | | | | | | | | | | | |
| | | | | |
Materials: 2.79% | | | | | | | | | | | | | | | | |
| | | | | |
| Chemicals: 2.11% | | | | | | | | | | | | | | | | |
Other securities | | | | | | | | | | | 53,509,505 | | | | 2.11 | |
| | | | | | | | | | | | | | | | |
The accompanying notes are an integral part of these financial statements.
| | | | |
| 76 | | Wells Fargo Equity Gateway Funds | | Summary portfolio of investments—November 30, 2015 (unaudited) |
INDEX PORTFOLIO
| | | | | | | | | | | | | | | | | | | | |
| Security name | | | | | | | | Shares | | | Value | | | Percent of
net assets | |
| | | | | |
| Construction Materials: 0.13% | | | | | | | | | | | | | | | | | | | | |
Other securities | | | | | | | | | | | | | | $ | 3,266,685 | | | | 0.13 | % |
| | | | | | | | | | | | | | | | | | | | |
| | | | | |
| Containers & Packaging: 0.22% | | | | | | | | | | | | | | | | | | | | |
Other securities | | | | | | | | | | | | | | | 5,572,841 | | | | 0.22 | |
| | | | | | | | | | | | | | | | | | | | |
| | | | | |
| Metals & Mining: 0.24% | | | | | | | | | | | | | | | | | | | | |
Other securities | | | | | | | | | | | | | | | 6,008,282 | | | | 0.24 | |
| | | | | | | | | | | | | | | | | | | | |
| | | | | |
| Paper & Forest Products: 0.09% | | | | | | | | | | | | | | | | | | | | |
Other securities | | | | | | | | | | | | | | | 2,356,828 | | | | 0.09 | |
| | | | | | | | | | | | | | | | | | | | |
| | | | | |
Telecommunication Services: 2.28% | | | | | | | | | | | | | | | | | | | | |
| | | | | |
| Diversified Telecommunication Services: 2.28% | | | | | | | | | | | | | | | | | | | | |
AT&T Incorporated | | | | | | | | | | | 829,616 | | | | 27,933,171 | | | | 1.10 | |
Verizon Communications Incorporated | | | | | | | | | | | 548,360 | | | | 24,922,962 | | | | 0.99 | |
Other securities | | | | | | | | | | | | | | | 4,807,075 | | | | 0.19 | |
| | | | | |
| | | | | | | | | | | | | | | 57,663,208 | | | | 2.28 | |
| | | | | | | | | | | | | | | | | | | | |
| | | | | |
Utilities: 2.79% | | | | | | | | | | | | | | | | | | | | |
| | | | | |
| Electric Utilities: 1.60% | | | | | | | | | | | | | | | | | | | | |
Other securities | | | | | | | | | | | | | | | 40,570,108 | | | | 1.60 | |
| | | | | | | | | | | | | | | | | | | | |
| | | | | |
| Gas Utilities: 0.04% | | | | | | | | | | | | | | | | | | | | |
Other securities | | | | | | | | | | | | | | | 1,013,446 | | | | 0.04 | |
| | | | | | | | | | | | | | | | | | | | |
| | | | | |
| Independent Power & Renewable Electricity Producers: 0.06% | | | | | | | | | | | | | | | | | | | | |
Other securities | | | | | | | | | | | | | | | 1,471,258 | | | | 0.06 | |
| | | | | | | | | | | | | | | | | | | | |
| | | | | |
| Multi-Utilities: 1.09% | | | | | | | | | | | | | | | | | | | | |
Other securities | | | | | | | | | | | | | | | 27,722,609 | | | | 1.09 | |
| | | | | | | | | | | | | | | | | | | | |
| | | | | |
Total Common Stocks (Cost $1,203,617,883) | | | | | | | | | | | | | | | 2,472,550,404 | | | | 97.62 | |
| | | | | | | | | | | | | | | | | | | | |
| | | | | |
| | | Yield | | | | | | | | | | | | | |
| Short-Term Investments: 1.79% | | | | | | | | | | | | | | | | | | | | |
| | | | | |
| Investment Companies: 1.72% | | | | | | | | | | | | | | | | | | | | |
Securities Lending Cash Investments, LLC (l)(r)(u) | | | 0.18 | % | | | | | | | 13,080,495 | | | | 13,080,495 | | | | 0.52 | |
Wells Fargo Cash Investment Money Market Fund, Select Class (l)(u) | | | 0.17 | | | | | | | | 30,518,256 | | | | 30,518,256 | | | | 1.20 | |
| | | | | |
| | | | | | | | | | | | | | | 43,598,751 | | | | 1.72 | |
| | | | | | | | | | | | | | | | | | | | |
| | | | | |
| | | | | | Maturity date | | | Principal | | | | | | | |
| U.S. Treasury Securities: 0.07% | | | | | | | | | | | | | | | | | | | | |
Treasury Bill (z)# | | | 0.05 | | | | 4-7-2016 | | | $ | 1,007,000 | | | | 1,006,239 | | | | 0.04 | |
Treasury Bill (z)# | | | 0.10 | | | | 4-21-2016 | | | | 255,000 | | | | 254,796 | | | | 0.01 | |
Treasury Bill (z)# | | | 0.16 | | | | 2-25-2016 | | | | 76,000 | | | | 75,968 | | | | 0.00 | |
Treasury Bill (z)# | | | 0.28 | | | | 5-5-2016 | | | | 360,000 | | | | 359,507 | | | | 0.02 | |
| | | | | |
| | | | | | | | | | | | | | | 1,696,510 | | | | 0.07 | |
| | | | | | | | | | | | | | | | | | | | |
The accompanying notes are an integral part of these financial statements.
| | | | | | |
| Summary portfolio of investments—November 30, 2015 (unaudited) | | Wells Fargo Equity Gateway Funds | | | 77 | |
INDEX PORTFOLIO
| | | | | | | | | | | | | | |
| | | | | | | | | Value | | | Percent of
net assets | |
| | | | |
Total Short-Term Investments (Cost $45,295,990) | | | | | | $ | 45,295,261 | | | | 1.79 | % |
| | | | | | | | | | | | | | |
| | | | | |
| Total investments in securities (Cost $1,248,913,873) * | | | | | | | | | 2,517,845,665 | | | | 99.41 | % |
Other assets and liabilities, net | | | | | | | | | 14,857,797 | | | | 0.59 | |
| | | | | | | | | | | | | | |
| Total net assets | | | | | | | | $ | 2,532,703,462 | | | | 100.00 | % |
| | | | | | | | | | | | | | |
| † | Non-income-earning security |
| « | All or a portion of this security is on loan. |
| (l) | The issuer of the security is an affiliated person of the Portfolio as defined in the Investment Company Act of 1940. |
| (r) | The investment is a non-registered investment vehicle purchased with cash collateral received from securities on loan. |
| (u) | The rate represents the 7-day annualized yield at period end. |
| (z) | Zero coupon security. The rate represents the current yield to maturity. |
| # | All or a portion of this security is segregated as collateral for investments in derivative instruments. |
| * | Cost for federal income tax purposes is $1,317,979,628 and unrealized gains (losses) consists of: |
| | | | |
Gross unrealized gains | | $ | 1,301,718,519 | |
Gross unrealized losses | | | (101,852,482 | ) |
| | | | |
Net unrealized gains | | $ | 1,199,866,037 | |
The accompanying notes are an integral part of these financial statements.
| | | | |
| 78 | | Wells Fargo Equity Gateway Funds | | Portfolio of investments—November 30, 2015 (unaudited) |
INTERNATIONAL GROWTH PORTFOLIO
| | | | | | | | | | | | |
| Security name | | | | | | Shares | | | Value | |
| | | | |
Common Stocks: 94.66% | | | | | | | | | | | | |
| | | | |
| Belgium: 3.51% | | | | | | | | | | | | |
Anheuser-Busch InBev NV (Consumer Staples, Beverages) | | | | | | | 22,037 | | | $ | 2,839,385 | |
Telenet Group Holding NV (Consumer Discretionary, Media) † | | | | | | | 22,809 | | | | 1,245,669 | |
UCB SA (Health Care, Pharmaceuticals) | | | | | | | 15,768 | | | | 1,408,076 | |
| | | | |
| | | | | | | | | | | 5,493,130 | |
| | | | | | | | | | | | |
| | | | |
| China: 8.44% | | | | | | | | | | | | |
Baidu Incorporated ADR (Information Technology, Internet Software & Services) † | | | | | | | 39,497 | | | | 8,609,161 | |
Tencent Holdings Limited (Information Technology, Internet Software & Services) | | | | | | | 230,500 | | | | 4,587,139 | |
| | | | |
| | | | | | | | | | | 13,196,300 | |
| | | | | | | | | | | | |
| | | | |
| France: 5.54% | | | | | | | | | | | | |
L’Oreal SA (Consumer Staples, Personal Products) | | | | | | | 6,888 | | | | 1,219,711 | |
LVMH Moet Hennessy Louis Vuitton SA (Consumer Discretionary, Textiles, Apparel & Luxury Goods) « | | | | | | | 7,971 | | | | 1,336,954 | |
Orange SA (Telecommunication Services, Diversified Telecommunication Services) | | | | | | | 77,130 | | | | 1,333,204 | |
Pernod-Ricard SA (Consumer Staples, Beverages) | | | | | | | 12,640 | | | | 1,438,311 | |
Zodiac Aerospace SA (Industrials, Aerospace & Defense) | | | | | | | 123,250 | | | | 3,337,532 | |
| | | | |
| | | | | | | | | | | 8,665,712 | |
| | | | | | | | | | | | |
| | | | |
| Germany: 11.29% | | | | | | | | | | | | |
Allianz AG (Financials, Insurance) | | | | | | | 8,871 | | | | 1,571,325 | |
Bayer AG (Health Care, Pharmaceuticals) | | | | | | | 53,082 | | | | 7,083,380 | |
Beiersdorf AG (Consumer Staples, Personal Products) | | | | | | | 24,795 | | | | 2,309,017 | |
Linde AG (Materials, Chemicals) | | | | | | | 25,604 | | | | 4,470,326 | |
Vonovia SE (Financials, Real Estate Management & Development) | | | | | | | 36,076 | | | | 1,118,135 | |
Wirecard AG (Information Technology, IT Services) | | | | | | | 22,432 | | | | 1,098,875 | |
| | | | |
| | | | | | | | | | | 17,651,058 | |
| | | | | | | | | | | | |
| | | | |
| Hong Kong: 3.74% | | | | | | | | | | | | |
AIA Group Limited (Financials, Insurance) | | | | | | | 932,400 | | | | 5,567,859 | |
Beijing Enterprises Water Group Limited (Utilities, Water Utilities) | | | | | | | 362,000 | | | | 282,935 | |
| | | | |
| | | | | | | | | | | 5,850,794 | |
| | | | | | | | | | | | |
| | | | |
| India: 2.07% | | | | | | | | | | | | |
Housing Development Finance Corporation Limited (Financials, Thrifts & Mortgage Finance) | | | | | | | 110,747 | | | | 2,012,404 | |
Infosys Limited ADR (Information Technology, IT Services) | | | | | | | 73,799 | | | | 1,230,967 | |
| | | | |
| | | | | | | | | | | 3,243,371 | |
| | | | | | | | | | | | |
| | | | |
| Ireland: 6.04% | | | | | | | | | | | | |
Allegion plc (Industrials, Building Products) | | | | | | | 4,928 | | | | 331,211 | |
Allergan plc (Health Care, Pharmaceuticals) † | | | | | | | 5,099 | | | | 1,600,525 | |
Medtronic plc (Health Care, Health Care Equipment & Supplies) | | | | | | | 99,664 | | | | 7,508,686 | |
| | | | |
| | | | | | | | | | | 9,440,422 | |
| | | | | | | | | | | | |
| | | | |
| Italy: 0.64% | | | | | | | | | | | | |
Mediaset SpA (Consumer Discretionary, Media) | | | | | | | 228,906 | | | | 1,006,582 | |
| | | | | | | | | | | | |
The accompanying notes are an integral part of these financial statements.
| | | | | | |
| Portfolio of investments—November 30, 2015 (unaudited) | | Wells Fargo Equity Gateway Funds | | | 79 | |
INTERNATIONAL GROWTH PORTFOLIO
| | | | | | | | | | | | |
| Security name | | | | | | Shares | | | Value | |
| | | | |
| Japan: 9.29% | | | | | | | | | | | | |
Ishikawajima-Harima Heavy Industries Company Limited (Industrials, Machinery) | | | | | | | 247,000 | | | $ | 646,093 | |
Japan Tobacco Incorporated (Consumer Staples, Tobacco) | | | | | | | 67,654 | | | | 2,423,673 | |
NGK Insulators Limited (Industrials, Machinery) | | | | | | | 122,000 | | | | 2,829,488 | |
Olympus Corporation (Health Care, Health Care Equipment & Supplies) | | | | | | | 75,400 | | | | 3,007,425 | |
Ono Pharmaceutical Company Limited (Health Care, Pharmaceuticals) | | | | | | | 8,100 | | | | 1,296,921 | |
Toyota Motor Corporation (Consumer Discretionary, Automobiles) | | | | | | | 69,400 | | | | 4,316,781 | |
| | | | |
| | | | | | | | | | | 14,520,381 | |
| | | | | | | | | | | | |
| | | | |
| Mexico: 1.94% | | | | | | | | | | | | |
Grupo Televisa SAB ADR (Consumer Discretionary, Media) | | | | | | | 107,696 | | | | 3,037,027 | |
| | | | | | | | | | | | |
| | | | |
| Netherlands: 2.28% | | | | | | | | | | | | |
ASML Holdings NV (Information Technology, Semiconductors & Semiconductor Equipment) | | | | | | | 38,503 | | | | 3,558,309 | |
| | | | | | | | | | | | |
| | | | |
| South Korea: 0.01% | | | | | | | | | | | | |
Orion Corporation (Consumer Staples, Food Products) | | | | | | | 18 | | | | 17,735 | |
| | | | | | | | | | | | |
| | | | |
| Spain: 1.48% | | | | | | | | | | | | |
Grifols SA (Health Care, Biotechnology) | | | | | | | 21,620 | | | | 1,026,090 | |
Grifols SA ADR (Health Care, Biotechnology) | | | | | | | 37,018 | | | | 1,286,376 | |
| | | | |
| | | | | | | | | | | 2,312,466 | |
| | | | | | | | | | | | |
| | | | |
| Sweden: 2.15% | | | | | | | | | | | | |
Autoliv Incorporated SDR (Consumer Discretionary, Auto Components) | | | | | | | 15,312 | | | | 1,927,650 | |
Swedbank AB Class A (Financials, Banks) | | | | | | | 65,125 | | | | 1,442,609 | |
| | | | |
| | | | | | | | | | | 3,370,259 | |
| | | | | | | | | | | | |
| | | | |
| Switzerland: 12.33% | | | | | | | | | | | | |
Actelion Limited (Health Care, Biotechnology) | | | | | | | 17,043 | | | | 2,393,657 | |
Adecco SA (Industrials, Professional Services) | | | | | | | 22,326 | | | | 1,527,677 | |
Nestle SA (Consumer Staples, Food Products) | | | | | | | 59,015 | | | | 4,379,448 | |
Novartis AG (Health Care, Pharmaceuticals) | | | | | | | 22,069 | | | | 1,886,542 | |
Roche Holding AG (Health Care, Pharmaceuticals) | | | | | | | 16,045 | | | | 4,296,445 | |
Syngenta AG (Materials, Chemicals) | | | | | | | 10,271 | | | | 3,786,548 | |
TE Connectivity Limited (Information Technology, Electronic Equipment, Instruments & Components) | | | | | | | 15,005 | | | | 1,006,685 | |
| | | | |
| | | | | | | | | | | 19,277,002 | |
| | | | | | | | | | | | |
| | | | |
| United Kingdom: 20.47% | | | | | | | | | | | | |
Aon plc (Financials, Insurance) | | | | | | | 8,124 | | | | 769,668 | |
Babcock International Group plc (Industrials, Commercial Services & Supplies) | | | | | | | 53,879 | | | | 869,086 | |
BT Group plc (Telecommunication Services, Diversified Telecommunication Services) | | | | | | | 201,076 | | | | 1,503,451 | |
Carnival plc (Consumer Discretionary, Hotels, Restaurants & Leisure) | | | | | | | 40,059 | | | | 2,090,532 | |
Croda International plc (Materials, Chemicals) | | | | | | | 35,756 | | | | 1,544,477 | |
Delphi Automotive plc (Consumer Discretionary, Auto Components) | | | | | | | 41,127 | | | | 3,614,241 | |
Diageo plc (Consumer Staples, Beverages) | | | | | | | 1,639 | | | | 47,148 | |
Imperial Tobacco Group plc (Consumer Staples, Tobacco) | | | | | | | 32,109 | | | | 1,735,133 | |
Intercontinental Hotels Group plc (Consumer Discretionary, Hotels, Restaurants & Leisure) | | | | | | | 37,990 | | | | 1,462,459 | |
International Consolidated Airlines Group SA (Industrials, Airlines) † | | | | | | | 299,860 | | | | 2,560,679 | |
Johnson Matthey plc (Materials, Chemicals) | | | | | | | 83,824 | | | | 3,572,797 | |
The accompanying notes are an integral part of these financial statements.
| | | | |
| 80 | | Wells Fargo Equity Gateway Funds | | Portfolio of investments—November 30, 2015 (unaudited) |
INTERNATIONAL GROWTH PORTFOLIO
| | | | | | | | | | | | | | | | |
| Security name | | | | | | | | Shares | | | Value | |
| | | | |
| United Kingdom (continued) | | | | | | | | | | | | | | | | |
Liberty Global plc Class A (Consumer Discretionary, Media) | | | | | | | | | | | 56,548 | | | $ | 2,398,201 | |
Liberty Global plc Class C (Consumer Discretionary, Media) | | | | | | | | | | | 94,351 | | | | 3,868,391 | |
Lloyds Banking Group plc (Financials, Banks) | | | | | | | | | | | 1,834,497 | | | | 2,015,835 | |
Worldpay Group plc (Information Technology, IT Services) 144A† | | | | | | | | | | | 244,315 | | | | 1,100,208 | |
WPP plc (Consumer Discretionary, Media) | | | | | | | | | | | 123,555 | | | | 2,856,421 | |
| | | | |
| | | | | | | | | | | | | | | 32,008,727 | |
| | | | | | | | | | | | | | | | |
| | | | |
| United States: 3.44% | | | | | | | | | | | | | | | | |
Cognizant Technology Solutions Corporation Class A (Information Technology, IT Services) † | | | | | | | | | | | 43,538 | | | | 2,811,684 | |
Royal Caribbean Cruises Limited (Consumer Discretionary, Hotels, Restaurants & Leisure) | | | | | | | | | | | 16,934 | | | | 1,568,258 | |
WABCO Holdings Incorporated (Industrials, Machinery) † | | | | | | | | | | | 9,256 | | | | 994,835 | |
| | | | |
| | | | | | | | | | | | | | | 5,374,777 | |
| | | | | | | | | | | | | | | | |
| | | | |
Total Common Stocks (Cost $124,324,775) | | | | | | | | | | | | | | | 148,024,052 | |
| | | | | | | | | | | | | | | | |
| | | | |
| | | | | | Expiration date | | | | | | | |
| | | | |
Participation Notes: 1.19% | | | | | | | | | | | | | | | | |
| | | | |
| Ireland: 1.19% | | | | | | | | | | | | | | | | |
HSBC Bank plc (Ryanair Holdings plc) (Industrials, Airlines) | | | | | | | 10-29-2018 | | | | 124,515 | | | | 1,864,418 | |
| | | | | | | | | | | | | | | | |
| | | | |
Total Participation Notes (Cost $1,147,504) | | | | | | | | | | | | | | | 1,864,418 | |
| | | | | | | | | | | | | | | | |
| | | | |
| | | Dividend yield | | | | | | | | | | |
| | | | |
Preferred Stocks: 0.89% | | | | | | | | | | | | | | | | |
| | | | |
| Germany: 0.89% | | | | | | | | | | | | | | | | |
Henkel AG & Company KGaA (Consumer Staples, Household Products) ± | | | 1.23 | % | | | | | | | 12,217 | | | | 1,387,596 | |
| | | | | | | | | | | | | | | | |
| | | | |
Total Preferred Stocks (Cost $874,798) | | | | | | | | | | | | | | | 1,387,596 | |
| | | | | | | | | | | | | | | | |
| | | Yield | | | | | | | | | | |
| Short-Term Investments: 3.60% | | | | | | | | | | | | | | | | |
| | | | |
| Investment Companies: 3.60% | | | | | | | | | | | | | | | | |
Securities Lending Cash Investments, LLC (l)(r)(u) | | | 0.18 | | | | | | | | 1,302,812 | | | | 1,302,812 | |
Wells Fargo Cash Investment Money Market Fund, Select Class (l)(u) | | | 0.17 | | | | | | | | 4,324,287 | | | | 4,324,287 | |
| | | | |
Total Short-Term Investments (Cost $5,627,099) | | | | | | | | | | | | | | | 5,627,099 | |
| | | | | | | | | | | | | | | | |
| | | | | | | | |
| Total investments in securities (Cost $131,974,176) * | | | 100.34 | % | | | 156,903,165 | |
Other assets and liabilities, net | | | (0.34 | ) | | | (532,486 | ) |
| | | | | | | | |
| Total net assets | | | 100.00 | % | | $ | 156,370,679 | |
| | | | | | | | |
The accompanying notes are an integral part of these financial statements.
| | | | | | |
| Portfolio of investments—November 30, 2015 (unaudited) | | Wells Fargo Equity Gateway Funds | | | 81 | |
INTERNATIONAL GROWTH PORTFOLIO
| † | Non-income-earning security |
| « | All or a portion of this security is on loan. |
| ± | Variable rate investment. The rate shown is the rate in effect at period end. |
| 144A | The security may be resold in transactions exempt from registration, normally to qualified institutional buyers, pursuant to Rule 144A under the Securities Act of 1933. |
| (l) | The issuer of the security is an affiliated person of the Portfolio as defined in the Investment Company Act of 1940. |
| (r) | The investment is a non-registered investment vehicle purchased with cash collateral received from securities on loan. |
| (u) | The rate represents the 7-day annualized yield at period end. |
| * | Cost for federal income tax purposes is $132,399,036 and unrealized gains (losses) consists of: |
| | | | |
Gross unrealized gains | | $ | 27,616,019 | |
Gross unrealized losses | | | (3,111,890 | ) |
| | | | |
Net unrealized gains | | $ | 24,504,129 | |
The following table shows the percent of total long-term investments by sector as of November 30, 2015:
| | | | |
Health Care | | | 21.67 | % |
Consumer Discretionary | | | 20.31 | |
Information Technology | | | 15.87 | |
Consumer Staples | | | 11.76 | |
Financials | | | 10.82 | |
Materials | | | 8.84 | |
Industrials | | | 8.66 | |
Telecommunication Services | | | 1.88 | |
Utilities | | | 0.19 | |
| | | | |
| | | 100.00 | % |
| | | | |
The accompanying notes are an integral part of these financial statements.
| | | | |
| 82 | | Wells Fargo Equity Gateway Funds | | Portfolio of investments—November 30, 2015 (unaudited) |
INTERNATIONAL VALUE PORTFOLIO
| | | | | | | | | | | | |
| Security name | | | | | | Shares | | | Value | |
| | | | |
Common Stocks: 96.94% | | | | | | | | | | | | |
| | | | |
| Australia: 5.05% | | | | | | | | | | | | |
AGL Energy Limited (Utilities, Multi-Utilities) | | | | | | | 131,500 | | | $ | 1,573,919 | |
Arrium Limited (Materials, Metals & Mining) | | | | | | | 3,063,400 | | | | 175,021 | |
Automotive Holdings Group (Consumer Discretionary) | | | | | | | 410,016 | | | | 1,254,295 | |
Bendigo Bank Limited (Financials, Banks) | | | | | | | 272,500 | | | | 2,199,324 | |
Boart Longyear Group Limited (Industrials, Construction & Engineering) † | | | | | | | 199,991 | | | | 10,703 | |
Cabcharge Australia Limited (Industrials, Commercial Services & Supplies) « | | | | | | | 207,386 | | | | 410,950 | |
Challenger Financial Services Group Limited (Financials, Diversified Financial Services) | | | | | | | 475,400 | | | | 2,901,751 | |
CSR Limited (Materials, Construction Materials) | | | | | | | 754,900 | | | | 1,665,129 | |
Downer EDI Limited (Industrials, Commercial Services & Supplies) | | | | | | | 518,900 | | | | 1,354,720 | |
Fortescue Metals Group Limited (Materials, Metals & Mining) « | | | | | | | 394,700 | | | | 559,476 | |
Independence Group NL (Materials, Metals & Mining) | | | | | | | 404,400 | | | | 707,758 | |
Lend Lease Corporation Limited (Financials, Real Estate Management & Development) | | | | | | | 350,500 | | | | 3,231,891 | |
McMillan Shakespeare Limited (Industrials, Professional Services) | | | | | | | 158,800 | | | | 1,535,467 | |
Metcash Limited (Consumer Staples, Food & Staples Retailing) « | | | | | | | 785,500 | | | | 840,749 | |
Mincor Resources NL (Materials, Metals & Mining) (i) | | | | | | | 570,994 | | | | 101,171 | |
Mineral Resources Limited (Materials, Metals & Mining) « | | | | | | | 144,300 | | | | 509,266 | |
Myer Holdings Limited (Consumer Discretionary, Multiline Retail) « | | | | | | | 1,059,500 | | | | 850,516 | |
Panoramic Resources Limited (Materials, Metals & Mining) | | | | | | | 368,800 | | | | 58,678 | |
Primary Health Care Limited (Health Care, Health Care Providers & Services) | | | | | | | 339,000 | | | | 786,979 | |
Qantas Airways Limited (Industrials, Airlines) | | | | | | | 580,020 | | | | 1,526,873 | |
Rio Tinto Limited (Materials, Metals & Mining) | | | | | | | 58,300 | | | | 1,935,684 | |
Seven Group Holdings Limited (Industrials, Trading Companies & Distributors) « | | | | | | | 165,800 | | | | 621,116 | |
United Construction Group Limited (Industrials, Construction & Engineering) | | | | | | | 152,800 | | | | 269,632 | |
| | | | |
| | | | | | | | | | | 25,081,068 | |
| | | | | | | | | | | | |
| | | | |
| Austria: 1.07% | | | | | | | | | | | | |
OMV AG (Energy, Oil, Gas & Consumable Fuels) | | | | | | | 41,100 | | | | 1,173,105 | |
Raiffeisen Bank International AG (Financials, Banks) †« | | | | | | | 81,200 | | | | 1,270,577 | |
RHI AG (Materials, Construction Materials) « | | | | | | | 64,721 | | | | 1,298,896 | |
Voestalpine AG (Materials, Metals & Mining) | | | | | | | 47,700 | | | | 1,552,241 | |
| | | | |
| | | | | | | | | | | 5,294,819 | |
| | | | | | | | | | | | |
| | | | |
| Belgium: 0.80% | | | | | | | | | | | | |
Delhaize Group SA (Consumer Staples, Food & Staples Retailing) | | | | | | | 39,400 | | | | 3,947,589 | |
| | | | | | | | | | | | |
| | | | |
| Brazil: 1.10% | | | | | | | | | | | | |
Banco do Brasil SA (Financials, Banks) | | | | | | | 309,500 | | | | 1,303,116 | |
Companhia de Saneamento Basico do Estado de Sao Paulo SA (Utilities, Water Utilities) | | | | | | | 253,200 | | | | 1,238,187 | |
Companhia de Saneamento de Minas Gerais SA (Utilities, Water Utilities) | | | | | | | 72,400 | | | | 305,955 | |
JBS SA (Consumer Staples, Food Products) | | | | | | | 805,600 | | | | 2,586,082 | |
| | | | |
| | | | | | | | | | | 5,433,340 | |
| | | | | | | | | | | | |
| | | | |
| Canada: 2.11% | | | | | | | | | | | | |
Magna International Incorporated Class A (Consumer Discretionary, Auto Components) | | | | | | | 131,600 | | | | 5,985,536 | |
Metro Incorporated (Consumer Staples, Food & Staples Retailing) | | | | | | | 90,100 | | | | 2,594,815 | |
WestJet Airlines Limited (Industrials, Airlines) | | | | | | | 120,000 | | | | 1,908,570 | |
| | | | |
| | | | | | | | | | | 10,488,921 | |
| | | | | | | | | | | | |
The accompanying notes are an integral part of these financial statements.
| | | | | | |
| Portfolio of investments—November 30, 2015 (unaudited) | | Wells Fargo Equity Gateway Funds | | | 83 | |
INTERNATIONAL VALUE PORTFOLIO
| | | | | | | | | | | | |
| Security name | | | | | | Shares | | | Value | |
| | | | |
| Cayman Islands: 0.63% | | | | | | | | | | | | |
China Resources Cement Holdings Limited (Materials, Construction Materials) | | | | | | | 3,186,000 | | | $ | 1,039,612 | |
Kingboard Laminates Holdings Limited (Information Technology, Electronic Equipment, Instruments & Components) | | | | | | | 2,204,000 | | | | 932,375 | |
TCL Communication Technology Holdings Limited (Information Technology, Technology Hardware, Storage & Peripherals) « | | | | | | | 1,586,000 | | | | 1,174,141 | |
| | | | |
| | | | | | | | | | | 3,146,128 | |
| | | | | | | | | | | | |
| | | | |
| China: 2.68% | | | | | | | | | | | | |
China BlueChemical Limited H Shares (Materials, Chemicals) | | | | | | | 1,984,000 | | | | 539,920 | |
China Communications Services Corporation Limited H Shares (Telecommunication Services, Diversified Telecommunication Services) | | | | | | | 2,836,000 | | | | 1,093,660 | |
China Petroleum & Chemical Corporation H Shares (Energy, Oil, Gas & Consumable Fuels) | | | | | | | 4,152,000 | | | | 2,543,642 | |
China Railway Construction Corporation Limited H Shares (Industrials, Construction & Engineering) | | | | | | | 1,747,500 | | | | 2,321,450 | |
Dongfeng Motor Group Company Limited H Shares (Consumer Discretionary, Automobiles) | | | | | | | 1,730,000 | | | | 2,351,753 | |
PICC Property & Casualty Company Limited H Shares (Financials, Insurance) | | | | | | | 1,225,000 | | | | 2,657,462 | |
Shanghai Pharmaceuticals Holding Company Limited H Shares (Health Care, Pharmaceuticals) | | | | | | | 823,400 | | | | 1,807,488 | |
| | | | |
| | | | | | | | | | | 13,315,375 | |
| | | | | | | | | | | | |
| | | | |
| Czech Republic: 0.21% | | | | | | | | | | | | |
CEZ AS (Utilities, Electric Utilities) | | | | | | | 57,500 | | | | 1,044,660 | |
| | | | | | | | | | | | |
| | | | |
| Denmark: 0.28% | | | | | | | | | | | | |
Sydbank AG (Financials, Banks) | | | | | | | 43,000 | | | | 1,410,994 | |
| | | | | | | | | | | | |
| | | | |
| Finland: 0.43% | | | | | | | | | | | | |
TietoEnator Oyj (Information Technology, IT Services) | | | | | | | 82,700 | | | | 2,109,273 | |
| | | | | | | | | | | | |
| | | | |
| France: 9.01% | | | | | | | | | | | | |
Alstom SA (Industrials, Machinery) †« | | | | | | | 83,800 | | | | 2,604,371 | |
AXA SA (Financials, Insurance) | | | | | | | 132,200 | | | | 3,577,099 | |
BNP Paribas SA (Financials, Banks) | | | | | | | 49,100 | | | | 2,910,796 | |
Compagnie Generale des Etablissements Michelin SCA Class B (Consumer Discretionary, Auto Components) | | | | | | | 24,000 | | | | 2,406,398 | |
Credit Agricole SA (Financials, Banks) | | | | | | | 219,328 | | | | 2,646,367 | |
Electricite de France SA (Utilities, Electric Utilities) « | | | | | | | 148,600 | | | | 2,214,531 | |
Engie SA (Utilities, Multi-Utilities) | | | | | | | 171,900 | | | | 2,994,929 | |
Renault SA (Consumer Discretionary, Automobiles) | | | | | | | 40,500 | | | | 4,086,898 | |
Sanofi-Aventis SA (Health Care, Pharmaceuticals) | | | | | | | 82,900 | | | | 7,390,673 | |
SCOR SE (Financials, Insurance) | | | | | | | 109,700 | | | | 4,302,338 | |
Societe Generale SA (Financials, Banks) | | | | | | | 39,000 | | | | 1,861,662 | |
Thales SA (Industrials, Aerospace & Defense) | | | | | | | 41,400 | | | | 3,082,439 | |
Total SA (Energy, Oil, Gas & Consumable Fuels) | | | | | | | 93,700 | | | | 4,652,939 | |
| | | | |
| | | | | | | | | | | 44,731,440 | |
| | | | | | | | | | | | |
| | | | |
| Germany: 8.61% | | | | | | | | | | | | |
Allianz AG (Financials, Insurance) | | | | | | | 35,700 | | | | 6,323,561 | |
BASF SE (Materials, Chemicals) | | | | | | | 46,500 | | | | 3,848,810 | |
Bayerische Motoren Werke AG (Consumer Discretionary, Automobiles) | | | | | | | 31,200 | | | | 3,405,217 | |
Daimler AG (Consumer Discretionary, Automobiles) | | | | | | | 75,700 | | | | 6,776,774 | |
Deutsche Bank AG (Financials, Capital Markets) | | | | | | | 130,100 | | | | 3,340,895 | |
E.ON SE (Utilities, Multi-Utilities) | | | | | | | 87,200 | | | | 828,812 | |
Hannover Rueckversicherung AG (Financials, Insurance) | | | | | | | 31,000 | | | | 3,627,399 | |
The accompanying notes are an integral part of these financial statements.
| | | | |
| 84 | | Wells Fargo Equity Gateway Funds | | Portfolio of investments—November 30, 2015 (unaudited) |
INTERNATIONAL VALUE PORTFOLIO
| | | | | | | | | | | | |
| Security name | | | | | | Shares | | | Value | |
| | | | |
| Germany (continued) | | | | | | | | | | | | |
Muenchener Rueckversicherungs Gesellschaft AG (Financials, Insurance) | | | | | | | 19,700 | | | $ | 3,970,276 | |
Norddeutsche Affinerie AG (Materials, Metals & Mining) | | | | | | | 25,900 | | | | 1,613,693 | |
Rhoen Klinikum AG (Health Care, Health Care Providers & Services) † | | | | | | | 18,500 | | | | 235 | |
Rhoen Klinikum AG (Health Care, Health Care Providers & Services) « | | | | | | | 73,100 | | | | 2,113,116 | |
Stada Arzneimittel AG (Health Care, Pharmaceuticals) | | | | | | | 56,900 | | | | 2,172,653 | |
Volkswagen AG (Consumer Discretionary, Automobiles) « | | | | | | | 22,600 | | | | 3,373,965 | |
Wincor Nixdorf AG (Information Technology, Technology Hardware, Storage & Peripherals) | | | | | | | 26,600 | | | | 1,346,333 | |
| | | | |
| | | | | | | | | | | 42,741,739 | |
| | | | | | | | | | | | |
| | | | |
| Hong Kong: 1.60% | | | | | | | | | | | | |
Shenzhen International Holdings Limited (Industrials, Transportation Infrastructure) | | | | | | | 1,012,500 | | | | 1,666,290 | |
Skyworth Digital Holdings Limited (Consumer Discretionary, Household Durables) | | | | | | | 3,680,000 | | | | 2,425,346 | |
Wheelock & Company Limited (Financials, Real Estate Management & Development) | | | | | | | 379,000 | | | | 1,637,529 | |
Yue Yuen Industrial Holdings Limited (Consumer Discretionary, Textiles, Apparel & Luxury Goods) | | | | | | | 611,500 | | | | 2,220,137 | |
| | | | |
| | | | | | | | | | | 7,949,302 | |
| | | | | | | | | | | | |
| | | | |
| Hungary: 0.23% | | | | | | | | | | | | |
Richter Gedeon (Health Care, Pharmaceuticals) | | | | | | | 59,700 | | | | 1,134,183 | |
| | | | | | | | | | | | |
| | | | |
| India: 0.89% | | | | | | | | | | | | |
Gail Limited (Utilities, Gas Utilities) | | | | | | | 28,100 | | | | 923,085 | |
Tata Motors Limited ADR (Consumer Discretionary, Automobiles) | | | | | | | 83,800 | | | | 2,645,566 | |
Tata Steel Limited GDR (Industrials, Machinery) (i) | | | | | | | 245,900 | | | | 850,814 | |
| | | | |
| | | | | | | | | | | 4,419,465 | |
| | | | | | | | | | | | |
| | | | |
| Ireland: 0.90% | | | | | | | | | | | | |
C&C Group plc (Consumer Staples, Beverages) | | | | | | | 240,000 | | | | 930,609 | |
Smurfit Kappa Group plc (Materials, Containers & Packaging) | | | | | | | 130,200 | | | | 3,557,373 | |
| | | | |
| | | | | | | | | | | 4,487,982 | |
| | | | | | | | | | | | |
| | | | |
| Israel: 1.20% | | | | | | | | | | | | |
Bank Hapoalim Limited (Financials, Banks) | | | | | | | 542,900 | | | | 2,807,366 | |
Teva Pharmaceutical Industries Limited (Health Care, Pharmaceuticals) | | | | | | | 51,404 | | | | 3,148,064 | |
| | | | |
| | | | | | | | | | | 5,955,430 | |
| | | | | | | | | | | | |
| | | | |
| Italy: 1.24% | | | | | | | | | | | | |
Enel SpA (Utilities, Electric Utilities) | | | | | | | 688,400 | | | | 3,035,871 | |
Mediobanca SpA (Financials, Capital Markets) | | | | | | | 324,800 | | �� | | 3,112,528 | |
| | | | |
| | | | | | | | | | | 6,148,399 | |
| | | | | | | | | | | | |
| | | | |
| Japan: 22.12% | | | | | | | | | | | | |
Adeka Corporation (Materials, Chemicals) | | | | | | | 155,300 | | | | 2,296,068 | |
Aisin Seiki Company Limited (Consumer Discretionary, Auto Components) | | | | | | | 46,400 | | | | 1,858,262 | |
Anritsu Corporation (Information Technology, Electronic Equipment, Instruments & Components) | | | | | | | 206,300 | | | | 1,382,595 | |
Aoyama Trading Company Limited (Consumer Discretionary, Specialty Retail) | | | | | | | 73,100 | | | | 2,713,786 | |
Aozora Bank Limited (Financials, Banks) | | | | | | | 588,000 | | | | 2,073,046 | |
Calsonic Kansei Corporation (Consumer Discretionary, Auto Components) | | | | | | | 326,000 | | | | 2,836,279 | |
Central Glass Company Limited (Industrials, Building Products) | | | | | | | 444,000 | | | | 2,099,171 | |
The accompanying notes are an integral part of these financial statements.
| | | | | | |
| Portfolio of investments—November 30, 2015 (unaudited) | | Wells Fargo Equity Gateway Funds | | | 85 | |
INTERNATIONAL VALUE PORTFOLIO
| | | | | | | | | | | | |
| Security name | | | | | | Shares | | | Value | |
| | | | |
| Japan (continued) | | | | | | | | | | | | |
CKD Corporation (Industrials, Machinery) | | | | | | | 171,200 | | | $ | 1,839,948 | |
Dainippon Ink & Chemicals Incorporated (Materials, Chemicals) | | | | | | | 808,700 | | | | 2,332,157 | |
DCM Japan Holdings Company Limited (Consumer Discretionary, Specialty Retail) | | | | | | | 143,100 | | | | 981,124 | |
Denki Kagaku Kogyo Kabushiki Kaisha (Materials, Chemicals) | | | | | | | 682,000 | | | | 3,013,875 | |
Eizo Nanao Corporation (Information Technology, Technology Hardware, Storage & Peripherals) | | | | | | | 63,300 | | | | 1,486,084 | |
Fujikura Limited (Industrials, Electrical Equipment) | | | | | | | 348,000 | | | | 1,970,398 | |
Isuzu Motors Limited (Consumer Discretionary, Automobiles) | | | | | | | 110,300 | | | | 1,240,987 | |
Itochu Corporation (Industrials, Trading Companies & Distributors) | | | | | | | 200,700 | | | | 2,448,833 | |
Japan Airlines Company Limited (Industrials, Airlines) | | | | | | | 80,700 | | | | 2,759,927 | |
JFE Holdings Incorporated (Materials, Metals & Mining) | | | | | | | 70,000 | | | | 1,104,305 | |
JX Holdings Incorporated (Energy, Oil, Gas & Consumable Fuels) | | | | | | | 408,000 | | | | 1,654,869 | |
KDDI Corporation (Telecommunication Services, Wireless Telecommunication Services) | | | | | | | 102,800 | | | | 2,553,716 | |
Kureha Corporation (Materials, Chemicals) | | | | | | | 271,000 | | | | 1,065,508 | |
Kyorin Company Limited (Health Care, Pharmaceuticals) | | | | | | | 99,000 | | | | 1,869,017 | |
Maeda Road Construction Company Limited (Industrials, Construction & Engineering) | | | | | | | 148,000 | | | | 2,459,854 | |
Marubeni Corporation (Industrials, Trading Companies & Distributors) | | | | | | | 516,000 | | | | 2,858,749 | |
Miraca Holdings Incorporated (Health Care, Health Care Providers & Services) | | | | | | | 25,100 | | | | 1,115,329 | |
Mitsubishi Corporation (Industrials, Trading Companies & Distributors) | | | | | | | 35,500 | | | | 597,530 | |
Mitsubishi Gas Chemical Company Incorporated (Materials, Chemicals) | | | | | | | 556,400 | | | | 3,014,775 | |
Mitsubishi UFJ Financial Group Incorporated (Financials, Banks) | | | | | | | 657,100 | | | | 4,216,970 | |
Mitsui & Company Limited (Industrials, Trading Companies & Distributors) | | | | | | | 260,300 | | | | 3,192,957 | |
Mizuho Financial Group Incorporated (Financials, Banks) | | | | | | | 2,244,400 | | | | 4,530,734 | |
Namura Shipbuilding Company Limited (Industrials, Machinery) | | | | | | | 108,800 | | | | 1,001,384 | |
Nichirei Corporation (Consumer Staples, Food Products) | | | | | | | 252,000 | | | | 1,649,976 | |
Nippon Telegraph & Telephone Corporation (Telecommunication Services, Diversified Telecommunication Services) | | | | | | | 234,000 | | | | 8,677,579 | |
Nissan Motor Company Limited (Consumer Discretionary, Automobiles) | | | | | | | 419,800 | | | | 4,482,755 | |
Nisshinbo Industries Incorporated (Industrials, Industrial Conglomerates) | | | | | | | 117,000 | | | | 1,383,851 | |
NTT DOCOMO Incorporated (Telecommunication Services, Wireless Telecommunication Services) | | | | | | | 180,000 | | | | 3,404,062 | |
Resona Holdings Incorporated (Financials, Banks) | | | | | | | 1,013,300 | | | | 4,945,497 | |
Ricoh Company Limited (Information Technology, Technology Hardware, Storage & Peripherals) | | | | | | | 166,000 | | | | 1,701,803 | |
Sankyu Incorporated (Industrials, Road & Rail) | | | | | | | 370,000 | | | | 1,845,491 | |
Sojitz Corporation (Industrials, Trading Companies & Distributors) | | | | | | | 678,000 | | | | 1,487,084 | |
Sumitomo Corporation (Industrials, Trading Companies & Distributors) | | | | | | | 285,000 | | | | 3,027,112 | |
Sumitomo Metal Mining Company Limited (Materials, Metals & Mining) | | | | | | | 149,000 | | | | 1,680,032 | |
Sumitomo Mitsui Financial Group Incorporated (Financials, Banks) | | | | | | | 100,400 | | | | 3,830,859 | |
The Keiyo Bank Limited (Financials, Banks) | | | | | | | 62,000 | | | | 296,653 | |
Toyo Tire & Rubber Company Limited (Consumer Discretionary, Auto Components) | | | | | | | 95,400 | | | | 2,062,996 | |
Tsumura & Company (Health Care, Pharmaceuticals) | | | | | | | 79,300 | | | | 2,180,589 | |
Yokohama Rubber Company Limited (Consumer Discretionary, Auto Components) | | | | | | | 148,500 | | | | 2,553,814 | |
| | | | |
| | | | | | | | | | | 109,778,390 | |
| | | | | | | | | | | | |
| | | | |
| Liechtenstein: 0.11% | | | | | | | | | | | | |
Verwaltungs-und Privat-Bank AG (Financials, Capital Markets) (i) | | | | | | | 6,558 | | | | 522,358 | |
| | | | | | | | | | | | |
| | | | |
| Netherlands: 2.22% | | | | | | | | | | | | |
Aegon NV (Financials, Insurance) | | | | | | | 334,000 | | | | 2,045,337 | |
ING Groep NV (Financials, Banks) | | | | | | | 237,100 | | | | 3,255,351 | |
Koninklijke Ahold NV (Consumer Staples, Food & Staples Retailing) | | | | | | | 263,630 | | | | 5,735,102 | |
| | | | |
| | | | | | | | | | | 11,035,790 | |
| | | | | | | | | | | | |
The accompanying notes are an integral part of these financial statements.
| | | | |
| 86 | | Wells Fargo Equity Gateway Funds | | Portfolio of investments—November 30, 2015 (unaudited) |
INTERNATIONAL VALUE PORTFOLIO
| | | | | | | | | | | | |
| Security name | | | | | | Shares | | | Value | |
| | | | |
| Norway: 1.31% | | | | | | | | | | | | |
Atea ASA (Information Technology, IT Services) | | | | | | | 84,900 | | | $ | 762,000 | |
DnB Nor ASA (Financials, Banks) | | | | | | | 148,800 | | | | 1,958,762 | |
Marine Harvest ASA (Consumer Staples, Food Products) | | | | | | | 97,500 | | | | 1,318,242 | |
Yara International ASA (Materials, Chemicals) | | | | | | | 53,600 | | | | 2,481,233 | |
| | | | |
| | | | | | | | | | | 6,520,237 | |
| | | | | | | | | | | | |
| | | | |
| Poland: 0.42% | | | | | | | | | | | | |
Asseco Poland SA (Information Technology, Software) | | | | | | | 101,800 | | | | 1,444,731 | |
KGHM Polska Miedz SA (Materials, Metals & Mining) | | | | | | | 36,500 | | | | 653,036 | |
| | | | |
| | | | | | | | | | | 2,097,767 | |
| | | | | | | | | | | | |
| | | | |
| Russia: 0.81% | | | | | | | | | | | | |
Gazprom Neft Sponsored ADR (Energy, Oil, Gas & Consumable Fuels) (i) | | | | | | | 150,014 | | | | 1,680,157 | |
Gazprom Neft Sponsored ADR (Energy, Oil, Gas & Consumable Fuels) | | | | | | | 886 | | | | 9,968 | |
LUKOIL OAO ADR (Energy, Oil, Gas & Consumable Fuels) | | | | | | | 60,400 | | | | 2,312,112 | |
| | | | |
| | | | | | | | | | | 4,002,237 | |
| | | | | | | | | | | | |
| | | | |
| Singapore: 0.85% | | | | | | | | | | | | |
DBS Group Holdings Limited (Financials, Banks) | | | | | | | 227,000 | | | | 2,655,347 | |
United Overseas Bank Limited (Financials, Banks) | | | | | | | 113,000 | | | | 1,553,344 | |
| | | | |
| | | | | | | | | | | 4,208,691 | |
| | | | | | | | | | | | |
| | | | |
| South Africa: 0.44% | | | | | | | | | | | | |
Barclays Africa Group Limited (Financials, Banks) | | | | | | | 200,300 | | | | 2,201,554 | |
| | | | | | | | | | | | |
| | | | |
| South Korea: 2.81% | | | | | | | | | | | | |
BS Financial Group Incorporated (Financials, Banks) | | | | | | | 13,188 | | | | 110,806 | |
E-MART Company Limited (Consumer Staples, Food & Staples Retailing) | | | | | | | 8,500 | | | | 1,570,744 | |
Industrial Bank of Korea (Financials, Banks) | | | | | | | 192,500 | | | | 2,210,829 | |
KT&G Corporation (Consumer Staples, Tobacco) | | | | | | | 43,000 | | | | 3,973,058 | |
Kwangju Bank (Financials, Banks) † | | | | | | | 13,510 | | | | 94,379 | |
SK Telecom Company Limited (Telecommunication Services, Wireless Telecommunication Services) | | | | | | | 22,300 | | | | 4,506,023 | |
Woori Bank (Financials, Banks) | | | | | | | 178,044 | | | | 1,459,037 | |
| | | | |
| | | | | | | | | | | 13,924,876 | |
| | | | | | | | | | | | |
| | | | |
| Spain: 1.03% | | | | | | | | | | | | |
Banco Santander Central Hispano SA (Financials, Banks) | | | | | | | 429,681 | | | | 2,346,165 | |
Gas Natural SDG SA (Utilities, Gas Utilities) | | | | | | | 128,100 | | | | 2,771,169 | |
| | | | |
| | | | | | | | | | | 5,117,334 | |
| | | | | | | | | | | | |
| | | | |
| Sweden: 2.34% | | | | | | | | | | | | |
Boliden AB (Materials, Metals & Mining) | | | | | | | 169,300 | | | | 3,111,604 | |
Nordea Bank AB (Financials, Banks) | | | | | | | 177,300 | | | | 1,964,737 | |
Skandinaviska Enskilda Banken AB Class A (Financials, Banks) | | | | | | | 144,900 | | | | 1,540,906 | |
Telefonaktiebolaget LM Ericsson Class B (Information Technology, Communications Equipment) | | | | | | | 304,500 | | | | 2,965,818 | |
TeliaSonera AB (Telecommunication Services, Diversified Telecommunication Services) | | | | | | | 417,000 | | | | 2,046,799 | |
| | | | |
| | | | | | | | | | | 11,629,864 | |
| | | | | | | | | | | | |
The accompanying notes are an integral part of these financial statements.
| | | | | | |
| Portfolio of investments—November 30, 2015 (unaudited) | | Wells Fargo Equity Gateway Funds | | | 87 | |
INTERNATIONAL VALUE PORTFOLIO
| | | | | | | | | | | | |
| Security name | | | | | | Shares | | | Value | |
| | | | |
| Switzerland: 5.30% | | | | | | | | | | | | |
Baloise Holding AG (Financials, Insurance) | | | | | | | 28,800 | | | $ | 3,499,052 | |
Credit Suisse Group AG (Financials, Capital Markets) | | | | | | | 273,395 | | | | 5,877,919 | |
Georg Fischer AG (Industrials, Machinery) | | | | | | | 3,000 | | | | 1,955,095 | |
Swiss Life Holding AG (Financials, Insurance) | | | | | | | 12,600 | | | | 3,178,014 | |
Swiss Reinsurance AG (Financials, Insurance) | | | | | | | 75,700 | | | | 7,214,254 | |
UBS Group AG (Financials, Capital Markets) | | | | | | | 5,400 | | | | 103,659 | |
Zurich Insurance Group AG (Financials, Insurance) | | | | | | | 17,100 | | | | 4,502,493 | |
| | | | |
| | | | | | | | | | | 26,330,486 | |
| | | | | | | | | | | | |
| | | | |
| Taiwan: 0.77% | | | | | | | | | | | | |
Innolux Display Corporation (Information Technology, Electronic Equipment, Instruments & Components) | | | | | | | 3,549,000 | | | | 1,086,162 | |
Pegatron Corporation (Information Technology, Technology Hardware, Storage & Peripherals) | | | | | | | 1,035,000 | | | | 2,730,026 | |
| | | | |
| | | | | | | | | | | 3,816,188 | |
| | | | | | | | | | | | |
| | | | |
| Thailand: 0.72% | | | | | | | | | | | | |
Bangchak Petroleum PCL (Energy, Oil, Gas & Consumable Fuels) | | | | | | | 2,188,900 | | | | 2,122,329 | |
Thanachart Capital PCL (Financials, Banks) | | | | | | | 1,481,500 | | | | 1,457,111 | |
| | | | |
| | | | | | | | | | | 3,579,440 | |
| | | | | | | | | | | | |
| | | | |
| United Kingdom: 17.65% | | | | | | | | | | | | |
3i Group plc (Financials, Capital Markets) | | | | | | | 409,100 | | | | 3,096,129 | |
Alent plc (Materials, Chemicals) (a) | | | | | | | 50,200 | | | | 379,921 | |
AMEC plc (Energy, Energy Equipment & Services) | | | | | | | 83,300 | | | | 546,244 | |
Amlin plc (Financials, Insurance) | | | | | | | 93,700 | | | | 930,696 | |
Anglo American plc (Materials, Metals & Mining) | | | | | | | 107,000 | | | | 658,550 | |
AstraZeneca plc (Health Care, Pharmaceuticals) | | | | | | | 38,500 | | | | 2,610,766 | |
Aviva plc (Financials, Insurance) | | | | | | | 314,900 | | | | 2,425,894 | |
BAE Systems plc (Industrials, Aerospace & Defense) | | | | | | | 939,800 | | | | 7,310,705 | |
Barclays plc (Financials, Banks) | | | | | | | 715,000 | | | | 2,403,553 | |
Barratt Developments plc (Consumer Discretionary, Household Durables) | | | | | | | 318,600 | | | | 2,883,857 | |
Berkeley Group Holdings plc (Consumer Discretionary, Household Durables) | | | | | | | 58,800 | | | | 2,843,617 | |
BP plc (Energy, Oil, Gas & Consumable Fuels) | | | | | | | 844,300 | | | | 4,898,836 | |
BT Group plc (Telecommunication Services, Diversified Telecommunication Services) | | | | | | | 509,700 | | | | 3,811,041 | |
Carillion plc (Industrials, Construction & Engineering) « | | | | | | | 261,500 | | | | 1,241,399 | |
Centrica plc (Utilities, Multi-Utilities) | | | | | | | 898,500 | | | | 2,951,394 | |
Chemring Group plc (Industrials, Aerospace & Defense) | | | | | | | 247,200 | | | | 742,754 | |
Crest Nicholson Holdings plc (Consumer Discretionary, Household Durables) | | | | | | | 264,876 | | | | 2,140,257 | |
Debenhams plc (Consumer Discretionary, Multiline Retail) | | | | | | | 1,238,200 | | | | 1,559,016 | |
easyJet plc (Industrials, Airlines) | | | | | | | 75,100 | | | | 1,869,676 | |
Firstgroup plc (Industrials, Road & Rail) † | | | | | | | 952,400 | | | | 1,510,432 | |
GlaxoSmithKline plc (Health Care, Pharmaceuticals) | | | | | | | 110,500 | | | | 2,255,876 | |
Home Retail Group plc (Consumer Discretionary, Internet & Catalog Retail) | | | | | | | 290,000 | | | | 449,435 | |
J Sainsbury plc (Consumer Staples, Food & Staples Retailing) | | | | | | | 1,211,800 | | | | 4,632,080 | |
Kesa Electricals plc (Consumer Discretionary, Specialty Retail) | | | | | | | 547,900 | | | | 821,066 | |
Lloyds Banking Group plc (Financials, Banks) | | | | | | | 1,749,400 | | | | 1,922,328 | |
Marks & Spencer Group plc (Consumer Discretionary, Multiline Retail) | | | | | | | 379,900 | | | | 2,875,139 | |
Marston’s plc (Consumer Discretionary, Hotels, Restaurants & Leisure) | | | | | | | 558,800 | | | | 1,447,566 | |
Mitchells & Butlers plc (Consumer Discretionary, Hotels, Restaurants & Leisure) † | | | | | | | 236,800 | | | | 1,179,422 | |
The accompanying notes are an integral part of these financial statements.
| | | | |
| 88 | | Wells Fargo Equity Gateway Funds | | Portfolio of investments—November 30, 2015 (unaudited) |
INTERNATIONAL VALUE PORTFOLIO
| | | | | | | | | | | | | | | | |
| Security name | | | | | | | | Shares | | | Value | |
| | | | |
| United Kingdom (continued) | | | | | | | | | | | | | | | | |
Mitie Group plc (Industrials, Commercial Services & Supplies) | | | | | | | | | | | 283,197 | | | $ | 1,361,034 | |
Mondi plc (Materials, Paper & Forest Products) | | | | | | | | | | | 67,600 | | | | 1,571,982 | |
Old Mutual plc (Financials, Insurance) | | | | | | | | | | | 982,800 | | | | 3,093,606 | |
Pace plc (Consumer Discretionary, Household Durables) | | | | | | | | | | | 308,800 | | | | 1,853,822 | |
Petrofac Limited (Energy, Energy Equipment & Services) | | | | | | | | | | | 149,300 | | | | 1,855,100 | |
Premier Foods plc (Consumer Staples, Food Products) † | | | | | | | | | | | 73,926 | | | | 43,750 | |
Redrow plc (Consumer Discretionary, Household Durables) | | | | | | | | | | | 141,600 | | | | 968,643 | |
Royal Dutch Shell plc Class B (Energy, Oil, Gas & Consumable Fuels) | | | | | | | | | | | 287,900 | | | | 7,163,169 | |
Standard Chartered plc (Financials, Banks) | | | | | | | | | | | 253,000 | | | | 2,123,172 | |
Tate & Lyle plc (Consumer Staples, Food Products) | | | | | | | | | | | 158,800 | | | | 1,411,094 | |
Tullett Prebon plc (Financials, Capital Markets) | | | | | | | | | | | 279,500 | | | | 1,472,920 | |
Vesuvius plc (Industrials, Machinery) | | | | | | | | | | | 145,400 | | | | 745,869 | |
William Morrison Supermarkets plc (Consumer Staples, Food & Staples Retailing) | | | | | | | | | | | 679,700 | | | | 1,561,136 | |
| | | | |
| | | | | | | | | | | | | | | 87,622,946 | |
| | | | | | | | | | | | | | | | |
| | | | |
Total Common Stocks (Cost $515,773,545) | | | | | | | | | | | | | | | 481,228,265 | |
| | | | | | | | | | | | | | | | |
| | | | |
| | | Dividend yield | | | | | | | | | | |
| | | | |
Preferred Stocks: 0.14% | | | | | | | | | | | | | | | | |
| | | | |
| Brazil: 0.14% | | | | | | | | | | | | | | | | |
Banco do Estado do Rio Grande do Sul SA (Financials, Banks) | | | 12.05 | % | | | | | | | 349,800 | | | | 492,740 | |
Companhia Energetica de Minas Gerais SA (Utilities, Electric Utilities) | | | 11.96 | | | | | | | | 109,056 | | | | 186,035 | |
| | | | |
Total Preferred Stocks (Cost $3,545,600) | | | | | | | | | | | | | | | 678,775 | |
| | | | | | | | | | | | | | | | |
| | | | |
| | | | | | Expiration date | | | | | | | |
| Rights: 0.02% | | | | | | | | | | | | | | | | |
| | | | |
| United Kingdom: 0.02% | | | | | | | | | | | | | | | | |
Standard Chartered plc (Financials, Banks) † | | | | | | | 2-23-2016 | | | | 72,286 | | | | 99,071 | |
| | | | | | | | | | | | | | | | |
| | | | |
Total Rights (Cost $0) | | | | | | | | | | | | | | | 99,071 | |
| | | | | | | | | | | | | | | | |
| | | | |
| | | Yield | | | | | | | | | | |
| | | | |
Short-Term Investments: 3.93% | | | | | | | | | | | | | | | | |
| | | | |
| Investment Companies: 3.93% | | | | | | | | | | | | | | | | |
Securities Lending Cash Investments, LLC (l)(r)(u) | | | 0.18 | | | | | | | | 15,597,666 | | | | 15,597,666 | |
Wells Fargo Cash Investment Money Market Fund, Select Class (l)(u) | | | 0.17 | | | | | | | | 3,910,661 | | | | 3,910,661 | |
| | | | |
Total Short-Term Investments (Cost $19,508,327) | | | | | | | | | | | | | | | 19,508,327 | |
| | | | | | | | | | | | | | | | |
| | | | | | | | |
| Total investments in securities (Cost $538,827,472) * | | | 101.03 | % | | | 501,514,438 | |
Other assets and liabilities, net | | | (1.03 | ) | | | (5,103,501 | ) |
| | | | | | | | |
| Total net assets | | | 100.00 | % | | $ | 496,410,937 | |
| | | | | | | | |
The accompanying notes are an integral part of these financial statements.
| | | | | | |
| Portfolio of investments—November 30, 2015 (unaudited) | | Wells Fargo Equity Gateway Funds | | | 89 | |
INTERNATIONAL VALUE PORTFOLIO
| † | Non-income-earning security |
| « | All or a portion of this security is on loan. |
| (l) | The issuer of the security is an affiliated person of the Portfolio as defined in the Investment Company Act of 1940. |
| (r) | The investment is a non-registered investment vehicle purchased with cash collateral received from securities on loan. |
| (u) | The rate represents the 7-day annualized yield at period end. |
| (a) | The security is fair valued in accordance with procedures approved by the Board of Trustees. |
| * | Cost for federal income tax purposes is $539,229,701 and unrealized gains (losses) consists of: |
| | | | |
Gross unrealized gains | | $ | 66,608,097 | |
Gross unrealized losses | | | (104,323,360 | |
| | | | |
Net unrealized losses | | $ | (37,715,263 | ) |
The following table shows the percent of total long-term investments by sector as of November 30, 2015:
| | | | |
Financials | | | 29.64 | % |
Consumer Discretionary | | | 15.67 | |
Industrials | | | 13.25 | |
Materials | | | 8.82 | |
Consumer Staples | | | 6.80 | |
Energy | | | 6.35 | |
Health Care | | | 5.93 | |
Telecommunication Services | | | 5.41 | |
Utilities Services | | | 4.16 | |
Information Technology | | | 3.97 | |
| | | | |
| | | 100.00 | % |
| | | | |
The accompanying notes are an integral part of these financial statements.
| | | | |
| 90 | | Wells Fargo Equity Gateway Funds | | Portfolio of investments—November 30, 2015 (unaudited) |
LARGE COMPANY VALUE PORTFOLIO
| | | | | | | | | | | | |
| Security name | | | | | | Shares | | | Value | |
| | | | |
Common Stocks: 98.13% | | | | | | | | | | | | |
| | | | |
Consumer Discretionary: 7.36% | | | | | | | | | | | | |
| | | | |
| Hotels, Restaurants & Leisure: 1.52% | | | | | | | | | | | | |
Norwegian Cruise Line Holdings Limited † | | | | | | | 20,897 | | | $ | 1,200,324 | |
| | | | | | | | | | | | |
| | | | |
| Household Durables: 1.50% | | | | | | | | | | | | |
Harman International Industries Incorporated | | | | | | | 11,488 | | | | 1,185,102 | |
| | | | | | | | | | | | |
| | | | |
| Leisure Products: 0.98% | | | | | | | | | | | | |
Mattel Incorporated | | | | | | | 31,070 | | | | 772,400 | |
| | | | | | | | | | | | |
| | | | |
| Media: 1.22% | | | | | | | | | | | | |
Omnicom Group Incorporated | | | | | | | 13,026 | | | | 962,882 | |
| | | | | | | | | | | | |
| | | | |
| Multiline Retail: 0.64% | | | | | | | | | | | | |
JCPenny Company Incorporated Ǡ | | | | | | | 63,783 | | | | 508,351 | |
| | | | | | | | | | | | |
| | | | |
| Textiles, Apparel & Luxury Goods: 1.50% | | | | | | | | | | | | |
PVH Corporation | | | | | | | 6,432 | | | | 587,177 | |
Skechers U.S.A. Incorporated Class A † | | | | | | | 19,787 | | | | 597,567 | |
| | | | |
| | | | | | | | | | | 1,184,744 | |
| | | | | | | | | | | | |
| | | | |
Consumer Staples: 6.11% | | | | | | | | | | | | |
| | | | |
| Food & Staples Retailing: 2.60% | | | | | | | | | | | | |
CVS Health Corporation | | | | | | | 21,792 | | | | 2,050,409 | |
| | | | | | | | | | | | |
| | | | |
| Food Products: 1.03% | | | | | | | | | | | | |
TreeHouse Foods Incorporated † | | | | | | | 9,442 | | | | 816,355 | |
| | | | | | | | | | | | |
| | | | |
| Household Products: 1.15% | | | | | | | | | | | | |
The Procter & Gamble Company | | | | | | | 12,169 | | | | 910,728 | |
| | | | | | | | | | | | |
| | | | |
| Personal Products: 1.33% | | | | | | | | | | | | |
Herbalife Limited Ǡ | | | | | | | 18,156 | | | | 1,048,146 | |
| | | | | | | | | | | | |
| | | | |
Energy: 11.56% | | | | | | | | | | | | |
| | | | |
| Energy Equipment & Services: 2.00% | | | | | | | | | | | | |
Baker Hughes Incorporated | | | | | | | 21,820 | | | | 1,179,807 | |
Noble Corporation plc « | | | | | | | 30,051 | | | | 398,777 | |
| | | | |
| | | | | | | | | | | 1,578,584 | |
| | | | | | | | | | | | |
| | | | |
| Oil, Gas & Consumable Fuels: 9.56% | | | | | | | | | | | | |
Chevron Corporation | | | | | | | 8,779 | | | | 801,698 | |
ConocoPhillips | | | | | | | 18,980 | | | | 1,025,869 | |
Exxon Mobil Corporation | | | | | | | 23,864 | | | | 1,948,734 | |
Marathon Oil Corporation | | | | | | | 56,883 | | | | 996,021 | |
Noble Energy Incorporated | | | | | | | 29,050 | | | | 1,065,264 | |
Valero Energy Corporation | | | | | | | 18,325 | | | | 1,316,835 | |
Whiting Petroleum Corporation † | | | | | | | 24,159 | | | | 398,865 | |
| | | | |
| | | | | | | | | | | 7,553,286 | |
| | | | | | | | | | | | |
The accompanying notes are an integral part of these financial statements.
| | | | | | |
| Portfolio of investments—November 30, 2015 (unaudited) | | Wells Fargo Equity Gateway Funds | | | 91 | |
LARGE COMPANY VALUE PORTFOLIO
| | | | | | | | | | | | |
| Security name | | | | | | Shares | | | Value | |
| | | | |
Financials: 28.69% | | | | | | | | | | | | |
| | | | |
| Banks: 11.98% | | | | | | | | | | | | |
Bank of America Corporation | | | | | | | 63,481 | | | $ | 1,106,474 | |
BOK Financial Corporation « | | | | | | | 29,357 | | | | 2,021,228 | |
Citigroup Incorporated | | | | | | | 20,562 | | | | 1,112,199 | |
First Republic Bank | | | | | | | 26,169 | | | | 1,801,997 | |
JPMorgan Chase & Company | | | | | | | 31,756 | | | | 2,117,490 | |
KeyCorp | | | | | | | 31,511 | | | | 413,109 | |
SunTrust Banks Incorporated | | | | | | | 20,443 | | | | 887,635 | |
| | | | |
| | | | | | | | | | | 9,460,132 | |
| | | | | | | | | | | | |
| | | | |
| Capital Markets: 3.44% | | | | | | | | | | | | |
Ameriprise Financial Incorporated | | | | | | | 16,299 | | | | 1,840,972 | |
Goldman Sachs Group Incorporated | | | | | | | 4,631 | | | | 879,983 | |
| | | | |
| | | | | | | | | | | 2,720,955 | |
| | | | | | | | | | | | |
| | | | |
| Insurance: 7.42% | | | | | | | | | | | | |
ACE Limited | | | | | | | 7,047 | | | | 809,348 | |
American International Group Incorporated | | | | | | | 28,732 | | | | 1,826,781 | |
Endurance Specialty Holdings Limited | | | | | | | 24,220 | | | | 1,597,551 | |
MetLife Incorporated | | | | | | | 31,892 | | | | 1,629,362 | |
| | | | |
| | | | | | | | | | | 5,863,042 | |
| | | | | | | | | | | | |
| | | | |
| REITs: 5.85% | | | | | | | | | | | | |
Alexandria Real Estate Equities Incorporated | | | | | | | 18,665 | | | | 1,718,860 | |
Equity Residential | | | | | | | 16,508 | | | | 1,317,669 | |
Prologis Incorporated | | | | | | | 18,090 | | | | 773,348 | |
VEREIT Incorporated | | | | | | | 97,729 | | | | 814,083 | |
| | | | |
| | | | | | | | | | | 4,623,960 | |
| | | | | | | | | | | | |
| | | | |
Health Care: 12.87% | | | | | | | | | | | | |
| | | | |
| Biotechnology: 1.89% | | | | | | | | | | | | |
Baxalta Incorporated | | | | | | | 25,511 | | | | 877,068 | �� |
Gilead Sciences Incorporated | | | | | | | 5,867 | | | | 621,667 | |
| | | | |
| | | | | | | | | | | 1,498,735 | |
| | | | | | | | | | | | |
| | | | |
| Health Care Equipment & Supplies: 0.97% | | | | | | | | | | | | |
Medtronic plc | | | | | | | 10,172 | | | | 766,358 | |
| | | | | | | | | | | | |
| | | | |
| Health Care Providers & Services: 2.61% | | | | | | | | | | | | |
Cigna Corporation | | | | | | | 5,529 | | | | 746,304 | |
HCA Holdings Incorporated † | | | | | | | 9,106 | | | | 619,754 | |
McKesson Corporation | | | | | | | 3,672 | | | | 695,293 | |
| | | | |
| | | | | | | | | | | 2,061,351 | |
| | | | | | | | | | | | |
| | | | |
| Pharmaceuticals: 7.40% | | | | | | | | | | | | |
AbbVie Incorporated | | | | | | | 10,488 | | | | 609,877 | |
Allergan plc † | | | | | | | 4,385 | | | | 1,376,408 | |
Johnson & Johnson | | | | | | | 7,594 | | | | 768,817 | |
The accompanying notes are an integral part of these financial statements.
| | | | |
| 92 | | Wells Fargo Equity Gateway Funds | | Portfolio of investments—November 30, 2015 (unaudited) |
LARGE COMPANY VALUE PORTFOLIO
| | | | | | | | | | | | |
| Security name | | | | | | Shares | | | Value | |
| | | | |
| Pharmaceuticals (continued) | | | | | | | | | | | | |
Mallinckrodt plc † | | | | | | | 11,924 | | | $ | 798,059 | |
Merck & Company Incorporated | | | | | | | 16,463 | | | | 872,704 | |
Pfizer Incorporated | | | | | | | 43,284 | | | | 1,418,417 | |
| | | | |
| | | | | | | | | | | 5,844,282 | |
| | | | | | | | | | | | |
| | | | |
Industrials: 11.87% | | | | | | | | | | | | |
| | | | |
| Aerospace & Defense: 2.90% | | | | | | | | | | | | |
Curtiss-Wright Corporation | | | | | | | 11,473 | | | | 807,814 | |
Raytheon Company | | | | | | | 11,949 | | | | 1,482,034 | |
| | | | |
| | | | | | | | | | | 2,289,848 | |
| | | | | | | | | | | | |
| | | | |
| Airlines: 0.44% | | | | | | | | | | | | |
United Continental Holdings Incorporated † | | | | | | | 6,218 | | | | 346,529 | |
| | | | | | | | | | | | |
| | | | |
| Commercial Services & Supplies: 1.73% | | | | | | | | | | | | |
Progressive Waste Solutions Limited | | | | | | | 23,414 | | | | 553,039 | |
West Corporation | | | | | | | 31,792 | | | | 810,696 | |
| | | | |
| | | | | | | | | | | 1,363,735 | |
| | | | | | | | | | | | |
| | | | |
| Electrical Equipment: 0.87% | | | | | | | | | | | | |
Eaton Corporation plc | | | | | | | 11,799 | | | | 686,230 | |
| | | | | | | | | | | | |
| | | | |
| Industrial Conglomerates: 1.63% | | | | | | | | | | | | |
General Electric Company | | | | | | | 42,941 | | | | 1,285,654 | |
| | | | | | | | | | | | |
| | | | |
| Machinery: 1.59% | | | | | | | | | | | | |
Stanley Black & Decker Incorporated | | | | | | | 11,540 | | | | 1,259,706 | |
| | | | | | | | | | | | |
| | | | |
| Professional Services: 0.84% | | | | | | | | | | | | |
CEB Incorporated | | | | | | | 8,546 | | | | 660,349 | |
| | | | | | | | | | | | |
| | | | |
| Road & Rail: 1.87% | | | | | | | | | | | | |
AMERCO | | | | | | | 1,434 | | | | 581,344 | |
Norfolk Southern Corporation | | | | | | | 9,471 | | | | 900,313 | |
| | | | |
| | | | | | | | | | | 1,481,657 | |
| | | | | | | | | | | | |
| | | | |
Information Technology: 10.73% | | | | | | | | | | | | |
| | | | |
| Communications Equipment: 0.96% | | | | | | | | | | | | |
Cisco Systems Incorporated | | | | | | | 28,008 | | | | 763,218 | |
| | | | | | | | | | | | |
| | | | |
| Electronic Equipment, Instruments & Components: 2.24% | | | | | | | | | | | | |
Synnex Corporation | | | | | | | 13,907 | | | | 1,311,013 | |
TE Connectivity Limited | | | | | | | 6,811 | | | | 456,950 | |
| | | | |
| | | | | | | | | | | 1,767,963 | |
| | | | | | | | | | | | |
| | | | |
| Internet Software & Services: 1.41% | | | | | | | | | | | | |
Alphabet Incorporated Class C † | | | | | | | 1,496 | | | | 1,110,930 | |
| | | | | | | | | | | | |
The accompanying notes are an integral part of these financial statements.
| | | | | | |
| Portfolio of investments—November 30, 2015 (unaudited) | | Wells Fargo Equity Gateway Funds | | | 93 | |
LARGE COMPANY VALUE PORTFOLIO
| | | | | | | | | | | | | | |
| Security name | | | | | | | Shares | | | Value | |
| | | | |
| Semiconductors & Semiconductor Equipment: 2.57% | | | | | | | | | | | | | | |
NXP Semiconductors NV † | | | | | | | | | 8,507 | | | $ | 795,064 | |
Skyworks Solutions Incorporated | | | | | | | | | 14,885 | | | | 1,235,753 | |
| | | | |
| | | | | | | | | | | | | 2,030,817 | |
| | | | | | | | | | | | | | |
| | | | |
| Software: 0.52% | | | | | | | | | | | | | | |
Citrix Systems Incorporated † | | | | | | | | | 5,363 | | | | 411,181 | |
| | | | | | | | | | | | | | |
| | | | |
| Technology Hardware, Storage & Peripherals: 3.03% | | | | | | | | | | | | | | |
Apple Incorporated | | | | | | | | | 7,011 | | | | 829,401 | |
NCR Corporation † | | | | | | | | | 48,898 | | | | 1,325,625 | |
Seagate Technology plc « | | | | | | | | | 6,638 | | | | 238,570 | |
| | | | |
| | | | | | | | | | | | | 2,393,596 | |
| | | | | | | | | | | | | | |
| | | | |
Materials: 3.29% | | | | | | | | | | | | | | |
| | | | |
| Chemicals: 1.72% | | | | | | | | | | | | | | |
Cabot Corporation | | | | | | | | | 11,863 | | | | 516,515 | |
FMC Corporation | | | | | | | | | 19,675 | | | | 845,435 | |
| | | | |
| | | | | | | | | | | | | 1,361,950 | |
| | | | | | | | | | | | | | |
| | | | |
| Containers & Packaging: 1.57% | | | | | | | | | | | | | | |
Crown Holdings Incorporated † | | | | | | | | | 17,021 | | | | 883,560 | |
WestRock Company | | | | | | | | | 7,059 | | | | 357,397 | |
| | | | |
| | | | | | | | | | | | | 1,240,957 | |
| | | | | | | | | | | | | | |
| | | | |
Telecommunication Services: 1.97% | | | | | | | | | | | | | | |
| | | | |
| Diversified Telecommunication Services: 1.97% | | | | | | | | | | | | | | |
AT&T Incorporated | | | | | | | | | 22,528 | | | | 758,518 | |
Verizon Communications Incorporated | | | | | | | | | 17,570 | | | | 798,557 | |
| | | | |
| | | | | | | | | | | | | 1,557,075 | |
| | | | | | | | | | | | | | |
| | | | |
Utilities: 3.68% | | | | | | | | | | | | | | |
| | | | |
| Electric Utilities: 2.75% | | | | | | | | | | | | | | |
Duke Energy Corporation | | | | | | | | | 15,099 | | | | 1,023,108 | |
The Southern Company | | | | | | | | | 25,711 | | | | 1,145,168 | |
| | | | |
| | | | | | | | | | | | | 2,168,276 | |
| | | | | | | | | | | | | | |
| | | | |
| Gas Utilities: 0.93% | | | | | | | | | | | | | | |
Atmos Energy Corporation | | | | | | | | | 11,822 | | | | 736,629 | |
| | | | | | | | | | | | | | |
| | | | |
Total Common Stocks (Cost $67,502,414) | | | | | | | | | | | | | 77,526,426 | |
| | | | | | | | | | | | | | |
| | | | |
| | | Yield | | | | | | | | | |
| Short-Term Investments: 6.19% | | | | | | | | | | | | | | |
| | | | |
| Investment Companies: 6.19% | | | | | | | | | | | | | | |
Securities Lending Cash Investments, LLC (l)(r)(u) | | | 0.18 | % | | | | | 3,413,200 | | | | 3,413,200 | |
Wells Fargo Cash Investment Money Market Fund, Select Class (l)(u) | | | 0.17 | | | | | | 1,477,801 | | | | 1,477,801 | |
| | | | |
Total Short-Term Investments (Cost $4,891,001) | | | | | | | | | | | | | 4,891,001 | |
| | | | | | | | | | | | | | |
The accompanying notes are an integral part of these financial statements.
| | | | |
| 94 | | Wells Fargo Equity Gateway Funds | | Portfolio of investments—November 30, 2015 (unaudited) |
LARGE COMPANY VALUE PORTFOLIO
| | | | | | | | |
| | | | | | Value | |
| Total investments in securities (Cost $72,393,415) * | | | 104.32 | % | | $ | 82,417,427 | |
Other assets and liabilities, net | | | (4.32 | ) | | | (3,416,112 | ) |
| | | | | | | | |
| Total net assets | | | 100.00 | % | | $ | 79,001,315 | |
| | | | | | | | |
| † | Non-income-earning security |
| « | All or a portion of this security is on loan. |
| (l) | The issuer of the security is an affiliated person of the Portfolio as defined in the Investment Company Act of 1940. |
| (r) | The investment is a non-registered investment vehicle purchased with cash collateral received from securities on loan. |
| (u) | The rate represents the 7-day annualized yield at period end. |
| * | Cost for federal income tax purposes is $73,133,631 and unrealized gains (losses) consists of: |
| | | | |
Gross unrealized gains | | $ | 13,349,290 | |
Gross unrealized losses | | | (4,065,494 | ) |
| | | | |
Net unrealized gains | | $ | 9,283,796 | |
The accompanying notes are an integral part of these financial statements.
| | | | | | |
| Portfolio of investments—November 30, 2015 (unaudited) | | Wells Fargo Equity Gateway Funds | | | 95 | |
SMALL COMPANY GROWTH PORTFOLIO
| | | | | | | | | | | | |
| Security name | | | | | | Shares | | | Value | |
| | | | |
Common Stocks: 94.77% | | | | | | | | | | | | |
| | | | |
Consumer Discretionary: 14.44% | | | | | | | | | | | | |
| | | | |
| Auto Components: 1.03% | | | | | | | | | | | | |
Gentherm Incorporated † | | | | | | | 234,165 | | | $ | 11,904,948 | |
| | | | | | | | | | | | |
| | | | |
| Diversified Consumer Services: 1.87% | | | | | | | | | | | | |
2U Incorporated †« | | | | | | | 403,201 | | | | 9,725,208 | |
Houghton Mifflin Harcourt Company † | | | | | | | 605,490 | | | | 11,964,482 | |
| | | | |
| | | | | | | | | | | 21,689,690 | |
| | | | | | | | | | | | |
| | | | |
| Hotels, Restaurants & Leisure: 3.06% | | | | | | | | | | | | |
Brinker International Incorporated | | | | | | | 112,145 | | | | 5,116,055 | |
Del Taco Restaurants Incorporated † | | | | | | | 524,230 | | | | 5,787,499 | |
Extended Stay America Incorporated | | | | | | | 540,270 | | | | 9,244,020 | |
Krispy Kreme Doughnuts Incorporated † | | | | | | | 631,710 | | | | 8,932,379 | |
Zoe’s Kitchen Incorporated †« | | | | | | | 184,820 | | | | 6,287,576 | |
| | | | |
| | | | | | | | | | | 35,367,529 | |
| | | | | | | | | | | | |
| | | | |
| Household Durables: 0.57% | | | | | | | | | | | | |
William Lyon Homes Class A † | | | | | | | 380,729 | | | | 6,651,336 | |
| | | | | | | | | | | | |
| | | | |
| Leisure Products: 0.37% | | | | | | | | | | | | |
Malibu Boats Incorporated † | | | | | | | 272,830 | | | | 4,234,322 | |
| | | | | | | | | | | | |
| | | | |
| Media: 2.54% | | | | | | | | | | | | |
IMAX Corporation † | | | | | | | 352,253 | | | | 13,343,344 | |
Lions Gate Entertainment Corporation | | | | | | | 283,304 | | | | 9,615,338 | |
Media General Incorporated †« | | | | | | | 410,540 | | | | 6,375,686 | |
| | | | |
| | | | | | | | | | | 29,334,368 | |
| | | | | | | | | | | | |
| | | | |
| Multiline Retail: 0.66% | | | | | | | | | | | | |
Burlington Stores Incorporated † | | | | | | | 159,770 | | | | 7,686,535 | |
| | | | | | | | | | | | |
| | | | |
| Specialty Retail: 3.12% | | | | | | | | | | | | |
Chico’s FAS Incorporated | | | | | | | 416,917 | | | | 5,003,004 | |
Dick’s Sporting Goods Incorporated | | | | | | | 191,709 | | | | 7,482,402 | |
Monro Muffler Brake Incorporated | | | | | | | 214,091 | | | | 15,851,298 | |
Party City Holdco Incorporated † | | | | | | | 609,380 | | | | 7,739,126 | |
| | | | |
| | | | | | | | | | | 36,075,830 | |
| | | | | | | | | | | | |
| | | | |
| Textiles, Apparel & Luxury Goods: 1.22% | | | | | | | | | | | | |
Kate Spade & Company † | | | | | | | 399,050 | | | | 7,996,962 | |
Skechers U.S.A. Incorporated Class A † | | | | | | | 202,276 | | | | 6,108,735 | |
| | | | |
| | | | | | | | | | | 14,105,697 | |
| | | | | | | | | | | | |
| | | | |
Consumer Staples: 1.42% | | | | | | | | | | | | |
| | | | |
| Food Products: 1.42% | | | | | | | | | | | | |
Amplify Snack Brands Incorporated †« | | | | | | | 588,819 | | | | 7,389,678 | |
Whitewave Foods Company † | | | | | | | 221,766 | | | | 9,010,353 | |
| | | | |
| | | | | | | | | | | 16,400,031 | |
| | | | | | | | | | | | |
The accompanying notes are an integral part of these financial statements.
| | | | |
| 96 | | Wells Fargo Equity Gateway Funds | | Portfolio of investments—November 30, 2015 (unaudited) |
SMALL COMPANY GROWTH PORTFOLIO
| | | | | | | | | | | | |
| Security name | | | | | | Shares | | | Value | |
| | | | |
Energy: 2.21% | | | | | | | | | | | | |
| | | | |
| Oil, Gas & Consumable Fuels: 2.21% | | | | | | | | | | | | |
Diamondback Energy Incorporated † | | | | | | | 110,719 | | | $ | 8,638,296 | |
GasLog Limited « | | | | | | | 473,043 | | | | 5,662,325 | |
Memorial Resource Development Corporation † | | | | | | | 487,900 | | | | 7,947,891 | |
Ring Energy Incorporated †« | | | | | | | 333,230 | | | | 3,322,303 | |
| | | | |
| | | | | | | | | | | 25,570,815 | |
| | | | | | | | | | | | |
| | | | |
Financials: 11.31% | | | | | | | | | | | | |
| | | | |
| Banks: 2.74% | | | | | | | | | | | | |
ServisFirst Bancshares Incorporated | | | | | | | 131,250 | | | | 6,460,125 | |
Signature Bank † | | | | | | | 64,395 | | | | 10,184,069 | |
SVB Financial Group † | | | | | | | 113,762 | | | | 15,071,190 | |
| | | | |
| | | | | | | | | | | 31,715,384 | |
| | | | | | | | | | | | |
| | | | |
| Capital Markets: 4.85% | | | | | | | | | | | | |
Evercore Partners Incorporated Class A | | | | | | | 272,124 | | | | 15,111,046 | |
LPL Financial Holdings Incorporated « | | | | | | | 276,707 | | | | 12,722,988 | |
Stifel Financial Corporation † | | | | | | | 241,601 | | | | 10,959,021 | |
Virtu Financial Incorporated | | | | | | | 434,428 | | | | 9,666,023 | |
Virtus Investment Partners Incorporated | | | | | | | 56,048 | | | | 7,635,980 | |
| | | | |
| | | | | | | | | | | 56,095,058 | |
| | | | | | | | | | | | |
| | | | |
| Insurance: 1.58% | | | | | | | | | | | | |
Argo Group International Holdings Limited | | | | | | | 212,801 | | | | 13,519,248 | |
Patriot National Incorporated † | | | | | | | 324,040 | | | | 4,724,503 | |
| | | | |
| | | | | | | | | | | 18,243,751 | |
| | | | | | | | | | | | |
| | | | |
| REITs: 0.98% | | | | | | | | | | | | |
QTS Realty Trust Incorporated Class A | | | | | | | 269,985 | | | | 11,398,767 | |
| | | | | | | | | | | | |
| | | | |
| Thrifts & Mortgage Finance: 1.16% | | | | | | | | | | | | |
Essent Group Limited † | | | | | | | 543,084 | | | | 13,425,036 | |
| | | | | | | | | | | | |
| | | | |
Health Care: 22.45% | | | | | | | | | | | | |
| | | | |
| Biotechnology: 5.13% | | | | | | | | | | | | |
Alder Biopharmaceuticals Inc † | | | | | | | 123,070 | | | | 4,585,588 | |
Alnylam Pharmaceuticals Incorporated † | | | | | | | 74,822 | | | | 7,785,977 | |
Celldex Therapeutics Incorporated †« | | | | | | | 289,876 | | | | 5,220,667 | |
Cepheid Incorporated † | | | | | | | 265,754 | | | | 9,551,199 | |
Flexion Therapeutics Incorporated †« | | | | | | | 318,310 | | | | 6,187,946 | |
Intrexon Corporation « | | | | | | | 118,354 | | | | 4,297,434 | |
Oncomed Pharmaceuticals Incorporated †« | | | | | | | 234,120 | | | | 5,349,642 | |
Portola Pharmaceuticals Incorporated † | | | | | | | 146,645 | | | | 7,275,058 | |
Radius Health Incorporated † | | | | | | | 73,960 | | | | 4,497,508 | |
Tesaro Incorporated † | | | | | | | 90,122 | | | | 4,599,827 | |
| | | | |
| | | | | | | | | | | 59,350,846 | |
| | | | | | | | | | | | |
The accompanying notes are an integral part of these financial statements.
| | | | | | |
| Portfolio of investments—November 30, 2015 (unaudited) | | Wells Fargo Equity Gateway Funds | | | 97 | |
SMALL COMPANY GROWTH PORTFOLIO
| | | | | | | | | | | | |
| Security name | | | | | | Shares | | | Value | |
| | | | |
| Health Care Equipment & Supplies: 7.12% | | | | | | | | | | | | |
Accuray Incorporated †« | | | | | | | 995,078 | | | $ | 7,005,349 | |
Analogic Corporation | | | | | | | 119,440 | | | | 9,979,212 | |
Atricure Incorporated † | | | | | | | 367,123 | | | | 7,885,802 | |
Cerus Corporation †« | | | | | | | 1,706,248 | | | | 9,674,426 | |
DexCom Incorporated † | | | | | | | 146,206 | | | | 12,430,434 | |
Inogen Incorporated † | | | | | | | 283,515 | | | | 10,844,449 | |
LDR Holding Corporation † | | | | | | | 325,109 | | | | 8,784,445 | |
Nevro Corporation †« | | | | | | | 160,860 | | | | 9,712,727 | |
The Spectranetics Corporation † | | | | | | | 437,994 | | | | 6,057,457 | |
| | | | |
| | | | | | | | | | | 82,374,301 | |
| | | | | | | | | | | | |
| | | | |
| Health Care Providers & Services: 6.50% | | | | | | | | | | | | |
Adeptus Health Incorporated Class A †« | | | | | | | 163,877 | | | | 9,847,369 | |
AMN Healthcare Services Incorporated † | | | | | | | 425,705 | | | | 12,558,298 | |
Capital Senior Living Corporation † | | | | | | | 391,700 | | | | 8,977,764 | |
Ensign Group Incorporated | | | | | | | 189,755 | | | | 9,026,645 | |
HealthEquity Incorporated † | | | | | | | 366,830 | | | | 12,105,390 | |
LifePoint Hospitals Incorporated † | | | | | | | 118,756 | | | | 8,504,117 | |
Surgery Partners Inc †« | | | | | | | 409,094 | | | | 7,817,786 | |
Teladoc Incorporated †« | | | | | | | 298,960 | | | | 6,352,900 | |
| | | | |
| | | | | | | | | | | 75,190,269 | |
| | | | | | | | | | | | |
| | | | |
| Health Care Technology: 1.20% | | | | | | | | | | | | |
Evolent Health Incorporated Class A † | | | | | | | 477,820 | | | | 7,778,910 | |
Medidata Solutions Incorporated † | | | | | | | 132,332 | | | | 6,064,776 | |
| | | | |
| | | | | | | | | | | 13,843,686 | |
| | | | | | | | | | | | |
| | | | |
| Life Sciences Tools & Services: 1.45% | | | | | | | | | | | | |
ICON plc ADR † | | | | | | | 225,962 | | | | 16,795,755 | |
| | | | | | | | | | | | |
| | | | |
| Pharmaceuticals: 1.05% | | | | | | | | | | | | |
Akorn Incorporated † | | | | | | | 195,388 | | | | 6,506,420 | |
Cempra Holdings Incorporated †« | | | | | | | 176,680 | | | | 5,637,859 | |
| | | | |
| | | | | | | | | | | 12,144,279 | |
| | | | | | | | | | | | |
| | | | |
Industrials: 14.99% | | | | | | | | | | | | |
| | | | |
| Aerospace & Defense: 1.40% | | | | | | | | | | | | |
Astronics Corporation | | | | | | | 190,522 | | | | 7,371,296 | |
Esterline Technologies Corporation † | | | | | | | 92,881 | | | | 8,831,125 | |
| | | | |
| | | | | | | | | | | 16,202,421 | |
| | | | | | | | | | | | |
| | | | |
| Air Freight & Logistics: 1.03% | | | | | | | | | | | | |
Hub Group Incorporated Class A † | | | | | | | 307,789 | | | | 11,859,110 | |
| | | | | | | | | | | | |
| | | | |
| Building Products: 2.63% | | | | | | | | | | | | |
A.O. Smith Corporation | | | | | | | 176,464 | | | | 14,074,769 | |
NCI Building Systems Incorporated † | | | | | | | 618,414 | | | | 7,334,390 | |
PGT Incorporated † | | | | | | | 813,650 | | | | 9,047,788 | |
| | | | |
| | | | | | | | | | | 30,456,947 | |
| | | | | | | | | | | | |
The accompanying notes are an integral part of these financial statements.
| | | | |
| 98 | | Wells Fargo Equity Gateway Funds | | Portfolio of investments—November 30, 2015 (unaudited) |
SMALL COMPANY GROWTH PORTFOLIO
| | | | | | | | | | | | |
| Security name | | | | | | Shares | | | Value | |
| | | | |
| Commercial Services & Supplies: 5.03% | | | | | | | | | | | | |
Copart Incorporated † | | | | | | | 326,873 | | | $ | 12,901,677 | |
KAR Auction Services Incorporated | | | | | | | 296,190 | | | | 11,234,487 | |
Mobile Mini Incorporated | | | | | | | 277,490 | | | | 9,837,021 | |
TrueBlue Incorporated † | | | | | | | 490,276 | | | | 14,360,184 | |
West Corporation | | | | | | | 386,200 | | | | 9,848,100 | |
| | | | |
| | | | | | | | | | | 58,181,469 | |
| | | | | | | | | | | | |
| | | | |
| Construction & Engineering: 1.19% | | | | | | | | | | | | |
Comfort Systems USA Incorporated | | | | | | | 236,422 | | | | 7,504,034 | |
Granite Construction Incorporated | | | | | | | 152,780 | | | | 6,228,841 | |
| | | | |
| | | | | | | | | | | 13,732,875 | |
| | | | | | | | | | | | |
| | | | |
| Machinery: 0.88% | | | | | | | | | | | | |
Wabash National Corporation † | | | | | | | 787,273 | | | | 10,210,931 | |
| | | | | | | | | | | | |
| | | | |
| Professional Services: 1.42% | | | | | | | | | | | | |
On Assignment Incorporated † | | | | | | | 245,704 | | | | 11,469,463 | |
RPX Corporation † | | | | | | | 356,064 | | | | 4,938,608 | |
| | | | |
| | | | | | | | | | | 16,408,071 | |
| | | | | | | | | | | | |
| | | | |
| Road & Rail: 1.41% | | | | | | | | | | | | |
Genesee & Wyoming Incorporated Class A † | | | | | | | 131,797 | | | | 9,129,578 | |
Swift Transportation Company †« | | | | | | | 453,346 | | | | 7,239,936 | |
| | | | |
| | | | | | | | | | | 16,369,514 | |
| | | | | | | | | | | | |
| | | | |
Information Technology: 24.60% | | | | | | | | | | | | |
| | | | |
| Communications Equipment: 2.68% | | | | | | | | | | | | |
Infinera Corporation † | | | | | | | 485,952 | | | | 10,943,639 | |
Radware Limited † | | | | | | | 572,960 | | | | 9,419,462 | |
Ruckus Wireless Incorporated † | | | | | | | 933,810 | | | | 10,692,125 | |
| | | | |
| | | | | | | | | | | 31,055,226 | |
| | | | | | | | | | | | |
| | | | |
| Electronic Equipment, Instruments & Components: 1.18% | | | | | | | | | | | | |
OSI Systems Incorporated † | | | | | | | 145,776 | | | | 13,649,007 | |
| | | | | | | | | | | | |
| | | | |
| Internet Software & Services: 3.58% | | | | | | | | | | | | |
Benefitfocus Incorporated †« | | | | | | | 245,410 | | | | 9,944,013 | |
Cornerstone OnDemand Incorporated † | | | | | | | 323,120 | | | | 11,603,239 | |
Marketo Incorporated † | | | | | | | 301,040 | | | | 9,112,481 | |
Pandora Media Incorporated † | | | | | | | 419,090 | | | | 5,783,442 | |
Zillow Group Incorporated Class A « | | | | | | | 46,841 | | | | 1,219,271 | |
Zillow Group Incorporated Class C †« | | | | | | | 150,822 | | | | 3,717,762 | |
| | | | |
| | | | | | | | | | | 41,380,208 | |
| | | | | | | | | | | | |
| | | | |
| IT Services: 2.95% | | | | | | | | | | | | |
Acxiom Corporation † | | | | | | | 539,610 | | | | 12,357,069 | |
MAXIMUS Incorporated | | | | | | | 184,690 | | | | 10,481,158 | |
Vantiv Incorporated Class A † | | | | | | | 214,420 | | | | 11,302,078 | |
| | | | |
| | | | | | | | | | | 34,140,305 | |
| | | | | | | | | | | | |
The accompanying notes are an integral part of these financial statements.
| | | | | | |
| Portfolio of investments—November 30, 2015 (unaudited) | | Wells Fargo Equity Gateway Funds | | | 99 | |
SMALL COMPANY GROWTH PORTFOLIO
| | | | | | | | | | | | | | |
| Security name | | | | | | | Shares | | | Value | |
| | | | |
| Semiconductors & Semiconductor Equipment: 5.72% | | | | | | | | | | | | | | |
Applied Micro Circuits Corporation † | | | | | | | | | 957,597 | | | $ | 7,009,610 | |
Cypress Semiconductor Corporation | | | | | | | | | 1,138,464 | | | | 12,318,180 | |
FormFactor Incorporated † | | | | | | | | | 1,013,475 | | | | 8,827,367 | |
Microsemi Corporation † | | | | | | | | | 347,420 | | | | 12,510,594 | |
Nanometrics Incorporated † | | | | | | | | | 294,549 | | | | 4,642,092 | |
Silicon Motion Technology Corporation | | | | | | | | | 241,644 | | | | 8,039,496 | |
Teradyne Incorporated | | | | | | | | | 619,377 | | | | 12,870,654 | |
| | | | |
| | | | | | | | | | | | | 66,217,993 | |
| | | | | | | | | | | | | | |
| | | | |
| Software: 8.49% | | | | | | | | | | | | | | |
Bottomline Technologies Incorporated † | | | | | | | | | 311,740 | | | | 9,635,883 | |
Cadence Design Systems Incorporated † | | | | | | | | | 675,612 | | | | 15,066,148 | |
PTC Incorporated † | | | | | | | | | 328,825 | | | | 11,850,853 | |
Qlik Technologies Incorporated † | | | | | | | | | 347,723 | | | | 11,061,069 | |
Rubicon Project Incorporated † | | | | | | | | | 580,644 | | | | 8,564,499 | |
SS&C Technologies Holdings | | | | | | | | | 252,358 | | | | 18,144,540 | |
Synchronoss Technologies Incorporated † | | | | | | | | | 180,230 | | | | 7,095,655 | |
Ultimate Software Group Incorporated † | | | | | | | | | 40,441 | | | | 7,987,098 | |
Zendesk Incorporated † | | | | | | | | | 342,773 | | | | 8,778,417 | |
| | | | |
| | | | | | | | | | | | | 98,184,162 | |
| | | | | | | | | | | | | | |
| | | | |
Materials: 3.03% | | | | | | | | | | | | | | |
| | | | |
| Chemicals: 1.40% | | | | | | | | | | | | | | |
Calgon Carbon Corporation | | | | | | | | | 514,099 | | | | 8,693,414 | |
Flotek Industries Incorporated †« | | | | | | | | | 657,247 | | | | 7,505,761 | |
| | | | |
| | | | | | | | | | | | | 16,199,175 | |
| | | | | | | | | | | | | | |
| | | | |
| Metals & Mining: 0.64% | | | | | | | | | | | | | | |
Steel Dynamics Incorporated | | | | | | | | | 424,593 | | | | 7,383,672 | |
| | | | | | | | | | | | | | |
| | | | |
| Paper & Forest Products: 0.99% | | | | | | | | | | | | | | |
Boise Cascade Company † | | | | | | | | | 366,107 | | | | 11,459,149 | |
| | | | | | | | | | | | | | |
| | | | |
Utilities: 0.32% | | | | | | | | | | | | | | |
| | | | |
| Independent Power & Renewable Electricity Producers: 0.32% | | | | | | | | | | | | | | |
Dynegy Incorporated † | | | | | | | | | 230,660 | | | | 3,718,239 | |
| | | | | | | | | | | | | | |
| | | | |
Total Common Stocks (Cost $995,453,082) | | | | | | | | | | | | | 1,096,406,707 | |
| | | | | | | | | | | | | | |
| | | | |
| | | Yield | | | | | | | | | |
| Short-Term Investments: 15.24% | | | | | | | | | | | | | | |
| | | | |
| Investment Companies: 15.24% | | | | | | | | | | | | | | |
Securities Lending Cash Investments, LLC (l)(r)(u) | | | 0.18 | % | | | | | 118,989,418 | | | | 118,989,418 | |
Wells Fargo Cash Investment Money Market Fund, Select Class (l)(u) | | | 0.17 | | | | | | 57,304,768 | | | | 57,304,768 | |
| | | | |
Total Short-Term Investments (Cost $176,294,186) | | | | | | | | | | | | | 176,294,186 | |
| | | | | | | | | | | | | | |
| | | | | | | | |
| Total investments in securities (Cost $1,171,747,268) * | | | 110.01 | % | | | 1,272,700,893 | |
Other assets and liabilities, net | | | (10.01 | ) | | | (115,825,971 | ) |
| | | | | | | | |
| Total net assets | | | 100.00 | % | | $ | 1,156,874,922 | |
| | | | | | | | |
The accompanying notes are an integral part of these financial statements.
| | | | |
| 100 | | Wells Fargo Equity Gateway Funds | | Portfolio of investments—November 30, 2015 (unaudited) |
SMALL COMPANY GROWTH PORTFOLIO
| † | Non-income-earning security |
| « | All or a portion of this security is on loan. |
| (l) | The issuer of the security is an affiliated person of the Portfolio as defined in the Investment Company Act of 1940. |
| (r) | The investment is a non-registered investment vehicle purchased with cash collateral received from securities on loan. |
| (u) | The rate represents the 7-day annualized yield at period end. |
| * | Cost for federal income tax purposes is $1,183,487,190 and unrealized gains (losses) consists of: |
| | | | |
Gross unrealized gains | | $ | 153,725,982 | |
Gross unrealized losses | | | (64,512,279 | ) |
| | | | |
Net unrealized gains | | $ | 89,213,703 | |
The accompanying notes are an integral part of these financial statements.
| | | | | | |
| Portfolio of investments—November 30, 2015 (unaudited) | | Wells Fargo Equity Gateway Funds | | | 101 | |
SMALL COMPANY VALUE PORTFOLIO
| | | | | | | | | | | | |
| Security name | | | | | | Shares | | | Value | |
| | | | |
Common Stocks: 95.47% | | | | | | | | | | | | |
| | | | |
Consumer Discretionary: 11.61% | | | | | | | | | | | | |
| | | | |
| Auto Components: 2.42% | | | | | | | | | | | | |
American Axle & Manufacturing Holdings Incorporated † | | | | | | | 127,519 | | | $ | 2,902,332 | |
Metaldyne Performance Group Incorporated | | | | | | | 94,700 | | | | 2,132,644 | |
| | | | |
| | | | | | | | | | | 5,034,976 | |
| | | | | | | | | | | | |
| | | | |
| Automobiles: 1.02% | | | | | | | | | | | | |
Thor Industries Incorporated | | | | | | | 36,550 | | | | 2,116,976 | |
| | | | | | | | | | | | |
| | | | |
| Hotels, Restaurants & Leisure: 0.97% | | | | | | | | | | | | |
ClubCorp Holdings Incorporated | | | | | | | 112,094 | | | | 2,012,087 | |
| | | | | | | | | | | | |
| | | | |
| Media: 2.59% | | | | | | | | | | | | |
National CineMedia Incorporated | | | | | | | 167,800 | | | | 2,662,986 | |
Scholastic Corporation | | | | | | | 63,693 | | | | 2,720,965 | |
| | | | |
| | | | | | | | | | | 5,383,951 | |
| | | | | | | | | | | | |
| | | | |
| Specialty Retail: 4.61% | | | | | | | | | | | | |
Asbury Automotive Group Incorporated † | | | | | | | 24,109 | | | | 1,810,586 | |
Ascena Retail Group Incorporated † | | | | | | | 121,820 | | | | 1,380,221 | |
DSW Incorporated Class A | | | | | | | 80,188 | | | | 1,841,116 | |
Outerwall Incorporated « | | | | | | | 38,790 | | | | 2,401,101 | |
The Men’s Wearhouse Incorporated | | | | | | | 43,000 | | | | 859,570 | |
Urban Outfitters Incorporated † | | | | | | | 57,550 | | | | 1,289,120 | |
| | | | |
| | | | | | | | | | | 9,581,714 | |
| | | | | | | | | | | | |
| | | | |
Consumer Staples: 1.62% | | | | | | | | | | | | |
| | | | |
| Food & Staples Retailing: 0.75% | | | | | | | | | | | | |
SUPERVALU Incorporated † | | | | | | | 231,850 | | | | 1,558,032 | |
| | | | | | | | | | | | |
| | | | |
| Food Products: 0.87% | | | | | | | | | | | | |
Darling Ingredients Incorporated † | | | | | | | 165,910 | | | | 1,816,715 | |
| | | | | | | | | | | | |
| | | | |
Energy: 5.41% | | | | | | | | | | | | |
| | | | |
| Energy Equipment & Services: 0.96% | | | | | | | | | | | | |
RPC Incorporated « | | | | | | | 150,400 | | | | 1,992,800 | |
| | | | | | | | | | | | |
| | | | |
| Oil, Gas & Consumable Fuels: 4.45% | | | | | | | | | | | | |
Carrizo Oil & Gas Incorporated † | | | | | | | 48,800 | | | | 1,970,544 | |
Parsley Energy Incorporated Class A † | | | | | | | 112,300 | | | | 2,206,695 | |
PDC Energy Incorporated † | | | | | | | 31,300 | | | | 1,768,137 | |
Rice Energy Incorporated † | | | | | | | 91,500 | | | | 1,233,420 | |
WPX Energy Incorporated † | | | | | | | 241,330 | | | | 2,070,611 | |
| | | | |
| | | | | | | | | | | 9,249,407 | |
| | | | | | | | | | | | |
The accompanying notes are an integral part of these financial statements.
| | | | |
| 102 | | Wells Fargo Equity Gateway Funds | | Portfolio of investments—November 30, 2015 (unaudited) |
SMALL COMPANY VALUE PORTFOLIO
| | | | | | | | | | | | |
| Security name | | | | | | Shares | | | Value | |
| | | | |
Financials: 40.79% | | | | | | | | | | | | |
| | | | |
| Banks: 21.24% | | | | | | | | | | | | |
Associated Banc-Corp | | | | | | | 110,800 | | | $ | 2,272,508 | |
BancorpSouth Incorporated | | | | | | | 97,092 | | | | 2,611,775 | |
BankUnited Incorporated | | | | | | | 67,650 | | | | 2,557,170 | |
Columbia Banking System Incorporated | | | | | | | 54,235 | | | | 1,927,512 | |
ConnectOne Bancorp Incorporated | | | | | | | 76,220 | | | | 1,487,052 | |
FirstMerit Corporation | | | | | | | 96,500 | | | | 1,952,195 | |
Great Western Bancorp Incorporated | | | | | | | 94,640 | | | | 2,860,021 | |
IBERIABANK Corporation | | | | | | | 38,117 | | | | 2,415,474 | |
Investors Bancorp Incorporated | | | | | | | 184,894 | | | | 2,370,341 | |
National Bank Holdings Corporation Class A | | | | | | | 108,825 | | | | 2,470,328 | |
Pinnacle Financial Partners Incorporated | | | | | | | 42,160 | | | | 2,290,553 | |
PrivateBancorp Incorporated | | | | | | | 63,397 | | | | 2,796,442 | |
Renasant Corporation | | | | | | | 71,000 | | | | 2,593,630 | |
Sterling BanCorp | | | | | | | 153,700 | | | | 2,695,898 | |
Talmer Bancorp Incorporated Class A | | | | | | | 145,900 | | | | 2,665,593 | |
Webster Financial Corporation | | | | | | | 66,037 | | | | 2,655,348 | |
Western Alliance Bancorp † | | | | | | | 84,378 | | | | 3,273,023 | |
Wintrust Financial Corporation | | | | | | | 43,077 | | | | 2,267,143 | |
| | | | |
| | | | | | | | | | | 44,162,006 | |
| | | | | | | | | | | | |
| | | | |
| Capital Markets: 0.94% | | | | | | | | | | | | |
Stifel Financial Corporation † | | | | | | | 42,993 | | | | 1,950,162 | |
| | | | | | | | | | | | |
| | | | |
| Insurance: 6.18% | | | | | | | | | | | | |
American Equity Investment Life Holding Company | | | | | | | 72,108 | | | | 1,933,215 | |
Employers Holdings Incorporated | | | | | | | 91,224 | | | | 2,500,450 | |
Horace Mann Educators Corporation | | | | | | | 67,210 | | | | 2,347,645 | |
Kemper Corporation | | | | | | | 47,210 | | | | 1,940,803 | |
OneBeacon Insurance Group Limited Class A | | | | | | | 97,056 | | | | 1,345,196 | |
Primerica Incorporated | | | | | | | 54,463 | | | | 2,790,684 | |
| | | | |
| | | | | | | | | | | 12,857,993 | |
| | | | | | | | | | | | |
| | | | |
| Real Estate Management & Development: 1.78% | | | | | | | | | | | | |
Alexander & Baldwin Incorporated | | | | | | | 40,981 | | | | 1,553,590 | |
Kennedy Wilson Holdings Incorporated | | | | | | | 81,900 | | | | 2,137,590 | |
| | | | |
| | | | | | | | | | | 3,691,180 | |
| | | | | | | | | | | | |
| | | | |
| REITs: 10.65% | | | | | | | | | | | | |
Columbia Property Trust Incorporated | | | | | | | 97,400 | | | | 2,440,844 | |
Corporate Office Properties Trust | | | | | | | 94,300 | | | | 2,101,947 | |
Education Realty Trust Incorporated | | | | | | | 57,200 | | | | 2,107,820 | |
Equity Commonwealth † | | | | | | | 99,600 | | | | 2,750,952 | |
Gramercy Property Trust Incorporated | | | | | | | 100,450 | | | | 2,399,751 | |
Highwoods Properties Incorporated | | | | | | | 50,800 | | | | 2,212,848 | |
Parkway Properties Incorporated | | | | | | | 122,297 | | | | 2,088,833 | |
Physicians Realty Trust | | | | | | | 130,900 | | | | 2,095,709 | |
Ramco-Gershenson Properties Trust | | | | | | | 141,021 | | | | 2,379,024 | |
Sunstone Hotel Investors Incorporated | | | | | | | 106,156 | | | | 1,558,370 | |
| | | | |
| | | | | | | | | | | 22,136,098 | |
| | | | | | | | | | | | |
The accompanying notes are an integral part of these financial statements.
| | | | | | |
| Portfolio of investments—November 30, 2015 (unaudited) | | Wells Fargo Equity Gateway Funds | | | 103 | |
SMALL COMPANY VALUE PORTFOLIO
| | | | | | | | | | | | |
| Security name | | | | | | Shares | | | Value | |
| | | | |
Health Care: 5.82% | | | | | | | | | | | | |
| | | | |
| Health Care Equipment & Supplies: 2.06% | | | | | | | | | | | | |
Alere Incorporated † | | | | | | | 66,697 | | | $ | 2,752,585 | |
Halyard Health Incorporated † | | | | | | | 47,780 | | | | 1,528,482 | |
| | | | |
| | | | | | | | | | | 4,281,067 | |
| | | | | | | | | | | | |
| | | | |
| Health Care Providers & Services: 3.48% | | | | | | | | | | | | |
Kindred Healthcare Incorporated | | | | | | | 169,300 | | | | 2,260,155 | |
Select Medical Holdings Corporation | | | | | | | 188,360 | | | | 2,273,505 | |
WellCare Health Plans Incorporated † | | | | | | | 32,743 | | | | 2,700,643 | |
| | | | |
| | | | | | | | | | | 7,234,303 | |
| | | | | | | | | | | | |
| | | | |
| Health Care Technology: 0.28% | | | | | | | | | | | | |
Computer Programs & Systems Incorporated « | | | | | | | 12,100 | | | | 589,512 | |
| | | | | | | | | | | | |
| | | | |
Industrials: 7.76% | | | | | | | | | | | | |
| | | | |
| Air Freight & Logistics: 0.88% | | | | | | | | | | | | |
Atlas Air Worldwide Holdings Incorporated † | | | | | | | 44,005 | | | | 1,818,287 | |
| | | | | | | | | | | | |
| | | | |
| Commercial Services & Supplies: 1.62% | | | | | | | | | | | | |
Essendant Incorporated | | | | | | | 47,819 | | | | 1,732,004 | |
Quad Graphics Incorporated | | | | | | | 158,600 | | | | 1,636,752 | |
| | | | |
| | | | | | | | | | | 3,368,756 | |
| | | | | | | | | | | | |
| | | | |
| Construction & Engineering: 1.88% | | | | | | | | | | | | |
KBR Incorporated | | | | | | | 109,190 | | | | 2,122,654 | |
Tutor Perini Corporation † | | | | | | | 94,495 | | | | 1,780,286 | |
| | | | |
| | | | | | | | | | | 3,902,940 | |
| | | | | | | | | | | | |
| | | | |
| Electrical Equipment: 1.08% | | | | | | | | | | | | |
Generac Holdings Incorporated † | | | | | | | 69,560 | | | | 2,232,876 | |
| | | | | | | | | | | | |
| | | | |
| Machinery: 0.80% | | | | | | | | | | | | |
NN Incorporated | | | | | | | 63,190 | | | | 1,077,390 | |
Titan International Incorporated | | | | | | | 136,820 | | | | 593,799 | |
| | | | |
| | | | | | | | | | | 1,671,189 | |
| | | | | | | | | | | | |
| | | | |
| Professional Services: 0.28% | | | | | | | | | | | | |
Hill International Incorporated † | | | | | | | 170,166 | | | | 587,073 | |
| | | | | | | | | | | | |
| | | | |
| Road & Rail: 0.15% | | | | | | | | | | | | |
Universal Truckload Services | | | | | | | 19,636 | | | | 318,889 | |
| | | | | | | | | | | | |
| | | | |
| Trading Companies & Distributors: 1.07% | | | | | | | | | | | | |
Air Lease Corporation | | | | | | | 66,100 | | | | 2,222,943 | |
| | | | | | | | | | | | |
| | | | |
Information Technology: 12.55% | | | | | | | | | | | | |
| | | | |
| Communications Equipment: 0.98% | | | | | | | | | | | | |
ARRIS Group Incorporated † | | | | | | | 66,983 | | | | 2,047,670 | |
| | | | | | | | | | | | |
The accompanying notes are an integral part of these financial statements.
| | | | |
| 104 | | Wells Fargo Equity Gateway Funds | | Portfolio of investments—November 30, 2015 (unaudited) |
SMALL COMPANY VALUE PORTFOLIO
| | | | | | | | | | | | |
| Security name | | | | | | Shares | | | Value | |
| | | | |
| Electronic Equipment, Instruments & Components: 4.04% | | | | | | | | | | | | |
Belden Incorporated | | | | | | | 50,350 | | | $ | 3,160,470 | |
Celestica Incorporated † | | | | | | | 180,136 | | | | 2,031,934 | |
Plexus Corporation † | | | | | | | 51,321 | | | | 1,909,141 | |
Tech Data Corporation † | | | | | | | 19,028 | | | | 1,287,244 | |
| | | | |
| | | | | | | | | | | 8,388,789 | |
| | | | | | | | | | | | |
| | | | |
| IT Services: 1.79% | | | | | | | | | | | | |
Cardtronics Incorporated † | | | | | | | 43,840 | | | | 1,648,822 | |
VeriFone Systems Incorporated † | | | | | | | 72,100 | | | | 2,067,828 | |
| | | | |
| | | | | | | | | | | 3,716,650 | |
| | | | | | | | | | | | |
| | | | |
| Semiconductors & Semiconductor Equipment: 4.02% | | | | | | | | | | | | |
Advanced Energy Industries Incorporated † | | | | | | | 86,845 | | | | 2,533,269 | |
Diodes Incorporated † | | | | | | | 113,040 | | | | 2,632,702 | |
Veeco Instruments Incorporated † | | | | | | | 55,250 | | | | 1,129,863 | |
Xcerra Corporation † | | | | | | | 340,471 | | | | 2,059,850 | |
| | | | |
| | | | | | | | | | | 8,355,684 | |
| | | | | | | | | | | | |
| | | | |
| Software: 1.13% | | | | | | | | | | | | |
Mentor Graphics Corporation | | | | | | | 125,417 | | | | 2,349,060 | |
| | | | | | | | | | | | |
| | | | |
| Technology Hardware, Storage & Peripherals: 0.59% | | | | | | | | | | | | |
Avid Technology Incorporated † | | | | | | | 162,200 | | | | 1,231,098 | |
| | | | | | | | | | | | |
| | | | |
Materials: 5.14% | | | | | | | | | | | | |
| | | | |
| Chemicals: 4.29% | | | | | | | | | | | | |
A. Schulman Incorporated | | | | | | | 68,900 | | | | 2,384,629 | |
Axiall Corporation | | | | | | | 69,300 | | | | 1,444,212 | |
Cabot Corporation | | | | | | | 58,600 | | | | 2,551,444 | |
Chemtura Corporation † | | | | | | | 83,013 | | | | 2,550,159 | |
| | | | |
| | | | | | | | | | | 8,930,444 | |
| | | | | | | | | | | | |
| | | | |
| Metals & Mining: 0.85% | | | | | | | | | | | | |
Globe Specialty Metals Incorporated | | | | | | | 173,500 | | | | 1,764,495 | |
| | | | | | | | | | | | |
| | | | |
Utilities: 4.77% | | | | | | | | | | | | |
| | | | |
| Electric Utilities: 3.52% | | | | | | | | | | | | |
El Paso Electric Company | | | | | | | 64,371 | | | | 2,487,939 | |
PNM Resources Incorporated | | | | | | | 101,017 | | | | 2,929,493 | |
Portland General Electric Company | | | | | | | 51,724 | | | | 1,909,650 | |
| | | | |
| | | | | | | | | | | 7,327,082 | |
| | | | | | | | | | | | |
| | | | |
| Multi-Utilities: 1.25% | | | | | | | | | | | | |
Avista Corporation | | | | | | | 74,910 | | | | 2,592,632 | |
| | | | | | | | | | | | |
| | | | |
Total Common Stocks (Cost $174,801,497) | | | | | | | | | | | 198,475,536 | |
| | | | | | | | | | | | |
The accompanying notes are an integral part of these financial statements.
| | | | | | |
| Portfolio of investments—November 30, 2015 (unaudited) | | Wells Fargo Equity Gateway Funds | | | 105 | |
SMALL COMPANY VALUE PORTFOLIO
| | | | | | | | | | | | | | | | |
| Security name | | | | | Expiration date | | | Shares | | | Value | |
| Warrants: 0.00% | | | | | | | | | | | | | | | | |
| | | | |
Health Care: 0.00% | | | | | | | | | | | | | | | | |
| | | | |
| Health Care Equipment & Supplies: 0.00% | | | | | | | | | | | | | | | | |
EnteroMedics Incorporated †(a) | | | | | | | 5-14-2016 | | | | 9,104 | | | $ | 2 | |
| | | | | | | | | | | | | | | | |
| | | | |
Total Warrants (Cost $0) | | | | | | | | | | | | | | | 2 | |
| | | | | | | | | | | | | | | | |
| | | | |
| | | Yield | | | | | | | | | | |
| Short-Term Investments: 6.15% | | | | | | | | | | | | | | | | |
| | | | |
| Investment Companies: 6.15% | | | | | | | | | | | | | | | | |
Securities Lending Cash Investments, LLC (l)(r)(u) | | | 0.18 | % | | | | | | | 4,795,850 | | | | 4,795,850 | |
Wells Fargo Cash Investment Money Market Fund, Select Class (l)(u) | | | 0.17 | | | | | | | | 7,987,779 | | | | 7,987,779 | |
| | | | |
Total Short-Term Investments (Cost $12,783,629) | | | | | | | | | | | | | | | 12,783,629 | |
| | | | | | | | | | | | | | | | |
| | | | | | | | |
| Total investments in securities (Cost $187,585,126) * | | | 101.62 | % | | | 211,259,167 | |
Other assets and liabilities, net | | | (1.62 | ) | | | (3,373,120 | ) |
| | | | | | | | |
| Total net assets | | | 100.00 | % | | $ | 207,886,047 | |
| | | | | | | | |
| † | Non-income-earning security |
| « | All or a portion of this security is on loan. |
| (a) | The security is fair valued in accordance with procedures approved by the Board of Trustees. |
| (l) | The issuer of the security is an affiliated person of the Portfolio as defined in the Investment Company Act of 1940. |
| (r) | The investment is a non-registered investment vehicle purchased with cash collateral received from securities on loan. |
| (u) | The rate represents the 7-day annualized yield at period end. |
| * | Cost for federal income tax purposes is $188,083,132 and unrealized gains (losses) consists of: |
| | | | |
Gross unrealized gains | | $ | 35,807,002 | |
Gross unrealized losses | | | (12,630,967 | ) |
| | | | |
Net unrealized gains | | $ | 23,176,035 | |
The accompanying notes are an integral part of these financial statements.
| | | | |
| 106 | | Wells Fargo Equity Gateway Funds | | Statements of assets and liabilities—November 30, 2015 (unaudited) |
| | | | | | | | |
| | | C&B Large
Cap Value
Portfolio | | | Diversified
Large Cap
Growth
Portfolio | |
| | |
Assets | | | | | | | | |
Investments | | | | | | | | |
In unaffiliated securities (including securities on loan), at value (see cost below) | | $ | 306,538,283 | | | $ | 116,615,718 | |
In affiliated securities, at value (see cost below) | | | 14,406,902 | | | | 2,802,541 | |
| | | | |
Total investments, at value (see cost below) | | | 320,945,185 | | | | 119,418,259 | |
Cash | | | 0 | | | | 0 | |
Foreign currency, at value (see cost below) | | | 0 | | | | 0 | |
Receivable for investments sold | | | 0 | | | | 121,450 | |
Receivable for dividends | | | 597,245 | | | | 103,426 | |
Receivable for securities lending income | | | 966 | | | | 641 | |
Prepaid expenses and other assets | | | 4,408 | | | | 5,307 | |
| | | | |
Total assets | | | 321,547,804 | | | | 119,649,083 | |
| | | | |
| | |
Liabilities | | | | | | | | |
Payable for investments purchased | | | 0 | | | | 146,808 | |
Payable upon receipt of securities loaned | | | 4,278,750 | | | | 1,326,875 | |
Payable for daily variation margin on open futures contracts | | | 0 | | | | 0 | |
Advisory fee payable | | | 169,545 | | | | 52,402 | |
Accrued expenses and other liabilities | | | 26,016 | | | | 25,248 | |
| | | | |
Total liabilities | | | 4,474,311 | | | | 1,551,333 | |
| | | | |
Total net assets | | $ | 317,073,493 | | | $ | 118,097,750 | |
| | | | |
| | |
Investments in unaffiliated securities (including securities on loan), at cost | | $ | 240,460,541 | | | $ | 75,203,099 | |
| | | | |
Investments in affiliated securities, at cost | | $ | 14,406,902 | | | $ | 2,802,541 | |
| | | | |
Total investments, at cost | | $ | 254,867,443 | | | $ | 78,005,640 | |
| | | | |
Securities on loan, at value | | $ | 4,192,650 | | | $ | 1,298,417 | |
| | | | |
Foreign currency, at cost | | $ | 0 | | | $ | 0 | |
| | | | |
The accompanying notes are an integral part of these financial statements.
| | | | | | |
| Statements of assets and liabilities—November 30, 2015 (unaudited) | | Wells Fargo Equity Gateway Funds | | | 107 | |
| | | | | | | | | | | | | | | | | | | | | | | | | | |
Emerging
Growth
Portfolio | | | Index
Portfolio | | | International
Growth
Portfolio | | | International
Value
Portfolio | | | Large Company
Value
Portfolio | | | Small Company
Growth
Portfolio | | | Small Company
Value
Portfolio | |
| | | | | | |
| | | | | | | | | | | | | | | | | | | | | | | | | | |
| | | | | | | | | | | | | | | | | | | | | | | | | | |
| $ | 1,006,634,764 | | | $ | 2,439,531,214 | | | $ | 151,276,066 | | | $ | 482,006,111 | | | $ | 77,526,426 | | | $ | 1,096,406,707 | | | $ | 198,475,538 | |
| | 109,355,356 | | | | 78,314,451 | | | | 5,627,099 | | | | 19,508,327 | | | | 4,891,001 | | | | 176,294,186 | | | | 12,783,629 | |
| | |
| | 1,115,990,120 | | | | 2,517,845,665 | | | | 156,903,165 | | | | 501,514,438 | | | | 82,417,427 | | | | 1,272,700,893 | | | | 211,259,167 | |
| | 0 | | | | 0 | | | | 0 | | | | 0 | | | | 0 | | | | 0 | | | | 9,762 | |
| | 0 | | | | 0 | | | | 55,488 | | | | 9,263,631 | | | | 0 | | | | 0 | | | | 0 | |
| | 2,900,476 | | | | 22,479,271 | | | | 684,540 | | | | 0 | | | | 678,828 | | | | 3,235,001 | | | | 2,799,733 | |
| | 6,402 | | | | 5,820,405 | | | | 209,219 | | | | 1,575,575 | | | | 173,142 | | | | 362,879 | | | | 238,835 | |
| | 335,217 | | | | 15,506 | | | | 5,635 | | | | 28,485 | | | | 2,440 | | | | 290,585 | | | | 4,653 | |
| | 3,410 | | | | 21,849 | | | | 18,636 | | | | 11,613 | | | | 6,885 | | | | 17,022 | | | | 3,350 | |
| | |
| | 1,119,235,625 | | | | 2,546,182,696 | | | | 157,876,683 | | | | 512,393,742 | | | | 83,278,722 | | | | 1,276,606,380 | | | | 214,315,500 | |
| | |
| | | | | | |
| | | | | | | | | | | | | | | | | | | | | | | | | | |
| | 3,644,031 | | | | 0 | | | | 53,395 | | | | 0 | | | | 798,059 | | | | 0 | | | | 1,474,888 | |
| | 97,288,111 | | | | 13,080,495 | | | | 1,302,812 | | | | 15,597,666 | | | | 3,413,200 | | | | 118,989,418 | | | | 4,795,850 | |
| | 0 | | | | 181,800 | | | | 0 | | | | 0 | | | | 0 | | | | 0 | | | | 0 | |
| | 666,423 | | | | 176,909 | | | | 108,660 | | | | 346,379 | | | | 40,928 | | | | 717,492 | | | | 134,522 | |
| | 40,995 | | | | 40,030 | | | | 41,137 | | | | 38,760 | | | | 25,220 | | | | 24,548 | | | | 24,193 | |
| | |
| | 101,639,560 | | | | 13,479,234 | | | | 1,506,004 | | | | 15,982,805 | | | | 4,277,407 | | | | 119,731,458 | | | | 6,429,453 | |
| | |
| $ | 1,017,596,065 | | | $ | 2,532,703,462 | | | $ | 156,370,679 | | | $ | 496,410,937 | | | $ | 79,001,315 | | | $ | 1,156,874,922 | | | $ | 207,886,047 | |
| | |
| | | | | | |
| $ | 760,204,702 | | | $ | 1,188,428,645 | | | $ | 126,347,077 | | | $ | 519,319,145 | | | $ | 67,502,414 | | | $ | 995,453,082 | | | $ | 174,801,497 | |
| | |
| $ | 109,355,356 | | | $ | 60,485,228 | | | $ | 5,627,099 | | | $ | 19,508,327 | | | $ | 4,891,001 | | | $ | 176,294,186 | | | $ | 12,783,629 | |
| | |
| $ | 869,560,058 | | | $ | 1,248,913,873 | | | $ | 131,974,176 | | | $ | 538,827,472 | | | $ | 72,393,415 | | | $ | 1,171,747,268 | | | $ | 187,585,126 | |
| | |
| $ | 94,857,530 | | | $ | 12,747,497 | | | $ | 1,240,646 | | | $ | 14,809,795 | | | $ | 3,325,447 | | | $ | 115,718,547 | | | $ | 4,677,670 | |
| | |
| $ | 0 | | | $ | 0 | | | $ | 55,503 | | | $ | 9,665,860 | | | $ | 0 | | | $ | 0 | | | $ | 0 | |
| | |
The accompanying notes are an integral part of these financial statements.
| | | | |
| 108 | | Wells Fargo Equity Gateway Funds | | Statements of operations—six months ended November 30, 2015 (unaudited) |
| | | | | | | | |
| | | C&B Large
Cap Value
Portfolio | | | Diversified
Large Cap
Growth
Portfolio | |
| | |
Investment income | | | | | | | | |
Dividends* | | $ | 3,185,662 | | | $ | 520,296 | |
Income from affiliated securities | | | 9,012 | | | | 1,195 | |
Securities lending income, net | | | 4,606 | | | | 3,218 | |
Interest | | | 0 | | | | 0 | |
| | | | |
Total investment income | | | 3,199,280 | | | | 524,709 | |
| | | | |
| | |
Expenses | | | | | | | | |
Advisory fee | | | 1,068,535 | | | | 387,876 | |
Custody and accounting fees | | | 12,147 | | | | 11,724 | |
Professional fees | | | 22,130 | | | | 24,088 | |
Shareholder report expenses | | | 531 | | | | 1,025 | |
Trustees’ fees and expenses | | | 6,301 | | | | 6,473 | |
Other fees and expenses | | | 4,550 | | | | 6,702 | |
| | | | |
Total expenses | | | 1,114,194 | | | | 437,888 | |
Less: Fee waivers and/or expense reimbursements | | | 0 | | | | (66,660 | ) |
| | | | |
Net expenses | | | 1,114,194 | | | | 371,228 | |
| | | | |
Net investment income (loss) | | | 2,085,086 | | | | 153,481 | |
| | | | |
| | |
REALIZED AND UNREALIZED GAINS (LOSSES) ON INVESTMENTS | | | | | | | | |
| | |
Net realized gains (losses) on: | | | | | | | | |
Unaffiliated securities | | | 10,230,399 | | | | 4,189,078 | |
Affiliated securities | | | 0 | | | | 0 | |
Futures transactions | | | 0 | | | | 0 | |
| | | | |
Net realized gain (losses) on investments | | | 10,230,399 | | | | 4,189,078 | |
| | | | |
| | |
Net change in unrealized gains (losses) on: | | | | | | | | |
Unaffiliated securities | | | (20,364,413 | ) | | | (2,879,730 | ) |
Affiliated securities | | | 0 | | | | 0 | |
Futures transactions | | | 0 | | | | 0 | |
| | | | |
Net change in unrealized gains (losses) on investments | | | (20,364,413 | ) | | | (2,879,730 | ) |
| | | | |
Net realized and unrealized gains (losses) on investments | | | (10,134,014 | ) | | | 1,309,348 | |
| | | | |
Net increase (decrease) in net assets resulting from operations | | $ | (8,048,928 | ) | | $ | 1,462,829 | |
| | | | |
| | |
* Net of foreign dividend withholding taxes in the amount of | | | $17,263 | | | | $1,173 | |
The accompanying notes are an integral part of these financial statements.
| | | | | | |
| Statements of operations—six months ended November 30, 2015 (unaudited) | | Wells Fargo Equity Gateway Funds | | | 109 | |
| | | | | | | | | | | | | | | | | | | | | | | | | | |
Emerging
Growth
Portfolio | | | Index
Portfolio | | |
International
Growth
Portfolio | | | International
Value
Portfolio | | | Large Company
Value
Portfolio | | | Small Company
Growth
Portfolio | | | Small Company
Value
Portfolio | |
| | | | | | |
| | | | | | | | | | | | | | | | | | | | | | | | | | |
| $ | 446,429 | | | $ | 27,262,952 | | | $ | 785,935 | | | $ | 5,888,648 | | | $ | 828,105 | | | $ | 2,031,225 | | | $ | 1,673,963 | |
| | 18,887 | | | | 505,801 | | | | 3,876 | | | | 4,240 | | | | 1,585 | | | | 38,880 | | | | 4,714 | |
| | 974,921 | | | | 62,626 | | | | 15,220 | | | | 183,620 | | | | 13,516 | | | | 852,443 | | | | 15,804 | |
| | 0 | | | | 264 | | | | 0 | | | | 0 | | | | 0 | | | | 0 | | | | 0 | |
| | |
| | 1,440,237 | | | | 27,831,643 | | | | 805,031 | | | | 6,076,508 | | | | 843,206 | | | | 2,922,548 | | | | 1,694,481 | |
| | |
| | | | | | |
| | | | | | | | | | | | | | | | | | | | | | | | | | |
| | 4,318,734 | | | | 1,090,712 | | | | 652,569 | | | | 2,142,625 | | | | 257,317 | | | | 3,793,458 | | | | 828,526 | |
| | 31,798 | | | | 73,520 | | | | 49,094 | | | | 94,192 | | | | 5,761 | | | | 32,910 | | | | 11,363 | |
| | 23,493 | | | | 30,361 | | | | 26,642 | | | | 30,417 | | | | 23,654 | | | | 24,297 | | | | 23,329 | |
| | 2,262 | | | | 3,562 | | | | 756 | | | | 1,323 | | | | 615 | | | | 992 | | | | 1,394 | |
| | 6,125 | | | | 4,773 | | | | 6,430 | | | | 5,982 | | | | 6,121 | | | | 5,971 | | | | 6,023 | |
| | 17,017 | | | | 193,132 | | | | 24,191 | | | | 26,968 | | | | 7,765 | | | | 12,515 | | | | 4,721 | |
| | |
| | 4,399,429 | | | | 1,396,060 | | | | 759,682 | | | | 2,301,507 | | | | 301,233 | | | | 3,870,143 | | | | 875,356 | |
| | 0 | | | | (11,554 | ) | | | 0 | | | | 0 | | | | (8,922 | ) | | | 0 | | | | 0 | |
| | |
| | 4,399,429 | | | | 1,384,506 | | | | 759,682 | | | | 2,301,507 | | | | 292,311 | | | | 3,870,143 | | | | 875,356 | |
| | |
| | (2,959,192 | ) | | | 26,447,137 | | | | 45,349 | | | | 3,775,001 | | | | 550,895 | | | | (947,595 | ) | | | 819,125 | |
| | |
| | | | | | |
| | | | | | | | | | | | | | | | | | | | | | | | | | |
| | | | | | |
| | | | | | | | | | | | | | | | | | | | | | | | | | |
| | 30,516,698 | | | | 76,603,043 | | | | (2,006,489 | ) | | | 68,474 | | | | 1,589,301 | | | | (33,533,955 | ) | | | 14,137,854 | |
| | 0 | | | | 1,061,279 | | | | 0 | | | | 0 | | | | 0 | | | | 0 | | | | 0 | |
| | 0 | | | | 40,989 | | | | 0 | | | | 0 | | | | 0 | | | | 0 | | | | 0 | |
| | |
| | 30,516,698 | | | | 77,705,311 | | | | (2,006,489 | ) | | | 68,474 | | | | 1,589,301 | | | | (33,533,955 | ) | | | 14,137,854 | |
| | |
| | | | | | |
| | | | | | | | | | | | | | | | | | | | | | | | | | |
| | (115,631,449 | ) | | | (111,490,822 | ) | | | (10,962,419 | ) | | | (53,900,425 | ) | | | (4,975,347 | ) | | | (33,388,318 | ) | | | (23,027,705 | ) |
| | 0 | | | | (1,620,608 | ) | | | 0 | | | | 0 | | | | 0 | | | | 0 | | | | 0 | |
| | 0 | | | | 935 | | | | 0 | | | | 0 | | | | 0 | | | | 0 | | | | 0 | |
| | |
| | (115,631,449 | ) | | | (113,110,495 | ) | | | (10,962,419 | ) | | | (53,900,425 | ) | | | (4,975,347 | ) | | | (33,388,318 | ) | | | (23,027,705 | ) |
| | |
| | (85,114,751 | ) | | | (35,405,184 | ) | | | (12,968,908 | ) | | | (53,831,951 | ) | | | (3,386,046 | ) | | | (66,922,273 | ) | | | (8,889,851 | ) |
| | |
| $ | (88,073,943 | ) | | $ | (8,958,047 | ) | | $ | (12,923,559 | ) | | $ | (50,056,950 | ) | | $ | (2,835,151 | ) | | $ | (67,869,868 | ) | | $ | (8,070,726 | ) |
| | |
| | | | | | |
| | $0 | | | | $3,832 | | | | $10,924 | | | | $657,280 | | | | $784 | | | | $6,205 | | | | $0 | |
The accompanying notes are an integral part of these financial statements.
| | | | |
| 110 | | Wells Fargo Equity Gateway Funds | | Statements of changes in net assets |
| | | | | | | | |
| | | C&B Large Cap Value Portfolio | |
| | | Six months ended
November 30, 2015
(unaudited) | | | Year ended May 31, 2015 | |
| | |
Operations | | | | | | | | |
Net investment income | | $ | 2,085,086 | | | $ | 3,962,347 | |
Net realized gains on investments | | | 10,230,399 | | | | 41,880,494 | |
Net change in unrealized gains (losses) on investments | | | (20,364,413 | ) | | | (13,267,776 | ) |
| | | | |
Net increase (decrease) in net assets resulting from operations | | | (8,048,928 | ) | | | 32,575,065 | |
| | | | |
| | |
Capital share transactions | | | | | | | | |
Transactions in investors’ beneficial interests | | | | | | | | |
Contributions | | | 26,534,974 | | | | 32,358,693 | |
Withdrawals | | | (36,947,357 | ) | | | (46,347,409 | ) |
| | | | |
Net decrease in net assets resulting from capital share transactions | | | (10,412,383 | ) | | | (13,988,716 | ) |
| | | | |
Total increase (decrease) in net assets | | | (18,461,311 | ) | | | 18,586,349 | |
| | | | |
| | |
Net assets | | | | | | | | |
Beginning of period | | | 335,534,804 | | | | 316,948,455 | |
| | | | |
End of period | | $ | 317,073,493 | | | $ | 335,534,804 | |
| | | | |
The accompanying notes are an integral part of these financial statements.
| | | | | | |
| Statements of changes in net assets | | Wells Fargo Equity Gateway Funds | | | 111 | |
| | | | | | | | |
| | | Diversified Large Cap Growth Portfolio | |
| | | Six months ended
November 30, 2015
(unaudited) | | | Year ended May 31, 2015 | |
| | |
Operations | | | | | | | | |
Net investment income | | $ | 153,481 | | | $ | 378,418 | |
Net realized gains on investments | | | 4,189,078 | | | | 13,356,513 | |
Net change in unrealized gains (losses) on investments | | | (2,879,730 | ) | | | 2,762,375 | |
| | | | |
Net increase in net assets resulting from operations | | | 1,462,829 | | | | 16,497,306 | |
| | | | |
| | |
Capital share transactions | | | | | | | | |
Transactions in investors’ beneficial interests | | | | | | | | |
Contributions | | | 1,990,449 | | | | 1,385,145 | |
Withdrawals | | | (8,685,389 | ) | | | (38,000,934 | ) |
| | | | |
Net decrease in net assets resulting from capital share transactions | | | (6,694,940 | ) | | | (36,615,789 | ) |
| | | | |
Total decrease in net assets | | | (5,232,111 | ) | | | (20,118,483 | ) |
| | | | |
| | |
Net assets | | | | | | | | |
Beginning of period | | | 123,329,861 | | | | 143,448,344 | |
| | | | |
End of period | | $ | 118,097,750 | | | $ | 123,329,861 | |
| | | | |
The accompanying notes are an integral part of these financial statements.
| | | | |
| 112 | | Wells Fargo Equity Gateway Funds | | Statements of changes in net assets |
| | | | | | | | |
| | | Emerging Growth Portfolio | |
| | | Six months ended
November 30, 2015
(unaudited) | | | Year ended
May 31, 2015 | |
| | |
Operations | | | | | | | | |
Net investment loss | | $ | (2,959,192 | ) | | $ | (7,075,125 | ) |
Net realized gains on investments | | | 30,516,698 | | | | 124,199,895 | |
Net change in unrealized gains (losses) on investments | | | (115,631,449 | ) | | | 125,177,937 | |
| | | | |
Net increase (decrease) in net assets resulting from operations | | | (88,073,943 | ) | | | 242,302,707 | |
| | | | |
| | |
Capital share transactions | | | | | | | | |
Transactions in investors’ beneficial interests | | | | | | | | |
Contributions | | | 70,849,193 | | | | 45,776,720 | |
Withdrawals | | | (112,946,618 | ) | | | (236,510,647 | ) |
| | | | |
Net decrease in net assets resulting from capital share transactions | | | (42,097,425 | ) | | | (190,733,927 | ) |
| | | | |
Total increase (decrease) in net assets | | | (130,171,368 | ) | | | 51,568,780 | |
| | | | |
| | |
Net assets | | | | | | | | |
Beginning of period | | | 1,147,767,433 | | | | 1,096,198,653 | |
| | | | |
End of period | | $ | 1,017,596,065 | | | $ | 1,147,767,433 | |
| | | | |
The accompanying notes are an integral part of these financial statements.
| | | | | | |
| Statements of changes in net assets | | Wells Fargo Equity Gateway Funds | | | 113 | |
| | | | | | | | |
| | | Index Portfolio | |
| | | Six months ended
November 30, 2015
(unaudited) | | | Year ended
May 31, 2015 | |
| | |
Operations | | | | | | | | |
Net investment income | | $ | 26,447,137 | | | $ | 54,937,429 | |
Net realized gains on investments | | | 77,705,311 | | | | 151,694,995 | |
Net change in unrealized gains (losses) on investments | | | (113,110,495 | ) | | | 106,085,589 | |
| | | | |
Net increase (decrease) in net assets resulting from operations | | | (8,958,047 | ) | | | 312,718,013 | |
| | | | |
| | |
Capital share transactions | | | | | | | | |
Transactions in investors’ beneficial interests | | | | | | | | |
Contributions | | | 35,484,942 | | | | 163,917,502 | |
Withdrawals | | | (264,067,367 | ) | | | (543,742,749 | ) |
| | | | |
Net decrease in net assets resulting from capital share transactions | | | (228,582,425 | ) | | | (379,825,247 | ) |
| | | | |
Total decrease in net assets | | | (237,540,472 | ) | | | (67,107,234 | ) |
| | | | |
| | |
Net assets | | | | | | | | |
Beginning of period | | | 2,770,243,934 | | | | 2,837,351,168 | |
| | | | |
End of period | | $ | 2,532,703,462 | | | $ | 2,770,243,934 | |
| | | | |
The accompanying notes are an integral part of these financial statements.
| | | | |
| 114 | | Wells Fargo Equity Gateway Funds | | Statements of changes in net assets |
| | | | | | | | |
| | | International Growth Portfolio | |
| | | Six months ended
November 30, 2015
(unaudited) | | | Year ended May 31, 2015 | |
| | |
Operations | | | | | | | | |
Net investment income | | $ | 45,349 | | | $ | 1,168,188 | |
Net realized gains (losses) on investments | | | (2,006,489 | ) | | | 5,764,586 | |
Net change in unrealized gains (losses) on investments | | | (10,962,419 | ) | | | 1,080,710 | |
| | | | |
Net increase (decrease) in net assets resulting from operations | | | (12,923,559 | ) | | | 8,013,484 | |
| | | | |
| | |
Capital share transactions | | | | | | | | |
Transactions in investors’ beneficial interests | | | | | | | | |
Contributions | | | 13,012,480 | | | | 9,541,797 | |
Withdrawals | | | (2,122,571 | ) | | | (15,259,152 | ) |
| | | | |
Net increase (decrease) in net assets resulting from capital share transactions | | | 10,889,909 | | | | (5,717,355 | ) |
| | | | |
Total increase (decrease) in net assets | | | (2,033,650 | ) | | | 2,296,129 | |
| | | | |
| | |
Net assets | | | | | | | | |
Beginning of period | | | 158,404,329 | | | | 156,108,200 | |
| | | | |
End of period | | $ | 156,370,679 | | | $ | 158,404,329 | |
| | | | |
The accompanying notes are an integral part of these financial statements.
| | | | | | |
| Statements of changes in net assets | | Wells Fargo Equity Gateway Funds | | | 115 | |
| | | | | | | | |
| | | International Value Portfolio | |
| | | Six months ended
November 30, 2015
(unaudited) | | | Year ended May 31, 2015 | |
| | |
Operations | | | | | | | | |
Net investment income | | $ | 3,775,001 | | | $ | 12,375,837 | |
Net realized gains on investments | | | 68,474 | | | | 12,459,307 | |
Net change in unrealized gains (losses) on investments | | | (53,900,425 | ) | | | (27,933,255 | ) |
| | | | |
Net decrease in net assets resulting from operations | | | (50,056,950 | ) | | | (3,098,111 | ) |
| | | | |
| | |
Capital share transactions | | | | | | | | |
Transactions in investors’ beneficial interests | | | | | | | | |
Contributions | | | 16,809,245 | | | | 42,159,536 | |
Withdrawals | | | (4,555,006 | ) | | | (17,083,113 | ) |
| | | | |
Net increase in net assets resulting from capital share transactions | | | 12,254,239 | | | | 25,076,423 | |
| | | | |
Total increase (decrease) in net assets | | | (37,802,711 | ) | | | 21,978,312 | |
| | | | |
| | |
Net assets | | | | | | | | |
Beginning of period | | | 534,213,648 | | | | 512,235,336 | |
| | | | |
End of period | | $ | 496,410,937 | | | $ | 534,213,648 | |
| | | | |
The accompanying notes are an integral part of these financial statements.
| | | | |
| 116 | | Wells Fargo Equity Gateway Funds | | Statements of changes in net assets |
| | | | | | | | |
| | | Large Company Value Portfolio | |
| | | Six months ended
November 30, 2015
(unaudited) | | | Year ended May 31, 2015 | |
| | |
Operations | | | | | | | | |
Net investment income | | $ | 550,895 | | | $ | 964,436 | |
Net realized gains on investments | | | 1,589,301 | | | | 9,724,164 | |
Net change in unrealized gains (losses) on investments | | | (4,975,347 | ) | | | (3,904,014 | ) |
| | | | |
Net increase (decrease) in net assets resulting from operations | | | (2,835,151 | ) | | | 6,784,586 | |
| | | | |
| | |
Capital share transactions | | | | | | | | |
Transactions in investors’ beneficial interests | | | | | | | | |
Contributions | | | 2,593,477 | | | | 1,636,829 | |
Withdrawals | | | (3,253,299 | ) | | | (21,975,522 | ) |
| | | | |
Net decrease in net assets resulting from capital share transactions | | | (659,822 | ) | | | (20,338,693 | ) |
| | | | |
Total decrease in net assets | | | (3,494,973 | ) | | | (13,554,107 | ) |
| | | | |
| | |
Net assets | | | | | | | | |
Beginning of period | | | 82,496,288 | | | | 96,050,395 | |
| | | | |
End of period | | $ | 79,001,315 | | | $ | 82,496,288 | |
| | | | |
The accompanying notes are an integral part of these financial statements.
| | | | | | |
| Statements of changes in net assets | | Wells Fargo Equity Gateway Funds | | | 117 | |
| | | | | | | | |
| | | Small Company Growth Portfolio | |
| | | Six months ended November 30, 2015
(unaudited) | | | Year ended May 31, 2015 | |
| | |
Operations | | | | | | | | |
Net investment loss | | $ | (947,595 | ) | | $ | (1,603,331 | ) |
Net realized gains (losses) on investments | | | (33,533,955 | ) | | | 17,519,892 | |
Net change in unrealized gains (losses) on investments | | | (33,388,318 | ) | | | 73,745,204 | |
| | | | |
Net increase (decrease) in net assets resulting from operations | | | (67,869,868 | ) | | | 89,661,765 | |
| | | | |
| | |
Capital share transactions | | | | | | | | |
Transactions in investors’ beneficial interests | | | | | | | | |
Contributions | | | 502,985,505 | | | | 343,108,775 | |
Withdrawals | | | (29,626,135 | ) | | | (37,300,648 | ) |
| | | | |
Net increase in net assets resulting from capital share transactions | | | 473,359,370 | | | | 305,808,127 | |
| | | | |
Total increase in net assets | | | 405,489,502 | | | | 395,469,892 | |
| | | | |
| | |
Net assets | | | | | | | | |
Beginning of period | | | 751,385,420 | | | | 355,915,528 | |
| | | | |
End of period | | $ | 1,156,874,922 | | | $ | 751,385,420 | |
| | | | |
The accompanying notes are an integral part of these financial statements.
| | | | |
| 118 | | Wells Fargo Equity Gateway Funds | | Statements of changes in net assets |
| | | | | | | | |
| | | Small Company Value Portfolio | |
| | | Six months ended
November 30, 2015
(unaudited) | | | Year ended May 31, 2015 | |
| | |
Operations | | | | | | | | |
Net investment income | | $ | 819,125 | | | $ | 1,850,375 | |
Net realized gains on investments | | | 14,137,854 | | | | 16,879,349 | |
Net change in unrealized gains (losses) on investments | | | (23,027,705 | ) | | | (3,678,556 | ) |
| | | | |
Net increase (decrease) in net assets resulting from operations | | | (8,070,726 | ) | | | 15,051,168 | |
| | | | |
| | |
Capital share transactions | | | | | | | | |
Transactions in investors’ beneficial interests | | | | | | | | |
Contributions | | | 9,367,320 | | | | 22,862,632 | |
Withdrawals | | | (9,106,770 | ) | | | (28,565,086 | ) |
| | | | |
Net increase (decrease) in net assets resulting from capital share transactions | | | 260,550 | | | | (5,702,454 | ) |
| | | | |
Total increase (decrease) in net assets | | | (7,810,176 | ) | | | 9,348,714 | |
| | | | |
| | |
Net assets | | | | | | | | |
Beginning of period | | | 215,696,223 | | | | 206,347,509 | |
| | | | |
End of period | | $ | 207,886,047 | | | $ | 215,696,223 | |
| | | | |
The accompanying notes are an integral part of these financial statements.
| | | | | | |
| Financial highlights | | Wells Fargo Equity Gateway Funds | | | 119 | |
| | | | | | | | | | | | | | | | | | | | |
| | | Ratio to average net assets (annualized) | | | | | | Portfolio
turnover
rate | |
| | | Net investment
income (loss) | | | Gross
expenses | | | Net
expenses | | | Total
return1 | | |
| | | | | |
C&B Large Cap Value Portfolio | | | | | | | | | | | | | | | | | | | | |
Six months ended November 30, 2015 (unaudited) | | | 1.27 | % | | | 0.68 | % | | | 0.68 | % | | | (2.13 | )% | | | 18 | % |
Year ended May 31, 2015 | | | 1.20 | % | | | 0.68 | % | | | 0.68 | % | | | 10.29 | % | | | 35 | % |
Year ended May 31, 2014 | | | 1.35 | % | | | 0.68 | % | | | 0.68 | % | | | 17.80 | % | | | 22 | % |
Year ended May 31, 2013 | | | 1.73 | % | | | 0.68 | % | | | 0.68 | % | | | 29.30 | % | | | 18 | % |
Year ended May 31, 2012 | | | 1.81 | % | | | 0.68 | % | | | 0.68 | % | | | (4.61 | )% | | | 21 | % |
Year ended May 31, 20112 | | | 1.27 | % | | | 0.67 | % | | | 0.67 | % | | | 18.08 | % | | | 17 | % |
Year ended September 30, 2010 | | | 1.40 | % | | | 0.70 | % | | | 0.68 | % | | | 7.49 | % | | | 13 | % |
| | | | | |
Diversified Large Cap Growth Portfolio | | | | | | | | | | | | | | | | | | | | |
Six months ended November 30, 2015 (unaudited) | | | 0.26 | % | | | 0.73 | % | | | 0.62 | % | | | 1.28 | % | | | 28 | % |
Year ended May 31, 2015 | | | 0.28 | % | | | 0.72 | % | | | 0.62 | % | | | 13.11 | % | | | 46 | % |
Year ended May 31, 2014 | | | 0.15 | % | | | 0.72 | % | | | 0.62 | % | | | 21.70 | % | | | 54 | % |
Year ended May 31, 2013 | | | 0.51 | % | | | 0.71 | % | | | 0.62 | % | | | 20.30 | % | | | 56 | % |
Year ended May 31, 2012 | | | 0.24 | % | | | 0.71 | % | | | 0.62 | % | | | 1.26 | % | | | 79 | % |
Year ended May 31, 20112,3 | | | 0.40 | % | | | 0.69 | % | | | 0.62 | % | | | 22.78 | % | | | 101 | % |
Year ended September 30, 20103 | | | 0.66 | % | | | 0.70 | % | | | 0.62 | % | | | 7.51 | % | | | 11 | % |
| | | | | |
Emerging Growth Portfolio | | | | | | | | | | | | | | | | | | | | |
Six months ended November 30, 2015 (unaudited) | | | (0.54 | )% | | | 0.80 | % | | | 0.80 | % | | | (7.70 | )% | | | 40 | % |
Year ended May 31, 2015 | | | (0.63 | )% | | | 0.80 | % | | | 0.80 | % | | | 24.02 | % | | | 56 | % |
Year ended May 31, 2014 | | | (0.62 | )% | | | 0.80 | % | | | 0.80 | % | | | 11.92 | % | | | 63 | % |
Year ended May 31, 2013 | | | (0.47 | )% | | | 0.80 | % | | | 0.80 | % | | | 20.53 | % | | | 65 | % |
Year ended May 31, 2012 | | | (0.57 | )% | | | 0.80 | % | | | 0.80 | % | | | (4.83 | )% | | | 75 | % |
Year ended May 31, 20112 | | | (0.77 | )% | | | 0.94 | % | | | 0.91 | % | | | 37.91 | % | | | 59 | % |
Year ended September 30, 2010 | | | (0.66 | )% | | | 1.02 | % | | | 0.94 | % | | | 20.49 | % | | | 97 | % |
| | | | | |
Index Portfolio | | | | | | | | | | | | | | | | | | | | |
Six months ended November 30, 2015 (unaudited) | | | 2.05 | % | | | 0.11 | % | | | 0.11 | % | | | (0.27 | )% | | | 2 | % |
Year ended May 31, 2015 | | | 1.96 | % | | | 0.11 | % | | | 0.11 | % | | | 11.69 | % | | | 4 | % |
Year ended May 31, 2014 | | | 1.99 | % | | | 0.10 | % | | | 0.10 | % | | | 20.33 | % | | | 5 | % |
Year ended May 31, 2013 | | | 2.20 | % | | | 0.09 | % | | | 0.09 | % | | | 27.22 | % | | | 4 | % |
Year ended May 31, 2012 | | | 2.09 | % | | | 0.10 | % | | | 0.10 | % | | | (0.52 | )% | | | 9 | % |
Year ended May 31, 20112 | | | 1.93 | % | | | 0.10 | % | | | 0.10 | % | | | 19.39 | % | | | 3 | % |
Year ended September 30, 2010 | | | 2.01 | % | | | 0.10 | % | | | 0.10 | % | | | 9.97 | % | | | 22 | % |
| | | | | |
International Growth Portfolio | | | | | | | | | | | | | | | | | | | | |
Six months ended November 30, 2015 (unaudited) | | | 0.06 | % | | | 0.99 | % | | | 0.99 | % | | | (8.10 | )% | | | 22 | % |
Year ended May 31, 2015 | | | 0.76 | % | | | 1.00 | % | | | 1.00 | % | | | 5.13 | % | | | 51 | % |
Year ended May 31, 2014 | | | 1.13 | % | | | 1.00 | % | | | 1.00 | % | | | 16.45 | % | | | 46 | % |
Year ended May 31, 2013 | | | 1.63 | % | | | 1.04 | % | | | 1.04 | % | | | 30.34 | % | | | 46 | % |
Year ended May 31, 2012 | | | 2.04 | % | | | 0.97 | % | | | 0.90 | % | | | (9.44 | )% | | | 69 | % |
Year ended May 31, 20112 | | | 1.62 | % | | | 1.10 | % | | | 1.10 | % | | | 14.50 | % | | | 53 | % |
Year ended September 30, 2010 | | | 0.89 | % | | | 1.42 | % | | | 1.20 | % | | | 3.25 | % | | | 89 | % |
| | | | | |
International Value Portfolio | | | | | | | | | | | | | | | | | | | | |
Six months ended November 30, 2015 (unaudited) | | | 1.50 | % | | | 0.91 | % | | | 0.91 | % | | | (9.32 | )% | | | 5 | % |
Year ended May 31, 2015 | | | 2.45 | % | | | 0.91 | % | | | 0.91 | % | | | (1.04 | )% | | | 18 | % |
Year ended May 31, 2014 | | | 3.09 | % | | | 0.91 | % | | | 0.91 | % | | | 18.22 | % | | | 11 | % |
Year ended May 31, 2013 | | | 3.04 | % | | | 0.91 | % | | | 0.91 | % | | | 29.45 | % | | | 16 | % |
Year ended May 31, 2012 | | | 3.44 | % | | | 0.91 | % | | | 0.85 | % | | | (21.07 | )% | | | 9 | % |
Year ended May 31, 20112 | | | 3.14 | % | | | 0.94 | % | | | 0.94 | % | | | 14.00 | % | | | 16 | % |
Year ended September 30, 2010 | | | 2.41 | % | | | 1.20 | % | | | 1.06 | % | | | 0.92 | % | | | 27 | % |
Please see footnotes on page 120.
The accompanying notes are an integral part of these financial statements.
| | | | |
| 120 | | Wells Fargo Equity Gateway Funds | | Financial highlights |
| | | | | | | | | | | | | | | | | | | | |
| | | Ratio to average net assets (annualized) | | | | | | Portfolio
turnover
rate | |
| | | Net investment
income (loss) | | | Gross
expenses | | | Net
expenses | | | Total
return1 | | |
| | | | | |
Large Company Value Portfolio | | | | | | | | | | | | | | | | | | | | |
Six months ended November 30, 2015 (unaudited) | | | 1.39 | % | | | 0.76 | % | | | 0.74 | % | | | (3.40 | )% | | | 30 | % |
Year ended May 31, 2015 | | | 1.09 | % | | | 0.74 | % | | | 0.74 | % | | | 7.90 | % | | | 72 | % |
Year ended May 31, 2014 | | | 0.99 | % | | | 0.73 | % | | | 0.73 | % | | | 20.26 | % | | | 62 | % |
Year ended May 31, 2013 | | | 1.49 | % | | | 0.78 | % | | | 0.74 | % | | | 28.91 | % | | | 95 | % |
Year ended May 31, 2012 | | | 1.67 | % | | | 0.77 | % | | | 0.74 | % | | | (6.06 | )% | | | 104 | % |
Year ended May 31, 20112 | | | 1.58 | % | | | 0.78 | % | | | 0.74 | % | | | 21.46 | % | | | 38 | % |
Year ended September 30, 2010 | | | 1.73 | % | | | 0.73 | % | | | 0.72 | % | | | 7.02 | % | | | 46 | % |
| | | | | |
Small Company Growth Portfolio | | | | | | | | | | | | | | | | | | | | |
Six months ended November 30, 2015 (unaudited) | | | (0.20 | )% | | | 0.80 | % | | | 0.80 | % | | | (6.99 | )% | | | 24 | % |
Year ended May 31, 2015 | | | (0.32 | )% | | | 0.82 | % | | | 0.82 | % | | | 18.07 | % | | | 58 | % |
Year ended May 31, 2014 | | | (0.37 | )% | | | 0.83 | % | | | 0.83 | % | | | 23.47 | % | | | 77 | % |
Year ended May 31, 2013 | | | (0.02 | )% | | | 0.86 | % | | | 0.86 | % | | | 31.39 | % | | | 109 | % |
Year ended May 31, 2012 | | | (0.12 | )% | | | 0.83 | % | | | 0.83 | % | | | (10.75 | )% | | | 107 | % |
Year ended May 31, 20112 | | | (0.42 | )% | | | 0.83 | % | | | 0.83 | % | | | 39.64 | % | | | 70 | % |
Year ended September 30, 2010 | | | (0.48 | )% | | | 0.87 | % | | | 0.86 | % | | | 15.25 | % | | | 129 | % |
| | | | | |
Small Company Value Portfolio | | | | | | | | | | | | | | | | | | | | |
Six months ended November 30, 2015 (unaudited) | | | 0.79 | % | | | 0.85 | % | | | 0.85 | % | | | (3.82 | )% | | | 34 | % |
Year ended May 31, 2015 | | | 0.89 | % | | | 0.84 | % | | | 0.84 | % | | | 7.29 | % | | | 54 | % |
Year ended May 31, 2014 | | | 0.89 | % | | | 0.85 | % | | | 0.85 | % | | | 18.09 | % | | | 47 | % |
Year ended May 31, 2013 | | | 0.58 | % | | | 0.85 | % | | | 0.85 | % | | | 30.76 | % | | | 57 | % |
Year ended May 31, 2012 | | | 0.69 | % | | | 0.84 | % | | | 0.84 | % | | | (7.17 | )% | | | 60 | % |
Year ended May 31, 20112 | | | 1.60 | % | | | 0.84 | % | | | 0.84 | % | | | 26.72 | % | | | 47 | % |
Year ended September 30, 2010 | | | 0.31 | % | | | 0.89 | % | | | 0.89 | % | | | 16.38 | % | | | 60 | % |
| 1 | Returns for periods of less than one year are not annualized. |
| 2 | For the eight months ended May 31, 2011. The Portfolio changed its fiscal year end from September 30 to May 31, effective May 31, 2011. |
| 3 | After the close of business on January 28, 2011, the Diversified Large Cap Growth Portfolio acquired the net assets of Wells Fargo Advantage Disciplined Growth Portfolio, Wells Fargo Advantage Large Cap Appreciation Portfolio, and Wells Fargo Advantage Large Company Growth Portfolio. Wells Fargo Advantage Large Company Growth Portfolio became the accounting and performance survivor in the transaction. The information for the periods prior to January 31, 2011 is that of the Wells Fargo Advantage Large Company Growth Portfolio. |
The accompanying notes are an integral part of these financial statements.
| | | | | | |
| Notes to financial statements (unaudited) | | Wells Fargo Equity Gateway Funds | | | 121 | |
1. ORGANIZATION
Wells Fargo Master Trust (the “Trust”), a Delaware statutory trust organized on March 10, 1999, is an open-end management investment company registered under the Investment Company Act of 1940, as amended (the “1940 Act”). As an investment company, the Trust follows the accounting and reporting guidance in Financial Accounting Standards Board (“FASB”) Accounting Standards Codification Topic 946, Financial Services – Investment Companies. These financial statements report on the following portfolios: the Wells Fargo C&B Large Cap Value Portfolio (“C&B Large Cap Value Portfolio”), the Wells Fargo Diversified Large Cap Growth Portfolio (“Diversified Large Cap Growth Portfolio”), the Wells Fargo Emerging Growth Portfolio (“Emerging Growth Portfolio”), the Wells Fargo Index Portfolio (“Index Portfolio”), the Wells Fargo International Growth Portfolio (“International Growth Portfolio”), the Wells Fargo International Value Portfolio (“International Value Portfolio”), the Wells Fargo Large Company Value Portfolio (“Large Company Value Portfolio”), the Wells Fargo Small Company Growth Portfolio (“Small Company Growth Portfolio”), and the Wells Fargo Small Company Value Portfolio (“Small Company Value Portfolio) (each, a “Portfolio”, collectively, the “Portfolios”). Each Portfolio is a diversified series of the Trust.
The Portfolios, which are master portfolios in a master/feeder structure, offer their shares to multiple feeder funds and other affiliated master portfolios rather than directly to the public.
2. SIGNIFICANT ACCOUNTING POLICIES
The following significant accounting policies, which are consistently followed in the preparation of the financial statements of each Portfolio, are in conformity with U.S. generally accepted accounting principles which require management to make estimates and assumptions that affect the reported amounts of assets and liabilities, disclosure of contingent assets and liabilities at the date of the financial statements, and the reported amounts of revenues and expenses during the reporting period. Actual results could differ from those estimates.
Securities valuation
All investments are valued each business day as of the close of regular trading on the New York Stock Exchange (generally 4 p.m. Eastern Time).
Equity securities and futures that are listed on a foreign or domestic exchange or market are valued at the official closing price or, if none, the last sales price. If no sale occurs on the primary exchange or market that day, the prior day’s price will be deemed “stale” and a fair value price will be determined in accordance with the Portfolio’s Valuation Procedures.
Equity securities that are not listed on a foreign or domestic exchange or market, but have a public trading market, are valued at the quoted bid price from an independent broker-dealer that the Management Valuation Team of Wells Fargo Funds Management, LLC (“Funds Management”) has determined is an acceptable source.
The values of securities denominated in foreign currencies are translated into U.S. dollars at rates provided by an independent foreign currency pricing source at a time each business day specified by the Management Valuation Team.
Many securities markets and exchanges outside the U.S. close prior to the close of the New York Stock Exchange and therefore may not fully reflect trading or events that occur after the close of the principal exchange in which the foreign securities are traded, but before the close of the New York Stock Exchange. If such trading or events are expected to materially affect the value of such securities, then fair value pricing procedures approved by the Board of Trustees of the Portfolios are applied. These procedures take into account multiple factors including movements in U.S. securities markets after foreign exchanges close. Foreign securities that are fair valued under these procedures are categorized as Level 2 and the application of these procedures may result in transfers between Level 1 and Level 2. Depending on market activity, such fair valuations may be frequent. Such fair value pricing may result in net asset values that are higher or lower than net asset values based on the last reported sales price or latest quoted bid price. On November 30, 2015, such fair value pricing was not used in pricing foreign securities.
Debt securities are valued at the evaluated bid price provided by an independent pricing service or, if a reliable price is not available, the quoted bid price from an independent broker-dealer.
Investments in registered open-end investment companies are valued at net asset value. Interests in non-registered investment vehicles that are redeemable at net asset value are fair valued at net asset value when available.
Investments which are not valued using any of the methods discussed above are valued at their fair value, as determined in good faith by the Board of Trustees. The Board of Trustees has established a Valuation Committee comprised of the Trustees and has delegated to it the authority to take any actions regarding the valuation of portfolio securities that the Valuation Committee deems necessary or appropriate, including determining the fair value of portfolio securities, unless
| | | | |
| 122 | | Wells Fargo Equity Gateway Funds | | Notes to financial statements (unaudited) |
the determination has been delegated to the Management Valuation Team. The Board of Trustees retains the authority to make or ratify any valuation decisions or approve any changes to the Valuation Procedures as it deems appropriate. On a quarterly basis, the Board of Trustees receives reports on any valuation actions taken by the Valuation Committee or the Management Valuation Team which may include items for ratification.
Valuations of fair valued securities are compared to the next actual sales price when available, or other appropriate market values, to assess the continued appropriateness of the fair valuation methodologies used. These securities are fair valued on a day-to-day basis, taking into consideration changes to appropriate market information and any significant changes to the inputs considered in the valuation process until there is a readily available price provided on an exchange or by an independent pricing service. Valuations received from an independent pricing service or independent broker-dealer quotes are periodically validated by comparisons to most recent trades and valuations provided by other independent pricing services in addition to the review of prices by the adviser and/or subadviser. Unobservable inputs used in determining fair valuations are identified based on the type of security, taking into consideration factors utilized by market participants in valuing the investment, knowledge about the issuer and the current market environment.
Foreign currency translation
The accounting records of the Portfolios are maintained in U.S. dollars. The value of other assets and liabilities denominated in foreign currencies are translated into U.S. dollars at rates provided by an independent foreign currency pricing source at a time each business day specified by the Management Valuation Team. Purchases and sales of securities, and income and expenses are converted at the rate of exchange on the respective dates of such transactions. Net realized foreign exchange gains or losses arise from sales of foreign currencies, currency gains or losses realized between the trade and settlement dates on securities transactions, and the difference between the amounts of dividends, interest and foreign withholding taxes recorded and the U.S. dollar equivalent of the amounts actually paid or received. Net unrealized foreign exchange gains and losses arise from changes in the fair value of assets and liabilities other than investments in securities resulting from changes in exchange rates. The changes in net assets arising from changes in exchange rates and the changes in net assets resulting from changes in market prices of securities are not separately presented. Such changes are included in net realized and unrealized gains or losses from investments.
Security loans
The Portfolios may lend their securities from time to time in order to earn additional income in the form of fees or interest on securities received as collateral or the investment of any cash received as collateral. The Portfolios continue to receive interest or dividends on the securities loaned. The Portfolios receive collateral in the form of cash or securities with a value at least equal to the value of the securities on loan. The value of the loaned securities is determined at the close of each business day and any additional required collateral is delivered to the Portfolios on the next business day. In a securities lending transaction, the net asset value of the Portfolios will be affected by an increase or decrease in the value of the securities loaned and by an increase or decrease in the value of the instrument in which collateral is invested. The amount of securities lending activity undertaken by the Portfolios fluctuate from time to time, In the event of default or bankruptcy by the borrower, the Portfolios may be prevented from recovering the loaned securities or gaining access to the collateral or may experience delays or costs in doing so. In addition, the investment of any cash collateral received may lose all or part of its value. The Portfolios have the right under the lending agreement to recover the securities from the borrower on demand.
The Portfolios lend their securities through an unaffiliated securities lending agent. Cash collateral received in connection with its securities lending transactions is invested in Securities Lending Cash Investments, LLC (the “Securities Lending Fund”). The Securities Lending Fund is exempt from registration under Section 3(c)(7) of the 1940 Act and is managed by Funds Management and is subadvised by Wells Capital Management Incorporated (“WellsCap”). Funds Management receives an advisory fee starting at 0.05% and declining to 0.01% as the average daily net assets of the Securities Lending Fund increase. All of the fees received by Funds Management are paid to WellsCap for its services as subadviser. The Securities Lending Fund seeks to provide a positive return compared to the daily Fed Funds Open rate by investing in high-quality, U.S. dollar-denominated short-term money market instruments. Securities Lending Fund investments are fair valued based upon the amortized cost valuation technique. Income earned from investment in the Securities Lending Fund is included in securities lending income on the Statements of Operations.
Futures contracts
The Portfolios are subject to interest rate risk or equity price risk in the normal course of pursuing its investment objectives. A Portfolio may buy and sell futures contracts in order to gain exposure to, or protect against, changes in security values and interest rates. The primary risks associated with the use of futures contracts are the imperfect correlation between changes in market values of securities held by the Portfolio and the prices of futures contracts, and the possibility of an illiquid market.
| | | | | | |
| Notes to financial statements (unaudited) | | Wells Fargo Equity Gateway Funds | | | 123 | |
The aggregate principal amounts of the contracts are not recorded in the financial statements. Fluctuations in the value of the contracts are recorded in the Statements of Assets and Liabilities as an asset or liability and in the Statements of Operations as unrealized gains or losses until the contracts are closed, at which point they are recorded as net realized gains or losses on futures contracts. With futures contracts, there is minimal counterparty risk to the Portfolio since futures are exchange traded and the exchange’s clearinghouse, as counterparty to all exchange traded futures, guarantees the futures against default.
Security transactions and income recognition
Securities transactions are recorded on a trade date basis. Realized gains or losses are recorded on the basis of identified cost.
Dividend income is recognized on the ex-dividend date, except for certain dividends from foreign securities which are recorded as soon as the custodian verifies the ex-dividend date.
Interest income is accrued daily and bond discounts are accreted and premiums are amortized daily based on the effective interest method. To the extent debt obligations are placed on non-accrual status, any related interest income may be reduced by writing off interest receivables when the collection of all or a portion of interest has become doubtful based on consistently applied procedures. If the issuer subsequently resumes interest payments or when the collectability of interest is reasonably assured, the debt obligation is removed from non-accrual status.
Income from foreign securities is recorded net of foreign taxes withheld where recovery of such taxes is not assured.
Federal and other taxes
Each Portfolio is treated as a separate entity for federal income tax purposes. The Portfolios are not required to pay federal income taxes on their net investment income and net capital gain as they are treated as partnerships for federal income tax purposes. All interest, dividends, gains and losses of a Portfolio are deemed to have been “passed through” to the interestholders in proportion to their holdings of the Portfolio regardless of whether such interest, dividends and gains have been distributed by the Portfolio.
Each Portfolio’s income tax returns and all financial records supporting those returns for the prior three fiscal years are subject to examination by the federal revenue authority. Management has analyzed each Portfolio’s tax positions taken on federal, state, and foreign tax returns for all open tax years and does not believe that there are any uncertain tax positions that require recognition of a tax liability.
3. FAIR VALUATION MEASUREMENTS
Fair value measurements of investments are determined within a framework that has established a fair value hierarchy based upon the various data inputs utilized in determining the value of each Portfolio’s investments. The three-level hierarchy gives the highest priority to unadjusted quoted prices in active markets for identical assets or liabilities (Level 1) and the lowest priority to significant unobservable inputs (Level 3). Each Portfolio’s investments are classified within the fair value hierarchy based on the lowest level of input that is significant to the fair value measurement. The inputs are summarized into three broad levels as follows:
| n | | Level 1 – quoted prices in active markets for identical securities |
| n | | Level 2 – other significant observable inputs (including quoted prices for similar securities, interest rates, prepayment speeds, credit risk, use of amortized cost, etc.) |
| n | | Level 3 – significant unobservable inputs (including the Portfolio’s own assumptions in determining the fair value of investments) |
The inputs or methodologies used for valuing investments in securities are not necessarily an indication of the risk associated with investing in those securities.
| | | | |
| 124 | | Wells Fargo Equity Gateway Funds | | Notes to financial statements (unaudited) |
The following is a summary of the inputs used in valuing each Portfolio’s assets and liabilities as of November 30, 2015:
| | | | | | | | | | | | | | | | |
| | | Quoted prices
(Level 1) | | | Other significant
observable inputs
(Level 2) | | | Significant
unobservable inputs (Level 3) | | | Total | |
C&B Large Cap Value Portfolio | | | | | | | | | | | | | | | | |
Assets | | | | | | | | | | | | | | | | |
Investments in: | | | | | | | | | | | | | | | | |
| | | | |
Common stocks | | | | | | | | | | | | | | | | |
Consumer discretionary | | $ | 43,570,238 | | | $ | 0 | | | $ | 0 | | | $ | 43,570,238 | |
Consumer staples | | | 27,529,378 | | | | 0 | | | | 0 | | | | 27,529,378 | |
Energy | | | 25,757,630 | | | | 0 | | | | 0 | | | | 25,757,630 | |
Financials | | | 80,695,540 | | | | 0 | | | | 0 | | | | 80,695,540 | |
Health care | | | 49,510,371 | | | | 0 | | | | 0 | | | | 49,510,371 | |
Industrials | | | 57,225,373 | | | | 0 | | | | 0 | | | | 57,225,373 | |
Information technology | | | 10,273,624 | | | | 0 | | | | 0 | | | | 10,273,624 | |
Materials | | | 11,976,129 | | | | 0 | | | | 0 | | | | 11,976,129 | |
| | | | |
Short-term investments | | | | | | | | | | | | | | | | |
Investment companies | | | 10,128,152 | | | | 4,278,750 | | | | 0 | | | | 14,406,902 | |
Total assets | | $ | 316,666,435 | | | $ | 4,278,750 | | | $ | 0 | | | $ | 320,945,185 | |
Diversified Large Cap Growth Portfolio | | | | | | | | | | | | | | | | |
Assets | | | | | | | | |
Investments in: | | | | | | | | | | | | | | | | |
| | |
Common stocks | | | | | | | | |
Consumer discretionary | | $ | 28,608,374 | | | $ | 0 | | | $ | 0 | | | $ | 28,608,374 | |
Consumer staples | | | 5,983,717 | | | | 0 | | | | 0 | | | | 5,983,717 | |
Energy | | | 1,099,377 | | | | 0 | | | | 0 | | | | 1,099,377 | |
Financials | | | 4,804,210 | | | | 0 | | | | 0 | | | | 4,804,210 | |
Health care | | | 19,153,581 | | | | 0 | | | | 0 | | | | 19,153,581 | |
Industrials | | | 9,543,122 | | | | 0 | | | | 0 | | | | 9,543,122 | |
Information technology | | | 41,703,620 | | | | 637,946 | | | | 0 | | | | 42,341,566 | |
Materials | | | 3,637,690 | | | | 0 | | | | 0 | | | | 3,637,690 | |
Telecommunication services | | | 1,444,081 | | | | 0 | | | | 0 | | | | 1,444,081 | |
| | | | |
Short-term investments | | | | | | | | | | | | | | | | |
Investment companies | | | 1,475,666 | | | | 1,326,875 | | | | 0 | | | | 2,802,541 | |
Total assets | | $ | 117,453,438 | | | $ | 1,964,821 | | | $ | 0 | | | $ | 119,418,259 | |
Emerging Growth Portfolio | | | | | | | | | | | | | | | | |
Assets | | | | | | | | |
Investments in: | | | | | | | | |
| | |
Common stocks | | | | | | | | |
Consumer discretionary | | $ | 153,846,329 | | | $ | 0 | | | $ | 0 | | | $ | 153,846,329 | |
Energy | | | 24,738,354 | | | | 0 | | | | 0 | | | | 24,738,354 | |
Financials | | | 69,190,937 | | | | 0 | | | | 0 | | | | 69,190,937 | |
Health care | | | 310,134,663 | | | | 0 | | | | 0 | | | | 310,134,663 | |
Industrials | | | 67,845,360 | | | | 0 | | | | 0 | | | | 67,845,360 | |
Information technology | | | 380,879,121 | | | | 0 | | | | 0 | | | | 380,879,121 | |
| | |
Short-term investments | | | | | | | | |
Investment companies | | | 12,067,245 | | | | 97,288,111 | | | | 0 | | | | 109,355,356 | |
Total assets | | $ | 1,018,702,009 | | | $ | 97,288,111 | | | $ | 0 | | | $ | 1,115,990,120 | |
| | | | | | |
| Notes to financial statements (unaudited) | | Wells Fargo Equity Gateway Funds | | | 125 | |
| | | | | | | | | | | | | | | | |
| | | Quoted prices
(Level 1) | | | Other significant
observable inputs
(Level 2) | | | Significant
unobservable inputs (Level 3) | | | Total | |
Index Portfolio | | | | | | | | | | | | | | | | |
Assets | | | | | | | | |
Investments in: | | | | | | | | |
| | |
Common stocks | | | | | | | | |
Consumer discretionary | | $ | 323,516,310 | | | $ | 0 | | | $ | 0 | | | $ | 323,516,310 | |
Consumer staples | | | 236,462,150 | | | | 0 | | | | 0 | | | | 236,462,150 | |
Energy | | | 174,453,010 | | | | 0 | | | | 0 | | | | 174,453,010 | |
Financials | | | 409,991,049 | | | | 0 | | | | 0 | | | | 409,991,049 | |
Health care | | | 361,254,412 | | | | 0 | | | | 0 | | | | 361,254,412 | |
Industrials | | | 250,237,198 | | | | 0 | | | | 0 | | | | 250,237,198 | |
Information technology | | | 517,481,505 | | | | 0 | | | | 0 | | | | 517,481,505 | |
Materials | | | 70,714,141 | | | | 0 | | | | 0 | | | | 70,714,141 | |
Telecommunication services | | | 57,663,208 | | | | 0 | | | | 0 | | | | 57,663,208 | |
Utilities | | | 70,777,421 | | | | 0 | | | | 0 | | | | 70,777,421 | |
| | |
Short-term investments | | | | | | | | |
Investment companies | | | 30,518,256 | | | | 13,080,495 | | | | 0 | | | | 43,598,751 | |
U.S. Treasury Securities | | | 1,696,510 | | | | 0 | | | | 0 | | | | 1,696,510 | |
Total assets | | $ | 2,504,765,170 | | | $ | 13,080,495 | | | $ | 0 | | | $ | 2,517,845,665 | |
Liabilities | | | | | | | | | | | | | | | | |
| | | | |
Futures contracts | | $ | 181,800 | | | $ | 0 | | | $ | 0 | | | $ | 181,800 | |
Total liabilities | | $ | 181,800 | | | $ | 0 | | | $ | 0 | | | $ | 181,800 | |
International Growth Portfolio | | | | | | | | | | | | | | | | |
Assets | | | | | | | | | | | | | | | | |
Investments in: | | | | | | | | | | | | | | | | |
| | | | |
Common stocks | | | | | | | | | | | | | | | | |
Belgium | | $ | 5,493,130 | | | $ | 0 | | | $ | 0 | | | $ | 5,493,130 | |
China | | | 13,196,300 | | | | 0 | | | | 0 | | | | 13,196,300 | |
France | | | 8,665,712 | | | | 0 | | | | 0 | | | | 8,665,712 | |
Germany | | | 17,651,058 | | | | 0 | | | | 0 | | | | 17,651,058 | |
Hong Kong | | | 5,850,794 | | | | 0 | | | | 0 | | | | 5,850,794 | |
India | | | 3,243,371 | | | | 0 | | | | 0 | | | | 3,243,371 | |
Ireland | | | 9,440,422 | | | | 0 | | | | 0 | | | | 9,440,422 | |
Italy | | | 1,006,582 | | | | 0 | | | | 0 | | | | 1,006,582 | |
Japan | | | 14,520,381 | | | | 0 | | | | 0 | | | | 14,520,381 | |
Mexico | | | 3,037,027 | | | | 0 | | | | 0 | | | | 3,037,027 | |
Netherlands | | | 3,558,309 | | | | 0 | | | | 0 | | | | 3,558,309 | |
South Korea | | | 17,735 | | | | 0 | | | | 0 | | | | 17,735 | |
Spain | | | 2,312,466 | | | | 0 | | | | 0 | | | | 2,312,466 | |
Sweden | | | 3,370,259 | | | | 0 | | | | 0 | | | | 3,370,259 | |
Switzerland | | | 19,277,002 | | | | 0 | | | | 0 | | | | 19,277,002 | |
United Kingdom | | | 32,008,727 | | | | 0 | | | | 0 | | | | 32,008,727 | |
United States | | | 5,374,777 | | | | 0 | | | | 0 | | | | 5,374,777 | |
| | | | |
Participation Notes | | | | | | | | | | | | | | | | |
Ireland | | | 0 | | | | 1,864,418 | | | | 0 | | | | 1,864,418 | |
| | | | |
Preferred stocks | | | | | | | | | | | | | | | | |
Germany | | | 1,387,596 | | | | 0 | | | | 0 | | | | 1,387,596 | |
| | | | |
Short-term investments | | | | | | | | | | | | | | | | |
Investment companies | | | 4,324,287 | | | | 1,302,812 | | | | 0 | | | | 5,627,099 | |
Total assets | | $ | 153,735,935 | | | $ | 3,167,230 | | | $ | 0 | | | $ | 156,903,165 | |
| | | | |
| 126 | | Wells Fargo Equity Gateway Funds | | Notes to financial statements (unaudited) |
| | | | | | | | | | | | | | | | |
| | | Quoted prices
(Level 1) | | | Other significant
observable inputs
(Level 2) | | | Significant
unobservable inputs (Level 3) | | | Total | |
International Value Portfolio | | | | | | | | | | | | | | | | |
Assets | | | | | | | | |
Investments in: | | | | | | | | |
| | | | |
Common stocks | | | | | | | | | | | | | | | | |
Australia | | $ | 25,081,068 | | | $ | 0 | | | $ | 0 | | | $ | 25,081,068 | |
Austria | | | 5,294,819 | | | | 0 | | | | 0 | | | | 5,294,819 | |
Belgium | | | 3,947,589 | | | | 0 | | | | 0 | | | | 3,947,589 | |
Brazil | | | 5,433,340 | | | | 0 | | | | 0 | | | | 5,433,340 | |
Canada | | | 10,488,921 | | | | 0 | | | | 0 | | | | 10,488,921 | |
Cayman Islands | | | 3,146,128 | | | | 0 | | | | 0 | | | | 3,146,128 | |
China | | | 13,315,375 | | | | 0 | | | | 0 | | | | 13,315,375 | |
Czech Republic | | | 1,044,660 | | | | 0 | | | | 0 | | | | 1,044,660 | |
Denmark | | | 1,410,994 | | | | 0 | | | | 0 | | | | 1,410,994 | |
Finland | | | 2,109,273 | | | | 0 | | | | 0 | | | | 2,109,273 | |
France | | | 44,731,440 | | | | 0 | | | | 0 | | | | 44,731,440 | |
Germany | | | 42,741,504 | | | | 235 | | | | 0 | | | | 42,741,739 | |
Hong Kong | | | 7,949,302 | | | | 0 | | | | 0 | | | | 7,949,302 | |
Hungary | | | 1,134,183 | | | | 0 | | | | 0 | | | | 1,134,183 | |
India | | | 4,419,465 | | | | 0 | | | | 0 | | | | 4,419,465 | |
Ireland | | | 4,487,982 | | | | 0 | | | | 0 | | | | 4,487,982 | |
Israel | | | 5,955,430 | | | | 0 | | | | 0 | | | | 5,955,430 | |
Italy | | | 6,148,399 | | | | 0 | | | | 0 | | | | 6,148,399 | |
Japan | | | 109,778,390 | | | | 0 | | | | 0 | | | | 109,778,390 | |
Liechtenstein | | | 522,358 | | | | 0 | | | | 0 | | | | 522,358 | |
Netherlands | | | 11,035,790 | | | | 0 | | | | 0 | | | | 11,035,790 | |
Norway | | | 6,520,237 | | | | 0 | | | | 0 | | | | 6,520,237 | |
Poland | | | 2,097,767 | | | | 0 | | | | 0 | | | | 2,097,767 | |
Russia | | | 4,002,237 | | | | 0 | | | | 0 | | | | 4,002,237 | |
Singapore | | | 4,208,691 | | | | 0 | | | | 0 | | | | 4,208,691 | |
South Africa | | | 2,201,554 | | | | 0 | | | | 0 | | | | 2,201,554 | |
South Korea | | | 13,924,876 | | | | 0 | | | | 0 | | | | 13,924,876 | |
Spain | | | 5,117,334 | | | | 0 | | | | 0 | | | | 5,117,334 | |
Sweden | | | 11,629,864 | | | | 0 | | | | 0 | | | | 11,629,864 | |
Switzerland | | | 26,330,486 | | | | 0 | | | | 0 | | | | 26,330,486 | |
Taiwan | | | 3,816,188 | | | | 0 | | | | 0 | | | | 3,816,188 | |
Thailand | | | 3,579,440 | | | | 0 | | | | 0 | | | | 3,579,440 | |
United Kingdom | | | 87,143,954 | | | | 478,992 | | | | 0 | | | | 87,622,946 | |
| | | | |
Rights | | | | | | | | | | | | | | | | |
United Kingdom | | | 99,071 | | | | 0 | | | | 0 | | | | 99,071 | |
| | | | |
Preferred stocks | | | | | | | | | | | | | | | | |
Brazil | | | 678,775 | | | | 0 | | | | 0 | | | | 678,775 | |
| | | | |
Short-term investments | | | | | | | | | | | | | | | | |
Investment companies | | | 3,910,661 | | | | 15,597,666 | | | | 0 | | | | 19,508,327 | |
Total assets | | $ | 485,437,545 | | | $ | 16,076,893 | | | $ | 0 | | | $ | 501,514,438 | |
| | | | | | |
| Notes to financial statements (unaudited) | | Wells Fargo Equity Gateway Funds | | | 127 | |
| | | | | | | | | | | | | | | | |
| | | Quoted prices
(Level 1) | | | Other significant
observable inputs
(Level 2) | | | Significant
unobservable inputs (Level 3) | | | Total | |
Large Company Value Portfolio | | | | | | | | | | | | | | | | |
Assets | | | | | | | | |
Investments in: | | | | | | | | |
| | | | |
Common stocks | | | | | | | | | | | | | | | | |
Consumer discretionary | | $ | 5,813,803 | | | $ | 0 | | | $ | 0 | | | $ | 5,813,803 | |
Consumer staples | | | 4,825,638 | | | | 0 | | | | 0 | | | | 4,825,638 | |
Energy | | | 9,131,870 | | | | 0 | | | | 0 | | | | 9,131,870 | |
Financials | | | 22,668,089 | | | | 0 | | | | 0 | | | | 22,668,089 | |
Health care | | | 10,170,726 | | | | 0 | | | | 0 | | | | 10,170,726 | |
Industrials | | | 9,373,708 | | | | 0 | | | | 0 | | | | 9,373,708 | |
Information technology | | | 8,477,705 | | | | 0 | | | | 0 | | | | 8,477,705 | |
Materials | | | 2,602,907 | | | | 0 | | | | 0 | | | | 2,602,907 | |
Telecommunication services | | | 1,557,075 | | | | 0 | | | | 0 | | | | 1,557,075 | |
Utilities | | | 2,904,905 | | | | 0 | | | | 0 | | | | 2,904,905 | |
| | | | |
Short-term investments | | | | | | | | | | | | | | | | |
Investment companies | | | 1,477,801 | | | | 3,413,200 | | | | 0 | | | | 4,891,001 | |
Total assets | | $ | 79,004,227 | | | $ | 3,413,200 | | | $ | 0 | | | $ | 82,417,427 | |
Small Company Growth Portfolio | | | | | | | | | | | | | | | | |
Assets | | | | | | | | |
Investments in: | | | | | | | | |
| | | | |
Common stocks | | | | | | | | | | | | | | | | |
Consumer discretionary | | $ | 167,050,255 | | | $ | 0 | | | $ | 0 | | | $ | 167,050,255 | |
Consumer staples | | | 16,400,031 | | | | 0 | | | | 0 | | | | 16,400,031 | |
Energy | | | 25,570,815 | | | | 0 | | | | 0 | | | | 25,570,815 | |
Financials | | | 130,877,996 | | | | 0 | | | | 0 | | | | 130,877,996 | |
Health care | | | 259,699,136 | | | | 0 | | | | 0 | | | | 259,699,136 | |
Industrials | | | 173,421,338 | | | | 0 | | | | 0 | | | | 173,421,338 | |
Information technology | | | 284,626,901 | | | | 0 | | | | 0 | | | | 284,626,901 | |
Materials | | | 35,041,996 | | | | 0 | | | | 0 | | | | 35,041,996 | |
Utilities | | | 3,718,239 | | | | 0 | | | | 0 | | | | 3,718,239 | |
| | | | |
Short-term investments | | | | | | | | | | | | | | | | |
Investment companies | | | 57,304,768 | | | | 118,989,418 | | | | 0 | | | | 176,294,186 | |
Total assets | | $ | 1,153,711,475 | | | $ | 118,989,418 | | | $ | 0 | | | $ | 1,272,700,893 | |
Small Company Value Portfolio | | | | | | | | | | | | | | | | |
Assets | | | | | | | | |
Investments in: | | | | | | | | |
| | |
Common stocks | | | | | | | | |
Consumer discretionary | | $ | 24,129,704 | | | $ | 0 | | | $ | 0 | | | $ | 24,129,704 | |
Consumer staples | | | 3,374,747 | | | | 0 | | | | 0 | | | | 3,374,747 | |
Energy | | | 11,242,207 | | | | 0 | | | | 0 | | | | 11,242,207 | |
Financials | | | 84,797,439 | | | | 0 | | | | 0 | | | | 84,797,439 | |
Health care | | | 12,104,882 | | | | 0 | | | | 0 | | | | 12,104,882 | |
Industrials | | | 16,122,953 | | | | 0 | | | | 0 | | | | 16,122,953 | |
Information technology | | | 26,088,951 | | | | 0 | | | | 0 | | | | 26,088,951 | |
Materials | | | 10,694,939 | | | | 0 | | | | 0 | | | | 10,694,939 | |
Utilities | | | 9,919,714 | | | | 0 | | | | 0 | | | | 9,919,714 | |
| | |
Warrants | | | | | | | | |
Health care | | | 0 | | | | 2 | | | | 0 | | | | 2 | |
| | |
Short-term investments | | | | | | | | |
Investment companies | | | 7,987,779 | | | | 4,795,850 | | | | 0 | | | | 12,783,629 | |
Total assets | | $ | 206,463,315 | | | $ | 4,795,852 | | | $ | 0 | | | $ | 211,259,167 | |
| | | | |
| 128 | | Wells Fargo Equity Gateway Funds | | Notes to financial statements (unaudited) |
Futures contracts are reported at their variation margin at measurement date, which represents the amount due from the Index Portfolio at that date. All other assets and liabilities are reported at their market value at measurement date.
The Portfolios recognize transfers between levels within the fair value hierarchy at the end of the reporting period. At November 30, 2015, the Portfolios did not have any transfers into/out of Level 1, Level 2, or Level 3.
4. TRANSACTIONS WITH AFFILIATES AND OTHER EXPENSES
Advisory fee
The Trust has entered into an advisory contract with Funds Management, an indirect wholly owned subsidiary of Wells Fargo & Company (“Wells Fargo”). The adviser is responsible for implementing investment policies and guidelines and for supervising the subadvisers, who are responsible for day-to-day portfolio management of the Portfolios. Pursuant to the contract, Funds Management is entitled to receive an annual advisory fee which is calculated based on the average daily net assets of each Portfolio.
Funds Management has retained the services of certain subadvisers to provide daily portfolio management for the Portfolios. Funds Management has engaged WellsCap (an affiliate of Funds Management and an indirect wholly owned subsidiary of Wells Fargo), Peregrine Capital Management, Inc. (an affiliate of Funds Management and a direct wholly owned subsidiary of Wells Fargo), Artisan Partners Limited Partnership, Cooke & Bieler, L.P., Golden Capital Management, LLC (an affiliate of Funds Management), LSV Asset Management and Phocas Financial Corporation as subadvisers.
The fees for subadvisory services are borne by Funds Management. The subadvisers are each entitled to receive from Funds Management an annual subadvisory fee which is calculated based on the average daily net assets of each Portfolio.
The annual advisory and subadvisory fee rates for each Portfolio are as follows:
| | | | | | | | | | | | | | | | | | | | |
| | | Advisory fee | | | Effective rate for the
six months ended November 30, 2015 | | | Subadviser | | Subadvisory fee | |
| | | starting at | | | declining to | | | | | starting at | | declining to | |
C&B Large Cap Value Portfolio | | | 0.65 | % | | | 0.475 | % | | | 0.65 | % | | Cooke & Bieler, L.P. | | 0.38% | | | 0.30 | % |
Diversified Large Cap Growth Portfolio | | | 0.65 | | | | 0.475 | | | | 0.65 | | | WellsCap | | 0.30 | | | 0.20 | |
Emerging Growth Portfolio | | | 0.80 | | | | 0.68 | | | | 0.78 | | | WellsCap | | 0.55 | | | 0.40 | |
Index Portfolio | | | 0.10 | | | | 0.05 | | | | 0.08 | | | Golden Capital Management, LLC | | 0.05 | | | 0.02 | |
International Growth Portfolio | | | 0.85 | | | | 0.70 | | | | 0.85 | | | Artisan Partners Limited Partnership | | 0.80 | | | 0.50 | |
International Value Portfolio | | | 0.85 | | | | 0.70 | | | | 0.85 | | | LSV Asset Management | | 0.35 | | | 0.30 | |
Large Company Value Portfolio | | | 0.65 | | | | 0.475 | | | | 0.65 | | | Phocas Financial Corporation | | 0.29 | | | 0.20 | |
Small Company Growth Portfolio | | | 0.80 | | | | 0.68 | | | | 0.79 | | | Peregrine Capital Management, Inc. | | 0.50 | | | 0.45 | |
Small Company Value Portfolio | | | 0.80 | | | | 0.68 | | | | 0.80 | | | Peregrine Capital Management, Inc. | | 0.45 | | | 0.40 | |
Funds Management has voluntarily waived and/or reimbursed advisory fees to the extent necessary to maintain certain net operating expense ratios for the Portfolios.
| | | | | | |
| Notes to financial statements (unaudited) | | Wells Fargo Equity Gateway Funds | | | 129 | |
5. INVESTMENT PORTFOLIO TRANSACTIONS
Purchases and sales of investments, excluding short-term securities, for the six months ended November 30, 2015 were as follows:
| | | | | | | | |
| | | Purchases at cost | | | Sales proceeds | |
C&B Large Cap Value Portfolio | | $ | 57,405,351 | | | $ | 62,971,984 | |
Diversified Large Cap Growth Portfolio | | | 32,564,848 | | | | 38,940,011 | |
Emerging Growth Portfolio | | | 426,627,598 | | | | 463,548,625 | |
Index Portfolio | | | 51,565,968 | | | | 219,216,738 | |
International Growth Portfolio | | | 41,302,536 | | | | 33,178,491 | |
International Value Portfolio | | | 42,162,582 | | | | 25,390,877 | |
Large Company Value Portfolio | | | 23,533,763 | | | | 23,142,265 | |
Small Company Growth Portfolio | | | 696,517,890 | | | | 220,797,193 | |
Small Company Value Portfolio | | | 67,171,241 | | | | 67,655,397 | |
6. DERIVATIVE TRANSACTIONS
During the six months ended November 30, 2015, Index Portfolio used uninvested cash to enter into futures contracts to gain market exposure.
At November 30, 2015, Index Portfolio had long futures contracts outstanding as follows:
| | | | | | | | | | | | | | | | | | |
| Expiration date | | Counterparty | | Contracts | | | Type | | | Contract value at
November 30, 2015 | | | Unrealized
gains | |
| 12-17-2015 | | Societe Generale | | | 72 Long | | | | S&P 500 Index | | | $ | 37,436,400 | | | $ | 168,015 | |
Index Portfolio had an average notional amount of $28,358,824 in long futures contracts outstanding during the six months ended November 30, 2015.
The payable for daily variation margin on open futures contracts reflected in the Statements of Assets and Liabilities only represents the current day’s variation margin. The realized gains or losses and change in unrealized gains or losses on derivative instruments are reflected in the Statements of Operations.
For certain types of derivative transactions, Index Portfolio has entered into International Swaps and Derivatives Association, Inc. master agreements (“ISDA Master Agreements”) or similar agreements with approved counterparties. The ISDA Master Agreements or similar agreements may have requirements to deliver/deposit securities or cash to/with an exchange or broker-dealer as collateral and allows the Portfolio to offset, with each counterparty, certain derivative financial instrument’s assets and/or liabilities with collateral held or pledged. Collateral requirements differ by type of derivative. Collateral or margin requirements are set by the broker or exchange clearing house for exchange traded derivatives while collateral terms are contract specific for over-the-counter traded derivatives. Cash collateral that has been pledged to cover obligations of the Portfolio under ISDA Master Agreements or similar agreements, if any, are reported separately in the Statements of Assets and Liabilities. Securities pledged as collateral, if any, are noted in the Summary Portfolio of Investments. With respect to balance sheet offsetting, absent an event of default by the counterparty or a termination of the agreement, the reported amounts of financial assets and financial liabilities in the Statements of Assets and Liabilities are not offset across transactions between the Portfolio and the applicable counterparty. A reconciliation of the gross amounts on the Statements of Assets and Liabilities to the net amounts by derivative type, including any collateral exposure, is as follows:
| | | | | | | | | | | | | | | | | | | | |
| | | Derivative type | | Counterparty | | Gross amounts
of liabilities in the
Statements of
Assets and
Liabilities | | | Amounts
subject to
netting
agreements | | | Collateral
pledged1 | | | Net amount
of liabilities | |
Index Portfolio | | Futures – variation margin | | Societe Generale | | $ | 181,800 | | | $ | 0 | | | $ | (181,800 | ) | | $ | 0 | |
| | 1 | Collateral pledged within this table is limited to the collateral for the net transaction with the counterparty. | |
| | | | |
| 130 | | Wells Fargo Equity Gateway Funds | | Notes to financial statements (unaudited) |
7. CONCENTRATION RISK
Concentration risks result from exposure to a limited number of sectors. Portfolios that invest a substantial portion of their assets in a sector may be more affected by changes in that sector than would be a portfolio whose investments are not heavily weighted in any sector. The Portfolio of Investments or Summary Portfolio of Investments include information on each Portfolio’s holdings, including sector composition, country and/or geographical composition as relevant.
8. INDEMNIFICATION
Under the Trust’s organizational documents, the officers and Trustees have been granted certain indemnification rights against certain liabilities that may arise out of performance of their duties to the Trust. Additionally, in the normal course of business, the Trust may enter into contracts with service providers that contain a variety of indemnification clauses. The Trust’s maximum exposure under these arrangements is dependent on future claims that may be made against the Portfolios and, therefore, cannot be estimated.
| | | | | | |
| Other information (unaudited) | | Wells Fargo Equity Gateway Funds | | | 131 | |
TAX INFORMATION
Pursuant to Section 853 of the Internal Revenue Code, the following amount was designated as foreign taxes paid for the fiscal year ended May 31, 2015. This amount may be less than the actual foreign taxes paid for financial statement purposes. Foreign taxes paid or withheld should be included in taxable income with an offsetting deduction from gross income or as a credit for taxes paid to foreign governments. None of the income was derived from ineligible foreign sources as defined under Section 901(j) of the Internal Revenue Code.
| | | | | | | | | | | | |
| | | Creditable
foreign taxes paid | | | Per share amount | | | Foreign income as % of
ordinary income
distributions | |
International Value Fund | | $ | 561,606 | | | $ | 0.0166 | | | | 100.00 | % |
PROXY VOTING INFORMATION
A description of the policies and procedures used to determine how to vote proxies relating to portfolio securities is available without charge, upon request, by calling 1-800-222-8222, visiting our website at wellsfargofunds.com, or visiting the SEC website at sec.gov. Information regarding how the proxies related to portfolio securities were voted during the most recent 12-month period ended June 30 is available on the website at wellsfargofunds.com or by visiting the SEC website at sec.gov.
PORTFOLIO HOLDINGS INFORMATION
The complete portfolio holdings are publicly available on the website (wellsfargofunds.com) on a one-month delayed basis. In addition, top ten holdings information (excluding derivative positions) is publicly available on the website on a monthly, seven-day or more delayed basis. Each Fund and Portfolio files its complete schedule of portfolio holdings with the SEC for the first and third quarters of each fiscal year on Form N-Q, which is available by visiting the SEC website at sec.gov. In addition, each Form N-Q may be reviewed and copied at the SEC’s Public Reference Room in Washington, DC, and at regional offices in New York City, at 233 Broadway, and in Chicago, at 175 West Jackson Boulevard, Suite 900. Information about the Public Reference Room may be obtained by calling 1-800-SEC-0330.
| | | | |
| 132 | | Wells Fargo Equity Gateway Funds | | Other information (unaudited) |
BOARD OF TRUSTEES AND OFFICERS
Each of the Trustees and Officers1 listed in the table below acts in identical capacities for each fund in the Wells Fargo family of funds, which consists of 144 mutual funds comprising the Wells Fargo Funds Trust, Wells Fargo Variable Trust, Wells Fargo Master Trust and four closed-end funds (collectively the “Fund Complex”). This table should be read in conjunction with the Prospectus and the Statement of Additional Information2. The mailing address of each Trustee and Officer is 525 Market Street, 12th Floor, San Francisco, CA 94105. Each Trustee and Officer serves an indefinite term, however, each Trustee serves such term until reaching the mandatory retirement age established by the Trustees.
Independent Trustees
| | | | | | |
Name and year of birth | | Position held and length of service* | | Principal occupations during past five years or longer | | Current other
public company or
investment company
directorships |
William R. Ebsworth (Born 1957) | | Trustee, since 2015 | | Retired. From 1984 to 2013, equities analyst, portfolio manager, research director at Fidelity Management and Research Company in Boston, Tokyo, and Hong Kong and retired in 2013 as Chief Investment Officer of Fidelity Strategic Advisers, Inc. where he lead a team of investment professionals managing client assets. Prior thereto, Board member of Hong Kong Securities Clearing Co., Hong Kong Options Clearing Corp., the Thailand International Fund, Ltd., Fidelity Investments Life Insurance Company, and Empire Fidelity Investments Life Insurance Company. Mr. Ebsworth is a CFA ® charterholder and an Adjunct Lecturer, Finance, at Babson College. | | Asset Allocation Trust |
Jane A. Freeman (Born 1953) | | Trustee, since 2015 | | Retired. From 2012 to 2014 and 1999 to 2008, Chief Financial Officer of Scientific Learning Corporation. From 2008 to 2012, Ms. Freeman provided consulting services related to strategic business projects. Prior to 1999, Portfolio Manager at Rockefeller & Co. and Scudder, Stevens & Clark. Board member of the Harding Loevner Funds from 1996 to 2014, serving as both Lead Independent Director and chair of the Audit Committee. Board member of the Russell Exchange Traded Funds Trust from 2011 to 2012 and the chair of the Audit Committee. Ms. Freeman is Chair of Taproot Foundation (non-profit organization), a Board Member of Ruth Bancroft Garden (non-profit organization) and an inactive chartered financial analyst. | | Asset Allocation Trust |
| Peter G. Gordon (Born 1942) | | Trustee, since 1998; Chairman, since 2005 | | Co-Founder, Retired Chairman, President and CEO of Crystal Geyser Water Company. Trustee Emeritus, Colby College. | | Asset Allocation Trust |
| Isaiah Harris, Jr. (Born 1952) | | Trustee, since 2009 | | Retired. Chairman of the Board of CIGNA Corporation since 2009, and Director since 2005. From 2003 to 2011, Director of Deluxe Corporation. Prior thereto, President and CEO of BellSouth Advertising and Publishing Corp. from 2005 to 2007, President and CEO of BellSouth Enterprises from 2004 to 2005 and President of BellSouth Consumer Services from 2000 to 2003. Emeritus member of the Iowa State University Foundation Board of Governors. Emeritus Member of the Advisory Board of Iowa State University School of Business. Advisory Board Member, Palm Harbor Academy (charter school). Mr. Harris is a certified public accountant. | | CIGNA Corporation; Asset Allocation Trust |
| Judith M. Johnson (Born 1949) | | Trustee, since 2008; Audit Committee Chairman, since 2008 | | Retired. Prior thereto, Chief Executive Officer and Chief Investment Officer of Minneapolis Employees Retirement Fund from 1996 to 2008. Ms. Johnson is an attorney, certified public accountant and a certified managerial accountant. | | Asset Allocation Trust |
| David F. Larcker (Born 1950) | | Trustee, since 2009 | | James Irvin Miller Professor of Accounting at the Graduate School of Business, Stanford University, Morgan Stanley Director of the Center for Leadership Development and Research and Senior Faculty of The Rock Center for Corporate Governance since 2006. From 2005 to 2008, Professor of Accounting at the Graduate School of Business, Stanford University. Prior thereto, Ernst & Young Professor of Accounting at The Wharton School, University of Pennsylvania from 1985 to 2005. | | Asset Allocation Trust |
| | | | | | |
| Other information (unaudited) | | Wells Fargo Equity Gateway Funds | | | 133 | |
| | | | | | |
Name and year of birth | | Position held and length of service* | | Principal occupations during past five years or longer | | Current other
public company or
investment company
directorships |
| Olivia S. Mitchell (Born 1953) | | Trustee, since 2006 | | International Foundation of Employee Benefit Plans Professor, Wharton School of the University of Pennsylvania since 1993. Director of Wharton’s Pension Research Council and Boettner Center on Pensions & Retirement Research, and Research Associate at the National Bureau of Economic Research. Previously, Cornell University Professor from 1978 to 1993. | | Asset Allocation Trust |
| Timothy J. Penny (Born 1951) | | Trustee, since 1996 | | President and Chief Executive Officer of Southern Minnesota Initiative Foundation, a non-profit organization, since 2007 and Senior Fellow at the Humphrey Institute Policy Forum at the University of Minnesota since 1995. Member of the Board of Trustees of NorthStar Education Finance, Inc., a non-profit organization, since 2007. | | Asset Allocation Trust |
Michael S. Scofield
(Born 1943) | | Trustee, since 2010 | | Served on the Investment Company Institute’s Board of Governors and Executive Committee from 2008-2011 as well the Governing Council of the Independent Directors Council from 2006-2011 and the Independent Directors Council Executive Committee from 2008-2011. Chairman of the IDC from 2008-2010. Institutional Investor (Fund Directions) Trustee of Year in 2007. Trustee of the Evergreen Funds complex (and its predecessors) from 1984 to 2010. Chairman of the Evergreen Funds from 2000-2010. Former Trustee of the Mentor Funds. Retired Attorney, Law Offices of Michael S. Scofield. | | Asset Allocation Trust |
Donald C. Willeke
(Born 1940) | | Trustee, since 1996** | | Principal of the law firm of Willeke & Daniels. General Counsel of the Minneapolis Employees Retirement Fund from 1984 until its consolidation into the Minnesota Public Employees Retirement Association on June 30, 2010. Director and Vice Chair of The Tree Trust (non-profit corporation). Director of the American Chestnut Foundation (non-profit corporation). | | Asset Allocation Trust |
| * | Length of service dates reflect the Trustee’s commencement of service with the Trust’s predecessor entities, where applicable. |
| ** | Donald Willeke retired as a Trustee effective December 31, 2015. |
Officers
| | | | | | |
Name and
year of birth | | Position held and
length of service | | Principal occupations during past five years or longer | | |
Karla M. Rabusch
(Born 1959) | | President, since 2003 | | Executive Vice President of Wells Fargo Bank, N.A. and President of Wells Fargo Funds Management, LLC since 2003. | | |
Nancy Wiser1
(Born 1967) | | Treasurer, since 2012 | | Executive Vice President of Wells Fargo Funds Management, LLC since 2011. Chief Operating Officer and Chief Compliance Officer at LightBox Capital Management LLC, from 2008 to 2011. | | |
C. David Messman
(Born 1960) | | Secretary, since 2000; Chief Legal Officer, since 2003 | | Senior Vice President and Secretary of Wells Fargo Funds Management, LLC since 2001. Assistant General Counsel of Wells Fargo Bank, N.A. since 2013 and Vice President and Managing Counsel of Wells Fargo Bank N.A. from 1996 to 2013. | | |
Debra Ann Early
(Born 1964) | | Chief Compliance Officer, since 2007 | | Executive Vice President of Wells Fargo Funds Management, LLC since 2014, Senior Vice President and Chief Compliance Officer from 2007 to 2014. | | |
David Berardi
(Born 1975) | | Assistant Treasurer, since 2009 | | Vice President of Wells Fargo Funds Management, LLC since 2009. Vice President of Evergreen Investment Management Company, LLC from 2008 to 2010. Manager of Fund Reporting and Control for Evergreen Investment Management Company, LLC from 2004 to 2010. | | |
Jeremy DePalma1
(Born 1974) | | Treasurer, since 2012; Assistant Treasurer, since 2009 | | Senior Vice President of Wells Fargo Funds Management, LLC since 2009. Senior Vice President of Evergreen Investment Management Company, LLC from 2008 to 2010 and head of the Fund Reporting and Control Team within Fund Administration from 2005 to 2010. | | |
| 1 | Jeremy DePalma acts as Treasurer of International Value Fund, International Growth Portfolio and International Value Portfolio and Assistant Treasurer of the remaining funds in this shareholder report. In addition, Jeremy DePalma acts as Treasurer of 69 other funds and the Assistant Treasurer of 59 other funds in the Fund Complex. Nancy Wiser serves a Treasurer of the remaining funds in this shareholder report as well as 59 other funds in the Fund Complex. |
| 2 | The Statement of Additional Information includes additional information about the Trustees and is available, without charge, upon request, by calling
1-800-222-8222 or by visiting the website at wellsfargofunds.com. |
| | | | |
| 134 | | Wells Fargo Equity Gateway Funds | | List of abbreviations |
The following is a list of common abbreviations for terms and entities that may have appeared in this report.
| ACA | — ACA Financial Guaranty Corporation |
| ADR | — American depositary receipt |
| ADS | — American depositary shares |
| AGC | — Assured Guaranty Corporation |
| AGM | — Assured Guaranty Municipal |
| Ambac | — Ambac Financial Group Incorporated |
| AMT | — Alternative minimum tax |
| BAN | — Bond anticipation notes |
| BHAC | — Berkshire Hathaway Assurance Corporation |
| CAB | — Capital appreciation bond |
| CCAB | — Convertible capital appreciation bond |
| CDA | — Community Development Authority |
| CDO | — Collateralized debt obligation |
| DRIVER | — Derivative inverse tax-exempt receipts |
| DW&P | — Department of Water & Power |
| DWR | — Department of Water Resources |
| ECFA | — Educational & Cultural Facilities Authority |
| EDA | — Economic Development Authority |
| EDFA | — Economic Development Finance Authority |
| ETF | — Exchange-traded fund |
| FDIC | — Federal Deposit Insurance Corporation |
| FFCB | — Federal Farm Credit Banks |
| FGIC | — Financial Guaranty Insurance Corporation |
| FHA | — Federal Housing Administration |
| FHLB | — Federal Home Loan Bank |
| FHLMC | — Federal Home Loan Mortgage Corporation |
| FICO | — The Financing Corporation |
| FNMA | — Federal National Mortgage Association |
| GDR | — Global depositary receipt |
| GNMA | — Government National Mortgage Association |
| HCFR | — Healthcare facilities revenue |
| HEFA | — Health & Educational Facilities Authority |
| HEFAR | — Higher education facilities authority revenue |
| HFA | — Housing Finance Authority |
| HFFA | — Health Facilities Financing Authority |
| HUD | — Department of Housing and Urban Development |
| IDA | — Industrial Development Authority |
| IDAG | — Industrial Development Agency |
| KRW | — Republic of Korea won |
| LIBOR | — London Interbank Offered Rate |
| LIFER | — Long Inverse Floating Exempt Receipts |
| LLC | — Limited liability company |
| LLLP | — Limited liability limited partnership |
| LLP | — Limited liability partnership |
| MBIA | — Municipal Bond Insurance Association |
| MFHR | — Multifamily housing revenue |
| MSTR | — Municipal securities trust receipts |
| MUD | — Municipal Utility District |
| National | — National Public Finance Guarantee Corporation |
| PCFA | — Pollution Control Financing Authority |
| PCL | — Public Company Limited |
| PCR | — Pollution control revenue |
| PFA | — Public Finance Authority |
| PFFA | — Public Facilities Financing Authority |
| PFOTER | — Puttable floating option tax-exempt receipts |
| plc | — Public limited company |
| PUTTER | — Puttable tax-exempt receipts |
| R&D | — Research & development |
| Radian | — Radian Asset Assurance |
| RAN | — Revenue anticipation notes |
| RDA | — Redevelopment Authority |
| RDFA | — Redevelopment Finance Authority |
| REIT | — Real estate investment trust |
| ROC | — Reset option certificates |
| SAVRS | — Select auction variable rate securities |
| SBA | — Small Business Authority |
| SDR | — Swedish depositary receipt |
| SFHR | — Single-family housing revenue |
| SFMR | — Single-family mortgage revenue |
| SPA | — Standby purchase agreement |
| SPDR | — Standard & Poor’s Depositary Receipts |
| SPEAR | — Short Puttable Exempt Adjustable Receipts |
| STRIPS | — Separate trading of registered interest and |
| TAN | — Tax anticipation notes |
| TIPS | — Treasury inflation-protected securities |
| TRAN | — Tax revenue anticipation notes |
| TTFA | — Transportation Trust Fund Authority |
| TVA | — Tennessee Valley Authority |
This page is intentionally left blank.
This page is intentionally left blank.

For more information
More information about Wells Fargo Funds is available free upon request. To obtain literature, please write, email, visit the Fund’s website, or call:
Wells Fargo Funds
P.O. Box 8266
Boston, MA 02266-8266
Email: wfaf@wellsfargo.com
Website: wellsfargofunds.com
Individual investors: 1-800-222-8222
Retail investment professionals: 1-888-877-9275
Institutional investment professionals: 1-866-765-0778
This report and the financial statements contained herein are submitted for the general information of the shareholders of Wells Fargo Funds. If this report is used for promotional purposes, distribution of the report must be accompanied or preceded by a current prospectus. Before investing, please consider the investment objectives, risks, charges, and expenses of the investment. For a current prospectus and, if available, a summary prospectus, containing this information, call 1-800-222-8222 or visit the Fund’s website at wellsfargofunds.com. Read the prospectus carefully before you invest or send money.
Wells Fargo Funds Management, LLC, a wholly owned subsidiary of Wells Fargo & Company, provides investment advisory and administrative services for Wells Fargo Funds. Other affiliates of Wells Fargo & Company provide subadvisory and other services for the Funds. The Funds are distributed by Wells Fargo Funds Distributor, LLC, Member FINRA, an affiliate of Wells Fargo & Company.
NOT FDIC INSURED ¡ NO BANK GUARANTEE ¡ MAY LOSE VALUE
© 2015 Wells Fargo Funds Management, LLC. All rights reserved.
| | |
 | | 239081 01-16 SEGF/SAR111 11-15 |
Semi-Annual Report
November 30, 2015

Income Funds

| n | | Wells Fargo Core Bond Fund |
| n | | Wells Fargo Real Return Fund |

Reduce clutter. Save trees.
Sign up for electronic delivery of prospectuses and shareholder reports at wellsfargo.com/advantagedelivery
Contents
| * | A complete schedule of portfolio holdings as of the report date may be obtained, free of charge, by accessing the following website: https://www.wellsfargofunds.com/assets/edocs/regulatory/holdings/core-bond-semi.pdf or by calling Wells Fargo Funds at 1-800-222-8222. This complete schedule, filed on Form N-CSRS, is also available on the SEC’s website at sec.gov. |
The views expressed and any forward-looking statements are as of November 30, 2015, unless otherwise noted, and are those of the Fund managers and/or Wells Fargo Funds Management, LLC. Discussions of individual securities, or the markets generally, or any Wells Fargo Fund are not intended as individual recommendations. Future events or results may vary significantly from those expressed in any forward-looking statements. The views expressed are subject to change at any time in response to changing circumstances in the market. Wells Fargo Funds Management, LLC and the Fund disclaim any obligation to publicly update or revise any views expressed or forward-looking statements.
NOT FDIC INSURED ¡ NO BANK GUARANTEE ¡ MAY LOSE VALUE
| | | | |
| 2 | | Wells Fargo Income Funds | | Letter to shareholders (unaudited) |

Karla M. Rabusch
President
Wells Fargo Funds
Major central banks continued to inject liquidity into global banks and markets through various accommodative monetary policies, including quantitative easing.
Dear Valued Shareholder:
We are pleased to offer you this semi-annual report for the Wells Fargo Income Funds for the six-month period that ended November 30, 2015. The period was marked by low interest rates, sustained weakness in commodity prices, and moderate U.S. economic growth. Investment-grade bonds, as measured by the Barclays U.S. Aggregate Bond Index,1 returned -0.12% during the period.
Major central banks continued to provide stimulus.
Major central banks continued to inject liquidity into global banks and markets through various accommodative monetary policies, including quantitative easing. In the U.S., the Federal Reserve (Fed) kept its key interest rate near zero in order to support the economy and the financial system. It set expectations for it to begin normalizing monetary policy with higher target ranges for the federal funds rate by the end of 2015 but also emphasized that any action would be slow and cautious. Meanwhile, European markets continued to benefit from the European Central Bank’s (ECB’s) willingness to maintain low interest rates. The ECB held its key rate at a historical low of 0.05%. In addition to its targeted longer-term refinancing operations that are designed to increase bank lending, the ECB expanded its quantitative easing program to include the buying of eurozone government bonds. In Japan, the Bank of Japan maintained an aggressive monetary program aimed at combating deflation.
Global economic growth was below trend, and oil prices plummeted.
Developed countries experienced subtrend growth and subdued inflation, with commodity prices trending even lower over the course of the year. In the U.S., however, economic growth advanced during the reporting period, the unemployment rate ticked lower to 5.0% as of November 2015, and inflation remained below the Fed’s longer-run objective of a 2% pace. The Consumer Price Index remained in a range between 0.0% and 0.3% on a year-over-year percent-change basis. The period was also marked by dramatically lower oil prices, which fell to less than $42 per barrel at the end of November 2015. While lower oil prices benefited consumers of oil products, the lower prices pressured companies within the energy sector.
Higher-rated credits were top performers, while high yield was challenged.
Ten-year U.S. Treasury yields ranged between 2.00% and 2.50% during the period, ending with a yield of 2.21%. Treasuries benefited both from their safe-haven status as well as their relative attractiveness to global investors considering other developed-country government bond yields were significantly lower. Mortgage-backed securities did the best among the investment-grade sectors. Looking at the credit categories, AAA-rated bonds outperformed BBB-rated bonds. Meanwhile, high-yield bonds returned -5.84%, as measured by the Barclays U.S. Corporate High Yield Bond Index,2 dragged down by the energy and mining-related sectors that were negatively affected by lower oil prices. Investor trepidation about weak global growth caused both investment-grade spreads and high-yield spreads to widen over the reporting period.
Since the end of the financial crisis, structural changes in the fixed-income markets have reduced trading liquidity (the degree to which assets can be bought or sold
| 1 | The Barclays U.S. Aggregate Bond Index is composed of the Barclays U.S. Government/Credit Index and the Barclays U.S. Mortgage-Backed Securities Index, and includes Treasury issues, agency issues, corporate bond issues, and mortgage-backed securities. You cannot invest directly in an index. |
| 2 | The Barclays U.S. Corporate High Yield Bond Index is an unmanaged, U.S. dollar–denominated, nonconvertible, non-investment-grade debt index. The index consists of domestic and corporate bonds rated Ba and below with a minimum outstanding amount of $150 million. You cannot invest directly in an index. |
| | | | | | |
| Letter to shareholders (unaudited) | | Wells Fargo Income Funds | | | 3 | |
without affecting the price). New regulations and capital requirements have caused traditional liquidity suppliers (banks and broker/dealers) to be more risk-averse and hold less inventory. Meanwhile, corporate-debt issuance has spiked as companies finance themselves at record-low yields, bond mutual funds hold larger amounts of this new debt supply, trading volumes are lower, and large-size trades are more difficult to execute. However, fixed-income markets appear to have functioned well over the past year with sufficient liquidity and muted volatility.
Don’t let short-term uncertainty derail long-term investment goals.
Periods of uncertainty can present challenges, but experience has taught us that maintaining long-term investment goals can be an effective way to plan for the future. To help you create a sound strategy based on your personal goals and risk tolerance, Wells Fargo Funds offers more than 100 mutual funds spanning a wide range of asset classes and investment styles. Although diversification cannot guarantee an investment profit or prevent losses, we believe it can be an effective way to manage investment risk and potentially smooth out overall portfolio performance. We encourage investors to know their investments and to understand that appropriate levels of risk-taking may unlock opportunities.
Thank you for choosing to invest in Wells Fargo Funds. We appreciate your confidence in us and remain committed to helping you meet your financial needs.
Sincerely,

Karla M. Rabusch
President
Wells Fargo Funds
Periods of uncertainty can present challenges, but experience has taught us that maintaining long-term investment goals can be an effective way to plan for the future.
Notice to shareholders
At a meeting held August 11-12, 2015, the Board of Trustees of the Funds and the underlying Master Portfolios approved a change in the name of each Fund and underlying Master Portfolio whereby the word “Advantage” was removed from its name, effective December 15, 2015.
For current information about your fund investments, contact your investment professional, visit our website at wellsfargofunds.com, or call us directly at 1-800-222-8222. We are available 24 hours a day, 7 days a week.
| | | | |
| 4 | | Wells Fargo Income Funds | | Performance highlights (unaudited) |
Wells Fargo Core Bond Fund1
Investment objective
The Fund seeks total return, consisting of income and capital appreciation.
Manager
Wells Fargo Funds Management, LLC
Subadviser for the master portfolio
Wells Capital Management Incorporated
Portfolio managers
Troy Ludgood
Thomas O’Connor, CFA®
Average annual total returns (%) as of November 30, 20152
| | | | | | | | | | | | | | | | | | | | | | | | | | | | | | | | | | |
| | | | | Including sales charge | | | Excluding sales charge | | | Expense ratios3 (%) | |
| | | Inception date | | 1 year | | | 5 year | | | 10 year | | | 1 year | | | 5 year | | | 10 year | | | Gross | | | Net4 | |
| Class A (MBFAX) | | 10-31-2001 | | | (3.94 | ) | | | 2.46 | | | | 4.52 | | | | 0.58 | | | | 3.41 | | | | 5.00 | | | | 0.85 | | | | 0.78 | |
| Class B (MBFBX)* | | 10-31-2001 | | | (5.17 | ) | | | 2.28 | | | | 4.42 | | | | (0.17 | ) | | | 2.64 | | | | 4.42 | | | | 1.60 | | | | 1.53 | |
| Class C (MBFCX) | | 10-31-2001 | | | (1.17 | ) | | | 2.64 | | | | 4.17 | | | | (0.17 | ) | | | 2.64 | | | | 4.17 | | | | 1.60 | | | | 1.53 | |
| Class R (WTRRX) | | 7-9-2010 | | | – | | | | – | | | | – | | | | 0.31 | | | | 3.15 | | | | 4.71 | | | | 1.10 | | | | 1.03 | |
| Class R4 (MBFRX) | | 11-30-2012 | | | – | | | | – | | | | – | | | | 0.82 | | | | 3.69 | | | | 5.28 | | | | 0.62 | | | | 0.52 | |
| Class R6 (WTRIX) | | 11-30-2012 | | | – | | | | – | | | | – | | | | 1.06 | | | | 3.84 | | | | 5.40 | | | | 0.47 | | | | 0.37 | |
| Administrator Class (MNTRX) | | 6-30-1997 | | | – | | | | – | | | | – | | | | 0.64 | | | | 3.50 | | | | 5.09 | | | | 0.79 | | | | 0.70 | |
| Institutional Class (MBFIX) | | 10-31-2001 | | | – | | | | – | | | | – | | | | 0.93 | | | | 3.80 | | | | 5.38 | | | | 0.52 | | | | 0.42 | |
| Barclays U.S. Aggregate Bond Index5 | | – | | | – | | | | – | | | | – | | | | 0.97 | | | | 3.09 | | | | 4.65 | | | | – | | | | – | |
| * | | Class B shares are closed to investment, except in connection with the reinvestment of any distributions and permitted exchanges. |
Figures quoted represent past performance, which is no guarantee of future results, and do not reflect taxes that a shareholder may pay on fund distributions or the redemption of fund shares. Investment return and principal value of an investment will fluctuate so that an investor’s shares, when redeemed, may be worth more or less than their original cost. Performance shown without sales charges would be lower if sales charges were reflected. Current performance may be lower or higher than the performance data quoted, which assumes the reinvestment of dividends and capital gains. Current month-end performance is available on the Fund’s website, wellsfargofunds.com.
Index returns do not include transaction costs associated with buying and selling securities, any mutual fund fees or expenses, or any taxes. It is not possible to invest directly in an index.
For Class A shares, the maximum front-end sales charge is 4.50%. For Class B shares, the maximum contingent deferred sales charge is 5.00%. For Class C shares, the maximum contingent deferred sales charge is 1.00%. Performance including a contingent deferred sales charge assumes the sales charge for the corresponding time period. Class R, Class R4, Class R6, Administrator Class, and Institutional Class shares are sold without a front-end sales charge or contingent deferred sales charge.
Bond values fluctuate in response to the financial condition of individual issuers, general market and economic conditions, and changes in interest rates. Changes in market conditions and government policies may lead to periods of heightened volatility in the bond market and reduced liquidity for certain bonds held by the Fund. In general, when interest rates rise, bond values fall and investors may lose principal value. Interest-rate changes and their impact on the Fund and its share price can be sudden and unpredictable. The use of derivatives may reduce returns and/or increase volatility. Certain investment strategies tend to increase the total risk of an investment (relative to the broader market). Securities issued by U.S. government agencies or government-sponsored entities may not be guaranteed by the U.S. Treasury. The Fund is exposed to foreign investment risk and mortgage- and asset-backed securities risk. Consult the Fund’s prospectus for additional information on these and other risks.
Please see footnotes on page 5.
| | | | | | |
| Performance highlights (unaudited) | | Wells Fargo Income Funds | | | 5 | |
Wells Fargo Core Bond Fund (continued)
| | | | |
| Ten largest holdings (%) as of November 30, 20156 | |
U.S. Treasury Note, 1.38%, 9-30-2020 | | | 3.08 | |
U.S. Treasury Note, 1.63%, 3-31-2019 | | | 2.64 | |
U.S. Treasury Note, 0.88%, 8-15-2017 | | | 2.04 | |
U.S. Treasury Note, 1.63%, 6-30-2020 | | | 1.96 | |
GNMA, 3.50%, 12-17-2045 | | | 1.67 | |
U.S. Treasury Note, 1.25%, 11-15-2018 | | | 1.55 | |
GNMA, 3.50%, 1-21-2046 | | | 1.50 | |
GNMA, 3.00%, 12-17-2045 | | | 1.38 | |
U.S. Treasury Note, 1.38%, 10-31-2020 | | | 1.36 | |
U.S. Treasury Note, 0.88%, 10-15-2018 | | | 1.35 | |
|
| Portfolio allocation as of November 30, 20157 |
|
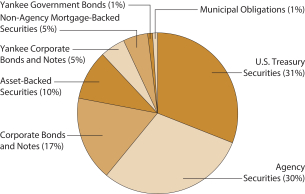 |
| 1 | The Fund is a gateway feeder fund that invests all of its assets in a single affiliated master portfolio of the Wells Fargo Master Trust with a substantially similar investment objective and substantially similar investment strategies. References to the investment activities of the Fund are intended to refer to the investment activities of the affiliated master portfolio in which it invests. |
| 2 | Historical performance shown for Class R shares prior to their inception reflects the performance of Administrator Class shares, adjusted to reflect the higher expenses applicable to Class R shares. Historical performance shown for Class R4 shares prior to their inception reflects the performance of Institutional Class shares, adjusted to reflect the higher expenses applicable to Class R4 shares. Historical performance shown for Class R6 shares prior to their inception reflects the performance of Institutional Class shares and includes the higher expenses applicable to Institutional Class shares. If these expenses had not been included, returns would be higher. |
| 3 | Reflects the expense ratios as stated in the most recent prospectuses. The expense ratios shown are subject to change and may differ from the annualized expense ratios shown in the financial highlights of this report. |
| 4 | The manager has contractually committed through September 30, 2016, to waive fees and/or reimburse expenses to the extent necessary to cap the Fund’s Total Annual Fund Operating Expenses After Fee Waiver at the amounts shown. After this time, the cap may be increased or the commitment to maintain the cap may be terminated only with the approval of the Board of Trustees. Brokerage commissions, stamp duty fees, interest, taxes, acquired fund fees and expenses, and extraordinary expenses are excluded from the cap. Expenses allocated from the affiliated master portfolio are included in the cap. Without this cap, the Fund’s returns would have been lower. |
| 5 | The Barclays U.S. Aggregate Bond Index is composed of the Barclays U.S. Government/Credit Index and the Barclays U.S. Mortgage-Backed Securities Index, and includes Treasury issues, agency issues, corporate bond issues, and mortgage-backed securities. You cannot invest directly in an index. |
| 6 | The ten largest holdings, excluding cash and cash equivalents, are calculated based on the value of the securities of the affiliated master portfolio allocable to the Fund divided by the total net assets of the Fund. Holdings are subject to change and may have changed since the date specified. |
| 7 | Amounts represent the portfolio allocation of the affiliated master portfolio which are calculated based on the total long-term investments of the affiliated master portfolio. These amounts are subject to change and may have changed since the date specified. |
| | | | |
| 6 | | Wells Fargo Income Funds | | Performance highlights (unaudited) |
Wells Fargo Real Return Fund1
Investment objective
The Fund seeks returns that exceed the rate of inflation over the long-term.
Manager
Wells Fargo Funds Management, LLC
Subadviser for the master portfolio
Wells Capital Management Incorporated
Portfolio managers
Kandarp R. Acharya, CFA®, FRM
Michael Bradshaw, CFA®
Christian L. Chan, CFA®
Jeffrey Everett, CFA®
Ann M. Miletti
Jay N. Mueller, CFA®
Thomas M. Price, CFA®
Dale Winner, CFA®
Average annual total returns (%) as of November 30, 2015
| | | | | | | | | | | | | | | | | | |
| | | | | Including sales charge | | Excluding sales charge | | Expense ratios2 (%) |
| | | Inception date | | 1 year | | 5 year | | 10 year | | 1 year | | 5 year | | 10 year | | Gross | | Net3 |
| Class A (IPBAX) | | 2-28-2003 | | (5.57) | | 0.94 | | 2.97 | | (1.12) | | 1.88 | | 3.45 | | 1.45 | | 0.85 |
| Class B (IPBBX)* | | 2-28-2003 | | (6.93) | | 0.72 | | 2.94 | | (1.93) | | 1.11 | | 2.94 | | 2.20 | | 1.60 |
| Class C (IPBCX) | | 2-28-2003 | | (2.83) | | 1.12 | | 2.71 | | (1.83) | | 1.12 | | 2.71 | | 2.20 | | 1.60 |
| Administrator Class (IPBIX) | | 2-28-2003 | | – | | – | | – | | (0.85) | | 2.12 | | 3.74 | | 1.39 | | 0.60 |
| Barclays U.S. Treasury Inflation-Protected Securities Index4 | | – | | – | | – | | – | | (1.77) | | 2.39 | | 4.14 | | – | | – |
| Consumer Price Index5 | | – | | – | | – | | – | | 0.50 | | 1.64 | | 1.85 | | – | | – |
| * | | Class B shares are closed to investment, except in connection with the reinvestment of any distributions and permitted exchanges. |
Figures quoted represent past performance, which is no guarantee of future results, and do not reflect taxes that a shareholder may pay on fund distributions or the redemption of fund shares. Investment return and principal value of an investment will fluctuate so that an investor’s shares, when redeemed, may be worth more or less than their original cost. Performance shown without sales charges would be lower if sales charges were reflected. Current performance may be lower or higher than the performance data quoted, which assumes the reinvestment of dividends and capital gains. Current month-end performance is available on the Fund’s website, wellsfargofunds.com.
Index returns do not include transaction costs associated with buying and selling securities, any mutual fund fees or expenses, or any taxes. It is not possible to invest directly in an index.
For Class A shares, the maximum front-end sales charge is 4.50%. For Class B shares, the maximum contingent deferred sales charge is 5.00%. For Class C shares, the maximum contingent deferred sales charge is 1.00%. Performance including a contingent deferred sales charge assumes the sales charge for the corresponding time period. Administrator Class shares are sold without a front-end sales charge or contingent deferred sales charge.
Please see footnotes on page 7.
| | | | | | |
| Performance highlights (unaudited) | | Wells Fargo Income Funds | | | 7 | |
Wells Fargo Real Return Fund (continued)
| | | | |
| Ten largest holdings (%) as of November 30, 20156 | |
TIPS, 0.13%, 4-15-2019 | | | 4.16 | |
TIPS, 0.13%, 7-15-2022 | | | 3.18 | |
TIPS, 0.25%, 1-15-2025 | | | 2.93 | |
TIPS, 0.13%, 1-15-2022 | | | 2.92 | |
TIPS, 0.63%, 1-15-2024 | | | 2.92 | |
TIPS, 0.13%, 7-15-2024 | | | 2.87 | |
TIPS, 0.63%, 7-15-2021 | | | 2.80 | |
TIPS, 0.38%, 7-15-2023 | | | 2.79 | |
TIPS, 0.13%, 4-15-2018 | | | 2.75 | |
TIPS, 0.13%, 1-15-2023 | | | 2.73 | |
|
| Effective maturity distribution as of November 30, 20157 |
|
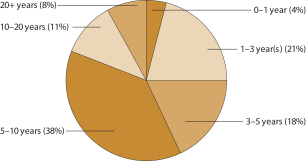 |
Bond values fluctuate in response to the financial condition of individual issuers, general market and economic conditions, and changes in interest rates. Changes in market conditions and government policies may lead to periods of heightened volatility in the bond market and reduced liquidity for certain bonds held by the Fund. In general, when interest rates rise, bond values fall and investors may lose principal value. Interest-rate changes and their impact on the fund and its share price can be sudden and unpredictable. Stock values fluctuate in response to the activities of individual companies and general market and economic conditions. High-yield securities have a greater risk of default and tend to be more volatile than higher-rated debt securities. Loans are subject to risks similar to those associated with other below-investment-grade bond investments, such as credit risk (for example, risk of issuer default), below-investment-grade bond risk (for example, risk of greater volatility in value), and risk that the loan may become illiquid or difficult to price. The use of derivatives may reduce returns and/or increase volatility. Foreign investments are especially volatile and can rise or fall dramatically due to differences in the political and economic conditions of the host country. These risks are generally intensified in emerging markets. Securities issued by U.S. government agencies or government-sponsored entities may not be guaranteed by the U.S. Treasury. The Fund is exposed to mortgage- and asset-backed securities risk and small-company securities risk. Consult the Fund’s prospectus for additional information on these and other risks.
| 1 | The Fund is a gateway feeder fund that invests all of its assets in a single affiliated master portfolio of the Wells Fargo Master Trust with a substantially similar investment objective and substantially similar investment strategies. References to the investment activities of the Fund are intended to refer to the investment activities of the affiliated master portfolio in which it invests. |
| 2 | Reflects the expense ratios as stated in the most recent prospectuses. The expense ratios shown are subject to change and may differ from the annualized expense ratios shown in the financial highlights of this report. |
| 3 | The manager has contractually committed through September 30, 2016, to waive fees and/or reimburse expenses to the extent necessary to cap the Fund’s Total Annual Fund Operating Expenses After Fee Waiver at the amounts shown. After this time, the cap may be increased or the commitment to maintain the cap may be terminated only with the approval of the Board of Trustees. Brokerage commissions, stamp duty fees, interest, taxes, acquired fund fees and expenses, and extraordinary expenses are excluded from the cap. Expenses allocated from the affiliated master portfolio are included in the cap. Without this cap, the Fund’s returns would have been lower. |
| 4 | The Barclays U.S. Treasury Inflation-Protected Securities Index is an index of inflation-indexed linked U.S. Treasury securities. You cannot invest directly in an index. |
| 5 | The Consumer Price Index (CPI) for All Urban Consumers in U.S. All Items is published monthly by the U.S. government as an indicator of changes in price levels (or inflation) paid by urban consumers for a representative basket of goods and services. You cannot invest directly in an index. |
| 6 | The ten largest holdings, excluding cash and cash equivalents, are calculated based on the value of the securities of the affiliated master portfolio allocable to the Fund divided by the total net assets of the Fund. Holdings are subject to change and may have changed since the date specified. |
| 7 | Amounts represent the effective maturity of the affiliated master portfolio which are calculated based on the total fixed-income investments of the affiliated master portfolio. These amounts are subject to change and may have changed since the date specified. |
| | | | |
| 8 | | Wells Fargo Income Funds | | Fund expenses (unaudited) |
As a shareholder of the Fund, you incur two types of costs: (1) transaction costs, including sales charges (loads) on
purchase payments and contingent deferred sales charges (if any) on redemptions and (2) ongoing costs, including
management fees, distribution (12b-1) and/or shareholder servicing fees, and other Fund expenses. This example is intended to help you understand your ongoing costs (in dollars) of investing in the Fund and to compare these costs with the ongoing costs of investing in other mutual funds.
The example is based on an investment of $1,000 invested at the beginning of the six-month period and held for the entire period from June 1, 2015 to November 30, 2015.
Actual expenses
The “Actual” line of the table below provides information about actual account values and actual expenses. You may use
the information in this line, together with the amount you invested, to estimate the expenses that you paid over the period. Simply divide your account value by $1,000 (for example, an $8,600 account value divided by $1,000 = 8.6), then multiply the result by the number in the “Actual” line under the heading entitled “Expenses paid during period” for your applicable class of shares to estimate the expenses you paid on your account during this period.
Hypothetical example for comparison purposes
The “Hypothetical” line of the table below provides information about hypothetical account values and hypothetical
expenses based on the Fund’s actual expense ratio and an assumed rate of return of 5% per year before expenses, which
is not the Fund’s actual return. The hypothetical account values and expenses may not be used to estimate the actual
ending account balance or expenses you paid for the period. You may use this information to compare the ongoing costs
of investing in the Fund and other funds. To do so, compare this 5% hypothetical example with the 5% hypothetical examples that appear in the shareholder reports of the other funds.
Please note that the expenses shown in the table are meant to highlight your ongoing costs only and do not reflect any transactional costs, such as sales charges (loads) and contingent deferred sales charges. Therefore, the “Hypothetical” line of the table is useful in comparing ongoing costs only and will not help you determine the relative total costs of owning different funds. In addition, if these transactional costs were included, your costs would have been higher.
| | | | | | | | | | | | | | | | |
| Wells Fargo Core Bond Fund | | Beginning
account value
6-1-2015 | | | Ending
account value
11-30-2015 | | | Expenses
paid during
the period¹ | | | Net annualized
expense ratio | |
Class A | | | | | | | | | | | | | | | | |
Actual | | $ | 1,000.00 | | | $ | 997.19 | | | $ | 3.89 | | | | 0.78 | % |
Hypothetical (5% return before expenses) | | $ | 1,000.00 | | | $ | 1,021.10 | | | $ | 3.94 | | | | 0.78 | % |
Class B | | | | | | | | | | | | | | | | |
Actual | | $ | 1,000.00 | | | $ | 993.42 | | | $ | 7.62 | | | | 1.53 | % |
Hypothetical (5% return before expenses) | | $ | 1,000.00 | | | $ | 1,017.35 | | | $ | 7.72 | | | | 1.53 | % |
Class C | | | | | | | | | | | | | | | | |
Actual | | $ | 1,000.00 | | | $ | 993.36 | | | $ | 7.62 | | | | 1.53 | % |
Hypothetical (5% return before expenses) | | $ | 1,000.00 | | | $ | 1,017.35 | | | $ | 7.72 | | | | 1.53 | % |
Class R | | | | | | | | | | | | | | | | |
Actual | | $ | 1,000.00 | | | $ | 995.70 | | | $ | 5.14 | | | | 1.03 | % |
Hypothetical (5% return before expenses) | | $ | 1,000.00 | | | $ | 1,019.85 | | | $ | 5.20 | | | | 1.03 | % |
Class R4 | | | | | | | | | | | | | | | | |
Actual | | $ | 1,000.00 | | | $ | 998.22 | | | $ | 2.60 | | | | 0.52 | % |
Hypothetical (5% return before expenses) | | $ | 1,000.00 | | | $ | 1,022.40 | | | $ | 2.63 | | | | 0.52 | % |
Class R6 | | | | | | | | | | | | | | | | |
Actual | | $ | 1,000.00 | | | $ | 999.76 | | | $ | 1.85 | | | | 0.37 | % |
Hypothetical (5% return before expenses) | | $ | 1,000.00 | | | $ | 1,023.15 | | | $ | 1.87 | | | | 0.37 | % |
Administrator Class | | | | | | | | | | | | | | | | |
Actual | | $ | 1,000.00 | | | $ | 997.34 | | | $ | 3.50 | | | | 0.70 | % |
Hypothetical (5% return before expenses) | | $ | 1,000.00 | | | $ | 1,021.50 | | | $ | 3.54 | | | | 0.70 | % |
Institutional Class | | | | | | | | | | | | | | | | |
Actual | | $ | 1,000.00 | | | $ | 998.73 | | | $ | 2.10 | | | | 0.42 | % |
Hypothetical (5% return before expenses) | | $ | 1,000.00 | | | $ | 1,022.90 | | | $ | 2.12 | | | | 0.42 | % |
Please see footnote on page 9.
| | | | | | |
| Fund expenses (unaudited) | | Wells Fargo Income Funds | | | 9 | |
| | | | | | | | | | | | | | | | |
| Wells Fargo Real Return Fund | | Beginning
account value
6-1-2015 | | | Ending
account value
11-30-2015 | | | Expenses
paid during
the period¹ | | | Net annualized
expense ratio | |
Class A | | | | | | | | | | | | | | | | |
Actual | | $ | 1,000.00 | | | $ | 968.22 | | | $ | 4.18 | | | | 0.85 | % |
Hypothetical (5% return before expenses) | | $ | 1,000.00 | | | $ | 1,020.75 | | | $ | 4.29 | | | | 0.85 | % |
Class B | | | | | | | | | | | | | | | | |
Actual | | $ | 1,000.00 | | | $ | 964.96 | | | $ | 7.86 | | | | 1.60 | % |
Hypothetical (5% return before expenses) | | $ | 1,000.00 | | | $ | 1,017.00 | | | $ | 8.07 | | | | 1.60 | % |
Class C | | | | | | | | | | | | | | | | |
Actual | | $ | 1,000.00 | | | $ | 965.00 | | | $ | 7.86 | | | | 1.60 | % |
Hypothetical (5% return before expenses) | | $ | 1,000.00 | | | $ | 1,017.00 | | | $ | 8.07 | | | | 1.60 | % |
Administrator Class | | | | | | | | | | | | | | | | |
Actual | | $ | 1,000.00 | | | $ | 969.16 | | | $ | 2.95 | | | | 0.60 | % |
Hypothetical (5% return before expenses) | | $ | 1,000.00 | | | $ | 1,022.00 | | | $ | 3.03 | | | | 0.60 | % |
| 1 | Expenses paid is equal to the annualized expense ratio of each class multiplied by the average account value over the period, multiplied by the number of days in the most recent fiscal half-year divided by the number of days in the fiscal year (to reflect the one-half-year period). |
| | | | |
| 10 | | Wells Fargo Income Funds | | Portfolio of investments—November 30, 2015 (unaudited) |
CORE BOND FUND
| | | | | | | | | | | | |
| Security name | | | | | | | | | | Value | |
| | | | | |
Investment Companies: 99.82% | | | | | | | | | | | | |
| | | | | |
| Affiliated Master Portfolios: 99.82% | | | | | | | | | | | | |
Wells Fargo Core Bond Portfolio | | | | | | | | | | $ | 3,214,934,983 | |
| | | | | | | | | | | | |
| | | | | |
Total Investment Companies (Cost $3,223,110,834) | | | | | | | | | | | 3,214,934,983 | |
| | | | | | | | | | | | |
| | | | | | | | |
| Total investments in securities (Cost $3,223,110,834) * | | | 99.82 | % | | | 3,214,934,983 | |
Other assets and liabilities, net | | | 0.18 | | | | 5,674,536 | |
| | | | | | | | |
| Total net assets | | | 100.00 | % | | $ | 3,220,609,519 | |
| | | | | | | | |
| | | | | | | | |
* | | Cost for federal income tax purposes is $3,230,152,624 and unrealized gains (losses) consists of: |
| | Gross unrealized gains | | $ | 0 | | | |
| | Gross unrealized losses | | | (15,217,641 | ) | | |
| | | | | | | | |
| | Net unrealized losses | | $ | (15,217,641 | ) | | |
REAL RETURN FUND
| | | | | | | | | | | | |
| Security name | | | | | | | | | | Value | |
| | | | | |
Investment Companies: 99.95% | | | | | | | | | | | | |
| | | | | |
| Affiliated Master Portfolios: 99.95% | | | | | | | | | | | | |
Wells Fargo Real Return Portfolio | | | | | | | | | | $ | 33,911,487 | |
| | | | | | | | | | | | |
| | | | | |
Total Investment Companies (Cost $34,516,170) | | | | | | | | | | | 33,911,487 | |
| | | | | | | | | | | | |
| | | | | | | | |
| Total investments in securities (Cost $34,516,170) * | | | 99.95 | % | | | 33,911,487 | |
Other assets and liabilities, net | | | 0.05 | | | | 17,485 | |
| | | | | | | | |
| Total net assets | | | 100.00 | % | | $ | 33,928,972 | |
| | | | | | | | |
| | | | | | | | |
* | | Cost for federal income tax purposes is $34,399,369 and unrealized gains (losses) consists of: |
| | Gross unrealized gains | | $ | 0 | | | |
| | Gross unrealized losses | | | (487,882 | ) | | |
| | | | | | | | |
| | Net unrealized losses | | $ | (487,882 | ) | | |
The accompanying notes are an integral part of these financial statements.
| | | | | | |
| Statements of assets and liabilities—November 30, 2015 (unaudited) | | Wells Fargo Income Funds | | | 11 | |
| | | | | | | | |
| | | Core Bond Fund | | | Real Return Fund | |
| | |
Assets | | | | | | | | |
Investment in affiliated Master Portfolio, at value (see cost below) | | $ | 3,214,934,983 | | | $ | 33,911,487 | |
Receivable for Fund shares sold | | | 12,094,885 | | | | 43,092 | |
Receivable from administrator | | | 0 | | | | 6,797 | |
Prepaid expenses and other assets | | | 160,868 | | | | 23,402 | |
| | | | |
Total assets | | | 3,227,190,736 | | | | 33,984,778 | |
| | | | |
| | |
Liabilities | | | | | | | | |
Dividends payable | | | 587,476 | | | | 0 | |
Payable for Fund shares redeemed | | | 5,483,281 | | | | 21,187 | |
Distribution fees payable | | | 44,902 | | | | 4,836 | |
Administration fees payable | | | 189,457 | | | | 0 | |
Shareholder report expenses payable | | | 2,326 | | | | 10,625 | |
Shareholder servicing fees payable | | | 225,059 | | | | 7,050 | |
Professional fees payable | | | 13,517 | | | | 10,494 | |
Accrued expenses and other liabilities | | | 35,199 | | | | 1,614 | |
| | | | |
Total liabilities | | | 6,581,217 | | | | 55,806 | |
| | | | |
Total net assets | | $ | 3,220,609,519 | | | $ | 33,928,972 | |
| | | | |
| | |
NET ASSETS CONSIST OF | | | | | | | | |
Paid-in capital | | $ | 3,283,259,067 | | | $ | 33,818,154 | |
Undistributed net investment income | | | 2,029,961 | | | | 33,935 | |
Accumulated net realized gains (losses) on investments | | | (56,503,658 | ) | | | 681,566 | |
Net unrealized losses on investments | | | (8,175,851 | ) | | | (604,683 | ) |
| | | | |
Total net assets | | $ | 3,220,609,519 | | | $ | 33,928,972 | |
| | | | |
| | |
COMPUTATION OF NET ASSET VALUE AND OFFERING PRICE PER SHARE | | | | | | | | |
Net assets – Class A | | $ | 575,932,082 | | | $ | 15,469,410 | |
Shares outstanding – Class A1 | | | 44,205,630 | | | | 1,596,615 | |
Net asset value per share – Class A | | | $13.03 | | | | $9.69 | |
Maximum offering price per share – Class A2 | | | $13.64 | | | | $10.15 | |
Net assets – Class B | | $ | 976,660 | | | $ | 47,501 | |
Shares outstanding – Class B1 | | | 75,204 | | | | 4,980 | |
Net asset value per share – Class B | | | $12.99 | | | | $9.54 | |
Net assets – Class C | | $ | 66,485,222 | | | $ | 7,796,278 | |
Shares outstanding – Class C1 | | | 5,152,138 | | | | 816,756 | |
Net asset value per share – Class C | | | $12.90 | | | | $9.55 | |
Net assets – Class R | | $ | 15,663,504 | | | | N/A | |
Shares outstanding – Class R1 | | | 1,231,410 | | | | N/A | |
Net asset value per share – Class R | | | $12.72 | | | | N/A | |
Net assets – Class R4 | | $ | 41,117,786 | | | | N/A | |
Share outstanding – Class R41 | | | 3,236,876 | | | | N/A | |
Net asset value per share – Class R4 | | | $12.70 | | | | N/A | |
Net assets – Class R6 | | $ | 567,319,032 | | | | N/A | |
Shares outstanding – Class R61 | | | 44,652,286 | | | | N/A | |
Net asset value per share – Class R6 | | | $12.71 | | | | N/A | |
Net assets – Administrator Class | | $ | 421,131,500 | | | $ | 10,615,783 | |
Shares outstanding – Administrator Class1 | | | 33,107,389 | | | | 1,087,583 | |
Net asset value per share – Administrator Class | | | $12.72 | | | | $9.76 | |
Net assets – Institutional Class | | $ | 1,531,983,733 | | | | N/A | |
Shares outstanding – Institutional Class1 | | | 120,612,154 | | | | N/A | |
Net asset value per share – Institutional Class | | | $12.70 | | | | N/A | |
| | |
Investments in affiliated Master Portfolio, at cost | | $ | 3,223,110,834 | | | $ | 34,516,170 | |
| | | | |
| 1 | Each Fund has an unlimited number of authorized shares. |
| 2 | Maximum offering price is computed as 100/95.50 of net asset value. On investments of $50,000 or more, the offering price is reduced. |
The accompanying notes are an integral part of these financial statements.
| | | | |
| 12 | | Wells Fargo Income Funds | | Statements of operations—six months ended November 30, 2015 (unaudited) |
| | | | | | | | |
| | | Core Bond Fund | | | Real Return Fund | |
| | |
Investment income | | | | | | | | |
Interest allocated from the affiliated Master Portfolio | | $ | 36,134,373 | | | $ | 324,514 | |
Dividends allocated from the affiliated Master Portfolio* | | | 107,388 | | | | 56,918 | |
Securities lending income allocated from the affiliated Master Portfolio | | | 56,197 | | | | 3,897 | |
Expenses allocated from the affiliated Master Portfolio | | | (6,009,135 | ) | | | (94,370 | ) |
Waivers allocated from the affiliated Master Portfolio | | | 236,230 | | | | 20,518 | |
| | | | |
Total investment income | | | 30,525,053 | | | | 311,477 | |
| | | | |
| | |
Expenses | | | | | | | | |
Management fee | | | 825,239 | | | | 8,431 | |
Administration fees | | | | | | | | |
Class A | | | 417,017 | | | | 11,179 | |
Class B | | | 915 | | | | 58 | |
Class C | | | 55,377 | | | | 6,434 | |
Class R | | | 12,598 | | | | N/A | |
Class R4 | | | 17,804 | | | | N/A | |
Class R6 | | | 109,342 | | | | N/A | |
Administrator Class | | | 229,679 | | | | 5,817 | |
Institutional Class | | | 561,648 | | | | N/A | |
Investor Class | | | 53,448 | 1 | | | N/A | |
Shareholder servicing fees | | | | | | | | |
Class A | | | 651,589 | | | | 17,467 | |
Class B | | | 1,429 | | | | 91 | |
Class C | | | 86,527 | | | | 10,054 | |
Class R | | | 19,684 | | | | N/A | |
Class R4 | | | 22,255 | | | | N/A | |
Administrator Class | | | 574,198 | | | | 14,542 | |
Investor Class | | | 70,326 | 1 | | | N/A | |
Distribution fees | | | | | | | | |
Class B | | | 4,287 | | | | 272 | |
Class C | | | 259,581 | | | | 30,161 | |
Class R | | | 19,684 | | | | N/A | |
Custody and accounting fees | | | 62,588 | | | | 1,461 | |
Professional fees | | | 15,974 | | | | 16,177 | |
Registration fees | | | 66,402 | | | | 25,615 | |
Shareholder report expenses | | | 63,044 | | | | 797 | |
Trustees’ fees and expenses | | | 11,342 | | | | 7,843 | |
Other fees and expenses | | | 17,915 | | | | 3,563 | |
| | | | |
Total expenses | | | 4,229,892 | | | | 159,962 | |
Less: Fee waivers and/or expense reimbursements | | | (1,107,540 | ) | | | (74,602 | ) |
| | | | |
Net expenses | | | 3,122,352 | | | | 85,360 | |
| | | | |
Net investment income | | | 27,402,701 | | | | 226,117 | |
| | | | |
| | |
REALIZED AND UNREALIZED GAINS (LOSSES) ON INVESTMENTS | | | | | | | | |
Net realized losses on securities transaction allocated from the affiliated Master Portfolio | | | (1,250,617 | ) | | | (39,815 | ) |
Net change in unrealized gains (losses) on securities transactions allocated from the affiliated Master Portfolio | | | (31,227,791 | ) | | | (1,239,760 | ) |
| | | | |
Net realized and unrealized gains (losses) on investments | | | (32,478,408 | ) | | | (1,279,575 | ) |
| | | | |
Net decrease in net assets resulting from operations | | $ | (5,075,707 | ) | | $ | (1,053,458 | ) |
| | | | |
| | |
* Net of foreign dividend withholding taxes allocated from the affiliated Master Portfolio in the amount of | | | $0 | | | | $3,640 | |
| 1 | For the period from June 1, 2015 to October 23, 2015. Effective at the close of business on October 23, 2015, Investor Class shares were converted to Class A shares and are no longer offered by the Fund. |
The accompanying notes are an integral part of these financial statements.
| | | | | | |
| Statements of changes in net assets | | Wells Fargo Income Funds | | | 13 | |
| | | | | | | | | | | | | | | | |
| | | Core Bond Fund | |
| | | Six months ended November 30, 2015 (unaudited) | | | Year ended May 31, 2015 | |
| | | | |
Operations | | | | | | | | | | | | | | | | |
Net investment income | | | | | | $ | 27,402,701 | | | | | | | $ | 44,382,432 | |
Net realized gains (losses) on investments | | | | | | | (1,250,617 | ) | | | | | | | 47,175,434 | |
Net change in unrealized gains (losses) on investments | | | | | | | (31,227,791 | ) | | | | | | | (14,214,826 | ) |
| | | | |
Net increase (decrease) in net assets resulting from operations | | | | | | | (5,075,707 | ) | | | | | | | 77,343,040 | |
| | | | |
| | | | |
Distributions to shareholders from | | | | | | | | | | | | | | | | |
Net investment income | | | | | | | | | | | | | | | | |
Class A | | | | | | | (3,717,904 | ) | | | | | | | (6,367,850 | ) |
Class B | | | | | | | (3,820 | ) | | | | | | | (13,601 | ) |
Class C | | | | | | | (232,699 | ) | | | | | | | (526,070 | ) |
Class R | | | | | | | (92,343 | ) | | | | | | | (204,535 | ) |
Class R4 | | | | | | | (373,605 | ) | | | | | | | (301,362 | ) |
Class R6 | | | | | | | (6,670,775 | ) | | | | | | | (8,573,230 | ) |
Administrator Class | | | | | | | (3,444,008 | ) | | | | | | | (6,530,804 | ) |
Institutional Class | | | | | | | (12,541,081 | ) | | | | | | | (21,645,383 | ) |
Investor Class | | | | | | | (390,665 | )1 | | | | | | | (1,042,999 | ) |
| | | | |
Total distributions to shareholders | | | | | | | (27,466,900 | ) | | | | | | | (45,205,834 | ) |
| | | | |
| | | | |
| Capital share transactions | | Shares | | | | | | Shares | | | | |
Proceeds from shares sold | | | | | | | | | | | | | | | | |
Class A | | | 11,670,268 | | | | 152,596,198 | | | | 17,971,486 | | | | 235,630,095 | |
Class B | | | 6,256 | | | | 81,276 | | | | 5,794 | | | | 75,748 | |
Class C | | | 461,468 | | | | 5,965,457 | | | | 1,111,855 | | | | 14,430,938 | |
Class R | | | 195,231 | | | | 2,487,151 | | | | 783,753 | | | | 10,023,919 | |
Class R4 | | | 213,547 | | | | 2,714,780 | | | | 4,293,814 | | | | 55,081,322 | |
Class R6 | | | 11,374,001 | | | | 144,730,094 | | | | 44,555,184 | | | | 572,349,232 | |
Administrator Class | | | 4,736,783 | | | | 60,345,056 | | | | 16,736,880 | | | | 215,246,257 | |
Institutional Class | | | 26,502,433 | | | | 337,115,943 | | | | 49,516,356 | | | | 633,001,084 | |
Investor Class | | | 428,364 | 1 | | | 5,459,147 | 1 | | | 1,213,452 | | | | 15,517,521 | |
| | | | |
| | | | | | | 711,495,102 | | | | | | | | 1,751,356,116 | |
| | | | |
Reinvestment of distributions | | | | | | | | | | | | | | | | |
Class A | | | 256,324 | | | | 3,344,887 | | | | 428,287 | | | | 5,615,379 | |
Class B | | | 282 | | | | 3,671 | | | | 992 | | | | 12,927 | |
Class C | | | 8,375 | | | | 108,249 | | | | 17,848 | | | | 231,386 | |
Class R | | | 3,048 | | | | 38,834 | | | | 6,287 | | | | 80,370 | |
Class R4 | | | 29,362 | | | | 373,605 | | | | 23,328 | | | | 301,362 | |
Class R6 | | | 496,334 | | | | 6,317,042 | | | | 663,379 | | | | 8,507,857 | |
Administrator Class | | | 265,850 | | | | 3,387,142 | | | | 501,436 | | | | 6,420,079 | |
Institutional Class | | | 775,932 | | | | 9,870,790 | | | | 1,327,635 | | | | 16,973,646 | |
Investor Class | | | 25,095 | 1 | | | 319,617 | 1 | | | 80,287 | | | | 1,027,384 | |
| | | | |
| | | | | | | 23,763,837 | | | | | | | | 39,170,390 | |
| | | | |
The accompanying notes are an integral part of these financial statements.
| | | | |
| 14 | | Wells Fargo Income Funds | | Statements of changes in net assets |
| | | | | | | | | | | | | | | | |
| | | Core Bond Fund | |
| | | Six months ended November 30, 2015 (unaudited) | | | Year ended May 31, 2015 | |
| | | | |
| | | Shares | | | | | | Shares | | | | |
| | | | |
Capital share transactions (continued) | | | | | | | | | | | | | | | | |
Payment for shares redeemed | | | | | | | | | | | | | | | | |
Class A | | | (6,173,705 | ) | | $ | (80,594,235 | ) | | | (10,589,489 | ) | | $ | (138,586,528 | ) |
Class B | | | (34,246 | ) | | | (445,423 | ) | | | (115,766 | ) | | | (1,507,965 | ) |
Class C | | | (902,602 | ) | | | (11,662,570 | ) | | | (1,858,972 | ) | | | (24,109,058 | ) |
Class R | | | (244,131 | ) | | | (3,105,881 | ) | | | (860,205 | ) | | | (11,034,948 | ) |
Class R4 | | | (845,078 | ) | | | (10,741,046 | ) | | | (479,442 | ) | | | (6,178,101 | ) |
Class R6 | | | (23,801,445 | ) | | | (303,139,656 | ) | | | (11,617,990 | ) | | | (149,382,398 | ) |
Administrator Class | | | (9,873,329 | ) | | | (125,880,037 | ) | | | (11,799,313 | ) | | | (150,982,820 | ) |
Institutional Class | | | (12,697,571 | ) | | | (161,434,548 | ) | | | (40,315,878 | ) | | | (513,863,486 | ) |
Investor Class | | | (6,089,488 | )1 | | | (77,924,960 | )1 | | | (1,491,148 | ) | | | (19,075,189 | ) |
| | | | |
| | | | | | | (774,928,356 | ) | | | | | | | (1,014,720,493 | ) |
| | | | |
Net increase (decrease) in net assets resulting from capital share transactions | | | | | | | (39,669,417 | ) | | | | | | | 775,806,013 | |
| | | | |
Total increase (decrease) in net assets | | | | | | | (72,212,024 | ) | | | | | | | 807,943,219 | |
| | | | |
| | | | |
Net assets | | | | | | | | | | | | | | | | |
Beginning of period | | | | | | | 3,292,821,543 | | | | | | | | 2,484,878,324 | |
| | | | |
End of period | | | | | | $ | 3,220,609,519 | | | | | | | $ | 3,292,821,543 | |
| | | | |
Undistributed net investment income | | | | | | $ | 2,029,961 | | | | | | | $ | 2,094,160 | |
| | | | |
| 1 | For the period from June 1, 2015 to October 23, 2015. Effective at the close of business on October 23, 2015, Investor Class shares were converted to Class A shares and are no longer offered by the Fund. |
The accompanying notes are an integral part of these financial statements.
| | | | | | |
| Statements of changes in net assets | | Wells Fargo Income Funds | | | 15 | |
| | | | | | | | | | | | | | | | |
| | | Real Return Fund | |
| | | Six months ended
November 30, 2015
(unaudited) | | | Year ended
May 31, 2015 | |
| | | | |
Operations | | | | | | | | | | | | | | | | |
Net investment income | | | | | | $ | 226,117 | | | | | | | $ | 102,117 | |
Net realized gains (losses) on investments | | | | | | | (39,815 | ) | | | | | | | 740,740 | |
Net change in unrealized gains (losses) on investments | | | | | | | (1,239,760 | ) | | | | | | | (641,821 | ) |
| | | | |
Net increase (decrease) in net assets resulting from operations | | | | | | | (1,053,458 | ) | | | | | | | 201,036 | |
| | | | |
| | | | |
Distributions to shareholders from | | | | | | | | | | | | | | | | |
Net investment income | | | | | | | | | | | | | | | | |
Class A | | | | | | | (83,359 | ) | | | | | | | (118,899 | ) |
Class B | | | | | | | (215 | ) | | | | | | | (784 | ) |
Class C | | | | | | | (19,227 | ) | | | | | | | (40,049 | ) |
Administrator Class | | | | | | | (89,158 | ) | | | | | | | (57,817 | ) |
Net realized gains | | | | | | | | | | | | | | | | |
Class A | | | | | | | 0 | | | | | | | | (105,640 | ) |
Class B | | | | | | | 0 | | | | | | | | (1,138 | ) |
Class C | | | | | | | 0 | | | | | | | | (66,105 | ) |
Administrator Class | | | | | | | 0 | | | | | | | | (44,811 | ) |
| | | | |
Total distributions to shareholders | | | | | | | (191,959 | ) | | | | | | | (435,243 | ) |
| | | | |
| | | | |
Capital share transactions | | | Shares | | | | | | | | Shares | | | | | |
Proceeds from shares sold | | | | | | | | | | | | | | | | |
Class A | | | 477,859 | | | | 4,642,937 | | | | 382,302 | | | | 3,837,289 | |
Class B | | | 0 | | | | 0 | | | | 333 | | | | 3,340 | |
Class C | | | 138,878 | | | | 1,354,175 | | | | 85,006 | | | | 845,717 | |
Administrator Class | | | 256,462 | | | | 2,545,337 | | | | 571,353 | | | | 5,803,056 | |
| | | | |
| | | | | | | 8,542,449 | | | | | | | | 10,489,402 | |
| | | | |
Reinvestment of distributions | | | | | | | | | | | | | | | | |
Class A | | | 7,400 | | | | 72,082 | | | | 20,753 | | | | 205,634 | |
Class B | | | 22 | | | | 215 | | | | 197 | | | | 1,922 | |
Class C | | | 1,786 | | | | 17,100 | | | | 9,408 | | | | 91,880 | |
Administrator Class | | | 8,819 | | | | 86,699 | | | | 9,708 | | | | 96,877 | |
| | | | |
| | | | | | | 176,096 | | | | | | | | 396,313 | |
| | | | |
Payment for shares redeemed | | | | | | | | | | | | | | | | |
Class A | | | (177,402 | ) | | | (1,731,894 | ) | | | (639,048 | ) | | | (6,367,493 | ) |
Class B | | | (4,580 | ) | | | (43,522 | ) | | | (9,996 | ) | | | (98,538 | ) |
Class C | | | (77,043 | ) | | | (741,193 | ) | | | (250,951 | ) | | | (2,472,907 | ) |
Administrator Class | | | (229,997 | ) | | | (2,248,920 | ) | | | (150,035 | ) | | | (1,512,161 | ) |
| | | | |
| | | | | | | (4,765,529 | ) | | | | | | | (10,451,099 | ) |
| | | | |
Net increase in net assets resulting from capital share transactions | | | | | | | 3,953,016 | | | | | | | | 434,616 | |
| | | | |
Total increase in net assets | | | | | | | 2,707,599 | | | | | | | | 200,409 | |
| | | | |
| | | | |
Net assets | | | | | | | | | | | | | | | | |
Beginning of period | | | | | | | 31,221,373 | | | | | | | | 31,020,964 | |
| | | | |
End of period | | | | | | $ | 33,928,972 | | | | | | | $ | 31,221,373 | |
| | | | |
Undistributed (overdistributed) net investment income | | | | | | $ | 33,935 | | | | | | | $ | (223 | ) |
| | | | |
The accompanying notes are an integral part of these financial statements.
| | | | |
| 16 | | Wells Fargo Income Funds | | Financial highlights |
| | | | | | | | | | | | | | | | | | | | | | | | |
| Core Bond Fund | | Beginning
net asset
value per
share | | | Net
investment
income1 | | | Net realized
and unrealized
gains (losses)
on investments | | | Distributions
from net
investment
income | | | Distributions
from net
realized gains | | | Ending
net asset
value per
share | |
Class A | | | | | | | | | | | | | | | | | | | | | | | | |
Six months ended November 30, 2015 (unaudited) | | $ | 13.16 | | | | 0.09 | | | | (0.13 | ) | | | (0.09 | ) | | | 0.00 | | | $ | 13.03 | |
Year ended May 31, 2015 | | $ | 12.98 | | | | 0.18 | | | | 0.19 | | | | (0.19 | ) | | | 0.00 | | | $ | 13.16 | |
Year ended May 31, 2014 | | $ | 13.02 | | | | 0.19 | | | | 0.12 | | | | (0.20 | ) | | | (0.15 | ) | | $ | 12.98 | |
Year ended May 31, 2013 | | $ | 13.46 | | | | 0.18 | | | | 0.12 | | | | (0.18 | ) | | | (0.56 | ) | | $ | 13.02 | |
Year ended May 31, 2012 | | $ | 13.05 | | | | 0.26 | | | | 0.72 | | | | (0.26 | ) | | | (0.31 | ) | | $ | 13.46 | |
Year ended May 31, 2011 | | $ | 13.25 | | | | 0.31 | | | | 0.52 | | | | (0.33 | ) | | | (0.70 | ) | | $ | 13.05 | |
Class B | | | | | | | | | | | | | | | | | | | | | | | | |
Six months ended November 30, 2015 (unaudited) | | $ | 13.12 | | | | 0.04 | 4 | | | (0.13 | ) | | | (0.04 | ) | | | 0.00 | | | $ | 12.99 | |
Year ended May 31, 2015 | | $ | 12.94 | | | | 0.09 | 4 | | | 0.18 | | | | (0.09 | ) | | | 0.00 | | | $ | 13.12 | |
Year ended May 31, 2014 | | $ | 12.98 | | | | 0.10 | 4 | | | 0.12 | | | | (0.11 | ) | | | (0.15 | ) | | $ | 12.94 | |
Year ended May 31, 2013 | | $ | 13.43 | | | | 0.08 | 4 | | | 0.10 | | | | (0.07 | ) | | | (0.56 | ) | | $ | 12.98 | |
Year ended May 31, 2012 | | $ | 13.01 | | | | 0.16 | | | | 0.73 | | | | (0.16 | ) | | | (0.31 | ) | | $ | 13.43 | |
Year ended May 31, 2011 | | $ | 13.22 | | | | 0.20 | | | | 0.52 | | | | (0.23 | ) | | | (0.70 | ) | | $ | 13.01 | |
Class C | | | | | | | | | | | | | | | | | | | | | | | | |
Six months ended November 30, 2015 (unaudited) | | $ | 13.03 | | | | 0.04 | | | | (0.13 | ) | | | (0.04 | ) | | | 0.00 | | | $ | 12.90 | |
Year ended May 31, 2015 | | $ | 12.86 | | | | 0.09 | | | | 0.17 | | | | (0.09 | ) | | | 0.00 | | | $ | 13.03 | |
Year ended May 31, 2014 | | $ | 12.90 | | | | 0.10 | | | | 0.12 | | | | (0.11 | ) | | | (0.15 | ) | | $ | 12.86 | |
Year ended May 31, 2013 | | $ | 13.34 | | | | 0.07 | | | | 0.12 | | | | (0.07 | ) | | | (0.56 | ) | | $ | 12.90 | |
Year ended May 31, 2012 | | $ | 12.93 | | | | 0.16 | | | | 0.72 | | | | (0.16 | ) | | | (0.31 | ) | | $ | 13.34 | |
Year ended May 31, 2011 | | $ | 13.14 | | | | 0.22 | | | | 0.50 | | | | (0.23 | ) | | | (0.70 | ) | | $ | 12.93 | |
Class R | | | | | | | | | | | | | | | | | | | | | | | | |
Six months ended November 30, 2015 (unaudited) | | $ | 12.85 | | | | 0.07 | 4 | | | (0.13 | ) | | | (0.07 | ) | | | 0.00 | | | $ | 12.72 | |
Year ended May 31, 2015 | | $ | 12.67 | | | | 0.15 | 4 | | | 0.18 | | | | (0.15 | ) | | | 0.00 | | | $ | 12.85 | |
Year ended May 31, 2014 | | $ | 12.71 | | | | 0.16 | 4 | | | 0.12 | | | | (0.17 | ) | | | (0.15 | ) | | $ | 12.67 | |
Year ended May 31, 2013 | | $ | 13.16 | | | | 0.14 | 4 | | | 0.11 | | | | (0.14 | ) | | | (0.56 | ) | | $ | 12.71 | |
Year ended May 31, 2012 | | $ | 12.76 | | | | 0.22 | | | | 0.71 | | | | (0.22 | ) | | | (0.31 | ) | | $ | 13.16 | |
Year ended May 31, 20115 | | $ | 12.78 | | | | 0.25 | | | | 0.33 | | | | (0.25 | ) | | | (0.35 | ) | | $ | 12.76 | |
Class R4 | | | | | | | | | | | | | | | | | | | | | | | | |
Six months ended November 30, 2015 (unaudited) | | $ | 12.83 | | | | 0.11 | | | | (0.13 | ) | | | (0.11 | ) | | | 0.00 | | | $ | 12.70 | |
Year ended May 31, 2015 | | $ | 12.66 | | | | 0.21 | | | | 0.18 | | | | (0.22 | ) | | | 0.00 | | | $ | 12.83 | |
Year ended May 31, 2014 | | $ | 12.70 | | | | 0.22 | | | | 0.12 | | | | (0.23 | ) | | | (0.15 | ) | | $ | 12.66 | |
Year ended May 31, 20136 | | $ | 13.46 | | | | 0.10 | 4 | | | (0.21 | ) | | | (0.09 | ) | | | (0.56 | ) | | $ | 12.70 | |
Class R6 | | | | | | | | | | | | | | | | | | | | | | | | |
Six months ended November 30, 2015 (unaudited) | | $ | 12.83 | | | | 0.12 | | | | (0.12 | ) | | | (0.12 | ) | | | 0.00 | | | $ | 12.71 | |
Year ended May 31, 2015 | | $ | 12.66 | | | | 0.23 | | | | 0.17 | | | | (0.23 | ) | | | 0.00 | | | $ | 12.83 | |
Year ended May 31, 2014 | | $ | 12.70 | | | | 0.24 | | | | 0.12 | | | | (0.25 | ) | | | (0.15 | ) | | $ | 12.66 | |
Year ended May 31, 20136 | | $ | 13.46 | | | | 0.11 | 4 | | | (0.21 | ) | | | (0.10 | ) | | | (0.56 | ) | | $ | 12.70 | |
Administrator Class | | | | | | | | | | | | | | | | | | | | | | | | |
Six months ended November 30, 2015 (unaudited) | | $ | 12.85 | | | | 0.10 | | | | (0.13 | ) | | | (0.10 | ) | | | 0.00 | | | $ | 12.72 | |
Year ended May 31, 2015 | | $ | 12.67 | | | | 0.19 | 4 | | | 0.18 | | | | (0.19 | ) | | | 0.00 | | | $ | 12.85 | |
Year ended May 31, 2014 | | $ | 12.71 | | | | 0.21 | | | | 0.11 | | | | (0.21 | ) | | | (0.15 | ) | | $ | 12.67 | |
Year ended May 31, 2013 | | $ | 13.16 | | | | 0.19 | | | | 0.10 | | | | (0.18 | ) | | | (0.56 | ) | | $ | 12.71 | |
Year ended May 31, 2012 | | $ | 12.76 | | | | 0.27 | | | | 0.71 | | | | (0.27 | ) | | | (0.31 | ) | | $ | 13.16 | |
Year ended May 31, 2011 | | $ | 12.98 | | | | 0.33 | | | | 0.49 | | | | (0.34 | ) | | | (0.70 | ) | | $ | 12.76 | |
Institutional Class | | | | | | | | | | | | | | | | | | | | | | | | |
Six months ended November 30, 2015 (unaudited) | | $ | 12.83 | | | | 0.11 | | | | (0.13 | ) | | | (0.11 | ) | | | 0.00 | | | $ | 12.70 | |
Year ended May 31, 2015 | | $ | 12.66 | | | | 0.22 | | | | 0.18 | | | | (0.23 | ) | | | 0.00 | | | $ | 12.83 | |
Year ended May 31, 2014 | | $ | 12.70 | | | | 0.23 | | | | 0.12 | | | | (0.24 | ) | | | (0.15 | ) | | $ | 12.66 | |
Year ended May 31, 2013 | | $ | 13.14 | | | | 0.22 | | | | 0.12 | | | | (0.22 | ) | | | (0.56 | ) | | $ | 12.70 | |
Year ended May 31, 2012 | | $ | 12.75 | | | | 0.31 | | | | 0.69 | | | | (0.30 | ) | | | (0.31 | ) | | $ | 13.14 | |
Year ended May 31, 2011 | | $ | 12.96 | | | | 0.36 | | | | 0.50 | | | | (0.37 | ) | | | (0.70 | ) | | $ | 12.75 | |
| 1 | Includes net expenses allocated from the affiliated Master Portfolio in which the Fund invests. |
| 2 | Total return calculations do not include any sales charges. Returns for periods of less than one year are not annualized. |
| 3 | Portfolio turnover rate is calculated by multiplying the Fund’s investment percentage in the affiliated Master Portfolio by the affiliated Master Portfolio’s portfolio turnover rate. |
| 4 | Calculated based upon average shares outstanding |
| 5 | For the period from July 9, 2010 (commencement of class operations) to May 31, 2011 |
| 6 | For the period from November 30, 2012 (commencement of class operations) to May 31, 2013 |
The accompanying notes are an integral part of these financial statements.
| | | | | | |
| Financial highlights | | Wells Fargo Income Funds | | | 17 | |
| | | | | | | | | | | | | | | | | | | | | | |
| Ratio to average net assets (annualized) | | | Total
return2 | | | Portfolio
turnover
rate3 | | | Net assets at
end of period
(000s omitted) | |
Net investment
income1 | | | Gross
expenses1 | | | Net
expenses1 | | | | |
| | | | | | | | | | | | | | | | | | | | | | |
| | 1.42 | % | | | 0.82 | % | | | 0.78 | % | | | (0.28 | )% | | | 303 | % | | $ | 575,932 | |
| | 1.39 | % | | | 0.83 | % | | | 0.78 | % | | | 2.85 | % | | | 586 | % | | $ | 506,043 | |
| | 1.52 | % | | | 0.83 | % | | | 0.78 | % | | | 2.46 | % | | | 646 | % | | $ | 397,780 | |
| | 1.31 | % | | | 0.83 | % | | | 0.80 | % | | | 2.14 | % | | | 547 | % | | $ | 408,864 | |
| | 1.91 | % | | | 0.82 | % | | | 0.82 | % | | | 7.65 | % | | | 803 | % | | $ | 450,013 | |
| | 2.42 | % | | | 0.83 | % | | | 0.83 | % | | | 6.55 | % | | | 761 | % | | $ | 346,740 | |
| | | | | | | | | | | | | | | | | | | | | | |
| | 0.66 | % | | | 1.57 | % | | | 1.53 | % | | | (0.66 | )% | | | 303 | % | | $ | 977 | |
| | 0.67 | % | | | 1.58 | % | | | 1.53 | % | | | 2.09 | % | | | 586 | % | | $ | 1,350 | |
| | 0.77 | % | | | 1.58 | % | | | 1.53 | % | | | 1.70 | % | | | 646 | % | | $ | 2,742 | |
| | 0.56 | % | | | 1.57 | % | | | 1.55 | % | | | 1.31 | % | | | 547 | % | | $ | 8,208 | |
| | 1.23 | % | | | 1.57 | % | | | 1.57 | % | | | 6.95 | % | | | 803 | % | | $ | 11,998 | |
| | 1.66 | % | | | 1.58 | % | | | 1.58 | % | | | 5.69 | % | | | 761 | % | | $ | 18,762 | |
| | | | | | | | | | | | | | | | | | | | | | |
| | 0.67 | % | | | 1.57 | % | | | 1.53 | % | | | (0.66 | )% | | | 303 | % | | $ | 66,485 | |
| | 0.65 | % | | | 1.58 | % | | | 1.53 | % | | | 2.02 | % | | | 586 | % | | $ | 72,798 | |
| | 0.77 | % | | | 1.58 | % | | | 1.53 | % | | | 1.71 | % | | | 646 | % | | $ | 81,187 | |
| | 0.53 | % | | | 1.58 | % | | | 1.55 | % | | | 1.39 | % | | | 547 | % | | $ | 116,837 | |
| | 1.18 | % | | | 1.57 | % | | | 1.57 | % | | | 6.90 | % | | | 803 | % | | $ | 127,677 | |
| | 1.67 | % | | | 1.58 | % | | | 1.58 | % | | | 5.71 | % | | | 761 | % | | $ | 111,140 | |
| | | | | | | | | | | | | | | | | | | | | | |
| | 1.17 | % | | | 1.07 | % | | | 1.03 | % | | | (0.43 | )% | | | 303 | % | | $ | 15,664 | |
| | 1.15 | % | | | 1.08 | % | | | 1.03 | % | | | 2.63 | % | | | 586 | % | | $ | 16,411 | |
| | 1.27 | % | | | 1.08 | % | | | 1.03 | % | | | 2.23 | % | | | 646 | % | | $ | 17,077 | |
| | 1.04 | % | | | 1.07 | % | | | 1.05 | % | | | 1.83 | % | | | 547 | % | | $ | 19,548 | |
| | 1.67 | % | | | 1.07 | % | | | 1.07 | % | | | 7.43 | % | | | 803 | % | | $ | 20,088 | |
| | 2.18 | % | | | 1.08 | % | | | 1.08 | % | | | 4.73 | % | | | 761 | % | | $ | 14,596 | |
| | | | | | | | | | | | | | | | | | | | | | |
| | 1.67 | % | | | 0.59 | % | | | 0.52 | % | | | (0.18 | )% | | | 303 | % | | $ | 41,118 | |
| | 1.53 | % | | | 0.59 | % | | | 0.52 | % | | | 3.07 | % | | | 586 | % | | $ | 49,261 | |
| | 1.78 | % | | | 0.58 | % | | | 0.52 | % | | | 2.75 | % | | | 646 | % | | $ | 17 | |
| | 1.56 | % | | | 0.57 | % | | | 0.52 | % | | | (0.84 | )% | | | 547 | % | | $ | 10 | |
| | | | | | | | | | | | | | | | | | | | | | |
| | 1.83 | % | | | 0.44 | % | | | 0.37 | % | | | (0.02 | )% | | | 303 | % | | $ | 567,319 | |
| | 1.76 | % | | | 0.45 | % | | | 0.37 | % | | | 3.23 | % | | | 586 | % | | $ | 726,165 | |
| | 1.94 | % | | | 0.45 | % | | | 0.37 | % | | | 2.91 | % | | | 646 | % | | $ | 290,977 | |
| | 1.72 | % | | | 0.45 | % | | | 0.37 | % | | | (0.77 | )% | | | 547 | % | | $ | 205,225 | |
| | | | | | | | | | | | | | | | | | | | | | |
| | 1.50 | % | | | 0.76 | % | | | 0.70 | % | | | (0.27 | )% | | | 303 | % | | $ | 421,132 | |
| | 1.47 | % | | | 0.77 | % | | | 0.70 | % | | | 2.96 | % | | | 586 | % | | $ | 487,981 | |
| | 1.60 | % | | | 0.77 | % | | | 0.70 | % | | | 2.57 | % | | | 646 | % | | $ | 412,419 | |
| | 1.43 | % | | | 0.76 | % | | | 0.70 | % | | | 2.19 | % | | | 547 | % | | $ | 526,028 | |
| | 2.08 | % | | | 0.76 | % | | | 0.70 | % | | | 7.83 | % | | | 803 | % | | $ | 802,788 | |
| | 2.54 | % | | | 0.77 | % | | | 0.70 | % | | | 6.62 | % | | | 761 | % | | $ | 1,073,115 | |
| | | | | | | | | | | | | | | | | | | | | | |
| | 1.78 | % | | | 0.49 | % | | | 0.42 | % | | | (0.13 | )% | | | 303 | % | | $ | 1,531,984 | |
| | 1.75 | % | | | 0.50 | % | | | 0.42 | % | | | 3.17 | % | | | 586 | % | | $ | 1,360,398 | |
| | 1.88 | % | | | 0.50 | % | | | 0.42 | % | | | 2.85 | % | | | 646 | % | | $ | 1,208,745 | |
| | 1.67 | % | | | 0.50 | % | | | 0.42 | % | | | 2.56 | % | | | 547 | % | | $ | 1,505,192 | |
| | 2.32 | % | | | 0.49 | % | | | 0.42 | % | | | 8.05 | % | | | 803 | % | | $ | 1,965,338 | |
| | 2.84 | % | | | 0.50 | % | | | 0.42 | % | | | 7.00 | % | | | 761 | % | | $ | 1,325,962 | |
The accompanying notes are an integral part of these financial statements.
| | | | |
| 18 | | Wells Fargo Income Funds | | Financial highlights |
| | | | | | | | | | | | | | | | | | | | | | | | |
| Real Return Fund | | Beginning
net asset
value per
share | | | Net
investment
income (loss)1 | | | Net realized
and unrealized
gains (losses)
on investments | | | Distributions
from net
investment
income | | | Distributions
from net
realized gains | | | Ending
net asset
value per
share | |
Class A | | | | | | | | | | | | | | | | | | | | | | | | |
Six months ended November 30, 2015 (unaudited) | | $ | 10.07 | | | | 0.07 | 4 | | | (0.39 | ) | | | (0.06 | ) | | | 0.00 | | | $ | 9.69 | |
Year ended May 31, 2015 | | $ | 10.11 | | | | 0.05 | 4 | | | 0.07 | | | | (0.08 | ) | | | (0.08 | ) | | $ | 10.07 | |
Year ended May 31, 2014 | | $ | 10.85 | | | | 0.10 | 4 | | | (0.21 | ) | | | (0.09 | ) | | | (0.54 | ) | | $ | 10.11 | |
Year ended May 31, 2013 | | $ | 11.66 | | | | 0.11 | | | | (0.36 | ) | | | (0.21 | ) | | | (0.35 | ) | | $ | 10.85 | |
Year ended May 31, 2012 | | $ | 10.84 | | | | 0.27 | | | | 1.01 | | | | (0.36 | ) | | | (0.10 | ) | | $ | 11.66 | |
Year ended May 31, 2011 | | $ | 10.29 | | | | 0.31 | | | | 0.47 | | | | (0.23 | ) | | | 0.00 | | | $ | 10.84 | |
Class B | | | | | | | | | | | | | | | | | | | | | | | | |
Six months ended November 30, 2015 (unaudited) | | $ | 9.91 | | | | 0.06 | 4 | | | (0.41 | ) | | | (0.02 | ) | | | 0.00 | | | $ | 9.54 | |
Year ended May 31, 2015 | | $ | 9.99 | | | | (0.03 | )4 | | | 0.07 | | | | (0.04 | ) | | | (0.08 | ) | | $ | 9.91 | |
Year ended May 31, 2014 | | $ | 10.75 | | | | 0.01 | 4 | | | (0.20 | ) | | | (0.03 | ) | | | (0.54 | ) | | $ | 9.99 | |
Year ended May 31, 2013 | | $ | 11.58 | | | | 0.03 | 4 | | | (0.36 | ) | | | (0.15 | ) | | | (0.35 | ) | | $ | 10.75 | |
Year ended May 31, 2012 | | $ | 10.76 | | | | 0.19 | 4 | | | 1.00 | | | | (0.27 | ) | | | (0.10 | ) | | $ | 11.58 | |
Year ended May 31, 2011 | | $ | 10.20 | | | | 0.19 | 4 | | | 0.53 | | | | (0.16 | ) | | | 0.00 | | | $ | 10.76 | |
Class C | | | | | | | | | | | | | | | | | | | | | | | | |
Six months ended November 30, 2015 (unaudited) | | $ | 9.92 | | | | 0.06 | | | | (0.41 | ) | | | (0.02 | ) | | | 0.00 | | | $ | 9.55 | |
Year ended May 31, 2015 | | $ | 10.00 | | | | (0.03 | )4 | | | 0.08 | | | | (0.05 | ) | | | (0.08 | ) | | $ | 9.92 | |
Year ended May 31, 2014 | | $ | 10.76 | | | | 0.03 | 4 | | | (0.21 | ) | | | (0.04 | ) | | | (0.54 | ) | | $ | 10.00 | |
Year ended May 31, 2013 | | $ | 11.59 | | | | 0.04 | | | | (0.37 | ) | | | (0.15 | ) | | | (0.35 | ) | | $ | 10.76 | |
Year ended May 31, 2012 | | $ | 10.77 | | | | 0.19 | | | | 1.00 | | | | (0.27 | ) | | | (0.10 | ) | | $ | 11.59 | |
Year ended May 31, 2011 | | $ | 10.21 | | | | 0.24 | 4 | | | 0.48 | | | | (0.16 | ) | | | 0.00 | | | $ | 10.77 | |
Administrator Class | | | | | | | | | | | | | | | | | | | | | | | | |
Six months ended November 30, 2015 (unaudited) | | $ | 10.15 | | | | 0.08 | | | | (0.39 | ) | | | (0.08 | ) | | | 0.00 | | | $ | 9.76 | |
Year ended May 31, 2015 | | $ | 10.17 | | | | 0.10 | 4 | | | 0.06 | | | | (0.10 | ) | | | (0.08 | ) | | $ | 10.15 | |
Year ended May 31, 2014 | | $ | 10.90 | | | | 0.13 | 4 | | | (0.22 | ) | | | (0.10 | ) | | | (0.54 | ) | | $ | 10.17 | |
Year ended May 31, 2013 | | $ | 11.71 | | | | 0.15 | 4 | | | (0.37 | ) | | | (0.24 | ) | | | (0.35 | ) | | $ | 10.90 | |
Year ended May 31, 2012 | | $ | 10.89 | | | | 0.39 | 4 | | | 0.92 | | | | (0.39 | ) | | | (0.10 | ) | | $ | 11.71 | |
Year ended May 31, 2011 | | $ | 10.30 | | | | 0.33 | | | | 0.51 | | | | (0.25 | ) | | | 0.00 | | | $ | 10.89 | |
| 1 | Includes net expenses allocated from the affiliated Master Portfolios in which the Fund invests. |
| 2 | Total return calculations do not include any sales charges. Returns for periods of less than one year are not annualized. |
| 3 | Portfolio turnover rate is calculated by multiplying the Fund’s investment percentage in the affiliated Master Portfolio by the affiliated Master Portfolio’s portfolio turnover rate. |
| 4 | Calculated based upon average shares outstanding |
The accompanying notes are an integral part of these financial statements.
| | | | | | |
| Financial highlights | | Wells Fargo Income Funds | | | 19 | |
| | | | | | | | | | | | | | | | | | | | | | |
| Ratio to average net assets (annualized) | | | Total
return2 | | | Portfolio
turnover
rate3 | | | Net assets at
end of period
(000s omitted) | |
Net investment
income (loss)1 | | | Gross
expenses1 | | | Net
expenses1 | | | | |
| | | | | | | | | | | | | | | | | | | | | | |
| | 1.34 | % | | | 1.23 | % | | | 0.85 | % | | | (3.18 | )% | | | 9 | % | | $ | 15,469 | |
| | 0.47 | % | | | 1.31 | % | | | 0.85 | % | | | 1.24 | % | | | 57 | % | | $ | 12,977 | |
| | 0.96 | % | | | 1.20 | % | | | 0.85 | % | | | (0.76 | )% | | | 9 | % | | $ | 15,415 | |
| | 1.09 | % | | | 1.08 | % | | | 0.85 | % | | | (2.27 | )% | | | 15 | % | | $ | 28,298 | |
| | 2.42 | % | | | 1.11 | % | | | 0.85 | % | | | 12.02 | % | | | 23 | % | | $ | 36,935 | |
| | 2.90 | % | | | 1.04 | % | | | 0.85 | % | | | 7.59 | % | | | 19 | % | | $ | 30,581 | |
| | | | | | | | | | | | | | | | | | | | | | |
| | 1.19 | % | | | 1.98 | % | | | 1.60 | % | | | (3.50 | )% | | | 9 | % | | $ | 48 | |
| | (0.30 | )% | | | 2.05 | % | | | 1.60 | % | | | 0.45 | % | | | 57 | % | | $ | 95 | |
| | 0.09 | % | | | 1.95 | % | | | 1.60 | % | | | (1.53 | )% | | | 9 | % | | $ | 190 | |
| | 0.29 | % | | | 1.83 | % | | | 1.60 | % | | | (3.02 | )% | | | 15 | % | | $ | 571 | |
| | 1.69 | % | | | 1.84 | % | | | 1.60 | % | | | 11.25 | % | | | 23 | % | | $ | 899 | |
| | 1.83 | % | | | 1.79 | % | | | 1.60 | % | | | 7.11 | % | | | 19 | % | | $ | 1,570 | |
| | | | | | | | | | | | | | | | | | | | | | |
| | 0.75 | % | | | 1.98 | % | | | 1.60 | % | | | (3.50 | )% | | | 9 | % | | $ | 7,796 | |
| | (0.33 | )% | | | 2.06 | % | | | 1.60 | % | | | 0.46 | % | | | 57 | % | | $ | 7,471 | |
| | 0.29 | % | | | 1.95 | % | | | 1.60 | % | | | (1.46 | )% | | | 9 | % | | $ | 9,095 | |
| | 0.39 | % | | | 1.83 | % | | | 1.60 | % | | | (3.01 | )% | | | 15 | % | | $ | 13,774 | |
| | 1.68 | % | | | 1.86 | % | | | 1.60 | % | | | 11.24 | % | | | 23 | % | | $ | 15,631 | |
| | 2.27 | % | | | 1.79 | % | | | 1.60 | % | | | 7.11 | % | | | 19 | % | | $ | 14,074 | |
| | | | | | | | | | | | | | | | | | | | | | |
| | 1.75 | % | | | 1.17 | % | | | 0.60 | % | | | (3.08 | )% | | | 9 | % | | $ | 10,616 | |
| | 0.99 | % | | | 1.27 | % | | | 0.60 | % | | | 1.56 | % | | | 57 | % | | $ | 10,679 | |
| | 1.31 | % | | | 1.14 | % | | | 0.60 | % | | | (0.51 | )% | | | 9 | % | | $ | 6,320 | |
| | 1.34 | % | | | 1.02 | % | | | 0.60 | % | | | (2.08 | )% | | | 15 | % | | $ | 8,271 | |
| | 3.42 | % | | | 1.01 | % | | | 0.60 | % | | | 12.26 | % | | | 23 | % | | $ | 9,833 | |
| | 3.32 | % | | | 0.98 | % | | | 0.60 | % | | | 8.22 | % | | | 19 | % | | $ | 35,427 | |
The accompanying notes are an integral part of these financial statements.
| | | | |
| 20 | | Wells Fargo Income Funds | | Notes to financial statements (unaudited) |
1. ORGANIZATION
Wells Fargo Funds Trust (the “Trust”), a Delaware statutory trust organized on March 10, 1999, is an open-end management investment company registered under the Investment Company Act of 1940, as amended (the “1940 Act”). As an investment company, the Trust follows the accounting and reporting guidance in Financial Accounting Standards Board (“FASB”) Accounting Standards Codification Topic 946, Financial Services—Investment Companies. These financial statements report on the following funds: Wells Fargo Core Bond Fund (“Core Bond Fund”) and Wells Fargo Real Return Fund (“Real Return Fund”) (each, a “Fund”, collectively, the “Funds”). Each Fund is a diversified series of the Trust.
After the close of business on October 23, 2015, Investor Class shares became Class A shares in a tax-free conversion. Investor Class shareholders of Core Bond Fund received Class A shares at a value equal to the value of their Investor Class shares immediately prior to the conversion. Investor Class shares are no longer offered by Core Bond Fund.
Each Fund seeks to achieve its investment objective by investing all investable assets in a separate diversified portfolio (an “affiliated Master Portfolio”) of Wells Fargo Master Trust, a registered open-end management investment company. Each affiliated Master Portfolio directly acquires portfolio securities, and a Fund investing in an affiliated Master Portfolio acquires an indirect interest in those securities. Each Fund accounts for its investment in the affiliated Master Portfolios as partnership investments and records on a daily basis its share of the affiliated Master Portfolio’s income, expense and realized and unrealized gains and losses. The financial statements of each affiliated Master Portfolio for the six months ended November 30, 2015 are included in this report and should be read in conjunction with each Fund’s financial statements. As of November 30, 2015, Core Bond Fund owned 88% of Wells Fargo Core Bond Portfolio and Real Return Fund owned 66% of Wells Fargo Real Return Portfolio.
2. SIGNIFICANT ACCOUNTING POLICIES
The following significant accounting policies, which are consistently followed in the preparation of the financial statements of each Fund, are in conformity with U.S. generally accepted accounting principles which require management to make estimates and assumptions that affect the reported amounts of assets and liabilities, disclosure of contingent assets and liabilities at the date of the financial statements, and the reported amounts of revenues and expenses during the reporting period. Actual results could differ from those estimates.
Securities valuation
All investments are valued each business day as of the close of regular trading on the New York Stock Exchange (generally 4 p.m. Eastern Time).
An investment in the affiliated Master Portfolio is valued daily based on the Fund’s proportionate share of the affiliated Master Portfolio’s net assets, which are also valued daily. Securities held in the affiliated Master Portfolios are valued as discussed in the Notes to Financial Statements of the affiliated Master Portfolios, which are included elsewhere in this report.
Security transactions and income recognition
Securities transactions are recorded on a trade date basis in each affiliated Master Portfolio. Realized gains or losses in each affiliated Master Portfolio are recorded on the basis of identified cost.
Interest income is accrued daily and bond discounts are accreted and premiums are amortized daily based on the effective interest method by each affiliated Master Portfolio. To the extent debt obligations are placed on non-accrual status, any related interest income may be reduced by writing off interest receivables when the collection of all or a portion of interest has become doubtful based on consistently applied procedures. If the issuer subsequently resumes interest payments or when the collectability of interest is reasonably assured, the debt obligation is removed from non-accrual status.
Dividend income in each affiliated Master Portfolio is recognized on the ex-dividend date, except for certain dividends from foreign securities which are recorded as soon as the custodian verifies the ex-dividend date. Dividend income from foreign securities in each affiliated Master Portfolio is recorded net of foreign taxes withheld where recovery of such taxes is not assured.
Each Fund records daily its proportionate share of each affiliated Master Portfolio’s interest and dividend income and realized and unrealized gains or losses.
Distributions to shareholders
For Core Bond Fund, distributions to shareholders from net investment income are accrued daily and paid monthly. For Real Return Fund, distributions to shareholders from net investment income are recorded on the ex-dividend date.
| | | | | | |
| Notes to financial statements (unaudited) | | Wells Fargo Income Funds | | | 21 | |
Distributions from net realized gains, if any, are recorded on the ex-dividend date. Such distributions are determined in conformity with federal income tax regulations, which may differ in amount or character from net investment income and realized gains recognized for purposes of U.S. generally accepted accounting principles.
Federal and other taxes
Each Fund is treated as a separate entity for federal income tax purposes. Each Fund intends to continue to qualify as a regulated investment company by distributing substantially all of its investment company taxable income and any net realized capital gains (after reduction for capital loss carryforwards) sufficient to relieve it from all, or substantially all, federal income taxes. Accordingly, no provision for federal income taxes was required.
Each Fund’s income and federal excise tax returns and all financial records supporting those returns for the prior three fiscal years are subject to examination by the federal and Delaware revenue authorities. Management has analyzed each Fund’s tax positions taken on federal, state, and foreign tax returns for all open tax years and does not believe that there are any uncertain tax positions that require recognition of a tax liability.
Class allocations
The separate classes of shares offered by each Fund differ principally in applicable sales charges, distribution, shareholder servicing, and administration fees. Class specific expenses are charged directly to that share class. Investment income, common expenses, and realized and unrealized gains (losses) on investments are allocated daily to each class of shares based on the relative proportion of net assets of each class.
3. FAIR VALUATION MEASUREMENTS
Fair value measurements of investments are determined within a framework that has established a fair value hierarchy based upon the various data inputs utilized in determining the value of each Fund’s investments. The three-level hierarchy gives the highest priority to unadjusted quoted prices in active markets for identical assets or liabilities (Level 1) and the lowest priority to significant unobservable inputs (Level 3). Each Fund’s investments are classified within the fair value hierarchy based on the lowest level of input that is significant to the fair value measurement. The inputs are summarized into three broad levels as follows:
| n | | Level 1 – quoted prices in active markets for identical securities |
| n | | Level 2 – other significant observable inputs (including quoted prices for similar securities, interest rates, prepayment speeds, credit risk, use of amortized cost, etc.) |
| n | | Level 3 – significant unobservable inputs (including the Fund’s own assumptions in determining the fair value of investments) |
The inputs or methodologies used for valuing investments in securities are not necessarily an indication of the risk associated with investing in those securities.
At November 30, 2015, each Fund’s investments in an affiliated Master Portfolio carried at fair value were designated as Level 2 inputs.
Further details on the investments of the affiliated Master Portfolios can be found in the Portfolio of Investments or Summary Portfolio of Investments of each affiliated Master Portfolio which is contained elsewhere in this report.
The Funds recognize transfers between levels within the fair value hierarchy at the end of the reporting period. At November 30, 2015, the Funds did not have any transfers into/out of Level 1, Level 2, or Level 3.
4. TRANSACTIONS WITH AFFILIATES
Management fee
Wells Fargo Funds Management (“Funds Management”), an indirect wholly owned subsidiary of Wells Fargo & Company (“Wells Fargo”), is the manager of each Fund and provides advisory and fund-level administrative services under an investment management agreement. Under the investment management agreement, Funds Management is responsible for, among other services, implementing the investment objectives and strategies of each Fund, supervising the applicable subadviser, providing fund-level administrative services in connection with each Fund’s operations, and providing any other fund-level administrative services reasonably necessary for the operation of each Fund. As long as each Fund continues to invest substantially all of its assets in a single affiliated Master Portfolio, each Fund pays Funds Management an investment management fee only for fund-level administrative services. As compensation for its services under the investment management agreement, Funds Management is entitled to receive an annual management fee starting at 0.05% and
| | | | |
| 22 | | Wells Fargo Income Funds | | Notes to financial statements (unaudited) |
declining to 0.03% as the average daily net assets of each Fund increase. For the six months ended November 30 ,2015, the management fee was equivalent to an annual rate of 0.05% of each Fund’s average daily net assets.
Prior to July 1, 2015, fund-level administrative services were provided by Funds Management under a separate administration agreement at an annual fee which started at 0.05% and declined to 0.03% as the average daily net assets of each Fund increased. For financial statement purposes, the fund-level administration fee under the prior administration agreement for each Fund has been included in management fee on the Statements of Operations.
Funds Management also serves as the adviser to each affiliated Master Portfolio and is entitled to receive a fee from each affiliated Master Portfolio for those services.
Administration fees
Under a class-level administration agreement, Funds Management provides class-level administrative services to each Fund, which includes paying fees and expenses for services provided by the transfer agent, sub-transfer agents, omnibus account servicers and record-keepers. As compensation for its services under the class-level administration agreement, Funds Management receives an annual fee which is calculated based on the average daily net assets of each class as follows:
| | | | |
| | | Class-level
administration fee | |
Class A, Class B, Class C, Class R | | | 0.16 | % |
Class R4, Institutional Class | | | 0.08 | |
Class R6 | | | 0.03 | |
Administrator Class | | | 0.10 | |
Investor Class | | | 0.19 | |
Funds Management has contractually waived and/or reimbursed management and administration fees to the extent necessary to maintain certain net operating expense ratios for the Funds. Waiver of fees and/or reimbursement of expenses by Funds Management were made first from fund level expenses on a proportionate basis and then from class specific expenses. Funds Management has committed through September 30, 2016 to waive fees and/or reimburse expenses to the extent necessary to cap each Fund’s expenses as follows:
| | | | | | | | | | | | | | | | | | | | | | | | | | | | | | | | |
| | | Class A | | | Class B | | | Class C | | | Class R | | | Class R4 | | | Class R6 | | | Administrator
Class | | | Institutional
Class | |
Core Bond Fund | | | 0.78% | | | | 1.53% | | | | 1.53% | | | | 1.03% | | | | 0.52% | | | | 0.37% | | | | 0.70% | | | | 0.42% | |
Real Return Fund | | | 0.85% | | | | 1.60% | | | | 1.60% | | | | N/A | | | | N/A | | | | N/A | | | | 0.60% | | | | N/A | |
After the expiration date, each expense cap may be increased or the commitment to maintain the cap may be terminated only with the approval of the Board of Trustees.
Distribution fees
The Trust has adopted a Distribution Plan for Class B, Class C and Class R shares of the applicable Funds pursuant to Rule 12b-1 under the 1940 Act. Distribution fees are charged to the Class B, Class C and Class R shares and paid to Wells Fargo Funds Distributor, LLC (“Funds Distributor”), the principal underwriter of each Fund, at an annual rate of 0.75% of the average daily net assets of Class B and Class C shares and 0.25% of the average daily net assets of Class R shares.
In addition, Funds Distributor is entitled to receive the front-end sales charge from the purchase of Class A shares and a contingent deferred sales charge on the redemption of certain Class A shares. Funds Distributor is also entitled to receive the contingent deferred sales charges from redemptions of Class B and Class C shares. For the six months ended November 30, 2015, Funds Distributor received the following amounts in front-end sales charges and contingent deferred sales charges.
| | | | | | | | |
| | | Front-end
sales charges | | | Contingent deferred sales charges | |
| | | Class A | | | Class C | |
Core Bond Fund | | $ | 430 | | | $ | 0 | |
Real Return Fund | | | 5,960 | | | | 36 | |
| | | | | | |
| Notes to financial statements (unaudited) | | Wells Fargo Income Funds | | | 23 | |
Shareholder servicing fees
The Trust has entered into contracts with one or more shareholder servicing agents, whereby Class A, Class B, Class C, Class R, Administrator Class, and Investor Class of each applicable Fund is charged a fee at an annual rate of 0.25% of the average daily net assets of each respective class. Class R4 of the Fund is charged a fee at an annual rate of 0.10% of its average daily net assets.
A portion of these total shareholder servicing fees were paid to affiliates of Wells Fargo.
5. INVESTMENT PORTFOLIO TRANSACTIONS
Purchases and sales of investments, excluding short-term securities, for the six months ended November 30, 2015 were as follows:
| | | | | | | | | | | | | | | | |
| | | Purchases at cost* | | | Sales proceeds* | |
| | | U.S.
government | | | Non-U.S.
government | | | U.S.
government | | | Non-U.S.
government | |
Core Bond Fund | | $ | 9,306,054,789 | | | $ | 1,310,251,278 | | | $ | 9,275,273,641 | | | $ | 1,259,925,043 | |
Real Return Fund | | | 3,589,526 | | | | 1,870,040 | | | | 2,060,371 | | | | 865,571 | |
| * | The Funds seek to achieve their investment objective by investing all of its investable assets in a single affiliated Master Portfolio. Purchases and sales have been calculated by multiplying each Fund’s ownership percentage of the respective affiliated Master Portfolio by the affiliated Master Portfolio’s purchases and sales. |
6. BANK BORROWINGS
The Trust (excluding the money market funds and certain other funds) and Wells Fargo Variable Trust are parties to a $200,000,000 revolving credit agreement whereby each Fund is permitted to use bank borrowings for temporary or emergency purposes, such as to fund shareholder redemption requests. Interest under the credit agreement is charged to each Fund based on a borrowing rate equal to the higher of the Federal Funds rate in effect on that day plus 1.25% or the overnight LIBOR rate in effect on that day plus 1.25%. In addition, an annual commitment fee equal to 0.20% of the unused balance is allocated to each participating fund. Prior to September 1, 2015, the revolving credit agreement amount was $150,000,000 and the annual commitment fee was equal to 0.10% of the unused balance which was allocated to each participating fund. For the six months ended November 30, 2015, the Core Bond Fund and Real Return Fund paid $2,381 and $23, respectively, in commitment fees.
For the six months ended November 30, 2015, there were no borrowings by the Funds under the agreement.
7. INDEMNIFICATION
Under the Trust’s organizational documents, the officers and Trustees have been granted certain indemnification rights against certain liabilities that may arise out of performance of their duties to the Trust. Additionally, in the normal course of business, the Trust may enter into contracts with service providers that contain a variety of indemnification clauses. The Trust’s maximum exposure under these arrangements is dependent on future claims that may be made against the Funds and, therefore, cannot be estimated.
8. REDEMPTION IN-KIND
After the close of business on October 29, 2015, Core Bond Fund redeemed assets through an in-kind redemption. In the redemption transaction, Core Bond Fund issued securities with a value of $223,656,162 and cash in the amount of $20,349,815. Core Bond Fund recognized losses in the amount of $525,821, which are reflected on the Statements of Operations. The redemption in-kind by a shareholder of Class R6 represented 7.17% of Core Bond Fund and is reflected on the Statements of Changes in Net Assets.
| | | | |
| 24 | | Wells Fargo Income Funds | | Notes to financial statements (unaudited) |
9. SUBSEQUENT DISTRIBUTIONS
On December 9, 2015, Real Return Fund declared distributions from capital gains to shareholders of record on December 8, 2015. The per share amounts payable on December 10, 2015 were as follows:
| | | | | | | | |
| | | Short-term capital gains | | | Long-term capital gains | |
Class A | | $ | 0.02136 | | | $ | 0.11947 | |
Class B | | | 0.02136 | | | | 0.11947 | |
Class C | | | 0.02136 | | | | 0.11947 | |
Administrator Class | | | 0.02136 | | | | 0.11947 | |
These distributions are not reflected in the accompanying financial statements. The final determination of the source of all distributions is subject to change and made after the tax year-end of each Fund.
| | | | | | |
| Summary portfolio of investments—November 30, 2015 (unaudited) | | Wells Fargo Income Funds | | | 25 | |
CORE BOND PORTFOLIO
The Summary portfolio of investments shows the 50 largest portfolio holdings in unaffiliated issuers and any holdings exceeding 1% of the total net assets as of the report date. The remaining securities held are grouped as “Other securities” in each category.
| | | | | | | | | | | | | | | | | | | | |
| Security name | | Interest rate | | | Maturity date | | | Principal | | | Value | | | Percent of
net assets | |
| | | | | |
Agency Securities: 31.34% | | | | | | | | | | | | | | | | | | | | |
FHLMC | | | 0.90-7.00 | % | | | 8-1-2017 to 12-10-2045 | | | $ | 188,381,872 | | | $ | 197,942,749 | | | | 5.42 | % |
FHLMC | | | 3.00 | | | | 2-15-2045 | | | | 20,186,411 | | | | 20,432,393 | | | | 0.56 | |
FHLMC | | | 3.50 | | | | 12-1-2043 | | | | 23,375,730 | | | | 24,264,399 | | | | 0.66 | |
FHLMC %% | | | 3.50 | | | | 1-14-2046 | | | | 31,900,000 | | | | 32,901,858 | | | | 0.90 | |
FHLMC | | | 4.00 | | | | 8-1-2044 | | | | 15,390,799 | | | | 16,470,560 | | | | 0.45 | |
FHLMC | | | 4.50 | | | | 8-1-2020 | | | | 13,649,699 | | | | 14,164,647 | | | | 0.39 | |
FHLMC | | | 5.00 | | | | 8-1-2039 | | | | 11,904,846 | | | | 13,373,077 | | | | 0.37 | |
FHLMC Series 300 Class 300 | | | 3.00 | | | | 1-15-2043 | | | | 19,758,962 | | | | 19,895,089 | | | | 0.54 | |
FHLMC Series 4483 Class PA | | | 2.50 | | | | 6-15-2045 | | | | 19,188,169 | | | | 19,455,398 | | | | 0.53 | |
FNMA | | | 0.00-8.19 | | | | 4-1-2017 to 12-10-2045 | | | | 347,881,570 | | | | 366,292,589 | | | | 9.98 | |
FNMA | | | 3.00 | | | | 10-25-2042 | | | | 17,545,991 | | | | 17,668,882 | | | | 0.48 | |
FNMA | | | 3.00 | | | | 4-1-2043 | | | | 13,319,454 | | | | 13,413,363 | | | | 0.37 | |
FNMA | | | 3.50 | | | | 6-1-2045 | | | | 18,521,741 | | | | 19,232,513 | | | | 0.53 | |
FNMA %% | | | 3.50 | | | | 1-14-2046 | | | | 38,300,000 | | | | 39,582,152 | | | | 1.08 | |
FNMA | | | 4.00 | | | | 7-1-2029 | | | | 16,926,160 | | | | 18,118,228 | | | | 0.50 | |
FNMA | | | 4.00 | | | | 2-1-2041 | | | | 13,768,411 | | | | 14,683,620 | | | | 0.40 | |
FNMA | | | 4.00 | | | | 12-1-2044 | | | | 13,461,521 | | | | 14,433,272 | | | | 0.39 | |
FNMA | | | 4.00 | | | | 10-1-2045 | | | | 14,357,970 | | | | 15,312,521 | | | | 0.42 | |
FNMA | | | 4.50 | | | | 2-1-2044 | | | | 15,370,157 | | | | 16,895,119 | | | | 0.46 | |
GNMA %% | | | 3.50 | | | | 12-17-2045 | | | | 58,500,000 | | | | 61,108,503 | | | | 1.67 | |
GNMA ± | | | 2.50 | | | | 5-20-2045 | | | | 14,494,986 | | | | 14,741,940 | | | | 0.40 | |
GNMA | | | 2.50-4.50 | | | | 4-15-2045 to 12-20-2045 | | | | 35,819,634 | | | | 38,272,470 | | | | 1.07 | |
GNMA %% | | | 3.00 | | | | 12-17-2045 | | | | 49,600,000 | | | | 50,433,131 | | | | 1.38 | |
GNMA %% | | | 3.50 | | | | 1-21-2046 | | | | 52,700,000 | | | | 54,911,957 | | | | 1.50 | |
GNMA %% | | | 4.00 | | | | 12-17-2045 | | | | 14,800,000 | | | | 15,722,978 | | | | 0.43 | |
Other securities | | | | | | | | | | | | | | | 16,881,810 | | | | 0.46 | |
| | | | | |
Total Agency Securities (Cost $1,146,474,469) | | | | | | | | | | | | | | | 1,146,605,218 | | | | 31.34 | |
| | | | | | | | | | | | | | | | | | | | |
| | | | | |
Asset-Backed Securities: 10.69% | | | | | | | | | | | | | | | | | | | | |
Capital Auto Receivables Asset Trust | | | 1.09-2.01 | | | | 3-20-2018 to 7-20-2020 | | | | 79,419,000 | | | | 79,311,438 | | | | 2.15 | |
SLM Student Loan Trust | | | 0.36-4.37 | | | | 1-25-2018 to 2-15-2046 | | | | 118,260,379 | | | | 114,446,453 | | | | 3.13 | |
Other securities | | | | | | | | | | | | | | | 197,416,052 | | | | 5.41 | |
| | | | | |
Total Asset-Backed Securities (Cost $394,809,590) | | | | | | | | | | | | | | | 391,173,943 | | | | 10.69 | |
| | | | | | | | | | | | | | | | | | | | |
| | | | | |
Corporate Bonds and Notes: 17.09% | | | | | | | | | | | | | | | | | | | | |
| | | | | |
Consumer Discretionary: 1.56% | | | | | | | | | | | | | | | | | | | | |
| | | | | |
| Automobiles: 0.38% | | | | | | | | | | | | | | | | | | | | |
Other securities | | | | | | | | | | | | | | | 13,803,360 | | | | 0.38 | |
| | | | | | | | | | | | | | | | | | | | |
| | | | | |
| Internet & Catalog Retail: 0.03% | | | | | | | | | | | | | | | | | | | | |
Other securities | | | | | | | | | | | | | | | 904,402 | | | | 0.03 | |
| | | | | | | | | | | | | | | | | | | | |
| | | | | |
| Media: 1.01% | | | | | | | | | | | | | | | | | | | | |
Other securities | | | | | | | | | | | | | | | 37,108,689 | | | | 1.01 | |
| | | | | | | | | | | | | | | | | | | | |
The accompanying notes are an integral part of these financial statements.
| | | | |
| 26 | | Wells Fargo Income Funds | | Summary portfolio of investments—November 30, 2015 (unaudited) |
CORE BOND PORTFOLIO
| | | | | | | | | | | | | | | | | | | | |
| Security name | | Interest rate | | | Maturity date | | | Principal | | | Value | | | Percent of
net assets | |
| | | | | |
| Multiline Retail: 0.04% | | | | | | | | | | | | | | | | | | | | |
Other securities | | | | | | | | | | | | | | $ | 1,490,024 | | | | 0.04 | % |
| | | | | | | | | | | | | | | | | | | | |
| | | | | |
| Specialty Retail: 0.05% | | | | | | | | | | | | | | | | | | | | |
Other securities | | | | | | | | | | | | | | | 1,871,533 | | | | 0.05 | |
| | | | | | | | | | | | | | | | | | | | |
| | | | | |
| Textiles, Apparel & Luxury Goods: 0.05% | | | | | | | | | | | | | | | | | | | | |
Other securities | | | | | | | | | | | | | | | 1,923,346 | | | | 0.05 | |
| | | | | | | | | | | | | | | | | | | | |
| | | | | |
Consumer Staples: 1.01% | | | | | | | | | | | | | | | | | | | | |
| | | | | |
| Beverages: 0.05% | | | | | | | | | | | | | | | | | | | | |
Other securities | | | | | | | | | | | | | | | 1,894,207 | | | | 0.05 | |
| | | | | | | | | | | | | | | | | | | | |
| | | | | |
| Food & Staples Retailing: 0.07% | | | | | | | | | | | | | | | | | | | | |
Other securities | | | | | | | | | | | | | | | 2,509,956 | | | | 0.07 | |
| | | | | | | | | | | | | | | | | | | | |
| | | | | |
| Food Products: 0.75% | | | | | | | | | | | | | | | | | | | | |
Other securities | | | | | | | | | | | | | | | 27,602,973 | | | | 0.75 | |
| | | | | | | | | | | | | | | | | | | | |
| | | | | |
| Tobacco: 0.14% | | | | | | | | | | | | | | | | | | | | |
Other securities | | | | | | | | | | | | | | | 4,986,445 | | | | 0.14 | |
| | | | | | | | | | | | | | | | | | | | |
| | | | | |
Energy: 1.81% | | | | | | | | | | | | | | | | | | | | |
| | | | | |
| Energy Equipment & Services: 0.10% | | | | | | | | | | | | | | | | | | | | |
Other securities | | | | | | | | | | | | | | | 3,773,695 | | | | 0.10 | |
| | | | | | | | | | | | | | | | | | | | |
| | | | | |
| Oil, Gas & Consumable Fuels: 1.71% | | | | | | | | | | | | | | | | | | | | |
Other securities | | | | | | | | | | | | | | | 62,432,630 | | | | 1.71 | |
| | | | | | | | | | | | | | | | | | | | |
| | | | | |
Financials: 6.34% | | | | | | | | | | | | | | | | | | | | |
| | | | | |
| Banks: 2.16% | | | | | | | | | | | | | | | | | | | | |
Other securities | | | | | | | | | | | | | | | 78,863,259 | | | | 2.16 | |
| | | | | | | | | | | | | | | | | | | | |
| | | | | |
| Capital Markets: 1.24% | | | | | | | | | | | | | | | | | | | | |
Morgan Stanley | | | 4.00 | % | | | 7-23-2025 | | | $ | 13,454,000 | | | | 13,976,096 | | | | 0.38 | |
Other securities | | | | | | | | | | | | | | | 31,302,504 | | | | 0.86 | |
| | | | | |
| | | | | | | | | | | | | | | 45,278,600 | | | | 1.24 | |
| | | | | | | | | | | | | | | | | | | | |
| | | | | |
| Consumer Finance: 0.79% | | | | | | | | | | | | | | | | | | | | |
Other securities | | | | | | | | | | | | | | | 28,902,001 | | | | 0.79 | |
| | | | | | | | | | | | | | | | | | | | |
| | | | | |
| Diversified Financial Services: 0.23% | | | | | | | | | | | | | | | | | | | | |
Other securities | | | | | | | | | | | | | | | 8,535,009 | | | | 0.23 | |
| | | | | | | | | | | | | | | | | | | | |
| | | | | |
| Insurance: 0.91% | | | | | | | | | | | | | | | | | | | | |
Other securities | | | | | | | | | | | | | | | 33,263,028 | | | | 0.91 | |
| | | | | | | | | | | | | | | | | | | | |
| | | | | |
| REITs: 1.01% | | | | | | | | | | | | | | | | | | | | |
Other securities | | | | | | | | | | | | | | | 37,137,541 | | | | 1.01 | |
| | | | | | | | | | | | | | | | | | | | |
The accompanying notes are an integral part of these financial statements.
| | | | | | |
| Summary portfolio of investments—November 30, 2015 (unaudited) | | Wells Fargo Income Funds | | | 27 | |
CORE BOND PORTFOLIO
| | | | | | | | | | | | | | |
| Security name | | | | | | | | Value | | | Percent of
net assets | |
| | | | | |
Health Care: 1.25% | | | | | | | | | | | | | | |
| | | | | |
| Biotechnology: 0.91% | | | | | | | | | | | | | | |
Other securities | | | | | | | | $ | 33,306,145 | | | | 0.91 | % |
| | | | | | | | | | | | | | |
| | | | | |
| Health Care Providers & Services: 0.04% | | | | | | | | | | | | | | |
Other securities | | | | | | | | | 1,429,515 | | | | 0.04 | |
| | | | | | | | | | | | | | |
| | | | | |
| Pharmaceuticals: 0.30% | | | | | | | | | | | | | | |
Other securities | | | | | | | | | 11,082,776 | | | | 0.30 | |
| | | | | | | | | | | | | | |
| | | | | |
Industrials: 1.02% | | | | | | | | | | | | | | |
| | | | | |
| Aerospace & Defense: 0.61% | | | | | | | | | | | | | | |
Other securities | | | | | | | | | 22,258,727 | | | | 0.61 | |
| | | | | | | | | | | | | | |
| | | | | |
| Machinery: 0.05% | | | | | | | | | | | | | | |
Other securities | | | | | | | | | 1,759,143 | | | | 0.05 | |
| | | | | | | | | | | | | | |
| | | | | |
| Professional Services: 0.01% | | | | | | | | | | | | | | |
Other securities | | | | | | | | | 533,651 | | | | 0.01 | |
| | | | | | | | | | | | | | |
| | | | | |
| Road & Rail: 0.29% | | | | | | | | | | | | | | |
Other securities | | | | | | | | | 10,521,512 | | | | 0.29 | |
| | | | | | | | | | | | | | |
| | | | | |
| Transportation Infrastructure: 0.06% | | | | | | | | | | | | | | |
Other securities | | | | | | | | | 2,264,467 | | | | 0.06 | |
| | | | | | | | | | | | | | |
| | | | | |
Information Technology: 1.49% | | | | | | | | | | | | | | |
| | | | | |
| Electronic Equipment, Instruments & Components: 0.04% | | | | | | | | | | | | | | |
Other securities | | | | | | | | | 1,461,020 | | | | 0.04 | |
| | | | | | | | | | | | | | |
| | | | | |
| IT Services: 0.50% | | | | | | | | | | | | | | |
Other securities | | | | | | | | | 18,223,030 | | | | 0.50 | |
| | | | | | | | | | | | | | |
| | | | | |
| Semiconductors & Semiconductor Equipment: 0.05% | | | | | | | | | | | | | | |
Other securities | | | | | | | | | 1,802,665 | | | | 0.05 | |
| | | | | | | | | | | | | | |
| | | | | |
| Software: 0.60% | | | | | | | | | | | | | | |
Other securities | | | | | | | | | 21,998,934 | | | | 0.60 | |
| | | | | | | | | | | | | | |
| | | | | |
| Technology Hardware, Storage & Peripherals: 0.30% | | | | | | | | | | | | | | |
Other securities | | | | | | | | | 11,029,267 | | | | 0.30 | |
| | | | | | | | | | | | | | |
| | | | | |
Materials: 0.21% | | | | | | | | | | | | | | |
| | | | | |
| Chemicals: 0.10% | | | | | | | | | | | | | | |
Other securities | | | | | | | | | 3,461,538 | | | | 0.10 | |
| | | | | | | | | | | | | | |
| | | | | |
| Metals & Mining: 0.02% | | | | | | | | | | | | | | |
Other securities | | | | | | | | | 850,298 | | | | 0.02 | |
| | | | | | | | | | | | | | |
The accompanying notes are an integral part of these financial statements.
| | | | |
| 28 | | Wells Fargo Income Funds | | Summary portfolio of investments—November 30, 2015 (unaudited) |
CORE BOND PORTFOLIO
| | | | | | | | | | | | | | | | | | | | |
| Security name | | Interest rate | | | Maturity date | | | Principal | | | Value | | | Percent of
net assets | |
| | | | | |
| Paper & Forest Products: 0.09% | | | | | | | | | | | | | | | | | | | | |
Other securities | | | | | | | | | | | | | | $ | 3,191,221 | | | | 0.09 | % |
| | | | | | | | | | | | | | | | | | | | |
| | | | | |
Telecommunication Services: 0.92% | | | | | | | | | | | | | | | | | | | | |
| | | | | |
| Diversified Telecommunication Services: 0.92% | | | | | | | | | | | | | | | | | | | | |
Other securities | | | | | | | | | | | | | | | 33,506,725 | | | | 0.92 | |
| | | | | | | | | | | | | | | | | | | | |
| | | | | |
Utilities: 1.48% | | | | | | | | | | | | | | | | | | | | |
| | | | | |
| Electric Utilities: 0.83% | | | | | | | | | | | | | | | | | | | | |
Other securities | | | | | | | | | | | | | | | 30,444,217 | | | | 0.83 | |
| | | | | | | | | | | | | | | | | | | | |
| | | | | |
| Multi-Utilities: 0.65% | | | | | | | | | | | | | | | | | | | | |
Other securities | | | | | | | | | | | | | | | 23,695,295 | | | | 0.65 | |
| | | | | | | | | | | | | | | | | | | | |
| | | | | |
Total Corporate Bonds and Notes (Cost $630,838,447) | | | | | | | | | | | | | | | 625,100,844 | | | | 17.09 | |
| | | | | | | | | | | | | | | | | | | | |
| | | | | |
Municipal Obligations: 0.94% | | | | | | | | | | | | | | | | | | | | |
| | | | | |
| California: 0.26% | | | | | | | | | | | | | | | | | | | | |
Other securities | | | | | | | | | | | | | | | 9,548,468 | | | | 0.26 | |
| | | | | | | | | | | | | | | | | | | | |
| | | | | |
| Nevada: 0.19% | | | | | | | | | | | | | | | | | | | | |
Other securities | | | | | | | | | | | | | | | 7,067,845 | | | | 0.19 | |
| | | | | | | | | | | | | | | | | | | | |
| | | | | |
| New Jersey: 0.17% | | | | | | | | | | | | | | | | | | | | |
Other securities | | | | | | | | | | | | | | | 6,299,380 | | | | 0.17 | |
| | | | | | | | | | | | | | | | | | | | |
| | | | | |
| New York: 0.13% | | | | | | | | | | | | | | | | | | | | |
Other securities | | | | | | | | | | | | | | | 4,519,967 | | | | 0.13 | |
| | | | | | | | | | | | | | | | | | | | |
| | | | | |
| Ohio: 0.04% | | | | | | | | | | | | | | | | | | | | |
Other securities | | | | | | | | | | | | | | | 1,313,630 | | | | 0.04 | |
| | | | | | | | | | | | | | | | | | | | |
| | | | | |
| Texas: 0.15% | | | | | | | | | | | | | | | | | | | | |
Other securities | | | | | | | | | | | | | | | 5,583,271 | | | | 0.15 | |
| | | | | | | | | | | | | | | | | | | | |
| | | | | |
Total Municipal Obligations (Cost $29,677,345) | | | | | | | | | | | | | | | 34,332,561 | | | | 0.94 | |
| | | | | | | | | | | | | | | | | | | | |
| | | | | |
Non-Agency Mortgage-Backed Securities: 4.66% | | | | | | | | | | | | | | | | | | | | |
Citigroup Commercial Mortgage Trust Series 2013-GC17 Class A4 | | | 4.13 | % | | | 11-10-2046 | | | $ | 12,758,000 | | | | 13,656,411 | | | | 0.37 | |
Commercial Mortgage Trust | | | 1.80-4.21 | | | | 5-15-2045 to 10-10-2053 | | | | 35,515,821 | | | | 36,806,796 | | | | 1.01 | |
Other securities | | | | | | | | | | | | | | | 120,044,696 | | | | 3.28 | |
| | | |
Total Non-Agency Mortgage-Backed Securities (Cost $170,318,800) | | | | | | | | 170,507,903 | | | | 4.66 | |
| | | | | | | | | | | | | | | | | | | | |
| | | | | |
U.S. Treasury Securities: 31.96% | | | | | | | | | | | | | | | | | | | | |
U.S. Treasury Bond | | | 2.50 | | | | 2-15-2045 | | | | 19,271,000 | | | | 17,384,543 | | | | 0.48 | |
U.S. Treasury Bond ## | | | 2.88 | | | | 8-15-2045 | | | | 32,694,000 | | | | 31,964,760 | | | | 0.87 | |
U.S. Treasury Bond | | | 3.00 | | | | 5-15-2045 | | | | 20,774,000 | | | | 20,802,398 | | | | 0.57 | |
U.S. Treasury Bond | | | 3.00-4.50 | | | | 8-15-2039 to 11-15-2045 | | | | 24,424,000 | | | | 25,717,746 | | | | 0.70 | |
U.S. Treasury Bond | | | 3.13 | | | | 2-15-2043 | | | | 33,657,000 | | | | 34,653,550 | | | | 0.95 | |
The accompanying notes are an integral part of these financial statements.
| | | | | | |
| Summary portfolio of investments—November 30, 2015 (unaudited) | | Wells Fargo Income Funds | | | 29 | |
CORE BOND PORTFOLIO
| | | | | | | | | | | | | | | | | | | | |
| Security name | | Interest rate | | | Maturity date | | | Principal | | | Value | | | Percent of
net assets | |
| | | | | |
U.S. Treasury Securities (continued) | | | | | | | | | | | | | | | | | | | | |
U.S. Treasury Note | | | 0.63 | % | | | 5-31-2017 | | | $ | 37,417,000 | | | $ | 37,292,776 | | | | 1.02 | % |
U.S. Treasury Note | | | 0.63 | | | | 8-31-2017 | | | | 16,856,000 | | | | 16,776,979 | | | | 0.46 | |
U.S. Treasury Note | | | 0.63-2.13 | | | | 9-30-2017 to 5-15-2025 | | | | 59,619,000 | | | | 59,439,081 | | | | 1.61 | |
U.S. Treasury Note | | | 0.63 | | | | 11-30-2017 | | | | 18,817,000 | | | | 18,692,036 | | | | 0.51 | |
U.S. Treasury Note | | | 0.75 | | | | 10-31-2017 | | | | 16,200,000 | | | | 16,144,952 | | | | 0.44 | |
U.S. Treasury Note | | | 0.75 | | | | 12-31-2017 | | | | 12,988,000 | | | | 12,924,073 | | | | 0.35 | |
U.S. Treasury Note | | | 0.75 | | | | 4-15-2018 | | | | 47,062,000 | | | | 46,707,200 | | | | 1.28 | |
U.S. Treasury Note | | | 0.88 | | | | 5-15-2017 | | | | 30,929,000 | | | | 30,949,537 | | | | 0.85 | |
U.S. Treasury Note | | | 0.88 | | | | 8-15-2017 | | | | 74,780,000 | | | | 74,768,334 | | | | 2.04 | |
U.S. Treasury Note | | | 0.88 | | | | 11-30-2017 | | | | 29,125,000 | | | | 29,088,594 | | | | 0.80 | |
U.S. Treasury Note | | | 0.88 | | | | 1-15-2018 | | | | 39,731,000 | | | | 39,614,588 | | | | 1.08 | |
U.S. Treasury Note | | | 0.88 | | | | 10-15-2018 | | | | 49,785,000 | | | | 49,308,558 | | | | 1.35 | |
U.S. Treasury Note | | | 1.00 | | | | 9-15-2018 | | | | 39,252,000 | | | | 39,046,555 | | | | 1.07 | |
U.S. Treasury Note | | | 1.25 | | | | 11-15-2018 | | | | 56,808,000 | | | | 56,852,360 | | | | 1.55 | |
U.S. Treasury Note | | | 1.38 | | | | 3-31-2020 | | | | 13,375,000 | | | | 13,261,099 | | | | 0.36 | |
U.S. Treasury Note | | | 1.38 | | | | 9-30-2020 | | | | 114,159,000 | | | | 112,669,568 | | | | 3.08 | |
U.S. Treasury Note « | | | 1.38 | | | | 10-31-2020 | | | | 50,610,000 | | | | 49,929,903 | | | | 1.37 | |
U.S. Treasury Note | | | 1.63 | | | | 3-31-2019 | | | | 95,667,000 | | | | 96,548,954 | | | | 2.64 | |
U.S. Treasury Note | | | 1.63 | | | | 6-30-2020 | | | | 71,619,000 | | | | 71,624,586 | | | | 1.96 | |
U.S. Treasury Note | | | 1.63 | | | | 7-31-2020 | | | | 37,340,000 | | | | 37,319,575 | | | | 1.02 | |
U.S. Treasury Note | | | 1.63 | | | | 11-30-2020 | | | | 46,024,000 | | | | 45,968,265 | | | | 1.26 | |
U.S. Treasury Note | | | 2.00 | | | | 8-15-2025 | | | | 40,732,000 | | | | 39,938,052 | | | | 1.09 | |
U.S. Treasury Note | | | 2.25 | | | | 11-15-2025 | | | | 43,719,000 | | | | 43,862,442 | | | | 1.20 | |
| | | |
Total U.S. Treasury Securities (Cost $1,165,035,704) | | | | | | | | 1,169,251,064 | | | | 31.96 | |
| | | | | | | | | | | | | | | | | | | | |
| | | | | |
Yankee Corporate Bonds and Notes: 5.30% | | | | | | | | | | | | | | | | | | | | |
| | | | | |
Consumer Discretionary: 0.20% | | | | | | | | | | | | | | | | | | | | |
| | | | | |
| Media: 0.20% | | | | | | | | | | | | | | | | | | | | |
Other securities | | | | | | | | | | | | | | | 7,308,961 | | | | 0.20 | |
| | | | | | | | | | | | | | | | | | | | |
| | | | | |
Energy: 0.72% | | | | | | | | | | | | | | | | | | | | |
| | | | | |
| Oil, Gas & Consumable Fuels: 0.72% | | | | | | | | | | | | | | | | | | | | |
Other securities | | | | | | | | | | | | | | | 26,174,223 | | | | 0.72 | |
| | | | | | | | | | | | | | | | | | | | |
| | | | | |
Financials: 2.67% | | | | | | | | | | | | | | | | | | | | |
| | | | | |
| Banks: 2.31% | | | | | | | | | | | | | | | | | | | | |
Other securities | | | | | | | | | | | | | | | 84,348,567 | | | | 2.31 | |
| | | | | | | | | | | | | | | | | | | | |
| | | | | |
| Consumer Finance: 0.16% | | | | | | | | | | | | | | | | | | | | |
Other securities | | | | | | | | | | | | | | | 5,979,104 | | | | 0.16 | |
| | | | | | | | | | | | | | | | | | | | |
| | | | | |
| Diversified Financial Services: 0.11% | | | | | | | | | | | | | | | | | | | | |
Other securities | | | | | | | | | | | | | | | 4,212,606 | | | | 0.11 | |
| | | | | | | | | | | | | | | | | | | | |
| | | | | |
| Insurance: 0.09% | | | | | | | | | | | | | | | | | | | | |
Other securities | | | | | | | | | | | | | | | 3,292,298 | | | | 0.09 | |
| | | | | | | | | | | | | | | | | | | | |
The accompanying notes are an integral part of these financial statements.
| | | | |
| 30 | | Wells Fargo Income Funds | | Summary portfolio of investments—November 30, 2015 (unaudited) |
CORE BOND PORTFOLIO
| | | | | | | | | | | | | | | | | | |
| Security name | | | | | | | | | | Value | | | Percent of
net assets | |
| | | | | |
Health Care: 0.50% | | | | | | | | | | | | | | | | | | |
| | | | | |
| Pharmaceuticals: 0.50% | | | | | | | | | | | | | | | | | | |
Other securities | | | | | | | | | | | | $ | 18,240,012 | | | | 0.50 | % |
| | | | | | | | | | | | | | | | | | |
| | | | | |
Industrials: 0.32% | | | | | | | | | | | | | | | | | | |
| | | | | |
| Aerospace & Defense: 0.05% | | | | | | | | | | | | | | | | | | |
Other securities | | | | | | | | | | | | | 1,761,403 | | | | 0.05 | |
| | | | | | | | | | | | | | | | | | |
| | | | | |
| Transportation Infrastructure: 0.27% | | | | | | | | | | | | | | | | | | |
Other securities | | | | | | | | | | | | | 9,775,390 | | | | 0.27 | |
| | | | | | | | | | | | | | | | | | |
| | | | | |
Information Technology: 0.09% | | | | | | | | | | | | | | | | | | |
| | | | | |
| Internet Software & Services: 0.09% | | | | | | | | | | | | | | | | | | |
Other securities | | | | | | | | | | | | | 3,340,177 | | | | 0.09 | |
| | | | | | | | | | | | | | | | | | |
| | | | | |
Materials: 0.35% | | | | | | | | | | | | | | | | | | |
| | | | | |
| Chemicals: 0.08% | | | | | | | | | | | | | | | | | | |
Other securities | | | | | | | | | | | | | 2,799,892 | | | | 0.08 | |
| | | | | | | | | | | | | | | | | | |
| | | | | |
| Metals & Mining: 0.27% | | | | | | | | | | | | | | | | | | |
Other securities | | | | | | | | | | | | | 9,898,008 | | | | 0.27 | |
| | | | | | | | | | | | | | | | | | |
| | | | | |
Telecommunication Services: 0.19% | | | | | | | | | | | | | | | | | | |
| | | | | |
| Wireless Telecommunication Services: 0.19% | | | | | | | | | | | | | | | | | | |
Other securities | | | | | | | | | | | | | 7,117,736 | | | | 0.19 | |
| | | | | | | | | | | | | | | | | | |
| | | | | |
Utilities: 0.26% | | | | | | | | | | | | | | | | | | |
| | | | | |
| Electric Utilities: 0.26% | | | | | | | | | | | | | | | | | | |
Other securities | | | | | | | | | | | | | 9,550,779 | | | | 0.26 | |
| | | | | | | | | | | | | | | | | | |
| | | | | |
Total Yankee Corporate Bonds and Notes (Cost $197,731,012) | | | | | | | | | | | | | 193,799,156 | | | | 5.30 | |
| | | | | | | | | | | | | | | | | | |
| | | | | |
Yankee Government Bonds: 1.32% | | | | | | | | | | | | | | | | | | |
Other securities | | | | | | | | | | | | | 48,344,874 | | | | 1.32 | |
| | | | | | | | | | | | | | | | | | |
| | | | | |
Total Yankee Government Bonds (Cost $47,763,128) | | | | | | | | | | | | | 48,344,874 | | | | 1.32 | |
| | | | | | | | | | | | | | | | | | |
| | | | | |
| | | Yield | | | | | Shares | | | | | | | |
| Short-Term Investments: 9.10% | | | | | | | | | | | | | | | | | | |
| | | | | |
| Investment Companies: 9.10% | | | | | | | | | | | | | | | | | | |
Securities Lending Cash Investments, LLC (l)(r)(u) | | | 0.18 | % | | | | | 60,450,000 | | | | 60,450,000 | | | | 1.65 | |
Wells Fargo Cash Investment Money Market Fund, Select Class (l)(u)## | | | 0.17 | | | | | | 272,482,327 | | | | 272,482,327 | | | | 7.45 | |
| | | | | |
Total Short-Term Investments (Cost $332,932,327) | | | | | | | | | | | | | 332,932,327 | | | | 9.10 | |
| | | | | | | | | | | | | | | | | | |
| | | | | |
| Total investments in securities (Cost $4,115,580,822) * | | | | | | | | | | | | | 4,112,047,890 | | | | 112.40 | % |
Other assets and liabilities, net | | | | | | | | | | | | | (453,594,674 | ) | | | (12.40 | ) |
| | | | | | | | | | | | | | | | | | |
| Total net assets | | | | | | | | | | | | $ | 3,658,453,216 | | | | 100.00 | % |
| | | | | | | | | | | | | | | | | | |
The accompanying notes are an integral part of these financial statements.
| | | | | | |
| Summary portfolio of investments—November 30, 2015 (unaudited) | | Wells Fargo Income Funds | | | 31 | |
CORE BOND PORTFOLIO
| ± | Variable rate investment. The rate shown is the rate in effect at period end. |
| %% | Security issued on a when-issued basis |
| ## | All or a portion of this security has been segregated for when-issued securities. |
| « | All or a portion of this security is on loan. |
| (l) | The issuer of the security is an affiliated person of the Portfolio as defined in the Investment Company Act of 1940. |
| (r) | The investment is a non-registered investment vehicle purchased with cash collateral received from securities on loan. |
| (u) | The rate represents the 7-day annualized yield at period end. |
| * | Cost for federal income tax purposes is $4,127,741,800 and unrealized gains (losses) consists of: |
| | | | |
Gross unrealized gains | | $ | 23,212,447 | |
Gross unrealized losses | | | (38,906,357 | ) |
| | | | |
Net unrealized losses | | $ | (15,693,910 | ) |
The accompanying notes are an integral part of these financial statements.
| | | | |
| 32 | | Wells Fargo Income Funds | | Portfolio of investments—November 30, 2015 (unaudited) |
REAL RETURN PORTFOLIO
| | | | | | | | | | | | |
| Security name | | | | | | Shares | | | Value | |
| | | | |
Common Stocks: 12.58% | | | | | | | | | | | | |
| | | | |
Consumer Staples: 1.53% | | | | | | | | | | | | |
| | | | |
| Food Products: 0.70% | | | | | | | | | | | | |
Biostime International Holdings Limited | | | | | | | 176,000 | | | $ | 296,456 | |
Marine Harvest ASA | | | | | | | 4,555 | | | | 61,586 | |
| | | | |
| | | | | | | | | | | 358,042 | |
| | | | | | | | | | | | |
| | | | |
| Household Products: 0.83% | | | | | | | | | | | | |
Reckitt Benckiser Group plc | | | | | | | 4,568 | | | | 428,615 | |
| | | | | | | | | | | | |
| | | | |
Energy: 2.16% | | | | | | | | | | | | |
| | | | |
| Oil, Gas & Consumable Fuels: 2.16% | | | | | | | | | | | | |
BP plc | | | | | | | 101,076 | | | | 586,468 | |
Eni SpA | | | | | | | 32,056 | | | | 522,256 | |
| | | | |
| | | | | | | | | | | 1,108,724 | |
| | | | | | | | | | | | |
| | | | |
Financials: 4.48% | | | | | | | | | | | | |
| | | | |
| REITs: 4.48% | | | | | | | | | | | | |
American Tower Corporation | | | | | | | 3,884 | | | | 385,992 | |
AvalonBay Communities Incorporated | | | | | | | 1,488 | | | | 270,504 | |
Boston Properties Incorporated | | | | | | | 1,800 | | | | 224,982 | |
General Growth Properties Incorporated | | | | | | | 9,274 | | | | 236,209 | |
Host Hotels & Resorts Incorporated | | | | | | | 9,905 | | | | 164,423 | |
Mid-America Apartment Communities Incorporated | | | | | | | 1,710 | | | | 151,438 | |
Physicians Realty Trust | | | | | | | 8,414 | | | | 134,708 | |
Prologis Incorporated | | | | | | | 3,676 | | | | 157,149 | |
Public Storage Incorporated | | | | | | | 916 | | | | 219,895 | |
Simon Property Group Incorporated | | | | | | | 1,345 | | | | 250,493 | |
Ventas Incorporated | | | | | | | 1,922 | | | | 102,519 | |
| | | | |
| | | | | | | | | | | 2,298,312 | |
| | | | | | | | | | | | |
| | | | |
| Materials: 4.41% | | | | | | | | | | | | |
| | | | |
| Chemicals: 2.60% | | | | | | | | | | | | |
Akzo Nobel NV | | | | | | | 8,858 | | | | 630,042 | |
Nitto Denko Corporation | | | | | | | 10,400 | | | | 700,881 | |
| | | | |
| | | | | | | | | | | 1,330,923 | |
| | | | | | | | | | | | |
| | | | |
| Metals & Mining: 1.81% | | | | | | | | | | | | |
Agnico-Eagle Mines Limited-U.S. Exchange Traded Shares | | | | | | | 6,000 | | | | 158,700 | |
Detour Gold Corporation † | | | | | | | 4,400 | | | | 45,830 | |
Franco-Nevada Corporation | | | | | | | 2,050 | | | | 98,536 | |
Fresnillo plc | | | | | | | 7,800 | | | | 83,995 | |
Goldcorp Incorporated-U.S. Exchange Traded Shares | | | | | | | 12,000 | | | | 141,720 | |
Newmont Mining Corporation | | | | | | | 6,600 | | | | 121,506 | |
Randgold Resources Limited ADR « | | | | | | | 2,850 | | | | 172,710 | |
The accompanying notes are an integral part of these financial statements.
| | | | | | |
| Portfolio of investments—November 30, 2015 (unaudited) | | Wells Fargo Income Funds | | | 33 | |
REAL RETURN PORTFOLIO
| | | | | | | | | | | | | | | | |
| Security name | | | | | | | | Shares | | | Value | |
| | | | |
| Metals & Mining (continued) | | | | | | | | | | | | | | | | |
Royal Gold Incorporated | | | | | | | | | | | 1,760 | | | $ | 63,272 | |
Tahoe Resources Incorporated | | | | | | | | | | | 4,800 | | | | 42,233 | |
| | | | |
| | | | | | | | | | | | | | | 928,502 | |
| | | | | | | | | | | | | | | | |
| | | | |
Total Common Stocks (Cost $6,733,020) | | | | | | | | | | | | | | | 6,453,118 | |
| | | | | | | | | | | | | | | | |
| | | | |
| | | Interest rate | | | Maturity date | | | Principal | | | | |
| | | | |
Corporate Bonds and Notes: 10.08% | | | | | | | | | | | | | | | | |
| | | | |
Consumer Discretionary: 3.56% | | | | | | | | | | | | | | | | |
| | | | |
| Auto Components: 0.50% | | | | | | | | | | | | | | | | |
Goodyear Tire & Rubber Company | | | 8.25 | % | | | 8-15-2020 | | | $ | 125,000 | | | | 130,213 | |
Tenneco Incorporated | | | 6.88 | | | | 12-15-2020 | | | | 125,000 | | | | 129,375 | |
| | | | |
| | | | | | | | | | | | | | | 259,588 | |
| | | | | | | | | | | | | | | | |
| | | | |
| Diversified Consumer Services: 0.15% | | | | | | | | | | | | | | | | |
Service Corporation International | | | 7.00 | | | | 6-15-2017 | | | | 70,000 | | | | 75,250 | |
| | | | | | | | | | | | | | | | |
| | | | |
| Hotels, Restaurants & Leisure: 0.32% | | | | | | | | | | | | | | | | |
Hilton Worldwide Finance LLC | | | 5.63 | | | | 10-15-2021 | | | | 50,000 | | | | 52,060 | |
MGM Resorts International | | | 7.63 | | | | 1-15-2017 | | | | 105,000 | | | | 110,775 | |
| | | | |
| | | | | | | | | | | | | | | 162,835 | |
| | | | | | | | | | | | | | | | |
| | | | |
| Household Durables: 0.72% | | | | | | | | | | | | | | | | |
DR Horton Incorporated | | | 3.63 | | | | 2-15-2018 | | | | 135,000 | | | | 136,688 | |
Jarden Corporation | | | 7.50 | | | | 5-1-2017 | | | | 120,000 | | | | 128,100 | |
Tempur Sealy International Incorporated | | | 6.88 | | | | 12-15-2020 | | | | 100,000 | | | | 105,875 | |
| | | | |
| | | | | | | | | | | | | | | 370,663 | |
| | | | | | | | | | | | | | | | |
| | | | |
| Media: 0.91% | | | | | | | | | | | | | | | | |
CCO Holdings LLC | | | 7.38 | | | | 6-1-2020 | | | | 125,000 | | | | 130,313 | |
CSC Holdings LLC | | | 7.63 | | | | 7-15-2018 | | | | 75,000 | | | | 78,375 | |
DISH DBS Corporation | | | 4.25 | | | | 4-1-2018 | | | | 130,000 | | | | 129,350 | |
Gannett Company Incorporated | | | 5.13 | | | | 10-15-2019 | | | | 50,000 | | | | 52,000 | |
Nexstar Broadcasting Group Incorporated | | | 6.88 | | | | 11-15-2020 | | | | 75,000 | | | | 76,406 | |
| | | | |
| | | | | | | | | | | | | | | 466,444 | |
| | | | | | | | | | | | | | | | |
| | | | |
| Specialty Retail: 0.71% | | | | | | | | | | | | | | | | |
Best Buy Company Incorporated | | | 5.00 | | | | 8-1-2018 | | | | 100,000 | | | | 104,000 | |
Limited Brands Incorporated | | | 6.90 | | | | 7-15-2017 | | | | 120,000 | | | | 128,850 | |
Sally Holdings Incorporated | | | 6.88 | | | | 11-15-2019 | | | | 125,000 | | | | 129,525 | |
| | | | |
| | | | | | | | | | | | | | | 362,375 | |
| | | | | | | | | | | | | | | | |
| | | | |
| Textiles, Apparel & Luxury Goods: 0.25% | | | | | | | | | | | | | | | | |
HanesBrands Incorporated | | | 6.38 | | | | 12-15-2020 | | | | 125,000 | | | | 129,219 | |
| | | | | | | | | | | | | | | | |
The accompanying notes are an integral part of these financial statements.
| | | | |
| 34 | | Wells Fargo Income Funds | | Portfolio of investments—November 30, 2015 (unaudited) |
REAL RETURN PORTFOLIO
| | | | | | | | | | | | | | | | |
| Security name | | Interest rate | | | Maturity date | | | Principal | | | Value | |
| | | | |
Consumer Staples: 0.50% | | | | | | | | | | | | | | | | |
| | | | |
| Food Products: 0.25% | | | | | | | | | | | | | | | | |
Smithfield Foods Incorporated | | | 7.75 | % | | | 7-1-2017 | | | $ | 120,000 | | | $ | 128,850 | |
| | | | | | | | | | | | | | | | |
| | | | |
| Household Products: 0.25% | | | | | | | | | | | | | | | | |
Spectrum Brands Incorporated | | | 6.38 | | | | 11-15-2020 | | | | 120,000 | | | | 128,400 | |
| | | | | | | | | | | | | | | | |
| | | | |
Energy: 1.03% | | | | | | | | | | | | | | | | |
| | | | |
| Energy Equipment & Services: 0.38% | | | | | | | | | | | | | | | | |
SESI LLC | | | 6.38 | | | | 5-1-2019 | | | | 70,000 | | | | 68,075 | |
Targa Resources Partners 144A | | | 5.00 | | | | 1-15-2018 | | | | 130,000 | | | | 127,725 | |
| | | | |
| | | | | | | | | | | | | | | 195,800 | |
| | | | | | | | | | | | | | | | |
| | | | |
| Oil, Gas & Consumable Fuels: 0.65% | | | | | | | | | | | | | | | | |
Kinder Morgan Incorporated | | | 7.00 | | | | 6-15-2017 | | | | 60,000 | | | | 62,550 | |
Sabine Pass LNG LP | | | 7.50 | | | | 11-30-2016 | | | | 65,000 | | | | 66,300 | |
Tesoro Corporation | | | 4.25 | | | | 10-1-2017 | | | | 65,000 | | | | 66,463 | |
Tesoro Logistics LP | | | 5.88 | | | | 10-1-2020 | | | | 65,000 | | | | 66,788 | |
WPX Energy Incorporated | | | 5.25 | | | | 1-15-2017 | | | | 70,000 | | | | 69,300 | |
| | | | |
| | | | | | | | | | | | | | | 331,401 | |
| | | | | | | | | | | | | | | | |
| | | | |
Financials: 1.50% | | | | | | | | | | | | | | | | |
| | | | |
| Banks: 0.26% | | | | | | | | | | | | | | | | |
CIT Group Incorporated | | | 4.25 | | | | 8-15-2017 | | | | 130,000 | | | | 132,560 | |
| | | | | | | | | | | | | | | | |
| | | | |
| Consumer Finance: 1.05% | | | | | | | | | | | | | | | | |
Ally Financial Incorporated | | | 6.25 | | | | 12-1-2017 | | | | 125,000 | | | | 131,875 | |
General Motors Financial Company Incorporated | | | 3.25 | | | | 5-15-2018 | | | | 135,000 | | | | 136,279 | |
SLM Corporation | | | 4.63 | | | | 9-25-2017 | | | | 130,000 | | | | 130,000 | |
Toll Brothers Finance Corporation | | | 4.00 | | | | 12-31-2018 | | | | 135,000 | | | | 139,725 | |
| | | | |
| | | | | | | | | | | | | | | 537,879 | |
| | | | | | | | | | | | | | | | |
| | | | |
| REITs: 0.19% | | | | | | | | | | | | | | | | |
ARC Properties Operating Partnership LP | | | 2.00 | | | | 2-6-2017 | | | | 100,000 | | | | 98,750 | |
| | | | | | | | | | | | | | | | |
| | | | |
Health Care: 0.52% | | | | | | | | | | | | | | | | |
| | | | |
| Health Care Providers & Services: 0.52% | | | | | | | | | | | | | | | | |
Fresenius Medical Care Holdings Incorporated | | | 6.88 | | | | 7-15-2017 | | | | 125,000 | | | | 134,375 | |
HCA Incorporated | | | 8.00 | | | | 10-1-2018 | | | | 115,000 | | | | 129,088 | |
| | | | |
| | | | | | | | | | | | | | | 263,463 | |
| | | | | | | | | | | | | | | | |
| | | | |
Industrials: 0.93% | | | | | | | | | | | | | | | | |
| | | | |
| Building Products: 0.18% | | | | | | | | | | | | | | | | |
USG Corporation | | | 9.75 | | | | 1-15-2018 | | | | 80,000 | | | | 89,800 | |
| | | | | | | | | | | | | | | | |
| | | | |
| Diversified Consumer Services: 0.13% | | | | | | | | | | | | | | | | |
ADT Corporation | | | 2.25 | | | | 7-15-2017 | | | | 70,000 | | | | 69,125 | |
| | | | | | | | | | | | | | | | |
The accompanying notes are an integral part of these financial statements.
| | | | | | |
| Portfolio of investments—November 30, 2015 (unaudited) | | Wells Fargo Income Funds | | | 35 | |
REAL RETURN PORTFOLIO
| | | | | | | | | | | | | | | | |
| Security name | | Interest rate | | | Maturity date | | | Principal | | | Value | |
| | | | |
| Machinery: 0.36% | | | | | | | | | | | | | | | | |
Case New Holland Industrial Incorporated | | | 7.88 | % | | | 12-1-2017 | | | $ | 65,000 | | | $ | 69,540 | |
Manitowoc Company Incorporated | | | 8.50 | | | | 11-1-2020 | | | | 30,000 | | | | 31,200 | |
SPX Flow Incorporated | | | 6.88 | | | | 9-1-2017 | | | | 80,000 | | | | 84,600 | |
| | | | |
| | | | | | | | | | | | | | | 185,340 | |
| | | | | | | | | | | | | | | | |
| | | | |
| Trading Companies & Distributors: 0.26% | | | | | | | | | | | | | | | | |
United Rentals North America Incorporated | | | 7.38 | | | | 5-15-2020 | | | | 125,000 | | | | 132,500 | |
| | | | | | | | | | | | | | | | |
| | | | |
Information Technology: 0.46% | | | | | | | | | | | | | | | | |
| | | | |
| Communications Equipment: 0.20% | | | | | | | | | | | | | | | | |
ViaSat Incorporated | | | 6.88 | | | | 6-15-2020 | | | | 100,000 | | | | 103,761 | |
| | | | | | | | | | | | | | | | |
| | | | |
| Internet Software & Services: 0.26% | | | | | | | | | | | | | | | | |
IAC/InterActiveCorp | | | 4.88 | | | | 11-30-2018 | | | | 130,000 | | | | 133,088 | |
| | | | | | | | | | | | | | | | |
| | | | |
Materials: 0.70% | | | | | | | | | | | | | | | | |
| | | | |
| Chemicals: 0.16% | | | | | | | | | | | | | | | | |
Ashland Incorporated | | | 3.88 | | | | 4-15-2018 | | | | 80,000 | | | | 81,900 | |
| | | | | | | | | | | | | | | | |
| | | | |
| Containers & Packaging: 0.51% | | | | | | | | | | | | | | | | |
Crown Americas LLC | | | 6.25 | | | | 2-1-2021 | | | | 125,000 | | | | 129,214 | |
Owens-Illinois Incorporated | | | 7.80 | | | | 5-15-2018 | | | | 120,000 | | | | 133,200 | |
| | | | |
| | | | | | | | | | | | | | | 262,414 | |
| | | | | | | | | | | | | | | | |
| | | | |
| Metals & Mining: 0.03% | | | | | | | | | | | | | | | | |
US Steel Corporation | | | 7.00 | | | | 2-1-2018 | | | | 25,000 | | | | 15,500 | |
| | | | | | | | | | | | | | | | |
| | | | |
Telecommunication Services: 0.64% | | | | | | | | | | | | | | | | |
| | | | |
| Diversified Telecommunication Services: 0.28% | | | | | | | | | | | | | | | | |
Frontier Communications Corporation | | | 8.13 | | | | 10-1-2018 | | | | 60,000 | | | | 62,775 | |
Hughes Satelite Systems Corporation | | | 6.50 | | | | 6-15-2019 | | | | 75,000 | | | | 81,000 | |
| | | | |
| | | | | | | | | | | | | | | 143,775 | |
| | | | | | | | | | | | | | | | |
| | | | |
| Wireless Telecommunication Services: 0.36% | | | | | | | | | | | | | | | | |
SBA Communications Corporation | | | 5.63 | | | | 10-1-2019 | | | | 80,000 | | | | 83,200 | |
T-Mobile USA Incorporated | | | 6.46 | | | | 4-28-2019 | | | | 100,000 | | | | 102,750 | |
| | | | |
| | | | | | | | | | | | | | | 185,950 | |
| | | | | | | | | | | | | | | | |
| | | | |
Utilities: 0.24% | | | | | | | | | | | | | | | | |
| | | | |
| Independent Power & Renewable Electricity Producers: 0.24% | | | | | | | | | | | | | | | | |
NRG Energy Incorporated | | | 7.63 | | | | 1-15-2018 | | | | 120,000 | | | | 124,800 | |
| | | | | | | | | | | | | | | | |
| | | | |
Total Corporate Bonds and Notes (Cost $5,227,053) | | | | | | | | | | | | | | | 5,171,430 | |
| | | | | | | | | | | | | | | | |
| | | | |
Loans: 4.07% | | | | | | | | | | | | | | | | |
| | | | |
Consumer Discretionary: 0.43% | | | | | | | | | | | | | | | | |
| | | | |
| Media: 0.17% | | | | | | | | | | | | | | | | |
Virgin Media Investment Holdings Limited ± | | | 3.50 | | | | 6-30-2023 | | | | 90,898 | | | | 89,444 | |
| | | | | | | | | | | | | | | | |
The accompanying notes are an integral part of these financial statements.
| | | | |
| 36 | | Wells Fargo Income Funds | | Portfolio of investments—November 30, 2015 (unaudited) |
REAL RETURN PORTFOLIO
| | | | | | | | | | | | | | | | |
| Security name | | Interest rate | | | Maturity date | | | Principal | | | Value | |
| | | | |
| Multiline Retail: 0.26% | | | | | | | | | | | | | | | | |
Michaels Stores Incorporated ± | | | 3.75 | % | | | 1-28-2020 | | | $ | 133,629 | | | $ | 132,245 | |
| | | | | | | | | | | | | | | | |
| | | | |
Financials: 0.26% | | | | | | | | | | | | | | | | |
| | | | |
| Diversified Financial Services: 0.26% | | | | | | | | | | | | | | | | |
Delos Finance SARL ± | | | 3.50 | | | | 3-6-2021 | | | | 135,000 | | | | 134,353 | |
| | | | | | | | | | | | | | | | |
| | | | |
Health Care: 0.51% | | | | | | | | | | | | | | | | |
| | | | |
| Health Care Providers & Services: 0.40% | | | | | | | | | | | | | | | | |
Community Health Systems Incorporated ± | | | 3.66 | | | | 12-31-2018 | | | | 133,987 | | | | 131,441 | |
Iasis Healthcare LLC ± | | | 4.50 | | | | 5-3-2018 | | | | 74,616 | | | | 73,451 | |
| | | | |
| | | | | | | | | | | | | | | 204,892 | |
| | | | | | | | | | | | | | | | |
| | | | |
| Pharmaceuticals: 0.11% | | | | | | | | | | | | | | | | |
Valeant Pharmaceuticals International Incorporated ± | | | 3.50 | | | | 2-13-2019 | | | | 60,000 | | | | 56,475 | |
| | | | | | | | | | | | | | | | |
| | | | |
Industrials: 1.46% | | | | | | | | | | | | | | | | |
| | | | |
| Aerospace & Defense: 0.23% | | | | | | | | | | | | | | | | |
TransDigm Incorporated ± | | | 3.75 | | | | 2-28-2020 | | | | 119,134 | | | | 116,057 | |
| | | | | | | | | | | | | | | | |
| | | | |
| Airlines: 0.26% | | | | | | | | | | | | | | | | |
Delta Air Lines Incorporated ± | | | 3.25 | | | | 8-24-2022 | | | | 135,000 | | | | 134,606 | |
| | | | | | | | | | | | | | | | |
| | | | |
| Commercial Services & Supplies: 0.78% | | | | | | | | | | | | | | | | |
Hertz Corporation ± | | | 3.00 | | | | 3-11-2018 | | | | 133,629 | | | | 131,709 | |
KAR Auction Services Incorporated ± | | | 3.50 | | | | 3-11-2021 | | | | 133,477 | | | | 132,643 | |
ServiceMaster Company ± | | | 4.25 | | | | 7-1-2021 | | | | 133,985 | | | | 133,052 | |
| | | | |
| | | | | | | | | | | | | | | 397,404 | |
| | | | | | | | | | | | | | | | |
| | | | |
| Diversified Consumer Services: 0.19% | | | | | | | | | | | | | | | | |
NXP BV ±< | | | 0.00 | | | | 10-30-2020 | | | | 100,000 | | | | 99,375 | |
| | | | | | | | | | | | | | | | |
| | | | |
Information Technology: 0.38% | | | | | | | | | | | | | | | | |
| | | | |
| Communications Equipment: 0.25% | | | | | | | | | | | | | | | | |
Cequel Communications LLC ± | | | 3.50 | | | | 2-14-2019 | | | | 130,495 | | | | 128,537 | |
| | | | | | | | | | | | | | | | |
| | | | |
| Internet Software & Services: 0.13% | | | | | | | | | | | | | | | | |
Zayo Group LLC ± | | | 3.75 | | | | 5-6-2021 | | | | 69,472 | | | | 68,614 | |
| | | | | | | | | | | | | | | | |
| | | | |
Materials: 0.51% | | | | | | | | | | | | | | | | |
| | | | |
| Chemicals: 0.25% | | | | | | | | | | | | | | | | |
Ineos US Finance LLC ± | | | 3.75 | | | | 12-15-2020 | | | | 133,646 | | | | 129,053 | |
| | | | | | | | | | | | | | | | |
| | | | |
| Containers & Packaging: 0.26% | | | | | | | | | | | | | | | | |
Berry Plastics Group Incorporated ± | | | 3.50 | | | | 2-8-2020 | | | | 133,629 | | | | 131,068 | |
| | | | | | | | | | | | | | | | |
The accompanying notes are an integral part of these financial statements.
| | | | | | |
| Portfolio of investments—November 30, 2015 (unaudited) | | Wells Fargo Income Funds | | | 37 | |
REAL RETURN PORTFOLIO
| | | | | | | | | | | | | | | | |
| Security name | | Interest rate | | | Maturity date | | | Principal | | | Value | |
| | | | |
Telecommunication Services: 0.52% | | | | | | | | | | | | | | | | |
| | | | |
| Diversified Telecommunication Services: 0.52% | | | | | | | | | | | | | | | | |
Level 3 Financing Incorporated ± | | | 3.50 | % | | | 5-31-2022 | | | $ | 135,000 | | | $ | 133,583 | |
West Corporation ± | | | 3.25 | | | | 6-30-2018 | | | | 135,000 | | | | 132,806 | |
| | | | |
| | | | | | | | | | | | | | | 266,389 | |
| | | | | | | | | | | | | | | | |
| | | | |
Total Loans (Cost $2,112,047) | | | | | | | | | | | | | | | 2,088,512 | |
| | | | | | | | | | | | | | | | |
| | | | |
U.S. Treasury Securities: 65.92% | | | | | | | | | | | | | | | | |
TIPS | | | 0.13 | | | | 4-15-2017 | | | | 670,509 | | | | 669,636 | |
TIPS | | | 0.13 | | | | 4-15-2018 | | | | 1,410,278 | | | | 1,410,260 | |
TIPS | | | 0.13 | | | | 4-15-2019 | | | | 2,142,747 | | | | 2,136,750 | |
TIPS | | | 0.13 | | | | 4-15-2020 | | | | 975,485 | | | | 967,458 | |
TIPS | | | 0.13 | | | | 1-15-2022 | | | | 1,534,971 | | | | 1,499,155 | |
TIPS | | | 0.13 | | | | 7-15-2022 | | | | 1,671,137 | | | | 1,633,580 | |
TIPS | | | 0.13 | | | | 1-15-2023 | | | | 1,448,429 | | | | 1,400,524 | |
TIPS | | | 0.13 | | | | 7-15-2024 | | | | 1,538,300 | | | | 1,475,407 | |
TIPS | | | 0.25 | | | | 1-15-2025 | | | | 1,557,223 | | | | 1,501,219 | |
TIPS | | | 0.38 | | | | 7-15-2023 | | | | 1,451,964 | | | | 1,431,716 | |
TIPS | | | 0.38 | | | | 7-15-2025 | | | | 1,364,665 | | | | 1,335,026 | |
TIPS | | | 0.63 | | | | 7-15-2021 | | | | 1,414,759 | | | | 1,435,538 | |
TIPS | | | 0.63 | | | | 1-15-2024 | | | | 1,499,150 | | | | 1,496,748 | |
TIPS | | | 0.63 | | | | 2-15-2043 | | | | 445,050 | | | | 384,829 | |
TIPS | | | 0.75 | | | | 2-15-2042 | | | | 679,243 | | | | 609,497 | |
TIPS | | | 0.75 | | | | 2-15-2045 | | | | 884,196 | | | | 787,740 | |
TIPS | | | 1.13 | | | | 1-15-2021 | | | | 1,321,665 | | | | 1,372,328 | |
TIPS | | | 1.25 | | | | 7-15-2020 | | | | 976,552 | | | | 1,021,515 | |
TIPS | | | 1.38 | | | | 7-15-2018 | | | | 1,064,868 | | | | 1,105,674 | |
TIPS | | | 1.38 | | | | 1-15-2020 | | | | 632,730 | | | | 661,409 | |
TIPS | | | 1.38 | | | | 2-15-2044 | | | | 755,555 | | | | 785,581 | |
TIPS | | | 1.63 | | | | 1-15-2018 | | | | 613,359 | | | | 634,124 | |
TIPS | | | 1.75 | | | | 1-15-2028 | | | | 675,831 | | | | 749,952 | |
TIPS | | | 1.88 | | | | 7-15-2019 | | | | 523,796 | | | | 558,102 | |
TIPS | | | 2.00 | | | | 1-15-2026 | | | | 719,346 | | | | 809,059 | |
TIPS | | | 2.13 | | | | 1-15-2019 | | | | 459,957 | | | | 488,836 | |
TIPS | | | 2.13 | | | | 2-15-2040 | | | | 269,730 | | | | 324,010 | |
TIPS | | | 2.13 | | | | 2-15-2041 | | | | 347,715 | | | | 419,771 | |
TIPS | | | 2.38 | | | | 1-15-2025 | | | | 871,049 | | | | 1,001,967 | |
TIPS | | | 2.38 | | | | 1-15-2027 | | | | 648,984 | | | | 760,731 | |
TIPS | | | 2.50 | | | | 1-15-2029 | | | | 509,832 | | | | 614,327 | |
TIPS | | | 2.63 | | | | 7-15-2017 | | | | 597,028 | | | | 625,153 | |
TIPS | | | 3.38 | | | | 4-15-2032 | | | | 201,090 | | | | 277,132 | |
TIPS | | | 3.63 | | | | 4-15-2028 | | | | 426,657 | | | | 566,626 | |
TIPS | | | 3.88 | | | | 4-15-2029 | | | | 622,421 | | | | 859,954 | |
| | | | |
Total U.S. Treasury Securities (Cost $33,559,816) | | | | | | | | | | | | | | | 33,811,334 | |
| | | | | | | | | | | | | | | | |
| | | | |
Yankee Corporate Bonds and Notes: 0.77% | | | | | | | | | | | | | | | | |
| | | | |
Consumer Discretionary: 0.20% | | | | | | | | | | | | | | | | |
| | | | |
| Automobiles: 0.20% | | | | | | | | | | | | | | | | |
Jaguar Land Rover Automotive plc 144A | | | 4.13 | | | | 12-15-2018 | | | | 100,000 | | | | 101,625 | |
| | | | | | | | | | | | | | | | |
The accompanying notes are an integral part of these financial statements.
| | | | |
| 38 | | Wells Fargo Income Funds | | Portfolio of investments—November 30, 2015 (unaudited) |
REAL RETURN PORTFOLIO
| | | | | | | | | | | | | | | | |
| Security name | | Interest rate | | | Maturity date | | | Principal | | | Value | |
| | | | |
Financials: 0.16% | | | | | | | | | | | | | | | | |
| | | | |
| Banks: 0.16% | | | | | | | | | | | | | | | | |
Royal Bank of Scotland Group plc | | | 4.70 | % | | | 7-3-2018 | | | $ | 80,000 | | | $ | 82,957 | |
| | | | | | | | | | | | | | | | |
| | | | |
Health Care: 0.13% | | | | | | | | | | | | | | | | |
| | | | |
| Pharmaceuticals: 0.13% | | | | | | | | | | | | | | | | |
Mallinckrodt International Finance SA | | | 3.50 | | | | 4-15-2018 | | | | 70,000 | | | | 64,575 | |
| | | | | | | | | | | | | | | | |
| | | | |
Information Technology: 0.04% | | | | | | | | | | | | | | | | |
| | | | |
| Communications Equipment: 0.04% | | | | | | | | | | | | | | | | |
Nokia Corporation | | | 5.38 | | | | 5-15-2019 | | | | 20,000 | | | | 21,374 | |
| | | | | | | | | | | | | | | | |
| | | | |
Materials: 0.24% | | | | | | | | | | | | | | | | |
| | | | |
| Metals & Mining: 0.24% | | | | | | | | | | | | | | | | |
ArcelorMittal SA | | | 6.13 | | | | 6-1-2018 | | | | 125,000 | | | | 121,563 | |
| | | | | | | | | | | | | | | | |
| | | | |
Total Yankee Corporate Bonds and Notes (Cost $406,389) | | | | | | | | | | | | | | | 392,094 | |
| | | | | | | | | | | | | | | | |
| | | | |
| | | Yield | | | | | | Shares | | | | |
| Short-Term Investments: 6.72% | | | | | | | | | | | | | | | | |
| | | | |
| Investment Companies: 6.67% | | | | | | | | | | | | | | | | |
Securities Lending Cash Investments, LLC (l)(r)(u) | | | 0.18 | | | | | | | | 166,050 | | | | 166,050 | |
Wells Fargo Government Money Market Fund, Select Class (l)(u) | | | 0.04 | | | | | | | | 3,255,779 | | | | 3,255,779 | |
| | | | |
| | | | | | | | | | | | | | | 3,421,829 | |
| | | | | | | | | | | | | | | | |
| | | | |
| | | | | | | | | Principal | | | | |
| U.S. Treasury Securities: 0.05% | | | | | | | | | | | | | | | | |
U.S. Treasury Bill (z)# | | | 0.08 | | | | 12-17-2015 | | | $ | 25,000 | | | | 24,999 | |
| | | | | | | | | | | | | | | | |
| | | | |
Total Short-Term Investments (Cost $3,446,828) | | | | | | | | | | | | | | | 3,446,828 | |
| | | | | | | | | | | | | | | | |
| | | | | | | | |
| Total investments in securities (Cost $51,485,153) * | | | 100.14 | % | | | 51,363,316 | |
Other assets and liabilities, net | | | (0.14 | ) | | | (69,676 | ) |
| | | | | | | | |
| Total net assets | | | 100.00 | % | | $ | 51,293,640 | |
| | | | | | | | |
| † | Non-income-earning security |
| « | All or a portion of this security is on loan. |
| 144A | The security may be resold in transactions exempt from registration, normally to qualified institutional buyers, pursuant to Rule 144A under the Securities Act of 1933. |
| ± | Variable rate investment. The rate shown is the rate in effect at period end. |
| < | All or a portion of the position represents an unfunded loan commitment. |
| (l) | The issuer of the security is an affiliated person of the Portfolio as defined in the Investment Company Act of 1940. |
| (r) | The investment is a non-registered investment vehicle purchased with cash collateral received from securities on loan. |
| (u) | The rate represents the 7-day annualized yield at period end. |
| (z) | Zero coupon security. The rate represents the current yield to maturity. |
| # | All or a portion of this security is segregated as collateral for investments in derivative instruments. |
| * | Cost for federal income tax purposes is $51,526,026 and unrealized gains (losses) consists of: |
| | | | |
Gross unrealized gains | | $ | 1,224,576 | |
Gross unrealized losses | | | (1,387,286 | ) |
| | | | |
Net unrealized losses | | $ | (162,710 | ) |
The accompanying notes are an integral part of these financial statements.
| | | | | | |
| Statements of assets and liabilities—November 30, 2015 (unaudited) | | Wells Fargo Income Funds | | | 39 | |
| | | | | | | | |
| | | Core Bond
Portfolio | | | Real Return
Portfolio | |
| | |
Assets | | | | | | | | |
Investments | | | | | | | | |
In unaffiliated securities (including securities on loan), at value (see cost below) | | $ | 3,779,115,563 | | | $ | 47,941,487 | |
In affiliated securities, at value (see cost below) | | | 332,932,327 | | | | 3,421,829 | |
| | | | |
Total investments, at value (see cost below) | | | 4,112,047,890 | | | | 51,363,316 | |
Cash | | | 3,585,903 | | | | 171 | |
Foreign currency, at value (see cost below) | | | 0 | | | | 5,124 | |
Receivable for investments sold | | | 297,335,015 | | | | 5,139 | |
Receivable for interest | | | 14,859,972 | | | | 216,420 | |
Receivable for securities lending income | | | 22,100 | | | | 87 | |
Prepaid expenses and other assets | | | 37,966 | | | | 3,006 | |
| | | | |
Total assets | | | 4,427,888,846 | | | | 51,593,263 | |
| | | | |
| | |
Liabilities | | | | | | | | |
Payable for investments purchased | | | 707,879,734 | | | | 103,035 | |
Payable upon receipt of securities loaned | | | 60,450,000 | | | | 166,050 | |
Payable for daily variation margin on open futures contracts | | | 0 | | | | 406 | |
Advisory fee payable | | | 1,011,736 | | | | 11,646 | |
Professional fees payable | | | 37,201 | | | | 17,754 | |
Accrued expenses and other liabilities | | | 56,959 | | | | 732 | |
| | | | |
Total liabilities | | | 769,435,630 | | | | 299,623 | |
| | | | |
Total net assets | | $ | 3,658,453,216 | | | $ | 51,293,640 | |
| | | | |
| | |
Investments in unaffiliated securities (including securities on loan), at cost | | $ | 3,782,648,495 | | | $ | 48,063,324 | |
| | | | |
Investments in affiliated securities, at cost | | $ | 332,932,327 | | | $ | 3,421,829 | |
| | | | |
Total investments, at cost | | $ | 4,115,580,822 | | | $ | 51,485,153 | |
| | | | |
Securities on loan, at value | | $ | 59,259,188 | | | $ | 162,486 | |
| | | | |
Foreign currency, at cost | | $ | 0 | | | $ | 5,147 | |
| | | | |
The accompanying notes are an integral part of these financial statements.
| | | | |
| 40 | | Wells Fargo Income Funds | | Statements of operations—six months ended November 30, 2015 (unaudited) |
| | | | | | | | |
| | | Core Bond
Portfolio | | | Real Return
Portfolio | |
| | |
Investment income | | | | | | | | |
Interest* | | $ | 41,053,852 | | | $ | 495,671 | |
Income from affiliated securities | | | 122,031 | | | | 152 | |
Securities lending income, net | | | 63,914 | | | | 5,818 | |
Dividends | | | 0 | | | | 85,388 | |
| | | | | | | | |
Total investment income | | | 41,239,797 | | | | 587,029 | |
| | | | | | | | |
| | |
Expenses | | | | | | | | |
Advisory fee | | | 6,666,958 | | | | 101,540 | |
Custody and accounting fees | | | 101,992 | | | | 6,179 | |
Professional fees | | | 39,202 | | | | 22,216 | |
Shareholder report expenses | | | 2,033 | | | | 717 | |
Trustees’ fees and expenses | | | 5,722 | | | | 7,328 | |
Other fees and expenses | | | 11,526 | | | | 4,289 | |
| | | | | | | | |
Total expenses | | | 6,827,433 | | | | 142,269 | |
Less: Fee waivers and/or expense reimbursements | | | (268,428 | ) | | | (30,930 | ) |
| | | | | | | | |
Net expenses | | | 6,559,005 | | | | 111,339 | |
| | | | | | | | |
Net investment income | | | 34,680,792 | | | | 475,690 | |
| | | | | | | | |
| | |
REALIZED AND UNREALIZED GAINS (LOSSES) ON INVESTMENTS | | | | | | | | |
| | |
Net realized gains (losses) on: | | | | | | | | |
Unaffiliated securities | | | (1,762,633 | ) | | | (61,660 | ) |
Futures transactions | | | 0 | | | | 7,530 | |
TBA sale commitments | | | 305,506 | | | | 0 | |
| | | | | | | | |
Net realized gain (losses) on investments | | | (1,457,127 | ) | | | (54,130 | ) |
| | | | | | | | |
| | |
Net change in unrealized gains (losses) on: | | | | | | | | |
Unaffiliated securities | | | (36,347,983 | ) | | | (1,916,517 | ) |
Futures transactions | | | 0 | | | | (2,851 | ) |
| | | | | | | | |
Net change in unrealized gains (losses) on investments | | | (36,347,983 | ) | | | (1,919,368 | ) |
| | | | | | | | |
Net realized and unrealized gains (losses) on investments | | | (37,805,110 | ) | | | (1,973,498 | ) |
| | | | | | | | |
Net increase (decrease) in net assets resulting from operations | | $ | (3,124,318 | ) | | $ | (1,497,808 | ) |
| | | | | | | | |
| | |
* Net of foreign interest withholding taxes in the amount of | | | $0 | | | | $5,397 | |
The accompanying notes are an integral part of these financial statements.
| | | | | | |
| Statements of changes in net assets | | Wells Fargo Income Funds | | | 41 | |
| | | | | | | | |
| | | Core Bond Portfolio | |
| | | Six months ended
November 30, 2015
(unaudited) | | | Year ended May 31, 2015 | |
| | |
Operations | | | | | | | | |
Net investment income | | $ | 34,680,792 | | | $ | 58,488,996 | |
Net realized gains (losses) on investments | | | (1,457,127 | ) | | | 54,777,871 | |
Net change in unrealized gains (losses) on investments | | | (36,347,983 | ) | | | (15,603,380 | ) |
| | | | |
Net increase (decrease) in net assets resulting from operations | | | (3,124,318 | ) | | | 97,663,487 | |
| | | | |
| | |
Capital share transactions | | | | | | | | |
Transactions in investors’ beneficial interests | | | | | | | | |
Contributions | | | 303,917,312 | | | | 1,275,843,092 | |
Withdrawals | | | (394,886,755 | ) | | | (517,501,361 | ) |
| | | | |
Net increase (decrease) in net assets resulting from capital share transactions | | | (90,969,443 | ) | | | 758,341,731 | |
| | | | |
Total increase (decrease) in net assets | | | (94,093,761 | ) | | | 856,005,218 | |
| | | | |
| | |
Net assets | | | | | | | | |
Beginning of period | | | 3,752,546,977 | | | | 2,896,541,759 | |
| | | | |
End of period | | $ | 3,658,453,216 | | | $ | 3,752,546,977 | |
| | | | |
The accompanying notes are an integral part of these financial statements.
| | | | |
| 42 | | Wells Fargo Income Funds | | Statements of changes in net assets |
| | | | | | | | |
| | | Real Return Portfolio | |
| | | Six months ended
November 30, 2015
(unaudited) | | | Year ended May 31, 2015 | |
| | |
Operations | | | | | | | | |
Net investment income | | $ | 475,690 | | | $ | 400,921 | |
Net realized gains (losses) on investments | | | (54,130 | ) | | | 1,132,514 | |
Net change in unrealized gains (losses) on investments | | | (1,919,368 | ) | | | (896,307 | ) |
| | | | |
Net increase (decrease) in net assets resulting from operations | | | (1,497,808 | ) | | | 637,128 | |
| | | | |
| | |
Capital share transactions | | | | | | | | |
Transactions in investors’ beneficial interests | | | | | | | | |
Contributions | | | 8,862,425 | | | | 12,526,145 | |
Withdrawals | | | (4,467,761 | ) | | | (11,966,906 | ) |
| | | | |
Net increase in net assets resulting from capital share transactions | | | 4,394,664 | | | | 559,239 | |
| | | | |
Total increase in net assets | | | 2,896,856 | | | | 1,196,367 | |
| | | | |
| | |
Net assets | | | | | | | | |
Beginning of period | | | 48,396,784 | | | | 47,200,417 | |
| | | | |
End of period | | $ | 51,293,640 | | | $ | 48,396,784 | |
| | | | |
The accompanying notes are an integral part of these financial statements.
| | | | | | |
| Financial highlights | | Wells Fargo Income Funds | | | 43 | |
| | | | | | | | | | | | | | | | | | | | |
| | | Ratio to average net assets (annualized) | | | | | | Portfolio
turnover
rate | |
| | | Net investment
income | | | Gross
expenses | | | Net
expenses | | | Total
return1 | | |
| | | | | |
Core Bond Portfolio | | | | | | | | | | | | | | | | | | | | |
Six months ended November 30, 2015 (unaudited) | | | 1.85 | % | | | 0.36 | % | | | 0.35 | % | | | (0.10 | )% | | | 303 | % |
Year ended May 31, 2015 | | | 1.82 | % | | | 0.37 | % | | | 0.35 | % | | | 3.22 | % | | | 586 | % |
Year ended May 31, 2014 | | | 1.94 | % | | | 0.37 | % | | | 0.35 | % | | | 2.90 | % | | | 646 | % |
Year ended May 31, 2013 | | | 1.75 | % | | | 0.37 | % | | | 0.35 | % | | | 2.61 | % | | | 547 | % |
Year ended May 31, 2012 | | | 2.33 | % | | | 0.37 | % | | | 0.35 | % | | | 8.20 | % | | | 803 | % |
Year ended May 31, 2011 | | | 2.99 | % | | | 0.37 | % | | | 0.35 | % | | | 7.02 | % | | | 789 | % |
| | | | | |
Real Return Portfolio | | | | | | | | | | | | | | | | | | | | |
Six months ended November 30, 2015 (unaudited) | | | 1.87 | % | | | 0.56 | % | | | 0.44 | % | | | (3.03 | )% | | | 9 | % |
Year ended May 31, 2015 | | | 0.89 | % | | | 0.57 | % | | | 0.44 | % | | | 1.50 | % | | | 57 | % |
Year ended May 31, 2014 | | | 1.45 | % | | | 0.53 | % | | | 0.44 | % | | | (0.26 | )% | | | 9 | % |
Year ended May 31, 2013 | | | 1.52 | % | | | 0.50 | % | | | 0.44 | % | | | (1.86 | )% | | | 15 | % |
Year ended May 31, 2012 | | | 3.00 | % | | | 0.48 | % | | | 0.44 | % | | | 12.62 | % | | | 23 | % |
Year ended May 31, 2011 | | | 3.25 | % | | | 0.44 | % | | | 0.43 | % | | | 8.19 | % | | | 19 | % |
| 1 | Returns for periods of less than one year are not annualized. |
The accompanying notes are an integral part of these financial statements.
| | | | |
| 44 | | Wells Fargo Income Funds | | Notes to financial statements (unaudited) |
1. ORGANIZATION
Wells Fargo Master Trust (the “Trust”), a Delaware statutory trust organized on March 10, 1999, is an open-end management investment company registered under the Investment Company Act of 1940, as amended (the “1940 Act”). As an investment company, the Trust follows the accounting and reporting guidance in Financial Accounting Standards Board (“FASB”) Accounting Standards Codification Topic 946, Financial Services—Investment Companies. These financial statements report on the following portfolios: the Wells Fargo Core Bond Portfolio (“Core Bond Portfolio”) and Wells Fargo Real Return Portfolio (“Real Return Portfolio”) (each, a “Portfolio”, collectively, the “Portfolios”). Each Portfolio is a diversified series of the Trust.
The Portfolios, which are master portfolios in a master/feeder structure, offer their shares to multiple feeder funds and
other affiliated master portfolios rather than directly to the public.
2. SIGNIFICANT ACCOUNTING POLICIES
The following significant accounting policies, which are consistently followed in the preparation of the financial statements of each Portfolio, are in conformity with U.S. generally accepted accounting principles which require management to make estimates and assumptions that affect the reported amounts of assets and liabilities, disclosure of contingent assets and liabilities at the date of the financial statements, and the reported amounts of revenues and expenses during the reporting period. Actual results could differ from those estimates.
Securities valuation
All investments are valued each business day as of the close of regular trading on the New York Stock Exchange (generally 4 p.m. Eastern Time).
Debt securities are valued at the evaluated bid price provided by an independent pricing service or, if a reliable price is not available, the quoted bid price from an independent broker-dealer.
Equity securities and futures that are listed on a foreign or domestic exchange or market are valued at the official closing price or, if none, the last sales price. If no sale occurs on the primary exchange or market that day, the prior day’s price will be deemed “stale” and a fair value price will be determined in accordance with the Portfolio’s Valuation Procedures.
Equity securities that are not listed on a foreign or domestic exchange or market, but have a public trading market, are valued at the quoted bid price from an independent broker-dealer that the Management Valuation Team of Wells Fargo Funds Management, LLC (“Funds Management”) has determined is an acceptable source.
Investments in registered open-end investment companies are valued at net asset value. Interests in non-registered investment vehicles that are redeemable at net asset value are fair valued at net asset value when available.
Investments which are not valued using any of the methods discussed above are valued at their fair value, as determined in good faith by the Board of Trustees of the Portfolios. The Board of Trustees has established a Valuation Committee comprised of the Trustees and has delegated to it the authority to take any actions regarding the valuation of portfolio securities that the Valuation Committee deems necessary or appropriate, including determining the fair value of portfolio securities, unless the determination has been delegated to the Management Valuation Team. The Board of Trustees retains the authority to make or ratify any valuation decisions or approve any changes to the Valuation Procedures as it deems appropriate. On a quarterly basis, the Board of Trustees receives reports on any valuation actions taken by the Valuation Committee or the Management Valuation Team which may include items for ratification.
Valuations of fair valued securities are compared to the next actual sales price when available, or other appropriate market values, to assess the continued appropriateness of the fair valuation methodologies used. These securities are fair valued on a day-to-day basis, taking into consideration changes to appropriate market information and any significant changes to the inputs considered in the valuation process until there is a readily available price provided on an exchange or by an independent pricing service. Valuations received from an independent pricing service or independent broker-dealer quotes are periodically validated by comparisons to most recent trades and valuations provided by other independent pricing services in addition to the review of prices by the adviser and/or subadviser. Unobservable inputs used in determining fair valuations are identified based on the type of security, taking into consideration factors utilized by market participants in valuing the investment, knowledge about the issuer and the current market environment.
Security loans
The Portfolios may lend their securities from time to time in order to earn additional income in the form of fees or interest on securities received as collateral or the investment of any cash received as collateral. The Portfolios continue to receive interest or dividends on the securities loaned. The Portfolios receive collateral in the form of cash or securities with a
| | | | | | |
| Notes to financial statements (unaudited) | | Wells Fargo Income Funds | | | 45 | |
value at least equal to the value of the securities on loan. The value of the loaned securities is determined at the close of each business day and any additional required collateral is delivered to the Portfolios on the next business day. In a securities lending transaction, the net asset value of the Portfolios will be affected by an increase or decrease in the value of the securities loaned and by an increase or decrease in the value of the instrument in which collateral is invested. The amount of securities lending activity undertaken by the Portfolios fluctuate from time to time, In the event of default or bankruptcy by the borrower, the Portfolios may be prevented from recovering the loaned securities or gaining access to the collateral or may experience delays or costs in doing so. In addition, the investment of any cash collateral received may lose all or part of its value. The Portfolios have the right under the lending agreement to recover the securities from the borrower on demand.
The Portfolios lend their securities through an unaffiliated securities lending agent. Cash collateral received in connection with its securities lending transactions is invested in Securities Lending Cash Investments, LLC (the “Securities Lending Fund”). The Securities Lending Fund is exempt from registration under Section 3(c)(7) of the 1940 Act and is managed by Funds Management and is subadvised by Wells Capital Management Incorporated (“WellsCap”). Funds Management receives an advisory fee starting at 0.05% and declining to 0.01% as the average daily net assets of the Securities Lending Fund increase. All of the fees received by Funds Management are paid to WellsCap for its services as subadviser. The Securities Lending Fund seeks to provide a positive return compared to the daily Fed Funds Open rate by investing in high-quality, U.S. dollar-denominated short-term money market instruments. Securities Lending Fund investments are fair valued based upon the amortized cost valuation technique. Income earned from investment in the Securities Lending Fund is included in securities lending income on the Statements of Operations.
When-issued transactions
Each Portfolio may purchase securities on a forward commitment or when-issued basis. A Portfolio records a when-issued transaction on the trade date and will segregate assets in an amount at least equal in value to the Portfolio’s commitment to purchase when-issued securities. Securities purchased on a when-issued basis are marked-to-market daily and the Portfolio begins earning interest on the settlement date. Losses may arise due to changes in the market value of the underlying securities or if the counterparty does not perform under the contract.
Loans
The Portfolios may invest in direct debt instruments which are interests in amounts owed to lenders by corporate or other borrowers. The loans pay interest at rates which are periodically reset by reference to a base lending rate plus a spread. Investments in loans may be in the form of participations in loans or assignments of all or a portion of loans from third parties. When the Portfolio purchases participations, it generally has no rights to enforce compliance with terms of the loan agreement with the borrower. As a result, the Portfolio assumes the credit risk of both the borrower and the lender that is selling the participation. When the Portfolio purchases assignments from lenders, it acquires direct rights against the borrower on the loan and may enforce compliance by the borrower with the terms of the loan agreement. Loans may include fully funded term loans or unfunded loan commitments, which are contractual obligations for future funding.
Futures contracts
Each Portfolio is subject to interest rate risk in the normal course of pursuing its investment objectives. The Portfolio may buy and sell futures contracts in order to gain exposure to, or protect against, changes in security values and interest rates. The primary risks associated with the use of futures contracts are the imperfect correlation between changes in market values of securities held by the Portfolio and the prices of futures contracts, and the possibility of an illiquid market.
The aggregate principal amounts of the contracts are not recorded in the financial statements. Fluctuations in the value of the contracts are recorded in the Statements of Assets and Liabilities as an asset or liability and in the Statements of Operations as unrealized gains or losses until the contracts are closed, at which point they are recorded as net realized gains or losses on futures contracts. With futures contracts, there is minimal counterparty risk to the Portfolio since futures are exchange traded and the exchange’s clearinghouse, as counterparty to all exchange traded futures, guarantees the futures against default.
TBA sale commitments
The Portfolio may enter into To Be Announced (“TBA”) sale commitments to hedge its portfolio positions or to sell mortgage-backed securities it owns under delayed delivery arrangements. Proceeds of TBA sale commitments are not received until the contractual settlement date. During the time a TBA sale commitment is outstanding, equivalent deliverable securities or offsetting TBA purchase commitments, which are deliverable on or before the sale commitment date, are held as ���cover” for the transaction. Unsettled TBA sale commitments are valued at the current market value of
| | | | |
| 46 | | Wells Fargo Income Funds | | Notes to financial statements (unaudited) |
the underlying securities, generally according to the procedures described under “Securities valuation”. The contract is marked-to-market daily and the change in market value is recorded by the Portfolio as an unrealized gain or loss. If the TBA sale commitment is closed through the acquisition of an offsetting purchase commitment, the Portfolio realizes a gain or loss. If the Portfolio delivers securities under the commitment, the Portfolio realizes a gain or a loss from the sale of the securities based upon the unit price established at the date the commitment was entered into.
Inflation-indexed bonds and TIPS
The Portfolios may invest in inflation-indexed bonds, including Treasury inflation-protected securities (TIPS). Inflation-indexed bonds are fixed income securities whose principal value is periodically adjusted according to the rate of inflation. If the index measuring inflation falls, the principal value of inflation-indexed bonds (other than municipal inflation indexed bonds and certain corporate inflation-indexed bonds) will be adjusted downward, and consequently the interest payable on these securities (calculated with respect to a smaller principal amount) will be reduced. Repayment of the original bond principal upon maturity (as adjusted for inflation) is guaranteed in the case of U.S. Treasury inflation-indexed bonds. For bonds that do not provide a similar guarantee, the adjusted principal value of the bond repaid at maturity may be less than the original principal. The value of inflation-indexed bonds is expected to change in response to changes in real interest rates. Real interest rates are tied to the relationship between nominal interest rates and the rate of inflation. If nominal interest rates increase at a faster rate than inflation, real interest rates may rise, leading to a decrease in value of inflation-indexed bonds. Inflation-indexed bonds, including TIPS, decline in value when real interest rates rise. In certain interest rate environments, such as when real interest rates are rising faster than nominal interest rates, inflation-indexed bonds may experience greater losses than other fixed income securities with similar durations.
Mortgage dollar roll transactions
Each Portfolio may engage in mortgage dollar roll transactions through TBA mortgage-backed securities issued by Government National Mortgage Association (GNMA), Federal National Mortgage Association (FNMA) and Federal Home Loan Mortgage Corporation (FHLMC). In a mortgage dollar roll transaction, a Portfolio sells a mortgage-backed security to a financial institution, such as a bank or broker-dealer and simultaneously agrees to repurchase a substantially similar security from the institution at a later date at an agreed upon price. The mortgage-backed securities that are repurchased will bear the same interest rate as those sold, but generally will be collateralized by different pools of mortgages with different pre-payment histories. During the roll period, a Portfolio foregoes principal and interest paid on the securities. A Portfolio is compensated by the difference between the current sales price and the forward price for the future purchase as well as by the earnings on the cash proceeds of the initial sale. Mortgage dollar rolls may be renewed without physical delivery of the securities subject to the contract. The Portfolios account for TBA dollar roll transactions as purchases and sales which, as a result, may increase its portfolio turnover rate.
Security transactions and income recognition
Securities transactions are recorded on a trade date basis. Realized gains or losses are recorded on the basis of identified cost.
Interest income is accrued daily and bond discounts are accreted and premiums are amortized daily based on the effective interest method. To the extent debt obligations are placed on non-accrual status, any related interest income may be reduced by writing off interest receivables when the collection of all or a portion of interest has become doubtful based on consistently applied procedures. If the issuer subsequently resumes interest payments or when the collectability of interest is reasonably assured, the debt obligation is removed from non-accrual status.
Dividend income is recognized on the ex-dividend date.
Income from foreign securities is recorded net of foreign taxes withheld where recovery of such taxes is not assured.
Federal and other taxes
Each Portfolio is treated as a separate entity for federal income tax purposes. The Portfolios are not required to pay federal income taxes on their net investment income and net capital gain as they are treated as partnerships for federal income tax purposes. All interest, dividends, gains and losses of a Portfolio are deemed to have been “passed through” to the interestholders in proportion to their holdings of the Portfolio regardless of whether such interest, dividends and gains have been distributed by the Portfolio.
Each Portfolio’s income tax returns and all financial records supporting those returns for the prior three fiscal years are subject to examination by the federal revenue authority. Management has analyzed each Portfolio’s tax positions taken on federal, state, and foreign tax returns for all open tax years and does not believe that there are any uncertain tax positions that require recognition of a tax liability.
| | | | | | |
| Notes to financial statements (unaudited) | | Wells Fargo Income Funds | | | 47 | |
3. FAIR VALUATION MEASUREMENTS
Fair value measurements of investments are determined within a framework that has established a fair value hierarchy based upon the various data inputs utilized in determining the value of each Portfolio’s investments. The three-level hierarchy gives the highest priority to unadjusted quoted prices in active markets for identical assets or liabilities (Level 1) and the lowest priority to significant unobservable inputs (Level 3). Each Portfolio’s investments are classified within the fair value hierarchy based on the lowest level of input that is significant to the fair value measurement. The inputs are summarized into three broad levels as follows:
| n | | Level 1 – quoted prices in active markets for identical securities |
| n | | Level 2 – other significant observable inputs (including quoted prices for similar securities, interest rates, prepayment speeds, credit risk, use of amortized cost, etc.) |
| n | | Level 3 – significant unobservable inputs (including the Portfolio’s own assumptions in determining the fair value of investments) |
The inputs or methodologies used for valuing investments in securities are not necessarily an indication of the risk associated with investing in those securities.
The following is a summary of the inputs used in valuing each Portfolio’s assets and liabilities as of November 30, 2015:
| | | | | | | | | | | | | | | | |
| | | Quoted prices
(Level 1) | | | Other significant
observable inputs
(Level 2) | | | Significant
unobservable inputs
(Level 3) | | | Total | |
Core Bond Portfolio | | | | | | | | | | | | | | | | |
Assets | | | | | | | | | | | | | | | | |
Investments in: | | | | | | | | | | | | | | | | |
| | | | |
Agency securities | | $ | 0 | | | $ | 1,146,605,218 | | | $ | 0 | | | $ | 1,146,605,218 | |
| | | | |
Asset-backed securities | | | 0 | | | | 391,173,943 | | | | 0 | | | | 391,173,943 | |
| | | | |
Corporate bonds and notes | | | 0 | | | | 625,100,844 | | | | 0 | | | | 625,100,844 | |
| | | | |
Municipal obligations | | | 0 | | | | 34,332,561 | | | | 0 | | | | 34,332,561 | |
| | | | |
Non-agency mortgage-backed securities | | | 0 | | | | 170,507,903 | | | | 0 | | | | 170,507,903 | |
| | | | |
U.S. Treasury securities | | | 1,169,251,064 | | | | 0 | | | | 0 | | | | 1,169,251,064 | |
| | | | |
Yankee corporate bonds and notes | | | 0 | | | | 193,799,156 | | | | 0 | | | | 193,799,156 | |
| | | | |
Yankee government bonds | | | 0 | | | | 48,344,874 | | | | 0 | | | | 48,344,874 | |
| | | | |
Short-term investments | | | | | | | | | | | | | | | | |
Investment companies | | | 272,482,327 | | | | 60,450,000 | | | | 0 | | | | 332,932,327 | |
Total assets | | $ | 1,441,733,391 | | | $ | 2,670,314,499 | | | $ | 0 | | | $ | 4,112,047,890 | |
Real Return Portfolio | | | | | | | | | | | | | | | | |
Assets | | | | | | | | | | | | | | | | |
Investments in: | | | | | | | | | | | | | | | | |
| | | | |
Common stocks | | | | | | | | | | | | | | | | |
Consumer staples | | $ | 786,657 | | | $ | 0 | | | $ | 0 | | | $ | 786,657 | |
Energy | | | 1,108,724 | | | | 0 | | | | 0 | | | | 1,108,724 | |
Financials | | | 2,298,312 | | | | 0 | | | | 0 | | | | 2,298,312 | |
Materials | | | 2,259,425 | | | | 0 | | | | 0 | | | | 2,259,425 | |
| | | | |
Corporate bonds and notes | | | 0 | | | | 5,171,430 | | | | 0 | | | | 5,171,430 | |
| | | | |
Loans | | | 0 | | | | 2,088,512 | | | | 0 | | | | 2,088,512 | |
| | | | |
U.S. Treasury securities | | | 33,811,334 | | | | 0 | | | | 0 | | | | 33,811,334 | |
| | | | |
Yankee corporate bonds and notes | | | 0 | | | | 392,094 | | | | 0 | | | | 392,094 | |
| | | | |
Short-term investments | | | | | | | | | | | | | | | | |
Investment companies | | | 3,255,779 | | | | 166,050 | | | | 0 | | | | 3,421,829 | |
U. S. Treasury securities | | | 24,999 | | | | 0 | | | | 0 | | | | 24,999 | |
Total assets | | $ | 43,545,230 | | | $ | 7,818,086 | | | $ | 0 | | | $ | 51,363,316 | |
Liabilities | | | | | | | | | | | | | | | | |
| | | | |
Futures contract | | | 406 | | | | 0 | | | | 0 | | | | 406 | |
Total liabilities | | $ | 406 | | | $ | 0 | | | $ | 0 | | | $ | 406 | |
| | | | |
| 48 | | Wells Fargo Income Funds | | Notes to financial statements (unaudited) |
The Portfolios recognize transfers between levels within the fair value hierarchy at the end of the reporting period. At November 30, 2015, the Portfolios did not have any transfers into/out of Level 1, Level 2, or Level 3.
4. TRANSACTIONS WITH AFFILIATES
Advisory fee
The Trust has entered into an advisory contract with Funds Management, an indirect wholly owned subsidiary of Wells Fargo & Company (“Wells Fargo”). The adviser is responsible for implementing investment policies and guidelines and for supervising the subadvisers, who are responsible for day-to-day portfolio management of the Portfolios.
Pursuant to the contract, Funds Management is entitled to receive an annual advisory fee starting at 0.40% and declining to 0.30% as the average daily net assets of each Portfolio increase. For the six months ended November 30, 2015, the advisory fee for Core Bond Portfolio and Real Return Portfolio was equivalent to an annual rate of 0.35% and 0.40%, respectively, of each Portfolio’s average daily net assets.
Funds Management has retained the services of a subadviser to provide daily portfolio management to the Funds. The fees for subadvisory services are borne by Funds Management. WellsCap, an affiliate of Funds Management and an indirect, wholly owned subsidiary of Wells Fargo, is the subadviser to each Portfolio and is entitled to receive a fee from Funds Management at an annual rate starting at 0.20% and declining to 0.10% as the average daily net assets of Core Bond Portfolio increase, and an annual rate starting at 0.28% and declining to 0.18% as the average daily net assets of Real Return Portfolio increase.
Funds Management has voluntarily waived and/or reimbursed advisory fees to the extent necessary to maintain certain net operating expense ratios for the Portfolios.
5. INVESTMENT PORTFOLIO TRANSACTIONS
Purchases and sales of investments, excluding short-term securities, for the six months ended November 30, 2015 were as follows:
| | | | | | | | | | | | | | | | |
| | | Purchases at cost | | | Sales proceeds | |
| | | U.S.
government | | | Non-U.S.
government | | | U.S.
government | | | Non-U.S.
government | |
Core Bond Portfolio | | $ | 10,589,875,023 | | | $ | 1,491,007,478 | | | $ | 10,554,847,450 | | | $ | 1,433,738,469 | |
Real Return Portfolio | | | 5,429,363 | | | | 2,828,542 | | | | 3,116,428 | | | | 1,309,226 | |
As of November 30, 2015, Real Return Portfolio had unfunded term loan commitments of $99,750.
6. DERIVATIVE TRANSACTIONS
During the six months ended November 30, 2015, Real Return Portfolio entered into futures contracts to speculate on interest rates and to help manage the duration of the portfolio.
At November 30, 2015, the Real Return Portfolio had long and short futures contracts outstanding as follows:
| | | | | | | | | | | | | | |
| Expiration date | | Counterparty | | Contracts | | Type | | Contract value at
November 30, 2015 | | | Unrealized
gains (losses) | |
03-21-2016 | | JPMorgan | | 2 Short | | U.S. Treasury Bonds | | $ | 308,000 | | | $ | (3,066 | ) |
03-21-2016 | | JPMorgan | | 2 Long | | 5 Year U.S. Treasury Notes | | | 237,359 | | | | 215 | |
Real Return Portfolio had an average notional amount of $143,629 and $454,141 in long and short futures contracts during the six months ended November 30, 2015.
The payable for daily variation margin on open futures contracts reflected in the Statements of Assets and Liabilities only represents the current day’s variation margin. The realized gains or losses and change in unrealized gains or losses on derivative instruments are reflected in the Statements of Operations.
For certain types of derivative transactions, the Portfolios have entered into International Swaps and Derivatives Association, Inc. master agreements (“ISDA Master Agreements”) or similar agreements with approved counterparties. The ISDA Master Agreements or similar agreements may have requirements to deliver/deposit securities or cash to/with an exchange or broker-dealer as collateral and allows the Portfolio to offset, with each counterparty, certain derivative financial instrument’s assets and/or liabilities with collateral held or pledged. Collateral requirements differ by type of derivative. Collateral or margin requirements are set by the broker or exchange clearing house for exchange traded
| | | | | | |
| Notes to financial statements (unaudited) | | Wells Fargo Income Funds | | | 49 | |
derivatives while collateral terms are contract specific for over-the-counter traded derivatives. Cash collateral that has been pledged to cover obligations of the Portfolios under ISDA Master Agreements or similar agreements, if any, are reported separately in the Statements of Assets and Liabilities. Securities pledged as collateral, if any, are noted in the Portfolio of Investments or Summary Portfolio of Investments. With respect to balance sheet offsetting, absent an event of default by the counterparty or a termination of the agreement, the reported amounts of financial assets and financial liabilities in the Statements of Assets and Liabilities are not offset across transactions between the Portfolio and the applicable counterparty. A reconciliation of the gross amounts on the Statements of Assets and Liabilities to the net amounts by derivative type, including any collateral exposure, is as follows:
| | | | | | | | | | | | | | | | | | | | |
| | | Derivative type | | Counterparty | | Gross amounts
of liabilities in the
Statements of
Assets and
Liabilities | | | Amounts
subject to
netting
agreements | | | Collateral
pledged1 | | | Net amount
of liabilities | |
Real Return Portfolio | | Futures – variation margin | | JPMorgan | | $ | 406 | | | $ | 0 | | | $ | (406 | ) | | $ | 0 | |
| 1 | | Collateral pledged within this table is limited to the collateral for the net transaction with the counterparty. |
7. INDEMNIFICATION
Under the Trust’s organizational documents, the officers and Trustees have been granted certain indemnification rights against certain liabilities that may arise out of performance of their duties to the Trust. Additionally, in the normal course of business, the Trust may enter into contracts with service providers that contain a variety of indemnification clauses. The Trust’s maximum exposure under these arrangements is dependent on future claims that may be made against the Portfolios and, therefore, cannot be estimated.
| | | | |
| 50 | | Wells Fargo Income Funds | | Other information (unaudited) |
PROXY VOTING INFORMATION
A description of the policies and procedures used to determine how to vote proxies relating to portfolio securities is available without charge, upon request, by calling 1-800-222-8222, visiting our website at wellsfargofunds.com, or visiting the SEC website at sec.gov. Information regarding how the proxies related to portfolio securities were voted during the most recent 12-month period ended June 30 is available on the website at wellsfargofunds.com or by visiting the SEC website at sec.gov.
PORTFOLIO HOLDINGS INFORMATION
The complete portfolio holdings are publicly available on the website (wellsfargofunds.com) on a one-month delayed basis. In addition, top ten holdings information (excluding derivative positions) is publicly available on the website on a monthly, seven-day or more delayed basis. Each Fund and Portfolio files its complete schedule of portfolio holdings with the SEC for the first and third quarters of each fiscal year on Form N-Q, which is available by visiting the SEC website at sec.gov. In addition, each Form N-Q may be reviewed and copied at the SEC’s Public Reference Room in Washington, DC, and at regional offices in New York City, at 233 Broadway, and in Chicago, at 175 West Jackson Boulevard, Suite 900. Information about the Public Reference Room may be obtained by calling 1-800-SEC-0330.
| | | | | | |
| Other information (unaudited) | | Wells Fargo Income Funds | | | 51 | |
BOARD OF TRUSTEES AND OFFICERS
Each of the Trustees and Officers1 listed in the table below acts in identical capacities for each fund in the Wells Fargo family of funds, which consists of 144 mutual funds comprising the Wells Fargo Funds Trust, Wells Fargo Variable Trust, Wells Fargo Master Trust and four closed-end funds (collectively the “Fund Complex”). This table should be read in conjunction with the Prospectus and the Statement of Additional Information2. The mailing address of each Trustee and Officer is 525 Market Street, 12th Floor, San Francisco, CA 94105. Each Trustee and Officer serves an indefinite term, however, each Trustee serves such term until reaching the mandatory retirement age established by the Trustees.
Independent Trustees
| | | | | | |
Name and
year of birth | | Position held and
length of service* | | Principal occupations during past five years or longer | | Current other
public company or
investment company
directorships |
| William R. Ebsworth (Born 1957) | | Trustee, since 2015 | | Retired. From 1984 to 2013, equities analyst, portfolio manager, research director at Fidelity Management and Research Company in Boston, Tokyo, and Hong Kong and retired in 2013 as Chief Investment Officer of Fidelity Strategic Advisers, Inc. where he lead a team of investment professionals managing client assets. Prior thereto, Board member of Hong Kong Securities Clearing Co., Hong Kong Options Clearing Corp., the Thailand International Fund, Ltd., Fidelity Investments Life Insurance Company, and Empire Fidelity Investments Life Insurance Company. Mr. Ebsworth is a CFA ® charterholder and an Adjunct Lecturer, Finance, at Babson College. | | Asset Allocation Trust |
| Jane A. Freeman (Born 1953) | | Trustee, since 2015 | | Retired. From 2012 to 2014 and 1999 to 2008, Chief Financial Officer of Scientific Learning Corporation. From 2008 to 2012, Ms. Freeman provided consulting services Loevner Funds; Russell related to strategic business projects. Prior to 1999, Portfolio Manager at Rockefeller Exchange Traded Funds Trust & Co. and Scudder, Stevens & Clark. Board member of the Harding Loevner Funds from 1996 to 2014, serving as both Lead Independent Director and chair of the Audit Committee. Board member of the Russell Exchange Traded Funds Trust from 2011 to 2012 and the chair of the Audit Committee. Ms. Freeman is Chair of Taproot Foundation (non-profit organization), a Board Member of Ruth Bancroft Garden (non-profit organization) and an inactive chartered financial analyst. | | Asset Allocation Trust |
| Peter G. Gordon (Born 1942) | | Trustee, since 1998; Chairman, since 2005 | | Co-Founder, Retired Chairman, President and CEO of Crystal Geyser Water Company. Trustee Emeritus, Colby College. | | Asset Allocation Trust |
| Isaiah Harris, Jr. (Born 1952) | | Trustee, since 2009 | | Retired. Chairman of the Board of CIGNA Corporation since 2009, and Director since 2005. From 2003 to 2011, Director of Deluxe Corporation. Prior thereto, President and CEO of BellSouth Advertising and Publishing Corp. from 2005 to 2007, President and CEO of BellSouth Enterprises from 2004 to 2005 and President of BellSouth Consumer Services from 2000 to 2003. Emeritus member of the Iowa State University Foundation Board of Governors. Emeritus Member of the Advisory Board of Iowa State University School of Business. Advisory Board Member, Palm Harbor Academy (charter school). Mr. Harris is a certified public accountant. | | CIGNA Corporation; Asset Allocation Trust |
| Judith M. Johnson (Born 1949) | | Trustee, since 2008;
Audit Committee Chairman, since 2008 | | Retired. Prior thereto, Chief Executive Officer and Chief Investment Officer of Minneapolis Employees Retirement Fund from 1996 to 2008. Ms. Johnson is an attorney, certified public accountant and a certified managerial accountant. | | Asset Allocation Trust |
| David F. Larcker (Born 1950) | | Trustee, since 2009 | | James Irvin Miller Professor of Accounting at the Graduate School of Business, Stanford University, Morgan Stanley Director of the Center for Leadership Development and Research and Senior Faculty of The Rock Center for Corporate Governance since 2006. From 2005 to 2008, Professor of Accounting at the Graduate School of Business, Stanford University. Prior thereto, Ernst & Young Professor of Accounting at The Wharton School, University of Pennsylvania from 1985 to 2005. | | Asset Allocation Trust |
| | | | |
| 52 | | Wells Fargo Income Funds | | Other information (unaudited) |
| | | | | | |
Name and
year of birth | | Position held and
length of service* | | Principal occupations during past five years or longer | | Current other
public company or
investment company
directorships |
| Olivia S. Mitchell (Born 1953) | | Trustee, since 2006 | | International Foundation of Employee Benefit Plans Professor, Wharton School of the University of Pennsylvania since 1993. Director of Wharton’s Pension Research Council and Boettner Center on Pensions & Retirement Research, and Research Associate at the National Bureau of Economic Research. Previously, Cornell University Professor from 1978 to 1993. | | Asset Allocation Trust |
| Timothy J. Penny (Born 1951) | | Trustee, since 1996 | | President and Chief Executive Officer of Southern Minnesota Initiative Foundation, a non-profit organization, since 2007 and Senior Fellow at the Humphrey Institute Policy Forum at the University of Minnesota since 1995. Member of the Board of Trustees of NorthStar Education Finance, Inc., a non-profit organization, since 2007. | | Asset Allocation Trust |
| Michael S. Scofield (Born 1943) | | Trustee, since 2010 | | Served on the Investment Company Institute’s Board of Governors and Executive Committee from 2008-2011 as well the Governing Council of the Independent Directors Council from 2006-2011 and the Independent Directors Council Executive Committee from 2008-2011. Chairman of the IDC from 2008-2010. Institutional Investor (Fund Directions) Trustee of Year in 2007. Trustee of the Evergreen Funds complex (and its predecessors) from 1984 to 2010. Chairman of the Evergreen Funds from 2000-2010. Former Trustee of the Mentor Funds. Retired Attorney, Law Offices of Michael S. Scofield. | | Asset Allocation Trust |
| Donald C. Willeke (Born 1940) | | Trustee, since 1996** | | Principal of the law firm of Willeke & Daniels. General Counsel of the Minneapolis Employees Retirement Fund from 1984 until its consolidation into the Minnesota Public Employees Retirement Association on June 30, 2010. Director and Vice Chair of The Tree Trust (non-profit corporation). Director of the American Chestnut Foundation (non-profit corporation). | | Asset Allocation Trust |
| * | Length of service dates reflect the Trustee’s commencement of service with the Trust’s predecessor entities, where applicable. |
| ** | Donald Willeke retired as a Trustee effective December 31, 2015. |
Officers
| | | | | | |
Name and
year of birth | | Position held and
length of service | | Principal occupations during past five years or longer | | |
| Karla M. Rabusch (Born 1959) | | President, since 2003 | | Executive Vice President of Wells Fargo Bank, N.A. and President of Wells Fargo Funds Management, LLC since 2003. | | |
Nancy Wiser1
(Born 1967) | | Treasurer, since 2012 | | Executive Vice President of Wells Fargo Funds Management, LLC since 2011. Chief Operating Officer and Chief Compliance Officer at LightBox Capital Management LLC, from 2008 to 2011. | | |
| C. David Messman (Born 1960) | | Secretary, since 2000; Chief Legal Officer, since 2003 | | Senior Vice President and Secretary of Wells Fargo Funds Management, LLC since 2001. Assistant General Counsel of Wells Fargo Bank, N.A. since 2013 and Vice President and Managing Counsel of Wells Fargo Bank N.A. from 1996 to 2013. | | |
Debra Ann Early
(Born 1964) | | Chief Compliance Officer, since 2007 | | Executive Vice President of Wells Fargo Funds Management, LLC since 2014, Senior Vice President and Chief Compliance Officer from 2007 to 2014. | | |
David Berardi
(Born 1975) | | Assistant Treasurer, since 2009 | | Vice President of Wells Fargo Funds Management, LLC since 2009. Vice President of Evergreen Investment Management Company, LLC from 2008 to 2010. Manager of Fund Reporting and Control for Evergreen Investment Management Company, LLC from 2004 to 2010. | | |
| Jeremy DePalma1 (Born 1974) | | Treasurer, since 2012; Assistant Treasurer, since 2009 | | Senior Vice President of Wells Fargo Funds Management, LLC since 2009. Senior Vice President of Evergreen Investment Management Company, LLC from 2008 to 2010 and head of the Fund Reporting and Control Team within Fund Administration from 2005 to 2010. | | |
| 1 | Nancy Wiser acts as Treasurer of 72 funds in the Fund Complex. Jeremy DePalma acts as Treasurer of 72 funds and Assistant Treasurer of 72 funds in the Fund Complex. |
| 2 | The Statement of Additional Information includes additional information about the Trustees and is available, without charge, upon request, by calling 1-800-222-8222 or by visiting the website at wellsfargofunds.com. |
| | | | | | |
| List of abbreviations | | Wells Fargo Income Funds | | | 53 | |
The following is a list of common abbreviations for terms and entities that may have appeared in this report.
| ACA | — ACA Financial Guaranty Corporation |
| ADR | — American depositary receipt |
| ADS | — American depositary shares |
| AGC | — Assured Guaranty Corporation |
| AGM | — Assured Guaranty Municipal |
| Ambac | — Ambac Financial Group Incorporated |
| AMT | — Alternative minimum tax |
| BAN | — Bond anticipation notes |
| BHAC | — Berkshire Hathaway Assurance Corporation |
| CAB | — Capital appreciation bond |
| CCAB | — Convertible capital appreciation bond |
| CDA | — Community Development Authority |
| CDO | — Collateralized debt obligation |
| DRIVER | — Derivative inverse tax-exempt receipts |
| DW&P | — Department of Water & Power |
| DWR | — Department of Water Resources |
| ECFA | — Educational & Cultural Facilities Authority |
| EDA | — Economic Development Authority |
| EDFA | — Economic Development Finance Authority |
| ETF | — Exchange-traded fund |
| FDIC | — Federal Deposit Insurance Corporation |
| FFCB | — Federal Farm Credit Banks |
| FGIC | — Financial Guaranty Insurance Corporation |
| FHA | — Federal Housing Administration |
| FHLB | — Federal Home Loan Bank |
| FHLMC | — Federal Home Loan Mortgage Corporation |
| FICO | — The Financing Corporation |
| FNMA | — Federal National Mortgage Association |
| GDR | — Global depositary receipt |
| GNMA | — Government National Mortgage Association |
| HCFR | — Healthcare facilities revenue |
| HEFA | — Health & Educational Facilities Authority |
| HEFAR | — Higher education facilities authority revenue |
| HFA | — Housing Finance Authority |
| HFFA | — Health Facilities Financing Authority |
| HUD | — Department of Housing and Urban Development |
| IDA | — Industrial Development Authority |
| IDAG | — Industrial Development Agency |
| KRW | — Republic of Korea won |
| LIBOR | — London Interbank Offered Rate |
| LIFER | — Long Inverse Floating Exempt Receipts |
| LLC | — Limited liability company |
| LLLP | — Limited liability limited partnership |
| LLP | — Limited liability partnership |
| MBIA | — Municipal Bond Insurance Association |
| MFHR | — Multifamily housing revenue |
| MSTR | — Municipal securities trust receipts |
| MUD | — Municipal Utility District |
| National | — National Public Finance Guarantee Corporation |
| PCFA | — Pollution Control Financing Authority |
| PCL | — Public Company Limited |
| PCR | — Pollution control revenue |
| PFA | — Public Finance Authority |
| PFFA | — Public Facilities Financing Authority |
| PFOTER | — Puttable floating option tax-exempt receipts |
| plc | — Public limited company |
| PUTTER | — Puttable tax-exempt receipts |
| R&D | — Research & development |
| Radian | — Radian Asset Assurance |
| RAN | — Revenue anticipation notes |
| RDA | — Redevelopment Authority |
| RDFA | — Redevelopment Finance Authority |
| REIT | — Real estate investment trust |
| ROC | — Reset option certificates |
| SAVRS | — Select auction variable rate securities |
| SBA | — Small Business Authority |
| SDR | — Swedish depositary receipt |
| SFHR | — Single-family housing revenue |
| SFMR | — Single-family mortgage revenue |
| SPA | — Standby purchase agreement |
| SPDR | — Standard & Poor’s Depositary Receipts |
| SPEAR | — Short Puttable Exempt Adjustable Receipts |
| STRIPS | — Separate trading of registered interest and |
| TAN | — Tax anticipation notes |
| TIPS | — Treasury inflation-protected securities |
| TRAN | — Tax revenue anticipation notes |
| TTFA | — Transportation Trust Fund Authority |
| TVA | — Tennessee Valley Authority |
This page is intentionally left blank.
This page is intentionally left blank.
This page is intentionally left blank.

For more information
More information about Wells Fargo Funds is available free upon request. To obtain literature, please write, email, visit the Fund’s website, or call:
Wells Fargo Funds
P.O. Box 8266
Boston, MA 02266-8266
Email: wfaf@wellsfargo.com
Website: wellsfargofunds.com
Individual investors: 1-800-222-8222
Retail investment professionals: 1-888-877-9275
Institutional investment professionals: 1-866-765-0778
This report and the financial statements contained herein are submitted for the general information of the shareholders of Wells Fargo Funds. If this report is used for promotional purposes, distribution of the report must be accompanied or preceded by a current prospectus. Before investing, please consider the investment objectives, risks, charges, and expenses of the investment. For a current prospectus and, if available, a summary prospectus, containing this information, call 1-800-222-8222 or visit the Fund’s website at wellsfargofunds.com. Read the prospectus carefully before you invest or send money.
Wells Fargo Funds Management, LLC, a wholly owned subsidiary of Wells Fargo & Company, provides investment advisory and administrative services for Wells Fargo Funds. Other affiliates of Wells Fargo & Company provide subadvisory and other services for the Funds. The Funds are distributed by Wells Fargo Funds Distributor, LLC, Member FINRA, an affiliate of Wells Fargo & Company.
NOT FDIC INSURED ¡ NO BANK GUARANTEE ¡ MAY LOSE VALUE
© 2015 Wells Fargo Funds Management, LLC. All rights reserved.
| | |
 | | 239090 01-16 SILD/SAR103 11-15 |
Semi-Annual Report
November 30, 2015

WealthBuilderSM Portfolios

| n | | Wells Fargo WealthBuilderSM Conservative Allocation Portfolio |
| n | | Wells Fargo WealthBuilderSM Moderate Balanced Portfolio |
| n | | Wells Fargo WealthBuilderSM Growth Balanced Portfolio |
| n | | Wells Fargo WealthBuilderSM Growth Allocation Portfolio |
| n | | Wells Fargo WealthBuilderSM Equity Portfolio |
| n | | Wells Fargo WealthBuilderSM Tactical Equity Portfolio |

Reduce clutter. Save trees.
Sign up for electronic delivery of prospectuses and shareholder reports at wellsfargo.com/advantagedelivery
Contents
The views expressed and any forward-looking statements are as of November 30, 2015, unless otherwise noted, and are those of the Portfolio managers and/or Wells Fargo Funds Management, LLC. Discussions of individual securities, or the markets generally, or any Wells Fargo Fund are not intended as individual recommendations. Future events or results may vary significantly from those expressed in any forward-looking statements. The views expressed are subject to change at any time in response to changing circumstances in the market. Wells Fargo Funds Management, LLC and the Portfolios disclaim any obligation to publicly update or revise any views expressed or forward-looking statements.
NOT FDIC INSURED ¡ NO BANK GUARANTEE ¡ MAY LOSE VALUE
| | | | |
| 2 | | Wells Fargo WealthBuilder Portfolios | | Letter to shareholders (unaudited) |

Karla M. Rabusch
President
Wells Fargo Funds
Central bank actions abroad diverged during the period to be more accommodative when compared with the U.S. Federal Reserve.
Dear Valued Shareholder:
We are pleased to offer you this semi-annual report for the Wells Fargo WealthBuilderSM Portfolios for the six-month period that ended November 30, 2015. Among the most significant influences on investment markets during the period were low interest rates; low prices for oil, natural gas, and other commodities; a strong U.S. dollar; and shifting investor sentiment, which sparked volatility in equity and bond markets at higher levels than during recent years, pushing markets generally lower.
U.S. economic growth remained slow and uneven.
U.S. annualized gross domestic product (GDP) growth was 2.1% for the three-month period ended September 30, 2015, a slower pace than the prior quarter that restrained investor activity during the third and fourth quarters of 2015. Investor concerns about economic growth in the U.S. were compounded by data on retail sales and industrial production. Retail sales increased in August but at a slightly slower pace than expected, and the overall trend remained constrained. Industrial production declined in August, and the trend remained fairly flat overall with the periodic exception of automobile manufacturing.
On a more positive note, unemployment eased to 5.0% in October 2015 and consumer spending was solid as housing demand improved, although corporate results, as measured by profits from current production, decreased in the third quarter after a second-quarter increase, according to the U.S. Bureau of Economic Analysis. Despite sometimes conflicting data, expectations grew throughout the period that the Federal Open Market Committee would announce the first increase in the federal funds rate since June 2006 after its December 2015 meeting. The S&P 500 Index1 was essentially flat for the period, recording a -0.21% return.
Overseas, central banks diverged from Federal Reserve policy due to economic concerns.
Central bank actions abroad diverged during the period to be more accommodative when compared with the U.S. Federal Reserve. Contentious negotiations between Greece and its debtors to refinance the country’s sovereign debt concerned investors in mid-2015 before the Greek government accepted additional reforms in order to secure new loan agreements with the European Central Bank (ECB). The ECB continued to encourage lending and investing in the region by making funds available to banks at low interest rates, imposing a negative interest rate on bank deposits it held, and purchasing bonds through its quantitative easing program.
During the summer of 2015, the Hang Seng Index2 in Hong Kong experienced a dramatic decline. The People’s Bank of China sought to spur growth by cutting interest rates six times in less than a year through October 2015; lowering bank reserve requirements to encourage lending; and allowing the renminbi to depreciate in support of exports and to advance government efforts to transition to a more market-driven economy. Slowing economic growth in China reduced its importing activity, which, combined with continued low prices for many commodities, negatively affected China’s trading partners, particularly emerging markets countries.
| 1 | The S&P 500 Index consists of 500 stocks chosen for market size, liquidity, and industry group representation. It is a market-value-weighted index with each stock’s weight in the index proportionate to its market value. You cannot invest directly in an index. |
| 2 | The Hang Seng Index is a free-float-adjusted market-capitalization-weighted stock market index in Hong Kong. It is used to record and monitor daily changes of the largest companies of the Hong Kong stock market and is the main indicator of the overall market performance in Hong Kong. You cannot invest directly in an index. |
| | | | | | |
| Letter to shareholders (unaudited) | | Wells Fargo WealthBuilder Portfolios | | | 3 | |
Although Japan’s third-quarter 2015 GDP was positive after contracting in the second quarter, the Bank of Japan expanded its economic stimulus programs to increase injections of liquidity into the economy through additional bond purchases. The Government Pension Investment Fund continued to reduce government bond investments and direct those assets to investments in the Japanese stock market.
Developed European and Asian equity markets returned -7.42%, as measured by the Morgan Stanley Capital International (MSCI) Europe, Australasia, Far East (EAFE) Index (Net)3 for the six-month period that ended November 30, 2015. U.S. investors in overseas markets saw the values of their investments fall as the U.S. dollar strengthened in comparison with other currencies.
Bond performance stumbled as investor concerns increased.
Bond investors were not spared the negative effects that stemmed from uncertain investor sentiment. While low interest rates restrained yields, periodic flights to the perceived quality of U.S. government bonds in the face of equity market volatility helped support domestic bond prices. As a result, U.S. bonds tended to fare better than bonds issued overseas. During the period, the Barclays U.S. Aggregate Bond Index4 was essentially flat, recording a -0.12% return, while the Barclays Global Aggregate ex U.S. Dollar Bond Index5 recorded a -1.76% return.
Don’t let short-term uncertainty derail long-term investment goals.
Periods of uncertainty can present challenges, but experience has taught us that maintaining long-term investment goals can be an effective way to plan for the future. To help you create a sound strategy based on your personal goals and risk tolerance, Wells Fargo Funds offers more than 100 mutual funds and other investments spanning a wide range of asset classes and investment styles. Although diversification cannot guarantee an investment profit or prevent losses, we believe it can be an effective way to manage investment risk and potentially smooth out overall portfolio performance. We encourage investors to know their investments and to understand that appropriate levels of risk-taking may unlock opportunities.
Thank you for choosing to invest with Wells Fargo Funds. We appreciate your confidence in us and remain committed to helping you meet your financial needs.
Sincerely,

Karla M. Rabusch
President
Wells Fargo Funds
Bond investors were not spared the negative effects that stemmed from uncertain investor sentiment.
| 3 | The Morgan Stanley Capital International (MSCI) Europe, Australasia, Far East (EAFE) Index (Net) is a free-float-adjusted market-capitalization-weighted index that is designed to measure the equity market performance of developed markets, excluding the U.S. and Canada. The MSCI EAFE Index (Net) consists of the following 21 developed markets country indexes: Australia, Austria, Belgium, Denmark, Finland, France, Germany, Hong Kong, Ireland, Israel, Italy, Japan, the Netherlands, New Zealand, Norway, Portugal, Singapore, Spain, Sweden, Switzerland, and the United Kingdom. You cannot invest directly in an index. Source: MSCI. MSCI makes no express or implied warranties or representations and shall have no liability whatsoever with respect to any MSCI data contained herein. The MSCI data may not be further redistributed or used as a basis for other indexes or any securities or financial products. This report is not approved, reviewed, or produced by MSCI. |
| 4 | The Barclays U.S. Aggregate Bond Index is composed of the Barclays U.S. Government/Credit Index and the Barclays U.S. Mortgage-Backed Securities Index, and includes Treasury issues, agency issues, corporate bond issues, and mortgage-backed securities. You cannot invest directly in an index. |
| 5 | The Barclays Global Aggregate ex U.S. Dollar Bond Index tracks an international basket of government, corporate, agency, and mortgage-related bonds. You cannot invest directly in an index. |
| | | | |
| 4 | | Wells Fargo WealthBuilder Portfolios | | Letter to shareholders (unaudited) |
Notice to shareholders
At a meeting held August 11–12, 2015, the Board of Trustees of the Portfolios approved a change in the name of each Portfolio whereby the word Advantage was removed from its name, effective December 15, 2015.
For current information about your fund investments, contact your investment professional, visit our website at wellsfargofunds.com, or call us directly at 1-800-222-8222. We are available 24 hours a day, 7 days a week.
| | | | | | |
| Performance highlights (unaudited) | | Wells Fargo WealthBuilder Portfolios | | | 5 | |
Wells Fargo WealthBuilder Conservative Allocation Portfolio
Investment objective
The Portfolio seeks current income with a secondary emphasis on capital appreciation.
Manager
Wells Fargo Funds Management, LLC
Subadviser
Wells Capital Management Incorporated
Portfolio managers
Kandarp R. Acharya, CFA®, FRM
Christian L. Chan, CFA®
Average annual total returns (%) as of November 30, 2015
| | | | | | | | | | | | | | | | | | | | | | | | | | | | | | | | | | |
| | | | | Including sales charge | | | Excluding sales charge | | | Expense ratios1 (%) | |
| | | Inception date | | 1 year | | | 5 year | | | 10 year | | | 1 year | | | 5 year | | | 10 year | | | Gross | | | Net2 | |
| Wells Fargo WealthBuilder Conservative Allocation Portfolio (WBCAX) | | 9-30-2004 | | | (2.97 | ) | | | 2.59 | | | | 3.22 | | | | (1.49 | ) | | | 2.90 | | | | 3.38 | | | | 2.04 | | | | 2.04 | |
| WealthBuilder Conservative Allocation Composite Index3 | | – | | | – | | | | – | | | | – | | | | 0.84 | | | | 4.73 | | | | 5.23 | | | | – | | | | – | |
| Barclays U.S. Aggregate Bond Index4 | | – | | | – | | | | – | | | | – | | | | 0.97 | | | | 3.09 | | | | 4.65 | | | | – | | | | – | |
| MSCI ACWI ex USA Index (Net)5 | | – | | | – | | | | – | | | | – | | | | (7.32 | ) | | | 2.99 | | | | 3.60 | | | | – | | | | – | |
| Russell 3000® Index6 | | – | | | – | | | | – | | | | – | | | | 2.58 | | | | 14.13 | | | | 7.59 | | | | – | | | | – | |
Figures quoted represent past performance, which is no guarantee of future results, and do not reflect taxes that a shareholder may pay on fund distributions or the redemption of fund shares. Investment return and principal value of an investment will fluctuate so that an investor’s shares, when redeemed, may be worth more or less than their original cost. Performance shown without sales charges would be lower if sales charges were reflected. Current performance may be lower or higher than the performance data quoted, which assumes the reinvestment of dividends and capital gains. Current month-end performance is available on the Portfolio’s website, wellsfargofunds.com.
Index returns do not include transaction costs associated with buying and selling securities, any mutual fund fees or expenses, or any taxes. It is not possible to invest directly in an index.
For WealthBuilder Portfolios, the maximum front-end sales charge is 1.50%.
Balanced funds may invest in stocks and bonds. Stock values fluctuate in response to the activities of individual companies and general market and economic conditions. Bond values fluctuate in response to the financial condition of individual issuers, general market and economic conditions, and changes in interest rates. Changes in market conditions and government policies may lead to periods of heightened volatility in the bond market and reduced liquidity for certain bonds held by the Portfolio. In general, when interest rates rise, bond values fall and investors may lose principal value. Interest-rate changes and their impact on the Portfolio and its share price can be sudden and unpredictable. The use of derivatives may reduce returns and/or increase volatility. The Portfolio will indirectly be exposed to all of the risks of an investment in the underlying funds and will indirectly bear expenses of the underlying funds. Certain investment strategies tend to increase the total risk of an investment (relative to the broader market). The Portfolio is exposed to alternative investment risk, foreign investment risk, high-yield securities risk, mortgage- and asset-backed securities risk, and smaller-company investment risk. Consult the Portfolio’s prospectus for additional information on these and other risks.
Please see footnotes on page 6.
| | | | |
| 6 | | Wells Fargo WealthBuilder Portfolios | | Performance highlights (unaudited) |
Wells Fargo WealthBuilder Conservative Allocation Portfolio (continued)
| | | | |
| Ten largest holdings (%) as of November 30, 20157 | |
Wells Fargo Core Bond Portfolio | | | 23.86 | |
Wells Fargo Short Duration Government Bond Fund Class R6 | | | 18.32 | |
Wells Fargo Government Securities Fund Institutional Class | | | 15.05 | |
PIMCO High Yield Fund Institutional Class | | | 10.04 | |
Oppenheimer International Bond Fund Class Y | | | 4.59 | |
MFS Value Fund Class I | | | 3.01 | |
PIMCO CommodityRealReturn Strategy Fund Institutional Class | | | 2.58 | |
Thornburg International Value Fund Institutional Class | | | 1.80 | |
Voya Global Real Estate Fund Class I | | | 1.78 | |
T. Rowe Price Blue Chip Growth Fund Retail Class | | | 1.75 | |
|
| Current target allocation as of November 30, 20158 |
|
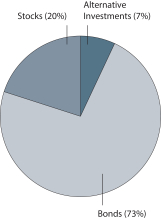 |
| 1 | Reflects the expense ratios as stated in the most recent prospectus, which include the impact of 0.54% in acquired fund fees and expenses. The expense ratios shown are subject to change and may differ from the annualized expense ratios shown in the financial highlights of this report, which do not include acquired fund fees and expenses. |
| 2 | The manager has contractually committed through September 30, 2016, to waive fees and/or reimburse expenses to the extent necessary to cap the Portfolio’s Total Annual Fund Operating Expenses After Fee Waiver at 1.50%. After this time, the cap may be increased or the commitment to maintain the cap may be terminated only with the approval of the Board of Trustees. Brokerage commissions, stamp duty fees, interest, taxes, acquired fund fees and expenses, allocated expenses from underlying affiliated Master Portfolios, and extraordinary expenses are excluded from the cap. Without this cap, the Portfolio’s returns would have been lower. |
| 3 | Source: Wells Fargo Funds Management, LLC. The WealthBuilder Conservative Allocation Composite Index is comprised of the following indexes: Russell 3000® Index (14%), MSCI ACWI ex USA Index (Net) (6%) and Barclays U.S. Aggregate Bond Index (80%). You cannot invest directly in an index. |
| 4 | The Barclays U.S. Aggregate Bond Index is composed of the Barclays U.S. Government/Credit Index and the Barclays U.S. Mortgage-Backed Securities Index, and includes Treasury issues, agency issues, corporate bond issues, and mortgage-backed securities. You cannot invest directly in an index. |
| 5 | The Morgan Stanley Capital International (MSCI) All Country World Index (ACWI) ex USA Index (Net) is a free-float-adjusted market-capitalization-weighted index that is designed to measure the equity market performance of developed and emerging markets. You cannot invest directly in an index. Source: MSCI. MSCI makes no express or implied warranties or representations and shall have no liability whatsoever with respect to any MSCI data contained herein. The MSCI data may not be further redistributed or used as a basis for other indexes or any securities or financial products. This report is not approved, reviewed, or produced by MSCI. |
| 6 | The Russell 3000® Index measures the performance of the 3,000 largest U.S. companies based on total market capitalization, which represents approximately 98% of the investable U.S. equity market. You cannot invest directly in an index. |
| 7 | The ten largest holdings, excluding cash and cash equivalents, are calculated based on the value of the investments divided by the total net assets of the Portfolio. Holdings are subject to change and may have changed since the date specified. |
| 8 | Current target allocation is calculated based on the total long-term investments of the Portfolio. The Portfolio’s use of futures contracts to implement a Tactical Asset Allocation (TAA) shift toward stocks or bonds is reflected in the allocation shown. These amounts are subject to change and may have changed since the date specified. |
| | | | | | |
| Performance highlights (unaudited) | | Wells Fargo WealthBuilder Portfolios | | | 7 | |
Wells Fargo WealthBuilder Moderate Balanced Portfolio
Investment objective
The Portfolio seeks a combination of current income and capital appreciation.
Manager
Wells Fargo Funds Management, LLC
Subadviser
Wells Capital Management Incorporated
Portfolio managers
Kandarp R. Acharya, CFA®, FRM
Christian L. Chan, CFA®
Average annual total returns (%) as of November 30, 2015
| | | | | | | | | | | | | | | | | | | | | | | | | | | | | | | | | | |
| | | | | Including sales charge | | | Excluding sales charge | | | Expense ratios1 (%) | |
| | | Inception date | | 1 year | | | 5 year | | | 10 year | | | 1 year | | | 5 year | | | 10 year | | | Gross | | | Net2 | |
| Wells Fargo WealthBuilder Moderate Balanced Portfolio (WBBBX) | | 9-30-2004 | | | (2.40 | ) | | | 4.60 | | | | 3.71 | | | | (0.91 | ) | | | 4.92 | | | | 3.87 | | | | 2.11 | | | | 2.11 | |
| WealthBuilder Moderate Balanced Composite Index3 | | – | | | – | | | | – | | | | – | | | | 0.63 | | | | 6.32 | | | | 5.71 | | | | – | | | | – | |
| Barclays U.S. Aggregate Bond Index4 | | – | | | – | | | | – | | | | – | | | | 0.97 | | | | 3.09 | | | | 4.65 | | | | – | | | | – | |
| MSCI ACWI ex USA Index (Net)5 | | – | | | – | | | | – | | | | – | | | | (7.32 | ) | | | 2.99 | | | | 3.60 | | | | – | | | | – | |
| Russell 3000® Index6 | | – | | | – | | | | – | | | | – | | | | 2.58 | | | | 14.13 | | | | 7.59 | | | | – | | | | – | |
Figures quoted represent past performance, which is no guarantee of future results, and do not reflect taxes that a shareholder may pay on fund distributions or the redemption of fund shares. Investment return and principal value of an investment will fluctuate so that an investor’s shares, when redeemed, may be worth more or less than their original cost. Performance shown without sales charges would be lower if sales charges were reflected. Current performance may be lower or higher than the performance data quoted, which assumes the reinvestment of dividends and capital gains. Current month-end performance is available on the Portfolio’s website, wellsfargofunds.com.
Index returns do not include transaction costs associated with buying and selling securities, any mutual fund fees or expenses, or any taxes. It is not possible to invest directly in an index.
For WealthBuilder Portfolios, the maximum front-end sales charge is 1.50%.
Balanced funds may invest in stocks and bonds. Stock values fluctuate in response to the activities of individual companies and general market and economic conditions. Bond values fluctuate in response to the financial condition of individual issuers, general market and economic conditions, and changes in interest rates. Changes in market conditions and government policies may lead to periods of heightened volatility in the bond market and reduced liquidity for certain bonds held by the Portfolio. In general, when interest rates rise, bond values fall and investors may lose principal value. Interest-rate changes and their impact on the Portfolio and its share price can be sudden and unpredictable. The Portfolio will indirectly be exposed to all of the risks of an investment in the underlying funds and will indirectly bear expenses of the underlying funds. The use of derivatives may reduce returns and/or increase volatility. Certain investment strategies tend to increase the total risk of an investment (relative to the broader market). The Portfolio is exposed to alternative investment risk, foreign investment risk, high-yield securities risk, mortgage- and asset-backed securities risk, and smaller-company investment risk. Consult the Portfolio’s prospectus for additional information on these and other risks.
Please see footnotes on page 8.
| | | | |
| 8 | | Wells Fargo WealthBuilder Portfolios | | Performance highlights (unaudited) |
Wells Fargo WealthBuilder Moderate Balanced Portfolio (continued)
| | | | |
| Ten largest holdings (%) as of November 30, 20157 | |
Wells Fargo Core Bond Portfolio | | | 17.26 | |
Wells Fargo Government Securities Fund Institutional Class | | | 11.41 | |
Wells Fargo Short Duration Government Bond Fund Class R6 | | | 10.56 | |
PIMCO High Yield Fund Institutional Class | | | 8.41 | |
MFS Value Fund Class I | | | 6.12 | |
Oppenheimer International Bond Fund Class Y | | | 4.41 | |
T. Rowe Price Blue Chip Growth Fund Retail Class | | | 3.59 | |
Thornburg International Value Fund Institutional Class | | | 3.56 | |
Oakmark Fund Class I | | | 3.05 | |
Invesco Growth and Income Fund Class R6 | | | 3.05 | |
|
| Current target allocation as of November 30, 20158 |
|
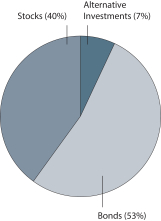 |
| 1 | Reflects the expense ratios as stated in the most recent prospectus, which include the impact of 0.61% in acquired fund fees and expenses. The expense ratios shown are subject to change and may differ from the annualized expense ratios shown in the financial highlights of this report, which do not include acquired fund fees and expenses. |
| 2 | The manager has contractually committed through September 30, 2016 to waive fees and/or reimburse expenses to the extent necessary to cap the Portfolio’s Total Annual Fund Operating Expenses After Fee Waiver at 1.50%. After this time, the cap may be increased or the commitment to maintain the cap may be terminated only with the approval of the Board of Trustees. Brokerage commissions, stamp duty fees, interest, taxes, acquired fund fees and expenses, allocated expenses from underlying affiliated Master Portfolios, and extraordinary expenses are excluded from the cap. Without this cap, the Portfolio’s returns would have been lower. |
| 3 | Source: Wells Fargo Funds Management, LLC. The WealthBuilder Moderate Balanced Composite Index is comprised of the following indexes: Russell 3000® Index (28%), MSCI ACWI ex USA Index (Net) (12%) and Barclays U.S. Aggregate Bond Index (60%). You cannot invest directly in an index. |
| 4 | The Barclays U.S. Aggregate Bond Index is composed of the Barclays U.S. Government/Credit Index and the Barclays U.S. Mortgage-Backed Securities Index, and includes Treasury issues, agency issues, corporate bond issues, and mortgage-backed securities. You cannot invest directly in an index. |
| 5 | The Morgan Stanley Capital International (MSCI) All Country World Index (ACWI) ex USA Index (Net) is a free-float-adjusted market-capitalization-weighted index that is designed to measure the equity market performance of developed and emerging markets. You cannot invest directly in an index. Source: MSCI. MSCI makes no express or implied warranties or representations and shall have no liability whatsoever with respect to any MSCI data contained herein. The MSCI data may not be further redistributed or used as a basis for other indexes or any securities or financial products. This report is not approved, reviewed, or produced by MSCI. |
| 6 | The Russell 3000® Index measures the performance of the 3,000 largest U.S. companies based on total market capitalization, which represents approximately 98% of the investable U.S. equity market. You cannot invest directly in an index. |
| 7 | The ten largest holdings, excluding cash and cash equivalents, are calculated based on the value of the investments divided by the total net assets of the Portfolio. Holdings are subject to change and may have changed since the date specified. |
| 8 | Current target allocation is calculated based on the total long-term investments of the Portfolio. The Portfolio’s use of futures contracts to implement a Tactical Asset Allocation (TAA) shift toward stocks or bonds is reflected in the allocation shown. These amounts are subject to change and may have changed since the date specified. |
| | | | | | |
| Performance highlights (unaudited) | | Wells Fargo WealthBuilder Portfolios | | | 9 | |
Wells Fargo WealthBuilder Growth Balanced Portfolio
Investment objective
The Portfolio seeks a combination of capital appreciation and current income.
Manager
Wells Fargo Funds Management, LLC
Subadviser
Wells Capital Management Incorporated
Portfolio managers
Kandarp R. Acharya, CFA®, FRM
Christian L. Chan, CFA®
Average annual total returns (%) as of November 30, 2015
| | | | | | | | | | | | | | | | | | | | | | | | | | | | | | | | | | |
| | | | | Including sales charge | | | Excluding sales charge | | | Expense ratios1 (%) | |
| | | Inception date | | 1 year | | | 5 year | | | 10 year | | | 1 year | | | 5 year | | | 10 year | | | Gross | | | Net2 | |
| Wells Fargo WealthBuilder Growth Balanced Portfolio (WBGBX) | | 10-1-1997 | | | (2.26 | ) | | | 6.77 | | | | 4.01 | | | | (0.77 | ) | | | 7.09 | | | | 4.17 | | | | 2.17 | | | | 2.17 | |
| WealthBuilder Growth Balanced Composite Index3 | | – | | | – | | | | – | | | | – | | | | 0.36 | | | | 7.85 | | | | 6.08 | | | | – | | | | – | |
| Barclays U.S. Aggregate Bond Index4 | | – | | | – | | | | – | | | | – | | | | 0.97 | | | | 3.09 | | | | 4.65 | | | | – | | | | – | |
| MSCI ACWI ex USA Index (Net)5 | | – | | | – | | | | – | | | | – | | | | (7.32 | ) | | | 2.99 | | | | 3.60 | | | | – | | | | – | |
| Russell 3000® Index6 | | – | | | – | | | | – | | | | – | | | | 2.58 | | | | 14.13 | | | | 7.59 | | | | – | | | | – | |
Figures quoted represent past performance, which is no guarantee of future results, and do not reflect taxes that a shareholder may pay on fund distributions or the redemption of fund shares. Investment return and principal value of an investment will fluctuate so that an investor’s shares, when redeemed, may be worth more or less than their original cost. Performance shown without sales charges would be lower if sales charges were reflected. Current performance may be lower or higher than the performance data quoted, which assumes the reinvestment of dividends and capital gains. Current month-end performance is available on the Portfolio’s website, wellsfargofunds.com.
Index returns do not include transaction costs associated with buying and selling securities, any mutual fund fees or expenses, or any taxes. It is not possible to invest directly in an index.
For WealthBuilder Portfolios, the maximum front-end sales charge is 1.50%.
Balanced funds may invest in stocks and bonds. Stock values fluctuate in response to the activities of individual companies and general market and economic conditions. Bond values fluctuate in response to the financial condition of individual issuers, general market and economic conditions, and changes in interest rates. Changes in market conditions and government policies may lead to periods of heightened volatility in the bond market and reduced liquidity for certain bonds held by the Portfolio. In general, when interest rates rise, bond values fall and investors may lose principal value. Interest-rate changes and their impact on the Portfolio and its share price can be sudden and unpredictable. The Portfolio will indirectly be exposed to all of the risks of an investment in the underlying funds and will indirectly bear expenses of the underlying funds. The use of derivatives may reduce returns and/or increase volatility. Certain investment strategies tend to increase the total risk of an investment (relative to the broader market). The Portfolio is exposed to alternative investment risk, foreign investment risk, high-yield securities risk, mortgage- and asset-backed securities risk, and smaller-company investment risk. Consult the Portfolio’s prospectus for additional information on these and other risks.
Please see footnotes on page 10.
| | | | |
| 10 | | Wells Fargo WealthBuilder Portfolios | | Performance highlights (unaudited) |
Wells Fargo WealthBuilder Growth Balanced Portfolio (continued)
| | | | |
| Ten largest holdings (%) as of November 30, 20157 | |
Wells Fargo Core Bond Portfolio | | | 11.36 | |
Wells Fargo Government Securities Fund Institutional Class | | | 9.97 | |
MFS Value Fund Class I | | | 9.13 | |
PIMCO High Yield Fund Institutional Class | | | 6.40 | |
T. Rowe Price Blue Chip Growth Fund Retail Class | | | 5.39 | |
Thornburg International Value Fund Institutional Class | | | 5.26 | |
Oppenheimer International Bond Fund Class Y | | | 4.74 | |
Oakmark Fund Class I | | | 4.55 | |
Invesco Growth and Income Fund Class R6 | | | 4.54 | |
American Century Growth Fund Institutional Class | | | 3.80 | |
|
| Current target allocation as of November 30, 20158 |
|
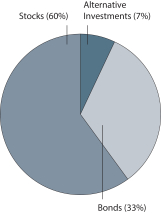 |
| 1 | Reflects the expense ratios as stated in the most recent prospectus, which include the impact of 0.68% in acquired fund fees and expenses. The expense ratios shown are subject to change and may differ from the annualized expense ratios shown in the financial highlights of this report, which do not include acquired fund fees and expenses. |
| 2 | The manager has contractually committed through September 30, 2016, to waive fees and/or reimburse expenses to the extent necessary to cap the Portfolio’s Total Annual Fund Operating Expenses After Fee Waiver at 1.50%. After this time, the cap may be increased or the commitment to maintain the cap may be terminated only with the approval of the Board of Trustees. Brokerage commissions, stamp duty fees, interest, taxes, acquired fund fees and expenses, allocated expenses from underlying affiliated Master Portfolios, and extraordinary expenses are excluded from the cap. Without this cap, the Portfolio’s returns would have been lower. |
| 3 | Source: Wells Fargo Funds Management, LLC. The WealthBuilder Growth Balanced Composite Index is comprised of the following indexes: Russell 3000® Index (42%), MSCI ACWI ex USA Index (Net) (18%) and Barclays U.S. Aggregate Bond Index (40%). You cannot invest directly in an index. |
| 4 | The Barclays U.S. Aggregate Bond Index is composed of the Barclays U.S. Government/Credit Index and the Barclays U.S. Mortgage-Backed Securities Index, and includes Treasury issues, agency issues, corporate bond issues, and mortgage-backed securities. You cannot invest directly in an index. |
| 5 | The Morgan Stanley Capital International (MSCI) All Country World Index (ACWI) ex USA Index (Net) is a free-float-adjusted market-capitalization-weighted index that is designed to measure the equity market performance of developed and emerging markets. You cannot invest directly in an index. Source: MSCI. MSCI makes no express or implied warranties or representations and shall have no liability whatsoever with respect to any MSCI data contained herein. The MSCI data may not be further redistributed or used as a basis for other indexes or any securities or financial products. This report is not approved, reviewed, or produced by MSCI. |
| 6 | The Russell 3000® Index measures the performance of the 3,000 largest U.S. companies based on total market capitalization, which represents approximately 98% of the investable U.S. equity market. You cannot invest directly in an index. |
| 7 | The ten largest holdings, excluding cash and cash equivalents, are calculated based on the value of the investments divided by the total net assets of the Portfolio. Holdings are subject to change and may have changed since the date specified. |
| 8 | Current target allocation is calculated based on the total long-term investments of the Portfolio. The Portfolio’s use of futures contracts to implement a Tactical Asset Allocation (TAA) shift toward stocks or bonds is reflected in the allocation shown. These amounts are subject to change and may have changed since the date specified. |
| | | | | | |
| Performance highlights (unaudited) | | Wells Fargo WealthBuilder Portfolios | | | 11 | |
Wells Fargo WealthBuilder Growth Allocation Portfolio
Investment objective
The Portfolio seeks capital appreciation with a secondary emphasis on current income.
Manager
Wells Fargo Funds Management, LLC
Subadviser
Wells Capital Management Incorporated
Portfolio managers
Kandarp R. Acharya, CFA®, FRM
Christian L. Chan, CFA®
Average annual total returns (%) as of November 30, 2015
| | | | | | | | | | | | | | | | | | | | | | | | | | | | | | | | | | |
| | | | | Including sales charge | | | Excluding sales charge | | | Expense ratios1 (%) | |
| | | Inception date | | 1 year | | | 5 year | | | 10 year | | | 1 year | | | 5 year | | | 10 year | | | Gross | | | Net2 | |
| Wells Fargo WealthBuilder Growth Allocation Portfolio (WBGGX) | | 9-30-2004 | | | (2.02 | ) | | | 7.80 | | | | 3.99 | | | | (0.53 | ) | | | 8.13 | | | | 4.15 | | | | 2.24 | | | | 2.24 | |
| WealthBuilder Growth Allocation Composite Index3 | | – | | | – | | | | – | | | | – | | | | 0.00 | | | | 9.33 | | | | 6.33 | | | | – | | | | – | |
| Barclays U.S. Aggregate Bond Index4 | | – | | | – | | | | – | | | | – | | | | 0.97 | | | | 3.09 | | | | 4.65 | | | | – | | | | – | |
| MSCI ACWI ex USA Index (Net)5 | | – | | | – | | | | – | | | | – | | | | (7.32 | ) | | | 2.99 | | | | 3.60 | | | | – | | | | – | |
| Russell 3000® Index6 | | – | | | – | | | | – | | | | – | | | | 2.58 | | | | 14.13 | | | | 7.59 | | | | – | | | | – | |
Figures quoted represent past performance, which is no guarantee of future results, and do not reflect taxes that a shareholder may pay on fund distributions or the redemption of fund shares. Investment return and principal value of an investment will fluctuate so that an investor’s shares, when redeemed, may be worth more or less than their original cost. Performance shown without sales charges would be lower if sales charges were reflected. Current performance may be lower or higher than the performance data quoted, which assumes the reinvestment of dividends and capital gains. Current month-end performance is available on the Portfolio’s website, wellsfargofunds.com.
Index returns do not include transaction costs associated with buying and selling securities, any mutual fund fees or expenses, or any taxes. It is not possible to invest directly in an index.
For WealthBuilder Portfolios, the maximum front-end sales charge is 1.50%.
Balanced funds may invest in stocks and bonds. Stock values fluctuate in response to the activities of individual companies and general market and economic conditions. Bond values fluctuate in response to the financial condition of individual issuers, general market and economic conditions, and changes in interest rates. Changes in market conditions and government policies may lead to periods of heightened volatility in the bond market and reduced liquidity for certain bonds held by the Portfolio. In general, when interest rates rise, bond values fall and investors may lose principal value. Interest-rate changes and their impact on the Portfolio and its share price can be sudden and unpredictable. The Portfolio will indirectly be exposed to all of the risks of an investment in the underlying funds and will indirectly bear expenses of the underlying funds. The use of derivatives may reduce returns and/or increase volatility. Certain investment strategies tend to increase the total risk of an investment (relative to the broader market). The Portfolio is exposed to alternative investment risk, foreign investment risk, high-yield securities risk, mortgage- and asset-backed securities risk, and smaller-company investment risk. Consult the Portfolio’s prospectus for additional information on these and other risks.
Please see footnotes on page 12.
| | | | |
| 12 | | Wells Fargo WealthBuilder Portfolios | | Performance highlights (unaudited) |
Wells Fargo WealthBuilder Growth Allocation Portfolio (continued)
| | | | |
| Ten largest holdings (%) as of November 30, 20157 | |
MFS Value Fund Class I | | | 12.01 | |
T. Rowe Price Blue Chip Growth Fund Retail Class | | | 7.11 | |
Thornburg International Value Fund Institutional Class | | | 7.05 | |
Oakmark Fund Class I | | | 5.98 | |
Invesco Growth and Income Fund Class R6 | | | 5.96 | |
American Century Growth Fund Institutional Class | | | 5.02 | |
Wells Fargo International Growth Portfolio | | | 4.79 | |
Wells Fargo Core Bond Portfolio | | | 4.71 | |
Wells Fargo Large Cap Growth Fund Class R6 | | | 4.02 | |
Wells Fargo Endeavor Select Fund Institutional Class | | | 4.01 | |
|
| Current target allocation as of November 30, 20158 |
|
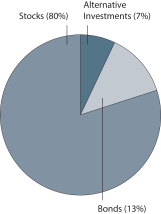 |
| 1 | Reflects the expense ratios as stated in the most recent prospectus, which include the impact of 0.74% in acquired fund fees and expenses. The expense ratios shown are subject to change and may differ from the annualized expense ratios shown in the financial highlights of this report, which do not include acquired fund fees and expenses. |
| 2 | The manager has contractually committed through September 30, 2016, to waive fees and/or reimburse expenses to the extent necessary to cap the Portfolio’s Total Annual Fund Operating Expenses After Fee Waiver at 1.50%. After this time, the cap may be increased or the commitment to maintain the cap may be terminated only with the approval of the Board of Trustees. Brokerage commissions, stamp duty fees, interest, taxes, acquired fund fees and expenses, allocated expenses from underlying affiliated Master Portfolios, and extraordinary expenses are excluded from the cap. Without this cap, the Portfolio’s returns would have been lower. |
| 3 | Source: Wells Fargo Funds Management, LLC. The WealthBuilder Growth Allocation Composite Index is comprised of the following indexes: Russell 3000® Index (56%), MSCI ACWI ex USA Index (Net) (24%) and Barclays U.S. Aggregate Bond Index (20%). You cannot invest directly in an index. |
| 4 | The Barclays U.S. Aggregate Bond Index is composed of the Barclays U.S. Government/Credit Index and the Barclays U.S. Mortgage-Backed Securities Index, and includes Treasury issues, agency issues, corporate bond issues, and mortgage-backed securities. You cannot invest directly in an index. |
| 5 | The Morgan Stanley Capital International (MSCI) All Country World Index (ACWI) ex USA Index (Net) is a free-float-adjusted market-capitalization-weighted index that is designed to measure the equity market performance of developed and emerging markets. You cannot invest directly in an index. Source: MSCI. MSCI makes no express or implied warranties or representations and shall have no liability whatsoever with respect to any MSCI data contained herein. The MSCI data may not be further redistributed or used as a basis for other indexes or any securities or financial products. This report is not approved, reviewed, or produced by MSCI. |
| 6 | The Russell 3000® Index measures the performance of the 3,000 largest U.S. companies based on total market capitalization, which represents approximately 98% of the investable U.S. equity market. You cannot invest directly in an index. |
| 7 | The ten largest holdings, excluding cash and cash equivalents, are calculated based on the value of the investments divided by the total net assets of the Portfolio. Holdings are subject to change and may have changed since the date specified. |
| 8 | Current target allocation is calculated based on the total long-term investments of the Portfolio. The Portfolio’s use of futures contracts to implement a Tactical Asset Allocation (TAA) shift toward stocks or bonds is reflected in the allocation shown. These amounts are subject to change and may have changed since the date specified. |
| | | | | | |
| Performance highlights (unaudited) | | Wells Fargo WealthBuilder Portfolios | | | 13 | |
Wells Fargo WealthBuilder Equity Portfolio
Investment objective
The Portfolio seeks long-term capital appreciation with no emphasis on income.
Manager
Wells Fargo Funds Management, LLC
Subadviser
Wells Capital Management Incorporated
Portfolio managers
Kandarp R. Acharya, CFA®, FRM
Christian L. Chan, CFA®
Average annual total returns (%) as of November 30, 2015
| | | | | | | | | | | | | | | | | | | | | | | | | | | | | | | | | | |
| | | | | Including sales charge | | | Excluding sales charge | | | Expense ratios1 (%) | |
| | | Inception date | | 1 year | | | 5 year | | | 10 year | | | 1 year | | | 5 year | | | 10 year | | | Gross | | | Net2 | |
| Wells Fargo WealthBuilder Equity Portfolio (WBGIX) | | 10-1-1997 | | | (1.69 | ) | | | 8.46 | | | | 4.00 | | | | (0.19 | ) | | | 8.79 | | | | 4.15 | | | | 2.35 | | | | 2.29 | |
| WealthBuilder Equity Composite Index3 | | – | | | – | | | | – | | | | – | | | | (0.42 | ) | | | 10.74 | | | | 6.47 | | | | – | | | | – | |
| MSCI ACWI ex USA Index (Net)4 | | – | | | – | | | | – | | | | – | | | | (7.32 | ) | | | 2.99 | | | | 3.60 | | | | – | | | | – | |
| Russell 3000® Index5 | | – | | | – | | | | – | | | | – | | | | 2.58 | | | | 14.13 | | | | 7.59 | | | | – | | | | – | |
Figures quoted represent past performance, which is no guarantee of future results, and do not reflect taxes that a shareholder may pay on fund distributions or the redemption of fund shares. Investment return and principal value of an investment will fluctuate so that an investor’s shares, when redeemed, may be worth more or less than their original cost. Performance shown without sales charges would be lower if sales charges were reflected. Current performance may be lower or higher than the performance data quoted, which assumes the reinvestment of dividends and capital gains. Current month-end performance is available on the Portfolio’s website, wellsfargofunds.com.
Index returns do not include transaction costs associated with buying and selling securities, any mutual fund fees or expenses, or any taxes. It is not possible to invest directly in an index.
For WealthBuilder Portfolios, the maximum front-end sales charge is 1.50%.
Stock values fluctuate in response to the activities of individual companies and general market and economic conditions. The Portfolio will indirectly be exposed to all of the risks of an investment in the underlying funds and will indirectly bear expenses of the underlying funds. The use of derivatives may reduce returns and/or increase volatility. Certain investment strategies tend to increase the total risk of an investment (relative to the broader market). The Portfolio is exposed to alternative investment risk, foreign investment risk and smaller-company investment risk. Consult the Portfolio’s prospectus for additional information on these and other risks.
Please see footnotes on page 14.
| | | | |
| 14 | | Wells Fargo WealthBuilder Portfolios | | Performance highlights (unaudited) |
Wells Fargo WealthBuilder Equity Portfolio (continued)
| | | | |
| Ten largest holdings (%) as of November 30, 20156 | |
MFS Value Fund Class I | | | 15.00 | |
T. Rowe Price Blue Chip Growth Fund Retail Class | | | 10.51 | |
Thornburg International Value Fund Institutional Class | | | 8.95 | |
Oakmark Fund Class I | | | 7.50 | |
Invesco Growth & Income Fund Class R6 | | | 7.50 | |
American Century Growth Fund Institutional Class | | | 7.50 | |
Wells Fargo Endeavor Select Fund Institutional Class | | | 6.02 | |
Wells Fargo International Growth Portfolio | | | 6.01 | |
Wells Fargo Large Cap Growth Fund Class R6 | | | 6.00 | |
Templeton Institutional Foreign Equity Fund Primary Class | | | 2.97 | |
|
| Portfolio allocation as of November 30, 20157 |
|
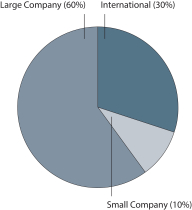 |
| 1 | Reflects the expense ratios as stated in the most recent prospectus, which include the impact of 0.79% in acquired fund fees and expenses. The expense ratios shown are subject to change and may differ from the annualized expense ratios shown in the financial highlights of this report, which do not include acquired fund fees and expenses. |
| 2 | The manager has contractually committed through September 30, 2016, to waive fees and/or reimburse expenses to the extent necessary to cap the Portfolio’s Total Annual Fund Operating Expenses After Fee Waiver at 1.50%. After this time, the cap may be increased or the commitment to maintain the cap may be terminated only with the approval of the Board of Trustees. Brokerage commissions, stamp duty fees, interest, taxes, acquired fund fees and expenses, allocated expenses from underlying affiliated Master Portfolios, and extraordinary expenses are excluded from the cap. Without this cap, the Portfolio’s returns would have been lower. |
| 3 | Source: Wells Fargo Funds Management, LLC. The WealthBuilder Equity Composite Index is weighted 70% in the Russell 3000® Index and 30% in the MSCI ACWI ex USA Index (Net) Index (Net). You cannot invest directly in an index. |
| 4 | The Morgan Stanley Capital International (MSCI) All Country World Index (ACWI) ex USA Index (Net) is a free-float-adjusted market-capitalization-weighted index that is designed to measure the equity market performance of developed and emerging markets. You cannot invest directly in an index. Source: MSCI. MSCI makes no express or implied warranties or representations and shall have no liability whatsoever with respect to any MSCI data contained herein. The MSCI data may not be further redistributed or used as a basis for other indexes or any securities or financial products. This report is not approved, reviewed, or produced by MSCI. |
| 5 | The Russell 3000® Index measures the performance of the 3,000 largest U.S. companies based on total market capitalization, which represents approximately 98% of the investable U.S. equity market. You cannot invest directly in an index. |
| 6 | The ten largest holdings, excluding cash and cash equivalents, are calculated based on the value of the investments divided by the total net assets of the Portfolio. Holdings are subject to change and may have changed since the date specified. |
| 7 | Amounts are calculated based on the long-term investments of the Portfolio. These amounts are subject to change and may have changed since the date specified. |
| | | | | | |
| Performance highlights (unaudited) | | Wells Fargo WealthBuilder Portfolios | | | 15 | |
Wells Fargo WealthBuilder Tactical Equity Portfolio
Investment objective
The Portfolio seeks long-term capital apprecaition with no emphasis on income.
Manager
Wells Fargo Funds Management, LLC
Subadviser
Wells Capital Management Incorporated
Portfolio managers
Kandarp R. Acharya, CFA®, FRM
Christian L. Chan, CFA®
Average annual total returns (%) as of November 30, 2015
| | | | | | | | | | | | | | | | | | | | | | | | | | | | | | | | | | |
| | | | | Including sales charge | | | Excluding sales charge | | | Expense ratios1 (%) | |
| | | Inception date | | 1 year | | | 5 year | | | 10 year | | | 1 year | | | 5 year | | | 10 year | | | Gross | | | Net2 | |
| Wells Fargo WealthBuilder Tactical Equity Portfolio (WBGAX) | | 10-1-1997 | | | (1.24 | ) | | | 8.53 | | | | 4.64 | | | | 0.27 | | | | 8.86 | | | | 4.80 | | | | 2.29 | | | | 2.29 | |
| WealthBuilder Tactical Equity Composite Index3 | | – | | | – | | | | – | | | | – | | | | (0.42 | ) | | | 10.74 | | | | 6.47 | | | | – | | | | – | |
| MSCI ACWI ex USA Index (Net)4 | | – | | | – | | | | – | | | | – | | | | (7.32 | ) | | | 2.99 | | | | 3.60 | | | | – | | | | – | |
| Russell 3000® Index5 | | – | | | – | | | | – | | | | – | | | | 2.58 | | | | 14.13 | | | | 7.59 | | | | – | | | | – | |
Figures quoted represent past performance, which is no guarantee of future results, and do not reflect taxes that a shareholder may pay on fund distributions or the redemption of fund shares. Investment return and principal value of an investment will fluctuate so that an investor’s shares, when redeemed, may be worth more or less than their original cost. Performance shown without sales charges would be lower if sales charges were reflected. Current performance may be lower or higher than the performance data quoted, which assumes the reinvestment of dividends and capital gains. Current month-end performance is available on the Portfolio’s website, wellsfargofunds.com.
Index returns do not include transaction costs associated with buying and selling securities, any mutual fund fees or expenses, or any taxes. It is not possible to invest directly in an index.
For WealthBuilder Portfolios, the maximum front-end sales charge is 1.50%.
Stock values fluctuate in response to the activities of individual companies and general market and economic conditions. The Portfolio will indirectly be exposed to all of the risks of an investment in the underlying funds and will indirectly bear expenses of the underlying funds. The use of derivatives may reduce returns and/or increase volatility. Certain investment strategies tend to increase the total risk of an investment (relative to the broader market). The Portfolio is exposed to alternative investment risk, foreign investment risk and smaller-company investment risk. Consult the Portfolio’s prospectus for additional information on these and other risks.
Please see footnotes on page 16.
| | | | |
| 16 | | Wells Fargo WealthBuilder Portfolios | | Performance highlights (unaudited) |
Wells Fargo WealthBuilder Tactical Equity Portfolio (continued)
| | | | |
| Ten largest holdings (%) as of November 30, 20156 | |
MFS Value Fund Class I | | | 14.90 | |
Thornburg International Value Fund Institutional Class | | | 8.89 | |
T. Rowe Price Blue Chip Growth Fund Retail Class | | | 8.70 | |
Invesco Growth and Income Fund Class R6 | | | 7.44 | |
Oakmark Fund Class I | | | 7.43 | |
American Century Growth Fund Institutional Class | | | 6.20 | |
Wells Fargo International Growth Portfolio | | | 5.98 | |
Wells Fargo Endeavor Select Fund Institutional Class | | | 4.97 | |
Wells Fargo Large Cap Growth Fund Class R6 | | | 4.96 | |
Wells Fargo Small Cap Value Fund Class R6 | | | 3.77 | |
|
| Portfolio allocation as of November 30, 20157 |
|
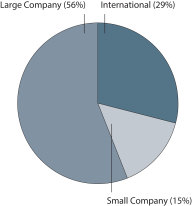 |
| 1 | Reflects the expense ratios as stated in the most recent prospectus, which include the impact of 0.79% in acquired fund fees and expenses. The expense ratios shown are subject to change and may differ from the annualized expense ratios shown in the financial highlights of this report, which do not include acquired fund fees and expenses. |
| 2 | The manager has contractually committed through September 30, 2016 to waive fees and/or reimburse expenses to the extent necessary to cap the Portfolio’s Total Annual Fund Operating Expenses After Fee Waiver at 1.50%. After this time, the cap may be increased or the commitment to maintain the cap may be terminated only with the approval of the Board of Trustees. Brokerage commissions, stamp duty fees, interest, taxes, acquired fund fees and expenses, allocated expenses from underlying affiliated Master Portfolios, and extraordinary expenses are excluded from the cap. Without this cap, the Portfolio’s returns would have been lower. |
| 3 | Source: Wells Fargo Funds Management, LLC. The WealthBuilder Tactical Equity Composite Index is weighted 70% in the Russell 3000® Index, and 30% in the MSCI ACWI ex USA Index (Net). You cannot invest directly in an index. |
| 4 | The Morgan Stanley Capital International (MSCI) All Country World Index (ACWI) ex USA Index (Net) is a free-float-adjusted market-capitalization-weighted index that is designed to measure the equity market performance of developed and emerging markets. You cannot invest directly in an index. Source: MSCI. MSCI makes no express or implied warranties or representations and shall have no liability whatsoever with respect to any MSCI data contained herein. The MSCI data may not be further redistributed or used as a basis for other indexes or any securities or financial products. This report is not approved, reviewed, or produced by MSCI. |
| 5 | The Russell 3000® Index measures the performance of the 3,000 largest U.S. companies based on total market capitalization, which represents approximately 98% of the investable U.S. equity market. You cannot invest directly in an index. |
| 6 | The ten largest holdings, excluding cash and cash equivalents, are calculated based on the value of the investments divided by the total net assets of the Portfolio. Holdings are subject to change and may have changed since the date specified. |
| 7 | Amounts are calculated based on the long-term investments of the Portfolio. These amounts are subject to change and may have changed since the date specified. |
| | | | | | |
| Fund expenses (unaudited) | | Wells Fargo WealthBuilder Portfolios | | | 17 | |
As a shareholder of the Fund, you incur two types of costs: (1) transaction costs, including sales charges (loads) on
purchase payments and (2) ongoing costs, including management fees, distribution (12b-1) and/or shareholder servicing fees, and other Fund expenses. This example is intended to help you understand your ongoing costs (in dollars) of investing in the Fund and to compare these costs with the ongoing costs of investing in other mutual funds.
The example is based on an investment of $1,000 invested at the beginning of the six-month period and held for the entire period from June 1, 2015 to November 30, 2015.
Actual expenses
The “Actual” line of the table below provides information about actual account values and actual expenses. You may use the information in this line, together with the amount you invested, to estimate the expenses that you paid over the period. Simply divide your account value by $1,000 (for example, an $8,600 account value divided by $1,000 = 8.6), then multiply the result by the number in the “Actual” line under the heading entitled “Expenses paid during period” for your applicable class of shares to estimate the expenses you paid on your account during this period.
Hypothetical example for comparison purposes
The “Hypothetical” line of the table below provides information about hypothetical account values and hypothetical expenses based on the Fund’s actual expense ratio and an assumed rate of return of 5% per year before expenses, which is not the Fund’s actual return. The hypothetical account values and expenses may not be used to estimate the actual ending account balance or expenses you paid for the period. You may use this information to compare the ongoing costs of investing in the Fund and other funds. To do so, compare this 5% hypothetical example with the 5% hypothetical examples that appear in the shareholder reports of the other funds.
Please note that the expenses shown in the table are meant to highlight your ongoing costs only and do not reflect any transactional costs, such as sales charges (loads) and contingent deferred sales charges. Therefore, the “Hypothetical” line of the table is useful in comparing ongoing costs only and will not help you determine the relative total costs of owning different funds. In addition, if these transactional costs were included, your costs would have been higher.
| | | | | | | | | | | | | | | | |
| | | Beginning
account value
6-1-2015 | | | Ending
account value
11-30-2015 | | | Expenses
paid during
the period¹ | | | Net annualized
expense ratio | |
Wells Fargo WealthBuilder Conservative Allocation Portfolio | | | | | | | | | | | | | | | | |
Actual | | $ | 1,000.00 | | | $ | 977.78 | | | $ | 7.42 | | | | 1.50 | % |
Hypothetical (5% return before expenses) | | $ | 1,000.00 | | | $ | 1,017.50 | | | $ | 7.57 | | | | 1.50 | % |
Wells Fargo WealthBuilder Moderate Balanced Portfolio | | | | | | | | | | | | | | | | |
Actual | | $ | 1,000.00 | | | $ | 974.39 | | | $ | 7.35 | | | | 1.49 | % |
Hypothetical (5% return before expenses) | | $ | 1,000.00 | | | $ | 1,017.55 | | | $ | 7.52 | | | | 1.49 | % |
Wells Fargo WealthBuilder Growth Balanced Portfolio | | | | | | | | | | | | | | | | |
Actual | | $ | 1,000.00 | | | $ | 968.32 | | | $ | 7.33 | | | | 1.49 | % |
Hypothetical (5% return before expenses) | | $ | 1,000.00 | | | $ | 1,017.55 | | | $ | 7.52 | | | | 1.49 | % |
Wells Fargo WealthBuilder Growth Allocation Portfolio | | | | | | | | | | | | | | | | |
Actual | | $ | 1,000.00 | | | $ | 963.81 | | | $ | 7.36 | | | | 1.50 | % |
Hypothetical (5% return before expenses) | | $ | 1,000.00 | | | $ | 1,017.50 | | | $ | 7.57 | | | | 1.50 | % |
Wells Fargo WealthBuilder Equity Portfolio | | | | | | | | | | | | | | | | |
Actual | | $ | 1,000.00 | | | $ | 964.42 | | | $ | 7.37 | | | | 1.50 | % |
Hypothetical (5% return before expenses) | | $ | 1,000.00 | | | $ | 1,017.50 | | | $ | 7.57 | | | | 1.50 | % |
Wells Fargo WealthBuilder Tactical Equity Portfolio | | | | | | | | | | | | | | | | |
Actual | | $ | 1,000.00 | | | $ | 963.48 | | | $ | 7.36 | | | | 1.50 | % |
Hypothetical (5% return before expenses) | | $ | 1,000.00 | | | $ | 1,017.50 | | | $ | 7.57 | | | | 1.50 | % |
| 1 | Expenses paid is equal to the annualized expense ratio multiplied by the average account value over the period, multiplied by the number of days in the most recent fiscal half-year divided by the number of days in the fiscal year (to reflect the one-half-year period). |
| | | | |
| 18 | | Wells Fargo WealthBuilder Portfolios | | Portfolio of investments—November 30, 2015 (unaudited) |
WEALTHBUILDER CONSERVATIVE ALLOCATION PORTFOLIO
| | | | | | | | | | | | |
| Security name | | | | | | Shares | | | Value | |
| | | | |
Exchange-Traded Funds: 1.67% | | | | | | | | | | | | |
iShares MSCI Japan Index ETF | | | | | | | 42,106 | | | $ | 521,693 | |
iShares National AMT-Free Municipal Bond ETF | | | | | | | 70,236 | | | | 7,728,067 | |
WisdomTree Japan Hedged Equity ETF | | | | | | | 9,586 | | | | 527,326 | |
| | | | |
Total Exchange-Traded Funds (Cost $8,660,092) | | | | | | | | | | | 8,777,086 | |
| | | | | | | | | | | | |
| | | | |
Investment Companies: 98.08% | | | | | | | | | | | | |
| | | | |
| Affiliated Master Portfolios: 26.59% | | | | | | | | | | | | |
Wells Fargo Core Bond Portfolio | | | | | | | | | | | 125,127,150 | |
Wells Fargo Emerging Growth Portfolio | | | | | | | | | | | 3,996,966 | |
Wells Fargo International Growth Portfolio | | | | | | | | | | | 6,346,593 | |
Wells Fargo Small Company Value Portfolio | | | | | | | | | | | 3,986,806 | |
| | | | |
| | | | | | | | | | | 139,457,515 | |
| | | | | | | | | | | | |
| | | | |
| Alternative Investment Funds: 6.38% | | | | | | | | | | | | |
AQR Managed Futures Strategy Fund Class I | | | | | | | 479,832 | | | | 5,302,147 | |
PIMCO CommodityRealReturn Strategy Fund Institutional Class | | | | | | | 2,028,818 | | | | 13,532,216 | |
The Arbitrage Fund Class I † | | | | | | | 403,282 | | | | 5,274,933 | |
Voya Global Real Estate Fund Class I | | | | | | | 479,083 | | | | 9,356,483 | |
| | | | |
| | | | | | | | | | | 33,465,779 | |
| | | | | | | | | | | | |
| | | | |
| Bond Funds: 47.99% | | | | | | | | | | | | |
Oppenheimer International Bond Fund Class Y | | | | | | | 4,303,209 | | | | 24,054,937 | |
PIMCO High Yield Fund Institutional Class | | | | | | | 6,072,562 | | | | 52,649,111 | |
Wells Fargo Government Securities Fund Institutional Class (l) | | | | | | | 7,045,041 | | | | 78,904,457 | |
Wells Fargo Short Duration Government Bond Fund Class R6 (l) | | | | | | | 9,599,993 | | | | 96,095,926 | |
| | | | |
| | | | | | | | | | | 251,704,431 | |
| | | | | | | | | | | | |
| | | | |
| Stock Funds: 17.12% | | | | | | | | | | | | |
American Century Growth Fund Institutional Class | | | | | | | 211,347 | | | | 6,551,769 | |
DFA International Small Cap Value Portfolio Institutional Class | | | | | | | 108,177 | | | | 2,086,737 | |
Dodge & Cox International Stock Fund | | | | | | | 79,418 | | | | 3,116,376 | |
Invesco Growth and Income Fund Class R6 | | | | | | | 300,033 | | | | 7,893,867 | |
MFS Value Fund Class I | | | | | | | 447,271 | | | | 15,779,728 | |
Oakmark Fund Class I | | | | | | | 118,988 | | | | 7,878,200 | |
Oppenheimer Developing Markets Fund Class Y | | | | | | | 49,971 | | | | 1,542,604 | |
Royce Pennsylvania Mutual Fund Investor Class | | | | | | | 326,275 | | | | 3,974,030 | |
T. Rowe Price Blue Chip Growth Fund Retail Class | | | | | | | 122,081 | | | | 9,175,613 | |
T. Rowe Price International Discovery Fund | | | | | | | 37,578 | | | | 2,122,760 | |
Templeton Institutional Foreign Equity Fund Primary Class | | | | | | | 156,138 | | | | 3,119,629 | |
Thornburg International Value Fund Institutional Class | | | | | | | 376,790 | | | | 9,427,284 | |
Wells Fargo Emerging Markets Equity Fund Class R6 (l) | | | | | | | 138,363 | | | | 2,573,550 | |
Wells Fargo Endeavor Select Fund Institutional Class †(l) | | | | | | | 369,683 | | | | 5,264,283 | |
Wells Fargo Large Cap Growth Fund Class R6 (l) | | | | | | | 104,436 | | | | 5,243,751 | |
Wells Fargo Small Cap Value Fund Class R6 (l) | | | | | | | 145,080 | | | | 3,991,154 | |
| | | | |
| | | | | | | | | | | 89,741,335 | |
| | | | | | | | | | | | |
| | | | |
Total Investment Companies (Cost $497,868,893) | | | | | | | | | | | 514,369,060 | |
| | | | | | | | | | | | |
The accompanying notes are an integral part of these financial statements.
| | | | | | |
| Portfolio of investments—November 30, 2015 (unaudited) | | Wells Fargo WealthBuilder Portfolios | | | 19 | |
WEALTHBUILDER CONSERVATIVE ALLOCATION PORTFOLIO
| | | | | | | | | | | | | | | | |
| Security name | | Yield | | | | | | Shares | | | Value | |
| | | | | | | | | | | | | |
| | | | |
Short-Term Investments: 0.23% | | | | | | | | | | | | | | | | |
| | | | |
| Investment Companies: 0.18% | | | | | | | | | | | | | | | | |
Wells Fargo Cash Investment Money Market Fund, Select Class (l)(u) | | | 0.17 | % | | | | | | | 969,913 | | | $ | 969,913 | |
| | | | | | | | | | | | | | | | |
| | | | |
| | | | | | Maturity date | | | Principal | | | | |
| | | | |
| U.S. Treasury Securities: 0.05% | | | | | | | | | | | | | | | | |
U.S. Treasury Bill #(z) | | | 0.04 | | | | 12-17-2015 | | | $ | 84,000 | | | | 83,998 | |
U.S. Treasury Bill #(z) | | | 0.04 | | | | 1-7-2016 | | | | 10,000 | | | | 9,999 | |
U.S. Treasury Bill #(z) | | | 0.05 | | | | 3-31-2016 | | | | 90,000 | | | | 89,937 | |
U.S. Treasury Bill #(z) | | | 0.09 | | | | 2-18-2016 | | | | 70,000 | | | | 69,977 | |
| | | | |
| | | | | | | | | | | | | | | 253,911 | |
| | | | | | | | | | | | | | | | |
| | | | |
Total Short-Term Investments (Cost $1,223,881) | | | | | | | | | | | | | | | 1,223,824 | |
| | | | | | | | | | | | | | | | |
| | | | | | | | |
| Total investments in securities (Cost $507,752,866) * | | | 99.98 | % | | | 524,369,970 | |
Other assets and liabilities, net | | | 0.02 | | | | 54,370 | |
| | | | | | | | |
| Total net assets | | | 100.00 | % | | $ | 524,424,340 | |
| | | | | | | | |
| † | Non-income-earning security |
| (l) | The issuer of the security is an affiliated person of the Portfolio as defined in the Investment Company Act of 1940. |
| (u) | The rate represents the 7-day annualized yield at period end. |
| # | All or a portion of this security is segregated as collateral for investments in derivative instruments. |
| (z) | Zero coupon security. The rate represents the current yield to maturity. |
| * | Cost for federal income tax purposes is $516,171,270 and unrealized gains (losses) consists of: |
| | | | |
Gross unrealized gains | | $ | 31,149,608 | |
Gross unrealized losses | | | (22,950,908 | ) |
| | | | |
Net unrealized gains | | $ | 8,198,700 | |
The accompanying notes are an integral part of these financial statements.
| | | | |
| 20 | | Wells Fargo WealthBuilder Portfolios | | Portfolio of investments—November 30, 2015 (unaudited) |
WEALTHBUILDER MODERATE BALANCED PORTFOLIO
| | | | | | | | | | | | |
| Security name | | | | | | Shares | | | Value | |
| | | | |
Exchange-Traded Funds: 1.47% | | | | | | | | | | | | |
iShares MSCI Japan Index ETF | | | | | | | 140,020 | | | $ | 1,734,848 | |
iShares National AMT-Free Municipal Bond ETF | | | | | | | 83,327 | | | | 9,168,470 | |
WisdomTree Japan Hedged Equity ETF | | | | | | | 32,093 | | | | 1,765,436 | |
| | | | |
Total Exchange-Traded Funds (Cost $12,578,036) | | | | | | | | | | | 12,668,754 | |
| | | | | | | | | | | | |
| | | | |
Investment Companies: 98.28% | | | | | | | | | | | | |
| | | | |
| Affiliated Master Portfolios: 22.67% | | | | | | | | | | | | |
Wells Fargo Core Bond Portfolio | | | | | | | | | | | | |
Wells Fargo Emerging Growth Portfolio | | | | | | | | | | | 148,236,784 | |
Wells Fargo International Growth Portfolio | | | | | | | | | | | 12,486,563 | |
Wells Fargo Small Company Value Portfolio | | | | | | | | | | | 21,006,555 | |
| | | | | | | | | | | 13,052,320 | |
| | | | |
| | | | | | | | | | | 194,782,222 | |
| | | | | | | | | | | | |
| | | | |
| Alternative Investment Funds: 6.19% | | | | | | | | | | | | |
AQR Managed Futures Strategy Fund Class I | | | | | | | 776,877 | | | | 8,584,495 | |
PIMCO CommodityRealReturn Strategy Fund Institutional Class | | | | | | | 3,107,603 | | | | 20,727,713 | |
The Arbitrage Fund Class I † | | | | | | | 654,427 | | | | 8,559,911 | |
Voya Global Real Estate Fund Class I | | | | | | | 781,060 | | | | 15,254,102 | |
| | | | |
| | | | | | | | | | | 53,126,221 | |
| | | | | | | | | | | | |
| | | | |
| Bond Funds: 34.79% | | | | | | | | | | | | |
Oppenheimer International Bond Fund Class Y | | | | | | | 6,772,772 | | | | 37,859,797 | |
PIMCO High Yield Fund Institutional Class | | | | | | | 8,333,453 | | | | 72,251,036 | |
Wells Fargo Government Securities Fund Institutional Class (l) | | | | | | | 8,754,522 | | | | 98,050,647 | |
Wells Fargo Short Duration Government Bond Fund Class R6 (l) | | | | | | | 9,062,159 | | | | 90,712,211 | |
| | | | |
| | | | | | | | | | | 298,873,691 | |
| | | | | | | | | | | | |
| | | | |
| Stock Funds: 34.63% | | | | | | | | | | | | |
American Century Growth Fund Institutional Class | | | | | | | 706,874 | | | | 21,913,106 | |
DFA International Small Cap Value Portfolio Institutional Class | | | | | | | 351,981 | | | | 6,789,709 | |
Dodge & Cox International Stock Fund | | | | | | | 260,299 | | | | 10,214,147 | |
Invesco Growth and Income Fund Class R6 | | | | | | | 995,858 | | | | 26,201,036 | |
MFS Value Fund Class I | | | | | | | 1,489,227 | | | | 52,539,924 | |
Oakmark Fund Class I | | | | | | | 395,761 | | | | 26,203,325 | |
Oppenheimer Developing Markets Fund Class Y | | | | | | | 165,572 | | | | 5,111,200 | |
Royce Pennsylvania Mutual Fund Investor Class | | | | | | | 1,073,270 | | | | 13,072,433 | |
T. Rowe Price Blue Chip Growth Fund Retail Class | | | | | | | 409,809 | | | | 30,801,222 | |
T. Rowe Price International Discovery Fund | | | | | | | 124,044 | | | | 7,007,253 | |
Templeton Institutional Foreign Equity Fund Primary Class | | | | | | | 510,556 | | | | 10,200,909 | |
Thornburg International Value Fund Institutional Class | | | | | | | 1,222,782 | | | | 30,594,007 | |
Wells Fargo Emerging Markets Equity Fund Class R6 (l) | | | | | | | 456,099 | | | | 8,483,436 | |
Wells Fargo Endeavor Select Fund Institutional Class †(l) | | | | | | | 1,233,158 | | | | 17,560,166 | |
Wells Fargo Large Cap Growth Fund Class R6 (l) | | | | | | | 348,471 | | | | 17,496,734 | |
Wells Fargo Small Cap Value Fund Class R6 (l) | | | | | | | 484,077 | | | | 13,316,957 | |
| | | | |
| | | | | | | | | | | 297,505,564 | |
| | | | | | | | | | | | |
| | | | |
Total Investment Companies (Cost $801,171,184) | | | | | | | | | | | 844,287,698 | |
| | | | | | | | | | | | |
The accompanying notes are an integral part of these financial statements.
| | | | | | |
| Portfolio of investments—November 30, 2015 (unaudited) | | Wells Fargo WealthBuilder Portfolios | | | 21 | |
WEALTHBUILDER MODERATE BALANCED PORTFOLIO
| | | | | | | | | | | | | | | | |
| Security name | | Yield | | | | | | Shares | | | Value | |
| | | | |
| | | | | | | | | | | | | |
| Short-Term Investments: 0.15% | | | | | | | | | | | | | | | | |
| | | | |
| Investment Companies: 0.05% | | | | | | | | | | | | | | | | |
Wells Fargo Cash Investment Money Market Fund, Select Class (l)(u) | | | 0.17 | % | | | | | | | 427,159 | | | $ | 427,159 | |
| | | | | | | | | | | | | | | | |
| | | | |
| | | | | | Maturity date | | | Principal | | | | |
| | | | |
| U.S. Treasury Securities: 0.10% | | | | | | | | | | | | | | | | |
U.S. Treasury Bill #(z) | | | 0.04 | | | | 12-17-2015 | | | $ | 275,000 | | | | 274,993 | |
U.S. Treasury Bill #(z) | | | 0.04 | | | | 1-7-2016 | | | | 30,000 | | | | 29,998 | |
U.S. Treasury Bill #(z) | | | 0.05 | | | | 3-31-2016 | | | | 280,000 | | | | 279,803 | |
U.S. Treasury Bill #(z) | | | 0.09 | | | | 2-18-2016 | | | | 240,000 | | | | 239,920 | |
| | | | |
| | | | | | | | | | | | | | | 824,714 | |
| | | | | | | | | | | | | | | | |
| | | | |
Total Short-Term Investments (Cost $1,252,056) | | | | | | | | | | | | | | | 1,251,873 | |
| | | | | | | | | | | | | | | | |
| | | | | | | | |
| Total investments in securities (Cost $815,001,276) * | | | 99.90 | % | | | 858,208,325 | |
Other assets and liabilities, net | | | 0.10 | | | | 863,787 | |
| | | | | | | | |
| Total net assets | | | 100.00 | % | | $ | 859,072,112 | |
| | | | | | | | |
| † | Non-income-earning security |
| (l) | The issuer of the security is an affiliated person of the Portfolio as defined in the Investment Company Act of 1940. |
| (u) | The rate represents the 7-day annualized yield at period end. |
| # | All or a portion of this security is segregated as collateral for investments in derivative instruments. |
| (z) | Zero coupon security. The rate represents the current yield to maturity. |
| * | Cost for federal income tax purposes is $828,040,399 and unrealized gains (losses) consists of: |
| | | | |
Gross unrealized gains | | $ | 70,965,174 | |
Gross unrealized losses | | | (40,797,248 | ) |
| | | | |
Net unrealized gains | | $ | 30,167,926 | |
The accompanying notes are an integral part of these financial statements.
| | | | |
| 22 | | Wells Fargo WealthBuilder Portfolios | | Portfolio of investments—November 30, 2015 (unaudited) |
WEALTHBUILDER GROWTH BALANCED PORTFOLIO
| | | | | | | | | | | | |
| Security name | | | | | | Shares | | | Value | |
| | | | |
Exchange-Traded Funds: 1.27% | | | | | | | | | | | | |
iShares MSCI Japan Index ETF | | | | | | | 244,685 | | | $ | 3,031,647 | |
iShares National AMT-Free Municipal Bond ETF | | | | | | | 60,729 | | | | 6,682,012 | |
WisdomTree Japan Hedged Equity ETF | | | | | | | 56,353 | | | | 3,099,979 | |
| | | | |
Total Exchange-Traded Funds (Cost $12,811,195) | | | | | | | | | | | 12,813,638 | |
| | | | | | | | | | | | |
| | | | |
Investment Companies: 98.28% | | | | | | | | | | | | |
| | | | |
| Affiliated Master Portfolios: 19.37% | | | | | | | | | | | | |
Wells Fargo Core Bond Portfolio | | | | | | | | | | | 114,169,820 | |
Wells Fargo Emerging Growth Portfolio | | | | | | | | | | | 21,503,036 | |
Wells Fargo International Growth Portfolio | | | | | | | | | | | 36,467,088 | |
Wells Fargo Small Company Value Portfolio | | | | | | | | | | | 22,541,719 | |
| | | | |
| | | | | | | | | | | 194,681,663 | |
| | | | | | | | | | | | |
| | | | |
| Alternative Investment Funds: 6.20% | | | | | | | | | | | | |
AQR Managed Futures Strategy Fund Class I | | | | | | | 934,494 | | | | 10,326,157 | |
PIMCO CommodityRealReturn Strategy Fund Institutional Class | | | | | | | 3,593,534 | | | | 23,968,873 | |
The Arbitrage Fund Class I † | | | | | | | 769,671 | | | | 10,067,303 | |
Voya Global Real Estate Fund Class I | | | | | | | 915,105 | | | | 17,872,001 | |
| | | | |
| | | | | | | | | | | 62,234,334 | |
| | | | | | | | | | | | |
| | | | |
| Bond Funds: 21.10% | | | | | | | | | | | | |
Oppenheimer International Bond Fund Class Y | | | | | | | 8,515,927 | | | | 47,604,035 | |
PIMCO High Yield Fund Institutional Class | | | | | | | 7,417,391 | | | | 64,308,780 | |
Wells Fargo Government Securities Fund Institutional Class (l) | | | | | | | 8,943,413 | | | | 100,166,229 | |
| | | | |
| | | | | | | | | | | 212,079,044 | |
| | | | | | | | | | | | |
| | | | |
| Stock Funds: 51.61% | | | | | | | | | | | | |
American Century Growth Fund Institutional Class | | | | | | | 1,233,313 | | | | 38,232,700 | |
DFA International Small Cap Value Portfolio Institutional Class | | | | | | | 609,298 | | | | 11,753,360 | |
Dodge & Cox International Stock Fund | | | | | | | 451,139 | | | | 17,702,693 | |
Invesco Growth and Income Fund Class R6 | | | | | | | 1,732,583 | | | | 45,584,260 | |
MFS Value Fund Class I | | | | | | | 2,600,561 | | | | 91,747,809 | |
Oakmark Fund Class I | | | | | | | 690,907 | | | | 45,744,982 | |
Oppenheimer Developing Markets Fund Class Y | | | | | | | 289,206 | | | | 8,927,789 | |
Royce Pennsylvania Mutual Fund Investor Class | | | | | | | 1,856,553 | | | | 22,612,815 | |
T. Rowe Price Blue Chip Growth Fund Retail Class | | | | | | | 720,833 | | | | 54,177,802 | |
T. Rowe Price International Discovery Fund | | | | | | | 216,076 | | | | 12,206,142 | |
Templeton Institutional Foreign Equity Fund Primary Class | | | | | | | 885,877 | | | | 17,699,830 | |
Thornburg International Value Fund Institutional Class | | | | | | | 2,111,778 | | | | 52,836,676 | |
Wells Fargo Emerging Markets Equity Fund Class R6 (l) | | | | | | | 797,019 | | | | 14,824,557 | |
Wells Fargo Endeavor Select Fund Institutional Class †(l) | | | | | | | 2,153,202 | | | | 30,661,590 | |
Wells Fargo Large Cap Growth Fund Class R6 (l) | | | | | | | 610,081 | | | | 30,632,164 | |
Wells Fargo Small Cap Value Fund Class R6 (l) | | | | | | | 847,806 | | | | 23,323,146 | |
| | | | |
| | | | | | | | | | | 518,668,315 | |
| | | | | | | | | | | | |
| | | | |
Total Investment Companies (Cost $904,906,363) | | | | | | | | | | | 987,663,356 | |
| | | | | | | | | | | | |
The accompanying notes are an integral part of these financial statements.
| | | | | | |
| Portfolio of investments—November 30, 2015 (unaudited) | | Wells Fargo WealthBuilder Portfolios | | | 23 | |
WEALTHBUILDER GROWTH BALANCED PORTFOLIO
| | | | | | | | | | | | | | | | |
| Security name | | Yield | | | | | | Shares | | | Value | |
| | | | |
| | | | | | | | | | | | | |
| Short-Term Investments: 0.41% | | | | | | | | | | | | | | | | |
| | | | |
| Investment Companies: 0.27% | | | | | | | | | | | | | | | | |
Wells Fargo Cash Investment Money Market Fund, Select Class (l)(u) | | | 0.17 | % | | | | | | | 2,652,130 | | | $ | 2,652,130 | |
| | | | | | | | | | | | | | | | |
| | | | |
| | | | | | Maturity date | | | Principal | | | | |
| | | | |
| U.S. Treasury Securities: 0.14% | | | | | | | | | | | | | | | | |
U.S. Treasury Bill #(z) | | | 0.04 | | | | 12-17-2015 | | | $ | 473,000 | | | | 472,989 | |
U.S. Treasury Bill #(z) | | | 0.04 | | | | 1-7-2016 | | | | 60,000 | | | | 59,996 | |
U.S. Treasury Bill #(z) | | | 0.05 | | | | 3-31-2016 | | | | 480,000 | | | | 479,663 | |
U.S. Treasury Bill #(z) | | | 0.09 | | | | 2-18-2016 | | | | 400,000 | | | | 399,867 | |
U.S. Treasury Bill #(z) | | | 0.18 | | | | 12-31-2015 | | | | 10,000 | | | | 9,999 | |
| | | | |
| | | | | | | | | | | | | | | 1,422,514 | |
| | | | | | | | | | | | | | | | |
| | | | |
Total Short-Term Investments (Cost $4,089,332) | | | | | | | | | | | | | | | 4,074,644 | |
| | | | | | | | | | | | | | | | |
| | | | | | | | |
| Total investments in securities (Cost $ 921,806,890) * | | | 99.96 | % | | | 1,004,551,638 | |
Other assets and liabilities, net | | | 0.04 | | | | 402,526 | |
| | | | | | | | |
| Total net assets | | | 100.00 | % | | $ | 1,004,954,164 | |
| | | | | | | | |
| † | Non-income-earning security |
| (l) | The issuer of the security is an affiliated person of the Portfolio as defined in the Investment Company Act of 1940. |
| (u) | The rate represents the 7-day annualized yield at period end. |
| # | All or a portion of this security is segregated as collateral for investments in derivative instruments. |
| (z) | Zero coupon security. The rate represents the current yield to maturity. |
| * | Cost for federal income tax purposes is $945,426,483 and unrealized gains (losses) consists of: |
| | | | |
Gross unrealized gains | | $ | 112,862,326 | |
Gross unrealized losses | | | (53,737,171 | ) |
| | | | |
Net unrealized gains | | $ | 59,125,155 | |
The accompanying notes are an integral part of these financial statements.
| | | | |
| 24 | | Wells Fargo WealthBuilder Portfolios | | Portfolio of investments—November 30, 2015 (unaudited) |
WEALTHBUILDER GROWTH ALLOCATION PORTFOLIO
| | | | | | | | | | | | |
| Security name | | | | | | Shares | | | Value | |
| | | | |
Exchange-Traded Funds: 1.07% | | | | | | | | | | | | |
iShares MSCI Japan Index ETF | | | | | | | 145,029 | | | $ | 1,796,909 | |
iShares National AMT-Free Municipal Bond ETF | | | | | | | 11,080 | | | | 1,219,132 | |
WisdomTree Japan Hedged Equity ETF | | | | | | | 33,463 | | | | 1,840,800 | |
| | | | |
Total Exchange-Traded Funds (Cost $4,901,278) | | | | | | | | | | | 4,856,841 | |
| | | | | | | | | | | | |
| | | | |
Investment Companies: 98.44% | | | | | | | | | | | | |
| | | | |
| Affiliated Master Portfolios: 15.48% | | | | | | | | | | | | |
Wells Fargo Core Bond Portfolio | | | | | | | | | | | 21,317,682 | |
Wells Fargo Emerging Growth Portfolio | | | | | | | | | | | 13,506,213 | |
Wells Fargo International Growth Portfolio | | | | | | | | | | | 21,690,749 | |
Wells Fargo Small Company Value Portfolio | | | | | | | | | | | 13,553,713 | |
| | | | |
| | | | | | | | | | | 70,068,357 | |
| | | | | | | | | | | | |
| | | | |
| Alternative Investment Funds: 6.30% | | | | | | | | | | | | |
AQR Managed Futures Strategy Fund Class I | | | | | | | 418,533 | | | | 4,624,786 | |
PIMCO CommodityRealReturn Strategy Fund Institutional Class | | | | | | | 1,696,645 | | | | 11,316,622 | |
The Arbitrage Fund Class I † | | | | | | | 343,707 | | | | 4,495,683 | |
Voya Global Real Estate Fund Class I | | | | | | | 412,098 | | | | 8,048,279 | |
| | | | |
| | | | | | | | | | | 28,485,370 | |
| | | | | | | | | | | | |
| | | | |
| Bond Funds: 8.49% | | | | | | | | | | | | |
Oppenheimer International Bond Fund Class Y | | | | | | | 1,635,794 | | | | 9,144,090 | |
PIMCO High Yield Fund Institutional Class | | | | | | | 1,410,431 | | | | 12,228,437 | |
Wells Fargo Government Securities Fund Institutional Class (l) | | | | | | | 1,522,948 | | | | 17,057,021 | |
| | | | |
| | | | | | | | | | | 38,429,548 | |
| | | | | | | | | | | | |
| | | | |
| Stock Funds: 68.17% | | | | | | | | | | | | |
American Century Growth Fund Institutional Class | | | | | | | 732,136 | | | | 22,696,220 | |
DFA International Small Cap Value Portfolio Institutional Class | | | | | | | 368,119 | | | | 7,101,017 | |
Dodge & Cox International Stock Fund | | | | | | | 269,576 | | | | 10,578,149 | |
Invesco Growth and Income Fund Class R6 | | | | | | | 1,024,923 | | | | 26,965,715 | |
MFS Value Fund Class I | | | | | | | 1,540,059 | | | | 54,333,277 | |
Oakmark Fund Class I | | | | | | | 409,006 | | | | 27,080,320 | |
Oppenheimer Developing Markets Fund Class Y | | | | | | | 171,603 | | | | 5,297,379 | |
Royce Pennsylvania Mutual Fund Investor Class | | | | | | | 1,108,116 | | | | 13,496,858 | |
T. Rowe Price Blue Chip Growth Fund Retail Class | | | | | | | 428,126 | | | | 32,177,928 | |
T. Rowe Price International Discovery Fund | | | | | | | 128,411 | | | | 7,253,958 | |
Templeton Institutional Foreign Equity Fund Primary Class | | | | | | | 531,519 | | | | 10,619,743 | |
Thornburg International Value Fund Institutional Class | | | | | | | 1,275,853 | | | | 31,921,852 | |
Wells Fargo Emerging Markets Equity Fund Class R6 (l) | | | | | | | 473,895 | | | | 8,814,453 | |
Wells Fargo Endeavor Select Fund Institutional Class †(l) | | | | | | | 1,274,069 | | | | 18,142,737 | |
Wells Fargo Large Cap Growth Fund Class R6 (l) | | | | | | | 361,980 | | | | 18,175,009 | |
Wells Fargo Small Cap Value Fund Class R6 (l) | | | | | | | 503,332 | | | | 13,846,666 | |
| | | | |
| | | | | | | | | | | 308,501,281 | |
| | | | | | | | | | | | |
| | | | |
Total Investment Companies (Cost $403,205,795) | | | | | | | | | | | 445,484,556 | |
| | | | | | | | | | | | |
The accompanying notes are an integral part of these financial statements.
| | | | | | |
| Portfolio of investments—November 30, 2015 (unaudited) | | Wells Fargo WealthBuilder Portfolios | | | 25 | |
WEALTHBUILDER GROWTH ALLOCATION PORTFOLIO
| | | | | | | | | | | | | | | | |
| Security name | | Yield | | | | | | Shares | | | Value | |
| | | | |
Short-Term Investments: 0.39% | | | | | | | | | | | | | | | | |
| | | | |
| Investment Companies: 0.21% | | | | | | | | | | | | | | | | |
Wells Fargo Cash Investment Money Market Fund, Select Class (l)(u) | | | 0.17 | % | | | | | | | 939,591 | | | $ | 939,591 | |
| | | | | | | | | | | | | | | | |
| | | | |
| | | | | | Maturity date | | | Principal | | | | |
| | | | |
| U.S. Treasury Securities: 0.18% | | | | | | | | | | | | | | | | |
U.S. Treasury Bill #(z) | | | 0.04 | | | | 12-17-2015 | | | $ | 279,000 | | | | 278,993 | |
U.S. Treasury Bill #(z) | | | 0.04 | | | | 1-7-2016 | | | | 10,000 | | | | 9,999 | |
U.S. Treasury Bill #(z) | | | 0.05 | | | | 3-31-2016 | | | | 290,000 | | | | 289,798 | |
U.S. Treasury Bill #(z) | | | 0.08 | | | | 12-24-2015 | | | | 10,000 | | | | 9,999 | |
U.S. Treasury Bill #(z) | | | 0.09 | | | | 2-18-2016 | | | | 240,000 | | | | 239,920 | |
U.S. Treasury Bill #(z) | | | 0.18 | | | | 12-31-2015 | | | | 20,000 | | | | 19,997 | |
| | | | |
| | | | | | | | | | | | | | | 848,706 | |
| | | | | | | | | | | | | | | | |
| | | | |
Total Short-Term Investments (Cost $1,788,482) | | | | | | | | | | | | | | | 1,788,297 | |
| | | | | | | | | | | | | | | | |
| | | | | | | | |
| Total investments in securities (Cost $409,895,555) * | | | 99.90 | % | | | 452,129,694 | |
Other assets and liabilities, net | | | 0.10 | | | | 436,086 | |
| | | | | | | | |
| Total net assets | | | 100.00 | % | | $ | 452,565,780 | |
| | | | | | | | |
| † | Non-income-earning security |
| (l) | The issuer of the security is an affiliated person of the Portfolio as defined in the Investment Company Act of 1940. |
| (u) | The rate represents the 7-day annualized yield at period end. |
| (z) | Zero coupon security. The rate represents the current yield to maturity. |
| # | All or a portion of this security is segregated as collateral for investments in derivative instruments. |
| * | Cost for federal income tax purposes is $419,327,090 and unrealized gains (losses) consists of: |
| | | | |
Gross unrealized gains | | $ | 55,549,919 | |
Gross unrealized losses | | | (22,747,315 | ) |
| | | | |
Net unrealized gains | | $ | 32,802,604 | |
The accompanying notes are an integral part of these financial statements.
| | | | |
| 26 | | Wells Fargo WealthBuilder Portfolios | | Portfolio of investments—November 30, 2015 (unaudited) |
WEALTHBUILDER EQUITY PORTFOLIO
| | | | | | | | | | | | | | |
| Security name | | | | | | | | | | Value | |
| | | | |
Investment Companies: 99.93% | | | | | | | | | | | | | | |
| | | | |
| Affiliated Master Portfolios: 11.08% | | | | | | | | | | | | | | |
Wells Fargo Emerging Growth Portfolio | | | | | | | | | | | | $ | 3,645,525 | |
Wells Fargo International Growth Portfolio | | | | | | | | | | | | | 8,635,066 | |
Wells Fargo Small Company Value Portfolio | | | | | | | | | | | | | 3,625,564 | |
| | | | |
| | | | | | | | | | | | | 15,906,155 | |
| | | | | | | | | | | | | | |
| | | | |
| | | | | | | | Shares | | | | |
| | | | |
| Stock Funds: 88.85% | | | | | | | | | | | | | | |
American Century Growth Fund Institutional Class | | | | | | | | | 347,207 | | | | 10,763,403 | |
DFA International Small Cap Value Portfolio Institutional Class | | | | | | | | | 147,446 | | | | 2,844,225 | |
Dodge & Cox International Stock Fund | | | | | | | | | 108,351 | | | | 4,251,679 | |
Invesco Growth and Income Fund Class R6 | | | | | | | | | 409,243 | | | | 10,767,194 | |
MFS Value Fund Class I | | | | | | | | | 610,528 | | | | 21,539,440 | |
Oakmark Fund Class I | | | | | | | | | 162,674 | | | | 10,770,650 | |
Oppenheimer Developing Markets Fund Class Y | | | | | | | | | 114,108 | | | | 3,522,513 | |
Royce Pennsylvania Mutual Fund Investor Class | | | | | | | | | 297,007 | | | | 3,617,550 | |
T. Rowe Price Blue Chip Growth Fund Retail Class | | | | | | | | | 200,785 | | | | 15,091,003 | |
T. Rowe Price International Discovery Fund | | | | | | | | | 51,182 | | | | 2,891,262 | |
Templeton Institutional Foreign Equity Fund Primary Class | | | | | | | | | 213,115 | | | | 4,258,045 | |
Thornburg International Value Fund Institutional Class | | | | | | | | | 513,834 | | | | 12,856,115 | |
Wells Fargo Emerging Markets Equity Fund Class R6 (l) | | | | | | | | | 189,087 | | | | 3,517,021 | |
Wells Fargo Endeavor Select Fund Institutional Class †(l) | | | | | | | | | 606,500 | | | | 8,636,565 | |
Wells Fargo Large Cap Growth Fund Class R6 (l) | | | | | | | | | 171,434 | | | | 8,607,689 | |
Wells Fargo Small Cap Value Fund Class R6 (l) | | | | | | | | | 132,055 | | | | 3,632,844 | |
| | | | |
| | | | | | | | | | | | | 127,567,198 | |
| | | | | | | | | | | | | | |
| | | | |
Total Investment Companies (Cost $115,473,705) | | | | | | | | | | | | | 143,473,353 | |
| | | | | | | | | | | | | | |
| | | | |
| | | Yield | | | | | | | | | |
| Short-Term Investments: 0.17% | | | | | | | | | | | | | | |
| | | | |
| Investment Companies: 0.17% | | | | | | | | | | | | | | |
Wells Fargo Cash Investment Money Market Fund, Select Class (l)(u) | | | 0.17 | % | | | | | 251,110 | | | | 251,110 | |
| | | | | | | | | | | | | | |
| | | | |
Total Short-Term Investments (Cost $251,110) | | | | | | | | | | | | | 251,110 | |
| | | | | | | | | | | | | | |
| | | | | | | | |
| Total investments in securities (Cost $115,724,815) * | | | 100.10 | % | | | 143,724,463 | |
Other assets and liabilities, net | | | (0.10 | ) | | | (150,557 | ) |
| | | | | | | | |
| Total net assets | | | 100.00 | % | | $ | 143,573,906 | |
| | | | | | | | |
| (l) | The issuer of the security is an affiliated person of the Portfolio as defined in the Investment Company Act of 1940. |
| † | Non-income-earning security |
| (u) | The rate represents the 7-day annualized yield at period end. |
| * | Cost for federal income tax purposes is $116,619,104 and unrealized gains (losses) consists of: |
| | | | |
Gross unrealized gains | | $ | 30,200,600 | |
Gross unrealized losses | | | (3,095,241 | ) |
| | | | |
Net unrealized gains | | $ | 27,105,359 | |
The accompanying notes are an integral part of these financial statements.
| | | | | | |
| Portfolio of investments—November 30, 2015 (unaudited) | | Wells Fargo WealthBuilder Portfolios | | | 27 | |
WEALTHBUILDER TACTICAL EQUITY PORTFOLIO
| | | | | | | | | | | | | | | | |
| Security name | | | | | | | | Shares | | | Value | |
| | | | |
Exchange-Traded Funds: 1.00% | | | | | | | | | | | | | | | | |
iShares MSCI Japan Index ETF | | | | | | | | | | | 177,383 | | | $ | 2,197,775 | |
WisdomTree Japan Hedged Equity ETF | | | | | | | | | | | 40,569 | | | | 2,231,701 | |
| | | | |
Total Exchange-Traded Funds (Cost $4,503,978) | | | | | | | | | | | | | | | 4,429,476 | |
| | | | | | | | | | | | | | | | |
| | | | |
Investment Companies: 98.28% | | | | | | | | | | | | | | | | |
| | | | |
| Affiliated Master Portfolios: 13.50% | | | | | | | | | | | | | | | | |
Wells Fargo Emerging Growth Portfolio | | | | | | | | | | | | | | | 16,733,057 | |
Wells Fargo International Growth Portfolio | | | | | | | | | | | | | | | 26,626,424 | |
Wells Fargo Small Company Value Portfolio | | | | | | | | | | | | | | | 16,742,611 | |
| | | | |
| | | | | | | | | | | | | | | 60,102,092 | |
| | | | | | | | | | | | | | | | |
| | | | |
| Stock Funds: 84.78% | | | | | | | | | | | | | | | | |
American Century Growth Fund Institutional Class | | | | | | | | | | | 890,180 | | | | 27,595,595 | |
DFA International Small Cap Value Portfolio Institutional Class | | | | | | | | | | | 456,934 | | | | 8,814,254 | |
Dodge & Cox International Stock Fund | | | | | | | | | | | 334,437 | | | | 13,123,290 | |
Invesco Growth and Income Fund Class R6 | | | | | | | | | | | 1,258,404 | | | | 33,108,604 | |
MFS Value Fund Class I | | | | | | | | | | | 1,879,763 | | | | 66,318,029 | |
Oakmark Fund Class I | | | | | | | | | | | 499,677 | | | | 33,083,612 | |
Oppenheimer Developing Markets Fund Class Y | | | | | | | | | | | 210,104 | | | | 6,485,901 | |
Royce Pennsylvania Mutual Fund Investor Class | | | | | | | | | | | 1,369,396 | | | | 16,679,245 | |
T. Rowe Price Blue Chip Growth Fund Retail Class | | | | | | | | | | | 515,105 | | | | 38,715,288 | |
T. Rowe Price International Discovery Fund | | | | | | | | | | | 157,492 | | | | 8,896,721 | |
Templeton Institutional Foreign Equity Fund Primary Class | | | | | | | | | | | 659,877 | | | | 13,184,334 | |
Thornburg International Value Fund Institutional Class | | | | | | | | | | | 1,582,383 | | | | 39,591,230 | |
Wells Fargo Emerging Markets Equity Fund Class R6 (l) | | | | | | | | | | | 581,975 | | | | 10,824,738 | |
Wells Fargo Endeavor Select Fund Institutional Class †(l) | | | | | | | | | | | 1,554,962 | | | | 22,142,658 | |
Wells Fargo Large Cap Growth Fund Class R6 (l) | | | | | | | | | | | 439,751 | | | | 22,079,884 | |
Wells Fargo Small Cap Value Fund Class R6 (l) | | | | | | | | | | | 609,984 | | | | 16,780,650 | |
| | | | |
| | | | | | | | | | | | | | | 377,424,033 | |
| | | | | | | | | | | | | | | | |
| | | | |
Total Investment Companies (Cost $369,731,434) | | | | | | | | | | | | | | | 437,526,125 | |
| | | | | | | | | | | | | | | | |
| | | | |
| | | Yield | | | | | | | | | | |
| Short-Term Investments: 0.66% | | | | | | | | | | | | | | | | |
| | | | |
| Investment Companies: 0.43% | | | | | | | | | | | | | | | | |
Wells Fargo Cash Investment Money Market Fund, Select Class (l)(u) | | | 0.17 | % | | | | | | | 1,924,013 | | | | 1,924,013 | |
| | | | | | | | | | | | | | | | |
| | | | |
| | | | | | Maturity date | | | Principal | | | | |
| U.S. Treasury Securities: 0.23% | | | | | | | | | | | | | | | | |
U.S. Treasury Bill #(z) | | | 0.04 | | | | 12-17-2015 | | | $ | 352,000 | | | | 351,992 | |
U.S. Treasury Bill #(z) | | | 0.04 | | | | 1-7-2016 | | | | 10,000 | | | | 9,999 | |
U.S. Treasury Bill #(z) | | | 0.05 | | | | 3-31-2016 | | | | 360,000 | | | | 359,747 | |
U.S. Treasury Bill #(z) | | | 0.09 | | | | 2-18-2016 | | | | 310,000 | | | | 309,897 | |
| | | | |
| | | | | | | | | | | | | | | 1,031,635 | |
| | | | | | | | | | | | | | | | |
| | | | |
Total Short-Term Investments (Cost $2,955,880) | | | | | | | | | | | | | | | 2,955,648 | |
| | | | | | | | | | | | | | | | |
The accompanying notes are an integral part of these financial statements.
| | | | |
| 28 | | Wells Fargo WealthBuilder Portfolios | | Portfolio of investments—November 30, 2015 (unaudited) |
WEALTHBUILDER TACTICAL EQUITY PORTFOLIO
| | | | | | | | |
| | | | | | Value | |
| Total investments in securities (Cost $377,191,292) * | | | 99.94 | % | | $ | 444,911,249 | |
Other assets and liabilities, net | | | 0.06 | | | | 268,637 | |
| | | | | | | | |
| Total net assets | | | 100.00 | % | | $ | 445,179,886 | |
| | | | | | | | |
| (l) | The issuer of the security is an affiliated person of the Portfolio as defined in the Investment Company Act of 1940. |
| † | Non-income-earning security |
| (u) | The rate represents the 7-day annualized yield at period end. |
| (z) | Zero coupon security. The rate represents the current yield to maturity. |
| # | All or a portion of this security is segregated as collateral for investments in derivative instruments. |
| * | Cost for federal income tax purposes is $384,118,893 and unrealized gains (losses) consists of: |
| | | | |
Gross unrealized gains | | $ | 74,374,491 | |
Gross unrealized losses | | | (13,582,135 | ) |
| | | | |
Net unrealized gains | | $ | 60,792,356 | |
The accompanying notes are an integral part of these financial statements.
This page is intentionally left blank.
| | | | |
| 30 | | Wells Fargo WealthBuilder Portfolios | | Statements of assets and liabilities—November 30, 2015 (unaudited) |
| | | | | | | | |
| | | WealthBuilder
Conservative
Allocation
Portfolio | | | WealthBuilder
Moderate
Balanced
Portfolio | |
| | |
Assets | | | | | | | | |
Investments | | | | | | | | |
In unaffiliated Underlying Funds and securities, at value (see cost below) | | $ | 191,869,421 | | | $ | 417,378,793 | |
In affiliated Underlying Funds, at value (see cost below) | | | 193,043,034 | | | | 246,047,310 | |
In affiliated Master Portfolios, at value (see cost below) | | | 139,457,515 | | | | 194,782,222 | |
| | | | |
Total investments, at value (see cost below) | | | 524,369,970 | | | | 858,208,325 | |
Cash | | | 0 | | | | 746,438 | |
Receivable for investments sold | | | 130,062 | | | | 107,089 | |
Receivable for Portfolio shares sold | | | 1,325,646 | | | | 2,710,511 | |
Receivable for dividends | | | 545,674 | | | | 686,057 | |
Receivable for daily variation margin on open futures contracts | | | 20,488 | | | | 67,456 | |
Prepaid expenses and other assets | | | 37,573 | | | | 45,382 | |
| | | | |
Total assets | | | 526,429,413 | | | | 862,571,258 | |
| | | | |
| | |
Liabilities | | | | | | | | |
Payable for investments purchased | | | 524,832 | | | | 659,390 | |
Payable for Portfolio shares redeemed | | | 813,981 | | | | 1,751,275 | |
Due to custodian bank | | | 0 | | | | 0 | |
Management fee payable | | | 107,199 | | | | 176,031 | |
Distribution fee payable | | | 322,971 | | | | 528,092 | |
Administration fee payable | | | 90,432 | | | | 147,866 | |
Shareholder servicing fees payable | | | 107,657 | | | | 176,031 | |
Accrued expenses and other liabilities | | | 38,001 | | | | 60,461 | |
| | | | |
Total liabilities | | | 2,005,073 | | | | 3,499,146 | |
| | | | |
Total net assets | | $ | 524,424,340 | | | $ | 859,072,112 | |
| | | | |
| | |
NET ASSETS CONSIST OF | | | | | | | | |
Paid-in capital | | $ | 501,338,856 | | | $ | 788,089,391 | |
Undistributed (accumulated) net investment income (loss) | | | 95,088 | | | | 705,627 | |
Accumulated net realized gains (losses) on investments | | | 6,035,325 | | | | 25,968,145 | |
Net unrealized gains on investments | | | 16,955,071 | | | | 44,308,949 | |
| | | | |
Total net assets | | $ | 524,424,340 | | | $ | 859,072,112 | |
| | | | |
| | |
COMPUTATION OF NET ASSET VALUE AND OFFERING PRICE PER SHARE | | | | | | | | |
Net assets | | $ | 524,424,340 | | | $ | 859,072,112 | |
Shares outstanding1 | | | 49,716,728 | | | | 72,359,094 | |
Net asset value per share | | | $10.55 | | | | $11.87 | |
Maximum offering price per share2 | | | $10.71 | | | | $12.05 | |
| | |
Investments in unaffiliated Underlying Funds and securities, at cost | | $ | 181,222,256 | | | $ | 385,460,350 | |
| | | | | | | | |
Investments in affiliated Underlying Funds, at cost | | $ | 185,396,059 | | | $ | 230,917,934 | |
| | | | | | | | |
Investments in affiliated Master Portfolios, at cost | | $ | 141,134,551 | | | $ | 198,622,992 | |
| | | | | | | | |
Total investments, at cost | | $ | 507,752,866 | | | $ | 815,001,276 | |
| | | | | | | | |
| 1 | Each Portfolio has an unlimited number of authorized shares. |
| 2 | Maximum offering price is computed as 100/98.50 of net asset value. On investments of $50,000 or more, the offering price is reduced. |
The accompanying notes are an integral part of these financial statements.
| | | | | | |
| Statements of assets and liabilities—November 30, 2015 (unaudited) | | Wells Fargo WealthBuilder Portfolios | | | 31 | |
| | | | | | | | | | | | | | |
WealthBuilder
Growth
Balanced
Portfolio | | | WealthBuilder
Growth
Allocation
Portfolio | | | WealthBuilder
Equity
Portfolio | | | WealthBuilder
Tactical
Equity
Portfolio | |
| | | |
| | | | | | | | | | | | | | |
| | | | | | | | | | | | | | |
| $ | 607,610,159 | | | $ | 305,085,860 | | | $ | 103,173,079 | | | $ | 311,057,214 | |
| | 202,259,816 | | | | 76,975,477 | | | | 24,645,229 | | | | 73,751,943 | |
| | 194,681,663 | | | | 70,068,357 | | | | 15,906,155 | | | | 60,102,092 | |
| | |
| | 1,004,551,638 | | | | 452,129,694 | | | | 143,724,463 | | | | 444,911,249 | |
| | 9,309 | | | | 0 | | | | 82,754 | | | | 0 | |
| | 5,073 | | | | 35,934 | | | | 66,136 | | | | 91,553 | |
| | 2,601,642 | | | | 1,095,635 | | | | 53,081 | | | | 967,693 | |
| | 539,508 | | | | 100,769 | | | | 0 | | | | 0 | |
| | 117,150 | | | | 69,419 | | | | 0 | | | | 84,894 | |
| | 55,440 | | | | 40,458 | | | | 26,433 | | | | 36,044 | |
| | |
| | 1,007,879,760 | | | | 453,471,909 | | | | 143,952,867 | | | | 446,091,433 | |
| | |
| | | |
| | | | | | | | | | | | | | |
| | 531,574 | | | | 98,640 | | | | 0 | | | | 0 | |
| | 1,123,340 | | | | 225,397 | | | | 190,526 | | | | 335,124 | |
| | 0 | | | | 6,491 | | | | 0 | | | | 15,538 | |
| | 205,663 | | | | 90,299 | | | | 22,315 | | | | 89,728 | |
| | 617,322 | | | | 277,283 | | | | 88,878 | | | | 272,942 | |
| | 172,850 | | | | 77,639 | | | | 24,886 | | | | 76,424 | |
| | 205,774 | | | | 92,428 | | | | 29,624 | | | | 90,689 | |
| | 69,073 | | | | 37,952 | | | | 22,732 | | | | 31,102 | |
| | |
| | 2,925,596 | | | | 906,129 | | | | 378,961 | | | | 911,547 | |
| | |
| $ | 1,004,954,164 | | | $ | 452,565,780 | | | $ | 143,573,906 | | | $ | 445,179,886 | |
| | |
| | | |
| | | | | | | | | | | | | | |
| $ | 891,367,907 | | | $ | 390,729,342 | | | $ | 120,830,092 | | | $ | 426,148,838 | |
| | (3,186 | ) | | | (1,224,837 | ) | | | (853,009 | ) | | | (2,906,128 | ) |
| | 28,940,216 | | | | 19,703,162 | | | | (4,402,825 | ) | | | (47,163,952 | ) |
| | 84,649,227 | | | | 43,358,113 | | | | 27,999,648 | | | | 69,101,128 | |
| | |
| $ | 1,004,954,164 | | | $ | 452,565,780 | | | $ | 143,573,906 | | | $ | 445,179,886 | |
| | |
| | | |
| | | | | | | | | | | | | | |
| $ | 1,004,954,164 | | | $ | 452,565,780 | | | $ | 143,573,906 | | | $ | 445,179,886 | |
| | 71,472,818 | | | | 31,461,117 | | | | 9,293,177 | | | | 23,769,000 | |
| | $14.06 | | | | $14.38 | | | | $15.45 | | | | $18.73 | |
| | $14.27 | | | | $14.60 | | | | $15.69 | | | | $19.02 | |
| | | |
| $ | 542,298,642 | | | $ | 270,228,332 | | | $ | 80,445,121 | | | $ | 253,627,319 | |
| | |
| $ | 178,642,916 | | | $ | 66,667,371 | | | $ | 18,550,483 | | | $ | 58,820,083 | |
| | |
| $ | 200,865,332 | | | $ | 72,999,852 | | | $ | 16,729,211 | | | $ | 64,743,890 | |
| | |
| $ | 921,806,890 | | | $ | 409,895,555 | | | $ | 115,724,815 | | | $ | 377,191,292 | |
| | |
The accompanying notes are an integral part of these financial statements.
| | | | |
| 32 | | Wells Fargo WealthBuilder Portfolios | | Statements of operations—six months ended November 30, 2015 (unaudited) |
| | | | | | | | |
| | | WealthBuilder
Conservative
Allocation
Portfolio | | | WealthBuilder
Moderate
Balanced
Portfolio | |
| | |
Investment income | | | | | | | | |
Dividends from affiliated Underlying Funds | | $ | 1,361,094 | | | $ | 1,436,322 | |
Dividends from unaffiliated Underlying Funds | | | 2,948,435 | | | | 4,883,446 | |
Interest allocated from affiliated Master Portfolios | | | 1,396,865 | | | | 1,667,939 | |
Dividends allocated from affiliated Master Portfolios* | | | 65,712 | | | | 212,106 | |
Securities lending income allocated from affiliated Master Portfolios | | | 6,681 | | | | 17,001 | |
Interest | | | 195 | | | | 637 | |
Expenses allocated from affiliated Master Portfolios | | | (295,211 | ) | | | (483,295 | ) |
Waivers allocated from affiliated Master Portfolios | | | 9,112 | | | | 10,858 | |
| | | | |
Total investment income | | | 5,492,883 | | | | 7,745,014 | |
| | | | |
| | |
Expenses | | | | | | | | |
Management fee | | | 665,795 | | | | 1,088,935 | |
Administration fee | | | 581,467 | | | | 951,249 | |
Shareholder servicing fees | | | 665,515 | | | | 1,088,935 | |
Distribution fee | | | 1,997,387 | | | | 3,266,806 | |
Custody and accounting fees | | | 36,434 | | | | 35,412 | |
Professional fees | | | 16,532 | | | | 16,532 | |
Registration fees | | | 27,697 | | | | 25,699 | |
Shareholder report expenses | | | 15,315 | | | | 25,499 | |
Trustees’ fees and expenses | | | 5,973 | | | | 6,381 | |
Interest expense | | | 0 | | | | 196 | |
Other fees and expenses | | | 6,050 | | | | 8,716 | |
| | | | |
Total expenses | | | 4,018,165 | | | | 6,514,360 | |
Less: Fee waivers and/or expense reimbursements | | | (23,395 | ) | | | (26,755 | ) |
| | | | |
Net expenses | | | 3,994,770 | | | | 6,487,605 | |
| | | | |
Net investment income (loss) | | | 1,498,113 | | | | 1,257,409 | |
| | | | |
| | |
REALIZED AND UNREALIZED GAINS (LOSSES) ON INVESTMENTS | | | | | | | | |
| | |
Net realized gains (losses) on: | | | | | | | | |
Unaffiliated Underlying Funds | | | (566,113 | ) | | | (1,195,470 | ) |
Affiliated Underlying Funds | | | 151,466 | | | | (204,257 | ) |
Futures transactions | | | 713,537 | | | | 2,687,964 | |
Capital gain distributions from unaffiliated Underlying Funds | | | 1,370,804 | | | | 4,448,619 | |
Securities transactions allocated from affiliated Master Portfolios | | | 804,165 | | | | 1,407,619 | |
| | | | |
Net realized gains on investments | | | 2,473,859 | | | | 7,144,475 | |
| | | | |
| | |
Net change in unrealized gains (losses) on: | | | | | | | | |
Unaffiliated Underlying Funds | | | (11,812,302 | ) | | | (24,571,515 | ) |
Affiliated Underlying Funds | | | (1,802,661 | ) | | | (2,080,491 | ) |
Futures transactions | | | 354,734 | | | | 1,154,167 | |
Securities transactions allocated from affiliated Master Portfolios | | | (3,084,800 | ) | | | (6,165,111 | ) |
| | | | |
Net change in unrealized gains (losses) on investments | | | (16,345,029 | ) | | | (31,662,950 | ) |
| | | | |
Net realized and unrealized gains (losses) on investments | | | (13,871,170 | ) | | | (24,518,475 | ) |
| | | | |
Net decrease in net assets resulting from operations | | $ | (12,373,057 | ) | | $ | (23,261,066 | ) |
| | | | |
| | |
* Net of foreign dividend withholding taxes allocated from affiliated Master Portfolios in the amount of | | | $441 | | | | $1,481 | |
The accompanying notes are an integral part of these financial statements.
| | | | | | |
| Statements of operations—six months ended November 30, 2015 (unaudited) | | Wells Fargo WealthBuilder Portfolios | | | 33 | |
| | | | | | | | | | | | | | |
WealthBuilder
Growth
Balanced
Portfolio | | | WealthBuilder
Growth
Allocation
Portfolio | | | WealthBuilder
Equity
Portfolio | | | WealthBuilder
Tactical
Equity
Portfolio | |
| | | |
| | | | | | | | | | | | | | |
| $ | 603,723 | | | $ | 101,470 | | | $ | 223 | | | $ | 1,299 | |
| | 5,694,098 | | | | 2,087,014 | | | | 449,278 | | | | 1,362,172 | |
| | 1,266,943 | | | | 233,774 | | | | 0 | | | | 0 | |
| | 370,510 | | | | 219,081 | | | | 74,851 | | | | 272,943 | |
| | 26,837 | | | | 15,364 | | | | 4,433 | | | | 18,646 | |
| | 885 | | | | 468 | | | | 0 | | | | 345 | |
| | (567,422 | ) | | | (250,722 | ) | | | (72,040 | ) | | | (263,379 | ) |
| | 8,257 | | | | 1,517 | | | | 0 | | | | 0 | |
| | |
| | 7,403,831 | | | | 2,407,966 | | | | 456,745 | | | | 1,392,026 | |
| | |
| | | |
| | | | | | | | | | | | | | |
| | 1,251,489 | | | | 555,521 | | | | 180,567 | | | | 550,937 | |
| | 1,094,155 | | | | 485,172 | | | | 157,805 | | | | 481,418 | |
| | 1,252,730 | | | | 555,521 | | | | 180,567 | | | | 550,645 | |
| | 3,758,189 | | | | 1,666,562 | | | | 541,702 | | | | 1,652,810 | |
| | 43,152 | | | | 29,941 | | | | 21,012 | | | | 26,065 | |
| | 16,282 | | | | 16,280 | | | | 16,058 | | | | 15,918 | |
| | 34,164 | | | | 24,251 | | | | 13,369 | | | | 18,732 | |
| | 38,340 | | | | 21,373 | | | | 5,862 | | | | 15,075 | |
| | 6,473 | | | | 6,473 | | | | 7,055 | | | | 7,041 | |
| | 0 | | | | 0 | | | | 0 | | | | 0 | |
| | 8,075 | | | | 4,750 | | | | 4,518 | | | | 3,263 | |
| | |
| | 7,503,049 | | | | 3,365,844 | | | | 1,128,515 | | | | 3,321,904 | |
| | (32,007 | ) | | | (32,722 | ) | | | (45,111 | ) | | | (22,070 | ) |
| | |
| | 7,471,042 | | | | 3,333,122 | | | | 1,083,404 | | | | 3,299,834 | |
| | |
| | (67,211 | ) | | | (925,156 | ) | | | (626,659 | ) | | | (1,907,808 | ) |
| | |
| | | |
| | | | | | | | | | | | | | |
| | | |
| | | | | | | | | | | | | | |
| | (1,102,002 | ) | | | (567,227 | ) | | | (51,830 | ) | | | (366,879 | ) |
| | 45,616 | | | | (943 | ) | | | (70,962 | ) | | | (317,188 | ) |
| | 2,606,868 | | | | 1,157,155 | | | | 0 | | | | 118,785 | |
| | 7,682,885 | | | | 4,640,650 | | | | 1,867,548 | | | | 5,731,884 | |
| | 1,928,434 | | | | 797,212 | | | | 534,194 | | | | 1,418,565 | |
| | |
| | 11,161,801 | | | | 6,026,847 | | | | 2,278,950 | | | | 6,585,167 | |
| | |
| | | |
| | | | | | | | | | | | | | |
| | (34,564,925 | ) | | | (17,042,930 | ) | | | (5,180,162 | ) | | | (15,843,280 | ) |
| | (2,147,808 | ) | | | (1,014,010 | ) | | | (230,529 | ) | | | (839,064 | ) |
| | 1,778,197 | | | | 956,246 | | | | 0 | | | | 899,283 | |
| | (8,678,140 | ) | | | (4,291,837 | ) | | | (1,689,201 | ) | | | (5,480,773 | ) |
| | |
| | (43,612,676 | ) | | | (21,392,531 | ) | | | (7,099,892 | ) | | | (21,263,834 | ) |
| | |
| | (32,450,875 | ) | | | (15,365,684 | ) | | | (4,820,942 | ) | | | (14,678,667 | ) |
| | |
| $ | (32,518,086 | ) | | $ | (16,290,840 | ) | | $ | (5,447,601 | ) | | $ | (16,586,475 | ) |
| | |
| | | |
| | $2,517 | | | | $1,465 | | | | $606 | | | | $1,862 | |
The accompanying notes are an integral part of these financial statements.
| | | | |
| 34 | | Wells Fargo WealthBuilder Portfolios | | Statements of changes in net assets |
| | | | | | | | | | | | | | | | |
| | | WealthBuilder Conservative Allocation Portfolio | |
| | | Six months ended
November 30, 2015
(unaudited) | | | Year ended
May 31, 2015 | |
| | | | |
Operations | | | | | | | | | | | | | | | | |
Net investment income | | | | | | $ | 1,498,113 | | | | | | | $ | 1,894,442 | |
Net realized gains on investments | | | | | | | 2,473,859 | | | | | | | | 18,152,708 | |
Net change in unrealized gains (losses) on investments | | | | | | | (16,345,029 | ) | | | | | | | (10,251,043 | ) |
| | | | |
Net increase (decrease) in net assets resulting from operations | | | | | | | (12,373,057 | ) | | | | | | | 9,796,107 | |
| | | | |
| | | | |
Distributions to shareholders from | | | | | | | | | | | | | | | | |
Net investment income | | | | | | | (1,486,490 | ) | | | | | | | (2,454,091 | ) |
Net realized gains | | | | | | | 0 | | | | | | | | (12,035,964 | ) |
| | | | |
Total distributions to shareholders | | | | | | | (1,486,490 | ) | | | | | | | (14,490,055 | ) |
| | | | |
| | | | |
Capital share transactions | | | Shares | | | | | | | | Shares | | | | | |
Proceeds from shares sold | | | 5,630,743 | | | | 59,773,342 | | | | 10,584,440 | | | | 114,883,902 | |
Reinvestment of distributions | | | 139,379 | | | | 1,480,714 | | | | 1,349,657 | | | | 14,475,121 | |
Payment for shares redeemed | | | (6,408,324 | ) | | | (68,029,131 | ) | | | (14,783,524 | ) | | | (160,542,713 | ) |
| | | | |
Net decrease in net assets resulting from capital share transactions | | | | | | | (6,775,075 | ) | | | | | | | (31,183,690 | ) |
| | | | |
Total decrease in net assets | | | | | | | (20,634,622 | ) | | | | | | | (35,877,638 | ) |
| | | | |
| | | | |
Net assets | | | | | | | | | | | | | | | | |
Beginning of period | | | | | | | 545,058,962 | | | | | | | | 580,936,600 | |
| | | | |
End of period | | | | | | $ | 524,424,340 | | | | | | | $ | 545,058,962 | |
| | | | |
Undistributed net investment income | | | | | | $ | 95,088 | | | | | | | $ | 83,465 | |
| | | | |
The accompanying notes are an integral part of these financial statements.
| | | | | | |
| Statements of changes in net assets | | Wells Fargo WealthBuilder Portfolios | | | 35 | |
| | | | | | | | | | | | | | | | |
| | | WealthBuilder Moderate Balanced Portfolio | |
| | | Six months ended
November 30, 2015
(unaudited) | | | Year ended
May 31, 2015 | |
| | | | |
Operations | | | | | | | | | | | | | | | | |
Net investment income | | | | | | $ | 1,257,409 | | | | | | | $ | 1,846,584 | |
Net realized gains on investments | | | | | | | 7,144,475 | | | | | | | | 46,273,697 | |
Net change in unrealized gains (losses) on investments | | | | | | | (31,662,950 | ) | | | | | | | (18,591,731 | ) |
| | | | |
Net increase (decrease) in net assets resulting from operations | | | | | | | (23,261,066 | ) | | | | | | | 29,528,550 | |
| | | | |
| | | | |
Distributions to shareholders from | | | | | | | | | | | | | | | | |
Net investment income | | | | | | | (559,871 | ) | | | | | | | (4,792,750 | ) |
Net realized gains | | | | | | | 0 | | | | | | | | (25,821,821 | ) |
| | | | |
Total distributions to shareholders | | | | | | | (559,871 | ) | | | | | | | (30,614,571 | ) |
| | | | |
| | | | |
Capital share transactions | | | Shares | | | | | | | | Shares | | | | | |
Proceeds from shares sold | | | 6,780,470 | | | | 80,899,329 | | | | 14,751,165 | | | | 179,406,067 | |
Reinvestment of distributions | | | 48,276 | | | | 559,039 | | | | 2,554,487 | | | | 30,574,626 | |
Payment for shares redeemed | | | (7,735,258 | ) | | | (91,740,595 | ) | | | (15,061,182 | ) | | | (183,046,028 | ) |
| | | | |
Net increase (decrease) in net assets resulting from capital share transactions | | | | | | | (10,282,227 | ) | | | | | | | 26,934,665 | |
| | | | |
Total increase (decrease) in net assets | | | | | | | (34,103,164 | ) | | | | | | | 25,848,644 | |
| | | | |
| | | | |
Net assets | | | | | | | | | | | | | | | | |
Beginning of period | | | | | | | 893,175,276 | | | | | | | | 867,326,632 | |
| | | | |
End of period | | | | | | $ | 859,072,112 | | | | | | | $ | 893,175,276 | |
| | | | |
Undistributed net investment income | | | | | | $ | 705,627 | | | | | | | $ | 8,089 | |
| | | | |
The accompanying notes are an integral part of these financial statements.
| | | | |
| 36 | | Wells Fargo WealthBuilder Portfolios | | Statements of changes in net assets |
| | | | | | | | | | | | | | | | |
| | | WealthBuilder Growth Balanced Portfolio | |
| | | Six months ended
November 30, 2015
(unaudited) | | | Year ended
May 31, 2015 | |
| | | | |
Operations | | | | | | | | | | | | | | | | |
Net investment income (loss) | | | | | | $ | (67,211 | ) | | | | | | $ | 624,272 | |
Net realized gains on investments | | | | | | | 11,161,801 | | | | | | | | 71,458,770 | |
Net change in unrealized (losses) on investments | | | | | | | (43,612,676 | ) | | | | | | | (25,710,997 | ) |
| | | | |
Net increase (decrease) in net assets resulting from operations | | | | | | | (32,518,086 | ) | | | | | | | 46,372,045 | |
| | | | |
| | | | |
Distributions to shareholders from | | | | | | | | | | | | | | | | |
Net investment income | | | | | | | 0 | | | | | | | | (7,084,736 | ) |
Net realized gains | | | | | | | 0 | | | | | | | | (31,685,911 | ) |
| | | | |
Total distributions to shareholders | | | | | | | 0 | | | | | | | | (38,770,647 | ) |
| | | | |
| | | | |
Capital share transactions | | | Shares | | | | | | | | Shares | | | | | |
Proceeds from shares sold | | | 6,919,529 | | | | 97,670,103 | | | | 13,462,004 | | | | 193,585,803 | |
Reinvestment of distributions | | | 0 | | | | 0 | | | | 2,738,063 | | | | 38,748,055 | |
Payment for shares redeemed | | | (5,601,650 | ) | | | (78,608,790 | ) | | | (10,990,169 | ) | | | (158,117,020 | ) |
| | | | |
Net increase in net assets resulting from capital share transactions | | | | | | | 19,061,313 | | | | | | | | 74,216,838 | |
| | | | |
Total increase (decrease) in net assets | | | | | | | (13,456,773 | ) | | | | | | | 81,818,236 | |
| | | | |
| | | | |
Net assets | | | | | | | | | | | | | | | | |
Beginning of period | | | | | | | 1,018,410,937 | | | | | | | | 936,592,701 | |
| | | | |
End of period | | | | | | $ | 1,004,954,164 | | | | | | | $ | 1,018,410,937 | |
| | | | |
Undistributed (accumulated) net investment income (loss) | | | | | | $ | (3,186 | ) | | | | | | $ | 64,025 | |
| | | | |
The accompanying notes are an integral part of these financial statements.
| | | | | | |
| Statements of changes in net assets | | Wells Fargo WealthBuilder Portfolios | | | 37 | |
| | | | | | | | | | | | | | | | |
| | | WealthBuilder Growth Allocation Portfolio | |
| | | Six months ended
November 30, 2015
(unaudited) | | | Year ended
May 31, 2015 | |
| | | | |
Operations | | | | | | | | | | | | | | | | |
Net investment loss | | | | | | $ | (925,156 | ) | | | | | | $ | (833,169 | ) |
Net realized gains on investments | | | | | | | 6,026,847 | | | | | | �� | | 36,094,950 | |
Net change in unrealized gains (losses) on investments | | | | | | | (21,392,531 | ) | | | | | | | (9,975,831 | ) |
| | | | |
Net increase (decrease) in net assets resulting from operations | | | | | | | (16,290,840 | ) | | | | | | | 25,285,950 | |
| | | | |
| | | | |
Distributions to shareholders from | | | | | | | | | | | | | | | | |
Net investment income | | | | | | | 0 | | | | | | | | (3,617,950 | ) |
Net realized gains | | | | | | | 0 | | | | | | | | (17,215,777 | ) |
| | | | |
Total distributions to shareholders | | | | | | | 0 | | | | | | | | (20,833,727 | ) |
| | | | |
| | | | |
Capital share transactions | | | Shares | | | | | | | | Shares | | | | | |
Proceeds from shares sold | | | 3,177,493 | | | | 45,810,174 | | | | 5,982,612 | | | | 88,279,600 | |
Reinvestment of distributions | | | 0 | | | | 0 | | | | 1,439,960 | | | | 20,806,021 | |
Payment for shares redeemed | | | (1,955,243 | ) | | | (28,092,884 | ) | | | (4,390,446 | ) | | | (64,636,176 | ) |
| | | | |
Net increase in net assets resulting from capital share transactions | | | | | | | 17,717,290 | | | | | | | | 44,449,445 | |
| | | | |
Total increase in net assets | | | | | | | 1,426,450 | | | | | | | | 48,901,668 | |
| | | | |
| | | | |
Net assets | | | | | | | | | | | | | | | | |
Beginning of period | | | | | | | 451,139,330 | | | | | | | | 402,237,662 | |
| | | | |
End of period | | | | | | $ | 452,565,780 | | | | | | | $ | 451,139,330 | |
| | | | |
Accumulated net investment loss | | | | | | $ | (1,224,837 | ) | | | | | | $ | (299,681 | ) |
| | | | |
The accompanying notes are an integral part of these financial statements.
| | | | |
| 38 | | Wells Fargo WealthBuilder Portfolios | | Statements of changes in net assets |
| | | | | | | | | | | | | | | | |
| | | WealthBuilder Equity Portfolio | |
| | | Six months ended
November 30, 2015
(unaudited) | | | Year ended
May 31, 2015 | |
| | | | |
Operations | | | | | | | | | | | | | | | | |
Net investment loss | | | | | | $ | (626,659 | ) | | | | | | $ | (633,406 | ) |
Net realized gains on investments | | | | | | | 2,278,950 | | | | | | | | 14,978,752 | |
Net change in unrealized gains (losses) on investments | | | | | | | (7,099,892 | ) | | | | | | | (4,136,119 | ) |
| | | | |
Net increase (decrease) in net assets resulting from operations | | | | | | | (5,447,601 | ) | | | | | | | 10,209,227 | |
| | | | |
| | | | |
Capital share transactions | | | Shares | | | | | | | | Shares | | | | | |
Proceeds from shares sold | | | 700,281 | | | | 10,848,697 | | | | 1,596,485 | | | | 24,451,434 | |
Payment for shares redeemed | | | (689,721 | ) | | | (10,544,810 | ) | | | (1,564,539 | ) | | | (24,079,607 | ) |
| | | | |
Net increase in net assets resulting from capital share transactions | | | | | | | 303,887 | | | | | | | | 371,827 | |
| | | | |
Total increase (decrease) in net assets | | | | | | | (5,143,714 | ) | | | | | | | 10,581,054 | |
| | | | |
| | | | |
Net assets | | | | | | | | | | | | | | | | |
Beginning of period | | | | | | | 148,717,620 | | | | | | | | 138,136,566 | |
| | | | |
End of period | | | | | | $ | 143,573,906 | | | | | | | $ | 148,717,620 | |
| | | | |
Accumulated net investment loss | | | | | | $ | (853,009 | ) | | | | | | $ | (226,350 | ) |
| | | | |
The accompanying notes are an integral part of these financial statements.
| | | | | | |
| Statements of changes in net assets | | Wells Fargo WealthBuilder Portfolios | | | 39 | |
| | | | | | | | | | | | | | | | |
| | | WealthBuilder Tactical Equity Portfolio | |
| | | Six months ended
November 30, 2015
(unaudited) | | | Year ended
May 31, 2015 | |
| | | | |
Operations | | | | | | | | | | | | | | | | |
Net investment loss | | | | | | $ | (1,907,808 | ) | | | | | | $ | (1,889,760 | ) |
Net realized gains on investments | | | | | | | 6,585,167 | | | | | | | | 44,444,424 | |
Net change in unrealized gains (losses) on investments | | | | | | | (21,263,834 | ) | | | | | | | (11,412,075 | ) |
| | | | |
Net increase (decrease) in net assets resulting from operations | | | | | | | (16,586,475 | ) | | | | | | | 31,142,589 | |
| | | | |
| | | | |
Capital share transactions | | | Shares | | | | | | | | Shares | | | | | |
Proceeds from shares sold | | | 1,924,752 | | | | 36,104,148 | | | | 4,276,140 | | | | 79,661,839 | |
Payment for shares redeemed | | | (1,419,245 | ) | | | (26,633,755 | ) | | | (4,359,610 | ) | | | (80,457,955 | ) |
| | | | |
Net increase (decrease) in net assets resulting from capital share transactions | | | | | | | 9,470,393 | | | | | | | | (796,116 | ) |
| | | | |
Total increase (decrease) in net assets | | | | | | | (7,116,082 | ) | | | | | | | 30,346,473 | |
| | | | |
| | | | |
Net assets | | | | | | | | | | | | | | | | |
Beginning of period | | | | | | | 452,295,968 | | | | | | | | 421,949,495 | |
| | | | |
End of period | | | | | | $ | 445,179,886 | | | | | | | $ | 452,295,968 | |
| | | | |
Accumulated net investment loss | | | | | | $ | (2,906,128 | ) | | | | | | $ | (998,320 | ) |
| | | | |
The accompanying notes are an integral part of these financial statements.
| | | | |
| 40 | | Wells Fargo WealthBuilder Portfolios | | Financial highlights |
| | | | | | | | | | | | | | | | | | | | | | | | |
| | | Beginning
net asset
value per
share | | | Net
investment
income (loss)1 | | | Net realized
and unrealized
gains (losses)
on investments | | | Distributions
from net
investment
income | | | Distributions
from net
realized gains | | | Ending
net asset
value per
share | |
| | | | | | |
WealthBuilder Conservative Allocation Portfolio | | | | | | | | | | | | | | | | | | | | | | | | |
Six months ended November 30, 2015 (unaudited) | | $ | 10.82 | | | | 0.03 | | | | (0.27 | ) | | | (0.03 | ) | | | 0.00 | | | $ | 10.55 | |
Year ended May 31, 2015 | | $ | 10.92 | | | | 0.04 | | | | 0.15 | | | | (0.05 | ) | | | (0.24 | ) | | $ | 10.82 | |
Year ended May 31, 2014 | | $ | 10.95 | | | | 0.03 | | | | 0.42 | | | | (0.05 | ) | | | (0.43 | ) | | $ | 10.92 | |
Year ended May 31, 2013 | | $ | 10.57 | | | | 0.06 | | | | 0.59 | | | | (0.08 | ) | | | (0.19 | ) | | $ | 10.95 | |
Year ended May 31, 2012 | | $ | 11.02 | | | | 0.16 | | | | (0.20 | ) | | | (0.21 | ) | | | (0.20 | ) | | $ | 10.57 | |
Year ended May 31, 2011 | | $ | 10.08 | | | | 0.18 | | | | 0.96 | | | | (0.20 | ) | | | 0.00 | | | $ | 11.02 | |
| | | | | | |
WealthBuilder Moderate Balanced Portfolio | | | | | | | | | | | | | | | | | | | | | | | | |
Six months ended November 30, 2015 (unaudited) | | $ | 12.19 | | | | 0.02 | | | | (0.33 | ) | | | (0.01 | ) | | | 0.00 | | | $ | 11.87 | |
Year ended May 31, 2015 | | $ | 12.21 | | | | 0.03 | | | | 0.39 | | | | (0.07 | ) | | | (0.37 | ) | | $ | 12.19 | |
Year ended May 31, 2014 | | $ | 12.03 | | | | 0.02 | | | | 0.91 | | | | (0.04 | ) | | | (0.71 | ) | | $ | 12.21 | |
Year ended May 31, 2013 | | $ | 10.96 | | | | 0.04 | 3 | | | 1.21 | | | | (0.06 | ) | | | (0.12 | ) | | $ | 12.03 | |
Year ended May 31, 2012 | | $ | 11.50 | | | | 0.13 | 3 | | | (0.48 | ) | | | (0.19 | ) | | | (0.00 | )4 | | $ | 10.96 | |
Year ended May 31, 2011 | | $ | 10.01 | | | | 0.14 | | | | 1.54 | | | | (0.19 | ) | | | 0.00 | | | $ | 11.50 | |
| | | | | | |
WealthBuilder Growth Balanced Portfolio | | | | | | | | | | | | | | | | | | | | | | | | |
Six months ended November 30, 2015 (unaudited) | | $ | 14.52 | | | | (0.00 | )4 | | | (0.46 | ) | | | 0.00 | | | | 0.00 | | | $ | 14.06 | |
Year ended May 31, 2015 | | $ | 14.42 | | | | 0.01 | | | | 0.67 | | | | (0.10 | ) | | | (0.48 | ) | | $ | 14.52 | |
Year ended May 31, 2014 | | $ | 12.90 | | | | 0.01 | | | | 1.55 | | | | (0.04 | ) | | | 0.00 | | | $ | 14.42 | |
Year ended May 31, 2013 | | $ | 10.97 | | | | 0.01 | | | | 1.95 | | | | (0.03 | ) | | | 0.00 | | | $ | 12.90 | |
Year ended May 31, 2012 | | $ | 11.82 | | | | 0.09 | | | | (0.82 | ) | | | (0.12 | ) | | | 0.00 | | | $ | 10.97 | |
Year ended May 31, 2011 | | $ | 9.60 | | | | 0.06 | | | | 2.26 | | | | (0.10 | ) | | | 0.00 | | | $ | 11.82 | |
| | | | | | |
WealthBuilder Growth Allocation Portfolio | | | | | | | | | | | | | | | | | | | | | | | | |
Six months ended November 30, 2015 (unaudited) | | $ | 14.92 | | | | (0.03 | ) | | | (0.51 | ) | | | 0.00 | | | | 0.00 | | | $ | 14.38 | |
Year ended May 31, 2015 | | $ | 14.78 | | | | (0.02 | ) | | | 0.89 | | | | (0.12 | ) | | | (0.61 | ) | | $ | 14.92 | |
Year ended May 31, 2014 | | $ | 13.08 | | | | (0.03 | ) | | | 1.89 | | | | (0.00 | )4 | | | (0.16 | ) | | $ | 14.78 | |
Year ended May 31, 2013 | | $ | 10.87 | | | | (0.01 | ) | | | 2.23 | | | | (0.01 | ) | | | 0.00 | | | $ | 13.08 | |
Year ended May 31, 2012 | | $ | 11.83 | | | | 0.05 | 3 | | | (0.94 | ) | | | (0.07 | ) | | | 0.00 | | | $ | 10.87 | |
Year ended May 31, 2011 | | $ | 9.34 | | | | 0.02 | | | | 2.53 | | | | (0.06 | ) | | | 0.00 | | | $ | 11.83 | |
| | | | | | |
WealthBuilder Equity Portfolio | | | | | | | | | | | | | | | | | | | | | | | | |
Six months ended November 30, 2015 (unaudited) | | $ | 16.02 | | | | (0.07 | ) | | | (0.50 | ) | | | 0.00 | | | | 0.00 | | | $ | 15.45 | |
Year ended May 31, 2015 | | $ | 14.93 | | | | (0.07 | ) | | | 1.16 | | | | 0.00 | | | | 0.00 | | | $ | 16.02 | |
Year ended May 31, 2014 | | $ | 12.82 | | | | (0.08 | ) | | | 2.19 | | | | 0.00 | | | | 0.00 | | | $ | 14.93 | |
Year ended May 31, 2013 | | $ | 10.34 | | | | (0.05 | ) | | | 2.53 | | | | 0.00 | | | | 0.00 | | | $ | 12.82 | |
Year ended May 31, 2012 | | $ | 11.45 | | | | (0.04 | ) | | | (1.07 | ) | | | 0.00 | | | | 0.00 | | | $ | 10.34 | |
Year ended May 31, 2011 | | $ | 9.10 | | | | (0.07 | ) | | | 2.42 | | | | 0.00 | | | | 0.00 | | | $ | 11.45 | |
| | | | | | |
WealthBuilder Tactical Equity Portfolio | | | | | | | | | | | | | | | | | | | | | | | | |
Six months ended November 30, 2015 (unaudited) | | $ | 19.44 | | | | (0.08 | ) | | | (0.63 | ) | | | 0.00 | | | | 0.00 | | | $ | 18.73 | |
Year ended May 31, 2015 | | $ | 18.07 | | | | (0.08 | ) | | | 1.45 | | | | 0.00 | | | | 0.00 | | | $ | 19.44 | |
Year ended May 31, 2014 | | $ | 15.61 | | | | (0.08 | ) | | | 2.54 | | | | 0.00 | | | | 0.00 | | | $ | 18.07 | |
Year ended May 31, 2013 | | $ | 13.12 | | | | (0.07 | ) | | | 2.58 | | | | (0.02 | ) | | | 0.00 | | | $ | 15.61 | |
Year ended May 31, 2012 | | $ | 13.89 | | | | (0.08 | )3 | | | (0.69 | ) | | | 0.00 | | | | 0.00 | | | $ | 13.12 | |
Year ended May 31, 2011 | | $ | 11.05 | | | | (0.10 | ) | | | 2.94 | | | | 0.00 | | | | 0.00 | | | $ | 13.89 | |
| 1 | Includes net expenses allocated from affiliated Master Portfolios in which the Portfolio invests. |
| 2 | Total return calculations do not include any sales charges. Returns for periods of less than one year are not annualized. |
| 3 | Calculated based upon average shares outstanding |
| 4 | Amount is less than $0.005. |
The accompanying notes are an integral part of these financial statements.
| | | | | | |
| Financial highlights | | Wells Fargo WealthBuilder Portfolios | | | 41 | |
| | | | | | | | | | | | | | | | | | | | | | |
| Ratio to average net assets (annualized) | | | | | | Portfolio | | |
Net assets at | |
Net investment
income (loss)1 | | | Gross
expenses | | | Net
expenses | | | Total
return2 | | | turnover
rate | | | end of period
(000s omitted) | |
| | | | | |
| | | | | | | | | | | | | | | | | | | | | | | |
| | 0.56 | % | | | 1.51 | % | | | 1.50 | % | | | (2.22 | )% | | | 83 | % | | $ | 524,424 | |
| | 0.34 | % | | | 1.55 | % | | | 1.50 | % | | | 1.75 | % | | | 169 | % | | $ | 545,059 | |
| | 0.32 | % | | | 1.55 | % | | | 1.50 | % | | | 4.19 | % | | | 139 | % | | $ | 580,937 | |
| | 0.53 | % | | | 1.54 | % | | | 1.50 | % | | | 6.19 | % | | | 128 | % | | $ | 659,977 | |
| | 1.51 | % | | | 1.54 | % | | | 1.50 | % | | | (0.32 | )% | | | 176 | % | | $ | 662,092 | |
| | 1.75 | % | | | 1.58 | % | | | 1.50 | % | | | 11.42 | % | | | 168 | % | | $ | 630,085 | |
| | | | | |
| | | | | | | | | | | | | | | | | | | | | | | |
| | 0.29 | % | | | 1.50 | % | | | 1.49 | % | | | (2.56 | )% | | | 63 | % | | $ | 859,072 | |
| | 0.21 | % | | | 1.55 | % | | | 1.50 | % | | | 3.44 | % | | | 129 | % | | $ | 893,175 | |
| | 0.17 | % | | | 1.54 | % | | | 1.50 | % | | | 7.94 | % | | | 110 | % | | $ | 867,327 | |
| | 0.34 | % | | | 1.54 | % | | | 1.50 | % | | | 11.42 | % | | | 115 | % | | $ | 799,251 | |
| | 1.20 | % | | | 1.54 | % | | | 1.50 | % | | | (2.96 | )% | | | 145 | % | | $ | 709,801 | |
| | 1.24 | % | | | 1.55 | % | | | 1.50 | % | | | 16.96 | % | | | 142 | % | | $ | 691,145 | |
| | | | | |
| | | | | | | | | | | | | | | | | | | | | | | |
| | (0.01 | )% | | | 1.50 | % | | | 1.49 | % | | | (3.17 | )% | | | 43 | % | | $ | 1,004,954 | |
| | 0.06 | % | | | 1.54 | % | | | 1.50 | % | | | 4.89 | % | | | 89 | % | | $ | 1,018,411 | |
| | 0.04 | % | | | 1.54 | % | | | 1.50 | % | | | 12.07 | % | | | 94 | % | | $ | 936,593 | |
| | 0.06 | % | | | 1.54 | % | | | 1.50 | % | | | 17.85 | % | | | 117 | % | | $ | 788,285 | |
| | 0.84 | % | | | 1.54 | % | | | 1.50 | % | | | (6.17 | )% | | | 131 | % | | $ | 689,816 | |
| | 0.59 | % | | | 1.54 | % | | | 1.50 | % | | | 24.27 | % | | | 140 | % | | $ | 785,283 | |
| | | | | |
| | | | | | | | | | | | | | | | | | | | | | | |
| | (0.42 | )% | | | 1.51 | % | | | 1.50 | % | | | (3.62 | )% | | | 22 | % | | $ | 452,566 | |
| | (0.20 | )% | | | 1.55 | % | | | 1.50 | % | | | 6.14 | % | | | 53 | % | | $ | 451,139 | |
| | (0.19 | )% | | | 1.57 | % | | | 1.50 | % | | | 14.28 | % | | | 60 | % | | $ | 402,238 | |
| | (0.13 | )% | | | 1.57 | % | | | 1.50 | % | | | 20.39 | % | | | 98 | % | | $ | 324,723 | |
| | 0.49 | % | | | 1.57 | % | | | 1.50 | % | | | (7.47 | )% | | | 96 | % | | $ | 276,657 | |
| | 0.16 | % | | | 1.57 | % | | | 1.50 | % | | | 27.33 | % | | | 110 | % | | $ | 313,206 | |
| | | | | |
| | | | | | | | | | | | | | | | | | | | | | | |
| | (0.87 | )% | | | 1.56 | % | | | 1.50 | % | | | (3.56 | )% | | | 7 | % | | $ | 143,574 | |
| | (0.46 | )% | | | 1.61 | % | | | 1.50 | % | | | 7.30 | % | | | 24 | % | | $ | 148,718 | |
| | (0.53 | )% | | | 1.61 | % | | | 1.50 | % | | | 16.46 | % | | | 26 | % | | $ | 138,137 | |
| | (0.38 | )% | | | 1.63 | % | | | 1.50 | % | | | 23.98 | % | | | 44 | % | | $ | 121,888 | |
| | (0.39 | )% | | | 1.60 | % | | | 1.50 | % | | | (9.69 | )% | | | 24 | % | | $ | 109,727 | |
| | (0.68 | )% | | | 1.60 | % | | | 1.50 | % | | | 25.82 | % | | | 52 | % | | $ | 141,425 | |
| | | | | |
| | | | | | | | | | | | | | | | | | | | | | | |
| | (0.87 | )% | | | 1.51 | % | | | 1.50 | % | | | (3.65 | )% | | | 8 | % | | $ | 445,180 | |
| | (0.44 | )% | | | 1.55 | % | | | 1.50 | % | | | 7.58 | % | | | 27 | % | | $ | 452,296 | |
| | (0.45 | )% | | | 1.56 | % | | | 1.50 | % | | | 15.76 | % | | | 23 | % | | $ | 421,949 | |
| | (0.49 | )% | | | 1.56 | % | | | 1.50 | % | | | 19.16 | % | | | 67 | % | | $ | 371,334 | |
| | (0.58 | )% | | | 1.56 | % | | | 1.50 | % | | | (5.54 | )% | | | 31 | % | | $ | 346,832 | |
| | (0.81 | )% | | | 1.55 | % | | | 1.50 | % | | | 25.70 | % | | | 73 | % | | $ | 416,863 | |
The accompanying notes are an integral part of these financial statements.
| | | | |
| 42 | | Wells Fargo WealthBuilder Portfolios | | Notes to financial statements (unaudited) |
1. ORGANIZATION
Wells Fargo Funds Trust (the “Trust”), a Delaware statutory trust organized on March 10, 1999, is an open-end management investment company registered under the Investment Company Act of 1940, as amended (the “1940 Act”). As an investment company, the Trust follows the accounting and reporting guidance in Financial Accounting Standards Board (“FASB”) Accounting Standards Codification Topic 946, Financial Services – Investment Companies. These financial statements report on the following portfolios: the Wells Fargo WealthBuilder Conservative Allocation Portfolio (“WealthBuilder Conservative Allocation Portfolio”), the Wells Fargo WealthBuilder Moderate Balanced Portfolio (“WealthBuilder Moderate Balanced Portfolio”), the Wells Fargo WealthBuilder Growth Balanced Portfolio (“WealthBuilder Growth Balanced Portfolio”), the Wells Fargo WealthBuilder Growth Allocation Portfolio (“WealthBuilder Growth Allocation Portfolio” ), the Wells Fargo WealthBuilder Equity Portfolio (“WealthBuilder Equity Portfolio” ), and the Wells Fargo WealthBuilder Tactical Equity Portfolio (“WealthBuilder Tactical Equity Portfolio”) (each, a “Portfolio”, collectively, the “Portfolios”). Each Portfolio is a diversified series of the Trust.
Each Portfolio is a fund-of-funds that invests in various affiliated mutual funds, unaffiliated mutual funds and exchange-traded funds (collectively, the “Underlying Funds”) to pursue its investment objective. The Underlying Funds incur separate expenses in seeking to achieve their investment objectives. Investments in affiliated funds may also include investments in one or more separate diversified portfolios (each, an “affiliated Master Portfolio”, collectively, the “affiliated Master Portfolios”) of Wells Fargo Master Trust, a registered open-end management investment company. Each affiliated Master Portfolio directly acquires portfolio securities, and a Portfolio investing in an affiliated Master Portfolio acquires an indirect interest in those securities. Each Portfolio accounts for its investment in the affiliated Master Portfolios as partnership investments and records on a daily basis its share of the affiliated Master Portfolio’s income, expense, and realized and unrealized gains and losses. The financial statements and financial highlights for the Underlying Funds are presented in separate financial statements and may be obtained by contacting Investor Services for the Wells Fargo Funds or by contacting the servicing agent of the unaffiliated mutual funds.
As of November 30, 2015, the Portfolios own the following percentages of the affiliated Master Portfolios:
| | | | | | | | | | | | | | | | |
| | | Wells Fargo
Core Bond
Portfolio | | | Wells Fargo
Emerging
Growth
Portfolio | | | Wells Fargo
International
Growth
Portfolio | | | Wells Fargo
Small Company
Value Portfolio | |
WealthBuilder Conservative Allocation Portfolio | | | 3 | % | | | 0 | %* | | | 4 | % | | | 2 | % |
WealthBuilder Moderate Balanced Portfolio | | | 4 | % | | | 1 | % | | | 13 | % | | | 6 | % |
WealthBuilder Growth Balanced Portfolio | | | 3 | % | | | 2 | % | | | 23 | % | | | 11 | % |
WealthBuilder Growth Allocation Portfolio | | | 1 | % | | | 1 | % | | | 14 | % | | | 7 | % |
WealthBuilder Equity Portfolio | | | N/A | | | | 0 | %* | | | 6 | % | | | 2 | % |
WealthBuilder Tactical Equity Portfolio | | | N/A | | | | 2 | % | | | 17 | % | | | 8 | % |
| * | The amount owned is less than 1%. |
2. SIGNIFICANT ACCOUNTING POLICIES
The following significant accounting policies, which are consistently followed in the preparation of the financial statements of each Portfolio, are in conformity with U.S. generally accepted accounting principles which require management to make estimates and assumptions that affect the reported amounts of assets and liabilities, disclosure of contingent assets and liabilities at the date of the financial statements, and the reported amounts of revenues and expenses during the reporting period. Actual results could differ from those estimates.
Securities valuation
All investments are valued each business day as of the close of regular trading on the New York Stock Exchange (generally 4 p.m. Eastern Time).
Investments in underlying open-end investment companies are valued at net asset per share as reported by the Underlying Funds as of the close of the regular trading on the New York Stock Exchange on each day the exchange is open for trading. Investments in affiliated Master Portfolios are valued daily based on each Portfolio’s proportionate share of each affiliated Master Portfolio’s net assets, which are also valued daily.
| | | | | | |
| Notes to financial statements (unaudited) | | Wells Fargo WealthBuilder Portfolios | | | 43 | |
Equity securities and futures that are listed on a foreign or domestic exchange or market are valued at the official closing price or, if none, the last sales price. If no sale occurs on the primary exchange or market that day, the prior day’s price will be deemed “stale” and a fair value price will be determined in accordance with the Portfolio’s Valuation Procedures.
Equity securities that are not listed on a foreign or domestic exchange or market, but have a public trading market, are valued at the quoted bid price from an independent broker-dealer that the Management Valuation Team of Wells Fargo Funds Management, LLC (“Funds Management”) has determined is an acceptable source.
Debt securities are valued at the evaluated bid price provided by an independent pricing service or, if a reliable price is not available, the quoted bid price from an independent broker-dealer.
Investments which are not valued using any of the methods discussed above are valued at their fair value, as determined in good faith by the Board of Trustees of the Portfolios. The Board of Trustees has established a Valuation Committee comprised of the Trustees and has delegated to it the authority to take any actions regarding the valuation of portfolio securities that the Valuation Committee deems necessary or appropriate, including determining the fair value of portfolio securities, unless the determination has been delegated to the Management Valuation Team. The Board of Trustees retains the authority to make or ratify any valuation decisions or approve any changes to the Valuation Procedures as it deems appropriate. On a quarterly basis, the Board of Trustees receives reports on any valuation actions taken by the Valuation Committee or the Management Valuation Team which may include items for ratification.
Valuations of fair valued securities are compared to the next actual sales price when available, or other appropriate market values, to assess the continued appropriateness of the fair valuation methodologies used. These securities are fair valued on a day-to-day basis, taking into consideration changes to appropriate market information and any significant changes to the inputs considered in the valuation process until there is a readily available price provided on an exchange or by an independent pricing service. Valuations received from an independent pricing service or independent broker-dealer quotes are periodically validated by comparisons to most recent trades and valuations provided by other independent pricing services in addition to the review of prices by the manager and/or subadviser. Unobservable inputs used in determining fair valuations are identified based on the type of security, taking into consideration factors utilized by market participants in valuing the investment, knowledge about the issuer and the current market environment.
Futures contracts
Each Portfolio is subject to interest rate risk, equity price risk and foreign currency exchange rate risk in the normal course of pursuing its investment objectives. A Portfolio may buy and sell futures contracts in order to effect tactical allocations changes in a Portfolio. The primary risks associated with the use of futures contracts are the imperfect correlation between changes in market values of securities held by the Portfolio and the prices of futures contracts, and the possibility of an illiquid market.
The aggregate principal amounts of the contracts are not recorded in the financial statements. Fluctuations in the value of the contracts are recorded in the Statements of Assets and Liabilities as an asset or liability and in the Statements of Operations as unrealized gains or losses until the contracts are closed, at which point they are recorded as net realized gains or losses on futures contracts. With futures contracts, there is minimal counterparty risk to the Portfolio since futures are exchange traded and the exchange’s clearinghouse, as counterparty to all exchange traded futures, guarantees the futures against default.
Security transactions and income recognition
Securities transactions are recorded on a trade date basis. Realized gains or losses are recorded on the basis of identified cost.
Income dividends and capital gain distributions from Underlying Funds are recorded on the ex-dividend date. Capital gain distributions from Underlying Funds are treated as realized gains.
Interest income for each Portfolio and each affiliated Master Portfolio is accrued daily and bond discounts are accreted and premiums are amortized daily based on the effective interest method. To the extent debt obligations are placed on non-accrual status, any related interest income may be reduced by writing off interest receivables when the collection of all or a portion of interest has become doubtful based on consistently applied procedures. If the issuer subsequently resumes interest payments or when the collectability of interest is reasonably assured, the debt obligation is removed from non-accrual status.
Each Portfolio records on a daily basis its proportionate share of each affiliated Master Portfolio’s interest and dividend income, in addition to expenses and realized and unrealized gains and losses.
| | | | |
| 44 | | Wells Fargo WealthBuilder Portfolios | | Notes to financial statements (unaudited) |
Distributions to shareholders
Distributions to shareholders from net investment income and net realized gains, if any, are recorded on the ex-dividend date. Such distributions are determined in conformity with federal income tax regulations, which may differ in amount or character from net investment income and realized gains recognized for purposes of U.S. generally accepted accounting principles.
Federal and other taxes
Each Portfolio is treated as a separate entity for federal income tax purposes. Each Portfolio intends to continue to qualify as a regulated investment company by distributing substantially all of its investment company taxable income and any net realized capital gains (after reduction for capital loss carryforwards) sufficient to relieve it from all, or substantially all, federal income taxes. Accordingly, no provision for federal income taxes was required.
Each Portfolio’s income and federal excise tax returns and all financial records supporting those returns for the prior three fiscal years are subject to examination by the federal and Delaware revenue authorities. Management has analyzed each Portfolio’s tax positions taken on federal, state, and foreign tax returns for all open tax years and does not believe that there are any uncertain tax positions that require recognition of a tax liability.
At May 31, 2015, capital loss carryforwards available to offset future net realized capital gains were as follows through the indicated expiration date:
| | | | |
| | | 2018 | |
WealthBuilder Equity Portfolio | | $ | 5,980,330 | |
WealthBuilder Tactical Equity Portfolio | | | 46,775,643 | |
At May 31, 2015, late-year ordinary losses, which will be recognized on the first day of the following fiscal year were as follows:
| | | | |
| | | Late-year ordinary loss | |
WealthBuilder Growth Allocation Portfolio | | $ | (311,623 | ) |
WealthBuilder Equity Portfolio | | | (223,510 | ) |
WealthBuilder Tactical Equity Portfolio | | | (1,084,514 | ) |
3. FAIR VALUATION MEASUREMENTS
Fair value measurements of investments are determined within a framework that has established a fair value hierarchy based upon the various data inputs utilized in determining the value of each Portfolio’s investments. The three-level hierarchy gives the highest priority to unadjusted quoted prices in active markets for identical assets or liabilities (Level 1) and the lowest priority to significant unobservable inputs (Level 3). Each Portfolio’s investments are classified within the fair value hierarchy based on the lowest level of input that is significant to the fair value measurement. The inputs are summarized into three broad levels as follows:
| n | | Level 1 – quoted prices in active markets for identical securities |
| n | | Level 2 – other significant observable inputs (including quoted prices for similar securities, interest rates, prepayment speeds, credit risk, use of amortized cost, etc.) |
| n | | Level 3 – significant unobservable inputs (including the Portfolio’s own assumptions in determining the fair value of investments) |
The inputs or methodologies used for valuing investments in securities are not necessarily an indication of the risk associated with investing in those securities.
| | | | | | |
| Notes to financial statements (unaudited) | | Wells Fargo WealthBuilder Portfolios | | | 45 | |
The following is a summary of the inputs used in valuing each Portfolio’s assets and liabilities as of November 30, 2015:
| | | | | | | | | | | | | | | | |
| | | Quoted prices
(Level 1) | | | Other significant
observable inputs
(Level 2) | | | Significant
unobservable inputs
(Level 3) | | | Total | |
WealthBuilder Conservative Allocation Portfolio | | | | | | | | | | | | | | | | |
Assets | | | | | | | | | | | | | | | | |
Investments in: | | | | | | | | | | | | | | | | |
| | | | |
Exchange-traded funds | | $ | 8,777,086 | | | $ | 0 | | | $ | 0 | | | $ | 8,777,086 | |
| | | | |
Investment companies | | | 374,911,545 | | | | 139,457,515 | | | | 0 | | | | 514,369,060 | |
| | | | |
Short-term investments | | | | | | | | | | | | | | | | |
Investment companies | | | 969,913 | | | | 0 | | | | 0 | | | | 969,913 | |
U.S. Treasury securities | | | 253,911 | | | | 0 | | | | 0 | | | | 253,911 | |
| | | | 384,912,455 | | | | 139,457,515 | | | | 0 | | | | 524,369,970 | |
| | | | |
Futures contracts | | | 20,488 | | | | 0 | | | | 0 | | | | 20,488 | |
Total assets | | $ | 384,932,943 | | | $ | 139,457,515 | | | $ | 0 | | | $ | 524,390,458 | |
WealthBuilder Moderate Balanced Portfolio | | | | | | | | | | | | | | | | |
Assets | | | | | | | | | | | | | | | | |
Investments in: | | | | | | | | | | | | | | | | |
| | | | |
Exchange-traded funds | | $ | 12,668,754 | | | $ | 0 | | | $ | 0 | | | $ | 12,668,754 | |
| | | | |
Investment companies | | | 649,505,476 | | | | 194,782,222 | | | | 0 | | | | 844,287,698 | |
| | | | |
Short-term investments | | | | | | | | | | | | | | | | |
Investment companies | | | 427,159 | | | | 0 | | | | 0 | | | | 427,159 | |
U.S. Treasury securities | | | 824,714 | | | | 0 | | | | 0 | | | | 824,714 | |
| | | $ | 663,426,103 | | | | 194,782,222 | | | | 0 | | | $ | 858,208,325 | |
| | | | |
Futures contracts | | | 67,456 | | | | 0 | | | | 0 | | | | 67,456 | |
Total assets | | $ | 663,493,559 | | | $ | 194,782,222 | | | $ | 0 | | | $ | 858,275,781 | |
WealthBuilder Growth Balanced Portfolio | | | | | | | | | | | | | | | | |
Assets | | | | | | | | | | | | | | | | |
Investments in: | | | | | | | | | | | | | | | | |
| | | | |
Exchange-traded funds | | $ | 12,813,638 | | | $ | 0 | | | $ | 0 | | | $ | 12,813,638 | |
| | | | |
Investment companies | | | 792,981,693 | | | | 194,681,663 | | | | 0 | | | | 987,663,356 | |
| | | | |
Short-term investments | | | | | | | | | | | | | | | | |
Investment companies | | | 2,652,130 | | | | 0 | | | | 0 | | | | 2,652,130 | |
U.S. Treasury securities | | | 1,422,514 | | | | 0 | | | | 0 | | | | 1,422,514 | |
| | | | 809,869,975 | | | | 194,681,663 | | | | 0 | | | | 1,004,551,638 | |
| | | | |
Futures contracts | | | 117,150 | | | | 0 | | | | 0 | | | | 117,150 | |
Total assets | | $ | 809,987,125 | | | $ | 194,681,663 | | | $ | 0 | | | $ | 1,004,668,788 | |
WealthBuilder Growth Allocation Portfolio | | | | | | | | | | | | | | | | |
Assets | | | | | | | | | | | | | | | | |
Investments in: | | | | | | | | | | | | | | | | |
| | | | |
Exchange-traded funds | | $ | 4,856,841 | | | $ | 0 | | | $ | 0 | | | $ | 4,856,841 | |
| | | | |
Investment companies | | | 375,416,199 | | | | 70,068,357 | | | | 0 | | | | 445,484,556 | |
| | | | |
Short-term investments | | | | | | | | | | | | | | | | |
Investment companies | | | 939,591 | | | | 0 | | | | 0 | | | | 939,591 | |
U.S. Treasury securities | | | 848,706 | | | | 0 | | | | 0 | | | | 848,706 | |
| | | | 382,061,337 | | | | 70,068,357 | | | | 0 | | | | 452,129,694 | |
| | | | |
Futures contracts | | | 69,419 | | | | 0 | | | | 0 | | | | 69,419 | |
Total assets | | $ | 382,130,756 | | | $ | 70,068,357 | | | $ | 0 | | | $ | 452,199,113 | |
| | | | |
| 46 | | Wells Fargo WealthBuilder Portfolios | | Notes to financial statements (unaudited) |
| | | | | | | | | | | | | | | | |
| | | Quoted prices
(Level 1) | | | Other significant
observable inputs
(Level 2) | | | Significant
unobservable inputs
(Level 3) | | | Total | |
WealthBuilder Equity Portfolio | | | | | | | | | | | | | | | | |
Assets | | | | | | | | | | | | | | | | |
Investments in: | | | | | | | | | | | | | | | | |
| | | | |
Investment companies | | $ | 127,567,198 | | | $ | 15,906,155 | | | $ | 0 | | | $ | 143,473,353 | |
| | | | |
Short-term investments | | | | | | | | | | | | | | | | |
Investment companies | | | 251,110 | | | | 0 | | | | 0 | | | | 251,110 | |
Total assets | | $ | 127,818,308 | | | $ | 15,906,155 | | | $ | 0 | | | $ | 143,724,463 | |
WealthBuilder Tactical Equity Portfolio | | | | | | | | | | | | | | | | |
Assets | | | | | | | | | | | | | | | | |
Investments in: | | | | | | | | | | | | | | | | |
| | | | |
Exchange-traded funds | | $ | 4,429,476 | | | $ | 0 | | | $ | 0 | | | $ | 4,429,476 | |
| | | | |
Investment companies | | | 377,424,033 | | | | 60,102,092 | | | | 0 | | | | 437,526,125 | |
| | | | |
Short-term investments | | | | | | | | | | | | | | | | |
Investment companies | | | 1,924,013 | | | | 0 | | | | 0 | | | | 1,924,013 | |
U.S. Treasury securities | | | 1,031,635 | | | | 0 | | | | 0 | | | | 1,031,635 | |
| | | | 384,809,157 | | | | 60,102,092 | | | | 0 | | | | 444,911,249 | |
| | | | |
Futures contracts | | | 84,894 | | | | 0 | | | | 0 | | | | 84,894 | |
Total assets | | $ | 384,894,051 | | | $ | 60,102,092 | | | $ | 0 | | | $ | 444,996,143 | |
Futures contracts are reported at their variation margin at measurement date, which represents the amount due to the Portfolio at that date. All other assets and liabilities are reported at their market value at measurement date.
The Portfolios recognize transfers between levels within the fair value hierarchy at the end of the reporting period. At November 30, 2015, the Portfolios did not have any transfers into/out of Level 1, Level 2, or Level 3.
4. TRANSACTIONS WITH AFFILIATES
Management fee
Wells Fargo Funds Management, LLC (“Funds Management”), an indirect wholly owned subsidiary of Wells Fargo & Company (“Wells Fargo”), is the manager of each Portfolio and provides advisory and fund-level administrative services under an investment management agreement. Under the investment management agreement, Funds Management is responsible for, among other services, implementing the investment objectives and strategies of each Portfolio, supervising the applicable subadviser, providing fund-level administrative services in connection with each Portfolio’s operations, and providing any other fund-level administrative services reasonably necessary for the operation of each Portfolio. As compensation for its services under the investment management agreement, Funds Management is entitled to receive an annual management fee starting at 0.25% and declining to 0.18% as the average daily net assets of each Portfolio increase.
Prior to July 1, 2015, Funds Management provided advisory services pursuant to an investment advisory agreement and was entitled to receive an annual fee which started at 0.20% and declined to 0.15% as the average daily net assets of each Portfolio increased. In addition, fund-level administrative services were provided by Funds Management under a separate administration agreement at an annual fee which started at 0.05% and declined to 0.03% as the average daily net assets of each Portfolio increased. For financial statement purposes, the advisory fee and fund-level administration fee for the six months ended November 30, 2015 have been included in management fee on the Statements of Operations.
For the six months ended November 30, 2015, the management fee was equivalent to an annual rate of 0.25% of each Portfolio’s average daily net assets.
Funds Management also serves as the manager to each affiliated Underlying Fund and the adviser to each affiliated Master Portfolio.
Funds Management has retained the services of a subadviser to provide daily portfolio management to the Portfolios. The fee for subadvisory services is borne by Funds Management. Wells Capital Management Incorporated, an affiliate of Funds Management and an indirect wholly owned subsidiary of Wells Fargo, is the subadviser to each Portfolio and is paid an annual subadvisory fee of 0.15% of the average daily net assets of each Portfolio.
| | | | | | |
| Notes to financial statements (unaudited) | | Wells Fargo WealthBuilder Portfolios | | | 47 | |
Administration fee
Under a class-level administration agreement, Funds Management provides class-level administrative services to each Portfolio, which includes paying fees and expenses for services provided by the transfer agent, sub-transfer agents, omnibus account servicers and record-keepers. Effective July 1, 2015, as compensation for its services under the class-level administration agreement, Funds Management receives a fee at an annual rate of 0.21% of the average daily net assets of each Portfolio. Prior to July 1, 2015, the class-level administration fee was 0.26% of the average daily net assets of each Portfolio.
For the six months ended November 30, 2015, the administration fee was equivalent to an annual rate of 0.22% of each Portfolio’s average daily net assets.
Funds Management has contractually waived and/or reimbursed management and administration fees to the extent necessary to maintain certain net operating expense ratios for the Portfolios. Funds Management has committed through September 30, 2016 to waive fees and/or reimburse expenses to the extent necessary to cap each Portfolio’s expenses at 1.50%. After this time, the cap may be increased or the commitment to maintain the cap may be terminated only with the approval of the Board of Trustees.
Distribution fee
The Trust has adopted a Distribution Plan for each Portfolio pursuant to Rule 12b-1 under the 1940 Act. A distribution fee is charged and paid to Wells Fargo Funds Distributor, LLC (“Funds Distributor”), the principal underwriter of each Portfolio, at an annual rate of 0.75% of each Portfolio’s average daily net assets.
In addition, Funds Distributor is entitled to receive the front-end sales charge from the purchase of Portfolio shares and a contingent sales charge on the redemption of certain shares. For the six months ended November 30, 2015, Funds Distributor received the following amounts in front-end sales charges:
| | | | |
| | | Front-end
sales charges | |
WealthBuilder Conservative Allocation Portfolio | | $ | 8,663 | |
WealthBuilder Moderate Balanced Portfolio | | | 13,257 | |
WealthBuilder Growth Balanced Portfolio | | | 12,509 | |
WealthBuilder Growth Allocation Portfolio | | | 6,501 | |
WealthBuilder Equity Portfolio | | | 1,149 | |
WealthBuilder Tactical Equity Portfolio | | | 3,908 | |
Shareholder servicing fees
The Trust has entered into contracts with one or more shareholder servicing agents, whereby each Portfolio is charged a fee at an annual rate of 0.25% of its average daily net assets.
A portion of these total shareholder servicing fees were paid to affiliates of Wells Fargo.
5. INVESTMENT PORTFOLIO TRANSACTIONS
Purchases and sales of investments, excluding short-term securities, for the six months ended November 30, 2015 were as follows:
| | | | | | | | | | | | | | | | |
| | | Purchases at cost* | | | Sales proceeds* | |
| | | U.S.
government | | | Non-U.S.
government | | | U.S.
government | | | Non-U.S.
government | |
WealthBuilder Conservative Allocation Portfolio | | $ | 362,197,095 | | | $ | 89,299,227 | | | $ | 360,999,075 | | | $ | 86,094,426 | |
WealthBuilder Moderate Balanced Portfolio | | | 429,090,991 | | | | 133,998,052 | | | | 427,671,709 | | | | 123,537,811 | |
WealthBuilder Growth Balanced Portfolio | | | 330,479,654 | | | | 143,844,209 | | | | 329,386,544 | | | | 105,290,920 | |
WealthBuilder Growth Allocation Portfolio | | | 61,706,852 | | | | 60,815,838 | | | | 61,502,747 | | | | 37,322,767 | |
WealthBuilder Equity Portfolio | | | 0 | | | | 12,095,265 | | | | 0 | | | | 10,653,942 | |
WealthBuilder Tactical Equity Portfolio | | | 0 | | | | 46,181,743 | | | | 0 | | | | 34,389,347 | |
| * | The Portfolios seek to achieve their investment objective by investing some of their investable assets in affiliated Master Portfolios. Purchases and sales related to these investments have been calculated by multiplying each Portfolio’s ownership percentage of the respective affiliated Master Portfolio by the corresponding affiliated Master Portfolio’s purchases and sales. Purchases and sales of the affiliated and unaffiliated Underlying Funds in which the Portfolios invest are actual aggregate purchases and sales of those investments. The results of these amounts are then aggregated. |
| | | | |
| 48 | | Wells Fargo WealthBuilder Portfolios | | Notes to financial statements (unaudited) |
6. INVESTMENTS IN AFFILIATES
An affiliated investment is a company which is under common ownership or control of a Portfolio or which a Portfolio has ownership of at least 5% of the outstanding voting shares. The following is a summary of transactions for the long-term holdings of issuers, excluding affiliated Master Portfolios, that were either affiliates of a Portfolio at the beginning of the period or the end of the period.
| | | | | | | | | | | | | | | | | | | | | | | | |
| | | Shares, beginning
of period | | | Shares
purchases | | | Shares
sold | | | Shares, end of
period | | | Value, end of
period | | | Dividends from
affiliated
underlying funds | |
WealthBuilder Conservative Allocation Portfolio | | | | | | | | | | | | | | | | | | | | | | | | |
Wells Fargo Emerging Markets Equity Fund Class R6 | | | 0 | | | | 148,706 | | | | 10,343 | | | | 138,363 | | | $ | 2,573,550 | | | $ | 0 | |
Wells Fargo Emerging Markets Equity Fund Institutional Class | | | 124,192 | | | | 2,809 | | | | 127,001 | | | | 0 | | | | 0 | | | | 0 | |
Wells Fargo Endeavor Select Fund Institutional Class | | | 383,422 | | | | 16,441 | | | | 30,180 | | | | 369,683 | | | | 5,264,283 | | | | 0 | |
Wells Fargo Government Securities Fund Institutional Class | | | 8,120,190 | | | | 174,944 | | | | 1,250,093 | | | | 7,045,041 | | | | 78,904,457 | | | | 479,912 | |
Wells Fargo Large Cap Growth Fund Class R6 | | | 0 | | | | 112,140 | | | | 7,704 | | | | 104,436 | | | | 5,243,751 | | | | 0 | |
Wells Fargo Large Cap Growth Fund Institutional Class | | | 109,534 | | | | 460 | | | | 109,994 | | | | 0 | | | | 0 | | | | 0 | |
Wells Fargo Short Duration Government Bond Fund Class R6 | | | 0 | | | | 10,040,942 | | | | 440,949 | | | | 9,599,993 | | | | 96,095,926 | | | | 727,548 | |
Wells Fargo Short Duration Government Bond Fund Institutional Class | | | 10,057,069 | | | | 27,125 | | | | 10,084,194 | | | | 0 | | | | 0 | | | | 153,142 | |
Wells Fargo Small Cap Value Fund Class R6 | | | 0 | | | | 155,569 | | | | 10,489 | | | | 145,080 | | | | 3,991,154 | | | | 0 | |
Wells Fargo Small Cap Value Fund Institutional Class | | | 142,460 | | | | 2,624 | | | | 145,084 | �� | | | 0 | | | | 0 | | | | 0 | |
| | | | | | | | | | | | | | | | | | | | | | | $ | 1,360,602 | |
WealthBuilder Moderate Balanced Portfolio | | | | | | | | | | | | | | | | | | | | | | | | |
Wells Fargo Emerging Markets Equity Fund Class R6 | | | 0 | | | | 470,220 | | | | 14,121 | | | | 456,099 | | | $ | 8,483,436 | | | $ | 0 | |
Wells Fargo Emerging Markets Equity Fund Institutional Class | | | 405,178 | | | | 10,572 | | | | 415,750 | | | | 0 | | | | 0 | | | | 0 | |
Wells Fargo Endeavor Select Fund Institutional Class | | | 1,261,792 | | | | 3,421 | | | | 32,055 | | | | 1,233,158 | | | | 17,560,166 | | | | 0 | |
Wells Fargo Government Securities Fund Institutional Class | | | 9,734,764 | | | | 409,952 | | | | 1,390,194 | | | | 8,754,522 | | | | 98,050,647 | | | | 595,582 | |
Wells Fargo Large Cap Growth Fund Class R6 | | | 0 | | | | 359,633 | | | | 11,162 | | | | 348,471 | | | | 17,496,734 | | | | 0 | |
Wells Fargo Large Cap Growth Fund Institutional Class | | | 359,376 | | | | 559 | | | | 359,935 | | | | 0 | | | | 0 | | | | 0 | |
Wells Fargo Short Duration Government Bond Fund Class R6 | | | 0 | | | | 9,685,411 | | | | 623,252 | | | | 9,062,159 | | | | 90,712,211 | | | | 688,837 | |
Wells Fargo Short Duration Government Bond Fund Institutional Class | | | 10,077,017 | | | | 93,318 | | | | 10,170,335 | | | | 0 | | | | 0 | | | | 151,236 | |
Wells Fargo Small Cap Value Fund Class R6 | | | 0 | | | | 495,900 | | | | 11,823 | | | | 484,077 | | | | 13,316,957 | | | | 0 | |
Wells Fargo Small Cap Value Fund Institutional Class | | | 466,718 | | | | 4,350 | | | | 471,068 | | | | 0 | | | | 0 | | | | 0 | |
| | | | | | | | | | | | | | | | | | | | | | | $ | 1,435,655 | |
WealthBuilder Growth Balanced Portfolio | | | | | | | | | | | | | | | | | | | | | | | | |
Wells Fargo Emerging Markets Equity Fund Class R6 | | | 0 | | | | 812,204 | | | | 15,185 | | | | 797,019 | | | $ | 14,824,557 | | | $ | 0 | |
Wells Fargo Emerging Markets Equity Fund Institutional Class | | | 690,996 | | | | 22,616 | | | | 713,612 | | | | 0 | | | | 0 | | | | 0 | |
Wells Fargo Endeavor Select Fund Institutional Class | | | 2,144,141 | | | | 21,815 | | | | 12,754 | | | | 2,153,202 | | | | 30,661,590 | | | | 0 | |
Wells Fargo Government Securities Fund Institutional Class | | | 10,020,967 | | | | 658,932 | | | | 1,736,486 | | | | 8,943,413 | | | | 100,166,229 | | | | 602,059 | |
Wells Fargo Large Cap Growth Fund Class R6 | | | 0 | | | | 616,519 | | | | 6,438 | | | | 610,081 | | | | 30,632,164 | | | | 0 | |
Wells Fargo Large Cap Growth Fund Institutional Class | | | 612,153 | | | | 4,533 | | | | 616,686 | | | | 0 | | | | 0 | | | | 0 | |
Wells Fargo Small Cap Value Fund Class R6 | | | 0 | | | | 858,136 | | | | 10,330 | | | | 847,806 | | | | 23,323,146 | | | | 0 | |
Wells Fargo Small Cap Value Fund Institutional Class | | | 791,335 | | | | 8,732 | | | | 800,067 | | | | 0 | | | | 0 | | | | 0 | |
| | | | | | | | | | | | | | | | | | | | | | | $ | 602,059 | |
| | | | | | |
| Notes to financial statements (unaudited) | | Wells Fargo WealthBuilder Portfolios | | | 49 | |
| | | | | | | | | | | | | | | | | | | | | | | | |
| | | Shares, beginning
of period | | | Shares
purchases | | | Shares
sold | | | Shares, end of
period | | | Value, end of
period | | | Dividends from
affiliated
underlying funds | |
WealthBuilder Growth Allocation Portfolio | | | | | | | | | | | | | | | | | | | | | | | | |
Wells Fargo Emerging Markets Equity Fund Class R6 | | | 0 | | | | 477,810 | | | | 3,915 | | | | 473,895 | | | $ | 8,814,453 | | | $ | 0 | |
Wells Fargo Emerging Markets Equity Fund Institutional Class | | | 411,518 | | | | 7,708 | | | | 419,226 | | | | 0 | | | | 0 | | | | 0 | |
Wells Fargo Endeavor Select Fund Institutional Class | | | 1,269,337 | | | | 11,074 | | | | 6,342 | | | | 1,274,069 | | | | 18,142,737 | | | | 0 | |
Wells Fargo Government Securities Fund Institutional Class | | | 1,743,801 | | | | 292,252 | | | | 513,105 | | | | 1,522,948 | | | | 17,057,021 | | | | 100,858 | |
Wells Fargo Large Cap Growth Fund Class R6 | | | 0 | | | | 364,620 | | | | 2,640 | | | | 361,980 | | | | 18,175,009 | | | | 0 | |
Wells Fargo Large Cap Growth Fund Institutional Class | | | 363,446 | | | | 692 | | | | 364,138 | | | | 0 | | | | 0 | | | | 0 | |
Wells Fargo Small Cap Value Fund Class R6 | | | 0 | | | | 506,993 | | | | 3,661 | | | | 503,332 | | | | 13,846,666 | | | | 0 | |
Wells Fargo Small Cap Value Fund Institutional Class | | | 474,722 | | | | 0 | | | | 474,722 | | | | 0 | | | | 0 | | | | 0 | |
| | | | | | | | | | | | | | | | | | | | | | | $ | 100,858 | |
WealthBuilder Equity Portfolio | | | | | | | | | | | | | | | | | | | | | | | | |
Wells Fargo Emerging Markets Equity Fund Class R6 | | | 0 | | | | 198,795 | | | | 9,708 | | | | 189,087 | | | $ | 3,517,021 | | | $ | 0 | |
Wells Fargo Emerging Markets Equity Fund Institutional Class | | | 172,208 | | | | 2,819 | | | | 175,027 | | | | 0 | | | | 0 | | | | 0 | |
Wells Fargo Endeavor Select Fund Institutional Class | | | 633,517 | | | | 8,857 | | | | 35,874 | | | | 606,500 | | | | 8,636,565 | | | | 0 | |
Wells Fargo Large Cap Growth Fund Class R6 | | | 0 | | | | 182,821 | | | | 11,387 | | | | 171,434 | | | | 8,607,689 | | | | 0 | |
Wells Fargo Large Cap Growth Fund Institutional Class | | | 181,327 | | | | 427 | | | | 181,754 | | | | 0 | | | | 0 | | | | 0 | |
Wells Fargo Small Cap Value Fund Class R6 | | | 0 | | | | 140,581 | | | | 8,526 | | | | 132,055 | | | | 3,632,844 | | | | 0 | |
Wells Fargo Small Cap Value Fund Institutional Class | | | 131,197 | | | | 19 | | | | 131,216 | | | | 0 | | | | 0 | | | | 0 | |
| | | | | | | | | | | | | | | | | | | | | | | $ | 0 | |
WealthBuilder Tactical Equity Portfolio | | | | | | | | | | | | | | | | | | | | | | | | |
Wells Fargo Emerging Markets Equity Fund Class R6 | | | 0 | | | | 601,297 | | | | 19,322 | | | | 581,975 | | | $ | 10,824,738 | | | $ | 0 | |
Wells Fargo Emerging Markets Equity Fund Institutional Class | | | 521,226 | | | | 12,149 | | | | 533,375 | | | | 0 | | | | 0 | | | | 0 | |
Wells Fargo Endeavor Select Fund Institutional Class | | | 1,596,060 | | | | 27,362 | | | | 68,460 | | | | 1,554,962 | | | | 22,142,658 | | | | 0 | |
Wells Fargo Large Cap Growth Fund Class R6 | | | 0 | | | | 459,585 | | | | 19,834 | | | | 439,751 | | | | 22,079,884 | | | | 0 | |
Wells Fargo Large Cap Growth Fund Institutional Class | | | 456,474 | | | | 3,827 | | | | 460,301 | | | | 0 | | | | 0 | | | | 0 | |
Wells Fargo Small Cap Value Fund Class R6 | | | 0 | | | | 637,601 | | | | 27,617 | | | | 609,984 | | | | 16,780,650 | | | | 0 | |
Wells Fargo Small Cap Value Fund Institutional Class | | | 597,307 | | | | 2,617 | | | | 599,924 | | | | 0 | | | | 0 | | | | 0 | |
| | | | | | | | | | | | | | | | | | | | | | | $ | 0 | |
7. DERIVATIVE TRANSACTIONS
During the six months ended November 30, 2015, the Portfolios entered into futures contracts to gain market exposure to certain asset classes consistent with an active asset allocation strategy.
At November 30, 2015, the Portfolios had long and short futures contracts outstanding as follows:
| | | | | | | | | | | | | | | | |
| | | Expiration date | | Counterparty | | Contracts | | Type | | Contract value at
November 30, 2015 | | | Unrealized
gains | |
WealthBuilder Conservative Allocation Portfolio | | 12-14-2015 | | Goldman Sachs | | 24 Short | | Euro FX Futures | | $ | 3,172,800 | | | $ | 183,118 | |
| | | 12-14-2015 | | Goldman Sachs | | 58 Short | | Japanese FX Futures | | | 5,890,263 | | | | 154,849 | |
WealthBuilder Moderate Balanced Portfolio | | 12-14-2015 | | Goldman Sachs | | 79 Short | | Euro FX Futures | | | 10,443,800 | | | | 592,030 | |
| | | 12-14-2015 | | Goldman Sachs | | 191 Short | | Japanese Yen Futures | | | 19,397,244 | | | | 509,870 | |
WealthBuilder Growth Balanced Portfolio | | 12-14-2015 | | Goldman Sachs | | 137 Short | | Euro FX Futures | | | 18,111,400 | | | | 1,023,477 | |
| | | 12-14-2015 | | Goldman Sachs | | 332 Short | | Japanese Yen Futures | | | 33,716,675 | | | | 881,002 | |
WealthBuilder Growth Allocation Portfolio | | 12-14-2015 | | Goldman Sachs | | 81 Short | | Euro FX Futures | | | 10,708,200 | | | | 603,570 | |
| | | 12-14-2015 | | Goldman Sachs | | 197 Short | | Japanese Yen Futures | | | 20,006,581 | | | | 520,404 | |
WealthBuilder Tactical Equity Portfolio | | 12-14-2015 | | Goldman Sachs | | 99 Short | | Euro FX Futures | | | 13,087,800 | | | | 741,392 | |
| | | 12-14-2015 | | Goldman Sachs | | 241 Short | | Japanese Yen Futures | | | 24,475,056 | | | | 639,779 | |
| | | | |
| 50 | | Wells Fargo WealthBuilder Portfolios | | Notes to financial statements (unaudited) |
The Portfolios had average notional amounts in futures contracts outstanding during the six months ended November 30, 2015 as follows:
| | | | | | | | |
| | | Long contracts | | | Short contracts | |
WealthBuilder Conservative Allocation Portfolio | | $ | 2,848,569 | | | $ | 13,872,580 | |
WealthBuilder Moderate Balanced Portfolio | | | 9,213,270 | | | | 45,253,164 | |
WealthBuilder Growth Balanced Portfolio | | | 10,776,229 | | | | 69,866,077 | |
WealthBuilder Growth Allocation Portfolio | | | 4,736,373 | | | | 38,795,240 | |
WealthBuilder Tactical Equity Portfolio | | | 0 | | | | 38,971,920 | |
A summary of derivative instruments by primary risk exposure is outlined in the following tables, unless the only primary risk exposure category is already reflected in the appropriate financial statements.
The fair value of derivative instruments as of November 30, 2015 was as follows for WealthBuilder Conservative Allocation Portfolio:
| | | | | | | | | | | | |
| | | Asset derivatives | | | Liability derivatives | |
| | | Statements of Assets and
Liabilities location | | Fair value | | | Statements of Assets and
Liabilities location | | Fair value | |
Foreign currency exchange contracts | | Receivable for daily variation margin on open futures contracts | | $ | 20,488 | * | | Payable for daily variation margin on open futures contracts | | $ | 0 | |
| | | | | $ | 20,488 | | | | | $ | 0 | |
| * | Only the current day’s variation margin as of November 30, 2015 is reported separately on the Statements of Assets and Liabilities. |
The effect of derivative instruments on the Statements of Operations for the six months ended November 30, 2015 was as follows for WealthBuilder Conservative Allocation Portfolio:
| | | | | | | | |
| | | Amount of realized
gains (losses) on
derivatives | | | Change in unrealized
gains (losses) on derivatives | |
Interest rate contracts | | $ | 315,405 | | | $ | 41,012 | |
Equity contracts | | | (233,670 | ) | | | 56,731 | |
Foreign currency exchange contracts | | | 631,802 | | | | 256,991 | |
| | | $ | 713,537 | | | $ | 354,734 | |
The fair value of derivative instruments as of November 30, 2015 was as follows for WealthBuilder Moderate Balanced Portfolio:
| | | | | | | | | | | | |
| | | Asset derivatives | | | Liability derivatives | |
| | | Statements of Assets and
Liabilities location | | Fair value | | | Statements of Assets and
Liabilities location | | Fair value | |
Foreign currency exchange contracts | | Receivable for daily variation margin on open futures contracts | | $ | 67,456 | * | | Payable for daily variation margin on open futures contracts | | $ | 0 | |
| | | | | $ | 67,456 | | | | | $ | 0 | |
| * | Only the current day’s variation margin as of November 30, 2015 is reported separately on the Statements of Assets and Liabilities. |
| | | | | | |
| Notes to financial statements (unaudited) | | Wells Fargo WealthBuilder Portfolios | | | 51 | |
The effect of derivative instruments on the Statements of Operations for the six months ended November 30, 2015 was as follows for WealthBuilder Moderate Balanced Portfolio:
| | | | | | | | |
| | | Amount of realized
gains (losses) on
derivatives | | | Change in unrealized
gains (losses) on derivatives | |
Interest rate contracts | | $ | 2,470,578 | | | $ | 186,217 | |
Equity contracts | | | 1,004,523 | | | | 133,290 | |
Foreign currency exchange contracts | | | (787,137 | ) | | | 834,660 | |
| | | $ | 2,687,964 | | | $ | 1,154,167 | |
The fair value of derivative instruments as of November 30, 2015 was as follows for WealthBuilder Growth Balanced Portfolio:
| | | | | | | | | | | | |
| | | Asset derivatives | | | Liability derivatives | |
| | | Statements of Assets and
Liabilities location | | Fair value | | | Statements of Assets and
Liabilities location | | Fair value | |
Foreign currency exchange contracts | | Receivable for daily variation margin on open futures contracts | | $ | 117,150 | * | | Payable for daily variation margin on open futures contracts | | $ | 0 | |
| | | | | $ | 117,150 | | | | | $ | 0 | |
| * | Only the current day’s variation margin as of November 30, 2015 is reported separately on the Statements of Assets and Liabilities. |
The effect of derivative instruments on the Statements of Operations for the six months ended November 30, 2015 was as follows for WealthBuilder Growth Balanced Portfolio:
| | | | | | | | |
| | | Amount of realized
gains (losses) on
derivatives | | | Change in unrealized
gains (losses) on
derivatives | |
Interest rate contracts | | $ | 1,165,467 | | | $ | 151,000 | |
Equity contracts | | | 2,314,382 | | | | 217,190 | |
Foreign currency exchange contracts | | | (872,981 | ) | | | 1,410,007 | |
| | | $ | 2,606,868 | | | $ | 1,778,197 | |
The fair value of derivative instruments as of November 30, 2015 was as follows for WealthBuilder Growth Allocation Portfolio:
| | | | | | | | | | | | |
| | | Asset derivatives | | | Liability derivatives | |
| | | Statements of Assets and
Liabilities location | | Fair value | | | Statements of Assets and
Liabilities location | | Fair value | |
Foreign currency exchange contracts | | Receivable for daily variation margin on open futures contracts | | $ | 69,419 | * | | Payable for daily variation margin on open futures contracts | | $ | 0 | |
| | | | | $ | 69,419 | | | | | $ | 0 | |
| * | Only the current day’s variation margin as of November 30, 2015 is reported separately on the Statements of Assets and Liabilities. |
The effect of derivative instruments on the Statements of Operations for the six months ended November 30, 2015 was as follows for WealthBuilder Growth Allocation Portfolio:
| | | | | | | | |
| | | Amount of realized
gains (losses) on
derivatives | | | Change in unrealized
gains (losses) on
derivatives | |
Interest rate contracts | | $ | 516,575 | | | $ | 67,111 | |
Equity contracts | | | 988,165 | | | | 95,352 | |
Foreign currency exchange contracts | | | (347,585 | ) | | | 793,783 | |
| | | $ | 1,157,155 | | | $ | 956,246 | |
| | | | |
| 52 | | Wells Fargo WealthBuilder Portfolios | | Notes to financial statements (unaudited) |
For WealthBuilder Tactical Equity Portfolio, the receivable for daily variation margin on open futures contracts reflected in the Statements of Assets and Liabilities only represents the current day’s variation margin. The realized gains and change in unrealized gains (losses) on futures contracts are reflected in the Statements of Operations.
For certain types of derivative transactions, the Portfolio has entered into International Swaps and Derivatives Association, Inc. master agreements (“ISDA Master Agreements”) or similar agreements with approved counterparties. The ISDA Master Agreements or similar agreements may have requirements to deliver/deposit securities or cash to/with an exchange or broker-dealer as collateral and allows the Portfolio to offset, with each counterparty, certain derivative financial instrument’s assets and/or liabilities with collateral held or pledged. Collateral requirements differ by type of derivative. Collateral or margin requirements are set by the broker or exchange clearing house for exchange traded derivatives while collateral terms are contract specific for over-the-counter traded derivatives. Cash collateral that has been pledged to cover obligations of the Portfolio under ISDA Master Agreements or similar agreements, if any, are reported separately in the Statements of Assets and Liabilities. Securities pledged as collateral, if any, are noted in the Portfolio of Investments. With respect to balance sheet offsetting, absent an event of default by the counterparty or a termination of the agreement, the reported amounts of financial assets and financial liabilities in the Statements of Assets and Liabilities are not offset across transactions between the Portfolio and the applicable counterparty. A reconciliation of the gross amounts on the Statements of Assets and Liabilities to the net amounts by derivative type, including any collateral exposure, is as follows:
| | | | | | | | | | | | | | | | | | | | |
| | | Derivative type | | Counterparty | | Gross amounts
of assets in the
Statements of
Assets and
Liabilities | | | Amounts
subject to
netting
agreements | | | Collateral
received | | | Net amount
of assets | |
WealthBuilder Conservative Allocation Portfolio | | Futures – variation margin | | Goldman Sachs | | $ | 20,488 | | | $ | 0 | | | $ | 0 | | | $ | 20,488 | |
WealthBuilder Moderate Balanced Portfolio | | Futures – variation margin | | Goldman Sachs | | | 67,456 | | | | 0 | | | | 0 | | | | 67,456 | |
WealthBuilder Growth Balanced Portfolio | | Futures – variation margin | | Goldman Sachs | | | 117,150 | | | | 0 | | | | 0 | | | | 117,150 | |
WealthBuilder Growth Allocation Portfolio | | Futures – variation margin | | Goldman Sachs | | | 69,419 | | | | 0 | | | | 0 | | | | 69,419 | |
WealthBuilder Tactical Equity Portfolio | | Futures – variation margin | | Goldman Sachs | | | 84,894 | | | | 0 | | | | 0 | | | | 84,894 | |
8. BANK BORROWINGS
The Trust (excluding the money market funds and certain other funds in the Trust) and Wells Fargo Variable Trust are parties to a $200,000,000 revolving credit agreement whereby the Portfolios are permitted to use bank borrowings for temporary or emergency purposes, such as to fund shareholder redemption requests. Interest under the credit agreement is charged to each Portfolio based on a borrowing rate equal to the higher of the Federal Funds rate in effect on that day plus 1.25% or the overnight LIBOR rate in effect on that day plus 1.25%. In addition, an annual commitment fee equal to 0.20% of the unused balance is allocated to each participating Portfolio. Prior to September 1, 2015, the revolving credit agreement amount was $150,000,000 and the annual commitment fee was equal to 0.10% of the unused balance is allocated to each participating Portfolio. For the six months ended November 30, 2015, the Portfolios paid the following amounts in commitment fees:
| | | | |
| | | Commitment fee | |
WealthBuilder Conservative Allocation Portfolio | | $ | 389 | |
WealthBuilder Moderate Balanced Portfolio | | | 635 | |
WealthBuilder Growth Balanced Portfolio | | | 964 | |
WealthBuilder Growth Allocation Portfolio | | | 426 | |
WealthBuilder Equity Portfolio | | | 140 | |
WealthBuilder Tactical Equity Portfolio | | | 424 | |
| | | | | | |
| Notes to financial statements (unaudited) | | Wells Fargo WealthBuilder Portfolios | | | 53 | |
For the six months ended November 30, 2015, there were no borrowings under the agreement by any Portfolio, except WealthBuilder Moderate Balanced Portfolio. During the six months ended November 30, 2015, the WealthBuilder Moderate Balanced Portfolio had average borrowings outstanding of $13,901 (annualized) at a an average rate of 1.41% and paid interest in the amount of $196.
9. INDEMNIFICATION
Under the Trust’s organizational documents, the officers and Trustees have been granted certain indemnification rights against certain liabilities that may arise out of performance of their duties to the Trust. Additionally, in the normal course of business, the Trust may enter into contracts with service providers that contain a variety of indemnification clauses. The Trust’s maximum exposure under these arrangements is dependent on future claims that may be made against the Portfolios and, therefore, cannot be estimated.
10. SUBSEQUENT DISTRIBUTIONS
On December 9, 2015, the Portfolios declared distributions from short-term capital gains and long-term capital gains to shareholders of record on December 8, 2015. The per share amounts payable on December 10, 2015 were as follows:
| | | | | | | | |
| | | Short-term capital gains | | | Long-term capital gains | |
WealthBuilder Conservative Allocation Portfolio | | $ | 0.04897 | | | $ | 0.23313 | |
WealthBuilder Moderate Balanced Portfolio | | | 0.06693 | | | | 0.39969 | |
WealthBuilder Growth Balanced Portfolio | | | 0.03592 | | | | 0.62887 | |
WealthBuilder Growth Allocation Portfolio | | | 0.00000 | | | | 0.76810 | |
On December 30, 2015, the Portfolios declared distributions from net investment income to shareholders of record on December 29, 2015. The per share amounts payable on December 31, 2015 were as follows:
| | | | |
| | | Net investment income | |
WealthBuilder Conservative Allocation Portfolio | | $ | 0.02966 | |
WealthBuilder Moderate Balanced Portfolio | | | 0.04401 | |
WealthBuilder Growth Balanced Portfolio | | | 0.06333 | |
WealthBuilder Growth Allocation Portfolio | | | 0.04059 | |
On January 25, 2016, WealthBuilder Conservative Allocation Portfolio declared distributions from net investment income in the amount of $0.00884 per share to shareholders of record on January 22, 2016. This amount was paid to shareholders on January 26, 2016.
These distributions are not reflected in the accompanying financial statements. The final determination of the source of all distributions is subject to change and made after the tax year-end of each Portfolio.
| | | | |
| 54 | | Wells Fargo WealthBuilder Portfolios | | Other information (unaudited) |
PROXY VOTING INFORMATION
A description of the policies and procedures used to determine how to vote proxies relating to portfolio securities is available without charge, upon request, by calling 1-800-222-8222, visiting our website at wellsfargofunds.com, or visiting the SEC website at sec.gov. Information regarding how the proxies related to portfolio securities were voted during the most recent 12-month period ended June 30 is available on the website at wellsfargofunds.com or by visiting the SEC website at sec.gov.
PORTFOLIO HOLDINGS INFORMATION
The complete portfolio holdings are publicly available on the website (wellsfargofunds.com) on a one-month delayed basis. In addition, top ten holdings information (excluding derivative positions) is publicly available on the website on a monthly, seven-day or more delayed basis. Each Portfolio files its complete schedule of portfolio holdings with the SEC for the first and third quarters of each fiscal year on Form N-Q, which is available by visiting the SEC website at sec.gov. In addition, each Form N-Q may be reviewed and copied at the SEC’s Public Reference Room in Washington, DC, and at regional offices in New York City, at 233 Broadway, and in Chicago, at 175 West Jackson Boulevard, Suite 900. Information about the Public Reference Room may be obtained by calling 1-800-SEC-0330.
| | | | | | |
| Other information (unaudited) | | Wells Fargo WealthBuilder Portfolios | | | 55 | |
BOARD OF TRUSTEES AND OFFICERS
Each of the Trustees and Officers1 listed in the table below acts in identical capacities for each fund in the Wells Fargo family of funds, which consists of 144 mutual funds comprising the Wells Fargo Funds Trust, Wells Fargo Variable Trust, Wells Fargo Master Trust and four closed-end funds (collectively the “Fund Complex”). This table should be read in conjunction with the Prospectus and the Statement of Additional Information2. The mailing address of each Trustee and Officer is 525 Market Street, 12th Floor, San Francisco, CA 94105. Each Trustee and Officer serves an indefinite term, however, each Trustee serves such term until reaching the mandatory retirement age established by the Trustees.
Independent Trustees
| | | | | | |
Name and
year of birth | | Position held and
length of service* | | Principal occupations during past five years or longer | | Current other
public company or
investment company
directorships |
William R. Ebsworth (Born 1957) | | Trustee, since 2015 | | Retired. From 1984 to 2013, equities analyst, portfolio manager, research director at Fidelity Management and Research Company in Boston, Tokyo, and Hong Kong and retired in 2013 as Chief Investment Officer of Fidelity Strategic Advisers, Inc. where he lead a team of investment professionals managing client assets. Prior thereto, Board member of Hong Kong Securities Clearing Co., Hong Kong Options Clearing Corp., the Thailand International Fund, Ltd., Fidelity Investments Life Insurance Company, and Empire Fidelity Investments Life Insurance Company. Mr. Ebsworth is a CFA ® charterholder and an Adjunct Lecturer, Finance, at Babson College. | | Asset Allocation Trust |
Jane A. Freeman (Born 1953) | | Trustee, since 2015 | | Retired. From 2012 to 2014 and 1999 to 2008, Chief Financial Officer of Scientific Learning Corporation. From 2008 to 2012, Ms. Freeman provided consulting services Loevner Funds; Russell related to strategic business projects. Prior to 1999, Portfolio Manager at Rockefeller Exchange Traded Funds Trust & Co. and Scudder, Stevens & Clark. Board member of the Harding Loevner Funds from 1996 to 2014, serving as both Lead Independent Director and chair of the Audit Committee. Board member of the Russell Exchange Traded Funds Trust from 2011 to 2012 and the chair of the Audit Committee. Ms. Freeman is Chair of Taproot Foundation (non-profit organization), a Board Member of Ruth Bancroft Garden (non-profit organization) and an inactive chartered financial analyst. | | Asset Allocation Trust |
Peter G. Gordon (Born 1942) | | Trustee, since 1998; Chairman, since 2005 | | Co-Founder, Retired Chairman, President and CEO of Crystal Geyser Water Company. Trustee Emeritus, Colby College. | | Asset Allocation Trust |
Isaiah Harris, Jr. (Born 1952) | | Trustee, since 2009 | | Retired. Chairman of the Board of CIGNA Corporation since 2009, and Director since 2005. From 2003 to 2011, Director of Deluxe Corporation. Prior thereto, President and CEO of BellSouth Advertising and Publishing Corp. from 2005 to 2007, President and CEO of BellSouth Enterprises from 2004 to 2005 and President of BellSouth Consumer Services from 2000 to 2003. Emeritus member of the Iowa State University Foundation Board of Governors. Emeritus Member of the Advisory Board of Iowa State University School of Business. Advisory Board Member, Palm Harbor Academy (charter school). Mr. Harris is a certified public accountant. | | CIGNA Corporation; Asset Allocation Trust |
Judith M. Johnson (Born 1949) | | Trustee, since 2008; Audit Committee Chairman, since 2008 | | Retired. Prior thereto, Chief Executive Officer and Chief Investment Officer of Minneapolis Employees Retirement Fund from 1996 to 2008. Ms. Johnson is an attorney, certified public accountant and a certified managerial accountant. | | Asset Allocation Trust |
David F. Larcker (Born 1950) | | Trustee, since 2009 | | James Irvin Miller Professor of Accounting at the Graduate School of Business, Stanford University, Morgan Stanley Director of the Center for Leadership Development and Research and Senior Faculty of The Rock Center for Corporate Governance since 2006. From 2005 to 2008, Professor of Accounting at the Graduate School of Business, Stanford University. Prior thereto, Ernst & Young Professor of Accounting at The Wharton School, University of Pennsylvania from 1985 to 2005. | | Asset Allocation Trust |
| | | | |
| 56 | | Wells Fargo WealthBuilder Portfolios | | Other information (unaudited) |
| | | | | | |
Name and
year of birth | | Position held and
length of service* | | Principal occupations during past five years or longer | | Current other
public company or
investment company
directorships |
Olivia S. Mitchell (Born 1953) | | Trustee, since 2006 | | International Foundation of Employee Benefit Plans Professor, Wharton School of the University of Pennsylvania since 1993. Director of Wharton’s Pension Research Council and Boettner Center on Pensions & Retirement Research, and Research Associate at the National Bureau of Economic Research. Previously, Cornell University Professor from 1978 to 1993. | | Asset Allocation Trust |
Timothy J. Penny (Born 1951) | | Trustee, since 1996 | | President and Chief Executive Officer of Southern Minnesota Initiative Foundation, a non-profit organization, since 2007 and Senior Fellow at the Humphrey Institute Policy Forum at the University of Minnesota since 1995. Member of the Board of Trustees of NorthStar Education Finance, Inc., a non-profit organization, since 2007. | | Asset Allocation Trust |
Michael S. Scofield (Born 1943) | | Trustee, since 2010 | | Served on the Investment Company Institute’s Board of Governors and Executive Committee from 2008-2011 as well the Governing Council of the Independent Directors Council from 2006-2011 and the Independent Directors Council Executive Committee from 2008-2011. Chairman of the IDC from 2008-2010. Institutional Investor (Fund Directions) Trustee of Year in 2007. Trustee of the Evergreen Funds complex (and its predecessors) from 1984 to 2010. Chairman of the Evergreen Funds from 2000-2010. Former Trustee of the Mentor Funds. Retired Attorney, Law Offices of Michael S. Scofield. | | Asset Allocation Trust |
Donald C. Willeke (Born 1940) | | Trustee, since 1996** | | Principal of the law firm of Willeke & Daniels. General Counsel of the Minneapolis Employees Retirement Fund from 1984 until its consolidation into the Minnesota Public Employees Retirement Association on June 30, 2010. Director and Vice Chair of The Tree Trust (non-profit corporation). Director of the American Chestnut Foundation (non-profit corporation). | | Asset Allocation Trust |
| * | Length of service dates reflect the Trustee’s commencement of service with the Trust’s predecessor entities, where applicable. |
| ** | Donald Willeke retired as a Trustee effective December 31, 2015. |
Officers
| | | | | | |
Name and
year of birth | | Position held and
length of service | | Principal occupations during past five years or longer | | |
Karla M. Rabusch (Born 1959) | | President, since 2003 | | Executive Vice President of Wells Fargo Bank, N.A. and President of Wells Fargo Funds Management, LLC since 2003. | | |
| Jeremy DePalma1 (Born 1974) | | Treasurer, since 2012; Assistant Treasurer, since 2009 | | Senior Vice President of Wells Fargo Funds Management, LLC since 2009. Senior Vice President of Evergreen Investment Management Company, LLC from 2008 to 2010 and head of the Fund Reporting and Control Team within Fund Administration from 2005 to 2010. | | |
C. David Messman (Born 1960) | | Secretary, since 2000; Chief Legal Officer, since 2003 | | Senior Vice President and Secretary of Wells Fargo Funds Management, LLC since 2001. Assistant General Counsel of Wells Fargo Bank, N.A. since 2013 and Vice President and Managing Counsel of Wells Fargo Bank N.A. from 1996 to 2013. | | |
Debra Ann Early (Born 1964) | | Chief Compliance Officer, since 2007 | | Executive Vice President of Wells Fargo Funds Management, LLC since 2014, Senior Vice President and Chief Compliance Officer from 2007 to 2014. | | |
David Berardi (Born 1975) | | Assistant Treasurer, since 2009 | | Vice President of Wells Fargo Funds Management, LLC since 2009. Vice President of Evergreen Investment Management Company, LLC from 2008 to 2010. Manager of Fund Reporting and Control for Evergreen Investment Management Company, LLC from 2004 to 2010. | | |
| 1 | Jeremy DePalma acts as Treasurer of 72 funds and Assistant Treasurer of 72 funds in the Fund Complex. |
| 2 | The Statement of Additional Information includes additional information about the Trustees and is available, without charge, upon request, by calling 1-800-222-8222 or by visiting the website at wellsfargofunds.com. |
| | | | | | |
| List of abbreviations | | Wells Fargo WealthBuilder Portfolios | | | 57 | |
The following is a list of common abbreviations for terms and entities that may have appeared in this report.
| ACA | — ACA Financial Guaranty Corporation |
| ADR | — American depositary receipt |
| ADS | — American depositary shares |
| AGC | — Assured Guaranty Corporation |
| AGM | — Assured Guaranty Municipal |
| Ambac | — Ambac Financial Group Incorporated |
| AMT | — Alternative minimum tax |
| BAN | — Bond anticipation notes |
| BHAC | — Berkshire Hathaway Assurance Corporation |
| CAB | — Capital appreciation bond |
| CCAB | — Convertible capital appreciation bond |
| CDA | — Community Development Authority |
| CDO | — Collateralized debt obligation |
| DRIVER | — Derivative inverse tax-exempt receipts |
| DW&P | — Department of Water & Power |
| DWR | — Department of Water Resources |
| ECFA | — Educational & Cultural Facilities Authority |
| EDA | — Economic Development Authority |
| EDFA | — Economic Development Finance Authority |
| ETF | — Exchange-traded fund |
| FDIC | — Federal Deposit Insurance Corporation |
| FFCB | — Federal Farm Credit Banks |
| FGIC | — Financial Guaranty Insurance Corporation |
| FHA | — Federal Housing Administration |
| FHLB | — Federal Home Loan Bank |
| FHLMC | — Federal Home Loan Mortgage Corporation |
| FICO | — The Financing Corporation |
| FNMA | — Federal National Mortgage Association |
| GDR | — Global depositary receipt |
| GNMA | — Government National Mortgage Association |
| HCFR | — Healthcare facilities revenue |
| HEFA | — Health & Educational Facilities Authority |
| HEFAR | — Higher education facilities authority revenue |
| HFA | — Housing Finance Authority |
| HFFA | — Health Facilities Financing Authority |
| HUD | — Department of Housing and Urban Development |
| IDA | — Industrial Development Authority |
| IDAG | — Industrial Development Agency |
| KRW | — Republic of Korea won |
| LIBOR | — London Interbank Offered Rate |
| LIFER | — Long Inverse Floating Exempt Receipts |
| LLC | — Limited liability company |
| LLLP | — Limited liability limited partnership |
| LLP | — Limited liability partnership |
| MBIA | — Municipal Bond Insurance Association |
| MFHR | — Multifamily housing revenue |
| MSTR | — Municipal securities trust receipts |
| MUD | — Municipal Utility District |
| National | — National Public Finance Guarantee Corporation |
| PCFA | — Pollution Control Financing Authority |
| PCL | — Public Company Limited |
| PCR | — Pollution control revenue |
| PFA | — Public Finance Authority |
| PFFA | — Public Facilities Financing Authority |
| PFOTER | — Puttable floating option tax-exempt receipts |
| plc | — Public limited company |
| PUTTER | — Puttable tax-exempt receipts |
| R&D | — Research & development |
| Radian | — Radian Asset Assurance |
| RAN | — Revenue anticipation notes |
| RDA | — Redevelopment Authority |
| RDFA | — Redevelopment Finance Authority |
| REIT | — Real estate investment trust |
| ROC | — Reset option certificates |
| SAVRS | — Select auction variable rate securities |
| SBA | — Small Business Authority |
| SDR | — Swedish depositary receipt |
| SFHR | — Single-family housing revenue |
| SFMR | — Single-family mortgage revenue |
| SPA | — Standby purchase agreement |
| SPDR | — Standard & Poor’s Depositary Receipts |
| SPEAR | — Short Puttable Exempt Adjustable Receipts |
| STRIPS | — Separate trading of registered interest and |
| TAN | — Tax anticipation notes |
| TIPS | — Treasury inflation-protected securities |
| TRAN | — Tax revenue anticipation notes |
| TTFA | — Transportation Trust Fund Authority |
| TVA | — Tennessee Valley Authority |
This page is intentionally left blank.
This page is intentionally left blank.
This page is intentionally left blank.

For more information
More information about Wells Fargo Funds is available free upon request. To obtain literature, please write, email, visit the Fund’s website, or call:
Wells Fargo Funds
P.O. Box 8266
Boston, MA 02266-8266
Email: wfaf@wellsfargo.com
Website: wellsfargofunds.com
Individual investors: 1-800-222-8222
Retail investment professionals: 1-888-877-9275
Institutional investment professionals: 1-866-765-0778
This report and the financial statements contained herein are submitted for the general information of the shareholders of Wells Fargo Funds. If this report is used for promotional purposes, distribution of the report must be accompanied or preceded by a current prospectus. Before investing, please consider the investment objectives, risks, charges, and expenses of the investment. For a current prospectus and, if available, a summary prospectus, containing this information, call 1-800-222-8222 or visit the Fund’s website at wellsfargofunds.com. Read the prospectus carefully before you invest or send money.
Wells Fargo Funds Management, LLC, a wholly owned subsidiary of Wells Fargo & Company, provides investment advisory and administrative services for Wells Fargo Funds. Other affiliates of Wells Fargo & Company provide subadvisory and other services for the Funds. The Funds are distributed by Wells Fargo Funds Distributor, LLC, Member FINRA, an affiliate of Wells Fargo & Company.
NOT FDIC INSURED ¡ NO BANK GUARANTEE ¡ MAY LOSE VALUE
© 2015 Wells Fargo Funds Management, LLC. All rights reserved.
| | |
 | | 239092 01-16 SWBP/SAR102 11-15 |
| | | | | | |
| | | | Semi-Annual Report November 30, 2015 | |  |
| | | | Dynamic Target Date Funds |
| | | | | | |

|
| | | | • Wells Fargo Dynamic Target Today Fund | | |
| | | |
| | | | • Wells Fargo Dynamic Target 2015 Fund | | |
| | | |
| | | | • Wells Fargo Dynamic Target 2020 Fund | | |
| | | |
| | | | • Wells Fargo Dynamic Target 2025 Fund | | |
| | | |
| | | | • Wells Fargo Dynamic Target 2030 Fund | | |
| | | |
| | | | • Wells Fargo Dynamic Target 2035 Fund | | |
| | | |
| | | | • Wells Fargo Dynamic Target 2040 Fund | | |
| | | |
| | | | • Wells Fargo Dynamic Target 2045 Fund | | |
| | | |
| | | | • Wells Fargo Dynamic Target 2050 Fund | | |
| | | |
| | | | • Wells Fargo Dynamic Target 2055 Fund | | |
| | | |
| | | | • Wells Fargo Dynamic Target 2060 Fund | | |
| | | | | | 
|

| | | | |
| Statements of assets and liabilities—November 30, 2015 (unaudited) | | | Wells Fargo Dynamic Target Date Funds | |
| | | | | | | | |
| | | Dynamic Target
Today Fund | | | Dynamic Target
2015 Fund | |
| | |
Assets | | | | | | | | |
Receivable for Fund shares sold | | | $5,000,000 | | | | $5,000,000 | |
Total assets | | | 5,000,000 | | | | 5,000,000 | |
Liabilities | | | | | | | | |
Total liabilities | | | 0 | | | | 0 | |
Total net assets | | $ | 5,000,000 | | | $ | 5,000,000 | |
NET ASSETS CONSIST OF | | | | | | | | |
Paid-in capital | | $ | 5,000,000 | | | $ | 5,000,000 | |
Total net assets | | $ | 5,000,000 | | | $ | 5,000,000 | |
COMPUTATION OF NET ASSET VALUE AND OFFERING PRICE PER SHARE | | | | | | | | |
Net assets - Class A | | $ | 100,000 | | | $ | 100,000 | |
Shares outstanding - Class A | | | 10,000 | | | | 10,000 | |
Net asset value per share - Class A1 | | $ | 10.00 | | | $ | 10.00 | |
Maximum offering price per share - Class A2 | | $ | 10.61 | | | $ | 10.61 | |
Net assets - Class C | | $ | 100,000 | | | $ | 100,000 | |
Shares outstanding - Class C1 | | | 10,000 | | | | 10,000 | |
Net asset value per share - Class C | | $ | 10.00 | | | $ | 10.00 | |
Net assets - Class R | | $ | 100,000 | | | $ | 100,000 | |
Shares outstanding - Class R1 | | | 10,000 | | | | 10,000 | |
Net asset value per share - Class R | | $ | 10.00 | | | $ | 10.00 | |
Net assets - Class R4 | | $ | 100,000 | | | $ | 100,000 | |
Share outstanding - Class R41 | | | 10,000 | | | | 10,000 | |
Net asset value per share - Class R4 | | $ | 10.00 | | | $ | 10.00 | |
Net assets - Class R6 | | $ | 4,600,000 | | | $ | 4,600,000 | |
Shares outstanding - Class R61 | | | 460,000 | | | | 460,000 | |
Net asset value per share - Class R6 | | $ | 10.00 | | | $ | 10.00 | |
| 1 | Each Fund has an unlimited number of authorized shares. |
| 2 | Maximum offering price is computed as 100/94.25 of net asset value. On investments of $50,000 or more, the offering price is reduced. |
The accompanying notes are an integral part of these financial statements.
1
| | |
| Wells Fargo Dynamic Target Date Funds | | Statements of assets and liabilities—November 30, 2015 (unaudited) |
| | | | | | | | | | | | | | | | | | | | | | | | | | |
Dynamic Target
2020 Fund | | | Dynamic Target
2025 Fund | | | Dynamic Target
2030 Fund | | | Dynamic Target
2035 Fund | | | Dynamic Target
2040 Fund | | | Dynamic Target
2045 Fund | | | Dynamic Target
2050 Fund | |
| | | | | | |
| | $5,000,000 | | | | $5,000,000 | | | | $5,000,000 | | | | $5,000,000 | | | | $5,000,000 | | | | $5,000,000 | | | | $5,000,000 | |
| | 5,000,000 | | | | 5,000,000 | | | | 5,000,000 | | | | 5,000,000 | | | | 5,000,000 | | | | 5,000,000 | | | | 5,000,000 | |
| | | | | | | | | | | | | | | | | | | | | | | | | | | |
| | 0 | | | | 0 | | | | 0 | | | | 0 | | | | 0 | | | | 0 | | | | 0 | |
| $ | 5,000,000 | | | $ | 5,000,000 | | | $ | 5,000,000 | | | $ | 5,000,000 | | | $ | 5,000,000 | | | $ | 5,000,000 | | | $ | 5,000,000 | |
| | | | | | |
| $ | 5,000,000 | | | $ | 5,000,000 | | | $ | 5,000,000 | | | $ | 5,000,000 | | | $ | 5,000,000 | | | $ | 5,000,000 | | | $ | 5,000,000 | |
| $ | 5,000,000 | | | $ | 5,000,000 | | | $ | 5,000,000 | | | $ | 5,000,000 | | | $ | 5,000,000 | | | $ | 5,000,000 | | | $ | 5,000,000 | |
| | | | | | |
| $ | 100,000 | | | $ | 100,000 | | | $ | 100,000 | | | $ | 100,000 | | | $ | 100,000 | | | $ | 100,000 | | | $ | 100,000 | |
| | 10,000 | | | | 10,000 | | | | 10,000 | | | | 10,000 | | | | 10,000 | | | | 10,000 | | | | 10,000 | |
| $ | 10.00 | | | $ | 10.00 | | | $ | 10.00 | | | $ | 10.00 | | | $ | 10.00 | | | $ | 10.00 | | | $ | 10.00 | |
| $ | 10.61 | | | $ | 10.61 | | | $ | 10.61 | | | $ | 10.61 | | | $ | 10.61 | | | $ | 10.61 | | | $ | 10.61 | |
| $ | 100,000 | | | $ | 100,000 | | | $ | 100,000 | | | $ | 100,000 | | | $ | 100,000 | | | $ | 100,000 | | | $ | 100,000 | |
| | 10,000 | | | | 10,000 | | | | 10,000 | | | | 10,000 | | | | 10,000 | | | | 10,000 | | | | 10,000 | |
| $ | 10.00 | | | $ | 10.00 | | | $ | 10.00 | | | $ | 10.00 | | | $ | 10.00 | | | $ | 10.00 | | | $ | 10.00 | |
| $ | 4,600,000 | | | $ | 4,600,000 | | | $ | 4,600,000 | | | $ | 4,600,000 | | | $ | 4,600,000 | | | $ | 4,600,000 | | | $ | 4,600,000 | |
| | 460,000 | | | | 460,000 | | | | 460,000 | | | | 460,000 | | | | 460,000 | | | | 460,000 | | | | 460,000 | |
| $ | 10.00 | | | $ | 10.00 | | | $ | 10.00 | | | $ | 10.00 | | | $ | 10.00 | | | $ | 10.00 | | | $ | 10.00 | |
The accompanying notes are an integral part of these financial statements.
2
| | | | |
| Statements of assets and liabilities—November 30, 2015 (unaudited) | | | Wells Fargo Dynamic Target Date Funds | |
| | | | | | | | |
| | | Dynamic Target
2055 Fund | | | Dynamic Target
2060 Fund | |
| | |
Assets | | | | | | | | |
Receivable for Fund shares sold | | | $5,000,000 | | | | $5,000,000 | |
Total assets | | | 5,000,000 | | | | 5,000,000 | |
Liabilities | | | | | | | | |
Total liabilities | | | 0 | | | | 0 | |
Total net assets | | $ | 5,000,000 | | | $ | 5,000,000 | |
NET ASSETS CONSIST OF | | | | | | | | |
Paid-in capital | | $ | 5,000,000 | | | $ | 5,000,000 | |
Total net assets | | $ | 5,000,000 | | | $ | 5,000,000 | |
COMPUTATION OF NET ASSET VALUE AND OFFERING PRICE PER SHARE | | | | | | | | |
Net assets - Class A | | $ | 100,000 | | | $ | 100,000 | |
Shares outstanding - Class A | | | 10,000 | | | | 10,000 | |
Net asset value per share - Class A1 | | $ | 10.00 | | | $ | 10.00 | |
Maximum offering price per share - Class A2 | | $ | 10.61 | | | $ | 10.61 | |
Net assets - Class C | | $ | 100,000 | | | $ | 100,000 | |
Shares outstanding - Class C1 | | | 10,000 | | | | 10,000 | |
Net asset value per share - Class C | | $ | 10.00 | | | $ | 10.00 | |
Net assets - Class R | | $ | 100,000 | | | $ | 100,000 | |
Shares outstanding - Class R1 | | | 10,000 | | | | 10,000 | |
Net asset value per share - Class R | | $ | 10.00 | | | $ | 10.00 | |
Net assets - Class R4 | | $ | 100,000 | | | $ | 100,000 | |
Share outstanding - Class R41 | | | 10,000 | | | | 10,000 | |
Net asset value per share - Class R4 | | $ | 10.00 | | | $ | 10.00 | |
Net assets - Class R6 | | $ | 4,600,000 | | | $ | 4,600,000 | |
Shares outstanding - Class R61 | | | 460,000 | | | | 460,000 | |
Net asset value per share - Class R6 | | $ | 10.00 | | | $ | 10.00 | |
| 1 | Each Fund has an unlimited number of authorized shares. |
| 2 | Maximum offering price is computed as 100/94.25 of net asset value. On investments of $50,000 or more, the offering price is reduced. |
The accompanying notes are an integral part of these financial statements.
3
| | |
| Statements of operations—November 30, 2015 (unaudited) | | Wells Fargo Dynamic Target Date Funds |
| | | | | | | | |
| | | Dynamic Target
Today Fund1 | | | Dynamic Target
2015 Fund1 | |
| | |
Investment income | | | | | | | | |
Total investment income | | | $0 | | | | $0 | |
Expenses | | | | | | | | |
Management fee | | | 0 | | | | 0 | |
Administration fees | | | | | | | | |
Class A | | | 0 | | | | 0 | |
Class C | | | 0 | | | | 0 | |
Class R | | | 0 | | | | 0 | |
Class R4 | | | 0 | | | | 0 | |
Class R6 | | | 0 | | | | 0 | |
Shareholding servicing fees | | | | | | | | |
Class A | | | 0 | | | | 0 | |
Class C | | | 0 | | | | 0 | |
Class R | | | 0 | | | | 0 | |
Class R4 | | | 0 | | | | 0 | |
Distribution fees | | | | | | | | |
Class C | | | 0 | | | | 0 | |
Class R | | | 0 | | | | 0 | |
Total expenses | | | 0 | | | | 0 | |
Less: Fee waivers and/or expense reimbursements | | | 0 | | | | 0 | |
Net expenses | | | 0 | | | | 0 | |
Net investment income | | | 0 | | | | 0 | |
REALIZED AND UNREALIZED GAINS (LOSSES) ON INVESTMENTS | | | | | | | | |
Net realized gains on investments | | | 0 | | | | 0 | |
Net change in unrealized gains (losses) on investments | | | 0 | | | | 0 | |
Net realized and unrealized gains (losses) on investments | | | 0 | | | | 0 | |
Net increase in net assets resulting from operations | | | $0 | | | | $0 | |
| 1 | The Fund commenced operations on November 30, 2015. Information represents activity for the one day of operation. |
The accompanying notes are an integral part of these financial statements.
4
| | |
| Wells Fargo Dynamic Target Date Funds | | Statements of operations—November 30, 2015 (unaudited) |
| | | | | | | | | | | | | | | | | | | | | | | | |
Dynamic Target
2020 Fund1 | | Dynamic Target
2025 Fund1 | | | Dynamic Target
2030 Fund1 | | | Dynamic Target
2035 Fund1 | | | Dynamic Target
2040 Fund1 | | | Dynamic Target
2045 Fund1 | | | Dynamic Target
2050 Fund1 | |
| | | | | | |
| | | | | | | | | | | | | | | | | | | | | | | | | |
$0 | | | $0 | | | | $0 | | | | $0 | | | | $0 | | | | $0 | | | | $0 | |
| | | | | | | | | | | | | | | | | | | | | | | | |
0 | | | 0 | | | | 0 | | | | 0 | | | | 0 | | | | 0 | | | | 0 | |
| | | | | | | | | | | | | | | | | | | | | | | | |
0 | | | 0 | | | | 0 | | | | 0 | | | | 0 | | | | 0 | | | | 0 | |
0 | | | 0 | | | | 0 | | | | 0 | | | | 0 | | | | 0 | | | | 0 | |
0 | | | 0 | | | | 0 | | | | 0 | | | | 0 | | | | 0 | | | | 0 | |
0 | | | 0 | | | | 0 | | | | 0 | | | | 0 | | | | 0 | | | | 0 | |
0 | | | 0 | | | | 0 | | | | 0 | | | | 0 | | | | 0 | | | | 0 | |
| | | | | | | | | | | | | | | | | | | | | | | | |
0 | | | 0 | | | | 0 | | | | 0 | | | | 0 | | | | 0 | | | | 0 | |
0 | | | 0 | | | | 0 | | | | 0 | | | | 0 | | | | 0 | | | | 0 | |
0 | | | 0 | | | | 0 | | | | 0 | | | | 0 | | | | 0 | | | | 0 | |
0 | | | 0 | | | | 0 | | | | 0 | | | | 0 | | | | 0 | | | | 0 | |
0 | | | 0 | | | | 0 | | | | 0 | | | | 0 | | | | 0 | | | | 0 | |
0 | | | 0 | | | | 0 | | | | 0 | | | | 0 | | | | 0 | | | | 0 | |
| | | | | | | | | | | | | | | | | | | | | | | | | |
0 | | | 0 | | | | 0 | | | | 0 | | | | 0 | | | | 0 | | | | 0 | |
0 | | | 0 | | | | 0 | | | | 0 | | | | 0 | | | | 0 | | | | 0 | |
0 | | | 0 | | | | 0 | | | | 0 | | | | 0 | | | | 0 | | | | 0 | |
$0 | | �� | $0 | | | | $0 | | | | $0 | | | | $0 | | | | $0 | | | | $0 | |
The accompanying notes are an integral part of these financial statements.
5
| | |
| Statements of operations—November 30, 2015 (unaudited) | | Wells Fargo Dynamic Target Date Funds |
| | | | | | | | |
| | | Dynamic Target
2055 Fund1 | | | Dynamic Target
2060 Fund1 | |
| | |
Investment income | | | | | | | | |
Total investment income | | | $0 | | | | $0 | |
Expenses | | | | | | | | |
Management fee | | | 0 | | | | 0 | |
Administration fees | | | | | | | | |
Class A | | | 0 | | | | 0 | |
Class C | | | 0 | | | | 0 | |
Class R | | | 0 | | | | 0 | |
Class R4 | | | 0 | | | | 0 | |
Class R6 | | | 0 | | | | 0 | |
Shareholding servicing fees | | | | | | | | |
Class A | | | 0 | | | | 0 | |
Class C | | | 0 | | | | 0 | |
Class R | | | 0 | | | | 0 | |
Class R4 | | | 0 | | | | 0 | |
Distribution fees | | | | | | | | |
Class C | | | 0 | | | | 0 | |
Class R | | | 0 | | | | 0 | |
Total expenses | | | 0 | | | | 0 | |
Less: Fee waivers and/or expense reimbursements | | | 0 | | | | 0 | |
Net expenses | | | 0 | | | | 0 | |
Net investment income | | | 0 | | | | 0 | |
REALIZED AND UNREALIZED GAINS (LOSSES) ON INVESTMENTS | | | | | | | | |
Net realized gains on investments | | | 0 | | | | 0 | |
Net change in unrealized gains (losses) on investments | | | 0 | | | | 0 | |
Net realized and unrealized gains (losses) on investments | | | 0 | | | | 0 | |
Net increase in net assets resulting from operations | | | $0 | | | | $0 | |
| 1 | The Fund commenced operations on November 30, 2015. Information represents activity for the one day of operation. |
The accompanying notes are an integral part of these financial statements.
6
| | |
| Statements of changes in net assets—November 30, 2015 (unaudited) | | Wells Fargo Dynamic Target Date Funds |
| | | | | | | | |
| | | Dynamic Target Today Fund | |
| | | Period ended | |
| | | November 30, 2015 (unaudited)1 | |
Operations | | | | | | | | |
Net investment income | | | | | | $ | 0 | |
Net realized gains on investments | | | | | | | 0 | |
Net change in unrealized gains (losses) on investments | | | | | | | 0 | |
| Net increase in net assets resulting from operations | | | | | | | 0 | |
| | | Shares | | | | |
Capital share transactions | | | | | | | | |
Proceeds from shares sold | | | | | | | | |
Class A | | | 10,000 | | | | 100,000 | |
Class C | | | 10,000 | | | | 100,000 | |
Class R | | | 10,000 | | | | 100,000 | |
Class R4 | | | 10,000 | | | | 100,000 | |
Class R6 | | | 460,000 | | | | 4,600,000 | |
| | | | | | | | 5,000,000 | |
Net increase in net assets resulting from capital share transactions | | | | | | | 5,000,000 | |
Total increase in net assets | | | | | | | 5,000,000 | |
Net assets | | | | | | | | |
Beginning of period | | | | | | | 0 | |
End of period | | | | | | $ | 5,000,000 | |
| 1 | The Fund commenced operations on November 30, 2015. Information represents activity for the one day of operation. |
The accompanying notes are an integral part of these financial statements.
7
| | |
| Wells Fargo Dynamic Target Date Funds | | Statements of changes in net assets—November 30, 2015 (unaudited) |
| | | | | | | | |
| | | Dynamic Target 2015 Fund | |
| | | Period ended | |
| | | November 30, 2015 (unaudited)1 | |
Operations | | | | | | | | |
Net investment income | | | | | | $ | 0 | |
Net realized gains on investments | | | | | | | 0 | |
Net change in unrealized gains (losses) on investments | | | | | | | 0 | |
| Net increase in net assets resulting from operations | | | | | | | 0 | |
| | | Shares | | | | | |
Capital share transactions | | | | | | | | |
Proceeds from shares sold | | | | | | | | |
Class A | | | 10,000 | | | | 100,000 | |
Class C | | | 10,000 | | | | 100,000 | |
Class R | | | 10,000 | | | | 100,000 | |
Class R4 | | | 10,000 | | | | 100,000 | |
Class R6 | | | 460,000 | | | | 4,600,000 | |
| | | | | | | | 5,000,000 | |
Net increase in net assets resulting from capital share transactions | | | | | | | 5,000,000 | |
Total increase in net assets | | | | | | | 5,000,000 | |
Net assets | | | | | | | | |
Beginning of period | | | | | | | 0 | |
End of period | | | | | | $ | 5,000,000 | |
| 1 | The Fund commenced operations on November 30, 2015. Information represents activity for the one day of operation. |
The accompanying notes are an integral part of these financial statements.
8
| | |
| Statements of changes in net assets—November 30, 2015 (unaudited) | | Wells Fargo Dynamic Target Date Funds |
| | | | | | | | |
| | | Dynamic Target 2020 Fund | |
| | | Period ended | |
| | | November 30, 2015 (unaudited)1 | |
Operations | | | | | | | | |
Net investment income | | | | | | $ | 0 | |
Net realized gains on investments | | | | | | | 0 | |
Net change in unrealized gains (losses) on investments | | | | | | | 0 | |
| Net increase in net assets resulting from operations | | | | | | | 0 | |
| | | Shares | | | | |
Capital share transactions | | | | | | | | |
Proceeds from shares sold | | | | | | | | |
Class A | | | 10,000 | | | | 100,000 | |
Class C | | | 10,000 | | | | 100,000 | |
Class R | | | 10,000 | | | | 100,000 | |
Class R4 | | | 10,000 | | | | 100,000 | |
Class R6 | | | 460,000 | | | | 4,600,000 | |
| | | | | | | | 5,000,000 | |
Net increase in net assets resulting from capital share transactions | | | | | | | 5,000,000 | |
Total increase in net assets | | | | | | | 5,000,000 | |
Net assets | | | | | | | | |
Beginning of period | | | | | | | 0 | |
End of period | | | | | | $ | 5,000,000 | |
| 1 | The Fund commenced operations on November 30, 2015. Information represents activity for the one day of operation. |
The accompanying notes are an integral part of these financial statements.
9
| | |
| Wells Fargo Dynamic Target Date Funds | | Statements of changes in net assets—November 30, 2015 (unaudited) |
| | | | | | | | |
| | | Dynamic Target 2025 Fund | |
| | | Period ended | |
| | | November 30, 2015 (unaudited)1 | |
Operations | | | | | | | | |
Net investment income | | | | | | $ | 0 | |
Net realized gains on investments | | | | | | | 0 | |
Net change in unrealized gains (losses) on investments | | | | | | | 0 | |
| Net increase in net assets resulting from operations | | | | | | | 0 | |
| | | Shares | | | | |
Capital share transactions | | | | | | | | |
Proceeds from shares sold | | | | | | | | |
Class A | | | 10,000 | | | | 100,000 | |
Class C | | | 10,000 | | | | 100,000 | |
Class R | | | 10,000 | | | | 100,000 | |
Class R4 | | | 10,000 | | | | 100,000 | |
Class R6 | | | 460,000 | | | | 4,600,000 | |
| | | | | | | | 5,000,000 | |
Net increase in net assets resulting from capital share transactions | | | | | | | 5,000,000 | |
Total increase in net assets | | | | | | | 5,000,000 | |
Net assets | | | | | | | | |
Beginning of period | | | | | | | 0 | |
End of period | | | | | | $ | 5,000,000 | |
| 1 | The Fund commenced operations on November 30, 2015. Information represents activity for the one day of operation. |
The accompanying notes are an integral part of these financial statements.
10
| | |
| Statements of changes in net assets—November 30, 2015 (unaudited) | | Wells Fargo Dynamic Target Date Funds |
| | | | | | | | |
| | | Dynamic Target 2030 Fund | |
| | | Period ended | |
| | | November 30, 2015 (unaudited)1 | |
Operations | | | | | | | | |
Net investment income | | | | | | $ | 0 | |
Net realized gains on investments | | | | | | | 0 | |
Net change in unrealized gains (losses) on investments | | | | | | | 0 | |
| Net increase in net assets resulting from operations | | | | | | | 0 | |
| | | Shares | | | | |
Capital share transactions | | | | | | | | |
Proceeds from shares sold | | | | | | | | |
Class A | | | 10,000 | | | | 100,000 | |
Class C | | | 10,000 | | | | 100,000 | |
Class R | | | 10,000 | | | | 100,000 | |
Class R4 | | | 10,000 | | | | 100,000 | |
Class R6 | | | 460,000 | | | | 4,600,000 | |
| | | | | | | | 5,000,000 | |
Net increase in net assets resulting from capital share transactions | | | | | | | 5,000,000 | |
Total increase in net assets | | | | | | | 5,000,000 | |
Net assets | | | | | | | | |
Beginning of period | | | | | | | 0 | |
End of period | | | | | | $ | 5,000,000 | |
| 1 | The Fund commenced operations on November 30, 2015. Information represents activity for the one day of operation. |
The accompanying notes are an integral part of these financial statements.
11
| | |
| Wells Fargo Dynamic Target Date Funds | | Statements of changes in net assets—November 30, 2015 (unaudited) |
| | | | | | | | |
| | | Dynamic Target 2035 Fund | |
| | | Period ended | |
| | | November 30, 2015 (unaudited)1 | |
Operations | | | | | | | | |
Net investment income | | | | | | $ | 0 | |
Net realized gains on investments | | | | | | | 0 | |
Net change in unrealized gains (losses) on investments | | | | | | | 0 | |
| Net increase in net assets resulting from operations | | | | | | | 0 | |
| | | Shares | | | | |
Capital share transactions | | | | | | | | |
Proceeds from shares sold | | | | | | | | |
Class A | | | 10,000 | | | | 100,000 | |
Class C | | | 10,000 | | | | 100,000 | |
Class R | | | 10,000 | | | | 100,000 | |
Class R4 | | | 10,000 | | | | 100,000 | |
Class R6 | | | 460,000 | | | | 4,600,000 | |
| | | | | | | | 5,000,000 | |
Net increase in net assets resulting from capital share transactions | | | | | | | 5,000,000 | |
Total increase in net assets | | | | | | | 5,000,000 | |
Net assets | | | | | | | | |
Beginning of period | | | | | | | 0 | |
End of period | | | | | | $ | 5,000,000 | |
| 1 | The Fund commenced operations on November 30, 2015. Information represents activity for the one day of operation. |
The accompanying notes are an integral part of these financial statements.
12
| | |
| Statements of changes in net assets—November 30, 2015 (unaudited) | | Wells Fargo Dynamic Target Date Funds |
| | | | | | | | |
| | | Dynamic Target 2040 Fund | |
| | | Period ended | |
| | | November 30, 2015 (unaudited)1 | |
Operations | | | | | | | | |
Net investment income | | | | | | $ | 0 | |
Net realized gains on investments | | | | | | | 0 | |
Net change in unrealized gains (losses) on investments | | | | | | | 0 | |
| Net increase in net assets resulting from operations | | | | | | | 0 | |
| | | Shares | | | | |
Capital share transactions | | | | | | | | |
Proceeds from shares sold | | | | | | | | |
Class A | | | 10,000 | | | | 100,000 | |
Class C | | | 10,000 | | | | 100,000 | |
Class R | | | 10,000 | | | | 100,000 | |
Class R4 | | | 10,000 | | | | 100,000 | |
Class R6 | | | 460,000 | | | | 4,600,000 | |
| | | | | | | | 5,000,000 | |
Net increase in net assets resulting from capital share transactions | | | | | | | 5,000,000 | |
Total increase in net assets | | | | | | | 5,000,000 | |
Net assets | | | | | | | | |
Beginning of period | | | | | | | 0 | |
End of period | | | | | | $ | 5,000,000 | |
| 1 | The Fund commenced operations on November 30, 2015. Information represents activity for the one day of operation. |
The accompanying notes are an integral part of these financial statements.
13
| | |
| Wells Fargo Dynamic Target Date Funds | | Statements of changes in net assets—November 30, 2015 (unaudited) |
| | | | | | | | |
| | | Dynamic Target 2045 Fund | |
| | | Period ended | |
| | | November 30, 2015 (unaudited)1 | |
Operations | | | | | | | | |
Net investment income | | | | | | $ | 0 | |
Net realized gains on investments | | | | | | | 0 | |
Net change in unrealized gains (losses) on investments | | | | | | | 0 | |
| Net increase in net assets resulting from operations | | | | | | | 0 | |
| | | Shares | | | | |
Capital share transactions | | | | | | | | |
Proceeds from shares sold | | | | | | | | |
Class A | | | 10,000 | | | | 100,000 | |
Class C | | | 10,000 | | | | 100,000 | |
Class R | | | 10,000 | | | | 100,000 | |
Class R4 | | | 10,000 | | | | 100,000 | |
Class R6 | | | 460,000 | | | | 4,600,000 | |
| | | | | | | | 5,000,000 | |
Net increase in net assets resulting from capital share transactions | | | | | | | 5,000,000 | |
Total increase in net assets | | | | | | | 5,000,000 | |
Net assets | | | | | | | | |
Beginning of period | | | | | | | 0 | |
End of period | | | | | | $ | 5,000,000 | |
| 1 | The Fund commenced operations on November 30, 2015. Information represents activity for the one day of operation. |
The accompanying notes are an integral part of these financial statements.
14
| | |
| Statements of changes in net assets—November 30, 2015 (unaudited) | | Wells Fargo Dynamic Target Date Funds |
| | | | | | | | |
| | | Dynamic Target 2050 Fund | |
| | | Period ended | |
| | | November 30, 2015 (unaudited)1 | |
Operations | | | | | | | | |
Net investment income | | | | | | $ | 0 | |
Net realized gains on investments | | | | | | | 0 | |
Net change in unrealized gains (losses) on investments | | | | | | | 0 | |
| Net increase in net assets resulting from operations | | | | | | | 0 | |
| | | Shares | | | | |
Capital share transactions | | | | | | | | |
Proceeds from shares sold | | | | | | | | |
Class A | | | 10,000 | | | | 100,000 | |
Class C | | | 10,000 | | | | 100,000 | |
Class R | | | 10,000 | | | | 100,000 | |
Class R4 | | | 10,000 | | | | 100,000 | |
Class R6 | | | 460,000 | | | | 4,600,000 | |
| | | | | | | | 5,000,000 | |
Net increase in net assets resulting from capital share transactions | | | | | | | 5,000,000 | |
Total increase in net assets | | | | | | | 5,000,000 | |
Net assets | | | | | | | | |
Beginning of period | | | | | | | 0 | |
End of period | | | | | | $ | 5,000,000 | |
| 1 | The Fund commenced operations on November 30, 2015. Information represents activity for the one day of operation. |
The accompanying notes are an integral part of these financial statements.
15
| | |
| Wells Fargo Dynamic Target Date Funds | | Statements of changes in net assets—November 30, 2015 (unaudited) |
| | | | | | | | |
| | | Dynamic Target 2055 Fund | |
| | | Period ended | |
| | | November 30, 2015 (unaudited)1 | |
Operations | | | | | | | | |
Net investment income | | | | | | $ | 0 | |
Net realized gains on investments | | | | | | | 0 | |
Net change in unrealized gains (losses) on investments | | | | | | | 0 | |
| Net increase in net assets resulting from operations | | | | | | | 0 | |
| | | Shares | | | | |
Capital share transactions | | | | | | | | |
Proceeds from shares sold | | | | | | | | |
Class A | | | 10,000 | | | | 100,000 | |
Class C | | | 10,000 | | | | 100,000 | |
Class R | | | 10,000 | | | | 100,000 | |
Class R4 | | | 10,000 | | | | 100,000 | |
Class R6 | | | 460,000 | | | | 4,600,000 | |
| | | | | | | | 5,000,000 | |
Net increase in net assets resulting from capital share transactions | | | | | | | 5,000,000 | |
Total increase in net assets | | | | | | | 5,000,000 | |
Net assets | | | | | | | | |
Beginning of period | | | | | | | 0 | |
End of period | | | | | | $ | 5,000,000 | |
| 1 | The Fund commenced operations on November 30, 2015. Information represents activity for the one day of operation. |
The accompanying notes are an integral part of these financial statements.
16
| | |
| Statements of changes in net assets—November 30, 2015 (unaudited) | | Wells Fargo Dynamic Target Date Funds |
| | | | | | | | |
| | | Dynamic Target 2060 Fund | |
| | | Period ended | |
| | | November 30, 2015 (unaudited)1 | |
Operations | | | | | | | | |
Net investment income | | | | | | $ | 0 | |
Net realized gains on investments | | | | | | | 0 | |
Net change in unrealized gains (losses) on investments | | | | | | | 0 | |
| Net increase in net assets resulting from operations | | | | | | | 0 | |
| | | Shares | | | | |
Capital share transactions | | | | | | | | |
Proceeds from shares sold | | | | | | | | |
Class A | | | 10,000 | | | | 100,000 | |
Class C | | | 10,000 | | | | 100,000 | |
Class R | | | 10,000 | | | | 100,000 | |
Class R4 | | | 10,000 | | | | 100,000 | |
Class R6 | | | 460,000 | | | | 4,600,000 | |
| | | | | | | | 5,000,000 | |
Net increase in net assets resulting from capital share transactions | | | | | | | 5,000,000 | |
Total increase in net assets | | | | | | | 5,000,000 | |
Net assets | | | | | | | | |
Beginning of period | | | | | | | 0 | |
End of period | | | | | | $ | 5,000,000 | |
| 1 | The Fund commenced operations on November 30, 2015. Information represents activity for the one day of operation. |
The accompanying notes are an integral part of these financial statements.
17
| | |
| Wells Fargo Dynamic Target Date Funds | | Financial highlights |
| | | | | | | | | | |
| | | Beginning
net asset
value per
share | | Net
investment
income | | Net realized
and unrealized
gains (losses)
on investments | | Ending
net asset
value per
share | | |
Dynamic Target Today Fund | | | | | | | | | | |
Class A Period ended November 30, 20152 (unaudited) | | $10.00 | | 0.00 | | 0.00 | | $10.00 | | |
| | | | | |
Class C Period ended November 30, 20152 (unaudited) | | $10.00 | | 0.00 | | 0.00 | | $10.00 | | |
| | | | | |
Class R Period ended November 30, 20152 (unaudited) | | $10.00 | | 0.00 | | 0.00 | | $10.00 | | |
| | | | | |
Class R4 Period ended November 30, 20152 (unaudited) | | $10.00 | | 0.00 | | 0.00 | | $10.00 | | |
| | | | | |
Class R6 Period ended November 30, 20152 (unaudited) | | $10.00 | | 0.00 | | 0.00 | | $10.00 | | |
| 1 | Total return calculations do not include any sales charges. Returns for periods of less than one year are not annualized. |
| 2 | The class commenced operations on November 30, 2015. Information represents activity for the one day of operation. |
The accompanying notes are an integral part of these financial statements.
18
| | |
| Financial highlights | | Wells Fargo Dynamic Target Date Funds |
| | | | | | | | | | | | |
| | | Ratio to average net assets (annualized) | | | | | | |
| | | Net investment income | | Gross expenses | | Net expenses | | Total return1 | | Portfolio turnover rate | | Net assets at end of period (000s omitted) |
| | | | | | | | | | | | |
| | 0% | | 0% | | 0% | | 0% | | 0% | | $100 |
| | | | | | |
| | 0% | | 0% | | 0% | | 0% | | 0% | | $100 |
| | | | | | |
| | 0% | | 0% | | 0% | | 0% | | 0% | | $100 |
| | | | | | |
| | 0% | | 0% | | 0% | | 0% | | 0% | | $100 |
| | | | | | |
| | 0% | | 0% | | 0% | | 0% | | 0% | | $4,600 |
The accompanying notes are an integral part of these financial statements.
19
| | |
| Wells Fargo Dynamic Target Date Funds | | Financial highlights |
| | | | | | | | | | |
| | | Beginning
net asset
value per
share | | Net
investment
income | | Net realized
and unrealized
gains (losses)
on investments | | Ending
net asset
value per
share | | |
Dynamic Target 2015 Fund | | | | | | | | | | |
Class A Period ended November 30, 20152 (unaudited) | | $10.00 | | 0.00 | | 0.00 | | $10.00 | | |
| | | | | |
Class C Period ended November 30, 20152 (unaudited) | | $10.00 | | 0.00 | | 0.00 | | $10.00 | | |
| | | | | |
Class R Period ended November 30, 20152 (unaudited) | | $10.00 | | 0.00 | | 0.00 | | $10.00 | | |
| | | | | |
Class R4 Period ended November 30, 20152 (unaudited) | | $10.00 | | 0.00 | | 0.00 | | $10.00 | | |
| | | | | |
Class R6 Period ended November 30, 20152 (unaudited) | | $10.00 | | 0.00 | | 0.00 | | $10.00 | | |
| 1 | Total return calculations do not include any sales charges. Returns for periods of less than one year are not annualized. |
| 2 | The class commenced operations on November 30, 2015. Information represents activity for the one day of operation. |
The accompanying notes are an integral part of these financial statements.
20
| | |
| Financial highlights | | Wells Fargo Dynamic Target Date Funds |
| | | | | | | | | | | | |
| | | Ratio to average net assets (annualized) | | | | | | |
| | | Net investment income | | Gross expenses | | Net expenses | | Total return1 | | Portfolio turnover rate | | Net assets at end of period (000s omitted) |
| | | | | | | | | | | | | |
| | 0% | | 0% | | 0% | | 0% | | 0% | | $100 |
| | | | | | |
| | 0% | | 0% | | 0% | | 0% | | 0% | | $100 |
| | | | | | |
| | 0% | | 0% | | 0% | | 0% | | 0% | | $100 |
| | | | | | |
| | 0% | | 0% | | 0% | | 0% | | 0% | | $100 |
| | | | | | |
| | 0% | | 0% | | 0% | | 0% | | 0% | | $4,600 |
The accompanying notes are an integral part of these financial statements.
21
| | |
| Wells Fargo Dynamic Target Date Funds | | Financial highlights |
| | | | | | | | | | |
| | | Beginning
net asset
value per
share | | Net
investment
income | | Net realized
and unrealized
gains (losses)
on investments | | Ending
net asset
value per
share | | |
Dynamic Target 2020 Fund | | | | | | | | | | |
Class A Period ended November 30, 20152 (unaudited) | | $10.00 | | 0.00 | | 0.00 | | $10.00 | | |
| | | | | |
Class C Period ended November 30, 20152 (unaudited) | | $10.00 | | 0.00 | | 0.00 | | $10.00 | | |
| | | | | |
Class R Period ended November 30, 20152 (unaudited) | | $10.00 | | 0.00 | | 0.00 | | $10.00 | | |
| | | | | |
Class R4 Period ended November 30, 20152 (unaudited) | | $10.00 | | 0.00 | | 0.00 | | $10.00 | | |
| | | | | |
Class R6 Period ended November 30, 20152 (unaudited) | | $10.00 | | 0.00 | | 0.00 | | $10.00 | | |
| 1 | Total return calculations do not include any sales charges. Returns for periods of less than one year are not annualized. |
| 2 | The class commenced operations on November 30, 2015. Information represents activity for the one day of operation. |
The accompanying notes are an integral part of these financial statements.
22
| | |
| Financial highlights | | Wells Fargo Dynamic Target Date Funds |
| | | | | | | | | | | | |
| | | Ratio to average net assets (annualized) | | | | | | |
| | | Net investment income | | Gross expenses | | Net expenses | | Total return1 | | Portfolio turnover rate | | Net assets at end of period (000s omitted) |
| | | | | | | | | | | | | |
| | 0% | | 0% | | 0% | | 0% | | 0% | | $100 |
| | | | | | |
| | 0% | | 0% | | 0% | | 0% | | 0% | | $100 |
| | | | | | |
| | 0% | | 0% | | 0% | | 0% | | 0% | | $100 |
| | | | | | |
| | 0% | | 0% | | 0% | | 0% | | 0% | | $100 |
| | | | | | |
| | 0% | | 0% | | 0% | | 0% | | 0% | | $4,600 |
The accompanying notes are an integral part of these financial statements.
23
| | |
| Wells Fargo Dynamic Target Date Funds | | Financial highlights |
| | | | | | | | | | |
| | | Beginning
net asset
value per
share | | Net
investment
income | | Net realized
and unrealized
gains (losses)
on investments | | Ending
net asset
value per
share | | |
Dynamic Target 2025 Fund | | | | | | | | | | |
Class A Period ended November 30, 20152 (unaudited) | | $10.00 | | 0.00 | | 0.00 | | $10.00 | | |
| | | | | |
Class C Period ended November 30, 20152 (unaudited) | | $10.00 | | 0.00 | | 0.00 | | $10.00 | | |
| | | | | |
Class R Period ended November 30, 20152 (unaudited) | | $10.00 | | 0.00 | | 0.00 | | $10.00 | | |
| | | | | |
Class R4 Period ended November 30, 20152 (unaudited) | | $10.00 | | 0.00 | | 0.00 | | $10.00 | | |
| | | | | |
Class R6 Period ended November 30, 20152 (unaudited) | | $10.00 | | 0.00 | | 0.00 | | $10.00 | | |
| 1 | Total return calculations do not include any sales charges. Returns for periods of less than one year are not annualized. |
| 2 | The class commenced operations on November 30, 2015. Information represents activity for the one day of operation. |
The accompanying notes are an integral part of these financial statements.
24
| | |
| Financial highlights | | Wells Fargo Dynamic Target Date Funds |
| | | | | | | | | | | | |
| | | Ratio to average net assets (annualized) | | | | | | |
| | | Net investment income | | Gross expenses | | Net expenses | | Total return1 | | Portfolio turnover rate | | Net assets at end of period (000s omitted) |
| | | | | | | | | | | | | |
| | 0% | | 0% | | 0% | | 0% | | 0% | | $100 |
| | | | | | |
| | 0% | | 0% | | 0% | | 0% | | 0% | | $100 |
| | | | | | |
| | 0% | | 0% | | 0% | | 0% | | 0% | | $100 |
| | | | | | |
| | 0% | | 0% | | 0% | | 0% | | 0% | | $100 |
| | | | | | |
| | 0% | | 0% | | 0% | | 0% | | 0% | | $4,600 |
The accompanying notes are an integral part of these financial statements.
25
| | |
| Wells Fargo Dynamic Target Date Funds | | Financial highlights |
| | | | | | | | | | |
| | | Beginning
net asset
value per
share | | Net
investment
income | | Net realized
and unrealized
gains (losses)
on investments | | Ending
net asset
value per
share | | |
Dynamic Target 2030 Fund | | | | | | | | | | |
Class A Period ended November 30, 20152 (unaudited) | | $10.00 | | 0.00 | | 0.00 | | $10.00 | | |
| | | | | |
Class C Period ended November 30, 20152 (unaudited) | | $10.00 | | 0.00 | | 0.00 | | $10.00 | | |
| | | | | |
Class R Period ended November 30, 20152 (unaudited) | | $10.00 | | 0.00 | | 0.00 | | $10.00 | | |
| | | | | |
Class R4 Period ended November 30, 20152 (unaudited) | | $10.00 | | 0.00 | | 0.00 | | $10.00 | | |
| | | | | |
Class R6 Period ended November 30, 20152 (unaudited) | | $10.00 | | 0.00 | | 0.00 | | $10.00 | | |
| 1 | Total return calculations do not include any sales charges. Returns for periods of less than one year are not annualized. |
| 2 | The class commenced operations on November 30, 2015. Information represents activity for the one day of operation. |
The accompanying notes are an integral part of these financial statements.
26
| | |
| Financial highlights | | Wells Fargo Dynamic Target Date Funds |
| | | | | | | | | | | | |
| | | Ratio to average net assets (annualized) | | | | | | |
| | | Net investment income | | Gross expenses | | Net expenses | | Total return1 | | Portfolio turnover rate | | Net assets at end of period (000s omitted) |
| | | | | | | | | | | | | |
| | 0% | | 0% | | 0% | | 0% | | 0% | | $100 |
| | | | | | |
| | 0% | | 0% | | 0% | | 0% | | 0% | | $100 |
| | | | | | |
| | 0% | | 0% | | 0% | | 0% | | 0% | | $100 |
| | | | | | |
| | 0% | | 0% | | 0% | | 0% | | 0% | | $100 |
| | | | | | |
| | 0% | | 0% | | 0% | | 0% | | 0% | | $4,600 |
The accompanying notes are an integral part of these financial statements.
27
| | |
| Wells Fargo Dynamic Target Date Funds | | Financial highlights |
| | | | | | | | | | |
| | | Beginning
net asset
value per
share | | Net
investment
income | | Net realized
and unrealized
gains (losses)
on investments | | Ending
net asset
value per
share | | |
Dynamic Target 2035 Fund | | | | | | | | | | |
Class A Period ended November 30, 20152 (unaudited) | | $10.00 | | 0.00 | | 0.00 | | $10.00 | | |
| | | | | |
Class C Period ended November 30, 20152 (unaudited) | | $10.00 | | 0.00 | | 0.00 | | $10.00 | | |
| | | | | |
Class R Period ended November 30, 20152 (unaudited) | | $10.00 | | 0.00 | | 0.00 | | $10.00 | | |
| | | | | |
Class R4 Period ended November 30, 20152 (unaudited) | | $10.00 | | 0.00 | | 0.00 | | $10.00 | | |
| | | | | |
Class R6 Period ended November 30, 20152 (unaudited) | | $10.00 | | 0.00 | | 0.00 | | $10.00 | | |
| 1 | Total return calculations do not include any sales charges. Returns for periods of less than one year are not annualized. |
| 2 | The class commenced operations on November 30, 2015. Information represents activity for the one day of operation. |
The accompanying notes are an integral part of these financial statements.
28
| | |
| Financial highlights | | Wells Fargo Dynamic Target Date Funds |
| | | | | | | | | | | | |
| | | Ratio to average net assets (annualized) | | | | | | |
| | | Net investment income | | Gross expenses | | Net expenses | | Total return1 | | Portfolio turnover rate | | Net assets at end of period (000s omitted) |
| | | | | | | | | | | | | |
| | 0% | | 0% | | 0% | | 0% | | 0% | | $100 |
| | | | | | |
| | 0% | | 0% | | 0% | | 0% | | 0% | | $100 |
| | | | | | |
| | 0% | | 0% | | 0% | | 0% | | 0% | | $100 |
| | | | | | |
| | 0% | | 0% | | 0% | | 0% | | 0% | | $100 |
| | | | | | |
| | 0% | | 0% | | 0% | | 0% | | 0% | | $4,600 |
The accompanying notes are an integral part of these financial statements.
29
| | |
| Wells Fargo Dynamic Target Date Funds | | Financial highlights |
| | | | | | | | | | |
| | | Beginning
net asset
value per
share | | Net
investment
income | | Net realized
and unrealized
gains (losses)
on investments | | Ending
net asset
value per
share | | |
Dynamic Target 2040 Fund | | | | | | | | | | |
Class A Period ended November 30, 20152 (unaudited) | | $10.00 | | 0.00 | | 0.00 | | $10.00 | | |
| | | | | |
Class C Period ended November 30, 20152 (unaudited) | | $10.00 | | 0.00 | | 0.00 | | $10.00 | | |
| | | | | |
Class R Period ended November 30, 20152 (unaudited) | | $10.00 | | 0.00 | | 0.00 | | $10.00 | | |
| | | | | |
Class R4 Period ended November 30, 20152 (unaudited) | | $10.00 | | 0.00 | | 0.00 | | $10.00 | | |
| | | | | |
Class R6 Period ended November 30, 20152 (unaudited) | | $10.00 | | 0.00 | | 0.00 | | $10.00 | | |
| 1 | Total return calculations do not include any sales charges. Returns for periods of less than one year are not annualized. |
| 2 | The class commenced operations on November 30, 2015. Information represents activity for the one day of operation. |
The accompanying notes are an integral part of these financial statements.
30
| | |
| Financial highlights | | Wells Fargo Dynamic Target Date Funds |
| | | | | | | | | | | | |
| | | Ratio to average net assets (annualized) | | | | | | |
| | | Net investment income | | Gross expenses | | Net expenses | | Total return1 | | Portfolio turnover rate | | Net assets at end of period (000s omitted) |
| | | | | | | | | | | | | |
| | 0% | | 0% | | 0% | | 0% | | 0% | | $100 |
| | | | | | |
| | 0% | | 0% | | 0% | | 0% | | 0% | | $100 |
| | | | | | |
| | 0% | | 0% | | 0% | | 0% | | 0% | | $100 |
| | | | | | |
| | 0% | | 0% | | 0% | | 0% | | 0% | | $100 |
| | | | | | |
| | 0% | | 0% | | 0% | | 0% | | 0% | | $4,600 |
The accompanying notes are an integral part of these financial statements.
31
| | |
| Wells Fargo Dynamic Target Date Funds | | Financial highlights |
| | | | | | | | | | |
| | | Beginning
net asset
value per
share | | Net
investment
income | | Net realized
and unrealized
gains (losses)
on investments | | Ending
net asset
value per
share | | |
Dynamic Target 2045 Fund | | | | | | | | | | |
Class A Period ended November 30, 20152 (unaudited) | | $10.00 | | 0.00 | | 0.00 | | $10.00 | | |
| | | | | |
Class C Period ended November 30, 20152 (unaudited) | | $10.00 | | 0.00 | | 0.00 | | $10.00 | | |
| | | | | |
Class R Period ended November 30, 20152 (unaudited) | | $10.00 | | 0.00 | | 0.00 | | $10.00 | | |
| | | | | |
Class R4 Period ended November 30, 20152 (unaudited) | | $10.00 | | 0.00 | | 0.00 | | $10.00 | | |
| | | | | |
Class R6 Period ended November 30, 20152 (unaudited) | | $10.00 | | 0.00 | | 0.00 | | $10.00 | | |
| 1 | Total return calculations do not include any sales charges. Returns for periods of less than one year are not annualized. |
| 2 | The class commenced operations on November 30, 2015. Information represents activity for the one day of operation. |
The accompanying notes are an integral part of these financial statements.
32
| | |
| Financial highlights | | Wells Fargo Dynamic Target Date Funds |
| | | | | | | | | | | | |
| | | Ratio to average net assets (annualized) | | | | | | |
| | | Net investment income | | Gross expenses | | Net expenses | | Total return1 | | Portfolio turnover rate | | Net assets at end of period (000s omitted) |
| | | | | | | | | | | | |
| | 0% | | 0% | | 0% | | 0% | | 0% | | $100 |
| | | | | | |
| | 0% | | 0% | | 0% | | 0% | | 0% | | $100 |
| | | | | | |
| | 0% | | 0% | | 0% | | 0% | | 0% | | $100 |
| | | | | | |
| | 0% | | 0% | | 0% | | 0% | | 0% | | $100 |
| | | | | | |
| | 0% | | 0% | | 0% | | 0% | | 0% | | $4,600 |
The accompanying notes are an integral part of these financial statements.
33
| | |
| Wells Fargo Dynamic Target Date Funds | | Financial highlights |
| | | | | | | | | | |
| | | Beginning
net asset
value per
share | | Net
investment
income | | Net realized
and unrealized
gains (losses)
on investments | | Ending
net asset
value per
share | | |
Dynamic Target 2050 Fund | | | | | | | | | | |
Class A Period ended November 30, 20152 (unaudited) | | $10.00 | | 0.00 | | 0.00 | | $10.00 | | |
| | | | | |
Class C Period ended November 30, 20152 (unaudited) | | $10.00 | | 0.00 | | 0.00 | | $10.00 | | |
| | | | | |
Class R Period ended November 30, 20152 (unaudited) | | $10.00 | | 0.00 | | 0.00 | | $10.00 | | |
| | | | | |
Class R4 Period ended November 30, 20152 (unaudited) | | $10.00 | | 0.00 | | 0.00 | | $10.00 | | |
| | | | | |
Class R6 Period ended November 30, 20152 (unaudited) | | $10.00 | | 0.00 | | 0.00 | | $10.00 | | |
| 1 | Total return calculations do not include any sales charges. Returns for periods of less than one year are not annualized. |
| 2 | The class commenced operations on November 30, 2015. Information represents activity for the one day of operation. |
The accompanying notes are an integral part of these financial statements.
34
| | |
| Financial highlights | | Wells Fargo Dynamic Target Date Funds |
| | | | | | | | | | | | |
| | | Ratio to average net assets (annualized) | | | | | | |
| | | Net investment income | | Gross expenses | | Net expenses | | Total return1 | | Portfolio turnover rate | | Net assets at end of period (000s omitted) |
| | | | | | | | | | | | |
| | 0% | | 0% | | 0% | | 0% | | 0% | | $100 |
| | | | | | |
| | 0% | | 0% | | 0% | | 0% | | 0% | | $100 |
| | | | | | |
| | 0% | | 0% | | 0% | | 0% | | 0% | | $100 |
| | | | | | |
| | 0% | | 0% | | 0% | | 0% | | 0% | | $100 |
| | | | | | |
| | 0% | | 0% | | 0% | | 0% | | 0% | | $4,600 |
The accompanying notes are an integral part of these financial statements.
35
| | |
| Wells Fargo Dynamic Target Date Funds | | Financial highlights |
| | | | | | | | | | |
| | | Beginning
net asset
value per
share | | Net
investment
income | | Net realized
and unrealized
gains (losses)
on investments | | Ending
net asset
value per
share | | |
Dynamic Target 2055 Fund | | | | | | | | | | |
Class A Period ended November 30, 20152 (unaudited) | | $10.00 | | 0.00 | | 0.00 | | $10.00 | | |
| | | | | |
Class C Period ended November 30, 20152 (unaudited) | | $10.00 | | 0.00 | | 0.00 | | $10.00 | | |
| | | | | |
Class R Period ended November 30, 20152 (unaudited) | | $10.00 | | 0.00 | | 0.00 | | $10.00 | | |
| | | | | |
Class R4 Period ended November 30, 20152 (unaudited) | | $10.00 | | 0.00 | | 0.00 | | $10.00 | | |
| | | | | |
Class R6 Period ended November 30, 20152 (unaudited) | | $10.00 | | 0.00 | | 0.00 | | $10.00 | | |
| 1 | Total return calculations do not include any sales charges. Returns for periods of less than one year are not annualized. |
| 2 | The class commenced operations on November 30, 2015. Information represents activity for the one day of operation. |
The accompanying notes are an integral part of these financial statements.
36
| | |
| Financial highlights | | Wells Fargo Dynamic Target Date Funds |
| | | | | | | | | | | | |
| | | Ratio to average net assets (annualized) | | | | | | |
| | | Net investment income | | Gross expenses | | Net expenses | | Total return1 | | Portfolio turnover rate | | Net assets at end of period (000s omitted) |
| | | | | | | | | | | | |
| | 0% | | 0% | | 0% | | 0% | | 0% | | $100 |
| | | | | | |
| | 0% | | 0% | | 0% | | 0% | | 0% | | $100 |
| | | | | | |
| | 0% | | 0% | | 0% | | 0% | | 0% | | $100 |
| | | | | | |
| | 0% | | 0% | | 0% | | 0% | | 0% | | $100 |
| | | | | | |
| | 0% | | 0% | | 0% | | 0% | | 0% | | $4,600 |
The accompanying notes are an integral part of these financial statements.
37
| | |
| Wells Fargo Dynamic Target Date Funds | | Financial highlights |
| | | | | | | | | | |
| | | Beginning
net asset
value per
share | | Net
investment
income | | Net realized
and unrealized
gains (losses)
on investments | | Ending
net asset
value per
share | | |
Dynamic Target 2060 Fund | | | | | | | | | | |
Class A Period ended November 30, 20152 (unaudited) | | $10.00 | | 0.00 | | 0.00 | | $10.00 | | |
| | | | | |
Class C Period ended November 30, 20152 (unaudited) | | $10.00 | | 0.00 | | 0.00 | | $10.00 | | |
| | | | | |
Class R Period ended November 30, 20152 (unaudited) | | $10.00 | | 0.00 | | 0.00 | | $10.00 | | |
| | | | | |
Class R4 Period ended November 30, 20152 (unaudited) | | $10.00 | | 0.00 | | 0.00 | | $10.00 | | |
| | | | | |
Class R6 Period ended November 30, 20152 (unaudited) | | $10.00 | | 0.00 | | 0.00 | | $10.00 | | |
| 1 | Total return calculations do not include any sales charges. Returns for periods of less than one year are not annualized. |
| 2 | The class commenced operations on November 30, 2015. Information represents activity for the one day of operation. |
The accompanying notes are an integral part of these financial statements.
38
| | |
| Financial highlights | | Wells Fargo Dynamic Target Date Funds |
| | | | | | | | | | | | |
| | | Ratio to average net assets (annualized) | | | | | | |
| | | Net investment income | | Gross expenses | | Net expenses | | Total return1 | | Portfolio turnover rate | | Net assets at end of period (000s omitted) |
| | | | | | | | | | | | |
| | 0% | | 0% | | 0% | | 0% | | 0% | | $100 |
| | | | | | |
| | 0% | | 0% | | 0% | | 0% | | 0% | | $100 |
| | | | | | |
| | 0% | | 0% | | 0% | | 0% | | 0% | | $100 |
| | | | | | |
| | 0% | | 0% | | 0% | | 0% | | 0% | | $100 |
| | | | | | |
| | 0% | | 0% | | 0% | | 0% | | 0% | | $4,600 |
The accompanying notes are an integral part of these financial statements.
39
| | |
| Wells Fargo Dynamic Target Date Funds | | Notes to financial statements (unaudited) |
1. ORGANIZATION
Wells Fargo Funds Trust (the “Trust”), a Delaware statutory trust organized on March 10, 1999, is an open-end management investment company registered under the Investment Company Act of 1940, as amended (the “1940 Act”). As an investment company, the Trust follows the accounting and reporting guidance in Financial Accounting Standards Board (“FASB”) Accounting Standards Codification Topic 946, Financial Services – Investment Companies. These financial statements report on the following funds: Wells Fargo Dynamic Target Today Fund (“Dynamic Target Today Fund”), Wells Fargo Dynamic Target 2015 Fund (“Dynamic Target 2015 Fund”), Wells Fargo Dynamic Target 2020 Fund (“Dynamic Target 2020 Fund”), Wells Fargo Dynamic Target 2025 Fund (“Dynamic Target 2025 Fund”), Wells Fargo Dynamic Target 2030 Fund (“Dynamic Target 2030 Fund”), Wells Fargo Dynamic Target 2035 Fund (“Dynamic Target 2035 Fund”), Wells Fargo Dynamic Target 2040 Fund (“Dynamic Target 2040 Fund”), Wells Fargo Dynamic Target 2045 Fund (“Dynamic Target 2045 Fund”), Wells Fargo Dynamic Target 2050 Fund (“Dynamic Target 2050 Fund”), Wells Fargo Dynamic Target 2055 Fund (“Dynamic Target 2055 Fund”) and Wells Fargo Dynamic Target 2060 Fund (“Dynamic Target 2060 Fund”) (each, a “Fund”, collectively, the “Funds”). Each Fund is a diversified series of the Trust.
Each Fund is a fund-of-funds that primarily invests in various affiliated mutual funds, unaffiliated mutual funds and exchange-traded funds (collectively, the “Underlying Funds”) to pursue its invesetment objective. The Underlying Funds incur separate expenses in seeking to achieve their investment objectives. The investment in affiliated funds may also include investments in one or more separate diversified portfolios (each, an “affiliated Master Portfolio”, collectively, the “affiliated Master Portfolios”) of Wells Fargo Master Trust, a registered open-end management investment company. Each affiliated Master Portfolio directly acquires portfolio securities, and a Fund investing in an affiliated Master Portfolio acquires an indirect interest in those securities. Each Fund accounts for its investment in an affiliated Master Portfolios as partnership investments and records on a daily basis its share of the affiliated Master Portfolio’s income, expense and realized and unrealized gains and losses. The financial statements and financial highlights for the Underlying Funds are presented in separate financial statements and may be obtained by contacting Investor Services for the Wells Fargo Funds or by contacting the servicing agent of the unaffiliated mutual funds.
2. SIGNIFICANT ACCOUNTING POLICIES
The following significant accounting policies, which are consistently followed in the preparation of the financial statements of each Fund, are in conformity with U.S. generally accepted accounting principles which require management to make estimates and assumptions that affect the reported amounts of assets and liabilities, disclosure of contingent assets and liabilities at the date of the financial statements, and the reported amounts of revenues and expenses during the reporting period. Actual results could differ from those estimates.
Securities valuation
All investments are valued each business day as of the close of regular trading on the New York Stock Exchange (generally 4 p.m. Eastern Time).
Investments in underlying open-end mutual fund are valued at net asset per share as reported by the Underlying Funds as of the close of the regular trading on the New York Stock Exchange on each day the exchange is open for trading. Investments in affiliated Master Portfolios are valued daily based on each Fund’s proportionate share of each affiliated Master Portfolio’s net assets, which are also valued daily.
Equity securities that are listed on a foreign or domestic exchange or market are valued at the official closing price or, if none, the last sales price. If no sale occurs on the primary exchange or market that day, the prior day’s price will be deemed “stale” and a fair value price will be determined in accordance with each Fund’s Valuation Procedures.
Equity securities that are not listed on a foreign or domestic exchange or market, but have a public trading market, are valued at the quoted bid price from an independent broker-dealer that the Management Valuation Team of Wells Fargo Funds Management, LLC (“Funds Management”) has determined is an acceptable source.
Investments in registered open-end investment companies are valued at net asset value.
Investments which are not valued using any of the methods discussed above are valued at their fair value, as determined in good faith by the Board of Trustees of the Funds. The Board of Trustees has established a Valuation Committee comprised of the Trustees and has delegated to it the authority to take any actions regarding the valuation of portfolio securities that the Valuation Committee deems necessary or appropriate, including determining the fair value of portfolio securities, unless the determination has been delegated to the Management Valuation Team. The Board of Trustees retains the authority to make or ratify any valuation decisions or approve any changes to the Valuation Procedures as it deems appropriate. On a quarterly basis, the Board of Trustees receives reports on any valuation actions taken by the Valuation Committee or the Management Valuation Team which may include items for ratification.
Valuations of fair valued securities are compared to the next actual sales price when available, or other appropriate market values, to assess the continued appropriateness of the fair valuation methodologies used. These securities are fair valued on a day-to-day basis, taking into consideration changes to appropriate market information and any significant changes to the inputs considered in the valuation process until there is a readily available price provided on an exchange or by an independent pricing service. Valuations received from an independent pricing service or independent broker-dealer quotes are periodically validated by comparisons to most recent trades and valuations provided by other independent pricing services in addition to the review of prices by the manager and/or subadviser. Unobservable inputs
40
| | |
| Notes to financial statements (unaudited) | | Wells Fargo Dynamic Target Date Funds |
used in determining fair valuations are identified based on the type of security, taking into consideration factors utilized by market participants in valuing the investment, knowledge about the issuer and the current market environment.
Security transactions and income recognition
Securities transactions are recorded on a trade date basis. Realized gains or losses are recorded on the basis of identified cost.
Income dividends and capital gain distributions from Underlying Funds are recorded on the ex-dividend date. Capital gain distributions from Underlying Funds are treated as realized gains.
Each Fund records on a daily basis its proportionate share of each affiliated Master Portfolio’s interest and dividend income, in addition to expenses and realized and unrealized gains and losses.
Distributions to shareholders
Distributions to shareholders from net investment income and net realized gains, if any, are recorded on the ex-dividend date. Such distributions are determined in conformity with federal income tax regulations, which may differ in amount or character from net investment income and realized gains recognized for purposes of U.S. generally accepted accounting principles.
Federal and other taxes
The Fund intends to qualify as a regulated investment company by distributing substantially all of its investment company taxable income and any net realized capital gains (after reduction for capital loss carryforwards) sufficient to relieve it from all, or substantially all, federal income taxes. Accordingly, no provision for federal income taxes was required.
Each Fund’s income and federal excise tax returns and all financial records supporting those returns will be subject to examination by the federal and Delaware revenue authorities.
Class allocations
The separate classes of shares offered by each Fund differ principally in applicable sales charges, distribution, shareholder servicing, and administration fees. Class specific expenses are charged directly to that share class. Investment income, common expenses, and realized and unrealized gains (losses) on investments are allocated daily to each class of shares based on the relative proportion of net assets of each class.
3. TRANSACTIONS WITH AFFILIATES
Management fee
Funds Management, an indirect wholly owned subsidiary of Wells Fargo & Company (“Wells Fargo”), is the manager of each Fund and provides advisory and fund-level administrative services under an investment management agreement. Under the investment management agreement, Funds Management is responsible for, among other services, implementing the investment objectives and strategies of each Fund, supervising the applicable subadviser, providing fund-level administrative services in connection with each Fund’s operations, and providing any other fund-level administrative services reasonably necessary for the operation of each Fund. As compensation for its services under the investment management agreement, Funds Management is entitled to receive an annual management fee starting at 0.20% and declining to 0.18% as the average daily net assets of each Fund increase.
Funds Management also serves as the manager to each affiliated Underlying Fund and the adviser to each affiliated Master Portfolio.
Funds Management has retained the service of a subadviser to provide daily portfolio management to the Funds. The fee for subadvisory services is borne by Funds Management. Wells Capital Management Incorporated, an affiliate of Funds Management and an indirect wholly owned subsidiary of Wells Fargo, is the subadviser to each Fund and is paid an annual subadvisory fee starting at 0.15% and declining to 0.08% each Fund’s average daily net assets.
Administration fees
Under a class-level administration agreement, Funds Management provides class-level administrative services to each Fund, which includes paying fees and expenses for services provided by the transfer agent, sub-transfer agents, omnibus account servicers and record- keepers. As compensation for its services under the class-level administration agreement, Funds Management receives an annual fee which is calculated based on the average daily net assets of each class as follows:
| | |
| | | Class-level
administration fee |
Class A, Class C, Class R | | 0.21% |
| |
Class R4 | | 0.08 |
| |
Class R6 | | 0.03 |
41
| | |
| Wells Fargo Dynamic Target Date Funds | | Notes to financial statements (unaudited) |
Funds Management contractually waives and/or reimburses management and administration fees to the extent necessary to maintain certain net operating expense ratios for the Funds. Waiver of fees and/or reimbursement of expenses by Funds Management are made first from fund level expenses on a proportionate basis and then from class specific expenses. Funds Management has committed through September 30, 2016 to waive fees and/or reimburse expenses to the extent necessary to cap each Fund’s expenses as follows:
| | | | | | | | | | | | |
| | | Class A | | Class C | | Class R | | Class R4 | | Class R6 | | |
Dynamic Target Today Fund | | 0.98% | | 1.73% | | 1.23% | | 0.67% | | 0.52% | | |
| | | | | | |
Dynamic Target 2015 Fund | | 1.00% | | 1.75% | | 1.25% | | 0.69% | | 0.54% | | |
| | | | | | |
Dynamic Target 2020 Fund | | 1.02% | | 1.77% | | 1.27% | | 0.71% | | 0.56% | | |
| | | | | | |
Dynamic Target 2025 Fund | | 1.04% | | 1.79% | | 1.29% | | 0.73% | | 0.58% | | |
| | | | | | |
Dynamic Target 2030 Fund | | 1.06% | | 1.81% | | 1.31% | | 0.75% | | 0.60% | | |
| | | | | | |
Dynamic Target 2035 Fund | | 1.07% | | 1.82% | | 1.32% | | 0.76% | | 0.61% | | |
| | | | | | |
Dynamic Target 2040 Fund | | 1.08% | | 1.83% | | 1.33% | | 0.77% | | 0.62% | | |
| | | | | | |
Dynamic Target 2045 Fund | | 1.08% | | 1.83% | | 1.33% | | 0.77% | | 0.62% | | |
| | | | | | |
Dynamic Target 2050 Fund | | 1.08% | | 1.83% | | 1.33% | | 0.77% | | 0.62% | | |
| | | | | | |
Dynamic Target 2055 Fund | | 1.08% | | 1.83% | | 1.33% | | 0.77% | | 0.62% | | |
| | | | | | |
Dynamic Target 2060 Fund | | 1.08% | | 1.83% | | 1.33% | | 0.77% | | 0.62% | | |
After September 30, 2016, each expense cap may be increased or the commitment to maintain the cap may be terminated only with the approval of the Board of Trustees.
Distribution fees
The Trust has adopted a Distribution Plan for Class C and Class R shares of each Fund pursuant to Rule 12b-1 under the 1940 Act. Distribution fees are charged to the Class C and Class R shares and paid to Wells Fargo Funds Distributor, LLC (“Funds Distributor”), the principal underwriter of each Fund, at an annual rate of 0.75% of the average daily net assets of Class C shares and 0.25% of the average daily net assets of Class R shares.
In addition, Funds Distributor is entitled to receive the front-end sales charge from the purchase of Class A shares and a contingent deferred sales charge on the redemption of certain Class A shares. Funds Distributor is also entitled to receive the contingent deferred sales charges from redemptions of Class C shares.
Shareholder servicing fees
The Trust has entered into contracts with one or more shareholder servicing agents, whereby Class A, Class C, and Class R shares of each Fund is charged a fee at an annual rate of 0.25% of the average daily net assets of each respective class. Class R4 shares are charged a fee at an annual rate of 0.10% of its average daily net assets.
A portion of these total shareholder servicing fees are paid to affiliates of Wells Fargo.
4. INDEMNIFICATION
Under the Trust’s organizational documents, the officers and Trustees have been granted certain indemnification rights against certain liabilities that may arise out of performance of their duties to the Trust. Additionally, in the normal course of business, the Trust may enter into contracts with service providers that contain a variety of indemnification clauses. The Trust’s maximum exposure under these arrangements is dependent on future claims that may be made against the Funds and, therefore, cannot be estimated.
5. SUBSEQUENT DISTRIBUTIONS
On December 30, 2015, the Funds declared distributions from net investment income to shareholders of record on December 29, 2015. The per share amounts payable on December 31, 2015 were as follows:
| | | | | | | | | | | | | | | | | | | | | | | | |
| | | | | Dynamic
Target
Today Fund | | | | | Dynamic
Target 2015
Fund | | | | | Dynamic
Target 2020
Fund | | | | | Dynamic
Target 2025
Fund | |
Net investment income | |
Class A | | | | $ | 0.03407 | | | | | $ | 0.04291 | | | | | $ | 0.04433 | | | | | $ | 0.05194 | |
Class C | | | | | 0.02739 | | | | | | 0.03606 | | | | | | 0.04022 | | | | | | 0.04513 | |
Class R | | | | | 0.03207 | | | | | | 0.04092 | | | | | | 0.04505 | | | | | | 0.05002 | |
Class R4 | | | | | 0.03683 | | | | | | 0.04574 | | | | | | 0.04987 | | | | | | 0.05476 | |
Class R6 | | | | | 0.03825 | | | | | | 0.04723 | | | | | | 0.05134 | | | | | | 0.05625 | |
42
| | |
| Notes to financial statements (unaudited) | | Wells Fargo Dynamic Target Date Funds |
| | | | | | | | | | | | | | | | | | | | | | | | |
| | | | | Dynamic
Target 2030
Fund | | | | | Dynamic
Target 2035
Fund | | | | | Dynamic
Target 2040
Fund | | | | | Dynamic
Target 2045
Fund | |
Net investment income | |
Class A | | | | $ | 0.05476 | | | | | $ | 0.05708 | | | | | $ | 0.05963 | | | | | $ | 0.06027 | |
Class C | | | | | 0.04895 | | | | | | 0.05169 | | | | | | 0.05436 | | | | | | 0.05490 | |
Class R | | | | | 0.05363 | | | | | | 0.05642 | | | | | | 0.05894 | | | | | | 0.05945 | |
Class R4 | | | | | 0.05859 | | | | | | 0.06129 | | | | | | 0.06366 | | | | | | 0.06422 | |
Class R6 | | | | | 0.06003 | | | | | | 0.06273 | | | | | | 0.06506 | | | | | | 0.06560 | |
| | | | | | | | | | | | | | | | | | |
| | | | | Dynamic
Target 2050
Fund | | | | | Dynamic
Target 2055
Fund | | | | | Dynamic
Target 2060
Fund | |
Net investment income | |
Class A | | | | $ | 0.06137 | | | | | $ | 0.06137 | | | | | $ | 0.06148 | |
Class C | | | | | 0.05458 | | | | | | 0.05458 | | | | | | 0.05489 | |
Class R | | | | | 0.05934 | | | | | | 0.05934 | | | | | | 0.05951 | |
Class R4 | | | | | 0.06418 | | | | | | 0.06418 | | | | | | 0.06421 | |
Class R6 | | | | | 0.06563 | | | | | | 0.06563 | | | | | | 0.06562 | |
These distributions are not reflected in the accompanying financial statements. The final determination of the source of all distributions is subject to change and made after the tax year-end of each Fund.
43
| | |
| Wells Fargo Dynamic Target Date Funds | | Other information (unaudited) |
PROXY VOTING INFORMATION
A description of the policies and procedures used to determine how to vote proxies relating to portfolio securities is available without charge, upon request, by calling 1-800-222-8222, visiting our website at wellsfargofunds.com, or visiting the SEC website at sec.gov. Information regarding how the proxies related to portfolio securities were voted during the most recent 12-month period ended June 30 is available on the website at wellsfargofunds.com or by visiting the SEC website at sec.gov.
PORTFOLIO HOLDINGS INFORMATION
The complete portfolio holdings are publicly available on the website (wellsfargofunds.com) on a one-month delayed basis. In addition, top ten holdings information (excluding derivative positions) is publicly available on the website on a monthly, seven-day or more delayed basis. Each Fund files its complete schedule of portfolio holdings with the SEC for the first and third quarters of each fiscal year on Form N-Q, which is available by visiting the SEC website at sec.gov. In addition, each Form N-Q may be reviewed and copied at the SEC’s Public Reference Room in Washington, DC, and at regional offices in New York City, at 233 Broadway, and in Chicago, at 175 West Jackson Boulevard, Suite 900. Information about the Public Reference Room may be obtained by calling 1-800-SEC-0330.
44
| | |
| Other information (unaudited) | | Wells Fargo Dynamic Target Date Funds |
BOARD OF TRUSTEES AND OFFICERS
Each of the Trustees and Officers1 listed in the table below acts in identical capacities for each fund in the Wells Fargo family of funds, which consists of 144 mutual funds comprising the Wells Fargo Funds Trust, Wells Fargo Variable Trust, Wells Fargo Master Trust and four closed-end funds (collectively the “Fund Complex”). This table should be read in conjunction with the Prospectus and the Statement of Additional Information2. The mailing address of each Trustee and Officer is 525 Market Street, 12th Floor, San Francisco, CA 94105. Each Trustee and Officer serves an indefinite term, however, each Trustee serves such term until reaching the mandatory retirement age established by the Trustees.
Independent Trustees
| | | | | | |
Name and year of birth | | Position held and length of service* | | Principal occupations during past five years or longer | | Current other public company or
investment company directorships |
William R. Ebsworth (Born 1957) | | Trustee, since 2015 | | Retired. From 1984 to 2013, equities analyst, portfolio manager, research director at Fidelity Management and Research Company in Boston, Tokyo, and Hong Kong and retired in 2013 as Chief Investment Officer of Fidelity Strategic Advisers, Inc. where he lead a team of investment professionals managing client assets. Prior thereto, Board member of Hong Kong Securities Clearing Co., Hong Kong Options Clearing Corp., the Thailand International Fund, Ltd., Fidelity Investments Life Insurance Company, and Empire Fidelity Investments Life Insurance Company. Mr. Ebsworth is a CFA ® charterholder and an Adjunct Lecturer, Finance, at Babson College. | | Asset Allocation Trust |
| | | |
| | | | | | |
Jane A. Freeman (Born 1953) | | Trustee, since 2015 | | Retired. From 2012 to 2014 and 1999 to 2008, Chief Financial Officer of Scientific Learning Corporation. From 2008 to 2012, Ms. Freeman provided consulting services related to strategic business projects. Prior to 1999, Portfolio Manager at Rockefeller rust & Co. and Scudder, Stevens & Clark. Board member of the Harding Loevner Funds from 1996 to 2014, serving as both Lead Independent Director and chair of the Audit Committee. Board member of the Russell Exchange Traded Funds Trust from 2011 to 2012 and the chair of the Audit Committee. Ms. Freeman is Chair of Taproot Foundation (non-profit organization), a Board Member of Ruth Bancroft Garden (non-profit organization) and an inactive chartered financial analyst. | | Asset Allocation Trust |
| | | |
| | | | | | |
Peter G. Gordon (Born 1942) | | Trustee, since 1998; Chairman, since 2005 | | Co-Founder, Retired Chairman, President and CEO of Crystal Geyser Water Company. Trustee Emeritus, Colby College. | | Asset Allocation Trust |
| | | |
| | | | | | |
Isaiah Harris, Jr. (Born 1952) | | Trustee, since 2009 | | Retired. Chairman of the Board of CIGNA Corporation since 2009, and Director since 2005. From 2003 to 2011, Director of Deluxe Corporation. Prior thereto, President and CEO of BellSouth Advertising and Publishing Corp. from 2005 to 2007, President and CEO of BellSouth Enterprises from 2004 to 2005 and President of BellSouth Consumer Services from 2000 to 2003. Emeritus member of the Iowa State University Foundation Board of Governors. Emeritus Member of the Advisory Board of Iowa State University School of Business. Advisory Board Member, Palm Harbor Academy (charter school). Mr. Harris is a certified public accountant. | | CIGNA Corporation; Asset Allocation Trust |
| | | |
| | | | | | |
Judith M. Johnson (Born 1949) | | Trustee, since 2008; Audit Committee Chairman, since 2008 | | Retired. Prior thereto, Chief Executive Officer and Chief Investment Officer of Minneapolis Employees Retirement Fund from 1996 to 2008. Ms. Johnson is an attorney, certified public accountant and a certified managerial accountant. | | Asset Allocation Trust |
| | | |
| | | | | | |
David F. Larcker (Born 1950) | | Trustee, since 2009 | | James Irvin Miller Professor of Accounting at the Graduate School of Business, Stanford University, Morgan Stanley Director of the Center for Leadership Development and Research and Senior Faculty of The Rock Center for Corporate Governance since 2006. From 2005 to 2008, Professor of Accounting at the Graduate School of Business, Stanford University. Prior thereto, Ernst & Young Professor of Accounting at The Wharton School, University of Pennsylvania from 1985 to 2005. | | Asset Allocation Trust |
| | | |
| | | | | | |
Olivia S. Mitchell (Born 1953) | | Trustee, since 2006 | | International Foundation of Employee Benefit Plans Professor, Wharton School of the University of Pennsylvania since 1993. Director of Wharton’s Pension Research Council and Boettner Center on Pensions & Retirement Research, and Research Associate at the National Bureau of Economic Research. Previously, Cornell University Professor from 1978 to 1993. | | Asset Allocation Trust |
| | | |
| | | | | | |
Timothy J. Penny (Born 1951) | | Trustee, since 1996 | | President and Chief Executive Officer of Southern Minnesota Initiative Foundation, a non-profit organization, since 2007 and Senior Fellow at the Humphrey Institute Policy Forum at the University of Minnesota since 1995. Member of the Board of Trustees of NorthStar Education Finance, Inc., a non-profit organization, since 2007. | | Asset Allocation Trust |
45
| | |
| Wells Fargo Dynamic Target Date Funds | | Other information (unaudited) |
| | | | | | |
Michael S. Scofield (Born 1943) | | Trustee, since 2010 | | Served on the Investment Company Institute’s Board of Governors and Executive Committee from 2008-2011 as well the Governing Council of the Independent Directors Council from 2006-2011 and the Independent Directors Council Executive Committee from 2008-2011. Chairman of the IDC from 2008-2010. Institutional Investor (Fund Directions) Trustee of Year in 2007. Trustee of the Evergreen Funds complex (and its predecessors) from 1984 to 2010. Chairman of the Evergreen Funds from 2000-2010. Former Trustee of the Mentor Funds. Retired Attorney, Law Offices of Michael S. Scofield. | | Asset Allocation Trust |
| | | |
| | | | | | |
Donald C. Willeke (Born 1940) | | Trustee, since 1996** | | Principal of the law firm of Willeke & Daniels. General Counsel of the Minneapolis Employees Retirement Fund from 1984 until its consolidation into the Minnesota Public Employees Retirement Association on June 30, 2010. Director and Vice Chair of The Tree Trust (non-profit corporation). Director of the American Chestnut Foundation (non-profit corporation). | | Asset Allocation Trust |
* Length of service dates reflect the Trustee’s commencement of service with the Trust’s predecessor entities, where applicable.
** Donald Willeke retired as a Trustee effective December 31, 2015.
Officers
| | | | | | |
Name and year of birth | | Position held and length of service | | Principal occupations during past five years or longer |
Karla M. Rabusch (Born 1959) | | President, since 2003 | | Executive Vice President of Wells Fargo Bank, N.A. and President of Wells Fargo Funds Management, LLC since 2003. | | |
| | | |
| | | | | | |
Jeremy DePalma1 (Born 1974) | | Treasurer, since 2012; Assistant Treasurer, since 2009 | | Senior Vice President of Wells Fargo Funds Management, LLC since 2009. Senior Vice President of Evergreen Investment Management Company, LLC from 2008 to 2010 and head of the Fund Reporting and Control Team within Fund Administration from 2005 to 2010. | | |
| | | |
| | | | | | |
C. David Messman (Born 1960) | | Secretary, since 2000; Chief Legal Officer, since 2003 | | Senior Vice President and Secretary of Wells Fargo Funds Management, LLC since 2001. Assistant General Counsel of Wells Fargo Bank, N.A. since 2013 and Vice President and Managing Counsel of Wells Fargo Bank N.A. from 1996 to 2013. | | |
| | | |
| | | | | | |
Debra Ann Early (Born 1964) | | Chief Compliance Officer, since 2007 | | Executive Vice President of Wells Fargo Funds Management, LLC since 2014, Senior Vice President and Chief Compliance Officer from 2007 to 2014. | | |
| | | |
| | | | | | |
David Berardi (Born 1975) | | Assistant Treasurer, since 2009 | | Vice President of Wells Fargo Funds Management, LLC since 2009. Vice President of Evergreen Investment Management Company, LLC from 2008 to 2010. Manager of Fund Reporting and Control for Evergreen Investment Management Company, LLC from 2004 to 2010. | | |
1 Jeremy DePalma acts as Treasurer of 72 funds and Assistant Treasurer of 72 funds in the Fund Complex.
2 The Statement of Additional Information includes additional information about the Trustees and is available, without charge, upon request, by calling 1-800-222-8222 or by visiting the website at wellsfargofunds.com.
46
_
| | | | |
 | | | | |
For more information More information about Wells Fargo Funds is available free upon request. To obtain literature, please write, email, visit the Fund’s website, or call: Wells Fargo Funds P.O. Box 8266 Boston, MA 02266-8266 Email: wfaf@wellsfargo.com Website: wellsfargofunds.com Individual investors: 1-800-222-8222 Retail investment professionals: 1-888-877-9275 Institutional investment professionals: 1-866-765-0778 | | This report and the financial statements contained herein are submitted for the general information of the shareholders of Wells Fargo Funds. If this report is used for promotional purposes, distribution of the report must be accompanied or preceded by acurrent prospectus. Before investing, please consider the investment objectives, risks, charges, and expenses of the investment. For a current prospectus and, if available, a summary prospectus, containing this information, call 1-800-222-8222 or visit the Fund’s website at wellsfargofunds.com. Read the prospectus carefully before you invest or send money. Wells Fargo Funds Management, LLC, a wholly owned subsidiary of Wells Fargo & Company, provides investment advisory and administrative services for Wells Fargo Funds. Other affiliates of Wells Fargo & Company provide subadvisory and other services for the Funds. The Funds are distributed by Wells Fargo Funds Distributor, LLC, Member FINRA, an affiliate of Wells Fargo & Company. |
| | NOT FDIC INSURED ¡ NO BANK GUARANTEE ¡ MAY LOSE VALUE | | |
| | © 2015 Wells Fargo Funds Management, LLC. All rights reserved. 
Printed on Recycled paper | | |
Not applicable.
| ITEM 3. | AUDIT COMMITTEE FINANCIAL EXPERT |
Not applicable.
| ITEM 4. | PRINCIPAL ACCOUNTANT FEES AND SERVICES |
Not applicable.
| ITEM 5. | AUDIT COMMITTEE OF LISTED REGISTRANTS |
Not applicable.
A Portfolio of Investments for each series of Wells Fargo Funds Trust is included as part of the report to shareholders filed under Item 1 of this Form.
The following funds did not have any holdings as of November 30, 2015:
Wells Fargo Dynamic Target Today, Wells Fargo Dynamic Target 2015, Wells Fargo Dynamic Target 2020, Wells Fargo Dynamic 2025, Wells Fargo Dynamic 2030, Wells Fargo Dynamic 2035, Wells Fargo Dynamic 2040, Wells Fargo Dynamic 2045, Wells Fargo Dynamic 2050, Wells Fargo Dynamic 2055, and Wells Fargo Dynamic 2060.
| ITEM 7. | DISCLOSURE OF PROXY VOTING POLICIES AND PROCEDURES FOR CLOSED-END MANAGEMENT INVESTMENT COMPANIES |
Not applicable.
| ITEM 8. | PORTFOLIO MANAGERS OF CLOSED-END MANAGEMENT INVESTMENT COMPANIES |
Not applicable.
| ITEM 9. | PURCHASES OF EQUITY SECURITIES BY CLOSED-END MANAGEMENT INVESTMENT COMPANY AND AFFILIATED PURCHASERS |
Not applicable.
| ITEM 10. | SUBMISSION OF MATTERS TO A VOTE OF SECURITY HOLDERS |
There have been no material changes to the procedures by which shareholders may recommend nominees to the registrant’s Board of Trustees that have been implemented since the registrant’s last provided disclosure in response to the requirements of this Item.
| ITEM 11. | CONTROLS AND PROCEDURES |
(a) The President and Treasurer have concluded that the Wells Fargo Funds Trust (the “Trust”) disclosure controls and procedures (as defined in Rule 30a-3(c) under the Investment Company Act of 1940) provide reasonable assurances that material information relating to the Trust is made known to them by the appropriate persons, based on their evaluation of these controls and procedures as of a date within 90 days of the filing of this report.
(b) There were no significant changes in the Trust’s internal controls over financial reporting (as defined in Rule 30a-3(d) under the Investment Company Act of 1940) that occurred during the second fiscal quarter of the period covered by this report that materially affected, or is reasonably likely to materially affect, the registrant’s internal control over financial reporting.
(a)(1) Not applicable.
(a)(2) Certification pursuant to Rule 30a-2(a) under the Investment Company Act of 1940 (17 CFR 270.30a-2(a)) is filed and attached hereto as Exhibit 99.CERT.
(a)(3) Not applicable.
(b) Certification pursuant to Rule 30a-2(b) under the Investment Company Act of 1940 (17 CFR 270.30a-2(b)) is filed and attached hereto as Exhibit 99.906CERT.
SIGNATURES
Pursuant to the requirements of the Securities Exchange Act of 1934 and the Investment Company Act of 1940, the registrant has duly caused this report to be signed on its behalf by the undersigned, thereunto duly authorized.
| | |
| Wells Fargo Funds Trust |
| |
| By: | | /s/ Karla M. Rabusch |
| | Karla M. Rabusch |
| | President |
| |
| | Date: January 27, 2016 |
Pursuant to the requirements of the Securities Exchange Act of 1934 and the Investment Company Act of 1940, this report has been signed below by the following persons on behalf of the registrant and in the capacities and on the date indicated.
| | |
| Wells Fargo Funds Trust |
| |
| By: | | /s/ Karla M. Rabusch |
| | Karla M. Rabusch |
| | President |
| |
| | Date: January 27, 2016 |
| |
| By: | | /s/ Nancy Wiser |
| | Nancy Wiser |
| | Treasurer |
| |
| | Date: January 27, 2016 |
| |
| By: | | /s/ Jeremy DePalma |
| | Jeremy DePalma |
| | Treasurer |
| |
| | Date: January 27, 2016 |