
UNITED STATES
SECURITIES AND EXCHANGE COMMISSION
Washington, D.C. 20549
FORM N-CSRS
CERTIFIED SHAREHOLDER REPORT OF REGISTERED
MANAGEMENT INVESTMENT COMPANIES
Investment Company Act file number: 811-09253
Wells Fargo Funds Trust
(Exact name of registrant as specified in charter)
525 Market St., San Francisco, CA 94105
(Address of principal executive offices) (Zip code)
C. David Messman
Wells Fargo Funds Management, LLC
525 Market St., San Francisco, CA 94105
(Name and address of agent for service)
Registrant’s telephone number, including area code: 800-222-8222
Date of fiscal year end: July 31
Registrant is making a filing for 10 of its series:
Wells Fargo Capital Growth Fund, Wells Fargo Disciplined U.S. Core Fund, Wells Fargo Endeavor Select Fund, Wells Fargo Growth Fund, Wells Fargo Intrinsic Value Fund, Wells Fargo Large Cap Core Fund, Wells Fargo Large Cap Growth Fund, Wells Fargo Large Company Value Fund, Wells Fargo Omega Growth Fund, and Wells Fargo Premier Large Company Growth Fund.
Date of reporting period: January 31, 2016
| ITEM 1. | REPORT TO STOCKHOLDERS |
Semi-Annual Report
January 31, 2016

Wells Fargo Capital Growth Fund


Reduce clutter. Save trees.
Sign up for electronic delivery of prospectuses and shareholder reports at wellsfargo.com/advantagedelivery
Contents
The views expressed and any forward-looking statements are as of January 31, 2016, unless otherwise noted, and are those of the Fund managers and/or Wells Fargo Funds Management, LLC. Discussions of individual securities, or the markets generally, or any Wells Fargo Fund are not intended as individual recommendations. Future events or results may vary significantly from those expressed in any forward-looking statements. The views expressed are subject to change at any time in response to changing circumstances in the market. Wells Fargo Funds Management, LLC and the Fund disclaim any obligation to publicly update or revise any views expressed or forward-looking statements.
NOT FDIC INSURED ¡ NO BANK GUARANTEE ¡ MAY LOSE VALUE
| | | | |
| 2 | | Wells Fargo Capital Growth Fund | | Letter to shareholders (unaudited) |

Karla M. Rabusch
President
Wells Fargo Funds
Despite generally improving U.S. economic data, ongoing global turmoil tempered U.S. economic growth during the period as many economies and markets outside the U.S. faced ongoing challenges.
Dear Valued Shareholder:
We are pleased to offer you this semi-annual report for the Wells Fargo Capital Growth Fund for the six-month period that ended January 31, 2016. Despite generally improving U.S. economic data, ongoing global turmoil tempered U.S. economic growth during the period as many economies and markets outside the U.S. faced continuing challenges. In this environment, the broad U.S. stock market experienced heightened volatility and ultimately fell 5.64% overall for the six-month period (as measured by the Russell 3000® Index,1 which is the index used to measure U.S. stock market performance throughout this letter).
As the reporting period began, China’s slowdown continued to take a toll on U.S. and international markets.
The U.S. stock market declined 6.04% and 2.91% in August and September 2015, respectively, as investors worried about the impact on the U.S. of China’s slowing growth. A number of positive economic indicators released during these months suggested the U.S. economy remained solid. However, the strengthening U.S. dollar coupled with ongoing global economic turmoil continued to hinder the economy. Although many investors believed the U.S. Federal Reserve (Fed) would raise the federal funds rate during the third quarter of 2015, at its September 2015 meeting the Fed left the rate unchanged. This decision fueled uncertainty about the U.S. economy’s stamina to remain healthy while facing the negative effects of troubles elsewhere in the world. One week later, Fed Chair Janet Yellen reassured investors that, barring unpleasant surprises, the Fed still intended to raise the rate in 2015. International markets were more volatile than the domestic market and delivered even weaker results in August and September. Investors’ anxiety was driven largely by China’s weakened economy. Because China is the world’s largest importer of many commodities, a number of emerging markets—key commodities exporters—struggled under the strains of reduced demand for commodities and lower prices for the commodities sold.
The U.S. stock market delivered a positive result overall for the last three months of 2015 despite ongoing concerns.
The broad U.S. stock market fluctuated widely in the fourth quarter of 2015, rising 7.90% in October and 0.55% in November before falling 2.05% in December, for an overall quarterly return of 6.27%. Stock markets outside the U.S. generally failed to keep pace with the domestic market as economic concerns, including China’s ongoing slowdown, continued to affect many countries worldwide. U.S. economic data released during the quarter indicated the economy remained solid, with modest growth. However, the strong U.S. dollar and global economic turmoil continued their drag on the economy. In December, the Fed, as expected, slightly raised its target short-term interest rate to between 0.25% and 0.50% after keeping it near zero for seven years. The move, which had been well telegraphed by the Fed for months, reflected confidence in the U.S. economy’s ability to stay healthy with less central-bank support. The Fed also made clear that future interest-rate increases will be gradual.
U.S. stocks struggled in January 2016.
The broad U.S. stock market dropped 5.64% for the month, weighed down by ongoing concerns about heightened market volatility, the continued plunge in oil prices, and the impact of weak global growth on U.S. companies. The U.S. economy, however, remained resilient in January—with continued solid hiring, a
| 1 | The Russell 3000® Index measures the performance of the 3,000 largest U.S. companies based on total market capitalization, which represents approximately 98% of the investable U.S. equity market. You cannot invest directly in an index. |
| | | | | | |
| Letter to shareholders (unaudited) | | Wells Fargo Capital Growth Fund | | | 3 | |
reduction in the jobless rate to 4.9%, and signs of an uptick in the pace of wage growth—despite some warning signs that became evident in recent months, such as weaknesses in manufacturing and business growth.
Don’t let short-term uncertainty derail long-term investment goals.
Periods of uncertainty can present challenges, but experience has taught us that maintaining long-term investment goals can be an effective way to plan for the future. To help you create a sound strategy based on your personal goals and risk tolerance, Wells Fargo Funds offers more than 100 mutual funds spanning a wide range of asset classes and investment styles. Although diversification cannot guarantee an investment profit or prevent losses, we believe it can be an effective way to manage investment risk and potentially smooth out overall portfolio performance. We encourage investors to know their investments and to understand that appropriate levels of risk-taking may unlock opportunities.
Thank you for choosing to invest in Wells Fargo Funds. We appreciate your confidence in us and remain committed to helping you meet your financial needs.
Sincerely,

Karla M. Rabusch
President
Wells Fargo Funds
Although diversification cannot guarantee an investment profit or prevent losses, we believe it can be an effective way to manage investment risk and potentially smooth out overall portfolio performance.
For further information about your Fund, contact your investment professional, visit our website at wellsfargofunds.com, or call us directly at 1-800-222-8222. We are available 24 hours a day, 7 days a week.
| | | | |
| 4 | | Wells Fargo Capital Growth Fund | | Performance highlights (unaudited) |
Investment objective
The Fund seeks long-term capital appreciation.
Manager
Wells Fargo Funds Management, LLC
Subadviser
Wells Capital Management Incorporated
Portfolio managers
Thomas J. Pence, CFA®
Michael T. Smith, CFA®
Average annual total returns (%) as of January 31, 20161
| | | | | | | | | | | | | | | | | | | | | | | | | | | | | | | | | | |
| | | | | Including sales charge | | | Excluding sales charge | | | Expense ratios2 (%) | |
| | | Inception date | | 1 year | | | 5 year | | | 10 year | | | 1 year | | | 5 year | | | 10 year | | | Gross | | | Net3 | |
| Class A (WFCGX) | | 7-31-2007 | | | (8.99 | ) | | | 7.41 | | | | 4.05 | | | | (3.43 | ) | | | 8.70 | | | | 4.66 | | | | 1.22 | | | | 1.11 | |
| Class C (WFCCX) | | 7-31-2007 | | | (5.14 | ) | | | 7.89 | | | | 3.92 | | | | (4.14 | ) | | | 7.89 | | | | 3.92 | | | | 1.97 | | | | 1.86 | |
| Class R4 (WCGRX) | | 11-30-2012 | | | – | | | | – | | | | – | | | | (3.00 | ) | | | 9.14 | | | | 5.15 | | | | 0.94 | | | | 0.75 | |
| Class R6 (WFCRX) | | 11-30-2012 | | | – | | | | – | | | | – | | | | (2.87 | ) | | | 9.26 | | | | 5.21 | | | | 0.79 | | | | 0.60 | |
| Administrator Class (WFCDX) | | 6-30-2003 | | | – | | | | – | | | | – | | | | (3.18 | ) | | | 8.94 | | | | 4.96 | | | | 1.14 | | | | 0.94 | |
| Institutional Class (WWCIX) | | 4-8-2005 | | | – | | | | – | | | | – | | | | (3.00 | ) | | | 9.23 | | | | 5.20 | | | | 0.89 | | | | 0.70 | |
| Russell 1000® Growth Index4 | | – | | | – | | | | – | | | | – | | | | 1.32 | | | | 11.67 | | | | 7.72 | | | | – | | | | – | |
Figures quoted represent past performance, which is no guarantee of future results, and do not reflect taxes that a shareholder may pay on fund distributions or the redemption of fund shares. Investment return and principal value of an investment will fluctuate so that an investor’s shares, when redeemed, may be worth more or less than their original cost. Performance shown without sales charges would be lower if sales charges were reflected. Current performance may be lower or higher than the performance data quoted, which assumes the reinvestment of dividends and capital gains. Current month-end performance is available on the Fund’s website, wellsfargofunds.com.
Index returns do not include transaction costs associated with buying and selling securities, any mutual fund fees or expenses, or any taxes. It is not possible to invest directly in an index.
For Class A shares, the maximum front-end sales charge is 5.75%. For Class C shares, the maximum contingent deferred sales charge is 1.00%. Performance including a contingent deferred sales charge assumes the sales charge for the corresponding time period. Class R4, Class R6, Administrator Class and Institutional Class shares are sold without a front-end sales charge or contingent deferred sales charge.
Stock values fluctuate in response to the activities of individual companies and general market and economic conditions. Certain investment strategies tend to increase the total risk of an investment (relative to the broader market). The Fund is exposed to foreign investment risk. Consult the Fund’s prospectus for additional information on these and other risks.
Please see footnotes on page 5.
| | | | | | |
| Performance highlights (unaudited) | | Wells Fargo Capital Growth Fund | | | 5 | |
| | | | |
| Ten largest holdings (%) as of January 31, 20165 | |
Alphabet Incorporated Class A | | | 6.10 | |
Apple Incorporated | | | 5.62 | |
Facebook Incorporated Class A | | | 4.75 | |
Amazon.com Incorporated | | | 3.99 | |
The Home Depot Incorporated | | | 3.63 | |
Visa Incorporated Class A | | | 3.47 | |
Starbucks Corporation | | | 2.64 | |
Bristol-Myers Squibb Company | | | 2.50 | |
UnitedHealth Group Incorporated | | | 2.39 | |
Intercontinental Exchange Incorporated | | | 2.34 | |
|
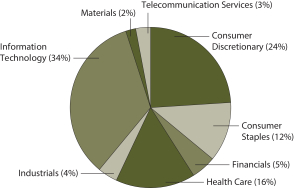
| Sector distribution as of January 31, 20166 |
|
 |
| 1 | Historical performance shown for Class A shares prior to their inception reflects the performance of the former Investor Class shares, and includes the higher expenses applicable to the former Investor Class shares. If these expenses had not been included, returns would be higher. Historical performance shown for Class C shares prior to their inception reflects the performance of the former Investor Class shares, adjusted to reflect the higher expenses applicable to Class C shares. Historical performance shown for Class R4 shares prior to their inception reflects the performance of Institutional Class shares, adjusted to reflect the higher expenses applicable to Class R4 shares. Historical performance shown for Class R6 shares prior to their inception reflects the performance of Institutional Class shares, and includes the higher expenses applicable to Institutional Class shares. If these expenses had not been included, returns would be higher. |
| 2 | Reflects the expense ratios as stated in the most recent prospectuses. The expense ratios shown are subject to change and may differ from the annualized expense ratios shown in the financial highlights of this report. |
| 3 | The manager has contractually committed through November 30, 2016, to waive fees and/or reimburse expenses to the extent necessary to cap the Fund’s Total Annual Fund Operating Expenses After Fee Waiver at the amounts shown. After this time, the cap may be increased or the commitment to maintain the cap may be terminated only with the approval of the Board of Trustees. Brokerage commissions, stamp duty fees, interest, taxes, acquired fund fees and expenses, and extraordinary expenses are excluded from the cap. Without this cap, the Fund’s returns would have been lower. |
| 4 | The Russell 1000® Growth Index measures the performance of those Russell 1000 Index companies with higher price-to-book ratios and higher forecasted growth values. You cannot invest directly in an index. |
| 5 | The ten largest holdings, excluding cash and cash equivalents, are calculated based on the value of the investments divided by total net assets of the Fund. Holdings are subject to change and may have changed since the date specified. |
| 6 | Amounts are calculated based on the total long-term investments of the Fund. These amounts are subject to change and may have changed since the date specified. |
| | | | |
| 6 | | Wells Fargo Capital Growth Fund | | Fund expenses (unaudited) |
As a shareholder of the Fund, you incur two types of costs: (1) transaction costs, including sales charges (loads) on purchase payments and contingent deferred sales charges (if any) on redemptions and (2) ongoing costs, including management fees, distribution (12b-1) and/or shareholder service fees, and other Fund expenses. This example is intended to help you understand your ongoing costs (in dollars) of investing in the Fund and to compare these costs with the ongoing costs of investing in other mutual funds.
The example is based on an investment of $1,000 invested at the beginning of the six-month period and held for the entire period from August 1, 2015 to January 31, 2016.
Actual expenses
The “Actual” line of the table below provides information about actual account values and actual expenses. You may use the information in this line, together with the amount you invested, to estimate the expenses that you paid over the period. Simply divide your account value by $1,000 (for example, an $8,600 account value divided by $1,000 = 8.6), then multiply the result by the number in the “Actual” line under the heading entitled “Expenses paid during period” for your applicable class of shares to estimate the expenses you paid on your account during this period.
Hypothetical example for comparison purposes
The “Hypothetical” line of the table below provides information about hypothetical account values and hypothetical expenses based on the Fund’s actual expense ratio and an assumed rate of return of 5% per year before expenses, which is not the Fund’s actual return. The hypothetical account values and expenses may not be used to estimate the actual ending account balance or expenses you paid for the period. You may use this information to compare the ongoing costs of investing in the Fund and other funds. To do so, compare this 5% hypothetical example with the 5% hypothetical examples that appear in the shareholder reports of the other funds.
Please note that the expenses shown in the table are meant to highlight your ongoing costs only and do not reflect any transactional costs, such as sales charges (loads) and contingent deferred sales charges. Therefore, the “Hypothetical” line of the table is useful in comparing ongoing costs only and will not help you determine the relative total costs of owning different funds. In addition, if these transactional costs were included, your costs would have been higher.
| | | | | | | | | | | | | | | | |
| | | Beginning
account value
8-1-2015 | | | Ending
account value
1-31-2016 | | | Expenses
paid during
the period¹ | | | Net annualized
expense ratio | |
Class A | | | | | | | | | | | | | | | | |
Actual | | $ | 1,000.00 | | | $ | 909.55 | | | $ | 5.33 | | | | 1.11 | % |
Hypothetical (5% return before expenses) | | $ | 1,000.00 | | | $ | 1,019.56 | | | $ | 5.63 | | | | 1.11 | % |
Class C | | | | | | | | | | | | | | | | |
Actual | | $ | 1,000.00 | | | $ | 906.19 | | | $ | 8.91 | | | | 1.86 | % |
Hypothetical (5% return before expenses) | | $ | 1,000.00 | | | $ | 1,015.79 | | | $ | 9.42 | | | | 1.86 | % |
Class R4 | | | | | | | | | | | | | | | | |
Actual | | $ | 1,000.00 | | | $ | 911.66 | | | $ | 3.60 | | | | 0.75 | % |
Hypothetical (5% return before expenses) | | $ | 1,000.00 | | | $ | 1,021.37 | | | $ | 3.81 | | | | 0.75 | % |
Class R6 | | | | | | | | | | | | | | | | |
Actual | | $ | 1,000.00 | | | $ | 912.60 | | | $ | 2.88 | | | | 0.60 | % |
Hypothetical (5% return before expenses) | | $ | 1,000.00 | | | $ | 1,022.12 | | | $ | 3.05 | | | | 0.60 | % |
Administrator Class | | | | | | | | | | | | | | | | |
Actual | | $ | 1,000.00 | | | $ | 910.43 | | | $ | 4.37 | | | | 0.91 | % |
Hypothetical (5% return before expenses) | | $ | 1,000.00 | | | $ | 1,020.56 | | | $ | 4.62 | | | | 0.91 | % |
Institutional Class | | | | | | | | | | | | | | | | |
Actual | | $ | 1,000.00 | | | $ | 911.31 | | | $ | 3.22 | | | | 0.67 | % |
Hypothetical (5% return before expenses) | | $ | 1,000.00 | | | $ | 1,021.77 | | | $ | 3.40 | | | | 0.67 | % |
| 1 | Expenses paid is equal to the annualized expense ratio of each class multiplied by the average account value over the period, multiplied by the number of days in the most recent fiscal half-year divided by the number of days in the fiscal year (to reflect the one-half-year period). |
| | | | | | |
| Portfolio of investments—January 31, 2016 (unaudited) | | Wells Fargo Capital Growth Fund | | | 7 | |
| | | | | | | | | | | | |
| Security name | | | | | | Shares | | | Value | |
| | | | |
Common Stocks: 99.68% | | | | | | | | | | | | |
| | | | |
Consumer Discretionary: 23.96% | | | | | | | | | | | | |
| | | | |
| Auto Components: 0.82% | | | | | | | | | | | | |
Delphi Automotive plc | | | | | | | 35,097 | | | $ | 2,279,195 | |
| | | | | | | | | | | | |
| | | | |
| Automobiles: 0.70% | | | | | | | | | | | | |
Tesla Motors Incorporated Ǡ | | | | | | | 10,165 | | | | 1,943,548 | |
| | | | | | | | | | | | |
| | | | |
| Diversified Consumer Services: 1.07% | | | | | | | | | | | | |
ServiceMaster Global Holdings Incorporated † | | | | | | | 71,000 | | | | 2,996,910 | |
| | | | | | | | | | | | |
| | | | |
| Hotels, Restaurants & Leisure: 5.97% | | | | | | | | | | | | |
Aramark | | | | | | | 44,950 | | | | 1,436,153 | |
Chipotle Mexican Grill Incorporated † | | | | | | | 3,750 | | | | 1,698,638 | |
McDonald’s Corporation | | | | | | | 49,850 | | | | 6,170,433 | |
Starbucks Corporation | | | | | | | 120,991 | | | | 7,352,623 | |
| |
| | | | 16,657,847 | |
| | | | | | | | | | | | |
| | | | |
| Internet & Catalog Retail: 4.42% | | | | | | | | | | | | |
Amazon.com Incorporated † | | | | | | | 18,955 | | | | 11,126,585 | |
Netflix Incorporated † | | | | | | | 13,050 | | | | 1,198,512 | |
| |
| | | | 12,325,097 | |
| | | | | | | | | | | | |
| | | | |
| Specialty Retail: 8.66% | | | | | | | | | | | | |
O’Reilly Automotive Incorporated † | | | | | | | 17,650 | | | | 4,604,885 | |
The Home Depot Incorporated | | | | | | | 80,633 | | | | 10,140,406 | |
The TJX Companies Incorporated | | | | | | | 75,460 | | | | 5,375,770 | |
ULTA Salon, Cosmetics and Fragrance Incorporated † | | | | | | | 22,350 | | | | 4,049,150 | |
| |
| | | | 24,170,211 | |
| | | | | | | | | | | | |
| | | | |
| Textiles, Apparel & Luxury Goods: 2.32% | | | | | | | | | | | | |
Nike Incorporated Class B | | | | | | | 104,314 | | | | 6,468,511 | |
| | | | | | | | | | | | |
| | | | |
Consumer Staples: 11.71% | | | | | | | | | | | | |
| | | | |
| Beverages: 5.41% | | | | | | | | | | | | |
Constellation Brands Incorporated Class A | | | | | | | 40,334 | | | | 6,150,128 | |
Dr Pepper Snapple Group Incorporated | | | | | | | 47,650 | | | | 4,471,476 | |
Monster Beverage Corporation † | | | | | | | 33,100 | | | | 4,469,493 | |
| |
| | | | 15,091,097 | |
| | | | | | | | | | | | |
| | | | |
| Food & Staples Retailing: 3.34% | | | | | | | | | | | | |
The Kroger Company | | | | | | | 98,300 | | | | 3,815,023 | |
Walgreens Boots Alliance Incorporated | | | | | | | 68,950 | | | | 5,496,694 | |
| |
| | | | 9,311,717 | |
| | | | | | | | | | | | |
| | | | |
| Food Products: 0.96% | | | | | | | | | | | | |
Hormel Foods Corporation | | | | | | | 33,250 | | | | 2,673,633 | |
| | | | | | | | | | | | |
| | | | |
| Tobacco: 2.00% | | | | | | | | | | | | |
Reynolds American Incorporated | | | | | | | 111,700 | | | | 5,579,415 | |
| | | | | | | | | | | | |
The accompanying notes are an integral part of these financial statements.
| | | | |
| 8 | | Wells Fargo Capital Growth Fund | | Portfolio of investments—January 31, 2016 (unaudited) |
| | | | | | | | | | | | |
| Security name | | | | | | Shares | | | Value | |
| | | | |
Financials: 4.65% | | | | | | | | | | | | |
| | | | |
| Capital Markets: 1.12% | | | | | | | | | | | | |
Charles Schwab Corporation | | | | | | | 122,300 | | | $ | 3,122,319 | |
| | | | | | | | | | | | |
| | | | |
| Diversified Financial Services: 3.53% | | | | | | | | | | | | |
Intercontinental Exchange Incorporated | | | | | | | 24,795 | | | | 6,540,921 | |
McGraw Hill Financial Incorporated | | | | | | | 38,813 | | | | 3,299,881 | |
| |
| | | | 9,840,802 | |
| | | | | | | | | | | | |
| | | | |
Health Care: 15.64% | | | | | | | | | | | | |
| | | | |
| Biotechnology: 4.88% | | | | | | | | | | | | |
Alexion Pharmaceuticals Incorporated † | | | | | | | 23,250 | | | | 3,392,873 | |
Celgene Corporation † | | | | | | | 41,950 | | | | 4,208,424 | |
Gilead Sciences Incorporated | | | | | | | 22,568 | | | | 1,873,144 | |
Regeneron Pharmaceuticals Incorporated † | | | | | | | 5,231 | | | | 2,197,491 | |
Vertex Pharmaceuticals Incorporated † | | | | | | | 21,383 | | | | 1,940,507 | |
| |
| | | | 13,612,439 | |
| | | | | | | | | | | | |
| | | | |
| Health Care Equipment & Supplies: 5.34% | | | | | | | | | | | | |
Align Technology Incorporated † | | | | | | | 45,700 | | | | 3,022,598 | |
Edwards Lifesciences Corporation † | | | | | | | 60,350 | | | | 4,719,974 | |
Hologic Incorporated † | | | | | | | 96,600 | | | | 3,278,604 | |
Intuitive Surgical Incorporated † | | | | | | | 7,150 | | | | 3,867,078 | |
| |
| | | | 14,888,254 | |
| | | | | | | | | | | | |
| | | | |
| Health Care Providers & Services: 2.39% | | | | | | | | | | | | |
UnitedHealth Group Incorporated | | | | | | | 57,800 | | | | 6,656,248 | |
| | | | | | | | | | | | |
| | | | |
| Pharmaceuticals: 3.03% | | | | | | | | | | | | |
Bristol-Myers Squibb Company | | | | | | | 112,138 | | | | 6,970,498 | |
Zoetis Incorporated | | | | | | | 34,724 | | | | 1,494,868 | |
| |
| | | | 8,465,366 | |
| | | | | | | | | | | | |
|
Industrials: 4.12% | |
| | | | |
| Airlines: 1.76% | | | | | | | | | | | | |
Delta Air Lines Incorporated | | | | | | | 110,775 | | | | 4,906,225 | |
| | | | | | | | | | | | |
| | | | |
| Electrical Equipment: 0.95% | | | | | | | | | | | | |
Acuity Brands Incorporated | | | | | | | 13,100 | | | | 2,651,833 | |
| | | | | | | | | | | | |
| | | | |
| Professional Services: 1.41% | | | | | | | | | | | | |
Verisk Analytics Incorporated † | | | | | | | 54,050 | | | | 3,945,650 | |
| | | | | | | | | | | | |
| | | | |
Information Technology: 34.48% | | | | | | | | | | | | |
| | | | |
| Communications Equipment: 1.84% | | | | | | | | | | | | |
Harris Corporation | | | | | | | 39,650 | | | | 3,448,361 | |
Palo Alto Networks Incorporated † | | | | | | | 11,185 | | | | 1,672,046 | |
| |
| | | | 5,120,407 | |
| | | | | | | | | | | | |
The accompanying notes are an integral part of these financial statements.
| | | | | | |
| Portfolio of investments—January 31, 2016 (unaudited) | | Wells Fargo Capital Growth Fund | | | 9 | |
| | | | | | | | | | | | | | |
| Security name | | | | | | | Shares | | | Value | |
| | | | |
| Internet Software & Services: 12.12% | | | | | | | | | | | | | | |
Alphabet Incorporated Class A † | | | | | | | | | 22,358 | | | $ | 17,022,263 | |
Facebook Incorporated Class A † | | | | | | | | | 118,174 | | | | 13,260,305 | |
Tencent Holdings Limited ADR | | | | | | | | | 189,150 | | | | 3,521,576 | |
| |
| | | | 33,804,144 | |
| | | | | | | | | | | | | | |
| | | | |
| IT Services: 7.90% | | | | | | | | | | | | | | |
Cognizant Technology Solutions Corporation Class A † | | | | | | | | | 75,350 | | | | 4,770,409 | |
Fidelity National Information Services Incorporated | | | | | | | | | 68,250 | | | | 4,076,573 | |
PayPal Holdings Incorporated † | | | | | | | | | 97,600 | | | | 3,527,264 | |
Visa Incorporated Class A | | | | | | | | | 129,833 | | | | 9,671,260 | |
| |
| | | | 22,045,506 | |
| | | | | | | | | | | | | | |
| | | | |
| Semiconductors & Semiconductor Equipment: 0.73% | | | | | | | | | | | | | | |
Avago Technologies Limited | | | | | | | | | 15,300 | | | | 2,045,763 | |
| | | | | | | | | | | | | | |
| | | | |
| Software: 6.28% | | | | | | | | | | | | | | |
Adobe Systems Incorporated † | | | | | | | | | 57,450 | | | | 5,120,519 | |
Electronic Arts Incorporated † | | | | | | | | | 73,600 | | | | 4,750,512 | |
Salesforce.com Incorporated † | | | | | | | | | 45,030 | | | | 3,064,742 | |
ServiceNow Incorporated † | | | | | | | | | 39,730 | | | | 2,471,603 | |
Tableau Software Incorporated Class A † | | | | | | | | | 26,300 | | | | 2,110,312 | |
| |
| | | | 17,517,688 | |
| | | | | | | | | | | | | | |
| | | | |
| Technology Hardware, Storage & Peripherals: 5.61% | | | | | | | | | | | | | | |
Apple Incorporated | | | | | | | | | 160,926 | | | | 15,664,537 | |
| | | | | | | | | | | | | | |
| | | | |
Materials: 1.82% | | | | | | | | | | | | | | |
| | | | |
| Chemicals: 1.82% | | | | | | | | | | | | | | |
The Sherwin-Williams Company | | | | | | | | | 19,900 | | | | 5,087,833 | |
| | | | | | | | | | | | | | |
| | | | |
Telecommunication Services: 3.30% | | | | | | | | | | | | | | |
| | | | |
| Diversified Telecommunication Services: 3.30% | | | | | | | | | | | | | | |
Level 3 Communications Incorporated † | | | | | | | | | 31,504 | | | | 1,537,710 | |
SBA Communications Corporation Class A † | | | | | | | | | 40,047 | | | | 3,975,866 | |
Zayo Group Holdings Incorporated † | | | | | | | | | 147,200 | | | | 3,682,944 | |
| | | | |
| | | | | | | | | | | | | 9,196,520 | |
| | | | | | | | | | | | | | |
| | | | |
Total Common Stocks (Cost $228,348,303) | | | | | | | | | | | | | 278,068,715 | |
| | | | | | | | | | | | | | |
| | | | |
| | | Yield | | | | | | | | | |
| Short-Term Investments: 0.78% | | | | | | | | | | | | | | |
| | | | |
| Investment Companies: 0.78% | | | | | | | | | | | | | | |
Securities Lending Cash Investments, LLC (l)(r)(u) | | | 0.42 | % | | | | | 1,896,300 | | | | 1,896,300 | |
Wells Fargo Cash Investment Money Market Fund, Select Class (l)(u) | | | 0.40 | | | | | | 274,367 | | | | 274,367 | |
| | | | |
Total Short-Term Investments (Cost $2,170,667) | | | | | | | | | | | | | 2,170,667 | |
| | | | | | | | | | | | | | |
| | | | | | | | |
| Total investments in securities (Cost $230,518,970) * | | | 100.46 | % | | | 280,239,382 | |
Other assets and liabilities, net | | | (0.46 | ) | | | (1,272,839 | ) |
| | | | | | | | |
| Total net assets | | | 100.00 | % | | $ | 278,966,543 | |
| | | | | | | | |
The accompanying notes are an integral part of these financial statements.
| | | | |
| 10 | | Wells Fargo Capital Growth Fund | | Portfolio of investments—January 31, 2016 (unaudited) |
| « | All or a portion of this security is on loan. |
| † | Non-income-earning security |
| (l) | The issuer of the security is an affiliated person of the Fund as defined in the Investment Company Act of 1940. |
| (r) | The investment is a non-registered investment vehicle purchased with cash collateral received from securities on loan. |
| (u) | The rate represents the 7-day annualized yield at period end. |
| * | Cost for federal income tax purposes is $231,307,479 and unrealized gains (losses) consists of: |
| | | | |
Gross unrealized gains | | $ | 57,835,275 | |
Gross unrealized losses | | | (8,903,372 | ) |
| | | | |
Net unrealized gains | | $ | 48,931,903 | |
The accompanying notes are an integral part of these financial statements.
| | | | | | |
| Statement of assets and liabilities—January 31, 2016 (unaudited) | | Wells Fargo Capital Growth Fund | | | 11 | |
| | | | |
| | | | |
| |
Assets | | | | |
Investments | | | | |
In unaffiliated securities (including $1,859,060 of securities loaned), at value (cost $228,348,303) | | $ | 278,068,715 | |
In affiliated securities, at value (cost $2,170,667) | | | 2,170,667 | |
| | | | |
Total investments, at value (cost $230,518,970) | | | 280,239,382 | |
Receivable for investments sold | | | 603,907 | |
Receivable for Fund shares sold | | | 212,149 | |
Receivable for dividends | | | 58,052 | |
Receivable for securities lending income | | | 2,397 | |
Prepaid expenses and other assets | | | 45,181 | |
| | | | |
Total assets | | | 281,161,068 | |
| | | | |
| |
Liabilities | | | | |
Payable for Fund shares redeemed | | | 92,437 | |
Payable upon receipt of securities loaned | | | 1,896,300 | |
Management fee payable | | | 122,975 | |
Distribution fee payable | | | 2,210 | |
Administration fees payable | | | 24,617 | |
Accrued expenses and other liabilities | | | 55,986 | |
| | | | |
Total liabilities | | | 2,194,525 | |
| | | | |
Total net assets | | $ | 278,966,543 | |
| | | | |
| |
NET ASSETS CONSIST OF | | | | |
Paid-in capital | | $ | 237,995,159 | |
Accumulated net investment loss | | | (608,408 | ) |
Accumulated net realized losses on investments | | | (8,140,620 | ) |
Net unrealized gains on investments | | | 49,720,412 | |
| | | | |
Total net assets | | $ | 278,966,543 | |
| | | | |
| |
COMPUTATION OF NET ASSET VALUE AND OFFERING PRICE PER SHARE | | | | |
Net assets – Class A | | $ | 80,398,499 | |
Shares outstanding – Class A1 | | | 5,888,487 | |
Net asset value per share – Class A | | | $13.65 | |
Maximum offering price per share – Class A2 | | | $14.48 | |
Net assets – Class C | | $ | 3,436,410 | |
Shares outstanding – Class C1 | | | 279,997 | |
Net asset value per share – Class C | | | $12.27 | |
Net assets – Class R4 | | $ | 14,181 | |
Share outstanding – Class R41 | | | 947 | |
Net asset value per share – Class R4 | | | $14.97 | |
Net assets – Class R6 | | $ | 141,558,406 | |
Shares outstanding – Class R61 | | | 9,402,383 | |
Net asset value per share – Class R6 | | | $15.06 | |
Net assets – Administrator Class | | $ | 29,933,719 | |
Shares outstanding – Administrator Class1 | | | 2,046,993 | |
Net asset value per share – Administrator Class | | | $14.62 | |
Net assets – Institutional Class | | $ | 23,625,328 | |
Shares outstanding – Institutional Class1 | | | 1,573,484 | |
Net asset value per share – Institutional Class | | | $15.01 | |
| 1 | The Fund has an unlimited number of authorized shares. |
| 2 | Maximum offering price is computed as 100/94.25 of net asset value. On investments of $50,000 or more, the offering price is reduced. |
The accompanying notes are an integral part of these financial statements.
| | | | |
| 12 | | Wells Fargo Capital Growth Fund | | Statement of operations—six months ended January 31, 2016 (unaudited) |
| | | | |
| | | | |
| |
Investment income | | | | |
Dividends (net of foreign withholding taxes of $9,186) | | $ | 940,939 | |
Securities lending income, net | | | 7,420 | |
Income from affiliated securities | | | 5,158 | |
| | | | |
Total investment income | | | 953,517 | |
| | | | |
| |
Expenses | | | | |
Management fee | | | 1,027,540 | |
Administration fees | | | | |
Class A | | | 58,200 | |
Class C | | | 3,968 | |
Class R4 | | | 5 | |
Class R6 | | | 21,864 | |
Administrator Class | | | 20,554 | |
Institutional Class | | | 14,340 | |
Investor Class | | | 55,871 | 1 |
Shareholder servicing fees | | | | |
Class A | | | 68,935 | |
Class C | | | 4,723 | |
Class R4 | | | 7 | |
Administrator Class | | | 39,526 | |
Investor Class | | | 43,445 | 1 |
Distribution fee | | | | |
Class C | | | 14,170 | |
Custody and accounting fees | | | 13,660 | |
Professional fees | | | 23,433 | |
Registration fees | | | 53,668 | |
Shareholder report expenses | | | 1,472 | |
Trustees’ fees and expenses | | | 11,588 | |
Other fees and expenses | | | 10,322 | |
| | | | |
Total expenses | | | 1,487,291 | |
Less: Fee waivers and/or expense reimbursements | | | (284,795 | ) |
| | | | |
Net expenses | | | 1,202,496 | |
| | | | |
Net investment loss | | | (248,979 | ) |
| | | | |
| |
REALIZED AND UNREALIZED GAINS (LOSSES) ON INVESTMENTS | | | | |
Net realized losses on investments | | | (6,433,501 | ) |
Net change in unrealized gains (losses) on investments | | | (21,191,438 | ) |
| | | | |
Net realized and unrealized gains (losses) on investments | | | (27,624,939 | ) |
| | | | |
Net decrease in net assets resulting from operations | | $ | (27,873,918 | ) |
| | | | |
| 1 | For the period from August 1, 2015 to October 23, 2015. Effective at the close of business on October 23, 2015, Investor Class shares were converted to Class A shares and are no longer offered by the Fund. |
The accompanying notes are an integral part of these financial statements.
| | | | | | |
| Statement of changes in net assets | | Wells Fargo Capital Growth Fund | | | 13 | |
| | | | | | | | | | | | | | | | |
| | | Six months ended
January 31, 2016 (unaudited) | | | Year ended
July 31, 2015 | |
| | | | |
Operations | | | | | | | | | | | | | | | | |
Net investment loss | | | | | | $ | (248,979 | ) | | | | | | $ | (385,156 | ) |
Net realized gains (losses) on investments | | | | | | | (6,433,501 | ) | | | | | | | 55,955,753 | |
Net change in unrealized gains (losses) on investments | | | | | | | (21,191,438 | ) | | | | | | | (17,785,562 | ) |
| | | | |
Net increase (decrease) in net assets resulting from operations | | | | | | | (27,873,918 | ) | | | | | | | 37,785,035 | |
| | | | |
| | | | |
Distributions to shareholders from | | | | | | | | | | | | | | | | |
Net realized gains | | | | | | | | | | | | | | | | |
Class A | | | | | | | (12,289,754 | ) | | | | | | | (4,805,732 | ) |
Class C | | | | | | | (556,329 | ) | | | | | | | (1,397,806 | ) |
Class R4 | | | | | | | (1,876 | ) | | | | | | | (3,693 | ) |
Class R6 | | | | | | | (18,521,143 | ) | | | | | | | (36,912,629 | ) |
Administrator Class | | | | | | | (4,001,022 | ) | | | | | | | (9,378,628 | ) |
Institutional Class | | | | | | | (3,150,712 | ) | | | | | | | (12,743,781 | ) |
Investor Class | | | | | | | 0 | 1 | | | | | | | (24,364,369 | ) |
| | | | |
Total distributions to shareholders | | | | | | | (38,520,836 | ) | | | | | | | (89,606,638 | ) |
| | | | |
| | | | |
Capital share transactions | | | Shares | | | | | | | | Shares | | | | | |
Proceeds from shares sold | | | | | | | | | | | | | | | | |
Class A | | | 4,684,911 | | | | 78,251,501 | | | | 91,633 | | | | 1,687,079 | |
Class C | | | 28,780 | | | | 413,209 | | | | 74,996 | | | | 1,252,857 | |
Class R6 | | | 615,426 | | | | 10,620,905 | | | | 698,773 | | | | 13,635,803 | |
Administrator Class | | | 114,117 | | | | 1,857,465 | | | | 196,115 | | | | 3,846,348 | |
Institutional Class | | | 349,538 | | | | 6,331,223 | | | | 569,045 | | | | 11,364,181 | |
Investor Class | | | 45,169 | 1 | | | 724,379 | 1 | | | 429,740 | | | | 7,934,159 | |
| | | | |
| | | | | | | 98,198,682 | | | | | | | | 39,720,427 | |
| | | | |
Reinvestment of distributions | | | | | | | | | | | | | | | | |
Class A | | | 842,774 | | | | 12,076,915 | | | | 283,053 | | | | 4,667,546 | |
Class C | | | 37,294 | | | | 480,716 | | | | 78,077 | | | | 1,185,209 | |
Class R4 | | | 119 | | | | 1,876 | | | | 208 | | | | 3,693 | |
Class R6 | | | 1,172,966 | | | | 18,521,143 | | | | 2,067,934 | | | | 36,912,629 | |
Administrator Class | | | 259,809 | | | | 3,985,470 | | | | 533,599 | | | | 9,316,635 | |
Institutional Class | | | 188,296 | | | | 2,965,656 | | | | 349,997 | | | | 6,236,949 | |
Investor Class | | | 0 | 1 | | | 0 | 1 | | | 1,450,130 | | | | 23,680,615 | |
| | | | |
| | | | | | | 38,031,776 | | | | | | | | 82,003,276 | |
| | | | |
Payment for shares redeemed | | | | | | | | | | | | | | | | |
Class A | | | (624,728 | ) | | | (9,139,810 | ) | | | (259,975 | ) | | | (4,889,075 | ) |
Class C | | | (50,706 | ) | | | (743,283 | ) | | | (118,419 | ) | | | (1,921,172 | ) |
Class R6 | | | (493,950 | ) | | | (8,581,035 | ) | | | (985,710 | ) | | | (19,513,578 | ) |
Administrator Class | | | (220,187 | ) | | | (3,787,664 | ) | | | (1,888,744 | ) | | | (41,533,388 | ) |
Institutional Class | | | (162,907 | ) | | | (2,844,845 | ) | | | (1,930,743 | ) | | | (37,357,917 | ) |
Investor Class | | | (4,836,074 | )1 | | | (80,008,433 | )1 | | | (1,294,319 | ) | | | (23,062,370 | ) |
| | | | |
| | | | | | | (105,105,070 | ) | | | | | | | (128,277,500 | ) |
| | | | |
Net increase (decrease) in net assets resulting from capital share transactions | | | | | | | 31,125,388 | | | | | | | | (6,553,797 | ) |
| | | | |
Total decrease in net assets | | | | | | | (35,269,366 | ) | | | | | | | (58,375,400 | ) |
| | | | |
| | | | |
Net assets | | | | | | | | | | | | | | | | |
Beginning of period | | | | | | | 314,235,909 | | | | | | | | 372,611,309 | |
| | | | |
End of period | | | | | | $ | 278,966,543 | | | | | | | $ | 314,235,909 | |
| | | | |
Accumulated net investment loss | | | | | | $ | (608,408 | ) | | | | | | $ | (359,429 | ) |
| | | | |
| 1 | For the period from August 1, 2015 to October 23, 2015. Effective at the close of business on October 23, 2015, Investor Class shares were converted to Class A shares and are no longer offered by the Fund. |
The accompanying notes are an integral part of these financial statements.
| | | | |
| 14 | | Wells Fargo Capital Growth Fund | | Financial highlights |
(For a share outstanding throughout each period)
| | | | | | | | | | | | | | | | | | | | | | | | |
| | | Six months ended
January 31, 2016 (unaudited) | | | Year ended July 31 | |
| CLASS A | | | 2015 | | | 2014 | | | 2013 | | | 2012 | | | 2011 | |
Net asset value, beginning of period | | | $17.38 | | | | $21.31 | | | | $19.87 | | | | $16.74 | | | | $16.25 | | | | $13.07 | |
Net investment income (loss) | | | (0.03 | )1 | | | (0.07 | )1 | | | (0.10 | )1 | | | 0.00 | 1,2 | | | (0.05 | )1 | | | (0.07 | )1 |
Net realized and unrealized gains (losses) on investments | | | (1.43 | ) | | | 2.09 | | | | 3.79 | | | | 3.43 | | | | 0.54 | | | | 3.25 | |
| | | | | | | | | | | | | | | | | | | | | | | | |
Total from investment operations | | | (1.46 | ) | | | 2.02 | | | | 3.69 | | | | 3.43 | | | | 0.49 | | | | 3.18 | |
Distributions to shareholders from | | | | | | | | | | | | | | | | | | | | | | | | |
Net investment income | | | 0.00 | | | | 0.00 | | | | (0.02 | ) | | | 0.00 | | | | 0.00 | | | | 0.00 | |
Net realized gains | | | (2.27 | ) | | | (5.95 | ) | | | (2.23 | ) | | | (0.30 | ) | | | 0.00 | | | | 0.00 | |
| | | | | | | | | | | | | | | | | | | | | | | | |
Total distributions to shareholders | | | (2.27 | ) | | | (5.95 | ) | | | (2.25 | ) | | | (0.30 | ) | | | 0.00 | | | | 0.00 | |
Net asset value, end of period | | | $13.65 | | | | $17.38 | | | | $21.31 | | | | $19.87 | | | | $16.74 | | | | $16.25 | |
Total return3 | | | (9.05 | )% | | | 11.00 | % | | | 19.09 | % | | | 20.85 | % | | | 3.02 | % | | | 24.43 | % |
Ratios to average net assets (annualized) | | | | | | | | | | | | | | | | | | | | | | | | |
Gross expenses | | | 1.24 | % | | | 1.27 | % | | | 1.26 | % | | | 1.26 | % | | | 1.21 | % | | | 1.21 | % |
Net expenses | | | 1.11 | % | | | 1.11 | % | | | 1.11 | % | | | 1.14 | % | | | 1.20 | % | | | 1.20 | % |
Net investment income (loss) | | | (0.44 | )% | | | (0.39 | )% | | | (0.46 | )% | | | 0.01 | % | | | (0.30 | )% | | | (0.48 | )% |
Supplemental data | | | | | | | | | | | | | | | | | | | | | | | | |
Portfolio turnover rate | | | 50 | % | | | 114 | % | | | 94 | % | | | 107 | % | | | 116 | % | | | 116 | % |
Net assets, end of period (000s omitted) | | | $80,398 | | | | $17,126 | | | | $18,561 | | | | $16,390 | | | | $17,784 | | | | $20,693 | |
| 1 | Calculated based upon average shares outstanding |
| 2 | Amount is less than $0.005. |
| 3 | Total return calculations do not include any sales charges. Returns for periods of less than one year are not annualized. |
The accompanying notes are an integral part of these financial statements.
| | | | | | |
| Financial highlights | | Wells Fargo Capital Growth Fund | | | 15 | |
(For a share outstanding throughout each period)
| | | | | | | | | | | | | | | | | | | | | | | | |
| | | Six months ended
January 31, 2016 (unaudited) | | | Year ended July 31 | |
| CLASS C | | | 2015 | | | 2014 | | | 2013 | | | 2012 | | | 2011 | |
Net asset value, beginning of period | | | $15.92 | | | | $20.12 | | | | $18.98 | | | | $16.12 | | | | $15.77 | | | | $12.77 | |
Net investment loss | | | (0.09 | )1 | | | (0.20 | )1 | | | (0.24 | )1 | | | (0.13 | )1 | | | (0.16 | )1 | | | (0.19 | )1 |
Net realized and unrealized gains (losses) on investments | | | (1.29 | ) | | | 1.95 | | | | 3.61 | | | | 3.29 | | | | 0.51 | | | | 3.19 | |
| | | | | | | | | | | | | | | | | | | | | | | | |
Total from investment operations | | | (1.38 | ) | | | 1.75 | | | | 3.37 | | | | 3.16 | | | | 0.35 | | | | 3.00 | |
Distributions to shareholders from | | | | | | | | | | | | | | | | | | | | | | | | |
Net realized gains | | | (2.27 | ) | | | (5.95 | ) | | | (2.23 | ) | | | (0.30 | ) | | | 0.00 | | | | 0.00 | |
Net asset value, end of period | | | $12.27 | | | | $15.92 | | | | $20.12 | | | | $18.98 | | | | $16.12 | | | | $15.77 | |
Total return2 | | | (9.38 | )% | | | 10.15 | % | | | 18.21 | % | | | 19.97 | % | | | 2.22 | % | | | 23.49 | % |
Ratios to average net assets (annualized) | | | | | | | | | | | | | | | | | | | | | | | | |
Gross expenses | | | 1.99 | % | | | 2.02 | % | | | 2.01 | % | | | 2.01 | % | | | 1.96 | % | | | 1.96 | % |
Net expenses | | | 1.86 | % | | | 1.86 | % | | | 1.86 | % | | | 1.89 | % | | | 1.95 | % | | | 1.95 | % |
Net investment loss | | | (1.20 | )% | | | (1.14 | )% | | | (1.20 | )% | | | (0.73 | )% | | | (1.05 | )% | | | (1.23 | )% |
Supplemental data | | | | | | | | | | | | | | | | | | | | | | | | |
Portfolio turnover rate | | | 50 | % | | | 114 | % | | | 94 | % | | | 107 | % | | | 116 | % | | | 116 | % |
Net assets, end of period (000s omitted) | | | $3,436 | | | | $4,212 | | | | $4,628 | | | | $4,503 | | | | $6,042 | | | | $8,272 | |
| 1 | Calculated based upon average shares outstanding |
| 2 | Total return calculations do not include any sales charges. Returns for periods of less than one year are not annualized. |
The accompanying notes are an integral part of these financial statements.
| | | | |
| 16 | | Wells Fargo Capital Growth Fund | | Financial highlights |
(For a share outstanding throughout each period)
| | | | | | | | | | | | | | | | |
| | | Six months ended January 31, 2016 (unaudited) | | | Year ended July 31 | |
| CLASS R4 | | | 2015 | | | 2014 | | | 20131 | |
Net asset value, beginning of period | | | $18.79 | | | | $22.52 | | | | $20.83 | | | | $18.22 | |
Net investment income (loss) | | | (0.01 | )2 | | | (0.01 | )2 | | | (0.02 | ) | | | 0.05 | |
Net realized and unrealized gains (losses) on investments | | | (1.54 | ) | | | 2.23 | | | | 3.99 | | | | 2.95 | |
| | | | | | | | | | | | | | | | |
Total from investment operations | | | (1.55 | ) | | | 2.22 | | | | 3.97 | | | | 3.00 | |
Distributions to shareholders from | | | | | | | | | | | | | | | | |
Net investment income | | | 0.00 | | | | 0.00 | | | | (0.05 | ) | | | (0.09 | ) |
Net realized gains | | | (2.27 | ) | | | (5.95 | ) | | | (2.23 | ) | | | (0.30 | ) |
| | | | | | | | | | | | | | | | |
Total distributions to shareholders | | | (2.27 | ) | | | (5.95 | ) | | | (2.28 | ) | | | (0.39 | ) |
Net asset value, end of period | | | $14.97 | | | | $18.79 | | | | $22.52 | | | | $20.83 | |
Total return3 | | | (8.83 | )% | | | 11.35 | % | | | 19.56 | % | | | 16.86 | % |
Ratios to average net assets (annualized) | | | | | | | | | | | | | | | | |
Gross expenses | | | 0.92 | % | | | 0.91 | % | | | 0.91 | % | | | 0.90 | % |
Net expenses | | | 0.75 | % | | | 0.75 | % | | | 0.75 | % | | | 0.75 | % |
Net investment income (loss) | | | (0.10 | )% | | | (0.04 | )% | | | (0.10 | )% | | | 0.37 | % |
Supplemental data | | | | | | | | | | | | | | | | |
Portfolio turnover rate | | | 50 | % | | | 114 | % | | | 94 | % | | | 107 | % |
Net assets, end of period (000s omitted) | | | $14 | | | | $16 | | | | $14 | | | | $12 | |
| 1 | For the period from November 30, 2012 (commencement of class operations) to July 31, 2013 |
| 2 | Calculated based upon average shares outstanding |
| 3 | Returns for periods of less than one year are not annualized. |
The accompanying notes are an integral part of these financial statements.
| | | | | | |
| Financial highlights | | Wells Fargo Capital Growth Fund | | | 17 | |
(For a share outstanding throughout each period)
| | | | | | | | | | | | | | | | |
| | | Six months ended January 31, 2016 (unaudited) | | | Year ended July 31 | |
| CLASS R6 | | | 2015 | | | 2014 | | | 20131 | |
Net asset value, beginning of period | | | $18.87 | | | | $22.56 | | | | $20.85 | | | | $18.22 | |
Net investment income | | | 0.00 | 2 | | | 0.02 | | | | 0.00 | 2,3 | | | 0.07 | |
Net realized and unrealized gains (losses) on investments | | | (1.54 | ) | | | 2.24 | | | | 4.00 | | | | 2.95 | |
| | | | | | | | | | | | | | | | |
Total from investment operations | | | (1.54 | ) | | | 2.26 | | | | 4.00 | | | | 3.02 | |
Distributions to shareholders from | | | | | | | | | | | | | | | | |
Net investment income | | | 0.00 | | | | 0.00 | | | | (0.06 | ) | | | (0.09 | ) |
Net realized gains | | | (2.27 | ) | | | (5.95 | ) | | | (2.23 | ) | | | (0.30 | ) |
| | | | | | | | | | | | | | | | |
Total distributions to shareholders | | | (2.27 | ) | | | (5.95 | ) | | | (2.29 | ) | | | (0.39 | ) |
Net asset value, end of period | | | $15.06 | | | | $18.87 | | | | $22.56 | | | | $20.85 | |
Total return4 | | | (8.74 | )% | | | 11.54 | % | | | 19.71 | % | | | 16.99 | % |
Ratios to average net assets (annualized) | | | | | | | | | | | | | | | | |
Gross expenses | | | 0.81 | % | | | 0.79 | % | | | 0.78 | % | | | 0.79 | % |
Net expenses | | | 0.60 | % | | | 0.60 | % | | | 0.60 | % | | | 0.60 | % |
Net investment income | | | 0.05 | % | | | 0.11 | % | | | 0.01 | % | | | 0.52 | % |
Supplemental data | | | | | | | | | | | | | | | | |
Portfolio turnover rate | | | 50 | % | | | 114 | % | | | 94 | % | | | 107 | % |
Net assets, end of period (000s omitted) | | | $141,558 | | | | $153,009 | | | | $142,754 | | | | $58 | |
| 1 | For the period from November 30, 2012 (commencement of class operations) to July 31, 2013 |
| 2 | Amount is less than $0.005 per share. |
| 3 | Calculated based upon average shares outstanding |
| 4 | Returns for periods of less than one year are not annualized. |
The accompanying notes are an integral part of these financial statements.
| | | | |
| 18 | | Wells Fargo Capital Growth Fund | | Financial highlights |
(For a share outstanding throughout each period)
| | | | | | | | | | | | | | | | | | | | | | | | |
| | | Six months ended
January 31, 2016 (unaudited) | | | Year ended July 31 | |
| ADMINISTRATOR CLASS | | | 2015 | | | 2014 | | | 2013 | | | 2012 | | | 2011 | |
Net asset value, beginning of period | | | $18.43 | | | | $22.22 | | | | $20.61 | | | | $17.32 | | | | $16.77 | | | | $13.45 | |
Net investment income (loss) | | | (0.02 | )1 | | | (0.03 | )1 | | | (0.05 | )1 | | | 0.04 | 1 | | | (0.00 | )1,2 | | | (0.03 | )1 |
Net realized and unrealized gains (losses) on investments | | | (1.52 | ) | | | 2.19 | | | | 3.93 | | | | 3.55 | | | | 0.55 | | | | 3.35 | |
| | | | | | | | | | | | | | | | | | | | | | | | |
Total from investment operations | | | (1.54 | ) | | | 2.16 | | | | 3.88 | | | | 3.59 | | | | 0.55 | | | | 3.32 | |
Distributions to shareholders from | | | | | | | | | | | | | | | | | | | | | | | | |
Net investment income | | | 0.00 | | | | 0.00 | | | | (0.04 | ) | | | 0.00 | | | | 0.00 | | | | 0.00 | |
Net realized gains | | | (2.27 | ) | | | (5.95 | ) | | | (2.23 | ) | | | (0.30 | ) | | | 0.00 | | | | 0.00 | |
| | | | | | | | | | | | | | | | | | | | | | | | |
Total distributions to shareholders | | | (2.27 | ) | | | (5.95 | ) | | | (2.27 | ) | | | (0.30 | ) | | | 0.00 | | | | 0.00 | |
Net asset value, end of period | | | $14.62 | | | | $18.43 | | | | $22.22 | | | | $20.61 | | | | $17.32 | | | | $16.77 | |
Total return3 | | | (8.96 | )% | | | 11.22 | % | | | 19.35 | % | | | 21.15 | % | | | 3.22 | % | | | 24.68 | % |
Ratios to average net assets (annualized) | | | | | | | | | | | | | | | | | | | | | | | | |
Gross expenses | | | 1.16 | % | | | 1.11 | % | | | 1.09 | % | | | 1.09 | % | | | 1.05 | % | | | 1.05 | % |
Net expenses | | | 0.91 | % | | | 0.90 | % | | | 0.90 | % | | | 0.91 | % | | | 0.94 | % | | | 0.94 | % |
Net investment income (loss) | | | (0.26 | )% | | | (0.16 | )% | | | (0.24 | )% | | | 0.24 | % | | | (0.01 | )% | | | (0.21 | )% |
Supplemental data | | | | | | | | | | | | | | | | | | | | | | | | |
Portfolio turnover rate | | | 50 | % | | | 114 | % | | | 94 | % | | | 107 | % | | | 116 | % | | | 116 | % |
Net assets, end of period (000s omitted) | | | $29,934 | | | | $34,886 | | | | $67,830 | | | | $63,786 | | | | $74,529 | | | | $372,178 | |
| 1 | Calculated based upon average shares outstanding |
| 2 | Amount is less than $0.005. |
| 3 | Returns for periods of less than one year are not annualized. |
The accompanying notes are an integral part of these financial statements.
| | | | | | |
| Financial highlights | | Wells Fargo Capital Growth Fund | | | 19 | |
(For a share outstanding throughout each period)
| | | | | | | | | | | | | | | | | | | | | | | | |
| | | Six months ended January 31, 2016 (unaudited) | | | Year ended July 31 | |
| INSTITUTIONAL CLASS | | | 2015 | | | 2014 | | | 2013 | | | 2012 | | | 2011 | |
Net asset value, beginning of period | | | $18.84 | | | | $22.54 | | | | $20.84 | | | | $17.56 | | | | $16.96 | | | | $13.57 | |
Net investment income (loss) | | | (0.00 | )1,2 | | | 0.02 | 1 | | | 0.01 | 1 | | | 0.09 | 1 | | | 0.03 | 1 | | | 0.00 | 1,2 |
Net realized and unrealized gains (losses) on investments | | | (1.56 | ) | | | 2.23 | | | | 4.00 | | | | 3.58 | | | | 0.57 | | | | 3.39 | |
| | | | | | | | | | | | | | | | | | | | | | | | |
Total from investment operations | | | (1.56 | ) | | | 2.25 | | | | 4.01 | | | | 3.67 | | | | 0.60 | | | | 3.39 | |
Distributions to shareholders from | | | | | | | | | | | | | | | | | | | | | | | | |
Net investment income | | | 0.00 | | | | 0.00 | | | | (0.08 | ) | | | (0.09 | ) | | | 0.00 | | | | 0.00 | |
Net realized gains | | | (2.27 | ) | | | (5.95 | ) | | | (2.23 | ) | | | (0.30 | ) | | | 0.00 | | | | 0.00 | |
| | | | | | | | | | | | | | | | | | | | | | | | |
Total distributions to shareholders | | | (2.27 | ) | | | (5.95 | ) | | | (2.31 | ) | | | (0.39 | ) | | | 0.00 | | | | 0.00 | |
Net asset value, end of period | | | $15.01 | | | | $18.84 | | | | $22.54 | | | | $20.84 | | | | $17.56 | | | | $16.96 | |
Total return3 | | | (8.87 | )% | | | 11.50 | % | | | 19.76 | % | | | 21.42 | % | | | 3.48 | % | | | 25.07 | % |
Ratios to average net assets (annualized) | | | | | | | | | | | | | | | | | | | | | | | | |
Gross expenses | | | 0.91 | % | | | 0.84 | % | | | 0.82 | % | | | 0.82 | % | | | 0.78 | % | | | 0.78 | % |
Net expenses | | | 0.67 | % | | | 0.65 | % | | | 0.65 | % | | | 0.67 | % | | | 0.70 | % | | | 0.70 | % |
Net investment income (loss) | | | (0.04 | )% | | | 0.09 | % | | | 0.05 | % | | | 0.46 | % | | | 0.21 | % | | | 0.00 | % |
Supplemental data | | | | | | | | | | | | | | | | | | | | | | | | |
Portfolio turnover rate | | | 50 | % | | | 114 | % | | | 94 | % | | | 107 | % | | | 116 | % | | | 116 | % |
Net assets, end of period (000s omitted) | | | $23,625 | | | | $22,578 | | | | $49,816 | | | | $331,310 | | | | $543,933 | | | | $988,633 | |
| 1 | Calculated based upon average shares outstanding |
| 2 | Amount is less than $0.005. |
| 3 | Returns for periods of less than one year are not annualized. |
The accompanying notes are an integral part of these financial statements.
| | | | |
| 20 | | Wells Fargo Capital Growth Fund | | Notes to financial statements (unaudited) |
1. ORGANIZATION
Wells Fargo Funds Trust (the “Trust”), a Delaware statutory trust organized on March 10, 1999, is an open-end management investment company registered under the Investment Company Act of 1940, as amended (the “1940 Act”). As an investment company, the Trust follows the accounting and reporting guidance in Financial Accounting Standards Board (“FASB”) Accounting Standards Codification Topic 946, Financial Services – Investment Companies. These financial statements report on the Wells Fargo Capital Growth Fund (the “Fund”) which is a diversified series of the Trust.
Effective at the close of business on October 23, 2015, Investor Class shares became Class A shares in a tax-free conversion. Shareholders of Investor Class received Class A shares at a value equal to the value of their Investor Class shares immediately prior to the conversion. Investor Class shares are no longer offered by the Fund.
2. SIGNIFICANT ACCOUNTING POLICIES
The following significant accounting policies, which are consistently followed in the preparation of the financial statements of the Fund, are in conformity with U.S. generally accepted accounting principles which require management to make estimates and assumptions that affect the reported amounts of assets and liabilities, disclosure of contingent assets and liabilities at the date of the financial statements, and the reported amounts of revenues and expenses during the reporting period. Actual results could differ from those estimates.
Securities valuation
All investments are valued each business day as of the close of regular trading on the New York Stock Exchange (generally 4 p.m. Eastern Time).
Equity securities that are listed on a foreign or domestic exchange or market are valued at the official closing price or, if none, the last sales price. If no sale occurs on the primary exchange or market that day, the prior day’s price will be deemed “stale” and a fair value price will be determined in accordance with the Fund’s Valuation Procedures.
Investments in registered open-end investment companies are valued at net asset value. Interests in non-registered investment vehicles that are redeemable at net asset value are fair valued normally at net asset value.
Investments which are not valued using any of the methods discussed above are valued at their fair value, as determined in good faith by the Board of Trustees of the Fund. The Board of Trustees has established a Valuation Committee comprised of the Trustees and has delegated to it the authority to take any actions regarding the valuation of portfolio securities that the Valuation Committee deems necessary or appropriate, including determining the fair value of portfolio securities, unless the determination has been delegated to the Management Valuation Team of Wells Fargo Funds Management, LLC (“Funds Management”). The Board of Trustees retains the authority to make or ratify any valuation decisions or approve any changes to the Valuation Procedures as it deems appropriate. On a quarterly basis, the Board of Trustees receives reports on any valuation actions taken by the Valuation Committee or the Management Valuation Team which may include items for ratification.
Valuations of fair valued securities are compared to the next actual sales price when available, or other appropriate market values, to assess the continued appropriateness of the fair valuation methodologies used. These securities are fair valued on a day-to-day basis, taking into consideration changes to appropriate market information and any significant changes to the inputs considered in the valuation process until there is a readily available price provided on an exchange or by an independent pricing service. Valuations received from an independent pricing service or independent broker-dealer quotes are periodically validated by comparisons to most recent trades and valuations provided by other independent pricing services in addition to the review of prices by the manager and/or subadviser. Unobservable inputs used in determining fair valuations are identified based on the type of security, taking into consideration factors utilized by market participants in valuing the investment, knowledge about the issuer and the current market environment.
Security loans
The Fund may lend its securities from time to time in order to earn additional income in the form of fees or interest on securities received as collateral or the investment of any cash received as collateral. The Fund continues to receive interest or dividends on the securities loaned. The Fund receives collateral in the form of cash or securities with a value at least equal to the value of the securities on loan. The value of the loaned securities is determined at the close of each business day and any additional required collateral is delivered to the Fund on the next business day. In a securities lending transaction, the net asset value of the Fund will be affected by an increase or decrease in the value of the securities loaned and by an increase or decrease in the value of the instrument in which collateral is invested. The amount of securities lending activity undertaken by the Fund fluctuates from time to time. In the event of default or bankruptcy by the borrower, the Fund may be prevented from recovering the loaned securities or gaining access to the collateral or
| | | | | | |
| Notes to financial statements (unaudited) | | Wells Fargo Capital Growth Fund | | | 21 | |
may experience delays or costs in doing so. In addition, the investment of any cash collateral received may lose all or part of its value. The Fund has the right under the lending agreement to recover the securities from the borrower on demand.
The Fund lends its securities through an unaffiliated securities lending agent. Cash collateral received in connection with its securities lending transactions is invested in Securities Lending Cash Investments, LLC (the “Securities Lending Fund”). The Securities Lending Fund is exempt from registration under Section 3(c)(7) of the 1940 Act and is managed by Funds Management and is subadvised by Wells Capital Management Incorporated (“WellsCap”), an affiliate of Funds Management and an indirect wholly owned subsidiary of Wells Fargo & Company (“Wells Fargo”). Funds Management receives an advisory fee starting at 0.05% and declining to 0.01% as the average daily net assets of the Securities Lending Fund increase. All of the fees received by Funds Management are paid to WellsCap for its services as subadviser. The Securities Lending Fund seeks to provide a positive return compared to the daily Fed Funds Open rate by investing in high-quality, U.S. dollar-denominated short-term money market instruments. Securities Lending Fund investments are fair valued based upon the amortized cost valuation technique. Income earned from investment in the Securities Lending Fund is included in securities lending income on the Statement of Operations.
Security transactions and income recognition
Securities transactions are recorded on a trade date basis. Realized gains or losses are recorded on the basis of identified cost.
Dividend income is recognized on the ex-dividend date. Dividend Income is recorded net of foreign taxes withheld where recovery of such taxes is not assured.
Distributions to shareholders
Distributions to shareholders from net investment income and net realized gains, if any, are recorded on the ex-dividend date. Such distributions are determined in conformity with federal income tax regulations, which may differ in amount or character from net investment income and realized gains recognized for purposes of U.S. generally accepted accounting principles.
Federal and other taxes
The Fund intends to continue to qualify as a regulated investment company by distributing substantially all of its investment company taxable income and any net realized capital gains (after reduction for capital loss carryforwards) sufficient to relieve it from all, or substantially all, federal income taxes. Accordingly, no provision for federal income taxes was required.
The Fund’s income and federal excise tax returns and all financial records supporting those returns for the prior three fiscal years are subject to examination by the federal and Delaware revenue authorities. Management has analyzed the Fund’s tax positions taken on federal, state, and foreign tax returns for all open tax years and does not believe that there are any uncertain tax positions that require recognition of a tax liability.
As of July 31, 2015, the Fund had capital loss carryforwards available to offset future net realized capital gains in the amount of $1,125,140 expiring in 2016.
Class allocations
The separate classes of shares offered by the Fund differ principally in applicable sales charges, distribution, shareholder servicing, and administration fees. Class specific expenses are charged directly to that share class. Investment income, common expenses, and realized and unrealized gains (losses) on investments are allocated daily to each class of shares based on the relative proportion of net assets of each class.
3. FAIR VALUATION MEASUREMENTS
Fair value measurements of investments are determined within a framework that has established a fair value hierarchy based upon the various data inputs utilized in determining the value of the Fund’s investments. The three-level hierarchy gives the highest priority to unadjusted quoted prices in active markets for identical assets or liabilities (Level 1) and the lowest priority to significant unobservable inputs (Level 3). The Fund’s investments are classified within the fair value hierarchy based on the lowest level of input that is significant to the fair value measurement. The inputs are summarized into three broad levels as follows:
| n | | Level 1 – quoted prices in active markets for identical securities |
| n | | Level 2 – other significant observable inputs (including quoted prices for similar securities, interest rates, prepayment speeds, credit risk, use of amortized cost, etc.) |
| n | | Level 3 – significant unobservable inputs (including the Fund’s own assumptions in determining the fair value of investments) |
| | | | |
| 22 | | Wells Fargo Capital Growth Fund | | Notes to financial statements (unaudited) |
The inputs or methodologies used for valuing investments in securities are not necessarily an indication of the risk associated with investing in those securities.
The following is a summary of the inputs used in valuing the Fund’s assets and liabilities as of January 31, 2016:
| | | | | | | | | | | | | | | | |
| | | Quoted prices
(Level 1) | | | Other significant
observable inputs
(Level 2) | | | Significant
unobservable inputs
(Level 3) | | | Total | |
Assets | | | | | | | | | | | | | | | | |
Investments in: | | | | | | | | | | | | | | | | |
| | | | |
Common stocks | | | | | | | | | | | | | | | | |
Consumer discretionary | | $ | 66,841,319 | | | $ | 0 | | | $ | 0 | | | $ | 66,841,319 | |
Consumer staples | | | 32,655,862 | | | | 0 | | | | 0 | | | | 32,655,862 | |
Financials | | | 12,963,121 | | | | 0 | | | | 0 | | | | 12,963,121 | |
Health care | | | 43,622,307 | | | | 0 | | | | 0 | | | | 43,622,307 | |
Industrials | | | 11,503,708 | | | | 0 | | | | 0 | | | | 11,503,708 | |
Information technology | | | 92,676,469 | | | | 3,521,576 | | | | 0 | | | | 96,198,045 | |
Materials | | | 5,087,833 | | | | 0 | | | | 0 | | | | 5,087,833 | |
Telecommunication services | | | 9,196,520 | | | | 0 | | | | 0 | | | | 9,196,520 | |
| | | | |
Short-term investments | | | | | | | | | | | | | | | | |
Investment companies | | | 274,367 | | | | 0 | | | | 0 | | | | 274,367 | |
Investments measured at net asset value* | | | | | | | | | | | | | | | 1,896,300 | |
Total assets | | $ | 274,821,506 | | | $ | 3,521,576 | | | $ | 0 | | | $ | 280,239,382 | |
| * | Investments that are measured at fair value using the net asset value per share (or its equivalent) as a practical expedient have not been categorized in the fair value hierarchy. The fair value amount presented in the table is intended to permit reconciliation of the fair value hierarchy to the amounts presented in the Statement of Assets and Liabilities. The Fund’s investment in Securities Lending Cash Investments, LLC valued at $1,896,300 does not have a redemption period notice, can be redeemed daily and does not have any unfunded commitments. |
The Fund recognizes transfers between levels within the fair value hierarchy at the end of the reporting period. At January 31, 2016 common stocks with a market value of $3,521,576 were transferred from Level 1 to Level 2 because of a decrease in the market activity of these securities. The Fund did not have any transfers into/out of Level 3.
4. TRANSACTIONS WITH AFFILIATES AND OTHER EXPENSES
Management fee
Funds Management, an indirect wholly owned subsidiary of Wells Fargo, is the manager of the Fund and provides advisory and fund-level administrative services under an investment management agreement. Under the investment management agreement, Funds Management is responsible for, among other services, implementing the investment objectives and strategies of the Fund, supervising the applicable subadviser, providing fund-level administrative services in connection with the Fund’s operations, and providing any other fund-level administrative services reasonably necessary for the operation of the Fund. As compensation for its services under the investment management agreement, Funds Management is entitled to receive an annual management fee starting at 0.70% and declining to 0.505% as the average daily net assets of the Fund increase. For the six months ended January 31, 2016, the management fee was equivalent to an annual rate of 0.70% of the Fund’s average daily net assets.
Funds Management has retained the services of a subadviser to provide daily portfolio management to the Fund. The fee for subadvisory services is borne by Funds Management. WellsCap is the subadviser to the Fund and is entitled to receive a fee from Funds Management at an annual rate starting at 0.30% and declining to 0.20% as the average daily net assets of the Fund increase.
| | | | | | |
| Notes to financial statements (unaudited) | | Wells Fargo Capital Growth Fund | | | 23 | |
Administration fees
Under a class-level administration agreement, Funds Management provides class-level administrative services to the Fund, which includes paying fees and expenses for services provided by the transfer agent, sub-transfer agents, omnibus account servicers and record-keepers. As compensation for its services under the class-level administration agreement, Funds Management receives an annual fee which is calculated based on the average daily net assets of each class as follows:
| | | | | | |
| | | | | Class-level
administration fee | |
Class A, Class C | | | | | 0.21 | % |
Class R4 | | | | | 0.08 | |
Class R6 | | | | | 0.03 | |
Administrator Class, Institutional Class | | | | | 0.13 | |
Investor Class | | | | | 0.32 | |
Funds Management has contractually waived and/or reimbursed management and administration fees to the extent necessary to maintain certain net operating expense ratios for the Fund. Waiver of fees and/or reimbursement of expenses by Funds Management were made first from fund level expenses on a proportionate basis and then from class specific expenses. Funds Management has committed through November 30, 2016 to waive fees and/or reimburse expenses to the extent necessary to cap the Fund’s expenses at 1.11% for Class A shares, 1.86% for Class C shares, 0.75% for Class R4 shares, 0.60% for R6 shares, 0.94% for Administrator Class shares, and 0.70% for Institutional Class shares. After this time, the cap may be increased or the commitment to maintain the cap may be terminated only with the approval of the Board of Trustees. Prior to December 1, 2015, the Fund’s expenses were capped at 0.90% for Administrator Class shares, and 0.65% for Institutional Class shares.
Distribution fee
The Trust has adopted a distribution plan for Class C shares of the Fund pursuant to Rule 12b-1 under the 1940 Act. A distribution fee is charged to Class C shares and paid to Wells Fargo Funds Distributor, LLC (“Funds Distributor”), the principal underwriter, at an annual rate of 0.75% of the average daily net assets of Class C shares.
In addition, Funds Distributor is entitled to receive the front-end sales charge from the purchase of Class A shares and a contingent deferred sales charge on the redemption of certain shares. Funds Distributor is also entitled to receive the contingent deferred sales charges from redemptions of Class C shares. For the six months ended January 31, 2016, Funds Distributor received $1,550 from the sale of Class A shares.
Shareholder servicing fees
The Trust has entered into contracts with one or more shareholder servicing agents, whereby Class A, Class C, Administrator Class and Investor Class of the Fund are charged a fee at an annual rate of 0.25% of the average daily net assets of each respective class. Class R4 shares are charged a fee at an annual rate of 0.10% of its average daily net assets.
A portion of these total shareholder servicing fees were paid to affiliates of Wells Fargo.
5. INVESTMENT PORTFOLIO TRANSACTIONS
Purchases and sales of investments, excluding U.S. government obligations (if any) and short-term securities, for the six months ended January 31, 2016 were $145,892,526 and $153,543,561, respectively.
6. BANK BORROWINGS
The Trust (excluding the money market funds and certain other funds) and Wells Fargo Variable Trust are parties to a $200,000,000 revolving credit agreement whereby the Fund is permitted to use bank borrowings for temporary or emergency purposes, such as to fund shareholder redemption requests. Interest under the credit agreement is charged to the Fund based on a borrowing rate equal to the higher of the Federal Funds rate in effect on that day plus 1.25% or the overnight LIBOR rate in effect on that day plus 1.25%. In addition, an annual commitment fee equal to 0.20% of the unused balance is allocated to each participating fund. Prior to September 1, 2015, the revolving credit agreement amount was $150,000,000 and the annual commitment fee was equal to 0.10% of the unused balance which was allocated to each participating fund. For the six months ended January 31, 2016, the Fund paid $498 in commitment fees.
For the six months ended January 31, 2016, there were no borrowings by the Fund under the agreement.
| | | | |
| 24 | | Wells Fargo Capital Growth Fund | | Notes to financial statements (unaudited) |
7. CONCENTRATION RISK
Concentration risks result from exposure to a limited number of sectors. A fund that invests a substantial portion of its assets in any sector may be more affected by changes in that sector than would be a fund whose investments are not heavily weighted in any sector.
8. INDEMNIFICATION
Under the Trust’s organizational documents, the officers and Trustees have been granted certain indemnification rights against certain liabilities that may arise out of performance of their duties to the Trust. Additionally, in the normal course of business, the Trust may enter into contracts with service providers that contain a variety of indemnification clauses. The Trust’s maximum exposure under these arrangements is dependent on future claims that may be made against the Fund and, therefore, cannot be estimated.
| | | | | | |
| Other information (unaudited) | | Wells Fargo Capital Growth Fund | | | 25 | |
PROXY VOTING INFORMATION
A description of the policies and procedures that the Fund uses to determine how to vote proxies relating to portfolio securities is available, upon request, by calling 1-800-222-8222, visiting our website at wellsfargofunds.com, or visiting the SEC website at sec.gov. Information regarding how the Fund voted proxies relating to portfolio securities during the most recent 12-month period ended June 30 is available on the Fund’s website at wellsfargofunds.com or by visiting the SEC website at sec.gov.
PORTFOLIO HOLDINGS INFORMATION
The complete portfolio holdings for the Fund are publicly available monthly on the Fund’s website (wellsfargofunds.com), on a one-month delayed basis. In addition, top ten holdings information (excluding derivative positions) for the Fund is publicly available on the Fund’s website on a monthly, seven-day or more delayed basis. The Fund files its complete schedule of portfolio holdings with the SEC for the first and third quarters of each fiscal year on Form N-Q, which is available by visiting the SEC website at sec.gov. In addition, the Fund’s Form N-Q may be reviewed and copied at the SEC’s Public Reference Room in Washington, DC, and at regional offices in New York City, at 233 Broadway, and in Chicago, at 175 West Jackson Boulevard, Suite 900. Information about the Public Reference Room may be obtained by calling 1-800-SEC-0330.
| | | | |
| 26 | | Wells Fargo Capital Growth Fund | | Other information (unaudited) |
BOARD OF TRUSTEES AND OFFICERS
Each of the Trustees and Officers1 listed in the table below acts in identical capacities for each fund in the Wells Fargo family of funds, which consists of 144 mutual funds comprising the Wells Fargo Funds Trust, Wells Fargo Variable Trust, Wells Fargo Master Trust and four closed-end funds (collectively the “Fund Complex”). This table should be read in conjunction with the Prospectus and the Statement of Additional Information2. The mailing address of each Trustee and Officer is 525 Market Street, 12th Floor, San Francisco, CA 94105. Each Trustee and Officer serves an indefinite term, however, each Trustee serves such term until reaching the mandatory retirement age established by the Trustees.
Independent Trustees
| | | | | | |
Name and
year of birth | | Position held and length of service* | | Principal occupations during past five years or longer | | Current other public company or
investment company
directorships |
| William R. Ebsworth (Born 1957) | | Trustee, since 2015 | | Retired. From 1984 to 2013, equities analyst, portfolio manager, research director and chief financial officer at Fidelity Management and Research Company in Boston, Tokyo, and Hong Kong and retired in 2013 as Chief Investment Officer of Fidelity Strategic Advisers, Inc. where he lead a team of investment professionals managing client assets. Prior thereto, Board member of Hong Kong Securities Clearing Co., Hong Kong Options Clearing Corp., the Thailand International Fund, Ltd., Fidelity Investments Life Insurance Company, and Empire Fidelity Investments Life Insurance Company. Mr. Ebsworth is a CFA® charterholder and an Adjunct Lecturer, Finance, at Babson College. | | Asset Allocation Trust |
| Jane A. Freeman (Born 1953) | | Trustee, since 2015 | | Retired. From 2012 to 2014 and 1999 to 2008, Chief Financial Officer of Scientific Learning Corporation. From 2008 to 2012, Ms. Freeman provided consulting services related to strategic business projects. Prior to 1999, Portfolio Manager at Rockefeller & Co. and Scudder, Stevens & Clark. Board member of the Harding Loevner Funds from 1996 to 2014, serving as both Lead Independent Director and chair of the Audit Committee. Board member of the Russell Exchange Traded Funds Trust from 2011 to 2012 and the chair of the Audit Committee. Ms. Freeman is Chair of Taproot Foundation (non-profit organization), a Board Member of Ruth Bancroft Garden (non-profit organization) and an inactive chartered financial analyst. | | Asset Allocation Trust |
| Peter G. Gordon (Born 1942) | | Trustee, since 1998; Chairman, since 2005 | | Co-Founder, Retired Chairman, President and CEO of Crystal Geyser Water Company. Trustee Emeritus, Colby College. | | Asset Allocation Trust |
| Isaiah Harris, Jr. (Born 1952) | | Trustee, since 2009 | | Retired. Chairman of the Board of CIGNA Corporation since 2009, and Director since 2005. From 2003 to 2011, Director of Deluxe Corporation. Prior thereto, President and CEO of BellSouth Advertising and Publishing Corp. from 2005 to 2007, President and CEO of BellSouth Enterprises from 2004 to 2005 and President of BellSouth Consumer Services from 2000 to 2003. Emeritus member of the Iowa State University Foundation Board of Governors. Emeritus Member of the Advisory Board of Iowa State University School of Business. Advisory Board Member, Palm Harbor Academy (charter school). Advisory Board Member, Child Evangelism Fellowship (non-profit). Mr. Harris is a certified public accountant (inactive status). | | CIGNA Corporation; Asset Allocation Trust |
| Judith M. Johnson (Born 1949) | | Trustee, since 2008; Audit Committee Chairman, since 2008 | | Retired. Prior thereto, Chief Executive Officer and Chief Investment Officer of Minneapolis Employees Retirement Fund from 1996 to 2008. Ms. Johnson is an attorney, certified public accountant and a certified managerial accountant. | | Asset Allocation Trust |
| David F. Larcker (Born 1950) | | Trustee, since 2009 | | James Irvin Miller Professor of Accounting at the Graduate School of Business, Stanford University, Director of the Corporate Governance Research Initiative and Senior Faculty of The Rock Center for Corporate Governance since 2006. From 2005 to 2008, Professor of Accounting at the Graduate School of Business, Stanford University. Prior thereto, Ernst & Young Professor of Accounting at The Wharton School, University of Pennsylvania from 1985 to 2005. | | Asset Allocation Trust |
| | | | | | |
| Other information (unaudited) | | Wells Fargo Capital Growth Fund | | | 27 | |
| | | | | | |
Name and
year of birth | | Position held and length of service* | | Principal occupations during past five years or longer | | Current other public company or
investment company
directorships |
| Olivia S. Mitchell (Born 1953) | | Trustee, since 2006 | | International Foundation of Employee Benefit Plans Professor, Wharton School of the University of Pennsylvania since 1993. Director of Wharton’s Pension Research Council and Boettner Center on Pensions & Retirement Research, and Research Associate at the National Bureau of Economic Research. Previously, Cornell University Professor from 1978 to 1993. | | Asset Allocation Trust |
| Timothy J. Penny (Born 1951) | | Trustee, since 1996 | | President and Chief Executive Officer of Southern Minnesota Initiative Foundation, a non-profit organization, since 2007 and Senior Fellow at the Humphrey Institute Policy Forum at the University of Minnesota since 1995. Member of the Board of Trustees of NorthStar Education Finance, Inc., a non-profit organization, since 2007. | | Asset Allocation Trust |
| Michael S. Scofield (Born 1943) | | Trustee, since 2010 | | Served on the Investment Company Institute’s Board of Governors and Executive Committee from 2008-2011 as well the Governing Council of the Independent Directors Council from 2006-2011 and the Independent Directors Council Executive Committee from 2008-2011. Chairman of the IDC from 2008-2010. Institutional Investor (Fund Directions) Trustee of Year in 2007. Trustee of the Evergreen Funds complex (and its predecessors) from 1984 to 2010. Chairman of the Evergreen Funds from 2000-2010. Former Trustee of the Mentor Funds. Retired Attorney, Law Offices of Michael S. Scofield. | | Asset Allocation Trust |
| * | Length of service dates reflect the Trustee’s commencement of service with the Trust’s predecessor entities, where applicable. |
Officers
| | | | | | |
Name and year of birth | | Position held and length of service | | Principal occupations during past five years or longer | | |
| Karla M. Rabusch (Born 1959) | | President, since 2003 | | Executive Vice President of Wells Fargo Bank, N.A. and President of Wells Fargo Funds Management, LLC since 2003. | | |
| Jeremy DePalma1 (Born 1974) | | Treasurer, since 2012; Assistant Treasurer, since 2009 | | Senior Vice President of Wells Fargo Funds Management, LLC since 2009. Senior Vice President of Evergreen Investment Management Company, LLC from 2008 to 2010 and head of the Fund Reporting and Control Team within Fund Administration from 2005 to 2010. | | |
| C. David Messman (Born 1960) | | Secretary, since 2000; Chief Legal Officer, since 2003 | | Senior Vice President and Secretary of Wells Fargo Funds Management, LLC since 2001. Assistant General Counsel of Wells Fargo Bank, N.A. since 2013 and Vice President and Managing Counsel of Wells Fargo Bank, N.A. from 1996 to 2013. | | |
| Debra Ann Early (Born 1964) | | Chief Compliance Officer, since 2007 | | Executive Vice President of Wells Fargo Funds Management, LLC since 2014, Senior Vice President and Chief Compliance Officer from 2007 to 2014. | | |
David Berardi
(Born 1975) | | Assistant Treasurer, since 2009 | | Vice President of Wells Fargo Funds Management, LLC since 2009. Vice President of Evergreen Investment Management Company, LLC from 2008 to 2010. Manager of Fund Reporting and Control for Evergreen Investment Management Company, LLC from 2004 to 2010. | | |
| 1 | Jeremy DePalma acts as Treasurer of 72 funds and Assistant Treasurer of 72 funds in the Fund Complex. |
| 2 | The Statement of Additional Information includes additional information about the Trustees and is available, without charge, upon request, by calling 1-800-222-8222 or by visiting the website at wellsfargofunds.com. |
| | | | |
| 28 | | Wells Fargo Capital Growth Fund | | List of abbreviations |
The following is a list of common abbreviations for terms and entities that may have appeared in this report.
| ACA | — ACA Financial Guaranty Corporation |
| ADR | — American depositary receipt |
| ADS | — American depositary shares |
| AGC | — Assured Guaranty Corporation |
| AGM | — Assured Guaranty Municipal |
| Ambac | — Ambac Financial Group Incorporated |
| AMT | — Alternative minimum tax |
| BAN | — Bond anticipation notes |
| BHAC | — Berkshire Hathaway Assurance Corporation |
| CAB | — Capital appreciation bond |
| CCAB | — Convertible capital appreciation bond |
| CDA | — Community Development Authority |
| CDO | — Collateralized debt obligation |
| DRIVER | — Derivative inverse tax-exempt receipts |
| DW&P | — Department of Water & Power |
| DWR | — Department of Water Resources |
| ECFA | — Educational & Cultural Facilities Authority |
| EDA | — Economic Development Authority |
| EDFA | — Economic Development Finance Authority |
| ETF | — Exchange-traded fund |
| FDIC | — Federal Deposit Insurance Corporation |
| FFCB | — Federal Farm Credit Banks |
| FGIC | — Financial Guaranty Insurance Corporation |
| FHA | — Federal Housing Administration |
| FHLB | — Federal Home Loan Bank |
| FHLMC | — Federal Home Loan Mortgage Corporation |
| FICO | — The Financing Corporation |
| FNMA | — Federal National Mortgage Association |
| GDR | — Global depositary receipt |
| GNMA | — Government National Mortgage Association |
| HCFR | — Healthcare facilities revenue |
| HEFA | — Health & Educational Facilities Authority |
| HEFAR | — Higher education facilities authority revenue |
| HFA | — Housing Finance Authority |
| HFFA | — Health Facilities Financing Authority |
| HUD | — Department of Housing and Urban Development |
| IDA | — Industrial Development Authority |
| IDAG | — Industrial Development Agency |
| KRW | — Republic of Korea won |
| LIBOR | — London Interbank Offered Rate |
| LIFER | — Long Inverse Floating Exempt Receipts |
| LLC | — Limited liability company |
| LLLP | — Limited liability limited partnership |
| LLP | — Limited liability partnership |
| MBIA | — Municipal Bond Insurance Association |
| MFHR | — Multifamily housing revenue |
| MSTR | — Municipal securities trust receipts |
| MUD | — Municipal Utility District |
| National | — National Public Finance Guarantee Corporation |
| PCFA | — Pollution Control Financing Authority |
| PCL | — Public Company Limited |
| PCR | — Pollution control revenue |
| PFA | — Public Finance Authority |
| PFFA | — Public Facilities Financing Authority |
| PFOTER | — Puttable floating option tax-exempt receipts |
| plc | — Public limited company |
| PUTTER | — Puttable tax-exempt receipts |
| R&D | — Research & development |
| Radian | — Radian Asset Assurance |
| RAN | — Revenue anticipation notes |
| RDA | — Redevelopment Authority |
| RDFA | — Redevelopment Finance Authority |
| REIT | — Real estate investment trust |
| ROC | — Reset option certificates |
| SAVRS | — Select auction variable rate securities |
| SBA | — Small Business Authority |
| SDR | — Swedish depositary receipt |
| SFHR | — Single-family housing revenue |
| SFMR | — Single-family mortgage revenue |
| SPA | — Standby purchase agreement |
| SPDR | — Standard & Poor’s Depositary Receipts |
| SPEAR | — Short Puttable Exempt Adjustable Receipts |
| STRIPS | — Separate trading of registered interest and |
| TAN | — Tax anticipation notes |
| TIPS | — Treasury inflation-protected securities |
| TRAN | — Tax revenue anticipation notes |
| TTFA | — Transportation Trust Fund Authority |
| TVA | — Tennessee Valley Authority |

For more information
More information about Wells Fargo Funds is available free upon request. To obtain literature, please write, email, visit the Fund’s website, or call:
Wells Fargo Funds
P.O. Box 8266
Boston, MA 02266-8266
Email: fundservice@wellsfargo.com
Website: wellsfargofunds.com
Individual investors: 1-800-222-8222
Retail investment professionals: 1-888-877-9275
Institutional investment professionals: 1-866-765-0778
This report and the financial statements contained herein are submitted for the general information of the shareholders of the Fund. If this report is used for promotional purposes, distribution of the report must be accompanied or preceded by a current prospectus. Before investing, please consider the investment objectives, risks, charges, and expenses of the investment. For a current prospectus and, if available, a summary prospectus, containing this information, call 1-800-222-8222 or visit the Fund’s website at wellsfargofunds.com. Read the prospectus carefully before you invest or send money.
Wells Fargo Asset Management (WFAM) is a trade name used by the asset management businesses of Wells Fargo & Company. Wells Fargo Funds Management, LLC, a wholly owned subsidiary of Wells Fargo & Company, provides investment advisory and administrative services for Wells Fargo Funds. Other affiliates of Wells Fargo & Company provide subadvisory and other services for the funds. The funds are distributed by Wells Fargo Funds Distributor, LLC, Member FINRA, an affiliate of Wells Fargo & Company.
NOT FDIC INSURED ¡ NO BANK GUARANTEE ¡ MAY LOSE VALUE
© 2016 Wells Fargo Funds Management, LLC. All rights reserved.
| | |
 | | 240793 03-16 SA200/SAR200 01-16 |
Semi-Annual Report
January 31, 2016

Wells Fargo Disciplined U.S. Core Fund


Reduce clutter. Save trees.
Sign up for electronic delivery of prospectuses and shareholder reports at wellsfargo.com/advantagedelivery
Contents
The views expressed and any forward-looking statements are as of January 31, 2016, unless otherwise noted, and are those of the Fund managers and/or Wells Fargo Funds Management, LLC. Discussions of individual securities, or the markets generally, or any Wells Fargo Fund are not intended as individual recommendations. Future events or results may vary significantly from those expressed in any forward-looking statements. The views expressed are subject to change at any time in response to changing circumstances in the market. Wells Fargo Funds Management, LLC and the Fund disclaim any obligation to publicly update or revise any views expressed or forward-looking statements.
NOT FDIC INSURED ¡ NO BANK GUARANTEE ¡ MAY LOSE VALUE
| | | | |
| 2 | | Wells Fargo Disciplined U.S. Core Fund | | Letter to shareholders (unaudited) |

Karla M. Rabusch
President
Wells Fargo Funds
Despite generally improving U.S. economic data, ongoing global turmoil tempered U.S. economic growth during the period as many economies and markets outside the U.S. faced ongoing challenges.
Dear Valued Shareholder:
We are pleased to offer you this semi-annual report for the Wells Fargo Disciplined U.S. Core Fund for the six-month period that ended January 31, 2016. Despite generally improving U.S. economic data, ongoing global turmoil tempered U.S. economic growth during the period as many economies and markets outside the U.S. faced continuing challenges. In this environment, the broad U.S. stock market experienced heightened volatility and ultimately fell 5.64% overall for the six-month period (as measured by the Russell 3000® Index,1 which is the index used to measure U.S. stock market performance throughout this letter).
As the reporting period began, China’s slowdown continued to take a toll on U.S. and international markets.
The U.S. stock market declined 6.04% and 2.91% in August and September 2015, respectively, as investors worried about the impact on the U.S. of China’s slowing growth. A number of positive economic indicators released during these months suggested the U.S. economy remained solid. However, the strengthening U.S. dollar coupled with ongoing global economic turmoil continued to hinder the economy. Although many investors believed the U.S. Federal Reserve (Fed) would raise the federal funds rate during the third quarter of 2015, at its September 2015 meeting the Fed left the rate unchanged. This decision fueled uncertainty about the U.S. economy’s stamina to remain healthy while facing the negative effects of troubles elsewhere in the world. One week later, Fed Chair Janet Yellen reassured investors that, barring unpleasant surprises, the Fed still intended to raise the rate in 2015. International markets were more volatile than the domestic market and delivered even weaker results in August and September. Investors’ anxiety was driven largely by China’s weakened economy. Because China is the world’s largest importer of many commodities, a number of emerging markets—key commodities exporters—struggled under the strains of reduced demand for commodities and lower prices for the commodities sold.
The U.S. stock market delivered a positive result overall for the last three months of 2015 despite ongoing concerns.
The broad U.S. stock market fluctuated widely in the fourth quarter of 2015, rising 7.90% in October and 0.55% in November before falling 2.05% in December, for an overall quarterly return of 6.27%. Stock markets outside the U.S. generally failed to keep pace with the domestic market as economic concerns, including China’s ongoing slowdown, continued to affect many countries worldwide. U.S. economic data released during the quarter indicated the economy remained solid, with modest growth. However, the strong U.S. dollar and global economic turmoil continued their drag on the economy. In December, the Fed, as expected, slightly raised its target short-term interest rate to between 0.25% and 0.50% after keeping it near zero for seven years. The move, which had been well telegraphed by the Fed for months, reflected confidence in the U.S. economy’s ability to stay healthy with less central-bank support. The Fed also made clear that future interest-rate increases will be gradual.
U.S. stocks struggled in January 2016.
The broad U.S. stock market dropped 5.64% for the month, weighed down by ongoing concerns about heightened market volatility, the continued plunge in oil prices, and the impact of weak global growth on U.S. companies. The U.S. economy, however, remained resilient in January—with continued solid hiring, a
| 1 | The Russell 3000® Index measures the performance of the 3,000 largest U.S. companies based on total market capitalization, which represents approximately 98% of the investable U.S. equity market. You cannot invest directly in an index. |
| | | | | | |
| Letter to shareholders (unaudited) | | Wells Fargo Disciplined U.S. Core Fund | | | 3 | |
reduction in the jobless rate to 4.9%, and signs of an uptick in the pace of wage growth—despite some warning signs that became evident in recent months, such as weaknesses in manufacturing and business growth.
Don’t let short-term uncertainty derail long-term investment goals.
Periods of uncertainty can present challenges, but experience has taught us that maintaining long-term investment goals can be an effective way to plan for the future. To help you create a sound strategy based on your personal goals and risk tolerance, Wells Fargo Funds offers more than 100 mutual funds spanning a wide range of asset classes and investment styles. Although diversification cannot guarantee an investment profit or prevent losses, we believe it can be an effective way to manage investment risk and potentially smooth out overall portfolio performance. We encourage investors to know their investments and to understand that appropriate levels of risk-taking may unlock opportunities.
Thank you for choosing to invest in Wells Fargo Funds. We appreciate your confidence in us and remain committed to helping you meet your financial needs.
Sincerely,

Karla M. Rabusch
President
Wells Fargo Funds
Although diversification cannot guarantee an investment profit or prevent losses, we believe it can be an effective way to manage investment risk and potentially smooth out overall portfolio performance.
For further information about your Fund, contact your investment professional, visit our website at wellsfargofunds.com, or call us directly at 1-800-222-8222. We are available 24 hours a day, 7 days a week.
| | | | |
| 4 | | Wells Fargo Disciplined U.S. Core Fund | | Performance highlights (unaudited) |
Investment objective
The Fund seeks long-term capital appreciation.
Manager
Wells Fargo Funds Management, LLC
Subadviser
Golden Capital Management, LLC
Portfolio managers
Greg Golden, CFA®
Average annual total returns (%) as of January 31, 20161
| | | | | | | | | | | | | | | | | | | | | | | | | | | | | | | | | | |
| | | | | Including sales charge | | | Excluding sales charge | | | Expense ratios2 (%) | |
| | | Inception date | | 1 year | | | 5 year | | | 10 year | | | 1 year | | | 5 year | | | 10 year | | | Gross | | | Net3 | |
| Class A (EVSAX) | | 2-28-1990 | | | (6.22 | ) | | | 10.16 | | | | 6.02 | | | | (0.47 | ) | | | 11.47 | | | | 6.65 | | | | 0.84 | | | | 0.84 | |
| Class C (EVSTX) | | 6-30-1999 | | | (2.16 | ) | | | 10.65 | | | | 5.86 | | | | (1.16 | ) | | | 10.65 | | | | 5.86 | | | | 1.59 | | | | 1.59 | |
| Class R (EVSHX) | | 9-30-2015 | | | – | | | | – | | | | – | | | | (0.68 | ) | | | 11.17 | | | | 6.34 | | | | 1.09 | | | | 1.09 | |
| Class R6 (EVSRX) | | 9-30-2015 | | | – | | | | – | | | | – | | | | 0.01 | | | | 11.95 | | | | 7.03 | | | | 0.41 | | | | 0.41 | |
| Administrator Class (EVSYX) | | 2-21-1995 | | | – | | | | – | | | | – | | | | (0.28 | ) | | | 11.66 | | | | 6.87 | | | | 0.76 | | | | 0.74 | |
| Institutional Class (EVSIX) | | 7-30-2010 | | | – | | | | – | | | | – | | | | (0.02 | ) | | | 11.95 | | | | 7.02 | | | | 0.51 | | | | 0.48 | |
| S&P 500 Index4 | | – | | | – | | | | – | | | | – | | | | (0.67 | ) | | | 10.91 | | | | 6.48 | | | | – | | | | – | |
Figures quoted represent past performance, which is no guarantee of future results, and do not reflect taxes that a shareholder may pay on fund distributions or the redemption of fund shares. Investment return and principal value of an investment will fluctuate so that an investor’s shares, when redeemed, may be worth more or less than their original cost. Performance shown without sales charges would be lower if sales charges were reflected. Current performance may be lower or higher than the performance data quoted, which assumes the reinvestment of dividends and capital gains. Current month-end performance is available on the Fund’s website, wellsfargofunds.com.
Index returns do not include transaction costs associated with buying and selling securities, any mutual fund fees or expenses, or any taxes. It is not possible to invest directly in an index.
For Class A shares, the maximum front-end sales charge is 5.75%. For Class C shares, the maximum contingent deferred sales charge is 1.00%. Performance including a contingent deferred sales charge assumes the sales charge for the corresponding time period. Class R, Class R6, Administrator Class and Institutional Class shares are sold without a front-end sales charge or contingent deferred sales charge.
Stock values fluctuate in response to the activities of individual companies and general market and economic conditions. The use of derivatives may reduce returns and/or increase volatility. Consult the Fund’s prospectus for additional information on these and other risks.
Please see footnotes on page 5.
| | | | | | |
| Performance highlights (unaudited) | | Wells Fargo Disciplined U.S. Core Fund | | | 5 | |
| | | | |
| Ten largest holdings (%) as of January 31, 20165 | |
Apple Incorporated | | | 3.76 | |
Microsoft Corporation | | | 3.05 | |
Exxon Mobil Corporation | | | 2.56 | |
Johnson & Johnson | | | 2.45 | |
Pfizer Incorporated | | | 1.80 | |
Chevron Corporation | | | 1.62 | |
The Home Depot Incorporated | | | 1.60 | |
Intel Corporation | | | 1.60 | |
JPMorgan Chase & Company | | | 1.58 | |
Alphabet Incorporated Class C | | | 1.57 | |
|
| Sector distribution as of January 31, 20166 |
|
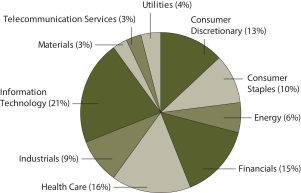 |
| 1 | Historical performance shown for Class R shares prior to their inception reflects the performance of Administrator Class shares, adjusted to reflect higher expenses applicable to Class R shares. Historical performance shown for Class R6 shares prior to their inception reflects the performance of Institutional Class shares, and includes the higher expenses applicable to Institutional Class shares. If these expenses had not been included, returns would be higher. Historical performance shown for Institutional Class shares prior to their inception reflects the performance of Administrator Class shares, and includes the higher expenses applicable to Administrator Class shares. If these expenses had not been included, returns would be higher. Historical performance shown for all classes of the Fund prior to July 19, 2010, is based on the performance of the Fund’s predecessor, Evergreen Enhanced S&P 500 Fund. |
| 2 | Reflects the expense ratios as stated in the most recent prospectuses. The expense ratios shown are subject to change and may differ from the annualized expense ratios shown in the financial highlights of this report. |
| 3 | The manager has contractually committed through November 30, 2016, to waive fees and/or reimburse expenses to the extent necessary to cap the Fund’s Total Annual Fund Operating Expenses After Fee Waiver at 0.92% for Class A, 1.67% for Class C, 1.17% for Class R, 0.43% for Class R6, 0.74% for Administrator Class, and 0.48% for Institutional Class. After this time, the cap may be increased or the commitment to maintain the cap may be terminated only with the approval of the Board of Trustees. Brokerage commissions, stamp duty fees, interest, taxes, acquired fund fees and expenses, and extraordinary expenses are excluded from the cap. Without this cap, the Fund’s returns would have been lower. |
| 4 | The S&P 500 Index consists of 500 stocks chosen for market size, liquidity, and industry group representation. It is a market-value weighted index with each stock’s weight in the index proportionate to its market value. You cannot invest directly in an index. |
| 5 | The ten largest holdings, excluding cash and cash equivalents, are calculated based on the value of the investments divided by total net assets of the Fund. Holdings are subject to change and may have changed since the date specified. |
| 6 | Amounts are calculated based on the total long-term investments of the Fund. These amounts are subject to change and may have changed since the date specified. |
| | | | |
| 6 | | Wells Fargo Disciplined U.S. Core Fund | | Fund expenses (unaudited) |
As a shareholder of the Fund, you incur two types of costs: (1) transaction costs, including sales charges (loads) on purchase payments and contingent deferred sales charges (if any) on redemptions and (2) ongoing costs, including management fees, distribution (12b-1) and/or shareholder servicing fees, and other Fund expenses. This example is intended to help you understand your ongoing costs (in dollars) of investing in the Fund and to compare these costs with the ongoing costs of investing in other mutual funds.
The example is based on an investment of $1,000 invested at the beginning of the six-month period and held for the entire period from August 1, 2015 to January 31, 2016.
Actual expenses
The “Actual” line of the table below provides information about actual account values and actual expenses. You may use the information in this line, together with the amount you invested, to estimate the expenses that you paid over the period. Simply divide your account value by $1,000 (for example, an $8,600 account value divided by $1,000 = 8.6), then multiply the result by the number in the “Actual” line under the heading entitled “Expenses paid during period” for your applicable class of shares to estimate the expenses you paid on your account during this period.
Hypothetical example for comparison purposes
The “Hypothetical” line of the table below provides information about hypothetical account values and hypothetical expenses based on the Fund’s actual expense ratio and an assumed rate of return of 5% per year before expenses, which is not the Fund’s actual return. The hypothetical account values and expenses may not be used to estimate the actual ending account balance or expenses you paid for the period. You may use this information to compare the ongoing costs of investing in the Fund and other funds. To do so, compare this 5% hypothetical example with the 5% hypothetical examples that appear in the shareholder reports of the other funds.
Please note that the expenses shown in the table are meant to highlight your ongoing costs only and do not reflect any transactional costs, such as sales charges (loads) and contingent deferred sales charges. Therefore, the “Hypothetical” line of the table is useful in comparing ongoing costs only and will not help you determine the relative total costs of owning different funds. In addition, if these transactional costs were included, your costs would have been higher.
| | | | | | | | | | | | | | | | |
| | | Beginning
account value
8-1-2015 | | | Ending
account value
1-31-2016 | | | Expenses
paid during
the period¹ | | | Net annualized
expense ratio | |
Class A | | | | | | | | | | | | | | | | |
Actual | | $ | 1,000.00 | | | $ | 935.39 | | | $ | 4.23 | | | | 0.87 | % |
Hypothetical (5% return before expenses) | | $ | 1,000.00 | | | $ | 1,020.76 | | | $ | 4.42 | | | | 0.87 | % |
Class C | | | | | | | | | | | | | | | | |
Actual | | $ | 1,000.00 | | | $ | 932.46 | | | $ | 7.87 | | | | 1.62 | % |
Hypothetical (5% return before expenses) | | $ | 1,000.00 | | | $ | 1,016.99 | | | $ | 8.21 | | | | 1.62 | % |
Class R | | | | | | | | | | | | | | | | |
Actual | | $ | 1,000.00 | | | $ | 934.85 | | | $ | 5.40 | | | | 1.11 | % |
Hypothetical (5% return before expenses) | | $ | 1,000.00 | | | $ | 1,019.56 | | | $ | 5.63 | | | | 1.11 | % |
Class R6 | | | | | | | | | | | | | | | | |
Actual | | $ | 1,000.00 | | | $ | 937.57 | | | $ | 2.09 | | | | 0.43 | % |
Hypothetical (5% return before expenses) | | $ | 1,000.00 | | | $ | 1,022.97 | | | $ | 2.19 | | | | 0.43 | % |
Administrator Class | | | | | | | | | | | | | | | | |
Actual | | $ | 1,000.00 | | | $ | 936.57 | | | $ | 3.60 | | | | 0.74 | % |
Hypothetical (5% return before expenses) | | $ | 1,000.00 | | | $ | 1,021.42 | | | $ | 3.76 | | | | 0.74 | % |
Institutional Class | | | | | | | | | | | | | | | | |
Actual | | $ | 1,000.00 | | | $ | 937.26 | | | $ | 2.34 | | | | 0.48 | % |
Hypothetical (5% return before expenses) | | $ | 1,000.00 | | | $ | 1,022.72 | | | $ | 2.44 | | | | 0.48 | % |
| 1 | Expenses paid is equal to the annualized expense ratio of each class multiplied by the average account value over the period, multiplied by the number of days in the most recent fiscal half-year divided by the number of days in the fiscal year (to reflect the one-half-year period). |
| | | | | | |
| Portfolio of investments—January 31, 2016 (unaudited) | | Wells Fargo Disciplined U.S. Core Fund | | | 7 | |
| | | | | | | | | | | | |
| Security name | | | | | | Shares | | | Value | |
| | | | |
Common Stocks: 98.08% | | | | | | | | | | | | |
| | | | |
Consumer Discretionary: 13.08% | | | | | | | | | | | | |
| | | | |
| Auto Components: 0.18% | | | | | | | | | | | | |
The Goodyear Tire & Rubber Company | | | | | | | 32,560 | | | $ | 925,030 | |
| | | | | | | | | | | | |
| | | | |
| Automobiles: 1.75% | | | | | | | | | | | | |
Ford Motor Company | | | | | | | 394,087 | | | | 4,705,399 | |
General Motors Company | | | | | | | 146,746 | | | | 4,349,551 | |
| | | | |
| | | | | | | | | | | 9,054,950 | |
| | | | | | | | | | | | |
| | | | |
| Diversified Consumer Services: 0.35% | | | | | | | | | | | | |
H&R Block Incorporated | | | | | | | 52,934 | | | | 1,802,403 | |
| | | | | | | | | | | | |
| | | | |
| Hotels, Restaurants & Leisure: 2.60% | | | | | | | | | | | | |
Carnival Corporation | | | | | | | 88,695 | | | | 4,268,890 | |
Darden Restaurants Incorporated | | | | | | | 64,231 | | | | 4,050,407 | |
Starbucks Corporation | | | | | | | 84,765 | | | | 5,151,169 | |
| | | | |
| | | | | | | | | | | 13,470,466 | |
| | | | | | | | | | | | |
| | | | |
| Household Durables: 0.18% | | | | | | | | | | | | |
D.R. Horton Incorporated | | | | | | | 34,111 | | | | 938,394 | |
| | | | | | | | | | | | |
| | | | |
| Internet & Catalog Retail: 0.77% | | | | | | | | | | | | |
Amazon.com Incorporated † | | | | | | | 4,746 | | | | 2,785,902 | |
Expedia Incorporated | | | | | | | 12,110 | | | | 1,223,594 | |
| | | | |
| | | | | | | | | | | 4,009,496 | |
| | | | | | | | | | | | |
| | | | |
| Media: 2.50% | | | | | | | | | | | | |
Comcast Corporation Class A | | | | | | | 120,742 | | | | 6,726,537 | |
The Walt Disney Company | | | | | | | 64,916 | | | | 6,220,251 | |
| | | | |
| | | | | | | | | | | 12,946,788 | |
| | | | | | | | | | | | |
| | | | |
| Multiline Retail: 0.98% | | | | | | | | | | | | |
Target Corporation | | | | | | | 70,122 | | | | 5,078,235 | |
| | | | | | | | | | | | |
| | | | |
| Specialty Retail: 3.41% | | | | | | | | | | | | |
Best Buy Company Incorporated | | | | | | | 54,937 | | | | 1,534,390 | |
GameStop Corporation Class A « | | | | | | | 38,691 | | | | 1,014,091 | |
Lowe’s Companies Incorporated | | | | | | | 76,313 | | | | 5,468,590 | |
Staples Incorporated | | | | | | | 153,982 | | | | 1,373,519 | |
The Home Depot Incorporated | | | | | | | 65,881 | | | | 8,285,195 | |
| | | | |
| | | | | | | | | | | 17,675,785 | |
| | | | | | | | | | | | |
| | | | |
| Textiles, Apparel & Luxury Goods: 0.36% | | | | | | | | | | | | |
Nike Incorporated Class B | | | | | | | 30,289 | | | | 1,878,222 | |
| | | | | | | | | | | | |
| | | | |
Consumer Staples: 9.65% | | | | | | | | | | | | |
| | | | |
| Beverages: 2.59% | | | | | | | | | | | | |
Dr Pepper Snapple Group Incorporated | | | | | | | 46,948 | | | | 4,405,600 | |
PepsiCo Incorporated | | | | | | | 53,924 | | | | 5,354,653 | |
The Coca-Cola Company | | | | | | | 85,746 | | | | 3,680,218 | |
| | | | |
| | | | | | | | | | | 13,440,471 | |
| | | | | | | | | | | | |
The accompanying notes are an integral part of these financial statements.
| | | | |
| 8 | | Wells Fargo Disciplined U.S. Core Fund | | Portfolio of investments—January 31, 2016 (unaudited) |
| | | | | | | | | | | | |
| Security name | | | | | | Shares | | | Value | |
| | | | |
| Food & Staples Retailing: 2.76% | | | | | | | | | | | | |
CVS Health Corporation | | | | | | | 69,201 | | | $ | 6,684,125 | |
The Kroger Company | | | | | | | 12,897 | | | | 500,533 | |
Wal-Mart Stores Incorporated | | | | | | | 107,395 | | | | 7,126,732 | |
| | | | |
| | | | | | | | | | | 14,311,390 | |
| | | | | | | | | | | | |
| | | | |
| Food Products: 1.07% | | | | | | | | | | | | |
Mondelez International Incorporated Class A | | | | | | | 27,901 | | | | 1,202,533 | |
Tyson Foods Incorporated Class A | | | | | | | 81,037 | | | | 4,324,134 | |
| | | | |
| | | | | | | | | | | 5,526,667 | |
| | | | | | | | | | | | |
| | | | |
| Household Products: 1.43% | | | | | | | | | | | | |
Church & Dwight Company Incorporated | | | | | | | 6,296 | | | | 528,864 | |
The Clorox Company | | | | | | | 32,479 | | | | 4,191,415 | |
The Procter & Gamble Company | | | | | | | 33,104 | | | | 2,704,266 | |
| | | | |
| | | | | | | | | | | 7,424,545 | |
| | | | | | | | | | | | |
| | | | |
| Tobacco: 1.80% | | | | | | | | | | | | |
Altria Group Incorporated | | | | | | | 127,461 | | | | 7,789,142 | |
Philip Morris International | | | | | | | 17,012 | | | | 1,531,250 | |
| | | | |
| | | | | | | | | | | 9,320,392 | |
| | | | | | | | | | | | |
| | | | |
Energy: 5.91% | | | | | | | | | | | | |
| | | | |
| Energy Equipment & Services: 0.62% | | | | | | | | | | | | |
Schlumberger Limited | | | | | | | 44,534 | | | | 3,218,472 | |
| | | | | | | | | | | | |
| | | | |
| Oil, Gas & Consumable Fuels: 5.29% | | | | | | | | | | | | |
Chevron Corporation | | | | | | | 97,361 | | | | 8,418,806 | |
EQT Corporation | | | | | | | 25,512 | | | | 1,575,111 | |
Exxon Mobil Corporation | | | | | | | 170,273 | | | | 13,255,753 | |
Tesoro Corporation | | | | | | | 16,026 | | | | 1,398,269 | |
Valero Energy Corporation | | | | | | | 40,921 | �� | | | 2,777,308 | |
| | | | |
| | | | | | | | | | | 27,425,247 | |
| | | | | | | | | | | | |
| | | | |
Financials: 14.73% | | | | | | | | | | | | |
| | | | |
| Banks: 5.09% | | | | | | | | | | | | |
Bank of America Corporation | | | | | | | 537,947 | | | | 7,606,571 | |
Citigroup Incorporated | | | | | | | 141,504 | | | | 6,025,240 | |
JPMorgan Chase & Company | | | | | | | 137,552 | | | | 8,184,344 | |
People’s United Financial Incorporated « | | | | | | | 44,581 | | | | 640,629 | |
Regions Financial Corporation | | | | | | | 157,456 | | | | 1,278,543 | |
SunTrust Banks Incorporated | | | | | | | 71,616 | | | | 2,619,713 | |
| | | | |
| | | | | | | | | | | 26,355,040 | |
| | | | | | | | | | | | |
| | | | |
| Capital Markets: 2.00% | | | | | | | | | | | | |
Ameriprise Financial Incorporated | | | | | | | 17,306 | | | | 1,568,789 | |
Goldman Sachs Group Incorporated | | | | | | | 30,968 | | | | 5,003,190 | |
Morgan Stanley | | | | | | | 147,240 | | | | 3,810,571 | |
| | | | |
| | | | | | | | | | | 10,382,550 | |
| | | | | | | | | | | | |
The accompanying notes are an integral part of these financial statements.
| | | | | | |
| Portfolio of investments—January 31, 2016 (unaudited) | | Wells Fargo Disciplined U.S. Core Fund | | | 9 | |
| | | | | | | | | | | | |
| Security name | | | | | | Shares | | | Value | |
| | | | |
| Consumer Finance: 0.43% | | | | | | | | | | | | |
Capital One Financial Corporation | | | | | | | 23,404 | | | $ | 1,535,770 | |
Synchrony Financial † | | | | | | | 25,184 | | | | 715,729 | |
| | | | |
| | | | | | | | | | | 2,251,499 | |
| | | | | | | | | | | | |
| | | | |
| Diversified Financial Services: 0.95% | | | | | | | | | | | | |
Berkshire Hathaway Incorporated Class B † | | | | | | | 37,738 | | | | 4,897,260 | |
| | | | | | | | | | | | |
| | | | |
| Insurance: 1.70% | | | | | | | | | | | | |
American International Group Incorporated | | | | | | | 56,684 | | | | 3,201,512 | |
MetLife Incorporated | | | | | | | 29,908 | | | | 1,335,392 | |
Principal Financial Group Incorporated | | | | | | | 18,380 | | | | 698,440 | |
Prudential Financial Incorporated | | | | | | | 25,489 | | | | 1,786,269 | |
The Travelers Companies Incorporated | | | | | | | 12,753 | | | | 1,365,081 | |
Unum Group | | | | | | | 14,014 | | | | 401,361 | |
| | | | |
| | | | | | | | | | | 8,788,055 | |
| | | | | | | | | | | | |
| | | | |
| Real Estate Management & Development: 0.60% | | | | | | | | | | | | |
CBRE Group Incorporated Class A † | | | | | | | 111,502 | | | | 3,118,711 | |
| | | | | | | | | | | | |
| | | | |
| REITs: 3.96% | | | | | | | | | | | | |
American Tower Corporation | | | | | | | 45,450 | | | | 4,287,753 | |
Crown Castle International Corporation | | | | | | | 40,763 | | | | 3,513,771 | |
General Growth Properties Incorporated | | | | | | | 108,387 | | | | 3,039,171 | |
Host Hotels & Resorts Incorporated | | | | | | | 104,477 | | | | 1,447,006 | |
Prologis Incorporated | | | | | | | 74,154 | | | | 2,926,858 | |
Simon Property Group Incorporated | | | | | | | 28,599 | | | | 5,327,422 | |
| | | | |
| | | | | | | | | | | 20,541,981 | |
| | | | | | | | | | | | |
| | | | |
Health Care: 15.41% | | | | | | | | | | | | |
| | | | |
| Biotechnology: 2.87% | | | | | | | | | | | | |
Amgen Incorporated | | | | | | | 44,615 | | | | 6,814,049 | |
Biogen Incorporated † | | | | | | | 5,986 | | | | 1,634,537 | |
Gilead Sciences Incorporated | | | | | | | 77,372 | | | | 6,421,876 | |
| | | | |
| | | | | | | | | | | 14,870,462 | |
| | | | | | | | | | | | |
| | | | |
| Health Care Equipment & Supplies: 1.30% | | | | | | | | | | | | |
Medtronic plc | | | | | | | 89,004 | | | | 6,757,184 | |
| | | | | | | | | | | | |
| | | | |
| Health Care Providers & Services: 3.83% | | | | | | | | | | | | |
Aetna Incorporated | | | | | | | 37,318 | | | | 3,800,465 | |
AmerisourceBergen Corporation | | | | | | | 10,662 | | | | 954,889 | |
Cigna Corporation | | | | | | | 10,234 | | | | 1,367,262 | |
Express Scripts Holding Company † | | | | | | | 13,001 | | | | 934,382 | |
HCA Holdings Incorporated † | | | | | | | 20,969 | | | | 1,459,023 | |
Humana Incorporated | | | | | | | 7,789 | | | | 1,267,971 | |
McKesson Corporation | | | | | | | 20,468 | | | | 3,294,939 | |
UnitedHealth Group Incorporated | | | | | | | 58,828 | | | | 6,774,632 | |
| | | | |
| | | | | | | | | | | 19,853,563 | |
| | | | | | | | | | | | |
The accompanying notes are an integral part of these financial statements.
| | | | |
| 10 | | Wells Fargo Disciplined U.S. Core Fund | | Portfolio of investments—January 31, 2016 (unaudited) |
| | | | | | | | | | | | |
| Security name | | | | | | Shares | | | Value | |
| | | | |
| Pharmaceuticals: 7.41% | | | | | | | | | | | | |
AbbVie Incorporated | | | | | | | 78,842 | | | $ | 4,328,426 | |
Bristol-Myers Squibb Company | | | | | | | 51,140 | | | | 3,178,862 | |
Eli Lilly & Company | | | | | | | 30,485 | | | | 2,411,364 | |
Johnson & Johnson | | | | | | | 121,809 | | | | 12,721,732 | |
Merck & Company Incorporated | | | | | | | 126,211 | | | | 6,395,111 | |
Pfizer Incorporated | | | | | | | 306,210 | | | | 9,336,343 | |
| | | | |
| | | | | | | | | | | 38,371,838 | |
| | | | | | | | | | | | |
| | | | |
Industrials: 9.21% | | | | | | | | | | | | |
| | | | |
| Aerospace & Defense: 2.99% | | | | | | | | | | | | |
General Dynamics Corporation | | | | | | | 37,437 | | | | 5,007,947 | |
Lockheed Martin Corporation | | | | | | | 25,073 | | | | 5,290,403 | |
The Boeing Company | | | | | | | 43,517 | | | | 5,227,697 | |
| | | | |
| | | | | | | | | | | 15,526,047 | |
| | | | | | | | | | | | |
| | | | |
| Air Freight & Logistics: 0.79% | | | | | | | | | | | | |
Expeditors International of Washington Incorporated | | | | | | | 47,068 | | | | 2,123,708 | |
United Parcel Service Incorporated Class B | | | | | | | 20,919 | | | | 1,949,651 | |
| | | | |
| | | | | | | | | | | 4,073,359 | |
| | | | | | | | | | | | |
| | | | |
| Airlines: 1.67% | | | | | | | | | | | | |
Delta Air Lines Incorporated | | | | | | | 48,768 | | | | 2,159,935 | |
Southwest Airlines Company | | | | | | | 108,000 | | | | 4,062,960 | |
United Continental Holdings Incorporated † | | | | | | | 50,967 | | | | 2,460,687 | |
| | | | |
| | | | | | | | | | | 8,683,582 | |
| | | | | | | | | | | | |
| | | | |
| Commercial Services & Supplies: 0.64% | | | | | | | | | | | | |
Waste Management Incorporated | | | | | | | 62,625 | | | | 3,315,994 | |
| | | | | | | | | | | | |
| | | | |
| Industrial Conglomerates: 1.69% | | | | | | | | | | | | |
3M Company | | | | | | | 10,392 | | | | 1,569,192 | |
General Electric Company | | | | | | | 246,467 | | | | 7,172,190 | |
| | | | |
| | | | | | | | | | | 8,741,382 | |
| | | | | | | | | | | | |
| | | | |
| Machinery: 0.69% | | | | | | | | | | | | |
Caterpillar Incorporated | | | | | | | 57,201 | | | | 3,560,190 | |
| | | | | | | | | | | | |
| | | | |
| Road & Rail: 0.74% | | | | | | | | | | | | |
Union Pacific Corporation | | | | | | | 52,976 | | | | 3,814,272 | |
| | | | | | | | | | | | |
| | | | |
Information Technology: 20.34% | | | | | | | | | | | | |
| | | | |
| Communications Equipment: 1.34% | | | | | | | | | | | | |
Cisco Systems Incorporated | | | | | | | 291,980 | | | | 6,946,204 | |
| | | | | | | | | | | | |
| | | | |
| Internet Software & Services: 4.38% | | | | | | | | | | | | |
Alphabet Incorporated Class A † | | | | | | | 10,394 | | | | 7,913,472 | |
Alphabet Incorporated Class C † | | | | | | | 10,963 | | | | 8,144,961 | |
eBay Incorporated | | | | | | | 37,966 | | | | 890,682 | |
Facebook Incorporated Class A † | | | | | | | 50,978 | | | | 5,720,241 | |
| | | | |
| | | | | | | | | | | 22,669,356 | |
| | | | | | | | | | | | |
The accompanying notes are an integral part of these financial statements.
| | | | | | |
| Portfolio of investments—January 31, 2016 (unaudited) | | Wells Fargo Disciplined U.S. Core Fund | | | 11 | |
| | | | | | | | | | | | |
| Security name | | | | | | Shares | | | Value | |
| | | | |
| IT Services: 3.36% | | | | | | | | | | | | |
Accenture plc Class A | | | | | | | 17,502 | | | $ | 1,847,161 | |
CSRA Incorporated | | | | | | | 38,756 | | | | 1,037,886 | |
International Business Machines Corporation | | | | | | | 27,286 | | | | 3,405,020 | |
Paychex Incorporated | | | | | | | 30,876 | | | | 1,477,725 | |
The Western Union Company | | | | | | | 140,236 | | | | 2,501,810 | |
Total System Services Incorporated | | | | | | | 77,807 | | | | 3,124,729 | |
Visa Incorporated Class A | | | | | | | 14,084 | | | | 1,049,117 | |
Xerox Corporation | | | | | | | 303,600 | | | | 2,960,100 | |
| | | | |
| | | | | | | | | | | 17,403,548 | |
| | | | | | | | | | | | |
| | | | |
| Semiconductors & Semiconductor Equipment: 3.18% | | | | | | | | | | | | |
Avago Technologies Limited | | | | | | | 33,102 | | | | 4,426,068 | |
Intel Corporation | | | | | | | 266,891 | | | | 8,278,959 | |
Linear Technology Corporation | | | | | | | 35,294 | | | | 1,508,113 | |
Skyworks Solutions Incorporated | | | | | | | 33,186 | | | | 2,287,179 | |
| | | | |
| | | | | | | | | | | 16,500,319 | |
| | | | | | | | | | | | |
| | | | |
| Software: 3.24% | | | | | | | | | | | | |
Citrix Systems Incorporated † | | | | | | | 14,053 | | | | 990,174 | |
Microsoft Corporation | | | | | | | 287,200 | | | | 15,821,848 | |
| | | | |
| | | | | | | | | | | 16,812,022 | |
| | | | | | | | | | | | |
| | | | |
| Technology Hardware, Storage & Peripherals: 4.84% | | | | | | | | | | | | |
Apple Incorporated | | | | | | | 200,395 | | | | 19,506,449 | |
EMC Corporation | | | | | | | 58,477 | | | | 1,448,475 | |
Hewlett-Packard Company | | | | | | | 422,448 | | | | 4,101,970 | |
| | | | |
| | | | | | | | | | | 25,056,894 | |
| | | | | | | | | | | | |
| | | | |
Materials: 3.06% | | | | | | | | | | | | |
| | | | |
| Chemicals: 1.82% | | | | | | | | | | | | |
Dow Chemical Company | | | | | | | 110,934 | | | | 4,659,228 | |
LyondellBasell Industries NV Class A | | | | | | | 46,374 | | | | 3,615,781 | |
The Sherwin-Williams Company | | | | | | | 4,485 | | | | 1,146,680 | |
| | | | |
| | | | | | | | | | | 9,421,689 | |
| | | | | | | | | | | | |
| | | | |
| Containers & Packaging: 0.35% | | | | | | | | | | | | |
Avery Dennison Corporation | | | | | | | 29,384 | | | | 1,789,192 | |
| | | | | | | | | | | | |
| | | | |
| Metals & Mining: 0.89% | | | | | | | | | | | | |
Newmont Mining Corporation | | | | | | | 232,437 | | | | 4,639,443 | |
| | | | | | | | | | | | |
| | | | |
Telecommunication Services: 2.96% | | | | | | | | | | | | |
| | | | |
| Diversified Telecommunication Services: 2.96% | | | | | | | | | | | | |
AT&T Incorporated | | | | | | | 211,846 | | | | 7,639,167 | |
CenturyLink Incorporated | | | | | | | 46,880 | | | | 1,191,690 | |
Verizon Communications Incorporated | | | | | | | 130,288 | | | | 6,510,491 | |
| | | | |
| | | | | | | | | | | 15,341,348 | |
| | | | | | | | | | | | |
The accompanying notes are an integral part of these financial statements.
| | | | |
| 12 | | Wells Fargo Disciplined U.S. Core Fund | | Portfolio of investments—January 31, 2016 (unaudited) |
| | | | | | | | | | | | | | |
| Security name | | | | | | | Shares | | | Value | |
| | | | |
Utilities: 3.73% | | | | | | | | | | | | | | |
| | | | |
| Electric Utilities: 1.84% | | | | | | | | | | | | | | |
American Electric Power Company Incorporated | | | | | | | | | 28,301 | | | $ | 1,725,512 | |
Edison International | | | | | | | | | 70,279 | | | | 4,343,242 | |
Exelon Corporation | | | | | | | | | 79,514 | | | | 2,351,229 | |
FirstEnergy Corporation | | | | | | | | | 34,111 | | | | 1,127,710 | |
| | | | |
| | | | | | | | | | | | | 9,547,693 | |
| | | | | | | | | | | | | | |
| | | | |
| Independent Power & Renewable Electricity Producers: 0.38% | | | | | | | | | | | | | | |
AES Corporation | | | | | | | | | 209,307 | | | | 1,988,417 | |
| | | | | | | | | | | | | | |
| | | | |
| Multi-Utilities: 1.51% | | | | | | | | | | | | | | |
Ameren Corporation | | | | | | | | | 53,388 | | | | 2,398,189 | |
DTE Energy Company | | | | | | | | | 14,833 | | | | 1,260,953 | |
Public Service Enterprise Group Incorporated | | | | | | | | | 100,309 | | | | 4,142,764 | |
| | | | |
| | | | | | | | | | | | | 7,801,906 | |
| | | | | | | | | | | | | | |
| | | | |
Total Common Stocks (Cost $404,166,523) | | | | | | | | | | | | | 508,267,953 | |
| | | | | | | | | | | | | | |
| | | | |
| | | Yield | | | | | | | | | |
| Short-Term Investments: 2.01% | | | | | | | | | | | | | | |
| | | | |
| Investment Companies: 2.01% | | | | | | | | | | | | | | |
Securities Lending Cash Investments, LLC (l)(r)(u) | | | 0.42 | % | | | | | 1,552,275 | | | | 1,552,275 | |
Wells Fargo Cash Investment Money Market Fund, Select Class (l)(u) | | | 0.40 | | | | | | 8,894,394 | | | | 8,894,394 | |
| | | | |
Total Short-Term Investments (Cost $10,446,669) | | | | | | | | | | | | | 10,446,669 | |
| | | | | | | | | | | | | | |
| | | | | | | | |
| Total investments in securities (Cost $414,613,192) * | | | 100.09 | % | | | 518,714,622 | |
Other assets and liabilities, net | | | (0.09 | ) | | | (480,812 | ) |
| | | | | | | | |
| Total net assets | | | 100.00 | % | | $ | 518,233,810 | |
| | | | | | | | |
| † | Non-income-earning security |
| « | All or a portion of this security is on loan. |
| (l) | The issuer of the security is an affiliated person of the Fund as defined in the Investment Company Act of 1940. |
| (r) | The investment is a non-registered investment vehicle purchased with cash collateral received from securities on loan. |
| (u) | The rate represents the 7-day annualized yield at period end. |
| * | Cost for federal income tax purposes is $416,633,642 and unrealized gains (losses) consists of: |
| | | | |
Gross unrealized gains | | $ | 121,955,143 | |
Gross unrealized losses | | | (19,874,163 | ) |
| | | | |
Net unrealized gains | | $ | 102,080,980 | |
The accompanying notes are an integral part of these financial statements.
| | | | | | |
| Statement of assets and liabilities—January 31, 2016 (unaudited) | | Wells Fargo Disciplined U.S. Core Fund | | | 13 | |
| | | | |
| | | | |
| |
Assets | | | | |
Investments | | | | |
In unaffiliated securities (including $1,513,599 of securities loaned), at value (cost $404,166,523) | | $ | 508,267,953 | |
In affiliated securities, at value (cost $10,446,669) | | | 10,446,669 | |
| | | | |
Total investments, at value (cost $414,613,192) | | | 518,714,622 | |
Receivable for Fund shares sold | | | 4,346,371 | |
Receivable for dividends | | | 779,629 | |
Receivable for securities lending income | | | 782 | |
Prepaid expenses and other assets | | | 59,568 | |
| | | | |
Total assets | | | 523,900,972 | |
| | | | |
| |
Liabilities | | | | |
Payable for investments purchased | | | 3,123,397 | |
Payable for Fund shares redeemed | | | 593,298 | |
Payable upon receipt of securities loaned | | | 1,552,275 | |
Management fee payable | | | 142,348 | |
Distribution fees payable | | | 14,307 | |
Administration fees payable | | | 78,667 | |
Accrued expenses and other liabilities | | | 162,870 | |
| | | | |
Total liabilities | | | 5,667,162 | |
| | | | |
Total net assets | | $ | 518,233,810 | |
| | | | |
| |
NET ASSETS CONSIST OF | | | | |
Paid-in capital | | $ | 403,778,482 | |
Undistributed net investment income | | | 3,689,918 | |
Accumulated net realized gains on investments | | | 6,663,980 | |
Net unrealized gains on investments | | | 104,101,430 | |
| | | | |
Total net assets | | $ | 518,233,810 | |
| | | | |
| |
COMPUTATION OF NET ASSET VALUE AND OFFERING PRICE PER SHARE | | | | |
Net assets – Class A | | $ | 316,073,162 | |
Shares outstanding – Class A1 | | | 24,512,557 | |
Net asset value per share – Class A | | | $12.89 | |
Maximum offering price per share – Class A2 | | | $13.68 | |
Net assets – Class C | | $ | 27,246,735 | |
Shares outstanding – Class C1 | | | 2,269,057 | |
Net asset value per share – Class C | | | $12.01 | |
Net assets – Class R | | $ | 25,456 | |
Shares outstanding – Class R1 | | | 1,936 | |
Net asset value per share – Class R | | | $13.15 | |
Net assets – Class R6 | | $ | 61,153 | |
Shares outstanding – Class R61 | | | 4,639 | |
Net asset value per share – Class R6 | | | $13.18 | |
Net assets – Administrator Class | | $ | 76,194,271 | |
Shares outstanding – Administrator Class1 | | | 5,772,584 | |
Net asset value per share – Administrator Class | | | $13.20 | |
Net assets – Institutional Class | | $ | 98,633,033 | |
Shares outstanding – Institutional Class1 | | | 7,552,343 | |
Net asset value per share – Institutional Class | | | $13.06 | |
| 1 | The Fund has an unlimited number of authorized shares. |
| 2 | Maximum offering price is computed as 100/94.25 of net asset value. On investments of $50,000 or more, the offering price is reduced. |
The accompanying notes are an integral part of these financial statements.
| | | | |
| 14 | | Wells Fargo Disciplined U.S. Core Fund | | Statement of operations—six months ended January 31, 2016 (unaudited) |
| | | | |
| | | | |
| |
Investment income | | | | |
Dividends | | $ | 5,803,761 | |
Securities lending income, net | | | 4,072 | |
Income from affiliated securities | | | 6,441 | |
| | | | |
Total investment income | | | 5,814,274 | |
| | | | |
| |
Expenses | | | | |
Management fee | | | 892,216 | |
Administration fees | | | | |
Class A | | | 338,755 | |
Class C | | | 23,843 | |
Class R | | | 18 | 1 |
Class R6 | | | 4 | 1 |
Administrator Class | | | 43,020 | |
Institutional Class | | | 63,878 | |
Shareholder servicing fees | | | | |
Class A | | | 403,279 | |
Class C | | | 28,385 | |
Class R | | | 22 | 1 |
Administrator Class | | | 82,732 | |
Distribution fees | | | | |
Class C | | | 85,154 | |
Class R | | | 22 | 1 |
Custody and accounting fees | | | 20,257 | |
Professional fees | | | 30,327 | |
Registration fees | | | 39,829 | |
Shareholder report expenses | | | 24,162 | |
Trustees’ fees and expenses | | | 12,999 | |
Interest expense | | | 1,658 | |
Other fees and expenses | | | 27,207 | |
| | | | |
Total expenses | | | 2,117,767 | |
Less: Fee waivers and/or expense reimbursements | | | (47,221 | ) |
| | | | |
Net expenses | | | 2,070,546 | |
| | | | |
Net investment income | | | 3,743,728 | |
| | | | |
| |
REALIZED AND UNREALIZED GAINS (LOSSES) ON INVESTMENTS | | | | |
Net realized gains on investments | | | 7,666,152 | |
Net change in unrealized gains (losses) on investments | | | (45,403,784 | ) |
| | | | |
Net realized and unrealized gains (losses) on investments | | | (37,737,632 | ) |
| | | | |
Net decrease in net assets resulting from operations | | $ | (33,993,904 | ) |
| | | | |
| 1 | For the period from September 30, 2015 (commencement of class operations) to January 31, 2016 |
The accompanying notes are an integral part of these financial statements.
| | | | | | |
| Statement of changes in net assets | | Wells Fargo Disciplined U.S. Core Fund | | | 15 | |
| | | | | | | | | | | | | | | | |
| | | Six months ended January 31, 2016 (unaudited) | | | Year ended July 31, 2015 | |
| | | | |
Operations | | | | | | | | | | | | | | | | |
Net investment income | | | | | | $ | 3,743,728 | | | | | | | $ | 7,538,035 | |
Net realized gains on investments | | | | | | | 7,666,152 | | | | | | | | 49,570,546 | |
Net change in unrealized gains (losses) on investments | | | | | | | (45,403,784 | ) | | | | | | | (1,189,230 | ) |
| | | | |
Net increase (decrease) in net assets resulting from operations | | | | | | | (33,993,904 | ) | | | | | | | 55,919,351 | |
| | | | |
| | | | |
Distributions to shareholders from | | | | | | | | | | | | | | | | |
Net investment income | | | | | | | | | | | | | | | | |
Class A | | | | | | | (4,528,285 | ) | | | | | | | (3,522,119 | ) |
Class C | | | | | | | (257,661 | ) | | | | | | | (84,291 | ) |
Class R | | | | | | | (495 | )1 | | | | | | | N/A | |
Class R6 | | | | | | | (1,177 | )1 | | | | | | | N/A | |
Administrator Class | | | | | | | (1,187,160 | ) | | | | | | | (647,073 | ) |
Institutional Class | | | | | | | (1,510,103 | ) | | | | | | | (1,537,330 | ) |
Net realized gains | | | | | | | | | | | | | | | | |
Class A | | | | | | | (31,556,160 | ) | | | | | | | (46,161,619 | ) |
Class C | | | | | | | (2,500,323 | ) | | | | | | | (2,082,924 | ) |
Class R | | | | | | | (2,461 | )1 | | | | | | | N/A | |
Class R6 | | | | | | | (5,846 | )1 | | | | | | | N/A | |
Administrator Class | | | | | | | (6,952,701 | ) | | | | | | | (7,515,200 | ) |
Institutional Class | | | | | | | (8,572,495 | ) | | | | | | | (15,983,371 | ) |
| | | | |
Total distributions to shareholders | | | | | | | (57,074,867 | ) | | | | | | | (77,533,927 | ) |
| | | | |
| | | | |
Capital share transactions | | | Shares | | | | | | | | Shares | | | | | |
Proceeds from shares sold | | | | | | | | | | | | | | | | |
Class A | | | 3,026,936 | | | | 43,409,389 | | | | 2,148,617 | | | | 33,269,672 | |
Class C | | | 986,041 | | | | 13,037,194 | | | | 823,111 | | | | 12,057,914 | |
Class R | | | 1,724 | 1 | | | 25,180 | 1 | | | N/A | | | | N/A | |
Class R6 | | | 4,135 | 1 | | | 62,680 | 1 | | | N/A | | | | N/A | |
Administrator Class | | | 2,178,467 | | | | 31,991,960 | | | | 1,319,355 | | | | 20,847,005 | |
Institutional Class | | | 2,716,755 | | | | 38,322,808 | | | | 3,114,670 | | | | 50,079,007 | |
| | | | |
| | | | | | | 126,849,211 | | | | | | | | 116,253,598 | |
| | | | |
Reinvestment of distributions | | | | | | | | | | | | | | | | |
Class A | | | 2,569,607 | | | | 34,916,831 | | | | 3,224,975 | | | | 47,843,154 | |
Class C | | | 155,194 | | | | 1,959,119 | | | | 105,097 | | | | 1,464,972 | |
Class R | | | 212 | 1 | | | 2,956 | 1 | | | N/A | | | | N/A | |
Class R6 | | | 504 | 1 | | | 7,023 | 1 | | | N/A | | | | N/A | |
Administrator Class | | | 553,449 | | | | 7,715,022 | | | | 491,872 | | | | 7,465,466 | |
Institutional Class | | | 369,132 | | | | 5,097,050 | | | | 561,645 | | | | 8,449,624 | |
| | | | |
| | | | | | | 49,698,001 | | | | | | | | 65,223,216 | |
| | | | |
Payment for shares redeemed | | | | | | | | | | | | | | | | |
Class A | | | (2,513,642 | ) | | | (35,292,271 | ) | | | (2,705,765 | ) | | | (42,183,445 | ) |
Class C | | | (298,117 | ) | | | (4,072,427 | ) | | | (207,673 | ) | | | (3,079,680 | ) |
Administrator Class | | | (979,907 | ) | | | (14,244,971 | ) | | | (832,349 | ) | | | (13,437,852 | ) |
Institutional Class | | | (2,552,936 | ) | | | (38,883,603 | ) | | | (2,190,447 | ) | | | (34,044,476 | ) |
| | | | |
| | | | | | | (92,493,272 | ) | | | | | | | (92,745,453 | ) |
| | | | |
Net increase in net assets resulting from capital share transactions | | | | | | | 84,053,940 | | | | | | | | 88,731,361 | |
| | | | |
Total increase (decrease) in net assets | | | | | | | (7,014,831 | ) | | | | | | | 67,116,785 | |
| | | | |
| | | | |
Net assets | | | | | | | | | | | | | | | | |
Beginning of period | | | | | | | 525,248,641 | | | | | | | | 458,131,856 | |
| | | | |
End of period | | | | | | $ | 518,233,810 | | | | | | | $ | 525,248,641 | |
| | | | |
Undistributed net investment income | | | | | | $ | 3,689,918 | | | | | | | $ | 7,431,071 | |
| | | | |
| 1 | For the period from September 30, 2015 (commencement of class operations) to January 31, 2016 |
The accompanying notes are an integral part of these financial statements.
| | | | |
| 16 | | Wells Fargo Disciplined U.S. Core Fund | | Financial highlights |
(For a share outstanding throughout each period)
| | | | | | | | | | | | | | | | | | | | | | | | |
| | | Six months ended January 31, 2016 (unaudited) | | | Year ended July 31 | |
| CLASS A | | | 2015 | | | 2014 | | | 2013 | | | 2012 | | | 2011 | |
Net asset value, beginning of period | | | $15.45 | | | | $16.29 | | | | $16.27 | | | | $14.65 | | | | $14.25 | | | | $11.93 | |
Net investment income | | | 0.10 | | | | 0.21 | | | | 0.19 | | | | 0.24 | | | | 0.20 | | | | 0.16 | |
Net realized and unrealized gains (losses) on investments | | | (1.03 | ) | | | 1.60 | | | | 2.35 | | | | 3.25 | | | | 0.93 | | | | 2.17 | |
| | | | | | | | | | | | | | | | | | | | | | | | |
Total from investment operations | | | (0.93 | ) | | | 1.81 | | | | 2.54 | | | | 3.49 | | | | 1.13 | | | | 2.33 | |
Distributions to shareholders from | | | | | | | | | | | | | | | | | | | | | | | | |
Net investment income | | | (0.19 | ) | | | (0.16 | ) | | | (0.24 | ) | | | (0.24 | ) | | | (0.23 | ) | | | (0.01 | ) |
Net realized gains | | | (1.44 | ) | | | (2.49 | ) | | | (2.28 | ) | | | (1.63 | ) | | | (0.50 | ) | | | 0.00 | |
| | | | | | | | | | | | | | | | | | | | | | | | |
Total distributions to shareholders | | | (1.63 | ) | | | (2.65 | ) | | | (2.52 | ) | | | (1.87 | ) | | | (0.73 | ) | | | (0.01 | ) |
Net asset value, end of period | | | $12.89 | | | | $15.45 | | | | $16.29 | | | | $16.27 | | | | $14.65 | | | | $14.25 | |
Total return1 | | | (6.46 | )% | | | 12.01 | % | | | 17.00 | % | | | 26.62 | % | | | 8.54 | % | | | 19.50 | % |
Ratios to average net assets (annualized) | | | | | | | | | | | | | | | | | | | | | | | | |
Gross expenses | | | 0.87 | % | | | 0.89 | % | | | 0.93 | % | | | 0.94 | % | | | 0.92 | % | | | 0.93 | % |
Net expenses | | | 0.87 | % | | | 0.89 | % | | | 0.92 | % | | | 0.92 | % | | | 0.92 | % | | | 0.92 | % |
Net investment income | | | 1.41 | % | | | 1.43 | % | | | 1.27 | % | | | 1.66 | % | | | 1.43 | % | | | 1.18 | % |
Supplemental data | | | | | | | | | | | | | | | | | | | | | | | | |
Portfolio turnover rate | | | 29 | % | | | 53 | % | | | 71 | % | | | 64 | % | | | 82 | % | | | 64 | % |
Net assets, end of period (000s omitted) | | | $316,073 | | | | $331,123 | | | | $305,577 | | | | $285,780 | | | | $254,272 | | | | $268,460 | |
| 1 | Total return calculations do not include any sales charges. Returns for periods of less than one year are not annualized. |
The accompanying notes are an integral part of these financial statements.
| | | | | | |
| Financial highlights | | Wells Fargo Disciplined U.S. Core Fund | | | 17 | |
(For a share outstanding throughout each period)
| | | | | | | | | | | | | | | | | | | | | | | | |
| | | Six months ended January 31, 2016 (unaudited) | | | Year ended July 31 | |
| CLASS C | | | 2015 | | | 2014 | | | 2013 | | | 2012 | | | 2011 | |
Net asset value, beginning of period | | | $14.50 | | | | $15.47 | | | | $15.58 | | | | $14.10 | | | | $13.69 | | | | $11.54 | |
Net investment income | | | 0.08 | | | | 0.13 | | | | 0.08 | | | | 0.12 | | | | 0.09 | | | | 0.05 | |
Net realized and unrealized gains (losses) on investments | | | (1.00 | ) | | | 1.48 | | | | 2.23 | | | | 3.12 | | | | 0.90 | | | | 2.10 | |
| | | | | | | | | | | | | | | | | | | | | | | | |
Total from investment operations | | | (0.92 | ) | | | 1.61 | | | | 2.31 | | | | 3.24 | | | | 0.99 | | | | 2.15 | |
Distributions to shareholders from | | | | | | | | | | | | | | | | | | | | | | | | |
Net investment income | | | (0.13 | ) | | | (0.09 | ) | | | (0.14 | ) | | | (0.13 | ) | | | (0.08 | ) | | | 0.00 | |
Net realized gains | | | (1.44 | ) | | | (2.49 | ) | | | (2.28 | ) | | | (1.63 | ) | | | (0.50 | ) | | | 0.00 | |
| | | | | | | | | | | | | | | | | | | | | | | | |
Total distributions to shareholders | | | (1.57 | ) | | | (2.58 | ) | | | (2.42 | ) | | | (1.76 | ) | | | (0.58 | ) | | | 0.00 | |
Net asset value, end of period | | | $12.01 | | | | $14.50 | | | | $15.47 | | | | $15.58 | | | | $14.10 | | | | $13.69 | |
Total return1 | | | (6.75 | )% | | | 11.18 | % | | | 16.10 | % | | | 25.65 | % | | | 7.75 | % | | | 18.63 | % |
Ratios to average net assets (annualized) | | | | | | | | | | | | | | | | | | | | | | | | |
Gross expenses | | | 1.62 | % | | | 1.64 | % | | | 1.68 | % | | | 1.69 | % | | | 1.67 | % | | | 1.68 | % |
Net expenses | | | 1.62 | % | | | 1.64 | % | | | 1.67 | % | | | 1.67 | % | | | 1.67 | % | | | 1.67 | % |
Net investment income | | | 0.66 | % | | | 0.66 | % | | | 0.51 | % | | | 0.92 | % | | | 0.68 | % | | | 0.44 | % |
Supplemental data | | | | | | | | | | | | | | | | | | | | | | | | |
Portfolio turnover rate | | | 29 | % | | | 53 | % | | | 71 | % | | | 64 | % | | | 82 | % | | | 64 | % |
Net assets, end of period (000s omitted) | | | $27,247 | | | | $20,680 | | | | $10,913 | | | | $9,544 | | | | $8,590 | | | | $8,768 | |
| 1 | Total return calculations do not include any sales charges. Returns for periods of less than one year are not annualized. |
The accompanying notes are an integral part of these financial statements.
| | | | |
| 18 | | Wells Fargo Disciplined U.S. Core Fund | | Financial highlights |
(For a share outstanding throughout each period)
| | | | |
| CLASS R | | Period ended January 31, 2016 (unaudited)1 | |
Net asset value, beginning of period | | | $14.62 | |
Net investment income | | | 0.06 | 2 |
Net realized and unrealized gains (losses) on investments | | | 0.17 | |
| | | | |
Total from investment operations | | | 0.23 | |
Distributions to shareholders from | | | | |
Net investment income | | | (0.26 | ) |
Net realized gains | | | (1.44 | ) |
| | | | |
Total distributions to shareholders | | | (1.70 | ) |
Net asset value, end of period | | | $13.15 | |
Total return3 | | | 1.11 | % |
Ratios to average net assets (annualized) | | | | |
Gross expenses | | | 1.11 | % |
Net expenses | | | 1.11 | % |
Net investment income | | | 1.27 | % |
Supplemental data | | | | |
Portfolio turnover rate | | | 29 | % |
Net assets, end of period (000s omitted) | | | $25 | |
| 1 | For the period from September 30, 2015 (commencement of class operations) to January 31, 2016 |
| 2 | Calculated based upon average shares outstanding |
| 3 | Returns for periods of less than one year are not annualized. |
The accompanying notes are an integral part of these financial statements.
| | | | | | |
| Financial highlights | | Wells Fargo Disciplined U.S. Core Fund | | | 19 | |
(For a share outstanding throughout each period)
| | | | |
| CLASS R6 | | Period ended January 31, 2016 (unaudited)1 | |
Net asset value, beginning of period | | | $14.62 | |
Net investment income | | | 0.09 | 2 |
Net realized and unrealized gains (losses) on investments | | | 0.17 | |
| | | | |
Total from investment operations | | | 0.26 | |
Distributions to shareholders from | | | | |
Net investment income | | | (0.26 | ) |
Net realized gains | | | (1.44 | ) |
| | | | |
Total distributions to shareholders | | | (1.70 | ) |
Net asset value, end of period | | | $13.18 | |
Total return3 | | | 1.32 | % |
Ratios to average net assets (annualized) | | | | |
Gross expenses | | | 0.43 | % |
Net expenses | | | 0.43 | % |
Net investment income | | | 1.82 | % |
Supplemental data | | | | |
Portfolio turnover rate | | | 29 | % |
Net assets, end of period (000s omitted) | | | $61 | |
| 1 | For the period from September 30, 2015 (commencement of class operations) to January 31, 2016 |
| 2 | Calculated based upon average shares outstanding |
| 3 | Returns for periods of less than one year are not annualized. |
The accompanying notes are an integral part of these financial statements.
| | | | |
| 20 | | Wells Fargo Disciplined U.S. Core Fund | | Financial highlights |
(For a share outstanding throughout each period)
| | | | | | | | | | | | | | | | | | | | | | | | |
| | | Six months ended January 31, 2016 (unaudited) | | | Year ended July 31 | |
| ADMINISTRATOR CLASS | | | 2015 | | | 2014 | | | 2013 | | | 2012 | | | 2011 | |
Net asset value, beginning of period | | | $15.80 | | | | $16.60 | | | | $16.47 | | | | $14.79 | | | | $14.36 | | | | $11.99 | |
Net investment income | | | 0.11 | 1 | | | 0.25 | 1 | | | 0.25 | 1 | | | 0.28 | 1 | | | 0.23 | 1 | | | 0.19 | 1 |
Net realized and unrealized gains (losses) on investments | | | (1.04 | ) | | | 1.63 | | | | 2.35 | | | | 3.27 | | | | 0.93 | | | | 2.19 | |
| | | | | | | | | | | | | | | | | | | | | | | | |
Total from investment operations | | | (0.93 | ) | | | 1.88 | | | | 2.60 | | | | 3.55 | | | | 1.16 | | | | 2.38 | |
Distributions to shareholders from | | | | | | | | | | | | | | | | | | | | | | | | |
Net investment income | | | (0.23 | ) | | | (0.19 | ) | | | (0.19 | ) | | | (0.24 | ) | | | (0.23 | ) | | | (0.01 | ) |
Net realized gains | | | (1.44 | ) | | | (2.49 | ) | | | (2.28 | ) | | | (1.63 | ) | | | (0.50 | ) | | | 0.00 | |
| | | | | | | | | | | | | | | | | | | | | | | | |
Total distributions to shareholders | | | (1.67 | ) | | | (2.68 | ) | | | (2.47 | ) | | | (1.87 | ) | | | (0.73 | ) | | | (0.01 | ) |
Net asset value, end of period | | | $13.20 | | | | $15.80 | | | | $16.60 | | | | $16.47 | | | | $14.79 | | | | $14.36 | |
Total return2 | | | (6.34 | )% | | | 12.20 | % | | | 17.12 | % | | | 26.82 | % | | | 8.72 | % | | | 19.84 | % |
Ratios to average net assets (annualized) | | | | | | | | | | | | | | | | | | | | | | | | |
Gross expenses | | | 0.79 | % | | | 0.74 | % | | | 0.76 | % | | | 0.78 | % | | | 0.75 | % | | | 0.77 | % |
Net expenses | | | 0.74 | % | | | 0.73 | % | | | 0.74 | % | | | 0.74 | % | | | 0.74 | % | | | 0.74 | % |
Net investment income | | | 1.55 | % | | | 1.58 | % | | | 1.56 | % | | | 1.87 | % | | | 1.63 | % | | | 1.37 | % |
Supplemental data | | | | | | | | | | | | | | | | | | | | | | | | |
Portfolio turnover rate | | | 29 | % | | | 53 | % | | | 71 | % | | | 64 | % | | | 82 | % | | | 64 | % |
Net assets, end of period (000s omitted) | | | $76,194 | | | | $63,544 | | | | $50,498 | | | | $127,384 | | | | $150,408 | | | | $244,716 | |
| 1 | Calculated based upon average shares outstanding |
| 2 | Returns for periods of less than one year are not annualized. |
The accompanying notes are an integral part of these financial statements.
| | | | | | |
| Financial highlights | | Wells Fargo Disciplined U.S. Core Fund | | | 21 | |
(For a share outstanding throughout each period)
| | | | | | | | | | | | | | | | | | | | | | | | |
| | | Six months ended January 31, 2016 (unaudited) | | | Year ended July 31 | |
| INSTITUTIONAL CLASS | | | 2015 | | | 2014 | | | 2013 | | | 2012 | | | 2011 | |
Net asset value, beginning of period | | | $15.66 | | | | $16.47 | | | | $16.43 | | | | $14.78 | | | | $14.39 | | | | $11.99 | |
Net investment income | | | 0.18 | | | | 0.30 | | | | 0.26 | 1 | | | 0.35 | | | | 0.26 | 1 | | | 0.22 | |
Net realized and unrealized gains (losses) on investments | | | (1.09 | ) | | | 1.61 | | | | 2.37 | | | | 3.23 | | | | 0.93 | | | | 2.19 | |
| | | | | | | | | | | | | | | | | | | | | | | | |
Total from investment operations | | | (0.91 | ) | | | 1.91 | | | | 2.63 | | | | 3.58 | | | | 1.19 | | | | 2.41 | |
Distributions to shareholders from | | | | | | | | | | | | | | | | | | | | | | | | |
Net investment income | | | (0.25 | ) | | | (0.23 | ) | | | (0.31 | ) | | | (0.30 | ) | | | (0.30 | ) | | | (0.01 | ) |
Net realized gains | | | (1.44 | ) | | | (2.49 | ) | | | (2.28 | ) | | | (1.63 | ) | | | (0.50 | ) | | | 0.00 | |
| | | | | | | | | | | | | | | | | | | | | | | | |
Total distributions to shareholders | | | (1.69 | ) | | | (2.72 | ) | | | (2.59 | ) | | | (1.93 | ) | | | (0.80 | ) | | | (0.01 | ) |
Net asset value, end of period | | | $13.06 | | | | $15.66 | | | | $16.47 | | | | $16.43 | | | | $14.78 | | | | $14.39 | |
Total return2 | | | (6.27 | )% | | | 12.55 | % | | | 17.48 | % | | | 27.16 | % | | | 9.02 | % | | | 20.10 | % |
Ratios to average net assets (annualized) | | | | | | | | | | | | | | | | | | | | | | | | |
Gross expenses | | | 0.54 | % | | | 0.47 | % | | | 0.50 | % | | | 0.51 | % | | | 0.49 | % | | | 0.51 | % |
Net expenses | | | 0.48 | % | | | 0.47 | % | | | 0.48 | % | | | 0.48 | % | | | 0.48 | % | | | 0.47 | % |
Net investment income | | | 1.78 | % | | | 1.86 | % | | | 1.63 | % | | | 2.08 | % | | | 1.80 | % | | | 1.62 | % |
Supplemental data | | | | | | | | | | | | | | | | | | | | | | | | |
Portfolio turnover rate | | | 29 | % | | | 53 | % | | | 71 | % | | | 64 | % | | | 82 | % | | | 64 | % |
Net assets, end of period (000s omitted) | | | $98,633 | | | | $109,901 | | | | $91,144 | | | | $1,875 | | | | $1,215 | | | | $12 | |
| 1 | Calculated based upon average shares outstanding |
| 2 | Returns for periods of less than one year are not annualized. |
The accompanying notes are an integral part of these financial statements.
| | | | |
| 22 | | Wells Fargo Disciplined U.S. Core Fund | | Notes to financial statements (unaudited) |
1. ORGANIZATION
Wells Fargo Funds Trust (the “Trust”), a Delaware statutory trust organized on March 10, 1999, is an open-end management investment company registered under the Investment Company Act of 1940, as amended (the “1940 Act”). As an investment company, the Trust follows the accounting and reporting guidance in Financial Accounting Standards Board (“FASB”) Accounting Standards Codification Topic 946, Financial Services – Investment Companies. These financial statements report on the Wells Fargo Disciplined U.S. Core Fund (the “Fund”) which is a diversified series of the Trust.
2. SIGNIFICANT ACCOUNTING POLICIES
The following significant accounting policies, which are consistently followed in the preparation of the financial statements of the Fund, are in conformity with U.S. generally accepted accounting principles which require management to make estimates and assumptions that affect the reported amounts of assets and liabilities, disclosure of contingent assets and liabilities at the date of the financial statements, and the reported amounts of revenues and expenses during the reporting period. Actual results could differ from those estimates.
Securities valuation
All investments are valued each business day as of the close of regular trading on the New York Stock Exchange (generally 4 p.m. Eastern Time).
Equity securities that are listed on a foreign or domestic exchange or market are valued at the official closing price or, if none, the last sales price. If no sale occurs on the principal exchange or market that day, the prior day’s price will be deemed “stale” and a fair value price will be determined in accordance with the Fund’s Valuation Procedures.
Investments in registered open-end investment companies are valued at net asset value. Interests in non-registered investment vehicles that are redeemable at net asset value are fair valued normally at net asset value.
Investments which are not valued using any of the methods discussed above are valued at their fair value, as determined in good faith by the Board of Trustees of the Fund. The Board of Trustees has established a Valuation Committee comprised of the Trustees and has delegated to it the authority to take any actions regarding the valuation of portfolio securities that the Valuation Committee deems necessary or appropriate, including determining the fair value of portfolio securities, unless the determination has been delegated to the Management Valuation Team of Wells Fargo Funds Management, LLC (“Funds Management”). The Board of Trustees retains the authority to make or ratify any valuation decisions or approve any changes to the Valuation Procedures as it deems appropriate. On a quarterly basis, the Board of Trustees receives reports on any valuation actions taken by the Valuation Committee or the Management Valuation Team which may include items for ratification.
Valuations of fair valued securities are compared to the next actual sales price when available, or other appropriate market values, to assess the continued appropriateness of the fair valuation methodologies used. These securities are fair valued on a day-to-day basis, taking into consideration changes to appropriate market information and any significant changes to the inputs considered in the valuation process until there is a readily available price provided on an exchange or by an independent pricing service. Valuations received from an independent pricing service or independent broker-dealer quotes are periodically validated by comparisons to most recent trades and valuations provided by other independent pricing services in addition to the review of prices by the manager and/or subadviser. Unobservable inputs used in determining fair valuations are identified based on the type of security, taking into consideration factors utilized by market participants in valuing the investment, knowledge about the issuer and the current market environment.
Security loans
The Fund may lend its securities from time to time in order to earn additional income in the form of fees or interest on securities received as collateral or the investment of any cash received as collateral. The Fund continues to receive interest or dividends on the securities loaned. The Fund receives collateral in the form of cash or securities with a value at least equal to the value of the securities on loan. The value of the loaned securities is determined at the close of each business day and any additional required collateral is delivered to the Fund on the next business day. In a securities lending transaction, the net asset value of the Fund will be affected by an increase or decrease in the value of the securities loaned and by an increase or decrease in the value of the instrument in which collateral is invested. The amount of securities lending activity undertaken by the Fund fluctuates from time to time. In the event of default or bankruptcy by the borrower, the Fund may be prevented from recovering the loaned securities or gaining access to the collateral or may experience delays or costs in doing so. In addition, the investment of any cash collateral received may lose all or part of its value. The Fund has the right under the lending agreement to recover the securities from the borrower on demand.
| | | | | | |
| Notes to financial statements (unaudited) | | Wells Fargo Disciplined U.S. Core Fund | | | 23 | |
The Fund lends its securities through an unaffiliated securities lending agent. Cash collateral received in connection with its securities lending transactions is invested in Securities Lending Cash Investments, LLC (the “Securities Lending Fund”). The Securities Lending Fund is exempt from registration under Section 3(c)(7) of the 1940 Act and is managed by Funds Management and is subadvised by Wells Capital Management Incorporated (“WellsCap”), an affiliate of Funds Management and an indirect wholly owned subsidiary of Wells Fargo & Company (“Wells Fargo”). Funds Management receives an advisory fee starting at 0.05% and declining to 0.01% as the average daily net assets of the Securities Lending Fund increase. All of the fees received by Funds Management are paid to WellsCap for its services as subadviser. The Securities Lending Fund seeks to provide a positive return compared to the daily Fed Funds Open rate by investing in high-quality, U.S. dollar-denominated short-term money market instruments. Securities Lending Fund investments are fair valued based upon the amortized cost valuation technique. Income earned from investment in the Securities Lending Fund is included in securities lending income on the Statement of Operations.
Security transactions and income recognition
Securities transactions are recorded on a trade date basis. Realized gains or losses are recorded on the basis of identified cost.
Dividend income is recognized on the ex-dividend date.
Distributions to shareholders
Distributions to shareholders from net investment income and net realized gains, if any, are recorded on the ex-dividend date. Such distributions are determined in conformity with federal income tax regulations, which may differ in amount or character from net investment income and realized gains recognized for purposes of U.S. generally accepted accounting principles.
Federal and other taxes
The Fund intends to continue to qualify as a regulated investment company by distributing substantially all of its investment company taxable income and any net realized capital gains (after reduction for capital loss carryforwards) sufficient to relieve it from all, or substantially all, federal income taxes. Accordingly, no provision for federal income taxes was required.
The Fund’s income and federal excise tax returns and all financial records supporting those returns for the prior three fiscal years are subject to examination by the federal and Delaware revenue authorities. Management has analyzed the Fund’s tax positions taken on federal, state, and foreign tax returns for all open tax years and does not believe that there are any uncertain tax positions that require recognition of a tax liability.
Class allocations
The separate classes of shares offered by the Fund differ principally in applicable sales charges, distribution, shareholder servicing, and administration fees. Class specific expenses are charged directly to that share class. Investment income, common expenses, and realized and unrealized gains (losses) on investments are allocated daily to each class of shares based on the relative proportion of net assets of each class.
3. FAIR VALUATION MEASUREMENTS
Fair value measurements of investments are determined within a framework that has established a fair value hierarchy based upon the various data inputs utilized in determining the value of the Fund’s investments. The three-level hierarchy gives the highest priority to unadjusted quoted prices in active markets for identical assets or liabilities (Level 1) and the lowest priority to significant unobservable inputs (Level 3). The Fund’s investments are classified within the fair value hierarchy based on the lowest level of input that is significant to the fair value measurement. The inputs are summarized into three broad levels as follows:
| n | | Level 1 – quoted prices in active markets for identical securities |
| n | | Level 2 – other significant observable inputs (including quoted prices for similar securities, interest rates, prepayment speeds, credit risk, use of amortized cost, etc.) |
| n | | Level 3 – significant unobservable inputs (including the Fund’s own assumptions in determining the fair value of investments) |
The inputs or methodologies used for valuing investments in securities are not necessarily an indication of the risk associated with investing in those securities.
| | | | |
| 24 | | Wells Fargo Disciplined U.S. Core Fund | | Notes to financial statements (unaudited) |
The following is a summary of the inputs used in valuing the Fund’s assets and liabilities as of January 31, 2016:
| | | | | | | | | | | | | | | | |
| | | Quoted prices (Level 1) | | | Other significant
observable inputs
(Level 2) | | | Significant
unobservable inputs
(Level 3) | | | Total | |
Assets | | | | | | | | | | | | | | | | |
Investments in: | | | | | | | | | | | | | | | | |
| | | | |
Common stocks | | | | | | | | | | | | | | | | |
Consumer discretionary | | $ | 67,779,769 | | | $ | 0 | | | $ | 0 | | | $ | 67,779,769 | |
Consumer staples | | | 50,023,465 | | | | 0 | | | | 0 | | | | 50,023,465 | |
Energy | | | 30,643,719 | | | | 0 | | | | 0 | | | | 30,643,719 | |
Financials | | | 76,335,096 | | | | 0 | | | | 0 | | | | 76,335,096 | |
Health care | | | 79,853,047 | | | | 0 | | | | 0 | | | | 79,853,047 | |
Industrials | | | 47,714,826 | | | | 0 | | | | 0 | | | | 47,714,826 | |
Information technology | | | 105,388,343 | | | | 0 | | | | 0 | | | | 105,388,343 | |
Materials | | | 15,850,324 | | | | 0 | | | | 0 | | | | 15,850,324 | |
Telecommunications | | | 15,341,348 | | | | 0 | | | | 0 | | | | 15,341,348 | |
Utilities | | | 19,338,016 | | | | 0 | | | | 0 | | | | 19,338,016 | |
| | | | |
Short-term investments | | | | | | | | | | | | | | | | |
Investment companies | | | 8,894,394 | | | | 0 | | | | 0 | | | | 8,894,394 | |
Investments measured at net asset value* | | | | | | | | | | | | | | | 1,552,275 | |
Total assets | | $ | 517,162,347 | | | $ | 0 | | | $ | 0 | | | $ | 518,714,622 | |
| * | Investments that are measured at fair value using the net asset value per share (or its equivalent) as a practical expedient have not been categorized in the fair value hierarchy. The fair value amount presented in the table is intended to permit reconciliation of the fair value hierarchy to the amounts presented in the Statement of Assets and Liabilities. The Fund’s investment in Securities Lending Cash Investments, LLC valued at $1,552,275 does not have a redemption period notice, can be redeemed daily and does not have any unfunded commitments. |
The Fund recognizes transfers between levels within the fair value hierarchy at the end of the reporting period. At January 31, 2016, the Fund did not have any transfers into/out of Level 1, Level 2, or Level 3.
4. TRANSACTIONS WITH AFFILIATES
Management fee
Funds Management, an indirect wholly owned subsidiary of Wells Fargo, is the manager of the Fund and provides advisory and fund-level administrative services under an investment management agreement. Under the investment management agreement, Funds Management is responsible for, among other services, implementing the investment objectives and strategies of the Fund, supervising the applicable subadviser, providing fund-level administrative services in connection with the Fund’s operations, and providing any other fund-level administrative services reasonably necessary for the operation of the Fund. As compensation for its services under the investment management agreement, Funds Management is entitled to receive an annual management fee starting at 0.35% and declining to 0.28% as the average daily net assets of the Fund increase. For the six months ended January 31, 2016, the management fee was equivalent to an annual rate of 0.35% of the Fund’s average daily net assets.
Funds Management has retained the services of a subadviser to provide daily portfolio management to the Fund. The fee for subadvisory services is borne by Funds Management. Golden Capital Management, LLC, an affiliate of Funds Management and an indirect wholly owned subsidiary of Wells Fargo, is the subadviser to the Fund and is entitled to receive a fee from Funds Management at an annual rate starting at 0.25% and declining to 0.15% as the average daily net assets of the Fund increase.
Administration fees
Under a class-level administration agreement, Funds Management provides class-level administrative services to the Fund, which includes paying fees and expenses for services provided by the transfer agent, sub-transfer agents, omnibus account servicers and record-keepers. As compensation for its services under the class-level administration agreement, Funds Management receives an annual fee which is calculated based on the average daily net assets of each class as follows:
| | | | |
| | | Class-level
administration fee | |
Class A, Class C, Class R | | | 0.21 | % |
Class R6 | | | 0.03 | |
Administrator Class, Institutional Class | | | 0.13 | |
| | | | | | |
| Notes to financial statements (unaudited) | | Wells Fargo Disciplined U.S. Core Fund | | | 25 | |
Funds Management has contractually waived and/or reimbursed management and administration fees to the extent necessary to maintain certain net operating expense ratios for the Fund. Waiver of fees and/or reimbursement of expenses by Funds Management were made first from fund level expenses on a proportionate basis and then from class specific expenses. Funds Management has committed through November 30, 2016 to waive fees and/or reimburse expenses to the extent necessary to cap the Fund’s expenses at 0.92% for Class A shares, 1.67% for Class C shares, 1.17% for Class R shares, 0.43% for Class R6 shares, 0.74% for Administrator Class shares, and 0.48% for Institutional Class shares. After this time, the cap may be increased or the commitment to maintain the cap may be terminated only with the approval of the Board of Trustees.
Distribution fees
The Trust has adopted a distribution plan for Class C and Class R shares of the Fund pursuant to Rule 12b-1 under the 1940 Act. Distribution fees are charged to Class C and Class R shares and paid to Wells Fargo Funds Distributor, LLC (“Funds Distributor”), the principal underwriter, at an annual rate of 0.75% of the average daily net assets of Class C shares and 0.25% of the average daily net assets of Class R shares.
In addition, Funds Distributor is entitled to receive the front-end sales charge from the purchase of Class A shares and a contingent deferred sales charge on the redemption of certain Class A shares. Funds Distributor is also entitled to receive the contingent deferred sales charges from redemptions of Class C shares. For the six months ended January 31, 2016, Funds Distributor received $23,634 from the sale of Class A shares and $367 in contingent deferred sales charges from redemptions of Class C shares.
Shareholder servicing fees
The Trust has entered into contracts with one or more shareholder servicing agents, whereby Class A, Class C, Class R, and Administrator Class of the Fund are charged a fee at an annual rate of 0.25% of the average daily net assets of each respective class.
A portion of these total shareholder servicing fees were paid to affiliates of Wells Fargo.
5. INVESTMENT PORTFOLIO TRANSACTIONS
Purchases and sales of investments, excluding U.S. government obligations (if any) and short-term securities, for the six months ended January 31, 2016 were $174,251,022 and $148,616,807, respectively.
6. BANK BORROWINGS
The Trust (excluding the money market funds and certain other funds) and Wells Fargo Variable Trust are parties to a $200,000,000 revolving credit agreement whereby the Fund is permitted to use bank borrowings for temporary or emergency purposes, such as to fund shareholder redemption requests. Interest under the credit agreement is charged to the Fund based on a borrowing rate equal to the higher of the Federal Funds rate in effect on that day plus 1.25% or the overnight LIBOR rate in effect on that day plus 1.25%. In addition, an annual commitment fee equal to 0.20% of the unused balance is allocated to each participating fund. Prior to September 1, 2015, the revolving credit agreement amount was $150,000,000 and the annual commitment fee was equal to 0.10% of the unused balance which was allocated to each participating fund. For the six months ended January 31, 2016, the Fund paid $856 in commitment fees.
During the six months ended January 31, 2016, the Fund had average borrowings outstanding of $121,022 (on an annualized basis) at an average rate of 1.37% and paid interest in the amount of $1,658.
7. INDEMNIFICATION
Under the Trust’s organizational documents, the officers and Trustees have been granted certain indemnification rights against certain liabilities that may arise out of performance of their duties to the Trust. Additionally, in the normal course of business, the Trust may enter into contracts with service providers that contain a variety of indemnification clauses. The Trust’s maximum exposure under these arrangements is dependent on future claims that may be made against the Fund and, therefore, cannot be estimated.
| | | | |
| 26 | | Wells Fargo Disciplined U.S. Core Fund | | Other information (unaudited) |
PROXY VOTING INFORMATION
A description of the policies and procedures that the Fund uses to determine how to vote proxies relating to portfolio securities is available, upon request, by calling 1-800-222-8222, visiting our website at wellsfargofunds.com, or visiting the SEC website at sec.gov. Information regarding how the Fund voted proxies relating to portfolio securities during the most recent 12-month period ended June 30 is available on the Fund’s website at wellsfargofunds.com or by visiting the SEC website at sec.gov.
PORTFOLIO HOLDINGS INFORMATION
The complete portfolio holdings for the Fund are publicly available monthly on the Fund’s website (wellsfargofunds.com), on a one-month delayed basis. In addition, top ten holdings information (excluding derivative positions) for the Fund is publicly available on the Fund’s website on a monthly, seven-day or more delayed basis. The Fund files its complete schedule of portfolio holdings with the SEC for the first and third quarters of each fiscal year on Form N-Q, which is available by visiting the SEC website at sec.gov. In addition, the Fund’s Form N-Q may be reviewed and copied at the SEC’s Public Reference Room in Washington, DC, and at regional offices in New York City, at 233 Broadway, and in Chicago, at 175 West Jackson Boulevard, Suite 900. Information about the Public Reference Room may be obtained by calling 1-800-SEC-0330.
| | | | | | |
| Other information (unaudited) | | Wells Fargo Disciplined U.S. Core Fund | | | 27 | |
BOARD OF TRUSTEES AND OFFICERS
Each of the Trustees and Officers1 listed in the table below acts in identical capacities for each fund in the Wells Fargo family of funds, which consists of 144 mutual funds comprising the Wells Fargo Funds Trust, Wells Fargo Variable Trust, Wells Fargo Master Trust and four closed-end funds (collectively the “Fund Complex”). This table should be read in conjunction with the Prospectus and the Statement of Additional Information2. The mailing address of each Trustee and Officer is 525 Market Street, 12th Floor, San Francisco, CA 94105. Each Trustee and Officer serves an indefinite term, however, each Trustee serves such term until reaching the mandatory retirement age established by the Trustees.
Independent Trustees
| | | | | | |
Name and year of birth | | Position held and
length of service* | | Principal occupations during past five years or longer | | Current other
public company or
investment company
directorships |
William R. Ebsworth
(Born 1957) | | Trustee, since 2015 | | Retired. From 1984 to 2013, equities analyst, portfolio manager, research director and chief financial officer at Fidelity Management and Research Company in Boston, Tokyo, and Hong Kong and retired in 2013 as Chief Investment Officer of Fidelity Strategic Advisers, Inc. where he lead a team of investment professionals managing client assets. Prior thereto, Board member of Hong Kong Securities Clearing Co., Hong Kong Options Clearing Corp., the Thailand International Fund, Ltd., Fidelity Investments Life Insurance Company, and Empire Fidelity Investments Life Insurance Company. Mr. Ebsworth is a CFA® charterholder and an Adjunct Lecturer, Finance, at Babson College. | | Asset Allocation Trust |
Jane A. Freeman
(Born 1953) | | Trustee, since 2015 | | Retired. From 2012 to 2014 and 1999 to 2008, Chief Financial Officer of Scientific Learning Corporation. From 2008 to 2012, Ms. Freeman provided consulting services related to strategic business projects. Prior to 1999, Portfolio Manager at Rockefeller & Co. and Scudder, Stevens & Clark. Board member of the Harding Loevner Funds from 1996 to 2014, serving as both Lead Independent Director and chair of the Audit Committee. Board member of the Russell Exchange Traded Funds Trust from 2011 to 2012 and the chair of the Audit Committee. Ms. Freeman is Chair of Taproot Foundation (non-profit organization), a Board Member of Ruth Bancroft Garden (non-profit organization) and an inactive chartered financial analyst. | | Asset Allocation Trust |
Peter G. Gordon
(Born 1942) | | Trustee, since 1998; Chairman, since 2005 | | Co-Founder, Retired Chairman, President and CEO of Crystal Geyser Water Company. Trustee Emeritus, Colby College. | | Asset Allocation Trust |
Isaiah Harris, Jr.
(Born 1952) | | Trustee, since 2009 | | Retired. Chairman of the Board of CIGNA Corporation since 2009, and Director since 2005. From 2003 to 2011, Director of Deluxe Corporation. Prior thereto, President and CEO of BellSouth Advertising and Publishing Corp. from 2005 to 2007, President and CEO of BellSouth Enterprises from 2004 to 2005 and President of BellSouth Consumer Services from 2000 to 2003. Emeritus member of the Iowa State University Foundation Board of Governors. Emeritus Member of the Advisory Board of Iowa State University School of Business. Advisory Board Member, Palm Harbor Academy (charter school). Advisory Board Member, Child Evangelism Fellowship (non-profit). Mr. Harris is a certified public accountant (inactive status). | | CIGNA Corporation; Asset Allocation Trust |
Judith M. Johnson
(Born 1949) | | Trustee, since 2008; Audit Committee Chairman, since 2008 | | Retired. Prior thereto, Chief Executive Officer and Chief Investment Officer of Minneapolis Employees Retirement Fund from 1996 to 2008. Ms. Johnson is an attorney, certified public accountant and a certified managerial accountant. | | Asset Allocation Trust |
David F. Larcker
(Born 1950) | | Trustee, since 2009 | | James Irvin Miller Professor of Accounting at the Graduate School of Business, Stanford University, Director of the Corporate Governance Research Initiative and Senior Faculty of The Rock Center for Corporate Governance since 2006. From 2005 to 2008, Professor of Accounting at the Graduate School of Business, Stanford University. Prior thereto, Ernst & Young Professor of Accounting at The Wharton School, University of Pennsylvania from 1985 to 2005. | | Asset Allocation Trust |
| | | | |
| 28 | | Wells Fargo Disciplined U.S. Core Fund | | Other information (unaudited) |
| | | | | | |
Name and
year of birth | | Position held and
length of service* | | Principal occupations during past five years or longer | | Current other
public company or
investment company
directorships |
Olivia S. Mitchell
(Born 1953) | | Trustee, since 2006 | | International Foundation of Employee Benefit Plans Professor, Wharton School of the University of Pennsylvania since 1993. Director of Wharton’s Pension Research Council and Boettner Center on Pensions & Retirement Research, and Research Associate at the National Bureau of Economic Research. Previously, Cornell University Professor from 1978 to 1993. | | Asset Allocation Trust |
Timothy J. Penny
(Born 1951) | | Trustee, since 1996 | | President and Chief Executive Officer of Southern Minnesota Initiative Foundation, a non-profit organization, since 2007 and Senior Fellow at the Humphrey Institute Policy Forum at the University of Minnesota since 1995. Member of the Board of Trustees of NorthStar Education Finance, Inc., a non-profit organization, since 2007. | | Asset Allocation Trust |
Michael S. Scofield
(Born 1943) | | Trustee, since 2010 | | Served on the Investment Company Institute’s Board of Governors and Executive Committee from 2008-2011 as well the Governing Council of the Independent Directors Council from 2006-2011 and the Independent Directors Council Executive Committee from 2008-2011. Chairman of the IDC from 2008-2010. Institutional Investor (Fund Directions) Trustee of Year in 2007. Trustee of the Evergreen Funds complex (and its predecessors) from 1984 to 2010. Chairman of the Evergreen Funds from 2000-2010. Former Trustee of the Mentor Funds. Retired Attorney, Law Offices of Michael S. Scofield. | | Asset Allocation Trust |
| * | Length of service dates reflect the Trustee’s commencement of service with the Trust’s predecessor entities, where applicable. |
Officers
| | | | | | |
Name and
year of birth | | Position held and
length of service | | Principal occupations during past five years or longer | | |
Karla M. Rabusch
(Born 1959) | | President, since 2003 | | Executive Vice President of Wells Fargo Bank, N.A. and President of Wells Fargo Funds Management, LLC since 2003. | | |
Jeremy DePalma1
(Born 1974) | | Treasurer, since 2012; Assistant Treasurer, since 2009 | | Senior Vice President of Wells Fargo Funds Management, LLC since 2009. Senior Vice President of Evergreen Investment Management Company, LLC from 2008 to 2010 and head of the Fund Reporting and Control Team within Fund Administration from 2005 to 2010. | | |
C. David Messman
(Born 1960) | | Secretary, since 2000; Chief Legal Officer, since 2003 | | Senior Vice President and Secretary of Wells Fargo Funds Management, LLC since 2001. Assistant General Counsel of Wells Fargo Bank, N.A. since 2013 and Vice President and Managing Counsel of Wells Fargo Bank, N.A. from 1996 to 2013. | | |
Debra Ann Early
(Born 1964) | | Chief Compliance Officer, since 2007 | | Executive Vice President of Wells Fargo Funds Management, LLC since 2014, Senior Vice President and Chief Compliance Officer from 2007 to 2014. | | |
David Berardi
(Born 1975) | | Assistant Treasurer, since 2009 | | Vice President of Wells Fargo Funds Management, LLC since 2009. Vice President of Evergreen Investment Management Company, LLC from 2008 to 2010. Manager of Fund Reporting and Control for Evergreen Investment Management Company, LLC from 2004 to 2010. | | |
| 1 | Jeremy DePalma acts as Treasurer of 72 funds and Assistant Treasurer of 72 funds in the Fund Complex. |
| 2 | The Statement of Additional Information includes additional information about the Trustees and is available, without charge, upon request, by calling 1-800-222-8222 or by visiting the website at wellsfargofunds.com. |
| | | | | | |
| List of abbreviations | | Wells Fargo Disciplined U.S. Core Fund | | | 29 | |
The following is a list of common abbreviations for terms and entities that may have appeared in this report.
| ACA | — ACA Financial Guaranty Corporation |
| ADR | — American depositary receipt |
| ADS | — American depositary shares |
| AGC | — Assured Guaranty Corporation |
| AGM | — Assured Guaranty Municipal |
| Ambac | — Ambac Financial Group Incorporated |
| AMT | — Alternative minimum tax |
| BAN | — Bond anticipation notes |
| BHAC | — Berkshire Hathaway Assurance Corporation |
| CAB | — Capital appreciation bond |
| CCAB | — Convertible capital appreciation bond |
| CDA | — Community Development Authority |
| CDO | — Collateralized debt obligation |
| DRIVER | — Derivative inverse tax-exempt receipts |
| DW&P | — Department of Water & Power |
| DWR | — Department of Water Resources |
| ECFA | — Educational & Cultural Facilities Authority |
| EDA | — Economic Development Authority |
| EDFA | — Economic Development Finance Authority |
| ETF | — Exchange-traded fund |
| FDIC | — Federal Deposit Insurance Corporation |
| FFCB | — Federal Farm Credit Banks |
| FGIC | — Financial Guaranty Insurance Corporation |
| FHA | — Federal Housing Administration |
| FHLB | — Federal Home Loan Bank |
| FHLMC | — Federal Home Loan Mortgage Corporation |
| FICO | — The Financing Corporation |
| FNMA | — Federal National Mortgage Association |
| GDR | — Global depositary receipt |
| GNMA | — Government National Mortgage Association |
| HCFR | — Healthcare facilities revenue |
| HEFA | — Health & Educational Facilities Authority |
| HEFAR | — Higher education facilities authority revenue |
| HFA | — Housing Finance Authority |
| HFFA | — Health Facilities Financing Authority |
| HUD | — Department of Housing and Urban Development |
| IDA | — Industrial Development Authority |
| IDAG | — Industrial Development Agency |
| KRW | — Republic of Korea won |
| LIBOR | — London Interbank Offered Rate |
| LIFER | — Long Inverse Floating Exempt Receipts |
| LLC | — Limited liability company |
| LLLP | — Limited liability limited partnership |
| LLP | — Limited liability partnership |
| MBIA | — Municipal Bond Insurance Association |
| MFHR | — Multifamily housing revenue |
| MSTR | — Municipal securities trust receipts |
| MUD | — Municipal Utility District |
| National | — National Public Finance Guarantee Corporation |
| PCFA | — Pollution Control Financing Authority |
| PCL | — Public Company Limited |
| PCR | — Pollution control revenue |
| PFA | — Public Finance Authority |
| PFFA | — Public Facilities Financing Authority |
| PFOTER | — Puttable floating option tax-exempt receipts |
| plc | — Public limited company |
| PUTTER | — Puttable tax-exempt receipts |
| R&D | — Research & development |
| Radian | — Radian Asset Assurance |
| RAN | — Revenue anticipation notes |
| RDA | — Redevelopment Authority |
| RDFA | — Redevelopment Finance Authority |
| REIT | — Real estate investment trust |
| ROC | — Reset option certificates |
| SAVRS | — Select auction variable rate securities |
| SBA | — Small Business Authority |
| SDR | — Swedish depositary receipt |
| SFHR | — Single-family housing revenue |
| SFMR | — Single-family mortgage revenue |
| SPA | — Standby purchase agreement |
| SPDR | — Standard & Poor’s Depositary Receipts |
| SPEAR | — Short Puttable Exempt Adjustable Receipts |
| STRIPS | — Separate trading of registered interest and |
| TAN | — Tax anticipation notes |
| TIPS | — Treasury inflation-protected securities |
| TRAN | — Tax revenue anticipation notes |
| TTFA | — Transportation Trust Fund Authority |
| TVA | — Tennessee Valley Authority |
This page is intentionally left blank.
This page is intentionally left blank.
This page is intentionally left blank.

For more information
More information about Wells Fargo Funds is available free upon request. To obtain literature, please write, email, visit the Fund’s website, or call:
Wells Fargo Funds
P.O. Box 8266
Boston, MA 02266-8266
Email: fundservice@wellsfargo.com
Website: wellsfargofunds.com
Individual investors: 1-800-222-8222
Retail investment professionals: 1-888-877-9275
Institutional investment professionals: 1-866-765-0778
This report and the financial statements contained herein are submitted for the general information of the shareholders of the Fund. If this report is used for promotional purposes, distribution of the report must be accompanied or preceded by a current prospectus. Before investing, please consider the investment objectives, risks, charges, and expenses of the investment. For a current prospectus and, if available, a summary prospectus, containing this information, call 1-800-222-8222 or visit the Fund’s website at wellsfargofunds.com. Read the prospectus carefully before you invest or send money.
Wells Fargo Asset Management (WFAM) is a trade name used by the asset management businesses of Wells Fargo & Company. Wells Fargo Funds Management, LLC, a wholly owned subsidiary of Wells Fargo & Company, provides investment advisory and administrative services for Wells Fargo Funds. Other affiliates of Wells Fargo & Company provide subadvisory and other services for the funds. The funds are distributed by Wells Fargo Funds Distributor, LLC, Member FINRA, an affiliate of Wells Fargo & Company.
NOT FDIC INSURED ¡ NO BANK GUARANTEE ¡ MAY LOSE VALUE
© 2016 Wells Fargo Funds Management, LLC. All rights reserved.
| | |
 | | 240794 03-16 SA203/SAR203 01-16 |
Semi-Annual Report
January 31, 2016

Wells Fargo Endeavor Select Fund


Reduce clutter. Save trees.
Sign up for electronic delivery of prospectuses and shareholder reports at wellsfargo.com/advantagedelivery
Contents
The views expressed and any forward-looking statements are as of January 31, 2016, unless otherwise noted, and are those of the Fund managers and/or Wells Fargo Funds Management, LLC. Discussions of individual securities, or the markets generally, or any Wells Fargo Fund are not intended as individual recommendations. Future events or results may vary significantly from those expressed in any forward-looking statements. The views expressed are subject to change at any time in response to changing circumstances in the market. Wells Fargo Funds Management, LLC and the Fund disclaim any obligation to publicly update or revise any views expressed or forward-looking statements.
NOT FDIC INSURED ¡ NO BANK GUARANTEE ¡ MAY LOSE VALUE
| | | | |
| 2 | | Wells Fargo Endeavor Select Fund | | Letter to shareholders (unaudited) |

Karla M. Rabusch
President
Wells Fargo Funds
Despite generally improving U.S. economic data, ongoing global turmoil tempered U.S. economic growth during the period as many economies and markets outside the U.S. faced ongoing challenges.
Dear Valued Shareholder:
We are pleased to offer you this semi-annual report for the Wells Fargo Endeavor Select Fund for the six-month period that ended January 31, 2016. Despite generally improving U.S. economic data, ongoing global turmoil tempered U.S. economic growth during the period as many economies and markets outside the U.S. faced continuing challenges. In this environment, the broad U.S. stock market experienced heightened volatility and ultimately fell 5.64% overall for the six-month period (as measured by the Russell 3000® Index,1 which is the index used to measure U.S. stock market performance throughout this letter).
As the reporting period began, China’s slowdown continued to take a toll on U.S. and international markets.
The U.S. stock market declined 6.04% and 2.91% in August and September 2015, respectively, as investors worried about the impact on the U.S. of China’s slowing growth. A number of positive economic indicators released during these months suggested the U.S. economy remained solid. However, the strengthening U.S. dollar coupled with ongoing global economic turmoil continued to hinder the economy. Although many investors believed the U.S. Federal Reserve (Fed) would raise the federal funds rate during the third quarter of 2015, at its September 2015 meeting the Fed left the rate unchanged. This decision fueled uncertainty about the U.S. economy’s stamina to remain healthy while facing the negative effects of troubles elsewhere in the world. One week later, Fed Chair Janet Yellen reassured investors that, barring unpleasant surprises, the Fed still intended to raise the rate in 2015. International markets were more volatile than the domestic market and delivered even weaker results in August and September. Investors’ anxiety was driven largely by China’s weakened economy. Because China is the world’s largest importer of many commodities, a number of emerging markets—key commodities exporters—struggled under the strains of reduced demand for commodities and lower prices for the commodities sold.
The U.S. stock market delivered a positive result overall for the last three months of 2015 despite ongoing concerns.
The broad U.S. stock market fluctuated widely in the fourth quarter of 2015, rising 7.90% in October and 0.55% in November before falling 2.05% in December, for an overall quarterly return of 6.27%. Stock markets outside the U.S. generally failed to keep pace with the domestic market as economic concerns, including China’s ongoing slowdown, continued to affect many countries worldwide. U.S. economic data released during the quarter indicated the economy remained solid, with modest growth. However, the strong U.S. dollar and global economic turmoil continued their drag on the economy. In December, the Fed, as expected, slightly raised its target short-term interest rate to between 0.25% and 0.50% after keeping it near zero for seven years. The move, which had been well telegraphed by the Fed for months, reflected confidence in the U.S. economy’s ability to stay healthy with less central-bank support. The Fed also made clear that future interest-rate increases will be gradual.
U.S. stocks struggled in January 2016.
The broad U.S. stock market dropped 5.64% for the month, weighed down by ongoing concerns about heightened market volatility, the continued plunge in oil prices, and the impact of weak global growth on U.S. companies. The U.S. economy, however, remained resilient in January—with continued solid hiring, a
| 1 | The Russell 3000® Index measures the performance of the 3,000 largest U.S. companies based on total market capitalization, which represents approximately 98% of the investable U.S. equity market. You cannot invest directly in an index. |
| | | | | | |
| Letter to shareholders (unaudited) | | Wells Fargo Endeavor Select Fund | | | 3 | |
reduction in the jobless rate to 4.9%, and signs of an uptick in the pace of wage growth—despite some warning signs that became evident in recent months, such as weaknesses in manufacturing and business growth.
Don’t let short-term uncertainty derail long-term investment goals.
Periods of uncertainty can present challenges, but experience has taught us that maintaining long-term investment goals can be an effective way to plan for the future. To help you create a sound strategy based on your personal goals and risk tolerance, Wells Fargo Funds offers more than 100 mutual funds spanning a wide range of asset classes and investment styles. Although diversification cannot guarantee an investment profit or prevent losses, we believe it can be an effective way to manage investment risk and potentially smooth out overall portfolio performance. We encourage investors to know their investments and to understand that appropriate levels of risk-taking may unlock opportunities.
Thank you for choosing to invest in Wells Fargo Funds. We appreciate your confidence in us and remain committed to helping you meet your financial needs.
Sincerely,

Karla M. Rabusch
President
Wells Fargo Funds
Although diversification cannot guarantee an investment profit or prevent losses, we believe it can be an effective way to manage investment risk and potentially smooth out overall portfolio performance.
For further information about your Fund, contact your investment professional, visit our website at wellsfargofunds.com, or call us directly at 1-800-222-8222. We are available 24 hours a day, 7 days a week.
| | | | |
| 4 | | Wells Fargo Endeavor Select Fund | | Performance highlights (unaudited) |
Investment objective
The Fund seeks long-term capital appreciation.
Manager
Wells Fargo Funds Management, LLC
Subadviser
Wells Capital Management Incorporated
Portfolio managers
Thomas J. Pence, CFA® Michael T. Smith, CFA®
Average annual total returns (%) as of January 31, 2016
| | | | | | | | | | | | | | | | | | | | | | | | | | | | | | | | | | |
| | | | | Including sales charge | | | Excluding sales charge | | | Expense ratios1 (%) | |
| | | Inception date | | 1 year | | | 5 year | | | 10 year | | | 1 year | | | 5 year | | | 10 year | | | Gross | | | Net2 | |
| Class A (STAEX) | | 12-29-2000 | | | (7.76 | ) | | | 7.63 | | | | 4.06 | | | | (2.12 | ) | | | 8.91 | | | | 4.67 | | | | 1.19 | | | | 1.19 | |
| Class B (WECBX)* | | 12-29-2000 | | | (7.76 | ) | | | 7.82 | | | | 4.10 | | | | (2.76 | ) | | | 8.11 | | | | 4.10 | | | | 1.94 | | | | 1.94 | |
| Class C (WECCX) | | 12-29-2000 | | | (3.84 | ) | | | 8.11 | | | | 3.89 | | | | (2.84 | ) | | | 8.11 | | | | 3.89 | | | | 1.94 | | | | 1.94 | |
| Administrator Class (WECDX) | | 4-8-2005 | | | – | | | | – | | | | – | | | | (1.87 | ) | | | 9.19 | | | | 4.94 | | | | 1.11 | | | | 1.00 | |
| Institutional Class (WFCIX) | | 4-8-2005 | | | – | | | | – | | | | – | | | | (1.74 | ) | | | 9.38 | | | | 5.14 | | | | 0.86 | | | | 0.80 | |
| Russell 1000® Growth Index3 | | – | | | – | | | | – | | | | – | | | | 1.32 | | | | 11.67 | | | | 7.72 | | | | – | | | | – | |
| * | | Class B shares are closed to investment, except in connection with the reinvestment of any distributions and permitted exchanges. |
Figures quoted represent past performance, which is no guarantee of future results, and do not reflect taxes that a shareholder may pay on fund distributions or the redemption of fund shares. Investment return and principal value of an investment will fluctuate so that an investor’s shares, when redeemed, may be worth more or less than their original cost. Performance shown without sales charges would be lower if sales charges were reflected. Current performance may be lower or higher than the performance data quoted, which assumes the reinvestment of dividends and capital gains. Current month-end performance is available on the Fund’s website, wellsfargofunds.com.
Index returns do not include transaction costs associated with buying and selling securities, any mutual fund fees or expenses, or any taxes. It is not possible to invest directly in an index.
For Class A shares, the maximum front-end sales charge is 5.75%. For Class B, the maximum contingent deferred sales charge is 5.00%. For Class C shares, the maximum contingent deferred sales charge is 1.00%. Performance including a contingent deferred sales charge assumes the sales charge for the corresponding time period. Administrator Class and Institutional Class shares are sold without a front-end sales charge or contingent deferred sales charge.
Stock values fluctuate in response to the activities of individual companies and general market and economic conditions. Certain investment strategies tend to increase the total risk of an investment (relative to the broader market). The Fund is exposed to foreign investment risk, focused portfolio risk, and smaller-company securities risk. Consult the Fund’s prospectus for additional information on these and other risks.
Please see footnotes on page 5.
| | | | | | |
| Performance highlights (unaudited) | | Wells Fargo Endeavor Select Fund | | | 5 | |
| | | | |
| Ten largest holdings (%) as of January 31, 20164 | |
Apple Incorporated | | | 5.71 | |
Facebook Incorporated Class A | | | 5.13 | |
The Home Depot Incorporated | | | 4.76 | |
Amazon.com Incorporated | | | 4.66 | |
Alphabet Incorporated Class A | | | 4.59 | |
Visa Incorporated Class A | | | 4.35 | |
UnitedHealth Group Incorporated | | | 3.82 | |
Bristol-Myers Squibb Company | | | 3.75 | |
Intercontinental Exchange Incorporated | | | 3.25 | |
Constellation Brands Incorporated Class A | | | 2.88 | |
|
| Sector distribution as of January 31, 20165 |
|
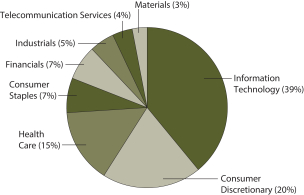 |
| 1 | Reflects the expense ratios as stated in the most recent prospectuses. The expense ratios shown are subject to change and may differ from the annualized expense ratios shown in the financial highlights of this report. |
| 2 | The manager has contractually committed through November 30, 2016, to waive fees and/or reimburse expenses to the extent necessary to cap the Fund’s Total Annual Fund Operating Expenses After Fee Waiver at 1.20% for Class A, 1.95% for Class B, 1.95% for Class C, 1.00% for Administrator Class, and 0.80% for the Institutional Class. After this time, the cap may be increased or the commitment to maintain the cap may be terminated only with the approval of the Board of Trustees. Brokerage commissions, stamp duty fees, interest, taxes, acquired fund fees and expenses, and extraordinary expenses are excluded from the cap. Without this cap, the Fund’s returns would have been lower. |
| 3 | The Russell 1000® Growth Index measures the performance of those Russell 1000 Index companies with higher price-to-book ratios and higher forecasted growth values. You cannot invest directly in an index. |
| 4 | The ten largest holdings, excluding cash and cash equivalents, are calculated based on the value of the investments divided by total net assets of the Fund. Holdings are subject to change and may have changed since the date specified. |
| 5 | Amounts are calculated based on the total long-term investments of the Fund. These amounts are subject to change and may have changed since the date specified. |
| | | | |
| 6 | | Wells Fargo Endeavor Select Fund | | Fund expenses (unaudited) |
As a shareholder of the Fund, you incur tow types of costs: (1) transaction costs, including sales charges (loads) on purchase payments and contingent deferred sales charges (if any) on redemptions and (2) ongoing costs, including management fees, distribution (12b-1) and/or shareholder servicing fees, and other Fund expenses. This example is intended to help you understand your ongoing costs (in dollars) of investing in the Fund and to compare these costs with the ongoing costs of investing in other mutual funds.
The example is based on an investment of $1,000 invested at the beginning of the six-month period and held for the entire period from August 1, 2015 to January 31, 2016.
Actual expenses
The “Actual” line of the table below provides information about actual account values and actual expenses. You may use the information in this line, together with the amount you invested, to estimate the expenses that you paid over the period. Simply divide your account value by $1,000 (for example, an $8,600 account value divided by $1,000 = 8.6), then multiply the result by the number in the “Actual” line under the heading entitled “Expenses paid during period” for your applicable class of shares to estimate the expenses you paid on your account during this period.
Hypothetical example for comparison purposes
The “Hypothetical” line of the table below provides information about hypothetical account values and hypothetical expenses based on the Fund’s actual expense ratio and an assumed rate of return of 5% per year before expenses, which is not the Fund’s actual return. The hypothetical account values and expenses may not be used to estimate the actual ending account balance or expenses you paid for the period. You may use this information to compare the ongoing costs of investing in the Fund and other funds. To do so, compare this 5% hypothetical example with the 5% hypothetical examples that appear in the shareholder reports of the other funds.
Please note that the expenses shown in the table are meant to highlight your ongoing costs only and do not reflect any transactional costs, such as sales charges (loads) and contingent deferred sales charges. Therefore, the “Hypothetical” line of the table is useful in comparing ongoing costs only and will not help you determine the relative total costs of owning different funds. In addition, if these transactional costs were included, your costs would have been higher.
| | | | | | | | | | | | | | | | |
| | | Beginning
account value
8-1-2015 | | | Ending
account value
1-31-2016 | | | Expenses
paid during
the period¹ | | | Net annualized
expense ratio | |
Class A | | | | | | | | | | | | | | | | |
Actual | | $ | 1,000.00 | | | $ | 908.99 | | | $ | 5.76 | | | | 1.20 | % |
Hypothetical (5% return before expenses) | | $ | 1,000.00 | | | $ | 1,019.10 | | | $ | 6.09 | | | | 1.20 | % |
Class B | | | | | | | | | | | | | | | | |
Actual | | $ | 1,000.00 | | | $ | 905.60 | | | $ | 9.34 | | | | 1.95 | % |
Hypothetical (5% return before expenses) | | $ | 1,000.00 | | | $ | 1,015.33 | | | $ | 9.88 | | | | 1.95 | % |
Class C | | | | | | | | | | | | | | | | |
Actual | | $ | 1,000.00 | | | $ | 905.60 | | | $ | 9.34 | | | | 1.95 | % |
Hypothetical (5% return before expenses) | | $ | 1,000.00 | | | $ | 1,015.33 | | | $ | 9.88 | | | | 1.95 | % |
Administrator Class | | | | | | | | | | | | | | | | |
Actual | | $ | 1,000.00 | | | $ | 909.81 | | | $ | 4.80 | | | | 1.00 | % |
Hypothetical (5% return before expenses) | | $ | 1,000.00 | | | $ | 1,020.11 | | | $ | 5.08 | | | | 1.00 | % |
Institutional Class | | | | | | | | | | | | | | | | |
Actual | | $ | 1,000.00 | | | $ | 910.19 | | | $ | 3.84 | | | | 0.80 | % |
Hypothetical (5% return before expenses) | | $ | 1,000.00 | | | $ | 1,021.11 | | | $ | 4.06 | | | | 0.80 | % |
| 1 | Expenses paid is equal to the annualized expense ratio of each class multiplied by the average account value over the period, multiplied by the number of days in the most recent fiscal half-year divided by the number of days in the fiscal year (to reflect the one-half-year period). |
| | | | | | |
| Portfolio of investments—January 31, 2016 (unaudited) | | Wells Fargo Endeavor Select Fund | | | 7 | |
| | | | | | | | | | | | |
| Security name | | | | | | Shares | | | Value | |
| | | | |
Common Stocks: 96.32% | | | | | | | | | | | | |
| | | | |
Consumer Discretionary: 19.48% | | | | | | | | | | | | |
| | | | |
| Auto Components: 2.09% | | | | | | | | | | | | |
Delphi Automotive plc | | | | | | | 68,377 | | | $ | 4,440,402 | |
| | | | | | | | | | | | |
| | | | |
| Hotels, Restaurants & Leisure: 2.74% | | | | | | | | | | | | |
Starbucks Corporation | | | | | | | 95,600 | | | | 5,809,612 | |
| | | | | | | | | | | | |
| | | | |
| Internet & Catalog Retail: 4.66% | | | | | | | | | | | | |
Amazon.com Incorporated † | | | | | | | 16,853 | | | | 9,892,711 | |
| | | | | | | | | | | | |
| | | | |
| Specialty Retail: 7.26% | | | | | | | | | | | | |
The Home Depot Incorporated | | | | | | | 80,383 | | | | 10,108,966 | |
The TJX Companies Incorporated | | | | | | | 74,417 | | | | 5,301,467 | |
| |
| | | | 15,410,433 | |
| | | | | | | | | | | | |
| | | | |
| Textiles, Apparel & Luxury Goods: 2.73% | | | | | | | | | | | | |
Nike Incorporated Class B | | | | | | | 93,472 | | | | 5,796,199 | |
| | | | | | | | | | | | |
| | | | |
Consumer Staples: 6.28% | | | | | | | | | | | | |
| | | | |
| Beverages: 4.59% | | | | | | | | | | | | |
Constellation Brands Incorporated Class A | | | | | | | 40,115 | | | | 6,116,735 | |
Dr Pepper Snapple Group Incorporated | | | | | | | 38,600 | | | | 3,622,224 | |
| |
| | | | 9,738,959 | |
| | | | | | | | | | | | |
| | | | |
| Food & Staples Retailing: 1.69% | | | | | | | | | | | | |
Walgreens Boots Alliance Incorporated | | | | | | | 45,000 | | | | 3,587,400 | |
| | | | | | | | | | | | |
| | | | |
Financials: 7.00% | | | | | | | | | | | | |
| | | | |
| Capital Markets: 1.68% | | | | | | | | | | | | |
Charles Schwab Corporation | | | | | | | 139,900 | | | | 3,571,647 | |
| | | | | | | | | | | | |
| | | | |
| Diversified Financial Services: 5.32% | | | | | | | | | | | | |
Intercontinental Exchange Incorporated | | | | | | | 26,183 | | | | 6,907,075 | |
McGraw Hill Financial Incorporated | | | | | | | 51,578 | | | | 4,385,162 | |
| |
| | | | 11,292,237 | |
| | | | | | | | | | | | |
| | | | |
Health Care: 14.79% | | | | | | | | | | | | |
| | | | |
| Biotechnology: 5.42% | | | | | | | | | | | | |
Alexion Pharmaceuticals Incorporated † | | | | | | | 28,300 | | | | 4,129,819 | |
Celgene Corporation † | | | | | | | 46,979 | | | | 4,712,933 | |
Gilead Sciences Incorporated | | | | | | | 32,025 | | | | 2,658,075 | |
| |
| | | | 11,500,827 | |
| | | | | | | | | | | | |
| | | | |
| Health Care Providers & Services: 3.82% | | | | | | | | | | | | |
UnitedHealth Group Incorporated | | | | | | | 70,400 | | | | 8,107,264 | |
| | | | | | | | | | | | |
| | | | |
| Pharmaceuticals: 5.55% | | | | | | | | | | | | |
Bristol-Myers Squibb Company | | | | | | | 128,100 | | | | 7,962,696 | |
Zoetis Incorporated | | | | | | | 88,860 | | | | 3,825,423 | |
| |
| | | | 11,788,119 | |
| | | | | | | | | | | | |
The accompanying notes are an integral part of these financial statements.
| | | | |
| 8 | | Wells Fargo Endeavor Select Fund | | Portfolio of investments—January 31, 2016 (unaudited) |
| | | | | | | | | | | | |
| Security name | | | | | | Shares | | | Value | |
| | | | |
Industrials: 4.72% | | | | | | | | | | | | |
| | | | |
| Airlines: 2.62% | | | | | | | | | | | | |
Delta Air Lines Incorporated | | | | | | | 125,479 | | | $ | 5,557,465 | |
| | | | | | | | | | | | |
| | | | |
| Professional Services: 2.10% | | | | | | | | | | | | |
Verisk Analytics Incorporated † | | | | | | | 61,200 | | | | 4,467,600 | |
| | | | | | | | | | | | |
| | | | |
Information Technology: 37.81% | | | | | | | | | | | | |
| | | | |
| Communications Equipment: 3.02% | | | | | | | | | | | | |
Harris Corporation | | | | | | | 59,100 | | | | 5,139,927 | |
Palo Alto Networks Incorporated † | | | | | | | 8,525 | | | | 1,274,402 | |
| |
| | | | 6,414,329 | |
| | | | | | | | | | | | |
| | | | |
| Internet Software & Services: 14.13% | | | | | | | | | | | | |
Alphabet Incorporated Class A † | | | | | | | 12,799 | | | | 9,744,519 | |
Alphabet Incorporated Class C † | | | | | | | 6,700 | | | | 4,977,765 | |
Facebook Incorporated Class A † | | | | | | | 96,949 | | | | 10,878,647 | |
Tencent Holdings Limited ADR | | | | | | | 235,800 | | | | 4,390,101 | |
| |
| | | | 29,991,032 | |
| | | | | | | | | | | | |
| | | | |
| IT Services: 6.69% | | | | | | | | | | | | |
Cognizant Technology Solutions Corporation Class A † | | | | | | | 78,500 | | | | 4,969,835 | |
Visa Incorporated Class A | | | | | | | 123,958 | | | | 9,233,631 | |
| |
| | | | 14,203,466 | |
| | | | | | | | | | | | |
| | | | |
| Software: 8.25% | | | | | | | | | | | | |
Adobe Systems Incorporated † | | | | | | | 55,100 | | | | 4,911,063 | |
Electronic Arts Incorporated † | | | | | | | 82,700 | | | | 5,337,872 | |
Salesforce.com Incorporated † | | | | | | | 64,800 | | | | 4,410,288 | |
ServiceNow Incorporated † | | | | | | | 45,768 | | | | 2,847,227 | |
| |
| | | | 17,506,450 | |
| | | | | | | | | | | | |
| | | | |
| Technology Hardware, Storage & Peripherals: 5.72% | | | | | | | | | | | | |
Apple Incorporated | | | | | | | 124,583 | | | | 12,126,909 | |
| | | | | | | | | | | | |
| | | | |
Materials: 2.56% | | | | | | | | | | | | |
| | | | |
| Chemicals: 2.56% | | | | | | | | | | | | |
The Sherwin-Williams Company | | | | | | | 21,200 | | | | 5,420,204 | |
| | | | | | | | | | | | |
| | | | |
Telecommunication Services: 3.68% | | | | | | | | | | | | |
| | | | |
| Diversified Telecommunication Services: 3.68% | | | | | | | | | | | | |
Level 3 Communications Incorporated † | | | | | | | 61,647 | | | | 3,008,990 | |
SBA Communications Corporation Class A † | | | | | | | 48,425 | | | | 4,807,635 | |
| |
| | | | 7,816,625 | |
| | | | | | | | | | | | |
| |
Total Common Stocks (Cost $157,997,779) | | | | 204,439,890 | |
| | | | | | | | | | | | |
The accompanying notes are an integral part of these financial statements.
| | | | | | |
| Portfolio of investments—January 31, 2016 (unaudited) | | Wells Fargo Endeavor Select Fund | | | 9 | |
| | | | | | | | | | | | | | |
| Security name | | Yield | | | | | Shares | | | Value | |
| | | | |
Short-Term Investments: 2.00% | | | | | | | | | | | | | | |
| | | | |
| Investment Companies: 2.00% | | | | | | | | | | | | | | |
Wells Fargo Cash Investment Money Market Fund, Select Class (l)(u) | | | 0.40 | % | | | | | 4,248,637 | | | $ | 4,248,637 | |
| | | | | | | | | | | | | | |
| | | | |
Total Short-Term Investments (Cost $4,248,637) | | | | | | | | | | | | | 4,248,637 | |
| | | | | | | | | | | | | | |
| | | | | | | | |
| Total investments in securities (Cost $162,246,416) * | | | 98.32 | % | | | 208,688,527 | |
Other assets and liabilities, net | | | 1.68 | | | | 3,568,143 | |
| | | | | | | | |
| Total net assets | | | 100.00 | % | | $ | 212,256,670 | |
| | | | | | | | |
| † | Non-income-earning security |
| (l) | The issuer of the security is an affiliated person of the Fund as defined in the Investment Company Act of 1940. |
| (u) | The rate represents the 7-day annualized yield at period end. |
| * | Cost for federal income tax purposes is $163,025,868 and unrealized gains (losses) consists of: |
| | | | |
Gross unrealized gains | | $ | 53,120,045 | |
Gross unrealized losses | | | (7,457,386 | ) |
| | | | |
Net unrealized gains | | $ | 45,662,659 | |
The accompanying notes are an integral part of these financial statements.
| | | | |
| 10 | | Wells Fargo Endeavor Select Fund | | Statement of assets and liabilities—January 31, 2016 (unaudited) |
| | | | |
| | | | |
| |
Assets | | | | |
Investments | | | | |
In unaffiliated securities, at value (cost $157,997,779) | | $ | 204,439,890 | |
In affiliated securities, at value (cost $4,248,637) | | | 4,248,637 | |
| | | | |
Total investments, at value (cost $162,246,416) | | | 208,688,527 | |
Receivable for investments sold | | | 9,272,838 | |
Receivable for Fund shares sold | | | 129,335 | |
Receivable for dividends | | | 72,324 | |
Prepaid expenses and other assets | | | 32,333 | |
| | | | |
Total assets | | | 218,195,357 | |
| | | | |
| |
Liabilities | | | | |
Payable for investments purchased | | | 5,440,333 | |
Payable for Fund shares redeemed | | | 274,029 | |
Management fee payable | | | 102,340 | |
Distribution fees payable | | | 3,363 | |
Administration fees payable | | | 25,910 | |
Accrued expenses and other liabilities | | | 92,712 | |
| | | | |
Total liabilities | | | 5,938,687 | |
| | | | |
Total net assets | | $ | 212,256,670 | |
| | | | |
| |
NET ASSETS CONSIST OF | | | | |
Paid-in capital | | $ | 160,984,247 | |
Accumulated net investment loss | | | (303,259 | ) |
Accumulated net realized gains on investments | | | 5,133,571 | |
Net unrealized gains on investments | | | 46,442,111 | |
| | | | |
Total net assets | | $ | 212,256,670 | |
| | | | |
| |
COMPUTATION OF NET ASSET VALUE AND OFFERING PRICE PER SHARE | | | | |
Net assets – Class A | | $ | 20,474,359 | |
Shares outstanding – Class A1 | | | 2,513,573 | |
Net asset value per share – Class A | | | $8.15 | |
Maximum offering price per share – Class A2 | | | $8.65 | |
Net assets – Class B | | $ | 20,718 | |
Shares outstanding – Class B1 | | | 3,203 | |
Net asset value per share – Class B | | | $6.47 | |
Net assets – Class C | | $ | 5,063,360 | |
Shares outstanding – Class C1 | | | 782,835 | |
Net asset value per share – Class C | | | $6.47 | |
Net assets – Administrator Class | | $ | 5,694,213 | |
Shares outstanding – Administrator Class1 | | | 668,230 | |
Net asset value per share – Administrator Class | | | $8.52 | |
Net assets – Institutional Class | | $ | 181,004,020 | |
Shares outstanding – Institutional Class1 | | | 20,661,476 | |
Net asset value per share – Institutional Class | | | $8.76 | |
| 1 | The Fund has an unlimited number of authorized shares. |
| 2 | Maximum offering price is computed as 100/94.25 of net asset value. On investments of $50,000 or more, the offering price is reduced. |
The accompanying notes are an integral part of these financial statements.
| | | | | | |
| Statement of operations—six months ended January 31, 2016 (unaudited) | | Wells Fargo Endeavor Select Fund | | | 11 | |
| | | | |
| | | | |
| |
Investment income | | | | |
Dividends (net of foreign withholding taxes of $80,071) | | $ | 805,769 | |
Income from affiliated securities | | | 4,187 | |
| | | | |
Total investment income | | | 809,956 | |
| | | | |
| |
Expenses | | | | |
Management fee | | | 889,877 | |
Administration fees | | | | |
Class A | | | 24,809 | |
Class B | | | 68 | |
Class C | | | 6,479 | |
Administrator Class | | | 8,664 | |
Institutional Class | | | 137,189 | |
Shareholder servicing fees | | | | |
Class A | | | 29,534 | |
Class B | | | 81 | |
Class C | | | 7,713 | |
Administrator Class | | | 12,052 | |
Distribution fees | | | | |
Class B | | | 242 | |
Class C | | | 23,138 | |
Custody and accounting fees | | | 12,103 | |
Professional fees | | | 20,850 | |
Registration fees | | | 33,523 | |
Shareholder report expenses | | | 53,283 | |
Trustees’ fees and expenses | | | 11,980 | |
Other fees and expenses | | | 10,098 | |
| | | | |
Total expenses | | | 1,281,683 | |
Less: Fee waivers and/or expense reimbursements | | | (168,468 | ) |
| | | | |
Net expenses | | | 1,113,215 | |
| | | | |
Net investment loss | | | (303,259 | ) |
| | | | |
| |
REALIZED AND UNREALIZED GAINS (LOSSES) ON INVESTMENTS | | | | |
Net realized gains on investments | | | 11,918,993 | |
Net change in unrealized gains (losses) on investments | | | (35,502,222 | ) |
| | | | |
Net realized and unrealized gains (losses) on investments | | | (23,583,229 | ) |
| | | | |
Net decrease in net assets resulting from operations | | $ | (23,886,488 | ) |
| | | | |
The accompanying notes are an integral part of these financial statements.
| | | | |
| 12 | | Wells Fargo Endeavor Select Fund | | Statement of changes in net assets |
| | | | | | | | | | | | | | | | |
| | | Six months ended
January 31, 2016
(unaudited) | | | Year ended
July 31, 2015 | |
| | | |
Operations | | | | | | | | | | | | |
Net investment loss | | | | | | $ | (303,259 | ) | | | | | | $ | (880,977 | ) |
Net realized gains on investments | | | | | | | 11,918,993 | | | | | | | | 133,384,136 | |
Net change in unrealized gains (losses) on investments | | | | | | | (35,502,222 | ) | | | | | | | (60,133,598 | ) |
| | | | |
Net increase (decrease) in net assets resulting from operations | | | | | | | (23,886,488 | ) | | | | | | | 72,369,561 | |
| | | | |
| | | |
Distributions to shareholders from | | | | | | | | | | | | |
Net realized gains | | | | | | | | | | | | | | | | |
Class A | | | | | | | (8,268,795 | ) | | | | | | | (4,180,367 | ) |
Class B | | | | | | | (16,431 | ) | | | | | | | (29,782 | ) |
Class C | | | | | | | (2,442,837 | ) | | | | | | | (1,041,460 | ) |
Administrator Class | | | | | | | (2,258,097 | ) | | | | | | | (6,299,282 | ) |
Institutional Class | | | | | | | (70,034,159 | ) | | | | | | | (81,434,953 | ) |
| | | | |
Total distributions to shareholders | | | | | | | (83,020,319 | ) | | | | | | | (92,985,844 | ) |
| | | | |
| | | | |
Capital share transactions | | | Shares | | | | | | | | Shares | | | | | |
Proceeds from shares sold | | | | | | | | | | | | | | | | |
Class A | | | 179,948 | | | | 1,961,103 | | | | 155,038 | | | | 2,127,588 | |
Class C | | | 22,215 | | | | 211,016 | | | | 80,725 | | | | 950,480 | |
Administrator Class | | | 30,919 | | | | 325,936 | | | | 353,463 | | | | 4,955,910 | |
Institutional Class | | | 3,064,635 | | | | 39,303,430 | | | | 4,502,805 | | | | 64,783,218 | |
| | | | |
| | | | | | | 41,801,485 | | | | | | | | 72,817,196 | |
| | | | |
Reinvestment of distributions | | | | | | | | | | | | | | | | |
Class A | | | 899,011 | | | | 7,758,473 | | | | 314,153 | | | | 4,011,740 | |
Class B | | | 2,395 | | | | 16,431 | | | | 2,673 | | | | 29,782 | |
Class C | | | 348,974 | | | | 2,393,965 | | | | 91,245 | | | | 1,017,377 | |
Administrator Class | | | 241,051 | | | | 2,176,690 | | | | 479,088 | | | | 6,280,838 | |
Institutional Class | | | 7,234,603 | | | | 67,137,120 | | | | 5,829,180 | | | | 77,761,267 | |
| | | | |
| | | | | | | 79,482,679 | | | | | | | | 89,101,004 | |
| | | | |
Payment for shares redeemed | | | | | | | | | | | | | | | | |
Class A | | | (471,788 | ) | | | (4,947,688 | ) | | | (1,513,775 | ) | | | (21,046,656 | ) |
Class B | | | (7,902 | ) | | | (76,962 | ) | | | (13,638 | ) | | | (161,929 | ) |
Class C | | | (167,727 | ) | | | (1,425,225 | ) | | | (127,822 | ) | | | (1,483,495 | ) |
Administrator Class | | | (2,631,241 | ) | | | (34,050,947 | ) | | | (1,166,520 | ) | | | (16,155,945 | ) |
Institutional Class | | | (5,050,973 | ) | | | (59,411,868 | ) | | | (37,137,527 | ) | | | (520,427,263 | ) |
| | | | |
| | | | | | | (99,912,690 | ) | | | | | | | (559,275,288 | ) |
| | | | |
Net increase (decrease) in net assets resulting from capital share transactions | | | | | | | 21,371,474 | | | | | | | | (397,357,088 | ) |
| | | | |
Total decrease in net assets | | | | | | | (85,535,333 | ) | | | | | | | (417,973,371 | ) |
| | | | |
| | | | |
Net assets | | | | | | | | | | | | | | | | |
Beginning of period | | | | | | | 297,792,003 | | | | | | | | 715,765,374 | |
| | | | |
End of period | | | | | | $ | 212,256,670 | | | | | | | $ | 297,792,003 | |
| | | | |
Undistributed (accumulated) net investment income (loss) | | | | | | $ | (303,259 | ) | | | | | | $ | 0 | |
| | | | |
The accompanying notes are an integral part of these financial statements.
| | | | | | |
| Financial highlights | | Wells Fargo Endeavor Select Fund | | | 13 | |
(For a share outstanding throughout each period)
| | | | | | | | | | | | | | | | | | | | | | | | |
| | | Six months ended
January 31, 2016 (unaudited) | | | Year ended July 31 | |
| CLASS A | | | 2015 | | | 2014 | | | 2013 | | | 2012 | | | 2011 | |
Net asset value, beginning of period | | | $13.74 | | | | $14.13 | | | | $12.52 | | | | $10.45 | | | | $10.12 | | | | $8.12 | |
Net investment income (loss) | | | (0.03 | )1 | | | (0.08 | )1 | | | (0.09 | )1 | | | 0.00 | 1,2 | | | (0.05 | )1 | | | (0.05 | )1 |
Net realized and unrealized gains (losses) on investments | | | (0.96 | ) | | | 1.65 | | | | 2.37 | | | | 2.07 | | | | 0.38 | | | | 2.05 | |
| | | | | | | | | | | | | | | | | | | | | | | | |
Total from investment operations | | | (0.99 | ) | | | 1.57 | | | | 2.28 | | | | 2.07 | | | | 0.33 | | | | 2.00 | |
Distributions to shareholders from | | | | | | | | | | | | | | | | | | | | | | | | |
Net realized gains | | | (4.60 | ) | | | (1.96 | ) | | | (0.67 | ) | | | 0.00 | | | | 0.00 | | | | 0.00 | |
Net asset value, end of period | | | $8.15 | | | | $13.74 | | | | $14.13 | | | | $12.52 | | | | $10.45 | | | | $10.12 | |
Total return3 | | | (9.10 | )% | | | 12.14 | % | | | 18.40 | % | | | 19.81 | % | | | 3.26 | % | | | 24.63 | % |
Ratios to average net assets (annualized) | | | | | | | | | | | | | | | | | | | | | | | | |
Gross expenses | | | 1.27 | % | | | 1.24 | % | | | 1.25 | % | | | 1.26 | % | | | 1.23 | % | | | 1.23 | % |
Net expenses | | | 1.20 | % | | | 1.23 | % | | | 1.24 | % | | | 1.25 | % | | | 1.23 | % | | | 1.23 | % |
Net investment income (loss) | | | (0.57 | )% | | | (0.55 | )% | | | (0.66 | )% | | | 0.03 | % | | | (0.49 | )% | | | (0.52 | )% |
Supplemental data | | | | | | | | | | | | | | | | | | | | | | | | |
Portfolio turnover rate | | | 39 | % | | | 126 | % | | | 100 | % | | | 97 | % | | | 94 | % | | | 100 | % |
Net assets, end of period (000s omitted) | | | $20,474 | | | | $26,197 | | | | $41,708 | | | | $44,041 | | | | $47,233 | | | | $94,704 | |
| 1 | Calculated based upon average shares outstanding |
| 2 | Amount is less than $0.005. |
| 3 | Total return calculations do not include any sales charges. Returns for periods of less than one year are not annualized. |
The accompanying notes are an integral part of these financial statements.
| | | | |
| 14 | | Wells Fargo Endeavor Select Fund | | Financial highlights |
(For a share outstanding throughout each period)
| | | | | | | | | | | | | | | | | | | | | | | | |
| | | Six months ended
January 31, 2016 (unaudited) | | | Year ended July 31 | |
| CLASS B | | | 2015 | | | 2014 | | | 2013 | | | 2012 | | | 2011 | |
Net asset value, beginning of period | | | $11.93 | | | | $12.60 | | | | $11.31 | | | | $9.51 | | | | $9.28 | | | | $7.50 | |
Net investment loss | | | (0.06 | )1 | | | (0.16 | )1 | | | (0.17 | )1 | | | (0.07 | )1 | | | (0.11 | )1 | | | (0.11 | )1 |
Net realized and unrealized gains (losses) on investments | | | (0.80 | ) | | | 1.45 | | | | 2.13 | | | | 1.87 | | | | 0.34 | | | | 1.89 | |
| | | | | | | | | | | | | | | | | | | | | | | | |
Total from investment operations | | | (0.86 | ) | | | 1.29 | | | | 1.96 | | | | 1.80 | | | | 0.23 | | | | 1.78 | |
Distributions to shareholders from | | | | | | | | | | | | | | | | | | | | | | | | |
Net realized gains | | | (4.60 | ) | | | (1.96 | ) | | | (0.67 | ) | | | 0.00 | | | | 0.00 | | | | 0.00 | |
Net asset value, end of period | | | $6.47 | | | | $11.93 | | | | $12.60 | | | | $11.31 | | | | $9.51 | | | | $9.28 | |
Total return2 | | | (9.44 | )% | | | 11.31 | % | | | 17.50 | % | | | 18.93 | % | | | 2.48 | % | | | 23.73 | % |
Ratios to average net assets (annualized) | | | | | | | | | | | | | | | | | | | | | | | | |
Gross expenses | | | 2.02 | % | | | 1.99 | % | | | 2.00 | % | | | 2.00 | % | | | 1.98 | % | | | 1.98 | % |
Net expenses | | | 1.95 | % | | | 1.98 | % | | | 1.99 | % | | | 2.00 | % | | | 1.98 | % | | | 1.98 | % |
Net investment loss | | | (1.22 | )% | | | (1.29 | )% | | | (1.41 | )% | | | (0.67 | )% | | | (1.24 | )% | | | (1.26 | )% |
Supplemental data | | | | | | | | | | | | | | | | | | | | | | | | |
Portfolio turnover rate | | | 39 | % | | | 126 | % | | | 100 | % | | | 97 | % | | | 94 | % | | | 100 | % |
Net assets, end of period (000s omitted) | | | $21 | | | | $104 | | | | $248 | | | | $495 | | | | $1,095 | | | | $1,633 | |
| 1 | Calculated based upon average shares outstanding |
| 2 | Total return calculations do not include any sales charges. Returns for periods of less than one year are not annualized. |
The accompanying notes are an integral part of these financial statements.
| | | | | | |
| Financial highlights | | Wells Fargo Endeavor Select Fund | | | 15 | |
(For a share outstanding throughout each period)
| | | | | | | | | | | | | | | | | | | | | | | | |
| | | Six months ended
January 31, 2016 (unaudited) | | | Year ended July 31 | |
| CLASS C | | | 2015 | | | 2014 | | | 2013 | | | 2012 | | | 2011 | |
Net asset value, beginning of period | | | $11.93 | | | | $12.61 | | | | $11.32 | | | | $9.51 | | | | $9.28 | | | | $7.50 | |
Net investment loss | | | (0.06 | )1 | | | (0.16 | )1 | | | (0.17 | )1 | | | (0.07 | )1 | | | (0.11 | )1 | | | (0.11 | )1 |
Net realized and unrealized gains (losses) on investments | | | (0.80 | ) | | | 1.44 | | | | 2.13 | | | | 1.88 | | | | 0.34 | | | | 1.89 | |
| | | | | | | | | | | | | | | | | | | | | | | | |
Total from investment operations | | | (0.86 | ) | | | 1.28 | | | | 1.96 | | | | 1.81 | | | | 0.23 | | | | 1.78 | |
Distributions to shareholders from | | | | | | | | | | | | | | | | | | | | | | | | |
Net realized gains | | | (4.60 | ) | | | (1.96 | ) | | | (0.67 | ) | | | 0.00 | | | | 0.00 | | | | 0.00 | |
Net asset value, end of period | | | $6.47 | | | | $11.93 | | | | $12.61 | | | | $11.32 | | | | $9.51 | | | | $9.28 | |
Total return2 | | | (9.44 | )% | | | 11.21 | % | | | 17.60 | % | | | 18.93 | % | | | 2.48 | % | | | 23.73 | % |
Ratios to average net assets (annualized) | | | | | | | | | | | | | | | | | | | | | | | | |
Gross expenses | | | 2.02 | % | | | 1.99 | % | | | 2.00 | % | | | 2.01 | % | | | 1.98 | % | | | 1.98 | % |
Net expenses | | | 1.95 | % | | | 1.99 | % | | | 1.99 | % | | | 2.00 | % | | | 1.98 | % | | | 1.98 | % |
Net investment loss | | | (1.32 | )% | | | (1.32 | )% | | | (1.41 | )% | | | (0.72 | )% | | | (1.25 | )% | | | (1.27 | )% |
Supplemental data | | | | | | | | | | | | | | | | | | | | | | | | |
Portfolio turnover rate | | | 39 | % | | | 126 | % | | | 100 | % | | | 97 | % | | | 94 | % | | | 100 | % |
Net assets, end of period (000s omitted) | | | $5,063 | | | | $6,914 | | | | $6,747 | | | | $6,320 | | | | $6,199 | | | | $7,448 | |
| 1 | Calculated based upon average shares outstanding |
| 2 | Total return calculations do not include any sales charges. Returns for periods of less than one year are not annualized. |
The accompanying notes are an integral part of these financial statements.
| | | | |
| 16 | | Wells Fargo Endeavor Select Fund | | Financial highlights |
(For a share outstanding throughout each period)
| | | | | | | | | | | | | | | | | | | | | | | | |
| | | Six months ended
January 31, 2016 (unaudited) | | | Year ended July 31 | |
| ADMINISTRATOR CLASS | | | 2015 | | | 2014 | | | 2013 | | | 2012 | | | 2011 | |
Net asset value, beginning of period | | | $14.13 | | | | $14.45 | | | | $12.78 | | | | $10.63 | | | | $10.26 | | | | $8.22 | |
Net investment income (loss) | | | 0.00 | 1,2 | | | (0.05 | )1 | | | (0.06 | )1 | | | 0.03 | 1 | | | (0.03 | )1 | | | (0.03 | )1 |
Net realized and unrealized gains (losses) on investments | | | (1.01 | ) | | | 1.69 | | | | 2.42 | | | | 2.12 | | | | 0.40 | | | | 2.07 | |
| | | | | | | | | | | | | | | | | | | | | | | | |
Total from investment operations | | | (1.01 | ) | | | 1.64 | | | | 2.36 | | | | 2.15 | | | | 0.37 | | | | 2.04 | |
Distributions to shareholders from | | | | | | | | | | | | | | | | | | | | | | | | |
Net investment income | | | 0.00 | | | | 0.00 | | | | (0.02 | ) | | | 0.00 | | | | 0.00 | | | | 0.00 | |
Net realized gains | | | (4.60 | ) | | | (1.96 | ) | | | (0.67 | ) | | | 0.00 | | | | 0.00 | | | | 0.00 | |
| | | | | | | | | | | | | | | | | | | | | | | | |
Total distributions to shareholders | | | (4.60 | ) | | | (1.96 | ) | | | (0.69 | ) | | | 0.00 | | | | 0.00 | | | | 0.00 | |
Net asset value, end of period | | | $8.52 | | | | $14.13 | | | | $14.45 | | | | $12.78 | | | | $10.63 | | | | $10.26 | |
Total return3 | | | (9.02 | )% | | | 12.38 | % | | | 18.77 | % | | | 20.13 | % | | | 3.51 | % | | | 24.94 | % |
Ratios to average net assets (annualized) | | | | | | | | | | | | | | | | | | | | | | | | |
Gross expenses | | | 1.12 | % | | | 1.05 | % | | | 1.06 | % | | | 1.08 | % | | | 1.07 | % | | | 1.07 | % |
Net expenses | | | 1.00 | % | | | 0.99 | % | | | 1.00 | % | | | 1.00 | % | | | 1.00 | % | | | 1.00 | % |
Net investment income (loss) | | | 0.04 | % | | | (0.32 | )% | | | (0.42 | )% | | | 0.23 | % | | | (0.27 | )% | | | (0.29 | )% |
Supplemental data | | | | | | | | | | | | | | | | | | | | | | | | |
Portfolio turnover rate | | | 39 | % | | | 126 | % | | | 100 | % | | | 97 | % | | | 94 | % | | | 100 | % |
Net assets, end of period (000s omitted) | | | $5,694 | | | | $42,776 | | | | $48,560 | | | | $68,611 | | | | $57,533 | | | | $232,954 | |
| 1 | Calculated based upon average shares outstanding |
| 2 | Amount is less than $0.005. |
| 3 | Returns for periods of less than one year are not annualized. |
The accompanying notes are an integral part of these financial statements.
| | | | | | |
| Financial highlights | | Wells Fargo Endeavor Select Fund | | | 17 | |
(For a share outstanding throughout each period)
| | | | | | | | | | | | | | | | | | | | | | | | |
| | | Six months ended
January 31, 2016 (unaudited) | | | Year ended July 31 | |
| INSTITUTIONAL CLASS | | | 2015 | | | 2014 | | | 2013 | | | 2012 | | | 2011 | |
Net asset value, beginning of period | | | $14.39 | | | | $14.65 | | | | $12.95 | | | | $10.75 | | | | $10.37 | | | | $8.28 | |
Net investment income (loss) | | | (0.01 | )1 | | | (0.01 | )1 | | | (0.03 | )1 | | | 0.06 | 1 | | | (0.01 | )1 | | | (0.01 | )1 |
Net realized and unrealized gains (losses) on investments | | | (1.02 | ) | | | 1.71 | | | | 2.45 | | | | 2.14 | | | | 0.39 | | | | 2.10 | |
| | | | | | | | | | | | | | | | | | | | | | | | |
Total from investment operations | | | (1.03 | ) | | | 1.70 | | | | 2.42 | | | | 2.20 | | | | 0.38 | | | | 2.09 | |
Distributions to shareholders from | | | | | | | | | | | | | | | | | | | | | | | | |
Net investment income | | | 0.00 | | | | 0.00 | | | | (0.05 | ) | | | 0.00 | | | | 0.00 | | | | 0.00 | |
Net realized gains | | | (4.60 | ) | | | (1.96 | ) | | | (0.67 | ) | | | 0.00 | | | | 0.00 | | | | 0.00 | |
| | | | | | | | | | | | | | | | | | | | | | | | |
Total distributions to shareholders | | | (4.60 | ) | | | (1.96 | ) | | | (0.72 | ) | | | 0.00 | | | | 0.00 | | | | 0.00 | |
Net asset value, end of period | | | $8.76 | | | | $14.39 | | | | $14.65 | | | | $12.95 | | | | $10.75 | | | | $10.37 | |
Total return2 | | | (8.98 | )% | | | 12.63 | % | | | 18.98 | % | | | 20.37 | % | | | 3.66 | % | | | 25.24 | % |
Ratios to average net assets (annualized) | | | | | | | | | | | | | | | | | | | | | | | | |
Gross expenses | | | 0.94 | % | | | 0.81 | % | | | 0.82 | % | | | 0.83 | % | | | 0.80 | % | | | 0.80 | % |
Net expenses | | | 0.80 | % | | | 0.80 | % | | | 0.80 | % | | | 0.80 | % | | | 0.79 | % | | | 0.80 | % |
Net investment income (loss) | | | (0.19 | )% | | | (0.09 | )% | | | (0.22 | )% | | | 0.50 | % | | | (0.06 | )% | | | (0.08 | )% |
Supplemental data | | | | | | | | | | | | | | | | | | | | | | | | |
Portfolio turnover rate | | | 39 | % | | | 126 | % | | | 100 | % | | | 97 | % | | | 94 | % | | | 100 | % |
Net assets, end of period (000s omitted) | | | $181,004 | | | | $221,801 | | | | $618,502 | | | | $508,685 | | | | $735,633 | | | | $853,494 | |
| 1 | Calculated based upon average shares outstanding |
| 2 | Returns for periods of less than one year are not annualized. |
The accompanying notes are an integral part of these financial statements.
| | | | |
| 18 | | Wells Fargo Endeavor Select Fund | | Notes to financial statements (unaudited) |
1. ORGANIZATION
Wells Fargo Funds Trust (the “Trust”), a Delaware statutory trust organized on March 10, 1999, is an open-end management investment company registered under the Investment Company Act of 1940, as amended (the “1940 Act”). As an investment company, the Trust follows the accounting and reporting guidance in Financial Accounting Standards Board (“FASB”) Accounting Standards Codification Topic 946, Financial Services – Investment Companies. These financial statements report on the Wells Fargo Endeavor Select Fund (the “Fund”) which is a diversified series of the Trust.
2. SIGNIFICANT ACCOUNTING POLICIES
The following significant accounting policies, which are consistently followed in the preparation of the financial statements of the Fund, are in conformity with U.S. generally accepted accounting principles which require management to make estimates and assumptions that affect the reported amounts of assets and liabilities, disclosure of contingent assets and liabilities at the date of the financial statements, and the reported amounts of revenues and expenses during the reporting period. Actual results could differ from those estimates.
Securities valuation
All investments are valued each business day as of the close of regular trading on the New York Stock Exchange (generally 4 p.m. Eastern Time).
Equity securities that are listed on a foreign or domestic exchange or market are valued at the official closing price or, if none, the last sales price. If no sale occurs on the principal exchange or market that day, the prior day’s price will be deemed “stale” and a fair value price will be determined in accordance with the Fund’s Valuation Procedures.
Investments in registered open-end investment companies are valued at net asset value. Interests in non-registered investment vehicles that are redeemable at net asset value are fair valued normally at net asset value.
Investments which are not valued using any of the methods discussed above are valued at their fair value, as determined in good faith by the Board of Trustees of the Fund. The Board of Trustees has established a Valuation Committee comprised of the Trustees and has delegated to it the authority to take any actions regarding the valuation of portfolio securities that the Valuation Committee deems necessary or appropriate, including determining the fair value of portfolio securities, unless the determination has been delegated to the Management Valuation Team of Wells Fargo Funds Management, LLC (“Funds Management”). The Board of Trustees retains the authority to make or ratify any valuation decisions or approve any changes to the Valuation Procedures as it deems appropriate. On a quarterly basis, the Board of Trustees receives reports on any valuation actions taken by the Valuation Committee or the Management Valuation Team which may include items for ratification.
Valuations of fair valued securities are compared to the next actual sales price when available, or other appropriate market values, to assess the continued appropriateness of the fair valuation methodologies used. These securities are fair valued on a day-to-day basis, taking into consideration changes to appropriate market information and any significant changes to the inputs considered in the valuation process until there is a readily available price provided on an exchange or by an independent pricing service. Valuations received from an independent pricing service or independent broker-dealer quotes are periodically validated by comparisons to most recent trades and valuations provided by other independent pricing services in addition to the review of prices by the manager and/or subadviser. Unobservable inputs used in determining fair valuations are identified based on the type of security, taking into consideration factors utilized by market participants in valuing the investment, knowledge about the issuer and the current market environment.
Security loans
The Fund may lend its securities from time to time in order to earn additional income in the form of fees or interest on securities received as collateral or the investment of any cash received as collateral. The Fund continues to receive interest or dividends on the securities loaned. The Fund receives collateral in the form of cash or securities with a value at least equal to the value of the securities on loan. The value of the loaned securities is determined at the close of each business day and any additional required collateral is delivered to the Fund on the next business day. In a securities lending transaction, the net asset value of the Fund will be affected by an increase or decrease in the value of the securities loaned and by an increase or decrease in the value of the instrument in which collateral is invested. The amount of securities lending activity undertaken by the Fund fluctuates from time to time. In the event of default or bankruptcy by the borrower, the Fund may be prevented from recovering the loaned securities or gaining access to the collateral or may experience delays or costs in doing so. In addition, the investment of any cash collateral received may lose all or part of its value. The Fund has the right under the lending agreement to recover the securities from the borrower on demand.
| | | | | | |
| Notes to financial statements (unaudited) | | Wells Fargo Endeavor Select Fund | | | 19 | |
The Fund lends its securities through an unaffiliated securities lending agent. Cash collateral received in connection with its securities lending transactions is invested in Securities Lending Cash Investments, LLC (the “Securities Lending Fund”). The Securities Lending Fund is exempt from registration under Section 3(c)(7) of the 1940 Act and is managed by Funds Management and is subadvised by Wells Capital Management Incorporated (“WellsCap”), an affiliate of Funds Management and an indirect wholly owned subsidiary of Wells Fargo & Company (“Wells Fargo”). Funds Management receives an advisory fee starting at 0.05% and declining to 0.01% as the average daily net assets of the Securities Lending Fund increase. All of the fees received by Funds Management are paid to WellsCap for its services as subadviser. The Securities Lending Fund seeks to provide a positive return compared to the daily Fed Funds Open rate by investing in high-quality, U.S. dollar-denominated short-term money market instruments. Securities Lending Fund investments are fair valued based upon the amortized cost valuation technique. Income earned from investment in the Securities Lending Fund is included in securities lending income on the Statement of Operations.
Security transactions and income recognition
Securities transactions are recorded on a trade date basis. Realized gains or losses are recorded on the basis of identified cost.
Dividend income is recognized on the ex-dividend date. Dividend income is recorded net of foreign taxes withheld where recovery of such taxes is not assured.
Distributions to shareholders
Distributions to shareholders from net investment income and net realized gains, if any, are recorded on the ex-dividend date. Such distributions are determined in conformity with federal income tax regulations, which may differ in amount or character from net investment income and realized gains recognized for purposes of U.S. generally accepted accounting principles.
Federal and other taxes
The Fund intends to continue to qualify as a regulated investment company by distributing substantially all of its investment company taxable income and any net realized capital gains (after reduction for capital loss carryforwards) sufficient to relieve it from all, or substantially all, federal income taxes. Accordingly, no provision for federal income taxes was required.
The Fund’s income and federal excise tax returns and all financial records supporting those returns for the prior three fiscal years are subject to examination by the federal and Delaware revenue authorities. Management has analyzed the Fund’s tax positions taken on federal, state, and foreign tax returns for all open tax years and does not believe that there are any uncertain tax positions that require recognition of a tax liability.
Class allocations
The separate classes of shares offered by the Fund differ principally in applicable sales charges, distribution, shareholder servicing, and administration fees. Class specific expenses are charged directly to that share class. Investment income, common expenses, and realized and unrealized gains (losses) on investments are allocated daily to each class of shares based on the relative proportion of net assets of each class.
3. FAIR VALUATION MEASUREMENTS
Fair value measurements of investments are determined within a framework that has established a fair value hierarchy based upon the various data inputs utilized in determining the value of the Fund’s investments. The three-level hierarchy gives the highest priority to unadjusted quoted prices in active markets for identical assets or liabilities (Level 1) and the lowest priority to significant unobservable inputs (Level 3). The Fund’s investments are classified within the fair value hierarchy based on the lowest level of input that is significant to the fair value measurement. The inputs are summarized into three broad levels as follows:
| n | | Level 1 – quoted prices in active markets for identical securities |
| n | | Level 2 – other significant observable inputs (including quoted prices for similar securities, interest rates, prepayment speeds, credit risk, use of amortized cost, etc.) |
| n | | Level 3 – significant unobservable inputs (including the Fund’s own assumptions in determining the fair value of investments) |
The inputs or methodologies used for valuing investments in securities are not necessarily an indication of the risk associated with investing in those securities.
| | | | |
| 20 | | Wells Fargo Endeavor Select Fund | | Notes to financial statements (unaudited) |
The following is a summary of the inputs used in valuing the Fund’s assets and liabilities as of January 31, 2016:
| | | | | | | | | | | | | | | | |
| | | Quoted prices (Level 1) | | | Other significant
observable inputs
(Level 2) | | | Significant
unobservable inputs
(Level 3) | | | Total | |
Assets | | | | | | | | | | | | | | | | |
Investments in: | | | | | | | | | | | | | | | | |
| | | | |
Common stocks | | | | | | | | | | | | | | | | |
Consumer discretionary | | $ | 41,349,357 | | | $ | 0 | | | $ | 0 | | | $ | 41,349,357 | |
Consumer staples | | | 13,326,359 | | | | 0 | | | | 0 | | | | 13,326,359 | |
Financials | | | 14,863,884 | | | | 0 | | | | 0 | | | | 14,863,884 | |
Health care | | | 31,396,210 | | | | 0 | | | | 0 | | | | 31,396,210 | |
Industrials | | | 10,025,065 | | | | 0 | | | | 0 | | | | 10,025,065 | |
Information technology | | | 75,852,085 | | | | 4,390,101 | | | | 0 | | | | 80,242,186 | |
Materials | | | 5,420,204 | | | | 0 | | | | 0 | | | | 5,420,204 | |
Telecommunication services | | | 7,816,625 | | | | 0 | | | | 0 | | | | 7,816,625 | |
| | | | |
Short-term investments | | | | | | | | | | | | | | | | |
Investment companies | | | 4,248,637 | | | | 0 | | | | 0 | | | | 4,248,637 | |
Total assets | | $ | 204,298,426 | | | $ | 4,390,101 | | | $ | 0 | | | $ | 208,688,527 | |
The Fund recognizes transfers between levels within the fair value hierarchy at the end of the reporting period. At January 31, 2016, the Fund did not have any transfers into/out of Level 1, Level 2, or Level 3.
4. TRANSACTIONS WITH AFFILIATES
Management fee
Funds Management, an indirect wholly owned subsidiary of Wells Fargo, is the manager of the Fund and provides advisory and fund-level administrative services under an investment management agreement. Under the investment management agreement, Funds Management is responsible for, among other services, implementing the investment objectives and strategies of the Fund, supervising the applicable subadviser, providing fund-level administrative services in connection with the Fund’s operations, and providing any other fund-level administrative services reasonably necessary for the operation of the Fund. As compensation for its services under the investment management agreement, Funds Management is entitled to receive an annual management fee starting at 0.70% and declining to 0.505% as the average daily net assets of the Fund increase. For the six months ended January 31, 2016, the management fee was equivalent to an annual rate of 0.70% of the Fund’s average daily net assets.
Funds Management has retained the services of a subadviser to provide daily portfolio management to the Fund. The fee for subadvisory services is borne by Funds Management. WellsCap is the subadviser to the Fund and is entitled to receive a fee from Funds Management at an annual rate starting at 0.30% and declining to 0.20% as the average daily net assets of the Fund increase.
Administration fees
Under a class-level administration agreement, Funds Management provides class-level administrative services to the Fund, which includes paying fees and expenses for services provided by the transfer agent, sub-transfer agents, omnibus account servicers and record-keepers. As compensation for its services under the class-level administration agreement, Funds Management receives an annual fee which is calculated based on the average daily net assets of each class as follows:
| | | | |
| | | Class-level administration fee | |
Class A, Class B, Class C | | | 0.21 | % |
Administrator Class, Institutional Class | | | 0.13 | |
| | | | | | |
| Notes to financial statements (unaudited) | | Wells Fargo Endeavor Select Fund | | | 21 | |
Funds Management has contractually waived and/or reimbursed management and administration fees to the extent necessary to maintain certain net operating expense ratios for the Fund. Waiver of fees and/or reimbursement of expenses by Funds Management were made first from fund level expenses on a proportionate basis and then from class specific expenses. Funds Management has committed through November 30, 2016 to waive fees and/or reimburse expenses to the extent necessary to cap the Fund’s expenses at 1.20% for Class A shares, 1.95% for Class B shares, 1.95% for Class C shares, 1.00% for Administrator Class shares, and 0.80% for Institutional Class shares. After this time, the cap may be increased or the commitment to maintain the cap may be terminated only with the approval of the Board of Trustees.
Distribution fees
The Trust has adopted a distribution plan for Class B and Class C shares of the Fund pursuant to Rule 12b-1 under the 1940 Act. Distribution fees are charged to Class B and Class C shares and paid to Wells Fargo Funds Distributor, LLC (“Funds Distributor”), the principal underwriter, at an annual rate of 0.75% of the average daily net assets of Class B and Class C shares.
In addition, Funds Distributor is entitled to receive the front-end sales charge from the purchase of Class A shares and a contingent deferred sales charge on the redemption of certain Class A shares. Funds Distributor is also entitled to receive the contingent deferred sales charges from redemptions of Class B and Class C shares. For the six months ended January 31, 2016, Funds Distributor received $1,594 from the sale of Class A shares.
Shareholder servicing fees
The Trust has entered into contracts with one or more shareholder servicing agents, whereby Class A, Class B, Class C, and Administrator of the Fund are charged a fee at an annual rate of 0.25% of the average daily net assets of each respective class.
A portion of these total shareholder servicing fees were paid to affiliates of Wells Fargo.
5. INVESTMENT PORTFOLIO TRANSACTIONS
Purchases and sales of investments, excluding U.S. government obligations (if any) and short-term securities, for the six months ended January 31, 2016 were $97,686,666 and $157,825,759, respectively.
6. BANK BORROWINGS
The Trust (excluding the money market funds and certain other funds) and Wells Fargo Variable Trust are parties to a $200,000,000 revolving credit agreement whereby the Fund is permitted to use bank borrowings for temporary or emergency purposes, such as to fund shareholder redemption requests. Interest under the credit agreement is charged to the Fund based on a borrowing rate equal to the higher of the Federal Funds rate in effect on that day plus 1.25% or the overnight LIBOR rate in effect on that day plus 1.25%. In addition, an annual commitment fee equal to 0.20% of the unused balance is allocated to each participating fund. Prior to September 1, 2015, the revolving credit agreement amount was $150,000,000 and the annual commitment fee was equal to 0.10% of the unused balance which was allocated to each participating fund. For the six months ended January 31, 2016, the Fund paid $445 in commitment fees.
For the six months ended January 31, 2016, there were no borrowings by the Fund under the agreement.
7. CONCENTRATION RISK
Concentration risks result from exposure to a limited number of sectors. A fund that invests a substantial portion of its assets in any sector may be more affected by changes in that sector than would be a fund whose investments are not heavily weighted in any sector.
8. INDEMNIFICATION
Under the Trust’s organizational documents, the officers and Trustees have been granted certain indemnification rights against certain liabilities that may arise out of performance of their duties to the Trust. Additionally, in the normal course of business, the Trust may enter into contracts with service providers that contain a variety of indemnification clauses. The Trust’s maximum exposure under these arrangements is dependent on future claims that may be made against the Fund and, therefore, cannot be estimated.
| | | | |
| 22 | | Wells Fargo Endeavor Select Fund | | Other information (unaudited) |
PROXY VOTING INFORMATION
A description of the policies and procedures that the Fund uses to determine how to vote proxies relating to portfolio securities is available, upon request, by calling 1-800-222-8222, visiting our website at wellsfargofunds.com, or visiting the SEC website at sec.gov. Information regarding how the Fund voted proxies relating to portfolio securities during the most recent 12-month period ended June 30 is available on the Fund’s website at wellsfargofunds.com or by visiting the SEC website at sec.gov.
PORTFOLIO HOLDINGS INFORMATION
The complete portfolio holdings for the Fund are publicly available monthly on the Fund’s website (wellsfargofunds.com), on a one-month delayed basis. In addition, top ten holdings information (excluding derivative positions) for the Fund is publicly available on the Fund’s website on a monthly, seven-day or more delayed basis. The Fund files its complete schedule of portfolio holdings with the SEC for the first and third quarters of each fiscal year on Form N-Q, which is available by visiting the SEC website at sec.gov. In addition, the Fund’s Form N-Q may be reviewed and copied at the SEC’s Public Reference Room in Washington, DC, and at regional offices in New York City, at 233 Broadway, and in Chicago, at 175 West Jackson Boulevard, Suite 900. Information about the Public Reference Room may be obtained by calling 1-800-SEC-0330.
| | | | | | |
| Other information (unaudited) | | Wells Fargo Endeavor Select Fund | | | 23 | |
BOARD OF TRUSTEES AND OFFICERS
Each of the Trustees and Officers1 listed in the table below acts in identical capacities for each fund in the Wells Fargo family of funds, which consists of 144 mutual funds comprising the Wells Fargo Funds Trust, Wells Fargo Variable Trust, Wells Fargo Master Trust and four closed-end funds (collectively the “Fund Complex”). This table should be read in conjunction with the Prospectus and the Statement of Additional Information2. The mailing address of each Trustee and Officer is 525 Market Street, 12th Floor, San Francisco, CA 94105. Each Trustee and Officer serves an indefinite term, however, each Trustee serves such term until reaching the mandatory retirement age established by the Trustees.
Independent Trustees
| | | | | | |
Name and year of birth | | Position held and length of service* | | Principal occupations during past five years or longer | | Current other
public company or
investment company
directorships |
| William R. Ebsworth (Born 1957) | | Trustee, since 2015 | | Retired. From 1984 to 2013, equities analyst, portfolio manager, research director and chief financial officer at Fidelity Management and Research Company in Boston, Tokyo, and Hong Kong and retired in 2013 as Chief Investment Officer of Fidelity Strategic Advisers, Inc. where he lead a team of investment professionals managing client assets. Prior thereto, Board member of Hong Kong Securities Clearing Co., Hong Kong Options Clearing Corp., the Thailand International Fund, Ltd., Fidelity Investments Life Insurance Company, and Empire Fidelity Investments Life Insurance Company. Mr. Ebsworth is a CFA® charterholder and an Adjunct Lecturer, Finance, at Babson College. | | Asset Allocation Trust |
| Jane A. Freeman (Born 1953) | | Trustee, since 2015 | | Retired. From 2012 to 2014 and 1999 to 2008, Chief Financial Officer of Scientific Learning Corporation. From 2008 to 2012, Ms. Freeman provided consulting services related to strategic business projects. Prior to 1999, Portfolio Manager at Rockefeller & Co. and Scudder, Stevens & Clark. Board member of the Harding Loevner Funds from 1996 to 2014, serving as both Lead Independent Director and chair of the Audit Committee. Board member of the Russell Exchange Traded Funds Trust from 2011 to 2012 and the chair of the Audit Committee. Ms. Freeman is Chair of Taproot Foundation (non-profit organization), a Board Member of Ruth Bancroft Garden (non-profit organization) and an inactive chartered financial analyst. | | Asset Allocation Trust |
| Peter G. Gordon (Born 1942) | | Trustee, since 1998; Chairman, since 2005 | | Co-Founder, Retired Chairman, President and CEO of Crystal Geyser Water Company. Trustee Emeritus, Colby College. | | Asset Allocation Trust |
| Isaiah Harris, Jr. (Born 1952) | | Trustee, since 2009 | | Retired. Chairman of the Board of CIGNA Corporation since 2009, and Director since 2005. From 2003 to 2011, Director of Deluxe Corporation. Prior thereto, President and CEO of BellSouth Advertising and Publishing Corp. from 2005 to 2007, President and CEO of BellSouth Enterprises from 2004 to 2005 and President of BellSouth Consumer Services from 2000 to 2003. Emeritus member of the Iowa State University Foundation Board of Governors. Emeritus Member of the Advisory Board of Iowa State University School of Business. Advisory Board Member, Palm Harbor Academy (charter school). Advisory Board Member, Child Evangelism Fellowship (non-profit). Mr. Harris is a certified public accountant (inactive status). | | CIGNA Corporation; Asset Allocation Trust |
| Judith M. Johnson (Born 1949) | | Trustee, since 2008; Audit Committee Chairman, since 2008 | | Retired. Prior thereto, Chief Executive Officer and Chief Investment Officer of Minneapolis Employees Retirement Fund from 1996 to 2008. Ms. Johnson is an attorney, certified public accountant and a certified managerial accountant. | | Asset Allocation Trust |
| David F. Larcker (Born 1950) | | Trustee, since 2009 | | James Irvin Miller Professor of Accounting at the Graduate School of Business, Stanford University, Director of the Corporate Governance Research Initiative and Senior Faculty of The Rock Center for Corporate Governance since 2006. From 2005 to 2008, Professor of Accounting at the Graduate School of Business, Stanford University. Prior thereto, Ernst & Young Professor of Accounting at The Wharton School, University of Pennsylvania from 1985 to 2005. | | Asset Allocation Trust |
| | | | |
| 24 | | Wells Fargo Endeavor Select Fund | | Other information (unaudited) |
| | | | | | |
Name and year of birth | | Position held and length of service* | | Principal occupations during past five years or longer | | Current other
public company or
investment company
directorships |
| Olivia S. Mitchell (Born 1953) | | Trustee, since 2006 | | International Foundation of Employee Benefit Plans Professor, Wharton School of the University of Pennsylvania since 1993. Director of Wharton’s Pension Research Council and Boettner Center on Pensions & Retirement Research, and Research Associate at the National Bureau of Economic Research. Previously, Cornell University Professor from 1978 to 1993. | | Asset Allocation Trust |
| Timothy J. Penny (Born 1951) | | Trustee, since 1996 | | President and Chief Executive Officer of Southern Minnesota Initiative Foundation, a non-profit organization, since 2007 and Senior Fellow at the Humphrey Institute Policy Forum at the University of Minnesota since 1995. Member of the Board of Trustees of NorthStar Education Finance, Inc., a non-profit organization, since 2007. | | Asset Allocation Trust |
| Michael S. Scofield (Born 1943) | | Trustee, since 2010 | | Served on the Investment Company Institute’s Board of Governors and Executive Committee from 2008-2011 as well the Governing Council of the Independent Directors Council from 2006-2011 and the Independent Directors Council Executive Committee from 2008-2011. Chairman of the IDC from 2008-2010. Institutional Investor (Fund Directions) Trustee of Year in 2007. Trustee of the Evergreen Funds complex (and its predecessors) from 1984 to 2010. Chairman of the Evergreen Funds from 2000-2010. Former Trustee of the Mentor Funds. Retired Attorney, Law Offices of Michael S. Scofield. | | Asset Allocation Trust |
| * | Length of service dates reflect the Trustee’s commencement of service with the Trust’s predecessor entities, where applicable. |
Officers
| | | | | | |
Name and year of birth | | Position held and length of service | | Principal occupations during past five years or longer | | |
Karla M. Rabusch (Born 1959) | | President, since 2003 | | Executive Vice President of Wells Fargo Bank, N.A. and President of Wells Fargo Funds Management, LLC since 2003. | | |
Jeremy DePalma1 (Born 1974) | | Treasurer, since 2012; Assistant Treasurer, since 2009 | | Senior Vice President of Wells Fargo Funds Management, LLC since 2009. Senior Vice President of Evergreen Investment Management Company, LLC from 2008 to 2010 and head of the Fund Reporting and Control Team within Fund Administration from 2005 to 2010. | | |
C. David Messman (Born 1960) | | Secretary, since 2000; Chief Legal Officer, since 2003 | | Senior Vice President and Secretary of Wells Fargo Funds Management, LLC since 2001. Assistant General Counsel of Wells Fargo Bank, N.A. since 2013 and Vice President and Managing Counsel of Wells Fargo Bank, N.A. from 1996 to 2013. | | |
Debra Ann Early (Born 1964) | | Chief Compliance Officer, since 2007 | | Executive Vice President of Wells Fargo Funds Management, LLC since 2014, Senior Vice President and Chief Compliance Officer from 2007 to 2014. | | |
David Berardi (Born 1975) | | Assistant Treasurer, since 2009 | | Vice President of Wells Fargo Funds Management, LLC since 2009. Vice President of Evergreen Investment Management Company, LLC from 2008 to 2010. Manager of Fund Reporting and Control for Evergreen Investment Management Company, LLC from 2004 to 2010. | | |
| 1 | Jeremy DePalma acts as Treasurer of 72 funds and Assistant Treasurer of 72 funds in the Fund Complex. |
| 2 | The Statement of Additional Information includes additional information about the Trustees and is available, without charge, upon request, by calling 1-800-222-8222 or by visiting the website at wellsfargofunds.com. |
| | | | | | |
| List of abbreviations | | Wells Fargo Endeavor Select Fund | | | 25 | |
The following is a list of common abbreviations for terms and entities that may have appeared in this report.
| ACA | — ACA Financial Guaranty Corporation |
| ADR | — American depositary receipt |
| ADS | — American depositary shares |
| AGC | — Assured Guaranty Corporation |
| AGM | — Assured Guaranty Municipal |
| Ambac | — Ambac Financial Group Incorporated |
| AMT | — Alternative minimum tax |
| BAN | — Bond anticipation notes |
| BHAC | — Berkshire Hathaway Assurance Corporation |
| CAB | — Capital appreciation bond |
| CCAB | — Convertible capital appreciation bond |
| CDA | — Community Development Authority |
| CDO | — Collateralized debt obligation |
| DRIVER | — Derivative inverse tax-exempt receipts |
| DW&P | — Department of Water & Power |
| DWR | — Department of Water Resources |
| ECFA | — Educational & Cultural Facilities Authority |
| EDA | — Economic Development Authority |
| EDFA | — Economic Development Finance Authority |
| ETF | — Exchange-traded fund |
| FDIC | — Federal Deposit Insurance Corporation |
| FFCB | — Federal Farm Credit Banks |
| FGIC | — Financial Guaranty Insurance Corporation |
| FHA | — Federal Housing Administration |
| FHLB | — Federal Home Loan Bank |
| FHLMC | — Federal Home Loan Mortgage Corporation |
| FICO | — The Financing Corporation |
| FNMA | — Federal National Mortgage Association |
| GDR | — Global depositary receipt |
| GNMA | — Government National Mortgage Association |
| HCFR | — Healthcare facilities revenue |
| HEFA | — Health & Educational Facilities Authority |
| HEFAR | — Higher education facilities authority revenue |
| HFA | — Housing Finance Authority |
| HFFA | — Health Facilities Financing Authority |
| HUD | — Department of Housing and Urban Development |
| IDA | — Industrial Development Authority |
| IDAG | — Industrial Development Agency |
| KRW | — Republic of Korea won |
| LIBOR | — London Interbank Offered Rate |
| LIFER | — Long Inverse Floating Exempt Receipts |
| LLC | — Limited liability company |
| LLLP | — Limited liability limited partnership |
| LLP | — Limited liability partnership |
| MBIA | — Municipal Bond Insurance Association |
| MFHR | — Multifamily housing revenue |
| MSTR | — Municipal securities trust receipts |
| MUD | — Municipal Utility District |
| National | — National Public Finance Guarantee Corporation |
| PCFA | — Pollution Control Financing Authority |
| PCL | — Public Company Limited |
| PCR | — Pollution control revenue |
| PFA | — Public Finance Authority |
| PFFA | — Public Facilities Financing Authority |
| PFOTER | — Puttable floating option tax-exempt receipts |
| plc | — Public limited company |
| PUTTER | — Puttable tax-exempt receipts |
| R&D | — Research & development |
| Radian | — Radian Asset Assurance |
| RAN | — Revenue anticipation notes |
| RDA | — Redevelopment Authority |
| RDFA | — Redevelopment Finance Authority |
| REIT | — Real estate investment trust |
| ROC | — Reset option certificates |
| SAVRS | — Select auction variable rate securities |
| SBA | — Small Business Authority |
| SDR | — Swedish depositary receipt |
| SFHR | — Single-family housing revenue |
| SFMR | — Single-family mortgage revenue |
| SPA | — Standby purchase agreement |
| SPDR | — Standard & Poor’s Depositary Receipts |
| SPEAR | — Short Puttable Exempt Adjustable Receipts |
| STRIPS | — Separate trading of registered interest and |
| TAN | — Tax anticipation notes |
| TIPS | — Treasury inflation-protected securities |
| TRAN | — Tax revenue anticipation notes |
| TTFA | — Transportation Trust Fund Authority |
| TVA | — Tennessee Valley Authority |
This page is intentionally left blank.
This page is intentionally left blank.
This page is intentionally left blank.

For more information
More information about Wells Fargo Funds is available free upon request. To obtain literature, please write, email, visit the Fund’s website, or call:
Wells Fargo Funds
P.O. Box 8266
Boston, MA 02266-8266
Email: fundservice@wellsfargo.com
Website: wellsfargofunds.com
Individual investors: 1-800-222-8222
Retail investment professionals: 1-888-877-9275
Institutional investment professionals: 1-866-765-0778
This report and the financial statements contained herein are submitted for the general information of the shareholders of the Fund. If this report is used for promotional purposes, distribution of the report must be accompanied or preceded by a current prospectus. Before investing, please consider the investment objectives, risks, charges, and expenses of the investment. For a current prospectus and, if available, a summary prospectus, containing this information, call 1-800-222-8222 or visit the Fund’s website at wellsfargofunds.com. Read the prospectus carefully before you invest or send money.
Wells Fargo Asset Management (WFAM) is a trade name used by the asset management businesses of Wells Fargo & Company. Wells Fargo Funds Management, LLC, a wholly owned subsidiary of Wells Fargo & Company, provides investment advisory and administrative services for Wells Fargo Funds. Other affiliates of Wells Fargo & Company provide subadvisory and other services for the funds. The funds are distributed by Wells Fargo Funds Distributor, LLC, Member FINRA, an affiliate of Wells Fargo & Company.
NOT FDIC INSURED ¡ NO BANK GUARANTEE ¡ MAY LOSE VALUE
© 2016 Wells Fargo Funds Management, LLC. All rights reserved.
| | |
 | | 240795 03-16 SA205/SAR205 01-16 |
Semi-Annual Report
January 31, 2016

Wells Fargo Growth Fund


Reduce clutter. Save trees.
Sign up for electronic delivery of prospectuses and shareholder reports at wellsfargo.com/advantagedelivery
Contents
The views expressed and any forward-looking statements are as of January 31, 2016, unless otherwise noted, and are those of the Fund managers and/or Wells Fargo Funds Management, LLC. Discussions of individual securities, or the markets generally, or any Wells Fargo Fund are not intended as individual recommendations. Future events or results may vary significantly from those expressed in any forward-looking statements. The views expressed are subject to change at any time in response to changing circumstances in the market. Wells Fargo Funds Management, LLC and the Fund disclaim any obligation to publicly update or revise any views expressed or forward-looking statements.
NOT FDIC INSURED ¡ NO BANK GUARANTEE ¡ MAY LOSE VALUE
| | | | |
| 2 | | Wells Fargo Growth Fund | | Letter to shareholders (unaudited) |

Karla M. Rabusch
President
Wells Fargo Funds
Despite generally improving U.S. economic data, ongoing global turmoil tempered U.S. economic growth during the period as many economies and markets outside the U.S. faced ongoing challenges.
Dear Valued Shareholder:
We are pleased to offer you this semi-annual report for the Wells Fargo Growth Fund for the six-month period that ended January 31, 2016. Despite generally improving U.S. economic data, ongoing global turmoil tempered U.S. economic growth during the period as many economies and markets outside the U.S. faced continuing challenges. In this environment, the broad U.S. stock market experienced heightened volatility and ultimately fell 5.64% overall for the six-month period (as measured by the Russell 3000® Index,1 which is the index used to measure U.S. stock market performance throughout this letter).
As the reporting period began, China’s slowdown continued to take a toll on U.S. and international markets.
The U.S. stock market declined 6.04% and 2.91% in August and September 2015, respectively, as investors worried about the impact on the U.S. of China’s slowing growth. A number of positive economic indicators released during these months suggested the U.S. economy remained solid. However, the strengthening U.S. dollar coupled with ongoing global economic turmoil continued to hinder the economy. Although many investors believed the U.S. Federal Reserve (Fed) would raise the federal funds rate during the third quarter of 2015, at its September 2015 meeting the Fed left the rate unchanged. This decision fueled uncertainty about the U.S. economy’s stamina to remain healthy while facing the negative effects of troubles elsewhere in the world. One week later, Fed Chair Janet Yellen reassured investors that, barring unpleasant surprises, the Fed still intended to raise the rate in 2015. International markets were more volatile than the domestic market and delivered even weaker results in August and September. Investors’ anxiety was driven largely by China’s weakened economy. Because China is the world’s largest importer of many commodities, a number of emerging markets—key commodities exporters—struggled under the strains of reduced demand for commodities and lower prices for the commodities sold.
The U.S. stock market delivered a positive result overall for the last three months of 2015 despite ongoing concerns.
The broad U.S. stock market fluctuated widely in the fourth quarter of 2015, rising 7.90% in October and 0.55% in November before falling 2.05% in December, for an overall quarterly return of 6.27%. Stock markets outside the U.S. generally failed to keep pace with the domestic market as economic concerns, including China’s ongoing slowdown, continued to affect many countries worldwide. U.S. economic data released during the quarter indicated the economy remained solid, with modest growth. However, the strong U.S. dollar and global economic turmoil continued their drag on the economy. In December, the Fed, as expected, slightly raised its target short-term interest rate to between 0.25% and 0.50% after keeping it near zero for seven years. The move, which had been well telegraphed by the Fed for months, reflected confidence in the U.S. economy’s ability to stay healthy with less central-bank support. The Fed also made clear that future interest-rate increases will be gradual.
U.S. stocks struggled in January 2016.
The broad U.S. stock market dropped 5.64% for the month, weighed down by ongoing concerns about heightened market volatility, the continued plunge in oil prices, and the impact of weak global growth on U.S. companies. The U.S. economy, however, remained resilient in January—with continued solid hiring, a
| 1 | The Russell 3000® Index measures the performance of the 3,000 largest U.S. companies based on total market capitalization, which represents approximately 98% of the investable U.S. equity market. You cannot invest directly in an index. |
| | | | | | |
| Letter to shareholders (unaudited) | | Wells Fargo Growth Fund | | | 3 | |
reduction in the jobless rate to 4.9%, and signs of an uptick in the pace of wage growth—despite some warning signs that became evident in recent months, such as weaknesses in manufacturing and business growth.
Don’t let short-term uncertainty derail long-term investment goals.
Periods of uncertainty can present challenges, but experience has taught us that maintaining long-term investment goals can be an effective way to plan for the future. To help you create a sound strategy based on your personal goals and risk tolerance, Wells Fargo Funds offers more than 100 mutual funds spanning a wide range of asset classes and investment styles. Although diversification cannot guarantee an investment profit or prevent losses, we believe it can be an effective way to manage investment risk and potentially smooth out overall portfolio performance. We encourage investors to know their investments and to understand that appropriate levels of risk-taking may unlock opportunities.
Thank you for choosing to invest in Wells Fargo Funds. We appreciate your confidence in us and remain committed to helping you meet your financial needs.
Sincerely,

Karla M. Rabusch
President
Wells Fargo Funds
Although diversification cannot guarantee an investment profit or prevent losses, we believe it can be an effective way to manage investment risk and potentially smooth out overall portfolio performance.
For further information about your Fund, contact your investment professional, visit our website at wellsfargofunds.com, or call us directly at 1-800-222-8222. We are available 24 hours a day, 7 days a week.
| | | | |
| 4 | | Wells Fargo Growth Fund | | Performance highlights (unaudited) |
The Fund is currently closed to most new investors.1
Investment objective
The Fund seeks long-term capital appreciation.
Manager
Wells Fargo Funds Management, LLC
Subadviser
Wells Capital Management Incorporated
Portfolio managers
Joseph M. Eberhardy, CFA®, CPA
Thomas C. Ognar, CFA®
Bruce C. Olson, CFA®
Average annual total returns (%) as of January 31, 20162
| | | | | | | | | | | | | | | | | | | | | | | | | | | | | | | | | | |
| | | | | Including sales charge | | | Excluding sales charge | | | Expense ratios3 (%) | |
| | | Inception date | | 1 year | | | 5 year | | | 10 year | | | 1 year | | | 5 year | | | 10 year | | | Gross | | | Net4 | |
| Class A (SGRAX) | | 2-24-2000 | | | (11.77 | ) | | | 8.10 | | | | 8.05 | | | | (6.38 | ) | | | 9.39 | | | | 8.69 | | | | 1.13 | | | | 1.13 | |
| Class C (WGFCX) | | 12-26-2002 | | | (8.09 | ) | | | 8.58 | | | | 7.88 | | | | (7.09 | ) | | | 8.58 | | | | 7.88 | | | | 1.88 | | | | 1.88 | |
| Class R6 (SGRHX) | | 9-30-2015 | | | – | | | | – | | | | – | | | | (5.97 | ) | | | 9.87 | | | | 9.19 | | | | 0.70 | | | | 0.70 | |
| Administrator Class (SGRKX) | | 8-30-2002 | | | – | | | | – | | | | – | | | | (6.19 | ) | | | 9.64 | | | | 9.00 | | | | 1.05 | | | | 0.96 | |
| Institutional Class (SGRNX) | | 2-24-2000 | | | – | | | | – | | | | – | | | | (5.99 | ) | | | 9.87 | | | | 9.19 | | | | 0.80 | | | | 0.75 | |
| Russell 3000® Growth Index5 | | – | | | – | | | | – | | | | – | | | | 0.41 | | | | 11.41 | | | | 7.56 | | | | – | | | | – | |
Figures quoted represent past performance, which is no guarantee of future results, and do not reflect taxes that a shareholder may pay on fund distributions or the redemption of fund shares. Investment return and principal value of an investment will fluctuate so that an investor’s shares, when redeemed, may be worth more or less than their original cost. Performance shown without sales charges would be lower if sales charges were reflected. Current performance may be lower or higher than the performance data quoted, which assumes the reinvestment of dividends and capital gains. Current month-end performance is available on the Fund’s website, wellsfargofunds.com.
Index returns do not include transaction costs associated with buying and selling securities, any mutual fund fees or expenses, or any taxes. It is not possible to invest directly in an index.
For Class A shares, the maximum front-end sales charge is 5.75%. For Class C shares, the maximum contingent deferred sales charge is 1.00%. Performance including a contingent deferred sales charge assumes the sales charge for the corresponding time period. Class R6, Administrator Class and Institutional Class shares are sold without a front-end sales charge or contingent deferred sales charge.
Stock values fluctuate in response to the activities of individual companies and general market and economic conditions. Certain investment strategies tend to increase the total risk of an investment (relative to the broader market). The Fund is exposed to foreign investment risk and smaller-company securities risk. Consult the Fund’s prospectus for additional information on these and other risks.
Please see footnotes on page 5.
| | | | | | |
| Performance highlights (unaudited) | | Wells Fargo Growth Fund | | | 5 | |
| | | | |
| Ten largest holdings (%) as of January 31, 20166 | |
Alphabet Incorporated Class A | | | 4.76 | |
Facebook Incorporated Class A | | | 4.33 | |
Dollar Tree Incorporated | | | 3.31 | |
Alexion Pharmaceuticals Incorporated | | | 3.24 | |
Amazon.com Incorporated | | | 3.04 | |
Microchip Technology Incorporated | | | 2.83 | |
MarketAxess Holdings Incorporated | | | 2.51 | |
MasterCard Incorporated Class A | | | 2.41 | |
Apple Incorporated | | | 2.23 | |
Alliance Data Systems Corporation | | | 2.21 | |
|
| Sector distribution as of January 31, 20167 |
|
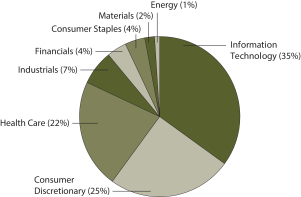 |
| 1 | Please see the Fund’s current Statement of Additional Information for further details. |
| 2 | Effective June 20, 2008, Advisor Class was renamed Class A and modified to assume the features and attributes of Class A. Historical performance shown for Class A shares through June 20, 2008, includes Advisor Class expenses. Historical performance shown for Class R6 shares prior to their inception reflects the performance of Institutional Class shares, and includes the higher expenses applicable to Institutional Class shares. If these expenses had not been included, returns would be higher. |
| 3 | Reflects the expense ratios as stated in the most recent prospectuses. The expense ratios shown are subject to change and may differ from the annualized expense ratios shown in the financial highlights of this report. |
| 4 | The manager has contractually committed through November 30, 2016, to waive fees and/or reimburse expenses to the extent necessary to cap the Fund’s Total Annual Fund Operating Expenses After Fee Waiver at 1.21% for Class A, 1.96% for Class C, 0.70% for Class R6, 0.96% for Administrator Class, and 0.75% for Institutional Class. After this time, the cap may be increased or the commitment to maintain the cap may be terminated only with the approval of the Board of Trustees. Brokerage commissions, stamp duty fees, interest, taxes, acquired fund fees and expenses, and extraordinary expenses are excluded from the cap. Without this cap, the Fund’s returns would have been lower. |
| 5 | The Russell 3000® Growth Index measures the performance of those Russell 3000 Index companies with higher price-to-book ratios and higher forecasted growth values. You cannot invest directly in an index. |
| 6 | The ten largest holdings, excluding cash and cash equivalents, are calculated based on the value of the investments divided by total net assets of the Fund. Holdings are subject to change and may have changed since the date specified. |
| 7 | Amounts are calculated based on the total long-term investments of the Fund. These amounts are subject to change and may have changed since the date specified. |
| | | | |
| 6 | | Wells Fargo Growth Fund | | Fund expenses (unaudited) |
As a shareholder of the Fund, you incur two types costs: (1) transaction costs, including sales charges (loads) on purchase payments and contingent deferred sales charges (if any) on redemptions and (2) ongoing costs, including management fees, distribution (12b-1) and/or shareholder servicing fees, and other Fund expenses. This example is intended to help you understand your ongoing costs (in dollars) of investing in the Fund and to compare these costs with the ongoing costs of investing in other mutual funds.
The example is based on an investment of $1,000 invested at the beginning of the six-month period and held for the entire period from August 1, 2015 to January 31, 2016.
Actual expenses
The “Actual” line of the table below provides information about actual account values and actual expenses. You may use the information in this line, together with the amount you invested, to estimate the expenses that you paid over the period. Simply divide your account value by $1,000 (for example, an $8,600 account value divided by $1,000 = 8.6), then multiply the result by the number in the “Actual” line under the heading entitled “Expenses paid during period” for your applicable class of shares to estimate the expenses you paid on your account during this period.
Hypothetical example for comparison purposes
The “Hypothetical” line of the table below provides information about hypothetical account values and hypothetical expenses based on the Fund’s actual expense ratio and an assumed rate of return of 5% per year before expenses, which is not the Fund’s actual return. The hypothetical account values and expenses may not be used to estimate the actual ending account balance or expenses you paid for the period. You may use this information to compare the ongoing costs of investing in the Fund and other funds. To do so, compare this 5% hypothetical example with the 5% hypothetical examples that appear in the shareholder reports of the other funds.
Please note that the expenses shown in the table are meant to highlight your ongoing costs only and do not reflect any transactional costs, such as sales charges (loads) and contingent deferred sales charges. Therefore, the “Hypothetical” line of the table is useful in comparing ongoing costs only and will not help you determine the relative total costs of owning different funds. In addition, if these transactional costs were included, your costs would have been higher.
| | | | | | | | | | | | | | | | |
| | | Beginning
account value
8-1-2015 | | | Ending
account value
1-31-2016 | | | Expenses
paid during
the period¹ | | | Net annualized
expense ratio | |
Class A | | | | | | | | | | | | | | | | |
Actual | | $ | 1,000.00 | | | $ | 855.22 | | | $ | 5.32 | | | | 1.14 | % |
Hypothetical (5% return before expenses) | | $ | 1,000.00 | | | $ | 1,019.41 | | | $ | 5.79 | | | | 1.14 | % |
Class C | | | | | | | | | | | | | | | | |
Actual | | $ | 1,000.00 | | | $ | 851.88 | | | $ | 8.80 | | | | 1.89 | % |
Hypothetical (5% return before expenses) | | $ | 1,000.00 | | | $ | 1,015.63 | | | $ | 9.58 | | | | 1.89 | % |
Class R6 | | | | | | | | | | | | | | | | |
Actual | | $ | 1,000.00 | | | $ | 857.19 | | | $ | 3.27 | | | | 0.70 | % |
Hypothetical (5% return before expenses) | | $ | 1,000.00 | | | $ | 1,021.62 | | | $ | 3.56 | | | | 0.70 | % |
Administrator Class | | | | | | | | | | | | | | | | |
Actual | | $ | 1,000.00 | | | $ | 855.95 | | | $ | 4.48 | | | | 0.96 | % |
Hypothetical (5% return before expenses) | | $ | 1,000.00 | | | $ | 1,020.31 | | | $ | 4.88 | | | | 0.96 | % |
Institutional Class | | | | | | | | | | | | | | | | |
Actual | | $ | 1,000.00 | | | $ | 857.01 | | | $ | 3.50 | | | | 0.75 | % |
Hypothetical (5% return before expenses) | | $ | 1,000.00 | | | $ | 1,021.37 | | | $ | 3.81 | | | | 0.75 | % |
| 1 | Expenses paid is equal to the annualized expense ratio of each class multiplied by the average account value over the period, multiplied by the number of days in the most recent fiscal half-year divided by the number of days in the fiscal year (to reflect the one-half-year period). |
| | | | | | |
| Portfolio of investments—January 31, 2016 (unaudited) | | Wells Fargo Growth Fund | | | 7 | |
| | | | | | | | | | | | |
| Security name | | | | | | Shares | | | Value | |
| | | | |
Common Stocks: 96.92% | | | | | | | | | | | | |
| | | | |
Consumer Discretionary: 24.17% | | | | | | | | | | | | |
| | | | |
| Auto Components: 0.45% | | | | | | | | | | | | |
Delphi Automotive plc | | | | | | | 538,510 | | | $ | 34,970,839 | |
| | | | | | | | | | | | |
| | | | |
| Distributors: 1.65% | | | | | | | | | | | | |
LKQ Corporation † | | | | | | | 4,713,750 | | | | 129,156,750 | |
| | | | | | | | | | | | |
| | | | |
| Diversified Consumer Services: 1.70% | | | | | | | | | | | | |
Grand Canyon Education Incorporated †(l) | | | | | | | 3,526,000 | | | | 132,753,900 | |
| | | | | | | | | | | | |
| | | | |
| Hotels, Restaurants & Leisure: 5.14% | | | | | | | | | | | | |
Fiesta Restaurant Group Incorporated †(l) | | | | | | | 2,330,983 | | | | 84,847,781 | |
Jack in the Box Incorporated | | | | | | | 1,544,000 | | | | 119,876,160 | |
Planet Fitness Incorporated Class A †« | | | | | | | 865,400 | | | | 12,366,566 | |
Starbucks Corporation | | | | | | | 2,591,720 | | | | 157,498,824 | |
The Habit Restaurants Incorporated Class A †(l)« | | | | | | | 1,381,000 | | | | 28,351,930 | |
| | | | |
| | | | | | | | | | | 402,941,261 | |
| | | | | | | | | | | | |
| | | | |
| Internet & Catalog Retail: 3.04% | | | | | | | | | | | | |
Amazon.com Incorporated † | | | | | | | 405,930 | | | | 238,280,910 | |
| | | | | | | | | | | | |
| | | | |
| Media: 0.57% | | | | | | | | | | | | |
The Walt Disney Company | | | | | | | 467,810 | | | | 44,825,554 | |
| | | | | | | | | | | | |
| | | | |
| Multiline Retail: 5.79% | | | | | | | | | | | | |
Burlington Stores Incorporated † | | | | | | | 3,103,100 | | | | 166,729,563 | |
Dollar General Corporation | | | | | | | 367,000 | | | | 27,547,020 | |
Dollar Tree Incorporated † | | | | | | | 3,188,235 | | | | 259,267,270 | |
| | | | |
| | | | | | | | | | | 453,543,853 | |
| | | | | | | | | | | | |
| | | | |
| Specialty Retail: 4.38% | | | | | | | | | | | | |
Boot Barn Holdings Incorporated †« | | | | | | | 863,300 | | | | 5,248,864 | |
CarMax Incorporated † | | | | | | | 2,448,000 | | | | 108,152,640 | |
Five Below Incorporated † | | | | | | | 1,168,243 | | | | 41,157,201 | |
The Home Depot Incorporated | | | | | | | 96,000 | | | | 12,072,960 | |
Tractor Supply Company | | | | | | | 1,698,230 | | | | 149,970,691 | |
ULTA Salon, Cosmetics and Fragrance Incorporated † | | | | | | | 148,000 | | | | 26,813,160 | |
| | | | |
| | | | | | | | | | | 343,415,516 | |
| | | | | | | | | | | | |
| | | | |
| Textiles, Apparel & Luxury Goods: 1.45% | | | | | | | | | | | | |
Skechers U.S.A. Incorporated Class A † | | | | | | | 1,290,467 | | | | 36,378,265 | |
Under Armour Incorporated Class A †« | | | | | | | 899,000 | | | | 76,801,570 | |
| | | | |
| | | | | | | | | | | 113,179,835 | |
| | | | | | | | | | | | |
| | | | |
Consumer Staples: 3.54% | | | | | | | | | | | | |
| | | | |
| Food & Staples Retailing: 2.64% | | | | | | | | | | | | |
Costco Wholesale Corporation | | | | | | | 271,270 | | | | 40,994,322 | |
Sprouts Farmers Market Incorporated † | | | | | | | 7,282,845 | | | | 166,048,866 | |
| | | | |
| | | | | | | | | | | 207,043,188 | |
| | | | | | | | | | | | |
The accompanying notes are an integral part of these financial statements.
| | | | |
| 8 | | Wells Fargo Growth Fund | | Portfolio of investments—January 31, 2016 (unaudited) |
| | | | | | | | | | | | |
| Security name | | | | | | Shares | | | Value | |
| | | | |
| Personal Products: 0.90% | | | | | | | | | | | | |
The Estee Lauder Companies Incorporated Class A | | | | | | | 825,550 | | | $ | 70,378,138 | |
| | | | | | | | | | | | |
| | | | |
Energy: 1.01% | | | | | | | | | | | | |
| | | | |
| Oil, Gas & Consumable Fuels: 1.01% | | | | | | | | | | | | |
Concho Resources Incorporated † | | | | | | | 830,000 | | | | 78,957,900 | |
| | | | | | | | | | | | |
| | | | |
Financials: 4.35% | | | | | | | | | | | | |
| | | | |
| Capital Markets: 1.83% | | | | | | | | | | | | |
Raymond James Financial Incorporated | | | | | | | 1,182,000 | | | | 51,783,420 | |
TD Ameritrade Holding Corporation | | | | | | | 3,310,630 | | | | 91,307,175 | |
| | | | |
| | | | | | | | | | | 143,090,595 | |
| | | | | | | | | | | | |
| | | | |
| Consumer Finance: 0.02% | | | | | | | | | | | | |
LendingClub Corporation †« | | | | | | | 207,000 | | | | 1,527,660 | |
| | | | | | | | | | | | |
| | | | |
| Diversified Financial Services: 2.50% | | | | | | | | | | | | |
MarketAxess Holdings Incorporated | | | | | | | 1,689,130 | | | | 196,327,580 | |
| | | | | | | | | | | | |
| | | | |
Health Care: 20.90% | | | | | | | | | | | | |
| | | | |
| Biotechnology: 9.93% | | | | | | | | | | | | |
Alexion Pharmaceuticals Incorporated † | | | | | | | 1,739,456 | | | | 253,838,814 | |
BioMarin Pharmaceutical Incorporated † | | | | | | | 820,000 | | | | 60,696,400 | |
Celgene Corporation † | | | | | | | 1,396,860 | | | | 140,132,995 | |
Incyte Corporation † | | | | | | | 459,000 | | | | 32,387,040 | |
Medivation Incorporated † | | | | | | | 1,300,640 | | | | 42,530,928 | |
PTC Therapeutics Incorporated †« | | | | | | | 877,000 | | | | 20,890,140 | |
Regeneron Pharmaceuticals Incorporated † | | | | | | | 258,910 | | | | 108,765,502 | |
Ultragenyx Pharmaceutical Incorporated † | | | | | | | 896,000 | | | | 50,310,400 | |
Vertex Pharmaceuticals Incorporated † | | | | | | | 747,000 | | | | 67,790,250 | |
| | | | |
| | | | | | | | | | | 777,342,469 | |
| | | | | | | | | | | | |
| | | | |
| Health Care Equipment & Supplies: 2.13% | | | | | | | | | | | | |
Align Technology Incorporated † | | | | | | | 645,000 | | | | 42,660,300 | |
Intuitive Surgical Incorporated † | | | | | | | 62,000 | | | | 33,532,700 | |
Medtronic plc | | | | | | | 1,193,951 | | | | 90,644,760 | |
| | | | |
| | | | | | | | | | | 166,837,760 | |
| | | | | | | | | | | | |
| | | | |
| Health Care Providers & Services: 4.56% | | | | | | | | | | | | |
Acadia Healthcare Company Incorporated † | | | | | | | 2,827,642 | | | | 172,570,991 | |
AmerisourceBergen Corporation | | | | | | | 923,840 | | | | 82,739,110 | |
Diplomat Pharmacy Incorporated †« | | | | | | | 1,321,000 | | | | 35,944,410 | |
VCA Incorporated † | | | | | | | 1,291,670 | | | | 66,223,921 | |
| | | | |
| | | | | | | | | | | 357,478,432 | |
| | | | | | | | | | | | |
| | | | |
| Health Care Technology: 1.94% | | | | | | | | | | | | |
Cerner Corporation † | | | | | | | 1,309,000 | | | | 75,935,090 | |
Veeva Systems Incorporated Class A †« | | | | | | | 3,144,000 | | | | 75,770,400 | |
| | | | |
| | | | | | | | | | | 151,705,490 | |
| | | | | | | | | | | | |
The accompanying notes are an integral part of these financial statements.
| | | | | | |
| Portfolio of investments—January 31, 2016 (unaudited) | | Wells Fargo Growth Fund | | | 9 | |
| | | | | | | | | | | | |
| Security name | | | | | | Shares | | | Value | |
| | | | |
| Life Sciences Tools & Services: 0.73% | | | | | | | | | | | | |
Quintiles Transnational Holdings Incorporated † | | | | | | | 942,360 | | | $ | 57,323,759 | |
| | | | | | | | | | | | |
| | | | |
| Pharmaceuticals: 1.61% | | | | | | | | | | | | |
Bristol-Myers Squibb Company | | | | | | | 1,456,000 | | | | 90,504,960 | |
Perrigo Company plc | | | | | | | 246,970 | | | | 35,706,923 | |
| | | | |
| | | | | | | | | | | 126,211,883 | |
| | | | | | | | | | | | |
| | | | |
Industrials: 6.97% | | | | | | | | | | | | |
| | | | |
| Aerospace & Defense: 0.57% | | | | | | | | | | | | |
The Boeing Company | | | | | | | 370,350 | | | | 44,490,146 | |
| | | | | | | | | | | | |
| | | | |
| Air Freight & Logistics: 1.05% | | | | | | | | | | | | |
United Parcel Service Incorporated Class B | | | | | | | 883,000 | | | | 82,295,600 | |
| | | | | | | | | | | | |
| | | | |
| Commercial Services & Supplies: 1.95% | | | | | | | | | | | | |
KAR Auction Services Incorporated | | | | | | | 1,580,000 | | | | 52,803,600 | |
Waste Connections Incorporated | | | | | | | 1,671,850 | | | | 100,260,845 | |
| | | | |
| | | | | | | | | | | 153,064,445 | |
| | | | | | | | | | | | |
| | | | |
| Machinery: 0.40% | | | | | | | | | | | | |
ITT Corporation | | | | | | | 963,000 | | | | 31,249,350 | |
| | | | | | | | | | | | |
| | | | |
| Road & Rail: 3.00% | | | | | | | | | | | | |
Genesee & Wyoming Incorporated Class A † | | | | | | | 50,000 | | | | 2,479,000 | |
Kansas City Southern | | | | | | | 1,195,000 | | | | 84,701,600 | |
Union Pacific Corporation | | | | | | | 2,047,940 | | | | 147,451,680 | |
| | | | |
| | | | | | | | | | | 234,632,280 | |
| | | | | | | | | | | | |
| | | | |
Information Technology: 33.96% | | | | | | | | | | | | |
| | | | |
| Internet Software & Services: 12.71% | | | | | | | | | | | | |
Akamai Technologies Incorporated † | | | | | | | 644,000 | | | | 29,379,280 | |
Alphabet Incorporated Class A † | | | | | | | 489,770 | | | | 372,886,390 | |
Alphabet Incorporated Class C † | | | | | | | 56,681 | | | | 42,111,149 | |
CoStar Group Incorporated † | | | | | | | 474,950 | | | | 83,291,982 | |
Envestnet Incorporated †(l) | | | | | | | 3,276,731 | | | | 76,839,342 | |
Facebook Incorporated Class A † | | | | | | | 3,024,760 | | | | 339,408,320 | |
New Relic Incorporated †« | | | | | | | 1,754,000 | | | | 49,497,880 | |
Shutterstock Incorporated †« | | | | | | | 81,000 | | | | 2,340,090 | |
| | | | |
| | | | | | | | | | | 995,754,433 | |
| | | | | | | | | | | | |
| | | | |
| IT Services: 8.10% | | | | | | | | | | | | |
Alliance Data Systems Corporation † | | | | | | | 866,603 | | | | 173,138,613 | |
Cognizant Technology Solutions Corporation Class A † | | | | | | | 448,000 | | | | 28,362,880 | |
Global Payments Incorporated | | | | | | | 786,900 | | | | 46,387,755 | |
MasterCard Incorporated Class A | | | | | | | 2,116,880 | | | | 188,465,826 | |
Vantiv Incorporated Class A † | | | | | | | 609,893 | | | | 28,695,466 | |
Visa Incorporated Class A | | | | | | | 2,270,300 | | | | 169,114,647 | |
| | | | |
| | | | | | | | | | | 634,165,187 | |
| | | | | | | | | | | | |
The accompanying notes are an integral part of these financial statements.
| | | | |
| 10 | | Wells Fargo Growth Fund | | Portfolio of investments—January 31, 2016 (unaudited) |
| | | | | | | | | | | | | | |
| Security name | | | | | | | Shares | | | Value | |
| | | | |
| Semiconductors & Semiconductor Equipment: 3.09% | | | | | | | | | | | | | | |
Microchip Technology Incorporated | | | | | | | | | 4,946,260 | | | $ | 221,641,911 | |
Monolithic Power Systems Incorporated | | | | | | | | | 112,000 | | | | 7,007,840 | |
Silicon Laboratories Incorporated † | | | | | | | | | 297,818 | | | | 13,580,501 | |
| | | | |
| | | | | | | | | | | | | 242,230,252 | |
| | | | | | | | | | | | | | |
| | | | |
| Software: 7.83% | | | | | | | | | | | | | | |
Adobe Systems Incorporated † | | | | | | | | | 275,080 | | | | 24,517,880 | |
Fortinet Incorporated † | | | | | | | | | 3,757,910 | | | | 105,747,587 | |
Paycom Software Incorporated † | | | | | | | | | 2,031,345 | | | | 61,245,052 | |
Paylocity Holding Corporation †« | | | | | | | | | 1,170,625 | | | | 36,429,850 | |
Proofpoint Incorporated † | | | | | | | | | 1,461,000 | | | | 73,575,960 | |
Red Hat Incorporated † | | | | | | | | | 349,726 | | | | 24,498,306 | |
Salesforce.com Incorporated † | | | | | | | | | 714,000 | | | | 48,594,840 | |
ServiceNow Incorporated † | | | | | | | | | 543,200 | | | | 33,792,472 | |
Splunk Incorporated † | | | | | | | | | 2,096,000 | | | | 97,023,840 | |
Synchronoss Technologies Incorporated † | | | | | | | | | 806,960 | | | | 24,725,254 | |
Tableau Software Incorporated Class A † | | | | | | | | | 702,000 | | | | 56,328,480 | |
Ultimate Software Group Incorporated † | | | | | | | | | 150,630 | | | | 26,455,147 | |
| | | | |
| | | | | | | | | | | | | 612,934,668 | |
| | | | | | | | | | | | | | |
| | | | |
| Technology Hardware, Storage & Peripherals: 2.23% | | | | | | | | | | | | | | |
Apple Incorporated | | | | | | | | | 1,794,610 | | | | 174,687,337 | |
| | | | | | | | | | | | | | |
| | | | |
Materials: 2.02% | | | | | | | | | | | | | | |
| | | | |
| Chemicals: 2.02% | | | | | | | | | | | | | | |
Ecolab Incorporated | | | | | | | | | 1,137,000 | | | | 122,648,190 | |
Praxair Incorporated | | | | | | | | | 355,630 | | | | 35,563,000 | |
| | | | |
| | | | | | | | | | | | | 158,211,190 | |
| | | | | | | | | | | | | | |
| | | | |
Total Common Stocks (Cost $5,444,619,628) | | | | | | | | | | | | | 7,591,008,160 | |
| | | | | | | | | | | | | | |
| | | | |
| | | Yield | | | | | | | | | |
| Short-Term Investments: 2.14% | | | | | | | | | | | | | | |
| | | | |
| Investment Companies: 2.14% | | | | | | | | | | | | | | |
Securities Lending Cash Investments, LLC (l)(r)(u) | | | 0.42 | % | | | | | 119,352,425 | | | | 119,352,425 | |
Wells Fargo Cash Investment Money Market Fund, Select Class (l)(u) | | | 0.40 | | | | | | 48,150,734 | | | | 48,150,734 | |
| | | | |
Total Short-Term Investments (Cost $167,503,159) | | | | | | | | | | | | | 167,503,159 | |
| | | | | | | | | | | | | | |
| | | | | | | | |
| Total investments in securities (Cost $5,612,122,787) * | | | 99.06 | % | | | 7,758,511,319 | |
Other assets and liabilities, net | | | 0.94 | | | | 73,581,381 | |
| | | | | | | | |
| Total net assets | | | 100.00 | % | | $ | 7,832,092,700 | |
| | | | | | | | |
| † | Non-income-earning security |
| (l) | The issuer of the security is an affiliated person of the Fund as defined in the Investment Company Act of 1940. |
| « | All or a portion of this security is on loan. |
| (r) | The investment is a non-registered investment vehicle purchased with cash collateral received from securities on loan. |
| (u) | The rate represents the 7-day annualized yield at period end. |
| * | Cost for federal income tax purposes is $5,632,654,064 and unrealized gains (losses) consists of: |
| | | | |
Gross unrealized gains | | $ | 2,555,996,000 | |
Gross unrealized losses | | | (430,138,745 | ) |
| | | | |
Net unrealized gains | | $ | 2,125,857,255 | |
The accompanying notes are an integral part of these financial statements.
| | | | | | |
| Statement of assets and liabilities—January 31, 2016 (unaudited) | | Wells Fargo Growth Fund | | | 11 | |
| | | | |
| | | | |
| |
Assets | | | | |
Investments | | | | |
In unaffiliated securities (including $116,533,976 of securities loaned), at value (cost $5,004,583,481) | | $ | 7,268,215,207 | |
In affiliated securities, at value (cost $607,539,306) | | | 490,296,112 | |
| | | | |
Total investments, at value (cost $5,612,122,787) | | | 7,758,511,319 | |
Cash | | | 1,246,376 | |
Receivable for investments sold | | | 247,515,241 | |
Receivable for Fund shares sold | | | 6,227,320 | |
Receivable for dividends | | | 1,069,482 | |
Receivable for securities lending income | | | 59,824 | |
Prepaid expenses and other assets | | | 111,731 | |
| | | | |
Total assets | | | 8,014,741,293 | |
| | | | |
| |
Liabilities | | | | |
Payable for investments purchased | | | 27,129,732 | |
Payable for Fund shares redeemed | | | 29,256,865 | |
Payable upon receipt of securities loaned | | | 119,352,425 | |
Management fee payable | | | 4,278,911 | |
Distribution fee payable | | | 230,332 | |
Administration fees payable | | | 1,109,278 | |
Accrued expenses and other liabilities | | | 1,291,050 | |
| | | | |
Total liabilities | | | 182,648,593 | |
| | | | |
Total net assets | | $ | 7,832,092,700 | |
| | | | |
| |
NET ASSETS CONSIST OF | | | | |
Paid-in capital | | $ | 5,588,337,085 | |
Accumulated net investment loss | | | (17,447,637 | ) |
Accumulated net realized gains on investments | | | 114,814,720 | |
Net unrealized gains on investments | | | 2,146,388,532 | |
| | | | |
Total net assets | | $ | 7,832,092,700 | |
| | | | |
| |
COMPUTATION OF NET ASSET VALUE AND OFFERING PRICE PER SHARE | | | | |
Net assets – Class A | | $ | 2,654,595,870 | |
Shares outstanding – Class A1 | | | 72,175,547 | |
Net asset value per share – Class A | | | $36.78 | |
Maximum offering price per share – Class A2 | | | $39.02 | |
Net assets – Class C | | $ | 348,413,191 | |
Shares outstanding – Class C1 | | | 10,762,890 | |
Net asset value per share – Class C | | | $32.37 | |
Net assets – Class R6 | | $ | 26,284 | |
Shares outstanding – Class R61 | | | 632 | |
Net asset value per share – Class R6 | | | $41.58 | |
Net assets – Administrator Class | | $ | 1,741,537,976 | |
Shares outstanding – Administrator Class1 | | | 43,882,802 | |
Net asset value per share – Administrator Class | | | $39.69 | |
Net assets – Institutional Class | | $ | 3,087,519,379 | |
Shares outstanding – Institutional Class1 | | | 74,281,276 | |
Net asset value per share – Institutional Class | | | $41.57 | |
| 1 | The Fund has an unlimited number of authorized shares. |
| 2 | Maximum offering price is computed as 100/94.25 of net asset value. On investments of $50,000 or more, the offering price is reduced. |
The accompanying notes are an integral part of these financial statements.
| | | | |
| 12 | | Wells Fargo Growth Fund | | Statement of operations—six months ended January 31, 2016 (unaudited) |
| | | | |
| | | | |
| |
Investment income | | | | |
Dividends | | $ | 27,232,205 | |
Securities lending income, net | | | 331,245 | |
Income from affiliated securities | | | 73,381 | |
| | | | |
Total investment income | | | 27,636,831 | |
| | | | |
| |
Expenses | | | | |
Management fee | | | 30,267,704 | |
Administration fees | | | | |
Class A | | | 2,341,588 | |
Class C | | | 430,154 | |
Class R6 | | | 2 | 1 |
Administrator Class | | | 1,316,103 | |
Institutional Class | | | 2,293,227 | |
Investor Class | | | 1,413,072 | 2 |
Shareholder servicing fees | | | | |
Class A | | | 2,785,861 | |
Class C | | | 512,087 | |
Administrator Class | | | 2,515,047 | |
Investor Class | | | 1,102,754 | 2 |
Distribution fee | | | | |
Class C | | | 1,536,262 | |
Custody and accounting fees | | | 243,769 | |
Professional fees | | | 22,976 | |
Registration fees | | | 80,227 | |
Shareholder report expenses | | | 267,341 | |
Trustees’ fees and expenses | | | 11,595 | |
Other fees and expenses | | | 62,936 | |
| | | | |
Total expenses | | | 47,202,705 | |
Less: Fee waivers and/or expense reimbursements | | | (2,118,237 | ) |
| | | | |
Net expenses | | | 45,084,468 | |
| | | | |
Net investment loss | | | (17,447,637 | ) |
| | | | |
| |
REALIZED AND UNREALIZED GAINS (LOSSES) ON INVESTMENTS | | | | |
| |
Net realized gains (losses) on: | | | | |
Unaffiliated securities | | | 524,656,349 | |
Affiliated securities | | | (81,051,839 | ) |
| | | | |
Net realized gains on investments | | | 443,604,510 | |
| | | | |
| |
Net change in unrealized gains (losses) on: | | | | |
Unaffiliated securities | | | (1,710,614,246 | ) |
Affiliated securities | | | (117,583,479 | ) |
| | | | |
Net change in unrealized gains (losses) on investments | | | (1,828,197,725 | ) |
| | | | |
Net realized and unrealized gains (losses) on investments | | | (1,384,593,215 | ) |
| | | | |
Net decrease in net assets resulting from operations | | $ | (1,402,040,852 | ) |
| | | | |
| 1 | For the period from September 30, 2015 (commencement of class operations) to January 31, 2016 |
| 2 | For the period from August 1, 2015 to October 23, 2015. Effective at the close of business on October 23, 2015, Investor Class shares were converted to Class A shares and are no longer offered by the Fund. |
The accompanying notes are an integral part of these financial statements.
| | | | | | |
| Statement of changes in net assets | | Wells Fargo Growth Fund | | | 13 | |
| | | | | | | | | | | | | | | | |
| | | Six months ended
January 31, 2016 (unaudited) | | | Year ended
July 31, 2015 | |
| | | | |
Operations | | | | | | | | | | | | | | | | |
Net investment loss | | | | | | $ | (17,447,637 | ) | | | | | | $ | (46,794,164 | ) |
Net realized gains on investments | | | | | | | 443,604,510 | | | | | | | | 1,219,370,154 | |
Net change in unrealized gains (losses) on investments | | | | | | | (1,828,197,725 | ) | | | | | | | 328,837,984 | |
| | | | |
Net increase (decrease) in net assets resulting from operations | | | | | | | (1,402,040,852 | ) | | | | | | | 1,501,413,974 | |
| | | | |
| | | | |
Distributions to shareholders from | | | | | | | | | | | | | | | | |
Net realized gains | | | | | | | | | | | | | | | | |
Class A | | | | | | | (399,298,978 | ) | | | | | | | (231,582,982 | ) |
Class C | | | | | | | (58,938,406 | ) | | | | | | | (75,250,933 | ) |
Class R6 | | | | | | | (3,078 | )1 | | | | | | | N/A | |
Administrator Class | | | | | | | (246,890,849 | ) | | | | | | | (343,165,487 | ) |
Institutional Class | | | | | | | (415,951,081 | ) | | | | | | | (470,228,817 | ) |
Investor Class | | | | | | | 0 | 2 | | | | | | | (300,177,941 | ) |
| | | | |
Total distributions to shareholders | | | | | | | (1,121,082,392 | ) | | | | | | | (1,420,406,160 | ) |
| | | | |
| | | | |
Capital share transactions | | | Shares | | | | | | | | Shares | | | | | |
Proceeds from shares sold | | | | | | | | | | | | | | | | |
Class A | | | 42,327,841 | | | | 1,958,427,302 | | | | 3,096,946 | | | | 149,093,930 | |
Class C | | | 502,562 | | | | 18,149,599 | | | | 687,649 | | | | 28,728,045 | |
Class R6 | | | 564 | 1 | | | 27,370 | 1 | | | N/A | | | | N/A | |
Administrator Class | | | 4,537,154 | | | | 213,535,847 | | | | 7,685,162 | | | | 396,601,510 | |
Institutional Class | | | 8,270,621 | | | | 403,724,363 | | | | 29,073,710 | | | | 1,572,598,987 | |
Investor Class | | | 481,943 | 2 | | | 22,113,995 | 2 | | | 1,516,862 | | | | 73,282,154 | |
| | | | |
| | | | | | | 2,615,978,476 | | | | | | | | 2,220,304,626 | |
| | | | |
Reinvestment of distributions | | | | | | | | | | | | | | | | |
Class A | | | 9,441,799 | | | | 377,011,011 | | | | 4,653,339 | | | | 208,236,915 | |
Class C | | | 1,219,231 | | | | 42,892,540 | | | | 1,331,646 | | | | 53,838,455 | |
Class R6 | | | 68 | 1 | | | 3,078 | 1 | | | N/A | | | | N/A | |
Administrator Class | | | 5,707,643 | | | | 245,828,196 | | | | 6,824,589 | | | | 325,601,120 | |
Institutional Class | | | 8,792,866 | | | | 396,558,261 | | | | 9,196,950 | | | | 455,984,759 | |
Investor Class | | | 0 | 2 | | | 0 | 2 | | | 6,596,013 | | | | 293,918,329 | |
| | | | |
| | | | | | | 1,062,293,086 | | | | | | | | 1,337,579,578 | |
| | | | |
Payment for shares redeemed | | | | | | | | | | | | | | | | |
Class A | | | (9,201,427 | ) | | | (393,223,571 | ) | | | (19,102,932 | ) | | | (941,145,013 | ) |
Class C | | | (1,425,230 | ) | | | (54,560,728 | ) | | | (3,749,283 | ) | | | (167,465,881 | ) |
Administrator Class | | | (10,810,691 | ) | | | (503,093,774 | ) | | | (33,692,681 | ) | | | (1,742,600,427 | ) |
Institutional Class | | | (13,028,774 | ) | | | (626,904,597 | ) | | | (22,580,802 | ) | | | (1,219,410,764 | ) |
Investor Class | | | (43,198,360 | )2 | | | (1,994,219,513 | )2 | | | (10,699,627 | ) | | | (519,360,449 | ) |
| | | | |
| | | | | | | (3,572,002,183 | ) | | | | | | | (4,589,982,534 | ) |
| | | | |
Net increase (decrease) in net assets resulting from capital share transactions | | | | | | | 106,269,379 | | | | | | | | (1,032,098,330 | ) |
| | | | |
Total decrease in net assets | | | | | | | (2,416,853,865 | ) | | | | | | | (951,090,516 | ) |
| | | | |
| | | | |
Net assets | | | | | | | | | | | | | | | | |
Beginning of period | | | | | | | 10,248,946,565 | | | | | | | | 11,200,037,081 | |
| | | | |
End of period | | | | | | $ | 7,832,092,700 | | | | | | | $ | 10,248,946,565 | |
| | | | |
Undistributed (accumulated) net investment income (loss) | | | | | | $ | (17,447,637 | ) | | | | | | $ | 0 | |
| | | | |
| 1 | For the period from September 30, 2015 (commencement of class operations) to January 31, 2016 |
| 2 | For the period from August 1, 2015 to October 23, 2015. Effective at the close of business on October 23, 2015, Investor Class shares were converted to Class A shares and are no longer offered by the Fund. |
The accompanying notes are an integral part of these financial statements.
| | | | |
| 14 | | Wells Fargo Growth Fund | | Financial highlights |
(For a share outstanding throughout each period)
| | | | | | | | | | | | | | | | | | | | | | | | |
| | | Six months ended January 31, 2016 (unaudited) | | | Year ended July 31 | |
| CLASS A | | | 2015 | | | 2014 | | | 2013 | | | 2012 | | | 2011 | |
Net asset value, beginning of period | | | $49.50 | | | | $49.99 | | | | $46.74 | | | | $37.85 | | | | $35.88 | | | | $26.10 | |
Net investment loss | | | (0.12 | )1 | | | (0.29 | )1 | | | (0.32 | )1 | | | (0.17 | )1 | | | (0.21 | )1 | | | (0.27 | )1 |
Net realized and unrealized gains (losses) on investments | | | (6.57 | ) | | | 7.03 | | | | 5.34 | | | | 9.06 | | | | 2.65 | | | | 10.05 | |
| | | | | | | | | | | | | | | | | | | | | | | | |
Total from investment operations | | | (6.69 | ) | | | 6.74 | | | | 5.02 | | | | 8.89 | | | | 2.44 | | | | 9.78 | |
Distributions to shareholders from | | | | | | | | | | | | | | | | | | | | | | | | |
Net realized gains | | | (6.03 | ) | | | (7.23 | ) | | | (1.77 | ) | | | 0.00 | | | | (0.47 | ) | | | 0.00 | |
Net asset value, end of period | | | $36.78 | | | | $49.50 | | | | $49.99 | | | | $46.74 | | | | $37.85 | | | | $35.88 | |
Total return2 | | | (14.48 | )% | | | 15.01 | % | | | 10.77 | % | | | 23.49 | % | | | 6.93 | % | | | 37.43 | % |
Ratios to average net assets (annualized) | | | | | | | | | | | | | | | | | | | | | | | | |
Gross expenses | | | 1.14 | % | | | 1.18 | % | | | 1.18 | % | | | 1.19 | % | | | 1.20 | % | | | 1.24 | % |
Net expenses | | | 1.14 | % | | | 1.18 | % | | | 1.18 | % | | | 1.19 | % | | | 1.20 | % | | | 1.24 | % |
Net investment loss | | | (0.54 | )% | | | (0.59 | )% | | | (0.64 | )% | | | (0.41 | )% | | | (0.56 | )% | | | (0.81 | )% |
Supplemental data | | | | | | | | | | | | | | | | | | | | | | | | |
Portfolio turnover rate | | | 21 | % | | | 35 | % | | | 42 | % | | | 38 | % | | | 47 | % | | | 54 | % |
Net assets, end of period (000s omitted) | | | $2,654,596 | | | | $1,465,643 | | | | $2,047,410 | | | | $2,464,533 | | | | $2,265,845 | | | | $1,204,675 | |
| 1 | Calculated based upon average shares outstanding |
| 2 | Total return calculations do not include any sales charges. Returns for periods of less than one year are not annualized. |
The accompanying notes are an integral part of these financial statements.
| | | | | | |
| Financial highlights | | Wells Fargo Growth Fund | | | 15 | |
(For a share outstanding throughout each period)
| | | | | | | | | | | | | | | | | | | | | | | | |
| | | Six months ended January 31, 2016 (unaudited) | | | Year ended July 31 | |
| CLASS C | | | 2015 | | | 2014 | | | 2013 | | | 2012 | | | 2011 | |
Net asset value, beginning of period | | | $44.51 | | | | $45.95 | | | | $43.41 | | | | $35.42 | | | | $33.86 | | | | $24.81 | |
Net investment loss | | | (0.19 | )1 | | | (0.60 | )1 | | | (0.64 | )1 | | | (0.45 | )1 | | | (0.46 | )1 | | | (0.51 | )1 |
Net realized and unrealized gains (losses) on investments | | | (5.92 | ) | | | 6.39 | | | | 4.95 | | | | 8.44 | | | | 2.49 | | | | 9.56 | |
| | | | | | | | | | | | | | | | | | | | | | | | |
Total from investment operations | | | (6.11 | ) | | | 5.79 | | | | 4.31 | | | | 7.99 | | | | 2.03 | | | | 9.05 | |
Distributions to shareholders from | | | | | | | | | | | | | | | | | | | | | | | | |
Net realized gains | | | (6.03 | ) | | | (7.23 | ) | | | (1.77 | ) | | | 0.00 | | | | (0.47 | ) | | | 0.00 | |
Net asset value, end of period | | | $32.37 | | | | $44.51 | | | | $45.95 | | | | $43.41 | | | | $35.42 | | | | $33.86 | |
Total return2 | | | (14.81 | )% | | | 14.16 | % | | | 9.96 | % | | | 22.56 | % | | | 6.12 | % | | | 36.44 | % |
Ratios to average net assets (annualized) | | | | | | | | | | | | | | | | | | | | | | | | |
Gross expenses | | | 1.89 | % | | | 1.93 | % | | | 1.93 | % | | | 1.94 | % | | | 1.95 | % | | | 1.99 | % |
Net expenses | | | 1.89 | % | | | 1.93 | % | | | 1.93 | % | | | 1.94 | % | | | 1.95 | % | | | 1.99 | % |
Net investment loss | | | (1.28 | )% | | | (1.34 | )% | | | (1.39 | )% | | | (1.16 | )% | | | (1.32 | )% | | | (1.57 | )% |
Supplemental data | | | | | | | | | | | | | | | | | | | | | | | | |
Portfolio turnover rate | | | 21 | % | | | 35 | % | | | 42 | % | | | 38 | % | | | 47 | % | | | 54 | % |
Net assets, end of period (000s omitted) | | | $348,413 | | | | $465,833 | | | | $560,481 | | | | $589,402 | | | | $525,285 | | | | $233,114 | |
| 1 | Calculated based upon average shares outstanding |
| 2 | Total return calculations do not include any sales charges. Returns for periods of less than one year are not annualized. |
The accompanying notes are an integral part of these financial statements.
| | | | |
| 16 | | Wells Fargo Growth Fund | | Financial highlights |
(For a share outstanding throughout the period)
| | | | |
| | | Period ended
January 31, 2016
(unaudited)1 | |
| CLASS R6 | |
Net asset value, beginning of period | | | $48.97 | |
Net investment loss | | | (0.03 | ) |
Net realized and unrealized gains (losses) on investments | | | (1.33 | ) |
| | | | |
Total from investment operations | | | (1.36 | ) |
Distributions to shareholders from | | | | |
Net realized gains | | | (6.03 | ) |
Net asset value, end of period | | | $41.58 | |
Total return2 | | | (3.74 | )% |
Ratios to average net assets (annualized) | | | | |
Gross expenses | | | 0.70 | % |
Net expenses | | | 0.70 | % |
Net investment loss | | | (0.23 | )% |
Supplemental data | | | | |
Portfolio turnover rate | | | 21 | % |
Net assets, end of period (000s omitted) | | | $26 | |
| 1 | For the period from September 30, 2015 (commencement of class operations) to January 31, 2016 |
| 2 | Returns for periods of less than one year are not annualized. |
The accompanying notes are an integral part of these financial statements.
| | | | | | |
| Financial highlights | | Wells Fargo Growth Fund | | | 17 | |
(For a share outstanding throughout each period)
| | | | | | | | | | | | | | | | | | | | | | | | |
| | | Six months ended January 31, 2016 (unaudited) | | | Year ended July 31 | |
| ADMINISTRATOR CLASS | | | 2015 | | | 2014 | | | 2013 | | | 2012 | | | 2011 | |
Net asset value, beginning of period | | | $52.86 | | | | $52.80 | | | | $49.16 | | | | $39.72 | | | | $37.54 | | | | $27.24 | |
Net investment loss | | | (0.08 | )1 | | | (0.20 | )1 | | | (0.23 | ) | | | (0.08 | )1 | | | (0.13 | )1 | | | (0.18 | )1 |
Net realized and unrealized gains (losses) on investments | | | (7.06 | ) | | | 7.49 | | | | 5.64 | | | | 9.52 | | | | 2.78 | | | | 10.48 | |
| | | | | | | | | | | | | | | | | | | | | | | | |
Total from investment operations | | | (7.14 | ) | | | 7.29 | | | | 5.41 | | | | 9.44 | | | | 2.65 | | | | 10.30 | |
Distributions to shareholders from | | | | | | | | | | | | | | | | | | | | | | | | |
Net realized gains | | | (6.03 | ) | | | (7.23 | ) | | | (1.77 | ) | | | 0.00 | | | | (0.47 | ) | | | 0.00 | |
Net asset value, end of period | | | $39.69 | | | | $52.86 | | | | $52.80 | | | | $49.16 | | | | $39.72 | | | | $37.54 | |
Total return2 | | | (14.40 | )% | | | 15.28 | % | | | 11.04 | % | | | 23.77 | % | | | 7.15 | % | | | 37.81 | % |
Ratios to average net assets (annualized) | | | | | | | | | | | | | | | | | | | | | | | | |
Gross expenses | | | 1.06 | % | | | 1.02 | % | | | 1.02 | % | | | 1.03 | % | | | 1.03 | % | | | 1.08 | % |
Net expenses | | | 0.96 | % | | | 0.96 | % | | | 0.96 | % | | | 0.96 | % | | | 0.96 | % | | | 0.96 | % |
Net investment loss | | | (0.35 | )% | | | (0.37 | )% | | | (0.42 | )% | | | (0.18 | )% | | | (0.33 | )% | | | (0.51 | )% |
Supplemental data | | | | | | | | | | | | | | | | | | | | | | | | |
Portfolio turnover rate | | | 21 | % | | | 35 | % | | | 42 | % | | | 38 | % | | | 47 | % | | | 54 | % |
Net assets, end of period (000s omitted) | | | $1,741,538 | | | | $2,349,359 | | | | $3,359,480 | | | | $3,309,683 | | | | $2,984,775 | | | | $1,339,245 | |
| 1 | Calculated based upon average shares outstanding |
| 2 | Returns for periods of less than one year are not annualized. |
The accompanying notes are an integral part of these financial statements.
| | | | |
| 18 | | Wells Fargo Growth Fund | | Financial highlights |
(For a share outstanding throughout each period)
| | | | | | | | | | | | | | | | | | | | | | | | |
| | | Six months ended January 31, 2016 (unaudited) | | | Year ended July 31 | |
| INSTITUTIONAL CLASS | | | 2015 | | | 2014 | | | 2013 | | | 2012 | | | 2011 | |
Net asset value, beginning of period | | | $54.99 | | | | $54.54 | | | | $50.63 | | | | $40.83 | | | | $38.49 | | | | $27.88 | |
Net investment income (loss) | | | (0.07 | )1 | | | (0.09 | )1 | | | (0.13 | ) | | | 0.01 | 1 | | | (0.05 | )1 | | | (0.12 | )1 |
Net realized and unrealized gains (losses) on investments | | | (7.32 | ) | | | 7.77 | | | | 5.81 | | | | 9.79 | | | | 2.86 | | | | 10.73 | |
| | | | | | | | | | | | | | | | | | | | | | | | |
Total from investment operations | | | (7.39 | ) | | | 7.68 | | | | 5.68 | | | | 9.80 | | | | 2.81 | | | | 10.61 | |
Distributions to shareholders from | | | | | | | | | | | | | | | | | | | | | | | | |
Net realized gains | | | (6.03 | ) | | | (7.23 | ) | | | (1.77 | ) | | | 0.00 | | | | (0.47 | ) | | | 0.00 | |
Net asset value, end of period | | | $41.57 | | | | $54.99 | | | | $54.54 | | | | $50.63 | | | | $40.83 | | | | $38.49 | |
Total return2 | | | (14.30 | )% | | | 15.53 | % | | | 11.26 | % | | | 24.03 | % | | | 7.37 | % | | | 38.06 | % |
Ratios to average net assets (annualized) | | | | | | | | | | | | | | | | | | | | | | | | |
Gross expenses | | | 0.81 | % | | | 0.76 | % | | | 0.75 | % | | | 0.76 | % | | | 0.77 | % | | | 0.81 | % |
Net expenses | | | 0.75 | % | | | 0.75 | % | | | 0.75 | % | | | 0.75 | % | | | 0.76 | % | | | 0.80 | % |
Net investment income (loss) | | | (0.14 | )% | | | (0.17 | )% | | | (0.21 | )% | | | 0.02 | % | | | (0.13 | )% | | | (0.35 | )% |
Supplemental data | | | | | | | | | | | | | | | | | | | | | | | | |
Portfolio turnover rate | | | 21 | % | | | 35 | % | | | 42 | % | | | 38 | % | | | 47 | % | | | 54 | % |
Net assets, end of period (000s omitted) | | | $3,087,519 | | | | $3,863,196 | | | | $2,975,721 | | | | $2,649,095 | | | | $2,312,074 | | | | $992,748 | |
| 1 | Calculated based upon average shares outstanding |
| 2 | Returns for periods of less than one year are not annualized. |
The accompanying notes are an integral part of these financial statements.
| | | | | | |
| Notes to financial statements (unaudited) | | Wells Fargo Growth Fund | | | 19 | |
1. ORGANIZATION
Wells Fargo Funds Trust (the “Trust”), a Delaware statutory trust organized on March 10, 1999, is an open-end management investment company registered under the Investment Company Act of 1940, as amended (the “1940 Act”). As an investment company, the Trust follows the accounting and reporting guidance in Financial Accounting Standards Board (“FASB”) Accounting Standards Codification Topic 946, Financial Services – Investment Companies. These financial statements report on the Wells Fargo Growth Fund (the “Fund”) which is a diversified series of the Trust.
Effective at the close of business on October 23, 2015, Investor Class shares became Class A shares in a tax-free conversion. Shareholders of Investor Class received Class A shares at a value equal to the value of their Investor Class shares immediately prior to the conversion. Investor Class shares are no longer offered by the Fund.
2. SIGNIFICANT ACCOUNTING POLICIES
The following significant accounting policies, which are consistently followed in the preparation of the financial statements of the Fund, are in conformity with U.S. generally accepted accounting principles which require management to make estimates and assumptions that affect the reported amounts of assets and liabilities, disclosure of contingent assets and liabilities at the date of the financial statements, and the reported amounts of revenues and expenses during the reporting period. Actual results could differ from those estimates.
Securities valuation
All investments are valued each business day as of the close of regular trading on the New York Stock Exchange (generally 4 p.m. Eastern Time).
Equity securities that are listed on a foreign or domestic exchange or market are valued at the official closing price or, if none, the last sales price. If no sale occurs on the principal exchange or market that day, the prior day’s price will be deemed “stale” and a fair value price will be determined in accordance with the Fund’s Valuation Procedures.
Investments in registered open-end investment companies are valued at net asset value. Interests in non-registered investment vehicles that are redeemable at net asset value are fair valued normally at net asset value.
Investments which are not valued using any of the methods discussed above are valued at their fair value, as determined in good faith by the Board of Trustees of the Fund. The Board of Trustees has established a Valuation Committee comprised of the Trustees and has delegated to it the authority to take any actions regarding the valuation of portfolio securities that the Valuation Committee deems necessary or appropriate, including determining the fair value of portfolio securities, unless the determination has been delegated to the Management Valuation Team of Wells Fargo Funds Management, LLC (“Funds Management”).The Board of Trustees retains the authority to make or ratify any valuation decisions or approve any changes to the Valuation Procedures as it deems appropriate. On a quarterly basis, the Board of Trustees receives reports on any valuation actions taken by the Valuation Committee or the Management Valuation Team which may include items for ratification.
Valuations of fair valued securities are compared to the next actual sales price when available, or other appropriate market values, to assess the continued appropriateness of the fair valuation methodologies used. These securities are fair valued on a day-to-day basis, taking into consideration changes to appropriate market information and any significant changes to the inputs considered in the valuation process until there is a readily available price provided on an exchange or by an independent pricing service. Valuations received from an independent pricing service or independent broker-dealer quotes are periodically validated by comparisons to most recent trades and valuations provided by other independent pricing services in addition to the review of prices by the manager and/or subadviser. Unobservable inputs used in determining fair valuations are identified based on the type of security, taking into consideration factors utilized by market participants in valuing the investment, knowledge about the issuer and the current market environment.
Security loans
The Fund may lend its securities from time to time in order to earn additional income in the form of fees or interest on securities received as collateral or the investment of any cash received as collateral. The Fund continues to receive interest or dividends on the securities loaned. The Fund receives collateral in the form of cash or securities with a value at least equal to the value of the securities on loan. The value of the loaned securities is determined at the close of each business day and any additional required collateral is delivered to the Fund on the next business day. In a securities lending transaction, the net asset value of the Fund will be affected by an increase or decrease in the value of the securities loaned and by an increase or decrease in the value of the instrument in which collateral is invested. The amount of securities lending activity undertaken by the Fund fluctuates from time to time. In the event of default or bankruptcy by the borrower, the Fund may be prevented from recovering the loaned securities or gaining access to the collateral or
| | | | |
| 20 | | Wells Fargo Growth Fund | | Notes to financial statements (unaudited) |
may experience delays or costs in doing so. In addition, the investment of any cash collateral received may lose all or part of its value. The Fund has the right under the lending agreement to recover the securities from the borrower on demand.
The Fund lends its securities through an unaffiliated securities lending agent. Cash collateral received in connection with its securities lending transactions is invested in Securities Lending Cash Investments, LLC (the “Securities Lending Fund”). The Securities Lending Fund is exempt from registration under Section 3(c)(7) of the 1940 Act and is managed by Funds Management and is subadvised by Wells Capital Management Incorporated (“WellsCap”), an affiliate of Funds Management and an indirect wholly owned subsidiary of Wells Fargo & Company (“Wells Fargo”). Funds Management receives an advisory fee starting at 0.05% and declining to 0.01% as the average daily net assets of the Securities Lending Fund increase. All of the fees received by Funds Management are paid to WellsCap for its services as subadviser. The Securities Lending Fund seeks to provide a positive return compared to the daily Fed Funds Open rate by investing in high-quality, U.S. dollar-denominated short-term money market instruments. Securities Lending Fund investments are fair valued based upon the amortized cost valuation technique. Income earned from investment in the Securities Lending Fund is included in securities lending income on the Statement of Operations.
Security transactions and income recognition
Securities transactions are recorded on a trade date basis. Realized gains or losses are recorded on the basis of identified cost.
Dividend income is recognized on the ex-dividend date.
Distributions to shareholders
Distributions to shareholders from net investment income and net realized gains, if any, are recorded on the ex-dividend date. Such distributions are determined in conformity with federal income tax regulations, which may differ in amount or character from net investment income and realized gains recognized for purposes of U.S. generally accepted accounting principles.
Federal and other taxes
The Fund intends to continue to qualify as a regulated investment company by distributing substantially all of its investment company taxable income and any net realized capital gains (after reduction for capital loss carryforwards) sufficient to relieve it from all, or substantially all, federal income taxes. Accordingly, no provision for federal income taxes was required.
The Fund’s income and federal excise tax returns and all financial records supporting those returns for the prior three fiscal years are subject to examination by the federal and Delaware revenue authorities. Management has analyzed the Fund’s tax positions taken on federal, state, and foreign tax returns for all open tax years and does not believe that there are any uncertain tax positions that require recognition of a tax liability.
Class allocations
The separate classes of shares offered by the Fund differ principally in applicable sales charges, distribution, shareholder servicing, and administration fees. Class specific expenses are charged directly to that share class. Investment income, common expenses, and realized and unrealized gains (losses) on investments are allocated daily to each class of shares based on the relative proportion of net assets of each class.
3. FAIR VALUATION MEASUREMENTS
Fair value measurements of investments are determined within a framework that has established a fair value hierarchy based upon the various data inputs utilized in determining the value of the Fund’s investments. The three-level hierarchy gives the highest priority to unadjusted quoted prices in active markets for identical assets or liabilities (Level 1) and the lowest priority to significant unobservable inputs (Level 3). The Fund’s investments are classified within the fair value hierarchy based on the lowest level of input that is significant to the fair value measurement. The inputs are summarized into three broad levels as follows:
| n | | Level 1 – quoted prices in active markets for identical securities |
| n | | Level 2 – other significant observable inputs (including quoted prices for similar securities, interest rates, prepayment speeds, credit risk, use of amortized cost, etc.) |
| n | | Level 3 – significant unobservable inputs (including the Fund’s own assumptions in determining the fair value of investments) |
The inputs or methodologies used for valuing investments in securities are not necessarily an indication of the risk associated with investing in those securities.
| | | | | | |
| Notes to financial statements (unaudited) | | Wells Fargo Growth Fund | | | 21 | |
The following is a summary of the inputs used in valuing the Fund’s assets and liabilities as of January 31, 2016:
| | | | | | | | | | | | | | | | |
| | | Quoted prices
(Level 1) | | | Other significant
observable inputs
(Level 2) | | | Significant
unobservable inputs
(Level 3) | | | Total | |
Assets | | | | | | | | | | | | | | | | |
Investments in: | | | | | | | | | | | | | | | | |
| | | | |
Common stocks | | | | | | | | | | | | | | | | |
Consumer discretionary | | $ | 1,893,068,418 | | | $ | 0 | | | $ | 0 | | | $ | 1,893,068,418 | |
Consumer staples | | | 277,421,326 | | | | 0 | | | | 0 | | | | 277,421,326 | |
Energy | | | 78,957,900 | | | | 0 | | | | 0 | | | | 78,957,900 | |
Financials | | | 340,945,835 | | | | 0 | | | | 0 | | | | 340,945,835 | |
Health care | | | 1,636,899,793 | | | | 0 | | | | 0 | | | | 1,636,899,793 | |
Industrials | | | 545,731,821 | | | | 0 | | | | 0 | | | | 545,731,821 | |
Information technology | | | 2,659,771,877 | | | | 0 | | | | 0 | | | | 2,659,771,877 | |
Materials | | | 158,211,190 | | | | 0 | | | | 0 | | | | 158,211,190 | |
| | | | |
Short-term investments | | | | | | | | | | | | | | | | |
Investment companies | | | 48,150,734 | | | | 0 | | | | 0 | | | | 48,150,734 | |
Investments measured at net asset value* | | | | | | | | | | | | | | | 119,352,425 | |
Total assets | | $ | 7,639,158,894 | | | $ | 0 | | | $ | 0 | | | $ | 7,758,511,319 | |
| * | Investments that are measured at fair value using the net asset value per share (or its equivalent) as a practical expedient have not been categorized in the fair value hierarchy. The fair value amount presented in the table is intended to permit reconciliation of the fair value hierarchy to the amounts presented in the Statement of Assets and Liabilities. The Fund’s investment in Securities Lending Cash Investments, LLC valued at $119,352,425 does not have a redemption period notice, can be redeemed daily and does not have any unfunded commitments. |
The Fund recognizes transfers between levels within the fair value hierarchy at the end of the reporting period. At January 31, 2016, the Fund did not have any transfers into/out of Level 1, Level 2, or Level 3.
4. TRANSACTIONS WITH AFFILIATES
Management fee
Funds Management, an indirect wholly owned subsidiary of Wells Fargo, is the manager of the Fund and provides advisory and fund-level administrative services under an investment management agreement. Under the investment management agreement, Funds Management is responsible for, among other services, implementing the investment objectives and strategies of the Fund, supervising the applicable subadviser, providing fund-level administrative services in connection with the Fund’s operations, and providing any other fund-level administrative services reasonably necessary for the operation of the Fund. As compensation for its services under the investment management agreement, Funds Management is entitled to receive an annual management fee starting at 0.80% and declining to 0.555% as the average daily net assets of the Fund increase. For the six months ended January 31, 2016, the management fee was equivalent to an annual rate of 0.67% of the Fund’s average daily net assets.
Funds Management has retained the services of a subadviser to provide daily portfolio management to the Fund. The fee for subadvisory services is borne by Funds Management. WellsCap is the subadviser to the Fund and is entitled to receive a fee from Funds Management at an annual rate starting at 0.45% and declining to 0.30% as the average daily net assets of the Fund increase.
Administration fees
Under a class-level administration agreement, Funds Management provides class-level administrative services to the Fund, which includes paying fees and expenses for services provided by the transfer agent, sub-transfer agents, omnibus account servicers and record-keepers. As compensation for its services under the class-level administration agreement, Funds Management receives an annual fee which is calculated based on the average daily net assets of each class as follows:
| | | | |
| | | Class-level
administration fee | |
Class A, Class C | | | 0.21 | % |
Class R6 | | | 0.03 | |
Administrator Class, Institutional Class | | | 0.13 | |
Investor Class | | | 0.32 | |
| | | | |
| 22 | | Wells Fargo Growth Fund | | Notes to financial statements (unaudited) |
Funds Management has contractually waived and/or reimbursed management and administration fees to the extent necessary to maintain certain net operating expense ratios for the Fund. Waiver of fees and/or reimbursement of expenses by Funds Management were made first from fund level expenses on a proportionate basis and then from class specific expenses. Funds Management has committed through November 30, 2016 to waive fees and/or reimburse expenses to the extent necessary to cap the Fund’s expenses at 1.21% for Class A shares, 1.96% for Class C shares, 0.70% for Class R6 shares, 0.96% for Administrator Class, and 0.75% for Institutional Class shares. After this time, the cap may be increased or the commitment to maintain the cap may be terminated only with the approval of the Board of Trustees.
Distribution fee
The Trust has adopted a distribution plan for Class C shares of the Fund pursuant to Rule 12b-1 under the 1940 Act. A distribution fee is charged to Class C shares and paid to Wells Fargo Funds Distributor, LLC, the principal underwriter, at an annual rate of 0.75% of the average daily net assets of Class C shares.
In addition, Funds Distributor is entitled to receive the front-end sales charge from the purchase of Class A shares and a contingent deferred sales charge on the redemption of certain Class A shares. Funds Distributor is also entitled to receive the contingent deferred sales charges from redemptions of Class C shares. For the six months ended January 31, 2016, Funds Distributor received $11,586 from the sale of Class A shares and $3,593 in contingent deferred sales charges from redemptions of Class C.
Shareholder servicing fees
The Trust has entered into contracts with one or more shareholder servicing agents, whereby Class A, Class C, Administrator Class, and Investor Class of the Fund are charged a fee at an annual rate of 0.25% of the average daily net assets of each respective class.
A portion of these total shareholder servicing fees were paid to affiliates of Wells Fargo.
5. INVESTMENT PORTFOLIO TRANSACTIONS
Purchases and sales of investments, excluding U.S. government obligations (if any) and short-term securities, for the six months ended January 31, 2016 were $1,858,961,907 and $2,914,831,035, respectively.
6. INVESTMENTS IN AFFILIATES
An affiliated investment is a company which is under common ownership or control of the Fund or which the Fund has ownership of at least 5% of the outstanding voting shares. The following is a summary of transactions for the long-term holdings of issuers that were either affiliates of the Fund at the beginning of the period or the end of the period.
| | | | | | | | | | | | | | | | | | | | | | | | | | | | |
| | | Shares, beginning of period | | | Shares purchased | | | Shares sold | | | Shares, end of period | | | Value, end of period | | | Income from
affiliated securities | | | Realized gains (losses) | |
Envestnet Incorporated | | | 3,268,908 | | | | 7,823 | | | | 0 | | | | 3,276,731 | | | $ | 76,839,342 | | | $ | 0 | | | $ | 0 | |
Fiesta Restaurant Group Incorporated | | | 2,098,000 | | | | 527,000 | | | | 294,017 | | | | 2,330,983 | | | | 84,847,781 | | | | 0 | | | | (8,479,131 | ) |
Grand Canyon Education Incorporated | | | 3,903,000 | | | | 0 | | | | 377,000 | | | | 3,526,000 | | | | 132,753,900 | | | | 0 | | | | (2,277,134 | ) |
Inovalon Holdings Incorporated* | | | 1,629,037 | | | | 0 | | | | 1,629,037 | | | | 0 | | | | 0 | | | | 0 | | | | (13,372,108 | ) |
Shutterstock Incorporated* | | | 2,028,000 | | | | 0 | | | | 1,947,000 | | | | 81,000 | | | | 2,340,090 | | | | 0 | | | | (56,923,466 | ) |
The Habit Restaurants Incorporated Class A | | | 0 | | | | 1,381,000 | | | | 0 | | | | 1,381,000 | | | | 28,351,930 | | | | 0 | | | | 0 | |
| | | | | | | | | | | | | | | | | | | | | | | $ | 0 | | | $ | (81,051,839 | ) |
| * | No longer an affiliate of the Fund at the end of the period. |
7. BANK BORROWINGS
The Trust (excluding the money market funds and certain other funds) and Wells Fargo Variable Trust are parties to a $200,000,000 revolving credit agreement whereby the Fund is permitted to use bank borrowings for temporary or emergency purposes, such as to fund shareholder redemption requests. Interest under the credit agreement is charged to the Fund based on a borrowing rate equal to the higher of the Federal Funds rate in effect on that day plus 1.25% or the overnight LIBOR rate in effect on that day plus 1.25%. In addition, an annual commitment fee equal to 0.20% of the unused balance is allocated to each participating fund. Prior to September 1, 2015, the revolving credit agreement amount was $150,000,000 and the annual commitment fee was equal to 0.10% of the unused balance which was allocated to each participating fund. For the six months ended January 31, 2016, the Fund paid $15,740 in commitment fees.
| | | | | | |
| Notes to financial statements (unaudited) | | Wells Fargo Growth Fund | | | 23 | |
For the six months ended January 31, 2016, there were no borrowings by the Fund under the agreement.
8. CONCENTRATION RISK
Concentration risks result from exposure to a limited number of sectors. A fund that invests a substantial portion of its assets in any sector may be more affected by changes in that sector than would be a fund whose investments are not heavily weighted in any sector.
9. INDEMNIFICATION
Under the Trust’s organizational documents, the officers and Trustees have been granted certain indemnification rights against certain liabilities that may arise out of performance of their duties to the Trust. Additionally, in the normal course of business, the Trust may enter into contracts with service providers that contain a variety of indemnification clauses. The Trust’s maximum exposure under these arrangements is dependent on future claims that may be made against the Fund and, therefore, cannot be estimated.
| | | | |
| 24 | | Wells Fargo Growth Fund | | Other information (unaudited) |
PROXY VOTING INFORMATION
A description of the policies and procedures that the Fund uses to determine how to vote proxies relating to portfolio securities is available, upon request, by calling 1-800-222-8222, visiting our website at wellsfargofunds.com, or visiting the SEC website at sec.gov. Information regarding how the Fund voted proxies relating to portfolio securities during the most recent 12-month period ended June 30 is available on the Fund’s website at wellsfargofunds.com or by visiting the SEC website at sec.gov.
PORTFOLIO HOLDINGS INFORMATION
The complete portfolio holdings for the Fund are publicly available monthly on the Fund’s website (wellsfargofunds.com), on a one-month delayed basis. In addition, top ten holdings information (excluding derivative positions) for the Fund is publicly available on the Fund’s website on a monthly, seven-day or more delayed basis. The Fund files its complete schedule of portfolio holdings with the SEC for the first and third quarters of each fiscal year on Form N-Q, which is available by visiting the SEC website at sec.gov. In addition, the Fund’s Form N-Q may be reviewed and copied at the SEC’s Public Reference Room in Washington, DC, and at regional offices in New York City, at 233 Broadway, and in Chicago, at 175 West Jackson Boulevard, Suite 900. Information about the Public Reference Room may be obtained by calling 1-800-SEC-0330.
| | | | | | |
| Other information (unaudited) | | Wells Fargo Growth Fund | | | 25 | |
BOARD OF TRUSTEES AND OFFICERS
Each of the Trustees and Officers1 listed in the table below acts in identical capacities for each fund in the Wells Fargo family of funds, which consists of 144 mutual funds comprising the Wells Fargo Funds Trust, Wells Fargo Variable Trust, Wells Fargo Master Trust and four closed-end funds (collectively the “Fund Complex”). This table should be read in conjunction with the Prospectus and the Statement of Additional Information2. The mailing address of each Trustee and Officer is 525 Market Street, 12th Floor, San Francisco, CA 94105. Each Trustee and Officer serves an indefinite term, however, each Trustee serves such term until reaching the mandatory retirement age established by the Trustees.
Independent Trustees
| | | | | | |
Name and
year of birth | | Position held and
length of service* | | Principal occupations during past five years or longer | | Current other
public company or
investment company
directorships |
| William R. Ebsworth (Born 1957) | | Trustee, since 2015 | | Retired. From 1984 to 2013, equities analyst, portfolio manager, research director and chief financial officer at Fidelity Management and Research Company in Boston, Tokyo, and Hong Kong and retired in 2013 as Chief Investment Officer of Fidelity Strategic Advisers, Inc. where he lead a team of investment professionals managing client assets. Prior thereto, Board member of Hong Kong Securities Clearing Co., Hong Kong Options Clearing Corp., the Thailand International Fund, Ltd., Fidelity Investments Life Insurance Company, and Empire Fidelity Investments Life Insurance Company. Mr. Ebsworth is a CFA® charterholder and an Adjunct Lecturer, Finance, at Babson College. | | Asset Allocation Trust |
| Jane A. Freeman (Born 1953) | | Trustee, since 2015 | | Retired. From 2012 to 2014 and 1999 to 2008, Chief Financial Officer of Scientific Learning Corporation. From 2008 to 2012, Ms. Freeman provided consulting services related to strategic business projects. Prior to 1999, Portfolio Manager at Rockefeller & Co. and Scudder, Stevens & Clark. Board member of the Harding Loevner Funds from 1996 to 2014, serving as both Lead Independent Director and chair of the Audit Committee. Board member of the Russell Exchange Traded Funds Trust from 2011 to 2012 and the chair of the Audit Committee. Ms. Freeman is Chair of Taproot Foundation (non-profit organization), a Board Member of Ruth Bancroft Garden (non-profit organization) and an inactive chartered financial analyst. | | Asset Allocation Trust |
| Peter G. Gordon (Born 1942) | | Trustee, since 1998; Chairman, since 2005 | | Co-Founder, Retired Chairman, President and CEO of Crystal Geyser Water Company. Trustee Emeritus, Colby College. | | Asset Allocation Trust |
| Isaiah Harris, Jr. (Born 1952) | | Trustee, since 2009 | | Retired. Chairman of the Board of CIGNA Corporation since 2009, and Director since 2005. From 2003 to 2011, Director of Deluxe Corporation. Prior thereto, President and CEO of BellSouth Advertising and Publishing Corp. from 2005 to 2007, President and CEO of BellSouth Enterprises from 2004 to 2005 and President of BellSouth Consumer Services from 2000 to 2003. Emeritus member of the Iowa State University Foundation Board of Governors. Emeritus Member of the Advisory Board of Iowa State University School of Business. Advisory Board Member, Palm Harbor Academy (charter school). Advisory Board Member, Child Evangelism Fellowship (non-profit). Mr. Harris is a certified public accountant (inactive status). | | CIGNA Corporation; Asset Allocation Trust |
| Judith M. Johnson (Born 1949) | | Trustee, since 2008; Audit Committee Chairman, since 2008 | | Retired. Prior thereto, Chief Executive Officer and Chief Investment Officer of Minneapolis Employees Retirement Fund from 1996 to 2008. Ms. Johnson is an attorney, certified public accountant and a certified managerial accountant. | | Asset Allocation Trust |
| | | | |
| 26 | | Wells Fargo Growth Fund | | Other information (unaudited) |
| | | | | | |
Name and
year of birth | | Position held and
length of service* | | Principal occupations during past five years or longer | | Current other
public company or
investment company
directorships |
| David F. Larcker (Born 1950) | | Trustee, since 2009 | | James Irvin Miller Professor of Accounting at the Graduate School of Business, Stanford University, Director of the Corporate Governance Research Initiative and Senior Faculty of The Rock Center for Corporate Governance since 2006. From 2005 to 2008, Professor of Accounting at the Graduate School of Business, Stanford University. Prior thereto, Ernst & Young Professor of Accounting at The Wharton School, University of Pennsylvania from 1985 to 2005. | | Asset Allocation Trust |
| Olivia S. Mitchell (Born 1953) | | Trustee, since 2006 | | International Foundation of Employee Benefit Plans Professor, Wharton School of the University of Pennsylvania since 1993. Director of Wharton’s Pension Research Council and Boettner Center on Pensions & Retirement Research, and Research Associate at the National Bureau of Economic Research. Previously, Cornell University Professor from 1978 to 1993. | | Asset Allocation Trust |
| Timothy J. Penny (Born 1951) | | Trustee, since 1996 | | President and Chief Executive Officer of Southern Minnesota Initiative Foundation, a non-profit organization, since 2007 and Senior Fellow at the Humphrey Institute Policy Forum at the University of Minnesota since 1995. Member of the Board of Trustees of NorthStar Education Finance, Inc., a non-profit organization, since 2007. | | Asset Allocation Trust |
| Michael S. Scofield (Born 1943) | | Trustee, since 2010 | | Served on the Investment Company Institute’s Board of Governors and Executive Committee from 2008-2011 as well the Governing Council of the Independent Directors Council from 2006-2011 and the Independent Directors Council Executive Committee from 2008-2011. Chairman of the IDC from 2008-2010. Institutional Investor (Fund Directions) Trustee of Year in 2007. Trustee of the Evergreen Funds complex (and its predecessors) from 1984 to 2010. Chairman of the Evergreen Funds from 2000-2010. Former Trustee of the Mentor Funds. Retired Attorney, Law Offices of Michael S. Scofield. | | Asset Allocation Trust |
| * | Length of service dates reflect the Trustee’s commencement of service with the Trust’s predecessor entities, where applicable. |
Officers
| | | | | | |
Name and
year of birth | | Position held and
length of service | | Principal occupations during past five years or longer | | |
| Karla M. Rabusch (Born 1959) | | President, since 2003 | | Executive Vice President of Wells Fargo Bank, N.A. and President of Wells Fargo Funds Management, LLC since 2003. | | |
| Jeremy DePalma1 (Born 1974) | | Treasurer, since 2012; Assistant Treasurer, since 2009 | | Senior Vice President of Wells Fargo Funds Management, LLC since 2009. Senior Vice President of Evergreen Investment Management Company, LLC from 2008 to 2010 and head of the Fund Reporting and Control Team within Fund Administration from 2005 to 2010. | | |
| C. David Messman (Born 1960) | | Secretary, since 2000; Chief Legal Officer, since 2003 | | Senior Vice President and Secretary of Wells Fargo Funds Management, LLC since 2001. Assistant General Counsel of Wells Fargo Bank, N.A. since 2013 and Vice President and Managing Counsel of Wells Fargo Bank, N.A. from 1996 to 2013. | | |
Debra Ann Early
(Born 1964) | | Chief Compliance Officer, since 2007 | | Executive Vice President of Wells Fargo Funds Management, LLC since 2014, Senior Vice President and Chief Compliance Officer from 2007 to 2014. | | |
David Berardi
(Born 1975) | | Assistant Treasurer, since 2009 | | Vice President of Wells Fargo Funds Management, LLC since 2009. Vice President of Evergreen Investment Management Company, LLC from 2008 to 2010. Manager of Fund Reporting and Control for Evergreen Investment Management Company, LLC from 2004 to 2010. | | |
| 1 | Jeremy DePalma acts as Treasurer of 72 funds and Assistant Treasurer of 72 funds in the Fund Complex. |
| 2 | The Statement of Additional Information includes additional information about the Trustees and is available, without charge, upon request, by calling 1-800-222-8222 or by visiting the website at wellsfargofunds.com. |
| | | | | | |
| List of abbreviations | | Wells Fargo Growth Fund | | | 27 | |
The following is a list of common abbreviations for terms and entities that may have appeared in this report.
| ACA | — ACA Financial Guaranty Corporation |
| ADR | — American depositary receipt |
| ADS | — American depositary shares |
| AGC | — Assured Guaranty Corporation |
| AGM | — Assured Guaranty Municipal |
| Ambac | — Ambac Financial Group Incorporated |
| AMT | — Alternative minimum tax |
| BAN | — Bond anticipation notes |
| BHAC | — Berkshire Hathaway Assurance Corporation |
| CAB | — Capital appreciation bond |
| CCAB | — Convertible capital appreciation bond |
| CDA | — Community Development Authority |
| CDO | — Collateralized debt obligation |
| DRIVER | — Derivative inverse tax-exempt receipts |
| DW&P | — Department of Water & Power |
| DWR | — Department of Water Resources |
| ECFA | — Educational & Cultural Facilities Authority |
| EDA | — Economic Development Authority |
| EDFA | — Economic Development Finance Authority |
| ETF | — Exchange-traded fund |
| FDIC | — Federal Deposit Insurance Corporation |
| FFCB | — Federal Farm Credit Banks |
| FGIC | — Financial Guaranty Insurance Corporation |
| FHA | — Federal Housing Administration |
| FHLB | — Federal Home Loan Bank |
| FHLMC | — Federal Home Loan Mortgage Corporation |
| FICO | — The Financing Corporation |
| FNMA | — Federal National Mortgage Association |
| GDR | — Global depositary receipt |
| GNMA | — Government National Mortgage Association |
| HCFR | — Healthcare facilities revenue |
| HEFA | — Health & Educational Facilities Authority |
| HEFAR | — Higher education facilities authority revenue |
| HFA | — Housing Finance Authority |
| HFFA | — Health Facilities Financing Authority |
| HUD | — Department of Housing and Urban Development |
| IDA | — Industrial Development Authority |
| IDAG | — Industrial Development Agency |
| KRW | — Republic of Korea won |
| LIBOR | — London Interbank Offered Rate |
| LIFER | — Long Inverse Floating Exempt Receipts |
| LLC | — Limited liability company |
| LLLP | — Limited liability limited partnership |
| LLP | — Limited liability partnership |
| MBIA | — Municipal Bond Insurance Association |
| MFHR | — Multifamily housing revenue |
| MSTR | — Municipal securities trust receipts |
| MUD | — Municipal Utility District |
| National | — National Public Finance Guarantee Corporation |
| PCFA | — Pollution Control Financing Authority |
| PCL | — Public Company Limited |
| PCR | — Pollution control revenue |
| PFA | — Public Finance Authority |
| PFFA | — Public Facilities Financing Authority |
| PFOTER | — Puttable floating option tax-exempt receipts |
| plc | — Public limited company |
| PUTTER | — Puttable tax-exempt receipts |
| R&D | — Research & development |
| Radian | — Radian Asset Assurance |
| RAN | — Revenue anticipation notes |
| RDA | — Redevelopment Authority |
| RDFA | — Redevelopment Finance Authority |
| REIT | — Real estate investment trust |
| ROC | — Reset option certificates |
| SAVRS | — Select auction variable rate securities |
| SBA | — Small Business Authority |
| SDR | — Swedish depositary receipt |
| SFHR | — Single-family housing revenue |
| SFMR | — Single-family mortgage revenue |
| SPA | — Standby purchase agreement |
| SPDR | — Standard & Poor’s Depositary Receipts |
| SPEAR | — Short Puttable Exempt Adjustable Receipts |
| STRIPS | — Separate trading of registered interest and |
| TAN | — Tax anticipation notes |
| TIPS | — Treasury inflation-protected securities |
| TRAN | — Tax revenue anticipation notes |
| TTFA | — Transportation Trust Fund Authority |
| TVA | — Tennessee Valley Authority |
This page is intentionally left blank.

For more information
More information about Wells Fargo Funds is available free upon request. To obtain literature, please write, email, visit the Fund’s website, or call:
Wells Fargo Funds
P.O. Box 8266
Boston, MA 02266-8266
Email: fundservice@wellsfargo.com
Website: wellsfargofunds.com
Individual investors: 1-800-222-8222
Retail investment professionals: 1-888-877-9275
Institutional investment professionals: 1-866-765-0778
This report and the financial statements contained herein are submitted for the general information of the shareholders of the Fund. If this report is used for promotional purposes, distribution of the report must be accompanied or preceded by a current prospectus. Before investing, please consider the investment objectives, risks, charges, and expenses of the investment. For a current prospectus and, if available, a summary prospectus, containing this information, call 1-800-222-8222 or visit the Fund’s website at wellsfargofunds.com. Read the prospectus carefully before you invest or send money.
Wells Fargo Asset Management (WFAM) is a trade name used by the asset management businesses of Wells Fargo & Company. Wells Fargo Funds Management, LLC, a wholly owned subsidiary of Wells Fargo & Company, provides investment advisory and administrative services for Wells Fargo Funds. Other affiliates of Wells Fargo & Company provide subadvisory and other services for the funds. The funds are distributed by Wells Fargo Funds Distributor, LLC, Member FINRA, an affiliate of Wells Fargo & Company.
NOT FDIC INSURED ¡ NO BANK GUARANTEE ¡ MAY LOSE VALUE
© 2016 Wells Fargo Funds Management, LLC. All rights reserved.
| | |
 | | 240796 03-16 SA206/SAR206 01-16 |
Semi-Annual Report
January 31, 2016

Wells Fargo Intrinsic Value Fund


Reduce clutter. Save trees.
Sign up for electronic delivery of prospectuses and shareholder reports at wellsfargo.com/advantagedelivery
Contents
The views expressed and any forward-looking statements are as of January 31, 2016, unless otherwise noted, and are those of the Fund managers and/or Wells Fargo Funds Management, LLC. Discussions of individual securities, or the markets generally, or any Wells Fargo Fund are not intended as individual recommendations. Future events or results may vary significantly from those expressed in any forward-looking statements. The views expressed are subject to change at any time in response to changing circumstances in the market. Wells Fargo Funds Management, LLC and the Fund disclaim any obligation to publicly update or revise any views expressed or forward-looking statements.
NOT FDIC INSURED ¡ NO BANK GUARANTEE ¡ MAY LOSE VALUE
| | | | |
| 2 | | Wells Fargo Intrinsic Value Fund | | Letter to shareholders (unaudited) |

Karla M. Rabusch
President
Wells Fargo Funds
Despite generally improving U.S. economic data, ongoing global turmoil tempered U.S. economic growth during the period as many economies and markets outside the U.S. faced ongoing challenges.
Dear Valued Shareholder:
We are pleased to offer you this semi-annual report for the Wells Fargo Intrinsic Value Fund for the six-month period that ended January 31, 2016. Despite generally improving U.S. economic data, ongoing global turmoil tempered U.S. economic growth during the period as many economies and markets outside the U.S. faced continuing challenges. In this environment, the broad U.S. stock market experienced heightened volatility and ultimately fell 5.64% overall for the six-month period (as measured by the Russell 3000® Index,1 which is the index used to measure U.S. stock market performance throughout this letter).
As the reporting period began, China’s slowdown continued to take a toll on U.S. and international markets.
The U.S. stock market declined 6.04% and 2.91% in August and September 2015, respectively, as investors worried about the impact on the U.S. of China’s slowing growth. A number of positive economic indicators released during these months suggested the U.S. economy remained solid. However, the strengthening U.S. dollar coupled with ongoing global economic turmoil continued to hinder the economy. Although many investors believed the U.S. Federal Reserve (Fed) would raise the federal funds rate during the third quarter of 2015, at its September 2015 meeting the Fed left the rate unchanged. This decision fueled uncertainty about the U.S. economy’s stamina to remain healthy while facing the negative effects of troubles elsewhere in the world. One week later, Fed Chair Janet Yellen reassured investors that, barring unpleasant surprises, the Fed still intended to raise the rate in 2015. International markets were more volatile than the domestic market and delivered even weaker results in August and September. Investors’ anxiety was driven largely by China’s weakened economy. Because China is the world’s largest importer of many commodities, a number of emerging markets—key commodities exporters—struggled under the strains of reduced demand for commodities and lower prices for the commodities sold.
The U.S. stock market delivered a positive result overall for the last three months of 2015 despite ongoing concerns.
The broad U.S. stock market fluctuated widely in the fourth quarter of 2015, rising 7.90% in October and 0.55% in November before falling 2.05% in December, for an overall quarterly return of 6.27%. Stock markets outside the U.S. generally failed to keep pace with the domestic market as economic concerns, including China’s ongoing slowdown, continued to affect many countries worldwide. U.S. economic data released during the quarter indicated the economy remained solid, with modest growth. However, the strong U.S. dollar and global economic turmoil continued their drag on the economy. In December, the Fed, as expected, slightly raised its target short-term interest rate to between 0.25% and 0.50% after keeping it near zero for seven years. The move, which had been well telegraphed by the Fed for months, reflected confidence in the U.S. economy’s ability to stay healthy with less central-bank support. The Fed also made clear that future interest-rate increases will be gradual.
U.S. stocks struggled in January 2016.
The broad U.S. stock market dropped 5.64% for the month, weighed down by ongoing concerns about heightened market volatility, the continued plunge in oil prices, and the impact of weak global growth on U.S. companies. The U.S. economy, however, remained resilient in January—with continued solid hiring, a
| 1 | The Russell 3000® Index measures the performance of the 3,000 largest U.S. companies based on total market capitalization, which represents approximately 98% of the investable U.S. equity market. You cannot invest directly in an index. |
| | | | | | |
| Letter to shareholders (unaudited) | | Wells Fargo Intrinsic Value Fund | | | 3 | |
reduction in the jobless rate to 4.9%, and signs of an uptick in the pace of wage growth—despite some warning signs that became evident in recent months, such as weaknesses in manufacturing and business growth.
Don’t let short-term uncertainty derail long-term investment goals.
Periods of uncertainty can present challenges, but experience has taught us that maintaining long-term investment goals can be an effective way to plan for the future. To help you create a sound strategy based on your personal goals and risk tolerance, Wells Fargo Funds offers more than 100 mutual funds spanning a wide range of asset classes and investment styles. Although diversification cannot guarantee an investment profit or prevent losses, we believe it can be an effective way to manage investment risk and potentially smooth out overall portfolio performance. We encourage investors to know their investments and to understand that appropriate levels of risk-taking may unlock opportunities.
Thank you for choosing to invest in Wells Fargo Funds. We appreciate your confidence in us and remain committed to helping you meet your financial needs.
Sincerely,

Karla M. Rabusch
President
Wells Fargo Funds
Although diversification cannot guarantee an investment profit or prevent losses, we believe it can be an effective way to manage investment risk and potentially smooth out overall portfolio performance.
Notice to shareholders
At a meeting held on February 17-18, 2016, the Board of Trustees approved a change to the subadviser for the Fund to Wells Capital Management Incorporated (“WellsCap”) in connection with the merger of Metropolitan West Capital Management, LLC (“MetWest”), the Fund’s current sub-adviser, into WellsCap (the “Merger”). The Merger is expected to take place on or about July 1, 2016. With the completion of the Merger, MetWest personnel will become exclusively personnel of WellsCap. The Merger will not result in any change to the services provided to the Fund or to the Fund’s strategies or fees and expenses.
For further information about your Fund, contact your investment professional, visit our website at wellsfargofunds.com, or call us directly at 1-800-222-8222. We are available 24 hours a day, 7 days a week.
| | | | |
| 4 | | Wells Fargo Intrinsic Value Fund | | Performance highlights (unaudited) |
Investment objective
The Fund seeks long-term capital appreciation.
Manager
Wells Fargo Funds Management, LLC
Subadviser
Metropolitan West Capital Management, LLC
Portfolio managers
Miguel E. Giaconi, CFA®
Jean-Baptiste Nadal, CFA®
Jeffrey Peck
Average annual total returns (%) as of January 31, 20161
| | | | | | | | | | | | | | | | | | | | | | | | | | | | | | | | | | |
| | | | | Including sales charge | | | Excluding sales charge | | | Expense ratios2 (%) | |
| | | Inception date | | 1 year | | | 5 year | | | Since
Inception | | | 1 year | | | 5 year | | | Since
Inception | | | Gross | | | Net3 | |
| Class A (EIVAX) | | 8-1-2006 | | | (9.28 | ) | | | 7.28 | | | | 5.93 | | | | (3.74 | ) | | | 8.56 | | | | 6.59 | | | | 1.17 | | | | 1.11 | |
| Class B (EIVBX)* | | 8-1-2006 | | | (8.78 | ) | | | 7.45 | | | | 6.01 | | | | (4.50 | ) | | | 7.74 | | | | 6.01 | | | | 1.92 | | | | 1.86 | |
| Class C (EIVCX) | | 8-1-2006 | | | (5.53 | ) | | | 7.73 | | | | 5.80 | | | | (4.53 | ) | | | 7.73 | | | | 5.80 | | | | 1.92 | | | | 1.86 | |
| Class R (EIVTX) | | 3-1-2013 | | | – | | | | – | | | | – | | | | (3.97 | ) | | | 8.32 | | | | 6.36 | | | | 1.42 | | | | 1.36 | |
| Class R4 (EIVRX) | | 11-30-2012 | | | – | | | | – | | | | – | | | | (3.42 | ) | | | 8.93 | | | | 6.91 | | | | 0.89 | | | | 0.80 | |
| Class R6 (EIVFX) | | 11-30-2012 | | | – | | | | – | | | | – | | | | (3.28 | ) | | | 8.94 | | | | 6.91 | | | | 0.74 | | | | 0.65 | |
| Administrator Class (EIVDX) | | 7-30-2010 | | | – | | | | – | | | | – | | | | (3.62 | ) | | | 8.78 | | | | 6.78 | | | | 1.09 | | | | 0.95 | |
| Institutional Class (EIVIX) | | 8-1-2006 | | | – | | | | – | | | | – | | | | (3.31 | ) | | | 9.01 | | | | 6.95 | | | | 0.84 | | | | 0.70 | |
| Russell 1000® Value Index4 | | – | | | – | | | | – | | | | – | | | | (5.00 | ) | | | 9.61 | | | | 4.95 | | | | – | | | | – | |
| * | | Class B shares are closed to investment, except in connection with the reinvestment of any distributions and permitted exchanges. |
Figures quoted represent past performance, which is no guarantee of future results, and do not reflect taxes that a shareholder may pay on fund distributions or the redemption of fund shares. Investment return and principal value of an investment will fluctuate so that an investor’s shares, when redeemed, may be worth more or less than their original cost. Performance shown without sales charges would be lower if sales charges were reflected. Current performance may be lower or higher than the performance data quoted, which assumes the reinvestment of dividends and capital gains. Current month-end performance is available on the Fund’s website, wellsfargofunds.com.
Index returns do not include transaction costs associated with buying and selling securities, any mutual fund fees or expenses, or any taxes. It is not possible to invest directly in an index.
For Class A shares, the maximum front-end sales charge is 5.75%. For Class B shares, the maximum contingent deferred sales charge is 5.00%. For Class C shares, the maximum contingent deferred sales charge is 1.00%. Performance including a contingent deferred sales charge assumes the sales charge for the corresponding time period. Class R, Class R4, Class R6, Administrator Class and Institutional Class shares are sold without a front-end sales charge or contingent deferred sales charge.
Stock values fluctuate in response to the activities of individual companies and general market and economic conditions. Certain investment strategies tend to increase the total risk of an investment (relative to the broader market). The Fund is exposed to foreign investment risk and focused portfolio risk. Consult the Fund’s prospectus for additional information on these and other risks.
Please see footnotes on page 5.
| | | | | | |
| Performance highlights (unaudited) | | Wells Fargo Intrinsic Value Fund | | | 5 | |
| | | | |
| Ten largest holdings (%) as of January 31, 20165 | |
Microsoft Corporation | | | 3.18 | |
Anheuser-Busch InBev NV ADR | | | 3.12 | |
Lockheed Martin Corporation | | | 3.08 | |
The TJX Companies Incorporated | | | 2.95 | |
BB&T Corporation | | | 2.94 | |
NextEra Energy Incorporated | | | 2.86 | |
Goldman Sachs Group Incorporated | | | 2.82 | |
Honeywell International Incorporated | | | 2.78 | |
Alphabet Incorporated Class C | | | 2.67 | |
The Procter & Gamble Company | | | 2.62 | |
|
| Sector distribution as of January 31, 20166 |
|
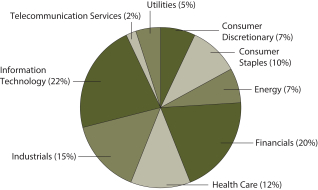 |
| 1 | Historical performance shown for Class R shares prior to their inception reflects the performance of Institutional Class shares, adjusted to reflect the higher expenses applicable to Class R shares. Historical performance shown for Class R4 shares prior to their inception reflects the performance of Institutional Class shares, adjusted to reflect the higher expenses applicable to Class R4 shares. Historical performance shown for Class R6 shares prior to their inception reflects the performance of Institutional Class shares, and includes the higher expenses applicable to Institutional Class shares. If these expenses had not been included, returns would be higher. Historical performance shown for Administrator Class shares prior to their inception reflects the performance of Institutional Class shares, adjusted to reflect the higher expenses applicable to Administrator Class shares. Historical performance shown for all classes of the Fund prior to July 19, 2010, is based on the performance of the Fund’s predecessor, Evergreen Intrinsic Value Fund. |
| 2 | Reflects the expense ratios as stated in the most recent prospectuses. The expense ratios shown are subject to change and may differ from the annualized expense ratios shown in the financial highlights of this report. |
| 3 | The manager has contractually committed through November 30, 2016, to waive fees and/or reimburse expenses to the extent necessary to cap the Fund’s Total Annual Fund Operating Expenses After Fee Waiver at the amounts shown. After this time, the cap may be increased or the commitment to maintain the cap may be terminated only with the approval of the Board of Trustees. Brokerage commissions, stamp duty fees, interest, taxes, acquired fund fees and expenses, and extraordinary expenses are excluded from the cap. Without this cap, the Fund’s returns would have been lower. |
| 4 | The Russell 1000® Value Index measures the performance of those Russell 1000 Index companies with lower price-to-book ratios and lower forecasted growth values. You cannot invest directly in an index. |
| 5 | The ten largest holdings, excluding cash and cash equivalents, are calculated based on the value of the investments divided by total net assets of the Fund. Holdings are subject to change and may have changed since the date specified. |
| 6 | Amounts are calculated based on the total long-term investments of the Fund. These amounts are subject to change and may have changed since the date specified. |
| | | | |
| 6 | | Wells Fargo Intrinsic Value Fund | | Fund expenses (unaudited) |
As a shareholder of the Fund, you incur two types of costs: (1) transaction costs, including sales charges (loads) on purchase payments and contingent deferred sales charges (if any) on redemptions and (2) ongoing costs, including management fees, distribution (12b-1) and/or shareholder service fees, and other Fund expenses. This example is intended to help you understand your ongoing costs (in dollars) of investing in the Fund and to compare these costs with the ongoing costs of investing in other mutual funds.
The example is based on an investment of $1,000 invested at the beginning of the six-month period and held for the entire period from August 1, 2015 to January 31, 2016.
Actual expenses
The “Actual” line of the table below provides information about actual account values and actual expenses. You may use the information in this line, together with the amount you invested, to estimate the expenses that you paid over the period. Simply divide your account value by $1,000 (for example, an $8,600 account value divided by $1,000 = 8.6), then multiply the result by the number in the “Actual” line under the heading entitled “Expenses paid during period” for your applicable class of shares to estimate the expenses you paid on your account during this period.
Hypothetical example for comparison purposes
The “Hypothetical” line of the table below provides information about hypothetical account values and hypothetical expenses based on the Fund’s actual expense ratio and an assumed rate of return of 5% per year before expenses, which is not the Fund’s actual return. The hypothetical account values and expenses may not be used to estimate the actual ending account balance or expenses you paid for the period. You may use this information to compare the ongoing costs of investing in the Fund and other funds. To do so, compare this 5% hypothetical example with the 5% hypothetical examples that appear in the shareholder reports of the other funds.
Please note that the expenses shown in the table are meant to highlight your ongoing costs only and do not reflect any transactional costs, such as sales charges (loads) and contingent deferred sales charges. Therefore, the “Hypothetical” line of the table is useful in comparing ongoing costs only and will not help you determine the relative total costs of owning different funds. In addition, if these transactional costs were included, your costs would have been higher.
| | | | | | | | | | | | | | | | |
| | | Beginning
account value
8-1-2015 | | | Ending
account value
1-31-2016 | | | Expenses
paid during
the period¹ | | | Net annualized
expense ratio | |
Class A | | | | | | | | | | | | | | | | |
Actual | | $ | 1,000.00 | | | $ | 895.99 | | | $ | 5.29 | | | | 1.11 | % |
Hypothetical (5% return before expenses) | | $ | 1,000.00 | | | $ | 1,019.56 | | | $ | 5.63 | | | | 1.11 | % |
Class B | | | | | | | | | | | | | | | | |
Actual | | $ | 1,000.00 | | | $ | 892.93 | | | $ | 8.85 | | | | 1.86 | % |
Hypothetical (5% return before expenses) | | $ | 1,000.00 | | | $ | 1,015.79 | | | $ | 9.42 | | | | 1.86 | % |
Class C | | | | | | | | | | | | | | | | |
Actual | | $ | 1,000.00 | | | $ | 892.26 | | | $ | 8.85 | | | | 1.86 | % |
Hypothetical (5% return before expenses) | | $ | 1,000.00 | | | $ | 1,015.79 | | | $ | 9.42 | | | | 1.86 | % |
Class R | | | | | | | | | | | | | | | | |
Actual | | $ | 1,000.00 | | | $ | 894.94 | | | $ | 6.48 | | | | 1.36 | % |
Hypothetical (5% return before expenses) | | $ | 1,000.00 | | | $ | 1,018.30 | | | $ | 6.90 | | | | 1.36 | % |
Class R4 | | | | | | | | | | | | | | | | |
Actual | | $ | 1,000.00 | | | $ | 897.83 | | | $ | 3.82 | | | | 0.80 | % |
Hypothetical (5% return before expenses) | | $ | 1,000.00 | | | $ | 1,021.11 | | | $ | 4.06 | | | | 0.80 | % |
Class R6 | | | | | | | | | | | | | | | | |
Actual | | $ | 1,000.00 | | | $ | 898.28 | | | $ | 3.10 | | | | 0.65 | % |
Hypothetical (5% return before expenses) | | $ | 1,000.00 | | | $ | 1,021.87 | | | $ | 3.30 | | | | 0.65 | % |
Administrator Class | | | | | | | | | | | | | | | | |
Actual | | $ | 1,000.00 | | | $ | 896.87 | | | $ | 4.53 | | | | 0.95 | % |
Hypothetical (5% return before expenses) | | $ | 1,000.00 | | | $ | 1,020.36 | | | $ | 4.82 | | | | 0.95 | % |
Institutional Class | | | | | | | | | | | | | | | | |
Actual | | $ | 1,000.00 | | | $ | 898.24 | | | $ | 3.34 | | | | 0.70 | % |
Hypothetical (5% return before expenses) | | $ | 1,000.00 | | | $ | 1,021.62 | | | $ | 3.56 | | | | 0.70 | % |
| 1 | Expenses paid is equal to the annualized expense ratio of each class multiplied by the average account value over the period, multiplied by the number of days in the most recent fiscal half-year divided by the number of days in the fiscal year (to reflect the one-half-year period). |
| | | | | | |
| Portfolio of investments—January 31, 2016 (unaudited) | | Wells Fargo Intrinsic Value Fund | | | 7 | |
| | | | | | | | | | | | |
| Security name | | | | | | Shares | | | Value | |
| | | | |
Common Stocks: 97.24% | | | | | | | | | | | | |
| | | | |
Consumer Discretionary: 7.27% | | | | | | | | | | | | |
| | | | |
| Hotels, Restaurants & Leisure: 1.88% | | | | | | | | | | | | |
Marriott International Incorporated Class A « | | | | | | | 310,087 | | | $ | 19,002,131 | |
| | | | | | | | | | | | |
| | | | |
| Media: 2.44% | | | | | | | | | | | | |
The Walt Disney Company | | | | | | | 257,095 | | | | 24,634,843 | |
| | | | | | | | | | | | |
| | | | |
| Specialty Retail: 2.95% | | | | | | | | | | | | |
The TJX Companies Incorporated | | | | | | | 419,010 | | | | 29,850,272 | |
| | | | | | | | | | | | |
| | | | |
Consumer Staples: 9.25% | | | | | | | | | | | | |
| | | | |
| Beverages: 6.62% | | | | | | | | | | | | |
Anheuser-Busch InBev NV ADR | | | | | | | 250,677 | | | | 31,545,194 | |
Diageo plc ADR | | | | | | | 98,421 | | | | 10,596,989 | |
PepsiCo Incorporated | | | | | | | 249,624 | | | | 24,787,663 | |
| | | | |
| | | | | | | | | | | 66,929,846 | |
| | | | | | | | | | | | |
| | | | |
| Household Products: 2.63% | | | | | | | | | | | | |
The Procter & Gamble Company | | | | | | | 324,709 | | | | 26,525,478 | |
| | | | | | | | | | | | |
| | | | |
Energy: 6.51% | | | | | | | | | | | | |
| | | | |
| Energy Equipment & Services: 3.25% | | | | | | | | | | | | |
FMC Technologies Incorporated † | | | | | | | 513,132 | | | | 12,905,270 | |
Schlumberger Limited | | | | | | | 276,300 | | | | 19,968,201 | |
| | | | |
| | | | | | | | | | | 32,873,471 | |
| | | | | | | | | | | | |
| | | | |
| Oil, Gas & Consumable Fuels: 3.26% | | | | | | | | | | | | |
EOG Resources Incorporated | | | | | | | 312,515 | | | | 22,194,815 | |
Occidental Petroleum Corporation | | | | | | | 155,431 | | | | 10,698,316 | |
| | | | |
| | | | | | | | | | | 32,893,131 | |
| | | | | | | | | | | | |
| | | | |
Financials: 19.89% | | | | | | | | | | | | |
| | | | |
| Banks: 6.91% | | | | | | | | | | | | |
BB&T Corporation | | | | | | | 910,414 | | | | 29,734,121 | |
CIT Group Incorporated | | | | | | | 605,920 | | | | 17,783,752 | |
SunTrust Banks Incorporated | | | | | | | 611,299 | | | | 22,361,317 | |
| | | | |
| | | | | | | | | | | 69,879,190 | |
| | | | | | | | | | | | |
| | | | |
| Capital Markets: 6.12% | | | | | | | | | | | | |
Charles Schwab Corporation | | | | | | | 615,059 | | | | 15,702,456 | |
Goldman Sachs Group Incorporated | | | | | | | 176,625 | | | | 28,535,535 | |
UBS Group AG | | | | | | | 1,058,174 | | | | 17,608,015 | |
| | | | |
| | | | | | | | | | | 61,846,006 | |
| | | | | | | | | | | | |
| | | | |
| Consumer Finance: 2.14% | | | | | | | | | | | | |
Synchrony Financial † | | | | | | | 761,768 | | | | 21,649,447 | |
| | | | | | | | | | | | |
The accompanying notes are an integral part of these financial statements.
| | | | |
| 8 | | Wells Fargo Intrinsic Value Fund | | Portfolio of investments—January 31, 2016 (unaudited) |
| | | | | | | | | | | | |
| Security name | | | | | | Shares | | | Value | |
| | | | |
| Insurance: 2.46% | | | | | | | | | | | | |
The Allstate Corporation | | | | | | | 409,529 | | | $ | 24,817,457 | |
| | | | | | | | | | | | |
| | | | |
| REITs: 2.26% | | | | | | | | | | | | |
Crown Castle International Corporation | | | | | | | 264,534 | | | | 22,802,831 | |
| | | | | | | | | | | | |
| | | | |
Health Care: 11.22% | | | | | | | | | | | | |
| | | | |
| Biotechnology: 2.08% | | | | | | | | | | | | |
Gilead Sciences Incorporated | | | | | | | 253,405 | | | | 21,032,615 | |
| | | | | | | | | | | | |
| | | | |
| Health Care Equipment & Supplies: 2.29% | | | | | | | | | | | | |
Abbott Laboratories | | | | | | | 611,469 | | | | 23,144,102 | |
| | | | | | | | | | | | |
| | | | |
| Health Care Providers & Services: 4.52% | | | | | | | | | | | | |
Cigna Corporation | | | | | | | 186,723 | | | | 24,946,193 | |
Express Scripts Holding Company † | | | | | | | 288,956 | | | | 20,767,268 | |
| | | | |
| | | | | | | | | | | 45,713,461 | |
| | | | | | | | | | | | |
| | | | |
| Pharmaceuticals: 2.33% | | | | | | | | | | | | |
Merck & Company Incorporated | | | | | | | 463,877 | | | | 23,504,648 | |
| | | | | | | | | | | | |
| | | | |
Industrials: 14.06% | | | | | | | | | | | | |
| | | | |
| Aerospace & Defense: 7.94% | | | | | | | | | | | | |
Honeywell International Incorporated | | | | | | | 271,998 | | | | 28,070,194 | |
Lockheed Martin Corporation | | | | | | | 147,354 | | | | 31,091,694 | |
The Boeing Company | | | | | | | 174,962 | | | | 21,018,185 | |
| | | | |
| | | | | | | | | | | 80,180,073 | |
| | | | | | | | | | | | |
| | | | |
| Air Freight & Logistics: 2.13% | | | | | | | | | | | | |
United Parcel Service Incorporated Class B | | | | | | | 230,690 | | | | 21,500,308 | |
| | | | | | | | | | | | |
| | | | |
| Electrical Equipment: 2.11% | | | | | | | | | | | | |
Sensata Technologies Holding NV † | | | | | | | 581,518 | | | | 21,341,711 | |
| | | | | | | | | | | | |
| | | | |
| Trading Companies & Distributors: 1.88% | | | | | | | | | | | | |
Aercap Holdings NV † | | | | | | | 619,637 | | | | 19,029,052 | |
| | | | | | | | | | | | |
| | | | |
Information Technology: 21.88% | | | | | | | | | | | | |
| | | | |
| Communications Equipment: 5.06% | | | | | | | | | | | | |
Cisco Systems Incorporated | | | | | | | 879,724 | | | | 20,928,634 | |
Motorola Solutions Incorporated | | | | | | | 389,914 | | | | 26,034,558 | |
QUALCOMM Incorporated | | | | | | | 91,758 | | | | 4,160,308 | |
| | | | |
| | | | | | | | | | | 51,123,500 | |
| | | | | | | | | | | | |
| | | | |
| Internet Software & Services: 2.68% | | | | | | | | | | | | |
Alphabet Incorporated Class C † | | | | | | | 36,382 | | | | 27,030,007 | |
| | | | | | | | | | | | |
| | | | |
| IT Services: 4.69% | | | | | | | | | | | | |
Accenture plc Class A | | | | | | | 248,706 | | | | 26,248,431 | |
The Western Union Company | | | | | | | 1,186,218 | | | | 21,162,129 | |
| | | | |
| | | | | | | | | | | 47,410,560 | |
| | | | | | | | | | | | |
The accompanying notes are an integral part of these financial statements.
| | | | | | |
| Portfolio of investments—January 31, 2016 (unaudited) | | Wells Fargo Intrinsic Value Fund | | | 9 | |
| | | | | | | | | | | | | | | | |
| Security name | | | | | | | | | Shares | | | Value | |
| | | | | |
| Semiconductors & Semiconductor Equipment: 2.24% | | | | | | | | | | | | | | | | |
Texas Instruments Incorporated | | | | | | | | | | | 427,559 | | | $ | 22,630,698 | |
| | | | | | | | | | | | | | | | |
| | | | | |
| Software: 5.37% | | | | | | | | | | | | | | | | |
Microsoft Corporation | | | | | | | | | | | 582,817 | �� | | | 32,107,389 | |
Oracle Corporation | | | | | | | | | | | 609,744 | | | | 22,139,805 | |
| | | | | |
| | | | | | | | | | | | | | | 54,247,194 | |
| | | | | | | | | | | | | | | | |
| | | | | |
| Technology Hardware, Storage & Peripherals: 1.84% | | | | | | | | | | | | | | | | |
Apple Incorporated | | | | | | | | | | | 191,528 | | | | 18,643,336 | |
| | | | | | | | | | | | | | | | |
| | | | | |
Telecommunication Services: 2.18% | | | | | | | | | | | | | | | | |
| | | | | |
| Diversified Telecommunication Services: 2.18% | | | | | | | | | | | | | | | | |
Verizon Communications Incorporated | | | | | | | | | | | 441,041 | | | | 22,038,819 | |
| | | | | | | | | | | | | | | | |
| | | | | |
Utilities: 4.98% | | | | | | | | | | | | | | | | |
| | | | | |
| Electric Utilities: 2.86% | | | | | | | | | | | | | | | | |
NextEra Energy Incorporated | | | | | | | | | | | 258,870 | | | | 28,918,368 | |
| | | | | | | | | | | | | | | | |
| | | | | |
| Multi-Utilities: 2.12% | | | | | | | | | | | | | | | | |
WEC Energy Group Incorporated | | | | | | | | | | | 388,280 | | | | 21,444,702 | |
| | | | | | | | | | | | | | | | |
| | | | | |
Total Common Stocks (Cost $909,001,320) | | | | | | | | | | | | | | | 982,637,257 | |
| | | | | | | | | | | | | | | | |
| | | | | |
| | | | | Yield | | | | | | | | | |
| Short-Term Investments: 4.55% | | | | | | | | | | | | | | | | |
| Investment Companies: 4.55% | | | | | | | | | | | | | | | | |
Securities Lending Cash Investments, LLC (l)(r)(u) | | | | | 0.42 | % | | | | | 17,817,250 | | | | 17,817,250 | |
Wells Fargo Cash Investment Money Market Fund, Select Class (l)(u) | | | | | 0.40 | | | | | | 28,112,628 | | | | 28,112,628 | |
| | | | | |
Total Short-Term Investments (Cost $45,929,878) | | | | | | | | | | | | | | | 45,929,878 | |
| | | | | | | | | | | | | | | | |
| | | | | | | | |
| Total investments in securities (Cost $954,931,198) * | | | 101.79 | % | | | 1,028,567,135 | |
Other assets and liabilities, net | | | (1.79 | ) | | | (18,053,362 | ) |
| | | | | | | | |
| Total net assets | | | 100.00 | % | | $ | 1,010,513,773 | |
| | | | | | | | |
| « | All or a portion of this security is on loan. |
| † | Non-income-earning security |
| (l) | The issuer of the security is an affiliated person of the Fund as defined in the Investment Company Act of 1940. |
| (r) | The investment is a non-registered investment vehicle purchased with cash collateral received from securities on loan. |
| (u) | The rate represents the 7-day annualized yield at period end. |
| * | Cost for federal income tax purposes is $955,222,134 and unrealized gains (losses) consists of: |
| | | | |
Gross unrealized gains | | $ | 135,039,885 | |
Gross unrealized losses | | | (61,694,884 | ) |
| | | | |
Net unrealized gains | | $ | 73,345,001 | |
The accompanying notes are an integral part of these financial statements.
| | | | |
| 10 | | Wells Fargo Intrinsic Value Fund | | Statement of assets and liabilities—January 31, 2016 (unaudited) |
| | | | |
| | | | |
| |
Assets | | | | |
Investments | | | | |
In unaffiliated securities (including $17,437,345 of securities loaned), at value (cost $909,001,320) | | $ | 982,637,257 | |
In affiliated securities, at value (cost $45,929,878) | | | 45,929,878 | |
| | | | |
Total investments, at value (cost $954,931,198) | | | 1,028,567,135 | |
Receivable for Fund shares sold | | | 334,341 | |
Receivable for dividends | | | 950,256 | |
Receivable for securities lending income | | | 4,399 | |
Prepaid expenses and other assets | | | 60,956 | |
| | | | |
Total assets | | | 1,029,917,087 | |
| | | | |
| |
Liabilities | | | | |
Payable for Fund shares redeemed | | | 576,850 | |
Payable upon receipt of securities loaned | | | 17,817,250 | |
Management fee payable | | | 494,031 | |
Distribution fees payable | | | 19,798 | |
Administration fees payable | | | 135,389 | |
Accrued expenses and other liabilities | | | 359,996 | |
| | | | |
Total liabilities | | | 19,403,314 | |
| | | | |
Total net assets | | $ | 1,010,513,773 | |
| | | | |
| |
NET ASSETS CONSIST OF | | | | |
Paid-in capital | | $ | 924,776,295 | |
Undistributed net investment income | | | 277,394 | |
Accumulated net realized gains on investments | | | 11,824,147 | |
Net unrealized gains on investments | | | 73,635,937 | |
| | | | |
Total net assets | | $ | 1,010,513,773 | |
| | | | |
| |
COMPUTATION OF NET ASSET VALUE AND OFFERING PRICE PER SHARE | | | | |
Net assets – Class A | | $ | 309,855,688 | |
Shares outstanding – Class A1 | | | 28,302,832 | |
Net asset value per share – Class A | | | $10.95 | |
Maximum offering price per share – Class A2 | | | $11.62 | |
Net assets – Class B | | $ | 1,047,155 | |
Shares outstanding – Class B1 | | | 96,632 | |
Net asset value per share – Class B | | | $10.84 | |
Net assets – Class C | | $ | 29,564,217 | |
Shares outstanding – Class C1 | | | 2,751,980 | |
Net asset value per share – Class C | | | $10.74 | |
Net assets – Class R | | $ | 31,846 | |
Shares outstanding – Class R1 | | | 2,885 | |
Net asset value per share – Class R | | | $11.04 | |
Net assets – Class R4 | | $ | 13,587 | |
Share outstanding – Class R41 | | | 1,238 | |
Net asset value per share – Class R4 | | | $10.97 | |
Net assets – Class R6 | | $ | 2,570,761 | |
Shares outstanding – Class R61 | | | 237,462 | |
Net asset value per share – Class R6 | | | $10.83 | |
Net assets – Administrator Class | | $ | 452,682,906 | |
Shares outstanding – Administrator Class1 | | | 39,714,379 | |
Net asset value per share – Administrator Class | | | $11.40 | |
Net assets – Institutional Class | | $ | 214,747,613 | |
Shares outstanding – Institutional Class1 | | | 19,543,047 | |
Net asset value per share – Institutional Class | | | $10.99 | |
| 1 | The Fund has an unlimited number of authorized shares. |
| 2 | Maximum offering price is computed as 100/94.25 of net asset value. On investments of $50,000 or more, the offering price is reduced. |
The accompanying notes are an integral part of these financial statements.
| | | | | | |
| Statement of operations—six months ended January 31, 2016 (unaudited) | | Wells Fargo Intrinsic Value Fund | | | 11 | |
| | | | |
| | | | |
| |
Investment income | | | | |
Dividends (net of foreign withholding taxes of $118,922) | | $ | 11,533,921 | |
Securities lending income, net | | | 166,852 | |
Income from affiliated securities | | | 36,710 | |
| | | | |
Total investment income | | | 11,737,483 | |
| | | | |
| |
Expenses | | | | |
Management fee | | | 3,771,641 | |
Administration fees | | | | |
Class A | | | 358,310 | |
Class B | | | 1,522 | |
Class C | | | 34,607 | |
Class R | | | 37 | |
Class R4 | | | 5 | |
Class R6 | | | 208 | |
Administrator Class | | | 317,837 | |
Institutional Class | | | 154,113 | |
Shareholder servicing fees | | | | |
Class A | | | 409,216 | |
Class B | | | 1,812 | |
Class C | | | 41,199 | |
Class R | | | 44 | |
Class R4 | | | 7 | |
Administrator Class | | | 611,019 | |
Distribution fees | | | | |
Class B | | | 5,435 | |
Class C | | | 123,597 | |
Class R | | | 44 | |
Custody and accounting fees | | | 33,031 | |
Professional fees | | | 20,840 | |
Registration fees | | | 52,088 | |
Shareholder report expenses | | | 43,001 | |
Trustees’ fees and expenses | | | 13,579 | |
Other fees and expenses | | | 11,168 | |
| | | | |
Total expenses | | | 6,004,360 | |
Less: Fee waivers and/or expense reimbursements | | | (633,138 | ) |
| | | | |
Net expenses | | | 5,371,222 | |
| | | | |
Net investment income | | | 6,366,261 | |
| | | | |
| |
REALIZED AND UNREALIZED GAINS (LOSSES) ON INVESTMENTS | | | | |
Net realized gains on investments | | | 43,576,161 | |
Net change in unrealized gains (losses) on investments | | | (170,114,692 | ) |
| | | | |
Net realized and unrealized gains (losses) on investments | | | (126,538,531 | ) |
| | | | |
Net decrease in net assets resulting from operations | | $ | (120,172,270 | ) |
| | | | |
The accompanying notes are an integral part of these financial statements.
| | | | |
| 12 | | Wells Fargo Intrinsic Value Fund | | Statement of changes in net assets |
| | | | | | | | | | | | | | | | |
| | | Six months ended January 31, 2016 (unaudited) | | | Year ended
July 31, 2015 | |
| | | | |
Operations | | | | | | | | | | | | | | | | |
Net investment income | | | | | | $ | 6,366,261 | | | | | | | $ | 11,044,365 | |
Net realized gains on investments | | | | | | | 43,576,161 | | | | | | | | 129,111,859 | |
Net change in unrealized gains (losses) on investments | | | | | | | (170,114,692 | ) | | | | | | | (31,816,136 | ) |
| | | | |
Net increase (decrease) in net assets resulting from operations | | | | | | | (120,172,270 | ) | | | | | | | 108,340,088 | |
| | | | |
| | | | |
Distributions to shareholders from | | | | | | | | | | | | | | | | |
Net investment income | | | | | | | | | | | | | | | | |
Class A | | | | | | | (3,169,347 | ) | | | | | | | (2,172,530 | ) |
Class C | | | | | | | (37,447 | ) | | | | | | | 0 | |
Class R | | | | | | | (201 | ) | | | | | | | (81 | ) |
Class R4 | | | | | | | (186 | ) | | | | | | | (130 | ) |
Class R6 | | | | | | | (38,287 | ) | | | | | | | (2,896 | ) |
Administrator Class | | | | | | | (5,583,834 | ) | | | | | | | (4,135,495 | ) |
Institutional Class | | | | | | | (3,324,787 | ) | | | | | | | (2,556,860 | ) |
Net realized gains | | | | | | | | | | | | | | | | |
Class A | | | | | | | (34,464,666 | ) | | | | | | | (27,285,622 | ) |
Class B | | | | | | | (132,772 | ) | | | | | | | (212,769 | ) |
Class C | | | | | | | (3,405,696 | ) | | | | | | | (2,625,365 | ) |
Class R | | | | | | | (3,205 | ) | | | | | | | (2,211 | ) |
Class R4 | | | | | | | (1,451 | ) | | | | | | | (1,003 | ) |
Class R6 | | | | | | | (277,898 | ) | | | | | | | (11,038 | ) |
Administrator Class | | | | | | | (47,759,263 | ) | | | | | | | (36,136,386 | ) |
Institutional Class | | | | | | | (24,324,139 | ) | | | | | | | (17,741,411 | ) |
| | | | |
Total distributions to shareholders | | | | | | | (122,523,179 | ) | | | | | | | (92,883,797 | ) |
| | | | |
| | | | |
Capital share transactions | | | Shares | | | | | | | | Shares | | | | | |
Proceeds from shares sold | | | | | | | | | | | | | | | | |
Class A | | | 279,966 | | | | 3,487,238 | | | | 624,836 | | | | 8,481,516 | |
Class B | | | 538 | | | | 6,161 | | | | 2,136 | | | | 28,654 | |
Class C | | | 149,437 | | | | 1,797,713 | | | | 209,050 | | | | 2,773,670 | |
Class R | | | 562 | | | | 6,983 | | | | 1,217 | | | | 16,683 | |
Class R6 | | | 209,989 | | | | 2,804,309 | | | | 339 | | | | 4,595 | |
Administrator Class | | | 301,909 | | | | 4,041,238 | | | | 690,160 | | | | 9,705,283 | |
Institutional Class | | | 1,750,898 | | | | 22,018,198 | | | | 2,658,478 | | | | 36,641,333 | |
| | | | |
| | | | | | | 34,161,840 | | | | | | | | 57,651,734 | |
| | | | |
Reinvestment of distributions | | | | | | | | | | | | | | | | |
Class A | | | 3,054,414 | | | | 35,703,185 | | | | 2,128,410 | | | | 27,919,064 | |
Class B | | | 11,006 | | | | 126,021 | | | | 15,779 | | | | 204,498 | |
Class C | | | 256,273 | | | | 2,914,692 | | | | 174,638 | | | | 2,247,594 | |
Class R | | | 290 | | | | 3,406 | | | | 174 | | | | 2,292 | |
Class R4 | | | 139 | | | | 1,637 | | | | 87 | | | | 1,132 | |
Class R6 | | | 27,254 | | | | 316,185 | | | | 1,068 | | | | 13,934 | |
Administrator Class | | | 4,139,213 | | | | 50,467,673 | | | | 2,786,857 | | | | 37,930,250 | |
Institutional Class | | | 2,026,547 | | | | 23,875,792 | | | | 1,210,532 | | | | 15,960,088 | |
| | | | |
| | | | | | | 113,408,591 | | | | | | | | 84,278,852 | |
| | | | |
Payment for shares redeemed | | | | | | | | | | | | | | | | |
Class A | | | (2,162,642 | ) | | | (26,880,737 | ) | | | (4,381,343 | ) | | | (59,669,917 | ) |
Class B | | | (58,656 | ) | | | (743,625 | ) | | | (163,321 | ) | | | (2,207,079 | ) |
Class C | | | (338,009 | ) | | | (4,053,888 | ) | | | (442,242 | ) | | | (5,907,017 | ) |
Class R | | | (938 | ) | | | (12,246 | ) | | | (470 | ) | | | (6,451 | ) |
Class R4 | | | 0 | | | | 0 | | | | (111 | ) | | | (1,553 | ) |
Class R6 | | | (12,217 | ) | | | (148,607 | ) | | | 0 | | | | 0 | |
Administrator Class | | | (1,867,930 | ) | | | (24,148,844 | ) | | | (4,305,966 | ) | | | (60,992,273 | ) |
Institutional Class | | | (2,747,419 | ) | | | (33,944,679 | ) | | | (3,233,572 | ) | | | (43,813,596 | ) |
| | | | |
| | | | | | | (89,932,626 | ) | | | | | | | (172,597,886 | ) |
| | | | |
Net increase (decrease) in net assets resulting from capital share transactions | | | | | | | 57,637,805 | | | | | | | | (30,667,300 | ) |
| | | | |
Total decrease in net assets | | | | | | | (185,057,644 | ) | | | | | | | (15,211,009 | ) |
| | | | |
| | | | |
Net assets | | | | | | | | | | | | | | | | |
Beginning of period | | | | | | | 1,195,571,417 | | | | | | | | 1,210,782,426 | |
| | | | |
End of period | | | | | | $ | 1,010,513,773 | | | | | | | $ | 1,195,571,417 | |
| | | | |
Undistributed net investment income | | | | | | $ | 277,394 | | | | | | | $ | 6,065,222 | |
| | | | |
The accompanying notes are an integral part of these financial statements.
| | | | | | |
| Financial highlights | | Wells Fargo Intrinsic Value Fund | | | 13 | |
(For a share outstanding throughout each period)
| | | | | | | | | | | | | | | | | | | | | | | | |
| | | Six months ended January 31, 2016 (unaudited) | | | Year ended July 31 | |
| CLASS A | | | 2015 | | | 2014 | | | 2013 | | | 2012 | | | 2011 | |
Net asset value, beginning of period | | | $13.73 | | | | $13.60 | | | | $12.52 | | | | $10.44 | | | | $11.50 | | | | $9.84 | |
Net investment income | | | 0.06 | | | | 0.10 | | | | 0.07 | | | | 0.07 | 1 | | | 0.11 | 1 | | | 0.10 | |
Net realized and unrealized gains (losses) on investments | | | (1.41 | ) | | | 1.09 | | | | 1.53 | | | | 2.75 | | | | 0.24 | | | | 1.65 | |
| | | | | | | | | | | | | | | | | | | | | | | | |
Total from investment operations | | | (1.35 | ) | | | 1.19 | | | | 1.60 | | | | 2.82 | | | | 0.35 | | | | 1.75 | |
Distributions to shareholders from | | | | | | | | | | | | | | | | | | | | | | | | |
Net investment income | | | (0.11 | ) | | | (0.07 | ) | | | (0.06 | ) | | | (0.10 | ) | | | (0.28 | ) | | | (0.09 | ) |
Net realized gains | | | (1.32 | ) | | | (0.99 | ) | | | (0.46 | ) | | | (0.64 | ) | | | (1.13 | ) | | | 0.00 | |
| | | | | | | | | | | | | | | | | | | | | | | | |
Total distributions to shareholders | | | (1.43 | ) | | | (1.06 | ) | | | (1.52 | ) | | | (0.74 | ) | | | (1.41 | ) | | | (0.09 | ) |
Net asset value, end of period | | | $10.95 | | | | $13.73 | | | | $13.60 | | | | $12.52 | | | | $10.44 | | | | $11.50 | |
Total return2 | | | (10.40 | )% | | | 9.19 | % | | | 13.09 | % | | | 28.53 | % | | | 4.38 | % | | | 17.88 | % |
Ratios to average net assets (annualized) | | | | | | | | | | | | | | | | | | | | | | | | |
Gross expenses | | | 1.16 | % | | | 1.20 | % | | | 1.21 | % | | | 1.20 | % | | | 1.24 | % | | | 1.24 | % |
Net expenses | | | 1.11 | % | | | 1.16 | % | | | 1.16 | % | | | 1.16 | % | | | 1.17 | % | | | 1.17 | % |
Net investment income | | | 1.02 | % | | | 0.75 | % | | | 0.53 | % | | | 0.57 | % | | | 1.05 | % | | | 0.81 | % |
Supplemental data | | | | | | | | | | | | | | | | | | | | | | | | |
Portfolio turnover rate | | | 21 | % | | | 29 | % | | | 23 | % | | | 28 | % | | | 34 | % | | | 25 | % |
Net assets, end of period (000s omitted) | | | $309,856 | | | | $372,443 | | | | $391,028 | | | | $386,655 | | | | $87,784 | | | | $159,178 | |
| 1 | Calculated based upon average shares outstanding |
| 2 | Total return calculations do not include any sales charges. Returns for periods of less than one year are not annualized. |
The accompanying notes are an integral part of these financial statements.
| | | | |
| 14 | | Wells Fargo Intrinsic Value Fund | | Financial highlights |
(For a share outstanding throughout each period)
| | | | | | | | | | | | | | | | | | | | | | | | |
| | | Six months ended January 31, 2016 (unaudited) | | | Year ended July 31 | |
| CLASS B | | | 2015 | | | 2014 | | | 2013 | | | 2012 | | | 2011 | |
Net asset value, beginning of period | | | $13.54 | | | | $13.45 | | | | $12.42 | | | | $10.34 | | | | $11.37 | | | | $9.72 | |
Net investment income (loss) | | | 0.02 | 1 | | | 0.00 | 1,2 | | | (0.03 | )1 | | | (0.02 | ) | | | 0.03 | 1 | | | 0.01 | 1 |
Net realized and unrealized gains (losses) on investments | | | (1.40 | ) | | | 1.08 | | | | 1.52 | | | | 2.74 | | | | 0.24 | | | | 1.64 | |
| | | | | | | | | | | | | | | | | | | | | | | | |
Total from investment operations | | | (1.38 | ) | | | 1.08 | | | | 1.49 | | | | 2.72 | | | | 0.27 | | | | 1.65 | |
Distributions to shareholders from | | | | | | | | | | | | | | | | | | | | | | | | |
Net investment income | | | 0.00 | | | | 0.00 | | | | 0.00 | | | | 0.00 | | | | (0.17 | ) | | | (0.00 | )2 |
Net realized gains | | | (1.32 | ) | | | (0.99 | ) | | | (0.46 | ) | | | (0.64 | ) | | | (1.13 | ) | | | 0.00 | |
| | | | | | | | | | | | | | | | | | | | | | | | |
Total distributions to shareholders | | | (1.32 | ) | | | (0.99 | ) | | | (0.46 | ) | | | (0.64 | ) | | | (1.30 | ) | | | (0.00 | )2 |
Net asset value, end of period | | | $10.84 | | | | $13.54 | | | | $13.45 | | | | $12.42 | | | | $10.34 | | | | $11.37 | |
Total return3 | | | (10.71 | )% | | | 8.36 | % | | | 12.25 | % | | | 27.57 | % | | | 3.56 | % | | | 17.03 | % |
Ratios to average net assets (annualized) | | | | | | | | | | | | | | | | | | | | | | | | |
Gross expenses | | | 1.92 | % | | | 1.96 | % | | | 1.97 | % | | | 1.97 | % | | | 2.01 | % | | | 1.99 | % |
Net expenses | | | 1.86 | % | | | 1.91 | % | | | 1.91 | % | | | 1.91 | % | | | 1.92 | % | | | 1.91 | % |
Net investment income (loss) | | | 0.31 | % | | | 0.00 | % | | | (0.20 | )% | | | (0.03 | )% | | | 0.27 | % | | | 0.07 | % |
Supplemental data | | | | | | | | | | | | | | | | | | | | | | | | |
Portfolio turnover rate | | | 21 | % | | | 29 | % | | | 23 | % | | | 28 | % | | | 34 | % | | | 25 | % |
Net assets, end of period (000s omitted) | | | $1,047 | | | | $1,947 | | | | $3,889 | | | | $5,589 | | | | $4,323 | | | | $7,666 | |
| 1 | Calculated based upon average shares outstanding |
| 2 | Amount is less than $0.005. |
| 3 | Total return calculations do not include any sales charges. Returns for periods of less than one year are not annualized. |
The accompanying notes are an integral part of these financial statements.
| | | | | | |
| Financial highlights | | Wells Fargo Intrinsic Value Fund | | | 15 | |
(For a share outstanding throughout each period)
| | | | | | | | | | | | | | | | | | | | | | | | |
| | | Six months ended January 31, 2016 (unaudited) | | | Year ended July 31 | |
| CLASS C | | | 2015 | | | 2014 | | | 2013 | | | 2012 | | | 2011 | |
Net asset value, beginning of period | | | $13.45 | | | | $13.36 | | | | $12.35 | | | | $10.30 | | | | $11.35 | | | | $9.72 | |
Net investment income (loss) | | | 0.02 | | | | 0.00 | 1 | | | (0.03 | ) | | | (0.01 | )2 | | | 0.03 | 2 | | | 0.02 | |
Net realized and unrealized gains (losses) on investments | | | (1.40 | ) | | | 1.08 | | | | 1.50 | | | | 2.72 | | | | 0.24 | | | | 1.63 | |
| | | | | | | | | | | | | | | | | | | | | | | | |
Total from investment operations | | | (1.38 | ) | | | 1.08 | | | | 1.47 | | | | 2.71 | | | | 0.27 | | | | 1.65 | |
Distributions to shareholders from | | | | | | | | | | | | | | | | | | | | | | | | |
Net investment income | | | (0.01 | ) | | | 0.00 | | | | 0.00 | | | | (0.02 | ) | | | (0.19 | ) | | | (0.02 | ) |
Net realized gains | | | (1.32 | ) | | | (0.99 | ) | | | (0.46 | ) | | | (0.64 | ) | | | (1.13 | ) | | | 0.00 | |
| | | | | | | | | | | | | | | | | | | | | | | | |
Total distributions to shareholders | | | (1.33 | ) | | | (0.99 | ) | | | (0.46 | ) | | | (0.66 | ) | | | (1.32 | ) | | | (0.02 | ) |
Net asset value, end of period | | | $10.74 | | | | $13.45 | | | | $13.36 | | | | $12.35 | | | | $10.30 | | | | $11.35 | |
Total return3 | | | (10.77 | )% | | | 8.42 | % | | | 12.24 | % | | | 27.50 | % | | | 3.62 | % | | | 16.98 | % |
Ratios to average net assets (annualized) | | | | | | | | | | | | | | | | | | | | | | | | |
Gross expenses | | | 1.92 | % | | | 1.96 | % | | | 1.97 | % | | | 1.97 | % | | | 2.01 | % | | | 1.97 | % |
Net expenses | | | 1.86 | % | | | 1.91 | % | | | 1.91 | % | | | 1.91 | % | | | 1.92 | % | | | 1.92 | % |
Net investment income (loss) | | | 0.27 | % | | | 0.00 | % | | | (0.22 | )% | | | (0.05 | )% | | | 0.26 | % | | | 0.07 | % |
Supplemental data | | | | | | | | | | | | | | | | | | | | | | | | |
Portfolio turnover rate | | | 21 | % | | | 29 | % | | | 23 | % | | | 28 | % | | | 34 | % | | | 25 | % |
Net assets, end of period (000s omitted) | | | $29,564 | | | | $36,098 | | | | $36,654 | | | | $35,616 | | | | $20,187 | | | | $28,230 | |
| 1 | Amount is less than $0.005. |
| 2 | Calculated based upon average shares outstanding |
| 3 | Total return calculations do not include any sales charges. Returns for periods of less than one year are not annualized. |
The accompanying notes are an integral part of these financial statements.
| | | | |
| 16 | | Wells Fargo Intrinsic Value Fund | | Financial highlights |
(For a share outstanding throughout each period)
| | | | | | | | | | | | | | | | |
| | | Six months ended January 31, 2016 (unaudited) | | | Year ended July 31 | |
| CLASS R | | | 2015 | | | 2014 | | | 20131 | |
Net asset value, beginning of period | | | $13.81 | | | | $13.66 | | | | $12.55 | | | | $11.20 | |
Net investment income | | | 0.05 | 2 | | | 0.05 | | | | 0.03 | | | | 0.00 | 3 |
Net realized and unrealized gains (losses) on investments | | | (1.43 | ) | | | 1.12 | | | | 1.54 | | | | 1.35 | |
| | | | | | | | | | | | | | | | |
Total from investment operations | | | (1.38 | ) | | | 1.17 | | | | 1.57 | | | | 1.35 | |
Distributions to shareholders from | | | | | | | | | | | | | | | | |
Net investment income | | | (0.07 | ) | | | (0.03 | ) | | | 0.00 | | | | 0.00 | |
Net realized gains | | | (1.32 | ) | | | (0.99 | ) | | | (0.46 | ) | | | 0.00 | |
| | | | | | | | | | | | | | | | |
Total distributions to shareholders | | | (1.39 | ) | | | (1.02 | ) | | | (0.46 | ) | | | 0.00 | |
Net asset value, end of period | | | $11.04 | | | | $13.81 | | | | $13.66 | | | | $12.55 | |
Total return4 | | | (10.51 | )% | | | 8.96 | % | | | 12.77 | % | | | 12.05 | % |
Ratios to average net assets (annualized) | | | | | | | | | | | | | | | | |
Gross expenses | | | 1.44 | % | | | 1.47 | % | | | 1.49 | % | | | 1.46 | % |
Net expenses | | | 1.36 | % | | | 1.40 | % | | | 1.41 | % | | | 1.41 | % |
Net investment income | | | 0.76 | % | | | 0.50 | % | | | 0.26 | % | | | 0.01 | % |
Supplemental data | | | | | | | | | | | | | | | | |
Portfolio turnover rate | | | 21 | % | | | 29 | % | | | 23 | % | | | 28 | % |
Net assets, end of period (000s omitted) | | | $32 | | | | $41 | | | | $28 | | | | $18 | |
| 1 | For the period from March 1, 2013 (commencement of class operations) to July 31, 2013 |
| 2 | Calculated based upon average shares outstanding |
| 3 | Amount is less than $0.005. |
| 4 | Returns for periods of less than one year are not annualized. |
The accompanying notes are an integral part of these financial statements.
| | | | | | |
| Financial highlights | | Wells Fargo Intrinsic Value Fund | | | 17 | |
(For a share outstanding throughout each period)
| | | | | | | | | | | | | | | | |
| | | Six months ended January 31, 2016 (unaudited) | | | Year ended July 31 | |
| CLASS R4 | | | 2015 | | | 2014 | | | 20131 | |
Net asset value, beginning of period | | | $13.78 | | | | $13.65 | | | | $12.55 | | | | $11.10 | |
Net investment income | | | 0.08 | 2 | | | 0.15 | | | | 0.12 | | | | 0.09 | |
Net realized and unrealized gains (losses) on investments | | | (1.42 | ) | | | 1.09 | | | | 1.54 | | | | 2.15 | |
| | | | | | | | | | | | | | | | |
Total from investment operations | | | (1.34 | ) | | | 1.24 | | | | 1.66 | | | | 2.24 | |
Distributions to shareholders from | | | | | | | | | | | | | | | | |
Net investment income | | | (0.15 | ) | | | (0.12 | ) | | | (0.10 | ) | | | (0.15 | ) |
Net realized gains | | | (1.32 | ) | | | (0.99 | ) | | | (0.46 | ) | | | (0.64 | ) |
| | | | | | | | | | | | | | | | |
Total distributions to shareholders | | | (1.47 | ) | | | (1.11 | ) | | | (0.56 | ) | | | (0.79 | ) |
Net asset value, end of period | | | $10.97 | | | | $13.78 | | | | $13.65 | | | | $12.55 | |
Total return3 | | | (10.22 | )% | | | 9.53 | % | | | 13.55 | % | | | 21.73 | % |
Ratios to average net assets (annualized) | | | | | | | | | | | | | | | | |
Gross expenses | | | 0.87 | % | | | 0.86 | % | | | 0.87 | % | | | 0.88 | % |
Net expenses | | | 0.80 | % | | | 0.80 | % | | | 0.80 | % | | | 0.80 | % |
Net investment income | | | 1.31 | % | | | 1.11 | % | | | 0.88 | % | | | 0.99 | % |
Supplemental data | | | | | | | | | | | | | | | | |
Portfolio turnover rate | | | 21 | % | | | 29 | % | | | 23 | % | | | 28 | % |
Net assets, end of period (000s omitted) | | | $14 | | | | $15 | | | | $15 | | | | $14 | |
| 1 | For the period from November 30, 2012 (commencement of class operations) to July 31, 2013 |
| 2 | Calculated based upon average shares outstanding |
| 3 | Returns for periods of less than one year are not annualized. |
The accompanying notes are an integral part of these financial statements.
| | | | |
| 18 | | Wells Fargo Intrinsic Value Fund | | Financial highlights |
(For a share outstanding throughout each period)
| | | | | | | | | | | | | | | | |
| | | Six months ended January 31, 2016 (unaudited) | | | Year ended July 31 | |
| CLASS R6 | | | 2015 | | | 2014 | | | 20131 | |
Net asset value, beginning of period | | | $13.62 | | | | $13.60 | | | | $12.56 | | | | $11.10 | |
Net investment income | | | 0.07 | 2 | | | 0.17 | 2 | | | 0.14 | 2 | | | 0.19 | |
Net realized and unrealized gains (losses) on investments | | | (1.37 | ) | | | 1.08 | | | | 1.47 | | | | 2.06 | |
| | | | | | | | | | | | | | | | |
Total from investment operations | | | (1.30 | ) | | | 1.25 | | | | 1.61 | | | | 2.25 | |
Distributions to shareholders from | | | | | | | | | | | | | | | | |
Net investment income | | | (0.17 | ) | | | (0.24 | ) | | | (0.11 | ) | | | (0.15 | ) |
Net realized gains | | | (1.32 | ) | | | (0.99 | ) | | | (0.46 | ) | | | (0.64 | ) |
| | | | | | | | | | | | | | | | |
Total distributions to shareholders | | | (1.49 | ) | | | (1.23 | ) | | | (0.57 | ) | | | (0.79 | ) |
Net asset value, end of period | | | $10.83 | | | | $13.62 | | | | $13.60 | | | | $12.56 | |
Total return3 | | | (10.17 | )% | | | 9.74 | % | | | 13.19 | % | | | 21.84 | % |
Ratios to average net assets (annualized) | | | | | | | | | | | | | | | | |
Gross expenses | | | 0.74 | % | | | 0.74 | % | | | 0.74 | % | | | 0.73 | % |
Net expenses | | | 0.65 | % | | | 0.65 | % | | | 0.65 | % | | | 0.65 | % |
Net investment income | | | 1.10 | % | | | 1.25 | % | | | 1.10 | % | | | 0.85 | % |
Supplemental data | | | | | | | | | | | | | | | | |
Portfolio turnover rate | | | 21 | % | | | 29 | % | | | 23 | % | | | 28 | % |
Net assets, end of period (000s omitted) | | | $2,571 | | | | $169 | | | | $150 | | | | $3,359 | |
| 1 | For the period from November 30, 2012 (commencement of class operations) to July 31, 2013 |
| 2 | Calculated based upon average shares outstanding |
| 3 | Returns for periods of less than one year are not annualized. |
The accompanying notes are an integral part of these financial statements.
| | | | | | |
| Financial highlights | | Wells Fargo Intrinsic Value Fund | | | 19 | |
(For a share outstanding throughout each period)
| | | | | | | | | | | | | | | | | | | | | | | | |
| | | Six months ended January 31, 2016 (unaudited) | | | Year ended July 31 | |
| ADMINISTRATOR CLASS | | | 2015 | | | 2014 | | | 2013 | | | 2012 | | | 2011 | |
Net asset value, beginning of period | | | $14.25 | | | | $14.08 | | | | $12.95 | | | | $10.78 | | | | $11.55 | | | | $9.87 | |
Net investment income | | | 0.07 | | | | 0.13 | | | | 0.10 | | | | 0.08 | 1 | | | 0.12 | 1 | | | 0.11 | 1 |
Net realized and unrealized gains (losses) on investments | | | (1.46 | ) | | | 1.14 | | | | 1.58 | | | | 2.87 | | | | 0.28 | | | | 1.68 | |
| | | | | | | | | | | | | | | | | | | | | | | | |
Total from investment operations | | | (1.39 | ) | | | 1.27 | | | | 1.68 | | | | 2.95 | | | | 0.40 | | | | 1.79 | |
Distributions to shareholders from | | | | | | | | | | | | | | | | | | | | | | | | |
Net investment income | | | (0.14 | ) | | | (0.11 | ) | | | (0.09 | ) | | | (0.14 | ) | | | (0.04 | ) | | | (0.11 | ) |
Net realized gains | | | (1.32 | ) | | | (0.99 | ) | | | (0.46 | ) | | | (0.64 | ) | | | (1.13 | ) | | | 0.00 | |
| | | | | | | | | | | | | | | | | | | | | | | | |
Total distributions to shareholders | | | (1.46 | ) | | | (1.10 | ) | | | (0.55 | ) | | | (0.78 | ) | | | (1.17 | ) | | | (0.11 | ) |
Net asset value, end of period | | | $11.40 | | | | $14.25 | | | | $14.08 | | | | $12.95 | | | | $10.78 | | | | $11.55 | |
Total return2 | | | (10.31 | )% | | | 9.42 | % | | | 13.36 | % | | | 28.77 | % | | | 4.57 | % | | | 18.23 | % |
Ratios to average net assets (annualized) | | | | | | | | | | | | | | | | | | | | | | | | |
Gross expenses | | | 1.10 | % | | | 1.06 | % | | | 1.06 | % | | | 1.05 | % | | | 1.09 | % | | | 1.06 | % |
Net expenses | | | 0.95 | % | | | 0.95 | % | | | 0.95 | % | | | 0.95 | % | | | 0.95 | % | | | 0.95 | % |
Net investment income | | | 1.18 | % | | | 0.95 | % | | | 0.74 | % | | | 0.68 | % | | | 1.13 | % | | | 1.04 | % |
Supplemental data | | | | | | | | | | | | | | | | | | | | | | | | |
Portfolio turnover rate | | | 21 | % | | | 29 | % | | | 23 | % | | | 28 | % | | | 34 | % | | | 25 | % |
Net assets, end of period (000s omitted) | | | $452,683 | | | | $529,293 | | | | $534,641 | | | | $515,012 | | | | $26,687 | | | | $9,693 | |
| 1 | Calculated based upon average shares outstanding |
| 2 | Returns for periods of less than one year are not annualized. |
The accompanying notes are an integral part of these financial statements.
| | | | |
| 20 | | Wells Fargo Intrinsic Value Fund | | Financial highlights |
(For a share outstanding throughout each period)
| | | | | | | | | | | | | | | | | | | | | | | | |
| | | Six months ended January 31, 2016 (unaudited) | | | Year ended July 31 | |
| INSTITUTIONAL CLASS | | | 2015 | | | 2014 | | | 2013 | | | 2012 | | | 2011 | |
Net asset value, beginning of period | | | $13.80 | | | | $13.67 | | | | $12.58 | | | | $10.48 | | | | $11.56 | | | | $9.87 | |
Net investment income | | | 0.09 | 1 | | | 0.15 | | | | 0.13 | | | | 0.16 | | | | 0.14 | 1 | | | 0.13 | 1 |
Net realized and unrealized gains (losses) on investments | | | (1.41 | ) | | | 1.11 | | | | 1.53 | | | | 2.73 | | | | 0.24 | | | | 1.67 | |
| | | | | | | | | | | | | | | | | | | | | | | | |
Total from investment operations | | | (1.32 | ) | | | 1.26 | | | | 1.66 | | | | 2.89 | | | | 0.38 | | | | 1.80 | |
Distributions to shareholders from | | | | | | | | | | | | | | | | | | | | | | | | |
Net investment income | | | (0.17 | ) | | | (0.14 | ) | | | (1.11 | ) | | | (0.15 | ) | | | (0.33 | ) | | | (0.11 | ) |
Net realized gains | | | (1.32 | ) | | | (0.99 | ) | | | (0.46 | ) | | | (0.64 | ) | | | (1.13 | ) | | | 0.00 | |
| | | | | | | | | | | | | | | | | | | | | | | | |
Total distributions to shareholders | | | (1.49 | ) | | | (1.13 | ) | | | (0.57 | ) | | | (0.79 | ) | | | (1.46 | ) | | | (0.11 | ) |
Net asset value, end of period | | | $10.99 | | | | $13.80 | | | | $13.67 | | | | $12.58 | | | | $10.48 | | | | $11.56 | |
Total return2 | | | (10.18 | )% | | | 9.66 | % | | | 13.64 | % | | | 29.04 | % | | | 4.71 | % | | | 18.32 | % |
Ratios to average net assets (annualized) | | | | | | | | | | | | | | | | | | | | | | | | |
Gross expenses | | | 0.85 | % | | | 0.79 | % | | | 0.79 | % | | | 0.79 | % | | | 0.83 | % | | | 0.79 | % |
Net expenses | | | 0.70 | % | | | 0.70 | % | | | 0.70 | % | | | 0.73 | % | | | 0.82 | % | | | 0.79 | % |
Net investment income | | | 1.43 | % | | | 1.20 | % | | | 0.99 | % | | | 1.21 | % | | | 1.35 | % | | | 1.16 | % |
Supplemental data | | | | | | | | | | | | | | | | | | | | | | | | |
Portfolio turnover rate | | | 21 | % | | | 29 | % | | | 23 | % | | | 28 | % | | | 34 | % | | | 25 | % |
Net assets, end of period (000s omitted) | | | $214,748 | | | | $255,565 | | | | $244,378 | | | | $221,128 | | | | $222,949 | | | | $277,329 | |
| 1 | Calculated based upon average shares outstanding |
| 2 | Returns for periods of less than one year are not annualized. |
The accompanying notes are an integral part of these financial statements.
| | | | | | |
| Notes to financial statements (unaudited) | | Wells Fargo Intrinsic Value Fund | | | 21 | |
1. ORGANIZATION
Wells Fargo Funds Trust (the “Trust”), a Delaware statutory trust organized on March 10, 1999, is an open-end management investment company registered under the Investment Company Act of 1940, as amended (the “1940 Act”). As an investment company, the Trust follows the accounting and reporting guidance in Financial Accounting Standards Board (“FASB”) Accounting Standards Codification Topic 946, Financial Services – Investment Companies. These financial statements report on the Wells Fargo Intrinsic Value Fund (the “Fund”) which is a diversified series of the Trust.
2. SIGNIFICANT ACCOUNTING POLICIES
The following significant accounting policies, which are consistently followed in the preparation of the financial statements of the Fund, are in conformity with U.S. generally accepted accounting principles which require management to make estimates and assumptions that affect the reported amounts of assets and liabilities, disclosure of contingent assets and liabilities at the date of the financial statements, and the reported amounts of revenues and expenses during the reporting period. Actual results could differ from those estimates.
Securities valuation
All investments are valued each business day as of the close of regular trading on the New York Stock Exchange (generally 4 p.m. Eastern Time).
Equity securities that are listed on a foreign or domestic exchange or market are valued at the official closing price or, if none, the last sales price. If no sale occurs on the principal exchange or market that day, the prior day’s price will be deemed “stale” and a fair value price will be determined in accordance with the Fund’s Valuation Procedures.
Investments in registered open-end investment companies are valued at net asset value. Interests in non-registered investment vehicles that are redeemable at net asset value are fair valued normally at net asset value.
Investments which are not valued using any of the methods discussed above are valued at their fair value, as determined in good faith by the Board of Trustees of the Fund. The Board of Trustees has established a Valuation Committee comprised of the Trustees and has delegated to it the authority to take any actions regarding the valuation of portfolio securities that the Valuation Committee deems necessary or appropriate, including determining the fair value of portfolio securities, unless the determination has been delegated to the Management Valuation Team of Wells Fargo Funds Management, LLC (“Funds Management”). The Board of Trustees retains the authority to make or ratify any valuation decisions or approve any changes to the Valuation Procedures as it deems appropriate. On a quarterly basis, the Board of Trustees receives reports on any valuation actions taken by the Valuation Committee or the Management Valuation Team which may include items for ratification.
Valuations of fair valued securities are compared to the next actual sales price when available, or other appropriate market values, to assess the continued appropriateness of the fair valuation methodologies used. These securities are fair valued on a day-to-day basis, taking into consideration changes to appropriate market information and any significant changes to the inputs considered in the valuation process until there is a readily available price provided on an exchange or by an independent pricing service. Valuations received from an independent pricing service or independent broker-dealer quotes are periodically validated by comparisons to most recent trades and valuations provided by other independent pricing services in addition to the review of prices by the manager and/or subadviser. Unobservable inputs used in determining fair valuations are identified based on the type of security, taking into consideration factors utilized by market participants in valuing the investment, knowledge about the issuer and the current market environment.
Security loans
The Fund may lend its securities from time to time in order to earn additional income in the form of fees or interest on securities received as collateral or the investment of any cash received as collateral. The Fund continues to receive interest or dividends on the securities loaned. The Fund receives collateral in the form of cash or securities with a value at least equal to the value of the securities on loan. The value of the loaned securities is determined at the close of each business day and any additional required collateral is delivered to the Fund on the next business day. In a securities lending transaction, the net asset value of the Fund will be affected by an increase or decrease in the value of the securities loaned and by an increase or decrease in the value of the instrument in which collateral is invested. The amount of securities lending activity undertaken by the Fund fluctuates from time to time. In the event of default or bankruptcy by the borrower, the Fund may be prevented from recovering the loaned securities or gaining access to the collateral or may experience delays or costs in doing so. In addition, the investment of any cash collateral received may lose all or part of its value. The Fund has the right under the lending agreement to recover the securities from the borrower on demand.
| | | | |
| 22 | | Wells Fargo Intrinsic Value Fund | | Notes to financial statements (unaudited) |
The Fund lends its securities through an unaffiliated securities lending agent. Cash collateral received in connection with its securities lending transactions is invested in Securities Lending Cash Investments, LLC (the “Securities Lending Fund”). The Securities Lending Fund is exempt from registration under Section 3(c)(7) of the 1940 Act and is managed by Funds Management and is subadvised by Wells Capital Management Incorporated (“WellsCaps”), an affiliate of Funds Management and an indirect wholly owned subsidiary of Wells Fargo & Company (“Wells Fargo”). Funds Management receives an advisory fee starting at 0.05% and declining to 0.01% as the average daily net assets of the Securities Lending Fund increase. All of the fees received by Funds Management are paid to WellsCap for its services as subadviser. The Securities Lending Fund seeks to provide a positive return compared to the daily Fed Funds Open rate by investing in high-quality, U.S. dollar-denominated short-term money market instruments. Securities Lending Fund investments are fair valued based upon the amortized cost valuation technique. Income earned from investment in the Securities Lending Fund is included in securities lending income on the Statement of Operations.
Security transactions and income recognition
Securities transactions are recorded on a trade date basis. Realized gains or losses are recorded on the basis of identified cost.
Dividend income is recognized on the ex-dividend date. Dividend income is recorded net of foreign taxes withheld where recovery of such taxes is not assured.
Distributions to shareholders
Distributions to shareholders from net investment income and net realized gains, if any, are recorded on the ex-dividend date. Such distributions are determined in conformity with federal income tax regulations, which may differ in amount or character from net investment income and realized gains recognized for purposes of U.S. generally accepted accounting principles.
Federal and other taxes
The Fund intends to continue to qualify as a regulated investment company by distributing substantially all of its investment company taxable income and any net realized capital gains (after reduction for capital loss carryforwards) sufficient to relieve it from all, or substantially all, federal income taxes. Accordingly, no provision for federal income taxes was required.
The Fund’s income and federal excise tax returns and all financial records supporting those returns for the prior three fiscal years are subject to examination by the federal and Delaware revenue authorities. Management has analyzed the Fund’s tax positions taken on federal, state, and foreign tax returns for all open tax years and does not believe that there are any uncertain tax positions that require recognition of a tax liability.
As of July 31, 2015, the Fund had capital loss carryforwards available to offset future net realized capital gains in the amount of $12,596,933 expiring in 2017.
Class allocations
The separate classes of shares offered by the Fund differ principally in applicable sales charges, distribution, shareholder servicing, and administration fees. Class specific expenses are charged directly to that share class. Investment income, common expenses, and realized and unrealized gains (losses) on investments are allocated daily to each class of shares based on the relative proportion of net assets of each class.
3. FAIR VALUATION MEASUREMENTS
Fair value measurements of investments are determined within a framework that has established a fair value hierarchy based upon the various data inputs utilized in determining the value of the Fund’s investments. The three-level hierarchy gives the highest priority to unadjusted quoted prices in active markets for identical assets or liabilities (Level 1) and the lowest priority to significant unobservable inputs (Level 3). The Fund’s investments are classified within the fair value hierarchy based on the lowest level of input that is significant to the fair value measurement. The inputs are summarized into three broad levels as follows:
| n | | Level 1 – quoted prices in active markets for identical securities |
| n | | Level 2 – other significant observable inputs (including quoted prices for similar securities, interest rates, prepayment speeds, credit risk, use of amortized cost, etc.) |
| n | | Level 3 – significant unobservable inputs (including the Fund’s own assumptions in determining the fair value of investments) |
| | | | | | |
| Notes to financial statements (unaudited) | | Wells Fargo Intrinsic Value Fund | | | 23 | |
The inputs or methodologies used for valuing investments in securities are not necessarily an indication of the risk associated with investing in those securities.
The following is a summary of the inputs used in valuing the Fund’s assets and liabilities as of January 31, 2016:
| | | | | | | | | | | | | | | | |
| | | Quoted prices
(Level 1) | | | Other significant
observable inputs
(Level 2) | | | Significant
unobservable inputs
(Level 3) | | | Total | |
Assets | | | | | | | | | | | | | | | | |
Investments in: | | | | | | | | | | | | | | | | |
| | | | |
Common stocks | | | | | | | | | | | | | | | | |
Consumer discretionary | | $ | 73,487,246 | | | $ | 0 | | | $ | 0 | | | $ | 73,487,246 | |
Consumer staples | | | 93,455,324 | | | | 0 | | | | 0 | | | | 93,455,324 | |
Energy | | | 65,766,602 | | | | 0 | | | | 0 | | | | 65,766,602 | |
Financials | | | 200,994,931 | | | | 0 | | | | 0 | | | | 200,994,931 | |
Health care | | | 113,394,826 | | | | 0 | | | | 0 | | | | 113,394,826 | |
Industrials | | | 142,051,144 | | | | 0 | | | | 0 | | | | 142,051,144 | |
Information technology | | | 221,085,295 | | | | 0 | | | | 0 | | | | 221,085,295 | |
Telecommunication services | | | 22,038,819 | | | | 0 | | | | 0 | | | | 22,038,819 | |
Utilities | | | 50,363,070 | | | | 0 | | | | 0 | | | | 50,363,070 | |
| | | | |
Short-term investments | | | | | | | | | | | | | | | | |
Investment companies | | | 28,112,628 | | | | 0 | | | | 0 | | | | 28,112,628 | |
Investments measured at net asset value* | | | | | | | | | | | | | | | 17,817,250 | |
Total assets | | $ | 1,010,749,885 | | | $ | 0 | | | $ | 0 | | | $ | 1,028,567,135 | |
| * | Investments that are measured at fair value using the net asset value per share (or its equivalent) as a practical expedient have not been categorized in the fair value hierarchy. The fair value amount presented in the table is intended to permit reconciliation of the fair value hierarchy to the amounts presented in the Statement of Assets and Liabilities. The Fund’s investment in Securities Lending Cash Investments, LLC valued at $17,817,250 does not have a redemption period notice, can be redeemed daily and does not have any unfunded commitments. |
The Fund recognizes transfers between levels within the fair value hierarchy at the end of the reporting period. At January 31, 2016, the Fund did not have any transfers into/out of Level 1, Level 2, or Level 3.
4. TRANSACTIONS WITH AFFILIATES
Management fee
Funds Management, an indirect wholly owned subsidiary of Wells Fargo, is the manager of the Fund and provides advisory and fund-level administrative services under an investment management agreement. Under the investment management agreement, Funds Management is responsible for, among other services, implementing the investment objectives and strategies of the Fund, supervising the applicable subadviser, providing fund-level administrative services in connection with the Fund’s operations, and providing any other fund-level administrative services reasonably necessary for the operation of the Fund. As compensation for its services under the investment management agreement, Funds Management is entitled to receive an annual management fee starting at 0.70% and declining to 0.505% as the average daily net assets of the Fund increase. For the six months ended January 31, 2016, the management fee was equivalent to an annual rate of 0.68% of the Fund’s average daily net assets.
Funds Management has retained the services of a subadviser to provide daily portfolio management to the Fund. The fee for subadvisory services is borne by Funds Management. Metropolitan West Capital Management, LLC, an affiliate of Funds Management and an indirect wholly owned subsidiary of Wells Fargo, is the subadviser to the Fund and is entitled to receive a fee from Funds Management at an annual rate starting at 0.35% and declining to 0.25% as the average daily net assets of the Fund increase.
| | | | |
| 24 | | Wells Fargo Intrinsic Value Fund | | Notes to financial statements (unaudited) |
Administration fees
Under a class-level administration agreement, Funds Management provides class-level administrative services to the Fund, which includes paying fees and expenses for services provided by the transfer agent, sub-transfer agents, omnibus account servicers and record-keepers. As compensation for its services under the class-level administration agreement, Funds Management receives an annual fee which is calculated based on the average daily net assets of each class as follows:
| | | | | | |
| | | | | Class-level
administration fee | |
Class A, Class B, Class C, Class R | | | | | 0.21 | % |
Class R4 | | | | | 0.08 | |
Class R6 | | | | | 0.03 | |
Administrator Class, Institutional Class | | | | | 0.13 | |
Funds Management has contractually waived and/or reimbursed advisory and administration fees to the extent necessary to maintain certain net operating expense ratios for the Fund. Waiver of fees and/or reimbursement of expenses by Funds Management were made first from fund level expenses on a proportionate basis and then from class specific expenses. Funds Management has committed through November 30, 2016 to waive fees and/or reimburse expenses to the extent necessary to cap the Fund’s expenses at 1.11% for Class A shares, 1.86% for Class B shares, 1.86% for Class C shares, 1.36% for Class R shares, 0.80% for Class R4 shares, 0.65% for Class R6 shares, 0.95% for Administrator Class shares and 0.70% for Institutional Class shares. After this time, the cap may be increased or the commitment to maintain the cap may be terminated only with the approval of the Board of Trustees.
Distribution fees
The Trust has adopted a distribution plan for Class B, Class C, and Class R shares of the Fund pursuant to Rule 12b-1 under the 1940 Act. Distribution fees are charged to Class B, Class C, and Class R shares and paid to Wells Fargo Funds Distributor, LLC (“Funds Distributor”), the principal underwriter, at an annual rate of 0.75% of the average daily net assets of Class B and Class C shares and 0.25% of the average daily net assets of Class R shares.
In addition, Funds Distributor is entitled to receive the front-end sales charge from the purchase of Class A shares and a contingent deferred sales charge on the redemption of certain Class A shares. Funds Distributor is also entitled to receive the contingent deferred sales charges from redemptions of Class B and Class C shares. For the six months ended January 31, 2016, Funds Distributor received $3,128 from the sale of Class A shares and $906 in contingent deferred sales charges from redemptions of Class C shares.
Shareholder servicing fees
The Trust has entered into contracts with one or more shareholder servicing agents, whereby Class A, Class B, Class C, Class R and Administrator Class of the Fund are charged a fee at an annual rate of 0.25% of the average daily net assets of each respective class. Class R4 shares are charged a fee at an annual rate of 0.10% of its average daily net assets.
A portion of these total shareholder servicing fees were paid to affiliates of Wells Fargo.
5. INVESTMENT PORTFOLIO TRANSACTIONS
Purchases and sales of investments, excluding U.S. government obligations (if any) and short-term securities, for the six months ended January 31, 2016 were $228,513,719 and $258,381,549, respectively.
6. BANK BORROWINGS
The Trust (excluding the money market funds and certain other funds) and Wells Fargo Variable Trust are parties to a $200,000,000 revolving credit agreement whereby the Fund is permitted to use bank borrowings for temporary or emergency purposes, such as to fund shareholder redemption requests. Interest under the credit agreement is charged to the Fund based on a borrowing rate equal to the higher of the Federal Funds rate in effect on that day plus 1.25% or the overnight LIBOR rate in effect on that day plus 1.25%. In addition, an annual commitment fee equal to 0.20% of the unused balance is allocated to each participating fund. Prior to September 1, 2015, the revolving credit agreement amount was $150,000,000 and the annual commitment fee was equal to 0.10% of the unused balance which was allocated to each participating fund. For the six months ended January 31, 2016, the Fund paid $1,898 in commitment fees.
| | | | | | |
| Notes to financial statements (unaudited) | | Wells Fargo Intrinsic Value Fund | | | 25 | |
For the six months ended January 31, 2016, there were no borrowings by the Fund under the agreement.
7. INDEMNIFICATION
Under the Trust’s organizational documents, the officers and Trustees have been granted certain indemnification rights against certain liabilities that may arise out of performance of their duties to the Trust. Additionally, in the normal course of business, the Trust may enter into contracts with service providers that contain a variety of indemnification clauses. The Trust’s maximum exposure under these arrangements is dependent on future claims that may be made against the Fund and, therefore, cannot be estimated.
| | | | |
| 26 | | Wells Fargo Intrinsic Value Fund | | Other information (unaudited) |
PROXY VOTING INFORMATION
A description of the policies and procedures that the Fund uses to determine how to vote proxies relating to portfolio securities is available, upon request, by calling 1-800-222-8222, visiting our website at wellsfargofunds.com, or visiting the SEC website at sec.gov. Information regarding how the Fund voted proxies relating to portfolio securities during the most recent 12-month period ended June 30 is available on the Fund’s website at wellsfargofunds.com or by visiting the SEC website at sec.gov.
PORTFOLIO HOLDINGS INFORMATION
The complete portfolio holdings for the Fund are publicly available monthly on the Fund’s website (wellsfargofunds.com), on a one-month delayed basis. In addition, top ten holdings information (excluding derivative positions) for the Fund is publicly available on the Fund’s website on a monthly, seven-day or more delayed basis. The Fund files its complete schedule of portfolio holdings with the SEC for the first and third quarters of each fiscal year on Form N-Q, which is available by visiting the SEC website at sec.gov. In addition, the Fund’s Form N-Q may be reviewed and copied at the SEC’s Public Reference Room in Washington, DC, and at regional offices in New York City, at 233 Broadway, and in Chicago, at 175 West Jackson Boulevard, Suite 900. Information about the Public Reference Room may be obtained by calling 1-800-SEC-0330.
| | | | | | |
| Other information (unaudited) | | Wells Fargo Intrinsic Value Fund | | | 27 | |
BOARD OF TRUSTEES AND OFFICERS
Each of the Trustees and Officers1 listed in the table below acts in identical capacities for each fund in the Wells Fargo family of funds, which consists of 144 mutual funds comprising the Wells Fargo Funds Trust, Wells Fargo Variable Trust, Wells Fargo Master Trust and four closed-end funds (collectively the “Fund Complex”). This table should be read in conjunction with the Prospectus and the Statement of Additional Information2. The mailing address of each Trustee and Officer is 525 Market Street, 12th Floor, San Francisco, CA 94105. Each Trustee and Officer serves an indefinite term, however, each Trustee serves such term until reaching the mandatory retirement age established by the Trustees.
Independent Trustees
| | | | | | |
Name and
year of birth | | Position held and
length of service* | | Principal occupations during past five years or longer | | Current other public
company or
investment company
directorships |
| William R. Ebsworth (Born 1957) | | Trustee, since 2015 | | Retired. From 1984 to 2013, equities analyst, portfolio manager, research director and chief financial officer at Fidelity Management and Research Company in Boston, Tokyo, and Hong Kong and retired in 2013 as Chief Investment Officer of Fidelity Strategic Advisers, Inc. where he lead a team of investment professionals managing client assets. Prior thereto, Board member of Hong Kong Securities Clearing Co., Hong Kong Options Clearing Corp., the Thailand International Fund, Ltd., Fidelity Investments Life Insurance Company, and Empire Fidelity Investments Life Insurance Company. Mr. Ebsworth is a CFA® charterholder and an Adjunct Lecturer, Finance, at Babson College. | | Asset Allocation Trust |
Jane A. Freeman
(Born 1953) | | Trustee, since 2015 | | Retired. From 2012 to 2014 and 1999 to 2008, Chief Financial Officer of Scientific Learning Corporation. From 2008 to 2012, Ms. Freeman provided consulting services related to strategic business projects. Prior to 1999, Portfolio Manager at Rockefeller & Co. and Scudder, Stevens & Clark. Board member of the Harding Loevner Funds from 1996 to 2014, serving as both Lead Independent Director and chair of the Audit Committee. Board member of the Russell Exchange Traded Funds Trust from 2011 to 2012 and the chair of the Audit Committee. Ms. Freeman is Chair of Taproot Foundation (non-profit organization), a Board Member of Ruth Bancroft Garden (non-profit organization) and an inactive chartered financial analyst. | | Asset Allocation Trust |
Peter G. Gordon
(Born 1942) | | Trustee, since 1998; Chairman, since 2005 | | Co-Founder, Retired Chairman, President and CEO of Crystal Geyser Water Company. Trustee Emeritus, Colby College. | | Asset Allocation Trust |
Isaiah Harris, Jr.
(Born 1952) | | Trustee, since 2009 | | Retired. Chairman of the Board of CIGNA Corporation since 2009, and Director since 2005. From 2003 to 2011, Director of Deluxe Corporation. Prior thereto, President and CEO of BellSouth Advertising and Publishing Corp. from 2005 to 2007, President and CEO of BellSouth Enterprises from 2004 to 2005 and President of BellSouth Consumer Services from 2000 to 2003. Emeritus member of the Iowa State University Foundation Board of Governors. Emeritus Member of the Advisory Board of Iowa State University School of Business. Advisory Board Member, Palm Harbor Academy (charter school). Advisory Board Member, Child Evangelism Fellowship (non-profit). Mr. Harris is a certified public accountant (inactive status). | | CIGNA Corporation; Asset Allocation Trust |
Judith M. Johnson
(Born 1949) | | Trustee, since 2008; Audit Committee Chairman, since 2008 | | Retired. Prior thereto, Chief Executive Officer and Chief Investment Officer of Minneapolis Employees Retirement Fund from 1996 to 2008. Ms. Johnson is an attorney, certified public accountant and a certified managerial accountant. | | Asset Allocation Trust |
David F. Larcker
(Born 1950) | | Trustee, since 2009 | | James Irvin Miller Professor of Accounting at the Graduate School of Business, Stanford University, Director of the Corporate Governance Research Initiative and Senior Faculty of The Rock Center for Corporate Governance since 2006. From 2005 to 2008, Professor of Accounting at the Graduate School of Business, Stanford University. Prior thereto, Ernst & Young Professor of Accounting at The Wharton School, University of Pennsylvania from 1985 to 2005. | | Asset Allocation Trust |
| | | | |
| 28 | | Wells Fargo Intrinsic Value Fund | | Other information (unaudited) |
| | | | | | |
Name and
year of birth | | Position held and
length of service* | | Principal occupations during past five years or longer | | Current other public
company or
investment company
directorships |
Olivia S. Mitchell
(Born 1953) | | Trustee, since 2006 | | International Foundation of Employee Benefit Plans Professor, Wharton School of the University of Pennsylvania since 1993. Director of Wharton’s Pension Research Council and Boettner Center on Pensions & Retirement Research, and Research Associate at the National Bureau of Economic Research. Previously, Cornell University Professor from 1978 to 1993. | | Asset Allocation Trust |
Timothy J. Penny
(Born 1951) | | Trustee, since 1996 | | President and Chief Executive Officer of Southern Minnesota Initiative Foundation, a non-profit organization, since 2007 and Senior Fellow at the Humphrey Institute Policy Forum at the University of Minnesota since 1995. Member of the Board of Trustees of NorthStar Education Finance, Inc., a non-profit organization, since 2007. | | Asset Allocation Trust |
Michael S. Scofield
(Born 1943) | | Trustee, since 2010 | | Served on the Investment Company Institute’s Board of Governors and Executive Committee from 2008-2011 as well the Governing Council of the Independent Directors Council from 2006-2011 and the Independent Directors Council Executive Committee from 2008-2011. Chairman of the IDC from 2008-2010. Institutional Investor (Fund Directions) Trustee of Year in 2007. Trustee of the Evergreen Funds complex (and its predecessors) from 1984 to 2010. Chairman of the Evergreen Funds from 2000-2010. Former Trustee of the Mentor Funds. Retired Attorney, Law Offices of Michael S. Scofield. | | Asset Allocation Trust |
| * | Length of service dates reflect the Trustee’s commencement of service with the Trust’s predecessor entities, where applicable. |
Officers
| | | | | | |
Name and
year of birth | | Position held and
length of service | | Principal occupations during past five years or longer | | |
Karla M. Rabusch
(Born 1959) | | President, since 2003 | | Executive Vice President of Wells Fargo Bank, N.A. and President of Wells Fargo Funds Management, LLC since 2003. | | |
Jeremy DePalma1
(Born 1974) | | Treasurer, since 2012; Assistant Treasurer, since 2009 | | Senior Vice President of Wells Fargo Funds Management, LLC since 2009. Senior Vice President of Evergreen Investment Management Company, LLC from 2008 to 2010 and head of the Fund Reporting and Control Team within Fund Administration from 2005 to 2010. | | |
C. David Messman
(Born 1960) | | Secretary, since 2000; Chief Legal Officer, since 2003 | | Senior Vice President and Secretary of Wells Fargo Funds Management, LLC since 2001. Assistant General Counsel of Wells Fargo Bank, N.A. since 2013 and Vice President and Managing Counsel of Wells Fargo Bank, N.A. from 1996 to 2013. | | |
Debra Ann Early
(Born 1964) | | Chief Compliance Officer, since 2007 | | Executive Vice President of Wells Fargo Funds Management, LLC since 2014, Senior Vice President and Chief Compliance Officer from 2007 to 2014. | | |
David Berardi
(Born 1975) | | Assistant Treasurer, since 2009 | | Vice President of Wells Fargo Funds Management, LLC since 2009. Vice President of Evergreen Investment Management Company, LLC from 2008 to 2010. Manager of Fund Reporting and Control for Evergreen Investment Management Company, LLC from 2004 to 2010. | | |
| 1 | Jeremy DePalma acts as Treasurer of 72 funds and Assistant Treasurer of 72 funds in the Fund Complex. |
| 2 | The Statement of Additional Information includes additional information about the Trustees and is available, without charge, upon request, by calling 1-800-222-8222 or by visiting the website at wellsfargofunds.com. |
| | | | | | |
| List of abbreviations | | Wells Fargo Intrinsic Value Fund | | | 29 | |
The following is a list of common abbreviations for terms and entities that may have appeared in this report.
| ACA | — ACA Financial Guaranty Corporation |
| ADR | — American depositary receipt |
| ADS | — American depositary shares |
| AGC | — Assured Guaranty Corporation |
| AGM | — Assured Guaranty Municipal |
| Ambac | — Ambac Financial Group Incorporated |
| AMT | — Alternative minimum tax |
| BAN | — Bond anticipation notes |
| BHAC | — Berkshire Hathaway Assurance Corporation |
| CAB | — Capital appreciation bond |
| CCAB | — Convertible capital appreciation bond |
| CDA | — Community Development Authority |
| CDO | — Collateralized debt obligation |
| DRIVER | — Derivative inverse tax-exempt receipts |
| DW&P | — Department of Water & Power |
| DWR | — Department of Water Resources |
| ECFA | — Educational & Cultural Facilities Authority |
| EDA | — Economic Development Authority |
| EDFA | — Economic Development Finance Authority |
| ETF | — Exchange-traded fund |
| FDIC | — Federal Deposit Insurance Corporation |
| FFCB | — Federal Farm Credit Banks |
| FGIC | — Financial Guaranty Insurance Corporation |
| FHA | — Federal Housing Administration |
| FHLB | — Federal Home Loan Bank |
| FHLMC | — Federal Home Loan Mortgage Corporation |
| FICO | — The Financing Corporation |
| FNMA | — Federal National Mortgage Association |
| GDR | — Global depositary receipt |
| GNMA | — Government National Mortgage Association |
| HCFR | — Healthcare facilities revenue |
| HEFA | — Health & Educational Facilities Authority |
| HEFAR | — Higher education facilities authority revenue |
| HFA | — Housing Finance Authority |
| HFFA | — Health Facilities Financing Authority |
| HUD | — Department of Housing and Urban Development |
| IDA | — Industrial Development Authority |
| IDAG | — Industrial Development Agency |
| KRW | — Republic of Korea won |
| LIBOR | — London Interbank Offered Rate |
| LIFER | — Long Inverse Floating Exempt Receipts |
| LLC | — Limited liability company |
| LLLP | — Limited liability limited partnership |
| LLP | — Limited liability partnership |
| MBIA | — Municipal Bond Insurance Association |
| MFHR | — Multifamily housing revenue |
| MSTR | — Municipal securities trust receipts |
| MUD | — Municipal Utility District |
| National | — National Public Finance Guarantee Corporation |
| PCFA | — Pollution Control Financing Authority |
| PCL | — Public Company Limited |
| PCR | — Pollution control revenue |
| PFA | — Public Finance Authority |
| PFFA | — Public Facilities Financing Authority |
| PFOTER | — Puttable floating option tax-exempt receipts |
| plc | — Public limited company |
| PUTTER | — Puttable tax-exempt receipts |
| R&D | — Research & development |
| Radian | — Radian Asset Assurance |
| RAN | — Revenue anticipation notes |
| RDA | — Redevelopment Authority |
| RDFA | — Redevelopment Finance Authority |
| REIT | — Real estate investment trust |
| ROC | — Reset option certificates |
| SAVRS | — Select auction variable rate securities |
| SBA | — Small Business Authority |
| SDR | — Swedish depositary receipt |
| SFHR | — Single-family housing revenue |
| SFMR | — Single-family mortgage revenue |
| SPA | — Standby purchase agreement |
| SPDR | — Standard & Poor’s Depositary Receipts |
| SPEAR | — Short Puttable Exempt Adjustable Receipts |
| STRIPS | — Separate trading of registered interest and |
| TAN | — Tax anticipation notes |
| TIPS | — Treasury inflation-protected securities |
| TRAN | — Tax revenue anticipation notes |
| TTFA | — Transportation Trust Fund Authority |
| TVA | — Tennessee Valley Authority |
This page is intentionally left blank.
This page is intentionally left blank.
This page is intentionally left blank.

For more information
More information about Wells Fargo Funds is available free upon request. To obtain literature, please write, email, visit the Fund’s website, or call:
Wells Fargo Funds
P.O. Box 8266
Boston, MA 02266-8266
Email: fundservice@wellsfargo.com
Website: wellsfargofunds.com
Individual investors: 1-800-222-8222
Retail investment professionals: 1-888-877-9275
Institutional investment professionals: 1-866-765-0778
This report and the financial statements contained herein are submitted for the general information of the shareholders of the Fund. If this report is used for promotional purposes, distribution of the report must be accompanied or preceded by a current prospectus. Before investing, please consider the investment objectives, risks, charges, and expenses of the investment. For a current prospectus and, if available, a summary prospectus, containing this information, call 1-800-222-8222 or visit the Fund’s website at wellsfargofunds.com. Read the prospectus carefully before you invest or send money.
Wells Fargo Asset Management (WFAM) is a trade name used by the asset management businesses of Wells Fargo & Company. Wells Fargo Funds Management, LLC, a wholly owned subsidiary of Wells Fargo & Company, provides investment advisory and administrative services for Wells Fargo Funds. Other affiliates of Wells Fargo & Company provide subadvisory and other services for the funds. The funds are distributed by Wells Fargo Funds Distributor, LLC, Member FINRA, an affiliate of Wells Fargo & Company.
NOT FDIC INSURED ¡ NO BANK GUARANTEE ¡ MAY LOSE VALUE
© 2016 Wells Fargo Funds Management, LLC. All rights reserved.
| | |
 | | 240797 03-16 SA207/SAR207 01-16 |
Semi-Annual Report
January 31, 2016

Wells Fargo Large Cap Core Fund


Reduce clutter. Save trees.
Sign up for electronic delivery of prospectuses and shareholder reports at wellsfargo.com/advantagedelivery
Contents
The views expressed and any forward-looking statements are as of January 31, 2016, unless otherwise noted, and are those of the Fund managers and/or Wells Fargo Funds Management, LLC. Discussions of individual securities, or the markets generally, or any Wells Fargo Fund are not intended as individual recommendations. Future events or results may vary significantly from those expressed in any forward-looking statements. The views expressed are subject to change at any time in response to changing circumstances in the market. Wells Fargo Funds Management, LLC and the Fund disclaim any obligation to publicly update or revise any views expressed or forward-looking statements.
NOT FDIC INSURED ¡ NO BANK GUARANTEE ¡ MAY LOSE VALUE
| | | | |
| 2 | | Wells Fargo Large Cap Core Fund | | Letter to shareholders (unaudited) |

Karla M. Rabusch
President
Wells Fargo Funds
Despite generally improving U.S. economic data, ongoing global turmoil tempered U.S. economic growth during the period as many economies and markets outside the U.S. faced ongoing challenges.
Dear Valued Shareholder:
We are pleased to offer you this semi-annual report for the Wells Fargo Large Cap Core Fund for the six-month period that ended January 31, 2016. Despite generally improving U.S. economic data, ongoing global turmoil tempered U.S. economic growth during the period as many economies and markets outside the U.S. faced continuing challenges. In this environment, the broad U.S. stock market experienced heightened volatility and ultimately fell 5.64% overall for the six-month period (as measured by the Russell 3000® Index,1 which is the index used to measure U.S. stock market performance throughout this letter).
As the reporting period began, China’s slowdown continued to take a toll on U.S. and international markets.
The U.S. stock market declined 6.04% and 2.91% in August and September 2015, respectively, as investors worried about the impact on the U.S. of China’s slowing growth. A number of positive economic indicators released during these months suggested the U.S. economy remained solid. However, the strengthening U.S. dollar coupled with ongoing global economic turmoil continued to hinder the economy. Although many investors believed the U.S. Federal Reserve (Fed) would raise the federal funds rate during the third quarter of 2015, at its September 2015 meeting the Fed left the rate unchanged. This decision fueled uncertainty about the U.S. economy’s stamina to remain healthy while facing the negative effects of troubles elsewhere in the world. One week later, Fed Chair Janet Yellen reassured investors that, barring unpleasant surprises, the Fed still intended to raise the rate in 2015. International markets were more volatile than the domestic market and delivered even weaker results in August and September. Investors’ anxiety was driven largely by China’s weakened economy. Because China is the world’s largest importer of many commodities, a number of emerging markets—key commodities exporters—struggled under the strains of reduced demand for commodities and lower prices for the commodities sold.
The U.S. stock market delivered a positive result overall for the last three months of 2015 despite ongoing concerns.
The broad U.S. stock market fluctuated widely in the fourth quarter of 2015, rising 7.90% in October and 0.55% in November before falling 2.05% in December, for an overall quarterly return of 6.27%. Stock markets outside the U.S. generally failed to keep pace with the domestic market as economic concerns, including China’s ongoing slowdown, continued to affect many countries worldwide. U.S. economic data released during the quarter indicated the economy remained solid, with modest growth. However, the strong U.S. dollar and global economic turmoil continued their drag on the economy. In December, the Fed, as expected, slightly raised its target short-term interest rate to between 0.25% and 0.50% after keeping it near zero for seven years. The move, which had been well telegraphed by the Fed for months, reflected confidence in the U.S. economy’s ability to stay healthy with less central-bank support. The Fed also made clear that future interest-rate increases will be gradual.
U.S. stocks struggled in January 2016.
The broad U.S. stock market dropped 5.64% for the month, weighed down by ongoing concerns about heightened market volatility, the continued plunge in oil prices, and the impact of weak global growth on U.S. companies. The U.S. economy, however, remained resilient in January—with continued solid hiring, a
| 1 | The Russell 3000® Index measures the performance of the 3,000 largest U.S. companies based on total market capitalization, which represents approximately 98% of the investable U.S. equity market. You cannot invest directly in an index. |
| | | | | | |
| Letter to shareholders (unaudited) | | Wells Fargo Large Cap Core Fund | | | 3 | |
reduction in the jobless rate to 4.9%, and signs of an uptick in the pace of wage growth—despite some warning signs that became evident in recent months, such as weaknesses in manufacturing and business growth.
Don’t let short-term uncertainty derail long-term investment goals.
Periods of uncertainty can present challenges, but experience has taught us that maintaining long-term investment goals can be an effective way to plan for the future. To help you create a sound strategy based on your personal goals and risk tolerance, Wells Fargo Funds offers more than 100 mutual funds spanning a wide range of asset classes and investment styles. Although diversification cannot guarantee an investment profit or prevent losses, we believe it can be an effective way to manage investment risk and potentially smooth out overall portfolio performance. We encourage investors to know their investments and to understand that appropriate levels of risk-taking may unlock opportunities.
Thank you for choosing to invest in Wells Fargo Funds. We appreciate your confidence in us and remain committed to helping you meet your financial needs.
Sincerely,

Karla M. Rabusch
President
Wells Fargo Funds
Although diversification cannot guarantee an investment profit or prevent losses, we believe it can be an effective way to manage investment risk and potentially smooth out overall portfolio performance.
For further information about your Fund, contact your investment professional, visit our website at wellsfargofunds.com, or call us directly at 1-800-222-8222. We are available 24 hours a day, 7 days a week.
| | | | |
| 4 | | Wells Fargo Large Cap Core Fund | | Performance highlights (unaudited) |
Investment objective
The Fund seeks long-term capital appreciation.
Manager
Wells Fargo Funds Management, LLC
Subadviser
Golden Capital Management, LLC
Portfolio managers
John Campbell, CFA®
Jeff C. Moser, CFA®
Average annual total returns (%) as of January 31, 20161
| | | | | | | | | | | | | | | | | | | | | | | | | | | | | | | | | | |
| | | | | Including sales charge | | | Excluding sales charge | | | Expense ratios2 (%) | |
| | | Inception date | | 1 year | | | 5 year | | | Since
Inception | | | 1 year | | | 5 year | | | Since
Inception | | | Gross | | | Net3 | |
| Class A (EGOAX) | | 12-17-2007 | | | (10.29 | ) | | | 9.41 | | | | 4.25 | | | | (4.84 | ) | | | 10.71 | | | | 5.01 | | | | 1.21 | | | | 1.14 | |
| Class C (EGOCX) | | 12-17-2007 | | | (6.51 | ) | | | 9.88 | | | | 4.25 | | | | (5.51 | ) | | | 9.88 | | | | 4.25 | | | | 1.96 | | | | 1.89 | |
| Class R (EGOHX) | | 9-30-2015 | | | – | | | | – | | | | – | | | | (5.07 | ) | | | 10.44 | | | | 4.77 | | | | 1.46 | | | | 1.39 | |
| Class R6 (EGORX) | | 9-30-2015 | | | – | | | | – | | | | – | | | | (4.33 | ) | | | 11.23 | | | | 5.45 | | | | 0.78 | | | | 0.68 | |
| Administrator Class (WFLLX) | | 7-16-2010 | | | – | | | | – | | | | – | | | | (4.57 | ) | | | 11.01 | | | | 5.22 | | | | 1.13 | | | | 1.00 | |
| Institutional Class (EGOIX) | | 12-17-2007 | | | – | | | | – | | | | – | | | | (4.36 | ) | | | 11.24 | | | | 5.46 | | | | 0.88 | | | | 0.70 | |
| S&P 500 Index4 | | – | | | – | | | | – | | | | – | | | | (0.67 | ) | | | 10.91 | | | | 5.96 | | | | – | | | | – | |
Figures quoted represent past performance, which is no guarantee of future results, and do not reflect taxes that a shareholder may pay on fund distributions or the redemption of fund shares. Investment return and principal value of an investment will fluctuate so that an investor’s shares, when redeemed, may be worth more or less than their original cost. Performance shown without sales charges would be lower if sales charges were reflected. Current performance may be lower or higher than the performance data quoted, which assumes the reinvestment of dividends and capital gains. Current month-end performance is available on the Fund’s website, wellsfargofunds.com.
Index returns do not include transaction costs associated with buying and selling securities, any mutual fund fees or expenses, or any taxes. It is not possible to invest directly in an index.
For Class A shares, the maximum front-end sales charge is 5.75%. For Class C shares, the maximum contingent deferred sales charge is 1.00%. Performance including a contingent deferred sales charge assumes the sales charge for the corresponding time period. Class R, Class R6, Administrator Class, and Institutional Class shares are sold without a front-end sales charge or contingent deferred sales charge.
Stock values fluctuate in response to the activities of individual companies and general market and economic conditions. Certain investment strategies tend to increase the total risk of an investment (relative to the broader market). The Fund is exposed to foreign investment risk and focused portfolio risk. Consult the Fund’s prospectus for additional information on these and other risks.
Please see footnotes on page 5.
| | | | | | |
| Performance highlights (unaudited) | | Wells Fargo Large Cap Core Fund | | | 5 | |
| | | | |
| Ten largest holdings (%) as of January 31, 20165 | |
The Home Depot Incorporated | | | 2.72 | |
Microsoft Corporation | | | 2.57 | |
Delta Air Lines Incorporated | | | 2.36 | |
CVS Health Corporation | | | 2.34 | |
Lowe’s Companies Incorporated | | | 2.33 | |
Northrop Grumman Corporation | | | 2.33 | |
Lear Corporation | | | 2.30 | |
Pinnacle Foods Incorporated | | | 2.26 | |
Foot Locker Incorporated | | | 2.24 | |
AT&T Incorporated | | | 2.23 | |
|
| Sector distribution as of January 31, 20166 |
|
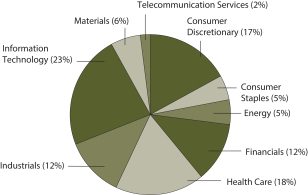 |
| 1 | Historical performance shown for Administrator Class shares prior to their inception reflects the performance of Institutional Class shares, adjusted to reflect higher expenses applicable to Administrator Class shares. Historical performance shown for Class R shares prior to their inception reflects the performance of Administrator Class shares, adjusted to reflect higher expenses applicable to Class R shares. Historical performance shown for Class R6 shares prior to their inception reflects the performance of Institutional Class shares, and includes the higher expenses applicable to Institutional Class shares. If these expenses had not been included, returns would be higher. Historical performance shown for all classes of the Fund prior to July 19, 2010, is based on the performance of the Fund’s predecessor, Evergreen Golden Large Cap Core Fund. |
| 2 | Reflects the expense ratios as stated in the most recent prospectuses. The expense ratios shown are subject to change and may differ from the annualized expense ratios shown in the financial highlights of this report. |
| 3 | The manager has contractually committed through November 30, 2016, to waive fees and/or reimburse expenses to the extent necessary to cap the Total Annual Fund Operating Expenses After Fee Waiver at the amounts shown. After this time the caps may be increased or the commitment to maintain the caps may be terminated only with the approval of the Board of Trustees. Brokerage commissions, stamp duty fees, interest, taxes, acquired fund fees and expenses, and extraordinary expenses are excluded from the cap. Without this cap, the Fund’s returns would have been lower. |
| 4 | The S&P 500 Index consists of 500 stocks chosen for market size, liquidity, and industry group representation. It is a market-value weighted index with each stock’s weight in the index proportionate to its market value. You cannot invest directly in an index. |
| 5 | The ten largest holdings, excluding cash and cash equivalents, are calculated based on the value of the investments divided by total net assets of the Fund. Holdings are subject to change and may have changed since the date specified. |
| 6 | Amounts are calculated based on the total long-term investments of the Fund. These amounts are subject to change and may have changed since the date specified. |
| | | | |
| 6 | | Wells Fargo Large Cap Core Fund | | Fund expenses (unaudited) |
As a shareholder of the Fund, you incur two types costs: (1) transaction costs, including sales charges (loads) on purchase payments and contingent deferred sales charges (if any) on redemptions and (2) ongoing costs, including management fees, distribution (12b-1) and/or shareholder servicing fees, and other Fund expenses. This example is intended to help you understand your ongoing costs (in dollars) of investing in the Fund and to compare these costs with the ongoing costs of investing in other mutual funds.
The example is based on an investment of $1,000 invested at the beginning of the six-month period and held for the entire period from August 1, 2015 to January 31, 2016.
Actual expenses
The “Actual” line of the table below provides information about actual account values and actual expenses. You may use the information in this line, together with the amount you invested, to estimate the expenses that you paid over the period. Simply divide your account value by $1,000 (for example, an $8,600 account value divided by $1,000 = 8.6), then multiply the result by the number in the “Actual” line under the heading entitled “Expenses paid during period” for your applicable class of shares to estimate the expenses you paid on your account during this period.
Hypothetical example for comparison purposes
The “Hypothetical” line of the table below provides information about hypothetical account values and hypothetical expenses based on the Fund’s actual expense ratio and an assumed rate of return of 5% per year before expenses, which is not the Fund’s actual return. The hypothetical account values and expenses may not be used to estimate the actual ending account balance or expenses you paid for the period. You may use this information to compare the ongoing costs of investing in the Fund and other funds. To do so, compare this 5% hypothetical example with the 5% hypothetical examples that appear in the shareholder reports of the other funds.
Please note that the expenses shown in the table are meant to highlight your ongoing costs only and do not reflect any transactional costs, such as sales charges (loads) and contingent deferred sales charges. Therefore, the “Hypothetical” line of the table is useful in comparing ongoing costs only and will not help you determine the relative total costs of owning different funds. In addition, if these transactional costs were included, your costs would have been higher.
| | | | | | | | | | | | | | | | |
| | | Beginning
account value
8-1-2015 | | | Ending
account value
1-31-2016 | | | Expenses
paid during
the period¹ | | | Net annualized
expense ratio | |
Class A | | | | | | | | | | | | | | | | |
Actual | | $ | 1,000.00 | | | $ | 892.01 | | | $ | 5.42 | | | | 1.14 | % |
Hypothetical (5% return before expenses) | | $ | 1,000.00 | | | $ | 1,019.41 | | | $ | 5.79 | | | | 1.14 | % |
Class C | | | | | | | | | | | | | | | | |
Actual | | $ | 1,000.00 | | | $ | 888.59 | | | $ | 8.97 | | | | 1.89 | % |
Hypothetical (5% return before expenses) | | $ | 1,000.00 | | | $ | 1,015.63 | | | $ | 9.58 | | | | 1.89 | % |
Class R | | | | | | | | | | | | | | | | |
Actual | | $ | 1,000.00 | | | $ | 890.93 | | | $ | 6.61 | | | | 1.39 | % |
Hypothetical (5% return before expenses) | | $ | 1,000.00 | | | $ | 1,018.15 | | | $ | 7.05 | | | | 1.39 | % |
Class R6 | | | | | | | | | | | | | | | | |
Actual | | $ | 1,000.00 | | | $ | 894.23 | | | $ | 3.24 | | | | 0.68 | % |
Hypothetical (5% return before expenses) | | $ | 1,000.00 | | | $ | 1,021.72 | | | $ | 3.46 | | | | 0.68 | % |
Administrator Class | | | | | | | | | | | | | | | | |
Actual | | $ | 1,000.00 | | | $ | 893.53 | | | $ | 4.43 | | | | 0.93 | % |
Hypothetical (5% return before expenses) | | $ | 1,000.00 | | | $ | 1,020.46 | | | $ | 4.72 | | | | 0.93 | % |
Institutional Class | | | | | | | | | | | | | | | | |
Actual | | $ | 1,000.00 | | | $ | 893.92 | | | $ | 3.24 | | | | 0.68 | % |
Hypothetical (5% return before expenses) | | $ | 1,000.00 | | | $ | 1,021.72 | | | $ | 3.46 | | | | 0.68 | % |
| 1 | Expenses paid is equal to the annualized expense ratio of each class multiplied by the average account value over the period, multiplied by the number of days in the most recent fiscal half-year divided by the number of days in the fiscal year (to reflect the one-half-year period). |
| | | | | | |
| Portfolio of investments—January 31, 2016 (unaudited) | | Wells Fargo Large Cap Core Fund | | | 7 | |
| | | | | | | | | | | | |
| Security name | | | | | | Shares | | | Value | |
| | | | | | | | | | | | |
| | | | |
Common Stocks: 97.54% | | | | | | | | | | | | |
| | | | |
Consumer Discretionary: 16.53% | | | | | | | | | | | | |
| | | | |
| Auto Components: 2.30% | | | | | | | | | | | | |
Lear Corporation | | | | | | | 186,844 | | | $ | 19,400,013 | |
| | | | | | | | | | | | |
| | | | |
| Automobiles: 3.07% | | | | | | | | | | | | |
Ford Motor Company | | | | | | | 798,110 | | | | 9,529,433 | |
General Motors Company | | | | | | | 553,420 | | | | 16,403,369 | |
| | | | |
| | | | | | | | | | | 25,932,802 | |
| | | | | | | | | | | | |
| | | | |
| Media: 1.98% | | | | | | | | | | | | |
Comcast Corporation Class A | | | | | | | 300,066 | | | | 16,716,677 | |
| | | | | | | | | | | | |
| | | | |
| Multiline Retail: 1.88% | | | | | | | | | | | | |
Target Corporation | | | | | | | 220,007 | | | | 15,932,907 | |
| | | | | | | | | | | | |
| | | | |
| Specialty Retail: 7.30% | | | | | | | | | | | | |
Foot Locker Incorporated | | | | | | | 280,669 | | | | 18,961,998 | |
Lowe’s Companies Incorporated | | | | | | | 275,137 | | | | 19,716,317 | |
The Home Depot Incorporated | | | | | | | 182,676 | | | | 22,973,334 | |
| | | | |
| | | | | | | | | | | 61,651,649 | |
| | | | | | | | | | | | |
| | | | |
Consumer Staples: 4.60% | | | | | | | | | | | | |
| | | | |
| Food & Staples Retailing: 2.34% | | | | | | | | | | | | |
CVS Health Corporation | | | | | | | 204,653 | | | | 19,767,433 | |
| | | | | | | | | | | | |
| | | | |
| Food Products: 2.26% | | | | | | | | | | | | |
Pinnacle Foods Incorporated | | | | | | | 445,832 | | | | 19,121,734 | |
| | | | | | | | | | | | |
| | | | |
Energy: 5.01% | | | | | | | | | | | | |
| | | | |
| Oil, Gas & Consumable Fuels: 5.01% | | | | | | | | | | | | |
Exxon Mobil Corporation | | | | | | | 146,036 | | | | 11,368,903 | |
Valero Energy Corporation | | | | | | | 267,655 | | | | 18,165,745 | |
Western Refining Incorporated | | | | | | | 387,677 | | | | 12,754,573 | |
| | | | |
| | | | | | | | | | | 42,289,221 | |
| | | | | | | | | | | | |
| | | | |
Financials: 12.15% | | | | | | | | | | | | |
| | | | |
| Banks: 5.36% | | | | | | | | | | | | |
Huntington Bancshares Incorporated | | | | | | | 1,532,883 | | | | 13,152,136 | |
JPMorgan Chase & Company | | | | | | | 276,542 | | | | 16,454,249 | |
SunTrust Banks Incorporated | | | | | | | 427,934 | | | | 15,653,826 | |
| | | | |
| | | | | | | | | | | 45,260,211 | |
| | | | | | | | | | | | |
| | | | |
| Capital Markets: 1.84% | | | | | | | | | | | | |
Goldman Sachs Group Incorporated | | | | | | | 96,374 | | | | 15,570,183 | |
| | | | | | | | | | | | |
| | | | |
| Diversified Financial Services: 1.50% | | | | | | | | | | | | |
Voya Financial Incorporated | | | | | | | 414,652 | | | | 12,680,058 | |
| | | | | | | | | | | | |
The accompanying notes are an integral part of these financial statements.
| | | | |
| 8 | | Wells Fargo Large Cap Core Fund | | Portfolio of investments—January 31, 2016 (unaudited) |
| | | | | | | | | | | | |
| Security name | | | | | | Shares | | | Value | |
| | | | | | | | | | | | |
| | | | |
| Insurance: 3.45% | | | | | | | | | | | | |
Lincoln National Corporation | | | | | | | 383,570 | | | $ | 15,135,672 | |
Prudential Financial Incorporated | | | | | | | 199,533 | | | | 13,983,273 | |
| | | | |
| | | | | | | | | | | 29,118,945 | |
| | | | | | | | | | | | |
| | | | |
Health Care: 17.63% | | | | | | | | | | | | |
| | | | |
| Biotechnology: 3.92% | | | | | | | | | | | | |
Amgen Incorporated | | | | | | | 110,009 | | | | 16,801,675 | |
Gilead Sciences Incorporated | | | | | | | 196,164 | | | | 16,281,612 | |
| | | | |
| | | | | | | | | | | 33,083,287 | |
| | | | | | | | | | | | |
| | | | |
| Health Care Providers & Services: 12.02% | | | | | | | | | | | | |
Aetna Incorporated | | | | | | | 174,878 | | | | 17,809,576 | |
AmerisourceBergen Corporation | | | | | | | 187,560 | | | | 16,797,874 | |
AmSurg Corporation † | | | | | | | 216,306 | | | | 15,831,436 | |
Centene Corporation † | | | | | | | 287,148 | | | | 17,820,405 | |
McKesson Corporation | | | | | | | 93,989 | | | | 15,130,349 | |
UnitedHealth Group Incorporated | | | | | | | 157,767 | | | | 18,168,448 | |
| | | | |
| | | | | | | | | | | 101,558,088 | |
| | | | | | | | | | | | |
| | | | |
| Pharmaceuticals: 1.69% | | | | | | | | | | | | |
Merck & Company Incorporated | | | | | | | 282,184 | | | | 14,298,263 | |
| | | | | | | | | | | | |
| | | | |
Industrials: 11.78% | | | | | | | | | | | | |
| | | | |
| Aerospace & Defense: 6.39% | | | | | | | | | | | | |
Northrop Grumman Corporation | | | | | | | 106,214 | | | | 19,655,963 | |
Orbital ATK Incorporated | | | | | | | 207,674 | | | | 18,738,425 | |
Spirit AeroSystems Holdings Incorporated Class A † | | | | | | | 367,240 | | | | 15,570,976 | |
| | | | |
| | | | | | | | | | | 53,965,364 | |
| | | | | | | | | | | | |
| | | | |
| Airlines: 4.40% | | | | | | | | | | | | |
Delta Air Lines Incorporated | | | | | | | 449,607 | | | | 19,913,094 | |
Southwest Airlines Company | | | | | | | 459,116 | | | | 17,271,944 | |
| | | | |
| | | | | | | | | | | 37,185,038 | |
| | | | | | | | | | | | |
| | | | |
| Machinery: 0.99% | | | | | | | | | | | | |
Trinity Industries Incorporated | | | | | | | 389,397 | | | | 8,340,884 | |
| | | | | | | | | | | | |
| | | | |
Information Technology: 21.73% | | | | | | | | | | | | |
| | | | |
| Electronic Equipment, Instruments & Components: 3.66% | | | | | | | | | | | | |
CDW Corporation of Delaware | | | | | | | 422,052 | | | | 16,227,899 | |
Jabil Circuit Incorporated | | | | | | | 736,264 | | | | 14,659,016 | |
| | | | |
| | | | | | | | | | | 30,886,915 | |
| | | | | | | | | | | | |
| | | | |
| Internet Software & Services: 3.51% | | | | | | | | | | | | |
Alphabet Incorporated Class C † | | | | | | | 22,343 | | | | 16,599,732 | |
Tessera Technologies Incorporated | | | | | | | 454,382 | | | | 13,095,289 | |
| | | | |
| | | | | | | | | | | 29,695,021 | |
| | | | | | | | | | | | |
The accompanying notes are an integral part of these financial statements.
| | | | | | |
| Portfolio of investments—January 31, 2016 (unaudited) | | Wells Fargo Large Cap Core Fund | | | 9 | |
| | | | | | | | | | | | | | |
| Security name | | | | | | | Shares | | | Value | |
| | | | | | | | | | | | | | |
| | | | |
| IT Services: 2.09% | | | | | | | | | | | | | | |
DST Systems Incorporated | | | | | | | | | 167,554 | | | $ | 17,661,867 | |
| | | | | | | | | | | | | | |
| | | | |
| Semiconductors & Semiconductor Equipment: 5.67% | | | | | | | | | | | | | | |
Intel Corporation | | | | | | | | | 480,396 | | | | 14,901,884 | |
Skyworks Solutions Incorporated | | | | | | | | | 213,195 | | | | 14,693,399 | |
Teradyne Incorporated | | | | | | | | | 941,359 | | | | 18,290,605 | |
| | | | |
| | | | | | | | | | | | | 47,885,888 | |
| | | | | | | | | | | | | | |
| | | | |
| Software: 4.67% | | | | | | | | | | | | | | |
Electronic Arts Incorporated † | | | | | | | | | 275,272 | | | | 17,767,431 | |
Microsoft Corporation | | | | | | | | | 393,892 | | | | 21,699,510 | |
| | | | |
| | | | | | | | | | | | | 39,466,941 | |
| | | | | | | | | | | | | | |
| | | | |
| Technology Hardware, Storage & Peripherals: 2.13% | | | | | | | | | | | | | | |
Apple Incorporated | | | | | | | | | 184,719 | | | | 17,980,547 | |
| | | | | | | | | | | | | | |
| | | | |
Materials: 5.88% | | | | | | | | | | | | | | |
| | | | |
| Chemicals: 3.71% | | | | | | | | | | | | | | |
Air Products & Chemicals Incorporated | | | | | | | | | 132,531 | | | | 16,793,003 | |
The Dow Chemical Company | | | | | | | | | 347,408 | | | | 14,591,137 | |
| | | | |
| | | | | | | | | | | | | 31,384,140 | |
| | | | | | | | | | | | | | |
| | | | |
| Containers & Packaging: 2.17% | | | | | | | | | | | | | | |
Avery Dennison Corporation | | | | | | | | | 300,774 | | | | 18,314,129 | |
| | | | | | | | | | | | | | |
| | | | |
Telecommunication Services: 2.23% | | | | | | | | | | | | | | |
| | | | |
| Diversified Telecommunication Services: 2.23% | | | | | | | | | | | | | | |
AT&T Incorporated | | | | | | | | | 521,984 | | | | 18,822,743 | |
| | | | | | | | | | | | | | |
| | | | |
Total Common Stocks (Cost $828,689,015) | | | | | | | | | | | | | 823,970,948 | |
| | | | | | | | | | | | | | |
| | | | |
| | | Yield | | | | | | | | | |
| Short-Term Investments: 2.10% | | | | | | | | | | | | | | |
| Investment Companies: 2.10% | | | | | | | | | | | | | | |
Wells Fargo Cash Investment Money Market Fund, Select Class (l)(u) | | | 0.40 | % | | | | | 17,764,199 | | | | 17,764,199 | |
| | | | | | | | | | | | | | |
| | | | |
Total Short-Term Investments (Cost $17,764,199) | | | | | | | | | | | | | 17,764,199 | |
| | | | | | | | | | | | | | |
| | | | | | | | |
| Total investments in securities (Cost $846,453,214) * | | | 99.64 | % | | | 841,735,147 | |
Other assets and liabilities, net | | | 0.36 | | | | 3,059,929 | |
| | | | | | | | |
| Total net assets | | | 100.00 | % | | $ | 844,795,076 | |
| | | | | | | | |
| † | Non-income-earning security |
| (l) | The issuer of the security is an affiliated person of the Fund as defined in the Investment Company Act of 1940. |
| (u) | The rate represents the 7-day annualized yield at period end. |
| * | Cost for federal income tax purposes is $846,688,267 and unrealized gains (losses) consists of: |
| | | | |
Gross unrealized gains | | $ | 50,195,580 | |
Gross unrealized losses | | | (55,148,700 | ) |
| | | | |
Net unrealized losses | | $ | (4,953,120 | ) |
The accompanying notes are an integral part of these financial statements.
| | | | |
| 10 | | Wells Fargo Large Cap Core Fund | | Statement of assets and liabilities—January 31, 2016 (unaudited) |
| | | | |
| | | | |
| |
Assets | | | | |
Investments | | | | |
In unaffiliated securities, at value (cost $828,689,015) | | $ | 823,970,948 | |
In affiliated securities, at value (cost $17,764,199) | | | 17,764,199 | |
| | | | |
Total investments, at value (cost $846,453,214) | | | 841,735,147 | |
Receivable for Fund shares sold | | | 8,617,989 | |
Receivable for dividends | | | 1,193,879 | |
Prepaid expenses and other assets | | | 88,280 | |
| | | | |
Total assets | | | 851,635,295 | |
| | | | |
| |
Liabilities | | | | |
Payable for investments purchased | | | 5,057,314 | |
Payable for Fund shares redeemed | | | 1,063,355 | |
Management fee payable | | | 422,404 | |
Distribution fees payable | | | 47,112 | |
Administration fees payable | | | 124,572 | |
Accrued expenses and other liabilities | | | 125,462 | |
| | | | |
Total liabilities | | | 6,840,219 | |
| | | | |
Total net assets | | $ | 844,795,076 | |
| | | | |
| |
NET ASSETS CONSIST OF | | | | |
Paid-in capital | | $ | 858,233,785 | |
Undistributed net investment income | | | 748,094 | |
Accumulated net realized losses on investments | | | (9,468,736 | ) |
Net unrealized losses on investments | | | (4,718,067 | ) |
| | | | |
Total net assets | | $ | 844,795,076 | |
| | | | |
| |
COMPUTATION OF NET ASSET VALUE AND OFFERING PRICE PER SHARE | | | | |
Net assets – Class A | | $ | 389,638,441 | |
Shares outstanding – Class A1 | | | 27,941,318 | |
Net asset value per share – Class A | | | $13.94 | |
Maximum offering price per share – Class A2 | | | $14.79 | |
Net assets – Class C | | $ | 74,275,757 | |
Shares outstanding – Class C1 | | | 5,400,471 | |
Net asset value per share – Class C | | | $13.75 | |
Net assets – Class R | | $ | 24,203 | |
Shares outstanding – Class R1 | | | 1,729 | |
Net asset value per share – Class R | | | $14.00 | |
Net assets – Class R6 | | $ | 1,775,669 | |
Shares outstanding – Class R61 | | | 126,743 | |
Net asset value per share – Class R6 | | | $14.01 | |
Net assets – Administrator Class | | $ | 107,154,585 | |
Shares outstanding – Administrator Class1 | | | 7,667,083 | |
Net asset value per share – Administrator Class | | | $13.98 | |
Net assets – Institutional Class | | $ | 271,926,421 | |
Shares outstanding – Institutional Class1 | | | 19,416,717 | |
Net asset value per share – Institutional Class | | | $14.00 | |
| 1 | The Fund has an unlimited number of authorized shares. |
| 2 | Maximum offering price is computed as 100/94.25 of net asset value. On investments of $50,000 or more, the offering price is reduced. |
The accompanying notes are an integral part of these financial statements.
| | | | | | |
| Statement of operations—six months ended January 31, 2016 (unaudited) | | Wells Fargo Large Cap Core Fund | | | 11 | |
| | | | |
| | | | |
| |
Investment income | | | | |
Dividends (net of foreign withholding taxes of $17,592) | | $ | 6,075,999 | |
Income from affiliated securities | | | 14,793 | |
Securities lending income, net | | | 4,008 | |
| | | | |
Total investment income | | | 6,094,800 | |
| | | | |
| |
Expenses | | | | |
Management fee | | | 2,346,920 | |
Administration fees | | | | |
Class A | | | 279,331 | |
Class C | | | 66,256 | |
Class R | | | 18 | 1 |
Class R6 | | | 2 | 1 |
Administrator Class | | | 63,845 | |
Institutional Class | | | 81,030 | |
Investor Class | | | 199,867 | 2 |
Shareholder servicing fees | | | | |
Class A | | | 330,184 | |
Class C | | | 78,877 | |
Class R | | | 22 | 1 |
Administrator Class | | | 122,778 | |
Investor Class | | | 150,680 | 2 |
Distribution fees | | | | |
Class C | | | 236,630 | |
Class R | | | 22 | 1 |
Custody and accounting fees | | | 26,426 | |
Professional fees | | | 23,187 | |
Registration fees | | | 73,383 | |
Shareholder report expenses | | | 32,627 | |
Trustees’ fees and expenses | | | 11,876 | |
Other fees and expenses | | | 5,107 | |
| | | | |
Total expenses | | | 4,129,068 | |
Less: Fee waivers and/or expense reimbursements | | | (387,157 | ) |
| | | | |
Net expenses | | | 3,741,911 | |
| | | | |
Net investment income | | | 2,352,889 | |
| | | | |
| |
REALIZED AND UNREALIZED GAINS (LOSSES) ON INVESTMENTS | | | | |
Net realized losses on investments | | | (9,102,291 | ) |
Net change in unrealized gains (losses) on investments | | | (80,778,069 | ) |
| | | | |
Net realized and unrealized gains (losses) on investments | | | (89,880,360 | ) |
| | | | |
Net decrease in net assets resulting from operations | | $ | (87,527,471 | ) |
| | | | |
| 1 | For the period from September 30, 2015 (commencement of class operations) to January 31, 2016 |
| 2 | For the period from August 1, 2015 to October 23, 2015. Effective at the close of business on October 23, 2015, Investor Class shares were converted to Class A shares and are no longer offered by the Fund. |
The accompanying notes are an integral part of these financial statements.
| | | | |
| 12 | | Wells Fargo Large Cap Core Fund | | Statement of changes in net assets |
| | | | | | | | | | | | | | | | |
| | | Six months ended
January 31, 2016 (unaudited) | | | Year ended
July 31, 2015 | |
| | | | |
Operations | | | | | | | | | | | | | | | | |
Net investment income | | | | | | $ | 2,352,889 | | | | | | | $ | 1,288,942 | |
Net realized gains (losses) on investments | | | | | | | (9,102,291 | ) | | | | | | | 23,591,082 | |
Net change in unrealized gains (losses) on investments | | | | | | | (80,778,069 | ) | | | | | | | 11,901,160 | |
| | | | |
Net increase (decrease) in net assets resulting from operations | | | | | | | (87,527,471 | ) | | | | | | | 36,781,184 | |
| | | | |
| | | | |
Distributions to shareholders from | | | | | | | | | | | | | | | | |
Net investment income | | | | | | | | | | | | | | | | |
Class A | | | | | | | (1,280,167 | ) | | | | | | | (183,035 | ) |
Class R | | | | | | | (136 | )1 | | | | | | | NA | |
Class R6 | | | | | | | (184 | )1 | | | | | | | NA | |
Administrator Class | | | | | | | (617,773 | ) | | | | | | | (122,314 | ) |
Institutional Class | | | | | | | (732,443 | ) | | | | | | | (94,797 | ) |
Investor Class | | | | | | | 0 | 2 | | | | | | | (308,152 | ) |
Net realized gains | | | | | | | | | | | | | | | | |
Class A | | | | | | | (3,571,260 | ) | | | | | | | 0 | |
Class C | | | | | | | (613,350 | ) | | | | | | | 0 | |
Class R | | | | | | | (222 | )1 | | | | | | | NA | |
Class R6 | | | | | | | (222 | )1 | | | | | | | NA | |
Administrator Class | | | | | | | (908,858 | ) | | | | | | | 0 | |
Institutional Class | | | | | | | (831,664 | ) | | | | | | | 0 | |
| | | | |
Total distributions to shareholders | | | | | | | (8,556,279 | ) | | | | | | | (708,298 | ) |
| | | | |
| | | | |
Capital share transactions | | | Shares | | | | | | | | Shares | | | | | |
Proceeds from shares sold | | | | | | | | | | | | | | | | |
Class A | | | 23,714,016 | | | | 368,097,469 | | | | 5,820,072 | | | | 89,378,472 | |
Class C | | | 2,396,940 | | | | 35,943,847 | | | | 3,114,897 | | | | 47,430,665 | |
Class R | | | 1,706 | 1 | | | 25,000 | 1 | | | NA | | | | NA | |
Class R6 | | | 126,716 | 1 | | | 1,776,408 | 1 | | | NA | | | | NA | |
Administrator Class | | | 3,650,940 | | | | 55,207,104 | | | | 5,744,427 | | | | 89,108,080 | |
Institutional Class | | | 17,028,551 | | | | 255,655,076 | | | | 3,978,349 | | | | 62,377,535 | |
Investor Class | | | 508,724 | 2 | | | 7,701,975 | 2 | | | 3,949,960 | | | | 61,216,814 | |
| | | | |
| | | | | | | 724,406,879 | | | | | | | | 349,511,566 | |
| | | | |
Reinvestment of distributions | | | | | | | | | | | | | | | | |
Class A | | | 311,622 | | | | 4,725,942 | | | | 11,869 | | | | 173,408 | |
Class C | | | 32,452 | | | | 481,595 | | | | 0 | | | | 0 | |
Class R | | | 23 | 1 | | | 358 | 1 | | | NA | | | | NA | |
Class R6 | | | 27 | 1 | | | 406 | 1 | | | NA | | | | NA | |
Administrator Class | | | 99,938 | | | | 1,525,664 | | | | 8,331 | | | | 122,042 | |
Institutional Class | | | 63,053 | | | | 966,052 | | | | 5,103 | | | | 74,803 | |
Investor Class | | | 0 | 2 | | | 0 | 2 | | | 20,620 | | | | 302,078 | |
| | | | |
| | | | | | | 7,700,017 | | | | | | | | 672,331 | |
| | | | |
Payment for shares redeemed | | | | | | | | | | | | | | | | |
Class A | | | (2,220,808 | ) | | | (33,098,437 | ) | | | (1,561,861 | ) | | | (24,219,042 | ) |
Class C | | | (429,095 | ) | | | (6,279,364 | ) | | | (323,242 | ) | | | (4,921,172 | ) |
Administrator Class | | | (1,356,106 | ) | | | (20,417,649 | ) | | | (958,200 | ) | | | (14,722,079 | ) |
Institutional Class | | | (1,649,689 | ) | | | (24,751,156 | ) | | | (411,020 | ) | | �� | (6,506,688 | ) |
Investor Class | | | (18,604,700 | )2 | | | (290,535,166 | )2 | | | (1,941,756 | ) | | | (29,909,371 | ) |
| | | | |
| | | | | | | (375,081,772 | ) | | | | | | | (80,278,352 | ) |
| | | | |
Net increase in net assets resulting from capital share transactions | | | | | | | 357,025,124 | | | | | | | | 269,905,545 | |
| | | | |
Total increase in net assets | | | | | | | 260,941,374 | | | | | | | | 305,978,431 | |
| | | | |
| | | | |
Net assets | | | | | | | | | | | | | | | | |
Beginning of period | | | | | | | 583,853,702 | | | | | | | | 277,875,271 | |
| | | | |
End of period | | | | | | $ | 844,795,076 | | | | | | | $ | 583,853,702 | |
| | | | |
Undistributed net investment income | | | | | | $ | 748,094 | | | | | | | $ | 1,025,908 | |
| | | | |
| 1 | For the period from September 30, 2015 (commencement of class operations) to January 31, 2016 |
| 2 | For the period from August 1, 2015 to October 23, 2015. Effective at the close of business on October 23, 2015, Investor Class shares were converted to Class A shares and are no longer offered by the Fund. |
The accompanying notes are an integral part of these financial statements.
| | | | | | |
| Financial highlights | | Wells Fargo Large Cap Core Fund | | | 13 | |
(For a share outstanding throughout each period)
| | | | | | | | | | | | | | | | | | | | | | | | |
| | | Six months ended
January 31, 2016 (unaudited) | | | Year ended July 31 | |
| CLASS A | | | 2015 | | | 2014 | | | 2013 | | | 2012 | | | 2011 | |
Net asset value, beginning of period | | | $15.81 | | | | $14.30 | | | | $12.13 | | | | $9.50 | | | | $8.75 | | | | $7.37 | |
Net investment income | | | 0.05 | 1 | | | 0.06 | | | | 0.06 | 1 | | | 0.07 | | | | 0.06 | | | | 0.05 | |
Net realized and unrealized gains (losses) on investments | | | (1.74 | ) | | | 1.50 | | | | 2.20 | | | | 2.64 | | | | 0.74 | | | | 1.36 | |
| | | | | | | | | | | | | | | | | | | | | | | | |
Total from investment operations | | | (1.69 | ) | | | 1.56 | | | | 2.26 | | | | 2.71 | | | | 0.80 | | | | 1.41 | |
Distributions to shareholders from | | | | | | | | | | | | | | | | | | | | | | | | |
Net investment income | | | (0.05 | ) | | | (0.05 | ) | | | (0.09 | ) | | | (0.08 | ) | | | (0.05 | ) | | | (0.03 | ) |
Net realized gains | | | (0.13 | ) | | | 0.00 | | | | 0.00 | | | | 0.00 | | | | 0.00 | | | | 0.00 | |
| | | | | | | | | | | | | | | | | | | | | | | | |
Total distributions to shareholders | | | (0.18 | ) | | | (0.05 | ) | | | (0.09 | ) | | | (0.08 | ) | | | (0.05 | ) | | | (0.03 | ) |
Net asset value, end of period | | | $13.94 | | | | $15.81 | | | | $14.30 | | | | $12.13 | | | | $9.50 | | | | $8.75 | |
Total return2 | | | (10.80 | )% | | | 10.99 | % | | | 18.58 | % | | | 28.76 | % | | | 9.27 | % | | | 19.16 | % |
Ratios to average net assets (annualized) | | | | | | | | | | | | | | | | | | | | | | | | |
Gross expenses | | | 1.20 | % | | | 1.26 | % | | | 1.29 | % | | | 1.33 | % | | | 1.37 | % | | | 1.30 | % |
Net expenses | | | 1.14 | % | | | 1.14 | % | | | 1.14 | % | | | 1.14 | % | | | 1.14 | % | | | 1.14 | % |
Net investment income | | | 0.71 | % | | | 0.35 | % | | | 0.47 | % | | | 0.75 | % | | | 0.71 | % | | | 0.61 | % |
Supplemental data | | | | | | | | | | | | | | | | | | | | | | | | |
Portfolio turnover rate | | | 22 | % | | | 44 | % | | | 61 | % | | | 67 | % | | | 41 | % | | | 43 | % |
Net assets, end of period (000s omitted) | | | $389,638 | | | | $97,041 | | | | $26,685 | | | | $15,267 | | | | $8,277 | | | | $7,495 | |
| 1 | Calculated based upon average shares outstanding |
| 2 | Total return calculations do not include any sales charges. Returns for periods of less than one year are not annualized. |
The accompanying notes are an integral part of these financial statements.
| | | | |
| 14 | | Wells Fargo Large Cap Core Fund | | Financial highlights |
(For a share outstanding throughout each period)
| | | | | | | | | | | | | | | | | | | | | | | | |
| | | Six months ended
January 31, 2016 (unaudited) | | | Year ended July 31 | |
| CLASS C | | | 2015 | | | 2014 | | | 2013 | | | 2012 | | | 2011 | |
Net asset value, beginning of period | | | $15.61 | | | | $14.17 | | | | $12.05 | | | | $9.45 | | | | $8.71 | | | | $7.37 | |
Net investment loss | | | (0.01 | )1 | | | (0.06 | )1 | | | (0.01 | ) | | | (0.00 | )2 | | | (0.00 | )2 | | | (0.01 | ) |
Net realized and unrealized gains (losses) on investments | | | (1.72 | ) | | | 1.50 | | | | 2.15 | | | | 2.62 | | | | 0.74 | | | | 1.35 | |
| | | | | | | | | | | | | | | | | | | | | | | | |
Total from investment operations | | | (1.73 | ) | | | 1.44 | | | | 2.14 | | | | 2.62 | | | | 0.74 | | | | 1.34 | |
Distributions to shareholders from | | | | | | | | | | | | | | | | | | | | | | | | |
Net investment income | | | 0.00 | | | | 0.00 | | | | (0.02 | ) | | | (0.02 | ) | | | 0.00 | | | | 0.00 | |
Net realized gains | | | (0.13 | ) | | | 0.00 | | | | 0.00 | | | | 0.00 | | | | 0.00 | | | | 0.00 | |
| | | | | | | | | | | | | | | | | | | | | | | | |
Total distributions to shareholders | | | (0.13 | ) | | | 0.00 | | | | (0.02 | ) | | | (0.02 | ) | | | 0.00 | | | | 0.00 | |
Net asset value, end of period | | | $13.75 | | | | $15.61 | | | | $14.17 | | | | $12.05 | | | | $9.45 | | | | $8.71 | |
Total return3 | | | (11.14 | )% | | | 10.16 | % | | | 17.73 | % | | | 27.82 | % | | | 8.50 | % | | | 18.18 | % |
Ratios to average net assets (annualized) | | | | | | | | | | | | | | | | | | | | | | | | |
Gross expenses | | | 1.96 | % | | | 2.01 | % | | | 2.04 | % | | | 2.08 | % | | | 2.12 | % | | | 2.05 | % |
Net expenses | | | 1.89 | % | | | 1.89 | % | | | 1.89 | % | | | 1.89 | % | | | 1.89 | % | | | 1.89 | % |
Net investment loss | | | (0.08 | )% | | | (0.38 | )% | | | (0.30 | )% | | | (0.01 | )% | | | (0.04 | )% | | | (0.13 | )% |
Supplemental data | | | | | | | | | | | | | | | | | | | | | | | | |
Portfolio turnover rate | | | 22 | % | | | 44 | % | | | 61 | % | | | 67 | % | | | 41 | % | | | 43 | % |
Net assets, end of period (000s omitted) | | | $74,276 | | | | $53,076 | | | | $8,624 | | | | $3,786 | | | | $2,041 | | | | $1,750 | |
| 1 | Calculated based upon average shares outstanding |
| 2 | Amount is less than $0.005. |
| 3 | Total return calculations do not include any sales charges. Returns for periods of less than one year are not annualized. |
The accompanying notes are an integral part of these financial statements.
| | | | | | |
| Financial highlights | | Wells Fargo Large Cap Core Fund | | | 15 | |
(For a share outstanding throughout the period)
| | | | |
| | | Period ended
January 31, 20161
(unaudited) | |
| CLASS R | |
Net asset value, beginning of period | | | $14.66 | |
Net investment income | | | 0.02 | |
Net realized and unrealized gains (losses) on investments | | | (0.47 | ) |
| | | | |
Total from investment operations | | | (0.45 | ) |
Distributions to shareholders from | | | | |
Net investment income | | | (0.08 | ) |
Net realized gains | | | (0.13 | ) |
| | | | |
Total distributions to shareholders | | | (0.21 | ) |
Net asset value, end of period | | | $14.00 | |
Total return | | | (3.19 | )% |
Ratios to average net assets (annualized) | | | | |
Gross expenses | | | 1.46 | % |
Net expenses | | | 1.39 | % |
Net investment income | | | 0.41 | % |
Supplemental data | | | | |
Portfolio turnover rate | | | 22 | % |
Net assets, end of period (000s omitted) | | | $24 | |
| 1 | For the period from September 30, 2015 (commencement of class operations) to January 31, 2016 |
The accompanying notes are an integral part of these financial statements.
| | | | |
| 16 | | Wells Fargo Large Cap Core Fund | | Financial highlights |
(For a share outstanding throughout the period)
| | | | |
| | | Period ended
January 31, 20161
(unaudited) | |
| CLASS R6 | |
Net asset value, beginning of period | | | $14.66 | |
Net investment income | | | 0.11 | |
Net realized and unrealized gains (losses) on investments | | | (0.52 | ) |
| | | | |
Total from investment operations | | | (0.41 | ) |
Distributions to shareholders from | | | | |
Net investment income | | | (0.11 | ) |
Net realized gains | | | (0.13 | ) |
| | | | |
Total distributions to shareholders | | | (0.24 | ) |
Net asset value, end of period | | | $14.01 | |
Total return | | | (2.95 | )% |
Ratios to average net assets (annualized) | | | | |
Gross expenses | | | 0.76 | % |
Net expenses | | | 0.68 | % |
Net investment income | | | 1.12 | % |
Supplemental data | | | | |
Portfolio turnover rate | | | 22 | % |
Net assets, end of period (000s omitted) | | | $1,776 | |
| 1 | For the period from September 30, 2015 (commencement of class operations) to January 31, 2016 |
The accompanying notes are an integral part of these financial statements.
| | | | | | |
| Financial highlights | | Wells Fargo Large Cap Core Fund | | | 17 | |
(For a share outstanding throughout each period)
| | | | | | | | | | | | | | | | | | | | | | | | |
| | | Six months ended January 31, 2016 (unaudited) | | | Year ended July 31 | |
| ADMINISTRATOR CLASS | | | 2015 | | | 2014 | | | 2013 | | | 2012 | | | 2011 | |
Net asset value, beginning of period | | | $15.87 | | | | $14.34 | | | | $12.16 | | | | $9.52 | | | | $8.77 | | | | $7.38 | |
Net investment income | | | 0.06 | | | | 0.10 | | | | 0.09 | | | | 0.10 | | | | 0.09 | | | | 0.07 | 1 |
Net realized and unrealized gains (losses) on investments | | | (1.73 | ) | | | 1.50 | | | | 2.20 | | | | 2.64 | | | | 0.74 | | | | 1.36 | |
| | | | | | | | | | | | | | | | | | | | | | | | |
Total from investment operations | | | (1.67 | ) | | | 1.60 | | | | 2.29 | | | | 2.74 | | | | 0.83 | | | | 1.43 | |
Distributions to shareholders from | | | | | | | | | | | | | | | | | | | | | | | | |
Net investment income | | | (0.09 | ) | | | (0.07 | ) | | | (0.11 | ) | | | (0.10 | ) | | | (0.08 | ) | | | (0.04 | ) |
Net realized gains | | | (0.13 | ) | | | 0.00 | | | | 0.00 | | | | 0.00 | | | | 0.00 | | | | 0.00 | |
| | | | | | | | | | | | | | | | | | | | | | | | |
Total distributions to shareholders | | | (0.22 | ) | | | (0.07 | ) | | | (0.11 | ) | | | (0.10 | ) | | | (0.08 | ) | | | (0.04 | ) |
Net asset value, end of period | | | $13.98 | | | | $15.87 | | | | $14.34 | | | | $12.16 | | | | $9.52 | | | | $8.77 | |
Total return2 | | | (10.65 | )% | | | 11.28 | % | | | 18.83 | % | | | 29.12 | % | | | 9.61 | % | | | 19.44 | % |
Ratios to average net assets (annualized) | | | | | | | | | | | | | | | | | | | | | | | | |
Gross expenses | | | 1.13 | % | | | 1.11 | % | | | 1.11 | % | | | 1.14 | % | | | 1.16 | % | | | 1.08 | % |
Net expenses | | | 0.93 | % | | | 0.90 | % | | | 0.90 | % | | | 0.89 | % | | | 0.87 | % | | | 0.86 | % |
Net investment income | | | 0.87 | % | | | 0.61 | % | | | 0.63 | % | | | 1.00 | % | | | 0.97 | % | | | 0.76 | % |
Supplemental data | | | | | | | | | | | | | | | | | | | | | | | | |
Portfolio turnover rate | | | 22 | % | | | 44 | % | | | 61 | % | | | 67 | % | | | 41 | % | | | 43 | % |
Net assets, end of period (000s omitted) | | | $107,155 | | | | $83,692 | | | | $6,849 | | | | $1,192 | | | | $522 | | | | $477 | |
| 1 | Calculated based upon average shares outstanding |
| 2 | Returns for periods of less than one year are not annualized. |
The accompanying notes are an integral part of these financial statements.
| | | | |
| 18 | | Wells Fargo Large Cap Core Fund | | Financial highlights |
(For a share outstanding throughout each period)
| | | | | | | | | | | | | | | | | | | | | | | | |
| | | Six months ended
January 31, 2016 (unaudited) | | | Year ended July 31 | |
| INSTITUTIONAL CLASS | | | 2015 | | | 2014 | | | 2013 | | | 2012 | | | 2011 | |
Net asset value, beginning of period | | | $15.91 | | | | $14.35 | | | | $12.16 | | | | $9.52 | | | | $8.77 | | | | $7.38 | |
Net investment income | | | 0.08 | | | | 0.14 | 1 | | | 0.11 | 1 | | | 0.13 | 1 | | | 0.12 | | | | 0.10 | 1 |
Net realized and unrealized gains (losses) on investments | | | (1.75 | ) | | | 1.50 | | | | 2.21 | | | | 2.63 | | | | 0.73 | | | | 1.35 | |
| | | | | | | | | | | | | | | | | | | | | | | | |
Total from investment operations | | | (1.67 | ) | | | 1.64 | | | | 2.32 | | | | 2.76 | | | | 0.85 | | | | 1.45 | |
Distributions to shareholders from | | | | | | | | | | | | | | | | | | | | | | | | |
Net investment income | | | (0.11 | ) | | | (0.08 | ) | | | (0.13 | ) | | | (0.12 | ) | | | (0.10 | ) | | | (0.06 | ) |
Net realized gains | | | (0.13 | ) | | | 0.00 | | | | 0.00 | | | | 0.00 | | | | 0.00 | | | | 0.00 | |
| | | | | | | | | | | | | | | | | | | | | | | | |
Total distributions to shareholders | | | (0.24 | ) | | | (0.08 | ) | | | (0.13 | ) | | | (0.12 | ) | | | (0.10 | ) | �� | | (0.06 | ) |
Net asset value, end of period | | | $14.00 | | | | $15.91 | | | | $14.35 | | | | $12.16 | | | | $9.52 | | | | $8.77 | |
Total return2 | | | (10.61 | )% | | | 11.51 | % | | | 19.21 | % | | | 29.38 | % | | | 9.88 | % | | | 19.65 | % |
Ratios to average net assets (annualized) | | | | | | | | | | | | | | | | | | | | | | | | |
Gross expenses | | | 0.87 | % | | | 0.84 | % | | | 0.85 | % | | | 0.90 | % | | | 0.94 | % | | | 0.86 | % |
Net expenses | | | 0.68 | % | | | 0.66 | % | | | 0.66 | % | | | 0.66 | % | | | 0.66 | % | | | 0.66 | % |
Net investment income | | | 1.10 | % | | | 0.86 | % | | | 0.83 | % | | | 1.24 | % | | | 1.19 | % | | | 1.32 | % |
Supplemental data | | | | | | | | | | | | | | | | | | | | | | | | |
Portfolio turnover rate | | | 22 | % | | | 44 | % | | | 61 | % | | | 67 | % | | | 41 | % | | | 43 | % |
Net assets, end of period (000s omitted) | | | $271,926 | | | | $63,235 | | | | $5,775 | | | | $537 | | | | $480 | | | | $478 | |
| 1 | Calculated based upon average shares outstanding |
| 2 | Returns for periods of less than one year are not annualized. |
The accompanying notes are an integral part of these financial statements.
| | | | | | |
| Notes to financial statements (unaudited) | | Wells Fargo Large Cap Core Fund | | | 19 | |
1. ORGANIZATION
Wells Fargo Funds Trust (the “Trust”), a Delaware statutory trust organized on March 10, 1999, is an open-end management investment company registered under the Investment Company Act of 1940, as amended (the “1940 Act”). As an investment company, the Trust follows the accounting and reporting guidance in Financial Accounting Standards Board (“FASB”) Accounting Standards Codification Topic 946, Financial Services – Investment Companies. These financial statements report on the Wells Fargo Large Cap Core Fund (the “Fund”) which is a diversified series of the Trust.
Effective at the close of business on October 23, 2015, Investor Class shares became Class A shares in a tax-free conversion. Shareholders of Investor Class received Class A shares at a value equal to the value of their Investor Class shares immediately prior to the conversion. Investor Class shares are no longer offered by the Fund.
2. SIGNIFICANT ACCOUNTING POLICIES
The following significant accounting policies, which are consistently followed in the preparation of the financial statements of the Fund, are in conformity with U.S. generally accepted accounting principles which require management to make estimates and assumptions that affect the reported amounts of assets and liabilities, disclosure of contingent assets and liabilities at the date of the financial statements, and the reported amounts of revenues and expenses during the reporting period. Actual results could differ from those estimates.
Securities valuation
All investments are valued each business day as of the close of regular trading on the New York Stock Exchange (generally 4 p.m. Eastern Time).
Equity securities that are listed on a foreign or domestic exchange or market are valued at the official closing price or, if none, the last sales price. If no sale occurs on the principal exchange or market that day, the prior day’s price will be deemed “stale” and a fair value price will be determined in accordance with the Fund’s Valuation Procedures.
Investments in registered open-end investment companies are valued at net asset value. Interests in non-registered investment vehicles that are redeemable at net asset value are fair valued normally at net asset value.
Investments which are not valued using any of the methods discussed above are valued at their fair value, as determined in good faith by the Board of Trustees of the Fund. The Board of Trustees has established a Valuation Committee comprised of the Trustees and has delegated to it the authority to take any actions regarding the valuation of portfolio securities that the Valuation Committee deems necessary or appropriate, including determining the fair value of portfolio securities, unless the determination has been delegated to the Management Valuation Team of Wells Fargo Funds Management, LLC (“Funds Management”). The Board of Trustees retains the authority to make or ratify any valuation decisions or approve any changes to the Valuation Procedures as it deems appropriate. On a quarterly basis, the Board of Trustees receives reports on any valuation actions taken by the Valuation Committee or the Management Valuation Team which may include items for ratification.
Valuations of fair valued securities are compared to the next actual sales price when available, or other appropriate market values, to assess the continued appropriateness of the fair valuation methodologies used. These securities are fair valued on a day-to-day basis, taking into consideration changes to appropriate market information and any significant changes to the inputs considered in the valuation process until there is a readily available price provided on an exchange or by an independent pricing service. Valuations received from an independent pricing service or independent broker-dealer quotes are periodically validated by comparisons to most recent trades and valuations provided by other independent pricing services in addition to the review of prices by the manager and/or subadviser. Unobservable inputs used in determining fair valuations are identified based on the type of security, taking into consideration factors utilized by market participants in valuing the investment, knowledge about the issuer and the current market environment.
Security loans
The Fund may lend its securities from time to time in order to earn additional income in the form of fees or interest on securities received as collateral or the investment of any cash received as collateral. The Fund continues to receive interest or dividends on the securities loaned. The Fund receives collateral in the form of cash or securities with a value at least equal to the value of the securities on loan. The value of the loaned securities is determined at the close of each business day and any additional required collateral is delivered to the Fund on the next business day. In a securities lending transaction, the net asset value of the Fund will be affected by an increase or decrease in the value of the securities loaned and by an increase or decrease in the value of the instrument in which collateral is invested. The amount of securities lending activity undertaken by the Fund fluctuates from time to time. In the event of default or bankruptcy by the borrower, the Fund may be prevented from recovering the loaned securities or gaining access to the collateral or
| | | | |
| 20 | | Wells Fargo Large Cap Core Fund | | Notes to financial statements (unaudited) |
may experience delays or costs in doing so. In addition, the investment of any cash collateral received may lose all or part of its value. The Fund has the right under the lending agreement to recover the securities from the borrower on demand.
The Fund lends its securities through an unaffiliated securities lending agent. Cash collateral received in connection with its securities lending transactions is invested in Securities Lending Cash Investments, LLC (the “Securities Lending Fund”). The Securities Lending Fund is exempt from registration under Section 3(c)(7) of the 1940 Act and is managed by Funds Management and is subadvised by Wells Capital Management Incorporated (“WellsCap”), an affiliate of Funds Management and an indirect wholly owned subsidiary of Wells Fargo & Company (“Wells Fargo”). Funds Management receives an advisory fee starting at 0.05% and declining to 0.01% as the average daily net assets of the Securities Lending Fund increase. All of the fees received by Funds Management are paid to WellsCap for its services as subadviser. The Securities Lending Fund seeks to provide a positive return compared to the daily Fed Funds Open rate by investing in high-quality, U.S. dollar-denominated short-term money market instruments. Securities Lending Fund investments are fair valued based upon the amortized cost valuation technique. Income earned from investment in the Securities Lending Fund is included in securities lending income on the Statement of Operations.
Security transactions and income recognition
Securities transactions are recorded on a trade date basis. Realized gains or losses are recorded on the basis of identified cost.
Dividend income is recognized on the ex-dividend date. Dividend income is recorded net of foreign taxes withheld where recovery of such taxes is not assured.
Distributions to shareholders
Distributions to shareholders from net investment income and net realized gains, if any, are recorded on the ex-dividend date. Such distributions are determined in conformity with federal income tax regulations, which may differ in amount or character from net investment income and realized gains recognized for purposes of U.S. generally accepted accounting principles.
Federal and other taxes
The Fund intends to continue to qualify as a regulated investment company by distributing substantially all of its investment company taxable income and any net realized capital gains (after reduction for capital loss carryforwards) sufficient to relieve it from all, or substantially all, federal income taxes. Accordingly, no provision for federal income taxes was required.
The Fund’s income and federal excise tax returns and all financial records supporting those returns for the prior three fiscal years are subject to examination by the federal and Delaware revenue authorities. Management has analyzed the Fund’s tax positions taken on federal, state, and foreign tax returns for all open tax years and does not believe that there are any uncertain tax positions that require recognition of a tax liability.
As of July 31, 2015, the Fund had capital loss carryforwards available to offset future net realized capital gains in the amount of $309,497 expiring in 2017.
Class allocations
The separate classes of shares offered by the Fund differ principally in applicable sales charges, distribution, shareholder servicing, and administration fees. Class specific expenses are charged directly to that share class. Investment income, common expenses, and realized and unrealized gains (losses) on investments are allocated daily to each class of shares based on the relative proportion of net assets of each class.
3. FAIR VALUATION MEASUREMENTS
Fair value measurements of investments are determined within a framework that has established a fair value hierarchy based upon the various data inputs utilized in determining the value of the Fund’s investments. The three-level hierarchy gives the highest priority to unadjusted quoted prices in active markets for identical assets or liabilities (Level 1) and the lowest priority to significant unobservable inputs (Level 3). The Fund’s investments are classified within the fair value hierarchy based on the lowest level of input that is significant to the fair value measurement. The inputs are summarized into three broad levels as follows:
| n | | Level 1 – quoted prices in active markets for identical securities |
| n | | Level 2 – other significant observable inputs (including quoted prices for similar securities, interest rates, prepayment speeds, credit risk, use of amortized cost, etc.) |
| | | | | | |
| Notes to financial statements (unaudited) | | Wells Fargo Large Cap Core Fund | | | 21 | |
| n | | Level 3 – significant unobservable inputs (including the Fund’s own assumptions in determining the fair value of investments) |
The inputs or methodologies used for valuing investments in securities are not necessarily an indication of the risk associated with investing in those securities.
The following is a summary of the inputs used in valuing the Fund’s assets and liabilities as of January 31, 2016:
| | | | | | | | | | | | | | | | |
| | | Quoted prices
(Level 1) | | | Other significant
observable inputs
(Level 2) | | | Significant
unobservable inputs
(Level 3) | | | Total | |
Assets | | | | | | | | | | | | | | | | |
Investments in: | | | | | | | | | | | | | | | | |
| | | | |
Common stocks | | | | | | | | | | | | | | | | |
Consumer discretionary | | $ | 139,634,048 | | | $ | 0 | | | $ | 0 | | | $ | 139,634,048 | |
Consumer staples | | | 38,889,167 | | | | 0 | | | | 0 | | | | 38,889,167 | |
Energy | | | 42,289,221 | | | | 0 | | | | 0 | | | | 42,289,221 | |
Financials | | | 102,629,397 | | | | 0 | | | | 0 | | | | 102,629,397 | |
Health care | | | 148,939,638 | | | | 0 | | | | 0 | | | | 148,939,638 | |
Industrials | | | 99,491,286 | | | | 0 | | | | 0 | | | | 99,491,286 | |
Information technology | | | 183,577,179 | | | | 0 | | | | 0 | | | | 183,577,179 | |
Materials | | | 49,698,269 | | | | 0 | | | | 0 | | | | 49,698,269 | |
Telecommunication services | | | 18,822,743 | | | | 0 | | | | 0 | | | | 18,822,743 | |
| | | | |
Short-term investments | | | | | | | | | | | | | | | | |
Investment companies | | | 17,764,199 | | | | 0 | | | | 0 | | | | 17,764,199 | |
Total assets | | $ | 841,735,147 | | | $ | 0 | | | $ | 0 | | | $ | 841,735,147 | |
The Fund recognizes transfers between levels within the fair value hierarchy at the end of the reporting period. At January 31, 2016, the Fund did not have any transfers into/out of Level 1, Level 2, or Level 3.
4. TRANSACTIONS WITH AFFILIATES
Management fee
Funds Management, an indirect wholly owned subsidiary of Wells Fargo, is the manager of the Fund and provides advisory and fund-level administrative services under an investment management agreement. Under the investment management agreement, Funds Management is responsible for, among other services, implementing the investment objectives and strategies of the Fund, supervising the applicable subadviser, providing fund-level administrative services in connection with the Fund’s operations, and providing any other fund-level administrative services reasonably necessary for the operation of the Fund. As compensation for its services under the investment management agreement, Funds Management is entitled to receive an annual management fee starting at 0.70% and declining to 0.505% as the average daily net assets of the Fund increase. For the six months ended January 31, 2016, the management fee was equivalent to an annual rate of 0.69% of the Fund’s average daily net assets.
Funds Management has retained the services of a subadviser to provide daily portfolio management to the Fund. The fee for subadvisory services is borne by Funds Management. Golden Capital Management, LLC, an affiliate of Funds Management, is the subadviser to the Fund and is entitled to receive a fee from Funds Management at an annual rate starting at 0.35% and declining to 0.30% as the average daily net assets of the Fund increase.
| | | | |
| 22 | | Wells Fargo Large Cap Core Fund | | Notes to financial statements (unaudited) |
Administration fees
Under a class-level administration agreement, Funds Management provides class-level administrative services to the Fund, which includes paying fees and expenses for services provided by the transfer agent, sub-transfer agents, omnibus account servicers and record-keepers. As compensation for its services under the class-level administration agreement, Funds Management receives an annual fee which is calculated based on the average daily net assets of each class as follows:
| | | | |
| | | Class-level
administration fee | |
Class A, Class C, Class R | | | 0.21 | % |
Class R6 | | | 0.03 | |
Administrator Class, Institutional Class | | | 0.13 | |
Investor Class | | | 0.32 | |
Funds Management has contractually waived and/or reimbursed management and administration fees to the extent necessary to maintain certain net operating expense ratios for the Fund. Waiver of fees and/or reimbursement of expenses by Funds Management were made first from fund level expenses on a proportionate basis and then from class specific expenses. Funds Management has committed through November 30, 2016 to waive fees and/or reimburse expenses to the extent necessary to cap the Fund’s expenses at 1.14% for Class A shares, 1.89% for Class C shares, 1.39% for Class R shares, 0.68% for Class R6 shares, 1.00% for Administrator Class shares and 0.70% for Institutional Class shares. After this time, the cap may be increased or the commitment to maintain the cap may be terminated only with the approval of the Board of Trustees. Prior to December 1, 2015, the Fund’s expenses were capped at 0.90% for Administrator Class shares and 0.66% for Institutional Class shares.
Distribution fees
The Trust has adopted a distribution plan for Class C and Class R shares of the Fund pursuant to Rule 12b-1 under the 1940 Act. Distribution fees are charged to Class C and Class R shares and paid to Wells Fargo Funds Distributor, LLC (“Funds Distributor”), the principal underwriter, at an annual rate of 0.75% of the average daily net assets of Class C shares and 0.25% of the average daily net assets of Class R shares.
In addition, Funds Distributor is entitled to receive the front-end sales charge from the purchase of Class A shares and a contingent deferred sales charge on the redemption of certain Class A shares. Funds Distributor is also entitled to receive the contingent deferred sales charges from redemptions of Class C shares. For the six months ended January 31, 2016, Funds Distributor received $53,172 from the sale of Class A shares and $861 in contingent deferred sales charges from redemptions of Class C shares.
Shareholder servicing fees
The Trust has entered into contracts with one or more shareholder servicing agents, whereby Class A, Class C, Class R, Administrator Class, and Investor Class of the Fund is charged a fee at an annual rate of 0.25% of the average daily net assets of each respective class.
A portion of these total shareholder servicing fees were paid to affiliates of Wells Fargo.
5. INVESTMENT PORTFOLIO TRANSACTIONS
Purchases and sales of investments, excluding U.S. government obligations (if any) and short-term securities, for the six months ended January 31, 2016 were $488,960,907 and $147,149,698, respectively.
6. BANK BORROWINGS
The Trust (excluding the money market funds and certain other funds) and Wells Fargo Variable Trust are parties to a $200,000,000 revolving credit agreement whereby the Fund is permitted to use bank borrowings for temporary or emergency purposes, such as to fund shareholder redemption requests. Interest under the credit agreement is charged to the Fund based on a borrowing rate equal to the higher of the Federal Funds rate in effect on that day plus 1.25% or the overnight LIBOR rate in effect on that day plus 1.25%. In addition, an annual commitment fee equal to 0.20% of the unused balance is allocated to each participating fund. Prior to September 1, 2015, the revolving credit agreement amount was $150,000,000 and the annual commitment fee was equal to 0.10% of the unused balance which was allocated to each participating fund. For the six months ended January 31, 2016, the Fund paid $1,041 in commitment fees.
| | | | | | |
| Notes to financial statements (unaudited) | | Wells Fargo Large Cap Core Fund | | | 23 | |
For the six months ended January 31, 2016, there were no borrowings by the Fund under the agreement.
7. INDEMNIFICATION
Under the Trust’s organizational documents, the officers and Trustees have been granted certain indemnification rights against certain liabilities that may arise out of performance of their duties to the Trust. Additionally, in the normal course of business, the Trust may enter into contracts with service providers that contain a variety of indemnification clauses. The Trust’s maximum exposure under these arrangements is dependent on future claims that may be made against the Fund and, therefore, cannot be estimated.
| | | | |
| 24 | | Wells Fargo Large Cap Core Fund | | Other information (unaudited) |
PROXY VOTING INFORMATION
A description of the policies and procedures that the Fund uses to determine how to vote proxies relating to portfolio securities is available, upon request, by calling 1-800-222-8222, visiting our website at wellsfargofunds.com, or visiting the SEC website at sec.gov. Information regarding how the Fund voted proxies relating to portfolio securities during the most recent 12-month period ended June 30 is available on the Fund’s website at wellsfargofunds.com or by visiting the SEC website at sec.gov.
PORTFOLIO HOLDINGS INFORMATION
The complete portfolio holdings for the Fund are publicly available monthly on the Fund’s website (wellsfargofunds.com), on a one-month delayed basis. In addition, top ten holdings information (excluding derivative positions) for the Fund is publicly available on the Fund’s website on a monthly, seven-day or more delayed basis. The Fund files its complete schedule of portfolio holdings with the SEC for the first and third quarters of each fiscal year on Form N-Q, which is available by visiting the SEC website at sec.gov. In addition, the Fund’s Form N-Q may be reviewed and copied at the SEC’s Public Reference Room in Washington, DC, and at regional offices in New York City, at 233 Broadway, and in Chicago, at 175 West Jackson Boulevard, Suite 900. Information about the Public Reference Room may be obtained by calling 1-800-SEC-0330.
| | | | | | |
| Other information (unaudited) | | Wells Fargo Large Cap Core Fund | | | 25 | |
BOARD OF TRUSTEES AND OFFICERS
Each of the Trustees and Officers1 listed in the table below acts in identical capacities for each fund in the Wells Fargo family of funds, which consists of 144 mutual funds comprising the Wells Fargo Funds Trust, Wells Fargo Variable Trust, Wells Fargo Master Trust and four closed-end funds (collectively the “Fund Complex”). This table should be read in conjunction with the Prospectus and the Statement of Additional Information2. The mailing address of each Trustee and Officer is 525 Market Street, 12th Floor, San Francisco, CA 94105. Each Trustee and Officer serves an indefinite term, however, each Trustee serves such term until reaching the mandatory retirement age established by the Trustees.
Independent Trustees
| | | | | | |
Name and
year of birth | | Position held and
length of service* | | Principal occupations during past five years or longer | | Current other
public company or
investment company
directorships |
William R. Ebsworth
(Born 1957) | | Trustee, since 2015 | | Retired. From 1984 to 2013, equities analyst, portfolio manager, research director and chief financial officer at Fidelity Management and Research Company in Boston, Tokyo, and Hong Kong and retired in 2013 as Chief Investment Officer of Fidelity Strategic Advisers, Inc. where he lead a team of investment professionals managing client assets. Prior thereto, Board member of Hong Kong Securities Clearing Co., Hong Kong Options Clearing Corp., the Thailand International Fund, Ltd., Fidelity Investments Life Insurance Company, and Empire Fidelity Investments Life Insurance Company. Mr. Ebsworth is a CFA® charterholder and an Adjunct Lecturer, Finance, at Babson College. | | Asset Allocation Trust |
Jane A. Freeman
(Born 1953) | | Trustee, since 2015 | | Retired. From 2012 to 2014 and 1999 to 2008, Chief Financial Officer of Scientific Learning Corporation. From 2008 to 2012, Ms. Freeman provided consulting services related to strategic business projects. Prior to 1999, Portfolio Manager at Rockefeller & Co. and Scudder, Stevens & Clark. Board member of the Harding Loevner Funds from 1996 to 2014, serving as both Lead Independent Director and chair of the Audit Committee. Board member of the Russell Exchange Traded Funds Trust from 2011 to 2012 and the chair of the Audit Committee. Ms. Freeman is Chair of Taproot Foundation (non-profit organization), a Board Member of Ruth Bancroft Garden (non-profit organization) and an inactive chartered financial analyst. | | Asset Allocation Trust |
Peter G. Gordon
(Born 1942) | | Trustee, since 1998; Chairman, since 2005 | | Co-Founder, Retired Chairman, President and CEO of Crystal Geyser Water Company. Trustee Emeritus, Colby College. | | Asset Allocation Trust |
Isaiah Harris, Jr.
(Born 1952) | | Trustee, since 2009 | | Retired. Chairman of the Board of CIGNA Corporation since 2009, and Director since 2005. From 2003 to 2011, Director of Deluxe Corporation. Prior thereto, President and CEO of BellSouth Advertising and Publishing Corp. from 2005 to 2007, President and CEO of BellSouth Enterprises from 2004 to 2005 and President of BellSouth Consumer Services from 2000 to 2003. Emeritus member of the Iowa State University Foundation Board of Governors. Emeritus Member of the Advisory Board of Iowa State University School of Business. Advisory Board Member, Palm Harbor Academy (charter school). Advisory Board Member, Child Evangelism Fellowship (non-profit). Mr. Harris is a certified public accountant (inactive status). | | CIGNA Corporation; Asset Allocation Trust |
Judith M. Johnson
(Born 1949) | | Trustee, since 2008; Audit Committee Chairman, since 2008 | | Retired. Prior thereto, Chief Executive Officer and Chief Investment Officer of Minneapolis Employees Retirement Fund from 1996 to 2008. Ms. Johnson is an attorney, certified public accountant and a certified managerial accountant. | | Asset Allocation Trust |
David F. Larcker
(Born 1950) | | Trustee, since 2009 | | James Irvin Miller Professor of Accounting at the Graduate School of Business, Stanford University, Director of the Corporate Governance Research Initiative and Senior Faculty of The Rock Center for Corporate Governance since 2006. From 2005 to 2008, Professor of Accounting at the Graduate School of Business, Stanford University. Prior thereto, Ernst & Young Professor of Accounting at The Wharton School, University of Pennsylvania from 1985 to 2005. | | Asset Allocation Trust |
| | | | |
| 26 | | Wells Fargo Large Cap Core Fund | | Other information (unaudited) |
| | | | | | |
Name and
year of birth | | Position held and
length of service* | | Principal occupations during past five years or longer | | Current other
public company or
investment company
directorships |
Olivia S. Mitchell
(Born 1953) | | Trustee, since 2006 | | International Foundation of Employee Benefit Plans Professor, Wharton School of the University of Pennsylvania since 1993. Director of Wharton’s Pension Research Council and Boettner Center on Pensions & Retirement Research, and Research Associate at the National Bureau of Economic Research. Previously, Cornell University Professor from 1978 to 1993. | | Asset Allocation Trust |
Timothy J. Penny
(Born 1951) | | Trustee, since 1996 | | President and Chief Executive Officer of Southern Minnesota Initiative Foundation, a non-profit organization, since 2007 and Senior Fellow at the Humphrey Institute Policy Forum at the University of Minnesota since 1995. Member of the Board of Trustees of NorthStar Education Finance, Inc., a non-profit organization, since 2007. | | Asset Allocation Trust |
Michael S. Scofield
(Born 1943) | | Trustee, since 2010 | | Served on the Investment Company Institute’s Board of Governors and Executive Committee from 2008-2011 as well the Governing Council of the Independent Directors Council from 2006-2011 and the Independent Directors Council Executive Committee from 2008-2011. Chairman of the IDC from 2008-2010. Institutional Investor (Fund Directions) Trustee of Year in 2007. Trustee of the Evergreen Funds complex (and its predecessors) from 1984 to 2010. Chairman of the Evergreen Funds from 2000-2010. Former Trustee of the Mentor Funds. Retired Attorney, Law Offices of Michael S. Scofield. | | Asset Allocation Trust |
| * | Length of service dates reflect the Trustee’s commencement of service with the Trust’s predecessor entities, where applicable. |
Officers
| | | | | | |
Name and
year of birth | | Position held and
length of service | | Principal occupations during past five years or longer | | |
Karla M. Rabusch
(Born 1959) | | President, since 2003 | | Executive Vice President of Wells Fargo Bank, N.A. and President of Wells Fargo Funds Management, LLC since 2003. | | |
Jeremy DePalma1
(Born 1974) | | Treasurer, since 2012; Assistant Treasurer, since 2009 | | Senior Vice President of Wells Fargo Funds Management, LLC since 2009. Senior Vice President of Evergreen Investment Management Company, LLC from 2008 to 2010 and head of the Fund Reporting and Control Team within Fund Administration from 2005 to 2010. | | |
C. David Messman
(Born 1960) | | Secretary, since 2000; Chief Legal Officer, since 2003 | | Senior Vice President and Secretary of Wells Fargo Funds Management, LLC since 2001. Assistant General Counsel of Wells Fargo Bank, N.A. since 2013 and Vice President and Managing Counsel of Wells Fargo Bank, N.A. from 1996 to 2013. | | |
Debra Ann Early
(Born 1964) | | Chief Compliance Officer, since 2007 | | Executive Vice President of Wells Fargo Funds Management, LLC since 2014, Senior Vice President and Chief Compliance Officer from 2007 to 2014. | | |
David Berardi
(Born 1975) | | Assistant Treasurer, since 2009 | | Vice President of Wells Fargo Funds Management, LLC since 2009. Vice President of Evergreen Investment Management Company, LLC from 2008 to 2010. Manager of Fund Reporting and Control for Evergreen Investment Management Company, LLC from 2004 to 2010. | | |
| 1 | Jeremy DePalma acts as Treasurer of 72 funds and Assistant Treasurer of 72 funds in the Fund Complex. |
| 2 | The Statement of Additional Information includes additional information about the Trustees and is available, without charge, upon request, by calling 1-800-222-8222 or by visiting the website at wellsfargofunds.com. |
| | | | | | |
| List of abbreviations | | Wells Fargo Large Cap Core Fund | | | 27 | |
The following is a list of common abbreviations for terms and entities that may have appeared in this report.
| ACA | — ACA Financial Guaranty Corporation |
| ADR | — American depositary receipt |
| ADS | — American depositary shares |
| AGC | — Assured Guaranty Corporation |
| AGM | — Assured Guaranty Municipal |
| Ambac | — Ambac Financial Group Incorporated |
| AMT | — Alternative minimum tax |
| BAN | — Bond anticipation notes |
| BHAC | — Berkshire Hathaway Assurance Corporation |
| CAB | — Capital appreciation bond |
| CCAB | — Convertible capital appreciation bond |
| CDA | — Community Development Authority |
| CDO | — Collateralized debt obligation |
| DRIVER | — Derivative inverse tax-exempt receipts |
| DW&P | — Department of Water & Power |
| DWR | — Department of Water Resources |
| ECFA | — Educational & Cultural Facilities Authority |
| EDA | — Economic Development Authority |
| EDFA | — Economic Development Finance Authority |
| ETF | — Exchange-traded fund |
| FDIC | — Federal Deposit Insurance Corporation |
| FFCB | — Federal Farm Credit Banks |
| FGIC | — Financial Guaranty Insurance Corporation |
| FHA | — Federal Housing Administration |
| FHLB | — Federal Home Loan Bank |
| FHLMC | — Federal Home Loan Mortgage Corporation |
| FICO | — The Financing Corporation |
| FNMA | — Federal National Mortgage Association |
| GDR | — Global depositary receipt |
| GNMA | — Government National Mortgage Association |
| HCFR | — Healthcare facilities revenue |
| HEFA | — Health & Educational Facilities Authority |
| HEFAR | — Higher education facilities authority revenue |
| HFA | — Housing Finance Authority |
| HFFA | — Health Facilities Financing Authority |
| HUD | — Department of Housing and Urban Development |
| IDA | — Industrial Development Authority |
| IDAG | — Industrial Development Agency |
| KRW | — Republic of Korea won |
| LIBOR | — London Interbank Offered Rate |
| LIFER | — Long Inverse Floating Exempt Receipts |
| LLC | — Limited liability company |
| LLLP | — Limited liability limited partnership |
| LLP | — Limited liability partnership |
| MBIA | — Municipal Bond Insurance Association |
| MFHR | — Multifamily housing revenue |
| MSTR | — Municipal securities trust receipts |
| MUD | — Municipal Utility District |
| National | — National Public Finance Guarantee Corporation |
| PCFA | — Pollution Control Financing Authority |
| PCL | — Public Company Limited |
| PCR | — Pollution control revenue |
| PFA | — Public Finance Authority |
| PFFA | — Public Facilities Financing Authority |
| PFOTER | — Puttable floating option tax-exempt receipts |
| plc | — Public limited company |
| PUTTER | — Puttable tax-exempt receipts |
| R&D | — Research & development |
| Radian | — Radian Asset Assurance |
| RAN | — Revenue anticipation notes |
| RDA | — Redevelopment Authority |
| RDFA | — Redevelopment Finance Authority |
| REIT | — Real estate investment trust |
| ROC | — Reset option certificates |
| SAVRS | — Select auction variable rate securities |
| SBA | — Small Business Authority |
| SDR | — Swedish depositary receipt |
| SFHR | — Single-family housing revenue |
| SFMR | — Single-family mortgage revenue |
| SPA | — Standby purchase agreement |
| SPDR | — Standard & Poor’s Depositary Receipts |
| SPEAR | — Short Puttable Exempt Adjustable Receipts |
| STRIPS | — Separate trading of registered interest and |
| TAN | — Tax anticipation notes |
| TIPS | — Treasury inflation-protected securities |
| TRAN | — Tax revenue anticipation notes |
| TTFA | — Transportation Trust Fund Authority |
| TVA | — Tennessee Valley Authority |
This page is intentionally left blank.

For more information
More information about Wells Fargo Funds is available free upon request. To obtain literature, please write, email, visit the Fund’s website, or call:
Wells Fargo Funds
P.O. Box 8266
Boston, MA 02266-8266
Email: fundservice@wellsfargo.com
Website: wellsfargofunds.com
Individual investors: 1-800-222-8222
Retail investment professionals: 1-888-877-9275
Institutional investment professionals: 1-866-765-0778
This report and the financial statements contained herein are submitted for the general information of the shareholders of the Fund. If this report is used for promotional purposes, distribution of the report must be accompanied or preceded by a current prospectus. Before investing, please consider the investment objectives, risks, charges, and expenses of the investment. For a current prospectus and, if available, a summary prospectus, containing this information, call 1-800-222-8222 or visit the Fund’s website at wellsfargofunds.com. Read the prospectus carefully before you invest or send money.
Wells Fargo Asset Management (WFAM) is a trade name used by the asset management businesses of Wells Fargo & Company. Wells Fargo Funds Management, LLC, a wholly owned subsidiary of Wells Fargo & Company, provides investment advisory and administrative services for Wells Fargo Funds. Other affiliates of Wells Fargo & Company provide subadvisory and other services for the funds. The funds are distributed by Wells Fargo Funds Distributor, LLC, Member FINRA, an affiliate of Wells Fargo & Company.
NOT FDIC INSURED ¡ NO BANK GUARANTEE ¡ MAY LOSE VALUE
© 2016 Wells Fargo Funds Management, LLC. All rights reserved.
| | |
 | | 240798 03-16 SA208/SAR208 01-16 |
Semi-Annual Report
January 31, 2016

Wells Fargo Large Cap Growth Fund


Reduce clutter. Save trees.
Sign up for electronic delivery of prospectuses and shareholder reports at wellsfargo.com/advantagedelivery
Contents
The views expressed and any forward-looking statements are as of January 31, 2016, unless otherwise noted, and are those of the Fund managers and/or Wells Fargo Funds Management, LLC. Discussions of individual securities, or the markets generally, or any Wells Fargo Fund are not intended as individual recommendations. Future events or results may vary significantly from those expressed in any forward-looking statements. The views expressed are subject to change at any time in response to changing circumstances in the market. Wells Fargo Funds Management, LLC and the Fund disclaim any obligation to publicly update or revise any views expressed or forward-looking statements.
NOT FDIC INSURED ¡ NO BANK GUARANTEE ¡ MAY LOSE VALUE
| | | | |
| 2 | | Wells Fargo Large Cap Growth Fund | | Letter to shareholders (unaudited) |

Karla M. Rabusch
President
Wells Fargo Funds
Despite generally improving U.S. economic data, ongoing global turmoil tempered U.S. economic growth during the period as many economies and markets outside the U.S. faced ongoing challenges.
Dear Valued Shareholder:
We are pleased to offer you this semi-annual report for the Wells Fargo Large Cap Growth Fund for the six-month period that ended January 31, 2016. Despite generally continuing U.S. economic data, ongoing global turmoil tempered U.S. economic growth during the period as many economies and markets outside the U.S. faced ongoing challenges. In this environment, the broad U.S. stock market experienced heightened volatility and ultimately fell 5.64% overall for the six-month period (as measured by the Russell 3000® Index,1 which is the index used to measure U.S. stock market performance throughout this letter).
As the reporting period began, China’s slowdown continued to take a toll on U.S. and international markets.
The U.S. stock market declined 6.04% and 2.91% in August and September 2015, respectively, as investors worried about the impact on the U.S. of China’s slowing growth. A number of positive economic indicators released during these months suggested the U.S. economy remained solid. However, the strengthening U.S. dollar coupled with ongoing global economic turmoil continued to hinder the economy. Although many investors believed the U.S. Federal Reserve (Fed) would raise the federal funds rate during the third quarter of 2015, at its September 2015 meeting the Fed left the rate unchanged. This decision fueled uncertainty about the U.S. economy’s stamina to remain healthy while facing the negative effects of troubles elsewhere in the world. One week later, Fed Chair Janet Yellen reassured investors that, barring unpleasant surprises, the Fed still intended to raise the rate in 2015. International markets were more volatile than the domestic market and delivered even weaker results in August and September. Investors’ anxiety was driven largely by China’s weakened economy. Because China is the world’s largest importer of many commodities, a number of emerging markets—key commodities exporters—struggled under the strains of reduced demand for commodities and lower prices for the commodities sold.
The U.S. stock market delivered a positive result overall for the last three months of 2015 despite ongoing concerns.
The broad U.S. stock market fluctuated widely in the fourth quarter of 2015, rising 7.90% in October and 0.55% in November before falling 2.05% in December, for an overall quarterly return of 6.27%. Stock markets outside the U.S. generally failed to keep pace with the domestic market as economic concerns, including China’s ongoing slowdown, continued to affect many countries worldwide. U.S. economic data released during the quarter indicated the economy remained solid, with modest growth. However, the strong U.S. dollar and global economic turmoil continued their drag on the economy. In December, the Fed, as expected, slightly raised its target short-term interest rate to between 0.25% and 0.50% after keeping it near zero for seven years. The move, which had been well telegraphed by the Fed for months, reflected confidence in the U.S. economy’s ability to stay healthy with less central-bank support. The Fed also made clear that future interest-rate increases will be gradual.
U.S. stocks struggled in January 2016.
The broad U.S. stock market dropped 5.64% for the month, weighed down by ongoing concerns about heightened market volatility, the continued plunge in oil prices, and the impact of weak global growth on U.S. companies. The U.S. economy, however, remained resilient in January—with continued solid hiring, a
| 1 | The Russell 3000® Index measures the performance of the 3,000 largest U.S. companies based on total market capitalization, which represents approximately 98% of the investable U.S. equity market. You cannot invest directly in an index. |
| | | | | | |
| Letter to shareholders (unaudited) | | Wells Fargo Large Cap Growth Fund | | | 3 | |
reduction in the jobless rate to 4.9%, and signs of an uptick in the pace of wage growth—despite some warning signs that became evident in recent months, such as weaknesses in manufacturing and business growth.
Don’t let short-term uncertainty derail long-term investment goals.
Periods of uncertainty can present challenges, but experience has taught us that maintaining long-term investment goals can be an effective way to plan for the future. To help you create a sound strategy based on your personal goals and risk tolerance, Wells Fargo Funds offers more than 100 mutual funds spanning a wide range of asset classes and investment styles. Although diversification cannot guarantee an investment profit or prevent losses, we believe it can be an effective way to manage investment risk and potentially smooth out overall portfolio performance. We encourage investors to know their investments and to understand that appropriate levels of risk-taking may unlock opportunities.
Thank you for choosing to invest in Wells Fargo Funds. We appreciate your confidence in us and remain committed to helping you meet your financial needs.
Sincerely,

Karla M. Rabusch
President
Wells Fargo Funds
Although diversification cannot guarantee an investment profit or prevent losses, we believe it can be an effective way to manage investment risk and potentially smooth out overall portfolio performance.
For further information about your Fund, contact your investment professional, visit our website at wellsfargofunds.com, or call us directly at 1-800-222-8222. We are available 24 hours a day, 7 days a week.
| | | | |
| 4 | | Wells Fargo Large Cap Growth Fund | | Performance highlights (unaudited) |
Investment objective
The Fund seeks long-term capital appreciation.
Manager
Wells Fargo Funds Management, LLC
Subadviser
Wells Fargo Funds Management Incorporated
Portfolio managers
Joseph M. Eberhardy, CFA®, CPA
Thomas C. Ognar, CFA®
Bruce C. Olson, , CFA®
Average annual total returns (%) as of January 31, 20161
| | | | | | | | | | | | | | | | | | | | | | | | | | | | | | | | | | |
| | | | | Including sales charge | | | Excluding sales charge | | | Expense ratios2 (%) | |
| | | Inception date | | 1 year | | | 5 year | | | 10 year | | | 1 year | | | 5 year | | | 10 year | | | Gross | | | Net3 | |
| Class A (STAFX) | | 7-30-2010 | | | (8.03 | ) | | | 8.76 | | | | 5.88 | | | | (2.41 | ) | | | 10.06 | | | | 6.51 | | | | 1.15 | | | | 1.07 | |
| Class C (STOFX) | | 7-30-2010 | | | (4.14 | ) | | | 9.24 | | | | 5.75 | | | | (3.14 | ) | | | 9.24 | | | | 5.75 | | | | 1.90 | | | | 1.82 | |
| Class R (STMFX) | | 6-15-2012 | | | – | | | | – | | | | – | | | | (2.66 | ) | | | 9.80 | | | | 6.31 | | | | 1.40 | | | | 1.32 | |
| Class R4 (SLGRX) | | 11-30-2012 | | | – | | | | – | | | | – | | | | (2.11 | ) | | | 10.43 | | | | 6.71 | | | | 0.87 | | | | 0.80 | |
| Class R6 (STFFX) | | 11-30-2012 | | | – | | | | – | | | | – | | | | (1.95 | ) | | | 10.54 | | | | 6.76 | | | | 0.72 | | | | 0.65 | |
| Administrator Class (STDFX) | | 7-30-2010 | | | – | | | | – | | | | – | | | | (2.30 | ) | | | 10.21 | | | | 6.59 | | | | 1.07 | | | | 0.95 | |
| Institutional Class (STNFX) | | 7-30-2010 | | | – | | | | – | | | | – | | | | (2.00 | ) | | | 10.50 | | | | 6.74 | | | | 0.82 | | | | 0.75 | |
| Russell 1000® Growth Index4 | | – | | | – | | | | – | | | | – | | | | 1.32 | | | | 11.67 | | | | 7.72 | | | | – | | | | – | |
Figures quoted represent past performance, which is no guarantee of future results, and do not reflect taxes that a shareholder may pay on fund distributions or the redemption of fund shares. Investment return and principal value of an investment will fluctuate so that an investor’s shares, when redeemed, may be worth more or less than their original cost. Performance shown without sales charges would be lower if sales charges were reflected. Current performance may be lower or higher than the performance data quoted, which assumes the reinvestment of dividends and capital gains. Current month-end performance is available on the Fund’s website, wellsfargofunds.com.
Index returns do not include transaction costs associated with buying and selling securities, any mutual fund fees or expenses, or any taxes. It is not possible to invest directly in an index.
For Class A shares, the maximum front-end sales charge is 5.75%. For Class C shares, the maximum contingent deferred sales charge is 1.00%. Performance including a contingent deferred sales charge assumes the sales charge for the corresponding time period. Class R, Class R4, Class R6, Administrator Class, and Institutional Class shares are sold without a front-end sales charge or contingent deferred sales charge.
Stock values fluctuate in response to the activities of individual companies and general market and economic conditions. Certain investment strategies tend to increase the total risk of an investment (relative to the broader market). The Fund is exposed to foreign investment risk. Consult the Fund’s prospectus for additional information on these and other risks.
Please see footnotes on page 5.
| | | | | | |
| Performance highlights (unaudited) | | Wells Fargo Large Cap Growth Fund | | | 5 | |
| | | | |
| Ten largest holdings (%) as of January 31, 20165 | |
Facebook Incorporated Class A | | | 4.67 | |
Alphabet Incorporated Class A | | | 3.63 | |
Dollar Tree Incorporated | | | 3.19 | |
Microsoft Corporation | | | 2.83 | |
Alphabet Incorporated Class C | | | 2.80 | |
Amazon.com Incorporated | | | 2.80 | |
Nike Incorporated Class B | | | 2.59 | |
MasterCard Incorporated Class A | | | 2.57 | |
Costco Wholesale Corporation | | | 2.53 | |
Alexion Pharmaceuticals Incorporated | | | 2.49 | |
|
| Sector distribution as of January 31, 20166 |
|
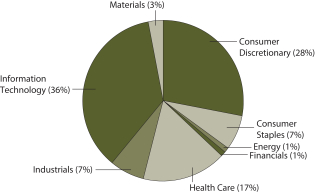 |
| 1 | Historical performance shown for Class A, Administator Class, and Institutional Class shares prior to their inception reflects the performance of the former Investor Class shares, and includes the higher expenses applicable to the former Investor Class shares. If these expenses had not been included, returns would be higher. Historical performance shown for Class C shares prior to their inception reflects the performance of the former Investor Class shares, adjusted to reflect the higher expenses applicable to Class C shares. Historical performance shown for Class R shares prior to their inception reflects the performance of the former Investor Class shares, adjusted to reflect the higher expenses applicable to Class R shares. Historical performance shown for Class R4 shares prior to their inception reflects the performance of Institutional Class shares, adjusted to reflect the higher expenses applicable to Class R4 shares. Historical performance shown for Class R6 shares prior to their inception reflects the performance of Institutional Class shares, and includes the higher expenses applicable to Institutional Class shares. If these expenses had not been included, returns would be higher. |
| 2 | Reflects the expense ratios as stated in the most recent prospectuses. The expense ratios shown are subject to change and may differ from the annualized expense ratios shown in the financial highlights of this report. |
| 3 | The manager has contractually committed through November 30, 2016, to waive fees and/or reimburse expenses to the extent necessary to cap the Fund’s Total Annual Fund Operating Expenses After Fee Waiver at the amounts shown. After this time, the cap may be increased or the commitment to maintain the cap may be terminated only with the approval of the Board of Trustees. Brokerage commissions, stamp duty fees, interest, taxes, acquired fund fees and expenses, and extraordinary expenses are excluded from the cap. Without this cap, the Fund’s returns would have been lower. |
| 4 | The Russell 1000® Growth Index measures the performance of those Russell 1000 Index companies with higher price-to-book ratios and higher forecasted growth values. You cannot invest directly in an index. |
| 5 | The ten largest holdings, excluding cash and cash equivalents, are calculated based on the value of the investments divided by total net assets of the Fund. Holdings are subject to change and may have changed since the date specified. |
| 6 | Amounts are calculated based on the total long-term investments of the Fund. These amounts are subject to change and may have changed since the date specified. |
| | | | |
| 6 | | Wells Fargo Large Cap Growth Fund | | Fund expenses (unaudited) |
As a shareholder of the Fund, you incur two types costs: (1) transaction costs, including sales charges (loads) on purchase payments and contingent deferred sales charges (if any) on redemptions and (2) ongoing costs, including management fees, distribution (12b-1) and/or shareholder servicing fees, and other Fund expenses. This example is intended to help you understand your ongoing costs (in dollars) of investing in the Fund and to compare these costs with the ongoing costs of investing in other mutual funds.
The example is based on an investment of $1,000 invested at the beginning of the six-month period and held for the entire period from August 1, 2015 to January 31, 2016.
Actual expenses
The “Actual” line of the table below provides information about actual account values and actual expenses. You may use the information in this line, together with the amount you invested, to estimate the expenses that you paid over the period. Simply divide your account value by $1,000 (for example, an $8,600 account value divided by $1,000 = 8.6), then multiply the result by the number in the “Actual” line under the heading entitled “Expenses paid during period” for your applicable class of shares to estimate the expenses you paid on your account during this period.
Hypothetical example for comparison purposes
The “Hypothetical” line of the table below provides information about hypothetical account values and hypothetical expenses based on the Fund’s actual expense ratio and an assumed rate of return of 5% per year before expenses, which is not the Fund’s actual return. The hypothetical account values and expenses may not be used to estimate the actual ending account balance or expenses you paid for the period. You may use this information to compare the ongoing costs of investing in the Fund and other funds. To do so, compare this 5% hypothetical example with the 5% hypothetical examples that appear in the shareholder reports of the other funds.
Please note that the expenses shown in the table are meant to highlight your ongoing costs only and do not reflect any transactional costs, such as sales charges (loads) and contingent deferred sales charges. Therefore, the “Hypothetical” line of the table is useful in comparing ongoing costs only and will not help you determine the relative total costs of owning different funds. In addition, if these transactional costs were included, your costs would have been higher.
| | | | | | | | | | | | | | | | |
| | | Beginning
account value
8-1-2015 | | | Ending
account value
1-31-2016 | | | Expenses
paid during
the period¹ | | | Net annualized
expense ratio | |
Class A | | | | | | | | | | | | | | | | |
Actual | | $ | 1,000.00 | | | $ | 897.08 | | | $ | 5.10 | | | | 1.07 | % |
Hypothetical (5% return before expenses) | | $ | 1,000.00 | | | $ | 1,019.76 | | | $ | 5.43 | | | | 1.07 | % |
Class C | | | | | | | | | | | | | | | | |
Actual | | $ | 1,000.00 | | | $ | 893.82 | | | $ | 8.66 | | | | 1.82 | % |
Hypothetical (5% return before expenses) | | $ | 1,000.00 | | | $ | 1,015.99 | | | $ | 9.22 | | | | 1.82 | % |
Class R | | | | | | | | | | | | | | | | |
Actual | | $ | 1,000.00 | | | $ | 895.93 | | | $ | 6.29 | | | | 1.32 | % |
Hypothetical (5% return before expenses) | | $ | 1,000.00 | | | $ | 1,018.50 | | | $ | 6.70 | | | | 1.32 | % |
Class R4 | | | | | | | | | | | | | | | | |
Actual | | $ | 1,000.00 | | | $ | 898.39 | | | $ | 3.67 | | | | 0.77 | % |
Hypothetical (5% return before expenses) | | $ | 1,000.00 | | | $ | 1,021.27 | | | $ | 3.91 | | | | 0.77 | % |
Class R6 | | | | | | | | | | | | | | | | |
Actual | | $ | 1,000.00 | | | $ | 899.08 | | | $ | 2.96 | | | | 0.62 | % |
Hypothetical (5% return before expenses) | | $ | 1,000.00 | | | $ | 1,022.02 | | | $ | 3.15 | | | | 0.62 | % |
Administrator Class | | | | | | | | | | | | | | | | |
Actual | | $ | 1,000.00 | | | $ | 897.63 | | | $ | 4.53 | | | | 0.95 | % |
Hypothetical (5% return before expenses) | | $ | 1,000.00 | | | $ | 1,020.36 | | | $ | 4.82 | | | | 0.95 | % |
Institutional Class | | | | | | | | | | | | | | | | |
Actual | | $ | 1,000.00 | | | $ | 898.94 | | | $ | 3.25 | | | | 0.68 | % |
Hypothetical (5% return before expenses) | | $ | 1,000.00 | | | $ | 1,021.72 | | | $ | 3.46 | | | | 0.68 | % |
| 1 | Expenses paid is equal to the annualized expense ratio of each class multiplied by the average account value over the period, multiplied by the number of days in the most recent fiscal half-year divided by the number of days in the fiscal year (to reflect the one-half-year period). |
| | | | | | |
| Portfolio of investments—January 31, 2016 (unaudited) | | Wells Fargo Large Cap Growth Fund | | | 7 | |
| | | | | | | | | | | | |
| Security name | | | | | | Shares | | | Value | |
| | | | |
Common Stocks: 98.15% | | | | | | | | | | | | |
| | | | |
Consumer Discretionary: 27.10% | | | | | | | | | | | | |
| | | | |
| Auto Components: 0.74% | | | | | | | | | | | | |
Delphi Automotive plc | | | | | | | 159,000 | | | $ | 10,325,460 | |
| | | | | | | | | | | | |
| | | | |
| Hotels, Restaurants & Leisure: 4.32% | | | | | | | | | | | | |
Hilton Worldwide Holdings Incorporated | | | | | | | 420,000 | | | | 7,480,200 | |
Marriott International Incorporated Class A « | | | | | | | 318,000 | | | | 19,487,040 | |
Starbucks Corporation | | | | | | | 555,000 | | | | 33,727,350 | |
| |
| | | | 60,694,590 | |
| | | | | | | | | | | | |
| | | | |
| Internet & Catalog Retail: 4.00% | | | | | | | | | | | | |
Amazon.com Incorporated † | | | | | | | 67,000 | | | | 39,329,000 | |
Netflix Incorporated † | | | | | | | 90,800 | | | | 8,339,072 | |
The Priceline Group Incorporated † | | | | | | | 8,000 | | | | 8,519,760 | |
| |
| | | | 56,187,832 | |
| | | | | | | | | | | | |
| | | | |
| Media: 2.18% | | | | | | | | | | | | |
Charter Communication Incorporated Class A Ǡ | | | | | | | 39,000 | | | | 6,683,040 | |
The Walt Disney Company | | | | | | | 250,000 | | | | 23,955,000 | |
| |
| | | | 30,638,040 | |
| | | | | | | | | | | | |
| | | | |
| Multiline Retail: 3.72% | | | | | | | | | | | | |
Dollar Tree Incorporated † | | | | | | | 551,000 | | | | 44,807,320 | |
Nordstrom Incorporated « | | | | | | | 153,000 | | | | 7,512,300 | |
| |
| | | | 52,319,620 | |
| | | | | | | | | | | | |
| | | | |
| Specialty Retail: 7.62% | | | | | | | | | | | | |
CarMax Incorporated Ǡ | | | | | | | 438,000 | | | | 19,350,840 | |
O’Reilly Automotive Incorporated † | | | | | | | 120,000 | | | | 31,308,000 | |
The Home Depot Incorporated | | | | | | | 226,000 | | | | 28,421,760 | |
Tractor Supply Company | | | | | | | 316,000 | | | | 27,905,960 | |
| |
| | | | 106,986,560 | |
| | | | | | | | | | | | |
| | | | |
| Textiles, Apparel & Luxury Goods: 4.52% | | | | | | | | | | | | |
Nike Incorporated Class B | | | | | | | 587,000 | | | | 36,399,870 | |
VF Corporation | | | | | | | 432,000 | | | | 27,043,200 | |
| |
| | | | 63,443,070 | |
| | | | | | | | | | | | |
| | | | |
Consumer Staples: 6.27% | | | | | | | | | | | | |
| | | | |
| Food & Staples Retailing: 4.13% | | | | | | | | | | | | |
Costco Wholesale Corporation | | | | | | | 235,000 | | | | 35,513,200 | |
CVS Health Corporation | | | | | | | 233,000 | | | | 22,505,470 | |
| |
| | | | 58,018,670 | |
| | | | | | | | | | | | |
| | | | |
| Household Products: 0.62% | | | | | | | | | | | | |
Colgate-Palmolive Company | | | | | | | 130,000 | | | | 8,778,900 | |
| | | | | | | | | | | | |
The accompanying notes are an integral part of these financial statements.
| | | | |
| 8 | | Wells Fargo Large Cap Growth Fund | | Portfolio of investments—January 31, 2016 (unaudited) |
| | | | | | | | | | | | |
| Security name | | | | | | Shares | | | Value | |
| | | | |
| Personal Products: 1.52% | | | | | | | | | | | | |
The Estee Lauder Companies Incorporated Class A | | | | | | | 250,000 | | | $ | 21,312,500 | |
| | | | | | | | | | | | |
| | | | |
Energy: 1.31% | | | | | | | | | | | | |
| | | | |
| Oil, Gas & Consumable Fuels: 1.31% | | | | | | | | | | | | |
Concho Resources Incorporated † | | | | | | | 194,000 | | | | 18,455,220 | |
| | | | | | | | | | | | |
| | | | |
Financials: 1.24% | | | | | | | | | | | | |
| | | | |
| Capital Markets: 1.24% | | | | | | | | | | | | |
TD Ameritrade Holding Corporation | | | | | | | 631,000 | | | | 17,402,980 | |
| | | | | | | | | | | | |
| | | | |
Health Care: 16.67% | | | | | | | | | | | | |
| | | | |
| Biotechnology: 8.71% | | | | | | | | | | | | |
Alexion Pharmaceuticals Incorporated † | | | | | | | 240,000 | | | | 35,023,200 | |
Biogen Incorporated † | | | | | | | 35,000 | | | | 9,557,100 | |
BioMarin Pharmaceutical Incorporated † | | | | | | | 76,000 | | | | 5,625,520 | |
Celgene Corporation † | | | | | | | 247,000 | | | | 24,779,040 | |
Gilead Sciences Incorporated | | | | | | | 132,000 | | | | 10,956,000 | |
Incyte Corporation † | | | | | | | 55,000 | | | | 3,880,800 | |
Medivation Incorporated † | | | | | | | 128,000 | | | | 4,185,600 | |
Regeneron Pharmaceuticals Incorporated † | | | | | | | 54,000 | | | | 22,684,860 | |
Vertex Pharmaceuticals Incorporated † | | | | | | | 63,000 | | | | 5,717,250 | |
| |
| | | | 122,409,370 | |
| | | | | | | | | | | | |
| | | | |
| Health Care Equipment & Supplies: 1.64% | | | | | | | | | | | | |
Medtronic plc | | | | | | | 303,148 | | | | 23,014,996 | |
| | | | | | | | | | | | |
| | | | |
| Health Care Providers & Services: 1.38% | | | | | | | | | | | | |
AmerisourceBergen Corporation | | | | | | | 216,050 | | | | 19,349,438 | |
| | | | | | | | | | | | |
| | | | |
| Health Care Technology: 0.90% | | | | | | | | | | | | |
Cerner Corporation † | | | | | | | 219,000 | | | | 12,704,190 | |
| | | | | | | | | | | | |
| | | | |
| Life Sciences Tools & Services: 0.79% | | | | | | | | | | | | |
Quintiles Transnational Holdings Incorporated † | | | | | | | 182,200 | | | | 11,083,226 | |
| | | | | | | | | | | | |
| | | | |
| Pharmaceuticals: 3.25% | | | | | | | | | | | | |
Allergan plc † | | | | | | | 36,125 | | | | 10,275,034 | |
Bristol-Myers Squibb Company | | | | | | | 297,000 | | | | 18,461,520 | |
Perrigo Company plc | | | | | | | 117,000 | | | | 16,915,861 | |
| |
| | | | 45,652,415 | |
| | | | | | | | | | | | |
| | | | |
Industrials: 6.99% | | | | | | | | | | | | |
| | | | |
| Aerospace & Defense: 1.10% | | | | | | | | | | | | |
The Boeing Company | | | | | | | 129,000 | | | | 15,496,770 | |
| | | | | | | | | | | | |
| | | | |
| Airlines: 1.29% | | | | | | | | | | | | |
Southwest Airlines Company | | | | | | | 482,000 | | | | 18,132,840 | |
| | | | | | | | | | | | |
The accompanying notes are an integral part of these financial statements.
| | | | | | |
| Portfolio of investments—January 31, 2016 (unaudited) | | Wells Fargo Large Cap Growth Fund | | | 9 | |
| | | | | | | | | | | | |
| Security name | | | | | | Shares | | | Value | |
| | | | |
| Industrial Conglomerates: 2.28% | | | | | | | | | | | | |
3M Company | | | | | | | 123,000 | | | $ | 18,573,000 | |
Danaher Corporation | | | | | | | 154,240 | | | | 13,364,896 | |
| |
| | | | 31,937,896 | |
| | | | | | | | | | | | |
| | | | |
| Road & Rail: 2.32% | | | | | | | | | | | | |
Kansas City Southern | | | | | | | 124,680 | | | | 8,837,318 | |
Union Pacific Corporation | | | | | | | 330,000 | | | | 23,760,000 | |
| |
| | | | 32,597,318 | |
| | | | | | | | | | | | |
| | | | |
Information Technology: 35.46% | | | | | | | | | | | | |
| | | | |
| Communications Equipment: 0.65% | | | | | | | | | | | | |
Palo Alto Networks Incorporated † | | | | | | | 61,000 | | | | 9,118,890 | |
| | | | | | | | | | | | |
| | | | |
| Internet Software & Services: 11.10% | | | | | | | | | | | | |
Alphabet Incorporated Class A † | | | | | | | 67,000 | | | | 51,010,450 | |
Alphabet Incorporated Class C † | | | | | | | 53,000 | | | | 39,376,350 | |
Facebook Incorporated Class A † | | | | | | | 584,000 | | | | 65,530,640 | |
| | | | |
| | | | | | | | | | | 155,917,440 | |
| | | | | | | | | | | | |
| | | | |
| IT Services: 8.86% | | | | | | | | | | | | |
Accenture plc Class A | | | | | | | 164,000 | | | | 17,308,560 | |
Alliance Data Systems Corporation † | | | | | | | 140,000 | | | | 27,970,600 | |
Cognizant Technology Solutions Corporation Class A † | | | | | | | 192,000 | | | | 12,155,520 | |
MasterCard Incorporated Class A | | | | | | | 405,000 | | | | 36,057,150 | |
Visa Incorporated Class A | | | | | | | 416,000 | | | | 30,987,840 | |
| | | | |
| | | | | | | | | | | 124,479,670 | |
| | | | | | | | | | | | |
| | | | |
| Semiconductors & Semiconductor Equipment: 4.04% | | | | | | | | | | | | |
ARM Holdings plc ADR | | | | | | | 135,000 | | | | 5,815,800 | |
Avago Technologies Limited | | | | | | | 89,000 | | | | 11,900,190 | |
Microchip Technology Incorporated « | | | | | | | 507,000 | | | | 22,718,670 | |
Texas Instruments Incorporated | | | | | | | 309,000 | | | | 16,355,370 | |
| | | | |
| | | | | | | | | | | 56,790,030 | |
| | | | | | | | | | | | |
| | | | |
| Software: 8.47% | | | | | | | | | | | | |
Adobe Systems Incorporated † | | | | | | | 208,000 | | | | 18,539,040 | |
Microsoft Corporation | | | | | | | 722,000 | | | | 39,774,980 | |
Red Hat Incorporated † | | | | | | | 92,000 | | | | 6,444,600 | |
Salesforce.com Incorporated † | | | | | | | 333,000 | | | | 22,663,980 | |
ServiceNow Incorporated † | | | | | | | 240,000 | | | | 14,930,400 | |
Splunk Incorporated † | | | | | | | 197,000 | | | | 9,119,130 | |
Tableau Software Incorporated Class A † | | | | | | | 93,000 | | | | 7,462,319 | |
| | | | |
| | | | | | | | | | | 118,934,449 | |
| | | | | | | | | | | | |
| | | | |
| Technology Hardware, Storage & Peripherals: 2.34% | | | | | | | | | | | | |
Apple Incorporated | | | | | | | 338,000 | | | | 32,900,920 | |
| | | | | | | | | | | | |
The accompanying notes are an integral part of these financial statements.
| | | | |
| 10 | | Wells Fargo Large Cap Growth Fund | | Portfolio of investments—January 31, 2016 (unaudited) |
| | | | | | | | | | | | | | |
| Security name | | | | | | | Shares | | | Value | |
| | | | |
Materials: 3.11% | | | | | | | | | | | | | | |
| | | | |
| Chemicals: 3.11% | | | | | | | | | | | | | | |
Ecolab Incorporated | | | | | | | | | 229,000 | | | $ | 24,702,230 | |
Praxair Incorporated | | | | | | | | | 190,000 | | | | 19,000,000 | |
| | | | |
| | | | | | | | | | | | | 43,702,230 | |
| | | | | | | | | | | | | | |
| | | | |
Total Common Stocks (Cost $961,179,595) | | | | | | | | | | | | | 1,378,785,530 | |
| | | | | | | | | | | | | | |
| | | | |
| | | Yield | | | | | | | | | |
| Short-Term Investments: 5.28% | | | | | | | | | | | | | | |
| | | | |
| Investment Companies: 5.28% | | | | | | | | | | | | | | |
Securities Lending Cash Investments, LLC (l)(r)(u) | | | 0.42 | % | | | | | 60,587,550 | | | | 60,587,550 | |
Wells Fargo Cash Investment Money Market Fund, Select Class (l)(u) | | | 0.40 | | | | | | 13,573,720 | | | | 13,573,720 | |
| | | | |
Total Short-Term Investments (Cost $74,161,270) | | | | | | | | | | | | | 74,161,270 | |
| | | | | | | | | | | | | | |
| | | | | | | | |
| Total investments in securities (Cost $1,035,340,865) * | | | 103.43 | % | | | 1,452,946,800 | |
Other assets and liabilities, net | | | (3.43 | ) | | | (48,233,981 | ) |
| | | | | | | | |
| Total net assets | | | 100.00 | % | | $ | 1,404,712,819 | |
| | | | | | | | |
| « | All or a portion of this security is on loan. |
| † | Non-income-earning security |
| (l) | The issuer of the security is an affiliated person of the Fund as defined in the Investment Company Act of 1940. |
| (r) | The investment is a non-registered investment vehicle purchased with cash collateral received from securities on loan. |
| (u) | The rate represents the 7-day annualized yield at period end. |
| * | Cost for federal income tax purposes is $1,037,181,274 and unrealized gains (losses) consists of: |
| | | | |
Gross unrealized gains | | $ | 452,291,268 | |
Gross unrealized losses | | | (36,525,742 | ) |
| | | | |
Net unrealized gains | | $ | 415,765,526 | |
The accompanying notes are an integral part of these financial statements.
| | | | | | |
| Statement of assets and liabilities—January 31, 2016 (unaudited) | | Wells Fargo Large Cap Growth Fund | | | 11 | |
| | | | |
| | | | |
| |
Assets | | | | |
Investments | | | | |
In unaffiliated securities (including $59,200,623 of securities loaned), at value (cost $961,179,595) | | $ | 1,378,785,530 | |
In affiliated securities, at value (cost $74,161,270) | | | 74,161,270 | |
| | | | |
Total investments, at value (cost $1,035,340,865) | | | 1,452,946,800 | |
Cash | | | 9,535 | |
Receivable for investments sold | | | 24,273,018 | |
Receivable for Fund shares sold | | | 1,904,282 | |
Receivable for dividends | | | 452,740 | |
Receivable for securities lending income | | | 14,300 | |
Prepaid expenses and other assets | | | 68,565 | |
| | | | |
Total assets | | | 1,479,669,240 | |
| | | | |
| |
Liabilities | | | | |
Payable for investments purchased | | | 12,116,246 | |
Payable for Fund shares redeemed | | | 1,083,404 | |
Payable upon receipt of securities loaned | | | 60,587,550 | |
Management fee payable | | | 702,470 | |
Distribution fees payable | | | 15,080 | |
Administration fees payable | | | 189,951 | |
Accrued expenses and other liabilities | | | 261,720 | |
| | | | |
Total liabilities | | | 74,956,421 | |
| | | | |
Total net assets | | $ | 1,404,712,819 | |
| | | | |
| |
NET ASSETS CONSIST OF | | | | |
Paid-in capital | | $ | 984,539,337 | |
Overdistributed net investment income | | | (633,259 | ) |
Accumulated net realized gains on investments | | | 3,200,806 | |
Net unrealized gains on investments | | | 417,605,935 | |
| | | | |
Total net assets | | $ | 1,404,712,819 | |
| | | | |
| |
COMPUTATION OF NET ASSET VALUE AND OFFERING PRICE PER SHARE | | | | |
Net assets – Class A | | $ | 571,030,980 | |
Shares outstanding – Class A1 | | | 13,569,906 | |
Net asset value per share – Class A | | | $42.08 | |
Maximum offering price per share – Class A2 | | | $44.65 | |
Net assets – Class C | | $ | 19,564,258 | |
Shares outstanding – Class C1 | | | 486,057 | |
Net asset value per share – Class C | | | $40.25 | |
Net assets – Class R | | $ | 10,871,095 | |
Shares outstanding – Class R1 | | | 261,127 | |
Net asset value per share – Class R | | | $41.63 | |
Net assets – Class R4 | | $ | 6,598,471 | |
Share outstanding – Class R41 | | | 154,870 | |
Net asset value per share – Class R4 | | | $42.61 | |
Net assets – Class R6 | | $ | 106,329,296 | |
Shares outstanding – Class R61 | | | 2,490,492 | |
Net asset value per share – Class R6 | | | $42.69 | |
Net assets – Administrator Class | | $ | 224,993,209 | |
Shares outstanding – Administrator Class1 | | | 5,318,943 | |
Net asset value per share – Administrator Class | | | $42.30 | |
Net assets – Institutional Class | | $ | 465,325,510 | |
Shares outstanding – Institutional Class1 | | | 10,910,624 | |
Net asset value per share – Institutional Class | | | $42.65 | |
| 1 | The Fund has an unlimited number of authorized shares. |
| 2 | Maximum offering price is computed as 100/94.25 of net asset value. On investments of $50,000 or more, the offering price is reduced. |
The accompanying notes are an integral part of these financial statements.
| | | | |
| 12 | | Wells Fargo Large Cap Growth Fund | | Statement of operations—six months ended January 31, 2016 (unaudited) |
| | | | |
| | | | |
| |
Investment income | | | | |
Dividends (net of foreign withholding taxes of $2,320) | | $ | 8,520,372 | |
Securities lending income, net | | | 44,357 | |
Income from affiliated securities | | | 14,089 | |
| | | | |
Total investment income | | | 8,578,818 | |
| | | | |
| |
Expenses | | | | |
Management fee | | | 5,130,577 | |
Administration fees | | | | |
Class A | | | 433,916 | |
Class C | | | 22,050 | |
Class R | | | 12,342 | |
Class R4 | | | 2,792 | |
Class R6 | | | 16,901 | |
Administrator Class | | | 157,306 | |
Institutional Class | | | 327,810 | |
Investor Class | | | 334,829 | 1 |
Shareholder servicing fees | | | | |
Class A | | | 516,566 | |
Class C | | | 26,250 | |
Class R | | | 14,693 | |
Class R4 | | | 3,490 | |
Administrator Class | | | 302,284 | |
Investor Class | | | 261,244 | 1 |
Distribution fees | | | | |
Class C | | | 78,749 | |
Class R | | | 14,693 | |
Custody and accounting fees | | | 40,912 | |
Professional fees | | | 21,574 | |
Registration fees | | | 56,569 | |
Shareholder report expenses | | | 56,284 | |
Trustees’ fees and expenses | | | 12,505 | |
Other fees and expenses | | | 15,727 | |
| | | | |
Total expenses | | | 7,860,063 | |
Less: Fee waivers and/or expense reimbursements | | | (951,667 | ) |
| | | | |
Net expenses | | | 6,908,396 | |
| | | | |
Net investment income | | | 1,670,422 | |
| | | | |
| |
REALIZED AND UNREALIZED GAINS (LOSSES) ON INVESTMENTS | | | | |
Net realized gains on investments | | | 15,142,110 | |
Net change in unrealized gains (losses) on investments | | | (179,809,958 | ) |
| | | | |
Net realized and unrealized gains (losses) on investments | | | (164,667,848 | ) |
| | | | |
Net decrease in net assets resulting from operations | | $ | (162,997,426 | ) |
| | | | |
| 1 | For the period from August 1, 2015 to October 23, 2015. Effective at the close of business on October 23, 2015, Investor Class shares were converted to Class A shares and are no longer offered by the Fund. |
The accompanying notes are an integral part of these financial statements.
| | | | | | |
| Statement of changes in net assets | | Wells Fargo Large Cap Growth Fund | | | 13 | |
| | | | | | | | | | | | | | | | |
| | | Six months ended
January 31, 2016 (unaudited) | | | Year ended
July 31, 2015 | |
| | | | |
Operations | | | | | | | | | | | | | | | | |
Net investment income | | | | | | $ | 1,670,422 | | | | | | | $ | 2,126,502 | |
Net realized gains on investments | | | | | | | 15,142,110 | | | | | | | | 86,753,919 | |
Net change in unrealized gains (losses) on investments | | | | | | | (179,809,958 | ) | | | | | | | 129,352,284 | |
| | | | |
Net increase (decrease) in net assets resulting from operations | | | | | | | (162,997,426 | ) | | | | | | | 218,232,705 | |
| | | | |
| | | | |
Distributions to shareholders from | | | | | | | | | | | | | | | | |
Net investment income | | | | | | | | | | | | | | | | |
Class A | | | | | | | (8,533 | ) | | | | | | | 0 | |
Class R4 | | | | | | | (26,255 | ) | | | | | | | 0 | |
Class R6 | | | | | | | (542,444 | ) | | | | | | | (5,386 | ) |
Administrator Class | | | | | | | (399,214 | ) | | | | | | | 0 | |
Institutional Class | | | | | | | (2,359,767 | ) | | | | | | | (392,482 | ) |
Net realized gains | | | | | | | | | | | | | | | | |
Class A | | | | | | | (33,357,991 | ) | | | | | | | (9,083,839 | ) |
Class C | | | | | | | (1,130,136 | ) | | | | | | | (1,024,179 | ) |
Class R | | | | | | | (642,814 | ) | | | | | | | (537,456 | ) |
Class R4 | | | | | | | (366,120 | ) | | | | | | | (95,079 | ) |
Class R6 | | | | | | | (5,970,675 | ) | | | | | | | (286,515 | ) |
Administrator Class | | | | | | | (12,858,667 | ) | | | | | | | (10,809,644 | ) |
Institutional Class | | | | | | | (26,507,074 | ) | | | | | | | (26,749,730 | ) |
Investor Class | | | | | | | 0 | 1 | | | | | | | (21,002,277 | ) |
| | | | |
Total distributions to shareholders | | | | | | | (84,169,690 | ) | | | | | | | (69,986,587 | ) |
| | | | |
| | | | |
Capital share transactions | | | Shares | | | | | | | | Shares | | | | | |
Proceeds from shares sold | | | | | | | | | | | | | | | | |
Class A | | | 10,082,076 | | | | 492,376,748 | | | | 604,229 | | | | 28,340,904 | |
Class C | | | 78,445 | | | | 3,514,099 | | | | 91,683 | | | | 4,185,001 | |
Class R | | | 64,713 | | | | 3,006,710 | | | | 83,403 | | | | 3,934,240 | |
Class R4 | | | 13,773 | | | | 646,505 | | | | 109,342 | | | | 5,395,990 | |
Class R6 | | | 110,366 | | | | 5,189,801 | | | | 2,237,120 | | | | 108,798,050 | |
Administrator Class | | | 469,544 | | | | 21,997,689 | | | | 1,113,913 | | | | 52,906,429 | |
Institutional Class | | | 946,029 | | | | 43,684,340 | | | | 1,575,447 | | | | 75,088,702 | |
Investor Class | | | 88,699 | 1 | | | 4,159,678 | 1 | | | 770,891 | | | | 36,000,565 | |
| | | | |
| | | | | | | 574,575,570 | | | | | | | | 314,649,881 | |
| | | | |
Reinvestment of distributions | | | | | | | | | | | | | | | | |
Class A | | | 689,341 | | | | 31,248,057 | | | | 162,603 | | | | 7,413,043 | |
Class C | | | 21,233 | | | | 921,496 | | | | 17,563 | | | | 774,161 | |
Class R | | | 5,901 | | | | 264,733 | | | | 4,111 | | | | 186,032 | |
Class R4 | | | 8,508 | | | | 392,375 | | | | 2,062 | | | | 95,079 | |
Class R6 | | | 140,783 | | | | 6,513,119 | | | | 6,321 | | | | 291,901 | |
Administrator Class | | | 290,191 | | | | 13,252,210 | | | | 235,753 | | | | 10,802,180 | |
Institutional Class | | | 541,392 | | | | 25,023,933 | | | | 511,339 | | | | 23,607,785 | |
Investor Class | | | 0 | 1 | | | 0 | 1 | | | 448,656 | | | | 20,413,846 | |
| | | | |
| | | | | | | 77,615,923 | | | | | | | | 63,584,027 | |
| | | | |
Payment for shares redeemed | | | | | | | | | | | | | | | | |
Class A | | | (925,268 | ) | | | (42,597,330 | ) | | | (1,728,758 | ) | | | (81,675,715 | ) |
Class C | | | (92,608 | ) | | | (4,166,574 | ) | | | (147,803 | ) | | | (6,761,459 | ) |
Class R | | | (55,599 | ) | | | (2,560,500 | ) | | | (114,456 | ) | | | (5,361,082 | ) |
Class R4 | | | (10,841 | ) | | | (524,399 | ) | | | (14,494 | ) | | | (712,377 | ) |
Class R6 | | | (99,570 | ) | | | (4,809,576 | ) | | | (34,221 | ) | | | (1,666,642 | ) |
Administrator Class | | | (708,545 | ) | | | (33,101,953 | ) | | | (1,474,270 | ) | | | (70,446,514 | ) |
Institutional Class | | | (1,211,877 | ) | | | (56,463,582 | ) | | | (4,464,060 | ) | | | (215,627,720 | ) |
Investor Class | | | (9,823,525 | )1 | | | (479,180,640 | )1 | | | (1,815,052 | ) | | | (85,116,561 | ) |
| | | | |
| | | | | | | (623,404,554 | ) | | | | | | | (467,368,070 | ) |
| | | | |
Net increase (decrease) in net assets resulting from capital share transactions | | | | | | | 28,786,939 | | | | | | | | (89,134,162 | ) |
| | | | |
Total increase (decrease) in net assets | | | | | | | (218,380,177 | ) | | | | | | | 59,111,956 | |
| | | | |
| | | | |
Net assets | | | | | | | | | | | | | | | | |
Beginning of period | | | | | | | 1,623,092,996 | | | | | | | | 1,563,981,040 | |
| | | | |
End of period | | | | | | $ | 1,404,712,819 | | | | | | | $ | 1,623,092,996 | |
| | | | |
Undistributed (overdistributed) net investment income | | | | | | $ | (633,259 | ) | | | | | | $ | 1,032,532 | |
| | | | |
| 1 | For the period from August 1, 2015 to October 23, 2015. Effective at the close of business on October 23, 2015, Investor Class shares were converted to Class A shares and are no longer offered by the Fund. |
The accompanying notes are an integral part of these financial statements.
| | | | |
| 14 | | Wells Fargo Large Cap Growth Fund | | Financial highlights |
(For a share outstanding throughout each period)
| | | | | | | | | | | | | | | | | | | | | | | | |
| | | Six months ended January 31, 2016 (unaudited) | | | Year ended July 31 | |
| CLASS A | | | 2015 | | | 2014 | | | 2013 | | | 2012 | | | 2011 | |
Net asset value, beginning of period | | | $49.55 | | | | $45.30 | | | | $39.73 | | | | $32.92 | | | | $31.62 | | | | $24.54 | |
Net investment income (loss) | | | (0.01 | )1 | | | (0.01 | )1 | | | (0.06 | ) | | | 0.04 | | | | (0.12 | )1 | | | (0.10 | )1 |
Net realized and unrealized gains (losses) on investments | | | (4.91 | ) | | | 6.33 | | | | 7.01 | | | | 6.81 | | | | 1.42 | | | | 7.18 | |
| | | | | | | | | | | | | | | | | | | | | | | | |
Total from investment operations | | | (4.92 | ) | | | 6.32 | | | | 6.95 | | | | 6.85 | | | | 1.30 | | | | 7.08 | |
Distributions to shareholders from | | | | | | | | | | | | | | | | | | | | | | | | |
Net investment income | | | (0.00 | )2 | | | 0.00 | | | | 0.00 | | | | (0.04 | ) | | | 0.00 | | | | 0.00 | |
Net realized gains | | | (2.55 | ) | | | (2.07 | ) | | | (1.38 | ) | | | 0.00 | | | | 0.00 | | | | 0.00 | |
| | | | | | | | | | | | | | | | | | | | | | | | |
Total distributions to shareholders | | | (2.55 | ) | | | (2.07 | ) | | | (1.38 | ) | | | (0.04 | ) | | | 0.00 | | | | 0.00 | |
Net asset value, end of period | | | $42.08 | | | | $49.55 | | | | $45.30 | | | | $39.73 | | | | $32.92 | | | | $31.62 | |
Total return3 | | | (10.29 | )% | | | 14.35 | % | | | 17.69 | % | | | 20.84 | % | | | 4.08 | % | | | 28.89 | % |
Ratios to average net assets (annualized) | | | | | | | | | | | | | | | | | | | | | | | | |
Gross expenses | | | 1.16 | % | | | 1.20 | % | | | 1.22 | % | | | 1.23 | % | | | 1.24 | % | | | 1.25 | % |
Net expenses | | | 1.07 | % | | | 1.07 | % | | | 1.07 | % | | | 1.07 | % | | | 1.10 | % | | | 1.12 | % |
Net investment income (loss) | | | (0.06 | )% | | | (0.02 | )% | | | (0.17 | )% | | | 0.09 | % | | | (0.37 | )% | | | (0.33 | )% |
Supplemental data | | | | | | | | | | | | | | | | | | | | | | | | |
Portfolio turnover rate | | | 14 | % | | | 26 | % | | | 35 | % | | | 57 | % | | | 46 | % | | | 47 | % |
Net assets, end of period (000s omitted) | | | $571,031 | | | | $184,504 | | | | $212,273 | | | | $131,616 | | | | $75,149 | | | | $2,368 | |
| 1 | Calculated based upon average shares outstanding |
| 2 | Amount is less than $0.005. |
| 3 | Total return calculations do not include any sales charges. Returns for periods of less than one year are not annualized. |
The accompanying notes are an integral part of these financial statements.
| | | | | | |
| Financial highlights | | Wells Fargo Large Cap Growth Fund | | | 15 | |
(For a share outstanding throughout each period)
| | | | | | | | | | | | | | | | | | | | | | | | |
| | | Six months ended
January 31, 2016 (unaudited) | | | Year ended July 31 | |
| CLASS C | | | 2015 | | | 2014 | | | 2013 | | | 2012 | | | 2011 | |
Net asset value, beginning of period | | | $47.68 | | | | $43.99 | | | | $38.90 | | | | $32.43 | | | | $31.38 | | | | $24.54 | |
Net investment loss | | | (0.13 | ) | | | (0.42 | ) | | | (0.33 | ) | | | (0.20 | ) | | | (0.37 | )1 | | | (0.32 | )1 |
Net realized and unrealized gains (losses) on investments | | | (4.75 | ) | | | 6.18 | | | | 6.80 | | | | 6.67 | | | | 1.42 | | | | 7.16 | |
| | | | | | | | | | | | | | | | | | | | | | | | |
Total from investment operations | | | (4.88 | ) | | | 5.76 | | | | 6.47 | | | | 6.47 | | | | 1.05 | | | | 6.84 | |
Distributions to shareholders from | | | | | | | | | | | | | | | | | | | | | | | | |
Net realized gains | | | (2.55 | ) | | | (2.07 | ) | | | (1.38 | ) | | | 0.00 | | | | 0.00 | | | | 0.00 | |
Net asset value, end of period | | | $40.25 | | | | $47.68 | | | | $43.99 | | | | $38.90 | | | | $32.43 | | | | $31.38 | |
Total return2 | | | (10.62 | )% | | | 13.47 | % | | | 16.81 | % | | | 19.95 | % | | | 3.31 | % | | | 27.91 | % |
Ratios to average net assets (annualized) | | | | | | | | | | | | | | | | | | | | | | | | |
Gross expenses | | | 1.91 | % | | | 1.95 | % | | | 1.97 | % | | | 1.98 | % | | | 1.99 | % | | | 2.00 | % |
Net expenses | | | 1.82 | % | | | 1.82 | % | | | 1.82 | % | | | 1.82 | % | | | 1.84 | % | | | 1.87 | % |
Net investment loss | | | (0.69 | )% | | | (0.77 | )% | | | (0.89 | )% | | | (0.65 | )% | | | (1.16 | )% | | | (1.04 | )% |
Supplemental data | | | | | | | | | | | | | | | | | | | | | | | | |
Portfolio turnover rate | | | 14 | % | | | 26 | % | | | 35 | % | | | 57 | % | | | 46 | % | | | 47 | % |
Net assets, end of period (000s omitted) | | | $19,564 | | | | $22,839 | | | | $22,767 | | | | $17,748 | | | | $11,829 | | | | $272 | |
| 1 | Calculated based upon average shares outstanding |
| 2 | Total return calculations do not include any sales charges. Returns for periods of less than one year are not annualized. |
The accompanying notes are an integral part of these financial statements.
| | | | |
| 16 | | Wells Fargo Large Cap Growth Fund | | Financial highlights |
(For a share outstanding throughout each period)
| | | | | | | | | | | | | | | | | | | | |
| | | Six months ended January 31, 2016 (unaudited) | | | Year ended July 31 | |
| CLASS R | | | 2015 | | | 2014 | | | 2013 | | | 20121 | |
Net asset value, beginning of period | | | $49.11 | | | | $45.03 | | | | $39.59 | | | | $32.86 | | | | $32.91 | |
Net investment loss | | | (0.02 | ) | | | (0.16 | ) | | | (0.15 | ) | | | (0.06 | )2 | | | (0.05 | )2 |
Net realized and unrealized gains (losses) on investments | | | (4.91 | ) | | | 6.31 | | | | 6.97 | | | | 6.80 | | | | 0.00 | 3 |
| | | | | | | | | | | | | | | | | | | | |
Total from investment operations | | | (4.93 | ) | | | 6.15 | | | | 6.82 | | | | 6.74 | | | | (0.05 | ) |
Distributions to shareholders from | | | | | | | | | | | | | | | | | | | | |
Net investment income | | | 0.00 | | | | 0.00 | | | | 0.00 | | | | (0.01 | ) | | | 0.00 | |
Net realized gains | | | (2.55 | ) | | | (2.07 | ) | | | (1.38 | ) | | | 0.00 | | | | 0.00 | |
| | | | | | | | | | | | | | | | | | | | |
Total distributions to shareholders | | | (2.55 | ) | | | (2.07 | ) | | | (1.38 | ) | | | (0.01 | ) | | | 0.00 | |
Net asset value, end of period | | | $41.63 | | | | $49.11 | | | | $45.03 | | | | $39.59 | | | | $32.86 | |
Total return4 | | | (10.41 | )% | | | 14.05 | % | | | 17.42 | % | | | 20.53 | % | | | (0.15 | )% |
Ratios to average net assets (annualized) | | | | | | | | | | | | | | | | | | | | |
Gross expenses | | | 1.41 | % | | | 1.45 | % | | | 1.47 | % | | | 1.47 | % | | | 1.47 | % |
Net expenses | | | 1.32 | % | | | 1.32 | % | | | 1.32 | % | | | 1.32 | % | | | 1.32 | % |
Net investment loss | | | (0.19 | )% | | | (0.28 | )% | | | (0.41 | )% | | | (0.16 | )% | | | (0.95 | )% |
Supplemental data | | | | | | | | | | | | | | | | | | | | |
Portfolio turnover rate | | | 14 | % | | | 26 | % | | | 35 | % | | | 57 | % | | | 46 | % |
Net assets, end of period (000s omitted) | | | $10,871 | | | | $12,086 | | | | $12,295 | | | | $8,149 | | | | $5,065 | |
| 1 | For the period from June 15, 2012 (commencement of class operations) to July 31, 2012 |
| 2 | Calculated based upon average shares outstanding |
| 3 | Amount is less than $0.005. |
| 4 | Returns for periods of less than one year are not annualized. |
The accompanying notes are an integral part of these financial statements.
| | | | | | |
| Financial highlights | | Wells Fargo Large Cap Growth Fund | | | 17 | |
(For a share outstanding throughout each period)
| | | | | | | | | | | | | | | | |
| | | Six months ended January 31, 2016 (unaudited) | | | Year ended July 31 | |
| CLASS R4 | | | 2015 | | | 2014 | | | 20131 | |
Net asset value, beginning of period | | | $50.23 | | | | $45.76 | | | | $40.05 | | | | $34.26 | |
Net investment income | | | 0.08 | | | | 0.07 | | | | 0.08 | | | | 0.09 | |
Net realized and unrealized gains (losses) on investments | | | (4.98 | ) | | | 6.47 | | | | 7.11 | | | | 5.81 | |
| | | | | | | | | | | | | | | | |
Total from investment operations | | | (4.90 | ) | | | 6.54 | | | | 7.19 | | | | 5.90 | |
Distributions to shareholders from | | | | | | | | | | | | | | | | |
Net investment income | | | (0.17 | ) | | | 0.00 | | | | (0.10 | ) | | | (0.11 | ) |
Net realized gains | | | (2.55 | ) | | | (2.07 | ) | | | (1.38 | ) | | | 0.00 | |
| | | | | | | | | | | | | | | | |
Total distributions to shareholders | | | (2.72 | ) | | | (2.07 | ) | | | (1.48 | ) | | | (0.11 | ) |
Net asset value, end of period | | | $42.61 | | | | $50.23 | | | | $45.76 | | | | $40.05 | |
Total return2 | | | (10.16 | )% | | | 14.69 | % | | | 18.07 | % | | | 17.37 | % |
Ratios to average net assets (annualized) | | | | | | | | | | | | | | | | |
Gross expenses | | | 0.88 | % | | | 0.87 | % | | | 0.89 | % | | | 0.87 | % |
Net expenses | | | 0.77 | % | | | 0.75 | % | | | 0.75 | % | | | 0.75 | % |
Net investment income | | | 0.36 | % | | | 0.17 | % | | | 0.17 | % | | | 0.39 | % |
Supplemental data | | | | | | | | | | | | | | | | |
Portfolio turnover rate | | | 14 | % | | | 26 | % | | | 35 | % | | | 57 | % |
Net assets, end of period (000s omitted) | | | $6,598 | | | | $7,205 | | | | $2,129 | | | | $12 | |
| 1 | For the period from November 30, 2012 (commencement of class operations) to July 31, 2013 |
| 2 | Returns for periods of less than one year are not annualized. |
The accompanying notes are an integral part of these financial statements.
| | | | |
| 18 | | Wells Fargo Large Cap Growth Fund | | Financial highlights |
(For a share outstanding throughout each period)
| | | | | | | | | | | | | | | | |
| | | Six months ended January 31, 2016 (unaudited) | | | Year ended July 31 | |
| CLASS R6 | | | 2015 | | | 2014 | | | 20131 | |
Net asset value, beginning of period | | | $50.34 | | | | $45.82 | | | | $40.11 | | | | $34.26 | |
Net investment income | | | 0.12 | | | | 0.07 | 2 | | | 0.12 | | | | 0.15 | |
Net realized and unrealized gains (losses) on investments | | | (5.00 | ) | | | 6.56 | | | | 7.11 | | | | 5.82 | |
| | | | | | | | | | | | | | | | |
Total from investment operations | | | (4.88 | ) | | | 6.63 | | | | 7.23 | | | | 5.97 | |
Distributions to shareholders from | | | | | | | | | | | | | | | | |
Net investment income | | | (0.22 | ) | | | (0.04 | ) | | | (0.14 | ) | | | (0.12 | ) |
Net realized gains | | | (2.55 | ) | | | (2.07 | ) | | | (1.38 | ) | | | 0.00 | |
| | | | | | | | | | | | | | | | |
Total distributions to shareholders | | | (2.77 | ) | | | (2.11 | ) | | | (1.52 | ) | | | (0.12 | ) |
Net asset value, end of period | | | $42.69 | | | | $50.34 | | | | $45.82 | | | | $40.11 | |
Total return3 | | | (10.09 | )% | | | 14.88 | % | | | 18.25 | % | | | 17.48 | % |
Ratios to average net assets (annualized) | | | | | | | | | | | | | | | | |
Gross expenses | | | 0.73 | % | | | 0.72 | % | | | 0.74 | % | | | 0.75 | % |
Net expenses | | | 0.62 | % | | | 0.60 | % | | | 0.60 | % | | | 0.60 | % |
Net investment income | | | 0.51 | % | | | 0.13 | % | | | 0.29 | % | | | 0.26 | % |
Supplemental data | | | | | | | | | | | | | | | | |
Portfolio turnover rate | | | 14 | % | | | 26 | % | | | 35 | % | | | 57 | % |
Net assets, end of period (000s omitted) | | | $106,329 | | | | $117,741 | | | | $5,942 | | | | $2,278 | |
| 1 | For the period from November 30, 2012 (commencement of class operations) to July 31, 2013 |
| 2 | Calculated based upon average shares outstanding |
| 3 | Returns for periods of less than one year are not annualized. |
The accompanying notes are an integral part of these financial statements.
| | | | | | |
| Financial highlights | | Wells Fargo Large Cap Growth Fund | | | 19 | |
(For a share outstanding throughout each period)
| | | | | | | | | | | | | | | | | | | | | | | | |
| | | Six months ended
January 31, 2016 (unaudited) | | | Year ended July 31 | |
| ADMINISTRATOR CLASS | | | 2015 | | | 2014 | | | 2013 | | | 2012 | | | 2011 | |
Net asset value, beginning of period | | | $49.84 | | | | $45.50 | | | | $39.86 | | | | $33.02 | | | | $31.67 | | | | $24.54 | |
Net investment income (loss) | | | 0.04 | | | | 0.05 | | | | (0.01 | ) | | | 0.09 | 1 | | | (0.06 | )1 | | | (0.06 | )1 |
Net realized and unrealized gains (losses) on investments | | | (4.95 | ) | | | 6.36 | | | | 7.04 | | | | 6.83 | | | | 1.41 | | | | 7.19 | |
| | | | | | | | | | | | | | | | | | | | | | | | |
Total from investment operations | | | (4.91 | ) | | | 6.41 | | | | 7.03 | | | | 6.92 | | | | 1.35 | | | | 7.13 | |
Distributions to shareholders from | | | | | | | | | | | | | | | | | | | | | | | | |
Net investment income | | | (0.08 | ) | | | 0.00 | | | | (0.01 | ) | | | (0.08 | ) | | | 0.00 | | | | 0.00 | |
Net realized gains | | | (2.55 | ) | | | (2.07 | ) | | | (1.38 | ) | | | 0.00 | | | | 0.00 | | | | 0.00 | |
| | | | | | | | | | | | | | | | | | | | | | | | |
Total distributions to shareholders | | | (2.63 | ) | | | (2.07 | ) | | | (1.39 | ) | | | (0.08 | ) | | | 0.00 | | | | 0.00 | |
Net asset value, end of period | | | $42.30 | | | | $49.84 | | | | $45.50 | | | | $39.86 | | | | $33.02 | | | | $31.67 | |
Total return2 | | | (10.24 | )% | | | 14.48 | % | | | 17.84 | % | | | 21.00 | % | | | 4.26 | % | | | 29.05 | % |
Ratios to average net assets (annualized) | | | | | | | | | | | | | | | | | | | | | | | | |
Gross expenses | | | 1.08 | % | | | 1.05 | % | | | 1.06 | % | | | 1.07 | % | | | 1.08 | % | | | 1.07 | % |
Net expenses | | | 0.95 | % | | | 0.95 | % | | | 0.95 | % | | | 0.95 | % | | | 0.95 | % | | | 0.94 | % |
Net investment income (loss) | | | 0.18 | % | | | 0.10 | % | | | (0.02 | )% | | | 0.24 | % | | | (0.17 | )% | | | (0.19 | )% |
Supplemental data | | | | | | | | | | | | | | | | | | | | | | | | |
Portfolio turnover rate | | | 14 | % | | | 26 | % | | | 35 | % | | | 57 | % | | | 46 | % | | | 47 | % |
Net assets, end of period (000s omitted) | | | $224,993 | | | | $262,535 | | | | $245,364 | | | | $208,053 | | | | $75,099 | | | | $1,379 | |
| 1 | Calculated based upon average shares outstanding |
| 2 | Returns for periods of less than one year are not annualized. |
The accompanying notes are an integral part of these financial statements.
| | | | |
| 20 | | Wells Fargo Large Cap Growth Fund | | Financial highlights |
(For a share outstanding throughout each period)
| | | | | | | | | | | | | | | | | | | | | | | | |
| | | Six months ended January 31, 2016 (unaudited) | | | Year ended July 31 | |
| INSTITUTIONAL CLASS | | | 2015 | | | 2014 | | | 2013 | | | 2012 | | | 2011 | |
Net asset value, beginning of period | | | $50.30 | | | | $45.80 | | | | $40.11 | | | | $33.16 | | | | $31.73 | | | | $24.54 | |
Net investment income (loss) | | | 0.10 | | | | 0.19 | 1 | | | 0.11 | | | | 0.20 | | | | (0.08 | )1 | | | (0.00 | )2 |
Net realized and unrealized gains (losses) on investments | | | (4.98 | ) | | | 6.41 | | | | 7.09 | | | | 6.86 | | | | 1.51 | | | | 7.19 | |
| | | | | | | | | | | | | | | | | | | | | | | | |
Total from investment operations | | | (4.88 | ) | | | 6.60 | | | | 7.20 | | | | 7.06 | | | | 1.43 | | | | 7.19 | |
Distributions to shareholders from | | | | | | | | | | | | | | | | | | | | | | | | |
Net investment income | | | (0.22 | ) | | | (0.03 | ) | | | (0.13 | ) | | | (0.11 | ) | | | 0.00 | | | | 0.00 | |
Net realized gains | | | (2.55 | ) | | | (2.07 | ) | | | (1.38 | ) | | | 0.00 | | | | 0.00 | | | | 0.00 | |
| | | | | | | | | | | | | | | | | | | | | | | | |
Total distributions to shareholders | | | (2.77 | ) | | | (2.10 | ) | | | (1.51 | ) | | | (0.11 | ) | | | 0.00 | | | | 0.00 | |
Net asset value, end of period | | | $42.65 | | | | $50.30 | | | | $45.80 | | | | $40.11 | | | | $33.16 | | | | $31.73 | |
Total return3 | | | (10.11 | )% | | | 14.82 | % | | | 18.16 | % | | | 21.34 | % | | | 4.47 | % | | | 29.34 | % |
Ratios to average net assets (annualized) | | | | | | | | | | | | | | | | | | | | | | | | |
Gross expenses | | | 0.83 | % | | | 0.78 | % | | | 0.79 | % | | | 0.79 | % | | | 0.80 | % | | | 0.81 | % |
Net expenses | | | 0.68 | % | | | 0.65 | % | | | 0.65 | % | | | 0.69 | % | | | 0.75 | % | | | 0.75 | % |
Net investment income (loss) | | | 0.44 | % | | | 0.40 | % | | | 0.28 | % | | | 0.53 | % | | | (0.25 | )% | | | (0.01 | )% |
Supplemental data | | | | | | | | | | | | | | | | | | | | | | | | |
Portfolio turnover rate | | | 14 | % | | | 26 | % | | | 35 | % | | | 57 | % | | | 46 | % | | | 47 | % |
Net assets, end of period (000s omitted) | | | $465,326 | | | | $534,975 | | | | $596,006 | | | | $508,853 | | | | $601,684 | | | | $846 | |
| 1 | Calculated based upon average shares outstanding |
| 2 | Amount is less than $0.005. |
| 3 | Returns for periods of less than one year are not annualized. |
The accompanying notes are an integral part of these financial statements.
| | | | | | |
| Notes to financial statements (unaudited) | | Wells Fargo Large Cap Growth Fund | | | 21 | |
1. ORGANIZATION
Wells Fargo Funds Trust (the “Trust”), a Delaware statutory trust organized on March 10, 1999, is an open-end management investment company registered under the Investment Company Act of 1940, as amended (the “1940 Act”). As an investment company, the Trust follows the accounting and reporting guidance in Financial Accounting Standards Board (“FASB”) Accounting Standards Codification Topic 946, Financial Services – Investment Companies. These financial statements report on the Wells Fargo Large Cap Growth Fund (the “Fund”) which is a diversified series of the Trust.
Effective at the close of business on October 23, 2015, Investor Class shares became Class A shares in a tax-free conversion. Shareholders of Investor Class received Class A shares at a value equal to the value of their Investor Class shares immediately prior to the conversion. Investor Class shares are no longer offered by the Fund.
2. SIGNIFICANT ACCOUNTING POLICIES
The following significant accounting policies, which are consistently followed in the preparation of the financial statements of the Fund, are in conformity with U.S. generally accepted accounting principles which require management to make estimates and assumptions that affect the reported amounts of assets and liabilities, disclosure of contingent assets and liabilities at the date of the financial statements, and the reported amounts of revenues and expenses during the reporting period. Actual results could differ from those estimates.
Securities valuation
All investments are valued each business day as of the close of regular trading on the New York Stock Exchange (generally 4 p.m. Eastern Time).
Equity securities that are listed on a foreign or domestic exchange or market are valued at the official closing price or, if none, the last sales price. If no sale occurs on the principal exchange or market that day, the prior day’s price will be deemed “stale” and a fair value price will be determined in accordance with the Fund’s Valuation Procedures.
Investments in registered open-end investment companies are valued at net asset value. Interests in non-registered investment vehicles that are redeemable at net asset value are fair valued normally at net asset value.
Investments which are not valued using any of the methods discussed above are valued at their fair value, as determined in good faith by the Board of Trustees of the Fund. The Board of Trustees has established a Valuation Committee comprised of the Trustees and has delegated to it the authority to take any actions regarding the valuation of portfolio securities that the Valuation Committee deems necessary or appropriate, including determining the fair value of portfolio securities, unless the determination has been delegated to the Management Valuation Team of Wells Fargo Funds Management, LLC (“Funds Management”). The Board of Trustees retains the authority to make or ratify any valuation decisions or approve any changes to the Valuation Procedures as it deems appropriate. On a quarterly basis, the Board of Trustees receives reports on any valuation actions taken by the Valuation Committee or the Management Valuation Team which may include items for ratification.
Valuations of fair valued securities are compared to the next actual sales price when available, or other appropriate market values, to assess the continued appropriateness of the fair valuation methodologies used. These securities are fair valued on a day-to-day basis, taking into consideration changes to appropriate market information and any significant changes to the inputs considered in the valuation process until there is a readily available price provided on an exchange or by an independent pricing service. Valuations received from an independent pricing service or independent broker-dealer quotes are periodically validated by comparisons to most recent trades and valuations provided by other independent pricing services in addition to the review of prices by the manager and/or subadviser. Unobservable inputs used in determining fair valuations are identified based on the type of security, taking into consideration factors utilized by market participants in valuing the investment, knowledge about the issuer and the current market environment.
Security loans
The Fund may lend its securities from time to time in order to earn additional income in the form of fees or interest on securities received as collateral or the investment of any cash received as collateral. The Fund continues to receive interest or dividends on the securities loaned. The Fund receives collateral in the form of cash or securities with a value at least equal to the value of the securities on loan. The value of the loaned securities is determined at the close of each business day and any additional required collateral is delivered to the Fund on the next business day. In a securities lending transaction, the net asset value of the Fund will be affected by an increase or decrease in the value of the securities loaned and by an increase or decrease in the value of the instrument in which collateral is invested. The amount of securities lending activity undertaken by the Fund fluctuates from time to time. In the event of default or bankruptcy by the borrower, the Fund may be prevented from recovering the loaned securities or gaining access to the collateral or
| | | | |
| 22 | | Wells Fargo Large Cap Growth Fund | | Notes to financial statements (unaudited) |
may experience delays or costs in doing so. In addition, the investment of any cash collateral received may lose all or part of its value. The Fund has the right under the lending agreement to recover the securities from the borrower on demand.
The Fund lends its securities through an unaffiliated securities lending agent. Cash collateral received in connection with its securities lending transactions is invested in Securities Lending Cash Investments, LLC (the “Securities Lending Fund”). The Securities Lending Fund is exempt from registration under Section 3(c)(7) of the 1940 Act and is managed by Funds Management and is subadvised by Wells Capital Management Incorporated (“WellsCap”), an affiliate of Funds Management and an indirect wholly owned subsidiary of Wells Fargo & Company (“Wells Fargo”). Funds Management receives an advisory fee starting at 0.05% and declining to 0.01% as the average daily net assets of the Securities Lending Fund increase. All of the fees received by Funds Management are paid to WellsCap for its services as subadviser. The Securities Lending Fund seeks to provide a positive return compared to the daily Fed Funds Open rate by investing in high-quality, U.S. dollar-denominated short-term money market instruments. Securities Lending Fund investments are fair valued based upon the amortized cost valuation technique. Income earned from investment in the Securities Lending Fund is included in securities lending income on the Statement of Operations.
Security transactions and income recognition
Securities transactions are recorded on a trade date basis. Realized gains or losses are recorded on the basis of identified cost.
Dividend income is recognized on the ex-dividend date. Dividend income is recorded net of foreign taxes withheld where recovery of such taxes is not assured.
Distributions to shareholders
Distributions to shareholders from net investment income and net realized gains, if any, are recorded on the ex-dividend date. Such distributions are determined in conformity with federal income tax regulations, which may differ in amount or character from net investment income and realized gains recognized for purposes of U.S. generally accepted accounting principles.
Federal and other taxes
The Fund intends to continue to qualify as a regulated investment company by distributing substantially all of its investment company taxable income and any net realized capital gains (after reduction for capital loss carryforwards) sufficient to relieve it from all, or substantially all, federal income taxes. Accordingly, no provision for federal income taxes was required.
The Fund’s income and federal excise tax returns and all financial records supporting those returns for the prior three fiscal years are subject to examination by the federal and Delaware revenue authorities. Management has analyzed the Fund’s tax positions taken on federal, state, and foreign tax returns for all open tax years and does not believe that there are any uncertain tax positions that require recognition of a tax liability.
Class allocations
The separate classes of shares offered by the Fund differ principally in applicable sales charges, distribution, shareholder servicing, and administration fees. Class specific expenses are charged directly to that share class. Investment income, common expenses, and realized and unrealized gains (losses) on investments are allocated daily to each class of shares based on the relative proportion of net assets of each class.
3. FAIR VALUATION MEASUREMENTS
Fair value measurements of investments are determined within a framework that has established a fair value hierarchy based upon the various data inputs utilized in determining the value of the Fund’s investments. The three-level hierarchy gives the highest priority to unadjusted quoted prices in active markets for identical assets or liabilities (Level 1) and the lowest priority to significant unobservable inputs (Level 3). The Fund’s investments are classified within the fair value hierarchy based on the lowest level of input that is significant to the fair value measurement. The inputs are summarized into three broad levels as follows:
| n | | Level 1 – quoted prices in active markets for identical securities |
| n | | Level 2 – other significant observable inputs (including quoted prices for similar securities, interest rates, prepayment speeds, credit risk, use of amortized cost, etc.) |
| n | | Level 3 – significant unobservable inputs (including the Fund’s own assumptions in determining the fair value of investments) |
| | | | | | |
| Notes to financial statements (unaudited) | | Wells Fargo Large Cap Growth Fund | | | 23 | |
The inputs or methodologies used for valuing investments in securities are not necessarily an indication of the risk associated with investing in those securities.
The following is a summary of the inputs used in valuing the Fund’s assets and liabilities as of January 31, 2016:
| | | | | | | | | | | | | | | | |
| | | Quoted prices
(Level 1) | | | Other significant
observable inputs
(Level 2) | | | Significant unobservable inputs (Level 3) | | | Total | |
Assets | | | | | | | | | | | | | | | | |
Investments in: | | | | |
| | | | |
Common stocks | | | | | | | | | | | | | | | | |
Consumer discretionary | | $ | 380,595,172 | | | $ | 0 | | | $ | 0 | | | $ | 380,595,172 | |
Consumer staples | | | 88,110,070 | | | | 0 | | | | 0 | | | | 88,110,070 | |
Energy | | | 18,455,220 | | | | 0 | | | | 0 | | | | 18,455,220 | |
Financials | | | 17,402,980 | | | | 0 | | | | 0 | | | | 17,402,980 | |
Health care | | | 234,213,635 | | | | 0 | | | | 0 | | | | 234,213,635 | |
Industrials | | | 98,164,824 | | | | 0 | | | | 0 | | | | 98,164,824 | |
Information technology | | | 498,141,399 | | | | 0 | | | | 0 | | | | 498,141,399 | |
Materials | | | 43,702,230 | | | | 0 | | | | 0 | | | | 43,702,230 | |
| | | | |
Short-term investments | | | | | | | | | | | | | | | | |
Investment companies | | | 13,573,720 | | | | 0 | | | | 0 | | | | 13,573,720 | |
Investments measured at net asset value* | | | | | | | | | | | | | | | 60,587,550 | |
Total assets | | $ | 1,392,359,250 | | | $ | 0 | | | $ | 0 | | | $ | 1,452,946,800 | |
| * | Investments that are measured at fair value using the net asset value per share (or its equivalent) as a practical expedient have not been categorized in the fair value hierarchy. The fair value amount presented in the table is intended to permit reconciliation of the fair value hierarchy to the amounts presented in the Statement of Assets and Liabilities. The Fund’s investment in Securities Lending Cash Investments, LLC valued at $60,587,550 does not have a redemption period notice, can be redeemed daily and does not have any unfunded commitments. |
The Fund recognizes transfers between levels within the fair value hierarchy at the end of the reporting period. At January 31, 2016, the Fund did not have any transfers into/out of Level 1, Level 2, or Level 3.
4. TRANSACTIONS WITH AFFILIATES
Management fee
Funds Management, an indirect wholly owned subsidiary of Wells Fargo, is the manager of the Fund and provides advisory and fund-level administrative services under an investment management agreement. Under the investment management agreement, Funds Management is responsible for, among other services, implementing the investment objectives and strategies of the Fund, supervising the applicable subadviser, providing fund-level administrative services in connection with the Fund’s operations, and providing any other fund-level administrative services reasonably necessary for the operation of the Fund. As compensation for its services under the investment management agreement, Funds Management is entitled to receive an annual management fee starting at 0.70% and declining to 0.505% as the average daily net assets of the Fund increase. For the six months ended January 31, 2016, the management fee was equivalent to an annual rate of 0.67% of the Fund’s average daily net assets.
Funds Management has retained the services of a subadviser to provide daily portfolio management to the Fund. The fee for subadvisory services is borne by Funds Management. WellsCap is the subadviser to the Fund and is entitled to receive a fee from Funds Management at an annual rate starting at 0.30% and declining to 0.20% as the average daily net assets of the Fund increase.
| | | | |
| 24 | | Wells Fargo Large Cap Growth Fund | | Notes to financial statements (unaudited) |
Administration fees
Under a class-level administration agreement, Funds Management provides class-level administrative services to the Fund, which includes paying fees and expenses for services provided by the transfer agent, sub-transfer agents, omnibus account servicers and record-keepers. As compensation for its services under the class-level administration agreement, Funds Management receives an annual fee which is calculated based on the average daily net assets of each class as follows:
| | | | |
| | | Class-level
administration fee | |
Class A, Class C, Class R | | | 0.21 | % |
Class R4 | | | 0.08 | |
Class R6 | | | 0.03 | |
Administrator Class, Institutional Class | | | 0.13 | |
Investor Class | | | 0.32 | |
Funds Management has contractually waived and/or reimbursed management and administration fees to the extent necessary to maintain certain net operating expense ratios for the Fund. Waiver of fees and/or reimbursement of expenses by Funds Management were made first from fund level expenses on a proportionate basis and then from class specific expenses. Funds Management has committed through November 30, 2016 to waive fees and/or reimburse expenses to the extent necessary to cap the Fund’s expenses at 1.07% for Class A shares, 1.82% for Class C shares, 1.32% for Class R shares, 0.80% for Class R4 shares, 0.65% for Class R6 shares, 0.95% for Administrator Class shares, and 0.75% for Institutional Class shares. After this time, the cap may be increased or the commitment to maintain the cap may be terminated only with the approval of the Board of Trustees. Prior to December 1, 2015, the Fund’s expenses were capped at 0.75% for Class R4 shares, 0.60% for Class R6 shares, and 0.65% for Institutional Class shares.
Distribution fees
The Trust has adopted a distribution plan for Class C and Class R shares of the Fund pursuant to Rule 12b-1 under the 1940 Act. Distribution fees are charged to Class C and Class R shares and paid to Wells Fargo Funds Distributor, LLC (“Funds Distributor”), the principal underwriter, at an annual rate of 0.75% of the average daily net assets of Class C shares and 0.25% of the average daily net assets of Class R shares.
In addition, Funds Distributor is entitled to receive the front-end sales charge from the purchase of Class A shares and a contingent deferred sales charge on the redemption of certain Class A shares. Funds Distributor is also entitled to receive the contingent deferred sales charges from redemptions of Class C shares. For the six months ended January 31, 2016, Funds Distributor received $10,109 from the sale of Class A shares and $51 in contingent deferred sales charges from redemptions of Class C shares.
Shareholder servicing fees
The Trust has entered into contracts with one or more shareholder servicing agents, where by Class A, Class C, Class R, Administrator Class, and Investor Class of the Fund is charged a fee at an annual rate of 0.25% of the average daily net assets of each respective class. Class R4 shares are charged a fee at an annual rate of 0.10% of its average daily net assets.
A portion of these total shareholder servicing fees were paid to affiliates of Wells Fargo.
5. INVESTMENT PORTFOLIO TRANSACTIONS
Purchases and sales of investments, excluding U.S. government obligations (if any) and short-term securities, for the six months ended January 31, 2016 were $217,618,089 and $285,933,421, respectively.
6. BANK BORROWINGS
The Trust (excluding the money market funds and certain other funds) and Wells Fargo Variable Trust are parties to a $200,000,000 revolving credit agreement whereby the Fund is permitted to use bank borrowings for temporary or emergency purposes, such as to fund shareholder redemption requests. Interest under the credit agreement is charged to the Fund based on a borrowing rate equal to the higher of the Federal Funds rate in effect on that day plus 1.25% or the overnight LIBOR rate in effect on that day plus 1.25%. In addition, an annual commitment fee equal to 0.20% of the unused balance is allocated to each participating fund. Prior to September 1, 2015, the revolving credit agreement amount was $150,000,000 and the annual commitment fee was equal to 0.10% of the unused balance which was allocated to each participating fund. For the six months ended January 31, 2016, the Fund paid $2,597 in commitment fees.
| | | | | | |
| Notes to financial statements (unaudited) | | Wells Fargo Large Cap Growth Fund | | | 25 | |
For the six months ended January 31, 2016, there were no borrowings by the Fund under the agreement.
7. CONCENTRATION RISK
Concentration risks result from exposure to a limited number of sectors. A fund that invests a substantial portion of its assets in any sector may be more affected by changes in that sector than would be a fund whose investments are not heavily weighted in any sector.
8. INDEMNIFICATION
Under the Trust’s organizational documents, the officers and Trustees have been granted certain indemnification rights against certain liabilities that may arise out of performance of their duties to the Trust. Additionally, in the normal course of business, the Trust may enter into contracts with service providers that contain a variety of indemnification clauses. The Trust’s maximum exposure under these
| | | | |
| 26 | | Wells Fargo Large Cap Growth Fund | | Other information (unaudited) |
PROXY VOTING INFORMATION
A description of the policies and procedures that the Fund uses to determine how to vote proxies relating to portfolio securities is available, upon request, by calling 1-800-222-8222, visiting our website at wellsfargofunds.com, or visiting the SEC website at sec.gov. Information regarding how the Fund voted proxies relating to portfolio securities during the most recent 12-month period ended June 30 is available on the Fund’s website at wellsfargofunds.com or by visiting the SEC website at sec.gov.
PORTFOLIO HOLDINGS INFORMATION
The complete portfolio holdings for the Fund are publicly available monthly on the Fund’s website (wellsfargofunds.com), on a one-month delayed basis. In addition, top ten holdings information (excluding derivative positions) for the Fund is publicly available on the Fund’s website on a monthly, seven-day or more delayed basis. The Fund files its complete schedule of portfolio holdings with the SEC for the first and third quarters of each fiscal year on Form N-Q, which is available by visiting the SEC website at sec.gov. In addition, the Fund’s Form N-Q may be reviewed and copied at the SEC’s Public Reference Room in Washington, DC, and at regional offices in New York City, at 233 Broadway, and in Chicago, at 175 West Jackson Boulevard, Suite 900. Information about the Public Reference Room may be obtained by calling 1-800-SEC-0330.
| | | | | | |
| Other information (unaudited) | | Wells Fargo Large Cap Growth Fund | | | 27 | |
BOARD OF TRUSTEES AND OFFICERS
Each of the Trustees and Officers1 listed in the table below acts in identical capacities for each fund in the Wells Fargo family of funds, which consists of 144 mutual funds comprising the Wells Fargo Funds Trust, Wells Fargo Variable Trust, Wells Fargo Master Trust and four closed-end funds (collectively the “Fund Complex”). This table should be read in conjunction with the Prospectus and the Statement of Additional Information2. The mailing address of each Trustee and Officer is 525 Market Street, 12th Floor, San Francisco, CA 94105. Each Trustee and Officer serves an indefinite term, however, each Trustee serves such term until reaching the mandatory retirement age established by the Trustees.
Independent Trustees
| | | | | | |
Name and year of birth | | Position held and length of service* | | Principal occupations during past five years or longer | | Current other public company or
investment company
directorships |
| William R. Ebsworth (Born 1957) | | Trustee, since 2015 | | Retired. From 1984 to 2013, equities analyst, portfolio manager, research director and chief financial officer at Fidelity Management and Research Company in Boston, Tokyo, and Hong Kong and retired in 2013 as Chief Investment Officer of Fidelity Strategic Advisers, Inc. where he lead a team of investment professionals managing client assets. Prior thereto, Board member of Hong Kong Securities Clearing Co., Hong Kong Options Clearing Corp., the Thailand International Fund, Ltd., Fidelity Investments Life Insurance Company, and Empire Fidelity Investments Life Insurance Company. Mr. Ebsworth is a CFA® charterholder and an Adjunct Lecturer, Finance, at Babson College. | | Asset Allocation Trust |
| Jane A. Freeman (Born 1953) | | Trustee, since 2015 | | Retired. From 2012 to 2014 and 1999 to 2008, Chief Financial Officer of Scientific Learning Corporation. From 2008 to 2012, Ms. Freeman provided consulting services related to strategic business projects. Prior to 1999, Portfolio Manager at Rockefeller & Co. and Scudder, Stevens & Clark. Board member of the Harding Loevner Funds from 1996 to 2014, serving as both Lead Independent Director and chair of the Audit Committee. Board member of the Russell Exchange Traded Funds Trust from 2011 to 2012 and the chair of the Audit Committee. Ms. Freeman is Chair of Taproot Foundation (non-profit organization), a Board Member of Ruth Bancroft Garden (non-profit organization) and an inactive chartered financial analyst. | | Asset Allocation Trust |
Peter G. Gordon (Born 1942) | | Trustee, since 1998; Chairman, since 2005 | | Co-Founder, Retired Chairman, President and CEO of Crystal Geyser Water Company. Trustee Emeritus, Colby College. | | Asset Allocation Trust |
Isaiah Harris, Jr.
(Born 1952) | | Trustee, since 2009 | | Retired. Chairman of the Board of CIGNA Corporation since 2009, and Director since 2005. From 2003 to 2011, Director of Deluxe Corporation. Prior thereto, President and CEO of BellSouth Advertising and Publishing Corp. from 2005 to 2007, President and CEO of BellSouth Enterprises from 2004 to 2005 and President of BellSouth Consumer Services from 2000 to 2003. Emeritus member of the Iowa State University Foundation Board of Governors. Emeritus Member of the Advisory Board of Iowa State University School of Business. Advisory Board Member, Palm Harbor Academy (charter school). Advisory Board Member, Child Evangelism Fellowship (non-profit). Mr. Harris is a certified public accountant (inactive status). | | CIGNA Corporation; Asset Allocation Trust |
| Judith M. Johnson (Born 1949) | | Trustee, since 2008; Audit Committee
Chairman, since 2008 | | Retired. Prior thereto, Chief Executive Officer and Chief Investment Officer of Minneapolis Employees Retirement Fund from 1996 to 2008. Ms. Johnson is an attorney, certified public accountant and a certified managerial accountant. | | Asset Allocation Trust |
David F. Larcker
(Born 1950) | | Trustee, since 2009 | | James Irvin Miller Professor of Accounting at the Graduate School of Business, Stanford University, Director of the Corporate Governance Research Initiative and Senior Faculty of The Rock Center for Corporate Governance since 2006. From 2005 to 2008, Professor of Accounting at the Graduate School of Business, Stanford University. Prior thereto, Ernst & Young Professor of Accounting at The Wharton School, University of Pennsylvania from 1985 to 2005. | | Asset Allocation Trust |
| | | | |
| 28 | | Wells Fargo Large Cap Growth Fund | | Other information (unaudited) |
| | | | | | |
Name and year of birth | | Position held and length of service* | | Principal occupations during past five years or longer | | Current other public company or
investment company
directorships |
| Olivia S. Mitchell (Born 1953) | | Trustee, since 2006 | | International Foundation of Employee Benefit Plans Professor, Wharton School of the University of Pennsylvania since 1993. Director of Wharton’s Pension Research Council and Boettner Center on Pensions & Retirement Research, and Research Associate at the National Bureau of Economic Research. Previously, Cornell University Professor from 1978 to 1993. | | Asset Allocation Trust |
| Timothy J. Penny (Born 1951) | | Trustee, since 1996 | | President and Chief Executive Officer of Southern Minnesota Initiative Foundation, a non-profit organization, since 2007 and Senior Fellow at the Humphrey Institute Policy Forum at the University of Minnesota since 1995. Member of the Board of Trustees of NorthStar Education Finance, Inc., a non-profit organization, since 2007. | | Asset Allocation Trust |
| Michael S. Scofield (Born 1943) | | Trustee, since 2010 | | Served on the Investment Company Institute’s Board of Governors and Executive Committee from 2008-2011 as well the Governing Council of the Independent Directors Council from 2006-2011 and the Independent Directors Council Executive Committee from 2008-2011. Chairman of the IDC from 2008-2010. Institutional Investor (Fund Directions) Trustee of Year in 2007. Trustee of the Evergreen Funds complex (and its predecessors) from 1984 to 2010. Chairman of the Evergreen Funds from 2000-2010. Former Trustee of the Mentor Funds. Retired Attorney, Law Offices of Michael S. Scofield. | | Asset Allocation Trust |
| * | Length of service dates reflect the Trustee’s commencement of service with the Trust’s predecessor entities, where applicable. |
Officers
| | | | | | |
Name and year of birth | | Position held and
length of service | | Principal occupations during past five years or longer | | |
| Karla M. Rabusch (Born 1959) | | President, since 2003 | | Executive Vice President of Wells Fargo Bank, N.A. and President of Wells Fargo Funds Management, LLC since 2003. | | |
| Jeremy DePalma1 (Born 1974) | | Treasurer, since 2012; Assistant Treasurer, since 2009 | | Senior Vice President of Wells Fargo Funds Management, LLC since 2009. Senior Vice President of Evergreen Investment Management Company, LLC from 2008 to 2010 and head of the Fund Reporting and Control Team within Fund Administration from 2005 to 2010. | | |
| C. David Messman (Born 1960) | | Secretary, since 2000; Chief Legal Officer, since 2003 | | Senior Vice President and Secretary of Wells Fargo Funds Management, LLC since 2001. Assistant General Counsel of Wells Fargo Bank, N.A. since 2013 and Vice President and Managing Counsel of Wells Fargo Bank, N.A. from 1996 to 2013. | | |
Debra Ann Early (Born 1964) | | Chief Compliance Officer, since 2007 | | Executive Vice President of Wells Fargo Funds Management, LLC since 2014, Senior Vice President and Chief Compliance Officer from 2007 to 2014. | | |
David Berardi (Born 1975) | | Assistant Treasurer, since 2009 | | Vice President of Wells Fargo Funds Management, LLC since 2009. Vice President of Evergreen Investment Management Company, LLC from 2008 to 2010. Manager of Fund Reporting and Control for Evergreen Investment Management Company, LLC from 2004 to 2010. | | |
| 1 | Jeremy DePalma acts as Treasurer of 72 funds and Assistant Treasurer of 72 funds in the Fund Complex. |
| 2 | The Statement of Additional Information includes additional information about the Trustees and is available, without charge, upon request, by calling 1-800-222-8222 or by visiting the website at wellsfargofunds.com. |
| | | | | | |
| List of abbreviations | | Wells Fargo Large Cap Growth Fund | | | 29 | |
The following is a list of common abbreviations for terms and entities that may have appeared in this report.
| ACA | — ACA Financial Guaranty Corporation |
| ADR | — American depositary receipt |
| ADS | — American depositary shares |
| AGC | — Assured Guaranty Corporation |
| AGM | — Assured Guaranty Municipal |
| Ambac | — Ambac Financial Group Incorporated |
| AMT | — Alternative minimum tax |
| BAN | — Bond anticipation notes |
| BHAC | — Berkshire Hathaway Assurance Corporation |
| CAB | — Capital appreciation bond |
| CCAB | — Convertible capital appreciation bond |
| CDA | — Community Development Authority |
| CDO | — Collateralized debt obligation |
| DRIVER | — Derivative inverse tax-exempt receipts |
| DW&P | — Department of Water & Power |
| DWR | — Department of Water Resources |
| ECFA | — Educational & Cultural Facilities Authority |
| EDA | — Economic Development Authority |
| EDFA | — Economic Development Finance Authority |
| ETF | — Exchange-traded fund |
| FDIC | — Federal Deposit Insurance Corporation |
| FFCB | — Federal Farm Credit Banks |
| FGIC | — Financial Guaranty Insurance Corporation |
| FHA | — Federal Housing Administration |
| FHLB | — Federal Home Loan Bank |
| FHLMC | — Federal Home Loan Mortgage Corporation |
| FICO | — The Financing Corporation |
| FNMA | — Federal National Mortgage Association |
| GDR | — Global depositary receipt |
| GNMA | — Government National Mortgage Association |
| HCFR | — Healthcare facilities revenue |
| HEFA | — Health & Educational Facilities Authority |
| HEFAR | — Higher education facilities authority revenue |
| HFA | — Housing Finance Authority |
| HFFA | — Health Facilities Financing Authority |
| HUD | — Department of Housing and Urban Development |
| IDA | — Industrial Development Authority |
| IDAG | — Industrial Development Agency |
| KRW | — Republic of Korea won |
| LIBOR | — London Interbank Offered Rate |
| LIFER | — Long Inverse Floating Exempt Receipts |
| LLC | — Limited liability company |
| LLLP | — Limited liability limited partnership |
| LLP | — Limited liability partnership |
| MBIA | — Municipal Bond Insurance Association |
| MFHR | — Multifamily housing revenue |
| MSTR | — Municipal securities trust receipts |
| MUD | — Municipal Utility District |
| National | — National Public Finance Guarantee Corporation |
| PCFA | — Pollution Control Financing Authority |
| PCL | — Public Company Limited |
| PCR | — Pollution control revenue |
| PFA | — Public Finance Authority |
| PFFA | — Public Facilities Financing Authority |
| PFOTER | — Puttable floating option tax-exempt receipts |
| plc | — Public limited company |
| PUTTER | — Puttable tax-exempt receipts |
| R&D | — Research & development |
| Radian | — Radian Asset Assurance |
| RAN | — Revenue anticipation notes |
| RDA | — Redevelopment Authority |
| RDFA | — Redevelopment Finance Authority |
| REIT | — Real estate investment trust |
| ROC | — Reset option certificates |
| SAVRS | — Select auction variable rate securities |
| SBA | — Small Business Authority |
| SDR | — Swedish depositary receipt |
| SFHR | — Single-family housing revenue |
| SFMR | — Single-family mortgage revenue |
| SPA | — Standby purchase agreement |
| SPDR | — Standard & Poor’s Depositary Receipts |
| SPEAR | — Short Puttable Exempt Adjustable Receipts |
| STRIPS | — Separate trading of registered interest and |
| TAN | — Tax anticipation notes |
| TIPS | — Treasury inflation-protected securities |
| TRAN | — Tax revenue anticipation notes |
| TTFA | — Transportation Trust Fund Authority |
| TVA | — Tennessee Valley Authority |
This page is intentionally left blank.
This page is intentionally left blank.
This page is intentionally left blank.

For more information
More information about Wells Fargo Funds is available free upon request. To obtain literature, please write, email, visit the Fund’s website, or call:
Wells Fargo Funds
P.O. Box 8266
Boston, MA 02266-8266
Email: fundservice@wellsfargo.com
Website: wellsfargofunds.com
Individual investors: 1-800-222-8222
Retail investment professionals: 1-888-877-9275
Institutional investment professionals: 1-866-765-0778
This report and the financial statements contained herein are submitted for the general information of the shareholders of the Fund. If this report is used for promotional purposes, distribution of the report must be accompanied or preceded by a current prospectus. Before investing, please consider the investment objectives, risks, charges, and expenses of the investment. For a current prospectus and, if available, a summary prospectus, containing this information, call 1-800-222-8222 or visit the Fund’s website at wellsfargofunds.com. Read the prospectus carefully before you invest or send money.
Wells Fargo Asset Management (WFAM) is a trade name used by the asset management businesses of Wells Fargo & Company. Wells Fargo Funds Management, LLC, a wholly owned subsidiary of Wells Fargo & Company, provides investment advisory and administrative services for Wells Fargo Funds. Other affiliates of Wells Fargo & Company provide subadvisory and other services for the funds. The funds are distributed by Wells Fargo Funds Distributor, LLC, Member FINRA, an affiliate of Wells Fargo & Company.
NOT FDIC INSURED ¡ NO BANK GUARANTEE ¡ MAY LOSE VALUE
© 2016 Wells Fargo Funds Management, LLC. All rights reserved.
| | |
 | | 240799 03-16 SA209/SAR209 01-16 |
Semi-Annual Report
January 31, 2016

Wells Fargo Large Company Value Fund


Reduce clutter. Save trees.
Sign up for electronic delivery of prospectuses and shareholder reports at wellsfargo.com/advantagedelivery
Contents
The views expressed and any forward-looking statements are as of January 31, 2016, unless otherwise noted, and are those of the Fund managers and/or Wells Fargo Funds Management, LLC. Discussions of individual securities, or the markets generally, or any Wells Fargo Fund are not intended as individual recommendations. Future events or results may vary significantly from those expressed in any forward-looking statements. The views expressed are subject to change at any time in response to changing circumstances in the market. Wells Fargo Funds Management, LLC and the Fund disclaim any obligation to publicly update or revise any views expressed or forward-looking statements.
NOT FDIC INSURED ¡ NO BANK GUARANTEE ¡ MAY LOSE VALUE
| | | | |
| 2 | | Wells Fargo Large Company Value Fund | | Letter to shareholders (unaudited) |

Karla M. Rabusch
President
Wells Fargo Funds
Despite generally improving U.S. economic data, ongoing global turmoil tempered U.S. economic growth during the period as many economies and markets outside the U.S. faced ongoing challenges.
Dear Valued Shareholder:
We are pleased to offer you this semi-annual report for the Wells Fargo Large Company Value Fund for the six-month period that ended January 31, 2016. Despite generally improving U.S. economic data, ongoing global turmoil tempered U.S. economic growth during the period as many economies and markets outside the U.S. faced continuing challenges. In this environment, the broad U.S. stock market experienced heightened volatility and ultimately fell 5.64% overall for the six-month period (as measured by the Russell 3000® Index,1 which is the index used to measure U.S. stock market performance throughout this letter).
As the reporting period began, China’s slowdown continued to take a toll on U.S. and international markets.
The U.S. stock market declined 6.04% and 2.91% in August and September 2015, respectively, as investors worried about the impact on the U.S. of China’s slowing growth. A number of positive economic indicators released during these months suggested the U.S. economy remained solid. However, the strengthening U.S. dollar coupled with ongoing global economic turmoil continued to hinder the economy. Although many investors believed the U.S. Federal Reserve (Fed) would raise the federal funds rate during the third quarter of 2015, at its September 2015 meeting the Fed left the rate unchanged. This decision fueled uncertainty about the U.S. economy’s stamina to remain healthy while facing the negative effects of troubles elsewhere in the world. One week later, Fed Chair Janet Yellen reassured investors that, barring unpleasant surprises, the Fed still intended to raise the rate in 2015. International markets were more volatile than the domestic market and delivered even weaker results in August and September. Investors’ anxiety was driven largely by China’s weakened economy. Because China is the world’s largest importer of many commodities, a number of emerging markets—key commodities exporters—struggled under the strains of reduced demand for commodities and lower prices for the commodities sold.
The U.S. stock market delivered a positive result overall for the last three months of 2015 despite ongoing concerns.
The broad U.S. stock market fluctuated widely in the fourth quarter of 2015, rising 7.90% in October and 0.55% in November before falling 2.05% in December, for an overall quarterly return of 6.27%. Stock markets outside the U.S. generally failed to keep pace with the domestic market as economic concerns, including China’s ongoing slowdown, continued to affect many countries worldwide. U.S. economic data released during the quarter indicated the economy remained solid, with modest growth. However, the strong U.S. dollar and global economic turmoil continued their drag on the economy. In December, the Fed, as expected, slightly raised its target short-term interest rate to between 0.25% and 0.50% after keeping it near zero for seven years. The move, which had been well telegraphed by the Fed for months, reflected confidence in the U.S. economy’s ability to stay healthy with less central-bank support. The Fed also made clear that future interest-rate increases will be gradual.
U.S. stocks struggled in January 2016.
The broad U.S. stock market dropped 5.64% for the month, weighed down by ongoing concerns about heightened market volatility, the continued plunge in oil prices, and the impact of weak global growth on U.S. companies. The U.S. economy, however, remained resilient in January—with continued solid hiring, a
| 1 | The Russell 3000® Index measures the performance of the 3,000 largest U.S. companies based on total market capitalization, which represents approximately 98% of the investable U.S. equity market. You cannot invest directly in an index. |
| | | | | | |
| Letter to shareholders (unaudited) | | Wells Fargo Large Company Value Fund | | | 3 | |
reduction in the jobless rate to 4.9%, and signs of an uptick in the pace of wage growth—despite some warning signs that became evident in recent months, such as weaknesses in manufacturing and business growth.
Don’t let short-term uncertainty derail long-term investment goals.
Periods of uncertainty can present challenges, but experience has taught us that maintaining long-term investment goals can be an effective way to plan for the future. To help you create a sound strategy based on your personal goals and risk tolerance, Wells Fargo Funds offers more than 100 mutual funds spanning a wide range of asset classes and investment styles. Although diversification cannot guarantee an investment profit or prevent losses, we believe it can be an effective way to manage investment risk and potentially smooth out overall portfolio performance. We encourage investors to know their investments and to understand that appropriate levels of risk-taking may unlock opportunities.
Thank you for choosing to invest in Wells Fargo Funds. We appreciate your confidence in us and remain committed to helping you meet your financial needs.
Sincerely,

Karla M. Rabusch
President
Wells Fargo Funds
Although diversification cannot guarantee an investment profit or prevent losses, we believe it can be an effective way to manage investment risk and potentially smooth out overall portfolio performance.
For further information about your Fund, contact your investment professional, visit our website at wellsfargofunds.com, or call us directly at 1-800-222-8222. We are available 24 hours a day, 7 days a week.
| | | | |
| 4 | | Wells Fargo Large Company Value Fund | | Performance highlights (unaudited) |
Investment objective
The Fund seeks long-term capital appreciation.
Manager
Wells Fargo Funds Management, LLC
Subadviser
Phocas Financial Corporation
Portfolio managers
Stephen L. Block, CFA®
William F.K. Schaff, CFA®
Average annual total returns (%) as of January 31, 20161
| | | | | | | | | | | | | | | | | | | | | | | | | | | | | | | | | | |
| | | | | Including sales charge | | | Excluding sales charge | | | Expense ratios2 (%) | |
| | | Inception date | | 1 year | | | 5 year | | | 10 year | | | 1 year | | | 5 year | | | 10 year | | | Gross | | | Net3 | |
| Class A (WLCAX) | | 3-31-2008 | | | (12.40 | ) | | | 5.73 | | | | 3.74 | | | | (7.08 | ) | | | 6.98 | | | | 4.35 | | | | 1.23 | | | | 1.10 | |
| Class C (WFLVX) | | 3-31-2008 | | | (8.79 | ) | | | 6.20 | | | | 3.62 | | | | (7.79 | ) | | | 6.20 | | | | 3.62 | | | | 1.98 | | | | 1.85 | |
| Administrator Class (WWIDX) | | 12-31-2001 | | | – | | | | – | | | | – | | | | (6.84 | ) | | | 7.26 | | | | 4.67 | | | | 1.15 | | | | 0.98 | |
| Institutional Class (WLCIX) | | 3-31-2008 | | | – | | | | – | | | | – | | | | (6.65 | ) | | | 7.49 | | | | 4.84 | | | | 0.90 | | | | 0.75 | |
| Russell 1000® Value Index4 | | – | | | – | | | | – | | | | – | | | | (5.00 | ) | | | 9.61 | | | | 5.19 | | | | – | | | | – | |
Figures quoted represent past performance, which is no guarantee of future results, and do not reflect taxes that a shareholder may pay on fund distributions or the redemption of fund shares. Investment return and principal value of an investment will fluctuate so that an investor’s shares, when redeemed, may be worth more or less than their original cost. Performance shown without sales charges would be lower if sales charges were reflected. Current performance may be lower or higher than the performance data quoted, which assumes the reinvestment of dividends and capital gains. Current month-end performance is available on the Fund’s website, wellsfargofunds.com.
Index returns do not include transaction costs associated with buying and selling securities, any mutual fund fees or expenses, or any taxes. It is not possible to invest directly in an index.
For Class A shares, the maximum front-end sales charge is 5.75%. For Class C shares, the maximum contingent deferred sales charge is 1.00%. Performance including a contingent deferred sales charge assumes the sales charge for the corresponding time period. Administrator Class and Institutional Class shares are sold without a front-end sales charge or contingent deferred sales charge.
Stock values fluctuate in response to the activities of individual companies and general market and economic conditions. Certain investment strategies tend to increase the total risk of an investment (relative to the broader market). The Fund is exposed to foreign investment risk. Consult the Fund’s prospectus for additional information on these and other risks.
Please see footnotes on page 5.
| | | | | | |
| Performance highlights (unaudited) | | Wells Fargo Large Company Value Fund | | | 5 | |
| | | | |
| Ten largest holdings (%) as of January 31, 20165 | |
Exxon Mobil Corporation | | | 3.08 | |
CVS Health Corporation | | | 2.93 | |
JPMorgan Chase & Company | | | 2.63 | |
First Republic Bank | | | 2.47 | |
American International Group Incorporated | | | 2.24 | |
Alexandria Real Estate Equities Incorporated | | | 2.05 | |
Ameriprise Financial Incorporated | | | 2.05 | |
MetLife Incorporated | | | 1.98 | |
Pfizer Incorporated | | | 1.82 | |
Baxalta Incorporated | | | 1.82 | |
|
| Sector distribution as of January 31, 20166 |
|
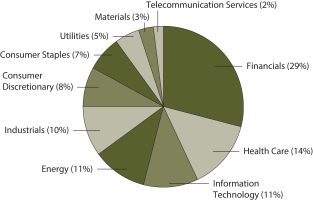 |
| 1 | Historical performance shown for Class A shares prior to their inception reflects the performance of the former Investor Class shares, and includes the higher expenses applicable to the former Investor Class shares (except during those periods in which the expenses of Class A shares would have been higher than those of the former Investor Class shares). If these expenses had not been included, returns would be higher. Historical performance shown for Class C shares prior to their inception reflects the performance of the former Investor Class shares, adjusted to reflect the higher expenses applicable to Class C shares. Historical performance shown for Institutional Class shares prior to their inception reflects the performance of the former Investor Class shares and includes the higher expenses applicable to the former Investor Class shares. If these expenses had not been included, returns would be higher. Historical performance shown for all classes of the Fund prior to March 21, 2008 does not reflect the Fund’s current investment objective and strategies. |
| 2 | Reflects the expense ratios as stated in the most recent prospectuses. The expense ratios shown are subject to change and may differ from the annualized expense ratios shown in the financial highlights of this report. |
| 3 | The manager has contractually committed through November 30, 2016, to waive fees and/or reimburse expenses to the extent necessary to cap the Fund’s Total Annual Fund Operating Expenses After Fee Waiver at the amounts shown. After this time, the cap may be increased or the commitment to maintain the cap may be terminated only with the approval of the Board of Trustees. Brokerage commissions, stamp duty fees, interest, taxes, acquired fund fees and expenses, and extraordinary expenses are excluded from the cap. Without this cap, the Fund’s returns would have been lower. |
| 4 | The Russell 1000® Value Index measures the performance of those Russell 1000 Index companies with higher price-to-book ratios and higher forecasted growth values. You cannot invest directly in an index. |
| 5 | The ten largest holdings, excluding cash and cash equivalents, are calculated based on the value of the investments divided by total net assets of the Fund. Holdings are subject to change and may have changed since the date specified. |
| 6 | Amounts are calculated based on the total long-term investments of the Fund. These amounts are subject to change and may have changed since the date specified. |
| | | | |
| 6 | | Wells Fargo Large Company Value Fund | | Fund expenses (unaudited) |
As a shareholder of the Fund, you incur two types of costs: (1) transaction costs, including sales charges (loads) on purchase payments and contingent deferred sales charges (if any) on redemptions and (2) ongoing costs, including management fees, distribution (12b-1) and/or shareholder servicing fees, and other Fund expenses. This example is intended to help you understand your ongoing costs (in dollars) of investing in the Fund and to compare these costs with the ongoing costs of investing in other mutual funds.
The example is based on an investment of $1,000 invested at the beginning of the six-month period and held for the entire period from August 1, 2015 to January 31, 2016.
Actual expenses
The “Actual” line of the table below provides information about actual account values and actual expenses. You may use the information in this line, together with the amount you invested, to estimate the expenses that you paid over the period. Simply divide your account value by $1,000 (for example, an $8,600 account value divided by $1,000 = 8.6), then multiply the result by the number in the “Actual” line under the heading entitled “Expenses paid during period” for your applicable class of shares to estimate the expenses you paid on your account during this period.
Hypothetical example for comparison purposes
The “Hypothetical” line of the table below provides information about hypothetical account values and hypothetical expenses based on the Fund’s actual expense ratio and an assumed rate of return of 5% per year before expenses, which is not the Fund’s actual return. The hypothetical account values and expenses may not be used to estimate the actual ending account balance or expenses you paid for the period. You may use this information to compare the ongoing costs of investing in the Fund and other funds. To do so, compare this 5% hypothetical example with the 5% hypothetical examples that appear in the shareholder reports of the other funds.
Please note that the expenses shown in the table are meant to highlight your ongoing costs only and do not reflect any transactional costs, such as sales charges (loads) and contingent deferred sales charges. Therefore, the “Hypothetical” line of the table is useful in comparing ongoing costs only and will not help you determine the relative total costs of owning different funds. In addition, if these transactional costs were included, your costs would have been higher.
| | | | | | | | | | | | | | | | |
| | | Beginning
account value
8-1-2015 | | | Ending
account value
1-31-2016 | | | Expenses
paid during
the period¹ | | | Net annualized
expense ratio | |
Class A | | | | | | | | | | | | | | | | |
Actual | | $ | 1,000.00 | | | $ | 879.34 | | | $ | 5.20 | | | | 1.10 | % |
Hypothetical (5% return before expenses) | | $ | 1,000.00 | | | $ | 1,019.61 | | | $ | 5.58 | | | | 1.10 | % |
Class C | | | | | | | | | | | | | | | | |
Actual | | $ | 1,000.00 | | | $ | 876.58 | | | $ | 8.73 | | | | 1.85 | % |
Hypothetical (5% return before expenses) | | $ | 1,000.00 | | | $ | 1,015.84 | | | $ | 9.37 | | | | 1.85 | % |
Administrator Class | | | | | | | | | | | | | | | | |
Actual | | $ | 1,000.00 | | | $ | 880.91 | | | $ | 4.21 | | | | 0.89 | % |
Hypothetical (5% return before expenses) | | $ | 1,000.00 | | | $ | 1,020.66 | | | $ | 4.52 | | | | 0.89 | % |
Institutional Class | | | | | | | | | | | | | | | | |
Actual | | $ | 1,000.00 | | | $ | 881.78 | | | $ | 3.41 | | | | 0.72 | % |
Hypothetical (5% return before expenses) | | $ | 1,000.00 | | | $ | 1,021.52 | | | $ | 3.66 | | | | 0.72 | % |
| 1 | Expenses paid is equal to the annualized expense ratio of each class multiplied by the average account value over the period, multiplied by the number of days in the most recent fiscal half-year divided by the number of days in the fiscal year (to reflect the one-half-year period). |
| | | | | | |
| Portfolio of investments—January 31, 2016 (unaudited) | | Wells Fargo Large Company Value Fund | | | 7 | |
| | | | | | | | | | | | |
| Security name | | | | | | Shares | | | Value | |
| | | | |
Common Stocks: 97.16% | | | | | | | | | | | | |
| | | | |
Consumer Discretionary: 7.61% | | | | | | | | | | | | |
| | | | |
| Hotels, Restaurants & Leisure: 1.33% | | | | | | | | | | | | |
Norwegian Cruise Line Holdings Limited † | | | | | | | 70,500 | | | $ | 3,198,585 | |
| | | | | | | | | | | | |
| | | | |
| Household Durables: 2.43% | | | | | | | | | | | | |
Harman International Industries Incorporated | | | | | | | 38,756 | | | | 2,883,059 | |
Jarden Corporation † | | | | | | | 55,832 | | | | 2,961,888 | |
| | | | |
| | | | | | | | | | | 5,844,947 | |
| | | | | | | | | | | | |
| | | | |
| Leisure Products: 1.19% | | | | | | | | | | | | |
Mattel Incorporated | | | | | | | 103,926 | | | | 2,867,318 | |
| | | | | | | | | | | | |
| | | | |
| Media: 1.25% | | | | | | | | | | | | |
Scripps Networks Interactive Incorporated Class A | | | | | | | 49,084 | | | | 2,992,651 | |
| | | | | | | | | | | | |
| | | | |
| Multiline Retail: 0.64% | | | | | | | | | | | | |
JCPenny Company Incorporated Ǡ | | | | | | | 213,347 | | | | 1,548,899 | |
| | | | | | | | | | | | |
| | | | |
| Textiles, Apparel & Luxury Goods: 0.77% | | | | | | | | | | | | |
Skechers U.S.A. Incorporated Class A † | | | | | | | 65,554 | | | | 1,847,967 | |
| | | | | | | | | | | | |
| | | | |
Consumer Staples: 6.52% | | | | | | | | | | | | |
| | | | |
| Food & Staples Retailing: 2.93% | | | | | | | | | | | | |
CVS Health Corporation | | | | | | | 72,890 | | | | 7,040,445 | |
| | | | | | | | | | | | |
| | | | |
| Food Products: 1.04% | | | | | | | | | | | | |
TreeHouse Foods Incorporated † | | | | | | | 31,582 | | | | 2,506,348 | |
| | | | | | | | | | | | |
| | | | |
| Household Products: 1.38% | | | | | | | | | | | | |
The Procter & Gamble Company | | | | | | | 40,705 | | | | 3,325,191 | |
| | | | | | | | | | | | |
| | | | |
| Personal Products: 1.17% | | | | | | | | | | | | |
Herbalife Limited Ǡ | | | | | | | 60,728 | | | | 2,806,241 | |
| | | | | | | | | | | | |
| | | | |
Energy: 11.02% | | | | | | | | | | | | |
| | | | |
| Energy Equipment & Services: 1.29% | | | | | | | | | | | | |
Baker Hughes Incorporated | | | | | | | 53,361 | | | | 2,321,737 | |
Noble Corporation plc « | | | | | | | 101,315 | | | | 789,244 | |
| | | | |
| | | | | | | | | | | 3,110,981 | |
| | | | | | | | | | | | |
| | | | |
| Oil, Gas & Consumable Fuels: 9.73% | | | | | | | | | | | | |
Chevron Corporation | | | | | | | 29,364 | | | | 2,539,105 | |
ConocoPhillips | | | | | | | 63,485 | | | | 2,480,994 | |
Exxon Mobil Corporation | | | | | | | 95,233 | | | | 7,413,889 | |
Kinder Morgan Incorporated | | | | | | | 223,575 | | | | 3,677,809 | |
Noble Energy Incorporated | | | | | | | 97,170 | | | | 3,145,393 | |
Valero Energy Corporation | | | | | | | 61,297 | | | | 4,160,227 | |
| | | | |
| | | | | �� | | | | | | 23,417,417 | |
| | | | | | | | | | | | |
The accompanying notes are an integral part of these financial statements.
| | | | |
| 8 | | Wells Fargo Large Company Value Fund | | Portfolio of investments—January 31, 2016 (unaudited) |
| | | | | | | | | | | | |
| Security name | | | | | | Shares | | | Value | |
| | | | |
Financials: 28.18% | | | | | | | | | | | | |
| | | | |
| Banks: 10.45% | | | | | | | | | | | | |
Bank of America Corporation | | | | | | | 212,335 | | | $ | 3,002,417 | |
BOK Financial Corporation « | | | | | | | 65,518 | | | | 3,276,555 | |
Citigroup Incorporated | | | | | | | 68,778 | | | | 2,928,567 | |
First Republic Bank | | | | | | | 87,533 | | | | 5,952,244 | |
JPMorgan Chase & Company | | | | | | | 106,221 | | | | 6,320,150 | |
KeyCorp | | | | | | | 104,886 | | | | 1,170,528 | |
SunTrust Banks Incorporated | | | | | | | 68,378 | | | | 2,501,267 | |
| | | | |
| | | | | | | | | | | 25,151,728 | |
| | | | | | | | | | | | |
| | | | |
| Capital Markets: 4.47% | | | | | | | | | | | | |
Affiliated Managers Group Incorporated † | | | | | | | 17,260 | | | | 2,316,119 | |
Ameriprise Financial Incorporated | | | | | | | 54,517 | | | | 4,941,966 | |
Goldman Sachs Group Incorporated | | | | | | | 21,572 | | | | 3,485,172 | |
| | | | |
| | | | | | | | | | | 10,743,257 | |
| | | | | | | | | | | | |
| | | | |
| Insurance: 7.40% | | | | | | | | | | | | |
American International Group Incorporated | | | | | | | 95,534 | | | | 5,395,760 | |
Arthur J. Gallagher & Company | | | | | | | 70,263 | | | | 2,644,699 | |
Chubb Ltd | | | | | | | 23,574 | | | | 2,665,512 | |
Endurance Specialty Holdings Limited | | | | | | | 37,787 | | | | 2,340,149 | |
MetLife Incorporated | | | | | | | 106,674 | | | | 4,762,994 | |
| | | | |
| | | | | | | | | | | 17,809,114 | |
| | | | | | | | | | | | |
| | | | |
| REITs: 5.86% | | | | | | | | | | | | |
Alexandria Real Estate Equities Incorporated | | | | | | | 62,432 | | | | 4,943,366 | |
Equity Residential | | | | | | | 55,215 | | | | 4,256,524 | |
Prologis Incorporated | | | | | | | 60,344 | | | | 2,381,778 | |
VEREIT Incorporated | | | | | | | 326,891 | | | | 2,520,330 | |
| | | | |
| | | | | | | | | | | 14,101,998 | |
| | | | | | | | | | | | |
| | | | |
Health Care: 13.05% | | | | | | | | | | | | |
| | | | |
| Biotechnology: 2.49% | | | | | | | | | | | | |
Baxalta Incorporated | | | | | | | 109,201 | | | | 4,369,132 | |
Gilead Sciences Incorporated | | | | | | | 19,446 | | | | 1,614,018 | |
| | | | |
| | | | | | | | | | | 5,983,150 | |
| | | | | | | | | | | | |
| | | | |
| Health Care Equipment & Supplies: 1.07% | | | | | | | | | | | | |
Medtronic plc | | | | | | | 34,022 | | | | 2,582,950 | |
| | | | | | | | | | | | |
| | | | |
| Health Care Providers & Services: 1.91% | | | | | | | | | | | | |
Cigna Corporation | | | | | | | 18,492 | | | | 2,470,531 | |
HCA Holdings Incorporated † | | | | | | | 30,459 | | | | 2,119,337 | |
| | | | |
| | | | | | | | | | | 4,589,868 | |
| | | | | | | | | | | | |
| | | | |
| Pharmaceuticals: 7.58% | | | | | | | | | | | | |
AbbVie Incorporated | | | | | | | 34,760 | | | | 1,908,324 | |
Allergan plc † | | | | | | | 14,596 | | | | 4,151,540 | |
The accompanying notes are an integral part of these financial statements.
| | | | | | |
| Portfolio of investments—January 31, 2016 (unaudited) | | Wells Fargo Large Company Value Fund | | | 9 | |
| | | | | | | | | | | | |
| Security name | | | | | | Shares | | | Value | |
| | | | |
| Pharmaceuticals (continued) | | | | | | | | | | | | |
Johnson & Johnson | | | | | | | 25,401 | | | $ | 2,652,880 | |
Mallinckrodt plc † | | | | | | | 40,772 | | | | 2,368,445 | |
Merck & Company Incorporated | | | | | | | 55,066 | | | | 2,790,194 | |
Pfizer Incorporated | | | | | | | 143,456 | | | | 4,373,973 | |
| | | | |
| | | | | | | | | | | 18,245,356 | |
| | | | | | | | | | | | |
| | | | |
Industrials: 10.06% | | | | | | | | | | | | |
| | | | |
| Aerospace & Defense: 3.01% | | | | | | | | | | | | |
Curtiss-Wright Corporation | | | | | | | 38,746 | | | | 2,673,474 | |
Raytheon Company | | | | | | | 19,019 | | | | 2,438,997 | |
The Boeing Company | | | | | | | 17,843 | | | | 2,143,480 | |
| | | | |
| | | | | | | | | | | 7,255,951 | |
| | | | | | | | | | | | |
| | | | |
| Airlines: 0.42% | | | | | | | | | | | | |
United Continental Holdings Incorporated † | | | | | | | 20,796 | | | | 1,004,031 | |
| | | | | | | | | | | | |
| | | | |
| Commercial Services & Supplies: 0.92% | | | | | | | | | | | | |
Progressive Waste Solutions Limited | | | | | | | 78,316 | | | | 2,206,162 | |
| | | | | | | | | | | | |
| | | | |
| Electrical Equipment: 0.83% | | | | | | | | | | | | |
Eaton Corporation plc | | | | | | | 39,467 | | | | 1,993,478 | |
| | | | | | | | | | | | |
| | | | |
| Industrial Conglomerates: 1.74% | | | | | | | | | | | | |
General Electric Company | | | | | | | 143,632 | | | | 4,179,691 | |
| | | | | | | | | | | | |
| | | | |
| Machinery: 1.51% | | | | | | | | | | | | |
Stanley Black & Decker Incorporated | | | | | | | 38,597 | | | | 3,641,241 | |
| | | | | | | | | | | | |
| | | | |
| Professional Services: 0.70% | | | | | | | | | | | | |
CEB Incorporated | | | | | | | 28,586 | | | | 1,686,002 | |
| | | | | | | | | | | | |
| | | | |
| Road & Rail: 0.93% | | | | | | | | | | | | |
Norfolk Southern Corporation | | | | | | | 31,798 | | | | 2,241,759 | |
| | | | | | | | | | | | |
| | | | |
Information Technology: 10.83% | | | | | | | | | | | | |
| | | | |
| Electronic Equipment, Instruments & Components: 2.56% | | | | | | | | | | | | |
Synnex Corporation | | | | | | | 46,519 | | | | 3,905,270 | |
TE Connectivity Limited | | | | | | | 39,505 | | | | 2,258,106 | |
| | | | |
| | | | | | | | | | | 6,163,376 | |
| | | | | | | | | | | | |
| | | | |
| Internet Software & Services: 1.54% | | | | | | | | | | | | |
Alphabet Incorporated Class C † | | | | | | | 5,002 | | | | 3,716,236 | |
| | | | | | | | | | | | |
| | | | |
| Semiconductors & Semiconductor Equipment: 3.82% | | | | | | | | | | | | |
Intel Corporation | | | | | | | 102,757 | | | | 3,187,522 | |
NXP Semiconductors NV † | | | | | | | 48,432 | | | | 3,621,745 | |
Skyworks Solutions Incorporated | | | | | | | 34,892 | | | | 2,375,098 | |
| | | | |
| | | | | | | | | | | 9,184,365 | |
| | | | | | | | | | | | |
The accompanying notes are an integral part of these financial statements.
| | | | |
| 10 | | Wells Fargo Large Company Value Fund | | Portfolio of investments—January 31, 2016 (unaudited) |
| | | | | | | | | | | | | | |
| Security name | | | | | | | Shares | | | Value | |
| | | | |
| Software: 0.52% | | | | | | | | | | | | | | |
Citrix Systems Incorporated † | | | | | | | | | 17,761 | | | $ | 1,251,440 | |
| | | | | | | | | | | | | | |
| | | | |
| Technology Hardware, Storage & Peripherals: 2.39% | | | | | | | | | | | | | | |
Apple Incorporated | | | | | | | | | 23,452 | | | | 2,282,818 | |
NCR Corporation † | | | | | | | | | 162,816 | | | | 3,474,493 | |
| | | | |
| | | | | | | | | | | | | 5,757,311 | |
| | | | | | | | | | | | | | |
| | | | |
Materials: 3.07% | | | | | | | | | | | | | | |
| | | | |
| Chemicals: 1.64% | | | | | | | | | | | | | | |
Cabot Corporation | | | | | | | | | 39,683 | | | | 1,600,812 | |
FMC Corporation | | | | | | | | | 65,488 | | | | 2,339,231 | |
| | | | |
| | | | | | | | | | | | | 3,940,043 | |
| | | | | | | | | | | | | | |
| | | | |
| Containers & Packaging: 1.43% | | | | | | | | | | | | | | |
Crown Holdings Incorporated † | | | | | | | | | 56,933 | | | | 2,612,086 | |
WestRock Company | | | | | | | | | 23,710 | | | | 836,489 | |
| | | | |
| | | | | | | | | | | | | 3,448,575 | |
| | | | | | | | | | | | | | |
| | | | |
Telecommunication Services: 2.35% | | | | | | | | | | | | | | |
| | | | |
| Diversified Telecommunication Services: 2.35% | | | | | | | | | | | | | | |
AT&T Incorporated | | | | | | | | | 75,353 | | | | 2,717,229 | |
Verizon Communications Incorporated | | | | | | | | | 58,767 | | | | 2,936,591 | |
| | | | |
| | | | | | | | | | | | | 5,653,820 | |
| | | | | | | | | | | | | | |
| | | | |
Utilities: 4.47% | | | | | | | | | | | | | | |
| | | | |
| Electric Utilities: 3.33% | | | | | | | | | | | | | | |
Duke Energy Corporation | | | | | | | | | 50,505 | | | | 3,803,027 | |
The Southern Company | | | | | | | | | 85,997 | | | | 4,206,973 | |
| | | | |
| | | | | | | | | | | | | 8,010,000 | |
| | | | | | | | | | | | | | |
| | | | |
| Gas Utilities: 1.14% | | | | | | | | | | | | | | |
Atmos Energy Corporation | | | | | | | | | 39,541 | | | | 2,737,028 | |
| | | | | | | | | | | | | | |
| | | | |
Total Common Stocks (Cost $209,745,358) | | | | | | | | | | | | | 233,784,920 | |
| | | | | | | | | | | | | | |
| | | | |
| | | Yield | | | | | | | | | |
| Short-Term Investments: 4.09% | | | | | | | | | | | | | | |
| | | | |
| Investment Companies: 4.09% | | | | | | | | | | | | | | |
Securities Lending Cash Investments, LLC (l)(r)(u) | | | 0.42 | % | | | | | 8,210,173 | | | | 8,210,173 | |
Wells Fargo Cash Investment Money Market Fund, Select Class (l)(u) | | | 0.40 | | | | | | 1,627,785 | | | | 1,627,785 | |
| | | | |
Total Short-Term Investments (Cost $9,837,958) | | | | | | | | | | | | | 9,837,958 | |
| | | | | | | | | | | | | | |
| | | | | | | | |
| Total investments in securities (Cost $219,583,316) * | | | 101.25 | % | | | 243,622,878 | |
Other assets and liabilities, net | | | (1.25 | ) | | | (2,998,106 | ) |
| | | | | | | | |
| Total net assets | | | 100.00 | % | | $ | 240,624,772 | |
| | | | | | | | |
The accompanying notes are an integral part of these financial statements.
| | | | | | |
| Portfolio of investments—January 31, 2016 (unaudited) | | Wells Fargo Large Company Value Fund | | | 11 | |
| † | Non-income-earning security |
| « | All or a portion of this security is on loan. |
| (l) | The issuer of the security is an affiliated person of the Fund as defined in the Investment Company Act of 1940. |
| (r) | The investment is a non-registered investment vehicle purchased with cash collateral received from securities on loan. |
| (u) | The rate represents the 7-day annualized yield at period end. |
| * | Cost for federal income tax purposes is $223,622,652 and unrealized gains (losses) consists of: |
| | | | |
Gross unrealized gains | | $ | 38,398,850 | |
Gross unrealized losses | | | (18,398,624 | ) |
| | | | |
Net unrealized gains | | $ | 20,000,226 | |
The accompanying notes are an integral part of these financial statements.
| | | | |
| 12 | | Wells Fargo Large Company Value Fund | | Statement of assets and liabilities—January 31, 2016 (unaudited) |
| | | | |
| | | | |
| |
Assets | | | | |
Investments | | | | |
In unaffiliated securities (including $8,001,830 of securities loaned), at value (cost $209,745,358) | | $ | 233,784,920 | |
In affiliated securities, at value (cost $9,837,958) | | | 9,837,958 | |
| | | | |
Total investments, at value (cost $219,583,316) | | | 243,622,878 | |
Cash | | | 685 | |
Receivable for investments sold | | | 8,642,906 | |
Receivable for Fund shares sold | | | 20,011 | |
Receivable for dividends | | | 297,634 | |
Receivable for securities lending income | | | 8,257 | |
Prepaid expenses and other assets | | | 43,272 | |
| | | | |
Total assets | | | 252,635,643 | |
| | | | |
| |
Liabilities | | | | |
Payable for investments purchased | | | 3,306,681 | |
Payable for Fund shares redeemed | | | 247,401 | |
Payable upon receipt of securities loaned | | | 8,210,173 | |
Management fee payable | | | 112,737 | |
Distribution fee payable | | | 2,339 | |
Administration fees payable | | | 41,063 | |
Accrued expenses and other liabilities | | | 90,477 | |
| | | | |
Total liabilities | | | 12,010,871 | |
| | | | |
Total net assets | | $ | 240,624,772 | |
| | | | |
| |
NET ASSETS CONSIST OF | | | | |
Paid-in capital | | $ | 229,190,750 | |
Undistributed net investment income | | | 95,455 | |
Accumulated net realized losses on investments | | | (12,700,995 | ) |
Net unrealized gains on investments | | | 24,039,562 | |
| | | | |
Total net assets | | $ | 240,624,772 | |
| | | | |
| |
COMPUTATION OF NET ASSET VALUE AND OFFERING PRICE PER SHARE | | | | |
Net assets – Class A | | $ | 205,640,688 | |
Shares outstanding – Class A1 | | | 15,784,679 | |
Net asset value per share – Class A | | | $13.03 | |
Maximum offering price per share – Class A2 | | | $13.82 | |
Net assets – Class C | | $ | 3,569,541 | |
Shares outstanding – Class C1 | | | 268,137 | |
Net asset value per share – Class C | | | $13.31 | |
Net assets – Administrator Class | | $ | 23,133,680 | |
Shares outstanding – Administrator Class1 | | | 1,764,663 | |
Net asset value per share – Administrator Class | | | $13.11 | |
Net assets – Institutional Class | | $ | 8,280,863 | |
Shares outstanding – Institutional Class1 | | | 632,242 | |
Net asset value per share – Institutional Class | | | $13.10 | |
| 1 | The Fund has an unlimited number of authorized shares. |
| 2 | Maximum offering price is computed as 100/94.25 of net asset value. On investments of $50,000 or more, the offering price is reduced. |
The accompanying notes are an integral part of these financial statements.
| | | | | | |
| Statement of operations—six months ended January 31, 2016 (unaudited) | | Wells Fargo Large Company Value Fund | | | 13 | |
| | | | |
| | | | |
| |
Investment income | | | | |
Dividends (net of foreign withholding taxes of $2,998) | | $ | 2,747,597 | |
Securities lending income, net | | | 51,488 | |
Income from affiliated securities | | | 5,925 | |
| | | | |
Total investment income | | | 2,805,010 | |
| | | | |
| |
Expenses | | | | |
Management fee | | | 908,249 | |
Administration fees | | | | |
Class A | | | 172,341 | |
Class C | | | 4,132 | |
Administrator Class | | | 17,468 | |
Institutional Class | | | 2,250 | |
Investor Class | | | 97,752 | 1 |
Shareholder servicing fees | | | | |
Class A | | | 204,622 | |
Class C | | | 4,919 | |
Administrator Class | | | 33,592 | |
Investor Class | | | 76,122 | 1 |
Distribution fee | | | | |
Class C | | | 14,758 | |
Custody and accounting fees | | | 10,881 | |
Professional fees | | | 20,149 | |
Registration fees | | | 32,782 | |
Shareholder report expenses | | | 24,586 | |
Trustees’ fees and expenses | | | 12,037 | |
Other fees and expenses | | | 5,751 | |
| | | | |
Total expenses | | | 1,642,391 | |
Less: Fee waivers and/or expense reimbursements | | | (216,735 | ) |
| | | | |
Net expenses | | | 1,425,656 | |
| | | | |
Net investment income | | | 1,379,354 | |
| | | | |
| |
REALIZED AND UNREALIZED GAINS (LOSSES) ON INVESTMENTS | | | | |
Net realized losses on investments | | | (5,065,164 | ) |
Net change in unrealized gains (losses) on investments | | | (29,906,439 | ) |
| | | | |
Net realized and unrealized gains (losses) on investments | | | (34,971,603 | ) |
| | | | |
Net decrease in net assets resulting from operations | | $ | (33,592,249 | ) |
| | | | |
| 1 | For the period from August 1, 2015 to October 23, 2015. Effective at the close of business on October 23, 2015, Investor Class shares were converted to Class A shares and are no longer offered by the Fund. |
The accompanying notes are an integral part of these financial statements.
| | | | |
| 14 | | Wells Fargo Large Company Value Fund | | Statement of changes in net assets |
| | | | | | | | | | | | | | | | |
| | | Six months ended January 31, 2016 (unaudited) | | | Year ended July 31, 2015 | |
| | | | |
Operations | | | | | | | | | | | | | | | | |
Net investment income | | | | | | $ | 1,379,354 | | | | | | | $ | 2,249,903 | |
Net realized gains (losses) on investments | | | | | | | (5,065,164 | ) | | | | | | | 31,510,363 | |
Net change in unrealized gains (losses) on investments | | | | | | | (29,906,439 | ) | | | | | | | (16,922,395 | ) |
| | | | |
Net increase (decrease) in net assets resulting from operations | | | | | | | (33,592,249 | ) | | | | | | | 16,837,871 | |
| | | | |
| | | | |
Distributions to shareholders from | | | | | | | | | | | | | | | | |
Net investment income | | | | | | | | | | | | | | | | |
Class A | | | | | | | (910,440 | ) | | | | | | | (879,902 | ) |
Class C | | | | | | | (2,861 | ) | | | | | | | (2,940 | ) |
Administrator Class | | | | | | | (181,824 | ) | | | | | | | (376,690 | ) |
Institutional Class | | | | | | | (41,773 | ) | | | | | | | (21,092 | ) |
Investor Class | | | | | | | (248,226 | )1 | | | | | | | (1,017,744 | ) |
Net realized gains | | | | | | | | | | | | | | | | |
Class A | | | | | | | (16,632,476 | ) | | | | | | | (9,704,404 | ) |
Class C | | | | | | | (275,850 | ) | | | | | | | (389,854 | ) |
Administrator Class | | | | | | | (1,889,643 | ) | | | | | | | (3,048,826 | ) |
Institutional Class | | | | | | | (642,971 | ) | | | | | | | (160,301 | ) |
Investor Class | | | | | | | 0 | 1 | | | | | | | (12,477,097 | ) |
| | | | |
Total distributions to shareholders | | | | | | | (20,826,064 | ) | | | | | | | (28,078,850 | ) |
| | | | |
| | | | |
Capital share transactions | | | Shares | | | | | | | | Shares | | | | | |
Proceeds from shares sold | | | | | | | | | | | | | | | | |
Class A | | | 8,785,895 | | | | 136,490,514 | | | | 123,205 | | | | 2,013,071 | |
Class C | | | 22,765 | | | | 335,852 | | | | 38,787 | | | | 642,242 | |
Administrator Class | | | 53,190 | | | | 785,882 | | | | 119,049 | | | | 1,984,735 | |
Institutional Class | | | 522,234 | | | | 7,965,902 | | | | 70,995 | | | | 1,223,711 | |
Investor Class | | | 32,361 | 1 | | | 501,185 | 1 | | | 320,863 | | | | 5,443,693 | |
| | | | |
| | | | | | | 146,079,335 | | | | | | | | 11,307,452 | |
| | | | |
Reinvestment of distributions | | | | | | | | | | | | | | | | |
Class A | | | 1,226,102 | | | | 17,042,852 | | | | 651,156 | | | | 10,256,986 | |
Class C | | | 17,519 | | | | 248,292 | | | | 21,352 | | | | 341,919 | |
Administrator Class | | | 133,451 | | | | 1,871,174 | | | | 197,644 | | | | 3,137,103 | |
Institutional Class | | | 45,488 | | | | 636,244 | | | | 6,036 | | | | 95,717 | |
Investor Class | | | 15,819 | 1 | | | 239,184 | 1 | | | 800,321 | | | | 12,965,138 | |
| | | | |
| | | | | | | 20,037,746 | | | | | | | | 26,796,863 | |
| | | | |
Payment for shares redeemed | | | | | | | | | | | | | | | | |
Class A | | | (716,112 | ) | | | (10,457,722 | ) | | | (1,205,076 | ) | | | (20,028,888 | ) |
Class C | | | (45,620 | ) | | | (692,449 | ) | | | (58,702 | ) | | | (985,449 | ) |
Administrator Class | | | (284,829 | ) | | | (4,267,479 | ) | | | (580,514 | ) | | | (9,574,977 | ) |
Institutional Class | | | (27,173 | ) | | | (400,503 | ) | | | (36,394 | ) | | | (597,478 | ) |
Investor Class | | | (8,624,994 | )1 | | | (137,935,922 | )1 | | | (1,044,020 | ) | | | (17,642,122 | ) |
| | | | |
| | | | | | | (153,754,075 | ) | | | | | | | (48,828,914 | ) |
| | | | |
Net increase (decrease) in net assets resulting from capital share transactions | | | | | | | 12,363,006 | | | | | | | | (10,724,599 | ) |
| | | | |
Total decrease in net assets | | | | | | | (42,055,307 | ) | | | | | | | (21,965,578 | ) |
| | | | |
| | | | |
Net assets | | | | | | | | | | | | | | | | |
Beginning of period | | | | | | | 282,680,079 | | | | | | | | 304,645,657 | |
| | | | |
End of period | | | | | | $ | 240,624,772 | | | | | | | $ | 282,680,079 | |
| | | | |
Undistributed net investment income | | | | | | $ | 95,455 | | | | | | | $ | 101,225 | |
| | | | |
| 1 | For the period from August 1, 2015 to October 23, 2015. Effective at the close of business on October 23, 2015, Investor Class shares were converted to Class A shares and are no longer offered by the Fund. |
The accompanying notes are an integral part of these financial statements.
| | | | | | |
| Financial highlights | | Wells Fargo Large Company Value Fund | | | 15 | |
(For a share outstanding throughout each period)
| | | | | | | | | | | | | | | | | | | | | | | | |
| | | Six months ended January 31, 2016 (unaudited) | | | Year ended July 31 | |
| CLASS A | | | 2015 | | | 2014 | | | 2013 | | | 2012 | | | 2011 | |
Net asset value, beginning of period | | | $16.10 | | | | $16.82 | | | | $16.39 | | | | $12.96 | | | | $12.61 | | | | $11.04 | |
Net investment income | | | 0.07 | 1 | | | 0.13 | 1 | | | 0.10 | | | | 0.14 | | | | 0.17 | | | | 0.12 | |
Net realized and unrealized gains (losses) on investments | | | (1.94 | ) | | | 0.78 | | | | 2.04 | | | | 3.48 | | | | 0.35 | | | | 1.51 | |
| | | | | | | | | | | | | | | | | | | | | | | | |
Total from investment operations | | | (1.87 | ) | | | 0.91 | | | | 2.14 | | | | 3.62 | | | | 0.52 | | | | 1.63 | |
Distributions to shareholders from | | | | | | | | | | | | | | | | | | | | | | | | |
Net investment income | | | (0.08 | ) | | | (0.13 | ) | | | (0.09 | ) | | | (0.19 | ) | | | (0.17 | ) | | | (0.06 | ) |
Net realized gains | | | (1.12 | ) | | | (1.50 | ) | | | (1.62 | ) | | | 0.00 | | | | 0.00 | | | | 0.00 | |
| | | | | | | | | | | | | | | | | | | | | | | | |
Total distributions to shareholders | | | (1.20 | ) | | | (1.63 | ) | | | (1.71 | ) | | | (0.19 | ) | | | (0.17 | ) | | | (0.06 | ) |
Net asset value, end of period | | | $13.03 | | | | $16.10 | | | | $16.82 | | | | $16.39 | | | | $12.96 | | | | $12.61 | |
Total return2 | | | (12.07 | )% | | | 5.72 | % | | | 13.68 | % | | | 28.16 | % | | | 4.21 | % | | | 14.77 | % |
Ratios to average net assets (annualized) | | | | | | | | | | | | | | | | | | | | | | | | |
Gross expenses | | | 1.24 | % | | | 1.27 | % | | | 1.28 | % | | | 1.28 | % | | | 1.27 | % | | | 1.32 | % |
Net expenses | | | 1.10 | % | | | 1.10 | % | | | 1.10 | % | | | 1.10 | % | | | 1.10 | % | | | 1.25 | % |
Net investment income | | | 1.02 | % | | | 0.76 | % | | | 0.61 | % | | | 1.00 | % | | | 1.29 | % | | | 0.74 | % |
Supplemental data | | | | | | | | | | | | | | | | | | | | | | | | |
Portfolio turnover rate | | | 33 | % | | | 71 | % | | | 59 | % | | | 78 | % | | | 37 | % | | | 35 | % |
Net assets, end of period (000s omitted) | | | $205,641 | | | | $104,453 | | | | $116,398 | | | | $115,895 | | | | $103,195 | | | | $642 | |
| 1 | Calculated based upon average shares outstanding |
| 2 | Total return calculations do not include any sales charges. Returns for periods of less than one year are not annualized. |
The accompanying notes are an integral part of these financial statements.
| | | | |
| 16 | | Wells Fargo Large Company Value Fund | | Financial highlights |
(For a share outstanding throughout each period)
| | | | | | | | | | | | | | | | | | | | | | | | |
| | | Six months ended January 31, 2016 (unaudited) | | | Year ended July 31 | |
| CLASS C | | | 2015 | | | 2014 | | | 2013 | | | 2012 | | | 2011 | |
Net asset value, beginning of period | | | $16.41 | | | | $17.12 | | | | $16.70 | | | | $13.21 | | | | $12.81 | | | | $11.26 | |
Net investment income (loss) | | | 0.02 | | | | 0.00 | 1 | | | (0.02 | ) | | | 0.04 | | | | 0.09 | | | | 0.01 | |
Net realized and unrealized gains (losses) on investments | | | (1.99 | ) | | | 0.80 | | | | 2.07 | | | | 3.54 | | | | 0.36 | | | | 1.55 | |
| | | | | | | | | | | | | | | | | | | | | | | | |
Total from investment operations | | | (1.97 | ) | | | 0.80 | | | | 2.05 | | | | 3.58 | | | | 0.45 | | | | 1.56 | |
Distributions to shareholders from | | | | | | | | | | | | | | | | | | | | | | | | |
Net investment income | | | (0.01 | ) | | | (0.01 | ) | | | (0.01 | ) | | | (0.09 | ) | | | (0.05 | ) | | | (0.01 | ) |
Net realized gains | | | (1.12 | ) | | | (1.50 | ) | | | (1.62 | ) | | | 0.00 | | | | 0.00 | | | | 0.00 | |
| | | | | | | | | | | | | | | | | | | | | | | | |
Total distributions to shareholders | | | (1.13 | ) | | | (1.51 | ) | | | (1.63 | ) | | | (0.09 | ) | | | (0.05 | ) | | | (0.01 | ) |
Net asset value, end of period | | | $13.31 | | | | $16.41 | | | | $17.12 | | | | $16.70 | | | | $13.21 | | | | $12.81 | |
Total return2 | | | (12.34 | )% | | | 4.92 | % | | | 12.83 | % | | | 27.17 | % | | | 3.49 | % | | | 13.85 | % |
Ratios to average net assets (annualized) | | | | | | | | | | | | | | | | | | | | | | | | |
Gross expenses | | | 1.99 | % | | | 2.02 | % | | | 2.03 | % | | | 2.03 | % | | | 2.02 | % | | | 2.08 | % |
Net expenses | | | 1.85 | % | | | 1.85 | % | | | 1.85 | % | | | 1.85 | % | | | 1.85 | % | | | 2.00 | % |
Net investment income (loss) | | | 0.32 | % | | | 0.01 | % | | | (0.14 | )% | | | 0.25 | % | | | 0.54 | % | | | 0.04 | % |
Supplemental data | | | | | | | | | | | | | | | | | | | | | | | | |
Portfolio turnover rate | | | 33 | % | | | 71 | % | | | 59 | % | | | 78 | % | | | 37 | % | | | 35 | % |
Net assets, end of period (000s omitted) | | | $3,570 | | | | $4,488 | | | | $4,659 | | | | $4,543 | | | | $4,022 | | | | $513 | |
| 1 | Amount is less than $0.005. |
| 2 | Total return calculations do not include any sales charges. Returns for periods of less than one year are not annualized. |
The accompanying notes are an integral part of these financial statements.
| | | | | | |
| Financial highlights | | Wells Fargo Large Company Value Fund | | | 17 | |
(For a share outstanding throughout each period)
| | | | | | | | | | | | | | | | | | | | | | | | |
| | | Six months ended January 31, 2016 (unaudited) | | | Year ended July 31 | |
| ADMINISTRATOR CLASS | | | 2015 | | | 2014 | | | 2013 | | | 2012 | | | 2011 | |
Net asset value, beginning of period | | | $16.20 | | | | $16.93 | | | | $16.47 | | | | $13.02 | | | | $12.68 | | | | $11.08 | |
Net investment income | | | 0.10 | | | | 0.17 | | | | 0.15 | | | | 0.21 | | | | 0.19 | 1 | | | 0.11 | |
Net realized and unrealized gains (losses) on investments | | | (1.97 | ) | | | 0.78 | | | | 2.05 | | | | 3.46 | | | | 0.36 | | | | 1.56 | |
| | | | | | | | | | | | | | | | | | | | | | | | |
Total from investment operations | | | (1.87 | ) | | | 0.95 | | | | 2.20 | | | | 3.67 | | | | 0.55 | | | | 1.67 | |
Distributions to shareholders from | | | | | | | | | | | | | | | | | | | | | | | | |
Net investment income | | | (0.10 | ) | | | (0.18 | ) | | | (0.12 | ) | | | (0.22 | ) | | | (0.21 | ) | | | (0.07 | ) |
Net realized gains | | | (1.12 | ) | | | (1.50 | ) | | | (1.62 | ) | | | 0.00 | | | | 0.00 | | | | 0.00 | |
| | | | | | | | | | | | | | | | | | | | | | | | |
Total distributions to shareholders | | | (1.22 | ) | | | (1.68 | ) | | | (1.74 | ) | | | (0.22 | ) | | | (0.21 | ) | | | (0.07 | ) |
Net asset value, end of period | | | $13.11 | | | | $16.20 | | | | $16.93 | | | | $16.47 | | | | $13.02 | | | | $12.68 | |
Total return2 | | | (11.91 | )% | | | 5.95 | % | | | 13.94 | % | | | 28.52 | % | | | 4.47 | % | | | 15.12 | % |
Ratios to average net assets (annualized) | | | | | | | | | | | | | | | | | | | | | | | | |
Gross expenses | | | 1.16 | % | | | 1.12 | % | | | 1.12 | % | | | 1.10 | % | | | 1.11 | % | | | 1.17 | % |
Net expenses | | | 0.89 | % | | | 0.85 | % | | | 0.85 | % | | | 0.85 | % | | | 0.85 | % | | | 0.96 | % |
Net investment income | | | 1.29 | % | | | 1.01 | % | | | 0.86 | % | | | 1.28 | % | | | 1.54 | % | | | 1.93 | % |
Supplemental data | | | | | | | | | | | | | | | | | | | | | | | | |
Portfolio turnover rate | | | 33 | % | | | 71 | % | | | 59 | % | | | 78 | % | | | 37 | % | | | 35 | % |
Net assets, end of period (000s omitted) | | | $23,134 | | | | $30,177 | | | | $36,002 | | | | $38,798 | | | | $176,623 | | | | $667 | |
| 1 | Calculated based upon average shares outstanding |
| 2 | Returns for periods of less than one year are not annualized. |
The accompanying notes are an integral part of these financial statements.
| | | | |
| 18 | | Wells Fargo Large Company Value Fund | | Financial highlights |
(For a share outstanding throughout each period)
| | | | | | | | | | | | | | | | | | | | | | | | |
| | | Six months ended January 31, 2016 (unaudited) | | | Year ended July 31 | |
| INSTITUTIONAL CLASS | | | 2015 | | | 2014 | | | 2013 | | | 2012 | | | 2011 | |
Net asset value, beginning of period | | | $16.17 | | | | $16.91 | | | | $16.44 | | | | $13.00 | | | | $12.68 | | | | $11.08 | |
Net investment income | | | 0.08 | 1 | | | 0.20 | 1 | | | 0.18 | 1 | | | 0.26 | 1 | | | 0.22 | | | | 0.14 | |
Net realized and unrealized gains (losses) on investments | | | (1.92 | ) | | | 0.78 | | | | 2.05 | | | | 3.45 | | | | 0.35 | | | | 1.54 | |
| | | | | | | | | | | | | | | | | | | | | | | | |
Total from investment operations | | | (1.84 | ) | | | 0.98 | | | | 2.23 | | | | 3.71 | | | | 0.57 | | | | 1.68 | |
Distributions to shareholders from | | | | | | | | | | | | | | | | | | | | | | | | |
Net investment income | | | (0.11 | ) | | | (0.22 | ) | | | (0.14 | ) | | | (0.27 | ) | | | (0.25 | ) | | | (0.08 | ) |
Net realized gains | | | (1.12 | ) | | | (1.50 | ) | | | (1.62 | ) | | | 0.00 | | | | 0.00 | | | | 0.00 | |
| | | | | | | | | | | | | | | | | | | | | | | | |
Total distributions to shareholders | | | (1.23 | ) | | | (1.72 | ) | | | (1.76 | ) | | | (0.27 | ) | | | (0.25 | ) | | | (0.08 | ) |
Net asset value, end of period | | | $13.10 | | | | $16.17 | | | | $16.91 | | | | $16.44 | | | | $13.00 | | | | $12.68 | |
Total return2 | | | (11.82 | )% | | | 6.14 | % | | | 14.16 | % | | | 28.93 | % | | | 4.67 | % | | | 15.36 | % |
Ratios to average net assets (annualized) | | | | | | | | | | | | | | | | | | | | | | | | |
Gross expenses | | | 0.91 | % | | | 0.85 | % | | | 0.85 | % | | | 0.84 | % | | | 0.85 | % | | | 0.89 | % |
Net expenses | | | 0.72 | % | | | 0.65 | % | | | 0.65 | % | | | 0.65 | % | | | 0.66 | % | | | 0.75 | % |
Net investment income | | | 1.17 | % | | | 1.23 | % | | | 1.10 | % | | | 1.83 | % | | | 1.80 | % | | | 1.12 | % |
Supplemental data | | | | | | | | | | | | | | | | | | | | | | | | |
Portfolio turnover rate | | | 33 | % | | | 71 | % | | | 59 | % | | | 78 | % | | | 37 | % | | | 35 | % |
Net assets, end of period (000s omitted) | | | $8,281 | | | | $1,483 | | | | $863 | | | | $3,299 | | | | $15,924 | | | | $14,401 | |
| 1 | Calculated based upon average shares outstanding |
| 2 | Returns for periods of less than one year are not annualized |
The accompanying notes are an integral part of these financial statements.
| | | | | | |
| Notes to financial statements (unaudited) | | Wells Fargo Large Company Value Fund | | | 19 | |
1. ORGANIZATION
Wells Fargo Funds Trust (the “Trust”), a Delaware statutory trust organized on March 10, 1999, is an open-end management investment company registered under the Investment Company Act of 1940, as amended (the “1940 Act”). As an investment company, the Trust follows the accounting and reporting guidance in Financial Accounting Standards Board (“FASB”) Accounting Standards Codification Topic 946, Financial Services – Investment Companies. These financial statements report on the Wells Fargo Large Company Value Fund (the “Fund”) which is a diversified series of the Trust.
Effective at the close of business on October 23, 2015, Investor Class shares became Class A shares in a tax-free conversion. Shareholders of Investor Class received Class A shares at a value equal to the value of their Investor Class shares immediately prior to the conversion. Investor Class shares are no longer offered by the Fund.
2. SIGNIFICANT ACCOUNTING POLICIES
The following significant accounting policies, which are consistently followed in the preparation of the financial statements of the Fund, are in conformity with U.S. generally accepted accounting principles which require management to make estimates and assumptions that affect the reported amounts of assets and liabilities, disclosure of contingent assets and liabilities at the date of the financial statements, and the reported amounts of revenues and expenses during the reporting period. Actual results could differ from those estimates.
Securities valuation
All investments are valued each business day as of the close of regular trading on the New York Stock Exchange (generally 4 p.m. Eastern Time).
Equity securities that are listed on a foreign or domestic exchange or market are valued at the official closing price or, if none, the last sales price. If no sale occurs on the principal exchange or market that day, the prior day’s price will be deemed “stale” and a fair value price will be determined in accordance with the Fund’s Valuation Procedures.
Investments in registered open-end investment companies are valued at net asset value. Interests in non-registered investment vehicles that are redeemable at net asset value are fair valued normally at net asset value.
Investments which are not valued using any of the methods discussed above are valued at their fair value, as determined in good faith by the Board of Trustees of the Fund. The Board of Trustees has established a Valuation Committee comprised of the Trustees and has delegated to it the authority to take any actions regarding the valuation of portfolio securities that the Valuation Committee deems necessary or appropriate, including determining the fair value of portfolio securities, unless the determination has been delegated to the Management Valuation Team of Wells Fargo Funds Management, LLC (“Funds Management”). The Board of Trustees retains the authority to make or ratify any valuation decisions or approve any changes to the Valuation Procedures as it deems appropriate. On a quarterly basis, the Board of Trustees receives reports on any valuation actions taken by the Valuation Committee or the Management Valuation Team which may include items for ratification.
Valuations of fair valued securities are compared to the next actual sales price when available, or other appropriate market values, to assess the continued appropriateness of the fair valuation methodologies used. These securities are fair valued on a day-to-day basis, taking into consideration changes to appropriate market information and any significant changes to the inputs considered in the valuation process until there is a readily available price provided on an exchange or by an independent pricing service. Valuations received from an independent pricing service or independent broker-dealer quotes are periodically validated by comparisons to most recent trades and valuations provided by other independent pricing services in addition to the review of prices by the manager and/or subadviser. Unobservable inputs used in determining fair valuations are identified based on the type of security, taking into consideration factors utilized by market participants in valuing the investment, knowledge about the issuer and the current market environment.
Security loans
The Fund may lend its securities from time to time in order to earn additional income in the form of fees or interest on securities received as collateral or the investment of any cash received as collateral. The Fund continues to receive interest or dividends on the securities loaned. The Fund receives collateral in the form of cash or securities with a value at least equal to the value of the securities on loan. The value of the loaned securities is determined at the close of each business day and any additional required collateral is delivered to the Fund on the next business day. In a securities lending transaction, the net asset value of the Fund will be affected by an increase or decrease in the value of the securities loaned and by an increase or decrease in the value of the instrument in which collateral is invested. The amount of securities lending activity undertaken by the Fund fluctuates from time to time. In the event of default or bankruptcy by the borrower, the Fund may be prevented from recovering the loaned securities or gaining access to the collateral or
| | | | |
| 20 | | Wells Fargo Large Company Value Fund | | Notes to financial statements (unaudited) |
may experience delays or costs in doing so. In addition, the investment of any cash collateral received may lose all or part of its value. The Fund has the right under the lending agreement to recover the securities from the borrower on demand.
The Fund lends its securities through an unaffiliated securities lending agent. Cash collateral received in connection with its securities lending transactions is invested in Securities Lending Cash Investments, LLC (the “Securities Lending Fund”). The Securities Lending Fund is exempt from registration under Section 3(c)(7) of the 1940 Act and is managed by Funds Management and is subadvised by Wells Capital Management Incorporated (“WellsCap”), an affiliate of Funds Management and an indirect wholly owned subsidiary of Wells Fargo & Company (“Wells Fargo”). Funds Management receives an advisory fee starting at 0.05% and declining to 0.01% as the average daily net assets of the Securities Lending Fund increase. All of the fees received by Funds Management are paid to WellsCap for its services as subadviser. The Securities Lending Fund seeks to provide a positive return compared to the daily Fed Funds Open rate by investing in high-quality, U.S. dollar-denominated short-term money market instruments. Securities Lending Fund investments are fair valued based upon the amortized cost valuation technique. Income earned from investment in the Securities Lending Fund is included in securities lending income on the Statement of Operations.
Security transactions and income recognition
Securities transactions are recorded on a trade date basis. Realized gains or losses are recorded on the basis of identified cost.
Dividend income is recognized on the ex-dividend date. Dividend income is recorded net of foreign taxes withheld where recovery of such taxes is not assured.
Distributions to shareholders
Distributions to shareholders from net investment income and net realized gains, if any, are recorded on the ex-dividend date. Such distributions are determined in conformity with federal income tax regulations, which may differ in amount or character from net investment income and realized gains recognized for purposes of U.S. generally accepted accounting principles.
Federal and other taxes
The Fund intends to continue to qualify as a regulated investment company by distributing substantially all of its investment company taxable income and any net realized capital gains (after reduction for capital loss carryforwards) sufficient to relieve it from all, or substantially all, federal income taxes. Accordingly, no provision for federal income taxes was required.
The Fund’s income and federal excise tax returns and all financial records supporting those returns for the prior three fiscal years are subject to examination by the federal and Delaware revenue authorities. Management has analyzed the Fund’s tax positions taken on federal, state, and foreign tax returns for all open tax years and does not believe that there are any uncertain tax positions that require recognition of a tax liability.
As of July 31, 2015, the Fund had capital loss carryforwards available to offset future net realized capital gains in the amount of $4,679,794 expiring in 2016.
Class allocations
The separate classes of shares offered by the Fund differ principally in applicable sales charges, distribution, shareholder servicing, and administration fees. Class specific expenses are charged directly to that share class. Investment income, common expenses, and realized and unrealized gains (losses) on investments are allocated daily to each class of shares based on the relative proportion of net assets of each class.
3. FAIR VALUATION MEASUREMENTS
Fair value measurements of investments are determined within a framework that has established a fair value hierarchy based upon the various data inputs utilized in determining the value of the Fund’s investments. The three-level hierarchy gives the highest priority to unadjusted quoted prices in active markets for identical assets or liabilities (Level 1) and the lowest priority to significant unobservable inputs (Level 3). The Fund’s investments are classified within the fair value hierarchy based on the lowest level of input that is significant to the fair value measurement. The inputs are summarized into three broad levels as follows:
| n | | Level 1 – quoted prices in active markets for identical securities |
| n | | Level 2 – other significant observable inputs (including quoted prices for similar securities, interest rates, prepayment speeds, credit risk, use of amortized cost, etc.) |
| n | | Level 3 – significant unobservable inputs (including the Fund’s own assumptions in determining the fair value of investments) |
| | | | | | |
| Notes to financial statements (unaudited) | | Wells Fargo Large Company Value Fund | | | 21 | |
The inputs or methodologies used for valuing investments in securities are not necessarily an indication of the risk associated with investing in those securities.
The following is a summary of the inputs used in valuing the Fund’s assets and liabilities as of January 31, 2016:
| | | | | | | | | | | | | | | | |
| | | Quoted prices
(Level 1) | | | Other significant
observable inputs
(Level 2) | | | Significant
unobservable inputs
(Level 3) | | | Total | |
Assets | | | | | | | | | | | | | | | | |
Investments in: | | | | | | | | | | | | | | | | |
| | | | |
Common stocks | | | | | | | | | | | | | | | | |
Consumer discretionary | | $ | 18,300,367 | | | $ | 0 | | | $ | 0 | | | $ | 18,300,367 | |
Consumer staples | | | 15,678,225 | | | | 0 | | | | 0 | | | | 15,678,225 | |
Energy | | | 26,528,398 | | | | 0 | | | | 0 | | | | 26,528,398 | |
Financials | | | 67,806,097 | | | | 0 | | | | 0 | | | | 67,806,097 | |
Health care | | | 31,401,324 | | | | 0 | | | | 0 | | | | 31,401,324 | |
Industrials | | | 24,208,315 | | | | 0 | | | | 0 | | | | 24,208,315 | |
Information technology | | | 26,072,728 | | | | 0 | | | | 0 | | | | 26,072,728 | |
Materials | | | 7,388,618 | | | | 0 | | | | 0 | | | | 7,388,618 | |
Telecommunication services | | | 5,653,820 | | | | 0 | | | | 0 | | | | 5,653,820 | |
Utilities | | | 10,747,028 | | | | 0 | | | | 0 | | | | 10,747,028 | |
| | | | |
Short-term investments | | | | | | | | | | | | | | | | |
Investment companies | | | 1,627,785 | | | | 0 | | | | 0 | | | | 1,627,785 | |
Investments measured at net asset value* | | | | | | | | | | | | | | | 8,210,173 | |
Total assets | | $ | 235,412,705 | | | $ | 0 | | | $ | 0 | | | $ | 243,622,878 | |
| * | Investments that are measured at fair value using the net asset value per share (or its equivalent) as a practical expedient have not been categorized in the fair value hierarchy. The fair value amount presented in the table is intended to permit reconciliation of the fair value hierarchy to the amounts presented in the Statement of Assets and Liabilities. The Fund’s investment in Securities Lending Cash Investments, LLC valued at $8,210,173 does not have a redemption period notice, can be redeemed daily and does not have any unfunded commitments. |
The Fund recognizes transfers between levels within the fair value hierarchy at the end of the reporting period. At January 31, 2016, the Fund did not have any transfers into/out of Level 1, Level 2 or Level 3.
4. TRANSACTIONS WITH AFFILIATES
Management fee
Funds Management, an indirect wholly owned subsidiary of Wells Fargo, is the manager of the Fund and provides advisory and fund-level administrative services under an investment management agreement. Under the investment management agreement, Funds Management is responsible for, among other services, implementing the investment objectives and strategies of the Fund, supervising the applicable subadviser, providing fund-level administrative services in connection with the Fund’s operations, and providing any other fund-level administrative services reasonably necessary for the operation of the Fund. As compensation for its services under the investment management agreement, Funds Management is entitled to receive an annual management fee starting at 0.70% and declining to 0.505% as the average daily net assets of the Fund increase. For the six months ended January 31, 2016, the management fee was equivalent to an annual rate of 0.70% of the Fund’s average daily net assets.
Funds Management has retained the services of a subadviser to provide daily portfolio management to the Fund. The fee for subadvisory services is borne by Funds Management. Phocas Financial Corporation is the subadviser to the Fund and is entitled to receive a fee from Funds Management at an annual rate starting at 0.29% and declining to 0.20% as the average daily net assets of the Fund increase.
Administration fees
Under a class-level administration agreement, Funds Management provides class-level administrative services to the Fund, which includes paying fees and expenses for services provided by the transfer agent, sub-transfer agents, omnibus account servicers and record-keepers. As compensation for its services under the class-level administration agreement, Funds Management receives an annual fee which is calculated based on the average daily net assets of each class as follows:
| | | | | | |
| | | | | Class-level
administration fee | |
Class A, Class C | | | | | 0.21 | % |
Administrator Class, Institutional Class | | | | | 0.13 | |
Investor Class | | | | | 0.32 | |
| | | | |
| 22 | | Wells Fargo Large Company Value Fund | | Notes to financial statements (unaudited) |
Funds Management has contractually waived and/or reimbursed management and administration fees to the extent necessary to maintain certain net operating expense ratios for the Fund. Waiver of fees and/or reimbursement of expenses by Funds Management were made first from fund level expenses on a proportionate basis and then from class specific expenses. Funds Management has committed through November 30, 2016 to waive fees and/or reimburse expenses to the extent necessary to cap the Fund’s expenses at 1.10% for Class A shares, 1.85% for Class C shares, 0.98% for Class Administrator Class shares, and 0.75% for Institutional Class shares. After this time, the cap may be increased or the commitment to maintain the cap may be terminated only with the approval of the Board of Trustees. Prior to October 23, 2015, the Fund’s expenses were capped at 0.85% for Administrator Class shares and 0.65% for Institutional Class shares.
Distribution fee
The Trust has adopted a distribution plan for Class C shares of the Fund pursuant to Rule 12b-1 under the 1940 Act. A distribution fee is charged to Class C shares and paid to Wells Fargo Funds Distributor, LLC, (“Funds Distributor”) the principal underwriter, at an annual rate of 0.75% of the average daily net assets of Class C shares.
In addition, Funds Distributor is entitled to receive the front-end sales charge from the purchase of Class A shares and a contingent deferred sales charge on the redemption of certain Class A shares. Funds Distributor is also entitled to receive the contingent deferred sales charges from redemptions of Class C shares. For the six months ended January 31, 2016, Funds Distributor received $800 from the sale of Class A shares.
Shareholder servicing fees
The Trust has entered into contracts with one or more shareholder servicing agents, whereby Class A, Class C, Administrator Class, and Investor Class of the Fund is charged a fee at an annual rate of 0.25% of the average daily net assets of each respective class.
A portion of these total shareholder servicing fees were paid to affiliates of Wells Fargo.
5. INVESTMENT PORTFOLIO TRANSACTIONS
Purchases and sales of investments, excluding U.S. government obligations (if any) and short-term securities, for the six months ended January 31, 2016 were $84,203,826 and $90,870,304, respectively.
6. BANK BORROWINGS
The Trust (excluding the money market funds and certain other funds) and Wells Fargo Variable Trust are parties to a $200,000,000 revolving credit agreement whereby the Fund is permitted to use bank borrowings for temporary or emergency purposes, such as to fund shareholder redemption requests. Interest under the credit agreement is charged to the Fund based on a borrowing rate equal to the higher of the Federal Funds rate in effect on that day plus 1.25% or the overnight LIBOR rate in effect on that day plus 1.25%. In addition, an annual commitment fee equal to 0.20% of the unused balance is allocated to each participating fund. Prior to September 1, 2015, the revolving credit agreement amount was $150,000,000 and the annual commitment fee was equal to 0.10% of the unused balance which was allocated to each participating fund. For the six months ended January 31, 2016, the Fund paid $446 in commitment fees.
For the six months ended January 31, 2016, there were no borrowings by the Fund under the agreement.
7. CONCENTRATION RISK
Concentration risks result from exposure to a limited number of sectors. A fund that invests a substantial portion of its assets in any sector may be more affected by changes in that sector than would be a fund whose investments are not heavily weighted in any sector.
8. INDEMNIFICATION
Under the Trust’s organizational documents, the officers and Trustees have been granted certain indemnification rights against certain liabilities that may arise out of performance of their duties to the Trust. Additionally, in the normal course of business, the Trust may enter into contracts with service providers that contain a variety of indemnification clauses. The Trust’s maximum exposure under these arrangements is dependent on future claims that may be made against the Fund and, therefore, cannot be estimated.
| | | | | | |
| Notes to financial statements (unaudited) | | Wells Fargo Large Company Value Fund | | | 23 | |
9. SUBSEQUENT DISTRIBUTION
On March 24, 2016, the Fund declared distributions from net investment income to shareholders of record on March 23, 2016. The per share amounts payable on March 28, 2016 were as follows:
| | | | |
| | | Net investment income | |
Class A | | $ | 0.05202 | |
Class C | | | 0.03189 | |
Administrator Class | | | 0.05012 | |
Institutional Class | | | 0.06091 | |
These distributions are not reflected in the accompanying financial statements. The final determination of the source of all distributions is subject to change and made after the Fund’s tax year-end.
| | | | |
| 24 | | Wells Fargo Large Company Value Fund | | Other information (unaudited) |
PROXY VOTING INFORMATION
A description of the policies and procedures that the Fund uses to determine how to vote proxies relating to portfolio securities is available, upon request, by calling 1-800-222-8222, visiting our website at wellsfargofunds.com, or visiting the SEC website at sec.gov. Information regarding how the Fund voted proxies relating to portfolio securities during the most recent 12-month period ended June 30 is available on the Fund’s website at wellsfargofunds.com or by visiting the SEC website at sec.gov.
PORTFOLIO HOLDINGS INFORMATION
The complete portfolio holdings for the Fund are publicly available monthly on the Fund’s website (wellsfargofunds.com), on a one-month delayed basis. In addition, top ten holdings information (excluding derivative positions) for the Fund is publicly available on the Fund’s website on a monthly, seven-day or more delayed basis. The Fund files its complete schedule of portfolio holdings with the SEC for the first and third quarters of each fiscal year on Form N-Q, which is available by visiting the SEC website at sec.gov. In addition, the Fund’s Form N-Q may be reviewed and copied at the SEC’s Public Reference Room in Washington, DC, and at regional offices in New York City, at 233 Broadway, and in Chicago, at 175 West Jackson Boulevard, Suite 900. Information about the Public Reference Room may be obtained by calling 1-800-SEC-0330.
| | | | | | |
| Other information (unaudited) | | Wells Fargo Large Company Value Fund | | | 25 | |
BOARD OF TRUSTEES AND OFFICERS
Each of the Trustees and Officers1 listed in the table below acts in identical capacities for each fund in the Wells Fargo family of funds, which consists of 144 mutual funds comprising the Wells Fargo Funds Trust, Wells Fargo Variable Trust, Wells Fargo Master Trust and four closed-end funds (collectively the “Fund Complex”). This table should be read in conjunction with the Prospectus and the Statement of Additional Information2. The mailing address of each Trustee and Officer is 525 Market Street, 12th Floor, San Francisco, CA 94105. Each Trustee and Officer serves an indefinite term, however, each Trustee serves such term until reaching the mandatory retirement age established by the Trustees.
Independent Trustees
| | | | | | |
Name and
year of birth | | Position held and
length of service* | | Principal occupations during past five years or longer | | Current other
public company or
investment company
directorships |
| William R. Ebsworth (Born 1957) | | Trustee, since 2015 | | Retired. From 1984 to 2013, equities analyst, portfolio manager, research director and chief financial officer at Fidelity Management and Research Company in Boston, Tokyo, and Hong Kong and retired in 2013 as Chief Investment Officer of Fidelity Strategic Advisers, Inc. where he lead a team of investment professionals managing client assets. Prior thereto, Board member of Hong Kong Securities Clearing Co., Hong Kong Options Clearing Corp., the Thailand International Fund, Ltd., Fidelity Investments Life Insurance Company, and Empire Fidelity Investments Life Insurance Company. Mr. Ebsworth is a CFA® charterholder and an Adjunct Lecturer, Finance, at Babson College. | | Asset Allocation Trust |
Jane A. Freeman
(Born 1953) | | Trustee, since 2015 | | Retired. From 2012 to 2014 and 1999 to 2008, Chief Financial Officer of Scientific Learning Corporation. From 2008 to 2012, Ms. Freeman provided consulting services related to strategic business projects. Prior to 1999, Portfolio Manager at Rockefeller & Co. and Scudder, Stevens & Clark. Board member of the Harding Loevner Funds from 1996 to 2014, serving as both Lead Independent Director and chair of the Audit Committee. Board member of the Russell Exchange Traded Funds Trust from 2011 to 2012 and the chair of the Audit Committee. Ms. Freeman is Chair of Taproot Foundation (non-profit organization), a Board Member of Ruth Bancroft Garden (non-profit organization) and an inactive chartered financial analyst. | | Asset Allocation Trust |
Peter G. Gordon
(Born 1942) | | Trustee, since 1998; Chairman, since 2005 | | Co-Founder, Retired Chairman, President and CEO of Crystal Geyser Water Company. Trustee Emeritus, Colby College. | | Asset Allocation Trust |
Isaiah Harris, Jr.
(Born 1952) | | Trustee, since 2009 | | Retired. Chairman of the Board of CIGNA Corporation since 2009, and Director since 2005. From 2003 to 2011, Director of Deluxe Corporation. Prior thereto, President and CEO of BellSouth Advertising and Publishing Corp. from 2005 to 2007, President and CEO of BellSouth Enterprises from 2004 to 2005 and President of BellSouth Consumer Services from 2000 to 2003. Emeritus member of the Iowa State University Foundation Board of Governors. Emeritus Member of the Advisory Board of Iowa State University School of Business. Advisory Board Member, Palm Harbor Academy (charter school). Advisory Board Member, Child Evangelism Fellowship (non-profit). Mr. Harris is a certified public accountant (inactive status). | | CIGNA Corporation; Asset Allocation Trust |
Judith M. Johnson
(Born 1949) | | Trustee, since 2008; Audit Committee Chairman, since 2008 | | Retired. Prior thereto, Chief Executive Officer and Chief Investment Officer of Minneapolis Employees Retirement Fund from 1996 to 2008. Ms. Johnson is an attorney, certified public accountant and a certified managerial accountant. | | Asset Allocation Trust |
David F. Larcker
(Born 1950) | | Trustee, since 2009 | | James Irvin Miller Professor of Accounting at the Graduate School of Business, Stanford University, Director of the Corporate Governance Research Initiative and Senior Faculty of The Rock Center for Corporate Governance since 2006. From 2005 to 2008, Professor of Accounting at the Graduate School of Business, Stanford University. Prior thereto, Ernst & Young Professor of Accounting at The Wharton School, University of Pennsylvania from 1985 to 2005. | | Asset Allocation Trust |
| | | | |
| 26 | | Wells Fargo Large Company Value Fund | | Other information (unaudited) |
| | | | | | |
Name and
year of birth | | Position held and
length of service* | | Principal occupations during past five years or longer | | Current other
public company or
investment company
directorships |
Olivia S. Mitchell
(Born 1953) | | Trustee, since 2006 | | International Foundation of Employee Benefit Plans Professor, Wharton School of the University of Pennsylvania since 1993. Director of Wharton’s Pension Research Council and Boettner Center on Pensions & Retirement Research, and Research Associate at the National Bureau of Economic Research. Previously, Cornell University Professor from 1978 to 1993. | | Asset Allocation Trust |
Timothy J. Penny
(Born 1951) | | Trustee, since 1996 | | President and Chief Executive Officer of Southern Minnesota Initiative Foundation, a non-profit organization, since 2007 and Senior Fellow at the Humphrey Institute Policy Forum at the University of Minnesota since 1995. Member of the Board of Trustees of NorthStar Education Finance, Inc., a non-profit organization, since 2007. | | Asset Allocation Trust |
Michael S. Scofield
(Born 1943) | | Trustee, since 2010 | | Served on the Investment Company Institute’s Board of Governors and Executive Committee from 2008-2011 as well the Governing Council of the Independent Directors Council from 2006-2011 and the Independent Directors Council Executive Committee from 2008-2011. Chairman of the IDC from 2008-2010. Institutional Investor (Fund Directions) Trustee of Year in 2007. Trustee of the Evergreen Funds complex (and its predecessors) from 1984 to 2010. Chairman of the Evergreen Funds from 2000-2010. Former Trustee of the Mentor Funds. Retired Attorney, Law Offices of Michael S. Scofield. | | Asset Allocation Trust |
| * | Length of service dates reflect the Trustee’s commencement of service with the Trust’s predecessor entities, where applicable. |
Officers
| | | | | | |
Name and
year of birth | | Position held and
length of service | | Principal occupations during past five years or longer | | |
Karla M. Rabusch
(Born 1959) | | President, since 2003 | | Executive Vice President of Wells Fargo Bank, N.A. and President of Wells Fargo Funds Management, LLC since 2003. | | |
Jeremy DePalma1
(Born 1974) | | Treasurer, since 2012; Assistant Treasurer, since 2009 | | Senior Vice President of Wells Fargo Funds Management, LLC since 2009. Senior Vice President of Evergreen Investment Management Company, LLC from 2008 to 2010 and head of the Fund Reporting and Control Team within Fund Administration from 2005 to 2010. | | |
C. David Messman
(Born 1960) | | Secretary, since 2000; Chief Legal Officer, since 2003 | | Senior Vice President and Secretary of Wells Fargo Funds Management, LLC since 2001. Assistant General Counsel of Wells Fargo Bank, N.A. since 2013 and Vice President and Managing Counsel of Wells Fargo Bank, N.A. from 1996 to 2013. | | |
Debra Ann Early
(Born 1964) | | Chief Compliance Officer, since 2007 | | Executive Vice President of Wells Fargo Funds Management, LLC since 2014, Senior Vice President and Chief Compliance Officer from 2007 to 2014. | | |
David Berardi
(Born 1975) | | Assistant Treasurer, since 2009 | | Vice President of Wells Fargo Funds Management, LLC since 2009. Vice President of Evergreen Investment Management Company, LLC from 2008 to 2010. Manager of Fund Reporting and Control for Evergreen Investment Management Company, LLC from 2004 to 2010. | | |
| 1 | Jeremy DePalma acts as Treasurer of 72 funds and Assistant Treasurer of 72 funds in the Fund Complex. |
| 2 | The Statement of Additional Information includes additional information about the Trustees and is available, without charge, upon request, by calling 1-800-222-8222 or by visiting the website at wellsfargofunds.com. |
| | | | | | |
| List of abbreviations | | Wells Fargo Large Company Value Fund | | | 27 | |
The following is a list of common abbreviations for terms and entities that may have appeared in this report.
| ACA | — ACA Financial Guaranty Corporation |
| ADR | — American depositary receipt |
| ADS | — American depositary shares |
| AGC | — Assured Guaranty Corporation |
| AGM | — Assured Guaranty Municipal |
| Ambac | — Ambac Financial Group Incorporated |
| AMT | — Alternative minimum tax |
| BAN | — Bond anticipation notes |
| BHAC | — Berkshire Hathaway Assurance Corporation |
| CAB | — Capital appreciation bond |
| CCAB | — Convertible capital appreciation bond |
| CDA | — Community Development Authority |
| CDO | — Collateralized debt obligation |
| DRIVER | — Derivative inverse tax-exempt receipts |
| DW&P | — Department of Water & Power |
| DWR | — Department of Water Resources |
| ECFA | — Educational & Cultural Facilities Authority |
| EDA | — Economic Development Authority |
| EDFA | — Economic Development Finance Authority |
| ETF | — Exchange-traded fund |
| FDIC | — Federal Deposit Insurance Corporation |
| FFCB | — Federal Farm Credit Banks |
| FGIC | — Financial Guaranty Insurance Corporation |
| FHA | — Federal Housing Administration |
| FHLB | — Federal Home Loan Bank |
| FHLMC | — Federal Home Loan Mortgage Corporation |
| FICO | — The Financing Corporation |
| FNMA | — Federal National Mortgage Association |
| GDR | — Global depositary receipt |
| GNMA | — Government National Mortgage Association |
| HCFR | — Healthcare facilities revenue |
| HEFA | — Health & Educational Facilities Authority |
| HEFAR | — Higher education facilities authority revenue |
| HFA | — Housing Finance Authority |
| HFFA | — Health Facilities Financing Authority |
| HUD | — Department of Housing and Urban Development |
| IDA | — Industrial Development Authority |
| IDAG | — Industrial Development Agency |
| KRW | — Republic of Korea won |
| LIBOR | — London Interbank Offered Rate |
| LIFER | — Long Inverse Floating Exempt Receipts |
| LLC | — Limited liability company |
| LLLP | — Limited liability limited partnership |
| LLP | — Limited liability partnership |
| MBIA | — Municipal Bond Insurance Association |
| MFHR | — Multifamily housing revenue |
| MSTR | — Municipal securities trust receipts |
| MUD | — Municipal Utility District |
| National | — National Public Finance Guarantee Corporation |
| PCFA | — Pollution Control Financing Authority |
| PCL | — Public Company Limited |
| PCR | — Pollution control revenue |
| PFA | — Public Finance Authority |
| PFFA | — Public Facilities Financing Authority |
| PFOTER | — Puttable floating option tax-exempt receipts |
| plc | — Public limited company |
| PUTTER | — Puttable tax-exempt receipts |
| R&D | — Research & development |
| Radian | — Radian Asset Assurance |
| RAN | — Revenue anticipation notes |
| RDA | — Redevelopment Authority |
| RDFA | — Redevelopment Finance Authority |
| REIT | — Real estate investment trust |
| ROC | — Reset option certificates |
| SAVRS | — Select auction variable rate securities |
| SBA | — Small Business Authority |
| SDR | — Swedish depositary receipt |
| SFHR | — Single-family housing revenue |
| SFMR | — Single-family mortgage revenue |
| SPA | — Standby purchase agreement |
| SPDR | — Standard & Poor’s Depositary Receipts |
| SPEAR | — Short Puttable Exempt Adjustable Receipts |
| STRIPS | — Separate trading of registered interest and |
| TAN | — Tax anticipation notes |
| TIPS | — Treasury inflation-protected securities |
| TRAN | — Tax revenue anticipation notes |
| TTFA | — Transportation Trust Fund Authority |
| TVA | — Tennessee Valley Authority |
This page is intentionally left blank.

For more information
More information about Wells Fargo Funds is available free upon request. To obtain literature, please write, email, visit the Fund’s website, or call:
Wells Fargo Funds
P.O. Box 8266
Boston, MA 02266-8266
Email: fundservice@wellsfargo.com
Website: wellsfargofunds.com
Individual investors: 1-800-222-8222
Retail investment professionals: 1-888-877-9275
Institutional investment professionals: 1-866-765-0778
This report and the financial statements contained herein are submitted for the general information of the shareholders of the Fund. If this report is used for promotional purposes, distribution of the report must be accompanied or preceded by a current prospectus. Before investing, please consider the investment objectives, risks, charges, and expenses of the investment. For a current prospectus and, if available, a summary prospectus, containing this information, call 1-800-222-8222 or visit the Fund’s website at wellsfargofunds.com. Read the prospectus carefully before you invest or send money.
Wells Fargo Asset Management (WFAM) is a trade name used by the asset management businesses of Wells Fargo & Company. Wells Fargo Funds Management, LLC, a wholly owned subsidiary of Wells Fargo & Company, provides investment advisory and administrative services for Wells Fargo Funds. Other affiliates of Wells Fargo & Company provide subadvisory and other services for the funds. The funds are distributed by Wells Fargo Funds Distributor, LLC, Member FINRA, an affiliate of Wells Fargo & Company.
NOT FDIC INSURED ¡ NO BANK GUARANTEE ¡ MAY LOSE VALUE
© 2016 Wells Fargo Funds Management, LLC. All rights reserved.
| | |
 | | 240800 03-16 SA210/SAR210 01-16 |
Semi-Annual Report
January 31, 2016

Wells Fargo Omega Growth Fund


Reduce clutter. Save trees.
Sign up for electronic delivery of prospectuses and shareholder reports at wellsfargo.com/advantagedelivery
Contents
The views expressed and any forward-looking statements are as of January 31, 2016, unless otherwise noted, and are those of the Fund managers and/or Wells Fargo Funds Management, LLC. Discussions of individual securities, or the markets generally, or any Wells Fargo Fund are not intended as individual recommendations. Future events or results may vary significantly from those expressed in any forward-looking statements. The views expressed are subject to change at any time in response to changing circumstances in the market. Wells Fargo Funds Management, LLC and the Fund disclaim any obligation to publicly update or revise any views expressed or forward-looking statements.
NOT FDIC INSURED ¡ NO BANK GUARANTEE ¡ MAY LOSE VALUE
| | | | |
| 2 | | Wells Fargo Omega Growth Fund | | Letter to shareholders (unaudited) |

Karla M. Rabusch
President
Wells Fargo Funds
Despite generally improving U.S. economic data, ongoing global turmoil tempered U.S. economic growth during the period as many economies and markets outside the U.S. faced ongoing challenges.
Dear Valued Shareholder:
We are pleased to offer you this semi-annual report for the Wells Fargo Omega Growth Fund for the six-month period that ended January 31, 2016. Despite generally improving U.S. economic data, ongoing global turmoil tempered U.S. economic growth during the period as many economies and markets outside the U.S. faced continuing challenges. In this environment, the broad U.S. stock market experienced heightened volatility and ultimately fell 5.64% overall for the six-month period (as measured by the Russell 3000® Index,1 which is the index used to measure U.S. stock market performance throughout this letter).
As the reporting period began, China’s slowdown continued to take a toll on U.S. and international markets.
The U.S. stock market declined 6.04% and 2.91% in August and September 2015, respectively, as investors worried about the impact on the U.S. of China’s slowing growth. A number of positive economic indicators released during these months suggested the U.S. economy remained solid. However, the strengthening U.S. dollar coupled with ongoing global economic turmoil continued to hinder the economy. Although many investors believed the U.S. Federal Reserve (Fed) would raise the federal funds rate during the third quarter of 2015, at its September 2015 meeting the Fed left the rate unchanged. This decision fueled uncertainty about the U.S. economy’s stamina to remain healthy while facing the negative effects of troubles elsewhere in the world. One week later, Fed Chair Janet Yellen reassured investors that, barring unpleasant surprises, the Fed still intended to raise the rate in 2015. International markets were more volatile than the domestic market and delivered even weaker results in August and September. Investors’ anxiety was driven largely by China’s weakened economy. Because China is the world’s largest importer of many commodities, a number of emerging markets—key commodities exporters—struggled under the strains of reduced demand for commodities and lower prices for the commodities sold.
The U.S. stock market delivered a positive result overall for the last three months of 2015 despite ongoing concerns.
The broad U.S. stock market fluctuated widely in the fourth quarter of 2015, rising 7.90% in October and 0.55% in November before falling 2.05% in December, for an overall quarterly return of 6.27%. Stock markets outside the U.S. generally failed to keep pace with the domestic market as economic concerns, including China’s ongoing slowdown, continued to affect many countries worldwide. U.S. economic data released during the quarter indicated the economy remained solid, with modest growth. However, the strong U.S. dollar and global economic turmoil continued their drag on the economy. In December, the Fed, as expected, slightly raised its target short-term interest rate to between 0.25% and 0.50% after keeping it near zero for seven years. The move, which had been well telegraphed by the Fed for months, reflected confidence in the U.S. economy’s ability to stay healthy with less central-bank support. The Fed also made clear that future interest-rate increases will be gradual.
U.S. stocks struggled in January 2016.
The broad U.S. stock market dropped 5.64% for the month, weighed down by ongoing concerns about heightened market volatility, the continued plunge in oil prices, and the impact of weak global growth on U.S. companies. The U.S. economy, however, remained resilient in January—with continued solid hiring, a
| 1 | The Russell 3000® Index measures the performance of the 3,000 largest U.S. companies based on total market capitalization, which represents approximately 98% of the investable U.S. equity market. You cannot invest directly in an index. |
| | | | | | |
| Letter to shareholders (unaudited) | | Wells Fargo Omega Growth Fund | | | 3 | |
reduction in the jobless rate to 4.9%, and signs of an uptick in the pace of wage growth—despite some warning signs that became evident in recent months, such as weaknesses in manufacturing and business growth.
Don’t let short-term uncertainty derail long-term investment goals.
Periods of uncertainty can present challenges, but experience has taught us that maintaining long-term investment goals can be an effective way to plan for the future. To help you create a sound strategy based on your personal goals and risk tolerance, Wells Fargo Funds offers more than 100 mutual funds spanning a wide range of asset classes and investment styles. Although diversification cannot guarantee an investment profit or prevent losses, we believe it can be an effective way to manage investment risk and potentially smooth out overall portfolio performance. We encourage investors to know their investments and to understand that appropriate levels of risk-taking may unlock opportunities.
Thank you for choosing to invest in Wells Fargo Funds. We appreciate your confidence in us and remain committed to helping you meet your financial needs.
Sincerely,

Karla M. Rabusch
President
Wells Fargo Funds
Although diversification cannot guarantee an investment profit or prevent losses, we believe it can be an effective way to manage investment risk and potentially smooth out overall portfolio performance.
For further information about your Fund, contact your investment professional, visit our website at wellsfargofunds.com, or call us directly at 1-800-222-8222. We are available 24 hours a day, 7 days a week.
| | | | |
| 4 | | Wells Fargo Omega Growth Fund | | Performance highlights (unaudited) |
Investment objective
The Fund seeks long-term capital appreciation.
Manager
Wells Fargo Funds Management, LLC
Subadviser
Wells Capital Management Incorporated
Portfolio managers
Thomas J. Pence, CFA®
Michael T. Smith, CFA®
Average annual total returns (%) as of January 31, 20161
| | | | | | | | | | | | | | | | | | | | | | | | | | | | | | | | | | |
| | | | | Including sales charge | | | Excluding sales charge | | | Expense ratios2 (%) | |
| | | Inception date | | 1 year | | | 5 year | | | 10 year | | | 1 year | | | 5 year | | | 10 year | | | Gross | | | Net3 | |
| Class A (EKOAX) | | 4-29-1968 | | | (10.67 | ) | | | 6.83 | | | | 6.86 | | | | (5.22 | ) | | | 8.10 | | | | 7.49 | | | | 1.27 | | | | 1.27 | |
| Class B (EKOBX)* | | 8-2-1993 | | | (10.08 | ) | | | 7.03 | | | | 6.93 | | | | (5.91 | ) | | | 7.30 | | | | 6.93 | | | | 2.02 | | | | 2.02 | |
| Class C (EKOCX) | | 8-2-1993 | | | (6.92 | ) | | | 7.30 | | | | 6.69 | | | | (5.92 | ) | | | 7.30 | | | | 6.69 | | | | 2.02 | | | | 2.02 | |
| Class R (EKORX) | | 10-10-2003 | | | – | | | | – | | | | – | | | | (5.42 | ) | | | 7.84 | | | | 7.23 | | | | 1.52 | | | | 1.52 | |
| Administrator Class (EOMYX) | | 1-13-1997 | | | – | | | | – | | | | – | | | | (4.99 | ) | | | 8.37 | | | | 7.76 | | | | 1.19 | | | | 1.10 | |
| Institutional Class (EKONX) | | 7-30-2010 | | | – | | | | – | | | | – | | | | (4.75 | ) | | | 8.64 | | | | 7.91 | | | | 0.94 | | | | 0.85 | |
| Russell 3000® Growth Index4 | | – | | | – | | | | – | | | | – | | | | 0.41 | | | | 11.41 | | | | 7.56 | | | | – | | | | – | |
| * | | Class B shares are closed to investment, except in connection with the reinvestment of any distributions and permitted exchanges. |
Figures quoted represent past performance, which is no guarantee of future results, and do not reflect taxes that a shareholder may pay on fund distributions or the redemption of fund shares. Investment return and principal value of an investment will fluctuate so that an investor’s shares, when redeemed, may be worth more or less than their original cost. Performance shown without sales charges would be lower if sales charges were reflected. Current performance may be lower or higher than the performance data quoted, which assumes the reinvestment of dividends and capital gains. Current month-end performance is available on the Fund’s website, wellsfargofunds.com.
Index returns do not include transaction costs associated with buying and selling securities, any mutual fund fees or expenses, or any taxes. It is not possible to invest directly in an index.
For Class A shares, the maximum front-end sales charge is 5.75%. For Class B shares, the maximum contingent deferred sales charge is 5.00%. For Class C shares, the maximum contingent deferred sales charge is 1.00%. Performance including a contingent deferred sales charge assumes the sales charge for the corresponding time period. Class R, Administrator Class, and Institutional Class shares are sold without a front-end sales charge or contingent deferred sales charge.
Stock values fluctuate in response to the activities of individual companies and general market and economic conditions. Certain investment strategies tend to increase the total risk of an investment (relative to the broader market). The Fund is exposed to foreign investment risk and smaller-company securities risk. Consult the Fund’s prospectus for additional information on these and other risks.
Please see footnotes on page 5.
| | | | | | |
| Performance highlights (unaudited) | | Wells Fargo Omega Growth Fund | | | 5 | |
| | | | |
| Ten largest holdings (%) as of January 31, 20165 | |
Facebook Incorporated Class A | | | 4.49 | |
Apple Incorporated | | | 3.87 | |
Amazon.com Incorporated | | | 3.81 | |
The Home Depot Incorporated | | | 3.60 | |
Visa Incorporated Class A | | | 3.40 | |
ServiceMaster Global Holdings Incorporated | | | 3.26 | |
Alphabet Incorporated Class A | | | 3.15 | |
Bristol-Myers Squibb Company | | | 2.69 | |
Alphabet Incorporated Class C | | | 2.66 | |
UnitedHealth Group Incorporated | | | 2.64 | |
|
| Sector distribution as of January 31, 20166 |
|
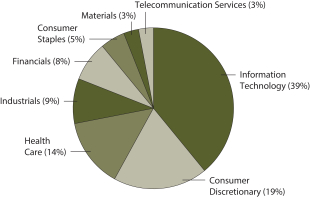 |
| 1 | Historical performance shown for Institutional Class shares prior to their inception reflects the performance of Administrator Class shares, and includes the higher expenses applicable to Administrator Class shares. If these expenses had not been included, returns would be higher. Historical performance shown for all classes of the Fund prior to July 19, 2010, is based on the performance of the Fund’s predecessor, Evergreen Omega Fund. |
| 2 | Reflects the expense ratios as stated in the most recent prospectuses. The expense ratios shown are subject to change and may differ from the annualized expense ratios shown in the financial highlights of this report. |
| 3 | The manager has contractually committed through November 30, 2016, to waive fees and/or reimburse expenses to the extent necessary to cap the Fund’s Total Annual Fund Operating Expenses After Fee Waiver at 1.30% for Class A, 2.05% for Class B, 2.05% for Class C, 1.55% for Class R, 1.10% for Administrator Class, and 0.85% for Institutional Class. After this time, the cap may be increased or the commitment to maintain the cap may be terminated only with the approval of the Board of Trustees. Brokerage commissions, stamp duty fees, interest, taxes, acquired fund fees and expenses, and extraordinary expenses are excluded from the cap. Without this cap, the Fund’s returns would have been lower. |
| 4 | The Russell 3000® Growth Index measures the performance of those Russell 3000 Index companies with higher price-to-book ratios and higher forecasted growth values. You cannot invest directly in an index. |
| 5 | The ten largest holdings, excluding cash and cash equivalents, are calculated based on the value of the investments divided by total net assets of the Fund. Holdings are subject to change and may have changed since the date specified. |
| 6 | Amounts are calculated based on the total long-term investments of the Fund. These amounts are subject to change and may have changed since the date specified. |
| | | | |
| 6 | | Wells Fargo Omega Growth Fund | | Fund expenses (unaudited) |
As a shareholder of the Fund, you incur two types of costs: (1) transaction costs, including sales charges (loads) on purchase payments and contingent deferred sales charges (if any) on redemptions and (2) ongoing costs, including management fees, distribution (12b-1) and/or shareholder servicing fees, and other Fund expenses. This example is intended to help you understand your ongoing costs (in dollars) of investing in the Fund and to compare these costs with the ongoing costs of investing in other mutual funds.
The example is based on an investment of $1,000 invested at the beginning of the six-month period and held for the entire period from August 1, 2015 to January 31, 2016.
Actual expenses
The “Actual” line of the table below provides information about actual account values and actual expenses. You may use the information in this line, together with the amount you invested, to estimate the expenses that you paid over the period. Simply divide your account value by $1,000 (for example, an $8,600 account value divided by $1,000 = 8.6), then multiply the result by the number in the “Actual” line under the heading entitled “Expenses paid during period” for your applicable class of shares to estimate the expenses you paid on your account during this period.
Hypothetical example for comparison purposes
The “Hypothetical” line of the table below provides information about hypothetical account values and hypothetical expenses based on the Fund’s actual expense ratio and an assumed rate of return of 5% per year before expenses, which is not the Fund’s actual return. The hypothetical account values and expenses may not be used to estimate the actual ending account balance or expenses you paid for the period. You may use this information to compare the ongoing costs of investing in the Fund and other funds. To do so, compare this 5% hypothetical example with the 5% hypothetical examples that appear in the shareholder reports of the other funds.
Please note that the expenses shown in the table are meant to highlight your ongoing costs only and do not reflect any transactional costs, such as sales charges (loads) and contingent deferred sales charges. Therefore, the “Hypothetical” line of the table is useful in comparing ongoing costs only and will not help you determine the relative total costs of owning different funds. In addition, if these transactional costs were included, your costs would have been higher.
| | | | | | | | | | | | | | | | |
| | | Beginning
account value
8-1-2015 | | | Ending
account value
1-31-2016 | | | Expenses
paid during
the period¹ | | | Net annualized
expense ratio | |
Class A | | | | | | | | | | | | | | | | |
Actual | | $ | 1,000.00 | | | $ | 870.88 | | | $ | 6.02 | | | | 1.28 | % |
Hypothetical (5% return before expenses) | | $ | 1,000.00 | | | $ | 1,018.70 | | | $ | 6.50 | | | | 1.28 | % |
Class B | | | | | | | | | | | | | | | | |
Actual | | $ | 1,000.00 | | | $ | 867.78 | | | $ | 9.53 | | | | 2.03 | % |
Hypothetical (5% return before expenses) | | $ | 1,000.00 | | | $ | 1,014.93 | | | $ | 10.28 | | | | 2.03 | % |
Class C | | | | | | | | | | | | | | | | |
Actual | | $ | 1,000.00 | | | $ | 867.92 | | | $ | 9.53 | | | | 2.03 | % |
Hypothetical (5% return before expenses) | | $ | 1,000.00 | | | $ | 1,014.93 | | | $ | 10.28 | | | | 2.03 | % |
Class R | | | | | | | | | | | | | | | | |
Actual | | $ | 1,000.00 | | | $ | 869.96 | | | $ | 7.19 | | | | 1.53 | % |
Hypothetical (5% return before expenses) | | $ | 1,000.00 | | | $ | 1,017.44 | | | $ | 7.76 | | | | 1.53 | % |
Administrator Class | | | | | | | | | | | | | | | | |
Actual | | $ | 1,000.00 | | | $ | 871.96 | | | $ | 4.99 | | | | 1.06 | % |
Hypothetical (5% return before expenses) | | $ | 1,000.00 | | | $ | 1,019.81 | | | $ | 5.38 | | | | 1.06 | % |
Institutional Class | | | | | | | | | | | | | | | | |
Actual | | $ | 1,000.00 | | | $ | 873.02 | | | $ | 3.81 | | | | 0.81 | % |
Hypothetical (5% return before expenses) | | $ | 1,000.00 | | | $ | 1,021.06 | | | $ | 4.12 | | | | 0.81 | % |
| 1 | Expenses paid is equal to the annualized expense ratio of each class multiplied by the average account value over the period, multiplied by the number of days in the most recent fiscal half-year divided by the number of days in the fiscal year (to reflect the one-half-year period). |
| | | | | | |
| Portfolio of investments—January 31, 2016 (unaudited) | | Wells Fargo Omega Growth Fund | | | 7 | |
| | | | | | | | | | | | |
| Security name | | | | | | Shares | | | Value | |
| | | | |
Common Stocks: 98.59% | | | | | | | | | | | | |
| | | | |
Consumer Discretionary: 19.00% | | | | | | | | | | | | |
| | | | |
| Auto Components: 1.26% | | | | | | | | | | | | |
Delphi Automotive plc | | | | | | | 148,100 | | | $ | 9,617,614 | |
| | | | | | | | | | | | |
| | | | |
| Diversified Consumer Services: 3.26% | | | | | | | | | | | | |
ServiceMaster Global Holdings Incorporated † | | | | | | | 592,312 | | | | 25,001,490 | |
| | | | | | | | | | | | |
| | | | |
| Hotels, Restaurants & Leisure: 4.13% | | | | | | | | | | | | |
Dave & Buster’s Entertainment Incorporated † | | | | | | | 146,668 | | | | 5,319,648 | |
Starbucks Corporation | | | | | | | 234,600 | | | | 14,256,642 | |
Vail Resorts Incorporated | | | | | | | 96,402 | | | | 12,050,250 | |
| |
| | | | 31,626,540 | |
| | | | | | | | | | | | |
| | | | |
| Internet & Catalog Retail: 4.73% | | | | | | | | | | | | |
Amazon.com Incorporated † | | | | | | | 49,700 | | | | 29,173,900 | |
Ctrip.com International Limited ADR † | | | | | | | 88,300 | | | | 3,768,644 | |
Netflix Incorporated † | | | | | | | 36,000 | | | | 3,306,240 | |
| |
| | | | 36,248,784 | |
| | | | | | | | | | | | |
| | | | |
| Media: 0.97% | | | | | | | | | | | | |
Cinemark Holdings Incorporated | | | | | | | 251,995 | | | | 7,431,333 | |
| | | | | | | | | | | | |
| | | | |
| Specialty Retail: 3.59% | | | | | | | | | | | | |
The Home Depot Incorporated | | | | | | | 219,000 | | | | 27,541,440 | |
| | | | | | | | | | | | |
| | | | |
| Textiles, Apparel & Luxury Goods: 1.06% | | | | | | | | | | | | |
Nike Incorporated Class B | | | | | | | 130,600 | | | | 8,098,506 | |
| | | | | | | | | | | | |
| | | | |
Consumer Staples: 4.80% | | | | | | | | | | | | |
| | | | |
| Beverages: 3.72% | | | | | | | | | | | | |
Constellation Brands Incorporated Class��A | | | | | | | 100,100 | | | | 15,263,248 | |
Dr Pepper Snapple Group Incorporated | | | | | | | 141,200 | | | | 13,250,208 | |
| |
| | | | 28,513,456 | |
| | | | | | | | | | | | |
| | | | |
| Food & Staples Retailing: 1.08% | | | | | | | | | | | | |
Walgreens Boots Alliance Incorporated | | | | | | | 103,600 | | | | 8,258,992 | |
| | | | | | | | | | | | |
| | | | |
Financials: 7.56% | | | | | | | | | | | | |
| | | | |
| Capital Markets: 2.55% | | | | | | | | | | | | |
Raymond James Financial Incorporated | | | | | | | 252,602 | | | | 11,066,494 | |
SEI Investments Company | | | | | | | 215,900 | | | | 8,471,916 | |
| |
| | | | 19,538,410 | |
| | | | | | | | | | | | |
| | | | |
| Diversified Financial Services: 3.65% | | | | | | | | | | | | |
Intercontinental Exchange Incorporated | | | | | | | 63,400 | | | | 16,724,920 | |
McGraw Hill Financial Incorporated | | | | | | | 132,200 | | | | 11,239,644 | |
| |
| | | | 27,964,564 | |
| | | | | | | | | | | | |
The accompanying notes are an integral part of these financial statements.
| | | | |
| 8 | | Wells Fargo Omega Growth Fund | | Portfolio of investments—January 31, 2016 (unaudited) |
| | | | | | | | | | | | |
| Security name | | | | | | Shares | | | Value | |
| | | | |
| Real Estate Management & Development: 1.36% | | | | | | | | | | | | |
CBRE Group Incorporated Class A † | | | | | | | 371,500 | | | $ | 10,390,855 | |
| | | | | | | | | | | | |
| | | | |
Health Care: 14.22% | | | | | | | | | | | | |
| | | | |
| Biotechnology: 5.18% | | | | | | | | | | | | |
Alexion Pharmaceuticals Incorporated † | | | | | | | 74,000 | | | | 10,798,820 | |
Celgene Corporation † | | | | | | | 126,075 | | | | 12,647,844 | |
Gilead Sciences Incorporated | | | | | | | 107,298 | | | | 8,905,734 | |
Vertex Pharmaceuticals Incorporated † | | | | | | | 80,900 | | | | 7,341,675 | |
| |
| | | | 39,694,073 | |
| | | | | | | | | | | | |
| | | | |
| Health Care Equipment & Supplies: 2.53% | | | | | | | | | | | | |
Alere Incorporated † | | | | | | | 251,400 | | | | 9,352,080 | |
Align Technology Incorporated † | | | | | | | 151,338 | | | | 10,009,495 | |
| |
| | | | 19,361,575 | |
| | | | | | | | | | | | |
| | | | |
| Health Care Providers & Services: 2.64% | | | | | | | | | | | | |
UnitedHealth Group Incorporated | | | | | | | 175,400 | | | | 20,199,064 | |
| | | | | | | | | | | | |
| | | | |
| Pharmaceuticals: 3.87% | | | | | | | | | | | | |
Bristol-Myers Squibb Company | | | | | | | 331,200 | | | | 20,587,392 | |
Zoetis Incorporated | | | | | | | 210,300 | | | | 9,053,415 | |
| |
| | | | 29,640,807 | |
| | | | | | | | | | | | |
| | | | |
Industrials: 9.21% | | | | | | | | | | | | |
| | | | |
| Aerospace & Defense: 1.02% | | | | | | | | | | | | |
Orbital ATK Incorporated | | | | | | | 86,500 | | | | 7,804,895 | |
| | | | | | | | | | | | |
| | | | |
| Airlines: 1.66% | | | | | | | | | | | | |
Delta Air Lines Incorporated | | | | | | | 288,100 | | | | 12,759,949 | |
| | | | | | | | | | | | |
| | | | |
| Commercial Services & Supplies: 1.52% | | | | | | | | | | | | |
KAR Auction Services Incorporated | | | | | | | 349,048 | | | | 11,665,184 | |
| | | | | | | | | | | | |
| | | | |
| Electrical Equipment: 0.46% | | | | | | | | | | | | |
Acuity Brands Incorporated | | | | | | | 17,582 | | | | 3,517,184 | |
| | | | | | | | | | | | |
| | | | |
| Industrial Conglomerates: 1.04% | | | | | | | | | | | | |
Carlisle Companies Incorporated | | | | | | | 95,200 | | | | 7,966,336 | |
| | | | | | | | | | | | |
| | | | |
| Machinery: 0.43% | | | | | | | | | | | | |
Proto Labs Incorporated †« | | | | | | | 60,202 | | | | 3,310,508 | |
| | | | | | | | | | | | |
| | | | |
| Professional Services: 1.38% | | | | | | | | | | | | |
Verisk Analytics Incorporated † | | | | | | | 144,500 | | | | 10,548,500 | |
| | | | | | | | | | | | |
| | | | |
| Trading Companies & Distributors: 1.70% | | | | | | | | | | | | |
Air Lease Corporation | | | | | | | 208,400 | | | | 5,368,384 | |
HD Supply Holdings Incorporated † | | | | | | | 291,177 | | | | 7,649,220 | |
| |
| | | | 13,017,604 | |
| | | | | | | | | | | | |
The accompanying notes are an integral part of these financial statements.
| | | | | | |
| Portfolio of investments—January 31, 2016 (unaudited) | | Wells Fargo Omega Growth Fund | | | 9 | |
| | | | | | | | | | | | |
| Security name | | | | | | Shares | | | Value | |
| | | | |
Information Technology: 38.16% | | | | | | | | | | | | |
| | | | |
| Communications Equipment: 2.12% | | | | | | | | | | | | |
Harris Corporation | | | | | | | 135,000 | | | $ | 11,740,950 | |
Palo Alto Networks Incorporated † | | | | | | | 30,106 | | | | 4,500,546 | |
| |
| | | | 16,241,496 | |
| | | | | | | | | | | | |
| | | | |
| Internet Software & Services: 13.04% | | | | | | | | | | | | |
Akamai Technologies Incorporated † | | | | | | | 54,100 | | | | 2,468,042 | |
Alphabet Incorporated Class A † | | | | | | | 31,700 | | | | 24,134,795 | |
Alphabet Incorporated Class C † | | | | | | | 27,385 | | | | 20,345,686 | |
CoStar Group Incorporated † | | | | | | | 46,600 | | | | 8,172,242 | |
Facebook Incorporated Class A † | | | | | | | 306,800 | | | | 34,426,028 | |
Tencent Holdings Limited ADR | | | | | | | 556,300 | | | | 10,357,138 | |
| |
| | | | 99,903,931 | |
| | | | | | | | | | | | |
| | | | |
| IT Services: 8.13% | | | | | | | | | | | | |
Alliance Data Systems Corporation † | | | | | | | 34,200 | | | | 6,832,818 | |
Cognizant Technology Solutions Corporation Class A † | | | | | | | 125,000 | | | | 7,913,750 | |
EPAM Systems Incorporated † | | | | | | | 148,641 | | | | 11,133,211 | |
PayPal Holdings Incorporated † | | | | | | | 286,200 | | | | 10,343,268 | |
Visa Incorporated Class A | | | | | | | 349,904 | | | | 26,064,349 | |
| |
| | | | 62,287,396 | |
| | | | | | | | | | | | |
| | | | |
| Software: 10.99% | | | | | | | | | | | | |
Adobe Systems Incorporated † | | | | | | | 126,900 | | | | 11,310,597 | |
CyberArk Software Limited †« | | | | | | | 91,200 | | | | 3,974,496 | |
Electronic Arts Incorporated † | | | | | | | 206,600 | | | | 13,334,997 | |
Paycom Software Incorporated † | | | | | | | 215,124 | | | | 6,485,989 | |
Salesforce.com Incorporated † | | | | | | | 95,800 | | | | 6,520,148 | |
ServiceNow Incorporated † | | | | | | | 106,400 | | | | 6,619,144 | |
Splunk Incorporated † | | | | | | | 159,300 | | | | 7,373,997 | |
Tableau Software Incorporated Class A † | | | | | | | 80,200 | | | | 6,435,248 | |
Take-Two Interactive Software Incorporated † | | | | | | | 340,400 | | | | 11,811,880 | |
Tyler Technologies Incorporated † | | | | | | | 65,600 | | | | 10,303,136 | |
| |
| | | | 84,169,632 | |
| | | | | | | | | | | | |
| | | | |
| Technology Hardware, Storage & Peripherals: 3.88% | | | | | | | | | | | | |
Apple Incorporated | | | | | | | 304,900 | | | | 29,678,966 | |
| | | | | | | | | | | | |
| | | | |
Materials: 2.95% | | | | | | | | | | | | |
| | | | |
| Chemicals: 1.66% | | | | | | | | | | | | |
The Sherwin-Williams Company | | | | | | | 49,700 | | | | 12,706,799 | |
| | | | | | | | | | | | |
| | | | |
| Construction Materials: 1.29% | | | | | | | | | | | | |
Vulcan Materials Company | | | | | | | 112,600 | | | | 9,931,320 | |
| | | | | | | | | | | | |
| | | | |
Telecommunication Services: 2.69% | | | | | | | | | | | | |
| | | | |
| Diversified Telecommunication Services: 1.05% | | | | | | | | | | | | |
Zayo Group Holdings Incorporated † | | | | | | | 319,800 | | | | 8,001,396 | |
| | | | | | | | | | | | |
The accompanying notes are an integral part of these financial statements.
| | | | |
| 10 | | Wells Fargo Omega Growth Fund | | Portfolio of investments—January 31, 2016 (unaudited) |
| | | | | | | | | | | | | | | | |
| Security name | | | | | | | | | Shares | | | Value | |
| | | | | |
| Wireless Telecommunication Services: 1.64% | | | | | | | | | | | | | | | | |
SBA Communications Corporation Class A † | | | | | | | | | | | 126,802 | | | $ | 12,588,901 | |
| | | | | | | | | | | | | | | | |
| | | | | |
Total Common Stocks (Cost $644,807,192) | | | | | | | | | | | | | | | 755,227,500 | |
| | | | | | | | | | | | | | | | |
| | | | | |
| | | | | Yield | | | | | | | | | |
| Short-Term Investments: 2.29% | | | | | | | | | | | | | | | | |
| | | | | |
| Investment Companies: 2.29% | | | | | | | | | | | | | | | | |
Securities Lending Cash Investments, LLC (l)(r)(u) | | | | | 0.42 | % | | | | | 6,640,900 | | | | 6,640,900 | |
Wells Fargo Cash Investment Money Market Fund, Select Class (l)(u) | | | | | 0.40 | | | | | | 10,900,136 | | | | 10,900,136 | |
| | | | | |
Total Short-Term Investments (Cost $17,541,036) | | | | | | | | | | | | | | | 17,541,036 | |
| | | | | | | | | | | | | | | | |
| | | | | | | | |
| Total investments in securities (Cost $662,348,228) * | | | 100.88 | % | | | 772,768,536 | |
Other assets and liabilities, net | | | (0.88 | ) | | | (6,744,416 | ) |
| | | | | | | | |
| Total net assets | | | 100.00 | % | | $ | 766,024,120 | |
| | | | | | | | |
| † | Non-income-earning security |
| « | All or a portion of this security is on loan. |
| (l) | The issuer of the security is an affiliated person of the Fund as defined in the Investment Company Act of 1940. |
| (r) | The investment is a non-registered investment vehicle purchased with cash collateral received from securities on loan. |
| (u) | The rate represents the 7-day annualized yield at period end. |
| * | Cost for federal income tax purposes is $664,407,504 and unrealized gains (losses) consists of: |
| | | | |
Gross unrealized gains | | $ | 152,910,314 | |
Gross unrealized losses | | | (44,549,282 | ) |
| | | | |
Net unrealized gains | | $ | 108,361,032 | |
The accompanying notes are an integral part of these financial statements.
| | | | | | |
| Statement of assets and liabilities—January 31, 2016 (unaudited) | | Wells Fargo Omega Growth Fund | | | 11 | |
| | | | |
| | | | |
| |
Assets | | | | |
Investments | | | | |
In unaffiliated securities (including $6,497,590 of securities loaned), at value (cost $644,807,192) | | $ | 755,227,500 | |
In affiliated securities, at value (cost $17,541,036) | | | 17,541,036 | |
| | | | |
Total investments, at value (cost $662,348,228) | | | 772,768,536 | |
Receivable for investments sold | | | 7,562,618 | |
Receivable for Fund shares sold | | | 185,631 | |
Receivable for dividends | | | 119,806 | |
Receivable for securities lending income | | | 4,325 | |
Prepaid expenses and other assets | | | 45,357 | |
| | | | |
Total assets | | | 780,686,273 | |
| | | | |
| |
Liabilities | | | | |
Payable for investments purchased | | | 5,963,965 | |
Payable for Fund shares redeemed | | | 1,075,494 | |
Payable upon receipt of securities loaned | | | 6,640,900 | |
Management fee payable | | | 510,286 | |
Distribution fees payable | | | 56,064 | |
Administration fees payable | | | 131,698 | |
Accrued expenses and other liabilities | | | 283,746 | |
| | | | |
Total liabilities | | | 14,662,153 | |
| | | | |
Total net assets | | $ | 766,024,120 | |
| | | | |
| |
NET ASSETS CONSIST OF | | | | |
Paid-in capital | | $ | 680,635,940 | |
Accumulated net investment loss | | | (7,180,757 | ) |
Accumulated net realized losses on investments | | | (17,851,371 | ) |
Net unrealized gains on investments | | | 110,420,308 | |
| | | | |
Total net assets | | $ | 766,024,120 | |
| | | | |
| |
COMPUTATION OF NET ASSET VALUE AND OFFERING PRICE PER SHARE | | | | |
Net assets – Class A | | $ | 556,714,605 | |
Shares outstanding – Class A1 | | | 14,502,642 | |
Net asset value per share – Class A | | | $38.39 | |
Maximum offering price per share – Class A2 | | | $40.73 | |
Net assets – Class B | | $ | 4,871,736 | |
Shares outstanding – Class B1 | | | 169,078 | |
Net asset value per share – Class B | | | $28.81 | |
Net assets – Class C | | $ | 77,513,093 | |
Shares outstanding – Class C1 | | | 2,680,779 | |
Net asset value per share – Class C | | | $28.91 | |
Net assets – Class R | | $ | 11,605,438 | |
Shares outstanding – Class R1 | | | 314,421 | |
Net asset value per share – Class R | | | $36.91 | |
Net assets – Administrator Class | | $ | 53,017,820 | |
Shares outstanding – Administrator Class1 | | | 1,294,174 | |
Net asset value per share – Administrator Class | | | $40.97 | |
Net assets – Institutional Class | | $ | 62,301,428 | |
Shares outstanding – Institutional Class1 | | | 1,493,090 | |
Net asset value per share – Institutional Class | | | $41.73 | |
| 1 | The Fund has an unlimited number of authorized shares. |
| 2 | Maximum offering price is computed as 100/94.25 of net asset value. On investments of $50,000 or more, the offering price is reduced. |
The accompanying notes are an integral part of these financial statements.
| | | | |
| 12 | | Wells Fargo Omega Growth Fund | | Statement of operations—six months ended January 31, 2016 (unaudited) |
| | | | |
| | | | |
| |
Investment income | | | | |
Dividends | | $ | 2,851,425 | |
Securities lending income, net | | | 103,917 | |
Income from affiliated securities | | | 7,302 | |
| | | | |
Total investment income | | | 2,962,644 | |
| | | | |
| |
Expenses | | | | |
Management fee | | | 3,390,524 | |
Administration fees | | | | |
Class A | | | 647,916 | |
Class B | | | 6,527 | |
Class C | | | 91,961 | |
Class R | | | 14,521 | |
Administrator Class | | | 45,872 | |
Institutional Class | | | 49,222 | |
Shareholder servicing fees | | | | |
Class A | | | 771,329 | |
Class B | | | 7,770 | |
Class C | | | 109,477 | |
Class R | | | 17,287 | |
Administrator Class | | | 82,201 | |
Distribution fees | | | | |
Class B | | | 23,311 | |
Class C | | | 328,431 | |
Class R | | | 17,287 | |
Custody and accounting fees | | | 30,915 | |
Professional fees | | | 24,168 | |
Registration fees | | | 42,495 | |
Shareholder report expenses | | | 59,878 | |
Trustees’ fees and expenses | | | 12,452 | |
Other fees and expenses | | | 10,091 | |
| | | | |
Total expenses | | | 5,783,635 | |
Less: Fee waivers and/or expense reimbursements | | | (92,520 | ) |
| | | | |
Net expenses | | | 5,691,115 | |
| | | | |
Net investment loss | | | (2,728,471 | ) |
| | | | |
| |
REALIZED AND UNREALIZED GAINS (LOSSES) ON INVESTMENTS | | | | |
Net realized losses on investments | | | (12,444,322 | ) |
Net change in unrealized gains (losses) on investments | | | (105,080,832 | ) |
| | | | |
Net realized and unrealized gains (losses) on investments | | | (117,525,154 | ) |
| | | | |
Net decrease in net assets resulting from operations | | $ | (120,253,625 | ) |
| | | | |
The accompanying notes are an integral part of these financial statements.
| | | | | | |
| Statement of changes in net assets | | Wells Fargo Omega Growth Fund | | | 13 | |
| | | | | | | | | | | | | | | | |
| | | Six months ended January 31, 2016 (unaudited) | | | Year ended July 31, 2015 | |
| | | | |
Operations | | | | | | | | | | | | | | | | |
Net investment loss | | | | | | $ | (2,728,471 | ) | | | | | | $ | (6,158,068 | ) |
Net realized gains (losses) on investments | | | | | | | (12,444,322 | ) | | | | | | | 83,493,222 | |
Net change in unrealized gains (losses) on investments | | | | | | | (105,080,832 | ) | | | | | | | 22,205,824 | |
| | | | |
Net increase (decrease) in net assets resulting from operations | | | | | | | (120,253,625 | ) | | | | | | | 99,540,978 | |
| | | | |
| | | | |
Distributions to shareholders from | | | | | | | | | | | | | | | | |
Net realized gains | | | | | | | | | | | | | | | | |
Class A | | | | | | | (53,442,331 | ) | | | | | | | (88,485,249 | ) |
Class B | | | | | | | (648,915 | ) | | | | | | | (1,659,485 | ) |
Class C | | | | | | | (9,667,016 | ) | | | | | | | (16,860,203 | ) |
Class R | | | | | | | (1,155,110 | ) | | | | | | | (2,357,246 | ) |
Administrator Class | | | | | | | (4,963,941 | ) | | | | | | | (11,565,611 | ) |
Institutional Class | | | | | | | (5,527,216 | ) | | | | | | | (8,555,196 | ) |
| | | | |
Total distributions to shareholders | | | | | | | (75,404,529 | ) | | | | | | | (129,482,990 | ) |
| | | | |
| | | | |
Capital share transactions | | | Shares | | | | | | | | Shares | | | | | |
Proceeds from shares sold | | | | | | | | | | | | | | | | |
Class A | | | 386,073 | | | | 17,117,742 | | | | 1,073,382 | | | | 51,726,380 | |
Class B | | | 101 | | | | 3,253 | | | | 3,036 | | | | 118,881 | |
Class C | | | 90,014 | | | | 2,959,519 | | | | 278,343 | | | | 10,475,969 | |
Class R | | | 56,404 | | | | 2,341,628 | | | | 114,110 | | | | 5,204,171 | |
Administrator Class | | | 84,204 | | | | 4,006,148 | | | | 459,293 | | | | 23,327,789 | |
Institutional Class | | | 45,632 | | | | 2,189,007 | | | | 1,015,747 | | | | 53,541,695 | |
| | | | |
| | | | | | | 28,617,297 | | | | | | | | 144,394,885 | |
| | | | |
Reinvestment of distributions | | | | | | | | | | | | | | | | |
Class A | | | 1,213,454 | | | | 49,860,826 | | | | 1,824,272 | | | | 82,165,203 | |
Class B | | | 20,867 | | | | 644,380 | | | | 46,774 | | | | 1,640,836 | |
Class C | | | 278,845 | | | | 8,638,611 | | | | 404,364 | | | | 14,229,572 | |
Class R | | | 11,870 | | | | 469,234 | | | | 21,691 | | | | 945,291 | |
Administrator Class | | | 110,013 | | | | 4,822,974 | | | | 205,792 | | | | 9,812,172 | |
Institutional Class | | | 110,554 | | | | 4,935,146 | | | | 136,046 | | | | 6,577,836 | |
| | | | |
| | | | | | | 69,371,171 | | | | | | | | 115,370,910 | |
| | | | |
Payment for shares redeemed | | | | | | | | | | | | | | | | |
Class A | | | (1,280,690 | ) | | | (56,002,654 | ) | | | (3,198,159 | ) | | | (154,561,009 | ) |
Class B | | | (60,692 | ) | | | (2,079,204 | ) | | | (150,668 | ) | | | (5,747,142 | ) |
Class C | | | (326,940 | ) | | | (11,039,847 | ) | | | (708,562 | ) | | | (26,619,160 | ) |
Class R | | | (122,490 | ) | | | (5,248,236 | ) | | | (180,460 | ) | | | (8,460,276 | ) |
Administrator Class | | | (594,390 | ) | | | (28,253,262 | ) | | | (1,166,619 | ) | | | (60,110,360 | ) |
Institutional Class | | | (337,459 | ) | | | (16,646,283 | ) | | | (418,232 | ) | | | (21,368,714 | ) |
| | | | |
| | | | | | | (119,269,486 | ) | | | | | | | (276,866,661 | ) |
| | | | |
Net decrease in net assets resulting from capital share transactions | | | | | | | (21,281,018 | ) | | | | | | | (17,100,866 | ) |
| | | | |
Total decrease in net assets | | | | | | | (216,939,172 | ) | | | | | | | (47,042,878 | ) |
| | | | |
| | | | |
Net assets | | | | | | | | | | | | | | | | |
Beginning of period | | | | | | | 982,963,292 | | | | | | | | 1,030,006,170 | |
| | | | |
End of period | | | | | | $ | 766,024,120 | | | | | | | $ | 982,963,292 | |
| | | | |
Accumulated net investment loss | | | | | | $ | (7,180,757 | ) | | | | | | $ | (4,452,286 | ) |
| | | | |
The accompanying notes are an integral part of these financial statements.
| | | | |
| 14 | | Wells Fargo Omega Growth Fund | | Financial highlights |
(For a share outstanding throughout each period)
| | | | | | | | | | | | | | | | | | | | | | | | |
| | | Six months ended January 31, 2016 (unaudited) | | | Year ended July 31 | |
| CLASS A | | | 2015 | | | 2014 | | | 2013 | | | 2012 | | | 2011 | |
Net asset value, beginning of period | | | $48.29 | | | | $49.99 | | | | $47.97 | | | | $39.09 | | | | $38.29 | | | | $30.11 | |
Net investment loss | | | (0.13 | ) | | | (0.28 | )1 | | | (0.49 | ) | | | (0.02 | ) | | | (0.28 | )1 | | | (0.29 | ) |
Net realized and unrealized gains (losses) on investments | | | (5.84 | ) | | | 5.12 | | | | 8.28 | | | | 10.31 | | | | 1.08 | | | | 8.47 | |
| | | | | | | | | | | | | | | | | | | | | | | | |
Total from investment operations | | | (5.97 | ) | | | 4.84 | | | | 7.79 | | | | 10.29 | | | | 0.80 | | | | 8.18 | |
Distributions to shareholders from | | | | | | | | | | | | | | | | | | | | | | | | |
Net realized gains | | | (3.93 | ) | | | (6.54 | ) | | | (5.77 | ) | | | (1.41 | ) | | | 0.00 | | | | 0.00 | |
Net asset value, end of period | | | $38.39 | | | | $48.29 | | | | $49.99 | | | | $47.97 | | | | $39.09 | | | | $38.29 | |
Total return2 | | | (12.91 | )% | | | 10.65 | % | | | 16.58 | % | | | 27.07 | % | | | 2.09 | % | | | 27.17 | % |
Ratios to average net assets (annualized) | | | | | | | | | | | | | | | | | | | | | | | | |
Gross expenses | | | 1.28 | % | | | 1.32 | % | | | 1.32 | % | | | 1.34 | % | | | 1.35 | % | | | 1.36 | % |
Net expenses | | | 1.28 | % | | | 1.30 | % | | | 1.30 | % | | | 1.30 | % | | | 1.30 | % | | | 1.30 | % |
Net investment loss | | | (0.60 | )% | | | (0.58 | )% | | | (0.84 | )% | | | (0.08 | )% | | | (0.75 | )% | | | (0.80 | )% |
Supplemental data | | | | | | | | | | | | | | | | | | | | | | | | |
Portfolio turnover rate | | | 44 | % | | | 94 | % | | | 101 | % | | | 88 | % | | | 101 | % | | | 123 | % |
Net assets, end of period (000s omitted) | | | $556,715 | | | | $685,005 | | | | $724,071 | | | | $668,992 | | | | $550,758 | | | | $584,871 | |
| 1 | Calculated based upon average shares outstanding |
| 2 | Total return calculations do not include any sales charges. Returns for periods of less than one year are not annualized. |
The accompanying notes are an integral part of these financial statements.
| | | | | | |
| Financial highlights | | Wells Fargo Omega Growth Fund | | | 15 | |
(For a share outstanding throughout each period)
| | | | | | | | | | | | | | | | | | | | | | | | |
| | | Six months ended January 31, 2016 (unaudited) | | | Year ended July 31 | |
| CLASS B | | | 2015 | | | 2014 | | | 2013 | | | 2012 | | | 2011 | |
Net asset value, beginning of period | | | $37.44 | | | | $40.45 | | | | $40.07 | | | | $33.12 | | | | $32.68 | | | | $25.89 | |
Net investment loss | | | (0.23 | )1 | | | (0.51 | )1 | | | (0.65 | )1 | | | (0.28 | )1 | | | (0.47 | )1 | | | (0.48 | )1 |
Net realized and unrealized gains (losses) on investments | | | (4.47 | ) | | | 4.04 | | | | 6.80 | | | | 8.64 | | | | 0.91 | | | | 7.27 | |
| | | | | | | | | | | | | | | | | | | | | | | | |
Total from investment operations | | | (4.70 | ) | | | 3.53 | | | | 6.15 | | | | 8.36 | | | | 0.44 | | | | 6.79 | |
Distributions to shareholders from | | | | | | | | | | | | | | | | | | | | | | | | |
Net realized gains | | | (3.93 | ) | | | (6.54 | ) | | | (5.77 | ) | | | (1.41 | ) | | | 0.00 | | | | 0.00 | |
Net asset value, end of period | | | $28.81 | | | | $37.44 | | | | $40.45 | | | | $40.07 | | | | $33.12 | | | | $32.68 | |
Total return2 | | | (13.22 | )% | | | 9.82 | % | | | 15.71 | % | | | 26.11 | % | | | 1.32 | % | | | 26.23 | % |
Ratios to average net assets (annualized) | | | | | | | | | | | | | | | | | | | | | | | | |
Gross expenses | | | 2.03 | % | | | 2.07 | % | | | 2.07 | % | | | 2.09 | % | | | 2.10 | % | | | 2.12 | % |
Net expenses | | | 2.03 | % | | | 2.05 | % | | | 2.05 | % | | | 2.05 | % | | | 2.05 | % | | | 2.05 | % |
Net investment loss | | | (1.34 | )% | | | (1.32 | )% | | | (1.58 | )% | | | (0.78 | )% | | | (1.51 | )% | | | (1.55 | )% |
Supplemental data | | | | | | | | | | | | | | | | | | | | | | | | |
Portfolio turnover rate | | | 44 | % | | | 94 | % | | | 101 | % | | | 88 | % | | | 101 | % | | | 123 | % |
Net assets, end of period (000s omitted) | | | $4,872 | | | | $7,817 | | | | $12,526 | | | | $17,476 | | | | $22,271 | | | | $40,023 | |
| 1 | Calculated based upon average shares outstanding |
| 2 | Total return calculations do not include any sales charges. Returns for periods of less than one year are not annualized. |
The accompanying notes are an integral part of these financial statements.
| | | | |
| 16 | | Wells Fargo Omega Growth Fund | | Financial highlights |
(For a share outstanding throughout each period)
| | | | | | | | | | | | | | | | | | | | | | | | |
| | | Six months ended January 31, 2016 (unaudited) | | | Year ended July 31 | |
| CLASS C | | | 2015 | | | 2014 | | | 2013 | | | 2012 | | | 2011 | |
Net asset value, beginning of period | | | $37.55 | | | | $40.56 | | | | $40.15 | | | | $33.18 | | | | $32.75 | | | | $25.94 | |
Net investment loss | | | (0.23 | )1 | | | (0.51 | )1 | | | (0.65 | )1 | | | (0.31 | )1 | | | (0.47 | )1 | | | (0.49 | )1 |
Net realized and unrealized gains (losses) on investments | | | (4.48 | ) | | | 4.04 | | | | 6.83 | | | | 8.69 | | | | 0.90 | | | | 7.30 | |
| | | | | | | | | | | | | | | | | | | | | | | | |
Total from investment operations | | | (4.71 | ) | | | 3.53 | | | | 6.18 | | | | 8.38 | | | | 0.43 | | | | 6.81 | |
Distributions to shareholders from | | | | | | | | | | | | | | | | | | | | | | | | |
Net realized gains | | | (3.93 | ) | | | (6.54 | ) | | | (5.77 | ) | | | (1.41 | ) | | | 0.00 | | | | 0.00 | |
Net asset value, end of period | | | $28.91 | | | | $37.55 | | | | $40.56 | | | | $40.15 | | | | $33.18 | | | | $32.75 | |
Total return2 | | | (13.21 | )% | | | 9.79 | % | | | 15.73 | % | | | 26.11 | % | | | 1.31 | % | | | 26.25 | % |
Ratios to average net assets (annualized) | | | | | | | | | | | | | | | | | | | | | | | | |
Gross expenses | | | 2.03 | % | | | 2.07 | % | | | 2.07 | % | | | 2.09 | % | | | 2.10 | % | | | 2.11 | % |
Net expenses | | | 2.03 | % | | | 2.05 | % | | | 2.05 | % | | | 2.05 | % | | | 2.05 | % | | | 2.05 | % |
Net investment loss | | | (1.35 | )% | | | (1.33 | )% | | | (1.59 | )% | | | (0.85 | )% | | | (1.49 | )% | | | (1.55 | )% |
Supplemental data | | | | | | | | | | | | | | | | | | | | | | | | |
Portfolio turnover rate | | | 44 | % | | | 94 | % | | | 101 | % | | | 88 | % | | | 101 | % | | | 123 | % |
Net assets, end of period (000s omitted) | | | $77,513 | | | | $99,100 | | | | $108,073 | | | | $83,206 | | | | $59,481 | | | | $58,329 | |
| 1 | Calculated based upon average shares outstanding |
| 2 | Total return calculations do not include any sales charges. Returns for periods of less than one year are not annualized. |
The accompanying notes are an integral part of these financial statements.
| | | | | | |
| Financial highlights | | Wells Fargo Omega Growth Fund | | | 17 | |
(For a share outstanding throughout each period)
| | | | | | | | | | | | | | | | | | | | | | | | |
| | | Six months ended January 31, 2016 (unaudited) | | | Year ended July 31 | |
| CLASS R | | | 2015 | | | 2014 | | | 2013 | | | 2012 | | | 2011 | |
Net asset value, beginning of period | | | $46.66 | | | | $48.62 | | | | $46.90 | | | | $38.35 | | | | $37.66 | | | | $29.69 | |
Net investment loss | | | (0.18 | )1 | | | (0.39 | )1 | | | (0.53 | )1 | | | (0.09 | ) | | | (0.36 | )1 | | | (0.13 | ) |
Net realized and unrealized gains (losses) on investments | | | (5.64 | ) | | | 4.97 | | | | 8.02 | | | | 10.05 | | | | 1.05 | | | | 8.10 | |
| | | | | | | | | | | | | | | | | | | | | | | | |
Total from investment operations | | | (5.82 | ) | | | 4.58 | | | | 7.49 | | | | 9.96 | | | | 0.69 | | | | 7.97 | |
Distributions to shareholders from | | | | | | | | | | | | | | | | | | | | | | | | |
Net realized gains | | | (3.93 | ) | | | (6.54 | ) | | | (5.77 | ) | | | (1.41 | ) | | | 0.00 | | | | 0.00 | |
Net asset value, end of period | | | $36.91 | | | | $46.66 | | | | $48.62 | | | | $46.90 | | | | $38.35 | | | | $37.66 | |
Total return2 | | | (13.00 | )% | | | 10.38 | % | | | 16.30 | % | | | 26.73 | % | | | 1.83 | % | | | 26.89 | % |
Ratios to average net assets (annualized) | | | | | | | | | | | | | | | | | | | | | | | | |
Gross expenses | | | 1.53 | % | | | 1.57 | % | | | 1.57 | % | | | 1.59 | % | | | 1.60 | % | | | 1.59 | % |
Net expenses | | | 1.53 | % | | | 1.55 | % | | | 1.55 | % | | | 1.55 | % | | | 1.55 | % | | | 1.55 | % |
Net investment loss | | | (0.84 | )% | | | (0.83 | )% | | | (1.09 | )% | | | (0.38 | )% | | | (0.99 | )% | | | (1.08 | )% |
Supplemental data | | | | | | | | | | | | | | | | | | | | | | | | |
Portfolio turnover rate | | | 44 | % | | | 94 | % | | | 101 | % | | | 88 | % | | | 101 | % | | | 123 | % |
Net assets, end of period (000s omitted) | | | $11,605 | | | | $17,199 | | | | $20,095 | | | | $23,745 | | | | $15,408 | | | | $6,515 | |
| 1 | Calculated based upon average shares outstanding |
| 2 | Returns for periods of less than one year are not annualized. |
The accompanying notes are an integral part of these financial statements.
| | | | |
| 18 | | Wells Fargo Omega Growth Fund | | Financial highlights |
(For a share outstanding throughout each period)
| | | | | | | | | | | | | | | | | | | | | | | | |
| | | Six months ended January 31, 2016 (unaudited) | | | Year ended July 31 | |
| ADMINISTRATOR CLASS | | | 2015 | | | 2014 | | | 2013 | | | 2012 | | | 2011 | |
Net asset value, beginning of period | | | $51.20 | | | | $52.50 | | | | $50.00 | | | | $40.60 | | | | $39.67 | | | | $31.12 | |
Net investment income (loss) | | | (0.09 | )1 | | | (0.17 | )1 | | | (0.31 | )1 | | | 0.07 | 1 | | | (0.19 | )1 | | | (0.21 | )1 |
Net realized and unrealized gains (losses) on investments | | | (6.21 | ) | | | 5.41 | | | | 8.58 | | | | 10.74 | | | | 1.12 | | | | 8.76 | |
| | | | | | | | | | | | | | | | | | | | | | | | |
Total from investment operations | | | (6.30 | ) | | | 5.24 | | | | 8.27 | | | | 10.81 | | | | 0.93 | | | | 8.55 | |
Distributions to shareholders from | | | | | | | | | | | | | | | | | | | | | | | | |
Net realized gains | | | (3.93 | ) | | | (6.54 | ) | | | (5.77 | ) | | | (1.41 | ) | | | 0.00 | | | | 0.00 | |
Net asset value, end of period | | | $40.97 | | | | $51.20 | | | | $52.50 | | | | $50.00 | | | | $40.60 | | | | $39.67 | |
Total return2 | | | (12.80 | )% | | | 10.91 | % | | | 16.89 | % | | | 27.35 | % | | | 2.34 | % | | | 27.47 | % |
Ratios to average net assets (annualized) | | | | | | | | | | | | | | | | | | | | | | | | |
Gross expenses | | | 1.18 | % | | | 1.15 | % | | | 1.15 | % | | | 1.17 | % | | | 1.17 | % | | | 1.18 | % |
Net expenses | | | 1.06 | % | | | 1.05 | % | | | 1.05 | % | | | 1.05 | % | | | 1.05 | % | | | 1.05 | % |
Net investment income (loss) | | | (0.37 | )% | | | (0.33 | )% | | | (0.59 | )% | | | 0.16 | % | | | (0.49 | )% | | | (0.56 | )% |
Supplemental data | | | | | | | | | | | | | | | | | | | | | | | | |
Portfolio turnover rate | | | 44 | % | | | 94 | % | | | 101 | % | | | 88 | % | | | 101 | % | | | 123 | % |
Net assets, end of period (000s omitted) | | | $53,018 | | | | $86,756 | | | | $115,281 | | | | $69,264 | | | | $51,560 | | | | $41,242 | |
| 1 | Calculated based upon average shares outstanding |
| 2 | Returns for periods of less than one year are not annualized. |
The accompanying notes are an integral part of these financial statements.
| | | | | | |
| Financial highlights | | Wells Fargo Omega Growth Fund | | | 19 | |
(For a share outstanding throughout each period)
| | | | | | | | | | | | | | | | | | | | | | | | |
| | | Six months ended January 31, 2016 (unaudited) | | | Year ended July 31 | |
| INSTITUTIONAL CLASS | | | 2015 | | | 2014 | | | 2013 | | | 2012 | | | 2011 | |
Net asset value, beginning of period | | | $52.01 | | | | $53.10 | | | | $50.40 | | | | $40.81 | | | | $39.77 | | | | $31.12 | |
Net investment income (loss) | | | (0.02 | ) | | | (0.04 | )1 | | | (0.24 | ) | | | 0.11 | 1 | | | (0.10 | ) | | | (0.03 | ) |
Net realized and unrealized gains (losses) on investments | | | (6.33 | ) | | | 5.49 | | | | 8.71 | | | | 10.89 | | | | 1.14 | | | | 8.68 | |
| | | | | | | | | | | | | | | | | | | | | | | | |
Total from investment operations | | | (6.35 | ) | | | 5.45 | | | | 8.47 | | | | 11.00 | | | | 1.04 | | | | 8.65 | |
Distributions to shareholders from | | | | | | | | | | | | | | | | | | | | | | | | |
Net realized gains | | | (3.93 | ) | | | (6.54 | ) | | | (5.77 | ) | | | (1.41 | ) | | | 0.00 | | | | 0.00 | |
Net asset value, end of period | | | $41.73 | | | | $52.01 | | | | $53.10 | | | | $50.40 | | | | $40.81 | | | | $39.77 | |
Total return2 | | | (12.70 | )% | | | 11.20 | % | | | 17.17 | % | | | 27.68 | % | | | 2.62 | % | | | 27.80 | % |
Ratios to average net assets (annualized) | | | | | | | | | | | | | | | | | | | | | | | | |
Gross expenses | | | 0.95 | % | | | 0.90 | % | | | 0.89 | % | | | 0.91 | % | | | 0.92 | % | | | 0.88 | % |
Net expenses | | | 0.81 | % | | | 0.80 | % | | | 0.80 | % | | | 0.80 | % | | | 0.80 | % | | | 0.80 | % |
Net investment income (loss) | | | (0.13 | )% | | | (0.09 | )% | | | (0.36 | )% | | | 0.24 | % | | | (0.24 | )% | | | (0.34 | )% |
Supplemental data | | | | | | | | | | | | | | | | | | | | | | | | |
Portfolio turnover rate | | | 44 | % | | | 94 | % | | | 101 | % | | | 88 | % | | | 101 | % | | | 123 | % |
Net assets, end of period (000s omitted) | | | $62,301 | | | | $87,085 | | | | $49,960 | | | | $3,507 | | | | $779 | | | | $656 | |
| 1 | Calculated based upon average shares outstanding |
| 2 | Returns for periods of less than one year are not annualized. |
The accompanying notes are an integral part of these financial statements.
| | | | |
| 20 | | Wells Fargo Omega Growth Fund | | Notes to financial statements (unaudited) |
1. ORGANIZATION
Wells Fargo Funds Trust (the “Trust”), a Delaware statutory trust organized on March 10, 1999, is an open-end management investment company registered under the Investment Company Act of 1940, as amended (the “1940 Act”). As an investment company, the Trust follows the accounting and reporting guidance in Financial Accounting Standards Board (“FASB”) Accounting Standards Codification Topic 946, Financial Services – Investment Companies. These financial statements report on the Wells Fargo Omega Growth Fund (the “Fund”) which is a diversified series of the Trust.
2. SIGNIFICANT ACCOUNTING POLICIES
The following significant accounting policies, which are consistently followed in the preparation of the financial statements of the Fund, are in conformity with U.S. generally accepted accounting principles which require management to make estimates and assumptions that affect the reported amounts of assets and liabilities, disclosure of contingent assets and liabilities at the date of the financial statements, and the reported amounts of revenues and expenses during the reporting period. Actual results could differ from those estimates.
Securities valuation
All investments are valued each business day as of the close of regular trading on the New York Stock Exchange (generally 4 p.m. Eastern Time).
Equity securities that are listed on a foreign or domestic exchange or market are valued at the official closing price or, if none, the last sales price. If no sale occurs on the principal exchange or market that day, the prior day’s price will be deemed “stale” and a fair value price will be determined in accordance with the Fund’s Valuation Procedures.
Investments in registered open-end investment companies are valued at net asset value. Interests in non-registered investment vehicles that are redeemable at net asset value are fair valued normally at net asset value.
Investments which are not valued using any of the methods discussed above are valued at their fair value, as determined in good faith by the Board of Trustees of the Fund. The Board of Trustees has established a Valuation Committee comprised of the Trustees and has delegated to it the authority to take any actions regarding the valuation of portfolio securities that the Valuation Committee deems necessary or appropriate, including determining the fair value of portfolio securities, unless the determination has been delegated to the Management Valuation Team of Wells Fargo Funds Management, LLC (“Funds Management”). The Board of Trustees retains the authority to make or ratify any valuation decisions or approve any changes to the Valuation Procedures as it deems appropriate. On a quarterly basis, the Board of Trustees receives reports on any valuation actions taken by the Valuation Committee or the Management Valuation Team which may include items for ratification.
Valuations of fair valued securities are compared to the next actual sales price when available, or other appropriate market values, to assess the continued appropriateness of the fair valuation methodologies used. These securities are fair valued on a day-to-day basis, taking into consideration changes to appropriate market information and any significant changes to the inputs considered in the valuation process until there is a readily available price provided on an exchange or by an independent pricing service. Valuations received from an independent pricing service or independent broker-dealer quotes are periodically validated by comparisons to most recent trades and valuations provided by other independent pricing services in addition to the review of prices by the manager and/or subadviser. Unobservable inputs used in determining fair valuations are identified based on the type of security, taking into consideration factors utilized by market participants in valuing the investment, knowledge about the issuer and the current market environment.
Security loans
The Fund may lend its securities from time to time in order to earn additional income in the form of fees or interest on securities received as collateral or the investment of any cash received as collateral. The Fund continues to receive interest or dividends on the securities loaned. The Fund receives collateral in the form of cash or securities with a value at least equal to the value of the securities on loan. The value of the loaned securities is determined at the close of each business day and any additional required collateral is delivered to the Fund on the next business day. In a securities lending transaction, the net asset value of the Fund will be affected by an increase or decrease in the value of the securities loaned and by an increase or decrease in the value of the instrument in which collateral is invested. The amount of securities lending activity undertaken by the Fund fluctuates from time to time. In the event of default or bankruptcy by the borrower, the Fund may be prevented from recovering the loaned securities or gaining access to the collateral or may experience delays or costs in doing so. In addition, the investment of any cash collateral received may lose all or part of its value. The Fund has the right under the lending agreement to recover the securities from the borrower on demand.
| | | | | | |
| Notes to financial statements (unaudited) | | Wells Fargo Omega Growth Fund | | | 21 | |
The Fund lends its securities through an unaffiliated securities lending agent. Cash collateral received in connection with its securities lending transactions is invested in Securities Lending Cash Investments, LLC (the “Securities Lending Fund”). The Securities Lending Fund is exempt from registration under Section 3(c)(7) of the 1940 Act and is managed by Funds Management and is subadvised by Wells Capital Management Incorporated (“WellsCap”), an affiliate of Funds Management and an indirect wholly owned subsidiary of Wells Fargo & Company (“Wells Fargo”). Funds Management receives an advisory fee starting at 0.05% and declining to 0.01% as the average daily net assets of the Securities Lending Fund increase. All of the fees received by Funds Management are paid to WellsCap for its services as subadviser. The Securities Lending Fund seeks to provide a positive return compared to the daily Fed Funds Open rate by investing in high-quality, U.S. dollar-denominated short-term money market instruments. Securities Lending Fund investments are fair valued based upon the amortized cost valuation technique. Income earned from investment in the Securities Lending Fund is included in securities lending income on the Statement of Operations.
Security transactions and income recognition
Securities transactions are recorded on a trade date basis. Realized gains or losses are recorded on the basis of identified cost.
Dividend income is recognized on the ex-dividend date.
Distributions to shareholders
Distributions to shareholders from net investment income and net realized gains, if any, are recorded on the ex-dividend date. Such distributions are determined in conformity with federal income tax regulations, which may differ in amount or character from net investment income and realized gains recognized for purposes of U.S. generally accepted accounting principles.
Federal and other taxes
The Fund intends to continue to qualify as a regulated investment company by distributing substantially all of its investment company taxable income and any net realized capital gains (after reduction for capital loss carryforwards) sufficient to relieve it from all, or substantially all, federal income taxes. Accordingly, no provision for federal income taxes was required.
The Fund’s income and federal excise tax returns and all financial records supporting those returns for the prior three fiscal years are subject to examination by the federal and Delaware revenue authorities. Management has analyzed the Fund’s tax positions taken on federal, state, and foreign tax returns for all open tax years and does not believe that there are any uncertain tax positions that require recognition of a tax liability.
As of July 31, 2015, the Fund had a qualified late-year ordinary loss of $4,425,506 which was recognized on the first day of the current fiscal year.
Class allocations
The separate classes of shares offered by the Fund differ principally in applicable sales charges, distribution, shareholder servicing, and administration fees. Class specific expenses are charged directly to that share class. Investment income, common expenses, and realized and unrealized gains (losses) on investments are allocated daily to each class of shares based on the relative proportion of net assets of each class.
3. FAIR VALUATION MEASUREMENTS
Fair value measurements of investments are determined within a framework that has established a fair value hierarchy based upon the various data inputs utilized in determining the value of the Fund’s investments. The three-level hierarchy gives the highest priority to unadjusted quoted prices in active markets for identical assets or liabilities (Level 1) and the lowest priority to significant unobservable inputs (Level 3). The Fund’s investments are classified within the fair value hierarchy based on the lowest level of input that is significant to the fair value measurement. The inputs are summarized into three broad levels as follows:
| n | | Level 1 – quoted prices in active markets for identical securities |
| n | | Level 2 – other significant observable inputs (including quoted prices for similar securities, interest rates, prepayment speeds, credit risk, use of amortized cost, etc.) |
| n | | Level 3 – significant unobservable inputs (including the Fund’s own assumptions in determining the fair value of investments) |
| | | | |
| 22 | | Wells Fargo Omega Growth Fund | | Notes to financial statements (unaudited) |
The inputs or methodologies used for valuing investments in securities are not necessarily an indication of the risk associated with investing in those securities.
The following is a summary of the inputs used in valuing the Fund’s assets and liabilities as of January 31, 2016:
| | | | | | | | | | | | | | | | |
| | | Quoted prices
(Level 1) | | | Other significant
observable inputs
(Level 2) | | | Significant
unobservable inputs (Level 3) | | | Total | |
Assets | | | | | | | | | | | | | | | | |
Investments in: | | | | |
| | | | |
Common stocks | | | | | | | | | | | | | | | | |
Consumer discretionary | | $ | 145,565,707 | | | $ | 0 | | | $ | 0 | | | $ | 145,565,707 | |
Consumer staples | | | 36,772,448 | | | | 0 | | | | 0 | | | | 36,772,448 | |
Financials | | | 57,893,829 | | | | 0 | | | | 0 | | | | 57,893,829 | |
Health care | | | 108,895,519 | | | | 0 | | | | 0 | | | | 108,895,519 | |
Industrials | | | 70,590,160 | | | | 0 | | | | 0 | | | | 70,590,160 | |
Information technology | | | 281,924,283 | | | | 10,357,138 | | | | 0 | | | | 292,281,421 | |
Materials | | | 22,638,119 | | | | 0 | | | | 0 | | | | 22,638,119 | |
Telecommunication services | | | 20,590,297 | | | | 0 | | | | 0 | | | | 20,590,297 | |
| | | | |
Short-term investments | | | | | | | | | | | | | | | | |
Investment companies | | | 10,900,136 | | | | 0 | | | | 0 | | | | 10,900,136 | |
Investments measured at net asset value* | | | | | | | | | | | | | | | 6,640,900 | |
Total assets | | $ | 755,770,498 | | | $ | 10,357,138 | | | $ | 0 | | | $ | 772,768,536 | |
| * | Investments that are measured at fair value using the net asset value per share (or its equivalent) as a practical expedient have not been categorized in the fair value hierarchy. The fair value amount presented in the table is intended to permit reconciliation of the fair value hierarchy to the amounts presented in the Statement of Assets and Liabilities. The Fund’s investment in Securities Lending Cash Investments, LLC valued at $6,640,900 does not have a redemption period notice, can be redeemed daily and does not have any unfunded commitments. |
The Fund recognizes transfers between levels within the fair value hierarchy at the end of the reporting period. At January 31, 2016, the Fund did not have any transfers into/out of Level 1, Level 2, or Level 3.
4. TRANSACTIONS WITH AFFILIATES
Management fee
Funds Management, an indirect wholly owned subsidiary of Wells Fargo, is the manager of the Fund and provides advisory and fund-level administrative services under an investment management agreement. Under the investment management agreement, Funds Management is responsible for, among other services, implementing the investment objectives and strategies of the Fund, supervising the applicable subadviser, providing fund-level administrative services in connection with the Fund’s operations, and providing any other fund-level administrative services reasonably necessary for the operation of the Fund. As compensation for its services under the investment management agreement, Funds Management is entitled to receive an annual management fee starting at 0.80% and declining to 0.555% as the average daily net assets of the Fund increase. For the six months ended January 31, 2016, the management fee was equivalent to an annual rate of 0.78% of the Fund’s average daily net assets.
Funds Management has retained the services of a subadviser to provide daily portfolio management to the Fund. The fee for subadvisory services is borne by Funds Management. WellsCap, is the subadviser to the Fund and is entitled to receive a fee from Funds Management at an annual rate starting at 0.45% and declining to 0.30% as the average daily net assets of the Fund increase.
| | | | | | |
| Notes to financial statements (unaudited) | | Wells Fargo Omega Growth Fund | | | 23 | |
Administration fees
Under a class-level administration agreement, Funds Management provides class-level administrative services to the Fund, which includes paying fees and expenses for services provided by the transfer agent, sub-transfer agents, omnibus account servicers and record-keepers. As compensation for its services under the class-level administration agreement, Funds Management receives an annual fee which is calculated based on the average daily net assets of each class as follows:
| | | | |
| | | Class-level
administration fee | |
Class A, Class B, Class C, Class R | | | 0.21 | % |
Administrator Class, Institutional Class | | | 0.13 | |
Funds Management has contractually waived and/or reimbursed management and administration fees to the extent necessary to maintain certain net operating expense ratios for the Fund. Waiver of fees and/or reimbursement of expenses by Funds Management were made first from fund level expenses on a proportionate basis and then from class specific expenses. Funds Management has committed through November 30, 2016 to waive fees and/or reimburse expenses to the extent necessary to cap the Fund’s expenses at 1.30% for Class A shares, 2.05% for Class B shares, 2.05% for Class C shares, 1.55% for Class R, 1.10% for Administrator Class shares, and 0.85% for Institutional Class shares. After this time, the cap may be increased or the commitment to maintain the cap may be terminated only with the approval of the Board of Trustees. Prior to December 1, 2015, the Fund’s expenses were capped at 1.05% for Administrator Class and 0.80% for Institutional Class shares.
Distribution fees
The Trust has adopted a distribution plan for Class B, Class C, and Class R shares of the Fund pursuant to Rule 12b-1 under the 1940 Act. Distribution fees are charged to Class B, Class C, and Class R shares and paid to Wells Fargo Funds Distributor, LLC (“Funds Distributor”), the principal underwriter, at an annual rate of 0.75% of the average daily net assets of Class B and Class C shares and 0.25% of the average daily net assets of Class R shares.
In addition, Funds Distributor is entitled to receive the front-end sales charge from the purchase of Class A shares and a contingent deferred sales charge on the redemption of certain Class A shares. Funds Distributor is also entitled to receive the contingent deferred sales charges from redemptions of Class B and Class C shares. For the six months ended January 31, 2016, Funds Distributor received $10,616 from the sale of Class A shares and $28 and $424 in contingent deferred sales charges from redemptions of Class B and Class C shares, respectively.
Shareholder servicing fees
The Trust has entered into contracts with one or more shareholder servicing agents, whereby Class A, Class B, Class C, Class R, and Administrator Class of the Fund is charged a fee at an annual rate of 0.25% of the average daily net assets of each respective class.
A portion of these total shareholder servicing fees were paid to affiliates of Wells Fargo.
5. INVESTMENT PORTFOLIO TRANSACTIONS
Purchases and sales of investments, excluding U.S. government obligations (if any) and short-term securities, for the six months ended January 31, 2016 were $386,531,412 and $487,055,096, respectively.
6. BANK BORROWINGS
The Trust (excluding the money market funds and certain other funds) and Wells Fargo Variable Trust are parties to a $200,000,000 revolving credit agreement whereby the Fund is permitted to use bank borrowings for temporary or emergency purposes, such as to fund shareholder redemption requests. Interest under the credit agreement is charged to the Fund based on a borrowing rate equal to the higher of the Federal Funds rate in effect on that day plus 1.25% or the overnight LIBOR rate in effect on that day plus 1.25%. In addition, an annual commitment fee equal to 0.20% of the unused balance is allocated to each participating fund. Prior to September 1, 2015, the revolving credit agreement amount was $150,000,000 and the annual commitment fee was equal to 0.10% of the unused balance which was allocated to each participating fund. For the six months ended January 31, 2016, the Fund paid $1,508 in commitment fees.
| | | | |
| 24 | | Wells Fargo Omega Growth Fund | | Notes to financial statements (unaudited) |
For the six months ended January 31, 2016, there were no borrowings by the Fund under the agreement.
7. CONCENTRATION RISK
Concentration risks result from exposure to a limited number of sectors. A fund that invests a substantial portion of its assets in any sector may be more affected by changes in that sector than would be a fund whose investments are not heavily weighted in any sector.
8. INDEMNIFICATION
Under the Trust’s organizational documents, the officers and Trustees have been granted certain indemnification rights against certain liabilities that may arise out of performance of their duties to the Trust. Additionally, in the normal course of business, the Trust may enter into contracts with service providers that contain a variety of indemnification clauses. The Trust’s maximum exposure under these arrangements is dependent on future claims that may be made against the Fund and, therefore, cannot be estimated.
| | | | | | |
| Other information (unaudited) | | Wells Fargo Omega Growth Fund | | | 25 | |
PROXY VOTING INFORMATION
A description of the policies and procedures that the Fund uses to determine how to vote proxies relating to portfolio securities is available, upon request, by calling 1-800-222-8222, visiting our website at wellsfargofunds.com, or visiting the SEC website at sec.gov. Information regarding how the Fund voted proxies relating to portfolio securities during the most recent 12-month period ended June 30 is available on the Fund’s website at wellsfargofunds.com or by visiting the SEC website at sec.gov.
PORTFOLIO HOLDINGS INFORMATION
The complete portfolio holdings for the Fund are publicly available monthly on the Fund’s website (wellsfargofunds.com), on a one-month delayed basis. In addition, top ten holdings information (excluding derivative positions) for the Fund is publicly available on the Fund’s website on a monthly, seven-day or more delayed basis. The Fund files its complete schedule of portfolio holdings with the SEC for the first and third quarters of each fiscal year on Form N-Q, which is available by visiting the SEC website at sec.gov. In addition, the Fund’s Form N-Q may be reviewed and copied at the SEC’s Public Reference Room in Washington, DC, and at regional offices in New York City, at 233 Broadway, and in Chicago, at 175 West Jackson Boulevard, Suite 900. Information about the Public Reference Room may be obtained by calling 1-800-SEC-0330.
| | | | |
| 26 | | Wells Fargo Omega Growth Fund | | Other information (unaudited) |
BOARD OF TRUSTEES AND OFFICERS
Each of the Trustees and Officers1 listed in the table below acts in identical capacities for each fund in the Wells Fargo family of funds, which consists of 144 mutual funds comprising the Wells Fargo Funds Trust, Wells Fargo Variable Trust, Wells Fargo Master Trust and four closed-end funds (collectively the “Fund Complex”). This table should be read in conjunction with the Prospectus and the Statement of Additional Information2. The mailing address of each Trustee and Officer is 525 Market Street, 12th Floor, San Francisco, CA 94105. Each Trustee and Officer serves an indefinite term, however, each Trustee serves such term until reaching the mandatory retirement age established by the Trustees.
Independent Trustees
| | | | | | |
Name and
year of birth | | Position held and
length of service* | | Principal occupations during past five years or longer | | Current other
public company or
investment company
directorships |
| William R. Ebsworth (Born 1957) | | Trustee, since 2015 | | Retired. From 1984 to 2013, equities analyst, portfolio manager, research director and chief financial officer at Fidelity Management and Research Company in Boston, Tokyo, and Hong Kong and retired in 2013 as Chief Investment Officer of Fidelity Strategic Advisers, Inc. where he lead a team of investment professionals managing client assets. Prior thereto, Board member of Hong Kong Securities Clearing Co., Hong Kong Options Clearing Corp., the Thailand International Fund, Ltd., Fidelity Investments Life Insurance Company, and Empire Fidelity Investments Life Insurance Company. Mr. Ebsworth is a CFA® charterholder and an Adjunct Lecturer, Finance, at Babson College. | | Asset Allocation Trust |
| Jane A. Freeman (Born 1953) | | Trustee, since 2015 | | Retired. From 2012 to 2014 and 1999 to 2008, Chief Financial Officer of Scientific Learning Corporation. From 2008 to 2012, Ms. Freeman provided consulting services related to strategic business projects. Prior to 1999, Portfolio Manager at Rockefeller & Co. and Scudder, Stevens & Clark. Board member of the Harding Loevner Funds from 1996 to 2014, serving as both Lead Independent Director and chair of the Audit Committee. Board member of the Russell Exchange Traded Funds Trust from 2011 to 2012 and the chair of the Audit Committee. Ms. Freeman is Chair of Taproot Foundation (non-profit organization), a Board Member of Ruth Bancroft Garden (non-profit organization) and an inactive chartered financial analyst. | | Asset Allocation Trust |
Peter G. Gordon (Born 1942) | | Trustee, since 1998; Chairman, since 2005 | | Co-Founder, Retired Chairman, President and CEO of Crystal Geyser Water Company. Trustee Emeritus, Colby College. | | Asset Allocation Trust |
Isaiah Harris, Jr. (Born 1952) | | Trustee, since 2009 | | Retired. Chairman of the Board of CIGNA Corporation since 2009, and Director since 2005. From 2003 to 2011, Director of Deluxe Corporation. Prior thereto, President and CEO of BellSouth Advertising and Publishing Corp. from 2005 to 2007, President and CEO of BellSouth Enterprises from 2004 to 2005 and President of BellSouth Consumer Services from 2000 to 2003. Emeritus member of the Iowa State University Foundation Board of Governors. Emeritus Member of the Advisory Board of Iowa State University School of Business. Advisory Board Member, Palm Harbor Academy (charter school). Advisory Board Member, Child Evangelism Fellowship (non-profit). Mr. Harris is a certified public accountant (inactive status). | | CIGNA Corporation; Asset Allocation Trust |
| Judith M. Johnson (Born 1949) | | Trustee, since 2008; Audit Committee Chairman, since 2008 | | Retired. Prior thereto, Chief Executive Officer and Chief Investment Officer of Minneapolis Employees Retirement Fund from 1996 to 2008. Ms. Johnson is an attorney, certified public accountant and a certified managerial accountant. | | Asset Allocation Trust |
| | | | | | |
| Other information (unaudited) | | Wells Fargo Omega Growth Fund | | | 27 | |
| | | | | | |
Name and
year of birth | | Position held and
length of service* | | Principal occupations during past five years or longer | | Current other
public company or
investment company
directorships |
| David F. Larcker (Born 1950) | | Trustee, since 2009 | | James Irvin Miller Professor of Accounting at the Graduate School of Business, Stanford University, Director of the Corporate Governance Research Initiative and Senior Faculty of The Rock Center for Corporate Governance since 2006. From 2005 to 2008, Professor of Accounting at the Graduate School of Business, Stanford University. Prior thereto, Ernst & Young Professor of Accounting at The Wharton School, University of Pennsylvania from 1985 to 2005. | | Asset Allocation Trust |
| Olivia S. Mitchell (Born 1953) | | Trustee, since 2006 | | International Foundation of Employee Benefit Plans Professor, Wharton School of the University of Pennsylvania since 1993. Director of Wharton’s Pension Research Council and Boettner Center on Pensions & Retirement Research, and Research Associate at the National Bureau of Economic Research. Previously, Cornell University Professor from 1978 to 1993. | | Asset Allocation Trust |
| Timothy J. Penny (Born 1951) | | Trustee, since 1996 | | President and Chief Executive Officer of Southern Minnesota Initiative Foundation, a non-profit organization, since 2007 and Senior Fellow at the Humphrey Institute Policy Forum at the University of Minnesota since 1995. Member of the Board of Trustees of NorthStar Education Finance, Inc., a non-profit organization, since 2007. | | Asset Allocation Trust |
| Michael S. Scofield (Born 1943) | | Trustee, since 2010 | | Served on the Investment Company Institute’s Board of Governors and Executive Committee from 2008-2011 as well the Governing Council of the Independent Directors Council from 2006-2011 and the Independent Directors Council Executive Committee from 2008-2011. Chairman of the IDC from 2008-2010. Institutional Investor (Fund Directions) Trustee of Year in 2007. Trustee of the Evergreen Funds complex (and its predecessors) from 1984 to 2010. Chairman of the Evergreen Funds from 2000-2010. Former Trustee of the Mentor Funds. Retired Attorney, Law Offices of Michael S. Scofield. | | Asset Allocation Trust |
| * | Length of service dates reflect the Trustee’s commencement of service with the Trust’s predecessor entities, where applicable. |
Officers
| | | | | | |
Name and
year of birth | | Position held and
length of service | | Principal occupations during past five years or longer | | |
Karla M. Rabusch (Born 1959) | | President, since 2003 | | Executive Vice President of Wells Fargo Bank, N.A. and President of Wells Fargo Funds Management, LLC since 2003. | | |
Jeremy DePalma1 (Born 1974) | | Treasurer, since 2012; Assistant Treasurer, since 2009 | | Senior Vice President of Wells Fargo Funds Management, LLC since 2009. Senior Vice President of Evergreen Investment Management Company, LLC from 2008 to 2010 and head of the Fund Reporting and Control Team within Fund Administration from 2005 to 2010. | | |
C. David Messman (Born 1960) | | Secretary, since 2000; Chief Legal Officer, since 2003 | | Senior Vice President and Secretary of Wells Fargo Funds Management, LLC since 2001. Assistant General Counsel of Wells Fargo Bank, N.A. since 2013 and Vice President and Managing Counsel of Wells Fargo Bank, N.A. from 1996 to 2013. | | |
Debra Ann Early
(Born 1964) | | Chief Compliance Officer, since 2007 | | Executive Vice President of Wells Fargo Funds Management, LLC since 2014, Senior Vice President and Chief Compliance Officer from 2007 to 2014. | | |
David Berardi
(Born 1975) | | Assistant Treasurer, since 2009 | | Vice President of Wells Fargo Funds Management, LLC since 2009. Vice President of Evergreen Investment Management Company, LLC from 2008 to 2010. Manager of Fund Reporting and Control for Evergreen Investment Management Company, LLC from 2004 to 2010. | | |
| 1 | Jeremy DePalma acts as Treasurer of 72 funds and Assistant Treasurer of 72 funds in the Fund Complex. |
| 2 | The Statement of Additional Information includes additional information about the Trustees and is available, without charge, upon request, by calling 1-800-222-8222 or by visiting the website at wellsfargofunds.com. |
| | | | |
| 28 | | Wells Fargo Omega Growth Fund | | List of abbreviations |
The following is a list of common abbreviations for terms and entities that may have appeared in this report.
| ACA | — ACA Financial Guaranty Corporation |
| ADR | — American depositary receipt |
| ADS | — American depositary shares |
| AGC | — Assured Guaranty Corporation |
| AGM | — Assured Guaranty Municipal |
| Ambac | — Ambac Financial Group Incorporated |
| AMT | — Alternative minimum tax |
| BAN | — Bond anticipation notes |
| BHAC | — Berkshire Hathaway Assurance Corporation |
| CAB | — Capital appreciation bond |
| CCAB | — Convertible capital appreciation bond |
| CDA | — Community Development Authority |
| CDO | — Collateralized debt obligation |
| DRIVER | — Derivative inverse tax-exempt receipts |
| DW&P | — Department of Water & Power |
| DWR | — Department of Water Resources |
| ECFA | — Educational & Cultural Facilities Authority |
| EDA | — Economic Development Authority |
| EDFA | — Economic Development Finance Authority |
| ETF | — Exchange-traded fund |
| FDIC | — Federal Deposit Insurance Corporation |
| FFCB | — Federal Farm Credit Banks |
| FGIC | — Financial Guaranty Insurance Corporation |
| FHA | — Federal Housing Administration |
| FHLB | — Federal Home Loan Bank |
| FHLMC | — Federal Home Loan Mortgage Corporation |
| FICO | — The Financing Corporation |
| FNMA | — Federal National Mortgage Association |
| GDR | — Global depositary receipt |
| GNMA | — Government National Mortgage Association |
| HCFR | — Healthcare facilities revenue |
| HEFA | — Health & Educational Facilities Authority |
| HEFAR | — Higher education facilities authority revenue |
| HFA | — Housing Finance Authority |
| HFFA | — Health Facilities Financing Authority |
| HUD | — Department of Housing and Urban Development |
| IDA | — Industrial Development Authority |
| IDAG | — Industrial Development Agency |
| KRW | — Republic of Korea won |
| LIBOR | — London Interbank Offered Rate |
| LIFER | — Long Inverse Floating Exempt Receipts |
| LLC | — Limited liability company |
| LLLP | — Limited liability limited partnership |
| LLP | — Limited liability partnership |
| MBIA | — Municipal Bond Insurance Association |
| MFHR | — Multifamily housing revenue |
| MSTR | — Municipal securities trust receipts |
| MUD | — Municipal Utility District |
| National | — National Public Finance Guarantee Corporation |
| PCFA | — Pollution Control Financing Authority |
| PCL | — Public Company Limited |
| PCR | — Pollution control revenue |
| PFA | — Public Finance Authority |
| PFFA | — Public Facilities Financing Authority |
| PFOTER | — Puttable floating option tax-exempt receipts |
| plc | — Public limited company |
| PUTTER | — Puttable tax-exempt receipts |
| R&D | — Research & development |
| Radian | — Radian Asset Assurance |
| RAN | — Revenue anticipation notes |
| RDA | — Redevelopment Authority |
| RDFA | — Redevelopment Finance Authority |
| REIT | — Real estate investment trust |
| ROC | — Reset option certificates |
| SAVRS | — Select auction variable rate securities |
| SBA | — Small Business Authority |
| SDR | — Swedish depositary receipt |
| SFHR | — Single-family housing revenue |
| SFMR | — Single-family mortgage revenue |
| SPA | — Standby purchase agreement |
| SPDR | — Standard & Poor’s Depositary Receipts |
| SPEAR | — Short Puttable Exempt Adjustable Receipts |
| STRIPS | — Separate trading of registered interest and |
| TAN | — Tax anticipation notes |
| TIPS | — Treasury inflation-protected securities |
| TRAN | — Tax revenue anticipation notes |
| TTFA | — Transportation Trust Fund Authority |
| TVA | — Tennessee Valley Authority |

For more information
More information about Wells Fargo Funds is available free upon request. To obtain literature, please write, email, visit the Fund’s website, or call:
Wells Fargo Funds
P.O. Box 8266
Boston, MA 02266-8266
Email: fundservice@wellsfargo.com
Website: wellsfargofunds.com
Individual investors: 1-800-222-8222
Retail investment professionals: 1-888-877-9275
Institutional investment professionals: 1-866-765-0778
This report and the financial statements contained herein are submitted for the general information of the shareholders of the Fund. If this report is used for promotional purposes, distribution of the report must be accompanied or preceded by a current prospectus. Before investing, please consider the investment objectives, risks, charges, and expenses of the investment. For a current prospectus and, if available, a summary prospectus, containing this information, call 1-800-222-8222 or visit the Fund’s website at wellsfargofunds.com. Read the prospectus carefully before you invest or send money.
Wells Fargo Asset Management (WFAM) is a trade name used by the asset management businesses of Wells Fargo & Company. Wells Fargo Funds Management, LLC, a wholly owned subsidiary of Wells Fargo & Company, provides investment advisory and administrative services for Wells Fargo Funds. Other affiliates of Wells Fargo & Company provide subadvisory and other services for the funds. The funds are distributed by Wells Fargo Funds Distributor, LLC, Member FINRA, an affiliate of Wells Fargo & Company.
NOT FDIC INSURED ¡ NO BANK GUARANTEE ¡ MAY LOSE VALUE
© 2016 Wells Fargo Funds Management, LLC. All rights reserved.
| | |
 | | 240801 03-16 SA211/SAR211 01-16 |
Semi-Annual Report
January 31, 2016

Wells Fargo
Premier Large Company Growth Fund


Reduce clutter. Save trees.
Sign up for electronic delivery of prospectuses and shareholder reports at wellsfargo.com/advantagedelivery
Contents
The views expressed and any forward-looking statements are as of January 31, 2016, unless otherwise noted, and are those of the Fund managers and/or Wells Fargo Funds Management, LLC. Discussions of individual securities, or the markets generally, or any Wells Fargo Fund are not intended as individual recommendations. Future events or results may vary significantly from those expressed in any forward-looking statements. The views expressed are subject to change at any time in response to changing circumstances in the market. Wells Fargo Funds Management, LLC and the Fund disclaim any obligation to publicly update or revise any views expressed or forward-looking statements.
NOT FDIC INSURED ¡ NO BANK GUARANTEE ¡ MAY LOSE VALUE
| | | | |
| 2 | | Wells Fargo Premier Large Company Growth Fund | | Letter to shareholders (unaudited) |

Karla M. Rabusch
President
Wells Fargo Funds
Despite generally improving U.S. economic data, ongoing global turmoil tempered U.S. economic growth during the period as many economies and markets outside the U.S. faced ongoing challenges.
Dear Valued Shareholder:
We are pleased to offer you this semi-annual report for the Wells Fargo Premier Large Company Growth Fund for the six-month period that ended January 31, 2016. Despite generally improving U.S. economic data, ongoing global turmoil tempered U.S. economic growth during the period as many economies and markets outside the U.S. faced continuing challenges. In this environment, the broad U.S. stock market experienced heightened volatility and ultimately fell 5.64% overall for the six-month period (as measured by the Russell 3000® Index,1 which is the index used to measure U.S. stock market performance throughout this letter).
As the reporting period began, China’s slowdown continued to take a toll on U.S. and international markets.
The U.S. stock market declined 6.04% and 2.91% in August and September 2015, respectively, as investors worried about the impact on the U.S. of China’s slowing growth. A number of positive economic indicators released during these months suggested the U.S. economy remained solid. However, the strengthening U.S. dollar coupled with ongoing global economic turmoil continued to hinder the economy. Although many investors believed the U.S. Federal Reserve (Fed) would raise the federal funds rate during the third quarter of 2015, at its September 2015 meeting the Fed left the rate unchanged. This decision fueled uncertainty about the U.S. economy’s stamina to remain healthy while facing the negative effects of troubles elsewhere in the world. One week later, Fed Chair Janet Yellen reassured investors that, barring unpleasant surprises, the Fed still intended to raise the rate in 2015. International markets were more volatile than the domestic market and delivered even weaker results in August and September. Investors’ anxiety was driven largely by China’s weakened economy. Because China is the world’s largest importer of many commodities, a number of emerging markets—key commodities exporters—struggled under the strains of reduced demand for commodities and lower prices for the commodities sold.
The U.S. stock market delivered a positive result overall for the last three months of 2015 despite ongoing concerns.
The broad U.S. stock market fluctuated widely in the fourth quarter of 2015, rising 7.90% in October and 0.55% in November before falling 2.05% in December, for an overall quarterly return of 6.27%. Stock markets outside the U.S. generally failed to keep pace with the domestic market as economic concerns, including China’s ongoing slowdown, continued to affect many countries worldwide. U.S. economic data released during the quarter indicated the economy remained solid, with modest growth. However, the strong U.S. dollar and global economic turmoil continued their drag on the economy. In December, the Fed, as expected, slightly raised its target short-term interest rate to between 0.25% and 0.50% after keeping it near zero for seven years. The move, which had been well telegraphed by the Fed for months, reflected confidence in the U.S. economy’s ability to stay healthy with less central-bank support. The Fed also made clear that future interest-rate increases will be gradual.
U.S. stocks struggled in January 2016.
The broad U.S. stock market dropped 5.64% for the month, weighed down by ongoing concerns about heightened market volatility, the continued plunge in oil prices, and the impact of weak global growth on U.S. companies. The U.S. economy, however, remained resilient in January—with continued solid hiring, a
| 1 | The Russell 3000® Index measures the performance of the 3,000 largest U.S. companies based on total market capitalization, which represents approximately 98% of the investable U.S. equity market. You cannot invest directly in an index. |
| | | | | | |
| Letter to shareholders (unaudited) | | Wells Fargo Premier Large Company Growth Fund | | | 3 | |
reduction in the jobless rate to 4.9%, and signs of an uptick in the pace of wage growth—despite some warning signs that became evident in recent months, such as weaknesses in manufacturing and business growth.
Don’t let short-term uncertainty derail long-term investment goals.
Periods of uncertainty can present challenges, but experience has taught us that maintaining long-term investment goals can be an effective way to plan for the future. To help you create a sound strategy based on your personal goals and risk tolerance, Wells Fargo Funds offers more than 100 mutual funds spanning a wide range of asset classes and investment styles. Although diversification cannot guarantee an investment profit or prevent losses, we believe it can be an effective way to manage investment risk and potentially smooth out overall portfolio performance. We encourage investors to know their investments and to understand that appropriate levels of risk-taking may unlock opportunities.
Thank you for choosing to invest in Wells Fargo Funds. We appreciate your confidence in us and remain committed to helping you meet your financial needs.
Sincerely,

Karla M. Rabusch
President
Wells Fargo Funds
Although diversification cannot guarantee an investment profit or prevent losses, we believe it can be an effective way to manage investment risk and potentially smooth out overall portfolio performance.
For further information about your Fund, contact your investment professional, visit our website at wellsfargofunds.com, or call us directly at 1-800-222-8222. We are available 24 hours a day, 7 days a week.
| | | | |
| 4 | | Wells Fargo Premier Large Company Growth Fund | | Performance highlights (unaudited) |
Investment objective
The Fund seeks long-term capital appreciation.
Manager
Wells Fargo Funds Management Incorporated
Subadviser
Wells Fargo Capital Management, LLC
Portfolio managers
Joseph M. Eberhardy, CFA®, CPA
Thomas C. Ognar, CFA®
Bruce C. Olson, CFA®
Average annual total returns (%) as of January 31, 20161
| | | | | | | | | | | | | | | | | | | | | | | | | | | | | | | | | | |
| | | | | Including sales charge | | | Excluding sales charge | | | Expense ratios2 (%) | |
| | | Inception date | | 1 year | | | 5 year | | | 10 year | | | 1 year | | | 5 year | | | 10 year | | | Gross | | | Net3 | |
| Class A (EKJAX) | | 1-20-1998 | | | (10.59 | ) | | | 8.42 | | | | 7.08 | | | | (5.13 | ) | | | 9.71 | | | | 7.72 | | | | 1.11 | | | | 1.11 | |
| Class B (EKJBX)* | | 9-11-1935 | | | (10.17 | ) | | | 8.62 | | | | 7.17 | | | | (5.82 | ) | | | 8.90 | | | | 7.17 | | | | 1.86 | | | | 1.86 | |
| Class C (EKJCX) | | 1-22-1998 | | | (6.84 | ) | | | 8.91 | | | | 6.93 | | | | (5.84 | ) | | | 8.91 | | | | 6.93 | | | | 1.86 | | | | 1.86 | |
| Class R4 (EKJRX) | | 11-30-2012 | | | – | | | | – | | | | – | | | | (4.85 | ) | | | 10.08 | | | | 8.05 | | | | 0.83 | | | | 0.80 | |
| Class R6 (EKJFX) | | 11-30-2012 | | | – | | | | – | | | | – | | | | (4.71 | ) | | | 10.18 | | | | 8.10 | | | | 0.68 | | | | 0.65 | |
| Administrator Class (WFPDX) | | 7-16-2010 | | | – | | | | – | | | | – | | | | (4.97 | ) | | | 9.89 | | | | 7.85 | | | | 1.03 | | | | 1.00 | |
| Institutional Class (EKJYX) | | 6-30-1999 | | | – | | | | – | | | | – | | | | (4.71 | ) | | | 10.17 | | | | 8.09 | | | | 0.78 | | | | 0.70 | |
| Russell 1000® Growth Index4 | | – | | | – | | | | – | | | | – | | | | 1.32 | | | | 11.67 | | | | 7.72 | | | | – | | | | – | |
| * | | Class B shares are closed to investment, except in connection with the reinvestment of any distributions and permitted exchanges. |
Figures quoted represent past performance, which is no guarantee of future results, and do not reflect taxes that a shareholder may pay on fund distributions or the redemption of fund shares. Investment return and principal value of an investment will fluctuate so that an investor’s shares, when redeemed, may be worth more or less than their original cost. Performance shown without sales charges would be lower if sales charges were reflected. Current performance may be lower or higher than the performance data quoted, which assumes the reinvestment of dividends and capital gains. Current month-end performance is available on the Fund’s website, wellsfargofunds.com.
Index returns do not include transaction costs associated with buying and selling securities, any mutual fund fees or expenses, or any taxes. It is not possible to invest directly in an index.
For Class A shares, the maximum front-end sales charge is 5.75%. For Class B shares, the maximum contingent deferred sales charge is 5.00%. For Class C shares, the maximum contingent deferred sales charge is 1.00%. Performance including a contingent deferred sales charge assumes the sales charge for the corresponding time period. Class R4, Class R6, Administrator Class, and Institutional Class shares are sold without a front-end sales charge or contingent deferred sales charge.
Stock values fluctuate in response to the activities of individual companies and general market and economic conditions. Certain investment strategies tend to increase the total risk of an investment (relative to the broader market). The Fund is exposed to foreign investment risk. Consult the Fund’s prospectus for additional information on these and other risks.
Please see footnotes on page 5.
| | | | | | |
| Performance highlights (unaudited) | | Wells Fargo Premier Large Company Growth Fund | | | 5 | |
| | | | |
| Ten largest holdings (%) as of January 31, 20165 | |
Facebook Incorporated Class A | | | 4.70 | |
Alphabet Incorporated Class A | | | 4.51 | |
Alexion Pharmaceuticals Incorporated | | | 3.35 | |
Amazon.com Incorporated | | | 3.25 | |
Dollar Tree Incorporated | | | 3.18 | |
Microchip Technology Incorporated | | | 2.89 | |
Apple Incorporated | | | 2.70 | |
MasterCard Incorporated Class A | | | 2.34 | |
Visa Incorporated Class A | | | 2.34 | |
Starbucks Corporation | | | 2.33 | |
|
| Sector distribution as of January 31, 20166 |
|
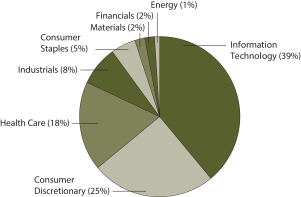 |
| 1 | Historical performance shown for Class R4 shares prior to their inception reflects the performance of Institutional Class shares, adjusted to reflect the higher expenses applicable to Class R4 shares. Historical performance shown for Class R6 shares prior to their inception reflects the performance of Institutional Class shares, and includes the higher expenses applicable to Institutional Class shares. If these expenses had not been included, returns would be higher. Historical performance shown for Administrator Class shares prior to their inception reflects the performance of Institutional Class shares, adjusted to reflect the higher expenses applicable to Administrator Class shares. Historical performance shown for all classes of the Fund prior to July 19, 2010, is based on the performance of the Fund’s predecessor, Evergreen Large Company Growth Fund. |
| 2 | Reflects the expense ratios as stated in the most recent prospectuses. The expense ratios shown are subject to change and may differ from the annualized expense ratios shown in the financial highlights of this report. |
| 3 | The manager has contractually committed through November 30, 2016 to waive fees and/or reimburse expenses to the extent necessary to cap the Fund’s Total Annual Fund Operating Expenses After Fee Waiver at the amounts shown. After this time, the cap may be increased or the commitment to maintain the cap may be terminated only with the approval of the Board of Trustees. Brokerage commissions, stamp duty fees, interest, taxes, acquired fund fees and expenses, and extraordinary expenses are excluded from the cap. Without this cap, the Fund’s returns would have been lower. |
| 4 | The Russell 1000® Growth Index measures the performance of those Russell 1000 Index companies with higher price-to-book ratios and higher forecasted growth values. You cannot invest directly in an index. |
| 5 | The ten largest holdings, excluding cash and cash equivalents, are calculated based on the value of the investments divided by total net assets of the Fund. Holdings are subject to change and may have changed since the date specified. |
| 6 | Amounts are calculated based on the total long-term investments of the Fund. These amounts are subject to change and may have changed since the date specified. |
| | | | |
| 6 | | Wells Fargo Premier Large Company Growth Fund | | Fund expenses (unaudited) |
As a shareholder of the Fund, you incur two types of costs: (1) transaction costs, including sales charges (loads) on purchase payments and contingent deferred sales charges (if any) on redemptions and (2) ongoing costs, including management fees, distribution (12b-1) and/or shareholder servicing fees, and other Fund expenses. This example is intended to help you understand your ongoing costs (in dollars) of investing in the Fund and to compare these costs with the ongoing costs of investing in other mutual funds.
The example is based on an investment of $1,000 invested at the beginning of the six-month period and held for the entire period from August 1, 2015 to January 31, 2016.
Actual expenses
The “Actual” line of the table below provides information about actual account values and actual expenses. You may use the information in this line, together with the amount you invested, to estimate the expenses that you paid over the period. Simply divide your account value by $1,000 (for example, an $8,600 account value divided by $1,000 = 8.6), then multiply the result by the number in the “Actual” line under the heading entitled “Expenses paid during period” for your applicable class of shares to estimate the expenses you paid on your account during this period.
Hypothetical example for comparison purposes
The “Hypothetical” line of the table below provides information about hypothetical account values and hypothetical expenses based on the Fund’s actual expense ratio and an assumed rate of return of 5% per year before expenses, which is not the Fund’s actual return. The hypothetical account values and expenses may not be used to estimate the actual ending account balance or expenses you paid for the period. You may use this information to compare the ongoing costs of investing in the Fund and other funds. To do so, compare this 5% hypothetical example with the 5% hypothetical examples that appear in the shareholder reports of the other funds.
Please note that the expenses shown in the table are meant to highlight your ongoing costs only and do not reflect any transactional costs, such as sales charges (loads) and contingent deferred sales charges. Therefore, the “Hypothetical” line of the table is useful in comparing ongoing costs only and will not help you determine the relative total costs of owning different funds. In addition, if these transactional costs were included, your costs would have been higher.
| | | | | | | | | | | | | | | | |
| | | Beginning
account value
8-1-2015 | | | Ending
account value
1-31-2016 | | | Expenses
paid during
the period¹ | | | Net annualized
expense ratio | |
Class A | | | | | | | | | | | | | | | | |
Actual | | $ | 1,000.00 | | | $ | 878.76 | | | $ | 5.24 | | | | 1.11 | % |
Hypothetical (5% return before expenses) | | $ | 1,000.00 | | | $ | 1,019.56 | | | $ | 5.63 | | | | 1.11 | % |
Class B | | | | | | | | | | | | | | | | |
Actual | | $ | 1,000.00 | | | $ | 875.91 | | | $ | 8.77 | | | | 1.86 | % |
Hypothetical (5% return before expenses) | | $ | 1,000.00 | | | $ | 1,015.79 | | | $ | 9.42 | | | | 1.86 | % |
Class C | | | | | | | | | | | | | | | | |
Actual | | $ | 1,000.00 | | | $ | 875.64 | | | $ | 8.79 | | | | 1.86 | % |
Hypothetical (5% return before expenses) | | $ | 1,000.00 | | | $ | 1,015.79 | | | $ | 9.42 | | | | 1.86 | % |
Class R4 | | | | | | | | | | | | | | | | |
Actual | | $ | 1,000.00 | | | $ | 880.25 | | | $ | 3.78 | | | | 0.80 | % |
Hypothetical (5% return before expenses) | | $ | 1,000.00 | | | $ | 1,021.11 | | | $ | 4.06 | | | | 0.80 | % |
Class R6 | | | | | | | | | | | | | | | | |
Actual | | $ | 1,000.00 | | | $ | 880.66 | | | $ | 3.07 | | | | 0.65 | % |
Hypothetical (5% return before expenses) | | $ | 1,000.00 | | | $ | 1,021.87 | | | $ | 3.30 | | | | 0.65 | % |
Administrator Class | | | | | | | | | | | | | | | | |
Actual | | $ | 1,000.00 | | | $ | 879.11 | | | $ | 4.53 | | | | 0.96 | % |
Hypothetical (5% return before expenses) | | $ | 1,000.00 | | | $ | 1,020.31 | | | $ | 4.88 | | | | 0.96 | % |
Institutional Class | | | | | | | | | | | | | | | | |
Actual | | $ | 1,000.00 | | | $ | 880.59 | | | $ | 3.31 | | | | 0.70 | % |
Hypothetical (5% return before expenses) | | $ | 1,000.00 | | | $ | 1,021.62 | | | $ | 3.56 | | | | 0.70 | % |
| 1 | Expenses paid is equal to the annualized expense ratio of each class multiplied by the average account value over the period, multiplied by the number of days in the most recent fiscal half-year divided by the number of days in the fiscal year (to reflect the one-half-year period). |
| | | | | | |
| Portfolio of investments—January 31, 2016 (unaudited) | | Wells Fargo Premier Large Company Growth Fund | | | 7 | |
| | | | | | | | | | | | |
| Security name | | | | | | Shares | | | Value | |
| | | | |
Common Stocks: 97.99% | | | | | | | | | | | | |
| | | | |
Consumer Discretionary: 24.12% | | | | | | | | | | | | |
| | | | |
| Auto Components: 0.62% | | | | | | | | | | | | |
Delphi Automotive plc | | | | | | | 414,880 | | | $ | 26,942,307 | |
| | | | | | | | | | | | |
| | | | |
| Distributors: 1.68% | | | | | | | | | | | | |
LKQ Corporation † | | | | | | | 2,645,060 | | | | 72,474,644 | |
| | | | | | | | | | | | |
| | | | |
| Hotels, Restaurants & Leisure: 2.76% | | | | | | | | | | | | |
Hilton Worldwide Holdings Incorporated | | | | | | | 1,062,290 | | | | 18,919,385 | |
Starbucks Corporation | | | | | | | 1,655,160 | | | | 100,584,073 | |
| | | | |
| | | | | | | | | | | 119,503,458 | |
| | | | | | | | | | | | |
| | | | |
| Internet & Catalog Retail: 3.61% | | | | | | | | | | | | |
Amazon.com Incorporated † | | | | | | | 239,230 | | | | 140,428,010 | |
Netflix Incorporated † | | | | | | | 173,890 | | | | 15,970,058 | |
| | | | |
| | | | | | | | | | | 156,398,068 | |
| | | | | | | | | | | | |
| | | | |
| Media: 1.15% | | | | | | | | | | | | |
Charter Communication Incorporated Class A †« | | | | | | | 126,000 | | | | 21,591,360 | |
The Walt Disney Company | | | | | | | 292,140 | | | | 27,992,855 | |
| | | | |
| | | | | | | | | | | 49,584,215 | |
| | | | | | | | | | | | |
| | | | |
| Multiline Retail: 5.20% | | | | | | | | | | | | |
Dollar General Corporation | | | | | | | 1,164,460 | | | | 87,404,368 | |
Dollar Tree Incorporated † | | | | | | | 1,689,480 | | | | 137,388,514 | |
| | | | |
| | | | | | | | | | | 224,792,882 | |
| | | | | | | | | | | | |
| | | | |
| Specialty Retail: 5.76% | | | | | | | | | | | | |
CarMax Incorporated † | | | | | | | 1,293,290 | | | | 57,137,552 | |
The Home Depot Incorporated | | | | | | | 496,880 | | | | 62,487,629 | |
The TJX Companies Incorporated | | | | | | | 666,730 | | | | 47,497,845 | |
Tractor Supply Company | | | | | | | 929,730 | | | | 82,104,456 | |
| | | | |
| | | | | | | | | | | 249,227,482 | |
| | | | | | | | | | | | |
| | | | |
| Textiles, Apparel & Luxury Goods: 3.34% | | | | | | | | | | | | |
Nike Incorporated Class B | | | | | | | 1,053,120 | | | | 65,303,971 | |
Under Armour Incorporated Class A † | | | | | | | 609,220 | | | | 52,045,665 | |
VF Corporation | | | | | | | 436,090 | | | | 27,299,234 | |
| | | | |
| | | | | | | | | | | 144,648,870 | |
| | | | | | | | | | | | |
| | | | |
Consumer Staples: 5.28% | | | | | | | | | | | | |
| | | | |
| Beverages: 1.06% | | | | | | | | | | | | |
The Coca-Cola Company | | | | | | | 1,070,470 | | | | 45,944,572 | |
| | | | | | | | | | | | |
| | | | |
| Food & Staples Retailing: 2.72% | | | | | | | | | | | | |
Costco Wholesale Corporation | | | | | | | 275,840 | | | | 41,684,941 | |
CVS Health Corporation | | | | | | | 455,850 | | | | 44,030,552 | |
Sprouts Farmers Market Incorporated †« | | | | | | | 1,391,802 | | | | 31,733,086 | |
| | | | |
| | | | | | | | | | | 117,448,579 | |
| | | | | | | | | | | | |
The accompanying notes are an integral part of these financial statements.
| | | | |
| 8 | | Wells Fargo Premier Large Company Growth Fund | | Portfolio of investments—January 31, 2016 (unaudited) |
| | | | | | | | | | | | |
| Security name | | | | | | Shares | | | Value | |
| | | | |
| Household Products: 0.50% | | | | | | | | | | | | |
Colgate-Palmolive Company | | | | | | | 319,110 | | | $ | 21,549,498 | |
| | | | | | | | | | | | |
| | | | |
| Personal Products: 1.00% | | | | | | | | | | | | |
The Estee Lauder Companies Incorporated Class A | | | | | | | 507,670 | | | | 43,278,868 | |
| | | | | | | | | | | | |
| | | | |
Energy: 0.96% | | | | | | | | | | | | |
| | | | |
| Oil, Gas & Consumable Fuels: 0.96% | | | | | | | | | | | | |
Concho Resources Incorporated † | | | | | | | 436,460 | | | | 41,520,440 | |
| | | | | | | | | | | | |
| | | | |
Financials: 2.01% | | | | | | | | | | | | |
| | | | |
| Capital Markets: 1.28% | | | | | | | | | | | | |
TD Ameritrade Holding Corporation | | | | | | | 2,014,520 | | | | 55,560,462 | |
| | | | | | | | | | | | |
| | | | |
| REITs: 0.73% | | | | | | | | | | | | |
American Tower Corporation | | | | | | | 332,560 | | | | 31,373,710 | |
| | | | | | | | | | | | |
| | | | |
Health Care: 17.78% | | | | | | | | | | | | |
| | | | |
| Biotechnology: 9.63% | | | | | | | | | | | | |
Alexion Pharmaceuticals Incorporated † | | | | | | | 993,624 | | | | 144,999,550 | |
BioMarin Pharmaceutical Incorporated † | | | | | | | 802,220 | | | | 59,380,324 | |
Celgene Corporation † | | | | | | | 759,418 | | | | 76,184,814 | |
Incyte Corporation † | | | | | | | 192,670 | | | | 13,594,795 | |
Medivation Incorporated † | | | | | | | 640,970 | | | | 20,959,719 | |
Regeneron Pharmaceuticals Incorporated † | | | | | | | 146,130 | | | | 61,387,752 | |
Vertex Pharmaceuticals Incorporated † | | | | | | | 442,090 | | | | 40,119,668 | |
| | | | |
| | | | | | | | | | | 416,626,622 | |
| | | | | | | | | | | | |
| | | | |
| Health Care Equipment & Supplies: 2.08% | | | | | | | | | | | | |
Intuitive Surgical Incorporated † | | | | | | | 38,880 | | | | 21,028,248 | |
Medtronic plc | | | | | | | 905,012 | | | | 68,708,511 | |
| | | | |
| | | | | | | | | | | 89,736,759 | |
| | | | | | | | | | | | |
| | | | |
| Health Care Providers & Services: 1.38% | | | | | | | | | | | | |
AmerisourceBergen Corporation | | | | | | | 666,670 | | | | 59,706,965 | |
| | | | | | | | | | | | |
| | | | |
| Health Care Technology: 1.23% | | | | | | | | | | | | |
Cerner Corporation † | | | | | | | 915,200 | | | | 53,090,752 | |
| | | | | | | | | | | | |
| | | | |
| Life Sciences Tools & Services: 0.87% | | | | | | | | | | | | |
Mettler-Toledo International Incorporated † | | | | | | | 12,750 | | | | 3,988,838 | |
Quintiles Transnational Holdings Incorporated † | | | | | | | 555,177 | | | | 33,771,417 | |
| | | | |
| | | | | | | | | | | 37,760,255 | |
| | | | | | | | | | | | |
| | | | |
| Pharmaceuticals: 2.59% | | | | | | | | | | | | |
Allergan plc † | | | | | | | 81,030 | | | | 23,047,363 | |
Bristol-Myers Squibb Company | | | | | | | 822,350 | | | | 51,117,276 | |
Perrigo Company plc | | | | | | | 261,710 | | | | 37,838,032 | |
| | | | |
| | | | | | | | | | | 112,002,671 | |
| | | | | | | | | | | | |
The accompanying notes are an integral part of these financial statements.
| | | | | | |
| Portfolio of investments—January 31, 2016 (unaudited) | | Wells Fargo Premier Large Company Growth Fund | | | 9 | |
| | | | | | | | | | | | |
| Security name | | | | | | Shares | | | Value | |
| | | | |
Industrials: 7.76% | | | | | | | | | | | | |
| | | | |
| Aerospace & Defense: 0.84% | | | | | | | | | | | | |
The Boeing Company | | | | | | | 301,270 | | | $ | 36,191,565 | |
| | | | | | | | | | | | |
| | | | |
| Air Freight & Logistics: 1.35% | | | | | | | | | | | | |
United Parcel Service Incorporated Class B | | | | | | | 629,290 | | | | 58,649,828 | |
| | | | | | | | | | | | |
| | | | |
| Airlines: 1.54% | | | | | | | | | | | | |
Southwest Airlines Company | | | | | | | 1,770,940 | | | | 66,622,763 | |
| | | | | | | | | | | | |
| | | | |
| Industrial Conglomerates: 0.81% | | | | | | | | | | | | |
Danaher Corporation | | | | | | | 405,360 | | | | 35,124,444 | |
| | | | | | | | | | | | |
| | | | |
| Road & Rail: 3.22% | | | | | | | | | | | | |
Canadian Pacific Railway Limited | | | | | | | 45,550 | | | | 5,453,702 | |
Kansas City Southern | | | | | | | 653,100 | | | | 46,291,728 | |
Union Pacific Corporation | | | | | | | 1,213,940 | | | | 87,403,680 | |
| | | | |
| | | | | | | | | | | 139,149,110 | |
| | | | | | | | | | | | |
| | | | |
Information Technology: 37.75% | | | | | | | | | | | | |
| | | | |
| Communications Equipment: 0.47% | | | | | | | | | | | | |
Palo Alto Networks Incorporated † | | | | | | | 136,500 | | | | 20,405,385 | |
| | | | | | | | | | | | |
| | | | |
| Internet Software & Services: 10.68% | | | | | | | | | | | | |
Akamai Technologies Incorporated † | | | | | | | 404,290 | | | | 18,443,710 | |
Alphabet Incorporated Class A † | | | | | | | 256,390 | | | | 195,202,527 | |
Alphabet Incorporated Class C † | | | | | | | 60,678 | | | | 45,080,720 | |
Facebook Incorporated Class A † | | | | | | | 1,812,080 | | | | 203,333,497 | |
| | | | |
| | | | | | | | | | | 462,060,454 | |
| | | | | | | | | | | | |
| | | | |
| IT Services: 9.59% | | | | | | | | | | | | |
Accenture plc Class A | | | | | | | 514,130 | | | | 54,261,280 | |
Alliance Data Systems Corporation † | | | | | | | 436,220 | | | | 87,152,394 | |
Cognizant Technology Solutions Corporation Class A † | | | | | | | 1,123,030 | | | | 71,099,029 | |
MasterCard Incorporated Class A | | | | | | | 1,137,340 | | | | 101,257,380 | |
Visa Incorporated Class A | | | | | | | 1,357,490 | | | | 101,119,430 | |
| | | | |
| | | | | | | | | | | 414,889,513 | |
| | | | | | | | | | | | |
| | | | |
| Semiconductors & Semiconductor Equipment: 6.83% | | | | | | | | | | | | |
ARM Holdings plc ADR « | | | | | | | 1,525,187 | | | | 65,705,056 | |
Avago Technologies Limited | | | | | | | 212,937 | | | | 28,471,806 | |
Broadcom Corporation Class A | | | | | | | 389,340 | | | | 21,285,218 | |
Microchip Technology Incorporated « | | | | | | | 2,787,790 | | | | 124,920,870 | |
Texas Instruments Incorporated | | | | | | | 1,037,960 | | | | 54,939,223 | |
| | | | |
| | | | | | | | | | | 295,322,173 | |
| | | | | | | | | | | | |
| | | | |
| Software: 7.48% | | | | | | | | | | | | |
Adobe Systems Incorporated † | | | | | | | 471,990 | | | | 42,068,469 | |
Fortinet Incorporated † | | | | | | | 2,172,970 | | | | 61,147,376 | |
Microsoft Corporation | | | | | | | 853,580 | | | | 47,023,722 | |
The accompanying notes are an integral part of these financial statements.
| | | | |
| 10 | | Wells Fargo Premier Large Company Growth Fund | | Portfolio of investments—January 31, 2016 (unaudited) |
| | | | | | | | | | | | | | |
| Security name | | | | | | | Shares | | | Value | |
| | | | |
| Software (continued) | | | | | | | | | | | | | | |
NetSuite Incorporated †« | | | | | | | | | 32,690 | | | $ | 2,267,705 | |
Red Hat Incorporated † | | | | | | | | | 480,930 | | | | 33,689,147 | |
Salesforce.com Incorporated † | | | | | | | | | 478,650 | | | | 32,576,919 | |
ServiceNow Incorporated † | | | | | | | | | 366,040 | | | | 22,771,348 | |
Splunk Incorporated † | | | | | | | | | 1,096,960 | | | | 50,778,278 | |
Tableau Software Incorporated Class A † | | | | | | | | | 392,154 | | | | 31,466,437 | |
| | | | |
| | | | | | | | | | | | | 323,789,401 | |
| | | | | | | | | | | | | | |
| | | | |
| Technology Hardware, Storage & Peripherals: 2.70% | | | | | | | | | | | | | | |
Apple Incorporated | | | | | | | | | 1,199,540 | | | | 116,763,224 | |
| | | | | | | | | | | | | | |
| | | | |
Materials: 2.33% | | | | | | | | | | | | | | |
| | | | |
| Chemicals: 2.33% | | | | | | | | | | | | | | |
Ecolab Incorporated | | | | | | | | | 695,580 | | | | 75,032,211 | |
Praxair Incorporated | | | | | | | | | 258,140 | | | | 25,814,000 | |
| | | | |
| | | | | | | | | | | | | 100,846,211 | |
| | | | | | | | | | | | | | |
| | | | |
Total Common Stocks (Cost $3,201,613,251) | | | | | | | | | | | | | 4,238,986,150 | |
| | | | | | | | | | | | | | |
| | | | |
| | | Yield | | | | | | | | | | | |
| Short-Term Investments: 4.75% | | | | | | | | | | | | | | |
| | | | |
| Investment Companies: 4.75% | | | | | | | | | | | | | | |
Securities Lending Cash Investments, LLC (l)(r)(u) | | | 0.42 | % | | | | | 142,620,425 | | | | 142,620,425 | |
Wells Fargo Cash Investment Money Market Fund, Select Class (l)(u) | | | 0.40 | | | | | | 62,671,289 | | | | 62,671,289 | |
| | | | |
Total Short-Term Investments (Cost $205,291,714) | | | | | | | | | | | | | 205,291,714 | |
| | | | | | | | | | | | | | |
| | | | | | | | |
| Total investments in securities (Cost $3,406,904,965) * | | | 102.74 | % | | | 4,444,277,864 | |
Other assets and liabilities, net | | | (2.74 | ) | | | (118,323,234 | ) |
| | | | | | | | |
| Total net assets | | | 100.00 | % | | $ | 4,325,954,630 | |
| | | | | | | | |
| † | Non-income-earning security |
| « | All or a portion of this security is on loan. |
| (l) | The issuer of the security is an affiliated person of the Fund as defined in the Investment Company Act of 1940. |
| (r) | The investment is a non-registered investment vehicle purchased with cash collateral received from securities on loan. |
| (u) | The rate represents the 7-day annualized yield at period end. |
| * | Cost for federal income tax purposes is $3,417,214,452 and unrealized gains (losses) consists of: |
| | | | |
Gross unrealized gains | | $ | 1,146,501,535 | |
Gross unrealized losses | | | (119,438,123 | ) |
| | | | |
Net unrealized gains | | $ | 1,027,063,412 | |
The accompanying notes are an integral part of these financial statements.
| | | | | | |
| Statement of assets and liabilities—January 31, 2016 (unaudited) | | Wells Fargo Premier Large Company Growth Fund | | | 11 | |
| | | | |
| | | | |
| |
Assets | | | | |
Investments | | | | |
In unaffiliated securities (including $139,194,220 of securities loaned), at value (cost $3,201,613,251) | | $ | 4,238,986,150 | |
In affiliated securities, at value (cost $205,291,714) | | | 205,291,714 | |
| | | | |
Total investments, at value (cost $3,406,904,965) | | | 4,444,277,864 | |
Cash | | | 23,272 | |
Receivable for investments sold | | | 42,492,483 | |
Receivable for Fund shares sold | | | 4,202,856 | |
Receivable for dividends | | | 1,284,376 | |
Receivable for securities lending income | | | 62,177 | |
Prepaid expenses and other assets | | | 162,027 | |
| | | | |
Total assets | | | 4,492,505,055 | |
| | | | |
| |
Liabilities | | | | |
Payable for investments purchased | | | 6,057,347 | |
Payable for Fund shares redeemed | | | 13,948,839 | |
Payable upon receipt of securities loaned | | | 142,620,425 | |
Management fee payable | | | 2,284,625 | |
Distribution fees payable | | | 210,354 | |
Administration fees payable | | | 644,624 | |
Accrued expenses and other liabilities | | | 784,211 | |
| | | | |
Total liabilities | | | 166,550,425 | |
| | | | |
Total net assets | | $ | 4,325,954,630 | |
| | | | |
| |
NET ASSETS CONSIST OF | | | | |
Paid-in capital | | $ | 3,298,149,033 | |
Accumulated net investment loss | | | (5,503,812 | ) |
Accumulated net realized losses on investments | | | (4,063,490 | ) |
Net unrealized gains on investments | | | 1,037,372,899 | |
| | | | |
Total net assets | | $ | 4,325,954,630 | |
| | | | |
| |
COMPUTATION OF NET ASSET VALUE AND OFFERING PRICE PER SHARE | | | | |
Net assets – Class A | | $ | 2,038,327,537 | |
Shares outstanding – Class A1 | | | 152,877,167 | |
Net asset value per share – Class A | | | $13.33 | |
Maximum offering price per share – Class A2 | | | $14.14 | |
Net assets – Class B | | $ | 1,251,515 | |
Shares outstanding – Class B1 | | | 108,346 | |
Net asset value per share – Class B | | | $11.55 | |
Net assets – Class C | | $ | 321,255,375 | |
Shares outstanding – Class C1 | | | 27,885,785 | |
Net asset value per share – Class C | | | $11.52 | |
Net assets – Class R4 | | $ | 2,002,883 | |
Share outstanding – Class R41 | | | 147,269 | |
Net asset value per share – Class R4 | | | $13.60 | |
Net assets – Class R6 | | $ | 168,209,299 | |
Shares outstanding – Class R61 | | | 12,311,553 | |
Net asset value per share – Class R6 | | | $13.66 | |
Net assets – Administrator Class | | $ | 579,520,535 | |
Shares outstanding – Administrator Class1 | | | 43,080,078 | |
Net asset value per share – Administrator Class | | | $13.45 | |
Net assets – Institutional Class | | $ | 1,215,387,486 | |
Shares outstanding – Institutional Class1 | | | 89,040,547 | |
Net asset value per share – Institutional Class | | | $13.65 | |
| 1 | The Fund has an unlimited number of authorized shares. |
| 2 | Maximum offering price is computed as 100/94.25 of net asset value. On investments of $50,000 or more, the offering price is reduced. |
The accompanying notes are an integral part of these financial statements.
| | | | |
| 12 | | Wells Fargo Premier Large Company Growth Fund | | Statement of operations—six months ended January 31, 2016 (unaudited) |
| | | | |
| | | | |
| |
Investment income | | | | |
Dividends (net of foreign withholding taxes of $9,133) | | $ | 22,213,989 | |
Securities lending income, net | | | 233,753 | |
Income from affiliated securities | | | 35,085 | |
| | | | |
Total investment income | | | 22,482,827 | |
| | | | |
| |
Expenses | | | | |
Management fee | | | 15,818,150 | |
Administration fees | | | | |
Class A | | | 2,297,155 | |
Class B | | | 1,716 | |
Class C | | | 374,525 | |
Class R4 | | | 819 | |
Class R6 | | | 26,928 | |
Administrator Class | | | 545,344 | |
Institutional Class | | | 853,919 | |
Investor Class | | | 132,962 | 1 |
Shareholder servicing fees | | | | |
Class A | | | 2,734,146 | |
Class B | | | 2,043 | |
Class C | | | 445,863 | |
Class R4 | | | 1,024 | |
Administrator Class | | | 1,035,439 | |
Investor Class | | | 103,446 | 1 |
Distribution fees | | | | |
Class B | | | 6,129 | |
Class C | | | 1,337,589 | |
Custody and accounting fees | | | 125,352 | |
Professional fees | | | 27,173 | |
Registration fees | | | 81,239 | |
Shareholder report expenses | | | 214,986 | |
Trustees’ fees and expenses | | | 12,318 | |
Other fees and expenses | | | 49,098 | |
| | | | |
Total expenses | | | 26,227,363 | |
Less: Fee waivers and/or expense reimbursements | | | (1,029,873 | ) |
| | | | |
Net expenses | | | 25,197,490 | |
| | | | |
Net investment loss | | | (2,714,663 | ) |
| | | | |
| |
REALIZED AND UNREALIZED GAINS (LOSSES) ON INVESTMENTS | | | | |
Net realized gains on investments | | | 165,333,691 | |
Net change in unrealized gains (losses) on investments | | | (791,676,422 | ) |
| | | | |
Net realized and unrealized gains (losses) on investments | | | (626,342,731 | ) |
| | | | |
Net decrease in net assets resulting from operations | | $ | (629,057,394 | ) |
| | | | |
| 1 | For the period from August 1, 2015 to October 23, 2015. Effective at the close of business on October 23, 2015, Investor Class shares were converted to Class A shares and are no longer offered by the Fund. |
The accompanying notes are an integral part of these financial statements.
| | | | | | |
| Statement of changes in net assets | | Wells Fargo Premier Large Company Growth Fund | | | 13 | |
| | | | | | | | | | | | | | | | |
| | | Six months ended January 31, 2016
(unaudited) | | | Year ended July 31, 2015 | |
| | | | |
Operations | | | | | | | | | | | | | | | | |
Net investment loss | | | | | | $ | (2,714,663 | ) | | | | | | $ | (4,932,440 | ) |
Net realized gains on investments | | | | | | | 165,333,691 | | | | | | | | 217,385,650 | |
Net change in unrealized gains (losses) on investments | | | | | | | (791,676,422 | ) | | | | | | | 456,933,003 | |
| | | | |
Net increase (decrease) in net assets resulting from operations | | | | | | | (629,057,394 | ) | | | | | | | 669,386,213 | |
| | | | |
| | | | |
Distributions to shareholders from | | | | | | | | | | | | | | | | |
Net realized gains | | | | | | | | | | | | | | | | |
Class A | | | | | | | (154,141,985 | ) | | | | | | | (25,289,106 | ) |
Class B | | | | | | | (115,925 | ) | | | | | | | (52,310 | ) |
Class C | | | | | | | (27,659,123 | ) | | | | | | | (6,075,432 | ) |
Class R4 | | | | | | | (138,255 | ) | | | | | | | (26,355 | ) |
Class R6 | | | | | | | (12,437,527 | ) | | | | | | | (2,294,051 | ) |
Administrator Class | | | | | | | (51,332,185 | ) | | | | | | | (17,637,288 | ) |
Institutional Class | | | | | | | (90,311,280 | ) | | | | | | | (16,043,030 | ) |
Investor Class | | | | | | | 0 | 1 | | | | | | | (2,767,968 | ) |
| | | | |
Total distributions to shareholders | | | | | | | (336,136,280 | ) | | | | | | | (70,185,540 | ) |
| | | | |
| | | | |
Capital share transactions | | | Shares | | | | | | | | Shares | | | | | |
Proceeds from shares sold | | | | | | | | | | | | | | | | |
Class A | | | 18,976,587 | | | | 293,542,817 | | | | 44,287,833 | | | | 683,559,842 | |
Class B | | | 5,432 | | | | 69,448 | | | | 4,474 | | | | 61,128 | |
Class C | | | 2,067,611 | | | | 26,834,778 | | | | 4,631,916 | | | | 62,766,733 | |
Class R4 | | | 9,715 | | | | 146,317 | | | | 89,416 | | | | 1,331,780 | |
Class R6 | | | 2,331,068 | | | | 37,093,722 | | | | 1,160,674 | | | | 18,210,412 | |
Administrator Class | | | 2,585,940 | | | | 39,178,964 | | | | 11,745,864 | | | | 181,283,260 | |
Institutional Class | | | 19,964,037 | | | | 305,416,475 | | | | 26,787,602 | | | | 422,028,125 | |
Investor Class | | | 204,065 | 1 | | | 3,092,910 | 1 | | | 1,217,432 | | | | 18,676,165 | |
| | | | |
| | | | | | | 705,375,431 | | | | | | | | 1,387,917,445 | |
| | | | |
Reinvestment of distributions | | | | | | | | | | | | | | | | |
Class A | | | 10,119,274 | | | | 145,413,973 | | | | 1,553,406 | | | | 23,409,833 | |
Class B | | | 7,422 | | | | 92,480 | | | | 3,219 | | | | 42,848 | |
Class C | | | 1,715,487 | | | | 21,323,504 | | | | 333,914 | | | | 4,431,032 | |
Class R4 | | | 9,437 | | | | 138,255 | | | | 1,723 | | | | 26,355 | |
Class R6 | | | 813,689 | | | | 11,977,506 | | | | 141,900 | | | | 2,176,746 | |
Administrator Class | | | 3,513,370 | | | | 50,943,861 | | | | 1,033,233 | | | | 15,674,143 | |
Institutional Class | | | 4,638,850 | | | | 68,237,489 | | | | 854,382 | | | | 13,097,671 | |
Investor Class | | | 0 | 1 | | | 0 | 1 | | | 181,619 | | | | 2,727,921 | |
| | | | |
| | | | | | | 298,127,068 | | | | | | | | 61,586,549 | |
| | | | |
Payment for shares redeemed | | | | | | | | | | | | | | | | |
Class A | | | (16,270,357 | ) | | | (242,742,181 | ) | | | (36,977,346 | ) | | | (568,178,692 | ) |
Class B | | | (56,247 | ) | | | (757,920 | ) | | | (166,018 | ) | | | (2,261,194 | ) |
Class C | | | (3,107,223 | ) | | | (40,629,042 | ) | | | (6,821,898 | ) | | | (93,243,358 | ) |
Class R4 | | | (438 | ) | | | (6,922 | ) | | | (14,450 | ) | | | (227,033 | ) |
Class R6 | | | (869,115 | ) | | | (12,930,953 | ) | | | (2,357,872 | ) | | | (37,477,435 | ) |
Administrator Class | | | (31,898,281 | ) | | | (477,933,646 | ) | | | (34,510,354 | ) | | | (539,756,076 | ) |
Institutional Class | | | (14,639,037 | ) | | | (223,817,643 | ) | | | (18,413,561 | ) | | | (290,307,468 | ) |
Investor Class | | | (12,187,103 | )1 | | | (190,582,272 | )1 | | | (3,060,955 | ) | | | (47,139,147 | ) |
| | | | |
| | | | | | | (1,189,400,579 | ) | | | | | | | (1,578,590,403 | ) |
| | | | |
Net decrease in net assets resulting from capital share transactions | | | | | | | (185,898,080 | ) | | | | | | | (129,086,409 | ) |
| | | | |
Total increase (decrease) in net assets | | | | | | | (1,151,091,754 | ) | | | | | | | 470,114,264 | |
| | | | |
| | | | |
Net assets | | | | | | | | | | | | | | | | |
Beginning of period | | | | | | | 5,477,046,384 | | | | | | | | 5,006,932,120 | |
| | | | |
End of period | | | | | | $ | 4,325,954,630 | | | | | | | $ | 5,477,046,384 | |
| | | | |
Accumulated net investment loss | | | | | | $ | (5,503,812 | ) | | | | | | $ | (2,789,149 | ) |
| | | | |
| 1 | For the period from August 1, 2015 to October 23, 2015. Effective at the close of business on October 23, 2015, Investor Class shares were converted to Class A shares and are no longer offered by the Fund. |
The accompanying notes are an integral part of these financial statements.
| | | | |
| 14 | | Wells Fargo Premier Large Company Growth Fund | | Financial highlights |
(For a share outstanding throughout each period)
| | | | | | | | | | | | | | | | | | | | | | | | |
| | | Six months ended
January 31, 2016
(unaudited) | | | Year ended July 31 | |
| CLASS A | | | 2015 | | | 2014 | | | 2013 | | | 2012 | | | 2011 | |
Net asset value, beginning of period | | | $16.28 | | | | $14.55 | | | | $12.57 | | | | $10.21 | | | | $9.89 | | | | $7.75 | |
Net investment loss | | | (0.01 | ) | | | (0.03 | ) | | | (0.05 | ) | | | (0.02 | ) | | | (0.03 | )1 | | | (0.01 | ) |
Net realized and unrealized gains (losses) on investments | | | (1.89 | ) | | | 1.97 | | | | 2.03 | | | | 2.38 | | | | 0.60 | | | | 2.15 | |
| | | | | | | | | | | | | | | | | | | | | | | | |
Total from investment operations | | | (1.90 | ) | | | 1.94 | | | | 1.98 | | | | 2.36 | | | | 0.57 | | | | 2.14 | |
Distributions to shareholders from | | | | | | | | | | | | | | | | | | | | | | | | |
Net investment income | | | 0.00 | | | | 0.00 | | | | 0.00 | | | | 0.00 | | | | 0.00 | | | | (0.00 | )2 |
Net realized gains | | | (1.05 | ) | | | (0.21 | ) | | | 0.00 | | | | 0.00 | | | | (0.25 | ) | | | 0.00 | |
| | | | | | | | | | | | | | | | | | | | | | | | |
Total distributions to shareholders | | | (1.05 | ) | | | (0.21 | ) | | | 0.00 | | | | 0.00 | | | | (0.25 | ) | | | (0.00 | )2 |
Net asset value, end of period | | | $13.33 | | | | $16.28 | | | | $14.55 | | | | $12.57 | | | | $10.21 | | | | $9.89 | |
Total return3 | | | (12.12 | )% | | | 13.46 | % | | | 15.75 | % | | | 23.11 | % | | | 6.08 | % | | | 27.55 | % |
Ratios to average net assets (annualized) | | | | | | | | | | | | | | | | | | | | | | | | |
Gross expenses | | | 1.12 | % | | | 1.16 | % | | | 1.17 | % | | | 1.19 | % | | | 1.23 | % | | | 1.24 | % |
Net expenses | | | 1.11 | % | | | 1.12 | % | | | 1.12 | % | | | 1.12 | % | | | 1.12 | % | | | 1.12 | % |
Net investment loss | | | (0.21 | )% | | | (0.18 | )% | | | (0.36 | )% | | | (0.15 | )% | | | (0.30 | )% | | | (0.13 | )% |
Supplemental data | | | | | | | | | | | | | | | | | | | | | | | | |
Portfolio turnover rate | | | 23 | % | | | 44 | % | | | 37 | % | | | 32 | % | | | 51 | % | | | 65 | % |
Net assets, end of period (000s omitted) | | | $2,038,328 | | | | $2,280,107 | | | | $1,908,455 | | | | $1,515,862 | | | | $932,106 | | | | $620,262 | |
| 1 | Calculated based upon average shares outstanding |
| 2 | Amount is less than $0.005. |
| 3 | Total return calculations do not include any sales charges. Returns for periods of less than one year are not annualized. |
The accompanying notes are an integral part of these financial statements.
| | | | | | |
| Financial highlights | | Wells Fargo Premier Large Company Growth Fund | | | 15 | |
(For a share outstanding throughout each period)
| | | | | | | | | | | | | | | | | | | | | | | | |
| | | Six months ended
January 31, 2016
(unaudited) | | | Year ended July 31 | |
| CLASS B | | | 2015 | | | 2014 | | | 2013 | | | 2012 | | | 2011 | |
Net asset value, beginning of period | | | $14.30 | | | | $12.90 | | | | $11.23 | | | | $9.19 | | | | $8.99 | | | | $7.10 | |
Net investment loss | | | (0.06 | )1 | | | (0.13 | )1 | | | (0.13 | )1 | | | (0.09 | )1 | | | (0.09 | )1 | | | (0.07 | )1 |
Net realized and unrealized gains (losses) on investments | | | (1.64 | ) | | | 1.74 | | | | 1.80 | | | | 2.13 | | | | 0.54 | | | | 1.96 | |
| | | | | | | | | | | | | | | | | | | | | | | | |
Total from investment operations | | | (1.70 | ) | | | 1.61 | | | | 1.67 | | | | 2.04 | | | | 0.45 | | | | 1.89 | |
Distributions to shareholders from | | | | | | | | | | | | | | | | | | | | | | | | |
Net realized gains | | | (1.05 | ) | | | (0.21 | ) | | | 0.00 | | | | 0.00 | | | | (0.25 | ) | | | 0.00 | |
Net asset value, end of period | | | $11.55 | | | | $14.30 | | | | $12.90 | | | | $11.23 | | | | $9.19 | | | | $8.99 | |
Total return2 | | | (12.41 | )% | | | 12.61 | % | | | 14.87 | % | | | 22.20 | % | | | 5.22 | % | | | 26.62 | % |
Ratios to average net assets (annualized) | | | | | | | | | | | | | | | | | | | | | | | | |
Gross expenses | | | 1.87 | % | | | 1.91 | % | | | 1.91 | % | | | 1.94 | % | | | 1.97 | % | | | 2.00 | % |
Net expenses | | | 1.86 | % | | | 1.87 | % | | | 1.87 | % | | | 1.87 | % | | | 1.87 | % | | | 1.87 | % |
Net investment loss | | | (0.94 | )% | | | (0.92 | )% | | | (1.09 | )% | | | (0.87 | )% | | | (1.04 | )% | | | (0.85 | )% |
Supplemental data | | | | | | | | | | | | | | | | | | | | | | | | |
Portfolio turnover rate | | | 23 | % | | | 44 | % | | | 37 | % | | | 32 | % | | | 51 | % | | | 65 | % |
Net assets, end of period (000s omitted) | | | $1,252 | | | | $2,170 | | | | $4,001 | | | | $5,637 | | | | $6,962 | | | | $10,244 | |
| 1 | Calculated based upon average shares outstanding |
| 2 | Total return calculations do not include any sales charges. Returns for periods of less than one year are not annualized. |
The accompanying notes are an integral part of these financial statements.
| | | | |
| 16 | | Wells Fargo Premier Large Company Growth Fund | | Financial highlights |
(For a share outstanding throughout each period)
| | | | | | | | | | | | | | | | | | | | | | | | |
| | | Six months ended
January 31, 2016
(unaudited) | | | Year ended July 31 | |
| CLASS C | | | 2015 | | | 2014 | | | 2013 | | | 2012 | | | 2011 | |
Net asset value, beginning of period | | | $14.27 | | | | $12.87 | | | | $11.20 | | | | $9.17 | | | | $8.97 | | | | $7.08 | |
Net investment loss | | | (0.06 | )1 | | | (0.13 | )1 | | | (0.14 | )1 | | | (0.09 | )1 | | | (0.10 | )1 | | | (0.08 | )1 |
Net realized and unrealized gains (losses) on investments | | | (1.64 | ) | | | 1.74 | | | | 1.81 | | | | 2.12 | | | | 0.55 | | | | 1.97 | |
| | | | | | | | | | | | | | | | | | | | | | | | |
Total from investment operations | | | (1.70 | ) | | | 1.61 | | | | 1.67 | | | | 2.03 | | | | 0.45 | | | | 1.89 | |
Distributions to shareholders from | | | | | | | | | | | | | | | | | | | | | | | | |
Net realized gains | | | (1.05 | ) | | | (0.21 | ) | | | 0.00 | | | | 0.00 | | | | (0.25 | ) | | | 0.00 | |
Net asset value, end of period | | | $11.52 | | | | $14.27 | | | | $12.87 | | | | $11.20 | | | | $9.17 | | | | $8.97 | |
Total return2 | | | (12.44 | )% | | | 12.65 | % | | | 14.91 | % | | | 22.14 | % | | | 5.24 | % | | | 26.69 | % |
Ratios to average net assets (annualized) | | | | | | | | | | | | | | | | | | | | | | | | |
Gross expenses | | | 1.87 | % | | | 1.91 | % | | | 1.92 | % | | | 1.94 | % | | | 1.98 | % | | | 1.99 | % |
Net expenses | | | 1.86 | % | | | 1.87 | % | | | 1.87 | % | | | 1.87 | % | | | 1.87 | % | | | 1.87 | % |
Net investment loss | | | (0.96 | )% | | | (0.93 | )% | | | (1.11 | )% | | | (0.91 | )% | | | (1.07 | )% | | | (0.90 | )% |
Supplemental data | | | | | | | | | | | | | | | | | | | | | | | | |
Portfolio turnover rate | | | 23 | % | | | 44 | % | | | 37 | % | | | 32 | % | | | 51 | % | | | 65 | % |
Net assets, end of period (000s omitted) | | | $321,255 | | | | $388,290 | | | | $374,136 | | | | $279,203 | | | | $129,980 | | | | $35,783 | |
| 1 | Calculated based upon average shares outstanding |
| 2 | Total return calculations do not include any sales charges. Returns for periods of less than one year are not annualized. |
The accompanying notes are an integral part of these financial statements.
| | | | | | |
| Financial highlights | | Wells Fargo Premier Large Company Growth Fund | | | 17 | |
(For a share outstanding throughout each period)
| | | | | | | | | | | | | | | | |
| | | Six months ended
January 31, 2016
(unaudited) | | | Year ended July 31 | |
| CLASS R4 | | | 2015 | | | 2014 | | | 20131 | |
Net asset value, beginning of period | | | $16.56 | | | | $14.75 | | | | $12.70 | | | | $10.81 | |
Net investment income (loss) | | | 0.01 | 3 | | | 0.02 | | | | (0.01 | ) | | | 0.00 | 2 |
Net realized and unrealized gains (losses) on investments | | | (1.92 | ) | | | 2.00 | | | | 2.06 | | | | 1.89 | |
| | | | | | | | | | | | | | | | |
Total from investment operations | | | (1.91 | ) | | | 2.02 | | | | 2.05 | | | | 1.89 | |
Distributions to shareholders from | | | | | | | | | | | | | | | | |
Net realized gains | | | (1.05 | ) | | | (0.21 | ) | | | 0.00 | | | | 0.00 | |
Net asset value, end of period | | | $13.60 | | | | $16.56 | | | | $14.75 | | | | $12.70 | |
Total return4 | | | (11.97 | )% | | | 13.82 | % | | | 16.14 | % | | | 17.48 | % |
Ratios to average net assets (annualized) | | | | | | | | | | | | | | | | |
Gross expenses | | | 0.84 | % | | | 0.83 | % | | | 0.84 | % | | | 0.85 | % |
Net expenses | | | 0.80 | % | | | 0.80 | % | | | 0.80 | % | | | 0.80 | % |
Net investment income (loss) | | | 0.09 | % | | | 0.13 | % | | | (0.11 | )% | | | 0.06 | % |
Supplemental data | | | | | | | | | | | | | | | | |
Portfolio turnover rate | | | 23 | % | | | 44 | % | | | 37 | % | | | 32 | % |
Net assets, end of period (000s omitted) | | | $2,003 | | | | $2,129 | | | | $765 | | | | $131 | |
| 1 | For the period from November 30, 2012 (commencement of class operations) to July 31, 2013 |
| 2 | Amount is less than $0.005. |
| 3 | Calculated based upon average shares outstanding |
| 4 | Returns for periods of less than one year are not annualized. |
The accompanying notes are an integral part of these financial statements.
| | | | |
| 18 | | Wells Fargo Premier Large Company Growth Fund | | Financial highlights |
(For a share outstanding throughout each period)
| | | | | | | | | | | | | | | | |
| | | Six months ended
January 31, 2016
(unaudited) | | | Year ended July 31 | |
| CLASS R6 | | | 2015 | | | 2014 | | | 20131 | |
Net asset value, beginning of period | | | $16.62 | | | | $14.77 | | | | $12.71 | | | | $10.81 | |
Net investment income | | | 0.02 | 3 | | | 0.05 | | | | 0.01 | | | | 0.00 | 2 |
Net realized and unrealized gains (losses) on investments | | | (1.93 | ) | | | 2.01 | | | | 2.05 | | | | 1.90 | |
| | | | | | | | | | | | | | | | |
Total from investment operations | | | (1.91 | ) | | | 2.06 | | | | 2.06 | | | | 1.90 | |
Distributions to shareholders from | | | | | | | | | | | | | | | | |
Net realized gains | | | (1.05 | ) | | | (0.21 | ) | | | 0.00 | | | | 0.00 | |
Net asset value, end of period | | | $13.66 | | | | $16.62 | | | | $14.77 | | | | $12.71 | |
Total return4 | | | (11.93 | )% | | | 14.00 | % | | | 16.29 | % | | | 17.58 | % |
Ratios to average net assets (annualized) | | | | | | | | | | | | | | | | |
Gross expenses | | | 0.69 | % | | | 0.68 | % | | | 0.69 | % | | | 0.71 | % |
Net expenses | | | 0.65 | % | | | 0.65 | % | | | 0.65 | % | | | 0.65 | % |
Net investment income | | | 0.24 | % | | | 0.29 | % | | | 0.09 | % | | | 0.05 | % |
Supplemental data | | | | | | | | | | | | | | | | |
Portfolio turnover rate | | | 23 | % | | | 44 | % | | | 37 | % | | | 32 | % |
Net assets, end of period (000s omitted) | | | $168,209 | | | | $166,768 | | | | $163,871 | | | | $4,629 | |
| 1 | For the period from November 30, 2012 (commencement of class operations) to July 31, 2013 |
| 2 | Amount is less than $0.005. |
| 3 | Calculated based upon average shares outstanding |
| 4 | Returns for periods of less than one year are not annualized. |
The accompanying notes are an integral part of these financial statements.
| | | | | | |
| Financial highlights | | Wells Fargo Premier Large Company Growth Fund | | | 19 | |
(For a share outstanding throughout each period)
| | | | | | | | | | | | | | | | | | | | | | | | |
| | | Six months ended
January 31, 2016 (unaudited) | | | Year ended July 31 | |
| ADMINISTRATOR CLASS | | | 2015 | | | 2014 | | | 2013 | | | 2012 | | | 2011 | |
Net asset value, beginning of period | | | $16.41 | | | | $14.63 | | | | $12.62 | | | | $10.24 | | | | $9.90 | | | | $7.75 | |
Net investment income (loss) | | | (0.00 | )1,2 | | | (0.00 | )1 | | | (0.02 | ) | | | (0.00 | )1 | | | (0.02 | ) | | | 0.00 | 1 |
Net realized and unrealized gains (losses) on investments | | | (1.91 | ) | | | 1.99 | | | | 2.03 | | | | 2.38 | | | | 0.61 | | | | 2.16 | |
| | | | | | | | | | | | | | | | | | | | | | | | |
Total from investment operations | | | (1.91 | ) | | | 1.99 | | | | 2.01 | | | | 2.38 | | | | 0.59 | | | | 2.16 | |
Distributions to shareholders from | | | | | | | | | | | | | | | | | | | | | | | | |
Net investment income | | | 0.00 | | | | 0.00 | | | | 0.00 | | | | 0.00 | | | | 0.00 | | | | (0.01 | ) |
Net realized gains | | | (1.05 | ) | | | (0.21 | ) | | | 0.00 | | | | 0.00 | | | | (0.25 | ) | | | 0.00 | |
| | | | | | | | | | | | | | | | | | | | | | | | |
Total distributions to shareholders | | | (1.05 | ) | | | (0.21 | ) | | | 0.00 | | | | 0.00 | | | | (0.25 | ) | | | (0.01 | ) |
Net asset value, end of period | | | $13.45 | | | | $16.41 | | | | $14.63 | | | | $12.62 | | | | $10.24 | | | | $9.90 | |
Total return3 | | | (12.09 | )% | | | 13.73 | % | | | 15.93 | % | | | 23.24 | % | | | 6.28 | % | | | 27.75 | % |
Ratios to average net assets (annualized) | | | | | | | | | | | | | | | | | | | | | | | | |
Gross expenses | | | 1.03 | % | | | 1.00 | % | | | 1.00 | % | | | 1.04 | % | | | 1.07 | % | | | 1.08 | % |
Net expenses | | | 0.96 | % | | | 0.95 | % | | | 0.95 | % | | | 0.95 | % | | | 0.95 | % | | | 0.95 | % |
Net investment income (loss) | | | (0.03 | )% | | | (0.01 | )% | | | (0.19 | )% | | | (0.01 | )% | | | (0.16 | )% | | | 0.01 | % |
Supplemental data | | | | | | | | | | | | | | | | | | | | | | | | |
Portfolio turnover rate | | | 23 | % | | | 44 | % | | | 37 | % | | | 32 | % | | | 51 | % | | | 65 | % |
Net assets, end of period (000s omitted) | | | $579,521 | | | | $1,129,970 | | | | $1,325,864 | | | | $640,494 | | | | $251,759 | | | | $54,335 | |
| 1 | Amount is less than $0.005. |
| 2 | Calculated based upon average shares outstanding |
| 3 | Returns for periods of less than one year are not annualized. |
The accompanying notes are an integral part of these financial statements.
| | | | |
| 20 | | Wells Fargo Premier Large Company Growth Fund | | Financial highlights |
(For a share outstanding throughout each period)
| | | | | | | | | | | | | | | | | | | | | | | | |
| | | Six months ended
January 31, 2016 (unaudited) | | | Year ended July 31 | |
| INSTITUTIONAL CLASS | | | 2015 | | | 2014 | | | 2013 | | | 2012 | | | 2011 | |
Net asset value, beginning of period | | | $16.61 | | | | $14.77 | | | | $12.71 | | | | $10.28 | | | | $9.91 | | | | $7.75 | |
Net investment income | | | 0.02 | 2 | | | 0.03 | | | | 0.01 | 2 | | | (0.00 | )1 | | | 0.00 | 1,2 | | | 0.02 | 2 |
Net realized and unrealized gains (losses) on investments | | | (1.93 | ) | | | 2.02 | | | | 2.05 | | | | 2.43 | | | | 0.62 | | | | 2.15 | |
| | | | | | | | | | | | | | | | | | | | | | | | |
Total from investment operations | | | (1.91 | ) | | | 2.05 | | | | 2.06 | | | | 2.43 | | | | 0.62 | | | | 2.17 | |
Distributions to shareholders from | | | | | | | | | | | | | | | | | | | | | | | | |
Net investment income | | | 0.00 | | | | 0.00 | | | | 0.00 | | | | 0.00 | | | | 0.00 | | | | (0.01 | ) |
Net realized gains | | | (1.05 | ) | | | (0.21 | ) | | | 0.00 | | | | 0.00 | | | | (0.25 | ) | | | 0.00 | |
| | | | | | | | | | | | | | | | | | | | | | | | |
Total distributions to shareholders | | | (1.05 | ) | | | (0.21 | ) | | | 0.00 | | | | 0.00 | | | | (0.25 | ) | | | (0.01 | ) |
Net asset value, end of period | | | $13.65 | | | | $16.61 | | | | $14.77 | | | | $12.71 | | | | $10.28 | | | | $9.91 | |
Total return3 | | | (11.94 | )% | | | 14.01 | % | | | 16.21 | % | | | 23.64 | % | | | 6.48 | % | | | 28.03 | % |
Ratios to average net assets (annualized) | | | | | | | | | | | | | | | | | | | | | | | | |
Gross expenses | | | 0.79 | % | | | 0.74 | % | | | 0.74 | % | | | 0.76 | % | | | 0.79 | % | | | 0.81 | % |
Net expenses | | | 0.70 | % | | | 0.70 | % | | | 0.70 | % | | | 0.71 | % | | | 0.75 | % | | | 0.75 | % |
Net investment income | | | 0.20 | % | | | 0.23 | % | | | 0.07 | % | | | 0.16 | % | | | 0.04 | % | | | 0.22 | % |
Supplemental data | | | | | | | | | | | | | | | | | | | | | | | | |
Portfolio turnover rate | | | 23 | % | | | 44 | % | | | 37 | % | | | 32 | % | | | 51 | % | | | 65 | % |
Net assets, end of period (000s omitted) | | | $1,215,387 | | | | $1,313,281 | | | | $1,031,979 | | | | $1,328,994 | | | | $223,616 | | | | $30,493 | |
| 1 | Amount is less than $0.005. |
| 2 | Calculated based upon average shares outstanding |
| 3 | Returns for periods of less than one year are not annualized. |
The accompanying notes are an integral part of these financial statements.
| | | | | | |
| Notes to financial statements (unaudited) | | Wells Fargo Premier Large Company Growth Fund | | | 21 | |
1. ORGANIZATION
Wells Fargo Funds Trust (the “Trust”), a Delaware statutory trust organized on March 10, 1999, is an open-end management investment company registered under the Investment Company Act of 1940, as amended (the “1940 Act”). As an investment company, the Trust follows the accounting and reporting guidance in Financial Accounting Standards Board (“FASB”) Accounting Standards Codification Topic 946, Financial Services – Investment Companies. These financial statements report on the Wells Fargo Premier Large Company Growth Fund (the “Fund”) which is a diversified series of the Trust.
Effective at the close of business on October 23, 2015, Investor Class shares became Class A shares in a tax-free conversion. Shareholders of Investor Class received Class A shares at a value equal to the value of their Investor Class shares immediately prior to the conversion. Investor Class shares are no longer offered by the Fund.
2. SIGNIFICANT ACCOUNTING POLICIES
The following significant accounting policies, which are consistently followed in the preparation of the financial statements of the Fund, are in conformity with U.S. generally accepted accounting principles which require management to make estimates and assumptions that affect the reported amounts of assets and liabilities, disclosure of contingent assets and liabilities at the date of the financial statements, and the reported amounts of revenues and expenses during the reporting period. Actual results could differ from those estimates.
Securities valuation
All investments are valued each business day as of the close of regular trading on the New York Stock Exchange (generally 4 p.m. Eastern Time).
Equity securities that are listed on a foreign or domestic exchange or market are valued at the official closing price or, if none, the last sales price. If no sale occurs on the principal exchange or market that day, the prior day’s price will be deemed “stale” and a fair value price will be determined in accordance with the Fund’s Valuation Procedures.
Investments in registered open-end investment companies are valued at net asset value. Interests in non-registered investment vehicles that are redeemable at net asset value are fair valued normally at net asset value.
Investments which are not valued using any of the methods discussed above are valued at their fair value, as determined in good faith by the Board of Trustees of the Fund. The Board of Trustees has established a Valuation Committee comprised of the Trustees and has delegated to it the authority to take any actions regarding the valuation of portfolio securities that the Valuation Committee deems necessary or appropriate, including determining the fair value of portfolio securities, unless the determination has been delegated to the Management Valuation Team of Wells Fargo Funds Management, LLC (“Funds Management”). The Board of Trustees retains the authority to make or ratify any valuation decisions or approve any changes to the Valuation Procedures as it deems appropriate. On a quarterly basis, the Board of Trustees receives reports on any valuation actions taken by the Valuation Committee or the Management Valuation Team which may include items for ratification.
Valuations of fair valued securities are compared to the next actual sales price when available, or other appropriate market values, to assess the continued appropriateness of the fair valuation methodologies used. These securities are fair valued on a day-to-day basis, taking into consideration changes to appropriate market information and any significant changes to the inputs considered in the valuation process until there is a readily available price provided on an exchange or by an independent pricing service. Valuations received from an independent pricing service or independent broker-dealer quotes are periodically validated by comparisons to most recent trades and valuations provided by other independent pricing services in addition to the review of prices by the manager and/or subadviser. Unobservable inputs used in determining fair valuations are identified based on the type of security, taking into consideration factors utilized by market participants in valuing the investment, knowledge about the issuer and the current market environment.
Security loans
The Fund may lend its securities from time to time in order to earn additional income in the form of fees or interest on securities received as collateral or the investment of any cash received as collateral. The Fund continues to receive interest or dividends on the securities loaned. The Fund receives collateral in the form of cash or securities with a value at least equal to the value of the securities on loan. The value of the loaned securities is determined at the close of each business day and any additional required collateral is delivered to the Fund on the next business day. In a securities lending transaction, the net asset value of the Fund will be affected by an increase or decrease in the value of the securities loaned and by an increase or decrease in the value of the instrument in which collateral is invested. The amount of securities lending activity undertaken by the Fund fluctuates from time to time. In the event of default or bankruptcy
| | | | |
| 22 | | Wells Fargo Premier Large Company Growth Fund | | Notes to financial statements (unaudited) |
by the borrower, the Fund may be prevented from recovering the loaned securities or gaining access to the collateral or may experience delays or costs in doing so. In addition, the investment of any cash collateral received may lose all or part of its value. The Fund has the right under the lending agreement to recover the securities from the borrower on demand.
The Fund lends its securities through an unaffiliated securities lending agent. Cash collateral received in connection with its securities lending transactions is invested in Securities Lending Cash Investments, LLC (the “Securities Lending Fund”). The Securities Lending Fund is exempt from registration under Section 3(c)(7) of the 1940 Act and is managed by Funds Management and is subadvised by Wells Capital Management Incorporated (“WellsCap”), an affiliate of Funds Management and an indirect wholly owned subsidiary of Wells Fargo & Company (“Wells Fargo”). Funds Management receives an advisory fee starting at 0.05% and declining to 0.01% as the average daily net assets of the Securities Lending Fund increase. All of the fees received by Funds Management are paid to WellsCap for its services as subadviser. The Securities Lending Fund seeks to provide a positive return compared to the daily Fed Funds Open rate by investing in high-quality, U.S. dollar-denominated short-term money market instruments. Securities Lending Fund investments are fair valued based upon the amortized cost valuation technique. Income earned from investment in the Securities Lending Fund is included in securities lending income on the Statement of Operations.
Security transactions and income recognition
Securities transactions are recorded on a trade date basis. Realized gains or losses are recorded on the basis of identified cost.
Dividend income is recognized on the ex-dividend date. Dividend income is recorded net of foreign taxes withheld where recovery of such taxes is not assured.
Distributions to shareholders
Distributions to shareholders from net investment income and net realized gains, if any, are recorded on the ex-dividend date. Such distributions are determined in conformity with federal income tax regulations, which may differ in amount or character from net investment income and realized gains recognized for purposes of U.S. generally accepted accounting principles.
Federal and other taxes
The Fund intends to continue to qualify as a regulated investment company by distributing substantially all of its investment company taxable income and any net realized capital gains (after reduction for capital loss carryforwards) sufficient to relieve it from all, or substantially all, federal income taxes. Accordingly, no provision for federal income taxes was required.
The Fund’s income and federal excise tax returns and all financial records supporting those returns for the prior three fiscal years are subject to examination by the federal and Delaware revenue authorities. Management has analyzed the Fund’s tax positions taken on federal, state, and foreign tax returns for all open tax years and does not believe that there are any uncertain tax positions that require recognition of a tax liability.
As of July 31, 2015, the Fund had capital loss carryforwards available to offset future net realized capital gains in the amount of $24,607,476 with $6,388,000 expiring in 2016 and $18,219,476 expiring in 2017.
As of July 31, 2015, the Fund had a qualified late-year ordinary loss of $2,767,595 which was recognized on the first day of the current fiscal year.
Class allocations
The separate classes of shares offered by the Fund differ principally in applicable sales charges, distribution, shareholder servicing, and administration fees. Class specific expenses are charged directly to that share class. Investment income, common expenses, and realized and unrealized gains (losses) on investments are allocated daily to each class of shares based on the relative proportion of net assets of each class.
3. FAIR VALUATION MEASUREMENTS
Fair value measurements of investments are determined within a framework that has established a fair value hierarchy based upon the various data inputs utilized in determining the value of the Fund’s investments. The three-level hierarchy gives the highest priority to unadjusted quoted prices in active markets for identical assets or liabilities (Level 1) and the lowest priority to significant unobservable inputs (Level 3). The Fund’s investments are classified within the fair value hierarchy based on the lowest level of input that is significant to the fair value measurement. The inputs are summarized into three broad levels as follows:
| | | | | | |
| Notes to financial statements (unaudited) | | Wells Fargo Premier Large Company Growth Fund | | | 23 | |
| n | | Level 1 – quoted prices in active markets for identical securities |
| n | | Level 2 – other significant observable inputs (including quoted prices for similar securities, interest rates, prepayment speeds, credit risk, use of amortized cost, etc.) |
| n | | Level 3 – significant unobservable inputs (including the Fund’s own assumptions in determining the fair value of investments) |
The inputs or methodologies used for valuing investments in securities are not necessarily an indication of the risk associated with investing in those securities.
The following is a summary of the inputs used in valuing the Fund’s assets and liabilities as of January 31, 2016:
| | | | | | | | | | | | | | | | |
| | | Quoted prices
(Level 1) | | | Other significant
observable inputs
(Level 2) | | | Significant
unobservable inputs
(Level 3) | | | Total | |
Assets | | | | | | | | | | | | | | | | |
Investments in: | | | | | | | | | | | | | | | | |
| | | | |
Common stocks | | | | | | | | | | | | | | | | |
Consumer discretionary | | $ | 1,043,571,926 | | | $ | 0 | | | $ | 0 | | | $ | 1,043,571,926 | |
Consumer staples | | | 228,221,517 | | | | 0 | | | | 0 | | | | 228,221,517 | |
Energy | | | 41,520,440 | | | | 0 | | | | 0 | | | | 41,520,440 | |
Financials | | | 86,934,172 | | | | 0 | | | | 0 | | | | 86,934,172 | |
Health care | | | 768,924,024 | | | | 0 | | | | 0 | | | | 768,924,024 | |
Industrials | | | 335,737,710 | | | | 0 | | | | 0 | | | | 335,737,710 | |
Information technology | | | 1,633,230,150 | | | | 0 | | | | 0 | | | | 1,633,230,150 | |
Materials | | | 100,846,211 | | | | 0 | | | | 0 | | | | 100,846,211 | |
| | | | |
Short-term investments | | | | | | | | | | | | | | | | |
Investment companies | | | 62,671,289 | | | | 0 | | | | 0 | | | | 62,671,289 | |
Investments measured at net asset value* | | | | | | | | | | | | | | | 142,620,425 | |
Total assets | | $ | 4,301,657,439 | | | $ | 0 | | | $ | 0 | | | $ | 4,444,277,864 | |
| * | Investments that are measured at fair value using the net asset value per share (or its equivalent) as a practical expedient have not been categorized in the fair value hierarchy. The fair value amount presented in the table is intended to permit reconciliation of the fair value hierarchy to the amounts presented in the Statement of Assets and Liabilities. The Fund’s investment in Securities Lending Cash Investments, LLC valued at $142,620,425 does not have a redemption period notice, can be redeemed daily and does not have any unfunded commitments. |
The Fund recognizes transfers between levels within the fair value hierarchy at the end of the reporting period. At January 31, 2016, the Fund did not have any transfers into/out of Level 1, Level 2, or Level 3.
4. TRANSACTIONS WITH AFFILIATES
Management fee
Funds Management, an indirect wholly owned subsidiary of Wells Fargo, is the manager of the Fund and provides advisory and fund-level administrative services under an investment management agreement. Under the investment management agreement, Funds Management is responsible for, among other services, implementing the investment objectives and strategies of the Fund, supervising the applicable subadviser, providing fund-level administrative services in connection with the Fund’s operations, and providing any other fund-level administrative services reasonably necessary for the operation of the Fund. As compensation for its services under the investment management agreement, Funds Management is entitled to receive an annual management fee starting at 0.70% and declining to 0.505% as the average daily net assets of the Fund increase. For the six months ended January 31, 2016, the management fee was equivalent to an annual rate of 0.64% of the Fund’s average daily net assets.
Funds Management has retained the services of a subadviser to provide daily portfolio management to the Fund. The fee for subadvisory services is borne by Funds Management. WellsCap is the subadviser to the Fund and is entitled to receive a fee from Funds Management at an annual rate starting at 0.35% and declining to 0.275% as the average daily net assets of the Fund increase.
| | | | |
| 24 | | Wells Fargo Premier Large Company Growth Fund | | Notes to financial statements (unaudited) |
Administration fees
Under a class-level administration agreement, Funds Management provides class-level administrative services to the Fund, which includes paying fees and expenses for services provided by the transfer agent, sub-transfer agents, omnibus account servicers and record-keepers. As compensation for its services under the class-level administration agreement, Funds Management receives an annual fee which is calculated based on the average daily net assets of each class as follows:
| | | | |
| | | Class-level
administration fee | |
Class A, Class B, Class C | | | 0.21 | % |
Class R4 | | | 0.08 | |
Class R6 | | | 0.03 | |
Administrator Class, Institutional Class | | | 0.13 | |
Investor Class | | | 0.32 | |
Funds Management has contractually waived and/or reimbursed management and administration fees to the extent necessary to maintain certain net operating expense ratios for the Fund. Waiver of fees and/or reimbursement of expenses by Funds Management were made first from fund level expenses on a proportionate basis and then from class specific expenses. Funds Management has committed through November 30, 2016 to waive fees and/or reimburse expenses to the extent necessary to cap the Fund’s expenses at 1.11% for Class A shares, 1.86% for Class B shares, 1.86% for Class C shares, 0.80% for Class R4 shares, 0.65% for Class R6 shares, 1.00% for Administrator Class shares, and 0.70% for Institutional Class shares. After this time, the cap may be increased or the commitment to maintain the cap may be terminated only with the approval of the Board of Trustees. Prior to December 1, 2015, the Fund’s expenses were capped at 0.95% for Administration Class shares.
Distribution fees
The Trust has adopted a distribution plan for Class B and Class C shares of the Fund pursuant to Rule 12b-1 under the 1940 Act. Distribution fees are charged to Class B and Class C shares and paid to Wells Fargo Funds Distributor, LLC (“Funds Distributor”), the principal underwriter, at an annual rate of 0.75% of the average daily net assets of Class B and Class C shares.
In addition, Funds Distributor is entitled to receive the front-end sales charge from the purchase of Class A shares and a contingent deferred sales charge on the redemption of certain Class A shares. Funds Distributor is also entitled to receive the contingent deferred sales charges from redemptions of Class B and Class C shares. For the six months ended January 31, 2016, Funds Distributor received $40,469 from the sale of Class A shares and $4,967 in contingent deferred sales charges from redemptions of Class C.
Shareholder servicing fees
The Trust has entered into contracts with one or more shareholder servicing agents, whereby Class A, Class B, Class C, Administrator Class, and Investor Class of the Fund is charged a fee at an annual rate of 0.25% of the average daily net assets of each respective class. Class R4 shares are charged a fee at an annual rate of 0.10% of its average daily net assets.
A portion of these total shareholder servicing fees were paid to affiliates of Wells Fargo.
5. INVESTMENT PORTFOLIO TRANSACTIONS
Purchases and sales of investments, excluding U.S. government obligations (if any) and short-term securities, for the six months ended January 31, 2016 were $1,154,862,240 and $1,683,955,817, respectively.
6. BANK BORROWINGS
The Trust (excluding the money market funds and certain other funds) and Wells Fargo Variable Trust are parties to a $200,000,000 revolving credit agreement whereby the Fund is permitted to use bank borrowings for temporary or emergency purposes, such as to fund shareholder redemption requests. Interest under the credit agreement is charged to the Fund based on a borrowing rate equal to the higher of the Federal Funds rate in effect on that day plus 1.25% or the overnight LIBOR rate in effect on that day plus 1.25%. In addition, an annual commitment fee equal to 0.20% of the unused balance is allocated to each participating fund. Prior to September 1, 2015, the revolving credit agreement
| | | | | | |
| Notes to financial statements (unaudited) | | Wells Fargo Premier Large Company Growth Fund | | | 25 | |
amount was $150,000,000 and the annual commitment fee was equal to 0.10% of the unused balance which was allocated to each participating fund. For the six months ended January 31, 2016, the Fund paid $8,569 in commitment fees.
For the six months ended January 31, 2016, there were no borrowings by the Fund under the agreement.
7. CONCENTRATION RISK
Concentration risks result from exposure to a limited number of sectors. A fund that invests a substantial portion of its assets in any sector may be more affected by changes in that sector than would be a fund whose investments are not heavily weighted in any sector.
8. INDEMNIFICATION
Under the Trust’s organizational documents, the officers and Trustees have been granted certain indemnification rights against certain liabilities that may arise out of performance of their duties to the Trust. Additionally, in the normal course of business, the Trust may enter into contracts with service providers that contain a variety of indemnification clauses. The Trust’s maximum exposure under these arrangements is dependent on future claims that may be made against the Fund and, therefore, cannot be estimated.
| | | | |
| 26 | | Wells Fargo Premier Large Company Growth Fund | | Other information (unaudited) |
PROXY VOTING INFORMATION
A description of the policies and procedures that the Fund uses to determine how to vote proxies relating to portfolio securities is available, upon request, by calling 1-800-222-8222, visiting our website at wellsfargofunds.com, or visiting the SEC website at sec.gov. Information regarding how the Fund voted proxies relating to portfolio securities during the most recent 12-month period ended June 30 is available on the Fund’s website at wellsfargofunds.com or by visiting the SEC website at sec.gov.
PORTFOLIO HOLDINGS INFORMATION
The complete portfolio holdings for the Fund are publicly available monthly on the Fund’s website (wellsfargofunds.com), on a one-month delayed basis. In addition, top ten holdings information (excluding derivative positions) for the Fund is publicly available on the Fund’s website on a monthly, seven-day or more delayed basis. The Fund files its complete schedule of portfolio holdings with the SEC for the first and third quarters of each fiscal year on Form N-Q, which is available by visiting the SEC website at sec.gov. In addition, the Fund’s Form N-Q may be reviewed and copied at the SEC’s Public Reference Room in Washington, DC, and at regional offices in New York City, at 233 Broadway, and in Chicago, at 175 West Jackson Boulevard, Suite 900. Information about the Public Reference Room may be obtained by calling 1-800-SEC-0330.
| | | | | | |
| Other information (unaudited) | | Wells Fargo Premier Large Company Growth Fund | | | 27 | |
BOARD OF TRUSTEES AND OFFICERS
Each of the Trustees and Officers1 listed in the table below acts in identical capacities for each fund in the Wells Fargo family of funds, which consists of 144 mutual funds comprising the Wells Fargo Funds Trust, Wells Fargo Variable Trust, Wells Fargo Master Trust and four closed-end funds (collectively the “Fund Complex”). This table should be read in conjunction with the Prospectus and the Statement of Additional Information2. The mailing address of each Trustee and Officer is 525 Market Street, 12th Floor, San Francisco, CA 94105. Each Trustee and Officer serves an indefinite term, however, each Trustee serves such term until reaching the mandatory retirement age established by the Trustees.
Independent Trustees
| | | | | | |
Name and
year of birth | | Position held and
length of service* | | Principal occupations during past five years or longer | | Current other
public company or
investment company
directorships |
William R. Ebsworth
(Born 1957) | | Trustee, since 2015 | | Retired. From 1984 to 2013, equities analyst, portfolio manager, research director and chief financial officer at Fidelity Management and Research Company in Boston, Tokyo, and Hong Kong and retired in 2013 as Chief Investment Officer of Fidelity Strategic Advisers, Inc. where he lead a team of investment professionals managing client assets. Prior thereto, Board member of Hong Kong Securities Clearing Co., Hong Kong Options Clearing Corp., the Thailand International Fund, Ltd., Fidelity Investments Life Insurance Company, and Empire Fidelity Investments Life Insurance Company. Mr. Ebsworth is a CFA® charterholder and an Adjunct Lecturer, Finance, at Babson College. | | Asset Allocation Trust |
Jane A. Freeman
(Born 1953) | | Trustee, since 2015 | | Retired. From 2012 to 2014 and 1999 to 2008, Chief Financial Officer of Scientific Learning Corporation. From 2008 to 2012, Ms. Freeman provided consulting services related to strategic business projects. Prior to 1999, Portfolio Manager at Rockefeller & Co. and Scudder, Stevens & Clark. Board member of the Harding Loevner Funds from 1996 to 2014, serving as both Lead Independent Director and chair of the Audit Committee. Board member of the Russell Exchange Traded Funds Trust from 2011 to 2012 and the chair of the Audit Committee. Ms. Freeman is Chair of Taproot Foundation (non-profit organization), a Board Member of Ruth Bancroft Garden (non-profit organization) and an inactive chartered financial analyst. | | Asset Allocation Trust |
Peter G. Gordon
(Born 1942) | | Trustee, since 1998; Chairman, since 2005 | | Co-Founder, Retired Chairman, President and CEO of Crystal Geyser Water Company. Trustee Emeritus, Colby College. | | Asset Allocation Trust |
Isaiah Harris, Jr.
(Born 1952) | | Trustee, since 2009 | | Retired. Chairman of the Board of CIGNA Corporation since 2009, and Director since 2005. From 2003 to 2011, Director of Deluxe Corporation. Prior thereto, President and CEO of BellSouth Advertising and Publishing Corp. from 2005 to 2007, President and CEO of BellSouth Enterprises from 2004 to 2005 and President of BellSouth Consumer Services from 2000 to 2003. Emeritus member of the Iowa State University Foundation Board of Governors. Emeritus Member of the Advisory Board of Iowa State University School of Business. Advisory Board Member, Palm Harbor Academy (charter school). Advisory Board Member, Child Evangelism Fellowship (non-profit). Mr. Harris is a certified public accountant (inactive status). | | CIGNA Corporation; Asset Allocation Trust |
Judith M. Johnson
(Born 1949) | | Trustee, since 2008; Audit Committee Chairman, since 2008 | | Retired. Prior thereto, Chief Executive Officer and Chief Investment Officer of Minneapolis Employees Retirement Fund from 1996 to 2008. Ms. Johnson is an attorney, certified public accountant and a certified managerial accountant. | | Asset Allocation Trust |
David F. Larcker
(Born 1950) | | Trustee, since 2009 | | James Irvin Miller Professor of Accounting at the Graduate School of Business, Stanford University, Director of the Corporate Governance Research Initiative and Senior Faculty of The Rock Center for Corporate Governance since 2006. From 2005 to 2008, Professor of Accounting at the Graduate School of Business, Stanford University. Prior thereto, Ernst & Young Professor of Accounting at The Wharton School, University of Pennsylvania from 1985 to 2005. | | Asset Allocation Trust |
| | | | |
| 28 | | Wells Fargo Premier Large Company Growth Fund | | Other information (unaudited) |
| | | | | | |
Name and
year of birth | | Position held and
length of service* | | Principal occupations during past five years or longer | | Current other
public company or
investment company
directorships |
Olivia S. Mitchell
(Born 1953) | | Trustee, since 2006 | | International Foundation of Employee Benefit Plans Professor, Wharton School of the University of Pennsylvania since 1993. Director of Wharton’s Pension Research Council and Boettner Center on Pensions & Retirement Research, and Research Associate at the National Bureau of Economic Research. Previously, Cornell University Professor from 1978 to 1993. | | Asset Allocation Trust |
Timothy J. Penny
(Born 1951) | | Trustee, since 1996 | | President and Chief Executive Officer of Southern Minnesota Initiative Foundation, a non-profit organization, since 2007 and Senior Fellow at the Humphrey Institute Policy Forum at the University of Minnesota since 1995. Member of the Board of Trustees of NorthStar Education Finance, Inc., a non-profit organization, since 2007. | | Asset Allocation Trust |
Michael S. Scofield
(Born 1943) | | Trustee, since 2010 | | Served on the Investment Company Institute’s Board of Governors and Executive Committee from 2008-2011 as well the Governing Council of the Independent Directors Council from 2006-2011 and the Independent Directors Council Executive Committee from 2008-2011. Chairman of the IDC from 2008-2010. Institutional Investor (Fund Directions) Trustee of Year in 2007. Trustee of the Evergreen Funds complex (and its predecessors) from 1984 to 2010. Chairman of the Evergreen Funds from 2000-2010. Former Trustee of the Mentor Funds. Retired Attorney, Law Offices of Michael S. Scofield. | | Asset Allocation Trust |
| * | Length of service dates reflect the Trustee’s commencement of service with the Trust’s predecessor entities, where applicable. |
Officers
| | | | | | |
Name and
year of birth | | Position held and
length of service | | Principal occupations during past five years or longer | | |
Karla M. Rabusch
(Born 1959) | | President, since 2003 | | Executive Vice President of Wells Fargo Bank, N.A. and President of Wells Fargo Funds Management, LLC since 2003. | | |
Jeremy DePalma1
(Born 1974) | | Treasurer, since 2012; Assistant Treasurer, since 2009 | | Senior Vice President of Wells Fargo Funds Management, LLC since 2009. Senior Vice President of Evergreen Investment Management Company, LLC from 2008 to 2010 and head of the Fund Reporting and Control Team within Fund Administration from 2005 to 2010. | | |
C. David Messman
(Born 1960) | | Secretary, since 2000; Chief Legal Officer, since 2003 | | Senior Vice President and Secretary of Wells Fargo Funds Management, LLC since 2001. Assistant General Counsel of Wells Fargo Bank, N.A. since 2013 and Vice President and Managing Counsel of Wells Fargo Bank, N.A. from 1996 to 2013. | | |
Debra Ann Early
(Born 1964) | | Chief Compliance Officer, since 2007 | | Executive Vice President of Wells Fargo Funds Management, LLC since 2014, Senior Vice President and Chief Compliance Officer from 2007 to 2014. | | |
David Berardi
(Born 1975) | | Assistant Treasurer, since 2009 | | Vice President of Wells Fargo Funds Management, LLC since 2009. Vice President of Evergreen Investment Management Company, LLC from 2008 to 2010. Manager of Fund Reporting and Control for Evergreen Investment Management Company, LLC from 2004 to 2010. | | |
| 1 | Jeremy DePalma acts as Treasurer of 72 funds and Assistant Treasurer of 72 funds in the Fund Complex. |
| 2 | The Statement of Additional Information includes additional information about the Trustees and is available, without charge, upon request, by calling 1-800-222-8222 or by visiting the website at wellsfargofunds.com. |
| | | | | | |
| List of abbreviations | | Wells Fargo Premier Large Company Growth Fund | | | 29 | |
The following is a list of common abbreviations for terms and entities that may have appeared in this report.
| ACA | — ACA Financial Guaranty Corporation |
| ADR | — American depositary receipt |
| ADS | — American depositary shares |
| AGC | — Assured Guaranty Corporation |
| AGM | — Assured Guaranty Municipal |
| Ambac | — Ambac Financial Group Incorporated |
| AMT | — Alternative minimum tax |
| BAN | — Bond anticipation notes |
| BHAC | — Berkshire Hathaway Assurance Corporation |
| CAB | — Capital appreciation bond |
| CCAB | — Convertible capital appreciation bond |
| CDA | — Community Development Authority |
| CDO | — Collateralized debt obligation |
| DRIVER | — Derivative inverse tax-exempt receipts |
| DW&P | — Department of Water & Power |
| DWR | — Department of Water Resources |
| ECFA | — Educational & Cultural Facilities Authority |
| EDA | — Economic Development Authority |
| EDFA | — Economic Development Finance Authority |
| ETF | — Exchange-traded fund |
| FDIC | — Federal Deposit Insurance Corporation |
| FFCB | — Federal Farm Credit Banks |
| FGIC | — Financial Guaranty Insurance Corporation |
| FHA | — Federal Housing Administration |
| FHLB | — Federal Home Loan Bank |
| FHLMC | — Federal Home Loan Mortgage Corporation |
| FICO | — The Financing Corporation |
| FNMA | — Federal National Mortgage Association |
| GDR | — Global depositary receipt |
| GNMA | — Government National Mortgage Association |
| HCFR | — Healthcare facilities revenue |
| HEFA | — Health & Educational Facilities Authority |
| HEFAR | — Higher education facilities authority revenue |
| HFA | — Housing Finance Authority |
| HFFA | — Health Facilities Financing Authority |
| HUD | — Department of Housing and Urban Development |
| IDA | — Industrial Development Authority |
| IDAG | — Industrial Development Agency |
| KRW | — Republic of Korea won |
| LIBOR | — London Interbank Offered Rate |
| LIFER | — Long Inverse Floating Exempt Receipts |
| LLC | — Limited liability company |
| LLLP | — Limited liability limited partnership |
| LLP | — Limited liability partnership |
| MBIA | — Municipal Bond Insurance Association |
| MFHR | — Multifamily housing revenue |
| MSTR | — Municipal securities trust receipts |
| MUD | — Municipal Utility District |
| National | — National Public Finance Guarantee Corporation |
| PCFA | — Pollution Control Financing Authority |
| PCL | — Public Company Limited |
| PCR | — Pollution control revenue |
| PFA | — Public Finance Authority |
| PFFA | — Public Facilities Financing Authority |
| PFOTER | — Puttable floating option tax-exempt receipts |
| plc | — Public limited company |
| PUTTER | — Puttable tax-exempt receipts |
| R&D | — Research & development |
| Radian | — Radian Asset Assurance |
| RAN | — Revenue anticipation notes |
| RDA | — Redevelopment Authority |
| RDFA | — Redevelopment Finance Authority |
| REIT | — Real estate investment trust |
| ROC | — Reset option certificates |
| SAVRS | — Select auction variable rate securities |
| SBA | — Small Business Authority |
| SDR | — Swedish depositary receipt |
| SFHR | — Single-family housing revenue |
| SFMR | — Single-family mortgage revenue |
| SPA | — Standby purchase agreement |
| SPDR | — Standard & Poor’s Depositary Receipts |
| SPEAR | — Short Puttable Exempt Adjustable Receipts |
| STRIPS | — Separate trading of registered interest and |
| TAN | — Tax anticipation notes |
| TIPS | — Treasury inflation-protected securities |
| TRAN | — Tax revenue anticipation notes |
| TTFA | — Transportation Trust Fund Authority |
| TVA | — Tennessee Valley Authority |
This page is intentionally left blank.
This page is intentionally left blank.
This page is intentionally left blank.

For more information
More information about Wells Fargo Funds is available free upon request. To obtain literature, please write, email, visit the Fund’s website, or call:
Wells Fargo Funds
P.O. Box 8266
Boston, MA 02266-8266
Email: fundservice@wellsfargo.com
Website: wellsfargofunds.com
Individual investors: 1-800-222-8222
Retail investment professionals: 1-888-877-9275
Institutional investment professionals: 1-866-765-0778
This report and the financial statements contained herein are submitted for the general information of the shareholders of the Fund. If this report is used for promotional purposes, distribution of the report must be accompanied or preceded by a current prospectus. Before investing, please consider the investment objectives, risks, charges, and expenses of the investment. For a current prospectus and, if available, a summary prospectus, containing this information, call 1-800-222-8222 or visit the Fund’s website at wellsfargofunds.com. Read the prospectus carefully before you invest or send money.
Wells Fargo Asset Management (WFAM) is a trade name used by the asset management businesses of Wells Fargo & Company. Wells Fargo Funds Management, LLC, a wholly owned subsidiary of Wells Fargo & Company, provides investment advisory and administrative services for Wells Fargo Funds. Other affiliates of Wells Fargo & Company provide subadvisory and other services for the funds. The funds are distributed by Wells Fargo Funds Distributor, LLC, Member FINRA, an affiliate of Wells Fargo & Company.
NOT FDIC INSURED ¡ NO BANK GUARANTEE ¡ MAY LOSE VALUE
© 2016 Wells Fargo Funds Management, LLC. All rights reserved.
| | |
 | | 240802 03-16 SA212/SAR212 01-16 |
Not applicable.
| ITEM 3. | AUDIT COMMITTEE FINANCIAL EXPERT |
Not applicable.
| ITEM 4. | PRINCIPAL ACCOUNTANT FEES AND SERVICES |
Not applicable.
| ITEM 5. | AUDIT COMMITTEE OF LISTED REGISTRANTS |
Not applicable.
A Portfolio of Investments for each series of Wells Fargo Funds Trust is included as part of the report to shareholders filed under Item 1 of this Form.
| ITEM 7. | DISCLOSURE OF PROXY VOTING POLICIES AND PROCEDURES FOR CLOSED-END MANAGEMENT INVESTMENT COMPANIES |
Not applicable.
| ITEM 8. | PORTFOLIO MANAGERS OF CLOSED-END MANAGEMENT INVESTMENT COMPANIES |
Not applicable.
| ITEM 9. | PURCHASES OF EQUITY SECURITIES BY CLOSED-END MANAGEMEENT INVESTMENT COMPANY AND AFFILIATED PURCHASERS |
Not applicable.
| ITEM 10. | SUBMISSION OF MATTERS TO A VOTE OF SECURITY HOLDERS |
There have been no material changes to the procedures by which shareholders may recommend nominees to the registrant’s Board of Trustees that have been implemented since the registrant’s last provided disclosure in response to the requirements of this Item.
| ITEM 11. | CONTROLS AND PROCEDURES |
(a) The President and Treasurer have concluded that the Wells Fargo Funds Trust (the “Trust”) disclosure controls and procedures (as defined in Rule 30a-3(c) under the Investment Company Act of 1940) provide reasonable assurances that material information relating to the Trust is made known to them by the appropriate persons, based on their evaluation of these controls and procedures as of a date within 90 days of the filing of this report.
(b) There were no significant changes in the Trust’s internal controls over financial reporting (as defined in Rule 30a-3(d) under the Investment Company Act of 1940) that occurred during the second fiscal quarter of the period covered by this report that materially affected, or is reasonably likely to materially affect, the registrant’s internal control over financial reporting.
(a)(1) Not applicable.
(a)(2) Certification pursuant to Rule 30a-2(a) under the Investment Company Act of 1940 (17 CFR 270.30a-2(a)) is filed and attached hereto as Exhibit 99.CERT.
(a)(3) Not applicable.
(b) Certification pursuant to Rule 30a-2(b) under the Investment Company Act of 1940 (17 CFR 270.30a-2(b)) is filed and attached hereto as Exhibit 99.906CERT.
SIGNATURES
Pursuant to the requirements of the Securities Exchange Act of 1934 and the Investment Company Act of 1940, the registrant has duly caused this report to be signed on its behalf by the undersigned, thereunto duly authorized.
| | |
| Wells Fargo Funds Trust |
| |
| By: | | |
| |
| | /s/ Karla M. Rabusch |
| |
| | Karla M. Rabusch |
| | President |
| |
| Date: | | March 24, 2016 |
Pursuant to the requirements of the Securities Exchange Act of 1934 and the Investment Company Act of 1940, this report has been signed below by the following persons on behalf of the registrant and in the capacities and on the date indicated.
| | |
| Wells Fargo Funds Trust |
| |
| By: | | |
| |
| | /s/ Karla M. Rabusch |
| |
| | Karla M. Rabusch |
| | President |
| |
| Date: | | March 24, 2016 |
| |
| By: | | |
| |
| | /s/ Jeremy DePalma |
| |
| | Jeremy DePalma |
| | Treasurer |
| |
| Date: | | March 24, 2016 |