
UNITED STATES
SECURITIES AND EXCHANGE COMMISSION
Washington, D.C. 20549
FORM N-CSRS
CERTIFIED SHAREHOLDER REPORT OF REGISTERED
MANAGEMENT INVESTMENT COMPANIES
Investment Company Act file number: 811-09253
Wells Fargo Funds Trust
(Exact name of registrant as specified in charter)
525 Market St., San Francisco, CA 94105
(Address of principal executive offices) (Zip code)
C. David Messman
Wells Fargo Funds Management, LLC
525 Market St., San Francisco, CA 94105
(Name and address of agent for service)
Registrant’s telephone number, including area code: 800-222-8222
Date of fiscal year end: October 31
Registrant is making a filing for 9 of its series:
Wells Fargo International Bond Fund, Wells Fargo Strategic Income Fund, Wells Fargo Asia Pacific Fund, Wells Fargo Diversified International Fund, Wells Fargo Emerging Markets Equity Fund, Wells Fargo Emerging Markets Equity Income Fund, Wells Fargo Global Opportunities Fund, Wells Fargo International Equity Fund, and Wells Fargo Intrinsic World Equity Fund.
Date of reporting period: April 30, 2016
| ITEM 1. | REPORT TO STOCKHOLDERS |
Semi-Annual Report
April 30, 2016

Wells Fargo International Bond Fund


Reduce clutter. Save trees.
Sign up for electronic delivery of prospectuses and shareholder reports at wellsfargo.com/advantagedelivery
Contents
The views expressed and any forward-looking statements are as of April 30, 2016, unless otherwise noted, and are those of the Fund managers and/or Wells Fargo Funds Management, LLC. Discussions of individual securities, or the markets generally, or any Wells Fargo Fund are not intended as individual recommendations. Future events or results may vary significantly from those expressed in any forward-looking statements. The views expressed are subject to change at any time in response to changing circumstances in the market. Wells Fargo Funds Management, LLC and the Fund disclaim any obligation to publicly update or revise any views expressed or forward-looking statements.
NOT FDIC INSURED ¡ NO BANK GUARANTEE ¡ MAY LOSE VALUE
| | | | |
| 2 | | Wells Fargo International Bond Fund | | Letter to shareholders (unaudited) |

Karla M. Rabusch
President
Wells Fargo Funds
The combination of U.S. moderate economic growth and low inflation allowed the Fed to raise its key rate by 0.25% in December 2015.
Across global markets, generally accommodative central banks and continued low inflation supported the returns of most major fixed-income asset classes, including sovereign bonds and investment-grade corporate bonds.
Dear Valued Shareholder:
We are pleased to offer you this semi-annual report for the Wells Fargo International Bond Fund for the six-month period that ended April 30, 2016. The reporting period was marked by moderate to disappointing economic growth and continued low interest rates around the globe. Even though the U.S. Federal Reserve (Fed) raised its key rate in December 2015, other major central banks continued or increased their quantitative easing programs.
Even though the Fed modestly tightened its monetary policy, other central banks continued to ease.
The U.S. delivered annualized real gross domestic product (GDP) growth of 1.4% in the fourth quarter of 2015. Reported inflation, as measured by the Core Personal Consumption Expenditures Price Index,1 remained well below the Fed’s target of 2.0%. The combination of U.S. moderate economic growth and low inflation allowed the Fed to raise its key rate by 0.25% in December 2015.
Given that GDP growth slowed in late 2015, investors initially worried that the Fed had moved too quickly, leading to fears of a central-bank-induced recession. However, the Fed remained on hold after its March 2016 meeting, and its guidance led investors to believe that the path of future rate increases would be gradual.
In contrast, the European Central Bank (ECB) showed no signs of raising rates in the near future, as the European Union continued to grapple with an elevated—albeit improving—unemployment rate and credit problems in Greece and Italy. The ECB maintained a variety of measures aimed at encouraging lending, including making funds available to banks at low interest rates and purchasing government bonds, mortgage notes, and eventually corporate bonds. In mid-2014, the ECB introduced negative interest rates on bank deposits held at the central bank and pushed its key rate further into negative territory through early 2016.
In Japan, the Bank of Japan (BOJ) likewise imposed a negative interest rate on surplus bank reserves in early 2016. The BOJ also continued to purchase shares and bonds in an attempt to support the asset markets.
Global bond markets benefited from low inflation and central-bank easing.
Across global markets, generally accommodative central banks and continued low inflation supported the returns of most major fixed-income asset classes, including sovereign bonds and investment-grade corporate bonds. Emerging markets debt also posted gains for the period, supported in part by actions of the People’s Bank of China to increase bank lending and support China’s currency. Non-U.S. bonds outperformed domestic issues as the ECB and the BOJ remained far more accommodative than the Fed. The Barclays Global Aggregate Bond Index,2 a broad measure of the international debt market, posted a 6.09% return for the reporting period compared with an 8.72% return for the Barclays Global Aggregate ex U.S. Dollar Bond Index.3
| 1 | The Core Personal Consumption Expenditures (PCE) Price Index is defined as personal consumption expenditures prices excluding food and energy prices. The core PCE price index measures the prices paid by consumers for goods and services without the volatility caused by movements in food and energy prices to reveal underlying inflation trends. Food prices consist of those included in the PCE category of “food and beverages purchased for off-premises consumption.” Prices included in the PCE category “food services and accommodations” are not included in the “food” price index because these services prices tend to be far less volatile than those for food commodities such as meats, fresh vegetables and fruits. Energy prices consist of those included in the PCE categories of “gasoline and other energy goods” and of “electricity and gas” utilities. All PCE prices appear in National Income and Product Accounts Table 2.4.4. Price Indexes for Personal Consumption Expenditures by Type of Product. A table showing the composition of PCE food and energy is shown in “Composition of PCE food and energy”. You cannot invest directly in an index. |
| 2 | The Barclays Global Aggregate Bond Index measures global investment-grade debt from 24 local currency markets. This multicurrency benchmark includes Treasury, government-related, corporate, and securitized fixed-rate bonds from both developed and emerging markets issuers. You cannot invest directly in an index. |
| 3 | The Barclays Global Aggregate ex U.S. Dollar Bond Index tracks an international basket of government, corporate, agency, and mortgage-related bonds. You cannot invest directly in an index. |
| | | | | | |
| Letter to shareholders (unaudited) | | Wells Fargo International Bond Fund | | | 3 | |
Among risk assets, the energy- and commodity-related subindustries of the high-yield bond universe again provided the main sour note as persistent low prices for oil, natural gas, and industrial metals such as copper put pressure on highly leveraged energy and metals and mining companies. High-yield bonds, nonetheless, benefited from worldwide low interest rates (which made high-yielding bonds even more attractive) and moderate default rates outside of the energy complex. The BofA Merrill Lynch High Yield Master II Index4 ended the six-month period with a return of 2.25%.
Don’t let short-term uncertainty derail long-term investment goals.
Periods of uncertainty can present challenges, but experience has taught us that maintaining long-term investment goals can be an effective way to plan for the future. To help you create a sound strategy based on your personal goals and risk tolerance, Wells Fargo Funds offers more than 100 mutual funds and other investments spanning a wide range of asset classes and investment styles.
Although diversification cannot guarantee an investment profit or prevent losses, we believe it can be an effective way to manage investment risk and potentially smooth out overall portfolio performance. We encourage investors to know their investments and to understand that appropriate levels of risk-taking may unlock opportunities.
Thank you for choosing to invest with Wells Fargo Funds. We appreciate your confidence in us and remain committed to helping you meet your financial needs.
Sincerely,

Karla M. Rabusch
President
Wells Fargo Funds
For further information about your Fund, contact your investment professional, visit our website at wellsfargofunds.com, or call us directly at 1-800-222-8222. We are available 24 hours a day, 7 days a week.
| 4 | The BofA Merrill Lynch High Yield Master II Index is a market-capitalization-weighted index of domestic and Yankee high-yield bonds. The index tracks the performance of high-yield securities traded in the U.S. bond market. You cannot invest directly in an index. |
| | | | |
| 4 | | Wells Fargo International Bond Fund | | Performance highlights (unaudited) |
Investment objective
The Fund seeks total return, consisting of income and capital appreciation.
Manager
Wells Fargo Funds Management, LLC
Subadviser
First International Advisors, LLC
Portfolio managers
Michael Lee
Tony Norris
Alex Perrin
Christopher Wightman
Peter Wilson
Average annual total returns (%) as of April 30, 20161
| | | | | | | | | | | | | | | | | | | | | | | | | | | | | | | | | | |
| | | | | Including sales charge | | | Excluding sales charge | | | Expense ratios2 (%) | |
| | | Inception date | | 1 year | | | 5 year | | | 10 year | | | 1 year | | | 5 year | | | 10 year | | | Gross | | | Net3 | |
| Class A (ESIYX) | | 9-30-2003 | | | (2.38 | ) | | | (1.19 | ) | | | 3.46 | | | | 2.27 | | | | (0.27 | ) | | | 3.94 | | | | 1.06 | | | | 1.03 | |
| Class B (ESIUX)* | | 9-30-2003 | | | (3.51 | ) | | | (1.38 | ) | | | 3.40 | | | | 1.49 | | | | (1.02 | ) | | | 3.40 | | | | 1.81 | | | | 1.78 | |
| Class C (ESIVX) | | 9-30-2003 | | | 0.41 | | | | (1.03 | ) | | | 3.17 | | | | 1.41 | | | | (1.03 | ) | | | 3.17 | | | | 1.81 | | | | 1.78 | |
| Class R6 (ESIRX) | | 11-30-2012 | | | – | | | | – | | | | – | | | | 2.64 | | | | 0.11 | | | | 4.28 | | | | 0.68 | | | | 0.65 | |
| Administrator Class (ESIDX) | | 7-30-2010 | | | – | | | | – | | | | – | | | | 2.46 | | | | (0.10 | ) | | | 4.11 | | | | 1.00 | | | | 0.85 | |
| Institutional Class (ESICX) | | 12-15-1993 | | | – | | | | – | | | | – | | | | 2.55 | | | | 0.06 | | | | 4.25 | | | | 0.73 | | | | 0.70 | |
| Barclays Global Aggregate ex USD Index (unhedged)4 | | – | | | – | | | | – | | | | – | | | | 6.55 | | | | (0.05 | ) | | | 3.77 | | | | – | | | | – | |
| BofA Merrill Lynch Global Broad Market ex U.S. Index5 | | – | | | – | | | | – | | | | – | | | | 7.18 | | | | 0.05 | | | | 3.87 | | | | – | | | | – | |
| * | | Class B shares are closed to investment, except in connection with the reinvestment of any distributions and permitted exchanges. |
Figures quoted represent past performance, which is no guarantee of future results, and do not reflect taxes that a shareholder may pay on fund distributions or the redemption of fund shares. Investment return and principal value of an investment will fluctuate so that an investor’s shares, when redeemed, may be worth more or less than their original cost. Performance shown without sales charges would be lower if sales charges were reflected. Current performance may be lower or higher than the performance data quoted, which assumes the reinvestment of dividends and capital gains. Current month-end performance is available on the Fund’s website,wellsfargofunds.com.
Index returns do not include transaction costs associated with buying and selling securities, any mutual fund fees or expenses, or any taxes. It is not possible to invest directly in an index.
For Class A shares, the maximum front-end sales charge is 4.50%. For Class B shares, the maximum contingent deferred sales charge is 5.00%. For Class C shares, the maximum contingent deferred sales charge is 1.00%. Performance including a contingent deferred sales charge assumes the sales charge for the corresponding time period. Class R6, Administrator Class, and Institutional Class shares are sold without a front-end sales charge or contingent deferred sales charge.
Please see footnotes on page 5.
| | | | | | |
| Performance highlights (unaudited) | | Wells Fargo International Bond Fund | | | 5 | |
Bond values fluctuate in response to the financial condition of individual issuers, general market and economic conditions, and changes in interest rates. Changes in market conditions and government policies may lead to periods of heightened volatility in the bond market and reduced liquidity for certain bonds held by the Fund. In general, when interest rates rise, bond values fall and investors may lose principal value. Interest-rate changes and their impact on the Fund and its share price can be sudden and unpredictable. Foreign investments are especially volatile and can rise or fall dramatically due to differences in the political and economic conditions of the host country. These risks are generally intensified in emerging markets. The use of derivatives may reduce returns and/or increase volatility. Securities issued by U.S. government agencies or government-sponsored entities may not be guaranteed by the U.S. Treasury. Certain investment strategies tend to increase the total risk of an investment (relative to the broader market). The Fund is exposed to high-yield securities risk and geographic risk. Consult the Fund’s prospectus for additional information on these and other risks.
| | | | |
| Ten largest holdings (%) as of April 30, 20166 | |
United Kingdom Gilt, 2.00%, 9-7-2025 | | | 6.12 | |
New Zealand, 4.50%, 4-15-2027 | | | 4.44 | |
Mexico, 4.75%, 6-14-2018 | | | 4.07 | |
Poland, 2.50%, 7-25-2026 | | | 3.87 | |
U.S. Treasury Note, 2.25%, 11-15-2025 | | | 3.65 | |
United Kingdom Gilt, 2.75%, 9-7-2024 | | | 3.55 | |
Thailand, 3.85%, 12-12-2025 | | | 2.98 | |
Singapore, 3.00%, 9-1-2024 | | | 2.56 | |
Norway, 0.00%, 6-15-2016 | | | 2.47 | |
Bonos y Obligaciones del Estado, 1.40%, 1-31-2020 | | | 2.42 | |
|
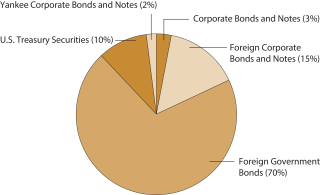
| Portfolio allocation as of April 30, 20167 |
|
 |
| 1 | Historical performance shown for Class R6 shares prior to their inception reflects the performance of Institutional Class shares and includes the higher expenses applicable to Institutional Class shares. If these expenses had not been included, returns would be higher. Historical performance shown for Administrator Class shares prior to their inception reflects the performance of Institutional Class shares and has been adjusted to reflect the higher expenses applicable to Administrator Class shares. Historical performance shown for all classes of the Fund prior to July 12, 2010, is based on the performance of the Fund’s predecessor, Evergreen International Bond Fund. |
| 2 | Reflects the expense ratios as stated in the most recent prospectuses. The expense ratios shown are subject to change and may differ from the annualized expense ratios shown in the financial highlights of this report. |
| 3 | The manager has contractually committed through February 28, 2017, to waive fees and/or reimburse expenses to the extent necessary to cap the Fund’s Total Annual Operating Expenses After Fee Waiver at the amounts shown. After this time, the cap may be increased or the commitment to maintain the cap may be terminated only with the approval of the Board of Trustees. Brokerage commissions, stamp duty fees, interest, taxes, acquired fund fees and expenses, and extraordinary expenses are excluded from the cap. Without this cap, the Fund’s returns would have been lower. |
| 4 | Effective March 1, 2016, the Fund changed its benchmark from the BofA Merrill Lynch Global Broad Market ex-U.S. Index to Barclays Global Aggregate ex USD Index (unhedged). The new index creates consistency among our taxable intermediate funds that now all have a Barclays benchmark. The Barclays Global Aggregate ex USD Index (unhedged) is an unmanaged index that provides a broad-based measure of the global investment grade fixed income markets excluding the U.S. dollar denominated debt market. You cannot invest directly in an index. |
| 5 | The BofA Merrill Lynch Global Broad Market ex U.S. Index tracks the performance of investment-grade debt publicly issued in the major domestic and euro bond markets, including sovereign, quasi-government, corporate, securitized, and collateralized securities, and excludes all securities denominated in U.S. dollars. You cannot invest directly in an index. |
| 6 | The ten largest holdings, excluding cash and cash equivalents, are calculated based on the value of the investments divided by total net assets of the Fund. Holdings are subject to change and may have changed since the date specified. |
| 7 | Amounts are calculated based on the total long-term investments of the Fund. These amounts are subject to change and may have changed since the date specified. |
| | | | |
| 6 | | Wells Fargo International Bond Fund | | Fund expenses (unaudited) |
As a shareholder of the Fund, you incur two types of costs: (1) transaction costs, including sales charges (loads) on purchase payments and contingent deferred sales charges (if any) on redemptions and (2) ongoing costs, including management fees, distribution (12b-1) and/or shareholder servicing fees, and other Fund expenses. This example is intended to help you understand your ongoing costs (in dollars) of investing in the Fund and to compare these costs with the ongoing costs of investing in other mutual funds.
The example is based on an investment of $1,000 invested at the beginning of the six-month period and held for the entire period from November 1, 2015 to April 30, 2016.
Actual expenses
The “Actual” line of the table below provides information about actual account values and actual expenses. You may use the information in this line, together with the amount you invested, to estimate the expenses that you paid over the period. Simply divide your account value by $1,000 (for example, an $8,600 account value divided by $1,000 = 8.6), then multiply the result by the number in the “Actual” line under the heading entitled “Expenses paid during period” for your applicable class of shares to estimate the expenses you paid on your account during this period.
Hypothetical example for comparison purposes
The “Hypothetical” line of the table below provides information about hypothetical account values and hypothetical expenses based on the Fund’s actual expense ratio and an assumed rate of return of 5% per year before expenses, which is not the Fund’s actual return. The hypothetical account values and expenses may not be used to estimate the actual ending account balance or expenses you paid for the period. You may use this information to compare the ongoing costs of investing in the Fund and other funds. To do so, compare this 5% hypothetical example with the 5% hypothetical examples that appear in the shareholder reports of the other funds.
Please note that the expenses shown in the table are meant to highlight your ongoing costs only and do not reflect any transactional costs, such as sales charges (loads) and contingent deferred sales charges. Therefore, the “Hypothetical” line of the table is useful in comparing ongoing costs only and will not help you determine the relative total costs of owning different funds. In addition, if these transactional costs were included, your costs would have been higher.
| | | | | | | | | | | | | | | | |
| | | Beginning
account value
11-1-2015 | | | Ending
account value
4-30-2016 | | | Expenses
paid during
the period¹ | | | Net annualized
expense ratio | |
Class A | | | | | | | | | | | | | | | | |
Actual | | $ | 1,000.00 | | | $ | 1,081.46 | | | $ | 5.33 | | | | 1.03 | % |
Hypothetical (5% return before expenses) | | $ | 1,000.00 | | | $ | 1,019.74 | | | $ | 5.17 | | | | 1.03 | % |
Class B | | | | | | | | | | | | | | | | |
Actual | | $ | 1,000.00 | | | $ | 1,077.89 | | | $ | 9.20 | | | | 1.78 | % |
Hypothetical (5% return before expenses) | | $ | 1,000.00 | | | $ | 1,016.01 | | | $ | 8.92 | | | | 1.78 | % |
Class C | | | | | | | | | | | | | | | | |
Actual | | $ | 1,000.00 | | | $ | 1,077.58 | | | $ | 9.19 | | | | 1.78 | % |
Hypothetical (5% return before expenses) | | $ | 1,000.00 | | | $ | 1,016.01 | | | $ | 8.92 | | | | 1.78 | % |
Class R6 | | | | | | | | | | | | | | | | |
Actual | | $ | 1,000.00 | | | $ | 1,084.03 | | | $ | 3.37 | | | | 0.65 | % |
Hypothetical (5% return before expenses) | | $ | 1,000.00 | | | $ | 1,021.63 | | | $ | 3.27 | | | | 0.65 | % |
Administrator Class | | | | | | | | | | | | | | | | |
Actual | | $ | 1,000.00 | | | $ | 1,082.40 | | | $ | 4.40 | | | | 0.85 | % |
Hypothetical (5% return before expenses) | | $ | 1,000.00 | | | $ | 1,020.64 | | | $ | 4.27 | | | | 0.85 | % |
Institutional Class | | | | | | | | | | | | | | | | |
Actual | | $ | 1,000.00 | | | $ | 1,083.09 | | | $ | 3.63 | | | | 0.70 | % |
Hypothetical (5% return before expenses) | | $ | 1,000.00 | | | $ | 1,021.38 | | | $ | 3.52 | | | | 0.70 | % |
| 1 | Expenses paid is equal to the annualized expense ratio of each class multiplied by the average account value over the period, multiplied by the number of days in the most recent fiscal half-year divided by the number of days in the fiscal year (to reflect the one-half-year period). |
| | | | | | |
| Portfolio of investments—April 30, 2016 (unaudited) | | Wells Fargo International Bond Fund | | | 7 | |
| | | | | | | | | | | | | | | | |
| Security name | | Interest rate | | | Maturity date | | | Principal | | | Value | |
| | | | | | | | | | | | | | | | |
| | | | |
Corporate Bonds and Notes: 2.91% | | | | | | | | | | | | | | | | |
| | | | |
| United States: 2.91% | | | | | | | | | | | | | | | | |
Amazon.com Incorporated (Consumer Discretionary, Internet & Catalog Retail) | | | 3.80 | % | | | 12-5-2024 | | | $ | 3,800,000 | | | $ | 4,184,834 | |
Arrow Electronics Incorporated (Information Technology, Electronic Equipment, Instruments & Components) | | | 3.50 | | | | 4-1-2022 | | | | 5,775,000 | | | | 5,769,225 | |
AT&T Incorporated (Telecommunication Services, Diversified Telecommunication Services) | | | 3.60 | | | | 2-17-2023 | | | | 3,625,000 | | | | 3,785,265 | |
Ford Motor Credit Company LLC (Consumer Discretionary, Automobiles) | | | 2.46 | | | | 3-27-2020 | | | | 2,600,000 | | | | 2,616,923 | |
Goldman Sachs Group Incorporated (Financials, Capital Markets) | | | 2.75 | | | | 9-15-2020 | | | | 3,000,000 | | | | 3,044,703 | |
JPMorgan Chase & Company (Financials, Banks) | | | 3.30 | | | | 4-1-2026 | | | | 2,575,000 | | | | 2,606,685 | |
Kraft Foods Group Incorporated (Consumer Staples, Food Products) | | | 3.50 | | | | 6-6-2022 | | | | 2,000,000 | | | | 2,121,834 | |
| | | | |
Total Corporate Bonds and Notes (Cost $23,639,138) | | | | | | | | | | | | | | | 24,129,469 | |
| | | | | | | | | | | | | | | | |
| | | | |
Foreign Corporate Bonds and Notes @: 14.40% | | | | | | | | | | | | | | | | |
| | | | |
| Australia: 0.43% | | | | | | | | | | | | | | | | |
General Electric Capital Corporation (Financials, Diversified Financial Services, AUD) | | | 6.00 | | | | 3-15-2019 | | | | 1,367,000 | | | | 1,124,732 | |
Transurban Finance Company Limited (Financials, Diversified Financial Services, EUR) | | | 1.88 | | | | 9-16-2024 | | | | 2,090,000 | | | | 2,439,803 | |
| | | | |
| | | | | �� | | | | | | | | | | 3,564,535 | |
| | | | | | | | | | | | | | | | |
| | | | |
| Austria: 0.14% | | | | | | | | | | | | | | | | |
Sappi Papier Holding GmbH (Materials, Paper & Forest Products, EUR) 144A | | | 4.00 | | | | 4-1-2023 | | | | 1,000,000 | | | | 1,166,028 | |
| | | | | | | | | | | | | | | | |
| | | | |
| Bermuda: 0.34% | | | | | | | | | | | | | | | | |
Bacardi Limited (Consumer Staples, Beverages, EUR) | | | 2.75 | | | | 7-3-2023 | | | | 2,204,000 | | | | 2,777,786 | |
| | | | | | | | | | | | | | | | |
| | | | |
| Brazil: 0.40% | | | | | | | | | | | | | | | | |
BRF SA (Consumer Staples, Food Products, BRL) 144A | | | 7.75 | | | | 5-22-2018 | | | | 13,137,000 | | | | 3,342,262 | |
| | | | | | | | | | | | | | | | |
| | | | |
| France: 0.39% | | | | | | | | | | | | | | | | |
Casino Guichard Perrachon SA (Consumer Staples, Food & Staples Retailing, EUR) | | | 3.25 | | | | 3-7-2024 | | | | 2,700,000 | | | | 3,189,205 | |
| | | | | | | | | | | | | | | | |
| | | | |
| Germany: 1.50% | | | | | | | | | | | | | | | | |
HP Pelzer Holding GmbH (Consumer Discretionary, Auto Components, EUR) | | | 7.50 | | | | 7-15-2021 | | | | 875,000 | | | | 1,063,337 | |
KfW (Financials, Banks, TRY) | | | 5.00 | | | | 1-16-2017 | | | | 3,745,000 | | | | 1,293,358 | |
KfW (Financials, Banks, AUD) | | | 5.00 | | | | 3-19-2024 | | | | 9,400,000 | | | | 8,171,696 | |
Landwirtschaftliche Rentenbank (Financials, Banks, ZAR) | | | 8.25 | | | | 5-23-2022 | | | | 5,400,000 | | | | 366,200 | |
Rapid Holding GmbH (Energy, Energy Equipment & Services, EUR) 144A | | | 6.63 | | | | 11-15-2020 | | | | 1,300,000 | | | | 1,570,585 | |
| | | | |
| | | | | | | | | | | | | | | 12,465,176 | |
| | | | | | | | | | | | | | | | |
| | | | |
| Ireland: 0.91% | | | | | | | | | | | | | | | | |
GE Capital UK Funding Company (Financials, Capital Markets, GBP) | | | 5.13 | | | | 5-24-2023 | | | | 1,000,000 | | | | 1,763,251 | |
Ryanair Limited (Industrials, Airlines, EUR) | | | 1.13 | | | | 3-10-2023 | | | | 5,080,000 | | | | 5,804,140 | |
| | | | |
| | | | | | | | | | | | | | | 7,567,391 | |
| | | | | | | | | | | | | | | | |
| | | | |
| Luxembourg: 0.45% | | | | | | | | | | | | | | | | |
Befesa Zinc Aser SA (Utilities, Water Utilities, EUR) | | | 8.88 | | | | 5-15-2018 | | | | 2,925,000 | | | | 3,349,272 | |
European Investment Bank (Financials, Banks, ZAR) | | | 9.00 | | | | 3-31-2021 | | | | 5,790,000 | | | | 406,988 | |
| | | | |
| | | | | | | | | | | | | | | 3,756,260 | |
| | | | | | | | | | | | | | | | |
The accompanying notes are an integral part of these financial statements.
| | | | |
| 8 | | Wells Fargo International Bond Fund | | Portfolio of investments—April 30, 2016 (unaudited) |
| | | | | | | | | | | | | | | | |
| Security name | | Interest rate | | | Maturity date | | | Principal | | | Value | |
| | | | | | | | | | | | | | | | |
| | | | |
| Mexico: 0.11% | | | | | | | | | | | | | | | | |
America Movil SAB de CV (Telecommunication Services, Wireless Telecommunication Services, MXN) | | | 7.13 | % | | | 12-9-2024 | | | | 7,250,000 | | | $ | 407,281 | |
Petroleos Mexicanos (Energy, Oil, Gas & Consumable Fuels, MXN) 144A | | | 7.19 | | | | 9-12-2024 | | | | 9,532,000 | | | | 487,878 | |
| | | | |
| | | | | | | | | | | | | | | 895,159 | |
| | | | | | | | | | | | | | | | |
| | | | |
| Netherlands: 0.28% | | | | | | | | | | | | | | | | |
Schaeffler Finance BV (Financials, Diversified Financial Services, EUR) | | | 3.50 | | | | 5-15-2022 | | | | 1,950,000 | | | | 2,299,834 | |
| | | | | | | | | | | | | | | | |
| | | | |
| Norway: 1.04% | | | | | | | | | | | | | | | | |
Kommunalbanken AS (Financials, Banks, AUD) | | | 5.25 | | | | 7-15-2024 | | | | 9,000,000 | | | | 7,882,979 | |
Lock AS (Financials, Diversified Financial Services, EUR) 144A | | | 7.00 | | | | 8-15-2021 | | | | 600,000 | | | | 728,458 | |
| | | | |
| | | | | | | | | | | | | | | 8,611,437 | |
| | | | | | | | | | | | | | | | |
| | | | |
| Philippines: 0.94% | | | | | | | | | | | | | | | | |
Asian Development Bank (Financials, Banks, AUD) | | | 3.75 | | | | 3-12-2025 | | | | 9,731,000 | | | | 7,830,953 | |
| | | | | | | | | | | | | | | | |
| | | | |
| Spain: 0.59% | | | | | | | | | | | | | | | | |
Ence Energia Y Celulosa (Materials, Paper & Forest Products, EUR) | | | 5.38 | | | | 11-1-2022 | | | | 1,200,000 | | | | 1,445,447 | |
Ephios Bondco plc (Health Care, Health Care Providers & Services, EUR) 144A | | | 6.25 | | | | 7-1-2022 | | | | 1,200,000 | | | | 1,459,802 | |
Grupo Antolin Irausa SA (Consumer Discretionary, Auto Components, EUR) 144A | | | 5.13 | | | | 6-30-2022 | | | | 500,000 | | | | 608,079 | |
PortAventura Entertainment Barcelona BV (Consumer Discretionary, Hotels, Restaurants & Leisure, EUR) | | | 7.25 | | | | 12-1-2020 | | | | 1,150,000 | | | | 1,376,024 | |
| | | | |
| | | | | | | | | | | | | | | 4,889,352 | |
| | | | | | | | | | | | | | | | |
| | | | |
| United Kingdom: 4.24% | | | | | | | | | | | | | | | | |
AA Bond Company Limted (Financials, Diversified Financial Services, GBP) | | | 5.50 | | | | 7-31-2043 | | | | 1,000,000 | | | | 1,410,011 | |
Alliance Automotive Finance plc (Financials, EUR) 144A | | | 6.25 | | | | 12-1-2021 | | | | 1,300,000 | | | | 1,594,194 | |
Delphi Automotive plc (Consumer Discretionary, Auto Components, EUR) | | | 1.50 | | | | 3-10-2025 | | | | 3,100,000 | | | | 3,402,700 | |
FirstGroup plc (Industrials, Road & Rail, GBP) | | | 5.25 | | | | 11-29-2022 | | | | 1,300,000 | | | | 2,088,023 | |
GKN plc (Consumer Discretionary, Auto Components, GBP) | | | 5.38 | | | | 9-19-2022 | | | | 2,000,000 | | | | 3,238,466 | |
Heathrow Funding Limited (Industrials, Transportation Infrastructure, EUR) | | | 1.88 | | | | 5-23-2022 | | | | 561,000 | | | | 677,556 | |
Heathrow Funding Limited (Industrials, Transportation Infrastructure, GBP) | | | 7.13 | | | | 2-14-2024 | | | | 1,900,000 | | | | 3,488,412 | |
Jaguar Land Rover plc (Consumer Discretionary, Automobiles, GBP) | | | 5.00 | | | | 2-15-2022 | | | | 1,000,000 | | | | 1,507,832 | |
Lincoln Finance Limited (Financials, Diversified Financial Services, EUR) 144A | | | 6.88 | | | | 4-15-2021 | | | | 500,000 | | | | 613,318 | |
Merlin Entertainments plc (Consumer Discretionary, Hotels, Restaurants & Leisure, EUR) | | | 2.75 | | | | 3-15-2022 | | | | 1,100,000 | | | | 1,250,109 | |
New Look Secured Issuer plc (Consumer Discretionary, Textiles, Apparel & Luxury Goods, GBP) 144A | | | 6.50 | | | | 7-1-2022 | | | | 1,600,000 | | | | 2,267,706 | |
TES Finance plc (Financials, Diversified Financial Services, GBP) | | | 6.75 | | | | 7-15-2020 | | | | 1,750,000 | | | | 2,164,001 | |
Tesco plc (Consumer Staples, Food & Staples Retailing, GBP) | | | 6.13 | | | | 2-24-2022 | | | | 2,400,000 | | | | 3,883,907 | |
Twinkle Pizza plc (Consumer Discretionary, Hotels, Restaurants & Leisure, GBP) | | | 6.63 | | | | 8-1-2021 | | | | 1,450,000 | | | | 2,148,385 | |
Vodafone Group plc (Telecommunication Services, Wireless Telecommunication Services, EUR) | | | 1.75 | | | | 8-25-2023 | | | | 1,250,000 | | | | 1,482,142 | |
Wagamama Finance plc (Financials, Diversified Financial Services, GBP) | | | 7.88 | | | | 2-1-2020 | | | | 620,000 | | | | 959,815 | |
Wagamama Finance plc (Financials, Diversified Financial Services, GBP) 144A | | | 7.88 | | | | 2-1-2020 | | | | 450,000 | | | | 696,640 | |
Worldpay Finance plc (Financials, Diversified Financial Services, EUR) 144A | | | 3.75 | | | | 11-15-2022 | | | | 1,925,000 | | | | 2,308,923 | |
| | | | |
| | | | | | | | | | | | | | | 35,182,140 | |
| | | | | | | | | | | | | | | | |
The accompanying notes are an integral part of these financial statements.
| | | | | | |
| Portfolio of investments—April 30, 2016 (unaudited) | | Wells Fargo International Bond Fund | | | 9 | |
| | | | | | | | | | | | | | | | |
| Security name | | Interest rate | | | Maturity date | | | Principal | | | Value | |
| | | | | | | | | | | | | | | | |
| | | | |
| United States: 2.64% | | | | | | | | | | | | | | | | |
Albemarle Corporation (Materials, Chemicals, EUR) | | | 1.88 | % | | | 12-8-2021 | | | | 3,910,000 | | | $ | 4,471,743 | |
Ball Corporation (Materials, Containers & Packaging, EUR) | | | 4.38 | | | | 12-15-2023 | | | | 1,700,000 | | | | 2,116,912 | |
Fedex Corporation (Industrials, Air Freight & Logistics, EUR) | | | 1.63 | | | | 1-11-2027 | | | | 1,450,000 | | | | 1,641,067 | |
Honeywell International Incorporated (Industrials, Aerospace & Defense, EUR) | | | 1.30 | | | | 2-22-2023 | | | | 850,000 | | | | 997,015 | |
Morgan Stanley (Financials, Capital Markets, EUR) | | | 1.75 | | | | 1-30-2025 | | | | 3,000,000 | | | | 3,439,809 | |
Priceline Group Incorporated (Consumer Discretionary, Internet & Catalog Retail, EUR) | | | 2.38 | | | | 9-23-2024 | | | | 4,159,000 | | | | 4,882,288 | |
Thermo Fisher Scientific Incorporated (Health Care, Life Sciences Tools & Services, EUR) | | | 2.15 | | | | 7-21-2022 | | | | 1,500,000 | | | | 1,816,762 | |
Verizon Communications Incorporated (Telecommunication Services, Diversified Telecommunication Services, EUR) | | | 3.25 | | | | 2-17-2026 | | | | 1,864,000 | | | | 2,491,740 | |
| | | | |
| | | | | | | | | | | | | | | 21,857,336 | |
| | | | | | | | | | | | | | | | |
| | | | |
Total Foreign Corporate Bonds and Notes (Cost $127,907,283) | | | | | | | | | | | | | | | 119,394,854 | |
| | | | | | | | | | | | | | | | |
| | | | |
Foreign Government Bonds @: 66.99% | | | | | | | | | | | | | | | | |
Australian Government Bond Series 138 (AUD) | | | 3.25 | | | | 4-21-2029 | | | | 19,050,000 | | | | 15,296,386 | |
Australian Government Bond Series 146 (AUD) | | | 1.75 | | | | 11-21-2020 | | | | 23,050,000 | | | | 17,335,925 | |
Bonos y Obligaciones del Estado (EUR) | | | 1.40 | | | | 1-31-2020 | | | | 16,800,000 | | | | 20,058,241 | |
Bonos y Obligaciones del Estado 144A (EUR) | | | 1.95 | | | | 4-30-2026 | | | | 9,875,000 | | | | 11,662,029 | |
Brazil (BRL) | | | 10.00 | | | | 1-1-2019 | | | | 33,045,000 | | | | 9,148,343 | |
Brazil (BRL) | | | 10.00 | | | | 1-1-2025 | | | | 65,740,000 | | | | 16,863,848 | |
Canada 144A (CAD) | | | 2.90 | | | | 6-15-2024 | | | | 14,000,000 | | | | 12,091,974 | |
Colombia (COP) | | | 7.00 | | | | 5-4-2022 | | | | 11,100,000,000 | | | | 3,751,464 | |
Hungary (HUF) | | | 3.00 | | | | 10-27-2027 | | | | 450,000,000 | | | | 1,618,658 | |
Hungary (HUF) | | | 5.50 | | | | 6-24-2025 | | | | 4,185,000,000 | | | | 18,146,009 | |
Indonesia (IDR) | | | 7.88 | | | | 4-15-2019 | | | | 48,400,000,000 | | | | 3,721,934 | |
Indonesia (IDR) | | | 8.38 | | | | 3-15-2024 | | | | 13,750,000,000 | | | | 1,087,822 | |
Korea (KRW) | | | 3.00 | | | | 9-10-2024 | | | | 13,550,000,000 | | | | 13,033,437 | |
Korea (KRW) | | | 3.13 | | | | 3-10-2019 | | | | 10,850,000,000 | | | | 9,956,851 | |
Malaysia (MYR) | | | 3.66 | | | | 10-15-2020 | | | | 7,650,000 | | | | 1,971,376 | |
Malaysia (MYR) | | | 3.96 | | | | 9-15-2025 | | | | 76,050,000 | | | | 19,504,737 | |
Malaysia (MYR) | | | 4.50 | | | | 4-15-2030 | | | | 17,950,000 | | | | 4,722,929 | |
Mexico (MXN) | | | 4.75 | | | | 6-14-2018 | | | | 577,000,000 | | | | 33,753,057 | |
Mexico (MXN) | | | 5.75 | | | | 3-5-2026 | | | | 13,000,000 | | | | 749,897 | |
Mexico (MXN) | | | 10.00 | | | | 12-5-2024 | | | | 39,450,000 | | | | 2,955,245 | |
New Zealand (NZD) | | | 4.50 | | | | 4-15-2027 | | | | 45,700,000 | | | | 36,800,040 | |
Norway 144A¤ (NOK) | | | 0.00 | | | | 6-15-2016 | | | | 164,745,000 | | | | 20,446,602 | |
Norway 144A¤ (NOK) | | | 0.00 | | | | 9-21-2016 | | | | 161,600,000 | | | | 20,034,057 | |
Poland (PLN) | | | 1.50 | | | | 4-25-2020 | | | | 5,000,000 | | | | 1,283,468 | |
Poland (PLN) | | | 2.50 | | | | 7-25-2026 | | | | 129,000,000 | | | | 32,077,181 | |
Poland (PLN) | | | 3.25 | | | | 7-25-2025 | | | | 7,000,000 | | | | 1,882,139 | |
Province of British Columbia (AUD) | | | 4.25 | | | | 11-27-2024 | | | | 10,090,000 | | | | 8,232,265 | |
Province of Ontario (AUD) | | | 6.25 | | | | 9-29-2020 | | | | 9,400,000 | | | | 8,121,743 | |
Queensland Treasury (AUD) | | | 5.75 | | | | 7-22-2024 | | | | 13,500,000 | | | | 12,456,386 | |
Republic of Peru (PEN) | | | 5.70 | | | | 8-12-2024 | | | | 5,000,000 | | | | 1,507,902 | |
Republic of Philippines (PHP) | | | 3.90 | | | | 11-26-2022 | | | | 40,000,000 | | | | 847,377 | |
Republic of South Africa (ZAR) | | | 7.75 | | | | 2-28-2023 | | | | 255,156,000 | | | | 16,960,810 | |
The accompanying notes are an integral part of these financial statements.
| | | | |
| 10 | | Wells Fargo International Bond Fund | | Portfolio of investments—April 30, 2016 (unaudited) |
| | | | | | | | | | | | | | | | |
| Security name | | Interest rate | | | Maturity date | | | Principal | | | Value | |
| | | | | | | | | | | | | | | | |
| | | | |
| Foreign Government Bonds @ (continued) | | | | | | | | | | | | | | | | |
Republic of South Africa (ZAR) | | | 8.00 | % | | | 12-21-2018 | | | | 115,925,000 | | | $ | 8,105,812 | |
Romania (RON) | | | 5.75 | | | | 4-29-2020 | | | | 28,200,000 | | | | 8,124,555 | |
Singapore (SGD) | | | 2.88 | | | | 9-1-2030 | | | | 14,600,000 | | | | 11,518,785 | |
Singapore (SGD) | | | 3.00 | | | | 9-1-2024 | | | | 26,490,000 | | | | 21,194,364 | |
State of New South Wales Australia (AUD) | | | 5.00 | | | | 8-20-2024 | | | | 13,800,000 | | | | 12,378,631 | |
Thailand (THB) | | | 3.85 | | | | 12-12-2025 | | | | 731,025,000 | | | | 24,689,244 | |
Turkey (TRY) | | | 9.00 | | | | 3-8-2017 | | | | 3,269,000 | | | | 1,167,166 | |
Turkey (TRY) | | | 9.40 | | | | 7-8-2020 | | | | 1,500,000 | | | | 544,139 | |
United Kingdom Gilt (GBP) | | | 2.00 | | | | 9-7-2025 | | | | 33,600,000 | | | | 50,746,903 | |
United Kingdom Gilt (GBP) | | | 2.75 | | | | 9-7-2024 | | | | 18,375,000 | | | | 29,460,807 | |
United Kingdom Gilt (GBP) | | | 4.75 | | | | 12-7-2030 | | | | 4,850,000 | | | | 9,546,561 | |
| | | | |
Total Foreign Government Bonds (Cost $560,525,304) | | | | | | | | | | | | | | | 555,557,099 | |
| | | | | | | | | | | | | | | | |
| | | | |
U.S. Treasury Securities: 9.34% | | | | | | | | | | | | | | | | |
U.S. Treasury Bond | | | 3.00 | | | | 11-15-2045 | | | $ | 14,500,000 | | | | 15,505,372 | |
U.S. Treasury Note | | | 1.38 | | | | 10-31-2020 | | | | 9,250,000 | | | | 9,303,835 | |
U.S. Treasury Note | | | 1.88 | | | | 11-30-2021 | | | | 3,750,000 | | | | 3,844,043 | |
U.S. Treasury Note | | | 2.00 | | | | 8-15-2025 | | | | 3,500,000 | | | | 3,558,926 | |
U.S. Treasury Note | | | 2.13 | | | | 12-31-2022 | | | | 14,500,000 | | | | 15,002,396 | |
U.S. Treasury Note | | | 2.25 | | | | 11-15-2025 | | | | 29,150,000 | | | | 30,247,672 | |
| | | | |
Total U.S. Treasury Securities (Cost $75,719,875) | | | | | | | | | | | | | | | 77,462,244 | |
| | | | | | | | | | | | | | | | |
| | | | |
Yankee Corporate Bonds and Notes: 1.98% | | | | | | | | | | | | | | | | |
| | | | |
| Cayman Islands: 0.15% | | | | | | | | | | | | | | | | |
UPCB Finance IV Limited (Financials, Diversified Financial Services) 144A | | | 5.38 | | | | 1-15-2025 | | | | 1,200,000 | | | | 1,221,000 | |
| | | | | | | | | | | | | | | | |
| | | | |
| Netherlands: 1.17% | | | | | | | | | | | | | | | | |
ABN AMRO Bank NV (Financials, Banks) 144A | | | 2.45 | | | | 6-4-2020 | | | | 2,325,000 | | | | 2,354,221 | |
Fiat Chrysler Automobiles NV (Consumer Discretionary, Automobiles) | | | 5.25 | | | | 4-15-2023 | | | | 2,150,000 | | | | 2,174,274 | |
Mubadala Development Company (Energy, Oil, Gas & Consumable Fuels) | | | 5.50 | | | | 4-20-2021 | | | | 1,700,000 | | | | 1,918,943 | |
Myriad International Holdings BV (Consumer Discretionary, Media) | | | 6.00 | | | | 7-18-2020 | | | | 2,950,000 | | | | 3,218,332 | |
| | | | | | | | | | | | | | | 9,665,770 | |
| | | | | | | | | | | | | | | | |
| | | | |
| Switzerland: 0.29% | | | | | | | | | | | | | | | | |
Credit Suisse Group Funding Limited (Financials, Diversified Financial Services) | | | 3.80 | | | | 9-15-2022 | | | | 2,400,000 | | | | 2,433,574 | |
| | | | | | | | | | | | | | | | |
| | | | |
| Turkey: 0.04% | | | | | | | | | | | | | | | | |
Anadolu Efes (Consumer Staples, Beverages) | | | 3.38 | | | | 11-1-2022 | | | | 425,000 | | | | 376,389 | |
| | | | | | | | | | | | | | | | |
| | | | |
| United Kingdom: 0.33% | | | | | | | | | | | | | | | | |
International Game Technology plc (Consumer Discretionary, Hotels, Restaurants & Leisure) 144A | | | 6.25 | | | | 2-15-2022 | | | | 1,500,000 | | | | 1,526,550 | |
Jaguar Land Rover Automobiles plc (Consumer Discretionary, Automobiles) 144A | | | 3.50 | | | | 3-15-2020 | | | | 1,200,000 | | | | 1,200,000 | |
| | | | |
| | | | | | | | | | | | | | | 2,726,550 | |
| | | | | | | | | | | | | | | | |
| | | | |
Total Yankee Corporate Bonds and Notes (Cost $15,849,449) | | | | | | | | | | | | | | | 16,423,283 | |
| | | | | | | | | | | | | | | | |
The accompanying notes are an integral part of these financial statements.
| | | | | | |
| Portfolio of investments—April 30, 2016 (unaudited) | | Wells Fargo International Bond Fund | | | 11 | |
| | | | | | | | | | | | | | |
| Security name | | Yield | | | | | Shares | | | Value | |
| | | | |
Short-Term Investments: 1.76% | | | | | | | | | | | | | | |
| | | | |
| Investment Companies: 1.76% | | | | | | | | | | | | | | |
Wells Fargo Cash Investment Money Market Fund Select Class (l)(u) | | | 0.43 | % | | | | | 14,570,503 | | | $ | 14,570,503 | |
| | | | | | | | | | | | | | |
| | | | |
Total Short-Term Investments (Cost $14,570,503) | | | | | | | | | | | | | 14,570,503 | |
| | | | | | | | | | | | | | |
| | | | | | | | |
| Total investments in securities (Cost $818,211,552) * | | | 97.38 | % | | | 807,537,452 | |
Other assets and liabilities, net | | | 2.62 | | | | 21,731,796 | |
| | | | | | | | |
| Total net assets | | | 100.00 | % | | $ | 829,269,248 | |
| | | | | | | | |
| @ | Foreign bond principal is denominated in the local currency of the issuer. |
| 144A | The security may be resold in transactions exempt from registration, normally to qualified institutional buyers, pursuant to Rule 144A under the Securities Act of 1933. |
| ¤ | The security is issued in zero coupon form with no periodic interest payments. |
| (l) | The issuer of the security is an affiliated person of the Fund as defined in the Investment Company Act of 1940. |
| (u) | The rate represents the 7-day annualized yield at period end. |
| * | Cost for federal income tax purposes is $819,471,923 and unrealized gains (losses) consists of: |
| | | | |
Gross unrealized gains | | $ | 21,255,536 | |
Gross unrealized losses | | | (33,190,007 | ) |
| | | | |
Net unrealized losses | | $ | (11,934,471 | ) |
The accompanying notes are an integral part of these financial statements.
| | | | |
| 12 | | Wells Fargo International Bond Fund | | Statement of assets and liabilities—April 30, 2016 (unaudited) |
| | | | |
| | | | |
| |
Assets | | | | |
Investments | | | | |
In unaffiliated securities, at value (cost $803,641,049) | | $ | 792,966,949 | |
In affiliated securities, at value (cost $14,570,503) | | | 14,570,503 | |
| | | | |
Total investments, at value (cost $818,211,552) | | | 807,537,452 | |
Foreign currency, at value (cost $5,079,874) | | | 5,221,449 | |
Receivable for Fund shares sold | | | 1,355,424 | |
Receivable for interest | | | 8,468,116 | |
Unrealized gains on forward foreign currency contracts | | | 28,167,396 | |
Prepaid expenses and other assets | | | 66,169 | |
| | | | |
Total assets | | | 850,816,006 | |
| | | | |
| |
Liabilities | | | | |
Payable for investments purchased | | | 4,527,210 | |
Payable for Fund shares redeemed | | | 4,500,821 | |
Unrealized losses on forward foreign currency contracts | | | 11,750,901 | |
Management fee payable | | | 343,455 | |
Distribution fees payable | | | 3,941 | |
Administration fees payable | | | 62,772 | |
Accrued expenses and other liabilities | | | 357,658 | |
| | | | |
Total liabilities | | | 21,546,758 | |
| | | | |
Total net assets | | $ | 829,269,248 | |
| | | | |
| |
NET ASSETS CONSIST OF | | | | |
Paid-in capital | | $ | 907,738,906 | |
Overdistributed net investment income | | | (34,256,875 | ) |
Accumulated net realized losses on investments | | | (50,974,081 | ) |
Net unrealized gains on investments | | | 6,761,298 | |
| | | | |
Total net assets | | $ | 829,269,248 | |
| | | | |
| |
COMPUTATION OF NET ASSET VALUE AND OFFERING PRICE PER SHARE | | | | |
Net assets – Class A | | $ | 51,456,336 | |
Shares outstanding – Class A1 | | | 4,912,515 | |
Net asset value per share – Class A | | | $10.47 | |
Maximum offering price per share – Class A2 | | | $10.96 | |
Net assets – Class B | | $ | 255,372 | |
Shares outstanding – Class B1 | | | 24,638 | |
Net asset value per share – Class B | | | $10.36 | |
Net assets – Class C | | $ | 5,959,050 | |
Shares outstanding – Class C1 | | | 580,439 | |
Net asset value per share – Class C | | | $10.27 | |
Net assets – Class R6 | | $ | 11,187,680 | |
Shares outstanding – Class R61 | | | 1,059,380 | |
Net asset value per share – Class R6 | | | $10.56 | |
Net assets – Administrator Class | | $ | 188,436,733 | |
Shares outstanding – Administrator Class1 | | | 17,956,349 | |
Net asset value per share – Administrator Class | | | $10.49 | |
Net assets – Institutional Class | | $ | 571,974,077 | |
Shares outstanding – Institutional Class1 | | | 54,251,636 | |
Net asset value per share – Institutional Class | | | $10.54 | |
| 1 | The Fund has an unlimited number of authorized shares. |
| 2 | Maximum offering price is computed as 100/95.50 of net asset value. On investments of $50,000 or more, the offering price is reduced. |
The accompanying notes are an integral part of these financial statements.
| | | | | | |
| Statement of operations—six months ended April 30, 2016 (unaudited) | | Wells Fargo International Bond Fund | | | 13 | |
| | | | |
| | | | |
| |
Investment income | | | | |
Interest (net of foreign interest withholding taxes of $72,634) | | $ | 17,455,146 | |
Income from affiliated securities | | | 28,096 | |
Securities lending income, net | | | 7,657 | |
| | | | |
Total investment income | | | 17,490,899 | |
| | | | |
| |
Expenses | | | | |
Management fee | | | 2,704,280 | |
Administration fees | | | | |
Class A | | | 46,838 | |
Class B | | | 262 | |
Class C | | | 4,835 | |
Class R6 | | | 2,343 | |
Administrator Class | | | 120,961 | |
Institutional Class | | | 238,709 | |
Shareholder servicing fees | | | | |
Class A | | | 73,184 | |
Class B | | | 409 | |
Class C | | | 7,555 | |
Administrator Class | | | 301,870 | |
Distribution fees | | | | |
Class B | | | 1,228 | |
Class C | | | 22,665 | |
Custody and accounting fees | | | 217,425 | |
Professional fees | | | 27,295 | |
Registration fees | | | 54,267 | |
Shareholder report expenses | | | 69,855 | |
Trustees’ fees and expenses | | | 10,867 | |
Other fees and expenses | | | 7,761 | |
| | | | |
Total expenses | | | 3,912,609 | |
Less: Fee waivers and/or expense reimbursements | | | (386,744 | ) |
| | | | |
Net expenses | | | 3,525,865 | |
| | | | |
Net investment income | | | 13,965,034 | |
| | | | |
| |
REALIZED AND UNREALIZED GAINS (LOSSES) ON INVESTMENTS | | | | |
| |
Net realized gains (losses) on: | | | | |
Unaffiliated securities | | | (60,487,200 | ) |
Forward foreign currency contract transactions | | | 3,715,182 | |
| | | | |
Net realized losses on investments | | | (56,772,018 | ) |
| | | | |
| |
Net change in unrealized gains (losses) on: | | | | |
Unaffiliated securities | | | 84,619,587 | |
Forward foreign currency contract transactions | | | 23,516,957 | |
| | | | |
Net change in unrealized gains (losses) on investments | | | 108,136,544 | |
| | | | |
Net realized and unrealized gains (losses) on investments | | | 51,364,526 | |
| | | | |
Net increase in net assets resulting from operations | | $ | 65,329,560 | |
| | | | |
The accompanying notes are an integral part of these financial statements.
| | | | |
| 14 | | Wells Fargo International Bond Fund | | Statement of changes in net assets |
| | | | | | | | | | | | | | | | |
| | | Six months ended
April 30, 2016 (unaudited) | | | Year ended
October 31, 2015 | |
| | | | |
Operations | | | | | | | | | | | | | | | | |
Net investment income | | | | | | $ | 13,965,034 | | | | | | | $ | 39,938,003 | |
Net realized losses on investments | | | | | | | (56,772,018 | ) | | | | | | | (103,876,702 | ) |
Net change in unrealized gains (losses) on investments | | | | | | | 108,136,544 | | | | | | | | (56,804,032 | ) |
| | | | |
Net increase (decrease) in net assets resulting from operations | | | | | | | 65,329,560 | | | | | | | | (120,742,731 | ) |
| | | | |
| | | | |
Distributions to shareholders from | | | | | | | | | | | | | | | | |
Net investment income | | | | | | | | | | | | | | | | |
Class A | | | | | | | 0 | | | | | | | | (423,572 | ) |
Class R6 | | | | | | | 0 | | | | | | | | (48,140 | ) |
Administrator Class | | | | | | | 0 | | | | | | | | (1,661,619 | ) |
Institutional Class | | | | | | | 0 | | | | | | | | (4,268,266 | ) |
Net realized gains | | | | | | | | | | | | | | | | |
Class A | | | | | | | (400,990 | ) | | | | | | | (287,937 | ) |
Class B | | | | | | | (2,261 | ) | | | | | | | (2,272 | ) |
Class C | | | | | | | (38,344 | ) | | | | | | | (31,156 | ) |
Class R6 | | | | | | | (83,111 | ) | | | | | | | (18,411 | ) |
Administrator Class | | | | | | | (1,513,668 | ) | | | | | | | (1,004,296 | ) |
Institutional Class | | | | | | | (3,929,124 | ) | | | | | | | (2,298,056 | ) |
| | | | |
Total distributions to shareholders | | | | | | | (5,967,498 | ) | | | | | | | (10,043,725 | ) |
| | | | |
| | | | |
Capital share transactions | | | Shares | | | | | | | | Shares | | | | | |
Proceeds from shares sold | | | | | | | | | | | | | | | | |
Class A | | | 593,508 | | | | 5,914,917 | | | | 4,376,785 | | | | 44,490,295 | |
Class B | | | 0 | | | | 0 | | | | 2 | | | | 19 | |
Class C | | | 7,732 | | | | 74,636 | | | | 29,172 | | | | 297,439 | |
Class R6 | | | 668,486 | | | | 6,454,113 | | | | 1,089,162 | | | | 11,067,245 | |
Administrator Class | | | 3,143,615 | | | | 30,627,128 | | | | 7,459,622 | | | | 76,084,803 | |
Institutional Class | | | 10,956,359 | | | | 109,076,509 | | | | 21,605,888 | | | | 222,681,252 | |
| | | | |
| | | | | | | 152,147,303 | | | | | | | | 354,621,053 | |
| | | | |
Reinvestment of distributions | | | | | | | | | | | | | | | | |
Class A | | | 41,796 | | | | 395,809 | | | | 66,631 | | | | 705,372 | |
Class B | | | 202 | | | | 1,896 | | | | 185 | | | | 1,968 | |
Class C | | | 3,463 | | | | 32,237 | | | | 2,403 | | | | 25,233 | |
Class R6 | | | 8,721 | | | | 83,111 | | | | 6,273 | | | | 66,551 | |
Administrator Class | | | 158,255 | | | | 1,500,258 | | | | 250,106 | | | | 2,645,484 | |
Institutional Class | | | 345,507 | | | | 3,289,229 | | | | 440,841 | | | | 4,675,573 | |
| | | | |
| | | | | | | 5,302,540 | | | | | | | | 8,120,181 | |
| | | | |
Payment for shares redeemed | | | | | | | | | | | | | | | | |
Class A | | | (3,909,816 | ) | | | (37,715,791 | ) | | | (5,719,183 | ) | | | (57,542,516 | ) |
Class B | | | (17,208 | ) | | | (167,704 | ) | | | (41,312 | ) | | | (422,819 | ) |
Class C | | | (150,371 | ) | | | (1,433,244 | ) | | | (395,376 | ) | | | (3,980,181 | ) |
Class R6 | | | (959,822 | ) | | | (9,835,222 | ) | | | (279,791 | ) | | | (2,789,621 | ) |
Administrator Class | | | (12,721,667 | ) | | | (126,118,833 | ) | | | (13,481,584 | ) | | | (136,684,425 | ) |
Institutional Class | | | (27,556,711 | ) | | | (269,261,898 | ) | | | (28,068,413 | ) | | | (285,845,548 | ) |
| | | | |
| | | | | | | (444,532,692 | ) | | | | | | | (487,265,110 | ) |
| | | | |
Net decrease in net assets resulting from capital share transactions | | | | | | | (287,082,849 | ) | | | | | | | (124,523,876 | ) |
| | | | |
Total decrease in net assets | | | | | | | (227,720,787 | ) | | | | | | | (255,310,332 | ) |
| | | | |
| | | | |
Net assets | | | | | | | | | | | | | | | | |
Beginning of period | | | | | | | 1,056,990,035 | | | | | | | | 1,312,300,367 | |
| | | | |
End of period | | | | | | $ | 829,269,248 | | | | | | | $ | 1,056,990,035 | |
| | | | |
Overdistributed net investment income | | | | | | $ | (34,256,875 | ) | | | | | | $ | (48,221,909 | ) |
| | | | |
The accompanying notes are an integral part of these financial statements.
| | | | | | |
| Financial highlights | | Wells Fargo International Bond Fund | | | 15 | |
(For a share outstanding throughout each period)
| | | | | | | | | | | | | | | | | | | | | | | | |
| | | Six months ended
April 30, 2016 (unaudited) | | | Year ended October 31 | |
| CLASS A | | | 2015 | | | 2014 | | | 2013 | | | 2012 | | | 2011 | |
Net asset value, beginning of period | | | $9.74 | | | | $10.84 | | | | $11.32 | | | | $11.83 | | | | $11.85 | | | | $12.23 | |
Net investment income | | | 0.13 | 1 | | | 0.31 | 1 | | | 0.37 | 1 | | | 0.36 | 1 | | | 0.33 | 1 | | | 0.39 | 1 |
Net realized and unrealized gains (losses) on investments | | | 0.66 | | | | (1.33 | ) | | | (0.34 | ) | | | (0.73 | ) | | | 0.08 | | | | (0.18 | ) |
| | | | | | | | | | | | | | | | | | | | | | | | |
Total from investment operations | | | 0.79 | | | | (1.02 | ) | | | 0.03 | | | | (0.37 | ) | | | 0.41 | | | | 0.21 | |
Distributions to shareholders from | | | | | | | | | | | | | | | | | | | | | | | | |
Net investment income | | | 0.00 | | | | (0.05 | ) | | | (0.12 | ) | | | (0.02 | ) | | | (0.29 | ) | | | (0.51 | ) |
Net realized gains | | | (0.06 | ) | | | (0.03 | ) | | | (0.39 | ) | | | (0.12 | ) | | | (0.14 | ) | | | (0.08 | ) |
| | | | | | | | | | | | | | | | | | | | | | | | |
Total distributions to shareholders | | | (0.06 | ) | | | (0.08 | ) | | | (0.51 | ) | | | (0.14 | ) | | | (0.43 | ) | | | (0.59 | ) |
Net asset value, end of period | | | $10.47 | | | | $9.74 | | | | $10.84 | | | | $11.32 | | | | $11.83 | | | | $11.85 | |
Total return2 | | | 8.15 | % | | | (9.50 | )% | | | 0.26 | % | | | (3.18 | )% | | | 3.66 | % | | | 1.93 | % |
Ratios to average net assets (annualized) | | | | | | | | | | | | | | | | | | | | | | | | |
Gross expenses | | | 1.08 | % | | | 1.06 | % | | | 1.05 | % | | | 1.05 | % | | | 1.04 | % | | | 1.02 | % |
Net expenses | | | 1.03 | % | | | 1.03 | % | | | 1.03 | % | | | 1.03 | % | | | 1.03 | % | | | 1.02 | % |
Net investment income | | | 2.78 | % | | | 3.07 | % | | | 3.29 | % | | | 2.93 | % | | | 2.88 | % | | | 3.26 | % |
Supplemental data | | | | | | | | | | | | | | | | | | | | | | | | |
Portfolio turnover rate | | | 49 | % | | | 136 | % | | | 103 | % | | | 129 | % | | | 79 | % | | | 88 | % |
Net assets, end of period (000s omitted) | | | $51,456 | | | | $79,727 | | | | $102,624 | | | | $113,846 | | | | $139,600 | | | | $286,577 | |
| 1 | Calculated based upon average shares outstanding |
| 2 | Total return calculations do not include any sales charges. Returns for periods of less than one year are not annualized. |
The accompanying notes are an integral part of these financial statements.
| | | | |
| 16 | | Wells Fargo International Bond Fund | | Financial highlights |
(For a share outstanding throughout each period)
| | | | | | | | | | | | | | | | | | | | | | | | |
| | | Six months ended
April 30, 2016 (unaudited) | | | Year ended October 31 | |
| CLASS B | | | 2015 | | | 2014 | | | 2013 | | | 2012 | | | 2011 | |
Net asset value, beginning of period | | | $9.67 | | | | $10.81 | | | | $11.27 | | | | $11.85 | | | | $11.88 | | | | $12.25 | |
Net investment income | | | 0.10 | 1 | | | 0.24 | 1 | | | 0.29 | 1 | | | 0.27 | 1 | | | 0.24 | 1 | | | 0.31 | 1 |
Net realized and unrealized gains (losses) on investments | | | 0.65 | | | | (1.35 | ) | | | (0.34 | ) | | | (0.73 | ) | | | 0.09 | | | | (0.19 | ) |
| | | | | | | | | | | | | | | | | | | | | | | | |
Total from investment operations | | | 0.75 | | | | (1.11 | ) | | | (0.05 | ) | | | (0.46 | ) | | | 0.33 | | | | 0.12 | |
Distributions to shareholders from | | | | | | | | | | | | | | | | | | | | | | | | |
Net investment income | | | 0.00 | | | | 0.00 | | | | (0.02 | ) | | | 0.00 | | | | (0.22 | ) | | | (0.41 | ) |
Net realized gains | | | (0.06 | ) | | | (0.03 | ) | | | (0.39 | ) | | | (0.12 | ) | | | (0.14 | ) | | | (0.08 | ) |
| | | | | | | | | | | | | | | | | | | | | | | | |
Total distributions to shareholders | | | (0.06 | ) | | | (0.03 | ) | | | (0.41 | ) | | | (0.12 | ) | | | (0.36 | ) | | | (0.49 | ) |
Net asset value, end of period | | | $10.36 | | | | $9.67 | | | | $10.81 | | | | $11.27 | | | | $11.85 | | | | $11.88 | |
Total return2 | | | 7.79 | % | | | (10.29 | )% | | | (0.44 | )% | | | (3.90 | )% | | | 2.90 | % | | | 1.15 | % |
Ratios to average net assets (annualized) | | | | | | | | | | | | | | | | | | | | | | | | |
Gross expenses | | | 1.83 | % | | | 1.80 | % | | | 1.78 | % | | | 1.80 | % | | | 1.79 | % | | | 1.77 | % |
Net expenses | | | 1.78 | % | | | 1.77 | % | | | 1.77 | % | | | 1.78 | % | | | 1.78 | % | | | 1.77 | % |
Net investment income | | | 2.03 | % | | | 2.33 | % | | | 2.57 | % | | | 2.13 | % | | | 2.12 | % | | | 2.53 | % |
Supplemental data | | | | | | | | | | | | | | | | | | | | | | | | |
Portfolio turnover rate | | | 49 | % | | | 136 | % | | | 103 | % | | | 129 | % | | | 79 | % | | | 88 | % |
Net assets, end of period (000s omitted) | | | $255 | | | | $403 | | | | $895 | | | | $1,998 | | | | $4,008 | | | | $6,925 | |
| 1 | Calculated based upon average shares outstanding |
| 2 | Total return calculations do not include any sales charges. Returns for periods of less than one year are not annualized. |
The accompanying notes are an integral part of these financial statements.
| | | | | | |
| Financial highlights | | Wells Fargo International Bond Fund | | | 17 | |
(For a share outstanding throughout each period)
| | | | | | | | | | | | | | | | | | | | | | | | |
| | | Six months ended
April 30, 2016 (unaudited) | | | Year ended October 31 | |
| CLASS C | | | 2015 | | | 2014 | | | 2013 | | | 2012 | | | 2011 | |
Net asset value, beginning of period | | | $9.58 | | | | $10.70 | | | | $11.19 | | | | $11.76 | | | | $11.81 | | | | $12.20 | |
Net investment income | | | 0.10 | 1 | | | 0.23 | 1 | | | 0.28 | 1 | | | 0.26 | 1 | | | 0.24 | 1 | | | 0.31 | 1 |
Net realized and unrealized gains (losses) on investments | | | 0.65 | | | | (1.32 | ) | | | (0.34 | ) | | | (0.71 | ) | | | 0.08 | | | | (0.19 | ) |
| | | | | | | | | | | | | | | | | | | | | | | | |
Total from investment operations | | | 0.75 | | | | (1.09 | ) | | | (0.06 | ) | | | (0.45 | ) | | | 0.32 | | | | 0.12 | |
Distributions to shareholders from | | | | | | | | | | | | | | | | | | | | | | | | |
Net investment income | | | 0.00 | | | | 0.00 | | | | (0.04 | ) | | | (0.00 | )2 | | | (0.23 | ) | | | (0.43 | ) |
Net realized gains | | | (0.06 | ) | | | (0.03 | ) | | | (0.39 | ) | | | (0.12 | ) | | | (0.14 | ) | | | (0.08 | ) |
| | | | | | | | | | | | | | | | | | | | | | | | |
Total distributions to shareholders | | | (0.06 | ) | | | (0.03 | ) | | | (0.43 | ) | | | (0.12 | ) | | | (0.37 | ) | | | (0.51 | ) |
Net asset value, end of period | | | $10.27 | | | | $9.58 | | | | $10.70 | | | | $11.19 | | | | $11.76 | | | | $11.81 | |
Total return3 | | | 7.76 | % | | | (10.21 | )% | | | (0.52 | )% | | | (3.84 | )% | | | 2.86 | % | | | 1.11 | % |
Ratios to average net assets (annualized) | | | | | | | | | | | | | | | | | | | | | | | | |
Gross expenses | | | 1.83 | % | | | 1.81 | % | | | 1.80 | % | | | 1.80 | % | | | 1.79 | % | | | 1.77 | % |
Net expenses | | | 1.78 | % | | | 1.78 | % | | | 1.78 | % | | | 1.78 | % | | | 1.78 | % | | | 1.77 | % |
Net investment income | | | 2.02 | % | | | 2.33 | % | | | 2.54 | % | | | 2.15 | % | | | 2.12 | % | | | 2.50 | % |
Supplemental data | | | | | | | | | | | | | | | | | | | | | | | | |
Portfolio turnover rate | | | 49 | % | | | 136 | % | | | 103 | % | | | 129 | % | | | 79 | % | | | 88 | % |
Net assets, end of period (000s omitted) | | | $5,959 | | | | $6,895 | | | | $11,597 | | | | $16,097 | | | | $23,448 | | | | $27,861 | |
| 1 | Calculated based upon average shares outstanding |
| 2 | Amount is less than $0.005 per share. |
| 3 | Total return calculations do not include any sales charges. Returns for periods of less than one year are not annualized. |
The accompanying notes are an integral part of these financial statements.
| | | | |
| 18 | | Wells Fargo International Bond Fund | | Financial highlights |
(For a share outstanding throughout each period)
| | | | | | | | | | | | | | | | |
| | | Six months ended
April 30, 2016 (unaudited) | | | Year ended October 31 | |
| CLASS R6 | | | 2015 | | | 2014 | | | 20131 | |
Net asset value, beginning of period | | | $9.80 | | | | $10.88 | | | | $11.36 | | | | $11.80 | |
Net investment income | | | 0.15 | 2 | | | 0.35 | 2 | | | 0.42 | 2 | | | 0.39 | 2 |
Net realized and unrealized gains (losses) on investments | | | 0.67 | | | | (1.34 | ) | | | (0.35 | ) | | | (0.69 | ) |
| | | | | | | | | | | | | | | | |
Total from investment operations | | | 0.82 | | | | (0.99 | ) | | | 0.07 | | | | (0.30 | ) |
Distributions to shareholders from | | | | | | | | | | | | | | | | |
Net investment income | | | 0.00 | | | | (0.06 | ) | | | (0.16 | ) | | | (0.02 | ) |
Net realized gains | | | (0.06 | ) | | | (0.03 | ) | | | (0.39 | ) | | | (0.12 | ) |
| | | | | | | | | | | | | | | | |
Total distributions to shareholders | | | (0.06 | ) | | | (0.09 | ) | | | (0.55 | ) | | | (0.14 | ) |
Net asset value, end of period | | | $10.56 | | | | $9.80 | | | | $10.88 | | | | $11.36 | |
Total return3 | | | 8.40 | % | | | (9.18 | )% | | | 0.60 | % | | | (2.52 | )% |
Ratios to average net assets (annualized) | | | | | | | | | | | | | | | | |
Gross expenses | | | 0.70 | % | | | 0.68 | % | | | 0.67 | % | | | 0.68 | % |
Net expenses | | | 0.65 | % | | | 0.65 | % | | | 0.65 | % | | | 0.65 | % |
Net investment income | | | 3.13 | % | | | 3.46 | % | | | 3.64 | % | | | 3.70 | % |
Supplemental data | | | | | | | | | | | | | | | | |
Portfolio turnover rate | | | 49 | % | | | 136 | % | | | 103 | % | | | 129 | % |
Net assets, end of period (000s omitted) | | | $11,188 | | | | $13,152 | | | | $5,729 | | | | $2,433 | |
| 1 | For the period from November 30, 2012 (commencement of class operations) to October 31, 2013 |
| 2 | Calculated based upon average shares outstanding |
| 3 | Returns for periods of less than one year are not annualized. |
The accompanying notes are an integral part of these financial statements.
| | | | | | |
| Financial highlights | | Wells Fargo International Bond Fund | | | 19 | |
(For a share outstanding throughout each period)
| | | | | | | | | | | | | | | | | | | | | | | | |
| | | Six months ended
April 30, 2016 (unaudited) | | | Year ended October 31 | |
| ADMINISTRATOR CLASS | | | 2015 | | | 2014 | | | 2013 | | | 2012 | | | 2011 | |
Net asset value, beginning of period | | | $9.75 | | | | $10.84 | | | | $11.32 | | | | $11.81 | | | | $11.83 | | | | $12.23 | |
Net investment income | | | 0.14 | 1 | | | 0.33 | 1 | | | 0.39 | 1 | | | 0.36 | 1 | | | 0.35 | 1 | | | 0.38 | 1 |
Net realized and unrealized gains (losses) on investments | | | 0.66 | | | | (1.34 | ) | | | (0.34 | ) | | | (0.71 | ) | | | 0.08 | | | | (0.16 | ) |
| | | | | | | | | | | | | | | | | | | | | | | | |
Total from investment operations | | | 0.80 | | | | (1.01 | ) | | | 0.05 | | | | (0.35 | ) | | | 0.43 | | | | 0.22 | |
Distributions to shareholders from | | | | | | | | | | | | | | | | | | | | | | | | |
Net investment income | | | 0.00 | | | | (0.05 | ) | | | (0.14 | ) | | | (0.02 | ) | | | (0.31 | ) | | | (0.54 | ) |
Net realized gains | | | (0.06 | ) | | | (0.03 | ) | | | (0.39 | ) | | | (0.12 | ) | | | (0.14 | ) | | | (0.08 | ) |
| | | | | | | | | | | | | | | | | | | | | | | | |
Total distributions to shareholders | | | (0.06 | ) | | | (0.08 | ) | | | (0.53 | ) | | | (0.14 | ) | | | (0.45 | ) | | | (0.62 | ) |
Net asset value, end of period | | | $10.49 | | | | $9.75 | | | | $10.84 | | | | $11.32 | | | | $11.81 | | | | $11.83 | |
Total return2 | | | 8.24 | % | | | (9.36 | )% | | | 0.43 | % | | | (2.98 | )% | | | 3.89 | % | | | 2.03 | % |
Ratios to average net assets (annualized) | | | | | | | | | | | | | | | | | | | | | | | | |
Gross expenses | | | 1.02 | % | | | 0.99 | % | | | 0.99 | % | | | 0.99 | % | | | 0.97 | % | | | 0.95 | % |
Net expenses | | | 0.85 | % | | | 0.85 | % | | | 0.85 | % | | | 0.85 | % | | | 0.85 | % | | | 0.85 | % |
Net investment income | | | 2.95 | % | | | 3.26 | % | | | 3.47 | % | | | 3.15 | % | | | 3.04 | % | | | 3.21 | % |
Supplemental data | | | | | | | | | | | | | | | | | | | | | | | | |
Portfolio turnover rate | | | 49 | % | | | 136 | % | | | 103 | % | | | 129 | % | | | 79 | % | | | 88 | % |
Net assets, end of period (000s omitted) | | | $188,437 | | | | $266,849 | | | | $359,383 | | | | $334,778 | | | | $294,330 | | | | $170,836 | |
| 1 | Calculated based upon average shares outstanding |
| 2 | Returns for periods of less than one year are not annualized. |
The accompanying notes are an integral part of these financial statements.
| | | | |
| 20 | | Wells Fargo International Bond Fund | | Financial highlights |
(For a share outstanding throughout each period)
| | | | | | | | | | | | | | | | | | | | | | | | |
| | | Six months ended
April 30, 2016 (unaudited) | | | Year ended October 31 | |
| INSTITUTIONAL CLASS | | | 2015 | | | 2014 | | | 2013 | | | 2012 | | | 2011 | |
Net asset value, beginning of period | | | $9.79 | | | | $10.87 | | | | $11.35 | | | | $11.82 | | | | $11.84 | | | | $12.23 | |
Net investment income | | | 0.15 | 1 | | | 0.35 | 1 | | | 0.41 | 1 | | | 0.37 | | | | 0.36 | | | | 0.44 | |
Net realized and unrealized gains (losses) on investments | | | 0.66 | | | | (1.34 | ) | | | (0.35 | ) | | | (0.70 | ) | | | 0.09 | | | | (0.20 | ) |
| | | | | | | | | | | | | | | | | | | | | | | | |
Total from investment operations | | | 0.81 | | | | (0.99 | ) | | | 0.06 | | | | (0.33 | ) | | | 0.45 | | | | 0.24 | |
Distributions to shareholders from | | | | | | | | | | | | | | | | | | | | | | | | |
Net investment income | | | 0.00 | | | | (0.06 | ) | | | (0.15 | ) | | | (0.02 | ) | | | (0.33 | ) | | | (0.55 | ) |
Net realized gains | | | (0.06 | ) | | | (0.03 | ) | | | (0.39 | ) | | | (0.12 | ) | | | (0.14 | ) | | | (0.08 | ) |
| | | | | | | | | | | | | | | | | | | | | | | | |
Total distributions to shareholders | | | (0.06 | ) | | | (0.09 | ) | | | (0.54 | ) | | | (0.14 | ) | | | (0.47 | ) | | | (0.63 | ) |
Net asset value, end of period | | | $10.54 | | | | $9.79 | | | | $10.87 | | | | $11.35 | | | | $11.82 | | | | $11.84 | |
Total return2 | | | 8.31 | % | | | (9.20 | )% | | | 0.55 | % | | | (2.78 | )% | | | 3.99 | % | | | 2.19 | % |
Ratios to average net assets (annualized) | | | | | | | | | | | | | | | | | | | | | | | | |
Gross expenses | | | 0.75 | % | | | 0.73 | % | | | 0.72 | % | | | 0.72 | % | | | 0.71 | % | | | 0.69 | % |
Net expenses | | | 0.70 | % | | | 0.70 | % | | | 0.70 | % | | | 0.70 | % | | | 0.71 | % | | | 0.69 | % |
Net investment income | | | 3.11 | % | | | 3.41 | % | | | 3.62 | % | | | 3.26 | % | | | 3.19 | % | | | 3.60 | % |
Supplemental data | | | | | | | | | | | | | | | | | | | | | | | | |
Portfolio turnover rate | | | 49 | % | | | 136 | % | | | 103 | % | | | 129 | % | | | 79 | % | | | 88 | % |
Net assets, end of period (000s omitted) | | | $571,974 | | | | $689,964 | | | | $832,072 | | | | $1,115,163 | | | | $1,270,164 | | | | $1,228,793 | |
| 1 | Calculated based upon average shares outstanding |
| 2 | Returns for periods of less than one year are not annualized. |
The accompanying notes are an integral part of these financial statements.
| | | | | | |
| Notes to financial statements (unaudited) | | Wells Fargo International Bond Fund | | | 21 | |
1. ORGANIZATION
Wells Fargo Funds Trust (the “Trust”), a Delaware statutory trust organized on March 10, 1999, is an open-end management investment company registered under the Investment Company Act of 1940, as amended (the “1940 Act”). As an investment company, the Trust follows the accounting and reporting guidance in Financial Accounting Standards Board (“FASB”) Accounting Standards Codification Topic 946, Financial Services – Investment Companies. These financial statements report on the Wells Fargo International Bond Fund (the “Fund”) which is a diversified series of the Trust.
2. SIGNIFICANT ACCOUNTING POLICIES
The following significant accounting policies, which are consistently followed in the preparation of the financial statements of the Fund, are in conformity with U.S. generally accepted accounting principles which require management to make estimates and assumptions that affect the reported amounts of assets and liabilities, disclosure of contingent assets and liabilities at the date of the financial statements, and the reported amounts of revenues and expenses during the reporting period. Actual results could differ from those estimates.
Securities valuation
All investments are valued each business day as of the close of regular trading on the New York Stock Exchange (generally 4 p.m. Eastern Time), although a Fund may deviate from this calculation time under unusual or unexpected circumstances.
Debt securities are valued at the evaluated bid price provided by an independent pricing service or, if a reliable price is not available, the quoted bid price from an independent broker-dealer.
The values of securities denominated in foreign currencies are translated into U.S. dollars at rates provided by an independent foreign currency pricing source at a time each business day specified by the Management Valuation Team of Wells Fargo Funds Management, LLC (“Funds Management”).
Investments in registered open-end investment companies are valued at net asset value. Interests in non-registered investment vehicles that are redeemable at net asset value are fair valued normally at net asset value.
Investments which are not valued using any of the methods discussed above are valued at their fair value, as determined in good faith by the Board of Trustees of the Fund. The Board of Trustees has established a Valuation Committee comprised of the Trustees and has delegated to it the authority to take any actions regarding the valuation of portfolio securities that the Valuation Committee deems necessary or appropriate, including determining the fair value of portfolio securities, unless the determination has been delegated to the Management Valuation Team. The Board of Trustees retains the authority to make or ratify any valuation decisions or approve any changes to the Valuation Procedures as it deems appropriate. On a quarterly basis, the Board of Trustees receives reports on any valuation actions taken by the Valuation Committee or the Management Valuation Team which may include items for ratification.
Valuations of fair valued securities are compared to the next actual sales price when available, or other appropriate market values, to assess the continued appropriateness of the fair valuation methodologies used. These securities are fair valued on a day-to-day basis, taking into consideration changes to appropriate market information and any significant changes to the inputs considered in the valuation process until there is a readily available price provided on an exchange or by an independent pricing service. Valuations received from an independent pricing service or independent broker-dealer quotes are periodically validated by comparisons to most recent trades and valuations provided by other independent pricing services in addition to the review of prices by the manager and/or subadviser. Unobservable inputs used in determining fair valuations are identified based on the type of security, taking into consideration factors utilized by market participants in valuing the investment, knowledge about the issuer and the current market environment.
Foreign currency translation
The accounting records of the Fund are maintained in U.S. dollars. The values of other assets and liabilities denominated in foreign currencies are translated into U.S. dollars at rates provided by an independent foreign currency pricing source at a time each business day specified by the Management Valuation Team. Purchases and sales of securities, and income and expenses are converted at the rate of exchange on the respective dates of such transactions. Net realized foreign exchange gains or losses arise from sales of foreign currencies, currency gains or losses realized between the trade and settlement dates on securities transactions, and the difference between the amounts of dividends, interest and foreign withholding taxes recorded and the U.S. dollar equivalent of the amounts actually paid or received. Net unrealized foreign exchange gains and losses arise from changes in the fair value of assets and liabilities other than investments in securities resulting from changes in exchange rates. The changes in net assets arising from changes in exchange rates and the changes in net assets resulting from changes in market prices of securities are not separately presented. Such changes are included in net realized and unrealized gains or losses from investments.
| | | | |
| 22 | | Wells Fargo International Bond Fund | | Notes to financial statements (unaudited) |
Forward foreign currency contracts
The Fund is subject to foreign currency exchange rate risk in the normal course of pursuing its investment objectives. A forward foreign currency contract is an agreement between two parties to purchase or sell a specific currency for an agreed-upon price at a future date. The Fund enters into forward foreign currency contracts to facilitate transactions in foreign-denominated securities and to attempt to minimize the risk to the Fund from adverse changes in the relationship between currencies. Forward foreign currency contracts are recorded at the forward rate and marked-to-market daily. When the contracts are closed, realized gains and losses arising from such transactions are recorded as realized gains or losses on forward foreign currency contract transactions. The Fund could be exposed to risks if the counterparties to the contracts are unable to meet the terms of their contracts or if the value of the foreign currency changes unfavorably. The Fund’s maximum risk of loss from counterparty credit risk is the unrealized gains on the contracts. This risk may be mitigated if there is a master netting arrangement between the Fund and the counterparty.
Security loans
The Fund may lend its securities from time to time in order to earn additional income in the form of fees or interest on securities received as collateral or the investment of any cash received as collateral. The Fund continues to receive interest or dividends on the securities loaned. The Fund receives collateral in the form of cash or securities with a value at least equal to the value of the securities on loan. The value of the loaned securities is determined at the close of each business day and any additional required collateral is delivered to the Fund on the next business day. In a securities lending transaction, the net asset value of the Fund will be affected by an increase or decrease in the value of the securities loaned and by an increase or decrease in the value of the instrument in which collateral is invested. The amount of securities lending activity undertaken by the Fund fluctuates from time to time. In the event of default or bankruptcy by the borrower, the Fund may be prevented from recovering the loaned securities or gaining access to the collateral or may experience delays or costs in doing so. In addition, the investment of any cash collateral received may lose all or part of its value. The Fund has the right under the lending agreement to recover the securities from the borrower on demand.
The Fund lends its securities through an unaffiliated securities lending agent. Cash collateral received in connection with its securities lending transactions is invested in Securities Lending Cash Investments, LLC (the “Securities Lending Fund”). The Securities Lending Fund is exempt from registration under Section 3(c)(7) of the 1940 Act and is managed by Funds Management and is subadvised by Wells Capital Management Incorporated (“WellsCap”), an affiliate of Funds Management and an indirect wholly owned subsidiary of Wells Fargo & Company (“Wells Fargo”). Funds Management receives an advisory fee starting at 0.05% and declining to 0.01% as the average daily net assets of the Securities Lending Fund increase. All of the fees received by Funds Management are paid to WellsCap for its services as subadviser. The Securities Lending Fund seeks to provide a positive return compared to the daily Fed Funds Open rate by investing in high-quality, U.S. dollar-denominated short-term money market instruments. Securities Lending Fund investments are fair valued based upon the amortized cost valuation technique. Income earned from investment in the Securities Lending Fund is included in securities lending income on the Statement of Operations.
When-issued transactions
The Fund may purchase securities on a forward commitment or when-issued basis. The Fund records a when-issued transaction on the trade date and will segregate assets in an amount at least equal in value to the Fund’s commitment to purchase when-issued securities. Securities purchased on a when-issued basis are marked-to-market daily and the Fund begins earning interest on the settlement date. Losses may arise due to changes in the market value of the underlying securities or if the counterparty does not perform under the contract.
Security transactions and income recognition
Securities transactions are recorded on a trade date basis. Realized gains or losses are recorded on the basis of identified cost.
Interest income is accrued daily and bond discounts are accreted and premiums are amortized daily based on the effective interest method. To the extent debt obligations are placed on non-accrual status, any related interest income may be reduced by writing off interest receivables when the collection of all or a portion of interest has become doubtful based on consistently applied procedures. If the issuer subsequently resumes interest payments or when the collectability of interest is reasonably assured, the debt obligation is removed from non-accrual status.
Income from foreign securities is recorded net of foreign taxes withheld where recovery of such taxes is not assured.
Distributions to shareholders
Distributions to shareholders from net investment income and net realized gains, if any, are recorded on the ex-dividend date. Such distributions are determined in conformity with federal income tax regulations, which may differ in amount or character from net investment income and realized gains recognized for purposes of U.S. generally accepted accounting principles.
| | | | | | |
| Notes to financial statements (unaudited) | | Wells Fargo International Bond Fund | | | 23 | |
Federal and other taxes
The Fund intends to continue to qualify as a regulated investment company by distributing substantially all of its investment company taxable income and any net realized capital gains (after reduction for capital loss carryforwards) sufficient to relieve it from all, or substantially all, federal income taxes. Accordingly, no provision for federal income taxes was required.
The Fund’s income and federal excise tax returns and all financial records supporting those returns for the prior three fiscal years are subject to examination by the federal and Delaware revenue authorities. Management has analyzed the Fund’s tax positions taken on federal, state, and foreign tax returns for all open tax years and does not believe that there are any uncertain tax positions that require recognition of a tax liability.
As of October 31, 2015, the Fund had qualified late-year ordinary losses of $47,186,120 which was recognized on the first day of the current fiscal year.
Class allocations
The separate classes of shares offered by the Fund differ principally in applicable sales charges, distribution, shareholder servicing, and administration fees. Class specific expenses are charged directly to that share class. Investment income, common expenses, and realized and unrealized gains (losses) on investments are allocated daily to each class of shares based on the relative proportion of net assets of each class.
3. FAIR VALUATION MEASUREMENTS
Fair value measurements of investments are determined within a framework that has established a fair value hierarchy based upon the various data inputs utilized in determining the value of the Fund’s investments. The three-level hierarchy gives the highest priority to unadjusted quoted prices in active markets for identical assets or liabilities (Level 1) and the lowest priority to significant unobservable inputs (Level 3). The Fund’s investments are classified within the fair value hierarchy based on the lowest level of input that is significant to the fair value measurement. The inputs are summarized into three broad levels as follows:
| n | | Level 1 – quoted prices in active markets for identical securities |
| n | | Level 2 – other significant observable inputs (including quoted prices for similar securities, interest rates, prepayment speeds, credit risk, use of amortized cost, etc.) |
| n | | Level 3 – significant unobservable inputs (including the Fund’s own assumptions in determining the fair value of investments) |
The inputs or methodologies used for valuing investments in securities are not necessarily an indication of the risk associated with investing in those securities.
The following is a summary of the inputs used in valuing the Fund’s assets and liabilities as of April 30, 2016:
| | | | | | | | | | | | | | | | |
| | | Quoted prices
(Level 1) | | | Other significant
observable inputs
(Level 2) | | | Significant
unobservable inputs (Level 3) | | | Total | |
Assets | | | | | | | | | | | | | | | | |
Investments in: | | | | | | | | | | | | | | | | |
| | | | |
Corporate bonds and notes | | $ | 0 | | | $ | 24,129,469 | | | $ | 0 | | | $ | 24,129,469 | |
| | | | |
Foreign corporate bonds and notes | | | 0 | | | | 119,394,854 | | | | 0 | | | | 119,394,854 | |
| | | | |
Foreign government bonds | | | 0 | | | | 555,557,099 | | | | 0 | | | | 555,557,099 | |
| | | | |
U.S. Treasury securities | | | 77,462,244 | | | | 0 | | | | 0 | | | | 77,462,244 | |
| | | | |
Yankee corporate bonds and notes | | | 0 | | | | 16,423,283 | | | | 0 | | | | 16,423,283 | |
| | | | |
Short-term investments | | | | | | | | | | | | | | | | |
Investment companies | | | 14,570,503 | | | | 0 | | | | 0 | | | | 14,570,503 | |
| | | 92,032,747 | | | | 715,504,705 | | | | 0 | | | | 807,537,452 | |
| | | | |
Forward foreign currency contracts | | | 0 | | | | 28,167,396 | | | | 0 | | | | 28,167,396 | |
Total assets | | $ | 92,032,747 | | | $ | 743,672,101 | | | $ | 0 | | | $ | 835,704,848 | |
Liabilities | | | | | | | | | | | | | | | | |
| | | | |
Forward foreign currency contracts | | $ | 0 | | | $ | 11,750,901 | | | $ | 0 | | | $ | 11,750,901 | |
Total liabilities | | $ | 0 | | | $ | 11,750,901 | | | $ | 0 | | | $ | 11,750,901 | |
| | | | |
| 24 | | Wells Fargo International Bond Fund | | Notes to financial statements (unaudited) |
Forward foreign currency contracts are reported at their unrealized gains (losses) at measurement date, which represents the change in the contract’s value from trade date. All other assets and liabilities are reported at their market value at measurement date.
The Fund recognizes transfers between levels within the fair value hierarchy at the end of the reporting period. At April 30, 2016, the Fund did not have any transfers into/out of Level 1, Level 2 or Level 3.
4. TRANSACTIONS WITH AFFILIATES
Management fee
Funds Management, an indirect wholly owned subsidiary of Wells Fargo, is the manager of the Fund and provides advisory and fund-level administrative services under an investment management agreement. Under the investment management agreement, Funds Management is responsible for, among other services, implementing the investment objectives and strategies of the Fund, supervising the applicable subadviser, providing fund-level administrative services in connection with the Fund’s operations, and providing any other fund-level administrative services reasonably necessary for the operation of the Fund. As compensation for its services under the investment management agreement, Funds Management is entitled to receive an annual management fee starting at 0.60% and declining to 0.48% as the average daily net assets of the Fund increase.
For the six months ended April 30, 2016, the management fee was equivalent to an annual rate of 0.59% of the Fund’s average daily net assets.
Funds Management has retained the services of a subadviser to provide daily portfolio management to the Fund. The fee for subadvisory services is borne by Funds Management. First International Advisors, LLC, an affiliate of Funds Management and an indirect wholly owned subsidiary of Wells Fargo, is the subadviser to the Fund and is entitled to receive a fee from Funds Management at an annual rate starting at 0.35% and declining to 0.20% as the average daily net assets of the Fund increase.
Administration fees
Under a class-level administration agreement, Funds Management provides class-level administrative services to the Fund, which includes paying fees and expenses for services provided by the transfer agent, sub-transfer agents, omnibus account servicers and record-keepers. As compensation for its services under the class-level administration agreement, Funds Management receives an annual fee which is calculated based on the average daily net assets of each class as follows:
| | | | |
| | | Class-level
administration fee | |
Class A, Class B, Class C | | | 0.16 | % |
Class R6 | | | 0.03 | |
Administrator Class | | | 0.10 | |
Institutional Class | | | 0.08 | |
Funds Management has contractually waived and/or reimbursed management and administration fees to the extent necessary to maintain certain net operating expense ratios for the Fund. Waiver of fees and/or reimbursement of expenses by Funds Management were made first from fund level expenses on a proportionate basis and then from class specific expenses. Funds Management has committed through February 28, 2017 to waive fees and/or reimburse expenses to the extent necessary to cap the Fund’s expenses at 1.03% for Class A shares, 1.78% for Class B shares, 1.78% for Class C shares, 0.65% for Class R6 shares, 0.85% for Administrator Class shares, and 0.70% for Institutional Class shares. After this time, the cap may be increased or the commitment to maintain the cap may be terminated only with the approval of the Board of Trustees.
Distribution fees
The Trust has adopted a distribution plan for Class B and Class C shares of the Fund pursuant to Rule 12b-1 under the 1940 Act. Distribution fees are charged to Class B and Class C shares and paid to Wells Fargo Funds Distributor, LLC (“Funds Distributor”), the principal underwriter, at an annual rate of 0.75% of the average daily net assets of Class B and Class C shares.
| | | | | | |
| Notes to financial statements (unaudited) | | Wells Fargo International Bond Fund | | | 25 | |
In addition, Funds Distributor is entitled to receive the front-end sales charge from the purchase of Class A shares and a contingent deferred sales charge on the redemption of certain Class A shares. Funds Distributor is also entitled to receive the contingent deferred sales charges from redemptions of Class B and Class C shares. For the six months ended April 30, 2016, Funds Distributor received $356 from the sale of Class A shares.
Shareholder servicing fees
The Trust has entered into contracts with one or more shareholder servicing agents, whereby Class A, Class B, Class C, and Administrator Class of the Fund are charged a fee at an annual rate of 0.25% of the average daily net assets of each respective class.
A portion of these total shareholder servicing fees were paid to affiliates of Wells Fargo.
5. INVESTMENT PORTFOLIO TRANSACTIONS
Purchases and sales of investments, excluding short-term securities, for the six months ended April 30, 2016 were as follows:
| | | | | | |
Purchases at cost | | Sales proceeds |
U.S.
government | | Non-U.S.
government | | U.S.
government | | Non-U.S.
government |
| $126,183,552 | | $310,850,500 | | $134,478,770 | | $555,871,110 |
6. DERIVATIVE TRANSACTIONS
During the six months ended April 30, 2016, the Fund entered into forward foreign currency contracts for economic hedging purposes.
At April 30, 2016, the Fund had forward foreign currency contracts outstanding as follows:
Forward foreign currency contracts to buy:
| | | | | | | | | | | | | | | | | | |
| Exchange date | | Counterparty | | Contracts to
receive | | | U.S. value at
April 30, 2016 | | | In exchange for U.S. $ | | | Unrealized
gains | |
| 5-9-2016 | | State Street Bank | | | 500,000,000 | HUF | | $ | 1,835,092 | | | $ | 1,833,539 | | | $ | 1,553 | |
| 5-11-2016 | | State Street Bank | | | 15,850,000 | THB | | | 453,706 | | | | 444,264 | | | | 9,442 | |
| 5-11-2016 | | State Street Bank | | | 10,500,000,000 | IDR | | | 795,334 | | | | 772,059 | | | | 23,275 | |
| 5-11-2016 | | State Street Bank | | | 49,125,000 | THB | | | 1,406,203 | | | | 1,381,857 | | | | 24,346 | |
| 5-11-2016 | | State Street Bank | | | 5,000,000 | MYR | | | 1,279,204 | | | | 1,191,753 | | | | 87,451 | |
| 5-12-2016 | | State Street Bank | | | 2,870,000,000 | JPY | | | 26,976,901 | | | | 25,415,346 | | | | 1,561,555 | |
| 5-12-2016 | | State Street Bank | | | 20,100,000,000 | JPY | | | 188,932,300 | | | | 174,812,251 | | | | 14,120,049 | |
| 5-12-2016 | | State Street Bank | | | 2,500,000,000 | JPY | | | 23,499,042 | | | | 21,816,665 | | | | 1,682,377 | |
| 5-16-2016 | | State Street Bank | | | 3,975,000 | RON | | | 1,016,064 | | | | 1,015,040 | | | | 1,024 | |
| 6-13-2016 | | State Street Bank | | | 1,000,000 | GBP | | | 1,461,302 | | | | 1,439,509 | | | | 21,793 | |
| 6-13-2016 | | State Street Bank | | | 800,000 | GBP | | | 1,169,042 | | | | 1,146,408 | | | | 22,634 | |
| 6-14-2016 | | State Street Bank | | | 6,000,000 | NZD | | | 4,180,167 | | | | 4,103,964 | | | | 76,203 | |
| 6-16-2016 | | State Street Bank | | | 27,5325,000 | EUR | | | 315,677,089 | | | | 306,851,915 | | | | 8,825,174 | |
| 6-16-2016 | | State Street Bank | | | 5,000,000 | EUR | | | 5,732,808 | | | | 5,716,560 | | | | 16,248 | |
| 6-17-2016 | | State Street Bank | | | 3,000,000 | AUD | | | 2,276,826 | | | | 2,230,959 | | | | 45,867 | |
| 7-29-2016 | | State Street Bank | | | 28,600,000 | CAD | | | 22,794,475 | | | | 22,794,021 | | | | 454 | |
| | | | | | | | | | | | | | | | | | | | | | |
| Exchange date | | Counterparty | | Contracts to
receive | | | U.S. value at
April 30, 2016 | | | In exchange
for | | | U.S. value at
April 30, 2016 | | | Unrealized
gains | |
| 7-22-2016 | | State Street Bank | | | 10,600,000,000 | JPY | | $ | 99,848,250 | | | | 85,549,413 | EUR | | $ | 98,200,299 | | | $ | 1,647,951 | |
| | | | |
| 26 | | Wells Fargo International Bond Fund | | Notes to financial statements (unaudited) |
Forward foreign currency contracts to sell:
| | | | | | | | | | | | | | | | | | |
| Exchange date | | Counterparty | | Contracts to
deliver | | | U.S. value at
April 30, 2016 | | | In exchange
for U.S. $ | | | Unrealized
losses | |
| 5-2-2016 | | State Street Bank | | | 18,250,000 | CAD | | $ | 13,551,564 | | | $ | 13,551,564 | | | $ | 0 | |
| 5-9-2016 | | State Street Bank | | | 500,000,000 | HUF | | | 1,835,091 | | | | 1,800,926 | | | | (34,165 | ) |
| 5-11-2016 | | State Street Bank | | | 10,500,000,000 | IDR | | | 795,334 | | | | 754,094 | | | | (41,240 | ) |
| 5-11-2016 | | State Street Bank | | | 5,000,000 | MYR | | | 1,279,204 | | | | 1,179,663 | | | | (99,541 | ) |
| 5-11-2016 | | State Street Bank | | | 64,975,000 | THB | | | 1,859,909 | | | | 1,852,459 | | | | (7,450 | ) |
| 5-12-2016 | | State Street Bank | | | 4,140,000,000 | JPY | | | 38,914,414 | | | | 38,321,269 | | | | (593,145 | ) |
| 5-12-2016 | | State Street Bank | | | 1,835,000,000 | JPY | | | 17,248,297 | | | | 16,359,404 | | | | (888,893 | ) |
| 5-12-2016 | | State Street Bank | | | 225,200,000 | THB | | | 6,446,193 | | | | 6,351,176 | | | | (95,017 | ) |
| 5-12-2016 | | State Street Bank | | | 975,000,000 | JPY | | | 9,164,627 | | | | 8,646,008 | | | | (518,619 | ) |
| 5-12-2016 | | State Street Bank | | | 206,875,000 | THB | | | 5,921,653 | | | | 5,771,538 | | | | (150,115 | ) |
| 5-12-2016 | | State Street Bank | | | 925,000,000 | JPY | | | 8,694,646 | | | | 8,268,230 | | | | (426,416 | ) |
| 5-12-2016 | | State Street Bank | | | 193,000,000 | THB | | | 5,524,491 | | | | 5,394,648 | | | | (129,843 | ) |
| 5-12-2016 | | State Street Bank | | | 185,000,000 | THB | | | 5,295,496 | | | | 5,183,089 | | | | (112,407 | ) |
| 5-12-2016 | | State Street Bank | | | 225,000,000 | JPY | | | 2,114,914 | | | | 1,981,956 | | | | (132,958 | ) |
| 5-12-2016 | | State Street Bank | | | 265,000,000 | JPY | | | 2,490,898 | | | | 2,358,950 | | | | (131,948 | ) |
| 5-12-2016 | | State Street Bank | | | 350,000,000 | JPY | | | 3,289,866 | | | | 3,085,331 | | | | (204,535 | ) |
| 5-16-2016 | | State Street Bank | | | 3,975,000 | RON | | | 1,016,064 | | | | 1,004,168 | | | | (11,896 | ) |
| 6-13-2016 | | State Street Bank | | | 60,850,000 | GBP | | | 88,920,224 | | | | 86,588,333 | | | | (2,331,891 | ) |
| 6-13-2016 | | State Street Bank | | | 5,486,053 | GBP | | | 8,016,779 | | | | 7,945,000 | | | | (71,779 | ) |
| 6-14-2016 | | State Street Bank | | | 60,000,000 | NZD | | | 41,801,670 | | | | 39,841,140 | | | | (1,960,530 | ) |
| 6-16-2016 | | State Street Bank | | | 4,800,000 | EUR | | | 5,503,496 | | | | 5,484,792 | | | | (18,704 | ) |
| 6-16-2016 | | State Street Bank | | | 26,000,000 | EUR | | | 29,810,603 | | | | 29,421,002 | | | | (389,601 | ) |
| 6-16-2016 | | State Street Bank | | | 8,600,000 | EUR | | | 9,860,430 | | | | 9,796,269 | | | | (64,161 | ) |
| 6-16-2016 | | State Street Bank | | | 13,650,000 | EUR | | | 15,650,567 | | | | 15,482,826 | | | | (167,741 | ) |
| 6-16-2016 | | State Street Bank | | | 1,750,000 | EUR | | | 2,006,483 | | | | 1,945,568 | | | | (60,915 | ) |
| 6-17-2016 | | State Street Bank | | | 90,000,000 | MYR | | | 22,961,022 | | | | 21,658,565 | | | | (1,302,457 | ) |
| 6-17-2016 | | State Street Bank | | | 107,450,000 | AUD | | | 81,548,324 | | | | 79,880,694 | | | | (1,667,630 | ) |
| 7-15-2016 | | State Street Bank | | | 8,250,000,000 | KRW | | | 7,232,357 | | | | 7,189,167 | | | | (43,190 | ) |
| 7-15-2016 | | State Street Bank | | | 44,700,000 | SGD | | | 33,189,290 | | | | 33,095,176 | | | | (94,114 | ) |
The Fund had average contract amounts of $156,763,006 and $538,578,318 in forward foreign currency contracts to buy and forward foreign currency contracts to sell, respectively, during the six months ended April 30, 2016.
The fair value, realized gains or losses and change in unrealized gains or losses, if any, on derivative instruments are reflected in the appropriate financial statements.
For certain types of derivative transactions, the Fund has entered into International Swaps and Derivatives Association, Inc. master agreements (“ISDA Master Agreements”) or similar agreements with approved counterparties. The ISDA Master Agreements or similar agreements may have requirements to deliver/deposit securities or cash to/with an exchange or broker-dealer as collateral and allows the Fund to offset, with each counterparty, certain derivative financial instrument’s assets and/or liabilities with collateral held or pledged. Collateral requirements differ by type of derivative. Collateral or margin requirements are set by the broker or exchange clearing house for exchange traded derivatives while collateral terms are contract specific for over-the-counter traded derivatives. Cash collateral that has been pledged to cover obligations of the Fund under ISDA Master Agreements or similar agreements, if any, are reported separately in the Statement of Assets and Liabilities. Securities pledged as collateral, if any, are noted in the Portfolio of Investments. With respect to balance sheet offsetting, absent an event of default by the counterparty or a termination of the agreement, the reported amounts of financial assets and financial liabilities in the Statement of Assets and Liabilities are not offset across
| | | | | | |
| Notes to financial statements (unaudited) | | Wells Fargo International Bond Fund | | | 27 | |
transactions between the Fund and the applicable counterparty. A reconciliation of the gross amounts on the Statement of Assets and Liabilities to the net amounts by derivative type, including any collateral exposure, is as follows:
| | | | | | | | | | | | | | | | |
| Derivative type | | Counterparty | | Gross amounts
of assets in the
Statement of
Assets and
Liabilities | | Amounts
subject to
netting
agreements | | | Collateral
received | | | Net amount
of assets | |
Forward foreign currency contracts | | State Street Bank | | $28,167,396* | | $ | (11,750,901 | ) | | $ | 0 | | | $ | 16,416,495 | |
| * | Amount represents net unrealized gains. |
| | | | | | | | | | | | | | | | |
| Derivative type | | Counterparty | | Gross amounts
of liabilities in the
Statement of
Assets and
Liabilities | | Amounts
subject to
netting
agreements | | | Collateral
received | | | Net amount
of liabilities | |
Forward foreign currency contracts | | State Street Bank | | $11,750,901* | | $ | (11,750,901 | ) | | $ | 0 | | | $ | 0 | |
| * | Amount represents net unrealized losses. |
7. BANK BORROWINGS
The Trust (excluding the money market funds and certain other fund) and Wells Fargo Variable Trust are parties to a $200,000,000 revolving credit agreement whereby the Fund is permitted to use bank borrowings for temporary or emergency purposes, such as to fund shareholder redemption requests. Interest under the credit agreement is charged to the Fund based on a borrowing rate equal to the higher of the Federal Funds rate in effect on that day plus 1.25% or the overnight LIBOR rate in effect on that day plus 1.25%. In addition, an annual commitment fee equal to 0.20% of the unused balance is allocated to each participating fund.
For the six months ended April 30, 2016, there were no borrowings by the Fund under the agreement.
8. INDEMNIFICATION
Under the Trust’s organizational documents, the officers and Trustees have been granted certain indemnification rights against certain liabilities that may arise out of performance of their duties to the Trust. Additionally, in the normal course of business, the Trust may enter into contracts with service providers that contain a variety of indemnification clauses. The Trust’s maximum exposure under these arrangements is dependent on future claims that may be made against the Fund and, therefore, cannot be estimated.
| | | | |
| 28 | | Wells Fargo International Bond Fund | | Other information (unaudited) |
PROXY VOTING INFORMATION
A description of the policies and procedures that the Fund uses to determine how to vote proxies relating to portfolio securities is available, upon request, by calling 1-800-222-8222, visiting our website at wellsfargofunds.com, or visiting the SEC website at sec.gov. Information regarding how the Fund voted proxies relating to portfolio securities during the most recent 12-month period ended June 30 is available on the Fund’s website at wellsfargofunds.com or by visiting the SEC website at sec.gov.
PORTFOLIO HOLDINGS INFORMATION
The complete portfolio holdings for the Fund are publicly available monthly on the Fund’s website (wellsfargofunds.com), on a one-month delayed basis. In addition, top ten holdings information (excluding derivative positions) for the Fund is publicly available on the Fund’s website on a monthly, seven-day or more delayed basis. The Fund files its complete schedule of portfolio holdings with the SEC for the first and third quarters of each fiscal year on Form N-Q, which is available by visiting the SEC website at sec.gov. In addition, the Fund’s Form N-Q may be reviewed and copied at the SEC’s Public Reference Room in Washington, DC, and at regional offices in New York City, at 233 Broadway, and in Chicago, at 175 West Jackson Boulevard, Suite 900. Information about the Public Reference Room may be obtained by calling 1-800-SEC-0330.
| | | | | | |
| Other information (unaudited) | | Wells Fargo International Bond Fund | | | 29 | |
BOARD OF TRUSTEES AND OFFICERS
Each of the Trustees and Officers1 listed in the table below acts in identical capacities for each fund in the Wells Fargo family of funds, which consists of 141 mutual funds comprising the Wells Fargo Funds Trust, Wells Fargo Variable Trust, Wells Fargo Master Trust and four closed-end funds (collectively the “Fund Complex”). This table should be read in conjunction with the Prospectus and the Statement of Additional Information2. The mailing address of each Trustee and Officer is 525 Market Street, 12th Floor, San Francisco, CA 94105. Each Trustee and Officer serves an indefinite term, however, each Trustee serves such term until reaching the mandatory retirement age established by the Trustees.
Independent Trustees
| | | | | | |
Name and year of birth | | Position held and length of service* | | Principal occupations during past five years or longer | | Current other public
company or investment
company directorships |
William R. Ebsworth
(Born 1957) | | Trustee, since 2015 | | Retired. From 1984 to 2013, equities analyst, portfolio manager, research director and chief financial officer at Fidelity Management and Research Company in Boston, Tokyo, and Hong Kong and retired in 2013 as Chief Investment Officer of Fidelity Strategic Advisers, Inc. where he lead a team of investment professionals managing client assets. Prior thereto, Board member of Hong Kong Securities Clearing Co., Hong Kong Options Clearing Corp., the Thailand International Fund, Ltd., Fidelity Investments Life Insurance Company, and Empire Fidelity Investments Life Insurance Company. Mr. Ebsworth is a CFA® charterholder and an Adjunct Lecturer, Finance, at Babson College. | | Asset Allocation Trust |
Jane A. Freeman
(Born 1953) | | Trustee, since 2015 | | Retired. From 2012 to 2014 and 1999 to 2008, Chief Financial Officer of Scientific Learning Corporation. From 2008 to 2012, Ms. Freeman provided consulting services related to strategic business projects. Prior to 1999, Portfolio Manager at Rockefeller & Co. and Scudder, Stevens & Clark. Board member of the Harding Loevner Funds from 1996 to 2014, serving as both Lead Independent Director and chair of the Audit Committee. Board member of the Russell Exchange Traded Funds Trust from 2011 to 2012 and the chair of the Audit Committee. Ms. Freeman is Chair of Taproot Foundation (non-profit organization), a Board Member of Ruth Bancroft Garden (non-profit organization) and an inactive chartered financial analyst. | | Asset Allocation Trust |
Peter G. Gordon
(Born 1942) | | Trustee, since 1998; Chairman, since 2005 | | Co-Founder, Retired Chairman, President and CEO of Crystal Geyser Water Company. Trustee Emeritus, Colby College. | | Asset Allocation Trust |
Isaiah Harris, Jr.
(Born 1952) | | Trustee, since 2009 | | Retired. Chairman of the Board of CIGNA Corporation since 2009, and Director since 2005. From 2003 to 2011, Director of Deluxe Corporation. Prior thereto, President and CEO of BellSouth Advertising and Publishing Corp. from 2005 to 2007, President and CEO of BellSouth Enterprises from 2004 to 2005 and President of BellSouth Consumer Services from 2000 to 2003. Emeritus member of the Iowa State University Foundation Board of Governors. Emeritus Member of the Advisory Board of Iowa State University School of Business. Advisory Board Member, Palm Harbor Academy (charter school). Advisory Board Member, Child Evangelism Fellowship (non-profit). Mr. Harris is a certified public accountant (inactive status). | | CIGNA Corporation; Asset Allocation Trust |
| Judith M. Johnson (Born 1949) | | Trustee, since 2008; Audit Committee Chairman, since 2008 | | Retired. Prior thereto, Chief Executive Officer and Chief Investment Officer of Minneapolis Employees Retirement Fund from 1996 to 2008. Ms. Johnson is an attorney, certified public accountant and a certified managerial accountant. | | Asset Allocation Trust |
| David F. Larcker (Born 1950) | | Trustee, since 2009 | | James Irvin Miller Professor of Accounting at the Graduate School of Business, Stanford University, Director of the Corporate Governance Research Initiative and Senior Faculty of The Rock Center for Corporate Governance since 2006. From 2005 to 2008, Professor of Accounting at the Graduate School of Business, Stanford University. Prior thereto, Ernst & Young Professor of Accounting at The Wharton School, University of Pennsylvania from 1985 to 2005. | | Asset Allocation Trust |
| | | | |
| 30 | | Wells Fargo International Bond Fund | | Other information (unaudited) |
| | | | | | |
Name and year of birth | | Position held and length of service* | | Principal occupations during past five years or longer | | Current other public
company or investment
company directorships |
Olivia S. Mitchell
(Born 1953) | | Trustee, since 2006 | | International Foundation of Employee Benefit Plans Professor, Wharton School of the University of Pennsylvania since 1993. Director of Wharton’s Pension Research Council and Boettner Center on Pensions & Retirement Research, and Research Associate at the National Bureau of Economic Research. Previously, Cornell University Professor from 1978 to 1993. | | Asset Allocation Trust |
Timothy J. Penny
(Born 1951) | | Trustee, since 1996 | | President and Chief Executive Officer of Southern Minnesota Initiative Foundation, a non-profit organization, since 2007 and Senior Fellow at the Humphrey Institute Policy Forum at the University of Minnesota since 1995. Member of the Board of Trustees of NorthStar Education Finance, Inc., a non-profit organization, since 2007. | | Asset Allocation Trust |
Michael S. Scofield
(Born 1943) | | Trustee, since 2010 | | Served on the Investment Company Institute’s Board of Governors and Executive Committee from 2008-2011 as well the Governing Council of the Independent Directors Council from 2006-2011 and the Independent Directors Council Executive Committee from 2008-2011. Chairman of the IDC from 2008-2010. Institutional Investor (Fund Directions) Trustee of Year in 2007. Trustee of the Evergreen Funds complex (and its predecessors) from 1984 to 2010. Chairman of the Evergreen Funds from 2000-2010. Former Trustee of the Mentor Funds. Retired Attorney, Law Offices of Michael S. Scofield. | | Asset Allocation Trust |
| * | Length of service dates reflect the Trustee’s commencement of service with the Trust’s predecessor entities, where applicable. |
Officers
| | | | | | |
Name and year of birth | | Position held and
length of service | | Principal occupations during past five years or longer | | |
Karla M. Rabusch
(Born 1959) | | President, since 2003 | | Executive Vice President of Wells Fargo Bank, N.A. and President of Wells Fargo Funds Management, LLC since 2003. | | |
Nancy Wiser1
(Born 1967) | | Treasurer, since 2012 | | Executive Vice President of Wells Fargo Funds Management, LLC since 2011. Chief Operating Officer and Chief Compliance Officer at LightBox Capital Management LLC, from 2008 to 2011. | | |
C. David Messman
(Born 1960) | | Secretary, since 2000; Chief Legal Officer, since 2003 | | Senior Vice President and Secretary of Wells Fargo Funds Management, LLC since 2001. Assistant General Counsel of Wells Fargo Bank, N.A. since 2013 and Vice President and Managing Counsel of Wells Fargo Bank, N.A. from 1996 to 2013. | | |
Michael Whitaker
(Born 1967) | | Chief Compliance Officer, since 2016* | | Executive Vice President of Wells Fargo Funds Management, LLC since 2016. Chief Compliance Officer of Fidelity’s Fixed Income Funds and Asset Allocation Funds from 2008 to 2016, Compliance Officer of FMR Co., Inc. from 2014 to 2016, Fidelity Investments Money Management, Inc. from 2014 to 2016, Fidelity Investments from 2007 to 2016. | | |
Debra Ann Early
(Born 1964) | | Chief Compliance Officer, since 2007** | | Executive Vice President of Wells Fargo Funds Management, LLC since 2014, Senior Vice President and Chief Compliance Officer from 2007 to 2014. | | |
David Berardi
(Born 1975) | | Assistant Treasurer, since 2009 | | Vice President of Wells Fargo Funds Management, LLC since 2009. Vice President of Evergreen Investment Management Company, LLC from 2008 to 2010. Manager of Fund Reporting and Control for Evergreen Investment Management Company, LLC from 2004 to 2010. | | |
Jeremy DePalma1
(Born 1974) | | Assistant Treasurer, since 2009 | | Senior Vice President of Wells Fargo Funds Management, LLC since 2009. Senior Vice President of Evergreen Investment Management Company, LLC from 2008 to 2010 and head of the Fund Reporting and Control Team within Fund Administration from 2005 to 2010. | | |
| 1 | Nancy Wiser acts as Treasurer of 72 funds in the Fund Complex. Jeremy DePalma acts as Treasurer of 69 funds and Assistant Treasurer of 72 funds in the Fund Complex. |
| 2 | The Statement of Additional Information includes additional information about the Trustees and is available, without charge, upon request, by calling 1-800-222-8222 or by visiting the website at wellsfargofunds.com. |
| * | Michael Whitaker became Chief Compliance Officer effective May 16, 2016. |
| ** | Debra Ann Early was the Chief Compliance Officer until May 15, 2016. |
| | | | | | |
| List of abbreviations | | Wells Fargo International Bond Fund | | | 31 | |
The following is a list of common abbreviations for terms and entities that may have appeared in this report.
| ACA | — ACA Financial Guaranty Corporation |
| ADR | — American depositary receipt |
| ADS | — American depositary shares |
| AGC | — Assured Guaranty Corporation |
| AGM | — Assured Guaranty Municipal |
| Ambac | — Ambac Financial Group Incorporated |
| AMT | — Alternative minimum tax |
| BAN | — Bond anticipation notes |
| BHAC | — Berkshire Hathaway Assurance Corporation |
| CAB | — Capital appreciation bond |
| CCAB | — Convertible capital appreciation bond |
| CDA | — Community Development Authority |
| CDO | — Collateralized debt obligation |
| DRIVER | — Derivative inverse tax-exempt receipts |
| DW&P | — Department of Water & Power |
| DWR | — Department of Water Resources |
| ECFA | — Educational & Cultural Facilities Authority |
| EDA | — Economic Development Authority |
| EDFA | — Economic Development Finance Authority |
| ETF | — Exchange-traded fund |
| FDIC | — Federal Deposit Insurance Corporation |
| FFCB | — Federal Farm Credit Banks |
| FGIC | — Financial Guaranty Insurance Corporation |
| FHA | — Federal Housing Administration |
| FHLB | — Federal Home Loan Bank |
| FHLMC | — Federal Home Loan Mortgage Corporation |
| FICO | — The Financing Corporation |
| FNMA | — Federal National Mortgage Association |
| GDR | — Global depositary receipt |
| GNMA | — Government National Mortgage Association |
| HCFR | — Healthcare facilities revenue |
| HEFA | — Health & Educational Facilities Authority |
| HEFAR | — Higher education facilities authority revenue |
| HFA | — Housing Finance Authority |
| HFFA | — Health Facilities Financing Authority |
| HUD | — Department of Housing and Urban Development |
| IDA | — Industrial Development Authority |
| IDAG | — Industrial Development Agency |
| KRW | — Republic of Korea won |
| LIBOR | — London Interbank Offered Rate |
| LIFER | — Long Inverse Floating Exempt Receipts |
| LLC | — Limited liability company |
| LLLP | — Limited liability limited partnership |
| LLP | — Limited liability partnership |
| MBIA | — Municipal Bond Insurance Association |
| MFHR | — Multifamily housing revenue |
| MSTR | — Municipal securities trust receipts |
| MUD | — Municipal Utility District |
| National | — National Public Finance Guarantee Corporation |
| PCFA | — Pollution Control Financing Authority |
| PCL | — Public Company Limited |
| PCR | — Pollution control revenue |
| PFA | — Public Finance Authority |
| PFFA | — Public Facilities Financing Authority |
| PFOTER | — Puttable floating option tax-exempt receipts |
| plc | — Public limited company |
| PUTTER | — Puttable tax-exempt receipts |
| R&D | — Research & development |
| Radian | — Radian Asset Assurance |
| RAN | — Revenue anticipation notes |
| RDA | — Redevelopment Authority |
| RDFA | — Redevelopment Finance Authority |
| REIT | — Real estate investment trust |
| ROC | — Reset option certificates |
| SAVRS | — Select auction variable rate securities |
| SBA | — Small Business Authority |
| SDR | — Swedish depositary receipt |
| SFHR | — Single-family housing revenue |
| SFMR | — Single-family mortgage revenue |
| SPA | — Standby purchase agreement |
| SPDR | — Standard & Poor’s Depositary Receipts |
| SPEAR | — Short Puttable Exempt Adjustable Receipts |
| STRIPS | — Separate trading of registered interest and |
| TAN | — Tax anticipation notes |
| TIPS | — Treasury inflation-protected securities |
| TRAN | — Tax revenue anticipation notes |
| TTFA | — Transportation Trust Fund Authority |
| TVA | — Tennessee Valley Authority |
This page is intentionally left blank.

For more information
More information about Wells Fargo Funds is available free upon request. To obtain literature, please write, email, visit the Fund’s website, or call:
Wells Fargo Funds
P.O. Box 8266
Boston, MA 02266-8266
Email: fundservice@wellsfargo.com
Website: wellsfargofunds.com
Individual investors: 1-800-222-8222
Retail investment professionals: 1-888-877-9275
Institutional investment professionals: 1-866-765-0778
This report and the financial statements contained herein are submitted for the general information of the shareholders of the Fund. If this report is used for promotional purposes, distribution of the report must be accompanied or preceded by a current prospectus. Before investing, please consider the investment objectives, risks, charges, and expenses of the investment. For a current prospectus and, if available, a summary prospectus, containing this information, call 1-800-222-8222 or visit the Fund’s website at wellsfargofunds.com. Read the prospectus carefully before you invest or send money.
Wells Fargo Asset Management (WFAM) is a trade name used by the asset management businesses of Wells Fargo & Company. Wells Fargo Funds Management, LLC, a wholly owned subsidiary of Wells Fargo & Company, provides investment advisory and administrative services for Wells Fargo Funds. Other affiliates of Wells Fargo & Company provide subadvisory and other services for the funds. The funds are distributed by Wells Fargo Funds Distributor, LLC, Member FINRA, an affiliate of Wells Fargo & Company.
NOT FDIC INSURED ¡ NO BANK GUARANTEE ¡ MAY LOSE VALUE
© 2016 Wells Fargo Funds Management, LLC. All rights reserved.
| | |
 | | 242226 06-16 SA235/SAR235 04-16 |
Semi-Annual Report
April 30, 2016

Wells Fargo Strategic Income Fund


Reduce clutter. Save trees.
Sign up for electronic delivery of prospectuses and shareholder reports at wellsfargo.com/advantagedelivery
Contents
The views expressed and any forward-looking statements are as of April 30, 2016, unless otherwise noted, and are those of the Fund managers and/or Wells Fargo Funds Management, LLC. Discussions of individual securities, or the markets generally, or any Wells Fargo Fund are not intended as individual recommendations. Future events or results may vary significantly from those expressed in any forward-looking statements. The views expressed are subject to change at any time in response to changing circumstances in the market. Wells Fargo Funds Management, LLC and the Fund disclaim any obligation to publicly update or revise any views expressed or forward-looking statements.
NOT FDIC INSURED ¡ NO BANK GUARANTEE ¡ MAY LOSE VALUE
| | | | |
| 2 | | Wells Fargo Strategic Income Fund | | Letter to shareholders (unaudited) |

Karla M. Rabusch
President
Wells Fargo Funds
The combination of U.S. moderate economic growth and low inflation allowed the Fed to raise its key rate by 0.25% in December 2015.
Across global markets, generally accommodative central banks and continued low inflation supported the returns of most major fixed-income asset classes, including sovereign bonds and investment-grade corporate bonds.
Dear Valued Shareholder:
We are pleased to offer you this semi-annual report for the Wells Fargo Strategic Income Fund for the six-month period that ended April 30, 2016. The reporting period was marked by moderate to disappointing economic growth and continued low interest rates around the globe. Even though the U.S. Federal Reserve (Fed) raised its key rate in December 2015, other major central banks continued or increased their quantitative easing programs.
Even though the Fed modestly tightened its monetary policy, other central banks continued to ease.
The U.S. delivered annualized real gross domestic product (GDP) growth of 1.4% in the fourth quarter of 2015. Reported inflation, as measured by the Core Personal Consumption Expenditures Price Index,1 remained well below the Fed’s target of 2.0%. The combination of U.S. moderate economic growth and low inflation allowed the Fed to raise its key rate by 0.25% in December 2015.
Given that GDP growth slowed in late 2015, investors initially worried that the Fed had moved too quickly, leading to fears of a central-bank-induced recession. However, the Fed remained on hold after its March 2016 meeting, and its guidance led investors to believe that the path of future rate increases would be gradual.
In contrast, the European Central Bank (ECB) showed no signs of raising rates in the near future, as the European Union continued to grapple with an elevated—albeit improving—unemployment rate and credit problems in Greece and Italy. The ECB maintained a variety of measures aimed at encouraging lending, including making funds available to banks at low interest rates and purchasing government bonds, mortgage notes, and eventually corporate bonds. In mid-2014, the ECB introduced negative interest rates on bank deposits held at the central bank and pushed its key rate further into negative territory through early 2016.
In Japan, the Bank of Japan (BOJ) likewise imposed a negative interest rate on surplus bank reserves in early 2016. The BOJ also continued to purchase shares and bonds in an attempt to support the asset markets.
Global bond markets benefited from low inflation and central-bank easing.
Across global markets, generally accommodative central banks and continued low inflation supported the returns of most major fixed-income asset classes, including sovereign bonds and investment-grade corporate bonds. Emerging markets debt also posted gains for the period, supported in part by actions of the People’s Bank of China to increase bank lending and support China’s currency. Non-U.S. bonds outperformed domestic issues as the ECB and the BOJ remained far more accommodative than the Fed. The Barclays Global Aggregate Bond Index,2 a broad measure of the international debt market, posted a 6.09% return for the reporting period compared with an 8.72% return for the Barclays Global Aggregate ex U.S. Dollar Bond Index.3
| 1 | The Core Personal Consumption Expenditures (PCE) Price Index is defined as personal consumption expenditures prices excluding food and energy prices. The core PCE price index measures the prices paid by consumers for goods and services without the volatility caused by movements in food and energy prices to reveal underlying inflation trends. Food prices consist of those included in the PCE category of “food and beverages purchased for off-premises consumption.” Prices included in the PCE category “food services and accommodations” are not included in the “food” price index because these services prices tend to be far less volatile than those for food commodities such as meats, fresh vegetables and fruits. Energy prices consist of those included in the PCE categories of “gasoline and other energy goods” and of “electricity and gas” utilities. All PCE prices appear in National Income and Product Accounts Table 2.4.4. Price Indexes for Personal Consumption Expenditures by Type of Product. A table showing the composition of PCE food and energy is shown in “Composition of PCE food and energy”. You cannot invest directly in an index. |
| 2 | The Barclays Global Aggregate Bond Index measures global investment-grade debt from 24 local currency markets. This multicurrency benchmark includes Treasury, government-related, corporate, and securitized fixed-rate bonds from both developed and emerging markets issuers. You cannot invest directly in an index. |
| 3 | The Barclays Global Aggregate ex U.S. Dollar Bond Index tracks an international basket of government, corporate, agency, and mortgage-related bonds. You cannot invest directly in an index. |
| | | | | | |
| Letter to shareholders (unaudited) | | Wells Fargo Strategic Income Fund | | | 3 | |
Among risk assets, the energy- and commodity-related subindustries of the high-yield bond universe again provided the main sour note as persistent low prices for oil, natural gas, and industrial metals such as copper put pressure on highly leveraged energy and metals and mining companies. High-yield bonds, nonetheless, benefited from worldwide low interest rates (which made high-yielding bonds even more attractive) and moderate default rates outside of the energy complex. The BofA Merrill Lynch High Yield Master II Index4 ended the six-month period with a return of 2.25%.
Don’t let short-term uncertainty derail long-term investment goals.
Periods of uncertainty can present challenges, but experience has taught us that maintaining long-term investment goals can be an effective way to plan for the future. To help you create a sound strategy based on your personal goals and risk tolerance, Wells Fargo Funds offers more than 100 mutual funds and other investments spanning a wide range of asset classes and investment styles.
Although diversification cannot guarantee an investment profit or prevent losses, we believe it can be an effective way to manage investment risk and potentially smooth out overall portfolio performance. We encourage investors to know their investments and to understand that appropriate levels of risk-taking may unlock opportunities.
Thank you for choosing to invest with Wells Fargo Funds. We appreciate your confidence in us and remain committed to helping you meet your financial needs.
Sincerely,

Karla M. Rabusch
President
Wells Fargo Funds
For further information about your Fund, contact your investment professional, visit our website at wellsfargofunds.com, or call us directly at 1-800-222-8222. We are available 24 hours a day, 7 days a week.
| 4 | The BofA Merrill Lynch High Yield Master II Index is a market-capitalization-weighted index of domestic and Yankee high-yield bonds. The index tracks the performance of high-yield securities traded in the U.S. bond market. You cannot invest directly in an index. |
| | | | |
| 4 | | Wells Fargo Strategic Income Fund | | Performance highlights (unaudited) |
Investment objective
The Fund seeks total return, consisting of a high level of current income and capital appreciation.
Manager
Wells Fargo Funds Management, LLC
Subadvisers
First International Advisors, LLC
Wells Capital Management Incorporated
Portfolio managers
Ashok Bhatia, CFA®
David Germany, Ph.D.
Niklas Nordenfelt, CFA®
Tony Norris
Margaret D. Patel
Alex Perrin
Thomas M. Price, CFA®
Scott M. Smith, CFA®
Noah Wise, CFA®
Average annual total returns (%) as of April 30, 2016
| | | | | | | | | | | | | | | | | | | | | | | | | | |
| | | | | Including sales charge | | | Excluding sales charge | | | Expense ratios1 (%) | |
| | | Inception date | | 1 year | | | Since
inception | | | 1 year | | | Since
inception | | | Gross | | | Net2 | |
| Class A (WSIAX) | | 1-31-2013 | | | (6.86 | ) | | | (1.48 | ) | | | (3.03 | ) | | | (0.22 | ) | | | 1.54 | | | | 0.91 | |
| Class C (WSICX) | | 1-31-2013 | | | (4.69 | ) | | | (0.95 | ) | | | (3.73 | ) | | | (0.95 | ) | | | 2.29 | | | | 1.66 | |
| Administrator Class (WSIDX) | | 1-31-2013 | | | – | | | | – | | | | (2.85 | ) | | | (0.03 | ) | | | 1.48 | | | | 0.76 | |
| Institutional Class (WSINX) | | 1-31-2013 | | | – | | | | – | | | | (2.72 | ) | | | 0.10 | | | | 1.21 | | | | 0.61 | |
| Barclays U.S. Universal Bond Index3 | | – | | | – | | | | – | | | | 2.57 | | | | 2.72 | | | | – | | | | – | |
| BofA Merrill Lynch 3 Month U.S. Dollar LIBOR Constant Maturity Index4 | | – | | | – | | | | – | | | | 0.35 | | | | 0.29 | | | | – | | | | – | |
Figures quoted represent past performance, which is no guarantee of future results, and do not reflect taxes that a shareholder may pay on fund distributions or the redemption of fund shares. Investment return and principal value of an investment will fluctuate so that an investor’s shares, when redeemed, may be worth more or less than their original cost. Performance shown without sales charges would be lower if sales charges were reflected. Current performance may be lower or higher than the performance data quoted, which assumes the reinvestment of dividends and capital gains. Current month-end performance is available on the Fund’s website, wellsfargofunds.com.
Index returns do not include transaction costs associated with buying and selling securities, any mutual fund fees or expenses, or any taxes. It is not possible to invest directly in an index.
For Class A shares, the maximum front-end sales charge is 4.00%. For Class C shares, the maximum contingent deferred sales charge is 1.00%. Performance including a contingent deferred sales charge assumes the sales charge for the corresponding time period. Administrator Class and Institutional Class shares are sold without a front-end sales charge or contingent deferred sales charge.
Bond values fluctuate in response to the financial condition of individual issuers, general market and economic conditions, and changes in interest rates. Changes in market conditions and government policies may lead to periods of heightened volatility in the bond market and reduced liquidity for certain bonds held by the Fund. In general, when interest rates rise, bond values fall and investors may lose principal value. Interest-rate changes and their impact on the Fund and its share price can be sudden and unpredictable. High-yield securities have a greater risk of default and tend to be more volatile than higher-rated debt securities. Loans are subject to risks similar to those associated with other below-investment-grade bond investments, such as credit risk (for example, risk of issuer default), below-investment-grade bond risk (for example, risk of greater volatility in value), and risk that the loan may become illiquid or difficult to price. Foreign investments are especially volatile and can rise or fall dramatically due to differences in the political and economic conditions of the host country. These risks are generally intensified in emerging markets. The use of derivatives may reduce returns and/or increase volatility. Certain investment strategies tend to increase the total risk of an investment (relative to the broader market). The Fund is exposed to mortgage- and asset-backed securities risk, regulatory risk, and geographic risk. Consult the Fund’s prospectus for additional information on these and other risks.
Please see footnotes on page 5.
| | | | | | |
| Performance highlights (unaudited) | | Wells Fargo Strategic Income Fund | | | 5 | |
| | | | |
| Ten largest holdings (%) as of April 30, 20165 | |
Indonesia, 7.88%, 4-15-2019 | | | 2.54 | |
Mexico, 4.75%, 6-14-2018 | | | 2.28 | |
Dominos Pizza Master Issuer LLC Series 2012-1A Class A2, 5.22%, 1-25-2042 | | | 2.07 | |
Poland, 4.00%, 10-25-2023 | | | 2.02 | |
ACAS CLO Limited Trust Series 2015-1A Class B, 2.73%, 4-18-2027 | | | 1.99 | |
Brazil, 10.00%, 1-1-2019 | | | 1.92 | |
321 Henderson Receivables LLC Series 2015-2A Class A, 3.87%, 3-15-2058 | | | 1.82 | |
Citi Held For Asset Issuance Trust Series 2015-PM3 Class B, 4.31%, 5-16-2022 | | | 1.74 | |
JPMBB Commercial Mortgage Securities Trust Series 2014-C19 Class D, 4.83%, 4-15-2047 | | | 1.63 | |
Malaysia, 3.80%, 9-30-2022 | | | 1.57 | |
|
| Portfolio allocation as of April 30, 20166 |
|
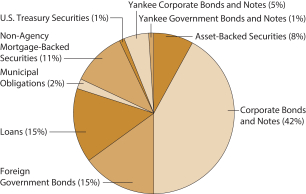 |
| 1 | Reflects the expense ratios as stated in the most recent prospectuses, which include the impact of 0.01% in acquired fund fees and expenses. The expense ratios shown are subject to change and may differ from the annualized expense ratios shown in the financial highlights of this report, which do not include acquired fund fees and expenses. |
| 2 | The manager has contractually committed through February 28, 2017, to waive fees and/or reimburse expenses to the extent necessary to cap the Fund’s Total Annual Operating Expenses After Fee Waiver at 0.90% for Class A, 1.65% for Class C, 0.75% for Administrator Class, and 0.60% for Institutional Class. After this time, the cap may be increased or the commitment to maintain the cap may be terminated only with the approval of the Board of Trustees. Brokerage commissions, stamp duty fees, interest, taxes, acquired fund fees and expenses, and extraordinary expenses are excluded from the cap. Without this cap, the Fund’s returns would have been lower. |
| 3 | The Barclays U.S. Universal Bond Index is an unmanaged market-value-weighted performance benchmark for the U.S. dollar–denominated bond market, which includes investment-grade, high-yield, and emerging markets debt securities with maturities of one year or more. You cannot invest directly in an index. |
| 4 | The BofA Merrill Lynch 3 Month U.S. Dollar LIBOR Constant Maturity Index is based on the assumed purchase of a synthetic instrument having 3 months to maturity and with a coupon equal to the closing quote for 3-Month LIBOR. That issue is sold the following day (priced at a yield equal to the current day closing 3-Month LIBOR rate) and is rolled into a new 3-Month instrument. The index, therefore, will always have a constant maturity equal to exactly 3 months. You cannot invest directly in an index. |
| 5 | The ten largest holdings, excluding cash and cash equivalents, are calculated based on the value of the investments divided by total net assets of the Fund. Holdings are subject to change and may have changed since the date specified. |
| 6 | Amounts are calculated based on the total long-term investments of the Fund. These amounts are subject to change and may have changed since the date specified. |
| | | | |
| 6 | | Wells Fargo Strategic Income Fund | | Fund expenses (unaudited) |
As a shareholder of the Fund, you incur two types of costs: (1) transaction costs, including sales charges (loads) on purchase payments and contingent deferred sales charges (if any) on redemptions and (2) ongoing costs, including management fees, distribution (12b-1) and/or shareholder servicing fees, and other Fund expenses. This example is intended to help you understand your ongoing costs (in dollars) of investing in the Fund and to compare these costs with the ongoing costs of investing in other mutual funds.
The example is based on an investment of $1,000 invested at the beginning of the six-month period and held for the entire period from November 1, 2015 to April 30, 2016.
Actual expenses
The “Actual” line of the table below provides information about actual account values and actual expenses. You may use the information in this line, together with the amount you invested, to estimate the expenses that you paid over the period. Simply divide your account value by $1,000 (for example, an $8,600 account value divided by $1,000 = 8.6), then multiply the result by the number in the “Actual” line under the heading entitled “Expenses paid during period” for your applicable class of shares to estimate the expenses you paid on your account during this period.
Hypothetical example for comparison purposes
The “Hypothetical” line of the table below provides information about hypothetical account values and hypothetical expenses based on the Fund’s actual expense ratio and an assumed rate of return of 5% per year before expenses, which is not the Fund’s actual return. The hypothetical account values and expenses may not be used to estimate the actual ending account balance or expenses you paid for the period. You may use this information to compare the ongoing costs of investing in the Fund and other funds. To do so, compare this 5% hypothetical example with the 5% hypothetical examples that appear in the shareholder reports of the other funds.
Please note that the expenses shown in the table are meant to highlight your ongoing costs only and do not reflect any transactional costs, such as sales charges (loads) and contingent deferred sales charges. Therefore, the “Hypothetical” line of the table is useful in comparing ongoing costs only and will not help you determine the relative total costs of owning different funds. In addition, if these transactional costs were included, your costs would have been higher.
| | | | | | | | | | | | | | | | |
| | | Beginning account value 11-1-2015 | | | Ending account value 4-30-2016 | | | Expenses paid during the period¹ | | | Net annualized expense ratio | |
Class A | | | | | | | | | | | | | | | | |
Actual | | $ | 1,000.00 | | | $ | 1,005.82 | | | $ | 4.49 | | | | 0.90 | % |
Hypothetical (5% return before expenses) | | $ | 1,000.00 | | | $ | 1,020.39 | | | $ | 4.52 | | | | 0.90 | % |
Class C | | | | | | | | | | | | | | | | |
Actual | | $ | 1,000.00 | | | $ | 1,002.91 | | | $ | 8.22 | | | | 1.65 | % |
Hypothetical (5% return before expenses) | | $ | 1,000.00 | | | $ | 1,016.66 | | | $ | 8.27 | | | | 1.65 | % |
Administrator Class | | | | | | | | | | | | | | | | |
Actual | | $ | 1,000.00 | | | $ | 1,007.54 | | | $ | 3.74 | | | | 0.75 | % |
Hypothetical (5% return before expenses) | | $ | 1,000.00 | | | $ | 1,021.13 | | | $ | 3.77 | | | | 0.75 | % |
Institutional Class | | | | | | | | | | | | | | | | |
Actual | | $ | 1,000.00 | | | $ | 1,007.93 | | | $ | 3.00 | | | | 0.60 | % |
Hypothetical (5% return before expenses) | | $ | 1,000.00 | | | $ | 1,021.88 | | | $ | 3.02 | | | | 0.60 | % |
| 1 | Expenses paid is equal to the annualized expense ratio of each class multiplied by the average account value over the period, multiplied by the number of days in the most recent fiscal half-year divided by the number of days in the fiscal year (to reflect the one-half-year period). |
| | | | | | |
| Portfolio of investments—April 30, 2016 (unaudited) | | Wells Fargo Strategic Income Fund | | | 7 | |
| | | | | | | | | | | | | | | | |
| Security name | | Interest rate | | | Maturity date | | | Principal | | | Value | |
| | | | | | | | | | | | | | | | |
| | | | |
Asset-Backed Securities: 7.12% | | | | | | | | | | | | | | | | |
AmeriCredit Automobile Receivables Trust Series 2015-4 Class D | | | 3.72 | % | | | 12-8-2021 | | | $ | 300,000 | | | $ | 307,866 | |
Avis Budget Rental Car Funding LLC Series 2012-3A Class B 144A | | | 3.04 | | | | 3-20-2019 | | | | 250,000 | | | | 250,113 | |
CLI Funding LLC Trust Series 2014-1A Class A 144A | | | 3.29 | | | | 6-18-2029 | | | | 404,123 | | | | 379,455 | |
Dell Equipment Finance Trust Series 2014-1 Class D 144A | | | 2.68 | | | | 6-22-2020 | | | | 300,000 | | | | 299,172 | |
Dominos Pizza Master Issuer LLC Series 2012-1A Class A2 144A | | | 5.22 | | | | 1-25-2042 | | | | 492,754 | | | | 507,685 | |
| | | | |
Total Asset-Backed Securities (Cost $1,732,526) | | | | | | | | | | | | | | | 1,744,291 | |
| | | | | | | | | | | | | | | | |
| | | | |
Corporate Bonds and Notes: 37.94% | | | | | | | | | | | | | | | | |
| | | | |
Consumer Discretionary: 8.73% | | | | | | | | | | | | | | | | |
| | | | |
| Automobiles: 1.08% | | | | | | | | | | | | | | | | |
Ford Motor Company | | | 7.45 | | | | 7-16-2031 | | | | 200,000 | | | | 265,238 | |
| | | | | | | | | | | | | | | | |
| | | | |
| Hotels, Restaurants & Leisure: 2.43% | | | | | | | | | | | | | | | | |
CCM Merger Incorporated 144A | | | 9.13 | | | | 5-1-2019 | | | | 70,000 | | | | 72,975 | |
Greektown Holdings LLC 144A | | | 8.88 | | | | 3-15-2019 | | | | 200,000 | | | | 207,000 | |
Hilton Worldwide Finance LLC | | | 5.63 | | | | 10-15-2021 | | | | 180,000 | | | | 187,479 | |
NCL Corporation Limited 144A | | | 5.25 | | | | 11-15-2019 | | | | 125,000 | | | | 128,438 | |
| | | | |
| | | | | | | | | | | | | | | 595,892 | |
| | | | | | | | | | | | | | | | |
| | | | |
| Household Durables: 1.41% | | | | | | | | | | | | | | | | |
DR Horton Incorporated | | | 4.75 | | | | 5-15-2017 | | | | 175,000 | | | | 179,813 | |
Pulte Group Incorporated | | | 7.63 | | | | 10-15-2017 | | | | 155,000 | | | | 165,850 | |
| | | | |
| | | | | | | | | | | | | | | 345,663 | |
| | | | | | | | | | | | | | | | |
| | | | |
| Leisure Products: 0.22% | | | | | | | | | | | | | | | | |
Vista Outdoor Incorporated 144A | | | 5.88 | | | | 10-1-2023 | | | | 50,000 | | | | 52,500 | |
| | | | | | | | | | | | | | | | |
| | | | |
| Media: 2.89% | | | | | | | | | | | | | | | | |
CCO Holdings LLC | | | 5.13 | | | | 2-15-2023 | | | | 115,000 | | | | 117,875 | |
CCO Holdings LLC 144A | | | 5.13 | | | | 5-1-2023 | | | | 5,000 | | | | 5,100 | |
CCO Holdings LLC 144A | | | 5.38 | | | | 5-1-2025 | | | | 5,000 | | | | 5,119 | |
CCO Holdings LLC 144A | | | 5.88 | | | | 5-1-2027 | | | | 5,000 | | | | 5,125 | |
CCO Safari II LLC 144A | | | 4.91 | | | | 7-23-2025 | | | | 300,000 | | | | 323,232 | |
Cequel Communications Holdings I LLC 144A | | | 5.13 | | | | 12-15-2021 | | | | 5,000 | | | | 4,713 | |
DISH DBS Corporation | | | 4.25 | | | | 4-1-2018 | | | | 165,000 | | | | 168,300 | |
Gray Television Incorporated | | | 7.50 | | | | 10-1-2020 | | | | 75,000 | | | | 78,563 | |
| | | | |
| | | | | | | | | | | | | | | 708,027 | |
| | | | | | | | | | | | | | | | |
| | | | |
| Specialty Retail: 0.29% | | | | | | | | | | | | | | | | |
Century Intermediate Holding Company (PIK at 10.50%) 144A¥(i) | | | 9.75 | | | | 2-15-2019 | | | | 5,000 | | | | 5,063 | |
Penske Auto Group Incorporated | | | 5.75 | | | | 10-1-2022 | | | | 50,000 | | | | 51,625 | |
Sonic Automotive Incorporated | | | 5.00 | | | | 5-15-2023 | | | | 15,000 | | | | 14,925 | |
| | | | |
| | | | | | | | | | | | | | | 71,613 | |
| | | | | | | | | | | | | | | | |
| | | | |
| Textiles, Apparel & Luxury Goods: 0.41% | | | | | | | | | | | | | | | | |
Levi Strauss & Company | | | 5.00 | | | | 5-1-2025 | | | | 100,000 | | | | 101,250 | |
| | | | | | | | | | | | | | | | |
The accompanying notes are an integral part of these financial statements.
| | | | |
| 8 | | Wells Fargo Strategic Income Fund | | Portfolio of investments—April 30, 2016 (unaudited) |
| | | | | | | | | | | | | | | | |
| Security name | | Interest rate | | | Maturity date | | | Principal | | | Value | |
| | | | | | | | | | | | | | | | |
| | | | |
Consumer Staples: 1.50% | | | | | | | | | | | | | | | | |
| | | | |
| Beverages: 1.50% | | | | | | | | | | | | | | | | |
Anheuser-Busch InBev Finance Company | | | 3.65 | % | | | 2-1-2026 | | | $ | 200,000 | | | $ | 211,076 | |
Constellation Brands Incorporated | | | 7.25 | | | | 9-1-2016 | | | | 155,000 | | | | 157,906 | |
| | | | |
| | | | | | | | | | | | | | | 368,982 | |
| | | | | | | | | | | | | | | | |
| | | | |
Energy: 4.81% | | | | | | | | | | | | | | | | |
| | | | |
| Energy Equipment & Services: 1.71% | | | | | | | | | | | | | | | | |
Bristow Group Incorporated | | | 6.25 | | | | 10-15-2022 | | | | 150,000 | | | | 123,000 | |
Era Group Incorporated | | | 7.75 | | | | 12-15-2022 | | | | 65,000 | | | | 56,225 | |
Hornbeck Offshore Services Incorporated | | | 1.50 | | | | 9-1-2019 | | | | 25,000 | | | | 15,313 | |
NGPL PipeCo LLC 144A | | | 7.77 | | | | 12-15-2037 | | | | 160,000 | | | | 147,200 | |
PHI Incorporated | | | 5.25 | | | | 3-15-2019 | | | | 85,000 | | | | 78,360 | |
| | | | |
| | | | | | | | | | | | | | | 420,098 | |
| | | | | | | | | | | | | | | | |
| | | | |
| Oil, Gas & Consumable Fuels: 3.10% | | | | | | | | | | | | | | | | |
Buckeye Partners LP | | | 4.35 | | | | 10-15-2024 | | | | 100,000 | | | | 94,271 | |
CSI Compressco LP | | | 7.25 | | | | 8-15-2022 | | | | 30,000 | | | | 23,550 | |
Enable Midstream Partner LP | | | 3.90 | | | | 5-15-2024 | | | | 100,000 | | | | 84,330 | |
Enlink Midstream LLC | | | 4.40 | | | | 4-1-2024 | | | | 50,000 | | | | 43,310 | |
Exterran Partners LP | | | 6.00 | | | | 4-1-2021 | | | | 50,000 | | | | 39,250 | |
Northern Tier Energy LLC | | | 7.13 | | | | 11-15-2020 | | | | 25,000 | | | | 24,813 | |
Rockies Express Pipeline LLC 144A | | | 5.63 | | | | 4-15-2020 | | | | 50,000 | | | | 49,625 | |
Sabine Pass LNG LP | | | 6.50 | | | | 11-1-2020 | | | | 75,000 | | | | 78,188 | |
Sabine Pass LNG LP | | | 7.50 | | | | 11-30-2016 | | | | 150,000 | | | | 153,469 | |
Suburban Propane Partners LP | | | 5.50 | | | | 6-1-2024 | | | | 15,000 | | | | 14,820 | |
Targa Resources Partners Incorporated | | | 5.00 | | | | 1-15-2018 | | | | 35,000 | | | | 35,197 | |
TC Pipelines LP | | | 4.38 | | | | 3-13-2025 | | | | 100,000 | | | | 91,359 | |
Ultra Petroleum Corporation 144A(s) | | | 6.13 | | | | 10-1-2024 | | | | 30,000 | | | | 4,500 | |
Western Gas Partners LP | | | 3.95 | | | | 6-1-2025 | | | | 25,000 | | | | 22,465 | |
| | | | |
| | | | | | | | | | | | | | | 759,147 | |
| | | | | | | | | | | | | | | | |
| | | | |
Financials: 12.17% | | | | | | | | | | | | | | | | |
| | | | |
| Banks: 2.52% | | | | | | | | | | | | | | | | |
Bank of America Corporation ± | | | 6.30 | | | | 12-29-2049 | | | | 200,000 | | | | 209,500 | |
CIT Group Incorporated | | | 4.25 | | | | 8-15-2017 | | | | 165,000 | | | | 167,372 | |
CIT Group Incorporated | | | 5.00 | | | | 8-1-2023 | | | | 100,000 | | | | 104,000 | |
JPMorgan Chase & Company ± | | | 6.00 | | | | 12-31-2049 | | | | 135,000 | | | | 138,051 | |
| | | | |
| | | | | | | | | | | | | | | 618,923 | |
| | | | | | | | | | | | | | | | |
| | | | |
| Capital Markets: 1.12% | | | | | | | | | | | | | | | | |
Goldman Sachs Group Incorporated | | | 4.25 | | | | 10-21-2025 | | | | 200,000 | | | | 204,102 | |
Jefferies Finance LLC 144A | | | 6.88 | | | | 4-15-2022 | | | | 55,000 | | | | 48,125 | |
Jefferies Finance LLC 144A | | | 7.38 | | | | 4-1-2020 | | | | 25,000 | | | | 23,063 | |
| | | | |
| | | | | | | | | | | | | | | 275,290 | |
| | | | | | | | | | | | | | | | |
The accompanying notes are an integral part of these financial statements.
| | | | | | |
| Portfolio of investments—April 30, 2016 (unaudited) | | Wells Fargo Strategic Income Fund | | | 9 | |
| | | | | | | | | | | | | | | | |
| Security name | | Interest rate | | | Maturity date | | | Principal | | | Value | |
| | | | | | | | | | | | | | | | |
| | | | |
| Consumer Finance: 2.70% | | | | | | | | | | | | | | | | |
Ally Financial Incorporated | | | 5.50 | % | | | 2-15-2017 | | | $ | 160,000 | | | $ | 163,400 | |
Ally Financial Incorporated | | | 7.50 | | | | 9-15-2020 | | | | 75,000 | | | | 84,188 | |
Navient Corporation | | | 6.00 | | | | 1-25-2017 | | | | 150,000 | | | | 152,438 | |
Navient Corporation | | | 8.00 | | | | 3-25-2020 | | | | 30,000 | | | | 31,200 | |
Springleaf Finance Corporation | | | 5.25 | | | | 12-15-2019 | | | | 200,000 | | | | 189,750 | |
Springleaf Finance Corporation | | | 8.25 | | | | 10-1-2023 | | | | 40,000 | | | | 40,000 | |
| | | | |
| | | | | | | | | | | | | | | 660,976 | |
| | | | | | | | | | | | | | | | |
| | | | |
| Diversified Financial Services: 0.90% | | | | | | | | | | | | | | | | |
McGraw Hill Financial Incorporated | | | 4.40 | | | | 2-15-2026 | | | | 200,000 | | | | 221,381 | |
| | | | | | | | | | | | | | | | |
| | | | |
| Insurance: 1.60% | | | | | | | | | | | | | | | | |
Fairfax US Incorporated 144A | | | 4.88 | | | | 8-13-2024 | | | | 200,000 | | | | 199,296 | |
Hub Holdings LLC (PIK at 8.88%) 144A¥ | | | 8.13 | | | | 7-15-2019 | | | | 35,000 | | | | 32,550 | |
MetLife Incorporated | | | 6.40 | | | | 12-15-2066 | | | | 150,000 | | | | 159,840 | |
| | | | |
| | | | | | | | | | | | | | | 391,686 | |
| | | | | | | | | | | | | | | | |
| | | | |
| REITs: 3.33% | | | | | | | | | | | | | | | | |
Digital Realty Trust LP | | | 4.75 | | | | 10-1-2025 | | | | 170,000 | | | | 176,635 | |
DuPont Fabros Technology Incorporated LP | | | 5.88 | | | | 9-15-2021 | | | | 85,000 | | | | 89,250 | |
ESH Hospitality Incorporated 144A | | | 5.25 | | | | 5-1-2025 | | | | 100,000 | | | | 98,625 | |
Iron Mountain Incorporated | | | 6.00 | | | | 8-15-2023 | | | | 75,000 | | | | 79,500 | |
Omega Healthcare Investors Incorporated | | | 4.50 | | | | 1-15-2025 | | | | 175,000 | | | | 170,488 | |
The GEO Group Incorporated | | | 5.88 | | | | 10-15-2024 | | | | 100,000 | | | | 102,000 | |
VEREIT Operating Partnership LP | | | 2.00 | | | | 2-6-2017 | | | | 100,000 | | | | 99,850 | |
| | | | |
| | | | | | | | | | | | | | | 816,348 | |
| | | | | | | | | | | | | | | | |
| | | | |
Health Care: 1.27% | | | | | | | | | | | | | | | | |
| | | | |
| Health Care Providers & Services: 1.27% | | | | | | | | | | | | | | | | |
DaVita HealthCare Partners Incorporated | | | 5.00 | | | | 5-1-2025 | | | | 100,000 | | | | 100,000 | |
MPH Acquisition Holdings LLC 144A | | | 6.63 | | | | 4-1-2022 | | | | 100,000 | | | | 104,416 | |
Tenet Healthcare Corporation | | | 6.25 | | | | 11-1-2018 | | | | 100,000 | | | | 107,000 | |
| | | | |
| | | | | | | | | | | | | | | 311,416 | |
| | | | | | | | | | | | | | | | |
| | | | |
Industrials: 2.41% | | | | | | | | | | | | | | | | |
| | | | |
| Airlines: 0.44% | | | | | | | | | | | | | | | | |
American Airlines Incorporated | | | 4.38 | | | | 4-1-2024 | | | | 108,072 | | | | 107,802 | |
| | | | | | | | | | | | | | | | |
| | | | |
| Building Products: 0.46% | | | | | | | | | | | | | | | | |
USG Corporation | | | 9.75 | | | | 1-15-2018 | | | | 100,000 | | | | 112,250 | |
| | | | | | | | | | | | | | | | |
| | | | |
| Commercial Services & Supplies: 0.18% | | | | | | | | | | | | | | | | |
Covanta Holding Corporation | | | 5.88 | | | | 3-1-2024 | | | | 45,000 | | | | 44,550 | |
| | | | | | | | | | | | | | | | |
| | | | |
| Machinery: 0.65% | | | | | | | | | | | | | | | | |
Case New Holland Industrial Incorporated | | | 7.88 | | | | 12-1-2017 | | | | 150,000 | | | | 159,750 | |
| | | | | | | | | | | | | | | | |
| | | | |
| Trading Companies & Distributors: 0.68% | | | | | | | | | | | | | | | | |
United Rentals North America Incorporated | | | 7.38 | | | | 5-15-2020 | | | | 160,000 | | | | 166,400 | |
| | | | | | | | | | | | | | | | |
The accompanying notes are an integral part of these financial statements.
| | | | |
| 10 | | Wells Fargo Strategic Income Fund | | Portfolio of investments—April 30, 2016 (unaudited) |
| | | | | | | | | | | | | | | | |
| Security name | | Interest rate | | | Maturity date | | | Principal | | | Value | |
| | | | | | | | | | | | | | | | |
| | | | |
Information Technology: 2.72% | | | | | | | | | | | | | | | | |
| | | | |
| Electronic Equipment, Instruments & Components: 0.44% | | | | | | | | | | | | | | | | |
Zebra Technologies Corporation | | | 7.25 | % | | | 10-15-2022 | | | $ | 100,000 | | | $ | 108,260 | |
| | | | | | | | | | | | | | | | |
| | | | |
| Internet Software & Services: 0.40% | | | | | | | | | | | | | | | | |
IAC/InterActiveCorp | | | 4.88 | | | | 11-30-2018 | | | | 95,000 | | | | 97,850 | |
| | | | | | | | | | | | | | | | |
| | | | |
| Semiconductors & Semiconductor Equipment: 0.86% | | | | | | | | | | | | | | | | |
KLA-Tencor Corporation | | | 4.13 | | | | 11-1-2021 | | | | 200,000 | | | | 211,758 | |
| | | | | | | | | | | | | | | | |
| | | | |
| Software: 0.22% | | | | | | | | | | | | | | | | |
Activision Blizzard Incorporated 144A | | | 5.63 | | | | 9-15-2021 | | | | 15,000 | | | | 15,788 | |
Boxer Parent Company Incorporated (PIK at 9.75%) 144A¥ | | | 9.00 | | | | 10-15-2019 | | | | 50,000 | | | | 36,750 | |
| | | | |
| | | | | | | | | | | | | | | 52,538 | |
| | | | | | | | | | | | | | | | |
| | | | |
| Technology Hardware, Storage & Peripherals: 0.80% | | | | | | | | | | | | | | | | |
NCR Corporation | | | 5.00 | | | | 7-15-2022 | | | | 175,000 | | | | 175,438 | |
NCR Corporation | | | 5.88 | | | | 12-15-2021 | | | | 10,000 | | | | 10,325 | |
NCR Corporation | | | 6.38 | | | | 12-15-2023 | | | | 10,000 | | | | 10,400 | |
| | | | |
| | | | | | | | | | | | | | | 196,163 | |
| | | | | | | | | | | | | | | | |
| | | | |
Materials: 0.53% | | | | | | | | | | | | | | | | |
| | | | |
| Containers & Packaging: 0.44% | | | | | | | | | | | | | | | | |
Owens-Illinois Incorporated 144A | | | 6.38 | | | | 8-15-2025 | | | | 100,000 | | | | 107,750 | |
| | | | | | | | | | | | | | | | |
| | | | |
| Metals & Mining: 0.09% | | | | | | | | | | | | | | | | |
Alcoa Incorporated | | | 6.75 | | | | 7-15-2018 | | | | 20,000 | | | | 21,594 | |
| | | | | | | | | | | | | | | | |
| | | | |
Telecommunication Services: 3.37% | | | | | | | | | | | | | | | | |
| | | | |
| Diversified Telecommunication Services: 0.84% | | | | | | | | | | | | | | | | |
Frontier Communications Corporation | | | 8.25 | | | | 4-15-2017 | | | | 85,000 | | | | 89,325 | |
GCI Incorporated | | | 6.75 | | | | 6-1-2021 | | | | 115,000 | | | | 116,150 | |
| | | | |
| | | | | | | | | | | | | | | 205,475 | |
| | | | | | | | | | | | | | | | |
| | | | |
| Wireless Telecommunication Services: 2.53% | | | | | | | | | | | | | | | | |
CC Holdings GS V LLC | | | 3.85 | | | | 4-15-2023 | | | | 200,000 | | | | 211,610 | |
SBA Communications Corporation | | | 4.88 | | | | 7-15-2022 | | | | 100,000 | | | | 100,688 | |
Sprint Communications Incorporated 144A | | | 7.00 | | | | 3-1-2020 | | | | 150,000 | | | | 153,938 | |
T-Mobile USA Incorporated | | | 6.38 | | | | 3-1-2025 | | | | 20,000 | | | | 21,000 | |
T-Mobile USA Incorporated | | | 6.50 | | | | 1-15-2024 | | | | 100,000 | | | | 106,500 | |
T-Mobile USA Incorporated | | | 6.84 | | | | 4-28-2023 | | | | 25,000 | | | | 26,656 | |
| | | | |
| | | | | | | | | | | | | | | 620,392 | |
| | | | | | | | | | | | | | | | |
| | | | |
Utilities: 0.43% | | | | | | | | | | | | | | | | |
| | | | |
| Independent Power & Renewable Electricity Producers: 0.43% | | | | | | | | | | | | | | | | |
NSG Holdings LLC 144A | | | 7.75 | | | | 12-15-2025 | | | | 98,587 | | | | 104,995 | |
| | | | | | | | | | | | | | | | |
| | | | |
Total Corporate Bonds and Notes (Cost $9,251,126) | | | | | | | | | | | | | | | 9,301,957 | |
| | | | | | | | | | | | | | | | |
The accompanying notes are an integral part of these financial statements.
| | | | | | |
| Portfolio of investments—April 30, 2016 (unaudited) | | Wells Fargo Strategic Income Fund | | | 11 | |
| | | | | | | | | | | | | | | | |
| Security name | | Interest rate | | | Maturity date | | | Principal | | | Value | |
| | | | | | | | | | | | | | | | |
| | | | |
Foreign Government Bonds @: 13.73% | | | | | | | | | | | | | | | | |
Brazil (BRL) | | | 10.00 | % | | | 1-1-2017 | | | | 430,000 | | | $ | 122,597 | |
Brazil (BRL) | | | 10.00 | | | | 1-1-2019 | | | | 1,700,000 | | | | 470,458 | |
Indonesia (IDR) | | | 7.88 | | | | 4-15-2019 | | | | 8,100,000,000 | | | | 622,886 | |
Malaysia (MYR) | | | 3.80 | | | | 9-30-2022 | | | | 1,500,000 | | | | 384,332 | |
Mexico (MXN) | | | 4.75 | | | | 6-14-2018 | | | | 9,565,000 | | | | 559,529 | |
Poland (PLN) | | | 4.00 | | | | 10-25-2023 | | | | 1,750,000 | | | | 496,168 | |
Republic of South Africa (ZAR) | | | 7.75 | | | | 2-28-2023 | | | | 3,675,000 | | | | 244,286 | |
Republic of South Africa (ZAR) | | | 8.00 | | | | 12-21-2018 | | | | 2,700,000 | | | | 188,792 | |
Romania (RON) | | | 4.75 | | | | 6-24-2019 | | | | 1,000,000 | | | | 277,265 | |
| | | | |
Total Foreign Government Bonds (Cost $3,753,620) | | | | | | | | | | | | | | | 3,366,313 | |
| | | | | | | | | | | | | | | | |
| | | | |
Loans: 13.22% | | | | | | | | | | | | | | | | |
| | | | |
Consumer Discretionary: 3.60% | | | | | | | | | | | | | | | | |
| | | | |
| Auto Components: 0.61% | | | | | | | | | | | | | | | | |
Allison Transmission Incorporated ± | | | 3.50 | | | | 8-23-2019 | | | $ | 149,941 | | | | 150,035 | |
| | | | | | | | | | | | | | | | |
| | | | |
| Distributors: 1.24% | | | | | | | | | | | | | | | | |
Spin Holdco Incorporated ± | | | 4.25 | | | | 11-14-2019 | | | | 309,498 | | | | 303,178 | |
| | | | | | | | | | | | | | | | |
| | | | |
| Hotels, Restaurants & Leisure: 0.42% | | | | | | | | | | | | | | | | |
Belmond Interfin Limited ± | | | 4.00 | | | | 3-21-2021 | | | | 102,900 | | | | 102,257 | |
| | | | | | | | | | | | | | | | |
| | | | |
| Media: 0.72% | | | | | | | | | | | | | | | | |
Learfield Communications Incorporated ± | | | 4.25 | | | | 10-9-2020 | | | | 151,979 | | | | 151,505 | |
Salem Communications Corporation ± | | | 4.50 | | | | 3-16-2020 | | | | 27,244 | | | | 26,154 | |
| | | | |
| | | | | | | | | | | | | | | 177,659 | |
| | | | | | | | | | | | | | | | |
| | | | |
| Specialty Retail: 0.61% | | | | | | | | | | | | | | | | |
Focus Brands Incorporated ± | | | 4.25 | | | | 2-21-2018 | | | | 148,739 | | | | 148,925 | |
| | | | | | | | | | | | | | | | |
| | | | |
Energy: 0.07% | | | | | | | | | | | | | | | | |
| | | | |
| Energy Equipment & Services: 0.07% | | | | | | | | | | | | | | | | |
ExGen Renewables I LLC ± | | | 5.25 | | | | 2-14-2021 | | | | 16,531 | | | | 16,572 | |
| | | | | | | | | | | | | | | | |
| | | | |
Financials: 0.41% | | | | | | | | | | | | | | | | |
| | | | |
| Real Estate Management & Development: 0.41% | | | | | | | | | | | | | | | | |
Capital Automotive LP ± | | | 4.00 | | | | 4-10-2019 | | | | 100,837 | | | | 101,089 | |
| | | | | | | | | | | | | | | | |
| | | | |
Health Care: 1.15% | | | | | | | | | | | | | | | | |
| | | | |
| Health Care Providers & Services: 0.48% | | | | | | | | | | | | | | | | |
Community Health Systems Incorporated ± | | | 4.00 | | | | 1-27-2021 | | | | 69,262 | | | | 68,207 | |
Surgery Center Holdings Incorporated ± | | | 5.25 | | | | 11-3-2020 | | | | 49,375 | | | | 49,468 | |
| | | | |
| | | | | | | | | | | | | | | 117,675 | |
| | | | | | | | | | | | | | | | |
| | | | |
| Pharmaceuticals: 0.67% | | | | | | | | | | | | | | | | |
Valeant Pharmaceuticals International Incorporated ± | | | 4.75 | | | | 12-11-2019 | | | | 168,684 | | | | 164,172 | |
| | | | | | | | | | | | | | | | |
The accompanying notes are an integral part of these financial statements.
| | | | |
| 12 | | Wells Fargo Strategic Income Fund | | Portfolio of investments—April 30, 2016 (unaudited) |
| | | | | | | | | | | | | | | | |
| Security name | | Interest rate | | | Maturity date | | | Principal | | | Value | |
| | | | | | | | | | | | | | | | |
| | | | |
Industrials: 1.22% | | | | | | | | | | | | | | | | |
| | | | |
| Commercial Services & Supplies: 0.55% | | | | | | | | | | | | | | | | |
KAR Auction Services Incorporated ± | | | 3.94 | % | | | 3-11-2021 | | | $ | 135,227 | | | $ | 135,677 | |
| | | | | | | | | | | | | | | | |
| | | | |
| Construction & Engineering: 0.14% | | | | | | | | | | | | | | | | |
USIC Holdings Incorporated ± | | | 4.00 | | | | 7-10-2020 | | | | 34,271 | | | | 33,885 | |
| | | | | | | | | | | | | | | | |
| | | | |
| Transportation Infrastructure: 0.53% | | | | | | | | | | | | | | | | |
OSG Bulk Ships Incorporated ± | | | 5.25 | | | | 8-5-2019 | | | | 13,403 | | | | 12,699 | |
OSG International Incorporated ± | | | 5.75 | | | | 8-5-2019 | | | | 117,862 | | | | 116,536 | |
| | | | |
| | | | | | | | | | | | | | | 129,235 | |
| | | | | | | | | | | | | | | | |
| | | | |
Information Technology: 3.18% | | | | | | | | | | | | | | | | |
| | | | |
| Internet Software & Services: 0.68% | | | | | | | | | | | | | | | | |
Applied Systems Incorporated ± | | | 4.26 | | | | 1-25-2021 | | | | 94,258 | | | | 93,865 | |
Vertafore Incorporated ± | | | 4.25 | | | | 10-3-2019 | | | | 73,340 | | | | 73,432 | |
| | | | |
| | | | | | | | | | | | | | | 167,297 | |
| | | | | | | | | | | | | | | | |
| | | | |
| IT Services: 1.43% | | | | | | | | | | | | | | | | |
First Data Corporation ± | | | 3.94 | | | | 9-24-2018 | | | | 350,000 | | | | 350,221 | |
| | | | | | | | | | | | | | | | |
| | | | |
| Technology Hardware, Storage & Peripherals: 1.07% | | | | | | | | | | | | | | | | |
Dell Incorporated ± | | | 4.00 | | | | 4-29-2020 | | | | 263,635 | | | | 263,540 | |
| | | | | | | | | | | | | | | | |
| | | | |
Telecommunication Services: 2.87% | | | | | | | | | | | | | | | | |
| | | | |
| Diversified Telecommunication Services: 2.10% | | | | | | | | | | | | | | | | |
Intelsat Jackson Holdings SA ± | | | 3.75 | | | | 6-30-2019 | | | | 240,332 | | | | 225,131 | |
Level 3 Financing Incorporated ± | | | 4.00 | | | | 8-1-2019 | | | | 288,205 | | | | 288,926 | |
| | | | |
| | | | | | | | | | | | | | | 514,057 | |
| | | | | | | | | | | | | | | | |
| | | | |
| Wireless Telecommunication Services: 0.77% | | | | | | | | | | | | | | | | |
Syniverse Holdings Incorporated ± | | | 4.00 | | | | 4-23-2019 | | | | 236,857 | | | | 189,486 | |
| | | | | | | | | | | | | | | | |
| | | | |
Utilities: 0.72% | | | | | | | | | | | | | | | | |
| | | | |
| Electric Utilities: 0.72% | | | | | | | | | | | | | | | | |
Green Energy Partners (i)± | | | 6.50 | | | | 11-13-2021 | | | | 45,000 | | | | 42,975 | |
Texas Competitive Electric Holdings Company LLC (s)± | | | 4.66 | | | | 10-10-2016 | | | | 400,000 | | | | 133,300 | |
| | | | |
| | | | | | | | | | | | | | | 176,275 | |
| | | | | | | | | | | | | | | | |
| | | | |
Total Loans (Cost $3,585,179) | | | | | | | | | | | | | | | 3,241,235 | |
| | | | | | | | | | | | | | | | |
| | | | |
Municipal Obligations: 1.99% | | | | | | | | | | | | | | | | |
| | | | |
| Idaho: 0.18% | | | | | | | | | | | | | | | | |
Idaho Housing & Finance Association Legacy Public Charter School (Education Revenue) | | | 7.00 | | | | 5-1-2017 | | | | 45,000 | | | | 45,043 | |
| | | | | | | | | | | | | | | | |
| | | | |
| Illinois: 0.79% | | | | | | | | | | | | | | | | |
Chicago IL Refunding Bonds Taxable Project Series E (GO Revenue) | | | 6.05 | | | | 1-1-2029 | | | | 200,000 | | | | 192,716 | |
| | | | | | | | | | | | | | | | |
The accompanying notes are an integral part of these financial statements.
| | | | | | |
| Portfolio of investments—April 30, 2016 (unaudited) | | Wells Fargo Strategic Income Fund | | | 13 | |
| | | | | | | | | | | | | | | | |
| Security name | | Interest rate | | | Maturity date | | | Principal | | | Value | |
| | | | | | | | | | | | | | | | |
| | | | |
| Texas: 1.02% | | | | | | | | | | | | | | | | |
North Texas Tollway Authority Build America Bonds Sub Lien Series B-2 (Transportation Revenue) | | | 8.91 | % | | | 2-1-2030 | | | $ | 210,000 | | | $ | 250,730 | |
| | | | | | | | | | | | | | | | |
| | | | |
Total Municipal Obligations (Cost $500,887) | | | | | | | | | | | | | | | 488,489 | |
| | | | | | | | | | | | | | | | |
| | | | |
Non-Agency Mortgage-Backed Securities: 10.06% | | | | | | | | | | | | | | | | |
321 Henderson Receivables LLC Series 2015-2A Class A 144A | | | 3.87 | | | | 3-15-2058 | | | | 447,665 | | | | 445,099 | |
ACAS CLO Limited Trust Series 2015-1A Class B 144A± | | | 2.73 | | | | 4-18-2027 | | | | 500,000 | | | | 488,658 | |
BB-UBS Trust Series 2012-TFT Class C 144A± | | | 3.58 | | | | 6-5-2030 | | | | 150,000 | | | | 146,316 | |
Citi Held For Asset Issuance Trust Series 2015-PM3 Class B 144A | | | 4.31 | | | | 5-16-2022 | | | | 450,000 | | | | 425,402 | |
Commercial Mortgage Trust Series 2015-LC23 Class C ± | | | 4.80 | | | | 10-10-2053 | | | | 300,000 | | | | 295,923 | |
GS Mortgage Securities Trust Series 2014-GC24 Class D 144A± | | | 4.66 | | | | 9-10-2047 | | | | 325,000 | | | | 239,195 | |
JPMBB Commercial Mortgage Securities Trust Series 2014-C19 Class D 144A± | | | 4.83 | | | | 4-15-2047 | | | | 493,000 | | | | 399,831 | |
Morgan Stanley Capital I Trust Series 2007-HQ11 Class AM ± | | | 5.48 | | | | 2-12-2044 | | | | 25,000 | | | | 25,326 | |
| | | | |
Total Non-Agency Mortgage-Backed Securities (Cost $2,611,442) | | | | | | | | | | | | | | | 2,465,750 | |
| | | | | | | | | | | | | | | | |
| | | | |
U.S. Treasury Securities: 0.52% | | | | | | | | | | | | | | | | |
U.S. Treasury Note | | | 1.63 | | | | 2-15-2026 | | | | 130,000 | | | | 127,664 | |
| | | | | | | | | | | | | | | | |
| | | | |
Total U.S. Treasury Securities (Cost $126,523) | | | | | | | | | | | | | | | 127,664 | |
| | | | | | | | | | | | | | | | |
| | | | |
Yankee Corporate Bonds and Notes: 4.28% | | | | | | | | | | | | | | | | |
| | | | |
Consumer Discretionary: 0.21% | | | | | | | | | | | | | | | | |
| | | | |
| Automobiles: 0.21% | | | | | | | | | | | | | | | | |
Jaguar Land Rover Automotive plc 144A | | | 4.13 | | | | 12-15-2018 | | | | 50,000 | | | | 51,375 | |
| | | | | | | | | | | | | | | | |
| | | | |
Financials: 2.26% | | | | | | | | | | | | | | | | |
| | | | |
| Banks: 2.26% | | | | | | | | | | | | | | | | |
BPCE SA 144A | | | 5.15 | | | | 7-21-2024 | | | | 230,000 | | | | 236,397 | |
Credit Suisse Group Funding (Guernsey) Limited 144A | | | 3.45 | | | | 4-16-2021 | | | | 210,000 | | | | 212,177 | |
Nielsen Holding and Finance BV 144A | | | 5.50 | | | | 10-1-2021 | | | | 100,000 | | | | 104,250 | |
| | | | |
| | | | | | | | | | | | | | | 552,824 | |
| | | | | | | | | | | | | | | | |
| | | | |
Health Care: 0.67% | | | | | | | | | | | | | | | | |
| | | | |
| Pharmaceuticals: 0.67% | | | | | | | | | | | | | | | | |
Mallinckrodt International Finance SA | | | 3.50 | | | | 4-15-2018 | | | | 170,000 | | | | 165,431 | |
| | | | | | | | | | | | | | | | |
| | | | |
Information Technology: 0.54% | | | | | | | | | | | | | | | | |
| | | | |
| Technology Hardware, Storage & Peripherals: 0.54% | | | | | | | | | | | | | | | | |
Seagate HDD Cayman | | | 4.75 | | | | 1-1-2025 | | | | 175,000 | | | | 133,215 | |
| | | | | | | | | | | | | | | | |
| | | | |
Materials: 0.21% | | | | | | | | | | | | | | | | |
| | | | |
| Containers & Packaging: 0.21% | | | | | | | | | | | | | | | | |
Ardagh Packaging Finance plc 144A± | | | 3.63 | | | | 12-15-2019 | | | | 50,000 | | | | 50,494 | |
| | | | | | | | | | | | | | | | |
The accompanying notes are an integral part of these financial statements.
| | | | |
| 14 | | Wells Fargo Strategic Income Fund | | Portfolio of investments—April 30, 2016 (unaudited) |
| | | | | | | | | | | | | | | | |
| Security name | | Interest rate | | | Maturity date | | | Principal | | | Value | |
| | | | | | | | | | | | | | | | |
| | | | |
Telecommunication Services: 0.39% | | | | | | | | | | | | | | | | |
| | | | |
| Diversified Telecommunication Services: 0.39% | | | | | | | | | | | | | | | | |
Intelsat Jackson Holdings SA | | | 5.50 | % | | | 8-1-2023 | | | $ | 100,000 | | | $ | 63,188 | |
Intelsat Luxembourg SA | | | 8.13 | | | | 6-1-2023 | | | | 85,000 | | | | 27,838 | |
Virgin Media Finance plc 144A | | | 5.38 | | | | 4-15-2021 | | | | 4,500 | | | | 4,703 | |
| | | | |
| | | | | | | | | | | | | | | 95,729 | |
| | | | | | | | | | | | | | | | |
| | | | |
Total Yankee Corporate Bonds and Notes (Cost $1,184,304) | | | | | | | | | | | | | | | 1,049,068 | |
| | | | | | | | | | | | | | | | |
| | | | |
Yankee Government Bonds: 0.83% | | | | | | | | | | | | | | | | |
Republic Of Argentina 144A | | | 7.50 | | | | 4-22-2026 | | | | 200,000 | | | | 203,000 | |
| | | | | | | | | | | | | | | | |
| | | | |
Total Yankee Government Bonds and Notes (Cost $200,000) | | | | | | | | | | | | | | | 203,000 | |
| | | | | | | | | | | | | | | | |
| | | | |
| | | Yield | | | | | | Shares | | | | |
| Short-Term Investments: 6.63% | | | | | | | | | | | | | | | | |
| | | | |
| Investment Companies: 5.77% | | | | | | | | | | | | | | | | |
Securities Lending Cash Investments LLC (l)(r)(u) | | | 0.45 | | | | | | | | 49,994 | | | | 49,994 | |
Wells Fargo Cash Investment Money Market Fund Select Class (l)(u) | | | 0.43 | | | | | | | | 1,365,995 | | | | 1,365,995 | |
| | | | |
| | | | | | | | | | | | | | | 1,415,989 | |
| | | | | | | | | | | | | | | | |
| | | | |
| | | | | | | | | Principal | | | | |
| U.S. Treasury Securities: 0.86% | | | | | | | | | | | | | | | | |
U.S. Treasury Bill #(z) | | | 0.31 | | | | 6-16-2016 | | | $ | 210,000 | | | | 209,962 | |
| | | | | | | | | | | | | | | | |
| | | | |
Total Short-Term Investments (Cost $1,625,904) | | | | | | | | | | | | | | | 1,625,951 | |
| | | | | | | | | | | | | | | | |
| | | | | | | | |
| Total investments in securities (Cost $24,571,511) * | | | 96.32 | % | | | 23,613,718 | |
Other assets and liabilities, net | | | 3.68 | | | | 903,361 | |
| | | | | | | | |
| Total net assets | | | 100.00 | % | | $ | 24,517,079 | |
| | | | | | | | |
| 144A | The security may be resold in transactions exempt from registration, normally to qualified institutional buyers, pursuant to Rule 144A under the Securities Act of 1933. |
| ¥ | A payment-in-kind (PIK) security is a security in which the issuer may make interest or dividend payments in cash or additional securities. These additional securities generally have the same terms as the original holdings. |
| ± | Variable rate investment. The rate shown is the rate in effect at period end. |
| @ | Foreign bond principal is denominated in the local currency of the issuer. |
| (s) | The security is currently in default with regards to scheduled interest and/or principal payments. The Fund has stopped accruing interest on the security. |
| (l) | The issuer of the security is an affiliated person of the Fund as defined in the Investment Company Act of 1940. |
| (r) | The investment is a non-registered investment vehicle purchased with cash collateral received from securities on loan. |
| (u) | The rate represents the 7-day annualized yield at period end. |
| # | All or a portion of this security is segregated as collateral for investments in derivative instruments. |
| (z) | Zero coupon security. The rate represents the current yield to maturity. |
| * | Cost for federal income tax purposes is $24,590,653 and unrealized gains (losses) consists of: |
| | | | |
Gross unrealized gains | | $ | 289,357 | |
Gross unrealized losses | | | (1,266,292 | ) |
| | | | |
Net unrealized losses | | $ | (976,935 | ) |
The accompanying notes are an integral part of these financial statements.
| | | | | | |
| Statement of assets and liabilities—April 30, 2016 (unaudited) | | Wells Fargo Strategic Income Fund | | | 15 | |
| | | | |
| | | | |
| |
Assets | | | | |
Investments | | | | |
In unaffiliated securities (including $48,992 of securities loaned), at value (cost $23,155,522) | | $ | 22,197,729 | |
In affiliated securities, at value (cost $1,415,989) | | | 1,415,989 | |
| | | | |
Total investments, at value (cost $24,571,511) | | | 23,613,718 | |
Segregated cash | | | 62,758 | |
Foreign currency, at value (cost $15,970) | | | 17,591 | |
Receivable for investments sold | | | 904,050 | |
Receivable for interest | | | 259,795 | |
Receivable for securities lending income | | | 15 | |
Unrealized gains on credit default swap transactions | | | 1,609 | |
Premiums paid on credit default swap transactions | | | 5,566 | |
Unrealized gains on forward foreign currency contracts | | | 7,263 | |
Receivable from manager | | | 5,502 | |
Prepaid expenses and other assets | | | 44,831 | |
| | | | |
Total assets | | | 24,922,698 | |
| | | | |
| |
Liabilities | | | | |
Payable for investments purchased | | | 262,477 | |
Payable for Fund shares redeemed | | | 153 | |
Unrealized losses on forward foreign currency contracts | | | 58,102 | |
Payable upon receipt of securities loaned | | | 49,994 | |
Payable for daily variation margin on open futures contracts | | | 8,810 | |
Distribution fee payable | | | 453 | |
Administration fees payable | | | 1,761 | |
Professional fees payable | | | 22,269 | |
Trustees fees payable | | | 1,600 | |
| | | | |
Total liabilities | | | 405,619 | |
| | | | |
Total net assets | | $ | 24,517,079 | |
| | | | |
| |
NET ASSETS CONSIST OF | | | | |
Paid-in capital | | $ | 27,068,399 | |
Undistributed net investment income | | | 191,859 | |
Accumulated net realized losses on investments | �� | | (1,775,524 | ) |
Net unrealized losses on investments | | | (967,655 | ) |
| | | | |
Total net assets | | $ | 24,517,079 | |
| | | | |
| |
COMPUTATION OF NET ASSET VALUE AND OFFERING PRICE PER SHARE | | | | |
Net assets – Class A | | $ | 942,554 | |
Shares outstanding – Class A1 | | | 103,767 | |
Net asset value per share – Class A | | | $9.08 | |
Maximum offering price per share – Class A2 | | | $9.46 | |
Net assets – Class C | | $ | 720,836 | |
Shares outstanding – Class C1 | | | 79,577 | |
Net asset value per share – Class C | | | $9.06 | |
Net assets – Administrator Class | | $ | 499,211 | |
Shares outstanding – Administrator Class1 | | | 54,763 | |
Net asset value per share – Administrator Class | | | $9.12 | |
Net assets – Institutional Class | | $ | 22,354,478 | |
Shares outstanding – Institutional Class1 | | | 2,462,580 | |
Net asset value per share – Institutional Class | | | $9.08 | |
| 1 | The Fund has an unlimited number of authorized shares. |
| 2 | Maximum offering price is computed as 100/96 of net asset value. On investments of $500,000 or more, the offering price is reduced. |
The accompanying notes are an integral part of these financial statements.
| | | | |
| 16 | | Wells Fargo Strategic Income Fund | | Statement of operations—six months ended April 30, 2016 (unaudited) |
| | | | |
| | | | |
| |
Investment income | | | | |
Interest (net of foreign interest withholding taxes of $4,872) | | $ | 531,377 | |
Income from affiliated securities | | | 3,296 | |
Securities lending income, net | | | 921 | |
| | | | |
Total investment income | | | 535,594 | |
| | | | |
| |
Expenses | | | | |
Management fee | | | 58,625 | |
Administration fees | | | | |
Class A | | | 699 | |
Class C | | | 568 | |
Administrator Class | | | 242 | |
Institutional Class | | | 8,106 | |
Shareholder servicing fees | | | | |
Class A | | | 1,093 | |
Class C | | | 888 | |
Administrator Class | | | 605 | |
Distribution fee | | | | |
Class C | | | 2,664 | |
Custody and accounting fees | | | 13,602 | |
Professional fees | | | 26,708 | |
Registration fees | | | 30,398 | |
Shareholder report expenses | | | 10,216 | |
Trustees’ fees and expenses | | | 6,651 | |
Other fees and expenses | | | 3,271 | |
| | | | |
Total expenses | | | 164,336 | |
Less: Fee waivers and/or expense reimbursements | | | (91,932 | ) |
| | | | |
Net expenses | | | 72,404 | |
| | | | |
Net investment income | | | 463,190 | |
| | | | |
| |
REALIZED AND UNREALIZED GAINS (LOSSES) ON INVESTMENTS | | | | |
| |
Net realized losses on: | | | | |
Unaffiliated securities | | | (220,532 | ) |
Futures transactions | | | (229,801 | ) |
Forward foreign currency contract transactions | | | (78,282 | ) |
Credit default swap transactions | | | (12,492 | ) |
| | | | |
Net realized losses on investments | | | (541,107 | ) |
| | | | |
| |
Net change in unrealized gains (losses) on: | | | | |
Unaffiliated securities | | | 373,861 | |
Futures transactions | | | (23,692 | ) |
Forward foreign currency contract transactions | | | (5,941 | ) |
Credit default swap transactions | | | 173 | |
| | | | |
Net change in unrealized gains (losses) on investments | | | 344,401 | |
| | | | |
Net realized and unrealized gains (losses) on investments | | | (196,706 | ) |
| | | | |
Net increase in net assets resulting from operations | | $ | 266,484 | |
| | | | |
The accompanying notes are an integral part of these financial statements.
| | | | | | |
| Statement of changes in net assets | | Wells Fargo Strategic Income Fund | | | 17 | |
| | | | | | | | | | | | | | | | |
| | | Six months ended
April 30, 2016
(unaudited) | | | Year ended
October 31, 2015 | |
| | | | |
Operations | | | | | | | | | | | | | | | | |
Net investment income | | | | | | $ | 463,190 | | | | | | | $ | 1,317,175 | |
Net realized losses on investments | | | | | | | (541,107 | ) | | | | | | | (1,296,981 | ) |
Net change in unrealized gains (losses) on investments | | | | | | | 344,401 | | | | | | | | (666,689 | ) |
| | | | |
Net increase (decrease) in net assets resulting from operations | | | | | | | 266,484 | | | | | | | | (646,495 | ) |
| | | | |
| | | | |
Distributions to shareholders from | | | | | | | | | | | | | | | | |
Net investment income | | | | | | | | | | | | | | | | |
Class A | | | | | | | (9,790 | ) | | | | | | | (21,334 | ) |
Class C | | | | | | | (4,576 | ) | | | | | | | (14,917 | ) |
Administrator Class | | | | | | | (5,795 | ) | | | | | | | (12,399 | ) |
Institutional Class | | | | | | | (296,052 | ) | | | | | | | (935,496 | ) |
Tax basis return of capital | | | | | | | | | | | | | | | | |
Class A | | | | | | | 0 | | | | | | | | (2,416 | ) |
Class C | | | | | | | 0 | | | | | | | | (1,689 | ) |
Administrator Class | | | | | | | 0 | | | | | | | | (1,404 | ) |
Institutional Class | | | | | | | 0 | | | | | | | | (105,941 | ) |
| | | | |
Total distributions to shareholders | | | | | | | (316,213 | ) | | | | | | | (1,095,596 | ) |
| | | | |
| | | | |
Capital share transactions | | | Shares | | | | | | | | Shares | | | | | |
Proceeds from shares sold | | | | | | | | | | | | | | | | |
Class A | | | 42,970 | | | | 378,776 | | | | 44,768 | | | | 426,513 | |
Class C | | | 6,171 | | | | 55,787 | | | | 5,907 | | | | 55,667 | |
Institutional Class | | | 589,670 | | | | 5,244,767 | | | | 190,379 | | | | 1,736,500 | |
| | | | |
| | | | | | | 5,679,330 | | | | | | | | 2,218,680 | |
| | | | |
Reinvestment of distributions | | | | | | | | | | | | | | | | |
Class A | | | 1,084 | | | | 9,684 | | | | 2,260 | | | | 21,553 | |
Class C | | | 491 | | | | 4,368 | | | | 1,740 | | | | 16,606 | |
Administrator Class | | | 647 | | | | 5,795 | | | | 1,443 | | | | 13,803 | |
Institutional Class | | | 33,214 | | | | 296,052 | | | | 109,213 | | | | 1,041,437 | |
| | | | |
| | | | | | | 315,899 | | | | | | | | 1,093,399 | |
| | | | |
Payment for shares redeemed | | | | | | | | | | | | | | | | |
Class A | | | (41,851 | ) | | | (368,660 | ) | | | (18,900 | ) | | | (178,898 | ) |
Class C | | | (5,243 | ) | | | (46,586 | ) | | | (15,520 | ) | | | (148,738 | ) |
Administrator Class | | | 0 | | | | 0 | | | | (4,192 | ) | | | (39,990 | ) |
Institutional Class | | | (81,225 | ) | | | (711,756 | ) | | | (2,358,709 | ) | | | (22,270,242 | ) |
| | | | |
| | | | | | | (1,127,002 | ) | | | | | | | (22,637,868 | ) |
| | | | |
Net increase (decrease) in net assets resulting from capital share transactions | | | | | | | 4,868,227 | | | | | | | | (19,325,789 | ) |
| | | | |
Total increase (decrease) in net assets | | | | | | | 4,818,498 | | | | | | | | (21,067,880 | ) |
| | | | |
| | | | |
Net assets | | | | | | | | | | | | | | | | |
Beginning of period | | | | | | | 19,698,581 | | | | | | | | 40,766,461 | |
| | | | |
End of period | | | | | | $ | 24,517,079 | | | | | | | $ | 19,698,581 | |
| | | | |
Undistributed net investment income | | | | | | $ | 191,859 | | | | | | | $ | 44,882 | |
| | | | |
The accompanying notes are an integral part of these financial statements.
| | | | |
| 18 | | Wells Fargo Strategic Income Fund | | Financial highlights |
(For a share outstanding throughout each period)
| | | | | | | | | | | | | | | | |
| | | Six months ended
April 30, 2016 (unaudited) | | | Year ended October 31 | |
| CLASS A | | | 2015 | | | 2014 | | | 20131 | |
Net asset value, beginning of period | | | $9.13 | | | | $9.72 | | | | $9.66 | | | | $10.00 | |
Net investment income | | | 0.17 | | | | 0.34 | | | | 0.37 | | | | 0.27 | |
Net realized and unrealized gains (losses) on investments | | | (0.12 | ) | | | (0.69 | ) | | | (0.05 | ) | | | (0.36 | ) |
| | | | | | | | | | | | | | | | |
Total from investment operations | | | 0.05 | | | | (0.35 | ) | | | 0.32 | | | | (0.09 | ) |
Distributions to shareholders from | | | | | | | | | | | | | | | | |
Net investment income | | | (0.10 | ) | | | (0.22 | ) | | | (0.26 | ) | | | (0.25 | ) |
Tax basis return of capital | | | 0.00 | | | | (0.02 | ) | | | 0.00 | | | | 0.00 | |
| | | | | | | | | | | | | | | | |
Total distributions to shareholders | | | (0.10 | ) | | | (0.24 | ) | | | (0.26 | ) | | | (0.25 | ) |
Net asset value, end of period | | | $9.08 | | | | $9.13 | | | | $9.72 | | | | $9.66 | |
Total return2 | | | 0.58 | % | | | (3.64 | )% | | | 3.36 | % | | | (0.89 | )% |
Ratios to average net assets (annualized) | | | | | | | | | | | | | | | | |
Gross expenses | | | 1.75 | % | | | 1.63 | % | | | 1.51 | % | | | 1.85 | % |
Net expenses | | | 0.90 | % | | | 0.90 | % | | | 0.90 | % | | | 0.90 | % |
Net investment income | | | 3.88 | % | | | 3.77 | % | | | 4.02 | % | | | 3.76 | % |
Supplemental data | | | | | | | | | | | | | | | | |
Portfolio turnover rate | | | 14 | % | | | 53 | % | | | 51 | % | | | 39 | % |
Net assets, end of period (000s omitted) | | | $943 | | | | $928 | | | | $714 | | | | $518 | |
| 1 | For the period from January 31, 2013 (commencement of class operations) to October 31, 2013 |
| 2 | Total return calculations do not include any sales charges. Returns for periods of less than one year are not annualized. |
The accompanying notes are an integral part of these financial statements.
| | | | | | |
| Financial highlights | | Wells Fargo Strategic Income Fund | | | 19 | |
(For a share outstanding throughout each period)
| | | | | | | | | | | | | | | | |
| | | Six months ended
April 30, 2016 (unaudited) | | | Year ended October 31 | |
| CLASS C | | | 2015 | | | 2014 | | | 20131 | |
Net asset value, beginning of period | | | $9.10 | | | | $9.71 | | | | $9.65 | | | | $10.00 | |
Net investment income | | | 0.14 | | | | 0.28 | | | | 0.31 | | | | 0.21 | |
Net realized and unrealized gains (losses) on investments | | | (0.12 | ) | | | (0.68 | ) | | | (0.06 | ) | | | (0.37 | ) |
| | | | | | | | | | | | | | | | |
Total from investment operations | | | 0.02 | | | | (0.40 | ) | | | 0.25 | | | | (0.16 | ) |
Distributions to shareholders from | | | | | | | | | | | | | | | | |
Net investment income | | | (0.06 | ) | | | (0.19 | ) | | | (0.19 | ) | | | (0.19 | ) |
Tax basis return of capital | | | 0.00 | | | | (0.02 | ) | | | 0.00 | | | | 0.00 | |
| | | | | | | | | | | | | | | | |
Total distributions to shareholders | | | (0.06 | ) | | | (0.21 | ) | | | (0.19 | ) | | | (0.19 | ) |
Net asset value, end of period | | | $9.06 | | | | $9.10 | | | | $9.71 | | | | $9.65 | |
Total return2 | | | 0.29 | % | | | (4.35 | )% | | | 2.61 | % | | | (1.51 | )% |
Ratios to average net assets (annualized) | | | | | | | | | | | | | | | | |
Gross expenses | | | 2.50 | % | | | 2.37 | % | | | 2.25 | % | | | 2.60 | % |
Net expenses | | | 1.65 | % | | | 1.65 | % | | | 1.65 | % | | | 1.65 | % |
Net investment income | | | 3.13 | % | | | 3.02 | % | | | 3.25 | % | | | 3.01 | % |
Supplemental data | | | | | | | | | | | | | | | | |
Portfolio turnover rate | | | 14 | % | | | 53 | % | | | 51 | % | | | 39 | % |
Net assets, end of period (000s omitted) | | | $721 | | | | $711 | | | | $835 | | | | $518 | |
| 1 | For the period from January 31, 2013 (commencement of class operations) to October 31, 2013 |
| 2 | Total return calculations do not include any sales charges. Returns for periods of less than one year are not annualized. |
The accompanying notes are an integral part of these financial statements.
| | | | |
| 20 | | Wells Fargo Strategic Income Fund | | Financial highlights |
(For a share outstanding throughout each period)
| | | | | | | | | | | | | | | | |
| | | Six months ended
April 30, 2016 (unaudited) | | | Year ended October 31 | |
| ADMINISTRATOR CLASS | | | 2015 | | | 2014 | | | 20131 | |
Net asset value, beginning of period | | | $9.16 | | | | $9.74 | | | | $9.66 | | | | $10.00 | |
Net investment income | | | 0.18 | | | | 0.37 | | | | 0.39 | | | | 0.28 | |
Net realized and unrealized gains (losses) on investments | | | (0.11 | ) | | | (0.70 | ) | | | (0.05 | ) | | | (0.37 | ) |
| | | | | | | | | | | | | | | | |
Total from investment operations | | | 0.07 | | | | (0.33 | ) | | | 0.34 | | | | (0.09 | ) |
Distributions to shareholders from | | | | | | | | | | | | | | | | |
Net investment income | | | (0.11 | ) | | | (0.22 | ) | | | (0.26 | ) | | | (0.25 | ) |
Tax basis return of capital | | | 0.00 | | | | (0.03 | ) | | | 0.00 | | | | 0.00 | |
| | | | | | | | | | | | | | | | |
Total distributions to shareholders | | | (0.11 | ) | | | (0.25 | ) | | | (0.26 | ) | | | (0.25 | ) |
Net asset value, end of period | | | $9.12 | | | | $9.16 | | | | $9.74 | | | | $9.66 | |
Total return2 | | | 0.75 | % | | | (3.51 | )% | | | 3.63 | % | | | (0.85 | )% |
Ratios to average net assets (annualized) | | | | | | | | | | | | | | | | |
Gross expenses | | | 1.69 | % | | | 1.56 | % | | | 1.46 | % | | | 1.79 | % |
Net expenses | | | 0.75 | % | | | 0.75 | % | | | 0.75 | % | | | 0.75 | % |
Net investment income | | | 4.04 | % | | | 3.92 | % | | | 4.18 | % | | | 3.90 | % |
Supplemental data | | | | | | | | | | | | | | | | |
Portfolio turnover rate | | | 14 | % | | | 53 | % | | | 51 | % | | | 39 | % |
Net assets, end of period (000s omitted) | | | $499 | | | | $496 | | | | $554 | | | | $496 | |
| 1 | For the period from January 31, 2013 (commencement of class operations) to October 31, 2013 |
| 2 | Returns for periods of less than one year are not annualized. |
The accompanying notes are an integral part of these financial statements.
| | | | | | |
| Financial highlights | | Wells Fargo Strategic Income Fund | | | 21 | |
(For a share outstanding throughout each period)
| | | | | | | | | | | | | | | | |
| | | Six months ended
April 30, 2016 (unaudited) | | | Year ended October 31 | |
| INSTITUTIONAL CLASS | | | 2015 | | | 2014 | | | 20131 | |
Net asset value, beginning of period | | | $9.14 | | | | $9.71 | | | | $9.66 | | | | $10.00 | |
Net investment income | | | 0.19 | 2 | | | 0.40 | | | | 0.41 | 2 | | | 0.29 | |
Net realized and unrealized gains (losses) on investments | | | (0.12 | ) | | | (0.71 | ) | | | (0.07 | ) | | | (0.36 | ) |
| | | | | | | | | | | | | | | | |
Total from investment operations | | | 0.07 | | | | (0.31 | ) | | | 0.34 | | | | (0.07 | ) |
Distributions to shareholders from | | | | | | | | | | | | | | | | |
Net investment income | | | (0.13 | ) | | | (0.23 | ) | | | (0.29 | ) | | | (0.27 | ) |
Tax basis return of capital | | | 0.00 | | | | (0.03 | ) | | | 0.00 | | | | 0.00 | |
| | | | | | | | | | | | | | | | |
Total distributions to shareholders | | | (0.13 | ) | | | (0.26 | ) | | | (0.29 | ) | | | (0.27 | ) |
Net asset value, end of period | | | $9.08 | | | | $9.14 | | | | $9.71 | | | | $9.66 | |
Total return3 | | | 0.79 | % | | | (3.28 | )% | | | 3.60 | % | | | (0.66 | )% |
Ratios to average net assets (annualized) | | | | | | | | | | | | | | | | |
Gross expenses | | | 1.42 | % | | | 1.19 | % | | | 1.14 | % | | | 1.52 | % |
Net expenses | | | 0.60 | % | | | 0.60 | % | | | 0.60 | % | | | 0.60 | % |
Net investment income | | | 4.20 | % | | | 4.04 | % | | | 4.25 | % | | | 4.05 | % |
Supplemental data | | | | | | | | | | | | | | | | |
Portfolio turnover rate | | | 14 | % | | | 53 | % | | | 51 | % | | | 39 | % |
Net assets, end of period (000s omitted) | | | $22,354 | | | | $17,564 | | | | $38,664 | | | | $23,338 | |
| 1 | For the period from January 31, 2013 (commencement of class operations) to October 31, 2013 |
| 2 | Calculated based upon average shares outstanding |
| 3 | Returns for periods of less than one year are not annualized. |
The accompanying notes are an integral part of these financial statements.
| | | | |
| 22 | | Wells Fargo Strategic Income Fund | | Notes to financial statements (unaudited) |
1. ORGANIZATION
Wells Fargo Funds Trust (the “Trust”), a Delaware statutory trust organized on March 10, 1999, is an open-end management investment company registered under the Investment Company Act of 1940, as amended (the “1940 Act”). As an investment company, the Trust follows the accounting and reporting guidance in Financial Accounting Standards Board (“FASB”) Accounting Standards Codification Topic 946, Financial Services – Investment Companies. These financial statements report on the Wells Fargo Strategic Income Fund (the “Fund”) which is a diversified series of the Trust.
2. SIGNIFICANT ACCOUNTING POLICIES
The following significant accounting policies, which are consistently followed in the preparation of the financial statements of the Fund, are in conformity with U.S. generally accepted accounting principles which require management to make estimates and assumptions that affect the reported amounts of assets and liabilities, disclosure of contingent assets and liabilities at the date of the financial statements, and the reported amounts of revenues and expenses during the reporting period. Actual results could differ from those estimates.
Securities valuation
All investments are valued each business day as of the close of regular trading on the New York Stock Exchange (generally 4 p.m. Eastern Time), although the Fund may deviate from this calculation time under unusual or unexpected circumstances.
Debt securities are valued at the evaluated bid price provided by an independent pricing service or, if a reliable price is not available, the quoted bid price from an independent broker-dealer.
Futures that are listed on a foreign or domestic exchange or market are valued at the official closing price or, if none, the last sales price.
Non-listed swaps are valued at the evaluated price provided by an independent pricing service or, if a reliable price is not available, the quoted bid price from an independent broker-dealer.
The values of securities denominated in foreign currencies are translated into U.S. dollars at rates provided by an independent foreign currency pricing source at a time each business day specified by the Management Valuation Team of Wells Fargo Funds Management, LLC (“Funds Management”).
Investments in registered open-end investment companies are valued at net asset value. Interests in non-registered investment vehicles that are redeemable at net asset value are fair valued normally at net asset value.
Investments which are not valued using any of the methods discussed above are valued at their fair value, as determined in good faith by the Board of Trustees of the Fund. The Board of Trustees has established a Valuation Committee comprised of the Trustees and has delegated to it the authority to take any actions regarding the valuation of portfolio securities that the Valuation Committee deems necessary or appropriate, including determining the fair value of portfolio securities, unless the determination has been delegated to the Management Valuation Team. The Board of Trustees retains the authority to make or ratify any valuation decisions or approve any changes to the Valuation Procedures as it deems appropriate. On a quarterly basis, the Board of Trustees receives reports on any valuation actions taken by the Valuation Committee or the Management Valuation Team which may include items for ratification.
Valuations of fair valued securities are compared to the next actual sales price when available, or other appropriate market values, to assess the continued appropriateness of the fair valuation methodologies used. These securities are fair valued on a day-to-day basis, taking into consideration changes to appropriate market information and any significant changes to the inputs considered in the valuation process until there is a readily available price provided on an exchange or by an independent pricing service. Valuations received from an independent pricing service or independent broker-dealer quotes are periodically validated by comparisons to most recent trades and valuations provided by other independent pricing services in addition to the review of prices by the manager and/or subadviser. Unobservable inputs used in determining fair valuations are identified based on the type of security, taking into consideration factors utilized by market participants in valuing the investment, knowledge about the issuer and the current market environment.
Foreign currency translation
The accounting records of the Fund are maintained in U.S. dollars. The values of other assets and liabilities denominated in foreign currencies are translated into U.S. dollars at rates provided by an independent foreign currency pricing source at a time each business day specified by the Management Valuation Team. Purchases and sales of securities, and income and expenses are converted at the rate of exchange on the respective dates of such transactions. Net realized foreign exchange gains or losses arise from sales of foreign currencies, currency gains or losses realized between the trade and
| | | | | | |
| Notes to financial statements (unaudited) | | Wells Fargo Strategic Income Fund | | | 23 | |
settlement dates on securities transactions, and the difference between the amounts of dividends, interest and foreign withholding taxes recorded and the U.S. dollar equivalent of the amounts actually paid or received. Net unrealized foreign exchange gains and losses arise from changes in the fair value of assets and liabilities other than investments in securities resulting from changes in exchange rates. The changes in net assets arising from changes in exchange rates and the changes in net assets resulting from changes in market prices of securities are not separately presented. Such changes are included in net realized and unrealized gains or losses from investments.
Forward foreign currency contracts
The Fund is subject to foreign currency exchange rate risk in the normal course of pursuing its investment objectives. A forward foreign currency contract is an agreement between two parties to purchase or sell a specific currency for an agreed-upon price at a future date. The Fund enters into forward foreign currency contracts to facilitate transactions in foreign-denominated securities and to attempt to minimize the risk to the Fund from adverse changes in the relationship between currencies. Forward foreign currency contracts are recorded at the forward rate and marked-to-market daily. When the contracts are closed, realized gains and losses arising from such transactions are recorded as realized gains or losses on forward foreign currency contract transactions. The Fund could be exposed to risks if the counterparties to the contracts are unable to meet the terms of their contracts or if the value of the foreign currency changes unfavorably. The Fund’s maximum risk of loss from counterparty credit risk is the unrealized gains on the contracts. This risk may be mitigated if there is a master netting arrangement between the Fund and the counterparty.
Security loans
The Fund may lend its securities from time to time in order to earn additional income in the form of fees or interest on securities received as collateral or the investment of any cash received as collateral. The Fund continues to receive interest or dividends on the securities loaned. The Fund receives collateral in the form of cash or securities with a value at least equal to the value of the securities on loan. The value of the loaned securities is determined at the close of each business day and any additional required collateral is delivered to the Fund on the next business day. In a securities lending transaction, the net asset value of the Fund will be affected by an increase or decrease in the value of the securities loaned and by an increase or decrease in the value of the instrument in which collateral is invested. The amount of securities lending activity undertaken by the Fund fluctuates from time to time. In the event of default or bankruptcy by the borrower, the Fund may be prevented from recovering the loaned securities or gaining access to the collateral or may experience delays or costs in doing so. In addition, the investment of any cash collateral received may lose all or part of its value. The Fund has the right under the lending agreement to recover the securities from the borrower on demand.
The Fund lends its securities through an unaffiliated securities lending agent. Cash collateral received in connection with its securities lending transactions is invested in Securities Lending Cash Investments, LLC (the “Securities Lending Fund”). The Securities Lending Fund is exempt from registration under Section 3(c)(7) of the 1940 Act and is managed by Funds Management and is subadvised by Wells Capital Management Incorporated (“WellsCap”), an affiliate of Funds Management and an indirect wholly owned subsidiary of Wells Fargo & Company (“Wells Fargo”). Funds Management receives an advisory fee starting at 0.05% and declining to 0.01% as the average daily net assets of the Securities Lending Fund increase. All of the fees received by Funds Management are paid to WellsCap for its services as subadviser. The Securities Lending Fund seeks to provide a positive return compared to the daily Fed Funds Open rate by investing in high-quality, U.S. dollar-denominated short-term money market instruments. Securities Lending Fund investments are fair valued based upon the amortized cost valuation technique. Income earned from investment in the Securities Lending Fund is included in securities lending income on the Statement of Operations
When-issued transactions
The Fund may purchase securities on a forward commitment or when-issued basis. The Fund records a when-issued transaction on the trade date and will segregate assets in an amount at least equal in value to the Fund’s commitment to purchase when-issued securities. Securities purchased on a when-issued basis are marked-to-market daily and the Fund begins earning interest on the settlement date. Losses may arise due to changes in the market value of the underlying securities or if the counterparty does not perform under the contract.
Loans
The Fund may invest in direct debt instruments which are interests in amounts owed to lenders by corporate or other borrowers. The loans pay interest at rates which are periodically reset by reference to a base lending rate plus a spread. Investments in loans may be in the form of participations in loans or assignments of all or a portion of loans from third parties. When the Fund purchases participations, it generally has no rights to enforce compliance with terms of the loan agreement with the borrower. As a result, the Fund assumes the credit risk of both the borrower and the lender that is selling the participation. When the Fund purchases assignments from lenders, it acquires direct rights against the
| | | | |
| 24 | | Wells Fargo Strategic Income Fund | | Notes to financial statements (unaudited) |
borrower on the loan and may enforce compliance by the borrower with the terms of the loan agreement. Loans may include fully funded term loans or unfunded loan commitments, which are contractual obligations for future funding.
Futures contracts
The Fund is subject to interest rate risk in the normal course of pursuing its investment objectives. The Fund may buy and sell futures contracts in order to gain exposure to, or protect against, changes in security values and interest rates. The primary risks associated with the use of futures contracts are the imperfect correlation between changes in market values of securities held by the Fund and the prices of futures contracts, and the possibility of an illiquid market.
The aggregate principal amounts of the contracts are not recorded in the financial statements. Fluctuations in the value of the contracts are recorded in the Statement of Assets and Liabilities as an asset or liability and in the Statement of Operations as unrealized gains or losses until the contracts are closed, at which point they are recorded as net realized gains or losses on futures contracts. With futures contracts, there is minimal counterparty risk to the Fund since futures are exchange traded and the exchange’s clearinghouse, as counterparty to all exchange traded futures, guarantees the futures against default.
Credit default swaps
The Fund is subject to credit risk in the normal course of pursuing its investment objectives. The Fund may enter into credit default swap contracts for hedging or speculative purposes to provide or receive a measure of protection against default on a referenced entity, obligation or index or for investment gains. Credit default swaps involve an exchange of a stream of payments for protection against the loss in value of an underlying security or index. Under the terms of the swap, one party acts as a guarantor (referred to as the seller of protection) and receives a periodic stream of payments, provided that there is no credit event, from another party (referred to as the buyer of protection) that is a fixed percentage applied to a notional principal amount over the term of the swap. An index credit default swap references all the names in the index, and if a credit event is triggered, the credit event is settled based on that name’s weight in the index. A credit event includes bankruptcy, failure to pay, obligation default, obligation acceleration, repudiation/moratorium, and restructuring. The Fund may enter into credit default swaps as either the seller of protection or the buyer of protection. As the seller of protection, the Fund is subject to investment exposure on the notional amount of the swap and has assumed the risk of default of the underlying security or index. As the buyer of protection, the Fund could be exposed to risks if the seller of the protection defaults on its obligation to perform, or if there are unfavorable changes in the fluctuation of interest rates. The maximum potential amount of future payments (undiscounted) that the Fund as the seller of protection could be required to make under the credit default swap contract would be an amount equal to the notional amount of the swap contract. The Fund’s maximum risk of loss from counterparty risk, either as the protection seller or as the protection buyer, is the fair value of the contract. This risk is mitigated by having a master netting arrangement between the Fund and the counterparty and by having the counterparty post collateral to cover the Fund’s exposure to the counterparty.
If the Fund is the seller of protection and a credit event occurs, as defined under the terms of that particular swap agreement, the Fund will pay to the buyer of protection the notional amount of the swap and take delivery of the referenced obligation or underlying securities comprising the referenced index. If the Fund is the buyer of protection and a credit event occurs, as defined under the terms of that particular swap agreement, the Fund will receive from the seller of protection the notional amount of the swap and deliver the referenced obligation or underlying securities comprising the referenced index.
Any premiums paid or received on the transactions are recorded as an asset or liability on the Statement of Assets and Liabilities and amortized. The value of the swap contract is marked-to-market daily based on quotations from an independent pricing service or an independent broker-dealer and any change in value is recorded as an unrealized gain or loss. Periodic payments made or received are recorded as realized gains or losses. In addition, payments received or made as a result of a credit event or termination of the contract are recognized as realized gains or losses.
Certain credit default swap contracts entered into by the Fund provide for conditions that result in events of default or termination that enable the counterparty to the agreement to cause an early termination of the transactions under those agreements
Security transactions and income recognition
Securities transactions are recorded on a trade date basis. Realized gains or losses are recorded on the basis of identified cost.
Interest income is accrued daily and bond discounts are accreted and premiums are amortized daily based on the effective interest method. To the extent debt obligations are placed on non-accrual status, any related interest income
| | | | | | |
| Notes to financial statements (unaudited) | | Wells Fargo Strategic Income Fund | | | 25 | |
may be reduced by writing off interest receivables when the collection of all or a portion of interest has become doubtful based on consistently applied procedures. If the issuer subsequently resumes interest payments or when the collectability of interest is reasonably assured, the debt obligation is removed from non-accrual status.
Income from foreign securities is recorded net of foreign taxes withheld where recovery of such taxes is not assured.
Distributions to shareholders
Distributions to shareholders from net investment income and net realized gains, if any, are recorded on the ex-dividend date. Such distributions are determined in conformity with federal income tax regulations, which may differ in amount or character from net investment income and realized gains recognized for purposes of U.S. generally accepted accounting principles.
Federal and other taxes
The Fund intends to continue to qualify as a regulated investment company by distributing substantially all of its investment company taxable income and any net realized capital gains (after reduction for capital loss carryforwards) sufficient to relieve it from all, or substantially all, federal income taxes. Accordingly, no provision for federal income taxes was required.
The Fund’s income and federal excise tax returns and all financial records supporting those returns for the prior three fiscal years are subject to examination by the federal and Delaware revenue authorities. Management has analyzed the Fund’s tax positions taken on federal, state, and foreign tax returns for all open tax years and does not believe that there are any uncertain tax positions that require recognition of a tax liability.
As of October 31, 2015, the Fund had capital loss carryforwards which consist of $497,909 in short-term capital losses and $656,818 in long-term capital losses.
Class allocations
The separate classes of shares offered by the Fund differ principally in applicable sales charges, distribution, shareholder servicing, and administration fees. Class specific expenses are charged directly to that share class. Investment income, common expenses, and realized and unrealized gains (losses) on investments are allocated daily to each class of shares based on the relative proportion of net assets of each class.
3. FAIR VALUATION MEASUREMENTS
Fair value measurements of investments are determined within a framework that has established a fair value hierarchy based upon the various data inputs utilized in determining the value of the Fund’s investments. The three-level hierarchy gives the highest priority to unadjusted quoted prices in active markets for identical assets or liabilities (Level 1) and the lowest priority to significant unobservable inputs (Level 3). The Fund’s investments are classified within the fair value hierarchy based on the lowest level of input that is significant to the fair value measurement. The inputs are summarized into three broad levels as follows:
| n | | Level 1 – quoted prices in active markets for identical securities |
| n | | Level 2 – other significant observable inputs (including quoted prices for similar securities, interest rates, prepayment speeds, credit risk, use of amortized cost, etc.) |
| n | | Level 3 – significant unobservable inputs (including the Fund’s own assumptions in determining the fair value of investments) |
The inputs or methodologies used for valuing investments in securities are not necessarily an indication of the risk associated with investing in those securities.
| | | | |
| 26 | | Wells Fargo Strategic Income Fund | | Notes to financial statements (unaudited) |
The following is a summary of the inputs used in valuing the Fund’s assets and liabilities as of April 30, 2016:
| | | | | | | | | | | | | | | | |
| | | Quoted prices (Level 1) | | | Other significant observable inputs (Level 2) | | | Significant unobservable inputs (Level 3) | | | Total | |
Assets | | | | | | | | | | | | | | | | |
Investments in: | | | | | | | | | | | | | | | | |
| | | | |
Asset-backed securities | | $ | 0 | | | $ | 1,744,291 | | | $ | 0 | | | $ | 1,744,291 | |
| | | | |
Corporate bonds and notes | | | 0 | | | | 9,301,957 | | | | 0 | | | | 9,301,957 | |
| | | | |
Foreign government bonds | | | 0 | | | | 3,366,313 | | | | 0 | | | | 3,366,313 | |
| | | | |
Loans | | | 0 | | | | 2,924,042 | | | | 317,193 | | | | 3,241,235 | |
| | | | |
Municipal obligations | | | 0 | | | | 488,489 | | | | 0 | | | | 488,489 | |
| | | | |
Non-agency mortgage-backed securities | | | 0 | | | | 2,465,750 | | | | 0 | | | | 2,465,750 | |
| | | | |
U.S. Treasury securities | | | 127,664 | | | | 0 | | | | 0 | | | | 127,664 | |
| | | | |
Yankee corporate bonds and notes | | | 0 | | | | 1,049,068 | | | | 0 | | | | 1,049,068 | |
| | | | |
Yankee government bonds and notes | | | 0 | | | | 203,000 | | | | 0 | | | | 203,000 | |
| | | | |
Short-term investments | | | | | | | | | | | | | | | | |
Investment companies | | | 1,365,995 | | | | 0 | | | | 0 | | | | 1,365,995 | |
U.S. Treasury securities | | | 209,962 | | | | 0 | | | | 0 | | | | 209,962 | |
Investments measured at net asset value* | | | | | | | | | | | | | | | 49,994 | |
| | | | |
| | | 1,703,621 | | | | 21,542,910 | | | | 317,193 | | | | 23,613,718 | |
| | | | |
Credit default swap contracts | | | 0 | | | | 7,175 | | | | 0 | | | | 7,175 | |
Forward foreign currency contracts | | | 0 | | | | 7,263 | | | | 0 | | | | 7,263 | |
Total assets | | $ | 1,703,621 | | | $ | 21,557,348 | | | $ | 317,193 | | | $ | 23,628,156 | |
Liabilities | | | | | | | | | | | | | | | | |
| | | | |
Forward foreign currency contracts | | | 0 | | | | 58,102 | | | | 0 | | | | 58,102 | |
Futures contracts | | | 8,810 | | | | 0 | | | | 0 | | | | 8,810 | |
Total liabilities | | $ | 8,810 | | | $ | 58,102 | | | $ | 0 | | | $ | 66,912 | |
| * | Investments that are measured at fair value using the net asset value per share (or its equivalent) as a practical expedient have not been categorized in the fair value hierarchy. The fair value amount presented in the table is intended to permit reconciliation of the fair value hierarchy to the amounts presented in the Statement of Assets and Liabilities. The Fund’s investment in Securities Lending Cash Investments, LLC valued at $49,994 does not have a redemption period notice, can be redeemed daily and does not have any unfunded commitments. |
Forward foreign currency contracts are reported at their unrealized gains (losses) at measurement date, which represents the change in the contract’s value from trade date. Futures contracts are reported at their variation margin at measurement date, which represents the amount due from the Fund at that date. Swap contracts consists of unrealized gains and premiums paid on swap contracts, which represents the change in the contract’s value from trade date. All other assets and liabilities are reported at their market value at measurement date.
The Fund recognizes transfers between levels within the fair value hierarchy at the end of the reporting period. At April 30, 2016, the Fund did not have any transfers between Level 1 and Level 2.
The following is a reconciliation of assets in which significant unobservable inputs (Level 3) were used in determining fair value:
| | | | |
| | | Loans | |
Balance as of October 31, 2015 | | $ | 242,048 | |
Accrued discounts (premiums) | | | 31 | |
Realized gains (losses) | | | 415 | |
Change in unrealized gains (losses) | | | (1,492 | ) |
Sales | | | (52,220 | ) |
Transfers into Level 3 | | | 128,411 | |
Balance as of April 30, 2016 | | $ | 317,193 | |
Change in unrealized gains (losses) relating to securities still held at April 30, 2016 | | $ | (1,425 | ) |
| | | | | | |
| Notes to financial statements (unaudited) | | Wells Fargo Strategic Income Fund | | | 27 | |
The investment type categorized above was valued using indicative broker quotes. These indicative broker quotes are considered Level 3 inputs. Quantitative unobservable inputs used by the brokers are often proprietary and not provided to the Fund and therefore the disclosure that would address these inputs is not included above.
4. TRANSACTIONS WITH AFFILIATES
Management fee
Funds Management, an indirect wholly owned subsidiary of Wells Fargo, is the manager of the Fund and provides advisory and fund-level administrative services under an investment management agreement. Under the investment management agreement, Funds Management is responsible for, among other services, implementing the investment objectives and strategies of the Fund, supervising the applicable subadvisers, providing fund-level administrative services in connection with the Fund’s operations, and providing any other fund-level administrative services reasonably necessary for the operation of the Fund. As compensation for its services under the investment management agreement, Funds Management is entitled to receive an annual management fee starting at 0.525% and declining to 0.405% as the average daily net assets of the Fund increase. For the six months ended April 30, 2016, the management fee was equivalent to an annual rate of 0.525% of the Fund’s average daily net assets.
Funds Management has retained the services of certain subadvisers to provide daily portfolio management to the Fund. The fee for subadvisory services is borne by Funds Management. WellsCap is a subadviser to the Fund and is entitled to receive a fee from Funds Management at an annual rate starting at 0.30% and declining to 0.15% as the average daily net assets of the Fund increase. First International Advisors, LLC, an affiliate of Funds Management and an indirect, wholly owned subsidiary of Wells Fargo, is also a subadviser to the Fund and is entitled to receive a fee from Funds Management at an annual rate starting at 0.35% and declining to 0.20% as the average daily net assets of the Fund increase.
Administration fees
Under a class-level administration agreement, Funds Management provides class-level administrative services to the Fund, which includes paying fees and expenses for services provided by the transfer agent, sub-transfer agents, omnibus account servicers and record-keepers. As compensation for its services under the class-level administration agreement, Funds Management receives an annual fee which is calculated based on the average daily net assets of each class as follows:
| | | | |
| | | Class-level administration fee | |
Class A, Class C | | | 0.16 | % |
Administrator Class | | | 0.10 | |
Institutional Class | | | 0.08 | |
Funds Management has contractually waived and/or reimbursed management and administration fees to the extent necessary to maintain certain net operating expense ratios for the Fund. Waiver of fees and/or reimbursement of expenses by Funds Management were made first from fund level expenses on a proportionate basis and then from class specific expenses. Funds Management has committed through February 28, 2017 to waive fees and/or reimburse expenses to the extent necessary to cap the Fund’s expenses at 0.90% for Class A shares, 1.65% for Class C shares, 0.75% for Administrator Class shares, and 0.60% for Institutional Class shares. After this time, the cap may be increased or the commitment to maintain the cap may be terminated only with the approval of the Board of Trustees.
Distribution fee
The Trust has adopted a distribution plan for Class C shares of the Fund pursuant to Rule 12b-1 under the 1940 Act. A distribution fee is charged to Class C shares and paid to Wells Fargo Funds Distributor, LLC (“Funds Distributor”), the principal underwriter, at an annual rate of 0.75% of the average daily net assets of Class C shares.
In addition, Funds Distributor is entitled to receive the front-end sales charge from the purchase of Class A shares and a contingent deferred sales charge on the redemption of certain Class A shares. Funds Distributor is also entitled to receive the contingent deferred sales charges from redemptions of Class C shares.
Shareholder servicing fees
The Trust has entered into contracts with one or more shareholder servicing agents, whereby Class A, Class C, and Administrator Class of the Fund are charged a fee at an annual rate of 0.25% of the average daily net assets of each respective class.
A portion of these total shareholder servicing fees were paid to affiliates of Wells Fargo.
| | | | |
| 28 | | Wells Fargo Strategic Income Fund | | Notes to financial statements (unaudited) |
5. INVESTMENT PORTFOLIO TRANSACTIONS
Purchases and sales of investments, excluding short-term securities, for the six months ended April 30, 2016 were as follows:
| | | | | | |
Purchases at cost | | Sales proceeds |
U.S. government | | Non-U.S. government | | U.S. government | | Non-U.S. government |
| $703,248 | | $8,607,678 | | $577,055 | | $2,046,430 |
6. DERIVATIVE TRANSACTIONS
During the six months ended April 30, 2016, the Fund entered into futures contracts to manage duration exposure.
At April 30, 2016, the Fund had short futures contracts outstanding as follows:
| | | | | | | | | | | | | | |
| Expiration date | | Counterparty | | Contracts | | Type | | Contract value at April 30, 2016 | | | Unrealized
gains | |
| 6-21-2016 | | JPMorgan | | 2 Short | | U.S. Treasury Bonds | | $ | 342,688 | | | $ | 6,880 | |
| 6-21-2016 | | JPMorgan | | 64 Short | | 10 Year U.S. Treasury Bonds | | | 8,324,000 | | | | 27,089 | |
The Fund had an average notional amount of $273,018 in long futures contracts and $8,447,818 in short futures contracts during the six months ended April 30, 2016.
During the six months ended April 30, 2016, the Fund entered into forward foreign currency contracts for economic hedging purposes.
At April 30, 2016, the Fund had forward foreign currency contracts outstanding as follows:
Forward foreign currency contracts to buy:
| | | | | | | | | | | | | | | | | | |
| Exchange date | | Counterparty | | Contracts to receive | | | U.S. value at April 30, 2016 | | | In exchange for U.S. $ | | | Unrealized
gains (losses) | |
| 5-5-2016 | | State Street Bank | | | 1,930,000 | PLN | | $ | 505,627 | | | $ | 508,444 | | | $ | (2,817 | ) |
| 6-17-2016 | | State Street Bank | | | 1,530,000 | MYR | | | 390,337 | | | | 383,074 | | | | 7,263 | |
Forward foreign currency contracts to sell:
| | | | | | | | | | | | | | | | | | |
| Exchange date | | Counterparty | | Contracts to deliver | | | U.S. value at April 30, 2016 | | | In exchange for U.S. $ | | | Unrealized
losses | |
| 5-5-2016 | | State Street Bank | | | 1,930,000 | PLN | | $ | 505,627 | | | $ | 478,918 | | | $ | (26,709 | ) |
| 5-16-2016 | | State Street Bank | | | 2,150,000 | RON | | | 549,569 | | | | 543,135 | | | | (6,434 | ) |
| 6-17-2016 | | State Street Bank | | | 1,530,000 | MYR | | | 390,337 | | | | 368,195 | | | | (22,142 | ) |
The Fund had average contract amounts of $376,651 and $1,518,173 in forward foreign currency contracts to buy and forward foreign currency contracts to sell, respectively, during the six months ended April 30, 2016.
The Fund enters into credit default swap contracts as a substitute for taking a position in the underlying security or basket of securities or to potentially enhance the Fund’s total return. At April 30, 2016, the Fund had the following credit default swap contracts outstanding:
Credit default swaps on an index – Sell protection
| | | | | | | | | | | | | | | | | | | | | | | | |
| Expiration | | Counterparty | | Reference index | | Notional amount | | | Fixed payments received | | | Value | | | Premiums paid | | | Unrealized gains | |
| 6-20-2021 | | Credit Suisse | | Markit CDX North America Investment Grade Index | | $ | 600,000 | | | | 1.00 | % | | $ | 7,175 | | | $ | 5,566 | | | $ | 1,609 | |
The Fund had an average notional balance on credit default swaps of $457,665 during the six months ended April 30, 2016.
| | | | | | |
| Notes to financial statements (unaudited) | | Wells Fargo Strategic Income Fund | | | 29 | |
The Fund’s credit default swap transactions may contain provisions for early termination in the event the net assets of the Fund declines below specific levels identified by the counterparty. If these levels are triggered, the counterparty may terminate the transaction and seek payment or request full collateralization of the derivative transactions in net liability positions. As of April 30, 2016, the Fund had segregated $62,758 as cash collateral for outstanding credit default swap transactions.
A summary of derivative instruments by primary risk exposure is outlined in the following tables.
The fair value of derivative instruments as of April 30, 2016 was as follows for the Fund:
| | | | | | | | | | | | |
| | | Asset derivatives | | | Liability derivatives | |
| | | Statement of Assets and Liabilities location | | Fair value | | | Statement of Assets and Liabilities location | | Fair value | |
Interest rate contracts | | Receivable for daily variation margin on open futures contracts | | $ | 0 | | | Payable for daily variation margin on open futures contracts | | $ | 8,810 | * |
Forward foreign currency contracts | | Unrealized gains on forward foreign currency contracts | | | 7,263 | | | Unrealized losses on forward foreign currency contracts | | | 58,102 | |
Credit contracts | | Unrealized gains and premiums paid on credit default swap transactions | | | 7,175 | | | Unrealized losses and premiums received on credit default swap transactions | | | 0 | |
| | | | | $ | 14,438 | | | | | $ | 66,912 | |
| * | Only the current day’s variation margin as of April 30, 2016 is reported separately on the Statement of Assets and Liabilities. |
The effect of derivative instruments on the Statement of Operations for the year ended April 30, 2016 was as follows for the Fund:
| | | | | | | | | | | | |
| | | Amount of realized gains (losses) on derivatives | |
| | | Futures contracts | | | Forward currency contracts | | | Credit default swaps | |
Interest rate contracts | | $ | (229,801 | ) | | $ | 0 | | | $ | 0 | |
Forward foreign currency contracts | | | 0 | | | | (78,282 | ) | | | 0 | |
Credit contracts | | | 0 | | | | 0 | | | | (12,492 | ) |
| | | $ | (229,801 | ) | | $ | (78,282 | ) | | $ | (12,492 | ) |
| |
| | | Change in unrealized gains (losses) on derivatives | |
| | | Futures contracts | | | Forward currency contracts | | | Credit default swaps | |
Interest rate contracts | | $ | (23,692 | ) | | $ | 0 | | | $ | 0 | |
Forward foreign currency contracts | | | 0 | | | | (5,941 | ) | | | 0 | |
Credit contracts | | | 0 | | | | 0 | | | | 173 | |
| | | $ | (23,692 | ) | | $ | (5,941 | ) | | $ | 173 | |
For certain types of derivative transactions, the Fund has entered into International Swaps and Derivatives Association, Inc. master agreements (“ISDA Master Agreements”) or similar agreements with approved counterparties. The ISDA Master Agreements or similar agreements may have requirements to deliver/deposit securities or cash to/with an exchange or broker-dealer as collateral and allows the Fund to offset, with each counterparty, certain derivative financial instrument’s assets and/or liabilities with collateral held or pledged. Collateral requirements differ by type of derivative. Collateral or margin requirements are set by the broker or exchange clearing house for exchange traded derivatives while collateral terms are contract specific for over-the-counter traded derivatives. Cash collateral that has been pledged to cover obligations of the Fund under ISDA Master Agreements or similar agreements, if any, will be reported separately in the Statement of Assets and Liabilities. Securities pledged as collateral, if any, for the same purpose are noted in the Portfolio of Investments. With respect to balance sheet offsetting, absent an event of default by the counterparty or a
| | | | |
| 30 | | Wells Fargo Strategic Income Fund | | Notes to financial statements (unaudited) |
termination of the agreement, the reported amounts of financial assets and financial liabilities in the Statement of Assets and Liabilities are not offset across transactions between the Fund and the applicable counterparty. A reconciliation of the gross amounts on the Statement of Assets and Liabilities to the net amounts by derivative type, including any collateral exposure, is as follows:
| | | | | | | | | | | | | | | | | | |
| Derivative type | | Counterparty | | Gross amounts of assets in the Statement of Assets and Liabilities | | | Amounts subject to netting agreements | | | Collateral received | | | Net amount of assets | |
Credit default swaps | | Credit Suisse | | $ | 7,175 | * | | $ | 0 | | | $ | 0 | | | $ | 7,175 | |
Forward foreign currency contracts | | State Street Bank | | | 7,263 | ** | | | (7,263 | ) | | | 0 | | | | 0 | |
| | * | The value of swap contracts consists of unrealized gains and premiums paid on swap contracts as reflected on the Statement of Assets and Liabilities. | |
| | ** | Amount represents net unrealized gains. | |
| | | | | | | | | | | | | | | | | | |
| Derivative type | | Counterparty | | Gross amounts of liabilities in the Statement of Assets and Liabilities | | | Amounts subject to netting agreements | | | Collateral pledged1 | | | Net amount of liabilities | |
Futures – variation margin | | JPMorgan | | $ | 8,810 | | | $ | 0 | | | $ | (8,810 | ) | | $ | 0 | |
Forward foreign currency contracts | | State Street Bank | | | 58,102 | * | | | (7,263 | ) | | | 0 | | | | 50,839 | |
| | * | Amount represents net unrealized losses. | |
7. BANK BORROWINGS
The Trust (excluding the money market funds and certain other funds) and Wells Fargo Variable Trust are parties to a $200,000,000 revolving credit agreement whereby the Fund is permitted to use bank borrowings for temporary or emergency purposes, such to fund shareholder redemption requests. Interest under the credit agreement is charged to the Fund based on a borrowing rate equal to the higher of the Federal Funds rate in effect on that day plus 1.25% or the overnight LIBOR in effect on that day plus 1.25%. In addition, an annual commitment fee equal to 0.20% of the unused balance is allocated to each participating fund.
For the six months ended April 30, 2016, there were no borrowings by the Fund under the agreement.
8. INDEMNIFICATION
Under the Trust’s organizational documents, the officers and Trustees have been granted certain indemnification rights against certain liabilities that may arise out of performance of their duties to the Trust. Additionally, in the normal course of business, the Trust may enter into contracts with service providers that contain a variety of indemnification clauses. The Trust’s maximum exposure under these arrangements is dependent on future claims that may be made against the Fund and, therefore, cannot be estimated.
9. SUBSEQUENT DISTRIBUTION
On June 24, 2016, the Fund declared distributions from net investment income to shareholders of record on June 23, 2016. The per share amounts payable on June 27, 2016 were as follows:
| | |
| | | Net investment
income |
Class A | | $0.03081 |
Class C | | 0.02531 |
Administrator Class | | 0.03125 |
Institutional Class | | 0.03326 |
These distributions are not reflected in the accompanying financial statements. The final determination of the source of all distributions is subject to change and made after the Fund’s tax year-end.
| | | | | | |
| Other information (unaudited) | | Wells Fargo Strategic Income Fund | | | 31 | |
PROXY VOTING INFORMATION
A description of the policies and procedures that the Fund uses to determine how to vote proxies relating to portfolio securities is available, upon request, by calling 1-800-222-8222, visiting our website at wellsfargofunds.com, or visiting the SEC website at sec.gov. Information regarding how the Fund voted proxies relating to portfolio securities during the most recent 12-month period ended June 30 is available on the Fund’s website at wellsfargofunds.com or by visiting the SEC website at sec.gov.
PORTFOLIO HOLDINGS INFORMATION
The complete portfolio holdings for the Fund are publicly available monthly on the Fund’s website (wellsfargofunds.com), on a one-month delayed basis. In addition, top ten holdings information (excluding derivative positions) for the Fund is publicly available on the Fund’s website on a monthly, seven-day or more delayed basis. The Fund files its complete schedule of portfolio holdings with the SEC for the first and third quarters of each fiscal year on Form N-Q, which is available by visiting the SEC website at sec.gov. In addition, the Fund’s Form N-Q may be reviewed and copied at the SEC’s Public Reference Room in Washington, DC, and at regional offices in New York City, at 233 Broadway, and in Chicago, at 175 West Jackson Boulevard, Suite 900. Information about the Public Reference Room may be obtained by calling 1-800-SEC-0330.
| | | | |
| 32 | | Wells Fargo Strategic Income Fund | | Other information (unaudited) |
BOARD OF TRUSTEES AND OFFICERS
Each of the Trustees and Officers1 listed in the table below acts in identical capacities for each fund in the Wells Fargo family of funds, which consists of 141 mutual funds comprising the Wells Fargo Funds Trust, Wells Fargo Variable Trust, Wells Fargo Master Trust and four closed-end funds (collectively the “Fund Complex”). This table should be read in conjunction with the Prospectus and the Statement of Additional Information2. The mailing address of each Trustee and Officer is 525 Market Street, 12th Floor, San Francisco, CA 94105. Each Trustee and Officer serves an indefinite term, however, each Trustee serves such term until reaching the mandatory retirement age established by the Trustees.
Independent Trustees
| | | | | | |
Name and year of birth | | Position held and length of service* | | Principal occupations during past five years or longer | | Current other public company or investment company directorships |
| William R. Ebsworth (Born 1957) | | Trustee, since 2015 | | Retired. From 1984 to 2013, equities analyst, portfolio manager, research director and chief financial officer at Fidelity Management and Research Company in Boston, Tokyo, and Hong Kong and retired in 2013 as Chief Investment Officer of Fidelity Strategic Advisers, Inc. where he lead a team of investment professionals managing client assets. Prior thereto, Board member of Hong Kong Securities Clearing Co., Hong Kong Options Clearing Corp., the Thailand International Fund, Ltd., Fidelity Investments Life Insurance Company, and Empire Fidelity Investments Life Insurance Company. Mr. Ebsworth is a CFA® charterholder and an Adjunct Lecturer, Finance, at Babson College. | | Asset Allocation Trust |
| Jane A. Freeman (Born 1953) | | Trustee, since 2015 | | Retired. From 2012 to 2014 and 1999 to 2008, Chief Financial Officer of Scientific Learning Corporation. From 2008 to 2012, Ms. Freeman provided consulting services related to strategic business projects. Prior to 1999, Portfolio Manager at Rockefeller & Co. and Scudder, Stevens & Clark. Board member of the Harding Loevner Funds from 1996 to 2014, serving as both Lead Independent Director and chair of the Audit Committee. Board member of the Russell Exchange Traded Funds Trust from 2011 to 2012 and the chair of the Audit Committee. Ms. Freeman is Chair of Taproot Foundation (non-profit organization), a Board Member of Ruth Bancroft Garden (non-profit organization) and an inactive chartered financial analyst. | | Asset Allocation Trust |
| Peter G. Gordon (Born 1942) | | Trustee, since 1998; Chairman, since 2005 | | Co-Founder, Retired Chairman, President and CEO of Crystal Geyser Water Company. Trustee Emeritus, Colby College. | | Asset Allocation Trust |
| Isaiah Harris, Jr. (Born 1952) | | Trustee, since 2009 | | Retired. Chairman of the Board of CIGNA Corporation since 2009, and Director since 2005. From 2003 to 2011, Director of Deluxe Corporation. Prior thereto, President and CEO of BellSouth Advertising and Publishing Corp. from 2005 to 2007, President and CEO of BellSouth Enterprises from 2004 to 2005 and President of BellSouth Consumer Services from 2000 to 2003. Emeritus member of the Iowa State University Foundation Board of Governors. Emeritus Member of the Advisory Board of Iowa State University School of Business. Advisory Board Member, Palm Harbor Academy (charter school). Advisory Board Member, Child Evangelism Fellowship (non-profit). Mr. Harris is a certified public accountant (inactive status). | | CIGNA Corporation; Asset Allocation Trust |
| Judith M. Johnson (Born 1949) | | Trustee, since 2008; Audit Committee Chairman, since 2008 | | Retired. Prior thereto, Chief Executive Officer and Chief Investment Officer of Minneapolis Employees Retirement Fund from 1996 to 2008. Ms. Johnson is an attorney, certified public accountant and a certified managerial accountant. | | Asset Allocation Trust |
| David F. Larcker (Born 1950) | | Trustee, since 2009 | | James Irvin Miller Professor of Accounting at the Graduate School of Business, Stanford University, Director of the Corporate Governance Research Initiative and Senior Faculty of The Rock Center for Corporate Governance since 2006. From 2005 to 2008, Professor of Accounting at the Graduate School of Business, Stanford University. Prior thereto, Ernst & Young Professor of Accounting at The Wharton School, University of Pennsylvania from 1985 to 2005. | | Asset Allocation Trust |
| Olivia S. Mitchell (Born 1953) | | Trustee, since 2006 | | International Foundation of Employee Benefit Plans Professor, Wharton School of the University of Pennsylvania since 1993. Director of Wharton’s Pension Research Council and Boettner Center on Pensions & Retirement Research, and Research Associate at the National Bureau of Economic Research. Previously, Cornell University Professor from 1978 to 1993. | | Asset Allocation Trust |
| | | | | | |
| Other information (unaudited) | | Wells Fargo Strategic Income Fund | | | 33 | |
| | | | | | |
Name and year of birth | | Position held and length of service* | | Principal occupations during past five years or longer | | Current other public company or investment company directorships |
| Timothy J. Penny (Born 1951) | | Trustee, since 1996 | | President and Chief Executive Officer of Southern Minnesota Initiative Foundation, a non-profit organization, since 2007 and Senior Fellow at the Humphrey Institute Policy Forum at the University of Minnesota since 1995. Member of the Board of Trustees of NorthStar Education Finance, Inc., a non-profit organization, since 2007. | | Asset Allocation Trust |
| Michael S. Scofield (Born 1943) | | Trustee, since 2010 | | Served on the Investment Company Institute’s Board of Governors and Executive Committee from 2008-2011 as well the Governing Council of the Independent Directors Council from 2006-2011 and the Independent Directors Council Executive Committee from 2008-2011. Chairman of the IDC from 2008-2010. Institutional Investor (Fund Directions) Trustee of Year in 2007. Trustee of the Evergreen Funds complex (and its predecessors) from 1984 to 2010. Chairman of the Evergreen Funds from 2000-2010. Former Trustee of the Mentor Funds. Retired Attorney, Law Offices of Michael S. Scofield. | | Asset Allocation Trust |
| * | Length of service dates reflect the Trustee’s commencement of service with the Trust’s predecessor entities, where applicable. |
Officers
| | | | | | |
Name and year of birth | | Position held and length of service | | Principal occupations during past five years or longer | | |
Karla M. Rabusch (Born 1959) | | President, since 2003 | | Executive Vice President of Wells Fargo Bank, N.A. and President of Wells Fargo Funds Management, LLC since 2003. | | |
| Nancy Wiser1 (Born 1967) | | Treasurer, since 2012 | | Executive Vice President of Wells Fargo Funds Management, LLC since 2011. Chief Operating Officer and Chief Compliance Officer at LightBox Capital Management LLC, from 2008 to 2011. | | |
C. David Messman (Born 1960) | | Secretary, since 2000; Chief Legal Officer, since 2003 | | Senior Vice President and Secretary of Wells Fargo Funds Management, LLC since 2001. Assistant General Counsel of Wells Fargo Bank, N.A. since 2013 and Vice President and Managing Counsel of Wells Fargo Bank, N.A. from 1996 to 2013. | | |
Michael Whitaker (Born 1967) | | Chief Compliance Officer, since 2016* | | Executive Vice President of Wells Fargo Funds Management, LLC since 2016. Chief Compliance Officer of Fidelity’s Fixed Income Funds and Asset Allocation Funds from 2008 to 2016, Compliance Officer of FMR Co., Inc. from 2014 to 2016, Fidelity Investments Money Management, Inc. from 2014 to 2016, Fidelity Investments from 2007 to 2016. | | |
| Debra Ann Early (Born 1964) | | Chief Compliance Officer, since 2007** | | Executive Vice President of Wells Fargo Funds Management, LLC since 2014, Senior Vice President and Chief Compliance Officer from 2007 to 2014. | | |
| David Berardi (Born 1975) | | Assistant Treasurer, since 2009 | | Vice President of Wells Fargo Funds Management, LLC since 2009. Vice President of Evergreen Investment Management Company, LLC from 2008 to 2010. Manager of Fund Reporting and Control for Evergreen Investment Management Company, LLC from 2004 to 2010. | | |
Jeremy DePalma1 (Born 1974) | | Assistant Treasurer, since 2009 | | Senior Vice President of Wells Fargo Funds Management, LLC since 2009. Senior Vice President of Evergreen Investment Management Company, LLC from 2008 to 2010 and head of the Fund Reporting and Control Team within Fund Administration from 2005 to 2010. | | |
| 1 | Nancy Wiser acts as Treasurer of 72 funds in the Fund Complex. Jeremy DePalma acts as Treasurer of 69 funds and Assistant Treasurer of 72 funds in the Fund Complex. |
| 2 | The Statement of Additional Information includes additional information about the Trustees and is available, without charge, upon request, by calling
1-800-222-8222 or by visiting the website at wellsfargofunds.com. |
| * | Michael Whitaker became Chief Compliance Officer effective May 16, 2016. |
| ** | Debra Ann Early was the Chief Compliance Officer until May 15, 2016. |
| | | | |
| 34 | | Wells Fargo Strategic Income Fund | | List of abbreviations |
The following is a list of common abbreviations for terms and entities that may have appeared in this report.
| ACA | — ACA Financial Guaranty Corporation |
| ADR | — American depositary receipt |
| ADS | — American depositary shares |
| AGC | — Assured Guaranty Corporation |
| AGM | — Assured Guaranty Municipal |
| Ambac | — Ambac Financial Group Incorporated |
| AMT | — Alternative minimum tax |
| BAN | — Bond anticipation notes |
| BHAC | — Berkshire Hathaway Assurance Corporation |
| CAB | — Capital appreciation bond |
| CCAB | — Convertible capital appreciation bond |
| CDA | — Community Development Authority |
| CDO | — Collateralized debt obligation |
| DRIVER | — Derivative inverse tax-exempt receipts |
| DW&P | — Department of Water & Power |
| DWR | — Department of Water Resources |
| ECFA | — Educational & Cultural Facilities Authority |
| EDA | — Economic Development Authority |
| EDFA | — Economic Development Finance Authority |
| ETF | — Exchange-traded fund |
| FDIC | — Federal Deposit Insurance Corporation |
| FFCB | — Federal Farm Credit Banks |
| FGIC | — Financial Guaranty Insurance Corporation |
| FHA | — Federal Housing Administration |
| FHLB | — Federal Home Loan Bank |
| FHLMC | — Federal Home Loan Mortgage Corporation |
| FICO | — The Financing Corporation |
| FNMA | — Federal National Mortgage Association |
| GDR | — Global depositary receipt |
| GNMA | — Government National Mortgage Association |
| HCFR | — Healthcare facilities revenue |
| HEFA | — Health & Educational Facilities Authority |
| HEFAR | — Higher education facilities authority revenue |
| HFA | — Housing Finance Authority |
| HFFA | — Health Facilities Financing Authority |
| HUD | — Department of Housing and Urban Development |
| IDA | — Industrial Development Authority |
| IDAG | — Industrial Development Agency |
| KRW | — Republic of Korea won |
| LIBOR | — London Interbank Offered Rate |
| LIFER | — Long Inverse Floating Exempt Receipts |
| LLC | — Limited liability company |
| LLLP | — Limited liability limited partnership |
| LLP | — Limited liability partnership |
| MBIA | — Municipal Bond Insurance Association |
| MFHR | — Multifamily housing revenue |
| MSTR | — Municipal securities trust receipts |
| MUD | — Municipal Utility District |
| National | — National Public Finance Guarantee Corporation |
| PCFA | — Pollution Control Financing Authority |
| PCL | — Public Company Limited |
| PCR | — Pollution control revenue |
| PFA | — Public Finance Authority |
| PFFA | — Public Facilities Financing Authority |
| PFOTER | — Puttable floating option tax-exempt receipts |
| plc | — Public limited company |
| PUTTER | — Puttable tax-exempt receipts |
| R&D | — Research & development |
| Radian | — Radian Asset Assurance |
| RAN | — Revenue anticipation notes |
| RDA | — Redevelopment Authority |
| RDFA | — Redevelopment Finance Authority |
| REIT | — Real estate investment trust |
| ROC | — Reset option certificates |
| SAVRS | — Select auction variable rate securities |
| SBA | — Small Business Authority |
| SDR | — Swedish depositary receipt |
| SFHR | — Single-family housing revenue |
| SFMR | — Single-family mortgage revenue |
| SPA | — Standby purchase agreement |
| SPDR | — Standard & Poor’s Depositary Receipts |
| SPEAR | — Short Puttable Exempt Adjustable Receipts |
| STRIPS | — Separate trading of registered interest and |
| TAN | — Tax anticipation notes |
| TIPS | — Treasury inflation-protected securities |
| TRAN | — Tax revenue anticipation notes |
| TTFA | — Transportation Trust Fund Authority |
| TVA | — Tennessee Valley Authority |
This page is intentionally left blank.
This page is intentionally left blank.

For more information
More information about Wells Fargo Funds is available free upon request. To obtain literature, please write, email, visit the Fund’s website, or call:
Wells Fargo Funds
P.O. Box 8266
Boston, MA 02266-8266
Email: fundservice@wellsfargo.com
Website: wellsfargofunds.com
Individual investors: 1-800-222-8222
Retail investment professionals: 1-888-877-9275
Institutional investment professionals: 1-866-765-0778
This report and the financial statements contained herein are submitted for the general information of the shareholders of the Fund. If this report is used for promotional purposes, distribution of the report must be accompanied or preceded by a current prospectus. Before investing, please consider the investment objectives, risks, charges, and expenses of the investment. For a current prospectus and, if available, a summary prospectus, containing this information, call 1-800-222-8222 or visit the Fund’s website at wellsfargofunds.com. Read the prospectus carefully before you invest or send money.
Wells Fargo Asset Management (WFAM) is a trade name used by the asset management businesses of Wells Fargo & Company. Wells Fargo Funds Management, LLC, a wholly owned subsidiary of Wells Fargo & Company, provides investment advisory and administrative services for Wells Fargo Funds. Other affiliates of Wells Fargo & Company provide subadvisory and other services for the funds. The funds are distributed by Wells Fargo Funds Distributor, LLC, Member FINRA, an affiliate of Wells Fargo & Company.
NOT FDIC INSURED ¡ NO BANK GUARANTEE ¡ MAY LOSE VALUE
© 2016 Wells Fargo Funds Management, LLC. All rights reserved.
| | |
 | | 242227 06-16 SA263/SAR263 04-16 |
Semi-Annual Report
April 30, 2016

Wells Fargo Asia Pacific Fund


Reduce clutter. Save trees.
Sign up for electronic delivery of prospectuses and shareholder reports at wellsfargo.com/advantagedelivery
Contents
The views expressed and any forward-looking statements are as of April 30, 2016, unless otherwise noted, and are those of the Fund managers and/or Wells Fargo Funds Management, LLC. Discussions of individual securities, or the markets generally, or any Wells Fargo Fund are not intended as individual recommendations. Future events or results may vary significantly from those expressed in any forward-looking statements. The views expressed are subject to change at any time in response to changing circumstances in the market. Wells Fargo Funds Management, LLC and the Fund disclaim any obligation to publicly update or revise any views expressed or forward-looking statements.
NOT FDIC INSURED ¡ NO BANK GUARANTEE ¡ MAY LOSE VALUE
| | | | |
| 2 | | Wells Fargo Asia Pacific Fund | | Letter to shareholders (unaudited) |

Karla M. Rabusch
President
Wells Fargo Funds
Despite the slowdown, China’s growth rate remained higher than that of most other economies.
India’s economy continued to show signs of improvement, growing at a 7.3% annualized rate in the three-month period that ended December 2015.
Dear Valued Shareholder:
We are pleased to offer you this semi-annual report for the Wells Fargo Asia Pacific Fund for the six-month period that ended April 30, 2016.
The reporting period was marked by concerns about slowing economic growth in the major markets of China and Japan. The Morgan Stanley Capital International (MSCI) All Country (AC) Asia Pacific Index (Net)1 returned -1.43% for the reporting period as stock market weakness in major markets was offset by growth in smaller markets such as Indonesia and Thailand.
Even as the Fed tightened its monetary policy, the People’s Bank of China remained accommodative.
Entering the reporting period, many emerging markets commentaries focused on the potential effect of the U.S. Federal Reserve (Fed) raising its key interest rate. In fact, a combination of U.S. moderate economic growth and low inflation did allow the Fed to raise its key rate by 0.25% in December 2015. Given that other central banks, including the European Central Bank and the People’s Bank of China (PBOC), remained in easing mode, the prospect of the Fed’s actions supported the value of the U.S. dollar relative to other currencies. A richly valued dollar had the potential to pressure emerging countries and companies with outstanding dollar-denominated debt.
Early in 2016, however, Fed officials dialed back their expectations of U.S. economic growth and indicated that they would raise the federal funds rate at a slower pace than initially expected. The Fed’s pullback, along with country-specific factors, prompted investors to focus more on country and company fundamentals than on the Fed’s actions.
The PBOC remained active throughout the reporting period. In November 2015, the central bank reduced short-term borrowing costs for banks. Coming after other PBOC stimulus prior to the reporting period, the central bank’s actions raised concerns that China’s economy was slowing more rapidly than anticipated. Investor fears were realized in January 2015, when China released a preliminary estimate of its 2015 gross domestic product growth that showed the country’s growth rate had dipped below 7% for the first time since 2009. Despite the slowdown, China’s growth rate remained higher than that of most other economies. In addition, the governor of the PBOC was able to allay some investor fears by better communicating the bank’s strategy. Investor sentiment on China thus improved as the period progressed.
India’s economy showed growth with moderate inflation, but Japan continued to grapple with stagnant consumer spending.
India’s economy continued to show signs of improvement, growing at a 7.3% annualized rate in the three-month period that ended December 2015. Given that India is an energy importer, lower oil prices helped keep the country’s inflation rate in check. Prime Minister Narendra Modi’s reform program, although stalled in some places, showed progress in such tangible areas as extending electrical service to rural areas. Moreover, the government continued efforts to attract more foreign direct investment by increasing the ease of doing business.
| 1 | The Morgan Stanley Capital International (MSCI) All Country (AC) Asia Pacific Index (Net) is a free-float-adjusted market-capitalization-weighted index that is designed to measure the equity market performance of the developed and emerging markets in the Pacific region. The MSCI AC Asia Pacific Index (Net) consists of the following 12 developed and emerging markets countries: Australia, China, Hong Kong, Indonesia, Japan, Korea, Malaysia, New Zealand, the Philippines, Singapore, Taiwan, and Thailand. Source: MSCI. MSCI makes no express or implied warranties or representations and shall have no liability whatsoever with respect to any MSCI data contained herein. The MSCI data may not be further redistributed or used as a basis for other indexes or any securities or financial products. This report is not approved, reviewed, or produced by MSCI. You cannot invest directly in an index. |
| | | | | | |
| Letter to shareholders (unaudited) | | Wells Fargo Asia Pacific Fund | | | 3 | |
A negative note came from India’s banks, which showed increased credit stress and came under heightened scrutiny from the Reserve Bank of India (RBI). To support India’s banks and economy, in April 2016 the RBI cut its key interest rate to the lowest level in five years and also lowered the percentage of deposits that banks needed to keep at the central bank. The RBI also purchased bonds to help provide bank liquidity. Despite the central bank’s actions, worries about distressed debt caused weakness in Indian stocks.
The Japanese economy was sluggish during the period as soft consumer spending weighed on growth. In response, the Bank of Japan (BOJ) increased its monetary easing program, imposing a negative interest rate on surplus bank reserves in early 2016. The central bank also continued to purchase shares and bonds in an attempt to support the asset markets. Although the BOJ’s long-lived stimulus program had yet to revive the Japanese economy, it did result in a weaker yen that spurred export growth. The weaker currency benefited Japan’s information technology, materials, and industrials sectors, and many Japanese companies reported strong earnings and improving fundamentals in the latter half of the period.
Don’t let short-term uncertainty derail long-term investment goals.
Periods of uncertainty can present challenges, but experience has taught us that maintaining long-term investment goals can be an effective way to plan for the future. To help you create a sound strategy based on your personal goals and risk tolerance, Wells Fargo Funds offers more than 100 mutual funds and other investments spanning a wide range of asset classes and investment styles. Although diversification cannot guarantee an investment profit or prevent losses, we believe it can be an effective way to manage investment risk and potentially smooth out overall portfolio performance. We encourage investors to know their investments and to understand that appropriate levels of risk-taking may unlock opportunities.
Thank you for choosing to invest with Wells Fargo Funds. We appreciate your confidence in us and remain committed to helping you meet your financial needs.
Sincerely,

Karla M. Rabusch
President
Wells Fargo Funds
For further information about your Fund, contact your investment professional, visit our website at wellsfargofunds.com, or call us directly at 1-800-222-8222. We are available 24 hours a day, 7 days a week.
| | | | |
| 4 | | Wells Fargo Asia Pacific Fund | | Performance highlights (unaudited) |
Investment objective
The Fund seeks long-term capital appreciation.
Manager
Wells Fargo Funds Management, LLC
Subadviser
Wells Capital Management Incorporated
Portfolio managers
Anthony L.T. Cragg
Alison Shimada
Average annual total returns (%) as of April 30, 20161
| | | | | | | | | | | | | | | | | | | | | | | | | | | | | | | | | | |
| | | | | Including sales charge | | | Excluding sales charge | | | Expense ratios2 (%) | |
| | | Inception date | | 1 year | | | 5 year | | | 10 year | | | 1 year | | | 5 year | | | 10 year | | | Gross | | | Net3 | |
| Class A (WFAAX) | | 7-31-2007 | | | (17.88 | ) | | | 2.16 | | | | 1.71 | | | | (12.86 | ) | | | 3.38 | | | | 2.31 | | | | 1.68 | | | | 1.61 | |
| Class C (WFCAX) | | 7-31-2007 | | | (14.52 | ) | | | 2.61 | | | | 1.54 | | | | (13.52 | ) | | | 2.61 | | | | 1.54 | | | | 2.43 | | | | 2.36 | |
| Administrator Class (WFADX) | | 7-30-2010 | | | – | | | | – | | | | – | | | | (12.82 | ) | | | 3.56 | | | | 2.42 | | | | 1.60 | | | | 1.51 | |
| Institutional Class (WFPIX) | | 7-30-2010 | | | – | | | | – | | | | – | | | | (12.62 | ) | | | 3.74 | | | | 2.51 | | | | 1.35 | | | | 1.26 | |
| MSCI AC Asia Pacific Index (Net)4 | | – | | | – | | | | – | | | | – | | | | (12.32 | ) | | | 1.31 | | | | 1.92 | | | | – | | | | – | |
Figures quoted represent past performance, which is no guarantee of future results, and do not reflect taxes that a shareholder may pay on fund distributions or the redemption of fund shares. Investment return and principal value of an investment will fluctuate so that an investor’s shares, when redeemed, may be worth more or less than their original cost. Performance shown without sales charges would be lower if sales charges were reflected. Current performance may be lower or higher than the performance data quoted, which assumes the reinvestment of dividends and capital gains. Current month-end performance is available on the Fund’s website, wellsfargofunds.com.
Index returns do not include transaction costs associated with buying and selling securities, any mutual fund fees or expenses, or any taxes. It is not possible to invest directly in an index.
For Class A shares, the maximum front-end sales charge is 5.75%. For Class C shares, the maximum contingent deferred sales charge is 1.00%. Performance including a contingent deferred sales charge assumes the sales charge for the corresponding time period. Administrator Class and Institutional Class shares are sold without a front-end sales charge or contingent deferred sales charge.
Stock values fluctuate in response to the activities of individual companies and general market and economic conditions. Foreign investments are especially volatile and can rise or fall dramatically due to differences in the political and economic conditions of the host country. These risks are generally intensified in emerging markets. The use of derivatives may reduce returns and/or increase volatility. Certain investment strategies tend to increase the total risk of an investment (relative to the broader market). The Fund is exposed to geographic risk and smaller-company securities risk. Consult the Fund’s prospectus for additional information on these and other risks.
Please see footnotes on page 5.
| | | | | | |
| Performance highlights (unaudited) | | Wells Fargo Asia Pacific Fund | | | 5 | |
| | | | |
| Ten largest holdings (%) as of April 30, 20165 | |
Mitsui Fudosan Company Limited | | | 2.47 | |
Japan Airlines Company Limited | | | 2.00 | |
China Construction Bank H Shares | | | 1.89 | |
LG Chem Limited | | | 1.81 | |
China Mobile Limited | | | 1.78 | |
Bridgestone Corporation | | | 1.71 | |
Sekisui House Limited | | | 1.70 | |
Baidu Incorporated ADR | | | 1.66 | |
Industrial & Commercial Bank of China Limited H Shares | | | 1.58 | |
Mitsubishi UFJ Financial Group Incorporated | | | 1.56 | |
| | |
| Sector distribution as of April 30, 20166 |
|
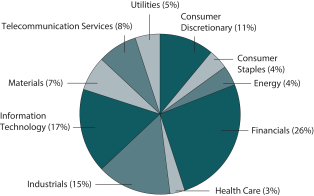 |
| | |
| Country allocation as of April 30, 20166 |
|
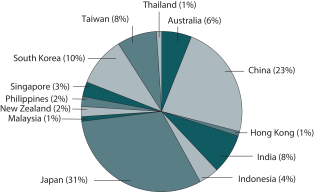 |
| 1 | Historical performance shown for the Class A shares prior to its inception reflects the performance of the former Investor Class shares, and includes the higher expenses applicable to the former Investor Class shares. If these expenses has not been included, returns would be higher. Historical performance shown for the Class C shares prior to its inception is based on the performance of the former Investor Class shares, and has been adjusted to reflect the higher expenses applicable to Class C shares. Historical performance shown for Administrator and Institutional Class shares prior to their inception reflects the performance of Class A shares, and includes the higher expenses applicable to Class A shares. If these expenses had not been included, returns would be higher. |
| 2 | Reflects the expense ratios as stated in the most recent prospectuses, which include the impact of 0.01% in acquired fund fees and expenses. The expense ratios shown are subject to change and may differ from the annualized expense ratios shown in the financial highlights of this report, which do not include acquired fund fees and expenses. |
| 3 | The manager has committed through February 28, 2017, to waive fees and/or reimburse expenses to the extent necessary to cap the Fund’s Total Annual Fund Operating Expenses After Fee Waiver at 1.60% for Class A, 2.35% for Class C, 1.50% for Administrator Class, and 1.25% for Institutional Class. After this time, the cap may be increased or the commitment to maintain the cap may be terminated only with the approval of the Board of Trustees. Brokerage commissions, stamp duty fees, interest, taxes, acquired fund fees and expenses, and extraordinary expenses are excluded from the cap. Without this cap, the Fund’s returns would have been lower. |
| 4 | The Morgan Stanley Capital International (MSCI) All Country (AC) Asia Pacific Index (Net) is a free-float-adjusted market-capitalization-weighted index that is designed to measure the equity market performance of the developed and emerging markets in the Pacific region. The MSCI AC Asia Pacific Index (Net) consists of the following 12 developed and emerging markets countries: Australia, China, Hong Kong, Indonesia, Japan, Korea, Malaysia, New Zealand, the Philippines, Singapore, Taiwan, and Thailand. Source: MSCI. MSCI makes no express or implied warranties or representations and shall have no liability whatsoever with respect to any MSCI data contained herein. The MSCI data may not be further redistributed or used as a basis for other indexes or any securities or financial products. You cannot invest directly in an index. |
| 5 | The ten largest holdings, excluding cash and cash equivalents, are calculated based on the value of the investments divided by total net assets of the Fund. Holdings are subject to change and may have changed since the date specified. |
| 6 | Amounts are calculated based on the total long-term investments of the Fund. These amounts are subject to change and may have changed since the date specified. |
| | | | |
| 6 | | Wells Fargo Asia Pacific Fund | | Fund expenses (unaudited) |
As a shareholder of the Fund, you incur two types of costs: (1) transaction costs, including sales charges (loads) on purchase payments and contingent deferred sales charges (if any) on redemptions and (2) ongoing costs, including management fees, distribution (12b-1) and/or shareholder servicing fees, and other Fund expenses. This example is intended to help you understand your ongoing costs (in dollars) of investing in the Fund and to compare these costs with the ongoing costs of investing in other mutual funds.
The example is based on an investment of $1,000 invested at the beginning of the six-month period and held for the entire period from November 1, 2015 to April 30, 2016.
Actual expenses
The “Actual” line of the table below provides information about actual account values and actual expenses. You may use the information in this line, together with the amount you invested, to estimate the expenses that you paid over the period. Simply divide your account value by $1,000 (for example, an $8,600 account value divided by $1,000 = 8.6), then multiply the result by the number in the “Actual” line under the heading entitled “Expenses paid during period” for your applicable class of shares to estimate the expenses you paid on your account during this period.
Hypothetical example for comparison purposes
The “Hypothetical” line of the table below provides information about hypothetical account values and hypothetical expenses based on the Fund’s actual expense ratio and an assumed rate of return of 5% per year before expenses, which is not the Fund’s actual return. The hypothetical account values and expenses may not be used to estimate the actual ending account balance or expenses you paid for the period. You may use this information to compare the ongoing costs of investing in the Fund and other funds. To do so, compare this 5% hypothetical example with the 5% hypothetical examples that appear in the shareholder reports of the other funds.
Please note that the expenses shown in the table are meant to highlight your ongoing costs only and do not reflect any transactional costs, such as sales charges (loads) and contingent deferred sales charges. Therefore, the “Hypothetical” line of the table is useful in comparing ongoing costs only and will not help you determine the relative total costs of owning different funds. In addition, if these transactional costs were included, your costs would have been higher.
| | | | | | | | | | | | | | | | |
| | | Beginning
account value
11-1-2015 | | | Ending
account value
4-30-2016 | | | Expenses
paid during
the period1 | | | Net annualized
expense ratio | |
Class A | | | | | | | | | | | | | | | | |
Actual | | $ | 1,000.00 | | | $ | 981.77 | | | $ | 7.88 | | | | 1.60 | % |
Hypothetical (5% return before expenses) | | $ | 1,000.00 | | | $ | 1,016.91 | | | $ | 8.02 | | | | 1.60 | % |
Class C | | | | | | | | | | | | | | | | |
Actual | | $ | 1,000.00 | | | $ | 978.12 | | | $ | 11.56 | | | | 2.35 | % |
Hypothetical (5% return before expenses) | | $ | 1,000.00 | | | $ | 1,013.18 | | | $ | 11.76 | | | | 2.35 | % |
Administrator Class | | | | | | | | | | | | | | | | |
Actual | | $ | 1,000.00 | | | $ | 981.89 | | | $ | 7.05 | | | | 1.43 | % |
Hypothetical (5% return before expenses) | | $ | 1,000.00 | | | $ | 1,017.75 | | | $ | 7.17 | | | | 1.43 | % |
Institutional Class | | | | | | | | | | | | | | | | |
Actual | | $ | 1,000.00 | | | $ | 983.25 | | | $ | 6.16 | | | | 1.25 | % |
Hypothetical (5% return before expenses) | | $ | 1,000.00 | | | $ | 1,018.65 | | | $ | 6.27 | | | | 1.25 | % |
| 1 | Expenses paid is equal to the annualized expense ratio of each class multiplied by the average account value over the period, multiplied by the number of days in the most recent fiscal half-year divided by the number of days in the fiscal year (to reflect the one-half-year period). |
| | | | | | |
| Portfolio of investments—April 30, 2016 (unaudited) | | Wells Fargo Asia Pacific Fund | | | 7 | |
| | | | | | | | | | | | |
| Security name | | | | | | Shares | | | Value | |
| | | | |
Common Stocks: 93.65% | | | | | | | | | | | | |
| | | | |
| Australia: 5.84% | | | | | | | | | | | | |
AMP Limited (Financials, Insurance) | | | | | | | 198,057 | | | $ | 885,485 | |
BHP Billiton Limited (Materials, Metals & Mining) | | | | | | | 91,400 | | | | 1,437,177 | |
Commonwealth Bank of Australia (Financials, Banks) | | | | | | | 13,500 | | | | 758,460 | |
Healthscope Limited (Health Care, Health Care Providers & Services) | | | | | | | 681,600 | | | | 1,409,652 | |
Medibank Private Limited (Financials, Insurance) | | | | | | | 511,627 | | | | 1,221,509 | |
MYOB Group Limited (Information Technology, Internet Software & Services) | | | | | | | 676,700 | | | | 1,749,398 | |
Suncorp Group Limited (Financials, Insurance) | | | | | | | 123,300 | | | | 1,171,889 | |
| | | | |
| | | | | | | | | | | 8,633,570 | |
| | | | | | | | | | | | |
| | | | |
| China: 20.76% | | | | | | | | | | | | |
Alibaba Group Holding Limited ADR (Information Technology, Internet Software & Services) † | | | | | | | 29,700 | | | | 2,285,118 | |
AviChina Industry & Technology Company Limited H Shares (Industrials, Aerospace & Defense) | | | | | | | 2,137,000 | | | | 1,498,702 | |
Baidu Incorporated ADR (Information Technology, Internet Software & Services) † | | | | | | | 12,641 | | | | 2,456,146 | |
Beijing Enterprises Water Group Limited (Utilities, Water Utilities) | | | | | | | 1,222,000 | | | | 732,548 | |
China Everbright International Limited (Industrials, Commercial Services & Supplies) | | | | | | | 579,000 | | | | 650,889 | |
China Construction Bank H Shares (Financials, Banks) | | | | | | | 4,335,000 | | | | 2,788,698 | |
China Galaxy Securities Company Limited H Shares (Financials, Capital Markets) | | | | | | | 817,000 | | | | 720,427 | |
China Longyuan Power Group Corporation H Shares (Utilities, Independent Power & Renewable Electricity Producers) | | | | | | | 1,470,000 | | | | 1,021,452 | |
China Merchants Bank Company Limited H Shares (Financials, Banks) | | | | | | | 344,000 | | | | 756,570 | |
China Mobile Limited (Telecommunication Services, Wireless Telecommunication Services) | | | | | | | 229,500 | | | | 2,631,725 | |
China Overseas Land & Investment Limited (Financials, Real Estate Management & Development) | | | | | | | 522,000 | | | | 1,665,549 | |
China Petroleum & Chemical Corporation H Shares (Energy, Oil, Gas & Consumable Fuels) | | | | | | | 2,854,000 | | | | 2,034,656 | |
China Power International Development Limited (Utilities, Independent Power & Renewable Electricity Producers) | | | | | | | 1,238,000 | | | | 531,467 | |
China State Construction International Holdings Limited (Industrials, Construction & Engineering) | | | | | | | 462,000 | | | | 721,866 | |
China Unicom Limited (Telecommunication Services, Diversified Telecommunication Services) | | | | | | | 530,000 | | | | 625,869 | |
COSCO Pacific Limited (Industrials, Transportation Infrastructure) | | | | | | | 630,241 | | | | 671,117 | |
Huaneng Renewables Corporation Limited H Shares (Utilities, Independent Power & Renewable Electricity Producers) | | | | | | | 4,424,000 | | | | 1,311,761 | |
Industrial & Commercial Bank of China Limited H Shares (Financials, Banks) | | | | | | | 4,315,000 | | | | 2,341,934 | |
PetroChina Company Limited H Shares (Energy, Oil, Gas & Consumable Fuels) | | | | | | | 2,298,000 | | | | 1,691,601 | |
Ping An Insurance (Group) Company of China Limited H Shares (Financials, Insurance) | | | | | | | 154,500 | | | | 729,986 | |
Sinotrans Limited H Shares (Industrials, Air Freight & Logistics) | | | | | | | 2,484,000 | | | | 1,152,832 | |
Zijin Mining Group Company Limited H Shares (Materials, Metals & Mining) | | | | | | | 3,030,000 | | | | 1,003,893 | |
ZTE Corporation H Shares (Information Technology, Communications Equipment) | | | | | | | 439,400 | | | | 686,554 | |
| | | | |
| | | | | | | | | | | 30,711,360 | |
| | | | | | | | | | | | |
| | | | |
| Hong Kong: 0.55% | | | | | | | | | | | | |
China Gas Holdings Limited (Utilities, Gas Utilities) | | | | | | | 566,000 | | | | 818,693 | |
| | | | |
| | | | | | | | | | | 818,693 | |
| | | | | | | | | | | | |
| | | | |
| India: 7.77% | | | | | | | | | | | | |
Astra Microwave Products Limited (Information Technology, Communications Equipment) | | | | | | | 315,900 | | | | 585,318 | |
Bharti Infratel Limited (Telecommunication Services, Diversified Telecommunication Services) | | | | | | | 136,500 | | | | 771,607 | |
Coal India Limited (Energy, Oil, Gas & Consumable Fuels) | | | | | | | 390,600 | | | | 1,696,251 | |
Emami Limited (Consumer Staples, Personal Products) | | | | | | | 58,800 | | | | 892,460 | |
HDFC Bank Limited (Financials, Banks) | | | | | | | 95,200 | | | | 1,625,203 | |
Hindalco Industries Limited (Materials, Metals & Mining) | | | | | | | 645,200 | | | | 937,208 | |
Inox Wind Limited (Industrials, Electrical Equipment) † | | | | | | | 157,300 | | | | 644,567 | |
Larsen & Toubro Limited (Industrials, Construction & Engineering) | | | | | | | 33,400 | | | | 631,745 | |
The accompanying notes are an integral part of these financial statements.
| | | | |
| 8 | | Wells Fargo Asia Pacific Fund | | Portfolio of investments—April 30, 2016 (unaudited) |
| | | | | | | | | | | | |
| Security name | | | | | | Shares | | | Value | |
| | | | |
| India (continued) | | | | | | | | | | | | |
Maruti Suzuki India Limited (Consumer Discretionary, Automobiles) | | | | | | | 26,100 | | | $ | 1,493,146 | |
Reliance Industries Limited (Energy, Oil, Gas & Consumable Fuels) | | | | | | | 64,300 | | | | 952,625 | |
Suzlon Energy Limited (Industrials, Electrical Equipment) † | | | | | | | 2,303,000 | | | | 519,069 | |
Voltas Limited (Industrials, Construction & Engineering) | | | | | | | 167,900 | | | | 742,932 | |
| | | | |
| | | | | | | | | | | 11,492,131 | |
| | | | | | | | | | | | |
| | | | |
| Indonesia: 3.91% | | | | | | | | | | | | |
PT Bank Rakyat Indonesia Tbk (Financials, Banks) | | | | | | | 912,400 | | | | 716,056 | |
PT Blue Bird Tbk (Industrials, Road & Rail) | | | | | | | 2,381,600 | | | | 772,914 | |
PT Bumi Serpong Damai Tbk (Financials, Real Estate Management & Development) | | | | | | | 5,170,500 | | | | 725,313 | |
PT Indocement Tunggal Prakarsa Tbk (Materials, Construction Materials) | | | | | | | 582,800 | | | | 871,681 | |
PT Siloam International Hospitals Tbk (Health Care, Health Care Providers & Services) | | | | | | | 1,270,000 | | | | 813,732 | |
PT Telekomunikasi Indonesia Persero Tbk (Telecommunication Services, Diversified Telecommunication Services) | | | | | | | 7,029,400 | | | | 1,892,203 | |
| | | | |
| | | | | | | | | | | 5,791,899 | |
| | | | | | | | | | | | |
| | | | |
| Japan: 30.29% | | | | | | | | | | | | |
Bridgestone Corporation (Consumer Discretionary, Auto Components) | | | | | | | 66,900 | | | | 2,525,860 | |
FUJIFILM Holdings Corporation (Information Technology, Technology Hardware, Storage & Peripherals) | | | | | | | 40,700 | | | | 1,711,000 | |
Hitachi Limited (Information Technology, Electronic Equipment, Instruments & Components) | | | | | | | 335,000 | | | | 1,583,258 | |
Isuzu Motors Limited (Consumer Discretionary, Automobiles) | | | | | | | 93,500 | | | | 1,026,639 | |
Japan Airlines Company Limited (Industrials, Airlines) | | | | | | | 80,800 | | | | 2,956,483 | |
Japan Hotel REIT Investment Corporation (Financials, REITs) | | | | | | | 2,000 | | | | 1,824,416 | |
Japan Rental Housing Investment Incorporated (Financials, REITs) | | | | | | | 2,400 | | | | 1,900,433 | |
Japan Tobacco Incorporated (Consumer Staples, Tobacco) | | | | | | | 28,300 | | | | 1,181,201 | |
Kawasaki Heavy Industries Limited (Industrials, Machinery) | | | | | | | 406,000 | | | | 1,173,978 | |
Kubota Corporation (Industrials, Machinery) | | | | | | | 101,300 | | | | 1,529,674 | |
Matsumotokiyoshi Holdings Company Limited (Consumer Staples, Food & Staples Retailing) | | | | | | | 31,600 | | | | 1,582,521 | |
Mitsubishi Electric Corporation (Industrials, Electrical Equipment) | | | | | | | 79,000 | | | | 866,604 | |
Mitsubishi UFJ Financial Group Incorporated (Financials, Banks) | | | | | | | 486,000 | | | | 2,310,783 | |
Mitsui Fudosan Company Limited (Financials, Real Estate Management & Development) | | | | | | | 146,000 | | | | 3,652,398 | |
Nagoya Railroad Company Limited (Industrials, Road & Rail) | | | | | | | 303,000 | | | | 1,550,438 | |
Nippon Telegraph and Telephone Corporation (Telecommunication Services, Diversified Telecommunication Services) | | | | | | | 18,900 | | | | 849,868 | |
NTT DOCOMO Incorporated (Telecommunication Services, Wireless Telecommunication Services) | | | | | | | 77,500 | | | | 1,885,424 | |
Obayashi Corporation (Industrials, Construction & Engineering) | | | | | | | 72,000 | | | | 719,044 | |
ORIX Corporation (Financials, Diversified Financial Services) | | | | | | | 136,700 | | | | 1,989,078 | |
Otsuka Corporation (Information Technology, IT Services) | | | | | | | 23,200 | | | | 1,131,384 | |
Panasonic Corporation (Consumer Discretionary, Household Durables) | | | | | | | 139,700 | | | | 1,284,793 | |
Resona Holdings Incorporated (Financials, Banks) | | | | | | | 295,600 | | | | 1,069,571 | |
Sekisui House Limited (Consumer Discretionary, Household Durables) | | | | | | | 141,700 | | | | 2,520,041 | |
Skylark Company Limited (Consumer Discretionary, Hotels, Restaurants & Leisure) | | | | | | | 55,000 | | | | 712,496 | |
Sumitomo Mitsui Trust Holdings Incorporated (Financials, Banks) | | | | | | | 641,000 | | | | 2,025,922 | |
Toyota Motor Corporation (Consumer Discretionary, Automobiles) | | | | | | | 36,900 | | | | 1,922,122 | |
Tsukui Corporation (Health Care, Health Care Providers & Services) | | | | | | | 107,900 | | | | 1,331,144 | |
| | | | |
| | | | | | | | | | | 44,816,573 | |
| | | | | | | | | | | | |
| | | | |
| Malaysia: 1.05% | | | | | | | | | | | | |
IHH Healthcare Bhd (Health Care, Health Care Providers & Services) | | | | | | | 493,400 | | | | 827,280 | |
Tenaga Nasional Bhd (Utilities, Electric Utilities) | | | | | | | 196,300 | | | | 721,584 | |
| | | | |
| | | | | | | | | | | 1,548,864 | |
| | | | | | | | | | | | |
The accompanying notes are an integral part of these financial statements.
| | | | | | |
| Portfolio of investments—April 30, 2016 (unaudited) | | Wells Fargo Asia Pacific Fund | | | 9 | |
| | | | | | | | | | | | |
| Security name | | | | | | Shares | | | Value | |
| | | | |
| New Zealand: 1.53% | | | | | | | | | | | | |
Air New Zealand Limited (Industrials, Airlines) | | | | | | | 491,200 | | | $ | 843,732 | |
SKYCITY Entertainment Group Limited (Consumer Discretionary, Hotels, Restaurants & Leisure) | | | | | | | 415,800 | | | | 1,419,725 | |
| | | | |
| | | | | | | | | | | 2,263,457 | |
| | | | | | | | | | | | |
| | | | |
| Philippines: 1.61% | | | | | | | | | | | | |
ABS-CBN Holdings Corporation (Consumer Discretionary, Media) | | | | | | | 656,550 | | | | 812,155 | |
Globe Telecom Incorporated (Telecommunication Services, Wireless Telecommunication Services) | | | | | | | 17,625 | | | | 824,724 | |
Metro Pacific Investments Corporation (Financials, Diversified Financial Services) | | | | | | | 6,082,700 | | | | 752,432 | |
| | | | |
| | | | | | | | | | | 2,389,311 | |
| | | | | | | | | | | | |
| | | | |
| Singapore: 2.47% | | | | | | | | | | | | |
City Developments Limited (Financials, Real Estate Management & Development) | | | | | | | 113,600 | | | | 704,483 | |
Singapore Post Limited (Industrials, Air Freight & Logistics) | | | | | | | 916,000 | | | | 1,069,353 | |
Singapore Technologies Engineering Limited (Industrials, Aerospace & Defense) | | | | | | | 322,000 | | | | 770,971 | |
Singapore Telecommunications Limited (Telecommunication Services, Diversified Telecommunication Services) | | | | | | | 386,100 | | | | 1,108,188 | |
| | | | |
| | | | | | | | | | | 3,652,995 | |
| | | | | | | | | | | | |
| | | | |
| South Korea: 8.69% | | | | | | | | | | | | |
Hana Financial Group Incorporated (Financials, Banks) | | | | | | | 51,790 | | | | 1,165,889 | |
Hyundai Motor Company (Consumer Discretionary, Automobiles) | | | | | | | 5,600 | | | | 705,283 | |
KB Financial Group Incorporated (Financials, Banks) | | | | | | | 39,500 | | | | 1,206,424 | |
Korea Electric Power Corporation (Utilities, Electric Utilities) | | | | | | | 35,190 | | | | 1,908,673 | |
LG Chem Limited (Materials, Chemicals) | | | | | | | 10,300 | | | | 2,684,834 | |
Macquarie Korea Infrastructure Fund (Financials, Capital Markets) | | | | | | | 203,900 | | | | 1,515,739 | |
POSCO (Materials, Metals & Mining) | | | | | | | 8,200 | | | | 1,730,823 | |
Samsung Electronics Company Limited (Information Technology, Technology Hardware, Storage & Peripherals) | | | | | | | 663 | | | | 724,447 | |
SK Telecom Company Limited (Telecommunication Services, Wireless Telecommunication Services) | | | | | | | 6,700 | | | | 1,211,339 | |
| | | | |
| | | | | | | | | | | 12,853,451 | |
| | | | | | | | | | | | |
| | | | |
| Taiwan: 7.79% | | | | | | | | | | | | |
Advanced Semiconductor Engineering Incorporated (Information Technology, Semiconductors & Semiconductor Equipment) | | | | | | | 718,000 | | | | 675,636 | |
Chicony Electronics Company Limited (Information Technology, Technology Hardware, Storage & Peripherals) | | | | | | | 362,598 | | | | 871,278 | |
CTBC Financial Holding Company Limited (Financials, Banks) | | | | | | | 1,430,163 | | | | 727,209 | |
Hon Hai Precision Industry Company Limited (Information Technology, Electronic Equipment, Instruments & Components) | | | | | | | 679,350 | | | | 1,623,969 | |
King Yuan Electronics Company Limited (Information Technology, Semiconductors & Semiconductor Equipment) | | | | | | | 1,047,000 | | | | 925,170 | |
Largan Precision Company Limited (Information Technology, Electronic Equipment, Instruments & Components) | | | | | | | 12,000 | | | | 844,573 | |
MediaTek Incorporated (Information Technology, Semiconductors & Semiconductor Equipment) | | | | | | | 97,000 | | | | 691,719 | |
Siliconware Precision Industries Company (Information Technology, Semiconductors & Semiconductor Equipment) | | | | | | | 673,000 | | | | 999,495 | |
Taiwan Semiconductor Manufacturing Company Limited (Information Technology, Semiconductors & Semiconductor Equipment) | | | | | | | 387,000 | | | | 1,799,833 | |
Uni-President Enterprises Corporation (Consumer Staples, Food Products) | | | | | | | 413,000 | | | | 745,252 | |
United Microelectronics Corporation (Information Technology, Semiconductors & Semiconductor Equipment) | | | | | | | 2,180,000 | | | | 811,087 | |
WPG Holdings Company Limited (Information Technology, Electronic Equipment, Instruments & Components) | | | | | | | 761,000 | | | | 814,017 | |
| | | | |
| | | | | | | | | | | 11,529,238 | |
| | | | | | | | | | | | |
| | | | |
| Thailand: 1.39% | | | | | | | | | | | | |
Major Cineplex Group PCL (Consumer Discretionary, Media) | | | | | | | 1,283,300 | | | | 1,157,285 | |
The accompanying notes are an integral part of these financial statements.
| | | | |
| 10 | | Wells Fargo Asia Pacific Fund | | Portfolio of investments—April 30, 2016 (unaudited) |
| | | | | | | | | | | | | | | | |
| Security name | | | | | | | | Shares | | | Value | |
| | | | |
| Thailand (continued) | | | | | | | | | | | | | | | | |
The Siam Cement PCL (Materials, Construction Materials) | | | | | | | | | | | 63,700 | | | $ | 893,587 | |
| | | | |
| | | | | | | | | | | | | | | 2,050,872 | |
| | | | | | | | | | | | | | | | |
| | | | |
Total Common Stocks (Cost $140,450,232) | | | | | | | | | | | | | | | 138,552,414 | |
| | | | | | | | | | | | | | | | |
| | | | |
| | | | | | Expiration date | | | | | | | |
| | | | |
Participation Notes: 2.42% | | | | | | | | | | | | | | | | |
| | | | |
| China: 2.42% | | | | | | | | | | | | | | | | |
HSBC Bank plc (Han’s Laser Technology Industry Group Company Limited Class A) (Industrials, Machinery) † | | | | | | | 3-18-2019 | | | | 229,000 | | | | 767,793 | |
HSBC Bank plc (Inner Monglolia Yili Industrial Group Company Limited Class A) (Consumer Staples, Food Products) † | | | | | | | 9-25-2023 | | | | 344,600 | | | | 798,406 | |
UBS AG (China Vanke Company Limited Class A) (Financials, Real Estate Management & Development) †(a) | | | | | | | 5-4-2018 | | | | 375,000 | | | | 1,232,564 | |
UBS AG (Shanghai International Air Company Limited Class A) (Industrials, Transportation Infrastructure) † | | | | | | | 8-29-2016 | | | | 187,382 | | | | 785,970 | |
| | | | |
Total Participation Notes (Cost $3,171,098) | | | | | | | | | | | | | | | 3,584,733 | |
| | | | | | | | | | | | | | | | |
| | | | |
| | | Dividend yield | | | | | | | | | | |
| | | | |
Preferred Stocks: 1.49% | | | | | | | | | | | | | | | | |
| | | | |
| South Korea: 1.49% | | | | | | | | | | | | | | | | |
Samsung Electronics Company Limited (Information Technology, Technology Hardware, Storage & Peripherals) ± | | | 1.97 | % | | | | | | | 2,400 | | | | 2,196,946 | |
| | | | | | | | | | | | | | | | |
| | | | |
Total Preferred Stocks (Cost $1,866,044) | | | | | | | | | | | | | | | 2,196,946 | |
| | | | | | | | | | | | | | | | |
| | | | |
| | | Yield | | | | | | | | | | |
| Short-Term Investments: 1.77% | | | | | | | | | | | | | | | | |
| | | | |
| Investment Companies: 1.77% | | | | | | | | | | | | | | | | |
Wells Fargo Cash Investment Money Market Fund Select Class (l)(u) | | | 0.43 | | | | | | | | 2,613,447 | | | | 2,613,447 | |
| | | | | | | | | | | | | | | | |
| | | | |
Total Short-Term Investments (Cost $2,613,447) | | | | | | | | | | | | | | | 2,613,447 | |
| | | | | | | | | | | | | | | | |
| | | | | | | | |
| Total investments in securities (Cost $148,100,821) * | | | 99.33 | % | | | 146,947,540 | |
Other assets and liabilities, net | | | 0.67 | | | | 991,841 | |
| | | | | | | | |
| Total net assets | | | 100.00 | % | | $ | 147,939,381 | |
| | | | | | | | |
| † | Non-income-earning security |
| (a) | The security is fair valued in accordance with procedures approved by the Board of Trustees. |
| ± | Variable rate investment. The rate shown is the rate in effect at period end. |
| (l) | The issuer of the security is an affiliated person of the Fund as defined in the Investment Company Act of 1940. |
| (u) | The rate represents the 7-day annualized yield at period end. |
| * | Cost for federal income tax purposes is $149,635,806 and unrealized gains (losses) consists of: |
| | | | |
Gross unrealized gains | | $ | 12,592,293 | |
Gross unrealized losses | | | (15,280,559 | ) |
| | | | |
Net unrealized losses | | $ | (2,688,266 | ) |
The accompanying notes are an integral part of these financial statements.
| | | | | | |
| Statement of assets and liabilities—April 30, 2016 (unaudited) | | Wells Fargo Asia Pacific Fund | | | 11 | |
| | | | |
| | | | |
| |
Assets | | | | |
Investments | | | | |
In unaffiliated securities, at value (cost $145,487,374) | | $ | 144,334,093 | |
In affiliated securities, at value (cost $2,613,447) | | | 2,613,447 | |
| | | | |
Total investments, at value (cost $148,100,821) | | | 146,947,540 | |
Foreign currency, at value (cost $303,762) | | | 307,032 | |
Receivable for investments sold | | | 610,793 | |
Receivable for Fund shares sold | | | 34,164 | |
Receivable for dividends | | | 564,605 | |
Receivable for securities lending income | | | 657 | |
Prepaid expenses and other assets | | | 37,456 | |
| | | | |
Total assets | | | 148,502,247 | |
| | | | |
| |
Liabilities | | | | |
Payable for investments purchased | | | 91,528 | |
Payable for Fund shares redeemed | | | 191,595 | |
Management fee payable | | | 116,626 | |
Distribution fee payable | | | 1,710 | |
Administration fees payable | | | 25,040 | |
Custodian and accounting fees payable | | | 73,939 | |
Shareholder servicing fees payable | | | 29,606 | |
Accrued expenses and other liabilities | | | 32,822 | |
| | | | |
Total liabilities | | | 562,866 | |
| | | | |
Total net assets | | $ | 147,939,381 | |
| | | | |
| |
NET ASSETS CONSIST OF | | | | |
Paid-in capital | | $ | 264,791,664 | |
Overdistributed net investment income | | | (353,417 | ) |
Accumulated net realized losses on investments | | | (115,375,541 | ) |
Net unrealized losses on investments | | | (1,123,325 | ) |
| | | | |
Total net assets | | $ | 147,939,381 | |
| | | | |
| |
COMPUTATION OF NET ASSET VALUE AND OFFERING PRICE PER SHARE | | | | |
Net assets – Class A | | $ | 125,202,316 | |
Shares outstanding – Class A1 | | | 10,900,247 | |
Net asset value per share – Class A | | | $11.49 | |
Maximum offering price per share – Class A2 | | | $12.19 | |
Net assets – Class C | | $ | 2,682,196 | |
Shares outstanding – Class C1 | | | 246,369 | |
Net asset value per share – Class C | | | $10.89 | |
Net assets – Administrator Class | | $ | 11,602,580 | |
Shares outstanding – Administrator Class1 | | | 1,030,080 | |
Net asset value per share – Administrator Class | | | $11.26 | |
Net assets – Institutional Class | | $ | 8,452,289 | |
Shares outstanding – Institutional Class1 | | | 750,796 | |
Net asset value per share – Institutional Class | | | $11.26 | |
| 1 | The Fund has an unlimited number of authorized shares. |
| 2 | Maximum offering price is computed as 100/94.25 of net asset value. On investments of $50,000 or more, the offering price is reduced. |
The accompanying notes are an integral part of these financial statements.
| | | | |
| 12 | | Wells Fargo Asia Pacific Fund | | Statement of operations—six months ended April 30, 2016 (unaudited) |
| | | | |
| | | | |
| |
Investment income | | | | |
Dividends (net of foreign withholding taxes of $170,050) | | $ | 1,531,881 | |
Securities lending income, net | | | 6,865 | |
Income from affiliated securities | | | 5,326 | |
| | | | |
Total investment income | | | 1,544,072 | |
| | | | |
| |
Expenses | | | | |
Management fee | | | 747,278 | |
Administration fees | | | | |
Class A | | | 131,251 | |
Class C | | | 3,079 | |
Administrator Class | | | 7,831 | |
Institutional Class | | | 6,159 | |
Shareholder servicing fees | | | | |
Class A | | | 155,961 | |
Class C | | | 3,665 | |
Administrator Class | | | 15,059 | |
Distribution fee | | | | |
Class C | | | 10,994 | |
Custody and accounting fees | | | 73,364 | |
Professional fees | | | 24,708 | |
Registration fees | | | 38,371 | |
Shareholder report expenses | | | 25,360 | |
Trustees’ fees and expenses | | | 8,363 | |
Other fees and expenses | | | 11,985 | |
| | | | |
Total expenses | | | 1,263,428 | |
Less: Fee waivers and/or expense reimbursements | | | (83,457 | ) |
| | | | |
Net expenses | | | 1,179,971 | |
| | | | |
Net investment income | | | 364,101 | |
| | | | |
| |
REALIZED AND UNREALIZED GAINS (LOSSES) ON INVESTMENTS | | | | |
Net realized losses on investments | | | (1,494,820 | ) |
Net change in unrealized gains (losses) on investments | | | (2,585,604 | ) |
| | | | |
Net realized and unrealized gains (losses) on investments | | | (4,080,424 | ) |
| | | | |
Net decrease in net assets resulting from operations | | $ | (3,716,323 | ) |
| | | | |
The accompanying notes are an integral part of these financial statements.
| | | | | | |
| Statement of changes in net assets | | Wells Fargo Asia Pacific Fund | | | 13 | |
| | | | | | | | | | | | | | | | |
| | | Six months ended April 30, 2016 (unaudited) | | | Year ended October 31, 2015 | |
| | | |
Operations | | | | | | | | | | | | |
Net investment income | | | | | | $ | 364,101 | | | | | | | $ | 1,087,833 | |
Net realized gains (losses) on investments | | | | | | | (1,494,820 | ) | | | | | | | 5,808,777 | |
Net change in unrealized gains (losses) on investments | | | | | | | (2,585,604 | ) | | | | | | | (10,236,642 | ) |
| | | | |
Net decrease in net assets resulting from operations | | | | | | | (3,716,323 | ) | | | | | | | (3,340,032 | ) |
| | | | |
| | | | |
Distributions to shareholders from | | | | | | | | | | | | | | | | |
Net investment income | | | | | | | | | | | | | | | | |
Class A | | | | | | | (2,403,259 | ) | | | | | | | (82,320 | ) |
Class C | | | | | | | (44,466 | ) | | | | | | | (18,378 | ) |
Administrator Class | | | | | | | (274,359 | ) | | | | | | | (197,300 | ) |
Institutional Class | | | | | | | (250,376 | ) | | | | | | | (18,960 | ) |
Investor Class | | | | | | | N/A | | | | | | | | (1,661,776 | )1 |
| | | | |
Total distributions to shareholders | | | | | | | (2,972,460 | ) | | | | | | | (1,978,734 | ) |
| | | | |
| | | | |
Capital share transactions | | | Shares | | | | | | | | Shares | | | | | |
Proceeds from shares sold | | | | | | | | | | | | | | | | |
Class A | | | 914,825 | | | | 10,357,112 | | | | 11,260,731 | | | | 136,016,227 | |
Class C | | | 12,682 | | | | 137,729 | | | | 140,676 | | | | 1,691,622 | |
Administrator Class | | | 42,643 | | | | 466,052 | | | | 1,087,437 | | | | 13,023,913 | |
Institutional Class | | | 91,556 | | | | 1,020,858 | | | | 971,690 | | | | 10,822,354 | |
Investor Class | | | N/A | | | | N/A | | | | 3,572,603 | 1 | | | 44,979,487 | 1 |
| | | | |
| | | | | | | 11,981,751 | | | | | | | | 206,533,603 | |
| | | | |
Reinvestment of distributions | | | | | | | | | | | | | | | | |
Class A | | | 203,382 | | | | 2,336,858 | | | | 6,243 | | | | 74,538 | |
Class C | | | 3,274 | | | | 35,719 | | | | 1,201 | | | | 13,666 | |
Administrator Class | | | 24,161 | | | | 272,051 | | | | 16,772 | | | | 196,572 | |
Institutional Class | | | 20,214 | | | | 227,203 | | | | 687 | | | | 8,043 | |
Investor Class | | | N/A | | | | N/A | | | | 138,610 | 1 | | | 1,630,058 | 1 |
| | | | |
| | | | | | | 2,871,831 | | | | | | | | 1,922,877 | |
| | | | |
Payment for shares redeemed | | | | | | | | | | | | | | | | |
Class A | | | (1,758,016 | ) | | | (19,672,466 | ) | | | (281,262 | ) | | | (3,389,825 | ) |
Class C | | | (79,062 | ) | | | (834,496 | ) | | | (42,158 | ) | | | (493,632 | ) |
Administrator Class | | | (235,207 | ) | | | (2,590,265 | ) | | | (1,069,973 | ) | | | (12,472,235 | ) |
Institutional Class | | | (301,651 | ) | | | (3,282,183 | ) | | | (73,533 | ) | | | (850,292 | ) |
Investor Class | | | N/A | | | | N/A | | | | (16,272,754 | )1 | | | (194,126,550 | )1 |
| | | | |
| | | | | | | (26,379,410 | ) | | | | | | | (211,332,534 | ) |
| | | | |
Net decrease in net assets resulting from capital share transactions | | | | | | | (11,525,828 | ) | | | | | | | (2,876,054 | ) |
| | | | |
Total decrease in net assets | | | | | | | (18,214,611 | ) | | | | | | | (8,194,820 | ) |
| | | | |
| | | | |
Net assets | | | | | | | | | | | | | | | | |
Beginning of period | | | | | | | 166,153,992 | | | | | | | | 174,348,812 | |
| | | | |
End of period | | | | | | $ | 147,939,381 | | | | | | | $ | 166,153,992 | |
| | | | |
Undistributed (overdistributed) net investment income | | | | | | $ | (353,417 | ) | | | | | | $ | 2,254,942 | |
| | | | |
| 1 | For the period from November 1, 2014 to October 23, 2015. Effective at the close of business on October 23, 2015, Investor Class shares were converted to Class A shares and are no longer offered by the Fund. |
The accompanying notes are an integral part of these financial statements.
| | | | |
| 14 | | Wells Fargo Asia Pacific Fund | | Financial highlights |
(For a share outstanding throughout each period)
| | | | | | | | | | | | | | | | | | | | | | | | |
| | | Six months ended
April 30, 2016 (unaudited) | | | Year ended October 31 | |
| CLASS A | | | 2015 | | | 2014 | | | 2013 | | | 2012 | | | 2011 | |
Net asset value, beginning of period | | | $11.92 | | | | $12.18 | | | | $11.72 | | | | $10.19 | | | | $9.30 | | | | $10.15 | |
Net investment income | | | 0.03 | | | | 0.04 | 1 | | | 0.09 | 1 | | | 0.12 | 1 | | | 0.10 | 1 | | | 0.08 | 1 |
Net realized and unrealized gains (losses) on investments | | | (0.25 | ) | | | (0.16 | ) | | | 0.67 | | | | 1.79 | | | | 0.79 | | | | (0.89 | ) |
| | | | | | | | | | | | | | | | | | | | | | | | |
Total from investment operations | | | (0.22 | ) | | | (0.12 | ) | | | 0.76 | | | | 1.91 | | | | 0.89 | | | | (0.81 | ) |
Distributions to shareholders from | | | | | | | | | | | | | | | | | | | | | | | | |
Net investment income | | | (0.21 | ) | | | (0.14 | ) | | | (0.30 | ) | | | (0.38 | ) | | | 0.00 | | | | (0.04 | ) |
Net asset value, end of period | | | $11.49 | | | | $11.92 | | | | $12.18 | | | | $11.72 | | | | $10.19 | | | | $9.30 | |
Total return2 | | | (1.82 | )% | | | (0.95 | )% | | | 6.61 | % | | | 19.24 | % | | | 9.57 | % | | | (7.97 | )% |
Ratios to average net assets (annualized) | | | | | | | | | | | | | | | | | | | | | | | | |
Gross expenses | | | 1.70 | % | | | 1.72 | % | | | 1.71 | % | | | 1.79 | % | | | 1.86 | % | | | 1.73 | % |
Net expenses | | | 1.60 | % | | | 1.60 | % | | | 1.60 | % | | | 1.60 | % | | | 1.60 | % | | | 1.60 | % |
Net investment income | | | 0.48 | % | | | 0.34 | % | | | 0.80 | % | | | 1.08 | % | | | 1.04 | % | | | 0.83 | % |
Supplemental data | | | | | | | | | | | | | | | | | | | | | | | | |
Portfolio turnover rate | | | 23 | % | | | 113 | % | | | 113 | % | | | 187 | % | | | 163 | % | | | 196 | % |
Net assets, end of period (000s omitted) | | | $125,202 | | | | $137,578 | | | | $6,755 | | | | $8,720 | | | | $5,699 | | | | $31,000 | |
| 1 | Calculated based upon average shares outstanding |
| 2 | Total return calculations do not include any sales charges. Returns for periods of less than one year are not annualized. |
The accompanying notes are an integral part of these financial statements.
| | | | | | |
| Financial highlights | | Wells Fargo Asia Pacific Fund | | | 15 | |
(For a share outstanding throughout each period)
| | | | | | | | | | | | | | | | | | | | | | | | |
| | | Six months ended
April 30, 2016 (unaudited) | | | Year ended October 31 | |
| CLASS C | | | 2015 | | | 2014 | | | 2013 | | | 2012 | | | 2011 | |
Net asset value, beginning of period | | | $11.29 | | | | $11.57 | | | | $11.15 | | | | $9.73 | | | | $8.98 | | | | $9.96 | |
Net investment income (loss) | | | (0.06 | ) | | | (0.00 | )1,2 | | | 0.01 | 1 | | | 0.05 | | | | 0.09 | 1 | | | 0.01 | |
Net realized and unrealized gains (losses) on investments | | | (0.19 | ) | | | (0.20 | ) | | | 0.63 | | | | 1.69 | | | | 0.69 | | | | (0.86 | ) |
| | | | | | | | | | | | | | | | | | | | | | | | |
Total from investment operations | | | (0.25 | ) | | | (0.20 | ) | | | 0.64 | | | | 1.74 | | | | 0.78 | | | | (0.85 | ) |
Distributions to shareholders from | | | | | | | | | | | | | | | | | | | | | | | | |
Net investment income | | | (0.15 | ) | | | (0.08 | ) | | | (0.22 | ) | | | (0.32 | ) | | | (0.03 | ) | | | (0.13 | ) |
Net asset value, end of period | | | $10.89 | | | | $11.29 | | | | $11.57 | | | | $11.15 | | | | $9.73 | | | | $8.98 | |
Total return3 | | | (2.19 | )% | | | (1.71 | )% | | | 5.76 | % | | | 18.44 | % | | | 8.78 | % | | | (8.67 | )% |
Ratios to average net assets (annualized) | | | | | | | | | | | | | | | | | | | | | | | | |
Gross expenses | | | 2.45 | % | | | 2.46 | % | | | 2.46 | % | | | 2.54 | % | | | 2.62 | % | | | 2.48 | % |
Net expenses | | | 2.35 | % | | | 2.35 | % | | | 2.35 | % | | | 2.35 | % | | | 2.35 | % | | | 2.35 | % |
Net investment income (loss) | | | (0.35 | )% | | | (0.01 | )% | | | 0.12 | % | | | 0.37 | % | | | 0.92 | % | | | 0.18 | % |
Supplemental data | | | | | | | | | | | | | | | | | | | | | | | | |
Portfolio turnover rate | | | 23 | % | | | 113 | % | | | 113 | % | | | 187 | % | | | 163 | % | | | 196 | % |
Net assets, end of period (000s omitted) | | | $2,682 | | | | $3,495 | | | | $2,427 | | | | $1,980 | | | | $1,673 | | | | $1,274 | |
| 1 | Calculated based upon average shares outstanding |
| 2 | Amount is less than $0.005. |
| 3 | Total return calculations do not include any sales charges. Returns for periods of less than one year are not annualized. |
The accompanying notes are an integral part of these financial statements.
| | | | |
| 16 | | Wells Fargo Asia Pacific Fund | | Financial highlights |
(For a share outstanding throughout each period)
| | | | | | | | | | | | | | | | | | | | | | | | |
| | | Six months ended
April 30, 2016 (unaudited) | | | Year ended October 31 | |
| ADMINISTRATOR CLASS | | | 2015 | | | 2014 | | | 2013 | | | 2012 | | | 2011 | |
Net asset value, beginning of period | | | $11.72 | | | | $11.99 | | | | $11.54 | | | | $10.04 | | | | $9.29 | | | | $10.15 | |
Net investment income | | | 0.03 | | | | 0.11 | 1 | | | 0.12 | 1 | | | 0.14 | 1 | | | 0.17 | | | | 0.12 | 1 |
Net realized and unrealized gains (losses) on investments | | | (0.24 | ) | | | (0.21 | ) | | | 0.65 | | | | 1.77 | | | | 0.71 | | | | (0.89 | ) |
| | | | | | | | | | | | | | | | | | | | | | | | |
Total from investment operations | | | (0.21 | ) | | | (0.10 | ) | | | 0.77 | | | | 1.91 | | | | 0.88 | | | | (0.77 | ) |
Distributions to shareholders from | | | | | | | | | | | | | | | | | | | | | | | | |
Net investment income | | | (0.25 | ) | | | (0.17 | ) | | | (0.32 | ) | | | (0.41 | ) | | | (0.13 | ) | | | (0.09 | ) |
Net asset value, end of period | | | $11.26 | | | | $11.72 | | | | $11.99 | | | | $11.54 | | | | $10.04 | | | | $9.29 | |
Total return2 | | | (1.81 | )% | | | (0.83 | )% | | | 6.86 | % | | | 19.57 | % | | | 9.66 | % | | | (7.68 | )% |
Ratios to average net assets (annualized) | | | | | | | | | | | | | | | | | | | | | | | | |
Gross expenses | | | 1.62 | % | | | 1.56 | % | | | 1.52 | % | | | 1.61 | % | | | 1.67 | % | | | 1.52 | % |
Net expenses | | | 1.43 | % | | | 1.40 | % | | | 1.40 | % | | | 1.40 | % | | | 1.40 | % | | | 1.39 | % |
Net investment income | | | 0.60 | % | | | 0.87 | % | | | 1.04 | % | | | 1.26 | % | | | 1.74 | % | | | 1.14 | % |
Supplemental data | | | | | | | | | | | | | | | | | | | | | | | | |
Portfolio turnover rate | | | 23 | % | | | 113 | % | | | 113 | % | | | 187 | % | | | 163 | % | | | 196 | % |
Net assets, end of period (000s omitted) | | | $11,603 | | | | $14,048 | | | | $13,956 | | | | $12,577 | | | | $12,860 | | | | $13,959 | |
| 1 | Calculated based upon average shares outstanding |
| 2 | Returns for periods of less than one year are not annualized. |
The accompanying notes are an integral part of these financial statements.
| | | | | | |
| Financial highlights | | Wells Fargo Asia Pacific Fund | | | 17 | |
(For a share outstanding throughout each period)
| | | | | | | | | | | | | | | | | | | | | | | | |
| | | Six months ended
April 30, 2016 (unaudited) | | | Year ended October 31 | |
| INSTITUTIONAL CLASS | | | 2015 | | | 2014 | | | 2013 | | | 2012 | | | 2011 | |
Net asset value, beginning of period | | | $11.73 | | | | $12.00 | | | | $11.55 | | | | $10.05 | | | | $9.30 | | | | $10.15 | |
Net investment income | | | 0.04 | 1 | | | 0.15 | 1 | | | 0.14 | 1 | | | 0.18 | 1 | | | 0.18 | | | | 0.13 | |
Net realized and unrealized gains (losses) on investments | | | (0.24 | ) | | | (0.23 | ) | | | 0.65 | | | | 1.74 | | | | 0.71 | | | | (0.89 | ) |
| | | | | | | | | | | | | | | | | | | | | | | | |
Total from investment operations | | | (0.20 | ) | | | (0.08 | ) | | | 0.79 | | | | 1.92 | | | | 0.89 | | | | (0.76 | ) |
Distributions to shareholders from | | | | | | | | | | | | | | | | | | | | | | | | |
Net investment income | | | (0.27 | ) | | | (0.19 | ) | | | (0.34 | ) | | | (0.42 | ) | | | (0.14 | ) | | | (0.09 | ) |
Net asset value, end of period | | | $11.26 | | | | $11.73 | | | | $12.00 | | | | $11.55 | | | | $10.05 | | | | $9.30 | |
Total return2 | | | (1.67 | )% | | | (0.65 | )% | | | 6.99 | % | | | 19.70 | % | | | 9.90 | % | | | (7.55 | )% |
Ratios to average net assets (annualized) | | | | | | | | | | | | | | | | | | | | | | | | |
Gross expenses | | | 1.37 | % | | | 1.36 | % | | | 1.27 | % | | | 1.33 | % | | | 1.42 | % | | | 1.29 | % |
Net expenses | | | 1.25 | % | | | 1.25 | % | | | 1.25 | % | | | 1.25 | % | | | 1.25 | % | | | 1.24 | % |
Net investment income | | | 0.74 | % | | | 1.27 | % | | | 1.15 | % | | | 1.62 | % | | | 1.86 | % | | | 1.30 | % |
Supplemental data | | | | | | | | | | | | | | | | | | | | | | | | |
Portfolio turnover rate | | | 23 | % | | | 113 | % | | | 113 | % | | | 187 | % | | | 163 | % | | | 196 | % |
Net assets, end of period (000s omitted) | | | $8,452 | | | | $11,034 | | | | $502 | | | | $129 | | | | $12 | | | | $11 | |
| 1 | Calculated based upon average shares outstanding |
| 2 | Returns for periods of less than one year are not annualized. |
The accompanying notes are an integral part of these financial statements.
| | | | |
| 18 | | Wells Fargo Asia Pacific Fund | | Notes to financial statements (unaudited) |
1. ORGANIZATION
Wells Fargo Funds Trust (the “Trust”), a Delaware statutory trust organized on March 10, 1999, is an open-end management investment company registered under the Investment Company Act of 1940, as amended (the “1940 Act”). As an investment company, the Trust follows the accounting and reporting guidance in Financial Accounting Standards Board (“FASB”) Accounting Standards Codification Topic 946, Financial Services – Investment Companies. These financial statements report on the Wells Fargo Asia Pacific Fund (the “Fund”) which is a diversified series of the Trust.
Effective at the close of business on October 23, 2015, Investor Class shares became Class A shares in a tax-free conversion. Shareholders of Investor Class received Class A shares at a value equal to the value of their Investor Class shares immediately prior to the conversion. Investor Class shares are no longer offered by the Fund.
2. SIGNIFICANT ACCOUNTING POLICIES
The following significant accounting policies, which are consistently followed in the preparation of the financial statements of the Fund, are in conformity with U.S. generally accepted accounting principles which require management to make estimates and assumptions that affect the reported amounts of assets and liabilities, disclosure of contingent assets and liabilities at the date of the financial statements, and the reported amounts of revenues and expenses during the reporting period. Actual results could differ from those estimates.
Securities valuation
All investments are valued each business day as of the close of regular trading on the New York Stock Exchange (generally 4 p.m. Eastern Time), although the Fund may deviate from this calculation time under unusual or unexpected circumstances.
Equity securities that are listed on a foreign or domestic exchange or market are valued at the official closing price or, if none, the last sales price. If no sale occurs on the principal exchange or market that day, the prior day’s price will be deemed “stale” and a fair value price will be determined in accordance with the Fund’s Valuation Procedures.
The values of securities denominated in foreign currencies are translated into U.S. dollars at rates provided by an independent foreign currency pricing source at a time each business day specified by the Management Valuation Team of Wells Fargo Funds Management, LLC (“Funds Management”).
Many securities markets and exchanges outside the U.S. close prior to the close of the New York Stock Exchange and therefore may not fully reflect trading or events that occur after the close of the principal exchange in which the foreign securities are traded, but before the close of the New York Stock Exchange. If such trading or events are expected to materially affect the value of such securities, then fair value pricing procedures approved by the Board of Trustees of the Fund are applied. These procedures take into account multiple factors including movements in U.S. securities markets after foreign exchanges close. Foreign securities that are fair valued under these procedures are categorized as Level 2 and the application of these procedures may result in transfers between Level 1 and Level 2. Depending on market activity, such fair valuations may be frequent. Such fair value pricing may result in net asset values that are higher or lower than net asset values based on the last reported sales price or latest quoted bid price. On April 30, 2016, such fair value pricing was not used in pricing foreign securities.
Investments in registered open-end investment companies are valued at net asset value. Interests in non-registered investment vehicles that are redeemable at net asset value are fair valued normally at net asset value.
Investments which are not valued using any of the methods discussed above are valued at their fair value, as determined in good faith by the Board of Trustees. The Board of Trustees has established a Valuation Committee comprised of the Trustees and has delegated to it the authority to take any actions regarding the valuation of portfolio securities that the Valuation Committee deems necessary or appropriate, including determining the fair value of portfolio securities, unless the determination has been delegated to the Management Valuation Team. The Board of Trustees retains the authority to make or ratify any valuation decisions or approve any changes to the Valuation Procedures as it deems appropriate. On a quarterly basis, the Board of Trustees receives reports on any valuation actions taken by the Valuation Committee or the Management Valuation Team which may include items for ratification.
Valuations of fair valued securities are compared to the next actual sales price when available, or other appropriate market values, to assess the continued appropriateness of the fair valuation methodologies used. These securities are fair valued on a day-to-day basis, taking into consideration changes to appropriate market information and any significant changes to the inputs considered in the valuation process until there is a readily available price provided on an exchange or by an independent pricing service. Valuations received from an independent pricing service or independent broker-dealer quotes
| | | | | | |
| Notes to financial statements (unaudited) | | Wells Fargo Asia Pacific Fund | | | 19 | |
are periodically validated by comparisons to most recent trades and valuations provided by other independent pricing services in addition to the review of prices by the manager and/or subadviser. Unobservable inputs used in determining fair valuations are identified based on the type of security, taking into consideration factors utilized by market participants in valuing the investment, knowledge about the issuer and the current market environment.
Foreign currency translation
The accounting records of the Fund are maintained in U.S. dollars. The values of other assets and liabilities denominated in foreign currencies are translated into U.S. dollars at rates provided by an independent foreign currency pricing source at a time each business day specified by the Management Valuation Team. Purchases and sales of securities, and income and expenses are converted at the rate of exchange on the respective dates of such transactions. Net realized foreign exchange gains or losses arise from sales of foreign currencies, currency gains or losses realized between the trade and settlement dates on securities transactions, and the difference between the amounts of dividends, interest and foreign withholding taxes recorded and the U.S. dollar equivalent of the amounts actually paid or received. Net unrealized foreign exchange gains and losses arise from changes in the fair value of assets and liabilities other than investments in securities resulting from changes in exchange rates. The changes in net assets arising from changes in exchange rates and the changes in net assets resulting from changes in market prices of securities are not separately presented. Such changes are included in net realized and unrealized gains or losses from investments.
Forward foreign currency contracts
The Fund is subject to foreign currency exchange rate risk in the normal course of pursuing its investment objectives. A forward foreign currency contract is an agreement between two parties to purchase or sell a specific currency for an agreed-upon price at a future date. The Fund enters into forward foreign currency contracts to facilitate transactions in foreign-denominated securities and to attempt to minimize the risk to the Fund from adverse changes in the relationship between currencies. Forward foreign currency contracts are recorded at the forward rate and marked-to-market daily. When the contracts are closed, realized gains and losses arising from such transactions are recorded as realized gains or losses on forward foreign currency contract transactions. The Fund could be exposed to risks if the counterparties to the contracts are unable to meet the terms of their contracts or if the value of the foreign currency changes unfavorably. The Fund’s maximum risk of loss from counterparty credit risk is the unrealized gains on the contracts. This risk may be mitigated if there is a master netting arrangement between the Fund and the counterparty.
Security loans
The Fund may lend its securities from time to time in order to earn additional income in the form of fees or interest on securities received as collateral or the investment of any cash received as collateral. The Fund continues to receive interest or dividends on the securities loaned. The Fund receives collateral in the form of cash or securities with a value at least equal to the value of the securities on loan. The value of the loaned securities is determined at the close of each business day and any additional required collateral is delivered to the Fund on the next business day. In a securities lending transaction, the net asset value of the Fund will be affected by an increase or decrease in the value of the securities loaned and by an increase or decrease in the value of the instrument in which collateral is invested. The amount of securities lending activity undertaken by the Fund fluctuates from time to time. In the event of default or bankruptcy by the borrower, the Fund may be prevented from recovering the loaned securities or gaining access to the collateral or may experience delays or costs in doing so. In addition, the investment of any cash collateral received may lose all or part of its value. The Fund has the right under the lending agreement to recover the securities from the borrower on demand.
The Fund lends its securities through an unaffiliated securities lending agent. Cash collateral received in connection with its securities lending transactions is invested in Securities Lending Cash Investments, LLC (the “Securities Lending Fund”). The Securities Lending Fund is exempt from registration under Section 3(c)(7) of the 1940 Act and is managed by Funds Management and is subadvised by Wells Capital Management Incorporated (“WellsCap”), an affiliate of Funds Management and an indirect wholly owned subsidiary of Wells Fargo & Company (“Wells Fargo”). Funds Management receives an advisory fee starting at 0.05% and declining to 0.01% as the average daily net assets of the Securities Lending Fund increase. All of the fees received by Funds Management are paid to WellsCap for its services as subadviser. The Securities Lending Fund seeks to provide a positive return compared to the daily Fed Funds Open rate by investing in high-quality, U.S. dollar-denominated short-term money market instruments. Securities Lending Fund investments are fair valued based upon the amortized cost valuation technique. Income earned from investment in the Securities Lending Fund is included in securities lending income on the Statement of Operations.
Security transactions and income recognition
Securities transactions are recorded on a trade date basis. Realized gains or losses are recorded on the basis of identified cost.
| | | | |
| 20 | | Wells Fargo Asia Pacific Fund | | Notes to financial statements (unaudited) |
Dividend income is recognized on the ex-dividend date, except for certain dividends from foreign securities, which are recorded as soon as the custodian verifies the ex-dividend date. Dividend income from foreign securities is recorded net of foreign taxes withheld where recovery of such taxes is not assured.
Distributions to shareholders
Distributions to shareholders from net investment income and net realized gains, if any, are recorded on the ex-dividend date. Such distributions are determined in conformity with federal income tax regulations, which may differ in amount or character from net investment income and realized gains recognized for purposes of U.S. generally accepted accounting principles.
Federal and other taxes
The Fund intends to continue to qualify as a regulated investment company by distributing substantially all of its investment company taxable income and any net realized capital gains (after reduction for capital loss carryforwards) sufficient to relieve it from all, or substantially all, federal income taxes. Accordingly, no provision for federal income taxes was required.
The Fund’s income and federal excise tax returns and all financial records supporting those returns for the prior three fiscal years are subject to examination by the federal and Delaware revenue authorities. Management has analyzed the Fund’s tax positions taken on federal, state, and foreign tax returns for all open tax years and does not believe that there are any uncertain tax positions that require recognition of a tax liability.
As of October 31, 2015, the Fund had capital loss carryforwards available to offset future net realized capital gains in the amount of $113,203,545 with $32,386,341 expiring in 2016; and $80,817,204 expiring in 2017.
Class allocations
The separate classes of shares offered by the Fund differ principally in applicable sales charges, distribution, shareholder servicing, and administration fees. Class specific expenses are charged directly to that share class. Investment income, common expenses, and realized and unrealized gains (losses) on investments are allocated daily to each class of shares based on the relative proportion of net assets of each class.
3. FAIR VALUATION MEASUREMENTS
Fair value measurements of investments are determined within a framework that has established a fair value hierarchy based upon the various data inputs utilized in determining the value of the Fund’s investments. The three-level hierarchy gives the highest priority to unadjusted quoted prices in active markets for identical assets or liabilities (Level 1) and the lowest priority to significant unobservable inputs (Level 3). The Fund’s investments are classified within the fair value hierarchy based on the lowest level of input that is significant to the fair value measurement. The inputs are summarized into three broad levels as follows:
| n | | Level 1 – quoted prices in active markets for identical securities |
| n | | Level 2 – other significant observable inputs (including quoted prices for similar securities, interest rates, prepayment speeds, credit risk, use of amortized cost, etc.) |
| n | | Level 3 – significant unobservable inputs (including the Fund’s own assumptions in determining the fair value of investments) |
The inputs or methodologies used for valuing investments in securities are not necessarily an indication of the risk associated with investing in those securities.
| | | | | | |
| Notes to financial statements (unaudited) | | Wells Fargo Asia Pacific Fund | | | 21 | |
The following is a summary of the inputs used in valuing the Fund’s assets and liabilities as of April 30, 2016:
| | | | | | | | | | | | | | | | |
| | | Quoted prices
(Level 1) | | | Other significant
observable inputs
(Level 2) | | | Significant
unobservable inputs (Level 3) | | | Total | |
Assets | | | | | | | | | | | | | | | | |
Investments in : | | | | | | | | | | | | | | | | |
| | | | |
Common stocks | | | | | | | | | | | | | | | | |
Australia | | $ | 8,633,570 | | | $ | 0 | | | $ | 0 | | | $ | 8,633,570 | |
China | | | 30,711,360 | | | | 0 | | | | 0 | | | | 30,711,360 | |
Hong Kong | | | 818,693 | | | | 0 | | | | 0 | | | | 818,693 | |
India | | | 11,492,131 | | | | 0 | | | | 0 | | | | 11,492,131 | |
Indonesia | | | 5,791,899 | | | | 0 | | | | 0 | | | | 5,791,899 | |
Japan | | | 44,816,573 | | | | 0 | | | | 0 | | | | 44,816,573 | |
Malaysia | | | 1,548,864 | | | | 0 | | | | 0 | | | | 1,548,864 | |
New Zealand | | | 2,263,457 | | | | 0 | | | | 0 | | | | 2,263,457 | |
Philippines | | | 2,389,311 | | | | 0 | | | | 0 | | | | 2,389,311 | |
Singapore | | | 3,652,995 | | | | 0 | | | | 0 | | | | 3,652,995 | |
South Korea | | | 12,853,451 | | | | 0 | | | | 0 | | | | 12,853,451 | |
Taiwan | | | 11,529,238 | | | | 0 | | | | 0 | | | | 11,529,238 | |
Thailand | | | 2,050,872 | | | | 0 | | | | 0 | | | | 2,050,872 | |
| | | | |
Participation notes | | | | | | | | | | | | | | | | |
China | | | 0 | | | | 3,584,733 | | | | 0 | | | | 3,584,733 | |
| | | | |
Preferred stocks | | | | | | | | | | | | | | | | |
South Korea | | | 2,196,946 | | | | 0 | | | | 0 | | | | 2,196,946 | |
| | | | |
Short-term investments | | | | | | | | | | | | | | | | |
Investment companies | | | 2,613,447 | | | | 0 | | | | 0 | | | | 2,613,447 | |
Total assets | | $ | 143,362,807 | | | $ | 3,584,733 | | | $ | 0 | | | $ | 146,947,540 | |
The Fund recognizes transfers between levels within the fair value hierarchy at the end of the reporting period. Fair value pricing that was used in pricing certain foreign securities at the previous period end was not used at April 30, 2016. As a result, common stocks and preferred stocks valued at $111,891,899 and $2,196,946 respectively, were transferred from Level 2 to Level 1 within the fair value hierarchy. The Fund had no material transfers into/out of Level 3.
4. TRANSACTIONS WITH AFFILIATES
Management fee
Funds Management, an indirect wholly owned subsidiary of Wells Fargo, is the manager of the Fund and provides advisory and fund-level administrative services under an investment management agreement. Under the investment management agreement, Funds Management is responsible for, among other services, implementing the investment objectives and strategies of the Fund, supervising the applicable subadviser, providing fund-level administrative services in connection with the Fund’s operations, and providing any other fund-level administrative services reasonably necessary for the operation of the Fund. As compensation for its services under the investment management agreement, Funds Management is entitled to receive an annual management fee starting at 1.00% and declining to 0.83% as the average daily net assets of the Fund increase. For the six months ended April 30, 2016, the management fee was equivalent to an annual rate of 1.00% of the Fund’s average daily net assets.
Funds Management has retained the services of a subadviser to provide daily portfolio management to the Fund. The fee for subadvisory services is borne by Funds Management. WellsCap is the subadviser to the Fund and is entitled to receive a fee from Funds Management at an annual rate starting at 0.65% and declining to 0.45% as the average daily net assets of the Fund increase.
Administration fees
Under a class-level administration agreement, Funds Management provides class-level administrative services to the Fund, which includes paying fees and expenses for services provided by the transfer agent, sub-transfer agents, omnibus account
| | | | |
| 22 | | Wells Fargo Asia Pacific Fund | | Notes to financial statements (unaudited) |
servicers and record-keepers. As compensation for its services under the class-level administration agreement, Funds Management receives an annual fee which is calculated based on the average daily net assets of each class as follows:
| | | | |
| | | Class-level
administration fee | |
Class A, Class C | | | 0.21 | % |
Administrator Class, Institutional Class | | | 0.13 | |
Funds Management has contractually waived and/or reimbursed management and administration fees to the extent necessary to maintain certain net operating expense ratios for the Fund. Waiver of fees and/or reimbursement of expenses by Funds Management were made first from fund level expenses on a proportionate basis and then from class specific expenses. Funds Management has committed through February 28, 2017 to waive fees and/or reimburse expenses to the extent necessary to cap the Fund’s expenses at 1.60% for Class A shares, 2.35% for Class C shares, 1.50% for Administrator Class shares, and 1.25% for Institutional Class shares. After this time, the cap may be increased or the commitment to maintain the cap may be terminated only with the approval of the Board of Trustees. Prior to March 1, 2016, the Fund’s expenses were capped at 1.40% for Administrator Class shares.
Distribution fee
The Trust has adopted a distribution plan for Class C shares of the Fund pursuant to Rule 12b-1 under the 1940 Act. A distribution fee is charged to Class C shares and paid to Wells Fargo Funds Distributor, LLC (“Funds Distributor”), the principal underwriter, at an annual rate of 0.75% of the average daily net assets of Class C shares.
In addition, Funds Distributor is entitled to receive the front-end sales charge from the purchase of Class A shares and a contingent deferred sales charge on the redemption of certain Class A shares. Funds Distributor is also entitled to receive the contingent deferred sales charges from redemptions of Class C shares. For the six months ended April 30, 2016, Funds Distributor received $877 from the sale of Class A shares and $52 in contingent deferred sales charges from redemptions of Class C shares, respectively.
Shareholder servicing fees
The Trust has entered into contracts with one or more shareholder servicing agents, whereby Class A, Class C, and Administrator Class of the Fund are charged a fee at an annual rate of 0.25% of the average daily net assets of each respective class.
A portion of these total shareholder servicing fees were paid to affiliates of Wells Fargo.
5. INVESTMENT PORTFOLIO TRANSACTIONS
Purchases and sales of investments, excluding U.S. government obligations (if any) and short-term securities, for the six months ended April 30, 2016 were $34,112,054 and $48,868,735, respectively.
6. BANK BORROWINGS
The Trust (excluding the money market funds and certain other funds) and Wells Fargo Variable Trust are parties to a $200,000,000 revolving credit agreement whereby the Fund is permitted to use bank borrowings for temporary or emergency purposes, such as to fund shareholder redemption requests. Interest under the credit agreement is charged to the Fund based on a borrowing rate equal to the higher of the Federal Funds rate in effect on that day plus 1.25% or the overnight LIBOR rate in effect on that day plus 1.25%. In addition, an annual commitment fee equal to 0.20% of the unused balance is allocated to each participating fund.
For the six months ended April 30, 2016, there were no borrowings by the Fund under the agreement.
7. CONCENTRATION RISK
Concentration risks result from exposure to a limited number of sectors or geographic region. A fund that invest a substantial portion of their assets in any sector or geographic region may be more affected by changes in that sector or geographic region than would be a fund whose investments are not heavily weighted in any sector or geographic region.
8. INDEMNIFICATION
Under the Trust’s organizational documents, the officers and Trustees have been granted certain indemnification rights against certain liabilities that may arise out of performance of their duties to the Trust. Additionally, in the normal course of business, the Trust may enter into contracts with service providers that contain a variety of indemnification clauses. The Trust’s maximum exposure under these arrangements is dependent on future claims that may be made against the Fund and, therefore, cannot be estimated.
| | | | | | |
| Other information (unaudited) | | Wells Fargo Asia Pacific Fund | | | 23 | |
TAX INFORMATION
Pursuant to Section 853 of the Internal Revenue Code, the following amounts were designated as foreign taxes paid for the fiscal year ended October 31, 2015. These amounts may be less than the actual foreign taxes paid for financial statement purposes. Foreign taxes paid or withheld should be included in taxable income with an offsetting deduction from gross income or as a credit for taxes paid to foreign governments. None of the income was derived from ineligible foreign sources as defined under Section 901(j) of the Internal Revenue Code.
| | | | |
Creditable foreign taxes paid | | Per share amount | | Foreign income as % of ordinary income distributions |
| $372,616 | | $0.0266 | | 69.49% |
PROXY VOTING INFORMATION
A description of the policies and procedures that the Fund uses to determine how to vote proxies relating to portfolio securities is available, upon request, by calling 1-800-222-8222, visiting our website at wellsfargofunds.com, or visiting the SEC website at sec.gov. Information regarding how the Fund voted proxies relating to portfolio securities during the most recent 12-month period ended June 30 is available on the Fund’s website at wellsfargofunds.com or by visiting the SEC website at sec.gov.
PORTFOLIO HOLDINGS INFORMATION
The complete portfolio holdings for the Fund are publicly available monthly on the Fund’s website (wellsfargofunds.com), on a one-month delayed basis. In addition, top ten holdings information (excluding derivative positions) for the Fund is publicly available on the Fund’s website on a monthly, seven-day or more delayed basis. The Fund files its complete schedule of portfolio holdings with the SEC for the first and third quarters of each fiscal year on Form N-Q, which is available by visiting the SEC website at sec.gov. In addition, the Fund’s Form N-Q may be reviewed and copied at the SEC’s Public Reference Room in Washington, DC, and at regional offices in New York City, at 233 Broadway, and in Chicago, at 175 West Jackson Boulevard, Suite 900. Information about the Public Reference Room may be obtained by calling 1-800-SEC-0330.
| | | | |
| 24 | | Wells Fargo Asia Pacific Fund | | Other information (unaudited) |
BOARD OF TRUSTEES AND OFFICERS
Each of the Trustees and Officers1 listed in the table below acts in identical capacities for each fund in the Wells Fargo family of funds, which consists of 141 mutual funds comprising the Wells Fargo Funds Trust, Wells Fargo Variable Trust, Wells Fargo Master Trust and four closed-end funds (collectively the “Fund Complex”). This table should be read in conjunction with the Prospectus and the Statement of Additional Information2. The mailing address of each Trustee and Officer is 525 Market Street, 12th Floor, San Francisco, CA 94105. Each Trustee and Officer serves an indefinite term, however, each Trustee serves such term until reaching the mandatory retirement age established by the Trustees.
Independent Trustees
| | | | | | |
Name and
year of birth | | Position held and
length of service* | | Principal occupations during past five years or longer | | Current other public
company or investment
company directorships |
| William R. Ebsworth (Born 1957) | | Trustee, since 2015 | | Retired. From 1984 to 2013, equities analyst, portfolio manager, research director and chief financial officer at Fidelity Management and Research Company in Boston, Tokyo, and Hong Kong and retired in 2013 as Chief Investment Officer of Fidelity Strategic Advisers, Inc. where he lead a team of investment professionals managing client assets. Prior thereto, Board member of Hong Kong Securities Clearing Co., Hong Kong Options Clearing Corp., the Thailand International Fund, Ltd., Fidelity Investments Life Insurance Company, and Empire Fidelity Investments Life Insurance Company. Mr. Ebsworth is a CFA® charterholder and an Adjunct Lecturer, Finance, at Babson College. | | Asset Allocation Trust |
| Jane A. Freeman (Born 1953) | | Trustee, since 2015 | | Retired. From 2012 to 2014 and 1999 to 2008, Chief Financial Officer of Scientific Learning Corporation. From 2008 to 2012, Ms. Freeman provided consulting services related to strategic business projects. Prior to 1999, Portfolio Manager at Rockefeller & Co. and Scudder, Stevens & Clark. Board member of the Harding Loevner Funds from 1996 to 2014, serving as both Lead Independent Director and chair of the Audit Committee. Board member of the Russell Exchange Traded Funds Trust from 2011 to 2012 and the chair of the Audit Committee. Ms. Freeman is Chair of Taproot Foundation (non-profit organization), a Board Member of Ruth Bancroft Garden (non-profit organization) and an inactive chartered financial analyst. | | Asset Allocation Trust |
| Peter G. Gordon (Born 1942) | | Trustee, since 1998; Chairman, since 2005 | | Co-Founder, Retired Chairman, President and CEO of Crystal Geyser Water Company. Trustee Emeritus, Colby College. | | Asset Allocation Trust |
| Isaiah Harris, Jr. (Born 1952) | | Trustee, since 2009 | | Retired. Chairman of the Board of CIGNA Corporation since 2009, and Director since 2005. From 2003 to 2011, Director of Deluxe Corporation. Prior thereto, President and CEO of BellSouth Advertising and Publishing Corp. from 2005 to 2007, President and CEO of BellSouth Enterprises from 2004 to 2005 and President of BellSouth Consumer Services from 2000 to 2003. Emeritus member of the Iowa State University Foundation Board of Governors. Emeritus Member of the Advisory Board of Iowa State University School of Business. Advisory Board Member, Palm Harbor Academy (charter school). Advisory Board Member, Child Evangelism Fellowship (non-profit). Mr. Harris is a certified public accountant (inactive status). | | CIGNA Corporation; Asset Allocation Trust |
| Judith M. Johnson (Born 1949) | | Trustee, since 2008; Audit Committee Chairman, since 2008 | | Retired. Prior thereto, Chief Executive Officer and Chief Investment Officer of Minneapolis Employees Retirement Fund from 1996 to 2008. Ms. Johnson is an attorney, certified public accountant and a certified managerial accountant. | | Asset Allocation Trust |
| David F. Larcker (Born 1950) | | Trustee, since 2009 | | James Irvin Miller Professor of Accounting at the Graduate School of Business, Stanford University, Director of the Corporate Governance Research Initiative and Senior Faculty of The Rock Center for Corporate Governance since 2006. From 2005 to 2008, Professor of Accounting at the Graduate School of Business, Stanford University. Prior thereto, Ernst & Young Professor of Accounting at The Wharton School, University of Pennsylvania from 1985 to 2005. | | Asset Allocation Trust |
| | | | | | |
| Other information (unaudited) | | Wells Fargo Asia Pacific Fund | | | 25 | |
| | | | | | |
Name and
year of birth | | Position held and
length of service* | | Principal occupations during past five years or longer | | Current other public
company or investment
company directorships |
| Olivia S. Mitchell (Born 1953) | | Trustee, since 2006 | | International Foundation of Employee Benefit Plans Professor, Wharton School of the University of Pennsylvania since 1993. Director of Wharton’s Pension Research Council and Boettner Center on Pensions & Retirement Research, and Research Associate at the National Bureau of Economic Research. Previously, Cornell University Professor from 1978 to 1993. | | Asset Allocation Trust |
| Timothy J. Penny (Born 1951) | | Trustee, since 1996 | | President and Chief Executive Officer of Southern Minnesota Initiative Foundation, a non-profit organization, since 2007 and Senior Fellow at the Humphrey Institute Policy Forum at the University of Minnesota since 1995. Member of the Board of Trustees of NorthStar Education Finance, Inc., a non-profit organization, since 2007. | | Asset Allocation Trust |
| Michael S. Scofield (Born 1943) | | Trustee, since 2010 | | Served on the Investment Company Institute’s Board of Governors and Executive Committee from 2008-2011 as well the Governing Council of the Independent Directors Council from 2006-2011 and the Independent Directors Council Executive Committee from 2008-2011. Chairman of the IDC from 2008-2010. Institutional Investor (Fund Directions) Trustee of Year in 2007. Trustee of the Evergreen Funds complex (and its predecessors) from 1984 to 2010. Chairman of the Evergreen Funds from 2000-2010. Former Trustee of the Mentor Funds. Retired Attorney, Law Offices of Michael S. Scofield. | | Asset Allocation Trust |
| * | Length of service dates reflect the Trustee’s commencement of service with the Trust’s predecessor entities, where applicable. |
Officers
| | | | | | |
Name and
year of birth | | Position held and
length of service | | Principal occupations during past five years or longer | | |
| Karla M. Rabusch (Born 1959) | | President, since 2003 | | Executive Vice President of Wells Fargo Bank, N.A. and President of Wells Fargo Funds Management, LLC since 2003. | | |
| Jeremy DePalma1 (Born 1974) | | Treasurer, since 2012 | | Senior Vice President of Wells Fargo Funds Management, LLC since 2009. Senior Vice President of Evergreen Investment Management Company, LLC from 2008 to 2010 and head of the Fund Reporting and Control Team within Fund Administration from 2005 to 2010. | | |
| C. David Messman (Born 1960) | | Secretary, since 2000; Chief Legal Officer, since 2003 | | Senior Vice President and Secretary of Wells Fargo Funds Management, LLC since 2001. Assistant General Counsel of Wells Fargo Bank, N.A. since 2013 and Vice President and Managing Counsel of Wells Fargo Bank, N.A. from 1996 to 2013. | | |
| Michael Whitaker (Born 1967) | | Chief Compliance Officer, since 2016* | | Executive Vice President of Wells Fargo Funds Management, LLC since 2016. Chief Compliance Officer of Fidelity’s Fixed Income Funds and Asset Allocation Funds from 2008 to 2016, Compliance Officer of FMR Co., Inc. from 2014 to 2016, Fidelity Investments Money Management, Inc. from 2014 to 2016, Fidelity Investments from 2007 to 2016. | | |
| Debra Ann Early (Born 1964) | | Chief Compliance Officer, since 2007** | | Executive Vice President of Wells Fargo Funds Management, LLC since 2014, Senior Vice President and Chief Compliance Officer from 2007 to 2014. | | |
| David Berardi (Born 1975) | | Assistant Treasurer, since 2009 | | Vice President of Wells Fargo Funds Management, LLC since 2009. Vice President of Evergreen Investment Management Company, LLC from 2008 to 2010. Manager of Fund Reporting and Control for Evergreen Investment Management Company, LLC from 2004 to 2010. | | |
| 1 | Jeremy DePalma acts as Treasurer of 69 funds and Assistant Treasurer of 72 funds in the Fund Complex. |
| 2 | The Statement of Additional Information includes additional information about the Trustees and is available, without charge, upon request, by calling 1-800-222-8222 or by visiting the website at wellsfargofunds.com. |
| * | Michael Whitaker became Chief Compliance Officer effective May 16, 2016. |
| ** | Debra Ann Early was the Chief Compliance Officer until May 15, 2016. |
| | | | |
| 26 | | Wells Fargo Asia Pacific Fund | | List of abbreviations |
The following is a list of common abbreviations for terms and entities that may have appeared in this report.
| ACA | — ACA Financial Guaranty Corporation |
| ADR | — American depositary receipt |
| ADS | — American depositary shares |
| AGC | — Assured Guaranty Corporation |
| AGM | — Assured Guaranty Municipal |
| Ambac | — Ambac Financial Group Incorporated |
| AMT | — Alternative minimum tax |
| BAN | — Bond anticipation notes |
| BHAC | — Berkshire Hathaway Assurance Corporation |
| CAB | — Capital appreciation bond |
| CCAB | — Convertible capital appreciation bond |
| CDA | — Community Development Authority |
| CDO | — Collateralized debt obligation |
| DRIVER | — Derivative inverse tax-exempt receipts |
| DW&P | — Department of Water & Power |
| DWR | — Department of Water Resources |
| ECFA | — Educational & Cultural Facilities Authority |
| EDA | — Economic Development Authority |
| EDFA | — Economic Development Finance Authority |
| ETF | — Exchange-traded fund |
| FDIC | — Federal Deposit Insurance Corporation |
| FFCB | — Federal Farm Credit Banks |
| FGIC | — Financial Guaranty Insurance Corporation |
| FHA | — Federal Housing Administration |
| FHLB | — Federal Home Loan Bank |
| FHLMC | — Federal Home Loan Mortgage Corporation |
| FICO | — The Financing Corporation |
| FNMA | — Federal National Mortgage Association |
| GDR | — Global depositary receipt |
| GNMA | — Government National Mortgage Association |
| HCFR | — Healthcare facilities revenue |
| HEFA | — Health & Educational Facilities Authority |
| HEFAR | — Higher education facilities authority revenue |
| HFA | — Housing Finance Authority |
| HFFA | — Health Facilities Financing Authority |
| HUD | — Department of Housing and Urban Development |
| IDA | — Industrial Development Authority |
| IDAG | — Industrial Development Agency |
| KRW | — Republic of Korea won |
| LIBOR | — London Interbank Offered Rate |
| LIFER | — Long Inverse Floating Exempt Receipts |
| LLC | — Limited liability company |
| LLLP | — Limited liability limited partnership |
| LLP | — Limited liability partnership |
| MBIA | — Municipal Bond Insurance Association |
| MFHR | — Multifamily housing revenue |
| MSTR | — Municipal securities trust receipts |
| MUD | — Municipal Utility District |
| National | — National Public Finance Guarantee Corporation |
| PCFA | — Pollution Control Financing Authority |
| PCL | — Public Company Limited |
| PCR | — Pollution control revenue |
| PFA | — Public Finance Authority |
| PFFA | — Public Facilities Financing Authority |
| PFOTER | — Puttable floating option tax-exempt receipts |
| plc | — Public limited company |
| PUTTER | — Puttable tax-exempt receipts |
| R&D | — Research & development |
| Radian | — Radian Asset Assurance |
| RAN | — Revenue anticipation notes |
| RDA | — Redevelopment Authority |
| RDFA | — Redevelopment Finance Authority |
| REIT | — Real estate investment trust |
| ROC | — Reset option certificates |
| SAVRS | — Select auction variable rate securities |
| SBA | — Small Business Authority |
| SDR | — Swedish depositary receipt |
| SFHR | — Single-family housing revenue |
| SFMR | — Single-family mortgage revenue |
| SPA | — Standby purchase agreement |
| SPDR | — Standard & Poor’s Depositary Receipts |
| SPEAR | — Short Puttable Exempt Adjustable Receipts |
| STRIPS | — Separate trading of registered interest and |
| TAN | — Tax anticipation notes |
| TIPS | — Treasury inflation-protected securities |
| TRAN | — Tax revenue anticipation notes |
| TTFA | — Transportation Trust Fund Authority |
| TVA | — Tennessee Valley Authority |
This page is intentionally left blank.
This page is intentionally left blank.

For more information
More information about Wells Fargo Funds is available free upon request. To obtain literature, please write, email, visit the Fund’s website, or call:
Wells Fargo Funds
P.O. Box 8266
Boston, MA 02266-8266
Email: fundservice@wellsfargo.com
Website: wellsfargofunds.com
Individual investors: 1-800-222-8222
Retail investment professionals: 1-888-877-9275
Institutional investment professionals: 1-866-765-0778
This report and the financial statements contained herein are submitted for the general information of the shareholders of the Fund. If this report is used for promotional purposes, distribution of the report must be accompanied or preceded by a current prospectus. Before investing, please consider the investment objectives, risks, charges, and expenses of the investment. For a current prospectus and, if available, a summary prospectus, containing this information, call 1-800-222-8222 or visit the Fund’s website at wellsfargofunds.com. Read the prospectus carefully before you invest or send money.
Wells Fargo Asset Management (WFAM) is a trade name used by the asset management businesses of Wells Fargo & Company. Wells Fargo Funds Management, LLC, a wholly owned subsidiary of Wells Fargo & Company, provides investment advisory and administrative services for Wells Fargo Funds. Other affiliates of Wells Fargo & Company provide subadvisory and other services for the funds. The funds are distributed by Wells Fargo Funds Distributor, LLC, Member FINRA, an affiliate of Wells Fargo & Company.
NOT FDIC INSURED ¡ NO BANK GUARANTEE ¡ MAY LOSE VALUE
© 2016 Wells Fargo Funds Management, LLC. All rights reserved.
| | |
 | | 242228 06-16 SA236/SAR236 04-16 |
Semi-Annual Report
April 30, 2016

Wells Fargo Diversified International Fund


Reduce clutter. Save trees.
Sign up for electronic delivery of prospectuses and shareholder reports at wellsfargo.com/advantagedelivery
Contents
The views expressed and any forward-looking statements are as of April 30, 2016, unless otherwise noted, and are those of the Fund managers and/or Wells Fargo Funds Management, LLC. Discussions of individual securities, or the markets generally, or any Wells Fargo Fund are not intended as individual recommendations. Future events or results may vary significantly from those expressed in any forward-looking statements. The views expressed are subject to change at any time in response to changing circumstances in the market.
Wells Fargo Funds Management, LLC and the Fund disclaim any obligation to publicly update or revise any views expressed or forward-looking statements.
NOT FDIC INSURED ¡ NO BANK GUARANTEE ¡ MAY LOSE VALUE
| | | | |
| 2 | | Wells Fargo Diversified International Fund | | Letter to shareholders (unaudited) |

Karla M. Rabusch
President
Wells Fargo Funds
As the U.S. dollar gained in strength relative to currencies overseas, investment returns earned outside the U.S. were reduced when translated into U.S. dollars.
Investors reacted positively when measurements of manufacturing activity in Japan, the U.S., and China indicated growth.
Dear Valued Shareholder:
We are pleased to offer you this semi-annual report for the Wells Fargo Diversified International Fund for the six-month period that ended April 30, 2016. During the period, international equity investors confronted concerns about slowing economic growth, particularly in China, and the potential for central bank policies to relieve recessionary pressures and support global business activity. These influences were pervasive throughout the period and caused elevated levels of volatility in international equity markets.
Investors kept a watchful eye on central bank initiatives while global growth slowed.
Persistently low inflation rates and oil prices along with a strengthening U.S. dollar combined to drive international equity prices lower. The U.S. dollar strengthened consistently after 2011 and more quickly following 2014 as expectations grew for an increase in the federal funds rate by the U.S. Federal Reserve (Fed). As the U.S. dollar gained in strength relative to currencies overseas, investment returns earned outside the U.S. were reduced when translated into U.S. dollars. The strong U.S. dollar also put pressure on import prices which, when combined with lower costs for fuel and other commodities, restrained inflation and prompted recession fears among investors.
Further dampening the international investment outlook in December was the lack of a deal to freeze or reduce oil output in an effort to stabilize prices among members of the Organization of Petroleum Exporting Countries. The lack of an agreement on a strategy to increase oil prices from their low levels left many investors doubtful of investment opportunities in emerging markets. In addition, the People’s Bank of China (PBOC) guided its currency’s value lower relative to a basket of foreign currencies. While the effort was seen as consistent with the government’s efforts to move China’s economy to a more global market-based footing, the currency devaluation tended to heighten fears of recession.
Central bank policies demonstrate resolve to reignite global economic growth.
As the end of 2015 approached, investors did take some reassurance from the decision of the European Central Bank (ECB) to push the deposit interest rate further into negative territory. Negative interest rates are intended to encourage banks to lend assets held in reserve rather than keep them on deposit, which could help spark business activity. The ECB also expanded and extended its bond-buying program, which helped inject liquidity into the markets and encourage investment. As anticipated, the Fed announced the long-awaited increase to the federal funds rate in December and suggested it planned to pursue additional increases in 2016.
In January 2016, the Bank of Japan (BOJ) followed the ECB’s lead by setting a negative deposit rate. A negative measurement for Japan’s gross domestic product in the fourth quarter may have prompted the BOJ’s accommodative initiative. Observing the actions of central banks overseas to implement policies that would accommodate higher levels of business activity, the Fed acknowledged that risks to global growth existed and indicated it would base further rate increases on data indicating the risks were being successfully addressed. Counterbalancing the accommodation of central banks were industrial production slowdowns stemming from plant closures in China due to elevated air pollution levels, the lack of further accommodative action by the ECB in January, and fresh declines in oil prices. Stocks worldwide entered correction territory, defined as a decline of 10% or more.
In February 2016, markets around the world hit low points before starting to rebound in the middle of the month. Investors reacted positively when measurements of manufacturing activity in Japan, the U.S., and China indicated growth. The PBOC reduced reserve ratios in February, which was intended to encourage banks to increase lending. Investors also were influenced favorably by further accommodation by the ECB in March, when the bank pushed negative interest rates lower, which ratcheted up pressure on banks to lend. The ECB also
| | | | | | |
| Letter to shareholders (unaudited) | | Wells Fargo Diversified International Fund | | | 3 | |
expanded its bond-buying program once again and took additional steps to lower costs for borrowers. March proved to be the strongest month for international stock index performance during the period. For the month, the Morgan Stanley Capital International (MSCI) Europe, Australasia, Far East (EAFE) Index (Net)1 gained 6.5%, the MSCI World Index2 increased 6.8%, the MSCI All Country World Index (ACWI) ex USA Index (Net)3 moved up 8.1%, and the S&P Developed Small Cap Index4 gained 8.6%. More positive, albeit lower, returns followed in April.
With the exception of the S&P Developed Small Cap Index, strong March and April returns were not enough to push performance of the indexes into positive territory for the period. For the six-month period that ended April 30, 2016, the MSCI EAFE Index (Net) returned -3.1%, the MSCI World Index returned -1.1%, and the MSCI ACWI ex USA Index (Net) returned -1.8%; the S&P Developed Small Cap Index gained 3.2%.
Don’t let short-term uncertainty derail long-term investment goals.
Periods of investment uncertainty can present challenges, but experience has taught us that maintaining long-term investment goals can be an effective way to plan for the future. To help you create a sound strategy based on your personal goals and risk tolerance, Wells Fargo Funds offers more than 100 mutual funds spanning a wide range of asset classes and investment styles. Although diversification cannot guarantee an investment profit or prevent losses, we believe it can be an effective way to manage investment risk and potentially smooth out overall portfolio performance. We encourage investors to know their investments and to understand that appropriate levels of risk-taking may unlock opportunities.
Thank you for choosing to invest with Wells Fargo Funds. We appreciate your confidence in us and remain committed to helping you meet your financial needs.
Sincerely,

Karla M. Rabusch
President
Wells Fargo Funds
For further information about your Fund, contact your investment professional, visit our website at wellsfargofunds.com, or call us directly at 1-800-222-8222. We are available 24 hours a day, 7 days a week.
| 1 | The Morgan Stanley Capital International (MSCI) Europe, Australasia, Far East (EAFE) Index (Net) is a free-float-adjusted market-capitalization-weighted index that is designed to measure the equity market performance of developed markets, excluding the U.S. and Canada. The MSCI EAFE Index (Net) consists of the following 21 developed markets country indexes: Australia, Austria, Belgium, Denmark, Finland, France, Germany, Hong Kong, Ireland, Israel, Italy, Japan, the Netherlands, New Zealand, Norway, Portugal, Singapore, Spain, Sweden, Switzerland, and the United Kingdom. Source: MSCI. MSCI makes no express or implied warranties or representations and shall have no liability whatsoever with respect to any MSCI data contained herein. The MSCI data may not be further redistributed or used as a basis for other indexes or any securities or financial products. This report is not approved, reviewed, or produced by MSCI. You cannot invest directly in an index. |
| 2 | The MSCI World Index is a free-float-adjusted market-capitalization-weighted index that is designed to measure the equity market performance of developed markets. The MSCI World Index consists of the following 23 developed markets country indexes: Australia, Austria, Belgium, Canada, Denmark, Finland, France, Germany, Hong Kong, Ireland, Israel, Italy, Japan, the Netherlands, New Zealand, Norway, Portugal, Singapore, Spain, Sweden, Switzerland, the United Kingdom, and the United States. You cannot invest directly in an index. |
| 3 | The MSCI All Country World Index (ACWI) ex USA Index (Net) is a free-float-adjusted market-capitalization-weighted index that is designed to measure the equity market performance of developed and emerging markets. The MSCI ACWI ex USA Index (Net) consists of 45 country indexes comprising 22 developed and 23 emerging markets country indexes. The developed markets country indexes included are Australia, Austria, Belgium, Canada, Denmark, Finland, France, Germany, Hong Kong, Ireland, Israel, Italy, Japan, the Netherlands, New Zealand, Norway, Portugal, Singapore, Spain, Sweden, Switzerland, and the United Kingdom. The emerging markets country indexes included are Brazil, Chile, China, Colombia, Czech Republic, Egypt, Greece, Hungary, India, Indonesia, Korea, Malaysia, Mexico, Peru, the Philippines, Poland, Qatar, Russia, South Africa, Taiwan, Thailand, Turkey, and United Arab Emirates. You cannot invest directly in an index. |
| 4 | The S&P Developed Small Cap Index is a free-float-adjusted market-capitalization-weighted index designed to measure the equity market performance of small-capitalization companies located in developed markets. The index is composed of companies within the bottom 15% of the cumulative market capitalization in developed markets. The index covers all publicly listed equities with float-adjusted market values of U.S. $100 million or more and annual dollar value traded of at least U.S. $50 million in all included countries. You cannot invest directly in an index. |
| | | | |
| 4 | | Wells Fargo Diversified International Fund | | Performance highlights (unaudited) |
Investment objective
The Fund seeks long-term total capital appreciation.
Manager
Wells Fargo Funds Management, LLC
Subadvisers
Artisan Partners Limited Partnership
LSV Asset Management
Wells Capital Management Incorporated
Portfolio managers
Josef Lakonishok, Ph.D.
Puneet Mansharamani, CFA®
Menno Vermeulen, CFA®
Dale A. Winner, CFA®
Mark L. Yockey, CFA®
Average annual total returns (%) as of April 30, 20161
| | | | | | | | | | | | | | | | | | | | | | | | | | | | | | | | | | |
| | | | | Including sales charge | | | Excluding sales charge | | | Expense ratios2 (%) | |
| | | Inception date | | 1 year | | | 5 year | | | 10 year | | | 1 year | | | 5 year | | | 10 year | | | Gross | | | Net3 | |
| Class A (SILAX) | | 9-24-1997 | | | (17.24 | ) | | | 0.40 | | | | 0.34 | | | | (12.22 | ) | | | 1.59 | | | | 0.94 | | | | 1.82 | | | | 1.35 | |
| Class B (SILBX)* | | 9-24-1997 | | | (17.89 | ) | | | 0.45 | | | | 0.43 | | | | (12.89 | ) | | | 0.84 | | | | 0.43 | | | | 2.57 | | | | 2.10 | |
| Class C (WFECX) | | 4-1-1998 | | | (13.82 | ) | | | 0.83 | | | | 0.21 | | | | (12.82 | ) | | | 0.83 | | | | 0.21 | | | | 2.57 | | | | 2.10 | |
| Class R (WDIHX) | | 9-30-2015 | | | – | | | | – | | | | – | | | | (12.46 | ) | | | 1.39 | | | | 0.77 | | | | 2.07 | | | | 1.60 | |
| Class R6 (WDIRX) | | 9-30-2015 | | | – | | | | – | | | | – | | | | (11.93 | ) | | | 1.80 | | | | 1.15 | | | | 1.39 | | | | 0.89 | |
| Administrator Class (WFIEX) | | 11-8-1999 | | | – | | | | – | | | | – | | | | (12.09 | ) | | | 1.76 | | | | 1.14 | | | | 1.74 | | | | 1.25 | |
| Institutional Class (WFISX) | | 8-31-2006 | | | – | | | | – | | | | – | | | | (11.84 | ) | | | 1.95 | | | | 1.33 | | | | 1.49 | | | | 0.99 | |
| MSCI EAFE Index (Net)4 | | – | | | – | | | | – | | | | – | | | | (9.32 | ) | | | 1.69 | | | | 1.61 | | | | – | | | | – | |
| * | | Class B shares are closed to investment, except in connection with the reinvestment of any distributions and permitted exchanges. |
Figures quoted represent past performance, which is no guarantee of future results, and do not reflect taxes that a shareholder may pay on fund distributions or the redemption of fund shares. Investment return and principal value of an investment will fluctuate so that an investor’s shares, when redeemed, may be worth more or less than their original cost. Performance shown without sales charges would be lower if sales charges were reflected. Current performance may be lower or higher than the performance data quoted, which assumes the reinvestment of dividends and capital gains. Current month-end performance is available on the Fund’s website, wellsfargofunds.com.
Index returns do not include transaction costs associated with buying and selling securities, any mutual fund fees or expenses, or any taxes. It is not possible to invest directly in an index.
For Class A shares, the maximum front-end sales charge is 5.75%. For Class B shares, the maximum contingent deferred sales charge is 5.00%. For Class C shares, the maximum contingent deferred sales charge is 1.00%. Performance including a contingent deferred sales charge assumes the sales charge for the corresponding time period. Class R, Class R6, Administrator Class, and Institutional Class shares are sold without a front-end sales charge or contingent deferred sales charge.
Stock values fluctuate in response to the activities of individual companies and general market and economic conditions. Foreign investments are especially volatile and can rise or fall dramatically due to differences in the political and economic conditions of the host country. These risks are generally intensified in emerging markets. The use of derivatives may reduce returns and/or increase volatility. Certain investment strategies tend to increase the total risk of an investment (relative to the broader market). The Fund is exposed to smaller-company securities risk. Consult the Fund’s prospectus for additional information on these and other risks.
Please see footnotes on page 5.
| | | | | | |
| Performance highlights (unaudited) | | Wells Fargo Diversified International Fund | | | 5 | |
| | | | |
| Ten largest holdings (%) as of April 30, 20165 | |
Bayer AG | | | 2.46 | |
Medtronic plc | | | 1.75 | |
Nestle SA | | | 1.51 | |
Japan Tobacco Incorporated | | | 1.31 | |
Siemens AG | | | 1.14 | |
Rheinmetall AG | | | 1.11 | |
Vodafone Group plc | | | 1.11 | |
AIA Group Limited | | | 1.11 | |
Zurich Insurance Group AG | | | 1.06 | |
Metro AG | | | 1.06 | |
|
| Sector distribution as of April 30, 20166 |
|
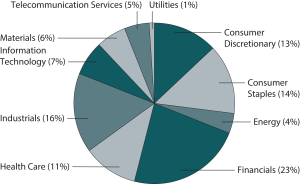 |
|
| Country allocation as of April 30, 20166 |
|
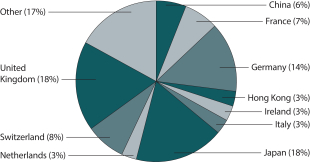 |
| 1 | Historical performance shown for the Class R shares prior to their inception reflects the performance of the Administrator Class shares, adjusted to reflect the higher expenses applicable to Class R shares. Historical performance shown for the Class R6 shares prior to their inception reflects the performance of the Administrator Class shares, and includes the higher expenses applicable to Administrator Class shares. If these expenses had not been included, returns for Class R6 would be higher. Historical performance shown for the Institutional Class shares prior to their inception reflects the performance of the Administrator Class shares, and includes the higher expenses applicable to the Administrator Class shares. If these expenses had not been included, returns would be higher. |
| 2 | Reflects the expense ratios as stated in the most recent prospectuses. The expense ratios shown are subject to change and may differ from the annualized expense ratios shown in the financial highlights of this report. |
| 3 | The manager has contractually committed through February 28, 2017 to waive fees and/or reimburse expenses to the extent necessary to cap the Fund’s Total Annual Operating Expenses After Fee Waiver at the amounts shown. After this time, the cap may be increased or the commitment to maintain the cap may be terminated only with the approval of the Board of Trustees. Brokerage commissions, stamp duty fees, interest, taxes, acquired fund fees and expenses, and extraordinary expenses are excluded from the cap. Without this cap, the Fund’s returns would have been lower. |
| 4 | The Morgan Stanley Capital International (MSCI) Europe, Australasia, and Far East (EAFE) Index (Net) is a free-float-adjusted market-capitalization weighted index that is designed to measure the equity market performance of developed markets, excluding the U.S. and Canada. The MSCI EAFE Index (Net) consists of the following 21 developed markets country indexes: Australia, Austria, Belgium, Denmark, Finland, France, Germany,
Hong Kong, Ireland, Israel, Italy, Japan, the Netherlands, New Zealand, Norway, Portugal, Singapore, Spain, Sweden, Switzerland, and the
United Kingdom. Source: MSCI. MSCI makes no express or implied warranties or representations and shall have no liability whatsoever with respect to any MSCI data contained herein. The MSCI data may not be further redistributed or used as a basis for other indexes or any securities or financial products. This report is not approved, reviewed, or produced by MSCI. You cannot invest directly in an index. |
| 5 | The ten largest holdings, excluding cash and cash equivalents, are calculated based on the value of the investments divided by total net assets of the Fund. Holdings are subject to change and may have changed since the date specified. |
| 6 | Amounts are calculated based on the total long-term investments of the Fund. These amounts are subject to change and may have changed since the date specified. |
| | | | |
| 6 | | Wells Fargo Diversified International Fund | | Fund expenses (unaudited) |
As a shareholder of the Fund, you incur two types of costs: (1) transaction costs, including sales charges (loads) on purchase payments and contingent deferred sales charges (if any) on redemptions and (2) ongoing costs, including management fees, distribution (12b-1) and/or shareholder servicing fees, and other Fund expenses. This example is intended to help you understand your ongoing costs (in dollars) of investing in the Fund and to compare these costs with the ongoing costs of investing in other mutual funds.
The example is based on an investment of $1,000 invested at the beginning of the six-month period and held for the entire period from November 1, 2015 to April 30, 2016.
Actual expenses
The “Actual” line of the table below provides information about actual account values and actual expenses. You may use the information in this line, together with the amount you invested, to estimate the expenses that you paid over the period. Simply divide your account value by $1,000 (for example, an $8,600 account value divided by $1,000 = 8.6), then multiply the result by the number in the “Actual” line under the heading entitled “Expenses paid during period” for your applicable class of shares to estimate the expenses you paid on your account during this period.
Hypothetical example for comparison purposes
The “Hypothetical” line of the table below provides information about hypothetical account values and hypothetical expenses based on the Fund’s actual expense ratio and an assumed rate of return of 5% per year before expenses, which is not the Fund’s actual return. The hypothetical account values and expenses may not be used to estimate the actual ending account balance or expenses you paid for the period. You may use this information to compare the ongoing costs of investing in the Fund and other funds. To do so, compare this 5% hypothetical example with the 5% hypothetical examples that appear in the shareholder reports of the other funds.
Please note that the expenses shown in the table are meant to highlight your ongoing costs only and do not reflect any transactional costs, such as sales charges (loads) and contingent deferred sales charges. Therefore, the “Hypothetical” line of the table is useful in comparing ongoing costs only and will not help you determine the relative total costs of owning different funds. In addition, if these transactional costs were included, your costs would have been higher.
| | | | | | | | | | | | | | | | |
| | | Beginning
account value
11-1-2015 | | | Ending
account value
4-30-2016 | | | Expenses
paid during
the period¹ | | | Net annualized
expense ratio | |
Class A | | | | | | | | | | | | | | | | |
Actual | | $ | 1,000.00 | | | $ | 956.92 | | | $ | 6.57 | | | | 1.35 | % |
Hypothetical (5% return before expenses) | | $ | 1,000.00 | | | $ | 1,018.15 | | | $ | 6.77 | | | | 1.35 | % |
Class B | | | | | | | | | | | | | | | | |
Actual | | $ | 1,000.00 | | | $ | 953.26 | | | $ | 10.20 | | | | 2.10 | % |
Hypothetical (5% return before expenses) | | $ | 1,000.00 | | | $ | 1,014.42 | | | $ | 10.52 | | | | 2.10 | % |
Class C | | | | | | | | | | | | | | | | |
Actual | | $ | 1,000.00 | | | $ | 953.78 | | | $ | 10.20 | | | | 2.10 | % |
Hypothetical (5% return before expenses) | | $ | 1,000.00 | | | $ | 1,014.42 | | | $ | 10.52 | | | | 2.10 | % |
Class R | | | | | | | | | | | | | | | | |
Actual | | $ | 1,000.00 | | | $ | 955.81 | | | $ | 7.78 | | | | 1.60 | % |
Hypothetical (5% return before expenses) | | $ | 1,000.00 | | | $ | 1,016.91 | | | $ | 8.02 | | | | 1.60 | % |
Class R6 | | | | | | | | | | | | | | | | |
Actual | | $ | 1,000.00 | | | $ | 959.38 | | | $ | 4.34 | | | | 0.89 | % |
Hypothetical (5% return before expenses) | | $ | 1,000.00 | | | $ | 1,020.44 | | | $ | 4.47 | | | | 0.89 | % |
Administrator Class | | | | | | | | | | | | | | | | |
Actual | | $ | 1,000.00 | | | $ | 957.61 | | | $ | 6.08 | | | | 1.25 | % |
Hypothetical (5% return before expenses) | | $ | 1,000.00 | | | $ | 1,018.65 | | | $ | 6.27 | | | | 1.25 | % |
Institutional Class | | | | | | | | | | | | | | | | |
Actual | | $ | 1,000.00 | | | $ | 959.13 | | | $ | 4.82 | | | | 0.99 | % |
Hypothetical (5% return before expenses) | | $ | 1,000.00 | | | $ | 1,019.94 | | | $ | 4.97 | | | | 0.99 | % |
| 1 | Expenses paid is equal to the annualized expense ratio of each class multiplied by the average account value over the period, multiplied by the number of days in the most recent fiscal half-year divided by the number of days in the fiscal year (to reflect the one-half-year period). |
| | | | | | |
| Portfolio of investments—April 30, 2016 (unaudited) | | Wells Fargo Diversified International Fund | | | 7 | |
| | | | | | | | | | | | |
| Security name | | | | | | Shares | | | Value | |
| | | | | | | | | | | | |
| | | | |
Common Stocks: 93.52% | | | | | | | | | | | | |
| | | | |
| Australia: 1.74% | | | | | | | | | | | | |
Arrium Limited (Materials, Metals & Mining) †(a) | | | | | | | 397,400 | | | $ | 6,648 | |
Asaleo Care Limited (Consumer Staples, Personal Products) | | | | | | | 114,700 | | | | 171,808 | |
Automotive Holdings Group (Consumer Discretionary, Specialty Retail) | | | | | | | 45,500 | | | | 135,616 | |
Bendigo Bank Limited (Financials, Banks) | | | | | | | 26,100 | | | | 184,957 | |
Challenger Financial Services Group Limited (Financials, Diversified Financial Services) | | | | | | | 36,300 | | | | 247,302 | |
CSR Limited (Materials, Construction Materials) | | | | | | | 59,900 | | | | 155,764 | |
Downer EDI Limited (Industrials, Commercial Services & Supplies) | | | | | | | 42,300 | | | | 119,646 | |
Harvey Norman Holdings Limited (Consumer Discretionary, Multiline Retail) | | | | | | | 65,000 | | | | 221,414 | |
Lend Lease Corporation Limited (Financials, Real Estate Management & Development) | | | | | | | 24,500 | | | | 236,583 | |
Metcash Limited (Consumer Staples, Food & Staples Retailing) † | | | | | | | 28,500 | | | | 38,139 | |
Mineral Resources Limited (Materials, Metals & Mining) | | | | | | | 14,900 | | | | 83,949 | |
Primary Health Care Limited (Health Care, Health Care Providers & Services) | | | | | | | 34,700 | | | | 91,553 | |
Qantas Airways Limited (Industrials, Airlines) | | | | | | | 59,300 | | | | 145,186 | |
Seven Group Holdings Limited (Industrials, Trading Companies & Distributors) | | | | | | | 15,300 | | | | 68,055 | |
United Construction Group Limited (Industrials, Construction & Engineering) † | | | | | | | 14,100 | | | | 33,878 | |
| | | | |
| | | | | | | | | | | 1,940,498 | |
| | | | | | | | | | | | |
| | | | |
| Austria: 0.28% | | | | | | | | | | | | |
OMV AG (Energy, Oil, Gas & Consumable Fuels) | | | | | | | 5,300 | | | | 159,062 | |
Voestalpine AG (Materials, Metals & Mining) | | | | | | | 4,300 | | | | 154,999 | |
| | | | |
| | | | | | | | | | | 314,061 | |
| | | | | | | | | | | | |
| | | | |
| Belgium: 1.04% | | | | | | | | | | | | |
Anheuser-Busch InBev NV (Consumer Staples, Beverages) | | | | | | | 1,928 | | | | 238,648 | |
Delhaize Group SA (Consumer Staples, Food & Staples Retailing) | | | | | | | 3,600 | | | | 377,303 | |
Telenet Group Holding NV (Consumer Discretionary, Media) † | | | | | | | 5,898 | | | | 293,102 | |
UCB SA (Health Care, Pharmaceuticals) | | | | | | | 3,419 | | | | 255,841 | |
| | | | |
| | | | | | | | | | | 1,164,894 | |
| | | | | | | | | | | | |
| | | | |
| Brazil: 0.34% | | | | | | | | | | | | |
Banco do Brasil SA (Financials, Banks) | | | | | | | 19,000 | | | | 122,146 | |
Companhia de Saneamento de Minas Gerais SA (Utilities, Water Utilities) | | | | | | | 5,300 | | | | 33,132 | |
Cosan Limited Class A (Energy, Oil, Gas & Consumable Fuels) | | | | | | | 7,976 | | | | 42,911 | |
JBS SA (Consumer Staples, Food Products) | | | | | | | 67,500 | | | | 177,422 | |
| | | | |
| | | | | | | | | | | 375,611 | |
| | | | | | | | | | | | |
| | | | |
| Canada: 2.01% | | | | | | | | | | | | |
Cameco Corporation (Energy, Oil, Gas & Consumable Fuels) | | | | | | | 57,562 | | | | 720,101 | |
Canadian Pacific Railway Limited (Industrials, Road & Rail) | | | | | | | 3,887 | | | | 560,700 | |
Lundin Mining Corporation (Materials, Metals & Mining) † | | | | | | | 99,259 | | | | 390,011 | |
Magna International Incorporated Class A (Consumer Discretionary, Auto Components) | | | | | | | 9,100 | | | | 382,219 | |
Metro Incorporated (Consumer Staples, Food & Staples Retailing) | | | | | | | 1,100 | | | | 36,813 | |
WestJet Airlines Limited (Industrials, Airlines) | | | | | | | 9,200 | | | | 153,981 | |
| | | | |
| | | | | | | | | | | 2,243,825 | |
| | | | | | | | | | | | |
The accompanying notes are an integral part of these financial statements.
| | | | |
| 8 | | Wells Fargo Diversified International Fund | | Portfolio of investments—April 30, 2016 (unaudited) |
| | | | | | | | | | | | |
| Security name | | | | | | Shares | | | Value | |
| | | | | | | | | | | | |
| | | | |
| China: 4.86% | | | | | | | | | | | | |
Baidu Incorporated ADR (Information Technology, Internet Software & Services) † | | | | | | | 2,326 | | | $ | 451,942 | |
China Communications Services Corporation Limited H Shares (Telecommunication Services, Diversified Telecommunication Services) | | | | | | | 220,000 | | | | 104,088 | |
China Everbright Limited (Financials, Capital Markets) | | | | | | | 428,000 | | | | 849,721 | |
China Mobile Limited (Telecommunication Services, Wireless Telecommunication Services) | | | | | | | 54,000 | | | | 619,229 | |
China Petroleum & Chemical Corporation H Shares (Energy, Oil, Gas & Consumable Fuels) | | | | | | | 218,000 | | | | 155,415 | |
China Railway Construction Corporation Limited H Shares (Industrials, Construction & Engineering) | | | | | | | 141,500 | | | | 180,959 | |
Dongfeng Motor Group Company Limited H Shares (Consumer Discretionary, Automobiles) | | | | | | | 788,000 | | | | 865,521 | |
Industrial & Commercial Bank of China Limited H Shares (Financials, Banks) | | | | | | | 927,000 | | | | 503,122 | |
PICC Property & Casualty Company Limited H Shares (Financials, Insurance) | | | | | | | 89,000 | | | | 162,926 | |
Shanghai Pharmaceuticals Holding Company Limited H Shares (Health Care, Pharmaceuticals) | | | | | | | 226,000 | | | | 480,733 | |
Shenzhen International Holdings Limited (Industrials, Transportation Infrastructure) | | | | | | | 49,500 | | | | 81,044 | |
TCL Communication Technology Holdings Limited (Information Technology, Technology Hardware, Storage & Peripherals) | | | | | | | 117,000 | | | | 76,020 | |
Tencent Holdings Limited (Information Technology, Internet Software & Services) | | | | | | | 14,200 | | | | 290,887 | |
Universal Health International Group Holding Limited (Health Care, Health Care Providers & Services) | | | | | | | 382,000 | | | | 34,473 | |
Xinyi Solar Holdings Limited (Information Technology, Semiconductors & Semiconductor Equipment) | | | | | | | 562,000 | | | | 222,426 | |
Xtep International Holdings Limited (Consumer Discretionary, Textiles, Apparel & Luxury Goods) | | | | | | | 468,050 | | | | 276,960 | |
Yantai Changyu Pioneer Wine Company Limited Class B (Consumer Staples, Beverages) | | | | | | | 23,400 | | | | 74,150 | |
| | | | |
| | | | | | | | | | | 5,429,616 | |
| | | | | | | | | | | | |
| | | | |
| Czech Republic: 0.09% | | | | | | | | | | | | |
CEZ AS (Utilities, Electric Utilities) | | | | | | | 4,900 | | | | 95,722 | |
| | | | | | | | | | | | |
| | | | |
| Denmark: 0.18% | | | | | | | | | | | | |
ISS A/S (Industrials, Commercial Services & Supplies) | | | | | | | 2,420 | | | | 91,890 | |
Sydbank AG (Financials, Banks) | | | | | | | 4,000 | | | | 113,113 | |
| | | | |
| | | | | | | | | | | 205,003 | |
| | | | | | | | | | | | |
| | | | |
| Finland: 0.12% | | | | | | | | | | | | |
TietoEnator Oyj (Information Technology, IT Services) | | | | | | | 5,300 | | | | 139,157 | |
| | | | | | | | | | | | |
| | | | |
| France: 7.03% | | | | | | | | | | | | |
Alstom SA (Industrials, Machinery) † | | | | | | | 5,100 | | | | 130,343 | |
Arkema SA (Materials, Chemicals) | | | | | | | 910 | | | | 72,606 | |
AXA SA (Financials, Insurance) | | | | | | | 11,300 | | | | 284,854 | |
BNP Paribas SA (Financials, Banks) | | | | | | | 4,400 | | | | 232,967 | |
Compagnie de Saint-Gobain SA (Industrials, Building Products) | | | | | | | 25,134 | | | | 1,151,044 | |
Compagnie Generale des Etablissements Michelin SCA Class B (Consumer Discretionary, Auto Components) | | | | | | | 2,200 | | | | 229,617 | |
Credit Agricole SA (Financials, Banks) | | | | | | | 13,900 | | | | 153,735 | |
Electricite de France SA (Utilities, Electric Utilities) | | | | | | | 12,500 | | | | 179,558 | |
Engie SA (Utilities, Multi-Utilities) | | | | | | | 13,300 | | | | 219,300 | |
Groupe Danone SA (Consumer Staples, Food Products) « | | | | | | | 13,562 | | | | 949,920 | |
L’Oreal SA (Consumer Staples, Personal Products) | | | | | | | 2,188 | | | | 396,976 | |
LVMH Moet Hennessy Louis Vuitton SA (Consumer Discretionary, Textiles, Apparel & Luxury Goods) | | | | | | | 1,789 | | | | 297,237 | |
Orange SA (Telecommunication Services, Diversified Telecommunication Services) | | | | | | | 37,006 | | | | 613,572 | |
Pernod-Ricard SA (Consumer Staples, Beverages) | | | | | | | 3,577 | | | | 386,156 | |
Renault SA (Consumer Discretionary, Automobiles) | | | | | | | 3,100 | | | | 299,165 | |
Sanofi-Aventis SA (Health Care, Pharmaceuticals) | | | | | | | 7,200 | | | | 594,501 | |
The accompanying notes are an integral part of these financial statements.
| | | | | | |
| Portfolio of investments—April 30, 2016 (unaudited) | | Wells Fargo Diversified International Fund | | | 9 | |
| | | | | | | | | | | | |
| Security name | | | | | | Shares | | | Value | |
| | | | | | | | | | | | |
| | | | |
| France (continued) | | | | | | | | | | | | |
SCOR SE (Financials, Insurance) « | | | | | | | 7,700 | | | $ | 262,170 | |
Societe Generale SA (Financials, Banks) | | | | | | | 3,700 | | | | 145,107 | |
Thales SA (Industrials, Aerospace & Defense) | | | | | | | 1,600 | | | | 138,322 | |
Total SA (Energy, Oil, Gas & Consumable Fuels) | | | | | | | 7,000 | | | | 352,114 | |
Zodiac Aerospace SA (Industrials, Aerospace & Defense) | | | | | | | 32,422 | | | | 760,131 | |
| | | | |
| | | | | | | | | | | 7,849,395 | |
| | | | | | | | | | | | |
| | | | |
| Germany: 13.26% | | | | | | | | | | | | |
Allianz AG (Financials, Insurance) | | | | | | | 5,756 | | | | 977,102 | |
Aurubis AG (Materials, Metals & Mining) | | | | | | | 2,300 | | | | 124,794 | |
BASF SE (Materials, Chemicals) | | | | | | | 3,500 | | | | 289,154 | |
Bayer AG (Health Care, Pharmaceuticals) | | | | | | | 23,803 | | | | 2,746,006 | |
Bayerische Motoren Werke AG (Consumer Discretionary, Automobiles) | | | | | | | 2,200 | | | | 202,788 | |
Beiersdorf AG (Consumer Staples, Personal Products) | | | | | | | 6,793 | | | | 609,510 | |
Daimler AG (Consumer Discretionary, Automobiles) | | | | | | | 6,200 | | | | 430,857 | |
Deutsche Bank AG (Financials, Capital Markets) | | | | | | | 9,100 | | | | 171,617 | |
Deutsche Boerse AG (Financials, Diversified Financial Services) | | | | | | | 11,693 | | | | 959,863 | |
E.ON SE (Utilities, Multi-Utilities) | | | | | | | 8,100 | | | | 83,558 | |
Hannover Rueckversicherung AG (Financials, Insurance) | | | | | | | 1,200 | | | | 136,829 | |
Linde AG (Materials, Chemicals) | | | | | | | 6,559 | | | | 1,001,885 | |
Metro AG (Consumer Staples, Food & Staples Retailing) | | | | | | | 37,141 | | | | 1,180,161 | |
Muenchener Rueckversicherungs Gesellschaft AG (Financials, Insurance) | | | | | | | 5,260 | | | | 975,420 | |
Rheinmetall AG (Industrials, Industrial Conglomerates) | | | | | | | 15,872 | | | | 1,241,664 | |
SAP SE (Information Technology, Software) | | | | | | | 11,829 | | | | 925,381 | |
Siemens AG (Industrials, Industrial Conglomerates) | | | | | | | 12,168 | | | | 1,269,573 | |
Stada Arzneimittel AG (Health Care, Pharmaceuticals) | | | | | | | 4,100 | | | | 173,939 | |
Volkswagen AG (Consumer Discretionary, Automobiles) | | | | | | | 1,600 | | | | 253,468 | |
Vonovia SE (Financials, Real Estate Management & Development) | | | | | | | 13,385 | | | | 450,369 | |
Wirecard AG (Information Technology, IT Services) « | | | | | | | 13,825 | | | | 597,041 | |
| | | | |
| | | | | | | | | | | 14,800,979 | |
| | | | | | | | | | | | |
| | | | |
| Hong Kong: 2.43% | | | | | | | | | | | | |
AIA Group Limited (Financials, Insurance) | | | | | | | 205,000 | | | | 1,234,191 | |
China Resources Cement Holdings Limited (Materials, Construction Materials) | | | | | | | 236,000 | | | | 77,887 | |
Kingboard Laminates Holdings Limited (Information Technology, Electronic Equipment, Instruments & Components) | | | | | | | 226,500 | | | | 116,215 | |
Skyworth Digital Holdings Limited (Consumer Discretionary, Household Durables) | | | | | | | 320,000 | | | | 209,568 | |
Television Broadcasts Limited (Consumer Discretionary, Media) | | | | | | | 10,300 | | | | 38,508 | |
Value Partners Group Limited (Financials, Capital Markets) | | | | | | | 375,000 | | | | 360,163 | |
Wheelock & Company Limited (Financials, Real Estate Management & Development) | | | | | | | 22,000 | | | | 102,103 | |
Xinyi Glass Holdings Limited (Consumer Discretionary, Auto Components) | | | | | | | 618,000 | | | | 423,053 | |
Yue Yuen Industrial Holdings Limited (Consumer Discretionary, Textiles, Apparel & Luxury Goods) | | | | | | | 42,000 | | | | 153,231 | |
| | | | |
| | | | | | | | | | | 2,714,919 | |
| | | | | | | | | | | | |
| | | | |
| Hungary: 0.06% | | | | | | | | | | | | |
Richter Gedeon (Health Care, Pharmaceuticals) | | | | | | | 3,500 | | | | 69,552 | |
| | | | | | | | | | | | |
The accompanying notes are an integral part of these financial statements.
| | | | |
| 10 | | Wells Fargo Diversified International Fund | | Portfolio of investments—April 30, 2016 (unaudited) |
| | | | | | | | | | | | |
| Security name | | | | | | Shares | | | Value | |
| | | | | | | | | | | | |
| | | | |
| India: 0.20% | | | | | | | | | | | | |
Gail Limited (Utilities, Gas Utilities) | | | | | | | 800 | | | $ | 25,680 | |
Tata Motors Limited ADR (Consumer Discretionary, Automobiles) † | | | | | | | 6,600 | | | | 200,508 | |
| | | | |
| | | | | | | | | | | 226,188 | |
| | | | | | | | | | | | |
| | | | |
| Ireland: 2.22% | | | | | | | | | | | | |
Allegion plc (Industrials, Building Products) | | | | | | | 519 | | | | 33,969 | |
C&C Group plc (Consumer Staples, Beverages) | | | | | | | 18,600 | | | | 83,552 | |
Medtronic plc (Health Care, Health Care Equipment & Supplies) | | | | | | | 24,693 | | | | 1,954,451 | |
Smurfit Kappa Group plc (Materials, Containers & Packaging) | | | | | | | 8,800 | | | | 233,270 | |
Willis Towers Watson plc (Financials, Insurance) | | | | | | | 1,378 | | | | 172,112 | |
| | | | |
| | | | | | | | | | | 2,477,354 | |
| | | | | | | | | | | | |
| | | | |
| Israel: 0.41% | | | | | | | | | | | | |
Bank Hapoalim Limited (Financials, Banks) | | | | | | | 38,000 | | | | 195,496 | |
Teva Pharmaceutical Industries Limited (Health Care, Pharmaceuticals) | | | | | | | 4,600 | | | | 256,413 | |
| | | | |
| | | | | | | | | | | 451,909 | |
| | | | | | | | | | | | |
| | | | |
| Italy: 3.30% | | | | | | | | | | | | |
ANIMA Holding SpA (Financials, Capital Markets) | | | | | | | 128,051 | | | | 906,142 | |
Enel SpA (Utilities, Electric Utilities) | | | | | | | 48,100 | | | | 217,994 | |
Eni SpA (Energy, Oil, Gas & Consumable Fuels) | | | | | | | 59,912 | | | | 974,152 | |
Mediaset SpA (Consumer Discretionary, Media) | | | | | | | 48,654 | | | | 218,945 | |
Mediobanca SpA (Financials, Capital Markets) | | | | | | | 23,400 | | | | 192,248 | |
Prysmian SpA (Industrials, Electrical Equipment) | | | | | | | 49,990 | | | | 1,178,594 | |
| | | | |
| | | | | | | | | | | 3,688,075 | |
| | | | | | | | | | | | |
| | | | |
| Japan: 17.35% | | | | | | | | | | | | |
Adeka Corporation (Materials, Chemicals) | | | | | | | 13,000 | | | | 186,517 | |
Aisin Seiki Company Limited (Consumer Discretionary, Auto Components) | | | | | | | 3,300 | | | | 131,380 | |
Alpine Electronics Incorporated (Consumer Discretionary, Household Durables) | | | | | | | 11,600 | | | | 146,178 | |
Aoyama Trading Company Limited (Consumer Discretionary, Specialty Retail) | | | | | | | 1,800 | | | | 68,385 | |
Aozora Bank Limited (Financials, Banks) | | | | | | | 41,000 | | | | 148,135 | |
Calsonic Kansei Corporation (Consumer Discretionary, Auto Components) | | | | | | | 26,000 | | | | 182,750 | |
Central Glass Company Limited (Industrials, Building Products) | | | | | | | 34,000 | | | | 193,629 | |
Coca-Cola East Japan Company Limited (Consumer Staples, Beverages) | | | | | | | 47,100 | | | | 877,999 | |
Dainippon Ink & Chemicals Incorporated (Materials, Chemicals) | | | | | | | 53,000 | | | | 125,216 | |
Daiwa House Industry Company Limited (Financials, Real Estate Management & Development) | | | | | | | 22,200 | | | | 606,249 | |
Daiwa Securities Group Incorporated (Financials, Capital Markets) | | | | | | | 130,000 | | | | 774,221 | |
DCM Holdings Company Limited (Consumer Discretionary, Specialty Retail) | | | | | | | 14,100 | | | | 108,124 | |
Denka Company Limited (Materials, Chemicals) | | | | | | | 50,000 | | | | 215,023 | |
Eizo Nanao Corporation (Information Technology, Technology Hardware, Storage & Peripherals) | | | | | | | 7,300 | | | | 186,124 | |
Fuji Oil Company Limited (Consumer Staples, Food Products) | | | | | | | 8,800 | | | | 166,411 | |
Fujikura Limited (Industrials, Electrical Equipment) | | | | | | | 25,000 | | | | 124,375 | |
Hitachi Limited (Information Technology, Electronic Equipment, Instruments & Components) | | | | | | | 218,000 | | | | 1,030,299 | |
Isuzu Motors Limited (Consumer Discretionary, Automobiles) | | | | | | | 16,500 | | | | 181,172 | |
Itochu Corporation (Industrials, Trading Companies & Distributors) | | | | | | | 14,600 | | | | 189,873 | |
Japan Airlines Company Limited (Industrials, Airlines) | | | | | | | 6,300 | | | | 230,518 | |
Japan Tobacco Incorporated (Consumer Staples, Tobacco) | | | | | | | 35,020 | | | | 1,461,684 | |
The accompanying notes are an integral part of these financial statements.
| | | | | | |
| Portfolio of investments—April 30, 2016 (unaudited) | | Wells Fargo Diversified International Fund | | | 11 | |
| | | | | | | | | | | | |
| Security name | | | | | | Shares | | | Value | |
| | | | | | | | | | | | |
| | | | |
| Japan (continued) | | | | | | | | | | | | |
KDDI Corporation (Telecommunication Services, Wireless Telecommunication Services) | | | | | | | 12,400 | | | $ | 361,460 | |
Kyorin Company Limited (Health Care, Pharmaceuticals) | | | | | | | 7,900 | | | | 159,262 | |
Maeda Road Construction Company Limited (Industrials, Construction & Engineering) | | | | | | | 11,000 | | | | 202,914 | |
Marubeni Corporation (Industrials, Trading Companies & Distributors) | | | | | | | 36,300 | | | | 196,387 | |
Matsumotokiyoshi Holdings Company Limited (Consumer Staples, Food & Staples Retailing) | | | | | | | 3,000 | | | | 150,239 | |
Miraca Holdings Incorporated (Health Care, Health Care Providers & Services) | | | | | | | 1,800 | | | | 78,070 | |
Mitsubishi Corporation (Industrials, Trading Companies & Distributors) | | | | | | | 8,800 | | | | 151,108 | |
Mitsubishi Gas Chemical Company Incorporated (Materials, Chemicals) | | | | | | | 42,000 | | | | 234,987 | |
Mitsubishi UFJ Financial Group Incorporated (Financials, Banks) | | | | | | | 246,500 | | | | 1,172,033 | |
Mitsui Fudosan Company Limited (Financials, Real Estate Management & Development) | | | | | | | 27,000 | | | | 675,443 | |
Mizuho Financial Group Incorporated (Financials, Banks) | | | | | | | 171,600 | | | | 264,449 | |
NGK Insulators Limited (Industrials, Machinery) | | | | | | | 23,000 | | | | 486,285 | |
Nippon Telegraph and Telephone Corporation (Telecommunication Services, Diversified Telecommunication Services) | | | | | | | 23,000 | | | | 1,034,231 | |
Nissan Motor Company Limited (Consumer Discretionary, Automobiles) | | | | | | | 32,200 | | | | 292,840 | |
Nisshinbo Industries Incorporated (Industrials, Industrial Conglomerates) | | | | | | | 12,400 | | | | 137,789 | |
Nitto Denko Corporation (Materials, Chemicals) | | | | | | | 7,600 | | | | 419,923 | |
Nomura Holdings Incorporated (Financials, Capital Markets) | | | | | | | 173,400 | | | | 757,044 | |
NTT DOCOMO Incorporated (Telecommunication Services, Wireless Telecommunication Services) | | | | | | | 43,203 | | | | 1,051,045 | |
Olympus Corporation (Health Care, Health Care Equipment & Supplies) | | | | | | | 16,400 | | | | 654,846 | |
Ono Pharmaceutical Company Limited (Health Care, Pharmaceuticals) | | | | | | | 7,300 | | | | 335,183 | |
Resona Holdings Incorporated (Financials, Banks) | | | | | | | 75,000 | | | | 271,373 | |
Ricoh Company Limited (Information Technology, Technology Hardware, Storage & Peripherals) | | | | | | | 14,500 | | | | 151,285 | |
S Foods Incorporated (Consumer Staples, Food Products) | | | | | | | 7,500 | | | | 180,917 | |
Sankyu Incorporated (Industrials, Road & Rail) | | | | | | | 28,000 | | | | 133,144 | |
SEINO Holdings Company Limited (Industrials, Road & Rail) | | | | | | | 3,000 | | | | 31,142 | |
Sojitz Corporation (Industrials, Trading Companies & Distributors) | | | | | | | 77,400 | | | | 158,646 | |
Sumitomo Corporation (Industrials, Trading Companies & Distributors) | | | | | | | 19,900 | | | | 214,598 | |
Sumitomo Metal Mining Company Limited (Materials, Metals & Mining) | | | | | | | 8,000 | | | | 91,990 | |
Sumitomo Mitsui Financial Group Incorporated (Financials, Banks) | | | | | | | 8,000 | | | | 251,542 | |
Toho Pharmaceutical (Health Care, Health Care Providers & Services) | | | | | | | 6,200 | | | | 146,348 | |
Toyo Ink Manufacturing Company Limited (Materials, Chemicals) | | | | | | | 36,800 | | | | 149,672 | |
Toyo Tire & Rubber Company Limited (Consumer Discretionary, Auto Components) | | | | | | | 5,900 | | | | 90,984 | |
Toyota Motor Corporation (Consumer Discretionary, Automobiles) | | | | | | | 15,100 | | | | 786,559 | |
Tsumura & Company (Health Care, Pharmaceuticals) | | | | | | | 3,800 | | | | 99,383 | |
UBE Industries Limited Japan (Materials, Chemicals) | | | | | | | 79,000 | | | | 153,086 | |
West Holdings Corporation (Consumer Discretionary, Household Durables) | | | | | | | 21,100 | | | | 127,941 | |
Yokohama Rubber Company Limited (Consumer Discretionary, Auto Components) | | | | | | | 10,500 | | | | 181,061 | |
| | | | |
| | | | | | | | | | | 19,369,471 | |
| | | | | | | | | | | | |
| | | | |
| Liechtenstein: 0.10% | | | | | | | | | | | | |
Verwaltungs-und Privat-Bank AG (Financials, Capital Markets) | | | | | | | 1,177 | | | | 114,841 | |
| | | | | | | | | | | | |
| | | | |
| Mexico: 0.37% | | | | | | | | | | | | |
Genomma Lab Internacional SAB (Health Care, Pharmaceuticals) † | | | | | | | 69,400 | | | | 76,239 | |
Grupo Televisa SAB ADR (Consumer Discretionary, Media) | | | | | | | 11,548 | | | | 337,548 | |
| | | | |
| | | | | | | | | | | 413,787 | |
| | | | | | | | | | | | |
The accompanying notes are an integral part of these financial statements.
| | | | |
| 12 | | Wells Fargo Diversified International Fund | | Portfolio of investments—April 30, 2016 (unaudited) |
| | | | | | | | | | | | |
| Security name | | | | | | Shares | | | Value | |
| | | | | | | | | | | | |
| | | | |
| Netherlands: 2.74% | | | | | | | | | | | | |
Aegon NV (Financials, Insurance) | | | | | | | 23,200 | | | $ | 133,145 | |
Akzo Nobel NV (Materials, Chemicals) | | | | | | | 11,612 | | | | 822,910 | |
ING Groep NV (Financials, Banks) | | | | | | | 20,600 | | | | 252,274 | |
Koninklijke Ahold NV (Consumer Staples, Food & Staples Retailing) | | | | | | | 7,400 | | | | 160,994 | |
Koninklijke Philips NV (Industrials, Industrial Conglomerates) | | | | | | | 34,293 | | | | 942,413 | |
NN Group NV (Financials, Insurance) | | | | | | | 21,684 | | | | 751,334 | |
| | | | |
| | | | | | | | | | | 3,063,070 | |
| | | | | | | | | | | | |
| | | | |
| Norway: 0.85% | | | | | | | | | | | | |
DnB Nor ASA (Financials, Banks) | | | | | | | 12,100 | | | | 154,935 | |
Frontline Limited (Energy, Oil, Gas & Consumable Fuels) « | | | | | | | 17,543 | | | | 145,868 | |
Marine Harvest ASA (Consumer Staples, Food Products) | | | | | | | 29,690 | | | | 462,025 | |
Yara International ASA (Materials, Chemicals) | | | | | | | 4,600 | | | | 184,186 | |
| | | | |
| | | | | | | | | | | 947,014 | |
| | | | | | | | | | | | |
| | | | |
| Poland: 0.08% | | | | | | | | | | | | |
Asseco Poland SA (Information Technology, Software) | | | | | | | 5,900 | | | | 89,498 | |
| | | | | | | | | | | | |
| | | | |
| Russia: 0.27% | | | | | | | | | | | | |
Gazprom Neft Sponsored ADR (Energy, Oil, Gas & Consumable Fuels) | | | | | | | 10,500 | | | | 123,900 | |
LUKOIL OAO ADR (Energy, Oil, Gas & Consumable Fuels) | | | | | | | 4,200 | | | | 178,500 | |
| | | | |
| | | | | | | | | | | 302,400 | |
| | | | | | | | | | | | |
| | | | |
| Singapore: 0.31% | | | | | | | | | | | | |
DBS Group Holdings Limited (Financials, Banks) | | | | | | | 17,000 | | | | 193,152 | |
United Overseas Bank Limited (Financials, Banks) | | | | | | | 10,700 | | | | 147,987 | |
| | | | |
| | | | | | | | | | | 341,139 | |
| | | | | | | | | | | | |
| | | | |
| South Africa: 0.23% | | | | | | | | | | | | |
Barclays Africa Group Limited (Financials, Banks) | | | | | | | 12,600 | | | | 127,724 | |
Imperial Holdings Limited (Consumer Discretionary, Distributors) | | | | | | | 5,700 | | | | 59,674 | |
Omnia Holdings Limited (Materials, Chemicals) | | | | | | | 7,600 | | | | 74,611 | |
| | | | |
| | | | | | | | | | | 262,009 | |
| | | | | | | | | | | | |
| | | | |
| South Korea: 2.28% | | | | | | | | | | | | |
BS Financial Group Incorporated (Financials, Banks) | | | | | | | 1,018 | | | | 8,300 | |
Hana Financial Group Incorporated (Financials, Banks) | | | | | | | 37,692 | | | | 848,517 | |
Industrial Bank of Korea (Financials, Banks) | | | | | | | 16,600 | | | | 177,014 | |
KT&G Corporation (Consumer Staples, Tobacco) | | | | | | | 2,300 | | | | 248,289 | |
Kwangju Bank (Financials, Banks) | | | | | | | 1,044 | | | | 8,237 | |
LS Industrial Systems Company Limited (Industrials, Electrical Equipment) | | | | | | | 2,300 | | | | 105,573 | |
Orion Corporation (Consumer Staples, Food Products) | | | | | | | 3 | | | | 2,449 | |
Samsung Electronics Company Limited GDR (Information Technology, Semiconductors & Semiconductor Equipment) 144A | | | | | | | 1,127 | | | | 614,215 | |
SK Telecom Company Limited (Telecommunication Services, Wireless Telecommunication Services) | | | | | | | 2,224 | | | | 402,092 | |
Woori Bank (Financials, Banks) | | | | | | | 13,760 | | | | 126,804 | |
| | | | |
| | | | | | | | | | | 2,541,490 | |
| | | | | | | | | | | | |
The accompanying notes are an integral part of these financial statements.
| | | | | | |
| Portfolio of investments—April 30, 2016 (unaudited) | | Wells Fargo Diversified International Fund | | | 13 | |
| | | | | | | | | | | | |
| Security name | | | | | | Shares | | | Value | |
| | | | | | | | | | | | |
| | | | |
| Spain: 1.62% | | | | | | | | | | | | |
Banco Santander Central Hispano SA (Financials, Banks) | | | | | | | 29,500 | | | $ | 149,337 | |
Distribuidora Internacional SA (Consumer Staples, Food & Staples Retailing) | | | | | | | 9,800 | | | | 54,379 | |
Gas Natural SDG SA (Utilities, Gas Utilities) | | | | | | | 15,700 | | | | 326,558 | |
Grifols SA (Health Care, Biotechnology) | | | | | | | 11,100 | | | | 241,428 | |
Grifols SA ADR (Health Care, Biotechnology) | | | | | | | 21,338 | | | | 335,433 | |
International Consolidated Airlines Group SA (Industrials, Airlines) | | | | | | | 90,717 | | | | 695,894 | |
| | | | |
| | | | | | | | | | | 1,803,029 | |
| | | | | | | | | | | | |
| | | | |
| Sweden: 1.01% | | | | | | | | | | | | |
Autoliv Incorporated SDR (Consumer Discretionary, Auto Components) | | | | | | | 254 | | | | 30,776 | |
Boliden AB (Materials, Metals & Mining) « | | | | | | | 11,400 | | | | 198,744 | |
Nordea Bank AB (Financials, Banks) | | | | | | | 15,000 | | | | 145,602 | |
Swedbank AB Class A (Financials, Banks) | | | | | | | 16,740 | | | | 361,047 | |
Telefonaktiebolaget LM Ericsson Class B (Information Technology, Communications Equipment) | | | | | | | 25,000 | | | | 202,355 | |
TeliaSonera AB (Telecommunication Services, Diversified Telecommunication Services) | | | | | | | 40,300 | | | | 192,456 | |
| | | | |
| | | | | | | | | | | 1,130,980 | |
| | | | | | | | | | | | |
| | | | |
| Switzerland: 7.34% | | | | | | | | | | | | |
ABB Limited (Industrials, Electrical Equipment) | | | | | | | 35,081 | | | | 741,627 | |
Actelion Limited (Health Care, Biotechnology) | | | | | | | 4,085 | | | | 660,039 | |
Aryzta AG (Consumer Staples, Food Products) | | | | | | | 2,100 | | | | 81,544 | |
Baloise Holding AG (Financials, Insurance) | | | | | | | 2,000 | | | | 247,472 | |
Credit Suisse Group AG (Financials, Capital Markets) | | | | | | | 20,800 | | | | 315,914 | |
Georg Fischer AG (Industrials, Machinery) | | | | | | | 300 | | | | 243,615 | |
Nestle SA (Consumer Staples, Food Products) | | | | | | | 22,637 | | | | 1,687,207 | |
Novartis AG (Health Care, Pharmaceuticals) | | | | | | | 11,079 | | | | 845,390 | |
Roche Holding AG (Health Care, Pharmaceuticals) | | | | | | | 2,323 | | | | 587,228 | |
Swiss Life Holding AG (Financials, Insurance) | | | | | | | 1,100 | | | | 277,609 | |
Swiss Reinsurance AG (Financials, Insurance) | | | | | | | 5,600 | | | | 496,779 | |
Syngenta AG (Materials, Chemicals) | | | | | | | 1,088 | | | | 435,518 | |
UBS Group AG (Financials, Capital Markets) | | | | | | | 10,600 | | | | 183,425 | |
Valiant Holding AG (Financials, Banks) | | | | | | | 1,900 | | | | 210,539 | |
Zurich Insurance Group AG (Financials, Insurance) | | | | | | | 5,279 | | | | 1,181,488 | |
| | | | |
| | | | | | | | | | | 8,195,394 | |
| | | | | | | | | | | | |
| | | | |
| Taiwan: 0.62% | | | | | | | | | | | | |
Pegatron Corporation (Information Technology, Technology Hardware, Storage & Peripherals) | | | | | | | 83,000 | | | | 175,763 | |
Taiwan Semiconductor Manufacturing Company Limited (Information Technology, Semiconductors & Semiconductor Equipment) | | | | | | | 85,000 | | | | 395,312 | |
Zhen Ding Technology Holding (Information Technology, Electronic Equipment, Instruments & Components) | | | | | | | 55,000 | | | | 115,788 | |
| | | | |
| | | | | | | | | | | 686,863 | |
| | | | | | | | | | | | |
| | | | |
| Thailand: 0.23% | | | | | | | | | | | | |
Bangchak Petroleum PCL (Energy, Oil, Gas & Consumable Fuels) | | | | | | | 135,400 | | | | 120,166 | |
Thai Oil PCL (Energy, Oil, Gas & Consumable Fuels) | | | | | | | 75,100 | | | | 141,901 | |
| | | | |
| | | | | | | | | | | 262,067 | |
| | | | | | | | | | | | |
The accompanying notes are an integral part of these financial statements.
| | | | |
| 14 | | Wells Fargo Diversified International Fund | | Portfolio of investments—April 30, 2016 (unaudited) |
| | | | | | | | | | | | |
| Security name | | | | | | Shares | | | Value | |
| | | | | | | | | | | | |
| | | | |
| United Kingdom: 16.64% | | | | | | | | | | | | |
3i Group plc (Financials, Capital Markets) | | | | | | | 27,100 | | | $ | 187,532 | |
Aon plc (Financials, Insurance) | | | | | | | 9,563 | | | | 1,005,263 | |
AstraZeneca plc (Health Care, Pharmaceuticals) | | | | | | | 2,700 | | | | 154,964 | |
Aviva plc (Financials, Insurance) | | | | | | | 22,000 | | | | 138,996 | |
Babcock International Group plc (Industrials, Commercial Services & Supplies) | | | | | | | 13,849 | | | | 191,731 | |
BAE Systems plc (Industrials, Aerospace & Defense) | | | | | | | 70,700 | | | | 493,067 | |
Barclays plc (Financials, Banks) | | | | | | | 66,900 | | | | 167,643 | |
Barratt Developments plc (Consumer Discretionary, Household Durables) | | | | | | | 23,400 | | | | 182,067 | |
Bellway plc (Consumer Discretionary, Household Durables) | | | | | | | 4,200 | | | | 150,168 | |
Berkeley Group Holdings plc (Consumer Discretionary, Household Durables) | | | | | | | 4,400 | | | | 192,550 | |
Bovis Homes Group plc (Consumer Discretionary, Household Durables) | | | | | | | 8,600 | | | | 109,575 | |
BP plc (Energy, Oil, Gas & Consumable Fuels) | | | | | | | 91,700 | | | | 500,778 | |
British American Tobacco plc (Consumer Staples, Tobacco) | | | | | | | 6,407 | | | | 390,378 | |
BT Group plc (Telecommunication Services, Diversified Telecommunication Services) | | | | | | | 18,500 | | | | 119,803 | |
Capita plc (Industrials, Professional Services) | | | | | | | 21,213 | | | | 310,264 | |
Carillion plc (Industrials, Construction & Engineering) « | | | | | | | 30,400 | | | | 130,592 | |
Centrica plc (Utilities, Multi-Utilities) | | | | | | | 68,900 | | | | 240,005 | |
Crest Nicholson Holdings plc (Consumer Discretionary, Household Durables) | | | | | | | 20,500 | | | | 156,058 | |
Croda International plc (Materials, Chemicals) | | | | | | | 3,602 | | | | 158,471 | |
Debenhams plc (Consumer Discretionary, Multiline Retail) | | | | | | | 93,500 | | | | 107,108 | |
Delphi Automotive plc (Consumer Discretionary, Auto Components) | | | | | | | 10,313 | | | | 759,346 | |
Diageo plc (Consumer Staples, Beverages) | | | | | | | 6,499 | | | | 175,297 | |
easyJet plc (Industrials, Airlines) | | | | | | | 6,900 | | | | 148,507 | |
Firstgroup plc (Industrials, Road & Rail) † | | | | | | | 54,400 | | | | 79,367 | |
Galliford Try plc (Industrials, Construction & Engineering) | | | | | | | 6,500 | | | | 121,188 | |
GlaxoSmithKline plc (Health Care, Pharmaceuticals) | | | | | | | 8,800 | | | | 187,600 | |
Imperial Tobacco Group plc (Consumer Staples, Tobacco) | | | | | | | 11,275 | | | | 612,603 | |
Intercontinental Hotels Group plc (Consumer Discretionary, Hotels, Restaurants & Leisure) | | | | | | | 9,765 | | | | 389,378 | |
J Sainsbury plc (Consumer Staples, Food & Staples Retailing) | | | | | | | 90,900 | | | | 383,713 | |
Johnson Matthey plc (Materials, Chemicals) | | | | | | | 7,372 | | | | 310,976 | |
Liberty Global plc Class A (Consumer Discretionary, Media) | | | | | | | 18,888 | | | | 712,644 | |
Liberty Global plc Class C (Consumer Discretionary, Media) | | | | | | | 28,867 | | | | 1,056,532 | |
Lloyds Banking Group plc (Financials, Banks) | | | | | | | 686,282 | | | | 672,552 | |
Marks & Spencer Group plc (Consumer Discretionary, Multiline Retail) | | | | | | | 33,900 | | | | 209,772 | |
Mitie Group plc (Industrials, Commercial Services & Supplies) | | | | | | | 31,900 | | | | 126,455 | |
Mondi plc (Materials, Paper & Forest Products) | | | | | | | 4,200 | | | | 80,270 | |
Old Mutual plc (Financials, Insurance) | | | | | | | 59,600 | | | | 161,542 | |
Qinetiq Group plc (Industrials, Aerospace & Defense) | | | | | | | 47,700 | | | | 155,912 | |
Reckitt Benckiser Group plc (Consumer Staples, Household Products) | | | | | | | 5,044 | | | | 490,403 | |
Redrow plc (Consumer Discretionary, Household Durables) | | | | | | | 24,200 | | | | 135,428 | |
Royal Dutch Shell plc Class B (Energy, Oil, Gas & Consumable Fuels) | | | | | | | 22,200 | | | | 579,335 | |
Royal Mail plc (Industrials, Air Freight & Logistics) | | | | | | | 10,800 | | | | 76,835 | |
Smiths Group plc (Industrials, Industrial Conglomerates) | | | | | | | 65,436 | | | | 1,059,380 | |
Standard Chartered plc (Financials, Banks) | | | | | | | 13,300 | | | | 107,291 | |
Tullett Prebon plc (Financials, Capital Markets) | | | | | | | 20,600 | | | | 101,948 | |
Unilever plc (Consumer Staples, Personal Products) | | | | | | | 19,171 | | | | 855,618 | |
United Business Media plc (Consumer Discretionary, Media) | | | | | | | 70,469 | | | | 585,876 | |
Vodafone Group plc (Telecommunication Services, Wireless Telecommunication Services) | | | | | | | 386,633 | | | | 1,238,325 | |
William Morrison Supermarkets plc (Consumer Staples, Food & Staples Retailing) | | | | | | | 66,200 | | | | 184,848 | |
The accompanying notes are an integral part of these financial statements.
| | | | | | |
| Portfolio of investments—April 30, 2016 (unaudited) | | Wells Fargo Diversified International Fund | | | 15 | |
| | | | | | | | | | | | | | | | |
| Security name | | | | | | | | Shares | | | Value | |
| | | | | | | | | | | | | | | | |
| | | | |
| United Kingdom (continued) | | | | | | | | | | | | | | | | |
Wolseley plc (Industrials, Trading Companies & Distributors) | | | | | | | | | | | 16,864 | | | $ | 941,527 | |
Worldpay Group plc (Information Technology, IT Services) 144A† | | | | | | | | | | | 52,473 | | | | 204,635 | |
WPP plc (Consumer Discretionary, Media) | | | | | | | | | | | 24,989 | | | | 582,743 | |
| | | | |
| | | | | | | | | | | | | | | 18,574,859 | |
| | | | | | | | | | | | | | | | |
| | | | |
| United States: 1.91% | | | | | | | | | | | | | | | | |
Coca-Cola Enterprises Incorporated (Consumer Staples, Beverages) | | | | | | | | | | | 6,460 | | | | 339,021 | |
Cognizant Technology Solutions Corporation Class A (Information Technology, IT Services) † | | | | | | | | | | | 15,858 | | | | 925,632 | |
Pfizer Incorporated (Health Care, Pharmaceuticals) | | | | | | | | | | | 16,787 | | | | 549,103 | |
WABCO Holdings Incorporated (Industrials, Machinery) † | | | | | | | | | | | 2,873 | | | | 322,236 | |
| | | | |
| | | | | | | | | | | | | | | 2,135,992 | |
| | | | | | | | | | | | | | | | |
| | | | |
Total Common Stocks (Cost $102,193,086) | | | | | | | | | | | | | | | 104,420,661 | |
| | | | | | | | | | | | | | | | |
| | | | |
| | | | | | Expiration date | | | | | | | |
| Participation Notes: 0.90% | | | | | | | | | | | | | | | | |
| | | | |
| China: 0.42% | | | | | | | | | | | | | | | | |
HSBC Bank plc (Kweichow Moutai Company Limited Class A) (Consumer Staples, Beverages) † | | | | | | | 2-19-2016 | | | | 12,090 | | | | 468,161 | |
| | | | | | | | | | | | | | | | |
| | | | |
| Ireland: 0.48% | | | | | | | | | | | | | | | | |
HSBC Bank plc (Ryanair Holdings plc) (Industrials, Airlines) | | | | | | | 10-29-2018 | | | | 36,087 | | | | 540,379 | |
| | | | | | | | | | | | | | | | |
| | | | |
Total Participation Notes (Cost $774,698) | | | | | | | | | | | | | | | 1,008,540 | |
| | | | | | | | | | | | | | | | |
| | | | |
| | | Dividend yield | | | | | | | | | | |
| Preferred Stocks: 0.34% | | | | | | | | | | | | | | | | |
| | | | |
| Brazil: 0.02% | | | | | | | | | | | | | | | | |
Companhia Energetica de Minas Gerais SA (Utilities, Electric Utilities) ± | | | 4.96 | % | | | | | | | 13,600 | | | | 27,087 | |
| | | | | | | | | | | | | | | | |
| | | | |
| Germany: 0.32% | | | | | | | | | | | | | | | | |
Henkel AG & Company KGaA (Consumer Staples, Household Products) ± | | | 1.47 | | | | | | | | 3,140 | | | | 358,395 | |
| | | | | | | | | | | | | | | | |
| | | | |
Total Preferred Stocks (Cost $350,602) | | | | | | | | | | | | | | | 385,482 | |
| | | | | | | | | | | | | | | | |
| | | | |
| | | Yield | | | | | | | | | | |
| Short-Term Investments: 5.82% | | | | | | | | | | | | | | | | |
| | | | |
| Investment Companies: 5.82% | | | | | | | | | | | | | | | | |
Securities Lending Cash Investments LLC (l)(r)(u) | | | 0.45 | | | | | | | | 2,316,326 | | | | 2,316,326 | |
Wells Fargo Cash Investment Money Market Fund Select
Class (l)(u) | | | 0.43 | | | | | | | | 4,178,623 | | | | 4,178,623 | |
| | | | |
Total Short-Term Investments (Cost $6,494,949) | | | | | | | | | | | | | | | 6,494,949 | |
| | | | | | | | | | | | | | | | |
| | | | | | | | |
| Total investments in securities (Cost $109,813,335) * | | | 100.58 | % | | | 112,309,632 | |
Other assets and liabilities, net | | | (0.58 | ) | | | (650,030 | ) |
| | | | | | | | |
| Total net assets | | | 100.00 | % | | $ | 111,659,602 | |
| | | | | | | | |
The accompanying notes are an integral part of these financial statements.
| | | | |
| 16 | | Wells Fargo Diversified International Fund | | Portfolio of investments—April 30, 2016 (unaudited) |
| † | Non-income-earning security |
| (a) | The security is fair valued in accordance with procedures approved by the Board of Trustees. |
| « | All or a portion of this security is on loan. |
| 144A | The security may be resold in transactions exempt from registration, normally to qualified institutional buyers, pursuant to Rule 144A under the Securities Act of 1933. |
| ± | Variable rate investment. The rate shown is the rate in effect at period end. |
| (l) | The issuer of the security is an affiliated person of the Fund as defined in the Investment Company Act of 1940. |
| (r) | The investment is a non-registered investment vehicle purchased with cash collateral received from securities on loan. |
| (u) | The rate represents the 7-day annualized yield at period end. |
| * | Cost for federal income tax purposes is $111,245,808 and unrealized gains (losses) consists of: |
| | | | |
Gross unrealized gains | | $ | 10,876,114 | |
Gross unrealized losses | | | (9,812,290 | ) |
| | | | |
Net unrealized gains | | $ | 1,063,824 | |
The accompanying notes are an integral part of these financial statements.
| | | | | | |
| Statement of assets and liabilities—April 30, 2016 (unaudited) | | Wells Fargo Diversified International Fund | | | 17 | |
| | | | |
| | | | |
| |
Assets | | | | |
Investments | | | | |
In unaffiliated securities (including $2,173,872 of securities loaned), at value (cost $103,318,386) | | $ | 105,814,683 | |
In affiliated securities, at value (cost $6,494,949) | | | 6,494,949 | |
| | | | |
Total investments, at value (cost $109,813,335) | | | 112,309,632 | |
Foreign currency, at value (cost $1,158,301) | | | 1,134,758 | |
Receivable for investments sold | | | 265,250 | |
Receivable for Fund shares sold | | | 89,849 | |
Receivable for dividends | | | 519,189 | |
Receivable for securities lending income | | | 10,283 | |
Unrealized gains on forward foreign currency contracts | | | 1,425 | |
Prepaid expenses and other assets | | | 59,844 | |
| | | | |
Total assets | | | 114,390,230 | |
| | | | |
| |
Liabilities | | | | |
Payable for investments purchased | | | 74,183 | |
Payable for Fund shares redeemed | | | 154,331 | |
Unrealized losses on forward foreign currency contracts | | | 30,983 | |
Payable upon receipt of securities loaned | | | 2,316,326 | |
Management fee payable | | | 44,415 | |
Distribution fees payable | | | 2,858 | |
Administration fees payable | | | 16,561 | |
Accrued expenses and other liabilities | | | 90,971 | |
| | | | |
Total liabilities | | | 2,730,628 | |
| | | | |
Total net assets | | $ | 111,659,602 | |
| | | | |
| |
NET ASSETS CONSIST OF | | | | |
Paid-in capital | | $ | 212,913,463 | |
Undistributed net investment income | | | 558,372 | |
Accumulated net realized losses on investments | | | (104,269,949 | ) |
Net unrealized gains on investments | | | 2,457,716 | |
| | | | |
Total net assets | | $ | 111,659,602 | |
| | | | |
| |
COMPUTATION OF NET ASSET VALUE AND OFFERING PRICE PER SHARE | | | | |
Net assets – Class A | | $ | 67,436,794 | |
Shares outstanding – Class A1 | | | 6,108,253 | |
Net asset value per share – Class A | | | $11.04 | |
Maximum offering price per share – Class A2 | | | $11.71 | |
Net assets – Class B | | $ | 13,901 | |
Shares outstanding – Class B1 | | | 1,286 | |
Net asset value per share – Class B | | | $10.81 | |
Net assets – Class C | | $ | 4,660,207 | |
Shares outstanding – Class C1 | | | 458,266 | |
Net asset value per share – Class C | | | $10.17 | |
Net assets – Class R | | $ | 25,471 | |
Shares outstanding – Class R1 | | | 2,270 | |
Net asset value per share – Class R | | | $11.22 | |
Net assets – Class R6 | | $ | 5,343,866 | |
Shares outstanding – Class R61 | | | 474,104 | |
Net asset value per share – Class R6 | | | $11.27 | |
Net assets – Administrator Class | | $ | 12,922,630 | |
Shares outstanding – Administrator Class1 | | | 1,149,919 | |
Net asset value per share – Administrator Class | | | $11.24 | |
Net assets – Institutional Class | | $ | 21,256,733 | |
Shares outstanding – Institutional Class1 | | | 2,013,544 | |
Net asset value per share – Institutional Class | | | $10.56 | |
| 1 | The Fund has an unlimited number of authorized shares. |
| 2 | Maximum offering price is computed as 100/94.25 of net asset value. On investments of $50,000 or more, the offering price is reduced. |
The accompanying notes are an integral part of these financial statements.
| | | | |
| 18 | | Wells Fargo Diversified International Fund | | Statement of operations—six months ended April 30, 2016 (unaudited) |
| | | | |
| | | | |
| |
Investment income | | | | |
Dividends (net of foreign withholding taxes of $128,444) | | $ | 1,321,724 | |
Securities lending income, net | | | 36,975 | |
Income from affiliated securities | | | 8,293 | |
| | | | |
Total investment income | | | 1,366,992 | |
| | | | |
| |
Expenses | | | | |
Management fee | | | 472,690 | |
Administration fees | | | | |
Class A | | | 70,682 | |
Class B | | | 18 | |
Class C | | | 4,221 | |
Class R | | | 26 | |
Class R6 | | | 634 | |
Administrator Class | | | 7,713 | |
Institutional Class | | | 11,422 | |
Shareholder servicing fees | | | | |
Class A | | | 83,789 | |
Class B | | | 21 | |
Class C | | | 5,024 | |
Class R | | | 31 | |
Administrator Class | | | 14,833 | |
Distribution fees | | | | |
Class B | | | 63 | |
Class C | | | 15,073 | |
Class R | | | 31 | |
Custody and accounting fees | | | 80,567 | |
Professional fees | | | 22,047 | |
Registration fees | | | 48,649 | |
Shareholder report expenses | | | 25,286 | |
Trustees’ fees and expenses | | | 7,628 | |
Other fees and expenses | | | 26,219 | |
| | | | |
Total expenses | | | 896,667 | |
Less: Fee waivers and/or expense reimbursements | | | (219,749 | ) |
| | | | |
Net expenses | | | 676,918 | |
| | | | |
Net investment income | | | 690,074 | |
| | | | |
| |
REALIZED AND UNREALIZED GAINS (LOSSES) ON INVESTMENTS | | | | |
| |
Net realized gains (losses) on: | | | | |
Unaffiliated securities | | | (2,013,193 | ) |
Forward foreign currency contract transactions | | | 15,182 | |
| | | | |
Net realized losses on investments | | | (1,998,011 | ) |
| | | | |
| |
Net change in unrealized gains (losses) on: | | | | |
Unaffiliated securities | | | (3,178,376 | ) |
Forward foreign currency contract transactions | | | (152,849 | ) |
| | | | |
Net change in unrealized gains (losses) on investments | | | (3,331,225 | ) |
| | | | |
Net realized and unrealized gains (losses) on investments | | | (5,329,236 | ) |
| | | | |
Net decrease in net assets resulting from operations | | $ | (4,639,162 | ) |
| | | | |
The accompanying notes are an integral part of these financial statements.
| | | | | | |
| Statement of changes in net assets | | Wells Fargo Diversified International Fund | | | 19 | |
| | | | | | | | | | | | | | | | |
| | | Six months ended
April 30, 2016 (unaudited) | | | Year ended
October 31, 2015 | |
| | | |
Operations | | | | | | | | | | | | |
Net investment income | | | | | | $ | 690,074 | | | | | | | $ | 992,143 | |
Net realized gains (losses) on investments | | | | | | | (1,998,011 | ) | | | | | | | 2,645,943 | |
Net change in unrealized gains (losses) on investments | | | | | | | (3,331,225 | ) | | | | | | | (4,768,915 | ) |
| | | | |
Net decrease in net assets resulting from operations | | | | | | | (4,639,162 | ) | | | | | | | (1,130,829 | ) |
| | | | |
| | | |
Distributions to shareholders from | | | | | | | | | | | | |
Net investment income | | | | | | | | | | | | | | | | |
Class A | | | | | | | (692,930 | ) | | | | | | | (567,395 | ) |
Class C | | | | | | | (30,743 | ) | | | | | | | (25,962 | ) |
Class R | | | | | | | (268 | ) | | | | | | | 0 | 1 |
Class R6 | | | | | | | (54,538 | ) | | | | | | | 0 | 1 |
Administrator Class | | | | | | | (136,524 | ) | | | | | | | (172,327 | ) |
Institutional Class | | | | | | | (249,898 | ) | | | | | | | (79,049 | ) |
Investor Class | | | | | | | N/A | | | | | | | | (1,116,769 | )2 |
| | | | |
Total distributions to shareholders | | | | | | | (1,164,901 | ) | | | | | | | (1,961,502 | ) |
| | | | |
| | | | |
Capital share transactions | | | Shares | | | | | | | | Shares | | | | | |
Proceeds from shares sold | | | | | | | | | | | | | | | | |
Class A | | | 226,707 | | | | 2,470,062 | | | | 4,606,846 | | | | 54,061,650 | |
Class B | | | 0 | | | | 0 | | | | 4,423 | | | | 54,704 | |
Class C | | | 183,380 | | | | 1,874,732 | | | | 226,478 | | | | 2,559,311 | |
Class R | | | 0 | | | | 0 | | | | 2,246 | 1 | | | 25,000 | 1 |
Class R6 | | | 496,399 | | | | 5,855,819 | | | | 2,246 | 1 | | | 25,000 | 1 |
Administrator Class | | | 342,282 | | | | 3,861,688 | | | | 459,323 | | | | 5,711,707 | |
Institutional Class | | | 1,433,378 | | | | 15,586,840 | | | | 523,640 | | | | 5,896,811 | |
Investor Class | | | N/A | | | | N/A | | | | 772,749 | 2 | | | 9,262,576 | 2 |
| | | | |
| | | | | | | 29,649,141 | | | | | | | | 77,596,759 | |
| | | | |
Reinvestment of distributions | | | | | | | | | | | | | | | | |
Class A | | | 60,092 | | | | 682,650 | | | | 45,755 | | | | 531,212 | |
Class C | | | 2,596 | | | | 27,233 | | | | 2,080 | | | | 22,425 | |
Class R | | | 24 | | | | 268 | | | | 0 | 1 | | | 0 | 1 |
Class R6 | | | 4,710 | | | | 54,538 | | | | 0 | 1 | | | 0 | 1 |
Administrator Class | | | 11,807 | | | | 136,486 | | | | 14,509 | | | | 171,495 | |
Institutional Class | | | 21,008 | | | | 227,935 | | | | 5,648 | | | | 62,524 | |
Investor Class | | | N/A | | | | N/A | | | | 94,956 | 2 | | | 1,098,641 | 2 |
| | | | |
| | | | | | | 1,129,110 | | | | | | | | 1,886,297 | |
| | | | |
Payment for shares redeemed | | | | | | | | | | | | | | | | |
Class A | | | (523,256 | ) | | | (5,718,708 | ) | | | (383,282 | ) | | | (4,674,632 | ) |
Class B | | | (3,137 | ) | | | (35,426 | ) | | | (3,247 | ) | | | (36,560 | ) |
Class C | | | (60,409 | ) | | | (585,185 | ) | | | (41,808 | ) | | | (464,550 | ) |
Class R6 | | | (29,251 | ) | | | (324,628 | ) | | | 0 | 1 | | | 0 | 1 |
Administrator Class | | | (92,393 | ) | | | (1,015,123 | ) | | | (180,963 | ) | | | (2,216,207 | ) |
Institutional Class | | | (78,684 | ) | | | (849,550 | ) | | | (124,691 | ) | | | (1,439,122 | ) |
Investor Class | | | N/A | | | | N/A | | | | (4,980,967 | )2 | | | (58,064,112 | )2 |
| | | | |
| | | | | | | (8,528,620 | ) | | | | | | | (66,895,183 | ) |
| | | | |
Net increase in net assets resulting from capital share transactions | | | | | | | 22,249,631 | | | | | | | | 12,587,873 | |
| | | | |
Total increase in net assets | | | | | | | 16,445,568 | | | | | | | | 9,495,542 | |
| | | | |
| | |
Net assets | | | | | | | | |
Beginning of period | | | | | | | 95,214,034 | | | | | | | | 85,718,492 | |
| | | | |
End of period | | | | | | $ | 111,659,602 | | | | | | | $ | 95,214,034 | |
| | | | |
Undistributed net investment income | | | | | | $ | 558,372 | | | | | | | $ | 1,033,199 | |
| | | | |
| 1 | For the period from September 30, 2015 (commencement of class operations) to October 31, 2015 |
| 2 | For the period from November 1, 2014 to October 23, 2015. Effective at the close of business on October 23, 2015, Investor Class shares were converted to Class A shares and are no longer offered by the Fund. |
The accompanying notes are an integral part of these financial statements.
| | | | |
| 20 | | Wells Fargo Diversified International Fund | | Financial highlights |
(For a share outstanding throughout each period)
| | | | | | | | | | | | | | | | | | | | | | | | |
| | | Six months ended
April 30, 2016
(unaudited) | | | Year ended October 31 | |
| CLASS A | | | 2015 | | | 2014 | | | 2013 | | | 2012 | | | 2011 | |
Net asset value, beginning of period | | | $11.65 | | | | $12.01 | | | | $12.25 | | | | $10.25 | | | | $9.69 | | | | $10.29 | |
Net investment income | | | 0.06 | | | | 0.13 | 1 | | | 0.24 | 1 | | | 0.19 | 1 | | | 0.19 | 1 | | | 0.16 | |
Net realized and unrealized gains (losses) on investments | | | (0.56 | ) | | | (0.21 | ) | | | (0.29 | ) | | | 2.41 | | | | 0.51 | | | | (0.65 | ) |
| | | | | | | | | | | | | | | | | | | | | | | | |
Total from investment operations | | | (0.50 | ) | | | (0.08 | ) | | | (0.05 | ) | | | 2.60 | | | | 0.70 | | | | (0.49 | ) |
Distributions to shareholders from | | | | | | | | | | | | | | | | | | | | | | | | |
Net investment income | | | (0.11 | ) | | | (0.28 | ) | | | (0.19 | ) | | | (0.60 | ) | | | (0.14 | ) | | | (0.11 | ) |
Net asset value, end of period | | | $11.04 | | | | $11.65 | | | | $12.01 | | | | $12.25 | | | | $10.25 | | | | $9.69 | |
Total return2 | | | (4.31 | )% | | | (0.66 | )% | | | (0.49 | )% | | | 26.59 | % | | | 7.45 | % | | | (4.83 | )% |
Ratios to average net assets (annualized) | | | | | | | | | | | | | | | | | | | | | | | | |
Gross expenses | | | 1.76 | % | | | 1.85 | % | | | 1.76 | % | | | 1.92 | % | | | 1.68 | % | | | 1.47 | % |
Net expenses | | | 1.35 | % | | | 1.40 | % | | | 1.41 | % | | | 1.41 | % | | | 1.41 | % | | | 1.41 | % |
Net investment income | | | 1.18 | % | | | 1.07 | % | | | 1.93 | % | | | 1.75 | % | | | 1.96 | % | | | 1.47 | % |
Supplemental data | | | | | | | | | | | | | | | | | | | | | | | | |
Portfolio turnover rate | | | 23 | % | | | 31 | % | | | 33 | % | | | 40 | % | | | 57 | % | | | 53 | % |
Net assets, end of period (000s omitted) | | | $67,437 | | | | $73,891 | | | | $24,921 | | | | $28,928 | | | | $22,434 | | | | $23,862 | |
| 1 | Calculated based upon average shares outstanding |
| 2 | Total return calculations do not include any sales charges. Returns for periods of less than one year are not annualized. |
The accompanying notes are an integral part of these financial statements.
| | | | | | |
| Financial highlights | | Wells Fargo Diversified International Fund | | | 21 | |
(For a share outstanding throughout each period)
| | | | | | | | | | | | | | | | | | | | | | | | |
| | | Six months ended
April 30, 2016 (unaudited) | | | Year ended October 31 | |
| CLASS B | | | 2015 | | | 2014 | | | 2013 | | | 2012 | | | 2011 | |
Net asset value, beginning of period | | | $11.34 | | | | $11.50 | | | | $11.71 | | | | $9.80 | | | | $9.19 | | | | $9.74 | |
Net investment income | | | 0.01 | 1 | | | 0.03 | 1 | | | 0.13 | 1 | | | 0.09 | 1 | | | 0.10 | 1 | | | 0.06 | 1 |
Net realized and unrealized gains (losses) on investments | | | (0.54 | ) | | | (0.19 | ) | | | (0.27 | ) | | | 2.32 | | | | 0.51 | | | | (0.61 | ) |
| | | | | | | | | | | | | | | | | | | | | | | | |
Total from investment operations | | | (0.53 | ) | | | (0.16 | ) | | | (0.14 | ) | | | 2.41 | | | | 0.61 | | | | (0.55 | ) |
Distributions to shareholders from | | | | | | | | | | | | | | | | | | | | | | | | |
Net investment income | | | 0.00 | | | | 0.00 | | | | (0.07 | ) | | | (0.50 | ) | | | (0.00 | )2 | | | 0.00 | |
Net asset value, end of period | | | $10.81 | | | | $11.34 | | | | $11.50 | | | | $11.71 | | | | $9.80 | | | | $9.19 | |
Total return3 | | | (4.67 | )% | | | (1.39 | )% | | | (1.25 | )% | | | 25.70 | % | | | 6.69 | % | | | (5.65 | )% |
Ratios to average net assets (annualized) | | | | | | | | | | | | | | | | | | | | | | | | |
Gross expenses | | | 2.51 | % | | | 2.59 | % | | | 2.52 | % | | | 2.68 | % | | | 2.35 | % | | | 2.23 | % |
Net expenses | | | 2.10 | % | | | 2.15 | % | | | 2.16 | % | | | 2.16 | % | | | 2.12 | % | | | 2.16 | % |
Net investment income | | | 0.22 | % | | | 0.29 | % | | | 1.10 | % | | | 0.88 | % | | | 1.11 | % | | | 0.64 | % |
Supplemental data | | | | | | | | | | | | | | | | | | | | | | | | |
Portfolio turnover rate | | | 23 | % | | | 31 | % | | | 33 | % | | | 40 | % | | | 57 | % | | | 53 | % |
Net assets, end of period (000s omitted) | | | $14 | | | | $50 | | | | $37 | | | | $174 | | | | $299 | | | | $482 | |
| 1 | Calculated based upon average shares outstanding |
| 2 | Amount is less than $0.005. |
| 3 | Total return calculations do not include any sales charges. Returns for periods of less than one year are not annualized. |
The accompanying notes are an integral part of these financial statements.
| | | | |
| 22 | | Wells Fargo Diversified International Fund | | Financial highlights |
(For a share outstanding throughout each period)
| | | | | | | | | | | | | | | | | | | | | | | | |
| | | Six months ended
April 30, 2016 (unaudited) | | | Year ended October 31 | |
| CLASS C | | | 2015 | | | 2014 | | | 2013 | | | 2012 | | | 2011 | |
Net asset value, beginning of period | | | $10.74 | | | | $11.08 | | | | $11.35 | | | | $9.54 | | | | $9.01 | | | | $9.59 | |
Net investment income | | | 0.03 | 1 | | | 0.04 | 1 | | | 0.13 | 1 | | | 0.09 | 1 | | | 0.11 | 1 | | | 0.07 | 1 |
Net realized and unrealized gains (losses) on investments | | | (0.52 | ) | | | (0.20 | ) | | | (0.27 | ) | | | 2.25 | | | | 0.48 | | | | (0.61 | ) |
| | | | | | | | | | | | | | | | | | | | | | | | |
Total from investment operations | | | (0.49 | ) | | | (0.16 | ) | | | (0.14 | ) | | | 2.34 | | | | 0.59 | | | | (0.54 | ) |
Distributions to shareholders from | | | | | | | | | | | | | | | | | | | | | | | | |
Net investment income | | | (0.08 | ) | | | (0.18 | ) | | | (0.13 | ) | | | (0.53 | ) | | | (0.06 | ) | | | (0.04 | ) |
Net asset value, end of period | | | $10.17 | | | | $10.74 | | | | $11.08 | | | | $11.35 | | | | $9.54 | | | | $9.01 | |
Total return2 | | | (4.62 | )% | | | (1.44 | )% | | | (1.24 | )% | | | 25.67 | % | | | 6.67 | % | | | (5.65 | )% |
Ratios to average net assets (annualized) | | | | | | | | | | | | | | | | | | | | | | | | |
Gross expenses | | | 2.51 | % | | | 2.60 | % | | | 2.51 | % | | | 2.66 | % | | | 2.43 | % | | | 2.22 | % |
Net expenses | | | 2.10 | % | | | 2.15 | % | | | 2.16 | % | | | 2.16 | % | | | 2.16 | % | | | 2.16 | % |
Net investment income | | | 0.55 | % | | | 0.33 | % | | | 1.15 | % | | | 0.84 | % | | | 1.21 | % | | | 0.72 | % |
Supplemental data | | | | | | | | | | | | | | | | | | | | | | | | |
Portfolio turnover rate | | | 23 | % | | | 31 | % | | | 33 | % | | | 40 | % | | | 57 | % | | | 53 | % |
Net assets, end of period (000s omitted) | | | $4,660 | | | | $3,573 | | | | $1,616 | | | | $1,746 | | | | $628 | | | | $625 | |
| 1 | Calculated based upon average shares outstanding |
| 2 | Total return calculations do not include any sales charges. Returns for periods of less than one year are not annualized. |
The accompanying notes are an integral part of these financial statements.
| | | | | | |
| Financial highlights | | Wells Fargo Diversified International Fund | | | 23 | |
(For a share outstanding throughout each period)
| | | | | | | | |
| CLASS R | | Six months ended
April 30, 2016 (unaudited) | | | Year ended October 31, 20151 | |
Net asset value, beginning of period | | | $11.86 | | | | $11.13 | |
Net investment income (loss) | | | 0.05 | 2 | | | (0.01 | ) |
Net realized and unrealized gains (losses) on investments | | | (0.57 | ) | | | 0.74 | |
| | | | | | | | |
Total from investment operations | | | (0.52 | ) | | | 0.73 | |
Distributions to shareholders from | | | | | | | | |
Net investment income | | | (0.12 | ) | | | 0.00 | |
Net asset value, end of period | | | $11.22 | | | | $11.86 | |
Total return3 | | | (4.42 | )% | | | 6.56 | % |
Ratios to average net assets (annualized) | | | | | | | | |
Gross expenses | | | 2.01 | % | | | 2.15 | % |
Net expenses | | | 1.60 | % | | | 1.60 | % |
Net investment income (loss) | | | 0.95 | % | | | (0.65 | )% |
Supplemental data | | | | | | | | |
Portfolio turnover rate | | | 23 | % | | | 31 | % |
Net assets, end of period (000s omitted) | | | $25 | | | | $27 | |
| 1 | For the period from September 30, 2015 (commencement of class operations) to October 31, 2015 |
| 2 | Calculated based upon average shares outstanding |
| 3 | Returns for periods of less than one year are not annualized. |
The accompanying notes are an integral part of these financial statements.
| | | | |
| 24 | | Wells Fargo Diversified International Fund | | Financial highlights |
(For a share outstanding throughout each period)
| | | | | | | | |
| CLASS R6 | | Six months ended
April 30, 2016
(unaudited) | | | Year ended
October 31, 20151 | |
Net asset value, beginning of period | | | $11.87 | | | | $11.13 | |
Net investment income | | | 0.11 | 2 | | | 0.00 | 3 |
Net realized and unrealized gains (losses) on investments | | | (0.59 | ) | | | 0.74 | |
| | | | | | | | |
Total from investment operations | | | (0.48 | ) | | | 0.74 | |
Distributions to shareholders from | | | | | | | | |
Net investment income | | | (0.12 | ) | | | 0.00 | |
Net asset value, end of period | | | $11.27 | | | | $11.87 | |
Total return4 | | | (4.06 | )% | | | 6.65 | % |
Ratios to average net assets (annualized) | | | | | | | | |
Gross expenses | | | 1.33 | % | | | 1.46 | % |
Net expenses | | | 0.89 | % | | | 0.89 | % |
Net investment income | | | 1.95 | % | | | 0.05 | % |
Supplemental data | | | | | | | | |
Portfolio turnover rate | | | 23 | % | | | 31 | % |
Net assets, end of period (000s omitted) | | | $5,344 | | | | $27 | |
| 1 | For the period from September 30, 2015 (commencement of class operations) to October 31, 2015 |
| 2 | Calculated based upon average shares outstanding |
| 3 | Amount is less than $0.005. |
| 4 | Returns for periods of less than one year are not annualized. |
The accompanying notes are an integral part of these financial statements.
| | | | | | |
| Financial highlights | | Wells Fargo Diversified International Fund | | | 25 | |
(For a share outstanding throughout each period)
| | | | | | | | | | | | | | | | | | | | | | | | |
| | | Six months ended
April 30, 2016 (unaudited) | | | Year ended October 31 | |
| ADMINISTRATOR CLASS | | | 2015 | | | 2014 | | | 2013 | | | 2012 | | | 2011 | |
Net asset value, beginning of period | | | $11.87 | | | | $12.23 | | | | $12.47 | | | | $10.42 | | | | $9.68 | | | | $10.28 | |
Net investment income | | | 0.08 | 1 | | | 0.16 | 1 | | | 0.26 | 1 | | | 0.19 | 1 | | | 0.21 | 1 | | | 0.05 | 1 |
Net realized and unrealized gains (losses) on investments | | | (0.58 | ) | | | (0.22 | ) | | | (0.30 | ) | | | 2.47 | | | | 0.53 | | | | (0.52 | ) |
| | | | | | | | | | | | | | | | | | | | | | | | |
Total from investment operations | | | (0.50 | ) | | | (0.06 | ) | | | (0.04 | ) | | | 2.66 | | | | 0.74 | | | | (0.47 | ) |
Distributions to shareholders from | | | | | | | | | | | | | | | | | | | | | | | | |
Net investment income | | | (0.13 | ) | | | (0.30 | ) | | | (0.20 | ) | | | (0.61 | ) | | | 0.00 | | | | (0.13 | ) |
Net asset value, end of period | | | $11.24 | | | | $11.87 | | | | $12.23 | | | | $12.47 | | | | $10.42 | | | | $9.68 | |
Total return2 | | | (4.24 | )% | | | (0.46 | )% | | | (0.39 | )% | | | 26.85 | % | | | 7.64 | % | | | (4.69 | )% |
Ratios to average net assets (annualized) | | | | | | | | | | | | | | | | | | | | | | | | |
Gross expenses | | | 1.68 | % | | | 1.72 | % | | | 1.60 | % | | | 1.74 | % | | | 1.52 | % | | | 1.35 | % |
Net expenses | | | 1.25 | % | | | 1.25 | % | | | 1.25 | % | | | 1.25 | % | | | 1.25 | % | | | 1.24 | % |
Net investment income | | | 1.37 | % | | | 1.31 | % | | | 2.10 | % | | | 1.72 | % | | | 2.11 | % | | | 0.44 | % |
Supplemental data | | | | | | | | | | | | | | | | | | | | | | | | |
Portfolio turnover rate | | | 23 | % | | | 31 | % | | | 33 | % | | | 40 | % | | | 57 | % | | | 53 | % |
Net assets, end of period (000s omitted) | | | $12,923 | | | | $10,540 | | | | $7,283 | | | | $8,195 | | | | $3,504 | | | | $3,421 | |
| 1 | Calculated based upon average shares outstanding |
| 2 | Returns for periods of less than one year are not annualized. |
The accompanying notes are an integral part of these financial statements.
| | | | |
| 26 | | Wells Fargo Diversified International Fund | | Financial highlights |
(For a share outstanding throughout each period)
| | | | | | | | | | | | | | | | | | | | | | | | |
| | | Six months ended
April 30, 2016 (unaudited) | | | Year ended October 31 | |
| INSTITUTIONAL CLASS | | | 2015 | | | 2014 | | | 2013 | | | 2012 | | | 2011 | |
Net asset value, beginning of period | | | $11.14 | | | | $11.50 | | | | $11.79 | | | | $10.20 | | | | $9.69 | | | | $10.29 | |
Net investment income | | | 0.09 | 1 | | | 0.17 | 1 | | | 0.26 | 1 | | | 0.20 | 1 | | | 0.19 | 1 | | | 0.23 | |
Net realized and unrealized gains (losses) on investments | | | (0.54 | ) | | | (0.20 | ) | | | (0.27 | ) | | | 2.37 | | | | 0.51 | | | | (0.68 | ) |
| | | | | | | | | | | | | | | | | | | | | | | | |
Total from investment operations | | | (0.45 | ) | | | (0.03 | ) | | | (0.01 | ) | | | 2.57 | | | | 0.70 | | | | (0.45 | ) |
Distributions to shareholders from | | | | | | | | | | | | | | | | | | | | | | | | |
Net investment income | | | (0.13 | ) | | | (0.33 | ) | | | (0.28 | ) | | | (0.98 | ) | | | (0.19 | ) | | | (0.15 | ) |
Net asset value, end of period | | | $10.56 | | | | $11.14 | | | | $11.50 | | | | $11.79 | | | | $10.20 | | | | $9.69 | |
Total return2 | | | (4.09 | )% | | | (0.23 | )% | | | (0.18 | )% | | | 27.28 | % | | | 7.51 | % | | | (4.48 | )% |
Ratios to average net assets (annualized) | | | | | | | | | | | | | | | | | | | | | | | | |
Gross expenses | | | 1.43 | % | | | 1.47 | % | | | 1.33 | % | | | 1.50 | % | | | 1.20 | % | | | 1.03 | % |
Net expenses | | | 0.99 | % | | | 0.99 | % | | | 0.99 | % | | | 0.99 | % | | | 0.99 | % | | | 0.99 | % |
Net investment income | | | 1.80 | % | | | 1.45 | % | | | 2.23 | % | | | 1.94 | % | | | 1.96 | % | | | 2.17 | % |
Supplemental data | | | | | | | | | | | | | | | | | | | | | | | | |
Portfolio turnover rate | | | 23 | % | | | 31 | % | | | 33 | % | | | 40 | % | | | 57 | % | | | 53 | % |
Net assets, end of period (000s omitted) | | | $21,257 | | | | $7,106 | | | | $2,683 | | | | $2,406 | | | | $7,367 | | | | $419,925 | |
| 1 | Calculated based upon average shares outstanding |
| 2 | Returns for periods of less than one year are not annualized. |
The accompanying notes are an integral part of these financial statements.
| | | | | | |
| Notes to financial statements (unaudited) | | Wells Fargo Diversified International Fund | | | 27 | |
1. ORGANIZATION
Wells Fargo Funds Trust (the “Trust”), a Delaware statutory trust organized on March 10, 1999, is an open-end management investment company registered under the Investment Company Act of 1940, as amended (the “1940 Act”). As an investment company, the Trust follows the accounting and reporting guidance in Financial Accounting Standards Board (“FASB”) Accounting Standards Codification Topic 946, Financial Services – Investment Companies. These financial statements report on the Wells Fargo Diversified International Fund (the “Fund”) which is a diversified series of the Trust.
Effective at the close of business on October 23, 2015, Investor Class shares became Class A shares in a tax-free conversion. Shareholders of Investor Class received Class A shares at a value equal to the value of their Investor Class shares immediately prior to the conversion. Investor Class shares are no longer offered by the Fund.
2. SIGNIFICANT ACCOUNTING POLICIES
The following significant accounting policies, which are consistently followed in the preparation of the financial statements of the Fund, are in conformity with U.S. generally accepted accounting principles which require management to make estimates and assumptions that affect the reported amounts of assets and liabilities, disclosure of contingent assets and liabilities at the date of the financial statements, and the reported amounts of revenues and expenses during the reporting period. Actual results could differ from those estimates.
Securities valuation
All investments are valued each business day as of the close of regular trading on the New York Stock Exchange (generally 4 p.m. Eastern Time), although the Fund may deviate from this calculation time under unusual or unexpected circumstances.
Equity securities that are listed on a foreign or domestic exchange or market are valued at the official closing price or, if none, the last sales price. If no sale occurs on the principal exchange or market that day, the prior day’s price will be deemed “stale” and a fair value price will be determined in accordance with the Fund’s Valuation Procedures.
The values of securities denominated in foreign currencies are translated into U.S. dollars at rates provided by an independent foreign currency pricing source at a time each business day specified by the Management Valuation Team of Wells Fargo Funds Management, LLC (“Funds Management”).
Many securities markets and exchanges outside the U.S. close prior to the close of the New York Stock Exchange and therefore may not fully reflect trading or events that occur after the close of the principal exchange in which the foreign securities are traded, but before the close of the New York Stock Exchange. If such trading or events are expected to materially affect the value of such securities, then fair value pricing procedures approved by the Board of Trustees of the Fund are applied. These procedures take into account multiple factors including movements in U.S. securities markets after foreign exchanges close. Foreign securities that are fair valued under these procedures are categorized as Level 2 and the application of these procedures may result in transfers between Level 1 and Level 2. Depending on market activity, such fair valuations may be frequent. Such fair value pricing may result in net asset values that are higher or lower than net asset values based on the last reported sales price or latest quoted bid price. On April 30, 2016, such fair value pricing was not used in pricing foreign securities.
Investments in registered open-end investment companies are valued at net asset value. Interests in non-registered investment vehicles that are redeemable at net asset value are fair valued normally at net asset value.
Investments which are not valued using any of the methods discussed above are valued at their fair value, as determined in good faith by the Board of Trustees. The Board of Trustees has established a Valuation Committee comprised of the Trustees and has delegated to it the authority to take any actions regarding the valuation of portfolio securities that the Valuation Committee deems necessary or appropriate, including determining the fair value of portfolio securities, unless the determination has been delegated to the Management Valuation Team. The Board of Trustees retains the authority to make or ratify any valuation decisions or approve any changes to the Valuation Procedures as it deems appropriate. On a quarterly basis, the Board of Trustees receives reports on any valuation actions taken by the Valuation Committee or the Management Valuation Team which may include items for ratification.
Valuations of fair valued securities are compared to the next actual sales price when available, or other appropriate market values, to assess the continued appropriateness of the fair valuation methodologies used. These securities are fair valued on a day-to-day basis, taking into consideration changes to appropriate market information and any significant changes to the inputs considered in the valuation process until there is a readily available price provided on an exchange or by an independent pricing service. Valuations received from an independent pricing service or independent broker-dealer quotes
| | | | |
| 28 | | Wells Fargo Diversified International Fund | | Notes to financial statements (unaudited) |
are periodically validated by comparisons to most recent trades and valuations provided by other independent pricing services in addition to the review of prices by the manager and/or subadviser. Unobservable inputs used in determining fair valuations are identified based on the type of security, taking into consideration factors utilized by market participants in valuing the investment, knowledge about the issuer and the current market environment.
Foreign currency translation
The accounting records of the Fund are maintained in U.S. dollars. The values of other assets and liabilities denominated in foreign currencies are translated into U.S. dollars at rates provided by an independent foreign currency pricing source at a time each business day specified by the Management Valuation Team. Purchases and sales of securities, and income and expenses are converted at the rate of exchange on the respective dates of such transactions. Net realized foreign exchange gains or losses arise from sales of foreign currencies, currency gains or losses realized between the trade and settlement dates on securities transactions, and the difference between the amounts of dividends, interest and foreign withholding taxes recorded and the U.S. dollar equivalent of the amounts actually paid or received. Net unrealized foreign exchange gains and losses arise from changes in the fair value of assets and liabilities other than investments in securities resulting from changes in exchange rates. The changes in net assets arising from changes in exchange rates and the changes in net assets resulting from changes in market prices of securities are not separately presented. Such changes are included in net realized and unrealized gains or losses from investments.
Forward foreign currency contracts
The Fund is subject to foreign currency exchange rate risk in the normal course of pursuing its investment objectives. A forward foreign currency contract is an agreement between two parties to purchase or sell a specific currency for an agreed-upon price at a future date. The Fund enters into forward foreign currency contracts to facilitate transactions in foreign-denominated securities and to attempt to minimize the risk to the Fund from adverse changes in the relationship between currencies. Forward foreign currency contracts are recorded at the forward rate and marked-to-market daily. When the contracts are closed, realized gains and losses arising from such transactions are recorded as realized gains or losses on forward foreign currency contract transactions. The Fund could be exposed to risks if the counterparties to the contracts are unable to meet the terms of their contracts or if the value of the foreign currency changes unfavorably. The Fund’s maximum risk of loss from counterparty credit risk is the unrealized gains on the contracts. This risk may be mitigated if there is a master netting arrangement between the Fund and the counterparty.
Security loans
The Fund may lend its securities from time to time in order to earn additional income in the form of fees or interest on securities received as collateral or the investment of any cash received as collateral. The Fund continues to receive interest or dividends on the securities loaned. The Fund receives collateral in the form of cash or securities with a value at least equal to the value of the securities on loan. The value of the loaned securities is determined at the close of each business day and any additional required collateral is delivered to the Fund on the next business day. In a securities lending transaction, the net asset value of the Fund will be affected by an increase or decrease in the value of the securities loaned and by an increase or decrease in the value of the instrument in which collateral is invested. The amount of securities lending activity undertaken by the Fund fluctuates from time to time. In the event of default or bankruptcy by the borrower, the Fund may be prevented from recovering the loaned securities or gaining access to the collateral or may experience delays or costs in doing so. In addition, the investment of any cash collateral received may lose all or part of its value. The Fund has the right under the lending agreement to recover the securities from the borrower on demand.
The Fund lends its securities through an unaffiliated securities lending agent. Cash collateral received in connection with its securities lending transactions is invested in Securities Lending Cash Investments, LLC (the “Securities Lending Fund”). The Securities Lending Fund is exempt from registration under Section 3(c)(7) of the 1940 Act and is managed by Funds Management and is subadvised by Wells Capital Management Incorporated (“WellsCap”), an affiliate of Funds Management and an indirect wholly owned subsidiary of Wells Fargo & Company (“Wells Fargo”). Funds Management receives an advisory fee starting at 0.05% and declining to 0.01% as the average daily net assets of the Securities Lending Fund increase. All of the fees received by Funds Management are paid to WellsCap for its services as subadviser. The Securities Lending Fund seeks to provide a positive return compared to the daily Fed Funds Open rate by investing in high-quality, U.S. dollar-denominated short-term money market instruments. Securities Lending Fund investments are fair valued based upon the amortized cost valuation technique. Income earned from investment in the Securities Lending Fund is included in securities lending income on the Statement of Operations.
Security transactions and income recognition
Securities transactions are recorded on a trade date basis. Realized gains or losses are recorded on the basis of identified cost.
| | | | | | |
| Notes to financial statements (unaudited) | | Wells Fargo Diversified International Fund | | | 29 | |
Dividend income is recognized on the ex-dividend date, except for certain dividends from foreign securities, which are recorded as soon as the custodian verifies the ex-dividend date. Dividend income from foreign securities is recorded net of foreign taxes withheld where recovery of such taxes is not assured.
Distributions to shareholders
Distributions to shareholders from net investment income and net realized gains, if any, are recorded on the ex-dividend date. Such distributions are determined in conformity with federal income tax regulations, which may differ in amount or character from net investment income and realized gains recognized for purposes of U.S. generally accepted accounting principles.
Federal and other taxes
The Fund intends to continue to qualify as a regulated investment company by distributing substantially all of its investment company taxable income and any net realized capital gains (after reduction for capital loss carryforwards) sufficient to relieve it from all, or substantially all, federal income taxes. Accordingly, no provision for federal income taxes was required.
The Fund’s income and federal excise tax returns and all financial records supporting those returns for the prior three fiscal years are subject to examination by the federal and Delaware revenue authorities. Management has analyzed the Fund’s tax positions taken on federal, state, and foreign tax returns for all open tax years and does not believe that there are any uncertain tax positions that require recognition of a tax liability.
Capital loss carryforwards that do not expire are required to be utilized prior to capital loss carryforwards that expire. As of October 31, 2015, capital loss carryforwards available to offset future net realized capital gains were as follows through the indicated expiration dates:
| | | | |
| | | No expiration |
| 2017 | | Short-term | | Long-term |
| $89,306,475 | | $9,194,452 | | $2,025,419 |
Class allocations
The separate classes of shares offered by the Fund differ principally in applicable sales charges, distribution, shareholder servicing, and administration fees. Class specific expenses are charged directly to that share class. Investment income, common expenses, and realized and unrealized gains (losses) on investments are allocated daily to each class of shares based on the relative proportion of net assets of each class.
3. FAIR VALUATION MEASUREMENTS
Fair value measurements of investments are determined within a framework that has established a fair value hierarchy based upon the various data inputs utilized in determining the value of the Fund’s investments. The three-level hierarchy gives the highest priority to unadjusted quoted prices in active markets for identical assets or liabilities (Level 1) and the lowest priority to significant unobservable inputs (Level 3). The Fund’s investments are classified within the fair value hierarchy based on the lowest level of input that is significant to the fair value measurement. The inputs are summarized into three broad levels as follows:
| n | | Level 1 – quoted prices in active markets for identical securities |
| n | | Level 2 – other significant observable inputs (including quoted prices for similar securities, interest rates, prepayment speeds, credit risk, use of amortized cost, etc.) |
| n | | Level 3 – significant unobservable inputs (including the Fund’s own assumptions in determining the fair value of investments) |
The inputs or methodologies used for valuing investments in securities are not necessarily an indication of the risk associated with investing in those securities.
| | | | |
| 30 | | Wells Fargo Diversified International Fund | | Notes to financial statements (unaudited) |
The following is a summary of the inputs used in valuing the Fund’s assets and liabilities as of April 30, 2016:
| | | | | | | | | | | | | | | | |
| | | Quoted prices
(Level 1) | | | Other significant
observable inputs
(Level 2) | | | Significant
unobservable inputs
(Level 3) | | | Total | |
Assets | | | | | | | | | | | | | | | | |
Investments in: | | | | | | | | | | | | | | | | |
| | | | |
Common stocks | | | | | | | | | | | | | | | | |
Australia | | $ | 1,933,850 | | | $ | 6,648 | | | $ | 0 | | | $ | 1,940,498 | |
Austria | | | 314,061 | | | | 0 | | | | 0 | | | | 314,061 | |
Belgium | | | 1,164,894 | | | | 0 | | | | 0 | | | | 1,164,894 | |
Brazil | | | 375,611 | | | | 0 | | | | 0 | | | | 375,611 | |
Canada | | | 2,243,825 | | | | 0 | | | | 0 | | | | 2,243,825 | |
China | | | 5,429,616 | | | | 0 | | | | 0 | | | | 5,429,616 | |
Czech Republic | | | 95,722 | | | | 0 | | | | 0 | | | | 95,722 | |
Denmark | | | 205,003 | | | | 0 | | | | 0 | | | | 205,003 | |
Finland | | | 139,157 | | | | 0 | | | | 0 | | | | 139,157 | |
France | | | 7,849,395 | | | | 0 | | | | 0 | | | | 7,849,395 | |
Germany | | | 14,800,979 | | | | 0 | | | | 0 | | | | 14,800,979 | |
Hong Kong | | | 2,714,919 | | | | 0 | | | | 0 | | | | 2,714,919 | |
Hungary | | | 69,552 | | | | 0 | | | | 0 | | | | 69,552 | |
India | | | 226,188 | | | | 0 | | | | 0 | | | | 226,188 | |
Ireland | | | 2,477,354 | | | | 0 | | | | 0 | | | | 2,477,354 | |
Israel | | | 451,909 | | | | 0 | | | | 0 | | | | 451,909 | |
Italy | | | 3,688,075 | | | | 0 | | | | 0 | | | | 3,688,075 | |
Japan | | | 19,369,471 | | | | 0 | | | | 0 | | | | 19,369,471 | |
Liechtenstein | | | 114,841 | | | | 0 | | | | 0 | | | | 114,841 | |
Mexico | | | 413,787 | | | | 0 | | | | 0 | | | | 413,787 | |
Netherlands | | | 3,063,070 | | | | 0 | | | | 0 | | | | 3,063,070 | |
Norway | | | 947,014 | | | | 0 | | | | 0 | | | | 947,014 | |
Poland | | | 89,498 | | | | 0 | | | | 0 | | | | 89,498 | |
Russia | | | 302,400 | | | | 0 | | | | 0 | | | | 302,400 | |
Singapore | | | 341,139 | | | | 0 | | | | 0 | | | | 341,139 | |
South Africa | | | 262,009 | | | | 0 | | | | 0 | | | | 262,009 | |
South Korea | | | 2,541,490 | | | | 0 | | | | 0 | | | | 2,541,490 | |
Spain | | | 1,803,029 | | | | 0 | | | | 0 | | | | 1,803,029 | |
Sweden | | | 1,130,980 | | | | 0 | | | | 0 | | | | 1,130,980 | |
Switzerland | | | 8,195,394 | | | | 0 | | | | 0 | | | | 8,195,394 | |
Taiwan | | | 686,863 | | | | 0 | | | | 0 | | | | 686,863 | |
Thailand | | | 262,067 | | | | 0 | | | | 0 | | | | 262,067 | |
United Kingdom | | | 18,574,859 | | | | 0 | | | | 0 | | | | 18,574,859 | |
United States | | | 2,135,992 | | | | 0 | | | | 0 | | | | 2,135,992 | |
| | | | |
Participation Notes | | | | | | | | | | | | | | | | |
China | | | 0 | | | | 468,161 | | | | 0 | | | | 468,161 | |
Ireland | | | 0 | | | | 540,379 | | | | 0 | | | | 540,379 | |
| | | | |
Preferred Stocks | | | | | | | | | | | | | | | | |
Brazil | | | 27,087 | | | | 0 | | | | 0 | | | | 27,087 | |
Germany | | | 358,395 | | | | 0 | | | | 0 | | | | 358,395 | |
| | | | |
Short-term investments | | | | | | | | | | | | | | | | |
Investment companies | | | 4,178,623 | | | | 0 | | | | 0 | | | | 4,178,623 | |
Investments measured at net asset value* | | | | | | | | | | | | | | | 2,316,326 | |
| | | 108,978,118 | | | | 1,015,188 | | | | 0 | | | | 112,309,632 | |
Forward foreign currency contracts | | | 0 | | | | 1,425 | | | | 0 | | | | 1,425 | |
Total assets | | $ | 108,978,118 | | | $ | 1,016,613 | | | $ | 0 | | | $ | 112,311,057 | |
Liabilities | | | | | | | | | | | | | | | | |
Forward foreign currency contracts | | $ | 0 | | | $ | 30,983 | | | $ | 0 | | | $ | 30,983 | |
Total liabilities | | $ | 0 | | | $ | 30,983 | | | $ | 0 | | | $ | 30,983 | |
| * | Investments that are measured at fair value using the net asset value per share (or its equivalent) as a practical expedient have not been categorized in the fair value hierarchy. The fair value amount presented in the table is intended to permit reconciliation of the fair value hierarchy to the amounts presented in the Statement of Assets and Liabilities. The Fund’s investment in Securities Lending Cash Investments, LLC valued at $2,316,326 does not have a redemption period notice, can be redeemed daily and does not have any unfunded commitments. |
| | | | | | |
| Notes to financial statements (unaudited) | | Wells Fargo Diversified International Fund | | | 31 | |
Forward foreign currency contracts are reported at their unrealized gains (losses) at measurement date, which represents the change in the contract’s value from trade date. All other assets and liabilities are reported at their market value at measurement date.
The Fund recognizes transfers between levels within the fair value hierarchy at the end of the reporting period. Fair value pricing that was used in pricing certain foreign securities at the previous period end was not used at April 30, 2016. As a result, common stocks and preferred stocks valued at $80,642,918 and $385,482, respectively were transferred from Level 2 to Level 1 within the fair value hierarchy. The Fund did not have any transfers into/out of Level 3.
4. TRANSACTIONS WITH AFFILIATES AND OTHER EXPENSES
Management fee
Funds Management, an indirect wholly owned subsidiary of Wells Fargo, is the manager of the Fund and provides advisory and fund-level administrative services under an investment management agreement. Under the investment management agreement, Funds Management is responsible for, among other services, implementing the investment objectives and strategies of the Fund, supervising the applicable subadviser, providing fund-level administrative services in connection with the Fund’s operations, and providing any other fund-level administrative services reasonably necessary for the operation of the Fund. As compensation for its services under the investment management agreement, Funds Management is entitled to receive an annual management fee starting at 0.90% and declining to 0.73% as the average daily net assets of the Fund increase. For the six months ended April 30, 2016, the management fee was equivalent to an annual rate of 0.90% of the Fund’s average daily net assets.
Funds Management has retained the services of certain subadvisers to provide daily portfolio management to the Fund. The fee for subadvisory services is borne by Funds Management. Artisan Partners Limited Partnership, LSV Asset Management, and Wells Cap are the subadvisers to the Fund and are each entitled to receive a fee from Funds Management which is calculated based on the average daily net assets of the Fund as follows:
| | | | | | | | |
| | | Annual subadvisory fee | |
| | | starting at | | | declining to | |
Artisan Partners Limited Partnership | | | 0.80 | % | | | 0.50 | % |
LSV Asset Management | | | 0.35 | | | | 0.30 | |
WellsCap | | | 0.45 | | | | 0.40 | |
Administration fees
Under a class-level administration agreement, Funds Management provides class-level administrative services to the Fund, which includes paying fees and expenses for services provided by the transfer agent, sub-transfer agents, omnibus account servicers and record-keepers. As compensation for its services under the class-level administration agreement, Funds Management receives an annual fee which is calculated based on the average daily net assets of each class as follows:
| | | | |
| | | Class-level
administration fee | |
Class A, Class B, Class C, Class R | | | 0.21 | % |
Class R6 | | | 0.03 | |
Administrator Class, Institutional Class | | | 0.13 | |
Funds Management has contractually waived and/or reimbursed management and administration fees to the extent necessary to maintain certain net operating expense ratios for the Fund. Waiver of fees and/or reimbursement of expenses by Funds Management were made first from fund level expenses on a proportionate basis and then from class specific expenses. Funds Management has committed through February 28, 2017 to waive fees and/or reimburse expenses to the extent necessary to cap the Fund’s expenses at 1.35% for Class A shares, 2.10% for Class B shares, 2.10% for Class C shares, 1.60% for Class R shares, 0.89% for Class R6 shares, 1.25% for Administrator Class shares, and 0.99% for Institutional Class shares. After this time, the cap may be increased or the commitment to maintain the cap may be terminated only with the approval of the Board of Trustees. Prior to March 1, 2016, the Fund’s expenses were capped at 1.41% for Class A shares, 2.16% for Class B shares, and 2.16% for Class C shares.
| | | | |
| 32 | | Wells Fargo Diversified International Fund | | Notes to financial statements (unaudited) |
Distribution fees
The Trust has adopted a distribution plan for Class B, Class C, and Class R shares of the Fund pursuant to Rule 12b-1 under the 1940 Act. Distribution fees are charged to Class B, Class C, and Class R shares and paid to Wells Fargo Funds Distributor, LLC (“Funds Distributor”), the principal underwriter, at an annual rate of 0.75% of the average daily net assets of Class B and Class C shares and 0.25% of the average daily net assets of Class R shares.
In addition, Funds Distributor is entitled to receive the front-end sales charge from the purchase of Class A shares and a contingent deferred sales charge on the redemption of certain Class A shares. Funds Distributor is also entitled to receive the contingent deferred sales charges from redemptions of Class B and Class C shares. For the six months ended April 30, 2016, Funds Distributor received $493 from the sale of Class A shares and $46 in contingent deferred sales charges from redemptions of Class A.
Shareholder servicing fees
The Trust has entered into contracts with one or more shareholder servicing agents, whereby Class A, Class B, Class C, Class R, and Administrator Class of the Fund are charged a fee at an annual rate of 0.25% of the average daily net assets of each respective class.
A portion of these total shareholder servicing fees were paid to affiliates of Wells Fargo.
5. INVESTMENT PORTFOLIO TRANSACTIONS
Purchases and sales of investments, excluding U.S. government obligations (if any) and short-term securities, for the six months ended April 30, 2016 were $42,686,864 and $22,569,293, respectively.
6. DERIVATIVE TRANSACTIONS
During the six months ended April 30, 2016, the Fund entered into forward foreign currency contracts for economic hedging purposes.
At April 30, 2016, the Fund had forward foreign currency contracts outstanding as follows:
Forward foreign currency contracts to buy:
| | | | | | | | | | | | | | | | | | |
| Exchange date | | Counterparty | | Contracts to
receive | | | U.S. value at April 30, 2016 | | | In exchange for U.S. $ | | | Unrealized
gains | |
| 7-13-2016 | | Citibank | | | 7,771,000 | JPY | | $ | 73,182 | | | $ | 71,757 | | | $ | 1,425 | |
Forward foreign currency contracts to sell:
| | | | | | | | | | | | | | | | | | |
| Exchange date | | Counterparty | | Contracts to
deliver | | | U.S. value at April 30, 2016 | | | In exchange for U.S. $ | | | Unrealized
losses | |
| 5-11-2016 | | Morgan Stanley | | | 493,000 | EUR | | $ | 564,639 | | | $ | 555,829 | | | $ | (8,810 | ) |
| 6-15-2016 | | Morgan Stanley | | | 310,000 | EUR | | | 355,422 | | | | 347,087 | | | | (8,335 | ) |
| 7-13-2016 | | Citibank | | | 75,231,000 | JPY | | | 708,472 | | | | 698,595 | | | | (9,877 | ) |
| 7-13-2016 | | Credit Suisse | | | 1,080,251 | EUR | | | 1,239,655 | | | | 1,238,621 | | | | (1,034 | ) |
| 7-25-2016 | | Morgan Stanley | | | 87,400 | GBP | | | 127,737 | | | | 126,762 | | | | (975 | ) |
| 7-25-2016 | | Morgan Stanley | | | 87,400 | GBP | | | 127,737 | | | | 127,636 | | | | (101 | ) |
| 7-25-2016 | | Morgan Stanley | | | 87,400 | GBP | | | 127,737 | | | | 125,886 | | | | (1,851 | ) |
The Fund had average contract amounts of $992,211 and $4,401,273 in forward foreign currency contracts to buy and forward foreign currency contracts to sell, respectively, during the six months ended April 30, 2016.
The fair value, realized gains or losses and change in unrealized gains or losses, if any, on derivative instruments are reflected in the appropriate financial statements.
For certain types of derivative transactions, the Fund has entered into International Swaps and Derivatives Association, Inc. master agreements (“ISDA Master Agreements”) or similar agreements with approved counterparties. The ISDA Master Agreements or similar agreements may have requirements to deliver/deposit securities or cash to/with an exchange or broker-dealer as collateral and allows the Fund to offset, with each counterparty, certain derivative financial instrument’s assets and/or liabilities with collateral held or pledged. Collateral requirements differ by type of derivative.
| | | | | | |
| Notes to financial statements (unaudited) | | Wells Fargo Diversified International Fund | | | 33 | |
Collateral or margin requirements are set by the broker or exchange clearing house for exchange traded derivatives while collateral terms are contract specific for over-the-counter traded derivatives. Cash collateral that has been pledged to cover obligations of the Fund under ISDA Master Agreements or similar agreements, if any, are reported separately in the Statement of Assets and Liabilities. Securities pledged as collateral, if any, are noted in the Portfolio of Investments. With respect to balance sheet offsetting, absent an event of default by the counterparty or a termination of the agreement, the reported amounts of financial assets and financial liabilities in the Statement of Assets and Liabilities are not offset across transactions between the Fund and the applicable counterparty. A reconciliation of the gross amounts on the Statement of Assets and Liabilities to the net amounts by derivative type, including any collateral exposure, is as follows:
| | | | | | | | | | | | | | | | | | |
| Derivative type | | Counterparty | | Gross amounts
of assets in the
Statement of
Assets and
Liabilities | | | Amounts
subject to
netting
agreements | | | Collateral
received | | | Net amount
of assets | |
Forward foreign currency contracts | | Citibank | | $ | 1,425 | * | | $ | (1,425 | ) | | $ | 0 | | | $ | 0 | |
| * | Amount represents net unrealized gains. |
| | | | | | | | | | | | | | | | | | |
Derivative type | | Counterparty | | Gross amounts
of liabilities in the
Statement of
Assets and
Liabilities | | | Amounts
subject to
netting
agreements | | | Collateral
pledged | | | Net amount
of liabilities | |
Forward foreign currency contracts | | Morgan Stanley | | $ | 20,072 | ** | | $ | 0 | | | $ | 0 | | | $ | 20,072 | |
| | Citibank | | | 9,877 | ** | | | (1,425 | ) | | | 0 | | | | 8,452 | |
| | Credit Suisse | | | 1,034 | ** | | | 0 | | | | 0 | | | | 1,034 | |
| ** | Amount represents net unrealized losses. |
7. BANK BORROWINGS
The Trust (excluding the money market funds and certain other funds) and Wells Fargo Variable Trust are parties to a $200,000,000 revolving credit agreement whereby the Fund is permitted to use bank borrowings for temporary or emergency purposes, such as to fund shareholder redemption requests. Interest under the credit agreement is charged to the Fund based on a borrowing rate equal to the higher of the Federal Funds rate in effect on that day plus 1.25% or the overnight LIBOR rate in effect on that day plus 1.25%. In addition, an annual commitment fee equal to 0.20% of the unused balance is allocated to each participating fund.
For the six months ended April 30, 2016, there were no borrowings by the Fund under the agreement.
8. INDEMNIFICATION
Under the Trust’s organizational documents, the officers and Trustees have been granted certain indemnification rights against certain liabilities that may arise out of performance of their duties to the Trust. Additionally, in the normal course of business, the Trust may enter into contracts with service providers that contain a variety of indemnification clauses. The Trust’s maximum exposure under these arrangements is dependent on future claims that may be made against the Fund and, therefore, cannot be estimated.
| | | | |
| 34 | | Wells Fargo Diversified International Fund | | Other information (unaudited) |
TAX INFORMATION
Pursuant to Section 853 of the Internal Revenue Code, the following amounts have been designated as foreign taxes paid for the fiscal year ended April 30, 2016. These amounts may be less than the actual foreign taxes paid for financial statement purposes. Foreign taxes paid or withheld should be included in taxable income with an offsetting deduction from gross income or as a credit for taxes paid to foreign governments. None of the income was derived from ineligible foreign sources as defined under Section 901(j) of the Internal Revenue Code.
| | | | |
Creditable foreign taxes paid | | Per share amount | | Foreign income as % of ordinary income distributions |
| $111,658 | | $0.0136 | | 91.13% |
PROXY VOTING INFORMATION
A description of the policies and procedures that the Fund uses to determine how to vote proxies relating to portfolio securities is available, upon request, by calling 1-800-222-8222, visiting our website at wellsfargofunds.com, or visiting the SEC website at sec.gov. Information regarding how the Fund voted proxies relating to portfolio securities during the most recent 12-month period ended June 30 is available on the Fund’s website at wellsfargofunds.com or by visiting the SEC website at sec.gov.
PORTFOLIO HOLDINGS INFORMATION
The complete portfolio holdings for the Fund are publicly available monthly on the Fund’s website (wellsfargofunds.com), on a one-month delayed basis. In addition, top ten holdings information (excluding derivative positions) for the Fund is publicly available on the Fund’s website on a monthly, seven-day or more delayed basis. The Fund files its complete schedule of portfolio holdings with the SEC for the first and third quarters of each fiscal year on Form N-Q, which is available by visiting the SEC website at sec.gov. In addition, the Fund’s Form N-Q may be reviewed and copied at the SEC’s Public Reference Room in Washington, DC, and at regional offices in New York City, at 233 Broadway, and in Chicago, at 175 West Jackson Boulevard, Suite 900. Information about the Public Reference Room may be obtained by calling 1-800-SEC-0330.
| | | | | | |
| Other information (unaudited) | | Wells Fargo Diversified International Fund | | | 35 | |
BOARD OF TRUSTEES AND OFFICERS
Each of the Trustees and Officers1 listed in the table below acts in identical capacities for each fund in the Wells Fargo family of funds, which consists of 141 mutual funds comprising the Wells Fargo Funds Trust, Wells Fargo Variable Trust, Wells Fargo Master Trust and four closed-end funds (collectively the “Fund Complex”). This table should be read in conjunction with the Prospectus and the Statement of Additional Information2. The mailing address of each Trustee and Officer is 525 Market Street, 12th Floor, San Francisco, CA 94105. Each Trustee and Officer serves an indefinite term, however, each Trustee serves such term until reaching the mandatory retirement age established by the Trustees.
Independent Trustees
| | | | | | |
Name and year of birth | | Position held and length of service* | | Principal occupations during past five years or longer | | Current other public
company or investment
company directorships |
William R. Ebsworth
(Born 1957) | | Trustee, since 2015 | | Retired. From 1984 to 2013, equities analyst, portfolio manager, research director and chief financial officer at Fidelity Management and Research Company in Boston, Tokyo, and Hong Kong and retired in 2013 as Chief Investment Officer of Fidelity Strategic Advisers, Inc. where he lead a team of investment professionals managing client assets. Prior thereto, Board member of Hong Kong Securities Clearing Co., Hong Kong Options Clearing Corp., the Thailand International Fund, Ltd., Fidelity Investments Life Insurance Company, and Empire Fidelity Investments Life Insurance Company. Mr. Ebsworth is a CFA ® charterholder and an Adjunct Adjunct Lecturer, Finance, at Babson College. | | Asset Allocation Trust |
Jane A. Freeman
(Born 1953) | | Trustee, since 2015 | | Retired. From 2012 to 2014 and 1999 to 2008, Chief Financial Officer of Scientific Learning Corporation. From 2008 to 2012, Ms. Freeman provided consulting services related to strategic business projects. Prior to 1999, Portfolio Manager at Rockefeller & Co. and Scudder, Stevens & Clark. Board member of the Harding Loevner Funds from 1996 to 2014, serving as both Lead Independent Director and chair of the Audit Committee. Board member of the Russell Exchange Traded Funds Trust from 2011 to 2012 and the chair of the Audit Committee. Ms. Freeman is Chair of Taproot Foundation (non-profit organization), a Board Member of Ruth Bancroft Garden (non-profit organization) and an inactive chartered financial analyst. | | Asset Allocation Trust |
Peter G. Gordon
(Born 1942) | | Trustee, since 1998; Chairman, since 2005 | | Co-Founder, Retired Chairman, President and CEO of Crystal Geyser Water Company. Trustee Emeritus, Colby College. | | Asset Allocation Trust |
Isaiah Harris, Jr.
(Born 1952) | | Trustee, since 2009 | | Retired. Chairman of the Board of CIGNA Corporation since 2009, and Director since 2005. From 2003 to 2011, Director of Deluxe Corporation. Prior thereto, President and CEO of BellSouth Advertising and Publishing Corp. from 2005 to 2007, President and CEO of BellSouth Enterprises from 2004 to 2005 and President of BellSouth Consumer Services from 2000 to 2003. Emeritus member of the Iowa State University Foundation Board of Governors. Emeritus Member of the Advisory Board of Iowa State University School of Business. Advisory Board Member, Palm Harbor Academy (charter school). Advisory Board Member, Child Evangelism Fellowship (non-profit). Mr. Harris is a certified public accountant (inactive status). | | CIGNA Corporation; Asset Allocation Trust |
| Judith M. Johnson (Born 1949) | | Trustee, since 2008; Audit Committee Chairman, since 2008 | | Retired. Prior thereto, Chief Executive Officer and Chief Investment Officer of Minneapolis Employees Retirement Fund from 1996 to 2008. Ms. Johnson is an attorney, certified public accountant and a certified managerial accountant. | | Asset Allocation Trust |
| David F. Larcker (Born 1950) | | Trustee, since 2009 | | James Irvin Miller Professor of Accounting at the Graduate School of Business, Stanford University, Director of the Corporate Governance Research Initiative and Senior Faculty of The Rock Center for Corporate Governance since 2006. From 2005 to 2008, Professor of Accounting at the Graduate School of Business, Stanford University. Prior thereto, Ernst & Young Professor of Accounting at The Wharton School, University of Pennsylvania from 1985 to 2005. | | Asset Allocation Trust |
| | | | |
| 36 | | Wells Fargo Diversified International Fund | | Other information (unaudited) |
| | | | | | |
Name and year of birth | | Position held and length of service* | | Principal occupations during past five years or longer | | Current other public
company or investment
company directorships |
| Olivia S. Mitchell (Born 1953) | | Trustee, since 2006 | | International Foundation of Employee Benefit Plans Professor, Wharton School of the University of Pennsylvania since 1993. Director of Wharton’s Pension Research Council and Boettner Center on Pensions & Retirement Research, and Research Associate at the National Bureau of Economic Research. Previously, Cornell University Professor from 1978 to 1993. | | Asset Allocation Trust |
| Timothy J. Penny (Born 1951) | | Trustee, since 1996 | | President and Chief Executive Officer of Southern Minnesota Initiative Foundation, a non-profit organization, since 2007 and Senior Fellow at the Humphrey Institute Policy Forum at the University of Minnesota since 1995. Member of the Board of Trustees of NorthStar Education Finance, Inc., a non-profit organization, since 2007. | | Asset Allocation Trust |
Michael S. Scofield
(Born 1943) | | Trustee, since 2010 | | Served on the Investment Company Institute’s Board of Governors and Executive Committee from 2008-2011 as well the Governing Council of the Independent Directors Council from 2006-2011 and the Independent Directors Council Executive Committee from 2008-2011. Chairman of the IDC from 2008-2010. Institutional Investor (Fund Directions) Trustee of Year in 2007. Trustee of the Evergreen Funds complex (and its predecessors) from 1984 to 2010. Chairman of the Evergreen Funds from 2000-2010. Former Trustee of the Mentor Funds. Retired Attorney, Law Offices of Michael S. Scofield. | | Asset Allocation Trust |
| * | Length of service dates reflect the Trustee’s commencement of service with the Trust’s predecessor entities, where applicable. |
Officers
| | | | | | |
Name and year of birth | | Position held and
length of service | | Principal occupations during past five years or longer | | |
Karla M. Rabusch
(Born 1959) | | President, since 2003 | | Executive Vice President of Wells Fargo Bank, N.A. and President of Wells Fargo Funds Management, LLC since 2003. | | |
Jeremy DePalma1
(Born 1974) | | Treasurer, since 2012 | | Senior Vice President of Wells Fargo Funds Management, LLC since 2009. Senior Vice President of Evergreen Investment Management Company, LLC from 2008 to 2010 and head of the Fund Reporting and Control Team within Fund Administration from 2005 to 2010. | | |
C. David Messman
(Born 1960) | | Secretary, since 2000; Chief Legal Officer, since 2003 | | Senior Vice President and Secretary of Wells Fargo Funds Management, LLC since 2001. Assistant General Counsel of Wells Fargo Bank, N.A. since 2013 and Vice President and Managing Counsel of Wells Fargo Bank, N.A. from 1996 to 2013. | | |
Michael Whitaker
(Born 1967) | | Chief Compliance Officer, since 2016* | | Executive Vice President of Wells Fargo Funds Management, LLC since 2016. Chief Compliance Officer of Fidelity’s Fixed Income Funds and Asset Allocation Funds from 2008 to 2016, Compliance Officer of FMR Co., Inc. from 2014 to 2016, Fidelity Investments Money Management, Inc. from 2014 to 2016, Fidelity Investments from 2007 to 2016. | | |
Debra Ann Early
(Born 1964) | | Chief Compliance Officer, since 2007** | | Executive Vice President of Wells Fargo Funds Management, LLC since 2014, Senior Vice President and Chief Compliance Officer from 2007 to 2014. | | |
David Berardi
(Born 1975) | | Assistant Treasurer, since 2009 | | Vice President of Wells Fargo Funds Management, LLC since 2009. Vice President of Evergreen Investment Management Company, LLC from 2008 to 2010. Manager of Fund Reporting and Control for Evergreen Investment Management Company, LLC from 2004 to 2010. | | |
| 1 | Jeremy DePalma acts as Treasurer of 69 funds and Assistant Treasurer of 72 funds in the Fund Complex. |
| 2 | The Statement of Additional Information includes additional information about the Trustees and is available, without charge, upon request, by calling 1-800-222-8222 or by visiting the website at wellsfargofunds.com. |
| * | Michael Whitaker became Chief Compliance Officer effective May 16, 2016. |
| ** | Debra Ann Early was the Chief Compliance Officer until May 15, 2016. |
| | | | | | |
| List of abbreviations | | Wells Fargo Diversified International Fund | | | 37 | |
The following is a list of common abbreviations for terms and entities that may have appeared in this report.
| ACA | — ACA Financial Guaranty Corporation |
| ADR | — American depositary receipt |
| ADS | — American depositary shares |
| AGC | — Assured Guaranty Corporation |
| AGM | — Assured Guaranty Municipal |
| Ambac | — Ambac Financial Group Incorporated |
| AMT | — Alternative minimum tax |
| BAN | — Bond anticipation notes |
| BHAC | — Berkshire Hathaway Assurance Corporation |
| CAB | — Capital appreciation bond |
| CCAB | — Convertible capital appreciation bond |
| CDA | — Community Development Authority |
| CDO | — Collateralized debt obligation |
| DRIVER | — Derivative inverse tax-exempt receipts |
| DW&P | — Department of Water & Power |
| DWR | — Department of Water Resources |
| ECFA | — Educational & Cultural Facilities Authority |
| EDA | — Economic Development Authority |
| EDFA | — Economic Development Finance Authority |
| ETF | — Exchange-traded fund |
| FDIC | — Federal Deposit Insurance Corporation |
| FFCB | — Federal Farm Credit Banks |
| FGIC | — Financial Guaranty Insurance Corporation |
| FHA | — Federal Housing Administration |
| FHLB | — Federal Home Loan Bank |
| FHLMC | — Federal Home Loan Mortgage Corporation |
| FICO | — The Financing Corporation |
| FNMA | — Federal National Mortgage Association |
| GDR | — Global depositary receipt |
| GNMA | — Government National Mortgage Association |
| HCFR | — Healthcare facilities revenue |
| HEFA | — Health & Educational Facilities Authority |
| HEFAR | — Higher education facilities authority revenue |
| HFA | — Housing Finance Authority |
| HFFA | — Health Facilities Financing Authority |
| HUD | — Department of Housing and Urban Development |
| IDA | — Industrial Development Authority |
| IDAG | — Industrial Development Agency |
| KRW | — Republic of Korea won |
| LIBOR | — London Interbank Offered Rate |
| LIFER | — Long Inverse Floating Exempt Receipts |
| LLC | — Limited liability company |
| LLLP | — Limited liability limited partnership |
| LLP | — Limited liability partnership |
| MBIA | — Municipal Bond Insurance Association |
| MFHR | — Multifamily housing revenue |
| MSTR | — Municipal securities trust receipts |
| MUD | — Municipal Utility District |
| National | — National Public Finance Guarantee Corporation |
| PCFA | — Pollution Control Financing Authority |
| PCL | — Public Company Limited |
| PCR | — Pollution control revenue |
| PFA | — Public Finance Authority |
| PFFA | — Public Facilities Financing Authority |
| PFOTER | — Puttable floating option tax-exempt receipts |
| plc | — Public limited company |
| PUTTER | — Puttable tax-exempt receipts |
| R&D | — Research & development |
| Radian | — Radian Asset Assurance |
| RAN | — Revenue anticipation notes |
| RDA | — Redevelopment Authority |
| RDFA | — Redevelopment Finance Authority |
| REIT | — Real estate investment trust |
| ROC | — Reset option certificates |
| SAVRS | — Select auction variable rate securities |
| SBA | — Small Business Authority |
| SDR | — Swedish depositary receipt |
| SFHR | — Single-family housing revenue |
| SFMR | — Single-family mortgage revenue |
| SPA | — Standby purchase agreement |
| SPDR | — Standard & Poor’s Depositary Receipts |
| SPEAR | — Short Puttable Exempt Adjustable Receipts |
| STRIPS | — Separate trading of registered interest and |
| TAN | — Tax anticipation notes |
| TIPS | — Treasury inflation-protected securities |
| TRAN | — Tax revenue anticipation notes |
| TTFA | — Transportation Trust Fund Authority |
| TVA | — Tennessee Valley Authority |
This page is intentionally left blank.
This page is intentionally left blank.
This page is intentionally left blank.

For more information
More information about Wells Fargo Funds is available free upon request. To obtain literature, please write, email, visit the Fund’s website, or call:
Wells Fargo Funds
P.O. Box 8266
Boston, MA 02266-8266
Email: fundservice@wellsfargo.com
Website: wellsfargofunds.com
Individual investors: 1-800-222-8222
Retail investment professionals: 1-888-877-9275
Institutional investment professionals: 1-866-765-0778
This report and the financial statements contained herein are submitted for the general information of the shareholders of the Fund. If this report is used for promotional purposes, distribution of the report must be accompanied or preceded by a current prospectus. Before investing, please consider the investment objectives, risks, charges, and expenses of the investment. For a current prospectus and, if available, a summary prospectus, containing this information, call 1-800-222-8222 or visit the Fund’s website at wellsfargofunds.com. Read the prospectus carefully before you invest or send money.
Wells Fargo Asset Management (WFAM) is a trade name used by the asset management businesses of Wells Fargo & Company. Wells Fargo Funds Management, LLC, a wholly owned subsidiary of Wells Fargo & Company, provides investment advisory and administrative services for Wells Fargo Funds. Other affiliates of Wells Fargo & Company provide subadvisory and other services for the funds. The funds are distributed by Wells Fargo Funds Distributor, LLC, Member FINRA, an affiliate of Wells Fargo & Company.
NOT FDIC INSURED ¡ NO BANK GUARANTEE ¡ MAY LOSE VALUE
© 2016 Wells Fargo Funds Management, LLC. All rights reserved.
| | |
 | | 242229 06-16 SA237/SAR237 04-16 |
Semi-Annual Report
April 30, 2016

Wells Fargo Emerging Markets Equity Fund


Reduce clutter. Save trees.
Sign up for electronic delivery of prospectuses and shareholder reports at wellsfargo.com/advantagedelivery
Contents
The views expressed and any forward-looking statements are as of April 30, 2016, unless otherwise noted, and are those of the Fund managers and/or Wells Fargo Funds Management, LLC. Discussions of individual securities, or the markets generally, or any Wells Fargo Fund are not intended as individual recommendations. Future events or results may vary significantly from those expressed in any forward-looking statements. The views expressed are subject to change at any time in response to changing circumstances in the market. Wells Fargo Funds Management, LLC and the Fund disclaim any obligation to publicly update or revise any views expressed or forward-looking statements.
NOT FDIC INSURED ¡ NO BANK GUARANTEE ¡ MAY LOSE VALUE
| | | | |
| 2 | | Wells Fargo Emerging Markets Equity Fund | | Letter to shareholders (unaudited) |

Karla M. Rabusch
President
Wells Fargo Funds
Despite the slowdown, China’s growth rate remained higher than that of most other economies.
Despite challenging fundamentals, the prospect that Brazil’s left-leaning president might soon be replaced by an investor-friendly center-right government boosted the country’s currency and stock markets later in the reporting period.
Dear Valued Shareholder:
We are pleased to offer you this semi-annual report for the Wells Fargo Emerging Market Equity Fund for the six-month period that ended April 30, 2016. The reporting period was marked by concerns about slowing economic growth in China and political upheaval in Brazil and South Africa.
Even as the Fed tightened its monetary policy, the People’s Bank of China remained accommodative.
Entering the reporting period, many emerging markets commentaries focused on the potential effect of the U.S. Federal Reserve (Fed) raising its key interest rate. In fact, a combination of U.S. moderate economic growth and low inflation did allow the Fed to raise its key rate by 0.25% in December 2015. Given that other central banks, including the European Central Bank and the People’s Bank of China (PBOC), remained in easing mode, the prospect of the Fed’s actions supported the value of the U.S. dollar relative to other currencies. A richly valued dollar had the potential to pressure emerging countries and companies with outstanding dollar-denominated debt.
Early in 2016, however, Fed officials dialed back their expectations of U.S. economic growth and indicated that they would raise the federal funds rate at a slower pace than initially expected. The Fed’s pullback, along with country-specific factors, prompted investors to focus more on country and company fundamentals than on the Fed’s actions.
The PBOC remained active throughout the reporting period. In November 2015, the central bank reduced short-term borrowing costs for banks. Coming after other PBOC stimulus prior to the reporting period, the central bank’s actions raised concerns that China’s economy was slowing more rapidly than anticipated. Investor fears were realized in January 2015, when China released a preliminary estimate of its 2015 gross domestic product growth that showed the country’s growth rate had dipped below 7% for the first time since 2009. Despite the slowdown, China’s growth rate remained higher than that of most other economies. In addition, the governor of the PBOC also was able to allay some investor fears by better communicating the bank’s strategy. Investor sentiment on China thus improved as the period progressed.
Brazil and South Africa continued to grapple with political and economic challenges
Major political scandals affected Brazil’s stock and currency markets. An ongoing investigation into bribery at the state-owned oil company, Petróleo Brasileiro S.A., ensnared several prominent politicians. Moreover, impeachment proceedings began against President Dilma Rousseff in October on the charge that she doctored the country’s fiscal accounts by taking unauthorized loans from state-owned banks. These scandals took place against a backdrop of a notable slowdown in global demand for commodities, pushing Brazil’s commodity-heavy economy into recession. Despite challenging fundamentals, the prospect that Brazil’s left-leaning president might soon be replaced by an investor-friendly center-right government boosted the country’s currency and stock markets later in the reporting period.
South Africa also sparked investor concerns in December 2015 after President Jacob Zuma first fired the country’s well-regarded finance minister; replaced him with a candidate widely regarded as unprepared; and then, after public and investor outcry, appointed a third, better-regarded minister. Africa’s most-significant economy thus had three finance ministers in a four-day period. In addition, South Africa’s highest court ruled in March 2016 that President Zuma had failed to uphold the constitution
| | | | | | |
| Letter to shareholders (unaudited) | | Wells Fargo Emerging Markets Equity Fund | | | 3 | |
when he ignored a state order to repay government funds used to upgrade a private residence. Economically, South Africa was affected by continued low prices for industrials and precious metals, which caused a slowdown in the country’s important mining sector.
The predominance of political risk caused notably high volatility in emerging markets, but the Morgan Stanley Capital International (MSCI) Emerging Markets (EM) Index (Net)1 ended the period with a nearly flat -0.13% return.
Don’t let short-term uncertainty derail long-term investment goals.
Periods of uncertainty can present challenges, but experience has taught us that maintaining long-term investment goals can be an effective way to plan for the future. To help you create a sound strategy based on your personal goals and risk tolerance, Wells Fargo Funds offers more than 100 mutual funds and other investments spanning a wide range of asset classes and investment styles. Although diversification cannot guarantee an investment profit or prevent losses, we believe it can be an effective way to manage investment risk and potentially smooth out overall portfolio performance. We encourage investors to know their investments and to understand that appropriate levels of risk-taking may unlock opportunities.
Thank you for choosing to invest with Wells Fargo Funds. We appreciate your confidence in us and remain committed to helping you meet your financial needs.
Sincerely,

Karla M. Rabusch
President
Wells Fargo Funds
For further information about your Fund, contact your investment professional, visit our website at wellsfargofunds.com, or call us directly at 1-800-222-8222. We are available 24 hours a day, 7 days a week.
| 1 | The Morgan Stanley Capital International (MSCI) Emerging Markets (EM) Index (Net) is a free-float-adjusted market-capitalization-weighted index that is designed to measure the equity market performance of emerging markets. The MSCI EM Index (Net) consists of the following 23 emerging markets country indexes: Brazil, Chile, China, Colombia, Czech Republic, Egypt, Greece, Hungary, India, Indonesia, Korea, Malaysia, Mexico, Peru, the Philippines, Poland, Qatar, Russia, South Africa, Taiwan, Thailand, Turkey, and United Arab Emirates. You cannot invest directly in an index. |
| | | | |
| 4 | | Wells Fargo Emerging Markets Equity Fund | | Performance highlights (unaudited) |
Investment objective
The Fund seeks long-term capital appreciation.
Manager
Wells Fargo Funds Management, LLC
Subadviser
Wells Capital Management Incorporated
Portfolio managers
Derrick Irwin, CFA®
Richard Peck, CFA®
Yi (Jerry) Zhang, Ph.D., CFA®
Average annual total returns (%) as of April 30, 20161
| | | | | | | | | | | | | | | | | | | | | | | | | | | | | | | | | | |
| | | | | Including sales charge | | | Excluding sales charge | | | Expense ratios2 (%) | |
| | | Inception date | | 1 year | | | 5 year | | | 10 year | | | 1 year | | | 5 year | | | 10 year | | | Gross | | | Net3 | |
| Class A (EMGAX) | | 9-6-1994 | | | (16.94 | ) | | | (5.51 | ) | | | 2.86 | | | | (11.88 | ) | | | (4.39 | ) | | | 3.47 | | | | 1.61 | | | | 1.61 | |
| Class B (EMGBX)* | | 9-6-1994 | | | (16.87 | ) | | | (5.47 | ) | | | 2.94 | | | | (12.50 | ) | | | (5.10 | ) | | | 2.94 | | | | 2.36 | | | | 2.36 | |
| Class C (EMGCX) | | 9-6-1994 | | | (13.49 | ) | | | (5.10 | ) | | | 2.70 | | | | (12.49 | ) | | | (5.10 | ) | | | 2.70 | | | | 2.36 | | | | 2.36 | |
| Class R6 (EMGDX) | | 6-28-2013 | | | – | | | | – | | | | – | | | | (11.45 | ) | | | (3.95 | ) | | | 3.86 | | | | 1.18 | | | | 1.18 | |
| Administrator Class (EMGYX) | | 9-6-1994 | | | – | | | | – | | | | – | | | | (11.73 | ) | | | (4.23 | ) | | | 3.68 | | | | 1.53 | | | | 1.49 | |
| Institutional Class (EMGNX) | | 7-30-2010 | | | – | | | | – | | | | – | | | | (11.48 | ) | | | (3.98 | ) | | | 3.85 | | | | 1.28 | | | | 1.22 | |
| MSCI Emerging Markets Index (Net)4 | | – | | | – | | | | – | | | | – | | | | (17.87 | ) | | | (4.61 | ) | | | 2.36 | | | | – | | | | – | |
| * | | Class B shares are closed to investment, except in connection with the reinvestment of any distributions and permitted exchanges. |
Figures quoted represent past performance, which is no guarantee of future results, and do not reflect taxes that a shareholder may pay on fund distributions or the redemption of fund shares. Investment return and principal value of an investment will fluctuate so that an investor’s shares, when redeemed, may be worth more or less than their original cost. Performance shown without sales charges would be lower if sales charges were reflected. Current performance may be lower or higher than the performance data quoted, which assumes the reinvestment of dividends and capital gains. Current month-end performance is available on the Fund’s website, wellsfargofunds.com.
Index returns do not include transaction costs associated with buying and selling securities, any mutual fund fees or expenses, or any taxes. It is not possible to invest directly in an index.
For Class A shares, the maximum front-end sales charge is 5.75%. For Class B shares, the maximum contingent deferred sales charge is 5.00%. For Class C shares, the maximum contingent deferred sales charge is 1.00%. Performance including a contingent deferred sales charge assumes the sales charge for the corresponding time period. Class R6, Administrator Class, and Institutional Class shares are sold without a front-end sales charge or contingent deferred sales charge.
Stock values fluctuate in response to the activities of individual companies and general market and economic conditions. Foreign investments are especially volatile and can rise or fall dramatically due to differences in the political and economic conditions of the host country. These risks are generally intensified in emerging markets. The use of derivatives may reduce returns and/or increase volatility. Certain investment strategies tend to increase the total risk of an investment (relative to the broader market). The Fund is exposed to smaller-company securities risk. Consult the Fund’s prospectus for additional information on these and other risks.
Please see footnotes on page 5.
| | | | | | |
| Performance highlights (unaudited) | | Wells Fargo Emerging Markets Equity Fund | | | 5 | |
| | | | |
| Ten largest holdings (%) as of April 30, 20165 | |
Samsung Electronics Company Limited | | | 4.77 | �� |
Taiwan Semiconductor Manufacturing Company Limited ADR | | | 3.30 | |
China Mobile Limited | | | 3.11 | |
Fomento Economico Mexicano SAB de CV ADR | | | 2.66 | |
WH Group Limited | | | 2.06 | |
AIA Group Limited | | | 2.02 | |
Uni-President Enterprises Corporation | | | 2.00 | |
China Life Insurance Company Limited H Shares | | | 1.96 | |
Fibra Uno Administracion SAB de CV | | | 1.93 | |
New Oriental Education & Technology Group Incorporated | | | 1.89 | |
| | |
| Country allocation as of April 30, 20166 |
|
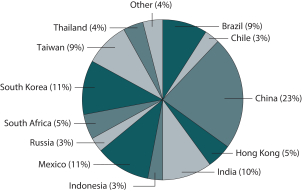 |
| | |
| Sector distribution as of April 30, 20166 |
|
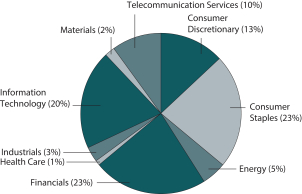 |
| 1 | Historical performance shown for Class R6 shares prior to their inception reflects the performance of Institutional Class shares and includes the higher expenses applicable to Institutional Class shares. If these expenses had not been included, returns would have been higher. Historical performance shown for Institutional Class shares prior to their inception reflects the performance of Administrator Class shares and includes the higher expenses applicable to Administrator Class shares. If these expenses had not been included, returns would be higher. Historical performance shown for all classes of the Fund prior to July 19, 2010, is based on the performance of the Fund’s predecessor, Evergreen Emerging Markets Growth Fund. |
| 2 | Reflects the expense ratios as stated in the most recent prospectuses. The expense ratios shown are subject to change and may differ from the annualized expense ratios shown in the financial highlights of this report. |
| 3 | The manager has contractually committed through February 28, 2017 to waive fees and/or reimburse expenses to the extent necessary to cap the Fund’s Total Annual Operating Expenses After Fee Waiver at the amounts shown. After this time, the cap may be increased or the commitment to maintain the cap may be terminated only with the approval of the Board of Trustees. Brokerage commissions, stamp duty fees, interest, taxes, acquired fund fees and expenses, and extraordinary expenses are excluded from the cap. Without this cap, the Fund’s returns would have been lower. |
| 4 | The Morgan Stanley Capital International (MSCI) Emerging Markets Index (Net) is a free-float-adjusted market-capitalization-weighted index that is designed to measure the equity market performance of emerging markets. The MSCI Emerging Markets Index (Net) consists of the following 23 emerging markets country indexes: Brazil, Chile, China, Colombia, Czech Republic, Egypt, Greece, Hungary, India, Indonesia, Korea, Malaysia, Mexico, Peru, the Philippines, Poland, Qatar, Russia, South Africa, Taiwan, Thailand, Turkey, and United Arab Emirates. Source: MSCI. MSCI makes no express or implied warranties or representations and shall have no liability whatsoever with respect to any MSCI data contained herein. The MSCI data may not be further redistributed or used as a basis for other indexes or any securities or financial products. This report is not approved, reviewed, or produced by MSCI. You cannot invest directly in an index. |
| 5 | The ten largest holdings, excluding cash and cash equivalents, are calculated based on the value of the investments divided by total net assets of the Fund. Holdings are subject to change and may have changed since the date specified. |
| 6 | Amounts are calculated based on the total long-term investments of the Fund. These amounts are subject to change and may have changed since the date specified. |
| | | | |
| 6 | | Wells Fargo Emerging Markets Equity Fund | | Fund expenses (unaudited) |
As a shareholder of the Fund, you incur two types of costs: (1) transaction costs, including sales charges (loads) on purchase payments and contingent deferred sales charges (if any) on redemptions and (2) ongoing costs, including management fees, distribution (12b-1) and/or shareholder servicing fees, and other Fund expenses. This example is intended to help you understand your ongoing costs (in dollars) of investing in the Fund and to compare these costs with the ongoing costs of investing in other mutual funds.
The example is based on an investment of $1,000 invested at the beginning of the six-month period and held for the entire period from November 1, 2015 to April 30, 2016.
Actual expenses
The “Actual” line of the table below provides information about actual account values and actual expenses. You may use the information in this line, together with the amount you invested, to estimate the expenses that you paid over the period. Simply divide your account value by $1,000 (for example, an $8,600 account value divided by $1,000 = 8.6), then multiply the result by the number in the “Actual” line under the heading entitled “Expenses paid during period” for your applicable class of shares to estimate the expenses you paid on your account during this period.
Hypothetical example for comparison purposes
The “Hypothetical” line of the table below provides information about hypothetical account values and hypothetical expenses based on the Fund’s actual expense ratio and an assumed rate of return of 5% per year before expenses, which is not the Fund’s actual return. The hypothetical account values and expenses may not be used to estimate the actual ending account balance or expenses you paid for the period. You may use this information to compare the ongoing costs of investing in the Fund and other funds. To do so, compare this 5% hypothetical example with the 5% hypothetical examples that appear in the shareholder reports of the other funds.
Please note that the expenses shown in the table are meant to highlight your ongoing costs only and do not reflect any transactional costs, such as sales charges (loads) and contingent deferred sales charges. Therefore, the “Hypothetical” line of the table is useful in comparing ongoing costs only and will not help you determine the relative total costs of owning different funds. In addition, if these transactional costs were included, your costs would have been higher.
| | | | | | | | | | | | | | | | |
| | | Beginning
account value
11-1-2015 | | | Ending
account value
4-30-2016 | | | Expenses
paid during
the period¹ | | | Net annualized
expense ratio | |
Class A | | | | | | | | | | | | | | | | |
Actual | | $ | 1,000.00 | | | $ | 1,022.02 | | | $ | 8.09 | | | | 1.61 | % |
Hypothetical (5% return before expenses) | | $ | 1,000.00 | | | $ | 1,016.86 | | | $ | 8.07 | | | | 1.61 | % |
Class B | | | | | | | | | | | | | | | | |
Actual | | $ | 1,000.00 | | | $ | 1,018.18 | | | $ | 11.84 | | | | 2.36 | % |
Hypothetical (5% return before expenses) | | $ | 1,000.00 | | | $ | 1,013.13 | | | $ | 11.81 | | | | 2.36 | % |
Class C | | | | | | | | | | | | | | | | |
Actual | | $ | 1,000.00 | | | $ | 1,018.32 | | | $ | 11.84 | | | | 2.36 | % |
Hypothetical (5% return before expenses) | | $ | 1,000.00 | | | $ | 1,013.13 | | | $ | 11.81 | | | | 2.36 | % |
Class R6 | | | | | | | | | | | | | | | | |
Actual | | $ | 1,000.00 | | | $ | 1,024.34 | | | $ | 5.94 | | | | 1.18 | % |
Hypothetical (5% return before expenses) | | $ | 1,000.00 | | | $ | 1,019.00 | | | $ | 5.92 | | | | 1.18 | % |
Administrator Class | | | | | | | | | | | | | | | | |
Actual | | $ | 1,000.00 | | | $ | 1,023.12 | | | $ | 7.49 | | | | 1.49 | % |
Hypothetical (5% return before expenses) | | $ | 1,000.00 | | | $ | 1,017.45 | | | $ | 7.47 | | | | 1.49 | % |
Institutional Class | | | | | | | | | | | | | | | | |
Actual | | $ | 1,000.00 | | | $ | 1,024.59 | | | $ | 6.14 | | | | 1.22 | % |
Hypothetical (5% return before expenses) | | $ | 1,000.00 | | | $ | 1,018.80 | | | $ | 6.12 | | | | 1.22 | % |
| 1 | Expenses paid is equal to the annualized expense ratio of each class multiplied by the average account value over the period, multiplied by the number of days in the most recent fiscal half-year divided by the number of days in the fiscal year (to reflect the one-half-year period). |
| | | | | | |
| Portfolio of investments—April 30, 2016 (unaudited) | | Wells Fargo Emerging Markets Equity Fund | | | 7 | |
| | | | | | | | | | | | |
| Security name | | | | | | Shares | | | Value | |
| | | | |
Common Stocks: 96.97% | | | | | | | | | | | | |
| | | | |
| Argentina: 0.61% | | | | | | | | | | | | |
MercadoLibre Incorporated (Information Technology, Internet Software & Services) | | | | | | | 155,300 | | | $ | 19,395,417 | |
| | | | | | | | | | | | |
| | | | |
| Brazil: 7.09% | | | | | | | | | | | | |
Ambev SA ADR (Consumer Staples, Beverages) | | | | | | | 6,902,000 | | | | 38,582,180 | |
B2W Cia Digital (Consumer Discretionary, Internet & Catalog Retail) † | | | | | | | 2,951,424 | | | | 11,756,781 | |
Banco Bradesco SA ADR (Financials, Banks) | | | | | | | 4,251,774 | | | | 31,760,751 | |
BM&F Bovespa SA (Financials, Diversified Financial Services) | | | | | | | 7,409,000 | | | | 37,009,993 | |
BRF Brasil Foods SA ADR (Consumer Staples, Food Products) | | | | | | | 976,078 | | | | 13,879,829 | |
CETIP SA (Financials, Capital Markets) | | | | | | | 2,941,437 | | | | 36,108,881 | |
Lojas Renner SA (Consumer Discretionary, Multiline Retail) | | | | | | | 3,473,000 | | | | 20,973,820 | |
Multiplan Empreendimentos Imobiliarios SA (Financials, Real Estate Management & Development) | | | | | | | 936,200 | | | | 16,046,810 | |
Raia Drogasil SA (Consumer Staples, Food & Staples Retailing) | | | | | | | 1,002,600 | | | | 16,045,098 | |
Rumo Logistica Operadora Multimodal SA (Industrials, Road & Rail) † | | | | | | | 3,095,351 | | | | 3,852,032 | |
| | | | |
| | | | | | | | | | | 226,016,175 | |
| | | | | | | | | | | | |
| | | | |
| Chile: 2.48% | | | | | | | | | | | | |
AES Gener SA (Utilities, Independent Power & Renewable Electricity Producers) | | | | | | | 16,613,250 | | | | 8,448,762 | |
Banco Santander Chile SA ADR (Financials, Banks) | | | | | | | 1,669,200 | | | | 32,382,480 | |
SACI Falabella (Consumer Discretionary, Multiline Retail) | | | | | | | 5,042,942 | | | | 38,204,002 | |
| | | | |
| | | | | | | | | | | 79,035,244 | |
| | | | | | | | | | | | |
| | | | |
| China: 22.80% | | | | | | | | | | | | |
51Job Incorporated ADR (Industrials, Professional Services) Ǡ | | | | | | | 1,113,941 | | | | 33,195,442 | |
Alibaba Group Holding Limited ADR (Information Technology, Internet Software & Services) † | | | | | | | 292,037 | | | | 22,469,327 | |
Baidu Incorporated ADR (Information Technology, Internet Software & Services) † | | | | | | | 112,540 | | | | 21,866,522 | |
Belle International Holdings Limited (Consumer Discretionary, Textiles, Apparel & Luxury Goods) | | | | | | | 53,959,000 | | | | 33,111,790 | |
China Auto Rental Incorporated (Consumer Discretionary, Automobiles) Ǡ | | | | | | | 1,256,469 | | | | 1,430,291 | |
China International Capital Corporation Limited H Shares (Financials, Diversified Financial Services) Ǡ | | | | | | | 1,334,904 | | | | 2,096,086 | |
China Life Insurance Company Limited H Shares (Financials, Insurance) | | | | | | | 26,768,290 | | | | 62,323,263 | |
China Mobile Limited (Telecommunication Services, Wireless Telecommunication Services) | | | | | | | 8,640,165 | | | | 99,078,585 | |
CNOOC Limited (Energy, Oil, Gas & Consumable Fuels) | | | | | | | 28,474,000 | | | | 35,459,892 | |
Ctrip.com International Limited ADR (Consumer Discretionary, Internet & Catalog Retail) Ǡ | | | | | | | 1,236,632 | | | | 53,929,522 | |
Hengan International Group Company Limited (Consumer Staples, Personal Products) | | | | | | | 5,007,000 | | | | 45,055,190 | |
Legend Holdings Corporation H Shares (Financials, Diversified Financial Services) | | | | | | | 908,901 | | | | 2,198,170 | |
Li Ning Company Limited (Consumer Discretionary, Textiles, Apparel & Luxury Goods) Ǡ | | | | | | | 25,884,207 | | | | 11,278,812 | |
New Oriental Education & Technology Group Incorporated (Consumer Discretionary, Diversified Consumer Services) | | | | | | | 1,538,182 | | | | 60,235,207 | |
PetroChina Company Limited H Shares (Energy, Oil, Gas & Consumable Fuels) | | | | | | | 19,666,000 | | | | 14,476,513 | |
Shandong Weigao Group Medical Polymer Company Limited H Shares (Health Care, Health Care Equipment & Supplies) | | | | | | | 18,024,000 | | | | 10,851,252 | |
SINA Corporation (Information Technology, Internet Software & Services) Ǡ | | | | | | | 1,033,907 | | | | 51,788,402 | |
Tencent Holdings Limited (Information Technology, Internet Software & Services) | | | | | | | 1,678,800 | | | | 34,390,197 | |
Tingyi Holding Corporation (Consumer Staples, Food Products) | | | | | | | 21,498,000 | | | | 25,137,215 | |
Tsingtao Brewery Company Limited H Shares (Consumer Staples, Beverages) | | | | | | | 8,310,000 | | | | 31,496,345 | |
Vipshop Holdings Limited ADR (Consumer Discretionary, Internet & Catalog Retail) † | | | | | | | 2,444,738 | | | | 33,346,226 | |
Want Want China Holdings Limited (Consumer Staples, Food Products) « | | | | | | | 14,104,000 | | | | 10,873,148 | |
Weibo Corporation ADR (Information Technology, Internet Software & Services) Ǡ | | | | | | | 1,243,046 | | | | 30,417,336 | |
| | | | |
| | | | | | | | | | | 726,504,733 | |
| | | | | | | | | | | | |
The accompanying notes are an integral part of these financial statements.
| | | | |
| 8 | | Wells Fargo Emerging Markets Equity Fund | | Portfolio of investments—April 30, 2016 (unaudited) |
| | | | | | | | | | | | |
| Security name | | | | | | Shares | | | Value | |
| | | | |
| Colombia: 0.60% | | | | | | | | | | | | |
Bancolombia SA ADR (Financials, Banks) | | | | | | | 492,400 | | | $ | 19,050,956 | |
| | | | | | | | | | | | |
| | | | |
| Hong Kong: 5.19% | | | | | | | | | | | | |
AIA Group Limited (Financials, Insurance) | | | | | | | 10,691,400 | | | | 64,367,000 | |
Johnson Electric Holdings Limited (Industrials, Electrical Equipment) | | | | | | | 4,214,250 | | | | 12,468,517 | |
Sun Art Retail Group Limited (Consumer Staples, Food & Staples Retailing) « | | | | | | | 30,190,500 | | | | 22,651,924 | |
WH Group Limited (Consumer Staples, Food Products) 144A | | | | | | | 81,205,500 | | | | 65,744,117 | |
| | | | |
| | | | | | | | | | | 165,231,558 | |
| | | | | | | | | | | | |
| | | | |
| India: 9.54% | | | | | | | | | | | | |
Bharti Airtel Limited (Telecommunication Services, Wireless Telecommunication Services) | | | | | | | 3,738,728 | | | | 20,494,520 | |
Bharti Infratel Limited (Telecommunication Services, Diversified Telecommunication Services) | | | | | | | 3,378,464 | | | | 19,097,770 | |
HDFC Bank Limited ADR (Financials, Banks) | | | | | | | 123,826 | | | | 7,784,941 | |
Housing Development Finance Corporation Limited (Financials, Thrifts & Mortgage Finance) | | | | | | | 2,230,700 | | | | 36,604,936 | |
ICICI Bank Limited ADR (Financials, Banks) | | | | | | | 4,741,775 | | | | 33,429,514 | |
Indusind Bank Limited (Financials, Banks) | | | | | | | 817,217 | | | | 12,922,329 | |
Infosys Limited ADR (Information Technology, IT Services) | | | | | | | 2,792,460 | | | | 52,498,248 | |
ITC Limited (Consumer Staples, Tobacco) | | | | | | | 11,212,640 | | | | 54,930,610 | |
Reliance Industries Limited (Energy, Oil, Gas & Consumable Fuels) | | | | | | | 1,064,200 | | | | 15,766,461 | |
Reliance Industries Limited GDR (Energy, Oil, Gas & Consumable Fuels) 144A | | | | | | | 1,246,587 | | | | 36,898,975 | |
Ultra Tech Cement Limited (Materials, Construction Materials) | | | | | | | 286,000 | | | | 13,631,459 | |
| | | | |
| | | | | | | | | | | 304,059,763 | |
| | | | | | | | | | | | |
| | | | |
| Indonesia: 2.62% | | | | | | | | | | | | |
PT Astra International Tbk (Consumer Discretionary, Automobiles) | | | | | | | 14,651,000 | | | | 7,471,032 | |
PT Bank Central Asia Tbk (Financials, Banks) | | | | | | | 9,549,500 | | | | 9,449,573 | |
PT Blue Bird Tbk (Industrials, Road & Rail) | | | | | | | 13,605,309 | | | | 4,415,432 | |
PT Link Net Tbk (Telecommunication Services, Diversified Telecommunication Services) | | | | | | | 44,178,161 | | | | 14,119,726 | |
PT Matahari Department Store Tbk (Consumer Discretionary, Multiline Retail) | | | | | | | 10,474,600 | | | | 15,090,795 | |
PT Telekomunikasi Indonesia Persero Sponsored ADR Tbk (Telecommunication Services, Diversified Telecommunication Services) « | | | | | | | 616,877 | | | | 32,922,725 | |
| | | | |
| | | | | | | | | | | 83,469,283 | |
| | | | | | | | | | | | |
| | | | |
| Malaysia: 1.32% | | | | | | | | | | | | |
Genting Bhd (Consumer Discretionary, Hotels, Restaurants & Leisure) | | | | | | | 8,480,900 | | | | 19,191,388 | |
Genting Malaysia Bhd (Consumer Discretionary, Hotels, Restaurants & Leisure) | | | | | | | 17,996,300 | | | | 20,592,208 | |
Sime Darby Bhd (Industrials, Industrial Conglomerates) | | | | | | | 1,215,937 | | | | 2,396,702 | |
| | | | |
| | | | | | | | | | | 42,180,298 | |
| | | | | | | | | | | | |
| | | | |
| Mexico: 10.57% | | | | | | | | | | | | |
America Movil SAB de CV ADR (Telecommunication Services, Wireless Telecommunication Services) | | | | | | | 3,032,320 | | | | 42,937,651 | |
Cemex SAB de CV ADR (Materials, Construction Materials) † | | | | | | | 3,026,394 | | | | 22,546,634 | |
Fibra Uno Administracion SAB de CV (Financials, REITs) | | | | | | | 25,836,922 | | | | 61,376,140 | |
Fomento Economico Mexicano SAB de CV ADR (Consumer Staples, Beverages) | | | | | | | 911,100 | | | | 84,923,631 | |
Grupo Financiero Banorte SAB de CV (Financials, Banks) | | | | | | | 9,048,188 | | | | 51,445,031 | |
Grupo Financiero Santander SAB de CV ADR (Financials, Banks) | | | | | | | 2,478,441 | | | | 22,652,951 | |
Grupo Sanborns SA de CV (Consumer Discretionary, Multiline Retail) | | | | | | | 891,926 | | | | 1,232,288 | |
Grupo Televisa SAB ADR (Consumer Discretionary, Media) | | | | | | | 897,000 | | | | 26,219,310 | |
Telesites SAB de CV (Telecommunication Services, Diversified Telecommunication Services)† | | | | | | | 3,052,320 | | | | 1,880,573 | |
Wal-Mart de Mexico SAB de CV (Consumer Staples, Food & Staples Retailing) | | | | | | | 8,777,100 | | | | 21,691,943 | |
| | | | |
| | | | | | | | | | | 336,906,152 | |
| | | | | | | | | | | | |
The accompanying notes are an integral part of these financial statements.
| | | | | | |
| Portfolio of investments—April 30, 2016 (unaudited) | | Wells Fargo Emerging Markets Equity Fund | | | 9 | |
| | | | | | | | | | | | |
| Security name | | | | | | Shares | | | Value | |
| | | | |
| Peru: 0.49% | | | | | | | | | | | | |
Compania de Minas Buenaventura SA ADR (Materials, Metals & Mining) Ǡ | | | | | | | 1,523,600 | | | $ | 15,464,540 | |
| | | | | | | | | | | | |
| | | | |
| Philippines: 0.88% | | | | | | | | | | | | |
Ayala Corporation (Financials, Diversified Financial Services) | | | | | | | 647,624 | | | | 10,649,280 | |
Metropolitan Bank & Trust Company (Financials, Banks) | | | | | | | 4,287,486 | | | | 7,429,661 | |
SM Investments Corporation (Industrials, Industrial Conglomerates) | | | | | | | 488,582 | | | | 9,836,767 | |
| | | | |
| | | | | | | | | | | 27,915,708 | |
| | | | | | | | | | | | |
| | | | |
| Russia: 2.91% | | | | | | | | | | | | |
LUKOIL PJSC ADR (Energy, Oil, Gas & Consumable Fuels) | | | | | | | 576,249 | | | | 24,424,314 | |
Magnit (Consumer Staples, Food & Staples Retailing) (a) | | | | | | | 95,300 | | | | 13,369,656 | |
Mobile Telesystems ADR (Telecommunication Services, Wireless Telecommunication Services) | | | | | | | 1,367,800 | | | | 12,665,828 | |
Sberbank of Russia ADR (Financials, Banks) | | | | | | | 2,031,195 | | | | 16,282,059 | |
Yandex NV Class A (Information Technology, Internet Software & Services) † | | | | | | | 1,265,106 | | | | 25,896,720 | |
| | | | |
| | | | | | | | | | | 92,638,577 | |
| | | | | | | | | | | | |
| | | | |
| South Africa: 4.68% | | | | | | | | | | | | |
AngloGold Ashanti Limited ADR (Materials, Metals & Mining) † | | | | | | | 1,077,592 | | | | 17,726,388 | |
Clicks Group Limited (Consumer Staples, Food & Staples Retailing) | | | | | | | 860,000 | | | | 6,281,182 | |
Impala Platinum Holdings Limited (Materials, Metals & Mining) † | | | | | | | 910,758 | | | | 3,774,765 | |
MTN Group Limited (Telecommunication Services, Wireless Telecommunication Services) | | | | | | | 2,102,643 | | | | 22,017,173 | |
Shoprite Holdings Limited (Consumer Staples, Food & Staples Retailing) « | | | | | | | 3,398,100 | | | | 40,874,355 | |
Standard Bank Group Limited (Financials, Banks) | | | | | | | 2,210,190 | | | | 19,830,032 | |
Tiger Brands Limited (Consumer Staples, Food Products) | | | | | | | 1,555,333 | | | | 38,475,651 | |
| | | | |
| | | | | | | | | | | 148,979,546 | |
| | | | | | | | | | | | |
| | | | |
| South Korea: 11.00% | | | | | | | | | | | | |
Amorepacific Corporation (Consumer Staples, Personal Products) | | | | | | | 30,300 | | | | 10,836,625 | |
KT Corporation ADR (Telecommunication Services, Diversified Telecommunication Services) « | | | | | | | 4,024,813 | | | | 54,777,705 | |
KT&G Corporation (Consumer Staples, Tobacco) | | | | | | | 255,091 | | | | 27,537,470 | |
Naver Corporation (Information Technology, Internet Software & Services) | | | | | | | 60,200 | | | | 35,769,177 | |
Samsung Electronics Company Limited (Information Technology, Technology Hardware, Storage & Peripherals) | | | | | | | 139,036 | | | | 151,921,906 | |
Samsung Life Insurance Company Limited (Financials, Insurance) | | | | | | | 479,337 | | | | 46,065,825 | |
SK Hynix Incorporated (Information Technology, Semiconductors & Semiconductor Equipment) | | | | | | | 963,000 | | | | 23,791,864 | |
| | | | |
| | | | | | | | | | | 350,700,572 | |
| | | | | | | | | | | | |
| | | | |
| Taiwan: 8.68% | | | | | | | | | | | | |
104 Corporation (Industrials, Commercial Services & Supplies) (l) | | | | | | | 1,655,000 | | | | 7,183,828 | |
Far Eastern New Century Corporation (Industrials, Industrial Conglomerates) | | | | | | | 11,466,448 | | | | 8,585,704 | |
MediaTek Incorporated (Information Technology, Semiconductors & Semiconductor Equipment) | | | | | | | 2,959,881 | | | | 21,107,265 | |
President Chain Store Corporation (Consumer Staples, Food & Staples Retailing) | | | | | | | 4,365,000 | | | | 30,924,333 | |
Taiwan Semiconductor Manufacturing Company Limited (Information Technology, Semiconductors & Semiconductor Equipment) | | | | | | | 8,585,224 | | | | 39,927,560 | |
Taiwan Semiconductor Manufacturing Company Limited ADR (Information Technology, Semiconductors & Semiconductor Equipment) | | | | | | | 4,457,852 | | | | 105,160,729 | |
Uni-President Enterprises Corporation (Consumer Staples, Food Products) | | | | | | | 35,312,368 | | | | 63,720,578 | |
| | | | |
| | | | | | | | | | | 276,609,997 | |
| | | | | | | | | | | | |
| | | | |
| Thailand: 3.73% | | | | | | | | | | | | |
Bangkok Bank PCL (Financials, Banks) | | | | | | | 2,419,800 | | | | 11,499,765 | |
PTT Exploration & Production PCL (Energy, Oil, Gas & Consumable Fuels) | | | | | | | 5,078,139 | | | | 10,939,879 | |
The accompanying notes are an integral part of these financial statements.
| | | | |
| 10 | | Wells Fargo Emerging Markets Equity Fund | | Portfolio of investments—April 30, 2016 (unaudited) |
| | | | | | | | | | | | | | | | |
| Security name | | | | | | | | Shares | | | Value | |
| | | | |
| Thailand (continued) | | | | | | | | | | | | | | | | |
PTT PCL (Energy, Oil, Gas & Consumable Fuels) | | | | | | | | | | | 2,945,900 | | | $ | 25,638,523 | |
Siam Commercial Bank PCL (Financials, Banks) | | | | | | | | | | | 7,905,100 | | | | 30,212,735 | |
Thai Beverage PCL (Consumer Staples, Beverages) | | | | | | | | | | | 73,527,000 | | | | 40,731,394 | |
| | | | |
| | | | | | | | | | | | | | | 119,022,296 | |
| | | | | | | | | | | | | | | | |
| | | | |
| Turkey: 0.94% | | | | | | | | | | | | | | | | |
Anadolu Efes Biracilik Ve Malt Sanayii AS (Consumer Staples, Beverages) | | | | | | | | | | | 2,690,453 | | | | 21,154,384 | |
Avivasa Emeklilik Ve Hayat AS (Financials, Insurance) | | | | | | | | | | | 1,246,853 | | | | 8,783,228 | |
| | | | |
| | | | | | | | | | | | | | | 29,937,612 | |
| | | | | | | | | | | | | | | | |
| | | | |
| United Arab Emirates: 0.09% | | | | | | | | | | | | | | | | |
Emaar Malls Group (Financials, Real Estate Management & Development) | | | | | | | | | | | 3,773,147 | | | | 2,974,475 | |
| | | | | | | | | | | | | | | | |
| | | | |
| United Kingdom: 0.75% | | | | | | | | | | | | | | | | |
Standard Chartered plc (Financials, Banks) | | | | | | | | | | | 2,975,244 | | | | 24,001,335 | |
| | | | | | | | | | | | | | | | |
| | | | |
Total Common Stocks (Cost $3,089,757,938) | | | | | | | | | | | | | | | 3,090,094,237 | |
| | | | | | | | | | | | | | | | |
| | | | |
| | | Interest rate | | | Maturity date | | | Principal | | | | |
| Convertible Debentures: 0.00% | | | | | | | | | | | | | | | | |
| | | | |
| Brazil: 0.00% | | | | | | | | | | | | | | | | |
Lupatech SA (Energy, Energy Equipment &
Services) (a)(i)(s) | | | 6.50 | % | | | 4-15-2018 | | | $ | 303,000 | | | | 1,410 | |
| | | | | | | | | | | | | | | | |
| | | | |
Total Convertible Debentures (Cost $160,691) | | | | | | | | | | | | | | | 1,410 | |
| | | | | | | | | | | | | | | | |
| | | | |
| | | Dividend yield | | | | | | Shares | | | | |
| Preferred Stocks: 1.45% | | | | | | | | | | | | | | | | |
| | | | |
| Brazil: 1.45% | | | | | | | | | | | | | | | | |
Lojas Americanas SA (Consumer Discretionary, Multiline Retail) ± | | | 0.07 | | | | | | | | 9,914,193 | | | | 46,209,061 | |
| | | | | | | | | | | | | | | | |
| | | | |
Total Preferred Stocks (Cost $39,764,880) | | | | | | | | | | | | | | | 46,209,061 | |
| | | | | | | | | | | | | | | | |
| | | | |
| | | Yield | | | | | | | | | | |
| Short-Term Investments: 5.00% | | | | | | | | | | | | | | | | |
| | | | |
| Investment Companies: 5.00% | | | | | | | | | | | | | | | | |
Securities Lending Cash Investments LLC (l)(r)(u) | | | 0.45 | | | | | | | | 120,567,678 | | | | 120,567,678 | |
Wells Fargo Cash Investment Money Market Fund Select Class (l)(u) | | | 0.43 | | | | | | | | 38,811,076 | | | | 38,811,076 | |
| | | | |
Total Short-Term Investments (Cost $159,378,754) | | | | | | | | | | | | | | | 159,378,754 | |
| | | | | | | | | | | | | | | | |
| | | | | | | | |
| Total investments in securities (Cost $3,289,062,263) * | | | 103.42 | % | | | 3,295,683,462 | |
Other assets and liabilities, net | | | (3.42 | ) | | | (108,899,924 | ) |
| | | | | | | | |
| Total net assets | | | 100.00 | % | | $ | 3,186,783,538 | |
| | | | | | | | |
The accompanying notes are an integral part of these financial statements.
| | | | | | |
| Portfolio of investments—April 30, 2016 (unaudited) | | Wells Fargo Emerging Markets Equity Fund | | | 11 | |
| † | Non-income-earning security |
| « | All or a portion of this security is on loan. |
| 144A | The security may be resold in transactions exempt from registration, normally to qualified institutional buyers, pursuant to Rule 144A under the Securities Act of 1933. |
| (a) | The security is fair valued in accordance with procedures approved by the Board of Trustees. |
| (l) | The issuer of the security is an affiliated person of the Fund as defined in the Investment Company Act of 1940. |
| (s) | The security is currently in default with regards to scheduled interest and/or principal payments. The Fund has stopped accruing interest on the security. |
| ± | Variable rate investment. The rate shown is the rate in effect at period end. |
| (r) | The investment is a non-registered investment vehicle purchased with cash collateral received from securities on loan. |
| (u) | The rate represents the 7-day annualized yield at period end. |
| * | Cost for federal income tax purposes is $3,310,041,597 and unrealized gains (losses) consists of: |
| | | | |
Gross unrealized gains | | $ | 542,832,278 | |
Gross unrealized losses | | | (557,190,413 | ) |
| | | | |
Net unrealized losses | | $ | (14,358,135 | ) |
The accompanying notes are an integral part of these financial statements.
| | | | |
| 12 | | Wells Fargo Emerging Markets Equity Fund | | Statement of assets and liabilities—April 30, 2016 (unaudited) |
| | | | |
| | | | |
| |
Assets | | | | |
Investments | | | | |
In unaffiliated securities (including $116,880,877 of securities loaned), at value (cost $3,124,007,573) | | $ | 3,129,120,880 | |
In affiliated securities, at value (cost $165,054,690) | | | 166,562,582 | |
| | | | |
Total investments, at value (cost $3,289,062,263) | | | 3,295,683,462 | |
Foreign currency, at value (cost $13,477,030) | | | 12,853,274 | |
Receivable for investments sold | | | 6,843,742 | |
Receivable for Fund shares sold | | | 7,582,723 | |
Receivable for dividends | | | 3,678,399 | |
Receivable for securities lending income | | | 70,231 | |
Prepaid expenses and other assets | | | 130,528 | |
| | | | |
Total assets | | | 3,326,842,359 | |
| | | | |
| |
Liabilities | | | | |
Payable for Fund shares redeemed | | | 14,377,647 | |
Payable upon receipt of securities loaned | | | 120,567,678 | |
Management fee payable | | | 2,649,986 | |
Distribution fees payable | | | 45,236 | |
Administration fees payable | | | 408,415 | |
Accrued expenses and other liabilities | | | 2,009,859 | |
| | | | |
Total liabilities | | | 140,058,821 | |
| | | | |
Total net assets | | $ | 3,186,783,538 | |
| | | | |
| |
NET ASSETS CONSIST OF | | | | |
Paid-in capital | | $ | 3,531,097,635 | |
Overdistributed net investment income | | | (21,277,724 | ) |
Accumulated net realized losses on investments | | | (329,089,912 | ) |
Net unrealized gains on investments | | | 6,053,539 | |
| | | | |
Total net assets | | $ | 3,186,783,538 | |
| | | | |
| |
COMPUTATION OF NET ASSET VALUE AND OFFERING PRICE PER SHARE | | | | |
Net assets – Class A | | $ | 840,176,280 | |
Shares outstanding – Class A1 | | | 45,693,480 | |
Net asset value per share – Class A | | | $18.39 | |
Maximum offering price per share – Class A2 | | | $19.51 | |
Net assets – Class B | | $ | 925,745 | |
Shares outstanding – Class B1 | | | 59,037 | |
Net asset value per share – Class B | | | $15.68 | |
Net assets – Class C | | $ | 70,386,349 | |
Shares outstanding – Class C1 | | | 4,522,972 | |
Net asset value per share – Class C | | | $15.56 | |
Net assets – Class R6 | | $ | 98,974,852 | |
Shares outstanding – Class R61 | | | 5,151,021 | |
Net asset value per share – Class R6 | | | $19.21 | |
Net assets – Administrator Class | | $ | 157,131,517 | |
Shares outstanding – Administrator Class1 | | | 8,136,837 | |
Net asset value per share – Administrator Class | | | $19.31 | |
Net assets – Institutional Class | | $ | 2,019,188,795 | |
Shares outstanding – Institutional Class1 | | | 105,059,293 | |
Net asset value per share – Institutional Class | | | $19.22 | |
| 1 | The Fund has an unlimited number of authorized shares. |
| 2 | Maximum offering price is computed as 100/94.25 of net asset value. On investments of $50,000 or more, the offering price is reduced. |
The accompanying notes are an integral part of these financial statements.
| | | | | | |
| Statement of operations—six months ended April 30, 2016 (unaudited) | | Wells Fargo Emerging Markets Equity Fund | | | 13 | |
| | | | |
| | | | |
| |
Investment income | | | | |
Dividends (net of foreign withholding taxes of $3,027,420) | | $ | 22,092,558 | |
Securities lending income, net | | | 317,611 | |
Income from affiliated securities | | | 91,292 | |
| | | | |
Total investment income | | | 22,501,461 | |
| | | | |
| |
Expenses | | | | |
Management fee | | | 16,200,300 | |
Administration fees | | | | |
Class A | | | 870,942 | |
Class B | | | 1,123 | |
Class C | | | 74,044 | |
Class R6 | | | 13,915 | |
Administrator Class | | | 98,718 | |
Institutional Class | | | 1,231,137 | |
Shareholder servicing fees | | | | |
Class A | | | 1,036,835 | |
Class B | | | 1,337 | |
Class C | | | 88,147 | |
Administrator Class | | | 185,327 | |
Distribution fees | | | | |
Class B | | | 4,011 | |
Class C | | | 264,442 | |
Custody and accounting fees | | | 1,520,610 | |
Professional fees | | | 36,830 | |
Registration fees | | | 94,187 | |
Shareholder report expenses | | | 436,902 | |
Trustees’ fees and expenses | | | 11,910 | |
Other fees and expenses | | | 23,886 | |
| | | | |
Total expenses | | | 22,194,603 | |
Less: Fee waivers and/or expense reimbursements | | | (1,440,150 | ) |
| | | | |
Net expenses | | | 20,754,453 | |
| | | | |
Net investment income | | | 1,747,008 | |
| | | | |
| |
REALIZED AND UNREALIZED GAINS (LOSSES) ON INVESTMENTS | | | | |
| |
Net realized gains (losses) on: | | | | |
Unaffiliated securities | | | (63,895,533 | ) |
Forward foreign currency contract transactions | | | 3,514 | |
| | | | |
Net realized losses on investments | | | (63,892,019 | ) |
| | | | |
| |
Net change in unrealized gains (losses) on: | | | | |
Unaffiliated securities | | | 137,620,070 | |
Affiiliated securities | | | (362,783 | ) |
| | | | |
Net change in unrealized gains (losses) on investments | | | 137,257,287 | |
| | | | |
Net realized and unrealized gains (losses) on investments | | | 73,365,268 | |
| | | | |
Net increase in net assets resulting from operations | | $ | 75,112,276 | |
| | | | |
The accompanying notes are an integral part of these financial statements.
| | | | |
| 14 | | Wells Fargo Emerging Markets Equity Fund | | Statement of changes in net assets—April 30, 2016 |
| | | | | | | | | | | | | | | | |
| | | Six months ended
April 30, 2016
(unaudited) | | | Year ended
October 31, 2015 | |
| | | |
Operations | | | | | | | | | | | | |
Net investment income | | | | | | $ | 1,747,008 | | | | | | | $ | 28,129,814 | |
Net realized losses on investments | | | | | | | (63,892,019 | ) | | | | | | | (251,701,617 | ) |
Net change in unrealized gains (losses) on investments | | | | | | | 137,257,287 | | | | | | | | (488,939,528 | ) |
| | | | |
Net increase (decrease) in net assets resulting from operations | | | | | | | 75,112,276 | | | | | | | | (712,511,331 | ) |
| | | | |
| | | | |
Distributions to shareholders from | | | | | | | | | | | | | | | | |
Net investment income | | | | | | | | | | | | | | | | |
Class A | | | | | | | (4,821,280 | ) | | | | | | | (9,924,128 | ) |
Class R6 | | | | | | | (1,207,067 | ) | | | | | | | (428,978 | ) |
Administrator Class | | | | | | | (915,237 | ) | | | | | | | (2,112,578 | ) |
Institutional Class | | | | | | | (22,745,172 | ) | | | | | | | (32,080,756 | ) |
| | | | |
Total distributions to shareholders | | | | | | | (29,688,756 | ) | | | | | | | (44,546,440 | ) |
| | | | |
| | | | |
Capital share transactions | | | Shares | | | | | | | | Shares | | | | | |
Proceeds from shares sold | | | | | | | | | | | | | | | | |
Class A | | | 6,739,660 | | | | 110,444,580 | | | | 18,081,212 | | | | 353,509,537 | |
Class B | | | 0 | | | | 0 | | | | 251 | | | | 4,375 | |
Class C | | | 126,452 | | | | 1,820,991 | | | | 176,868 | | | | 2,961,953 | |
Class R6 | | | 472,899 | | | | 8,441,716 | | | | 3,603,754 | | | | 73,604,149 | |
Administrator Class | | | 1,262,330 | | | | 22,063,071 | | | | 4,842,916 | | | | 101,861,997 | |
Institutional Class | | | 16,658,623 | | | | 293,842,208 | | | | 43,932,979 | | | | 875,566,645 | |
| | | | |
| | | | | | | 436,612,566 | | | | | | | | 1,407,508,656 | |
| | | | |
Reinvestment of distributions | | | | | | | | | | | | | | | | |
Class A | | | 275,442 | | | | 4,701,801 | | | | 489,710 | | | | 9,691,371 | |
Class R6 | | | 66,974 | | | | 1,193,482 | | | | 20,724 | | | | 428,978 | |
Administrator Class | | | 49,021 | | | | 878,463 | | | | 97,246 | | | | 2,017,592 | |
Institutional Class | | | 1,178,702 | | | | 21,004,467 | | | | 1,420,577 | | | | 29,405,954 | |
| | | | |
| | | | | | | 27,778,213 | | | | | | | | 41,543,895 | |
| | | | |
Payment for shares redeemed | | | | | | | | | | | | | | | | |
Class A | | | (9,629,884 | ) | | | (167,883,772 | ) | | | (40,351,435 | ) | | | (778,700,113 | ) |
Class B | | | (35,369 | ) | | | (522,508 | ) | | | (200,667 | ) | | | (3,410,499 | ) |
Class C | | | (1,101,279 | ) | | | (15,964,273 | ) | | | (2,307,745 | ) | | | (38,097,771 | ) |
Class R6 | | | (398,492 | ) | | | (7,250,448 | ) | | | (211,230 | ) | | | (4,141,231 | ) |
Administrator Class | | | (2,715,347 | ) | | | (48,792,968 | ) | | | (16,085,608 | ) | | | (308,944,371 | ) |
Institutional Class | | | (25,791,534 | ) | | | (465,155,057 | ) | | | (61,121,682 | ) | | | (1,222,764,057 | ) |
| | | | |
| | | | | | | (705,569,026 | ) | | | | | | | (2,356,058,042 | ) |
| | | | |
Net decrease in net assets resulting from capital share transactions | | | | | | | (241,178,247 | ) | | | | | | | (907,005,491 | ) |
| | | | |
Total decrease in net assets | | | | | | | (195,754,727 | ) | | | | | | | (1,664,063,262 | ) |
| | | | |
| | | | |
Net assets | | | | | | | | | | | | | | | | |
Beginning of period | | | | | | | 3,382,538,265 | | | | | | | | 5,046,601,527 | |
| | | | |
End of period | | | | | | $ | 3,186,783,538 | | | | | | | $ | 3,382,538,265 | |
| | | | |
Undistributed (overdistributed) net investment income | | | | | | $ | (21,277,724 | ) | | | | | | $ | 6,664,024 | |
| | | | |
The accompanying notes are an integral part of these financial statements.
| | | | | | |
| Financial highlights | | Wells Fargo Emerging Markets Equity Fund | | | 15 | |
(For a share outstanding throughout each period)
| | | | | | | | | | | | | | | | | | | | | | | | |
| | | Six months ended April 30, 2016 (unaudited) | | | Year ended October 31 | |
| CLASS A | | | 2015 | | | 2014 | | | 2013 | | | 2012 | | | 2011 | |
Net asset value, beginning of period | | | $18.09 | | | | $21.44 | | | | $21.77 | | | | $20.48 | | | | $20.93 | | | | $21.65 | |
Net investment income (loss) | | | (0.01 | ) | | | 0.08 | | | | 0.07 | | | | 0.02 | | | | 0.10 | | | | 0.08 | |
Net realized and unrealized gains (losses) on investments | | | 0.41 | | | | (3.29 | ) | | | (0.40 | ) | | | 1.33 | | | | (0.19 | ) | | | (0.80 | ) |
| | | | | | | | | | | | | | | | | | | | | | | | |
Total from investment operations | | | 0.40 | | | | (3.21 | ) | | | (0.33 | ) | | | 1.35 | | | | (0.09 | ) | | | (0.72 | ) |
Distributions to shareholders from | | | | | | | | | | | | | | | | | | | | | | | | |
Net investment income | | | (0.10 | ) | | | (0.14 | ) | | | 0.00 | | | | (0.06 | ) | | | (0.14 | ) | | | (0.00 | )1 |
Net realized gains | | | 0.00 | | | | 0.00 | | | | 0.00 | | | | 0.00 | | | | (0.22 | ) | | | 0.00 | |
| | | | | | | | | | | | | | | | | | | | | | | | |
Total distributions to shareholders | | | (0.10 | ) | | | (0.14 | ) | | | 0.00 | | | | (0.06 | ) | | | (0.36 | ) | | | (0.00 | )1 |
Net asset value, end of period | | | $18.39 | | | | $18.09 | | | | $21.44 | | | | $21.77 | | | | $20.48 | | | | $20.93 | |
Total return2 | | | 2.20 | % | | | (15.02 | )% | | | (1.52 | )% | | | 6.62 | % | | | (0.31 | )% | | | (3.32 | )% |
Ratios to average net assets (annualized) | | | | | | | | | | | | | | | | | | | | | | | | |
Gross expenses | | | 1.67 | % | | | 1.64 | % | | | 1.64 | % | | | 1.65 | % | | | 1.67 | % | | | 1.68 | % |
Net expenses | | | 1.61 | % | | | 1.64 | % | | | 1.64 | % | | | 1.65 | % | | | 1.67 | % | | | 1.68 | % |
Net investment income (loss) | | | (0.13 | )% | | | 0.37 | % | | | 0.36 | % | | | 0.15 | % | | | 0.51 | % | | | 0.44 | % |
Supplemental data | | | | | | | | | | | | | | | | | | | | | | | | |
Portfolio turnover rate | | | 1 | % | | | 8 | % | | | 7 | % | | | 13 | % | | | 7 | % | | | 5 | % |
Net assets, end of period (000s omitted) | | | $840,176 | | | | $873,992 | | | | $1,502,597 | | | | $1,306,269 | | | | $920,709 | | | | $917,633 | |
| 1 | Amount is less than $0.005. |
| 2 | Total return calculations do not include any sales charge. Returns for periods of less than one year are not annualized. |
The accompanying notes are an integral part of these financial statements.
| | | | |
| 16 | | Wells Fargo Emerging Markets Equity Fund | | Financial highlights |
(For a share outstanding throughout each period)
| | | | | | | | | | | | | | | | | | | | | | | | |
| | | Six months ended
April 30, 2016 (unaudited) | | | Year ended October 31 | |
| CLASS B | | | 2015 | | | 2014 | | | 2013 | | | 2012 | | | 2011 | |
Net asset value, beginning of period | | | $15.40 | | | | $18.25 | | | | $18.67 | | | | $17.64 | | | | $18.06 | | | | $18.82 | |
Net investment loss | | | (0.06 | )1 | | | (0.08 | )1 | | | (0.08 | )1 | | | (0.12 | )1 | | | (0.05 | )1 | | | (0.08 | )1 |
Net realized and unrealized gains (losses) on investments | | | 0.34 | | | | (2.77 | ) | | | (0.34 | ) | | | 1.15 | | | | (0.15 | ) | | | (0.68 | ) |
| | | | | | | | | | | | | | | | | | | | | | | | |
Total from investment operations | | | 0.28 | | | | (2.85 | ) | | | (0.42 | ) | | | 1.03 | | | | (0.20 | ) | | | (0.76 | ) |
Distributions to shareholders from | | | | | | | | | | | | | | | | | | | | | | | | |
Net realized gains | | | 0.00 | | | | 0.00 | | | | 0.00 | | | | 0.00 | | | | (0.22 | ) | | | 0.00 | |
Net asset value, end of period | | | $15.68 | | | | $15.40 | | | | $18.25 | | | | $18.67 | | | | $17.64 | | | | $18.06 | |
Total return2 | | | 1.82 | % | | | (15.62 | )% | | | (2.25 | )% | | | 5.84 | % | | | (1.06 | )% | | | (4.04 | )% |
Ratios to average net assets (annualized) | | | | | | | | | | | | | | | | | | | | | | | | |
Gross expenses | | | 2.41 | % | | | 2.38 | % | | | 2.39 | % | | | 2.39 | % | | | 2.41 | % | | | 2.43 | % |
Net expenses | | | 2.36 | % | | | 2.38 | % | | | 2.39 | % | | | 2.39 | % | | | 2.41 | % | | | 2.43 | % |
Net investment loss | | | (0.88 | )% | | | (0.46 | )% | | | (0.46 | )% | | | (0.64 | )% | | | (0.28 | )% | | | (0.39 | )% |
Supplemental data | | | | | | | | | | | | | | | | | | | | | | | | |
Portfolio turnover rate | | | 1 | % | | | 8 | % | | | 7 | % | | | 13 | % | | | 7 | % | | | 5 | % |
Net assets, end of period (000s omitted) | | | $926 | | | | $1,453 | | | | $5,380 | | | | $11,071 | | | | $15,408 | | | | $21,652 | |
| 1 | Calculated based upon average shares outstanding |
| 2. | Total return calculations do not include any sales charges. Returns for periods of less than one year are not annualized. |
The accompanying notes are an integral part of these financial statements.
| | | | | | |
| Financial highlights | | Wells Fargo Emerging Markets Equity Fund | | | 17 | |
(For a share outstanding throughout each period)
| | | | | | | | | | | | | | | | | | | | | | | | |
| | | Six months ended
April 30, 2016 (unaudited) | | | Year ended October 31 | |
| CLASS C | | | 2015 | | | 2014 | | | 2013 | | | 2012 | | | 2011 | |
Net asset value, beginning of period | | | $15.28 | | | | $18.11 | | | | $18.53 | | | | $17.51 | | | | $17.92 | | | | $18.68 | |
Net investment loss | | | (0.06 | )1 | | | (0.06 | )1 | | | (0.08 | )1 | | | (0.11 | )1 | | | (0.06 | ) | | | (0.06 | )1 |
Net realized and unrealized gains (losses) on investments | | | 0.34 | | | | (2.77 | ) | | | (0.34 | ) | | | 1.13 | | | | (0.13 | ) | | | (0.70 | ) |
| | | | | | | | | | | | | | | | | | | | | | | | |
Total from investment operations | | | 0.28 | | | | (2.83 | ) | | | (0.42 | ) | | | 1.02 | | | | (0.19 | ) | | | (0.76 | ) |
Distributions to shareholders from | | | | | | | | | | | | | | | | | | | | |
Net realized gains | | | 0.00 | | | | 0.00 | | | | 0.00 | | | | 0.00 | | | | (0.22 | ) | | | 0.00 | |
Net asset value, end of period | | | $15.56 | | | | $15.28 | | | | $18.11 | | | | $18.53 | | | | $17.51 | | | | $17.92 | |
Total return2 | | | 1.83 | % | | | (15.63 | )% | | | (2.27 | )% | | | 5.83 | % | | | (1.01 | )% | | | (4.07 | )% |
Ratios to average net assets (annualized) | | | | | | | | | | | | | | | | | | | | |
Gross expenses | | | 2.41 | % | | | 2.39 | % | | | 2.39 | % | | | 2.39 | % | | | 2.42 | % | | | 2.43 | % |
Net expenses | | | 2.36 | % | | | 2.39 | % | | | 2.39 | % | | | 2.39 | % | | | 2.42 | % | | | 2.43 | % |
Net investment loss | | | (0.88 | )% | | | (0.39 | )% | | | (0.42 | )% | | | (0.62 | )% | | | (0.24 | )% | | | (0.32 | )% |
Supplemental data | | | | | | | | | | | | | | | | | | | | |
Portfolio turnover rate | | | 1 | % | | | 8 | % | | | 7 | % | | | 13 | % | | | 7 | % | | | 5 | % |
Net assets, end of period (000s omitted) | | | $70,386 | | | | $84,004 | | | | $138,169 | | | | $173,454 | | | | $183,471 | | | | $200,796 | |
| 1 | Calculated based upon average shares outstanding |
| 2 | Total return calculations do not include any sales charges. Returns for periods of less than one year are not annualized. |
The accompanying notes are an integral part of these financial statements.
| | | | |
| 18 | | Wells Fargo Emerging Markets Equity Fund | | Financial highlights |
(For a share outstanding throughout each period)
| | | | | | | | | | | | | | | | |
| | | Six months ended
April 30, 2016 (unaudited) | | | Year ended October 31 | |
| CLASS R6 | | | 2015 | | | 2014 | | | 20131 | |
Net asset value, beginning of period | | | $19.00 | | | | $22.53 | | | | $22.86 | | | | $20.89 | |
Net investment income | | | 0.03 | | | | 0.19 | | | | 0.21 | | | | 0.01 | 2 |
Net realized and unrealized gains (losses) on investments | | | 0.41 | | | | (3.46 | ) | | | (0.44 | ) | | | 1.96 | |
| | | | | | | | | | | | | | | | |
Total from investment operations | | | 0.44 | | | | (3.27 | ) | | | (0.23 | ) | | | 1.97 | |
Distributions to shareholders from | | | | | | | | | | | | | | | | |
Net investment income | | | (0.23 | ) | | | (0.26 | ) | | | (0.10 | ) | | | 0.00 | |
Net asset value, end of period | | | $19.21 | | | | $19.00 | | | | $22.53 | | | | $22.86 | |
Total return3 | | | 2.43 | % | | | (14.61 | )% | | | (1.01 | )% | | | 9.43 | % |
Ratios to average net assets (annualized) | | | | | | | | | | | | | | | | |
Gross expenses | | | 1.24 | % | | | 1.19 | % | | | 1.17 | % | | | 1.17 | % |
Net expenses | | | 1.18 | % | | | 1.18 | % | | | 1.17 | % | | | 1.17 | % |
Net investment income | | | 0.30 | % | | | 0.84 | % | | | 0.88 | % | | | 0.15 | % |
Supplemental data | | | | | | | | | | | | | | | | |
Portfolio turnover rate | | | 1 | % | | | 8 | % | | | 7 | % | | | 13 | % |
Net assets, end of period (000s omitted) | | | $98,975 | | | | $95,190 | | | | $35,967 | | | | $4,809 | |
| 1 | For the period from June 28, 2013 (commencement of class operations) to October 31, 2013. |
| 2 | Calculated based upon average shares outstanding |
| 3 | Returns for periods of less than one year are not annualized. |
The accompanying notes are an integral part of these financial statements.
| | | | | | |
| Financial highlights | | Wells Fargo Emerging Markets Equity Fund | | | 19 | |
(For a share outstanding throughout each period)
| | | | | | | | | | | | | | | | | | | | | | | | |
| | | Six months ended April 30, 2016 (unaudited) | | | Year ended October 31 | |
| ADMINISTRATOR CLASS | | | 2015 | | | 2014 | | | 2013 | | | 2012 | | | 2011 | |
Net asset value, beginning of period | | | $18.99 | | | | $22.44 | | | | $22.79 | | | | $21.44 | | | | $21.90 | | | | $22.63 | |
Net investment income (loss) | | | (0.00 | )1,2 | | | 0.12 | 1 | | | 0.13 | 1 | | | 0.05 | | | | 0.14 | | | | 0.02 | |
Net realized and unrealized gains (losses) on investments | | | 0.43 | | | | (3.46 | ) | | | (0.44 | ) | | | 1.40 | | | | (0.18 | ) | | | (0.73 | ) |
| | | | | | | | | | | | | | | | | | | | | | | | |
Total from investment operations | | | 0.43 | | | | (3.34 | ) | | | (0.31 | ) | | | 1.45 | | | | (0.04 | ) | | | (0.71 | ) |
Distributions to shareholders from | | | | | | | | | | | | | | | | | | | | |
Net investment income | | | (0.11 | ) | | | (0.11 | ) | | | (0.04 | ) | | | (0.10 | ) | | | (0.20 | ) | | | (0.02 | ) |
Net realized gains | | | 0.00 | | | | 0.00 | | | | 0.00 | | | | 0.00 | | | | (0.22 | ) | | | 0.00 | |
| | | | | | | | | | | | | | | | | | | | | | | | |
Total distributions to shareholders | | | (0.11 | ) | | | (0.11 | ) | | | (0.04 | ) | | | (0.10 | ) | | | (0.42 | ) | | | (0.02 | ) |
Net asset value, end of period | | | $19.31 | | | | $18.99 | | | | $22.44 | | | | $22.79 | | | | $21.44 | | | | $21.90 | |
Total return3 | | | 2.31 | % | | | (14.91 | )% | | | (1.36 | )% | | | 6.83 | % | | | (0.13 | )% | | | (3.14 | )% |
Ratios to average net assets (annualized) | | | | | | | | | | | | | | | | | | | | |
Gross expenses | | | 1.58 | % | | | 1.49 | % | | | 1.48 | % | | | 1.48 | % | | | 1.47 | % | | | 1.47 | % |
Net expenses | | | 1.49 | % | | | 1.48 | % | | | 1.48 | % | | | 1.48 | % | | | 1.47 | % | | | 1.47 | % |
Net investment income (loss) | | | (0.01 | )% | | | 0.58 | % | | | 0.57 | % | | | 0.35 | % | | | 0.72 | % | | | 0.70 | % |
Supplemental data | | | | | | | | | | | | | | | | | | | | |
Portfolio turnover rate | | | 1 | % | | | 8 | % | | | 7 | % | | | 13 | % | | | 7 | % | | | 5 | % |
Net assets, end of period (000s omitted) | | | $157,132 | | | | $181,224 | | | | $464,135 | | | | $1,050,660 | | | | $634,428 | | | | $529,083 | |
| 1 | Calculated based upon average shares outstanding |
| 2 | Amount is less than $0.005. |
| 3 | Returns for periods of less than one year are not annualized. |
The accompanying notes are an integral part of these financial statements.
| | | | |
| 20 | | Wells Fargo Emerging Markets Equity Fund | | Financial highlights |
(For a share outstanding throughout each period)
| | | | | | | | | | | | | | | | | | | | | | | | |
| | | Six months ended April 30, 2016 (unaudited) | | | Year ended October 31 | |
| INSTITUTIONAL CLASS | | | 2015 | | | 2014 | | | 2013 | | | 2012 | | | 2011 | |
Net asset value, beginning of period | | | $18.99 | | | | $22.52 | | | | $22.86 | | | | $21.50 | | | | $21.96 | | | | $22.66 | |
Net investment income | | | 0.03 | | | | 0.17 | | | | 0.15 | | | | 0.11 | | | | 0.22 | | | | 0.16 | |
Net realized and unrealized gains (losses) on investments | | | 0.42 | | | | (3.45 | ) | | | (0.40 | ) | | | 1.40 | | | | (0.22 | ) | | | (0.81 | ) |
| | | | | | | | | | | | | | | | | | | | | | | | |
Total from investment operations | | | 0.45 | | | | (3.28 | ) | | | (0.25 | ) | | | 1.51 | | | | 0.00 | | | | (0.65 | ) |
Distributions to shareholders from | | | | | | | | | | | | | | | | | | | | | | | | |
Net investment income | | | (0.22 | ) | | | (0.25 | ) | | | (0.09 | ) | | | (0.15 | ) | | | (0.24 | ) | | | (0.05 | ) |
Net realized gains | | | 0.00 | | | | 0.00 | | | | 0.00 | | | | 0.00 | | | | (0.22 | ) | | | 0.00 | |
| | | | | | | | | | | | | | | | | | | | | | | | |
Total distributions to shareholders | | | (0.22 | ) | | | (0.25 | ) | | | (0.09 | ) | | | (0.15 | ) | | | (0.46 | ) | | | (0.05 | ) |
Net asset value, end of period | | | $19.22 | | | | $18.99 | | | | $22.52 | | | | $22.86 | | | | $21.50 | | | | $21.96 | |
Total return1 | | | 2.46 | % | | | (14.66 | )% | | | (1.09 | )% | | | 7.07 | % | | | 0.13 | % | | | (2.89 | )% |
Ratios to average net assets (annualized) | | | | | | | | | | | | | | | | | | | | | | | | |
Gross expenses | | | 1.34 | % | | | 1.24 | % | | | 1.21 | % | | | 1.22 | % | | | 1.24 | % | | | 1.24 | % |
Net expenses | | | 1.22 | % | | | 1.22 | % | | | 1.21 | % | | | 1.22 | % | | | 1.24 | % | | | 1.23 | % |
Net investment income | | | 0.26 | % | | | 0.82 | % | | | 0.77 | % | | | 0.57 | % | | | 1.04 | % | | | 0.93 | % |
Supplemental data | | | | | | | | | | | | | | | | | | | | | | | | |
Portfolio turnover rate | | | 1 | % | | | 8 | % | | | 7 | % | | | 13 | % | | | 7 | % | | | 5 | % |
Net assets, end of period (000s omitted) | | | $2,019,189 | | | | $2,146,675 | | | | $2,900,353 | | | | $2,183,281 | | | | $1,176,567 | | | | $541,644 | |
| 1 | Returns for periods of less than one year are not annualized. |
The accompanying notes are an integral part of these financial statements.
| | | | | | |
| Notes to financial statements (unaudited) | | Wells Fargo Emerging Markets Equity Fund | | | 21 | |
1. ORGANIZATION
Wells Fargo Funds Trust (the “Trust”), a Delaware statutory trust organized on March 10, 1999, is an open-end management investment company registered under the Investment Company Act of 1940, as amended (the “1940 Act”). As an investment company, the Trust follows the accounting and reporting guidance in Financial Accounting Standards Board (“FASB”) Accounting Standards Codification Topic 946, Financial Services – Investment Companies. These financial statements report on the Wells Fargo Emerging Markets Equity Fund (the “Fund”) which is a diversified series of the Trust.
2. SIGNIFICANT ACCOUNTING POLICIES
The following significant accounting policies, which are consistently followed in the preparation of the financial statements of the Fund, are in conformity with U.S. generally accepted accounting principles which require management to make estimates and assumptions that affect the reported amounts of assets and liabilities, disclosure of contingent assets and liabilities at the date of the financial statements, and the reported amounts of revenues and expenses during the reporting period. Actual results could differ from those estimates.
Securities valuation
All investments are valued each business day as of the close of regular trading on the New York Stock Exchange (generally 4 p.m. Eastern Time), although a Fund may deviate from this calculation time under unusual or unexpected circumstances.
Equity securities that are listed on a foreign or domestic exchange or market are valued at the official closing price or, if none, the last sales price. If no sale occurs on the principal exchange or market that day, the prior day’s price will be deemed “stale” and a fair value price will be determined in accordance with the Fund’s Valuation Procedures.
The values of securities denominated in foreign currencies are translated into U.S. dollars at rates provided by an independent foreign currency pricing source at a time each business day specified by the Management Valuation Team of Wells Fargo Funds Management, LLC (“Funds Management”).
Many securities markets and exchanges outside the U.S. close prior to the close of the New York Stock Exchange and therefore may not fully reflect trading or events that occur after the close of the principal exchange in which the foreign securities are traded, but before the close of the New York Stock Exchange. If such trading or events are expected to materially affect the value of such securities, then fair value pricing procedures approved by the Board of Trustees of the Fund are applied. These procedures take into account multiple factors including movements in U.S. securities markets after foreign exchanges close. Foreign securities that are fair valued under these procedures are categorized as Level 2 and the application of these procedures may result in transfers between Level 1 and Level 2. Depending on market activity, such fair valuations may be frequent. Such fair value pricing may result in net asset values that are higher or lower than net asset values based on the last reported sales price or latest quoted bid price. On April 30, 2016, such fair value pricing was not used in pricing foreign securities.
Debt securities are valued at the evaluated bid price provided by an independent pricing service or, if a reliable price is not available, the quoted bid price from an independent broker-dealer.
Investments in registered open-end investment companies are valued at net asset value. Interests in non-registered investment vehicles that are redeemable at net asset value are fair valued normally at net asset value.
Investments which are not valued using any of the methods discussed above are valued at their fair value, as determined in good faith by the Board of Trustees. The Board of Trustees has established a Valuation Committee comprised of the Trustees and has delegated to it the authority to take any actions regarding the valuation of portfolio securities that the Valuation Committee deems necessary or appropriate, including determining the fair value of portfolio securities, unless the determination has been delegated to the Management Valuation Team. The Board of Trustees retains the authority to make or ratify any valuation decisions or approve any changes to the Valuation Procedures as it deems appropriate. On a quarterly basis, the Board of Trustees receives reports on any valuation actions taken by the Valuation Committee or the Management Valuation Team which may include items for ratification.
Valuations of fair valued securities are compared to the next actual sales price when available, or other appropriate market values, to assess the continued appropriateness of the fair valuation methodologies used. These securities are fair valued on a day-to-day basis, taking into consideration changes to appropriate market information and any significant changes to the inputs considered in the valuation process until there is a readily available price provided on an exchange or by an independent pricing service. Valuations received from an independent pricing service or independent broker-dealer quotes are periodically validated by comparisons to most recent trades and valuations provided by other
| | | | |
| 22 | | Wells Fargo Emerging Markets Equity Fund | | Notes to financial statements (unaudited) |
independent pricing services in addition to the review of prices by the manager and/or subadviser. Unobservable inputs used in determining fair valuations are identified based on the type of security, taking into consideration factors utilized by market participants in valuing the investment, knowledge about the issuer and the current market environment.
Foreign currency translation
The accounting records of the Fund are maintained in U.S. dollars. The values of other assets and liabilities denominated in foreign currencies are translated into U.S. dollars at rates provided by an independent foreign currency pricing source at a time each business day specified by the Management Valuation Team. Purchases and sales of securities, and income and expenses are converted at the rate of exchange on the respective dates of such transactions. Net realized foreign exchange gains or losses arise from sales of foreign currencies, currency gains or losses realized between the trade and settlement dates on securities transactions, and the difference between the amounts of dividends, interest and foreign withholding taxes recorded and the U.S. dollar equivalent of the amounts actually paid or received. Net unrealized foreign exchange gains and losses arise from changes in the fair value of assets and liabilities other than investments in securities resulting from changes in exchange rates. The changes in net assets arising from changes in exchange rates and the changes in net assets resulting from changes in market prices of securities are not separately presented. Such changes are included in net realized and unrealized gains or losses from investments.
Forward foreign currency contracts
The Fund is subject to foreign currency exchange rate risk in the normal course of pursuing its investment objectives. A forward foreign currency contract is an agreement between two parties to purchase or sell a specific currency for an agreed-upon price at a future date. The Fund enters into forward foreign currency contracts to facilitate transactions in foreign-denominated securities and to attempt to minimize the risk to the Fund from adverse changes in the relationship between currencies. Forward foreign currency contracts are recorded at the forward rate and marked-to-market daily. When the contracts are closed, realized gains and losses arising from such transactions are recorded as realized gains or losses on forward foreign currency contract transactions. The Fund could be exposed to risks if the counterparties to the contracts are unable to meet the terms of their contracts or if the value of the foreign currency changes unfavorably. The Fund’s maximum risk of loss from counterparty credit risk is the unrealized gains on the contracts. This risk may be mitigated if there is a master netting arrangement between the Fund and the counterparty.
Security loans
The Fund may lend its securities from time to time in order to earn additional income in the form of fees or interest on securities received as collateral or the investment of any cash received as collateral. The Fund continues to receive interest or dividends on the securities loaned. The Fund receives collateral in the form of cash or securities with a value at least equal to the value of the securities on loan. The value of the loaned securities is determined at the close of each business day and any additional required collateral is delivered to the Fund on the next business day. In a securities lending transaction, the net asset value of the Fund will be affected by an increase or decrease in the value of the securities loaned and by an increase or decrease in the value of the instrument in which collateral is invested. The amount of securities lending activity undertaken by the Fund fluctuates from time to time. In the event of default or bankruptcy by the borrower, the Fund may be prevented from recovering the loaned securities or gaining access to the collateral or may experience delays or costs in doing so. In addition, the investment of any cash collateral received may lose all or part of its value. The Fund has the right under the lending agreement to recover the securities from the borrower on demand.
The Fund lends its securities through an unaffiliated securities lending agent. Cash collateral received in connection with its securities lending transactions is invested in Securities Lending Cash Investments, LLC (the “Securities Lending Fund”). The Securities Lending Fund is exempt from registration under Section 3(c)(7) of the 1940 Act and is managed by Funds Management and is subadvised by Wells Capital Management Incorporated (“WellsCap”), an affiliate of Funds Management and an indirect wholly owned subsidiary of Wells Fargo & Company (“Wells Fargo”). Funds Management receives an advisory fee starting at 0.05% and declining to 0.01% as the average daily net assets of the Securities Lending Fund increase. All of the fees received by Funds Management are paid to WellsCap for its services as subadviser. The Securities Lending Fund seeks to provide a positive return compared to the daily Fed Funds Open rate by investing in high-quality, U.S. dollar-denominated short-term money market instruments. Securities Lending Fund investments are fair valued based upon the amortized cost valuation technique. Income earned from investment in the Securities Lending Fund is included in securities lending income on the Statement of Operations.
Security transactions and income recognition
Securities transactions are recorded on a trade date basis. Realized gains or losses are recorded on the basis of identified cost.
| | | | | | |
| Notes to financial statements (unaudited) | | Wells Fargo Emerging Markets Equity Fund | | | 23 | |
Dividend income is recognized on the ex-dividend date, except for certain dividends from foreign securities, which are recorded as soon as the custodian verifies the ex-dividend date. Dividend income from foreign securities is recorded net of foreign taxes withheld where recovery of such taxes is not assured.
Distributions to shareholders
Distributions to shareholders from net investment income and net realized gains, if any, are recorded on the ex-dividend date. Such distributions are determined in conformity with federal income tax regulations, which may differ in amount or character from net investment income and realized gains recognized for purposes of U.S. generally accepted accounting principles.
Federal and other taxes
The Fund intends to continue to qualify as a regulated investment company by distributing substantially all of its investment company taxable income and any net realized capital gains (after reduction for capital loss carryforwards) sufficient to relieve it from all, or substantially all, federal income taxes. Accordingly, no provision for federal income taxes was required.
The Fund’s income and federal excise tax returns and all financial records supporting those returns for the prior three fiscal years are subject to examination by the federal and Delaware revenue authorities. Management has analyzed the Fund’s tax positions taken on federal, state, and foreign tax returns for all open tax years and does not believe that there are any uncertain tax positions that require recognition of a tax liability.
Capital loss carryforwards that do not expire are required to be utilized prior to capital loss carryforwards that expire. As of October 31, 2015, capital loss carryforwards available to offset future net realized capital gains were as follows through the indicated expiration dates:
| | | | |
| | | No expiration |
| 2017 | | Short-term | | Long-term |
| $10,889,490 | | $27,469,490 | | $223,167,755 |
Class allocations
The separate classes of shares offered by the Fund differ principally in applicable sales charges, distribution, shareholder servicing, and administration fees. Class specific expenses are charged directly to that share class. Investment income, common expenses, and realized and unrealized gains (losses) on investments are allocated daily to each class of shares based on the relative proportion of net assets of each class.
3. FAIR VALUATION MEASUREMENTS
Fair value measurements of investments are determined within a framework that has established a fair value hierarchy based upon the various data inputs utilized in determining the value of the Fund’s investments. The three-level hierarchy gives the highest priority to unadjusted quoted prices in active markets for identical assets or liabilities (Level 1) and the lowest priority to significant unobservable inputs (Level 3). The Fund’s investments are classified within the fair value hierarchy based on the lowest level of input that is significant to the fair value measurement. The inputs are summarized into three broad levels as follows:
| n | | Level 1 – quoted prices in active markets for identical securities |
| n | | Level 2 – other significant observable inputs (including quoted prices for similar securities, interest rates, prepayment speeds, credit risk, use of amortized cost, etc.) |
| n | | Level 3 – significant unobservable inputs (including the Fund’s own assumptions in determining the fair value of investments) |
The inputs or methodologies used for valuing investments in securities are not necessarily an indication of the risk associated with investing in those securities.
| | | | |
| 24 | | Wells Fargo Emerging Markets Equity Fund | | Notes to financial statements (unaudited) |
The following is a summary of the inputs used in valuing the Fund’s assets and liabilities as of April 30, 2016:
| | | | | | | | | | | | | | | | |
| | | Quoted prices
(Level 1) | | | Other significant observable inputs (Level 2) | | | Significant unobservable inputs (Level 3) | | | Total | |
Assets | | | | | | | | | | | | | | | | |
Investments in: | | | | | | | | | | | | | | | | |
| | | | |
Common stocks | | | | | | | | | | | | | | | | |
Argentina | | $ | 19,395,417 | | | $ | 0 | | | $ | 0 | | | $ | 19,395,417 | |
Brazil | | | 226,016,175 | | | | 0 | | | | 0 | | | | 226,016,175 | |
Chile | | | 79,035,244 | | | | 0 | | | | 0 | | | | 79,035,244 | |
China | | | 726,504,733 | | | | 0 | | | | 0 | | | | 726,504,733 | |
Colombia | | | 19,050,956 | | | | 0 | | | | 0 | | | | 19,050,956 | |
Hong Kong | | | 165,231,558 | | | | 0 | | | | 0 | | | | 165,231,558 | |
India | | | 304,059,763 | | | | 0 | | | | 0 | | | | 304,059,763 | |
Indonesia | | | 83,469,283 | | | | 0 | | | | 0 | | | | 83,469,283 | |
Malaysia | | | 42,180,298 | | | | 0 | | | | 0 | | | | 42,180,298 | |
Mexico | | | 336,906,152 | | | | 0 | | | | 0 | | | | 336,906,152 | |
Peru | | | 15,464,540 | | | | 0 | | | | 0 | | | | 15,464,540 | |
Philippines | | | 27,915,708 | | | | 0 | | | | 0 | | | | 27,915,708 | |
Russia | | | 79,268,921 | | | | 13,369,656 | | | | 0 | | | | 92,638,577 | |
South Africa | | | 148,979,546 | | | | 0 | | | | 0 | | | | 148,979,546 | |
South Korea | | | 350,700,572 | | | | 0 | | | | 0 | | | | 350,700,572 | |
Taiwan | | | 276,609,997 | | | | 0 | | | | 0 | | | | 276,609,997 | |
Thailand | | | 119,022,296 | | | | 0 | | | | 0 | | | | 119,022,296 | |
Turkey | | | 29,937,612 | | | | 0 | | | | 0 | | | | 29,937,612 | |
United Arab Emirates | | | 2,974,475 | | | | 0 | | | | 0 | | | | 2,974,475 | |
United Kingdom | | | 24,001,335 | | | | 0 | | | | 0 | | | | 24,001,335 | |
| | | | |
Convertible debentures | | | 0 | | | | 0 | | | | 1,410 | | | | 1,410 | |
| | | | |
Preferred stocks | | | | | | | | | | | | | | | | |
Brazil | | | 46,209,061 | | | | 0 | | | | 0 | | | | 46,209,061 | |
| | | | |
Short-term investments | | | | | | | | | | | | | | | | |
Investment companies | | | 38,811,076 | | | | 0 | | | | 0 | | | | 38,811,076 | |
Investments measured at net asset value* | | | | | | | | | | | | | | | 120,567,678 | |
Total assets | | $ | 3,161,744,718 | | | $ | 13,369,656 | | | $ | 1,410 | | | $ | 3,295,683,462 | |
| * | Investments that are measured at fair value using the net asset value per share (or its equivalent) as a practical expedient have not been categorized in the fair value hierarchy. The fair value amount presented in the table is intended to permit reconciliation of the fair value hierarchy to the amounts presented in the Statement of Assets and Liabilities. The Fund’s investment in Securities Lending Cash Investments, LLC valued at $120,567,678 does not have a redemption period notice, can be redeemed daily and does not have any unfunded commitments. |
The Fund recognizes transfers between levels within the fair value hierarchy at the end of the reporting period. Fair value pricing that was used in pricing certain foreign securities at the previous period end was not used at April 30, 2016. As a result common stocks and preferred stocks valued at $1,719,558,688 and $46,209,061, respectively, were transferred from Level 2 to Level 1 within the fair value hierarchy. The Fund did not have any transfers into/out of Level 3.
4. TRANSACTIONS WITH AFFILIATES
Management fee
Funds Management, an indirect wholly owned subsidiary of Wells Fargo, is the manager of the Fund and provides advisory and fund-level administrative services under an investment management agreement. Under the investment management agreement, Funds Management is responsible for, among other services, implementing the investment objectives and strategies of the Fund, supervising the applicable subadviser, providing fund-level administrative services in connection with the Fund’s operations, and providing any other fund-level administrative services reasonably necessary for the operation of the Fund. As compensation for its services under the investment management agreement, Funds Management is entitled to receive an annual management fee starting at 1.15% and declining to 0.955% as the
| | | | | | |
| Notes to financial statements (unaudited) | | Wells Fargo Emerging Markets Equity Fund | | | 25 | |
average daily net assets of the Fund increase. For the six months ended April 30, 2016, the management fee was equivalent to an annual rate of 1.07% of the Fund’s average daily net assets.
Funds Management has retained the services of a subadviser to provide daily portfolio management to the Fund. The fee for subadvisory services is borne by Funds Management. WellsCap, is the subadviser to the Fund and is entitled to receive a fee from Funds Management at an annual rate starting at 0.65% and declining to 0.45% as the average daily net assets of the Fund increase.
Administration fees
Under a class-level administration agreement, Funds Management provides class-level administrative services to the Fund, which includes paying fees and expenses for services provided by the transfer agent, sub-transfer agents, omnibus account servicers and record-keepers. As compensation for its services under the class-level administration agreement, Funds Management receives an annual fee which is calculated based on the average daily net assets of each class as follows:
| | | | |
| | | Class-level administration fee | |
Class A, Class B, Class C | | | 0.21 | % |
Class R6 | | | 0.03 | |
Administrator Class, Institutional Class | | | 0.13 | |
Funds Management has contractually waived and/or reimbursed management and administration fees to the extent necessary to maintain certain net operating expense ratios for the Fund. Waiver of fees and/or reimbursement of expenses by Funds Management were made first from fund level expenses on a proportionate basis and then from class specific expenses. Funds Management has committed through February 28, 2017 to waive fees and/or reimburse expenses to the extent necessary to cap the Fund’s expenses at 1.61% for Class A shares, 2.36% for Class B shares, 2.36% for Class C shares, and 1.18% for Class R6 shares, 1.49% for Administrator Class and 1.22% for Institutional Class shares. After this time, the cap may be increased or the commitment to maintain the cap may be terminated only with the approval of the Board of Trustees.
Distribution fees
The Trust has adopted a distribution plan for Class B and Class C shares of the Fund pursuant to Rule 12b-1 under the 1940 Act. Distribution fees are charged to Class B and Class C shares, and paid to Wells Fargo Funds Distributor, LLC (“Funds Distributor”), the principal underwriter, at an annual rate of 0.75% of the average daily net assets of Class B and Class C shares.
In addition, Funds Distributor is entitled to receive the front-end sales charge from the purchase of Class A shares and a contingent deferred sales charge on the redemption of certain Class A shares. Funds Distributor is also entitled to receive the contingent deferred sales charges from redemptions of Class B and Class C shares. For the six months ended April 30, 2016, Funds Distributor received $3,808 from the sale of Class A shares and $1,001 in contingent deferred sales charges from redemptions of Class A.
Shareholder servicing fees
The Trust has entered into contracts with one or more shareholder servicing agents, whereby Class A, Class B, Class C, and Administrator Class of the Fund are charged a fee at an annual rate of 0.25% of the average daily net assets of each respective class.
A portion of these total shareholder servicing fees were paid to affiliates of Wells Fargo.
5. INVESTMENT PORTFOLIO TRANSACTIONS
Purchases and sales of investments, excluding U.S. government obligations (if any) and short-term securities, for the six months ended April 30, 2016 were $30,080,741 and $288,070,928, respectively.
| | | | |
| 26 | | Wells Fargo Emerging Markets Equity Fund | | Notes to financial statements (unaudited) |
6. INVESTMENTS IN AFFILIATES
An affiliated investment is a company which is under common ownership or control of the Fund or which the Fund has ownership of at least 5% of the outstanding voting shares. The following is a summary of transactions for the long-term holdings of issuers that were either affiliates of the Fund at the beginning of the period or the end of the period.
| | | | | | | | | | | | | | | | | | | | | | | | | | | | |
| | | Shares,
beginning of
period | | | Shares
purchased | | | Shares
sold | | | Shares, end of period | | | Value, end of period | | | Income from
affiliated securities | | | Realized gains (losses) | |
104 Corporation | | | 1,655,000 | | | | 0 | | | | 0 | | | | 1,655,000 | | | $ | 7,183,828 | | | $ | 0 | | | $ | 0 | |
7. DERIVATIVE TRANSACTIONS
During the six months ended April 30, 2016, the Fund entered into forward foreign currency contracts for economic hedging purposes.
As of April 30, 2016, the Fund did not have any open forward foreign currency contracts. The Fund had average contract amounts of $14,047 in forward foreign currency contracts to sell during the six months ended April 30, 2016.
The fair value, realized gains or losses and change in unrealized gains or losses, if any, on derivative instruments are reflected in the appropriate financial statements.
8. BANK BORROWINGS
The Trust (excluding the money market funds and certain other funds) and Wells Fargo Variable Trust are parties to a $200,000,000 revolving credit agreement whereby the Fund is permitted to use bank borrowings for temporary or emergency purposes, such as to fund shareholder redemption requests. Interest under the credit agreement is charged to the Fund based on a borrowing rate equal to the higher of the Federal Funds rate in effect on that day plus 1.25% or the overnight LIBOR rate in effect on that day plus 1.25%. In addition, an annual commitment fee equal to 0.20% of the unused balance is allocated to each participating fund.
For the six months ended April 30, 2016, there were no borrowings by the Fund under the agreement.
9. INDEMNIFICATION
Under the Trust’s organizational documents, the officers and Trustees have been granted certain indemnification rights against certain liabilities that may arise out of performance of their duties to the Trust. Additionally, in the normal course of business, the Trust may enter into contracts with service providers that contain a variety of indemnification clauses. The Trust’s maximum exposure under these arrangements is dependent on future claims that may be made against the Fund and, therefore, cannot be estimated.
| | | | | | |
| Other information (unaudited) | | Wells Fargo Emerging Markets Equity Fund | | | 27 | |
TAX INFORMATION
Pursuant to Section 853 of the Internal Revenue Code, the following amounts have been designated as foreign taxes paid for the fiscal year ended October 31, 2015. These amounts may be less than the actual foreign taxes paid for financial statement purposes. Foreign taxes paid or withheld should be included in taxable income with an offsetting deduction from gross income or as a credit for taxes paid to foreign governments. None of the income was derived from ineligible foreign sources as defined under Section 901(j) of the Internal Revenue Code.
| | | | |
Creditable foreign taxes paid | | Per share
amount | | Foreign income as % of
ordinary income
distributions |
| $7,220,008 | | $0.0398 | | 100% |
PROXY VOTING INFORMATION
A description of the policies and procedures that the Fund uses to determine how to vote proxies relating to portfolio securities is available, upon request, by calling 1-800-222-8222, visiting our website at wellsfargofunds.com, or visiting the SEC website at sec.gov. Information regarding how the Fund voted proxies relating to portfolio securities during the most recent 12-month period ended June 30 is available on the Fund’s website at wellsfargofunds.com or by visiting the SEC website at sec.gov.
PORTFOLIO HOLDINGS INFORMATION
The complete portfolio holdings for the Fund are publicly available monthly on the Fund’s website (wellsfargofunds.com), on a one-month delayed basis. In addition, top ten holdings information (excluding derivative positions) for the Fund is publicly available on the Fund’s website on a monthly, seven-day or more delayed basis. The Fund files its complete schedule of portfolio holdings with the SEC for the first and third quarters of each fiscal year on Form N-Q, which is available by visiting the SEC website at sec.gov. In addition, the Fund’s Form N-Q may be reviewed and copied at the SEC’s Public Reference Room in Washington, DC, and at regional offices in New York City, at 233 Broadway, and in Chicago, at 175 West Jackson Boulevard, Suite 900. Information about the Public Reference Room may be obtained by calling 1-800-SEC-0330.
| | | | |
| 28 | | Wells Fargo Emerging Markets Equity Fund | | Other information (unaudited) |
BOARD OF TRUSTEES AND OFFICERS
Each of the Trustees and Officers1 listed in the table below acts in identical capacities for each fund in the Wells Fargo family of funds, which consists of 141 mutual funds comprising the Wells Fargo Funds Trust, Wells Fargo Variable Trust, Wells Fargo Master Trust and four closed-end funds (collectively the “Fund Complex”). This table should be read in conjunction with the Prospectus and the Statement of Additional Information2. The mailing address of each Trustee and Officer is 525 Market Street, 12th Floor, San Francisco, CA 94105. Each Trustee and Officer serves an indefinite term, however, each Trustee serves such term until reaching the mandatory retirement age established by the Trustees.
Independent Trustees
| | | | | | |
Name and year of birth | | Position held and length of service* | | Principal occupations during past five years or longer | | Current other public company or
investment company
directorships |
William R. Ebsworth (Born 1957) | | Trustee, since 2015 | | Retired. From 1984 to 2013, equities analyst, portfolio manager, research director and chief financial officer at Fidelity Management and Research Company in Boston, Tokyo, and Hong Kong and retired in 2013 as Chief Investment Officer of Fidelity Strategic Advisers, Inc. where he lead a team of investment professionals managing client assets. Prior thereto, Board member of Hong Kong Securities Clearing Co., Hong Kong Options Clearing Corp., the Thailand International Fund, Ltd., Fidelity Investments Life Insurance Company, and Empire Fidelity Investments Life Insurance Company. Mr. Ebsworth is a CFA ® charterholder and an Adjunct Lecturer, Finance, at Babson College. | | Asset Allocation Trust |
| Jane A. Freeman (Born 1953) | | Trustee, since 2015 | | Retired. From 2012 to 2014 and 1999 to 2008, Chief Financial Officer of Scientific Learning Corporation. From 2008 to 2012, Ms. Freeman provided consulting services related to strategic business projects. Prior to 1999, Portfolio Manager at Rockefeller & Co. and Scudder, Stevens & Clark. Board member of the Harding Loevner Funds from 1996 to 2014, serving as both Lead Independent Director and chair of the Audit Committee. Board member of the Russell Exchange Traded Funds Trust from 2011 to 2012 and the chair of the Audit Committee. Ms. Freeman is Chair of Taproot Foundation (non-profit organization), a Board Member of Ruth Bancroft Garden (non-profit organization) and an inactive chartered financial analyst. | | Asset Allocation Trust |
| Peter G. Gordon (Born 1942) | | Trustee, since 1998; Chairman, since 2005 | | Co-Founder, Retired Chairman, President and CEO of Crystal Geyser Water Company. Trustee Emeritus, Colby College. | | Asset Allocation Trust |
| Isaiah Harris, Jr. (Born 1952) | | Trustee, since 2009 | | Retired. Chairman of the Board of CIGNA Corporation since 2009, and Director since 2005. From 2003 to 2011, Director of Deluxe Corporation. Prior thereto, President and CEO of BellSouth Advertising and Publishing Corp. from 2005 to 2007, President and CEO of BellSouth Enterprises from 2004 to 2005 and President of BellSouth Consumer Services from 2000 to 2003. Emeritus member of the Iowa State University Foundation Board of Governors. Emeritus Member of the Advisory Board of Iowa State University School of Business. Advisory Board Member, Palm Harbor Academy (charter school). Advisory Board Member, Child Evangelism Fellowship (non-profit). Mr. Harris is a certified public accountant (inactive status). | | CIGNA Corporation; Asset Allocation Trust |
| Judith M. Johnson (Born 1949) | | Trustee, since 2008;
Audit Committee
Chairman, since 2008 | | Retired. Prior thereto, Chief Executive Officer and Chief Investment Officer of Minneapolis Employees Retirement Fund from 1996 to 2008. Ms. Johnson is an attorney, certified public accountant and a certified managerial accountant. | | Asset Allocation Trust |
| David F. Larcker (Born 1950) | | Trustee, since 2009 | | James Irvin Miller Professor of Accounting at the Graduate School of Business, Stanford University, Director of the Corporate Governance Research Initiative and Senior Faculty of The Rock Center for Corporate Governance since 2006. From 2005 to 2008, Professor of Accounting at the Graduate School of Business, Stanford University. Prior thereto, Ernst & Young Professor of Accounting at The Wharton School, University of Pennsylvania from 1985 to 2005. | | Asset Allocation Trust |
| | | | | | |
| Other information (unaudited) | | Wells Fargo Emerging Markets Equity Fund | | | 29 | |
| | | | | | |
Name and year of birth | | Position held and length of service* | | Principal occupations during past five years or longer | | Current other public company or
investment company
directorships |
| Olivia S. Mitchell (Born 1953) | | Trustee, since 2006 | | International Foundation of Employee Benefit Plans Professor, Wharton School of the University of Pennsylvania since 1993. Director of Wharton’s Pension Research Council and Boettner Center on Pensions & Retirement Research, and Research Associate at the National Bureau of Economic Research. Previously, Cornell University Professor from 1978 to 1993. | | Asset Allocation Trust |
| Timothy J. Penny (Born 1951) | | Trustee, since 1996 | | President and Chief Executive Officer of Southern Minnesota Initiative Foundation, a non-profit organization, since 2007 and Senior Fellow at the Humphrey Institute Policy Forum at the University of Minnesota since 1995. Member of the Board of Trustees of NorthStar Education Finance, Inc., a non-profit organization, since 2007. | | Asset Allocation Trust |
| Michael S. Scofield (Born 1943) | | Trustee, since 2010 | | Served on the Investment Company Institute’s Board of Governors and Executive Committee from 2008-2011 as well the Governing Council of the Independent Directors Council from 2006-2011 and the Independent Directors Council Executive Committee from 2008-2011. Chairman of the IDC from 2008-2010. Institutional Investor (Fund Directions) Trustee of Year in 2007. Trustee of the Evergreen Funds complex (and its predecessors) from 1984 to 2010. Chairman of the Evergreen Funds from 2000-2010. Former Trustee of the Mentor Funds. Retired Attorney, Law Offices of Michael S. Scofield. | | Asset Allocation Trust |
| * | Length of service dates reflect the Trustee’s commencement of service with the Trust’s predecessor entities, where applicable. |
Officers
| | | | | | |
Name and year of birth | | Position held and length of service | | Principal occupations during past five years or longer | | |
| Karla M. Rabusch (Born 1959) | | President, since 2003 | | Executive Vice President of Wells Fargo Bank, N.A. and President of Wells Fargo Funds Management, LLC since 2003. | | |
| Jeremy DePalma1 (Born 1974) | | Treasurer, since 2012 | | Senior Vice President of Wells Fargo Funds Management, LLC since 2009. Senior Vice President of Evergreen Investment Management Company, LLC from 2008 to 2010 and head of the Fund Reporting and Control Team within Fund Administration from 2005 to 2010. | | |
| C. David Messman (Born 1960) | | Secretary, since 2000; Chief Legal Officer, since 2003 | | Senior Vice President and Secretary of Wells Fargo Funds Management, LLC since 2001. Assistant General Counsel of Wells Fargo Bank, N.A. since 2013 and Vice President and Managing Counsel of Wells Fargo Bank, N.A. from 1996 to 2013. | | |
| Michael Whitaker (Born 1967) | | Chief Compliance Officer, since 2016* | | Executive Vice President of Wells Fargo Funds Management, LLC since 2016. Chief Compliance Officer of Fidelity’s Fixed Income Funds and Asset Allocation Funds from 2008 to 2016, Compliance Officer of FMR Co., Inc. from 2014 to 2016, Fidelity Investments Money Management, Inc. from 2014 to 2016, Fidelity Investments from 2007 to 2016. | | |
Debra Ann Early
(Born 1964) | | Chief Compliance Officer, since 2007** | | Executive Vice President of Wells Fargo Funds Management, LLC since 2014, Senior Vice President and Chief Compliance Officer from 2007 to 2014. | | |
David Berardi
(Born 1975) | | Assistant Treasurer, since 2009 | | Vice President of Wells Fargo Funds Management, LLC since 2009. Vice President of Evergreen Investment Management Company, LLC from 2008 to 2010. Manager of Fund Reporting and Control for Evergreen Investment Management Company, LLC from 2004 to 2010. | | |
| 1 | Jeremy DePalma acts as Treasurer of 69 funds and Assistant Treasurer of 72 funds in the Fund Complex. |
| 2 | The Statement of Additional Information includes additional information about the Trustees and is available, without charge, upon request, by calling 1-800-222-8222 or by visiting the website at wellsfargofunds.com. |
| * | Michael Whitaker became Chief Compliance Officer effective May 16, 2016. |
| ** | Debra Ann Early was the Chief Compliance Officer until May 15, 2016. |
| | | | |
| 30 | | Wells Fargo Emerging Markets Equity Fund | | List of abbreviations |
The following is a list of common abbreviations for terms and entities that may have appeared in this report.
| ACA | — ACA Financial Guaranty Corporation |
| ADR | — American depositary receipt |
| ADS | — American depositary shares |
| AGC | — Assured Guaranty Corporation |
| AGM | — Assured Guaranty Municipal |
| Ambac | — Ambac Financial Group Incorporated |
| AMT | — Alternative minimum tax |
| BAN | — Bond anticipation notes |
| BHAC | — Berkshire Hathaway Assurance Corporation |
| CAB | — Capital appreciation bond |
| CCAB | — Convertible capital appreciation bond |
| CDA | — Community Development Authority |
| CDO | — Collateralized debt obligation |
| DRIVER | — Derivative inverse tax-exempt receipts |
| DW&P | — Department of Water & Power |
| DWR | — Department of Water Resources |
| ECFA | — Educational & Cultural Facilities Authority |
| EDA | — Economic Development Authority |
| EDFA | — Economic Development Finance Authority |
| ETF | — Exchange-traded fund |
| FDIC | — Federal Deposit Insurance Corporation |
| FFCB | — Federal Farm Credit Banks |
| FGIC | — Financial Guaranty Insurance Corporation |
| FHA | — Federal Housing Administration |
| FHLB | — Federal Home Loan Bank |
| FHLMC | — Federal Home Loan Mortgage Corporation |
| FICO | — The Financing Corporation |
| FNMA | — Federal National Mortgage Association |
| GDR | — Global depositary receipt |
| GNMA | — Government National Mortgage Association |
| HCFR | — Healthcare facilities revenue |
| HEFA | — Health & Educational Facilities Authority |
| HEFAR | — Higher education facilities authority revenue |
| HFA | — Housing Finance Authority |
| HFFA | — Health Facilities Financing Authority |
| HUD | — Department of Housing and Urban Development |
| IDA | — Industrial Development Authority |
| IDAG | — Industrial Development Agency |
| KRW | — Republic of Korea won |
| LIBOR | — London Interbank Offered Rate |
| LIFER | — Long Inverse Floating Exempt Receipts |
| LLC | — Limited liability company |
| LLLP | — Limited liability limited partnership |
| LLP | — Limited liability partnership |
| MBIA | — Municipal Bond Insurance Association |
| MFHR | — Multifamily housing revenue |
| MSTR | — Municipal securities trust receipts |
| MUD | — Municipal Utility District |
| National | — National Public Finance Guarantee Corporation |
| PCFA | — Pollution Control Financing Authority |
| PCL | — Public Company Limited |
| PCR | — Pollution control revenue |
| PFA | — Public Finance Authority |
| PFFA | — Public Facilities Financing Authority |
| PFOTER | — Puttable floating option tax-exempt receipts |
| plc | — Public limited company |
| PUTTER | — Puttable tax-exempt receipts |
| R&D | — Research & development |
| Radian | — Radian Asset Assurance |
| RAN | — Revenue anticipation notes |
| RDA | — Redevelopment Authority |
| RDFA | — Redevelopment Finance Authority |
| REIT | — Real estate investment trust |
| ROC | — Reset option certificates |
| SAVRS | — Select auction variable rate securities |
| SBA | — Small Business Authority |
| SDR | — Swedish depositary receipt |
| SFHR | — Single-family housing revenue |
| SFMR | — Single-family mortgage revenue |
| SPA | — Standby purchase agreement |
| SPDR | — Standard & Poor’s Depositary Receipts |
| SPEAR | — Short Puttable Exempt Adjustable Receipts |
| STRIPS | — Separate trading of registered interest and |
| TAN | — Tax anticipation notes |
| TIPS | — Treasury inflation-protected securities |
| TRAN | — Tax revenue anticipation notes |
| TTFA | — Transportation Trust Fund Authority |
| TVA | — Tennessee Valley Authority |
This page is intentionally left blank.
This page is intentionally left blank.

For more information
More information about Wells Fargo Funds is available free upon request. To obtain literature, please write, email, visit the Fund’s website, or call:
Wells Fargo Funds
P.O. Box 8266
Boston, MA 02266-8266
Email: fundservice@wellsfargo.com
Website: wellsfargofunds.com
Individual investors: 1-800-222-8222
Retail investment professionals: 1-888-877-9275
Institutional investment professionals: 1-866-765-0778
This report and the financial statements contained herein are submitted for the general information of the shareholders of the Fund. If this report is used for promotional purposes, distribution of the report must be accompanied or preceded by a current prospectus. Before investing, please consider the investment objectives, risks, charges, and expenses of the investment. For a current prospectus and, if available, a summary prospectus, containing this information, call 1-800-222-8222 or visit the Fund’s website at wellsfargofunds.com. Read the prospectus carefully before you invest or send money.
Wells Fargo Asset Management (WFAM) is a trade name used by the asset management businesses of Wells Fargo & Company. Wells Fargo Funds Management, LLC, a wholly owned subsidiary of Wells Fargo & Company, provides investment advisory and administrative services for Wells Fargo Funds. Other affiliates of Wells Fargo & Company provide subadvisory and other services for the funds. The funds are distributed by Wells Fargo Funds Distributor, LLC, Member FINRA, an affiliate of Wells Fargo & Company.
NOT FDIC INSURED ¡ NO BANK GUARANTEE ¡ MAY LOSE VALUE
© 2016 Wells Fargo Funds Management, LLC. All rights reserved.
| | |
 | | 242230 06-16 SA238/SAR238 04-16 |
Semi-Annual Report
April 30, 2016

Wells Fargo Emerging Markets Equity Income Fund


Reduce clutter. Save trees.
Sign up for electronic delivery of prospectuses and shareholder reports at wellsfargo.com/advantagedelivery
Contents
The views expressed and any forward-looking statements are as of April 30, 2016, unless otherwise noted, and are those of the Fund managers and/or Wells Fargo Funds Management, LLC. Discussions of individual securities, or the markets generally, or any Wells Fargo Fund are not intended as individual recommendations. Future events or results may vary significantly from those expressed in any forward-looking statements. The views expressed are subject to change at any time in response to changing circumstances in the market. Wells Fargo Funds Management, LLC and the Fund disclaim any obligation to publicly update or revise any views expressed or forward-looking statements.
NOT FDIC INSURED ¡ NO BANK GUARANTEE ¡ MAY LOSE VALUE
| | | | |
| 2 | | Wells Fargo Emerging Markets Equity Income Fund | | Letter to shareholders (unaudited) |

Karla M. Rabusch
President
Wells Fargo Funds
Despite the slowdown, China’s growth rate remained higher than that of most other economies.
Despite challenging fundamentals, the prospect that Brazil’s left-leaning president might soon be replaced by an investor-friendly center-right government boosted the country’s currency and stock markets later in the reporting period.
Dear Valued Shareholder:
We are pleased to offer you this semi-annual report for the Wells Fargo Emerging Markets Equity Income Fund for the six-month period that ended April 30, 2016. The reporting period was marked by concerns about slowing economic growth in China and political upheaval in Brazil and South Africa.
Even as the Fed tightened its monetary policy, the People’s Bank of China remained accommodative.
Entering the reporting period, many emerging markets commentaries focused on the potential effect of the U.S. Federal Reserve (Fed) raising its key interest rate. In fact, a combination of U.S. moderate economic growth and low inflation did allow the Fed to raise its key rate by 0.25% in December 2015. Given that other central banks, including the European Central Bank and the People’s Bank of China (PBOC), remained in easing mode, the prospect of the Fed’s actions supported the value of the U.S. dollar relative to other currencies. A richly valued dollar had the potential to pressure emerging countries and companies with outstanding dollar-denominated debt.
Early in 2016, however, Fed officials dialed back their expectations of U.S. economic growth and indicated that they would raise the federal funds rate at a slower pace than initially expected. The Fed’s pullback, along with country-specific factors, prompted investors to focus more on country and company fundamentals than on the Fed’s actions.
The PBOC remained active throughout the reporting period. In November 2015, the central bank reduced short-term borrowing costs for banks. Coming after other PBOC stimulus prior to the reporting period, the central bank’s actions raised concerns that China’s economy was slowing more rapidly than anticipated. Investor fears were realized in January 2015, when China released a preliminary estimate of its 2015 gross domestic product growth that showed the country’s growth rate had dipped below 7% for the first time since 2009. Despite the slowdown, China’s growth rate remained higher than that of most other economies. In addition, the governor of the PBOC also was able to allay some investor fears by better communicating the bank’s strategy. Investor sentiment on China thus improved as the period progressed.
Brazil and South Africa continued to grapple with political and economic challenges
Major political scandals affected Brazil’s stock and currency markets. An ongoing investigation into bribery at the state-owned oil company, Petróleo Brasileiro S.A., ensnared several prominent politicians. Moreover, impeachment proceedings began against President Dilma Rousseff in October on the charge that she doctored the country’s fiscal accounts by taking unauthorized loans from state-owned banks. These scandals took place against a backdrop of a notable slowdown in global demand for commodities, pushing Brazil’s commodity-heavy economy into recession. Despite challenging fundamentals, the prospect that Brazil’s left-leaning president might soon be replaced by an investor-friendly center-right government boosted the country’s currency and stock markets later in the reporting period.
South Africa also sparked investor concerns in December 2015 after President Jacob Zuma first fired the country’s well-regarded finance minister; replaced him with a candidate widely regarded as unprepared; and then, after public and
1 The Morgan Stanley Capital International (MSCI) Emerging Markets Index (Net) is a free-float-adjusted market-capitalization-weighted index that is designed to measure the equity market performance of emerging markets. The MSCI Emerging Markets Index (Net) consists of the following 23 emerging markets country indexes: Brazil, Chile, China, Colombia, Czech Republic, Egypt, Greece, Hungary, India, Indonesia, Korea, Malaysia, Mexico, Peru, the Philippines, Poland, Qatar, Russia, South Africa, Taiwan, Thailand, Turkey, and United Arab Emirates. You cannot invest directly in an index.
| | | | | | |
| Letter to shareholders (unaudited) | | Wells Fargo Emerging Markets Equity Income Fund | | | 3 | |
investor outcry, appointed a third, better-regarded minister. Africa’s most-significant economy thus had three finance ministers in a four-day period. In addition, South Africa’s highest court ruled in March 2016 that President Zuma had failed to uphold the constitution when he ignored a state order to repay government funds used to upgrade a private residence. Economically, South Africa was affected by continued low prices for industrials and precious metals, which caused a slowdown in the country’s important mining sector.
The predominance of political risk caused notably high volatility in emerging markets, but the Morgan Stanley Capital International (MSCI) Emerging Markets Index (Net)1 ended the period with a nearly flat -0.13% return.
Don’t let short-term uncertainty derail long-term investment goals.
Periods of uncertainty can present challenges, but experience has taught us that maintaining long-term investment goals can be an effective way to plan for the future. To help you create a sound strategy based on your personal goals and risk tolerance, Wells Fargo Funds offers more than 100 mutual funds and other investments spanning a wide range of asset classes and investment styles. Although diversification cannot guarantee an investment profit or prevent losses, we believe it can be an effective way to manage investment risk and potentially smooth out overall portfolio performance. We encourage investors to know their investments and to understand that appropriate levels of risk-taking may unlock opportunities.
Thank you for choosing to invest with Wells Fargo Funds. We appreciate your confidence in us and remain committed to helping you meet your financial needs.
Sincerely,

Karla M. Rabusch
President
Wells Fargo Funds
For further information about your Fund, contact your investment professional, visit our website at wellsfargofunds.com, or call us directly at 1-800-222-8222. We are available 24 hours a day, 7 days a week.
| | | | |
| 4 | | Wells Fargo Emerging Markets Equity Income Fund | | Performance highlights (unaudited) |
Investment objective
The Fund seeks long-term capital appreciation and current income.
Manager
Wells Fargo Funds Management, LLC
Subadviser
Wells Capital Management Incorporated
Portfolio managers
Anthony L.T. Cragg
Alison Shimada
Average annual total returns (%) as of April 30, 20161
| | | | | | | | | | | | | | | | | | | | | | | | | | |
| | | | | Including sales charge | | | Excluding sales charge | | | Expense ratios2 (%) | |
| | | Inception date | | 1 year | | | Since inception | | | 1 year | | | Since inception | | | Gross | | | Net3 | |
| Class A (EQIAX) | | 5-31-2012 | | | (18.63 | ) | | | 1.96 | | | | (13.63 | ) | | | 3.51 | | | | 1.88 | | | | 1.67 | |
| Class C (EQICX) | | 5-31-2012 | | | (15.18 | ) | | | 2.74 | | | | (14.34 | ) | | | 2.74 | | | | 2.63 | | | | 2.42 | |
| Class R (EQIHX) | | 9-30-2015 | | | | | | | | | | | (13.93 | ) | | | 3.25 | | | | 2.13 | | | | 1.92 | |
| Class R6 (EQIRX) | | 9-30-2015 | | | | | | | | | | | (13.27 | ) | | | 3.93 | | | | 1.45 | | | | 1.22 | |
| Administrator Class (EQIDX) | | 5-31-2012 | | | | | | | | | | | (13.52 | ) | | | 3.72 | | | | 1.80 | | | | 1.47 | |
| Institutional Class (EQIIX) | | 5-31-2012 | | | | | | | | | | | (13.30 | ) | | | 3.93 | | | | 1.55 | | | | 1.27 | |
| MSCI Emerging Markets Index (Net)4 | | – | | | | | | | | | | | (17.87 | ) | | | 0.45 | | | | – | | | | – | |
Figures quoted represent past performance, which is no guarantee of future results, and do not reflect taxes that a shareholder may pay on fund distributions or the redemption of fund shares. Investment return and principal value of an investment will fluctuate so that an investor’s shares, when redeemed, may be worth more or less than their original cost. Performance shown without sales charges would be lower if sales charges were reflected. Current performance may be lower or higher than the performance data quoted, which assumes the reinvestment of dividends and capital gains. Current month-end performance is available on the Fund’s website, wellsfargofunds.com.
Index returns do not include transaction costs associated with buying and selling securities, any mutual fund fees or expenses, or any taxes. It is not possible to invest directly in an index.
For Class A shares, the maximum front-end sales charge is 5.75%. For Class C shares, the maximum contingent deferred sales charge is 1.00%. Performance including a contingent deferred sales charge assumes the sales charge for the corresponding time period. Class R, Class R6, Administrator Class, and Institutional Class shares are sold without a front-end sales charge or contingent deferred sales charge.
Stock values fluctuate in response to the activities of individual companies and general market and economic conditions. Foreign investments are especially volatile and can rise or fall dramatically due to differences in the political and economic conditions of the host country. These risks are generally intensified in emerging markets. The use of derivatives may reduce returns and/or increase volatility. Certain investment strategies tend to increase the total risk of an investment (relative to the broader market). The Fund is exposed to smaller-company securities risk. Consult the Fund’s prospectus for additional information on these and other risks.
Please see footnotes on page 5.
| | | | | | |
| Performance highlights (unaudited) | | Wells Fargo Emerging Markets Equity Income Fund | | | 5 | |
| | | | |
| Ten largest holdings (%) as of April 30, 20165 | |
China Mobile Limited | | | 2.28 | |
China Petroleum & Chemical Corporation H Shares | | | 2.25 | |
PT Telekomunikasi Indonesia Persero Tbk | | | 2.16 | |
Grupo Financiero Santander SAB de CV Class B | | | 1.97 | |
HSBC Bank plc (China Vanke Company Limited Class A) | | | 1.92 | |
POSCO | | | 1.83 | |
China Construction Bank H Shares | | | 1.80 | |
Industrial & Commercial Bank of China Limited H Shares | | | 1.76 | |
SK Telecom Company Limited ADR | | | 1.73 | |
Singapore Telecommunications Limited | | | 1.73 | |
| | |
| Sector distribution as of April 30, 20166 |
|
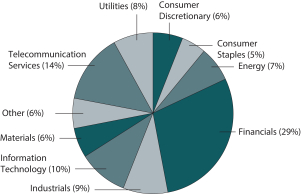 |
| | |
| Country allocation as of April 30, 20166 |
|
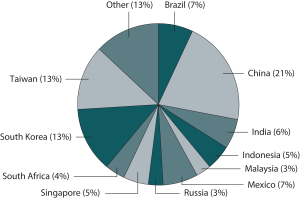 |
| 1 | Historical performance shown for the Class R shares prior to their inception reflects the performance of the Administrator Class shares, adjusted to reflect the higher expenses applicable to Class R shares. Historical performance shown for the Class R6 shares prior to their inception reflects the performance of the Institutional Class shares, and includes the higher expenses applicable to Institutional Class shares. If these expenses had not been included, returns for Class R6 shares would be higher. |
| 2 | Reflects the expense ratios as stated in the most recent prospectuses, which include the impact of 0.02% in acquired fund fees and expenses. The expense ratios shown are subject to change and may differ from the annualized expense ratios shown in the financial highlights of this report, which do not include acquired fund fees and expenses. |
| 3 | The manager has contractually committed through February 28, 2017 to waive fees and/or reimburse expenses to the extent necessary to cap the Fund’s Total Annual Operating Expenses After Fee Waiver at 1.65% for Class A, 2.40% for Class C, 1.90% for Class R, 1.20% for Class R6, 1.45% for Administrator Class, and 1.25% for Institutional Class. After this time, the cap may be increased or the commitment to maintain the cap may be terminated only with the approval of the Board of Trustees. Brokerage commissions, stamp duty fees, interest, taxes, acquired fund fees and expenses, and extraordinary expenses are excluded from the cap. Without this cap, the Fund’s returns would have been lower. |
| 4 | The Morgan Stanley Capital International (MSCI) Emerging Markets Index (Net) is a free-float-adjusted market-capitalization-weighted index that is designed to measure the equity market performance of emerging markets. The MSCI Emerging Markets Index (Net) consists of the following 23 emerging markets country indexes: Brazil, Chile, China, Colombia, Czech Republic, Egypt, Greece, Hungary, India, Indonesia, Korea, Malaysia, Mexico, Peru, the Philippines, Poland, Qatar, Russia, South Africa, Taiwan, Thailand, Turkey, and United Arab Emirates. Source: MSCI. MSCI makes no express or implied warranties or representations and shall have no liability whatsoever with respect to any MSCI data contained herein. The MSCI data may not be further redistributed or used as a basis for other indexes or any securities or financial products. This report is not approved, reviewed, or produced by MSCI. You cannot invest directly in an index. |
| 5 | The ten largest holdings, excluding cash and cash equivalents, are calculated based on the value of the investments divided by total net assets of the Fund. Holdings are subject to change and may have changed since the date specified. |
| 6 | Amounts are calculated based on the total long-term investments of the Fund. These amounts are subject to change and may have changed since the date specified. |
| | | | |
| 6 | | Wells Fargo Emerging Markets Equity Income Fund | | Fund expenses (unaudited) |
As a shareholder of the Fund, you incur two types of costs: (1) transaction costs, including sales charges (loads) on purchase payments and contingent deferred sales charges (if any) on redemptions and (2) ongoing costs, including management fees, distribution (12b-1) and/or shareholder servicing fees, and other Fund expenses. This example is intended to help you understand your ongoing costs (in dollars) of investing in the Fund and to compare these costs with the ongoing costs of investing in other mutual funds.
The example is based on an investment of $1,000 invested at the beginning of the six-month period and held for the entire period from November 1, 2015 to April 30, 2016.
Actual expenses
The “Actual” line of the table below provides information about actual account values and actual expenses. You may use the information in this line, together with the amount you invested, to estimate the expenses that you paid over the period. Simply divide your account value by $1,000 (for example, an $8,600 account value divided by $1,000 = 8.6), then multiply the result by the number in the “Actual” line under the heading entitled “Expenses paid during period” for your applicable class of shares to estimate the expenses you paid on your account during this period.
Hypothetical example for comparison purposes
The “Hypothetical” line of the table below provides information about hypothetical account values and hypothetical expenses based on the Fund’s actual expense ratio and an assumed rate of return of 5% per year before expenses, which is not the Fund’s actual return. The hypothetical account values and expenses may not be used to estimate the actual ending account balance or expenses you paid for the period. You may use this information to compare the ongoing costs of investing in the Fund and other funds. To do so, compare this 5% hypothetical example with the 5% hypothetical examples that appear in the shareholder reports of the other funds.
Please note that the expenses shown in the table are meant to highlight your ongoing costs only and do not reflect any transactional costs, such as sales charges (loads) and contingent deferred sales charges. Therefore, the “Hypothetical” line of the table is useful in comparing ongoing costs only and will not help you determine the relative total costs of owning different funds. In addition, if these transactional costs were included, your costs would have been higher.
| | | | | | | | | | | | | | | | |
| | | Beginning
account value
11-1-2015 | | | Ending
account value
4-30-2016 | | | Expenses
paid during
the period¹ | | | Net annualized
expense ratio | |
Class A | | | | | | | | | | | | | | | | |
Actual | | $ | 1,000.00 | | | $ | 999.61 | | | $ | 8.20 | | | | 1.65 | % |
Hypothetical (5% return before expenses) | | $ | 1,000.00 | | | $ | 1,016.66 | | | $ | 8.27 | | | | 1.65 | % |
Class C | | | | | | | | | | | | | | | | |
Actual | | $ | 1,000.00 | | | $ | 995.24 | | | $ | 11.91 | | | | 2.40 | % |
Hypothetical (5% return before expenses) | | $ | 1,000.00 | | | $ | 1,012.93 | | | $ | 12.01 | | | | 2.40 | % |
Class R | | | | | | | | | | | | | | | | |
Actual | | $ | 1,000.00 | | | $ | 998.26 | | | $ | 9.44 | | | | 1.90 | % |
Hypothetical (5% return before expenses) | | $ | 1,000.00 | | | $ | 1,015.42 | | | $ | 9.52 | | | | 1.90 | % |
Class R6 | | | | | | | | | | | | | | | | |
Actual | | $ | 1,000.00 | | | $ | 1,002.65 | | | $ | 5.98 | | | | 1.20 | % |
Hypothetical (5% return before expenses) | | $ | 1,000.00 | | | $ | 1,018.90 | | | $ | 6.02 | | | | 1.20 | % |
Administrator Class | | | | | | | | | | | | | | | | |
Actual | | $ | 1,000.00 | | | $ | 999.99 | | | $ | 7.21 | | | | 1.45 | % |
Hypothetical (5% return before expenses) | | $ | 1,000.00 | | | $ | 1,017.65 | | | $ | 7.27 | | | | 1.45 | % |
Institutional Class | | | | | | | | | | | | | | | | |
Actual | | $ | 1,000.00 | | | $ | 1,001.43 | | | $ | 6.22 | | | | 1.25 | % |
Hypothetical (5% return before expenses) | | $ | 1,000.00 | | | $ | 1,018.65 | | | $ | 6.27 | | | | 1.25 | % |
| 1 | Expenses paid is equal to the annualized expense ratio of each class multiplied by the average account value over the period, multiplied by the number of days in the most recent fiscal half-year divided by the number of days in the fiscal year (to reflect the one-half-year period). |
| | | | | | |
| Portfolio of investments—April 30, 2016 (unaudited) | | Wells Fargo Emerging Markets Equity Income Fund | | | 7 | |
| | | | | | | | | | | | |
| Security name | | | | | | Shares | | | Value | |
| | | | |
Common Stocks: 81.91% | | | | | | | | | | | | |
| | | | |
| Brazil: 5.24% | | | | | | | | | | | | |
Ambev SA (Consumer Staples, Beverages) | | | | | | | 607,400 | | | $ | 3,424,434 | |
BB Seguridade Participacoes SA (Financials, Insurance) | | | | | | | 461,196 | | | | 4,022,935 | |
Telefonica Brasil ADR (Telecommunication Services, Diversified Telecommunication Services) | | | | | | | 294,045 | | | | 3,622,634 | |
Valid Solucoes SA (Industrials, Commercial Services & Supplies) | | | | | | | 370,768 | | | | 3,773,171 | |
WEG SA (Industrials, Machinery) | | | | | | | 361,800 | | | | 1,596,896 | |
| | | | |
| | | | | | | | | | | 16,440,070 | |
| | | | | | | | | | | | |
| | | | |
| Cayman Islands: 0.85% | | | | | | | | | | | | |
KWG Property Holding Limited (Financials, Real Estate Management & Development) | | | | | | | 4,082,500 | | | | 2,652,580 | |
| | | | | | | | | | | | |
| | | | |
| Chile: 1.11% | | | | | | | | | | | | |
Aguas Andinas SA Class A (Utilities, Water Utilities) | | | | | | | 6,001,575 | | | | 3,483,716 | |
| | | | | | | | | | | | |
| | | | |
| China: 17.59% | | | | | | | | | | | | |
Bank of China Limited H Shares (Financials, Banks) | | | | | | | 9,641,000 | | | | 3,939,972 | |
Beijing Capital International Airport Company Limited H Shares (Industrials, Transportation Infrastructure) | | | | | | | 2,780,000 | | | | 2,992,561 | |
China Construction Bank H Shares (Financials, Banks) | | | | | | | 8,761,000 | | | | 5,635,936 | |
China Mobile Limited (Telecommunication Services, Wireless Telecommunication Services) | | | | | | | 625,000 | | | | 7,167,006 | |
China Petroleum & Chemical Corporation H Shares (Energy, Oil, Gas & Consumable Fuels) | | | | | | | 9,883,600 | | | | 7,046,153 | |
China Power International Development Limited (Utilities, Independent Power & Renewable Electricity Producers) | | | | | | | 12,035,000 | | | | 5,166,568 | |
China State Construction International Holdings Limited (Industrials, Construction & Engineering) | | | | | | | 998,000 | | | | 1,559,355 | |
CNOOC Limited (Energy, Oil, Gas & Consumable Fuels) | | | | | | | 1,806,000 | | | | 2,249,089 | |
COSCO Pacific Limited (Industrials, Transportation Infrastructure) | | | | | | | 3,587,517 | | | | 3,820,198 | |
Franshion Properties China Limited (Financials, Real Estate Management & Development) | | | | | | | 8,712,000 | | | | 2,504,578 | |
Huaneng Power International Incorporated H Shares (Utilities, Independent Power & Renewable Electricity Producers) | | | | | | | 3,434,000 | | | | 2,465,854 | |
Industrial & Commercial Bank of China Limited H Shares (Financials, Banks) | | | | | | | 10,190,000 | | | | 5,530,547 | |
PetroChina Company Limited H Shares (Energy, Oil, Gas & Consumable Fuels) | | | | | | | 4,826,000 | | | | 3,552,509 | |
Sinotrans Limited H Shares (Industrials, Air Freight & Logistics) | | | | | | | 3,414,000 | | | | 1,584,447 | |
| | | | |
| | | | | | | | | | | 55,214,773 | |
| | | | | | | | | | | | |
| | | | |
| Cyprus: 0.44% | | | | | | | | | | | | |
Ros Agro plc (Consumer Staples, Food & Staples Retailing) | | | | | | | 91,364 | | | | 1,388,733 | |
| | | | | | | | | | | | |
| | | | |
| Czech Republic: 0.99% | | | | | | | | | | | | |
Komercni Banka AS (Financials, Banks) | | | | | | | 15,146 | | | | 3,115,886 | |
| | | | | | | | | | | | |
| | | | |
| Indonesia: 4.27% | | | | | | | | | | | | |
PT Bank Rakyat Indonesia Tbk (Financials, Banks) | | | | | | | 1,912,300 | | | | 1,500,781 | |
PT Hanjaya Mandala Sampoerna Tbk (Consumer Staples, Tobacco) | | | | | | | 211,200 | | | | 1,599,454 | |
PT Indocement Tunggal Prakarsa Tbk (Materials, Construction Materials) | | | | | | | 1,502,800 | | | | 2,247,705 | |
PT Perusahaan Gas Negara Persero Tbk (Utilities, Gas Utilities) | | | | | | | 6,349,000 | | | | 1,261,327 | |
PT Telekomunikasi Indonesia Persero Tbk (Telecommunication Services, Diversified Telecommunication Services) | | | | | | | 25,204,900 | | | | 6,784,758 | |
| | | | |
| | | | | | | | | | | 13,394,025 | |
| | | | | | | | | | | | |
| | | | |
| Malaysia: 2.99% | | | | | | | | | | | | |
Malakoff Corporation Bhd (Utilities, Independent Power & Renewable Electricity Producers) | | | | | | | 5,182,575 | | | | 2,175,713 | |
Telecom Malaysia Bhd (Telecommunication Services, Diversified Telecommunication Services) | | | | | | | 1,662,081 | | | | 2,829,346 | |
Tenaga Nasional Bhd (Utilities, Electric Utilities) | | | | | | | 1,189,500 | | | | 4,372,512 | |
| | | | |
| | | | | | | | | | | 9,377,571 | |
| | | | | | | | | | | | |
The accompanying notes are an integral part of these financial statements.
| | | | |
| 8 | | Wells Fargo Emerging Markets Equity Income Fund | | Portfolio of investments—April 30, 2016 (unaudited) |
| | | | | | | | | | | | |
| Security name | | | | | | Shares | | | Value | |
| | | | |
| Mexico: 6.42% | | | | | | | | | | | | |
Bolsa Mexicana de Valores SAB de CV (Financials, Diversified Financial Services) | | | | | | | 1,150,955 | | | $ | 1,908,597 | |
Grupo Aeroportuario del Centro Norte SAB de CV (Industrials, Transportation Infrastructure) | | | | | | | 829,956 | | | | 4,812,444 | |
Grupo Financiero Santander SAB de CV Class B (Financials, Banks) | | | | | | | 3,375,080 | | | | 6,191,206 | |
Macquarie Mexico Real Estate Management SA de CV (Financials, REITs) 144A | | | | | | | 2,790,575 | | | | 3,876,553 | |
Wal-Mart de Mexico SAB de CV (Consumer Staples, Food & Staples Retailing) | | | | | | | 1,361,643 | | | | 3,365,198 | |
| | | | |
| | | | | | | | | | | 20,153,998 | |
| | | | | | | | | | | | |
| | | | |
| Panama: 0.71% | | | | | | | | | | | | |
Banco Latinoamericano de Comercio Exterior SA (Financials, Banks) | | | | | | | 86,189 | | | | 2,228,848 | |
| | | | | | | | | | | | |
| | | | |
| Philippines: 2.22% | | | | | | | | | | | | |
Globe Telecom Incorporated (Telecommunication Services, Wireless Telecommunication Services) | | | | | | | 62,745 | | | | 2,936,018 | |
Semirara Mining and Power Corporation (Energy, Oil, Gas & Consumable Fuels) | | | | | | | 1,491,310 | | | | 4,039,379 | |
| | | | |
| | | | | | | | | | | 6,975,397 | |
| | | | | | | | | | | | |
| | | | |
| Poland: 1.01% | | | | | | | | | | | | |
Asseco Poland SA (Information Technology, Software) | | | | | | | 208,923 | | | | 3,169,191 | |
| | | | | | | | | | | | |
| | | | |
| Russia: 2.66% | | | | | | | | | | | | |
Lukoil PJSC ADR (Energy, Oil, Gas & Consumable Fuels) | | | | | | | 35,719 | | | | 1,536,131 | |
MMC Norilsk Nickel PJSC (Materials, Metals & Mining) | | | | | | | 108,622 | | | | 1,602,175 | |
Moscow Exchange MICEX-RTS OAO (Financials, Diversified Financial Services) (a) | | | | | | | 958,417 | | | | 1,525,742 | |
Severstal PAO GDR (Materials, Metals & Mining) | | | | | | | 132,374 | | | | 1,538,186 | |
Tatneft ADR (Energy, Oil, Gas & Consumable Fuels) | | | | | | | 68,388 | | | | 2,143,964 | |
| | | | |
| | | | | | | | | | | 8,346,198 | |
| | | | | | | | | | | | |
| | | | |
| Singapore: 4.34% | | | | | | | | | | | | |
Asian Pay Television Trust (Consumer Discretionary, Media) | | | | | | | 4,542,600 | | | | 2,026,665 | |
CapitaRetail China Trust (Financials, REITs) | | | | | | | 2,124,100 | | | | 2,329,663 | |
Jardine Cycle & Carriage Limited (Consumer Discretionary, Distributors) | | | | | | | 64,600 | | | | 1,855,115 | |
Lippo Malls Indonesia Retail Trust (Financials, REITs) | | | | | | | 8,147,100 | | | | 1,968,850 | |
Singapore Telecommunications Limited (Telecommunication Services, Diversified Telecommunication Services) | | | | | | | 1,892,500 | | | | 5,431,870 | |
| | | | |
| | | | | | | | | | | 13,612,163 | |
| | | | | | | | | | | | |
| | | | |
| South Africa: 3.34% | | | | | | | | | | | | |
Sasol Limited (Energy, Oil, Gas & Consumable Fuels) | | | | | | | 38,017 | | | | 1,240,238 | |
Telkom South Africa Limited (Telecommunication Services, Diversified Telecommunication Services) | | | | | | | 969,175 | | | | 3,858,930 | |
Truworths International Limited (Consumer Discretionary, Specialty Retail) | | | | | | | 299,127 | | | | 2,233,905 | |
Vodacom Group Proprietary Limited (Consumer Discretionary, Media) | | | | | | | 133,483 | | | | 1,551,883 | |
Woolworths Holdings Limited (Consumer Discretionary, Multiline Retail) | | | | | | | 248,048 | | | | 1,596,296 | |
| | | | |
| | | | | | | | | | | 10,481,252 | |
| | | | | | | | | | | | |
| | | | |
| South Korea: 11.92% | | | | | | | | | | | | |
Hite Jinro Company Limited (Consumer Staples, Beverages) | | | | | | | 139,419 | | | | 3,420,011 | |
Hyundai Motor Company (Consumer Discretionary, Automobiles) | | | | | | | 17,239 | | | | 2,171,140 | |
Kangwon Land Incorporated (Consumer Discretionary, Hotels, Restaurants & Leisure) | | | | | | | 76,611 | | | | 2,867,702 | |
KB Financial Group Incorporated (Financials, Banks) | | | | | | | 103,780 | | | | 3,169,689 | |
Korea Electric Power Corporation (Utilities, Electric Utilities) | | | | | | | 98,416 | | | | 5,337,993 | |
Korea Reinsurance Company (Financials, Insurance) | | | | | | | 185,443 | | | | 2,164,641 | |
Macquarie Korea Infrastructure Fund (Financials, Capital Markets) | | | | | | | 547,598 | | | | 4,070,700 | |
The accompanying notes are an integral part of these financial statements.
| | | | | | |
| Portfolio of investments—April 30, 2016 (unaudited) | | Wells Fargo Emerging Markets Equity Income Fund | | | 9 | |
| | | | | | | | | | | | |
| Security name | | | | | | Shares | | | Value | |
| | | | |
| South Korea (continued) | | | | | | | | | | | | |
POSCO (Materials, Metals & Mining) | | | | | | | 27,277 | | | $ | 5,757,520 | |
Shinhan Financial Group Company Limited (Financials, Banks) | | | | | | | 81,764 | | | | 2,999,592 | |
SK Telecom Company Limited ADR (Telecommunication Services, Wireless Telecommunication Services) | | | | | | | 271,751 | | | | 5,435,020 | |
| | | | |
| | | | | | | | | | | 37,394,008 | |
| | | | | | | | | | | | |
| | | | |
| Taiwan: 12.09% | | | | | | | | | | | | |
Advanced Semiconductor Engineering Incorporated (Information Technology, Semiconductors & Semiconductor Equipment) | | | | | | | 2,405,000 | | | | 2,263,100 | |
Cathay Financial Holding Company Limited (Financials, Insurance) | | | | | | | 1,031,000 | | | | 1,158,768 | |
Chicony Electronics Company Limited (Information Technology, Technology Hardware, Storage & Peripherals) | | | | | | | 1,604,972 | | | | 3,856,551 | |
Chunghwa Telecom Company Limited (Telecommunication Services, Diversified Telecommunication Services) | | | | | | | 461,000 | | | | 1,557,964 | |
CTBC Financial Holding Company Limited (Financials, Banks) | | | | | | | 2,495,380 | | | | 1,268,850 | |
CTCI Corporation (Industrials, Construction & Engineering) | | | | | | | 1,158,000 | | | | 1,509,748 | |
Delta Electronics Incorporated (Information Technology, Electronic Equipment, Instruments & Components) | | | | | | | 401,283 | | | | 1,866,259 | |
Hon Hai Precision Industry Company Limited (Information Technology, Electronic Equipment, Instruments & Components) | | | | | | | 1,743,300 | | | | 4,167,316 | |
Largan Precision Company Limited (Information Technology, Electronic Equipment, Instruments & Components) | | | | | | | 25,000 | | | | 1,759,526 | |
MediaTek Incorporated (Information Technology, Semiconductors & Semiconductor Equipment) | | | | | | | 179,000 | | | | 1,276,470 | |
Merida Industry Company Limited (Consumer Discretionary, Leisure Products) | | | | | | | 232,000 | | | | 953,090 | |
Namchow Chemical Industrial Company Limited (Consumer Staples, Food Products) | | | | | | | 560,000 | | | | 1,040,027 | |
Nan Ya Plastics Corporation (Materials, Chemicals) | | | | | | | 752,000 | | | | 1,473,550 | |
Siliconware Precision Industries Company (Information Technology, Semiconductors & Semiconductor Equipment) | | | | | | | 1,889,000 | | | | 2,805,417 | |
Taiwan Semiconductor Manufacturing Company Limited (Information Technology, Semiconductors & Semiconductor Equipment) | | | | | | | 936,000 | | | | 4,353,083 | |
Teco Electric & Machinery Company Limited (Industrials, Electrical Equipment) | | | | | | | 1,688,000 | | | | 1,334,574 | |
Uni-President Enterprises Corporation (Consumer Staples, Food Products) | | | | | | | 849,000 | | | | 1,532,006 | |
United Microelectronics Corporation ADR (Information Technology, Semiconductors & Semiconductor Equipment) | | | | | | | 1,182,902 | | | | 2,235,685 | |
WPG Holdings Company Limited (Information Technology, Electronic Equipment, Instruments & Components) | | | | | | | 1,440,000 | | | | 1,540,322 | |
| | | | |
| | | | | | | | | | | 37,952,306 | |
| | | | | | | | | | | | |
| | | | |
| Thailand: 1.45% | | | | | | | | | | | | |
Land & Houses PCL (Financials, Real Estate Management & Development) | | | | | | | 5,936,100 | | | | 1,436,016 | |
Major Cineplex Group PCL (Consumer Discretionary, Media) | | | | | | | 3,458,200 | | | | 3,118,617 | |
| | | | |
| | | | | | | | | | | 4,554,633 | |
| | | | | | | | | | | | |
| | | | |
| Turkey: 1.81% | | | | | | | | | | | | |
Emlak Konut Gayrimenkul Yati (Financials, REITs) | | | | | | | 3,944,083 | | | | 4,242,920 | |
TAV Havalimanlari Holding AS (Industrials, Transportation Infrastructure) | | | | | | | 244,340 | | | | 1,424,298 | |
| | | | |
| | | | | | | | | | | 5,667,218 | |
| | | | | | | | | | | | |
| | | | |
| United Arab Emirates: 0.46% | | | | | | | | | | | | |
Abu Dhabi Commercial Bank PJSC (Financials, Banks) | | | | | | | 804,214 | | | | 1,443,790 | |
| | | | | | | | | | | | |
| | | | |
Total Common Stocks (Cost $260,517,158) | | | | | | | | | | | 257,046,356 | |
| | | | | | | | | | | | |
| | | | |
Exchange-Traded Funds: 1.23% | | | | | | | | | | | | |
| | | | |
| United States: 1.23% | | | | | | | | | | | | |
Market Vectors Russia ETF | | | | | | | 217,167 | | | | 3,852,543 | |
| | | | | | | | | | | | |
| | | | |
Total Exchange-Traded Funds (Cost $3,549,349) | | | | | | | | | | | 3,852,543 | |
| | | | | | | | | | | | |
The accompanying notes are an integral part of these financial statements.
| | | | |
| 10 | | Wells Fargo Emerging Markets Equity Income Fund | | Portfolio of investments—April 30, 2016 (unaudited) |
| | | | | | | | | | | | | | | | |
| Security name | | | | | Expiration date | | | Shares | | | Value | |
| | | | |
Participation Notes: 9.24% | | | | | | | | | | | | | | | | |
| | | | |
| China: 3.20% | | | | | | | | | | | | | | | | |
HSBC Bank plc (China Vanke Company Limited Class A) (Financials, Real Estate Management & Development) †(a) | | | | | | | 2-11-2019 | | | | 1,836,000 | | | $ | 6,034,631 | |
HSBC Bank plc (Inner Mongolia Yili Industrial Group Company Limited Class A) (Consumer Staples, Food Products) † | | | | | | | 12-19-2022 | | | | 707,700 | | | | 1,639,674 | |
UBS AG (Midea Group Company Class A) (Utilities, Electric Utilities) † | | | | | | | 12-19-2016 | | | | 476,486 | | | | 2,357,787 | |
| | | | |
| | | | | | | | | | | | | | | 10,032,092 | |
| | | | | | | | | | | | | | | | |
| | | | |
| India: 6.04% | | | | | | | | | | | | | | | | |
HSBC Bank plc (Bharti Infratel Limited) (Telecommunication Services, Wireless Telecommunication Services) † | | | | | | | 10-1-2018 | | | | 106,320 | | | | 600,688 | |
HSBC Bank plc (Bharti Infratel Limited) (Telecommunication Services, Wireless Telecommunication Services) † | | | | | | | 11-22-2023 | | | | 454,683 | | | | 2,568,875 | |
HSBC Bank plc (Coal India Limited) (Materials, Metals & Mining) † | | | | | | | 11-2-2020 | | | | 1,143,628 | | | | 4,963,792 | |
HSBC Bank plc (Credit Analysis & Research) (Financials, Diversified Financial Services) † | | | | | | | 5-2-2024 | | | | 132,925 | | | | 2,024,970 | |
HSBC Bank plc (Gujarat Pipavav Limited) (Industrials, Marine) † | | | | | | | 3-3-2025 | | | | 499,540 | | | | 1,284,134 | |
HSBC Bank plc (Hero Motorcorp) (Industrials, Automobiles) † | | | | | | | 7-29-2019 | | | | 62,595 | | | | 2,732,807 | |
HSBC Bank plc (Hexaware Technologies Limited) (Information Technology, Software) † | | | | | | | 5-12-2016 | | | | 726,581 | | | | 2,640,719 | |
HSBC Bank plc (NTPC Limited) (Utilities, Electric Utilities) † | | | | | | | 5-6-2024 | | | | 378,530 | | | | 794,534 | |
HSBC Bank plc (Oil & Natural Gas Corporation Limited) (Energy, Oil, Gas & Consumable Fuels) † | | | | | | | 1-10-2024 | | | | 414,314 | | | | 1,356,283 | |
| | | | |
| | | | | | | | | | | | | | | 18,966,802 | |
| | | | | | | | | | | | | | | | |
| | | | |
Total Participation Notes (Cost $29,043,448) | | | | | | | | | | | | | | | 28,998,894 | |
| | | | | | | | | | | | | | | | |
| | | | |
| | | Dividend yield | | | | | | | | | | |
| Preferred Stocks: 1.53% | | | | | | | | | | | | | | | | |
| | | | |
| Brazil: 1.53% | | | | | | | | | | | | | | | | |
Itausa Investimentos Itau SA (Financials, Banks) | | | 3.81 | % | | | | | | | 1,914,500 | | | | 4,820,691 | |
| | | | | | | | | | | | | | | | |
| | | | |
Total Preferred Stocks (Cost $4,544,846) | | | | | | | | | | | | | | | 4,820,691 | |
| | | | | | | | | | | | | | | | |
| | | | |
| | | Yield | | | | | | | | | | |
| Short-Term Investments: 5.20% | | | | | | | | | | | | | | | | |
| | | | |
| Investment Companies: 5.20% | | | | | | | | | | | | | | | | |
Wells Fargo Cash Investment Money Market Fund Select Class (l)(u) | | | 0.43 | | | | | | | | 16,314,180 | | | | 16,314,180 | |
| | | | | | | | | | | | | | | | |
| | | | |
Total Short-Term Investments (Cost $16,314,180) | | | | | | | | | | | | | | | 16,314,180 | |
| | | | | | | | | | | | | | | | |
| | | | | | | | | | | | |
| Total investments in securities (Cost $313,968,981) * | | | | | 99.11 | % | | | | | 311,032,664 | |
Other assets and liabilities, net | | | | | 0.89 | | | | | | 2,790,209 | |
| | | | | | | | | | | | |
| Total net assets | | | | | 100.00 | % | | | | $ | 313,822,873 | |
| | | | | | | | | | | | |
| 144A | The security may be resold in transactions exempt from registration, normally to qualified institutional buyers, pursuant to Rule 144A under the Securities Act of 1933. |
| † | Non-income-earning security |
| (a) | The security is fair valued in accordance with procedures approved by the Board of Trustees. |
| (l) | The issuer of the security is an affiliated person of the Fund as defined in the Investment Company Act of 1940. |
| (u) | The rate represents the 7-day annualized yield at period end. |
| * | Cost for federal income tax purposes is $314,621,251 and unrealized gains (losses) consists of: |
| | | | |
Gross unrealized gains | | $ | 14,657,358 | |
Gross unrealized losses | | | (18,245,945 | ) |
| | | | |
Net unrealized losses | | $ | (3,588,587 | ) |
| | | | |
The accompanying notes are an integral part of these financial statements.
| | | | | | |
| Statement of assets and liabilities—April 30, 2016 (unaudited) | | Wells Fargo Emerging Markets Equity Income Fund | | | 11 | |
| | | | |
| | | | |
| |
Assets | | | | |
Investments | | | | |
In unaffiliated securities, at value (cost $297,654,801) | | $ | 294,718,484 | |
In affiliated securities, at value (cost $16,314,180) | | | 16,314,180 | |
| | | | |
Total investments, at value (cost $313,968,981) | | | 311,032,664 | |
Cash | | | 951,470 | |
Foreign currency, at value (cost $451,230) | | | 453,798 | |
Receivable for investments sold | | | 2,661,672 | |
Receivable for Fund shares sold | | | 5,291,835 | |
Receivable for dividends | | | 1,084,933 | |
Prepaid expenses and other assets | | | 71,955 | |
| | | | |
Total assets | | | 321,548,327 | |
| | | | |
| |
Liabilities | | | | |
Payable for investments purchased | | | 6,865,246 | |
Payable for Fund shares redeemed | | | 449,750 | |
Management fee payable | | | 242,230 | |
Distribution fees payable | | | 7,575 | |
Administration fees payable | | | 35,568 | |
Accrued expenses and other liabilities | | | 125,085 | |
| | | | |
Total liabilities | | | 7,725,454 | |
| | | | |
Total net assets | | $ | 313,822,873 | |
| | | | |
| |
NET ASSETS CONSIST OF | | | | |
Paid-in capital | | $ | 332,652,949 | |
Undistributed net investment income | | | 708,258 | |
Accumulated net realized losses on investments | | | (16,611,007 | ) |
Net unrealized losses on investments | | | (2,927,327 | ) |
| | | | |
Total net assets | | $ | 313,822,873 | |
| | | | |
| |
COMPUTATION OF NET ASSET VALUE AND OFFERING PRICE PER SHARE | | | | |
Net assets – Class A | | $ | 23,978,991 | |
Shares outstanding – Class A1 | | | 2,419,990 | |
Net asset value per share – Class A | | | $9.91 | |
Maximum offering price per share – Class A2 | | | $10.51 | |
Net assets – Class C | | $ | 12,425,421 | |
Shares outstanding – Class C1 | | | 1,258,402 | |
Net asset value per share – Class C | | | $9.87 | |
Net assets – Class R | | $ | 26,429 | |
Shares outstanding – Class R1 | | | 2,660 | |
Net asset value per share – Class R | | | $9.93 | |
Net assets – Class R6 | | $ | 2,472,053 | |
Shares outstanding – Class R61 | | | 249,206 | |
Net asset value per share – Class R6 | | | $9.92 | |
Net assets – Administrator Class | | $ | 46,785,855 | |
Shares outstanding – Administrator Class1 | | | 4,705,433 | |
Net asset value per share – Administrator Class | | | $9.94 | |
Net assets – Institutional Class | | $ | 228,134,124 | |
Shares outstanding – Institutional Class1 | | | 22,992,436 | |
Net asset value per share – Institutional Class | | | $9.92 | |
| 1 | The Fund has an unlimited number of authorized shares. |
| 2 | Maximum offering price is computed as 100/94.25 of net asset value. On investments of $50,000 or more, the offering price is reduced. |
The accompanying notes are an integral part of these financial statements.
| | | | |
| 12 | | Wells Fargo Emerging Markets Equity Income Fund | | Statement of operations—six months ended April 30, 2016 (unaudited) |
| | | | |
| | | | |
| |
Investment income | | | | |
Dividends (net of foreign withholding taxes of $331,983) | | $ | 4,027,192 | |
Income from affiliated securities | | | 24,146 | |
| | | | |
Total investment income | | | 4,051,338 | |
| | | | |
| |
Expenses | | | | |
Management fee | | | 1,355,522 | |
Administration fees | | | | |
Class A | | | 23,005 | |
Class C | | | 11,932 | |
Class R | | | 26 | |
Class R6 | | | 298 | |
Administrator Class | | | 28,803 | |
Institutional Class | | | 101,496 | |
Shareholder servicing fees | | | | |
Class A | | | 27,387 | |
Class C | | | 14,205 | |
Class R | | | 31 | |
Administrator Class | | | 54,253 | |
Distribution fees | | | | |
Class C | | | 42,615 | |
Class R | | | 31 | |
Custody and accounting fees | | | 140,748 | |
Professional fees | | | 26,174 | |
Registration fees | | | 54,428 | |
Shareholder report expenses | | | 13,674 | |
Trustees’ fees and expenses | | | 11,145 | |
Other fees and expenses | | | 7,398 | |
| | | | |
Total expenses | | | 1,913,171 | |
Less: Fee waivers and/or expense reimbursements | | | (286,718 | ) |
| | | | |
Net expenses | | | 1,626,453 | |
| | | | |
Net investment income | | | 2,424,885 | |
| | | | |
| |
REALIZED AND UNREALIZED GAINS (LOSSES) ON INVESTMENTS | | | | |
| |
Net realized gains (losses) on: | | | | |
Unaffiliated securities | | | (8,987,298 | ) |
Forward foreign currency contract transactions | | | 9,640 | |
| | | | |
Net realized losses on investments | | | (8,977,658 | ) |
| | | | |
Net change in unrealized gains (losses) on investments | | | 7,562,965 | |
| | | | |
Net realized and unrealized gains (losses) on investments | | | (1,414,693 | ) |
| | | | |
Net increase in net assets resulting from operations | | $ | 1,010,192 | |
| | | | |
The accompanying notes are an integral part of these financial statements.
| | | | | | |
| Statement of changes in net assets | | Wells Fargo Emerging Markets Equity Income Fund | | | 13 | |
| | | | | | | | | | | | | | | | |
| | | Six months ended
April 30, 2016
(unaudited) | | | Year ended
October 31, 2015 | |
| | | | |
Operations | | | | | | | | | | | | | | | | |
Net investment income | | | | | | $ | 2,424,885 | | | | | | | $ | 3,115,405 | |
Net realized losses on investments | | | | | | | (8,977,658 | ) | | | | | | | (5,853,265 | ) |
Net change in unrealized gains (losses) on investments | | | | | | | 7,562,965 | | | | | | | | (14,976,313 | ) |
| | | | |
Net increase (decrease) in net assets resulting from operations | | | | | | | 1,010,192 | | | | | | | | (17,714,173 | ) |
| | | | |
| | | | |
Distributions to shareholders from | | | | | | | | | | | | | | | | |
Net investment income | | | | | | | | | | | | | | | | |
Class A | | | | | | | (129,996 | ) | | | | | | | (384,317 | ) |
Class C | | | | | | | (27,525 | ) | | | | | | | (127,515 | ) |
Class R | | | | | | | (112 | ) | | | | | | | (10 | )1 |
Class R6 | | | | | | | (17,156 | ) | | | | | | | (19 | )1 |
Administrator Class | | | | | | | (279,186 | ) | | | | | | | (1,016,111 | ) |
Institutional Class | | | | | | | (1,348,339 | ) | | | | | | | (1,553,325 | ) |
| | | | |
Total distributions to shareholders | | | | | | | (1,802,314 | ) | | | | | | | (3,081,297 | ) |
| | | | |
| | | | |
Capital share transactions | | | Shares | | | | | | | | Shares | | | | | |
Proceeds from shares sold | | | | | | | | | | | | | | | | |
Class A | | | 1,098,602 | | | | 10,531,447 | | | | 1,696,774 | | | | 18,394,271 | |
Class C | | | 521,869 | | | | 5,030,050 | | | | 795,767 | | | | 8,556,504 | |
Class R | | | 0 | | | | 0 | | | | 2,648 | 1 | | | 25,000 | 1 |
Class R6 | | | 268,629 | | | | 2,622,128 | | | | 2,654 | 1 | | | 25,000 | 1 |
Administrator Class | | | 2,165,716 | | | | 20,607,610 | | | | 5,721,244 | | | | 61,488,744 | |
Institutional Class | | | 18,353,770 | | | | 175,712,497 | | | | 12,481,918 | | | | 130,171,618 | |
| | | | |
| | | | | | | 214,503,732 | | | | | | | | 218,661,137 | |
| | | | |
Reinvestment of distributions | | | | | | | | | | | | | | | | |
Class A | | | 13,020 | | | | 127,425 | | | | 36,083 | | | | 380,492 | |
Class C | | | 2,419 | | | | 23,635 | | | | 11,577 | | | | 122,069 | |
Class R | | | 11 | | | | 112 | | | | 1 | 1 | | | 10 | 1 |
Class R6 | | | 1,757 | | | | 17,156 | | �� | | 2 | 1 | | | 19 | 1 |
Administrator Class | | | 28,385 | | | | 277,851 | | | | 94,283 | | | | 997,261 | |
Institutional Class | | | 102,247 | | | | 1,002,714 | | | | 77,609 | | | | 795,126 | |
| | | | |
| | | | | | | 1,448,893 | | | | | | | | 2,294,977 | |
| | | | |
Payment for shares redeemed | | | | | | | | | | | | | | | | |
Class A | | | (985,077 | ) | | | (9,398,254 | ) | | | (675,914 | ) | | | (7,063,488 | ) |
Class C | | | (291,119 | ) | | | (2,804,734 | ) | | | (346,771 | ) | | | (3,609,550 | ) |
Class R6 | | | (23,836 | ) | | | (221,231 | ) | | | 0 | 1 | | | 0 | 1 |
Administrator Class | | | (1,882,507 | ) | | | (17,506,737 | ) | | | (6,081,753 | ) | | | (63,197,111 | ) |
Institutional Class | | | (8,780,986 | ) | | | (81,361,359 | ) | | | (2,337,484 | ) | | | (24,746,171 | ) |
| | | | |
| | | | | | | (111,292,315 | ) | | | | | | | (98,616,320 | ) |
| | | | |
Net increase in net assets resulting from capital share transactions | | | | | | | 104,660,310 | | | | | | | | 122,339,794 | |
| | | | |
Total increase in net assets | | | | | | | 103,868,188 | | | | | | | | 101,544,324 | |
| | | | |
| | | | |
Net assets | | | | | | | | | | | | | | | | |
Beginning of period | | | | | | | 209,954,685 | | | | | | | | 108,410,361 | |
| | | | |
End of period | | | | | | $ | 313,822,873 | | | | | | | $ | 209,954,685 | |
| | | | |
Undistributed net investment income | | | | | | $ | 708,258 | | | | | | | $ | 85,687 | |
| | | | |
| 1 | For the period from September 30, 2015 (commencement of class operations) to October 31, 2015 |
The accompanying notes are an integral part of these financial statements.
| | | | |
| 14 | | Wells Fargo Emerging Markets Equity Income Fund | | Financial highlights |
(For a share outstanding throughout each period)
| | | | | | | | | | | | | | | | | | | | |
| | | Six months ended
April 30, 2016
(unaudited) | | | Year ended October 31 | |
| CLASS A | | | 2015 | | | 2014 | | | 2013 | | | 20121 | |
Net asset value, beginning of period | | | $9.97 | | | | $11.33 | | | | $11.79 | | | | $11.17 | | | | $10.00 | |
Net investment income | | | 0.07 | | | | 0.20 | | | | 0.33 | | | | 0.31 | | | | 0.13 | |
Net realized and unrealized gains (losses) on investments | | | (0.07 | ) | | | (1.36 | ) | | | (0.11 | ) | | | 0.88 | | | | 1.15 | |
| | | | | | | | | | | | | | | | | | | | |
Total from investment operations | | | 0.00 | | | | (1.16 | ) | | | 0.22 | | | | 1.19 | | | | 1.28 | |
Distributions to shareholders from | | | | | | | | | | | | | | | | | | | | |
Net investment income | | | (0.06 | ) | | | (0.20 | ) | | | (0.31 | ) | | | (0.34 | ) | | | (0.11 | ) |
Net realized gains | | | 0.00 | | | | 0.00 | | | | (0.37 | ) | | | (0.23 | ) | | | 0.00 | |
| | | | | | | | | | | | | | | | | | | | |
Total distributions to shareholders | | | (0.06 | ) | | | (0.20 | ) | | | (0.68 | ) | | | (0.57 | ) | | | (0.11 | ) |
Net asset value, end of period | | | $9.91 | | | | $9.97 | | | | $11.33 | | | | $11.79 | | | | $11.17 | |
Total return2 | | | (0.04 | )% | | | (10.34 | )% | | | 2.05 | % | | | 10.94 | % | | | 12.80 | % |
Ratios to average net assets (annualized) | | | | | | | | | | | | | | | | | | | | |
Gross expenses | | | 1.82 | % | | | 1.89 | % | | | 2.09 | % | | | 2.88 | % | | | 4.29 | % |
Net expenses | | | 1.65 | % | | | 1.65 | % | | | 1.65 | % | | | 1.65 | % | | | 1.65 | % |
Net investment income | | | 1.58 | % | | | 2.22 | % | | | 3.12 | % | | | 2.64 | % | | | 2.94 | % |
Supplemental data | | | | | | | | | | | | | | | | | | | | |
Portfolio turnover rate | | | 24 | % | | | 84 | % | | | 91 | % | | | 85 | % | | | 39 | % |
Net assets, end of period (000s omitted) | | | $23,979 | | | | $22,866 | | | | $14,010 | | | | $8,658 | | | | $628 | |
| 1 | For the period from May 31, 2012 (commencement of class operations) to October 31, 2012. |
| 2 | Total return calculations do not include any sales charges. Returns for periods of less than one year are not annualized. |
The accompanying notes are an integral part of these financial statements.
| | | | | | |
| Financial highlights | | Wells Fargo Emerging Markets Equity Income Fund | | | 15 | |
(For a share outstanding throughout each period)
| | | | | | | | | | | | | | | | | | | | |
| | | Six months ended
April 30, 2016
(unaudited) | | | Year ended October 31 | |
| CLASS C | | | 2015 | | | 2014 | | | 2013 | | | 20121 | |
Net asset value, beginning of period | | | $9.94 | | | | $11.32 | | | | $11.79 | | | | $11.16 | | | | $10.00 | |
Net investment income | | | 0.04 | | | | 0.14 | | | | 0.23 | | | | 0.22 | | | | 0.10 | |
Net realized and unrealized gains (losses) on investments | | | (0.09 | ) | | | (1.38 | ) | | | (0.08 | ) | | | 0.89 | | | | 1.13 | |
| | | | | | | | | | | | | | | | | | | | |
Total from investment operations | | | (0.05 | ) | | | (1.24 | ) | | | 0.15 | | | | 1.11 | | | | 1.23 | |
Distributions to shareholders from | | | | | | | | | | | | | | | | | | | | |
Net investment income | | | (0.02 | ) | | | (0.14 | ) | | | (0.25 | ) | | | (0.25 | ) | | | (0.07 | ) |
Net realized gains | | | 0.00 | | | | 0.00 | | | | (0.37 | ) | | | (0.23 | ) | | | 0.00 | |
| | | | | | | | | | | | | | | | | | | | |
Total distributions to shareholders | | | (0.02 | ) | | | (0.14 | ) | | | (0.62 | ) | | | (0.48 | ) | | | (0.07 | ) |
Net asset value, end of period | | | $9.87 | | | | $9.94 | | | | $11.32 | | | | $11.79 | | | | $11.16 | |
Total return2 | | | (0.48 | )% | | | (10.95 | )% | | | 1.27 | % | | | 10.11 | % | | | 12.49 | % |
Ratios to average net assets (annualized) | | | | | | | | | | | | | | | | | | | | |
Gross expenses | | | 2.58 | % | | | 2.64 | % | | | 2.83 | % | | | 3.81 | % | | | 5.03 | % |
Net expenses | | | 2.40 | % | | | 2.40 | % | | | 2.40 | % | | | 2.40 | % | | | 2.41 | % |
Net investment income | | | 0.84 | % | | | 1.45 | % | | | 2.17 | % | | | 1.80 | % | | | 2.24 | % |
Supplemental data | | | | | | | | | | | | | | | | | | | | |
Portfolio turnover rate | | | 24 | % | | | 84 | % | | | 91 | % | | | 85 | % | | | 39 | % |
Net assets, end of period (000s omitted) | | | $12,425 | | | | $10,190 | | | | $6,390 | | | | $2,028 | | | | $562 | |
| 1 | For the period from May 31, 2012 (commencement of class operations) to October 31, 2012. |
| 2 | Total return calculations do not include any sales charges. Returns for periods of less than one year are not annualized. |
The accompanying notes are an integral part of these financial statements.
| | | | |
| 16 | | Wells Fargo Emerging Markets Equity Income Fund | | Financial highlights |
(For a share outstanding throughout each period)
| | | | | | | | |
| CLASS R | | Six months ended April 30, 2016 (unaudited) | | | Year ended
October 31 20151 | |
Net asset value, beginning of period | | | $9.99 | | | | $9.44 | |
Net investment income (loss) | | | 0.06 | | | | (0.01 | )2 |
Net realized and unrealized gains (losses) on investments | | | (0.08 | ) | | | 0.56 | |
| | | | | | | | |
Total from investment operations | | | (0.02 | ) | | | 0.55 | |
Distributions to shareholders from | | | | | | | | |
Net investment income | | | (0.04 | ) | | | (0.00 | )3 |
Net asset value, end of period | | | $9.93 | | | | $9.99 | |
Total return4 | | | (0.17 | )% | | | 5.87 | % |
Ratios to average net assets (annualized) | | | | | | | | |
Gross expenses | | | 2.07 | % | | | 2.10 | % |
Net expenses | | | 1.90 | % | | | 1.90 | % |
Net investment income (loss) | | | 1.31 | % | | | (0.90 | )% |
Supplemental data | | | | | | | | |
Portfolio turnover rate | | | 24 | % | | | 84 | % |
Net assets, end of period (000s omitted) | | | $26 | | | | $26 | |
| 1 | For the period from September 30, 2015 (commencement of class operations) to October 31, 2015 |
| 2 | Calculated based upon average shares outstanding |
| 3 | Amount is less than $0.005. |
| 4 | Returns for periods of less than one year are not annualized. |
The accompanying notes are an integral part of these financial statements.
| | | | | | |
| Financial highlights | | Wells Fargo Emerging Markets Equity Income Fund | | | 17 | |
(For a share outstanding throughout each period)
| | | | | | | | |
| CLASS R6 | | Six months ended April 30, 2016 (unaudited) | | | Year ended
October 31 20151 | |
Net asset value, beginning of period | | | $9.97 | | | | $9.42 | |
Net investment income (loss) | | | 0.12 | | | | (0.00 | )2,3 |
Net realized and unrealized gains (losses) on investments | | | (0.09 | ) | | | 0.56 | |
| | | | | | | | |
Total from investment operations | | | 0.03 | | | | 0.56 | |
Distributions to shareholders from | | | | | | | | |
Net investment income | | | (0.08 | ) | | | (0.01 | ) |
Net asset value, end of period | | | $9.92 | | | | $9.97 | |
Total return4 | | | 0.26 | % | | | 5.91 | % |
Ratios to average net assets (annualized) | | | | | | | | |
Gross expenses | | | 1.39 | % | | | 1.40 | % |
Net expenses | | | 1.20 | % | | | 1.20 | % |
Net investment income (loss) | | | 2.42 | % | | | (0.19 | )% |
Supplemental data | | | | | | | | |
Portfolio turnover rate | | | 24 | % | | | 84 | % |
Net assets, end of period (000s omitted) | | | $2,472 | | | | $26 | |
| 1 | For the period from September 30, 2015 (commencement of class operations) to October 31, 2015 |
| 2 | Amount is less than $0.005 per share. |
| 3 | Calculated based upon average shares outstanding |
| 4 | Returns for periods of less than one year are not annualized. |
The accompanying notes are an integral part of these financial statements.
| | | | |
| 18 | | Wells Fargo Emerging Markets Equity Income Fund | | Financial highlights |
(For a share outstanding throughout each period)
| | | | | | | | | | | | | | | | | | | | |
| | | Six months ended
April 30, 2016
(unaudited) | | | Year ended October 31 | |
| ADMINISTRATOR CLASS | | | 2015 | | | 2014 | | | 2013 | | | 20121 | |
Net asset value, beginning of period | | | $10.00 | | | | $11.35 | | | | $11.80 | | | | $11.17 | | | | $10.00 | |
Net investment income | | | 0.08 | | | | 0.23 | | | | 0.33 | 2 | | | 0.32 | | | | 0.14 | |
Net realized and unrealized gains (losses) on investments | | | (0.08 | ) | | | (1.37 | ) | | | (0.08 | ) | | | 0.89 | | | | 1.14 | |
| | | | | | | | | | | | | | | | | | | | |
Total from investment operations | | | 0.00 | | | | (1.14 | ) | | | 0.25 | | | | 1.21 | | | | 1.28 | |
Distributions to shareholders from | | | | | | | | | | | | | | | | | | | | |
Net investment income | | | (0.06 | ) | | | (0.21 | ) | | | (0.33 | ) | | | (0.35 | ) | | | (0.11 | ) |
Net realized gains | | | 0.00 | | | | 0.00 | | | | (0.37 | ) | | | (0.23 | ) | | | 0.00 | |
| | | | | | | | | | | | | | | | | | | | |
Total distributions to shareholders | | | (0.06 | ) | | | (0.21 | ) | | | (0.70 | ) | | | (0.58 | ) | | | (0.11 | ) |
Net asset value, end of period | | | $9.94 | | | | $10.00 | | | | $11.35 | | | | $11.80 | | | | $11.17 | |
Total return3 | | | 0.00 | % | | | (10.12 | )% | | | 2.30 | % | | | 11.13 | % | | | 12.89 | % |
Ratios to average net assets (annualized) | | | | | | | | | | | | | | | | | | | | |
Gross expenses | | | 1.74 | % | | | 1.76 | % | | | 1.91 | % | | | 2.94 | % | | | 4.14 | % |
Net expenses | | | 1.45 | % | | | 1.45 | % | | | 1.45 | % | | | 1.45 | % | | | 1.45 | % |
Net investment income | | | 1.76 | % | | | 2.38 | % | | | 2.89 | % | | | 2.70 | % | | | 3.17 | % |
Supplemental data | | | | | | | | | | | | | | | | | | | | |
Portfolio turnover rate | | | 24 | % | | | 84 | % | | | 91 | % | | | 85 | % | | | 39 | % |
Net assets, end of period (000s omitted) | | | $46,786 | | | | $43,928 | | | | $52,896 | | | | $13,527 | | | | $5,285 | |
| 1 | For the period from May 31, 2012 (commencement of class operations) to October 31, 2012. |
| 2 | Calculated based upon average shares outstanding |
| 3 | Returns for periods of less than one year are not annualized. |
The accompanying notes are an integral part of these financial statements.
| | | | | | |
| Financial highlights | | Wells Fargo Emerging Markets Equity Income Fund | | | 19 | |
(For a share outstanding throughout each period)
| | | | | | | | | | | | | | | | | | | | |
| | | Six months ended
April 30, 2016
(unaudited) | | | Year ended October 31 | |
| INSTITUTIONAL CLASS | | | 2015 | | | 2014 | | | 2013 | | | 20121 | |
Net asset value, beginning of period | | | $9.98 | | | | $11.34 | | | | $11.79 | | | | $11.17 | | | | $10.00 | |
Net investment income | | | 0.09 | | | | 0.25 | 2 | | | 0.35 | | | | 0.34 | | | | 0.15 | |
Net realized and unrealized gains (losses) on investments | | | (0.08 | ) | | | (1.36 | ) | | | (0.07 | ) | | | 0.89 | | | | 1.14 | |
| | | | | | | | | | | | | | | | | | | | |
Total from investment operations | | | 0.01 | | | | (1.11 | ) | | | 0.28 | | | | 1.23 | | | | 1.29 | |
Distributions to shareholders from | | | | | | | | | | | | | | | | | | | | |
Net investment income | | | (0.07 | ) | | | (0.25 | ) | | | (0.36 | ) | | | (0.38 | ) | | | (0.12 | ) |
Net realized gains | | | 0.00 | | | | 0.00 | | | | (0.37 | ) | | | (0.23 | ) | | | 0.00 | |
| | | | | | | | | | | | | | | | | | | | |
Total distributions to shareholders | | | (0.07 | ) | | | (0.25 | ) | | | (0.73 | ) | | | (0.61 | ) | | | (0.12 | ) |
Net asset value, end of period | | | $9.92 | | | | $9.98 | | | | $11.34 | | | | $11.79 | | | | $11.17 | |
Total return3 | | | 0.14 | % | | | (9.95 | )% | | | 2.52 | % | | | 11.32 | % | | | 12.98 | % |
Ratios to average net assets (annualized) | | | | | | | | | | | | | | | | | | | | |
Gross expenses | | | 1.50 | % | | | 1.51 | % | | | 1.62 | % | | | 2.74 | % | | | 3.92 | % |
Net expenses | | | 1.25 | % | | | 1.25 | % | | | 1.25 | % | | | 1.25 | % | | | 1.25 | % |
Net investment income | | | 2.29 | % | | | 2.41 | % | | | 3.69 | % | | | 2.88 | % | | | 3.39 | % |
Supplemental data | | | | | | | | | | | | | | | | | | | | |
Portfolio turnover rate | | | 24 | % | | | 84 | % | | | 91 | % | | | 85 | % | | | 39 | % |
Net assets, end of period (000s omitted) | | | $228,134 | | | | $132,918 | | | | $35,114 | | | | $6,077 | | | | $5,082 | |
| 1 | For the period from May 31, 2012 (commencement of class operations) to October 31, 2012. |
| 2 | Calculated based upon average shares outstanding |
| 3 | Returns for periods of less than one year are not annualized. |
The accompanying notes are an integral part of these financial statements.
| | | | |
| 20 | | Wells Fargo Emerging Markets Equity Income Fund | | Notes to financial statements (unaudited) |
1. ORGANIZATION
Wells Fargo Funds Trust (the “Trust”), a Delaware statutory trust organized on March 10, 1999, is an open-end management investment company registered under the Investment Company Act of 1940, as amended (the “1940 Act”). As an investment company, the Trust follows the accounting and reporting guidance in Financial Accounting Standards Board (“FASB”) Accounting Standards Codification Topic 946, Financial Services – Investment Companies. These financial statements report on the Wells Fargo Emerging Markets Equity Income Fund (the “Fund”) which is a diversified series of the Trust.
2. SIGNIFICANT ACCOUNTING POLICIES
The following significant accounting policies, which are consistently followed in the preparation of the financial statements of the Fund, are in conformity with U.S. generally accepted accounting principles which require management to make estimates and assumptions that affect the reported amounts of assets and liabilities, disclosure of contingent assets and liabilities at the date of the financial statements, and the reported amounts of revenues and expenses during the reporting period. Actual results could differ from those estimates.
Securities valuation
All investments are valued each business day as of the close of regular trading on the New York Stock Exchange (generally 4 p.m. Eastern Time), although a Fund may deviate from this calculation time under unusual or unexpected circumstances.
Equity securities that are listed on a foreign or domestic exchange or market are valued at the official closing price or, if none, the last sales price. If no sale occurs on the principal exchange or market that day, the prior day’s price will be deemed “stale” and a fair value price will be determined in accordance with the Fund’s Valuation Procedures.
The values of securities denominated in foreign currencies are translated into U.S. dollars at rates provided by an independent foreign currency pricing source at a time each business day specified by the Management Valuation Team of Wells Fargo Funds Management, LLC (“Funds Management”).
Many securities markets and exchanges outside the U.S. close prior to the close of the New York Stock Exchange and therefore may not fully reflect trading or events that occur after the close of the principal exchange in which the foreign securities are traded, but before the close of the New York Stock Exchange. If such trading or events are expected to materially affect the value of such securities, then fair value pricing procedures approved by the Board of Trustees of the Fund are applied. These procedures take into account multiple factors including movements in U.S. securities markets after foreign exchanges close. Foreign securities that are fair valued under these procedures are categorized as Level 2 and the application of these procedures may result in transfers between Level 1 and Level 2. Depending on market activity, such fair valuations may be frequent. Such fair value pricing may result in net asset values that are higher or lower than net asset values based on the last reported sales price or latest quoted bid price. On April 30, 2016, such fair value pricing was not used in pricing foreign securities.
Investments in registered open-end investment companies are valued at net asset value.
Investments which are not valued using any of the methods discussed above are valued at their fair value, as determined in good faith by the Board of Trustees. The Board of Trustees has established a Valuation Committee comprised of the Trustees and has delegated to it the authority to take any actions regarding the valuation of portfolio securities that the Valuation Committee deems necessary or appropriate, including determining the fair value of portfolio securities, unless the determination has been delegated to the Management Valuation Team. The Board of Trustees retains the authority to make or ratify any valuation decisions or approve any changes to the Valuation Procedures as it deems appropriate. On a quarterly basis, the Board of Trustees receives reports on any valuation actions taken by the Valuation Committee or the Management Valuation Team which may include items for ratification.
Valuations of fair valued securities are compared to the next actual sales price when available, or other appropriate market values, to assess the continued appropriateness of the fair valuation methodologies used. These securities are fair valued on a day-to-day basis, taking into consideration changes to appropriate market information and any significant changes to the inputs considered in the valuation process until there is a readily available price provided on an exchange or by an independent pricing service. Valuations received from an independent pricing service or independent broker-dealer quotes are periodically validated by comparisons to most recent trades and valuations provided by other independent pricing services in addition to the review of prices by the manager and/or subadviser. Unobservable inputs used in determining fair valuations are identified based on the type of security, taking into consideration factors utilized by market participants in valuing the investment, knowledge about the issuer and the current market environment.
| | | | | | |
| Notes to financial statements (unaudited) | | Wells Fargo Emerging Markets Equity Income Fund | | | 21 | |
Foreign currency translation
The accounting records of the Fund are maintained in U.S. dollars. The values of other assets and liabilities denominated in foreign currencies are translated into U.S. dollars at rates provided by an independent foreign currency pricing source at a time each business day specified by the Management Valuation Team. Purchases and sales of securities, and income and expenses are converted at the rate of exchange on the respective dates of such transactions. Net realized foreign exchange gains or losses arise from sales of foreign currencies, currency gains or losses realized between the trade and settlement dates on securities transactions, and the difference between the amounts of dividends, interest and foreign withholding taxes recorded and the U.S. dollar equivalent of the amounts actually paid or received. Net unrealized foreign exchange gains and losses arise from changes in the fair value of assets and liabilities other than investments in securities resulting from changes in exchange rates. The changes in net assets arising from changes in exchange rates and the changes in net assets resulting from changes in market prices of securities are not separately presented. Such changes are included in net realized and unrealized gains or losses from investments.
Forward foreign currency contracts
The Fund is subject to foreign currency exchange rate risk in the normal course of pursuing its investment objectives. A forward foreign currency contract is an agreement between two parties to purchase or sell a specific currency for an agreed-upon price at a future date. The Fund enters into forward foreign currency contracts to facilitate transactions in foreign-denominated securities and to attempt to minimize the risk to the Fund from adverse changes in the relationship between currencies. Forward foreign currency contracts are recorded at the forward rate and marked-to-market daily. When the contracts are closed, realized gains and losses arising from such transactions are recorded as realized gains or losses on forward foreign currency contract transactions. The Fund could be exposed to risks if the counterparties to the contracts are unable to meet the terms of their contracts or if the value of the foreign currency changes unfavorably. The Fund’s maximum risk of loss from counterparty credit risk is the unrealized gains on the contracts. This risk may be mitigated if there is a master netting arrangement between the Fund and the counterparty.
Security transactions and income recognition
Securities transactions are recorded on a trade date basis. Realized gains or losses are recorded on the basis of identified cost.
Dividend income is recognized on the ex-dividend date, except for certain dividends from foreign securities, which are recorded as soon as the custodian verifies the ex-dividend date. Dividend income from foreign securities is recorded net of foreign taxes withheld where recovery of such taxes is not assured.
Distributions to shareholders
Distributions to shareholders from net investment income and net realized gains, if any, are recorded on the ex-dividend date. Such distributions are determined in conformity with federal income tax regulations, which may differ in amount or character from net investment income and realized gains recognized for purposes of U.S. generally accepted accounting principles.
Federal and other taxes
The Fund intends to continue to qualify as a regulated investment company by distributing substantially all of its investment company taxable income and any net realized capital gains (after reduction for capital loss carryforwards) sufficient to relieve it from all, or substantially all, federal income taxes. Accordingly, no provision for federal income taxes was required.
The Fund’s income and federal excise tax returns and all financial records supporting those returns for the prior three fiscal years are subject to examination by the federal and Delaware revenue authorities. Management has analyzed the Fund’s tax positions taken on federal, state, and foreign tax returns for all open tax years and does not believe that there are any uncertain tax positions that require recognition of a tax liability.
As of October 31, 2015, the Fund had capital loss carryforwards which consist of $5,052,990 in short-term capital losses and $1,973,419 in long-term capital losses.
Class allocations
The separate classes of shares offered by the Fund differ principally in applicable sales charges, distribution, shareholder servicing, and administration fees. Class specific expenses are charged directly to that share class. Investment income, common expenses, and realized and unrealized gains (losses) on investments are allocated daily to each class of shares based on the relative proportion of net assets of each class.
| | | | |
| 22 | | Wells Fargo Emerging Markets Equity Income Fund | | Notes to financial statements (unaudited) |
3. FAIR VALUATION MEASUREMENTS
Fair value measurements of investments are determined within a framework that has established a fair value hierarchy based upon the various data inputs utilized in determining the value of the Fund’s investments. The three-level hierarchy gives the highest priority to unadjusted quoted prices in active markets for identical assets or liabilities (Level 1) and the lowest priority to significant unobservable inputs (Level 3). The Fund’s investments are classified within the fair value hierarchy based on the lowest level of input that is significant to the fair value measurement. The inputs are summarized into three broad levels as follows:
| n | | Level 1 – quoted prices in active markets for identical securities |
| n | | Level 2 – other significant observable inputs (including quoted prices for similar securities, interest rates, prepayment speeds, credit risk, use of amortized cost, etc.) |
| n | | Level 3 – significant unobservable inputs (including the Fund’s own assumptions in determining the fair value of investments) |
The inputs or methodologies used for valuing investments in securities are not necessarily an indication of the risk associated with investing in those securities.
The following is a summary of the inputs used in valuing the Fund’s assets and liabilities as of April 30, 2016:
| | | | | | | | | | | | | | | | |
| | | Quoted prices
(Level 1) | | | Other significant
observable inputs
(Level 2) | | | Significant
unobservable inputs
(Level 3) | | | Total | |
Assets | | | | | | | | | | | | | | | | |
Investments in: | | | | | | | | | | | | | | | | |
| | | | |
Common stocks | | | | | | | | | | | | | | | | |
Brazil | | $ | 16,440,070 | | | $ | 0 | | | $ | 0 | | | $ | 16,440,070 | |
Cayman Islands | | | 2,652,580 | | | | 0 | | | | 0 | | | | 2,652,580 | |
Chile | | | 3,483,716 | | | | 0 | | | | 0 | | | | 3,483,716 | |
China | | | 55,214,773 | | | | 0 | | | | 0 | | | | 55,214,773 | |
Cyprus | | | 1,388,733 | | | | 0 | | | | 0 | | | | 1,388,733 | |
Czech Republic | | | 3,115,886 | | | | 0 | | | | 0 | | | | 3,115,886 | |
Indonesia | | | 13,394,025 | | | | 0 | | | | 0 | | | | 13,394,025 | |
Malaysia | | | 9,377,571 | | | | 0 | | | | 0 | | | | 9,377,571 | |
Mexico | | | 20,153,998 | | | | 0 | | | | 0 | | | | 20,153,998 | |
Panama | | | 2,228,848 | | | | 0 | | | | 0 | | | | 2,228,848 | |
Philippines | | | 6,975,397 | | | | 0 | | | | 0 | | | | 6,975,397 | |
Poland | | | 3,169,191 | | | | 0 | | | | 0 | | | | 3,169,191 | |
Russia | | | 6,820,456 | | | | 1,525,742 | | | | 0 | | | | 8,346,198 | |
Singapore | | | 13,612,163 | | | | 0 | | | | 0 | | | | 13,612,163 | |
South Africa | | | 10,481,252 | | | | 0 | | | | 0 | | | | 10,481,252 | |
South Korea | | | 37,394,008 | | | | 0 | | | | 0 | | | | 37,394,008 | |
Taiwan | | | 37,952,306 | | | | 0 | | | | 0 | | | | 37,952,306 | |
Thailand | | | 4,554,633 | | | | 0 | | | | 0 | | | | 4,554,633 | |
Turkey | | | 5,667,218 | | | | 0 | | | | 0 | | | | 5,667,218 | |
United Arab Emirates | | | 1,443,790 | | | | 0 | | | | 0 | | | | 1,443,790 | |
| | | | |
Exchange-traded funds | | | | | | | | | | | | | | | | |
United States | | | 3,852,543 | | | | 0 | | | | 0 | | | | 3,852,543 | |
| | | | |
Participation notes | | | | | | | | | | | | | | | | |
China | | | 0 | | | | 10,032,092 | | | | 0 | | | | 10,032,092 | |
India | | | 0 | | | | 18,966,802 | | | | 0 | | | | 18,966,802 | |
| | | | |
Preferred stock | | | | | | | | | | | | | | | | |
Brazil | | | 4,820,691 | | | | 0 | | | | 0 | | | | 4,820,691 | |
| | | | |
Short-term investments | | | | | | | | | | | | | | | | |
Investment companies | | | 16,314,180 | | | | 0 | | | | 0 | | | | 16,314,180 | |
Total assets | | $ | 280,508,028 | | | $ | 30,524,636 | | | $ | 0 | | | $ | 311,032,664 | |
| | | | | | |
| Notes to financial statements (unaudited) | | Wells Fargo Emerging Markets Equity Income Fund | | | 23 | |
The Fund recognizes transfers between levels within the fair value hierarchy at the end of the reporting period. Fair value pricing that was used in pricing certain foreign securities at the previous period end was not used at April 30, 2016. As a result common stocks valued at $160,684,335 were transferred from Level 2 to Level 1 within the fair value hierarchy. In addition, common stocks with a market value of $3,820,198 were transferred from Level 3 to Level 1 because of a increase in the market activity of these securities.
4. TRANSACTIONS WITH AFFILIATES
Management fee
Funds Management, an indirect wholly owned subsidiary of Wells Fargo & Company (“Wells Fargo”), is the manager of the Fund and provides advisory and fund-level administrative services under an investment management agreement. Under the investment management agreement, Funds Management is responsible for, among other services, implementing the investment objectives and strategies of the Fund, supervising the applicable subadviser, providing fund-level administrative services in connection with the Fund’s operations, and providing any other fund-level administrative services reasonably necessary for the operation of the Fund. As compensation for its services under the investment management agreement, Funds Management is entitled to receive an annual management fee starting at 1.15% and declining to 0.955% as the average daily net assets of the Fund increase.
For the six months ended April 30, 2016, the management fee was equivalent to an annual rate of 1.15% of the Fund’s average daily net assets.
Funds Management has retained the services of a subadviser to provide daily portfolio management to the Fund. The fee for subadvisory services is borne by Funds Management. Wells Capital Management Incorporated, an affiliate of Funds Management and an indirect wholly owned subsidiary of Wells Fargo, is the subadviser to the Fund and is entitled to receive a fee from Funds Management at an annual rate starting at 0.65% and declining to 0.45% as the average daily net assets of the Fund increase.
Administration fees
Under a class-level administration agreement, Funds Management provides class-level administrative services to the Fund, which includes paying fees and expenses for services provided by the transfer agent, sub-transfer agents, omnibus account servicers and record-keepers. As compensation for its services under the class-level administration agreement, Funds Management receives an annual fee which is calculated based on the average daily net assets of each class as follows:
| | | | |
| | | Class-level
administration fee | |
Class A, Class C, Class R | | | 0.21 | % |
Class R6 | | | 0.03 | |
Administrator Class, Institutional Class | | | 0.13 | |
Funds Management has contractually waived and/or reimbursed management and administration fees to the extent necessary to maintain certain net operating expense ratios for the Fund. Waiver of fees and/or reimbursement of expenses by Funds Management were made first from fund level expenses on a proportionate basis and then from class specific expenses. Funds Management has committed through February 28, 2017 to waive fees and/or reimburse expenses to the extent necessary to cap the Fund’s expenses at 1.65% for Class A shares, 2.40% for Class C shares, 1.90% for Class R shares, 1.20% for Class R6 shares, 1.45% for Administrator Class shares, and 1.25% for Institutional Class shares. After this time, the cap may be increased or the commitment to maintain the cap may be terminated only with the approval of the Board of Trustees.
Distribution fees
The Trust has adopted a distribution plan for Class C and Class R shares of the Fund pursuant to Rule 12b-1 under the 1940 Act. Distribution fees are charged to Class C and Class R shares and paid to Wells Fargo Funds Distributor, LLC (“Funds Distributor”), the principal underwriter, at an annual rate of 0.75% of the average daily net assets of Class C shares and 0.25% of the average daily net assets of Class R shares.
In addition, Funds Distributor is entitled to receive the front-end sales charge from the purchase of Class A shares and a contingent deferred sales charge on the redemption of certain Class A shares. Funds Distributor is also entitled to receive the contingent deferred sales charges from redemptions of Class C shares. For the six months ended April 30, 2016, Funds Distributor received $9,139 from the sale of Class A shares and $500 and $40 in contingent deferred sales charges from redemptions of Class A and Class C shares, respectively.
| | | | |
| 24 | | Wells Fargo Emerging Markets Equity Income Fund | | Notes to financial statements (unaudited) |
Shareholder servicing fees
The Trust has entered into contracts with one or more shareholder servicing agents, whereby Class A, Class C, Class R, and Administrator Class of the Fund are charged a fee at an annual rate of 0.25% of the average daily net assets of each respective class.
A portion of these total shareholder servicing fees were paid to affiliates of Wells Fargo.
5. INVESTMENT PORTFOLIO TRANSACTIONS
Purchases and sales of investments, excluding U.S. government obligations (if any) and short-term securities, for the six months ended April 30, 2016 were $154,289,420 and $55,565,664, respectively.
6. DERIVATIVE TRANSACTIONS
During the six months ended April 30, 2016, the Fund entered into forward foreign currency contracts for economic hedging purposes. As of April 30, 2016, the Fund did not have any open forward foreign currency contracts. The Fund had average contract amounts of $14,047 in forward foreign currency contracts to sell during the six months ended April 30, 2016.
The fair value, realized gains or losses and change in unrealized gains or losses, if any, on derivative instruments are reflected in the appropriate financial statements.
7. BANK BORROWINGS
The Trust (excluding the money market funds and certain other funds) and Wells Fargo Variable Trust are parties to a $200,000,000 revolving credit agreement whereby the Fund is permitted to use bank borrowings for temporary or emergency purposes, such as to fund shareholder redemption requests. Interest under the credit agreement is charged to the Fund based on a borrowing rate equal to the higher of the Federal Funds rate in effect on that day plus 1.25% or the overnight LIBOR rate in effect on that day plus 1.25%. In addition, an annual commitment fee equal to 0.20% of the unused balance is allocated to each participating fund.
For the six months ended April 30, 2016, there were no borrowings by the Fund under the agreement.
8. CONCENTRATION RISK
Concentration risks result from exposure to a limited number of sectors. A fund that invests a substantial portion of its assets in any sector may be more affected by changes in that sector than would be a fund whose investments are not heavily weighted in any sector.
9. INDEMNIFICATION
Under the Trust’s organizational documents, the officers and Trustees have been granted certain indemnification rights against certain liabilities that may arise out of performance of their duties to the Trust. Additionally, in the normal course of business, the Trust may enter into contracts with service providers that contain a variety of indemnification clauses. The Trust’s maximum exposure under these arrangements is dependent on future claims that may be made against the Fund and, therefore, cannot be estimated.
10. SUBSEQUENT DISTRIBUTIONS
On May 24, 2016, the Fund declared distributions from net investment income to shareholders of record on May 23, 2016. The per share amounts payable on May 25, 2016 were as follows:
| | | | |
| | | Net
investment
income | |
Class A | | $ | 0.03639 | |
Class C | | $ | 0.03034 | |
Class R | | $ | 0.03424 | |
Class R6 | | $ | 0.04003 | |
Administrator Class | | $ | 0.03721 | |
Institutional Class | | $ | 0.03929 | |
| | | | | | |
| Notes to financial statements (unaudited) | | Wells Fargo Emerging Markets Equity Income Fund | | | 25 | |
On June 24, 2016, the Fund declared distributions from net investment income to shareholders of record on June 23, 2016. The per share amounts payable on June 27, 2016 were as follows:
| | | | |
| | | Net
investment
income | |
Class A | | $ | 0.03288 | |
Class C | | $ | 0.02713 | |
Class R | | $ | 0.03099 | |
Class R6 | | $ | 0.03629 | |
Administrator Class | | $ | 0.03356 | |
Institutional Class | | $ | 0.03554 | |
These distributions are not reflected in the accompanying financial statements. The final determination of the source of all distributions is subject to change and made after the Fund’s tax year-end.
| | | | |
| 26 | | Wells Fargo Emerging Markets Equity Income Fund | | Other information (unaudited) |
TAX INFORMATION
Pursuant to Section 853 of the Internal Revenue Code, the following amounts have been designated as foreign taxes paid for the fiscal year ended October 31, 2015. These amounts may be less than the actual foreign taxes paid for financial statement purposes. Foreign taxes paid or withheld should be included in taxable income with an offsetting deduction from gross income or as a credit for taxes paid to foreign governments. None of the income was derived from ineligible foreign sources as defined under Section 901(j) of the Internal Revenue Code.
| | | | |
Creditable
foreign taxes paid | | Per share
amount | | Foreign income as % of ordinary
income distributions |
| $477,780 | | $0.0227 | | 100% |
PROXY VOTING INFORMATION
A description of the policies and procedures that the Fund uses to determine how to vote proxies relating to portfolio securities is available, upon request, by calling 1-800-222-8222, visiting our website at wellsfargofunds.com, or visiting the SEC website at sec.gov. Information regarding how the Fund voted proxies relating to portfolio securities during the most recent 12-month period ended June 30 is available on the Fund’s website at wellsfargofunds.com or by visiting the SEC website at sec.gov.
PORTFOLIO HOLDINGS INFORMATION
The complete portfolio holdings for the Fund are publicly available monthly on the Fund’s website (wellsfargofunds.com), on a one-month delayed basis. In addition, top ten holdings information (excluding derivative positions) for the Fund is publicly available on the Fund’s website on a monthly, seven-day or more delayed basis. The Fund files its complete schedule of portfolio holdings with the SEC for the first and third quarters of each fiscal year on Form N-Q, which is available by visiting the SEC website at sec.gov. In addition, the Fund’s Form N-Q may be reviewed and copied at the SEC’s Public Reference Room in Washington, DC, and at regional offices in New York City, at 233 Broadway, and in Chicago, at 175 West Jackson Boulevard, Suite 900. Information about the Public Reference Room may be obtained by calling 1-800-SEC-0330.
| | | | | | |
| Other information (unaudited) | | Wells Fargo Emerging Markets Equity Income Fund | | | 27 | |
BOARD OF TRUSTEES AND OFFICERS
Each of the Trustees and Officers1 listed in the table below acts in identical capacities for each fund in the Wells Fargo family of funds, which consists of 141 mutual funds comprising the Wells Fargo Funds Trust, Wells Fargo Variable Trust, Wells Fargo Master Trust and four closed-end funds (collectively the “Fund Complex”). This table should be read in conjunction with the Prospectus and the Statement of Additional Information2. The mailing address of each Trustee and Officer is 525 Market Street, 12th Floor, San Francisco, CA 94105. Each Trustee and Officer serves an indefinite term, however, each Trustee serves such term until reaching the mandatory retirement age established by the Trustees.
Independent Trustees
| | | | | | |
Name and
year of birth | | Position held and
length of service* | | Principal occupations during past five years or longer | | Current other public
company or investment
company directorships |
William R. Ebsworth
(Born 1957) | | Trustee, since 2015 | | Retired. From 1984 to 2013, equities analyst, portfolio manager, research director and chief financial officer at Fidelity Management and Research Company in Boston, Tokyo, and Hong Kong and retired in 2013 as Chief Investment Officer of Fidelity Strategic Advisers, Inc. where he lead a team of investment professionals managing client assets. Prior thereto, Board member of Hong Kong Securities Clearing Co., Hong Kong Options Clearing Corp., the Thailand International Fund, Ltd., Fidelity Investments Life Insurance Company, and Empire Fidelity Investments Life Insurance Company. Mr. Ebsworth is a CFA ® charterholder and an Adjunct Lecturer, Finance, at Babson College. | | Asset Allocation Trust |
| Jane A. Freeman (Born 1953) | | Trustee, since 2015 | | Retired. From 2012 to 2014 and 1999 to 2008, Chief Financial Officer of Scientific Learning Corporation. From 2008 to 2012, Ms. Freeman provided consulting services related to strategic business projects. Prior to 1999, Portfolio Manager at Rockefeller & Co. and Scudder, Stevens & Clark. Board member of the Harding Loevner Funds from 1996 to 2014, serving as both Lead Independent Director and chair of the Audit Committee. Board member of the Russell Exchange Traded Funds Trust from 2011 to 2012 and the chair of the Audit Committee. Ms. Freeman is Chair of Taproot Foundation (non-profit organization) (non-profit organization), a Board Member of Ruth Bancroft Garden (non-profit organization) and an inactive chartered financial analyst. | | Asset Allocation Trust |
| Peter G. Gordon (Born 1942) | | Trustee, since 1998; Chairman, since 2005 | | Co-Founder, Retired Chairman, President and CEO of Crystal Geyser Water Company. Trustee Emeritus, Colby College. | | Asset Allocation Trust |
| Isaiah Harris, Jr. (Born 1952) | | Trustee, since 2009 | | Retired. Chairman of the Board of CIGNA Corporation since 2009, and Director since 2005. From 2003 to 2011, Director of Deluxe Corporation. Prior thereto, President and CEO of BellSouth Advertising and Publishing Corp. from 2005 to 2007, President and CEO of BellSouth Enterprises from 2004 to 2005 and President of BellSouth Consumer Services from 2000 to 2003. Emeritus member of the Iowa State University Foundation Board of Governors. Emeritus Member of the Advisory Board of Iowa State University School of Business. Advisory Board Member, Palm Harbor Academy (charter school). Advisory Board Member, Child Evangelism Fellowship (non-profit). Mr. Harris is a certified public accountant (inactive status). | | CIGNA Corporation; Asset Allocation Trust |
| Judith M. Johnson (Born 1949) | | Trustee, since 2008;
Audit Committee Chairman, since 2008 | | Retired. Prior thereto, Chief Executive Officer and Chief Investment Officer of Minneapolis Employees Retirement Fund from 1996 to 2008. Ms. Johnson is an attorney, certified public accountant and a certified managerial accountant. | | Asset Allocation Trust |
| David F. Larcker (Born 1950) | | Trustee, since 2009 | | James Irvin Miller Professor of Accounting at the Graduate School of Business, Stanford University, Director of the Corporate Governance Research Initiative and Senior Faculty of The Rock Center for Corporate Governance since 2006. From 2005 to 2008, Professor of Accounting at the Graduate School of Business, Stanford University. Prior thereto, Ernst & Young Professor of Accounting at The Wharton School, University of Pennsylvania from 1985 to 2005. | | Asset Allocation Trust |
| | | | |
| 28 | | Wells Fargo Emerging Markets Equity Income Fund | | Other information (unaudited) |
| | | | | | |
Name and
year of birth | | Position held and
length of service* | | Principal occupations during past five years or longer | | Current other public
company or investment
company directorships |
Olivia S. Mitchell (Born 1953) | | Trustee, since 2006 | | International Foundation of Employee Benefit Plans Professor, Wharton School of the University of Pennsylvania since 1993. Director of Wharton’s Pension Research Council and Boettner Center on Pensions & Retirement Research, and Research Associate at the National Bureau of Economic Research. Previously, Cornell University Professor from 1978 to 1993. | | Asset Allocation Trust |
Timothy J. Penny (Born 1951) | | Trustee, since 1996 | | President and Chief Executive Officer of Southern Minnesota Initiative Foundation, a non-profit organization, since 2007 and Senior Fellow at the Humphrey Institute Policy Forum at the University of Minnesota since 1995. Member of the Board of Trustees of NorthStar Education Finance, Inc., a non-profit organization, since 2007. | | Asset Allocation Trust |
Michael S. Scofield (Born 1943) | | Trustee, since 2010 | | Served on the Investment Company Institute’s Board of Governors and Executive Committee from 2008-2011 as well the Governing Council of the Independent Directors Council from 2006-2011 and the Independent Directors Council Executive Committee from 2008-2011. Chairman of the IDC from 2008-2010. Institutional Investor (Fund Directions) Trustee of Year in 2007. Trustee of the Evergreen Funds complex (and its predecessors) from 1984 to 2010. Chairman of the Evergreen Funds from 2000-2010. Former Trustee of the Mentor Funds. Retired Attorney, Law Offices of Michael S. Scofield. | | Asset Allocation Trust |
| * | Length of service dates reflect the Trustee’s commencement of service with the Trust’s predecessor entities, where applicable. |
Officers
| | | | | | |
Name and
year of birth | | Position held and
length of service | | Principal occupations during past five years or longer | | |
Karla M. Rabusch (Born 1959) | | President, since 2003 | | Executive Vice President of Wells Fargo Bank, N.A. and President of Wells Fargo Funds Management, LLC since 2003. | | |
Jeremy DePalma1 (Born 1974) | | Treasurer, since 2012 | | Senior Vice President of Wells Fargo Funds Management, LLC since 2009. Senior Vice President of Evergreen Investment Management Company, LLC from 2008 to 2010 and head of the Fund Reporting and Control Team within Fund Administration from 2005 to 2010. | | |
C. David Messman (Born 1960) | | Secretary, since 2000; Chief Legal Officer, since 2003 | | Senior Vice President and Secretary of Wells Fargo Funds Management, LLC since 2001. Assistant General Counsel of Wells Fargo Bank, N.A. since 2013 and Vice President and Managing Counsel of Wells Fargo Bank, N.A. from 1996 to 2013. | | |
Michael Whitaker (Born 1967) | | Chief Compliance Officer, since 2016* | | Executive Vice President of Wells Fargo Funds Management, LLC since 2016. Chief Compliance Officer of Fidelity’s Fixed Income Funds and Asset Allocation Funds from 2008 to 2016, Compliance Officer of FMR Co., Inc. from 2014 to 2016, Fidelity Investments Money Management, Inc. from 2014 to 2016, Fidelity Investments from 2007 to 2016. | | |
Debra Ann Early (Born 1964) | | Chief Compliance Officer, since 2007** | | Executive Vice President of Wells Fargo Funds Management, LLC since 2014, Senior Vice President and Chief Compliance Officer from 2007 to 2014. | | |
David Berardi (Born 1975) | | Assistant Treasurer, since 2009 | | Vice President of Wells Fargo Funds Management, LLC since 2009. Vice President of Evergreen Investment Management Company, LLC from 2008 to 2010. Manager of Fund Reporting and Control for Evergreen Investment Management Company, LLC from 2004 to 2010. | | |
| 1 | Jeremy DePalma acts as Treasurer of 69 funds and Assistant Treasurer of 72 funds in the Fund Complex. |
| 2 | The Statement of Additional Information includes additional information about the Trustees and is available, without charge, upon request, by calling 1-800-222-8222 or by visiting the website at wellsfargofunds.com. |
| * | Michael Whitaker became Chief Compliance Officer effective May 16, 2016. |
| ** | Debra Ann Early was the Chief Compliance Officer until May 15, 2016. |
| | | | | | |
| List of abbreviations | | Wells Fargo Emerging Markets Equity Income Fund | | | 29 | |
The following is a list of common abbreviations for terms and entities that may have appeared in this report.
| ACA | — ACA Financial Guaranty Corporation |
| ADR | — American depositary receipt |
| ADS | — American depositary shares |
| AGC | — Assured Guaranty Corporation |
| AGM | — Assured Guaranty Municipal |
| Ambac | — Ambac Financial Group Incorporated |
| AMT | — Alternative minimum tax |
| BAN | — Bond anticipation notes |
| BHAC | — Berkshire Hathaway Assurance Corporation |
| CAB | — Capital appreciation bond |
| CCAB | — Convertible capital appreciation bond |
| CDA | — Community Development Authority |
| CDO | — Collateralized debt obligation |
| DRIVER | — Derivative inverse tax-exempt receipts |
| DW&P | — Department of Water & Power |
| DWR | — Department of Water Resources |
| ECFA | — Educational & Cultural Facilities Authority |
| EDA | — Economic Development Authority |
| EDFA | — Economic Development Finance Authority |
| ETF | — Exchange-traded fund |
| FDIC | — Federal Deposit Insurance Corporation |
| FFCB | — Federal Farm Credit Banks |
| FGIC | — Financial Guaranty Insurance Corporation |
| FHA | — Federal Housing Administration |
| FHLB | — Federal Home Loan Bank |
| FHLMC | — Federal Home Loan Mortgage Corporation |
| FICO | — The Financing Corporation |
| FNMA | — Federal National Mortgage Association |
| GDR | — Global depositary receipt |
| GNMA | — Government National Mortgage Association |
| HCFR | — Healthcare facilities revenue |
| HEFA | — Health & Educational Facilities Authority |
| HEFAR | — Higher education facilities authority revenue |
| HFA | — Housing Finance Authority |
| HFFA | — Health Facilities Financing Authority |
| HUD | — Department of Housing and Urban Development |
| IDA | — Industrial Development Authority |
| IDAG | — Industrial Development Agency |
| KRW | — Republic of Korea won |
| LIBOR | — London Interbank Offered Rate |
| LIFER | — Long Inverse Floating Exempt Receipts |
| LLC | — Limited liability company |
| LLLP | — Limited liability limited partnership |
| LLP | — Limited liability partnership |
| MBIA | — Municipal Bond Insurance Association |
| MFHR | — Multifamily housing revenue |
| MSTR | — Municipal securities trust receipts |
| MUD | — Municipal Utility District |
| National | — National Public Finance Guarantee Corporation |
| PCFA | — Pollution Control Financing Authority |
| PCL | — Public Company Limited |
| PCR | — Pollution control revenue |
| PFA | — Public Finance Authority |
| PFFA | — Public Facilities Financing Authority |
| PFOTER | — Puttable floating option tax-exempt receipts |
| plc | — Public limited company |
| PUTTER | — Puttable tax-exempt receipts |
| R&D | — Research & development |
| Radian | — Radian Asset Assurance |
| RAN | — Revenue anticipation notes |
| RDA | — Redevelopment Authority |
| RDFA | — Redevelopment Finance Authority |
| REIT | — Real estate investment trust |
| ROC | — Reset option certificates |
| SAVRS | — Select auction variable rate securities |
| SBA | — Small Business Authority |
| SDR | — Swedish depositary receipt |
| SFHR | — Single-family housing revenue |
| SFMR | — Single-family mortgage revenue |
| SPA | — Standby purchase agreement |
| SPDR | — Standard & Poor’s Depositary Receipts |
| SPEAR | — Short Puttable Exempt Adjustable Receipts |
| STRIPS | — Separate trading of registered interest and |
| TAN | — Tax anticipation notes |
| TIPS | — Treasury inflation-protected securities |
| TRAN | — Tax revenue anticipation notes |
| TTFA | — Transportation Trust Fund Authority |
| TVA | — Tennessee Valley Authority |
This page is intentionally left blank.
This page is intentionally left blank.
This page is intentionally left blank.

For more information
More information about Wells Fargo Funds is available free upon request. To obtain literature, please write, email, visit the Fund’s website, or call:
Wells Fargo Funds
P.O. Box 8266
Boston, MA 02266-8266
Email: fundservice@wellsfargo.com
Website: wellsfargofunds.com
Individual investors: 1-800-222-8222
Retail investment professionals: 1-888-877-9275
Institutional investment professionals: 1-866-765-0778
This report and the financial statements contained herein are submitted for the general information of the shareholders of the Fund. If this report is used for promotional purposes, distribution of the report must be accompanied or preceded by a current prospectus. Before investing, please consider the investment objectives, risks, charges, and expenses of the investment. For a current prospectus and, if available, a summary prospectus, containing this information, call 1-800-222-8222 or visit the Fund’s website at wellsfargofunds.com. Read the prospectus carefully before you invest or send money.
Wells Fargo Asset Management (WFAM) is a trade name used by the asset management businesses of Wells Fargo & Company. Wells Fargo Funds Management, LLC, a wholly owned subsidiary of Wells Fargo & Company, provides investment advisory and administrative services for Wells Fargo Funds. Other affiliates of Wells Fargo & Company provide subadvisory and other services for the funds. The funds are distributed by Wells Fargo Funds Distributor, LLC, Member FINRA, an affiliate of Wells Fargo & Company.
NOT FDIC INSURED ¡ NO BANK GUARANTEE ¡ MAY LOSE VALUE
© 2016 Wells Fargo Funds Management, LLC. All rights reserved.
| | |
 | | 242231 06-16 SA262/SAR262 04-16 |
Semi-Annual Report
April 30, 2016

Wells Fargo Global Opportunities Fund


Reduce clutter. Save trees.
Sign up for electronic delivery of prospectuses and shareholder reports at wellsfargo.com/advantagedelivery
Contents
The views expressed and any forward-looking statements are as of April 30, 2016, unless otherwise noted, and are those of the Fund managers and/or Wells Fargo Funds Management, LLC. Discussions of individual securities, or the markets generally, or any Wells Fargo Fund are not intended as individual recommendations. Future events or results may vary significantly from those expressed in any forward-looking statements. The views expressed are subject to change at any time in response to changing circumstances in the market. Wells Fargo Funds Management, LLC and the Fund disclaim any obligation to publicly update or revise any views expressed or forward-looking statements.
NOT FDIC INSURED ¡ NO BANK GUARANTEE ¡ MAY LOSE VALUE
| | | | |
| 2 | | Wells Fargo Global Opportunities Fund | | Letter to shareholders (unaudited) |

Karla M. Rabusch
President
Wells Fargo Funds
As the U.S. dollar gained in strength relative to currencies overseas, investment returns earned outside the U.S. were reduced when translated into U.S. dollars.
Dear Valued Shareholder:
We are pleased to offer you this semi-annual report for the Wells Fargo Global Opportunities Fund for the six-month period that ended April 30, 2016. During the period, international equity investors confronted concerns about slowing economic growth, particularly in China, and the potential for central bank policies to relieve recessionary pressures and support global business activity. These influences were pervasive throughout the period and caused elevated levels of volatility in international equity markets.
Investors kept a watchful eye on central bank initiatives while global growth slowed.
Persistently low inflation rates and oil prices along with a strengthening U.S. dollar combined to drive international equity prices lower. The U.S. dollar strengthened consistently after 2011 and more quickly following 2014 as expectations grew for an increase in the federal funds rate by the U.S. Federal Reserve (Fed). As the U.S. dollar gained in strength relative to currencies overseas, investment returns earned outside the U.S. were reduced when translated into U.S. dollars. The strong U.S. dollar also put pressure on import prices which, when combined with lower costs for fuel and other commodities, restrained inflation and prompted recession fears among investors.
Further dampening the international investment outlook in December was the lack of a deal to freeze or reduce oil output in an effort to stabilize prices among members of the Organization of Petroleum Exporting Countries. The lack of an agreement on a strategy to increase oil prices from their low levels left many investors doubtful of investment opportunities in emerging markets. In addition, the People’s Bank of China (PBOC) guided its currency’s value lower relative to a basket of foreign currencies. While the effort was seen as consistent with the government’s efforts to move China’s economy to a more global market-based footing, the currency devaluation tended to heighten fears of recession.
Central bank policies demonstrate resolve to reignite global economic growth.
As the end of 2015 approached, investors did take some reassurance from the decision of the European Central Bank (ECB) to push the deposit interest rate further into negative territory. Negative interest rates are intended to encourage banks to lend assets held in reserve rather than keep them on deposit, which could help spark business activity. The ECB also expanded and extended its bond-buying program, which helped inject liquidity into the markets and encourage investment. As anticipated, the Fed announced the long-awaited increase to the federal funds rate in December and suggested it planned to pursue additional increases in 2016.
In January 2016, the Bank of Japan (BOJ) followed the ECB’s lead by setting a negative deposit rate. A negative measurement for Japan’s gross domestic product in the fourth quarter may have prompted the BOJ’s accommodative initiative. Observing the actions of central banks overseas to implement policies that would accommodate higher levels of business activity, the Fed acknowledged that risks to global growth existed and indicated it would base further rate increases on data indicating the risks were being successfully addressed. Counterbalancing the accommodation of central banks were industrial production slowdowns stemming from plant closures in China due to elevated air pollution levels, the lack of further accommodative action by the ECB in January, and fresh declines in oil prices. Stocks worldwide entered correction territory, defined as a decline of 10% or more.
| 1 | The Morgan Stanley Capital International (MSCI) Europe, Australasia, Far East (EAFE) Index (Net) is a free-float-adjusted market-capitalization-weighted index that is designed to measure the equity market performance of developed markets, excluding the U.S. and Canada. The MSCI EAFE Index (Net) consists of the following 21 developed markets country indexes: Australia, Austria, Belgium, Denmark, Finland, France, Germany, Hong Kong, Ireland, Israel, Italy, Japan, the Netherlands, New Zealand, Norway, Portugal, Singapore, Spain, Sweden, Switzerland, and the United Kingdom. Source: MSCI. MSCI makes no express or implied warranties or representations and shall have no liability whatsoever with respect to any MSCI data contained herein. The MSCI data may not be further redistributed or used as a basis for other indexes or any securities or financial products. This report is not approved, reviewed, or produced by MSCI. You cannot invest directly in an index. |
| | | | | | |
| Letter to shareholders (unaudited) | | Wells Fargo Global Opportunities Fund | | | 3 | |
In February 2016, markets around the world hit low points before starting to rebound in the middle of the month. Investors reacted positively when measurements of manufacturing activity in Japan, the U.S., and China indicated growth. The PBOC reduced reserve ratios in February, which was intended to encourage banks to increase lending. Investors also were influenced favorably by further accommodation by the ECB in March, when the bank pushed negative interest rates lower, which ratcheted up pressure on banks to lend. The ECB also expanded its bond-buying program once again and took additional steps to lower costs for borrowers. March proved to be the strongest month for international stock index performance during the period. For the month, the Morgan Stanley Capital International (MSCI) Europe, Australasia, Far East (EAFE) Index (Net)1 gained 6.5%, the MSCI World Index2 increased 6.8%, the MSCI All Country World Index(ACWI) ex USA Index (Net)3 moved up 8.1%, and the S&P Developed SmallCap Index4 gained 8.6%. More positive, albeit lower, returns followed in April.
With the exception of the S&P Developed SmallCap Index, strong March and April returns were not enough to push performance of the indexes into positive territory for the period. For the six-month period that ended April 30, 2016, the MSCI EAFE Index (Net) returned -3.1%, the MSCI World Index returned -1.1%, and the MSCI ACWI ex USA Index (Net) returned -1.8%; the S&P Developed SmallCap Index gained 3.2%.
Don’t let short-term uncertainty derail long-term investment goals.
Periods of investment uncertainty can present challenges, but experience has taught us that maintaining long-term investment goals can be an effective way to plan for the future. To help you create a sound strategy based on your personal goals and risk tolerance, Wells Fargo Funds offers more than 100 mutual funds spanning a wide range of asset classes and investment styles. Although diversification cannot guarantee an investment profit or prevent losses, we believe it can be an effective way to manage investment risk and potentially smooth out overall portfolio performance. We encourage investors to know their investments and to understand that appropriate levels of risk-taking may unlock opportunities.
Thank you for choosing to invest with Wells Fargo Funds. We appreciate your confidence in us and remain committed to helping you meet your financial needs.
Sincerely,

Karla M. Rabusch
President
Wells Fargo Funds
Investors reacted positively when measurements of manufacturing activity in Japan, the U.S., and China indicated growth.
For further information about your Fund, contact your investment professional, visit our website at wellsfargofunds.com, or call us directly at 1-800-222-8222. We are available 24 hours a day, 7 days a week.
| 2 | The MSCI World Index is a free-float-adjusted market-capitalization-weighted index that is designed to measure the equity market performance of developed markets. The MSCI World Index consists of the following 23 developed markets country indexes: Australia, Austria, Belgium, Canada, Denmark, Finland, France, Germany, Hong Kong, Ireland, Israel, Italy, Japan, the Netherlands, New Zealand, Norway, Portugal, Singapore, Spain, Sweden, Switzerland, the United Kingdom, and the United States. You cannot invest directly in an index. |
| 3 | The MSCI All Country World Index (ACWI) ex USA Index (Net) is a free-float-adjusted market-capitalization-weighted index that is designed to measure the equity market performance of developed and emerging markets. The MSCI ACWI ex USA Index (Net) consists of 45 country indexes comprising 22 developed and 23 emerging markets country indexes. The developed markets country indexes included are Australia, Austria, Belgium, Canada, Denmark, Finland, France, Germany, Hong Kong, Ireland, Israel, Italy, Japan, the Netherlands, New Zealand, Norway, Portugal, Singapore, Spain, Sweden, Switzerland, and the United Kingdom. The emerging markets country indexes included are Brazil, Chile, China, Colombia, Czech Republic, Egypt, Greece, Hungary, India, Indonesia, Korea, Malaysia, Mexico, Peru, the Philippines, Poland, Qatar, Russia, South Africa, Taiwan, Thailand, Turkey, and United Arab Emirates. You cannot invest directly in an index. |
| 4 | The S&P Developed SmallCap Index is a free-float-adjusted market-capitalization-weighted index designed to measure the equity market performance of small-capitalization companies located in developed markets. The index is composed of companies within the bottom 15% of the cumulative market capitalization in developed markets. The index covers all publicly listed equities with float-adjusted market values of U.S. $100 million or more and annual dollar value traded of at least U.S. $50 million in all included countries. You cannot invest directly in an index. |
| | | | |
| 4 | | Wells Fargo Global Opportunities Fund | | Performance highlights (unaudited) |
Investment objective
The Fund seeks long-term capital appreciation.
Manager
Wells Fargo Funds Management, LLC
Subadviser
Wells Capital Management Incorporated
Portfolio managers
Oleg Makhorine
Robert Rifkin, CFA®
James M. Tringas, CFA®, CPA
Bryant VanCronkhite, CFA®, CPA
Average annual total returns (%) as of April 30, 20161
| | | | | | | | | | | | | | | | | | | | | | | | | | | | | | | | | | |
| | | | | Including sales charge | | | Excluding sales charge | | | Expense ratios2 (%) | |
| | | Inception date | | 1 year | | | 5 year | | | 10 year | | | 1 year | | | 5 year | | | 10 year | | | Gross | | | Net3 | |
| Class A (EKGAX) | | 3-16-1988 | | | (6.98 | ) | | | 2.83 | | | | 4.14 | | | | (1.30 | ) | | | 4.05 | | | | 4.76 | | | | 1.55 | | | | 1.55 | |
| Class B (EKGBX)* | | 2-1-1993 | | | (6.65 | ) | | | 2.96 | | | | 4.22 | | | | (2.04 | ) | | | 3.28 | | | | 4.22 | | | | 2.30 | | | | 2.30 | |
| Class C (EKGCX) | | 2-1-1993 | | | (3.06 | ) | | | 3.28 | | | | 3.98 | | | | (2.06 | ) | | | 3.28 | | | | 3.98 | | | | 2.30 | | | | 2.30 | |
| Administrator Class (EKGYX) | | 1-13-1997 | | | – | | | | – | | | | – | | | | (1.17 | ) | | | 4.22 | | | | 4.97 | | | | 1.47 | | | | 1.41 | |
| Institutional Class (EKGIX) | | 7-30-2010 | | | – | | | | – | | | | – | | | | (0.93 | ) | | | 4.48 | | | | 5.13 | | | | 1.22 | | | | 1.16 | |
| S&P Developed SmallCap Index4 | | – | | | – | | | | – | | | | – | | | | (2.72 | ) | | | 6.38 | | | | 5.28 | | | | – | | | | – | |
| * | | Class B shares are closed to investment, except in connection with the reinvestment of any distributions and permitted exchanges. |
Figures quoted represent past performance, which is no guarantee of future results, and do not reflect taxes that a shareholder may pay on fund distributions or the redemption of fund shares. Investment return and principal value of an investment will fluctuate so that an investor’s shares, when redeemed, may be worth more or less than their original cost. Performance shown without sales charges would be lower if sales charges were reflected. Current performance may be lower or higher than the performance data quoted, which assumes the reinvestment of dividends and capital gains. Current month-end performance is available on the Fund’s website, wellsfargofunds.com.
Index returns do not include transaction costs associated with buying and selling securities, any mutual fund fees or expenses, or any taxes. It is not possible to invest directly in an index.
For Class A shares, the maximum front-end sales charge is 5.75%. For Class B shares, the maximum contingent deferred sales charge is 5.00%. For Class C shares, the maximum contingent deferred sales charge is 1.00%. Performance including a contingent deferred sales charge assumes the sales charge for the corresponding time period. Administrator Class and Institutional Class shares are sold without a front-end sales charge or contingent deferred sales charge.
Stock values fluctuate in response to the activities of individual companies and general market and economic conditions. Foreign investments are especially volatile and can rise or fall dramatically due to differences in the political and economic conditions of the host country. These risks are generally intensified in emerging markets. The use of derivatives may reduce returns and/or increase volatility. Certain investment strategies tend to increase the total risk of an investment (relative to the broader market). The Fund is exposed to geographic risk and smaller-company securities risk. Consult the Fund’s prospectus for additional information on these and other risks.
Please see footnotes on page 5.
| | | | | | |
| Performance highlights (unaudited) | | Wells Fargo Global Opportunities Fund | | | 5 | |
| | | | |
| Ten largest holdings (%) as of April 30, 20165 | |
Krispy Kreme Doughnuts Incorporated | | | 2.23 | |
GSI Group Incorporated | | | 2.22 | |
Eagle Materials Incorporated | | | 2.02 | |
Douglas Dynamics Incorporated | | | 1.96 | |
Quaker Chemical Corporation | | | 1.95 | |
Vishay Intertechnology Incorporated | | | 1.93 | |
Mueller Industries Incorporated | | | 1.91 | |
Analogic Corporation | | | 1.91 | |
Simpson Manufacturing Company Incorporated | | | 1.91 | |
Innospec Incorporated | | | 1.85 | |
|
| Sector distribution as of April 30, 20166 |
|
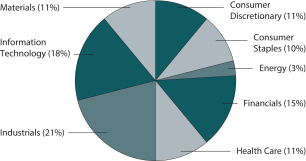 |
|
| Country allocation as of April 30, 20166 |
|
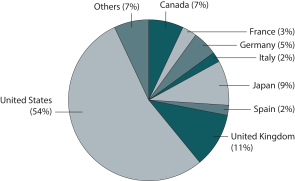 |
| 1 | Historical performance shown for Institutional Class shares prior to their inception reflects the performance of Administrator Class shares, and includes the higher expenses applicable to Administrator Class shares. If these expenses had not been included, returns would be higher. Historical performance shown for all classes of the Fund prior to July 19, 2010, is based on the performance of the Fund’s predecessor, Evergreen Global Opportunities Fund. |
| 2 | Reflects the expense ratios as stated in the most recent prospectuses, which include the impact of 0.01% in acquired fund fees and expenses. The expense ratios shown are subject to change and may differ from the annualized expense ratios shown in the financial highlights of this report, which do not include acquired fund fees and expenses. |
| 3 | The manager has contractually committed through February 28, 2017 to waive fees and/or reimburse expenses to the extent necessary to cap the Fund’s Total Annual Operating Expenses After Fee Waiver at 1.55% for Class A, 2.30% for Class B, 2.30% for Class C, 1.40% for Administrator Class, and 1.15% for Institutional Class. After this time, the cap may be increased or the commitment to maintain the cap may be terminated only with the approval of the Board of Trustees. Brokerage commissions, stamp duty fees, interest, taxes, acquired fund fees and expenses, and extraordinary expenses are excluded from the cap. Without this cap, the Fund’s returns would have been lower. |
| 4 | The S&P Developed SmallCap Index is a free-float-adjusted market-capitalization-weighted index designed to measure the equity market performance of small-capitalization companies located in developed markets. The index is composed of companies within the bottom 15% of the cumulative market capitalization in developed markets. The index covers all publicly listed equities with float-adjusted market values of U.S. $100 million or more and annual dollar value traded of at least U.S. $50 million in all included countries. You cannot invest directly in an index. |
| 5 | The ten largest holdings, excluding cash and cash equivalents, are calculated based on the value of the investments divided by total net assets of the Fund. Holdings are subject to change and may have changed since the date specified. |
| 6 | Amounts are calculated based on the total long-term investments of the Fund. These amounts are subject to change and may have changed since the date specified. |
| | | | |
| 6 | | Wells Fargo Global Opportunities Fund | | Fund expenses (unaudited) |
As a shareholder of the Fund, you incur two types of costs: (1) transaction costs, including sales charges (loads) on purchase payments and contingent deferred sales charges (if any) on redemptions and (2) ongoing costs, including management fees, distribution (12b-1) and/or shareholder servicing fees, and other Fund expenses. This example is intended to help you understand your ongoing costs (in dollars) of investing in the Fund and to compare these costs with the ongoing costs of investing in other mutual funds.
The example is based on an investment of $1,000 invested at the beginning of the six-month period and held for the entire period from November 1, 2015 to April 30, 2016.
Actual expenses
The “Actual” line of the table below provides information about actual account values and actual expenses. You may use the information in this line, together with the amount you invested, to estimate the expenses that you paid over the period. Simply divide your account value by $1,000 (for example, an $8,600 account value divided by $1,000 = 8.6), then multiply the result by the number in the “Actual” line under the heading entitled “Expenses paid during period” for your applicable class of shares to estimate the expenses you paid on your account during this period.
Hypothetical example for comparison purposes
The “Hypothetical” line of the table below provides information about hypothetical account values and hypothetical expenses based on the Fund’s actual expense ratio and an assumed rate of return of 5% per year before expenses, which is not the Fund’s actual return. The hypothetical account values and expenses may not be used to estimate the actual ending account balance or expenses you paid for the period. You may use this information to compare the ongoing costs of investing in the Fund and other funds. To do so, compare this 5% hypothetical example with the 5% hypothetical examples that appear in the shareholder reports of the other funds.
Please note that the expenses shown in the table are meant to highlight your ongoing costs only and do not reflect any transactional costs, such as sales charges (loads) and contingent deferred sales charges. Therefore, the “Hypothetical” line of the table is useful in comparing ongoing costs only and will not help you determine the relative total costs of owning different funds. In addition, if these transactional costs were included, your costs would have been higher.
| | | | | | | | | | | | | | | | |
| | | Beginning account value 11-1-2015 | | | Ending account value 4-30-2016 | | | Expenses paid during the period¹ | | | Net annualized expense ratio | |
Class A | | | | | | | | | | | | | | | | |
Actual | | $ | 1,000.00 | | | $ | 1,031.22 | | | $ | 7.83 | | | | 1.55 | % |
Hypothetical (5% return before expenses) | | $ | 1,000.00 | | | $ | 1,017.16 | | | $ | 7.77 | | | | 1.55 | % |
Class B | | | | | | | | | | | | | | | | |
Actual | | $ | 1,000.00 | | | $ | 1,027.54 | | | $ | 11.59 | | | | 2.30 | % |
Hypothetical (5% return before expenses) | | $ | 1,000.00 | | | $ | 1,013.43 | | | $ | 11.51 | | | | 2.30 | % |
Class C | | | | | | | | | | | | | | | | |
Actual | | $ | 1,000.00 | | | $ | 1,027.37 | | | $ | 11.59 | | | | 2.30 | % |
Hypothetical (5% return before expenses) | | $ | 1,000.00 | | | $ | 1,013.43 | | | $ | 11.51 | | | | 2.30 | % |
Administrator Class | | | | | | | | | | | | | | | | |
Actual | | $ | 1,000.00 | | | $ | 1,032.05 | | | $ | 7.07 | | | | 1.40 | % |
Hypothetical (5% return before expenses) | | $ | 1,000.00 | | | $ | 1,017.90 | | | $ | 7.02 | | | | 1.40 | % |
Institutional Class | | | | | | | | | | | | | | | | |
Actual | | $ | 1,000.00 | | | $ | 1,033.28 | | | $ | 5.81 | | | | 1.15 | % |
Hypothetical (5% return before expenses) | | $ | 1,000.00 | | | $ | 1,019.14 | | | $ | 5.77 | | | | 1.15 | % |
| 1 | Expenses paid is equal to the annualized expense ratio of each class multiplied by the average account value over the period, multiplied by the number of days in the most recent fiscal half-year divided by the number of days in the fiscal year (to reflect the one-half-year period). |
| | | | | | |
| Portfolio of investments—April 30, 2016 (unaudited) | | Wells Fargo Global Opportunities Fund | | | 7 | |
| | | | | | | | | | | | |
| Security name | | | | | | Shares | | | Value | |
| | | | |
Common Stocks: 96.51% | | | | | | | | | | | | |
| | | | |
| Australia: 0.33% | | | | | | | | | | | | |
Ansell Limited (Health Care, Health Care Equipment & Supplies) | | | | | | | 46,934 | | | $ | 711,227 | |
| | | | | | | | | | | | |
| | | | |
| Austria: 0.82% | | | | | | | | | | | | |
Ams AG (Information Technology, Semiconductors & Semiconductor Equipment) | | | | | | | 18,551 | | | | 490,220 | |
UNIQA Insurance Group AG (Financials, Insurance) | | | | | | | 114,518 | | | | 826,636 | |
Zumtobel Group AG (Industrials, Electrical Equipment) | | | | | | | 35,142 | | | | 457,522 | |
| | | | |
| | | | | | | | | | | 1,774,378 | |
| | | | | | | | | | | | |
| | | | |
| Canada: 6.90% | | | | | | | | | | | | |
Colliers International Group (Financials, Real Estate Management & Development) | | | | | | | 11,410 | | | | 471,969 | |
Cott Corporation (Consumer Staples, Beverages) | | | | | | | 152,980 | | | | 2,027,622 | |
Finning International Incorporated (Industrials, Trading Companies & Distributors) | | | | | | | 57,571 | | | | 1,023,219 | |
GSI Group Incorporated (Information Technology, Electronic Equipment, Instruments & Components) † | | | | | | | 331,271 | | | | 4,819,993 | |
Maple Leaf Foods Incorporated (Consumer Staples, Food Products) | | | | | | | 126,801 | | | | 2,625,560 | |
MBAC Fertilizer Corporation - Legend Shares (Materials, Chemicals) (i) | | | | | | | 84,000 | | | | 2,008 | |
MTY Food Group Incorporated (Consumer Discretionary, Hotels, Restaurants & Leisure) | | | | | | | 38,802 | | | | 1,028,267 | |
Mullen Group Limited (Energy, Energy Equipment & Services) | | | | | | | 67,902 | | | | 790,666 | |
Parex Resources Incorporated (Energy, Oil, Gas & Consumable Fuels) † | | | | | | | 108,900 | | | | 1,090,996 | |
Western Forest Products Incorporated (Materials, Paper & Forest Products) | | | | | | | 625,617 | | | | 1,121,892 | |
| | | | |
| | | | | | | | | | | 15,002,192 | |
| | | | | | | | | | | | |
| | | | |
| China: 0.63% | | | | | | | | | | | | |
Plastec Technologies Limited (Materials, Chemicals) (a) | | | | | | | 152,138 | | | | 1,369,242 | |
| | | | | | | | | | | | |
| | | | |
| Denmark: 0.26% | | | | | | | | | | | | |
Jyske Bank AS (Financials, Banks) | | | | | | | 14,118 | | | | 577,996 | |
| | | | | | | | | | | | |
| | | | |
| France: 2.84% | | | | | | | | | | | | |
ALTEN SA (Information Technology, IT Services) | | | | | | | 37,151 | | | | 2,297,147 | |
Eutelsat Communications SA (Consumer Discretionary, Media) | | | | | | | 21,450 | | | | 666,226 | |
M6 Metropole Television SA (Consumer Discretionary, Media) | | | | | | | 76,886 | | | | 1,458,355 | |
Teleperformance SE (Industrials, Professional Services) | | | | | | | 19,455 | | | | 1,746,513 | |
| | | | |
| | | | | | | | | | | 6,168,241 | |
| | | | | | | | | | | | |
| | | | |
| Germany: 4.33% | | | | | | | | | | | | |
Cancom SE (Information Technology, IT Services) | | | | | | | 24,748 | | | | 1,262,587 | |
Gerresheimer AG (Health Care, Life Sciences Tools & Services) | | | | | | | 31,941 | | | | 2,375,119 | |
Kion Group AG (Industrials, Machinery) | | | | | | | 22,861 | | | | 1,245,502 | |
SMA Solar Technology AG (Information Technology, Semiconductors & Semiconductor Equipment)« | | | | | | | 12,358 | | | | 654,462 | |
TAG Immobilien AG (Financials, Real Estate Management & Development) | | | | | | | 137,371 | | | | 1,823,855 | |
TLG Immobilien AG (Financials, Real Estate Management & Development) | | | | | | | 74,326 | | | | 1,571,501 | |
Wincor Nixdorf AG Tender (Information Technology, Technology Hardware, Storage & Peripherals) † | | | | | | | 8,812 | | | | 481,907 | |
| | | | |
| | | | | | | | | | | 9,414,933 | |
| | | | | | | | | | | | |
| | | | |
| Hong Kong: 0.77% | | | | | | | | | | | | |
Sunlight REIT (Financials, REITs) | | | | | | | 3,182,000 | | | | 1,677,781 | |
| | | | | | | | | | | | |
The accompanying notes are an integral part of these financial statements.
| | | | |
| 8 | | Wells Fargo Global Opportunities Fund | | Portfolio of investments—April 30, 2016 (unaudited) |
| | | | | | | | | | | | |
| Security name | | | | | | Shares | | | Value | |
| | | | |
| Israel: 0.95% | | | | | | | | | | | | |
Orbotech Limited (Information Technology, Electronic Equipment, Instruments & Components) † | | | | | | | 85,800 | | | $ | 2,066,064 | |
| | | | | | | | | | | | |
| | | | |
| Italy: 1.63% | | | | | | | | | | | | |
Azimut Holding SpA (Financials, Capital Markets) | | | | | | | 63,760 | | | | 1,604,725 | |
Davide Campari-Milano SpA (Consumer Staples, Beverages) | | | | | | | 200,999 | | | | 1,940,198 | |
| | | | |
| | | | | | | | | | | 3,544,923 | |
| | | | | | | | | | | | |
| | | | |
| Japan: 9.20% | | | | | | | | | | | | |
Aeon Delight Company Limited (Industrials, Commercial Services & Supplies) | | | | | | | 91,000 | | | | 2,560,717 | |
Chiba Bank Limited (Financials, Banks) | | | | | | | 153,000 | | | | 792,659 | |
DTS Corporation (Information Technology, IT Services) | | | | | | | 78,400 | | | | 1,583,963 | |
FamilyMart Company Limited (Consumer Staples, Food & Staples Retailing) | | | | | | | 33,200 | | | | 1,779,253 | |
Fuji Seal International Incorporated (Materials, Containers & Packaging) | | | | | | | 25,400 | | | | 882,295 | |
Hitachi Chemical Company Limited (Materials, Chemicals) | | | | | | | 53,900 | | | | 929,207 | |
Horiba Limited (Information Technology, Electronic Equipment, Instruments & Components) | | | | | | | 42,700 | | | | 1,647,737 | |
Meitec Corporation (Industrials, Professional Services) | | | | | | | 34,300 | | | | 1,214,487 | |
Musashi Seimitsu Industry Company Limited (Consumer Discretionary, Auto Components) | | | | | | | 69,800 | | | | 1,366,422 | |
Nihon Parkerizing Company Limited (Materials, Chemicals) | | | | | | | 122,200 | | | | 1,102,998 | |
ORIX JREIT Incorporated (Financials, REITs) | | | | | | | 923 | | | | 1,552,111 | |
Ship Healthcare Holdings Incorporated (Health Care, Health Care Providers & Services) | | | | | | | 50,669 | | | | 1,276,437 | |
Sumitomo Warehouse Company Limited (Industrials, Transportation Infrastructure) | | | | | | | 384,000 | | | | 1,957,385 | |
Taikisha Limited (Industrials, Construction & Engineering) | | | | | | | 58,400 | | | | 1,360,286 | |
| | | | |
| | | | | | | | | | | 20,005,957 | |
| | | | | | | | | | | | |
| | | | |
| Netherlands: 0.21% | | | | | | | | | | | | |
BinckBank NV (Financials, Capital Markets) | | | | | | | 76,530 | | | | 450,509 | |
| | | | | | | | | | | | |
| | | | |
| Norway: 0.45% | | | | | | | | | | | | |
SpareBank 1 SR Bank ASA (Financials, Banks) | | | | | | | 202,314 | | | | 987,468 | |
| | | | | | | | | | | | |
| | | | |
| South Korea: 0.53% | | | | | | | | | | | | |
BS Financial Group Incorporated (Financials, Banks) | | | | | | | 140,820 | | | | 1,148,164 | |
| | | | | | | | | | | | |
| | | | |
| Spain: 1.54% | | | | | | | | | | | | |
Almirall SA (Health Care, Pharmaceuticals) | | | | | | | 94,857 | | | | 1,558,640 | |
Merlin Properties Socimi SA (Financials, REITs) | | | | | | | 154,024 | | | | 1,790,107 | |
| | | | |
| | | | | | | | | | | 3,348,747 | |
| | | | | | | | | | | | |
| | | | |
| Sweden: 0.44% | | | | | | | | | | | | |
Rezidor Hotel Group AB (Consumer Discretionary, Hotels, Restaurants & Leisure) | | | | | | | 223,954 | | | | 948,195 | |
| | | | | | | | | | | | |
| | | | |
| Switzerland: 1.41% | | | | | | | | | | | | |
Aryzta AG (Consumer Staples, Food Products) | | | | | | | 28,709 | | | | 1,114,782 | |
OC Oerlikon Corporation AG (Information Technology, Electronic Equipment, Instruments & Components) | | | | | | | 202,149 | | | | 1,951,318 | |
| | | | |
| | | | | | | | | | | 3,066,100 | |
| | | | | | | | | | | | |
| | | | |
| United Kingdom: 10.78% | | | | | | | | | | | | |
ARRIS International plc (Information Technology, Communications Equipment) † | | | | | | | 121,498 | | | | 2,766,509 | |
Bovis Homes Group plc (Consumer Discretionary, Household Durables) | | | | | | | 111,744 | | | | 1,423,757 | |
Cambian Group plc (Health Care, Health Care Providers & Services) | | | | | | | 468,938 | | | | 417,965 | |
The accompanying notes are an integral part of these financial statements.
| | | | | | |
| Portfolio of investments—April 30, 2016 (unaudited) | | Wells Fargo Global Opportunities Fund | | | 9 | |
| | | | | | | | | | | | |
| Security name | | | | | | Shares | | | Value | |
| | | | |
| United Kingdom (continued) | | | | | | | | | | | | |
Consort Medical plc (Health Care, Health Care Equipment & Supplies) | | | | | | | 40,761 | | | $ | 588,433 | |
Cybg plc (Financials, Banks) † | | | | | | | 222,174 | | | | 719,866 | |
Elementis plc (Materials, Chemicals) | | | | | | | 281,737 | | | | 888,775 | |
Hunting plc (Energy, Energy Equipment & Services) | | | | | | | 122,416 | | | | 655,552 | |
IMI plc (Industrials, Machinery) | | | | | | | 113,464 | | | | 1,550,118 | |
Jupiter Fund Management plc (Financials, Capital Markets) | | | | | | | 304,007 | | | | 1,869,638 | |
Keller Group plc (Industrials, Construction & Engineering) | | | | | | | 84,865 | | | | 1,095,545 | |
Lancashire Holdings Limited (Financials, Insurance) | | | | | | | 144,626 | | | | 1,161,206 | |
Mears Group plc (Industrials, Commercial Services & Supplies) | | | | | | | 211,082 | | | | 1,229,064 | |
Micro Focus International plc (Information Technology, Software) | | | | | | | 60,387 | | | | 1,349,106 | |
Morgan Advanced Materials plc (Industrials, Machinery) | | | | | | | 315,130 | | | | 1,086,207 | |
Nomad Foods Limited (Consumer Staples, Food Products) † | | | | | | | 143,900 | | | | 1,171,346 | |
Savills plc (Financials, Real Estate Management & Development) | | | | | | | 166,148 | | | | 1,801,333 | |
SIG plc (Industrials, Trading Companies & Distributors) | | | | | | | 487,736 | | | | 965,649 | |
Spectris plc (Information Technology, Electronic Equipment, Instruments & Components) | | | | | | | 26,561 | | | | 706,723 | |
Steris Corporation (Health Care, Health Care Equipment & Supplies) | | | | | | | 19,567 | | | | 1,382,800 | |
Stock Spirits Group plc (Consumer Staples, Beverages) | | | | | | | 259,707 | | | | 611,897 | |
| | | | |
| | | | | | | | | | | 23,441,489 | |
| | | | | | | | | | | | |
| | | | |
| United States: 52.49% | | | | | | | | | | | | |
ACCO Brands Corporation (Industrials, Commercial Services & Supplies) † | | | | | | | 303,612 | | | | 2,896,459 | |
ACI Worldwide Incorporated (Information Technology, Software)† | | | | | | | 107,800 | | | | 2,154,922 | |
Analogic Corporation (Health Care, Health Care Equipment & Supplies) | | | | | | | 52,524 | | | | 4,148,871 | |
Brown & Brown Incorporated (Financials, Insurance) | | | | | | | 103,622 | | | | 3,638,168 | |
Christopher & Banks Corporation (Consumer Discretionary, Specialty Retail)« † | | | | | | | 172,028 | | | | 447,273 | |
Delta Apparel Incorporated (Consumer Discretionary, Textiles, Apparel & Luxury Goods) † | | | | | | | 32,866 | | | | 665,537 | |
Denny’s Corporation (Consumer Discretionary, Hotels, Restaurants & Leisure) † | | | | | | | 356,699 | | | | 3,527,753 | |
Depomed Incorporated (Health Care, Pharmaceuticals) † | | | | | | | 38,350 | | | | 666,523 | |
DineEquity Incorporated (Consumer Discretionary, Hotels, Restaurants & Leisure) | | | | | | | 19,992 | | | | 1,719,312 | |
Douglas Dynamics Incorporated (Industrials, Machinery) | | | | | | | 186,302 | | | | 4,268,179 | |
DSP Group Incorporated (Information Technology, Semiconductors & Semiconductor Equipment) † | | | | | | | 53,189 | | | | 505,296 | |
Eagle Materials Incorporated (Materials, Construction Materials) | | | | | | | 59,200 | | | | 4,387,904 | |
ESCO Technologies Incorporated (Industrials, Machinery) | | | | | | | 62,990 | | | | 2,423,855 | |
First Citizens BancShares Corporation Class A (Financials, Banks) | | | | | | | 8,446 | | | | 2,153,730 | |
Franklin Electric Company Incorporated (Industrials, Electrical Equipment) | | | | | | | 103,162 | | | | 3,258,888 | |
Gulfport Energy Corporation (Energy, Oil, Gas & Consumable Fuels) † | | | | | | | 34,300 | | | | 1,073,590 | |
Haemonetics Corporation (Health Care, Health Care Equipment & Supplies) † | | | | | | | 63,376 | | | | 2,055,284 | |
Helen of Troy Limited (Consumer Discretionary, Household Durables) † | | | | | | | 26,600 | | | | 2,647,498 | |
Horizon Pharma plc (Health Care, Pharmaceuticals) † | | | | | | | 40,000 | | | | 614,800 | |
ICU Medical Incorporated (Health Care, Health Care Equipment & Supplies) † | | | | | | | 25,100 | | | | 2,493,434 | |
Imation Corporation (Information Technology, Technology Hardware, Storage & Peripherals) † | | | | | | | 536,388 | | | | 842,129 | |
Innospec Incorporated (Materials, Chemicals) | | | | | | | 83,203 | | | | 4,023,697 | |
Innoviva Incorporated (Health Care, Pharmaceuticals)« | | | | | | | 189,708 | | | | 2,340,997 | |
J & J Snack Foods Corporation (Consumer Staples, Food Products) | | | | | | | 25,136 | | | | 2,542,004 | |
Kadant Incorporated (Industrials, Machinery) | | | | | | | 78,976 | | | | 3,739,514 | |
Korn/Ferry International (Industrials, Professional Services) | | | | | | | 92,200 | | | | 2,502,308 | |
Krispy Kreme Doughnuts Incorporated (Consumer Discretionary, Hotels, Restaurants & Leisure) † | | | | | | | 279,000 | | | | 4,857,390 | |
Lannett Company Incorporated (Health Care, Pharmaceuticals)« † | | | | | | | 41,000 | | | | 786,380 | |
Liberty Tax Incorporated (Consumer Discretionary, Diversified Consumer Services)« | | | 87,600 | | | | 1,046,820 | |
Mueller Industries Incorporated (Industrials, Machinery) | | | 131,500 | | | | 4,150,140 | |
The accompanying notes are an integral part of these financial statements.
| | | | |
| 10 | | Wells Fargo Global Opportunities Fund | | Portfolio of investments—April 30, 2016 (unaudited) |
| | | | | | | | | | | | | | |
| Security name | | | | | | | Shares | | | Value | |
| | | | |
| United States (continued) | | | | | | | | | | | | | | |
Myriad Genetics Incorporated (Health Care, Biotechnology)« † | | | | 17,500 | | | $ | 630,000 | |
Neenah Paper Incorporated (Materials, Paper & Forest Products) | | | | 27,950 | | | | 1,819,266 | |
NETGEAR Incorporated (Information Technology, Communications Equipment) † | | | | 42,593 | | | | 1,805,943 | |
NetScout Systems Incorporated (Information Technology, Communications Equipment) † | | | | 96,300 | | | | 2,143,638 | |
Patterson-UTI Energy Incorporated (Energy, Energy Equipment & Services) | | | | 85,300 | | | | 1,684,675 | |
Popeyes Louisiana Kitchen Incorporated (Consumer Discretionary, Hotels, Restaurants & Leisure) † | | | | 41,175 | | | | 2,213,568 | |
ProAssurance Corporation (Financials, Insurance) | | | | 48,300 | | | | 2,305,359 | |
Progress Software Corporation (Information Technology, Software) † | | | | 116,100 | | | | 2,962,872 | |
Quaker Chemical Corporation (Materials, Chemicals) | | | | 47,500 | | | | 4,230,350 | |
Schweitzer-Mauduit International Incorporated (Materials, Paper & Forest Products) | | | | 79,127 | | | | 2,721,178 | |
Simpson Manufacturing Company Incorporated (Industrials, Building Products) | | | | 110,170 | | | | 4,142,392 | |
Spectrum Brands Holdings Incorporated (Consumer Staples, Household Products) | | | | 24,700 | | | | 2,805,920 | |
Steel Excel Incorporated (Energy, Energy Equipment & Services) † | | | | 119,034 | | | | 1,130,823 | |
TreeHouse Foods Incorporated (Consumer Staples, Food Products) † | | | | 42,200 | | | | 3,730,480 | |
Vishay Intertechnology Incorporated (Information Technology, Electronic Equipment, Instruments & Components) | | | | 344,690 | | | | 4,191,430 | |
Westwood Holdings Group Incorporated (Financials, Capital Markets) | | | | 52,850 | | | | 3,041,518 | |
| | | | |
| | | | | | | | | | | | | 114,138,067 | |
| | | | | | | | | | | | | | |
| | | | |
Total Common Stocks (Cost $189,906,158) | | | | | | | | | | | | | 209,841,673 | |
| | | | | | | | | | | | | | |
| | | | |
| | | | | Dividend yield | | | | | | | |
| | | | |
Preferred Stocks: 0.46% | | | | | | | | | | | | | | |
| | | | |
| Germany: 0.46% | | | | | | | | | | | | | | |
Draegerwerk AG & Company KGAA (Health Care, Health Care Equipment & Supplies) ± | | | | | 2.66 | % | | | 15,140 | | | | 1,004,278 | |
| | | | | | | | | | | | | | |
| | |
Total Preferred Stocks (Cost $1,430,836) | | | | | | | | 1,004,278 | |
| | | | | | | | | | | | | | |
| | | | |
| | | | | Yield | | | | | | | |
| | | | |
Short-Term Investments: 5.49% | | | | | | | | | | | | | | |
| | | | |
| Investment Companies: 5.49% | | | | | | | | | | | | | | |
Securities Lending Cash Investments LLC (l)(r)(u) | | | | | 0.45 | | | | 5,017,015 | | | | 5,017,015 | |
Wells Fargo Cash Investment Money Market Fund Select Class (l)(u) | | | | | 0.43 | | | | 6,919,415 | | | | 6,919,415 | |
| | |
Total Short-Term Investments (Cost $11,936,430) | | | | | | | | 11,936,430 | |
| | | | | | | | | | | | | | |
| | | | | | | | |
| Total investments in securities (Cost $203,273,424) * | | | 102.46 | % | | | 222,782,381 | |
Other assets and liabilities, net | | | (2.46 | ) | | | (5,347,372 | ) |
| | | | | | | | |
| Total net assets | | | 100.00 | % | | $ | 217,435,009 | |
| | | | | | | | |
| † | Non-income-earning security |
| (a) | The security is fair valued in accordance with procedures approved by the Board of Trustees. |
| « | All or a portion of this security is on loan. |
| ± | Variable rate investment. The rate shown is the rate in effect at period end. |
| (l) | The issuer of the security is an affiliated person of the Fund as defined in the Investment Company Act of 1940. |
| (r) | The investment is a non-registered investment vehicle purchased with cash collateral received from securities on loan. |
| (u) | The rate represents the 7-day annualized yield at period end. |
| * | Cost for federal income tax purposes is $205,069,689 and unrealized gains (losses) consists of: |
| | | | | | |
Gross unrealized gains | | $ | 34,459,736 | |
Gross unrealized losses | | | (16,747,044 | ) |
| | | | | | |
Net unrealized gains | | $ | 17,712,692 | |
The accompanying notes are an integral part of these financial statements.
| | | | | | |
| Statement of assets and liabilities—April 30, 2016 (unaudited) | | Wells Fargo Global Opportunities Fund | | | 11 | |
| | | | |
| | | | |
| |
Assets | | | | |
Investments | | | | |
In unaffiliated securities (including $4,853,016 of securities loaned), at value (cost $191,336,994) | | $ | 210,845,951 | |
In affiliated securities, at value (cost $11,936,430) | | | 11,936,430 | |
| | | | |
Total investments, at value (cost $203,273,424) | | | 222,782,381 | |
Foreign currency, at value (cost $60,056) | | | 60,665 | |
Receivable for investments sold | | | 326,191 | |
Receivable for Fund shares sold | | | 458,556 | |
Receivable for dividends | | | 512,416 | |
Receivable for securities lending income | | | 9,838 | |
Prepaid expenses and other assets | | | 47,447 | |
| | | | |
Total assets | | | 224,197,494 | |
| | | | |
| |
Liabilities | | | | |
Payable for investments purchased | | | 741,494 | |
Payable for Fund shares redeemed | | | 640,711 | |
Payable upon receipt of securities loaned | | | 5,017,015 | |
Management fee payable | | | 171,785 | |
Distribution fees payable | | | 21,959 | |
Administration fees payable | | | 35,732 | |
Accrued expenses and other liabilities | | | 133,789 | |
| | | | |
Total liabilities | | | 6,762,485 | |
| | | | |
Total net assets | | $ | 217,435,009 | |
| | | | |
| |
NET ASSETS CONSIST OF | | | | |
Paid-in capital | | $ | 195,295,191 | |
Undistributed net investment income | | | 193,664 | |
Accumulated net realized gains on investments | | | 2,420,612 | |
Net unrealized gains on investments | | | 19,525,542 | |
| | | | |
Total net assets | | $ | 217,435,009 | |
| | | | |
| |
COMPUTATION OF NET ASSET VALUE AND OFFERING PRICE PER SHARE | | | | |
Net assets – Class A | | $ | 140,099,441 | |
Shares outstanding – Class A1 | | | 3,840,573 | |
Net asset value per share – Class A | | | $36.48 | |
Maximum offering price per share – Class A2 | | | $38.71 | |
Net assets – Class B | | $ | 1,157,098 | |
Shares outstanding – Class B1 | | | 42,384 | |
Net asset value per share – Class B | | | $27.30 | |
Net assets – Class C | | $ | 33,376,053 | |
Shares outstanding – Class C1 | | | 1,214,510 | |
Net asset value per share – Class C | | | $27.48 | |
Net assets – Administrator Class | | $ | 30,845,082 | |
Shares outstanding – Administrator Class1 | | | 813,719 | |
Net asset value per share – Administrator Class | | | $37.91 | |
Net assets – Institutional Class | | $ | 11,957,335 | |
Shares outstanding – Institutional Class1 | | | 316,415 | |
Net asset value per share – Institutional Class | | | $37.79 | |
| 1 | The Fund has an unlimited number of authorized shares. |
| 2 | Maximum offering price is computed as 100/94.25 of net asset value. On investments of $50,000 or more, the offering price is reduced. |
The accompanying notes are an integral part of these financial statements.
| | | | |
| 12 | | Wells Fargo Global Opportunities Fund | | Statement of operations—six months ended April 30, 2016 (unaudited) |
| | | | |
| | | | |
| |
Investment income | | | | |
Dividends (net of foreign withholding taxes of $74,674) | | $ | 1,923,873 | |
Securities lending income, net | | | 61,273 | |
Income from affiliated securities | | | 11,768 | |
| | | | |
Total investment income | | | 1,996,914 | |
| | | | |
| |
Expenses | | | | |
Management fee | | | 1,022,528 | |
Administration fees | | | | |
Class A | | | 146,866 | |
Class B | | | 2,360 | |
Class C | | | 34,678 | |
Administrator Class | | | 19,374 | |
Institutional Class | | | 6,706 | |
Shareholder servicing fees | | | | |
Class A | | | 174,840 | |
Class B | | | 2,809 | |
Class C | | | 41,284 | |
Administrator Class | | | 37,015 | |
Distribution fees | | | | |
Class B | | | 8,428 | |
Class C | | | 123,851 | |
Custody and accounting fees | | | 51,243 | |
Professional fees | | | 30,000 | |
Registration fees | | | 36,737 | |
Shareholder report expenses | | | 23,865 | |
Trustees’ fees and expenses | | | 9,311 | |
Other fees and expenses | | | 9,448 | |
| | | | |
Total expenses | | | 1,781,343 | |
Less: Fee waivers and/or expense reimbursements | | | (23,753 | ) |
| | | | |
Net expenses | | | 1,757,590 | |
| | | | |
Net investment income | | | 239,324 | |
| | | | |
| |
REALIZED AND UNREALIZED GAINS (LOSSES) ON INVESTMENTS | | | | |
Net realized gains on investments | | | 4,345,785 | |
Net change in unrealized gains (losses) on investments | | | 744,995 | |
| | | | |
Net realized and unrealized gains (losses) on investments | | | 5,090,780 | |
| | | | |
Net increase in net assets resulting from operations | | $ | 5,330,104 | |
| | | | |
The accompanying notes are an integral part of these financial statements.
| | | | | | |
| Statement of changes in net assets | | Wells Fargo Global Opportunities Fund | | | 13 | |
| | | | | | | | | | | | | | | | |
| | | Six months ended April 30, 2016 (unaudited) | | | Year ended
October 31, 2015 | |
| | | | |
Operations | | | | | | | | | | | | | | | | |
Net investment income | | | | | | $ | 239,324 | | | | | | | $ | 419,069 | |
Net realized gains on investments | | | | | | | 4,345,785 | | | | | | | | 10,609,101 | |
Net change in unrealized gains (losses) on investments | | | | | | | 744,995 | | | | | | | | (5,394,548 | ) |
| | | | |
Net increase in net assets resulting from operations | | | | | | | 5,330,104 | | | | | | | | 5,633,622 | |
| | | | |
| | | | |
Distributions to shareholders from | | | | | | | | | | | | | | | | |
Net investment income | | | | | | | | | | | | | | | | |
Class A | | | | | | | (886,929 | ) | | | | | | | (112,091 | ) |
Administrator Class | | | | | | | (231,279 | ) | | | | | | | (31,925 | ) |
Institutional Class | | | | | | | (115,938 | ) | | | | | | | (45,625 | ) |
Net realized gains | | | | | | | | | | | | | | | | |
Class A | | | | | | | (6,414,005 | ) | | | | | | | (25,688,232 | ) |
Class B | | | | | | | (179,734 | ) | | | | | | | (2,100,714 | ) |
Class C | | | | | | | (1,977,317 | ) | | | | | | | (7,981,435 | ) |
Administrator Class | | | | | | | (1,289,238 | ) | | | | | | | (5,573,313 | ) |
Institutional Class | | | | | | | (426,341 | ) | | | | | | | (1,170,657 | ) |
| | | | |
Total distributions to shareholders | | | | | | | (11,520,781 | ) | | | | | | | (42,703,992 | ) |
| | | | |
| | | | |
Capital share transactions | | | Shares | | | | | | | | Shares | | | | | |
Proceeds from shares sold | | | | | | | | | | | | | | | | |
Class A | | | 164,733 | | | | 5,769,312 | | | | 385,971 | | | | 14,800,661 | |
Class B | | | 19 | | | | 491 | | | | 2,614 | | | | 75,178 | |
Class C | | | 32,071 | | | | 835,843 | | | | 83,130 | | | | 2,405,203 | |
Administrator Class | | | 79,869 | | | | 2,884,255 | | | | 192,685 | | | | 7,651,580 | |
Institutional Class | | | 64,861 | | | | 2,352,451 | | | | 207,276 | | | | 8,364,650 | |
| | | | |
| | | | | | | 11,842,352 | | | | | | | | 33,297,272 | |
| | | | |
Reinvestment of distributions | | | | | | | | | | | | | | | | |
Class A | | | 196,310 | | | | 6,790,837 | | | | 656,362 | | | | 23,808,617 | |
Class B | | | 6,892 | | | | 177,539 | | | | 73,234 | | | | 2,024,915 | |
Class C | | | 63,376 | | | | 1,643,340 | | | | 236,312 | | | | 6,574,187 | |
Administrator Class | | | 41,455 | | | | 1,492,072 | | | | 146,011 | | | | 5,492,203 | |
Institutional Class | | | 11,643 | | | | 418,957 | | | | 21,540 | | | | 812,381 | |
| | | | |
| | | | | | | 10,522,745 | | | | | | | | 38,712,303 | |
| | | | |
Payment for shares redeemed | | | | | | | | | | | | | | | | |
Class A | | | (596,028 | ) | | | (20,219,525 | ) | | | (830,863 | ) | | | (31,796,199 | ) |
Class B | | | (113,606 | ) | | | (2,977,582 | ) | | | (267,575 | ) | | | (7,895,832 | ) |
Class C | | | (156,438 | ) | | | (4,135,085 | ) | | | (244,958 | ) | | | (7,212,225 | ) |
Administrator Class | | | (129,429 | ) | | | (4,648,902 | ) | | | (726,799 | ) | | | (30,614,585 | ) |
Institutional Class | | | (28,495 | ) | | | (1,054,561 | ) | | | (78,685 | ) | | | (3,130,872 | ) |
| | | | |
| | | | | | | (33,035,655 | ) | | | | | | | (80,649,713 | ) |
| | | | |
Net decrease in net assets resulting from capital share transactions | | | | | | | (10,670,558 | ) | | | | | | | (8,640,138 | ) |
| | | | |
Total decrease in net assets | | | | | | | (16,861,235 | ) | | | | | | | (45,710,508 | ) |
| | | | |
| | |
Net assets | | | | | | | | |
Beginning of period | | | | | | | 234,296,244 | | | | | | | | 280,006,752 | |
| | | | |
End of period | | | | | | $ | 217,435,009 | | | | | | | $ | 234,296,244 | |
| | | | |
Undistributed net investment income | | | | | | $ | 193,664 | | | | | | | $ | 1,188,486 | |
| | | | |
The accompanying notes are an integral part of these financial statements.
| | | | |
| 14 | | Wells Fargo Global Opportunities Fund | | Financial highlights |
(For a share outstanding throughout each period)
| | | | | | | | | | | | | | | | | | | | | | | | |
| | | Six months ended
April 30, 2016
(unaudited) | | | Year ended October 31 | |
| CLASS A | | | 2015 | | | 2014 | | | 2013 | | | 2012 | | | 2011 | |
Net asset value, beginning of period | | | $37.23 | | | | $43.26 | | | | $42.68 | | | | $33.17 | | | | $30.14 | | | | $31.91 | |
Net investment income | | | 0.05 | 1 | | | 0.10 | 1 | | | 0.03 | 1 | | | 0.16 | 1 | | | 0.20 | 1 | | | 0.12 | 1 |
Net realized and unrealized gains (losses) on investments | | | 1.00 | | | | 0.64 | | | | 0.86 | | | | 9.58 | | | | 2.87 | | | | (1.89 | ) |
| | | | | | | | | | | | | | | | | | | | | | | | |
Total from investment operations | | | 1.05 | | | | 0.74 | | | | 0.89 | | | | 9.74 | | | | 3.07 | | | | (1.77 | ) |
Distributions to shareholders from | | | | | | | | | | | | | | | | | | | | | | | | |
Net investment income | | | (0.21 | ) | | | (0.03 | ) | | | (0.31 | ) | | | (0.23 | ) | | | (0.04 | ) | | | 0.00 | |
Net realized gains | | | (1.59 | ) | | | (6.74 | ) | | | 0.00 | | | | 0.00 | | | | 0.00 | | | | 0.00 | |
| | | | | | | | | | | | | | | | | | | | | | | | |
Total distributions to shareholders | | | (1.80 | ) | | | (6.77 | ) | | | (0.31 | ) | | | (0.23 | ) | | | (0.04 | ) | | | 0.00 | |
Net asset value, end of period | | | $36.48 | | | | $37.23 | | | | $43.26 | | | | $42.68 | | | | $33.17 | | | | $30.14 | |
Total return2 | | | 3.12 | % | | | 2.12 | % | | | 2.07 | % | | | 29.50 | % | | | 10.24 | % | | | (5.55 | )% |
Ratios to average net assets (annualized) | | | | | | | | | | | | | | | | | | | | | | | | |
Gross expenses | | | 1.56 | % | | | 1.57 | % | | | 1.57 | % | | | 1.59 | % | | | 1.55 | % | | | 1.55 | % |
Net expenses | | | 1.55 | % | | | 1.55 | % | | | 1.55 | % | | | 1.55 | % | | | 1.54 | % | | | 1.53 | % |
Net investment income | | | 0.30 | % | | | 0.27 | % | | | 0.06 | % | | | 0.43 | % | | | 0.65 | % | | | 0.34 | % |
Supplemental data | | | | | | | | | | | | | | | | | | | | | | | | |
Portfolio turnover rate | | | 27 | % | | | 42 | % | | | 66 | % | | | 59 | % | | | 85 | % | | | 76 | % |
Net assets, end of period (000s omitted) | | | $140,099 | | | | $151,740 | | | | $167,166 | | | | $181,764 | | | | $156,433 | | | | $174,937 | |
| 1 | Calculated based upon average shares outstanding |
| 2 | Total return calculations do not include any sales charges. Returns for periods of less than one year are not annualized. |
The accompanying notes are an integral part of these financial statements.
| | | | | | |
| Financial highlights | | Wells Fargo Global Opportunities Fund | | | 15 | |
(For a share outstanding throughout each period)
| | | | | | | | | | | | | | | | | | | | | | | | |
| | | Six months ended
April 30, 2016
(unaudited) | | | Year ended October 31 | |
| CLASS B | | | 2015 | | | 2014 | | | 2013 | | | 2012 | | | 2011 | |
Net asset value, beginning of period | | | $28.21 | | | | $34.62 | | | | $34.18 | | | | $26.58 | | | | $24.30 | | | | $25.92 | |
Net investment loss | | | (0.08 | )1 | | | (0.14 | )1 | | | (0.25 | )1 | | | (0.09 | )1 | | | (0.03 | )1 | | | (0.12 | )1 |
Net realized and unrealized gains (losses) on investments | | | 0.76 | | | | 0.47 | | | | 0.69 | | | | 7.69 | | | | 2.31 | | | | (1.50 | ) |
| | | | | | | | | | | | | | | | | | | | | | | | |
Total from investment operations | | | 0.68 | | | | 0.33 | | | | 0.44 | | | | 7.60 | | | | 2.28 | | | | (1.62 | ) |
Distributions to shareholders from | | | | | | | | | | | | | | | | | | | | | | | | |
Net realized gains | | | (1.59 | ) | | | (6.74 | ) | | | 0.00 | | | | 0.00 | | | | 0.00 | | | | 0.00 | |
Net asset value, end of period | | | $27.30 | | | | $28.21 | | | | $34.62 | | | | $34.18 | | | | $26.58 | | | | $24.30 | |
Total return2 | | | 2.75 | % | | | 1.34 | % | | | 1.29 | % | | | 28.54 | % | | | 9.42 | % | | | (6.25 | )% |
Ratios to average net assets (annualized) | | | | | | | | | | | | | | | | | | | | | | | | |
Gross expenses | | | 2.31 | % | | | 2.32 | % | | | 2.32 | % | | | 2.34 | % | | | 2.30 | % | | | 2.30 | % |
Net expenses | | | 2.30 | % | | | 2.30 | % | | | 2.30 | % | | | 2.30 | % | | | 2.29 | % | | | 2.28 | % |
Net investment loss | | | (0.61 | )% | | | (0.49 | )% | | | (0.71 | )% | | | (0.32 | )% | | | (0.10 | )% | | | (0.43 | )% |
Supplemental data | | | | | | | | | | | | | | | | | | | | | | | | |
Portfolio turnover rate | | | 27 | % | | | 42 | % | | | 66 | % | | | 59 | % | | | 85 | % | | | 76 | % |
Net assets, end of period (000s omitted) | | | $1,157 | | | | $4,206 | | | | $11,799 | | | | $19,446 | | | | $21,181 | | | | $26,598 | |
| 1 | Calculated based upon average shares outstanding |
| 2 | Total return calculations do not include any sales charges. Returns for periods of less than one year are not annualized. |
The accompanying notes are an integral part of these financial statements.
| | | | |
| 16 | | Wells Fargo Global Opportunities Fund | | Financial highlights |
(For a share outstanding throughout each period)
| | | | | | | | | | | | | | | | | | | | | | | | |
| | | Six months ended
April 30, 2016
(unaudited) | | | Year ended October 31 | |
| CLASS C | | | 2015 | | | 2014 | | | 2013 | | | 2012 | | | 2011 | |
Net asset value, beginning of period | | | $28.39 | | | | $34.80 | | | | $34.36 | | | | $26.73 | | | | $24.43 | | | | $26.05 | |
Net investment loss | | | (0.06 | )1 | | | (0.14 | )1 | | | (0.24 | )1 | | | (0.09 | )1 | | | (0.03 | )1 | | | (0.11 | )1 |
Net realized and unrealized gains (losses) on investments | | | 0.74 | | | | 0.47 | | | | 0.69 | | | | 7.72 | | | | 2.33 | | | | (1.51 | ) |
| | | | | | | | | | | | | | | | | | | | | | | | |
Total from investment operations | | | 0.68 | | | | 0.33 | | | | 0.45 | | | | 7.63 | | | | 2.30 | | | | (1.62 | ) |
Distributions to shareholders from | | | | | | | | | | | | | | | | | | | | | | | | |
Net investment income | | | 0.00 | | | | 0.00 | | | | (0.01 | ) | | | 0.00 | | | | 0.00 | | | | 0.00 | |
Net realized gains | | | (1.59 | ) | | | (6.74 | ) | | | 0.00 | | | | 0.00 | | | | 0.00 | | | | 0.00 | |
| | | | | | | | | | | | | | | | | | | | | | | | |
Total distributions to shareholders | | | (1.59 | ) | | | (6.74 | ) | | | (0.01 | ) | | | 0.00 | | | | 0.00 | | | | 0.00 | |
Net asset value, end of period | | | $27.48 | | | | $28.39 | | | | $34.80 | | | | $34.36 | | | | $26.73 | | | | $24.43 | |
Total return2 | | | 2.74 | % | | | 1.34 | % | | | 1.32 | % | | | 28.54 | % | | | 9.41 | % | | | (6.25 | )% |
Ratios to average net assets (annualized) | | | | | | | | | | | | | | | | | | | | | | | | |
Gross expenses | | | 2.31 | % | | | 2.32 | % | | | 2.32 | % | | | 2.34 | % | | | 2.30 | % | | | 2.30 | % |
Net expenses | | | 2.30 | % | | | 2.30 | % | | | 2.30 | % | | | 2.30 | % | | | 2.29 | % | | | 2.28 | % |
Net investment loss | | | (0.44 | )% | | | (0.48 | )% | | | (0.69 | )% | | | (0.31 | )% | | | (0.11 | )% | | | (0.41 | )% |
Supplemental data | | | | | | | | | | | | | | | | | | | | | | | | |
Portfolio turnover rate | | | 27 | % | | | 42 | % | | | 66 | % | | | 59 | % | | | 85 | % | | | 76 | % |
Net assets, end of period (000s omitted) | | | $33,376 | | | | $36,215 | | | | $41,792 | | | | $44,618 | | | | $37,753 | | | | $45,135 | |
| 1 | Calculated based upon average shares outstanding |
| 2 | Total return calculations do not include any sales charges. Returns for periods of less than one year are not annualized. |
The accompanying notes are an integral part of these financial statements.
| | | | | | |
| Financial highlights | | Wells Fargo Global Opportunities Fund | | | 17 | |
(For a share outstanding throughout each period)
| | | | | | | | | | | | | | | | | | | | | | | | |
| | | Six months ended
April 30, 2016
(unaudited) | | | Year ended October 31 | |
| ADMINISTRATOR CLASS | | | 2015 | | | 2014 | | | 2013 | | | 2012 | | | 2011 | |
Net asset value, beginning of period | | | $38.65 | | | | $44.60 | | | | $44.00 | | | | $34.21 | | | | $31.10 | | | | $32.92 | |
Net investment income | | | 0.09 | | | | 0.16 | 1 | | | 0.09 | | | | 0.22 | 1 | | | 0.26 | 1 | | | 0.15 | |
Net realized and unrealized gains (losses) on investments | | | 1.03 | | | | 0.66 | | | | 0.90 | | | | 9.86 | | | | 2.96 | | | | (1.93 | ) |
| | | | | | | | | | | | | | | | | | | | | | | | |
Total from investment operations | | | 1.12 | | | | 0.82 | | | | 0.99 | | | | 10.08 | | | | 3.22 | | | | (1.78 | ) |
Distributions to shareholders from | | | | | | | | | | | | | | | | | | | | | | | | |
Net investment income | | | (0.27 | ) | | | (0.03 | ) | | | (0.39 | ) | | | (0.29 | ) | | | (0.11 | ) | | | (0.04 | ) |
Net realized gains | | | (1.59 | ) | | | (6.74 | ) | | | 0.00 | | | | 0.00 | | | | 0.00 | | | | 0.00 | |
| | | | | | | | | | | | | | | | | | | | | | | | |
Total distributions to shareholders | | | (1.86 | ) | | | (6.77 | ) | | | (0.39 | ) | | | (0.29 | ) | | | (0.11 | ) | | | (0.04 | ) |
Net asset value, end of period | | | $37.91 | | | | $38.65 | | | | $44.60 | | | | $44.00 | | | | $34.21 | | | | $31.10 | |
Total return2 | | | 3.21 | % | | | 2.27 | % | | | 2.22 | % | | | 29.73 | % | | | 10.44 | % | | | (5.39 | )% |
Ratios to average net assets (annualized) | | | | | | | | | | | | | | | | | | | | | | | | |
Gross expenses | | | 1.48 | % | | | 1.43 | % | | | 1.41 | % | | | 1.42 | % | | | 1.38 | % | | | 1.37 | % |
Net expenses | | | 1.40 | % | | | 1.40 | % | | | 1.40 | % | | | 1.40 | % | | | 1.38 | % | | | 1.36 | % |
Net investment income | | | 0.46 | % | | | 0.41 | % | | | 0.22 | % | | | 0.58 | % | | | 0.81 | % | | | 0.53 | % |
Supplemental data | | | | | | | | | | | | | | | | | | | | | | | | |
Portfolio turnover rate | | | 27 | % | | | 42 | % | | | 66 | % | | | 59 | % | | | 85 | % | | | 76 | % |
Net assets, end of period (000s omitted) | | | $30,845 | | | | $31,765 | | | | $53,966 | | | | $52,461 | | | | $44,360 | | | | $49,860 | |
| 1 | Calculated based upon average shares outstanding |
| 2 | Returns for periods of less than one year are not annualized. |
The accompanying notes are an integral part of these financial statements.
| | | | |
| 18 | | Wells Fargo Global Opportunities Fund | | Financial highlights |
(For a share outstanding throughout each period)
| | | | | | | | | | | | | | | | | | | | | | | | |
| | | Six months ended
April 30, 2016
(unaudited) | | | Year ended October 31 | |
| INSTITUTIONAL CLASS | | | 2015 | | | 2014 | | | 2013 | | | 2012 | | | 2011 | |
Net asset value, beginning of period | | | $38.63 | | | | $44.67 | | | | $44.05 | | | | $34.25 | | | | $31.18 | | | | $32.94 | |
Net investment income | | | 0.14 | | | | 0.20 | | | | 0.15 | | | | 0.32 | 1 | | | 0.36 | 1 | | | 0.25 | |
Net realized and unrealized gains (losses) on investments | | | 1.02 | | | | 0.72 | | | | 0.96 | | | | 9.86 | | | | 2.93 | | | | (1.94 | ) |
| | | | | | | | | | | | | | | | | | | | | | | | |
Total from investment operations | | | 1.16 | | | | 0.92 | | | | 1.11 | | | | 10.18 | | | | 3.29 | | | | (1.69 | ) |
Distributions to shareholders from | | | | | | | | | | | | | | | | | | | | | | | | |
Net investment income | | | (0.41 | ) | | | (0.22 | ) | | | (0.49 | ) | | | (0.38 | ) | | | (0.22 | ) | | | (0.07 | ) |
Net realized gains | | | (1.59 | ) | | | (6.74 | ) | | | 0.00 | | | | 0.00 | | | | 0.00 | | | | 0.00 | |
| | | | | | | | | | | | | | | | | | | | | | | | |
Total distributions to shareholders | | | (2.00 | ) | | | (6.96 | ) | | | (0.49 | ) | | | (0.38 | ) | | | (0.22 | ) | | | (0.07 | ) |
Net asset value, end of period | | | $37.79 | | | | $38.63 | | | | $44.67 | | | | $44.05 | | | | $34.25 | | | | $31.18 | |
Total return2 | | | 3.33 | % | | | 2.53 | % | | | 2.48 | % | | | 30.06 | % | | | 10.70 | % | | | (5.15 | )% |
Ratios to average net assets (annualized) | | | | | | | | | | | | | | | | | | | | | | | | |
Gross expenses | | | 1.23 | % | | | 1.18 | % | | | 1.14 | % | | | 1.16 | % | | | 1.12 | % | | | 1.08 | % |
Net expenses | | | 1.15 | % | | | 1.15 | % | | | 1.14 | % | | | 1.15 | % | | | 1.12 | % | | | 1.08 | % |
Net investment income | | | 0.75 | % | | | 0.66 | % | | | 0.47 | % | | | 0.83 | % | | | 1.13 | % | | | 1.18 | % |
Supplemental data | | | | | | | | | | | | | | | | | | | | | | | | |
Portfolio turnover rate | | | 27 | % | | | 42 | % | | | 66 | % | | | 59 | % | | | 85 | % | | | 76 | % |
Net assets, end of period (000s omitted) | | | $11,957 | | | | $10,369 | | | | $5,284 | | | | $2,151 | | | | $1,263 | | | | $1,486 | |
| 1 | Calculated based upon average shares outstanding |
| 2 | Returns for periods of less than one year are not annualized. |
The accompanying notes are an integral part of these financial statements.
| | | | | | |
| Notes to financial statements (unaudited) | | Wells Fargo Global Opportunities Fund | | | 19 | |
1. ORGANIZATION
Wells Fargo Funds Trust (the “Trust”), a Delaware statutory trust organized on March 10, 1999, is an open-end management investment company registered under the Investment Company Act of 1940, as amended (the “1940 Act”). As an investment company, the Trust follows the accounting and reporting guidance in Financial Accounting Standards Board (“FASB”) Accounting Standards Codification Topic 946, Financial Services – Investment Companies. These financial statements report on the Wells Fargo Global Opportunities Fund (the “Fund”) which is a diversified series of the Trust.
2. SIGNIFICANT ACCOUNTING POLICIES
The following significant accounting policies, which are consistently followed in the preparation of the financial statements of the Fund, are in conformity with U.S. generally accepted accounting principles which require management to make estimates and assumptions that affect the reported amounts of assets and liabilities, disclosure of contingent assets and liabilities at the date of the financial statements, and the reported amounts of revenues and expenses during the reporting period. Actual results could differ from those estimates.
Securities valuation
All investments are valued each business day as of the close of regular trading on the New York Stock Exchange (generally 4 p.m. Eastern Time), although the Fund may deviate from this calculation time under unusual or unexpected circumstances.
Equity securities that are listed on a foreign or domestic exchange or market are valued at the official closing price or, if none, the last sales price. If no sale occurs on the principal exchange or market that day, the prior day’s price will be deemed “stale” and a fair value price will be determined in accordance with the Fund’s Valuation Procedures.
The values of securities denominated in foreign currencies are translated into U.S. dollars at rates provided by an independent foreign currency pricing source at a time each business day specified by the Management Valuation Team of Wells Fargo Funds Management, LLC (“Funds Management”).
Many securities markets and exchanges outside the U.S. close prior to the close of the New York Stock Exchange and therefore may not fully reflect trading or events that occur after the close of the principal exchange in which the foreign securities are traded, but before the close of the New York Stock Exchange. If such trading or events are expected to materially affect the value of such securities, then fair value pricing procedures approved by the Board of Trustees of the Fund are applied. These procedures take into account multiple factors including movements in U.S. securities markets after foreign exchanges close. Foreign securities that are fair valued under these procedures are categorized as Level 2 and the application of these procedures may result in transfers between Level 1 and Level 2. Depending on market activity, such fair valuations may be frequent. Such fair value pricing may result in net asset values that are higher or lower than net asset values based on the last reported sales price or latest quoted bid price. On April 30, 2016, such fair value pricing was not used in pricing foreign securities.
Investments in registered open-end investment companies are valued at net asset value. Interests in non-registered investment vehicles that are redeemable at net asset value are fair valued normally at net asset value.
Investments which are not valued using any of the methods discussed above are valued at their fair value, as determined in good faith by the Board of Trustees. The Board of Trustees has established a Valuation Committee comprised of the Trustees and has delegated to it the authority to take any actions regarding the valuation of portfolio securities that the Valuation Committee deems necessary or appropriate, including determining the fair value of portfolio securities, unless the determination has been delegated to the Management Valuation Team. The Board of Trustees retains the authority to make or ratify any valuation decisions or approve any changes to the Valuation Procedures as it deems appropriate. On a quarterly basis, the Board of Trustees receives reports on any valuation actions taken by the Valuation Committee or the Management Valuation Team which may include items for ratification.
Valuations of fair valued securities are compared to the next actual sales price when available, or other appropriate market values, to assess the continued appropriateness of the fair valuation methodologies used. These securities are fair valued on a day-to-day basis, taking into consideration changes to appropriate market information and any significant changes to the inputs considered in the valuation process until there is a readily available price provided on an exchange or by an independent pricing service. Valuations received from an independent pricing service or independent broker-dealer quotes are periodically validated by comparisons to most recent trades and valuations provided by other independent pricing services in addition to the review of prices by the manager and/or subadviser. Unobservable inputs used in determining fair valuations are identified based on the type of security, taking into consideration factors utilized by market participants in valuing the investment, knowledge about the issuer and the current market environment.
| | | | |
| 20 | | Wells Fargo Global Opportunities Fund | | Notes to financial statements (unaudited) |
Foreign currency translation
The accounting records of the Fund are maintained in U.S. dollars. The values of other assets and liabilities denominated in foreign currencies are translated into U.S. dollars at rates provided by an independent foreign currency pricing source at a time each business day specified by the Management Valuation Team. Purchases and sales of securities, and income and expenses are converted at the rate of exchange on the respective dates of such transactions. Net realized foreign exchange gains or losses arise from sales of foreign currencies, currency gains or losses realized between the trade and settlement dates on securities transactions, and the difference between the amounts of dividends, interest and foreign withholding taxes recorded and the U.S. dollar equivalent of the amounts actually paid or received. Net unrealized foreign exchange gains and losses arise from changes in the fair value of assets and liabilities other than investments in securities resulting from changes in exchange rates. The changes in net assets arising from changes in exchange rates and the changes in net assets resulting from changes in market prices of securities are not separately presented. Such changes are included in net realized and unrealized gains or losses from investments.
Forward foreign currency contracts
The Fund is subject to foreign currency exchange rate risk in the normal course of pursuing its investment objectives. A forward foreign currency contract is an agreement between two parties to purchase or sell a specific currency for an agreed-upon price at a future date. The Fund enters into forward foreign currency contracts to facilitate transactions in foreign-denominated securities and to attempt to minimize the risk to the Fund from adverse changes in the relationship between currencies. Forward foreign currency contracts are recorded at the forward rate and marked-to-market daily. When the contracts are closed, realized gains and losses arising from such transactions are recorded as realized gains or losses on forward foreign currency contract transactions. The Fund could be exposed to risks if the counterparties to the contracts are unable to meet the terms of their contracts or if the value of the foreign currency changes unfavorably. The Fund’s maximum risk of loss from counterparty credit risk is the unrealized gains on the contracts. This risk may be mitigated if there is a master netting arrangement between the Fund and the counterparty.
Security loans
The Fund may lend its securities from time to time in order to earn additional income in the form of fees or interest on securities received as collateral or the investment of any cash received as collateral. The Fund continues to receive interest or dividends on the securities loaned. The Fund receives collateral in the form of cash or securities with a value at least equal to the value of the securities on loan. The value of the loaned securities is determined at the close of each business day and any additional required collateral is delivered to the Fund on the next business day. In a securities lending transaction, the net asset value of the Fund will be affected by an increase or decrease in the value of the securities loaned and by an increase or decrease in the value of the instrument in which collateral is invested. The amount of securities lending activity undertaken by the Fund fluctuates from time to time. In the event of default or bankruptcy by the borrower, the Fund may be prevented from recovering the loaned securities or gaining access to the collateral or may experience delays or costs in doing so. In addition, the investment of any cash collateral received may lose all or part of its value. The Fund has the right under the lending agreement to recover the securities from the borrower on demand.
The Fund lends its securities through an unaffiliated securities lending agent. Cash collateral received in connection with its securities lending transactions is invested in Securities Lending Cash Investments, LLC (the “Securities Lending Fund”). The Securities Lending Fund is exempt from registration under Section 3(c)(7) of the 1940 Act and is managed by Funds Management and is subadvised by Wells Capital Management Incorporated (“WellsCap”), an affiliate of Funds Management and an indirect wholly owned subsidiary of Wells Fargo & Company (“Wells Fargo”). Funds Management receives an advisory fee starting at 0.05% and declining to 0.01% as the average daily net assets of the Securities Lending Fund increase. All of the fees received by Funds Management are paid to WellsCap for its services as subadviser. The Securities Lending Fund seeks to provide a positive return compared to the daily Fed Funds Open rate by investing in high-quality, U.S. dollar-denominated short-term money market instruments. Securities Lending Fund investments are fair valued based upon the amortized cost valuation technique. Income earned from investment in the Securities Lending Fund is included in securities lending income on the Statement of Operations.
Security transactions and income recognition
Securities transactions are recorded on a trade date basis. Realized gains or losses are recorded on the basis of identified cost.
Dividend income is recognized on the ex-dividend date, except for certain dividends from foreign securities, which are recorded as soon as the custodian verifies the ex-dividend date. Dividend income from foreign securities is recorded net of foreign taxes withheld where recovery of such taxes is not assured.
| | | | | | |
| Notes to financial statements (unaudited) | | Wells Fargo Global Opportunities Fund | | | 21 | |
Distributions to shareholders
Distributions to shareholders from net investment income and net realized gains, if any, are recorded on the ex-dividend date. Such distributions are determined in conformity with federal income tax regulations, which may differ in amount or character from net investment income and realized gains recognized for purposes of U.S. generally accepted accounting principles.
Federal and other taxes
The Fund intends to continue to qualify as a regulated investment company by distributing substantially all of its investment company taxable income and any net realized capital gains (after reduction for capital loss carryforwards) sufficient to relieve it from all, or substantially all, federal income taxes. Accordingly, no provision for federal income taxes was required.
The Fund’s income and federal excise tax returns and all financial records supporting those returns for the prior three fiscal years are subject to examination by the federal and Delaware revenue authorities. Management has analyzed the Fund’s tax positions taken on federal, state, and foreign tax returns for all open tax years and does not believe that there are any uncertain tax positions that require recognition of a tax liability.
Class allocations
The separate classes of shares offered by the Fund differ principally in applicable sales charges, distribution, shareholder servicing, and administration fees. Class specific expenses are charged directly to that share class. Investment income, common expenses, and realized and unrealized gains (losses) on investments are allocated daily to each class of shares based on the relative proportion of net assets of each class.
3. FAIR VALUATION MEASUREMENTS
Fair value measurements of investments are determined within a framework that has established a fair value hierarchy based upon the various data inputs utilized in determining the value of the Fund’s investments. The three-level hierarchy gives the highest priority to unadjusted quoted prices in active markets for identical assets or liabilities (Level 1) and the lowest priority to significant unobservable inputs (Level 3). The Fund’s investments are classified within the fair value hierarchy based on the lowest level of input that is significant to the fair value measurement. The inputs are summarized into three broad levels as follows:
| n | | Level 1 – quoted prices in active markets for identical securities |
| n | | Level 2 – other significant observable inputs (including quoted prices for similar securities, interest rates, prepayment speeds, credit risk, use of amortized cost, etc.) |
| n | | Level 3 – significant unobservable inputs (including the Fund’s own assumptions in determining the fair value of investments) |
The inputs or methodologies used for valuing investments in securities are not necessarily an indication of the risk associated with investing in those securities.
| | | | |
| 22 | | Wells Fargo Global Opportunities Fund | | Notes to financial statements (unaudited) |
The following is a summary of the inputs used in valuing the Fund’s assets and liabilities as of April 30, 2016:
| | | | | | | | | | | | | | | | |
| | | Quoted prices
(Level 1) | | | Other significant
observable inputs
(Level 2) | | | Significant
unobservable inputs (Level 3) | | | Total | |
Assets | | | | | | | | | | | | | | | | |
Investments in: | | | | | | | | | | | | | | | | |
| | | | |
Common stocks | | | | | | | | | | | | | | | | |
Australia | | $ | 711,227 | | | $ | 0 | | | $ | 0 | | | $ | 711,227 | |
Austria | | | 1,774,378 | | | | 0 | | | | 0 | | | | 1,774,378 | |
Canada | | | 15,000,184 | | | | 2,008 | | | | 0 | | | | 15,002,192 | |
China | | | 0 | | | | 0 | | | | 1,369,242 | | | | 1,369,242 | |
Denmark | | | 577,996 | | | | 0 | | | | 0 | | | | 577,996 | |
France | | | 6,168,241 | | | | 0 | | | | 0 | | | | 6,168,241 | |
Germany | | | 9,414,933 | | | | 0 | | | | 0 | | | | 9,414,933 | |
Hong Kong | | | 1,677,781 | | | | 0 | | | | 0 | | | | 1,677,781 | |
Israel | | | 2,066,064 | | | | 0 | | | | 0 | | | | 2,066,064 | |
Italy | | | 3,544,923 | | | | 0 | | | | 0 | | | | 3,544,923 | |
Japan | | | 20,005,957 | | | | 0 | | | | 0 | | | | 20,005,957 | |
Netherlands | | | 450,509 | | | | 0 | | | | 0 | | | | 450,509 | |
Norway | | | 987,468 | | | | 0 | | | | 0 | | | | 987,468 | |
South Korea | | | 1,148,164 | | | | 0 | | | | 0 | | | | 1,148,164 | |
Spain | | | 3,348,747 | | | | 0 | | | | 0 | | | | 3,348,747 | |
Sweden | | | 948,195 | | | | 0 | | | | 0 | | | | 948,195 | |
Switzerland | | | 3,066,100 | | | | 0 | | | | 0 | | | | 3,066,100 | |
United Kingdom | | | 23,441,489 | | | | 0 | | | | 0 | | | | 23,441,489 | |
United States | | | 113,007,244 | | | | 1,130,823 | | | | 0 | | | | 114,138,067 | |
| | | | |
Preferred stocks | | | | | | | | | | | | | | | | |
Germany | | | 1,004,278 | | | | 0 | | | | 0 | | | | 1,004,278 | |
| | | | |
Short-term investments | | | | | | | | | | | | | | | | |
Investment companies | | | 6,919,415 | | | | 0 | | | | 0 | | | | 6,919,415 | |
Investments measured at net asset value* | | | | | | | | | | | | | | | 5,017,015 | |
Total assets | | $ | 215,263,293 | | | $ | 1,132,831 | | | $ | 1,369,242 | | | $ | 222,782,381 | |
| * | Investments that are measured at fair value using the net asset value per share (or its equivalent) as a practical expedient have not been categorized in the fair value hierarchy. The fair value amount presented in the table is intended to permit reconciliation of the fair value hierarchy to the amounts presented in the Statement of Assets and Liabilities. The Fund’s investment in Securities Lending Cash Investments, LLC valued at $5,017,015 does not have a redemption period notice, can be redeemed daily and does not have any unfunded commitments. |
The Fund recognizes transfers between levels within the fair value hierarchy at the end of the reporting period. Fair value pricing that was used in pricing certain foreign securities at the previous period end was not used at April 30, 2016. As a result common stocks and preferred stocks valued at $58,749,914 and $1,004,278, respectively, were transferred from Level 2 to Level 1 within the fair value hierarchy. The Fund did not have any transfers into/out of Level 3.
4. TRANSACTIONS WITH AFFILIATES
Management fee
Funds Management, an indirect wholly owned subsidiary of Wells Fargo, is the manager of the Fund and provides advisory and fund-level administrative services under an investment management agreement. Under the investment management agreement, Funds Management is responsible for, among other services, implementing the investment objectives and strategies of the Fund, supervising the applicable subadviser, providing fund-level administrative services in connection with the Fund’s operations, and providing any other fund-level administrative services reasonably necessary for the operation of the Fund. As compensation for its services under the investment management agreement, Funds Management is entitled to receive an annual management fee starting at 0.95% and declining to 0.83% as the average daily net assets of the Fund increase. For the six months ended April 30, 2016, the management fee was equivalent to an annual rate of 0.95% of the Fund’s average daily net assets.
| | | | | | |
| Notes to financial statements (unaudited) | | Wells Fargo Global Opportunities Fund | | | 23 | |
Funds Management has retained the services of a subadviser to provide daily portfolio management to the Fund. The fee for subadvisory services is borne by Funds Management. WellsCap is the subadviser to the Fund and is entitled to receive a fee from Funds Management at an annual rate starting at 0.55% and declining to 0.40% as the average daily net assets of the Fund increase.
Administration fees
Under a class-level administration agreement, Funds Management provides class-level administrative services to the Fund, which includes paying fees and expenses for services provided by the transfer agent, sub-transfer agents, omnibus account servicers and record-keepers. As compensation for its services under the class-level administration agreement, Funds Management receives an annual fee which is calculated based on the average daily net assets of each class as follows:
| | | | |
| | | Class-level
administration fee | |
Class A, Class B, Class C | | | 0.21 | % |
Administrator Class, Institutional Class | | | 0.13 | |
Funds Management has contractually waived and/or reimbursed management and administration fees to the extent necessary to maintain certain net operating expense ratios for the Fund. Waiver of fees and/or reimbursement of expenses by Funds Management were made first from fund level expenses on a proportionate basis and then from class specific expenses. Funds Management has committed through February 28, 2017 to waive fees and/or reimburse expenses to the extent necessary to cap the Fund’s expenses at 1.55% for Class A shares, 2.30% for Class B shares, 2.30% for Class C shares, 1.40% for Administrator Class shares, and 1.15% for Institutional Class shares. After this time, the cap may be increased or the commitment to maintain the cap may be terminated only with the approval of the Board of Trustees.
Distribution fees
The Trust has adopted a distribution plan for Class B and Class C shares of the Fund pursuant to Rule 12b-1 under the 1940 Act. Distribution fees are charged to Class B and Class C shares and paid to Wells Fargo Funds Distributor, LLC (“Funds Distributor”), the principal underwriter, at an annual rate of 0.75% of the average daily net assets of Class B and Class C shares.
In addition, Funds Distributor is entitled to receive the front-end sales charge from the purchase of Class A shares and a contingent deferred sales charge on the redemption of certain Class A shares. Funds Distributor is also entitled to receive the contingent deferred sales charges from redemptions of Class B and Class C shares. For the six months ended April 30, 2016, Funds Distributor received $2,779 from the sale of Class A shares.
Shareholder servicing fees
The Trust has entered into contracts with one or more shareholder servicing agents, whereby Class A, Class B, Class C, and Administrator Class of the Fund are charged a fee at an annual rate of 0.25% of the average daily net assets of each respective class.
A portion of these total shareholder servicing fees were paid to affiliates of Wells Fargo.
5. INVESTMENT PORTFOLIO TRANSACTIONS
Purchases and sales of investments, excluding U.S. government obligations (if any) and short-term securities, for the six months ended April 30, 2016 were $56,841,339 and $76,950,527, respectively.
6. BANK BORROWINGS
The Trust (excluding the money market funds and certain other funds) and Wells Fargo Variable Trust are parties to a $200,000,000 revolving credit agreement whereby the Fund is permitted to use bank borrowings for temporary or emergency purposes, such as to fund shareholder redemption requests. Interest under the credit agreement is charged to the Fund based on a borrowing rate equal to the higher of the Federal Funds rate in effect on that day plus 1.25% or the overnight LIBOR rate in effect on that day plus 1.25%. In addition, an annual commitment fee equal to 0.20% of the unused balance is allocated to each participating fund.
For the six months ended April 30, 2016, there were no borrowings by the Fund under the agreement.
| | | | |
| 24 | | Wells Fargo Global Opportunities Fund | | Notes to financial statements (unaudited) |
7. INDEMNIFICATION
Under the Trust’s organizational documents, the officers and Trustees have been granted certain indemnification rights against certain liabilities that may arise out of performance of their duties to the Trust. Additionally, in the normal course of business, the Trust may enter into contracts with service providers that contain a variety of indemnification clauses. The Trust’s maximum exposure under these arrangements is dependent on future claims that may be made against the Fund and, therefore, cannot be estimated.
| | | | | | |
| Other information (unaudited) | | Wells Fargo Global Opportunities Fund | | | 25 | |
PROXY VOTING INFORMATION
A description of the policies and procedures that the Fund uses to determine how to vote proxies relating to portfolio securities is available, upon request, by calling 1-800-222-8222, visiting our website at wellsfargofunds.com, or visiting the SEC website at sec.gov. Information regarding how the Fund voted proxies relating to portfolio securities during the most recent 12-month period ended June 30 is available on the Fund’s website at wellsfargofunds.com or by visiting the SEC website at sec.gov.
PORTFOLIO HOLDINGS INFORMATION
The complete portfolio holdings for the Fund are publicly available monthly on the Fund’s website (wellsfargofunds.com), on a one-month delayed basis. In addition, top ten holdings information (excluding derivative positions) for the Fund is publicly available on the Fund’s website on a monthly, seven-day or more delayed basis. The Fund files its complete schedule of portfolio holdings with the SEC for the first and third quarters of each fiscal year on Form N-Q, which is available by visiting the SEC website at sec.gov. In addition, the Fund’s Form N-Q may be reviewed and copied at the SEC’s Public Reference Room in Washington, DC, and at regional offices in New York City, at 233 Broadway, and in Chicago, at 175 West Jackson Boulevard, Suite 900. Information about the Public Reference Room may be obtained by calling 1-800-SEC-0330.
| | | | |
| 26 | | Wells Fargo Global Opportunities Fund | | Other information (unaudited) |
BOARD OF TRUSTEES AND OFFICERS
Each of the Trustees and Officers1 listed in the table below acts in identical capacities for each fund in the Wells Fargo family of funds, which consists of 141 mutual funds comprising the Wells Fargo Funds Trust, Wells Fargo Variable Trust, Wells Fargo Master Trust and four closed-end funds (collectively the “Fund Complex”). This table should be read in conjunction with the Prospectus and the Statement of Additional Information2. The mailing address of each Trustee and Officer is 525 Market Street, 12th Floor, San Francisco, CA 94105. Each Trustee and Officer serves an indefinite term, however, each Trustee serves such term until reaching the mandatory retirement age established by the Trustees.
Independent Trustees
| | | | | | |
Name and year of birth | | Position held and length of service* | | Principal occupations during past five years or longer | | Current other public
company or investment
company directorships |
William R. Ebsworth
(Born 1957) | | Trustee, since 2015 | | Retired. From 1984 to 2013, equities analyst, portfolio manager, research director and chief financial officer at Fidelity Management and Research Company in Boston, Tokyo, and Hong Kong and retired in 2013 as Chief Investment Officer of Fidelity Strategic Advisers, Inc. where he lead a team of investment professionals managing client assets. Prior thereto, Board member of Hong Kong Securities Clearing Co., Hong Kong Options Clearing Corp., the Thailand International Fund, Ltd., Fidelity Investments Life Insurance Company, and Empire Fidelity Investments Life Insurance Company. Mr. Ebsworth is a CFA ® charterholder and an Adjunct Lecturer, Finance, at Babson College. | | Asset Allocation Trust |
Jane A. Freeman
(Born 1953) | | Trustee, since 2015 | | Retired. From 2012 to 2014 and 1999 to 2008, Chief Financial Officer of Scientific Learning Corporation. From 2008 to 2012, Ms. Freeman provided consulting services related to strategic business projects. Prior to 1999, Portfolio Manager at Rockefeller & Co. and Scudder, Stevens & Clark. Board member of the Harding Loevner Funds from 1996 to 2014, serving as both Lead Independent Director and chair of the Audit Committee. Board member of the Russell Exchange Traded Funds Trust from 2011 to 2012 and the chair of the Audit Committee. Ms. Freeman is Chair of Taproot Foundation (non-profit organization), a Board Member of Ruth Bancroft Garden (non-profit organization) and an inactive chartered financial analyst. | | Asset Allocation Trust |
Peter G. Gordon
(Born 1942) | | Trustee, since 1998; Chairman, since 2005 | | Co-Founder, Retired Chairman, President and CEO of Crystal Geyser Water Company. Trustee Emeritus, Colby College. | | Asset Allocation Trust |
Isaiah Harris, Jr.
(Born 1952) | | Trustee, since 2009 | | Retired. Chairman of the Board of CIGNA Corporation since 2009, and Director since 2005. From 2003 to 2011, Director of Deluxe Corporation. Prior thereto, President and CEO of BellSouth Advertising and Publishing Corp. from 2005 to 2007, President and CEO of BellSouth Enterprises from 2004 to 2005 and President of BellSouth Consumer Services from 2000 to 2003. Emeritus member of the Iowa State University Foundation Board of Governors. Emeritus Member of the Advisory Board of Iowa State University School of Business. Advisory Board Member, Palm Harbor Academy (charter school). Advisory Board Member, Child Evangelism Fellowship (non-profit). Mr. Harris is a certified public accountant (inactive status). | | CIGNA Corporation; Asset Allocation Trust |
Judith M. Johnson
(Born 1949) | | Trustee, since 2008;
Audit Committee Chairman, since 2008 | | Retired. Prior thereto, Chief Executive Officer and Chief Investment Officer of Minneapolis Employees Retirement Fund from 1996 to 2008. Ms. Johnson is an attorney, certified public accountant and a certified managerial accountant. | | Asset Allocation Trust |
David F. Larcker
(Born 1950) | | Trustee, since 2009 | | James Irvin Miller Professor of Accounting at the Graduate School of Business, Stanford University, Director of the Corporate Governance Research Initiative and Senior Faculty of The Rock Center for Corporate Governance since 2006. From 2005 to 2008, Professor of Accounting at the Graduate School of Business, Stanford University. Prior thereto, Ernst & Young Professor of Accounting at The Wharton School, University of Pennsylvania from 1985 to 2005. | | Asset Allocation Trust |
| | | | | | |
| Other information (unaudited) | | Wells Fargo Global Opportunities Fund | | | 27 | |
| | | | | | |
Name and year of birth | | Position held and length of service* | | Principal occupations during past five years or longer | | Current other public
company or investment
company directorships |
Olivia S. Mitchell
(Born 1953) | | Trustee, since 2006 | | International Foundation of Employee Benefit Plans Professor, Wharton School of the University of Pennsylvania since 1993. Director of Wharton’s Pension Research Council and Boettner Center on Pensions & Retirement Research, and Research Associate at the National Bureau of Economic Research. Previously, Cornell University Professor from 1978 to 1993. | | Asset Allocation Trust |
Timothy J. Penny
(Born 1951) | | Trustee, since 1996 | | President and Chief Executive Officer of Southern Minnesota Initiative Foundation, a non-profit organization, since 2007 and Senior Fellow at the Humphrey Institute Policy Forum at the University of Minnesota since 1995. Member of the Board of Trustees of NorthStar Education Finance, Inc., a non-profit organization, since 2007. | | Asset Allocation Trust |
Michael S. Scofield
(Born 1943) | | Trustee, since 2010 | | Served on the Investment Company Institute’s Board of Governors and Executive Committee from 2008-2011 as well the Governing Council of the Independent Directors Council from 2006-2011 and the Independent Directors Council Executive Committee from 2008-2011. Chairman of the IDC from 2008-2010. Institutional Investor (Fund Directions) Trustee of Year in 2007. Trustee of the Evergreen Funds complex (and its predecessors) from 1984 to 2010. Chairman of the Evergreen Funds from 2000-2010. Former Trustee of the Mentor Funds. Retired Attorney, Law Offices of Michael S. Scofield. | | Asset Allocation Trust |
| * | Length of service dates reflect the Trustee’s commencement of service with the Trust’s predecessor entities, where applicable. |
Officers
| | | | | | |
Name and year of birth | | Position held and length of service | | Principal occupations during past five years or longer | | |
Karla M. Rabusch
(Born 1959) | | President, since 2003 | | Executive Vice President of Wells Fargo Bank, N.A. and President of Wells Fargo Funds Management, LLC since 2003. | | |
Jeremy DePalma1
(Born 1974) | | Treasurer, since 2012 | | Senior Vice President of Wells Fargo Funds Management, LLC since 2009. Senior Vice President of Evergreen Investment Management Company, LLC from 2008 to 2010 and head of the Fund Reporting and Control Team within Fund Administration from 2005 to 2010. | | |
C. David Messman
(Born 1960) | | Secretary, since 2000; Chief Legal Officer, since 2003 | | Senior Vice President and Secretary of Wells Fargo Funds Management, LLC since 2001. Assistant General Counsel of Wells Fargo Bank, N.A. since 2013 and Vice President and Managing Counsel of Wells Fargo Bank, N.A. from 1996 to 2013. | | |
Michael Whitaker
(Born 1967) | | Chief Compliance Officer, since 2016* | | Executive Vice President of Wells Fargo Funds Management, LLC since 2016. Chief Compliance Officer of Fidelity’s Fixed Income Funds and Asset Allocation Funds from 2008 to 2016, Compliance Officer of FMR Co., Inc. from 2014 to 2016, Fidelity Investments Money Management, Inc. from 2014 to 2016, Fidelity Investments from 2007 to 2016. | | |
Debra Ann Early
(Born 1964) | | Chief Compliance Officer, since 2007** | | Executive Vice President of Wells Fargo Funds Management, LLC since 2014, Senior Vice President and Chief Compliance Officer from 2007 to 2014. | | |
David Berardi
(Born 1975) | | Assistant Treasurer, since 2009 | | Vice President of Wells Fargo Funds Management, LLC since 2009. Vice President of Evergreen Investment Management Company, LLC from 2008 to 2010. Manager of Fund Reporting and Control for Evergreen Investment Management Company, LLC from 2004 to 2010. | | |
| 1 | Jeremy DePalma acts as Treasurer of 69 funds and Assistant Treasurer of 72 funds in the Fund Complex. |
| 2 | The Statement of Additional Information includes additional information about the Trustees and is available, without charge, upon request, by calling 1-800-222-8222 or by visiting the website at wellsfargofunds.com. |
| * | Michael Whitaker became Chief Compliance Officer effective May 16, 2016. |
| ** | Debra Ann Early was the Chief Compliance Officer until May 15, 2016. |
| | | | |
| 28 | | Wells Fargo Global Opportunities Fund | | List of abbreviations |
The following is a list of common abbreviations for terms and entities that may have appeared in this report.
| ACA | — ACA Financial Guaranty Corporation |
| ADR | — American depositary receipt |
| ADS | — American depositary shares |
| AGC | — Assured Guaranty Corporation |
| AGM | — Assured Guaranty Municipal |
| Ambac | — Ambac Financial Group Incorporated |
| AMT | — Alternative minimum tax |
| BAN | — Bond anticipation notes |
| BHAC | — Berkshire Hathaway Assurance Corporation |
| CAB | — Capital appreciation bond |
| CCAB | — Convertible capital appreciation bond |
| CDA | — Community Development Authority |
| CDO | — Collateralized debt obligation |
| DRIVER | — Derivative inverse tax-exempt receipts |
| DW&P | — Department of Water & Power |
| DWR | — Department of Water Resources |
| ECFA | — Educational & Cultural Facilities Authority |
| EDA | — Economic Development Authority |
| EDFA | — Economic Development Finance Authority |
| ETF | — Exchange-traded fund |
| FDIC | — Federal Deposit Insurance Corporation |
| FFCB | — Federal Farm Credit Banks |
| FGIC | — Financial Guaranty Insurance Corporation |
| FHA | — Federal Housing Administration |
| FHLB | — Federal Home Loan Bank |
| FHLMC | — Federal Home Loan Mortgage Corporation |
| FICO | — The Financing Corporation |
| FNMA | — Federal National Mortgage Association |
| GDR | — Global depositary receipt |
| GNMA | — Government National Mortgage Association |
| HCFR | — Healthcare facilities revenue |
| HEFA | — Health & Educational Facilities Authority |
| HEFAR | — Higher education facilities authority revenue |
| HFA | — Housing Finance Authority |
| HFFA | — Health Facilities Financing Authority |
| HUD | — Department of Housing and Urban Development |
| IDA | — Industrial Development Authority |
| IDAG | — Industrial Development Agency |
| KRW | — Republic of Korea won |
| LIBOR | — London Interbank Offered Rate |
| LIFER | — Long Inverse Floating Exempt Receipts |
| LLC | — Limited liability company |
| LLLP | — Limited liability limited partnership |
| LLP | — Limited liability partnership |
| MBIA | — Municipal Bond Insurance Association |
| MFHR | — Multifamily housing revenue |
| MSTR | — Municipal securities trust receipts |
| MUD | — Municipal Utility District |
| National | — National Public Finance Guarantee Corporation |
| PCFA | — Pollution Control Financing Authority |
| PCL | — Public Company Limited |
| PCR | — Pollution control revenue |
| PFA | — Public Finance Authority |
| PFFA | — Public Facilities Financing Authority |
| PFOTER | — Puttable floating option tax-exempt receipts |
| plc | — Public limited company |
| PUTTER | — Puttable tax-exempt receipts |
| R&D | — Research & development |
| Radian | — Radian Asset Assurance |
| RAN | — Revenue anticipation notes |
| RDA | — Redevelopment Authority |
| RDFA | — Redevelopment Finance Authority |
| REIT | — Real estate investment trust |
| ROC | — Reset option certificates |
| SAVRS | — Select auction variable rate securities |
| SBA | — Small Business Authority |
| SDR | — Swedish depositary receipt |
| SFHR | — Single-family housing revenue |
| SFMR | — Single-family mortgage revenue |
| SPA | — Standby purchase agreement |
| SPDR | — Standard & Poor’s Depositary Receipts |
| SPEAR | — Short Puttable Exempt Adjustable Receipts |
| STRIPS | — Separate trading of registered interest and |
| TAN | — Tax anticipation notes |
| TIPS | — Treasury inflation-protected securities |
| TRAN | — Tax revenue anticipation notes |
| TTFA | — Transportation Trust Fund Authority |
| TVA | — Tennessee Valley Authority |

For more information
More information about Wells Fargo Funds is available free upon request. To obtain literature, please write, email, visit the Fund’s website, or call:
Wells Fargo Funds
P.O. Box 8266
Boston, MA 02266-8266
Email: fundservice@wellsfargo.com
Website: wellsfargofunds.com
Individual investors: 1-800-222-8222
Retail investment professionals: 1-888-877-9275
Institutional investment professionals: 1-866-765-0778
This report and the financial statements contained herein are submitted for the general information of the shareholders of the Fund. If this report is used for promotional purposes, distribution of the report must be accompanied or preceded by a current prospectus. Before investing, please consider the investment objectives, risks, charges, and expenses of the investment. For a current prospectus and, if available, a summary prospectus, containing this information, call 1-800-222-8222 or visit the Fund’s website at wellsfargofunds.com. Read the prospectus carefully before you invest or send money.
Wells Fargo Asset Management (WFAM) is a trade name used by the asset management businesses of Wells Fargo & Company. Wells Fargo Funds Management, LLC, a wholly owned subsidiary of Wells Fargo & Company, provides investment advisory and administrative services for Wells Fargo Funds. Other affiliates of Wells Fargo & Company provide subadvisory and other services for the funds. The funds are distributed by Wells Fargo Funds Distributor, LLC, Member FINRA, an affiliate of Wells Fargo & Company.
NOT FDIC INSURED ¡ NO BANK GUARANTEE ¡ MAY LOSE VALUE
© 2016 Wells Fargo Funds Management, LLC. All rights reserved.
| | |
 | | 242233 06-16 SA239/SAR239 04-16 |
Semi-Annual Report
April 30, 2016

Wells Fargo International Equity Fund


Reduce clutter. Save trees.
Sign up for electronic delivery of prospectuses and shareholder reports at wellsfargo.com/advantagedelivery
Contents
The views expressed and any forward-looking statements are as of April 30, 2016, unless otherwise noted, and are those of the Fund managers and/or Wells Fargo Funds Management, LLC. Discussions of individual securities, or the markets generally, or any Wells Fargo Fund are not intended as individual recommendations. Future events or results may vary significantly from those expressed in any forward-looking statements. The views expressed are subject to change at any time in response to changing circumstances in the market. Wells Fargo Funds Management, LLC and the Fund disclaim any obligation to publicly update or revise any views expressed or forward-looking statements.
NOT FDIC INSURED ¡ NO BANK GUARANTEE ¡ MAY LOSE VALUE
| | | | |
| 2 | | Wells Fargo International Equity Fund | | Letter to shareholders (unaudited) |

Karla M. Rabusch
President
Wells Fargo Funds
As the U.S. dollar gained in strength relative to currencies overseas, investment returns earned outside the U.S. were reduced when translated into U.S. dollars.
Investors reacted positively when measurements of manufacturing activity in Japan, the U.S., and China indicated growth.
Dear Valued Shareholder:
We are pleased to offer you this semi-annual report for the Wells Fargo International Equity Fund for the six-month period that ended April 30, 2016. During the period, international equity investors confronted concerns about slowing economic growth, particularly in China, and the potential for central bank policies to relieve recessionary pressures and support global business activity. These influences were pervasive throughout the period and caused elevated levels of volatility in international equity markets.
Investors kept a watchful eye on central bank initiatives while global growth slowed.
Persistently low inflation rates and oil prices along with a strengthening U.S. dollar combined to drive international equity prices lower. The U.S. dollar strengthened consistently after 2011 and more quickly following 2014 as expectations grew for an increase in the federal funds rate by the U.S. Federal Reserve (Fed). As the U.S. dollar gained in strength relative to currencies overseas, investment returns earned outside the U.S. were reduced when translated into U.S. dollars. The strong U.S. dollar also put pressure on import prices which, when combined with lower costs for fuel and other commodities, restrained inflation and prompted recession fears among investors.
Further dampening the international investment outlook in December was the lack of a deal to freeze or reduce oil output in an effort to stabilize prices among members of the Organization of Petroleum Exporting Countries. The lack of an agreement on a strategy to increase oil prices from their low levels left many investors doubtful of investment opportunities in emerging markets. In addition, the People’s Bank of China (PBOC) guided its currency’s value lower relative to a basket of foreign currencies. While the effort was seen as consistent with the government’s efforts to move China’s economy to a more global market-based footing, the currency devaluation tended to heighten fears of recession.
Central bank policies demonstrate resolve to reignite global economic growth.
As the end of 2015 approached, investors did take some reassurance from the decision of the European Central Bank (ECB) to push the deposit interest rate further into negative territory. Negative interest rates are intended to encourage banks to lend assets held in reserve rather than keep them on deposit, which could help spark business activity. The ECB also expanded and extended its bond-buying program, which helped inject liquidity into the markets and encourage investment. As anticipated, the Fed announced the long-awaited increase to the federal funds rate in December and suggested it planned to pursue additional increases in 2016.
In January 2016, the Bank of Japan (BOJ) followed the ECB’s lead by setting a negative deposit rate. A negative measurement for Japan’s gross domestic product in the fourth quarter may have prompted the BOJ’s accommodative initiative. Observing the actions of central banks overseas to implement policies that would accommodate higher levels of business activity, the Fed acknowledged that risks to global growth existed and indicated it would base further rate increases on data indicating the risks were being successfully addressed. Counterbalancing the accommodation of central banks were industrial production slowdowns stemming from plant closures in China due to elevated air pollution levels, the lack of further accommodative action by the ECB in January, and fresh declines in oil prices. Stocks worldwide entered correction territory, defined as a decline of 10% or more.
In February 2016, markets around the world hit low points before starting to rebound in the middle of the month. Investors reacted positively when measurements of manufacturing activity in Japan, the U.S., and China indicated growth. The PBOC reduced reserve ratios in February, which was intended to encourage banks to increase lending. Investors also were influenced favorably by further accommodation by the ECB in March, when the bank pushed negative interest rates lower, which ratcheted up pressure on banks to lend. The ECB also expanded its bond-buying program once again and took additional steps to lower costs for borrowers. March proved to be the strongest month for international stock index performance during
| | | | | | |
| Letter to shareholders (unaudited) | | Wells Fargo International Equity Fund | | | 3 | |
the period. For the month, the Morgan Stanley Capital International (MSCI) Europe, Australasia, Far East (EAFE) Index (Net)1 gained 6.5%, the MSCI World Index2 increased 6.8%, the MSCI All Country World Index (ACWI) ex USA Index (Net)3 moved up 8.1%, and the S&P Developed Small Cap Index4 gained 8.6%. More positive, albeit lower, returns followed in April.
With the exception of the S&P Developed Small Cap Index, strong March and April returns were not enough to push performance of the indexes into positive territory for the period. For the six-month period that ended April 30, 2016, the MSCI EAFE Index (Net) returned -3.1%, the MSCI World Index returned -1.1%, and the MSCI ACWI ex USA Index (Net) returned -1.8%; the S&P Developed Small Cap Index gained 3.2%.
Don’t let short-term uncertainty derail long-term investment goals.
Periods of investment uncertainty can present challenges, but experience has taught us that maintaining long-term investment goals can be an effective way to plan for the future. To help you create a sound strategy based on your personal goals and risk tolerance, Wells Fargo Funds offers more than 100 mutual funds spanning a wide range of asset classes and investment styles. Although diversification cannot guarantee an investment profit or prevent losses, we believe it can be an effective way to manage investment risk and potentially smooth out overall portfolio performance. We encourage investors to know their investments and to understand that appropriate levels of risk-taking may unlock opportunities.
Thank you for choosing to invest with Wells Fargo Funds. We appreciate your confidence in us and remain committed to helping you meet your financial needs.
Sincerely,

Karla M. Rabusch
President
Wells Fargo Funds
For further information about your Fund, contact your investment professional, visit our website at wellsfargofunds.com, or call us directly at 1-800-222-8222. We are available 24 hours a day, 7 days a week.
| 1 | The Morgan Stanley Capital International (MSCI) Europe, Australasia, Far East (EAFE) Index (Net) is a free-float-adjusted market-capitalization-weighted index that is designed to measure the equity market performance of developed markets, excluding the U.S. and Canada. The MSCI EAFE Index (Net) consists of the following 21 developed markets country indexes: Australia, Austria, Belgium, Denmark, Finland, France, Germany, Hong Kong, Ireland, Israel, Italy, Japan, the Netherlands, New Zealand, Norway, Portugal, Singapore, Spain, Sweden, Switzerland, and the United Kingdom. Source: MSCI. MSCI makes no express or implied warranties or representations and shall have no liability whatsoever with respect to any MSCI data contained herein. The MSCI data may not be further redistributed or used as a basis for other indexes or any securities or financial products. This report is not approved, reviewed, or produced by MSCI. You cannot invest directly in an index. |
| 2 | The MSCI World Index is a free-float-adjusted market-capitalization-weighted index that is designed to measure the equity market performance of developed markets. The MSCI World Index consists of the following 23 developed markets country indexes: Australia, Austria, Belgium, Canada, Denmark, Finland, France, Germany, Hong Kong, Ireland, Israel, Italy, Japan, the Netherlands, New Zealand, Norway, Portugal, Singapore, Spain, Sweden, Switzerland, the United Kingdom, and the United States. You cannot invest directly in an index. |
| 3 | The MSCI All Country World Index (ACWI) ex USA Index (Net) is a free-float-adjusted market-capitalization-weighted index that is designed to measure the equity market performance of developed and emerging markets. The MSCI ACWI ex USA Index (Net) consists of 45 country indexes comprising 22 developed and 23 emerging markets country indexes. The developed markets country indexes included are Australia, Austria, Belgium, Canada, Denmark, Finland, France, Germany, Hong Kong, Ireland, Israel, Italy, Japan, the Netherlands, New Zealand, Norway, Portugal, Singapore, Spain, Sweden, Switzerland, and the United Kingdom. The emerging markets country indexes included are Brazil, Chile, China, Colombia, Czech Republic, Egypt, Greece, Hungary, India, Indonesia, Korea, Malaysia, Mexico, Peru, the Philippines, Poland, Qatar, Russia, South Africa, Taiwan, Thailand, Turkey, and United Arab Emirates. You cannot invest directly in an index. |
| 4 | The S&P Developed Small Cap Index is a free-float-adjusted market-capitalization-weighted index designed to measure the equity market performance of small-capitalization companies located in developed markets. The index is composed of companies within the bottom 15% of the cumulative market capitalization in developed markets. The index covers all publicly listed equities with float-adjusted market values of U.S. $100 million or more and annual dollar value traded of at least U.S. $50 million in all included countries. You cannot invest directly in an index. |
| | | | |
| 4 | | Wells Fargo International Equity Fund | | Performance highlights (unaudited) |
Investment objective
The Fund seeks long-term capital appreciation.
Manager
Wells Fargo Funds Management, LLC
Subadviser
Wells Capital Management Incorporated
Portfolio manager
Dale A. Winner, CFA®
Average annual total returns (%) as of April 30, 20161
| | | | | | | | | | | | | | | | | | | | | | | | | | | | | | | | | | |
| | | | | Including sales charge | | | Excluding sales charge | | | Expense ratios2 (%) | |
| | | Inception date | | 1 year | | | 5 year | | | 10 year | | | 1 year | | | 5 year | | | 10 year | | | Gross | | | Net3 | |
| Class A (WFEAX) | | 1-20-1998 | | | (18.23 | ) | | | (0.63 | ) | | | 0.11 | | | | (13.22 | ) | | | 0.56 | | | | 0.70 | | | | 1.51 | | | | 1.15 | |
| Class B (WFEBX)* | | 9-6-1979 | | | (18.15 | ) | | | (0.58 | ) | | | 0.17 | | | | (13.85 | ) | | | (0.20 | ) | | | 0.17 | | | | 2.26 | | | | 1.90 | |
| Class C (WFEFX) | | 3-6-1998 | | | (14.82 | ) | | | (0.19 | ) | | | (0.04 | ) | | | (13.82 | ) | | | (0.19 | ) | | | (0.04 | ) | | | 2.26 | | | | 1.90 | |
| Class R (WFERX) | | 10-10-2003 | | | – | | | | – | | | | – | | | | (13.40 | ) | | | 0.31 | | | | 0.45 | | | | 1.76 | | | | 1.40 | |
| Class R6 (WFEHX) | | 9-30-2015 | | | – | | | | – | | | | – | | | | (12.94 | ) | | | 0.78 | | | | 0.87 | | | | 1.08 | | | | 0.85 | |
| Administrator Class (WFEDX) | | 7-16-2010 | | | – | | | | – | | | | – | | | | (13.21 | ) | | | 0.56 | | | | 0.82 | | | | 1.43 | | | | 1.15 | |
| Institutional Class (WFENX) | | 3-9-1998 | | | – | | | | – | | | | – | | | | (12.95 | ) | | | 0.82 | | | | 0.96 | | | | 1.18 | | | | 0.90 | |
| MSCI ACWI ex USA (Net)4 | | – | | | – | | | | – | | | | – | | | | (11.28 | ) | | | (0.13 | ) | | | 1.70 | | | | – | | | | – | |
| * | | Class B shares are closed to investment, except in connection with the reinvestment of any distributions and permitted exchanges. |
Figures quoted represent past performance, which is no guarantee of future results, and do not reflect taxes that a shareholder may pay on fund distributions or the redemption of fund shares. Investment return and principal value of an investment will fluctuate so that an investor’s shares, when redeemed, may be worth more or less than their original cost. Performance shown without sales charges would be lower if sales charges were reflected. Current performance may be lower or higher than the performance data quoted, which assumes the reinvestment of dividends and capital gains. Current month-end performance is available on the Fund’s website, wellsfargofunds.com.
Index returns do not include transaction costs associated with buying and selling securities, any mutual fund fees or expenses, or any taxes. It is not possible to invest directly in an index.
For Class A shares, the maximum front-end sales charge is 5.75%. For Class B shares, the maximum contingent deferred sales charge is 5.00%. For Class C shares, the maximum contingent deferred sales charge is 1.00%. Performance including a contingent deferred sales charge assumes the sales charge for the corresponding time period. Class R, Class R6, Administrator Class, and Institutional Class shares are sold without a front-end sales charge or contingent deferred sales charge.
Stock values fluctuate in response to the activities of individual companies and general market and economic conditions. Foreign investments are especially volatile and can rise or fall dramatically due to differences in the political and economic conditions of the host country. These risks are generally intensified in emerging markets. The use of derivatives may reduce returns and/or increase volatility. Certain investment strategies tend to increase the total risk of an investment (relative to the broader market). The Fund is exposed to smaller-company securities risk. Consult the Fund’s prospectus for additional information on these and other risks.
Please see footnotes on page 5.
| | | | | | |
| Performance highlights (unaudited) | | Wells Fargo International Equity Fund | | | 5 | |
| | | | |
| Ten largest holdings (%) as of April 30, 20165 | |
Rheinmetall AG | | | 3.61 | |
Vodafone Group plc | | | 3.60 | |
Prysmian SpA | | | 3.42 | |
Compagnie de Saint-Gobain SA | | | 3.24 | |
Siemens AG | | | 3.24 | |
Hitachi Limited | | | 3.08 | |
Smiths Group plc | | | 3.08 | |
Wolseley plc | | | 2.89 | |
Metro AG | | | 2.87 | |
Eni SpA | | | 2.73 | |
|
| Sector distribution as of April 30, 20166 |
|
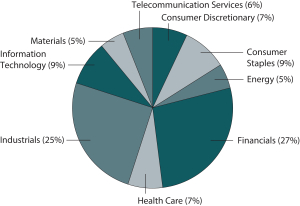
|
|
| Country allocation as of April 30, 20166 |
|
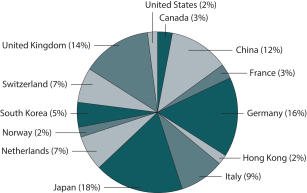
|
| 1 | Historical performance shown for Class R6 shares prior to their inception reflects the performance of Institutional Class shares and includes the higher expenses applicable to Institutional Class shares. If these expenses had not been included, returns would be higher. Historical performance shown for Administrator Class shares prior to their inception reflects the performance of Institutional Class shares and has been adjusted to reflect the higher expenses applicable to Administrator Class shares. Historical performance shown for all classes of the Fund prior to July 12, 2010, is based on the performance of the Fund’s predecessor, Evergreen International Equity Fund. |
| 2 | Reflects the expense ratios as stated in the most recent prospectuses, which include the impact of 0.01% in acquired fund fees and expenses. The expense ratios shown are subject to change and may differ from the annualized expense ratios shown in the financial highlights of this report, which do not include acquired fund fees and expenses. |
| 3 | The manager has contractually committed through February 28, 2017 to waive fees and/or reimburse expenses to the extent necessary to cap the Fund’s Total Annual Operating Expenses After Fee Waiver at 1.14% for Class A, 1.89% for Class B, 1.89% for Class C, 1.39% for Class R, 0.84% for Class R6, 1.14% for Administrator Class, and 0.89% for Institutional Class. After this time, the cap may be increased or the commitment to maintain the cap may be terminated only with the approval of the Board of Trustees. Brokerage commissions, stamp duty fees, interest, taxes, acquired fund fees and expenses, and extraordinary expenses are excluded from the cap. Without this cap, the Fund’s returns would have been lower. |
| 4 | The Morgan Stanley Capital International (MSCI) All Country World Index (ACWI) is a free-float-adjusted market-capitalization-weighted index that is designed to measure the equity market performance of developed and emerging markets. The MSCI ACWI consists of 46 country indexes comprising 23 developed and 23 emerging markets country indexes. The developed markets country indexes included are Australia, Austria, Belgium, Canada, Denmark, Finland, France, Germany, Hong Kong, Ireland, Israel, Italy, Japan, the Netherlands, New Zealand, Norway, Portugal, Singapore, Spain, Sweden, Switzerland, the United Kingdom, and the United States. The emerging markets country indexes included are Brazil, Chile, China, Colombia, Czech Republic, Egypt, Greece, Hungary, India, Indonesia, Korea, Malaysia, Mexico, Peru, the Philippines, Poland, Qatar, Russia, South Africa, Taiwan, Thailand, Turkey, and United Arab Emirates. Source: MSCI. MSCI makes no express or implied warranties or representations and shall have no liability whatsoever with respect to any MSCI data contained herein. The MSCI data may not be further redistributed or used as a basis for other indexes or any securities or financial products. This report is not approved, reviewed, or produced by MSCI. You cannot ivest directly in an index. |
| 5 | The ten largest holdings, excluding cash and cash equivalents, are calculated based on the value of the investments divided by total net assets of the Fund. Holdings are subject to change and may have changed since the date specified. |
| 6 | Amounts are calculated based on the total long-term investments of the Fund. These amounts are subject to change and may have changed since the date specified. |
| | | | |
| 6 | | Wells Fargo International Equity Fund | | Fund expenses (unaudited) |
As a shareholder of the Fund, you incur two types of costs: (1) transaction costs, including sales charges (loads) on purchase payments and contingent deferred sales charges (if any) on redemptions and (2) ongoing costs, including management fees, distribution (12b-1) and/or shareholder servicing fees, and other Fund expenses. This example is intended to help you understand your ongoing costs (in dollars) of investing in the Fund and to compare these costs with the ongoing costs of investing in other mutual funds.
The example is based on an investment of $1,000 invested at the beginning of the six-month period and held for the entire period from November 1, 2015 to April 30, 2016.
Actual expenses
The “Actual” line of the table below provides information about actual account values and actual expenses. You may use the information in this line, together with the amount you invested, to estimate the expenses that you paid over the period. Simply divide your account value by $1,000 (for example, an $8,600 account value divided by $1,000 = 8.6), then multiply the result by the number in the “Actual” line under the heading entitled “Expenses paid during period” for your applicable class of shares to estimate the expenses you paid on your account during this period.
Hypothetical example for comparison purposes
The “Hypothetical” line of the table below provides information about hypothetical account values and hypothetical expenses based on the Fund’s actual expense ratio and an assumed rate of return of 5% per year before expenses, which is not the Fund’s actual return. The hypothetical account values and expenses may not be used to estimate the actual ending account balance or expenses you paid for the period. You may use this information to compare the ongoing costs of investing in the Fund and other funds. To do so, compare this 5% hypothetical example with the 5% hypothetical examples that appear in the shareholder reports of the other funds.
Please note that the expenses shown in the table are meant to highlight your ongoing costs only and do not reflect any transactional costs, such as sales charges (loads) and contingent deferred sales charges. Therefore, the “Hypothetical” line of the table is useful in comparing ongoing costs only and will not help you determine the relative total costs of owning different funds. In addition, if these transactional costs were included, your costs would have been higher.
| | | | | | | | | | | | | | | | |
| | | Beginning
account value
11-1-2015 | | | Ending
account value
4-30-2016 | | | Expenses
paid during
the period¹ | | | Net annualized
expense ratio | |
Class A | | | | | | | | | | | | | | | | |
Actual | | $ | 1,000.00 | | | $ | 946.03 | | | $ | 5.37 | | | | 1.11 | % |
Hypothetical (5% return before expenses) | | $ | 1,000.00 | | | $ | 1,019.34 | | | $ | 5.57 | | | | 1.11 | % |
Class B | | | | | | | | | | | | | | | | |
Actual | | $ | 1,000.00 | | | $ | 943.00 | | | $ | 8.94 | | | | 1.85 | % |
Hypothetical (5% return before expenses) | | $ | 1,000.00 | | | $ | 1,015.66 | | | $ | 9.27 | | | | 1.85 | % |
Class C | | | | | | | | | | | | | | | | |
Actual | | $ | 1,000.00 | | | $ | 943.44 | | | $ | 8.99 | | | | 1.86 | % |
Hypothetical (5% return before expenses) | | $ | 1,000.00 | | | $ | 1,015.61 | | | $ | 9.32 | | | | 1.86 | % |
Class R | | | | | | | | | | | | | | | | |
Actual | | $ | 1,000.00 | | | $ | 945.51 | | | $ | 6.58 | | | | 1.36 | % |
Hypothetical (5% return before expenses) | | $ | 1,000.00 | | | $ | 1,018.10 | | | $ | 6.82 | | | | 1.36 | % |
Class R6 | | | | | | | | | | | | | | | | |
Actual | | $ | 1,000.00 | | | $ | 948.05 | | | $ | 4.21 | | | | 0.87 | % |
Hypothetical (5% return before expenses) | | $ | 1,000.00 | | | $ | 1,020.54 | | | $ | 4.37 | | | | 0.87 | % |
Administrator Class | | | | | | | | | | | | | | | | |
Actual | | $ | 1,000.00 | | | $ | 946.06 | | | $ | 5.37 | | | | 1.11 | % |
Hypothetical (5% return before expenses) | | $ | 1,000.00 | | | $ | 1,019.34 | | | $ | 5.57 | | | | 1.11 | % |
Institutional Class | | | | | | | | | | | | | | | | |
Actual | | $ | 1,000.00 | | | $ | 947.83 | | | $ | 4.16 | | | | 0.86 | % |
Hypothetical (5% return before expenses) | | $ | 1,000.00 | | | $ | 1,020.59 | | | $ | 4.32 | | | | 0.86 | % |
| 1 | Expenses paid is equal to the annualized expense ratio of each class multiplied by the average account value over the period, multiplied by the number of days in the most recent fiscal half-year divided by the number of days in the fiscal year (to reflect the one-half-year period). |
| | | | | | |
| Portfolio of investments—April 30, 2016 (unaudited) | | Wells Fargo International Equity Fund | | | 7 | |
| | | | | | | | | | | | |
| Security name | | | | | | Shares | | | Value | |
| | | | | | | | | | | | |
| | | | |
Common Stocks: 97.05% | | | | | | | | | | | | |
| | | | |
| Brazil: 0.13% | | | | | | | | | | | | |
Cosan Limited Class A (Energy, Oil, Gas & Consumable Fuels) | | | | | | | 99,329 | | | $ | 534,390 | |
| | | | | | | | | | | | |
| | | | |
| Canada: 3.10% | | | | | | | | | | | | |
Cameco Corporation (Energy, Oil, Gas & Consumable Fuels) | | | | | | | 662,931 | | | | 8,293,267 | |
Lundin Mining Corporation (Materials, Metals & Mining) † | | | | | | | 1,213,010 | | | | 4,766,191 | |
| | | | |
| | | | | | | | | | | 13,059,458 | |
| | | | | | | | | | | | |
| | | | |
| China: 10.18% | | | | | | | | | | | | |
China Everbright Limited (Financials, Capital Markets) | | | | | | | 5,188,000 | | | | 10,299,888 | |
China Mobile Limited (Telecommunication Services, Wireless Telecommunication Services) | | | | | | | 658,000 | | | | 7,545,424 | |
Dongfeng Motor Group Company Limited H Shares (Consumer Discretionary, Automobiles) | | | | | | | 8,180,000 | | | | 8,984,723 | |
Industrial & Commercial Bank of China Limited H Shares (Financials, Banks) | | | | | | | 11,165,000 | | | | 6,059,721 | |
Shanghai Pharmaceuticals Holding Company Limited H Shares (Health Care, Pharmaceuticals) | | | | | | | 1,861,900 | | | | 3,960,519 | |
Xinyi Solar Holdings Limited (Information Technology, Semiconductors & Semiconductor Equipment) | | | | | | | 6,964,000 | | | | 2,756,189 | |
Xtep International Holdings Limited (Consumer Discretionary, Textiles, Apparel & Luxury Goods) | | | | | | | 5,524,180 | | | | 3,268,830 | |
| | | | |
| | | | | | | | | | | 42,875,294 | |
| | | | | | | | | | | | |
| | | | |
| France: 3.24% | | | | | | | | | | | | |
Compagnie de Saint-Gobain SA (Industrials, Building Products) | | | | | | | 298,381 | | | | 13,664,743 | |
| | | | | | | | | | | | |
| | | | |
| Germany: 16.13% | | | | | | | | | | | | |
Bayer AG (Health Care, Pharmaceuticals) | | | | | | | 70,094 | | | | 8,086,312 | |
Metro AG (Consumer Staples, Food & Staples Retailing) | | | | | | | 380,271 | | | | 12,083,168 | |
Muenchener Rueckversicherungs Gesellschaft AG (Financials, Insurance) | | | | | | | 41,365 | | | | 7,670,763 | |
Rheinmetall AG (Industrials, Industrial Conglomerates) | | | | | | | 194,564 | | | | 15,220,711 | |
SAP SE (Information Technology, Software) | | | | | | | 143,850 | | | | 11,253,363 | |
Siemens AG (Industrials, Industrial Conglomerates) | | | | | | | 130,963 | | | | 13,664,286 | |
| | | | |
| | | | | | | | | | | 67,978,603 | |
| | | | | | | | | | | | |
| | | | |
| Hong Kong: 5.37% | | | | | | | | | | | | |
Value Partners Group Limited (Financials, Capital Markets) | | | | | | | 4,515,000 | | | | 4,336,365 | |
Xinyi Glass Holdings Limited (Consumer Discretionary, Auto Components) | | | | | | | 7,668,000 | | | | 5,249,143 | |
| | | | |
| | | | | | | | | | | 9,585,508 | |
| | | | | | | | | | | | |
| | | | |
| Italy: 8.76% | | | | | | | | | | | | |
ANIMA Holding SpA (Financials, Capital Markets) | | | | | | | 1,557,083 | | | | 11,018,560 | |
Eni SpA (Energy, Oil, Gas & Consumable Fuels) | | | | | | | 706,721 | | | | 11,491,083 | |
Prysmian SpA (Industrials, Electrical Equipment) | | | | | | | 611,444 | | | | 14,415,763 | |
| | | | |
| | | | | | | | | | | 36,925,406 | |
| | | | | | | | | | | | |
| | | | |
| Japan: 17.99% | | | | | | | | | | | | |
Coca-Cola East Japan Company Limited (Consumer Staples, Beverages) | | | | | | | 578,900 | | | | 10,791,368 | |
Daiwa House Industry Company Limited (Financials, Real Estate Management & Development) | | | | | | | 295,100 | | | | 8,058,739 | |
Daiwa Securities Group Incorporated (Financials, Capital Markets) | | | | | | | 1,367,000 | | | | 8,141,233 | |
Hitachi Limited (Information Technology, Electronic Equipment, Instruments & Components) | | | | | | | 2,748,000 | | | | 12,987,440 | |
Mitsubishi UFJ Financial Group Incorporated (Financials, Banks) | | | | | | | 2,011,700 | | | | 9,565,023 | |
Mitsui Fudosan Company Limited (Financials, Real Estate Management & Development) | | | | | | | 371,000 | | | | 9,281,093 | |
The accompanying notes are an integral part of these financial statements.
| | | | |
| 8 | | Wells Fargo International Equity Fund | | Portfolio of investments—April 30, 2016 (unaudited) |
| | | | | | | | | | | | | | |
| Security name | | | | | | | Shares | | | Value | |
| | | | | | | | | | | | | | |
| | | | |
| Japan (continued) | | | | | | | | | | | | | | |
Nitto Denko Corporation (Materials, Chemicals) | | | | | | | | | 92,388 | | | $ | 5,104,714 | |
Nomura Holdings Incorporated (Financials, Capital Markets) | | | | | | | | | 1,388,700 | | | | 6,062,904 | |
Toyota Motor Corporation (Consumer Discretionary, Automobiles) | | | | | | | | | 80,500 | | | | 4,193,247 | |
West Holdings Corporation (Consumer Discretionary, Household Durables) | | | | | | | | | 264,300 | | | | 1,602,597 | |
| | | | |
| | | | | | | | | | | | | 75,788,358 | |
| | | | | | | | | | | | | | |
| | | | |
| Netherlands: 7.16% | | | | | | | | | | | | | | |
Akzo Nobel NV (Materials, Chemicals) | | | | | | | | | 148,954 | | | | 10,555,948 | |
Koninklijke Philips NV (Industrials, Industrial Conglomerates) | | | | | | | | | 394,952 | | | | 10,853,759 | |
NN Group NV (Financials, Insurance) | | | | | | | | | 252,508 | | | | 8,749,207 | |
| | | | |
| | | | | | | | | | | | | 30,158,914 | |
| | | | | | | | | | | | | | |
| | | | |
| Norway: 1.41% | | | | | | | | | | | | | | |
Frontline Limited (Energy, Oil, Gas & Consumable Fuels) « | | | | | | | | | 187,330 | | | | 1,557,623 | |
Marine Harvest ASA (Consumer Staples, Food Products) | | | | | | | | | 282,707 | | | | 4,399,385 | |
| | | | |
| | | | | | | | | | | | | 5,957,008 | |
| | | | | | | | | | | | | | |
| | | | |
| South Korea: 4.63% | | | | | | | | | | | | | | |
Hana Financial Group Incorporated (Financials, Banks) | | | | | | | | | 434,476 | | | | 9,780,858 | |
Samsung Electronics Company Limited GDR (Information Technology, Semiconductors & Semiconductor Equipment) 144A | | | | | | | | | 16,328 | | | | 8,898,760 | |
SK Telecom Company Limited (Telecommunication Services, Wireless Telecommunication Services) | | | | | | | | | 4,478 | | | | 809,609 | |
| | | | |
| | | | | | | | | | | | | 19,489,227 | |
| | | | | | | | | | | | | | |
| | | | |
| Switzerland: 6.88% | | | | | | | | | | | | | | |
ABB Limited (Industrials, Electrical Equipment) | | | | | | | | | 387,215 | | | | 8,185,886 | |
Novartis AG (Health Care, Pharmaceuticals) | | | | | | | | | 134,721 | | | | 10,279,972 | |
Zurich Insurance Group AG (Financials, Insurance) | | | | | | | | | 47,013 | | | | 10,521,934 | |
| | | | |
| | | | | | | | | | | | | 28,987,792 | |
| | | | | | | | | | | | | | |
| | | | |
| United Kingdom: 13.66% | | | | | | | | | | | | | | |
Capita plc (Industrials, Professional Services) | | | | | | | | | 263,980 | | | | 3,861,003 | |
Reckitt Benckiser Group plc (Consumer Staples, Household Products) | | | | | | | | | 62,566 | | | | 6,082,978 | |
Smiths Group plc (Industrials, Industrial Conglomerates) | | | | | | | | | 801,418 | | | | 12,974,599 | |
United Business Media plc (Consumer Discretionary, Media) | | | | | | | | | 877,897 | | | | 7,298,791 | |
Vodafone Group plc (Telecommunication Services, Wireless Telecommunication Services) | | | | | | | | | 4,733,733 | | | | 15,161,403 | |
Wolseley plc (Industrials, Trading Companies & Distributors) | | | | | | | | | 217,793 | | | | 12,159,506 | |
| | | | |
| | | | | | | | | | | | | 57,538,280 | |
| | | | | | | | | | | | | | |
| | | | |
| United States: 1.51% | | | | | | | | | | | | | | |
Pfizer Incorporated (Health Care, Pharmaceuticals) | | | | | | | | | 195,020 | | | | 6,379,104 | |
| | | | | | | | | | | | | | |
| | | | |
Total Common Stocks (Cost $397,490,713) | | | | | | | | | | | | | 408,922,085 | |
| | | | | | | | | | | | | | |
| | | | |
| | | | | Expiration date | | | | | | | |
| Participation Notes: 1.32% | | | | | | | | | | | | | | |
| | | | |
| China: 1.32% | | | | | | | | | | | | | | |
HSBC Bank plc (Kweichow Moutai Company Limited Class A) (Consumer Staples, Beverages) † | | | | | 2-19-2019 | | | | 101,006 | | | | 3,911,255 | |
HSBC Bank plc (Kweichow Moutai Company Limited Class A) (Consumer Staples, Beverages) † | | | | | 12-4-2024 | | | | 43,031 | | | | 1,666,289 | |
| | | | |
Total Participation Notes (Cost $4,522,600) | | | | | | | | | | | | | 5,577,544 | |
| | | | | | | | | | | | | | |
The accompanying notes are an integral part of these financial statements.
| | | | | | |
| Portfolio of investments—April 30, 2016 (unaudited) | | Wells Fargo International Equity Fund | | | 9 | |
| | | | | | | | | | | | | | |
| Security name | | Yield | | | | | Shares | | | Value | |
| | | | | | | | | | | | | | |
| | | | |
Short-Term Investments: 1.67% | | | | | | | | | | | | | | |
| | | | |
| Investment Companies: 1.67% | | | | | | | | | | | | | | |
Securities Lending Cash Investments LLC (l)(r)(u) | | | 0.45 | % | | | | | 1,594,548 | | | $ | 1,594,548 | |
Wells Fargo Cash Investment Money Market Fund Select Class (l)(u) | | | 0.43 | | | | | | 5,428,477 | | | | 5,428,477 | |
| | | | |
Total Short-Term Investments (Cost $7,023,025) | | | | | | | | | | | | | 7,023,025 | |
| | | | | | | | | | | | | | |
| | | | | | | | |
| Total investments in securities (Cost $409,036,338) * | | | 100.04 | % | | | 421,522,654 | |
Other assets and liabilities, net | | | (0.04 | ) | | | (163,692 | ) |
| | | | | | | | |
| Total net assets | | | 100.00 | % | | $ | 421,358,962 | |
| | | | | | | | |
| † | Non-income-earning security |
| 144A | The security may be resold in transactions exempt from registration, normally to qualified institutional buyers, pursuant to Rule 144A under the Securities Act of 1933. |
| « | All or a portion of this security is on loan. |
| (l) | The issuer of the security is an affiliated person of the Fund as defined in the Investment Company Act of 1940. |
| (r) | The investment is a non-registered investment vehicle purchased with cash collateral received from securities on loan. |
| (u) | The rate represents the 7-day annualized yield at period end. |
| * | Cost for federal income tax purposes is $410,992,864 and unrealized gains (losses) consists of: |
| | | | |
Gross unrealized gains | | $ | 30,884,559 | |
Gross unrealized losses | | | (20,354,769 | ) |
| | | | |
Net unrealized gains | | $ | 10,529,790 | |
The accompanying notes are an integral part of these financial statements.
| | | | |
| 10 | | Wells Fargo International Equity Fund | | Statement of assets and liabilities—April 30, 2016 (unaudited) |
| | | | |
| | | | |
| |
Assets | | | | |
Investments | | | | |
In unaffiliated securities (including $1,518,580 of securities loaned), at value (cost $402,013,313) | | $ | 414,499,629 | |
In affiliated securities, at value (cost $7,023,025) | | | 7,023,025 | |
| | | | |
Total investments, at value (cost $409,036,338) | | | 421,522,654 | |
Foreign currency, at value (cost $610,944) | | | 616,009 | |
Segregated cash | | | 256,000 | |
Receivable for investments sold | | | 3,607 | |
Receivable for Fund shares sold | | | 671,046 | |
Receivable for dividends | | | 1,923,492 | |
Receivable for securities lending income | | | 9,491 | |
Unrealized gains on forward foreign currency contracts | | | 13,324 | |
Prepaid expenses and other assets | | | 105,764 | |
| | | | |
Total assets | | | 425,121,387 | |
| | | | |
| |
Liabilities | | | | |
Payable for Fund shares redeemed | | | 1,169,453 | |
Unrealized losses on forward foreign currency contracts | | | 561,585 | |
Payable upon receipt of securities loaned | | | 1,594,548 | |
Management fee payable | | | 234,390 | |
Distribution fees payable | | | 22,407 | |
Administration fees payable | | | 59,184 | |
Accrued expenses and other liabilities | | | 120,858 | |
| | | | |
Total liabilities | | | 3,762,425 | |
| | | | |
Total net assets | | $ | 421,358,962 | |
| | | | |
| |
NET ASSETS CONSIST OF | | | | |
Paid-in capital | | $ | 471,623,068 | |
Undistributed net investment income | | | 1,803,523 | |
Accumulated net realized losses on investments | | | (64,074,721 | ) |
Net unrealized gains on investments | | | 12,007,092 | |
| | | | |
Total net assets | | $ | 421,358,962 | |
| | | | |
| |
COMPUTATION OF NET ASSET VALUE AND OFFERING PRICE PER SHARE | | | | |
Net assets – Class A | | $ | 142,737,825 | |
Shares outstanding – Class A1 | | | 13,247,925 | |
Net asset value per share – Class A | | | $10.77 | |
Maximum offering price per share – Class A2 | | | $11.43 | |
Net assets – Class B | | $ | 1,810,368 | |
Shares outstanding – Class B1 | | | 171,563 | |
Net asset value per share – Class B | | | $10.55 | |
Net assets – Class C | | $ | 32,715,095 | |
Shares outstanding – Class C1 | | | 3,096,230 | |
Net asset value per share – Class C | | | $10.57 | |
Net assets – Class R | | $ | 2,073,762 | |
Shares outstanding – Class R1 | | | 190,114 | |
Net asset value per share – Class R | | | $10.91 | |
Net assets – Class R6 | | $ | 25,006 | |
Shares outstanding – Class R61 | | | 2,326 | |
Net asset value per share – Class R6 | | | $10.75 | |
Net assets – Administrator Class | | $ | 43,951,775 | |
Shares outstanding – Administrator Class1 | | | 4,152,507 | |
Net asset value per share – Administrator Class | | | $10.58 | |
Net assets – Institutional Class | | $ | 198,045,131 | |
Shares outstanding – Institutional Class1 | | | 18,437,220 | |
Net asset value per share – Institutional Class | | | $10.74 | |
| 1 | The Fund has an unlimited number of authorized shares. |
| 2 | Maximum offering price is computed as 100/94.25 of net asset value. On investments of $50,000 or more, the offering price is reduced. |
The accompanying notes are an integral part of these financial statements.
| | | | | | |
| Statement of operations—six months ended April 30, 2016 (unaudited) | | Wells Fargo International Equity Fund | | | 11 | |
| | | | |
| | | | |
| |
Investment income | | | | |
Dividends (net of foreign withholding taxes of $478,809) | | $ | 5,259,467 | |
Securities lending income, net | | | 49,496 | |
Income from affiliated securities | | | 43,334 | |
| | | | |
Total investment income | | | 5,352,297 | |
| | | | |
| |
Expenses | | | | |
Management fee | | | 1,941,737 | |
Administration fees | | | | |
Class A | | | 152,129 | |
Class B | | | 2,208 | |
Class C | | | 33,402 | |
Class R | | | 2,164 | |
Class R6 | | | 4 | |
Administrator Class | | | 31,838 | |
Institutional Class | | | 131,061 | |
Shareholder servicing fees | | | | |
Class A | | | 181,106 | |
Class B | | | 2,629 | |
Class C | | | 39,764 | |
Class R | | | 2,576 | |
Administrator Class | | | 60,331 | |
Distribution fees | | | | |
Class B | | | 7,886 | |
Class C | | | 119,292 | |
Class R | | | 2,576 | |
Custody and accounting fees | | | 50,504 | |
Professional fees | | | 30,729 | |
Registration fees | | | 49,554 | |
Shareholder report expenses | | | 27,073 | |
Trustees’ fees and expenses | | | 3,248 | |
Other fees and expenses | | | 5,082 | |
| | | | |
Total expenses | | | 2,876,893 | |
Less: Fee waivers and/or expense reimbursements | | | (611,599 | ) |
| | | | |
Net expenses | | | 2,265,294 | |
| | | | |
Net investment income | | | 3,087,003 | |
| | | | |
| |
REALIZED AND UNREALIZED GAINS (LOSSES) ON INVESTMENTS | | | | |
| |
Net realized gains (losses) on: | | | | |
Unaffiliated securities | | | (18,067,392 | ) |
Forward foreign currency contract transactions | | | 243,758 | |
| | | | |
Net realized losses on investments | | | (17,823,634 | ) |
| | | | |
| |
Net change in unrealized gains (losses) on: | | | | |
Unaffiliated securities | | | (11,049,312 | ) |
Forward foreign currency contract transactions | | | (1,783,645 | ) |
| | | | |
Net change in unrealized gains (losses) on investments | | | (12,832,957 | ) |
| | | | |
Net realized and unrealized gains (losses) on investments | | | (30,656,591 | ) |
| | | | |
Net decrease in net assets resulting from operations | | $ | (27,569,588 | ) |
| | | | |
The accompanying notes are an integral part of these financial statements.
| | | | |
| 12 | | Wells Fargo International Equity Fund | | Statement of changes in net assets |
| | | | | | | | | | | | | | | | |
| | | Six months ended
April 30, 2016
(unaudited) | | | Year ended
October 31, 2015 | |
| | | | |
Operations | | | | | | | | | | | | | | | | |
Net investment income | | | | | | $ | 3,087,003 | | | | | | | $ | 3,816,017 | |
Net realized gains (losses) on investments | | | | | | | (17,823,634 | ) | | | | | | | 6,811,584 | |
Net change in unrealized gains (losses) on investments | | | | | | | (12,832,957 | ) | | | | | | | (5,436,792 | ) |
| | | | |
Net increase (decrease) in net assets resulting from operations | | | | | | | (27,569,588 | ) | | | | | | | 5,190,809 | |
| | | | |
| | | | |
Distributions to shareholders from | | | | | | | | | | | | | | | | |
Net investment income | | | | | | | | | | | | | | | | |
Class A | | | | | | | (1,980,548 | ) | | | | | | | (4,144,449 | ) |
Class B | | | | | | | (4,737 | ) | | | | | | | (133,491 | ) |
Class C | | | | | | | (292,082 | ) | | | | | | | (589,249 | ) |
Class R | | | | | | | (24,021 | ) | | | | | | | (58,692 | ) |
Class R6 | | | | | | | (338 | ) | | | | | | | 0 | 1 |
Administrator Class | | | | | | | (731,926 | ) | | | | | | | (444,265 | ) |
Institutional Class | | | | | | | (3,153,699 | ) | | | | | | | (3,012,972 | ) |
| | | | |
Total distributions to shareholders | | | | | | | (6,187,351 | ) | | | | | | | (8,383,118 | ) |
| | | | |
| | | | |
Capital share transactions | | | Shares | | | | | | | | Shares | | | | | |
Proceeds from shares sold | | | | | | | | | | | | | | | | |
Class A | | | 3,153,052 | | | | 34,528,505 | | | | 5,686,291 | | | | 68,771,982 | |
Class B | | | 814 | | | | 8,663 | | | | 4,367 | | | | 52,179 | |
Class C | | | 948,086 | | | | 10,295,834 | | | | 1,364,465 | | | | 16,286,613 | |
Class R | | | 55,798 | | | | 620,020 | | | | 127,293 | | | | 1,581,522 | |
Class R6 | | | 0 | | | | 0 | | | | 2,296 | 1 | | | 25,000 | 1 |
Administrator Class | | | 2,350,799 | | | | 25,371,033 | | | | 5,575,269 | | | | 66,219,302 | |
Institutional Class | | | 8,086,506 | | | | 87,892,433 | | | | 14,609,456 | | | | 168,904,517 | |
| | | | |
| | | | | | | 158,716,488 | | | | | | | | 321,841,115 | |
| | | | |
Reinvestment of distributions | | | | | | | | | | | | | | | | |
Class A | | | 167,795 | | | | 1,860,967 | | | | 350,957 | | | | 3,835,959 | |
Class B | | | 431 | | | | 4,689 | | | | 12,086 | | | | 129,201 | |
Class C | | | 23,355 | | | | 254,804 | | | | 47,129 | | | | 508,047 | |
Class R | | | 822 | | | | 9,244 | | | | 2,725 | | | | 30,167 | |
Class R6 | | | 30 | | | | 338 | | | | 0 | 1 | | | 0 | 1 |
Administrator Class | | | 67,082 | | | | 731,191 | | | | 41,287 | | | | 443,423 | |
Institutional Class | | | 230,119 | | | | 2,542,811 | | | | 220,501 | | | | 2,396,847 | |
| | | | |
| | | | | | | 5,404,044 | | | | | | | | 7,343,644 | |
| | | | |
Payment for shares redeemed | | | | | | | | | | | | | | | | |
Class A | | | (2,708,122 | ) | | | (28,665,159 | ) | | | (2,058,420 | ) | | | (23,991,275 | ) |
Class B | | | (65,050 | ) | | | (672,356 | ) | | | (158,096 | ) | | | (1,803,160 | ) |
Class C | | | (448,635 | ) | | | (4,730,473 | ) | | | (316,369 | ) | | | (3,631,747 | ) |
Class R | | | (50,662 | ) | | | (538,168 | ) | | | (84,187 | ) | | | (995,805 | ) |
Administrator Class | | | (2,897,008 | ) | | | (30,373,251 | ) | | | (2,153,660 | ) | | | (24,140,441 | ) |
Institutional Class | | | (6,655,208 | ) | | | (68,840,044 | ) | | | (3,722,844 | ) | | | (43,032,964 | ) |
| | | | |
| | | | | | | (133,819,451 | ) | | | | | | | (97,595,392 | ) |
| | | | |
Net increase in net assets resulting from capital share transactions | | | | | | | 30,301,081 | | | | | | | | 231,589,367 | |
| | | | |
Total increase (decrease) in net assets | | | | | | | (3,455,858 | ) | | | | | | | 228,397,058 | |
| | | | |
| | | | |
Net assets | | | | | | | | | | | | | | | | |
Beginning of period | | | | | | | 424,814,820 | | | | | | | | 196,417,762 | |
| | | | |
End of period | | | | | | $ | 421,358,962 | | | | | | | $ | 424,814,820 | |
| | | | |
Undistributed net investment income | | | | | | $ | 1,803,523 | | | | | | | $ | 4,903,871 | |
| | | | |
| 1 | For the period from September 30, 2015 (commencement of class operations) to October 31, 2015 |
The accompanying notes are an integral part of these financial statements.
| | | | | | |
| Financial highlights | | Wells Fargo International Equity Fund | | | 13 | |
(For a share outstanding throughout each period)
| | | | | | | | | | | | | | | | | | | | | | | | |
| | | Six months ended
April 30, 2016
(unaudited) | | | Year ended October 31 | |
| CLASS A | | | 2015 | | | 2014 | | | 2013 | | | 2012 | | | 2011 | |
Net asset value, beginning of period | | | $11.53 | | | | $11.28 | | | | $11.98 | | | | $9.77 | | | | $9.82 | | | | $10.41 | |
Net investment income | | | 0.07 | | | | 0.18 | 1 | | | 0.37 | 1 | | | 0.21 | | | | 0.25 | | | | 0.17 | |
Net realized and unrealized gains (losses) on investments | | | (0.69 | ) | | | 0.57 | | | | (0.81 | ) | | | 2.27 | | | | (0.09 | ) | | | (0.75 | ) |
| | | | | | | | | | | | | | | | | | | | | | | | |
Total from investment operations | | | (0.62 | ) | | | 0.75 | | | | (0.44 | ) | | | 2.48 | | | | 0.16 | | | | (0.58 | ) |
Distributions to shareholders from | | | | | | | | | | | | | | | | | | | | | | | | |
Net investment income | | | (0.14 | ) | | | (0.50 | ) | | | (0.26 | ) | | | (0.27 | ) | | | (0.21 | ) | | | (0.01 | ) |
Net asset value, end of period | | | $10.77 | | | | $11.53 | | | | $11.28 | | | | $11.98 | | | | $9.77 | | | | $9.82 | |
Total return2 | | | (5.40 | )% | | | 6.85 | % | | | (3.77 | )% | | | 25.99 | % | | | 1.83 | % | | | (5.62 | )% |
Ratios to average net assets (annualized) | | | | | | | | | | | | | | | | | | | | | | | | |
Gross expenses | | | 1.44 | % | | | 1.53 | % | | | 1.53 | % | | | 1.56 | % | | | 1.53 | % | | | 1.46 | % |
Net expenses | | | 1.11 | % | | | 1.09 | % | | | 1.09 | % | | | 1.09 | % | | | 1.09 | % | | | 1.09 | % |
Net investment income | | | 1.39 | % | | | 1.50 | % | | | 3.14 | % | | | 2.03 | % | | | 2.49 | % | | | 1.55 | % |
Supplemental data | | | | | | | | | | | | | | | | | | | | | | | | |
Portfolio turnover rate | | | 24 | % | | | 27 | % | | | 32 | % | | | 38 | % | | | 115 | % | | | 44 | % |
Net assets, end of period (000s omitted) | | | $142,738 | | | | $145,654 | | | | $97,640 | | | | $115,821 | | | | $114,219 | | | | $162,954 | |
| 1 | Calculated based upon average shares outstanding |
| 2 | Total return calculations do not include any sales charges. Returns for periods of less than one year are not annualized. |
The accompanying notes are an integral part of these financial statements.
| | | | |
| 14 | | Wells Fargo International Equity Fund | | Financial highlights |
(For a share outstanding throughout each period)
| | | | | | | | | | | | | | | | | | | | | | | | |
| | | Six months ended
April 30, 2016 (unaudited) | | | Year ended October 31 | |
| CLASS B | | | 2015 | | | 2014 | | | 2013 | | | 2012 | | | 2011 | |
Net asset value, beginning of period | | | $11.21 | | | | $10.95 | | | | $11.62 | | | | $9.47 | | | | $9.48 | | | | $10.12 | |
Net investment income | | | 0.03 | 1 | | | 0.08 | 1 | | | 0.28 | 1 | | | 0.13 | 1 | | | 0.16 | 1 | | | 0.08 | 1 |
Net realized and unrealized gains (losses) on investments | | | (0.67 | ) | | | 0.56 | | | | (0.79 | ) | | | 2.21 | | | | (0.07 | ) | | | (0.72 | ) |
| | | | | | | | | | | | | | | | | | | | | | | | |
Total from investment operations | | | (0.64 | ) | | | 0.64 | | | | (0.51 | ) | | | 2.34 | | | | 0.09 | | | | (0.64 | ) |
Distributions to shareholders from | | | | | | | | | | | | | | | | | | | | | | | | |
Net investment income | | | (0.02 | ) | | | (0.38 | ) | | | (0.16 | ) | | | (0.19 | ) | | | (0.10 | ) | | | 0.00 | |
Net asset value, end of period | | | $10.55 | | | | $11.21 | | | | $10.95 | | | | $11.62 | | | | $9.47 | | | | $9.48 | |
Total return2 | | | (5.70 | )% | | | 6.00 | % | | | (4.48 | )% | | | 25.07 | % | | | 0.99 | % | | | (6.32 | )% |
Ratios to average net assets (annualized) | | | | | | | | | | | | | | | | | | | | | | | | |
Gross expenses | | | 2.18 | % | | | 2.29 | % | | | 2.28 | % | | | 2.31 | % | | | 2.28 | % | | | 2.21 | % |
Net expenses | | | 1.85 | % | | | 1.84 | % | | | 1.84 | % | | | 1.84 | % | | | 1.84 | % | | | 1.84 | % |
Net investment income | | | 0.48 | % | | | 0.68 | % | | | 2.40 | % | | | 1.27 | % | | | 1.67 | % | | | 0.77 | % |
Supplemental data | | | | | | | | | | | | | | | | | | | | | | | | |
Portfolio turnover rate | | | 24 | % | | | 27 | % | | | 32 | % | | | 38 | % | | | 115 | % | | | 44 | % |
Net assets, end of period (000s omitted) | | | $1,810 | | | | $2,639 | | | | $4,127 | | | | $6,810 | | | | $8,303 | | | | $12,873 | |
| 1 | Calculated based upon average shares outstanding |
| 2 | Total return calculations do not include any sales charges. Returns for periods of less than one year are not annualized. |
The accompanying notes are an integral part of these financial statements.
| | | | | | |
| Financial highlights | | Wells Fargo International Equity Fund | | | 15 | |
(For a share outstanding throughout each period)
| | | | | | | | | | | | | | | | | | | | | | | | |
| | | Six months ended
April 30, 2016 (unaudited) | | | Year ended October 31 | |
| CLASS C | | | 2015 | | | 2014 | | | 2013 | | | 2012 | | | 2011 | |
Net asset value, beginning of period | | | $11.30 | | | | $11.06 | | | | $11.75 | | | | $9.58 | | | | $9.59 | | | | $10.24 | |
Net investment income | | | 0.05 | | | | 0.08 | 1 | | | 0.27 | 1 | | | 0.14 | 1 | | | 0.16 | 1 | | | 0.06 | |
Net realized and unrealized gains (losses) on investments | | | (0.69 | ) | | | 0.57 | | | | (0.79 | ) | | | 2.22 | | | | (0.07 | ) | | | (0.71 | ) |
| | | | | | | | | | | | | | | | | | | | | | | | |
Total from investment operations | | | (0.64 | ) | | | 0.65 | | | | (0.52 | ) | | | 2.36 | | | | 0.09 | | | | (0.65 | ) |
Distributions to shareholders from | | | | | | | | | | | | | | | | | | | | | | | | |
Net investment income | | | (0.09 | ) | | | (0.41 | ) | | | (0.17 | ) | | | (0.19 | ) | | | (0.10 | ) | | | 0.00 | |
Net asset value, end of period | | | $10.57 | | | | $11.30 | | | | $11.06 | | | | $11.75 | | | | $9.58 | | | | $9.59 | |
Total return2 | | | (5.66 | )% | | | 6.03 | % | | | (4.49 | )% | | | 25.05 | % | | | 1.08 | % | | | (6.35 | )% |
Ratios to average net assets (annualized) | | | | | | | | | | | | | | | | | | | | | | | | |
Gross expenses | | | 2.19 | % | | | 2.28 | % | | | 2.28 | % | | | 2.31 | % | | | 2.28 | % | | | 2.21 | % |
Net expenses | | | 1.86 | % | | | 1.84 | % | | | 1.84 | % | | | 1.84 | % | | | 1.84 | % | | | 1.84 | % |
Net investment income | | | 0.69 | % | | | 0.72 | % | | | 2.37 | % | | | 1.30 | % | | | 1.72 | % | | | 0.79 | % |
Supplemental data | | | | | | | | | | | | | | | | | | | | | | | | |
Portfolio turnover rate | | | 24 | % | | | 27 | % | | | 32 | % | | | 38 | % | | | 115 | % | | | 44 | % |
Net assets, end of period (000s omitted) | | | $32,715 | | | | $29,080 | | | | $16,346 | | | | $16,997 | | | | $16,760 | | | | $22,578 | |
| 1 | Calculated based upon average shares outstanding |
| 2 | Total return calculations do not include any sales charges. Returns for periods of less than one year are not annualized. |
The accompanying notes are an integral part of these financial statements.
| | | | |
| 16 | | Wells Fargo International Equity Fund | | Financial highlights |
(For a share outstanding throughout each period)
| | | | | | | | | | | | | | | | | | | | | | | | |
| | | Six months ended
April 30, 2016 (unaudited) | | | Year ended October 31 | |
| CLASS R | | | 2015 | | | 2014 | | | 2013 | | | 2012 | | | 2011 | |
Net asset value, beginning of period | | | $11.66 | | | | $11.40 | | | | $11.96 | | | | $9.75 | | | | $9.79 | | | | $10.40 | |
Net investment income | | | 0.06 | 1 | | | 0.15 | 1 | | | 0.32 | 1 | | | 0.18 | 1 | | | 0.20 | 1 | | | 0.14 | 1 |
Net realized and unrealized gains (losses) on investments | | | (0.69 | ) | | | 0.57 | | | | (0.79 | ) | | | 2.27 | | | | (0.06 | ) | | | (0.75 | ) |
| | | | | | | | | | | | | | | | | | | | | | | | |
Total from investment operations | | | (0.63 | ) | | | 0.72 | | | | (0.47 | ) | | | 2.45 | | | | 0.14 | | | | (0.61 | ) |
Distributions to shareholders from | | | | | | | | | | | | | | | | | | | | | | | | |
Net investment income | | | (0.12 | ) | | | (0.46 | ) | | | (0.09 | ) | | | (0.24 | ) | | | (0.18 | ) | | | 0.00 | |
Net asset value, end of period | | | $10.91 | | | | $11.66 | | | | $11.40 | | | | $11.96 | | | | $9.75 | | | | $9.79 | |
Total return2 | | | (5.45 | )% | | | 6.53 | % | | | (4.00 | )% | | | 25.68 | % | | | 1.58 | % | | | (5.87 | )% |
Ratios to average net assets (annualized) | | | | | | | | | | | | | | | | | | | | | | | | |
Gross expenses | | | 1.69 | % | | | 1.78 | % | | | 1.78 | % | | | 1.81 | % | | | 1.78 | % | | | 1.71 | % |
Net expenses | | | 1.36 | % | | | 1.34 | % | | | 1.34 | % | | | 1.34 | % | | | 1.34 | % | | | 1.34 | % |
Net investment income | | | 1.13 | % | | | 1.23 | % | | | 2.71 | % | | | 1.72 | % | | | 2.11 | % | | | 1.31 | % |
Supplemental data | | | | | | | | | | | | | | | | | | | | | | | | |
Portfolio turnover rate | | | 24 | % | | | 27 | % | | | 32 | % | | | 38 | % | | | 115 | % | | | 44 | % |
Net assets, end of period (000s omitted) | | | $2,074 | | | | $2,147 | | | | $1,576 | | | | $2,234 | | | | $2,196 | | | | $3,050 | |
| 1 | Calculated based upon average shares outstanding |
| 2 | Returns for periods of less than one year are not annualized. |
The accompanying notes are an integral part of these financial statements.
| | | | | | |
| Financial highlights | | Wells Fargo International Equity Fund | | | 17 | |
(For a share outstanding throughout each period)
| | | | | | | | |
| | | Six months ended
April 30, 2016 (unaudited) | | | Year ended October 31, 20151 | |
| CLASS R6 | | |
Net asset value, beginning of period | | | $11.49 | | | | $10.89 | |
Net investment income | | | 0.09 | | | | 0.00 | 2 |
Net realized and unrealized gains (losses) on investments | | | (0.68 | ) | | | 0.60 | |
| | | | | | | | |
Total from investment operations | | | (0.59 | ) | | | 0.60 | |
Distributions to shareholders from | | | | | | | | |
Net investment income | | | (0.15 | ) | | | 0.00 | |
Net asset value, end of period | | | $10.75 | | | | $11.49 | |
Total return3 | | | (5.19 | )% | | | 5.51 | % |
Ratios to average net assets (annualized) | | | | | | | | |
Gross expenses | | | 1.00 | % | | | 1.05 | % |
Net expenses | | | 0.87 | % | | | 0.88 | % |
Net investment income | | | 1.65 | % | | | 0.23 | % |
Supplemental data | | | | | | | | |
Portfolio turnover rate | | | 24 | % | | | 27 | % |
Net assets, end of period (000s omitted) | | | $25 | | | | $26 | |
| 1 | For the period from September 30, 2015 (commencement of class operations) to October 31, 2015 |
| 2 | Amount is less than $0.005 per share. |
| 3 | Returns for periods of less than one year are not annualized. |
The accompanying notes are an integral part of these financial statements.
| | | | |
| 18 | | Wells Fargo International Equity Fund | | Financial highlights |
(For a share outstanding throughout each period)
| | | | | | | | | | | | | | | | | | | | | | | | |
| | | Six months ended
April 30, 2016
(unaudited) | | | Year ended October 31 | |
| ADMINISTRATOR CLASS | | | 2015 | | | 2014 | | | 2013 | | | 2012 | | | 2011 | |
Net asset value, beginning of period | | | $11.33 | | | | $11.09 | | | | $11.79 | | | | $9.62 | | | | $9.67 | | | | $10.28 | |
Net investment income | | | 0.07 | 1 | | | 0.17 | 1 | | | 0.37 | 1 | | | 0.22 | | | | 0.25 | | | | 0.16 | |
Net realized and unrealized gains (losses) on investments | | | (0.68 | ) | | | 0.57 | | | | (0.80 | ) | | | 2.22 | | | | (0.09 | ) | | | (0.74 | ) |
| | | | | | | | | | | | | | | | | | | | | | | | |
Total from investment operations | | | (0.61 | ) | | | 0.74 | | | | (0.43 | ) | | | 2.44 | | | | 0.16 | | | | (0.58 | ) |
Distributions to shareholders from | | | | | | | | | | | | | | | | | | | | | | | | |
Net investment income | | | (0.14 | ) | | | (0.50 | ) | | | (0.27 | ) | | | (0.27 | ) | | | (0.21 | ) | | | (0.03 | ) |
Net asset value, end of period | | | $10.58 | | | | $11.33 | | | | $11.09 | | | | $11.79 | | | | $9.62 | | | | $9.67 | |
Total return2 | | | (5.39 | )% | | | 6.89 | % | | | (3.82 | )% | | | 26.00 | % | | | 1.88 | % | | | (5.68 | )% |
Ratios to average net assets (annualized) | | | | | | | | | | | | | | | | | | | | | | | | |
Gross expenses | | | 1.35 | % | | | 1.40 | % | | | 1.37 | % | | | 1.37 | % | | | 1.36 | % | | | 1.25 | % |
Net expenses | | | 1.11 | % | | | 1.09 | % | | | 1.09 | % | | | 1.09 | % | | | 1.09 | % | | | 1.09 | % |
Net investment income | | | 1.28 | % | | | 1.44 | % | | | 3.21 | % | | | 2.08 | % | | | 2.52 | % | | | 1.58 | % |
Supplemental data | | | | | | | | | | | | | | | | | | | | | | | | |
Portfolio turnover rate | | | 24 | % | | | 27 | % | | | 32 | % | | | 38 | % | | | 115 | % | | | 44 | % |
Net assets, end of period (000s omitted) | | | $43,952 | | | | $52,469 | | | | $12,962 | | | | $3,955 | | | | $3,505 | | | | $3,436 | |
| 1 | Calculated based upon average shares outstanding |
| 2 | Returns for periods of less than one year are not annualized. |
The accompanying notes are an integral part of these financial statements.
| | | | | | |
| Financial highlights | | Wells Fargo International Equity Fund | | | 19 | |
(For a share outstanding throughout each period)
| | | | | | | | | | | | | | | | | | | | | | | | |
| | | Six months ended
April 30, 2016
(unaudited) | | | Year ended October 31 | |
| INSTITUTIONAL CLASS | | | 2015 | | | 2014 | | | 2013 | | | 2012 | | | 2011 | |
Net asset value, beginning of period | | | $11.49 | | | | $11.25 | | | | $11.96 | | | | $9.76 | | | | $9.83 | | | | $10.42 | |
Net investment income | | | 0.09 | 1 | | | 0.19 | 1 | | | 0.37 | 1 | | | 0.24 | 1 | | | 0.37 | | | | 0.19 | 1 |
Net realized and unrealized gains (losses) on investments | | | (0.69 | ) | | | 0.58 | | | | (0.77 | ) | | | 2.26 | | | | (0.19 | ) | | | (0.75 | ) |
| | | | | | | | | | | | | | | | | | | | | | | | |
Total from investment operations | | | (0.60 | ) | | | 0.77 | | | | (0.40 | ) | | | 2.50 | | | | 0.18 | | | | (0.56 | ) |
Distributions to shareholders from | | | | | | | | | | | | | | | | | | | | | | | | |
Net investment income | | | (0.15 | ) | | | (0.53 | ) | | | (0.31 | ) | | | (0.30 | ) | | | (0.25 | ) | | | (0.03 | ) |
Net asset value, end of period | | | $10.74 | | | | $11.49 | | | | $11.25 | | | | $11.96 | | | | $9.76 | | | | $9.83 | |
Total return2 | | | (5.22 | )% | | | 7.07 | % | | | (3.53 | )% | | | 26.31 | % | | | 2.05 | % | | | (5.38 | )% |
Ratios to average net assets (annualized) | | | | | | | | | | | | | | | | | | | | | | | | |
Gross expenses | | | 1.11 | % | | | 1.15 | % | | | 1.10 | % | | | 1.13 | % | | | 1.10 | % | | | 1.03 | % |
Net expenses | | | 0.86 | % | | | 0.84 | % | | | 0.84 | % | | | 0.84 | % | | | 0.84 | % | | | 0.84 | % |
Net investment income | | | 1.63 | % | | | 1.67 | % | | | 3.18 | % | | | 2.29 | % | | | 2.67 | % | | | 1.78 | % |
Supplemental data | | | | | | | | | | | | | | | | | | | | | | | | |
Portfolio turnover rate | | | 24 | % | | | 27 | % | | | 32 | % | | | 38 | % | | | 115 | % | | | 44 | % |
Net assets, end of period (000s omitted) | | | $198,045 | | | | $192,799 | | | | $63,766 | | | | $82,982 | | | | $138,245 | | | | $227,158 | |
| 1 | Calculated based upon average shares outstanding |
| 2 | Returns for periods of less than one year are not annualized. |
The accompanying notes are an integral part of these financial statements.
| | | | |
| 20 | | Wells Fargo International Equity Fund | | Notes to financial statements (unaudited) |
1. ORGANIZATION
Wells Fargo Funds Trust (the “Trust”), a Delaware statutory trust organized on March 10, 1999, is an open-end management investment company registered under the Investment Company Act of 1940, as amended (the “1940 Act”). As an investment company, the Trust follows the accounting and reporting guidance in Financial Accounting Standards Board (“FASB”) Accounting Standards Codification Topic 946, Financial Services – Investment Companies. These financial statements report on the Wells Fargo International Equity Fund (the “Fund”) which is a diversified series of the Trust.
2. SIGNIFICANT ACCOUNTING POLICIES
The following significant accounting policies, which are consistently followed in the preparation of the financial statements of the Fund, are in conformity with U.S. generally accepted accounting principles which require management to make estimates and assumptions that affect the reported amounts of assets and liabilities, disclosure of contingent assets and liabilities at the date of the financial statements, and the reported amounts of revenues and expenses during the reporting period. Actual results could differ from those estimates.
Securities valuation
All investments are valued each business day as of the close of regular trading on the New York Stock Exchange (generally 4 p.m. Eastern Time), although a Fund may deviate from this calculation time under unusual or unexpected circumstances.
Equity securities that are listed on a foreign or domestic exchange or market are valued at the official closing price or, if none, the last sales price. If no sale occurs on the principal exchange or market that day, the prior day’s price will be deemed “stale” and a fair value price will be determined in accordance with the Fund’s Valuation Procedures.
The values of securities denominated in foreign currencies are translated into U.S. dollars at rates provided by an independent foreign currency pricing source at a time each business day specified by the Management Valuation Team of Wells Fargo Funds Management, LLC (“Funds Management”).
Many securities markets and exchanges outside the U.S. close prior to the close of the New York Stock Exchange and therefore may not fully reflect trading or events that occur after the close of the principal exchange in which the foreign securities are traded, but before the close of the New York Stock Exchange. If such trading or events are expected to materially affect the value of such securities, then fair value pricing procedures approved by the Board of Trustees of the Fund are applied. These procedures take into account multiple factors including movements in U.S. securities markets after foreign exchanges close. Foreign securities that are fair valued under these procedures are categorized as Level 2 and the application of these procedures may result in transfers between Level 1 and Level 2. Depending on market activity, such fair valuations may be frequent. Such fair value pricing may result in net asset values that are higher or lower than net asset values based on the last reported sales price or latest quoted bid price. On April 30, 2016, such fair value pricing was not used in pricing foreign securities.
Investments in registered open-end investment companies are valued at net asset value. Interests in non-registered investment vehicles that are redeemable at net asset value are fair valued normally at net asset value.
Investments which are not valued using any of the methods discussed above are valued at their fair value, as determined in good faith by the Board of Trustees. The Board of Trustees has established a Valuation Committee comprised of the Trustees and has delegated to it the authority to take any actions regarding the valuation of portfolio securities that the Valuation Committee deems necessary or appropriate, including determining the fair value of portfolio securities, unless the determination has been delegated to the Management Valuation Team. The Board of Trustees retains the authority to make or ratify any valuation decisions or approve any changes to the Valuation Procedures as it deems appropriate. On a quarterly basis, the Board of Trustees receives reports on any valuation actions taken by the Valuation Committee or the Management Valuation Team which may include items for ratification.
Valuations of fair valued securities are compared to the next actual sales price when available, or other appropriate market values, to assess the continued appropriateness of the fair valuation methodologies used. These securities are fair valued on a day-to-day basis, taking into consideration changes to appropriate market information and any significant changes to the inputs considered in the valuation process until there is a readily available price provided on an exchange or by an independent pricing service. Valuations received from an independent pricing service or independent broker-dealer quotes are periodically validated by comparisons to most recent trades and valuations provided by other independent pricing services in addition to the review of prices by the manager and/or subadviser. Unobservable inputs used in determining fair valuations are identified based on the type of security, taking into consideration factors utilized by market participants in valuing the investment, knowledge about the issuer and the current market environment.
| | | | | | |
| Notes to financial statements (unaudited) | | Wells Fargo International Equity Fund | | | 21 | |
Foreign currency translation
The accounting records of the Fund are maintained in U.S. dollars. The values of other assets and liabilities denominated in foreign currencies are translated into U.S. dollars at rates provided by an independent foreign currency pricing source at a time each business day specified by the Management Valuation Team. Purchases and sales of securities, and income and expenses are converted at the rate of exchange on the respective dates of such transactions. Net realized foreign exchange gains or losses arise from sales of foreign currencies, currency gains or losses realized between the trade and settlement dates on securities transactions, and the difference between the amounts of dividends, interest and foreign withholding taxes recorded and the U.S. dollar equivalent of the amounts actually paid or received. Net unrealized foreign exchange gains and losses arise from changes in the fair value of assets and liabilities other than investments in securities resulting from changes in exchange rates. The changes in net assets arising from changes in exchange rates and the changes in net assets resulting from changes in market prices of securities are not separately presented. Such changes are included in net realized and unrealized gains or losses from investments.
Forward foreign currency contracts
The Fund is subject to foreign currency exchange rate risk in the normal course of pursuing its investment objectives. A forward foreign currency contract is an agreement between two parties to purchase or sell a specific currency for an agreed-upon price at a future date. The Fund enters into forward foreign currency contracts to facilitate transactions in foreign-denominated securities and to attempt to minimize the risk to the Fund from adverse changes in the relationship between currencies. Forward foreign currency contracts are recorded at the forward rate and marked-to-market daily. When the contracts are closed, realized gains and losses arising from such transactions are recorded as realized gains or losses on forward foreign currency contract transactions. The Fund could be exposed to risks if the counterparties to the contracts are unable to meet the terms of their contracts or if the value of the foreign currency changes unfavorably. The Fund’s maximum risk of loss from counterparty credit risk is the unrealized gains on the contracts. This risk may be mitigated if there is a master netting arrangement between the Fund and the counterparty.
Security loans
The Fund may lend its securities from time to time in order to earn additional income in the form of fees or interest on securities received as collateral or the investment of any cash received as collateral. The Fund continues to receive interest or dividends on the securities loaned. The Fund receives collateral in the form of cash or securities with a value at least equal to the value of the securities on loan. The value of the loaned securities is determined at the close of each business day and any additional required collateral is delivered to the Fund on the next business day. In a securities lending transaction, the net asset value of the Fund will be affected by an increase or decrease in the value of the securities loaned and by an increase or decrease in the value of the instrument in which collateral is invested. The amount of securities lending activity undertaken by the Fund fluctuates from time to time. In the event of default or bankruptcy by the borrower, the Fund may be prevented from recovering the loaned securities or gaining access to the collateral or may experience delays or costs in doing so. In addition, the investment of any cash collateral received may lose all or part of its value. The Fund has the right under the lending agreement to recover the securities from the borrower on demand.
The Fund lends its securities through an unaffiliated securities lending agent. Cash collateral received in connection with its securities lending transactions is invested in Securities Lending Cash Investments, LLC (the “Securities Lending Fund”). The Securities Lending Fund is exempt from registration under Section 3(c)(7) of the 1940 Act and is managed by Funds Management and is subadvised by Wells Capital Management Incorporated (“WellsCap”), an affiliate of Funds Management and an indirect wholly owned subsidiary of Wells Fargo & Company (“Wells Fargo”). Funds Management receives an advisory fee starting at 0.05% and declining to 0.01% as the average daily net assets of the Securities Lending Fund increase. All of the fees received by Funds Management are paid to WellsCap for its services as subadviser. The Securities Lending Fund seeks to provide a positive return compared to the daily Fed Funds Open rate by investing in high-quality, U.S. dollar-denominated short-term money market instruments. Securities Lending Fund investments are fair valued based upon the amortized cost valuation technique. Income earned from investment in the Securities Lending Fund is included in securities lending income on the Statement of Operations.
Security transactions and income recognition
Securities transactions are recorded on a trade date basis. Realized gains or losses are recorded on the basis of identified cost.
Dividend income is recognized on the ex-dividend date, except for certain dividends from foreign securities, which are recorded as soon as the custodian verifies the ex-dividend date. Dividend income from foreign securities is recorded net of foreign taxes withheld where recovery of such taxes is not assured.
| | | | |
| 22 | | Wells Fargo International Equity Fund | | Notes to financial statements (unaudited) |
Distributions to shareholders
Distributions to shareholders from net investment income and net realized gains, if any, are recorded on the ex-dividend date. Such distributions are determined in conformity with federal income tax regulations, which may differ in amount or character from net investment income and realized gains recognized for purposes of U.S. generally accepted accounting principles.
Federal and other taxes
The Fund intends to continue to qualify as a regulated investment company by distributing substantially all of its investment company taxable income and any net realized capital gains (after reduction for capital loss carryforwards) sufficient to relieve it from all, or substantially all, federal income taxes. Accordingly, no provision for federal income taxes was required.
The Fund’s income and federal excise tax returns and all financial records supporting those returns for the prior three fiscal years are subject to examination by the federal and Delaware revenue authorities. Management has analyzed the Fund’s tax positions taken on federal, state, and foreign tax returns for all open tax years and does not believe that there are any uncertain tax positions that require recognition of a tax liability.
As of October 31, 2015, the Fund had capital loss carryforwards available to offset future net realized capital gains in the amount of $43,946,020 expiring in 2016.
Class allocations
The separate classes of shares offered by the Fund differ principally in applicable sales charges, distribution, shareholder servicing, and administration fees. Class specific expenses are charged directly to that share class. Investment income, common expenses, and realized and unrealized gains (losses) on investments are allocated daily to each class of shares based on the relative proportion of net assets of each class.
3. FAIR VALUATION MEASUREMENTS
Fair value measurements of investments are determined within a framework that has established a fair value hierarchy based upon the various data inputs utilized in determining the value of the Fund’s investments. The three-level hierarchy gives the highest priority to unadjusted quoted prices in active markets for identical assets or liabilities (Level 1) and the lowest priority to significant unobservable inputs (Level 3). The Fund’s investments are classified within the fair value hierarchy based on the lowest level of input that is significant to the fair value measurement. The inputs are summarized into three broad levels as follows:
| n | | Level 1 – quoted prices in active markets for identical securities |
| n | | Level 2 – other significant observable inputs (including quoted prices for similar securities, interest rates, prepayment speeds, credit risk, use of amortized cost, etc.) |
| n | | Level 3 – significant unobservable inputs (including the Fund’s own assumptions in determining the fair value of investments) |
The inputs or methodologies used for valuing investments in securities are not necessarily an indication of the risk associated with investing in those securities.
| | | | | | |
| Notes to financial statements (unaudited) | | Wells Fargo International Equity Fund | | | 23 | |
The following is a summary of the inputs used in valuing the Fund’s assets and liabilities as of April 30, 2016:
| | | | | | | | | | | | | | | | |
| | | Quoted prices
(Level 1) | | | Other significant
observable inputs
(Level 2) | | | Significant
unobservable inputs
(Level 3) | | | Total | |
Assets | | | | | | | | | | | | | | | | |
Investments in: | | | | | | | | | | | | | | | | |
| | | | |
Common stocks | | | | | | | | | | | | | | | | |
Brazil | | $ | 534,390 | | | $ | 0 | | | $ | 0 | | | $ | 534,390 | |
Canada | | | 13,059,458 | | | | 0 | | | | 0 | | | | 13,059,458 | |
China | | | 42,875,294 | | | | 0 | | | | 0 | | | | 42,875,294 | |
France | | | 13,664,743 | | | | 0 | | | | 0 | | | | 13,664,743 | |
Germany | | | 67,978,603 | | | | 0 | | | | 0 | | | | 67,978,603 | |
Hong Kong | | | 9,585,508 | | | | 0 | | | | 0 | | | | 9,585,508 | |
Italy | | | 36,925,406 | | | | 0 | | | | 0 | | | | 36,925,406 | |
Japan | | | 75,788,358 | | | | 0 | | | | 0 | | | | 75,788,358 | |
Netherlands | | | 30,158,914 | | | | 0 | | | | 0 | | | | 30,158,914 | |
Norway | | | 5,957,008 | | | | 0 | | | | 0 | | | | 5,957,008 | |
South Korea | | | 19,489,227 | | | | 0 | | | | 0 | | | | 19,489,227 | |
Switzerland | | | 28,987,792 | | | | 0 | | | | 0 | | | | 28,987,792 | |
United Kingdom | | | 57,538,280 | | | | 0 | | | | 0 | | | | 57,538,280 | |
United States | | | 6,379,104 | | | | 0 | | | | 0 | | | | 6,379,104 | |
| | | | |
Participation notes | | | | | | | | | | | | | | | | |
China | | | 0 | | | | 5,577,544 | | | | 0 | | | | 5,577,544 | |
| | | | |
Short-term investments | | | | | | | | | | | | | | | | |
Investment companies | | | 5,428,477 | | | | | | | | 0 | | | | 5,428,477 | |
Investments measured at net asset value* | | | | | | | | | | | | | | | 1,594,548 | |
| | | 414,350,562 | | | | 5,577,544 | | | | 0 | | | | 421,522,654 | |
Forward foreign currency contracts | | | 0 | | | | 13,324 | | | | 0 | | | | 13,324 | |
Total assets | | $ | 414,350,562 | | | $ | 5,590,868 | | | $ | 0 | | | $ | 421,535,978 | |
Liabilities | | | | | | | | | | | | | | | | |
| | | | |
Forward foreign currency contracts | | $ | 0 | | | $ | 561,585 | | | $ | 0 | | | $ | 561,585 | |
Total liabilities | | $ | 0 | | | $ | 561,585 | | | $ | 0 | | | $ | 561,585 | |
| * | Investments that are measured at fair value using the net asset value per share (or its equivalent) as a practical expedient have not been categorized in the fair value hierarchy. The fair value amount presented in the table is intended to permit reconciliation of the fair value hierarchy to the amounts presented in the Statement of Assets and Liabilities. The Fund’s investment in Securities Lending Cash Investments, LLC valued at $1,594,548 does not have a redemption period notice, can be redeemed daily and does not have any unfunded commitments. |
Forward foreign currency contracts are reported at their unrealized gains (losses) at measurement date, which represents the change in the contract’s value from trade date. All other assets and liabilities are reported at their market value at measurement date.
The Fund recognizes transfers between levels within the fair value hierarchy at the end of the reporting period. Fair value pricing that was used in pricing certain foreign securities at the previous period end was not used at April 30, 2016. As a result common stocks valued at $349,550,163 were transferred from Level 2 to Level 1 within the fair value hierarchy. The Fund did not have any transfers into/out of Level 3.
4. TRANSACTIONS WITH AFFILIATES
Management fee
Funds Management, an indirect wholly owned subsidiary of Wells Fargo, is the manager of the Fund and provides advisory and fund-level administrative services under an investment management agreement. Under the investment management agreement, Funds Management is responsible for, among other services, implementing the investment objectives and strategies of the Fund, supervising the applicable subadviser, providing fund-level administrative services in connection with the Fund’s operations, and providing any other fund-level administrative services reasonably
| | | | |
| 24 | | Wells Fargo International Equity Fund | | Notes to financial statements (unaudited) |
necessary for the operation of the Fund. As compensation for its services under the investment management agreement, Funds Management is entitled to receive an annual management fee starting at 0.90% and declining to 0.73% as the average daily net assets of the Fund increase.
For the six months ended April 30, 2016, the management fee was equivalent to an annual rate of 0.90% of the Fund’s average daily net assets.
Funds Management has retained the services of a subadviser to provide daily portfolio management to the Fund. The fee for subadvisory services is borne by Funds Management. WellsCap is the subadviser to the Fund and is entitled to receive a fee from Funds Management at an annual rate starting at 0.45% and declining to 0.40% as the average daily net assets of the Fund increase.
Administration fees
Under a class-level administration agreement, Funds Management provides class-level administrative services to the Fund, which includes paying fees and expenses for services provided by the transfer agent, sub-transfer agents, omnibus account servicers and record-keepers. As compensation for its services under the class-level administration agreement, Funds Management receives an annual fee which is calculated based on the average daily net assets of each class as follows:
| | | | |
| | | Class-level
administration fee | |
Class A, Class B, Class C, Class R | | | 0.21 | % |
Class R6 | | | 0.03 | |
Administrator Class, Institutional Class | | | 0.13 | |
Funds Management has contractually waived and/or reimbursed management and administration fees to the extent necessary to maintain certain net operating expense ratios for the Fund. Waiver of fees and/or reimbursement of expenses by Funds Management were made first from fund level expenses on a proportionate basis and then from class specific expenses. Funds Management has committed through February 28, 2017 to waive fees and/or reimburse expenses to the extent necessary to cap the Fund’s expenses at 1.14% for Class A shares, 1.89% for Class B shares, 1.89% for Class C shares, 1.39% for Class R shares, 0.84% for Class R6 shares, 1.14% for Administrator Class shares, and 0.89% for Institutional Class shares. After this time, the cap may be increased or the commitment to maintain the cap may be terminated only with the approval of the Board of Trustees. Prior to March 1, 2016, the Fund’s expense were capped at 1.09% for Class A shares, 1.84% for Class B shares, 1.84% for Class C shares, 1.34% for Class R shares, 0.88% for Class R6 shares, 1.09% for Administrator Class shares, and 0.84% for Institutional Class shares.
Distribution fees
The Trust has adopted a distribution plan for Class B, Class C, and Class R shares of the Fund pursuant to Rule 12b-1 under the 1940 Act. Distribution fees are charged to Class B, Class C, and Class R shares and paid to Wells Fargo Funds Distributor, LLC (“Funds Distributor”), the principal underwriter, at an annual rate of 0.75% of the average daily net assets of Class B and Class C shares and 0.25% of the average daily net assets of Class R shares.
In addition, Funds Distributor is entitled to receive the front-end sales charge from the purchase of Class A shares and a contingent deferred sales charge on the redemption of certain Class A shares. Funds Distributor is also entitled to receive the contingent deferred sales charges from redemptions of Class B and Class C shares. For the six months ended April 30, 2016, Funds Distributor received $22,044 from the sale of Class A shares and $315 in contingent deferred sales charges from redemptions of Class C shares.
Shareholder servicing fees
The Trust has entered into contracts with one or more shareholder servicing agents, whereby Class A, Class B, Class C, Class R, and Administrator Class of the Fund are charged a fee at an annual rate of 0.25% of the average daily net assets of each respective class.
A portion of these total shareholder servicing fees were paid to affiliates of Wells Fargo.
5. INVESTMENT PORTFOLIO TRANSACTIONS
Purchases and sales of investments, excluding U.S. government obligations (if any) and short-term securities, for the six months ended April 30, 2016 were $157,034,721 and $96,207,891, respectively.
| | | | | | |
| Notes to financial statements (unaudited) | | Wells Fargo International Equity Fund | | | 25 | |
6. DERIVATIVE TRANSACTIONS
During the six months ended April 30, 2016, the Fund entered into forward foreign currency contracts for economic hedging purposes.
At April 30, 2016, the Fund had forward foreign currency contracts outstanding as follows:
Forward foreign currency contracts to buy:
| | | | | | | | | | | | | | | | | | |
| Exchange date | | Counterparty | | Contracts to
receive | | | U.S. value at
April 30, 2016 | | | In exchange
for U.S. $ | | | Unrealized
gains | |
| 7-13-2016 | | Citibank | | | 72,683,000 | JPY | | $ | 684,477 | | | $ | 671,153 | | | $ | 13,324 | |
Forward foreign currency contracts to sell:
| | | | | | | | | | | | | | | | | | |
| Exchange date | | Counterparty | | Contracts to
deliver | | | U.S. value at
April 30, 2016 | | | In exchange
for U.S. $ | | | Unrealized
losses | |
| 5-11-2016 | | Morgan Stanley | | | 5,792,600 | EUR | | $ | 6,634,342 | | | $ | 6,530,820 | | | $ | (103,522 | ) |
| 5-31-2016 | | Barclays | | | 2,743,800 | EUR | | | 3,144,317 | | | | 3,033,109 | | | | (111,208 | ) |
| 6-15-2016 | | Morgan Stanley | | | 7,419,000 | EUR | | | 8,506,060 | | | | 8,306,579 | | | | (199,481 | ) |
| 7-13-2016 | | Citibank | | | 797,844,000 | JPY | | | 7,513,529 | | | | 7,408,779 | | | | (104,750 | ) |
| 7-13-2016 | | Morgan Stanley | | | 8,851,000 | EUR | | | 10,157,068 | | | | 10,148,601 | | | | (8,467 | ) |
| 7-25-2016 | | Morgan Stanley | | | 1,020,000 | GBP | | | 1,490,755 | | | | 1,489,578 | | | | (1,177 | ) |
| 7-25-2016 | | Morgan Stanley | | | 1,020,000 | GBP | | | 1,490,755 | | | | 1,479,378 | | | | (11,377 | ) |
| 7-25-2016 | | Morgan Stanley | | | 1,020,000 | GBP | | | 1,490,755 | | | | 1,469,152 | | | | (21,603 | ) |
The Fund had average contract amounts of $13,067,896 and $54,988,224 in forward foreign currency contracts to buy and forward foreign currency contracts to sell, respectively, during the six months ended April 30, 2016. As of April 30, 2016, the Fund had segregated $256,000 as cash collateral for forward foreign currency contracts.
The fair value, realized gains or losses and change in unrealized gains or losses, if any, on derivative instruments are reflected in the appropriate financial statements.
For certain types of derivative transactions, the Fund has entered into International Swaps and Derivatives Association, Inc. master agreements (“ISDA Master Agreements”) or similar agreements with approved counterparties. The ISDA Master Agreements or similar agreements may have requirements to deliver/deposit securities or cash to/with an exchange or broker-dealer as collateral and allows the Fund to offset, with each counterparty, certain derivative financial instrument’s assets and/or liabilities with collateral held or pledged. Collateral requirements differ by type of derivative. Collateral or margin requirements are set by the broker or exchange clearing house for exchange traded derivatives while collateral terms are contract specific for over-the-counter traded derivatives. Cash collateral that has been pledged to cover obligations of the Fund under ISDA Master Agreements or similar agreements, if any, are reported separately in the Statement of Assets and Liabilities. Securities pledged as collateral, if any, are noted in the Portfolio of Investments. With respect to balance sheet offsetting, absent an event of default by the counterparty or a termination of the agreement, the reported amounts of financial assets and financial liabilities in the Statement of Assets and Liabilities are not offset across transactions between the Fund and the applicable counterparty. A reconciliation of the gross amounts on the Statement of Assets and Liabilities to the net amounts by derivative type, including any collateral exposure, is as follows:
| | | | | | | | | | | | | | | | |
| Derivative type | | Counterparty | | Gross amounts of assets in the Statement of
Assets and
Liabilities | | Amounts
subject to
netting
agreements | | | Collateral
received | | | Net amount
of assets | |
Forward foreign currency contracts | | Citibank | | $13,324* | | $ | (13,324 | ) | | $ | 0 | | | $ | 0 | |
| * | Amount represents net unrealized gains. |
| | | | |
| 26 | | Wells Fargo International Equity Fund | | Notes to financial statements (unaudited) |
| | | | | | | | | | | | | | | | |
| Derivative type | | Counterparty | | Gross amounts
of liabilities in the
Statement of
Assets and
Liabilities | | Amounts
subject to
netting
agreements | | | Collateral
pledged1 | | | Net amount
of liabilities | |
Forward foreign currency contracts | | Morgan Stanley | | $345,627* | | $ | 0 | | | $ | (256,000 | ) | | $ | 89,627 | |
| | Barclays | | 111,208* | | | 0 | | | | 0 | | | | 111,208 | |
| | Citibank | | 104,750* | | | (13,324 | ) | | | 0 | | | | 91,426 | |
| * | Amount represents net unrealized loss. |
| 1 | Collateral pledged within this table is limited to the collateral for the net transaction with the counterparty. |
7. BANK BORROWINGS
The Trust (excluding the money market funds and certain other funds) and Wells Fargo Variable Trust are parties to a $200,000,000 revolving credit agreement whereby the Fund is permitted to use bank borrowings for temporary or emergency purposes, such as to fund shareholder redemption requests. Interest under the credit agreement is charged to the Fund based on a borrowing rate equal to the higher of the Federal Funds rate in effect on that day plus 1.25% or the overnight LIBOR rate in effect on that day plus 1.25%. In addition, an annual commitment fee equal to 0.20% of the unused balance is allocated to each participating fund.
For the six months ended April 30, 2016, there were no borrowings by the Fund under the agreement.
8. CONCENTRATION RISK
Concentration risks result from exposure to a limited number of sectors. A fund that invests a substantial portion of its assets in any sector may be more affected by changes in that sector than would be a fund whose investments are not heavily weighted in any sector.
9. INDEMNIFICATION
Under the Trust’s organizational documents, the officers and Trustees have been granted certain indemnification rights against certain liabilities that may arise out of performance of their duties to the Trust. Additionally, in the normal course of business, the Trust may enter into contracts with service providers that contain a variety of indemnification clauses. The Trust’s maximum exposure under these arrangements is dependent on future claims that may be made against the Fund and, therefore, cannot be estimated.
| | | | | | |
| Other information (unaudited) | | Wells Fargo International Equity Fund | | | 27 | |
TAX INFORMATION
Pursuant to Section 853 of the Internal Revenue Code, the following amounts have been designated as foreign taxes paid for the fiscal year ended October 31, 2015. These amounts may be less than the actual foreign taxes paid for financial statement purposes. Foreign taxes paid or withheld should be included in taxable income with an offsetting deduction from gross income or as a credit for taxes paid to foreign governments. None of the income was derived from ineligible foreign sources as defined under Section 901(j) of the Internal Revenue Code.
| | | | | | | | |
Creditable foreign taxes paid | | Per share
amount | | | Foreign income as % of
ordinary income
distributions | |
$295,393 | | $ | 0.0080 | | | | 72.42 | % |
PROXY VOTING INFORMATION
A description of the policies and procedures that the Fund uses to determine how to vote proxies relating to portfolio securities is available, upon request, by calling 1-800-222-8222, visiting our website at wellsfargofunds.com, or visiting the SEC website at sec.gov. Information regarding how the Fund voted proxies relating to portfolio securities during the most recent 12-month period ended June 30 is available on the Fund’s website at wellsfargofunds.com or by visiting the SEC website at sec.gov.
PORTFOLIO HOLDINGS INFORMATION
The complete portfolio holdings for the Fund are publicly available monthly on the Fund’s website (wellsfargofunds.com), on a one-month delayed basis. In addition, top ten holdings information (excluding derivative positions) for the Fund is publicly available on the Fund’s website on a monthly, seven-day or more delayed basis. The Fund files its complete schedule of portfolio holdings with the SEC for the first and third quarters of each fiscal year on Form N-Q, which is available by visiting the SEC website at sec.gov. In addition, the Fund’s Form N-Q may be reviewed and copied at the SEC’s Public Reference Room in Washington, DC, and at regional offices in New York City, at 233 Broadway, and in Chicago, at 175 West Jackson Boulevard, Suite 900. Information about the Public Reference Room may be obtained by calling 1-800-SEC-0330.
| | | | |
| 28 | | Wells Fargo International Equity Fund | | Other information (unaudited) |
BOARD OF TRUSTEES AND OFFICERS
Each of the Trustees and Officers1 listed in the table below acts in identical capacities for each fund in the Wells Fargo family of funds, which consists of 141 mutual funds comprising the Wells Fargo Funds Trust, Wells Fargo Variable Trust, Wells Fargo Master Trust and four closed-end funds (collectively the “Fund Complex”). This table should be read in conjunction with the Prospectus and the Statement of Additional Information2. The mailing address of each Trustee and Officer is 525 Market Street, 12th Floor, San Francisco, CA 94105. Each Trustee and Officer serves an indefinite term, however, each Trustee serves such term until reaching the mandatory retirement age established by the Trustees.
Independent Trustees
| | | | | | |
Name and
year of birth | | Position held and
length of service* | | Principal occupations during past five years or longer | | Current other public
company or investment
company directorships |
| William R. Ebsworth (Born 1957) | | Trustee, since 2015 | | Retired. From 1984 to 2013, equities analyst, portfolio manager, research director and chief financial officer at Fidelity Management and Research Company in Boston, Tokyo, and Hong Kong and retired in 2013 as Chief Investment Officer of Fidelity Strategic Advisers, Inc. where he lead a team of investment professionals managing client assets. Prior thereto, Board member of Hong Kong Securities Clearing Co., Hong Kong Options Clearing Corp., the Thailand International Fund, Ltd., Fidelity Investments Life Insurance Company, and Empire Fidelity Investments Life Insurance Company. Mr. Ebsworth is a CFA® charterholder and an Adjunct Lecturer, Finance, at Babson College. | | Asset Allocation Trust |
| Jane A. Freeman (Born 1953) | | Trustee, since 2015 | | Retired. From 2012 to 2014 and 1999 to 2008, Chief Financial Officer of Scientific Learning Corporation. From 2008 to 2012, Ms. Freeman provided consulting services related to strategic business projects. Prior to 1999, Portfolio Manager at Rockefeller & Co. and Scudder, Stevens & Clark. Board member of the Harding Loevner Funds from 1996 to 2014, serving as both Lead Independent Director and chair of the Audit Committee. Board member of the Russell Exchange Traded Funds Trust from 2011 to 2012 and the chair of the Audit Committee. Ms. Freeman is Chair of Taproot Foundation (non-profit organization), a Board Member of Ruth Bancroft Garden (non-profit organization) and an inactive chartered financial analyst. | | Asset Allocation Trust |
| Peter G. Gordon (Born 1942) | | Trustee, since 1998; Chairman, since 2005 | | Co-Founder, Retired Chairman, President and CEO of Crystal Geyser Water Company. Trustee Emeritus, Colby College. | | Asset Allocation Trust |
| Isaiah Harris, Jr. (Born 1952) | | Trustee, since 2009 | | Retired. Chairman of the Board of CIGNA Corporation since 2009, and Director since 2005. From 2003 to 2011, Director of Deluxe Corporation. Prior thereto, President and CEO of BellSouth Advertising and Publishing Corp. from 2005 to 2007, President and CEO of BellSouth Enterprises from 2004 to 2005 and President of BellSouth Consumer Services from 2000 to 2003. Emeritus member of the Iowa State University Foundation Board of Governors. Emeritus Member of the Advisory Board of Iowa State University School of Business. Advisory Board Member, Palm Harbor Academy (charter school). Advisory Board Member, Child Evangelism Fellowship (non-profit). Mr. Harris is a certified public accountant (inactive status). | | CIGNA Corporation; Asset Allocation Trust |
| Judith M. Johnson (Born 1949) | | Trustee, since 2008; Audit Committee Chairman, since 2008 | | Retired. Prior thereto, Chief Executive Officer and Chief Investment Officer of Minneapolis Employees Retirement Fund from 1996 to 2008. Ms. Johnson is an attorney, certified public accountant and a certified managerial accountant. | | Asset Allocation Trust |
| David F. Larcker (Born 1950) | | Trustee, since 2009 | | James Irvin Miller Professor of Accounting at the Graduate School of Business, Stanford University, Director of the Corporate Governance Research Initiative and Senior Faculty of The Rock Center for Corporate Governance since 2006. From 2005 to 2008, Professor of Accounting at the Graduate School of Business, Stanford University. Prior thereto, Ernst & Young Professor of Accounting at The Wharton School, University of Pennsylvania from 1985 to 2005. | | Asset Allocation Trust |
| Olivia S. Mitchell (Born 1953) | | Trustee, since 2006 | | International Foundation of Employee Benefit Plans Professor, Wharton School of the University of Pennsylvania since 1993. Director of Wharton’s Pension Research Council and Boettner Center on Pensions & Retirement Research, and Research Associate at the National Bureau of Economic Research. Previously, Cornell University Professor from 1978 to 1993. | | Asset Allocation Trust |
| | | | | | |
| Other information (unaudited) | | Wells Fargo International Equity Fund | | | 29 | |
| | | | | | |
Name and
year of birth | | Position held and
length of service* | | Principal occupations during past five years or longer | | Current other public
company or investment
company directorships |
| Timothy J. Penny (Born 1951) | | Trustee, since 1996 | | President and Chief Executive Officer of Southern Minnesota Initiative Foundation, a non-profit organization, since 2007 and Senior Fellow at the Humphrey Institute Policy Forum at the University of Minnesota since 1995. Member of the Board of Trustees of NorthStar Education Finance, Inc., a non-profit organization, since 2007. | | Asset Allocation Trust |
| Michael S. Scofield (Born 1943) | | Trustee, since 2010 | | Served on the Investment Company Institute’s Board of Governors and Executive Committee from 2008-2011 as well the Governing Council of the Independent Directors Council from 2006-2011 and the Independent Directors Council Executive Committee from 2008-2011. Chairman of the IDC from 2008-2010. Institutional Investor (Fund Directions) Trustee of Year in 2007. Trustee of the Evergreen Funds complex (and its predecessors) from 1984 to 2010. Chairman of the Evergreen Funds from 2000-2010. Former Trustee of the Mentor Funds. Retired Attorney, Law Offices of Michael S. Scofield. | | Asset Allocation Trust |
| * | Length of service dates reflect the Trustee’s commencement of service with the Trust’s predecessor entities, where applicable. |
Officers
| | | | | | |
Name and
year of birth | | Position held and
length of service | | Principal occupations during past five years or longer | | |
| Karla M. Rabusch (Born 1959) | | President, since 2003 | | Executive Vice President of Wells Fargo Bank, N.A. and President of Wells Fargo Funds Management, LLC since 2003. | | |
| Jeremy DePalma1 (Born 1974) | | Treasurer, since 2012 | | Senior Vice President of Wells Fargo Funds Management, LLC since 2009. Senior Vice President of Evergreen Investment Management Company, LLC from 2008 to 2010 and head of the Fund Reporting and Control Team within Fund Administration from 2005 to 2010. | | |
| C. David Messman (Born 1960) | | Secretary, since 2000; Chief Legal Officer, since 2003 | | Senior Vice President and Secretary of Wells Fargo Funds Management, LLC since 2001. Assistant General Counsel of Wells Fargo Bank, N.A. since 2013 and Vice President and Managing Counsel of Wells Fargo Bank, N.A. from 1996 to 2013. | | |
| Michael Whitaker (Born 1967) | | Chief Compliance Officer, since 2016* | | Executive Vice President of Wells Fargo Funds Management, LLC since 2016. Chief Compliance Officer of Fidelity’s Fixed Income Funds and Asset Allocation Funds from 2008 to 2016, Compliance Officer of FMR Co., Inc. from 2014 to 2016, Fidelity Investments Money Management, Inc. from 2014 to 2016, Fidelity Investments from 2007 to 2016. | | |
| Debra Ann Early (Born 1964) | | Chief Compliance Officer, since 2007** | | Executive Vice President of Wells Fargo Funds Management, LLC since 2014, Senior Vice President and Chief Compliance Officer from 2007 to 2014. | | |
| David Berardi (Born 1975) | | Assistant Treasurer, since 2009 | | Vice President of Wells Fargo Funds Management, LLC since 2009. Vice President of Evergreen Investment Management Company, LLC from 2008 to 2010. Manager of Fund Reporting and Control for Evergreen Investment Management Company, LLC from 2004 to 2010. | | |
| 1 | Jeremy DePalma acts as Treasurer of 69 funds and Assistant Treasurer of 72 funds in the Fund Complex. |
| 2 | The Statement of Additional Information includes additional information about the Trustees and is available, without charge, upon request, by calling 1-800-222-8222 or by visiting the website at wellsfargofunds.com. |
| * | Michael Whitaker became Chief Compliance Officer effective May 16, 2016. |
| ** | Debra Ann Early was the Chief Compliance Officer until May 15, 2016. |
| | | | |
| 30 | | Wells Fargo International Equity Fund | | List of abbreviations |
The following is a list of common abbreviations for terms and entities that may have appeared in this report.
| ACA | — ACA Financial Guaranty Corporation |
| ADR | — American depositary receipt |
| ADS | — American depositary shares |
| AGC | — Assured Guaranty Corporation |
| AGM | — Assured Guaranty Municipal |
| Ambac | — Ambac Financial Group Incorporated |
| AMT | — Alternative minimum tax |
| BAN | — Bond anticipation notes |
| BHAC | — Berkshire Hathaway Assurance Corporation |
| CAB | — Capital appreciation bond |
| CCAB | — Convertible capital appreciation bond |
| CDA | — Community Development Authority |
| CDO | — Collateralized debt obligation |
| DRIVER | — Derivative inverse tax-exempt receipts |
| DW&P | — Department of Water & Power |
| DWR | — Department of Water Resources |
| ECFA | — Educational & Cultural Facilities Authority |
| EDA | — Economic Development Authority |
| EDFA | — Economic Development Finance Authority |
| ETF | — Exchange-traded fund |
| FDIC | — Federal Deposit Insurance Corporation |
| FFCB | — Federal Farm Credit Banks |
| FGIC | — Financial Guaranty Insurance Corporation |
| FHA | — Federal Housing Administration |
| FHLB | — Federal Home Loan Bank |
| FHLMC | — Federal Home Loan Mortgage Corporation |
| FICO | — The Financing Corporation |
| FNMA | — Federal National Mortgage Association |
| GDR | — Global depositary receipt |
| GNMA | — Government National Mortgage Association |
| HCFR | — Healthcare facilities revenue |
| HEFA | — Health & Educational Facilities Authority |
| HEFAR | — Higher education facilities authority revenue |
| HFA | — Housing Finance Authority |
| HFFA | — Health Facilities Financing Authority |
| HUD | — Department of Housing and Urban Development |
| IDA | — Industrial Development Authority |
| IDAG | — Industrial Development Agency |
| KRW | — Republic of Korea won |
| LIBOR | — London Interbank Offered Rate |
| LIFER | — Long Inverse Floating Exempt Receipts |
| LLC | — Limited liability company |
| LLLP | — Limited liability limited partnership |
| LLP | — Limited liability partnership |
| MBIA | — Municipal Bond Insurance Association |
| MFHR | — Multifamily housing revenue |
| MSTR | — Municipal securities trust receipts |
| MUD | — Municipal Utility District |
| National | — National Public Finance Guarantee Corporation |
| PCFA | — Pollution Control Financing Authority |
| PCL | — Public Company Limited |
| PCR | — Pollution control revenue |
| PFA | — Public Finance Authority |
| PFFA | — Public Facilities Financing Authority |
| PFOTER | — Puttable floating option tax-exempt receipts |
| plc | — Public limited company |
| PUTTER | — Puttable tax-exempt receipts |
| R&D | — Research & development |
| Radian | — Radian Asset Assurance |
| RAN | — Revenue anticipation notes |
| RDA | — Redevelopment Authority |
| RDFA | — Redevelopment Finance Authority |
| REIT | — Real estate investment trust |
| ROC | — Reset option certificates |
| SAVRS | — Select auction variable rate securities |
| SBA | — Small Business Authority |
| SDR | — Swedish depositary receipt |
| SFHR | — Single-family housing revenue |
| SFMR | — Single-family mortgage revenue |
| SPA | — Standby purchase agreement |
| SPDR | — Standard & Poor’s Depositary Receipts |
| SPEAR | — Short Puttable Exempt Adjustable Receipts |
| STRIPS | — Separate trading of registered interest and |
| TAN | — Tax anticipation notes |
| TIPS | — Treasury inflation-protected securities |
| TRAN | — Tax revenue anticipation notes |
| TTFA | — Transportation Trust Fund Authority |
| TVA | — Tennessee Valley Authority |
This page is intentionally left blank.
This page is intentionally left blank.

For more information
More information about Wells Fargo Funds is available free upon request. To obtain literature, please write, email, visit the Fund’s website, or call:
Wells Fargo Funds
P.O. Box 8266
Boston, MA 02266-8266
Email: fundservice@wellsfargo.com
Website: wellsfargofunds.com
Individual investors: 1-800-222-8222
Retail investment professionals: 1-888-877-9275
Institutional investment professionals: 1-866-765-0778
This report and the financial statements contained herein are submitted for the general information of the shareholders of the Fund. If this report is used for promotional purposes, distribution of the report must be accompanied or preceded by a current prospectus. Before investing, please consider the investment objectives, risks, charges, and expenses of the investment. For a current prospectus and, if available, a summary prospectus, containing this information, call 1-800-222-8222 or visit the Fund’s website at wellsfargofunds.com. Read the prospectus carefully before you invest or send money.
Wells Fargo Asset Management (WFAM) is a trade name used by the asset management businesses of Wells Fargo & Company. Wells Fargo Funds Management, LLC, a wholly owned subsidiary of Wells Fargo & Company, provides investment advisory and administrative services for Wells Fargo Funds. Other affiliates of Wells Fargo & Company provide subadvisory and other services for the funds. The funds are distributed by Wells Fargo Funds Distributor, LLC, Member FINRA, an affiliate of Wells Fargo & Company.
NOT FDIC INSURED ¡ NO BANK GUARANTEE ¡ MAY LOSE VALUE
© 2016 Wells Fargo Funds Management, LLC. All rights reserved.
| | |
 | | 242234 06-16 SA240/SAR240 04-16 |
Semi-Annual Report
April 30, 2016

Wells Fargo Intrinsic World Equity Fund


Reduce clutter. Save trees.
Sign up for electronic delivery of prospectuses and shareholder reports at wellsfargo.com/advantagedelivery
Contents
The views expressed and any forward-looking statements are as of April 30, 2016, unless otherwise noted, and are those of the Fund managers and/or Wells Fargo Funds Management, LLC. Discussions of individual securities, or the markets generally, or any Wells Fargo Fund are not intended as individual recommendations. Future events or results may vary significantly from those expressed in any forward-looking statements. The views expressed are subject to change at any time in response to changing circumstances in the market. Wells Fargo Funds Management, LLC and the Fund disclaim any obligation to publicly update or revise any views expressed or forward-looking statements.
NOT FDIC INSURED ¡ NO BANK GUARANTEE ¡ MAY LOSE VALUE
| | | | |
| 2 | | Wells Fargo Intrinsic World Equity Fund | | Letter to shareholders (unaudited) |

Karla M. Rabusch
President
Wells Fargo Funds
As the U.S. dollar gained in strength relative to currencies overseas, investment returns earned outside the U.S. were reduced when translated into U.S. dollars.
Dear Valued Shareholder:
We are pleased to offer you this semi-annual report for the Wells Fargo Intrinsic World Equity Fund for the six-month period that ended April 30, 2016. During the period, international equity investors confronted concerns about slowing economic growth, particularly in China, and the potential for central bank policies to relieve recessionary pressures and support global business activity. These influences were pervasive throughout the period and caused elevated levels of volatility in international equity markets.
Investors kept a watchful eye on central bank initiatives while global growth slowed.
Persistently low inflation rates and oil prices along with a strengthening U.S. dollar combined to drive international equity prices lower. The U.S. dollar strengthened consistently after 2011 and more quickly following 2014 as expectations grew for an increase in the federal funds rate by the U.S. Federal Reserve (Fed). As the U.S. dollar gained in strength relative to currencies overseas, investment returns earned outside the U.S. were reduced when translated into U.S. dollars. The strong U.S. dollar also put pressure on import prices which, when combined with lower costs for fuel and other commodities, restrained inflation and prompted recession fears among investors.
Further dampening the international investment outlook in December was the lack of a deal to freeze or reduce oil output in an effort to stabilize prices among members of the Organization of Petroleum Exporting Countries. The lack of an agreement on a strategy to increase oil prices from their low levels left many investors doubtful of investment opportunities in emerging markets. In addition, the People’s Bank of China (PBOC) guided its currency’s value lower relative to a basket of foreign currencies. While the effort was seen as consistent with the government’s efforts to move China’s economy to a more global market-based footing, the currency devaluation tended to heighten fears of recession.
Central bank policies demonstrate resolve to reignite global economic growth.
As the end of 2015 approached, investors did take some reassurance from the decision of the European Central Bank (ECB) to push the deposit interest rate further into negative territory. Negative interest rates are intended to encourage banks to lend assets held in reserve rather than keep them on deposit, which could help spark business activity. The ECB also expanded and extended its bond-buying program, which helped inject liquidity into the markets and encourage investment. As anticipated, the Fed announced the long-awaited increase to the federal funds rate in December and suggested it planned to pursue additional increases in 2016.
In January 2016, the Bank of Japan (BOJ) followed the ECB’s lead by setting a negative deposit rate. A negative measurement for Japan’s gross domestic product in the fourth quarter may have prompted the BOJ’s accommodative initiative. Observing the actions of central banks overseas to implement policies that would accommodate higher levels of business activity, the Fed acknowledged that risks to global growth existed and indicated it would base further rate increases on data indicating the risks were being successfully addressed. Counterbalancing the accommodation of central banks were industrial production slowdowns stemming from plant closures in China due to elevated air pollution levels, the lack of further accommodative action by the ECB in January, and fresh declines in oil prices. Stocks worldwide entered correction territory, defined as a decline of 10% or more.
| | | | | | |
| Letter to shareholders (unaudited) | | Wells Fargo Intrinsic World Equity Fund | | | 3 | |
In February 2016, markets around the world hit low points before starting to rebound in the middle of the month. Investors reacted positively when measurements of manufacturing activity in Japan, the U.S., and China indicated growth. The PBOC reduced reserve ratios in February, which was intended to encourage banks to increase lending. Investors also were influenced favorably by further accommodation by the ECB in March, when the bank pushed negative interest rates lower, which ratcheted up pressure on banks to lend. The ECB also expanded its bond-buying program once again and took additional steps to lower costs for borrowers. March proved to be the strongest month for international stock index performance during the period. For the month, the Morgan Stanley Capital International (MSCI) Europe, Australasia, Far East (EAFE) Index (Net)1 gained 6.5%, the MSCI World Index2 increased 6.8%, the MSCI All Country World Index (ACWI) ex USA Index (Net)3 moved up 8.1%, and the S&P Developed Small Cap Index4 gained 8.6%. More positive, albeit lower, returns followed in April.
With the exception of the S&P Developed Small Cap Index, strong March and April returns were not enough to push performance of the indexes into positive territory for the period. For the six-month period that ended April 30, 2016, the MSCI EAFE Index (Net) returned -3.1%, the MSCI World Index returned -1.1%, and the MSCI ACWI ex USA Index (Net) returned -1.8%; the S&P Developed Small Cap Index gained 3.2%.
Don’t let short-term uncertainty derail long-term investment goals.
Periods of investment uncertainty can present challenges, but experience has taught us that maintaining long-term investment goals can be an effective way to plan for the future. To help you create a sound strategy based on your personal goals and risk tolerance, Wells Fargo Funds offers more than 100 mutual funds spanning a wide range of asset classes and investment styles. Although diversification cannot guarantee an investment profit or prevent losses, we believe it can be an effective way to manage investment risk and potentially smooth out overall portfolio performance. We encourage investors to know their investments and to understand that appropriate levels of risk-taking may unlock opportunities.
Thank you for choosing to invest with Wells Fargo Funds. We appreciate your confidence in us and remain committed to helping you meet your financial needs.
Sincerely,

Karla M. Rabusch
President
Wells Fargo Funds
Investors reacted positively when measurements of manufacturing activity in Japan, the U.S., and China indicated growth.
Notice to shareholders
At a meeting held on February 17-18, 2016, the Board of Trustees approved a change to the subadviser for the Fund to Wells Capital Management Incorporated (“WellsCap”) in connection with the merger of Metropolitan West Capital Management, LLC (“MetWest”), the Fund’s current subadviser, into WellsCap (the “Merger”). The Merger is expected to take place on or about July 1, 2016. With the completion of the Merger, MetWest personnel will become exclusively personnel of WellsCap. The Merger will not result in any change to the services provided to the Fund or to the Fund’s strategies or fees and expenses.
For further information about your Fund, contact your investment professional, visit our website at wellsfargofunds.com, or call us directly at 1-800-222-8222. We are available 24 hours a day, 7 days a week.
| | | | |
| 4 | | Wells Fargo Intrinsic World Equity Fund | | Letter to shareholders (unaudited) |
| 1 | The Morgan Stanley Capital International (MSCI) Europe, Australasia, Far East (EAFE) Index (Net) is a free-float-adjusted market-capitalization-weighted index that is designed to measure the equity market performance of developed markets, excluding the U.S. and Canada. The MSCI EAFE Index (Net) consists of the following 21 developed markets country indexes: Australia, Austria, Belgium, Denmark, Finland, France, Germany, Hong Kong, Ireland, Israel, Italy, Japan, the Netherlands, New Zealand, Norway, Portugal, Singapore, Spain, Sweden, Switzerland, and the United Kingdom. Source: MSCI. MSCI makes no express or implied warranties or representations and shall have no liability whatsoever with respect to any MSCI data contained herein. The MSCI data may not be further redistributed or used as a basis for other indexes or any securities or financial products. This report is not approved, reviewed, or produced by MSCI. You cannot invest directly in an index. |
| 2 | The MSCI World Index is a free-float-adjusted market-capitalization-weighted index that is designed to measure the equity market performance of developed markets. The MSCI World Index consists of the following 23 developed markets country indexes: Australia, Austria, Belgium, Canada, Denmark, Finland, France, Germany, Hong Kong, Ireland, Israel, Italy, Japan, the Netherlands, New Zealand, Norway, Portugal, Singapore, Spain, Sweden, Switzerland, the United Kingdom, and the United States. You cannot invest directly in an index. |
| 3 | The MSCI All Country World Index (ACWI) ex USA Index (Net) is a free-float-adjusted market-capitalization-weighted index that is designed to measure the equity market performance of developed and emerging markets. The MSCI ACWI ex USA Index (Net) consists of 45 country indexes comprising 22 developed and 23 emerging markets country indexes. The developed markets country indexes included are Australia, Austria, Belgium, Canada, Denmark, Finland, France, Germany, Hong Kong, Ireland, Israel, Italy, Japan, the Netherlands, New Zealand, Norway, Portugal, Singapore, Spain, Sweden, Switzerland, and the United Kingdom. The emerging markets country indexes included are Brazil, Chile, China, Colombia, Czech Republic, Egypt, Greece, Hungary, India, Indonesia, Korea, Malaysia, Mexico, Peru, the Philippines, Poland, Qatar, Russia, South Africa, Taiwan, Thailand, Turkey, and United Arab Emirates. You cannot invest directly in an index. |
| 4 | The S&P Developed Small Cap Index is a free-float-adjusted market-capitalization-weighted index designed to measure the equity market performance of small-capitalization companies located in developed markets. The index is composed of companies within the bottom 15% of the cumulative market capitalization in developed markets. The index covers all publicly listed equities with float-adjusted market values of U.S. $100 million or more and annual dollar value traded of at least U.S. $50 million in all included countries. You cannot invest directly in an index. |
This page is intentionally left blank.
| | | | |
| 6 | | Wells Fargo Intrinsic World Equity Fund | | Performance highlights (unaudited) |
Investment objective
The Fund seeks long-term capital appreciation.
Manager
Wells Fargo Funds Management, LLC
Subadviser
Metropolitan West Capital Management, LLC
Portfolio managers
Jean-Baptiste Nadal, CFA®
Jeffrey Peck
Average annual total returns (%) as of April 30, 20161
| | | | | | | | | | | | | | | | | | | | | | | | | | | | | | | | | | |
| | | | | Including sales charge | | | Excluding sales charge | | | Expense ratios2 (%) | |
| | | Inception date | | 1 year | | | 5 year | | | 10 year | | | 1 year | | | 5 year | | | 10 year | | | Gross | | | Net3 | |
| Class A (EWEAX) | | 4-30-1996 | | | (12.53 | ) | | | 4.97 | | | | 3.53 | | | | (7.18 | ) | | | 6.22 | | | | 4.15 | | | | 1.45 | | | | 1.35 | |
| Class C (EWECX) | | 5-18-2007 | | | (8.88 | ) | | | 5.43 | | | | 3.38 | | | | (7.88 | ) | | | 5.43 | | | | 3.38 | | | | 2.20 | | | | 2.10 | |
| Administrator Class (EWEIX) | | 5-18-2007 | | | – | | | | – | | | | – | | | | (6.98 | ) | | | 6.48 | | | | 4.37 | | | | 1.37 | | | | 1.25 | |
| Institutional Class (EWENX) | | 7-30-2010 | | | – | | | | – | | | | – | | | | (6.79 | ) | | | 6.69 | | | | 4.49 | | | | 1.12 | | | | 0.95 | |
| MSCI World Index (Net)4 | | – | | | – | | | | – | | | | – | | | | (4.17 | ) | | | 5.96 | | | | 4.13 | | | | – | | | | – | |
Figures quoted represent past performance, which is no guarantee of future results, and do not reflect taxes that a shareholder may pay on fund distributions or the redemption of fund shares. Investment return and principal value of an investment will fluctuate so that an investor’s shares, when redeemed, may be worth more or less than their original cost. Performance shown without sales charges would be lower if sales charges were reflected. Current performance may be lower or higher than the performance data quoted, which assumes the reinvestment of dividends and capital gains. Current month-end performance is available on the Fund’s website, wellsfargofunds.com.
Index returns do not include transaction costs associated with buying and selling securities, any mutual fund fees or expenses, or any taxes. It is not possible to invest directly in an index.
For Class A shares, the maximum front-end sales charge is 5.75%. For Class C shares, the maximum contingent deferred sales charge is 1.00%. Performance including a contingent deferred sales charge assumes the sales charge for the corresponding time period. Administrator Class and Institutional Class shares are sold without a front-end sales charge or contingent deferred sales charge.
Stock values fluctuate in response to the activities of individual companies and general market and economic conditions. Foreign investments are especially volatile and can rise or fall dramatically due to differences in the political and economic conditions of the host country. These risks are generally intensified in emerging markets. The use of derivatives may reduce returns and/or increase volatility. Certain investment strategies tend to increase the total risk of an investment (relative to the broader market). The Fund is exposed to focused portfolio risk, geographic risk, and smaller-company securities risk. Consult the Fund’s prospectus for additional information on these and other risks.
Please see footnotes on page 7.
| | | | | | |
| Performance highlights (unaudited) | | Wells Fargo Intrinsic World Equity Fund | | | 7 | |
| | | | |
| Ten largest holdings (%) as of April 30, 20165 | |
Microsoft Corporation | | | 2.52 | |
AIA Group Limited | | | 2.48 | |
Motorola Solutions Incorporated | | | 2.47 | |
ORIX Corporation | | | 2.46 | |
Merck & Company Incorporated | | | 2.35 | |
EOG Resources Incorporated | | | 2.35 | |
Visa Incorporated Class A | | | 2.27 | |
Texas Instruments Incorporated | | | 2.25 | |
Novartis AG ADR | | | 2.21 | |
AerCap Holdings NV | | | 2.16 | |
| | |
| Sector distribution as of April 30, 20166 |
|
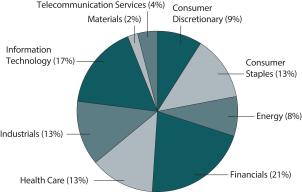 |
| | |
| Country allocation as of April 30, 20166 |
|
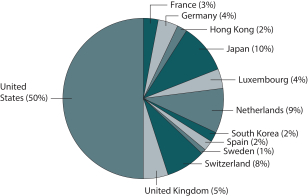 |
| 1 | Historical performance shown for Class C shares prior to their inception reflects the performance of Class A shares, and has been adjusted to reflect the higher expenses applicable to Class C shares. Historical performance shown for Institutional Class shares prior to their inception reflects the performance of Administrator Class shares, and includes the higher expenses applicable to Administrator Class shares. If these expenses had not been included, returns would be higher. Historical performance shown for Administrator Class shares prior to their inception reflects the performance of Class A shares, and includes the higher expenses applicable to Class A shares. If these expenses had not been included, returns would be higher. Historical performance shown for all classes of the Fund prior to July 19, 2010, is based on the performance of the Fund’s predecessor, Evergreen Intrinsic World Equity Fund. |
| 2 | Reflects the expense ratios as stated in the most recent prospectuses. The expense ratios shown are subject to change and may differ from the annualized expense ratios shown in the financial highlights of this report. |
| 3 | The manager has contractually committed through February 28, 2017 to waive fees and/or reimburse expenses to the extent necessary to cap the Fund’s Total Annual Operating Expenses After Fee Waiver at the amounts shown. After this time, the cap may be increased or the commitment to maintain the cap may be terminated only with the approval of the Board of Trustees. Brokerage commissions, stamp duty fees, interest, taxes, acquired fund fees and expenses, and extraordinary expenses are excluded from the cap. Without this cap, the Fund’s returns would have been lower. |
| 4 | The Morgan Stanley Capital International (MSCI) World Index (Net) is a free-float-adjusted market-capitalization-weighted index that is designed to measure the equity market performance of developed markets. The MSCI World Index (Net) consists of the following 23 developed markets country indexes: Australia, Austria, Belgium, Canada, Denmark, Finland, France, Germany, Hong Kong, Ireland, Israel, Italy, Japan, the Netherlands, New Zealand, Norway, Portugal, Singapore, Spain, Sweden, Switzerland, the United Kingdom, and the United States. Source: MSCI. MSCI makes no express or implied warranties or representations and shall have no liability whatsoever with respect to any MSCI data contained herein. The MSCI data may not be further redistributed or used as a basis for other indexes or any securities or financial products. This report is not approved, reviewed, or produced by MSCI. You cannot invest directly in an index. |
| 5 | The ten largest holdings, excluding cash and cash equivalents, are calculated based on the value of the investments divided by total net assets of the Fund. Holdings are subject to change and may have changed since the date specified. |
| 6 | Amounts are calculated based on the total long-term investments of the Fund. These amounts are subject to change and may have changed since the date specified. |
| | | | |
| 8 | | Wells Fargo Intrinsic World Equity Fund | | Fund expenses (unaudited) |
As a shareholder of the Fund, you incur two types of costs: (1) transaction costs, including sales charges (loads) on purchase payments and contingent deferred sales charges (if any) on redemptions and (2) ongoing costs, including management fees, distribution (12b-1) and/or shareholder servicing fees, and other Fund expenses. This example is intended to help you understand your ongoing costs (in dollars) of investing in the Fund and to compare these costs with the ongoing costs of investing in other mutual funds.
The example is based on an investment of $1,000 invested at the beginning of the six-month period and held for the entire period from November 1, 2015 to April 30, 2016.
Actual expenses
The “Actual” line of the table below provides information about actual account values and actual expenses. You may use the information in this line, together with the amount you invested, to estimate the expenses that you paid over the period. Simply divide your account value by $1,000 (for example, an $8,600 account value divided by $1,000 = 8.6), then multiply the result by the number in the “Actual” line under the heading entitled “Expenses paid during period” for your applicable class of shares to estimate the expenses you paid on your account during this period.
Hypothetical example for comparison purposes
The “Hypothetical” line of the table below provides information about hypothetical account values and hypothetical expenses based on the Fund’s actual expense ratio and an assumed rate of return of 5% per year before expenses, which is not the Fund’s actual return. The hypothetical account values and expenses may not be used to estimate the actual ending account balance or expenses you paid for the period. You may use this information to compare the ongoing costs of investing in the Fund and other funds. To do so, compare this 5% hypothetical example with the 5% hypothetical examples that appear in the shareholder reports of the other funds.
Please note that the expenses shown in the table are meant to highlight your ongoing costs only and do not reflect any transactional costs, such as sales charges (loads) and contingent deferred sales charges. Therefore, the “Hypothetical” line of the table is useful in comparing ongoing costs only and will not help you determine the relative total costs of owning different funds. In addition, if these transactional costs were included, your costs would have been higher.
| | | | | | | | | | | | | | | | |
| | | Beginning
account value
11-1-2015 | | | Ending
account value
4-30-2016 | | | Expenses
paid during
the period¹ | | | Net annualized
expense ratio | |
Class A | | | | | | | | | | | | | | | | |
Actual | | $ | 1,000.00 | | | $ | 958.67 | | | $ | 6.72 | | | | 1.38 | % |
Hypothetical (5% return before expenses) | | $ | 1,000.00 | | | $ | 1,018.00 | | | $ | 6.92 | | | | 1.38 | % |
Class C | | | | | | | | | | | | | | | | |
Actual | | $ | 1,000.00 | | | $ | 955.51 | | | $ | 10.36 | | | | 2.13 | % |
Hypothetical (5% return before expenses) | | $ | 1,000.00 | | | $ | 1,014.27 | | | $ | 10.67 | | | | 2.13 | % |
Administrator Class | | | | | | | | | | | | | | | | |
Actual | | $ | 1,000.00 | | | $ | 959.62 | | | $ | 5.75 | | | | 1.18 | % |
Hypothetical (5% return before expenses) | | $ | 1,000.00 | | | $ | 1,019.00 | | | $ | 5.92 | | | | 1.18 | % |
Institutional Class | | | | | | | | | | | | | | | | |
Actual | | $ | 1,000.00 | | | $ | 960.64 | | | $ | 4.63 | | | | 0.95 | % |
Hypothetical (5% return before expenses) | | $ | 1,000.00 | | | $ | 1,020.14 | | | $ | 4.77 | | | | 0.95 | % |
| 1 | Expenses paid is equal to the annualized expense ratio of each class multiplied by the average account value over the period, multiplied by the number of days in the most recent fiscal half-year divided by the number of days in the fiscal year (to reflect the one-half-year period). |
| | | | | | |
| Portfolio of investments—April 30, 2016 (unaudited) | | Wells Fargo Intrinsic World Equity Fund | | | 9 | |
| | | | | | | | | | | | |
| Security name | | | | | | Shares | | | Value | |
| | | | |
Common Stocks: 99.45% | | | | | | | | | | | | |
| | | | |
| France: 3.46% | | | | | | | | | | | | |
Air Liquide SA (Materials, Chemicals) | | | | | | | 20,500 | | | $ | 2,323,880 | |
Societe Generale SA (Financials, Banks) | | | | | | | 74,882 | | | | 2,936,721 | |
| | | | |
| | | | | | | | | | | 5,260,601 | |
| | | | | | | | | | | | |
| | | | |
| Germany: 3.52% | | | | | | | | | | | | |
Bayer AG (Health Care, Pharmaceuticals) | | | | | | | 16,680 | | | | 1,924,269 | |
Deutsche Telekom AG (Telecommunication Services, Diversified Telecommunication Services) | | | | | | | 109,160 | | | | 1,910,529 | |
Siemens AG (Industrials, Industrial Conglomerates) | | | | | | | 14,614 | | | | 1,524,781 | |
| | | | |
| | | | | | | | | | | 5,359,579 | |
| | | | | | | | | | | | |
| | | | |
| Hong Kong: 2.48% | | | | | | | | | | | | |
AIA Group Limited (Financials, Insurance) | | | | | | | 627,400 | | | | 3,777,228 | |
| | | | | | | | | | | | |
| | | | |
| Japan: 10.23% | | | | | | | | | | | | |
Honda Motor Company Limited (Consumer Discretionary, Automobiles) | | | | | | | 94,920 | | | | 2,624,578 | |
Kao Corporation (Consumer Staples, Personal Products) | | | | | | | 53,100 | | | | 2,997,131 | |
Nidec Corporation (Industrials, Electrical Equipment) | | | | | | | 43,010 | | | | 3,236,615 | |
ORIX Corporation (Financials, Diversified Financial Services) | | | | | | | 257,500 | | | | 3,746,800 | |
Sony Corporation (Consumer Discretionary, Household Durables) | | | | | | | 119,720 | | | | 2,975,748 | |
| | | | |
| | | | | | | | | | | 15,580,872 | |
| | | | | | | | | | | | |
| | | | |
| Luxembourg: 3.65% | | | | | | | | | | | | |
Millicom International Cellular SA (Telecommunication Services, Wireless Telecommunication Services) | | | | | | | 39,850 | | | | 2,302,536 | |
Samsonite International SA (Consumer Discretionary, Textiles, Apparel & Luxury Goods) | | | | | | | 1,007,890 | | | | 3,254,863 | |
| | | | |
| | | | | | | | | | | 5,557,399 | |
| | | | | | | | | | | | |
| | | | |
| Netherlands: 8.97% | | | | | | | | | | | | |
AerCap Holdings NV (Industrials, Trading Companies & Distributors) † | | | | | | | 82,207 | | | | 3,289,102 | |
Airbus Group NV (Industrials, Aerospace & Defense) | | | | | | | 24,090 | | | | 1,506,377 | |
Heineken NV (Consumer Staples, Beverages) | | | | | | | 33,570 | | | | 3,146,260 | |
Sensata Technologies Holding NV (Industrials, Electrical Equipment) † | | | | | | | 75,112 | | | | 2,829,469 | |
Unilever NV (Consumer Staples, Food Products) « | | | | | | | 65,456 | | | | 2,881,373 | |
| | | | |
| | | | | | | | | | | 13,652,581 | |
| | | | | | | | | | | | |
| | | | |
| South Korea: 2.13% | | | | | | | | | | | | |
Samsung Electronics Company Limited (Information Technology, Technology Hardware, Storage & Peripherals) | | | | | | | 2,973 | | | | 3,248,539 | |
| | | | | | | | | | | | |
| | | | |
| Spain: 1.83% | | | | | | | | | | | | |
CaixaBank SA (Financials, Banks) | | | | | | | 924,674 | | | | 2,783,581 | |
| | | | | | | | | | | | |
| | | | |
| Sweden: 1.04% | | | | | | | | | | | | |
Autoliv Incorporated SDR (Consumer Discretionary, Auto Components) | | | | | | | 13,012 | | | | 1,576,584 | |
| | | | | | | | | | | | |
| | | | |
| Switzerland: 7.98% | | | | | | | | | | | | |
Nestle SA (Consumer Staples, Food Products) | | | | | | | 41,190 | | | | 3,070,035 | |
Novartis AG ADR (Health Care, Pharmaceuticals) | | | | | | | 44,361 | | | | 3,370,105 | |
Roche Holding AG (Health Care, Pharmaceuticals) | | | | | | | 11,987 | | | | 3,030,176 | |
UBS Group AG (Financials, Capital Markets) | | | | | | | 154,900 | | | | 2,680,434 | |
| | | | |
| | | | | | | | | | | 12,150,750 | |
| | | | | | | | | | | | |
The accompanying notes are an integral part of these financial statements.
| | | | |
| 10 | | Wells Fargo Intrinsic World Equity Fund | | Portfolio of investments—April 30, 2016 (unaudited) |
| | | | | | | | | | | | | | |
| Security name | | | | | | | Shares | | | Value | |
| | | | |
| United Kingdom: 4.76% | | | | | | | | | | | | | | |
Barclays plc (Financials, Banks) | | | | | | | | | 985,381 | | | $ | 2,469,240 | |
Diageo plc (Consumer Staples, Beverages) | | | | | | | | | 86,176 | | | | 2,324,412 | |
Royal Dutch Shell plc Class A (Energy, Oil, Gas & Consumable Fuels) | | | | | | | | | 93,194 | | | | 2,454,372 | |
| | | | |
| | | | | | | | | | | | | 7,248,024 | |
| | | | | | | | | | | | | | |
| | | | |
| United States: 49.40% | | | | | | | | | | | | | | |
Abbott Laboratories (Health Care, Health Care Equipment & Supplies) | | | | | | | | | 68,195 | | | | 2,652,786 | |
Apple Incorporated (Information Technology, Technology Hardware, Storage & Peripherals) | | | | | | | | | 26,284 | | | | 2,463,862 | |
BB&T Corporation (Financials, Banks) | | | | | | | | | 79,840 | | | | 2,824,739 | |
Charles Schwab Corporation (Financials, Capital Markets) | | | | | | | | | 93,915 | | | | 2,668,125 | |
Chevron Corporation (Energy, Oil, Gas & Consumable Fuels) | | | | | | | | | 30,371 | | | | 3,103,309 | |
CIT Group Incorporated (Financials, Banks) | | | | | | | | | 69,709 | | | | 2,409,840 | |
EMC Corporation (Information Technology, Technology Hardware, Storage & Peripherals) | | | | | | | | | 47,907 | | | | 1,250,852 | |
EOG Resources Incorporated (Energy, Oil, Gas & Consumable Fuels) | | | | | | | | | 43,219 | | | | 3,570,754 | |
Express Scripts Holding Company (Health Care, Health Care Providers & Services) † | | | | | | | | | 36,746 | | | | 2,709,283 | |
Gilead Sciences Incorporated (Health Care, Biotechnology) | | | | | | | | | 33,791 | | | | 2,980,704 | |
Goldman Sachs Group Incorporated (Financials, Capital Markets) | | | | | | | | | 18,159 | | | | 2,980,073 | |
Honeywell International Incorporated (Industrials, Aerospace & Defense) | | | | | | | | | 19,397 | | | | 2,216,495 | |
Lockheed Martin Corporation (Industrials, Aerospace & Defense) | | | | | | | | | 9,595 | | | | 2,229,686 | |
Merck & Company Incorporated (Health Care, Pharmaceuticals) | | | | | | | | | 65,174 | | | | 3,574,142 | |
Microsoft Corporation (Information Technology, Software) | | | | | | | | | 76,894 | | | | 3,834,702 | |
Motorola Solutions Incorporated (Information Technology, Communications Equipment) | | | | | | | | | 50,100 | | | | 3,767,019 | |
Oracle Corporation (Information Technology, Software) | | | | | | | | | 72,813 | | | | 2,902,326 | |
PepsiCo Incorporated (Consumer Staples, Beverages) | | | | | | | | | 28,037 | | | | 2,886,690 | |
QUALCOMM Incorporated (Information Technology, Communications Equipment) | | | | | | | | | 25,316 | | | | 1,278,964 | |
Schlumberger Limited (Energy, Energy Equipment & Services) | | | | | | | | | 36,760 | | | | 2,953,298 | |
SunTrust Banks Incorporated (Financials, Banks) | | | | | | | | | 56,014 | | | | 2,338,024 | |
Texas Instruments Incorporated (Information Technology, Semiconductors & Semiconductor Equipment) | | | 59,973 | | | | 3,420,860 | |
The Procter & Gamble Company (Consumer Staples, Household Products) | | | | | | | | | 31,655 | | | | 2,536,199 | |
The Walt Disney Company (Consumer Discretionary, Media) | | | | | | | | | 28,576 | | | | 2,950,758 | |
United Parcel Service Incorporated Class B (Industrials, Air Freight & Logistics) | | | | | | | | | 29,580 | | | | 3,107,971 | |
Verizon Communications Incorporated (Telecommunication Services, Diversified Telecommunication Services) | | | 41,961 | | | | 2,137,493 | |
Visa Incorporated Class A (Information Technology, IT Services) | | | | | | | | | 44,702 | | | | 3,452,782 | |
| | | | |
| | | | | | | | | | | | | 75,201,736 | |
| | | | | | | | | | | | | | |
| | | | |
Total Common Stocks (Cost $131,985,116) | | | | | | | | | | | | | 151,397,474 | |
| | | | | | | | | | | | | | |
| | | | |
| | | Yield | | | | | | | | | |
| Short-Term Investments: 2.68% | | | | | | | | | | | | | | |
| | | | |
| Investment Companies: 2.68% | | | | | | | | | | | | | | |
Securities Lending Cash Investments LLC (l)(r)(u) | | | 0.45 | % | | | | | 2,825,550 | | | | 2,825,550 | |
Wells Fargo Cash Investment Money Market Fund Select Class (l)(u) | | | 0.43 | | | | | | 1,250,956 | | | | 1,250,956 | |
| | | | |
Total Short-Term Investments (Cost $4,076,506) | | | | | | | | | | | | | 4,076,506 | |
| | | | | | | | | | | | | | |
| | | | | | | | |
| Total investments in securities (Cost $136,061,622) * | | | 102.13 | % | | | 155,473,980 | |
Other assets and liabilities, net | | | (2.13 | ) | | | (3,249,974 | ) |
| | | | | | | | |
| Total net assets | | | 100.00 | % | | $ | 152,224,006 | |
| | | | | | | | |
The accompanying notes are an integral part of these financial statements.
| | | | | | |
| Portfolio of investments—April 30, 2016 (unaudited) | | Wells Fargo Intrinsic World Equity Fund | | | 11 | |
| † | Non-income-earning security |
| « | All or a portion of this security is on loan. |
| (l) | The issuer of the security is an affiliated person of the Fund as defined in the Investment Company Act of 1940. |
| (r) | The investment is a non-registered investment vehicle purchased with cash collateral received from securities on loan. |
| (u) | The rate represents the 7-day annualized yield at period end. |
| * | Cost for federal income tax purposes is $136,787,235 and unrealized gains (losses) consists of: |
| | | | |
Gross unrealized gains | | $ | 30,108,406 | |
Gross unrealized losses | | | (11,421,661 | ) |
| | | | |
Net unrealized gains | | $ | 18,686,745 | |
The accompanying notes are an integral part of these financial statements.
| | | | |
| 12 | | Wells Fargo Intrinsic World Equity Fund | | Statement of assets and liabilities—April 30, 2016 (unaudited) |
| | | | |
| | | | |
| |
Assets | | | | |
Investments | | | | |
In unaffiliated securities (including $2,763,450 of securities loaned), at value (cost $131,985,116) | | $ | 151,397,474 | |
In affiliated securities, at value (cost $4,076,506) | | | 4,076,506 | |
| | | | |
Total investments, at value (cost $136,061,622) | | | 155,473,980 | |
Foreign currency, at value (cost $78) | | | 72 | |
Receivable for Fund shares sold | | | 47,157 | |
Receivable for dividends | | | 355,627 | |
Prepaid expenses and other assets | | | 43,665 | |
| | | | |
Total assets | | | 155,920,501 | |
| | | | |
| |
Liabilities | | | | |
Payable for investments purchased | | | 428,368 | |
Payable for Fund shares redeemed | | | 226,495 | |
Payable upon receipt of securities loaned | | | 2,825,550 | |
Management fee payable | | | 95,676 | |
Distribution fee payable | | | 4,780 | |
Administration fees payable | | | 26,440 | |
Accrued expenses and other liabilities | | | 89,186 | |
| | | | |
Total liabilities | | | 3,696,495 | |
| | | | |
Total net assets | | $ | 152,224,006 | |
| | | | |
| |
NET ASSETS CONSIST OF | | | | |
Paid-in capital | | $ | 130,447,703 | |
Undistributed net investment income | | | 79,320 | |
Accumulated net realized gains on investments | | | 2,276,822 | |
Net unrealized gains on investments | | | 19,420,161 | |
| | | | |
Total net assets | | $ | 152,224,006 | |
| | | | |
| |
COMPUTATION OF NET ASSET VALUE AND OFFERING PRICE PER SHARE | | | | |
Net assets – Class A | | $ | 134,508,943 | |
Shares outstanding – Class A1 | | | 7,002,884 | |
Net asset value per share – Class A | | | $19.21 | |
Maximum offering price per share – Class A2 | | | $20.38 | |
Net assets – Class C | | $ | 7,565,776 | |
Shares outstanding – Class C1 | | | 408,187 | |
Net asset value per share – Class C | | | $18.54 | |
Net assets – Administrator Class | | $ | 5,935,370 | |
Shares outstanding – Administrator Class1 | | | 310,634 | |
Net asset value per share – Administrator Class | | | $19.11 | |
Net assets – Institutional Class | | $ | 4,213,917 | |
Shares outstanding – Institutional Class1 | | | 220,041 | |
Net asset value per share – Institutional Class | | | $19.15 | |
| 1 | The Fund has an unlimited number of authorized shares. |
| 2 | Maximum offering price is computed as 100/94.25 of net asset value. On investments of $50,000 or more, the offering price is reduced. |
The accompanying notes are an integral part of these financial statements.
| | | | | | |
| Statement of operations—six months ended April 30, 2016 (unaudited) | | Wells Fargo Intrinsic World Equity Fund | | | 13 | |
| | | | |
| | | | |
| |
Investment income | | | | |
Dividends (net of foreign withholding taxes of $111,380) | | $ | 1,788,169 | |
Securities lending income, net | | | 2,347 | |
Income from affiliated securities | | | 1,263 | |
| | | | |
Total investment income | | | 1,791,779 | |
| | | | |
| |
Expenses | | | | |
Management fee | | | 650,418 | |
Administration fees | | | | |
Class A | | | 141,861 | |
Class C | | | 8,305 | |
Administrator Class | | | 3,578 | |
Institutional Class | | | 2,938 | |
Shareholder servicing fees | | | | |
Class A | | | 168,882 | |
Class C | | | 9,887 | |
Administrator Class | | | 6,625 | |
Distribution fee | | | | |
Class C | | | 29,663 | |
Custody and accounting fees | | | 19,628 | |
Professional fees | | | 25,617 | |
Registration fees | | | 31,062 | |
Shareholder report expenses | | | 23,474 | |
Trustees’ fees and expenses | | | 7,398 | |
Other fees and expenses | | | 4,036 | |
| | | | |
Total expenses | | | 1,133,372 | |
Less: Fee waivers and/or expense reimbursements | | | (60,470 | ) |
| | | | |
Net expenses | | | 1,072,902 | |
| | | | |
Net investment income | | | 718,877 | |
| | | | |
| |
REALIZED AND UNREALIZED GAINS (LOSSES) ON INVESTMENTS | | | | |
Net realized gains on investments | | | 2,348,350 | |
Net change in unrealized gains (losses) on investments | | | (10,360,090 | ) |
| | | | |
Net realized and unrealized gains (losses) on investments | | | (8,011,740 | ) |
| | | | |
Net decrease in net assets resulting from operations | | $ | (7,292,863 | ) |
| | | | |
The accompanying notes are an integral part of these financial statements.
| | | | |
| 14 | | Wells Fargo Intrinsic World Equity Fund | | Statement of changes in net assets |
| | | | | | | | | | | | | | | | |
| | | Six months ended
April 30, 2016
(unaudited) | | | Year ended
October 31, 2015 | |
| | | | |
Operations | | | | | | | | | | | | | | | | |
Net investment income | | | | | | $ | 718,877 | | | | | | | $ | 1,348,061 | |
Net realized gains on investments | | | | | | | 2,348,350 | | | | | | | | 18,667,164 | |
Net change in unrealized gains (losses) on investments | | | | | | | (10,360,090 | ) | | | | | | | (12,629,315 | ) |
| | | | |
Net increase (decrease) in net assets resulting from operations | | | | | | | (7,292,863 | ) | | | | | | | 7,385,910 | |
| | | | |
| | | | |
Distributions to shareholders from | | | | | | | | | | | | | | | | |
Net investment income | | | | | | | | | | | | | | | | |
Class A | | | | | | | (1,480,000 | ) | | | | | | | (856,992 | ) |
Class C | | | | | | | (5,766 | ) | | | | | | | 0 | |
Administrator Class | | | | | | | (77,002 | ) | | | | | | | (51,944 | ) |
Institutional Class | | | | | | | (77,098 | ) | | | | | | | (48,847 | ) |
Net realized gains | | | | | | | | | | | | | | | | |
Class A | | | | | | | (15,944,560 | ) | | | | | | | (2,600,451 | ) |
Class C | | | | | | | (992,532 | ) | | | | | | | (169,828 | ) |
Administrator Class | | | | | | | (637,316 | ) | | | | | | | (108,609 | ) |
Institutional Class | | | | | | | (554,534 | ) | | | | | | | (77,473 | ) |
| | | | |
Total distributions to shareholders | | | | | | | (19,768,808 | ) | | | | | | | (3,914,144 | ) |
| | | | |
| | | | |
Capital share transactions | | | Shares | | | | | | | | Shares | | | | | |
Proceeds from shares sold | | | | | | | | | | | | | | | | |
Class A | | | 59,680 | | | | 1,165,060 | | | | 179,787 | | | | 4,097,757 | |
Class C | | | 38,834 | | | | 725,599 | | | | 35,552 | | | | 773,618 | |
Administrator Class | | | 56,475 | | | | 1,048,459 | | | | 93,043 | | | | 2,104,873 | |
Institutional Class | | | 36,912 | | | | 724,427 | | | | 161,738 | | | | 3,667,260 | |
| | | | |
| | | | | | | 3,663,545 | | | | | | | | 10,643,508 | |
| | | | |
Reinvestment of distributions | | | | | | | | | | | | | | | | |
Class A | | | 871,879 | | | | 16,927,692 | | | | 152,110 | | | | 3,351,854 | |
Class C | | | 51,392 | | | | 955,480 | | | | 7,388 | | | | 156,548 | |
Administrator Class | | | 36,033 | | | | 697,376 | | | | 7,067 | | | | 155,486 | |
Institutional Class | | | 24,158 | | | | 469,358 | | | | 3,982 | | | | 87,906 | |
| | | | |
| | | | | | | 19,049,906 | | | | | | | | 3,751,794 | |
| | | | |
Payment for shares redeemed | | | | | | | | | | | | | | | | |
Class A | | | (480,586 | ) | | | (9,299,362 | ) | | | (795,378 | ) | | | (18,121,192 | ) |
Class C | | | (89,330 | ) | | | (1,590,279 | ) | | | (88,016 | ) | | | (1,946,944 | ) |
Administrator Class | | | (56,027 | ) | | | (1,094,978 | ) | | | (154,125 | ) | | | (3,437,971 | ) |
Institutional Class | | | (62,588 | ) | | | (1,189,567 | ) | | | (86,058 | ) | | | (1,969,384 | ) |
| | | | |
| | | | | | | (13,174,186 | ) | | | | | | | (25,475,491 | ) |
| | | | |
Net increase (decrease) in net assets resulting from capital share transactions | | | | | | | 9,539,265 | | | | | | | | (11,080,189 | ) |
| | | | |
Total decrease in net assets | | | | | | | (17,522,406 | ) | | | | | | | (7,608,423 | ) |
| | | | |
| | | | |
Net assets | | | | | | | | | | | | | | | | |
Beginning of period | | | | | | | 169,746,412 | | | | | | | | 177,354,835 | |
| | | | |
End of period | | | | | | $ | 152,224,006 | | | | | | | $ | 169,746,412 | |
| | | | |
Undistributed net investment income | | | | | | $ | 79,320 | | | | | | | $ | 1,000,309 | |
| | | | |
The accompanying notes are an integral part of these financial statements.
| | | | | | |
| Financial highlights | | Wells Fargo Intrinsic World Equity Fund | | | 15 | |
(For a share outstanding throughout each period)
| | | | | | | | | | | | | | | | | | | | | | | | |
| | | Six months ended
April 30, 2016
(unaudited) | | | Year ended October 31 | |
| CLASS A | | | 2015 | | | 2014 | | | 2013 | | | 2012 | | | 2011 | |
Net asset value, beginning of period | | | $22.82 | | | | $22.39 | | | | $21.88 | | | | $17.94 | | | | $15.55 | | | | $15.06 | |
Net investment income | | | 0.07 | | | | 0.19 | | | | 0.17 | | | | 0.20 | | | | 0.16 | | | | 0.12 | 1 |
Net realized and unrealized gains (losses) on investments | | | (1.02 | ) | | | 0.73 | | | | 0.59 | | | | 4.00 | | | | 1.87 | | | | 0.48 | |
| | | | | | | | | | | | | | | | | | | | | | | | |
Total from investment operations | | | (0.95 | ) | | | 0.92 | | | | 0.76 | | | | 4.20 | | | | 2.03 | | | | 0.60 | |
Distributions to shareholders from | | | | | | | | | | | | | | | | | | | | | | | | |
Net investment income | | | (0.20 | ) | | | (0.12 | ) | | | (0.25 | ) | | | (0.26 | ) | | | (0.11 | ) | | | (0.11 | ) |
Net realized gains | | | (2.46 | ) | | | (0.37 | ) | | | 0.00 | | | | 0.00 | | | | 0.00 | | | | 0.00 | |
| | | | | | | | | | | | | | | | | | | | | | | | |
Total distributions to shareholders | | | (2.66 | ) | | | (0.49 | ) | | | (0.25 | ) | | | (0.26 | ) | | | (0.11 | ) | | | (0.11 | ) |
Regulatory settlement proceeds | | | 0.00 | | | | 0.00 | | | | 0.00 | | | | 0.00 | | | | 0.47 | | | | 0.00 | |
Net asset value, end of period | | | $19.21 | | | | $22.82 | | | | $22.39 | | | | $21.88 | | | | $17.94 | | | | $15.55 | |
Total return2 | | | (4.13 | )% | | | 4.23 | % | | | 3.45 | % | | | 23.74 | % | | | 16.25 | %3 | | | 4.00 | % |
Ratios to average net assets (annualized) | | | | | | | | | | | | | | | | | | | | | | | | |
Gross expenses | | | 1.46 | % | | | 1.48 | % | | | 1.47 | % | | | 1.49 | % | | | 1.51 | % | | | 1.50 | % |
Net expenses | | | 1.38 | % | | | 1.40 | % | | | 1.40 | % | | | 1.40 | % | | | 1.40 | % | | | 1.40 | % |
Net investment income | | | 0.96 | % | | | 0.79 | % | | | 0.70 | % | | | 0.95 | % | | | 0.91 | % | | | 0.79 | % |
Supplemental data | | | | | | | | | | | | | | | | | | | | | | | | |
Portfolio turnover rate | | | 10 | % | | | 32 | % | | | 23 | % | | | 22 | % | | | 27 | % | | | 12 | % |
Net assets, end of period (000s omitted) | | | $134,509 | | | | $149,492 | | | | $157,061 | | | | $168,621 | | | | $146,930 | | | | $139,100 | |
| 1 | Calculated based upon average shares outstanding |
| 2 | Total return calculations do not include any sales charges. Returns for periods of less than one year are not annualized. |
| 3 | During the year ended October 31, 2012, the Fund received a regulatory settlement from an unaffiliated third party which had an impact of 2.92% on the total return. |
The accompanying notes are an integral part of these financial statements.
| | | | |
| 16 | | Wells Fargo Intrinsic World Equity Fund | | Financial highlights |
(For a share outstanding throughout each period)
| | | | | | | | | | | | | | | | | | | | | | | | |
| | | Six months ended
April 30, 2016
(unaudited) | | | Year ended October 31 | |
| CLASS C | | | 2015 | | | 2014 | | | 2013 | | | 2012 | | | 2011 | |
Net asset value, beginning of period | | | $21.99 | | | | $21.64 | | | | $21.19 | | | | $17.37 | | | | $15.15 | | | | $14.68 | |
Net investment income (loss) | | | 0.02 | | | | 0.01 | 1 | | | (0.02 | ) | | | 0.05 | | | | 0.02 | | | | (0.01 | )1 |
Net realized and unrealized gains (losses) on investments | | | (1.00 | ) | | | 0.71 | | | | 0.58 | | | | 3.89 | | | | 1.82 | | | | 0.49 | |
| | | | | | | | | | | | | | | | | | | | | | | | |
Total from investment operations | | | (0.98 | ) | | | 0.72 | | | | 0.56 | | | | 3.94 | | | | 1.84 | | | | 0.48 | |
Distributions to shareholders from | | | | | | | | | | | | | | | | | | | | | | | | |
Net investment income | | | (0.01 | ) | | | 0.00 | | | | (0.11 | ) | | | (0.12 | ) | | | (0.09 | ) | | | (0.01 | ) |
Net realized gains | | | (2.46 | ) | | | (0.37 | ) | | | 0.00 | | | | 0.00 | | | | 0.00 | | | | 0.00 | |
| | | | | | | | | | | | | | | | | | | | | | | | |
Total distributions to shareholders | | | (2.47 | ) | | | (0.37 | ) | | | (0.11 | ) | | | (0.12 | ) | | | (0.09 | ) | | | (0.01 | ) |
Regulatory settlement proceeds | | | 0.00 | | | | 0.00 | | | | 0.00 | | | | 0.00 | | | | 0.47 | | | | 0.00 | |
Net asset value, end of period | | | $18.54 | | | | $21.99 | | | | $21.64 | | | | $21.19 | | | | $17.37 | | | | $15.15 | |
Total return2 | | | (4.45 | )% | | | 3.41 | % | | | 2.65 | % | | | 22.82 | % | | | 15.39 | %3 | | | 3.27 | % |
Ratios to average net assets (annualized) | | | | | | | | | | | | | | | | | | | | | | | | |
Gross expenses | | | 2.20 | % | | | 2.23 | % | | | 2.22 | % | | | 2.24 | % | | | 2.26 | % | | | 2.20 | % |
Net expenses | | | 2.13 | % | | | 2.15 | % | | | 2.15 | % | | | 2.15 | % | | | 2.15 | % | | | 2.15 | % |
Net investment income (loss) | | | 0.19 | % | | | 0.05 | % | | | (0.06 | )% | | | 0.20 | % | | | 0.16 | % | | | (0.05 | )% |
Supplemental data | | | | | | | | | | | | | | | | | | | | | | | | |
Portfolio turnover rate | | | 10 | % | | | 32 | % | | | 23 | % | | | 22 | % | | | 27 | % | | | 12 | % |
Net assets, end of period (000s omitted) | | | $7,566 | | | | $8,958 | | | | $9,788 | | | | $9,949 | | | | $7,341 | | | | $6,817 | |
| 1 | Calculated based upon average shares outstanding |
| 2 | Total return calculations do not include any sales charges. Returns for periods of less than one year are not annualized. |
| 3 | During the year ended October 31, 2012, the Fund received a regulatory settlement from an unaffiliated third party which had an impact of 2.92% on the total return. |
The accompanying notes are an integral part of these financial statements.
| | | | | | |
| Financial highlights | | Wells Fargo Intrinsic World Equity Fund | | | 17 | |
(For a share outstanding throughout each period)
| | | | | | | | | | | | | | | | | | | | | | | | |
| | | Six months ended
April 30, 2016
(unaudited) | | | Year ended October 31 | |
| ADMINISTRATOR CLASS | | | 2015 | | | 2014 | | | 2013 | | | 2012 | | | 2011 | |
Net asset value, beginning of period | | | $22.76 | | | | $22.33 | | | | $21.81 | | | | $17.89 | | | | $15.52 | | | | $15.02 | |
Net investment income | | | 0.11 | 1 | | | 0.23 | 1 | | | 0.22 | 1 | | | 0.24 | 1 | | | 0.19 | 1 | | | 0.15 | 1 |
Net realized and unrealized gains (losses) on investments | | | (1.03 | ) | | | 0.75 | | | | 0.59 | | | | 3.99 | | | | 1.87 | | | | 0.49 | |
| | | | | | | | | | | | | | | | | | | | | | | | |
Total from investment operations | | | (0.92 | ) | | | 0.98 | | | | 0.81 | | | | 4.23 | | | | 2.06 | | | | 0.64 | |
Distributions to shareholders from | | | | | | | | | | | | | | | | | | | | | | | | |
Net investment income | | | (0.27 | ) | | | (0.18 | ) | | | (0.29 | ) | | | (0.31 | ) | | | (0.16 | ) | | | (0.14 | ) |
Net realized gains | | | (2.46 | ) | | | (0.37 | ) | | | 0.00 | | | | 0.00 | | | | 0.00 | | | | 0.00 | |
| | | | | | | | | | | | | | | | | | | | | | | | |
Total distributions to shareholders | | | (2.73 | ) | | | (0.55 | ) | | | (0.29 | ) | | | (0.31 | ) | | | (0.16 | ) | | | (0.14 | ) |
Regulatory settlement proceeds | | | 0.00 | | | | 0.00 | | | | 0.00 | | | | 0.00 | | | | 0.47 | | | | 0.00 | |
Net asset value, end of period | | | $19.11 | | | | $22.76 | | | | $22.33 | | | | $21.81 | | | | $17.89 | | | | $15.52 | |
Total return2 | | | (4.04 | )% | | | 4.51 | % | | | 3.70 | % | | | 24.03 | % | | | 16.52 | %3 | | | 4.27 | % |
Ratios to average net assets (annualized) | | | | | | | | | | | | | | | | | | | | | | | | |
Gross expenses | | | 1.37 | % | | | 1.34 | % | | | 1.29 | % | | | 1.31 | % | | | 1.34 | % | | | 1.30 | % |
Net expenses | | | 1.18 | % | | | 1.15 | % | | | 1.15 | % | | | 1.15 | % | | | 1.15 | % | | | 1.15 | % |
Net investment income | | | 1.15 | % | | | 1.01 | % | | | 0.96 | % | | | 1.18 | % | | | 1.14 | % | | | 0.99 | % |
Supplemental data | | | | | | | | | | | | | | | | | | | | | | | | |
Portfolio turnover rate | | | 10 | % | | | 32 | % | | | 23 | % | | | 22 | % | | | 27 | % | | | 12 | % |
Net assets, end of period (000s omitted) | | | $5,935 | | | | $6,239 | | | | $7,327 | | | | $5,306 | | | | $2,001 | | | | $1,986 | |
| 1 | Calculated based upon average shares outstanding |
| 2 | Returns for periods of less than one year are not annualized. |
| 3 | During the year ended October 31, 2012, the Fund received a regulatory settlement from an unaffiliated third party which had an impact of 2.93% on the total return. |
The accompanying notes are an integral part of these financial statements.
| | | | |
| 18 | | Wells Fargo Intrinsic World Equity Fund | | Financial highlights |
(For a share outstanding throughout each period)
| | | | | | | | | | | | | | | | | | | | | | | | |
| | | Six months ended
April 30, 2016
(unaudited) | | | Year ended October 31 | |
| INSTITUTIONAL CLASS | | | 2015 | | | 2014 | | | 2013 | | | 2012 | | | 2011 | |
Net asset value, beginning of period | | | $22.83 | | | | $22.40 | | | | $21.87 | | | | $17.93 | | | | $15.54 | | | | $15.02 | |
Net investment income | | | 0.13 | 1 | | | 0.28 | | | | 0.25 | 1 | | | 0.26 | 1 | | | 0.17 | 1 | | | 0.16 | |
Net realized and unrealized gains (losses) on investments | | | (1.03 | ) | | | 0.75 | | | | 0.60 | | | | 4.02 | | | | 1.92 | | | | 0.51 | |
| | | | | | | | | | | | | | | | | | | | | | | | |
Total from investment operations | | | (0.90 | ) | | | 1.03 | | | | 0.85 | | | | 4.28 | | | | 2.09 | | | | 0.67 | |
Distributions to shareholders from | | | | | | | | | | | | | | | | | | | | | | | | |
Net investment income | | | (0.32 | ) | | | (0.23 | ) | | | (0.32 | ) | | | (0.34 | ) | | | (0.17 | ) | | | (0.15 | ) |
Net realized gains | | | (2.46 | ) | | | (0.37 | ) | | | 0.00 | | | | 0.00 | | | | 0.00 | | | | 0.00 | |
| | | | | | | | | | | | | | | | | | | | | | | | |
Total distributions to shareholders | | | (2.78 | ) | | | (0.60 | ) | | | (0.32 | ) | | | (0.34 | ) | | | (0.17 | ) | | | (0.15 | ) |
Regulatory settlement proceeds | | | 0.00 | | | | 0.00 | | | | 0.00 | | | | 0.00 | | | | 0.47 | | | | 0.00 | |
Net asset value, end of period | | | $19.15 | | | | $22.83 | | | | $22.40 | | | | $21.87 | | | | $17.93 | | | | $15.54 | |
Total return2 | | | (3.94 | )% | | | 4.72 | % | | | 3.90 | % | | | 24.28 | % | | | 16.74 | %3 | | | 4.50 | % |
Ratios to average net assets (annualized) | | | | | | | | | | | | | | | | | | | | | | | | |
Gross expenses | | | 1.12 | % | | | 1.09 | % | | | 1.04 | % | | | 1.06 | % | | | 1.10 | % | | | 1.00 | % |
Net expenses | | | 0.95 | % | | | 0.95 | % | | | 0.95 | % | | | 0.95 | % | | | 0.95 | % | | | 0.95 | % |
Net investment income | | | 1.38 | % | | | 1.23 | % | | | 1.11 | % | | | 1.32 | % | | | 1.03 | % | | | 1.12 | % |
Supplemental data | | | | | | | | | | | | | | | | | | | | | | | | |
Portfolio turnover rate | | | 10 | % | | | 32 | % | | | 23 | % | | | 22 | % | | | 27 | % | | | 12 | % |
Net assets, end of period (000s omitted) | | | $4,214 | | | | $5,058 | | | | $3,179 | | | | $2,352 | | | | $561 | | | | $573 | |
| 1 | Calculated based upon average shares outstanding |
| 2 | Returns for periods of less than one year are not annualized. |
| 3 | During the year ended October 31, 2012, the Fund received a regulatory settlement from an unaffiliated third party which had an impact of 2.93% on the total return. |
The accompanying notes are an integral part of these financial statements.
| | | | | | |
| Notes to financial statements (unaudited) | | Wells Fargo Intrinsic World Equity Fund | | | 19 | |
1. ORGANIZATION
Wells Fargo Funds Trust (the “Trust”), a Delaware statutory trust organized on March 10, 1999, is an open-end management investment company registered under the Investment Company Act of 1940, as amended (the “1940 Act”). As an investment company, the Trust follows the accounting and reporting guidance in Financial Accounting Standards Board (“FASB”) Accounting Standards Codification Topic 946, Financial Services – Investment Companies. These financial statements report on the Wells Fargo Intrinsic World Equity Fund (the “Fund”) which is a diversified series of the Trust.
2. SIGNIFICANT ACCOUNTING POLICIES
The following significant accounting policies, which are consistently followed in the preparation of the financial statements of the Fund, are in conformity with U.S. generally accepted accounting principles which require management to make estimates and assumptions that affect the reported amounts of assets and liabilities, disclosure of contingent assets and liabilities at the date of the financial statements, and the reported amounts of revenues and expenses during the reporting period. Actual results could differ from those estimates.
Securities valuation
All investments are valued each business day as of the close of regular trading on the New York Stock Exchange (generally 4 p.m. Eastern Time), although the Fund may deviate from this calculation time under unusual or unexpected circumstances.
Equity securities that are listed on a foreign or domestic exchange or market are valued at the official closing price or, if none, the last sales price. If no sale occurs on the principal exchange or market that day, the prior day’s price will be deemed “stale” and a fair value price will be determined in accordance with the Fund’s Valuation Procedures.
The values of securities denominated in foreign currencies are translated into U.S. dollars at rates provided by an independent foreign currency pricing source at a time each business day specified by the Management Valuation Team of Wells Fargo Funds Management, LLC (“Funds Management”).
Many securities markets and exchanges outside the U.S. close prior to the close of the New York Stock Exchange and therefore may not fully reflect trading or events that occur after the close of the principal exchange in which the foreign securities are traded, but before the close of the New York Stock Exchange. If such trading or events are expected to materially affect the value of such securities, then fair value pricing procedures approved by the Board of Trustees of the Fund are applied. These procedures take into account multiple factors including movements in U.S. securities markets after foreign exchanges close. Foreign securities that are fair valued under these procedures are categorized as Level 2 and the application of these procedures may result in transfers between Level 1 and Level 2. Depending on market activity, such fair valuations may be frequent. Such fair value pricing may result in net asset values that are higher or lower than net asset values based on the last reported sales price or latest quoted bid price. On April 30, 2016, such fair value pricing was not used in pricing foreign securities.
Investments in registered open-end investment companies are valued at net asset value. Interests in non-registered investment vehicles that are redeemable at net asset value are fair valued normally at net asset value.
Investments which are not valued using any of the methods discussed above are valued at their fair value, as determined in good faith by the Board of Trustees. The Board of Trustees has established a Valuation Committee comprised of the Trustees and has delegated to it the authority to take any actions regarding the valuation of portfolio securities that the Valuation Committee deems necessary or appropriate, including determining the fair value of portfolio securities, unless the determination has been delegated to the Management Valuation Team. The Board of Trustees retains the authority to make or ratify any valuation decisions or approve any changes to the Valuation Procedures as it deems appropriate. On a quarterly basis, the Board of Trustees receives reports on any valuation actions taken by the Valuation Committee or the Management Valuation Team which may include items for ratification.
Valuations of fair valued securities are compared to the next actual sales price when available, or other appropriate market values, to assess the continued appropriateness of the fair valuation methodologies used. These securities are fair valued on a day-to-day basis, taking into consideration changes to appropriate market information and any significant changes to the inputs considered in the valuation process until there is a readily available price provided on an exchange or by an independent pricing service. Valuations received from an independent pricing service or independent broker-dealer quotes are periodically validated by comparisons to most recent trades and valuations provided by other independent pricing services in addition to the review of prices by the manager and/or subadviser. Unobservable inputs used in determining fair valuations are identified based on the type of security, taking into consideration factors utilized by market participants in valuing the investment, knowledge about the issuer and the current market environment.
| | | | |
| 20 | | Wells Fargo Intrinsic World Equity Fund | | Notes to financial statements (unaudited) |
Foreign currency translation
The accounting records of the Fund are maintained in U.S. dollars. The values of other assets and liabilities denominated in foreign currencies are translated into U.S. dollars at rates provided by an independent foreign currency pricing source at a time each business day specified by the Management Valuation Team. Purchases and sales of securities, and income and expenses are converted at the rate of exchange on the respective dates of such transactions. Net realized foreign exchange gains or losses arise from sales of foreign currencies, currency gains or losses realized between the trade and settlement dates on securities transactions, and the difference between the amounts of dividends, interest and foreign withholding taxes recorded and the U.S. dollar equivalent of the amounts actually paid or received. Net unrealized foreign exchange gains and losses arise from changes in the fair value of assets and liabilities other than investments in securities resulting from changes in exchange rates. The changes in net assets arising from changes in exchange rates and the changes in net assets resulting from changes in market prices of securities are not separately presented. Such changes are included in net realized and unrealized gains or losses from investments.
Security loans
The Fund may lend its securities from time to time in order to earn additional income in the form of fees or interest on securities received as collateral or the investment of any cash received as collateral. The Fund continues to receive interest or dividends on the securities loaned. The Fund receives collateral in the form of cash or securities with a value at least equal to the value of the securities on loan. The value of the loaned securities is determined at the close of each business day and any additional required collateral is delivered to the Fund on the next business day. In a securities lending transaction, the net asset value of the Fund will be affected by an increase or decrease in the value of the securities loaned and by an increase or decrease in the value of the instrument in which collateral is invested. The amount of securities lending activity undertaken by the Fund fluctuates from time to time. In the event of default or bankruptcy by the borrower, the Fund may be prevented from recovering the loaned securities or gaining access to the collateral or may experience delays or costs in doing so. In addition, the investment of any cash collateral received may lose all or part of its value. The Fund has the right under the lending agreement to recover the securities from the borrower on demand.
The Fund lends its securities through an unaffiliated securities lending agent. Cash collateral received in connection with its securities lending transactions is invested in Securities Lending Cash Investments, LLC (the “Securities Lending Fund”). The Securities Lending Fund is exempt from registration under Section 3(c)(7) of the 1940 Act and is managed by Funds Management and is subadvised by Wells Capital Management Incorporated (“WellsCap”), an affiliate of Funds Management and an indirect wholly owned subsidiary of Wells Fargo & Company (“Wells Fargo”). Funds Management receives an advisory fee starting at 0.05% and declining to 0.01% as the average daily net assets of the Securities Lending Fund increase. All of the fees received by Funds Management are paid to WellsCap for its services as subadviser. The Securities Lending Fund seeks to provide a positive return compared to the daily Fed Funds Open rate by investing in high-quality, U.S. dollar-denominated short-term money market instruments. Securities Lending Fund investments are fair valued based upon the amortized cost valuation technique. Income earned from investment in the Securities Lending Fund is included in securities lending income on the Statement of Operations.
Security transactions and income recognition
Securities transactions are recorded on a trade date basis. Realized gains or losses are recorded on the basis of identified cost.
Dividend income is recognized on the ex-dividend date, except for certain dividends from foreign securities, which are recorded as soon as the custodian verifies the ex-dividend date. Dividend income from foreign securities is recorded net of foreign taxes withheld where recovery of such taxes is not assured.
Distributions to shareholders
Distributions to shareholders from net investment income and net realized gains, if any, are recorded on the ex-dividend date. Such distributions are determined in conformity with federal income tax regulations, which may differ in amount or character from net investment income and realized gains recognized for purposes of U.S. generally accepted accounting principles.
Federal and other taxes
The Fund intends to continue to qualify as a regulated investment company by distributing substantially all of its investment company taxable income and any net realized capital gains (after reduction for capital loss carryforwards) sufficient to relieve it from all, or substantially all, federal income taxes. Accordingly, no provision for federal income taxes was required.
| | | | | | |
| Notes to financial statements (unaudited) | | Wells Fargo Intrinsic World Equity Fund | | | 21 | |
The Fund’s income and federal excise tax returns and all financial records supporting those returns for the prior three fiscal years are subject to examination by the federal and Delaware revenue authorities. Management has analyzed the Fund’s tax positions taken on federal, state, and foreign tax returns for all open tax years and does not believe that there are any uncertain tax positions that require recognition of a tax liability.
Class allocations
The separate classes of shares offered by the Fund differ principally in applicable sales charges, distribution, shareholder servicing, and administration fees. Class specific expenses are charged directly to that share class. Investment income, common expenses, and realized and unrealized gains (losses) on investments are allocated daily to each class of shares based on the relative proportion of net assets of each class.
3. FAIR VALUATION MEASUREMENTS
Fair value measurements of investments are determined within a framework that has established a fair value hierarchy based upon the various data inputs utilized in determining the value of the Fund’s investments. The three-level hierarchy gives the highest priority to unadjusted quoted prices in active markets for identical assets or liabilities (Level 1) and the lowest priority to significant unobservable inputs (Level 3). The Fund’s investments are classified within the fair value hierarchy based on the lowest level of input that is significant to the fair value measurement. The inputs are summarized into three broad levels as follows:
| n | | Level 1 – quoted prices in active markets for identical securities |
| n | | Level 2 – other significant observable inputs (including quoted prices for similar securities, interest rates, prepayment speeds, credit risk, use of amortized cost, etc.) |
| n | | Level 3 – significant unobservable inputs (including the Fund’s own assumptions in determining the fair value of investments) |
The inputs or methodologies used for valuing investments in securities are not necessarily an indication of the risk associated with investing in those securities.
The following is a summary of the inputs used in valuing the Fund’s assets and liabilities as of April 30, 2016:
| | | | | | | | | | | | | | | | |
| | | Quoted prices
(Level 1) | | | Other significant
observable inputs
(Level 2) | | | Significant
unobservable inputs
(Level 3) | | | Total | |
Assets | | | | | | | | | |
Investments in: | | | | | | | | | |
| | |
Common stocks | | | | | | | | | |
France | | $ | 5,260,601 | | | $ | 0 | | | $ | 0 | | | $ | 5,260,601 | |
Germany | | | 5,359,579 | | | | 0 | | | | 0 | | | | 5,359,579 | |
Hong Kong | | | 3,777,228 | | | | 0 | | | | 0 | | | | 3,777,228 | |
Japan | | | 15,580,872 | | | | 0 | | | | 0 | | | | 15,580,872 | |
Luxembourg | | | 5,557,399 | | | | 0 | | | | 0 | | | | 5,557,399 | |
Netherlands | | | 13,652,581 | | | | 0 | | | | 0 | | | | 13,652,581 | |
South Korea | | | 3,248,539 | | | | 0 | | | | 0 | | | | 3,248,539 | |
Spain | | | 2,783,581 | | | | 0 | | | | 0 | | | | 2,783,581 | |
Sweden | | | 1,576,584 | | | | 0 | | | | 0 | | | | 1,576,584 | |
Switzerland | | | 12,150,750 | | | | 0 | | | | 0 | | | | 12,150,750 | |
United Kingdom | | | 7,248,024 | | | | 0 | | | | 0 | | | | 7,248,024 | |
United States | | | 75,201,736 | | | | 0 | | | | 0 | | | | 75,201,736 | |
| | | | |
Short-term investments | | | | | | | | | | | | | | | | |
Investment companies | | | 1,250,956 | | | | 0 | | | | 0 | | | | 1,250,956 | |
Investments measured at net asset value* | | | | | | | | 2,825,550 | |
Total assets | | $ | 152,648,430 | | | $ | 0 | | | $ | 0 | | | $ | 155,473,980 | |
| * | Investments that are measured at fair value using the net asset value per share (or its equivalent) as a practical expedient have not been categorized in the fair value hierarchy. The fair value amount presented in the table is intended to permit reconciliation of the fair value hierarchy to the amounts presented in the Statement of Assets and Liabilities. The Fund’s investment in Securities Lending Cash Investments, LLC valued at $2,825,550 does not have a redemption period notice, can be redeemed daily and does not have any unfunded commitments. |
| | | | |
| 22 | | Wells Fargo Intrinsic World Equity Fund | | Notes to financial statements (unaudited) |
The Fund recognizes transfers between levels within the fair value hierarchy at the end of the reporting period. Fair value pricing that was used in pricing certain foreign securities at the previous period end was not used at April 30, 2016. As a result, common stocks valued at $51,342,113 were transferred from Level 2 to Level 1 within the fair value hierarchy. The Fund did not have any transfers into/out of Level 3.
4. TRANSACTIONS WITH AFFILIATES
Management fee
Funds Management, an indirect wholly owned subsidiary of Wells Fargo, is the manager of the Fund and provides advisory and fund-level administrative services under an investment management agreement. Under the investment management agreement, Funds Management is responsible for, among other services, implementing the investment objectives and strategies of the Fund, supervising the applicable subadviser, providing fund-level administrative services in connection with the Fund’s operations, and providing any other fund-level administrative services reasonably necessary for the operation of the Fund. As compensation for its services under the investment management agreement, Funds Management is entitled to receive an annual management fee starting at 0.85% and declining to 0.68% as the average daily net assets of the Fund increase. For the six months ended April 30, 2016, the management fee was equivalent to an annual rate of 0.85% of the Fund’s average daily net assets.
Funds Management has retained the services of a subadviser to provide daily portfolio management to the Fund. The fee for subadvisory services is borne by Funds Management. Metropolitan West Capital Management, LLC, an affiliate of Funds Management and an indirect wholly owned subsidiary of Wells Fargo, is the subadviser to the Fund and is entitled to receive a fee from Funds Management at an annual rate starting at 0.35% and declining to 0.20% as the average daily net assets of the Fund increase.
Administration fees
Under a class-level administration agreement, Funds Management provides class-level administrative services to the Fund, which includes paying fees and expenses for services provided by the transfer agent, sub-transfer agents, omnibus account servicers and record-keepers. As compensation for its services under the class-level administration agreement, Funds Management receives an annual fee which is calculated based on the average daily net assets of each class as follows:
| | | | |
| | | Class-level
administration fee | |
Class A, Class C | | | 0.21 | % |
Administrator Class, Institutional Class | | | 0.13 | |
Funds Management has contractually waived and/or reimbursed management and administration fees to the extent necessary to maintain certain net operating expense ratios for the Fund. Waiver of fees and/or reimbursement of expenses by Funds Management were made first from fund level expenses on a proportionate basis and then from class specific expenses. Funds Management has committed through February 28, 2017 to waive fees and/or reimburse expenses to the extent necessary to cap the Fund’s expenses at 1.35% for Class A shares, 2.10% for Class C shares, 1.25% for Administrator Class shares, and 0.95% for Institutional Class shares. After this time, the cap may be increased or the commitment to maintain the cap may be terminated only with the approval of the Board of Trustees. Prior to March 1, 2016, the Fund’s expenses were capped at 1.40% for Class A shares, 2.15% for Class C shares, and 1.15% for Administrator Class shares.
Distribution fee
The Trust has adopted a distribution plan for Class C shares of the Fund pursuant to Rule 12b-1 under the 1940 Act. A distribution fee is charged to Class C shares and paid to Wells Fargo Funds Distributor, LLC (“Funds Distributor”), the principal underwriter, at an annual rate of 0.75% of the average daily net assets of Class C shares.
In addition, Funds Distributor is entitled to receive the front-end sales charge from the purchase of Class A shares and a contingent deferred sales charge on the redemption of certain Class A shares. Funds Distributor is also entitled to receive the contingent deferred sales charges from redemptions of Class C shares. For the six months ended April 30, 2016, Funds Distributor received $984 from the sale of Class A shares.
Shareholder servicing fees
The Trust has entered into contracts with one or more shareholder servicing agents, whereby Class A, Class C and Administrator Class of the Fund are charged a fee at an annual rate of 0.25% of the average daily net assets of each respective class.
A portion of these total shareholder servicing fees were paid to affiliates of Wells Fargo.
| | | | | | |
| Notes to financial statements (unaudited) | | Wells Fargo Intrinsic World Equity Fund | | | 23 | |
5. INVESTMENT PORTFOLIO TRANSACTIONS
Purchases and sales of investments, excluding U.S. government obligations (if any) and short-term securities, for the six months ended April 30, 2016 were $15,007,256 and $22,095,848, respectively.
6. BANK BORROWINGS
The Trust (excluding the money market funds and certain other funds) and Wells Fargo Variable Trust are parties to a $200,000,000 revolving credit agreement whereby the Fund is permitted to use bank borrowings for temporary or emergency purposes, such as to fund shareholder redemption requests. Interest under the credit agreement is charged to the Fund based on a borrowing rate equal to the higher of the Federal Funds rate in effect on that day plus 1.25% or the overnight LIBOR rate in effect on that day plus 1.25%. In addition, an annual commitment fee equal to 0.20% of the unused balance is allocated to each participating fund.
For the six months ended April 30, 2016, there were no borrowings by the Fund under the agreement.
7. INDEMNIFICATION
Under the Trust’s organizational documents, the officers and Trustees have been granted certain indemnification rights against certain liabilities that may arise out of performance of their duties to the Trust. Additionally, in the normal course of business, the Trust may enter into contracts with service providers that contain a variety of indemnification clauses. The Trust’s maximum exposure under these arrangements is dependent on future claims that may be made against the Fund and, therefore, cannot be estimated.
| | | | |
| 24 | | Wells Fargo Intrinsic World Equity Fund | | Other information (unaudited) |
PROXY VOTING INFORMATION
A description of the policies and procedures that the Fund uses to determine how to vote proxies relating to portfolio securities is available, upon request, by calling 1-800-222-8222, visiting our website at wellsfargofunds.com, or visiting the SEC website at sec.gov. Information regarding how the Fund voted proxies relating to portfolio securities during the most recent 12-month period ended June 30 is available on the Fund’s website at wellsfargofunds.com or by visiting the SEC website at sec.gov.
PORTFOLIO HOLDINGS INFORMATION
The complete portfolio holdings for the Fund are publicly available monthly on the Fund’s website (wellsfargofunds.com), on a one-month delayed basis. In addition, top ten holdings information (excluding derivative positions) for the Fund is publicly available on the Fund’s website on a monthly, seven-day or more delayed basis. The Fund files its complete schedule of portfolio holdings with the SEC for the first and third quarters of each fiscal year on Form N-Q, which is available by visiting the SEC website at sec.gov. In addition, the Fund’s Form N-Q may be reviewed and copied at the SEC’s Public Reference Room in Washington, DC, and at regional offices in New York City, at 233 Broadway, and in Chicago, at 175 West Jackson Boulevard, Suite 900. Information about the Public Reference Room may be obtained by calling 1-800-SEC-0330.
| | | | | | |
| Other information (unaudited) | | Wells Fargo Intrinsic World Equity Fund | | | 25 | |
BOARD OF TRUSTEES AND OFFICERS
Each of the Trustees and Officers1 listed in the table below acts in identical capacities for each fund in the Wells Fargo family of funds, which consists of 141 mutual funds comprising the Wells Fargo Funds Trust, Wells Fargo Variable Trust, Wells Fargo Master Trust and four closed-end funds (collectively the “Fund Complex”). This table should be read in conjunction with the Prospectus and the Statement of Additional Information2. The mailing address of each Trustee and Officer is 525 Market Street, 12th Floor, San Francisco, CA 94105. Each Trustee and Officer serves an indefinite term, however, each Trustee serves such term until reaching the mandatory retirement age established by the Trustees.
Independent Trustees
| | | | | | |
Name and year of birth | | Position held and
length of service* | | Principal occupations during past five years or longer | | Current other public
company or investment
company directorships |
| William R. Ebsworth (Born 1957) | | Trustee, since 2015 | | Retired. From 1984 to 2013, equities analyst, portfolio manager, research director and chief financial officer at Fidelity Management and Research Company in Boston, Tokyo, and Hong Kong and retired in 2013 as Chief Investment Officer of Fidelity Strategic Advisers, Inc. where he lead a team of investment professionals managing client assets. Prior thereto, Board member of Hong Kong Securities Clearing Co., Hong Kong Options Clearing Corp., the Thailand International Fund, Ltd., Fidelity Investments Life Insurance Company, and Empire Fidelity Investments Life Insurance Company. Mr. Ebsworth is a CFA® charterholder and an Adjunct Lecturer, Finance, at Babson College. | | Asset Allocation Trust |
| Jane A. Freeman (Born 1953) | | Trustee, since 2015 | | Retired. From 2012 to 2014 and 1999 to 2008, Chief Financial Officer of Scientific Learning Corporation. From 2008 to 2012, Ms. Freeman provided consulting services related to strategic business projects. Prior to 1999, Portfolio Manager at Rockefeller & Co. and Scudder, Stevens & Clark. Board member of the Harding Loevner Funds from 1996 to 2014, serving as both Lead Independent Director and chair of the Audit Committee. Board member of the Russell Exchange Traded Funds Trust from 2011 to 2012 and the chair of the Audit Committee. Ms. Freeman is Chair of Taproot Foundation (non-profit organization), a Board Member of Ruth Bancroft Garden (non-profit organization) and an inactive chartered financial analyst. | | Asset Allocation Trust |
| Peter G. Gordon (Born 1942) | | Trustee, since 1998; Chairman, since 2005 | | Co-Founder, Retired Chairman, President and CEO of Crystal Geyser Water Company. Trustee Emeritus, Colby College. | | Asset Allocation Trust |
| Isaiah Harris, Jr. (Born 1952) | | Trustee, since 2009 | | Retired. Chairman of the Board of CIGNA Corporation since 2009, and Director since 2005. From 2003 to 2011, Director of Deluxe Corporation. Prior thereto, President and CEO of BellSouth Advertising and Publishing Corp. from 2005 to 2007, President and CEO of BellSouth Enterprises from 2004 to 2005 and President of BellSouth Consumer Services from 2000 to 2003. Emeritus member of the Iowa State University Foundation Board of Governors. Emeritus Member of the Advisory Board of Iowa State University School of Business. Advisory Board Member, Palm Harbor Academy (charter school). Advisory Board Member, Child Evangelism Fellowship (non-profit). Mr. Harris is a certified public accountant (inactive status). | | CIGNA Corporation; Asset Allocation Trust |
| Judith M. Johnson (Born 1949) | | Trustee, since 2008;
Audit Committee Chairman, since 2008 | | Retired. Prior thereto, Chief Executive Officer and Chief Investment Officer of Minneapolis Employees Retirement Fund from 1996 to 2008. Ms. Johnson is an attorney, certified public accountant and a certified managerial accountant. | | Asset Allocation Trust |
| David F. Larcker (Born 1950) | | Trustee, since 2009 | | James Irvin Miller Professor of Accounting at the Graduate School of Business, Stanford University, Director of the Corporate Governance Research Initiative and Senior Faculty of The Rock Center for Corporate Governance since 2006. From 2005 to 2008, Professor of Accounting at the Graduate School of Business, Stanford University. Prior thereto, Ernst & Young Professor of Accounting at The Wharton School, University of Pennsylvania from 1985 to 2005. | | Asset Allocation Trust |
| | | | |
| 26 | | Wells Fargo Intrinsic World Equity Fund | | Other information (unaudited) |
| | | | | | |
Name and year of birth | | Position held and
length of service* | | Principal occupations during past five years or longer | | Current other public
company or investment
company directorships |
| Olivia S. Mitchell (Born 1953) | | Trustee, since 2006 | | International Foundation of Employee Benefit Plans Professor, Wharton School of the University of Pennsylvania since 1993. Director of Wharton’s Pension Research Council and Boettner Center on Pensions & Retirement Research, and Research Associate at the National Bureau of Economic Research. Previously, Cornell University Professor from 1978 to 1993. | | Asset Allocation Trust |
| Timothy J. Penny (Born 1951) | | Trustee, since 1996 | | President and Chief Executive Officer of Southern Minnesota Initiative Foundation, a non-profit organization, since 2007 and Senior Fellow at the Humphrey Institute Policy Forum at the University of Minnesota since 1995. Member of the Board of Trustees of NorthStar Education Finance, Inc., a non-profit organization, since 2007. | | Asset Allocation Trust |
| Michael S. Scofield (Born 1943) | | Trustee, since 2010 | | Served on the Investment Company Institute’s Board of Governors and Executive Committee from 2008-2011 as well the Governing Council of the Independent Directors Council from 2006-2011 and the Independent Directors Council Executive Committee from 2008-2011. Chairman of the IDC from 2008-2010. Institutional Investor (Fund Directions) Trustee of Year in 2007. Trustee of the Evergreen Funds complex (and its predecessors) from 1984 to 2010. Chairman of the Evergreen Funds from 2000-2010. Former Trustee of the Mentor Funds. Retired Attorney, Law Offices of Michael S. Scofield. | | Asset Allocation Trust |
| * | Length of service dates reflect the Trustee’s commencement of service with the Trust’s predecessor entities, where applicable. |
Officers
| | | | | | |
Name and
year of birth | | Position held and
length of service | | Principal occupations during past five years or longer | | |
| Karla M. Rabusch (Born 1959) | | President, since 2003 | | Executive Vice President of Wells Fargo Bank, N.A. and President of Wells Fargo Funds Management, LLC since 2003. | | |
| Jeremy DePalma1 (Born 1974) | | Treasurer, since 2012 | | Senior Vice President of Wells Fargo Funds Management, LLC since 2009. Senior Vice President of Evergreen Investment Management Company, LLC from 2008 to 2010 and head of the Fund Reporting and Control Team within Fund Administration from 2005 to 2010. | | |
| C. David Messman (Born 1960) | | Secretary, since 2000; Chief Legal Officer, since 2003 | | Senior Vice President and Secretary of Wells Fargo Funds Management, LLC since 2001. Assistant General Counsel of Wells Fargo Bank, N.A. since 2013 and Vice President and Managing Counsel of Wells Fargo Bank, N.A. from 1996 to 2013. | | |
| Michael Whitaker (Born 1967) | | Chief Compliance Officer, since 2016* | | Executive Vice President of Wells Fargo Funds Management, LLC since 2016. Chief Compliance Officer of Fidelity’s Fixed Income Funds and Asset Allocation Funds from 2008 to 2016, Compliance Officer of FMR Co., Inc. from 2014 to 2016, Fidelity Investments Money Management, Inc. from 2014 to 2016, Fidelity Investments from 2007 to 2016. | | |
Debra Ann Early
(Born 1964) | | Chief Compliance Officer, since 2007** | | Executive Vice President of Wells Fargo Funds Management, LLC since 2014, Senior Vice President and Chief Compliance Officer from 2007 to 2014. | | |
David Berardi
(Born 1975) | | Assistant Treasurer, since 2009 | | Vice President of Wells Fargo Funds Management, LLC since 2009. Vice President of Evergreen Investment Management Company, LLC from 2008 to 2010. Manager of Fund Reporting and Control for Evergreen Investment Management Company, LLC from 2004 to 2010. | | |
| 1 | Jeremy DePalma acts as Treasurer of 69 funds and Assistant Treasurer of 72 funds in the Fund Complex. |
| 2 | The Statement of Additional Information includes additional information about the Trustees and is available, without charge, upon request, by calling 1-800-222-8222 or by visiting the website at wellsfargofunds.com. |
| * | Michael Whitaker became Chief Compliance Officer effective May 16, 2016. |
| ** | Debra Ann Early was the Chief Compliance Officer until May 15, 2016. |
| | | | | | |
| List of abbreviations | | Wells Fargo Intrinsic World Equity Fund | | | 27 | |
The following is a list of common abbreviations for terms and entities that may have appeared in this report.
| ACA | — ACA Financial Guaranty Corporation |
| ADR | — American depositary receipt |
| ADS | — American depositary shares |
| AGC | — Assured Guaranty Corporation |
| AGM | — Assured Guaranty Municipal |
| Ambac | — Ambac Financial Group Incorporated |
| AMT | — Alternative minimum tax |
| BAN | — Bond anticipation notes |
| BHAC | — Berkshire Hathaway Assurance Corporation |
| CAB | — Capital appreciation bond |
| CCAB | — Convertible capital appreciation bond |
| CDA | — Community Development Authority |
| CDO | — Collateralized debt obligation |
| DRIVER | — Derivative inverse tax-exempt receipts |
| DW&P | — Department of Water & Power |
| DWR | — Department of Water Resources |
| ECFA | — Educational & Cultural Facilities Authority |
| EDA | — Economic Development Authority |
| EDFA | — Economic Development Finance Authority |
| ETF | — Exchange-traded fund |
| FDIC | — Federal Deposit Insurance Corporation |
| FFCB | — Federal Farm Credit Banks |
| FGIC | — Financial Guaranty Insurance Corporation |
| FHA | — Federal Housing Administration |
| FHLB | — Federal Home Loan Bank |
| FHLMC | — Federal Home Loan Mortgage Corporation |
| FICO | — The Financing Corporation |
| FNMA | — Federal National Mortgage Association |
| GDR | — Global depositary receipt |
| GNMA | — Government National Mortgage Association |
| HCFR | — Healthcare facilities revenue |
| HEFA | — Health & Educational Facilities Authority |
| HEFAR | — Higher education facilities authority revenue |
| HFA | — Housing Finance Authority |
| HFFA | — Health Facilities Financing Authority |
| HUD | — Department of Housing and Urban Development |
| IDA | — Industrial Development Authority |
| IDAG | — Industrial Development Agency |
| KRW | — Republic of Korea won |
| LIBOR | — London Interbank Offered Rate |
| LIFER | — Long Inverse Floating Exempt Receipts |
| LLC | — Limited liability company |
| LLLP | — Limited liability limited partnership |
| LLP | — Limited liability partnership |
| MBIA | — Municipal Bond Insurance Association |
| MFHR | — Multifamily housing revenue |
| MSTR | — Municipal securities trust receipts |
| MUD | — Municipal Utility District |
| National | — National Public Finance Guarantee Corporation |
| PCFA | — Pollution Control Financing Authority |
| PCL | — Public Company Limited |
| PCR | — Pollution control revenue |
| PFA | — Public Finance Authority |
| PFFA | — Public Facilities Financing Authority |
| PFOTER | — Puttable floating option tax-exempt receipts |
| plc | — Public limited company |
| PUTTER | — Puttable tax-exempt receipts |
| R&D | — Research & development |
| Radian | — Radian Asset Assurance |
| RAN | — Revenue anticipation notes |
| RDA | — Redevelopment Authority |
| RDFA | — Redevelopment Finance Authority |
| REIT | — Real estate investment trust |
| ROC | — Reset option certificates |
| SAVRS | — Select auction variable rate securities |
| SBA | — Small Business Authority |
| SDR | — Swedish depositary receipt |
| SFHR | — Single-family housing revenue |
| SFMR | — Single-family mortgage revenue |
| SPA | — Standby purchase agreement |
| SPDR | — Standard & Poor’s Depositary Receipts |
| SPEAR | — Short Puttable Exempt Adjustable Receipts |
| STRIPS | — Separate trading of registered interest and |
| TAN | — Tax anticipation notes |
| TIPS | — Treasury inflation-protected securities |
| TRAN | — Tax revenue anticipation notes |
| TTFA | — Transportation Trust Fund Authority |
| TVA | — Tennessee Valley Authority |
This page is intentionally left blank.

For more information
More information about Wells Fargo Funds is available free upon request. To obtain literature, please write, email, visit the Fund’s website, or call:
Wells Fargo Funds
P.O. Box 8266
Boston, MA 02266-8266
Email: fundservice@wellsfargo.com
Website: wellsfargofunds.com
Individual investors: 1-800-222-8222
Retail investment professionals: 1-888-877-9275
Institutional investment professionals: 1-866-765-0778
This report and the financial statements contained herein are submitted for the general information of the shareholders of the Fund. If this report is used for promotional purposes, distribution of the report must be accompanied or preceded by a current prospectus. Before investing, please consider the investment objectives, risks, charges, and expenses of the investment. For a current prospectus and, if available, a summary prospectus, containing this information, call 1-800-222-8222 or visit the Fund’s website at wellsfargofunds.com. Read the prospectus carefully before you invest or send money.
Wells Fargo Asset Management (WFAM) is a trade name used by the asset management businesses of Wells Fargo & Company. Wells Fargo Funds Management, LLC, a wholly owned subsidiary of Wells Fargo & Company, provides investment advisory and administrative services for Wells Fargo Funds. Other affiliates of Wells Fargo & Company provide subadvisory and other services for the funds. The funds are distributed by Wells Fargo Funds Distributor, LLC, Member FINRA, an affiliate of Wells Fargo & Company.
NOT FDIC INSURED ¡ NO BANK GUARANTEE ¡ MAY LOSE VALUE
© 2016 Wells Fargo Funds Management, LLC. All rights reserved.
| | |
 | | 242235 06-16 SA241/SAR241 04-16 |
Not applicable.
| ITEM 3. | AUDIT COMMITTEE FINANCIAL EXPERT |
Not applicable.
| ITEM 4. | PRINCIPAL ACCOUNTANT FEES AND SERVICES |
Not applicable.
| ITEM 5. | AUDIT COMMITTEE OF LISTED REGISTRANTS |
Not applicable.
A Portfolio of Investments for each series of Wells Fargo Funds Trust is included as part of the report to shareholders filed under Item 1 of this Form.
| ITEM 7. | DISCLOSURE OF PROXY VOTING POLICIES AND PROCEDURES FOR CLOSED-END MANAGEMENT INVESTMENT COMPANIES |
Not applicable.
| ITEM 8. | PORTFOLIO MANAGERS OF CLOSED-END MANAGEMENT INVESTMENT COMPANIES |
Not applicable.
| ITEM 9. | PURCHASES OF EQUITY SECURITIES BY CLOSED-END MANAGEMENT INVESTMENT COMPANY AND AFFILIATED PURCHASERS |
Not applicable.
| ITEM 10. | SUBMISSION OF MATTERS TO A VOTE OF SECURITY HOLDERS |
There have been no material changes to the procedures by which shareholders may recommend nominees to the registrant’s Board of Trustees that have been implemented since the registrant’s last provided disclosure in response to the requirements of this Item.
| ITEM 11. | CONTROLS AND PROCEDURES |
(a) The President and Treasurer have concluded that the Wells Fargo Funds Trust (the “Trust”) disclosure controls and procedures (as defined in Rule 30a-3(c) under the Investment Company Act of 1940) provide reasonable assurances that material information relating to the Trust is made known to them by the appropriate persons, based on their evaluation of these controls and procedures as of a date within 90 days of the filing of this report.
(b) There were no significant changes in the Trust’s internal controls over financial reporting (as defined in Rule 30a-3(d) under the Investment Company Act of 1940) that occurred during the second fiscal quarter of the period covered by this report that materially affected, or is reasonably likely to materially affect, the registrant’s internal control over financial reporting.
(a)(1) Not applicable.
(a)(2) Certification pursuant to Rule 30a-2(a) under the Investment Company Act of 1940 (17 CFR 270.30a-2(a)) is filed and attached hereto as Exhibit 99.CERT.
(a)(3) Not applicable.
(b) Certification pursuant to Rule 30a-2(b) under the Investment Company Act of 1940 (17 CFR 270.30a-2(b)) is filed and attached hereto as Exhibit 99.906CERT.
SIGNATURES
Pursuant to the requirements of the Securities Exchange Act of 1934 and the Investment Company Act of 1940, the registrant has duly caused this report to be signed on its behalf by the undersigned, thereunto duly authorized.
| | |
| Wells Fargo Funds Trust |
| |
| By: | | |
| | /s/ Karla M. Rabusch |
| | Karla M. Rabusch |
| | President |
| |
| Date: | | June 27, 2016 |
Pursuant to the requirements of the Securities Exchange Act of 1934 and the Investment Company Act of 1940, this report has been signed below by the following persons on behalf of the registrant and in the capacities and on the date indicated.
| | |
| Wells Fargo Funds Trust |
| |
| By: | | |
| | /s/ Karla M. Rabusch |
| | Karla M. Rabusch |
| | President |
| |
| Date: | | June 27, 2016 |
| | |
| By: | | |
| | /s/ Nancy Wiser |
| | Nancy Wiser |
| | Treasurer |
| |
| Date: | | June 27, 2016 |
| | |
| By: | | |
| | /s/ Jeremy DePalma |
| | Jeremy DePalma |
| | Treasurer |
| |
| Date: | | June 27, 2016 |