
UNITED STATES
SECURITIES AND EXCHANGE COMMISSION
Washington, D.C. 20549
FORM N-CSRS
CERTIFIED SHAREHOLDER REPORT OF REGISTERED
MANAGEMENT INVESTMENT COMPANIES
Investment Company Act file number: 811-09253
Allspring Funds Trust
(Exact name of registrant as specified in charter)
1415 Vantage Park Drive, 3rd Floor, Charlotte, NC 28203
(Address of principal executive offices) (Zip code)
Matthew Prasse
Allspring Funds Management, LLC
1415 Vantage Park Drive, 3rd Floor, Charlotte, NC 28203
(Name and address of agent for service)
Registrant’s telephone number, including area code: 800-222-8222
Date of fiscal year end: May 31
Registrant is making a filing for 15 of its series:
Allspring Asset Allocation Fund, Allspring Growth Balanced Fund, Allspring Moderate Balanced Fund, Allspring Index Fund, Allspring C&B Large Cap Value Fund, Allspring Emerging Growth Fund, Allspring Small Company Growth Fund, Allspring Small Company Value Fund, Allspring Core Bond Fund, Allspring Real Return Fund, Allspring Spectrum Income Allocation Fund, Allspring Spectrum Growth Fund, Allspring Spectrum Moderate Growth Fund, Allspring Spectrum Conservative Growth Fund and Allspring Spectrum Aggressive Growth Fund
Date of reporting period: November 30, 2022
| ITEM 1. | REPORT TO STOCKHOLDERS |

| 2 | |
| 6 | |
| 9 | |
| Allspring Core Bond Fund | |
| 11 | |
| Financial statements | |
| 12 | |
| 13 | |
| 14 | |
| 15 | |
| 22 | |
| Allspring Core Bond Portfolio | |
| 26 | |
| Financial statements | |
| 52 | |
| 53 | |
| 54 | |
| 55 | |
| 56 | |
| 61 |

| 1 | The S&P 500 Index consists of 500 stocks chosen for market size, liquidity, and industry group representation. It is a market-value-weighted index with each stock's weight in the index proportionate to its market value. You cannot invest directly in an index. |
| 2 | The Morgan Stanley Capital International (MSCI) All Country World Index (ACWI) ex USA Index (Net) is a free-float-adjusted market-capitalization-weighted index that is designed to measure the equity market performance of developed and emerging markets, excluding the U.S. Source: MSCI. MSCI makes no express or implied warranties or representations and shall have no liability whatsoever with respect to any MSCI data contained herein. The MSCI data may not be further redistributed or used as a basis for other indexes or any securities or financial products. This report is not approved, reviewed, or produced by MSCI. You cannot invest directly in an index. |
| 3 | The MSCI Emerging Markets (EM) Index (Net) (USD) is a free-float-adjusted market-capitalization-weighted index that is designed to measure equity market performance of emerging markets. You cannot invest directly in an index. |
| 4 | The Bloomberg U.S. Aggregate Bond Index is a broad-based benchmark that measures the investment-grade, U.S.-dollar-denominated, fixed-rate taxable bond market, including Treasuries, government-related and corporate securities, mortgage-backed securities (agency fixed-rate and hybrid adjustable-rate mortgage pass-throughs), asset-backed securities, and commercial mortgage-backed securities. You cannot invest directly in an index. |
| 5 | The Bloomberg Global Aggregate ex-USD Index (unhedged) is an unmanaged index that provides a broad-based measure of the global investment-grade fixed-income markets excluding the U.S.-dollar-denominated debt market. You cannot invest directly in an index. |
| 6 | The Bloomberg Municipal Bond Index is an unmanaged index composed of long-term tax-exempt bonds with a minimum credit rating of Baa. You cannot invest directly in an index. |
| 7 | The ICE BofA U.S. High Yield Index is a market-capitalization-weighted index of domestic and Yankee high-yield bonds. The index tracks the performance of high-yield securities traded in the U.S. bond market. You cannot invest directly in an index. Copyright 2023. ICE Data Indices, LLC. All rights reserved. |

President
Allspring Funds
| Investment objective | The Fund seeks total return, consisting of income and capital appreciation. |
| Manager | Allspring Funds Management, LLC |
| Portfolio managers | Maulik Bhansali, CFA®‡, Jarad Vasquez |
| Average annual total returns (%) as of November 30, 2022 | |||||||||||
| Including sales charge | Excluding sales charge | Expense ratios1 (%) | |||||||||
| Inception date | 1 year | 5 year | 10 year | 1 year | 5 year | 10 year | Gross | Net 2 | |||
| Class A (MBFAX) | 10-31-2001 | -17.36 | -1.06 | 0.33 | -13.50 | -0.14 | 0.80 | 0.82 | 0.78 | ||
| Class C (MBFCX) | 10-31-2001 | -15.15 | -0.89 | 0.19 | -14.15 | -0.89 | 0.19 | 1.57 | 1.53 | ||
| Class R (WTRRX) | 7-9-2010 | – | – | – | -13.60 | -0.31 | 0.58 | 1.07 | 1.03 | ||
| Class R4 (MBFRX) | 11-30-2012 | – | – | – | -13.28 | 0.14 | 1.06 | 0.59 | 0.52 | ||
| Class R6 (WTRIX) | 11-30-2012 | – | – | – | -13.16 | 0.27 | 1.21 | 0.44 | 0.37 | ||
| Administrator Class (MNTRX) | 6-30-1997 | – | – | – | -13.43 | -0.06 | 0.87 | 0.76 | 0.70 | ||
| Institutional Class (MBFIX) | 10-31-2001 | – | – | – | -13.20 | 0.22 | 1.16 | 0.49 | 0.42 | ||
| Bloomberg U.S. Aggregate Bond Index3 | – | – | – | – | -12.84 | 0.21 | 1.09 | – | – | ||
| 1 | Reflects the expense ratios as stated in the most recent prospectuses. The expense ratios shown are subject to change and may differ from the annualized expense ratios shown in the financial highlights of this report. |
| 2 | The manager has contractually committed through September 30, 2023, to waive fees and/or reimburse expenses to the extent necessary to cap total annual fund operating expenses after fee waivers at 0.78% for Class A, 1.53% for Class C, 1.03% for Class R, 0.52% for Class R4, 0.37% for Class R6, 0.70% for Administrator Class, and 0.42% for Institutional Class. Brokerage commissions, stamp duty fees, interest, taxes, acquired fund fees and expenses (if any) from funds in which the affiliated master portfolio invests, and extraordinary expenses are excluded from the expense caps. Net expenses from the affiliated master portfolio are included in the expense caps. Prior to or after the commitment expiration date, the caps may be increased or the commitment to maintain the caps may be terminated only with the approval of the Board of Trustees. Without these caps, the Fund’s returns would have been lower. The expense ratio paid by an investor is the net expense ratio (the total annual fund operating expenses after fee waivers) as stated in the prospectuses. |
| 3 | The Bloomberg U.S. Aggregate Bond Index is a broad-based benchmark that measures the investment-grade, U.S. dollar–denominated, fixed-rate taxable bond market, including Treasuries, government-related and corporate securities, mortgage-backed securities (agency fixed-rate and hybrid adjustable-rate mortgage pass-throughs), asset-backed securities, and commercial mortgage-backed securities. You cannot invest directly in an index. |
| * | The Fund is a feeder fund in a master-feeder structure that invests substantially all of its assets in a single affiliated master portfolio of the Allspring Master Trust with a substantially identical investment objective and substantially similar investment strategies. References to the investment activities of the Fund are intended to refer to the investment activities of the affiliated master portfolio in which it invests. |
| ‡ | CFA® and Chartered Financial Analyst® are trademarks owned by CFA Institute. |
| Ten largest holdings (%) as of November 30, 20221 | |
| U.S. Treasury Bond, 1.38%, 11-15-2040 | 2.34 |
| U.S. Treasury Bond, 1.75%, 8-15-2041 | 2.28 |
| U.S. Treasury Note, 3.88%, 11-30-2027 | 2.16 |
| U.S. Treasury Note, 1.50%, 8-15-2026 | 2.07 |
| U.S. Treasury Note, 4.13%, 10-31-2027 | 1.43 |
| U.S. Treasury Bond, 1.13%, 5-15-2040 | 1.25 |
| U.S. Treasury Bond, 1.13%, 8-15-2040 | 1.21 |
| U.S. Treasury Note, 2.75%, 5-31-2029 | 1.09 |
| FNMA Series FS2648 Class FN , 3.00%, 10-1-2049 | 0.97 |
| U.S. Treasury Note, 0.38%, 1-31-2026 | 0.91 |
| 1 | Each holding represents the Fund’s allocable portion of the affiliated master portfolio security. Figures represent each holding as a percentage of the Fund’s net assets. Holdings are subject to change and may have changed since the date specified. |
| Portfolio composition as of November 30, 20221 |

| 1 | Figures represent the portfolio allocation of the affiliated master portfolio as a percentage of the long-term investments of the affiliated master portfolio. Allocations are subject to change and may have changed since the date specified. |
| Beginning account value 6-1-2022 | Ending account value 11-30-2022 | Expenses paid during the period1,2 | Annualized net expense ratio2 | |
| Class A | ||||
| Actual | $1,000.00 | $ 956.64 | $3.83 | 0.78% |
| Hypothetical (5% return before expenses) | $1,000.00 | $1,021.16 | $3.95 | 0.78% |
| Class C | ||||
| Actual | $1,000.00 | $ 953.29 | $7.49 | 1.53% |
| Hypothetical (5% return before expenses) | $1,000.00 | $1,017.40 | $7.74 | 1.53% |
| Class R | ||||
| Actual | $1,000.00 | $ 956.28 | $4.46 | 0.91% |
| Hypothetical (5% return before expenses) | $1,000.00 | $1,020.51 | $4.61 | 0.91% |
| Class R4 | ||||
| Actual | $1,000.00 | $ 958.17 | $2.55 | 0.52% |
| Hypothetical (5% return before expenses) | $1,000.00 | $1,022.46 | $2.64 | 0.52% |
| Class R6 | ||||
| Actual | $1,000.00 | $ 958.85 | $1.82 | 0.37% |
| Hypothetical (5% return before expenses) | $1,000.00 | $1,023.21 | $1.88 | 0.37% |
| Administrator Class | ||||
| Actual | $1,000.00 | $ 957.31 | $3.43 | 0.70% |
| Hypothetical (5% return before expenses) | $1,000.00 | $1,021.56 | $3.55 | 0.70% |
| Institutional Class | ||||
| Actual | $1,000.00 | $ 958.61 | $2.06 | 0.42% |
| Hypothetical (5% return before expenses) | $1,000.00 | $1,022.96 | $2.13 | 0.42% |
| Value | |||||
| Investment companies: 100.13% | |||||
| Affiliated master portfolio: 100.13% | |||||
| Allspring Core Bond Portfolio | $4,273,624,467 | ||||
| Total Investment companies (Cost $4,625,276,908) | 4,273,624,467 | ||||
| Total investments in securities (Cost $4,625,276,908) | 100.13% | 4,273,624,467 | |||
| Other assets and liabilities, net | (0.13) | (5,460,978) | |||
| Total net assets | 100.00% | $4,268,163,489 |
| % of ownership, beginning of period | % of ownership, end of period | Net realized gains (losses) on securities transactions allocated from affiliated Master Portfolio | Net change in unrealized gains (losses) on securities transactions allocated from affiliated Master Portfolio | Interest allocated from affiliated Master Portfolio | Affiliated income allocated from affiliated Master Portfolio | Value, end of period | ||
| Allspring Core Bond Portfolio | 94.49% | 95.37% | $(225,061,915) | $(25,677,296) | $66,013,441 | $1,827,050 | $4,273,624,467 |
| Assets | |
Investments in affiliated Master Portfolio, at value (cost $4,625,276,908) | $ 4,273,624,467 |
Receivable for Fund shares sold | 3,966,996 |
Receivable from manager | 108,232 |
Prepaid expenses and other assets | 200,663 |
Total assets | 4,277,900,358 |
| Liabilities | |
Payable for Fund shares redeemed | 8,398,817 |
Dividends payable | 924,108 |
Administration fees payable | 234,683 |
Distribution fees payable | 4,154 |
Trustees’ fees and expenses payable | 792 |
Accrued expenses and other liabilities | 174,315 |
Total liabilities | 9,736,869 |
Total net assets | $4,268,163,489 |
| Net assets consist of | |
Paid-in capital | $ 5,036,750,053 |
Total distributable loss | (768,586,564) |
Total net assets | $4,268,163,489 |
| Computation of net asset value and offering price per share | |
Net assets – Class A | $ 298,367,471 |
Shares outstanding – Class A1 | 26,238,915 |
Net asset value per share – Class A | $11.37 |
Maximum offering price per share – Class A2 | $11.91 |
Net assets – Class C | $ 6,528,956 |
Shares outstanding – Class C1 | 580,302 |
Net asset value per share – Class C | $11.25 |
Net assets – Class R | $ 1,363,978 |
Shares outstanding – Class R1 | 123,064 |
Net asset value per share – Class R | $11.08 |
Net assets – Class R4 | $ 1,964,548 |
Shares outstanding – Class R41 | 177,288 |
Net asset value per share – Class R4 | $11.08 |
Net assets – Class R6 | $ 1,497,086,371 |
Shares outstanding – Class R61 | 135,207,179 |
Net asset value per share – Class R6 | $11.07 |
Net assets – Administrator Class | $ 77,593,131 |
Shares outstanding – Administrator Class1 | 7,001,062 |
Net asset value per share – Administrator Class | $11.08 |
Net assets – Institutional Class | $ 2,385,259,034 |
Shares outstanding – Institutional Class1 | 215,501,662 |
Net asset value per share – Institutional Class | $11.07 |
| 1 | The Fund has an unlimited number of authorized shares. |
| 2 | Maximum offering price is computed as 100/95.50 of net asset value. On investments of $50,000 or more, the offering price is reduced. |
| Investment income | |
Interest allocated from affiliated Master Portfolio | $ 66,013,441 |
Affiliated income allocated from affiliated Master Portfolio | 1,827,050 |
Expenses allocated from affiliated Master Portfolio | (8,035,412) |
Waivers allocated from affiliated Master Portfolio | 83,468 |
Total investment income | 59,888,547 |
| Expenses | |
Management fee | 1,103,282 |
| Administration fees | |
Class A | 245,201 |
Class C | 5,664 |
Class R | 1,110 |
Class R4 | 675 |
Class R6 | 232,414 |
Administrator Class | 63,578 |
Institutional Class | 967,955 |
| Shareholder servicing fees | |
Class A | 383,126 |
Class C | 8,850 |
Class R | 1,206 |
Class R4 | 841 |
Administrator Class | 151,714 |
| Distribution fees | |
Class C | 26,551 |
Class R | 1,214 |
Custody and accounting fees | 73,002 |
Professional fees | 22,227 |
Registration fees | 55,966 |
Shareholder report expenses | 51,117 |
Trustees’ fees and expenses | 10,873 |
Other fees and expenses | 13,282 |
Total expenses | 3,419,848 |
| Less: Fee waivers and/or expense reimbursements | |
Fund-level | (1,108,333) |
Class A | (4,408) |
Class R4 | (259) |
Class R6 | (232,414) |
Administrator Class | (5,704) |
Institutional Class | (371,789) |
Net expenses | 1,696,941 |
Net investment income | 58,191,606 |
| Realized and unrealized gains (losses) on investments | |
Net realized losses on securities transactions allocated from affiliated Master Portfolio | (225,061,915) |
Net change in unrealized gains (losses) on securities transactions allocated from affiliated Master Portfolio | (25,677,296) |
Net realized and unrealized gains (losses) on investments | (250,739,211) |
Net decrease in net assets resulting from operations | $(192,547,605) |
| Six months ended November 30, 2022 (unaudited) | Year ended May 31, 2022 | |||
| Operations | ||||
Net investment income | $ 58,191,606 | $ 62,869,235 | ||
Net realized losses on investments | (225,061,915) | (160,127,410) | ||
Net change in unrealized gains (losses) on investments | (25,677,296) | (336,112,120) | ||
Net decrease in net assets resulting from operations | (192,547,605) | (433,370,295) | ||
| Distributions to shareholders from | ||||
| Net investment income and net realized gains | ||||
Class A | (3,163,704) | (6,433,689) | ||
Class C | (46,145) | (110,382) | ||
Class R | (13,395) | (26,649) | ||
Class R4 | (19,969) | (36,787) | ||
Class R6 | (19,155,361) | (39,431,641) | ||
Administrator Class | (1,307,829) | (4,031,398) | ||
Institutional Class | (29,354,395) | (58,058,159) | ||
Total distributions to shareholders | (53,060,798) | (108,128,705) | ||
| Capital share transactions | Shares | Shares | ||
| Proceeds from shares sold | ||||
Class A | 1,405,890 | 16,109,690 | 3,702,453 | 48,486,367 |
Class C | 71,788 | 823,528 | 108,019 | 1,407,245 |
Class R | 5,424 | 61,486 | 34,646 | 423,424 |
Class R4 | 73,405 | 806,507 | 28,978 | 375,499 |
Class R6 | 19,735,385 | 221,026,463 | 35,298,112 | 443,259,488 |
Administrator Class | 976,709 | 11,179,369 | 2,796,248 | 36,167,197 |
Institutional Class | 50,153,044 | 561,674,227 | 81,429,382 | 1,025,963,187 |
| 811,681,270 | 1,556,082,407 | |||
| Reinvestment of distributions | ||||
Class A | 259,247 | 2,971,800 | 459,521 | 6,030,239 |
Class C | 4,040 | 45,750 | 8,369 | 109,235 |
Class R | 825 | 9,219 | 1,429 | 18,254 |
Class R4 | 1,793 | 19,969 | 2,874 | 36,727 |
Class R6 | 1,363,898 | 15,230,832 | 2,565,625 | 32,770,856 |
Administrator Class | 102,060 | 1,152,408 | 297,680 | 3,811,913 |
Institutional Class | 2,509,805 | 28,005,895 | 4,290,277 | 54,802,544 |
| 47,435,873 | 97,579,768 | |||
| Payment for shares redeemed | ||||
Class A | (2,444,359) | (28,183,477) | (4,763,948) | (62,340,443) |
Class C | (152,505) | (1,732,397) | (467,425) | (6,084,370) |
Class R | (6,994) | (79,323) | (43,328) | (536,185) |
Class R4 | (31,846) | (345,193) | (33,896) | (428,263) |
Class R6 | (26,439,664) | (295,205,432) | (48,563,677) | (619,916,699) |
Administrator Class | (9,225,977) | (104,628,969) | (4,352,230) | (55,087,181) |
Institutional Class | (46,455,427) | (517,341,135) | (86,745,436) | (1,095,982,497) |
| (947,515,926) | (1,840,375,638) | |||
Net decrease in net assets resulting from capital share transactions | (88,398,783) | (186,713,463) | ||
Total decrease in net assets | (334,007,186) | (728,212,463) | ||
| Net assets | ||||
Beginning of period | 4,602,170,675 | 5,330,383,138 | ||
End of period | $4,268,163,489 | $ 4,602,170,675 | ||
| Year ended May 31 | ||||||
| Class A | Six months ended November 30, 2022 (unaudited) | 2022 | 2021 | 2020 | 2019 | 2018 |
Net asset value, beginning of period | $12.01 | $13.43 | $14.17 | $13.28 | $12.86 | $13.22 |
Net investment income | 0.13 | 0.12 | 0.12 1 | 0.25 | 0.32 | 0.24 |
Net realized and unrealized gains (losses) on investments | (0.65) | (1.30) | (0.06) | 0.93 | 0.42 | (0.36) |
Total from investment operations | (0.52) | (1.18) | 0.06 | 1.18 | 0.74 | (0.12) |
| Distributions to shareholders from | ||||||
Net investment income | (0.12) | (0.12) | (0.15) | (0.26) | (0.32) | (0.24) |
Net realized gains | 0.00 | (0.12) | (0.65) | (0.03) | 0.00 | 0.00 |
Total distributions to shareholders | (0.12) | (0.24) | (0.80) | (0.29) | (0.32) | (0.24) |
Net asset value, end of period | $11.37 | $12.01 | $13.43 | $14.17 | $13.28 | $12.86 |
Total return2 | (4.34)% | (8.95)% | 0.31% | 9.03% | 5.87% | (0.96)% |
| Ratios to average net assets (annualized)* | ||||||
Gross expenses | 0.83% | 0.82% | 0.82% | 0.82% | 0.83% | 0.83% |
Net expenses | 0.78% | 0.78% | 0.78% | 0.78% | 0.78% | 0.78% |
Net investment income | 2.30% | 0.91% | 0.87% | 1.85% | 2.50% | 1.79% |
| Supplemental data | ||||||
Portfolio turnover rate3 | 213% | 432% | 457% | 603% | 577% | 542% |
Net assets, end of period (000s omitted) | $298,367 | $324,431 | $370,882 | $299,642 | $302,246 | $320,208 |
| * | Ratios include net expenses allocated from the affiliated Master Portfolio which were as follows: |
| Six months ended November 30, 2022 (unaudited) | 0.36% |
| Year ended May 31, 2022 | 0.36% |
| Year ended May 31, 2021 | 0.35% |
| Year ended May 31, 2020 | 0.35% |
| Year ended May 31, 2019 | 0.35% |
| Year ended May 31, 2018 | 0.35% |
| 1 | Calculated based upon average shares outstanding |
| 2 | Total return calculations do not include any sales charges. Returns for periods of less than one year are not annualized. |
| 3 | Portfolio turnover rate is calculated by multiplying the affiliated Master Portfolio’s percentage of the Fund’s total investment in securities at the end of the period by the affiliated Master Portfolio’s portfolio turnover rate. |
| Year ended May 31 | ||||||
| Class C | Six months ended November 30, 2022 (unaudited) | 2022 | 2021 | 2020 | 2019 | 2018 |
Net asset value, beginning of period | $11.88 | $13.29 | $14.03 | $13.15 | $12.74 | $13.09 |
Net investment income | 0.09 1 | 0.05 | 0.03 | 0.15 | 0.23 | 0.14 |
Net realized and unrealized gains (losses) on investments | (0.64) | (1.32) | (0.07) | 0.92 | 0.40 | (0.35) |
Total from investment operations | (0.55) | (1.27) | (0.04) | 1.07 | 0.63 | (0.21) |
| Distributions to shareholders from | ||||||
Net investment income | (0.08) | (0.02) | (0.05) | (0.16) | (0.22) | (0.14) |
Net realized gains | 0.00 | (0.12) | (0.65) | (0.03) | 0.00 | 0.00 |
Total distributions to shareholders | (0.08) | (0.14) | (0.70) | (0.19) | (0.22) | (0.14) |
Net asset value, end of period | $11.25 | $11.88 | $13.29 | $14.03 | $13.15 | $12.74 |
Total return2 | (4.67)% | (9.65)% | (0.45)% | 8.22% | 5.04% | (1.65)% |
| Ratios to average net assets (annualized)* | ||||||
Gross expenses | 1.58% | 1.57% | 1.57% | 1.57% | 1.58% | 1.58% |
Net expenses | 1.53% | 1.53% | 1.53% | 1.53% | 1.53% | 1.53% |
Net investment income | 1.54% | 0.13% | 0.16% | 1.11% | 1.75% | 1.04% |
| Supplemental data | ||||||
Portfolio turnover rate3 | 213% | 432% | 457% | 603% | 577% | 542% |
Net assets, end of period (000s omitted) | $6,529 | $7,806 | $13,399 | $27,971 | $34,494 | $47,843 |
| * | Ratios include net expenses allocated from the affiliated Master Portfolio which were as follows: |
| Six months ended November 30, 2022 (unaudited) | 0.36% |
| Year ended May 31, 2022 | 0.36% |
| Year ended May 31, 2021 | 0.35% |
| Year ended May 31, 2020 | 0.35% |
| Year ended May 31, 2019 | 0.35% |
| Year ended May 31, 2018 | 0.35% |
| 1 | Calculated based upon average shares outstanding |
| 2 | Total return calculations do not include any sales charges. Returns for periods of less than one year are not annualized. |
| 3 | Portfolio turnover rate is calculated by multiplying the affiliated Master Portfolio’s percentage of the Fund’s total investment in securities at the end of the period by the affiliated Master Portfolio’s portfolio turnover rate. |
| Year ended May 31 | ||||||
| Class R | Six months ended November 30, 2022 (unaudited) | 2022 | 2021 | 2020 | 2019 | 2018 |
Net asset value, beginning of period | $11.70 | $13.09 | $13.83 | $12.96 | $12.55 | $12.90 |
Net investment income | 0.12 1 | 0.10 1 | 0.11 1 | 0.22 1 | 0.28 1 | 0.20 1 |
Net realized and unrealized gains (losses) on investments | (0.63) | (1.27) | (0.06) | 0.90 | 0.41 | (0.35) |
Total from investment operations | (0.51) | (1.17) | 0.05 | 1.12 | 0.69 | (0.15) |
| Distributions to shareholders from | ||||||
Net investment income | (0.11) | (0.10) | (0.14) | (0.22) | (0.28) | (0.20) |
Net realized gains | 0.00 | (0.12) | (0.65) | (0.03) | 0.00 | 0.00 |
Total distributions to shareholders | (0.11) | (0.22) | (0.79) | (0.25) | (0.28) | (0.20) |
Net asset value, end of period | $11.08 | $11.70 | $13.09 | $13.83 | $12.96 | $12.55 |
Total return2 | (4.37)% | (9.09)% | 0.22% | 8.80% | 5.61% | (1.19)% |
| Ratios to average net assets (annualized)* | ||||||
Gross expenses | 0.93% | 0.92% | 0.87% | 1.05% | 1.07% | 1.08% |
Net expenses | 0.91% | 0.90% | 0.86% | 1.02% | 1.03% | 1.03% |
Net investment income | 2.16% | 0.79% | 0.81% | 1.66% | 2.25% | 1.54% |
| Supplemental data | ||||||
Portfolio turnover rate3 | 213% | 432% | 457% | 603% | 577% | 542% |
Net assets, end of period (000s omitted) | $1,364 | $1,449 | $1,716 | $3,241 | $8,565 | $12,230 |
| * | Ratios include net expenses allocated from the affiliated Master Portfolio which were as follows: |
| Six months ended November 30, 2022 (unaudited) | 0.36% |
| Year ended May 31, 2022 | 0.36% |
| Year ended May 31, 2021 | 0.35% |
| Year ended May 31, 2020 | 0.35% |
| Year ended May 31, 2019 | 0.35% |
| Year ended May 31, 2018 | 0.35% |
| 1 | Calculated based upon average shares outstanding |
| 2 | Returns for periods of less than one year are not annualized. |
| 3 | Portfolio turnover rate is calculated by multiplying the affiliated Master Portfolio’s percentage of the Fund’s total investment in securities at the end of the period by the affiliated Master Portfolio’s portfolio turnover rate. |
| Year ended May 31 | ||||||
| Class R4 | Six months ended November 30, 2022 (unaudited) | 2022 | 2021 | 2020 | 2019 | 2018 |
Net asset value, beginning of period | $11.70 | $13.09 | $13.83 | $12.95 | $12.55 | $12.89 |
Net investment income | 0.15 1 | 0.15 | 0.16 1 | 0.29 1 | 0.35 | 0.26 1 |
Net realized and unrealized gains (losses) on investments | (0.64) | (1.27) | (0.06) | 0.91 | 0.40 | (0.34) |
Total from investment operations | (0.49) | (1.12) | 0.10 | 1.20 | 0.75 | (0.08) |
| Distributions to shareholders from | ||||||
Net investment income | (0.13) | (0.15) | (0.19) | (0.29) | (0.35) | (0.26) |
Net realized gains | 0.00 | (0.12) | (0.65) | (0.03) | 0.00 | 0.00 |
Total distributions to shareholders | (0.13) | (0.27) | (0.84) | (0.32) | (0.35) | (0.26) |
Net asset value, end of period | $11.08 | $11.70 | $13.09 | $13.83 | $12.95 | $12.55 |
Total return2 | (4.18)% | (8.74)% | 0.55% | 9.34% | 6.07% | (0.61)% |
| Ratios to average net assets (annualized)* | ||||||
Gross expenses | 0.60% | 0.59% | 0.59% | 0.59% | 0.60% | 0.60% |
Net expenses | 0.52% | 0.52% | 0.52% | 0.52% | 0.52% | 0.52% |
Net investment income | 2.61% | 1.17% | 1.16% | 2.19% | 2.76% | 2.01% |
| Supplemental data | ||||||
Portfolio turnover rate3 | 213% | 432% | 457% | 603% | 577% | 542% |
Net assets, end of period (000s omitted) | $1,965 | $1,567 | $1,780 | $4,549 | $10,805 | $11,680 |
| * | Ratios include net expenses allocated from the affiliated Master Portfolio which were as follows: |
| Six months ended November 30, 2022 (unaudited) | 0.36% |
| Year ended May 31, 2022 | 0.36% |
| Year ended May 31, 2021 | 0.35% |
| Year ended May 31, 2020 | 0.35% |
| Year ended May 31, 2019 | 0.35% |
| Year ended May 31, 2018 | 0.35% |
| 1 | Calculated based upon average shares outstanding |
| 2 | Returns for periods of less than one year are not annualized. |
| 3 | Portfolio turnover rate is calculated by multiplying the affiliated Master Portfolio’s percentage of the Fund’s total investment in securities at the end of the period by the affiliated Master Portfolio’s portfolio turnover rate. |
| Year ended May 31 | ||||||
| Class R6 | Six months ended November 30, 2022 (unaudited) | 2022 | 2021 | 2020 | 2019 | 2018 |
Net asset value, beginning of period | $11.69 | $13.08 | $13.82 | $12.95 | $12.54 | $12.89 |
Net investment income | 0.15 | 0.17 | 0.18 1 | 0.30 | 0.37 | 0.28 |
Net realized and unrealized gains (losses) on investments | (0.63) | (1.27) | (0.06) | 0.91 | 0.41 | (0.35) |
Total from investment operations | (0.48) | (1.10) | 0.12 | 1.21 | 0.78 | (0.07) |
| Distributions to shareholders from | ||||||
Net investment income | (0.14) | (0.17) | (0.21) | (0.31) | (0.37) | (0.28) |
Net realized gains | 0.00 | (0.12) | (0.65) | (0.03) | 0.00 | 0.00 |
Total distributions to shareholders | (0.14) | (0.29) | (0.86) | (0.34) | (0.37) | (0.28) |
Net asset value, end of period | $11.07 | $11.69 | $13.08 | $13.82 | $12.95 | $12.54 |
Total return2 | (4.11)% | (8.61)% | 0.70% | 9.42% | 6.31% | (0.54)% |
| Ratios to average net assets (annualized)* | ||||||
Gross expenses | 0.45% | 0.44% | 0.44% | 0.44% | 0.45% | 0.45% |
Net expenses | 0.37% | 0.37% | 0.37% | 0.37% | 0.37% | 0.37% |
Net investment income | 2.71% | 1.32% | 1.29% | 2.26% | 2.92% | 2.24% |
| Supplemental data | ||||||
Portfolio turnover rate3 | 213% | 432% | 457% | 603% | 577% | 542% |
Net assets, end of period (000s omitted) | $1,497,086 | $1,643,353 | $1,978,164 | $2,545,332 | $2,513,644 | $1,360,847 |
| * | Ratios include net expenses allocated from the affiliated Master Portfolio which were as follows: |
| Six months ended November 30, 2022 (unaudited) | 0.36% |
| Year ended May 31, 2022 | 0.36% |
| Year ended May 31, 2021 | 0.35% |
| Year ended May 31, 2020 | 0.35% |
| Year ended May 31, 2019 | 0.35% |
| Year ended May 31, 2018 | 0.35% |
| 1 | Calculated based upon average shares outstanding |
| 2 | Returns for periods of less than one year are not annualized. |
| 3 | Portfolio turnover rate is calculated by multiplying the affiliated Master Portfolio’s percentage of the Fund’s total investment in securities at the end of the period by the affiliated Master Portfolio’s portfolio turnover rate. |
| Year ended May 31 | ||||||
| Administrator Class | Six months ended November 30, 2022 (unaudited) | 2022 | 2021 | 2020 | 2019 | 2018 |
Net asset value, beginning of period | $11.70 | $13.09 | $13.83 | $12.96 | $12.56 | $12.90 |
Net investment income | 0.13 1 | 0.13 | 0.13 | 0.26 | 0.33 1 | 0.24 1 |
Net realized and unrealized gains (losses) on investments | (0.63) | (1.27) | (0.06) | 0.90 | 0.40 | (0.34) |
Total from investment operations | (0.50) | (1.14) | 0.07 | 1.16 | 0.73 | (0.10) |
| Distributions to shareholders from | ||||||
Net investment income | (0.12) | (0.13) | (0.16) | (0.26) | (0.33) | (0.24) |
Net realized gains | 0.00 | (0.12) | (0.65) | (0.03) | 0.00 | 0.00 |
Total distributions to shareholders | (0.12) | (0.25) | (0.81) | (0.29) | (0.33) | (0.24) |
Net asset value, end of period | $11.08 | $11.70 | $13.09 | $13.83 | $12.96 | $12.56 |
Total return2 | (4.27)% | (8.90)% | 0.37% | 9.14% | 5.87% | (0.79)% |
| Ratios to average net assets (annualized)* | ||||||
Gross expenses | 0.76% | 0.74% | 0.76% | 0.76% | 0.76% | 0.77% |
Net expenses | 0.70% | 0.69% | 0.70% | 0.70% | 0.70% | 0.70% |
Net investment income | 2.28% | 0.99% | 0.95% | 1.92% | 2.58% | 1.86% |
| Supplemental data | ||||||
Portfolio turnover rate3 | 213% | 432% | 457% | 603% | 577% | 542% |
Net assets, end of period (000s omitted) | $77,593 | $177,305 | $214,796 | $218,522 | $205,825 | $269,057 |
| * | Ratios include net expenses allocated from the affiliated Master Portfolio which were as follows: |
| Six months ended November 30, 2022 (unaudited) | 0.36% |
| Year ended May 31, 2022 | 0.36% |
| Year ended May 31, 2021 | 0.35% |
| Year ended May 31, 2020 | 0.35% |
| Year ended May 31, 2019 | 0.35% |
| Year ended May 31, 2018 | 0.35% |
| 1 | Calculated based upon average shares outstanding |
| 2 | Returns for periods of less than one year are not annualized. |
| 3 | Portfolio turnover rate is calculated by multiplying the affiliated Master Portfolio’s percentage of the Fund’s total investment in securities at the end of the period by the affiliated Master Portfolio’s portfolio turnover rate. |
| Year ended May 31 | ||||||
| Institutional Class | Six months ended November 30, 2022 (unaudited) | 2022 | 2021 | 2020 | 2019 | 2018 |
Net asset value, beginning of period | $11.69 | $13.07 | $13.82 | $12.94 | $12.54 | $12.88 |
Net investment income | 0.15 | 0.16 | 0.17 | 0.29 | 0.36 | 0.28 |
Net realized and unrealized gains (losses) on investments | (0.63) | (1.26) | (0.07) | 0.92 | 0.40 | (0.34) |
Total from investment operations | (0.48) | (1.10) | 0.10 | 1.21 | 0.76 | (0.06) |
| Distributions to shareholders from | ||||||
Net investment income | (0.14) | (0.16) | (0.20) | (0.30) | (0.36) | (0.28) |
Net realized gains | 0.00 | (0.12) | (0.65) | (0.03) | 0.00 | 0.00 |
Total distributions to shareholders | (0.14) | (0.28) | (0.85) | (0.33) | (0.36) | (0.28) |
Net asset value, end of period | $11.07 | $11.69 | $13.07 | $13.82 | $12.94 | $12.54 |
Total return1 | (4.14)% | (8.59)% | 0.58% | 9.45% | 6.18% | (0.51)% |
| Ratios to average net assets (annualized)* | ||||||
Gross expenses | 0.50% | 0.49% | 0.49% | 0.49% | 0.50% | 0.50% |
Net expenses | 0.42% | 0.42% | 0.42% | 0.42% | 0.42% | 0.42% |
Net investment income | 2.65% | 1.27% | 1.22% | 2.21% | 2.86% | 2.16% |
| Supplemental data | ||||||
Portfolio turnover rate2 | 213% | 432% | 457% | 603% | 577% | 542% |
Net assets, end of period (000s omitted) | $2,385,259 | $2,446,260 | $2,749,647 | $2,365,421 | $2,343,238 | $3,318,290 |
| * | Ratios include net expenses allocated from the affiliated Master Portfolio which were as follows: |
| Six months ended November 30, 2022 (unaudited) | 0.36% |
| Year ended May 31, 2022 | 0.36% |
| Year ended May 31, 2021 | 0.35% |
| Year ended May 31, 2020 | 0.35% |
| Year ended May 31, 2019 | 0.35% |
| Year ended May 31, 2018 | 0.35% |
| 1 | Returns for periods of less than one year are not annualized. |
| 2 | Portfolio turnover rate is calculated by multiplying the affiliated Master Portfolio’s percentage of the Fund’s total investment in securities at the end of the period by the affiliated Master Portfolio’s portfolio turnover rate. |
| Gross unrealized gains | $ 0 |
| Gross unrealized losses | (377,422,800) |
| Net unrealized losses | $(377,422,800) |
| Affiliated Master Portfolio | Investment objective | Fair value of affiliated Master Portfolio |
| Allspring Core Bond Portfolio | Seeks total return, consisting of income and capital appreciation | $4,273,624,467 |
| Average daily net assets | Management fee |
| First $5 billion | 0.050% |
| Next $5 billion | 0.040 |
| Over $10 billion | 0.030 |
| Class-level administration fee | |
| Class A | 0.16% |
| Class C | 0.16 |
| Class R | 0.16 |
| Class R4 | 0.08 |
| Class R6 | 0.03 |
| Administrator Class | 0.10 |
| Institutional Class | 0.08 |
| Expense ratio caps | |
| Class A | 0.78% |
| Class C | 1.53 |
| Class R | 1.03 |
| Class R4 | 0.52 |
| Class R6 | 0.37 |
| Administrator Class | 0.70 |
| Institutional Class | 0.42 |
| Purchases at cost | Sales proceeds | |||
| U.S. government | Non-U.S. government | U.S. government | Non-U.S. government | |
| $5,346,708,468 | $4,299,415,163 | $5,589,995,382 | $4,157,124,076 | |
| Interest rate | Maturity date | Principal | Value | |||
| Agency securities: 32.35% | ||||||
| FHLMC ¤ | 0.00% | 12-14-2029 | $ | 6,390,000 | $ 4,804,667 | |
| FHLMC | 1.75 | 5-15-2043 | 1,755,108 | 1,499,443 | ||
| FHLMC | 2.00 | 4-1-2041 | 2,938,440 | 2,532,614 | ||
| FHLMC | 2.00 | 11-1-2041 | 2,189,909 | 1,860,323 | ||
| FHLMC | 2.00 | 11-1-2041 | 2,924,675 | 2,484,507 | ||
| FHLMC | 2.00 | 12-1-2041 | 12,994,291 | 11,038,623 | ||
| FHLMC | 2.00 | 1-1-2042 | 3,396,142 | 2,884,991 | ||
| FHLMC | 2.00 | 2-1-2042 | 18,825,038 | 15,991,552 | ||
| FHLMC | 2.00 | 3-1-2042 | 391,683 | 332,728 | ||
| FHLMC | 2.00 | 4-1-2042 | 3,019,769 | 2,565,236 | ||
| FHLMC | 2.00 | 4-1-2042 | 4,597,502 | 3,899,792 | ||
| FHLMC | 2.00 | 5-1-2042 | 2,044,836 | 1,734,509 | ||
| FHLMC | 2.00 | 2-1-2047 | 2,173,537 | 1,801,684 | ||
| FHLMC | 2.00 | 12-1-2051 | 1,541,849 | 1,278,062 | ||
| FHLMC (12 Month LIBOR +1.64%) ± | 2.32 | 8-1-2043 | 501,828 | 504,390 | ||
| FHLMC (12 Month LIBOR +1.65%) ± | 2.34 | 3-1-2043 | 823,864 | 838,290 | ||
| FHLMC (12 Month LIBOR +1.64%) ± | 2.36 | 7-1-2043 | 325,992 | 326,920 | ||
| FHLMC (12 Month LIBOR +1.64%) ± | 2.44 | 9-1-2045 | 6,373,485 | 6,415,149 | ||
| FHLMC | 2.45 | 4-25-2032 | 4,278,000 | 3,645,590 | ||
| FHLMC | 2.50 | 4-1-2042 | 1,369,381 | 1,206,536 | ||
| FHLMC | 2.50 | 5-1-2042 | 6,412,612 | 5,642,090 | ||
| FHLMC | 2.50 | 6-1-2042 | 2,308,107 | 2,033,634 | ||
| FHLMC | 2.50 | 11-25-2048 | 1,913,542 | 1,686,913 | ||
| FHLMC | 2.50 | 4-25-2049 | 4,763,494 | 4,135,469 | ||
| FHLMC | 2.50 | 5-25-2049 | 2,943,439 | 2,625,448 | ||
| FHLMC | 2.50 | 5-25-2049 | 4,293,454 | 3,743,026 | ||
| FHLMC | 2.50 | 8-1-2051 | 1,717,687 | 1,478,986 | ||
| FHLMC | 2.50 | 9-1-2051 | 11,179,628 | 9,713,593 | ||
| FHLMC | 2.50 | 1-1-2052 | 11,330,413 | 9,749,497 | ||
| FHLMC | 2.50 | 2-1-2052 | 1,204,646 | 1,037,862 | ||
| FHLMC | 2.50 | 3-1-2052 | 3,991,135 | 3,429,276 | ||
| FHLMC (12 Month LIBOR +1.63%) ± | 2.51 | 11-1-2043 | 536,854 | 537,403 | ||
| FHLMC (12 Month LIBOR +1.65%) ± | 2.53 | 10-1-2043 | 1,085,034 | 1,091,432 | ||
| FHLMC (12 Month LIBOR +1.61%) ± | 2.56 | 9-1-2043 | 256,584 | 257,044 | ||
| FHLMC (12 Month LIBOR +1.61%) ± | 2.70 | 10-1-2043 | 626,811 | 627,059 | ||
| FHLMC (12 Month LIBOR +1.64%) ± | 2.81 | 5-1-2049 | 1,936,527 | 1,869,170 | ||
| FHLMC (12 Month LIBOR +1.72%) ± | 2.88 | 1-1-2044 | 1,125,878 | 1,137,527 | ||
| FHLMC | 2.92 | 6-25-2032 | 8,221,000 | 7,298,739 | ||
| FHLMC | 3.00 | 10-15-2047 | 4,182,603 | 3,840,611 | ||
| FHLMC | 3.00 | 5-15-2050 | 3,375,015 | 3,116,508 | ||
| FHLMC | 3.12 | 8-25-2032 | 4,268,000 | 3,835,788 | ||
| FHLMC (12 Month LIBOR +1.69%) ± | 3.16 | 9-1-2047 | 5,927,612 | 5,990,000 | ||
| FHLMC (12 Month LIBOR +1.64%) ± | 3.46 | 3-1-2049 | 2,891,421 | 2,860,391 | ||
| FHLMC (12 Month LIBOR +1.64%) ± | 3.59 | 4-1-2048 | 6,765,765 | 6,752,674 | ||
| FHLMC (12 Month LIBOR +1.69%) ± | 3.81 | 2-1-2043 | 784,397 | 804,815 | ||
| FHLMC (30 Day Average U.S. SOFR +2.13%) ± | 3.91 | 7-1-2052 | 2,311,818 | 2,218,702 | ||
| FHLMC (30 Day Average U.S. SOFR +2.14%) ± | 3.99 | 8-1-2052 | 3,142,206 | 2,994,826 | ||
| FHLMC | 4.00 | 4-1-2037 | 1,228,294 | 1,200,027 | ||
| FHLMC | 4.00 | 7-1-2049 | 8,008,721 | 7,837,916 | ||
| FHLMC (30 Day Average U.S. SOFR +2.38%) ± | 4.12 | 9-1-2052 | 1,762,958 | 1,699,295 | ||
| FHLMC (30 Day Average U.S. SOFR +2.13%) ± | 4.30 | 7-1-2052 | 2,837,429 | 2,760,304 | ||
| FHLMC | 4.50 | 6-1-2039 | 189,608 | 187,769 | ||
| FHLMC | 4.50 | 7-1-2039 | 228,906 | 227,802 | ||
| FHLMC (12 Month LIBOR +1.77%) ± | 5.50 | 9-1-2042 | 427,559 | 437,727 | ||
| Interest rate | Maturity date | Principal | Value | |||
| Agency securities (continued) | ||||||
| FHLMC | 2.58% | 5-25-2032 | $ | 4,278,000 | $ 3,683,993 | |
| FHLMC | 3.00 | 6-25-2032 | 8,221,000 | 7,347,160 | ||
| FHLMC Series 8B6021 Class FH (30 Day Average U.S. SOFR +2.24%) ± | 3.89 | 12-1-2052 | 2,993,161 | 2,877,176 | ||
| FHLMC Series G08721 Class FG | 3.00 | 9-1-2046 | 5,468,808 | 4,946,987 | ||
| FHLMC Series G08727 Class FG | 3.50 | 10-1-2046 | 1,987,470 | 1,864,052 | ||
| FHLMC Series RB5085 Class FR | 2.00 | 11-1-2040 | 1,084,488 | 934,722 | ||
| FHLMC Series RB5095 Class FR | 2.00 | 1-1-2041 | 2,609,743 | 2,242,871 | ||
| FHLMC Series RB5118 Class FR | 2.00 | 7-1-2041 | 4,475,722 | 3,824,303 | ||
| FHLMC Series RB5134 Class FR | 1.50 | 11-1-2041 | 4,794,206 | 3,918,871 | ||
| FHLMC Series SC0319 Class FR | 2.00 | 4-1-2042 | 5,373,196 | 4,591,108 | ||
| FHLMC Series SD1149 Class FR | 3.00 | 11-1-2048 | 1,881,720 | 1,696,256 | ||
| FHLMC Series ZT2255 Class FR | 3.50 | 6-1-2046 | 2,410,815 | 2,247,649 | ||
| FHLMC Series 1897 Class K | 7.00 | 9-15-2026 | 113 | 114 | ||
| FHLMC Series 264 Class 30 | 3.00 | 7-15-2042 | 5,662,227 | 5,189,726 | ||
| FHLMC Series 5091 Class AB | 1.50 | 3-25-2051 | 6,554,059 | 5,443,018 | ||
| FHLMC Series 5119 Class AB | 1.50 | 8-25-2049 | 3,365,427 | 2,756,351 | ||
| FHLMC Series 5201 Class CA | 2.50 | 7-25-2048 | 4,289,960 | 3,859,615 | ||
| FHLMC Series 5217 Class CD | 2.50 | 7-25-2049 | 3,735,390 | 3,428,591 | ||
| FHLMC Series 841499 Class FH (30 Day Average U.S. SOFR +2.18%) ± | 3.57 | 10-1-2052 | 18,501,674 | 17,793,379 | ||
| FNMA ¤ | 0.00 | 11-15-2030 | 18,777,000 | 13,554,840 | ||
| FNMA | 1.50 | 10-1-2041 | 14,594,749 | 12,075,619 | ||
| FNMA | 1.50 | 11-1-2041 | 42,723,285 | 34,926,147 | ||
| FNMA | 1.50 | 1-25-2043 | 2,125,743 | 1,781,151 | ||
| FNMA | 1.50 | 1-25-2043 | 7,011,094 | 6,249,997 | ||
| FNMA (30 Day Average U.S. SOFR +2.21%) ± | 1.61 | 12-1-2051 | 1,503,198 | 1,343,346 | ||
| FNMA | 1.70 | 8-25-2033 | 7,978,680 | 7,292,216 | ||
| FNMA | 1.75 | 5-25-2043 | 2,438,965 | 2,141,260 | ||
| FNMA | 1.75 | 6-25-2046 | 15,722,107 | 13,230,561 | ||
| FNMA | 2.00 | 6-25-2038 | 7,954,067 | 7,209,931 | ||
| FNMA | 2.00 | 1-1-2041 | 16,355,261 | 13,965,153 | ||
| FNMA | 2.00 | 1-1-2042 | 5,069,310 | 4,306,340 | ||
| FNMA | 2.00 | 2-1-2042 | 39,504,360 | 33,558,224 | ||
| FNMA | 2.00 | 3-1-2042 | 21,216,227 | 18,022,726 | ||
| FNMA | 2.00 | 1-1-2047 | 2,048,272 | 1,700,380 | ||
| FNMA | 2.00 | 3-1-2047 | 2,187,568 | 1,820,080 | ||
| FNMA | 2.00 | 12-1-2050 | 17,219,848 | 14,256,844 | ||
| FNMA (12 Month LIBOR +1.56%) ± | 2.26 | 6-1-2043 | 421,545 | 426,346 | ||
| FNMA (12 Month LIBOR +1.57%) ± | 2.44 | 3-1-2043 | 200,683 | 204,987 | ||
| FNMA | 2.50 | 12-1-2035 | 13,083,326 | 12,126,357 | ||
| FNMA | 2.50 | 3-1-2036 | 7,442,300 | 6,898,067 | ||
| FNMA | 2.50 | 5-1-2036 | 8,863,892 | 8,215,490 | ||
| FNMA | 2.50 | 5-1-2036 | 6,789,193 | 6,292,744 | ||
| FNMA | 2.50 | 6-1-2036 | 8,134,323 | 7,539,112 | ||
| FNMA | 2.50 | 8-1-2041 | 4,108,816 | 3,625,260 | ||
| FNMA | 2.50 | 2-1-2042 | 4,314,322 | 3,833,515 | ||
| FNMA | 2.50 | 4-1-2042 | 10,097,941 | 8,897,098 | ||
| FNMA | 2.50 | 5-1-2042 | 5,330,923 | 4,690,497 | ||
| FNMA | 2.50 | 6-1-2042 | 4,928,714 | 4,342,944 | ||
| FNMA | 2.50 | 12-1-2047 | 10,099,306 | 9,023,936 | ||
| FNMA | 2.50 | 10-1-2050 | 6,569,841 | 5,724,026 | ||
| FNMA | 2.50 | 6-1-2051 | 4,566,764 | 3,944,875 | ||
| FNMA | 2.50 | 9-1-2051 | 5,209,181 | 4,491,733 | ||
| FNMA | 2.50 | 12-1-2051 | 9,604,859 | 8,288,196 | ||
| Interest rate | Maturity date | Principal | Value | |||
| Agency securities (continued) | ||||||
| FNMA | 2.50% | 12-1-2051 | $ | 4,591,343 | $ 3,961,956 | |
| FNMA | 2.50 | 12-1-2051 | 14,033,882 | 12,110,101 | ||
| FNMA | 2.50 | 3-1-2052 | 1,855,841 | 1,599,610 | ||
| FNMA | 2.50 | 3-1-2052 | 2,985,592 | 2,565,288 | ||
| FNMA %% | 2.50 | 12-13-2052 | 30,800,000 | 26,346,031 | ||
| FNMA (12 Month LIBOR +1.58%) ± | 2.73 | 1-1-2046 | 4,202,019 | 4,242,962 | ||
| FNMA (12 Month LIBOR +1.58%) ± | 2.99 | 10-1-2043 | 1,471,628 | 1,480,627 | ||
| FNMA | 3.00 | 1-1-2043 | 4,718,503 | 4,288,663 | ||
| FNMA | 3.00 | 5-25-2048 | 5,853,820 | 5,366,678 | ||
| FNMA %% | 3.00 | 12-13-2052 | 16,600,000 | 14,690,168 | ||
| FNMA | 3.00 | 2-1-2055 | 2,144,216 | 1,925,811 | ||
| FNMA | 3.00 | 7-1-2060 | 26,891,030 | 23,733,712 | ||
| FNMA (12 Month LIBOR +1.58%) ± | 3.08 | 6-1-2045 | 1,600,106 | 1,602,476 | ||
| FNMA | 3.50 | 4-1-2050 | 5,558,470 | 5,248,710 | ||
| FNMA (30 Day Average U.S. SOFR +2.37%) ± | 3.68 | 8-1-2052 | 3,495,302 | 3,330,459 | ||
| FNMA (30 Day Average U.S. SOFR +2.12%) ± | 3.96 | 8-1-2052 | 2,269,403 | 2,167,160 | ||
| FNMA | 4.00 | 9-1-2033 | 1,515,075 | 1,489,143 | ||
| FNMA | 4.00 | 10-1-2037 | 1,084,651 | 1,074,628 | ||
| FNMA | 4.00 | 6-1-2038 | 2,032,620 | 2,013,843 | ||
| FNMA | 4.00 | 9-1-2045 | 641,631 | 633,292 | ||
| FNMA | 4.00 | 1-1-2046 | 4,486,798 | 4,428,493 | ||
| FNMA | 4.00 | 2-1-2047 | 2,189,360 | 2,132,454 | ||
| FNMA | 4.00 | 4-1-2047 | 614,717 | 596,073 | ||
| FNMA | 4.00 | 4-1-2047 | 419,781 | 414,325 | ||
| FNMA | 4.00 | 4-1-2047 | 122,945 | 118,797 | ||
| FNMA | 4.00 | 10-1-2047 | 518,970 | 512,224 | ||
| FNMA | 4.00 | 10-1-2047 | 413,639 | 405,575 | ||
| FNMA | 4.00 | 7-1-2048 | 14,127,539 | 13,646,949 | ||
| FNMA | 4.00 | 12-1-2048 | 2,283,132 | 2,253,458 | ||
| FNMA | 4.00 | 2-1-2049 | 2,522,327 | 2,448,442 | ||
| FNMA | 4.00 | 5-1-2049 | 302,853 | 289,356 | ||
| FNMA | 4.00 | 5-1-2049 | 1,995,019 | 1,945,652 | ||
| FNMA | 4.00 | 12-1-2049 | 2,192,215 | 2,134,388 | ||
| FNMA | 4.00 | 8-1-2059 | 2,683,598 | 2,579,556 | ||
| FNMA (30 Day Average U.S. SOFR +2.12%) ± | 4.17 | 7-1-2052 | 5,784,135 | 5,568,565 | ||
| FNMA (30 Day Average U.S. SOFR +2.37%) ± | 4.22 | 9-1-2052 | 1,761,290 | 1,709,355 | ||
| FNMA (30 Day Average U.S. SOFR +2.13%) ± | 4.32 | 8-1-2052 | 6,526,671 | 6,369,759 | ||
| FNMA (30 Day Average U.S. SOFR +2.12%) ± | 4.35 | 7-1-2052 | 6,030,969 | 5,894,552 | ||
| FNMA | 4.50 | 6-1-2041 | 177,581 | 178,031 | ||
| FNMA | 4.50 | 3-1-2043 | 2,319,146 | 2,325,015 | ||
| FNMA | 4.50 | 10-1-2045 | 3,612,014 | 3,621,170 | ||
| FNMA | 4.50 | 2-1-2046 | 91,354 | 90,738 | ||
| FNMA | 4.50 | 7-1-2048 | 3,594,820 | 3,600,716 | ||
| FNMA | 4.50 | 11-1-2048 | 1,606,652 | 1,605,425 | ||
| FNMA (12 Month LIBOR +1.64%) ± | 4.53 | 1-1-2043 | 451,336 | 465,213 | ||
| FNMA (30 Day Average U.S. SOFR +2.13%) ± | 4.62 | 8-1-2052 | 7,001,887 | 6,904,275 | ||
| FNMA (30 Day Average U.S. SOFR +2.12%) ± | 4.65 | 8-1-2052 | 5,401,022 | 5,297,480 | ||
| FNMA (30 Day Average U.S. SOFR +2.13%) ± | 4.65 | 8-1-2052 | 5,496,323 | 5,424,746 | ||
| FNMA | 5.00 | 7-1-2044 | 257,787 | 262,541 | ||
| FNMA | 5.50 | 12-1-2048 | 2,540,599 | 2,630,122 | ||
| FNMA | 6.00 | 2-1-2029 | 1,279 | 1,308 | ||
| FNMA | 6.00 | 3-1-2033 | 16,715 | 17,416 | ||
| FNMA | 6.00 | 11-1-2033 | 5,635 | 5,872 | ||
| FNMA %% | 6.00 | 1-12-2053 | 26,400,000 | 26,962,910 | ||
| FNMA %% | 6.50 | 2-13-2053 | 6,900,000 | 7,078,120 | ||
| Interest rate | Maturity date | Principal | Value | |||
| Agency securities (continued) | ||||||
| FNMA Series FS1204 Class FN | 3.00% | 2-1-2048 | $ | 2,764,170 | $ 2,497,825 | |
| FNMA Series FS2252 Class FN | 3.00 | 7-1-2050 | 23,011,732 | 20,703,335 | ||
| FNMA Series FS3009 Class FN | 2.00 | 5-1-2042 | 2,374,324 | 2,028,763 | ||
| FNMA Series MA4387 Class FN | 2.00 | 7-1-2041 | 20,771,076 | 17,748,156 | ||
| FNMA Series BQ7047 Class FN | 2.00 | 1-1-2042 | 3,101,373 | 2,634,561 | ||
| FNMA Series CB5158 Class FN | 6.50 | 11-1-2052 | 1,933,994 | 2,065,534 | ||
| FNMA Series BF0555 Class FN | 3.00 | 5-1-2050 | 11,888,725 | 10,777,314 | ||
| FNMA Series BM6942 Class FN | 3.50 | 7-1-2048 | 1,738,362 | 1,620,900 | ||
| FNMA Series BM7041 Class FN | 3.50 | 2-1-2046 | 5,340,699 | 5,020,102 | ||
| FNMA Series BM7102 Class FN (30 Day Average U.S. SOFR +2.13%) ± | 4.16 | 10-1-2052 | 12,296,143 | 12,042,854 | ||
| FNMA Series FM8576 Class FN | 3.00 | 2-1-2050 | 7,120,545 | 6,426,701 | ||
| FNMA Series FS1456 Class FN | 3.00 | 12-1-2048 | 8,688,163 | 7,823,518 | ||
| FNMA Series FS1681 Class FN | 2.00 | 3-1-2047 | 12,699,472 | 10,534,784 | ||
| FNMA Series FS2021 Class FN | 3.50 | 7-1-2049 | 15,356,655 | 14,304,469 | ||
| FNMA Series FS2244 Class FN | 3.00 | 2-1-2045 | 4,051,660 | 3,712,204 | ||
| FNMA Series FS2401 Class FN | 4.00 | 3-1-2035 | 26,045,734 | 26,106,448 | ||
| FNMA Series FS2648 Class FN | 3.00 | 10-1-2049 | 47,540,735 | 43,629,046 | ||
| FNMA Series FS2709 Class FN | 3.00 | 2-1-2047 | 10,522,952 | 9,645,698 | ||
| FNMA Series FS2880 Class FN | 3.50 | 4-1-2050 | 8,482,584 | 7,888,254 | ||
| FNMA Series FS2975 Class FN | 2.00 | 8-1-2042 | 4,376,590 | 3,717,911 | ||
| FNMA Series FS3006 Class FN | 2.00 | 4-1-2041 | 1,894,791 | 1,633,135 | ||
| FNMA Series FS3098 Class FN | 3.00 | 2-1-2044 | 3,914,039 | 3,592,000 | ||
| FNMA Series FS3324 Class FN | 2.50 | 12-1-2040 | 6,972,000 | 6,195,021 | ||
| FNMA Series MA2771 Class FN | 3.00 | 10-1-2046 | 5,531,440 | 4,996,443 | ||
| FNMA Series MA2806 Class FN | 3.00 | 11-1-2046 | 6,694,371 | 6,036,308 | ||
| FNMA Series MA2833 Class FN | 3.00 | 12-1-2046 | 15,644,384 | 14,111,412 | ||
| FNMA Series MA2863 Class FN | 3.00 | 1-1-2047 | 2,407,763 | 2,169,368 | ||
| FNMA Series MA4268 Class FN | 2.00 | 2-1-2041 | 1,086,867 | 936,766 | ||
| FNMA Series MA4333 Class FN | 2.00 | 5-1-2041 | 4,953,891 | 4,269,769 | ||
| FNMA Series MA4364 Class FN | 2.00 | 6-1-2041 | 1,311,974 | 1,130,786 | ||
| FNMA Series MA4407 Class FN | 2.00 | 8-1-2041 | 1,493,171 | 1,275,843 | ||
| FNMA Series FS2740 Class FN | 3.50 | 6-1-2049 | 28,140,147 | 26,229,592 | ||
| FNMA Series FS2836 Class FN | 4.00 | 1-1-2027 | 14,069,704 | 14,103,212 | ||
| FNMA Series FS3338 Class FN | 3.00 | 12-1-2043 | 3,791,394 | 3,479,326 | ||
| FNMA Series MA2895 Class FN | 3.00 | 2-1-2047 | 2,676,486 | 2,413,747 | ||
| FNMA Series MA4176 Class FN | 2.00 | 11-1-2040 | 842,298 | 725,991 | ||
| FNMA Series BE2310 Class FN | 3.00 | 1-1-2047 | 3,325,947 | 3,003,070 | ||
| FNMA Series BV2186 Class FN | 2.00 | 2-1-2042 | 9,270,817 | 7,875,359 | ||
| FNMA Series BW1302 Class FN (30 Day Average U.S. SOFR +2.13%) ± | 4.26 | 11-1-2052 | 4,189,444 | 4,093,812 | ||
| FNMA Series BW1383 Class FN (30 Day Average U.S. SOFR +2.12%) ± | 4.66 | 12-1-2052 | 4,700,000 | 4,617,750 | ||
| FNMA Series CA8305 Class FN | 2.00 | 12-1-2040 | 23,140,350 | 19,944,668 | ||
| FNMA Series CB0470 Class FN | 2.50 | 5-1-2041 | 7,317,512 | 6,501,544 | ||
| FNMA Series FS1513 Class FN | 2.00 | 2-1-2042 | 5,084,939 | 4,319,644 | ||
| FNMA Series FS1972 Class FN | 2.00 | 4-1-2042 | 3,978,222 | 3,384,404 | ||
| FNMA Series MA4606 Class FN | 2.00 | 5-1-2042 | 3,893,504 | 3,307,511 | ||
| FNMA Series 310206 Class FN | 3.50 | 12-1-2043 | 9,854,227 | 9,225,837 | ||
| FNMA Series AS0039 Class FN | 3.00 | 7-1-2043 | 2,872,305 | 2,632,571 | ||
| FNMA Series AU3735 Class FN | 3.00 | 8-1-2043 | 3,982,323 | 3,649,158 | ||
| FNMA Series CB4696 Class FN | 5.50 | 9-1-2052 | 4,573,616 | 4,763,116 | ||
| FNMA Series FM9263 Class FN | 2.00 | 10-1-2041 | 7,709,911 | 6,587,794 | ||
| FNMA Series FS1789 Class FN | 3.50 | 7-1-2047 | 25,038,610 | 23,618,801 | ||
| FNMA Series FS1918 Class FN | 3.00 | 2-1-2050 | 30,401,397 | 27,427,956 | ||
| Interest rate | Maturity date | Principal | Value | |||
| Agency securities (continued) | ||||||
| FNMA Series MA4204 Class FN | 2.00% | 12-1-2040 | $ | 6,048,666 | $ 5,213,411 | |
| FNMA Series 2017-13 Class PA | 3.00 | 8-25-2046 | 2,238,643 | 2,054,280 | ||
| FNMA Series 2017-M7 Class A2 ±± | 2.96 | 2-25-2027 | 1,605,685 | 1,517,827 | ||
| FNMA Series 2018-14 Class KC | 3.00 | 3-25-2048 | 2,758,214 | 2,562,744 | ||
| FNMA Series 2018-8 Class KL | 2.50 | 3-25-2047 | 2,718,742 | 2,404,904 | ||
| FNMA Series 2020-45 Class JL | 3.00 | 7-25-2040 | 4,381,186 | 3,999,325 | ||
| FNMA Series 2020-48 Class AB | 2.00 | 7-25-2050 | 3,651,526 | 3,114,025 | ||
| FNMA Series 2020-48 Class DA | 2.00 | 7-25-2050 | 8,181,933 | 7,091,696 | ||
| FNMA Series 2021-27 Class EC | 1.50 | 5-25-2051 | 10,491,572 | 8,684,746 | ||
| FNMA Series 2021-78 Class ND | 1.50 | 11-25-2051 | 5,994,804 | 4,968,040 | ||
| FNMA Series 2021-78 Class PA | 2.50 | 11-25-2051 | 3,779,091 | 3,323,161 | ||
| FNMA Series 2022-11 Class A | 2.50 | 7-25-2047 | 9,689,431 | 8,762,274 | ||
| FNMA Series 2022-28 Class CA | 2.00 | 1-25-2048 | 3,523,100 | 3,119,292 | ||
| FNMA Series 2022-M13 Class A2 | 2.68 | 6-25-2032 | 3,393,000 | 2,912,690 | ||
| FNMA Series 414 Class A35 | 3.50 | 10-25-2042 | 5,165,644 | 4,875,144 | ||
| FNMA Series AB6912 Class FN | 3.50 | 11-1-2042 | 2,056,393 | 1,939,736 | ||
| FNMA Series AQ0225 Class FN | 3.00 | 11-1-2042 | 3,751,931 | 3,442,931 | ||
| GNMA | 2.50 | 12-20-2051 | 15,369,519 | 13,532,078 | ||
| GNMA | 3.00 | 10-20-2046 | 660,221 | 602,385 | ||
| GNMA | 3.00 | 12-20-2046 | 923,769 | 842,100 | ||
| GNMA | 3.00 | 1-20-2047 | 700,702 | 638,750 | ||
| GNMA | 3.00 | 3-20-2047 | 2,176,821 | 1,984,373 | ||
| GNMA | 3.00 | 3-20-2047 | 284,982 | 259,786 | ||
| GNMA | 3.00 | 4-20-2047 | 1,720,663 | 1,568,894 | ||
| GNMA | 3.00 | 7-20-2047 | 1,272,543 | 1,160,393 | ||
| GNMA | 3.00 | 9-20-2047 | 1,163,936 | 1,061,304 | ||
| GNMA | 3.00 | 9-20-2047 | 693,942 | 626,376 | ||
| GNMA | 3.00 | 11-20-2047 | 245,665 | 223,958 | ||
| GNMA | 3.00 | 3-20-2048 | 367,874 | 335,428 | ||
| GNMA | 3.00 | 10-20-2050 | 10,083,237 | 9,138,420 | ||
| GNMA | 3.50 | 1-20-2048 | 2,472,260 | 2,333,600 | ||
| GNMA | 3.50 | 3-20-2049 | 1,556,526 | 1,482,796 | ||
| GNMA | 4.00 | 6-20-2047 | 17,455,874 | 16,911,519 | ||
| GNMA | 4.00 | 3-20-2048 | 646,446 | 620,986 | ||
| GNMA | 4.00 | 4-20-2048 | 969,807 | 932,045 | ||
| GNMA | 4.00 | 4-20-2048 | 681,658 | 654,811 | ||
| GNMA | 4.00 | 4-20-2048 | 710,387 | 682,728 | ||
| GNMA %% | 4.00 | 12-20-2052 | 5,200,000 | 4,963,359 | ||
| GNMA | 4.50 | 8-15-2047 | 407,275 | 408,743 | ||
| GNMA | 4.50 | 6-20-2048 | 2,641,606 | 2,623,193 | ||
| GNMA | 4.50 | 2-20-2049 | 3,012,313 | 2,913,969 | ||
| GNMA | 5.00 | 12-20-2039 | 117,317 | 118,451 | ||
| GNMA | 5.00 | 3-20-2048 | 4,708,405 | 4,793,786 | ||
| GNMA | 5.00 | 5-20-2048 | 2,188,133 | 2,208,753 | ||
| GNMA | 5.00 | 6-20-2048 | 8,173,986 | 8,225,793 | ||
| GNMA | 5.00 | 7-20-2048 | 1,423,288 | 1,433,573 | ||
| GNMA | 5.00 | 8-20-2048 | 2,183,528 | 2,195,515 | ||
| GNMA | 5.00 | 12-20-2048 | 2,181,365 | 2,192,034 | ||
| GNMA | 5.00 | 1-20-2049 | 410,050 | 411,775 | ||
| GNMA | 5.00 | 1-20-2049 | 2,395,845 | 2,395,529 | ||
| GNMA | 5.00 | 2-20-2049 | 162,073 | 166,715 | ||
| GNMA | 5.00 | 3-20-2049 | 734,010 | 753,867 | ||
| GNMA Series CL3644 Class G2 | 3.00 | 2-20-2048 | 956,254 | 871,708 | ||
| GNMA Series CM1041 Class G2 | 3.00 | 12-20-2046 | 261,422 | 238,530 | ||
| GNMA Series CN5874 Class G2 | 3.00 | 1-20-2048 | 1,012,925 | 914,307 | ||
| Interest rate | Maturity date | Principal | Value | |||
| Agency securities (continued) | ||||||
| GNMA Series CP3380 Class G2 | 3.00% | 11-20-2047 | $ | 638,653 | $ 576,472 | |
| GNMA Series CP9544 Class G2 | 3.00 | 7-20-2047 | 1,199,440 | 1,093,390 | ||
| GNMA Series 6713 Class G2 | 3.00 | 12-20-2047 | 239,764 | 216,420 | ||
| GNMA Series 786309 Class GN | 3.00 | 11-15-2047 | 11,503,199 | 10,646,587 | ||
| GNMA Series CN6482 Class G2 | 3.00 | 1-20-2048 | 410,695 | 370,710 | ||
| GNMA Series 2021-27 Class BD | 5.00 | 2-20-2051 | 2,444,447 | 2,484,323 | ||
| GNMA Series 2021-27 Class CW | 5.00 | 2-20-2051 | 1,458,549 | 1,462,104 | ||
| GNMA Series 2021-27 Class NT | 5.00 | 2-20-2051 | 3,009,759 | 2,966,497 | ||
| GNMA Series 2021-8 Class CY | 5.00 | 1-20-2051 | 978,020 | 980,306 | ||
| GNMA Series CM2623 Class G2 | 3.00 | 6-20-2043 | 4,406,519 | 4,017,187 | ||
| GNMA Series CN9873 Class G2 | 3.00 | 8-20-2043 | 1,410,867 | 1,286,209 | ||
| GNMA Series CO7019 Class G2 | 3.00 | 1-20-2047 | 359,494 | 327,711 | ||
| GNMA Series CO7322 Class G2 | 3.00 | 4-20-2047 | 1,637,479 | 1,492,707 | ||
| GNMA Series CO7380 Class G2 | 3.00 | 5-20-2047 | 613,900 | 559,625 | ||
| GNMA Series CO9408 Class G2 | 3.00 | 2-20-2048 | 215,513 | 194,528 | ||
| GNMA Series CO9450 Class G2 | 3.00 | 1-20-2047 | 1,421,263 | 1,295,601 | ||
| GNMA Series CO9673 Class G2 | 3.00 | 12-20-2046 | 847,611 | 765,088 | ||
| GNMA Series 2012-141 Class WA | 4.53 | 11-16-2041 | 841,841 | 834,616 | ||
| GNMA Series 2017-167 Class BQ | 2.50 | 8-20-2044 | 2,704,520 | 2,469,363 | ||
| GNMA Series 2019-132 Class NA | 3.50 | 9-20-2049 | 2,151,087 | 2,062,421 | ||
| GNMA Series 2021-23 Class MG | 1.50 | 2-20-2051 | 7,919,870 | 6,577,789 | ||
| GNMA Series 2021-27 Class Q | 5.00 | 2-20-2051 | 2,578,968 | 2,549,011 | ||
| GNMA Series 2022-107 Class C | 2.50 | 6-20-2051 | 12,205,488 | 10,411,677 | ||
| GNMA Series 2022-31 Class GH | 2.50 | 12-20-2049 | 8,351,052 | 7,456,253 | ||
| GNMA Series 2022-50 Class DC | 2.50 | 8-20-2051 | 3,758,429 | 3,255,725 | ||
| GNMA Series 2022-84 Class A | 2.50 | 1-20-2052 | 4,316,344 | 3,693,081 | ||
| GNMA Series CN0172 Class G2 | 3.00 | 12-20-2046 | 241,776 | 220,401 | ||
| Total Agency securities (Cost $1,513,146,880) | 1,449,795,707 | |||||
| Asset-backed securities: 11.11% | ||||||
| Ally Auto Receivables Trust Series 2022-1 Class A3 | 3.31 | 11-15-2026 | 4,276,000 | 4,162,445 | ||
| Ally Auto Receivables Trust Series 2022-2 Class A4 | 4.87 | 4-17-2028 | 3,716,000 | 3,714,462 | ||
| American Express Credit Account Master Trust Series 2022-3 Class A | 3.75 | 8-15-2027 | 9,271,000 | 9,021,033 | ||
| American Express Credit Account Master Trust Series 2022-4 Class A | 4.95 | 10-15-2027 | 6,007,000 | 6,036,635 | ||
| AmeriCredit Automobile Receivables Series 2022-1 Class A3 | 2.45 | 11-18-2026 | 1,432,000 | 1,380,019 | ||
| AmeriCredit Automobile Receivables Series 2022-2 Class A3 | 4.38 | 4-18-2028 | 3,567,000 | 3,488,394 | ||
| Avis Budget Rental Car Funding LLC Series 2019-3A Class A1 | 2.36 | 3-20-2026 | 3,825,000 | 3,550,623 | ||
| Avis Budget Rental Car Funding LLC Series 2021-2A Class A 144A | 1.66 | 2-20-2028 | 7,680,000 | 6,594,435 | ||
| Avis Budget Rental Car Funding LLC Series 2022 Class 4A 144A | 4.77 | 2-20-2029 | 3,340,000 | 3,218,262 | ||
| Avis Budget Rental Car Funding LLC Series 2022-3A Class A 144A | 4.62 | 2-20-2027 | 6,739,000 | 6,515,117 | ||
| Bank of America Credit Card Trust Series 2022-A1 Class A1 | 3.53 | 11-15-2027 | 7,084,000 | 6,863,795 | ||
| Bank of America Credit Card Trust Series 2022-A2 Class A2 | 5.00 | 4-17-2028 | 5,075,000 | 5,081,059 | ||
| Capital One Multi-Asset Execution Trust Series 2021-A2 Class A2 | 1.39 | 7-15-2030 | 5,392,000 | 4,490,018 | ||
| Interest rate | Maturity date | Principal | Value | |||
| Asset-backed securities (continued) | ||||||
| Capital One Multi-Asset Execution Trust Series 2022-A3 Class A | 4.95% | 10-15-2027 | $ | 4,294,000 | $ 4,312,411 | |
| Capital One Series 2022-A2 Class A | 3.49 | 5-15-2027 | 5,110,000 | 4,939,966 | ||
| Chase Auto Owner Trust Series 2022-AA Class A4 144A | 3.99 | 3-27-2028 | 2,419,000 | 2,352,799 | ||
| Chase Issuance Trust Series 2022-A1 Class A | 3.97 | 9-15-2027 | 1,552,000 | 1,519,187 | ||
| College Avenue Student Loan Trust Series 2017-A Class A1 (1 Month LIBOR +1.65%) 144A± | 5.67 | 11-26-2046 | 1,604,330 | 1,560,772 | ||
| College Avenue Student Loan Trust Series 2018-A Class A2 144A | 4.13 | 12-26-2047 | 1,314,029 | 1,224,402 | ||
| College Avenue Student Loan Trust Series 2019-A Class A2 144A | 3.28 | 12-28-2048 | 2,214,389 | 1,986,376 | ||
| College Avenue Student Loan Trust Series 2021-A Class A2 144A | 1.60 | 7-25-2051 | 2,835,795 | 2,418,874 | ||
| Discover Card Series 2022-A3 Class A3 | 3.56 | 7-15-2027 | 16,027,000 | 15,381,392 | ||
| Ford Credit Auto Owner Trust Series 2022-C Class A4 | 4.59 | 12-15-2027 | 6,031,000 | 5,949,662 | ||
| Ford Credit Auto Owner Trust Series 2020-2 Class A 144A | 1.06 | 4-15-2033 | 2,467,000 | 2,190,503 | ||
| Ford Credit Auto Owner Trust Series 2022 -1 Class A 144A | 3.88 | 11-15-2034 | 11,752,000 | 11,236,356 | ||
| Ford Credit Auto Owner Trust Series 2022-A Class A3 | 1.29 | 6-15-2026 | 2,308,000 | 2,198,022 | ||
| Ford Credit Auto Owner Trust Series 2022-A Class A3 | 3.23 | 5-15-2025 | 7,684,000 | 7,503,251 | ||
| Ford Credit Auto Owner Trust Series 2022-A Class A4 | 3.37 | 7-15-2025 | 3,364,000 | 3,263,727 | ||
| Ford Credit Auto Owner Trust Series 2022-D Class A4 | 5.30 | 3-15-2028 | 1,673,000 | 1,682,334 | ||
| GM Financial Automobile Leasing Trust Series 2022-2 Class A3 | 3.42 | 6-20-2025 | 1,969,000 | 1,919,768 | ||
| GM Financial Automobile Leasing Trust Series 2022-2 Class A4 | 3.54 | 5-20-2026 | 3,844,000 | 3,731,063 | ||
| GM Financial Automobile Leasing Trust Series 2022-3 Class A4 | 4.11 | 8-20-2026 | 5,054,000 | 4,948,925 | ||
| GM Financial Revolving Receivable Trust Series 2022 -1 Class A 144A | 5.91 | 10-11-2035 | 4,422,000 | 4,498,422 | ||
| GM Financial Securitized Term Series 2022-2 Class A3 | 3.10 | 2-16-2027 | 9,921,000 | 9,584,637 | ||
| GM Financial Securitized Term Series 2022-2 Class A4 | 3.25 | 4-17-2028 | 5,291,000 | 5,064,100 | ||
| GM Financial Securitized Term Series 2022-3 Class A4 | 3.71 | 12-16-2027 | 3,100,000 | 2,981,006 | ||
| GM Financial Securitized Term Series 2022-4 Class A3 | 4.82 | 8-16-2027 | 4,868,000 | 4,850,287 | ||
| GM Financial Securitized Term Series 2022-4 Class A4 | 4.88 | 8-16-2028 | 5,310,000 | 5,310,758 | ||
| Hertz Vehicle Financing LLC Series 2021-2A Class A 144A | 1.68 | 12-27-2027 | 4,377,000 | 3,741,619 | ||
| Hertz Vehicle Financing LLC Series 2022-1A Class A 144A | 1.99 | 6-25-2026 | 9,104,000 | 8,327,675 | ||
| Hertz Vehicle Financing LLC Series 2022-2A Class A 144A | 2.33 | 6-26-2028 | 8,078,000 | 7,032,671 | ||
| Hertz Vehicle Financing LLC Series 2022-4A Class A 144A | 3.73 | 9-25-2026 | 1,924,000 | 1,819,533 | ||
| Hertz Vehicle Financing LLC Series 2022-5A Class A 144A | 3.89 | 9-25-2028 | 8,274,000 | 7,646,253 | ||
| Honda Automobile Receivables Owners Trust Series 2022-2 Class A4 | 3.76 | 12-18-2028 | 2,317,000 | 2,255,188 | ||
| Hyundai Auto Lease Securitization Series 2022-C Class A4 144A | 4.48 | 8-17-2026 | 4,938,000 | 4,870,706 | ||
| Hyundai Auto Receivables Trust Series 2021-C Class A4 | 1.03 | 12-15-2027 | 2,976,000 | 2,702,640 | ||
| Hyundai Auto Receivables Trust Series 2022-A Class A3 | 2.22 | 10-15-2026 | 5,544,000 | 5,273,270 | ||
| Hyundai Auto Receivables Trust Series 2022-A Class A4 | 2.35 | 4-17-2028 | 1,708,000 | 1,590,652 | ||
| Hyundai Auto Receivables Trust Series 2022-C Class A4 | 5.52 | 10-16-2028 | 3,910,000 | 3,959,249 | ||
| Hyundai Auto Receivables Trust Series 2022-C Class A3 | 5.39 | 6-15-2027 | 9,572,000 | 9,641,833 | ||
| Interest rate | Maturity date | Principal | Value | |||
| Asset-backed securities (continued) | ||||||
| Mercedes Benz Auto Receivables Series 2022-1 Class A4 | 5.25% | 2-15-2029 | $ | 3,874,000 | $ 3,885,596 | |
| Navient Student Loan Trust Series 2014-AA Class A3 (1 Month LIBOR +1.60%) 144A± | 5.47 | 10-15-2031 | 2,622,000 | 2,580,396 | ||
| Navient Student Loan Trust Series 2016-AA Class A2B (1 Month LIBOR +2.15%) 144A± | 6.02 | 12-15-2045 | 1,111,162 | 1,119,460 | ||
| Navient Student Loan Trust Series 2018-CA Class A2 144A | 3.52 | 6-16-2042 | 249,944 | 244,679 | ||
| Navient Student Loan Trust Series 2018-DA Class A2A 144A | 4.00 | 12-15-2059 | 3,293,222 | 3,147,908 | ||
| Navient Student Loan Trust Series 2019-A Class A2A | 3.42 | 1-15-2043 | 3,325,790 | 3,162,677 | ||
| Navient Student Loan Trust Series 2019-BA Class A2A 144A | 3.39 | 12-15-2059 | 5,142,881 | 4,824,263 | ||
| Navient Student Loan Trust Series 2019-CA Class A2 144A | 3.13 | 2-15-2068 | 2,816,698 | 2,669,321 | ||
| Navient Student Loan Trust Series 2019-D Class A2A 144A | 3.01 | 12-15-2059 | 6,615,358 | 6,039,848 | ||
| Navient Student Loan Trust Series 2019-FA Class A2 144A | 2.60 | 8-15-2068 | 3,566,386 | 3,296,741 | ||
| Navient Student Loan Trust Series 2020-BA ClassA2 144A | 2.12 | 1-15-2069 | 2,337,602 | 2,119,175 | ||
| Navient Student Loan Trust Series 2020-GA Class A 144A | 1.17 | 9-16-2069 | 2,911,759 | 2,562,447 | ||
| Navient Student Loan Trust Series 2020-HA Class A 144A | 1.31 | 1-15-2069 | 2,031,802 | 1,822,994 | ||
| Navient Student Loan Trust Series 2020-IA Class A1A 144A | 1.33 | 4-15-2069 | 1,686,127 | 1,434,750 | ||
| Navient Student Loan Trust Series 2021-3A Class A1A 144A | 1.77 | 8-25-2070 | 5,716,146 | 4,944,277 | ||
| Navient Student Loan Trust Series 2021-A Class A 144A | 0.84 | 5-15-2069 | 950,689 | 811,720 | ||
| Navient Student Loan Trust Series 2021-BA Class A 144A | 0.94 | 7-15-2069 | 1,440,690 | 1,215,978 | ||
| Navient Student Loan Trust Series 2021-CA Class A | 1.06 | 10-15-2069 | 5,913,666 | 5,107,043 | ||
| Navient Student Loan Trust Series 2021-EA Class A 144A | 0.97 | 12-16-2069 | 10,159,642 | 8,393,143 | ||
| Navient Student Loan Trust Series 2021-FA Class A 144A | 1.11 | 2-18-2070 | 5,133,435 | 4,205,246 | ||
| Navient Student Loan Trust Series 2022-A Class A 144A | 2.23 | 7-15-2070 | 3,653,175 | 3,177,487 | ||
| Nelnet Student Loan Trust Series 2004-4 Class A5 (3 Month LIBOR +0.16%) ± | 4.52 | 1-25-2037 | 2,811,283 | 2,742,881 | ||
| Nelnet Student Loan Trust Series 2004-5 Class A5 (3 Month LIBOR +0.18%) ± | 4.54 | 10-27-2036 | 1,457,021 | 1,409,008 | ||
| Nelnet Student Loan Trust Series 2005-1 Class A5 (3 Month LIBOR +0.11%) ± | 4.47 | 10-25-2033 | 11,702,372 | 11,239,059 | ||
| Nelnet Student Loan Trust Series 2005-2 Class A5 (3 Month LIBOR +0.10%) ± | 3.70 | 3-23-2037 | 11,904,617 | 11,477,810 | ||
| Nelnet Student Loan Trust Series 2005-3 Class A5 (3 Month LIBOR +0.12%) ± | 3.72 | 12-24-2035 | 9,013,653 | 8,707,760 | ||
| Nelnet Student Loan Trust Series 2005-4 Class A4 (3 Month LIBOR +0.18%) ± | 3.78 | 3-22-2032 | 2,254,470 | 2,183,423 | ||
| Nissan Auto Lease Trust Series 2022-A Class A3 | 3.81 | 5-15-2025 | 6,746,000 | 6,625,255 | ||
| Nissan Auto Receivables Owner Trust Series 2022-B Class A4 | 4.45 | 11-15-2029 | 4,179,000 | 4,105,226 | ||
| Penfed Auto Receivables Owner Trust Series 2022-A Class A3 144A | 3.96 | 4-15-2026 | 3,548,000 | 3,482,517 | ||
| Interest rate | Maturity date | Principal | Value | |||
| Asset-backed securities (continued) | ||||||
| Penfed Auto Receivables Owner Trust Series 2022-A Class A4 144A | 4.18% | 12-15-2028 | $ | 1,743,000 | $ 1,707,397 | |
| Santander Drive Auto Receivable Series 2022-2 Class A3 | 2.98 | 10-15-2026 | 10,521,000 | 10,271,112 | ||
| Santander Drive Auto Receivable Series 2022-4 Class A3 | 4.14 | 2-16-2027 | 5,140,000 | 5,004,372 | ||
| Santander Drive Auto Receivable Series 2022-5 Class A3 | 4.11 | 8-17-2026 | 4,588,000 | 4,485,792 | ||
| Santander Drive Auto Receivables Series 2022-3 Class A3 | 3.40 | 12-15-2026 | 3,524,000 | 3,448,729 | ||
| Santander Drive Auto Receivables Series 2022-6 Class A3 | 4.49 | 11-16-2026 | 8,785,000 | 8,648,441 | ||
| Santander Drive Auto Receivables Series 2022-7 Class A3 | 5.75 | 4-15-2027 | 2,810,000 | 2,811,020 | ||
| SMB Private Education Loan Trust Series 2016-B Class A2A 144A | 2.43 | 2-17-2032 | 1,313,325 | 1,239,887 | ||
| SMB Private Education Loan Trust Series 2016-B Class A2B (1 Month LIBOR +1.45%) 144A± | 5.32 | 2-17-2032 | 1,023,789 | 1,012,479 | ||
| SMB Private Education Loan Trust Series 2016-C Class A2B | 4.97 | 9-15-2034 | 1,160,544 | 1,154,284 | ||
| SMB Private Education Loan Trust Series 2018-C Class A2A 144A | 3.63 | 11-15-2035 | 2,045,153 | 1,919,146 | ||
| SMB Private Education Loan Trust Series 2019-A Class A2A 144A | 3.44 | 7-15-2036 | 7,602,639 | 7,226,363 | ||
| SMB Private Education Loan Trust Series 2020-BA Class A1A 144A | 1.29 | 7-15-2053 | 2,914,682 | 2,566,623 | ||
| SMB Private Education Loan Trust Series 2020-PTA Class A2A 144A | 1.60 | 9-15-2054 | 4,550,047 | 4,008,050 | ||
| SMB Private Education Loan Trust Series 2020-PTB Class A2A 144A | 1.60 | 9-15-2054 | 13,112,427 | 11,590,759 | ||
| SMB Private Education Loan Trust Series 2021-A Class APT1 144A | 1.07 | 1-15-2053 | 10,453,979 | 8,777,059 | ||
| SMB Private Education Loan Trust Series 2021-B Class A 144A | 1.31 | 7-17-2051 | 2,918,515 | 2,605,540 | ||
| SMB Private Education Loan Trust Series 2021-C Class A2 (1 Month LIBOR +0.80%) 144A± | 4.68 | 1-15-2053 | 6,986,000 | 6,620,731 | ||
| SMB Private Education Loan Trust Series 2021-D Class A1A 144A | 1.34 | 3-17-2053 | 7,984,321 | 7,066,996 | ||
| SMB Private Education Loan Trust Series 2021-E Class A1A 144A | 1.68 | 2-15-2051 | 6,351,170 | 5,673,004 | ||
| SMB Private Education Loan Trust Series 2022-C Class A1A 144A | 4.48 | 5-16-2050 | 3,191,960 | 3,062,072 | ||
| SMB Private Education Loan Trust Series 2022-D Class A1B (30 Day Average U.S. SOFR +1.80%) ± | 5.02 | 10-15-2058 | 4,299,717 | 4,235,441 | ||
| SoFi Professional Loan Program LLC Series 2017-D Class A2 144A | 2.65 | 9-25-2040 | 122,190 | 116,891 | ||
| SoFi Professional Loan Program LLC Series 2017-E Class A2B 144A | 2.72 | 11-26-2040 | 182,664 | 181,158 | ||
| SoFi Professional Loan Program LLC Series 2020-C Class AFX | 1.95 | 2-15-2046 | 498,398 | 446,775 | ||
| SoFi Professional Loan Program LLC Series 2021-A Class AFX 144A | 1.03 | 8-17-2043 | 1,778,206 | 1,413,082 | ||
| SoFi Professional Loan Program LLC Series 2021-B Class AFX 144A | 1.14 | 2-15-2047 | 4,076,879 | 3,192,593 | ||
| Synchrony Card Issuance Trust Series 2022-A1 Class A | 3.37 | 4-15-2028 | 6,013,000 | 5,792,753 | ||
| Synchrony Card Issuance Trust Series 2022-A2 Class A | 3.86 | 7-15-2028 | 6,090,000 | 5,946,046 | ||
| Interest rate | Maturity date | Principal | Value | |||
| Asset-backed securities (continued) | ||||||
| Toyota Auto Loan Extended Note Series 2022-1A Class A 144A | 3.82% | 4-25-2035 | $ | 4,199,000 | $ 3,966,265 | |
| Toyota Auto Receivables Owner Trust Series 2022-B Class A4 | 3.11 | 8-16-2027 | 3,985,000 | 3,786,957 | ||
| Toyota Auto Receivables Owner Trust Series 2022-C Class A4 | 3.77 | 2-15-2028 | 3,857,000 | 3,739,553 | ||
| Toyota Auto Receivables Owner Trust Series 2022-D Class A4 | 5.43 | 4-17-2028 | 2,132,000 | 2,162,883 | ||
| Triton Container Finance LLC Series 2020-1A Class A 144A | 2.11 | 9-20-2045 | 2,051,821 | 1,743,601 | ||
| World Omni Automobile Lease Series 2022-A Class A3 | 3.21 | 2-18-2025 | 3,723,000 | 3,637,985 | ||
| World Omni Automobile Lease Series 2022-A Class A4 | 3.34 | 6-15-2027 | 2,190,000 | 2,133,265 | ||
| Total Asset-backed securities (Cost $528,238,543) | 497,719,778 | |||||
| Corporate bonds and notes: 20.95% | ||||||
| Communication services: 1.57% | ||||||
| Diversified telecommunication services: 0.75% | ||||||
| AT&T Incorporated | 1.70 | 3-25-2026 | 7,747,000 | 6,982,906 | ||
| AT&T Incorporated | 3.50 | 6-1-2041 | 1,664,000 | 1,271,431 | ||
| AT&T Incorporated | 3.65 | 9-15-2059 | 1,629,000 | 1,131,491 | ||
| AT&T Incorporated | 3.80 | 12-1-2057 | 4,685,000 | 3,401,160 | ||
| T-Mobile USA Incorporated | 2.25 | 2-15-2026 | 7,045,000 | 6,450,561 | ||
| T-Mobile USA Incorporated | 2.88 | 2-15-2031 | 707,000 | 590,698 | ||
| T-Mobile USA Incorporated | 3.38 | 4-15-2029 | 8,243,000 | 7,283,275 | ||
| T-Mobile USA Incorporated | 3.50 | 4-15-2031 | 473,000 | 411,879 | ||
| Verizon Communications Incorporated | 2.36 | 3-15-2032 | 1,755,000 | 1,408,791 | ||
| Verizon Communications Incorporated | 2.55 | 3-21-2031 | 2,445,000 | 2,038,373 | ||
| Verizon Communications Incorporated | 2.65 | 11-20-2040 | 2,180,000 | 1,509,090 | ||
| Verizon Communications Incorporated | 3.55 | 3-22-2051 | 1,558,000 | 1,152,871 | ||
| 33,632,526 | ||||||
| Entertainment: 0.11% | ||||||
| Netflix Incorporated 144A | 5.38 | 11-15-2029 | 1,827,000 | 1,793,217 | ||
| Netflix Incorporated | 5.88 | 11-15-2028 | 2,969,000 | 2,999,313 | ||
| 4,792,530 | ||||||
| Media: 0.71% | ||||||
| Charter Communications Operating LLC | 3.50 | 6-1-2041 | 895,000 | 605,001 | ||
| Charter Communications Operating LLC | 3.50 | 3-1-2042 | 4,356,000 | 2,951,756 | ||
| Comcast Corporation | 1.50 | 2-15-2031 | 2,031,000 | 1,603,385 | ||
| Comcast Corporation | 2.99 | 11-1-2063 | 1,947,000 | 1,231,745 | ||
| Comcast Corporation | 4.05 | 11-1-2052 | 2,196,000 | 1,786,290 | ||
| Comcast Corporation | 5.35 | 11-15-2027 | 3,420,000 | 3,523,518 | ||
| Comcast Corporation | 5.50 | 11-15-2032 | 6,842,000 | 7,172,126 | ||
| Discovery Communications LLC | 4.00 | 9-15-2055 | 1,820,000 | 1,166,680 | ||
| Magallanes Incorporated 144A | 5.05 | 3-15-2042 | 3,416,000 | 2,734,673 | ||
| Magallanes Incorporated 144A | 5.14 | 3-15-2052 | 7,851,000 | 6,083,434 | ||
| Magallanes Incorporated 144A | 5.39 | 3-15-2062 | 3,882,000 | 3,003,852 | ||
| 31,862,460 | ||||||
| Interest rate | Maturity date | Principal | Value | |||
| Consumer discretionary: 0.96% | ||||||
| Automobiles: 0.11% | ||||||
| Ford Motor Company | 4.75% | 1-15-2043 | $ | 336,000 | $ 248,653 | |
| General Motors Company | 5.40 | 10-15-2029 | 4,078,000 | 3,935,205 | ||
| General Motors Company | 5.60 | 10-15-2032 | 842,000 | 809,257 | ||
| 4,993,115 | ||||||
| Diversified consumer services: 0.06% | ||||||
| John Deere Capital Corporation | 4.85 | 10-11-2029 | 2,853,000 | 2,895,801 | ||
| Hotels, restaurants & leisure: 0.24% | ||||||
| GLP Capital LP | 5.30 | 1-15-2029 | 1,505,000 | 1,414,926 | ||
| Marriott International Incorporated | 4.63 | 6-15-2030 | 2,546,000 | 2,390,882 | ||
| McDonald's Corporation | 3.63 | 9-1-2049 | 2,534,000 | 1,964,611 | ||
| McDonald's Corporation | 4.20 | 4-1-2050 | 3,740,000 | 3,195,918 | ||
| McDonald's Corporation | 5.15 | 9-9-2052 | 1,635,000 | 1,613,555 | ||
| 10,579,892 | ||||||
| Internet & direct marketing retail: 0.11% | ||||||
| Amazon.com Incorporated | 2.88 | 5-12-2041 | 1,087,000 | 830,402 | ||
| Amazon.com Incorporated %% | 4.70 | 12-1-2032 | 4,277,000 | 4,313,193 | ||
| 5,143,595 | ||||||
| Specialty retail: 0.44% | ||||||
| Home Depot Incorporated | 2.38 | 3-15-2051 | 2,485,000 | 1,548,157 | ||
| Home Depot Incorporated | 3.13 | 12-15-2049 | 3,014,000 | 2,206,318 | ||
| Home Depot Incorporated | 3.30 | 4-15-2040 | 642,000 | 519,812 | ||
| Home Depot Incorporated | 3.63 | 4-15-2052 | 1,547,000 | 1,227,151 | ||
| Home Depot Incorporated | 4.50 | 9-15-2032 | 3,265,000 | 3,242,158 | ||
| Home Depot Incorporated | 4.95 | 9-15-2052 | 3,402,000 | 3,366,614 | ||
| Lowe's Companies Incorporated | 4.25 | 4-1-2052 | 3,264,000 | 2,664,258 | ||
| Lowe's Companies Incorporated | 5.63 | 4-15-2053 | 4,904,000 | 4,906,194 | ||
| 19,680,662 | ||||||
| Consumer staples: 1.01% | ||||||
| Beverages: 0.39% | ||||||
| Anheuser-Busch InBev Worldwide Incorporated | 3.75 | 7-15-2042 | 1,416,000 | 1,175,438 | ||
| Anheuser-Busch InBev Worldwide Incorporated | 4.38 | 4-15-2038 | 4,614,000 | 4,224,453 | ||
| Anheuser-Busch InBev Worldwide Incorporated | 4.70 | 2-1-2036 | 4,396,000 | 4,217,939 | ||
| Anheuser-Busch InBev Worldwide Incorporated | 4.90 | 2-1-2046 | 8,583,000 | 8,029,253 | ||
| 17,647,083 | ||||||
| Food & staples retailing: 0.35% | ||||||
| Nestle Holdings Incorporated Company 144A | 4.13 | 10-1-2027 | 2,590,000 | 2,543,084 | ||
| Nestle Holdings Incorporated Company 144A | 4.70 | 1-15-2053 | 1,758,000 | 1,711,983 | ||
| Walmart Incorporated | 3.95 | 9-9-2027 | 4,085,000 | 4,059,261 | ||
| Walmart Incorporated | 4.15 | 9-9-2032 | 4,902,000 | 4,844,948 | ||
| Walmart Incorporated | 4.50 | 9-9-2052 | 2,451,000 | 2,384,502 | ||
| 15,543,778 | ||||||
| Tobacco: 0.27% | ||||||
| Philip Morris International Incorporated | 5.00 | 11-17-2025 | 3,672,000 | 3,669,339 | ||
| Interest rate | Maturity date | Principal | Value | |||
| Tobacco (continued) | ||||||
| Philip Morris International Incorporated | 5.13% | 11-17-2027 | $ | 5,509,000 | $ 5,520,648 | |
| Philip Morris International Incorporated | 5.75 | 11-17-2032 | 2,747,000 | 2,828,795 | ||
| 12,018,782 | ||||||
| Energy: 0.63% | ||||||
| Oil, gas & consumable fuels: 0.63% | ||||||
| Boardwalk Pipelines LP | 3.40 | 2-15-2031 | 678,000 | 573,145 | ||
| Enable Midstream Partners | 4.40 | 3-15-2027 | 767,000 | 733,501 | ||
| Enable Midstream Partners | 4.95 | 5-15-2028 | 5,731,000 | 5,519,917 | ||
| Energy Transfer Operating Partners LP | 5.30 | 4-15-2047 | 4,482,000 | 3,809,096 | ||
| Energy Transfer Operating Partners LP | 6.13 | 12-15-2045 | 1,385,000 | 1,311,736 | ||
| Exxon Mobil Corporation | 3.45 | 4-15-2051 | 4,354,000 | 3,373,097 | ||
| Exxon Mobil Corporation | 4.33 | 3-19-2050 | 5,731,000 | 5,165,149 | ||
| Kinder Morgan Incorporated | 5.45 | 8-1-2052 | 5,060,000 | 4,627,727 | ||
| Pioneer Natural Resource | 2.15 | 1-15-2031 | 2,318,000 | 1,871,611 | ||
| Sunoco Logistics Partner LP | 5.40 | 10-1-2047 | 1,329,000 | 1,146,100 | ||
| 28,131,079 | ||||||
| Financials: 7.09% | ||||||
| Banks: 3.98% | ||||||
| Bank of America Corporation (U.S. SOFR +0.65%) ± | 1.53 | 12-6-2025 | 14,423,000 | 13,247,153 | ||
| Bank of America Corporation (U.S. SOFR +0.91%) ± | 1.66 | 3-11-2027 | 12,345,000 | 10,938,875 | ||
| Bank of America Corporation (U.S. SOFR +0.96%) ± | 1.73 | 7-22-2027 | 11,189,000 | 9,804,082 | ||
| Bank of America Corporation (U.S. SOFR +1.32%) ± | 2.69 | 4-22-2032 | 11,907,000 | 9,646,330 | ||
| Bank of America Corporation (U.S. SOFR +1.33%) ± | 3.38 | 4-2-2026 | 6,380,000 | 6,075,192 | ||
| Bank of America Corporation (3 Month LIBOR +1.04%) ± | 3.42 | 12-20-2028 | 8,622,000 | 7,861,998 | ||
| Bank of America Corporation (U.S. SOFR +2.16%) ± | 5.02 | 7-22-2033 | 3,596,000 | 3,471,645 | ||
| Bank of America Corporation (U.S. SOFR +1.99%) ± | 6.20 | 11-10-2028 | 8,429,000 | 8,718,241 | ||
| Citigroup Incorporated (U.S. SOFR +1.89%) ± | 4.66 | 5-24-2028 | 3,934,000 | 3,829,183 | ||
| Citigroup Incorporated (U.S. SOFR +2.09%) ± | 4.91 | 5-24-2033 | 4,396,000 | 4,185,493 | ||
| Citigroup Incorporated (U.S. SOFR +2.34%) ± | 6.27 | 11-17-2033 | 5,951,000 | 6,271,710 | ||
| JPMorgan Chase & Company (U.S. SOFR 3 Month +0.70%) ± | 1.04 | 2-4-2027 | 15,571,000 | 13,569,804 | ||
| JPMorgan Chase & Company (U.S. SOFR +0.80%) ± | 1.05 | 11-19-2026 | 4,825,000 | 4,256,304 | ||
| JPMorgan Chase & Company (U.S. SOFR +0.77%) ± | 1.47 | 9-22-2027 | 3,873,000 | 3,361,807 | ||
| JPMorgan Chase & Company (U.S. SOFR +0.61%) ± | 1.56 | 12-10-2025 | 22,778,000 | 21,039,672 | ||
| JPMorgan Chase & Company (U.S. SOFR +0.89%) ± | 1.58 | 4-22-2027 | 3,851,000 | 3,400,056 | ||
| JPMorgan Chase & Company (U.S. SOFR +1.89%) ± | 2.18 | 6-1-2028 | 4,767,000 | 4,170,154 | ||
| JPMorgan Chase & Company (U.S. SOFR +1.56%) ± | 4.32 | 4-26-2028 | 2,536,000 | 2,430,467 | ||
| JPMorgan Chase & Company (U.S. SOFR +1.75%) ± | 4.57 | 6-14-2030 | 3,933,000 | 3,749,311 | ||
| JPMorgan Chase & Company (U.S. SOFR +1.99%) ± | 4.85 | 7-25-2028 | 4,007,000 | 3,923,255 | ||
| JPMorgan Chase & Company (U.S. SOFR +2.08%) ± | 4.91 | 7-25-2033 | 3,256,000 | 3,139,809 | ||
| PNC Bank (U.S. SOFR +2.14%) ± | 6.04 | 10-28-2033 | 5,120,000 | 5,378,350 | ||
| Truist Financial Corporation (U.S. SOFR +1.37%) ± | 4.12 | 6-6-2028 | 4,765,000 | 4,548,759 | ||
| Truist Financial Corporation (U.S. SOFR +2.30%) ± | 6.12 | 10-28-2033 | 2,386,000 | 2,514,088 | ||
| Wells Fargo & Company (U.S. SOFR +1.51%) ± | 3.53 | 3-24-2028 | 16,251,000 | 15,095,490 | ||
| Wells Fargo & Company (U.S. SOFR +1.98%) ± | 4.81 | 7-25-2028 | 1,701,000 | 1,661,319 | ||
| Wells Fargo & Company (U.S. SOFR +2.10%) ± | 4.90 | 7-25-2033 | 2,436,000 | 2,347,241 | ||
| 178,635,788 | ||||||
| Capital markets: 2.03% | ||||||
| Antares Holdings LP 144A | 3.75 | 7-15-2027 | 3,989,000 | 3,251,322 | ||
| Interest rate | Maturity date | Principal | Value | |||
| Capital markets (continued) | ||||||
| Athene Global Funding 144A | 2.50% | 3-24-2028 | $ | 5,440,000 | $ 4,603,240 | |
| Athene Global Funding 144A | 2.65 | 10-4-2031 | 5,133,000 | 3,949,590 | ||
| Blackstone Private Equity Funds 144A | 6.20 | 4-22-2033 | 5,131,000 | 5,304,118 | ||
| Goldman Sachs Group Incorporated (U.S. SOFR +0.51%) ± | 0.66 | 9-10-2024 | 7,791,000 | 7,467,140 | ||
| Goldman Sachs Group Incorporated (U.S. SOFR +0.49%) ± | 0.93 | 10-21-2024 | 11,567,000 | 11,032,173 | ||
| Goldman Sachs Group Incorporated (U.S. SOFR +0.73%) ± | 1.76 | 1-24-2025 | 6,529,000 | 6,223,529 | ||
| Goldman Sachs Group Incorporated (U.S. SOFR +0.91%) ± | 1.95 | 10-21-2027 | 3,854,000 | 3,373,959 | ||
| Morgan Stanley (U.S. SOFR +0.51%) ± | 0.79 | 1-22-2025 | 9,927,000 | 9,336,517 | ||
| Morgan Stanley (U.S. SOFR +0.53%) ± | 0.79 | 5-30-2025 | 10,029,000 | 9,292,713 | ||
| Morgan Stanley (U.S. SOFR +0.75%) ± | 0.86 | 10-21-2025 | 3,094,000 | 2,823,552 | ||
| Morgan Stanley (U.S. SOFR +0.72%) ± | 0.99 | 12-10-2026 | 7,916,000 | 6,942,472 | ||
| Morgan Stanley (U.S. SOFR +1.00%) ± | 2.48 | 1-21-2028 | 1,547,000 | 1,374,460 | ||
| Morgan Stanley (U.S. SOFR +2.56%) ± | 6.34 | 10-18-2033 | 8,500,000 | 9,038,870 | ||
| Morgan Stanley (U.S. SOFR +0.86%) ± | 1.51 | 7-20-2027 | 6,054,000 | 5,267,692 | ||
| Owl Rock Capital Corporation | 3.13 | 4-13-2027 | 2,113,000 | 1,754,576 | ||
| 91,035,923 | ||||||
| Consumer finance: 0.71% | ||||||
| Bunge Limited Finance Corporation | 1.63 | 8-17-2025 | 1,785,000 | 1,625,067 | ||
| Ford Motor Credit Company LLC | 2.70 | 8-10-2026 | 5,703,000 | 4,976,364 | ||
| Ford Motor Credit Company LLC | 2.90 | 2-10-2029 | 2,851,000 | 2,350,821 | ||
| General Motors Financial Company Incorporated | 3.10 | 1-12-2032 | 1,675,000 | 1,343,720 | ||
| Hyundai Capital America Company 144A | 0.80 | 1-8-2024 | 1,369,000 | 1,298,010 | ||
| Hyundai Capital America Company 144A | 1.30 | 1-8-2026 | 3,282,000 | 2,853,568 | ||
| Hyundai Capital America Company 144A | 2.00 | 6-15-2028 | 1,547,000 | 1,252,173 | ||
| John Deere Capital Corporation | 2.35 | 3-8-2027 | 3,882,000 | 3,554,683 | ||
| John Deere Capital Corporation | 4.15 | 9-15-2027 | 8,169,000 | 8,017,062 | ||
| Toyota Motor Credit Corporation | 5.45 | 11-10-2027 | 4,594,000 | 4,723,533 | ||
| 31,995,001 | ||||||
| Diversified financial services: 0.03% | ||||||
| Jackson Financial Incorporated « | 5.67 | 6-8-2032 | 1,256,000 | 1,193,267 | ||
| Insurance: 0.34% | ||||||
| Brighthouse Financial Incorporated | 3.85 | 12-22-2051 | 1,536,000 | 969,939 | ||
| Export Finance and Insurance Corporation 144A | 4.63 | 10-26-2027 | 5,931,000 | 6,009,031 | ||
| Liberty Mutual Group Incorporated 144A | 5.50 | 6-15-2052 | 1,507,000 | 1,356,734 | ||
| Marsh and McLennan Companies Incorporated | 6.25 | 11-1-2052 | 853,000 | 953,237 | ||
| SBL Holdings Incorporated 144A | 5.00 | 2-18-2031 | 5,384,000 | 4,212,293 | ||
| Stewart Information Services Corporation | 3.60 | 11-15-2031 | 2,096,000 | 1,624,359 | ||
| 15,125,593 | ||||||
| Health care: 2.12% | ||||||
| Biotechnology: 0.45% | ||||||
| AbbVie Incorporated | 4.05 | 11-21-2039 | 1,838,000 | 1,605,769 | ||
| AbbVie Incorporated | 4.25 | 11-21-2049 | 10,571,000 | 9,089,787 | ||
| AbbVie Incorporated | 4.30 | 5-14-2036 | 1,125,000 | 1,038,790 | ||
| AbbVie Incorporated | 4.45 | 5-14-2046 | 1,145,000 | 1,009,974 | ||
| Amgen Incorporated | 4.05 | 8-18-2029 | 2,567,000 | 2,445,562 | ||
| Gilead Sciences Incorporated | 2.60 | 10-1-2040 | 2,693,000 | 1,924,727 | ||
| Interest rate | Maturity date | Principal | Value | |||
| Biotechnology (continued) | ||||||
| Gilead Sciences Incorporated | 2.80% | 10-1-2050 | $ | 2,513,000 | $ 1,661,941 | |
| Gilead Sciences Incorporated | 4.00 | 9-1-2036 | 1,385,000 | 1,233,947 | ||
| 20,010,497 | ||||||
| Health care providers & services: 1.16% | ||||||
| Centene Corporation | 2.50 | 3-1-2031 | 1,451,000 | 1,147,045 | ||
| Centene Corporation | 3.00 | 10-15-2030 | 3,489,000 | 2,878,774 | ||
| Cigna Corporation | 3.40 | 3-15-2050 | 785,000 | 566,494 | ||
| CVS Health Corporation | 3.00 | 8-15-2026 | 1,676,000 | 1,575,481 | ||
| CVS Health Corporation | 4.30 | 3-25-2028 | 3,542,000 | 3,443,235 | ||
| CVS Health Corporation | 5.05 | 3-25-2048 | 1,171,000 | 1,087,456 | ||
| GE Healthcare Holding Company 144A | 5.65 | 11-15-2027 | 4,253,000 | 4,337,411 | ||
| GSK Consumer Healthcare Company | 3.38 | 3-24-2027 | 3,658,000 | 3,415,148 | ||
| GSK Consumer Healthcare Company | 3.38 | 3-24-2029 | 1,568,000 | 1,420,544 | ||
| GSK Consumer Healthcare Company | 4.00 | 3-24-2052 | 2,600,000 | 2,072,748 | ||
| HCA Incorporated 144A | 4.63 | 3-15-2052 | 6,143,000 | 4,953,014 | ||
| UnitedHealth Group Incorporated | 2.75 | 5-15-2040 | 1,187,000 | 881,129 | ||
| UnitedHealth Group Incorporated | 3.05 | 5-15-2041 | 815,000 | 623,317 | ||
| UnitedHealth Group Incorporated | 3.25 | 5-15-2051 | 3,478,000 | 2,552,184 | ||
| UnitedHealth Group Incorporated | 4.00 | 5-15-2029 | 2,387,000 | 2,292,199 | ||
| UnitedHealth Group Incorporated | 4.63 | 7-15-2035 | 2,445,000 | 2,400,135 | ||
| UnitedHealth Group Incorporated | 5.25 | 2-15-2028 | 2,604,000 | 2,678,600 | ||
| UnitedHealth Group Incorporated | 5.30 | 2-15-2030 | 4,338,000 | 4,479,849 | ||
| UnitedHealth Group Incorporated | 5.35 | 2-15-2033 | 4,338,000 | 4,516,928 | ||
| UnitedHealth Group Incorporated | 5.88 | 2-15-2053 | 4,159,000 | 4,602,527 | ||
| 51,924,218 | ||||||
| Life sciences tools & services: 0.12% | ||||||
| Danaher Corporation | 2.60 | 10-1-2050 | �� | 1,847,000 | 1,217,718 | |
| Danaher Corporation | 2.80 | 12-10-2051 | 1,238,000 | 852,505 | ||
| Thermo Fisher Scientific Incorporated | 1.75 | 10-15-2028 | 1,565,000 | 1,338,652 | ||
| Thermo Fisher Scientific Incorporated | 2.80 | 10-15-2041 | 2,493,000 | 1,876,209 | ||
| 5,285,084 | ||||||
| Pharmaceuticals: 0.39% | ||||||
| Astrazeneca plc | 1.75 | 5-28-2028 | 5,480,000 | 4,764,899 | ||
| Pfizer Incorporated | 1.75 | 8-18-2031 | 3,140,000 | 2,554,734 | ||
| Pfizer Incorporated | 2.55 | 5-28-2040 | 5,402,000 | 4,018,785 | ||
| Roche Holdings Incorporated 144A | 2.08 | 12-13-2031 | 5,854,000 | 4,834,467 | ||
| Roche Holdings Incorporated 144A | 2.61 | 12-13-2051 | 2,154,000 | 1,442,056 | ||
| 17,614,941 | ||||||
| Industrials: 1.44% | ||||||
| Aerospace & defense: 0.64% | ||||||
| Lockheed Martin Corporation | 5.10 | 11-15-2027 | 4,329,000 | 4,452,795 | ||
| Lockheed Martin Corporation | 5.70 | 11-15-2054 | 3,464,000 | 3,755,518 | ||
| Lockheed Martin Corporation | 5.90 | 11-15-2063 | 1,731,000 | 1,914,612 | ||
| Northrop Grunman | 4.40 | 5-1-2030 | 5,544,000 | 5,432,757 | ||
| The Boeing Company | 2.20 | 2-4-2026 | 5,885,000 | 5,349,556 | ||
| The Boeing Company | 3.25 | 2-1-2035 | 1,905,000 | 1,444,562 | ||
| The Boeing Company | 3.75 | 2-1-2050 | 3,400,000 | 2,384,797 | ||
| The Boeing Company | 5.93 | 5-1-2060 | 4,416,000 | 4,098,676 | ||
| 28,833,273 | ||||||
| Interest rate | Maturity date | Principal | Value | |||
| Airlines: 0.20% | ||||||
| Delta Air Lines Incorporated 144A | 4.75% | 10-20-2028 | $ | 9,156,000 | $ 8,678,983 | |
| Construction & engineering: 0.06% | ||||||
| Quanta Services Incorporated | 0.95 | 10-1-2024 | 3,093,000 | 2,832,472 | ||
| Industrial conglomerates: 0.12% | ||||||
| Honeywell International Incorporated | 5.00 | 2-15-2033 | 5,218,000 | 5,370,506 | ||
| Machinery: 0.17% | ||||||
| Parker Hannifin Corporation | 4.25 | 9-15-2027 | 4,720,000 | 4,577,580 | ||
| Parker Hannifin Corporation | 4.50 | 9-15-2029 | 3,147,000 | 3,054,865 | ||
| 7,632,445 | ||||||
| Road & rail: 0.20% | ||||||
| CSX Corporation | 4.10 | 11-15-2032 | 4,069,000 | 3,865,718 | ||
| Union Pacific Corporation | 2.38 | 5-20-2031 | 1,649,000 | 1,396,020 | ||
| Union Pacific Corporation | 2.80 | 2-14-2032 | 2,238,000 | 1,947,422 | ||
| Union Pacific Corporation | 3.38 | 2-14-2042 | 1,862,000 | 1,507,714 | ||
| 8,716,874 | ||||||
| Transportation infrastructure: 0.05% | ||||||
| Crowley Conro LLC | 4.18 | 8-15-2043 | 2,435,118 | 2,308,233 | ||
| Information technology: 2.13% | ||||||
| Electronic equipment, instruments & components: 0.16% | ||||||
| Dell International LLC 144A | 3.38 | 12-15-2041 | 3,853,000 | 2,655,219 | ||
| Dell International LLC 144A | 3.45 | 12-15-2051 | 4,622,000 | 2,979,445 | ||
| Dell International LLC | 6.10 | 7-15-2027 | 1,576,000 | 1,619,259 | ||
| 7,253,923 | ||||||
| Semiconductors & semiconductor equipment: 0.96% | ||||||
| Advanced Micro Devices | 3.92 | 6-1-2032 | 5,004,000 | 4,720,315 | ||
| Broadcom Incorporated 144A | 2.45 | 2-15-2031 | 2,713,000 | 2,140,460 | ||
| Broadcom Incorporated | 3.15 | 11-15-2025 | 2,033,000 | 1,934,493 | ||
| Broadcom Incorporated 144A | 3.42 | 4-15-2033 | 7,383,000 | 5,998,910 | ||
| Broadcom Incorporated 144A | 3.47 | 4-15-2034 | 3,465,000 | 2,750,902 | ||
| Broadcom Incorporated | 4.15 | 11-15-2030 | 1,833,000 | 1,646,290 | ||
| Broadcom Incorporated 144A | 4.93 | 5-15-2037 | 2,478,000 | 2,174,427 | ||
| Broadcom Incorporated 144A | 4.15 | 4-15-2032 | 2,334,000 | 2,057,750 | ||
| Intel Corporation | 2.80 | 8-12-2041 | 4,056,000 | 2,879,459 | ||
| Intel Corporation | 4.90 | 8-5-2052 | 3,773,000 | 3,443,544 | ||
| Intel Corporation | 5.05 | 8-5-2062 | 1,625,000 | 1,476,380 | ||
| KLA Corporation | 3.30 | 3-1-2050 | 3,711,000 | 2,779,900 | ||
| KLA Corporation | 4.95 | 7-15-2052 | 1,444,000 | 1,391,023 | ||
| Qualcomm Incorporated | 4.50 | 5-20-2052 | 2,571,000 | 2,282,020 | ||
| Qualcomm Incorporated | 6.00 | 5-20-2053 | 3,907,000 | 4,251,900 | ||
| Xilinx Incorporated | 2.38 | 6-1-2030 | 1,327,000 | 1,128,789 | ||
| 43,056,562 | ||||||
| Software: 0.67% | ||||||
| Oracle Corporation | 3.95 | 3-25-2051 | 3,280,000 | 2,400,207 | ||
| Oracle Corporation | 4.00 | 7-15-2046 | 3,011,000 | 2,224,980 | ||
| Oracle Corporation | 4.38 | 5-15-2055 | 1,045,000 | 794,533 | ||
| Oracle Corporation | 6.90 | 11-9-2052 | 3,467,000 | 3,839,960 | ||
| Interest rate | Maturity date | Principal | Value | |||
| Software (continued) | ||||||
| VMware Incorporated | 0.60% | 8-15-2023 | $ | 7,593,000 | $ 7,352,820 | |
| VMware Incorporated | 1.00 | 8-15-2024 | 5,391,000 | 5,019,711 | ||
| VMware Incorporated | 1.40 | 8-15-2026 | 5,424,000 | 4,770,240 | ||
| VMware Incorporated | 1.80 | 8-15-2028 | 940,000 | 775,985 | ||
| VMware Incorporated | 4.70 | 5-15-2030 | 3,116,000 | 2,925,910 | ||
| 30,104,346 | ||||||
| Technology hardware, storage & peripherals: 0.34% | ||||||
| Apple Incorporated | 2.38 | 2-8-2041 | 1,262,000 | 923,946 | ||
| Apple Incorporated | 2.40 | 8-20-2050 | 200,000 | 132,655 | ||
| Apple Incorporated | 2.65 | 5-11-2050 | 2,389,000 | 1,651,588 | ||
| Apple Incorporated | 2.65 | 2-8-2051 | 1,062,000 | 726,289 | ||
| Apple Incorporated | 2.80 | 2-8-2061 | 1,102,000 | 732,683 | ||
| Apple Incorporated | 3.25 | 8-8-2029 | 6,518,000 | 6,108,827 | ||
| Apple Incorporated | 3.95 | 8-8-2052 | 3,265,000 | 2,855,249 | ||
| Apple Incorporated | 4.10 | 8-8-2062 | 2,444,000 | 2,116,792 | ||
| 15,248,029 | ||||||
| Materials: 0.32% | ||||||
| Chemicals: 0.19% | ||||||
| Dow Chemical Corporation | 6.90 | 5-15-2053 | 1,625,000 | 1,766,890 | ||
| Dow Chemical Corporation | 7.38 | 11-1-2029 | 3,996,000 | 4,435,118 | ||
| Rohm & Haas Company | 7.85 | 7-15-2029 | 1,946,000 | 2,180,829 | ||
| 8,382,837 | ||||||
| Metals & mining: 0.13% | ||||||
| Freeport-McMoRan Incorporated | 5.25 | 9-1-2029 | 4,834,000 | 4,618,162 | ||
| Glencore Funding Company 144A | 4.88 | 3-12-2029 | 1,380,000 | 1,329,517 | ||
| 5,947,679 | ||||||
| Real estate: 1.68% | ||||||
| Equity REITs: 1.30% | ||||||
| Agree LP Company | 2.00 | 6-15-2028 | 3,245,000 | 2,670,227 | ||
| Agree LP Company | 2.60 | 6-15-2033 | 738,000 | 562,135 | ||
| Agree LP Company | 4.80 | 10-1-2032 | 1,627,000 | 1,496,520 | ||
| American Tower Corporation | 2.70 | 4-15-2031 | 1,236,000 | 1,020,415 | ||
| American Tower Corporation | 3.13 | 1-15-2027 | 1,627,000 | 1,496,486 | ||
| American Tower Corporation | 3.65 | 3-15-2027 | 2,296,000 | 2,145,201 | ||
| Brixmor Operating Partnership | 2.50 | 8-16-2031 | 1,807,000 | 1,369,474 | ||
| Crown Castle International Corporation | 1.05 | 7-15-2026 | 4,654,000 | 4,027,403 | ||
| Crown Castle International Corporation | 2.10 | 4-1-2031 | 680,000 | 539,229 | ||
| Crown Castle International Corporation | 2.50 | 7-15-2031 | 2,553,000 | 2,083,106 | ||
| Crown Castle International Corporation | 2.90 | 3-15-2027 | 5,084,000 | 4,646,082 | ||
| Crown Castle International Corporation | 2.90 | 4-1-2041 | 2,854,000 | 2,001,547 | ||
| Crown Castle International Corporation | 3.30 | 7-1-2030 | 2,684,000 | 2,360,474 | ||
| Crown Castle International Corporation | 4.00 | 3-1-2027 | 776,000 | 740,901 | ||
| Federal Realty Investment Trust | 3.95 | 1-15-2024 | 2,065,000 | 2,036,725 | ||
| Kimco Realty Corporation | 4.60 | 2-1-2033 | 2,445,000 | 2,286,674 | ||
| Mid-America Apartments LP | 3.95 | 3-15-2029 | 1,498,000 | 1,405,899 | ||
| Mid-America Apartments LP | 4.00 | 11-15-2025 | 1,833,000 | 1,774,856 | ||
| Mid-America Apartments LP | 4.30 | 10-15-2023 | 1,531,000 | 1,520,107 | ||
| Realty Income Corporation | 2.20 | 6-15-2028 | 1,600,000 | 1,372,196 | ||
| Interest rate | Maturity date | Principal | Value | |||
| Equity REITs (continued) | ||||||
| Realty Income Corporation | 2.85% | 12-15-2032 | $ | 2,162,000 | $ 1,773,957 | |
| Realty Income Corporation | 3.65 | 1-15-2028 | 1,678,000 | 1,572,409 | ||
| Realty Income Corporation | 5.63 | 10-13-2032 | 4,742,000 | 4,899,559 | ||
| Regency Centers LP | 2.95 | 9-15-2029 | 4,078,000 | 3,430,361 | ||
| Rexford Industrial Realty Trust Company | 2.15 | 9-1-2031 | 800,000 | 617,663 | ||
| Store Capital Corporation | 2.70 | 12-1-2031 | 1,038,000 | 780,932 | ||
| Store Capital Corporation | 2.75 | 11-18-2030 | 2,642,000 | 2,060,243 | ||
| Store Capital Corporation | 4.50 | 3-15-2028 | 3,993,000 | 3,636,095 | ||
| Store Capital Corporation | 4.63 | 3-15-2029 | 1,905,000 | 1,744,551 | ||
| 58,071,427 | ||||||
| Real estate management & development: 0.38% | ||||||
| Invitation Homes Operating Partnership LP | 2.00 | 8-15-2031 | 515,000 | 381,243 | ||
| American Homes 4 Rent | 3.63 | 4-15-2032 | 2,987,000 | 2,530,875 | ||
| American Homes 4 Rent | 4.30 | 4-15-2052 | 1,338,000 | 992,600 | ||
| Essex Portfolio LP | 1.70 | 3-1-2028 | 3,909,000 | 3,247,546 | ||
| Essex Portfolio LP | 2.55 | 6-15-2031 | 1,540,000 | 1,231,836 | ||
| Extra Space Storage LP | 2.35 | 3-15-2032 | 1,336,000 | 1,016,191 | ||
| Extra Space Storage LP | 3.90 | 4-1-2029 | 1,495,000 | 1,346,826 | ||
| Inviation Homes Operation | 4.15 | 4-15-2032 | 2,985,000 | 2,616,858 | ||
| Sun Communities Operating LP | 2.30 | 11-1-2028 | 1,495,000 | 1,229,900 | ||
| Sun Communities Operating LP | 4.20 | 4-15-2032 | 2,987,000 | 2,577,080 | ||
| 17,170,955 | ||||||
| Utilities: 2.00% | ||||||
| Electric utilities: 1.59% | ||||||
| American Transmission System Incorporated 144A | 2.65 | 1-15-2032 | 1,078,000 | 880,302 | ||
| Duke Energy Carolinas LLC | 2.55 | 4-15-2031 | 1,575,000 | 1,331,476 | ||
| Duke Energy Carolinas LLC | 2.85 | 3-15-2032 | 2,874,000 | 2,463,258 | ||
| Duke Energy Carolinas LLC | 3.55 | 3-15-2052 | 2,093,000 | 1,596,132 | ||
| Duke Energy Corporation | 3.75 | 9-1-2046 | 478,000 | 356,695 | ||
| Duke Energy Corporation | 4.30 | 3-15-2028 | 4,069,000 | 3,921,365 | ||
| Duke Energy Corporation 144A | 6.30 | 10-11-2027 | 1,891,000 | 1,923,017 | ||
| Duke Energy Florida LLC | 2.40 | 12-15-2031 | 2,307,000 | 1,896,759 | ||
| Duke Energy Progress LLC | 2.50 | 8-15-2050 | 2,334,000 | 1,433,183 | ||
| Duke Energy Progress LLC | 2.55 | 6-15-2031 | 1,695,000 | 1,394,080 | ||
| Duke Energy Progress LLC | 3.50 | 6-15-2051 | 478,000 | 340,448 | ||
| Entergy Arkansas LLC | 2.65 | 6-15-2051 | 2,084,000 | 1,296,917 | ||
| Eversource Energy | 1.40 | 8-15-2026 | 1,315,000 | 1,158,467 | ||
| Eversource Energy | 1.65 | 8-15-2030 | 2,629,000 | 2,060,089 | ||
| Eversource Energy | 3.38 | 3-1-2032 | 590,000 | 516,887 | ||
| FirstEnergy Corporation 144A | 2.75 | 3-1-2032 | 2,542,000 | 2,067,171 | ||
| Florida Power & Light Company | 3.95 | 3-1-2048 | 2,040,000 | 1,712,046 | ||
| Metropolitan Edison Company 144A | 4.30 | 1-15-2029 | 2,720,000 | 2,563,495 | ||
| Mid-American Energy Company | 2.70 | 8-1-2052 | 2,005,000 | 1,308,706 | ||
| Mississippi Power Company | 3.10 | 7-30-2051 | 2,774,000 | 1,814,983 | ||
| Mississippi Power Company | 3.95 | 3-30-2028 | 2,773,000 | 2,603,212 | ||
| Mississippi Power Company | 4.25 | 3-15-2042 | 1,064,000 | 878,560 | ||
| Northern States Power Company | 3.20 | 4-1-2052 | 1,565,000 | 1,133,481 | ||
| Pacific Gas & Electric Company | 2.10 | 8-1-2027 | 1,238,000 | 1,053,399 | ||
| Pacific Gas & Electric Company | 3.95 | 12-1-2047 | 3,581,000 | 2,497,171 | ||
| Pacific Gas & Electric Company | 4.20 | 6-1-2041 | 1,344,000 | 1,020,406 | ||
| Pacific Gas & Electric Company | 4.50 | 7-1-2040 | 796,000 | 634,894 | ||
| Pacific Gas & Electric Company | 4.75 | 2-15-2044 | 778,000 | 608,481 | ||
| Interest rate | Maturity date | Principal | Value | |||
| Electric utilities (continued) | ||||||
| Pacific Gas & Electric Company | 4.95% | 7-1-2050 | $ | 4,840,000 | $ 3,874,676 | |
| PacifiCorp Electric Service Company %% | 5.35 | 12-1-2053 | 2,563,000 | 2,578,220 | ||
| Pennsylvania Electric Company 144A | 3.25 | 3-15-2028 | 2,254,000 | 2,041,825 | ||
| Public Service Company of Oklahoma | 3.15 | 8-15-2051 | 1,565,000 | 1,052,778 | ||
| Public Service Electric and Gas Company | 1.90 | 8-15-2031 | 3,104,000 | 2,500,807 | ||
| Public Service Electric and Gas Company | 2.05 | 8-1-2050 | 642,000 | 362,525 | ||
| Public Service Electric and Gas Company | 2.70 | 5-1-2050 | 1,264,000 | 830,758 | ||
| Southern California Edison Company | 4.13 | 3-1-2048 | 1,744,000 | 1,393,433 | ||
| STAR Electric Company | 3.10 | 6-1-2051 | 1,427,000 | 995,402 | ||
| STAR Electric Company | 4.55 | 6-1-2052 | 1,880,000 | 1,718,783 | ||
| STAR Electric Company | 4.95 | 9-15-2052 | 816,000 | 794,143 | ||
| Targa Resources Partners Company | 4.88 | 2-1-2031 | 3,651,000 | 3,325,404 | ||
| Targa Resources Partners Company | 5.50 | 3-1-2030 | 915,000 | 874,832 | ||
| Trans-Allegheny Interstate Line Company 144A | 3.85 | 6-1-2025 | 1,093,000 | 1,056,694 | ||
| Virginia Electric & Power Company | 2.95 | 11-15-2051 | 2,314,000 | 1,547,742 | ||
| Virginia Electric & Power Company | 4.63 | 5-15-2052 | 1,740,000 | 1,547,705 | ||
| Wisconsin Electric Power | 4.75 | 9-30-2032 | 2,322,000 | 2,300,261 | ||
| 71,261,068 | ||||||
| Gas utilities: 0.04% | ||||||
| Baltimore Gas & Electric Gas Company | 2.25 | 6-15-2031 | 2,314,000 | 1,892,948 | ||
| Independent power & renewable electricity producers: 0.04% | ||||||
| AES Corporation | 1.38 | 1-15-2026 | 1,753,000 | 1,557,256 | ||
| Multi-utilities: 0.33% | ||||||
| CenterPoint Energy Incorporated | 3.60 | 3-1-2052 | 1,709,000 | 1,336,394 | ||
| Consumers Energy Company | 2.50 | 5-1-2060 | 1,324,000 | 768,640 | ||
| Consumers Energy Company | 2.65 | 8-15-2052 | 1,036,000 | 661,115 | ||
| Dominion Energy Incorporated | 5.38 | 11-15-2032 | 5,102,000 | 5,102,299 | ||
| DTE Energy Company | 1.05 | 6-1-2025 | 1,385,000 | 1,254,905 | ||
| DTE Energy Company | 2.95 | 3-1-2050 | 2,702,000 | 1,864,127 | ||
| DTE Energy Company | 3.65 | 3-1-2052 | 1,236,000 | 968,625 | ||
| Public Service Enterprise Group | 1.60 | 8-15-2030 | 1,782,000 | 1,389,026 | ||
| Public Service Enterprise Group | 2.45 | 11-15-2031 | 2,004,000 | 1,614,894 | ||
| 14,960,025 | ||||||
| Total Corporate bonds and notes (Cost $1,036,434,696) | 939,021,456 | |||||
| Municipal obligations: 0.36% | ||||||
| Nevada: 0.09% | ||||||
| Airport revenue: 0.09% | ||||||
| Clark County NV Airport Authority Build America Bonds Series C | 6.82 | 7-1-2045 | 3,365,000 | 4,045,445 | ||
| New York: 0.11% | ||||||
| Airport revenue: 0.11% | ||||||
| Port Authority of New York & New Jersey Consolidated Bonds Series 174 | 4.46 | 10-1-2062 | 5,505,000 | 4,950,533 | ||
| Interest rate | Maturity date | Principal | Value | |||
| Ohio: 0.04% | ||||||
| Education revenue: 0.04% | ||||||
| Ohio State University General Receipts Taxable Bonds Series A | 4.80% | 6-1-2111 | $ | 1,957,000 | $ 1,666,618 | |
| Texas: 0.12% | ||||||
| Education revenue: 0.02% | ||||||
| University of Texas Financing System Bond Series B | 2.44 | 8-15-2049 | 1,695,000 | 1,102,522 | ||
| Transportation revenue: 0.10% | ||||||
| North Texas Tollway Authority | 6.72 | 1-1-2049 | 3,609,000 | 4,320,587 | ||
| Total Municipal obligations (Cost $17,147,003) | 16,085,705 | |||||
| Non-agency mortgage-backed securities: 4.86% | ||||||
| 3650R Commercial Mortgage Trust Series 2021-PF1 Class A5 | 2.52 | 11-15-2054 | 2,521,000 | 2,036,303 | ||
| Angel Oak Mortgage Trust Series 2020-2 Class A1 144A±± | 2.53 | 1-26-2065 | 5,401,000 | 1,207,741 | ||
| Angel Oak Mortgage Trust Series 2020-5 Class A1 144A±± | 1.37 | 5-25-2065 | 2,508,000 | 512,141 | ||
| Angel Oak Mortgage Trust Series 2021-6 Class A1 144A±± | 1.46 | 9-25-2066 | 3,665,000 | 2,176,697 | ||
| Bank 2022-BNK44 Class A5 ±± | 5.75 | 10-15-2032 | 3,828,000 | 4,034,331 | ||
| Barclays Commercial Mortgage Series 2018-C2 Class ASB | 4.24 | 12-15-2051 | 1,159,000 | 1,117,758 | ||
| Barclays Commercial Mortgage Series 2019-C3 Class A3 | 3.32 | 5-15-2052 | 4,090,000 | 3,683,659 | ||
| Barclays Commercial Mortgage Series 2022-C18 Class A5 ±±%% | 5.71 | 12-15-2055 | 2,752,000 | 2,882,263 | ||
| Benchmark Mortgage Trust Series 2022-B35 Class A5 | 4.45 | 5-15-2055 | 2,238,000 | 2,144,556 | ||
| Bunker Hill Loan Depositary Trust Series 2019-2 Class A1 144A | 2.88 | 7-25-2049 | 1,974,841 | 1,817,754 | ||
| Bunker Hill Loan Depositary Trust Series 2019-3 Class A1 144A | 2.72 | 11-25-2059 | 1,327,495 | 1,276,642 | ||
| BX Trust Series 2021-VOLT Class A | 4.58 | 9-15-2036 | 10,912,000 | 10,443,582 | ||
| BX Trust Series 2021-XL2 Class A | 4.56 | 10-15-2038 | 5,041,330 | 4,807,928 | ||
| CFCRE Commercial Mortgage Trust Series 2017-C8 Class ASB | 3.37 | 6-15-2050 | 1,442,100 | 1,378,235 | ||
| Citigroup Commercial Mortgage Series 2022-GC48 Class A5 ±± | 4.58 | 5-15-2054 | 3,191,000 | 3,080,278 | ||
| Colt Funding LLC Series 2021-2 Class A1 144A±± | 0.92 | 8-25-2066 | 3,698,410 | 3,000,990 | ||
| Colt Funding LLC Series 2021-4 Class A1 144A±± | 1.40 | 10-25-2066 | 3,922,412 | 3,189,833 | ||
| Commercial Mortgage Pass-Through Certificate Series 2013-CR13 Class A4 ±± | 4.19 | 11-10-2046 | 1,746,000 | 1,707,362 | ||
| Commercial Mortgage Trust Pass-Through Certificate Series 2012-CR3 Class A3 | 2.82 | 10-15-2045 | 306,028 | 299,907 | ||
| Commercial Mortgage Trust Series 2013-CR10 Class A4 | 4.21 | 8-10-2046 | 89,000 | 88,160 | ||
| Commercial Mortgage Trust Series 2013-CR11 Class A4 | 4.26 | 8-10-2050 | 12,738,000 | 12,579,041 | ||
| Commercial Mortgage Trust Series 2013-CR6 Class A4 | 3.10 | 3-10-2046 | 4,871,589 | 4,856,787 | ||
| Commercial Mortgage Trust Series 2014-UBS4 Class A4 | 3.42 | 8-10-2047 | 3,937,000 | 3,790,270 | ||
| Commercial Mortgage Trust Series 2015-LC19 Class A3 | 2.92 | 2-10-2048 | 8,129,307 | 7,773,959 | ||
| Interest rate | Maturity date | Principal | Value | |||
| Non-agency mortgage-backed securities (continued) | ||||||
| Commercial Mortgage Trust Series 2015-LC23 Class A3 | 3.52% | 10-10-2048 | $ | 1,982,000 | $ 1,874,513 | |
| CSAIL Commercial Mortgage Trust Series 2019-C16 Class A2 | 3.07 | 6-15-2052 | 1,924,000 | 1,685,562 | ||
| CSAIL Commercial Mortgage Trust Series 2021-C20 Class A3 | 2.80 | 3-15-2054 | 1,257,000 | 1,055,237 | ||
| EQUS Mortgage Trust Series 2021-EQAZ (1 Month LIBOR +0.75%) 144A± | 4.63 | 10-15-2038 | 4,122,917 | 3,939,447 | ||
| Goldman Sachs Mortgage Securities Trust Series 2013-GC14 Class A5 | 4.24 | 8-10-2046 | 2,275,000 | 2,245,172 | ||
| Goldman Sachs Mortgage Securities Trust Series 2014-GC18 Class A4 | 4.07 | 1-10-2047 | 5,471,323 | 5,338,380 | ||
| Goldman Sachs Mortgage Securities Trust Series 2015-GC32 Class A3 | 3.50 | 7-10-2048 | 1,895,326 | 1,808,819 | ||
| Goldman Sachs Mortgage Securities Trust Series 2020-GC47 Class A5 | 2.38 | 5-12-2053 | 1,792,000 | 1,479,097 | ||
| Goldman Sachs Mortgage Securities Trust Series 2020-GSA2 Class A4 | 1.72 | 12-12-2053 | 5,595,000 | 4,359,481 | ||
| Impact Funding LLC Series 2010-1 Class A1 144A | 5.31 | 1-25-2051 | 3,942,583 | 3,821,518 | ||
| JPM DB Commercial Mortgage Securities Series 2013-C12 Class A5 | 3.66 | 7-15-2045 | 3,316,000 | 3,276,949 | ||
| JPM DB Commercial Mortgage Securities Series 2013-C17 Class A4 | 4.20 | 1-15-2047 | 1,095,000 | 1,072,689 | ||
| JPM DB Commercial Mortgage Securities Series 2014-C23 Class A4 | 3.67 | 9-15-2047 | 1,659,938 | 1,598,944 | ||
| JPMorgan Chase Commercial Mortgage Securities Trust Series 2013-C16 Class A4 | 4.17 | 12-15-2046 | 4,973,000 | 4,890,945 | ||
| JPMorgan Chase Commercial Mortgage Securities Trust Series 2015-C28 Class A3 | 2.91 | 10-15-2048 | 7,575,913 | 7,177,816 | ||
| JPMorgan Chase Commercial Mortgage Securities Trust Series 2015-C30 Class A5 | 3.82 | 7-15-2048 | 3,008,000 | 2,866,247 | ||
| JPMorgan Chase Commercial Mortgage Securities Trust Series 2016-JP3 Class A3 | 3.39 | 12-15-2049 | 1,080,000 | 998,651 | ||
| Med Trust Series 2021-MDLN (1 Month LIBOR +0.95%) 144A± | 4.83 | 11-15-2038 | 6,662,000 | 6,361,469 | ||
| MFRA Trust Series 2021-NQM2 Class A1 | 1.03 | 11-25-2064 | 1,600,239 | 1,281,988 | ||
| Morgan Stanley Capital 1 Trust Series 2019- L2 Class A3 | 3.81 | 3-15-2052 | 2,625,000 | 2,411,147 | ||
| Morgan Stanley Capital International Trust Series 2020-HR8 Class A3 | 1.79 | 7-15-2053 | 3,030,000 | 2,408,124 | ||
| New Residential Mortgage Loan Trust Series 2019-NQM4 Class A1 144A±± | 2.49 | 9-25-2059 | 846,787 | 766,291 | ||
| NewRez WareHouse Securitization Series 2021-1 Class A (1 Month LIBOR +0.75%) 144A± | 4.79 | 5-25-2055 | 10,288,000 | 10,067,016 | ||
| Peco Energy Company 1st Mortgage | 2.85 | 9-15-2051 | 2,791,000 | 1,862,455 | ||
| Starwood Mortgage Residential Trust Series 2020-1 Class A1 144A | 2.28 | 2-25-2050 | 300,219 | 287,260 | ||
| Starwood Mortgage Residential Trust Series 2020-INV1 Class A1 144A | 1.03 | 11-25-2055 | 1,219,740 | 1,121,953 | ||
| Starwood Mortgage Residential Trust Series 2020-INV3 Class A1 144A | 1.49 | 4-25-2065 | 1,413,812 | 1,335,012 | ||
| Starwood Mortgage Residential Trust Series 2021-1 Class A1 144A | 1.22 | 5-25-2065 | 1,491,937 | 1,371,406 | ||
| Starwood Mortgage Residential Trust Series 2021-4 Class A1 144A | 1.16 | 8-25-2056 | 3,729,117 | 2,977,100 | ||
| T- Mobile US Trust Series 2022-1A Class A 144A | 4.91 | 5-22-2028 | 6,475,000 | 6,450,851 | ||
| Interest rate | Maturity date | Principal | Value | |||
| Non-agency mortgage-backed securities (continued) | ||||||
| Verizon Master Trust Series 2022-2 Class A | 1.53% | 7-20-2028 | $ | 3,146,000 | $ 2,928,764 | |
| Verizon Master Trust Series 2022-4 Class A | 3.40 | 11-20-2028 | 6,886,000 | 6,651,667 | ||
| Verizon Master Trust Series 2022-6 Class A 144A±± | 3.67 | 1-22-2029 | 6,257,000 | 6,064,790 | ||
| Verus Securitization Trust Series 2019-2 Class A1 144A±± | 2.91 | 7-25-2059 | 752,865 | 724,868 | ||
| Verus Securitization Trust Series 2019-3 Class A1 144A±± | 2.69 | 11-25-2059 | 665,592 | 624,559 | ||
| Verus Securitization Trust Series 2019-4 Class A1 144A | 2.64 | 11-25-2059 | 1,406,121 | 1,332,644 | ||
| Verus Securitization Trust Series 2020-1 Class A1 ±± | 2.42 | 1-25-2060 | 309,955 | 291,078 | ||
| Verus Securitization Trust Series 2020-2 Class A1 | 2.23 | 5-25-2060 | 1,000,156 | 957,718 | ||
| Verus Securitization Trust Series 2020-5 Class A1 144A±± | 1.22 | 5-25-2065 | 623,777 | 566,685 | ||
| Verus Securitization Trust Series 2021-1 Class A1 144A±± | 0.82 | 1-25-2066 | 2,071,570 | 1,678,749 | ||
| Verus Securitization Trust Series 2021-2 Class A1 | 1.03 | 2-25-2066 | 3,719,622 | 3,072,006 | ||
| Verus Securitization Trust Series 2021-3 Class A1 144A±± | 1.05 | 6-25-2066 | 2,729,506 | 2,199,811 | ||
| Verus Securitization Trust Series 2021-4 Class A1 144A±± | 0.94 | 7-25-2066 | 3,307,263 | 2,537,670 | ||
| Verus Securitization Trust Series 2021-5 Class A1 144A±± | 1.01 | 9-25-2066 | 11,082,093 | 8,842,388 | ||
| Verus Securitization Trust Series 2021-7 Class A1 144A±± | 1.83 | 10-25-2066 | 4,913,872 | 4,113,199 | ||
| Verus Securitization Trust Series 2021-8 Class A1 144A±± | 1.82 | 11-25-2066 | 3,465,440 | 2,905,058 | ||
| Verus Securitization Trust Series 2021-R1 Class A1 144A±± | 0.82 | 10-25-2063 | 1,805,413 | 1,569,162 | ||
| Verus Securitization Trust Series 2021-R3 Class A1 | 1.02 | 4-25-2064 | 1,732,409 | 1,493,797 | ||
| Visio Trust Series 2020-1R Class A1 144A | 1.31 | 11-25-2055 | 1,371,374 | 1,224,688 | ||
| Total Non-agency mortgage-backed securities (Cost $237,758,968) | 217,857,017 | |||||
| U.S. Treasury securities: 26.41% | ||||||
| TIPS | 4.13 | 11-15-2032 | 17,584,000 | 18,270,875 | ||
| U.S. Treasury Bond | 1.13 | 5-15-2040 | 87,097,000 | 55,735,276 | ||
| U.S. Treasury Bond | 1.13 | 8-15-2040 | 85,421,000 | 54,252,345 | ||
| U.S. Treasury Bond ## | 1.38 | 11-15-2040 | 158,031,000 | 104,800,480 | ||
| U.S. Treasury Bond | 1.38 | 8-15-2050 | 14,688,000 | 8,470,845 | ||
| U.S. Treasury Bond | 1.63 | 11-15-2050 | 15,145,000 | 9,354,404 | ||
| U.S. Treasury Bond ## | 1.75 | 8-15-2041 | 146,129,000 | 101,947,810 | ||
| U.S. Treasury Bond | 1.88 | 2-15-2041 | 6,755,000 | 4,881,543 | ||
| U.S. Treasury Bond | 2.00 | 8-15-2051 | 31,558,000 | 21,447,113 | ||
| U.S. Treasury Bond | 2.25 | 2-15-2052 | 11,829,000 | 8,542,294 | ||
| U.S. Treasury Bond | 2.88 | 5-15-2052 | 5,762,000 | 4,789,663 | ||
| U.S. Treasury Bond | 3.00 | 8-15-2052 | 34,328,000 | 29,393,350 | ||
| U.S. Treasury Bond | 5.25 | 11-15-2028 | 10,576,000 | 11,339,042 | ||
| U.S. Treasury Bond | 5.25 | 2-15-2029 | 8,249,000 | 8,869,608 | ||
| U.S. Treasury Note | 0.25 | 8-31-2025 | 28,317,000 | 25,480,875 | ||
| U.S. Treasury Note | 0.38 | 11-30-2025 | 233,000 | 208,854 | ||
| U.S. Treasury Note | 0.38 | 1-31-2026 | 45,675,000 | 40,727,470 | ||
| U.S. Treasury Note | 0.75 | 5-31-2026 | 5,070,000 | 4,532,105 | ||
| U.S. Treasury Note | 0.88 | 6-30-2026 | 6,392,000 | 5,730,078 | ||
| U.S. Treasury Note | 1.38 | 10-31-2028 | 30,676,000 | 26,740,844 | ||
| U.S. Treasury Note | 1.50 | 8-15-2026 | 101,122,000 | 92,487,130 | ||
| U.S. Treasury Note | 1.50 | 11-30-2028 | 11,372,000 | 9,973,155 | ||
| Interest rate | Maturity date | Principal | Value | |||
| U.S. Treasury securities (continued) | ||||||
| U.S. Treasury Note | 1.63% | 5-15-2026 | $ | 41,786,000 | $ 38,567,172 | |
| U.S. Treasury Note | 1.88 | 11-15-2051 | 7,074,000 | 4,651,984 | ||
| U.S. Treasury Note | 2.00 | 11-15-2026 | 41,350,000 | 38,405,428 | ||
| U.S. Treasury Note | 2.25 | 11-15-2027 | 9,209,000 | 8,547,103 | ||
| U.S. Treasury Note | 2.38 | 8-15-2024 | 18,881,000 | 18,217,215 | ||
| U.S. Treasury Note | 2.50 | 5-15-2024 | 16,804,000 | 16,307,101 | ||
| U.S. Treasury Note | 2.63 | 7-31-2029 | 8,779,000 | 8,190,533 | ||
| U.S. Treasury Note | 2.75 | 2-15-2028 | 37,619,000 | 35,674,862 | ||
| U.S. Treasury Note | 2.75 | 5-31-2029 | 51,797,000 | 48,713,460 | ||
| U.S. Treasury Note | 2.88 | 4-30-2025 | 16,500,000 | 15,987,598 | ||
| U.S. Treasury Note | 3.00 | 6-30-2024 | 2,271,000 | 2,217,419 | ||
| U.S. Treasury Note | 3.13 | 8-31-2029 | 2,239,000 | 2,153,726 | ||
| U.S. Treasury Note | 3.25 | 6-30-2027 | 18,369,000 | 17,891,119 | ||
| U.S. Treasury Note | 3.25 | 6-30-2029 | 13,449,000 | 13,029,769 | ||
| U.S. Treasury Note | 3.38 | 8-15-2042 | 5,064,000 | 4,632,769 | ||
| U.S. Treasury Note | 3.88 | 11-30-2027 | 96,442,000 | 96,803,658 | ||
| U.S. Treasury Note | 3.88 | 9-30-2029 | 554,000 | 557,809 | ||
| U.S. Treasury Note | 3.88 | 11-30-2029 | 1,348,000 | 1,357,057 | ||
| U.S. Treasury Note | 4.00 | 10-31-2029 | 4,256,000 | 4,320,505 | ||
| U.S. Treasury Note | 4.00 | 11-15-2052 | 15,608,000 | 16,232,320 | ||
| U.S. Treasury Note | 4.13 | 9-30-2027 | 38,580,000 | 39,050,194 | ||
| U.S. Treasury Note | 4.13 | 10-31-2027 | 63,363,000 | 64,169,889 | ||
| U.S. Treasury Note | 4.25 | 9-30-2024 | 6,000 | 5,982 | ||
| U.S. Treasury Note | 4.38 | 10-31-2024 | 8,162,000 | 8,160,087 | ||
| U.S. Treasury Note | 4.50 | 11-30-2024 | 17,441,000 | 17,492,778 | ||
| U.S. Treasury Note | 4.50 | 11-15-2025 | 13,935,000 | 14,091,769 | ||
| Total U.S. Treasury securities (Cost $1,319,517,564) | 1,183,404,465 | |||||
| Yankee corporate bonds and notes: 4.40% | ||||||
| Communication services: 0.06% | ||||||
| Wireless telecommunication services: 0.06% | ||||||
| Rogers Communications Incorporated 144A | 4.55 | 3-15-2052 | 1,927,000 | 1,568,469 | ||
| Vodafone Group plc | 4.25 | 9-17-2050 | 616,000 | 486,156 | ||
| Vodafone Group plc | 5.00 | 5-30-2038 | 778,000 | 720,456 | ||
| 2,775,081 | ||||||
| Consumer staples: 0.32% | ||||||
| Beverages: 0.21% | ||||||
| Diageo Capital plc | 5.30 | 10-24-2027 | 4,333,000 | 4,463,823 | ||
| Diageo Capital plc | 5.50 | 1-24-2033 | 4,497,000 | 4,747,376 | ||
| 9,211,199 | ||||||
| Food products: 0.11% | ||||||
| Viterra Finance BV 144A | 3.20 | 4-21-2031 | 766,000 | 581,268 | ||
| Viterra Finance BV 144A | 5.25 | 4-21-2032 | 5,047,000 | 4,457,695 | ||
| 5,038,963 | ||||||
| Energy: 0.32% | ||||||
| Oil, gas & consumable fuels: 0.32% | ||||||
| Aker BP ASA 144A | 3.75 | 1-15-2030 | 520,000 | 460,843 | ||
| Aker BP ASA 144A | 4.00 | 1-15-2031 | 1,981,000 | 1,759,404 | ||
| Interest rate | Maturity date | Principal | Value | |||
| Oil, gas & consumable fuels (continued) | ||||||
| Galaxy Pipeline Assets Company 144A | 1.75% | 9-30-2027 | $ | 3,046,584 | $ 2,814,619 | |
| Galaxy Pipeline Assets Company 144A | 2.16 | 3-31-2034 | 3,350,043 | 2,828,925 | ||
| Galaxy Pipeline Assets Company 144A | 2.63 | 3-31-2036 | 2,354,000 | 1,874,405 | ||
| Galaxy Pipeline Assets Company 144A | 2.94 | 9-30-2040 | 1,493,289 | 1,191,159 | ||
| Petroleos Mexicanos Company | 2.38 | 4-15-2025 | 907,250 | 876,489 | ||
| Petroleos Mexicanos Company | 2.46 | 12-15-2025 | 2,822,750 | 2,714,016 | ||
| 14,519,860 | ||||||
| Financials: 2.84% | ||||||
| Banks: 1.56% | ||||||
| Banco Santander SA (1 Year Treasury Constant Maturity +0.90%) ± | 1.72 | 9-14-2027 | 3,700,000 | 3,169,875 | ||
| Banco Santander SA (1 Year Treasury Constant Maturity +1.60%) ± | 3.23 | 11-22-2032 | 2,600,000 | 1,937,180 | ||
| Banco Santander SA | 5.29 | 8-18-2027 | 1,600,000 | 1,552,588 | ||
| Barclays plc (1 Year Treasury Constant Maturity +3.30%) ± | 7.39 | 11-2-2028 | 8,642,000 | 8,940,432 | ||
| Barclays plc (1 Year Treasury Constant Maturity +3.50%) ± | 7.44 | 11-2-2033 | 5,184,000 | 5,491,372 | ||
| Cooperative Rabobank UA (1 Year Treasury Constant Maturity +1.22%) 144A± | 3.65 | 4-6-2028 | 9,070,000 | 8,360,845 | ||
| Cooperative Rabobank UA (1 Year Treasury Constant Maturity +1.42%) 144A± | 3.76 | 4-6-2033 | 5,694,000 | 4,876,989 | ||
| Export-Import Bank Korea | 4.50 | 9-15-2032 | 2,398,000 | 2,363,765 | ||
| HSBC Holdings plc (U.S. SOFR +3.35%) ± | 7.39 | 11-3-2028 | 5,087,000 | 5,334,950 | ||
| Lloyds Banking Group PLC (1 Year Treasury Constant Maturity +1.75%) ± | 4.72 | 8-11-2026 | 6,608,000 | 6,411,167 | ||
| Lloyds Banking Group PLC (1 Year Treasury Constant Maturity +2.30%) ± | 4.98 | 8-11-2033 | 3,844,000 | 3,537,785 | ||
| Mitsubishi UFJ Financial Group (1 Year Treasury Constant Maturity +0.95%) ± | 2.31 | 7-20-2032 | 3,931,000 | 3,064,780 | ||
| Mitsubishi UFJ Financial Group (1 Year Treasury Constant Maturity +2.13%) ± | 5.13 | 7-20-2033 | 3,284,000 | 3,192,886 | ||
| Mitsubishi UFJ Financial Group (1 Year Treasury Constant Maturity +1.90%) ± | 5.35 | 9-13-2028 | 4,231,000 | 4,210,070 | ||
| Mitsubishi UFJ Financial Group (1 Year Treasury Constant Maturity +2.13%) ± | 5.47 | 9-13-2033 | 658,000 | 655,630 | ||
| Santander UK Group Holdings (U.S. SOFR +2.75%) ± | 6.83 | 11-21-2026 | 6,791,000 | 6,860,698 | ||
| 69,961,012 | ||||||
| Capital markets: 0.69% | ||||||
| Credit Suisse Group AG (U.S. SOFR +5.02%) 144A± | 9.02 | 11-15-2033 | 4,333,000 | 4,399,154 | ||
| Deutsche Bank AG (U.S. SOFR +2.26%) ± | 3.74 | 1-7-2033 | 7,567,000 | 5,401,862 | ||
| Macquarie Group Limited 144A | 6.21 | 11-22-2024 | 5,131,000 | 5,160,716 | ||
| UBS Group AG (1 Year Treasury Constant Maturity +1.60%) 144A± | 4.49 | 8-5-2025 | 5,380,000 | 5,269,397 | ||
| UBS Group AG (1 Year Treasury Constant Maturity +2.05%) 144A± | 4.70 | 8-5-2027 | 11,191,000 | 10,824,651 | ||
| 31,055,780 | ||||||
| Diversified financial services: 0.52% | ||||||
| AerCap Ireland Capital Designated Activity Company / AerCap Global Aviation Trust | 1.15 | 10-29-2023 | 9,371,000 | 8,955,148 | ||
| DH Europe Finance II | 2.20 | 11-15-2024 | 4,258,000 | 4,046,836 | ||
| Interest rate | Maturity date | Principal | Value | |||
| Diversified financial services (continued) | ||||||
| GE Capital International Funding Company | 4.42% | 11-15-2035 | $ | 1,122,000 | $ 1,059,003 | |
| Lundin Energy Finance Company 144A | 2.00 | 7-15-2026 | 4,111,000 | 3,619,349 | ||
| Lundin Energy Finance Company 144A | 3.10 | 7-15-2031 | 4,752,000 | 3,915,867 | ||
| Trust Fibrauno 144A | 6.39 | 1-15-2050 | 2,091,000 | 1,577,186 | ||
| 23,173,389 | ||||||
| Insurance: 0.07% | ||||||
| Enstar Group Limited | 3.10 | 9-1-2031 | 3,909,000 | 2,865,414 | ||
| Health care: 0.24% | ||||||
| Biotechnology: 0.03% | ||||||
| CSL Finance plc 144A | 4.05 | 4-27-2029 | 1,565,000 | 1,491,417 | ||
| Pharmaceuticals: 0.21% | ||||||
| Astrazeneca plc | 1.38 | 8-6-2030 | 1,575,000 | 1,259,930 | ||
| Shire Acquisitions Investments Ireland Designated Activity Company | 2.88 | 9-23-2023 | 1,276,000 | 1,251,742 | ||
| Takeda Pharmaceutical | 2.05 | 3-31-2030 | 4,382,000 | 3,609,061 | ||
| Takeda Pharmaceutical | 3.03 | 7-9-2040 | 1,727,000 | 1,291,479 | ||
| Takeda Pharmaceutical | 3.18 | 7-9-2050 | 1,323,000 | 926,249 | ||
| Takeda Pharmaceutical | 4.40 | 11-26-2023 | 986,000 | 978,399 | ||
| 9,316,860 | ||||||
| Industrials: 0.23% | ||||||
| Road & rail: 0.20% | ||||||
| Canadian National Railway | 3.85 | 8-5-2032 | 2,445,000 | 2,296,199 | ||
| Canadian National Railway | 4.40 | 8-5-2052 | 1,629,000 | 1,473,291 | ||
| Canadian Pacific Railway Company | 1.35 | 12-2-2024 | 3,854,000 | 3,588,867 | ||
| Canadian Pacific Railway Company | 1.75 | 12-2-2026 | 745,000 | 665,779 | ||
| Canadian Pacific Railway Company | 2.45 | 12-2-2031 | 624,000 | 520,029 | ||
| Canadian Pacific Railway Company | 3.00 | 12-2-2041 | 760,000 | 572,068 | ||
| 9,116,233 | ||||||
| Transportation infrastructure: 0.03% | ||||||
| Adani Ports & Special Company 144A | 3.00 | 2-16-2031 | 1,342,500 | 1,051,810 | ||
| Information technology: 0.16% | ||||||
| Semiconductors & semiconductor equipment: 0.16% | ||||||
| NXP BV | 2.65 | 2-15-2032 | 3,204,000 | 2,515,534 | ||
| NXP BV | 3.25 | 5-11-2041 | 1,700,000 | 1,216,383 | ||
| NXP BV | 3.40 | 5-1-2030 | 2,156,000 | 1,874,735 | ||
| NXP BV | 4.40 | 6-1-2027 | 1,878,000 | 1,795,511 | ||
| 7,402,163 | ||||||
| Materials: 0.20% | ||||||
| Metals & mining: 0.20% | ||||||
| Anglo American Capital Company 144A | 3.88 | 3-16-2029 | 4,368,000 | 3,930,903 | ||
| Anglo American Capital Company 144A | 4.75 | 3-16-2052 | 3,434,000 | 2,849,639 | ||
| Glencore Finance Canada Company 144A | 6.00 | 11-15-2041 | 200,000 | 189,209 | ||
| Glencore Finance Canada Company 144A | 6.90 | 11-15-2037 | 1,789,000 | 1,886,388 | ||
| 8,856,139 | ||||||
| Interest rate | Maturity date | Principal | Value | |||
| Utilities: 0.03% | ||||||
| Electric utilities: 0.03% | ||||||
| Israel Electric Corporation Limited 144A | 3.75% | 2-22-2032 | $ | 1,561,000 | $ 1,359,275 | |
| Total Yankee corporate bonds and notes (Cost $213,517,232) | 197,194,595 | |||||
| Yankee government bonds: 0.73% | ||||||
| Government of Bermuda 144A | 5.00 | 7-15-2032 | 2,063,000 | 1,985,759 | ||
| Province of Saskatchewan | 3.25 | 6-8-2027 | 2,358,000 | 2,266,153 | ||
| Republic of Chile « | 4.34 | 3-7-2042 | 1,368,000 | 1,166,136 | ||
| Republic of Indonesia | 4.65 | 9-20-2032 | 1,430,000 | 1,404,066 | ||
| Republic of Paraguay 144A | 5.40 | 3-30-2050 | 2,746,000 | 2,306,640 | ||
| Republic of Peru | 3.00 | 1-15-2034 | 1,182,000 | 953,363 | ||
| Republic of Peru | 3.60 | 1-15-2072 | 915,000 | 607,088 | ||
| Republic of Poland | 5.75 | 11-16-2032 | 3,411,000 | 3,596,558 | ||
| United Mexican States | 3.50 | 2-12-2034 | 4,150,000 | 3,438,969 | ||
| United Mexican States | 3.75 | 4-19-2071 | 3,662,000 | 2,409,644 | ||
| United Mexican States | 4.40 | 2-12-2052 | 5,036,000 | 3,867,284 | ||
| United Mexican States | 4.50 | 4-22-2029 | 4,105,000 | 3,983,454 | ||
| United Mexican States | 4.60 | 2-10-2048 | 883,000 | 709,944 | ||
| United Mexican States | 4.88 | 5-19-2033 | 4,045,000 | 3,799,230 | ||
| Total Yankee government bonds (Cost $34,868,980) | 32,494,288 | |||||
| Yield | Shares | |||||
| Short-term investments: 0.87% | ||||||
| Investment companies: 0.87% | ||||||
| Allspring Government Money Market Fund Select Class ♠∞## | 3.60 | 37,348,017 | 37,348,017 | |||
| Securities Lending Cash Investments LLC ♠∩∞ | 3.90 | 1,613,470 | 1,613,470 | |||
| Total Short-term investments (Cost $38,961,487) | 38,961,487 | |||||
| Total investments in securities (Cost $4,939,591,353) | 102.04% | 4,572,534,498 | ||||
| Other assets and liabilities, net | (2.04) | (91,311,862) | ||||
| Total net assets | 100.00% | $4,481,222,636 | ||||
| ¤ | The security is issued in zero coupon form with no periodic interest payments. |
| ± | Variable rate investment. The rate shown is the rate in effect at period end. |
| ±± | The coupon of the security is adjusted based on the principal and/or interest payments received from the underlying pool of mortgages as well as the credit quality and the actual prepayment speed of the underlying mortgages. The rate shown is the rate in effect at period end. |
| 144A | The security may be resold in transactions exempt from registration, normally to qualified institutional buyers, pursuant to Rule 144A under the Securities Act of 1933. |
| ## | All or a portion of this security is segregated for when-issued securities. |
| « | All or a portion of this security is on loan. |
| ♠ | The issuer of the security is an affiliated person of the Portfolio as defined in the Investment Company Act of 1940. |
| ∩ | The investment is a non-registered investment company purchased with cash collateral received from securities on loan. |
| ∞ | The rate represents the 7-day annualized yield at period end. |
| %% | The security is purchased on a when-issued basis. |
| Abbreviations: | |
| FHLMC | Federal Home Loan Mortgage Corporation |
| FNMA | Federal National Mortgage Association |
| GNMA | Government National Mortgage Association |
| LIBOR | London Interbank Offered Rate |
| REIT | Real estate investment trust |
| SOFR | Secured Overnight Financing Rate |
| TIPS | Treasury Inflation-Protected Securities |
| Value, beginning of period | Purchases | Sales proceeds | Net realized gains (losses) | Net change in unrealized gains (losses) | Value, end of period | Shares, end of period | Income from affiliated securities | |||
| Short-term investments | ||||||||||
| Allspring Government Money Market Fund Select Class | $114,848,590 | $1,185,890,482 | $(1,263,391,055) | $0 | $0 | $ 37,348,017 | 37,348,017 | $ 1,894,960 | ||
| Securities Lending Cash Investments LLC | 10,235,000 | 121,493,634 | (130,115,164) | 0 | 0 | 1,613,470 | 1,613,470 | 41,542 # | ||
| $0 | $0 | $38,961,487 | $1,936,502 | |||||||
| # | Amount shown represents income before fees and rebates. |
| Assets | |
Investments in unaffiliated securities (including $1,581,413 of securities loaned), at value (cost $4,900,629,866) | $ 4,533,573,011 |
Investments in affiliated securities, at value (cost $38,961,487) | 38,961,487 |
Cash | 7,094,487 |
Receivable for investments sold | 455,563,907 |
Receivable for interest | 19,996,365 |
Principal paydown receivable | 690,715 |
Receivable for securities lending income, net | 64 |
Prepaid expenses and other assets | 100,837 |
Total assets | 5,055,980,873 |
| Liabilities | |
Payable for investments purchased | 376,461,961 |
Payable for when-issued transactions | 194,749,530 |
Payable upon receipt of securities loaned | 1,613,470 |
Advisory fee payable | 1,250,216 |
Cash collateral due to broker | 570,000 |
Accrued expenses and other liabilities | 113,060 |
Total liabilities | 574,758,237 |
Total net assets | $ 4,481,222,636 |
| Investment income | |
Interest | $ 69,415,509 |
Income from affiliated securities | 1,921,172 |
Total investment income | 71,336,681 |
| Expenses | |
Advisory fee | 8,114,449 |
Custody and accounting fees | 158,250 |
Professional fees | 83,026 |
Interest holder report expenses | 18,990 |
Trustees’ fees and expenses | 10,879 |
Other fees and expenses | 65,707 |
Total expenses | 8,451,301 |
Less: Fee waivers and/or expense reimbursements | (87,772) |
Net expenses | 8,363,529 |
Net investment income | 62,973,152 |
| Realized and unrealized gains (losses) on investments | |
Net realized losses on investments | (236,621,883) |
Net change in unrealized gains (losses) on investments | (27,902,946) |
Net realized and unrealized gains (losses) on investments | (264,524,829) |
Net decrease in net assets resulting from operations | $(201,551,677) |
| Six months ended November 30, 2022 (unaudited) | Year ended May 31, 2022 | |
| Operations | ||
Net investment income | $ 62,973,152 | $ 71,113,325 |
Net realized losses on investments | (236,621,883) | (167,999,743) |
Net change in unrealized gains (losses) on investments | (27,902,946) | (357,074,109) |
Net decrease in net assets resulting from operations | (201,551,677) | (453,960,527) |
| Capital transactions | ||
| Transactions in investors’ beneficial interests | ||
Contributions | 307,992,830 | 733,615,538 |
Withdrawals | (483,764,848) | (1,063,241,380) |
Net decrease in net assets resulting from capital transactions | (175,772,018) | (329,625,842) |
Total decrease in net assets | (377,323,695) | (783,586,369) |
| Net assets | ||
Beginning of period | 4,858,546,331 | 5,642,132,700 |
End of period | $4,481,222,636 | $ 4,858,546,331 |
| Year ended May 31 | ||||||
| Six months ended November 30, 2022 (unaudited) | 2022 | 2021 | 2020 | 2019 | 2018 | |
Total return1 | (4.12)% | (8.55)% | 0.65% | 9.49% | 6.30% | (0.53)% |
| Ratios to average net assets (annualized) | ||||||
Gross expenses | 0.36% | 0.36% | 0.35% | 0.35% | 0.35% | 0.35% |
Net expenses2 | 0.36% | 0.36% | 0.35% | 0.35% | 0.35% | 0.35% |
Net investment income | 2.71% | 1.33% | 1.30% | 2.28% | 2.93% | 2.23% |
| Supplemental data | ||||||
Portfolio turnover rate | 213% | 432% | 457% | 603% | 577% | 542% |
| 1 | Returns for periods of less than one year are not annualized. |
| 2 | Net expense ratios reflect voluntary waivers, if any. |
| Gross unrealized gains | $ 24,102,043 |
| Gross unrealized losses | (423,307,770) |
| Net unrealized losses | $(399,205,727) |
| ■ | Level 1 – quoted prices in active markets for identical securities |
| ■ | Level 2 – other significant observable inputs (including quoted prices for similar securities, interest rates, prepayment speeds, credit risk, etc.) |
| ■ | Level 3 – significant unobservable inputs (including the Portfolio’s own assumptions in determining the fair value of investments) |
| Quoted prices (Level 1) | Other significant observable inputs (Level 2) | Significant unobservable inputs (Level 3) | Total | |
| Assets | ||||
| Investments in: | ||||
| Agency securities | $ 0 | $ 1,449,795,707 | $0 | $ 1,449,795,707 |
| Asset-backed securities | 0 | 497,719,778 | 0 | 497,719,778 |
| Corporate bonds and notes | 0 | 939,021,456 | 0 | 939,021,456 |
| Municipal obligations | 0 | 16,085,705 | 0 | 16,085,705 |
| Non-agency mortgage-backed securities | 0 | 217,857,017 | 0 | 217,857,017 |
| U.S. Treasury securities | 1,183,404,465 | 0 | 0 | 1,183,404,465 |
| Yankee corporate bonds and notes | 0 | 197,194,595 | 0 | 197,194,595 |
| Yankee government bonds | 0 | 32,494,288 | 0 | 32,494,288 |
| Short-term investments | ||||
| Investment companies | 38,961,487 | 0 | 0 | 38,961,487 |
| Total assets | $1,222,365,952 | $3,350,168,546 | $0 | $4,572,534,498 |
| Average daily net assets | Advisory fee |
| First $500 million | 0.400% |
| Next $500 million | 0.375 |
| Next $2 billion | 0.350 |
| Next $2 billion | 0.325 |
| Next $5 billion | 0.300 |
| Over $10 billion | 0.290 |
| Purchases at cost | Sales proceeds | |||
| U.S. government | Non-U.S. government | U.S. government | Non-U.S. government | |
| $5,658,491,341 | $4,550,127,170 | $5,915,965,057 | $4,399,538,656 | |
| Counterparty | Values of securities on loan | Collateral received1 | Net amount |
| Barclays Capital Incorporated | $ 460,665 | $ (460,665) | $0 |
| Citigroup Global Markets Incorporated | 1,120,748 | (1,120,748) | 0 |
| Name and year of birth | Position held and length of service* | Principal occupations during past five years or longer | Current other public company or investment company directorships |
| William R. Ebsworth (Born 1957) | Trustee, since 2015 | Retired. From 1984 to 2013, equities analyst, portfolio manager, research director and chief investment officer at Fidelity Management and Research Company in Boston, Tokyo, and Hong Kong, and retired in 2013 as Chief Investment Officer of Fidelity Strategic Advisers, Inc. where he led a team of investment professionals managing client assets. Prior thereto, Board member of Hong Kong Securities Clearing Co., Hong Kong Options Clearing Corp., the Thailand International Fund, Ltd., Fidelity Investments Life Insurance Company, and Empire Fidelity Investments Life Insurance Company. Audit Committee Chair and Investment Committee Chair of the Vincent Memorial Hospital Endowment (non-profit organization). Mr. Ebsworth is a CFA® charterholder. | N/A |
| Jane A. Freeman (Born 1953) | Trustee, since 2015; Chair Liaison, since 2018 | Retired. From 2012 to 2014 and 1999 to 2008, Chief Financial Officer of Scientific Learning Corporation. From 2008 to 2012, Ms. Freeman provided consulting services related to strategic business projects. Prior to 1999, Portfolio Manager at Rockefeller & Co. and Scudder, Stevens & Clark. Board member of the Harding Loevner Funds from 1996 to 2014, serving as both Lead Independent Director and chair of the Audit Committee. Board member of the Russell Exchange Traded Funds Trust from 2011 to 2012 and the chair of the Audit Committee. Ms. Freeman is also an inactive Chartered Financial Analyst. | N/A |
| Isaiah Harris, Jr. (Born 1952) | Trustee, since 2009; Audit Committee Chair, since 2019 | Retired. Chairman of the Board of CIGNA Corporation from 2009 to 2021, and Director from 2005 to 2008. From 2003 to 2011, Director of Deluxe Corporation. Prior thereto, President and CEO of BellSouth Advertising and Publishing Corp. from 2005 to 2007, President and CEO of BellSouth Enterprises from 2004 to 2005 and President of BellSouth Consumer Services from 2000 to 2003. Emeritus member of the Iowa State University Foundation Board of Governors. Emeritus Member of the Advisory Board of Iowa State University School of Business. Advisory Board Member, Palm Harbor Academy (private school). Advisory Board Member, Fellowship of Christian Athletes. Mr. Harris is a certified public accountant (inactive status). | N/A |
| David F. Larcker (Born 1950) | Trustee, since 2009 | James Irvin Miller Professor of Accounting at the Graduate School of Business (Emeritus), Stanford University, Director of the Corporate Governance Research Initiative and Senior Faculty of The Rock Center for Corporate Governance since 2006. From 2005 to 2008, Professor of Accounting at the Graduate School of Business, Stanford University. Prior thereto, Ernst & Young Professor of Accounting at The Wharton School, University of Pennsylvania from 1985 to 2005. | N/A |
| Name and year of birth | Position held and length of service* | Principal occupations during past five years or longer | Current other public company or investment company directorships |
| Olivia S. Mitchell (Born 1953) | Trustee, since 2006; Nominating and Governance Committee Chair, since 2018 | International Foundation of Employee Benefit Plans Professor since 1993, Wharton School of the University of Pennsylvania. Director of Wharton’s Pension Research Council and Boettner Center on Pensions & Retirement Research, and Research Associate at the National Bureau of Economic Research. Previously taught at Cornell University from 1978 to 1993. | N/A |
| Timothy J. Penny (Born 1951) | Trustee, since 1996; Chair, since 2018 | President and Chief Executive Officer of Southern Minnesota Initiative Foundation, a non-profit organization, since 2007. Vice Chair of the Economic Club of Minnesota, since 2007. Co-Chair of the Committee for a Responsible Federal Budget, since 1995. Member of the Board of Trustees of NorthStar Education Finance, Inc., a non-profit organization, since 2007. Senior Fellow of the University of Minnesota Humphrey Institute from 1995 to 2017. | N/A |
| James G. Polisson (Born 1959) | Trustee, since 2018 | Retired. Chief Marketing Officer, Source (ETF) UK Services, Ltd, from 2015 to 2017. From 2012 to 2015, Principal of The Polisson Group, LLC, a management consulting, corporate advisory and principal investing company. Chief Executive Officer and Managing Director at Russell Investments, Global Exchange Traded Funds from 2010 to 2012. Managing Director of Barclays Global Investors from 1998 to 2010 and Global Chief Marketing Officer for iShares and Barclays Global Investors from 2000 to 2010. Trustee of the San Francisco Mechanics’ Institute, a non-profit organization, from 2013 to 2015. Board member of the Russell Exchange Traded Fund Trust from 2011 to 2012. Director of Barclays Global Investors Holdings Deutschland GmbH from 2006 to 2009. Mr. Polisson is an attorney and has a retired status with the Massachusetts and District of Columbia Bar Associations. | N/A |
| Pamela Wheelock (Born 1959) | Trustee, since January 2020; previously Trustee from January 2018 to July 2019 | Retired. Executive and Senior Financial leadership positions in the public, private and nonprofit sectors. Interim President and CEO, McKnight Foundation, 2020. Interim Commissioner, Minnesota Department of Human Services, 2019. Chief Operating Officer, Twin Cities Habitat for Humanity, 2017-2019. Vice President for University Services, University of Minnesota, 2012-2016. Interim President and CEO, Blue Cross and Blue Shield of Minnesota, 2011-2012. Executive Vice-President and Chief Financial Officer, Minnesota Wild, 2002-2008. Commissioner, Minnesota Department of Finance, 1999-2002. Chair of the Board of Directors of Destination Medical Center Corporation. Board member of the Minnesota Wild Foundation. | N/A |
| Name and year of birth | Position held and length of service | Principal occupations during past five years or longer |
| Andrew Owen (Born 1960) | President, since 2017 | President and Chief Executive Officer of Allspring Funds Management, LLC since 2017 and Head of Global Fund Governance of Allspring Global Investments since 2022. Prior thereto, co-president of Galliard Capital Management, LLC, an affiliate of Allspring Funds Management, LLC, from 2019 to 2022 and Head of Affiliated Managers, Allspring Global Investments, from 2014 to 2019 and Executive Vice President responsible for marketing, investments and product development for Allspring Funds Management, LLC, from 2009 to 2014. |
| Jeremy DePalma (Born 1974) | Treasurer, since 2012 (for certain funds in the Fund Complex); since 2021 (for the remaining funds in the Fund Complex) | Senior Vice President of Allspring Funds Management, LLC since 2009. Senior Vice President of Evergreen Investment Management Company, LLC from 2008 to 2010 and head of the Fund Reporting and Control Team within Fund Administration from 2005 to 2010. |
| Christopher Baker (Born 1976) | Chief Compliance Officer, since 2022 | Global Chief Compliance Officer for Allspring Global Investments since 2022. Prior thereto, Chief Compliance Officer for State Street Global Advisors from 2018 to 2021. Senior Compliance Officer for the State Street divisions of Alternative Investment Solutions, Sector Solutions, and Global Marketing from 2015 to 2018. From 2010 to 2015 Vice President, Global Head of Investment and Marketing Compliance for State Street Global Advisors. |
| Matthew Prasse (Born 1983) | Chief Legal Officer, since 2022; Secretary, since 2021 | Senior Counsel of the Allspring Legal Department since 2021. Senior Counsel of the Wells Fargo Legal Department from 2018 to 2021. Previously, Counsel for Barings LLC from 2015 to 2018. Prior to joining Barings, Associate at Morgan, Lewis & Bockius LLP from 2008 to 2015. |
P.O. Box 219967
Kansas City, MO 64121-9967

1-800-222-8222 or visit the Fund's website at allspringglobal.com. Read the prospectus carefully before you invest or send money.
SA287/SAR287 11-22

| 2 | |
| 6 | |
| 9 | |
| Allspring Real Return Fund | |
| 10 | |
| Financial statements | |
| 11 | |
| 12 | |
| 13 | |
| 14 | |
| 19 | |
| Allspring Real Return Portfolio | |
| 23 | |
| Financial statements | |
| 34 | |
| 35 | |
| 36 | |
| 37 | |
| 38 | |
| 44 |

| 1 | The S&P 500 Index consists of 500 stocks chosen for market size, liquidity, and industry group representation. It is a market-value-weighted index with each stock's weight in the index proportionate to its market value. You cannot invest directly in an index. |
| 2 | The Morgan Stanley Capital International (MSCI) All Country World Index (ACWI) ex USA Index (Net) is a free-float-adjusted market-capitalization-weighted index that is designed to measure the equity market performance of developed and emerging markets, excluding the U.S. Source: MSCI. MSCI makes no express or implied warranties or representations and shall have no liability whatsoever with respect to any MSCI data contained herein. The MSCI data may not be further redistributed or used as a basis for other indexes or any securities or financial products. This report is not approved, reviewed, or produced by MSCI. You cannot invest directly in an index. |
| 3 | The MSCI Emerging Markets (EM) Index (Net) (USD) is a free-float-adjusted market-capitalization-weighted index that is designed to measure equity market performance of emerging markets. You cannot invest directly in an index. |
| 4 | The Bloomberg U.S. Aggregate Bond Index is a broad-based benchmark that measures the investment-grade, U.S.-dollar-denominated, fixed-rate taxable bond market, including Treasuries, government-related and corporate securities, mortgage-backed securities (agency fixed-rate and hybrid adjustable-rate mortgage pass-throughs), asset-backed securities, and commercial mortgage-backed securities. You cannot invest directly in an index. |
| 5 | The Bloomberg Global Aggregate ex-USD Index (unhedged) is an unmanaged index that provides a broad-based measure of the global investment-grade fixed-income markets excluding the U.S.-dollar-denominated debt market. You cannot invest directly in an index. |
| 6 | The Bloomberg Municipal Bond Index is an unmanaged index composed of long-term tax-exempt bonds with a minimum credit rating of Baa. You cannot invest directly in an index. |
| 7 | The ICE BofA U.S. High Yield Index is a market-capitalization-weighted index of domestic and Yankee high-yield bonds. The index tracks the performance of high-yield securities traded in the U.S. bond market. You cannot invest directly in an index. Copyright 2023. ICE Data Indices, LLC. All rights reserved. |

President
Allspring Funds
| Investment objective | The Fund seeks returns that exceed the rate of inflation over the long-term. |
| Manager | Allspring Funds Management, LLC |
| Portfolio managers | Kandarp R. Acharya, CFA®‡, FRM, Petros N. Bocray, CFA®‡, FRM, Michael Bradshaw, CFA®‡, Travis L. Keshemberg, CFA®‡, CIPM, FRM, Garth B. Newport, CFA®‡, Michael Schueller, CFA®‡, Michal Stanczyk |
| Average annual total returns (%) as of November 30, 2022 | |||||||||||
| Including sales charge | Excluding sales charge | Expense ratios1 (%) | |||||||||
| Inception date | 1 year | 5 year | 10 year | 1 year | 5 year | 10 year | Gross | Net 2 | |||
| Class A (IPBAX) | 2-28-2003 | -11.71 | 1.62 | 0.80 | -7.55 | 2.56 | 1.26 | 1.07 | 0.78 | ||
| Class C (IPBCX) | 2-28-2003 | -9.11 | 1.80 | 0.65 | -8.11 | 1.80 | 0.65 | 1.82 | 1.53 | ||
| Class R6 (IPBJX)3 | 10-31-2016 | – | – | – | -7.12 | 2.97 | 1.61 | 0.69 | 0.40 | ||
| Administrator Class (IPBIX) | 2-28-2003 | – | – | – | -7.36 | 2.74 | 1.48 | 1.01 | 0.60 | ||
| Institutional Class (IPBNX)4 | 10-31-2016 | – | – | – | -7.17 | 2.90 | 1.57 | 0.74 | 0.45 | ||
| Bloomberg U.S. TIPS Index5 | – | – | – | – | -10.66 | 2.50 | 1.15 | – | – | ||
| CPI 6 | – | – | – | – | 7.11 | 3.83 | 2.60 | – | – | ||
| 1 | Reflects the expense ratios as stated in the most recent prospectuses. The expense ratios shown are subject to change and may differ from the annualized expense ratios shown in the financial highlights of this report. |
| 2 | The manager has contractually committed through September 30, 2023, to waive fees and/or reimburse expenses to the extent necessary to cap total annual fund operating expenses after fee waivers at 0.78% for Class A, 1.53% for Class C, 0.40% for Class R6, 0.60% for Administrator Class, and 0.45% for Institutional Class. Brokerage commissions, stamp duty fees, interest, taxes, acquired fund fees and expenses (if any) from funds in which the affiliated master portfolio invests, and extraordinary expenses are excluded from the expense caps. Net expenses from the affiliated master portfolio are included in the expense caps. Prior to or after the commitment expiration date, the caps may be increased or the commitment to maintain the caps may be terminated only with the approval of the Board of Trustees. Without these caps, the Fund’s returns would have been lower. The expense ratio paid by an investor is the net expense ratio (the total annual fund operating expenses after fee waivers) as stated in the prospectuses. |
| 3 | Historical performance shown for the Class R6 shares prior to their inception reflects the performance of the Administrator Class shares, and is not adjusted to reflect the Class R6 expenses. If these expenses had been included, returns for the Class R6 shares would be higher. |
| 4 | Historical performance shown for the Institutional Class shares prior to their inception reflects the performance of the Administrator Class shares, and includes the higher expenses applicable to the Administrator Class shares. If these expenses had not been included, returns for the Institutional Class shares would be higher. |
| 5 | The Bloomberg U.S. Treasury Inflation-Protected Securities (TIPS) Index is an index of inflation-indexed-linked U.S. Treasury securities. You cannot invest directly in an index. |
| 6 | The Consumer Price Index (CPI) for All Urban Consumers in U.S. All Items is published monthly by the U.S. government as an indicator of changes in price levels (or inflation) paid by urban consumers for a representative basket of goods and services. You cannot invest directly in an index. |
| * | The Fund is a feeder fund in a master-feeder structure that invests substantially all of its assets in a single affiliated master portfolio of the Allspring Master Trust with a substantially identical investment objective and substantially similar investment strategies. References to the investment activities of the Fund are intended to refer to the investment activities of the affiliated master portfolio in which it invests. |
| ‡ | CFA® and Chartered Financial Analyst® are trademarks owned by CFA Institute. |
| Ten largest holdings (%) as of November 30, 20221 | |
| TIPS, 0.13%, 1-15-2032 | 2.77 |
| TIPS, 0.13%, 4-15-2026 | 2.73 |
| TIPS, 0.25%, 1-15-2025 | 2.30 |
| TIPS, 0.13%, 4-15-2027 | 2.27 |
| TIPS, 0.63%, 7-15-2032 | 2.26 |
| TIPS, 0.63%, 1-15-2026 | 2.19 |
| TIPS, 0.13%, 1-15-2031 | 2.05 |
| TIPS, 0.13%, 1-15-2030 | 2.03 |
| TIPS, 1.63%, 10-15-2027 | 1.91 |
| TIPS, 0.13%, 10-15-2024 | 1.90 |
| 1 | Each holding represents the Fund’s allocable portion of the affiliated master portfolio security. Figures represent each holding as a percentage of the Fund’s net assets. Holdings are subject to change and may have changed since the date specified. |
| Portfolio allocation as of November 30, 20221 |

| 1 | Figures represent the portfolio allocation of the affiliated master portfolio as a percentage of the long-term investments of the affiliated master portfolio. Allocations are subject to change and may have changed since the date specified. |
| Beginning account value 6-1-2022 | Ending account value 11-30-2022 | Expenses paid during the period1,2 | Annualized net expense ratio2 | |
| Class A | ||||
| Actual | $1,000.00 | $ 963.16 | $3.84 | 0.78% |
| Hypothetical (5% return before expenses) | $1,000.00 | $1,021.16 | $3.95 | 0.78% |
| Class C | ||||
| Actual | $1,000.00 | $ 959.84 | $7.52 | 1.53% |
| Hypothetical (5% return before expenses) | $1,000.00 | $1,017.40 | $7.74 | 1.53% |
| Class R6 | ||||
| Actual | $1,000.00 | $ 965.44 | $1.97 | 0.40% |
| Hypothetical (5% return before expenses) | $1,000.00 | $1,023.06 | $2.03 | 0.40% |
| Administrator Class | ||||
| Actual | $1,000.00 | $ 964.18 | $2.95 | 0.60% |
| Hypothetical (5% return before expenses) | $1,000.00 | $1,022.06 | $3.04 | 0.60% |
| Institutional Class | ||||
| Actual | $1,000.00 | $ 965.19 | $2.22 | 0.45% |
| Hypothetical (5% return before expenses) | $1,000.00 | $1,022.81 | $2.28 | 0.45% |
| Value | |||||
| Investment companies: 100.42% | |||||
| Affiliated master portfolio: 100.42% | |||||
| Allspring Real Return Portfolio | $78,762,415 | ||||
| Total Investment companies (Cost $82,876,564) | 78,762,415 | ||||
| Total investments in securities (Cost $82,876,564) | 100.42% | 78,762,415 | |||
| Other assets and liabilities, net | (0.42) | (333,167) | |||
| Total net assets | 100.00% | $78,429,248 |
| % of ownership, beginning of period | % of ownership, end of period | Net realized gains (losses) on securities transactions allocated from affiliated Master Portfolio | Net change in unrealized gains (losses) on securities transactions allocated from affiliated Master Portfolio | Interest allocated from affiliated Master Portfolio | Dividends allocated from affiliated Master Portfolio | Affiliated income allocated from affiliated Master Portfolio | Value, end of period | ||
| Allspring Real Return Portfolio | 40.08% | 36.14% | $190,705 | $(5,708,871) | $2,277,994 | $163,261 | $8,250 | $78,762,415 |
| Assets | |
Investments in affiliated Master Portfolio, at value (cost $82,876,564) | $ 78,762,415 |
Receivable for Fund shares sold | 120,656 |
Receivable from manager | 21,961 |
Prepaid expenses and other assets | 48,389 |
Total assets | 78,953,421 |
| Liabilities | |
Payable for Fund shares redeemed | 473,008 |
Administration fees payable | 6,033 |
Trustees’ fees and expenses payable | 1,104 |
Distribution fee payable | 960 |
Accrued expenses and other liabilities | 43,068 |
Total liabilities | 524,173 |
Total net assets | $78,429,248 |
| Net assets consist of | |
Paid-in capital | $ 83,053,698 |
Total distributable loss | (4,624,450) |
Total net assets | $78,429,248 |
| Computation of net asset value and offering price per share | |
Net assets – Class A | $ 15,501,484 |
Shares outstanding – Class A1 | 1,600,652 |
Net asset value per share – Class A | $9.68 |
Maximum offering price per share – Class A2 | $10.14 |
Net assets – Class C | $ 1,583,975 |
Shares outstanding – Class C1 | 166,766 |
Net asset value per share – Class C | $9.50 |
Net assets – Class R6 | $ 11,244,064 |
Shares outstanding – Class R61 | 1,147,301 |
Net asset value per share – Class R6 | $9.80 |
Net assets – Administrator Class | $ 14,459,424 |
Shares outstanding – Administrator Class1 | 1,462,915 |
Net asset value per share – Administrator Class | $9.88 |
Net assets – Institutional Class | $ 35,640,301 |
Shares outstanding – Institutional Class1 | 3,637,485 |
Net asset value per share – Institutional Class | $9.80 |
| 1 | The Fund has an unlimited number of authorized shares. |
| 2 | Maximum offering price is computed as 100/95.50 of net asset value. On investments of $50,000 or more, the offering price is reduced. |
| Investment income | |
Interest allocated from affiliated Master Portfolio | $ 2,277,994 |
Dividends allocated from affiliated Master Portfolio (net of foreign withholding taxes of $2,099) | 163,261 |
Affiliated income allocated from affiliated Master Portfolio | 8,250 |
Expenses allocated from affiliated Master Portfolio | (212,341) |
Waivers allocated from affiliated Master Portfolio | 48,493 |
Total investment income | 2,285,657 |
| Expenses | |
Management fee | 21,033 |
| Administration fees | |
Class A | 13,355 |
Class C | 1,303 |
Class R6 | 1,902 |
Administrator Class | 7,388 |
Institutional Class | 15,343 |
| Shareholder servicing fees | |
Class A | 20,867 |
Class C | 2,036 |
Administrator Class | 17,855 |
| Distribution fee | |
Class C | 6,107 |
Custody and accounting fees | 1,792 |
Professional fees | 25,801 |
Registration fees | 37,352 |
Shareholder report expenses | 21,822 |
Trustees’ fees and expenses | 10,873 |
Other fees and expenses | 4,130 |
Total expenses | 208,959 |
| Less: Fee waivers and/or expense reimbursements | |
Fund-level | (123,057) |
Class A | (174) |
Administrator Class | (16,209) |
Net expenses | 69,519 |
Net investment income | 2,216,138 |
| Realized and unrealized gains (losses) on investments | |
Net realized gains on securities transactions allocated from affiliated Master Portfolio | 190,705 |
Net change in unrealized gains (losses) on securities transactions allocated from affiliated Master Portfolio | (5,708,871) |
Net realized and unrealized gains (losses) on investments | (5,518,166) |
Net decrease in net assets resulting from operations | $(3,302,028) |
| Six months ended November 30, 2022 (unaudited) | Year ended May 31, 2022 | |||
| Operations | ||||
Net investment income | $ 2,216,138 | $ 4,090,448 | ||
Net realized gains on investments | 190,705 | 935,582 | ||
Net change in unrealized gains (losses) on investments | (5,708,871) | (6,398,528) | ||
Net decrease in net assets resulting from operations | (3,302,028) | (1,372,498) | ||
| Distributions to shareholders from | ||||
| Net investment income and net realized gains | ||||
Class A | (493,854) | (836,596) | ||
Class C | (42,822) | (65,210) | ||
Class R6 | (409,748) | (755,640) | ||
Administrator Class | (436,391) | (640,606) | ||
Institutional Class | (1,184,817) | (1,520,901) | ||
Total distributions to shareholders | (2,567,632) | (3,818,953) | ||
| Capital share transactions | Shares | Shares | ||
| Proceeds from shares sold | ||||
Class A | 91,448 | 905,025 | 791,258 | 8,668,328 |
Class C | 7,973 | 78,794 | 91,579 | 986,457 |
Class R6 | 144,032 | 1,454,370 | 486,424 | 5,304,807 |
Administrator Class | 134,918 | 1,382,051 | 894,909 | 9,920,837 |
Institutional Class | 776,759 | 7,697,826 | 4,023,778 | 44,177,808 |
| 11,518,066 | 69,058,237 | |||
| Reinvestment of distributions | ||||
Class A | 42,443 | 418,563 | 63,937 | 691,464 |
Class C | 4,381 | 42,432 | 6,087 | 64,531 |
Class R6 | 40,966 | 409,748 | 60,586 | 663,004 |
Administrator Class | 41,623 | 418,493 | 55,532 | 610,960 |
Institutional Class | 118,828 | 1,184,803 | 139,813 | 1,520,105 |
| 2,474,039 | 3,550,064 | |||
| Payment for shares redeemed | ||||
Class A | (244,370) | (2,383,323) | (408,579) | (4,414,389) |
Class C | (13,790) | (131,689) | (40,714) | (429,356) |
Class R6 | (401,648) | (4,038,065) | (2,460,305) | (27,125,717) |
Administrator Class | (160,338) | (1,582,869) | (691,012) | (7,672,910) |
Institutional Class | (1,441,361) | (14,323,576) | (956,389) | (10,220,364) |
| (22,459,522) | (49,862,736) | |||
Net increase (decrease) in net assets resulting from capital share transactions | (8,467,417) | 22,745,565 | ||
Total increase (decrease) in net assets | (14,337,077) | 17,554,114 | ||
| Net assets | ||||
Beginning of period | 92,766,325 | 75,212,211 | ||
End of period | $ 78,429,248 | $ 92,766,325 | ||
| Year ended May 31 | ||||||
| Class A | Six months ended November 30, 2022 (unaudited) | 2022 | 2021 | 2020 | 2019 | 2018 |
Net asset value, beginning of period | $10.35 | $10.93 | $10.22 | $9.89 | $9.87 | $9.96 |
Net investment income | 0.25 1 | 0.56 1 | 0.22 | 0.12 | 0.15 | 0.21 |
Net realized and unrealized gains (losses) on investments | (0.63) | (0.60) | 0.70 | 0.42 | 0.09 | (0.09) |
Total from investment operations | (0.38) | (0.04) | 0.92 | 0.54 | 0.24 | 0.12 |
| Distributions to shareholders from | ||||||
Net investment income | (0.29) | (0.54) | (0.21) | (0.21) | (0.19) | (0.21) |
Net realized gains | 0.00 | 0.00 | 0.00 | 0.00 | (0.03) | 0.00 |
Total distributions to shareholders | (0.29) | (0.54) | (0.21) | (0.21) | (0.22) | (0.21) |
Net asset value, end of period | $9.68 | $10.35 | $10.93 | $10.22 | $9.89 | $9.87 |
Total return2 | (3.68)% | (0.52)% | 9.10% | 5.48% | 2.56% | 1.25% |
| Ratios to average net assets (annualized)* | ||||||
Gross expenses | 1.09% | 1.07% | 1.29% | 1.43% | 1.16% | 1.04% |
Net expenses | 0.78% | 0.78% | 0.78% | 0.78% | 0.77% | 0.80% |
Net investment income | 5.01% | 5.13% | 2.09% | 1.79% | 1.95% | 2.15% |
| Supplemental data | ||||||
Portfolio turnover rate3 | 15% | 31% | 20% | 24% | 39% | 29% |
Net assets, end of period (000s omitted) | $15,501 | $17,713 | $13,825 | $13,196 | $17,716 | $26,133 |
| * | Ratios include net expenses allocated from the affiliated Master Portfolio which were as follows: |
| Six months ended November 30, 2022 (unaudited) | 0.39% |
| Year ended May 31, 2022 | 0.39% |
| Year ended May 31, 2021 | 0.39% |
| Year ended May 31, 2020 | 0.39% |
| Year ended May 31, 2019 | 0.39% |
| Year ended May 31, 2018 | 0.41% |
| 1 | Calculated based upon average shares outstanding |
| 2 | Total return calculations do not include any sales charges. Returns for periods of less than one year are not annualized. |
| 3 | Portfolio turnover rate is calculated by multiplying the affiliated Master Portfolio’s percentage of the Fund’s total investment in securities at the end of the period by the affiliated Master Portfolio’s portfolio turnover rate. |
| Year ended May 31 | ||||||
| Class C | Six months ended November 30, 2022 (unaudited) | 2022 | 2021 | 2020 | 2019 | 2018 |
Net asset value, beginning of period | $10.16 | $10.74 | $10.06 | $9.73 | $9.73 | $9.82 |
Net investment income | 0.20 | 0.47 1 | 0.12 1 | 0.11 1 | 0.10 1 | 0.03 |
Net realized and unrealized gains (losses) on investments | (0.61) | (0.59) | 0.71 | 0.35 | 0.07 | 0.02 |
Total from investment operations | (0.41) | (0.12) | 0.83 | 0.46 | 0.17 | 0.05 |
| Distributions to shareholders from | ||||||
Net investment income | (0.25) | (0.46) | (0.15) | (0.13) | (0.14) | (0.14) |
Net realized gains | 0.00 | 0.00 | 0.00 | 0.00 | (0.03) | 0.00 |
Total distributions to shareholders | (0.25) | (0.46) | (0.15) | (0.13) | (0.17) | (0.14) |
Net asset value, end of period | $9.50 | $10.16 | $10.74 | $10.06 | $9.73 | $9.73 |
Total return2 | (4.02)% | (1.26)% | 8.27% | 4.77% | 1.79% | 0.53% |
| Ratios to average net assets (annualized)* | ||||||
Gross expenses | 1.84% | 1.81% | 2.06% | 2.18% | 1.91% | 1.79% |
Net expenses | 1.53% | 1.53% | 1.53% | 1.53% | 1.52% | 1.56% |
Net investment income | 4.23% | 4.42% | 1.17% | 1.09% | 1.08% | 1.39% |
| Supplemental data | ||||||
Portfolio turnover rate3 | 15% | 31% | 20% | 24% | 39% | 29% |
Net assets, end of period (000s omitted) | $1,584 | $1,709 | $1,195 | $1,714 | $2,553 | $3,517 |
| * | Ratios include net expenses allocated from the affiliated Master Portfolio which were as follows: |
| Six months ended November 30, 2022 (unaudited) | 0.39% |
| Year ended May 31, 2022 | 0.39% |
| Year ended May 31, 2021 | 0.39% |
| Year ended May 31, 2020 | 0.39% |
| Year ended May 31, 2019 | 0.39% |
| Year ended May 31, 2018 | 0.41% |
| 1 | Calculated based upon average shares outstanding |
| 2 | Total return calculations do not include any sales charges. Returns for periods of less than one year are not annualized. |
| 3 | Portfolio turnover rate is calculated by multiplying the affiliated Master Portfolio’s percentage of the Fund’s total investment in securities at the end of the period by the affiliated Master Portfolio’s portfolio turnover rate. |
| Year ended May 31 | ||||||
| Class R6 | Six months ended November 30, 2022 (unaudited) | 2022 | 2021 | 2020 | 2019 | 2018 |
Net asset value, beginning of period | $10.47 | $11.05 | $10.33 | $9.99 | $9.96 | $10.05 |
Net investment income | 0.29 1 | 0.63 1 | 0.29 | 0.22 | 0.23 1 | 0.22 |
Net realized and unrealized gains (losses) on investments | (0.65) | (0.63) | 0.69 | 0.37 | 0.06 | (0.06) |
Total from investment operations | (0.36) | 0.00 | 0.98 | 0.59 | 0.29 | 0.16 |
| Distributions to shareholders from | ||||||
Net investment income | (0.31) | (0.58) | (0.26) | (0.25) | (0.23) | (0.25) |
Net realized gains | 0.00 | 0.00 | 0.00 | 0.00 | (0.03) | 0.00 |
Total distributions to shareholders | (0.31) | (0.58) | (0.26) | (0.25) | (0.26) | (0.25) |
Net asset value, end of period | $9.80 | $10.47 | $11.05 | $10.33 | $9.99 | $9.96 |
Total return2 | (3.46)% | (0.15)% | 9.52% | 5.94% | 2.99% | 1.63% |
| Ratios to average net assets (annualized)* | ||||||
Gross expenses | 0.71% | 0.68% | 0.85% | 1.05% | 0.82% | 0.66% |
Net expenses | 0.40% | 0.40% | 0.40% | 0.40% | 0.39% | 0.42% |
Net investment income | 5.73% | 5.68% | 2.70% | 2.08% | 2.34% | 2.52% |
| Supplemental data | ||||||
Portfolio turnover rate3 | 15% | 31% | 20% | 24% | 39% | 29% |
Net assets, end of period (000s omitted) | $11,244 | $14,282 | $36,202 | $18,224 | $14,358 | $11,750 |
| * | Ratios include net expenses allocated from the affiliated Master Portfolio which were as follows: |
| Six months ended November 30, 2022 (unaudited) | 0.39% |
| Year ended May 31, 2022 | 0.39% |
| Year ended May 31, 2021 | 0.39% |
| Year ended May 31, 2020 | 0.39% |
| Year ended May 31, 2019 | 0.39% |
| Year ended May 31, 2018 | 0.41% |
| 1 | Calculated based upon average shares outstanding |
| 2 | Returns for periods of less than one year are not annualized. |
| 3 | Portfolio turnover rate is calculated by multiplying the affiliated Master Portfolio’s percentage of the Fund’s total investment in securities at the end of the period by the affiliated Master Portfolio’s portfolio turnover rate. |
| Year ended May 31 | ||||||
| Administrator Class | Six months ended November 30, 2022 (unaudited) | 2022 | 2021 | 2020 | 2019 | 2018 |
Net asset value, beginning of period | $10.55 | $11.12 | $10.38 | $10.03 | $9.99 | $10.06 |
Net investment income | 0.26 1 | 0.60 1 | 0.25 1 | 0.20 1 | 0.21 1 | 0.24 1 |
Net realized and unrealized gains (losses) on investments | (0.64) | (0.63) | 0.71 | 0.36 | 0.06 | (0.09) |
Total from investment operations | (0.38) | (0.03) | 0.96 | 0.56 | 0.27 | 0.15 |
| Distributions to shareholders from | ||||||
Net investment income | (0.29) | (0.54) | (0.22) | (0.21) | (0.20) | (0.22) |
Net realized gains | 0.00 | 0.00 | 0.00 | 0.00 | (0.03) | 0.00 |
Total distributions to shareholders | (0.29) | (0.54) | (0.22) | (0.21) | (0.23) | (0.22) |
Net asset value, end of period | $9.88 | $10.55 | $11.12 | $10.38 | $10.03 | $9.99 |
Total return2 | (3.58)% | (0.36)% | 9.31% | 5.67% | 2.78% | 1.50% |
| Ratios to average net assets (annualized)* | ||||||
Gross expenses | 1.02% | 0.99% | 1.23% | 1.37% | 1.10% | 0.97% |
Net expenses | 0.60% | 0.60% | 0.60% | 0.60% | 0.59% | 0.60% |
Net investment income | 5.12% | 5.42% | 2.26% | 1.92% | 2.15% | 2.39% |
| Supplemental data | ||||||
Portfolio turnover rate3 | 15% | 31% | 20% | 24% | 39% | 29% |
Net assets, end of period (000s omitted) | $14,459 | $15,267 | $13,203 | $13,544 | $13,562 | $23,331 |
| * | Ratios include net expenses allocated from the affiliated Master Portfolio which were as follows: |
| Six months ended November 30, 2022 (unaudited) | 0.39% |
| Year ended May 31, 2022 | 0.39% |
| Year ended May 31, 2021 | 0.39% |
| Year ended May 31, 2020 | 0.39% |
| Year ended May 31, 2019 | 0.39% |
| Year ended May 31, 2018 | 0.41% |
| 1 | Calculated based upon average shares outstanding |
| 2 | Returns for periods of less than one year are not annualized. |
| 3 | Portfolio turnover rate is calculated by multiplying the affiliated Master Portfolio’s percentage of the Fund’s total investment in securities at the end of the period by the affiliated Master Portfolio’s portfolio turnover rate. |
| Year ended May 31 | ||||||
| Institutional Class | Six months ended November 30, 2022 (unaudited) | 2022 | 2021 | 2020 | 2019 | 2018 |
Net asset value, beginning of period | $10.47 | $11.05 | $10.33 | $9.99 | $9.97 | $10.06 |
Net investment income | 0.27 | 0.63 1 | 0.26 | 0.21 | 0.22 | 0.24 |
Net realized and unrealized gains (losses) on investments | (0.63) | (0.64) | 0.71 | 0.37 | 0.05 | (0.08) |
Total from investment operations | (0.36) | (0.01) | 0.97 | 0.58 | 0.27 | 0.16 |
| Distributions to shareholders from | ||||||
Net investment income | (0.31) | (0.57) | (0.25) | (0.24) | (0.22) | (0.25) |
Net realized gains | 0.00 | 0.00 | 0.00 | 0.00 | (0.03) | 0.00 |
Total distributions to shareholders | (0.31) | (0.57) | (0.25) | (0.24) | (0.25) | (0.25) |
Net asset value, end of period | $9.80 | $10.47 | $11.05 | $10.33 | $9.99 | $9.97 |
Total return2 | (3.48)% | (0.19)% | 9.46% | 5.88% | 2.84% | 1.57% |
| Ratios to average net assets (annualized)* | ||||||
Gross expenses | 0.76% | 0.74% | 0.95% | 1.10% | 0.84% | 0.71% |
Net expenses | 0.45% | 0.45% | 0.45% | 0.45% | 0.44% | 0.47% |
Net investment income | 5.33% | 5.76% | 2.37% | 2.09% | 2.20% | 2.62% |
| Supplemental data | ||||||
Portfolio turnover rate3 | 15% | 31% | 20% | 24% | 39% | 29% |
Net assets, end of period (000s omitted) | $35,640 | $43,796 | $10,787 | $10,587 | $11,094 | $12,110 |
| * | Ratios include net expenses allocated from the affiliated Master Portfolio which were as follows: |
| Six months ended November 30, 2022 (unaudited) | 0.39% |
| Year ended May 31, 2022 | 0.39% |
| Year ended May 31, 2021 | 0.39% |
| Year ended May 31, 2020 | 0.39% |
| Year ended May 31, 2019 | 0.39% |
| Year ended May 31, 2018 | 0.41% |
| 1 | Calculated based upon average shares outstanding |
| 2 | Returns for periods of less than one year are not annualized. |
| 3 | Portfolio turnover rate is calculated by multiplying the affiliated Master Portfolio’s percentage of the Fund’s total investment in securities at the end of the period by the affiliated Master Portfolio’s portfolio turnover rate. |
| Gross unrealized gains | $ 0 |
| Gross unrealized losses | (4,157,483) |
| Net unrealized losses | $(4,157,483) |
| Affiliated Master Portfolio | Investment objective | Fair value of affiliated Master Portfolio |
| Allspring Real Return Portfolio | Seeks returns that exceed the rate inflation over the long-term | $78,762,415 |
| Average daily net assets | Management fee |
| First $5 billion | 0.050% |
| Next $5 billion | 0.040 |
| Over $10 billion | 0.030 |
| Class-level administration fee | |
| Class A | 0.16% |
| Class C | 0.16 |
| Class R6 | 0.03 |
| Administrator Class | 0.10 |
| Institutional Class | 0.08 |
| Expense ratio caps | |
| Class A | 0.78% |
| Class C | 1.53 |
| Class R6 | 0.40 |
| Administrator Class | 0.60 |
| Institutional Class | 0.45 |
| Purchases at cost | Sales proceeds | |||
| U.S. government | Non-U.S. government | U.S. government | Non-U.S. government | |
| $7,180,216 | $4,795,768 | $5,508,631 | $6,145,520 | |
| Shares | Value | |||||
| Common stocks: 13.63% | ||||||
| Consumer staples: 3.56% | ||||||
| Beverages: 0.60% | ||||||
| PepsiCo Incorporated | 7,102 | $ 1,317,492 | ||||
| Food & staples retailing: 1.20% | ||||||
| Costco Wholesale Corporation | 1,900 | 1,024,575 | ||||
| Sysco Corporation | 5,485 | 474,507 | ||||
| Walmart Incorporated | 7,370 | 1,123,335 | ||||
| 2,622,417 | ||||||
| Food products: 0.44% | ||||||
| Mondelez International Incorporated Class A | 9,456 | 639,320 | ||||
| Nomad Foods Limited † | 18,625 | 325,751 | ||||
| 965,071 | ||||||
| Household products: 1.14% | ||||||
| Church & Dwight Company Incorporated | 7,031 | 575,628 | ||||
| The Clorox Company | 1,494 | 222,083 | ||||
| The Procter & Gamble Company | 11,229 | 1,674,918 | ||||
| 2,472,629 | ||||||
| Personal products: 0.09% | ||||||
| The Estee Lauder Companies Incorporated Class A | 832 | 196,177 | ||||
| Tobacco: 0.09% | ||||||
| Philip Morris International Incorporated | 1,851 | 184,489 | ||||
| Energy: 1.65% | ||||||
| Oil, gas & consumable fuels: 1.65% | ||||||
| Chevron Corporation | 11,015 | 2,019,160 | ||||
| EOG Resources Incorporated | 2,942 | 417,558 | ||||
| Phillips 66 | 10,575 | 1,146,753 | ||||
| 3,583,471 | ||||||
| Materials: 3.05% | ||||||
| Chemicals: 1.25% | ||||||
| Ashland Global Holdings Incorporated | 3,310 | 370,290 | ||||
| Ecolab Incorporated | 2,032 | 304,455 | ||||
| Linde plc | 3,417 | 1,149,752 | ||||
| Olin Corporation | 3,371 | 192,080 | ||||
| The Sherwin-Williams Company | 1,085 | 270,360 | ||||
| Westlake Chemical Corporation | 4,005 | 431,138 | ||||
| 2,718,075 | ||||||
| Construction materials: 0.15% | ||||||
| Martin Marietta Materials Incorporated | 897 | 328,733 | ||||
| Containers & packaging: 0.12% | ||||||
| Crown Holdings Incorporated | 3,249 | 267,100 | ||||
| Metals & mining: 1.53% | ||||||
| Agnico-Eagle Mines Limited | 2,489 | 125,361 | ||||
| Agnico-Eagle Mines Limited-U.S. Exchange Traded Shares « | 2,700 | 135,999 | ||||
| Alamos Gold Incorporated Class A | 11,000 | 106,635 | ||||
| Shares | Value | |||||
| Metals & mining (continued) | ||||||
| AngloGold Ashanti Limited ADR | 2,900 | $ 53,157 | ||||
| Artemis Gold Incorporated † | 4,000 | 13,827 | ||||
| B2Gold Corporation | 30,500 | 106,341 | ||||
| Barrick Gold Corporation | 10,356 | 169,010 | ||||
| Dundee Precious Metals Incorporated | ��� 8,800 | 41,542 | ||||
| Endeavour Mining plc | 7,480 | 158,759 | ||||
| Evolution Mining Limited | 10,000 | 18,638 | ||||
| Franco-Nevada Corporation | 1,400 | 204,502 | ||||
| Gold Fields Limited ADR « | 11,000 | 122,650 | ||||
| Kinross Gold Corporation | 25,500 | 105,401 | ||||
| Lundin Gold Incorporated | 12,000 | 118,381 | ||||
| MAG Silver Corporation † | 5,800 | 91,151 | ||||
| Newcrest Mining Limited | 9,000 | 122,555 | ||||
| Newmont Corporation | 3,790 | 179,911 | ||||
| Northern Star Resources Limited | 15,000 | 109,826 | ||||
| Pan American Silver Corporation « | 2,500 | 40,975 | ||||
| Royal Gold Incorporated | 2,895 | 325,195 | ||||
| SilverCrest Metals Incorporated † | 13,000 | 86,303 | ||||
| SSR Mining Incorporated | 5,750 | 87,170 | ||||
| SSR Mining Incorporated-U.S. Exchange Traded Shares | 1,272 | 19,272 | ||||
| Steel Dynamics Incorporated | 5,038 | 523,599 | ||||
| Torex Gold Resources Incorporated † | 6,400 | 59,235 | ||||
| Triple Flag Precious Metals Corporation « | 2,000 | 25,425 | ||||
| Wheaton Precious Metals Corporation | 4,400 | 171,728 | ||||
| Yamana Gold Incorporated | 3,000 | 16,348 | ||||
| 3,338,896 | ||||||
| Real estate: 5.37% | ||||||
| Equity REITs: 5.37% | ||||||
| Alexandria Real Estate Equities Incorporated | 2,887 | 449,246 | ||||
| American Homes 4 Rent Class A | 13,098 | 433,151 | ||||
| American Tower Corporation | 5,657 | 1,251,611 | ||||
| Apartment Income REIT Corporation | 9,104 | 346,407 | ||||
| Camden Property Trust | 3,230 | 388,666 | ||||
| Equinix Incorporated | 1,908 | 1,317,760 | ||||
| Federal Realty Investment Trust | 2,735 | 303,859 | ||||
| Four Corners Property Trust Incorporated | 18,070 | 490,420 | ||||
| Gaming and Leisure Properties Incorporated | 7,228 | 380,265 | ||||
| Invitation Homes Incorporated | 14,353 | 468,338 | ||||
| Life Storage Incorporated | 5,329 | 572,814 | ||||
| Mid-America Apartment Communities Incorporated | 2,502 | 412,530 | ||||
| Prologis Incorporated | 10,721 | 1,262,827 | ||||
| SBA Communications Corporation | 2,923 | 874,854 | ||||
| Simon Property Group Incorporated | 2,459 | 293,703 | ||||
| Sun Communities Incorporated | 5,523 | 811,329 | ||||
| Terreno Realty Corporation | 8,141 | 477,388 | ||||
| VICI Properties Incorporated | 17,664 | 604,109 | ||||
| Welltower Incorporated | 7,982 | 566,961 | ||||
| 11,706,238 | ||||||
| Total Common stocks (Cost $19,736,561) | 29,700,788 | |||||
| Interest rate | Maturity date | Principal | Value | |||
| Corporate bonds and notes: 13.57% | ||||||
| Communication services: 0.81% | ||||||
| Entertainment: 0.24% | ||||||
| Live Nation Entertainment Incorporated 144A | 4.88% | 11-1-2024 | $ | 190,000 | $ 187,030 | |
| Live Nation Entertainment Incorporated 144A | 6.50 | 5-15-2027 | 335,000 | 335,634 | ||
| 522,664 | ||||||
| Media: 0.57% | ||||||
| Cinemark USA Incorporated 144A | 8.75 | 5-1-2025 | 420,000 | 428,411 | ||
| DISH DBS Corporation | 5.00 | 3-15-2023 | 200,000 | 198,475 | ||
| Gray Television Incorporated 144A | 5.88 | 7-15-2026 | 460,000 | 423,718 | ||
| Townsquare Media Incorporated 144A | 6.88 | 2-1-2026 | 215,000 | 199,457 | ||
| 1,250,061 | ||||||
| Consumer discretionary: 2.16% | ||||||
| Auto components: 0.22% | ||||||
| Clarios Global LP 144A | 6.25 | 5-15-2026 | 201,000 | 199,117 | ||
| Clarios Global LP 144A | 6.75 | 5-15-2025 | 282,000 | 281,820 | ||
| 480,937 | ||||||
| Hotels, restaurants & leisure: 1.22% | ||||||
| Carnival Corporation 144A | 10.50 | 2-1-2026 | 285,000 | 288,449 | ||
| CCM Merger Incorporated 144A | 6.38 | 5-1-2026 | 145,000 | 134,231 | ||
| Cedar Fair LP 144A | 5.50 | 5-1-2025 | 375,000 | 373,808 | ||
| Hilton Domestic Operating Company Incorporated 144A | 5.38 | 5-1-2025 | 280,000 | 278,211 | ||
| Las Vegas Sands Corporation | 3.20 | 8-8-2024 | 550,000 | 525,560 | ||
| MGM Resorts International | 6.75 | 5-1-2025 | 195,000 | 194,070 | ||
| Royal Caribbean Cruises Limited 144A | 11.50 | 6-1-2025 | 221,000 | 237,023 | ||
| SeaWorld Parks & Entertainment Incorporated 144A | 8.75 | 5-1-2025 | 250,000 | 255,618 | ||
| Six Flags Entertainment Company 144A« | 7.00 | 7-1-2025 | 380,000 | 380,941 | ||
| 2,667,911 | ||||||
| Household durables: 0.09% | ||||||
| Newell Brands Incorporated | 4.45 | 4-1-2026 | 195,000 | 183,955 | ||
| Internet & direct marketing retail: 0.19% | ||||||
| QVC Incorporated | 4.85 | 4-1-2024 | 430,000 | 409,405 | ||
| Specialty retail: 0.20% | ||||||
| Bath & Body Works Incorporated 144A | 9.38 | 7-1-2025 | 294,000 | 308,257 | ||
| Penske Automotive Group Incorporated | 3.50 | 9-1-2025 | 140,000 | 131,088 | ||
| 439,345 | ||||||
| Textiles, apparel & luxury goods: 0.24% | ||||||
| G-III Apparel Group Limited 144A | 7.88 | 8-15-2025 | 435,000 | 421,406 | ||
| Michael Kors USA Incorporated 144A | 4.25 | 11-1-2024 | 110,000 | 103,538 | ||
| 524,944 | ||||||
| Interest rate | Maturity date | Principal | Value | |||
| Consumer staples: 0.34% | ||||||
| Food products: 0.34% | ||||||
| Performance Food Group Incorporated 144A | 6.88% | 5-1-2025 | $ | 355,000 | $ 355,000 | |
| US Foods Incorporated 144A | 6.25 | 4-15-2025 | 370,000 | 373,456 | ||
| 728,456 | ||||||
| Energy: 2.55% | ||||||
| Energy equipment & services: 0.34% | ||||||
| Oceaneering International Incorporated | 4.65 | 11-15-2024 | 650,000 | 629,922 | ||
| USA Compression Partners LP | 6.88 | 4-1-2026 | 115,000 | 110,113 | ||
| 740,035 | ||||||
| Oil, gas & consumable fuels: 2.21% | ||||||
| Antero Midstream Company 144A | 7.88 | 5-15-2026 | 105,000 | 107,123 | ||
| Antero Resources Corporation 144A | 8.38 | 7-15-2026 | 390,000 | 410,264 | ||
| Buckeye Partners LP 144A | 4.13 | 3-1-2025 | 35,000 | 33,608 | ||
| Crestwood Midstream Partners LP | 5.75 | 4-1-2025 | 605,000 | 589,800 | ||
| DCP Midstream Operating LP | 5.38 | 7-15-2025 | 455,000 | 449,348 | ||
| EnLink Midstream Partners LP | 4.15 | 6-1-2025 | 232,000 | 221,363 | ||
| Enviva Partners LP 144A | 6.50 | 1-15-2026 | 680,000 | 648,313 | ||
| EQM Midsteram Partners LP | 4.00 | 8-1-2024 | 65,000 | 62,075 | ||
| EQT Corporation | 6.13 | 2-1-2025 | 405,000 | 406,170 | ||
| Murphy Oil Corporation | 5.75 | 8-15-2025 | 200,000 | 199,111 | ||
| Range Resources Corporation | 4.88 | 5-15-2025 | 225,000 | 218,034 | ||
| Range Resources Corporation | 8.25 | 1-15-2029 | 90,000 | 93,894 | ||
| Rockies Express Pipeline LLC 144A | 3.60 | 5-15-2025 | 529,000 | 494,615 | ||
| Southwestern Energy Company | 5.70 | 1-23-2025 | 32,000 | 31,680 | ||
| Southwestern Energy Company | 7.75 | 10-1-2027 | 110,000 | 113,168 | ||
| Tallgrass Energy Partners LP 144A | 7.50 | 10-1-2025 | 360,000 | 364,500 | ||
| Western Gas Partners LP | 4.65 | 7-1-2026 | 385,000 | 374,426 | ||
| 4,817,492 | ||||||
| Financials: 2.63% | ||||||
| Consumer finance: 1.02% | ||||||
| Ford Motor Credit Company LLC | 5.58 | 3-18-2024 | 400,000 | 395,500 | ||
| LFS TopCo LLC 144A | 5.88 | 10-15-2026 | 215,000 | 172,004 | ||
| Navient Corporation | 5.88 | 10-25-2024 | 590,000 | 573,237 | ||
| Navient Corporation | 7.25 | 9-25-2023 | 87,000 | 87,008 | ||
| OneMain Finance Corporation | 3.50 | 1-15-2027 | 120,000 | 98,357 | ||
| OneMain Finance Corporation | 6.13 | 3-15-2024 | 475,000 | 463,268 | ||
| PRA Group Incorporated 144A | 7.38 | 9-1-2025 | 290,000 | 281,557 | ||
| Rocket Mortgage LLC 144A | 2.88 | 10-15-2026 | 165,000 | 140,705 | ||
| 2,211,636 | ||||||
| Diversified financial services: 0.49% | ||||||
| Hat Holdings LLC 144A | 3.38 | 6-15-2026 | 245,000 | 213,103 | ||
| Hat Holdings LLC 144A | 6.00 | 4-15-2025 | 270,000 | 260,850 | ||
| United Wholesale Mortgage LLC 144A | 5.50 | 11-15-2025 | 650,000 | 602,316 | ||
| 1,076,269 | ||||||
| Insurance: 0.25% | ||||||
| Tri Pointe Homes Incorporated | 5.88 | 6-15-2024 | 535,000 | 534,119 | ||
| Interest rate | Maturity date | Principal | Value | |||
| Mortgage REITs: 0.33% | ||||||
| Starwood Property Trust Incorporated 144A | 3.75% | 12-31-2024 | $ | 110,000 | $ 103,950 | |
| Starwood Property Trust Incorporated | 4.75 | 3-15-2025 | 495,000 | 473,770 | ||
| Starwood Property Trust Incorporated 144A | 5.50 | 11-1-2023 | 150,000 | 149,486 | ||
| 727,206 | ||||||
| Thrifts & mortgage finance: 0.54% | ||||||
| Enact Holdings Incorporated 144A | 6.50 | 8-15-2025 | 750,000 | 729,173 | ||
| Ladder Capital Finance Holdings LP 144A | 5.25 | 10-1-2025 | 475,000 | 451,374 | ||
| 1,180,547 | ||||||
| Health care: 0.38% | ||||||
| Health care providers & services: 0.27% | ||||||
| Tenet Healthcare Corporation | 4.63 | 7-15-2024 | 235,000 | 229,946 | ||
| Tenet Healthcare Corporation 144A | 4.88 | 1-1-2026 | 375,000 | 355,868 | ||
| 585,814 | ||||||
| Health care technology: 0.11% | ||||||
| IQVIA Incorporated 144A | 5.00 | 10-15-2026 | 250,000 | 240,625 | ||
| Industrials: 2.23% | ||||||
| Aerospace & defense: 0.31% | ||||||
| TransDigm Group Incorporated 144A | 6.25 | 3-15-2026 | 305,000 | 303,518 | ||
| TransDigm Group Incorporated 144A | 8.00 | 12-15-2025 | 364,000 | 370,370 | ||
| 673,888 | ||||||
| Airlines: 0.63% | ||||||
| American Airlines Group Incorporated 144A | 5.50 | 4-20-2026 | 170,000 | 164,869 | ||
| Hawaiian Airlines Incorporated | 3.90 | 7-15-2027 | 181,052 | 151,819 | ||
| Hawaiian Brand Intellectual Property Limited 144A | 5.75 | 1-20-2026 | 340,000 | 322,232 | ||
| Mileage Plus Holdings LLC 144A | 6.50 | 6-20-2027 | 180,500 | 179,596 | ||
| Spirit Loyalty Cayman Limited 144A | 8.00 | 9-20-2025 | 545,000 | 551,104 | ||
| 1,369,620 | ||||||
| Commercial services & supplies: 0.62% | ||||||
| Allied Universal Holdco LLC 144A | 6.63 | 7-15-2026 | 205,000 | 194,750 | ||
| Aramark Services Incorporated 144A | 6.38 | 5-1-2025 | 590,000 | 588,832 | ||
| CoreCivic Incorporated | 8.25 | 4-15-2026 | 335,000 | 342,219 | ||
| Stericycle Incorporated 144A | 5.38 | 7-15-2024 | 215,000 | 212,506 | ||
| 1,338,307 | ||||||
| Diversified consumer services: 0.11% | ||||||
| Prime Security Services Borrower LLC 144A | 5.75 | 4-15-2026 | 245,000 | 242,550 | ||
| Machinery: 0.10% | ||||||
| Stevens Holding Company Incorporated 144A | 6.13 | 10-1-2026 | 215,000 | 216,808 | ||
| Road & rail: 0.24% | ||||||
| Uber Technologies Incorporated 144A | 7.50 | 5-15-2025 | 525,000 | 528,181 | ||
| Trading companies & distributors: 0.22% | ||||||
| Fortress Transportation & Infrastructure Investors LLC 144A | 6.50 | 10-1-2025 | 505,000 | 485,027 | ||
| Interest rate | Maturity date | Principal | Value | |||
| Information technology: 0.74% | ||||||
| Electronic equipment, instruments & components: 0.27% | ||||||
| Wesco Distribution Incorporated 144A | 7.13% | 6-15-2025 | $ | 575,000 | $ 582,188 | |
| IT services: 0.30% | ||||||
| Block Incorporated | 2.75 | 6-1-2026 | 85,000 | 75,965 | ||
| Sabre GLBL Incorporated 144A | 7.38 | 9-1-2025 | 55,000 | 52,388 | ||
| Sabre GLBL Incorporated 144A | 9.25 | 4-15-2025 | 530,000 | 528,675 | ||
| 657,028 | ||||||
| Software: 0.17% | ||||||
| NCR Corporation 144A | 5.75 | 9-1-2027 | 98,000 | 95,305 | ||
| NortonLifeLock Incorporated 144A | 5.00 | 4-15-2025 | 285,000 | 276,450 | ||
| 371,755 | ||||||
| Materials: 0.69% | ||||||
| Chemicals: 0.30% | ||||||
| Avient Corporation 144A | 5.75 | 5-15-2025 | 50,000 | 48,749 | ||
| Celanese US Holding LLC | 6.05 | 3-15-2025 | 615,000 | 611,911 | ||
| 660,660 | ||||||
| Containers & packaging: 0.16% | ||||||
| Sealed Air Corporation 144A | 5.13 | 12-1-2024 | 50,000 | 49,925 | ||
| Sealed Air Corporation 144A | 5.50 | 9-15-2025 | 300,000 | 297,588 | ||
| 347,513 | ||||||
| Metals & mining: 0.09% | ||||||
| Cleveland-Cliffs Incorporated 144A | 6.75 | 3-15-2026 | 195,000 | 195,488 | ||
| Paper & forest products: 0.14% | ||||||
| Clearwater Paper Corporation 144A | 5.38 | 2-1-2025 | 315,000 | 305,804 | ||
| Real estate: 0.09% | ||||||
| Equity REITs: 0.09% | ||||||
| Service Properties Trust Company | 7.50 | 9-15-2025 | 210,000 | 203,175 | ||
| Utilities: 0.95% | ||||||
| Electric utilities: 0.34% | ||||||
| NextEra Energy Operating Partners LP 144A | 4.25 | 7-15-2024 | 755,000 | 729,551 | ||
| Independent power & renewable electricity producers: 0.61% | ||||||
| NSG Holdings LLC 144A | 7.75 | 12-15-2025 | 554,386 | 539,351 | ||
| Vistra Operations Company LLC 144A | 5.63 | 2-15-2027 | 825,000 | 798,149 | ||
| 1,337,500 | ||||||
| Total Corporate bonds and notes (Cost $30,927,630) | 29,566,464 | |||||
| Loans: 1.36% | ||||||
| Communication services: 0.10% | ||||||
| Entertainment: 0.06% | ||||||
| Live Nation Entertainment Incorporated (1 Month LIBOR +1.75%) ± | 5.75 | 10-17-2026 | 122,125 | 119,469 | ||
| Interest rate | Maturity date | Principal | Value | |||
| Media: 0.04% | ||||||
| Gray Television Incorporated (1 Month LIBOR +2.50%) ± | 6.27% | 2-7-2024 | $ | 69,582 | $ 69,408 | |
| Hubbard Radio LLC (3 Month LIBOR +4.25%) ± | 8.32 | 3-28-2025 | 26,302 | 23,047 | ||
| 92,455 | ||||||
| Consumer discretionary: 0.33% | ||||||
| Auto components: 0.05% | ||||||
| Clarios Global LP (1 Month LIBOR +3.25%) ± | 7.32 | 4-30-2026 | 118,779 | 116,726 | ||
| Hotels, restaurants & leisure: 0.11% | ||||||
| Carnival Corporation (1 Month LIBOR +3.00%) ± | 5.88 | 6-30-2025 | 78,422 | 75,309 | ||
| Wyndham Hotels & Resorts Incorporated (3 Month LIBOR +1.75%) ± | 5.82 | 5-30-2025 | 157,300 | 156,485 | ||
| 231,794 | ||||||
| Leisure products: 0.17% | ||||||
| SeaWorld Parks & Entertainment Incorporated (1 Month LIBOR +3.00%) ± | 7.13 | 8-25-2028 | 370,283 | 362,648 | ||
| Energy: 0.08% | ||||||
| Oil, gas & consumable fuels: 0.08% | ||||||
| GIP II Blue Holdings LP (1 Month LIBOR +4.50%) ± | 8.17 | 9-29-2028 | 173,605 | 172,013 | ||
| Financials: 0.24% | ||||||
| Diversified financial services: 0.19% | ||||||
| Resolute Investment Managers Incorporated (1 Month LIBOR +4.25%) ౠ| 7.92 | 4-30-2024 | 93,341 | 77,706 | ||
| Russell Investments US Institutional Holdco Incorporated (1 Month LIBOR +3.50%) ± | 7.57 | 5-30-2025 | 361,938 | 339,316 | ||
| 417,022 | ||||||
| Mortgage REITs: 0.05% | ||||||
| Claros Mortgage Trust Incorporated (U.S. SOFR 1 Month +4.50%) ౠ| 8.40 | 8-9-2026 | 119,100 | 117,165 | ||
| Industrials: 0.41% | ||||||
| Airlines: 0.36% | ||||||
| American Airlines Incorporated (3 Month LIBOR +2.00%) ± | 5.80 | 12-15-2023 | 150,000 | 149,147 | ||
| Mileage Plus Holdings LLC (1 Month LIBOR +5.25%) ± | 8.78 | 6-21-2027 | 403,750 | 414,853 | ||
| SkyMiles IP Limited (3 Month LIBOR +3.75%) ± | 7.99 | 10-20-2027 | 215,000 | 217,849 | ||
| 781,849 | ||||||
| Machinery: 0.00% | ||||||
| Vertical US Newco Incorporated (6 Month LIBOR +3.50%) ± | 6.87 | 7-30-2027 | 855 | 819 | ||
| Road & rail: 0.05% | ||||||
| Uber Technologies Incorporated (1 Month LIBOR +3.50%) ± | 8.23 | 4-4-2025 | 117,846 | 117,552 | ||
| Interest rate | Maturity date | Principal | Value | |||
| Information technology: 0.06% | ||||||
| Software: 0.06% | ||||||
| SS&C Technologies Incorporated Term Loan B3 (1 Month LIBOR +1.75%) ± | 5.82% | 4-16-2025 | $ | 67,248 | $ 65,959 | |
| SS&C Technologies Incorporated Term Loan B4 (1 Month LIBOR +1.75%) ± | 5.82 | 4-16-2025 | 56,185 | 55,108 | ||
| 121,067 | ||||||
| Utilities: 0.14% | ||||||
| Electric utilities: 0.14% | ||||||
| ExGen Renewables IV LLC (1 Month LIBOR +2.50%) ± | 7.24 | 12-15-2027 | 306,706 | 303,575 | ||
| Total Loans (Cost $3,029,658) | 2,954,154 | |||||
| U.S. Treasury securities: 68.17% | ||||||
| TIPS | 0.13 | 7-15-2024 | 2,849,795 | 2,765,915 | ||
| TIPS | 0.13 | 10-15-2024 | 4,280,049 | 4,139,025 | ||
| TIPS | 0.13 | 4-15-2025 | 4,297,260 | 4,119,327 | ||
| TIPS | 0.13 | 10-15-2025 | 2,264,764 | 2,170,988 | ||
| TIPS | 0.13 | 4-15-2026 | 6,280,880 | 5,954,814 | ||
| TIPS | 0.13 | 7-15-2026 | 4,203,519 | 3,997,736 | ||
| TIPS | 0.13 | 10-15-2026 | 3,258,330 | 3,092,391 | ||
| TIPS | 0.13 | 4-15-2027 | 5,256,289 | 4,952,871 | ||
| TIPS | 0.13 | 1-15-2030 | 4,844,868 | 4,422,961 | ||
| TIPS | 0.13 | 7-15-2030 | 4,375,539 | 3,990,002 | ||
| TIPS | 0.13 | 1-15-2031 | 4,936,633 | 4,472,538 | ||
| TIPS | 0.13 | 7-15-2031 | 3,017,474 | 2,724,724 | ||
| TIPS | 0.13 | 1-15-2032 | 6,745,095 | 6,042,291 | ||
| TIPS | 0.13 | 2-15-2051 | 3,055,066 | 2,099,841 | ||
| TIPS | 0.13 | 2-15-2052 | 1,860,414 | 1,286,980 | ||
| TIPS | 0.25 | 1-15-2025 | 5,200,116 | 5,019,128 | ||
| TIPS | 0.25 | 7-15-2029 | 2,384,334 | 2,215,382 | ||
| TIPS | 0.25 | 2-15-2050 | 4,225,067 | 3,014,542 | ||
| TIPS | 0.38 | 7-15-2025 | 2,916,018 | 2,816,274 | ||
| TIPS | 0.38 | 1-15-2027 | 3,274,299 | 3,122,991 | ||
| TIPS | 0.38 | 7-15-2027 | 4,003,758 | 3,821,047 | ||
| TIPS | 0.50 | 4-15-2024 | 3,665,576 | 3,574,152 | ||
| TIPS | 0.50 | 1-15-2028 | 3,080,166 | 2,937,027 | ||
| TIPS | 0.63 | 1-15-2024 | 3,319,816 | 3,254,522 | ||
| TIPS | 0.63 | 1-15-2026 | 4,927,463 | 4,769,919 | ||
| TIPS | 0.63 | 7-15-2032 | 5,235,034 | 4,923,658 | ||
| TIPS | 0.63 | 2-15-2043 | 2,368,765 | 1,962,343 | ||
| TIPS | 0.75 | 7-15-2028 | 4,031,779 | 3,895,024 | ||
| TIPS | 0.75 | 2-15-2042 | 3,198,226 | 2,748,476 | ||
| TIPS | 0.75 | 2-15-2045 | 1,833,795 | 1,533,129 | ||
| TIPS | 0.88 | 1-15-2029 | 3,314,572 | 3,203,352 | ||
| TIPS | 0.88 | 2-15-2047 | 1,813,483 | 1,544,105 | ||
| TIPS | 1.00 | 2-15-2046 | 1,791,161 | 1,575,452 | ||
| TIPS | 1.00 | 2-15-2048 | 1,378,042 | 1,203,472 | ||
| TIPS | 1.00 | 2-15-2049 | 1,574,539 | 1,376,656 | ||
| TIPS | 1.38 | 2-15-2044 | 2,585,083 | 2,468,855 | ||
| TIPS | 1.63 | 10-15-2027 | 4,122,736 | 4,168,151 | ||
| TIPS | 1.75 | 1-15-2028 | 2,712,923 | 2,750,791 | ||
| TIPS | 2.00 | 1-15-2026 | 3,364,470 | 3,392,398 | ||
| TIPS | 2.13 | 2-15-2040 | 1,428,055 | 1,549,245 | ||
| Interest rate | Maturity date | Principal | Value | |||
| U.S. Treasury securities (continued) | ||||||
| TIPS | 2.13% | 2-15-2041 | $ | 1,822,811 | $ 1,972,517 | |
| TIPS | 2.38 | 1-15-2025 | 3,463,878 | 3,492,248 | ||
| TIPS | 2.38 | 1-15-2027 | 2,494,515 | 2,575,416 | ||
| TIPS | 2.50 | 1-15-2029 | 2,612,604 | 2,765,958 | ||
| TIPS | 2.75 | 8-15-2032 | 1,045,000 | 967,931 | ||
| TIPS | 3.38 | 4-15-2032 | 1,053,385 | 1,233,304 | ||
| TIPS | 3.63 | 4-15-2028 | 2,119,379 | 2,347,522 | ||
| TIPS | 3.88 | 4-15-2029 | 2,780,239 | 3,174,975 | ||
| TIPS | 4.13 | 11-15-2032 | 925,000 | 961,133 | ||
| Total U.S. Treasury securities (Cost $161,909,642) | 148,563,499 | |||||
| Yankee corporate bonds and notes: 1.89% | �� | |||||
| Communication services: 0.16% | ||||||
| Media: 0.16% | ||||||
| Videotron Limited 144A | 5.38 | 6-15-2024 | 360,000 | 356,400 | ||
| Consumer discretionary: 0.09% | ||||||
| Auto components: 0.09% | ||||||
| Adient Global Holdings Limited 144A | 4.88 | 8-15-2026 | 220,000 | 205,350 | ||
| Energy: 0.24% | ||||||
| Oil, gas & consumable fuels: 0.24% | ||||||
| NorthRiver Midstream Finance LP 144A | 5.63 | 2-15-2026 | 555,000 | 525,595 | ||
| Financials: 0.45% | ||||||
| Diversified financial services: 0.45% | ||||||
| DAE Funding LLC 144A | 2.63 | 3-20-2025 | 370,000 | 343,260 | ||
| FMG Resources Proprietary Limited 144A | 5.13 | 5-15-2024 | 300,000 | 297,563 | ||
| New Red Finance Incorporated 144A | 5.75 | 4-15-2025 | 335,000 | 335,838 | ||
| 976,661 | ||||||
| Health care: 0.28% | ||||||
| Pharmaceuticals: 0.28% | ||||||
| Teva Pharmaceutical Finance Netherlands III BV | 6.00 | 4-15-2024 | 625,000 | 616,319 | ||
| Industrials: 0.26% | ||||||
| Airlines: 0.14% | ||||||
| Air Canada Pass-Through Trust Series 2020-1 Class C 144A | 10.50 | 7-15-2026 | 290,000 | 294,334 | ||
| Trading companies & distributors: 0.12% | ||||||
| Fly Leasing Limited 144A | 7.00 | 10-15-2024 | 355,000 | 265,337 | ||
| Materials: 0.41% | ||||||
| Chemicals: 0.19% | ||||||
| Park Aerospace Holdings Company 144A | 5.50 | 2-15-2024 | 415,000 | 408,896 | ||
| Containers & packaging: 0.09% | ||||||
| Ardagh Packaging Finance plc 144A | 5.25 | 4-30-2025 | 200,000 | 192,482 | ||
| Metals & mining: 0.13% | ||||||
| Constellium SE 144A | 5.88 | 2-15-2026 | 300,000 | 287,781 | ||
| Total Yankee corporate bonds and notes (Cost $4,393,768) | 4,129,155 | |||||
| Yield | Shares | Value | ||||
| Short-term investments: 1.27% | ||||||
| Investment companies: 1.27% | ||||||
| Allspring Government Money Market Fund Select Class ♠∞ | 3.60% | 2,111,826 | $ 2,111,826 | |||
| Securities Lending Cash Investments LLC ♠∩∞ | 3.90 | 660,678 | 660,678 | |||
| Total Short-term investments (Cost $2,772,504) | 2,772,504 | |||||
| Total investments in securities (Cost $222,769,763) | 99.89% | 217,686,564 | ||||
| Other assets and liabilities, net | 0.11 | 246,958 | ||||
| Total net assets | 100.00% | $217,933,522 | ||||
| † | Non-income-earning security |
| 144A | The security may be resold in transactions exempt from registration, normally to qualified institutional buyers, pursuant to Rule 144A under the Securities Act of 1933. |
| ± | Variable rate investment. The rate shown is the rate in effect at period end. |
| ‡ | Security is valued using significant unobservable inputs. |
| « | All or a portion of this security is on loan. |
| ♠ | The issuer of the security is an affiliated person of the Portfolio as defined in the Investment Company Act of 1940. |
| ∩ | The investment is a non-registered investment company purchased with cash collateral received from securities on loan. |
| ∞ | The rate represents the 7-day annualized yield at period end. |
| Abbreviations: | |
| ADR | American depositary receipt |
| LIBOR | London Interbank Offered Rate |
| REIT | Real estate investment trust |
| SOFR | Secured Overnight Financing Rate |
| TIPS | Treasury Inflation-Protected Securities |
| Value, beginning of period | Purchases | Sales proceeds | Net realized gains (losses) | Net change in unrealized gains (losses) | Value, end of period | Shares, end of period | Income from affiliated securities | |||
| Short-term investments | ||||||||||
| Allspring Government Money Market Fund Select Class | $2,766,670 | $35,979,060 | $(36,633,904) | $0 | $0 | $ 2,111,826 | 2,111,826 | $ 20,696 | ||
| Securities Lending Cash Investments LLC | 0 | 2,665,525 | (2,004,847) | 0 | 0 | 660,678 | 660,678 | 2,751 # | ||
| $0 | $0 | $2,772,504 | $23,447 | |||||||
| # | Amount shown represents income before fees and rebates. |
| Description | Number of contracts | Expiration date | Notional cost | Notional value | Unrealized gains | Unrealized losses | |
| Long | |||||||
| 2-Year U.S. Treasury Notes | 14 | 3-31-2023 | $ 2,868,163 | $ 2,875,031 | $ 6,868 | $0 | |
| Short | |||||||
| 10-Year Ultra Futures | (12) | 3-22-2023 | (1,437,256) | (1,435,875) | 1,381 | 0 | |
| U.S. Ultra Treasury Bonds | (12) | 3-22-2023 | (1,658,227) | (1,635,375) | 22,852 | 0 | |
| $31,101 | $0 |
| Assets | |
Investments in unaffiliated securities (including $645,403 of securities loaned), at value (cost $219,997,259) | $ 214,914,060 |
Investments in affiliated securities, at value (cost $2,772,504) | 2,772,504 |
Cash at broker segregated for futures contracts | 336,000 |
Foreign currency, at value (cost $15,420) | 15,711 |
Receivable for dividends and interest | 912,603 |
Receivable for investments sold | 102,138 |
Receivable for daily variation margin on open futures contracts | 5,688 |
Receivable for securities lending income, net | 262 |
Total assets | 219,058,966 |
| Liabilities | |
Payable upon receipt of securities loaned | 660,678 |
Payable for investments purchased | 364,022 |
Advisory fee payable | 55,041 |
Payable for daily variation margin on open futures contracts | 1,313 |
Accrued expenses and other liabilities | 44,390 |
Total liabilities | 1,125,444 |
Total net assets | $217,933,522 |
| Investment income | |
Interest | $ 5,791,848 |
Dividends (net of foreign withholdings taxes of $5,413) | 423,764 |
Income from affiliated securities | 21,836 |
Total investment income | 6,237,448 |
| Expenses | |
Advisory fee | 436,122 |
Custody and accounting fees | 21,029 |
Professional fees | 55,549 |
Interest holder report expenses | 18,590 |
Trustees’ fees and expenses | 10,879 |
Other fees and expenses | 8,294 |
Total expenses | 550,463 |
Less: Fee waivers and/or expense reimbursements | (125,244) |
Net expenses | 425,219 |
Net investment income | 5,812,229 |
| Realized and unrealized gains (losses) on investments | |
| Net realized gains on | |
Unaffiliated securities | 368,295 |
Futures contracts | 197,920 |
Net realized gains on investments | 566,215 |
| Net change in unrealized gains (losses) on | |
Unaffiliated securities | (13,796,410) |
Futures contracts | (23,372) |
Net change in unrealized gains (losses) on investments | (13,819,782) |
Net realized and unrealized gains (losses) on investments | (13,253,567) |
Net decrease in net assets resulting from operations | $ (7,441,338) |
| Six months ended November 30, 2022 (unaudited) | Year ended May 31, 2022 | |
| Operations | ||
Net investment income | $ 5,812,229 | $ 12,910,301 |
Net realized gains on investments | 566,215 | 2,843,667 |
Net change in unrealized gains (losses) on investments | (13,819,782) | (16,501,133) |
Net decrease in net assets resulting from operations | (7,441,338) | (747,165) |
| Capital transactions | ||
| Transactions in investors’ beneficial interests | ||
Contributions | 24,531,853 | 73,678,375 |
Withdrawals | (30,752,284) | (80,677,859) |
Net decrease in net assets resulting from capital transactions | (6,220,431) | (6,999,484) |
Total decrease in net assets | (13,661,769) | (7,746,649) |
| Net assets | ||
Beginning of period | 231,595,291 | 239,341,940 |
End of period | $217,933,522 | $231,595,291 |
| Year ended May 31 | ||||||
| Six months ended November 30, 2022 (unaudited) | 2022 | 2021 | 2020 | 2019 | 2018 | |
Total return1 | (3.47)% | (0.14)% | 9.58% | 5.92% | 2.99% | 1.67% |
| Ratios to average net assets (annualized) | ||||||
Gross expenses | 0.50% | 0.48% | 0.47% | 0.45% | 0.45% | 0.48% |
Net expenses2 | 0.39% | 0.39% | 0.39% | 0.39% | 0.40% | 0.41% |
Net investment income | 5.33% | 5.54% | 2.57% | 2.16% | 2.29% | 2.40% |
| Supplemental data | ||||||
Portfolio turnover rate | 15% | 31% | 20% | 24% | 39% | 29% |
| 1 | Returns for periods of less than one year are not annualized. |
| 2 | Net expense ratios reflect voluntary waivers, if any. |
| Gross unrealized gains | $ 10,612,177 |
| Gross unrealized losses | (15,685,010) |
| Net unrealized losses | $ (5,072,833) |
| ■ | Level 1 – quoted prices in active markets for identical securities |
| ■ | Level 2 – other significant observable inputs (including quoted prices for similar securities, interest rates, prepayment speeds, credit risk, etc.) |
| ■ | Level 3 – significant unobservable inputs (including the Portfolio’s own assumptions in determining the fair value of investments) |
| Quoted prices (Level 1) | Other significant observable inputs (Level 2) | Significant unobservable inputs (Level 3) | Total | |
| Assets | ||||
| Investments in: | ||||
| Common stocks | ||||
| Consumer staples | $ 7,758,275 | $ 0 | $ 0 | $ 7,758,275 |
| Energy | 3,583,471 | 0 | 0 | 3,583,471 |
| Materials | 6,401,785 | 251,019 | 0 | 6,652,804 |
| Real estate | 11,706,238 | 0 | 0 | 11,706,238 |
| Corporate bonds and notes | 0 | 29,566,464 | 0 | 29,566,464 |
| Loans | 0 | 2,759,283 | 194,871 | 2,954,154 |
| U.S. Treasury securities | 148,563,499 | 0 | 0 | 148,563,499 |
| Yankee corporate bonds and notes | 0 | 4,129,155 | 0 | 4,129,155 |
| Short-term investments | ||||
| Investment companies | 2,772,504 | 0 | 0 | 2,772,504 |
| 180,785,772 | 36,705,921 | 194,871 | 217,686,564 | |
| Futures contracts | 31,101 | 0 | 0 | 31,101 |
| Total assets | $180,816,873 | $36,705,921 | $194,871 | $217,717,665 |
| Average daily net assets | Advisory fee |
| First $500 million | 0.400% |
| Next $500 million | 0.375 |
| Next $2 billion | 0.350 |
| Next $2 billion | 0.325 |
| Next $5 billion | 0.300 |
| Over $10 billion | 0.290 |
| Purchases at cost | Sales proceeds | |||
| U.S. government | Non-U.S. government | U.S. government | Non-U.S. government | |
| $19,867,469 | $13,269,762 | $15,242,237 | $17,004,491 | |
| Counterparty | Value of securities on loan | Collateral received1 | Net amount |
| Bank of America Securities Incorporated | $372,279 | $(372,279) | $0 |
| Barclays Capital Incorporated | 113,568 | (113,568) | 0 |
| BNP Paribas Securities Corporation | 124,725 | (124,725) | 0 |
| Citigroup Global Markets Incorporated | 11,956 | (11,956) | 0 |
| SG Americas Securities LLC | 22,875 | (22,875) | 0 |
| Name and year of birth | Position held and length of service* | Principal occupations during past five years or longer | Current other public company or investment company directorships |
| William R. Ebsworth (Born 1957) | Trustee, since 2015 | Retired. From 1984 to 2013, equities analyst, portfolio manager, research director and chief investment officer at Fidelity Management and Research Company in Boston, Tokyo, and Hong Kong, and retired in 2013 as Chief Investment Officer of Fidelity Strategic Advisers, Inc. where he led a team of investment professionals managing client assets. Prior thereto, Board member of Hong Kong Securities Clearing Co., Hong Kong Options Clearing Corp., the Thailand International Fund, Ltd., Fidelity Investments Life Insurance Company, and Empire Fidelity Investments Life Insurance Company. Audit Committee Chair and Investment Committee Chair of the Vincent Memorial Hospital Endowment (non-profit organization). Mr. Ebsworth is a CFA® charterholder. | N/A |
| Jane A. Freeman (Born 1953) | Trustee, since 2015; Chair Liaison, since 2018 | Retired. From 2012 to 2014 and 1999 to 2008, Chief Financial Officer of Scientific Learning Corporation. From 2008 to 2012, Ms. Freeman provided consulting services related to strategic business projects. Prior to 1999, Portfolio Manager at Rockefeller & Co. and Scudder, Stevens & Clark. Board member of the Harding Loevner Funds from 1996 to 2014, serving as both Lead Independent Director and chair of the Audit Committee. Board member of the Russell Exchange Traded Funds Trust from 2011 to 2012 and the chair of the Audit Committee. Ms. Freeman is also an inactive Chartered Financial Analyst. | N/A |
| Isaiah Harris, Jr. (Born 1952) | Trustee, since 2009; Audit Committee Chair, since 2019 | Retired. Chairman of the Board of CIGNA Corporation from 2009 to 2021, and Director from 2005 to 2008. From 2003 to 2011, Director of Deluxe Corporation. Prior thereto, President and CEO of BellSouth Advertising and Publishing Corp. from 2005 to 2007, President and CEO of BellSouth Enterprises from 2004 to 2005 and President of BellSouth Consumer Services from 2000 to 2003. Emeritus member of the Iowa State University Foundation Board of Governors. Emeritus Member of the Advisory Board of Iowa State University School of Business. Advisory Board Member, Palm Harbor Academy (private school). Advisory Board Member, Fellowship of Christian Athletes. Mr. Harris is a certified public accountant (inactive status). | N/A |
| David F. Larcker (Born 1950) | Trustee, since 2009 | James Irvin Miller Professor of Accounting at the Graduate School of Business (Emeritus), Stanford University, Director of the Corporate Governance Research Initiative and Senior Faculty of The Rock Center for Corporate Governance since 2006. From 2005 to 2008, Professor of Accounting at the Graduate School of Business, Stanford University. Prior thereto, Ernst & Young Professor of Accounting at The Wharton School, University of Pennsylvania from 1985 to 2005. | N/A |
| Name and year of birth | Position held and length of service* | Principal occupations during past five years or longer | Current other public company or investment company directorships |
| Olivia S. Mitchell (Born 1953) | Trustee, since 2006; Nominating and Governance Committee Chair, since 2018 | International Foundation of Employee Benefit Plans Professor since 1993, Wharton School of the University of Pennsylvania. Director of Wharton’s Pension Research Council and Boettner Center on Pensions & Retirement Research, and Research Associate at the National Bureau of Economic Research. Previously taught at Cornell University from 1978 to 1993. | N/A |
| Timothy J. Penny (Born 1951) | Trustee, since 1996; Chair, since 2018 | President and Chief Executive Officer of Southern Minnesota Initiative Foundation, a non-profit organization, since 2007. Vice Chair of the Economic Club of Minnesota, since 2007. Co-Chair of the Committee for a Responsible Federal Budget, since 1995. Member of the Board of Trustees of NorthStar Education Finance, Inc., a non-profit organization, since 2007. Senior Fellow of the University of Minnesota Humphrey Institute from 1995 to 2017. | N/A |
| James G. Polisson (Born 1959) | Trustee, since 2018 | Retired. Chief Marketing Officer, Source (ETF) UK Services, Ltd, from 2015 to 2017. From 2012 to 2015, Principal of The Polisson Group, LLC, a management consulting, corporate advisory and principal investing company. Chief Executive Officer and Managing Director at Russell Investments, Global Exchange Traded Funds from 2010 to 2012. Managing Director of Barclays Global Investors from 1998 to 2010 and Global Chief Marketing Officer for iShares and Barclays Global Investors from 2000 to 2010. Trustee of the San Francisco Mechanics’ Institute, a non-profit organization, from 2013 to 2015. Board member of the Russell Exchange Traded Fund Trust from 2011 to 2012. Director of Barclays Global Investors Holdings Deutschland GmbH from 2006 to 2009. Mr. Polisson is an attorney and has a retired status with the Massachusetts and District of Columbia Bar Associations. | N/A |
| Pamela Wheelock (Born 1959) | Trustee, since January 2020; previously Trustee from January 2018 to July 2019 | Retired. Executive and Senior Financial leadership positions in the public, private and nonprofit sectors. Interim President and CEO, McKnight Foundation, 2020. Interim Commissioner, Minnesota Department of Human Services, 2019. Chief Operating Officer, Twin Cities Habitat for Humanity, 2017-2019. Vice President for University Services, University of Minnesota, 2012-2016. Interim President and CEO, Blue Cross and Blue Shield of Minnesota, 2011-2012. Executive Vice-President and Chief Financial Officer, Minnesota Wild, 2002-2008. Commissioner, Minnesota Department of Finance, 1999-2002. Chair of the Board of Directors of Destination Medical Center Corporation. Board member of the Minnesota Wild Foundation. | N/A |
| Name and year of birth | Position held and length of service | Principal occupations during past five years or longer |
| Andrew Owen (Born 1960) | President, since 2017 | President and Chief Executive Officer of Allspring Funds Management, LLC since 2017 and Head of Global Fund Governance of Allspring Global Investments since 2022. Prior thereto, co-president of Galliard Capital Management, LLC, an affiliate of Allspring Funds Management, LLC, from 2019 to 2022 and Head of Affiliated Managers, Allspring Global Investments, from 2014 to 2019 and Executive Vice President responsible for marketing, investments and product development for Allspring Funds Management, LLC, from 2009 to 2014. |
| Jeremy DePalma (Born 1974) | Treasurer, since 2012 (for certain funds in the Fund Complex); since 2021 (for the remaining funds in the Fund Complex) | Senior Vice President of Allspring Funds Management, LLC since 2009. Senior Vice President of Evergreen Investment Management Company, LLC from 2008 to 2010 and head of the Fund Reporting and Control Team within Fund Administration from 2005 to 2010. |
| Christopher Baker (Born 1976) | Chief Compliance Officer, since 2022 | Global Chief Compliance Officer for Allspring Global Investments since 2022. Prior thereto, Chief Compliance Officer for State Street Global Advisors from 2018 to 2021. Senior Compliance Officer for the State Street divisions of Alternative Investment Solutions, Sector Solutions, and Global Marketing from 2015 to 2018. From 2010 to 2015 Vice President, Global Head of Investment and Marketing Compliance for State Street Global Advisors. |
| Matthew Prasse (Born 1983) | Chief Legal Officer, since 2022; Secretary, since 2021 | Senior Counsel of the Allspring Legal Department since 2021. Senior Counsel of the Wells Fargo Legal Department from 2018 to 2021. Previously, Counsel for Barings LLC from 2015 to 2018. Prior to joining Barings, Associate at Morgan, Lewis & Bockius LLP from 2008 to 2015. |
P.O. Box 219967
Kansas City, MO 64121-9967

1-800-222-8222 or visit the Fund's website at allspringglobal.com. Read the prospectus carefully before you invest or send money.
SA288/SAR288 11-22


| 1 | The S&P 500 Index consists of 500 stocks chosen for market size, liquidity, and industry group representation. It is a market-value-weighted index with each stock's weight in the index proportionate to its market value. You cannot invest directly in an index. |
| 2 | The Morgan Stanley Capital International (MSCI) All Country World Index (ACWI) ex USA Index (Net) is a free-float-adjusted market-capitalization-weighted index that is designed to measure the equity market performance of developed and emerging markets, excluding the U.S. Source: MSCI. MSCI makes no express or implied warranties or representations and shall have no liability whatsoever with respect to any MSCI data contained herein. The MSCI data may not be further redistributed or used as a basis for other indexes or any securities or financial products. This report is not approved, reviewed, or produced by MSCI. You cannot invest directly in an index. |
| 3 | The MSCI Emerging Markets (EM) Index (Net) (USD) is a free-float-adjusted market-capitalization-weighted index that is designed to measure equity market performance of emerging markets. You cannot invest directly in an index. |
| 4 | The Bloomberg U.S. Aggregate Bond Index is a broad-based benchmark that measures the investment-grade, U.S.-dollar-denominated, fixed-rate taxable bond market, including Treasuries, government-related and corporate securities, mortgage-backed securities (agency fixed-rate and hybrid adjustable-rate mortgage pass-throughs), asset-backed securities, and commercial mortgage-backed securities. You cannot invest directly in an index. |
| 5 | The Bloomberg Global Aggregate ex-USD Index (unhedged) is an unmanaged index that provides a broad-based measure of the global investment-grade fixed-income markets excluding the U.S.-dollar-denominated debt market. You cannot invest directly in an index. |
| 6 | The Bloomberg Municipal Bond Index is an unmanaged index composed of long-term tax-exempt bonds with a minimum credit rating of Baa. You cannot invest directly in an index. |
| 7 | The ICE BofA U.S. High Yield Index is a market-capitalization-weighted index of domestic and Yankee high-yield bonds. The index tracks the performance of high-yield securities traded in the U.S. bond market. You cannot invest directly in an index. Copyright 2023. ICE Data Indices, LLC. All rights reserved. |

President
Allspring Funds
| Investment objective | The Fund seeks long-term total return, consisting of capital appreciation and current income. |
| Manager | Allspring Funds Management, LLC |
| Subadviser | Allspring Global Investments, LLC |
| Portfolio managers | Kandarp R. Acharya, CFA®‡, FRM, Petros N. Bocray, CFA®‡, FRM, Travis L. Keshemberg, CFA®‡, CIPM, FRM |
| Average annual total returns (%) as of November 30, 2022 | |||||||||||
| Including sales charge | Excluding sales charge | Expense ratios1 (%) | |||||||||
| Inception date | 1 year | 5 year | 10 year | 1 year | 5 year | 10 year | Gross | Net 2 | |||
| Class A (EAAFX) | 7-29-1996 | -16.00 | 2.86 | 4.01 | -10.87 | 4.09 | 4.63 | 1.19 | 1.13 | ||
| Class C (EACFX) | 10-3-2002 | -12.48 | 3.44 | 4.14 | -11.48 | 3.44 | 4.14 | 1.94 | 1.88 | ||
| Class R (EAXFX) | 10-10-2003 | – | – | – | -11.06 | 3.91 | 4.41 | 1.44 | 1.38 | ||
| Administrator Class (EAIFX) | 10-3-2002 | – | – | – | -9.78 | 4.65 | 5.01 | 1.11 | 0.95 | ||
| Institutional Class (EAAIX) | 11-30-2012 | – | – | – | -10.58 | 4.45 | 5.02 | 0.86 | 0.80 | ||
| Asset Allocation Blended Index3 | – | – | – | – | -11.41 | 5.14 | 6.49 | – | – | ||
| Bloomberg U.S. Aggregate Bond Index4 | – | – | – | – | -12.84 | 0.21 | 1.09 | – | – | ||
| MSCI ACWI ex USA Index (Net)5 | – | – | – | – | -11.87 | 1.48 | 4.23 | – | – | ||
| Russell 3000® Index6 | – | – | – | – | -10.80 | 10.33 | 12.95 | – | – | ||
| 1 | Reflects the expense ratios as stated in the most recent prospectuses, which include the impact of 0.43% in acquired fund fees and expenses. The expense ratios shown are subject to change and may differ from the annualized expense ratios shown in the financial highlights of this report, which do not include acquired fund fees and expenses. |
| 2 | The manager has contractually committed through September 30, 2023, to waive fees and/or reimburse expenses to the extent necessary to cap total annual fund operating expenses after fee waivers at 1.13% for Class A, 1.88% for Class C, 1.38% for Class R, 0.95% for Administrator Class, and 0.80% for Institutional Class. Brokerage commissions, stamp duty fees, interest, taxes, acquired fund fees and expenses (if any) from funds in which the affiliated master portfolios and funds invest and from money market funds, and extraordinary expenses are excluded from the expense caps. All other acquired fund fees and expenses from the affiliated master portfolios and funds are included in the expense caps. Prior to or after the commitment expiration date, the caps may be increased or the commitment to maintain the caps may be terminated only with the approval of the Board of Trustees. Without these caps, the Fund’s returns would have been lower. The expense ratio paid by an investor is the net expense ratio (the total annual fund operating expenses after fee waivers) as stated in the prospectuses. |
| 3 | Source: Allspring Funds Management, LLC. The Asset Allocation Blended Index is composed of the 45% Russell 3000® Index, 35% of the Bloomberg U.S. Aggregate Bond Index and 20% of the MSCI ACWI ex USA Index (Net). Prior to June 16, 2018, it was comprised of 65% of the MSCI ACWI Index (Net) and 35% of the Bloomberg U.S. Aggregate Bond Index. You cannot invest directly in an index. |
| 4 | The Bloomberg U.S. Aggregate Bond Index is a broad-based benchmark that measures the investment-grade, U.S. dollar–denominated, fixed-rate taxable bond market, including Treasuries, government-related and corporate securities, mortgage-backed securities (agency fixed-rate and hybrid adjustable-rate mortgage pass-throughs), asset-backed securities, and commercial mortgage-backed securities. You cannot invest directly in an index. |
| ‡ | CFA® and Chartered Financial Analyst® are trademarks owned by CFA Institute. |
| 5 | The Morgan Stanley Capital International (MSCI) All Country World Index (ACWI) ex USA Index (Net) is a free-float-adjusted market- capitalization-weighted index that is designed to measure the equity market performance of developed and emerging markets, excluding the U.S. Source: MSCI. MSCI makes no express or implied warranties or representations and shall have no liability whatsoever with respect to any MSCI data contained herein. The MSCI data may not be further redistributed or used as a basis for other indexes or any securities or financial products. This report is not approved, reviewed, or produced by MSCI. You cannot invest directly in an index. |
| 6 | The Russell 3000® Index measures the performance of the 3,000 largest U.S. companies based on total market capitalization, which represents approximately 98% of the investable U.S. equity market. You cannot invest directly in an index. |
| Ten largest holdings (%) as of November 30, 20221 | |
| Allspring Managed Fixed Income Portfolio | 21.59 |
| Allspring Disciplined U.S. Core Fund Class R6 | 13.87 |
| Allspring Large Company Value Portfolio | 11.73 |
| Allspring Diversified Large Cap Growth Portfolio | 11.22 |
| Allspring Disciplined International Developed Markets Portfolio | 8.84 |
| Allspring Core Bond Portfolio | 6.04 |
| iShares Core MSCI EAFE ETF | 4.04 |
| Allspring C&B Large Cap Value Portfolio | 3.53 |
| Allspring Real Return Portfolio | 3.38 |
| Allspring Factor Enhanced International Equity Portfolio | 3.28 |
| 1 | Figures represent the percentage of the Fund's net assets. Holdings are subject to change and may have changed since the date specified. |
| Allocation (%) as of November 30, 2022 | ||
| Neutral allocation | Effective allocation1 | |
| Bond Funds | 35 | 42 |
| Stock Funds | 65 | 45 |
| International Stock Funds | 0 | 20 |
| Effective Cash | 0 | (7) |
| 1 | Effective allocation reflects the effect of the tactical futures overlay that may be in place. Effective cash, if any, represents the net offset to such future positions. Effective allocations are subject to change and may have changed since the date specified. |
| Beginning account value 6-1-2022 | Ending account value 11-30-2022 | Expenses paid during the period1,2 | Annualized net expense ratio2 | |
| Class A | ||||
| Actual | $1,000.00 | $ 978.61 | $5.16 | 1.04% |
| Hypothetical (5% return before expenses) | $1,000.00 | $1,019.85 | $5.27 | 1.04% |
| Class C | ||||
| Actual | $1,000.00 | $ 975.26 | $8.86 | 1.79% |
| Hypothetical (5% return before expenses) | $1,000.00 | $1,016.09 | $9.05 | 1.79% |
| Class R | ||||
| Actual | $1,000.00 | $ 977.07 | $6.39 | 1.29% |
| Hypothetical (5% return before expenses) | $1,000.00 | $1,018.60 | $6.53 | 1.29% |
| Administrator Class | ||||
| Actual | $1,000.00 | $ 989.20 | $4.29 | 0.86% |
| Hypothetical (5% return before expenses) | $1,000.00 | $1,020.76 | $4.36 | 0.86% |
| Institutional Class | ||||
| Actual | $1,000.00 | $ 980.15 | $3.52 | 0.71% |
| Hypothetical (5% return before expenses) | $1,000.00 | $1,021.51 | $3.60 | 0.71% |
| Shares | Value | ||||
| Investment companies: 99.23% | |||||
| Affiliated master portfolios: 75.97% | |||||
| Allspring C&B Large Cap Value Portfolio | $ 49,495,345 | ||||
| Allspring Core Bond Portfolio | 84,815,464 | ||||
| Allspring Disciplined International Developed Markets Portfolio | 124,038,196 | ||||
| Allspring Diversified Large Cap Growth Portfolio | 157,428,181 | ||||
| Allspring Emerging Growth Portfolio | 15,685,315 | ||||
| Allspring Factor Enhanced Emerging Markets Equity Portfolio | 19,226,270 | ||||
| Allspring Factor Enhanced International Equity Portfolio | 45,993,177 | ||||
| Allspring Large Company Value Portfolio | 164,583,726 | ||||
| Allspring Managed Fixed Income Portfolio | 302,892,983 | ||||
| Allspring Real Return Portfolio | 47,456,771 | ||||
| Allspring Small Company Growth Portfolio | 15,513,610 | ||||
| Allspring Small Company Value Portfolio | 38,711,346 | ||||
| 1,065,840,384 | |||||
| Exchange-traded funds: 6.69% | |||||
| iShares Core MSCI EAFE ETF | 898,255 | 56,634,978 | |||
| iShares Core U.S. Aggregate Bond ETF | 378,957 | 37,247,684 | |||
| 93,882,662 | |||||
| Stock funds: 16.57% | |||||
| Allspring Disciplined U.S. Core Fund Class R6 ♠ | 9,362,766 | 194,558,277 | |||
| Allspring Emerging Markets Equity Fund Class R6 ♠ | 788,824 | 18,963,331 | |||
| Allspring Emerging Markets Equity Income Fund Class R6 ♠ | 1,846,088 | 18,940,859 | |||
| 232,462,467 | |||||
| Total Investment companies (Cost $1,333,145,733) | 1,392,185,513 | ||||
| Total investments in securities (Cost $1,333,145,733) | 99.23% | 1,392,185,513 | |||
| Other assets and liabilities, net | 0.77 | 10,787,220 | |||
| Total net assets | 100.00% | $1,402,972,733 |
| ♠ | The issuer of the security is an affiliated person of the Fund as defined in the Investment Company Act of 1940. |
| Value, beginning of period | Purchases | Sales proceeds | Net realized gains (losses) on affiliated Underlying Funds | Net change in unrealized gains (losses) on affiliated Underlying Funds | Value, end of period | |||
| Investment companies | ||||||||
| Allspring Disciplined U.S. Core Fund Class R6 | $211,238,729 | $1,032,983 | $(14,421,559) | $ (1,500,627) | $ (1,791,249) | $ 194,558,277 | ||
| Allspring Emerging Markets Equity Fund Class R6 | 19,242,347 | 1,282,806 | (365,580) | (124,041) | (1,072,201) | 18,963,331 | ||
| Allspring Emerging Markets Equity Income Fund Class R6 | 21,014,247 | 667,782 | (524,123) | (108,819) | (2,108,228) | 18,940,859 | ||
| $(1,733,487) | $(4,971,678) | $232,462,467 |
| Shares, end of period | Dividends from affiliated Underlying Funds | |
| Investment companies | ||
| Allspring Disciplined U.S. Core Fund Class R6 | 9,362,766 | $ 0 |
| Allspring Emerging Markets Equity Fund Class R6 | 788,824 | 0 |
| Allspring Emerging Markets Equity Income Fund Class R6 | 1,846,088 | 348,395 |
| $348,395 |
| % of ownership, beginning of period | % of ownership, end of period | Net realized gains (losses) on securities transactions allocated from affiliated Master Portfolios | Net change in unrealized gains (losses) on securities transactions allocated from affiliated Master Portfolios | Interest allocated from affiliated Master Portfolios | Dividends allocated from affiliated Master Portfolios | Affiliated income allocated from affiliated Master Portfolios | Value, end of period | ||||||||
| Allspring C&B Large Cap Value Portfolio | 16.61% | 16.91% | $ 2,268,649 | $ (2,963,623) | $ 0 | $ 539,126 | $ 2,211 | $ 49,495,345 | |||||||
| Allspring Core Bond Portfolio | 1.96 | 1.89 | (4,492,541) | (608,386) | 1,319,397 | 0 | 36,407 | 84,815,464 | |||||||
| Allspring Disciplined International Developed Markets Portfolio | 86.56 | 85.90 | (5,194,472) | 1,032,210 | 0 | 1,414,202 | 28,784 | 124,038,196 | |||||||
| Allspring Diversified Large Cap Growth Portfolio | 84.39 | 84.13 | 816,961 | (1,698,050) | 0 | 806,415 | 35,330 | 157,428,181 | |||||||
| Allspring Emerging Growth Portfolio | 3.85 | 4.29 | (418,568) | 1,243,270 | 0 | 20,156 | 9,166 | 15,685,315 | |||||||
| Allspring Factor Enhanced Emerging Markets Equity Portfolio | 15.23 | 16.41 | (1,153,603) | (713,440) | 0 | 422,306 | 8,802 | 19,226,270 | |||||||
| Allspring Factor Enhanced International Equity Portfolio | 9.49 | 9.79 | (1,903,187) | (69,861) | 0 | 538,234 | 15,410 | 45,993,177 | |||||||
| Allspring Large Company Value Portfolio | 84.92 | 84.31 | (11,303,380) | 8,564,352 | 0 | 2,021,975 | 34,650 | 164,583,726 | |||||||
| Allspring Managed Fixed Income Portfolio | 81.56 | 81.08 | (3,762,929) | (14,652,191) | 5,778,339 | 0 | 54,216 | 302,892,983 | |||||||
| Allspring Real Return Portfolio | 22.84 | 21.78 | 116,718 | (3,302,855) | 1,325,667 | 95,573 | 5,461 | 47,456,771 | |||||||
| Allspring Small Company Growth Portfolio | 2.03 | 2.20 | 355,075 | (316,036) | 0 | 31,096 | 4,392 | 15,513,610 | |||||||
| Allspring Small Company Value Portfolio | 7.28 | 6.42 | (300,754) | 35,099 | 0 | 387,664 | 27,485 | 38,711,346 | |||||||
| $(24,972,031) | $(13,449,511) | $8,423,403 | $6,276,747 | $262,314 | $1,065,840,384 | ||||||||||
| Description | Number of contracts | Expiration date | Notional cost | Notional value | Unrealized gains | Unrealized losses | |
| Long | |||||||
| CAC 40 Index | 454 | 12-16-2022 | $ 29,949,172 | $ 30,583,710 | $ 634,538 | $ 0 | |
| E-Mini Consumer Staples Select Sector Index | 583 | 12-16-2022 | 42,840,443 | 45,304,930 | 2,464,487 | 0 | |
| 10-Year U.S. Treasury Notes | 1,256 | 3-22-2023 | 141,430,742 | 142,556,000 | 1,125,258 | 0 | |
| Short | |||||||
| DAX Index | (87) | 12-16-2022 | (27,770,813) | (31,504,837) | 0 | (3,734,024) | |
| Euro STOXX 50 Index | (1,113) | 12-16-2022 | (39,947,551) | (44,300,275) | 0 | (4,352,724) | |
| U.S. Ultra Treasury Bonds | (343) | 3-22-2023 | (45,964,622) | (46,744,469) | 0 | (779,847) | |
| $4,224,283 | $(8,866,595) |
| Assets | |
Investments in affiliated Master Portfolios, at value (cost $1,018,223,977) | $ 1,065,840,384 |
Investments in unaffiliated securities, at value (cost $110,485,849) | 93,882,662 |
Investments in affiliated Underlying Funds, at value (cost $204,435,907) | 232,462,467 |
Cash | 228,463 |
Cash at broker segregated for futures contracts | 11,915,102 |
Receivable for daily variation margin on open futures contracts | 1,920,562 |
Receivable for investments sold | 217,835 |
Receivable for Fund shares sold | 47,583 |
Prepaid expenses and other assets | 73,020 |
Total assets | 1,406,588,078 |
| Liabilities | |
Payable for Fund shares redeemed | 2,197,693 |
Payable for daily variation margin on open futures contracts | 497,100 |
Shareholder servicing fees payable | 242,159 |
Administration fees payable | 222,209 |
Management fee payable | 215,197 |
Distribution fees payable | 14,788 |
Trustees’ fees and expenses payable | 4,114 |
Accrued expenses and other liabilities | 222,085 |
Total liabilities | 3,615,345 |
Total net assets | $1,402,972,733 |
| Net assets consist of | |
Paid-in capital | $ 1,341,739,511 |
Total distributable earnings | 61,233,222 |
Total net assets | $1,402,972,733 |
| Computation of net asset value and offering price per share | |
Net assets – Class A | $ 1,172,982,866 |
Shares outstanding – Class A1 | 88,383,760 |
Net asset value per share – Class A | $13.27 |
Maximum offering price per share – Class A2 | $14.08 |
Net assets – Class C | $ 23,689,767 |
Shares outstanding – Class C1 | 1,821,285 |
Net asset value per share – Class C | $13.01 |
Net assets – Class R | $ 2,200,573 |
Shares outstanding – Class R1 | 166,552 |
Net asset value per share – Class R | $13.21 |
Net assets – Administrator Class | $ 15,913,233 |
Shares outstanding – Administrator Class1 | 1,157,857 |
Net asset value per share – Administrator Class | $13.74 |
Net assets – Institutional Class | $ 188,186,294 |
Shares outstanding – Institutional Class1 | 14,112,838 |
Net asset value per share – Institutional Class | $13.33 |
| 1 | The Fund has an unlimited number of authorized shares. |
| 2 | Maximum offering price is computed as 100/94.25 of net asset value. On investments of $50,000 or more, the offering price is reduced. |
| Investment income | |
Interest allocated from affiliated Master Portfolios | $ 8,423,403 |
Dividends allocated from affiliated Master Portfolios (net of foreign withholding taxes of $248,238) | 6,276,747 |
Dividends from unaffiliated securities | 1,737,170 |
Dividends from affiliated Underlying Funds | 348,395 |
Affiliated income allocated from affiliated Master Portfolios | 262,314 |
Expenses allocated from affiliated Master Portfolios | (2,863,316) |
Waivers allocated from affiliated Master Portfolios | 333,458 |
Total investment income | 14,518,171 |
| Expenses | |
Management fee | 1,995,766 |
| Administration fees | |
Class A | 1,236,208 |
Class C | 27,352 |
Class R | 2,463 |
Administrator Class | 10,444 |
Institutional Class | 128,505 |
| Shareholder servicing fees | |
Class A | 1,469,129 |
Class C | 32,393 |
Class R | 2,868 |
Administrator Class | 19,852 |
| Distribution fees | |
Class C | 96,844 |
Class R | 2,793 |
Custody and accounting fees | 20,009 |
Professional fees | 7,177 |
Registration fees | 37,391 |
Shareholder report expenses | 42,861 |
Trustees’ fees and expenses | 10,994 |
Other fees and expenses | 7,831 |
Total expenses | 5,150,880 |
| Less: Fee waivers and/or expense reimbursements | |
Fund-level | (378,719) |
Class A | (58,868) |
Class C | (1,302) |
Administrator Class | (8,837) |
Institutional Class | (19,770) |
Net expenses | 4,683,384 |
Net investment income | 9,834,787 |
| Realized and unrealized gains (losses) on investments | |
| Net realized gains (losses) on | |
Securities transactions allocated from affiliated Master Portfolios | (24,972,031) |
Affiliated Underlying Funds | (1,733,487) |
Unaffiliated securities | (1,621,500) |
Futures contracts | 8,416,588 |
Net realized losses on investments | (19,910,430) |
| Net change in unrealized gains (losses) on | |
Securities transactions allocated from affiliated Master Portfolios | (13,449,511) |
Affiliated Underlying Funds | (4,971,678) |
Unaffiliated securities | (2,969,407) |
Futures contracts | (4,840,032) |
Net change in unrealized gains (losses) on investments | (26,230,628) |
Net realized and unrealized gains (losses) on investments | (46,141,058) |
Net decrease in net assets resulting from operations | $(36,306,271) |
| Six months ended November 30, 2022 (unaudited) | Year ended May 31, 2022 | |||
| Operations | ||||
Net investment income | $ 9,834,787 | $ 21,071,267 | ||
Net realized gains (losses) on investments | (19,910,430) | 83,811,245 | ||
Net change in unrealized gains (losses) on investments | (26,230,628) | (226,564,977) | ||
Net decrease in net assets resulting from operations | (36,306,271) | (121,682,465) | ||
| Distributions to shareholders from | ||||
| Net investment income and net realized gains | ||||
Class A | 0 | (202,891,728) | ||
Class C | 0 | (5,423,558) | ||
Class R | 0 | (467,417) | ||
Administrator Class | 0 | (3,106,447) | ||
Institutional Class | 0 | (36,625,295) | ||
Total distributions to shareholders | 0 | (248,514,445) | ||
| Capital share transactions | Shares | Shares | ||
| Proceeds from shares sold | ||||
Class A | 637,148 | 8,192,368 | 2,611,398 | 40,863,057 |
Class C | 47,417 | 593,333 | 182,136 | 2,833,723 |
Class R | 17,736 | 227,027 | 12,849 | 202,101 |
Administrator Class | 10,884 | 144,230 | 52,285 | 846,945 |
Institutional Class | 574,036 | 7,389,094 | 1,834,135 | 29,224,220 |
| 16,546,052 | 73,970,046 | |||
| Reinvestment of distributions | ||||
Class A | 0 | 0 | 12,001,744 | 182,452,406 |
Class C | 0 | 0 | 357,553 | 5,298,942 |
Class R | 0 | 0 | 29,730 | 449,906 |
Administrator Class | 0 | 0 | 183,747 | 2,863,149 |
Institutional Class | 0 | 0 | 1,858,632 | 28,382,924 |
| 0 | 219,447,327 | |||
| Payment for shares redeemed | ||||
Class A | (6,102,477) | (77,991,343) | (12,061,446) | (190,070,003) |
Class C | (553,060) | (7,000,169) | (1,380,131) | (21,542,495) |
Class R | (62,992) | (811,567) | (32,919) | (483,592) |
Administrator Class | (173,315) | (2,299,302) | (366,341) | (5,897,327) |
Institutional Class | (2,525,736) | (32,297,420) | (3,378,156) | (52,642,800) |
| (120,399,801) | (270,636,217) | |||
Net increase (decrease) in net assets resulting from capital share transactions | (103,853,749) | 22,781,156 | ||
Total decrease in net assets | (140,160,020) | (347,415,754) | ||
| Net assets | ||||
Beginning of period | 1,543,132,753 | 1,890,548,507 | ||
End of period | $1,402,972,733 | $1,543,132,753 | ||
| Year ended May 31 | Year ended April 30 | |||||||
| Class A | Six months ended November 30, 2022 (unaudited) | 2022 | 2021 | 2020 1 | 2020 | 2019 | 2018 | |
Net asset value, beginning of period | $13.56 | $16.90 | $13.57 | $13.12 | $13.49 | $14.33 | $13.62 | |
Net investment income (loss) | 0.09 2 | 0.18 2 | 0.18 2 | 0.02 | 0.21 2 | 0.15 2 | (0.12) | |
Payment from affiliate | 0.00 | 0.00 | 0.00 3 | 0.00 | 0.00 | 0.00 | 0.00 | |
Net realized and unrealized gains (losses) on investments | (0.38) | (1.20) | 3.75 | 0.43 | (0.36) | 0.04 | 1.08 | |
Total from investment operations | (0.29) | (1.02) | 3.93 | 0.45 | (0.15) | 0.19 | 0.96 | |
| Distributions to shareholders from | ||||||||
Net investment income | 0.00 | (0.18) | (0.41) | 0.00 | (0.06) | (0.06) | (0.25) | |
Net realized gains | 0.00 | (2.14) | (0.19) | 0.00 | (0.16) | (0.97) | 0.00 | |
Total distributions to shareholders | 0.00 | (2.32) | (0.60) | 0.00 | (0.22) | (1.03) | (0.25) | |
Net asset value, end of period | $13.27 | $13.56 | $16.90 | $13.57 | $13.12 | $13.49 | $14.33 | |
Total return4 | (2.14)% | (7.42)% | 29.45% 5 | 3.43% | (1.26)% | 1.96% | 7.01% | |
| Ratios to average net assets (annualized) | ||||||||
Gross expenses | 1.10% * | 1.09% * | 1.14% * | 1.21% * | 1.22% * | 1.18% *,6 | 0.82% 6 | |
Net expenses | 1.04% * | 1.04% * | 1.04% * | 1.05% * | 1.05% * | 1.04% *,6 | 0.82% 6 | |
Net investment income (loss) | 1.35% * | 1.15% * | 1.19% * | 1.22% * | 1.54% * | 1.08% *,6 | (0.82)% 6 | |
| Supplemental data | ||||||||
Portfolio turnover rate | 51% 7 | 111% 7 | 137% 7 | 13% 7 | 109% 7 | 189% 7 | 0% 8 | |
Net assets, end of period (000s omitted) | $1,172,983 | $1,272,420 | $1,542,707 | $1,287,856 | $1,253,699 | $1,472,484 | $1,348,107 | |
| * | Ratios include only the net expenses allocated from the affiliated Master Portfolios and do not include expenses from any other affiliated Underlying Funds. Net expenses allocated from the affiliated Master Portfolios included in the ratios were as follows: |
| Six months ended November 30, 2022 (unaudited) | 0.35% |
| Year ended May 31, 2022 | 0.34% |
| Year ended May 31, 2021 | 0.38% |
| Year ended May 31, 20201 | 0.45% |
| Year ended April 30, 2020 | 0.45% |
| Year ended April 30, 2019 | 0.40% |
| 1 | For the one month ended May 31, 2020. The Fund changed its fiscal year end from April 30 to May 31, effective May 31, 2020. |
| 2 | Calculated based upon average shares outstanding |
| 3 | Amount is less than $0.005. |
| 4 | Total return calculations do not include any sales charges. Returns for periods of less than one year are not annualized. |
| 5 | For year ended May 31, 2021, the Fund received a payment from an affiliate that had an impact of less than 0.005% on total return. |
| 6 | Ratios did not include any expenses from Asset Allocation Trust or its investments in underlying funds. Asset Allocation Trust did not have any net expenses. |
| 7 | Portfolio turnover rate is calculated by multiplying the Fund’s ownership percentage in the respective affiliated Master Portfolio by the corresponding affiliated Master Portfolio’s purchases and sales. These purchases and sales amounts are aggregated with the direct purchases and sales in the affiliated Underlying Funds and unaffiliated securities and included in the portfolio turnover calculation. |
| 8 | Portfolio turnover rate represents the purchase and sales of the Fund’s investment in Asset Allocation Trust and not the underlying investment transactions of Asset Allocation Trust. |
| Year ended May 31 | Year ended April 30 | |||||||
| Class C | Six months ended November 30, 2022 (unaudited) | 2022 | 2021 | 2020 1 | 2020 | 2019 | 2018 | |
Net asset value, beginning of period | $13.34 | $16.60 | $13.01 | $12.58 | $12.99 | $13.87 | $13.17 | |
Net investment income (loss) | 0.04 2 | 0.06 2 | 0.06 2 | 0.01 2 | 0.11 2 | 0.03 2 | (0.22) 2 | |
Payment from affiliate | 0.00 | 0.00 | 0.17 | 0.00 | 0.00 | 0.00 | 0.00 | |
Net realized and unrealized gains (losses) on investments | (0.37) | (1.18) | 3.54 | 0.42 | (0.36) | 0.06 | 1.03 | |
Total from investment operations | (0.33) | (1.12) | 3.77 | 0.43 | (0.25) | 0.09 | 0.81 | |
| Distributions to shareholders from | ||||||||
Net investment income | 0.00 | 0.00 | 0.00 | 0.00 | 0.00 | 0.00 | (0.11) | |
Net realized gains | 0.00 | (2.14) | (0.18) | 0.00 | (0.16) | (0.97) | 0.00 | |
Total distributions to shareholders | 0.00 | (2.14) | (0.18) | 0.00 | (0.16) | (0.97) | (0.11) | |
Net asset value, end of period | $13.01 | $13.34 | $16.60 | $13.01 | $12.58 | $12.99 | $13.87 | |
Total return3 | (2.47)% | (8.08)% | 29.19% 4 | 3.42% | (2.02)% | 1.21% | 6.16% | |
| Ratios to average net assets (annualized) | ||||||||
Gross expenses | 1.85% * | 1.83% * | 1.89% * | 1.96% * | 1.97% * | 1.92% *,5 | 1.57% 5 | |
Net expenses | 1.79% * | 1.78% * | 1.79% * | 1.79% * | 1.80% * | 1.78% *,5 | 1.57% 5 | |
Net investment income (loss) | 0.62% * | 0.38% * | 0.43% * | 0.47% * | 0.82% * | 0.23% *,5 | (1.57)% 5 | |
| Supplemental data | ||||||||
Portfolio turnover rate | 51% 6 | 111% 6 | 137% 6 | 13% 6 | 109% 6 | 189% 6 | 0% 7 | |
Net assets, end of period (000s omitted) | $23,690 | $31,038 | $52,586 | $118,081 | $120,029 | $237,096 | $905,336 | |
| * | Ratios include only the net expenses allocated from the affiliated Master Portfolios and do not include expenses from any other affiliated Underlying Funds. Net expenses allocated from the affiliated Master Portfolios included in the ratios were as follows: |
| Six months ended November 30, 2022 (unaudited) | 0.35% |
| Year ended May 31, 2022 | 0.34% |
| Year ended May 31, 2021 | 0.39% |
| Year ended May 31, 20201 | 0.44% |
| Year ended April 30, 2020 | 0.45% |
| Year ended April 30, 2019 | 0.38% |
| 1 | For the one month ended May 31, 2020. The Fund changed its fiscal year end from April 30 to May 31, effective May 31, 2020. |
| 2 | Calculated based upon average shares outstanding |
| 3 | Total return calculations do not include any sales charges. Returns for periods of less than one year are not annualized. |
| 4 | For year ended May 31, 2021, the Fund received a payment from an affiliate which had a 1.29% impact on the total return. |
| 5 | Ratios did not include any expenses from Asset Allocation Trust or its investments in underlying funds. Asset Allocation Trust did not have any net expenses. |
| 6 | Portfolio turnover rate is calculated by multiplying the Fund’s ownership percentage in the respective affiliated Master Portfolio by the corresponding affiliated Master Portfolio’s purchases and sales. These purchases and sales amounts are aggregated with the direct purchases and sales in the affiliated Underlying Funds and unaffiliated securities and included in the portfolio turnover calculation. |
| 7 | Portfolio turnover rate represents the purchase and sales of the Fund’s investment in Asset Allocation Trust and not the underlying investment transactions of Asset Allocation Trust. |
| Year ended May 31 | Year ended April 30 | |||||||
| Class R | Six months ended November 30, 2022 (unaudited) | 2022 | 2021 | 2020 1 | 2020 | 2019 | 2018 | |
Net asset value, beginning of period | $13.52 | $16.86 | $13.47 | $13.02 | $13.37 | $14.20 | $13.49 | |
Net investment income (loss) | 0.07 2 | 0.14 2 | 0.14 2 | 0.01 2 | 0.18 2 | 0.11 2 | (0.15) 2 | |
Payment from affiliate | 0.00 | 0.00 | 0.07 | 0.00 | 0.00 | 0.00 | 0.00 | |
Net realized and unrealized gains (losses) on investments | (0.38) | (1.19) | 3.71 | 0.44 | (0.37) | 0.05 | 1.05 | |
Total from investment operations | (0.31) | (1.05) | 3.92 | 0.45 | 0.19 | 0.16 | 0.90 | |
| Distributions to shareholders from | ||||||||
Net investment income | 0.00 | (0.15) | (0.34) | 0.00 | 0.00 | (0.02) | (0.19) | |
Net realized gains | 0.00 | (2.14) | (0.19) | 0.00 | (0.16) | (0.97) | 0.00 | |
Total distributions to shareholders | 0.00 | (2.29) | (0.53) | 0.00 | (0.16) | (0.99) | (0.19) | |
Net asset value, end of period | $13.21 | $13.52 | $16.86 | $13.47 | $13.02 | $13.37 | $14.20 | |
Total return3 | (2.29)% | (7.57)% | 29.44% 4 | 3.46% | (1.51)% | 1.73% | 6.70% | |
| Ratios to average net assets (annualized) | ||||||||
Gross expenses | 1.34% * | 1.33% * | 1.37% * | 1.44% * | 1.47% * | 1.42% *,5 | 1.06% 5 | |
Net expenses | 1.29% * | 1.28% * | 1.28% * | 1.27% * | 1.30% * | 1.29% *,5 | 1.06% 5 | |
Net investment income (loss) | 1.13% * | 0.91% * | 0.95% * | 0.99% * | 1.32% * | 0.77% *,5 | (1.06)% 5 | |
| Supplemental data | ||||||||
Portfolio turnover rate | 51% 6 | 111% 6 | 137% 6 | 13% 6 | 109% 6 | 189% 6 | 0% 7 | |
Net assets, end of period (000s omitted) | $2,201 | $2,863 | $3,407 | $4,318 | $4,106 | $7,619 | $15,658 | |
| * | Ratios include only the net expenses allocated from the affiliated Master Portfolios and do not include expenses from any other affiliated Underlying Funds. Net expenses allocated from the affiliated Master Portfolios included in the ratios were as follows: |
| Six months ended November 30, 2022 (unaudited) | 0.35% |
| Year ended May 31, 2022 | 0.34% |
| Year ended May 31, 2021 | 0.38% |
| Year ended May 31, 20201 | 0.45% |
| Year ended April 30, 2020 | 0.45% |
| Year ended April 30, 2019 | 0.39% |
| 1 | For the one month ended May 31, 2020. The Fund changed its fiscal year end from April 30 to May 31, effective May 31, 2020. |
| 2 | Calculated based upon average shares outstanding |
| 3 | Returns for periods of less than one year are not annualized. |
| 4 | For year ended May 31, 2021, the Fund received a payment from an affiliate which had a 0.51% impact on the total return. |
| 5 | Ratios did not include any expenses from Asset Allocation Trust or its investments in underlying funds. Asset Allocation Trust did not have any net expenses. |
| 6 | Portfolio turnover rate is calculated by multiplying the Fund’s ownership percentage in the respective affiliated Master Portfolio by the corresponding affiliated Master Portfolio’s purchases and sales. These purchases and sales amounts are aggregated with the direct purchases and sales in the affiliated Underlying Funds and unaffiliated securities and included in the portfolio turnover calculation. |
| 7 | Portfolio turnover rate represents the purchase and sales of the Fund’s investment in Asset Allocation Trust and not the underlying investment transactions of Asset Allocation Trust. |
| Year ended May 31 | Year ended April 30 | |||||||
| Administrator Class | Six months ended November 30, 2022 (unaudited) | 2022 | 2021 | 2020 1 | 2020 | 2019 | 2018 | |
Net asset value, beginning of period | $13.89 | $17.25 | $13.75 | $13.29 | $13.66 | $14.49 | $13.78 | |
Net investment income (loss) | 0.10 2 | 0.21 2 | 0.21 2 | 0.02 2 | 0.24 2 | 0.16 2 | (0.09) 2 | |
Payment from affiliate | 0.00 | 0.00 | 0.12 | 0.00 | 0.00 | 0.00 | 0.00 | |
Net realized and unrealized gains (losses) on investments | (0.25) | (1.22) | 3.81 | 0.44 | (0.37) | 0.06 | 1.07 | |
Total from investment operations | (0.15) | (1.01) | 4.14 | 0.46 | (0.13) | 0.22 | 0.98 | |
| Distributions to shareholders from | ||||||||
Net investment income | 0.00 | (0.21) | (0.45) | 0.00 | (0.08) | (0.08) | (0.27) | |
Net realized gains | 0.00 | (2.14) | (0.19) | 0.00 | (0.16) | (0.97) | 0.00 | |
Total distributions to shareholders | 0.00 | (2.35) | (0.64) | 0.00 | (0.24) | (1.05) | (0.27) | |
Net asset value, end of period | $13.74 | $13.89 | $17.25 | $13.75 | $13.29 | $13.66 | $14.49 | |
Total return3 | (1.08)% 4 | (7.21)% | 30.62% 5 | 3.46% | (1.08)% | 2.18% | 7.10% | |
| Ratios to average net assets (annualized) | ||||||||
Gross expenses | 1.02% * | 1.01% * | 1.06% * | 1.13% * | 1.14% * | 1.08% *,6 | 0.73% 6 | |
Net expenses | 0.86% * | 0.86% * | 0.87% * | 0.86% * | 0.86% * | 0.86% *,6 | 0.64% 6 | |
Net investment income (loss) | 1.52% * | 1.32% * | 1.36% * | 1.40% * | 1.74% * | 1.17% *,6 | (0.64)% 6 | |
| Supplemental data | ||||||||
Portfolio turnover rate | 51% 7 | 111% 7 | 137% 7 | 13% 7 | 109% 7 | 189% 7 | 0% 8 | |
Net assets, end of period (000s omitted) | $15,913 | $18,332 | $25,026 | $21,628 | $21,316 | $31,610 | $69,607 | |
| * | Ratios include only the net expenses allocated from the affiliated Master Portfolios and do not include expenses from any other affiliated Underlying Funds. Net expenses allocated from the affiliated Master Portfolios included in the ratios were as follows: |
| Six months ended November 30, 2022 (unaudited) | 0.35% |
| Year ended May 31, 2022 | 0.34% |
| Year ended May 31, 2021 | 0.38% |
| Year ended May 31, 20201 | 0.45% |
| Year ended April 30, 2020 | 0.44% |
| Year ended April 30, 2019 | 0.38% |
| 1 | For the one month ended May 31, 2020. The Fund changed its fiscal year end from April 30 to May 31, effective May 31, 2020. |
| 2 | Calculated based upon average shares outstanding |
| 3 | Returns for periods of less than one year are not annualized. |
| 4 | During the six months ended November 30, 2022, the Fund received payments from a service provider which had a 1.04% impact on the total return. |
| 5 | For year ended May 31, 2021, the Fund received a payment from an affiliate which had a 0.90% impact on the total return. |
| 6 | Ratios did not include any expenses from Asset Allocation Trust or its investments in underlying funds. Asset Allocation Trust did not have any net expenses. |
| 7 | Portfolio turnover rate is calculated by multiplying the Fund’s ownership percentage in the respective affiliated Master Portfolio by the corresponding affiliated Master Portfolio’s purchases and sales. These purchases and sales amounts are aggregated with the direct purchases and sales in the affiliated Underlying Funds and unaffiliated securities and included in the portfolio turnover calculation. |
| 8 | Portfolio turnover rate represents the purchase and sales of the Fund’s investment in Asset Allocation Trust and not the underlying investment transactions of Asset Allocation Trust. |
| Year ended May 31 | Year ended April 30 | |||||||
| Institutional Class | Six months ended November 30, 2022 (unaudited) | 2022 | 2021 | 2020 1 | 2020 | 2019 | 2018 | |
Net asset value, beginning of period | $13.60 | $16.94 | $13.61 | $13.14 | $13.52 | $14.36 | $13.66 | |
Net investment income (loss) | 0.11 2 | 0.24 2 | 0.24 | 0.02 2 | 0.26 2 | 0.19 2 | (0.06) 2 | |
Net realized and unrealized gains (losses) on investments | (0.38) | (1.20) | 3.74 | 0.45 | (0.38) | 0.05 | 1.06 | |
Total from investment operations | (0.27) | (0.96) | 3.98 | 0.47 | (0.12) | 0.24 | 1.00 | |
| Distributions to shareholders from | ||||||||
Net investment income | 0.00 | (0.24) | (0.46) | 0.00 | (0.10) | (0.11) | (0.30) | |
Net realized gains | 0.00 | (2.14) | (0.19) | 0.00 | (0.16) | 0.97 | 0.00 | |
Total distributions to shareholders | 0.00 | (2.38) | (0.65) | 0.00 | (0.26) | (1.08) | (0.30) | |
Net asset value, end of period | $13.33 | $13.60 | $16.94 | $13.61 | $13.14 | $13.52 | $14.36 | |
Total return3 | (1.99)% | (7.10)% | 29.76% | 3.58% | (1.01)% | 2.39% | 7.33% | |
| Ratios to average net assets (annualized) | ||||||||
Gross expenses | 0.78% * | 0.76% * | 0.81% * | 0.88% * | 0.89% * | 0.84% *,4 | 0.49% 4 | |
Net expenses | 0.71% * | 0.71% * | 0.71% * | 0.72% * | 0.72% * | 0.69% *,4 | 0.44% 4 | |
Net investment income (loss) | 1.69% * | 1.48% * | 1.52% * | 1.55% * | 1.88% * | 1.34% *,4 | (0.44)% 4 | |
| Supplemental data | ||||||||
Portfolio turnover rate | 51% 5 | 111% 5 | 137% 5 | 13% 5 | 109% 5 | 189% 6 | 0% 6 | |
Net assets, end of period (000s omitted) | $188,186 | $218,479 | $266,822 | $231,652 | $227,529 | $311,958 | $572,803 | |
| * | Ratios include only the net expenses allocated from the affiliated Master Portfolios and do not include expenses from any other affiliated Underlying Funds. Net expenses allocated from the affiliated Master Portfolios included in the ratios were as follows: |
| Six months ended November 30, 2022 (unaudited) | 0.35% |
| Year ended May 31, 2022 | 0.34% |
| Year ended May 31, 2021 | 0.38% |
| Year ended May 31, 20201 | 0.45% |
| Year ended April 30, 2020 | 0.45% |
| Year ended April 30, 2019 | 0.38% |
| 1 | For the one month ended May 31, 2020. The Fund changed its fiscal year end from April 30 to May 31, effective May 31, 2020. |
| 2 | Calculated based upon average shares outstanding |
| 3 | Returns for periods of less than one year are not annualized. |
| 4 | Ratios did not include any expenses from Asset Allocation Trust or its investments in underlying funds. Asset Allocation Trust did not have any net expenses. |
| 5 | Portfolio turnover rate is calculated by multiplying the Fund’s ownership percentage in the respective affiliated Master Portfolio by the corresponding affiliated Master Portfolio’s purchases and sales. These purchases and sales amounts are aggregated with the direct purchases and sales in the affiliated Underlying Funds and unaffiliated securities and included in the portfolio turnover calculation. |
| 6 | Portfolio turnover rate represents the purchase and sales of the Fund’s investment in Asset Allocation Trust and not the underlying investment transactions of Asset Allocation Trust. |
| Gross unrealized gains | $ 75,642,967 |
| Gross unrealized losses | (25,029,541) |
| Net unrealized gains | $ 50,613,426 |
| ■ | Level 1 – quoted prices in active markets for identical securities |
| ■ | Level 2 – other significant observable inputs (including quoted prices for similar securities, interest rates, prepayment speeds, credit risk, etc.) |
| ■ | Level 3 – significant unobservable inputs (including the Fund’s own assumptions in determining the fair value of investments) |
| Quoted prices (Level 1) | Other significant observable inputs (Level 2) | Significant unobservable inputs (Level 3) | Total | |
| Assets | ||||
| Investments in: | ||||
| Investment companies | $ 326,345,129 | $0 | $0 | $ 326,345,129 |
| Investments measured at net asset value* | 1,065,840,384 | |||
| 326,345,129 | 0 | 0 | 1,392,185,513 | |
| Futures contracts | 4,224,283 | 0 | 0 | 4,224,283 |
| Total assets | 330,569,412 | $0 | $0 | $1,396,409,796 |
| Liabilities | ||||
| Futures contracts | $ 8,866,595 | $0 | $0 | $ 8,866,595 |
| Total liabilities | $ 8,866,595 | $0 | $0 | $ 8,866,595 |
| * | Investments that are measured at fair value using the net asset value per share (or its equivalent) as a practical expedient have not been categorized in the fair value hierarchy. The fair value amount presented in the table is intended to permit reconciliation of the fair value hierarchy to the amounts presented in the Statement of Assets and Liabilities. The Fund’s investments in the affiliated Master Portfolios are valued at $1,065,840,384. Each affiliated Master Portfolio does not have a redemption period notice, can be redeemed daily and does not have any unfunded commitments. |
| Affiliated Master Portfolio | Investment objective |
| Allspring C&B Large Cap Value Portfolio | Seeks maximum long-term total return (current income and capital appreciation), consistent with minimizing risk to principal |
| Allspring Core Bond Portfolio | Seeks total return, consisting of income and capital appreciation |
| Allspring Disciplined International Developed Markets Portfolio | Seeks long-term capital appreciation |
| Allspring Diversified Large Cap Growth Portfolio | Seeks long-term capital appreciation |
| Allspring Emerging Growth Portfolio | Seeks long-term capital appreciation |
| Allspring Factor Enhanced Emerging Markets Equity Portfolio | Seeks long-term capital appreciation |
| Allspring Factor Enhanced International Equity Portfolio | Seeks long-term capital appreciation |
| Allspring Large Company Value Portfolio | Seeks long-term capital appreciation |
| Allspring Managed Fixed Income Portfolio | Seeks consistent fixed-income returns |
| Allspring Real Return Portfolio | Seeks returns that exceed the rate of inflation over the long-term |
| Allspring Small Company Growth Portfolio | Seeks long-term capital appreciation |
| Allspring Small Company Value Portfolio | Seeks long-term capital appreciation |
| Average daily net assets | Management fee |
| First $500 million | 0.300% |
| Next $500 million | 0.280 |
| Next $2 billion | 0.260 |
| Next $2 billion | 0.240 |
| Next $5 billion | 0.230 |
| Over $10 billion | 0.220 |
| Class-level administration fee | |
| Class A | 0.21% |
| Class C | 0.21 |
| Class R | 0.21 |
| Administrator Class | 0.13 |
| Institutional Class | 0.13 |
| Expense ratio caps | |
| Class A | 1.13% |
| Class C | 1.88 |
| Class R | 1.38 |
| Administrator Class | 0.95 |
| Institutional Class | 0.80 |
| Purchases at cost | Sales proceeds | |||
| U.S. government | Non-U.S. government | U.S. government | Non-U.S. government | |
| $134,237,491 | $573,428,114 | $137,948,462 | $614,151,130 | |
| Asset derivatives | Liability derivatives | ||||
| Statement of Assets and Liabilities location | Fair value | Statement of Assets and Liabilities location | Fair value | ||
| Interest rate risk | Unrealized gains on futures contracts | $ 1,125,258* | Unrealized losses on futures contracts | $ 779,847* | |
| Equity risk | Unrealized gains on futures contracts | 3,099,025* | Unrealized losses on futures contracts | 8,086,748* | |
| $4,224,283 | $8,866,595 | ||||
| * | Amount represents cumulative unrealized gains (losses) on futures contracts as reported in the table following the Portfolio of Investments. For futures contracts, only the current day’s variation margin as of November 30, 2022 is reported separately on the Statement of Assets and Liabilities. |
| Net realized gains (losses) on derivatives | Net change in unrealized gains (losses) on derivatives | |
| Interest rate risk | $ 542,723 | $ 297,053 |
| Equity risk | 10,097,264 | (4,750,252) |
| Foreign currency risk | (2,223,399) | (386,833) |
| $ 8,416,588 | $(4,840,032) |
| Name and year of birth | Position held and length of service* | Principal occupations during past five years or longer | Current other public company or investment company directorships |
| William R. Ebsworth (Born 1957) | Trustee, since 2015 | Retired. From 1984 to 2013, equities analyst, portfolio manager, research director and chief investment officer at Fidelity Management and Research Company in Boston, Tokyo, and Hong Kong, and retired in 2013 as Chief Investment Officer of Fidelity Strategic Advisers, Inc. where he led a team of investment professionals managing client assets. Prior thereto, Board member of Hong Kong Securities Clearing Co., Hong Kong Options Clearing Corp., the Thailand International Fund, Ltd., Fidelity Investments Life Insurance Company, and Empire Fidelity Investments Life Insurance Company. Audit Committee Chair and Investment Committee Chair of the Vincent Memorial Hospital Endowment (non-profit organization). Mr. Ebsworth is a CFA® charterholder. | N/A |
| Jane A. Freeman (Born 1953) | Trustee, since 2015; Chair Liaison, since 2018 | Retired. From 2012 to 2014 and 1999 to 2008, Chief Financial Officer of Scientific Learning Corporation. From 2008 to 2012, Ms. Freeman provided consulting services related to strategic business projects. Prior to 1999, Portfolio Manager at Rockefeller & Co. and Scudder, Stevens & Clark. Board member of the Harding Loevner Funds from 1996 to 2014, serving as both Lead Independent Director and chair of the Audit Committee. Board member of the Russell Exchange Traded Funds Trust from 2011 to 2012 and the chair of the Audit Committee. Ms. Freeman is also an inactive Chartered Financial Analyst. | N/A |
| Isaiah Harris, Jr. (Born 1952) | Trustee, since 2009; Audit Committee Chair, since 2019 | Retired. Chairman of the Board of CIGNA Corporation from 2009 to 2021, and Director from 2005 to 2008. From 2003 to 2011, Director of Deluxe Corporation. Prior thereto, President and CEO of BellSouth Advertising and Publishing Corp. from 2005 to 2007, President and CEO of BellSouth Enterprises from 2004 to 2005 and President of BellSouth Consumer Services from 2000 to 2003. Emeritus member of the Iowa State University Foundation Board of Governors. Emeritus Member of the Advisory Board of Iowa State University School of Business. Advisory Board Member, Palm Harbor Academy (private school). Advisory Board Member, Fellowship of Christian Athletes. Mr. Harris is a certified public accountant (inactive status). | N/A |
| David F. Larcker (Born 1950) | Trustee, since 2009 | James Irvin Miller Professor of Accounting at the Graduate School of Business (Emeritus), Stanford University, Director of the Corporate Governance Research Initiative and Senior Faculty of The Rock Center for Corporate Governance since 2006. From 2005 to 2008, Professor of Accounting at the Graduate School of Business, Stanford University. Prior thereto, Ernst & Young Professor of Accounting at The Wharton School, University of Pennsylvania from 1985 to 2005. | N/A |
| Name and year of birth | Position held and length of service* | Principal occupations during past five years or longer | Current other public company or investment company directorships |
| Olivia S. Mitchell (Born 1953) | Trustee, since 2006; Nominating and Governance Committee Chair, since 2018 | International Foundation of Employee Benefit Plans Professor since 1993, Wharton School of the University of Pennsylvania. Director of Wharton’s Pension Research Council and Boettner Center on Pensions & Retirement Research, and Research Associate at the National Bureau of Economic Research. Previously taught at Cornell University from 1978 to 1993. | N/A |
| Timothy J. Penny (Born 1951) | Trustee, since 1996; Chair, since 2018 | President and Chief Executive Officer of Southern Minnesota Initiative Foundation, a non-profit organization, since 2007. Vice Chair of the Economic Club of Minnesota, since 2007. Co-Chair of the Committee for a Responsible Federal Budget, since 1995. Member of the Board of Trustees of NorthStar Education Finance, Inc., a non-profit organization, since 2007. Senior Fellow of the University of Minnesota Humphrey Institute from 1995 to 2017. | N/A |
| James G. Polisson (Born 1959) | Trustee, since 2018 | Retired. Chief Marketing Officer, Source (ETF) UK Services, Ltd, from 2015 to 2017. From 2012 to 2015, Principal of The Polisson Group, LLC, a management consulting, corporate advisory and principal investing company. Chief Executive Officer and Managing Director at Russell Investments, Global Exchange Traded Funds from 2010 to 2012. Managing Director of Barclays Global Investors from 1998 to 2010 and Global Chief Marketing Officer for iShares and Barclays Global Investors from 2000 to 2010. Trustee of the San Francisco Mechanics’ Institute, a non-profit organization, from 2013 to 2015. Board member of the Russell Exchange Traded Fund Trust from 2011 to 2012. Director of Barclays Global Investors Holdings Deutschland GmbH from 2006 to 2009. Mr. Polisson is an attorney and has a retired status with the Massachusetts and District of Columbia Bar Associations. | N/A |
| Pamela Wheelock (Born 1959) | Trustee, since January 2020; previously Trustee from January 2018 to July 2019 | Retired. Executive and Senior Financial leadership positions in the public, private and nonprofit sectors. Interim President and CEO, McKnight Foundation, 2020. Interim Commissioner, Minnesota Department of Human Services, 2019. Chief Operating Officer, Twin Cities Habitat for Humanity, 2017-2019. Vice President for University Services, University of Minnesota, 2012-2016. Interim President and CEO, Blue Cross and Blue Shield of Minnesota, 2011-2012. Executive Vice-President and Chief Financial Officer, Minnesota Wild, 2002-2008. Commissioner, Minnesota Department of Finance, 1999-2002. Chair of the Board of Directors of Destination Medical Center Corporation. Board member of the Minnesota Wild Foundation. | N/A |
| Name and year of birth | Position held and length of service | Principal occupations during past five years or longer |
| Andrew Owen (Born 1960) | President, since 2017 | President and Chief Executive Officer of Allspring Funds Management, LLC since 2017 and Head of Global Fund Governance of Allspring Global Investments since 2022. Prior thereto, co-president of Galliard Capital Management, LLC, an affiliate of Allspring Funds Management, LLC, from 2019 to 2022 and Head of Affiliated Managers, Allspring Global Investments, from 2014 to 2019 and Executive Vice President responsible for marketing, investments and product development for Allspring Funds Management, LLC, from 2009 to 2014. |
| Jeremy DePalma (Born 1974) | Treasurer, since 2012 (for certain funds in the Fund Complex); since 2021 (for the remaining funds in the Fund Complex) | Senior Vice President of Allspring Funds Management, LLC since 2009. Senior Vice President of Evergreen Investment Management Company, LLC from 2008 to 2010 and head of the Fund Reporting and Control Team within Fund Administration from 2005 to 2010. |
| Christopher Baker (Born 1976) | Chief Compliance Officer, since 2022 | Global Chief Compliance Officer for Allspring Global Investments since 2022. Prior thereto, Chief Compliance Officer for State Street Global Advisors from 2018 to 2021. Senior Compliance Officer for the State Street divisions of Alternative Investment Solutions, Sector Solutions, and Global Marketing from 2015 to 2018. From 2010 to 2015 Vice President, Global Head of Investment and Marketing Compliance for State Street Global Advisors. |
| Matthew Prasse (Born 1983) | Chief Legal Officer, since 2022; Secretary, since 2021 | Senior Counsel of the Allspring Legal Department since 2021. Senior Counsel of the Wells Fargo Legal Department from 2018 to 2021. Previously, Counsel for Barings LLC from 2015 to 2018. Prior to joining Barings, Associate at Morgan, Lewis & Bockius LLP from 2008 to 2015. |
P.O. Box 219967
Kansas City, MO 64121-9967

1-800-222-8222 or visit the Fund's website at allspringglobal.com. Read the prospectus carefully before you invest or send money.
SA224/SAR224 11-22


| 1 | The S&P 500 Index consists of 500 stocks chosen for market size, liquidity, and industry group representation. It is a market-value-weighted index with each stock's weight in the index proportionate to its market value. You cannot invest directly in an index. |
| 2 | The Morgan Stanley Capital International (MSCI) All Country World Index (ACWI) ex USA Index (Net) is a free-float-adjusted market-capitalization-weighted index that is designed to measure the equity market performance of developed and emerging markets, excluding the U.S. Source: MSCI. MSCI makes no express or implied warranties or representations and shall have no liability whatsoever with respect to any MSCI data contained herein. The MSCI data may not be further redistributed or used as a basis for other indexes or any securities or financial products. This report is not approved, reviewed, or produced by MSCI. You cannot invest directly in an index. |
| 3 | The MSCI Emerging Markets (EM) Index (Net) (USD) is a free-float-adjusted market-capitalization-weighted index that is designed to measure equity market performance of emerging markets. You cannot invest directly in an index. |
| 4 | The Bloomberg U.S. Aggregate Bond Index is a broad-based benchmark that measures the investment-grade, U.S.-dollar-denominated, fixed-rate taxable bond market, including Treasuries, government-related and corporate securities, mortgage-backed securities (agency fixed-rate and hybrid adjustable-rate mortgage pass-throughs), asset-backed securities, and commercial mortgage-backed securities. You cannot invest directly in an index. |
| 5 | The Bloomberg Global Aggregate ex-USD Index (unhedged) is an unmanaged index that provides a broad-based measure of the global investment-grade fixed-income markets excluding the U.S.-dollar-denominated debt market. You cannot invest directly in an index. |
| 6 | The Bloomberg Municipal Bond Index is an unmanaged index composed of long-term tax-exempt bonds with a minimum credit rating of Baa. You cannot invest directly in an index. |
| 7 | The ICE BofA U.S. High Yield Index is a market-capitalization-weighted index of domestic and Yankee high-yield bonds. The index tracks the performance of high-yield securities traded in the U.S. bond market. You cannot invest directly in an index. Copyright 2023. ICE Data Indices, LLC. All rights reserved. |

President
Allspring Funds
| Investment objective | The Fund seeks total return, consisting of capital appreciation and current income. |
| Manager | Allspring Funds Management, LLC |
| Subadviser | Allspring Global Investments, LLC |
| Portfolio managers | Kandarp R. Acharya, CFA®‡, FRM, Petros N. Bocray, CFA®‡, FRM, Travis L. Keshemberg, CFA®‡, CIPM, FRM |
| Average annual total returns (%) as of November 30, 2022 | |||||||||||
| Including sales charge | Excluding sales charge | Expense ratios1 (%) | |||||||||
| Inception date | 1 year | 5 year | 10 year | 1 year | 5 year | 10 year | Gross | Net 2 | |||
| Class A (WFGBX) | 10-14-1998 | -15.99 | 3.41 | 6.83 | -10.87 | 4.64 | 7.47 | 1.24 | 1.13 | ||
| Class C (WFGWX) | 10-1-1998 | -12.50 | 3.87 | 6.84 | -11.50 | 3.87 | 6.84 | 1.99 | 1.88 | ||
| Administrator Class (NVGBX) | 11-11-1994 | – | – | – | -10.68 | 4.84 | 7.71 | 1.16 | 0.95 | ||
| Growth Balanced Blended Index3 | – | – | – | – | -11.41 | 5.31 | 7.68 | – | – | ||
| Bloomberg U.S. Aggregate Bond Index4 | – | – | – | – | -12.84 | 0.21 | 1.09 | – | – | ||
| MSCI ACWI ex USA Index (Net)5 | – | – | – | – | -11.87 | 1.48 | 4.23 | – | – | ||
| Russell 3000® Index6 | – | – | – | – | -10.80 | 10.33 | 12.95 | – | – | ||
| 1 | Reflects the expense ratios as stated in the most recent prospectuses, which include the impact of 0.43% in acquired fund fees and expenses. The expense ratios shown are subject to change and may differ from the annualized expense ratios shown in the financial highlights of this report, which do not include acquired fund fees and expenses. |
| 2 | The manager has contractually committed through September 30, 2023, to waive fees and/or reimburse expenses to the extent necessary to cap total annual fund operating expenses after fee waivers at 1.13% for Class A, 1.88% for Class C, and 0.95% for Administrator Class. Brokerage commissions, stamp duty fees, interest, taxes, acquired fund fees and expenses (if any) from funds in which the affiliated master portfolios and funds invest and from money market funds, and extraordinary expenses are excluded from the expense caps. All other acquired fund fees and expenses from the affiliated master portfolios and funds are included in the expense caps. Prior to or after the commitment expiration date, the caps may be increased or the commitment to maintain the caps may be terminated only with the approval of the Board of Trustees. Without these caps, the Fund’s returns would have been lower. The expense ratio paid by an investor is the net expense ratio (the total annual fund operating expenses after fee waivers) as stated in the prospectuses. |
| 3 | Source: Allspring Funds Management, LLC. The Growth Balanced Blended Index is composed 45% of the Russell 3000® Index, 35% of the Bloomberg U.S. Aggregate Bond Index, and 20% of the MSCI ACWI ex USA Index (Net). Prior to November 30, 2017, the Growth Balanced Blended Index was composed 35% of the Bloomberg U.S. Aggregate Bond Index, 16.25% of the Russell 1000® Growth Index, 16.25% of the Russell 1000® Value Index, 16.25% of the S&P 500 Index, 9.75% of the MSCI EAFE Index (Net), and 6.50% of the Russell 2000® Index. You cannot invest directly in an index. |
| 4 | The Bloomberg U.S. Aggregate Bond Index is a broad-based benchmark that measures the investment-grade, U.S. dollar–denominated, fixed-rate taxable bond market, including Treasuries, government-related and corporate securities, mortgage-backed securities (agency fixed-rate and hybrid adjustable-rate mortgage pass-throughs), asset-backed securities, and commercial mortgage-backed securities. You cannot invest directly in an index. |
| 5 | The Morgan Stanley Capital International (MSCI) All Country World Index (ACWI) ex USA Index (Net) is a free-float-adjusted market- capitalization-weighted index that is designed to measure the equity market performance of developed and emerging markets, excluding the U.S. Source: MSCI. MSCI makes no express or implied warranties or representations and shall have no liability whatsoever with respect to any MSCI data contained herein. The MSCI data may not be further redistributed or used as a basis for other indexes or any securities or financial products. This report is not approved, reviewed, or produced by MSCI. You cannot invest directly in an index. |
| ‡ | CFA® and Chartered Financial Analyst® are trademarks owned by CFA Institute. |
| 6 | The Russell 3000® Index measures the performance of the 3,000 largest U.S. companies based on total market capitalization, which represents approximately 98% of the investable U.S. equity market. You cannot invest directly in an index. |
| Ten largest holdings (%) as of November 30, 20221 | |
| Allspring Managed Fixed Income Portfolio | 21.00 |
| Allspring Disciplined U.S. Core Fund Class R6 | 13.81 |
| Allspring Large Company Value Portfolio | 11.76 |
| Allspring Diversified Large Cap Growth Portfolio | 11.11 |
| Allspring Disciplined International Developed Markets Portfolio | 8.95 |
| Allspring Core Bond Portfolio | 6.52 |
| iShares Core MSCI EAFE ETF | 4.10 |
| Allspring C&B Large Cap Value Portfolio | 3.53 |
| Allspring Real Return Portfolio | 3.38 |
| Allspring Factor Enhanced International Equity Portfolio | 3.32 |
| 1 | Figures represent the percentage of the Fund's net assets. Holdings are subject to change and may have changed since the date specified. |
| Allocation (%) as of November 30, 2022 | ||
| Neutral allocation | Effective allocation1 | |
| Bond Funds | 35 | 42 |
| Stock Funds | 65 | 65 |
| Effective Cash | 0 | (7) |
| 1 | Effective allocation includes the effect of any tactical futures overlay that may be in place. Effective cash, if any, represents the net offset to such future positions. Effective allocations are subject to change and may have changed since the date specified. |
| Beginning account value 6-1-2022 | Ending account value 11-30-2022 | Expenses paid during the period1,2 | Annualized net expense ratio2 | |
| Class A | ||||
| Actual | $1,000.00 | $ 978.89 | $5.21 | 1.05% |
| Hypothetical (5% return before expenses) | $1,000.00 | $1,019.80 | $5.32 | 1.05% |
| Class C | ||||
| Actual | $1,000.00 | $ 975.35 | $8.91 | 1.80% |
| Hypothetical (5% return before expenses) | $1,000.00 | $1,016.04 | $9.10 | 1.80% |
| Administrator Class | ||||
| Actual | $1,000.00 | $ 979.92 | $4.27 | 0.86% |
| Hypothetical (5% return before expenses) | $1,000.00 | $1,020.76 | $4.36 | 0.86% |
| Shares | Value | ||||
| Investment companies: 99.12% | |||||
| Affiliated master portfolios: 75.91% | |||||
| Allspring C&B Large Cap Value Portfolio | $ 6,732,950 | ||||
| Allspring Core Bond Portfolio | 12,427,631 | ||||
| Allspring Disciplined International Developed Markets Portfolio | 17,042,686 | ||||
| Allspring Diversified Large Cap Growth Portfolio | 21,157,917 | ||||
| Allspring Emerging Growth Portfolio | 2,108,075 | ||||
| Allspring Factor Enhanced Emerging Markets Equity Portfolio | 2,623,274 | ||||
| Allspring Factor Enhanced International Equity Portfolio | 6,316,896 | ||||
| Allspring Large Company Value Portfolio | 22,395,117 | ||||
| Allspring Managed Fixed Income Portfolio | 40,000,958 | ||||
| Allspring Real Return Portfolio | 6,434,675 | ||||
| Allspring Small Company Growth Portfolio | 2,085,008 | ||||
| Allspring Small Company Value Portfolio | 5,250,804 | ||||
| 144,575,991 | |||||
| Exchange-traded funds: 6.72% | |||||
| iShares Core MSCI EAFE ETF | 123,713 | 7,800,105 | |||
| iShares Core U.S. Aggregate Bond ETF | 50,779 | 4,991,068 | |||
| 12,791,173 | |||||
| Stock funds: 16.49% | |||||
| Allspring Disciplined U.S. Core Fund Class R6 ♠ | 1,266,050 | 26,308,519 | |||
| Allspring Emerging Markets Equity Fund Class R6 ♠ | 106,382 | 2,557,428 | |||
| Allspring Emerging Markets Equity Income Fund Class R6 ♠ | 248,562 | 2,550,251 | |||
| 31,416,198 | |||||
| Total Investment companies (Cost $172,282,993) | 188,783,362 | ||||
| Total investments in securities (Cost $172,282,993) | 99.12% | 188,783,362 | |||
| Other assets and liabilities, net | 0.88 | 1,669,608 | |||
| Total net assets | 100.00% | $190,452,970 |
| ♠ | The issuer of the security is an affiliated person of the Fund as defined in the Investment Company Act of 1940. |
| Value, beginning of period | Purchases | Sales proceeds | Net realized gains (losses) on affiliated Underlying Funds | Net change in unrealized gains (losses) on affiliated Underlying Funds | Value, end of period | |||
| Investment companies | ||||||||
| Allspring Disciplined U.S. Core Fund Class R6 | $27,300,335 | $572,525 | $(1,206,489) | $ (15,140) | $ (342,712) | $ 26,308,519 | ||
| Allspring Emerging Markets Equity Fund Class R6 | 2,608,804 | 122,573 | (14,161) | (7,356) | (152,432) | 2,557,428 | ||
| Allspring Emerging Markets Equity Income Fund Class R6 | 2,716,244 | 130,184 | (11,145) | (3,225) | (281,807) | 2,550,251 | ||
| $(25,721) | $(776,951) | $31,416,198 |
| Shares, end of period | Dividends from affiliated Underlying Funds | |
| Investment companies | ||
| Allspring Disciplined U.S. Core Fund Class R6 | 1,266,050 | $ 0 |
| Allspring Emerging Markets Equity Fund Class R6 | 106,382 | 0 |
| Allspring Emerging Markets Equity Income Fund Class R6 | 248,562 | 45,623 |
| $45,623 |
| % of ownership, beginning of period | % of ownership, end of period | Net realized gains (losses) on securities transactions allocated from affiliated Master Portfolios | Net change in unrealized gains (losses) on securities transactions allocated from affiliated Master Portfolios | Interest allocated from affiliated Master Portfolios | Dividends allocated from affiliated Master Portfolios | Affiliated income allocated from affiliated Master Portfolios | Value, end of period | ||||||||
| Allspring C&B Large Cap Value Portfolio | 2.15% | 2.30% | $ 297,536 | $ (381,783) | $ 0 | $ 71,405 | $ 1,281 | $ 6,732,950 | |||||||
| Allspring Core Bond Portfolio | 0.28 | 0.28 | (647,198) | (75,224) | 191,738 | 0 | 5,149 | 12,427,631 | |||||||
| Allspring Disciplined International Developed Markets Portfolio | 11.21 | 11.80 | (687,657) | 224,735 | 0 | 187,048 | 3,689 | 17,042,686 | |||||||
| Allspring Diversified Large Cap Growth Portfolio | 11.13 | 11.31 | 110,905 | (199,074) | 0 | 107,374 | 4,559 | 21,157,917 | |||||||
| Allspring Emerging Growth Portfolio | 0.54 | 0.58 | (57,335) | 175,852 | 0 | 2,704 | 1,228 | 2,108,075 | |||||||
| Allspring Factor Enhanced Emerging Markets Equity Portfolio | 2.00 | 2.24 | (152,940) | (85,397) | 0 | 55,715 | 1,153 | 2,623,274 | |||||||
| Allspring Factor Enhanced International Equity Portfolio | 1.23 | 1.34 | (253,209) | 23,740 | 0 | 71,179 | 2,000 | 6,316,896 | |||||||
| Allspring Large Company Value Portfolio | 10.96 | 11.47 | (1,469,929) | 1,173,680 | 0 | 267,427 | 4,439 | 22,395,117 | |||||||
| Allspring Managed Fixed Income Portfolio | 10.40 | 10.71 | (488,750) | (1,862,986) | 733,672 | 0 | 6,789 | 40,000,958 | |||||||
| Allspring Real Return Portfolio | 2.98 | 2.95 | 16,020 | (434,834) | 176,314 | 12,671 | 681 | 6,434,675 | |||||||
| Allspring Small Company Growth Portfolio | 0.27 | 0.30 | 47,939 | (40,807) | 0 | 4,146 | 571 | 2,085,008 | |||||||
| Allspring Small Company Value Portfolio | 0.94 | 0.87 | (40,349) | 23,097 | 0 | 51,431 | 3,617 | 5,250,804 | |||||||
| $(3,324,967) | $(1,459,001) | $1,101,724 | $831,100 | $35,156 | $144,575,991 | ||||||||||
| Description | Number of contracts | Expiration date | Notional cost | Notional value | Unrealized gains | Unrealized losses | |
| Long | |||||||
| CAC 40 Index | 60 | 12-16-2022 | $ 4,122,142 | $ 4,206,001 | $ 83,859 | $ 0 | |
| E-Mini Consumer Staples Select Sector Index | 75 | 12-16-2022 | 5,511,206 | 5,828,250 | 317,044 | 0 | |
| 10-Year U.S. Treasury Notes | 166 | 3-22-2023 | 18,692,262 | 18,841,000 | 148,738 | 0 | |
| Short | |||||||
| DAX Index | (11) | 12-16-2022 | (3,653,809) | (4,125,927) | 0 | (472,118) | |
| Euro STOXX 50 Index | (150) | 12-16-2022 | (5,602,465) | (6,188,969) | 0 | (586,504) | |
| U.S. Ultra Treasury Bonds | (45) | 3-22-2023 | (6,030,344) | (6,132,656) | 0 | (102,312) | |
| $549,641 | $(1,160,934) |
| Assets | |
Investments in affiliated Master Portfolios, at value (cost $130,554,839) | $ 144,575,991 |
Investments in affiliated Underlying Funds, at value (cost $26,754,455) | 31,416,198 |
Investments in unaffiliated securities, at value (cost $14,973,699) | 12,791,173 |
Cash | 85,363 |
Cash at broker segregated for futures contracts | 1,561,894 |
Receivable for daily variation margin on open futures contracts | 260,962 |
Receivable for Fund shares sold | 12,804 |
Receivable for investments sold | 204 |
Prepaid expenses and other assets | 43,834 |
Total assets | 190,748,423 |
| Liabilities | |
Payable for Fund shares redeemed | 84,058 |
Payable for daily variation margin on open futures contracts | 65,844 |
Shareholder servicing fees payable | 37,812 |
Administration fees payable | 24,251 |
Shareholder report expenses payable | 21,494 |
Professional fees payable | 17,084 |
Management fee payable | 15,685 |
Distribution fee payable | 2,930 |
Trustees’ fees and expenses payable | 2,089 |
Accrued expenses and other liabilities | 24,206 |
Total liabilities | 295,453 |
Total net assets | $190,452,970 |
| Net assets consist of | |
Paid-in capital | $ 175,926,514 |
Total distributable earnings | 14,526,456 |
Total net assets | $190,452,970 |
| Computation of net asset value and offering price per share | |
Net assets – Class A | $ 66,795,377 |
Shares outstanding – Class A1 | 1,484,929 |
Net asset value per share – Class A | $44.98 |
Maximum offering price per share – Class A2 | $47.72 |
Net assets – Class C | $ 4,868,416 |
Shares outstanding – Class C1 | 130,887 |
Net asset value per share – Class C | $37.20 |
Net assets – Administrator Class | $ 118,789,177 |
Shares outstanding – Administrator Class1 | 3,080,825 |
Net asset value per share – Administrator Class | $38.56 |
| 1 | The Fund has an unlimited number of authorized shares. |
| 2 | Maximum offering price is computed as 100/94.25 of net asset value. On investments of $50,000 or more, the offering price is reduced. |
| Investment income | |
Interest allocated from affiliated Master Portfolios | $ 1,101,724 |
Dividends allocated from affiliated Master Portfolios (net of foreign withholding taxes of $32,874) | 831,100 |
Dividends from unaffiliated securities | 222,252 |
Dividends from affiliated Underlying Funds | 45,623 |
Affiliated income allocated from affiliated Master Portfolios | 35,156 |
Expenses allocated from affiliated Master Portfolios | (370,379) |
Waivers allocated from affiliated Master Portfolios | 44,165 |
Total investment income | 1,909,641 |
| Expenses | |
Management fee | 282,535 |
| Administration fees | |
Class A | 70,159 |
Class C | 5,261 |
Administrator Class | 75,743 |
| Shareholder servicing fees | |
Class A | 83,523 |
Class C | 6,226 |
Administrator Class | 144,683 |
| Distribution fee | |
Class C | 18,679 |
Custody and accounting fees | 7,930 |
Professional fees | 18,720 |
Registration fees | 24,604 |
Shareholder report expenses | 8,095 |
Trustees’ fees and expenses | 10,874 |
Other fees and expenses | 2,828 |
Total expenses | 759,860 |
| Less: Fee waivers and/or expense reimbursements | |
Fund-level | (119,891) |
Class A | (2,640) |
Administrator Class | (68,275) |
Net expenses | 569,054 |
Net investment income | 1,340,587 |
| Realized and unrealized gains (losses) on investments | |
| Net realized gains (losses) on | |
Securities transactions allocated from affiliated Master Portfolios | (3,324,967) |
Affiliated Underlying Funds | (25,721) |
Unaffiliated securities | (187,318) |
Futures contracts | 1,134,257 |
Net realized losses on investments | (2,403,749) |
| Net change in unrealized gains (losses) on | |
Securities transactions allocated from affiliated Master Portfolios | (1,459,001) |
Affiliated Underlying Funds | (776,951) |
Unaffiliated securities | (412,615) |
Futures contracts | (642,760) |
Net change in unrealized gains (losses) on investments | (3,291,327) |
Net realized and unrealized gains (losses) on investments | (5,695,076) |
Net decrease in net assets resulting from operations | $(4,354,489) |
| Six months ended November 30, 2022 (unaudited) | Year ended May 31, 2022 | |||
| Operations | ||||
Net investment income | $ 1,340,587 | $ 2,828,206 | ||
Net realized gains (losses) on investments | (2,403,749) | 10,787,930 | ||
Net change in unrealized gains (losses) on investments | (3,291,327) | (29,404,828) | ||
Net decrease in net assets resulting from operations | (4,354,489) | (15,788,692) | ||
| Distributions to shareholders from | ||||
| Net investment income and net realized gains | ||||
Class A | 0 | (10,097,006) | ||
Class C | 0 | (1,172,850) | ||
Administrator Class | 0 | (20,615,474) | ||
Total distributions to shareholders | 0 | (31,885,330) | ||
| Capital share transactions | Shares | Shares | ||
| Proceeds from shares sold | ||||
Class A | 30,640 | 1,338,878 | 87,465 | 4,683,432 |
Class C | 2,452 | 86,960 | 12,808 | 560,338 |
Administrator Class | 57,778 | 2,166,367 | 133,987 | 6,154,188 |
| 3,592,205 | 11,397,958 | |||
| Reinvestment of distributions | ||||
Class A | 0 | 0 | 192,468 | 9,901,778 |
Class C | 0 | 0 | 27,531 | 1,172,634 |
Administrator Class | 0 | 0 | 464,785 | 20,538,888 |
| 0 | 31,613,300 | |||
| Payment for shares redeemed | ||||
Class A | (98,091) | (4,237,213) | (201,168) | (10,553,283) |
Class C | (28,910) | (1,068,741) | (82,846) | (3,614,242) |
Administrator Class | (123,633) | (4,621,778) | (413,340) | (18,657,031) |
| (9,927,732) | (32,824,556) | |||
Net increase (decrease) in net assets resulting from capital share transactions | (6,335,527) | 10,186,702 | ||
Total decrease in net assets | (10,690,016) | (37,487,320) | ||
| Net assets | ||||
Beginning of period | 201,142,986 | 238,630,306 | ||
End of period | $190,452,970 | $201,142,986 | ||
| Year ended May 31 | ||||||
| Class A | Six months ended November 30, 2022 (unaudited) | 2022 | 2021 | 2020 | 2019 | 2018 |
Net asset value, beginning of period | $45.95 | $56.39 | $46.33 | $45.15 | $47.12 | $43.91 |
Net investment income | 0.28 | 0.61 | 0.61 1 | 0.65 1 | 0.72 1 | 0.53 |
Net realized and unrealized gains (losses) on investments | (1.25) | (4.08) | 12.62 | 1.80 | (0.60) | 3.13 |
Total from investment operations | (0.97) | (3.47) | 13.23 | 2.45 | 0.12 | 3.66 |
| Distributions to shareholders from | ||||||
Net investment income | 0.00 | (0.53) | (0.50) | (0.47) | (1.26) | (0.45) |
Net realized gains | 0.00 | (6.44) | (2.67) | (0.80) | (0.83) | 0.00 |
Total distributions to shareholders | 0.00 | (6.97) | (3.17) | (1.27) | (2.09) | (0.45) |
Net asset value, end of period | $44.98 | $45.95 | $56.39 | $46.33 | $45.15 | $47.12 |
Total return2 | (2.11)% | (7.41)% | 29.31% | 5.31% | 0.53% | 8.34% |
| Ratios to average net assets (annualized)* | ||||||
Gross expenses | 1.18% | 1.15% | 1.22% | 1.32% | 1.33% | 1.35% |
Net expenses | 1.05% | 1.04% | 1.05% | 1.04% | 1.07% | 1.17% |
Net investment income | 1.33% | 1.14% | 1.18% | 1.40% | 1.55% | 1.27% |
| Supplemental data | ||||||
Portfolio turnover rate3 | 53% | 113% | 140% | 116% | 149% | 114% |
Net assets, end of period (000s omitted) | $66,795 | $71,327 | $83,102 | $68,581 | $68,832 | $62,473 |
| * | Ratios include only the net expenses allocated from the affiliated Master Portfolios and do not include expenses from any other affiliated Underlying Funds. Net expenses allocated from the affiliated Master Portfolios included in the ratios were as follows: |
| Six months ended November 30, 2022 (unaudited) | 0.35% |
| Year ended May 31, 2022 | 0.34% |
| Year ended May 31, 2021 | 0.38% |
| Year ended May 31, 2020 | 0.45% |
| Year ended May 31, 2019 | 0.47% |
| Year ended May 31, 2018 | 0.51% |
| 1 | Calculated based upon average shares outstanding |
| 2 | Total return calculations do not include any sales charges. Returns for periods of less than one year are not annualized. |
| 3 | Portfolio turnover rate is calculated by multiplying the Fund’s ownership percentage in the respective affiliated Master Portfolio by the corresponding affiliated Master Portfolio’s purchases and sales. These purchases and sales amounts are aggregated with the direct purchases and sales in the affiliated Underlying Funds and unaffiliated securities and included in the portfolio turnover calculation. |
| Year ended May 31 | ||||||
| Class C | Six months ended November 30, 2022 (unaudited) | 2022 | 2021 | 2020 | 2019 | 2018 |
Net asset value, beginning of period | $38.14 | $47.98 | $39.81 | $38.95 | $40.86 | $38.14 |
Net investment income | 0.11 1 | 0.17 1 | 0.19 1 | 0.26 1 | 0.37 1 | 0.14 |
Net realized and unrealized gains (losses) on investments | (1.05) | (3.37) | 10.80 | 1.54 | (0.56) | 2.74 |
Total from investment operations | (0.94) | (3.20) | 10.99 | 1.80 | (0.19) | 2.88 |
| Distributions to shareholders from | ||||||
Net investment income | 0.00 | (0.20) | (0.15) | (0.14) | (0.89) | (0.16) |
Net realized gains | 0.00 | (6.44) | (2.67) | (0.80) | (0.83) | 0.00 |
Total distributions to shareholders | 0.00 | (6.64) | (2.82) | (0.94) | (1.72) | (0.16) |
Net asset value, end of period | $37.20 | $38.14 | $47.98 | $39.81 | $38.95 | $40.86 |
Total return2 | (2.46)% | (8.09)% | 28.35% | 4.52% | (0.23)% | 7.55% |
| Ratios to average net assets (annualized)* | ||||||
Gross expenses | 1.93% | 1.89% | 1.97% | 2.07% | 2.08% | 2.10% |
Net expenses | 1.80% | 1.78% | 1.80% | 1.79% | 1.82% | 1.92% |
Net investment income | 0.59% | 0.38% | 0.43% | 0.64% | 0.93% | 0.52% |
| Supplemental data | ||||||
Portfolio turnover rate3 | 53% | 113% | 140% | 116% | 149% | 114% |
Net assets, end of period (000s omitted) | $4,868 | $6,001 | $9,588 | $10,108 | $11,434 | $16,649 |
| * | Ratios include only the net expenses allocated from the affiliated Master Portfolios and do not include expenses from any other affiliated Underlying Funds. Net expenses allocated from the affiliated Master Portfolios included in the ratios were as follows: |
| Six months ended November 30, 2022 (unaudited) | 0.35% |
| Year ended May 31, 2022 | 0.34% |
| Year ended May 31, 2021 | 0.38% |
| Year ended May 31, 2020 | 0.45% |
| Year ended May 31, 2019 | 0.48% |
| Year ended May 31, 2018 | 0.51% |
| 1 | Calculated based upon average shares outstanding |
| 2 | Total return calculations do not include any sales charges. Returns for periods of less than one year are not annualized. |
| 3 | Portfolio turnover rate is calculated by multiplying the Fund’s ownership percentage in the respective affiliated Master Portfolio by the corresponding affiliated Master Portfolio’s purchases and sales. These purchases and sales amounts are aggregated with the direct purchases and sales in the affiliated Underlying Funds and unaffiliated securities and included in the portfolio turnover calculation. |
| Year ended May 31 | ||||||
| Administrator Class | Six months ended November 30, 2022 (unaudited) | 2022 | 2021 | 2020 | 2019 | 2018 |
Net asset value, beginning of period | $39.35 | $49.28 | $40.83 | $39.93 | $42.04 | $39.22 |
Net investment income | 0.31 | 0.61 1 | 0.68 | 0.84 | 1.05 | 0.75 |
Net realized and unrealized gains (losses) on investments | (1.10) | (3.46) | 11.03 | 1.41 | (0.90) | 2.63 |
Total from investment operations | (0.79) | (2.85) | 11.71 | 2.25 | 0.15 | 3.38 |
| Distributions to shareholders from | ||||||
Net investment income | 0.00 | (0.64) | (0.59) | (0.55) | (1.43) | (0.56) |
Net realized gains | 0.00 | (6.44) | (2.67) | (0.80) | (0.83) | 0.00 |
Total distributions to shareholders | 0.00 | (7.08) | (3.26) | (1.35) | (2.26) | (0.56) |
Net asset value, end of period | $38.56 | $39.35 | $49.28 | $40.83 | $39.93 | $42.04 |
Total return2 | (2.01)% | (7.25)% | 29.56% | 5.51% | 0.70% | 8.63% |
| Ratios to average net assets (annualized)* | ||||||
Gross expenses | 1.10% | 1.07% | 1.14% | 1.24% | 1.25% | 1.27% |
Net expenses | 0.86% | 0.86% | 0.86% | 0.86% | 0.89% | 0.92% |
Net investment income | 1.51% | 1.33% | 1.37% | 1.57% | 1.72% | 1.51% |
| Supplemental data | ||||||
Portfolio turnover rate3 | 53% | 113% | 140% | 116% | 149% | 114% |
Net assets, end of period (000s omitted) | $118,789 | $123,815 | $145,940 | $129,531 | $138,788 | $157,889 |
| * | Ratios include only the net expenses allocated from the affiliated Master Portfolios and do not include expenses from any other affiliated Underlying Funds. Net expenses allocated from the affiliated Master Portfolios included in the ratios were as follows: |
| Six months ended November 30, 2022 (unaudited) | 0.35% |
| Year ended May 31, 2022 | 0.34% |
| Year ended May 31, 2021 | 0.38% |
| Year ended May 31, 2020 | 0.45% |
| Year ended May 31, 2019 | 0.47% |
| Year ended May 31, 2018 | 0.51% |
| 1 | Calculated based upon average shares outstanding |
| 2 | Returns for periods of less than one year are not annualized. |
| 3 | Portfolio turnover rate is calculated by multiplying the Fund’s ownership percentage in the respective affiliated Master Portfolio by the corresponding affiliated Master Portfolio’s purchases and sales. These purchases and sales amounts are aggregated with the direct purchases and sales in the affiliated Underlying Funds and unaffiliated securities and included in the portfolio turnover calculation. |
| Gross unrealized gains | $21,177,757 |
| Gross unrealized losses | (6,025,989) |
| Net unrealized gains | $15,151,768 |
| ■ | Level 1 – quoted prices in active markets for identical securities |
| ■ | Level 2 – other significant observable inputs (including quoted prices for similar securities, interest rates, prepayment speeds, credit risk, etc.) |
| ■ | Level 3 – significant unobservable inputs (including the Fund’s own assumptions in determining the fair value of investments) |
| Quoted prices (Level 1) | Other significant observable inputs (Level 2) | Significant unobservable inputs (Level 3) | Total | |
| Assets | ||||
| Investments in: | ||||
| Investment companies | $ 44,207,371 | $0 | $0 | $ 44,207,371 |
| Investments measured at net asset value* | 144,575,991 | |||
| 44,207,371 | 0 | 0 | 188,783,362 | |
| Futures contracts | 549,641 | 0 | 0 | 549,641 |
| Total assets | $44,757,012 | $0 | $0 | $189,333,003 |
| Liabilities | ||||
| Futures contracts | $ 1,160,934 | $0 | $0 | $ 1,160,934 |
| Total liabilities | $ 1,160,934 | $0 | $0 | $ 1,160,934 |
| * | Investments that are measured at fair value using the net asset value per share (or its equivalent) as a practical expedient have not been categorized in the fair value hierarchy. The fair value amount presented in the table is intended to permit reconciliation of the fair value hierarchy to the amounts presented in the Statement of Assets and Liabilities. The Fund’s investments in the affiliated Master Portfolios are valued at $144,575,991. Each affiliated Master Portfolio does not have a redemption period notice, can be redeemed daily and does not have any unfunded commitments. |
| Affiliated Master Portfolio | Investment objective |
| Allspring C&B Large Cap Value Portfolio | Seeks maximum long-term total return (current income and capital appreciation), consistent with minimizing risk to principal |
| Allspring Core Bond Portfolio | Seeks total return, consisting of income and capital appreciation |
| Allspring Disciplined International Developed Markets Portfolio | Seeks long-term capital appreciation |
| Allspring Diversified Large Cap Growth Portfolio | Seeks long-term capital appreciation |
| Allspring Emerging Growth Portfolio | Seeks long-term capital appreciation |
| Allspring Factor Enhanced Emerging Markets Equity Portfolio | Seeks long-term capital appreciation |
| Allspring Factor Enhanced International Equity Portfolio | Seeks long-term capital appreciation |
| Allspring Large Company Value Portfolio | Seeks long-term capital appreciation |
| Allspring Managed Fixed Income Portfolio | Seeks consistent fixed-income return |
| Allspring Real Return Portfolio | Seeks returns that exceed the rate of inflation over the long-term |
| Allspring Small Company Growth Portfolio | Seeks long-term capital appreciation |
| Allspring Small Company Value Portfolio | Seeks long-term capital appreciation |
| Average daily net assets | Management fee |
| First $500 million | 0.300% |
| Next $500 million | 0.280 |
| Next $2 billion | 0.260 |
| Next $2 billion | 0.240 |
| Next $5 billion | 0.230 |
| Over $10 billion | 0.220 |
| Class-level administration fee | |
| Class A | 0.21% |
| Class C | 0.21 |
| Administrator Class | 0.13 |
| Expense ratio caps | |
| Class A | 1.13% |
| Class C | 1.88 |
| Administrator Class | 0.95 |
| Purchases at cost | Sales proceeds | |||
| U.S. government | Non-U.S. government | U.S. government | Non-U.S. government | |
| $19,004,571 | $78,783,399 | $19,549,668 | $85,023,281 | |
| Asset derivatives | Liability derivatives | ||||
| Statement of Assets and Liabilities location | Fair value | Statement of Assets and Liabilities location | Fair value | ||
| Interest rate risk | Unrealized gains on futures contracts | $ 148,738* | Unrealized losses on futures contracts | $ 102,312* | |
| Equity risk | Unrealized gains on futures contracts | 400,903* | Unrealized losses on futures contracts | 1,058,622* | |
| $549,641 | $1,160,934 | ||||
| * | Amount represents cumulative unrealized gains (losses) on futures contracts as reported in the table following the Portfolio of Investments. For futures contracts, only the current day’s variation margin as of November 30, 2022 is reported separately on the Statement of Assets and Liabilities. |
| Net realized gains (losses) on derivatives | Net change in unrealized gains (losses) on derivatives | |
| Interest rate risk | $ 64,096 | $ 40,612 |
| Equity risk | 1,360,884 | (632,622) |
| Foreign currency risk | (290,723) | (50,750) |
| $1,134,257 | $(642,760) |
| Name and year of birth | Position held and length of service* | Principal occupations during past five years or longer | Current other public company or investment company directorships |
| William R. Ebsworth (Born 1957) | Trustee, since 2015 | Retired. From 1984 to 2013, equities analyst, portfolio manager, research director and chief investment officer at Fidelity Management and Research Company in Boston, Tokyo, and Hong Kong, and retired in 2013 as Chief Investment Officer of Fidelity Strategic Advisers, Inc. where he led a team of investment professionals managing client assets. Prior thereto, Board member of Hong Kong Securities Clearing Co., Hong Kong Options Clearing Corp., the Thailand International Fund, Ltd., Fidelity Investments Life Insurance Company, and Empire Fidelity Investments Life Insurance Company. Audit Committee Chair and Investment Committee Chair of the Vincent Memorial Hospital Endowment (non-profit organization). Mr. Ebsworth is a CFA® charterholder. | N/A |
| Jane A. Freeman (Born 1953) | Trustee, since 2015; Chair Liaison, since 2018 | Retired. From 2012 to 2014 and 1999 to 2008, Chief Financial Officer of Scientific Learning Corporation. From 2008 to 2012, Ms. Freeman provided consulting services related to strategic business projects. Prior to 1999, Portfolio Manager at Rockefeller & Co. and Scudder, Stevens & Clark. Board member of the Harding Loevner Funds from 1996 to 2014, serving as both Lead Independent Director and chair of the Audit Committee. Board member of the Russell Exchange Traded Funds Trust from 2011 to 2012 and the chair of the Audit Committee. Ms. Freeman is also an inactive Chartered Financial Analyst. | N/A |
| Isaiah Harris, Jr. (Born 1952) | Trustee, since 2009; Audit Committee Chair, since 2019 | Retired. Chairman of the Board of CIGNA Corporation from 2009 to 2021, and Director from 2005 to 2008. From 2003 to 2011, Director of Deluxe Corporation. Prior thereto, President and CEO of BellSouth Advertising and Publishing Corp. from 2005 to 2007, President and CEO of BellSouth Enterprises from 2004 to 2005 and President of BellSouth Consumer Services from 2000 to 2003. Emeritus member of the Iowa State University Foundation Board of Governors. Emeritus Member of the Advisory Board of Iowa State University School of Business. Advisory Board Member, Palm Harbor Academy (private school). Advisory Board Member, Fellowship of Christian Athletes. Mr. Harris is a certified public accountant (inactive status). | N/A |
| David F. Larcker (Born 1950) | Trustee, since 2009 | James Irvin Miller Professor of Accounting at the Graduate School of Business (Emeritus), Stanford University, Director of the Corporate Governance Research Initiative and Senior Faculty of The Rock Center for Corporate Governance since 2006. From 2005 to 2008, Professor of Accounting at the Graduate School of Business, Stanford University. Prior thereto, Ernst & Young Professor of Accounting at The Wharton School, University of Pennsylvania from 1985 to 2005. | N/A |
| Name and year of birth | Position held and length of service* | Principal occupations during past five years or longer | Current other public company or investment company directorships |
| Olivia S. Mitchell (Born 1953) | Trustee, since 2006; Nominating and Governance Committee Chair, since 2018 | International Foundation of Employee Benefit Plans Professor since 1993, Wharton School of the University of Pennsylvania. Director of Wharton’s Pension Research Council and Boettner Center on Pensions & Retirement Research, and Research Associate at the National Bureau of Economic Research. Previously taught at Cornell University from 1978 to 1993. | N/A |
| Timothy J. Penny (Born 1951) | Trustee, since 1996; Chair, since 2018 | President and Chief Executive Officer of Southern Minnesota Initiative Foundation, a non-profit organization, since 2007. Vice Chair of the Economic Club of Minnesota, since 2007. Co-Chair of the Committee for a Responsible Federal Budget, since 1995. Member of the Board of Trustees of NorthStar Education Finance, Inc., a non-profit organization, since 2007. Senior Fellow of the University of Minnesota Humphrey Institute from 1995 to 2017. | N/A |
| James G. Polisson (Born 1959) | Trustee, since 2018 | Retired. Chief Marketing Officer, Source (ETF) UK Services, Ltd, from 2015 to 2017. From 2012 to 2015, Principal of The Polisson Group, LLC, a management consulting, corporate advisory and principal investing company. Chief Executive Officer and Managing Director at Russell Investments, Global Exchange Traded Funds from 2010 to 2012. Managing Director of Barclays Global Investors from 1998 to 2010 and Global Chief Marketing Officer for iShares and Barclays Global Investors from 2000 to 2010. Trustee of the San Francisco Mechanics’ Institute, a non-profit organization, from 2013 to 2015. Board member of the Russell Exchange Traded Fund Trust from 2011 to 2012. Director of Barclays Global Investors Holdings Deutschland GmbH from 2006 to 2009. Mr. Polisson is an attorney and has a retired status with the Massachusetts and District of Columbia Bar Associations. | N/A |
| Pamela Wheelock (Born 1959) | Trustee, since January 2020; previously Trustee from January 2018 to July 2019 | Retired. Executive and Senior Financial leadership positions in the public, private and nonprofit sectors. Interim President and CEO, McKnight Foundation, 2020. Interim Commissioner, Minnesota Department of Human Services, 2019. Chief Operating Officer, Twin Cities Habitat for Humanity, 2017-2019. Vice President for University Services, University of Minnesota, 2012-2016. Interim President and CEO, Blue Cross and Blue Shield of Minnesota, 2011-2012. Executive Vice-President and Chief Financial Officer, Minnesota Wild, 2002-2008. Commissioner, Minnesota Department of Finance, 1999-2002. Chair of the Board of Directors of Destination Medical Center Corporation. Board member of the Minnesota Wild Foundation. | N/A |
| Name and year of birth | Position held and length of service | Principal occupations during past five years or longer |
| Andrew Owen (Born 1960) | President, since 2017 | President and Chief Executive Officer of Allspring Funds Management, LLC since 2017 and Head of Global Fund Governance of Allspring Global Investments since 2022. Prior thereto, co-president of Galliard Capital Management, LLC, an affiliate of Allspring Funds Management, LLC, from 2019 to 2022 and Head of Affiliated Managers, Allspring Global Investments, from 2014 to 2019 and Executive Vice President responsible for marketing, investments and product development for Allspring Funds Management, LLC, from 2009 to 2014. |
| Jeremy DePalma (Born 1974) | Treasurer, since 2012 (for certain funds in the Fund Complex); since 2021 (for the remaining funds in the Fund Complex) | Senior Vice President of Allspring Funds Management, LLC since 2009. Senior Vice President of Evergreen Investment Management Company, LLC from 2008 to 2010 and head of the Fund Reporting and Control Team within Fund Administration from 2005 to 2010. |
| Christopher Baker (Born 1976) | Chief Compliance Officer, since 2022 | Global Chief Compliance Officer for Allspring Global Investments since 2022. Prior thereto, Chief Compliance Officer for State Street Global Advisors from 2018 to 2021. Senior Compliance Officer for the State Street divisions of Alternative Investment Solutions, Sector Solutions, and Global Marketing from 2015 to 2018. From 2010 to 2015 Vice President, Global Head of Investment and Marketing Compliance for State Street Global Advisors. |
| Matthew Prasse (Born 1983) | Chief Legal Officer, since 2022; Secretary, since 2021 | Senior Counsel of the Allspring Legal Department since 2021. Senior Counsel of the Wells Fargo Legal Department from 2018 to 2021. Previously, Counsel for Barings LLC from 2015 to 2018. Prior to joining Barings, Associate at Morgan, Lewis & Bockius LLP from 2008 to 2015. |
P.O. Box 219967
Kansas City, MO 64121-9967

1-800-222-8222 or visit the Fund's website at allspringglobal.com. Read the prospectus carefully before you invest or send money.
SA278/SAR278 11-22


| 1 | The S&P 500 Index consists of 500 stocks chosen for market size, liquidity, and industry group representation. It is a market-value-weighted index with each stock's weight in the index proportionate to its market value. You cannot invest directly in an index. |
| 2 | The Morgan Stanley Capital International (MSCI) All Country World Index (ACWI) ex USA Index (Net) is a free-float-adjusted market-capitalization-weighted index that is designed to measure the equity market performance of developed and emerging markets, excluding the U.S. Source: MSCI. MSCI makes no express or implied warranties or representations and shall have no liability whatsoever with respect to any MSCI data contained herein. The MSCI data may not be further redistributed or used as a basis for other indexes or any securities or financial products. This report is not approved, reviewed, or produced by MSCI. You cannot invest directly in an index. |
| 3 | The MSCI Emerging Markets (EM) Index (Net) (USD) is a free-float-adjusted market-capitalization-weighted index that is designed to measure equity market performance of emerging markets. You cannot invest directly in an index. |
| 4 | The Bloomberg U.S. Aggregate Bond Index is a broad-based benchmark that measures the investment-grade, U.S.-dollar-denominated, fixed-rate taxable bond market, including Treasuries, government-related and corporate securities, mortgage-backed securities (agency fixed-rate and hybrid adjustable-rate mortgage pass-throughs), asset-backed securities, and commercial mortgage-backed securities. You cannot invest directly in an index. |
| 5 | The Bloomberg Global Aggregate ex-USD Index (unhedged) is an unmanaged index that provides a broad-based measure of the global investment-grade fixed-income markets excluding the U.S.-dollar-denominated debt market. You cannot invest directly in an index. |
| 6 | The Bloomberg Municipal Bond Index is an unmanaged index composed of long-term tax-exempt bonds with a minimum credit rating of Baa. You cannot invest directly in an index. |
| 7 | The ICE BofA U.S. High Yield Index is a market-capitalization-weighted index of domestic and Yankee high-yield bonds. The index tracks the performance of high-yield securities traded in the U.S. bond market. You cannot invest directly in an index. Copyright 2023. ICE Data Indices, LLC. All rights reserved. |

President
Allspring Funds
| Investment objective | The Fund seeks total return, consisting of current income and capital appreciation. |
| Manager | Allspring Funds Management, LLC |
| Subadviser | Allspring Global Investments, LLC |
| Portfolio managers | Kandarp R. Acharya, CFA®‡, FRM, Petros N. Bocray, CFA®‡, FRM, Travis L. Keshemberg, CFA®‡, CIPM, FRM |
| Average annual total returns (%) as of November 30, 2022 | |||||||||||
| Including sales charge | Excluding sales charge | Expense ratios1 (%) | |||||||||
| Inception date | 1 year | 5 year | 10 year | 1 year | 5 year | 10 year | Gross | Net 2 | |||
| Class A (WFMAX) | 1-30-2004 | -15.28 | 2.24 | 4.67 | -10.11 | 3.45 | 5.29 | 1.26 | 1.15 | ||
| Class C (WFBCX) | 1-30-2004 | -11.76 | 2.68 | 4.68 | -10.76 | 2.68 | 4.68 | 2.01 | 1.90 | ||
| Administrator Class (NVMBX) | 11-11-1994 | – | – | – | -9.85 | 3.72 | 5.56 | 1.18 | 0.90 | ||
| Institutional Class (WFMYX)3 | 7-31-2018 | – | – | – | -9.77 | 3.81 | 5.61 | 0.93 | 0.80 | ||
| Moderate Balanced Blended Index4 | – | – | – | – | -9.67 | 4.14 | 5.43 | – | – | ||
| Bloomberg U.S. Aggregate Bond Index5 | – | – | – | – | -12.84 | 0.21 | 1.09 | – | – | ||
| Bloomberg U.S. Short Treasury 9-12 Months Index6 | – | – | – | – | -0.90 | 1.13 | 0.77 | – | – | ||
| MSCI EAFE Index (Net)7 | – | – | – | – | -10.14 | 1.85 | 4.99 | – | – | ||
| Russell 1000® Growth Index8 | – | – | – | – | -21.64 | 12.92 | 15.01 | – | – | ||
| Russell 1000® Value Index9 | – | – | – | – | 2.42 | 7.86 | 10.97 | – | – | ||
| Russell 2000® Index10 | – | – | – | – | -13.01 | 5.45 | 10.13 | – | – | ||
| S&P 500 Index11 | – | – | – | – | -9.21 | 10.98 | 13.34 | – | – | ||
| 1 | Reflects the expense ratios as stated in the most recent prospectuses, which include the impact of 0.39% in acquired fund fees and expenses. The expense ratios shown are subject to change and may differ from the annualized expense ratios shown in the financial highlights of this report, which do not include acquired fund fees and expenses. |
| 2 | The manager has contractually committed through September 30, 2023, to waive fees and/or reimburse expenses to the extent necessary to cap total annual fund operating expenses after fee waivers at 1.15% for Class A, 1.90% for Class C, 0.90% for Administrator Class, and 0.80% for Institutional Class. Brokerage commissions, stamp duty fees, interest, taxes, acquired fund fees and expenses (if any) from funds in which the affiliated master portfolios and funds invest and from money market funds, and extraordinary expenses are excluded from the expense caps. All other acquired fund fees and expenses from the affiliated master portfolios and funds are included in the expense caps. Prior to or after the commitment expiration date, the caps may be increased or the commitment to maintain the caps may be terminated only with the approval of the Board of Trustees. Without these caps, the Fund’s returns would have been lower. The expense ratio paid by an investor is the net expense ratio (the total annual fund operating expenses after fee waivers) as stated in the prospectuses. |
| 3 | Historical performance shown for the Institutional Class shares prior to their inception reflects the performance of the Administrator Class shares, and includes the higher expenses applicable to the Administrator Class shares. If these expenses had not been included, returns for the Institutional Class shares would be higher. |
| ‡ | CFA® and Chartered Financial Analyst® are trademarks owned by CFA Institute. |
| 4 | Source: Allspring Funds Management, LLC. The Moderate Balanced Blended Index is composed 45% of the Bloomberg U.S. Aggregate Bond Index, 15% of the Bloomberg U.S. Short Treasury 9-12 Months Index, 10% of the Russell 1000® Growth Index, 10% of the Russell 1000® Value Index, 10% of the S&P 500 Index, 6% of the MSCI EAFE Index (Net), and 4% of the Russell 2000® Index. You cannot invest directly in an index. |
| 5 | The Bloomberg U.S. Aggregate Bond Index is a broad-based benchmark that measures the investment-grade, U.S. dollar–denominated, fixed-rate taxable bond market, including Treasuries, government-related and corporate securities, mortgage-backed securities (agency fixed-rate and hybrid adjustable-rate mortgage pass-throughs), asset-backed securities, and commercial mortgage-backed securities. You cannot invest directly in an index. |
| 6 | The Bloomberg U.S. Short Treasury 9–12 Months Index is an unmanaged index that includes aged U.S. Treasury bills, notes, and bonds with a remaining maturity from 9 up to (but not including) 12 months. It excludes zero-coupon STRIPS. You cannot invest directly in an index. |
| 7 | The Morgan Stanley Capital International (MSCI) Europe, Australasia, Far East (EAFE) Index (Net) is a free-float-adjusted market capitalization-weighted index that is designed to measure the equity market performance of developed markets, excluding the U.S. and Canada. Source: MSCI. MSCI makes no express or implied representations and shall have no liability whatsoever with respect to any MSCI data contained herein. The MSCI data may not be further redistributed or used as a basis for other indexes or any securities or financial products. This report is not approved, reviewed, or produced by MSCI. You cannot invest directly in an index. |
| 8 | The Russell 1000® Growth Index measures the performance of those Russell 1000 companies with higher price/book ratios and higher forecasted growth values. You cannot invest directly in an index. |
| 9 | The Russell 1000® Value Index measures the performance of those Russell 1000 companies with lower price/book ratios and lower forecasted growth values. You cannot invest directly in an index. |
| 10 | The Russell 2000® Index measures the performance of the 2,000 smallest companies in the Russell 3000® Index, which represents approximately 8% of the total market capitalization of the Russell 3000® Index. You cannot invest directly in an index. |
| 11 | The S&P 500 Index consists of 500 stocks chosen for market size, liquidity, and industry group representation. It is a market-value weighted index with each stock’s weight in the index proportionate to its market value. You cannot invest directly in an index. |
| Ten largest holdings (%) as of November 30, 20221 | |
| Allspring Managed Fixed Income Portfolio | 28.52 |
| Allspring Conservative Income Fund Institutional Class | 14.42 |
| Allspring Disciplined Large Cap Portfolio | 8.47 |
| Allspring Core Bond Portfolio | 8.32 |
| Allspring Diversified Large Cap Growth Portfolio | 7.94 |
| Allspring Large Company Value Portfolio | 7.66 |
| Allspring Real Return Portfolio | 4.43 |
| Allspring C&B Large Cap Value Portfolio | 3.85 |
| Allspring Disciplined International Developed Markets Portfolio | 3.09 |
| iShares Core U.S. Aggregate Bond ETF | 2.66 |
| 1 | Figures represent the percentage of the Fund's net assets. Holdings are subject to change and may have changed since the date specified. |
| Allocation (%) as of November 30, 2022 | ||
| Neutral allocation | Effective allocation1 | |
| Bond Funds | 60 | 67 |
| Stock Funds | 40 | 40 |
| Effective Cash | 0 | (7) |
| 1 | Effective allocation includes the effect of any tactical futures overlay that may be in place. Effective cash, if any, represents the net offset to such future positions. Effective allocations are subject to change and may have changed since the date specified. |
| Beginning account value 6-1-2022 | Ending account value 11-30-2022 | Expenses paid during the period1,2 | Annualized net expense ratio2 | |
| Class A | ||||
| Actual | $1,000.00 | $ 980.15 | $5.16 | 1.04% |
| Hypothetical (5% return before expenses) | $1,000.00 | $1,019.85 | $5.27 | 1.04% |
| Class C | ||||
| Actual | $1,000.00 | $ 976.37 | $8.87 | 1.79% |
| Hypothetical (5% return before expenses) | $1,000.00 | $1,016.09 | $9.05 | 1.79% |
| Administrator Class | ||||
| Actual | $1,000.00 | $ 981.43 | $3.87 | 0.78% |
| Hypothetical (5% return before expenses) | $1,000.00 | $1,021.16 | $3.95 | 0.78% |
| Institutional Class | ||||
| Actual | $1,000.00 | $ 981.97 | $3.43 | 0.69% |
| Hypothetical (5% return before expenses) | $1,000.00 | $1,021.61 | $3.50 | 0.69% |
| Shares | Value | ||||
| Investment companies: 99.03% | |||||
| Affiliated master portfolios: 78.20% | |||||
| Allspring C&B Large Cap Value Portfolio | $ 4,139,466 | ||||
| Allspring Core Bond Portfolio | 8,950,705 | ||||
| Allspring Disciplined International Developed Markets Portfolio | 3,323,127 | ||||
| Allspring Disciplined Large Cap Portfolio | 9,111,652 | ||||
| Allspring Diversified Large Cap Growth Portfolio | 8,545,014 | ||||
| Allspring Emerging Growth Portfolio | 1,086,471 | ||||
| Allspring Factor Enhanced Emerging Markets Equity Portfolio | 935,126 | ||||
| Allspring Factor Enhanced International Equity Portfolio | 1,105,217 | ||||
| Allspring Large Company Value Portfolio | 8,233,418 | ||||
| Allspring Managed Fixed Income Portfolio | 30,673,346 | ||||
| Allspring Real Return Portfolio | 4,765,727 | ||||
| Allspring Small Company Growth Portfolio | 1,066,151 | ||||
| Allspring Small Company Value Portfolio | 2,171,412 | ||||
| 84,106,832 | |||||
| Bond funds: 14.42% | |||||
| Allspring Conservative Income Fund Institutional Class ♠ | 1,577,504 | 15,506,861 | |||
| Exchange-traded funds: 4.71% | |||||
| iShares Core MSCI EAFE ETF | 35,062 | 2,210,659 | |||
| iShares Core U.S. Aggregate Bond ETF | 29,097 | 2,859,944 | |||
| 5,070,603 | |||||
| Stock funds: 1.70% | |||||
| Allspring Emerging Markets Equity Fund Class R6 ♠ | 38,057 | 914,902 | |||
| Allspring Emerging Markets Equity Income Fund Class R6 ♠ | 88,820 | 911,295 | |||
| 1,826,197 | |||||
| Total Investment companies (Cost $103,140,219) | 106,510,493 | ||||
| Total investments in securities (Cost $103,140,219) | 99.03% | 106,510,493 | |||
| Other assets and liabilities, net | 0.97 | 1,039,836 | |||
| Total net assets | 100.00% | $107,550,329 |
| ♠ | The issuer of the security is an affiliated person of the Fund as defined in the Investment Company Act of 1940. |
| Value, beginning of period | Purchases | Sales proceeds | Net realized gains (losses) on affiliated Underlying Funds | Net change in unrealized gains (losses) on affiliated Underlying Funds | Value, end of period | |||
| Investment companies | ||||||||
| Allspring Conservative Income Fund Institutional Class | $18,019,461 | $179,968 | $(2,572,496) | $ (34,209) | $ (85,863) | $ 15,506,861 | ||
| Allspring Emerging Markets Equity Fund Class R6 | 963,943 | 38,444 | (29,203) | (11,416) | (46,866) | 914,902 | ||
| Allspring Emerging Markets Equity Income Fund Class R6 | 994,083 | 54,165 | (34,723) | (6,338) | (95,892) | 911,295 | ||
| $(51,963) | $(228,621) | $17,333,058 |
| Shares, end of period | Dividends from affiliated Underlying Funds | |
| Investment companies | ||
| Allspring Conservative Income Fund Institutional Class | 1,577,504 | $ 179,637 |
| Allspring Emerging Markets Equity Fund Class R6 | 38,057 | 0 |
| Allspring Emerging Markets Equity Income Fund Class R6 | 88,820 | 16,465 |
| $196,102 |
| % of ownership, beginning of period | % of ownership, end of period | Net realized gains (losses) on securities transactions allocated from affiliated Master Portfolios | Net change in unrealized gains (losses) on securities transactions allocated from affiliated Master Portfolios | Interest allocated from affiliated Master Portfolios | Dividends allocated from affiliated Master Portfolios | Affiliated income allocated from affiliated Master Portfolios | Value, end of period | ||||||||
| Allspring C&B Large Cap Value Portfolio | 1.35% | 1.28% | $ 186,644 | $ (231,836) | $ 0 | $ 44,146 | $ 801 | $ 4,139,466 | |||||||
| Allspring Core Bond Portfolio | 0.20 | 0.20 | (464,748) | (44,621) | 136,243 | 0 | 3,693 | 8,950,705 | |||||||
| Allspring Disciplined International Developed Markets Portfolio | 2.23 | 2.01 | (134,972) | 49,347 | 0 | 36,620 | 728 | 3,323,127 | |||||||
| Allspring Disciplined Large Cap Portfolio | 3.61 | 3.42 | 259,545 | (367,717) | 0 | 83,789 | 1,793 | 9,111,652 | |||||||
| Allspring Diversified Large Cap Growth Portfolio | 4.48 | 3.65 | 42,888 | (41,674) | 0 | 43,064 | 1,849 | 8,545,014 | |||||||
| Allspring Emerging Growth Portfolio | 0.27 | 0.14 | (29,062) | 91,821 | 0 | 1,372 | 627 | 1,086,471 | |||||||
| Allspring Factor Enhanced Emerging Markets Equity Portfolio | 0.73 | 0.62 | (54,318) | (31,595) | 0 | 20,082 | 413 | 935,126 | |||||||
| Allspring Factor Enhanced International Equity Portfolio | 0.22 | 0.19 | (44,776) | 5,933 | 0 | 12,508 | 354 | 1,105,217 | |||||||
| Allspring Large Company Value Portfolio | 4.12 | 3.61 | (549,281) | 454,986 | 0 | 99,094 | 1,659 | 8,233,418 | |||||||
| Allspring Managed Fixed Income Portfolio | 8.04 | 7.88 | (374,053) | (1,390,304) | 561,019 | 0 | 5,221 | 30,673,346 | |||||||
| Allspring Real Return Portfolio | 2.24 | 2.52 | 12,001 | (313,960) | 129,021 | 9,350 | 508 | 4,765,727 | |||||||
| Allspring Small Company Growth Portfolio | 0.14 | 0.10 | 24,338 | (17,650) | 0 | 2,093 | 290 | 1,066,151 | |||||||
| Allspring Small Company Value Portfolio | 0.40 | 0.45 | (17,046) | 15,186 | 0 | 21,367 | 1,494 | 2,171,412 | |||||||
| $(1,142,840) | $(1,822,084) | $826,283 | $373,485 | $19,430 | $84,106,832 | ||||||||||
| Description | Number of contracts | Expiration date | Notional cost | Notional value | Unrealized gains | Unrealized losses | |
| Long | |||||||
| CAC 40 Index | 34 | 12-16-2022 | $ 2,335,880 | $ 2,383,401 | $ 47,521 | $ 0 | |
| E-Mini Consumer Staples Select Sector Index | 44 | 12-16-2022 | 3,233,241 | 3,419,240 | 185,999 | 0 | |
| 10-Year U.S. Treasury Notes | 93 | 3-22-2023 | 10,472,170 | 10,555,500 | 83,330 | 0 | |
| Short | |||||||
| DAX Index | (7) | 12-16-2022 | (2,325,151) | (2,625,590) | 0 | (300,439) | |
| Euro STOXX 50 Index | (86) | 12-16-2022 | (3,212,021) | (3,548,342) | 0 | (336,321) | |
| U.S. Ultra Treasury Bonds | (26) | 3-22-2023 | (3,484,199) | (3,543,313) | 0 | (59,114) | |
| $316,850 | $(695,874) |
| Assets | |
Investments in affiliated Master Portfolios, at value (cost $79,723,112) | $ 84,106,832 |
Investments in affiliated Underlying Funds, at value (cost $17,506,316) | 17,333,058 |
Investments in unaffiliated securities, at value (cost $5,910,791) | 5,070,603 |
Cash | 39,315 |
Cash at broker segregated for futures contracts | 911,937 |
Receivable for daily variation margin on open futures contracts | 149,955 |
Receivable for Fund shares sold | 59,293 |
Receivable for dividends | 37,794 |
Receivable for investments sold | 9,251 |
Prepaid expenses and other assets | 54,447 |
Total assets | 107,772,485 |
| Liabilities | |
Payable for Fund shares redeemed | 75,336 |
Payable for investments purchased | 39,153 |
Payable for daily variation margin on open futures contracts | 38,851 |
Professional fees payable | 15,360 |
Administration fees payable | 13,681 |
Shareholder report expenses payable | 12,146 |
Management fee payable | 4,363 |
Distribution fee payable | 3,196 |
Trustees’ fees and expenses payable | 2,193 |
Accrued expenses and other liabilities | 17,877 |
Total liabilities | 222,156 |
Total net assets | $107,550,329 |
| Net assets consist of | |
Paid-in capital | $ 102,577,519 |
Total distributable earnings | 4,972,810 |
Total net assets | $107,550,329 |
| Computation of net asset value and offering price per share | |
Net assets – Class A | $ 32,989,634 |
Shares outstanding – Class A1 | 1,712,795 |
Net asset value per share – Class A | $19.26 |
Maximum offering price per share – Class A2 | $20.44 |
Net assets – Class C | $ 5,306,458 |
Shares outstanding – Class C1 | 285,475 |
Net asset value per share – Class C | $18.59 |
Net assets – Administrator Class | $ 19,616,841 |
Shares outstanding – Administrator Class1 | 1,003,554 |
Net asset value per share – Administrator Class | $19.55 |
Net assets – Institutional Class | $ 49,637,396 |
Shares outstanding – Institutional Class1 | 2,531,659 |
Net asset value per share – Institutional Class | $19.61 |
| 1 | The Fund has an unlimited number of authorized shares. |
| 2 | Maximum offering price is computed as 100/94.25 of net asset value. On investments of $50,000 or more, the offering price is reduced. |
| Investment income | |
Interest allocated from affiliated Master Portfolios | $ 826,283 |
Dividends allocated from affiliated Master Portfolios (net of foreign withholding taxes of $8,725) | 373,485 |
Dividends from affiliated Underlying Funds | 196,102 |
Dividends from unaffiliated securities | 80,726 |
Affiliated income allocated from affiliated Master Portfolios | 19,430 |
Expenses allocated from affiliated Master Portfolios | (205,658) |
Waivers allocated from affiliated Master Portfolios | 24,025 |
Total investment income | 1,314,393 |
| Expenses | |
Management fee | 162,411 |
| Administration fees | |
Class A | 34,341 |
Class C | 5,613 |
Administrator Class | 13,456 |
Institutional Class | 32,190 |
| Shareholder servicing fees | |
Class A | 40,882 |
Class C | 6,667 |
Administrator Class | 21,638 |
| Distribution fee | |
Class C | 20,001 |
Custody and accounting fees | 9,611 |
Professional fees | 21,855 |
Registration fees | 34,274 |
Shareholder report expenses | 8,081 |
Trustees’ fees and expenses | 10,873 |
Other fees and expenses | 994 |
Total expenses | 422,887 |
| Less: Fee waivers and/or expense reimbursements | |
Fund-level | (113,642) |
Class A | (922) |
Administrator Class | (14,704) |
Institutional Class | (5,693) |
Net expenses | 287,926 |
Net investment income | 1,026,467 |
| Realized and unrealized gains (losses) on investments | |
| Net realized gains (losses) on | |
Securities transactions allocated from affiliated Master Portfolios | (1,142,840) |
Affiliated Underlying Funds | (51,963) |
Unaffiliated securities | (80,487) |
Futures contracts | 657,562 |
Net realized losses on investments | (617,728) |
| Net change in unrealized gains (losses) on | |
Securities transactions allocated from affiliated Master Portfolios | (1,822,084) |
Affiliated Underlying Funds | (228,621) |
Unaffiliated securities | (162,034) |
Futures contracts | (404,483) |
Net change in unrealized gains (losses) on investments | (2,617,222) |
Net realized and unrealized gains (losses) on investments | (3,234,950) |
Net decrease in net assets resulting from operations | $(2,208,483) |
| Six months ended November 30, 2022 (unaudited) | Year ended May 31, 2022 | |||
| Operations | ||||
Net investment income | $ 1,026,467 | $ 1,488,209 | ||
Net realized gains (losses) on investments | (617,728) | 4,657,358 | ||
Net change in unrealized gains (losses) on investments | (2,617,222) | (14,729,750) | ||
Net decrease in net assets resulting from operations | (2,208,483) | (8,584,183) | ||
| Distributions to shareholders from | ||||
| Net investment income and net realized gains | ||||
Class A | 0 | (3,868,924) | ||
Class C | 0 | (643,902) | ||
Administrator Class | 0 | (7,300,294) | ||
Institutional Class | 0 | (1,611,488) | ||
Total distributions to shareholders | 0 | (13,424,608) | ||
| Capital share transactions | Shares | Shares | ||
| Proceeds from shares sold | ||||
Class A | 114,965 | 2,151,040 | 194,763 | 4,339,052 |
Class C | 28,235 | 513,149 | 77,990 | 1,716,267 |
Administrator Class | 29,668 | 568,717 | 186,756 | 4,236,804 |
Institutional Class | 84,015 | 1,604,343 | 2,280,595 | 47,694,894 |
| 4,837,249 | 57,987,017 | |||
| Reinvestment of distributions | ||||
Class A | 0 | 0 | 171,433 | 3,722,882 |
Class C | 0 | 0 | 30,756 | 643,772 |
Administrator Class | 0 | 0 | 330,130 | 7,273,495 |
Institutional Class | 0 | 0 | 72,918 | 1,611,488 |
| 0 | 13,251,637 | |||
| Payment for shares redeemed | ||||
Class A | (142,616) | (2,678,601) | (289,386) | (6,396,781) |
Class C | (40,009) | (726,046) | (139,167) | (3,030,276) |
Administrator Class | (250,729) | (4,934,632) | (2,328,139) | (48,484,933) |
Institutional Class | (188,841) | (3,637,053) | (475,121) | (10,947,858) |
| (11,976,332) | (68,859,848) | |||
Net increase (decrease) in net assets resulting from capital share transactions | (7,139,083) | 2,378,806 | ||
Total decrease in net assets | (9,347,566) | (19,629,985) | ||
| Net assets | ||||
Beginning of period | 116,897,895 | 136,527,880 | ||
End of period | $107,550,329 | $116,897,895 | ||
| Year ended May 31 | ||||||
| Class A | Six months ended November 30, 2022 (unaudited) | 2022 | 2021 | 2020 | 2019 | 2018 |
Net asset value, beginning of period | $19.65 | $23.45 | $20.87 | $20.35 | $22.73 | $23.47 |
Net investment income | 0.16 | 0.23 | 0.25 | 0.30 | 0.36 1 | 0.29 |
Net realized and unrealized gains (losses) on investments | (0.55) | (1.64) | 3.62 | 0.86 | 0.11 | 0.97 |
Total from investment operations | (0.39) | (1.41) | 3.87 | 1.16 | 0.47 | 1.26 |
| Distributions to shareholders from | ||||||
Net investment income | 0.00 | (0.20) | (0.24) | (0.35) | (0.42) | (0.32) |
Net realized gains | 0.00 | (2.19) | (1.05) | (0.29) | (2.43) | (1.68) |
Total distributions to shareholders | 0.00 | (2.39) | (1.29) | (0.64) | (2.85) | (2.00) |
Net asset value, end of period | $19.26 | $19.65 | $23.45 | $20.87 | $20.35 | $22.73 |
Total return2 | (1.98)% | (6.93)% | 18.90% | 5.65% | 2.68% | 5.38% |
| Ratios to average net assets (annualized)* | ||||||
Gross expenses | 1.25% | 1.20% | 1.24% | 1.30% | 1.31% | 1.33% |
Net expenses | 1.04% | 1.07% | 1.09% | 1.08% | 1.12% | 1.13% |
Net investment income | 1.73% | 0.99% | 0.93% | 1.43% | 1.65% | 1.42% |
| Supplemental data | ||||||
Portfolio turnover rate3 | 46% | 110% | 119% | 119% | 191% | 113% |
Net assets, end of period (000s omitted) | $32,990 | $34,201 | $39,005 | $31,334 | $30,132 | $31,980 |
| * | Ratios include only the net expenses allocated from the affiliated Master Portfolios and do not include expenses from any other affiliated Underlying Funds. Net expenses allocated from the affiliated Master Portfolios included in the ratios were as follows: |
| Six months ended November 30, 2022 (unaudited) | 0.34% |
| Year ended May 31, 2022 | 0.33% |
| Year ended May 31, 2021 | 0.34% |
| Year ended May 31, 2020 | 0.37% |
| Year ended May 31, 2019 | 0.40% |
| Year ended May 31, 2018 | 0.44% |
| 1 | Calculated based upon average shares outstanding |
| 2 | Total return calculations do not include any sales charges. Returns for periods of less than one year are not annualized. |
| 3 | Portfolio turnover rate is calculated by multiplying the Fund’s ownership percentage in the respective affiliated Master Portfolio by the corresponding affiliated Master Portfolio’s purchases and sales. These purchases and sales amounts are aggregated with the direct purchases and sales in the affiliated Underlying Funds and unaffiliated securities and included in the portfolio turnover calculation. |
| Year ended May 31 | ||||||
| Class C | Six months ended November 30, 2022 (unaudited) | 2022 | 2021 | 2020 | 2019 | 2018 |
Net asset value, beginning of period | $19.04 | $22.78 | $20.30 | $19.80 | $22.20 | $22.97 |
Net investment income | 0.09 1 | 0.05 1 | 0.04 1 | 0.09 | 0.12 | 0.10 |
Net realized and unrealized gains (losses) on investments | (0.54) | (1.58) | 3.55 | 0.88 | 0.18 | 0.95 |
Total from investment operations | (0.45) | (1.53) | 3.59 | 0.97 | 0.30 | 1.05 |
| Distributions to shareholders from | ||||||
Net investment income | 0.00 | (0.02) | (0.06) | (0.18) | (0.27) | (0.14) |
Net realized gains | 0.00 | (2.19) | (1.05) | (0.29) | (2.43) | (1.68) |
Total distributions to shareholders | 0.00 | (2.21) | (1.11) | (0.47) | (2.70) | (1.82) |
Net asset value, end of period | $18.59 | $19.04 | $22.78 | $20.30 | $19.80 | $22.20 |
Total return2 | (2.36)% | (7.60)% | 18.01% | 4.89% | 1.90% | 4.56% |
| Ratios to average net assets (annualized)* | ||||||
Gross expenses | 2.00% | 1.94% | 1.99% | 2.05% | 2.06% | 2.08% |
Net expenses | 1.79% | 1.83% | 1.84% | 1.84% | 1.87% | 1.88% |
Net investment income | 0.97% | 0.23% | 0.19% | 0.69% | 0.89% | 0.66% |
| Supplemental data | ||||||
Portfolio turnover rate3 | 46% | 110% | 119% | 119% | 191% | 113% |
Net assets, end of period (000s omitted) | $5,306 | $5,658 | $7,463 | $7,935 | $8,509 | $10,260 |
| * | Ratios include only the net expenses allocated from the affiliated Master Portfolios and do not include expenses from any other affiliated Underlying Funds. Net expenses allocated from the affiliated Master Portfolios included in the ratios were as follows: |
| Six months ended November 30, 2022 (unaudited) | 0.34% |
| Year ended May 31, 2022 | 0.33% |
| Year ended May 31, 2021 | 0.34% |
| Year ended May 31, 2020 | 0.37% |
| Year ended May 31, 2019 | 0.40% |
| Year ended May 31, 2018 | 0.44% |
| 1 | Calculated based upon average shares outstanding |
| 2 | Total return calculations do not include any sales charges. Returns for periods of less than one year are not annualized. |
| 3 | Portfolio turnover rate is calculated by multiplying the Fund’s ownership percentage in the respective affiliated Master Portfolio by the corresponding affiliated Master Portfolio’s purchases and sales. These purchases and sales amounts are aggregated with the direct purchases and sales in the affiliated Underlying Funds and unaffiliated securities and included in the portfolio turnover calculation. |
| Year ended May 31 | ||||||
| Administrator Class | Six months ended November 30, 2022 (unaudited) | 2022 | 2021 | 2020 | 2019 | 2018 |
Net asset value, beginning of period | $19.92 | $23.73 | $21.10 | $20.56 | $22.94 | $23.68 |
Net investment income | 0.19 1 | 0.27 1 | 0.38 | 0.35 1 | 0.41 1 | 0.38 |
Net realized and unrealized gains (losses) on investments | (0.56) | (1.64) | 3.59 | 0.88 | 0.12 | 0.94 |
Total from investment operations | (0.37) | (1.37) | 3.97 | 1.23 | 0.53 | 1.32 |
| Distributions to shareholders from | ||||||
Net investment income | 0.00 | (0.25) | (0.29) | (0.40) | (0.48) | (0.38) |
Net realized gains | 0.00 | (2.19) | (1.05) | (0.29) | (2.43) | (1.68) |
Total distributions to shareholders | 0.00 | (2.44) | (1.34) | (0.69) | (2.91) | (2.06) |
Net asset value, end of period | $19.55 | $19.92 | $23.73 | $21.10 | $20.56 | $22.94 |
Total return2 | (1.86)% | (6.67)% | 19.19% | 5.94% | 2.95% | 5.59% |
| Ratios to average net assets (annualized)* | ||||||
Gross expenses | 1.13% | 1.11% | 1.17% | 1.22% | 1.23% | 1.25% |
Net expenses | 0.78% | 0.83% | 0.84% | 0.83% | 0.87% | 0.88% |
Net investment income | 1.98% | 1.19% | 1.21% | 1.69% | 1.88% | 1.67% |
| Supplemental data | ||||||
Portfolio turnover rate3 | 46% | 110% | 119% | 119% | 191% | 113% |
Net assets, end of period (000s omitted) | $19,617 | $24,391 | $72,033 | $78,538 | $78,209 | $112,302 |
| * | Ratios include only the net expenses allocated from the affiliated Master Portfolios and do not include expenses from any other affiliated Underlying Funds. Net expenses allocated from the affiliated Master Portfolios included in the ratios were as follows: |
| Six months ended November 30, 2022 (unaudited) | 0.34% |
| Year ended May 31, 2022 | 0.33% |
| Year ended May 31, 2021 | 0.34% |
| Year ended May 31, 2020 | 0.37% |
| Year ended May 31, 2019 | 0.41% |
| Year ended May 31, 2018 | 0.44% |
| 1 | Calculated based upon average shares outstanding |
| 2 | Returns for periods of less than one year are not annualized. |
| 3 | Portfolio turnover rate is calculated by multiplying the Fund’s ownership percentage in the respective affiliated Master Portfolio by the corresponding affiliated Master Portfolio’s purchases and sales. These purchases and sales amounts are aggregated with the direct purchases and sales in the affiliated Underlying Funds and unaffiliated securities and included in the portfolio turnover calculation. |
| Year ended May 31 | |||||
| Institutional Class | Six months ended November 30, 2022 (unaudited) | 2022 | 2021 | 2020 | 2019 1 |
Net asset value, beginning of period | $19.97 | $23.78 | $21.14 | $20.60 | $23.24 |
Net investment income | 0.20 | 0.31 2 | 0.42 | 0.37 2 | 0.37 2 |
Net realized and unrealized gains (losses) on investments | (0.56) | (1.66) | 3.58 | 0.88 | (0.12) |
Total from investment operations | (0.36) | (1.35) | 4.00 | 1.25 | 0.25 |
| Distributions to shareholders from | |||||
Net investment income | 0.00 | (0.27) | (0.31) | (0.42) | (0.46) |
Net realized gains | 0.00 | (2.19) | (1.05) | (0.29) | (2.43) |
Total distributions to shareholders | 0.00 | (2.46) | (1.36) | (0.71) | (2.89) |
Net asset value, end of period | $19.61 | $19.97 | $23.78 | $21.14 | $20.60 |
Total return3 | (1.80)% | (6.61)% | 19.35% | 6.02% | 1.72% |
| Ratios to average net assets (annualized)* | |||||
Gross expenses | 0.92% | 0.88% | 0.91% | 0.97% | 0.98% |
Net expenses | 0.69% | 0.72% | 0.74% | 0.74% | 0.75% |
Net investment income | 2.07% | 1.43% | 1.27% | 1.78% | 2.15% |
| Supplemental data | |||||
Portfolio turnover rate4 | 46% | 110% | 119% | 119% | 191% |
Net assets, end of period (000s omitted) | $49,637 | $52,647 | $18,028 | $10,504 | $8,871 |
| * | Ratios include only the net expenses allocated from the affiliated Master Portfolios and do not include expenses from any other affiliated Underlying Funds. Net expenses allocated from the affiliated Master Portfolios included in the ratios were as follows: |
| Six months ended November 30, 2022 (unaudited) | 0.34% |
| Year ended May 31, 2022 | 0.33% |
| Year ended May 31, 2021 | 0.34% |
| Year ended May 31, 2020 | 0.37% |
| Year ended May 31, 20191 | 0.38% |
| 1 | For the period from July 31, 2018 (commencement of class operations) to May 31, 2019 |
| 2 | Calculated based upon average shares outstanding |
| 3 | Returns for periods of less than one year are not annualized. |
| 4 | Portfolio turnover rate is calculated by multiplying the Fund’s ownership percentage in the respective affiliated Master Portfolio by the corresponding affiliated Master Portfolio’s purchases and sales. These purchases and sales amounts are aggregated with the direct purchases and sales in the affiliated Underlying Funds and unaffiliated securities and included in the portfolio turnover calculation. |
| Gross unrealized gains | $ 5,385,354 |
| Gross unrealized losses | (1,762,155) |
| Net unrealized gains | $ 3,623,199 |
| ■ | Level 1 – quoted prices in active markets for identical securities |
| ■ | Level 2 – other significant observable inputs (including quoted prices for similar securities, interest rates, prepayment speeds, credit risk, etc.) |
| ■ | Level 3 – significant unobservable inputs (including the Fund’s own assumptions in determining the fair value of investments) |
| Quoted prices (Level 1) | Other significant observable inputs (Level 2) | Significant unobservable inputs (Level 3) | Total | |
| Assets | ||||
| Investments in: | ||||
| Investment companies | $ 22,403,661 | $0 | $0 | $ 22,403,661 |
| Investments measured at net asset value* | 84,106,832 | |||
| 22,403,661 | 0 | 0 | 106,510,493 | |
| Futures contracts | 316,850 | 0 | 0 | 316,850 |
| Total assets | $22,720,511 | $0 | $0 | $106,827,343 |
| Liabilities | ||||
| Futures contracts | $ 695,874 | $0 | $0 | $ 695,874 |
| Total liabilities | $ 695,874 | $0 | $0 | $ 695,874 |
| * | Investments that are measured at fair value using the net asset value per share (or its equivalent) as a practical expedient have not been categorized in the fair value hierarchy. The fair value amount presented in the table is intended to permit reconciliation of the fair value hierarchy to the amounts presented in the Statement of Assets and Liabilities. The Fund’s investments in the affiliated Master Portfolios are valued at $84,106,832. Each affiliated Master Portfolio does not have a redemption period notice, can be redeemed daily and does not have any unfunded commitments. |
| Affiliated Master Portfolio | Investment objective |
| Allspring C&B Large Cap Value Portfolio | Seeks maximum long-term total return (current income and capital appreciation), consistent with minimizing risk to principal |
| Allspring Core Bond Portfolio | Seeks total return, consisting of income and capital appreciation |
| Allspring Disciplined International Developed Markets Portfolio | Seeks long-term capital appreciation |
| Allspring Disciplined Large Cap Portfolio | Seeks long-term capital appreciation |
| Allspring Diversified Large Cap Growth Portfolio | Seeks long-term capital appreciation |
| Allspring Emerging Growth Portfolio | Seeks long-term capital appreciation |
| Allspring Factor Enhanced Emerging Markets Equity Portfolio | Seeks long-term capital appreciation |
| Allspring Factor Enhanced International Equity Portfolio | Seeks long-term capital appreciation |
| Allspring Large Company Value Portfolio | Seeks long-term capital appreciation |
| Allspring Managed Fixed Income Portfolio | Seeks consistent fixed-income return |
| Allspring Real Return Portfolio | Seeks returns that exceed the rate of inflation over the long-term |
| Allspring Small Company Growth Portfolio | Seeks long-term capital appreciation |
| Allspring Small Company Value Portfolio | Seeks long-term capital appreciation |
| Average daily net assets | Management fee |
| First $500 million | 0.300% |
| Next $500 million | 0.280 |
| Next $2 billion | 0.260 |
| Next $2 billion | 0.240 |
| Next $5 billion | 0.230 |
| Over $10 billion | 0.220 |
| Class-level administration fee | |
| Class A | 0.21% |
| Class C | 0.21 |
| Administrator Class | 0.13 |
| Institutional Class | 0.13 |
| Expense ratio caps | |
| Class A | 1.15% |
| Class C | 1.90 |
| Administrator Class | 0.90 |
| Institutional Class | 0.80 |
| Purchases at cost | Sales proceeds | |||
| U.S. government | Non-U.S. government | U.S. government | Non-U.S. government | |
| $13,817,791 | $37,035,299 | $14,205,645 | $43,433,675 | |
| Asset derivatives | Liability derivatives | ||||
| Statement of Assets and Liabilities location | Fair value | Statement of Assets and Liabilities location | Fair value | ||
| Interest rate risk | Unrealized gains on futures contracts | $ 83,330* | Unrealized losses on futures contracts | $ 59,114* | |
| Equity risk | Unrealized gains on futures contracts | 233,520* | Unrealized losses on futures contracts | 636,760* | |
| $316,850 | $695,874 | ||||
| * | Amount represents cumulative unrealized gains (losses) on futures contracts as reported in the table following the Portfolio of Investments. For futures contracts, only the current day’s variation margin as of November 30, 2022 is reported separately on the Statement of Assets and Liabilities. |
| Net realized gains (losses) on derivatives | Net change in unrealized gains (losses) on derivatives | |
| Interest rate risk | $ 54,918 | $ 20,288 |
| Equity risk | 779,579 | (396,526) |
| Foreign currency risk | (176,935) | (28,245) |
| $ 657,562 | $(404,483) |
| Name and year of birth | Position held and length of service* | Principal occupations during past five years or longer | Current other public company or investment company directorships |
| William R. Ebsworth (Born 1957) | Trustee, since 2015 | Retired. From 1984 to 2013, equities analyst, portfolio manager, research director and chief investment officer at Fidelity Management and Research Company in Boston, Tokyo, and Hong Kong, and retired in 2013 as Chief Investment Officer of Fidelity Strategic Advisers, Inc. where he led a team of investment professionals managing client assets. Prior thereto, Board member of Hong Kong Securities Clearing Co., Hong Kong Options Clearing Corp., the Thailand International Fund, Ltd., Fidelity Investments Life Insurance Company, and Empire Fidelity Investments Life Insurance Company. Audit Committee Chair and Investment Committee Chair of the Vincent Memorial Hospital Endowment (non-profit organization). Mr. Ebsworth is a CFA® charterholder. | N/A |
| Jane A. Freeman (Born 1953) | Trustee, since 2015; Chair Liaison, since 2018 | Retired. From 2012 to 2014 and 1999 to 2008, Chief Financial Officer of Scientific Learning Corporation. From 2008 to 2012, Ms. Freeman provided consulting services related to strategic business projects. Prior to 1999, Portfolio Manager at Rockefeller & Co. and Scudder, Stevens & Clark. Board member of the Harding Loevner Funds from 1996 to 2014, serving as both Lead Independent Director and chair of the Audit Committee. Board member of the Russell Exchange Traded Funds Trust from 2011 to 2012 and the chair of the Audit Committee. Ms. Freeman is also an inactive Chartered Financial Analyst. | N/A |
| Isaiah Harris, Jr. (Born 1952) | Trustee, since 2009; Audit Committee Chair, since 2019 | Retired. Chairman of the Board of CIGNA Corporation from 2009 to 2021, and Director from 2005 to 2008. From 2003 to 2011, Director of Deluxe Corporation. Prior thereto, President and CEO of BellSouth Advertising and Publishing Corp. from 2005 to 2007, President and CEO of BellSouth Enterprises from 2004 to 2005 and President of BellSouth Consumer Services from 2000 to 2003. Emeritus member of the Iowa State University Foundation Board of Governors. Emeritus Member of the Advisory Board of Iowa State University School of Business. Advisory Board Member, Palm Harbor Academy (private school). Advisory Board Member, Fellowship of Christian Athletes. Mr. Harris is a certified public accountant (inactive status). | N/A |
| David F. Larcker (Born 1950) | Trustee, since 2009 | James Irvin Miller Professor of Accounting at the Graduate School of Business (Emeritus), Stanford University, Director of the Corporate Governance Research Initiative and Senior Faculty of The Rock Center for Corporate Governance since 2006. From 2005 to 2008, Professor of Accounting at the Graduate School of Business, Stanford University. Prior thereto, Ernst & Young Professor of Accounting at The Wharton School, University of Pennsylvania from 1985 to 2005. | N/A |
| Name and year of birth | Position held and length of service* | Principal occupations during past five years or longer | Current other public company or investment company directorships |
| Olivia S. Mitchell (Born 1953) | Trustee, since 2006; Nominating and Governance Committee Chair, since 2018 | International Foundation of Employee Benefit Plans Professor since 1993, Wharton School of the University of Pennsylvania. Director of Wharton’s Pension Research Council and Boettner Center on Pensions & Retirement Research, and Research Associate at the National Bureau of Economic Research. Previously taught at Cornell University from 1978 to 1993. | N/A |
| Timothy J. Penny (Born 1951) | Trustee, since 1996; Chair, since 2018 | President and Chief Executive Officer of Southern Minnesota Initiative Foundation, a non-profit organization, since 2007. Vice Chair of the Economic Club of Minnesota, since 2007. Co-Chair of the Committee for a Responsible Federal Budget, since 1995. Member of the Board of Trustees of NorthStar Education Finance, Inc., a non-profit organization, since 2007. Senior Fellow of the University of Minnesota Humphrey Institute from 1995 to 2017. | N/A |
| James G. Polisson (Born 1959) | Trustee, since 2018 | Retired. Chief Marketing Officer, Source (ETF) UK Services, Ltd, from 2015 to 2017. From 2012 to 2015, Principal of The Polisson Group, LLC, a management consulting, corporate advisory and principal investing company. Chief Executive Officer and Managing Director at Russell Investments, Global Exchange Traded Funds from 2010 to 2012. Managing Director of Barclays Global Investors from 1998 to 2010 and Global Chief Marketing Officer for iShares and Barclays Global Investors from 2000 to 2010. Trustee of the San Francisco Mechanics’ Institute, a non-profit organization, from 2013 to 2015. Board member of the Russell Exchange Traded Fund Trust from 2011 to 2012. Director of Barclays Global Investors Holdings Deutschland GmbH from 2006 to 2009. Mr. Polisson is an attorney and has a retired status with the Massachusetts and District of Columbia Bar Associations. | N/A |
| Pamela Wheelock (Born 1959) | Trustee, since January 2020; previously Trustee from January 2018 to July 2019 | Retired. Executive and Senior Financial leadership positions in the public, private and nonprofit sectors. Interim President and CEO, McKnight Foundation, 2020. Interim Commissioner, Minnesota Department of Human Services, 2019. Chief Operating Officer, Twin Cities Habitat for Humanity, 2017-2019. Vice President for University Services, University of Minnesota, 2012-2016. Interim President and CEO, Blue Cross and Blue Shield of Minnesota, 2011-2012. Executive Vice-President and Chief Financial Officer, Minnesota Wild, 2002-2008. Commissioner, Minnesota Department of Finance, 1999-2002. Chair of the Board of Directors of Destination Medical Center Corporation. Board member of the Minnesota Wild Foundation. | N/A |
| Name and year of birth | Position held and length of service | Principal occupations during past five years or longer |
| Andrew Owen (Born 1960) | President, since 2017 | President and Chief Executive Officer of Allspring Funds Management, LLC since 2017 and Head of Global Fund Governance of Allspring Global Investments since 2022. Prior thereto, co-president of Galliard Capital Management, LLC, an affiliate of Allspring Funds Management, LLC, from 2019 to 2022 and Head of Affiliated Managers, Allspring Global Investments, from 2014 to 2019 and Executive Vice President responsible for marketing, investments and product development for Allspring Funds Management, LLC, from 2009 to 2014. |
| Jeremy DePalma (Born 1974) | Treasurer, since 2012 (for certain funds in the Fund Complex); since 2021 (for the remaining funds in the Fund Complex) | Senior Vice President of Allspring Funds Management, LLC since 2009. Senior Vice President of Evergreen Investment Management Company, LLC from 2008 to 2010 and head of the Fund Reporting and Control Team within Fund Administration from 2005 to 2010. |
| Christopher Baker (Born 1976) | Chief Compliance Officer, since 2022 | Global Chief Compliance Officer for Allspring Global Investments since 2022. Prior thereto, Chief Compliance Officer for State Street Global Advisors from 2018 to 2021. Senior Compliance Officer for the State Street divisions of Alternative Investment Solutions, Sector Solutions, and Global Marketing from 2015 to 2018. From 2010 to 2015 Vice President, Global Head of Investment and Marketing Compliance for State Street Global Advisors. |
| Matthew Prasse (Born 1983) | Chief Legal Officer, since 2022; Secretary, since 2021 | Senior Counsel of the Allspring Legal Department since 2021. Senior Counsel of the Wells Fargo Legal Department from 2018 to 2021. Previously, Counsel for Barings LLC from 2015 to 2018. Prior to joining Barings, Associate at Morgan, Lewis & Bockius LLP from 2008 to 2015. |
P.O. Box 219967
Kansas City, MO 64121-9967

1-800-222-8222 or visit the Fund's website at allspringglobal.com. Read the prospectus carefully before you invest or send money.
SA279/SAR279 11-22

| ■ | Allspring Spectrum Aggressive Growth Fund |
| ■ | Allspring Spectrum Conservative Growth Fund |
| ■ | Allspring Spectrum Growth Fund |
| ■ | Allspring Spectrum Income Allocation Fund |
| ■ | Allspring Spectrum Moderate Growth Fund |
| 2 | |
| Performance highlights | |
| 6 | |
| 9 | |
| 12 | |
| 15 | |
| 18 | |
| 21 | |
| Portfolio of investments | |
| 23 | |
| 26 | |
| 30 | |
| 34 | |
| 38 | |
| Financial statements | |
| 42 | |
| 44 | |
| 46 | |
| Financial highlights | |
| 51 | |
| 55 | |
| 58 | |
| 61 | |
| 64 | |
| 67 | |
| 80 |

| 1 | The S&P 500 Index consists of 500 stocks chosen for market size, liquidity, and industry group representation. It is a market-value-weighted index with each stock's weight in the index proportionate to its market value. You cannot invest directly in an index. |
| 2 | The Morgan Stanley Capital International (MSCI) All Country World Index (ACWI) ex USA Index (Net) is a free-float-adjusted market-capitalization-weighted index that is designed to measure the equity market performance of developed and emerging markets, excluding the U.S. Source: MSCI. MSCI makes no express or implied warranties or representations and shall have no liability whatsoever with respect to any MSCI data contained herein. The MSCI data may not be further redistributed or used as a basis for other indexes or any securities or financial products. This report is not approved, reviewed, or produced by MSCI. You cannot invest directly in an index. |
| 3 | The MSCI Emerging Markets (EM) Index (Net) (USD) is a free-float-adjusted market-capitalization-weighted index that is designed to measure equity market performance of emerging markets. You cannot invest directly in an index. |
| 4 | The Bloomberg U.S. Aggregate Bond Index is a broad-based benchmark that measures the investment-grade, U.S.-dollar-denominated, fixed-rate taxable bond market, including Treasuries, government-related and corporate securities, mortgage-backed securities (agency fixed-rate and hybrid adjustable-rate mortgage pass-throughs), asset-backed securities, and commercial mortgage-backed securities. You cannot invest directly in an index. |
| 5 | The Bloomberg Global Aggregate ex-USD Index (unhedged) is an unmanaged index that provides a broad-based measure of the global investment-grade fixed-income markets excluding the U.S.-dollar-denominated debt market. You cannot invest directly in an index. |
| 6 | The Bloomberg Municipal Bond Index is an unmanaged index composed of long-term tax-exempt bonds with a minimum credit rating of Baa. You cannot invest directly in an index. |
| 7 | The ICE BofA U.S. High Yield Index is a market-capitalization-weighted index of domestic and Yankee high-yield bonds. The index tracks the performance of high-yield securities traded in the U.S. bond market. You cannot invest directly in an index. Copyright 2023. ICE Data Indices, LLC. All rights reserved. |

President
Allspring Funds
| Investment objective | The Fund seeks long-term capital appreciation with no emphasis on income. |
| Manager | Allspring Funds Management, LLC |
| Subadviser | Allspring Global Investments, LLC |
| Portfolio managers | Kandarp R. Acharya, CFA®‡, FRM, Petros N. Bocray, CFA®‡, FRM, Travis L. Keshemberg, CFA®‡, CIPM, FRM |
| Average annual total returns (%) as of November 30, 2022 | |||||||||||
| Including sales charge | Excluding sales charge | Expense ratios1 (%) | |||||||||
| Inception date | 1 year | 5 year | 10 year | 1 year | 5 year | 10 year | Gross | Net 2 | |||
| Class A (WEAFX)3 | 2-10-2017 | -17.36 | 6.06 | 8.50 | -12.31 | 7.32 | 9.14 | 1.03 | 1.02 | ||
| Class C (WEACX) | 10-1-1997 | -13.98 | 6.52 | 8.83 | -12.98 | 6.52 | 8.83 | 1.78 | 1.77 | ||
| Administrator Class 4 | 2-4-2022 | – | – | – | -12.23 | 7.44 | 9.20 | 0.95 | 0.94 | ||
| Institutional Class (WEAYX)5 | 7-31-2018 | – | – | – | -12.00 | 7.63 | 9.30 | 0.70 | 0.69 | ||
| Spectrum Aggressive Growth Blended Index6 | – | – | – | – | -11.02 | 7.68 | 10.34 | – | – | ||
| MSCI ACWI ex USA Index (Net)7 | – | – | – | – | -11.87 | 1.48 | 4.23 | – | – | ||
| Russell 3000® Index8 | – | – | – | – | -10.80 | 10.33 | 12.95 | – | – | ||
| 1 | Reflects the expense ratios as stated in the most recent prospectuses, which include the impact of 0.27% in acquired fund fees and expenses. Net expenses from affiliated master portfolios are included in the acquired fund fees and expense amount. The expense ratios shown are subject to change and may differ from the annualized expense ratios shown in the financial highlights of this report, which do not include acquired fund fees and expenses. |
| 2 | The manager has contractually committed through September 30, 2023, to waive fees and/or reimburse expenses to the extent necessary to cap total annual fund operating expenses after fee waivers at 0.75% for Class A, 1.50% for Class C, 0.67% for Administrator Class, and 0.42% for Institutional Class. Brokerage commissions, stamp duty fees, interest, taxes, acquired fund fees and expenses (if any), net expenses from affiliated master portfolios, and extraordinary expenses are excluded from the expense caps. Prior to or after the commitment expiration date, the caps may be increased or the commitment to maintain the caps may be terminated only with the approval of the Board of Trustees. Without these caps, the Fund’s returns would have been lower. The expense ratio paid by an investor is the net expense ratio (the total annual fund operating expenses after fee waivers) as stated in the prospectuses. |
| 3 | Historical performance for the Class A shares prior to their inception reflects the performance of the Class C shares and includes the higher expenses applicable to the Class C shares. If these expenses had not been included, returns for the Class A shares would be higher. |
| 4 | Historical performance shown for the Administrator Class shares prior to their inception reflects the performance of the Institutional Class shares, adjusted to reflect the higher expenses applicable to the Administrator Class shares. |
| 5 | Historical performance shown for the Institutional Class shares prior to their inception reflects the performance of the Class A shares adjusted to reflect that the Institutional Class shares do not have a sales load but is not adjusted to reflect the Institutional Class expenses. If these expenses had been included, returns for the Institutional Class shares would be higher. |
| 6 | Source: Allspring Funds Management, LLC. The Spectrum Aggressive Growth Blended Index is composed 70% of the Russell 3000® Index and 30% of the MSCI ACWI ex USA Index (Net). Effective November 2, 2020, the WealthBuilder Equity Blended Index was renamed the Spectrum Aggressive Growth Blended Index. You cannot invest directly in an index. |
| ‡ | CFA® and Chartered Financial Analyst® are trademarks owned by CFA Institute. |
| 7 | The Morgan Stanley Capital International (MSCI) All Country World Index (ACWI) ex USA Index (Net) is a free-float-adjusted market- capitalization-weighted index that is designed to measure the equity market performance of developed and emerging markets, excluding the U.S. Source: MSCI. MSCI makes no express or implied warranties or representations and shall have no liability whatsoever with respect to any MSCI data contained herein. The MSCI data may not be further redistributed or used as a basis for other indexes or any securities or financial products. This report is not approved, reviewed, or produced by MSCI. You cannot invest directly in an index. |
| 8 | The Russell 3000® Index measures the performance of the 3,000 largest U.S. companies based on total market capitalization, which represents approximately 98% of the investable U.S. equity market. You cannot invest directly in an index. |
| Ten largest holdings (%) as of November 30, 20221 | |
| Allspring Disciplined Large Cap Portfolio | 23.65 |
| Allspring Factor Enhanced International Equity Portfolio | 20.02 |
| iShares Core S&P 500 ETF | 12.81 |
| Allspring Factor Enhanced U.S. Large Cap Equity Portfolio | 10.81 |
| Allspring Special Large Cap Value Fund Class R6 | 3.95 |
| Allspring Discovery Large Cap Growth Fund Class R6 | 3.87 |
| Allspring Premier Large Company Growth Fund Class R6 | 3.86 |
| Allspring Emerging Markets Equity Fund Class R6 | 3.01 |
| iShares Core S&P Small-Cap ETF | 2.94 |
| Allspring Factor Enhanced U.S. Small Cap Equity Portfolio | 2.91 |
| 1 | Figures represent the percentage of the Fund's net assets. Holdings are subject to change and may have changed since the date specified. |
| Allocation (%) as of November 30, 2022 | ||
| Neutral allocation | Effective allocation1 | |
| Large Cap Funds | 60 | 60 |
| International Developed Funds | 23 | 23 |
| Small Cap Funds | 10 | 10 |
| Emerging Markets Funds | 7 | 7 |
| 1 | Effective allocation includes the effect of any tactical futures overlay that may be in place. Effective cash, if any, represents the net offset to such future positions. The effective allocation does not reflect futures positions held in dynamic risk hedging strategies. Effective allocations are subject to change and may have changed since the date specified. |
| Investment objective | The Fund seeks a combination of current income and capital appreciation. |
| Manager | Allspring Funds Management, LLC |
| Subadviser | Allspring Global Investments, LLC |
| Portfolio managers | Kandarp R. Acharya, CFA®‡, FRM, Petros N. Bocray, CFA®‡, FRM, Travis L. Keshemberg, CFA®‡, CIPM, FRM |
| Average annual total returns (%) as of November 30, 2022 | |||||||||||
| Including sales charge | Excluding sales charge | Expense ratios1 (%) | |||||||||
| Inception date | 1 year | 5 year | 10 year | 1 year | 5 year | 10 year | Gross | Net 2 | |||
| Class A (WMBGX)3 | 2-10-2017 | -16.62 | 2.01 | 3.76 | -11.54 | 3.23 | 4.38 | 1.13 | 1.10 | ||
| Class C (WMBFX) | 9-30-2004 | -13.14 | 2.49 | 4.09 | -12.14 | 2.49 | 4.09 | 1.88 | 1.85 | ||
| Institutional Class (WMBZX)4 | 7-31-2018 | – | – | – | -11.22 | 3.52 | 4.53 | 0.80 | 0.77 | ||
| Spectrum Conservative Growth Blended Index5 | – | – | – | – | -11.16 | 3.46 | 4.92 | – | – | ||
| Bloomberg U.S. Aggregate Bond Index6 | – | – | – | – | -12.84 | 0.21 | 1.09 | – | – | ||
| Bloomberg U.S. TIPS Index7 | – | – | – | – | -10.66 | 2.50 | 1.15 | – | – | ||
| ICE BofA U.S. High Yield Constrained Index8 | – | – | – | – | -8.82 | 2.32 | 4.18 | – | – | ||
| MSCI ACWI ex USA Index (Net)9 | – | – | – | – | -11.87 | 1.48 | 4.23 | – | – | ||
| Russell 3000® Index10 | – | – | – | – | -10.80 | 10.33 | 12.95 | – | – | ||
| 1 | Reflects the expense ratios as stated in the most recent prospectuses, which include the impact of 0.35% in acquired fund fees and expenses. Net expenses from affiliated master portfolios are included in the acquired fund fees and expense amount. The expense ratios shown are subject to change and may differ from the annualized expense ratios shown in the financial highlights of this report, which do not include acquired fund fees and expenses. |
| 2 | The manager has contractually committed through September 30, 2023, to waive fees and/or reimburse expenses to the extent necessary to cap total annual fund operating expenses after fee waivers at 0.75% for Class A, 1.50% for Class C, and 0.42% for Institutional Class. Brokerage commissions, stamp duty fees, interest, taxes, acquired fund fees and expenses (if any), net expenses from affiliated master portfolios, and extraordinary expenses are excluded from the expense caps. Prior to or after the commitment expiration date, the caps may be increased or the commitment to maintain the caps may be terminated only with the approval of the Board of Trustees. Without these caps, the Fund’s returns would have been lower. The expense ratio paid by an investor is the net expense ratio (the total annual fund operating expenses after fee waivers) as stated in the prospectuses. |
| 3 | Historical performance for the Class A shares prior to their inception reflects the performance of the Class C shares and includes the higher expenses applicable to the Class C shares. If these expenses had not been included, returns for the Class A shares would be higher. |
| 4 | Historical performance shown for the Institutional Class shares prior to their inception reflects the performance of the Class A shares adjusted to reflect that the Institutional Class shares do not have a sales load but is not adjusted to reflect the Institutional Class expenses. If these expenses had been included, returns for the Institutional Class shares would be higher. |
| 5 | Source: Allspring Funds Management, LLC. Spectrum Conservative Growth Blended Index is composed 41% of the Bloomberg U.S. Aggregate Bond Index, 20% of the Russell 3000® Index, 15% of the Bloomberg U.S. TIPS Index, 15% of ICE BofA U.S. High Yield Constrained Index, and 9% of the MSCI ACWI ex USA Index (Net). Effective November 2, 2020, the WealthBuilder Moderate Balanced Blended Index, which was composed 60% of the Bloomberg U.S. Aggregate Bond Index, 28% of the Russell 3000® Index, and 12% of the MSCI ACWI ex USA Index (Net), was renamed the Spectrum Conservative Growth Blended Index. You cannot invest directly in an index. |
| ‡ | CFA® and Chartered Financial Analyst® are trademarks owned by CFA Institute. |
| 6 | The Bloomberg U.S. Aggregate Bond Index is a broad-based benchmark that measures the investment-grade, U.S. dollar–denominated, fixed-rate taxable bond market, including Treasuries, government-related and corporate securities, mortgage-backed securities (agency fixed-rate and hybrid adjustable-rate mortgage pass-throughs), asset-backed securities, and commercial mortgage-backed securities. You cannot invest directly in an index. |
| 7 | The Bloomberg U.S. Treasury Inflation-Protected Securities (TIPS) Index is an index of inflation-indexed-linked U.S. Treasury securities. You cannot invest directly in an index. |
| 8 | The ICE BofA U.S. High Yield Constrained Index is a market-value-weighted index of all domestic and Yankee high-yield bonds, including deferred interest bonds and payment-in-kind securities. Issues included in the index have maturities of one year or more and have a credit rating lower than BBB-/Baa3 but are not in default. The ICE BofA U.S. High Yield Constrained Index limits any individual issuer to a maximum of 2% benchmark exposure. You cannot invest directly in an index. Copyright 2023. ICE Data Indices, LLC. All rights reserved. |
| 9 | The Morgan Stanley Capital International (MSCI) All Country World Index (ACWI) ex USA Index (Net) is a free-float-adjusted market- capitalization-weighted index that is designed to measure the equity market performance of developed and emerging markets, excluding the U.S. Source: MSCI. MSCI makes no express or implied warranties or representations and shall have no liability whatsoever with respect to any MSCI data contained herein. The MSCI data may not be further redistributed or used as a basis for other indexes or any securities or financial products. This report is not approved, reviewed, or produced by MSCI. You cannot invest directly in an index. |
| 10 | The Russell 3000® Index measures the performance of the 3,000 largest U.S. companies based on total market capitalization, which represents approximately 98% of the investable U.S. equity market. You cannot invest directly in an index. |
| Ten largest holdings (%) as of November 30, 20221 | |
| Allspring Bloomberg US Aggregate ex-Corporate Portfolio | 13.05 |
| Allspring Core Bond Portfolio | 11.78 |
| Allspring Income Plus Fund Institutional Class | 11.18 |
| Allspring Real Return Portfolio | 7.73 |
| Allspring Disciplined Large Cap Portfolio | 7.01 |
| Allspring High Yield Bond Fund Institutional Class | 6.81 |
| Allspring Factor Enhanced International Equity Portfolio | 5.83 |
| iShares Core U.S. Aggregate Bond ETF | 5.40 |
| Allspring Diversified Income Builder Fund Class R6 | 4.66 |
| iShares Core S&P 500 ETF | 3.82 |
| 1 | Figures represent the percentage of the Fund's net assets. Holdings are subject to change and may have changed since the date specified. |
| Allocation (%) as of November 30, 2022 | ||
| Neutral allocation | Effective allocation1 | |
| Bond Funds | 54 | 64 |
| Stock Funds | 28 | 29 |
| Inflation Sensitive Funds | 14 | 10 |
| Alternative Investment Funds | 4 | 4 |
| Effective Cash | 0 | (7) |
| 1 | Effective allocation includes the effect of any tactical futures overlay that may be in place. Effective cash, if any, represents the net offset to such future positions. The effective allocation does not reflect futures positions held in dynamic risk hedging strategies. Effective allocations are subject to change and may have changed since the date specified. |
| Investment objective | The Fund seeks capital appreciation with a secondary emphasis on current income. |
| Manager | Allspring Funds Management, LLC |
| Subadviser | Allspring Global Investments, LLC |
| Portfolio managers | Kandarp R. Acharya, CFA®‡, FRM, Petros N. Bocray, CFA®‡, FRM, Travis L. Keshemberg, CFA®‡, CIPM, FRM |
| Average annual total returns (%) as of November 30, 2022 | |||||||||||
| Including sales charge | Excluding sales charge | Expense ratios1 (%) | |||||||||
| Inception date | 1 year | 5 year | 10 year | 1 year | 5 year | 10 year | Gross | Net 2 | |||
| Class A (WGAFX)3 | 2-10-2017 | -16.79 | 4.29 | 7.02 | -11.71 | 5.53 | 7.66 | 1.09 | 1.04 | ||
| Class C (WGCFX) | 9-30-2004 | -13.38 | 4.78 | 7.37 | -12.38 | 4.78 | 7.37 | 1.84 | 1.79 | ||
| Institutional Class (WGAYX)4 | 7-31-2018 | – | – | – | -11.40 | 5.82 | 7.80 | 0.76 | 0.71 | ||
| Spectrum Growth Blended Index5 | – | – | – | – | -10.71 | 5.52 | 8.15 | – | – | ||
| Bloomberg U.S. Aggregate Bond Index6 | – | – | – | – | -12.84 | 0.21 | 1.09 | – | – | ||
| Bloomberg U.S. TIPS Index7 | – | – | – | – | -10.66 | 2.50 | 1.15 | – | – | ||
| ICE BofA U.S. High Yield Constrained Index8 | – | – | – | – | -8.82 | 2.32 | 4.18 | – | – | ||
| MSCI ACWI ex USA Index (Net)9 | – | – | – | – | -11.87 | 1.48 | 4.23 | – | – | ||
| Russell 3000® Index10 | – | – | – | – | -10.80 | 10.33 | 12.95 | – | – | ||
| 1 | Reflects the expense ratios as stated in the most recent prospectuses, which include the impact of 0.29% in acquired fund fees and expenses. Net expenses from affiliated master portfolios are included in the acquired fund fees and expense amount. The expense ratios shown are subject to change and may differ from the annualized expense ratios shown in the financial highlights of this report, which do not include acquired fund fees and expenses. |
| 2 | The manager has contractually committed through September 30, 2023, to waive fees and/or reimburse expenses to the extent necessary to cap total annual fund operating expenses after fee waivers at 0.75% for Class A, 1.50% for Class C, and 0.42% for Institutional Class. Brokerage commissions, stamp duty fees, interest, taxes, acquired fund fees and expenses (if any), net expenses from affiliated master portfolios, and extraordinary expenses are excluded from the expense caps. Prior to or after the commitment expiration date, the caps may be increased or the commitment to maintain the caps may be terminated only with the approval of the Board of Trustees. Without these caps, the Fund’s returns would have been lower. The expense ratio paid by an investor is the net expense ratio (the total annual fund operating expenses after fee waivers) as stated in the prospectuses. |
| 3 | Historical performance for the Class A shares prior to their inception reflects the performance of the Class C shares and includes the higher expenses applicable to the Class C shares. If these expenses had not been included, returns for the Class A shares would be higher. |
| 4 | Historical performance shown for the Institutional Class shares prior to their inception reflects the performance of the Class A shares adjusted to reflect that the Institutional Class shares do not have a sales load but is not adjusted to reflect the Institutional Class expenses. If these expenses had been included, returns for the Institutional Class shares would be higher. |
| 5 | Source: Allspring Funds Management, LLC. Spectrum Growth Blended Index is composed 40% of the Russell 3000® Index, 17% of the MSCI ACWI ex USA Index (Net), 15% of the Bloomberg U.S. Aggregate Bond Index, 14% of the Bloomberg U.S. TIPS Index, and 14% of ICE BofA U.S. High Yield Constrained Index. Effective November 2, 2020, the WealthBuilder Growth Allocation Blended Index, which was composed 56% of the Russell 3000® Index, 24% of the MSCI ACWI ex USA Index (Net), and 20% of the Bloomberg U.S. Aggregate Bond Index, was renamed the Spectrum Growth Blended Index. You cannot invest directly in an index. |
| ‡ | CFA® and Chartered Financial Analyst® are trademarks owned by CFA Institute. |
| 6 | The Bloomberg U.S. Aggregate Bond Index is a broad-based benchmark that measures the investment-grade, U.S. dollar–denominated, fixed-rate taxable bond market, including Treasuries, government-related and corporate securities, mortgage-backed securities (agency fixed-rate and hybrid adjustable-rate mortgage pass-throughs), asset-backed securities, and commercial mortgage-backed securities. You cannot invest directly in an index. |
| 7 | The Bloomberg U.S. Treasury Inflation-Protected Securities (TIPS) Index is an index of inflation-indexed-linked U.S. Treasury securities. You cannot invest directly in an index. |
| 8 | The ICE BofA U.S. High Yield Constrained Index is a market-value-weighted index of all domestic and Yankee high-yield bonds, including deferred interest bonds and payment-in-kind securities. Issues included in the index have maturities of one year or more and have a credit rating lower than BBB-/Baa3 but are not in default. The ICE BofA U.S. High Yield Constrained Index limits any individual issuer to a maximum of 2% benchmark exposure. You cannot invest directly in an index. Copyright 2023. ICE Data Indices, LLC. All rights reserved. |
| 9 | The Morgan Stanley Capital International (MSCI) All Country World Index (ACWI) ex USA Index (Net) is a free-float-adjusted market- capitalization-weighted index that is designed to measure the equity market performance of developed and emerging markets, excluding the U.S. Source: MSCI. MSCI makes no express or implied warranties or representations and shall have no liability whatsoever with respect to any MSCI data contained herein. The MSCI data may not be further redistributed or used as a basis for other indexes or any securities or financial products. This report is not approved, reviewed, or produced by MSCI. You cannot invest directly in an index. |
| 10 | The Russell 3000® Index measures the performance of the 3,000 largest U.S. companies based on total market capitalization, which represents approximately 98% of the investable U.S. equity market. You cannot invest directly in an index. |
| Ten largest holdings (%) as of November 30, 20221 | |
| Allspring Disciplined Large Cap Portfolio | 14.87 |
| Allspring Factor Enhanced International Equity Portfolio | 12.20 |
| Allspring Real Return Portfolio | 7.84 |
| Allspring High Yield Bond Fund Institutional Class | 7.26 |
| Allspring Factor Enhanced U.S. Large Cap Equity Portfolio | 6.83 |
| Allspring Diversified Income Builder Fund Class R6 | 5.54 |
| iShares Core U.S. Aggregate Bond ETF | 5.29 |
| iShares Core S&P 500 ETF | 5.03 |
| Allspring Core Bond Portfolio | 3.81 |
| Allspring Bloomberg US Aggregate ex-Corporate Portfolio | 3.34 |
| 1 | Figures represent the percentage of the Fund's net assets. Holdings are subject to change and may have changed since the date specified. |
| Allocation (%) as of November 30, 2022 | ||
| Neutral allocation | Effective allocation1 | |
| Stock Funds | 58 | 57 |
| Bond Funds | 24 | 37 |
| Inflation Sensitive Funds | 15 | 10 |
| Alternative Investment Funds | 3 | 3 |
| Effective Cash | 0 | (7) |
| 1 | Effective allocation includes the effect of any tactical futures overlay that may be in place. Effective cash, if any, represents the net offset to such future positions. The effective allocation does not reflect futures positions held in dynamic risk hedging strategies. Effective allocations are subject to change and may have changed since the date specified. |
| Investment objective | The Fund seeks current income with a secondary emphasis on capital appreciation. |
| Manager | Allspring Funds Management, LLC |
| Subadviser | Allspring Global Investments, LLC |
| Portfolio managers | Kandarp R. Acharya, CFA®‡, FRM, Petros N. Bocray, CFA®‡, FRM, Travis L. Keshemberg, CFA®‡, CIPM, FRM |
| Average annual total returns (%) as of November 30, 2022 | |||||||||||
| Including sales charge | Excluding sales charge | Expense ratios1 (%) | |||||||||
| Inception date | 1 year | 5 year | 10 year | 1 year | 5 year | 10 year | Gross | Net 2 | |||
| Class A (WCAFX)3 | 2-10-2017 | -16.71 | 0.35 | 1.62 | -11.63 | 1.54 | 2.23 | 1.11 | 1.05 | ||
| Class C (WCCFX) | 9-30-2004 | -13.24 | 0.76 | 1.92 | -12.24 | 0.76 | 1.92 | 1.86 | 1.80 | ||
| Institutional Class (WCYFX)4 | 7-31-2018 | – | – | – | -11.25 | 1.83 | 2.37 | 0.78 | 0.72 | ||
| Spectrum Income Allocation Blended Index5 | – | – | – | – | -11.71 | 1.82 | 3.00 | – | – | ||
| Bloomberg U.S. Aggregate Bond Index6 | – | – | – | – | -12.84 | 0.21 | 1.09 | – | – | ||
| Bloomberg U.S. TIPS Index7 | – | – | – | – | -10.66 | 2.50 | 1.15 | – | – | ||
| ICE BofA U.S. High Yield Constrained Index8 | – | – | – | – | -8.82 | 2.32 | 4.18 | – | – | ||
| MSCI ACWI ex USA Index (Net)9 | – | – | – | – | -11.87 | 1.48 | 4.23 | – | – | ||
| Russell 3000® Index10 | – | – | – | – | -10.80 | 10.33 | 12.95 | – | – | ||
| 1 | Reflects the expense ratios as stated in the most recent prospectuses, which include the impact of 0.30% in acquired fund fees and expenses. Net expenses from affiliated master portfolios are included in the acquired fund fees and expense amount. The expense ratios shown are subject to change and may differ from the annualized expense ratios shown in the financial highlights of this report, which do not include acquired fund fees and expenses. |
| 2 | The manager has contractually committed through September 30, 2023, to waive fees and/or reimburse expenses to the extent necessary to cap total annual fund operating expenses after fee waivers at 0.75% for Class A, 1.50% for Class C, and 0.42% for Institutional Class. Brokerage commissions, stamp duty fees, interest, taxes, acquired fund fees and expenses (if any), net expenses from affiliated master portfolios, and extraordinary expenses are excluded from the expense caps. Prior to or after the commitment expiration date, the caps may be increased or the commitment to maintain the caps may be terminated only with the approval of the Board of Trustees. Without these caps, the Fund’s returns would have been lower. The expense ratio paid by an investor is the net expense ratio (the total annual fund operating expenses after fee waivers) as stated in the prospectuses. |
| 3 | Historical performance for the Class A shares prior to their inception reflects the performance of the Class C shares and includes the higher expenses applicable to the Class C shares. If these expenses had not been included, returns for the Class A shares would be higher. |
| 4 | Historical performance shown for the Institutional Class shares prior to their inception reflects the performance of the Class A shares adjusted to reflect that the Institutional Class shares do not have a sales load but is not adjusted to reflect the Institutional Class expenses. If these expenses had been included, returns for the Institutional Class shares would be higher. |
| 5 | Source: Allspring Funds Management, LLC. Spectrum Income Allocation Blended Index is composed 65% of the Bloomberg U.S. Aggregate Bond Index, 15% of ICE BofA U.S. High Yield Constrained Index, 10% of the Bloomberg U.S. TIPS Index, 7% of the Russell 3000® Index, and 3% of the MSCI ACWI ex USA Index (Net). Effective November 2, 2020, the WealthBuilder Conservative Allocation Blended Index, which was composed 80% of the Bloomberg U.S. Aggregate Bond Index, 14% of the Russell 3000® Index, and 6% of the MSCI ACWI ex USA Index (Net), was renamed the Spectrum Income Allocation Blended Index. You cannot invest directly in an index. |
| ‡ | CFA® and Chartered Financial Analyst® are trademarks owned by CFA Institute. |
| 6 | The Bloomberg U.S. Aggregate Bond Index is a broad-based benchmark that measures the investment-grade, U.S. dollar–denominated, fixed-rate taxable bond market, including Treasuries, government-related and corporate securities, mortgage-backed securities (agency fixed-rate and hybrid adjustable-rate mortgage pass-throughs), asset-backed securities, and commercial mortgage-backed securities. You cannot invest directly in an index. |
| 7 | The Bloomberg U.S. Treasury Inflation-Protected Securities (TIPS) Index is an index of inflation-indexed-linked U.S. Treasury securities. You cannot invest directly in an index. |
| 8 | The ICE BofA U.S. High Yield Constrained Index is a market-value-weighted index of all domestic and Yankee high-yield bonds, including deferred interest bonds and payment-in-kind securities. Issues included in the index have maturities of one year or more and have a credit rating lower than BBB-/Baa3 but are not in default. The ICE BofA U.S. High Yield Constrained Index limits any individual issuer to a maximum of 2% benchmark exposure. You cannot invest directly in an index. Copyright 2023. ICE Data Indices, LLC. All rights reserved. |
| 9 | The Morgan Stanley Capital International (MSCI) All Country World Index (ACWI) ex USA Index (Net) is a free-float-adjusted market- capitalization-weighted index that is designed to measure the equity market performance of developed and emerging markets, excluding the U.S. Source: MSCI. MSCI makes no express or implied warranties or representations and shall have no liability whatsoever with respect to any MSCI data contained herein. The MSCI data may not be further redistributed or used as a basis for other indexes or any securities or financial products. This report is not approved, reviewed, or produced by MSCI. You cannot invest directly in an index. |
| 10 | The Russell 3000® Index measures the performance of the 3,000 largest U.S. companies based on total market capitalization, which represents approximately 98% of the investable U.S. equity market. You cannot invest directly in an index. |
| Ten largest holdings (%) as of November 30, 20221 | |
| Allspring Bloomberg US Aggregate ex-Corporate Portfolio | 23.84 |
| Allspring Core Bond Portfolio | 23.44 |
| Allspring Income Plus Fund Institutional Class | 9.75 |
| Allspring Real Return Portfolio | 7.07 |
| Allspring High Yield Bond Fund Institutional Class | 6.27 |
| iShares Core U.S. Aggregate Bond ETF | 5.41 |
| Allspring Diversified Income Builder Fund Class R6 | 4.14 |
| Allspring Alternative Risk Premia Fund Class R6 | 3.02 |
| Allspring Global Investment Grade Credit Fund Class R6 | 2.98 |
| Allspring Disciplined Large Cap Portfolio | 2.58 |
| 1 | Figures represent the percentage of the Fund's net assets. Holdings are subject to change and may have changed since the date specified. |
| Allocation (%) as of November 30, 2022 | ||
| Neutral allocation | Effective allocation1 | |
| Bond Funds | 77 | 84 |
| Stock Funds | 10 | 10 |
| Inflation Sensitive Funds | 10 | 9 |
| Alternative Investment Funds | 3 | 3 |
| Effective Cash | 0 | (6) |
| 1 | Effective allocation includes the effect of any tactical futures overlay that may be in place. Effective cash, if any, represents the net offset to such future positions. The effective allocation does not reflect futures positions held in dynamic risk hedging strategies. Effective allocations are subject to change and may have changed since the date specified. |
| Investment objective | The Fund seeks a combination of capital appreciation and current income. |
| Manager | Allspring Funds Management, LLC |
| Subadviser | Allspring Global Investments, LLC |
| Portfolio managers | Kandarp R. Acharya, CFA®‡, FRM, Petros N. Bocray, CFA®‡, FRM, Travis L. Keshemberg, CFA®‡, CIPM, FRM |
| Average annual total returns (%) as of November 30, 2022 | |||||||||||
| Including sales charge | Excluding sales charge | Expense ratios1 (%) | |||||||||
| Inception date | 1 year | 5 year | 10 year | 1 year | 5 year | 10 year | Gross | Net 2 | |||
| Class A (WGBAX)3 | 2-10-2017 | -16.60 | 3.36 | 5.75 | -11.52 | 4.59 | 6.37 | 1.05 | 1.05 | ||
| Class C (WGBFX) | 10-1-1997 | -13.22 | 3.82 | 6.08 | -12.22 | 3.82 | 6.08 | 1.80 | 1.80 | ||
| Institutional Class (WGBIX)4 | 7-31-2018 | – | – | – | -11.30 | 4.87 | 6.51 | 0.72 | 0.72 | ||
| Spectrum Moderate Growth Blended Index5 | – | – | – | – | -10.89 | 4.71 | 6.65 | – | – | ||
| Bloomberg U.S. Aggregate Bond Index6 | – | – | – | – | -12.84 | 0.21 | 1.09 | – | – | ||
| Bloomberg U.S. TIPS Index7 | – | – | – | – | -10.66 | 2.50 | 1.15 | – | – | ||
| ICE BofA U.S. High Yield Constrained Index8 | – | – | – | – | -8.82 | 2.32 | 4.18 | – | – | ||
| MSCI ACWI ex USA Index (Net)9 | – | – | – | – | -11.87 | 1.48 | 4.23 | – | – | ||
| Russell 3000® Index10 | – | – | – | – | -10.80 | 10.33 | 12.95 | – | – | ||
| 1 | Reflects the expense ratios as stated in the most recent prospectuses, which include the impact of 0.31% in acquired fund fees and expenses. Net expenses from affiliated master portfolios are included in the acquired fund fees and expense amount. The expense ratios shown are subject to change and may differ from the annualized expense ratios shown in the financial highlights of this report, which do not include acquired fund fees and expenses. |
| 2 | The manager has contractually committed through September 30, 2023, to waive fees and/or reimburse expenses to the extent necessary to cap total annual fund operating expenses after fee waivers at 0.75% for Class A, 1.50% for Class C, and 0.42% for Institutional Class. Brokerage commissions, stamp duty fees, interest, taxes, acquired fund fees and expenses (if any), net expenses from affiliated master portfolios, and extraordinary expenses are excluded from the expense caps. Prior to or after the commitment expiration date, the caps may be increased or the commitment to maintain the caps may be terminated only with the approval of the Board of Trustees. Without these caps, the Fund’s returns would have been lower. The expense ratio paid by an investor is the net expense ratio (the total annual fund operating expenses after fee waivers) as stated in the prospectuses. |
| 3 | Historical performance for the Class A shares prior to their inception reflects the performance of the Class C shares and includes the higher expenses applicable to the Class C shares. If these expenses had not been included, returns for the Class A shares would be higher. |
| 4 | Historical performance shown for the Institutional Class shares prior to their inception reflects the performance of the Class A shares adjusted to reflect that the Institutional Class shares do not have a sales load but is not adjusted to reflect the Institutional Class expenses. If these expenses had been included, returns for the Institutional Class shares would be higher. |
| 5 | Source: Allspring Funds Management, LLC. Spectrum Moderate Growth Blended Index is composed 32% of the Russell 3000® Index, 26% of the Bloomberg U.S. Aggregate Bond Index, 14% of the Bloomberg U.S. TIPS Index, 14% of ICE BofA U.S. High Yield Constrained Index, and 14% of the MSCI ACWI ex USA Index (Net). Effective November 2, 2020, the WealthBuilder Growth Balanced Blended Index, which was composed of 42% of the Russell 3000® Index, 40% of the Bloomberg U.S. Aggregate Bond Index, and 18% of the MSCI ACWI ex USA Index (Net), was renamed the Spectrum Moderate Growth Blended Index. You cannot invest directly in an index. |
| ‡ | CFA® and Chartered Financial Analyst® are trademarks owned by CFA Institute. |
| 6 | The Bloomberg U.S. Aggregate Bond Index is a broad-based benchmark that measures the investment-grade, U.S. dollar–denominated, fixed-rate taxable bond market, including Treasuries, government-related and corporate securities, mortgage-backed securities (agency fixed-rate and hybrid adjustable-rate mortgage pass-throughs), asset-backed securities, and commercial mortgage-backed securities. You cannot invest directly in an index. |
| 7 | The Bloomberg U.S. Treasury Inflation-Protected Securities (TIPS) Index is an index of inflation-indexed-linked U.S. Treasury securities. You cannot invest directly in an index. |
| 8 | The ICE BofA U.S. High Yield Constrained Index is a market-value-weighted index of all domestic and Yankee high-yield bonds, including deferred interest bonds and payment-in-kind securities. Issues included in the index have maturities of one year or more and have a credit rating lower than BBB-/Baa3 but are not in default. The ICE BofA U.S. High Yield Constrained Index limits any individual issuer to a maximum of 2% benchmark exposure. You cannot invest directly in an index. Copyright 2023. ICE Data Indices, LLC. All rights reserved. |
| 9 | The Morgan Stanley Capital International (MSCI) All Country World Index (ACWI) ex USA Index (Net) is a free-float-adjusted market- capitalization-weighted index that is designed to measure the equity market performance of developed and emerging markets, excluding the U.S. Source: MSCI. MSCI makes no express or implied warranties or representations and shall have no liability whatsoever with respect to any MSCI data contained herein. The MSCI data may not be further redistributed or used as a basis for other indexes or any securities or financial products. This report is not approved, reviewed, or produced by MSCI. You cannot invest directly in an index. |
| 10 | The Russell 3000® Index measures the performance of the 3,000 largest U.S. companies based on total market capitalization, which represents approximately 98% of the investable U.S. equity market. You cannot invest directly in an index. |
| Ten largest holdings (%) as of November 30, 20221 | |
| Allspring Disciplined Large Cap Portfolio | 12.08 |
| Allspring Factor Enhanced International Equity Portfolio | 10.16 |
| Allspring Income Plus Fund Institutional Class | 7.57 |
| Allspring Real Return Portfolio | 7.52 |
| Allspring High Yield Bond Fund Institutional Class | 6.33 |
| Allspring Factor Enhanced U.S. Large Cap Equity Portfolio | 6.04 |
| Allspring Core Bond Portfolio | 5.95 |
| Allspring Bloomberg US Aggregate ex-Corporate Portfolio | 5.76 |
| iShares Core U.S. Aggregate Bond ETF | 5.32 |
| Allspring Diversified Income Builder Fund Class R6 | 4.93 |
| 1 | Figures represent the percentage of the Fund's net assets. Holdings are subject to change and may have changed since the date specified. |
| Allocation (%) as of November 30, 2022 | ||
| Neutral allocation | Effective allocation1 | |
| Stock Funds | 45 | 46 |
| Bond Funds | 37 | 47 |
| Inflation Sensitive Funds | 14 | 10 |
| Alternative Investment Funds | 4 | 4 |
| Effective Cash | 0 | (7) |
| 1 | Effective allocation includes the effect of any tactical futures overlay that may be in place. Effective cash, if any, represents the net offset to such future positions. The effective allocation does not reflect futures positions held in dynamic risk hedging strategies. Effective allocations are subject to change and may have changed since the date specified. |
| Beginning account value 6-1-2022 | Ending account value 11-30-2022 | Expenses paid during the period1,2 | Annualized net expense ratio2 | |
| Spectrum Aggressive Growth Fund | ||||
| Class A | ||||
| Actual | $1,000.00 | $ 990.09 | $3.74 | 0.75% |
| Hypothetical (5% return before expenses) | $1,000.00 | $1,021.31 | $3.80 | 0.75% |
| Class C | ||||
| Actual | $1,000.00 | $ 986.11 | $7.47 | 1.50% |
| Hypothetical (5% return before expenses) | $1,000.00 | $1,017.55 | $7.59 | 1.50% |
| Administrator Class | ||||
| Actual | $1,000.00 | $ 906.51 | $2.03 | 0.67% |
| Hypothetical (5% return before expenses) | $1,000.00 | $1,013.76 | $2.14 | 0.67% |
| Institutional Class | ||||
| Actual | $1,000.00 | $ 991.78 | $2.10 | 0.42% |
| Hypothetical (5% return before expenses) | $1,000.00 | $1,022.96 | $2.13 | 0.42% |
| Beginning account value 6-1-2022 | Ending account value 11-30-2022 | Expenses paid during the period1,2 | Annualized net expense ratio2 | |
| Spectrum Conservative Growth Fund | ||||
| Class A | ||||
| Actual | $1,000.00 | $ 961.02 | $3.69 | 0.75% |
| Hypothetical (5% return before expenses) | $1,000.00 | $1,021.31 | $3.80 | 0.75% |
| Class C | ||||
| Actual | $1,000.00 | $ 957.99 | $7.36 | 1.50% |
| Hypothetical (5% return before expenses) | $1,000.00 | $1,017.55 | $7.59 | 1.50% |
| Institutional Class | ||||
| Actual | $1,000.00 | $ 961.85 | $2.07 | 0.42% |
| Hypothetical (5% return before expenses) | $1,000.00 | $1,022.96 | $2.13 | 0.42% |
| Spectrum Growth Fund | ||||
| Class A | ||||
| Actual | $1,000.00 | $ 967.99 | $3.70 | 0.75% |
| Hypothetical (5% return before expenses) | $1,000.00 | $1,021.31 | $3.80 | 0.75% |
| Class C | ||||
| Actual | $1,000.00 | $ 964.67 | $7.39 | 1.50% |
| Hypothetical (5% return before expenses) | $1,000.00 | $1,017.55 | $7.59 | 1.50% |
| Institutional Class | ||||
| Actual | $1,000.00 | $ 970.51 | $2.07 | 0.42% |
| Hypothetical (5% return before expenses) | $1,000.00 | $1,022.96 | $2.13 | 0.42% |
| Spectrum Income Allocation Fund | ||||
| Class A | ||||
| Actual | $1,000.00 | $ 959.68 | $3.68 | 0.75% |
| Hypothetical (5% return before expenses) | $1,000.00 | $1,021.31 | $3.80 | 0.75% |
| Class C | ||||
| Actual | $1,000.00 | $ 955.88 | $7.35 | 1.50% |
| Hypothetical (5% return before expenses) | $1,000.00 | $1,017.55 | $7.59 | 1.50% |
| Institutional Class | ||||
| Actual | $1,000.00 | $ 961.31 | $2.07 | 0.42% |
| Hypothetical (5% return before expenses) | $1,000.00 | $1,022.96 | $2.13 | 0.42% |
| Spectrum Moderate Growth Fund | ||||
| Class A | ||||
| Actual | $1,000.00 | $ 965.61 | $3.70 | 0.75% |
| Hypothetical (5% return before expenses) | $1,000.00 | $1,021.31 | $3.80 | 0.75% |
| Class C | ||||
| Actual | $1,000.00 | $ 962.22 | $7.33 | 1.49% |
| Hypothetical (5% return before expenses) | $1,000.00 | $1,017.60 | $7.54 | 1.49% |
| Institutional Class | ||||
| Actual | $1,000.00 | $ 967.33 | $2.07 | 0.42% |
| Hypothetical (5% return before expenses) | $1,000.00 | $1,022.96 | $2.13 | 0.42% |
| Shares | Value | ||||
| Investment companies: 98.77% | |||||
| Affiliated master portfolios: 63.82% | |||||
| Allspring Disciplined Large Cap Portfolio | $ 113,413,155 | ||||
| Allspring Emerging Growth Portfolio | 9,272,059 | ||||
| Allspring Factor Enhanced Emerging Markets Equity Portfolio | 12,191,858 | ||||
| Allspring Factor Enhanced International Equity Portfolio | 96,027,331 | ||||
| Allspring Factor Enhanced U.S. Large Cap Equity Portfolio | 51,866,847 | ||||
| Allspring Factor Enhanced U.S. Small Cap Equity Portfolio | 13,954,110 | ||||
| Allspring Small Company Value Portfolio | 9,377,024 | ||||
| 306,102,384 | |||||
| Exchange-traded funds: 20.26% | |||||
| iShares Core MSCI EAFE ETF | 190,806 | 12,030,318 | |||
| iShares Core MSCI Emerging Markets ETF | 197,746 | 9,602,546 | |||
| iShares Core S&P 500 ETF | 150,095 | 61,436,886 | |||
| iShares Core S&P Small-Cap ETF | 138,288 | 14,083,250 | |||
| 97,153,000 | |||||
| Stock funds: 14.69% | |||||
| Allspring Discovery Large Cap Growth Fund Class R6 ♠† | 2,083,911 | 18,546,806 | |||
| Allspring Emerging Markets Equity Fund Class R6 ♠ | 600,237 | 14,429,687 | |||
| Allspring Premier Large Company Growth Fund Class R6 ♠† | 1,533,880 | 18,513,927 | |||
| Allspring Special Large Cap Value Fund Class R6 ♠† | 1,528,342 | 18,966,720 | |||
| 70,457,140 | |||||
| Total Investment companies (Cost $449,484,003) | 473,712,524 |
| Yield | |||||
| Short-term investments: 0.50% | |||||
| Investment companies: 0.50% | |||||
| Allspring Government Money Market Fund Select Class ♠∞ | 3.60% | 2,400,005 | 2,400,005 | ||
| Total Short-term investments (Cost $2,400,005) | 2,400,005 | ||||
| Total investments in securities (Cost $451,884,008) | 99.27% | 476,112,529 | |||
| Other assets and liabilities, net | 0.73 | 3,525,113 | |||
| Total net assets | 100.00% | $479,637,642 |
| † | Non-income-earning security |
| ♠ | The issuer of the security is an affiliated person of the Fund as defined in the Investment Company Act of 1940. |
| ∞ | The rate represents the 7-day annualized yield at period end. |
| Value, beginning of period | Purchases | Sales proceeds | Net realized gains (losses) on affiliated Underlying Funds | Net change in unrealized gains (losses) on affiliated Underlying Funds | Value, end of period | |||
| Investment companies | ||||||||
| Allspring Discovery Large Cap Growth Fund Class R6† | $20,058,723 | $ 4,510,874 | $ (5,652,419) | $ (1,204,509) | $ 834,137 | $ 18,546,806 | ||
| Allspring Emerging Markets Equity Fund Class R6 | 15,314,331 | 2,757,177 | (2,793,382) | (942,924) | 94,485 | 14,429,687 | ||
| Allspring Premier Large Company Growth Fund Class R6† | 20,066,524 | 3,793,266 | (4,883,692) | (1,008,801) | 546,630 | 18,513,927 | ||
| Allspring Special Large Cap Value Fund Class R6† | 19,984,560 | 1,421,149 | (3,483,830) | (423,784) | 1,468,625 | 18,966,720 | ||
| Short-term investments | ||||||||
| Allspring Government Money Market Fund Select Class | 2,400,005 | 34,478,643 | (34,478,643) | 0 | 0 | 2,400,005 | ||
| $(3,580,018) | $2,943,877 | $72,857,145 |
| Shares, end of period | Dividends from affiliated Underlying Funds | |
| Investment companies | ||
| Allspring Discovery Large Cap Growth Fund Class R6† | 2,083,911 | $ 0 |
| Allspring Emerging Markets Equity Fund Class R6 | 600,237 | 0 |
| Allspring Premier Large Company Growth Fund Class R6† | 1,533,880 | 0 |
| Allspring Special Large Cap Value Fund Class R6† | 1,528,342 | 0 |
| Short-term investments | ||
| Allspring Government Money Market Fund Select Class | 2,400,005 | 14,378 |
| $14,378 |
| † | Non-income-earning security |
| % of ownership, beginning of period | % of ownership, end of period | Net realized gains (losses) on securities transactions allocated from affiliated Master Portfolios | Net change in unrealized gains (losses) on securities transactions allocated from affiliated Master Portfolios | Dividends allocated from affiliated Master Portfolios | Affiliated income allocated from affiliated Master Portfolios | Value, end of period | |||||||
| Allspring Disciplined Large Cap Portfolio | 44.89% | 49.62% | $ 2,820,784 | $ (4,559,594) | $ 1,030,152 | $ 29,346 | $ 113,413,155 | ||||||
| Allspring Emerging Growth Portfolio | 2.67 | 2.54 | (272,276) | 761,699 | 11,742 | 5,941 | 9,272,059 | ||||||
| Allspring Factor Enhanced Emerging Markets Equity Portfolio | 9.37 | 10.41 | (747,820) | (290,216) | 253,490 | 6,123 | 12,191,858 | ||||||
| Allspring Factor Enhanced International Equity Portfolio | 18.40 | 20.44 | (4,144,082) | 706,825 | 1,072,885 | 36,494 | 96,027,331 | ||||||
| Allspring Factor Enhanced U.S. Large Cap Equity Portfolio | 9.31 | 9.31 | 1,420,371 | (1,932,591) | 416,924 | 25,636 | 51,866,847 | ||||||
| Allspring Factor Enhanced U.S. Small Cap Equity Portfolio | 9.95 | 10.89 | (207,962) | 294,883 | 113,327 | 5,931 | 13,954,110 | ||||||
| Allspring Small Company Value Portfolio | 1.68 | 1.56 | (103,752) | 72,498 | 91,062 | 6,997 | 9,377,024 | ||||||
| $(1,234,737) | $(4,946,496) | $2,989,582 | $116,468 | $306,102,384 | |||||||||
| Description | Number of contracts | Expiration date | Notional cost | Notional value | Unrealized gains | Unrealized losses | |
| Long | |||||||
| CAC 40 Index | 150 | 12-16-2022 | $ 9,895,101 | $ 10,104,750 | $ 209,649 | $ 0 | |
| E-Mini Consumer Staples Select Sector Index | 194 | 12-16-2022 | 14,255,654 | 15,075,740 | 820,086 | 0 | |
| Short | |||||||
| DAX Index | (28) | 12-16-2022 | (8,890,845) | (10,092,600) | 0 | (1,201,755) | |
| E-Mini Russell 2000 Index | (6) | 12-16-2022 | (551,580) | (566,250) | 0 | (14,670) | |
| E-Mini S&P 500 Index | (10) | 12-16-2022 | (1,977,862) | (2,040,625) | 0 | (62,763) | |
| Euro STOXX 50 Index | (371) | 12-16-2022 | (13,259,406) | (14,710,150) | 0 | (1,450,744) | |
| MSCI EAFE Index | (8) | 12-16-2022 | (766,498) | (791,920) | 0 | (25,422) | |
| MSCI Emerging Markets Index | (6) | 12-16-2022 | (283,068) | (294,750) | 0 | (11,682) | |
| $1,029,735 | $(2,767,036) |
| Shares | Value | ||||
| Investment companies: 98.24% | |||||
| Affiliated master portfolios: 51.61% | |||||
| Allspring Bloomberg US Aggregate ex-Corporate Portfolio | $ 36,209,455 | ||||
| Allspring Core Bond Portfolio | 32,699,334 | ||||
| Allspring Disciplined Large Cap Portfolio | 19,453,507 | ||||
| Allspring Emerging Growth Portfolio | 1,667,666 | ||||
| Allspring Factor Enhanced Emerging Markets Equity Portfolio | 1,994,076 | ||||
| Allspring Factor Enhanced International Equity Portfolio | 16,171,236 | ||||
| Allspring Factor Enhanced U.S. Large Cap Equity Portfolio | 9,169,257 | ||||
| Allspring Factor Enhanced U.S. Small Cap Equity Portfolio | 2,759,661 | ||||
| Allspring Real Return Portfolio | 21,448,734 | ||||
| Allspring Small Company Value Portfolio | 1,655,653 | ||||
| 143,228,579 | |||||
| Alternative investment funds: 5.36% | |||||
| Allspring Alternative Risk Premia Fund Class R6 ♠† | 1,062,098 | 9,665,095 | |||
| PIMCO CommodityRealReturn Strategy Fund Institutional Class | 951,299 | 5,222,630 | |||
| 14,887,725 | |||||
| Bond funds: 20.95% | |||||
| Allspring Global Investment Grade Credit Fund Class R6 ♠ | 966,589 | 8,216,009 | |||
| Allspring High Yield Bond Fund Institutional Class ♠ | 6,469,112 | 18,889,808 | |||
| Allspring Income Plus Fund Institutional Class ♠ | 3,637,143 | 31,024,833 | |||
| 58,130,650 | |||||
| Exchange-traded funds: 11.23% | |||||
| iShares Core MSCI EAFE ETF | 35,436 | 2,234,240 | |||
| iShares Core MSCI Emerging Markets ETF | 23,257 | 1,129,360 | |||
| iShares Core S&P 500 ETF | 25,869 | 10,588,699 | |||
| iShares Core S&P Small-Cap ETF | 21,698 | 2,209,724 | |||
| iShares Core U.S. Aggregate Bond ETF | 152,527 | 14,991,879 | |||
| 31,153,902 | |||||
| Multi-asset funds: 4.66% | |||||
| Allspring Diversified Income Builder Fund Class R6 ♠ | 2,449,430 | 12,932,991 | |||
| Stock funds: 4.43% | |||||
| Allspring Discovery Large Cap Growth Fund Class R6 ♠† | 375,226 | 3,339,515 | |||
| Allspring Emerging Markets Equity Fund Class R6 ♠ | 94,239 | 2,265,517 | |||
| Allspring Premier Large Company Growth Fund Class R6 ♠† | 278,153 | 3,357,307 | |||
| Allspring Special Large Cap Value Fund Class R6 ♠† | 268,140 | 3,327,623 | |||
| 12,289,962 | |||||
| Total Investment companies (Cost $280,253,849) | 272,623,809 |
| Yield | Shares | Value | |||
| Short-term investments: 0.46% | |||||
| Investment companies: 0.46% | |||||
| Allspring Government Money Market Fund Select Class ♠∞ | 3.60% | 1,280,702 | $ 1,280,702 | ||
| Total Short-term investments (Cost $1,280,702) | 1,280,702 | ||||
| Total investments in securities (Cost $281,534,551) | 98.70% | 273,904,511 | |||
| Other assets and liabilities, net | 1.30 | 3,602,079 | |||
| Total net assets | 100.00% | $277,506,590 |
| † | Non-income-earning security |
| ♠ | The issuer of the security is an affiliated person of the Fund as defined in the Investment Company Act of 1940. |
| ∞ | The rate represents the 7-day annualized yield at period end. |
| Value, beginning of period | Purchases | Sales proceeds | Net realized gains (losses) on affiliated Underlying Funds | Net change in unrealized gains (losses) on affiliated Underlying Funds | Value, end of period | |||
| Investment companies | ||||||||
| Allspring Alternative Risk Premia Fund Class R6† | $ 5,907,585 | $4,947,486 | $(1,282,464) | $ (98,377) | $ 190,865 | $ 9,665,095 | ||
| Allspring Discovery Large Cap Growth Fund Class R6† | 3,720,335 | 495,500 | (816,437) | (184,922) | 125,039 | 3,339,515 | ||
| Allspring Diversified Income Builder Fund Class R6 | 10,795,571 | 3,539,565 | (991,485) | (103,223) | (307,437) | 12,932,991 | ||
| Allspring Emerging Markets Equity Fund Class R6 | 2,548,936 | 152,950 | (283,844) | (155,334) | 2,809 | 2,265,517 | ||
| Allspring Global Investment Grade Credit Fund Class R6 | 9,264,236 | 151,852 | (726,759) | (158,869) | (314,451) | 8,216,009 | ||
| Allspring High Yield Bond Fund Institutional Class | 13,050,676 | 8,181,155 | (1,934,475) | (319,615) | (87,933) | 18,889,808 | ||
| Allspring Income Plus Fund Institutional Class | 35,290,646 | 1,091,573 | (3,691,993) | (431,757) | (1,233,636) | 31,024,833 | ||
| Allspring Premier Large Company Growth Fund Class R6† | 3,721,531 | 413,705 | (700,281) | (131,730) | 54,082 | 3,357,307 | ||
| Allspring Special Large Cap Value Fund Class R6† | 3,706,054 | 111,319 | (678,366) | (62,999) | 251,615 | 3,327,623 | ||
| Short-term investments | ||||||||
| Allspring Government Money Market Fund Select Class | 1,280,702 | 7,276,497 | (7,276,497) | 0 | 0 | 1,280,702 | ||
| $(1,646,826) | $(1,319,047) | $94,299,400 |
| Shares, end of period | Dividends from affiliated Underlying Funds | |
| Investment companies | ||
| Allspring Alternative Risk Premia Fund Class R6† | 1,062,098 | $ 0 |
| Allspring Discovery Large Cap Growth Fund Class R6† | 375,226 | 0 |
| Allspring Diversified Income Builder Fund Class R6 | 2,449,430 | 254,772 |
| Allspring Emerging Markets Equity Fund Class R6 | 94,239 | 0 |
| Allspring Global Investment Grade Credit Fund Class R6 | 966,589 | 114,992 |
| Allspring High Yield Bond Fund Institutional Class | 6,469,112 | 405,756 |
| Allspring Income Plus Fund Institutional Class | 3,637,143 | 603,769 |
| Allspring Premier Large Company Growth Fund Class R6† | 278,153 | 0 |
| Allspring Special Large Cap Value Fund Class R6† | 268,140 | 0 |
| Short-term investments | ||
| Allspring Government Money Market Fund Select Class | 1,280,702 | 8,347 |
| $1,387,636 |
| † | Non-income-earning security |
| % of ownership, beginning of period | % of ownership, end of period | Net realized gains (losses) on securities transactions allocated from affiliated Master Portfolios | Net change in unrealized gains (losses) on securities transactions allocated from affiliated Master Portfolios | Interest allocated from affiliated Master Portfolios | Dividends allocated from affiliated Master Portfolios | Affiliated income allocated from affiliated Master Portfolios | Value, end of period | ||||||||
| Allspring Bloomberg US Aggregate ex-Corporate Portfolio | 9.86% | 13.83% | $ (1,842,670) | $ (91,369) | $ 401,995 | $ 0 | $ 28,329 | $ 36,209,455 | |||||||
| Allspring Core Bond Portfolio | 0.94 | 0.73 | (1,981,462) | (608,297) | 588,662 | 0 | 15,934 | 32,699,334 | |||||||
| Allspring Disciplined Large Cap Portfolio | 11.17 | 8.51 | 694,869 | (2,043,222) | 0 | 223,647 | 4,682 | 19,453,507 | |||||||
| Allspring Emerging Growth Portfolio | 0.49 | 0.46 | (45,836) | 137,096 | 0 | 2,067 | 988 | 1,667,666 | |||||||
| Allspring Factor Enhanced Emerging Markets Equity Portfolio | 1.64 | 1.70 | (122,529) | (71,099) | 0 | 44,240 | 908 | 1,994,076 | |||||||
| Allspring Factor Enhanced International Equity Portfolio | 3.32 | 3.44 | (683,150) | 14,283 | 0 | 190,142 | 5,323 | 16,171,236 | |||||||
| Allspring Factor Enhanced U.S. Large Cap Equity Portfolio | 1.72 | 1.82 | 294,167 | (384,647) | 0 | 76,376 | 4,058 | 9,169,257 | |||||||
| Allspring Factor Enhanced U.S. Small Cap Equity Portfolio | 2.05 | 2.15 | (33,133) | 53,372 | 0 | 23,047 | 1,018 | 2,759,661 | |||||||
| Allspring Real Return Portfolio | 7.88 | 9.84 | 61,247 | (911,931) | 474,523 | 35,170 | 2,004 | 21,448,734 | |||||||
| Allspring Small Company Value Portfolio | 0.31 | 0.27 | (13,426) | 7,200 | 0 | 16,673 | 1,176 | 1,655,653 | |||||||
| $(3,671,923) | $(3,898,614) | $1,465,180 | $611,362 | $64,420 | $143,228,579 | ||||||||||
| Description | Number of contracts | Expiration date | Notional cost | Notional value | Unrealized gains | Unrealized losses | |
| Long | |||||||
| CAC 40 Index | 91 | 12-16-2022 | $ 6,003,028 | $ 6,130,215 | $ 127,187 | $ 0 | |
| E-Mini Consumer Staples Select Sector Index | 118 | 12-16-2022 | 8,670,964 | 9,169,780 | 498,816 | 0 | |
| 10-Year U.S. Treasury Notes | 251 | 3-22-2023 | 28,263,628 | 28,488,500 | 224,872 | 0 | |
| Short | |||||||
| DAX Index | (17) | 12-16-2022 | (5,398,013) | (6,127,650) | 0 | (729,637) | |
| E-Mini Russell 2000 Index | (1) | 12-16-2022 | (91,254) | (94,375) | 0 | (3,121) | |
| E-Mini S&P 500 Index | (2) | 12-16-2022 | (388,561) | (408,125) | 0 | (19,564) | |
| Euro STOXX 50 Index | (225) | 12-16-2022 | (8,041,289) | (8,921,250) | 0 | (879,961) | |
| MSCI EAFE Index | (1) | 12-16-2022 | (96,515) | (98,990) | 0 | (2,475) | |
| MSCI Emerging Markets Index | (1) | 12-16-2022 | (46,853) | (49,125) | 0 | (2,272) | |
| U.S. Ultra Treasury Bonds | (69) | 3-22-2023 | (9,246,527) | (9,403,406) | 0 | (156,879) | |
| $850,875 | $(1,793,909) |
| Shares | Value | ||||
| Investment companies: 98.44% | |||||
| Affiliated master portfolios: 54.82% | |||||
| Allspring Bloomberg US Aggregate ex-Corporate Portfolio | $ 7,425,016 | ||||
| Allspring Core Bond Portfolio | 8,486,443 | ||||
| Allspring Disciplined Large Cap Portfolio | 33,080,864 | ||||
| Allspring Emerging Growth Portfolio | 2,663,307 | ||||
| Allspring Factor Enhanced Emerging Markets Equity Portfolio | 3,423,094 | ||||
| Allspring Factor Enhanced International Equity Portfolio | 27,129,759 | ||||
| Allspring Factor Enhanced U.S. Large Cap Equity Portfolio | 15,188,002 | ||||
| Allspring Factor Enhanced U.S. Small Cap Equity Portfolio | 4,419,120 | ||||
| Allspring Real Return Portfolio | 17,432,891 | ||||
| Allspring Small Company Value Portfolio | 2,663,191 | ||||
| 121,911,687 | |||||
| Alternative investment funds: 4.13% | |||||
| Allspring Alternative Risk Premia Fund Class R6 ♠† | 562,683 | 5,120,412 | |||
| PIMCO CommodityRealReturn Strategy Fund Institutional Class | 740,518 | 4,065,445 | |||
| 9,185,857 | |||||
| Bond funds: 11.20% | |||||
| Allspring Global Investment Grade Credit Fund Class R6 ♠ | 506,718 | 4,307,105 | |||
| Allspring High Yield Bond Fund Institutional Class ♠ | 5,529,807 | 16,147,035 | |||
| Allspring Income Plus Fund Institutional Class ♠ | 521,441 | 4,447,888 | |||
| 24,902,028 | |||||
| Exchange-traded funds: 13.34% | |||||
| iShares Core MSCI EAFE ETF | 28,689 | 1,808,841 | |||
| iShares Core MSCI Emerging Markets ETF | 41,958 | 2,037,480 | |||
| iShares Core S&P 500 ETF | 27,316 | 11,180,985 | |||
| iShares Core S&P Small-Cap ETF | 28,290 | 2,881,054 | |||
| iShares Core U.S. Aggregate Bond ETF | 119,696 | 11,764,921 | |||
| 29,673,281 | |||||
| Multi-asset funds: 5.54% | |||||
| Allspring Diversified Income Builder Fund Class R6 ♠ | 2,333,563 | 12,321,213 | |||
| Stock funds: 9.41% | |||||
| Allspring Discovery Large Cap Growth Fund Class R6 ♠† | 620,776 | 5,524,909 | |||
| Allspring Emerging Markets Equity Fund Class R6 ♠ | 179,195 | 4,307,854 | |||
| Allspring Premier Large Company Growth Fund Class R6 ♠† | 456,286 | 5,507,374 | |||
| Allspring Special Large Cap Value Fund Class R6 ♠† | 450,444 | 5,590,010 | |||
| 20,930,147 | |||||
| Total Investment companies (Cost $210,432,846) | 218,924,213 |
| Yield | Shares | Value | |||
| Short-term investments: 0.44% | |||||
| Investment companies: 0.44% | |||||
| Allspring Government Money Market Fund Select Class ♠∞ | 3.60% | 966,952 | $ 966,952 | ||
| Total Short-term investments (Cost $966,952) | 966,952 | ||||
| Total investments in securities (Cost $211,399,798) | 98.88% | 219,891,165 | |||
| Other assets and liabilities, net | 1.12 | 2,494,922 | |||
| Total net assets | 100.00% | $222,386,087 |
| † | Non-income-earning security |
| ♠ | The issuer of the security is an affiliated person of the Fund as defined in the Investment Company Act of 1940. |
| ∞ | The rate represents the 7-day annualized yield at period end. |
| Value, beginning of period | Purchases | Sales proceeds | Net realized gains (losses) on affiliated Underlying Funds | Net change in unrealized gains (losses) on affiliated Underlying Funds | Value, end of period | |||
| Investment companies | ||||||||
| Allspring Alternative Risk Premia Fund Class R6† | $ 3,138,549 | $ 2,774,643 | $ (841,182) | $ 34,592 | $ 13,810 | $ 5,120,412 | ||
| Allspring Discovery Large Cap Growth Fund Class R6† | 6,069,094 | 787,800 | (1,215,978) | (272,288) | 156,281 | 5,524,909 | ||
| Allspring Diversified Income Builder Fund Class R6 | 9,642,438 | 3,930,636 | (910,445) | (139,654) | (201,762) | 12,321,213 | ||
| Allspring Emerging Markets Equity Fund Class R6 | 4,728,342 | 333,990 | (476,173) | (254,435) | (23,870) | 4,307,854 | ||
| Allspring Global Investment Grade Credit Fund Class R6 | 4,811,276 | 264,542 | (521,446) | (141,954) | (105,313) | 4,307,105 | ||
| Allspring High Yield Bond Fund Institutional Class | 11,640,635 | 7,249,134 | (2,343,852) | (347,773) | (51,109) | 16,147,035 | ||
| Allspring Income Plus Fund Institutional Class | 5,010,516 | 536,212 | (859,682) | (73,791) | (165,367) | 4,447,888 | ||
| Allspring Premier Large Company Growth Fund Class R6† | 6,071,093 | 633,829 | (1,054,163) | (198,786) | 55,401 | 5,507,374 | ||
| Allspring Special Large Cap Value Fund Class R6† | 6,051,349 | 177,918 | (947,962) | (97,789) | 406,494 | 5,590,010 | ||
| Short-term investments | ||||||||
| Allspring Government Money Market Fund Select Class | 966,952 | 14,975,464 | (14,975,464) | 0 | 0 | 966,952 | ||
| $(1,491,878) | $ 84,565 | $64,240,752 |
| Shares, end of period | Dividends from affiliated Underlying Funds | |
| Investment companies | ||
| Allspring Alternative Risk Premia Fund Class R6† | 562,683 | $ 0 |
| Allspring Discovery Large Cap Growth Fund Class R6† | 620,776 | 0 |
| Allspring Diversified Income Builder Fund Class R6 | 2,333,563 | 232,558 |
| Allspring Emerging Markets Equity Fund Class R6 | 179,195 | 0 |
| Allspring Global Investment Grade Credit Fund Class R6 | 506,718 | 59,702 |
| Allspring High Yield Bond Fund Institutional Class | 5,529,807 | 353,552 |
| Allspring Income Plus Fund Institutional Class | 521,441 | 85,886 |
| Allspring Premier Large Company Growth Fund Class R6† | 456,286 | 0 |
| Allspring Special Large Cap Value Fund Class R6† | 450,444 | 0 |
| Short-term investments | ||
| Allspring Government Money Market Fund Select Class | 966,952 | 5,748 |
| $737,446 |
| † | Non-income-earning security |
| % of ownership, beginning of period | % of ownership, end of period | Net realized gains (losses) on securities transactions allocated from affiliated Master Portfolios | Net change in unrealized gains (losses) on securities transactions allocated from affiliated Master Portfolios | Interest allocated from affiliated Master Portfolios | Dividends allocated from affiliated Master Portfolios | Affiliated income allocated from affiliated Master Portfolios | Value, end of period | ||||||||
| Allspring Bloomberg US Aggregate ex-Corporate Portfolio | 1.60% | 2.84% | $ (288,436) | $ 3,538 | $ 62,805 | $ 0 | $ 4,861 | $ 7,425,016 | |||||||
| Allspring Core Bond Portfolio | 0.19 | 0.19 | (396,269) | (113,031) | 123,066 | 0 | 3,463 | 8,486,443 | |||||||
| Allspring Disciplined Large Cap Portfolio | 14.75 | 14.47 | 1,207,225 | (2,210,577) | 0 | 327,568 | 6,531 | 33,080,864 | |||||||
| Allspring Emerging Growth Portfolio | 0.77 | 0.73 | (54,315) | 193,369 | 0 | 3,470 | 1,523 | 2,663,307 | |||||||
| Allspring Factor Enhanced Emerging Markets Equity Portfolio | 2.74 | 2.92 | (183,796) | (137,040) | 0 | 74,386 | 1,500 | 3,423,094 | |||||||
| Allspring Factor Enhanced International Equity Portfolio | 5.38 | 5.77 | (937,504) | (100,696) | 0 | 310,987 | 8,444 | 27,129,759 | |||||||
| Allspring Factor Enhanced U.S. Large Cap Equity Portfolio | 2.79 | 3.02 | 570,187 | (732,233) | 0 | 124,923 | 6,462 | 15,188,002 | |||||||
| Allspring Factor Enhanced U.S. Small Cap Equity Portfolio | 3.21 | 3.45 | (24,707) | 46,763 | 0 | 36,623 | 1,568 | 4,419,120 | |||||||
| Allspring Real Return Portfolio | 7.69 | 8.00 | 153,149 | (1,162,445) | 340,039 | 33,512 | 1,629 | 17,432,891 | |||||||
| Allspring Small Company Value Portfolio | 0.49 | 0.44 | (4,632) | (6,984) | 0 | 26,461 | 1,827 | 2,663,191 | |||||||
| $ 40,902 | $(4,219,336) | $525,910 | $937,930 | $37,808 | $121,911,687 | ||||||||||
| Description | Number of contracts | Expiration date | Notional cost | Notional value | Unrealized gains | Unrealized losses | |
| Long | |||||||
| CAC 40 Index | 72 | 12-16-2022 | $ 4,946,570 | $ 5,047,202 | $ 100,632 | $ 0 | |
| E-Mini S&P 500 Consumer Staples Select Sector Index | 92 | 12-16-2022 | 6,760,413 | 7,149,320 | 388,907 | 0 | |
| 10-Year U.S. Treasury Notes | 199 | 3-22-2023 | 22,408,215 | 22,586,500 | 178,285 | 0 | |
| Short | |||||||
| DAX Index | (14) | 12-16-2022 | (4,650,303) | (5,251,180) | 0 | (600,877) | |
| E-Mini Russell 2000 Index | (1) | 12-16-2022 | (91,877) | (94,375) | 0 | (2,498) | |
| E-Mini S&P 500 Index | (3) | 12-16-2022 | (594,614) | (612,187) | 0 | (17,573) | |
| Euro STOXX 50 Index | (177) | 12-16-2022 | (6,610,772) | (7,302,983) | 0 | (692,211) | |
| MSCI EAFE Index | (2) | 12-16-2022 | (181,131) | (197,980) | 0 | (16,849) | |
| MSCI Emerging Markets Index | (2) | 12-16-2022 | (93,907) | (98,250) | 0 | (4,343) | |
| U.S. Ultra Treasury Bonds | (54) | 3-22-2023 | (7,236,413) | (7,359,188) | 0 | (122,775) | |
| $667,824 | $(1,457,126) |
| Shares | Value | ||||
| Investment companies: 97.79% | |||||
| Affiliated master portfolios: 60.71% | |||||
| Allspring Bloomberg US Aggregate ex-Corporate Portfolio | $ 36,399,767 | ||||
| Allspring Core Bond Portfolio | 35,792,720 | ||||
| Allspring Disciplined Large Cap Portfolio | 3,946,738 | ||||
| Allspring Emerging Growth Portfolio | 301,900 | ||||
| Allspring Factor Enhanced Emerging Markets Equity Portfolio | 311,462 | ||||
| Allspring Factor Enhanced International Equity Portfolio | 2,893,715 | ||||
| Allspring Factor Enhanced U.S. Large Cap Equity Portfolio | 1,516,352 | ||||
| Allspring Factor Enhanced U.S. Small Cap Equity Portfolio | 448,016 | ||||
| Allspring Real Return Portfolio | 10,787,986 | ||||
| Allspring Small Company Value Portfolio | 301,103 | ||||
| 92,699,759 | |||||
| Alternative investment funds: 4.87% | |||||
| Allspring Alternative Risk Premia Fund Class R6 ♠† | 507,282 | 4,616,269 | |||
| PIMCO CommodityRealReturn Strategy Fund Institutional Class | 513,638 | 2,819,875 | |||
| 7,436,144 | |||||
| Bond funds: 19.00% | |||||
| Allspring Global Investment Grade Credit Fund Class R6 ♠ | 535,600 | 4,552,603 | |||
| Allspring High Yield Bond Fund Institutional Class ♠ | 3,276,242 | 9,566,626 | |||
| Allspring Income Plus Fund Institutional Class ♠ | 1,746,076 | 14,894,028 | |||
| 29,013,257 | |||||
| Exchange-traded funds: 7.58% | |||||
| iShares Core MSCI EAFE ETF | 7,189 | 453,266 | |||
| iShares Core MSCI Emerging Markets ETF | 9,436 | 458,212 | |||
| iShares Core S&P 500 ETF | 4,426 | 1,811,650 | |||
| iShares Core S&P Small-Cap ETF | 5,854 | 596,171 | |||
| iShares Core U.S. Aggregate Bond ETF | 84,019 | 8,258,229 | |||
| 11,577,528 | |||||
| Multi-asset funds: 4.14% | |||||
| Allspring Diversified Income Builder Fund Class R6 ♠ | 1,195,335 | 6,311,368 | |||
| Stock funds: 1.49% | |||||
| Allspring Discovery Large Cap Growth Fund Class R6 ♠† | 67,501 | 600,761 | |||
| Allspring Emerging Markets Equity Fund Class R6 ♠ | 19,292 | 463,776 | |||
| Allspring Premier Large Company Growth Fund Class R6 ♠† | 50,416 | 608,523 | |||
| Allspring Special Large Cap Value Fund Class R6 ♠† | 48,894 | 606,771 | |||
| 2,279,831 | |||||
| Total Investment companies (Cost $159,393,297) | 149,317,887 |
| Yield | Shares | Value | |||
| Short-term investments: 0.72% | |||||
| Investment companies: 0.72% | |||||
| Allspring Government Money Market Fund Select Class ♠∞ | 3.60% | 1,100,002 | $ 1,100,002 | ||
| Total Short-term investments (Cost $1,100,002) | 1,100,002 | ||||
| Total investments in securities (Cost $160,493,299) | 98.51% | 150,417,889 | |||
| Other assets and liabilities, net | 1.49 | 2,281,831 | |||
| Total net assets | 100.00% | $152,699,720 |
| † | Non-income-earning security |
| ♠ | The issuer of the security is an affiliated person of the Fund as defined in the Investment Company Act of 1940. |
| ∞ | The rate represents the 7-day annualized yield at period end. |
| Value, beginning of period | Purchases | Sales proceeds | Net realized gains (losses) on affiliated Underlying Funds | Net change in unrealized gains (losses) on affiliated Underlying Funds | Value, end of period | |||
| Investment companies | ||||||||
| Allspring Alternative Risk Premia Fund Class R6† | $ 2,785,846 | $2,550,492 | $ (764,415) | $ (58,086) | $ 102,432 | $ 4,616,269 | ||
| Allspring Discovery Large Cap Growth Fund Class R6† | 698,564 | 81,686 | (167,776) | 9,418 | (21,131) | 600,761 | ||
| Allspring Diversified Income Builder Fund Class R6 | 6,126,706 | 1,246,875 | (793,430) | (138,342) | (130,441) | 6,311,368 | ||
| Allspring Emerging Markets Equity Fund Class R6 | 538,374 | 32,464 | (74,266) | (37,506) | 4,710 | 463,776 | ||
| Allspring Global Investment Grade Credit Fund Class R6 | 5,201,022 | 81,241 | (460,012) | (106,551) | (163,097) | 4,552,603 | ||
| Allspring High Yield Bond Fund Institutional Class | 8,791,749 | 2,775,942 | (1,635,861) | (261,070) | (104,134) | 9,566,626 | ||
| Allspring Income Plus Fund Institutional Class | 17,365,555 | 754,738 | (2,400,024) | (264,991) | (561,250) | 14,894,028 | ||
| Allspring Premier Large Company Growth Fund Class R6† | 698,985 | 72,956 | (148,720) | (27,080) | 12,382 | 608,523 | ||
| Allspring Special Large Cap Value Fund Class R6† | 349,550 | 321,305 | (134,403) | (12,614) | 82,933 | 606,771 | ||
| Short-term investments | ||||||||
| Allspring Government Money Market Fund Select Class | 1,100,002 | 8,210,308 | (8,210,308) | 0 | 0 | 1,100,002 | ||
| $(896,822) | $(777,596) | $43,320,727 |
| Shares, end of period | Dividends from affiliated Underlying Funds | |
| Investment companies | ||
| Allspring Alternative Risk Premia Fund Class R6† | 507,282 | $ 0 |
| Allspring Discovery Large Cap Growth Fund Class R6† | 67,501 | 0 |
| Allspring Diversified Income Builder Fund Class R6 | 1,195,335 | 137,374 |
| Allspring Emerging Markets Equity Fund Class R6 | 19,292 | 0 |
| Allspring Global Investment Grade Credit Fund Class R6 | 535,600 | 64,895 |
| Allspring High Yield Bond Fund Institutional Class | 3,276,242 | 242,986 |
| Allspring Income Plus Fund Institutional Class | 1,746,076 | 296,429 |
| Allspring Premier Large Company Growth Fund Class R6† | 50,416 | 0 |
| Allspring Special Large Cap Value Fund Class R6† | 48,894 | 0 |
| Short-term investments | ||
| Allspring Government Money Market Fund Select Class | 1,100,002 | 8,530 |
| $750,214 |
| † | Non-income-earning security |
| % of ownership, beginning of period | % of ownership, end of period | Net realized gains (losses) on securities transactions allocated from affiliated Master Portfolios | Net change in unrealized gains (losses) on securities transactions allocated from affiliated Master Portfolios | Interest allocated from affiliated Master Portfolios | Dividends allocated from affiliated Master Portfolios | Affiliated income allocated from affiliated Master Portfolios | Value, end of period | ||||||||
| Allspring Bloomberg US Aggregate ex-Corporate Portfolio | 10.18% | 13.91% | $ (1,896,254) | $ (128,442) | $ 407,601 | $ 0 | $ 29,272 | $ 36,399,767 | |||||||
| Allspring Core Bond Portfolio | 1.06 | 0.80 | (2,234,783) | (691,836) | 663,468 | 0 | 18,089 | 35,792,720 | |||||||
| Allspring Disciplined Large Cap Portfolio | 2.80 | 1.73 | 161,350 | (568,198) | 0 | 46,903 | 1,091 | 3,946,738 | |||||||
| Allspring Emerging Growth Portfolio | 0.09 | 0.08 | (8,904) | 26,751 | 0 | 369 | 186 | 301,900 | |||||||
| Allspring Factor Enhanced Emerging Markets Equity Portfolio | 0.26 | 0.27 | (19,702) | (12,310) | 0 | 7,078 | 145 | 311,462 | |||||||
| Allspring Factor Enhanced International Equity Portfolio | 0.61 | 0.62 | (125,899) | (3,623) | 0 | 34,839 | 981 | 2,893,715 | |||||||
| Allspring Factor Enhanced U.S. Large Cap Equity Portfolio | 0.29 | 0.30 | 50,262 | (64,255) | 0 | 12,895 | 687 | 1,516,352 | |||||||
| Allspring Factor Enhanced U.S. Small Cap Equity Portfolio | 0.35 | 0.35 | (5,707) | 10,236 | 0 | 3,848 | 171 | 448,016 | |||||||
| Allspring Real Return Portfolio | 1.86 | 4.95 | 40,400 | (17,662) | 130,943 | 11,638 | 806 | 10,787,986 | |||||||
| Allspring Small Company Value Portfolio | 0.06 | 0.05 | (2,499) | 1,810 | 0 | 3,096 | 219 | 301,103 | |||||||
| $(4,041,736) | $(1,447,529) | $1,202,012 | $120,666 | $51,647 | $92,699,759 | ||||||||||
| Description | Number of contracts | Expiration date | Notional cost | Notional value | Unrealized gains | Unrealized losses | |
| Long | |||||||
| CAC 40 Index | 52 | 12-16-2022 | $ 3,430,302 | $ 3,502,980 | $ 72,678 | $ 0 | |
| E-Mini Consumer Staples Select Sector Index | 67 | 12-16-2022 | 4,923,344 | 5,206,570 | 283,226 | 0 | |
| 10-Year U.S. Treasury Notes | 141 | 3-22-2023 | 15,877,177 | 16,003,500 | 126,323 | 0 | |
| Short | |||||||
| DAX Index | (10) | 12-16-2022 | (3,175,302) | (3,604,500) | 0 | (429,198) | |
| Euro STOXX 50 Index | (127) | 12-16-2022 | (4,538,827) | (5,035,550) | 0 | (496,723) | |
| U.S. Ultra Treasury Bonds | (39) | 3-22-2023 | (5,226,298) | (5,314,969) | 0 | (88,671) | |
| $482,227 | $(1,014,592) |
| Shares | Value | ||||
| Investment companies: 98.27% | |||||
| Affiliated master portfolios: 52.24% | |||||
| Allspring Bloomberg US Aggregate ex-Corporate Portfolio | $ 23,635,251 | ||||
| Allspring Core Bond Portfolio | 24,425,137 | ||||
| Allspring Disciplined Large Cap Portfolio | 49,546,003 | ||||
| Allspring Emerging Growth Portfolio | 4,119,587 | ||||
| Allspring Factor Enhanced Emerging Markets Equity Portfolio | 5,072,204 | ||||
| Allspring Factor Enhanced International Equity Portfolio | 41,676,021 | ||||
| Allspring Factor Enhanced U.S. Large Cap Equity Portfolio | 24,761,971 | ||||
| Allspring Factor Enhanced U.S. Small Cap Equity Portfolio | 6,135,050 | ||||
| Allspring Real Return Portfolio | 30,843,598 | ||||
| Allspring Small Company Value Portfolio | 4,093,471 | ||||
| 214,308,293 | |||||
| Alternative investment funds: 5.57% | |||||
| Allspring Alternative Risk Premia Fund Class R6 ♠† | 1,678,261 | 15,272,176 | |||
| PIMCO CommodityRealReturn Strategy Fund Institutional Class | 1,383,319 | 7,594,423 | |||
| 22,866,599 | |||||
| Bond funds: 16.83% | |||||
| Allspring Global Investment Grade Credit Fund Class R6 ♠ | 1,413,385 | 12,013,769 | |||
| Allspring High Yield Bond Fund Institutional Class ♠ | 8,897,877 | 25,981,800 | |||
| Allspring Income Plus Fund Institutional Class ♠ | 3,638,888 | 31,039,713 | |||
| 69,035,282 | |||||
| Exchange-traded funds: 11.16% | |||||
| iShares Core MSCI EAFE ETF | 19,800 | 1,248,390 | |||
| iShares Core MSCI Emerging Markets ETF | 60,425 | 2,934,238 | |||
| iShares Core S&P 500 ETF | 36,337 | 14,873,461 | |||
| iShares Core S&P Small-Cap ETF | 48,248 | 4,913,576 | |||
| iShares Core U.S. Aggregate Bond ETF | 222,089 | 21,829,128 | |||
| 45,798,793 | |||||
| Multi-asset funds: 4.93% | |||||
| Allspring Diversified Income Builder Fund Class R6 ♠ | 3,833,080 | 20,238,662 | |||
| Stock funds: 7.54% | |||||
| Allspring Discovery Large Cap Growth Fund Class R6 ♠† | 923,014 | 8,214,820 | |||
| Allspring Emerging Markets Equity Fund Class R6 ♠ | 261,773 | 6,293,029 | |||
| Allspring Premier Large Company Growth Fund Class R6 ♠† | 679,342 | 8,199,657 | |||
| Allspring Special Large Cap Value Fund Class R6 ♠† | 663,738 | 8,236,995 | |||
| 30,944,501 | |||||
| Total Investment companies (Cost $402,148,905) | 403,192,130 |
| Yield | Shares | Value | |||
| Short-term investments: 0.65% | |||||
| Investment companies: 0.65% | |||||
| Allspring Government Money Market Fund Select Class ♠∞ | 3.60% | 2,652,135 | $ 2,652,135 | ||
| Total Short-term investments (Cost $2,652,135) | 2,652,135 | ||||
| Total investments in securities (Cost $404,801,040) | 98.92% | 405,844,265 | |||
| Other assets and liabilities, net | 1.08 | 4,419,701 | |||
| Total net assets | 100.00% | $410,263,966 |
| † | Non-income-earning security |
| ♠ | The issuer of the security is an affiliated person of the Fund as defined in the Investment Company Act of 1940. |
| ∞ | The rate represents the 7-day annualized yield at period end. |
| Value, beginning of period | Purchases | Sales proceeds | Net realized gains (losses) on affiliated Underlying Funds | Net change in unrealized gains (losses) on affiliated Underlying Funds | Value, end of period | |||
| Investment companies | ||||||||
| Allspring Alternative Risk Premia Fund Class R6† | $ 9,053,738 | $ 8,303,512 | $ (2,219,178) | $ (177,227) | $ 311,331 | $ 15,272,176 | ||
| Allspring Discovery Large Cap Growth Fund Class R6† | 9,057,449 | 993,960 | (1,670,193) | (357,730) | 191,334 | 8,214,820 | ||
| Allspring Diversified Income Builder Fund Class R6 | 15,800,480 | 6,442,822 | (1,456,624) | (244,405) | (303,611) | 20,238,662 | ||
| Allspring Emerging Markets Equity Fund Class R6 | 6,975,576 | 337,444 | (604,974) | (322,600) | (92,417) | 6,293,029 | ||
| Allspring Global Investment Grade Credit Fund Class R6 | 13,518,921 | 416,128 | (1,229,989) | (322,618) | (368,673) | 12,013,769 | ||
| Allspring High Yield Bond Fund Institutional Class | 19,995,524 | 10,092,790 | (3,379,622) | (555,015) | (171,877) | 25,981,800 | ||
| Allspring Income Plus Fund Institutional Class | 35,340,494 | 1,925,145 | (4,553,610) | (515,406) | (1,156,910) | 31,039,713 | ||
| Allspring Premier Large Company Growth Fund Class R6† | 9,060,356 | 804,974 | (1,459,025) | (259,578) | 52,931 | 8,199,657 | ||
| Allspring Special Large Cap Value Fund Class R6† | 9,056,281 | 238,118 | (1,523,733) | (142,124) | 608,453 | 8,236,995 | ||
| Short-term investments | ||||||||
| Allspring Government Money Market Fund Select Class | 2,652,135 | 25,488,003 | (25,488,003) | 0 | 0 | 2,652,135 | ||
| $(2,896,703) | $ (929,439) | $138,142,756 |
| Shares, end of period | Dividends from affiliated Underlying Funds | |
| Investment companies | ||
| Allspring Alternative Risk Premia Fund Class R6† | 1,678,261 | $ 0 |
| Allspring Discovery Large Cap Growth Fund Class R6† | 923,014 | 0 |
| Allspring Diversified Income Builder Fund Class R6 | 3,833,080 | 381,984 |
| Allspring Emerging Markets Equity Fund Class R6 | 261,773 | 0 |
| Allspring Global Investment Grade Credit Fund Class R6 | 1,413,385 | 167,506 |
| Allspring High Yield Bond Fund Institutional Class | 8,897,877 | 591,249 |
| Allspring Income Plus Fund Institutional Class | 3,638,888 | 603,894 |
| Allspring Premier Large Company Growth Fund Class R6† | 679,342 | 0 |
| Allspring Special Large Cap Value Fund Class R6† | 663,738 | 0 |
| Short-term investments | ||
| Allspring Government Money Market Fund Select Class | 2,652,135 | 18,247 |
| $1,762,880 |
| † | Non-income-earning security |
| % of ownership, beginning of period | % of ownership, end of period | Net realized gains (losses) on securities transactions allocated from affiliated Master Portfolios | Net change in unrealized gains (losses) on securities transactions allocated from affiliated Master Portfolios | Interest allocated from affiliated Master Portfolios | Dividends allocated from affiliated Master Portfolios | Affiliated income allocated from affiliated Master Portfolios | Value, end of period | ||||||||
| Allspring Bloomberg US Aggregate ex-Corporate Portfolio | 6.43% | 9.03% | $(1,035,332) | $ (241,746) | $ 230,279 | $ 0 | $ 18,351 | $ 23,635,251 | |||||||
| Allspring Core Bond Portfolio | 0.56 | 0.55 | (1,125,959) | (328,169) | 354,614 | 0 | 10,056 | 24,425,137 | |||||||
| Allspring Disciplined Large Cap Portfolio | 22.77 | 21.68 | 1,880,437 | (3,507,642) | 0 | 502,350 | 10,103 | 49,546,003 | |||||||
| Allspring Emerging Growth Portfolio | 1.20 | 1.13 | (82,036) | 301,175 | 0 | 5,391 | 2,386 | 4,119,587 | |||||||
| Allspring Factor Enhanced Emerging Markets Equity Portfolio | 4.09 | 4.33 | (269,208) | (213,387) | 0 | 111,056 | 2,246 | 5,072,204 | |||||||
| Allspring Factor Enhanced International Equity Portfolio | 8.37 | 8.87 | (1,429,156) | (198,053) | 0 | 483,558 | 13,221 | 41,676,021 | |||||||
| Allspring Factor Enhanced U.S. Large Cap Equity Portfolio | 4.58 | 4.92 | 958,488 | (1,201,707) | 0 | 205,454 | 10,677 | 24,761,971 | |||||||
| Allspring Factor Enhanced U.S. Small Cap Equity Portfolio | 4.49 | 4.79 | (29,294) | 70,115 | 0 | 51,196 | 2,204 | 6,135,050 | |||||||
| Allspring Real Return Portfolio | 14.43 | 14.15 | 294,436 | (2,236,071) | 655,741 | 61,359 | 3,021 | 30,843,598 | |||||||
| Allspring Small Company Value Portfolio | 0.76 | 0.68 | (3,766) | (10,584) | 0 | 41,090 | 2,846 | 4,093,471 | |||||||
| $ (841,390) | $(7,566,069) | $1,240,634 | $1,461,454 | $75,111 | $214,308,293 | ||||||||||
| Description | Number of contracts | Expiration date | Notional cost | Notional value | Unrealized gains | Unrealized losses | |
| Long | |||||||
| CAC 40 Index | 133 | 12-16-2022 | $ 9,137,414 | $ 9,323,303 | $ 185,889 | $ 0 | |
| E-Mini S&P 500 Consumer Staples Select Sector Index | 173 | 12-16-2022 | 12,712,516 | 13,443,830 | 731,314 | 0 | |
| 10-Year U.S. Treasury Notes | 369 | 3-22-2023 | 41,550,911 | 41,881,500 | 330,589 | 0 | |
| Short | |||||||
| DAX Index | (25) | 12-16-2022 | (8,304,112) | (9,377,107) | 0 | (1,072,995) | |
| E-Mini Russell 2000 Index | (2) | 12-16-2022 | (182,507) | (188,750) | 0 | (6,243) | |
| E-Mini S&P 500 Index | (4) | 12-16-2022 | (788,545) | (816,250) | 0 | (27,705) | |
| Euro STOXX 50 Index | (330) | 12-16-2022 | (12,325,103) | (13,615,732) | 0 | (1,290,629) | |
| MSCI EAFE Index | (3) | 12-16-2022 | (289,022) | (296,970) | 0 | (7,948) | |
| MSCI Emerging Markets Index | (2) | 12-16-2022 | (94,629) | (98,250) | 0 | (3,621) | |
| U.S. Ultra Treasury Bonds | (101) | 3-22-2023 | (13,534,772) | (13,764,406) | 0 | (229,634) | |
| $1,247,792 | $(2,638,775) |
| Spectrum Aggressive Growth Fund | Spectrum Conservative Growth Fund | |
| Assets | ||
Investments in affiliated Master Portfolios, at value (see cost below) | $ 306,102,384 | $ 143,228,579 |
Investments in unaffiliated Underlying Funds, at value (see cost below) | 97,153,000 | 36,376,532 |
Investments in affiliated Underlying Funds, at value (see cost below) | 72,857,145 | 94,299,400 |
Cash | 0 | 1,289,211 |
Cash at broker segregated for futures contracts | 4,347,847 | 2,533,808 |
Receivable for daily variation margin on open futures contracts | 411,153 | 402,028 |
Receivable for Fund shares sold | 46,920 | 3,750 |
Receivable for investments sold | 41,399 | 5,830,910 |
Receivable for dividends | 0 | 97,138 |
Prepaid expenses and other assets | 113,568 | 66,957 |
Total assets | 481,073,416 | 284,128,313 |
| Liabilities | ||
Payable for Fund shares redeemed | 629,466 | 691,093 |
Payable for daily variation margin on open futures contracts | 259,888 | 116,954 |
Distribution fee payable | 165,572 | 140,887 |
Shareholder servicing fees payable | 93,536 | 53,468 |
Management fee payable | 84,340 | 48,794 |
Administration fees payable | 74,533 | 46,234 |
Overdraft due to custodian bank | 65,717 | 0 |
Trustees’ fees and expenses payable | 3,692 | 881 |
Payable for investments purchased | 0 | 5,470,025 |
Accrued expenses and other liabilities | 59,030 | 53,387 |
Total liabilities | 1,435,774 | 6,621,723 |
Total net assets | $479,637,642 | $277,506,590 |
| Net assets consist of | ||
Paid-in capital | $ 433,464,626 | $ 293,062,179 |
Total distributable earnings (loss) | 46,173,016 | (15,555,589) |
Total net assets | $479,637,642 | $277,506,590 |
| Computation of net asset value and offering price per share | ||
Net assets – Class A | $ 120,407,370 | $ 32,061,933 |
Shares outstanding – Class A1 | 6,692,032 | 3,423,931 |
Net asset value per share – Class A | $17.99 | $9.36 |
Maximum offering price per share – Class A2 | $19.09 | $9.93 |
Net assets – Class C | $ 280,686,978 | $ 233,030,179 |
Shares outstanding – Class C1 | 15,808,768 | 24,231,519 |
Net asset value per share – Class C | $17.76 | $9.62 |
Net assets – Administrator Class | $ 73,213,616 | N/A |
Shares outstanding – Administrator Class | 4,055,289 | N/A |
Net asset value per share – Administrator Class | $18.05 | N/A |
Net assets – Institutional Class | $ 5,329,678 | $ 12,414,478 |
Shares outstanding – Institutional Class1 | 294,602 | 1,322,939 |
Net asset value per share – Institutional Class | $18.09 | $9.38 |
Investments in affiliated Master Portfolios, at cost | $ 287,553,264 | $ 146,636,409 |
Investments in unaffiliated Underlying Funds, at cost | $ 88,586,408 | $ 33,514,418 |
Investments in affiliated Underlying Funds, at cost | $ 75,744,336 | $ 101,383,724 |
| 1 | Each Fund has an unlimited number of authorized shares. |
| 2 | Maximum offering price is computed as 100/94.25 of net asset value. On investments of $50,000 or more, the offering price is reduced. |
| Spectrum Growth Fund | Spectrum Income Allocation Fund | Spectrum Moderate Growth Fund | |
| Assets | |||
Investments in affiliated Master Portfolios, at value (see cost below) | $ 121,911,687 | $ 92,699,759 | $ 214,308,293 |
Investments in unaffiliated Underlying Funds, at value (see cost below) | 33,738,726 | 14,397,403 | 53,393,216 |
Investments in affiliated Underlying Funds, at value (see cost below) | 64,240,752 | 43,320,727 | 138,142,756 |
Cash | 345,793 | 643,475 | 487,532 |
Cash at broker segregated for futures contracts | 2,133,862 | 1,495,887 | 3,849,735 |
Receivable for daily variation margin on open futures contracts | 315,906 | 227,737 | 587,718 |
Receivable for Fund shares sold | 16,778 | 16,163 | 33,739 |
Receivable for investments sold | 4,568,631 | 3,271,422 | 8,674,438 |
Receivable for dividends | 115,977 | 46,628 | 174,963 |
Prepaid expenses and other assets | 60,363 | 61,536 | 57,815 |
Total assets | 227,448,475 | 156,180,737 | 419,710,205 |
| Liabilities | |||
Payable for Fund shares redeemed | 290,805 | 188,496 | 691,036 |
Payable for daily variation margin on open futures contracts | 105,657 | 56,838 | 182,581 |
Distribution fee payable | 117,072 | 78,003 | 217,637 |
Shareholder servicing fees payable | 44,067 | 29,942 | 81,176 |
Management fee payable | 36,453 | 21,276 | 79,513 |
Administration fees payable | 37,230 | 25,753 | 68,915 |
Trustees’ fees and expenses payable | 579 | 1,798 | 1,803 |
Payable for investments purchased | 4,360,619 | 3,023,827 | 8,060,583 |
Accrued expenses and other liabilities | 69,906 | 55,084 | 62,995 |
Total liabilities | 5,062,388 | 3,481,017 | 9,446,239 |
Total net assets | $222,386,087 | $152,699,720 | $410,263,966 |
| Net assets consist of | |||
Paid-in capital | $ 212,743,483 | $ 172,200,507 | $ 407,160,678 |
Total distributable earnings (loss) | 9,642,604 | (19,500,787) | 3,103,288 |
Total net assets | $222,386,087 | $152,699,720 | $410,263,966 |
| Computation of net asset value and offering price per share | |||
Net assets – Class A | $ 24,877,310 | $ 19,389,820 | $ 42,849,859 |
Shares outstanding – Class A1 | 2,164,542 | 2,235,202 | 3,816,252 |
Net asset value per share – Class A | $11.49 | $8.67 | $11.23 |
Maximum offering price per share – Class A2 | $12.19 | $9.20 | $11.92 |
Net assets – Class C | $ 195,499,989 | $ 127,697,901 | $ 360,845,506 |
Shares outstanding – Class C1 | 16,647,640 | 14,728,872 | 31,489,855 |
Net asset value per share – Class C | $11.74 | $8.67 | $11.46 |
Net assets – Institutional Class | $ 2,008,788 | $ 5,611,999 | $ 6,568,601 |
Shares outstanding – Institutional Class1 | 174,415 | 648,289 | 583,808 |
Net asset value per share – Institutional Class | $11.52 | $8.66 | $11.25 |
Investments in affiliated Master Portfolios, at cost | $ 112,317,163 | $ 99,495,993 | $ 206,184,930 |
Investments in unaffiliated Underlying Funds, at cost | $ 30,951,684 | $ 14,226,269 | $ 50,623,864 |
Investments in affiliated Underlying Funds, at cost | $ 68,130,951 | $ 46,771,037 | $ 147,992,246 |
| 1 | Each Fund has an unlimited number of authorized shares. |
| 2 | Maximum offering price is computed as 100/94.25 of net asset value. On investments of $50,000 or more, the offering price is reduced. |
| Spectrum Aggressive Growth Fund | Spectrum Conservative Growth Fund | |
| Investment income | ||
Dividends allocated from affiliated Master Portfolios* | $ 2,989,582 | $ 611,362 |
Dividends from unaffiliated Underlying Funds | 963,575 | 2,793,472 |
Affiliated income allocated from affiliated Master Portfolios | 116,468 | 64,420 |
Dividends from affiliated Underlying Funds | 14,378 | 1,387,636 |
Interest allocated from affiliated Master Portfolios** | 0 | 1,465,180 |
Expenses allocated from affiliated Master Portfolios | (424,007) | (223,005) |
Waivers allocated from affiliated Master Portfolios | 57,313 | 30,974 |
Total investment income | 3,717,309 | 6,130,039 |
| Expenses | ||
Management fee | 583,087 | 357,574 |
| Administration fees | ||
Class A | 121,826 | 34,129 |
Class C | 288,202 | 253,246 |
Administrator Class | 45,933 | N/A |
Institutional Class | 3,446 | 8,040 |
| Shareholder servicing fees | ||
Class A | 145,031 | 40,629 |
Class C | 342,220 | 300,849 |
Administrator Class | 87,648 | N/A |
| Distribution fee | ||
Class C | 1,022,610 | 901,515 |
Custody and accounting fees | 20,018 | 27,337 |
Professional fees | 28,242 | 25,605 |
Registration fees | 28,316 | 30,438 |
Shareholder report expenses | 35,698 | 16,310 |
Trustees’ fees and expenses | 10,880 | 10,879 |
Other fees and expenses | 4,360 | 3,276 |
Total expenses | 2,767,517 | 2,009,827 |
| Less: Fee waivers and/or expense reimbursements | ||
Fund-level | (27,941) | (53,068) |
Class A | (163) | (41) |
Class C | (129) | (33) |
Net expenses | 2,739,284 | 1,956,685 |
Net investment income | 978,025 | 4,173,354 |
| Realized and unrealized gains (losses) on investments | ||
| Net realized gains (losses) on | ||
Securities transactions allocated from affiliated Master Portfolios | (1,234,737) | (3,671,923) |
Affiliated Underlying Funds | (3,580,018) | (1,646,826) |
Unaffiliated Underlying Funds | (2,841,785) | (3,681,004) |
Futures contracts | 2,329,167 | 256,829 |
Net realized losses on investments | (5,327,373) | (8,742,924) |
| Net change in unrealized gains (losses) on | ||
Securities transactions allocated from affiliated Master Portfolios | (4,946,496) | (3,898,614) |
Affiliated Underlying Funds | 2,943,877 | (1,319,047) |
Unaffiliated Underlying Funds | 867,647 | (2,841,252) |
Futures contracts | (1,874,758) | (638,566) |
Net change in unrealized gains (losses) on investments | (3,009,730) | (8,697,479) |
Net realized and unrealized gains (losses) on investments | (8,337,103) | (17,440,403) |
Net decrease in net assets resulting from operations | $(7,359,078) | $(13,267,049) |
*Net of foreign dividend withholding taxes allocated from affiliated Master Portfolios in the amount of | $171,083 | $31,014 |
**Net of foreign interest withholding taxes allocated from affiliated Master Portfolios in the amount of | 0 | 21 |
| Spectrum Growth Fund | Spectrum Income Allocation Fund | Spectrum Moderate Growth Fund | |
| Investment income | |||
Dividends allocated from affiliated Master Portfolios* | $ 937,930 | $ 120,666 | $ 1,461,454 |
Dividends from unaffiliated Underlying Funds | 2,321,291 | 1,470,319 | 4,159,585 |
Affiliated income allocated from affiliated Master Portfolios | 37,808 | 51,647 | 75,111 |
Dividends from affiliated Underlying Funds | 737,446 | 750,214 | 1,762,880 |
Interest allocated from affiliated Master Portfolios** | 525,910 | 1,202,012 | 1,240,634 |
Expenses allocated from affiliated Master Portfolios | (191,184) | (134,549) | (336,375) |
Waivers allocated from affiliated Master Portfolios | 28,524 | 15,608 | 50,316 |
Interest | 134,726 | 4,450 | 245,825 |
Total investment income | 4,532,451 | 3,480,367 | 8,659,430 |
| Expenses | |||
Management fee | 280,660 | 202,161 | 524,081 |
| Administration fees | |||
Class A | 25,882 | 20,746 | 45,534 |
Class C | 207,672 | 143,126 | 387,795 |
Institutional Class | 1,362 | 3,679 | 4,271 |
| Shareholder servicing fees | |||
Class A | 30,812 | 24,697 | 54,208 |
Class C | 246,692 | 170,027 | 460,684 |
| Distribution fee | |||
Class C | 738,164 | 509,545 | 1,380,482 |
Custody and accounting fees | 22,162 | 18,891 | 15,847 |
Professional fees | 29,274 | 18,915 | 18,422 |
Registration fees | 31,799 | 25,853 | 18,399 |
Shareholder report expenses | 20,805 | 17,910 | 16,224 |
Trustees’ fees and expenses | 10,879 | 10,880 | 10,879 |
Other fees and expenses | 4,792 | 3,903 | 2,888 |
Total expenses | 1,650,955 | 1,170,333 | 2,939,714 |
| Less: Fee waivers and/or expense reimbursements | |||
Fund-level | (70,750) | (62,025) | (5,207) |
Class A | (93) | (108) | (18) |
Class C | (64) | (19) | (52) |
Net expenses | 1,580,048 | 1,108,181 | 2,934,437 |
Net investment income | 2,952,403 | 2,372,186 | 5,724,993 |
| Realized and unrealized gains (losses) on investments | |||
| Net realized gains (losses) on | |||
Securities transactions allocated from affiliated Master Portfolios | 40,902 | (4,041,736) | (841,390) |
Affiliated Underlying Funds | (1,491,878) | (896,822) | (2,896,703) |
Unaffiliated Underlying Funds | (3,435,032) | (1,141,763) | (6,366,906) |
Futures contracts | 432,549 | 842,907 | 481,533 |
Net realized losses on investments | (4,453,459) | (5,237,414) | (9,623,466) |
| Net change in unrealized gains (losses) on | |||
Securities transactions allocated from affiliated Master Portfolios | (4,219,336) | (1,447,529) | (7,566,069) |
Affiliated Underlying Funds | 84,565 | (777,596) | (929,439) |
Unaffiliated Underlying Funds | (2,882,025) | (2,040,941) | (4,492,599) |
Futures contracts | (440,739) | (446,201) | (821,070) |
Net change in unrealized gains (losses) on investments | (7,457,535) | (4,712,267) | (13,809,177) |
Net realized and unrealized gains (losses) on investments | (11,910,994) | (9,949,681) | (23,432,643) |
Net decrease in net assets resulting from operations | $ (8,958,591) | $(7,577,495) | $(17,707,650) |
*Net of foreign dividend withholding taxes allocated from affiliated Master Portfolios in the amount of | $50,185 | $5,663 | $77,570 |
**Net of foreign interest withholding taxes allocated from affiliated Master Portfolios in the amount of | 4 | 19 | 15 |
| Spectrum Aggressive Growth Fund | ||||
| Six months ended November 30, 2022 (unaudited) | Year ended May 31, 2022 | |||
| Operations | ||||
Net investment income | $ 978,025 | $ 925,743 | ||
Net realized gains (losses) on investments | (5,327,373) | 26,183,999 | ||
Net change in unrealized gains (losses) on investments | (3,009,730) | (77,972,191) | ||
Net decrease in net assets resulting from operations | (7,359,078) | (50,862,449) | ||
| Distributions to shareholders from | ||||
| Net investment income and net realized gains | ||||
Class A | 0 | (10,049,605) | ||
Class C | 0 | (46,652,606) | ||
Institutional Class | 0 | (874,349) | ||
Total distributions to shareholders | 0 | (57,576,560) | ||
| Capital share transactions | Shares | Shares | ||
| Proceeds from shares sold | ||||
Class A | 183,544 | 3,106,766 | 816,312 | 18,171,153 |
Class C | 163,084 | 2,746,555 | 343,193 | 7,214,990 |
Administrator Class | 45,556 | 769,084 | 45,122 1 | 865,939 1 |
Institutional Class | 70,664 | 1,232,847 | 634,500 | 14,278,622 |
| 7,855,252 | 40,530,704 | |||
| Reinvestment of distributions | ||||
Class A | 0 | 0 | 480,525 | 10,028,952 |
Class C | 0 | 0 | 2,264,481 | 46,540,235 |
Institutional Class | 0 | 0 | 41,686 | 874,349 |
| 0 | 57,443,536 | |||
| Payment for shares redeemed | ||||
Class A | (381,441) | (6,484,592) | (680,485) | (14,517,658) |
Class C | (1,155,836) | (19,459,863) | (2,606,924) | (55,520,562) |
Administrator Class | (199,059) | (3,427,053) | (563,869) 1 | (10,089,956) 1 |
Institutional Class | (93,696) | (1,584,837) | (706,658) | (16,276,740) |
| (30,956,345) | (96,404,916) | |||
| Net asset value of shares issued in acquisition | ||||
Class A | 0 | 0 | 3,370,579 | 67,600,166 |
Class C | 0 | 0 | 57,632 | 1,147,568 |
Administrator Class | 0 | 0 | 4,727,539 1 | 95,077,457 1 |
| 0 | 163,825,191 | |||
Net increase (decrease) in net assets resulting from capital share transactions | (23,101,093) | 165,394,515 | ||
Total increase (decrease) in net assets | (30,460,171) | 56,955,506 | ||
| Net assets | ||||
Beginning of period | 510,097,813 | 453,142,307 | ||
End of period | $479,637,642 | $510,097,813 | ||
| 1 | For the period from February 4, 2022 (commencement of class operations) to May 31, 2022 |
| Spectrum Conservative Growth Fund | ||||
| Six months ended November 30, 2022 (unaudited) | Year ended May 31, 2022 | |||
| Operations | ||||
Net investment income | $ 4,173,354 | $ 6,806,428 | ||
Net realized gains (losses) on investments | (8,742,924) | 8,220,605 | ||
Net change in unrealized gains (losses) on investments | (8,697,479) | (36,062,340) | ||
Net decrease in net assets resulting from operations | (13,267,049) | (21,035,307) | ||
| Distributions to shareholders from | ||||
| Net investment income and net realized gains | ||||
Class A | (737,259) | (4,026,983) | ||
Class C | (4,344,118) | (28,133,207) | ||
Institutional Class | (301,375) | (1,743,701) | ||
Total distributions to shareholders | (5,382,752) | (33,903,891) | ||
| Capital share transactions | Shares | Shares | ||
| Proceeds from shares sold | ||||
Class A | 247,396 | 2,331,917 | 405,172 | 4,537,206 |
Class C | 337,604 | 3,170,255 | 390,078 | 4,442,312 |
Institutional Class | 87,291 | 808,671 | 1,635,750 | 19,304,397 |
| 6,310,843 | 28,283,915 | |||
| Reinvestment of distributions | ||||
Class A | 80,715 | 734,062 | 362,796 | 4,006,426 |
Class C | 464,849 | 4,341,516 | 2,485,248 | 28,094,921 |
Institutional Class | 33,102 | 301,375 | 158,208 | 1,742,918 |
| 5,376,953 | 33,844,265 | |||
| Payment for shares redeemed | ||||
Class A | (329,899) | (3,067,817) | (782,754) | (8,635,241) |
Class C | (2,296,361) | (21,984,570) | (5,251,986) | (60,023,029) |
Institutional Class | (85,541) | (791,086) | (770,543) | (8,351,769) |
| (25,843,473) | (77,010,039) | |||
Net decrease in net assets resulting from capital share transactions | (14,155,677) | (14,881,859) | ||
Total decrease in net assets | (32,805,478) | (69,821,057) | ||
| Net assets | ||||
Beginning of period | 310,312,068 | 380,133,125 | ||
End of period | $277,506,590 | $310,312,068 | ||
| Spectrum Growth Fund | ||||
| Six months ended November 30, 2022 (unaudited) | Year ended May 31, 2022 | |||
| Operations | ||||
Net investment income | $ 2,952,403 | $ 5,149,272 | ||
Net realized gains (losses) on investments | (4,453,459) | 14,558,737 | ||
Net change in unrealized gains (losses) on investments | (7,457,535) | (36,266,865) | ||
Net decrease in net assets resulting from operations | (8,958,591) | (16,558,856) | ||
| Distributions to shareholders from | ||||
| Net investment income and net realized gains | ||||
Class A | 0 | (4,137,271) | ||
Class C | 0 | (30,888,748) | ||
Institutional Class | 0 | (338,432) | ||
Total distributions to shareholders | 0 | (35,364,451) | ||
| Capital share transactions | Shares | Shares | ||
| Proceeds from shares sold | ||||
Class A | 137,982 | 1,520,379 | 246,428 | 3,515,326 |
Class C | 169,802 | 1,939,638 | 465,805 | 6,529,020 |
Institutional Class | 66,234 | 735,173 | 204,168 | 2,791,934 |
| 4,195,190 | 12,836,280 | |||
| Reinvestment of distributions | ||||
Class A | 0 | 0 | 307,722 | 4,128,480 |
Class C | 0 | 0 | 2,251,455 | 30,852,298 |
Institutional Class | 0 | 0 | 25,184 | 338,432 |
| 0 | 35,319,210 | |||
| Payment for shares redeemed | ||||
Class A | (224,609) | (2,496,570) | (467,843) | (6,436,687) |
Class C | (1,264,818) | (14,398,018) | (2,997,181) | (42,147,744) |
Institutional Class | (100,293) | (1,116,859) | (199,958) | (2,769,747) |
| (18,011,447) | (51,354,178) | |||
Net decrease in net assets resulting from capital share transactions | (13,816,257) | (3,198,688) | ||
Total decrease in net assets | (22,774,848) | (55,121,995) | ||
| Net assets | ||||
Beginning of period | 245,160,935 | 300,282,930 | ||
End of period | $222,386,087 | $245,160,935 | ||
| Spectrum Income Allocation Fund | ||||
| Six months ended November 30, 2022 (unaudited) | Year ended May 31, 2022 | |||
| Operations | ||||
Net investment income | $ 2,372,186 | $ 3,406,997 | ||
Net realized losses on investments | (5,237,414) | (547,741) | ||
Net change in unrealized gains (losses) on investments | (4,712,267) | (16,587,889) | ||
Net decrease in net assets resulting from operations | (7,577,495) | (13,728,633) | ||
| Distributions to shareholders from | ||||
| Net investment income and net realized gains | ||||
Class A | (310,554) | (1,594,768) | ||
Class C | (1,629,771) | (10,477,880) | ||
Institutional Class | (98,389) | (790,454) | ||
Total distributions to shareholders | (2,038,714) | (12,863,102) | ||
| Capital share transactions | Shares | Shares | ||
| Proceeds from shares sold | ||||
Class A | 172,451 | 1,497,246 | 287,235 | 2,920,363 |
Class C | 139,207 | 1,212,841 | 367,054 | 3,613,412 |
Institutional Class | 33,493 | 296,794 | 1,272,557 | 13,383,942 |
| 3,006,881 | 19,917,717 | |||
| Reinvestment of distributions | ||||
Class A | 36,023 | 310,219 | 157,714 | 1,593,948 |
Class C | 188,004 | 1,625,638 | 1,036,351 | 10,471,257 |
Institutional Class | 11,471 | 98,389 | 78,749 | 789,993 |
| 2,034,246 | 12,855,198 | |||
| Payment for shares redeemed | ||||
Class A | (221,539) | (1,932,039) | (498,067) | (5,053,056) |
Class C | (1,756,866) | (15,265,415) | (3,981,333) | (39,973,681) |
Institutional Class | (37,817) | (331,709) | (818,687) | (7,694,286) |
| (17,529,163) | (52,721,023) | |||
Net decrease in net assets resulting from capital share transactions | (12,488,036) | (19,948,108) | ||
Total decrease in net assets | (22,104,245) | (46,539,843) | ||
| Net assets | ||||
Beginning of period | 174,803,965 | 221,343,808 | ||
End of period | $152,699,720 | $174,803,965 | ||
| Spectrum Moderate Growth Fund | ||||
| Six months ended November 30, 2022 (unaudited) | Year ended May 31, 2022 | |||
| Operations | ||||
Net investment income | $ 5,724,993 | $ 9,720,875 | ||
Net realized gains (losses) on investments | (9,623,466) | 22,358,842 | ||
Net change in unrealized gains (losses) on investments | (13,809,177) | (62,757,073) | ||
Net decrease in net assets resulting from operations | (17,707,650) | (30,677,356) | ||
| Distributions to shareholders from | ||||
| Net investment income and net realized gains | ||||
Class A | 0 | (6,498,756) | ||
Class C | 0 | (50,916,068) | ||
Institutional Class | 0 | (1,255,455) | ||
Total distributions to shareholders | 0 | (58,670,279) | ||
| Capital share transactions | Shares | Shares | ||
| Proceeds from shares sold | ||||
Class A | 119,725 | 1,335,778 | 437,749 | 5,871,568 |
Class C | 314,925 | 3,545,914 | 525,068 | 7,193,590 |
Institutional Class | 169,768 | 1,854,682 | 861,717 | 11,938,967 |
| 6,736,374 | 25,004,125 | |||
| Reinvestment of distributions | ||||
Class A | 0 | 0 | 496,494 | 6,478,082 |
Class C | 0 | 0 | 3,817,523 | 50,833,512 |
Institutional Class | 0 | 0 | 96,014 | 1,255,455 |
| 0 | 58,567,049 | |||
| Payment for shares redeemed | ||||
Class A | (315,638) | (3,453,459) | (945,140) | (12,411,416) |
Class C | (2,639,438) | (29,676,421) | (5,676,098) | (76,893,468) |
Institutional Class | (219,493) | (2,407,131) | (571,340) | (7,428,017) |
| (35,537,011) | (96,732,901) | |||
Net decrease in net assets resulting from capital share transactions | (28,800,637) | (13,161,727) | ||
Total decrease in net assets | (46,508,287) | (102,509,362) | ||
| Net assets | ||||
Beginning of period | 456,772,253 | 559,281,615 | ||
End of period | $410,263,966 | $ 456,772,253 | ||
| Year ended May 31 | ||||||
| Class A | Six months ended November 30, 2022 (unaudited) | 2022 | 2021 | 2020 | 2019 | 2018 |
Net asset value, beginning of period | $18.17 | $22.82 | $18.59 | $16.52 | $20.55 | $21.41 |
Net investment income | 0.07 | 0.25 | 0.14 | 0.19 | 0.17 1 | 0.10 |
Net realized and unrealized gains (losses) on investments | (0.25) | (1.74) | 6.65 | 2.11 | (0.81) | 2.59 |
Total from investment operations | (0.18) | (1.49) | 6.79 | 2.30 | (0.64) | 2.69 |
| Distributions to shareholders from | ||||||
Net investment income | 0.00 | (0.18) | (0.22) | (0.19) | (0.26) | 0.00 |
Net realized gains | 0.00 | (2.98) | (2.34) | (0.04) | (3.13) | (3.55) |
Total distributions to shareholders | 0.00 | (3.16) | (2.56) | (0.23) | (3.39) | (3.55) |
Net asset value, end of period | $17.99 | $18.17 | $22.82 | $18.59 | $16.52 | $20.55 |
Total return2 | (0.99)% | (8.22)% | 38.53% | 13.91% | (2.35)% | 12.61% |
| Ratios to average net assets (annualized) | ||||||
Gross expenses* | 0.76% | 0.76% | 0.77% | 0.77% | 0.76% | 0.75% |
Net expenses* | 0.75% | 0.75% | 0.75% | 0.75% | 0.75% | 0.75% |
Net investment income | 0.84% | 0.76% | 0.63% | 1.08% | 0.97% | 0.75% |
| Supplemental data | ||||||
Portfolio turnover rate3 | 23% | 62% | 82% | 71% | 78% | 63% |
Net assets, end of period (000s omitted) | $120,407 | $125,195 | $66,239 | $44,714 | $42,588 | $3,993 |
| * | Including net expenses allocated from the affiliated Master Portfolios, the expense ratios would be increased by the following amounts: |
| Six months ended November 30, 2022 (unaudited) | 0.16% |
| Year ended May 31, 2022 | 0.16% |
| Year ended May 31, 2021 | 0.15% |
| Year ended May 31, 2020 | 0.18% |
| Year ended May 31, 2019 | 0.18% |
| Year ended May 31, 2018 | 0.12% |
| 1 | Calculated based upon average shares outstanding |
| 2 | Total return calculations do not include any sales charges. Returns for periods of less than one year are not annualized. |
| 3 | Portfolio turnover rate is calculated by multiplying the Fund’s ownership percentage in the respective affiliated Master Portfolio by the corresponding affiliated Master Portfolio’s purchases and sales. These purchases and sales amounts are aggregated with the direct purchases and sales in the Underlying Funds and included in the portfolio turnover calculation. |
| Year ended May 31 | ||||||
| Class C | Six months ended November 30, 2022 (unaudited) | 2022 | 2021 | 2020 | 2019 | 2018 |
Net asset value, beginning of period | $18.00 | $22.63 | $18.45 | $16.39 | $20.33 | $21.36 |
Net investment income (loss) | 0.01 | (0.01) | (0.03) | 0.07 | 0.06 | (0.02) 1 |
Net realized and unrealized gains (losses) on investments | (0.25) | (1.63) | 6.62 | 2.07 | (0.82) | 2.54 |
Total from investment operations | (0.24) | (1.64) | 6.59 | 2.14 | (0.76) | 2.52 |
| Distributions to shareholders from | ||||||
Net investment income | 0.00 | (0.01) | (0.07) | (0.04) | (0.05) | 0.00 |
Net realized gains | 0.00 | (2.98) | (2.34) | (0.04) | (3.13) | (3.55) |
Total distributions to shareholders | 0.00 | (2.99) | (2.41) | (0.08) | (3.18) | (3.55) |
Net asset value, end of period | $17.76 | $18.00 | $22.63 | $18.45 | $16.39 | $20.33 |
Total return2 | (1.39)% | (8.87)% | 37.57% | 13.06% | (3.16)% | 11.80% |
| Ratios to average net assets (annualized) | ||||||
Gross expenses* | 1.51% | 1.50% | 1.52% | 1.52% | 1.51% | 1.50% |
Net expenses* | 1.50% | 1.50% | 1.50% | 1.50% | 1.50% | 1.50% |
Net investment income (loss) | 0.10% | (0.03)% | (0.12)% | 0.33% | 0.32% | (0.10)% |
| Supplemental data | ||||||
Portfolio turnover rate3 | 23% | 62% | 82% | 71% | 78% | 63% |
Net assets, end of period (000s omitted) | $280,687 | $302,402 | $378,941 | $323,778 | $355,837 | $491,304 |
| * | Including net expenses allocated from the affiliated Master Portfolios, the expense ratios would be increased by the following amounts: |
| Six months ended November 30, 2022 (unaudited) | 0.16% |
| Year ended May 31, 2022 | 0.16% |
| Year ended May 31, 2021 | 0.15% |
| Year ended May 31, 2020 | 0.18% |
| Year ended May 31, 2019 | 0.18% |
| Year ended May 31, 2018 | 0.12% |
| 1 | Calculated based upon average shares outstanding |
| 2 | Total return calculations do not include any sales charges. Returns for periods of less than one year are not annualized. |
| 3 | Portfolio turnover rate is calculated by multiplying the Fund’s ownership percentage in the respective affiliated Master Portfolio by the corresponding affiliated Master Portfolio’s purchases and sales. These purchases and sales amounts are aggregated with the direct purchases and sales in the Underlying Funds and included in the portfolio turnover calculation. |
| Year ended May 31 | ||
| Administrator Class | Six months ended November 30, 2022 (unaudited) | 2022 1 |
Net asset value, beginning of period | $18.23 | $20.11 |
Net investment income | 0.08 | 0.06 |
Net realized and unrealized gains (losses) on investments | (0.26) | (1.94) |
Total from investment operations | (0.18) | (1.88) |
| Distributions to shareholders from | ||
Net investment income | 0.00 | 0.00 |
Net realized gains | 0.00 | 0.00 |
Total distributions to shareholders | 0.00 | 0.00 |
Net asset value, end of period | $18.05 | $18.23 |
Total return2 | (0.99)% | (9.35)% |
| Ratios to average net assets (annualized) | ||
Gross expenses* | 0.68% | 0.67% |
Net expenses* | 0.67% | 0.67% |
Net investment income | 0.92% | 0.98% |
| Supplemental data | ||
Portfolio turnover rate3 | 23% | 62% |
Net assets, end of period (000s omitted) | $73,214 | $76,706 |
| * | Including net expenses allocated from the affiliated Master Portfolios, the expense ratios would be increased by the following amounts: |
| Six months ended November 30, 2022 (unaudited) | 0.16% |
| Year ended May 31, 20221 | 0.15% |
| 1 | For the period from February 4, 2022 (commencement of class operations) to May 31, 2022 |
| 2 | Returns for periods of less than one year are not annualized. |
| 3 | Portfolio turnover rate is calculated by multiplying the Fund’s ownership percentage in the respective affiliated Master Portfolio by the corresponding affiliated Master Portfolio’s purchases and sales. These purchases and sales amounts are aggregated with the direct purchases and sales in the Underlying Funds and included in the portfolio turnover calculation. |
| Year ended May 31 | |||||
| Institutional Class | Six months ended November 30, 2022 (unaudited) | 2022 | 2021 | 2020 | 2019 1 |
Net asset value, beginning of period | $18.24 | $22.87 | $18.62 | $16.55 | $21.08 |
Net investment income | 0.11 | 0.27 | 0.22 | 0.29 | 0.14 |
Net realized and unrealized gains (losses) on investments | (0.26) | (1.69) | 6.65 | 2.07 | (1.26) |
Total from investment operations | (0.15) | (1.42) | 6.87 | 2.36 | (1.12) |
| Distributions to shareholders from | |||||
Net investment income | 0.00 | (0.23) | (0.28) | (0.25) | (0.28) |
Net realized gains | 0.00 | (2.98) | (2.34) | (0.04) | (3.13) |
Total distributions to shareholders | 0.00 | (3.21) | (2.62) | (0.29) | (3.41) |
Net asset value, end of period | $18.09 | $18.24 | $22.87 | $18.62 | $16.55 |
Total return2 | (0.82)% | (7.89)% | 38.96% | 14.26% | (4.54)% |
| Ratios to average net assets (annualized) | |||||
Gross expenses* | 0.43% | 0.43% | 0.43% | 0.44% | 0.43% |
Net expenses* | 0.42% | 0.42% | 0.42% | 0.42% | 0.42% |
Net investment income | 1.18% | 1.00% | 0.96% | 1.40% | 1.40% |
| Supplemental data | |||||
Portfolio turnover rate3 | 23% | 62% | 82% | 71% | 78% |
Net assets, end of period (000s omitted) | $5,330 | $5,794 | $7,962 | $2,281 | $1,172 |
| * | Including net expenses allocated from the affiliated Master Portfolios, the expense ratios would be increased by the following amounts: |
| Six months ended November 30, 2022 (unaudited) | 0.16% |
| Year ended May 31, 2022 | 0.16% |
| Year ended May 31, 2021 | 0.15% |
| Year ended May 31, 2020 | 0.18% |
| Year ended May 31, 20191 | 0.18% |
| 1 | For the period from July 31, 2018 (commencement of class operations) to May 31, 2019 |
| 2 | Returns for periods of less than one year are not annualized. |
| 3 | Portfolio turnover rate is calculated by multiplying the Fund’s ownership percentage in the respective affiliated Master Portfolio by the corresponding affiliated Master Portfolio’s purchases and sales. These purchases and sales amounts are aggregated with the direct purchases and sales in the Underlying Funds and included in the portfolio turnover calculation. |
| Year ended May 31 | ||||||
| Class A | Six months ended November 30, 2022 (unaudited) | 2022 | 2021 | 2020 | 2019 | 2018 |
Net asset value, beginning of period | $9.97 | $11.73 | $10.92 | $10.30 | $10.90 | $11.83 |
Net investment income | 0.17 | 0.28 | 0.14 | 0.15 | 0.19 1 | 0.18 1 |
Net realized and unrealized gains (losses) on investments | (0.57) | (0.85) | 1.56 | 0.76 | 0.03 | 0.40 |
Total from investment operations | (0.40) | (0.57) | 1.70 | 0.91 | 0.22 | 0.58 |
| Distributions to shareholders from | ||||||
Net investment income | (0.21) | (0.29) | (0.11) | (0.21) | (0.18) | (0.50) |
Net realized gains | 0.00 | (0.90) | (0.78) | (0.08) | (0.64) | (1.01) |
Total distributions to shareholders | (0.21) | (1.19) | (0.89) | (0.29) | (0.82) | (1.51) |
Net asset value, end of period | $9.36 | $9.97 | $11.73 | $10.92 | $10.30 | $10.90 |
Total return2 | (3.90)% | (5.69)% | 16.04% | 8.95% | 2.40% | 4.87% |
| Ratios to average net assets (annualized) | ||||||
Gross expenses* | 0.83% | 0.78% | 0.77% | 0.77% | 0.76% | 0.75% |
Net expenses* | 0.75% | 0.75% | 0.75% | 0.75% | 0.75% | 0.75% |
Net investment income | 3.54% | 2.52% | 1.07% | 1.47% | 1.81% | 1.58% |
| Supplemental data | ||||||
Portfolio turnover rate3 | 60% | 137% | 152% | 162% | 155% | 161% |
Net assets, end of period (000s omitted) | $32,062 | $34,171 | $40,354 | $31,965 | $34,104 | $2,712 |
| * | Including net expenses allocated from the affiliated Master Portfolios, the expense ratios would be increased by the following amounts: |
| Six months ended November 30, 2022 (unaudited) | 0.13% |
| Year ended May 31, 2022 | 0.14% |
| Year ended May 31, 2021 | 0.15% |
| Year ended May 31, 2020 | 0.16% |
| Year ended May 31, 2019 | 0.16% |
| Year ended May 31, 2018 | 0.13% |
| 1 | Calculated based upon average shares outstanding |
| 2 | Total return calculations do not include any sales charges. Returns for periods of less than one year are not annualized. |
| 3 | Portfolio turnover rate is calculated by multiplying the Fund’s ownership percentage in the respective affiliated Master Portfolio by the corresponding affiliated Master Portfolio’s purchases and sales. These purchases and sales amounts are aggregated with the direct purchases and sales in the Underlying Funds and included in the portfolio turnover calculation. |
| Year ended May 31 | ||||||
| Class C | Six months ended November 30, 2022 (unaudited) | 2022 | 2021 | 2020 | 2019 | 2018 |
Net asset value, beginning of period | $10.23 | $11.98 | $11.14 | $10.50 | $11.10 | $11.83 |
Net investment income | 0.14 | 0.21 | 0.04 | 0.09 | 0.12 1 | 0.09 |
Net realized and unrealized gains (losses) on investments | (0.58) | (0.88) | 1.61 | 0.77 | 0.02 | 0.41 |
Total from investment operations | (0.44) | (0.67) | 1.65 | 0.86 | 0.14 | 0.50 |
| Distributions to shareholders from | ||||||
Net investment income | (0.17) | (0.18) | (0.03) | (0.14) | (0.10) | (0.22) |
Net realized gains | 0.00 | (0.90) | (0.78) | (0.08) | (0.64) | (1.01) |
Total distributions to shareholders | (0.17) | (1.08) | (0.81) | (0.22) | (0.74) | (1.23) |
Net asset value, end of period | $9.62 | $10.23 | $11.98 | $11.14 | $10.50 | $11.10 |
Total return2 | (4.20)% | (6.38)% | 15.17% | 8.24% | 1.58% | 4.11% |
| Ratios to average net assets (annualized) | ||||||
Gross expenses* | 1.58% | 1.53% | 1.52% | 1.52% | 1.51% | 1.50% |
Net expenses* | 1.50% | 1.50% | 1.50% | 1.50% | 1.50% | 1.50% |
Net investment income | 2.79% | 1.80% | 0.31% | 0.73% | 1.13% | 0.81% |
| Supplemental data | ||||||
Portfolio turnover rate3 | 60% | 137% | 152% | 162% | 155% | 161% |
Net assets, end of period (000s omitted) | $233,030 | $263,264 | $336,665 | $339,482 | $393,207 | $559,104 |
| * | Including net expenses allocated from the affiliated Master Portfolios, the expense ratios would be increased by the following amounts: |
| Six months ended November 30, 2022 (unaudited) | 0.13% |
| Year ended May 31, 2022 | 0.14% |
| Year ended May 31, 2021 | 0.15% |
| Year ended May 31, 2020 | 0.16% |
| Year ended May 31, 2019 | 0.17% |
| Year ended May 31, 2018 | 0.13% |
| 1 | Calculated based upon average shares outstanding |
| 2 | Total return calculations do not include any sales charges. Returns for periods of less than one year are not annualized. |
| 3 | Portfolio turnover rate is calculated by multiplying the Fund’s ownership percentage in the respective affiliated Master Portfolio by the corresponding affiliated Master Portfolio’s purchases and sales. These purchases and sales amounts are aggregated with the direct purchases and sales in the Underlying Funds and included in the portfolio turnover calculation. |
| Year ended May 31 | |||||
| Institutional Class | Six months ended November 30, 2022 (unaudited) | 2022 | 2021 | 2020 | 2019 1 |
Net asset value, beginning of period | $10.00 | $11.77 | $10.94 | $10.32 | $11.06 |
Net investment income | 0.18 | 0.34 | 0.17 | 0.20 | 0.14 |
Net realized and unrealized gains (losses) on investments | (0.57) | (0.87) | 1.57 | 0.74 | (0.04) |
Total from investment operations | (0.39) | (0.53) | 1.74 | 0.94 | 0.10 |
| Distributions to shareholders from | |||||
Net investment income | (0.23) | (0.34) | (0.13) | (0.24) | (0.20) |
Net realized gains | 0.00 | (0.90) | (0.78) | (0.08) | (0.64) |
Total distributions to shareholders | (0.23) | (1.24) | (0.91) | (0.32) | (0.84) |
Net asset value, end of period | $9.38 | $10.00 | $11.77 | $10.94 | $10.32 |
Total return2 | (3.82)% | (5.36)% | 16.44% | 9.26% | 1.28% |
| Ratios to average net assets (annualized) | |||||
Gross expenses* | 0.50% | 0.45% | 0.44% | 0.44% | 0.43% |
Net expenses* | 0.42% | 0.42% | 0.42% | 0.42% | 0.42% |
Net investment income | 3.83% | 2.24% | 1.39% | 1.80% | 1.37% |
| Supplemental data | |||||
Portfolio turnover rate3 | 60% | 137% | 152% | 162% | 155% |
Net assets, end of period (000s omitted) | $12,414 | $12,877 | $3,114 | $2,678 | $1,817 |
| * | Including net expenses allocated from the affiliated Master Portfolios, the expense ratios would be increased by the following amounts: |
| Six months ended November 30, 2022 (unaudited) | 0.13% |
| Year ended May 31, 2022 | 0.14% |
| Year ended May 31, 2021 | 0.15% |
| Year ended May 31, 2020 | 0.16% |
| Year ended May 31, 20191 | 0.16% |
| 1 | For the period from July 31, 2018 (commencement of class operations) to May 31, 2019 |
| 2 | Returns for periods of less than one year are not annualized. |
| 3 | Portfolio turnover rate is calculated by multiplying the Fund’s ownership percentage in the respective affiliated Master Portfolio by the corresponding affiliated Master Portfolio’s purchases and sales. These purchases and sales amounts are aggregated with the direct purchases and sales in the Underlying Funds and included in the portfolio turnover calculation. |
| Year ended May 31 | ||||||
| Class A | Six months ended November 30, 2022 (unaudited) | 2022 | 2021 | 2020 | 2019 | 2018 |
Net asset value, beginning of period | $11.87 | $14.46 | $12.70 | $11.57 | $13.88 | $14.60 |
Net investment income | 0.18 | 0.34 1 | 0.13 | 0.15 | 0.14 1 | 0.12 |
Net realized and unrealized gains (losses) on investments | (0.56) | (1.00) | 3.24 | 1.17 | (0.30) | 1.39 |
Total from investment operations | (0.38) | (0.66) | 3.37 | 1.32 | (0.16) | 1.51 |
| Distributions to shareholders from | ||||||
Net investment income | 0.00 | (0.33) | (0.13) | (0.18) | (0.23) | (0.30) |
Net realized gains | 0.00 | (1.60) | (1.48) | (0.01) | (1.92) | (1.93) |
Total distributions to shareholders | 0.00 | (1.93) | (1.61) | (0.19) | (2.15) | (2.23) |
Net asset value, end of period | $11.49 | $11.87 | $14.46 | $12.70 | $11.57 | $13.88 |
Total return2 | (3.20)% | (5.83)% | 27.87% | 11.34% | (0.38)% | 10.33% |
| Ratios to average net assets (annualized) | ||||||
Gross expenses* | 0.82% | 0.80% | 0.79% | 0.79% | 0.78% | 0.78% |
Net expenses* | 0.75% | 0.75% | 0.75% | 0.75% | 0.75% | 0.75% |
Net investment income | 3.29% | 2.46% | 0.90% | 1.14% | 1.20% | 1.07% |
| Supplemental data | ||||||
Portfolio turnover rate3 | 37% | 61% | 100% | 98% | 97% | 93% |
Net assets, end of period (000s omitted) | $24,877 | $26,717 | $31,295 | $25,089 | $23,420 | $2,009 |
| * | Including net expenses allocated from the affiliated Master Portfolios, the expense ratios would be increased by the following amounts: |
| Six months ended November 30, 2022 (unaudited) | 0.14% |
| Year ended May 31, 2022 | 0.14% |
| Year ended May 31, 2021 | 0.14% |
| Year ended May 31, 2020 | 0.16% |
| Year ended May 31, 2019 | 0.17% |
| Year ended May 31, 2018 | 0.12% |
| 1 | Calculated based upon average shares outstanding |
| 2 | Total return calculations do not include any sales charges. Returns for periods of less than one year are not annualized. |
| 3 | Portfolio turnover rate is calculated by multiplying the Fund’s ownership percentage in the respective affiliated Master Portfolio by the corresponding affiliated Master Portfolio’s purchases and sales. These purchases and sales amounts are aggregated with the direct purchases and sales in the Underlying Funds and included in the portfolio turnover calculation. |
| Year ended May 31 | ||||||
| Class C | Six months ended November 30, 2022 (unaudited) | 2022 | 2021 | 2020 | 2019 | 2018 |
Net asset value, beginning of period | $12.17 | $14.78 | $12.96 | $11.78 | $14.02 | $14.58 |
Net investment income | 0.15 1 | 0.24 | 0.02 | 0.06 | 0.08 | 0.04 |
Net realized and unrealized gains (losses) on investments | (0.58) | (1.03) | 3.30 | 1.20 | (0.33) | 1.34 |
Total from investment operations | (0.43) | (0.79) | 3.32 | 1.26 | (0.25) | 1.38 |
| Distributions to shareholders from | ||||||
Net investment income | 0.00 | (0.22) | (0.02) | (0.07) | (0.07) | (0.01) |
Net realized gains | 0.00 | (1.60) | (1.48) | (0.01) | (1.92) | (1.93) |
Total distributions to shareholders | 0.00 | (1.82) | (1.50) | (0.08) | (1.99) | (1.94) |
Net asset value, end of period | $11.74 | $12.17 | $14.78 | $12.96 | $11.78 | $14.02 |
Total return2 | (3.53)% | (6.53)% | 26.86% | 10.67% | (1.12)% | 9.45% |
| Ratios to average net assets (annualized) | ||||||
Gross expenses* | 1.56% | 1.55% | 1.54% | 1.53% | 1.52% | 1.51% |
Net expenses* | 1.50% | 1.50% | 1.50% | 1.50% | 1.50% | 1.50% |
Net investment income | 2.54% | 1.73% | 0.15% | 0.40% | 0.56% | 0.26% |
| Supplemental data | ||||||
Portfolio turnover rate3 | 37% | 61% | 100% | 98% | 97% | 93% |
Net assets, end of period (000s omitted) | $195,500 | $215,969 | $266,399 | $241,980 | $261,722 | $354,185 |
| * | Including net expenses allocated from the affiliated Master Portfolios, the expense ratios would be increased by the following amounts: |
| Six months ended November 30, 2022 (unaudited) | 0.14% |
| Year ended May 31, 2022 | 0.14% |
| Year ended May 31, 2021 | 0.15% |
| Year ended May 31, 2020 | 0.16% |
| Year ended May 31, 2019 | 0.17% |
| Year ended May 31, 2018 | 0.12% |
| 1 | Calculated based upon average shares outstanding |
| 2 | Total return calculations do not include any sales charges. Returns for periods of less than one year are not annualized. |
| 3 | Portfolio turnover rate is calculated by multiplying the Fund’s ownership percentage in the respective affiliated Master Portfolio by the corresponding affiliated Master Portfolio’s purchases and sales. These purchases and sales amounts are aggregated with the direct purchases and sales in the Underlying Funds and included in the portfolio turnover calculation. |
| Year ended May 31 | |||||
| Institutional Class | Six months ended November 30, 2022 (unaudited) | 2022 | 2021 | 2020 | 2019 1 |
Net asset value, beginning of period | $11.87 | $14.46 | $12.70 | $11.57 | $14.20 |
Net investment income | 0.22 | 0.42 | 0.22 | 0.16 | 0.18 |
Net realized and unrealized gains (losses) on investments | (0.57) | (1.03) | 3.19 | 1.20 | (0.65) |
Total from investment operations | (0.35) | (0.61) | 3.41 | 1.36 | (0.47) |
| Distributions to shareholders from | |||||
Net investment income | 0.00 | (0.38) | (0.17) | (0.22) | (0.24) |
Net realized gains | 0.00 | (1.60) | (1.48) | (0.01) | (1.92) |
Total distributions to shareholders | 0.00 | (1.98) | (1.65) | (0.23) | (2.16) |
Net asset value, end of period | $11.52 | $11.87 | $14.46 | $12.70 | $11.57 |
Total return2 | (2.95)% | (5.55)% | 28.25% | 11.71% | (2.47)% |
| Ratios to average net assets (annualized) | |||||
Gross expenses* | 0.49% | 0.47% | 0.46% | 0.46% | 0.45% |
Net expenses* | 0.42% | 0.42% | 0.42% | 0.42% | 0.42% |
Net investment income | 3.63% | 2.85% | 1.24% | 1.44% | 1.84% |
| Supplemental data | |||||
Portfolio turnover rate3 | 37% | 61% | 100% | 98% | 97% |
Net assets, end of period (000s omitted) | $2,009 | $2,475 | $2,589 | $1,016 | $699 |
| * | Including net expenses allocated from the affiliated Master Portfolios, the expense ratios would be increased by the following amounts: |
| Six months ended November 30, 2022 (unaudited) | 0.14% |
| Year ended May 31, 2022 | 0.14% |
| Year ended May 31, 2021 | 0.14% |
| Year ended May 31, 2020 | 0.16% |
| Year ended May 31, 20191 | 0.17% |
| 1 | For the period from July 31, 2018 (commencement of class operations) to May 31, 2019 |
| 2 | Returns for periods of less than one year are not annualized. |
| 3 | Portfolio turnover rate is calculated by multiplying the Fund’s ownership percentage in the respective affiliated Master Portfolio by the corresponding affiliated Master Portfolio’s purchases and sales. These purchases and sales amounts are aggregated with the direct purchases and sales in the Underlying Funds and included in the portfolio turnover calculation. |
| Year ended May 31 | ||||||
| Class A | Six months ended November 30, 2022 (unaudited) | 2022 | 2021 | 2020 | 2019 | 2018 |
Net asset value, beginning of period | $9.18 | $10.50 | $10.40 | $9.82 | $10.05 | $10.52 |
Net investment income | 0.12 | 0.23 | 0.11 | 0.16 | 0.18 | 0.20 |
Net realized and unrealized gains (losses) on investments | (0.49) | (0.83) | 0.71 | 0.59 | 0.18 | 0.02 |
Total from investment operations | (0.37) | (0.60) | 0.82 | 0.75 | 0.36 | 0.22 |
| Distributions to shareholders from | ||||||
Net investment income | (0.14) | (0.25) | (0.14) | (0.17) | (0.19) | (0.19) |
Net realized gains | 0.00 | (0.47) | (0.58) | 0.00 | (0.40) | (0.50) |
Total distributions to shareholders | (0.14) | (0.72) | (0.72) | (0.17) | (0.59) | (0.69) |
Net asset value, end of period | $8.67 | $9.18 | $10.50 | $10.40 | $9.82 | $10.05 |
Total return1 | (4.03)% | (6.28)% | 8.07% | 7.72% | 3.84% | 2.05% |
| Ratios to average net assets (annualized) | ||||||
Gross expenses* | 0.83% | 0.81% | 0.80% | 0.80% | 0.79% | 0.77% |
Net expenses* | 0.75% | 0.75% | 0.75% | 0.75% | 0.75% | 0.75% |
Net investment income | 3.54% | 2.26% | 1.04% | 1.61% | 2.15% | 1.81% |
| Supplemental data | ||||||
Portfolio turnover rate2 | 92% | 225% | 206% | 197% | 183% | 192% |
Net assets, end of period (000s omitted) | $19,390 | $20,647 | $24,170 | $21,256 | $16,242 | $4,532 |
| * | Including net expenses allocated from the affiliated Master Portfolios, the expense ratios would be increased by the following amounts: |
| Six months ended November 30, 2022 (unaudited) | 0.15% |
| Year ended May 31, 2022 | 0.16% |
| Year ended May 31, 2021 | 0.16% |
| Year ended May 31, 2020 | 0.15% |
| Year ended May 31, 2019 | 0.16% |
| Year ended May 31, 2018 | 0.13% |
| 1 | Total return calculations do not include any sales charges. Returns for periods of less than one year are not annualized. |
| 2 | Portfolio turnover rate is calculated by multiplying the Fund’s ownership percentage in the respective affiliated Master Portfolio by the corresponding affiliated Master Portfolio’s purchases and sales. These purchases and sales amounts are aggregated with the direct purchases and sales in the Underlying Funds and included in the portfolio turnover calculation. |
| Year ended May 31 | ||||||
| Class C | Six months ended November 30, 2022 (unaudited) | 2022 | 2021 | 2020 | 2019 | 2018 |
Net asset value, beginning of period | $9.18 | $10.46 | $10.36 | $9.81 | $10.06 | $10.51 |
Net investment income | 0.09 | 0.15 | 0.03 | 0.09 | 0.14 1 | 0.11 |
Net realized and unrealized gains (losses) on investments | (0.50) | (0.82) | 0.71 | 0.58 | 0.13 | 0.04 |
Total from investment operations | (0.41) | (0.67) | 0.74 | 0.67 | 0.27 | 0.15 |
| Distributions to shareholders from | ||||||
Net investment income | (0.10) | (0.14) | (0.06) | (0.12) | (0.12) | (0.10) |
Net realized gains | 0.00 | (0.47) | (0.58) | 0.00 | (0.40) | (0.50) |
Total distributions to shareholders | (0.10) | (0.61) | (0.64) | (0.12) | (0.52) | (0.60) |
Net asset value, end of period | $8.67 | $9.18 | $10.46 | $10.36 | $9.81 | $10.06 |
Total return2 | (4.41)% | (6.91)% | 7.25% | 6.90% | 2.89% | 1.37% |
| Ratios to average net assets (annualized) | ||||||
Gross expenses* | 1.58% | 1.56% | 1.55% | 1.55% | 1.54% | 1.52% |
Net expenses* | 1.50% | 1.50% | 1.50% | 1.50% | 1.50% | 1.50% |
Net investment income | 2.81% | 1.53% | 0.30% | 0.89% | 1.41% | 1.05% |
| Supplemental data | ||||||
Portfolio turnover rate3 | 92% | 225% | 206% | 197% | 183% | 192% |
Net assets, end of period (000s omitted) | $127,698 | $148,281 | $196,035 | $212,465 | $237,153 | $319,498 |
| * | Including net expenses allocated from the affiliated Master Portfolios, the expense ratios would be increased by the following amounts: |
| Six months ended November 30, 2022 (unaudited) | 0.15% |
| Year ended May 31, 2022 | 0.16% |
| Year ended May 31, 2021 | 0.16% |
| Year ended May 31, 2020 | 0.15% |
| Year ended May 31, 2019 | 0.16% |
| Year ended May 31, 2018 | 0.13% |
| 1 | Calculated based upon average shares outstanding |
| 2 | Total return calculations do not include any sales charges. Returns for periods of less than one year are not annualized. |
| 3 | Portfolio turnover rate is calculated by multiplying the Fund’s ownership percentage in the respective affiliated Master Portfolio by the corresponding affiliated Master Portfolio’s purchases and sales. These purchases and sales amounts are aggregated with the direct purchases and sales in the Underlying Funds and included in the portfolio turnover calculation. |
| Year ended May 31 | |||||
| Institutional Class | Six months ended November 30, 2022 (unaudited) | 2022 | 2021 | 2020 | 2019 1 |
Net asset value, beginning of period | $9.17 | $10.50 | $10.39 | $9.80 | $10.15 |
Net investment income | 0.13 | 0.20 2 | 0.19 | 0.21 | 0.15 |
Net realized and unrealized gains (losses) on investments | (0.49) | (0.77) | 0.68 | 0.57 | 0.12 |
Total from investment operations | (0.36) | (0.57) | 0.87 | 0.78 | 0.27 |
| Distributions to shareholders from | |||||
Net investment income | (0.15) | (0.29) | (0.18) | (0.19) | (0.22) |
Net realized gains | 0.00 | (0.47) | (0.58) | 0.00 | (0.40) |
Total distributions to shareholders | (0.15) | (0.76) | (0.76) | (0.19) | (0.62) |
Net asset value, end of period | $8.66 | $9.17 | $10.50 | $10.39 | $9.80 |
Total return3 | (3.87)% | (5.93)% | 8.51% | 8.07% | 2.95% |
| Ratios to average net assets (annualized) | |||||
Gross expenses* | 0.50% | 0.48% | 0.47% | 0.47% | 0.46% |
Net expenses* | 0.42% | 0.42% | 0.42% | 0.42% | 0.42% |
Net investment income | 3.87% | 1.98% | 1.33% | 1.96% | 1.61% |
| Supplemental data | |||||
Portfolio turnover rate4 | 92% | 225% | 206% | 197% | 183% |
Net assets, end of period (000s omitted) | $5,612 | $5,876 | $1,139 | $710 | $434 |
| * | Including net expenses allocated from the affiliated Master Portfolios, the expense ratios would be increased by the following amounts: |
| Six months ended November 30, 2022 (unaudited) | 0.15% |
| Year ended May 31, 2022 | 0.16% |
| Year ended May 31, 2021 | 0.16% |
| Year ended May 31, 2020 | 0.15% |
| Year ended May 31, 20191 | 0.16% |
| 1 | For the period from July 31, 2018 (commencement of class operations) to May 31, 2019 |
| 2 | Calculated based upon average shares outstanding |
| 3 | Returns for periods of less than one year are not annualized. |
| 4 | Portfolio turnover rate is calculated by multiplying the Fund’s ownership percentage in the respective affiliated Master Portfolio by the corresponding affiliated Master Portfolio’s purchases and sales. These purchases and sales amounts are aggregated with the direct purchases and sales in the Underlying Funds and included in the portfolio turnover calculation. |
| Year ended May 31 | ||||||
| Class A | Six months ended November 30, 2022 (unaudited) | 2022 | 2021 | 2020 | 2019 | 2018 |
Net asset value, beginning of period | $11.63 | $13.92 | $12.64 | $11.64 | $13.27 | $14.24 |
Net investment income | 0.19 | 0.32 | 0.14 | 0.15 | 0.18 1 | 0.19 1 |
Net realized and unrealized gains (losses) on investments | (0.59) | (0.95) | 2.59 | 1.07 | (0.14) | 0.89 |
Total from investment operations | (0.40) | (0.63) | 2.73 | 1.22 | 0.04 | 1.08 |
| Distributions to shareholders from | ||||||
Net investment income | 0.00 | (0.32) | (0.15) | (0.21) | (0.23) | (0.42) |
Net realized gains | 0.00 | (1.34) | (1.30) | (0.01) | (1.44) | (1.63) |
Total distributions to shareholders | 0.00 | (1.66) | (1.45) | (0.22) | (1.67) | (2.05) |
Net asset value, end of period | $11.23 | $11.63 | $13.92 | $12.64 | $11.64 | $13.27 |
Total return2 | (3.44)% | (5.66)% | 22.56% | 10.49% | 1.02% | 7.51% |
| Ratios to average net assets (annualized) | ||||||
Gross expenses* | 0.75% | 0.74% | 0.75% | 0.76% | 0.76% | 0.75% |
Net expenses* | 0.75% | 0.74% | 0.75% | 0.75% | 0.75% | 0.75% |
Net investment income | 3.38% | 2.49% | 0.96% | 1.31% | 1.51% | 1.33% |
| Supplemental data | ||||||
Portfolio turnover rate3 | 41% | 89% | 120% | 131% | 126% | 129% |
Net assets, end of period (000s omitted) | $42,850 | $46,650 | $56,004 | $46,133 | $46,380 | $3,031 |
| * | Including net expenses allocated from the affiliated Master Portfolios, the expense ratios would be increased by the following amounts: |
| Six months ended November 30, 2022 (unaudited) | 0.14% |
| Year ended May 31, 2022 | 0.14% |
| Year ended May 31, 2021 | 0.15% |
| Year ended May 31, 2020 | 0.16% |
| Year ended May 31, 2019 | 0.17% |
| Year ended May 31, 2018 | 0.12% |
| 1 | Calculated based upon average shares outstanding |
| 2 | Total return calculations do not include any sales charges. Returns for periods of less than one year are not annualized. |
| 3 | Portfolio turnover rate is calculated by multiplying the Fund’s ownership percentage in the respective affiliated Master Portfolio by the corresponding affiliated Master Portfolio’s purchases and sales. These purchases and sales amounts are aggregated with the direct purchases and sales in the Underlying Funds and included in the portfolio turnover calculation. |
| Year ended May 31 | ||||||
| Class C | Six months ended November 30, 2022 (unaudited) | 2022 | 2021 | 2020 | 2019 | 2018 |
Net asset value, beginning of period | $11.91 | $14.22 | $12.87 | $11.85 | $13.40 | $14.21 |
Net investment income | 0.15 1 | 0.24 1 | 0.03 | 0.08 | 0.11 | 0.09 |
Net realized and unrealized gains (losses) on investments | (0.60) | (1.00) | 2.66 | 1.06 | (0.14) | 0.87 |
Total from investment operations | (0.45) | (0.76) | 2.69 | 1.14 | (0.03) | 0.96 |
| Distributions to shareholders from | ||||||
Net investment income | 0.00 | (0.21) | (0.04) | (0.11) | (0.08) | (0.14) |
Net realized gains | 0.00 | (1.34) | (1.30) | (0.01) | (1.44) | (1.63) |
Total distributions to shareholders | 0.00 | (1.55) | (1.34) | (0.12) | (1.52) | (1.77) |
Net asset value, end of period | $11.46 | $11.91 | $14.22 | $12.87 | $11.85 | $13.40 |
Total return2 | (3.78)% | (6.39)% | 21.79% | 9.58% | 0.31% | 6.65% |
| Ratios to average net assets (annualized) | ||||||
Gross expenses* | 1.50% | 1.49% | 1.50% | 1.51% | 1.50% | 1.50% |
Net expenses* | 1.49% | 1.49% | 1.50% | 1.50% | 1.50% | 1.50% |
Net investment income | 2.64% | 1.76% | 0.21% | 0.57% | 0.84% | 0.56% |
| Supplemental data | ||||||
Portfolio turnover rate3 | 41% | 89% | 120% | 131% | 126% | 129% |
Net assets, end of period (000s omitted) | $360,846 | $402,753 | $499,835 | $477,998 | $539,352 | $732,031 |
| * | Including net expenses allocated from the affiliated Master Portfolios, the expense ratios would be increased by the following amounts: |
| Six months ended November 30, 2022 (unaudited) | 0.14% |
| Year ended May 31, 2022 | 0.14% |
| Year ended May 31, 2021 | 0.15% |
| Year ended May 31, 2020 | 0.16% |
| Year ended May 31, 2019 | 0.17% |
| Year ended May 31, 2018 | 0.12% |
| 1 | Calculated based upon average shares outstanding |
| 2 | Total return calculations do not include any sales charges. Returns for periods of less than one year are not annualized. |
| 3 | Portfolio turnover rate is calculated by multiplying the Fund’s ownership percentage in the respective affiliated Master Portfolio by the corresponding affiliated Master Portfolio’s purchases and sales. These purchases and sales amounts are aggregated with the direct purchases and sales in the Underlying Funds and included in the portfolio turnover calculation. |
| Year ended May 31 | |||||
| Institutional Class | Six months ended November 30, 2022 (unaudited) | 2022 | 2021 | 2020 | 2019 1 |
Net asset value, beginning of period | $11.63 | $13.93 | $12.64 | $11.65 | $13.52 |
Net investment income | 0.21 2 | 0.31 2 | 0.23 | 0.25 | 0.15 |
Net realized and unrealized gains (losses) on investments | (0.59) | (0.90) | 2.55 | 1.01 | (0.33) |
Total from investment operations | (0.38) | (0.59) | 2.78 | 1.26 | (0.18) |
| Distributions to shareholders from | |||||
Net investment income | 0.00 | (0.37) | (0.19) | (0.26) | (0.25) |
Net realized gains | 0.00 | (1.34) | (1.30) | (0.01) | (1.44) |
Total distributions to shareholders | 0.00 | (1.71) | (1.49) | (0.27) | (1.69) |
Net asset value, end of period | $11.25 | $11.63 | $13.93 | $12.64 | $11.65 |
Total return3 | (3.27)% | (5.40)% | 22.99% | 10.78% | (0.62)% |
| Ratios to average net assets (annualized) | |||||
Gross expenses* | 0.42% | 0.41% | 0.42% | 0.43% | 0.43% |
Net expenses* | 0.42% | 0.41% | 0.42% | 0.42% | 0.42% |
Net investment income | 3.73% | 2.38% | 1.32% | 1.63% | 1.38% |
| Supplemental data | |||||
Portfolio turnover rate4 | 41% | 89% | 120% | 131% | 126% |
Net assets, end of period (000s omitted) | $6,569 | $7,369 | $3,443 | $1,945 | $1,067 |
| * | Including net expenses allocated from the affiliated Master Portfolios, the expense ratios would be increased by the following amounts: |
| Six months ended November 30, 2022 (unaudited) | 0.14% |
| Year ended May 31, 2022 | 0.14% |
| Year ended May 31, 2021 | 0.15% |
| Year ended May 31, 2020 | 0.16% |
| Year ended May 31, 20191 | 0.16% |
| 1 | For the period from July 31, 2018 (commencement of class operations) to May 31, 2019 |
| 2 | Calculated based upon average shares outstanding |
| 3 | Returns for periods of less than one year are not annualized. |
| 4 | Portfolio turnover rate is calculated by multiplying the Fund’s ownership percentage in the respective affiliated Master Portfolio by the corresponding affiliated Master Portfolio’s purchases and sales. These purchases and sales amounts are aggregated with the direct purchases and sales in the Underlying Funds and included in the portfolio turnover calculation. |
| Net investment income | Net realized gains | |
| Allspring Spectrum Aggressive Growth Fund | Annually | Annually |
| Allspring Spectrum Conservative Growth Fund | Quarterly | Annually |
| Allspring Spectrum Growth Fund | Annually | Annually |
| Allspring Spectrum Income Allocation Fund | Monthly | Annually |
| Allspring Spectrum Moderate Growth Fund | Annually | Annually |
| Tax cost | Gross unrealized gains | Gross unrealized losses | Net unrealized gains (losses) | |
| Spectrum Aggressive Growth Fund | $409,259,671 | $ 98,845,111 | $ (33,729,554) | $ 65,115,557 |
| Spectrum Conservative Growth Fund | 287,397,376 | 12,457,988 | (26,893,887) | (14,435,899) |
| Spectrum Growth Fund | 210,895,696 | 93,588,977 | (85,382,810) | 8,206,167 |
| Spectrum Income Allocation Fund | 169,058,532 | 3,492,983 | (22,665,991) | (19,173,008) |
| Spectrum Moderate Growth Fund | 401,599,015 | 170,802,209 | (167,947,942) | 2,854,267 |
| ■ | Level 1 – quoted prices in active markets for identical securities |
| ■ | Level 2 – other significant observable inputs (including quoted prices for similar securities, interest rates, prepayment speeds, credit risk, etc.) |
| ■ | Level 3 – significant unobservable inputs (including the Fund’s own assumptions in determining the fair value of investments) |
| Spectrum Aggressive Growth Fund | Quoted prices (Level 1) | Other significant observable inputs (Level 2) | Significant unobservable inputs (Level 3) | Total |
| Assets | ||||
| Investments in: | ||||
| Investment companies | $ 167,610,140 | $0 | $0 | $ 167,610,140 |
| Short-term investments | ||||
| Investment companies | 2,400,005 | 0 | 0 | 2,400,005 |
| Investments measured at net asset value* | 306,102,384 | |||
| 170,010,145 | 0 | 0 | 476,112,529 | |
| Futures contracts | 1,029,735 | 0 | 0 | 1,029,735 |
| Total assets | $171,039,880 | $0 | $0 | $477,142,264 |
| Liabilities | ||||
| Futures contracts | $ 2,767,036 | $0 | $0 | $ 2,767,036 |
| Total liabilities | $ 2,767,036 | $0 | $0 | $ 2,767,036 |
| * | Investments that are measured at fair value using the net asset value per share (or its equivalent) as a practical expedient have not been categorized in the fair value hierarchy. The fair value amount presented in the table is intended to permit reconciliation of the fair value hierarchy to the amounts presented in the Statements of Assets and Liabilities. The Fund’s investments in the affiliated Master Portfolios are valued at $306,102,384. Each affiliated Master Portfolio does not have a redemption period notice, can be redeemed daily and does not have any unfunded commitments. |
| Spectrum Conservative Growth Fund | Quoted prices (Level 1) | Other significant observable inputs (Level 2) | Significant unobservable inputs (Level 3) | Total |
| Assets | ||||
| Investments in: | ||||
| Investment companies | $ 129,395,230 | $0 | $0 | $ 129,395,230 |
| Short-term investments | ||||
| Investment companies | 1,280,702 | 0 | 0 | 1,280,702 |
| Investments measured at net asset value* | 143,228,579 | |||
| 130,675,932 | 0 | 0 | 273,904,511 | |
| Futures contracts | 850,875 | 0 | 0 | 850,875 |
| Total assets | $131,526,807 | $0 | $0 | $274,755,386 |
| Liabilities | ||||
| Futures contracts | $ 1,793,909 | $0 | $0 | $ 1,793,909 |
| Total liabilities | $ 1,793,909 | $0 | $0 | $ 1,793,909 |
| * | Investments that are measured at fair value using the net asset value per share (or its equivalent) as a practical expedient have not been categorized in the fair value hierarchy. The fair value amount presented in the table is intended to permit reconciliation of the fair value hierarchy to the amounts presented in the Statements of Assets and Liabilities. The Fund’s investments in the affiliated Master Portfolios are valued at $143,228,579. Each affiliated Master Portfolio does not have a redemption period notice, can be redeemed daily and does not have any unfunded commitments. |
| Spectrum Growth Fund | Quoted prices (Level 1) | Other significant observable inputs (Level 2) | Significant unobservable inputs (Level 3) | Total |
| Assets | ||||
| Investments in: | ||||
| Investment companies | $ 97,012,526 | $0 | $0 | $ 97,012,526 |
| Short-term investments | ||||
| Investment companies | 966,952 | 0 | 0 | 966,952 |
| Investments measured at net asset value* | 121,911,687 | |||
| 97,979,478 | 0 | 0 | 219,891,165 | |
| Futures contracts | 667,824 | 0 | 0 | 667,824 |
| Total assets | $98,647,302 | $0 | $0 | $220,558,989 |
| Liabilities | ||||
| Futures contracts | $ 1,457,126 | $0 | $0 | $ 1,457,126 |
| Total liabilities | $ 1,457,126 | $0 | $0 | $ 1,457,126 |
| * | Investments that are measured at fair value using the net asset value per share (or its equivalent) as a practical expedient have not been categorized in the fair value hierarchy. The fair value amount presented in the table is intended to permit reconciliation of the fair value hierarchy to the amounts presented in the Statements of Assets and Liabilities. The Fund’s investments in the affiliated Master Portfolios are valued at $121,911,687. Each affiliated Master Portfolio does not have a redemption period notice, can be redeemed daily and does not have any unfunded commitments. |
| Spectrum Income Allocation Fund | Quoted prices (Level 1) | Other significant observable inputs (Level 2) | Significant unobservable inputs (Level 3) | Total |
| Assets | ||||
| Investments in: | ||||
| Investment companies | $ 56,618,128 | $0 | $0 | $ 56,618,128 |
| Short-term investments | ||||
| Investment companies | 1,100,002 | 0 | 0 | 1,100,002 |
| Investments measured at net asset value | 92,699,759 | |||
| 57,718,130 | 0 | 0 | 150,417,889 | |
| Futures contracts | 482,227 | 0 | 0 | 482,227 |
| Total assets | $58,200,357 | $0 | $0 | $150,900,116 |
| Liabilities | ||||
| Futures contracts | $ 1,014,592 | $0 | $0 | $ 1,014,592 |
| Total liabilities | $ 1,014,592 | $0 | $0 | $ 1,014,592 |
| * | Investments that are measured at fair value using the net asset value per share (or its equivalent) as a practical expedient have not been categorized in the fair value hierarchy. The fair value amount presented in the table is intended to permit reconciliation of the fair value hierarchy to the amounts presented in the Statements of Assets and Liabilities. The Fund’s investments in the affiliated Master Portfolios are valued at $92,699,759. Each affiliated Master Portfolio does not have a redemption period notice, can be redeemed daily and does not have any unfunded commitments. |
| Spectrum Moderate Growth Fund | Quoted prices (Level 1) | Other significant observable inputs (Level 2) | Significant unobservable inputs (Level 3) | Total |
| Assets | ||||
| Investments in: | ||||
| Investment companies | $ 188,883,837 | $0 | $0 | $ 188,883,837 |
| Short-term investments | ||||
| Investment companies | 2,652,135 | 0 | 0 | 2,652,135 |
| Investments measured at net asset value* | 214,308,293 | |||
| 191,535,972 | 0 | 0 | 405,844,265 | |
| Futures contracts | 1,247,792 | 0 | 0 | 1,247,792 |
| Total assets | $192,783,764 | $0 | $0 | $407,092,057 |
| Liabilities | ||||
| Futures contracts | $ 2,638,775 | $0 | $0 | $ 2,638,775 |
| Total liabilities | $ 2,638,775 | $0 | $0 | $ 2,638,775 |
| * | Investments that are measured at fair value using the net asset value per share (or its equivalent) as a practical expedient have not been categorized in the fair value hierarchy. The fair value amount presented in the table is intended to permit reconciliation of the fair value hierarchy to the amounts presented in the Statements of Assets and Liabilities. The Fund’s investments in the affiliated Master Portfolios are valued at $214,308,293. Each affiliated Master Portfolio does not have a redemption period notice, can be redeemed daily and does not have any unfunded commitments. |
| Affiliated Master Portfolio | Investment objective |
| Allspring Bloomberg US Aggregate ex-Corporate Portfolio | Seeks to replicate the total return of the Bloomberg U.S. Aggregate ex-Corporate Index, before fee and expenses |
| Allspring Core Bond Portfolio | Seeks total return consisting of income and capital appreciation |
| Allspring Disciplined Large Cap Portfolio | Seeks long-term capital appreciation |
| Allspring Emerging Growth Portfolio | Seeks long-term capital appreciation |
| Allspring Factor Enhanced Emerging Markets Equity Portfolio | Seeks long-term capital appreciation |
| Allspring Factor Enhanced International Equity Portfolio | Seeks long-term capital appreciation |
| Allspring Factor Enhanced U.S. Large Cap Equity Portfolio | Seeks long-term capital appreciation |
| Allspring Factor Enhanced U.S. Small Cap Equity Portfolio | Seeks long-term capital appreciation |
| Allspring Real Return Portfolio | Seeks returns that exceed the rate of inflation over the long-term |
| Allspring Small Company Value Portfolio | Seeks long-term capital appreciation |
| Average daily net assets | Management fee |
| First $1 billion | 0.250% |
| Next $4 billion | 0.225 |
| Next $5 billion | 0.190 |
| Over $10 billion | 0.180 |
| Class-level administration fee | |
| Class A | 0.21% |
| Class C | 0.21 |
| Administrator Class | 0.13 |
| Institutional Class | 0.13 |
| Expense ratio caps | |
| Class A | 0.75% |
| Class C | 1.50 |
| Administrator Class | 0.67 |
| Institutional Class | 0.42 |
| Front-end sales charges | Contingent deferred sales charges | |||
| Class A | Class A | Class C | ||
| Spectrum Aggressive Growth Fund | $ 1,887 | $ 36 | $ 18 | |
| Spectrum Conservative Growth Fund | 336 | 0 | 8 | |
| Spectrum Growth Fund | 1,505 | 0 | 46 | |
| Spectrum Income Allocation Fund | 479 | 0 | 0 | |
| Spectrum Moderate Growth Fund | 628 | 0 | 8 | |
| Purchases at cost | Sales proceeds | ||||
| U.S. government | Non-U.S. government | U.S. government | Non-U.S. government | ||
| Spectrum Aggressive Growth Fund | $ 0 | $104,039,667 | $ 0 | $135,850,179 | |
| Spectrum Conservative Growth Fund | 37,910,471 | 129,059,049 | 45,896,565 | 139,377,954 | |
| Spectrum Growth Fund | 8,437,466 | 71,555,995 | 9,766,092 | 83,949,480 | |
| Spectrum Income Allocation Fund | 41,052,079 | 106,687,289 | 49,570,194 | 11,601,602 | |
| Spectrum Moderate Growth Fund | 25,349,933 | 142,863,238 | 30,341,411 | 165,190,959 | |
| Long contracts | Short contracts | |
| Spectrum Aggressive Growth Fund | $ 37,730,670 | $103,396,023 |
| Spectrum Conservative Growth Fund | 58,900,586 | 62,913,993 |
| Spectrum Growth Fund | 43,157,910 | 57,039,830 |
| Spectrum Income Allocation Fund | 30,123,403 | 31,615,798 |
| Spectrum Moderate Growth Fund | 149,172,697 | 138,837,844 |
| Asset derivatives | Liability derivatives | ||||
| Statements of Assets and Liabilities location | Fair value | Statements of Assets and Liabilities location | Fair value | ||
| Equity risk | Unrealized gains on futures contracts | $ 1,029,735* | Unrealized losses on futures contracts | $ 2,767,036* | |
| $1,029,735 | $2,767,036 | ||||
| Net realized gains (losses) on derivatives | Net change in unrealized gains (losses) on derivatives | |
| Equity risk | $ 3,037,548 | $ 391,396 |
| Foreign currency risk | (708,381) | (1,874,758) |
| $2,329,167 | $(1,874,758) |
| Asset derivatives | Liability derivatives | ||||
| Statements of Assets and Liabilities location | Fair value | Statements of Assets and Liabilities location | Fair value | ||
| Interest rate risk | Unrealized gains on futures contracts | $ 224,872* | Unrealized losses on futures contracts | $ 156,879* | |
| Equity risk | Unrealized gains on futures contracts | 626,003* | Unrealized losses on futures contracts | 1,637,030* | |
| $850,875 | $1,793,909 | ||||
| Net realized gains (losses) on derivatives | Net change in unrealized gains (losses) on derivatives | |
| Interest rate risk | $1,642,243 | $ 57,152 |
| Equity risk | (926,228) | (617,923) |
| Foreign currency risk | (459,186) | (77,795) |
| $ 256,829 | $(638,566) |
| Asset derivatives | Liability derivatives | ||||
| Statements of Assets and Liabilities location | Fair value | Statements of Assets and Liabilities location | Fair value | ||
| Interest rate risk | Unrealized gains on futures contracts | $ 178,285* | Unrealized losses on futures contracts | $ 122,775* | |
| Equity risk | Unrealized gains on futures contracts | 489,539* | Unrealized losses on futures contracts | 1,334,351* | |
| $667,824 | $1,457,126 | ||||
| Net realized gains (losses) on derivatives | Net change in unrealized gains (losses) on derivatives | |
| Interest rate risk | $ (333,059) | $ 48,773 |
| Equity risk | 1,105,952 | (426,312) |
| Foreign currency risk | (340,344) | (63,200) |
| $ 432,549 | $(440,739) |
| Asset derivatives | Liability derivatives | ||||
| Statements of Assets and Liabilities location | Fair value | Statements of Assets and Liabilities location | Fair value | ||
| Interest rate risk | Unrealized gains on futures contracts | $ 126,323* | Unrealized losses on futures contracts | $ 88,671* | |
| Equity risk | Unrealized gains on futures contracts | 355,904* | Unrealized losses on futures contracts | 925,921* | |
| $482,227 | $1,014,592 | ||||
| Net realized gains (losses) on derivatives | Net change in unrealized gains (losses) on derivatives | |
| Interest rate risk | $1,015,006 | $ 32,310 |
| Equity risk | 75,595 | (430,631) |
| Foreign currency risk | (247,694) | (47,880) |
| $ 842,907 | $(446,201) |
| Asset derivatives | Liability derivatives | ||||
| Statements of Assets and Liabilities location | Fair value | Statements of Assets and Liabilities location | Fair value | ||
| Interest rate risk | Unrealized gains on futures contracts | $ 330,589* | Unrealized losses on futures contracts | $ 229,634* | |
| Equity risk | Unrealized gains on futures contracts | 917,203* | Unrealized losses on futures contracts | 2,409,141* | |
| $1,247,792 | $2,638,775 | ||||
| Net realized gains (losses) on derivatives | Net change in unrealized gains (losses) on derivatives | |
| Interest rate risk | $ (887,078) | $ 86,283 |
| Equity risk | 2,017,948 | (790,535) |
| Foreign currency risk | (649,337) | (116,818) |
| $ 481,533 | $(821,070) |
| Net investment income | $ 1,889,609 |
| Net realized and unrealized gains (losses) on investments | (64,314,900) |
| Net decrease in net assets resulting from operations | (62,425,291) |
| Name and year of birth | Position held and length of service* | Principal occupations during past five years or longer | Current other public company or investment company directorships |
| William R. Ebsworth (Born 1957) | Trustee, since 2015 | Retired. From 1984 to 2013, equities analyst, portfolio manager, research director and chief investment officer at Fidelity Management and Research Company in Boston, Tokyo, and Hong Kong, and retired in 2013 as Chief Investment Officer of Fidelity Strategic Advisers, Inc. where he led a team of investment professionals managing client assets. Prior thereto, Board member of Hong Kong Securities Clearing Co., Hong Kong Options Clearing Corp., the Thailand International Fund, Ltd., Fidelity Investments Life Insurance Company, and Empire Fidelity Investments Life Insurance Company. Audit Committee Chair and Investment Committee Chair of the Vincent Memorial Hospital Endowment (non-profit organization). Mr. Ebsworth is a CFA® charterholder. | N/A |
| Jane A. Freeman (Born 1953) | Trustee, since 2015; Chair Liaison, since 2018 | Retired. From 2012 to 2014 and 1999 to 2008, Chief Financial Officer of Scientific Learning Corporation. From 2008 to 2012, Ms. Freeman provided consulting services related to strategic business projects. Prior to 1999, Portfolio Manager at Rockefeller & Co. and Scudder, Stevens & Clark. Board member of the Harding Loevner Funds from 1996 to 2014, serving as both Lead Independent Director and chair of the Audit Committee. Board member of the Russell Exchange Traded Funds Trust from 2011 to 2012 and the chair of the Audit Committee. Ms. Freeman is also an inactive Chartered Financial Analyst. | N/A |
| Isaiah Harris, Jr. (Born 1952) | Trustee, since 2009; Audit Committee Chair, since 2019 | Retired. Chairman of the Board of CIGNA Corporation from 2009 to 2021, and Director from 2005 to 2008. From 2003 to 2011, Director of Deluxe Corporation. Prior thereto, President and CEO of BellSouth Advertising and Publishing Corp. from 2005 to 2007, President and CEO of BellSouth Enterprises from 2004 to 2005 and President of BellSouth Consumer Services from 2000 to 2003. Emeritus member of the Iowa State University Foundation Board of Governors. Emeritus Member of the Advisory Board of Iowa State University School of Business. Advisory Board Member, Palm Harbor Academy (private school). Advisory Board Member, Fellowship of Christian Athletes. Mr. Harris is a certified public accountant (inactive status). | N/A |
| David F. Larcker (Born 1950) | Trustee, since 2009 | James Irvin Miller Professor of Accounting at the Graduate School of Business (Emeritus), Stanford University, Director of the Corporate Governance Research Initiative and Senior Faculty of The Rock Center for Corporate Governance since 2006. From 2005 to 2008, Professor of Accounting at the Graduate School of Business, Stanford University. Prior thereto, Ernst & Young Professor of Accounting at The Wharton School, University of Pennsylvania from 1985 to 2005. | N/A |
| Name and year of birth | Position held and length of service* | Principal occupations during past five years or longer | Current other public company or investment company directorships |
| Olivia S. Mitchell (Born 1953) | Trustee, since 2006; Nominating and Governance Committee Chair, since 2018 | International Foundation of Employee Benefit Plans Professor since 1993, Wharton School of the University of Pennsylvania. Director of Wharton’s Pension Research Council and Boettner Center on Pensions & Retirement Research, and Research Associate at the National Bureau of Economic Research. Previously taught at Cornell University from 1978 to 1993. | N/A |
| Timothy J. Penny (Born 1951) | Trustee, since 1996; Chair, since 2018 | President and Chief Executive Officer of Southern Minnesota Initiative Foundation, a non-profit organization, since 2007. Vice Chair of the Economic Club of Minnesota, since 2007. Co-Chair of the Committee for a Responsible Federal Budget, since 1995. Member of the Board of Trustees of NorthStar Education Finance, Inc., a non-profit organization, since 2007. Senior Fellow of the University of Minnesota Humphrey Institute from 1995 to 2017. | N/A |
| James G. Polisson (Born 1959) | Trustee, since 2018 | Retired. Chief Marketing Officer, Source (ETF) UK Services, Ltd, from 2015 to 2017. From 2012 to 2015, Principal of The Polisson Group, LLC, a management consulting, corporate advisory and principal investing company. Chief Executive Officer and Managing Director at Russell Investments, Global Exchange Traded Funds from 2010 to 2012. Managing Director of Barclays Global Investors from 1998 to 2010 and Global Chief Marketing Officer for iShares and Barclays Global Investors from 2000 to 2010. Trustee of the San Francisco Mechanics’ Institute, a non-profit organization, from 2013 to 2015. Board member of the Russell Exchange Traded Fund Trust from 2011 to 2012. Director of Barclays Global Investors Holdings Deutschland GmbH from 2006 to 2009. Mr. Polisson is an attorney and has a retired status with the Massachusetts and District of Columbia Bar Associations. | N/A |
| Pamela Wheelock (Born 1959) | Trustee, since January 2020; previously Trustee from January 2018 to July 2019 | Retired. Executive and Senior Financial leadership positions in the public, private and nonprofit sectors. Interim President and CEO, McKnight Foundation, 2020. Interim Commissioner, Minnesota Department of Human Services, 2019. Chief Operating Officer, Twin Cities Habitat for Humanity, 2017-2019. Vice President for University Services, University of Minnesota, 2012-2016. Interim President and CEO, Blue Cross and Blue Shield of Minnesota, 2011-2012. Executive Vice-President and Chief Financial Officer, Minnesota Wild, 2002-2008. Commissioner, Minnesota Department of Finance, 1999-2002. Chair of the Board of Directors of Destination Medical Center Corporation. Board member of the Minnesota Wild Foundation. | N/A |
| Name and year of birth | Position held and length of service | Principal occupations during past five years or longer |
| Andrew Owen (Born 1960) | President, since 2017 | President and Chief Executive Officer of Allspring Funds Management, LLC since 2017 and Head of Global Fund Governance of Allspring Global Investments since 2022. Prior thereto, co-president of Galliard Capital Management, LLC, an affiliate of Allspring Funds Management, LLC, from 2019 to 2022 and Head of Affiliated Managers, Allspring Global Investments, from 2014 to 2019 and Executive Vice President responsible for marketing, investments and product development for Allspring Funds Management, LLC, from 2009 to 2014. |
| Jeremy DePalma (Born 1974) | Treasurer, since 2012 (for certain funds in the Fund Complex); since 2021 (for the remaining funds in the Fund Complex) | Senior Vice President of Allspring Funds Management, LLC since 2009. Senior Vice President of Evergreen Investment Management Company, LLC from 2008 to 2010 and head of the Fund Reporting and Control Team within Fund Administration from 2005 to 2010. |
| Christopher Baker (Born 1976) | Chief Compliance Officer, since 2022 | Global Chief Compliance Officer for Allspring Global Investments since 2022. Prior thereto, Chief Compliance Officer for State Street Global Advisors from 2018 to 2021. Senior Compliance Officer for the State Street divisions of Alternative Investment Solutions, Sector Solutions, and Global Marketing from 2015 to 2018. From 2010 to 2015 Vice President, Global Head of Investment and Marketing Compliance for State Street Global Advisors. |
| Matthew Prasse (Born 1983) | Chief Legal Officer, since 2022; Secretary, since 2021 | Senior Counsel of the Allspring Legal Department since 2021. Senior Counsel of the Wells Fargo Legal Department from 2018 to 2021. Previously, Counsel for Barings LLC from 2015 to 2018. Prior to joining Barings, Associate at Morgan, Lewis & Bockius LLP from 2008 to 2015. |
P.O. Box 219967
Kansas City, MO 64121-9967

1-800-222-8222 or visit the Funds' website at allspringglobal.com. Read the prospectus carefully before you invest or send money.
SWBP/SAR102 11-22

C&B Large Cap Value Fund
| 2 | |
| 6 | |
| 8 | |
| Allspring C&B Large Cap Value Fund | |
| 9 | |
| Financial statements | |
| 10 | |
| 11 | |
| 12 | |
| 13 | |
| 18 | |
| Allspring C&B Large Cap Value Portfolio | |
| 22 | |
| Financial statements | |
| 26 | |
| 27 | |
| 28 | |
| 29 | |
| 30 | |
| 35 |

| 1 | The S&P 500 Index consists of 500 stocks chosen for market size, liquidity, and industry group representation. It is a market-value-weighted index with each stock's weight in the index proportionate to its market value. You cannot invest directly in an index. |
| 2 | The Morgan Stanley Capital International (MSCI) All Country World Index (ACWI) ex USA Index (Net) is a free-float-adjusted market-capitalization-weighted index that is designed to measure the equity market performance of developed and emerging markets, excluding the U.S. Source: MSCI. MSCI makes no express or implied warranties or representations and shall have no liability whatsoever with respect to any MSCI data contained herein. The MSCI data may not be further redistributed or used as a basis for other indexes or any securities or financial products. This report is not approved, reviewed, or produced by MSCI. You cannot invest directly in an index. |
| 3 | The MSCI Emerging Markets (EM) Index (Net) (USD) is a free-float-adjusted market-capitalization-weighted index that is designed to measure equity market performance of emerging markets. You cannot invest directly in an index. |
| 4 | The Bloomberg U.S. Aggregate Bond Index is a broad-based benchmark that measures the investment-grade, U.S.-dollar-denominated, fixed-rate taxable bond market, including Treasuries, government-related and corporate securities, mortgage-backed securities (agency fixed-rate and hybrid adjustable-rate mortgage pass-throughs), asset-backed securities, and commercial mortgage-backed securities. You cannot invest directly in an index. |
| 5 | The Bloomberg Global Aggregate ex-USD Index (unhedged) is an unmanaged index that provides a broad-based measure of the global investment-grade fixed-income markets excluding the U.S.-dollar-denominated debt market. You cannot invest directly in an index. |
| 6 | The Bloomberg Municipal Bond Index is an unmanaged index composed of long-term tax-exempt bonds with a minimum credit rating of Baa. You cannot invest directly in an index. |
| 7 | The ICE BofA U.S. High Yield Index is a market-capitalization-weighted index of domestic and Yankee high-yield bonds. The index tracks the performance of high-yield securities traded in the U.S. bond market. You cannot invest directly in an index. Copyright 2023. ICE Data Indices, LLC. All rights reserved. |

President
Allspring Funds
| Investment objective | The Fund seeks maximum long-term total return (current income and capital appreciation), consistent with minimizing risk to principal. |
| Manager | Allspring Funds Management, LLC |
| Portfolio managers | Andrew B. Armstrong, CFA®‡, Wesley Lim, CFA®‡, Steve Lyons, CFA®‡, Michael M. Meyer, CFA®‡, Edward W. O'Connor, CFA®‡, R. James O'Neil, CFA®‡, Mehul Trivedi, CFA®‡, William Weber, CFA®‡ |
| Average annual total returns (%) as of November 30, 2022 | |||||||||||
| Including sales charge | Excluding sales charge | Expense ratios1 (%) | |||||||||
| Inception date | 1 year | 5 year | 10 year | 1 year | 5 year | 10 year | Gross | Net 2 | |||
| Class A (CBEAX) | 7-26-2004 | -2.85 | 6.69 | 10.77 | 3.09 | 7.96 | 11.43 | 1.19 | 1.08 | ||
| Class C (CBECX) | 7-26-2004 | 1.29 | 7.14 | 10.75 | 2.29 | 7.14 | 10.75 | 1.94 | 1.83 | ||
| Class R6 (CBEJX)3 | 10-31-2016 | – | – | – | 3.50 | 8.43 | 11.85 | 0.76 | 0.65 | ||
| Administrator Class (CBLLX) | 7-26-2004 | – | – | – | 3.11 | 8.05 | 11.56 | 1.11 | 1.00 | ||
| Institutional Class (CBLSX) | 7-26-2004 | – | – | – | 3.40 | 8.31 | 11.83 | 0.86 | 0.75 | ||
| Russell 1000® Value Index4 | – | – | – | – | 2.42 | 7.86 | 10.97 | – | – | ||
| 1 | Reflects the expense ratios as stated in the most recent prospectuses. The expense ratios shown are subject to change and may differ from the annualized expense ratios shown in the financial highlights of this report. |
| 2 | The manager has contractually committed through September 30, 2023, to waive fees and/or reimburse expenses to the extent necessary to cap total annual fund operating expenses after fee waivers at 1.08% for Class A, 1.83% for Class C, 0.65% for Class R6, 1.00% for Administrator Class, and 0.75% for Institutional Class. Brokerage commissions, stamp duty fees, interest, taxes, acquired fund fees and expenses (if any) from funds in which the affiliated master portfolio invests, and extraordinary expenses are excluded from the expense caps. Net expenses from the affiliated master portfolio are included in the expense caps. Prior to or after the commitment expiration date, the caps may be increased or the commitment to maintain the caps may be terminated only with the approval of the Board of Trustees. Without these caps, the Fund’s returns would have been lower. The expense ratio paid by an investor is the net expense ratio (the total annual fund operating expenses after fee waivers) as stated in the prospectuses. |
| 3 | Historical performance shown for the Class R6 shares prior to their inception reflects the performance of the Institutional Class shares, and includes the higher expenses applicable to the Institutional Class shares. If these expenses had not been included, returns for the Class R6 shares would be higher. |
| 4 | The Russell 1000® Value Index measures the performance of those Russell 1000 companies with lower price/book ratios and lower forecasted growth values. You cannot invest directly in an index. |
| * | The Fund is a feeder fund in a master-feeder structure that invests substantially all of its assets in a single affiliated master portfolio of the Allspring Master Trust with a substantially identical investment objective and substantially similar investment strategies. References to the investment activities of the Fund are intended to refer to the investment activities of the affiliated master portfolio in which it invests. |
| ‡ | CFA® and Chartered Financial Analyst® are trademarks owned by CFA Institute. |
| Ten largest holdings (%) as of November 30, 20221 | |
| Arrow Electronics Incorporated | 3.42 |
| Brookfield Asset Management Incorporated Class A | 3.38 |
| AerCap Holdings NV | 3.26 |
| State Street Corporation | 3.10 |
| Johnson & Johnson | 2.96 |
| Omnicom Group Incorporated | 2.67 |
| London Stock Exchange Group plc ADR | 2.67 |
| TE Connectivity Limited | 2.61 |
| HCA Healthcare Incorporated | 2.60 |
| The Charles Schwab Corporation | 2.54 |
| 1 | Each holding represents the Fund’s allocable portion of the affiliated master portfolio security. Figures represent each holding as a percentage of the Fund’s net assets. Holdings are subject to change and may have changed since the date specified. |
| Sector allocation as of November 30, 20221 |

| 1 | Figures represent the sector allocation of the affiliated master portfolio as a percentage of the long-term investments of the affiliated master portfolio. Allocations are subject to change and may have changed since the date specified. |
| Beginning account value 6-1-2022 | Ending account value 11-30-2022 | Expenses paid during the period1,2 | Annualized net expense ratio2 | |
| Class A | ||||
| Actual | $1,000.00 | $ 995.95 | $5.35 | 1.07% |
| Hypothetical (5% return before expenses) | $1,000.00 | $1,019.70 | $5.42 | 1.07% |
| Class C | ||||
| Actual | $1,000.00 | $ 992.47 | $9.14 | 1.83% |
| Hypothetical (5% return before expenses) | $1,000.00 | $1,015.89 | $9.25 | 1.83% |
| Class R6 | ||||
| Actual | $1,000.00 | $ 997.99 | $3.26 | 0.65% |
| Hypothetical (5% return before expenses) | $1,000.00 | $1,021.81 | $3.29 | 0.65% |
| Administrator Class | ||||
| Actual | $1,000.00 | $ 995.96 | $4.95 | 0.99% |
| Hypothetical (5% return before expenses) | $1,000.00 | $1,020.10 | $5.01 | 0.99% |
| Institutional Class | ||||
| Actual | $1,000.00 | $ 997.32 | $3.76 | 0.75% |
| Hypothetical (5% return before expenses) | $1,000.00 | $1,021.31 | $3.80 | 0.75% |
| Value | |||||
| Investment companies: 99.97% | |||||
| Affiliated master portfolio: 99.97% | |||||
| Allspring C&B Large Cap Value Portfolio | $232,338,356 | ||||
| Total Investment companies (Cost $188,366,033) | 232,338,356 | ||||
| Total investments in securities (Cost $188,366,033) | 99.97% | 232,338,356 | |||
| Other assets and liabilities, net | 0.03 | 68,335 | |||
| Total net assets | 100.00% | $232,406,691 |
| % of ownership, beginning of period | % of ownership, end of period | Net realized gains (losses) on securities transactions allocated from affiliated Master Portfolio | Net change in unrealized gains (losses) on securities transactions allocated from affiliated Master Portfolio | Dividends allocated from affiliated Master Portfolio | Affiliated income allocated from affiliated Master Portfolio | Value, end of period | ||
| Allspring C&B Large Cap Value Portfolio | 79.89% | 79.38% | $10,459,729 | $(14,694,571) | $2,513,118 | $46,703 | $232,338,356 |
| Assets | |
Investments in affiliated Master Portfolio, at value (cost $188,366,033) | $ 232,338,356 |
Receivable for Fund shares sold | 300,108 |
Receivable from manager | 15,216 |
Prepaid expenses and other assets | 57,114 |
Total assets | 232,710,794 |
| Liabilities | |
Payable for Fund shares redeemed | 229,377 |
Administration fees payable | 28,173 |
Distribution fee payable | 2,549 |
Trustees’ fees and expenses payable | 2,092 |
Accrued expenses and other liabilities | 41,912 |
Total liabilities | 304,103 |
Total net assets | $232,406,691 |
| Net assets consist of | |
Paid-in capital | $ 146,393,475 |
Total distributable earnings | 86,013,216 |
Total net assets | $232,406,691 |
| Computation of net asset value and offering price per share | |
Net assets – Class A | $ 87,631,190 |
Shares outstanding – Class A1 | 5,938,811 |
Net asset value per share – Class A | $14.76 |
Maximum offering price per share – Class A2 | $15.66 |
Net assets – Class C | $ 4,272,349 |
Shares outstanding – Class C1 | 294,639 |
Net asset value per share – Class C | $14.50 |
Net assets – Class R6 | $ 20,608,565 |
Shares outstanding – Class R61 | 1,385,826 |
Net asset value per share – Class R6 | $14.87 |
Net assets – Administrator Class | $ 5,696,680 |
Shares outstanding – Administrator Class1 | 384,872 |
Net asset value per share – Administrator Class | $14.80 |
Net assets – Institutional Class | $ 114,197,907 |
Shares outstanding – Institutional Class1 | 7,684,706 |
Net asset value per share – Institutional Class | $14.86 |
| 1 | The Fund has an unlimited number of authorized shares. |
| 2 | Maximum offering price is computed as 100/94.25 of net asset value. On investments of $50,000 or more, the offering price is reduced. |
| Investment income | |
Dividends allocated from affiliated Master Portfolio (net of foreign withholding taxes of $47,406) | $ 2,513,118 |
Affiliated income allocated from affiliated Master Portfolio | 46,703 |
Expenses allocated from affiliated Master Portfolio | (812,966) |
Waivers allocated from affiliated Master Portfolio | 71,651 |
Total investment income | 1,818,506 |
| Expenses | |
Management fee | 57,915 |
| Administration fees | |
Class A | 91,435 |
Class C | 4,103 |
Class R6 | 3,273 |
Administrator Class | 3,564 |
Institutional Class | 73,688 |
| Shareholder servicing fees | |
Class A | 108,852 |
Class C | 4,883 |
Administrator Class | 6,854 |
| Distribution fee | |
Class C | 14,636 |
Custody and accounting fees | 3,156 |
Professional fees | 18,244 |
Registration fees | 18,382 |
Shareholder report expenses | 13,807 |
Trustees’ fees and expenses | 10,873 |
Other fees and expenses | 2,373 |
Total expenses | 436,038 |
| Less: Fee waivers and/or expense reimbursements | |
Fund-level | (147,913) |
Class A | (2,876) |
Administrator Class | (220) |
Net expenses | 285,029 |
Net investment income | 1,533,477 |
| Realized and unrealized gains (losses) on investments | |
Net realized gains on securities transactions allocated from affiliated Master Portfolio | 10,459,729 |
Net change in unrealized gains (losses) on securities transactions allocated from affiliated Master Portfolio | (14,694,571) |
Net realized and unrealized gains (losses) on investments | (4,234,842) |
Net decrease in net assets resulting from operations | $ (2,701,365) |
| Six months ended November 30, 2022 (unaudited) | Year ended May 31, 2022 | |||
| Operations | ||||
Net investment income | $ 1,533,477 | $ 2,669,791 | ||
Net realized gains on investments | 10,459,729 | 47,346,569 | ||
Net change in unrealized gains (losses) on investments | (14,694,571) | (53,785,190) | ||
Net decrease in net assets resulting from operations | (2,701,365) | (3,768,830) | ||
| Distributions to shareholders from | ||||
| Net investment income and net realized gains | ||||
Class A | 0 | (12,919,436) | ||
Class C | 0 | (535,250) | ||
Class R6 | 0 | (6,057,662) | ||
Administrator Class | 0 | (841,849) | ||
Institutional Class | 0 | (17,599,026) | ||
Total distributions to shareholders | 0 | (37,953,223) | ||
| Capital share transactions | Shares | Shares | ||
| Proceeds from shares sold | ||||
Class A | 151,325 | 2,073,022 | 989,891 | 15,969,277 |
Class C | 32,009 | 421,648 | 43,159 | 682,181 |
Class R6 | 98,590 | 1,405,441 | 349,706 | 5,728,171 |
Administrator Class | 1,556 | 21,648 | 55,766 | 954,376 |
Institutional Class | 610,551 | 8,571,740 | 1,764,097 | 28,100,206 |
| 12,493,499 | 51,434,211 | |||
| Reinvestment of distributions | ||||
Class A | 0 | 0 | 845,770 | 12,689,368 |
Class C | 0 | 0 | 36,313 | 535,250 |
Class R6 | 0 | 0 | 80,021 | 1,208,696 |
Administrator Class | 0 | 0 | 34,924 | 525,330 |
Institutional Class | 0 | 0 | 1,158,450 | 17,489,868 |
| 0 | 32,448,512 | |||
| Payment for shares redeemed | ||||
Class A | (1,063,032) | (14,609,292) | (946,956) | (15,053,324) |
Class C | (18,125) | (246,467) | (76,840) | (1,207,888) |
Class R6 | (289,143) | (4,121,120) | (1,596,640) | (24,419,329) |
Administrator Class | (20,661) | (287,024) | (34,305) | (524,769) |
Institutional Class | (1,714,343) | (24,124,004) | (3,201,272) | (51,615,218) |
| (43,387,907) | (92,820,528) | |||
Net decrease in net assets resulting from capital share transactions | (30,894,408) | (8,937,805) | ||
Total decrease in net assets | (33,595,773) | (50,659,858) | ||
| Net assets | ||||
Beginning of period | 266,002,464 | 316,662,322 | ||
End of period | $232,406,691 | $266,002,464 | ||
| Year ended May 31 | ||||||
| Class A | Six months ended November 30, 2022 (unaudited) | 2022 | 2021 | 2020 | 2019 | 2018 |
Net asset value, beginning of period | $14.82 | $17.16 | $11.49 | $13.01 | $13.91 | $14.54 |
Net investment income | 0.08 | 0.11 | 0.10 | 0.12 | 0.11 | 0.09 1 |
Net realized and unrealized gains (losses) on investments | (0.14) | (0.34) | 6.29 | (0.33) | 0.02 | 0.87 |
Total from investment operations | (0.06) | (0.23) | 6.39 | (0.21) | 0.13 | 0.96 |
| Distributions to shareholders from | ||||||
Net investment income | 0.00 | (0.11) | (0.11) | (0.13) | (0.12) | (0.06) |
Net realized gains | 0.00 | (2.00) | (0.61) | (1.18) | (0.91) | (1.53) |
Total distributions to shareholders | 0.00 | (2.11) | (0.72) | (1.31) | (1.03) | (1.59) |
Net asset value, end of period | $14.76 | $14.82 | $17.16 | $11.49 | $13.01 | $13.91 |
Total return2 | (0.40)% | (1.37)% | 56.98% | (3.61)% | 1.33% | 6.29% |
| Ratios to average net assets (annualized)* | ||||||
Gross expenses | 1.21% | 1.19% | 1.24% | 1.27% | 1.23% | 1.21% |
Net expenses | 1.07% | 1.07% | 1.07% | 1.07% | 1.08% | 1.10% |
Net investment income | 1.15% | 0.69% | 0.73% | 0.92% | 0.83% | 0.58% |
| Supplemental data | ||||||
Portfolio turnover rate3 | 17% | 32% | 38% | 33% | 47% | 42% |
Net assets, end of period (000s omitted) | $87,631 | $101,496 | $102,332 | $70,680 | $79,172 | $85,707 |
| * | Ratios include net expenses allocated from the affiliated Master Portfolio which were as follows: |
| Six months ended November 30, 2022 (unaudited) | 0.64% |
| Year ended May 31, 2022 | 0.64% |
| Year ended May 31, 2021 | 0.64% |
| Year ended May 31, 2020 | 0.64% |
| Year ended May 31, 2019 | 0.65% |
| Year ended May 31, 2018 | 0.66% |
| 1 | Calculated based upon average shares outstanding |
| 2 | Total return calculations do not include any sales charges. Returns for periods of less than one year are not annualized. |
| 3 | Portfolio turnover rate is calculated by multiplying the affiliated Master Portfolio’s percentage of the Fund’s total investment in securities at the end of the period by the affiliated Master Portfolio’s portfolio turnover rate. |
| Year ended May 31 | ||||||
| Class C | Six months ended November 30, 2022 (unaudited) | 2022 | 2021 | 2020 | 2019 | 2018 |
Net asset value, beginning of period | $14.61 | $16.97 | $11.36 | $12.87 | $13.75 | $14.44 |
Net investment income (loss) | 0.03 | (0.01) | (0.03) | 0.02 1 | 0.01 1 | (0.02) 1 |
Net realized and unrealized gains (losses) on investments | (0.14) | (0.35) | 6.25 | (0.35) | 0.03 | 0.86 |
Total from investment operations | (0.11) | (0.36) | 6.22 | (0.33) | 0.04 | 0.84 |
| Distributions to shareholders from | ||||||
Net investment income | 0.00 | 0.00 | 0.00 | 0.00 | (0.01) | 0.00 |
Net realized gains | 0.00 | (2.00) | (0.61) | (1.18) | (0.91) | (1.53) |
Total distributions to shareholders | 0.00 | (2.00) | (0.61) | (1.18) | (0.92) | (1.53) |
Net asset value, end of period | $14.50 | $14.61 | $16.97 | $11.36 | $12.87 | $13.75 |
Total return2 | (0.75)% | (2.22)% | 55.94% | (4.41)% | 0.61% | 5.46% |
| Ratios to average net assets (annualized)* | ||||||
Gross expenses | 1.96% | 1.94% | 1.99% | 2.02% | 1.97% | 1.96% |
Net expenses | 1.83% | 1.83% | 1.83% | 1.83% | 1.83% | 1.85% |
Net investment income (loss) | 0.38% | (0.08)% | (0.04)% | 0.16% | 0.07% | (0.16)% |
| Supplemental data | ||||||
Portfolio turnover rate3 | 17% | 32% | 38% | 33% | 47% | 42% |
Net assets, end of period (000s omitted) | $4,272 | $4,103 | $4,719 | $3,576 | $5,098 | $11,031 |
| * | Ratios include net expenses allocated from the affiliated Master Portfolio which were as follows: |
| Six months ended November 30, 2022 (unaudited) | 0.64% |
| Year ended May 31, 2022 | 0.64% |
| Year ended May 31, 2021 | 0.64% |
| Year ended May 31, 2020 | 0.64% |
| Year ended May 31, 2019 | 0.65% |
| Year ended May 31, 2018 | 0.66% |
| 1 | Calculated based upon average shares outstanding |
| 2 | Total return calculations do not include any sales charges. Returns for periods of less than one year are not annualized. |
| 3 | Portfolio turnover rate is calculated by multiplying the affiliated Master Portfolio’s percentage of the Fund’s total investment in securities at the end of the period by the affiliated Master Portfolio’s portfolio turnover rate. |
| Year ended May 31 | ||||||
| Class R6 | Six months ended November 30, 2022 (unaudited) | 2022 | 2021 | 2020 | 2019 | 2018 |
Net asset value, beginning of period | $14.90 | $17.24 | $11.53 | $13.06 | $13.97 | $14.59 |
Net investment income | 0.11 1 | 0.18 1 | 0.16 1 | 0.18 1 | 0.18 1 | 0.18 1 |
Net realized and unrealized gains (losses) on investments | (0.14) | (0.34) | 6.32 | (0.33) | 0.00 2 | 0.85 |
Total from investment operations | (0.03) | (0.16) | 6.48 | (0.15) | 0.18 | 1.03 |
| Distributions to shareholders from | ||||||
Net investment income | 0.00 | (0.18) | (0.16) | (0.20) | (0.18) | (0.12) |
Net realized gains | 0.00 | (2.00) | (0.61) | (1.18) | (0.91) | (1.53) |
Total distributions to shareholders | 0.00 | (2.18) | (0.77) | (1.38) | (1.09) | (1.65) |
Net asset value, end of period | $14.87 | $14.90 | $17.24 | $11.53 | $13.06 | $13.97 |
Total return3 | (0.20)% | (0.98)% | 57.75% | (3.25)% | 1.74% | 6.76% |
| Ratios to average net assets (annualized)* | ||||||
Gross expenses | 0.78% | 0.76% | 0.82% | 0.84% | 0.79% | 0.77% |
Net expenses | 0.65% | 0.65% | 0.65% | 0.65% | 0.65% | 0.65% |
Net investment income | 1.55% | 1.11% | 1.14% | 1.33% | 1.27% | 1.28% |
| Supplemental data | ||||||
Portfolio turnover rate4 | 17% | 32% | 38% | 33% | 47% | 42% |
Net assets, end of period (000s omitted) | $20,609 | $23,487 | $47,301 | $37,859 | $68,366 | $110,665 |
| * | Ratios include net expenses allocated from the affiliated Master Portfolio which were as follows: |
| Six months ended November 30, 2022 (unaudited) | 0.64% |
| Year ended May 31, 2022 | 0.64% |
| Year ended May 31, 2021 | 0.64% |
| Year ended May 31, 2020 | 0.64% |
| Year ended May 31, 2019 | 0.65% |
| Year ended May 31, 2018 | 0.65% |
| 1 | Calculated based upon average shares outstanding |
| 2 | Amount is less than $0.005. |
| 3 | Returns for periods of less than one year are not annualized. |
| 4 | Portfolio turnover rate is calculated by multiplying the affiliated Master Portfolio’s percentage of the Fund’s total investment in securities at the end of the period by the affiliated Master Portfolio’s portfolio turnover rate. |
| Year ended May 31 | ||||||
| Administrator Class | Six months ended November 30, 2022 (unaudited) | 2022 | 2021 | 2020 | 2019 | 2018 |
Net asset value, beginning of period | $14.86 | $17.20 | $11.51 | $13.03 | $13.92 | $14.56 |
Net investment income | 0.09 1 | 0.12 1 | 0.11 1 | 0.13 1 | 0.12 1 | 0.10 1 |
Net realized and unrealized gains (losses) on investments | (0.15) | (0.33) | 6.30 | (0.33) | 0.02 | 0.87 |
Total from investment operations | (0.06) | (0.21) | 6.41 | (0.20) | 0.14 | 0.97 |
| Distributions to shareholders from | ||||||
Net investment income | 0.00 | (0.13) | (0.11) | (0.14) | (0.12) | (0.08) |
Net realized gains | 0.00 | (2.00) | (0.61) | (1.18) | (0.91) | (1.53) |
Total distributions to shareholders | 0.00 | (2.13) | (0.72) | (1.32) | (1.03) | (1.61) |
Net asset value, end of period | $14.80 | $14.86 | $17.20 | $11.51 | $13.03 | $13.92 |
Total return2 | (0.40)% | (1.29)% | 57.12% | (3.56)% | 1.44% | 6.36% |
| Ratios to average net assets (annualized)* | ||||||
Gross expenses | 1.13% | 1.11% | 1.17% | 1.19% | 1.15% | 1.13% |
Net expenses | 0.99% | 0.99% | 0.99% | 0.99% | 1.00% | 1.00% |
Net investment income | 1.22% | 0.76% | 0.81% | 1.00% | 0.90% | 0.69% |
| Supplemental data | ||||||
Portfolio turnover rate3 | 17% | 32% | 38% | 33% | 47% | 42% |
Net assets, end of period (000s omitted) | $5,697 | $6,001 | $5,980 | $6,167 | $9,274 | $12,742 |
| * | Ratios include net expenses allocated from the affiliated Master Portfolio which were as follows: |
| Six months ended November 30, 2022 (unaudited) | 0.64% |
| Year ended May 31, 2022 | 0.64% |
| Year ended May 31, 2021 | 0.64% |
| Year ended May 31, 2020 | 0.64% |
| Year ended May 31, 2019 | 0.65% |
| Year ended May 31, 2018 | 0.66% |
| 1 | Calculated based upon average shares outstanding |
| 2 | Returns for periods of less than one year are not annualized. |
| 3 | Portfolio turnover rate is calculated by multiplying the affiliated Master Portfolio’s percentage of the Fund’s total investment in securities at the end of the period by the affiliated Master Portfolio’s portfolio turnover rate. |
| Year ended May 31 | ||||||
| Institutional Class | Six months ended November 30, 2022 (unaudited) | 2022 | 2021 | 2020 | 2019 | 2018 |
Net asset value, beginning of period | $14.90 | $17.24 | $11.53 | $13.05 | $13.96 | $14.58 |
Net investment income | 0.10 | 0.16 | 0.15 | 0.16 | 0.14 | 0.13 1 |
Net realized and unrealized gains (losses) on investments | (0.14) | (0.34) | 6.32 | (0.33) | 0.02 | 0.89 |
Total from investment operations | (0.04) | (0.18) | 6.47 | (0.17) | 0.16 | 1.02 |
| Distributions to shareholders from | ||||||
Net investment income | 0.00 | (0.16) | (0.15) | (0.17) | (0.16) | (0.11) |
Net realized gains | 0.00 | (2.00) | (0.61) | (1.18) | (0.91) | (1.53) |
Total distributions to shareholders | 0.00 | (2.16) | (0.76) | (1.35) | (1.07) | (1.64) |
Net asset value, end of period | $14.86 | $14.90 | $17.24 | $11.53 | $13.05 | $13.96 |
Total return2 | (0.27)% | (1.08)% | 57.58% | (3.33)% | 1.64% | 6.68% |
| Ratios to average net assets (annualized)* | ||||||
Gross expenses | 0.88% | 0.86% | 0.91% | 0.94% | 0.90% | 0.88% |
Net expenses | 0.75% | 0.75% | 0.75% | 0.75% | 0.75% | 0.77% |
Net investment income | 1.46% | 1.01% | 1.05% | 1.25% | 1.17% | 0.87% |
| Supplemental data | ||||||
Portfolio turnover rate3 | 17% | 32% | 38% | 33% | 47% | 42% |
Net assets, end of period (000s omitted) | $114,198 | $130,915 | $156,330 | $96,838 | $108,613 | $135,082 |
| * | Ratios include net expenses allocated from the affiliated Master Portfolio which were as follows: |
| Six months ended November 30, 2022 (unaudited) | 0.64% |
| Year ended May 31, 2022 | 0.64% |
| Year ended May 31, 2021 | 0.64% |
| Year ended May 31, 2020 | 0.64% |
| Year ended May 31, 2019 | 0.65% |
| Year ended May 31, 2018 | 0.66% |
| 1 | Calculated based upon average shares outstanding |
| 2 | Returns for periods of less than one year are not annualized. |
| 3 | Portfolio turnover rate is calculated by multiplying the affiliated Master Portfolio’s percentage of the Fund’s total investment in securities at the end of the period by the affiliated Master Portfolio’s portfolio turnover rate. |
| Gross unrealized gains | $49,285,050 |
| Gross unrealized losses | 0 |
| Net unrealized gains | $49,285,050 |
| Affiliated Master Portfolio | Investment objective | Fair value of affiliated Master Portfolio |
| Allspring C&B Large Cap Value Portfolio | Seeks maximum long-term total return (current income and capital appreciation), consistent with minimizing risk to principal | $232,338,356 |
| Average daily net assets | Management fee |
| First $5 billion | 0.050% |
| Next $5 billion | 0.040 |
| Over $10 billion | 0.030 |
| Class-level administration fee | |
| Class A | 0.21% |
| Class C | 0.21 |
| Class R6 | 0.03 |
| Administrator Class | 0.13 |
| Institutional Class | 0.13 |
| Expense ratio caps | |
| Class A | 1.08% |
| Class C | 1.83 |
| Class R6 | 0.65 |
| Administrator Class | 1.00 |
| Institutional Class | 0.75 |
| Shares | Value | ||||
| Common stocks: 98.01% | |||||
| Communication services: 10.26% | |||||
| Diversified telecommunication services: 1.97% | |||||
| Verizon Communications Incorporated | 148,000 | $ 5,769,040 | |||
| Entertainment: 4.01% | |||||
| Activision Blizzard Incorporated | 80,750 | 5,971,463 | |||
| Warner Music Group Corporation Class A | 168,300 | 5,767,641 | |||
| 11,739,104 | |||||
| Interactive media & services: 1.61% | |||||
| Alphabet Incorporated Class A † | 46,750 | 4,721,283 | |||
| Media: 2.67% | |||||
| Omnicom Group Incorporated | 97,950 | 7,812,492 | |||
| Consumer discretionary: 8.13% | |||||
| Household durables: 1.42% | |||||
| Whirlpool Corporation | 28,300 | 4,146,799 | |||
| Leisure products: 1.77% | |||||
| Hasbro Incorporated | 82,670 | 5,193,329 | |||
| Specialty retail: 2.02% | |||||
| CarMax Incorporated † | 85,420 | 5,924,731 | |||
| Textiles, apparel & luxury goods: 2.92% | |||||
| Gildan Activewear Incorporated | 181,400 | 5,240,646 | |||
| HanesBrands Incorporated | 490,000 | 3,292,800 | |||
| 8,533,446 | |||||
| Consumer staples: 6.78% | |||||
| Food products: 2.67% | |||||
| Ingredion Incorporated | 31,560 | 3,091,933 | |||
| The Kraft Heinz Company | 120,280 | 4,733,018 | |||
| 7,824,951 | |||||
| Personal products: 2.44% | |||||
| Unilever plc ADR | 141,650 | 7,136,327 | |||
| Tobacco: 1.67% | |||||
| Philip Morris International Incorporated | 49,000 | 4,883,830 | |||
| Energy: 3.84% | |||||
| Oil, gas & consumable fuels: 3.84% | |||||
| EOG Resources Incorporated | 30,300 | 4,300,479 | |||
| The Williams Companies Incorporated | 199,700 | 6,929,590 | |||
| 11,230,069 | |||||
| Financials: 32.81% | |||||
| Banks: 5.87% | |||||
| JPMorgan Chase & Company | 48,850 | 6,750,093 |
| Shares | Value | ||||
| Banks (continued) | |||||
| PNC Financial Services Group Incorporated | 26,950 | $ 4,534,607 | |||
| US Bancorp | 129,500 | 5,878,005 | |||
| 17,162,705 | |||||
| Capital markets: 11.68% | |||||
| Brookfield Asset Management Incorporated Class A | 209,660 | 9,885,469 | |||
| London Stock Exchange Group plc ADR | 313,900 | 7,806,693 | |||
| State Street Corporation | 113,920 | 9,076,006 | |||
| The Charles Schwab Corporation | 89,950 | 7,424,473 | |||
| 34,192,641 | |||||
| Consumer finance: 1.24% | |||||
| Synchrony Financial | 96,700 | 3,633,986 | |||
| Diversified financial services: 2.49% | |||||
| Berkshire Hathaway Incorporated Class B † | 22,880 | 7,289,568 | |||
| Insurance: 11.53% | |||||
| Arch Capital Group Limited † | 98,130 | 5,878,968 | |||
| Chubb Limited | 25,150 | 5,522,689 | |||
| Fidelity National Financial Incorporated | 172,000 | 6,941,920 | |||
| Globe Life Incorporated | 48,500 | 5,818,060 | |||
| Progressive Corporation | 42,427 | 5,606,728 | |||
| The Allstate Corporation | 29,760 | 3,984,864 | |||
| 33,753,229 | |||||
| Health care: 13.33% | |||||
| Health care equipment & supplies: 5.74% | |||||
| Becton Dickinson & Company | 18,520 | 4,617,777 | |||
| Dentsply Sirona Incorporated | 166,070 | 5,025,278 | |||
| Medtronic plc | 90,500 | 7,153,120 | |||
| 16,796,175 | |||||
| Health care providers & services: 4.63% | |||||
| HCA Healthcare Incorporated | 31,650 | 7,602,963 | |||
| Laboratory Corporation of America Holdings | 24,730 | 5,952,511 | |||
| 13,555,474 | |||||
| Pharmaceuticals: 2.96% | |||||
| Johnson & Johnson | 48,650 | 8,659,700 | |||
| Industrials: 11.78% | |||||
| Aerospace & defense: 1.14% | |||||
| Woodward Incorporated | 34,939 | 3,347,156 | |||
| Commercial services & supplies: 2.03% | |||||
| IAA Incorporated † | 158,940 | 5,939,588 | |||
| Electrical equipment: 1.92% | |||||
| AMETEK Incorporated | 39,540 | 5,631,287 | |||
| Machinery: 3.43% | |||||
| ESAB Corporation | 40,793 | 1,931,141 |
| Shares | Value | ||||
| Machinery (continued) | |||||
| PACCAR Incorporated | 27,450 | $ 2,907,230 | |||
| Stanley Black & Decker Incorporated | 63,710 | 5,206,381 | |||
| 10,044,752 | |||||
| Trading companies & distributors: 3.26% | |||||
| AerCap Holdings NV † | 155,300 | 9,535,420 | |||
| Information technology: 7.85% | |||||
| Electronic equipment, instruments & components: 6.03% | |||||
| Arrow Electronics Incorporated † | 92,210 | 10,026,915 | |||
| TE Connectivity Limited | 60,485 | 7,628,368 | |||
| 17,655,283 | |||||
| Software: 1.82% | |||||
| Open Text Corporation | 181,240 | 5,324,831 | |||
| Real estate: 1.65% | |||||
| Real estate management & development: 1.65% | |||||
| CBRE Group Incorporated Class A † | 60,590 | 4,822,964 | |||
| Utilities: 1.58% | |||||
| Gas utilities: 1.58% | |||||
| Atmos Energy Corporation | 38,400 | 4,615,680 | |||
| Total Common stocks (Cost $223,581,547) | 286,875,840 |
| Yield | |||||
| Short-term investments: 1.13% | |||||
| Investment companies: 1.13% | |||||
| Allspring Government Money Market Fund Select Class ♠∞ | 3.60% | 3,312,130 | 3,312,130 | ||
| Total Short-term investments (Cost $3,312,130) | 3,312,130 | ||||
| Total investments in securities (Cost $226,893,677) | 99.14% | 290,187,970 | |||
| Other assets and liabilities, net | 0.86 | 2,519,678 | |||
| Total net assets | 100.00% | $292,707,648 |
| † | Non-income-earning security |
| ♠ | The issuer of the security is an affiliated person of the Portfolio as defined in the Investment Company Act of 1940. |
| ∞ | The rate represents the 7-day annualized yield at period end. |
| Abbreviations: | |
| ADR | American depositary receipt |
| Value, beginning of period | Purchases | Sales proceeds | Net realized gains (losses) | Net change in unrealized gains (losses) | Value, end of period | Shares, end of period | Income from affiliated securities | |||
| Short-term investments | ||||||||||
| Allspring Government Money Market Fund Select Class | $12,217,232 | $53,781,696 | $(62,686,798) | $ 0 | $0 | $ 3,312,130 | 3,312,130 | $ 57,234 | ||
| Investments in affiliates no longer held at end of period | ||||||||||
| Securities Lending Cash Investments LLC | 0 | 1,756,645 | (1,756,643) | (2) | 0 | 0 | 0 | 330 # | ||
| $(2) | $0 | $3,312,130 | $57,564 | |||||||
| # | Amount shown represents income before fees and rebates. |
| Assets | |
Investments in unaffiliated securities, at value (cost $223,581,547) | $ 286,875,840 |
Investments in affiliated securities, at value (cost $3,312,130) | 3,312,130 |
Receivable for investments sold | 2,644,321 |
Receivable for dividends | 542,620 |
Receivable for securities lending income, net | 15 |
Prepaid expenses and other assets | 6,465 |
Total assets | 293,381,391 |
| Liabilities | |
Payable for investments purchased | 516,810 |
Advisory fee payable | 137,001 |
Accrued expenses and other liabilities | 19,932 |
Total liabilities | 673,743 |
Total net assets | $292,707,648 |
| Investment income | |
Dividends (net of foreign withholdings taxes of $59,735) | $ 3,167,246 |
Income from affiliated securities | 58,867 |
Total investment income | 3,226,113 |
| Expenses | |
Advisory fee | 949,250 |
Custody and accounting fees | 14,139 |
Professional fees | 28,381 |
Interest holder report expenses | 9,857 |
Trustees’ fees and expenses | 10,879 |
Other fees and expenses | 12,476 |
Total expenses | 1,024,982 |
Less: Fee waivers and/or expense reimbursements | (90,337) |
Net expenses | 934,645 |
Net investment income | 2,291,468 |
| Realized and unrealized gains (losses) on investments | |
| Net realized gains (losses) on | |
Unaffiliated securities | 13,200,119 |
Affiliated securities | (2) |
Net realized gains on investments | 13,200,117 |
Net change in unrealized gains (losses) on investments | (18,336,081) |
Net realized and unrealized gains (losses) on investments | (5,135,964) |
Net decrease in net assets resulting from operations | $ (2,844,496) |
| Six months ended November 30, 2022 (unaudited) | Year ended May 31, 2022 | |
| Operations | ||
Net investment income | $ 2,291,468 | $ 4,228,372 |
Net realized gains on investments | 13,200,117 | 59,295,012 |
Net change in unrealized gains (losses) on investments | (18,336,081) | (67,362,442) |
Net decrease in net assets resulting from operations | (2,844,496) | (3,839,058) |
| Capital transactions | ||
| Transactions in investors’ beneficial interests | ||
Contributions | 4,346,118 | 20,407,586 |
Withdrawals | (41,854,746) | (94,906,626) |
Net decrease in net assets resulting from capital transactions | (37,508,628) | (74,499,040) |
Total decrease in net assets | (40,353,124) | (78,338,098) |
| Net assets | ||
Beginning of period | 333,060,772 | 411,398,870 |
End of period | $292,707,648 | $333,060,772 |
| Year ended May 31 | ||||||
| Six months ended November 30, 2022 (unaudited) | 2022 | 2021 | 2020 | 2019 | 2018 | |
Total return1 | (0.17)% | (1.05)% | 57.96% | (3.40)% | 1.80% | 6.65% |
| Ratios to average net assets (annualized) | ||||||
Gross expenses | 0.70% | 0.69% | 0.68% | 0.68% | 0.67% | 0.67% |
Net expenses2 | 0.64% | 0.64% | 0.64% | 0.64% | 0.65% | 0.66% |
Net investment income | 1.57% | 1.12% | 1.16% | 1.36% | 1.27% | 1.02% |
| Supplemental data | ||||||
Portfolio turnover rate | 17% | 32% | 38% | 33% | 47% | 42% |
| 1 | Returns for periods of less than one year are not annualized. |
| 2 | Net expense ratios reflect voluntary waivers, if any. |
| Gross unrealized gains | $ 90,380,735 |
| Gross unrealized losses | (18,436,922) |
| Net unrealized gains | $ 71,943,813 |
| ■ | Level 1 – quoted prices in active markets for identical securities |
| ■ | Level 2 – other significant observable inputs (including quoted prices for similar securities, interest rates, prepayment speeds, credit risk, etc.) |
| ■ | Level 3 – significant unobservable inputs (including the Portfolio’s own assumptions in determining the fair value of investments) |
| Quoted prices (Level 1) | Other significant observable inputs (Level 2) | Significant unobservable inputs (Level 3) | Total | |
| Assets | ||||
| Investments in: | ||||
| Common stocks | ||||
| Communication services | $ 30,041,919 | $0 | $0 | $ 30,041,919 |
| Consumer discretionary | 23,798,305 | 0 | 0 | 23,798,305 |
| Consumer staples | 19,845,108 | 0 | 0 | 19,845,108 |
| Energy | 11,230,069 | 0 | 0 | 11,230,069 |
| Financials | 96,032,129 | 0 | 0 | 96,032,129 |
| Health care | 39,011,349 | 0 | 0 | 39,011,349 |
| Industrials | 34,498,203 | 0 | 0 | 34,498,203 |
| Information technology | 22,980,114 | 0 | 0 | 22,980,114 |
| Real estate | 4,822,964 | 0 | 0 | 4,822,964 |
| Utilities | 4,615,680 | 0 | 0 | 4,615,680 |
| Short-term investments | ||||
| Investment companies | 3,312,130 | 0 | 0 | 3,312,130 |
| Total assets | $290,187,970 | $0 | $0 | $290,187,970 |
| Average daily net assets | Advisory fee |
| First $500 million | 0.650% |
| Next $500 million | 0.625 |
| Next $1 billion | 0.600 |
| Next $2 billion | 0.575 |
| Next $4 billion | 0.550 |
| Next $4 billion | 0.525 |
| Next $4 billion | 0.500 |
| Over $16 billion | 0.475 |
| Name and year of birth | Position held and length of service* | Principal occupations during past five years or longer | Current other public company or investment company directorships |
| William R. Ebsworth (Born 1957) | Trustee, since 2015 | Retired. From 1984 to 2013, equities analyst, portfolio manager, research director and chief investment officer at Fidelity Management and Research Company in Boston, Tokyo, and Hong Kong, and retired in 2013 as Chief Investment Officer of Fidelity Strategic Advisers, Inc. where he led a team of investment professionals managing client assets. Prior thereto, Board member of Hong Kong Securities Clearing Co., Hong Kong Options Clearing Corp., the Thailand International Fund, Ltd., Fidelity Investments Life Insurance Company, and Empire Fidelity Investments Life Insurance Company. Audit Committee Chair and Investment Committee Chair of the Vincent Memorial Hospital Endowment (non-profit organization). Mr. Ebsworth is a CFA® charterholder. | N/A |
| Jane A. Freeman (Born 1953) | Trustee, since 2015; Chair Liaison, since 2018 | Retired. From 2012 to 2014 and 1999 to 2008, Chief Financial Officer of Scientific Learning Corporation. From 2008 to 2012, Ms. Freeman provided consulting services related to strategic business projects. Prior to 1999, Portfolio Manager at Rockefeller & Co. and Scudder, Stevens & Clark. Board member of the Harding Loevner Funds from 1996 to 2014, serving as both Lead Independent Director and chair of the Audit Committee. Board member of the Russell Exchange Traded Funds Trust from 2011 to 2012 and the chair of the Audit Committee. Ms. Freeman is also an inactive Chartered Financial Analyst. | N/A |
| Isaiah Harris, Jr. (Born 1952) | Trustee, since 2009; Audit Committee Chair, since 2019 | Retired. Chairman of the Board of CIGNA Corporation from 2009 to 2021, and Director from 2005 to 2008. From 2003 to 2011, Director of Deluxe Corporation. Prior thereto, President and CEO of BellSouth Advertising and Publishing Corp. from 2005 to 2007, President and CEO of BellSouth Enterprises from 2004 to 2005 and President of BellSouth Consumer Services from 2000 to 2003. Emeritus member of the Iowa State University Foundation Board of Governors. Emeritus Member of the Advisory Board of Iowa State University School of Business. Advisory Board Member, Palm Harbor Academy (private school). Advisory Board Member, Fellowship of Christian Athletes. Mr. Harris is a certified public accountant (inactive status). | N/A |
| David F. Larcker (Born 1950) | Trustee, since 2009 | James Irvin Miller Professor of Accounting at the Graduate School of Business (Emeritus), Stanford University, Director of the Corporate Governance Research Initiative and Senior Faculty of The Rock Center for Corporate Governance since 2006. From 2005 to 2008, Professor of Accounting at the Graduate School of Business, Stanford University. Prior thereto, Ernst & Young Professor of Accounting at The Wharton School, University of Pennsylvania from 1985 to 2005. | N/A |
| Name and year of birth | Position held and length of service* | Principal occupations during past five years or longer | Current other public company or investment company directorships |
| Olivia S. Mitchell (Born 1953) | Trustee, since 2006; Nominating and Governance Committee Chair, since 2018 | International Foundation of Employee Benefit Plans Professor since 1993, Wharton School of the University of Pennsylvania. Director of Wharton’s Pension Research Council and Boettner Center on Pensions & Retirement Research, and Research Associate at the National Bureau of Economic Research. Previously taught at Cornell University from 1978 to 1993. | N/A |
| Timothy J. Penny (Born 1951) | Trustee, since 1996; Chair, since 2018 | President and Chief Executive Officer of Southern Minnesota Initiative Foundation, a non-profit organization, since 2007. Vice Chair of the Economic Club of Minnesota, since 2007. Co-Chair of the Committee for a Responsible Federal Budget, since 1995. Member of the Board of Trustees of NorthStar Education Finance, Inc., a non-profit organization, since 2007. Senior Fellow of the University of Minnesota Humphrey Institute from 1995 to 2017. | N/A |
| James G. Polisson (Born 1959) | Trustee, since 2018 | Retired. Chief Marketing Officer, Source (ETF) UK Services, Ltd, from 2015 to 2017. From 2012 to 2015, Principal of The Polisson Group, LLC, a management consulting, corporate advisory and principal investing company. Chief Executive Officer and Managing Director at Russell Investments, Global Exchange Traded Funds from 2010 to 2012. Managing Director of Barclays Global Investors from 1998 to 2010 and Global Chief Marketing Officer for iShares and Barclays Global Investors from 2000 to 2010. Trustee of the San Francisco Mechanics’ Institute, a non-profit organization, from 2013 to 2015. Board member of the Russell Exchange Traded Fund Trust from 2011 to 2012. Director of Barclays Global Investors Holdings Deutschland GmbH from 2006 to 2009. Mr. Polisson is an attorney and has a retired status with the Massachusetts and District of Columbia Bar Associations. | N/A |
| Pamela Wheelock (Born 1959) | Trustee, since January 2020; previously Trustee from January 2018 to July 2019 | Retired. Executive and Senior Financial leadership positions in the public, private and nonprofit sectors. Interim President and CEO, McKnight Foundation, 2020. Interim Commissioner, Minnesota Department of Human Services, 2019. Chief Operating Officer, Twin Cities Habitat for Humanity, 2017-2019. Vice President for University Services, University of Minnesota, 2012-2016. Interim President and CEO, Blue Cross and Blue Shield of Minnesota, 2011-2012. Executive Vice-President and Chief Financial Officer, Minnesota Wild, 2002-2008. Commissioner, Minnesota Department of Finance, 1999-2002. Chair of the Board of Directors of Destination Medical Center Corporation. Board member of the Minnesota Wild Foundation. | N/A |
| Name and year of birth | Position held and length of service | Principal occupations during past five years or longer |
| Andrew Owen (Born 1960) | President, since 2017 | President and Chief Executive Officer of Allspring Funds Management, LLC since 2017 and Head of Global Fund Governance of Allspring Global Investments since 2022. Prior thereto, co-president of Galliard Capital Management, LLC, an affiliate of Allspring Funds Management, LLC, from 2019 to 2022 and Head of Affiliated Managers, Allspring Global Investments, from 2014 to 2019 and Executive Vice President responsible for marketing, investments and product development for Allspring Funds Management, LLC, from 2009 to 2014. |
| Jeremy DePalma (Born 1974) | Treasurer, since 2012 (for certain funds in the Fund Complex); since 2021 (for the remaining funds in the Fund Complex) | Senior Vice President of Allspring Funds Management, LLC since 2009. Senior Vice President of Evergreen Investment Management Company, LLC from 2008 to 2010 and head of the Fund Reporting and Control Team within Fund Administration from 2005 to 2010. |
| Christopher Baker (Born 1976) | Chief Compliance Officer, since 2022 | Global Chief Compliance Officer for Allspring Global Investments since 2022. Prior thereto, Chief Compliance Officer for State Street Global Advisors from 2018 to 2021. Senior Compliance Officer for the State Street divisions of Alternative Investment Solutions, Sector Solutions, and Global Marketing from 2015 to 2018. From 2010 to 2015 Vice President, Global Head of Investment and Marketing Compliance for State Street Global Advisors. |
| Matthew Prasse (Born 1983) | Chief Legal Officer, since 2022; Secretary, since 2021 | Senior Counsel of the Allspring Legal Department since 2021. Senior Counsel of the Wells Fargo Legal Department from 2018 to 2021. Previously, Counsel for Barings LLC from 2015 to 2018. Prior to joining Barings, Associate at Morgan, Lewis & Bockius LLP from 2008 to 2015. |
P.O. Box 219967
Kansas City, MO 64121-9967

1-800-222-8222 or visit the Fund's website at allspringglobal.com. Read the prospectus carefully before you invest or send money.
SA280/SAR280 11-22

| 2 | |
| 6 | |
| 8 | |
| Allspring Emerging Growth Fund | |
| 9 | |
| Financial statements | |
| 10 | |
| 11 | |
| 12 | |
| 13 | |
| 18 | |
| Allspring Emerging Growth Portfolio | |
| 22 | |
| Financial statements | |
| 27 | |
| 28 | |
| 29 | |
| 30 | |
| 31 | |
| 36 |

| 1 | The S&P 500 Index consists of 500 stocks chosen for market size, liquidity, and industry group representation. It is a market-value-weighted index with each stock's weight in the index proportionate to its market value. You cannot invest directly in an index. |
| 2 | The Morgan Stanley Capital International (MSCI) All Country World Index (ACWI) ex USA Index (Net) is a free-float-adjusted market-capitalization-weighted index that is designed to measure the equity market performance of developed and emerging markets, excluding the U.S. Source: MSCI. MSCI makes no express or implied warranties or representations and shall have no liability whatsoever with respect to any MSCI data contained herein. The MSCI data may not be further redistributed or used as a basis for other indexes or any securities or financial products. This report is not approved, reviewed, or produced by MSCI. You cannot invest directly in an index. |
| 3 | The MSCI Emerging Markets (EM) Index (Net) (USD) is a free-float-adjusted market-capitalization-weighted index that is designed to measure equity market performance of emerging markets. You cannot invest directly in an index. |
| 4 | The Bloomberg U.S. Aggregate Bond Index is a broad-based benchmark that measures the investment-grade, U.S.-dollar-denominated, fixed-rate taxable bond market, including Treasuries, government-related and corporate securities, mortgage-backed securities (agency fixed-rate and hybrid adjustable-rate mortgage pass-throughs), asset-backed securities, and commercial mortgage-backed securities. You cannot invest directly in an index. |
| 5 | The Bloomberg Global Aggregate ex-USD Index (unhedged) is an unmanaged index that provides a broad-based measure of the global investment-grade fixed-income markets excluding the U.S.-dollar-denominated debt market. You cannot invest directly in an index. |
| 6 | The Bloomberg Municipal Bond Index is an unmanaged index composed of long-term tax-exempt bonds with a minimum credit rating of Baa. You cannot invest directly in an index. |
| 7 | The ICE BofA U.S. High Yield Index is a market-capitalization-weighted index of domestic and Yankee high-yield bonds. The index tracks the performance of high-yield securities traded in the U.S. bond market. You cannot invest directly in an index. Copyright 2023. ICE Data Indices, LLC. All rights reserved. |

President
Allspring Funds
| Investment objective | The Fund seeks long-term capital appreciation. |
| Manager | Allspring Funds Management, LLC |
| Portfolio managers | Robert Gruendyke, CFA®‡, David Nazaret, CFA®‡, Thomas C. Ognar, CFA®‡ |
| Average annual total returns (%) as of November 30, 2022 | |||||||||||
| Including sales charge | Excluding sales charge | Expense ratios1 (%) | |||||||||
| Inception date | 1 year | 5 year | 10 year | 1 year | 5 year | 10 year | Gross | Net 2 | |||
| Class A (WEMAX) | 3-31-2008 | -34.45 | 7.20 | 10.70 | -30.45 | 8.48 | 11.36 | 1.36 | 1.28 | ||
| Class C (WEMCX) | 3-31-2008 | -32.04 | 7.67 | 10.71 | -31.04 | 7.67 | 10.71 | 2.11 | 2.03 | ||
| Class R6 (WEGRX)3 | 7-31-2018 | – | – | – | -30.21 | 8.97 | 11.86 | 0.93 | 0.85 | ||
| Administrator Class (WFGDX) | 1-31-2007 | – | – | – | -30.42 | 8.57 | 11.49 | 1.28 | 1.20 | ||
| Institutional Class (WEMIX) | 3-31-2008 | – | – | – | -30.25 | 8.88 | 11.82 | 1.03 | 0.90 | ||
| Russell 2000® Growth Index4 | – | – | – | – | -20.96 | 4.91 | 10.24 | – | – | ||
| 1 | Reflects the expense ratios as stated in the most recent prospectuses. The expense ratios shown are subject to change and may differ from the annualized expense ratios shown in the financial highlights of this report. |
| 2 | The manager has contractually committed through September 30, 2023, to waive fees and/or reimburse expenses to the extent necessary to cap total annual fund operating expenses after fee waivers at 1.28% for Class A, 2.03% for Class C, 0.85% for Class R6, 1.20% for Administrator Class, and 0.90% for Institutional Class. Brokerage commissions, stamp duty fees, interest, taxes, acquired fund fees and expenses (if any) from funds in which the affiliated master portfolio invests, and extraordinary expenses are excluded from the expense caps. Net expenses from the affiliated master portfolio are included in the expense caps. Prior to or after the commitment expiration date, the caps may be increased or the commitment to maintain the caps may be terminated only with the approval of the Board of Trustees. Without these caps, the Fund’s returns would have been lower. The expense ratio paid by an investor is the net expense ratio (the total annual fund operating expenses after fee waivers) as stated in the prospectuses. |
| 3 | Historical performance shown for the Class R6 shares prior to their inception reflects the performance of the Institutional Class shares, and includes the higher expenses applicable to the Institutional Class shares. If these expenses had not been included, returns for the Class R6 shares would be higher. |
| 4 | The Russell 2000® Growth Index measures the performance of those Russell 2000 companies with higher price/book ratios and higher forecasted growth values. You cannot invest directly in an index. |
| * | The Fund is a feeder fund in a master-feeder structure that invests substantially all of its assets in a single affiliated master portfolio of the Allspring Master Trust with a substantially identical investment objective and substantially similar investment strategies. References to the investment activities of the Fund are intended to refer to the investment activities of the affiliated master portfolio in which it invests. |
| ‡ | CFA® and Chartered Financial Analyst® are trademarks owned by CFA Institute. |
| Ten largest holdings (%) as of November 30, 20221 | |
| Kinsale Capital Group Incorporated | 3.89 |
| SPS Commerce Incorporated | 3.85 |
| Casella Waste Systems Incorporated Class A | 3.00 |
| Calix Incorporated | 2.94 |
| Novanta Incorporated | 2.87 |
| ASGN Incorporated | 2.61 |
| TransMedics Group Incorporated | 2.31 |
| Diodes Incorporated | 2.31 |
| The Chef's Warehouse Incorporated | 2.15 |
| Shockwave Medical Incorporated | 2.06 |
| 1 | Each holding represents the Fund’s allocable portion of the affiliated master portfolio security. Figures represent each holding as a percentage of the Fund’s net assets. Holdings are subject to change and may have changed since the date specified. |
| Sector allocation as of November 30, 20221 |

| 1 | Figures represent the sector allocation of the affiliated master portfolio as a percentage of the long-term investments of the affiliated master portfolio. Allocations are subject to change and may have changed since the date specified. |
| Beginning account value 6-1-2022 | Ending account value 11-30-2022 | Expenses paid during the period1,2 | Annualized net expense ratio2 | |
| Class A | ||||
| Actual | $1,000.00 | $1,042.65 | $ 6.50 | 1.27% |
| Hypothetical (5% return before expenses) | $1,000.00 | $1,018.70 | $ 6.43 | 1.27% |
| Class C | ||||
| Actual | $1,000.00 | $1,038.34 | $10.37 | 2.03% |
| Hypothetical (5% return before expenses) | $1,000.00 | $1,014.89 | $10.25 | 2.03% |
| Class R6 | ||||
| Actual | $1,000.00 | $1,044.49 | $ 4.36 | 0.85% |
| Hypothetical (5% return before expenses) | $1,000.00 | $1,020.81 | $ 4.31 | 0.85% |
| Administrator Class | ||||
| Actual | $1,000.00 | $1,042.80 | $ 6.15 | 1.20% |
| Hypothetical (5% return before expenses) | $1,000.00 | $1,019.05 | $ 6.07 | 1.20% |
| Institutional Class | ||||
| Actual | $1,000.00 | $1,044.78 | $ 4.61 | 0.90% |
| Hypothetical (5% return before expenses) | $1,000.00 | $1,020.56 | $ 4.56 | 0.90% |
| Value | |||||
| Investment companies: 100.09% | |||||
| Affiliated master portfolio: 100.09% | |||||
| Allspring Emerging Growth Portfolio | $328,348,557 | ||||
| Total Investment companies (Cost $237,900,612) | 328,348,557 | ||||
| Total investments in securities (Cost $237,900,612) | 100.09% | 328,348,557 | |||
| Other assets and liabilities, net | (0.09) | (282,093) | |||
| Total net assets | 100.00% | $328,066,464 |
| % of ownership, beginning of period | % of ownership, end of period | Net realized gains (losses) on securities transactions allocated from affiliated Master Portfolio | Net change in unrealized gains (losses) on securities transactions allocated from affiliated Master Portfolio | Dividends allocated from affiliated Master Portfolio | Securities lending income allocated from affiliated Master Portfolio | Affiliated income allocated from affiliated Master Portfolio | Value, end of period | ||
| Allspring Emerging Growth Portfolio | 90.11% | 89.90% | $(8,705,532) | $23,061,927 | $425,009 | $93,024 | $100,008 | $328,348,557 |
| Assets | |
Investments in affiliated Master Portfolio, at value (cost $237,900,612) | $ 328,348,557 |
Receivable for Fund shares sold | 87,047 |
Receivable from manager | 23,341 |
Prepaid expenses and other assets | 70,844 |
Total assets | 328,529,789 |
| Liabilities | |
Payable for Fund shares redeemed | 317,249 |
Administration fees payable | 40,375 |
Shareholder servicing fees payable | 30,567 |
Trustees’ fees and expenses payable | 3,069 |
Distribution fee payable | 987 |
Accrued expenses and other liabilities | 71,078 |
Total liabilities | 463,325 |
Total net assets | $328,066,464 |
| Net assets consist of | |
Paid-in capital | $ 258,269,064 |
Total distributable earnings | 69,797,400 |
Total net assets | $328,066,464 |
| Computation of net asset value and offering price per share | |
Net assets – Class A | $ 133,688,824 |
Shares outstanding – Class A1 | 14,397,801 |
Net asset value per share – Class A | $9.29 |
Maximum offering price per share – Class A2 | $9.86 |
Net assets – Class C | $ 1,654,882 |
Shares outstanding – Class C1 | 254,537 |
Net asset value per share – Class C | $6.50 |
Net assets – Class R6 | $ 27,443,995 |
Shares outstanding – Class R61 | 2,434,357 |
Net asset value per share – Class R6 | $11.27 |
Net assets – Administrator Class | $ 17,977,742 |
Shares outstanding – Administrator Class1 | 1,799,060 |
Net asset value per share – Administrator Class | $9.99 |
Net assets – Institutional Class | $ 147,301,021 |
Shares outstanding – Institutional Class1 | 13,151,866 |
Net asset value per share – Institutional Class | $11.20 |
| 1 | The Fund has an unlimited number of authorized shares. |
| 2 | Maximum offering price is computed as 100/94.25 of net asset value. On investments of $50,000 or more, the offering price is reduced. |
| Investment income | |
Dividends allocated from affiliated Master Portfolio | $ 425,009 |
Affiliated income allocated from affiliated Master Portfolio | 100,008 |
Securities lending income allocated from affiliated Master Portfolio | 93,024 |
Expenses allocated from affiliated Master Portfolio | (1,374,537) |
Waivers allocated from affiliated Master Portfolio | 7,755 |
Total investment income | (748,741) |
| Expenses | |
Management fee | 81,373 |
| Administration fees | |
Class A | 138,713 |
Class C | 1,744 |
Class R6 | 3,783 |
Administrator Class | 11,376 |
Institutional Class | 96,854 |
| Shareholder servicing fees | |
Class A | 164,950 |
Class C | 2,064 |
Administrator Class | 21,758 |
| Distribution fee | |
Class C | 6,191 |
Custody and accounting fees | 10,223 |
Professional fees | 18,698 |
Registration fees | 21,772 |
Shareholder report expenses | 14,720 |
Trustees’ fees and expenses | 10,874 |
Other fees and expenses | 3,780 |
Total expenses | 608,873 |
| Less: Fee waivers and/or expense reimbursements | |
Fund-level | (177,528) |
Class A | (13,211) |
Class R6 | (1,260) |
Administrator Class | (875) |
Institutional Class | (44,702) |
Net expenses | 371,297 |
Net investment loss | (1,120,038) |
| Realized and unrealized gains (losses) on investments | |
Net realized losses on securities transactions allocated from affiliated Master Portfolio | (8,705,532) |
Net change in unrealized gains (losses) on securities transactions allocated from affiliated Master Portfolio | 23,061,927 |
Net realized and unrealized gains (losses) on investments | 14,356,395 |
Net increase in net assets resulting from operations | $13,236,357 |
| Six months ended November 30, 2022 (unaudited) | Year ended May 31, 2022 | |||
| Operations | ||||
Net investment loss | $ (1,120,038) | $ (5,137,253) | ||
Net realized gains (losses) on investments | (8,705,532) | 232,050,592 | ||
Net change in unrealized gains (losses) on investments | 23,061,927 | (327,135,019) | ||
Net increase (decrease) in net assets resulting from operations | 13,236,357 | (100,221,680) | ||
| Distributions to shareholders from | ||||
| Net investment income and net realized gains | ||||
Class A | 0 | (62,681,311) | ||
Class C | 0 | (1,233,291) | ||
Class R6 | 0 | (5,898,804) | ||
Administrator Class | 0 | (7,999,256) | ||
Institutional Class | 0 | (61,664,834) | ||
Total distributions to shareholders | 0 | (139,477,496) | ||
| Capital share transactions | Shares | Shares | ||
| Proceeds from shares sold | ||||
Class A | 227,938 | 1,985,714 | 422,522 | 6,066,711 |
Class C | 887 | 5,591 | 97,992 | 1,394,743 |
Class R6 | 427,601 | 4,851,877 | 1,375,088 | 22,705,246 |
Administrator Class | 74,475 | 711,677 | 159,434 | 2,285,979 |
Institutional Class | 979,592 | 10,509,845 | 5,047,859 | 87,194,049 |
| 18,064,704 | 119,646,728 | |||
| Reinvestment of distributions | ||||
Class A | 0 | 0 | 4,788,131 | 60,617,734 |
Class C | 0 | 0 | 138,107 | 1,233,291 |
Class R6 | 0 | 0 | 125,710 | 1,924,617 |
Administrator Class | 0 | 0 | 585,228 | 7,964,955 |
Institutional Class | 0 | 0 | 4,040,376 | 61,494,520 |
| 0 | 133,235,117 | |||
| Payment for shares redeemed | ||||
Class A | (965,793) | (8,597,900) | (1,754,937) | (23,706,994) |
Class C | (27,197) | (167,852) | (117,521) | (1,197,540) |
Class R6 | (216,766) | (2,170,899) | (330,224) | (6,538,508) |
Administrator Class | (119,900) | (1,170,667) | (413,854) | (5,802,034) |
Institutional Class | (2,460,771) | (26,322,086) | (26,013,236) | (552,947,062) |
| (38,429,404) | (590,192,138) | |||
Net decrease in net assets resulting from capital share transactions | (20,364,700) | (337,310,293) | ||
Total decrease in net assets | (7,128,343) | (577,009,469) | ||
| Net assets | ||||
Beginning of period | 335,194,807 | 912,204,276 | ||
End of period | $328,066,464 | $ 335,194,807 | ||
| Year ended May 31 | ||||||
| Class A | Six months ended November 30, 2022 (unaudited) | 2022 | 2021 | 2020 | 2019 | 2018 |
Net asset value, beginning of period | $8.91 | $18.05 | $14.71 | $13.51 | $17.04 | $14.57 |
Net investment loss | (0.04) 1 | (0.16) 1 | (0.20) 1 | (0.17) | (0.16) 1 | (0.15) |
Net realized and unrealized gains (losses) on investments | 0.42 | (3.47) | 7.69 | 2.13 | (0.19) | 4.57 |
Total from investment operations | 0.38 | (3.63) | 7.49 | 1.96 | (0.35) | 4.42 |
| Distributions to shareholders from | ||||||
Net realized gains | 0.00 | (5.51) | (4.15) | (0.76) | (3.18) | (1.95) |
Net asset value, end of period | $9.29 | $8.91 | $18.05 | $14.71 | $13.51 | $17.04 |
Total return2 | 4.26% | (29.16)% | 53.22% | 14.97% | (0.84)% | 32.91% |
| Ratios to average net assets (annualized)* | ||||||
Gross expenses | 1.40% | 1.36% | 1.35% | 1.36% | 1.35% | 1.36% |
Net expenses | 1.27% | 1.26% | 1.27% | 1.27% | 1.29% | 1.35% |
Net investment loss | (0.89)% | (1.10)% | (1.12)% | (1.08)% | (1.06)% | (1.01)% |
| Supplemental data | ||||||
Portfolio turnover rate3 | 35% | 51% | 48% | 55% | 71% | 47% |
Net assets, end of period (000s omitted) | $133,689 | $134,825 | $210,838 | $148,866 | $145,898 | $153,526 |
| * | Ratios include net expenses allocated from the affiliated Master Portfolio which were as follows: |
| Six months ended November 30, 2022 (unaudited) | 0.84% |
| Year ended May 31, 2022 | 0.82% |
| Year ended May 31, 2021 | 0.81% |
| Year ended May 31, 2020 | 0.81% |
| Year ended May 31, 2019 | 0.81% |
| Year ended May 31, 2018 | 0.81% |
| 1 | Calculated based upon average shares outstanding |
| 2 | Total return calculations do not include any sales charges. Returns for periods of less than one year are not annualized. |
| 3 | Portfolio turnover rate is calculated by multiplying the affiliated Master Portfolio’s percentage of the Fund’s total investment in securities at the end of the period by the affiliated Master Portfolio’s portfolio turnover rate. |
| Year ended May 31 | ||||||
| Class C | Six months ended November 30, 2022 (unaudited) | 2022 | 2021 | 2020 | 2019 | 2018 |
Net asset value, beginning of period | $6.26 | $14.41 | $12.40 | $11.58 | $15.19 | $13.28 |
Net investment loss | (0.05) 1 | (0.20) 1 | (0.28) 1 | (0.21) 1 | (0.25) 1 | (0.25) 1 |
Net realized and unrealized gains (losses) on investments | 0.29 | (2.44) | 6.44 | 1.79 | (0.18) | 4.11 |
Total from investment operations | 0.24 | (2.64) | 6.16 | 1.58 | (0.43) | 3.86 |
| Distributions to shareholders from | ||||||
Net realized gains | 0.00 | (5.51) | (4.15) | (0.76) | (3.18) | (1.95) |
Net asset value, end of period | $6.50 | $6.26 | $14.41 | $12.40 | $11.58 | $15.19 |
Total return2 | 3.83% | (29.71)% | 52.19% | 14.16% | (1.55)% | 31.82% |
| Ratios to average net assets (annualized)* | ||||||
Gross expenses | 2.14% | 2.10% | 2.10% | 2.11% | 2.10% | 2.11% |
Net expenses | 2.03% | 2.03% | 2.03% | 2.03% | 2.04% | 2.10% |
Net investment loss | (1.65)% | (1.86)% | (1.89)% | (1.84)% | (1.78)% | (1.76)% |
| Supplemental data | ||||||
Portfolio turnover rate3 | 35% | 51% | 48% | 55% | 71% | 47% |
Net assets, end of period (000s omitted) | $1,655 | $1,758 | $2,338 | $1,599 | $1,761 | $4,190 |
| * | Ratios include net expenses allocated from the affiliated Master Portfolio which were as follows: |
| Six months ended November 30, 2022 (unaudited) | 0.84% |
| Year ended May 31, 2022 | 0.82% |
| Year ended May 31, 2021 | 0.81% |
| Year ended May 31, 2020 | 0.81% |
| Year ended May 31, 2019 | 0.81% |
| Year ended May 31, 2018 | 0.81% |
| 1 | Calculated based upon average shares outstanding |
| 2 | Total return calculations do not include any sales charges. Returns for periods of less than one year are not annualized. |
| 3 | Portfolio turnover rate is calculated by multiplying the affiliated Master Portfolio’s percentage of the Fund’s total investment in securities at the end of the period by the affiliated Master Portfolio’s portfolio turnover rate. |
| Year ended May 31 | |||||
| Class R6 | Six months ended November 30, 2022 (unaudited) | 2022 | 2021 | 2020 | 2019 1 |
Net asset value, beginning of period | $10.79 | $20.64 | $16.34 | $14.86 | $18.70 |
Net investment loss | (0.02) 2 | (0.10) | (0.14) | (0.10) 2 | (0.07) 2 |
Net realized and unrealized gains (losses) on investments | 0.50 | (4.24) | 8.59 | 2.34 | (0.59) |
Total from investment operations | 0.48 | (4.34) | 8.45 | 2.24 | (0.66) |
| Distributions to shareholders from | |||||
Net realized gains | 0.00 | (5.51) | (4.15) | (0.76) | (3.18) |
Net asset value, end of period | $11.27 | $10.79 | $20.64 | $16.34 | $14.86 |
Total return3 | 4.45% | (28.91)% | 53.85% | 15.51% | (2.35)% |
| Ratios to average net assets (annualized)* | |||||
Gross expenses | 0.97% | 0.94% | 0.92% | 0.93% | 0.92% |
Net expenses | 0.85% | 0.85% | 0.85% | 0.85% | 0.85% |
Net investment loss | (0.46)% | (0.68)% | (0.68)% | (0.67)% | (0.51)% |
| Supplemental data | |||||
Portfolio turnover rate4 | 35% | 51% | 48% | 55% | 71% |
Net assets, end of period (000s omitted) | $27,444 | $23,999 | $21,729 | $19,458 | $22 |
| * | Ratios include net expenses allocated from the affiliated Master Portfolio which were as follows: |
| Six months ended November 30, 2022 (unaudited) | 0.84% |
| Year ended May 31, 2022 | 0.83% |
| Year ended May 31, 2021 | 0.81% |
| Year ended May 31, 2020 | 0.81% |
| Year ended May 31, 20191 | 0.81% |
| 1 | For the period from July 31, 2018 (commencement of class operations) to May 31, 2019 |
| 2 | Calculated based upon average shares outstanding |
| 3 | Returns for periods of less than one year are not annualized. |
| 4 | Portfolio turnover rate is calculated by multiplying the affiliated Master Portfolio’s percentage of the Fund’s total investment in securities at the end of the period by the affiliated Master Portfolio’s portfolio turnover rate. |
| Year ended May 31 | ||||||
| Administrator Class | Six months ended November 30, 2022 (unaudited) | 2022 | 2021 | 2020 | 2019 | 2018 |
Net asset value, beginning of period | $9.58 | $18.98 | $15.31 | $14.02 | $17.54 | $14.93 |
Net investment loss | (0.04) 1 | (0.17) 1 | (0.20) 1 | (0.14) 1 | (0.15) 1 | (0.14) 1 |
Net realized and unrealized gains (losses) on investments | 0.45 | (3.72) | 8.02 | 2.19 | (0.19) | 4.70 |
Total from investment operations | 0.41 | (3.89) | 7.82 | 2.05 | (0.34) | 4.56 |
| Distributions to shareholders from | ||||||
Net realized gains | 0.00 | (5.51) | (4.15) | (0.76) | (3.18) | (1.95) |
Net asset value, end of period | $9.99 | $9.58 | $18.98 | $15.31 | $14.02 | $17.54 |
Total return2 | 4.28% | (29.09)% | 53.31% | 15.07% | (0.75)% | 33.06% |
| Ratios to average net assets (annualized)* | ||||||
Gross expenses | 1.32% | 1.28% | 1.27% | 1.28% | 1.27% | 1.28% |
Net expenses | 1.20% | 1.20% | 1.20% | 1.20% | 1.20% | 1.20% |
Net investment loss | (0.82)% | (1.04)% | (1.05)% | (1.01)% | (0.94)% | (0.86)% |
| Supplemental data | ||||||
Portfolio turnover rate3 | 35% | 51% | 48% | 55% | 71% | 47% |
Net assets, end of period (000s omitted) | $17,978 | $17,676 | $28,730 | $21,250 | $23,549 | $52,335 |
| * | Ratios include net expenses allocated from the affiliated Master Portfolio which were as follows: |
| Six months ended November 30, 2022 (unaudited) | 0.84% |
| Year ended May 31, 2022 | 0.82% |
| Year ended May 31, 2021 | 0.81% |
| Year ended May 31, 2020 | 0.81% |
| Year ended May 31, 2019 | 0.81% |
| Year ended May 31, 2018 | 0.81% |
| 1 | Calculated based upon average shares outstanding |
| 2 | Returns for periods of less than one year are not annualized. |
| 3 | Portfolio turnover rate is calculated by multiplying the affiliated Master Portfolio’s percentage of the Fund’s total investment in securities at the end of the period by the affiliated Master Portfolio’s portfolio turnover rate. |
| Year ended May 31 | ||||||
| Institutional Class | Six months ended November 30, 2022 (unaudited) | 2022 | 2021 | 2020 | 2019 | 2018 |
Net asset value, beginning of period | $10.72 | $20.55 | $16.29 | $14.83 | $18.30 | $15.46 |
Net investment loss | (0.03) 1 | (0.14) 1 | (0.15) | (0.11) 1 | (0.13) | (0.09) |
Net realized and unrealized gains (losses) on investments | 0.51 | (4.18) | 8.56 | 2.33 | (0.16) | 4.88 |
Total from investment operations | 0.48 | (4.32) | 8.41 | 2.22 | (0.29) | 4.79 |
| Distributions to shareholders from | ||||||
Net realized gains | 0.00 | (5.51) | (4.15) | (0.76) | (3.18) | (1.95) |
Net asset value, end of period | $11.20 | $10.72 | $20.55 | $16.29 | $14.83 | $18.30 |
Total return2 | 4.48% | (28.95)% | 53.75% | 15.40% | (0.42)% | 33.44% |
| Ratios to average net assets (annualized)* | ||||||
Gross expenses | 1.07% | 1.02% | 1.02% | 1.03% | 1.02% | 1.03% |
Net expenses | 0.90% | 0.90% | 0.90% | 0.90% | 0.90% | 0.90% |
Net investment loss | (0.52)% | (0.75)% | (0.75)% | (0.71)% | (0.67)% | (0.56)% |
| Supplemental data | ||||||
Portfolio turnover rate3 | 35% | 51% | 48% | 55% | 71% | 47% |
Net assets, end of period (000s omitted) | $147,301 | $156,936 | $648,569 | $471,512 | $578,073 | $606,729 |
| * | Ratios include net expenses allocated from the affiliated Master Portfolio which were as follows: |
| Six months ended November 30, 2022 (unaudited) | 0.84% |
| Year ended May 31, 2022 | 0.82% |
| Year ended May 31, 2021 | 0.81% |
| Year ended May 31, 2020 | 0.81% |
| Year ended May 31, 2019 | 0.81% |
| Year ended May 31, 2018 | 0.81% |
| 1 | Calculated based upon average shares outstanding |
| 2 | Returns for periods of less than one year are not annualized. |
| 3 | Portfolio turnover rate is calculated by multiplying the affiliated Master Portfolio’s percentage of the Fund’s total investment in securities at the end of the period by the affiliated Master Portfolio’s portfolio turnover rate. |
| Gross unrealized gains | $90,988,751 |
| Gross unrealized losses | 0 |
| Net unrealized gains | $90,988,751 |
| Affiliated Master Portfolio | Investment objective | Fair value of affiliated Master Portfolio |
| Allspring Emerging Growth Portfolio | Seek long-term capital appreciation | $328,348,557 |
| Average daily net assets | Management fee |
| First $5 billion | 0.050% |
| Next $5 billion | 0.040 |
| Over $10 billion | 0.030 |
| Class-level administration fee | |
| Class A | 0.21% |
| Class C | 0.21 |
| Class R6 | 0.03 |
| Administrator Class | 0.13 |
| Institutional Class | 0.13 |
| Expense ratio caps | |
| Class A | 1.28% |
| Class C | 2.03 |
| Class R6 | 0.85 |
| Administrator Class | 1.20 |
| Institutional Class | 0.90 |
| Date | Value of securities issued | Cash paid | Realized gains (losses) | % of the Fund |
| 8-27-2021 | $348,404,897 | $1,817,058 | $176,872,468 | 39.45% |
| Shares | Value | ||||
| Common stocks: 95.66% | |||||
| Communication services: 0.36% | |||||
| Media: 0.36% | |||||
| TechTarget Incorporated † | 29,100 | $ 1,328,706 | |||
| Consumer discretionary: 8.73% | |||||
| Auto components: 1.65% | |||||
| Fox Factory Holding Corporation † | 56,618 | 6,007,170 | |||
| Hotels, restaurants & leisure: 4.96% | |||||
| First Watch Restaurant Group † | 107,863 | 1,691,292 | |||
| Hilton Grand Vacations Incorporated † | 131,900 | 5,806,238 | |||
| Papa John's International Incorporated | 81,665 | 6,799,428 | |||
| Wingstop Incorporated | 23,178 | 3,836,191 | |||
| 18,133,149 | |||||
| Specialty retail: 0.80% | |||||
| Boot Barn Holdings Incorporated † | 17,950 | 1,208,933 | |||
| Leslie's Incorporated † | 117,714 | 1,718,624 | |||
| 2,927,557 | |||||
| Textiles, apparel & luxury goods: 1.32% | |||||
| Crocs Incorporated † | 29,675 | 2,997,175 | |||
| Deckers Outdoor Corporation † | 4,603 | 1,836,045 | |||
| 4,833,220 | |||||
| Consumer staples: 6.08% | |||||
| Beverages: 2.18% | |||||
| Celsius Holdings Incorporated † | 30,185 | 3,360,798 | |||
| Duckhorn Portfolio Incorporated † | 209,771 | 3,368,922 | |||
| MGP Ingredients Incorporated | 9,800 | 1,225,588 | |||
| 7,955,308 | |||||
| Food & staples retailing: 2.15% | |||||
| The Chef's Warehouse Incorporated † | 202,395 | 7,863,046 | |||
| Food products: 0.81% | |||||
| The Simply Good Foods Company † | 73,900 | 2,948,610 | |||
| Personal products: 0.94% | |||||
| e.l.f. Beauty Incorporated † | 62,400 | 3,429,504 | |||
| Energy: 3.64% | |||||
| Energy equipment & services: 1.37% | |||||
| Helmerich & Payne Incorporated | 97,800 | 4,995,624 | |||
| Oil, gas & consumable fuels: 2.27% | |||||
| Matador Resources Company | 56,900 | 3,775,884 | |||
| Talos Energy Incorporated † | 44,400 | 872,460 | |||
| Viper Energy Partners LP | 110,000 | 3,633,300 | |||
| 8,281,644 |
| Shares | Value | ||||
| Financials: 4.88% | |||||
| Capital markets: 0.99% | |||||
| Stifel Financial Corporation | 56,066 | $ 3,602,241 | |||
| Insurance: 3.89% | |||||
| Kinsale Capital Group Incorporated | 46,093 | 14,206,324 | |||
| Health care: 25.16% | |||||
| Biotechnology: 4.68% | |||||
| Apellis Pharmaceuticals Incorporated † | 27,200 | 1,358,096 | |||
| Arcutis Biotherapeutics Incorporated † | 271,656 | 4,680,633 | |||
| Cytokinetics Incorporated † | 50,900 | 2,163,250 | |||
| Halozyme Therapeutics Incorporated † | 103,540 | 5,928,700 | |||
| Immunocore Holdings PLC ADR † | 26,200 | 1,645,622 | |||
| Vericel Corporation † | 56,933 | 1,299,780 | |||
| 17,076,081 | |||||
| Health care equipment & supplies: 14.67% | |||||
| Axonics Incorporated † | 101,150 | 6,926,752 | |||
| Inari Medical Incorporated † | 68,100 | 5,010,798 | |||
| Inspire Medical Systems Incorporated † | 29,299 | 7,077,759 | |||
| iRhythm Technologies Incorporated † | 41,800 | 4,558,290 | |||
| Lantheus Holdings Incorporated † | 26,200 | 1,626,496 | |||
| Orthopediatrics Corporation † | 71,681 | 3,153,247 | |||
| Outset Medical Incorporated † | 78,411 | 1,652,904 | |||
| Shockwave Medical Incorporated † | 29,625 | 7,512,900 | |||
| SI-BONE Incorporated † | 192,693 | 2,366,270 | |||
| Silk Road Medical Incorporated † | 68,924 | 3,670,203 | |||
| TransMedics Group Incorporated † | 136,486 | 8,444,389 | |||
| Treace Medical Concepts Incorporated † | 68,714 | 1,590,729 | |||
| 53,590,737 | |||||
| Health care providers & services: 2.55% | |||||
| Castle Biosciences Incorporated † | 96,756 | 2,282,474 | |||
| DocGo Incorporated †« | 79,900 | 587,265 | |||
| HealthEquity Incorporated † | 74,800 | 4,748,304 | |||
| Privia Health Group Incorporated † | 71,227 | 1,704,462 | |||
| 9,322,505 | |||||
| Health care technology: 0.72% | |||||
| Evolent Health Incorporated Class A † | 91,515 | 2,634,717 | |||
| Life sciences tools & services: 0.19% | |||||
| Akoya Biosciences Incorporated † | 52,846 | 685,941 | |||
| Pharmaceuticals: 2.35% | |||||
| Amylyx Pharmaceuticals Incorporated †« | 73,400 | 2,816,358 | |||
| Harmony Biosciences Holdings † | 42,800 | 2,558,156 | |||
| Pacira Biosciences Incorporated † | 16,999 | 820,202 | |||
| Revance Therapeutics Incorporated † | 110,200 | 2,392,442 | |||
| 8,587,158 | |||||
| Industrials: 15.70% | |||||
| Building products: 1.67% | |||||
| Zurn Water Solutions Corporation | 251,384 | 6,086,007 |
| Shares | Value | ||||
| Commercial services & supplies: 3.00% | |||||
| Casella Waste Systems Incorporated Class A † | 127,341 | $ 10,962,787 | |||
| Construction & engineering: 0.79% | |||||
| Construction Partners Incorporated Class A † | 56,385 | 1,612,611 | |||
| Dycom Industries Incorporated † | 14,170 | 1,291,454 | |||
| 2,904,065 | |||||
| Electrical equipment: 1.64% | |||||
| Array Technologies Incorporated † | 16,100 | 337,134 | |||
| Regal Rexnord Corporation | 19,617 | 2,571,985 | |||
| Shoals Technologies Group Class A † | 106,400 | 3,082,408 | |||
| 5,991,527 | |||||
| Machinery: 2.45% | |||||
| Evoqua Water Technologies Company † | 134,900 | 5,866,801 | |||
| SPX Technologies Incorporated † | 45,800 | 3,064,020 | |||
| 8,930,821 | |||||
| Professional services: 2.61% | |||||
| ASGN Incorporated † | 105,301 | 9,540,271 | |||
| Road & rail: 0.90% | |||||
| Marten Transport Limited | 33,400 | 711,754 | |||
| Saia Incorporated † | 10,611 | 2,584,733 | |||
| 3,296,487 | |||||
| Trading companies & distributors: 2.64% | |||||
| Applied Industrial Technologies Incorporated | 39,400 | 5,220,106 | |||
| SiteOne Landscape Supply Incorporated † | 35,127 | 4,409,492 | |||
| 9,629,598 | |||||
| Information technology: 31.11% | |||||
| Communications equipment: 2.94% | |||||
| Calix Incorporated † | 150,600 | 10,737,780 | |||
| Electronic equipment, instruments & components: 2.86% | |||||
| Novanta Incorporated † | 66,305 | 10,459,614 | |||
| IT services: 8.65% | |||||
| DigitalOcean Holdings Incorporated † | 114,850 | 3,425,976 | |||
| Endava plc ADR † | 47,014 | 3,606,444 | |||
| EVO Payments Incorporated Class A † | 159,917 | 5,390,802 | |||
| ExlService Holdings Incorporated † | 39,600 | 7,413,120 | |||
| Flywire Corporation † | 155,500 | 3,372,795 | |||
| Shift4 Payments Incorporated Class A † | 93,900 | 4,351,326 | |||
| WNS Holdings Limited ADR † | 47,600 | 4,013,632 | |||
| 31,574,095 | |||||
| Semiconductors & semiconductor equipment: 6.76% | |||||
| Allegro MicroSystems Incorporated † | 218,612 | 6,807,576 | |||
| Diodes Incorporated † | 91,486 | 8,437,754 | |||
| Semtech Corporation † | 188,456 | 5,793,137 | |||
| Silicon Laboratories Incorporated † | 25,074 | 3,646,763 | |||
| 24,685,230 |
| Shares | Value | ||||
| Software: 9.90% | |||||
| CyberArk Software Limited † | 30,615 | $ 4,563,778 | |||
| EngageSmart Incorporated † | 111,700 | 1,895,549 | |||
| Jamf Holding Corporation † | 134,018 | 2,851,903 | |||
| Paycor HCM Incorporated † | 206,395 | 5,968,943 | |||
| Sprout Social Incorporated Class A † | 58,196 | 3,451,023 | |||
| SPS Commerce Incorporated † | 98,696 | 14,040,493 | |||
| Verint Systems Incorporated † | 19,900 | 782,667 | |||
| Workiva Incorporated † | 32,520 | 2,619,811 | |||
| 36,174,167 | |||||
| Total Common stocks (Cost $250,103,323) | 349,381,691 |
| Investment companies: 0.98% | |||||
| Exchange-traded funds: 0.98% | |||||
| iShares Russell 2000 Growth ETF « | 15,600 | 3,579,732 | |||
| Total Investment companies (Cost $3,371,012) | 3,579,732 |
| Yield | |||||
| Short-term investments: 5.80% | |||||
| Investment companies: 5.80% | |||||
| Allspring Government Money Market Fund Select Class ♠∞ | 3.60% | 14,675,126 | 14,675,126 | ||
| Securities Lending Cash Investments LLC ♠∩∞ | 3.90 | 6,513,575 | 6,513,575 | ||
| Total Short-term investments (Cost $21,188,701) | 21,188,701 | ||||
| Total investments in securities (Cost $274,663,036) | 102.44% | 374,150,124 | |||
| Other assets and liabilities, net | (2.44) | (8,897,187) | |||
| Total net assets | 100.00% | $365,252,937 |
| † | Non-income-earning security |
| « | All or a portion of this security is on loan. |
| ♠ | The issuer of the security is an affiliated person of the Portfolio as defined in the Investment Company Act of 1940. |
| ∩ | The investment is a non-registered investment company purchased with cash collateral received from securities on loan. |
| ∞ | The rate represents the 7-day annualized yield at period end. |
| Abbreviations: | |
| ADR | American depositary receipt |
| Value, beginning of period | Purchases | Sales proceeds | Net realized gains (losses) | Net change in unrealized gains (losses) | Value, end of period | Shares, end of period | Income from affiliated securities | |||
| Short-term investments | ||||||||||
| Allspring Government Money Market Fund Select Class | $6,288,467 | $71,833,521 | $(63,446,862) | $ 0 | $0 | $ 14,675,126 | 14,675,126 | $ 111,144 | ||
| Securities Lending Cash Investments LLC | 3,803,495 | 56,483,690 | (53,773,794) | 184 | 0 | 6,513,575 | 6,513,575 | 70,279 # | ||
| $184 | $0 | $21,188,701 | $181,423 | |||||||
| # | Amount shown represents income before fees and rebates. |
| Assets | |
Investments in unaffiliated securities (including $6,380,108 of securities loaned), at value (cost $253,474,335) | $ 352,961,423 |
Investments in affiliated securities, at value (cost $21,188,701) | 21,188,701 |
Receivable for investments sold | 1,522,055 |
Receivable for dividends | 143,036 |
Receivable for securities lending income, net | 750 |
Prepaid expenses and other assets | 10,265 |
Total assets | 375,826,230 |
| Liabilities | |
Payable upon receipt of securities loaned | 6,513,575 |
Payable for investments purchased | 3,773,404 |
Advisory fee payable | 231,890 |
Accrued expenses and other liabilities | 54,424 |
Total liabilities | 10,573,293 |
Total net assets | $365,252,937 |
| Investment income | |
Dividends | $ 472,262 |
Income from affiliated securities | 111,144 |
Securities lending income (including from affiliate), net | 103,535 |
Total investment income | 686,941 |
| Expenses | |
Advisory fee | 1,447,304 |
Custody and accounting fees | 35,268 |
Professional fees | 24,154 |
Interest holder report expenses | 5,541 |
Trustees’ fees and expenses | 10,879 |
Other fees and expenses | 5,088 |
Total expenses | 1,528,234 |
Less: Fee waivers and/or expense reimbursements | (8,625) |
Net expenses | 1,519,609 |
Net investment loss | (832,668) |
| Realized and unrealized gains (losses) on investments | |
| Net realized gains (losses) on | |
Unaffiliated securities | (9,687,453) |
Affiliated securities | 184 |
Net realized losses on investments | (9,687,269) |
Net change in unrealized gains (losses) on investments | 26,004,611 |
Net realized and unrealized gains (losses) on investments | 16,317,342 |
Net increase in net assets resulting from operations | $15,484,674 |
| Six months ended November 30, 2022 (unaudited) | Year ended May 31, 2022 | |
| Operations | ||
Net investment loss | $ (832,668) | $ (4,149,201) |
Net realized gains (losses) on investments | (9,687,269) | 254,745,270 |
Net change in unrealized gains (losses) on investments | 26,004,611 | (361,893,191) |
Net increase (decrease) in net assets resulting from operations | 15,484,674 | (111,297,122) |
| Capital transactions | ||
| Transactions in investors’ beneficial interests | ||
Contributions | 11,587,018 | 75,769,980 |
Withdrawals | (33,790,822) | (550,022,954) |
Net decrease in net assets resulting from capital transactions | (22,203,804) | (474,252,974) |
Total decrease in net assets | (6,719,130) | (585,550,096) |
| Net assets | ||
Beginning of period | 371,972,067 | 957,522,163 |
End of period | $365,252,937 | $ 371,972,067 |
| Year ended May 31 | ||||||
| Six months ended November 30, 2022 (unaudited) | 2022 | 2021 | 2020 | 2019 | 2018 | |
Total return1 | 4.50% | (28.85)% | 53.94% | 15.49% | (0.28)% | 33.60% |
| Ratios to average net assets (annualized) | ||||||
Gross expenses | 0.84% | 0.82% | 0.81% | 0.81% | 0.81% | 0.81% |
Net expenses2 | 0.84% | 0.82% | 0.81% | 0.81% | 0.81% | 0.81% |
Net investment loss | (0.46)% | (0.67)% | (0.66)% | (0.62)% | (0.57)% | (0.47)% |
| Supplemental data | ||||||
Portfolio turnover rate | 35% | 51% | 48% | 55% | 71% | 47% |
| 1 | Returns for periods of less than one year are not annualized. |
| 2 | Net expense ratios reflect voluntary waivers, if any. |
| Gross unrealized gains | $118,390,966 |
| Gross unrealized losses | (17,662,431) |
| Net unrealized gains | $100,728,535 |
| ■ | Level 1 – quoted prices in active markets for identical securities |
| ■ | Level 2 – other significant observable inputs (including quoted prices for similar securities, interest rates, prepayment speeds, credit risk, etc.) |
| ■ | Level 3 – significant unobservable inputs (including the Portfolio’s own assumptions in determining the fair value of investments) |
| Quoted prices (Level 1) | Other significant observable inputs (Level 2) | Significant unobservable inputs (Level 3) | Total | |
| Assets | ||||
| Investments in: | ||||
| Common stocks | ||||
| Communication services | $ 1,328,706 | $0 | $0 | $ 1,328,706 |
| Consumer discretionary | 31,901,096 | 0 | 0 | 31,901,096 |
| Consumer staples | 22,196,468 | 0 | 0 | 22,196,468 |
| Energy | 13,277,268 | 0 | 0 | 13,277,268 |
| Financials | 17,808,565 | 0 | 0 | 17,808,565 |
| Health care | 91,897,139 | 0 | 0 | 91,897,139 |
| Industrials | 57,341,563 | 0 | 0 | 57,341,563 |
| Information technology | 113,630,886 | 0 | 0 | 113,630,886 |
| Investment companies | 3,579,732 | 0 | 0 | 3,579,732 |
| Short-term investments | ||||
| Investment companies | 21,188,701 | 0 | 0 | 21,188,701 |
| Total assets | $374,150,124 | $0 | $0 | $374,150,124 |
| Average daily net assets | Advisory fee |
| First $500 million | 0.800% |
| Next $500 million | 0.775 |
| Next $1 billion | 0.750 |
| Next $1 billion | 0.725 |
| Next $1 billion | 0.700 |
| Over $4 billion | 0.680 |
| Counterparty | Value of securities on loan | Collateral received1 | Net amount |
| Bank of America Securities Incorporated | $3,297,144 | $(3,297,144) | $0 |
| Citigroup Global Markets Incorporated | 2,578,900 | (2,578,900) | 0 |
| National Financial Services LLC | 504,064 | (504,064) | 0 |
| Name and year of birth | Position held and length of service* | Principal occupations during past five years or longer | Current other public company or investment company directorships |
| William R. Ebsworth (Born 1957) | Trustee, since 2015 | Retired. From 1984 to 2013, equities analyst, portfolio manager, research director and chief investment officer at Fidelity Management and Research Company in Boston, Tokyo, and Hong Kong, and retired in 2013 as Chief Investment Officer of Fidelity Strategic Advisers, Inc. where he led a team of investment professionals managing client assets. Prior thereto, Board member of Hong Kong Securities Clearing Co., Hong Kong Options Clearing Corp., the Thailand International Fund, Ltd., Fidelity Investments Life Insurance Company, and Empire Fidelity Investments Life Insurance Company. Audit Committee Chair and Investment Committee Chair of the Vincent Memorial Hospital Endowment (non-profit organization). Mr. Ebsworth is a CFA® charterholder. | N/A |
| Jane A. Freeman (Born 1953) | Trustee, since 2015; Chair Liaison, since 2018 | Retired. From 2012 to 2014 and 1999 to 2008, Chief Financial Officer of Scientific Learning Corporation. From 2008 to 2012, Ms. Freeman provided consulting services related to strategic business projects. Prior to 1999, Portfolio Manager at Rockefeller & Co. and Scudder, Stevens & Clark. Board member of the Harding Loevner Funds from 1996 to 2014, serving as both Lead Independent Director and chair of the Audit Committee. Board member of the Russell Exchange Traded Funds Trust from 2011 to 2012 and the chair of the Audit Committee. Ms. Freeman is also an inactive Chartered Financial Analyst. | N/A |
| Isaiah Harris, Jr. (Born 1952) | Trustee, since 2009; Audit Committee Chair, since 2019 | Retired. Chairman of the Board of CIGNA Corporation from 2009 to 2021, and Director from 2005 to 2008. From 2003 to 2011, Director of Deluxe Corporation. Prior thereto, President and CEO of BellSouth Advertising and Publishing Corp. from 2005 to 2007, President and CEO of BellSouth Enterprises from 2004 to 2005 and President of BellSouth Consumer Services from 2000 to 2003. Emeritus member of the Iowa State University Foundation Board of Governors. Emeritus Member of the Advisory Board of Iowa State University School of Business. Advisory Board Member, Palm Harbor Academy (private school). Advisory Board Member, Fellowship of Christian Athletes. Mr. Harris is a certified public accountant (inactive status). | N/A |
| David F. Larcker (Born 1950) | Trustee, since 2009 | James Irvin Miller Professor of Accounting at the Graduate School of Business (Emeritus), Stanford University, Director of the Corporate Governance Research Initiative and Senior Faculty of The Rock Center for Corporate Governance since 2006. From 2005 to 2008, Professor of Accounting at the Graduate School of Business, Stanford University. Prior thereto, Ernst & Young Professor of Accounting at The Wharton School, University of Pennsylvania from 1985 to 2005. | N/A |
| Name and year of birth | Position held and length of service* | Principal occupations during past five years or longer | Current other public company or investment company directorships |
| Olivia S. Mitchell (Born 1953) | Trustee, since 2006; Nominating and Governance Committee Chair, since 2018 | International Foundation of Employee Benefit Plans Professor since 1993, Wharton School of the University of Pennsylvania. Director of Wharton’s Pension Research Council and Boettner Center on Pensions & Retirement Research, and Research Associate at the National Bureau of Economic Research. Previously taught at Cornell University from 1978 to 1993. | N/A |
| Timothy J. Penny (Born 1951) | Trustee, since 1996; Chair, since 2018 | President and Chief Executive Officer of Southern Minnesota Initiative Foundation, a non-profit organization, since 2007. Vice Chair of the Economic Club of Minnesota, since 2007. Co-Chair of the Committee for a Responsible Federal Budget, since 1995. Member of the Board of Trustees of NorthStar Education Finance, Inc., a non-profit organization, since 2007. Senior Fellow of the University of Minnesota Humphrey Institute from 1995 to 2017. | N/A |
| James G. Polisson (Born 1959) | Trustee, since 2018 | Retired. Chief Marketing Officer, Source (ETF) UK Services, Ltd, from 2015 to 2017. From 2012 to 2015, Principal of The Polisson Group, LLC, a management consulting, corporate advisory and principal investing company. Chief Executive Officer and Managing Director at Russell Investments, Global Exchange Traded Funds from 2010 to 2012. Managing Director of Barclays Global Investors from 1998 to 2010 and Global Chief Marketing Officer for iShares and Barclays Global Investors from 2000 to 2010. Trustee of the San Francisco Mechanics’ Institute, a non-profit organization, from 2013 to 2015. Board member of the Russell Exchange Traded Fund Trust from 2011 to 2012. Director of Barclays Global Investors Holdings Deutschland GmbH from 2006 to 2009. Mr. Polisson is an attorney and has a retired status with the Massachusetts and District of Columbia Bar Associations. | N/A |
| Pamela Wheelock (Born 1959) | Trustee, since January 2020; previously Trustee from January 2018 to July 2019 | Retired. Executive and Senior Financial leadership positions in the public, private and nonprofit sectors. Interim President and CEO, McKnight Foundation, 2020. Interim Commissioner, Minnesota Department of Human Services, 2019. Chief Operating Officer, Twin Cities Habitat for Humanity, 2017-2019. Vice President for University Services, University of Minnesota, 2012-2016. Interim President and CEO, Blue Cross and Blue Shield of Minnesota, 2011-2012. Executive Vice-President and Chief Financial Officer, Minnesota Wild, 2002-2008. Commissioner, Minnesota Department of Finance, 1999-2002. Chair of the Board of Directors of Destination Medical Center Corporation. Board member of the Minnesota Wild Foundation. | N/A |
| Name and year of birth | Position held and length of service | Principal occupations during past five years or longer |
| Andrew Owen (Born 1960) | President, since 2017 | President and Chief Executive Officer of Allspring Funds Management, LLC since 2017 and Head of Global Fund Governance of Allspring Global Investments since 2022. Prior thereto, co-president of Galliard Capital Management, LLC, an affiliate of Allspring Funds Management, LLC, from 2019 to 2022 and Head of Affiliated Managers, Allspring Global Investments, from 2014 to 2019 and Executive Vice President responsible for marketing, investments and product development for Allspring Funds Management, LLC, from 2009 to 2014. |
| Jeremy DePalma (Born 1974) | Treasurer, since 2012 (for certain funds in the Fund Complex); since 2021 (for the remaining funds in the Fund Complex) | Senior Vice President of Allspring Funds Management, LLC since 2009. Senior Vice President of Evergreen Investment Management Company, LLC from 2008 to 2010 and head of the Fund Reporting and Control Team within Fund Administration from 2005 to 2010. |
| Christopher Baker (Born 1976) | Chief Compliance Officer, since 2022 | Global Chief Compliance Officer for Allspring Global Investments since 2022. Prior thereto, Chief Compliance Officer for State Street Global Advisors from 2018 to 2021. Senior Compliance Officer for the State Street divisions of Alternative Investment Solutions, Sector Solutions, and Global Marketing from 2015 to 2018. From 2010 to 2015 Vice President, Global Head of Investment and Marketing Compliance for State Street Global Advisors. |
| Matthew Prasse (Born 1983) | Chief Legal Officer, since 2022; Secretary, since 2021 | Senior Counsel of the Allspring Legal Department since 2021. Senior Counsel of the Wells Fargo Legal Department from 2018 to 2021. Previously, Counsel for Barings LLC from 2015 to 2018. Prior to joining Barings, Associate at Morgan, Lewis & Bockius LLP from 2008 to 2015. |
P.O. Box 219967
Kansas City, MO 64121-9967

1-800-222-8222 or visit the Fund's website at allspringglobal.com. Read the prospectus carefully before you invest or send money.
SA282/SAR282 11-22


| 1 | The S&P 500 Index consists of 500 stocks chosen for market size, liquidity, and industry group representation. It is a market-value-weighted index with each stock's weight in the index proportionate to its market value. You cannot invest directly in an index. |
| 2 | The Morgan Stanley Capital International (MSCI) All Country World Index (ACWI) ex USA Index (Net) is a free-float-adjusted market-capitalization-weighted index that is designed to measure the equity market performance of developed and emerging markets, excluding the U.S. Source: MSCI. MSCI makes no express or implied warranties or representations and shall have no liability whatsoever with respect to any MSCI data contained herein. The MSCI data may not be further redistributed or used as a basis for other indexes or any securities or financial products. This report is not approved, reviewed, or produced by MSCI. You cannot invest directly in an index. |
| 3 | The MSCI Emerging Markets (EM) Index (Net) (USD) is a free-float-adjusted market-capitalization-weighted index that is designed to measure equity market performance of emerging markets. You cannot invest directly in an index. |
| 4 | The Bloomberg U.S. Aggregate Bond Index is a broad-based benchmark that measures the investment-grade, U.S.-dollar-denominated, fixed-rate taxable bond market, including Treasuries, government-related and corporate securities, mortgage-backed securities (agency fixed-rate and hybrid adjustable-rate mortgage pass-throughs), asset-backed securities, and commercial mortgage-backed securities. You cannot invest directly in an index. |
| 5 | The Bloomberg Global Aggregate ex-USD Index (unhedged) is an unmanaged index that provides a broad-based measure of the global investment-grade fixed-income markets excluding the U.S.-dollar-denominated debt market. You cannot invest directly in an index. |
| 6 | The Bloomberg Municipal Bond Index is an unmanaged index composed of long-term tax-exempt bonds with a minimum credit rating of Baa. You cannot invest directly in an index. |
| 7 | The ICE BofA U.S. High Yield Index is a market-capitalization-weighted index of domestic and Yankee high-yield bonds. The index tracks the performance of high-yield securities traded in the U.S. bond market. You cannot invest directly in an index. Copyright 2023. ICE Data Indices, LLC. All rights reserved. |

President
Allspring Funds
| Investment objective | The Fund seeks to replicate the total returns of the S&P 500 Index, before fees and expenses. |
| Manager | Allspring Funds Management, LLC |
| Subadviser | Allspring Global Investments, LLC |
| Portfolio managers | John R. Campbell, CFA®‡, David Neal, CFA®‡, Robert M. Wicentowski, CFA®‡ |
| Average annual total returns (%) as of November 30, 2022 | |||||||||||
| Including sales charge | Excluding sales charge | Expense ratios1 (%) | |||||||||
| Inception date | 1 year | 5 year | 10 year | 1 year | 5 year | 10 year | Gross | Net 2 | |||
| Class A (WFILX) | 11-4-1998 | -14.82 | 9.12 | 12.10 | -9.62 | 10.42 | 12.77 | 0.63 | 0.45 | ||
| Class C (WFINX) | 4-30-1999 | -11.29 | 9.62 | 12.11 | -10.29 | 9.62 | 12.11 | 1.38 | 1.20 | ||
| Administrator Class (WFIOX) | 2-14-1985 | – | – | – | -9.43 | 10.64 | 13.03 | 0.40 | 0.25 | ||
| S&P 500 Index3 | – | – | – | – | -9.21 | 10.98 | 13.34 | – | – | ||
| 1 | Reflects the expense ratios as stated in the most recent prospectuses. The expense ratios shown are subject to change and may differ from the annualized expense ratios shown in the financial highlights of this report. |
| 2 | The manager has contractually committed through September 30, 2023, to waive fees and/or reimburse expenses to the extent necessary to cap total annual fund operating expenses after fee waivers at 0.45% for Class A, 1.20% for Class C and 0.25% for Administrator Class. Brokerage commissions, stamp duty fees, interest, taxes, acquired fund fees and expenses (if any), and extraordinary expenses are excluded from the expense caps. Prior to or after the commitment expiration date, the caps may be increased or the commitment to maintain the caps may be terminated only with the approval of the Board of Trustees. Without these caps, the Fund’s returns would have been lower. The expense ratio paid by an investor is the net expense ratio (the total annual fund operating expenses after fee waivers) as stated in the prospectuses. |
| 3 | The S&P 500 Index consists of 500 stocks chosen for market size, liquidity, and industry group representation. It is a market-value weighted index with each stock’s weight in the index proportionate to its market value. You cannot invest directly in an index. |
| ‡ | CFA® and Chartered Financial Analyst® are trademarks owned by CFA Institute. |
| Ten largest holdings (%) as of November 30, 20221 | |
| Apple Incorporated | 6.36 |
| Microsoft Corporation | 5.41 |
| Amazon.com Incorporated | 2.43 |
| Alphabet Incorporated Class A | 1.72 |
| Berkshire Hathaway Incorporated Class B | 1.63 |
| Alphabet Incorporated Class C | 1.55 |
| Tesla Motors Incorporated | 1.47 |
| UnitedHealth Group Incorporated | 1.46 |
| Johnson & Johnson | 1.33 |
| Exxon Mobil Corporation | 1.32 |
| 1 | Figures represent the percentage of the Fund's net assets. Holdings are subject to change and may have changed since the date specified. |
| Sector allocation as of November 30, 20221 |
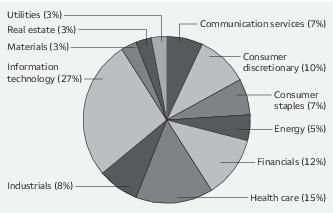
| 1 | Figures represent the percentage of the Fund's long-term investments. Allocations are subject to change and may have changed since the date specified. |
| Beginning account value 6-1-2022 | Ending account value 11-30-2022 | Expenses paid during the period1 | Annualized net expense ratio | |
| Class A | ||||
| Actual | $1,000.00 | $ 993.62 | $2.20 | 0.44% |
| Hypothetical (5% return before expenses) | $1,000.00 | $1,022.86 | $2.23 | 0.44% |
| Class C | ||||
| Actual | $1,000.00 | $ 990.11 | $5.99 | 1.20% |
| Hypothetical (5% return before expenses) | $1,000.00 | $1,019.05 | $6.07 | 1.20% |
| Administrator Class | ||||
| Actual | $1,000.00 | $ 994.86 | $1.25 | 0.25% |
| Hypothetical (5% return before expenses) | $1,000.00 | $1,023.82 | $1.27 | 0.25% |
| Shares | Value | ||||
| Common stocks: 97.56% | |||||
| Communication services: 7.27% | |||||
| Diversified telecommunication services: 0.87% | |||||
| AT&T Incorporated | 223,547 | $ 4,309,986 | |||
| Lumen Technologies Incorporated | 29,881 | 163,449 | |||
| Verizon Communications Incorporated | 131,748 | 5,135,537 | |||
| 9,608,972 | |||||
| Entertainment: 1.29% | |||||
| Activision Blizzard Incorporated | 22,333 | 1,651,525 | |||
| Electronic Arts Incorporated | 8,286 | 1,083,643 | |||
| Live Nation Entertainment Incorporated † | 4,457 | 324,291 | |||
| Netflix Incorporated † | 13,951 | 4,262,449 | |||
| Take-Two Interactive Software Incorporated † | 4,915 | 519,466 | |||
| The Walt Disney Company † | 57,191 | 5,597,283 | |||
| Warner Bros. Discovery Incorporated † | 69,301 | 790,031 | |||
| 14,228,688 | |||||
| Interactive media & services: 4.08% | |||||
| Alphabet Incorporated Class A † | 188,099 | 18,996,118 | |||
| Alphabet Incorporated Class C † | 168,204 | 17,064,296 | |||
| Match Group Incorporated † | 8,877 | 448,821 | |||
| Meta Platforms Incorporated Class A † | 71,546 | 8,449,583 | |||
| 44,958,818 | |||||
| Media: 0.77% | |||||
| Charter Communications Incorporated Class A † | 3,478 | 1,360,907 | |||
| Comcast Corporation Class A | 138,150 | 5,061,816 | |||
| DISH Network Corporation Class A † | 7,874 | 126,378 | |||
| Fox Corporation Class A | 9,614 | 311,974 | |||
| Fox Corporation Class B | 4,415 | 134,746 | |||
| Interpublic Group of Companies Incorporated | 12,267 | 421,494 | |||
| News Corporation Class A | 12,096 | 231,638 | |||
| News Corporation Class B | 3,747 | 72,879 | |||
| Omnicom Group Incorporated | 6,426 | 512,538 | |||
| Paramount Global Class B | 15,841 | 318,087 | |||
| 8,552,457 | |||||
| Wireless telecommunication services: 0.26% | |||||
| T-Mobile US Incorporated † | 18,883 | 2,860,019 | |||
| Consumer discretionary: 10.15% | |||||
| Auto components: 0.11% | |||||
| Aptiv plc † | 8,499 | 906,588 | |||
| BorgWarner Incorporated | 7,430 | 315,849 | |||
| 1,222,437 | |||||
| Automobiles: 1.80% | |||||
| Ford Motor Company | 123,895 | 1,722,141 | |||
| General Motors Company | 45,740 | 1,855,214 | |||
| Tesla Motors Incorporated † | 83,554 | 16,267,964 | |||
| 19,845,319 |
| Shares | Value | ||||
| Distributors: 0.15% | |||||
| Genuine Parts Company | 4,437 | $ 813,435 | |||
| LKQ Corporation | 8,177 | 444,256 | |||
| Pool Corporation | 1,242 | 409,127 | |||
| 1,666,818 | |||||
| Hotels, restaurants & leisure: 1.97% | |||||
| Booking Holdings Incorporated † | 1,246 | 2,590,995 | |||
| Caesars Entertainment Incorporated † | 6,726 | 341,748 | |||
| Carnival Corporation † | 30,965 | 307,482 | |||
| Chipotle Mexican Grill Incorporated † | 871 | 1,417,082 | |||
| Darden Restaurants Incorporated | 3,845 | 565,177 | |||
| Domino's Pizza Incorporated | 1,126 | 437,710 | |||
| Expedia Group Incorporated † | 4,769 | 509,520 | |||
| Hilton Worldwide Holdings Incorporated | 8,605 | 1,227,245 | |||
| Las Vegas Sands Corporation † | 10,308 | 482,827 | |||
| Marriott International Incorporated Class A | 8,654 | 1,430,939 | |||
| McDonald's Corporation | 23,080 | 6,295,993 | |||
| MGM Resorts International | 10,235 | 377,262 | |||
| Norwegian Cruise Line Holdings Limited † | 13,219 | 217,320 | |||
| Royal Caribbean Cruises Limited † | 6,881 | 412,378 | |||
| Starbucks Corporation | 35,995 | 3,678,689 | |||
| Wynn Resorts Limited † | 3,247 | 271,644 | |||
| Yum! Brands Incorporated | 8,926 | 1,148,419 | |||
| 21,712,430 | |||||
| Household durables: 0.31% | |||||
| D.R. Horton Incorporated | 9,920 | 853,120 | |||
| Garmin Limited | 4,840 | 450,072 | |||
| Lennar Corporation Class A | 7,999 | 702,552 | |||
| Mohawk Industries Incorporated † | 1,654 | 167,600 | |||
| Newell Rubbermaid Incorporated | 11,807 | 153,137 | |||
| NVR Incorporated † | 97 | 449,984 | |||
| PulteGroup Incorporated | 7,262 | 325,192 | |||
| Whirlpool Corporation | 1,710 | 250,566 | |||
| 3,352,223 | |||||
| Internet & direct marketing retail: 2.55% | |||||
| Amazon.com Incorporated † | 278,044 | 26,842,368 | |||
| eBay Incorporated | 17,234 | 783,113 | |||
| Etsy Incorporated † | 3,972 | 524,661 | |||
| 28,150,142 | |||||
| Leisure products: 0.02% | |||||
| Hasbro Incorporated | 4,072 | 255,803 | |||
| Multiline retail: 0.48% | |||||
| Dollar General Corporation | 7,121 | 1,820,697 | |||
| Dollar Tree Incorporated † | 6,622 | 995,220 | |||
| Target Corporation | 14,546 | 2,430,200 | |||
| 5,246,117 | |||||
| Specialty retail: 2.29% | |||||
| Advance Auto Parts Incorporated | 1,902 | 287,183 | |||
| AutoZone Incorporated † | 611 | 1,575,769 | |||
| Bath & Body Works Incorporated | 7,162 | 304,385 |
| Shares | Value | ||||
| Specialty retail (continued) | |||||
| Best Buy Company Incorporated | 6,287 | $ 536,281 | |||
| CarMax Incorporated † | 4,993 | 346,314 | |||
| Lowe's Companies Incorporated | 20,050 | 4,261,628 | |||
| O'Reilly Automotive Incorporated † | 2,000 | 1,729,080 | |||
| Ross Stores Incorporated | 10,977 | 1,291,664 | |||
| The Home Depot Incorporated | 32,241 | 10,445,762 | |||
| The TJX Companies Incorporated | 36,755 | 2,942,238 | |||
| Tractor Supply Company | 3,482 | 788,011 | |||
| Ulta Beauty Incorporated † | 1,626 | 755,830 | |||
| 25,264,145 | |||||
| Textiles, apparel & luxury goods: 0.47% | |||||
| Nike Incorporated Class B | 39,642 | 4,348,331 | |||
| Ralph Lauren Corporation | 1,346 | 152,260 | |||
| Tapestry Incorporated | 7,899 | 298,345 | |||
| VF Corporation | 10,359 | 339,982 | |||
| 5,138,918 | |||||
| Consumer staples: 6.82% | |||||
| Beverages: 1.82% | |||||
| Brown-Forman Corporation Class B | 5,736 | 418,843 | |||
| Constellation Brands Incorporated Class A | 5,039 | 1,296,787 | |||
| Keurig Dr. Pepper Incorporated | 26,654 | 1,030,710 | |||
| Molson Coors Brewing Company Class B | 5,904 | 325,369 | |||
| Monster Beverage Corporation † | 12,066 | 1,241,109 | |||
| PepsiCo Incorporated | 43,294 | 8,031,470 | |||
| The Coca-Cola Company | 122,100 | 7,766,781 | |||
| 20,111,069 | |||||
| Food & staples retailing: 1.60% | |||||
| Costco Wholesale Corporation | 13,896 | 7,493,418 | |||
| Sysco Corporation | 15,983 | 1,382,689 | |||
| The Kroger Company | 20,427 | 1,004,804 | |||
| Walgreens Boots Alliance Incorporated | 22,503 | 933,875 | |||
| Walmart Incorporated | 44,716 | 6,815,613 | |||
| 17,630,399 | |||||
| Food products: 1.12% | |||||
| Archer Daniels Midland Company | 17,585 | 1,714,538 | |||
| Campbell Soup Company | 6,318 | 339,087 | |||
| ConAgra Foods Incorporated | 15,061 | 572,017 | |||
| General Mills Incorporated | 18,688 | 1,594,086 | |||
| Hormel Foods Corporation | 9,079 | 426,713 | |||
| Kellogg Company | 8,002 | 583,746 | |||
| Lamb Weston Holdings Incorporated | 4,509 | 391,832 | |||
| McCormick & Company Incorporated | 7,857 | 669,259 | |||
| Mondelez International Incorporated Class A | 42,996 | 2,906,960 | |||
| The Hershey Company | 4,607 | 1,083,428 | |||
| The J.M. Smucker Company | 3,343 | 514,855 | |||
| The Kraft Heinz Company | 24,988 | 983,278 | |||
| Tyson Foods Incorporated Class A | 9,085 | 602,154 | |||
| 12,381,953 |
| Shares | Value | ||||
| Household products: 1.44% | |||||
| Church & Dwight Company Incorporated | 7,620 | $ 623,849 | |||
| Colgate-Palmolive Company | 26,167 | 2,027,419 | |||
| Kimberly-Clark Corporation | 10,591 | 1,436,457 | |||
| The Clorox Company | 3,864 | 574,384 | |||
| The Procter & Gamble Company | 74,962 | 11,181,332 | |||
| 15,843,441 | |||||
| Personal products: 0.16% | |||||
| The Estee Lauder Companies Incorporated Class A | 7,272 | 1,714,665 | |||
| Tobacco: 0.68% | |||||
| Altria Group Incorporated | 56,493 | 2,631,444 | |||
| Philip Morris International Incorporated | 48,630 | 4,846,952 | |||
| 7,478,396 | |||||
| Energy: 5.00% | |||||
| Energy equipment & services: 0.39% | |||||
| Baker Hughes Company | 31,739 | 921,066 | |||
| Halliburton Company | 28,451 | 1,078,008 | |||
| Schlumberger Limited | 44,370 | 2,287,274 | |||
| 4,286,348 | |||||
| Oil, gas & consumable fuels: 4.61% | |||||
| APA Corporation | 10,243 | 479,885 | |||
| Chevron Corporation | 56,494 | 10,355,915 | |||
| ConocoPhillips | 39,936 | 4,932,495 | |||
| Coterra Energy Incorporated | 24,958 | 696,578 | |||
| Devon Energy Corporation | 20,542 | 1,407,538 | |||
| Diamondback Energy Incorporated | 5,576 | 825,360 | |||
| EOG Resources Incorporated | 18,385 | 2,609,383 | |||
| EQT Corporation | 11,606 | 492,210 | |||
| Exxon Mobil Corporation | 130,742 | 14,556,814 | |||
| Hess Corporation | 8,742 | 1,258,061 | |||
| Kinder Morgan Incorporated | 62,197 | 1,189,207 | |||
| Marathon Oil Corporation | 21,256 | 651,071 | |||
| Marathon Petroleum Corporation | 15,642 | 1,905,352 | |||
| Occidental Petroleum Corporation | 23,377 | 1,624,468 | |||
| ONEOK Incorporated | 14,018 | 938,085 | |||
| Phillips 66 | 15,091 | 1,636,468 | |||
| Pioneer Natural Resources Company | 7,487 | 1,766,857 | |||
| Targa Resources Corporation | 7,107 | 528,690 | |||
| The Williams Companies Incorporated | 38,226 | 1,326,442 | |||
| Valero Energy Corporation | 12,359 | 1,651,410 | |||
| 50,832,289 | |||||
| Financials: 11.33% | |||||
| Banks: 3.81% | |||||
| Bank of America Corporation | 219,302 | 8,300,581 | |||
| Citigroup Incorporated | 60,756 | 2,941,198 | |||
| Citizens Financial Group Incorporated | 15,549 | 658,967 | |||
| Comerica Incorporated | 4,104 | 294,421 | |||
| Fifth Third Bancorp | 21,526 | 782,685 | |||
| First Republic Bank | 5,732 | 731,461 | |||
| Huntington Bancshares Incorporated | 45,243 | 700,362 |
| Shares | Value | ||||
| Banks (continued) | |||||
| JPMorgan Chase & Company | 91,997 | $ 12,712,145 | |||
| KeyCorp | 29,258 | 550,343 | |||
| M&T Bank Corporation | 5,509 | 936,640 | |||
| PNC Financial Services Group Incorporated | 12,866 | 2,164,833 | |||
| Regions Financial Corporation | 29,313 | 680,355 | |||
| Signature Bank | 1,974 | 275,373 | |||
| SVB Financial Group † | 1,853 | 429,488 | |||
| Truist Financial Corporation | 41,610 | 1,947,764 | |||
| US Bancorp | 42,415 | 1,925,217 | |||
| Wells Fargo & Company | 118,991 | 5,705,618 | |||
| Zions Bancorporation | 4,720 | 244,590 | |||
| 41,982,041 | |||||
| Capital markets: 3.05% | |||||
| Ameriprise Financial Incorporated | 3,393 | 1,126,306 | |||
| Bank of New York Mellon Corporation | 23,069 | 1,058,867 | |||
| BlackRock Incorporated | 4,730 | 3,386,680 | |||
| Cboe Global Markets Incorporated | 3,327 | 421,997 | |||
| CME Group Incorporated | 11,276 | 1,990,214 | |||
| FactSet Research Systems Incorporated | 1,191 | 549,396 | |||
| Franklin Resources Incorporated | 8,911 | 238,904 | |||
| Intercontinental Exchange Incorporated | 17,519 | 1,897,483 | |||
| Invesco Limited | 14,271 | 272,719 | |||
| MarketAxess Holdings Incorporated | 1,181 | 316,414 | |||
| Moody's Corporation | 4,951 | 1,476,735 | |||
| Morgan Stanley | 42,009 | 3,909,778 | |||
| MSCI Incorporated | 2,525 | 1,282,271 | |||
| Northern Trust Corporation | 6,537 | 608,660 | |||
| Raymond James Financial Incorporated | 6,094 | 712,389 | |||
| S&P Global Incorporated | 10,688 | 3,770,726 | |||
| State Street Corporation | 11,532 | 918,754 | |||
| T. Rowe Price Group Incorporated | 7,080 | 884,363 | |||
| The Charles Schwab Corporation | 47,901 | 3,953,749 | |||
| The Goldman Sachs Group Incorporated | 10,709 | 4,135,280 | |||
| The NASDAQ Incorporated | 10,633 | 727,935 | |||
| 33,639,620 | |||||
| Consumer finance: 0.52% | |||||
| American Express Company | 18,816 | 2,965,213 | |||
| Capital One Financial Corporation | 12,041 | 1,243,113 | |||
| Discover Financial Services | 8,570 | 928,645 | |||
| Synchrony Financial | 15,113 | 567,947 | |||
| 5,704,918 | |||||
| Diversified financial services: 1.63% | |||||
| Berkshire Hathaway Incorporated Class B † | 56,619 | 18,038,813 | |||
| Insurance: 2.32% | |||||
| AFLAC Incorporated | 18,040 | 1,297,618 | |||
| American International Group Incorporated | 23,855 | 1,505,489 | |||
| Aon plc Class A | 6,617 | 2,039,889 | |||
| Arch Capital Group Limited † | 11,580 | 693,758 | |||
| Arthur J. Gallagher & Company | 6,598 | 1,313,728 | |||
| Assurant Incorporated | 1,669 | 213,999 | |||
| Brown & Brown Incorporated | 7,354 | 438,225 | |||
| Chubb Limited | 13,102 | 2,877,068 |
| Shares | Value | ||||
| Insurance (continued) | |||||
| Cincinnati Financial Corporation | 4,994 | $ 554,134 | |||
| Everest Reinsurance Group Limited | 1,236 | 417,694 | |||
| Globe Life Incorporated | 2,843 | 341,046 | |||
| Lincoln National Corporation | 4,859 | 189,209 | |||
| Loews Corporation | 6,274 | 364,833 | |||
| Marsh & McLennan Companies Incorporated | 15,655 | 2,711,133 | |||
| MetLife Incorporated | 21,018 | 1,612,081 | |||
| Principal Financial Group Incorporated | 7,271 | 652,063 | |||
| Progressive Corporation | 18,349 | 2,424,820 | |||
| Prudential Financial Incorporated | 11,670 | 1,260,710 | |||
| The Allstate Corporation | 8,479 | 1,135,338 | |||
| The Hartford Financial Services Group Incorporated | 10,137 | 774,163 | |||
| The Travelers Companies Incorporated | 7,445 | 1,413,135 | |||
| W.R. Berkley Corporation | 6,408 | 488,802 | |||
| Willis Towers Watson plc | 3,450 | 849,252 | |||
| 25,568,187 | |||||
| Health care: 14.85% | |||||
| Biotechnology: 2.35% | |||||
| AbbVie Incorporated | 55,466 | 8,940,010 | |||
| Amgen Incorporated | 16,781 | 4,806,078 | |||
| Biogen Incorporated † | 4,552 | 1,389,134 | |||
| Gilead Sciences Incorporated | 39,319 | 3,453,388 | |||
| Incyte Corporation † | 5,792 | 461,449 | |||
| Moderna Incorporated † | 10,554 | 1,856,554 | |||
| Regeneron Pharmaceuticals Incorporated † | 3,363 | 2,527,967 | |||
| Vertex Pharmaceuticals Incorporated † | 8,045 | 2,545,438 | |||
| 25,980,018 | |||||
| Health care equipment & supplies: 2.63% | |||||
| Abbott Laboratories | 54,937 | 5,910,122 | |||
| Abiomed Incorporated † | 1,426 | 538,729 | |||
| Align Technology Incorporated † | 2,279 | 448,188 | |||
| Baxter International Incorporated | 15,799 | 893,117 | |||
| Becton Dickinson & Company | 8,947 | 2,230,845 | |||
| Boston Scientific Corporation † | 44,911 | 2,033,121 | |||
| Dentsply Sirona Incorporated | 6,759 | 204,527 | |||
| DexCom Incorporated † | 12,316 | 1,432,104 | |||
| Edwards Lifesciences Corporation † | 19,448 | 1,502,358 | |||
| Hologic Incorporated † | 7,832 | 596,485 | |||
| IDEXX Laboratories Incorporated † | 2,612 | 1,112,372 | |||
| Intuitive Surgical Incorporated † | 11,203 | 3,029,179 | |||
| Medtronic plc | 41,682 | 3,294,545 | |||
| ResMed Incorporated | 4,593 | 1,057,309 | |||
| STERIS plc | 3,138 | 582,852 | |||
| Stryker Corporation | 10,563 | 2,470,580 | |||
| Teleflex Incorporated | 1,471 | 344,391 | |||
| The Cooper Companies Incorporated | 1,548 | 489,710 | |||
| Zimmer Biomet Holdings Incorporated | 6,582 | 790,498 | |||
| 28,961,032 | |||||
| Health care providers & services: 3.51% | |||||
| AmerisourceBergen Corporation | 5,081 | 867,276 | |||
| Cardinal Health Incorporated | 8,546 | 685,133 |
| Shares | Value | ||||
| Health care providers & services (continued) | |||||
| Centene Corporation † | 17,931 | $ 1,560,894 | |||
| Cigna Corporation | 9,572 | 3,148,135 | |||
| CVS Health Corporation | 41,184 | 4,195,826 | |||
| DaVita HealthCare Partners Incorporated † | 1,747 | 128,806 | |||
| Elevance Health Incorporated | 7,529 | 4,012,355 | |||
| HCA Healthcare Incorporated | 6,753 | 1,622,206 | |||
| Henry Schein Incorporated † | 4,270 | 345,528 | |||
| Humana Incorporated | 3,970 | 2,183,103 | |||
| Laboratory Corporation of America Holdings | 2,836 | 682,625 | |||
| McKesson Corporation | 4,509 | 1,720,995 | |||
| Molina Healthcare Incorporated † | 1,823 | 613,932 | |||
| Quest Diagnostics Incorporated | 3,658 | 555,394 | |||
| UnitedHealth Group Incorporated | 29,344 | 16,073,469 | |||
| Universal Health Services Incorporated Class B | 2,062 | 269,813 | |||
| 38,665,490 | |||||
| Life sciences tools & services: 1.83% | |||||
| Agilent Technologies Incorporated | 9,371 | 1,452,318 | |||
| Bio-Rad Laboratories Incorporated Class A † | 672 | 278,685 | |||
| Bio-Techne Corporation | 4,924 | 418,491 | |||
| Charles River Laboratories International Incorporated † | 1,596 | 364,798 | |||
| Danaher Corporation | 20,538 | 5,615,295 | |||
| Illumina Incorporated † | 4,928 | 1,074,698 | |||
| IQVIA Holdings Incorporated † | 5,851 | 1,275,635 | |||
| Mettler-Toledo International Incorporated † | 706 | 1,037,509 | |||
| PerkinElmer Incorporated | 3,960 | 553,331 | |||
| Thermo Fisher Scientific Incorporated | 12,291 | 6,885,664 | |||
| Waters Corporation † | 1,878 | 650,915 | |||
| West Pharmaceutical Services Incorporated | 2,323 | 545,115 | |||
| 20,152,454 | |||||
| Pharmaceuticals: 4.53% | |||||
| Bristol-Myers Squibb Company | 66,984 | 5,377,476 | |||
| Catalent Incorporated † | 5,622 | 281,831 | |||
| Eli Lilly & Company | 24,740 | 9,180,519 | |||
| Johnson & Johnson | 82,479 | 14,681,262 | |||
| Merck & Company Incorporated | 79,471 | 8,751,347 | |||
| Organon & Company | 7,979 | 207,614 | |||
| Pfizer Incorporated | 176,063 | 8,826,038 | |||
| Viatris Incorporated | 38,039 | 419,570 | |||
| Zoetis Incorporated | 14,686 | 2,263,700 | |||
| 49,989,357 | |||||
| Industrials: 8.23% | |||||
| Aerospace & defense: 1.73% | |||||
| General Dynamics Corporation | 7,055 | 1,780,611 | |||
| Howmet Aerospace Incorporated | 11,598 | 436,897 | |||
| Huntington Ingalls Industries Incorporated | 1,253 | 290,646 | |||
| L3Harris Technologies Incorporated | 6,003 | 1,363,161 | |||
| Lockheed Martin Corporation | 7,403 | 3,591,862 | |||
| Northrop Grumman Corporation | 4,562 | 2,432,869 | |||
| Raytheon Technologies Corporation | 46,319 | 4,572,612 | |||
| Textron Incorporated | 6,636 | 473,678 |
| Shares | Value | ||||
| Aerospace & defense (continued) | |||||
| The Boeing Company † | 17,511 | $ 3,132,368 | |||
| TransDigm Group Incorporated | 1,616 | 1,015,656 | |||
| 19,090,360 | |||||
| Air freight & logistics: 0.61% | |||||
| C.H. Robinson Worldwide Incorporated | 3,886 | 389,455 | |||
| Expeditors International of Washington Incorporated | 5,132 | 595,620 | |||
| FedEx Corporation | 7,499 | 1,366,468 | |||
| United Parcel Service Incorporated Class B | 22,959 | 4,356,011 | |||
| 6,707,554 | |||||
| Airlines: 0.22% | |||||
| Alaska Air Group Incorporated † | 3,977 | 188,669 | |||
| American Airlines Group Incorporated † | 20,386 | 294,170 | |||
| Delta Air Lines Incorporated † | 20,115 | 711,468 | |||
| Southwest Airlines Company † | 18,614 | 742,885 | |||
| United Airlines Holdings Incorporated † | 10,250 | 452,743 | |||
| 2,389,935 | |||||
| Building products: 0.46% | |||||
| A.O. Smith Corporation | 4,030 | 244,782 | |||
| Allegion plc | 2,756 | 313,219 | |||
| Carrier Global Corporation | 26,401 | 1,170,092 | |||
| Fortune Brands Home & Security Incorporated | 4,057 | 265,084 | |||
| Johnson Controls International plc | 21,608 | 1,435,636 | |||
| Masco Corporation | 7,075 | 359,269 | |||
| Trane Technologies plc | 7,269 | 1,296,935 | |||
| 5,085,017 | |||||
| Commercial services & supplies: 0.48% | |||||
| Cintas Corporation | 2,698 | 1,245,882 | |||
| Copart Incorporated † | 13,421 | 893,302 | |||
| Republic Services Incorporated | 6,442 | 897,306 | |||
| Rollins Incorporated | 7,260 | 293,594 | |||
| Waste Management Incorporated | 11,800 | 1,979,096 | |||
| 5,309,180 | |||||
| Construction & engineering: 0.06% | |||||
| Quanta Services Incorporated | 4,487 | 672,512 | |||
| Electrical equipment: 0.55% | |||||
| AMETEK Incorporated | 7,202 | 1,025,709 | |||
| Eaton Corporation plc | 12,495 | 2,042,308 | |||
| Emerson Electric Company | 18,549 | 1,776,438 | |||
| Generac Holdings Incorporated † | 2,002 | 211,251 | |||
| Rockwell Automation Incorporated | 3,621 | 956,741 | |||
| 6,012,447 | |||||
| Industrial conglomerates: 0.89% | |||||
| 3M Company | 17,367 | 2,187,721 | |||
| General Electric Company | 34,400 | 2,957,368 | |||
| Honeywell International Incorporated | 21,134 | 4,639,970 | |||
| 9,785,059 |
| Shares | Value | ||||
| Machinery: 1.77% | |||||
| Caterpillar Incorporated | 16,561 | $ 3,915,186 | |||
| Cummins Incorporated | 4,423 | 1,110,881 | |||
| Deere & Company | 8,725 | 3,847,725 | |||
| Dover Corporation | 4,503 | 639,201 | |||
| Fortive Corporation | 11,158 | 753,723 | |||
| IDEX Corporation | 2,368 | 562,376 | |||
| Illinois Tool Works Incorporated | 8,839 | 2,010,607 | |||
| Ingersoll Rand Incorporated | 12,648 | 682,613 | |||
| Nordson Corporation | 1,696 | 401,087 | |||
| Otis Worldwide Corporation | 13,183 | 1,029,460 | |||
| PACCAR Incorporated | 10,908 | 1,155,266 | |||
| Parker-Hannifin Corporation | 4,027 | 1,203,831 | |||
| Pentair plc | 5,159 | 236,127 | |||
| Snap-on Incorporated | 1,671 | 402,043 | |||
| Stanley Black & Decker Incorporated | 4,637 | 378,936 | |||
| Wabtec Corporation | 5,706 | 576,820 | |||
| Xylem Incorporated | 5,652 | 635,002 | |||
| 19,540,884 | |||||
| Professional services: 0.35% | |||||
| CoStar Group Incorporated † | 12,421 | 1,006,598 | |||
| Equifax Incorporated | 3,840 | 757,901 | |||
| Jacobs Solutions Incorporated | 4,003 | 506,540 | |||
| Leidos Holdings Incorporated | 4,283 | 468,260 | |||
| Robert Half International Incorporated | 3,437 | 270,767 | |||
| Verisk Analytics Incorporated | 4,924 | 904,588 | |||
| 3,914,654 | |||||
| Road & rail: 0.88% | |||||
| CSX Corporation | 67,172 | 2,195,853 | |||
| J.B. Hunt Transport Services Incorporated | 2,605 | 479,033 | |||
| Norfolk Southern Corporation | 7,368 | 1,889,892 | |||
| Old Dominion Freight Line Incorporated | 2,875 | 870,004 | |||
| Union Pacific Corporation | 19,590 | 4,259,454 | |||
| 9,694,236 | |||||
| Trading companies & distributors: 0.23% | |||||
| Fastenal Company | 18,028 | 928,622 | |||
| United Rentals Incorporated † | 2,195 | 774,901 | |||
| W.W. Grainger Incorporated | 1,420 | 856,345 | |||
| 2,559,868 | |||||
| Information technology: 25.76% | |||||
| Communications equipment: 0.87% | |||||
| Arista Networks Incorporated † | 7,732 | 1,077,068 | |||
| Cisco Systems Incorporated | 129,905 | 6,458,877 | |||
| F5 Networks Incorporated † | 1,869 | 288,966 | |||
| Juniper Networks Incorporated | 10,120 | 336,389 | |||
| Motorola Solutions Incorporated | 5,235 | 1,424,967 | |||
| 9,586,267 | |||||
| Electronic equipment, instruments & components: 0.63% | |||||
| Amphenol Corporation Class A | 18,660 | 1,500,824 | |||
| CDW Corporation of Delaware | 4,243 | 800,400 |
| Shares | Value | ||||
| Electronic equipment, instruments & components (continued) | |||||
| Corning Incorporated | 23,866 | $ 814,547 | |||
| Keysight Technologies Incorporated † | 5,645 | 1,021,124 | |||
| TE Connectivity Limited | 10,034 | 1,265,488 | |||
| Teledyne Technologies Incorporated † | 1,470 | 617,547 | |||
| Trimble Incorporated † | 7,769 | 464,198 | |||
| Zebra Technologies Corporation Class A † | 1,625 | 439,205 | |||
| 6,923,333 | |||||
| IT services: 4.35% | |||||
| Accenture plc Class A | 19,843 | 5,971,354 | |||
| Akamai Technologies Incorporated † | 4,987 | 473,067 | |||
| Automatic Data Processing Incorporated | 13,035 | 3,443,065 | |||
| Broadridge Financial Solutions Incorporated | 3,677 | 548,277 | |||
| Cognizant Technology Solutions Corporation Class A | 16,243 | 1,010,477 | |||
| DXC Technology Company † | 7,211 | 213,950 | |||
| EPAM Systems Incorporated † | 1,800 | 663,444 | |||
| Fidelity National Information Services Incorporated | 19,073 | 1,384,318 | |||
| Fiserv Incorporated † | 20,064 | 2,093,879 | |||
| FleetCor Technologies Incorporated † | 2,353 | 461,659 | |||
| Gartner Incorporated † | 2,481 | 869,268 | |||
| Global Payments Incorporated | 8,695 | 902,367 | |||
| International Business Machines Corporation | 28,333 | 4,218,784 | |||
| Jack Henry & Associates Incorporated | 2,286 | 432,854 | |||
| MasterCard Incorporated Class A | 26,766 | 9,539,402 | |||
| Paychex Incorporated | 10,049 | 1,246,377 | |||
| PayPal Holdings Incorporated † | 36,279 | 2,844,636 | |||
| VeriSign Incorporated † | 2,928 | 585,044 | |||
| Visa Incorporated Class A | 51,292 | 11,130,364 | |||
| 48,032,586 | |||||
| Semiconductors & semiconductor equipment: 5.15% | |||||
| Advanced Micro Devices Incorporated † | 50,642 | 3,931,338 | |||
| Analog Devices Incorporated | 16,307 | 2,803,336 | |||
| Applied Materials Incorporated | 27,291 | 2,991,094 | |||
| Broadcom Incorporated | 12,668 | 6,980,448 | |||
| Enphase Energy Incorporated † | 4,249 | 1,362,187 | |||
| Intel Corporation | 128,808 | 3,873,257 | |||
| KLA Corporation | 4,448 | 1,748,731 | |||
| Lam Research Corporation | 4,297 | 2,029,817 | |||
| Microchip Technology Incorporated | 17,332 | 1,372,521 | |||
| Micron Technology Incorporated | 34,606 | 1,995,036 | |||
| Monolithic Power Systems Incorporated | 1,394 | 532,452 | |||
| NVIDIA Corporation | 78,553 | 13,293,524 | |||
| NXP Semiconductors NV | 8,238 | 1,448,570 | |||
| ON Semiconductor Corporation † | 13,591 | 1,022,043 | |||
| Qorvo Incorporated † | 3,238 | 321,372 | |||
| Qualcomm Incorporated | 35,229 | 4,456,116 | |||
| Skyworks Solutions Incorporated | 5,033 | 481,255 | |||
| Solaredge Technologies Incorporated † | 1,745 | 521,511 | |||
| Teradyne Incorporated | 4,918 | 459,587 | |||
| Texas Instruments Incorporated | 28,664 | 5,172,705 | |||
| 56,796,900 | |||||
| Software: 8.15% | |||||
| Adobe Incorporated † | 14,681 | 5,063,917 |
| Shares | Value | ||||
| Software (continued) | |||||
| ANSYS Incorporated † | 2,731 | $ 694,493 | |||
| Autodesk Incorporated † | 6,816 | 1,376,491 | |||
| Cadence Design Systems Incorporated † | 8,591 | 1,477,996 | |||
| Ceridian HCM Holding Incorporated † | 4,802 | 328,649 | |||
| Fortinet Incorporated † | 20,531 | 1,091,428 | |||
| Intuit Incorporated | 8,849 | 3,606,764 | |||
| Microsoft Corporation | 233,959 | 59,692,299 | |||
| NortonLifeLock Incorporated | 18,574 | 426,459 | |||
| Oracle Corporation | 47,652 | 3,956,546 | |||
| Paycom Software Incorporated † | 1,525 | 517,128 | |||
| PTC Incorporated † | 3,316 | 421,828 | |||
| Roper Technologies Incorporated | 3,326 | 1,459,748 | |||
| Salesforce.com Incorporated † | 31,214 | 5,002,044 | |||
| ServiceNow Incorporated † | 6,337 | 2,638,093 | |||
| Synopsys Incorporated † | 4,799 | 1,629,452 | |||
| Tyler Technologies Incorporated † | 1,304 | 446,933 | |||
| 89,830,268 | |||||
| Technology hardware, storage & peripherals: 6.61% | |||||
| Apple Incorporated | 473,901 | 70,151,565 | |||
| Hewlett Packard Enterprise Company | 40,761 | 683,970 | |||
| HP Incorporated | 28,549 | 857,612 | |||
| NetApp Incorporated | 6,893 | 466,036 | |||
| Seagate Technology Holdings plc | 6,127 | 324,547 | |||
| Western Digital Corporation † | 9,824 | 361,032 | |||
| 72,844,762 | |||||
| Materials: 2.62% | |||||
| Chemicals: 1.83% | |||||
| Air Products & Chemicals Incorporated | 6,958 | 2,158,093 | |||
| Albemarle Corporation | 3,674 | 1,021,335 | |||
| Celanese Corporation Series A | 3,127 | 335,527 | |||
| CF Industries Holdings Incorporated | 6,251 | 676,296 | |||
| Corteva Incorporated | 22,543 | 1,513,988 | |||
| Dow Incorporated | 22,529 | 1,148,303 | |||
| DuPont de Nemours Incorporated | 15,714 | 1,107,994 | |||
| Eastman Chemical Company | 3,853 | 333,747 | |||
| Ecolab Incorporated | 7,778 | 1,165,378 | |||
| FMC Corporation | 3,951 | 516,159 | |||
| International Flavors & Fragrances Incorporated | 7,998 | 846,348 | |||
| Linde plc | 15,634 | 5,260,528 | |||
| LyondellBasell Industries NV Class A | 7,982 | 678,550 | |||
| PPG Industries Incorporated | 7,372 | 996,842 | |||
| The Mosaic Company | 10,831 | 555,630 | |||
| The Sherwin-Williams Company | 7,399 | 1,843,683 | |||
| 20,158,401 | |||||
| Construction materials: 0.14% | |||||
| Martin Marietta Materials Incorporated | 1,957 | 717,201 | |||
| Vulcan Materials Company | 4,169 | 764,303 | |||
| 1,481,504 | |||||
| Containers & packaging: 0.27% | |||||
| Amcor plc | 47,143 | 582,216 |
| Shares | Value | ||||
| Containers & packaging (continued) | |||||
| Avery Dennison Corporation | 2,549 | $ 492,798 | |||
| Ball Corporation | 9,860 | 552,949 | |||
| International Paper Company | 11,357 | 421,572 | |||
| Packaging Corporation of America | 2,941 | 399,652 | |||
| Sealed Air Corporation | 4,556 | 242,516 | |||
| WestRock Company | 7,977 | 302,488 | |||
| 2,994,191 | |||||
| Metals & mining: 0.38% | |||||
| Freeport-McMoRan Incorporated | 44,860 | 1,785,428 | |||
| Newmont Corporation | 24,898 | 1,181,908 | |||
| Nucor Corporation | 8,212 | 1,231,389 | |||
| 4,198,725 | |||||
| Real estate: 2.61% | |||||
| Equity REITs: 2.54% | |||||
| Alexandria Real Estate Equities Incorporated | 4,658 | 724,831 | |||
| American Tower Corporation | 14,606 | 3,231,578 | |||
| AvalonBay Communities Incorporated | 4,387 | 767,286 | |||
| Boston Properties Incorporated | 4,474 | 322,486 | |||
| Camden Property Trust | 3,342 | 402,143 | |||
| Crown Castle International Corporation | 13,585 | 1,921,327 | |||
| Digital Realty Trust Incorporated | 9,016 | 1,013,939 | |||
| Equinix Incorporated | 2,857 | 1,973,187 | |||
| Equity Residential | 10,619 | 688,748 | |||
| Essex Property Trust Incorporated | 2,043 | 450,236 | |||
| Extra Space Storage Incorporated | 4,201 | 675,059 | |||
| Federal Realty Investment Trust | 2,284 | 253,752 | |||
| Healthpeak Properties Incorporated | 16,927 | 444,503 | |||
| Host Hotels & Resorts Incorporated | 22,427 | 424,767 | |||
| Invitation Homes Incorporated | 18,190 | 593,540 | |||
| Iron Mountain Incorporated | 9,119 | 495,435 | |||
| Kimco Realty Corporation | 19,402 | 444,694 | |||
| Mid-America Apartment Communities Incorporated | 3,621 | 597,030 | |||
| Prologis Incorporated | 28,963 | 3,411,552 | |||
| Public Storage Incorporated | 4,956 | 1,476,690 | |||
| Realty Income Corporation | 19,374 | 1,221,918 | |||
| Regency Centers Corporation | 4,831 | 320,923 | |||
| SBA Communications Corporation | 3,384 | 1,012,831 | |||
| Simon Property Group Incorporated | 10,269 | 1,226,529 | |||
| UDR Incorporated | 9,581 | 397,324 | |||
| Ventas Incorporated | 12,539 | 583,440 | |||
| VICI Properties Incorporated | 30,213 | 1,033,285 | |||
| Vornado Realty Trust | 5,054 | 127,816 | |||
| Welltower Incorporated | 14,536 | 1,032,492 | |||
| Weyerhaeuser Company | 23,224 | 759,657 | |||
| 28,028,998 | |||||
| Real estate management & development: 0.07% | |||||
| CBRE Group Incorporated Class A † | 10,075 | 801,970 | |||
| Utilities: 2.92% | |||||
| Electric utilities: 1.90% | |||||
| Alliant Energy Corporation | 7,872 | 443,194 |
| Shares | Value | ||||
| Electric utilities (continued) | |||||
| American Electric Power Company Incorporated | 16,116 | $ 1,560,029 | |||
| Constellation Energy Corporation | 10,253 | 985,518 | |||
| Duke Energy Corporation | 24,154 | 2,413,709 | |||
| Edison International | 11,966 | 797,654 | |||
| Entergy Corporation | 6,381 | 741,919 | |||
| Evergy Incorporated | 7,200 | 426,312 | |||
| Eversource Energy | 10,868 | 900,522 | |||
| Exelon Corporation | 31,112 | 1,287,103 | |||
| FirstEnergy Corporation | 17,029 | 702,276 | |||
| NextEra Energy Incorporated | 61,636 | 5,220,569 | |||
| NRG Energy Incorporated | 7,377 | 313,154 | |||
| PG&E Corporation † | 50,507 | 792,960 | |||
| Pinnacle West Capital Corporation | 3,546 | 277,723 | |||
| PPL Corporation | 23,095 | 681,764 | |||
| The Southern Company | 33,347 | 2,255,591 | |||
| Xcel Energy Incorporated | 17,159 | 1,204,905 | |||
| 21,004,902 | |||||
| Gas utilities: 0.05% | |||||
| Atmos Energy Corporation | 4,389 | 527,558 | |||
| Independent power & renewable electricity producers: 0.05% | |||||
| AES Corporation | 20,954 | 605,990 | |||
| Multi-utilities: 0.84% | |||||
| Ameren Corporation | 8,105 | 723,939 | |||
| CenterPoint Energy Incorporated | 19,748 | 614,360 | |||
| CMS Energy Corporation | 9,104 | 555,981 | |||
| Consolidated Edison Incorporated | 11,123 | 1,090,499 | |||
| Dominion Energy Incorporated | 26,116 | 1,595,949 | |||
| DTE Energy Company | 6,078 | 705,109 | |||
| NiSource Incorporated | 12,735 | 355,816 | |||
| Public Service Enterprise Group Incorporated | 15,650 | 947,608 | |||
| Sempra Energy | 9,860 | 1,638,633 | |||
| WEC Energy Group Incorporated | 9,895 | 980,990 | |||
| 9,208,884 | |||||
| Water utilities: 0.08% | |||||
| American Water Works Company Incorporated | 5,703 | 865,487 | |||
| Total Common stocks (Cost $313,357,162) | 1,075,676,228 |
| Yield | |||||
| Short-term investments: 2.01% | |||||
| Investment companies: 2.01% | |||||
| Allspring Government Money Market Fund Select Class ♠∞ | 3.60% | 22,127,104 | 22,127,104 | ||
| Total Short-term investments (Cost $22,127,104) | 22,127,104 | ||||
| Total investments in securities (Cost $335,484,266) | 99.57% | 1,097,803,332 | |||
| Other assets and liabilities, net | 0.43 | 4,748,046 | |||
| Total net assets | 100.00% | $1,102,551,378 |
| † | Non-income-earning security |
| ♠ | The issuer of the security is an affiliated person of the Fund as defined in the Investment Company Act of 1940. |
| ∞ | The rate represents the 7-day annualized yield at period end. |
| Abbreviations: | |
| REIT | Real estate investment trust |
| Value, beginning of period | Purchases | Sales proceeds | Net realized gains (losses) | Net change in unrealized gains (losses) | Value, end of period | Shares, end of period | Income from affiliated securities | |
| Short-term investments | ||||||||
| Allspring Government Money Market Fund Select Class | $0 | $65,837,714 | $(43,710,610) | $0 | $0 | $22,127,104 | 22,127,104 | $179,752 |
| Description | Number of contracts | Expiration date | Notional cost | Notional value | Unrealized gains | Unrealized losses |
| Long | ||||||
| E-Mini S&P 500 Index | 130 | 12-16-2022 | $24,938,222 | $26,528,125 | $1,589,903 | $0 |
| Assets | |
Investments in unaffiliated securities, at value (cost $313,357,162) | $ 1,075,676,228 |
Investments in affiliated securities, at value (cost $22,127,104) | 22,127,104 |
Cash | 10,121 |
Cash at broker segregated for futures contracts | 1,954,799 |
Receivable for dividends | 1,856,311 |
Receivable for Fund shares sold | 1,220,110 |
Receivable for daily variation margin on open futures contracts | 775,124 |
Receivable from manager | 19,605 |
Prepaid expenses and other assets | 130,223 |
Total assets | 1,103,769,625 |
| Liabilities | |
Payable for Fund shares redeemed | 821,518 |
Shareholder servicing fees payable | 174,593 |
Administration fees payable | 160,467 |
Distribution fee payable | 5,321 |
Accrued expenses and other liabilities | 56,348 |
Total liabilities | 1,218,247 |
Total net assets | $1,102,551,378 |
| Net assets consist of | |
Paid-in capital | $ 175,360,734 |
Total distributable earnings | 927,190,644 |
Total net assets | $1,102,551,378 |
| Computation of net asset value and offering price per share | |
Net assets – Class A | $ 738,904,149 |
Shares outstanding – Class A1 | 16,345,814 |
Net asset value per share – Class A | $45.20 |
Maximum offering price per share – Class A2 | $47.96 |
Net assets – Class C | $ 9,015,205 |
Shares outstanding – Class C1 | 195,827 |
Net asset value per share – Class C | $46.04 |
Net assets – Administrator Class | $ 354,632,024 |
Shares outstanding – Administrator Class1 | 7,628,707 |
Net asset value per share – Administrator Class | $46.49 |
| 1 | The Fund has an unlimited number of authorized shares. |
| 2 | Maximum offering price is computed as 100/94.25 of net asset value. On investments of $50,000 or more, the offering price is reduced. |
| Investment income | |
Dividends (net of foreign withholdings taxes of $2,152) | $ 9,360,796 |
Income from affiliated securities | 179,752 |
Total investment income | 9,540,548 |
| Expenses | |
Management fee | 536,053 |
| Administration fees | |
Class A | 759,602 |
Class C | 9,431 |
Administrator Class | 225,261 |
| Shareholder servicing fees | |
Class A | 904,288 |
Class C | 11,191 |
Administrator Class | 152,087 |
| Distribution fee | |
Class C | 33,456 |
Custody and accounting fees | 12,465 |
Professional fees | 20,909 |
Registration fees | 16,776 |
Shareholder report expenses | 21,247 |
Trustees’ fees and expenses | 10,873 |
Other fees and expenses | 2,181 |
Total expenses | 2,715,820 |
| Less: Fee waivers and/or expense reimbursements | |
Fund-level | (427,370) |
Class A | (196,707) |
Class C | (1,563) |
Administrator Class | (503) |
Net expenses | 2,089,677 |
Net investment income | 7,450,871 |
| Realized and unrealized gains (losses) on investments | |
| Net realized gains (losses) on | |
Unaffiliated securities | 80,974,099 |
Futures contracts | (1,095,927) |
Net realized gains on investments | 79,878,172 |
| Net change in unrealized gains (losses) on | |
Securities transactions allocated from affiliated Master Portfolio | (1,022,786,053) |
Unaffiliated securities | 925,278,110 |
Futures contracts | 1,589,903 |
Net change in unrealized gains (losses) on investments | (95,918,040) |
Net realized and unrealized gains (losses) on investments | (16,039,868) |
Net decrease in net assets resulting from operations | $ (8,588,997) |
| Six months ended November 30, 2022 (unaudited) | Year ended May 31, 2022 | |||
| Operations | ||||
Net investment income | $ 7,450,871 | $ 12,547,735 | ||
Net realized gains on investments | 79,878,172 | 112,329,479 | ||
Net change in unrealized gains (losses) on investments | (95,918,040) | (127,015,918) | ||
Net decrease in net assets resulting from operations | (8,588,997) | (2,138,704) | ||
| Distributions to shareholders from | ||||
| Net investment income and net realized gains | ||||
Class A | 0 | (77,882,126) | ||
Class C | 0 | (1,006,598) | ||
Administrator Class | 0 | (38,543,455) | ||
Total distributions to shareholders | 0 | (117,432,179) | ||
| Capital share transactions | Shares | Shares | ||
| Proceeds from shares sold | ||||
Class A | 166,623 | 7,150,048 | 434,540 | 22,338,966 |
Class C | 2,515 | 110,745 | 20,668 | 1,096,073 |
Administrator Class | 259,932 | 11,594,363 | 541,048 | 28,070,542 |
| 18,855,156 | 51,505,581 | |||
| Reinvestment of distributions | ||||
Class A | 0 | 0 | 1,474,352 | 75,486,719 |
Class C | 0 | 0 | 16,134 | 841,241 |
Administrator Class | 0 | 0 | 682,313 | 35,905,912 |
| 0 | 112,233,872 | |||
| Payment for shares redeemed | ||||
Class A | (790,436) | (34,106,594) | (1,599,593) | (81,454,786) |
Class C | (33,295) | (1,450,304) | (54,965) | (2,849,529) |
Administrator Class | (547,828) | (24,587,379) | (1,365,467) | (70,021,494) |
| (60,144,277) | (154,325,809) | |||
Net increase (decrease) in net assets resulting from capital share transactions | (41,289,121) | 9,413,644 | ||
Total decrease in net assets | (49,878,118) | (110,157,239) | ||
| Net assets | ||||
Beginning of period | 1,152,429,496 | 1,262,586,735 | ||
End of period | $1,102,551,378 | $1,152,429,496 | ||
| Year ended May 31 | ||||||
| Class A | Six months ended November 30, 2022 (unaudited) | 2022 | 2021 | 2020 | 2019 | 2018 |
Net asset value, beginning of period | $45.49 | $50.17 | $41.27 | $49.48 | $63.35 | $66.85 |
Net investment income | 0.28 | 0.46 | 0.48 | 0.65 | 0.82 | 0.99 1 |
Net realized and unrealized gains (losses) on investments | (0.57) | (0.33) | 14.92 | 5.82 | 0.54 | 7.99 |
Total from investment operations | (0.29) | 0.13 | 15.40 | 6.47 | 1.36 | 8.98 |
| Distributions to shareholders from | ||||||
Net investment income | 0.00 | (0.46) | (0.57) | (0.67) | (0.90) | (1.02) |
Net realized gains | 0.00 | (4.35) | (5.93) | (14.01) | (14.33) | (11.46) |
Total distributions to shareholders | 0.00 | (4.81) | (6.50) | (14.68) | (15.23) | (12.48) |
Net asset value, end of period | $45.20 | $45.49 | $50.17 | $41.27 | $49.48 | $63.35 |
Total return2 | (0.64)% | (0.74)% | 39.71% | 12.02% | 3.32% | 13.87% |
| Ratios to average net assets (annualized) | ||||||
Gross expenses | 0.58% | 0.63% * | 0.65% * | 0.67% * | 0.65% * | 0.63% * |
Net expenses | 0.44% | 0.44% * | 0.44% * | 0.44% * | 0.45% * | 0.45% * |
Net investment income | 1.33% | 0.92% * | 1.08% * | 1.47% * | 1.51% * | 1.49% * |
| Supplemental data | ||||||
Portfolio turnover rate | 1% | 2% 3 | 4% 3 | 3% 3 | 4% 3 | 3% 3 |
Net assets, end of period (000s omitted) | $738,904 | $771,925 | $835,781 | $660,101 | $676,511 | $702,866 |
| * | Ratios include net expenses allocated from the affiliated Master Portfolios which were as follows: |
| Year ended May 31, 2022 | 0.11% |
| Year ended May 31, 2021 | 0.11% |
| Year ended May 31, 2020 | 0.12% |
| Year ended May 31, 2019 | 0.11% |
| Year ended May 31, 2018 | 0.10% |
| 1 | Calculated based upon average shares outstanding |
| 2 | Total return calculations do not include any sales charges. Returns for periods of less than one year are not annualized. |
| 3 | Portfolio turnover rate is calculated by multiplying the affiliated Master Portfolio’s percentage of the Fund’s total investment in securities at the end of the period by the affiliated Master Portfolio’s portfolio turnover rate. |
| Year ended May 31 | ||||||
| Class C | Six months ended November 30, 2022 (unaudited) | 2022 | 2021 | 2020 | 2019 | 2018 |
Net asset value, beginning of period | $46.50 | $51.19 | $41.90 | $50.02 | $63.67 | $67.11 |
Net investment income | 0.13 1 | 0.08 1 | 0.16 1 | 0.30 | 0.46 1 | 0.50 1 |
Net realized and unrealized gains (losses) on investments | (0.59) | (0.37) | 15.21 | 5.84 | 0.52 | 8.00 |
Total from investment operations | (0.46) | (0.29) | 15.37 | 6.14 | 0.98 | 8.50 |
| Distributions to shareholders from | ||||||
Net investment income | 0.00 | (0.05) | (0.15) | (0.25) | (0.30) | (0.48) |
Net realized gains | 0.00 | (4.35) | (5.93) | (14.01) | (14.33) | (11.46) |
Total distributions to shareholders | 0.00 | (4.40) | (6.08) | (14.26) | (14.63) | (11.94) |
Net asset value, end of period | $46.04 | $46.50 | $51.19 | $41.90 | $50.02 | $63.67 |
Total return2 | (0.99)% | (1.48)% | 38.83% | 11.17% | 2.54% | 13.02% |
| Ratios to average net assets (annualized) | ||||||
Gross expenses | 1.32% | 1.37% * | 1.40% * | 1.42% * | 1.39% * | 1.38% * |
Net expenses | 1.20% | 1.20% * | 1.20% * | 1.20% * | 1.20% * | 1.20% * |
Net investment income | 0.57% | 0.16% * | 0.34% * | 0.72% * | 0.77% * | 0.72% * |
| Supplemental data | ||||||
Portfolio turnover rate | 1% | 2% 3 | 4% 3 | 3% 3 | 4% 3 | 3% 3 |
Net assets, end of period (000s omitted) | $9,015 | $10,538 | $12,530 | $16,103 | $19,146 | $66,117 |
| * | Ratios include net expenses allocated from the affiliated Master Portfolios which were as follows: |
| Year ended May 31, 2022 | 0.11% |
| Year ended May 31, 2021 | 0.11% |
| Year ended May 31, 2020 | 0.12% |
| Year ended May 31, 2019 | 0.11% |
| Year ended May 31, 2018 | 0.10% |
| 1 | Calculated based upon average shares outstanding |
| 2 | Total return calculations do not include any sales charges. Returns for periods of less than one year are not annualized. |
| 3 | Portfolio turnover rate is calculated by multiplying the affiliated Master Portfolio’s percentage of the Fund’s total investment in securities at the end of the period by the affiliated Master Portfolio’s portfolio turnover rate. |
| Year ended May 31 | ||||||
| Administrator Class | Six months ended November 30, 2022 (unaudited) | 2022 | 2021 | 2020 | 2019 | 2018 |
Net asset value, beginning of period | $46.73 | $51.41 | $42.15 | $50.24 | $64.04 | $67.43 |
Net investment income | 0.39 | 0.58 | 0.58 | 0.81 | 1.02 1 | 1.26 |
Net realized and unrealized gains (losses) on investments | (0.63) | (0.36) | 15.26 | 5.85 | 0.48 | 7.94 |
Total from investment operations | (0.24) | 0.22 | 15.84 | 6.66 | 1.50 | 9.20 |
| Distributions to shareholders from | ||||||
Net investment income | 0.00 | (0.55) | (0.65) | (0.74) | (0.97) | (1.13) |
Net realized gains | 0.00 | (4.35) | (5.93) | (14.01) | (14.33) | (11.46) |
Total distributions to shareholders | 0.00 | (4.90) | (6.58) | (14.75) | (15.30) | (12.59) |
Net asset value, end of period | $46.49 | $46.73 | $51.41 | $42.15 | $50.24 | $64.04 |
Total return2 | (0.51)% | (0.55)% | 39.97% | 12.25% | 3.52% | 14.10% |
| Ratios to average net assets (annualized) | ||||||
Gross expenses | 0.33% | 0.37% * | 0.42% * | 0.44% * | 0.41% * | 0.40% * |
Net expenses | 0.25% | 0.25% * | 0.25% * | 0.25% * | 0.25% * | 0.25% * |
Net investment income | 1.52% | 1.11% * | 1.28% * | 1.67% * | 1.72% * | 1.70% * |
| Supplemental data | ||||||
Portfolio turnover rate | 1% | 2% 3 | 4% 3 | 3% 3 | 4% 3 | 3% 3 |
Net assets, end of period (000s omitted) | $354,632 | $369,967 | $414,276 | $343,609 | $460,934 | $829,004 |
| * | Ratios include net expenses allocated from the affiliated Master Portfolios which were as follows: |
| Year ended May 31, 2022 | 0.11% |
| Year ended May 31, 2021 | 0.11% |
| Year ended May 31, 2020 | 0.12% |
| Year ended May 31, 2019 | 0.11% |
| Year ended May 31, 2018 | 0.10% |
| 1 | Calculated based upon average shares outstanding |
| 2 | Returns for periods of less than one year are not annualized. |
| 3 | Portfolio turnover rate is calculated by multiplying the affiliated Master Portfolio’s percentage of the Fund’s total investment in securities at the end of the period by the affiliated Master Portfolio’s portfolio turnover rate. |
| Gross unrealized gains | $777,768,289 |
| Gross unrealized losses | (31,207,580) |
| Net unrealized gains | $746,560,709 |
| ■ | Level 1 – quoted prices in active markets for identical securities |
| ■ | Level 2 – other significant observable inputs (including quoted prices for similar securities, interest rates, prepayment speeds, credit risk, etc.) |
| ■ | Level 3 – significant unobservable inputs (including the Fund’s own assumptions in determining the fair value of investments) |
| Quoted prices (Level 1) | Other significant observable inputs (Level 2) | Significant unobservable inputs (Level 3) | Total | |
| Assets | ||||
| Investments in: | ||||
| Common stocks | ||||
| Communication services | $ 80,208,954 | $0 | $0 | $ 80,208,954 |
| Consumer discretionary | 111,854,352 | 0 | 0 | 111,854,352 |
| Consumer staples | 75,159,923 | 0 | 0 | 75,159,923 |
| Energy | 55,118,637 | 0 | 0 | 55,118,637 |
| Financials | 124,933,579 | 0 | 0 | 124,933,579 |
| Health care | 163,748,351 | 0 | 0 | 163,748,351 |
| Industrials | 90,761,706 | 0 | 0 | 90,761,706 |
| Information technology | 284,014,116 | 0 | 0 | 284,014,116 |
| Materials | 28,832,821 | 0 | 0 | 28,832,821 |
| Real estate | 28,830,968 | 0 | 0 | 28,830,968 |
| Utilities | 32,212,821 | 0 | 0 | 32,212,821 |
| Short-term investments | ||||
| Investment companies | 22,127,104 | 0 | 0 | 22,127,104 |
| 1,097,803,332 | 0 | 0 | 1,097,803,332 | |
| Futures contracts | 1,589,903 | 0 | 0 | 1,589,903 |
| Total assets | $1,099,393,235 | $0 | $0 | $1,099,393,235 |
| Average daily net assets | Management fee |
| First $1 billion | 0.150% |
| Next $4 billion | 0.125 |
| Next $5 billion | 0.090 |
| Over $10 billion | 0.080 |
| Class-level administration fee | |
| Class A | 0.21% |
| Class C | 0.21 |
| Administrator Class | 0.13 |
| Expense ratio caps | |
| Class A | 0.45% |
| Class C | 1.20 |
| Administrator Class | 0.25 |
| Name and year of birth | Position held and length of service* | Principal occupations during past five years or longer | Current other public company or investment company directorships |
| William R. Ebsworth (Born 1957) | Trustee, since 2015 | Retired. From 1984 to 2013, equities analyst, portfolio manager, research director and chief investment officer at Fidelity Management and Research Company in Boston, Tokyo, and Hong Kong, and retired in 2013 as Chief Investment Officer of Fidelity Strategic Advisers, Inc. where he led a team of investment professionals managing client assets. Prior thereto, Board member of Hong Kong Securities Clearing Co., Hong Kong Options Clearing Corp., the Thailand International Fund, Ltd., Fidelity Investments Life Insurance Company, and Empire Fidelity Investments Life Insurance Company. Audit Committee Chair and Investment Committee Chair of the Vincent Memorial Hospital Endowment (non-profit organization). Mr. Ebsworth is a CFA® charterholder. | N/A |
| Jane A. Freeman (Born 1953) | Trustee, since 2015; Chair Liaison, since 2018 | Retired. From 2012 to 2014 and 1999 to 2008, Chief Financial Officer of Scientific Learning Corporation. From 2008 to 2012, Ms. Freeman provided consulting services related to strategic business projects. Prior to 1999, Portfolio Manager at Rockefeller & Co. and Scudder, Stevens & Clark. Board member of the Harding Loevner Funds from 1996 to 2014, serving as both Lead Independent Director and chair of the Audit Committee. Board member of the Russell Exchange Traded Funds Trust from 2011 to 2012 and the chair of the Audit Committee. Ms. Freeman is also an inactive Chartered Financial Analyst. | N/A |
| Isaiah Harris, Jr. (Born 1952) | Trustee, since 2009; Audit Committee Chair, since 2019 | Retired. Chairman of the Board of CIGNA Corporation from 2009 to 2021, and Director from 2005 to 2008. From 2003 to 2011, Director of Deluxe Corporation. Prior thereto, President and CEO of BellSouth Advertising and Publishing Corp. from 2005 to 2007, President and CEO of BellSouth Enterprises from 2004 to 2005 and President of BellSouth Consumer Services from 2000 to 2003. Emeritus member of the Iowa State University Foundation Board of Governors. Emeritus Member of the Advisory Board of Iowa State University School of Business. Advisory Board Member, Palm Harbor Academy (private school). Advisory Board Member, Fellowship of Christian Athletes. Mr. Harris is a certified public accountant (inactive status). | N/A |
| David F. Larcker (Born 1950) | Trustee, since 2009 | James Irvin Miller Professor of Accounting at the Graduate School of Business (Emeritus), Stanford University, Director of the Corporate Governance Research Initiative and Senior Faculty of The Rock Center for Corporate Governance since 2006. From 2005 to 2008, Professor of Accounting at the Graduate School of Business, Stanford University. Prior thereto, Ernst & Young Professor of Accounting at The Wharton School, University of Pennsylvania from 1985 to 2005. | N/A |
| Name and year of birth | Position held and length of service* | Principal occupations during past five years or longer | Current other public company or investment company directorships |
| Olivia S. Mitchell (Born 1953) | Trustee, since 2006; Nominating and Governance Committee Chair, since 2018 | International Foundation of Employee Benefit Plans Professor since 1993, Wharton School of the University of Pennsylvania. Director of Wharton’s Pension Research Council and Boettner Center on Pensions & Retirement Research, and Research Associate at the National Bureau of Economic Research. Previously taught at Cornell University from 1978 to 1993. | N/A |
| Timothy J. Penny (Born 1951) | Trustee, since 1996; Chair, since 2018 | President and Chief Executive Officer of Southern Minnesota Initiative Foundation, a non-profit organization, since 2007. Vice Chair of the Economic Club of Minnesota, since 2007. Co-Chair of the Committee for a Responsible Federal Budget, since 1995. Member of the Board of Trustees of NorthStar Education Finance, Inc., a non-profit organization, since 2007. Senior Fellow of the University of Minnesota Humphrey Institute from 1995 to 2017. | N/A |
| James G. Polisson (Born 1959) | Trustee, since 2018 | Retired. Chief Marketing Officer, Source (ETF) UK Services, Ltd, from 2015 to 2017. From 2012 to 2015, Principal of The Polisson Group, LLC, a management consulting, corporate advisory and principal investing company. Chief Executive Officer and Managing Director at Russell Investments, Global Exchange Traded Funds from 2010 to 2012. Managing Director of Barclays Global Investors from 1998 to 2010 and Global Chief Marketing Officer for iShares and Barclays Global Investors from 2000 to 2010. Trustee of the San Francisco Mechanics’ Institute, a non-profit organization, from 2013 to 2015. Board member of the Russell Exchange Traded Fund Trust from 2011 to 2012. Director of Barclays Global Investors Holdings Deutschland GmbH from 2006 to 2009. Mr. Polisson is an attorney and has a retired status with the Massachusetts and District of Columbia Bar Associations. | N/A |
| Pamela Wheelock (Born 1959) | Trustee, since January 2020; previously Trustee from January 2018 to July 2019 | Retired. Executive and Senior Financial leadership positions in the public, private and nonprofit sectors. Interim President and CEO, McKnight Foundation, 2020. Interim Commissioner, Minnesota Department of Human Services, 2019. Chief Operating Officer, Twin Cities Habitat for Humanity, 2017-2019. Vice President for University Services, University of Minnesota, 2012-2016. Interim President and CEO, Blue Cross and Blue Shield of Minnesota, 2011-2012. Executive Vice-President and Chief Financial Officer, Minnesota Wild, 2002-2008. Commissioner, Minnesota Department of Finance, 1999-2002. Chair of the Board of Directors of Destination Medical Center Corporation. Board member of the Minnesota Wild Foundation. | N/A |
| Name and year of birth | Position held and length of service | Principal occupations during past five years or longer |
| Andrew Owen (Born 1960) | President, since 2017 | President and Chief Executive Officer of Allspring Funds Management, LLC since 2017 and Head of Global Fund Governance of Allspring Global Investments since 2022. Prior thereto, co-president of Galliard Capital Management, LLC, an affiliate of Allspring Funds Management, LLC, from 2019 to 2022 and Head of Affiliated Managers, Allspring Global Investments, from 2014 to 2019 and Executive Vice President responsible for marketing, investments and product development for Allspring Funds Management, LLC, from 2009 to 2014. |
| Jeremy DePalma (Born 1974) | Treasurer, since 2012 (for certain funds in the Fund Complex); since 2021 (for the remaining funds in the Fund Complex) | Senior Vice President of Allspring Funds Management, LLC since 2009. Senior Vice President of Evergreen Investment Management Company, LLC from 2008 to 2010 and head of the Fund Reporting and Control Team within Fund Administration from 2005 to 2010. |
| Christopher Baker (Born 1976) | Chief Compliance Officer, since 2022 | Global Chief Compliance Officer for Allspring Global Investments since 2022. Prior thereto, Chief Compliance Officer for State Street Global Advisors from 2018 to 2021. Senior Compliance Officer for the State Street divisions of Alternative Investment Solutions, Sector Solutions, and Global Marketing from 2015 to 2018. From 2010 to 2015 Vice President, Global Head of Investment and Marketing Compliance for State Street Global Advisors. |
| Matthew Prasse (Born 1983) | Chief Legal Officer, since 2022; Secretary, since 2021 | Senior Counsel of the Allspring Legal Department since 2021. Senior Counsel of the Wells Fargo Legal Department from 2018 to 2021. Previously, Counsel for Barings LLC from 2015 to 2018. Prior to joining Barings, Associate at Morgan, Lewis & Bockius LLP from 2008 to 2015. |
P.O. Box 219967
Kansas City, MO 64121-9967

1-800-222-8222 or visit the Fund's website at allspringglobal.com. Read the prospectus carefully before you invest or send money.
SA283/SAR283 11-22

Small Company Growth Fund
| 2 | |
| 6 | |
| 8 | |
| Allspring Small Company Growth Fund | |
| 9 | |
| Financial statements | |
| 10 | |
| 11 | |
| 12 | |
| 13 | |
| 18 | |
| Allspring Small Company Growth Portfolio | |
| 22 | |
| Financial statements | |
| 28 | |
| 29 | |
| 30 | |
| 31 | |
| 32 | |
| 37 |

| 1 | The S&P 500 Index consists of 500 stocks chosen for market size, liquidity, and industry group representation. It is a market-value-weighted index with each stock's weight in the index proportionate to its market value. You cannot invest directly in an index. |
| 2 | The Morgan Stanley Capital International (MSCI) All Country World Index (ACWI) ex USA Index (Net) is a free-float-adjusted market-capitalization-weighted index that is designed to measure the equity market performance of developed and emerging markets, excluding the U.S. Source: MSCI. MSCI makes no express or implied warranties or representations and shall have no liability whatsoever with respect to any MSCI data contained herein. The MSCI data may not be further redistributed or used as a basis for other indexes or any securities or financial products. This report is not approved, reviewed, or produced by MSCI. You cannot invest directly in an index. |
| 3 | The MSCI Emerging Markets (EM) Index (Net) (USD) is a free-float-adjusted market-capitalization-weighted index that is designed to measure equity market performance of emerging markets. You cannot invest directly in an index. |
| 4 | The Bloomberg U.S. Aggregate Bond Index is a broad-based benchmark that measures the investment-grade, U.S.-dollar-denominated, fixed-rate taxable bond market, including Treasuries, government-related and corporate securities, mortgage-backed securities (agency fixed-rate and hybrid adjustable-rate mortgage pass-throughs), asset-backed securities, and commercial mortgage-backed securities. You cannot invest directly in an index. |
| 5 | The Bloomberg Global Aggregate ex-USD Index (unhedged) is an unmanaged index that provides a broad-based measure of the global investment-grade fixed-income markets excluding the U.S.-dollar-denominated debt market. You cannot invest directly in an index. |
| 6 | The Bloomberg Municipal Bond Index is an unmanaged index composed of long-term tax-exempt bonds with a minimum credit rating of Baa. You cannot invest directly in an index. |
| 7 | The ICE BofA U.S. High Yield Index is a market-capitalization-weighted index of domestic and Yankee high-yield bonds. The index tracks the performance of high-yield securities traded in the U.S. bond market. You cannot invest directly in an index. Copyright 2023. ICE Data Indices, LLC. All rights reserved. |

President
Allspring Funds
| Investment objective | The Fund seeks long-term capital appreciation. |
| Manager | Allspring Funds Management, LLC |
| Portfolio managers | William A. Grierson, CFA®‡, Daniel J. Hagen, CFA®‡, Paul E. von Kuster, CFA®‡, Ryan H. Smith, CFA®‡, Samuel D. Smith, CFA®‡ |
| Average annual total returns (%) as of November 30, 2022 | |||||||||||
| Including sales charge | Excluding sales charge | Expense ratios1 (%) | |||||||||
| Inception date | 1 year | 5 year | 10 year | 1 year | 5 year | 10 year | Gross | Net 2 | |||
| Class A (WFSAX) | 1-30-2004 | -22.04 | 5.92 | 10.23 | -17.28 | 7.18 | 10.89 | 1.34 | 1.29 | ||
| Class C (WSMCX) | 1-30-2004 | -18.90 | 6.41 | 10.23 | -17.90 | 6.41 | 10.23 | 2.09 | 2.04 | ||
| Class R6 (WSCRX)3 | 10-31-2014 | – | – | – | -16.91 | 7.65 | 11.38 | 0.91 | 0.86 | ||
| Administrator Class (NVSCX) | 11-11-1994 | – | – | – | -17.19 | 7.30 | 11.05 | 1.26 | 1.19 | ||
| Institutional Class (WSCGX) | 3-31-2008 | – | – | – | -16.97 | 7.57 | 11.32 | 1.01 | 0.94 | ||
| Russell 2000® Growth Index4 | – | – | – | – | -20.96 | 4.91 | 10.24 | – | – | ||
| 1 | Reflects the expense ratios as stated in the most recent prospectuses. The expense ratios shown are subject to change and may differ from the annualized expense ratios shown in the financial highlights of this report. |
| 2 | The manager has contractually committed through September 30, 2023, to waive fees and/or reimburse expenses to the extent necessary to cap total annual fund operating expenses after fee waivers at 1.29% for Class A, 2.04% for Class C, 0.86% for Class R6, 1.19% for Administrator Class, and 0.94% for Institutional Class. Brokerage commissions, stamp duty fees, interest, taxes, acquired fund fees and expenses (if any) from funds in which the affiliated master portfolio invests, and extraordinary expenses are excluded from the expense caps. Net expenses from the affiliated master portfolio are included in the expense caps. Prior to or after the commitment expiration date, the caps may be increased or the commitment to maintain the caps may be terminated only with the approval of the Board of Trustees. Without these caps, the Fund’s returns would have been lower. The expense ratio paid by an investor is the net expense ratio (the total annual fund operating expenses after fee waivers) as stated in the prospectuses. |
| 3 | Historical performance shown for the Class R6 shares prior to their inception reflects the performance of the Institutional Class shares, and includes the higher expenses applicable to the Institutional Class shares. If these expenses had not been included, returns for the Class R6 shares would be higher. |
| 4 | The Russell 2000® Growth Index measures the performance of those Russell 2000 companies with higher price/book ratios and higher forecasted growth values. You cannot invest directly in an index. |
| * | The Fund is a feeder fund in a master-feeder structure that invests substantially all of its assets in a single affiliated master portfolio of the Allspring Master Trust with a substantially identical investment objective and substantially similar investment strategies. References to the investment activities of the Fund are intended to refer to the investment activities of the affiliated master portfolio in which it invests. |
| ‡ | CFA® and Chartered Financial Analyst® are trademarks owned by CFA Institute. |
| Ten largest holdings (%) as of November 30, 20221 | |
| PTC Incorporated | 1.70 |
| ICON plc ADR | 1.65 |
| Element Solutions Incorporated | 1.48 |
| International Game Technology plc | 1.44 |
| BRP Group Incorporated Class A | 1.42 |
| KBR Incorporated | 1.41 |
| ASGN Incorporated | 1.36 |
| Box Incorporated Class A | 1.35 |
| Avantor Incorporated | 1.30 |
| Ciena Corporation | 1.30 |
| 1 | Each holding represents the Fund’s allocable portion of the affiliated master portfolio security. Figures represent each holding as a percentage of the Fund’s net assets. Holdings are subject to change and may have changed since the date specified. |
| Sector allocation as of November 30, 20221 |

| 1 | Figures represent the sector allocation of the affiliated master portfolio as a percentage of the long-term investments of the affiliated master portfolio. Allocations are subject to change and may have changed since the date specified. |
| Beginning account value 6-1-2022 | Ending account value 11-30-2022 | Expenses paid during the period1,2 | Annualized net expense ratio2 | |
| Class A | ||||
| Actual | $1,000.00 | $ 995.47 | $ 6.45 | 1.29% |
| Hypothetical (5% return before expenses) | $1,000.00 | $1,018.60 | $ 6.53 | 1.29% |
| Class C | ||||
| Actual | $1,000.00 | $ 992.16 | $10.19 | 2.04% |
| Hypothetical (5% return before expenses) | $1,000.00 | $1,014.84 | $10.30 | 2.04% |
| Class R6 | ||||
| Actual | $1,000.00 | $ 997.81 | $ 4.31 | 0.86% |
| Hypothetical (5% return before expenses) | $1,000.00 | $1,020.76 | $ 4.36 | 0.86% |
| Administrator Class | ||||
| Actual | $1,000.00 | $ 996.17 | $ 5.95 | 1.19% |
| Hypothetical (5% return before expenses) | $1,000.00 | $1,019.10 | $ 6.02 | 1.19% |
| Institutional Class | ||||
| Actual | $1,000.00 | $ 997.52 | $ 4.71 | 0.94% |
| Hypothetical (5% return before expenses) | $1,000.00 | $1,020.36 | $ 4.76 | 0.94% |
| Value | |||||
| Investment companies: 100.10% | |||||
| Affiliated master portfolio: 100.10% | |||||
| Allspring Small Company Growth Portfolio | $685,131,135 | ||||
| Total Investment companies (Cost $555,083,404) | 685,131,135 | ||||
| Total investments in securities (Cost $555,083,404) | 100.10% | 685,131,135 | |||
| Other assets and liabilities, net | (0.10) | (700,211) | |||
| Total net assets | 100.00% | $684,430,924 |
| % of ownership, beginning of period | % of ownership, end of period | Net realized gains (losses) on securities transactions allocated from affiliated Master Portfolio | Net change in unrealized gains (losses) on securities transactions allocated from affiliated Master Portfolio | Dividends allocated from affiliated Master Portfolio | Affiliated income allocated from affiliated Master Portfolio | Value, end of period | ||
| Allspring Small Company Growth Portfolio | 97.57% | 97.35% | $15,615,776 | $(20,074,464) | $1,407,968 | $199,562 | $685,131,135 |
| Assets | |
Investments in affiliated Master Portfolio, at value (cost $555,083,404) | $ 685,131,135 |
Receivable for Fund shares sold | 1,009,071 |
Receivable from manager | 12,092 |
Prepaid expenses and other assets | 21,824 |
Total assets | 686,174,122 |
| Liabilities | |
Payable for Fund shares redeemed | 1,561,035 |
Administration fees payable | 56,957 |
Trustees’ fees and expenses payable | 3,095 |
Distribution fee payable | 2,320 |
Accrued expenses and other liabilities | 119,791 |
Total liabilities | 1,743,198 |
Total net assets | $684,430,924 |
| Net assets consist of | |
Paid-in capital | $ 511,128,111 |
Total distributable earnings | 173,302,813 |
Total net assets | $684,430,924 |
| Computation of net asset value and offering price per share | |
Net assets – Class A | $ 30,314,771 |
Shares outstanding – Class A1 | 984,417 |
Net asset value per share – Class A | $30.79 |
Maximum offering price per share – Class A2 | $32.67 |
Net assets – Class C | $ 3,878,893 |
Shares outstanding – Class C1 | 180,428 |
Net asset value per share – Class C | $21.50 |
Net assets – Class R6 | $ 222,512,206 |
Shares outstanding – Class R61 | 6,100,127 |
Net asset value per share – Class R6 | $36.48 |
Net assets – Administrator Class | $ 41,867,449 |
Shares outstanding – Administrator Class1 | 1,239,018 |
Net asset value per share – Administrator Class | $33.79 |
Net assets – Institutional Class | $ 385,857,605 |
Shares outstanding – Institutional Class1 | 10,674,525 |
Net asset value per share – Institutional Class | $36.15 |
| 1 | The Fund has an unlimited number of authorized shares. |
| 2 | Maximum offering price is computed as 100/94.25 of net asset value. On investments of $50,000 or more, the offering price is reduced. |
| Investment income | |
Dividends allocated from affiliated Master Portfolio (net of foreign withholding taxes of $2,321) | $ 1,407,968 |
Affiliated income allocated from affiliated Master Portfolio | 199,562 |
Expenses allocated from affiliated Master Portfolio | (2,971,812) |
Total investment income | (1,364,282) |
| Expenses | |
Management fee | 180,972 |
| Administration fees | |
Class A | 33,843 |
Class C | 4,616 |
Class R6 | 33,069 |
Administrator Class | 27,117 |
Institutional Class | 276,306 |
| Shareholder servicing fees | |
Class A | 40,289 |
Class C | 5,445 |
Administrator Class | 52,016 |
| Distribution fee | |
Class C | 16,194 |
Custody and accounting fees | 15,781 |
Professional fees | 22,148 |
Registration fees | 20,172 |
Shareholder report expenses | 39,311 |
Trustees’ fees and expenses | 10,873 |
Other fees and expenses | 4,881 |
Total expenses | 783,033 |
| Less: Fee waivers and/or expense reimbursements | |
Fund-level | (189,910) |
Class A | (3,214) |
Class R6 | (21,986) |
Administrator Class | (8,321) |
Institutional Class | (84,785) |
Net expenses | 474,817 |
Net investment loss | (1,839,099) |
| Realized and unrealized gains (losses) on investments | |
Net realized gains on securities transactions allocated from affiliated Master Portfolio | 15,615,776 |
Net change in unrealized gains (losses) on securities transactions allocated from affiliated Master Portfolio | (20,074,464) |
Net realized and unrealized gains (losses) on investments | (4,458,688) |
Net decrease in net assets resulting from operations | $ (6,297,787) |
| Six months ended November 30, 2022 (unaudited) | Year ended May 31, 2022 | |||
| Operations | ||||
Net investment loss | $ (1,839,099) | $ (5,624,754) | ||
Net realized gains on investments | 15,615,776 | 234,292,155 | ||
Net change in unrealized gains (losses) on investments | (20,074,464) | (380,610,924) | ||
Net decrease in net assets resulting from operations | (6,297,787) | (151,943,523) | ||
| Distributions to shareholders from | ||||
| Net investment income and net realized gains | ||||
Class A | 0 | (25,935,297) | ||
Class C | 0 | (5,561,323) | ||
Class R6 | 0 | (100,466,883) | ||
Administrator Class | 0 | (21,521,432) | ||
Institutional Class | 0 | (248,029,970) | ||
Total distributions to shareholders | 0 | (401,514,905) | ||
| Capital share transactions | Shares | Shares | ||
| Proceeds from shares sold | ||||
Class A | 94,839 | 2,902,325 | 600,158 | 33,843,292 |
Class C | 619 | 13,254 | 89,397 | 4,393,866 |
Class R6 | 407,222 | 14,551,671 | 837,876 | 41,916,286 |
Administrator Class | 92,869 | 3,119,410 | 132,770 | 6,666,051 |
Institutional Class | 2,011,044 | 71,486,249 | 8,331,378 | 426,789,587 |
| 92,072,909 | 513,609,082 | |||
| Reinvestment of distributions | ||||
Class A | 0 | 0 | 643,072 | 23,980,172 |
Class C | 0 | 0 | 206,792 | 5,422,079 |
Class R6 | 0 | 0 | 2,119,772 | 93,248,751 |
Administrator Class | 0 | 0 | 525,535 | 21,483,861 |
Institutional Class | 0 | 0 | 3,043,545 | 132,759,448 |
| 0 | 276,894,311 | |||
| Payment for shares redeemed | ||||
Class A | (461,880) | (13,491,237) | (611,917) | (25,389,359) |
Class C | (97,881) | (2,042,843) | (200,817) | (6,158,661) |
Class R6 | (474,998) | (17,210,554) | (2,783,941) | (175,259,458) |
Administrator Class | (101,443) | (3,391,397) | (366,235) | (17,779,520) |
Institutional Class | (5,000,160) | (175,965,807) | (9,833,729) | (544,346,151) |
| (212,101,838) | (768,933,149) | |||
Net increase (decrease) in net assets resulting from capital share transactions | (120,028,929) | 21,570,244 | ||
Total decrease in net assets | (126,326,716) | (531,888,184) | ||
| Net assets | ||||
Beginning of period | 810,757,640 | 1,342,645,824 | ||
End of period | $ 684,430,924 | $ 810,757,640 | ||
| Year ended May 31 | ||||||
| Class A | Six months ended November 30, 2022 (unaudited) | 2022 | 2021 | 2020 | 2019 | 2018 |
Net asset value, beginning of period | $30.93 | $61.44 | $46.62 | $48.98 | $56.66 | $44.26 |
Net investment loss | (0.13) 1 | (0.47) 1 | (0.47) 1 | (0.34) 1 | (0.36) | (0.35) 1 |
Net realized and unrealized gains (losses) on investments | (0.01) | (5.55) | 24.27 | 2.49 | (3.22) | 12.75 |
Total from investment operations | (0.14) | (6.02) | 23.80 | 2.15 | (3.58) | 12.40 |
| Distributions to shareholders from | ||||||
Net realized gains | 0.00 | (24.49) | (8.98) | (4.51) | (4.10) | 0.00 |
Net asset value, end of period | $30.79 | $30.93 | $61.44 | $46.62 | $48.98 | $56.66 |
Total return2 | (0.45)% | (16.59)% | 53.84% | 3.70% | (6.13)% | 28.02% |
| Ratios to average net assets (annualized)* | ||||||
Gross expenses | 1.36% | 1.34% | 1.33% | 1.32% | 1.31% | 1.32% |
Net expenses | 1.29% | 1.29% | 1.29% | 1.32% | 1.31% | 1.32% |
Net investment loss | (0.84)% | (1.04)% | (0.85)% | (0.69)% | (0.63)% | (0.71)% |
| Supplemental data | ||||||
Portfolio turnover rate3 | 18% | 61% | 44% | 41% | 54% | 37% |
Net assets, end of period (000s omitted) | $30,315 | $41,795 | $44,249 | $36,534 | $64,182 | $76,065 |
| * | Ratios include net expenses allocated from the affiliated Master Portfolio which were as follows: |
| Six months ended November 30, 2022 (unaudited) | 0.82% |
| Year ended May 31, 2022 | 0.81% |
| Year ended May 31, 2021 | 0.79% |
| Year ended May 31, 2020 | 0.78% |
| Year ended May 31, 2019 | 0.78% |
| Year ended May 31, 2018 | 0.78% |
| 1 | Calculated based upon average shares outstanding |
| 2 | Total return calculations do not include any sales charges. Returns for periods of less than one year are not annualized. |
| 3 | Portfolio turnover rate is calculated by multiplying the affiliated Master Portfolio’s percentage of the Fund’s total investment in securities at the end of the period by the affiliated Master Portfolio’s portfolio turnover rate. |
| Year ended May 31 | ||||||
| Class C | Six months ended November 30, 2022 (unaudited) | 2022 | 2021 | 2020 | 2019 | 2018 |
Net asset value, beginning of period | $21.67 | $50.65 | $39.84 | $42.75 | $50.38 | $39.65 |
Net investment loss | (0.17) 1 | (0.60) 1 | (0.75) 1 | (0.61) 1 | (0.66) 1 | (0.64) 1 |
Net realized and unrealized gains (losses) on investments | 0.00 2 | (3.89) | 20.54 | 2.21 | (2.87) | 11.37 |
Total from investment operations | (0.17) | (4.49) | 19.79 | 1.60 | (3.53) | 10.73 |
| Distributions to shareholders from | ||||||
Net realized gains | 0.00 | (24.49) | (8.98) | (4.51) | (4.10) | 0.00 |
Net asset value, end of period | $21.50 | $21.67 | $50.65 | $39.84 | $42.75 | $50.38 |
Total return3 | (0.78)% | (17.25)% | 52.86% | 2.92% | (6.82)% | 27.06% |
| Ratios to average net assets (annualized)* | ||||||
Gross expenses | 2.09% | 2.08% | 2.08% | 2.07% | 2.06% | 2.07% |
Net expenses | 2.04% | 2.04% | 2.04% | 2.07% | 2.06% | 2.07% |
Net investment loss | (1.61)% | (1.71)% | (1.60)% | (1.44)% | (1.38)% | (1.47)% |
| Supplemental data | ||||||
Portfolio turnover rate4 | 18% | 61% | 44% | 41% | 54% | 37% |
Net assets, end of period (000s omitted) | $3,879 | $6,018 | $9,235 | $9,336 | $13,968 | $19,979 |
| * | Ratios include net expenses allocated from the affiliated Master Portfolio which were as follows: |
| Six months ended November 30, 2022 (unaudited) | 0.82% |
| Year ended May 31, 2022 | 0.81% |
| Year ended May 31, 2021 | 0.79% |
| Year ended May 31, 2020 | 0.78% |
| Year ended May 31, 2019 | 0.78% |
| Year ended May 31, 2018 | 0.78% |
| 1 | Calculated based upon average shares outstanding |
| 2 | Amount is less than $0.005. |
| 3 | Total return calculations do not include any sales charges. Returns for periods of less than one year are not annualized. |
| 4 | Portfolio turnover rate is calculated by multiplying the affiliated Master Portfolio’s percentage of the Fund’s total investment in securities at the end of the period by the affiliated Master Portfolio’s portfolio turnover rate. |
| Year ended May 31 | ||||||
| Class R6 | Six months ended November 30, 2022 (unaudited) | 2022 | 2021 | 2020 | 2019 | 2018 |
Net asset value, beginning of period | $36.55 | $67.95 | $50.64 | $52.65 | $60.31 | $46.91 |
Net investment loss | (0.07) 1 | (0.26) 1 | (0.17) | (0.14) 1 | (0.12) | (0.14) |
Net realized and unrealized gains (losses) on investments | 0.00 2 | (6.65) | 26.46 | 2.64 | (3.44) | 13.54 |
Total from investment operations | (0.07) | (6.91) | 26.29 | 2.50 | (3.56) | 13.40 |
| Distributions to shareholders from | ||||||
Net realized gains | 0.00 | (24.49) | (8.98) | (4.51) | (4.10) | 0.00 |
Net asset value, end of period | $36.48 | $36.55 | $67.95 | $50.64 | $52.65 | $60.31 |
Total return3 | (0.22)% | (16.24)% | 54.53% | 4.12% | (5.73)% | 28.59% |
| Ratios to average net assets (annualized)* | ||||||
Gross expenses | 0.93% | 0.91% | 0.90% | 0.90% | 0.88% | 0.89% |
Net expenses | 0.86% | 0.86% | 0.86% | 0.89% | 0.88% | 0.89% |
Net investment loss | (0.41)% | (0.48)% | (0.41)% | (0.27)% | (0.20)% | (0.29)% |
| Supplemental data | ||||||
Portfolio turnover rate4 | 18% | 61% | 44% | 41% | 54% | 37% |
Net assets, end of period (000s omitted) | $222,512 | $225,464 | $407,311 | $462,050 | $564,516 | $618,523 |
| * | Ratios include net expenses allocated from the affiliated Master Portfolio which were as follows: |
| Six months ended November 30, 2022 (unaudited) | 0.82% |
| Year ended May 31, 2022 | 0.81% |
| Year ended May 31, 2021 | 0.79% |
| Year ended May 31, 2020 | 0.78% |
| Year ended May 31, 2019 | 0.78% |
| Year ended May 31, 2018 | 0.78% |
| 1 | Calculated based upon average shares outstanding |
| 2 | Amount is less than $0.005. |
| 3 | Returns for periods of less than one year are not annualized. |
| 4 | Portfolio turnover rate is calculated by multiplying the affiliated Master Portfolio’s percentage of the Fund’s total investment in securities at the end of the period by the affiliated Master Portfolio’s portfolio turnover rate. |
| Year ended May 31 | ||||||
| Administrator Class | Six months ended November 30, 2022 (unaudited) | 2022 | 2021 | 2020 | 2019 | 2018 |
Net asset value, beginning of period | $33.92 | $64.98 | $48.87 | $51.10 | $58.85 | $45.91 |
Net investment loss | (0.12) 1 | (0.47) 1 | (0.44) 1 | (0.29) 1 | (0.29) 1 | (0.30) 1 |
Net realized and unrealized gains (losses) on investments | (0.01) | (6.10) | 25.53 | 2.57 | (3.36) | 13.24 |
Total from investment operations | (0.13) | (6.57) | 25.09 | 2.28 | (3.65) | 12.94 |
| Distributions to shareholders from | ||||||
Net realized gains | 0.00 | (24.49) | (8.98) | (4.51) | (4.10) | 0.00 |
Net asset value, end of period | $33.79 | $33.92 | $64.98 | $48.87 | $51.10 | $58.85 |
Total return2 | (0.38)% | (16.52)% | 54.02% | 3.80% | (6.02)% | 28.19% |
| Ratios to average net assets (annualized)* | ||||||
Gross expenses | 1.28% | 1.26% | 1.25% | 1.24% | 1.23% | 1.24% |
Net expenses | 1.19% | 1.19% | 1.19% | 1.20% | 1.20% | 1.20% |
Net investment loss | (0.74)% | (0.93)% | (0.74)% | (0.57)% | (0.51)% | (0.60)% |
| Supplemental data | ||||||
Portfolio turnover rate3 | 18% | 61% | 44% | 41% | 54% | 37% |
Net assets, end of period (000s omitted) | $41,867 | $42,317 | $62,092 | $55,917 | $87,850 | $114,429 |
| * | Ratios include net expenses allocated from the affiliated Master Portfolio which were as follows: |
| Six months ended November 30, 2022 (unaudited) | 0.82% |
| Year ended May 31, 2022 | 0.81% |
| Year ended May 31, 2021 | 0.79% |
| Year ended May 31, 2020 | 0.78% |
| Year ended May 31, 2019 | 0.78% |
| Year ended May 31, 2018 | 0.78% |
| 1 | Calculated based upon average shares outstanding |
| 2 | Returns for periods of less than one year are not annualized. |
| 3 | Portfolio turnover rate is calculated by multiplying the affiliated Master Portfolio’s percentage of the Fund’s total investment in securities at the end of the period by the affiliated Master Portfolio’s portfolio turnover rate. |
| Year ended May 31 | ||||||
| Institutional Class | Six months ended November 30, 2022 (unaudited) | 2022 | 2021 | 2020 | 2019 | 2018 |
Net asset value, beginning of period | $36.24 | $67.62 | $50.47 | $52.51 | $60.20 | $46.85 |
Net investment loss | (0.09) 1 | (0.27) 1 | (0.29) | (0.17) 1 | (0.15) | (0.19) |
Net realized and unrealized gains (losses) on investments | 0.00 2 | (6.62) | 26.42 | 2.64 | (3.44) | 13.54 |
Total from investment operations | (0.09) | (6.89) | 26.13 | 2.47 | (3.59) | 13.35 |
| Distributions to shareholders from | ||||||
Net realized gains | 0.00 | (24.49) | (8.98) | (4.51) | (4.10) | 0.00 |
Net asset value, end of period | $36.15 | $36.24 | $67.62 | $50.47 | $52.51 | $60.20 |
Total return3 | (0.25)% | (16.31)% | 54.39% | 4.07% | (5.77)% | 28.50% |
| Ratios to average net assets (annualized)* | ||||||
Gross expenses | 1.03% | 1.01% | 1.00% | 1.00% | 0.98% | 0.99% |
Net expenses | 0.94% | 0.94% | 0.94% | 0.95% | 0.95% | 0.95% |
Net investment loss | (0.50)% | (0.51)% | (0.49)% | (0.32)% | (0.26)% | (0.35)% |
| Supplemental data | ||||||
Portfolio turnover rate4 | 18% | 61% | 44% | 41% | 54% | 37% |
Net assets, end of period (000s omitted) | $385,858 | $495,163 | $819,760 | $793,581 | $1,047,883 | $1,169,555 |
| * | Ratios include net expenses allocated from the affiliated Master Portfolio which were as follows: |
| Six months ended November 30, 2022 (unaudited) | 0.82% |
| Year ended May 31, 2022 | 0.81% |
| Year ended May 31, 2021 | 0.79% |
| Year ended May 31, 2020 | 0.78% |
| Year ended May 31, 2019 | 0.78% |
| Year ended May 31, 2018 | 0.78% |
| 1 | Calculated based upon average shares outstanding |
| 2 | Amount is less than $0.005. |
| 3 | Returns for periods of less than one year are not annualized. |
| 4 | Portfolio turnover rate is calculated by multiplying the affiliated Master Portfolio’s percentage of the Fund’s total investment in securities at the end of the period by the affiliated Master Portfolio’s portfolio turnover rate. |
| Gross unrealized gains | $118,073,224 |
| Gross unrealized losses | 0 |
| Net unrealized gains | $118,073,224 |
| Affiliated Master Portfolio | Investment objective | Fair value of affiliated Master Portfolio |
| Allspring Small Company Growth Portfolio | Seek long-term capital appreciation | $685,131,135 |
| Average daily net assets | Management fee |
| First $5 billion | 0.050% |
| Next $5 billion | 0.040 |
| Over $10 billion | 0.030 |
| Class-level administration fee | |
| Class A | 0.21% |
| Class C | 0.21 |
| Class R6 | 0.03 |
| Administrator Class | 0.13 |
| Institutional Class | 0.13 |
| Expense ratio caps | |
| Class A | 1.29% |
| Class C | 2.04 |
| Class R6 | 0.86 |
| Administrator Class | 1.19 |
| Institutional Class | 0.94 |
| Shares | Value | ||||
| Common stocks: 96.77% | |||||
| Communication services: 0.30% | |||||
| Entertainment: 0.30% | |||||
| Lions Gate Entertainment Class B † | 295,627 | $ 2,104,864 | |||
| Consumer discretionary: 9.04% | |||||
| Auto components: 0.78% | |||||
| Fox Factory Holding Corporation † | 51,799 | 5,495,874 | |||
| Hotels, restaurants & leisure: 2.24% | |||||
| International Game Technology plc | 412,097 | 10,112,860 | |||
| Papa John's International Incorporated | 67,847 | 5,648,941 | |||
| 15,761,801 | |||||
| Household durables: 1.41% | |||||
| Skyline Champion Corporation † | 117,794 | 6,124,110 | |||
| Sonos Incorporated † | 215,820 | 3,783,325 | |||
| 9,907,435 | |||||
| Leisure products: 0.76% | |||||
| Callaway Golf Company † | 255,035 | 5,342,983 | |||
| Multiline retail: 0.87% | |||||
| Ollie's Bargain Outlet Holdings Incorporated † | 100,450 | 6,117,405 | |||
| Specialty retail: 2.98% | |||||
| Academy Sports & Outdoors Corporation | 139,238 | 7,028,730 | |||
| Burlington Stores Incorporated † | 24,305 | 4,756,002 | |||
| Five Below Incorporated † | 38,726 | 6,229,464 | |||
| Monro Muffler Brake Incorporated | 65,066 | 2,958,551 | |||
| 20,972,747 | |||||
| Consumer staples: 4.40% | |||||
| Food & staples retailing: 1.22% | |||||
| Performance Food Group Company † | 140,490 | 8,567,080 | |||
| Food products: 1.94% | |||||
| Lamb Weston Holdings Incorporated | 87,929 | 7,641,030 | |||
| TreeHouse Foods Incorporated † | 122,480 | 6,054,186 | |||
| 13,695,216 | |||||
| Personal products: 1.24% | |||||
| e.l.f. Beauty Incorporated † | 158,746 | 8,724,680 | |||
| Energy: 2.19% | |||||
| Energy equipment & services: 0.74% | |||||
| ChampionX Corporation | 168,700 | 5,202,708 | |||
| Oil, gas & consumable fuels: 1.45% | |||||
| Callon Petroleum Company † | 117,243 | 4,914,827 | |||
| Ranger Oil Corporation Class A | 120,909 | 5,268,005 | |||
| 10,182,832 |
| Shares | Value | ||||
| Financials: 8.65% | |||||
| Banks: 0.93% | |||||
| Triumph Bancorp Incorporated † | 108,941 | $ 6,510,314 | |||
| Capital markets: 3.41% | |||||
| Evercore Partners Incorporated Class A | 53,332 | 6,142,780 | |||
| Focus Financial Partners Class A † | 123,225 | 4,702,266 | |||
| Stifel Financial Corporation | 137,183 | 8,814,008 | |||
| Virtu Financial Incorporated Class A | 196,397 | 4,356,085 | |||
| 24,015,139 | |||||
| Insurance: 3.40% | |||||
| BRP Group Incorporated Class A † | 333,078 | 10,005,663 | |||
| Palomar Holdings Incorporated † | 90,437 | 5,674,017 | |||
| Ryan Specialty Group Holdings Incorporated † | 205,513 | 8,278,064 | |||
| 23,957,744 | |||||
| Thrifts & mortgage finance: 0.91% | |||||
| Essent Group Limited | 159,167 | 6,381,005 | |||
| Health care: 26.14% | |||||
| Biotechnology: 5.71% | |||||
| Amicus Therapeutics Incorporated † | 451,568 | 5,463,973 | |||
| Avid Bioservices Incorporated † | 225,801 | 3,536,044 | |||
| Blueprint Medicines Corporation † | 74,080 | 3,540,283 | |||
| Cytokinetics Incorporated † | 100,959 | 4,290,758 | |||
| Insmed Incorporated † | 203,208 | 3,757,316 | |||
| Ionis Pharmaceuticals Incorporated † | 76,175 | 3,107,178 | |||
| Iovance Biotherapeutics Incorporated † | 168,999 | 1,081,594 | |||
| Neurocrine Biosciences Incorporated † | 39,306 | 4,994,220 | |||
| Sarepta Therapeutics Incorporated † | 41,694 | 5,120,440 | |||
| Springworks Therapeutics Incorporated † | 95,147 | 2,300,654 | |||
| Ultragenyx Pharmaceutical Incorporated † | 83,394 | 3,027,202 | |||
| 40,219,662 | |||||
| Health care equipment & supplies: 8.98% | |||||
| Atricure Incorporated † | 90,835 | 4,138,443 | |||
| Axonics Incorporated † | 113,160 | 7,749,197 | |||
| BioLife Solutions Incorporated † | 165,211 | 3,497,517 | |||
| Conmed Corporation | 65,651 | 5,439,185 | |||
| Glaukos Corporation † | 66,528 | 3,098,209 | |||
| Haemonetics Corporation † | 72,568 | 6,190,776 | |||
| iRhythm Technologies Incorporated † | 46,206 | 5,038,764 | |||
| Novocure Limited † | 19,108 | 1,468,259 | |||
| Omnicell Incorporated † | 96,844 | 4,998,119 | |||
| Silk Road Medical Incorporated † | 169,241 | 9,012,083 | |||
| Tandem Diabetes Care Incorporated † | 106,936 | 4,496,659 | |||
| TransMedics Group Incorporated † | 77,884 | 4,818,683 | |||
| ViewRay Incorporated † | 673,254 | 3,245,084 | |||
| 63,190,978 | |||||
| Health care providers & services: 3.43% | |||||
| AMN Healthcare Services Incorporated † | 56,148 | 6,945,508 | |||
| HealthEquity Incorporated † | 97,939 | 6,217,168 | |||
| Oak Street Health Incorporated † | 143,035 | 3,092,417 |
| Shares | Value | ||||
| Health care providers & services (continued) | |||||
| Privia Health Group Incorporated † | 153,885 | $ 3,682,468 | |||
| U.S. Physical Therapy Incorporated | 48,468 | 4,188,120 | |||
| 24,125,681 | |||||
| Health care technology: 2.51% | |||||
| Allscripts Healthcare Solutions Incorporated † | 347,818 | 6,587,673 | |||
| Evolent Health Incorporated Class A † | 195,616 | 5,631,785 | |||
| Phreesia Incorporated † | 196,039 | 5,453,805 | |||
| 17,673,263 | |||||
| Life sciences tools & services: 4.32% | |||||
| Adaptive Biotechnologies Corporation † | 152,326 | 1,337,422 | |||
| Avantor Incorporated † | 410,675 | 9,149,839 | |||
| Azenta Incorporated | 67,226 | 4,047,677 | |||
| ICON plc ADR † | 53,934 | 11,619,541 | |||
| Syneos Health Incorporated † | 121,318 | 4,280,099 | |||
| 30,434,578 | |||||
| Pharmaceuticals: 1.19% | |||||
| Axsome Therapeutics Incorporated †« | 59,302 | 4,286,942 | |||
| Pacira Biosciences Incorporated † | 84,072 | 4,056,474 | |||
| 8,343,416 | |||||
| Industrials: 20.08% | |||||
| Aerospace & defense: 1.39% | |||||
| Kratos Defense & Security Solutions Incorporated † | 428,383 | 4,078,206 | |||
| Mercury Systems Incorporated † | 112,264 | 5,705,256 | |||
| 9,783,462 | |||||
| Air freight & logistics: 0.59% | |||||
| GXO Logistics Incorporated † | 89,118 | 4,176,069 | |||
| Building products: 3.03% | |||||
| Advanced Drainage Systems Incorporated | 66,966 | 6,513,113 | |||
| Masonite International Corporation † | 83,065 | 6,252,303 | |||
| The AZEK Company Incorporated † | 191,825 | 3,709,896 | |||
| Zurn Water Solutions Corporation | 200,349 | 4,850,449 | |||
| 21,325,761 | |||||
| Commercial services & supplies: 0.98% | |||||
| IAA Incorporated † | 93,427 | 3,491,367 | |||
| KAR Auction Services Incorporated † | 245,679 | 3,375,629 | |||
| 6,866,996 | |||||
| Construction & engineering: 0.82% | |||||
| Dycom Industries Incorporated † | 62,927 | 5,735,167 | |||
| Electrical equipment: 1.48% | |||||
| Atkore Incorporated † | 50,458 | 6,163,445 | |||
| Vicor Corporation † | 79,326 | 4,282,811 | |||
| 10,446,256 | |||||
| Machinery: 2.56% | |||||
| Chart Industries Incorporated † | 36,402 | 5,205,122 |
| Shares | Value | ||||
| Machinery (continued) | |||||
| SPX Technologies Incorporated † | 106,485 | $ 7,123,847 | |||
| Wabash National Corporation | 227,895 | 5,713,328 | |||
| 18,042,297 | |||||
| Professional services: 6.04% | |||||
| ASGN Incorporated † | 105,854 | 9,590,372 | |||
| Clarivate plc † | 309,552 | 3,030,514 | |||
| FTI Consulting Incorporated † | 49,422 | 8,541,110 | |||
| ICF International Incorporated | 68,715 | 7,446,645 | |||
| KBR Incorporated | 191,884 | 9,914,646 | |||
| Sterling Check Corporation † | 275,201 | 4,001,423 | |||
| 42,524,710 | |||||
| Road & rail: 1.64% | |||||
| Knight-Swift Transportation Holdings Incorporated | 107,610 | 5,964,822 | |||
| Schneider National Incorporated Class B | 215,301 | 5,546,154 | |||
| 11,510,976 | |||||
| Trading companies & distributors: 1.55% | |||||
| Boise Cascade Company | 70,866 | 5,246,919 | |||
| Core & Main Incorporated † | 273,286 | 5,684,349 | |||
| 10,931,268 | |||||
| Information technology: 22.07% | |||||
| Communications equipment: 2.10% | |||||
| Ciena Corporation † | 202,611 | 9,109,391 | |||
| Lumentum Holdings Incorporated † | 102,972 | 5,657,282 | |||
| 14,766,673 | |||||
| Electronic equipment, instruments & components: 1.02% | |||||
| Itron Incorporated † | 86,834 | 4,617,832 | |||
| Par Technology Corporation †« | 106,664 | 2,599,402 | |||
| 7,217,234 | |||||
| IT services: 2.81% | |||||
| SS&C Technologies Holdings Incorporated | 155,609 | 8,365,540 | |||
| Verra Mobility Corporation † | 370,875 | 5,878,369 | |||
| WEX Incorporated † | 32,689 | 5,529,017 | |||
| 19,772,926 | |||||
| Semiconductors & semiconductor equipment: 3.13% | |||||
| FormFactor Incorporated † | 107,755 | 2,485,908 | |||
| Onto Innovation Incorporated † | 70,949 | 5,672,373 | |||
| Silicon Motion Technology Corporation ADR | 70,664 | 4,458,898 | |||
| Synaptics Incorporated † | 41,625 | 4,411,001 | |||
| Teradyne Incorporated | 53,311 | 4,981,913 | |||
| 22,010,093 | |||||
| Software: 13.01% | |||||
| Black Knight Incorporated † | 143,074 | 8,869,157 | |||
| Box Incorporated Class A † | 344,799 | 9,464,733 | |||
| CyberArk Software Limited † | 48,763 | 7,269,100 | |||
| Doubleverify Holdings Incorporated † | 185,155 | 4,851,061 | |||
| HashiCorp Incorporated Class A †« | 185,092 | 5,053,012 |
| Shares | Value | ||||
| Software (continued) | |||||
| Jamf Holding Corporation † | 288,034 | $ 6,129,364 | |||
| JFrog Limited † | 284,218 | 6,247,112 | |||
| LiveRamp Holdings Incorporated † | 157,008 | 3,447,896 | |||
| Nutanix Incorporated Class A † | 225,158 | 6,362,965 | |||
| Pagerduty Incorporated † | 338,580 | 7,530,019 | |||
| PTC Incorporated † | 93,960 | 11,952,652 | |||
| Sprout Social Incorporated Class A † | 115,286 | 6,836,460 | |||
| Varonis Systems Incorporated † | 208,473 | 4,427,967 | |||
| Zuora Incorporated † | 405,025 | 3,110,592 | |||
| 91,552,090 | |||||
| Materials: 3.15% | |||||
| Chemicals: 2.28% | |||||
| Element Solutions Incorporated | 533,075 | 10,426,947 | |||
| Orion Engineered Carbons SA | 298,542 | 5,606,619 | |||
| 16,033,566 | |||||
| Metals & mining: 0.87% | |||||
| Steel Dynamics Incorporated | 59,378 | 6,171,156 | |||
| Real estate: 0.75% | |||||
| Equity REITs: 0.75% | |||||
| Ryman Hospitality Properties Incorporated | 57,639 | 5,275,698 | |||
| Total Common stocks (Cost $500,262,108) | 681,069,803 |
| Yield | |||||
| Short-term investments: 4.56% | |||||
| Investment companies: 4.56% | |||||
| Allspring Government Money Market Fund Select Class ♠∞ | 3.60% | 23,643,529 | 23,643,529 | ||
| Securities Lending Cash Investments LLC ♠∩∞ | 3.90 | 8,469,457 | 8,469,457 | ||
| Total Short-term investments (Cost $32,112,719) | 32,112,986 | ||||
| Total investments in securities (Cost $532,374,827) | 101.33% | 713,182,789 | |||
| Other assets and liabilities, net | (1.33) | (9,386,884) | |||
| Total net assets | 100.00% | $703,795,905 |
| † | Non-income-earning security |
| « | All or a portion of this security is on loan. |
| ♠ | The issuer of the security is an affiliated person of the Portfolio as defined in the Investment Company Act of 1940. |
| ∩ | The investment is a non-registered investment company purchased with cash collateral received from securities on loan. |
| ∞ | The rate represents the 7-day annualized yield at period end. |
| Abbreviations: | |
| ADR | American depositary receipt |
| REIT | Real estate investment trust |
| Value, beginning of period | Purchases | Sales proceeds | Net realized gains (losses) | Net change in unrealized gains (losses) | Value, end of period | Shares, end of period | Income from affiliated securities | |||
| Short-term investments | ||||||||||
| Allspring Government Money Market Fund Select Class | $32,660,804 | $122,172,537 | $(131,189,812) | $ 0 | $ 0 | $ 23,643,529 | 23,643,529 | $ 195,137 | ||
| Securities Lending Cash Investments LLC | 2,594,900 | 66,267,816 | (60,393,698) | 172 | 267 | 8,469,457 | 8,469,457 | 57,836 # | ||
| $172 | $267 | $32,112,986 | $252,973 | |||||||
| # | Amount shown represents income before fees and rebates. |
| Assets | |
Investments in unaffiliated securities (including $8,266,299 of securities loaned), at value (cost $500,262,108) | $ 681,069,803 |
Investments in affiliated securities, at value (cost $32,112,719) | 32,112,986 |
Receivable for dividends | 512,597 |
Receivable for securities lending income, net | 1,356 |
Prepaid expenses and other assets | 29,751 |
Total assets | 713,726,493 |
| Liabilities | |
Payable upon receipt of securities loaned | 8,469,018 |
Payable for investments purchased | 931,990 |
Advisory fee payable | 453,527 |
Trustees’ fees and expenses payable | 1,319 |
Accrued expenses and other liabilities | 74,734 |
Total liabilities | 9,930,588 |
Total net assets | $703,795,905 |
| Investment income | |
Dividends (net of foreign withholdings taxes of $2,381) | $ 1,445,303 |
Income from affiliated securities | 204,833 |
Total investment income | 1,650,136 |
| Expenses | |
Advisory fee | 2,941,240 |
Custody and accounting fees | 31,295 |
Professional fees | 34,742 |
Interest holder report expenses | 11,045 |
Trustees’ fees and expenses | 10,879 |
Other fees and expenses | 20,808 |
Total expenses | 3,050,009 |
Net investment loss | (1,399,873) |
| Realized and unrealized gains (losses) on investments | |
| Net realized gains on | |
Unaffiliated securities | 16,042,953 |
Affiliated securities | 172 |
Net realized gains on investments | 16,043,125 |
| Net change in unrealized gains (losses) on | |
Unaffiliated securities | (20,449,223) |
Affiliated securities | 267 |
Net change in unrealized gains (losses) on investments | (20,448,956) |
Net realized and unrealized gains (losses) on investments | (4,405,831) |
Net decrease in net assets resulting from operations | $ (5,805,704) |
| Six months ended November 30, 2022 (unaudited) | Year ended May 31, 2022 | |
| Operations | ||
Net investment loss | $ (1,399,873) | $ (4,263,313) |
Net realized gains on investments | 16,043,125 | 238,329,906 |
Net change in unrealized gains (losses) on investments | (20,448,956) | (388,267,734) |
Net decrease in net assets resulting from operations | (5,805,704) | (154,201,141) |
| Capital transactions | ||
| Transactions in investors’ beneficial interests | ||
Contributions | 17,814,945 | 222,703,095 |
Withdrawals | (137,473,434) | (617,532,776) |
Net decrease in net assets resulting from capital transactions | (119,658,489) | (394,829,681) |
Total decrease in net assets | (125,464,193) | (549,030,822) |
| Net assets | ||
Beginning of period | 829,260,098 | 1,378,290,920 |
End of period | $ 703,795,905 | $ 829,260,098 |
| Year ended May 31 | ||||||
| Six months ended November 30, 2022 (unaudited) | 2022 | 2021 | 2020 | 2019 | 2018 | |
Total return1 | (0.23)% | (16.28)% | 54.64% | 4.08% | (5.64)% | 28.74% |
| Ratios to average net assets (annualized) | ||||||
Gross expenses | 0.82% | 0.81% | 0.79% | 0.78% | 0.78% | 0.78% |
Net expenses | 0.82% | 0.81% | 0.79% | 0.78% | 0.78% | 0.78% |
Net investment loss | (0.38)% | (0.42)% | (0.34)% | (0.16)% | (0.09)% | (0.18)% |
| Supplemental data | ||||||
Portfolio turnover rate | 18% | 61% | 44% | 41% | 54% | 37% |
| 1 | Returns for periods of less than one year are not annualized. |
| Gross unrealized gains | $237,991,923 |
| Gross unrealized losses | (57,183,961) |
| Net unrealized gains | $180,807,962 |
| ■ | Level 1 – quoted prices in active markets for identical securities |
| ■ | Level 2 – other significant observable inputs (including quoted prices for similar securities, interest rates, prepayment speeds, credit risk, etc.) |
| ■ | Level 3 – significant unobservable inputs (including the Portfolio’s own assumptions in determining the fair value of investments) |
| Quoted prices (Level 1) | Other significant observable inputs (Level 2) | Significant unobservable inputs (Level 3) | Total | |
| Assets | ||||
| Investments in: | ||||
| Common stocks | ||||
| Communication services | $ 2,104,864 | $0 | $0 | $ 2,104,864 |
| Consumer discretionary | 63,598,245 | 0 | 0 | 63,598,245 |
| Consumer staples | 30,986,976 | 0 | 0 | 30,986,976 |
| Energy | 15,385,540 | 0 | 0 | 15,385,540 |
| Financials | 60,864,202 | 0 | 0 | 60,864,202 |
| Health care | 183,987,578 | 0 | 0 | 183,987,578 |
| Industrials | 141,342,962 | 0 | 0 | 141,342,962 |
| Information technology | 155,319,016 | 0 | 0 | 155,319,016 |
| Materials | 22,204,722 | 0 | 0 | 22,204,722 |
| Real estate | 5,275,698 | 0 | 0 | 5,275,698 |
| Short-term investments | ||||
| Investment companies | 32,112,986 | 0 | 0 | 32,112,986 |
| Total assets | $713,182,789 | $0 | $0 | $713,182,789 |
| Average daily net assets | Advisory fee |
| First $500 million | 0.800% |
| Next $500 million | 0.775 |
| Next $1 billion | 0.750 |
| Next $1 billion | 0.725 |
| Next $1 billion | 0.700 |
| Over $4 billion | 0.680 |
| Counterparty | Value of securities on loan | Collateral received1 | Net amount |
| Barclays Capital Incorporated | $ 793,408 | $ (793,408) | $0 |
| Citigroup Global Markets Incorporated | 1,367,212 | (1,367,212) | 0 |
| JPMorgan Securities LLC | 1,109,284 | (1,109,284) | 0 |
| Morgan Stanley & Company LLC | 3,581,459 | (3,581,459) | 0 |
| National Financial Services LLC | 557,772 | (557,772) | 0 |
| Scotia Capital (USA) Incorporated | 857,164 | (857,164) | 0 |
| Name and year of birth | Position held and length of service* | Principal occupations during past five years or longer | Current other public company or investment company directorships |
| William R. Ebsworth (Born 1957) | Trustee, since 2015 | Retired. From 1984 to 2013, equities analyst, portfolio manager, research director and chief investment officer at Fidelity Management and Research Company in Boston, Tokyo, and Hong Kong, and retired in 2013 as Chief Investment Officer of Fidelity Strategic Advisers, Inc. where he led a team of investment professionals managing client assets. Prior thereto, Board member of Hong Kong Securities Clearing Co., Hong Kong Options Clearing Corp., the Thailand International Fund, Ltd., Fidelity Investments Life Insurance Company, and Empire Fidelity Investments Life Insurance Company. Audit Committee Chair and Investment Committee Chair of the Vincent Memorial Hospital Endowment (non-profit organization). Mr. Ebsworth is a CFA® charterholder. | N/A |
| Jane A. Freeman (Born 1953) | Trustee, since 2015; Chair Liaison, since 2018 | Retired. From 2012 to 2014 and 1999 to 2008, Chief Financial Officer of Scientific Learning Corporation. From 2008 to 2012, Ms. Freeman provided consulting services related to strategic business projects. Prior to 1999, Portfolio Manager at Rockefeller & Co. and Scudder, Stevens & Clark. Board member of the Harding Loevner Funds from 1996 to 2014, serving as both Lead Independent Director and chair of the Audit Committee. Board member of the Russell Exchange Traded Funds Trust from 2011 to 2012 and the chair of the Audit Committee. Ms. Freeman is also an inactive Chartered Financial Analyst. | N/A |
| Isaiah Harris, Jr. (Born 1952) | Trustee, since 2009; Audit Committee Chair, since 2019 | Retired. Chairman of the Board of CIGNA Corporation from 2009 to 2021, and Director from 2005 to 2008. From 2003 to 2011, Director of Deluxe Corporation. Prior thereto, President and CEO of BellSouth Advertising and Publishing Corp. from 2005 to 2007, President and CEO of BellSouth Enterprises from 2004 to 2005 and President of BellSouth Consumer Services from 2000 to 2003. Emeritus member of the Iowa State University Foundation Board of Governors. Emeritus Member of the Advisory Board of Iowa State University School of Business. Advisory Board Member, Palm Harbor Academy (private school). Advisory Board Member, Fellowship of Christian Athletes. Mr. Harris is a certified public accountant (inactive status). | N/A |
| David F. Larcker (Born 1950) | Trustee, since 2009 | James Irvin Miller Professor of Accounting at the Graduate School of Business (Emeritus), Stanford University, Director of the Corporate Governance Research Initiative and Senior Faculty of The Rock Center for Corporate Governance since 2006. From 2005 to 2008, Professor of Accounting at the Graduate School of Business, Stanford University. Prior thereto, Ernst & Young Professor of Accounting at The Wharton School, University of Pennsylvania from 1985 to 2005. | N/A |
| Name and year of birth | Position held and length of service* | Principal occupations during past five years or longer | Current other public company or investment company directorships |
| Olivia S. Mitchell (Born 1953) | Trustee, since 2006; Nominating and Governance Committee Chair, since 2018 | International Foundation of Employee Benefit Plans Professor since 1993, Wharton School of the University of Pennsylvania. Director of Wharton’s Pension Research Council and Boettner Center on Pensions & Retirement Research, and Research Associate at the National Bureau of Economic Research. Previously taught at Cornell University from 1978 to 1993. | N/A |
| Timothy J. Penny (Born 1951) | Trustee, since 1996; Chair, since 2018 | President and Chief Executive Officer of Southern Minnesota Initiative Foundation, a non-profit organization, since 2007. Vice Chair of the Economic Club of Minnesota, since 2007. Co-Chair of the Committee for a Responsible Federal Budget, since 1995. Member of the Board of Trustees of NorthStar Education Finance, Inc., a non-profit organization, since 2007. Senior Fellow of the University of Minnesota Humphrey Institute from 1995 to 2017. | N/A |
| James G. Polisson (Born 1959) | Trustee, since 2018 | Retired. Chief Marketing Officer, Source (ETF) UK Services, Ltd, from 2015 to 2017. From 2012 to 2015, Principal of The Polisson Group, LLC, a management consulting, corporate advisory and principal investing company. Chief Executive Officer and Managing Director at Russell Investments, Global Exchange Traded Funds from 2010 to 2012. Managing Director of Barclays Global Investors from 1998 to 2010 and Global Chief Marketing Officer for iShares and Barclays Global Investors from 2000 to 2010. Trustee of the San Francisco Mechanics’ Institute, a non-profit organization, from 2013 to 2015. Board member of the Russell Exchange Traded Fund Trust from 2011 to 2012. Director of Barclays Global Investors Holdings Deutschland GmbH from 2006 to 2009. Mr. Polisson is an attorney and has a retired status with the Massachusetts and District of Columbia Bar Associations. | N/A |
| Pamela Wheelock (Born 1959) | Trustee, since January 2020; previously Trustee from January 2018 to July 2019 | Retired. Executive and Senior Financial leadership positions in the public, private and nonprofit sectors. Interim President and CEO, McKnight Foundation, 2020. Interim Commissioner, Minnesota Department of Human Services, 2019. Chief Operating Officer, Twin Cities Habitat for Humanity, 2017-2019. Vice President for University Services, University of Minnesota, 2012-2016. Interim President and CEO, Blue Cross and Blue Shield of Minnesota, 2011-2012. Executive Vice-President and Chief Financial Officer, Minnesota Wild, 2002-2008. Commissioner, Minnesota Department of Finance, 1999-2002. Chair of the Board of Directors of Destination Medical Center Corporation. Board member of the Minnesota Wild Foundation. | N/A |
| Name and year of birth | Position held and length of service | Principal occupations during past five years or longer |
| Andrew Owen (Born 1960) | President, since 2017 | President and Chief Executive Officer of Allspring Funds Management, LLC since 2017 and Head of Global Fund Governance of Allspring Global Investments since 2022. Prior thereto, co-president of Galliard Capital Management, LLC, an affiliate of Allspring Funds Management, LLC, from 2019 to 2022 and Head of Affiliated Managers, Allspring Global Investments, from 2014 to 2019 and Executive Vice President responsible for marketing, investments and product development for Allspring Funds Management, LLC, from 2009 to 2014. |
| Jeremy DePalma (Born 1974) | Treasurer, since 2012 (for certain funds in the Fund Complex); since 2021 (for the remaining funds in the Fund Complex) | Senior Vice President of Allspring Funds Management, LLC since 2009. Senior Vice President of Evergreen Investment Management Company, LLC from 2008 to 2010 and head of the Fund Reporting and Control Team within Fund Administration from 2005 to 2010. |
| Christopher Baker (Born 1976) | Chief Compliance Officer, since 2022 | Global Chief Compliance Officer for Allspring Global Investments since 2022. Prior thereto, Chief Compliance Officer for State Street Global Advisors from 2018 to 2021. Senior Compliance Officer for the State Street divisions of Alternative Investment Solutions, Sector Solutions, and Global Marketing from 2015 to 2018. From 2010 to 2015 Vice President, Global Head of Investment and Marketing Compliance for State Street Global Advisors. |
| Matthew Prasse (Born 1983) | Chief Legal Officer, since 2022; Secretary, since 2021 | Senior Counsel of the Allspring Legal Department since 2021. Senior Counsel of the Wells Fargo Legal Department from 2018 to 2021. Previously, Counsel for Barings LLC from 2015 to 2018. Prior to joining Barings, Associate at Morgan, Lewis & Bockius LLP from 2008 to 2015. |
P.O. Box 219967
Kansas City, MO 64121-9967

1-800-222-8222 or visit the Fund's website at allspringglobal.com. Read the prospectus carefully before you invest or send money.
SA285/SAR285 11-22

Small Company Value Fund
| 2 | |
| 6 | |
| 8 | |
| Allspring Small Company Value Fund | |
| 9 | |
| Financial statements | |
| 10 | |
| 11 | |
| 12 | |
| 13 | |
| 18 | |
| Allspring Small Company Value Portfolio | |
| 22 | |
| Financial statements | |
| 29 | |
| 30 | |
| 31 | |
| 32 | |
| 33 | |
| 38 |

| 1 | The S&P 500 Index consists of 500 stocks chosen for market size, liquidity, and industry group representation. It is a market-value-weighted index with each stock's weight in the index proportionate to its market value. You cannot invest directly in an index. |
| 2 | The Morgan Stanley Capital International (MSCI) All Country World Index (ACWI) ex USA Index (Net) is a free-float-adjusted market-capitalization-weighted index that is designed to measure the equity market performance of developed and emerging markets, excluding the U.S. Source: MSCI. MSCI makes no express or implied warranties or representations and shall have no liability whatsoever with respect to any MSCI data contained herein. The MSCI data may not be further redistributed or used as a basis for other indexes or any securities or financial products. This report is not approved, reviewed, or produced by MSCI. You cannot invest directly in an index. |
| 3 | The MSCI Emerging Markets (EM) Index (Net) (USD) is a free-float-adjusted market-capitalization-weighted index that is designed to measure equity market performance of emerging markets. You cannot invest directly in an index. |
| 4 | The Bloomberg U.S. Aggregate Bond Index is a broad-based benchmark that measures the investment-grade, U.S.-dollar-denominated, fixed-rate taxable bond market, including Treasuries, government-related and corporate securities, mortgage-backed securities (agency fixed-rate and hybrid adjustable-rate mortgage pass-throughs), asset-backed securities, and commercial mortgage-backed securities. You cannot invest directly in an index. |
| 5 | The Bloomberg Global Aggregate ex-USD Index (unhedged) is an unmanaged index that provides a broad-based measure of the global investment-grade fixed-income markets excluding the U.S.-dollar-denominated debt market. You cannot invest directly in an index. |
| 6 | The Bloomberg Municipal Bond Index is an unmanaged index composed of long-term tax-exempt bonds with a minimum credit rating of Baa. You cannot invest directly in an index. |
| 7 | The ICE BofA U.S. High Yield Index is a market-capitalization-weighted index of domestic and Yankee high-yield bonds. The index tracks the performance of high-yield securities traded in the U.S. bond market. You cannot invest directly in an index. Copyright 2023. ICE Data Indices, LLC. All rights reserved. |

President
Allspring Funds
| Investment objective | The Fund seeks long-term capital appreciation. |
| Manager | Allspring Funds Management, LLC |
| Portfolio managers | Jeff Goverman, Gustaf Little, Garth R. Nisbet, CFA®‡, Craig Pieringer, CFA®‡ |
| Average annual total returns (%) as of November 30, 2022 | |||||||||||
| Including sales charge | Excluding sales charge | Expense ratios1 (%) | |||||||||
| Inception date | 1 year | 5 year | 10 year | 1 year | 5 year | 10 year | Gross | Net 2 | |||
| Class A (SCVAX) | 1-31-2002 | -7.40 | 5.20 | 9.63 | -1.75 | 6.46 | 10.28 | 1.32 | 1.15 | ||
| Class C (SCVFX) | 8-30-2002 | -3.53 | 5.70 | 9.64 | -2.53 | 5.70 | 9.64 | 2.07 | 1.90 | ||
| Class R6 (SCVJX)3 | 10-31-2016 | – | – | – | -1.37 | 6.89 | 10.63 | 0.89 | 0.75 | ||
| Administrator Class (SCVIX) | 1-31-2002 | – | – | – | -1.68 | 6.55 | 10.43 | 1.24 | 1.05 | ||
| Institutional Class (SCVNX) | 7-30-2010 | – | – | – | -1.47 | 6.78 | 10.66 | 0.99 | 0.85 | ||
| Russell 2000® Value Index4 | – | – | – | – | -4.75 | 5.35 | 9.67 | – | – | ||
| 1 | Reflects the expense ratios as stated in the most recent prospectuses. The expense ratios shown are subject to change and may differ from the annualized expense ratios shown in the financial highlights of this report. |
| 2 | The manager has contractually committed through September 30, 2023, to waive fees and/or reimburse expenses to the extent necessary to cap total annual fund operating expenses after fee waivers at 1.15% for Class A, 1.90% for Class C, 0.75% for Class R6, 1.05% for Administrator Class, and 0.85% for Institutional Class. Brokerage commissions, stamp duty fees, interest, taxes, acquired fund fees and expenses (if any) from funds in which the affiliated master portfolio invests, and extraordinary expenses are excluded from the expense caps. Net expenses from the affiliated master portfolio are included in the expense caps. Prior to or after the commitment expiration date, the caps may be increased or the commitment to maintain the caps may be terminated only with the approval of the Board of Trustees. Without these caps, the Fund’s returns would have been lower. The expense ratio paid by an investor is the net expense ratio (the total annual fund operating expenses after fee waivers) as stated in the prospectuses. |
| 3 | Historical performance shown for the Class R6 shares prior to their inception reflects the performance of the Institutional Class shares, and includes the higher expenses applicable to the Institutional Class shares. If these expenses had not been included, returns for the Class R6 shares would be higher. |
| 4 | The Russell 2000® Value Index measures the performance of those Russell 2000 companies with lower price/book ratios and lower forecasted growth values. You cannot invest directly in an index. |
| * | The Fund is a feeder fund in a master-feeder structure that invests substantially all of its assets in a single affiliated master portfolio of the Allspring Master Trust with a substantially identical investment objective and substantially similar investment strategies. References to the investment activities of the Fund are intended to refer to the investment activities of the affiliated master portfolio in which it invests. |
| ‡ | CFA® and Chartered Financial Analyst® are trademarks owned by CFA Institute. |
| Ten largest holdings (%) as of November 30, 20221 | |
| Piper Sandler Companies | 1.36 |
| Helmerich & Payne Incorporated | 1.35 |
| Patterson-UTI Energy Incorporated | 1.32 |
| Sterling Construction Company Incorporated | 1.28 |
| UFP Technologies Incorporated | 1.27 |
| Annaly Capital Management Incorporated | 1.26 |
| Sanmina Corporation | 1.25 |
| Federal Signal Corporation | 1.24 |
| MYR Group Incorporated | 1.22 |
| Ameris Bancorp | 1.20 |
| 1 | Each holding represents the Fund’s allocable portion of the affiliated master portfolio security. Figures represent each holding as a percentage of the Fund’s net assets. Holdings are subject to change and may have changed since the date specified. |
| Sector allocation as of November 30, 20221 |
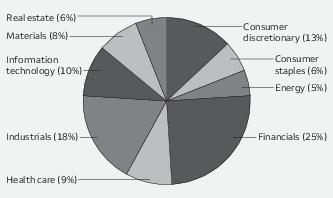
| 1 | Figures represent the sector allocation of the affiliated master portfolio as a percentage of the long-term investments of the affiliated master portfolio. Allocations are subject to change and may have changed since the date specified. |
| Beginning account value 6-1-2022 | Ending account value 11-30-2022 | Expenses paid during the period1,2 | Annualized net expense ratio2 | |
| Class A | ||||
| Actual | $1,000.00 | $1,003.50 | $5.73 | 1.14% |
| Hypothetical (5% return before expenses) | $1,000.00 | $1,019.35 | $5.77 | 1.14% |
| Class C | ||||
| Actual | $1,000.00 | $ 999.66 | $9.52 | 1.90% |
| Hypothetical (5% return before expenses) | $1,000.00 | $1,015.54 | $9.60 | 1.90% |
| Class R6 | ||||
| Actual | $1,000.00 | $1,005.36 | $3.77 | 0.75% |
| Hypothetical (5% return before expenses) | $1,000.00 | $1,021.31 | $3.80 | 0.75% |
| Administrator Class | ||||
| Actual | $1,000.00 | $1,003.98 | $5.27 | 1.05% |
| Hypothetical (5% return before expenses) | $1,000.00 | $1,019.80 | $5.32 | 1.05% |
| Institutional Class | ||||
| Actual | $1,000.00 | $1,005.10 | $4.27 | 0.85% |
| Hypothetical (5% return before expenses) | $1,000.00 | $1,020.81 | $4.31 | 0.85% |
| Value | |||||
| Investment companies: 99.92% | |||||
| Affiliated master portfolio: 99.92% | |||||
| Allspring Small Company Value Portfolio | $538,623,041 | ||||
| Total Investment companies (Cost $430,377,654) | 538,623,041 | ||||
| Total investments in securities (Cost $430,377,654) | 99.92% | 538,623,041 | |||
| Other assets and liabilities, net | 0.08 | 453,569 | |||
| Total net assets | 100.00% | $539,076,610 |
| % of ownership, beginning of period | % of ownership, end of period | Net realized gains (losses) on securities transactions allocated from affiliated Master Portfolio | Net change in unrealized gains (losses) on securities transactions allocated from affiliated Master Portfolio | Dividends allocated from affiliated Master Portfolio | Securities lending income allocated from affiliated Master Portfolio | Affiliated income allocated from affiliated Master Portfolio | Value, end of period | ||
| Allspring Small Company Value Portfolio | 88.09% | 89.35% | $(4,010,334) | $4,106,939 | $5,062,842 | $305,669 | $55,982 | $538,623,041 |
| Assets | |
Investments in affiliated Master Portfolio, at value (cost $430,377,654) | $ 538,623,041 |
Receivable for Fund shares sold | 838,059 |
Receivable from manager | 40,751 |
Prepaid expenses and other assets | 69,254 |
Total assets | 539,571,105 |
| Liabilities | |
Payable for Fund shares redeemed | 297,137 |
Administration fees payable | 78,605 |
Trustees’ fees and expenses payable | 3,427 |
Distribution fee payable | 1,260 |
Accrued expenses and other liabilities | 114,066 |
Total liabilities | 494,495 |
Total net assets | $539,076,610 |
| Net assets consist of | |
Paid-in capital | $ 425,198,340 |
Total distributable earnings | 113,878,270 |
Total net assets | $539,076,610 |
| Computation of net asset value and offering price per share | |
Net assets – Class A | $ 367,748,864 |
Shares outstanding – Class A1 | 10,685,032 |
Net asset value per share – Class A | $34.42 |
Maximum offering price per share – Class A2 | $36.52 |
Net assets – Class C | $ 2,095,949 |
Shares outstanding – Class C1 | 70,376 |
Net asset value per share – Class C | $29.78 |
Net assets – Class R6 | $ 12,189,280 |
Shares outstanding – Class R61 | 341,915 |
Net asset value per share – Class R6 | $35.65 |
Net assets – Administrator Class | $ 20,976,736 |
Shares outstanding – Administrator Class1 | 594,438 |
Net asset value per share – Administrator Class | $35.29 |
Net assets – Institutional Class | $ 136,065,781 |
Shares outstanding – Institutional Class1 | 3,835,273 |
Net asset value per share – Institutional Class | $35.48 |
| 1 | The Fund has an unlimited number of authorized shares. |
| 2 | Maximum offering price is computed as 100/94.25 of net asset value. On investments of $50,000 or more, the offering price is reduced. |
| Investment income | |
Dividends allocated from affiliated Master Portfolio (net of foreign withholding taxes of $7,566) | $ 5,062,842 |
Securities lending income allocated from affiliated Master Portfolio | 305,669 |
Affiliated income allocated from affiliated Master Portfolio | 55,982 |
Expenses allocated from affiliated Master Portfolio | (2,114,223) |
Waivers allocated from affiliated Master Portfolio | 240,072 |
Total investment income | 3,550,342 |
| Expenses | |
Management fee | 126,713 |
| Administration fees | |
Class A | 368,986 |
Class C | 2,165 |
Class R6 | 1,484 |
Administrator Class | 13,734 |
Institutional Class | 79,526 |
| Shareholder servicing fees | |
Class A | 439,269 |
Class C | 2,578 |
Administrator Class | 26,326 |
| Distribution fee | |
Class C | 7,732 |
Custody and accounting fees | 6,512 |
Professional fees | 22,772 |
Registration fees | 36,155 |
Shareholder report expenses | 34,888 |
Trustees’ fees and expenses | 10,873 |
Other fees and expenses | 57,787 |
Total expenses | 1,237,500 |
| Less: Fee waivers and/or expense reimbursements | |
Fund-level | (346,386) |
Class A | (70,091) |
Class C | (308) |
Administrator Class | (4,214) |
Net expenses | 816,501 |
Net investment income | 2,733,841 |
| Realized and unrealized gains (losses) on investments | |
Net realized losses on securities transactions allocated from affiliated Master Portfolio | (4,010,334) |
Net change in unrealized gains (losses) on securities transactions allocated from affiliated Master Portfolio | 4,106,939 |
Net realized and unrealized gains (losses) on investments | 96,605 |
Net increase in net assets resulting from operations | $ 2,830,446 |
| Six months ended November 30, 2022 (unaudited) | Year ended May 31, 2022 | |||
| Operations | ||||
Net investment income | $ 2,733,841 | $ 1,997,250 | ||
Net realized gains (losses) on investments | (4,010,334) | 55,806,887 | ||
Net change in unrealized gains (losses) on investments | 4,106,939 | (68,307,228) | ||
Net increase (decrease) in net assets resulting from operations | 2,830,446 | (10,503,091) | ||
| Distributions to shareholders from | ||||
| Net investment income and net realized gains | ||||
Class A | 0 | (23,780,784) | ||
Class C | 0 | (208,181) | ||
Class R6 | 0 | (352,499) | ||
Administrator Class | 0 | (1,952,485) | ||
Institutional Class | 0 | (4,608,431) | ||
Total distributions to shareholders | 0 | (30,902,380) | ||
| Capital share transactions | Shares | Shares | ||
| Proceeds from shares sold | ||||
Class A | 236,240 | 7,522,474 | 656,676 | 24,000,526 |
Class C | 3,853 | 106,440 | 19,681 | 658,109 |
Class R6 | 161,421 | 5,387,295 | 189,729 | 7,081,211 |
Administrator Class | 149,328 | 4,971,756 | 415,003 | 15,666,878 |
Institutional Class | 1,062,065 | 35,330,170 | 2,016,490 | 74,654,109 |
| 53,318,135 | 122,060,833 | |||
| Reinvestment of distributions | ||||
Class A | 0 | 0 | 658,773 | 23,358,988 |
Class C | 0 | 0 | 6,753 | 208,181 |
Class R6 | 0 | 0 | 9,588 | 352,499 |
Administrator Class | 0 | 0 | 52,212 | 1,898,392 |
Institutional Class | 0 | 0 | 124,652 | 4,555,015 |
| 0 | 30,373,075 | |||
| Payment for shares redeemed | ||||
Class A | (516,541) | (16,713,408) | (1,505,117) | (54,479,971) |
Class C | (9,950) | (275,963) | (53,609) | (1,691,679) |
Class R6 | (45,731) | (1,507,712) | (208,117) | (7,991,882) |
Administrator Class | (232,357) | (7,661,334) | (651,213) | (24,288,201) |
Institutional Class | (498,017) | (16,576,396) | (761,649) | (28,166,610) |
| (42,734,813) | (116,618,343) | |||
Net increase in net assets resulting from capital share transactions | 10,583,322 | 35,815,565 | ||
Total increase (decrease) in net assets | 13,413,768 | (5,589,906) | ||
| Net assets | ||||
Beginning of period | 525,662,842 | 531,252,748 | ||
End of period | $539,076,610 | $ 525,662,842 | ||
| Year ended May 31 | ||||||
| Class A | Six months ended November 30, 2022 (unaudited) | 2022 | 2021 | 2020 | 2019 | 2018 |
Net asset value, beginning of period | $34.30 | $37.11 | $20.91 | $24.22 | $28.60 | $24.01 |
Net investment income | 0.16 | 0.12 1 | 0.09 | 0.18 1 | 0.09 | 0.09 |
Net realized and unrealized gains (losses) on investments | (0.04) | (0.71) | 16.22 | (3.35) | (4.31) | 4.58 |
Total from investment operations | 0.12 | (0.59) | 16.31 | (3.17) | (4.22) | 4.67 |
| Distributions to shareholders from | ||||||
Net investment income | 0.00 | (0.08) | (0.11) | (0.14) | (0.16) | (0.08) |
Net realized gains | 0.00 | (2.14) | 0.00 | 0.00 | 0.00 | 0.00 |
Total distributions to shareholders | 0.00 | (2.22) | (0.11) | (0.14) | (0.16) | (0.08) |
Net asset value, end of period | $34.42 | $34.30 | $37.11 | $20.91 | $24.22 | $28.60 |
Total return2 | 0.35% | (1.77)% | 77.80% | (13.25)% | (14.72)% | 19.48% |
| Ratios to average net assets (annualized)* | ||||||
Gross expenses | 1.32% | 1.32% | 1.32% | 1.32% | 1.49% | 1.47% |
Net expenses | 1.14% | 1.14% | 1.14% | 1.13% | 1.15% | 1.33% |
Net investment income | 1.00% | 0.33% | 0.33% | 0.74% | 0.38% | 0.46% |
| Supplemental data | ||||||
Portfolio turnover rate3 | 50% | 70% | 62% | 78% | 168% | 144% |
Net assets, end of period (000s omitted) | $367,749 | $376,072 | $414,013 | $262,574 | $11,902 | $15,665 |
| * | Ratios include net expenses allocated from the affiliated Master Portfolio which were as follows: |
| Six months ended November 30, 2022 (unaudited) | 0.74% |
| Year ended May 31, 2022 | 0.74% |
| Year ended May 31, 2021 | 0.74% |
| Year ended May 31, 2020 | 0.74% |
| Year ended May 31, 2019 | 0.75% |
| Year ended May 31, 2018 | 0.84% |
| 1 | Calculated based upon average shares outstanding |
| 2 | Total return calculations do not include any sales charges. Returns for periods of less than one year are not annualized. |
| 3 | Portfolio turnover rate is calculated by multiplying the affiliated Master Portfolio’s percentage of the Fund’s total investment in securities at the end of the period by the affiliated Master Portfolio’s portfolio turnover rate. |
| Year ended May 31 | ||||||
| Class C | Six months ended November 30, 2022 (unaudited) | 2022 | 2021 | 2020 | 2019 | 2018 |
Net asset value, beginning of period | $29.79 | $32.69 | $18.43 | $21.48 | $25.38 | $21.40 |
Net investment income (loss) | 0.03 1 | (0.12) 1 | (0.07) 1 | 0.01 1 | (0.08) 1 | (0.07) 1 |
Net realized and unrealized gains (losses) on investments | (0.04) | (0.64) | 14.33 | (3.00) | (3.82) | 4.05 |
Total from investment operations | (0.01) | (0.76) | 14.26 | (2.99) | (3.90) | 3.98 |
| Distributions to shareholders from | ||||||
Net investment income | 0.00 | 0.00 | 0.00 | (0.06) | 0.00 | 0.00 |
Net realized gains | 0.00 | (2.14) | 0.00 | 0.00 | 0.00 | 0.00 |
Total distributions to shareholders | 0.00 | (2.14) | 0.00 | (0.06) | 0.00 | 0.00 |
Net asset value, end of period | $29.78 | $29.79 | $32.69 | $18.43 | $21.48 | $25.38 |
Total return2 | (0.03)% | (2.56)% | 76.80% | (13.98)% | (15.37)% | 18.60% |
| Ratios to average net assets (annualized)* | ||||||
Gross expenses | 2.07% | 2.07% | 2.06% | 2.08% | 2.22% | 2.21% |
Net expenses | 1.90% | 1.90% | 1.90% | 1.90% | 1.90% | 2.08% |
Net investment income (loss) | 0.23% | (0.39)% | (0.29)% | 0.02% | (0.35)% | (0.29)% |
| Supplemental data | ||||||
Portfolio turnover rate3 | 50% | 70% | 62% | 78% | 168% | 144% |
Net assets, end of period (000s omitted) | $2,096 | $2,278 | $3,388 | $4,431 | $1,099 | $1,980 |
| * | Ratios include net expenses allocated from the affiliated Master Portfolio which were as follows: |
| Six months ended November 30, 2022 (unaudited) | 0.74% |
| Year ended May 31, 2022 | 0.74% |
| Year ended May 31, 2021 | 0.74% |
| Year ended May 31, 2020 | 0.74% |
| Year ended May 31, 2019 | 0.75% |
| Year ended May 31, 2018 | 0.84% |
| 1 | Calculated based upon average shares outstanding |
| 2 | Total return calculations do not include any sales charges. Returns for periods of less than one year are not annualized. |
| 3 | Portfolio turnover rate is calculated by multiplying the affiliated Master Portfolio’s percentage of the Fund’s total investment in securities at the end of the period by the affiliated Master Portfolio’s portfolio turnover rate. |
| Year ended May 31 | ||||||
| Class R6 | Six months ended November 30, 2022 (unaudited) | 2022 | 2021 | 2020 | 2019 | 2018 |
Net asset value, beginning of period | $35.46 | $38.33 | $21.56 | $24.92 | $29.44 | $24.69 |
Net investment income | 0.24 1 | 0.33 | 0.20 | 0.31 | 0.21 1 | 0.29 1 |
Net realized and unrealized gains (losses) on investments | (0.05) | (0.80) | 16.78 | (3.50) | (4.45) | 4.65 |
Total from investment operations | 0.19 | (0.47) | 16.98 | (3.19) | (4.24) | 4.94 |
| Distributions to shareholders from | ||||||
Net investment income | 0.00 | (0.26) | (0.21) | (0.17) | (0.28) | (0.19) |
Net realized gains | 0.00 | (2.14) | 0.00 | 0.00 | 0.00 | 0.00 |
Total distributions to shareholders | 0.00 | (2.40) | (0.21) | (0.17) | (0.28) | (0.19) |
Net asset value, end of period | $35.65 | $35.46 | $38.33 | $21.56 | $24.92 | $29.44 |
Total return2 | 0.54% | (1.41)% | 78.63% | (12.97)% | (14.38)% | 20.03% |
| Ratios to average net assets (annualized)* | ||||||
Gross expenses | 0.89% | 0.89% | 0.89% | 0.90% | 1.09% | 1.03% |
Net expenses | 0.75% | 0.75% | 0.75% | 0.75% | 0.75% | 0.88% |
Net investment income | 1.42% | 0.71% | 0.73% | 1.22% | 0.77% | 1.04% |
| Supplemental data | ||||||
Portfolio turnover rate3 | 50% | 70% | 62% | 78% | 168% | 144% |
Net assets, end of period (000s omitted) | $12,189 | $8,021 | $9,007 | $6,491 | $731 | $322 |
| * | Ratios include net expenses allocated from the affiliated Master Portfolio which were as follows: |
| Six months ended November 30, 2022 (unaudited) | 0.74% |
| Year ended May 31, 2022 | 0.74% |
| Year ended May 31, 2021 | 0.74% |
| Year ended May 31, 2020 | 0.74% |
| Year ended May 31, 2019 | 0.75% |
| Year ended May 31, 2018 | 0.84% |
| 1 | Calculated based upon average shares outstanding |
| 2 | Returns for periods of less than one year are not annualized. |
| 3 | Portfolio turnover rate is calculated by multiplying the affiliated Master Portfolio’s percentage of the Fund’s total investment in securities at the end of the period by the affiliated Master Portfolio’s portfolio turnover rate. |
| Year ended May 31 | ||||||
| Administrator Class | Six months ended November 30, 2022 (unaudited) | 2022 | 2021 | 2020 | 2019 | 2018 |
Net asset value, beginning of period | $35.15 | $37.98 | $21.40 | $24.80 | $29.23 | $24.53 |
Net investment income | 0.18 1 | 0.17 1 | 0.10 1 | 0.21 1 | 0.14 1 | 0.20 |
Net realized and unrealized gains (losses) on investments | (0.04) | (0.75) | 16.62 | (3.43) | (4.43) | 4.63 |
Total from investment operations | 0.14 | (0.58) | 16.72 | (3.22) | (4.29) | 4.83 |
| Distributions to shareholders from | ||||||
Net investment income | 0.00 | (0.11) | (0.14) | (0.18) | (0.14) | (0.13) |
Net realized gains | 0.00 | (2.14) | 0.00 | 0.00 | 0.00 | 0.00 |
Total distributions to shareholders | 0.00 | (2.25) | (0.14) | (0.18) | (0.14) | (0.13) |
Net asset value, end of period | $35.29 | $35.15 | $37.98 | $21.40 | $24.80 | $29.23 |
Total return2 | 0.40% | (1.71)% | 77.91% | (13.18)% | (14.65)% | 19.71% |
| Ratios to average net assets (annualized)* | ||||||
Gross expenses | 1.23% | 1.24% | 1.24% | 1.32% | 1.35% | 1.38% |
Net expenses | 1.05% | 1.05% | 1.05% | 1.05% | 1.05% | 1.19% |
Net investment income | 1.08% | 0.45% | 0.35% | 0.82% | 0.49% | 0.59% |
| Supplemental data | ||||||
Portfolio turnover rate3 | 50% | 70% | 62% | 78% | 168% | 144% |
Net assets, end of period (000s omitted) | $20,977 | $23,813 | $32,721 | $15,581 | $13,905 | $60,379 |
| * | Ratios include net expenses allocated from the affiliated Master Portfolio which were as follows: |
| Six months ended November 30, 2022 (unaudited) | 0.74% |
| Year ended May 31, 2022 | 0.74% |
| Year ended May 31, 2021 | 0.74% |
| Year ended May 31, 2020 | 0.74% |
| Year ended May 31, 2019 | 0.75% |
| Year ended May 31, 2018 | 0.84% |
| 1 | Calculated based upon average shares outstanding |
| 2 | Returns for periods of less than one year are not annualized. |
| 3 | Portfolio turnover rate is calculated by multiplying the affiliated Master Portfolio’s percentage of the Fund’s total investment in securities at the end of the period by the affiliated Master Portfolio’s portfolio turnover rate. |
| Year ended May 31 | ||||||
| Institutional Class | Six months ended November 30, 2022 (unaudited) | 2022 | 2021 | 2020 | 2019 | 2018 |
Net asset value, beginning of period | $35.30 | $38.13 | $21.46 | $24.86 | $29.40 | $24.68 |
Net investment income | 0.22 1 | 0.20 1 | 0.15 1 | 0.25 | 0.19 1 | 0.21 |
Net realized and unrealized gains (losses) on investments | (0.04) | (0.71) | 16.70 | (3.43) | (4.45) | 4.69 |
Total from investment operations | 0.18 | (0.51) | 16.85 | (3.18) | (4.26) | 4.90 |
| Distributions to shareholders from | ||||||
Net investment income | 0.00 | (0.18) | (0.18) | (0.22) | (0.28) | (0.18) |
Net realized gains | 0.00 | (2.14) | 0.00 | 0.00 | 0.00 | 0.00 |
Total distributions to shareholders | 0.00 | (2.32) | (0.18) | (0.22) | (0.28) | (0.18) |
Net asset value, end of period | $35.48 | $35.30 | $38.13 | $21.46 | $24.86 | $29.40 |
Total return2 | 0.51% | (1.53)% | 78.39% | (13.03)% | (14.46)% | 19.90% |
| Ratios to average net assets (annualized)* | ||||||
Gross expenses | 0.99% | 0.99% | 0.99% | 1.07% | 1.14% | 1.14% |
Net expenses | 0.85% | 0.85% | 0.85% | 0.85% | 0.85% | 0.99% |
Net investment income | 1.30% | 0.54% | 0.52% | 1.04% | 0.68% | 0.78% |
| Supplemental data | ||||||
Portfolio turnover rate3 | 50% | 70% | 62% | 78% | 168% | 144% |
Net assets, end of period (000s omitted) | $136,066 | $115,479 | $72,123 | $33,600 | $33,116 | $60,973 |
| * | Ratios include net expenses allocated from the affiliated Master Portfolio which were as follows: |
| Six months ended November 30, 2022 (unaudited) | 0.74% |
| Year ended May 31, 2022 | 0.74% |
| Year ended May 31, 2021 | 0.74% |
| Year ended May 31, 2020 | 0.74% |
| Year ended May 31, 2019 | 0.75% |
| Year ended May 31, 2018 | 0.84% |
| 1 | Calculated based upon average shares outstanding |
| 2 | Returns for periods of less than one year are not annualized. |
| 3 | Portfolio turnover rate is calculated by multiplying the affiliated Master Portfolio’s percentage of the Fund’s total investment in securities at the end of the period by the affiliated Master Portfolio’s portfolio turnover rate. |
| Gross unrealized gains | $95,132,538 |
| Gross unrealized losses | 0 |
| Net unrealized gains | $95,132,538 |
| Affiliated Master Portfolio | Investment objective | Fair value of affiliated Master Portfolio |
| Allspring Small Company Value Portfolio | Seek long-term capital appreciation | $538,623,041 |
| Average daily net assets | Management fee |
| First $5 billion | 0.050% |
| Next $5 billion | 0.040 |
| Over $10 billion | 0.030 |
| Class-level administration fee | |
| Class A | 0.21% |
| Class C | 0.21 |
| Class R6 | 0.03 |
| Administrator Class | 0.13 |
| Institutional Class | 0.13 |
| Expense ratio caps | |
| Class A | 1.15% |
| Class C | 1.90 |
| Class R6 | 0.75 |
| Administrator Class | 1.05 |
| Institutional Class | 0.85 |
| Shares | Value | ||||
| Common stocks: 99.02% | |||||
| Consumer discretionary: 13.16% | |||||
| Auto components: 0.53% | |||||
| Patrick Industries Incorporated | 57,040 | $ 3,190,247 | |||
| Diversified consumer services: 0.28% | |||||
| Carriage Services Incorporated | 67,275 | 1,691,966 | |||
| Hotels, restaurants & leisure: 1.80% | |||||
| Dine Brands Global Incorporated | 70,004 | 5,221,598 | |||
| Wyndham Hotels & Resorts Incorporated | 76,956 | 5,642,414 | |||
| 10,864,012 | |||||
| Household durables: 2.12% | |||||
| Cavco Industries Incorporated † | 12,418 | 2,851,545 | |||
| Century Communities Incorporated | 70,668 | 3,403,371 | |||
| Ethan Allen Interiors Incorporated | 70,415 | 2,003,307 | |||
| GoPro Incorporated Class A † | 217,097 | 1,189,692 | |||
| Meritage Corporation † | 38,780 | 3,350,980 | |||
| 12,798,895 | |||||
| Internet & direct marketing retail: 0.56% | |||||
| 1-800-Flowers.com Incorporated Class A † | 400,589 | 3,388,983 | |||
| Leisure products: 1.99% | |||||
| Johnson Outdoors Incorporated Class A | 71,353 | 4,035,726 | |||
| Malibu Boats Incorporated Class A † | 101,765 | 5,872,858 | |||
| Peloton Interactive Incorporated Class A †« | 181,251 | 2,062,636 | |||
| 11,971,220 | |||||
| Multiline retail: 0.93% | |||||
| Macy's Incorporated | 239,531 | 5,628,979 | |||
| Specialty retail: 3.64% | |||||
| American Eagle Outfitters Incorporated | 266,557 | 4,216,932 | |||
| Destination XL Group Incorporated † | 514,406 | 3,425,944 | |||
| Dick's Sporting Goods Incorporated | 51,315 | 6,136,248 | |||
| Shoe Carnival Incorporated | 221,825 | 5,858,398 | |||
| Williams-Sonoma Incorporated | 19,688 | 2,301,527 | |||
| 21,939,049 | |||||
| Textiles, apparel & luxury goods: 1.31% | |||||
| HanesBrands Incorporated | 178,372 | 1,198,660 | |||
| Lakeland Industries Incorporated † | 105,202 | 1,402,343 | |||
| Rocky Brands Incorporated | 97,384 | 2,754,020 | |||
| Under Armour Incorporated Class A † | 250,628 | 2,506,280 | |||
| 7,861,303 | |||||
| Consumer staples: 5.63% | |||||
| Beverages: 0.41% | |||||
| Coca Cola Bottling Corporation | 4,956 | 2,437,361 |
| Shares | Value | ||||
| Food & staples retailing: 1.43% | |||||
| Grocery Outlet Holding Corporation † | 138,774 | $ 4,200,689 | |||
| Sprouts Farmers Market Incorporated † | 129,457 | 4,444,259 | |||
| 8,644,948 | |||||
| Food products: 3.79% | |||||
| Cal-Maine Foods Incorporated | 82,198 | 4,790,499 | |||
| Flowers Foods Incorporated | 156,229 | 4,694,681 | |||
| Hostess Brands Incorporated † | 160,829 | 4,245,886 | |||
| Pilgrim's Pride Corporation † | 172,344 | 4,508,519 | |||
| Post Holdings Incorporated | 49,284 | 4,613,475 | |||
| 22,853,060 | |||||
| Energy: 4.79% | |||||
| Energy equipment & services: 2.68% | |||||
| Helmerich & Payne Incorporated | 159,862 | 8,165,751 | |||
| Patterson-UTI Energy Incorporated | 445,007 | 7,987,876 | |||
| 16,153,627 | |||||
| Oil, gas & consumable fuels: 2.11% | |||||
| Diamondback Energy Incorporated | 39,470 | 5,842,349 | |||
| W&T Offshore Incorporated † | 1,001,947 | 6,883,376 | |||
| 12,725,725 | |||||
| Financials: 25.19% | |||||
| Banks: 13.60% | |||||
| Ameris Bancorp | 136,694 | 7,228,379 | |||
| Atlantic Union Bankshares Corporation | 170,079 | 6,066,718 | |||
| Banc of California Incorporated | 176,807 | 3,000,415 | |||
| Banner Corporation | 99,927 | 7,056,845 | |||
| FB Financial Corporation | 129,273 | 5,534,177 | |||
| First Interstate BancSystem Class A | 149,495 | 6,520,972 | |||
| Great Southern Bancorp Incorporated | 97,385 | 6,101,170 | |||
| Heritage Financial Corporation | 214,342 | 7,051,852 | |||
| Independent Bank Corporation | 228,905 | 5,617,329 | |||
| OceanFirst Financial Corporation | 235,135 | 5,492,754 | |||
| OFG Bancorp | 208,961 | 6,053,600 | |||
| Synovus Financial Corporation | 120,425 | 5,073,505 | |||
| Umpqua Holdings Corporation | 270,394 | 5,480,886 | |||
| Univest Financial Corporation | 202,934 | 5,724,768 | |||
| 82,003,370 | |||||
| Capital markets: 2.66% | |||||
| Donnelley Financial Solutions † | 54,296 | 2,073,021 | |||
| Piper Sandler Companies | 56,954 | 8,182,012 | |||
| Stifel Financial Corporation | 89,703 | 5,763,418 | |||
| 16,018,451 | |||||
| Diversified financial services: 0.76% | |||||
| Jackson Financial Incorporation Class A | 123,325 | 4,606,189 | |||
| Insurance: 5.04% | |||||
| American Equity Investment Life Holding Company | 158,397 | 6,416,662 |
| Shares | Value | ||||
| Insurance (continued) | |||||
| Brighthouse Financial Incorporated † | 77,176 | $ 4,301,790 | |||
| Genworth Financial Incorporated Class A † | 700,704 | 3,524,541 | |||
| Horace Mann Educators Corporation | 110,216 | 4,253,235 | |||
| Lincoln National Corporation | 61,552 | 2,396,835 | |||
| United Fire Group Incorporated | 143,378 | 4,380,198 | |||
| UnumProvident Corporation | 120,473 | 5,081,551 | |||
| 30,354,812 | |||||
| Mortgage REITs: 2.42% | |||||
| AGNC Investment Corporation | 700,072 | 6,993,719 | |||
| Annaly Capital Management Incorporated | 351,627 | 7,619,757 | |||
| 14,613,476 | |||||
| Thrifts & mortgage finance: 0.71% | |||||
| Axos Financial Incorporated † | 106,569 | 4,274,483 | |||
| Health care: 8.97% | |||||
| Health care equipment & supplies: 3.62% | |||||
| EDAP TMS SA ADR † | 292,794 | 3,314,428 | |||
| Masimo Corporation † | 14,623 | 2,119,458 | |||
| Merit Medical Systems Incorporated † | 66,929 | 4,818,888 | |||
| Quidlelothro Corporation † | 36,057 | 3,158,954 | |||
| Semler Scientific Incorporated † | 25,237 | 748,025 | |||
| UFP Technologies Incorporated † | 63,893 | 7,670,355 | |||
| 21,830,108 | |||||
| Health care providers & services: 3.96% | |||||
| Acadia Healthcare Company Incorporated † | 34,315 | 3,056,094 | |||
| Addus Homecare Corporation † | 41,628 | 4,590,736 | |||
| AMN Healthcare Services Incorporated † | 44,742 | 5,534,585 | |||
| Option Care Health Incorporated † | 107,564 | 3,238,752 | |||
| Premier Incorporated Class A | 42,762 | 1,426,113 | |||
| The Ensign Group Incorporated | 47,724 | 4,533,780 | |||
| U.S. Physical Therapy Incorporated | 17,631 | 1,523,495 | |||
| 23,903,555 | |||||
| Health care technology: 0.87% | |||||
| Allscripts Healthcare Solutions Incorporated † | 189,377 | 3,586,800 | |||
| Computer Programs & Systems Incorporated † | 55,023 | 1,628,681 | |||
| 5,215,481 | |||||
| Pharmaceuticals: 0.52% | |||||
| Prestige Consumer Healthcare Incorporated † | 50,665 | 3,113,871 | |||
| Industrials: 18.09% | |||||
| Air freight & logistics: 0.19% | |||||
| Radiant Logistics Incorporated † | 220,645 | 1,178,244 | |||
| Airlines: 0.63% | |||||
| Alaska Air Group Incorporated † | 80,547 | 3,821,150 | |||
| Building products: 1.61% | |||||
| CSW Industrials Incorporated | 41,079 | 4,968,505 |
| Shares | Value | ||||
| Building products (continued) | |||||
| UFP Industries Incorporated | 39,912 | $ 3,267,196 | |||
| Zurn Water Solutions Corporation | 59,861 | 1,449,235 | |||
| 9,684,936 | |||||
| Commercial services & supplies: 1.57% | |||||
| ABM Industries Incorporated | 100,799 | 4,755,697 | |||
| ACCO Brands Corporation | 259,090 | 1,443,131 | |||
| ADT Incorporated | 348,162 | 3,251,833 | |||
| 9,450,661 | |||||
| Construction & engineering: 3.60% | |||||
| Comfort Systems Incorporated | 52,112 | 6,605,717 | |||
| MYR Group Incorporated † | 77,074 | 7,362,879 | |||
| Sterling Construction Company Incorporated † | 235,832 | 7,723,498 | |||
| 21,692,094 | |||||
| Electrical equipment: 1.99% | |||||
| Atkore Incorporated † | 43,350 | 5,295,203 | |||
| Generac Holdings Incorporated † | 27,476 | 2,899,268 | |||
| Nuscale Power Corporation †« | 131,618 | 1,434,636 | |||
| Regal Rexnord Corporation | 17,885 | 2,344,902 | |||
| 11,974,009 | |||||
| Machinery: 5.38% | |||||
| Federal Signal Corporation | 153,912 | 7,478,584 | |||
| Hillenbrand Incorporated | 132,369 | 6,618,450 | |||
| Kadant Incorporated | 34,507 | 6,661,231 | |||
| Miller Industries Incorporated | 99,860 | 2,755,137 | |||
| Standex International Corporation | 19,600 | 2,058,980 | |||
| The Shyft Group Incorporated | 149,401 | 3,664,807 | |||
| The Timken Company | 42,037 | 3,193,971 | |||
| 32,431,160 | |||||
| Professional services: 1.72% | |||||
| Barrett Business Services Incorporated | 21,922 | 2,155,590 | |||
| CBIZ Incorporated † | 129,088 | 6,409,219 | |||
| First Advantage Corporation † | 135,965 | 1,808,335 | |||
| 10,373,144 | |||||
| Road & rail: 0.69% | |||||
| Arcbest Corporation | 50,026 | 4,140,652 | |||
| Trading companies & distributors: 0.71% | |||||
| Boise Cascade Company | 58,300 | 4,316,532 | |||
| Information technology: 10.23% | |||||
| Communications equipment: 0.43% | |||||
| Aviat Networks Incorporated † | 39,635 | 1,246,917 | |||
| Silicom Limited † | 29,628 | 1,353,407 | |||
| 2,600,324 | |||||
| Electronic equipment, instruments & components: 5.14% | |||||
| ePlus Incorporated † | 82,818 | 4,112,742 |
| Shares | Value | ||||
| Electronic equipment, instruments & components (continued) | |||||
| Insight Enterprises Incorporated † | 57,430 | $ 5,967,551 | |||
| Methode Electronics Incorporated | 116,090 | 5,302,991 | |||
| PC Connection Incorporated | 77,975 | 4,331,511 | |||
| Richardson Electric Limited | 146,577 | 3,728,919 | |||
| Sanmina Corporation † | 114,439 | 7,563,274 | |||
| 31,006,988 | |||||
| IT services: 2.14% | |||||
| Cass Information Systems Incorporated | 36,807 | 1,600,368 | |||
| EPAM Systems Incorporated † | 12,014 | 4,428,120 | |||
| Hackett Group Incorporated | 75,055 | 1,733,771 | |||
| TTEC Holdings Incorporated | 43,273 | 2,074,940 | |||
| WEX Incorporated † | 17,979 | 3,040,968 | |||
| 12,878,167 | |||||
| Semiconductors & semiconductor equipment: 2.11% | |||||
| Cirrus Logic Incorporated † | 31,440 | 2,348,882 | |||
| Diodes Incorporated † | 28,470 | 2,625,788 | |||
| FormFactor Incorporated † | 108,197 | 2,496,105 | |||
| Ichor Holdings Limited † | 81,456 | 2,425,760 | |||
| Onto Innovation Incorporated † | 35,012 | 2,799,209 | |||
| 12,695,744 | |||||
| Software: 0.41% | |||||
| Verint Systems Incorporated † | 62,454 | 2,456,316 | |||
| Materials: 7.35% | |||||
| Chemicals: 4.84% | |||||
| Advansix Incorporated | 147,941 | 6,089,252 | |||
| Hawkins Incorporated | 160,901 | 6,693,482 | |||
| Hudson Technologies Incorporated † | 178,780 | 2,018,426 | |||
| Ingevity Corporation † | 54,931 | 4,299,449 | |||
| Intrepid Potash Incorporated † | 61,023 | 2,199,879 | |||
| Minerals Technologies Incorporated | 58,725 | 3,540,530 | |||
| Stepan Company | 39,062 | 4,358,147 | |||
| 29,199,165 | |||||
| Construction materials: 1.11% | |||||
| Eagle Materials Incorporated | 49,029 | 6,684,614 | |||
| Containers & packaging: 0.45% | |||||
| Greif Incorporated Class A | 38,543 | 2,709,958 | |||
| Metals & mining: 0.95% | |||||
| Schnitzer Steel Industries Incorporated Class A | 166,927 | 5,730,604 | |||
| Real estate: 5.61% | |||||
| Equity REITs: 5.61% | |||||
| Agree Realty Corporation | 82,849 | 5,795,288 | |||
| Armada Hoffler Properties Incorporated | 210,347 | 2,555,716 | |||
| Global Medical REIT Incorporated | 144,759 | 1,462,066 | |||
| LXP Industrial Trust | 250,879 | 2,699,458 | |||
| One Liberty Properties Incorporated « | 103,654 | 2,471,111 | |||
| Outfront Media Incorporated | 177,448 | 3,245,524 |
| Shares | Value | ||||
| Equity REITs (continued) | |||||
| PotlatchDeltic Corporation | 74,845 | $ 3,576,843 | |||
| Retail Opportunity Investment Corporation | 175,648 | 2,678,632 | |||
| STAG Industrial Incorporated | 188,196 | 6,193,530 | |||
| Summit Hotel Properties Incorporated | 367,396 | 3,141,236 | |||
| 33,819,404 | |||||
| Total Common stocks (Cost $453,185,394) | 596,927,037 |
| Expiration date | |||||
| Warrants: 0.00% | |||||
| Energy: 0.00% | |||||
| Energy equipment & services: 0.00% | |||||
| Parker Drilling Company † | 9-16-2024 | 8,457 | 211 | ||
| Total Warrants (Cost $0) | 211 |
| Yield | |||||
| Short-term investments: 1.26% | |||||
| Investment companies: 1.26% | |||||
| Allspring Government Money Market Fund Select Class ♠∞ | 3.60% | 6,090,358 | 6,090,358 | ||
| Securities Lending Cash Investments LLC ♠∩∞ | 3.90 | 1,523,945 | 1,523,945 | ||
| Total Short-term investments (Cost $7,614,303) | 7,614,303 | ||||
| Total investments in securities (Cost $460,799,697) | 100.28% | 604,541,551 | |||
| Other assets and liabilities, net | (0.28) | (1,694,503) | |||
| Total net assets | 100.00% | $602,847,048 |
| † | Non-income-earning security |
| « | All or a portion of this security is on loan. |
| ♠ | The issuer of the security is an affiliated person of the Portfolio as defined in the Investment Company Act of 1940. |
| ∩ | The investment is a non-registered investment company purchased with cash collateral received from securities on loan. |
| ∞ | The rate represents the 7-day annualized yield at period end. |
| Abbreviations: | |
| ADR | American depositary receipt |
| REIT | Real estate investment trust |
| Value, beginning of period | Purchases | Sales proceeds | Net realized gains (losses) | Net change in unrealized gains (losses) | Value, end of period | Shares, end of period | Income from affiliated securities | |||
| Short-term investments | ||||||||||
| Allspring Government Money Market Fund Select Class | $5,144,446 | $45,756,582 | $(44,810,670) | $0 | $0 | $ 6,090,358 | 6,090,358 | $ 62,990 | ||
| Securities Lending Cash Investments LLC | 8,022,300 | 65,408,527 | (71,906,882) | 0 | 0 | 1,523,945 | 1,523,945 | 87,174 # | ||
| $0 | $0 | $7,614,303 | $150,164 | |||||||
| # | Amount shown represents income before fees and rebates. |
| Assets | |
Investments in unaffiliated securities (including $1,465,274 of securities loaned), at value (cost $453,185,394) | $ 596,927,248 |
Investments in affiliated securities, at value (cost $7,614,303) | 7,614,303 |
Receivable for investments sold | 3,312,792 |
Receivable for dividends | 732,209 |
Receivable for securities lending income, net | 29,447 |
Prepaid expenses and other assets | 11,499 |
Total assets | 608,627,498 |
| Liabilities | |
Payable for investments purchased | 3,879,889 |
Payable upon receipt of securities loaned | 1,523,945 |
Advisory fee payable | 342,874 |
Accrued expenses and other liabilities | 33,742 |
Total liabilities | 5,780,450 |
Total net assets | $602,847,048 |
| Investment income | |
Dividends (net of foreign withholdings taxes of $8,530) | $ 5,701,667 |
Securities lending income (including from affiliate), net | 343,948 |
Income from affiliated securities | 62,990 |
Total investment income | 6,108,605 |
| Expenses | |
Advisory fee | 2,274,155 |
Custody and accounting fees | 30,257 |
Professional fees | 43,224 |
Interest holder report expenses | 13,495 |
Trustees’ fees and expenses | 10,879 |
Other fees and expenses | 10,148 |
Total expenses | 2,382,158 |
Less: Fee waivers and/or expense reimbursements | (270,549) |
Net expenses | 2,111,609 |
Net investment income | 3,996,996 |
| Realized and unrealized gains (losses) on investments | |
Net realized losses on investments | (4,578,364) |
Net change in unrealized gains (losses) on investments | 4,256,164 |
Net realized and unrealized gains (losses) on investments | (322,200) |
Net increase in net assets resulting from operations | $ 3,674,796 |
| Six months ended November 30, 2022 (unaudited) | Year ended May 31, 2022 | |
| Operations | ||
Net investment income | $ 3,996,996 | $ 4,422,079 |
Net realized gains (losses) on investments | (4,578,364) | 64,991,534 |
Net change in unrealized gains (losses) on investments | 4,256,164 | (80,777,394) |
Net increase (decrease) in net assets resulting from operations | 3,674,796 | (11,363,781) |
| Capital transactions | ||
| Transactions in investors’ beneficial interests | ||
Contributions | 29,434,327 | 74,799,145 |
Withdrawals | (26,454,713) | (87,265,392) |
Net increase (decrease) in net assets resulting from capital transactions | 2,979,614 | (12,466,247) |
Total increase (decrease) in net assets | 6,654,410 | (23,830,028) |
| Net assets | ||
Beginning of period | 596,192,638 | 620,022,666 |
End of period | $602,847,048 | $596,192,638 |
| Year ended May 31 | ||||||
| Six months ended November 30, 2022 (unaudited) | 2022 | 2021 | 2020 | 2019 | 2018 | |
Total return1 | 0.53% | (1.78)% | 78.76% | (13.74)% | (14.51)% | 20.10% |
| Ratios to average net assets (annualized) | ||||||
Gross expenses | 0.83% | 0.83% | 0.83% | 0.82% | 0.86% | 0.85% |
Net expenses2 | 0.74% | 0.74% | 0.74% | 0.74% | 0.75% | 0.84% |
Net investment income | 1.40% | 0.72% | 0.71% | 1.15% | 0.80% | 0.87% |
| Supplemental data | ||||||
Portfolio turnover rate | 50% | 70% | 62% | 78% | 168% | 144% |
| 1 | Returns for periods of less than one year are not annualized. |
| 2 | Net expense ratios reflect voluntary waivers, if any. |
| Gross unrealized gains | $151,909,224 |
| Gross unrealized losses | (8,157,893) |
| Net unrealized gains | $143,751,331 |
| ■ | Level 1 – quoted prices in active markets for identical securities |
| ■ | Level 2 – other significant observable inputs (including quoted prices for similar securities, interest rates, prepayment speeds, credit risk, etc.) |
| ■ | Level 3 – significant unobservable inputs (including the Portfolio’s own assumptions in determining the fair value of investments) |
| Quoted prices (Level 1) | Other significant observable inputs (Level 2) | Significant unobservable inputs (Level 3) | Total | |
| Assets | ||||
| Investments in: | ||||
| Common stocks | ||||
| Consumer discretionary | $ 79,334,654 | $ 0 | $0 | $ 79,334,654 |
| Consumer staples | 33,935,369 | 0 | 0 | 33,935,369 |
| Energy | 28,879,352 | 0 | 0 | 28,879,352 |
| Financials | 151,870,781 | 0 | 0 | 151,870,781 |
| Health care | 54,063,015 | 0 | 0 | 54,063,015 |
| Industrials | 109,062,582 | 0 | 0 | 109,062,582 |
| Information technology | 61,637,539 | 0 | 0 | 61,637,539 |
| Materials | 44,324,341 | 0 | 0 | 44,324,341 |
| Real estate | 33,819,404 | 0 | 0 | 33,819,404 |
| Warrants | ||||
| Energy | 0 | 211 | 0 | 211 |
| Short-term investments | ||||
| Investment companies | 7,614,303 | 0 | 0 | 7,614,303 |
| Total assets | $604,541,340 | $211 | $0 | $604,541,551 |
| Average daily net assets | Advisory fee |
| First $500 million | 0.800% |
| Next $500 million | 0.775 |
| Next $1 billion | 0.750 |
| Next $1 billion | 0.725 |
| Next $1 billion | 0.700 |
| Over $4 billion | 0.680 |
| Counterparty | Value of securities on loan | Collateral received1 | Net amount |
| Barclays Capital Incorporated | $1,465,274 | $(1,465,274) | $0 |
| Name and year of birth | Position held and length of service* | Principal occupations during past five years or longer | Current other public company or investment company directorships |
| William R. Ebsworth (Born 1957) | Trustee, since 2015 | Retired. From 1984 to 2013, equities analyst, portfolio manager, research director and chief investment officer at Fidelity Management and Research Company in Boston, Tokyo, and Hong Kong, and retired in 2013 as Chief Investment Officer of Fidelity Strategic Advisers, Inc. where he led a team of investment professionals managing client assets. Prior thereto, Board member of Hong Kong Securities Clearing Co., Hong Kong Options Clearing Corp., the Thailand International Fund, Ltd., Fidelity Investments Life Insurance Company, and Empire Fidelity Investments Life Insurance Company. Audit Committee Chair and Investment Committee Chair of the Vincent Memorial Hospital Endowment (non-profit organization). Mr. Ebsworth is a CFA® charterholder. | N/A |
| Jane A. Freeman (Born 1953) | Trustee, since 2015; Chair Liaison, since 2018 | Retired. From 2012 to 2014 and 1999 to 2008, Chief Financial Officer of Scientific Learning Corporation. From 2008 to 2012, Ms. Freeman provided consulting services related to strategic business projects. Prior to 1999, Portfolio Manager at Rockefeller & Co. and Scudder, Stevens & Clark. Board member of the Harding Loevner Funds from 1996 to 2014, serving as both Lead Independent Director and chair of the Audit Committee. Board member of the Russell Exchange Traded Funds Trust from 2011 to 2012 and the chair of the Audit Committee. Ms. Freeman is also an inactive Chartered Financial Analyst. | N/A |
| Isaiah Harris, Jr. (Born 1952) | Trustee, since 2009; Audit Committee Chair, since 2019 | Retired. Chairman of the Board of CIGNA Corporation from 2009 to 2021, and Director from 2005 to 2008. From 2003 to 2011, Director of Deluxe Corporation. Prior thereto, President and CEO of BellSouth Advertising and Publishing Corp. from 2005 to 2007, President and CEO of BellSouth Enterprises from 2004 to 2005 and President of BellSouth Consumer Services from 2000 to 2003. Emeritus member of the Iowa State University Foundation Board of Governors. Emeritus Member of the Advisory Board of Iowa State University School of Business. Advisory Board Member, Palm Harbor Academy (private school). Advisory Board Member, Fellowship of Christian Athletes. Mr. Harris is a certified public accountant (inactive status). | N/A |
| David F. Larcker (Born 1950) | Trustee, since 2009 | James Irvin Miller Professor of Accounting at the Graduate School of Business (Emeritus), Stanford University, Director of the Corporate Governance Research Initiative and Senior Faculty of The Rock Center for Corporate Governance since 2006. From 2005 to 2008, Professor of Accounting at the Graduate School of Business, Stanford University. Prior thereto, Ernst & Young Professor of Accounting at The Wharton School, University of Pennsylvania from 1985 to 2005. | N/A |
| Name and year of birth | Position held and length of service* | Principal occupations during past five years or longer | Current other public company or investment company directorships |
| Olivia S. Mitchell (Born 1953) | Trustee, since 2006; Nominating and Governance Committee Chair, since 2018 | International Foundation of Employee Benefit Plans Professor since 1993, Wharton School of the University of Pennsylvania. Director of Wharton’s Pension Research Council and Boettner Center on Pensions & Retirement Research, and Research Associate at the National Bureau of Economic Research. Previously taught at Cornell University from 1978 to 1993. | N/A |
| Timothy J. Penny (Born 1951) | Trustee, since 1996; Chair, since 2018 | President and Chief Executive Officer of Southern Minnesota Initiative Foundation, a non-profit organization, since 2007. Vice Chair of the Economic Club of Minnesota, since 2007. Co-Chair of the Committee for a Responsible Federal Budget, since 1995. Member of the Board of Trustees of NorthStar Education Finance, Inc., a non-profit organization, since 2007. Senior Fellow of the University of Minnesota Humphrey Institute from 1995 to 2017. | N/A |
| James G. Polisson (Born 1959) | Trustee, since 2018 | Retired. Chief Marketing Officer, Source (ETF) UK Services, Ltd, from 2015 to 2017. From 2012 to 2015, Principal of The Polisson Group, LLC, a management consulting, corporate advisory and principal investing company. Chief Executive Officer and Managing Director at Russell Investments, Global Exchange Traded Funds from 2010 to 2012. Managing Director of Barclays Global Investors from 1998 to 2010 and Global Chief Marketing Officer for iShares and Barclays Global Investors from 2000 to 2010. Trustee of the San Francisco Mechanics’ Institute, a non-profit organization, from 2013 to 2015. Board member of the Russell Exchange Traded Fund Trust from 2011 to 2012. Director of Barclays Global Investors Holdings Deutschland GmbH from 2006 to 2009. Mr. Polisson is an attorney and has a retired status with the Massachusetts and District of Columbia Bar Associations. | N/A |
| Pamela Wheelock (Born 1959) | Trustee, since January 2020; previously Trustee from January 2018 to July 2019 | Retired. Executive and Senior Financial leadership positions in the public, private and nonprofit sectors. Interim President and CEO, McKnight Foundation, 2020. Interim Commissioner, Minnesota Department of Human Services, 2019. Chief Operating Officer, Twin Cities Habitat for Humanity, 2017-2019. Vice President for University Services, University of Minnesota, 2012-2016. Interim President and CEO, Blue Cross and Blue Shield of Minnesota, 2011-2012. Executive Vice-President and Chief Financial Officer, Minnesota Wild, 2002-2008. Commissioner, Minnesota Department of Finance, 1999-2002. Chair of the Board of Directors of Destination Medical Center Corporation. Board member of the Minnesota Wild Foundation. | N/A |
| Name and year of birth | Position held and length of service | Principal occupations during past five years or longer |
| Andrew Owen (Born 1960) | President, since 2017 | President and Chief Executive Officer of Allspring Funds Management, LLC since 2017 and Head of Global Fund Governance of Allspring Global Investments since 2022. Prior thereto, co-president of Galliard Capital Management, LLC, an affiliate of Allspring Funds Management, LLC, from 2019 to 2022 and Head of Affiliated Managers, Allspring Global Investments, from 2014 to 2019 and Executive Vice President responsible for marketing, investments and product development for Allspring Funds Management, LLC, from 2009 to 2014. |
| Jeremy DePalma (Born 1974) | Treasurer, since 2012 (for certain funds in the Fund Complex); since 2021 (for the remaining funds in the Fund Complex) | Senior Vice President of Allspring Funds Management, LLC since 2009. Senior Vice President of Evergreen Investment Management Company, LLC from 2008 to 2010 and head of the Fund Reporting and Control Team within Fund Administration from 2005 to 2010. |
| Christopher Baker (Born 1976) | Chief Compliance Officer, since 2022 | Global Chief Compliance Officer for Allspring Global Investments since 2022. Prior thereto, Chief Compliance Officer for State Street Global Advisors from 2018 to 2021. Senior Compliance Officer for the State Street divisions of Alternative Investment Solutions, Sector Solutions, and Global Marketing from 2015 to 2018. From 2010 to 2015 Vice President, Global Head of Investment and Marketing Compliance for State Street Global Advisors. |
| Matthew Prasse (Born 1983) | Chief Legal Officer, since 2022; Secretary, since 2021 | Senior Counsel of the Allspring Legal Department since 2021. Senior Counsel of the Wells Fargo Legal Department from 2018 to 2021. Previously, Counsel for Barings LLC from 2015 to 2018. Prior to joining Barings, Associate at Morgan, Lewis & Bockius LLP from 2008 to 2015. |
P.O. Box 219967
Kansas City, MO 64121-9967

1-800-222-8222 or visit the Fund's website at allspringglobal.com. Read the prospectus carefully before you invest or send money.
SA286/SAR286 11-22
| ITEM 2. | CODE OF ETHICS |
Not applicable.
| ITEM 3. | AUDIT COMMITTEE FINANCIAL EXPERT |
Not applicable.
| ITEM 4. | PRINCIPAL ACCOUNTANT FEES AND SERVICES |
Not applicable.
| ITEM 5. | AUDIT COMMITTEE OF LISTED REGISTRANTS |
Not applicable.
| ITEM 6. | INVESTMENTS |
A Portfolio of Investments for each series of Allspring Funds Trust is included as part of the report to shareholders filed under Item 1 of this Form.
| ITEM 7. | DISCLOSURE OF PROXY VOTING POLICIES AND PROCEDURES FOR CLOSED-END MANAGEMENT INVESTMENT COMPANIES |
Not applicable.
| ITEM 8. | PORTFOLIO MANAGERS OF CLOSED-END MANAGEMENT INVESTMENT COMPANIES |
Not applicable.
| ITEM 9. | PURCHASES OF EQUITY SECURITIES BY CLOSED-END MANAGEMEENT INVESTMENT COMPANY AND AFFILIATED PURCHASERS |
Not applicable.
| ITEM 10. | SUBMISSION OF MATTERS TO A VOTE OF SECURITY HOLDERS |
There have been no material changes to the procedures by which shareholders may recommend nominees to the registrant’s Board of Trustees that have been implemented since the registrant’s last provided disclosure in response to the requirements of this Item.
| ITEM 11. | CONTROLS AND PROCEDURES |
(a) The President and Treasurer have concluded that the Allspring Funds Trust disclosure controls and procedures (as defined in Rule 30a-3(c) under the Investment Company Act of 1940) provide reasonable assurances that material information relating to the registrant is made known to them by the appropriate persons, based on their evaluation of these controls and procedures as of a date within 90 days of the filing of this report.
(b) There were no significant changes in the registrant’s internal controls over financial reporting (as defined in Rule 30a-3(d) under the Investment Company Act of 1940) that occurred during the most recent fiscal half-year of the period covered by this report that materially affected, or is reasonably likely to materially affect, the registrant’s internal control over financial reporting.
| ITEM 12. | DISCLOSURES OF SECURITIES LENDING ACTIVITES FOR CLOSED-END MANAGEMENT INVESTMENT COMPANIES |
Not applicable.
| ITEM 13. | EXHIBITS |
(a)(1) Not applicable.
(a)(2) Certifications pursuant to Section 302 of the Sarbanes-Oxley Act of 2002.
(b) Certifications pursuant to Section 906 of the Sarbanes-Oxley Act of 2002.
SIGNATURES
Pursuant to the requirements of the Securities Exchange Act of 1934 and the Investment Company Act of 1940, the registrant has duly caused this report to be signed on its behalf by the undersigned, thereunto duly authorized.
| Allspring Funds Trust | ||
| By: | /s/ Andrew Owen | |
| Andrew Owen | ||
| President | ||
| Date: January 26, 2023 | ||
Pursuant to the requirements of the Securities Exchange Act of 1934 and the Investment Company Act of 1940, this report has been signed below by the following persons on behalf of the registrant and in the capacities and on the date indicated.
| Allspring Funds Trust | ||
| By: | /s/ Andrew Owen | |
| Andrew Owen | ||
| President | ||
| Date: January 26, 2023 | ||
| By: | /s/ Jeremy DePalma | |
| Jeremy DePalma | ||
| Treasurer | ||
| Date: January 26, 2023 | ||