
UNITED STATES
SECURITIES AND EXCHANGE COMMISSION
Washington, D.C. 20549
FORM N-CSRS
CERTIFIED SHAREHOLDER REPORT OF REGISTERED
MANAGEMENT INVESTMENT COMPANIES
Investment Company Act file number: 811-09253
Allspring Funds Trust
(Exact name of registrant as specified in charter)
1415 Vantage Park Drive, 3rd Floor, Charlotte, NC 28203
(Address of principal executive offices) (Zip code)
Matthew Prasse
Allspring Funds Management, LLC
1415 Vantage Park Drive, 3rd Floor, Charlotte, NC 28203
(Name and address of agent for service)
Registrant’s telephone number, including area code: 800-222-8222
Date of fiscal year end: July 31
Registrant is making a filing for 9 of its series:
Allspring Disciplined U.S. Core Fund, Allspring Discovery Large Cap Growth Fund, Allspring Growth Fund, Allspring Special Large Cap Value Fund, Allspring Large Cap Core Fund, Allspring Large Cap Growth Fund, Allspring Large Company Value Fund, Allspring Discovery All Cap Growth Fund and Allspring Premier Large Company Growth Fund.
Date of reporting period: January 31, 2023
| ITEM 1. | REPORT TO STOCKHOLDERS |

Special Large Cap Value Fund

| 1 | The S&P 500 Index consists of 500 stocks chosen for market size, liquidity, and industry group representation. It is a market-value-weighted index with each stock's weight in the index proportionate to its market value. You cannot invest directly in an index. |
| 2 | The Morgan Stanley Capital International (MSCI) All Country World Index (ACWI) ex USA Index (Net) is a free-float-adjusted market-capitalization-weighted index that is designed to measure the equity market performance of developed and emerging markets, excluding the U.S. Source: MSCI. MSCI makes no express or implied warranties or representations and shall have no liability whatsoever with respect to any MSCI data contained herein. The MSCI data may not be further redistributed or used as a basis for other indexes or any securities or financial products. This report is not approved, reviewed, or produced by MSCI. You cannot invest directly in an index. |
| 3 | The MSCI Emerging Markets (EM) Index (Net) (USD) is a free-float-adjusted market-capitalization-weighted index that is designed to measure equity market performance of emerging markets. You cannot invest directly in an index. |
| 4 | The Bloomberg U.S. Aggregate Bond Index is a broad-based benchmark that measures the investment-grade, U.S.-dollar-denominated, fixed-rate taxable bond market, including Treasuries, government-related and corporate securities, mortgage-backed securities (agency fixed-rate and hybrid adjustable-rate mortgage pass-throughs), asset-backed securities, and commercial mortgage-backed securities. You cannot invest directly in an index. |
| 5 | The Bloomberg Global Aggregate ex-USD Index (unhedged) is an unmanaged index that provides a broad-based measure of the global investment-grade fixed-income markets excluding the U.S.-dollar-denominated debt market. You cannot invest directly in an index. |
| 6 | The Bloomberg Municipal Bond Index is an unmanaged index composed of long-term tax-exempt bonds with a minimum credit rating of Baa. You cannot invest directly in an index. |
| 7 | The ICE BofA U.S. High Yield Index is a market-capitalization-weighted index of domestic and Yankee high-yield bonds. The index tracks the performance of high-yield securities traded in the U.S. bond market. You cannot invest directly in an index. Copyright 2023. ICE Data Indices, LLC. All rights reserved. |
| 1 | The Consumer Price Index (CPI) is a measure of the average change over time in the prices paid by urban consumers for a market basket of consumer goods and services. You cannot invest directly in an index. |

President
Allspring Funds
| Investment objective | The Fund seeks long-term capital appreciation. |
| Manager | Allspring Funds Management, LLC |
| Subadviser | Allspring Global Investments, LLC |
| Portfolio managers | James M. Tringas, CFA ®‡, Bryant VanCronkhite, CFA ®‡, CPA, Shane Zweck, CFA ®‡ |
| Average annual total returns (%) as of January 31, 2023 | |||||||||||
| Including sales charge | Excluding sales charge | Expense ratios1 (%) | |||||||||
| Inception date | 1 year | 5 year | 10 year | 1 year | 5 year | 10 year | Gross | Net 2 | |||
| Class A (EIVAX) | 8-1-2006 | -5.98 | 6.21 | 9.05 | -0.25 | 7.48 | 9.69 | 1.18 | 1.11 | ||
| Class C (EIVCX) | 8-1-2006 | -2.01 | 6.71 | 9.05 | -1.01 | 6.71 | 9.05 | 1.93 | 1.86 | ||
| Class R (EIVTX)3 | 3-1-2013 | – | – | – | -0.49 | 7.26 | 9.46 | 1.43 | 1.36 | ||
| Class R6 (EIVFX) | 11-30-2012 | – | – | – | 0.25 | 8.14 | 10.24 | 0.75 | 0.65 | ||
| Administrator Class (EIVDX) | 7-30-2010 | – | – | – | -0.08 | 7.66 | 9.89 | 1.10 | 0.95 | ||
| Institutional Class (EIVIX) | 8-1-2006 | – | – | – | 0.15 | 7.91 | 10.15 | 0.85 | 0.70 | ||
| Russell 1000® Value Index4 | – | – | – | – | -0.43 | 6.94 | 10.15 | – | – | ||
| 1 | Reflects the expense ratios as stated in the most recent prospectuses. The expense ratios shown are subject to change and may differ from the annualized expense ratios shown in the financial highlights of this report. |
| 2 | The manager has contractually committed through November 30, 2023, to waive fees and/or reimburse expenses to the extent necessary to cap total annual fund operating expenses after fee waivers at 1.11% for Class A, 1.86% for Class C, 1.36% for Class R, 0.65% for Class R6, 0.95% for Administrator Class, and 0.70% for Institutional Class. Brokerage commissions, stamp duty fees, interest, taxes, acquired fund fees and expenses (if any), and extraordinary expenses are excluded from the expense caps. Prior to or after the commitment expiration date, the caps may be increased or the commitment to maintain the caps may be terminated only with the approval of the Board of Trustees. Without these caps, the Fund’s returns would have been lower. The expense ratio paid by an investor is the net expense ratio (the total annual fund operating expenses after fee waivers) as stated in the prospectuses. |
| 3 | Historical performance shown for the Class R shares prior to their inception reflects the performance of the Institutional Class shares, adjusted to reflect the higher expenses applicable to the Class R shares. |
| 4 | The Russell 1000® Value Index measures the performance of those Russell 1000 companies with lower price/book ratios and lower forecasted growth values. You cannot invest directly in an index. |
| ‡ | CFA® and Chartered Financial Analyst® are trademarks owned by CFA Institute. |
| Ten largest holdings (%) as of January 31, 20231 | |
| Walmart Incorporated | 3.79 |
| AerCap Holdings NV | 3.77 |
| General Motors Company | 3.24 |
| ConocoPhillips | 3.20 |
| Caterpillar Incorporated | 3.16 |
| Merck & Company Incorporated | 3.13 |
| American International Group Incorporated | 3.09 |
| Alphabet Incorporated Class C | 3.07 |
| Bank of America Corporation | 3.02 |
| NextEra Energy Incorporated | 3.00 |
| 1 | Figures represent the percentage of the Fund's net assets. Holdings are subject to change and may have changed since the date specified. |
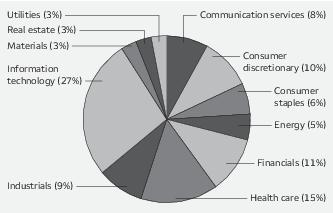
| Sector allocation as of January 31, 20231 |

| 1 | Figures represent the percentage of the Fund's long-term investments. Allocations are subject to change and may have changed since the date specified. |
| Beginning account value 8-1-2022 | Ending account value 1-31-2023 | Expenses paid during the period1 | Annualized net expense ratio | |
| Class A | ||||
| Actual | $1,000.00 | $1,087.35 | $5.79 | 1.10% |
| Hypothetical (5% return before expenses) | $1,000.00 | $1,019.66 | $5.60 | 1.10% |
| Class C | ||||
| Actual | $1,000.00 | $1,082.88 | $9.76 | 1.86% |
| Hypothetical (5% return before expenses) | $1,000.00 | $1,015.83 | $9.45 | 1.86% |
| Class R | ||||
| Actual | $1,000.00 | $1,085.43 | $7.15 | 1.36% |
| Hypothetical (5% return before expenses) | $1,000.00 | $1,018.35 | $6.92 | 1.36% |
| Class R6 | ||||
| Actual | $1,000.00 | $1,090.24 | $3.42 | 0.65% |
| Hypothetical (5% return before expenses) | $1,000.00 | $1,021.93 | $3.31 | 0.65% |
| Administrator Class | ||||
| Actual | $1,000.00 | $1,088.17 | $5.00 | 0.95% |
| Hypothetical (5% return before expenses) | $1,000.00 | $1,020.42 | $4.84 | 0.95% |
| Institutional Class | ||||
| Actual | $1,000.00 | $1,090.03 | $3.69 | 0.70% |
| Hypothetical (5% return before expenses) | $1,000.00 | $1,021.68 | $3.57 | 0.70% |
| Shares | Value | ||||
| Common stocks: 97.44% | |||||
| Communication services: 4.74% | |||||
| Interactive media & services: 3.07% | |||||
| Alphabet Incorporated Class C † | 248,602 | $ 24,827,882 | |||
| Media: 1.67% | |||||
| Comcast Corporation Class A | 342,622 | 13,482,176 | |||
| Consumer discretionary: 6.00% | |||||
| Automobiles: 3.24% | |||||
| General Motors Company | 666,539 | 26,208,313 | |||
| Household durables: 2.76% | |||||
| D.R. Horton Incorporated | 226,268 | 22,330,389 | |||
| Consumer staples: 8.17% | |||||
| Beverages: 1.95% | |||||
| Keurig Dr. Pepper Incorporated | 446,003 | 15,734,986 | |||
| Food & staples retailing: 3.79% | |||||
| Walmart Incorporated | 212,729 | 30,605,321 | |||
| Personal products: 2.43% | |||||
| Unilever plc ADR | 385,293 | 19,688,472 | |||
| Energy: 8.19% | |||||
| Oil, gas & consumable fuels: 8.19% | |||||
| ConocoPhillips | 212,162 | 25,856,183 | |||
| EOG Resources Incorporated | 169,239 | 22,381,858 | |||
| Exxon Mobil Corporation | 154,848 | 17,963,916 | |||
| 66,201,957 | |||||
| Financials: 15.08% | |||||
| Banks: 6.02% | |||||
| Bank of America Corporation | 688,240 | 24,418,755 | |||
| JPMorgan Chase & Company | 173,242 | 24,246,950 | |||
| 48,665,705 | |||||
| Capital markets: 3.44% | |||||
| Intercontinental Exchange Incorporated | 182,570 | 19,635,404 | |||
| The Goldman Sachs Group Incorporated | 22,321 | 8,165,245 | |||
| 27,800,649 | |||||
| Insurance: 5.62% | |||||
| American International Group Incorporated | 394,788 | 24,958,497 | |||
| The Allstate Corporation | 159,570 | 20,499,958 | |||
| 45,458,455 | |||||
| Health care: 15.52% | |||||
| Biotechnology: 1.37% | |||||
| Vertex Pharmaceuticals Incorporated † | 34,361 | 11,102,039 |
| Shares | Value | ||||
| Health care equipment & supplies: 6.29% | |||||
| Abbott Laboratories | 73,103 | $ 8,081,536 | |||
| Medtronic plc | 233,293 | 19,524,291 | |||
| Stryker Corporation | 23,435 | 5,948,037 | |||
| Teleflex Incorporated | 71,177 | 17,325,905 | |||
| 50,879,769 | |||||
| Health care providers & services: 4.73% | |||||
| Cigna Corporation | 71,465 | 22,630,822 | |||
| Humana Incorporated | 30,455 | 15,583,824 | |||
| 38,214,646 | |||||
| Pharmaceuticals: 3.13% | |||||
| Merck & Company Incorporated | 235,294 | 25,272,929 | |||
| Industrials: 17.43% | |||||
| Aerospace & defense: 3.47% | |||||
| L3Harris Technologies Incorporated | 40,973 | 8,801,820 | |||
| Raytheon Technologies Corporation | 192,788 | 19,249,882 | |||
| 28,051,702 | |||||
| Commercial services & supplies: 2.28% | |||||
| Waste Management Incorporated | 119,087 | 18,426,332 | |||
| Industrial conglomerates: 2.63% | |||||
| Honeywell International Incorporated | 101,831 | 21,229,727 | |||
| Machinery: 3.68% | |||||
| Caterpillar Incorporated | 101,382 | 25,577,665 | |||
| Parker-Hannifin Corporation | 12,805 | 4,174,430 | |||
| 29,752,095 | |||||
| Trading companies & distributors: 5.37% | |||||
| AerCap Holdings NV † | 483,011 | 30,531,125 | |||
| Ferguson plc | 90,810 | 12,925,895 | |||
| 43,457,020 | |||||
| Information technology: 12.51% | |||||
| IT services: 7.10% | |||||
| Accenture plc Class A | 55,590 | 15,512,390 | |||
| Akamai Technologies Incorporated † | 173,925 | 15,470,629 | |||
| Fiserv Incorporated † | 114,797 | 12,246,544 | |||
| Visa Incorporated Class A | 61,472 | 14,151,469 | |||
| 57,381,032 | |||||
| Semiconductors & semiconductor equipment: 1.39% | |||||
| NXP Semiconductors NV | 61,215 | 11,282,537 | |||
| Software: 4.02% | |||||
| Cadence Design Systems Incorporated † | 52,286 | 9,559,449 | |||
| Microsoft Corporation | 92,486 | 22,918,956 | |||
| 32,478,405 |
| Shares | Value | ||||
| Materials: 2.86% | |||||
| Construction materials: 2.86% | |||||
| Vulcan Materials Company | 126,293 | $ 23,153,296 | |||
| Real estate: 3.94% | |||||
| Equity REITs: 2.31% | |||||
| Boston Properties Incorporated | 139,228 | 10,378,055 | |||
| Public Storage Incorporated | 27,394 | 8,337,090 | |||
| 18,715,145 | |||||
| Real estate management & development: 1.63% | |||||
| CBRE Group Incorporated Class A † | 153,846 | 13,155,371 | |||
| Utilities: 3.00% | |||||
| Electric utilities: 3.00% | |||||
| NextEra Energy Incorporated | 325,533 | 24,294,528 | |||
| Total Common stocks (Cost $621,637,015) | 787,850,878 |
| Yield | |||||
| Short-term investments: 2.94% | |||||
| Investment companies: 2.94% | |||||
| Allspring Government Money Market Fund Select Class ♠∞ | 4.16% | 23,820,636 | 23,820,636 | ||
| Total Short-term investments (Cost $23,820,636) | 23,820,636 | ||||
| Total investments in securities (Cost $645,457,651) | 100.38% | 811,671,514 | |||
| Other assets and liabilities, net | (0.38) | (3,110,983) | |||
| Total net assets | 100.00% | $808,560,531 |
| † | Non-income-earning security |
| ♠ | The issuer of the security is an affiliated person of the Fund as defined in the Investment Company Act of 1940. |
| ∞ | The rate represents the 7-day annualized yield at period end. |
| Abbreviations: | |
| ADR | American depositary receipt |
| REIT | Real estate investment trust |
| Value, beginning of period | Purchases | Sales proceeds | Net realized gains (losses) | Net change in unrealized gains (losses) | Value, end of period | Shares, end of period | Income from affiliated securities | |||
| Short-term investments | ||||||||||
| Allspring Government Money Market Fund Select Class | $24,131,967 | $98,004,045 | $(98,315,376) | $0 | $0 | $ 23,820,636 | 23,820,636 | $ 386,454 | ||
| Investments in affiliates no longer held at end of period | ||||||||||
| Securities Lending Cash Investments LLC | 0 | 36,875 | (36,875) | 0 | 0 | 0 | 0 | 67 # | ||
| $0 | $0 | $23,820,636 | $386,521 | |||||||
| # | Amount shown represents income before fees and rebates. |
| Assets | |
Investments in unaffiliated securities, at value (cost $621,637,015) | $ 787,850,878 |
Investments in affiliated securities, at value (cost $23,820,636) | 23,820,636 |
Receivable for dividends | 463,480 |
Receivable for Fund shares sold | 28,317 |
Prepaid expenses and other assets | 43,979 |
Total assets | 812,207,290 |
| Liabilities | |
Payable for investments purchased | 2,221,241 |
Payable for Fund shares redeemed | 622,646 |
Management fee payable | 382,169 |
Administration fees payable | 101,616 |
Trustees’ fees and expenses payable | 6,166 |
Distribution fees payable | 960 |
Accrued expenses and other liabilities | 311,961 |
Total liabilities | 3,646,759 |
Total net assets | $808,560,531 |
| Net assets consist of | |
Paid-in capital | $ 632,099,228 |
Total distributable earnings | 176,461,303 |
Total net assets | $808,560,531 |
| Computation of net asset value and offering price per share | |
Net assets – Class A | $ 255,583,666 |
Shares outstanding – Class A1 | 22,028,127 |
Net asset value per share – Class A | $11.60 |
Maximum offering price per share – Class A2 | $12.31 |
Net assets – Class C | $ 1,502,092 |
Shares outstanding – Class C1 | 133,582 |
Net asset value per share – Class C | $11.24 |
Net assets – Class R | $ 116,406 |
Shares outstanding – Class R1 | 9,909 |
Net asset value per share – Class R | $11.75 |
Net assets – Class R6 | $ 41,668,412 |
Shares outstanding – Class R61 | 3,681,379 |
Net asset value per share – Class R6 | $11.32 |
Net assets – Administrator Class | $ 451,644,957 |
Shares outstanding – Administrator Class1 | 36,240,381 |
Net asset value per share – Administrator Class | $12.46 |
Net assets – Institutional Class | $ 58,044,998 |
Shares outstanding – Institutional Class1 | 4,959,803 |
Net asset value per share – Institutional Class | $11.70 |
| 1 | The Fund has an unlimited number of authorized shares. |
| 2 | Maximum offering price is computed as 100/94.25 of net asset value. On investments of $50,000 or more, the offering price is reduced. |
| Investment income | |
Dividends (net of foreign withholdings taxes of $17,576) | $ 8,368,667 |
Income from affiliated securities | 386,459 |
Total investment income | 8,755,126 |
| Expenses | |
Management fee | 2,696,025 |
| Administration fees | |
Class A | 260,488 |
Class C | 1,727 |
Class R | 114 |
Class R6 | 6,194 |
Administrator Class | 285,136 |
Institutional Class | 32,726 |
| Shareholder servicing fees | |
Class A | 303,021 |
Class C | 2,051 |
Class R | 136 |
Administrator Class | 544,114 |
| Distribution fees | |
Class C | 6,154 |
Class R | 118 |
Custody and accounting fees | 19,780 |
Professional fees | 23,832 |
Registration fees | 37,836 |
Shareholder report expenses | 25,210 |
Trustees’ fees and expenses | 11,027 |
Other fees and expenses | 7,137 |
Total expenses | 4,262,826 |
| Less: Fee waivers and/or expense reimbursements | |
Fund-level | (275,323) |
Class A | (9,179) |
Class R6 | (6,194) |
Administrator Class | (176,913) |
Institutional Class | (20,608) |
Net expenses | 3,774,609 |
Net investment income | 4,980,517 |
| Realized and unrealized gains (losses) on investments | |
Net realized gains on investments | 9,821,478 |
Net change in unrealized gains (losses) on investments | 51,680,236 |
Net realized and unrealized gains (losses) on investments | 61,501,714 |
Net increase in net assets resulting from operations | $66,482,231 |
| Six months ended January 31, 2023 (unaudited) | Year ended July 31, 2022 | |||
| Operations | ||||
Net investment income | $ 4,980,517 | $ 5,610,182 | ||
Net realized gains on investments | 9,821,478 | 76,574,770 | ||
Net change in unrealized gains (losses) on investments | 51,680,236 | (125,314,708) | ||
Net increase (decrease) in net assets resulting from operations | 66,482,231 | (43,129,756) | ||
| Distributions to shareholders from | ||||
| Net investment income and net realized gains | ||||
Class A | (21,506,191) | (53,341,156) | ||
Class C | (109,116) | (416,230) | ||
Class R | (9,285) | (18,487) | ||
Class R6 | (3,760,345) | (1,180,752) | ||
Administrator Class | (36,706,544) | (87,453,886) | ||
Institutional Class | (4,220,939) | (12,533,899) | ||
Total distributions to shareholders | (66,312,420) | (154,944,410) | ||
| Capital share transactions | Shares | Shares | ||
| Proceeds from shares sold | ||||
Class A | 216,778 | 2,476,591 | 324,090 | 4,276,971 |
Class C | 19,163 | 208,599 | 36,301 | 482,008 |
Class R | 284 | 3,339 | 948 | 12,262 |
Class R6 | 207,479 | 2,242,283 | 3,978,072 | 49,735,620 |
Administrator Class | 55,765 | 683,413 | 171,967 | 2,395,405 |
Institutional Class | 1,142,568 | 12,964,487 | 1,030,473 | 15,516,545 |
| 18,578,712 | 72,418,811 | |||
| Reinvestment of distributions | ||||
Class A | 1,821,930 | 20,569,076 | 3,914,851 | 50,679,898 |
Class C | 10,048 | 109,116 | 33,272 | 416,230 |
Class R | 814 | 9,285 | 1,414 | 18,487 |
Class R6 | 340,628 | 3,760,345 | 92,916 | 1,180,752 |
Administrator Class | 2,870,257 | 34,825,949 | 5,964,339 | 82,619,695 |
Institutional Class | 366,284 | 4,179,246 | 904,435 | 11,838,887 |
| 63,453,017 | 146,753,949 | |||
| Payment for shares redeemed | ||||
Class A | (1,387,056) | (16,111,769) | (2,509,378) | (32,782,415) |
Class C | (66,203) | (757,587) | (60,475) | (791,051) |
Class R | (36) | (404) | (1,052) | (16,024) |
Class R6 | (621,746) | (7,060,844) | (1,355,475) | (18,601,665) |
Administrator Class | (1,682,770) | (20,872,562) | (2,691,847) | (37,718,367) |
Institutional Class | (922,815) | (10,783,512) | (1,720,987) | (23,698,526) |
| (55,586,678) | (113,608,048) | |||
Net increase in net assets resulting from capital share transactions | 26,445,051 | 105,564,712 | ||
Total increase (decrease) in net assets | 26,614,862 | (92,509,454) | ||
| Net assets | ||||
Beginning of period | 781,945,669 | 874,455,123 | ||
End of period | $808,560,531 | $ 781,945,669 | ||
| Year ended July 31 | ||||||
| Class A | Six months ended January 31, 2023 (unaudited) | 2022 | 2021 | 2020 | 2019 | 2018 |
Net asset value, beginning of period | $11.66 | $14.98 | $11.35 | $13.13 | $13.05 | $12.61 |
Net investment income | 0.06 | 0.06 | 0.11 | 0.14 | 0.10 | 0.11 |
Payment from affiliate | 0.00 | 0.00 | 0.00 1 | 0.00 | 0.00 | 0.00 |
Net realized and unrealized gains (losses) on investments | 0.92 | (0.59) | 3.66 | (0.58) | 0.94 | 1.39 |
Total from investment operations | 0.98 | (0.53) | 3.77 | (0.44) | 1.04 | 1.50 |
| Distributions to shareholders from | ||||||
Net investment income | (0.10) | (0.09) | (0.14) | (0.10) | (0.12) | (0.06) |
Net realized gains | (0.94) | (2.70) | 0.00 | (1.24) | (0.84) | (1.00) |
Total distributions to shareholders | (1.04) | (2.79) | (0.14) | (1.34) | (0.96) | (1.06) |
Net asset value, end of period | $11.60 | $11.66 | $14.98 | $11.35 | $13.13 | $13.05 |
Total return2 | 8.73% | (5.29)% | 33.49% 3 | (4.25)% | 9.03% | 12.43% |
| Ratios to average net assets (annualized) | ||||||
Gross expenses | 1.18% | 1.17% | 1.18% | 1.18% | 1.18% | 1.18% |
Net expenses | 1.10% | 1.09% | 1.09% | 1.10% | 1.10% | 1.10% |
Net investment income | 1.15% | 0.52% | 0.77% | 1.20% | 0.81% | 0.83% |
| Supplemental data | ||||||
Portfolio turnover rate | 22% | 40% | 46% | 34% | 27% | 21% |
Net assets, end of period (000s omitted) | $255,584 | $249,213 | $294,248 | $245,977 | $291,111 | $289,683 |
| 1 | Amount is less than $0.005. |
| 2 | Total return calculations do not include any sales charges. Returns for periods of less than one year are not annualized. |
| 3 | During the year ended July 31, 2021, the Fund received a payment from an affiliate that had an impact of less than 0.005% on total return. |
| Year ended July 31 | ||||||
| Class C | Six months ended January 31, 2023 (unaudited) | 2022 | 2021 | 2020 | 2019 | 2018 |
Net asset value, beginning of period | $11.28 | $14.59 | $10.99 | $12.75 | $12.69 | $12.31 |
Net investment income (loss) | 0.02 1 | (0.03) 1 | 0.01 1 | 0.05 1 | 0.00 1,2 | 0.01 1 |
Payment from affiliate | 0.00 | 0.00 | 0.05 | 0.00 | 0.00 | 0.00 |
Net realized and unrealized gains (losses) on investments | 0.88 | (0.58) | 3.54 | (0.57) | 0.92 | 1.37 |
Total from investment operations | 0.90 | (0.61) | 3.60 | (0.52) | 0.92 | 1.38 |
| Distributions to shareholders from | ||||||
Net investment income | 0.00 | 0.00 | 0.00 | 0.00 | (0.02) | 0.00 |
Net realized gains | (0.94) | (2.70) | 0.00 | (1.24) | (0.84) | (1.00) |
Total distributions to shareholders | (0.94) | (2.70) | 0.00 | (1.24) | (0.86) | (1.00) |
Net asset value, end of period | $11.24 | $11.28 | $14.59 | $10.99 | $12.75 | $12.69 |
Total return3 | 8.29% | (5.99)% | 32.76% 4 | (4.99)% | 8.16% | 11.65% |
| Ratios to average net assets (annualized) | ||||||
Gross expenses | 1.93% | 1.92% | 1.93% | 1.94% | 1.94% | 1.93% |
Net expenses | 1.86% | 1.86% | 1.86% | 1.86% | 1.86% | 1.86% |
Net investment income (loss) | 0.38% | (0.24)% | 0.05% | 0.44% | 0.03% | 0.08% |
| Supplemental data | ||||||
Portfolio turnover rate | 22% | 40% | 46% | 34% | 27% | 21% |
Net assets, end of period (000s omitted) | $1,502 | $1,923 | $2,356 | $4,401 | $7,370 | $19,874 |
| 1 | Calculated based upon average shares outstanding |
| 2 | Amount is less than $0.005. |
| 3 | Total return calculations do not include any sales charges. Returns for periods of less than one year are not annualized. |
| 4 | During the year ended July 31, 2021, the Fund received a payment from an affiliate that had an impact of 0.50% on total return. |
| Year ended July 31 | ||||||
| Class R | Six months ended January 31, 2023 (unaudited) | 2022 | 2021 | 2020 | 2019 | 2018 |
Net asset value, beginning of period | $11.79 | $15.11 | $11.42 | $13.22 | $13.15 | $12.70 |
Net investment income | 0.05 | 0.04 | 0.07 | 0.11 | 0.06 | 0.05 |
Payment from affiliate | 0.00 | 0.00 | 0.03 | 0.00 | 0.00 | 0.00 |
Net realized and unrealized gains (losses) on investments | 0.93 | (0.61) | 3.71 | (0.59) | 0.95 | 1.44 |
Total from investment operations | 0.98 | (0.57) | 3.81 | (0.48) | 1.01 | 1.49 |
| Distributions to shareholders from | ||||||
Net investment income | (0.08) | (0.05) | (0.12) | (0.08) | (0.10) | (0.04) |
Net realized gains | (0.94) | (2.70) | 0.00 | (1.24) | (0.84) | (1.00) |
Total distributions to shareholders | (1.02) | (2.75) | (0.12) | (1.32) | (0.94) | (1.04) |
Net asset value, end of period | $11.75 | $11.79 | $15.11 | $11.42 | $13.22 | $13.15 |
Total return1 | 8.64% | (5.47)% | 33.51% 2 | (4.56)% | 8.70% | 12.21% |
| Ratios to average net assets (annualized) | ||||||
Gross expenses | 1.40% | 1.36% | 1.41% | 1.41% | 1.43% | 1.44% |
Net expenses | 1.36% | 1.33% | 1.36% | 1.36% | 1.36% | 1.36% |
Net investment income | 0.89% | 0.30% | 0.49% | 0.95% | 0.55% | 0.56% |
| Supplemental data | ||||||
Portfolio turnover rate | 22% | 40% | 46% | 34% | 27% | 21% |
Net assets, end of period (000s omitted) | $116 | $104 | $114 | $76 | $88 | $74 |
| 1 | Returns for periods of less than one year are not annualized. |
| 2 | During the year ended July 31, 2021, the Fund received a payment from an affiliate that had an impact of 0.23% on total return. |
| Year ended July 31 | ||||||
| Class R6 | Six months ended January 31, 2023 (unaudited) | 2022 | 2021 | 2020 | 2019 | 2018 |
Net asset value, beginning of period | $11.42 | $14.73 | $11.16 | $12.93 | $12.92 | $12.49 |
Net investment income | 0.09 | 0.18 | 0.16 | 0.19 1 | 0.16 1 | 0.16 |
Net realized and unrealized gains (losses) on investments | 0.90 | (0.64) | 3.60 | (0.57) | 1.00 | 1.39 |
Total from investment operations | 0.99 | (0.46) | 3.76 | (0.38) | 1.16 | 1.55 |
| Distributions to shareholders from | ||||||
Net investment income | (0.15) | (0.15) | (0.19) | (0.15) | (0.31) | (0.12) |
Net realized gains | (0.94) | (2.70) | 0.00 | (1.24) | (0.84) | (1.00) |
Total distributions to shareholders | (1.09) | (2.85) | (0.19) | (1.39) | (1.15) | (1.12) |
Net asset value, end of period | $11.32 | $11.42 | $14.73 | $11.16 | $12.93 | $12.92 |
Total return2 | 9.02% | (4.86)% | 34.05% | (3.87)% | 10.38% | 12.96% |
| Ratios to average net assets (annualized) | ||||||
Gross expenses | 0.75% | 0.75% | 0.76% | 0.76% | 0.76% | 0.75% |
Net expenses | 0.65% | 0.65% | 0.65% | 0.65% | 0.65% | 0.65% |
Net investment income | 1.60% | 0.97% | 1.22% | 1.67% | 1.27% | 1.29% |
| Supplemental data | ||||||
Portfolio turnover rate | 22% | 40% | 46% | 34% | 27% | 21% |
Net assets, end of period (000s omitted) | $41,668 | $42,878 | $15,313 | $11,552 | $4,231 | $2,578 |
| 1 | Calculated based upon average shares outstanding |
| 2 | Returns for periods of less than one year are not annualized. |
| Year ended July 31 | ||||||
| Administrator Class | Six months ended January 31, 2023 (unaudited) | 2022 | 2021 | 2020 | 2019 | 2018 |
Net asset value, beginning of period | $12.47 | $15.83 | $11.99 | $13.81 | $13.68 | $13.17 |
Net investment income | 0.08 | 0.09 | 0.13 | 0.17 | 0.12 | 0.13 |
Payment from affiliate | 0.00 | 0.00 | 0.00 1 | 0.00 | 0.00 | 0.00 |
Net realized and unrealized gains (losses) on investments | 0.98 | (0.63) | 3.88 | (0.62) | 1.00 | 1.47 |
Total from investment operations | 1.06 | (0.54) | 4.01 | (0.45) | 1.12 | 1.60 |
| Distributions to shareholders from | ||||||
Net investment income | (0.13) | (0.12) | (0.17) | (0.13) | (0.15) | (0.09) |
Net realized gains | (0.94) | (2.70) | 0.00 | (1.24) | (0.84) | (1.00) |
Total distributions to shareholders | (1.07) | (2.82) | (0.17) | (1.37) | (0.99) | (1.09) |
Net asset value, end of period | $12.46 | $12.47 | $15.83 | $11.99 | $13.81 | $13.68 |
Total return2 | 8.82% | (5.07)% | 33.75% 3 | (4.15)% | 9.21% | 12.63% |
| Ratios to average net assets (annualized) | ||||||
Gross expenses | 1.10% | 1.09% | 1.11% | 1.11% | 1.11% | 1.10% |
Net expenses | 0.95% | 0.92% | 0.92% | 0.93% | 0.95% | 0.95% |
Net investment income | 1.30% | 0.70% | 0.94% | 1.37% | 0.96% | 0.98% |
| Supplemental data | ||||||
Portfolio turnover rate | 22% | 40% | 46% | 34% | 27% | 21% |
Net assets, end of period (000s omitted) | $451,645 | $436,335 | $499,628 | $402,567 | $464,041 | $469,464 |
| 1 | Amount is less than $0.005. |
| 2 | Returns for periods of less than one year are not annualized. |
| 3 | During the year ended July 31, 2021, the Fund received a payment from an affiliate that had an impact of 0.03% on total return. |
| Year ended July 31 | ||||||
| Institutional Class | Six months ended January 31, 2023 (unaudited) | 2022 | 2021 | 2020 | 2019 | 2018 |
Net asset value, beginning of period | $11.77 | $15.10 | $11.44 | $13.22 | $13.14 | $12.68 |
Net investment income | 0.09 1 | 0.12 1 | 0.16 1 | 0.19 1 | 0.15 1 | 0.22 |
Net realized and unrealized gains (losses) on investments | 0.93 | (0.61) | 3.70 | (0.58) | 0.94 | 1.35 |
Total from investment operations | 1.02 | (0.49) | 3.86 | (0.39) | 1.09 | 1.57 |
| Distributions to shareholders from | ||||||
Net investment income | (0.15) | (0.14) | (0.20) | (0.15) | (0.17) | (0.11) |
Net realized gains | (0.94) | (2.70) | 0.00 | (1.24) | (0.84) | (1.00) |
Total distributions to shareholders | (1.09) | (2.84) | (0.20) | (1.39) | (1.01) | (1.11) |
Net asset value, end of period | $11.70 | $11.77 | $15.10 | $11.44 | $13.22 | $13.14 |
Total return2 | 9.00% | (4.96)% | 34.01% | (3.86)% | 9.44% | 12.96% |
| Ratios to average net assets (annualized) | ||||||
Gross expenses | 0.85% | 0.85% | 0.86% | 0.86% | 0.86% | 0.85% |
Net expenses | 0.70% | 0.70% | 0.70% | 0.70% | 0.70% | 0.70% |
Net investment income | 1.50% | 0.92% | 1.22% | 1.59% | 1.22% | 1.24% |
| Supplemental data | ||||||
Portfolio turnover rate | 22% | 40% | 46% | 34% | 27% | 21% |
Net assets, end of period (000s omitted) | $58,045 | $51,492 | $62,796 | $84,544 | $106,869 | $137,263 |
| 1 | Calculated based upon average shares outstanding |
| 2 | Returns for periods of less than one year are not annualized. |
| Gross unrealized gains | $189,786,301 |
| Gross unrealized losses | (22,804,590) |
| Net unrealized gains | $166,981,711 |
| ■ | Level 1 – quoted prices in active markets for identical securities |
| ■ | Level 2 – other significant observable inputs (including quoted prices for similar securities, interest rates, prepayment speeds, credit risk, etc.) |
| ■ | Level 3 – significant unobservable inputs (including the Fund’s own assumptions in determining the fair value of investments) |
| Quoted prices (Level 1) | Other significant observable inputs (Level 2) | Significant unobservable inputs (Level 3) | Total | |
| Assets | ||||
| Investments in: | ||||
| Common stocks | ||||
| Communication services | $ 38,310,058 | $0 | $0 | $ 38,310,058 |
| Consumer discretionary | 48,538,702 | 0 | 0 | 48,538,702 |
| Consumer staples | 66,028,779 | 0 | 0 | 66,028,779 |
| Energy | 66,201,957 | 0 | 0 | 66,201,957 |
| Financials | 121,924,809 | 0 | 0 | 121,924,809 |
| Health care | 125,469,383 | 0 | 0 | 125,469,383 |
| Industrials | 140,916,876 | 0 | 0 | 140,916,876 |
| Information technology | 101,141,974 | 0 | 0 | 101,141,974 |
| Materials | 23,153,296 | 0 | 0 | 23,153,296 |
| Real estate | 31,870,516 | 0 | 0 | 31,870,516 |
| Utilities | 24,294,528 | 0 | 0 | 24,294,528 |
| Short-term investments | ||||
| Investment companies | 23,820,636 | 0 | 0 | 23,820,636 |
| Total assets | $811,671,514 | $0 | $0 | $811,671,514 |
| Average daily net assets | Management fee |
| First $500 million | 0.700% |
| Next $500 million | 0.675 |
| Next $1 billion | 0.650 |
| Next $2 billion | 0.625 |
| Next $1 billion | 0.600 |
| Next $3 billion | 0.590 |
| Next $2 billion | 0.565 |
| Next $2 billion | 0.555 |
| Next $4 billion | 0.530 |
| Over $16 billion | 0.505 |
| Class-level administration fee | |
| Class A | 0.21% |
| Class C | 0.21 |
| Class R | 0.21 |
| Class R6 | 0.03 |
| Administrator Class | 0.13 |
| Institutional Class | 0.13 |
| Expense ratio caps | |
| Class A | 1.11% |
| Class C | 1.86 |
| Class R | 1.36 |
| Class R6 | 0.65 |
| Administrator Class | 0.95 |
| Institutional Class | 0.70 |
| Name and year of birth | Position held and length of service* | Principal occupations during past five years or longer | Current other public company or investment company directorships |
| William R. Ebsworth (Born 1957) | Trustee, since 2015 | Retired. From 1984 to 2013, equities analyst, portfolio manager, research director and chief investment officer at Fidelity Management and Research Company in Boston, Tokyo, and Hong Kong, and retired in 2013 as Chief Investment Officer of Fidelity Strategic Advisers, Inc. where he led a team of investment professionals managing client assets. Prior thereto, Board member of Hong Kong Securities Clearing Co., Hong Kong Options Clearing Corp., the Thailand International Fund, Ltd., Fidelity Investments Life Insurance Company, and Empire Fidelity Investments Life Insurance Company. Audit Committee Chair and Investment Committee Chair of the Vincent Memorial Hospital Foundation (non-profit organization). Mr. Ebsworth is a CFA® charterholder. | N/A |
| Jane A. Freeman (Born 1953) | Trustee, since 2015; Chair Liaison, since 2018 | Retired. From 2012 to 2014 and 1999 to 2008, Chief Financial Officer of Scientific Learning Corporation. From 2008 to 2012, Ms. Freeman provided consulting services related to strategic business projects. Prior to 1999, Portfolio Manager at Rockefeller & Co. and Scudder, Stevens & Clark. Board member of the Harding Loevner Funds from 1996 to 2014, serving as both Lead Independent Director and chair of the Audit Committee. Board member of the Russell Exchange Traded Funds Trust from 2011 to 2012 and the chair of the Audit Committee. Ms. Freeman is also an inactive Chartered Financial Analyst. | N/A |
| Isaiah Harris, Jr. (Born 1952) | Trustee, since 2009; Audit Committee Chair, since 2019 | Retired. Member of the Advisory Board of CEF of East Central Florida. Chairman of the Board of CIGNA Corporation from 2009 to 2021, and Director from 2005 to 2008. From 2003 to 2011, Director of Deluxe Corporation. Prior thereto, President and CEO of BellSouth Advertising and Publishing Corp. from 2005 to 2007, President and CEO of BellSouth Enterprises from 2004 to 2005 and President of BellSouth Consumer Services from 2000 to 2003. Emeritus member of the Iowa State University Foundation Board of Governors. Emeritus Member of the Advisory Board of Iowa State University School of Business. Advisory Board Member, Palm Harbor Academy (private school). Advisory Board Member, Fellowship of Christian Athletes. Mr. Harris is a certified public accountant (inactive status). | N/A |
| David F. Larcker (Born 1950) | Trustee, since 2009 | Distinguished Visiting Fellow at the Hoover Institution since 2022. James Irvin Miller Professor of Accounting at the Graduate School of Business (Emeritus), Stanford University, Director of the Corporate Governance Research Initiative and Senior Faculty of The Rock Center for Corporate Governance since 2006. From 2005 to 2008, Professor of Accounting at the Graduate School of Business, Stanford University. Prior thereto, Ernst & Young Professor of Accounting at The Wharton School, University of Pennsylvania from 1985 to 2005. | N/A |
| Name and year of birth | Position held and length of service* | Principal occupations during past five years or longer | Current other public company or investment company directorships |
| Olivia S. Mitchell (Born 1953) | Trustee, since 2006; Nominating and Governance Committee Chair, since 2018 | International Foundation of Employee Benefit Plans Professor since 1993, Wharton School of the University of Pennsylvania. Director of Wharton’s Pension Research Council and Boettner Center on Pensions & Retirement Research, and Research Associate at the National Bureau of Economic Research. Previously taught at Cornell University from 1978 to 1993. | N/A |
| Timothy J. Penny (Born 1951) | Trustee, since 1996; Chair, since 2018 | President and Chief Executive Officer of Southern Minnesota Initiative Foundation, a non-profit organization, since 2007. Vice Chair of the Economic Club of Minnesota, since 2007. Co-Chair of the Committee for a Responsible Federal Budget, since 1995. Member of the Board of Trustees of NorthStar Education Finance, Inc., a non-profit organization, from 2007-2022. Senior Fellow of the University of Minnesota Humphrey Institute from 1995 to 2017. | N/A |
| James G. Polisson (Born 1959) | Trustee, since 2018 | Retired. Chief Marketing Officer, Source (ETF) UK Services, Ltd, from 2015 to 2017. From 2012 to 2015, Principal of The Polisson Group, LLC, a management consulting, corporate advisory and principal investing company. Chief Executive Officer and Managing Director at Russell Investments, Global Exchange Traded Funds from 2010 to 2012. Managing Director of Barclays Global Investors from 1998 to 2010 and Global Chief Marketing Officer for iShares and Barclays Global Investors from 2000 to 2010. Trustee of the San Francisco Mechanics’ Institute, a non-profit organization, from 2013 to 2015. Board member of the Russell Exchange Traded Fund Trust from 2011 to 2012. Director of Barclays Global Investors Holdings Deutschland GmbH from 2006 to 2009. Mr. Polisson is an attorney and has a retired status with the Massachusetts and District of Columbia Bar Associations. | N/A |
| Pamela Wheelock (Born 1959) | Trustee, since January 2020; previously Trustee from January 2018 to July 2019 | Retired. Executive and Senior Financial leadership positions in the public, private and nonprofit sectors. Interim President and CEO, McKnight Foundation, 2020. Interim Commissioner, Minnesota Department of Human Services, 2019. Chief Operating Officer, Twin Cities Habitat for Humanity, 2017-2019. Vice President for University Services, University of Minnesota, 2012-2016. Interim President and CEO, Blue Cross and Blue Shield of Minnesota, 2011-2012. Executive Vice-President and Chief Financial Officer, Minnesota Wild, 2002-2008. Commissioner, Minnesota Department of Finance, 1999-2002. Chair of the Board of Directors of Destination Medical Center Corporation. Board member of the Minnesota Wild Foundation. | N/A |
| Name and year of birth | Position held and length of service | Principal occupations during past five years or longer |
| Andrew Owen (Born 1960) | President, since 2017 | President and Chief Executive Officer of Allspring Funds Management, LLC since 2017 and Head of Global Fund Governance of Allspring Global Investments since 2022. Prior thereto, co-president of Galliard Capital Management, LLC, an affiliate of Allspring Funds Management, LLC, from 2019 to 2022 and Head of Affiliated Managers, Allspring Global Investments, from 2014 to 2019 and Executive Vice President responsible for marketing, investments and product development for Allspring Funds Management, LLC, from 2009 to 2014. |
| Jeremy DePalma (Born 1974) | Treasurer, since 2012 (for certain funds in the Fund Complex); since 2021 (for the remaining funds in the Fund Complex) | Senior Vice President of Allspring Funds Management, LLC since 2009. Senior Vice President of Evergreen Investment Management Company, LLC from 2008 to 2010 and head of the Fund Reporting and Control Team within Fund Administration from 2005 to 2010. |
| Christopher Baker (Born 1976) | Chief Compliance Officer, since 2022 | Global Chief Compliance Officer for Allspring Global Investments since 2022. Prior thereto, Chief Compliance Officer for State Street Global Advisors from 2018 to 2021. Senior Compliance Officer for the State Street divisions of Alternative Investment Solutions, Sector Solutions, and Global Marketing from 2015 to 2018. From 2010 to 2015 Vice President, Global Head of Investment and Marketing Compliance for State Street Global Advisors. |
| Matthew Prasse (Born 1983) | Chief Legal Officer, since 2022; Secretary, since 2021 | Senior Counsel of the Allspring Legal Department since 2021. Senior Counsel of the Wells Fargo Legal Department from 2018 to 2021. Previously, Counsel for Barings LLC from 2015 to 2018. Prior to joining Barings, Associate at Morgan, Lewis & Bockius LLP from 2008 to 2015. |
P.O. Box 219967
Kansas City, MO 64121-9967

1-800-222-8222 or visit the Fund's website at allspringglobal.com. Read the prospectus carefully before you invest or send money.
SAR4302 01-23

Disciplined U.S. Core Fund

| 1 | The S&P 500 Index consists of 500 stocks chosen for market size, liquidity, and industry group representation. It is a market-value-weighted index with each stock's weight in the index proportionate to its market value. You cannot invest directly in an index. |
| 2 | The Morgan Stanley Capital International (MSCI) All Country World Index (ACWI) ex USA Index (Net) is a free-float-adjusted market-capitalization-weighted index that is designed to measure the equity market performance of developed and emerging markets, excluding the U.S. Source: MSCI. MSCI makes no express or implied warranties or representations and shall have no liability whatsoever with respect to any MSCI data contained herein. The MSCI data may not be further redistributed or used as a basis for other indexes or any securities or financial products. This report is not approved, reviewed, or produced by MSCI. You cannot invest directly in an index. |
| 3 | The MSCI Emerging Markets (EM) Index (Net) (USD) is a free-float-adjusted market-capitalization-weighted index that is designed to measure equity market performance of emerging markets. You cannot invest directly in an index. |
| 4 | The Bloomberg U.S. Aggregate Bond Index is a broad-based benchmark that measures the investment-grade, U.S.-dollar-denominated, fixed-rate taxable bond market, including Treasuries, government-related and corporate securities, mortgage-backed securities (agency fixed-rate and hybrid adjustable-rate mortgage pass-throughs), asset-backed securities, and commercial mortgage-backed securities. You cannot invest directly in an index. |
| 5 | The Bloomberg Global Aggregate ex-USD Index (unhedged) is an unmanaged index that provides a broad-based measure of the global investment-grade fixed-income markets excluding the U.S.-dollar-denominated debt market. You cannot invest directly in an index. |
| 6 | The Bloomberg Municipal Bond Index is an unmanaged index composed of long-term tax-exempt bonds with a minimum credit rating of Baa. You cannot invest directly in an index. |
| 7 | The ICE BofA U.S. High Yield Index is a market-capitalization-weighted index of domestic and Yankee high-yield bonds. The index tracks the performance of high-yield securities traded in the U.S. bond market. You cannot invest directly in an index. Copyright 2023. ICE Data Indices, LLC. All rights reserved. |
| 1 | The Consumer Price Index (CPI) is a measure of the average change over time in the prices paid by urban consumers for a market basket of consumer goods and services. You cannot invest directly in an index. |

President
Allspring Funds
| Investment objective | The Fund seeks long-term capital appreciation. |
| Manager | Allspring Funds Management, LLC |
| Subadviser | Allspring Global Investments, LLC |
| Portfolio managers | Justin P. Carr, CFA®‡, Robert M. Wicentowski, CFA®‡ |
| Average annual total returns (%) as of January 31, 2023 | |||||||||||
| Including sales charge | Excluding sales charge | Expense ratios1 (%) | |||||||||
| Inception date | 1 year | 5 year | 10 year | 1 year | 5 year | 10 year | Gross | Net 2 | |||
| Class A (EVSAX) | 2-28-1990 | -13.69 | 6.87 | 11.39 | -8.43 | 8.15 | 12.05 | 0.84 | 0.84 | ||
| Class C (EVSTX) | 6-30-1999 | -10.13 | 7.34 | 11.39 | -9.13 | 7.34 | 11.39 | 1.59 | 1.59 | ||
| Class R (EVSHX)3 | 9-30-2015 | – | – | – | -8.66 | 7.88 | 11.77 | 1.09 | 1.09 | ||
| Class R6 (EVSRX)4 | 9-30-2015 | – | – | – | -8.04 | 8.61 | 12.53 | 0.41 | 0.41 | ||
| Administrator Class (EVSYX) | 2-21-1995 | – | – | – | -8.33 | 8.27 | 12.19 | 0.76 | 0.74 | ||
| Institutional Class (EVSIX) | 7-30-2010 | – | – | – | -8.12 | 8.55 | 12.48 | 0.51 | 0.48 | ||
| S&P 500 Index5 | – | – | – | – | -8.22 | 9.54 | 12.68 | – | – | ||
| 1 | Reflects the expense ratios as stated in the most recent prospectuses. The expense ratios shown are subject to change and may differ from the annualized expense ratios shown in the financial highlights of this report. |
| 2 | The manager has contractually committed through November 30, 2023, to waive fees and/or reimburse expenses to the extent necessary to cap total annual fund operating expenses after fee waivers at 0.87% for Class A, 1.62% for Class C, 1.12% for Class R, 0.43% for Class R6, 0.74% for Administrator Class, and 0.48% for Institutional Class. Brokerage commissions, stamp duty fees, interest, taxes, acquired fund fees and expenses (if any), and extraordinary expenses are excluded from the expense caps. Prior to or after the commitment expiration date, the caps may be increased or the commitment to maintain the caps may be terminated only with the approval of the Board of Trustees. Without these caps, the Fund’s returns would have been lower. The expense ratio paid by an investor is the net expense ratio (the total annual fund operating expenses after fee waivers) as stated in the prospectuses. |
| 3 | Historical performance shown for the Class R shares prior to their inception reflects the performance of the Administrator Class shares, adjusted to reflect the higher expenses applicable to the Class R shares. |
| 4 | Historical performance shown for the Class R6 shares prior to their inception reflects the performance of the Institutional Class shares, and includes the higher expenses applicable to the Institutional Class shares. If these expenses had not been included, returns for the Class R6 shares would be higher. |
| 5 | The S&P 500 Index consists of 500 stocks chosen for market size, liquidity, and industry group representation. It is a market-value weighted index with each stock’s weight in the index proportionate to its market value. You cannot invest directly in an index. |
| ‡ | CFA® and Chartered Financial Analyst® are trademarks owned by CFA Institute. |
| Ten largest holdings (%) as of January 31, 20231 | |
| Apple Incorporated | 6.25 |
| Microsoft Corporation | 5.67 |
| Amazon.com Incorporated | 2.30 |
| Exxon Mobil Corporation | 2.08 |
| Alphabet Incorporated Class C | 2.00 |
| Visa Incorporated Class A | 1.76 |
| Berkshire Hathaway Incorporated Class B | 1.70 |
| Alphabet Incorporated Class A | 1.65 |
| Johnson & Johnson | 1.56 |
| Chevron Corporation | 1.45 |
| 1 | Figures represent the percentage of the Fund's net assets. Holdings are subject to change and may have changed since the date specified. |
| Sector allocation as of January 31, 20231 |
| 1 | Figures represent the percentage of the Fund's long-term investments. Allocations are subject to change and may have changed since the date specified. |
| Beginning account value 8-1-2022 | Ending account value 1-31-2023 | Expenses paid during the period1 | Annualized net expense ratio | |
| Class A | ||||
| Actual | $1,000.00 | $ 993.05 | $4.27 | 0.85% |
| Hypothetical (5% return before expenses) | $1,000.00 | $1,020.92 | $4.33 | 0.85% |
| Class C | ||||
| Actual | $1,000.00 | $ 988.88 | $7.97 | 1.59% |
| Hypothetical (5% return before expenses) | $1,000.00 | $1,017.19 | $8.08 | 1.59% |
| Class R | ||||
| Actual | $1,000.00 | $ 991.68 | $5.47 | 1.09% |
| Hypothetical (5% return before expenses) | $1,000.00 | $1,019.71 | $5.55 | 1.09% |
| Class R6 | ||||
| Actual | $1,000.00 | $ 994.74 | $2.11 | 0.42% |
| Hypothetical (5% return before expenses) | $1,000.00 | $1,023.09 | $2.14 | 0.42% |
| Administrator Class | ||||
| Actual | $1,000.00 | $ 993.48 | $3.72 | 0.74% |
| Hypothetical (5% return before expenses) | $1,000.00 | $1,021.48 | $3.77 | 0.74% |
| Institutional Class | ||||
| Actual | $1,000.00 | $ 994.29 | $2.41 | 0.48% |
| Hypothetical (5% return before expenses) | $1,000.00 | $1,022.79 | $2.45 | 0.48% |
| Shares | Value | ||||
| Common stocks: 99.14% | |||||
| Communication services: 7.70% | |||||
| Diversified telecommunication services: 0.61% | |||||
| AT&T Incorporated | 177,852 | $ 3,622,845 | |||
| Verizon Communications Incorporated | 43,490 | 1,807,879 | |||
| 5,430,724 | |||||
| Entertainment: 1.41% | |||||
| Activision Blizzard Incorporated | 67,239 | 5,148,490 | |||
| Netflix Incorporated † | 14,761 | 5,223,327 | |||
| The Walt Disney Company † | 19,018 | 2,063,263 | |||
| 12,435,080 | |||||
| Interactive media & services: 4.89% | |||||
| Alphabet Incorporated Class A † | 147,799 | 14,608,453 | |||
| Alphabet Incorporated Class C † | 177,129 | 17,689,873 | |||
| Meta Platforms Incorporated Class A † | 73,335 | 10,924,715 | |||
| 43,223,041 | |||||
| Media: 0.79% | |||||
| Comcast Corporation Class A | 128,514 | 5,057,026 | |||
| Fox Corporation Class A | 55,467 | 1,882,550 | |||
| 6,939,576 | |||||
| Consumer discretionary: 9.66% | |||||
| Automobiles: 1.87% | |||||
| Ford Motor Company | 398,128 | 5,378,709 | |||
| Tesla Motors Incorporated † | 64,257 | 11,130,598 | |||
| 16,509,307 | |||||
| Hotels, restaurants & leisure: 0.78% | |||||
| McDonald's Corporation | 18,115 | 4,843,951 | |||
| Starbucks Corporation | 18,988 | 2,072,350 | |||
| 6,916,301 | |||||
| Household durables: 1.07% | |||||
| D.R. Horton Incorporated | 29,711 | 2,932,179 | |||
| Lennar Corporation Class A | 22,309 | 2,284,442 | |||
| PulteGroup Incorporated | 75,213 | 4,278,868 | |||
| 9,495,489 | |||||
| Internet & direct marketing retail: 2.30% | |||||
| Amazon.com Incorporated † | 197,228 | 20,340,125 | |||
| Multiline retail: 0.23% | |||||
| Target Corporation | 11,874 | 2,043,990 | |||
| Specialty retail: 2.95% | |||||
| AutoZone Incorporated † | 1,220 | 2,975,397 | |||
| Lowe's Companies Incorporated | 27,605 | 5,748,741 | |||
| The Home Depot Incorporated | 33,498 | 10,859,047 | |||
| Ulta Beauty Incorporated † | 12,523 | 6,436,321 | |||
| 26,019,506 |
| Shares | Value | ||||
| Textiles, apparel & luxury goods: 0.46% | |||||
| Nike Incorporated Class B | 15,375 | $ 1,957,699 | |||
| Tapestry Incorporated | 45,697 | 2,082,412 | |||
| 4,040,111 | |||||
| Consumer staples: 6.34% | |||||
| Beverages: 0.63% | |||||
| Monster Beverage Corporation † | 10,844 | 1,128,644 | |||
| PepsiCo Incorporated | 12,096 | 2,068,658 | |||
| The Coca-Cola Company | 38,416 | 2,355,669 | |||
| 5,552,971 | |||||
| Food & staples retailing: 2.61% | |||||
| Costco Wholesale Corporation | 17,364 | 8,875,435 | |||
| Performance Food Group Company † | 61,226 | 3,754,378 | |||
| The Kroger Company | 103,599 | 4,623,623 | |||
| Walmart Incorporated | 40,243 | 5,789,760 | |||
| 23,043,196 | |||||
| Food products: 1.72% | |||||
| Archer Daniels Midland Company | 73,043 | 6,051,613 | |||
| Bunge Limited | 45,092 | 4,468,617 | |||
| Tyson Foods Incorporated Class A | 71,373 | 4,692,775 | |||
| 15,213,005 | |||||
| Household products: 0.67% | |||||
| The Procter & Gamble Company | 41,599 | 5,922,866 | |||
| Tobacco: 0.71% | |||||
| Altria Group Incorporated | 55,748 | 2,510,890 | |||
| Philip Morris International Incorporated | 36,212 | 3,774,739 | |||
| 6,285,629 | |||||
| Energy: 5.12% | |||||
| Oil, gas & consumable fuels: 5.12% | |||||
| Chevron Corporation | 73,366 | 12,767,151 | |||
| EOG Resources Incorporated | 19,629 | 2,595,935 | |||
| EQT Corporation | 49,564 | 1,619,256 | |||
| Exxon Mobil Corporation | 158,052 | 18,335,613 | |||
| Marathon Petroleum Corporation | 44,267 | 5,689,195 | |||
| Valero Energy Corporation | 29,600 | 4,144,888 | |||
| Vitesse Energy Incorporated †« | 5,327 | 85,019 | |||
| 45,237,057 | |||||
| Financials: 11.33% | |||||
| Banks: 3.38% | |||||
| Bank of America Corporation | 151,038 | 5,358,828 | |||
| Citigroup Incorporated | 50,108 | 2,616,640 | |||
| Citizens Financial Group Incorporated | 54,495 | 2,360,723 | |||
| JPMorgan Chase & Company | 86,727 | 12,138,311 | |||
| Popular Incorporated | 36,784 | 2,524,854 | |||
| US Bancorp | 97,271 | 4,844,096 | |||
| 29,843,452 |
| Shares | Value | ||||
| Capital markets: 2.37% | |||||
| Bank of New York Mellon Corporation | 121,681 | $ 6,153,408 | |||
| Interactive Brokers Group Incorporated Class A | 28,342 | 2,265,659 | |||
| Jefferies Financial Group Incorporated | 45,262 | 1,777,891 | |||
| Northern Trust Corporation | 37,076 | 3,595,260 | |||
| The Carlyle Group Incorporated | 53,494 | 1,924,179 | |||
| The Goldman Sachs Group Incorporated | 14,291 | 5,227,791 | |||
| 20,944,188 | |||||
| Consumer finance: 0.71% | |||||
| Capital One Financial Corporation | 42,728 | 5,084,632 | |||
| Synchrony Financial | 31,646 | 1,162,358 | |||
| 6,246,990 | |||||
| Diversified financial services: 1.70% | |||||
| Berkshire Hathaway Incorporated Class B † | 48,040 | 14,965,421 | |||
| Insurance: 3.17% | |||||
| Arch Capital Group Limited † | 52,645 | 3,387,706 | |||
| Everest Reinsurance Group Limited | 17,365 | 6,072,367 | |||
| Fidelity National Financial Incorporated | 23,209 | 1,021,892 | |||
| MetLife Incorporated | 89,961 | 6,568,952 | |||
| Reinsurance Group of America Incorporated | 15,664 | 2,377,325 | |||
| The Hartford Financial Services Group Incorporated | 45,715 | 3,547,941 | |||
| W.R. Berkley Corporation | 72,111 | 5,057,866 | |||
| 28,034,049 | |||||
| Health care: 14.94% | |||||
| Biotechnology: 2.75% | |||||
| AbbVie Incorporated | 11,815 | 1,745,666 | |||
| Biogen Incorporated † | 8,701 | 2,531,121 | |||
| Exelixis Incorporated † | 317,702 | 5,597,909 | |||
| Moderna Incorporated † | 15,083 | 2,655,513 | |||
| United Therapeutics Corporation † | 19,408 | 5,107,603 | |||
| Vertex Pharmaceuticals Incorporated † | 20,714 | 6,692,693 | |||
| 24,330,505 | |||||
| Health care equipment & supplies: 2.26% | |||||
| Abbott Laboratories | 58,903 | 6,511,727 | |||
| Edwards Lifesciences Corporation † | 22,015 | 1,688,551 | |||
| Hologic Incorporated † | 52,893 | 4,303,903 | |||
| Intuitive Surgical Incorporated † | 12,437 | 3,055,647 | |||
| Medtronic plc | 52,333 | 4,379,749 | |||
| 19,939,577 | |||||
| Health care providers & services: 4.58% | |||||
| AmerisourceBergen Corporation | 36,909 | 6,236,145 | |||
| Cardinal Health Incorporated | 8,593 | 663,809 | |||
| Centene Corporation † | 44,256 | 3,374,077 | |||
| CVS Health Corporation | 80,584 | 7,109,120 | |||
| Elevance Health Incorporated | 9,297 | 4,648,407 | |||
| McKesson Corporation | 17,024 | 6,446,648 | |||
| Molina Healthcare Incorporated † | 10,672 | 3,327,850 | |||
| UnitedHealth Group Incorporated | 17,230 | 8,601,044 | |||
| 40,407,100 |
| Shares | Value | ||||
| Life sciences tools & services: 0.28% | |||||
| Thermo Fisher Scientific Incorporated | 4,351 | $ 2,481,506 | |||
| Pharmaceuticals: 5.07% | |||||
| Bristol-Myers Squibb Company | 117,666 | 8,548,435 | |||
| Eli Lilly & Company | 5,469 | 1,882,156 | |||
| Jazz Pharmaceuticals plc † | 11,563 | 1,811,460 | |||
| Johnson & Johnson | 84,349 | 13,784,314 | |||
| Merck & Company Incorporated | 91,015 | 9,775,921 | |||
| Pfizer Incorporated | 202,942 | 8,961,919 | |||
| 44,764,205 | |||||
| Industrials: 8.63% | |||||
| Aerospace & defense: 1.29% | |||||
| General Dynamics Corporation | 24,382 | 5,682,469 | |||
| Lockheed Martin Corporation | 12,341 | 5,717,092 | |||
| 11,399,561 | |||||
| Air freight & logistics: 1.39% | |||||
| Expeditors International of Washington Incorporated | 54,373 | 5,880,440 | |||
| FedEx Corporation | 25,118 | 4,869,375 | |||
| United Parcel Service Incorporated Class B | 8,149 | 1,509,439 | |||
| 12,259,254 | |||||
| Airlines: 0.65% | |||||
| Alaska Air Group Incorporated † | 112,832 | 5,792,795 | |||
| Building products: 1.38% | |||||
| Builders FirstSource Incorporated † | 28,123 | 2,241,403 | |||
| Masco Corporation | 83,887 | 4,462,788 | |||
| Owens Corning Incorporated | 56,587 | 5,469,134 | |||
| 12,173,325 | |||||
| Commercial services & supplies: 0.44% | |||||
| Waste Management Incorporated | 25,182 | 3,896,411 | |||
| Electrical equipment: 1.29% | |||||
| Acuity Brands Incorporated | 22,352 | 4,213,799 | |||
| AMETEK Incorporated | 12,296 | 1,781,936 | |||
| Regal Rexnord Corporation | 38,617 | 5,375,486 | |||
| 11,371,221 | |||||
| Machinery: 1.29% | |||||
| AGCO Corporation | 23,906 | 3,302,136 | |||
| Cummins Incorporated | 4,549 | 1,135,157 | |||
| Parker-Hannifin Corporation | 14,772 | 4,815,672 | |||
| The Timken Company | 25,599 | 2,108,078 | |||
| 11,361,043 | |||||
| Road & rail: 0.35% | |||||
| CSX Corporation | 101,733 | 3,145,584 | |||
| Trading companies & distributors: 0.55% | |||||
| United Rentals Incorporated † | 10,991 | 4,846,481 |
| Shares | Value | ||||
| Information technology: 26.75% | |||||
| Communications equipment: 1.13% | |||||
| Cisco Systems Incorporated | 204,445 | $ 9,950,338 | |||
| Electronic equipment, instruments & components: 0.99% | |||||
| Jabil Circuit Incorporated | 67,466 | 5,304,852 | |||
| Keysight Technologies Incorporated † | 19,314 | 3,463,966 | |||
| 8,768,818 | |||||
| IT services: 4.77% | |||||
| Accenture plc Class A | 20,696 | 5,775,219 | |||
| Amdocs Limited | 20,164 | 1,853,677 | |||
| Cognizant Technology Solutions Corporation Class A | 23,923 | 1,596,860 | |||
| FleetCor Technologies Incorporated † | 19,808 | 4,136,108 | |||
| MasterCard Incorporated Class A | 29,646 | 10,986,808 | |||
| PayPal Holdings Incorporated † | 27,355 | 2,229,159 | |||
| Visa Incorporated Class A | 67,344 | 15,503,262 | |||
| 42,081,093 | |||||
| Semiconductors & semiconductor equipment: 5.34% | |||||
| Advanced Micro Devices Incorporated † | 26,878 | 2,019,882 | |||
| Broadcom Incorporated | 19,235 | 11,252,667 | |||
| Enphase Energy Incorporated † | 10,845 | 2,400,866 | |||
| KLA Corporation | 14,127 | 5,544,565 | |||
| Lam Research Corporation | 1,830 | 915,183 | |||
| Microchip Technology Incorporated | 55,069 | 4,274,456 | |||
| Monolithic Power Systems Incorporated | 3,323 | 1,417,459 | |||
| NVIDIA Corporation | 63,489 | 12,403,846 | |||
| Qualcomm Incorporated | 52,138 | 6,945,303 | |||
| 47,174,227 | |||||
| Software: 8.06% | |||||
| Adobe Incorporated † | 9,540 | 3,533,044 | |||
| Cadence Design Systems Incorporated † | 7,100 | 1,298,093 | |||
| Dropbox Incorporated Class A † | 205,388 | 4,771,163 | |||
| Fortinet Incorporated † | 47,492 | 2,485,731 | |||
| Microsoft Corporation | 201,996 | 50,056,629 | |||
| Salesforce.com Incorporated † | 23,572 | 3,959,389 | |||
| Synopsys Incorporated † | 14,375 | 5,085,156 | |||
| 71,189,205 | |||||
| Technology hardware, storage & peripherals: 6.46% | |||||
| Apple Incorporated | 382,520 | 55,193,811 | |||
| HP Incorporated | 64,939 | 1,892,322 | |||
| 57,086,133 | |||||
| Materials: 2.75% | |||||
| Chemicals: 2.15% | |||||
| Celanese Corporation Series A | 19,318 | 2,379,978 | |||
| CF Industries Holdings Incorporated | 58,356 | 4,942,753 | |||
| LyondellBasell Industries NV Class A | 50,116 | 4,845,716 | |||
| Olin Corporation | 32,990 | 2,130,824 | |||
| Westlake Chemical Corporation | 38,140 | 4,681,685 | |||
| 18,980,956 |
| Shares | Value | ||||
| Metals & mining: 0.60% | |||||
| Reliance Steel & Aluminum Company | 23,461 | $ 5,336,204 | |||
| Real estate: 2.85% | |||||
| Equity REITs: 2.85% | |||||
| CubeSmart | 37,453 | 1,714,973 | |||
| Extra Space Storage Incorporated | 29,328 | 4,628,838 | |||
| Gaming and Leisure Properties Incorporated | 32,941 | 1,764,320 | |||
| Medical Properties Trust Incorporated | 353,393 | 4,576,439 | |||
| Prologis Incorporated | 30,827 | 3,985,315 | |||
| Public Storage Incorporated | 8,469 | 2,577,455 | |||
| SBA Communications Corporation | 9,467 | 2,816,717 | |||
| Simon Property Group Incorporated | 24,439 | 3,139,434 | |||
| 25,203,491 | |||||
| Utilities: 3.07% | |||||
| Electric utilities: 0.95% | |||||
| American Electric Power Company Incorporated | 26,102 | 2,452,544 | |||
| NextEra Energy Incorporated | 47,047 | 3,511,118 | |||
| The Southern Company | 35,403 | 2,396,075 | |||
| 8,359,737 | |||||
| Gas utilities: 0.53% | |||||
| National Fuel Gas Company | 81,232 | 4,716,330 | |||
| Independent power & renewable electricity producers: 0.40% | |||||
| AES Corporation | 127,945 | 3,506,972 | |||
| Multi-utilities: 1.19% | |||||
| DTE Energy Company | 44,041 | 5,125,051 | |||
| Sempra Energy | 33,746 | 5,410,496 | |||
| 10,535,547 | |||||
| Total Common stocks (Cost $526,089,455) | 875,739,693 |
| Yield | |||||
| Short-term investments: 0.75% | |||||
| Investment companies: 0.75% | |||||
| Allspring Government Money Market Fund Select Class ♠∞ | 4.16% | 6,609,351 | 6,609,351 | ||
| Securities Lending Cash Investments LLC ♠∩∞ | 4.38 | 871 | 871 | ||
| Total Short-term investments (Cost $6,610,222) | 6,610,222 | ||||
| Total investments in securities (Cost $532,699,677) | 99.89% | 882,349,915 | |||
| Other assets and liabilities, net | 0.11 | 939,829 | |||
| Total net assets | 100.00% | $883,289,744 |
| † | Non-income-earning security |
| « | All or a portion of this security is on loan. |
| ♠ | The issuer of the security is an affiliated person of the Fund as defined in the Investment Company Act of 1940. |
| ∩ | The investment is a non-registered investment company purchased with cash collateral received from securities on loan. |
| ∞ | The rate represents the 7-day annualized yield at period end. |
| Abbreviations: | |
| REIT | Real estate investment trust |
| Value, beginning of period | Purchases | Sales proceeds | Net realized gains (losses) | Net change in unrealized gains (losses) | Value, end of period | Shares, end of period | Income from affiliated securities | |||
| Short-term investments | ||||||||||
| Allspring Government Money Market Fund Select Class | $8,984,426 | $55,884,779 | $(58,259,854) | $0 | $0 | $ 6,609,351 | 6,609,351 | $ 207,883 | ||
| Securities Lending Cash Investments LLC | 0 | 4,861,226 | (4,860,359) | 4 | 0 | 871 | 871 | 1,714 # | ||
| $4 | $0 | $6,610,222 | $209,597 | |||||||
| # | Amount shown represents income before fees and rebates. |
| Description | Number of contracts | Expiration date | Notional cost | Notional value | Unrealized gains | Unrealized losses |
| Long | ||||||
| E-Mini S&P 500 Index | 30 | 3-17-2023 | $5,970,980 | $6,135,000 | $164,020 | $0 |
| Assets | |
Investments in unaffiliated securities (including $844 of securities loaned), at value (cost $526,089,455) | $ 875,739,693 |
Investments in affiliated securities, at value (cost $6,610,222) | 6,610,222 |
Cash | 299 |
Cash at broker segregated for futures contracts | 1,587,600 |
Receivable for dividends | 596,117 |
Receivable for Fund shares sold | 220,054 |
Receivable for daily variation margin on open futures contracts | 94,927 |
Receivable for securities lending income, net | 161 |
Prepaid expenses and other assets | 123,278 |
Total assets | 884,972,351 |
| Liabilities | |
Payable for Fund shares redeemed | 1,164,847 |
Management fee payable | 250,010 |
Administration fees payable | 102,970 |
Shareholder servicing fees payable | 101,190 |
Distribution fees payable | 9,613 |
Trustees’ fees and expenses payable | 4,442 |
Payable upon receipt of securities loaned | 866 |
Accrued expenses and other liabilities | 48,669 |
Total liabilities | 1,682,607 |
Total net assets | $883,289,744 |
| Net assets consist of | |
Paid-in capital | $ 492,022,378 |
Total distributable earnings | 391,267,366 |
Total net assets | $883,289,744 |
| Computation of net asset value and offering price per share | |
Net assets – Class A | $ 429,336,284 |
Shares outstanding – Class A1 | 24,368,808 |
Net asset value per share – Class A | $17.62 |
Maximum offering price per share – Class A2 | $18.69 |
Net assets – Class C | $ 17,472,608 |
Shares outstanding – Class C1 | 1,102,907 |
Net asset value per share – Class C | $15.84 |
Net assets – Class R | $ 2,881,227 |
Shares outstanding – Class R1 | 161,435 |
Net asset value per share – Class R | $17.85 |
Net assets – Class R6 | $ 256,931,308 |
Shares outstanding – Class R61 | 14,093,771 |
Net asset value per share – Class R6 | $18.23 |
Net assets – Administrator Class | $ 44,955,685 |
Shares outstanding – Administrator Class1 | 2,451,441 |
Net asset value per share – Administrator Class | $18.34 |
Net assets – Institutional Class | $ 131,712,632 |
Shares outstanding – Institutional Class1 | 7,316,167 |
Net asset value per share – Institutional Class | $18.00 |
| 1 | The Fund has an unlimited number of authorized shares. |
| 2 | Maximum offering price is computed as 100/94.25 of net asset value. On investments of $50,000 or more, the offering price is reduced. |
| Investment income | |
Dividends (net of foreign withholdings taxes of $2,070) | $ 7,411,631 |
Income from affiliated securities | 208,044 |
Total investment income | 7,619,675 |
| Expenses | |
Management fee | 1,548,113 |
| Administration fees | |
Class A | 448,366 |
Class C | 19,922 |
Class R | 3,021 |
Class R6 | 38,502 |
Administrator Class | 29,226 |
Institutional Class | 87,183 |
| Shareholder servicing fees | |
Class A | 533,769 |
Class C | 23,650 |
Class R | 3,592 |
Administrator Class | 53,290 |
| Distribution fees | |
Class C | 70,950 |
Class R | 3,544 |
Custody and accounting fees | 26,686 |
Professional fees | 24,574 |
Registration fees | 42,707 |
Shareholder report expenses | 25,553 |
Trustees’ fees and expenses | 11,026 |
Other fees and expenses | 27,733 |
Total expenses | 3,021,407 |
| Less: Fee waivers and/or expense reimbursements | |
Administrator Class | (2,928) |
Institutional Class | (23,985) |
Net expenses | 2,994,494 |
Net investment income | 4,625,181 |
| Realized and unrealized gains (losses) on investments | |
| Net realized gains (losses) on | |
Unaffiliated securities | 42,271,297 |
Affiliated securities | 4 |
Futures contracts | (335,575) |
Net realized gains on investments | 41,935,726 |
| Net change in unrealized gains (losses) on | |
Unaffiliated securities | (54,495,119) |
Futures contracts | (339,312) |
Net change in unrealized gains (losses) on investments | (54,834,431) |
Net realized and unrealized gains (losses) on investments | (12,898,705) |
Net decrease in net assets resulting from operations | $ (8,273,524) |
| Six months ended January 31, 2023 (unaudited) | Year ended July 31, 2022 | |||
| Operations | ||||
Net investment income | $ 4,625,181 | $ 9,388,867 | ||
Net realized gains on investments | 41,935,726 | 100,713,525 | ||
Net change in unrealized gains (losses) on investments | (54,834,431) | (140,109,744) | ||
Net decrease in net assets resulting from operations | (8,273,524) | (30,007,352) | ||
| Distributions to shareholders from | ||||
| Net investment income and net realized gains | ||||
Class A | (52,376,607) | �� | (41,800,708) | |
Class C | (2,335,076) | (2,103,959) | ||
Class R | (328,100) | (325,019) | ||
Class R6 | (31,761,771) | (27,186,743) | ||
Administrator Class | (5,446,143) | (4,249,188) | ||
Institutional Class | (16,672,329) | (13,233,665) | ||
Total distributions to shareholders | (108,920,026) | (88,899,282) | ||
| Capital share transactions | Shares | Shares | ||
| Proceeds from shares sold | ||||
Class A | 715,213 | 12,720,931 | 872,276 | 19,043,317 |
Class C | 17,007 | 279,357 | 66,563 | 1,291,580 |
Class R | 8,172 | 156,415 | 32,976 | 767,963 |
Class R6 | 219,466 | 4,091,642 | 374,988 | 8,156,586 |
Administrator Class | 81,035 | 1,555,691 | 261,446 | 6,154,474 |
Institutional Class | 526,253 | 9,984,497 | 837,224 | 18,892,679 |
| 28,788,533 | 54,306,599 | |||
| Reinvestment of distributions | ||||
Class A | 2,876,593 | 49,070,040 | 1,721,849 | 39,080,723 |
Class C | 150,602 | 2,295,178 | 100,635 | 2,069,063 |
Class R | 19,052 | 328,100 | 14,203 | 325,019 |
Class R6 | 1,721,944 | 30,504,253 | 1,103,953 | 25,895,916 |
Administrator Class | 268,307 | 4,768,503 | 164,016 | 3,859,677 |
Institutional Class | 858,896 | 15,013,566 | 509,416 | 11,813,677 |
| 101,979,640 | 83,044,075 | |||
| Payment for shares redeemed | ||||
Class A | (1,631,037) | (29,758,169) | (3,094,354) | (68,315,947) |
Class C | (228,658) | (3,768,982) | (305,748) | (6,087,730) |
Class R | (19,488) | (369,615) | (72,052) | (1,563,821) |
Class R6 | (1,130,812) | (22,000,777) | (2,713,444) | (63,086,684) |
Administrator Class | (175,461) | (3,306,193) | (325,023) | (7,511,866) |
Institutional Class | (970,645) | (17,985,735) | (1,475,152) | (33,016,713) |
| (77,189,471) | (179,582,761) | |||
Net increase (decrease) in net assets resulting from capital share transactions | 53,578,702 | (42,232,087) | ||
Total decrease in net assets | (63,614,848) | (161,138,721) | ||
| Net assets | ||||
Beginning of period | 946,904,592 | 1,108,043,313 | ||
End of period | $ 883,289,744 | $ 946,904,592 | ||
| Year ended July 31 | ||||||
| Class A | Six months ended January 31, 2023 (unaudited) | 2022 | 2021 | 2020 | 2019 | 2018 |
Net asset value, beginning of period | $20.25 | $22.77 | $18.22 | $17.29 | $17.70 | $16.30 |
Net investment income | 0.07 | 0.16 | 0.14 | 0.23 | 0.25 | 0.24 |
Net realized and unrealized gains (losses) on investments | (0.31) | (0.78) | 6.18 | 1.47 | 0.38 | 1.90 |
Total from investment operations | (0.24) | (0.62) | 6.32 | 1.70 | 0.63 | 2.14 |
| Distributions to shareholders from | ||||||
Net investment income | (0.15) | (0.16) | (0.33) | (0.33) | (0.19) | (0.15) |
Net realized gains | (2.24) | (1.74) | (1.44) | (0.44) | (0.85) | (0.59) |
Total distributions to shareholders | (2.39) | (1.90) | (1.77) | (0.77) | (1.04) | (0.74) |
Net asset value, end of period | $17.62 | $20.25 | $22.77 | $18.22 | $17.29 | $17.70 |
Total return1 | (0.69)% | (3.60)% | 36.73% | 9.97% | 4.31% | 13.28% |
| Ratios to average net assets (annualized) | ||||||
Gross expenses | 0.85% | 0.84% | 0.85% | 0.86% | 0.84% | 0.83% |
Net expenses | 0.85% | 0.84% | 0.85% | 0.85% | 0.84% | 0.83% |
Net investment income | 0.88% | 0.73% | 0.76% | 1.25% | 1.40% | 1.33% |
| Supplemental data | ||||||
Portfolio turnover rate | 23% | 25% | 36% | 50% | 63% | 73% |
Net assets, end of period (000s omitted) | $429,336 | $453,829 | $521,702 | $421,005 | $434,367 | $480,602 |
| 1 | Total return calculations do not include any sales charges. Returns for periods of less than one year are not annualized. |
| Year ended July 31 | ||||||
| Class C | Six months ended January 31, 2023 (unaudited) | 2022 | 2021 | 2020 | 2019 | 2018 |
Net asset value, beginning of period | $18.37 | $20.82 | $16.70 | $15.85 | $16.28 | $15.04 |
Net investment income (loss) | 0.02 | (0.00) 1 | 0.02 | 0.11 | 0.12 | 0.09 |
Net realized and unrealized gains (losses) on investments | (0.31) | (0.71) | 5.64 | 1.32 | 0.35 | 1.76 |
Total from investment operations | (0.29) | (0.71) | 5.66 | 1.43 | 0.47 | 1.85 |
| Distributions to shareholders from | ||||||
Net investment income | 0.00 | 0.00 | (0.10) | (0.14) | (0.05) | (0.02) |
Net realized gains | (2.24) | (1.74) | (1.44) | (0.44) | (0.85) | (0.59) |
Total distributions to shareholders | (2.24) | (1.74) | (1.54) | (0.58) | (0.90) | (0.61) |
Net asset value, end of period | $15.84 | $18.37 | $20.82 | $16.70 | $15.85 | $16.28 |
Total return2 | (1.11)% | (4.30)% | 35.80% | 9.09% | 3.59% | 12.41% |
| Ratios to average net assets (annualized) | ||||||
Gross expenses | 1.59% | 1.59% | 1.60% | 1.60% | 1.59% | 1.58% |
Net expenses | 1.59% | 1.59% | 1.60% | 1.60% | 1.59% | 1.58% |
Net investment income (loss) | 0.15% | (0.02)% | 0.02% | 0.51% | 0.66% | 0.58% |
| Supplemental data | ||||||
Portfolio turnover rate | 23% | 25% | 36% | 50% | 63% | 73% |
Net assets, end of period (000s omitted) | $17,473 | $21,381 | $27,121 | $29,141 | $38,708 | $52,647 |
| 1 | Amount is more than $(0.005). |
| 2 | Total return calculations do not include any sales charges. Returns for periods of less than one year are not annualized. |
| Year ended July 31 | ||||||
| Class R | Six months ended January 31, 2023 (unaudited) | 2022 | 2021 | 2020 | 2019 | 2018 |
Net asset value, beginning of period | $20.43 | $22.96 | $18.38 | $17.44 | $17.88 | $16.51 |
Net investment income | 0.06 1 | 0.04 | 0.07 | 0.18 | 0.19 1 | 0.18 1 |
Net realized and unrealized gains (losses) on investments | (0.32) | (0.73) | 6.25 | 1.49 | 0.41 | 1.94 |
Total from investment operations | (0.26) | (0.69) | 6.32 | 1.67 | 0.60 | 2.12 |
| Distributions to shareholders from | ||||||
Net investment income | (0.08) | (0.10) | (0.30) | (0.29) | (0.19) | (0.16) |
Net realized gains | (2.24) | (1.74) | (1.44) | (0.44) | (0.85) | (0.59) |
Total distributions to shareholders | (2.32) | (1.84) | (1.74) | (0.73) | (1.04) | (0.75) |
Net asset value, end of period | $17.85 | $20.43 | $22.96 | $18.38 | $17.44 | $17.88 |
Total return2 | (0.83)% | (3.82)% | 36.38% | 9.68% | 4.07% | 12.97% |
| Ratios to average net assets (annualized) | ||||||
Gross expenses | 1.09% | 1.09% | 1.10% | 1.10% | 1.09% | 1.08% |
Net expenses | 1.09% | 1.09% | 1.10% | 1.10% | 1.09% | 1.08% |
Net investment income | 0.68% | 0.48% | 0.51% | 0.97% | 1.15% | 1.04% |
| Supplemental data | ||||||
Portfolio turnover rate | 23% | 25% | 36% | 50% | 63% | 73% |
Net assets, end of period (000s omitted) | $2,881 | $3,140 | $4,101 | $3,507 | $3,126 | $3,298 |
| 1 | Calculated based upon average shares outstanding |
| 2 | Returns for periods of less than one year are not annualized. |
| Year ended July 31 | ||||||
| Class R6 | Six months ended January 31, 2023 (unaudited) | 2022 | 2021 | 2020 | 2019 | 2018 |
Net asset value, beginning of period | $20.93 | $23.46 | $18.72 | $17.76 | $18.17 | $16.71 |
Net investment income | 0.13 | 0.26 1 | 0.24 | 0.31 | 0.32 | 0.30 1 |
Net realized and unrealized gains (losses) on investments | (0.34) | (0.80) | 6.36 | 1.51 | 0.40 | 1.97 |
Total from investment operations | (0.21) | (0.54) | 6.60 | 1.82 | 0.72 | 2.27 |
| Distributions to shareholders from | ||||||
Net investment income | (0.25) | (0.25) | (0.42) | (0.42) | (0.28) | (0.22) |
Net realized gains | (2.24) | (1.74) | (1.44) | (0.44) | (0.85) | (0.59) |
Total distributions to shareholders | (2.49) | (1.99) | (1.86) | (0.86) | (1.13) | (0.81) |
Net asset value, end of period | $18.23 | $20.93 | $23.46 | $18.72 | $17.76 | $18.17 |
Total return2 | (0.53)% | (3.15)% | 37.35% | 10.39% | 4.77% | 13.78% |
| Ratios to average net assets (annualized) | ||||||
Gross expenses | 0.42% | 0.41% | 0.42% | 0.43% | 0.41% | 0.40% |
Net expenses | 0.42% | 0.41% | 0.42% | 0.42% | 0.41% | 0.40% |
Net investment income | 1.31% | 1.16% | 1.18% | 1.70% | 1.84% | 1.71% |
| Supplemental data | ||||||
Portfolio turnover rate | 23% | 25% | 36% | 50% | 63% | 73% |
Net assets, end of period (000s omitted) | $256,931 | $277,956 | $340,631 | $253,223 | $340,606 | $445,678 |
| 1 | Calculated based upon average shares outstanding |
| 2 | Returns for periods of less than one year are not annualized. |
| Year ended July 31 | ||||||
| Administrator Class | Six months ended January 31, 2023 (unaudited) | 2022 | 2021 | 2020 | 2019 | 2018 |
Net asset value, beginning of period | $21.00 | $23.55 | $18.78 | $17.80 | $18.17 | $16.71 |
Net investment income | 0.10 1 | 0.19 1 | 0.19 1 | 0.24 1 | 0.26 1 | 0.25 1 |
Net realized and unrealized gains (losses) on investments | (0.34) | (0.82) | 6.37 | 1.53 | 0.41 | 1.97 |
Total from investment operations | (0.24) | (0.63) | 6.56 | 1.77 | 0.67 | 2.22 |
| Distributions to shareholders from | ||||||
Net investment income | (0.18) | (0.18) | (0.35) | (0.35) | (0.19) | (0.17) |
Net realized gains | (2.24) | (1.74) | (1.44) | (0.44) | (0.85) | (0.59) |
Total distributions to shareholders | (2.42) | (1.92) | (1.79) | (0.79) | (1.04) | (0.76) |
Net asset value, end of period | $18.34 | $21.00 | $23.55 | $18.78 | $17.80 | $18.17 |
Total return2 | (0.65)% | (3.49)% | 36.93% | 10.08% | 4.43% | 13.40% |
| Ratios to average net assets (annualized) | ||||||
Gross expenses | 0.75% | 0.74% | 0.77% | 0.77% | 0.76% | 0.75% |
Net expenses | 0.74% | 0.73% | 0.74% | 0.74% | 0.74% | 0.74% |
Net investment income | 1.03% | 0.85% | 0.89% | 1.37% | 1.50% | 1.42% |
| Supplemental data | ||||||
Portfolio turnover rate | 23% | 25% | 36% | 50% | 63% | 73% |
Net assets, end of period (000s omitted) | $44,956 | $47,831 | $51,271 | $50,655 | $58,808 | $94,058 |
| 1 | Calculated based upon average shares outstanding |
| 2 | Returns for periods of less than one year are not annualized. |
| Year ended July 31 | ||||||
| Institutional Class | Six months ended January 31, 2023 (unaudited) | 2022 | 2021 | 2020 | 2019 | 2018 |
Net asset value, beginning of period | $20.69 | $23.22 | $18.54 | $17.57 | $17.98 | $16.55 |
Net investment income | 0.12 1 | 0.24 | 0.23 1 | 0.29 1 | 0.30 1 | 0.28 |
Net realized and unrealized gains (losses) on investments | (0.34) | (0.80) | 6.29 | 1.51 | 0.40 | 1.95 |
Total from investment operations | (0.22) | (0.56) | 6.52 | 1.80 | 0.70 | 2.23 |
| Distributions to shareholders from | ||||||
Net investment income | (0.23) | (0.23) | (0.40) | (0.39) | (0.26) | (0.21) |
Net realized gains | (2.24) | (1.74) | (1.44) | (0.44) | (0.85) | (0.59) |
Total distributions to shareholders | (2.47) | (1.97) | (1.84) | (0.83) | (1.11) | (0.80) |
Net asset value, end of period | $18.00 | $20.69 | $23.22 | $18.54 | $17.57 | $17.98 |
Total return2 | (0.57)% | (3.24)% | 37.26% | 10.39% | 4.69% | 13.65% |
| Ratios to average net assets (annualized) | ||||||
Gross expenses | 0.52% | 0.51% | 0.52% | 0.52% | 0.51% | 0.50% |
Net expenses | 0.48% | 0.48% | 0.48% | 0.48% | 0.48% | 0.48% |
Net investment income | 1.31% | 1.09% | 1.14% | 1.67% | 1.77% | 1.67% |
| Supplemental data | ||||||
Portfolio turnover rate | 23% | 25% | 36% | 50% | 63% | 73% |
Net assets, end of period (000s omitted) | $131,713 | $142,768 | $163,217 | $146,707 | $285,616 | $411,988 |
| 1 | Calculated based upon average shares outstanding |
| 2 | Returns for periods of less than one year are not annualized. |
| Gross unrealized gains | $362,303,085 |
| Gross unrealized losses | (15,019,715) |
| Net unrealized gains | $347,283,370 |
| ■ | Level 1 – quoted prices in active markets for identical securities |
| ■ | Level 2 – other significant observable inputs (including quoted prices for similar securities, interest rates, prepayment speeds, credit risk, etc.) |
| ■ | Level 3 – significant unobservable inputs (including the Fund’s own assumptions in determining the fair value of investments) |
| Quoted prices (Level 1) | Other significant observable inputs (Level 2) | Significant unobservable inputs (Level 3) | Total | |
| Assets | ||||
| Investments in: | ||||
| Common stocks | ||||
| Communication services | $ 68,028,421 | $0 | $0 | $ 68,028,421 |
| Consumer discretionary | 85,364,829 | 0 | 0 | 85,364,829 |
| Consumer staples | 56,017,667 | 0 | 0 | 56,017,667 |
| Energy | 45,237,057 | 0 | 0 | 45,237,057 |
| Financials | 100,034,100 | 0 | 0 | 100,034,100 |
| Health care | 131,922,893 | 0 | 0 | 131,922,893 |
| Industrials | 76,245,675 | 0 | 0 | 76,245,675 |
| Information technology | 236,249,814 | 0 | 0 | 236,249,814 |
| Materials | 24,317,160 | 0 | 0 | 24,317,160 |
| Real estate | 25,203,491 | 0 | 0 | 25,203,491 |
| Utilities | 27,118,586 | 0 | 0 | 27,118,586 |
| Short-term investments | ||||
| Investment companies | 6,610,222 | 0 | 0 | 6,610,222 |
| 882,349,915 | 0 | 0 | 882,349,915 | |
| Futures contracts | 164,020 | 0 | 0 | 164,020 |
| Total assets | $882,513,935 | $0 | $0 | $882,513,935 |
| Average daily net assets | Management fee |
| First $1 billion | 0.350% |
| Next $4 billion | 0.325 |
| Next $5 billion | 0.290 |
| Over $10 billion | 0.280 |
| Class-level administration fee | |
| Class A | 0.21% |
| Class C | 0.21 |
| Class R | 0.21 |
| Class R6 | 0.03 |
| Administrator Class | 0.13 |
| Institutional Class | 0.13 |
| Expense ratio caps | |
| Class A | 0.87% |
| Class C | 1.62 |
| Class R | 1.12 |
| Class R6 | 0.43 |
| Administrator Class | 0.74 |
| Institutional Class | 0.48 |
| Counterparty | Value of securities on loan | Collateral received1 | Net amount |
| Credit Suisse Securities (USA) LLC | $844 | $(844) | $0 |
| Name and year of birth | Position held and length of service* | Principal occupations during past five years or longer | Current other public company or investment company directorships |
| William R. Ebsworth (Born 1957) | Trustee, since 2015 | Retired. From 1984 to 2013, equities analyst, portfolio manager, research director and chief investment officer at Fidelity Management and Research Company in Boston, Tokyo, and Hong Kong, and retired in 2013 as Chief Investment Officer of Fidelity Strategic Advisers, Inc. where he led a team of investment professionals managing client assets. Prior thereto, Board member of Hong Kong Securities Clearing Co., Hong Kong Options Clearing Corp., the Thailand International Fund, Ltd., Fidelity Investments Life Insurance Company, and Empire Fidelity Investments Life Insurance Company. Audit Committee Chair and Investment Committee Chair of the Vincent Memorial Hospital Foundation (non-profit organization). Mr. Ebsworth is a CFA® charterholder. | N/A |
| Jane A. Freeman (Born 1953) | Trustee, since 2015; Chair Liaison, since 2018 | Retired. From 2012 to 2014 and 1999 to 2008, Chief Financial Officer of Scientific Learning Corporation. From 2008 to 2012, Ms. Freeman provided consulting services related to strategic business projects. Prior to 1999, Portfolio Manager at Rockefeller & Co. and Scudder, Stevens & Clark. Board member of the Harding Loevner Funds from 1996 to 2014, serving as both Lead Independent Director and chair of the Audit Committee. Board member of the Russell Exchange Traded Funds Trust from 2011 to 2012 and the chair of the Audit Committee. Ms. Freeman is also an inactive Chartered Financial Analyst. | N/A |
| Isaiah Harris, Jr. (Born 1952) | Trustee, since 2009; Audit Committee Chair, since 2019 | Retired. Member of the Advisory Board of CEF of East Central Florida. Chairman of the Board of CIGNA Corporation from 2009 to 2021, and Director from 2005 to 2008. From 2003 to 2011, Director of Deluxe Corporation. Prior thereto, President and CEO of BellSouth Advertising and Publishing Corp. from 2005 to 2007, President and CEO of BellSouth Enterprises from 2004 to 2005 and President of BellSouth Consumer Services from 2000 to 2003. Emeritus member of the Iowa State University Foundation Board of Governors. Emeritus Member of the Advisory Board of Iowa State University School of Business. Advisory Board Member, Palm Harbor Academy (private school). Advisory Board Member, Fellowship of Christian Athletes. Mr. Harris is a certified public accountant (inactive status). | N/A |
| David F. Larcker (Born 1950) | Trustee, since 2009 | Distinguished Visiting Fellow at the Hoover Institution since 2022. James Irvin Miller Professor of Accounting at the Graduate School of Business (Emeritus), Stanford University, Director of the Corporate Governance Research Initiative and Senior Faculty of The Rock Center for Corporate Governance since 2006. From 2005 to 2008, Professor of Accounting at the Graduate School of Business, Stanford University. Prior thereto, Ernst & Young Professor of Accounting at The Wharton School, University of Pennsylvania from 1985 to 2005. | N/A |
| Name and year of birth | Position held and length of service* | Principal occupations during past five years or longer | Current other public company or investment company directorships |
| Olivia S. Mitchell (Born 1953) | Trustee, since 2006; Nominating and Governance Committee Chair, since 2018 | International Foundation of Employee Benefit Plans Professor since 1993, Wharton School of the University of Pennsylvania. Director of Wharton’s Pension Research Council and Boettner Center on Pensions & Retirement Research, and Research Associate at the National Bureau of Economic Research. Previously taught at Cornell University from 1978 to 1993. | N/A |
| Timothy J. Penny (Born 1951) | Trustee, since 1996; Chair, since 2018 | President and Chief Executive Officer of Southern Minnesota Initiative Foundation, a non-profit organization, since 2007. Vice Chair of the Economic Club of Minnesota, since 2007. Co-Chair of the Committee for a Responsible Federal Budget, since 1995. Member of the Board of Trustees of NorthStar Education Finance, Inc., a non-profit organization, from 2007-2022. Senior Fellow of the University of Minnesota Humphrey Institute from 1995 to 2017. | N/A |
| James G. Polisson (Born 1959) | Trustee, since 2018 | Retired. Chief Marketing Officer, Source (ETF) UK Services, Ltd, from 2015 to 2017. From 2012 to 2015, Principal of The Polisson Group, LLC, a management consulting, corporate advisory and principal investing company. Chief Executive Officer and Managing Director at Russell Investments, Global Exchange Traded Funds from 2010 to 2012. Managing Director of Barclays Global Investors from 1998 to 2010 and Global Chief Marketing Officer for iShares and Barclays Global Investors from 2000 to 2010. Trustee of the San Francisco Mechanics’ Institute, a non-profit organization, from 2013 to 2015. Board member of the Russell Exchange Traded Fund Trust from 2011 to 2012. Director of Barclays Global Investors Holdings Deutschland GmbH from 2006 to 2009. Mr. Polisson is an attorney and has a retired status with the Massachusetts and District of Columbia Bar Associations. | N/A |
| Pamela Wheelock (Born 1959) | Trustee, since January 2020; previously Trustee from January 2018 to July 2019 | Retired. Executive and Senior Financial leadership positions in the public, private and nonprofit sectors. Interim President and CEO, McKnight Foundation, 2020. Interim Commissioner, Minnesota Department of Human Services, 2019. Chief Operating Officer, Twin Cities Habitat for Humanity, 2017-2019. Vice President for University Services, University of Minnesota, 2012-2016. Interim President and CEO, Blue Cross and Blue Shield of Minnesota, 2011-2012. Executive Vice-President and Chief Financial Officer, Minnesota Wild, 2002-2008. Commissioner, Minnesota Department of Finance, 1999-2002. Chair of the Board of Directors of Destination Medical Center Corporation. Board member of the Minnesota Wild Foundation. | N/A |
| Name and year of birth | Position held and length of service | Principal occupations during past five years or longer |
| Andrew Owen (Born 1960) | President, since 2017 | President and Chief Executive Officer of Allspring Funds Management, LLC since 2017 and Head of Global Fund Governance of Allspring Global Investments since 2022. Prior thereto, co-president of Galliard Capital Management, LLC, an affiliate of Allspring Funds Management, LLC, from 2019 to 2022 and Head of Affiliated Managers, Allspring Global Investments, from 2014 to 2019 and Executive Vice President responsible for marketing, investments and product development for Allspring Funds Management, LLC, from 2009 to 2014. |
| Jeremy DePalma (Born 1974) | Treasurer, since 2012 (for certain funds in the Fund Complex); since 2021 (for the remaining funds in the Fund Complex) | Senior Vice President of Allspring Funds Management, LLC since 2009. Senior Vice President of Evergreen Investment Management Company, LLC from 2008 to 2010 and head of the Fund Reporting and Control Team within Fund Administration from 2005 to 2010. |
| Christopher Baker (Born 1976) | Chief Compliance Officer, since 2022 | Global Chief Compliance Officer for Allspring Global Investments since 2022. Prior thereto, Chief Compliance Officer for State Street Global Advisors from 2018 to 2021. Senior Compliance Officer for the State Street divisions of Alternative Investment Solutions, Sector Solutions, and Global Marketing from 2015 to 2018. From 2010 to 2015 Vice President, Global Head of Investment and Marketing Compliance for State Street Global Advisors. |
| Matthew Prasse (Born 1983) | Chief Legal Officer, since 2022; Secretary, since 2021 | Senior Counsel of the Allspring Legal Department since 2021. Senior Counsel of the Wells Fargo Legal Department from 2018 to 2021. Previously, Counsel for Barings LLC from 2015 to 2018. Prior to joining Barings, Associate at Morgan, Lewis & Bockius LLP from 2008 to 2015. |
P.O. Box 219967
Kansas City, MO 64121-9967

1-800-222-8222 or visit the Fund's website at allspringglobal.com. Read the prospectus carefully before you invest or send money.
SAR0616 01-23

Discovery Large Cap Growth Fund

| 1 | The S&P 500 Index consists of 500 stocks chosen for market size, liquidity, and industry group representation. It is a market-value-weighted index with each stock's weight in the index proportionate to its market value. You cannot invest directly in an index. |
| 2 | The Morgan Stanley Capital International (MSCI) All Country World Index (ACWI) ex USA Index (Net) is a free-float-adjusted market-capitalization-weighted index that is designed to measure the equity market performance of developed and emerging markets, excluding the U.S. Source: MSCI. MSCI makes no express or implied warranties or representations and shall have no liability whatsoever with respect to any MSCI data contained herein. The MSCI data may not be further redistributed or used as a basis for other indexes or any securities or financial products. This report is not approved, reviewed, or produced by MSCI. You cannot invest directly in an index. |
| 3 | The MSCI Emerging Markets (EM) Index (Net) (USD) is a free-float-adjusted market-capitalization-weighted index that is designed to measure equity market performance of emerging markets. You cannot invest directly in an index. |
| 4 | The Bloomberg U.S. Aggregate Bond Index is a broad-based benchmark that measures the investment-grade, U.S.-dollar-denominated, fixed-rate taxable bond market, including Treasuries, government-related and corporate securities, mortgage-backed securities (agency fixed-rate and hybrid adjustable-rate mortgage pass-throughs), asset-backed securities, and commercial mortgage-backed securities. You cannot invest directly in an index. |
| 5 | The Bloomberg Global Aggregate ex-USD Index (unhedged) is an unmanaged index that provides a broad-based measure of the global investment-grade fixed-income markets excluding the U.S.-dollar-denominated debt market. You cannot invest directly in an index. |
| 6 | The Bloomberg Municipal Bond Index is an unmanaged index composed of long-term tax-exempt bonds with a minimum credit rating of Baa. You cannot invest directly in an index. |
| 7 | The ICE BofA U.S. High Yield Index is a market-capitalization-weighted index of domestic and Yankee high-yield bonds. The index tracks the performance of high-yield securities traded in the U.S. bond market. You cannot invest directly in an index. Copyright 2023. ICE Data Indices, LLC. All rights reserved. |
| 1 | The Consumer Price Index (CPI) is a measure of the average change over time in the prices paid by urban consumers for a market basket of consumer goods and services. You cannot invest directly in an index. |

President
Allspring Funds
| Investment objective | The Fund seeks long-term capital appreciation. |
| Manager | Allspring Funds Management, LLC |
| Subadviser | Allspring Global Investments, LLC |
| Portfolio managers | Michael T. Smith, CFA®‡, Christopher J. Warner, CFA®‡ |
| Average annual total returns (%) as of January 31, 2023 | |||||||||||
| Including sales charge | Excluding sales charge | Expense ratios1 (%) | |||||||||
| Inception date | 1 year | 5 year | 10 year | 1 year | 5 year | 10 year | Gross | Net 2 | |||
| Class A (STAEX) | 12-29-2000 | -24.05 | 7.22 | 11.66 | -19.43 | 8.50 | 12.32 | 1.26 | 1.03 | ||
| Class C (WECCX) | 12-29-2000 | -20.96 | 7.68 | 11.65 | -19.96 | 7.68 | 11.65 | 2.01 | 1.78 | ||
| Class R6 (WECRX)3 | 9-20-2019 | – | – | – | -19.15 | 8.96 | 12.80 | 0.83 | 0.60 | ||
| Administrator Class (WECDX) | 4-8-2005 | – | – | – | -19.38 | 8.69 | 12.54 | 1.18 | 0.94 | ||
| Institutional Class (WFCIX) | 4-8-2005 | – | – | – | -19.32 | 8.85 | 12.74 | 0.93 | 0.70 | ||
| Russell 1000® Growth Index4 | – | – | – | – | -16.02 | 11.22 | 14.53 | – | – | ||
| 1 | Reflects the expense ratios as stated in the most recent prospectuses. The expense ratios shown are subject to change and may differ from the annualized expense ratios shown in the financial highlights of this report. |
| 2 | The manager has contractually committed through November 30, 2023, to waive fees and/or reimburse expenses to the extent necessary to cap total annual fund operating expenses after fee waivers at 1.03% for Class A, 1.78% for Class C, 0.60% for Class R6, 0.94% for Administrator Class, and 0.70% for Institutional Class. Brokerage commissions, stamp duty fees, interest, taxes, acquired fund fees and expenses (if any), and extraordinary expenses are excluded from the expense caps. Prior to or after the commitment expiration date, the caps may be increased or the commitment to maintain the caps may be terminated only with the approval of the Board of Trustees. Without these caps, the Fund’s returns would have been lower. The expense ratio paid by an investor is the net expense ratio (the total annual fund operating expenses after fee waivers) as stated in the prospectuses. |
| 3 | Historical performance shown for the Class R6 shares prior to their inception reflects the performance of the Institutional Class shares, and includes the higher expenses applicable to the Institutional Class shares. If these expenses had not been included, returns for the Class R6 shares would be higher. |
| 4 | The Russell 1000® Growth Index measures the performance of those Russell 1000 companies with higher price/book ratios and higher forecasted growth values. You cannot invest directly in an index. |
| ‡ | CFA® and Chartered Financial Analyst® are trademarks owned by CFA Institute. |
| Ten largest holdings (%) as of January 31, 20231 | |
| Microsoft Corporation | 9.41 |
| Amazon.com Incorporated | 7.15 |
| Alphabet Incorporated Class A | 6.47 |
| Visa Incorporated Class A | 5.95 |
| Waste Connections Incorporated | 3.34 |
| UnitedHealth Group Incorporated | 3.15 |
| Cadence Design Systems Incorporated | 3.11 |
| Chipotle Mexican Grill Incorporated | 2.88 |
| The Home Depot Incorporated | 2.76 |
| Motorola Solutions Incorporated | 2.57 |
| 1 | Figures represent the percentage of the Fund's net assets. Holdings are subject to change and may have changed since the date specified. |
| Sector allocation as of January 31, 20231 |
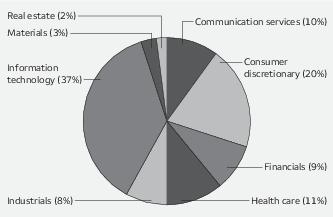
| 1 | Figures represent the percentage of the Fund's long-term investments. Allocations are subject to change and may have changed since the date specified. |
| Beginning account value 8-1-2022 | Ending account value 1-31-2023 | Expenses paid during the period1 | Annualized net expense ratio | |
| Class A | ||||
| Actual | $1,000.00 | $ 951.07 | $5.07 | 1.03% |
| Hypothetical (5% return before expenses) | $1,000.00 | $1,020.01 | $5.24 | 1.03% |
| Class C | ||||
| Actual | $1,000.00 | $ 945.66 | $8.73 | 1.78% |
| Hypothetical (5% return before expenses) | $1,000.00 | $1,016.23 | $9.05 | 1.78% |
| Class R6 | ||||
| Actual | $1,000.00 | $ 952.40 | $2.95 | 0.60% |
| Hypothetical (5% return before expenses) | $1,000.00 | $1,022.18 | $3.06 | 0.60% |
| Administrator Class | ||||
| Actual | $1,000.00 | $ 951.57 | $4.62 | 0.94% |
| Hypothetical (5% return before expenses) | $1,000.00 | $1,020.47 | $4.79 | 0.94% |
| Institutional Class | ||||
| Actual | $1,000.00 | $ 951.06 | $3.44 | 0.70% |
| Hypothetical (5% return before expenses) | $1,000.00 | $1,021.68 | $3.57 | 0.70% |
| Shares | Value | ||||
| Common stocks: 97.36% | |||||
| Communication services: 9.87% | |||||
| Entertainment: 1.48% | |||||
| Spotify Technology SA † | 24,100 | $ 2,716,552 | |||
| Interactive media & services: 8.39% | |||||
| Alphabet Incorporated Class A † | 119,840 | 11,844,986 | |||
| Alphabet Incorporated Class C † | 11,700 | 1,168,479 | |||
| Match Group Incorporated † | 43,486 | 2,353,462 | |||
| 15,366,927 | |||||
| Consumer discretionary: 19.18% | |||||
| Auto components: 1.46% | |||||
| Aptiv plc † | 23,650 | 2,674,579 | |||
| Automobiles: 2.44% | |||||
| Ferrari NV | 17,800 | 4,473,318 | |||
| Hotels, restaurants & leisure: 2.88% | |||||
| Chipotle Mexican Grill Incorporated † | 3,200 | 5,268,416 | |||
| Internet & direct marketing retail: 9.64% | |||||
| Amazon.com Incorporated † | 127,060 | 13,103,698 | |||
| MercadoLibre Incorporated † | 3,850 | 4,549,507 | |||
| 17,653,205 | |||||
| Specialty retail: 2.76% | |||||
| The Home Depot Incorporated | 15,616 | 5,062,239 | |||
| Financials: 8.86% | |||||
| Capital markets: 6.41% | |||||
| Intercontinental Exchange Incorporated | 34,090 | 3,666,380 | |||
| MarketAxess Holdings Incorporated | 10,700 | 3,893,195 | |||
| S&P Global Incorporated | 11,141 | 4,177,207 | |||
| 11,736,782 | |||||
| Insurance: 2.45% | |||||
| Progressive Corporation | 33,000 | 4,499,550 | |||
| Health care: 11.08% | |||||
| Health care equipment & supplies: 7.93% | |||||
| Align Technology Incorporated † | 7,900 | 2,130,867 | |||
| DexCom Incorporated † | 43,900 | 4,701,251 | |||
| Edwards Lifesciences Corporation † | 43,850 | 3,363,295 | |||
| Intuitive Surgical Incorporated † | 17,650 | 4,336,429 | |||
| 14,531,842 | |||||
| Health care providers & services: 3.15% | |||||
| UnitedHealth Group Incorporated | 11,547 | 5,764,147 | |||
| Industrials: 8.17% | |||||
| Commercial services & supplies: 3.34% | |||||
| Waste Connections Incorporated | 46,040 | 6,118,716 |
| Shares | Value | ||||
| Machinery: 2.31% | |||||
| Deere & Company | 10,000 | $ 4,228,400 | |||
| Road & rail: 2.52% | |||||
| Union Pacific Corporation | 22,600 | 4,614,694 | |||
| Information technology: 35.65% | |||||
| Communications equipment: 2.57% | |||||
| Motorola Solutions Incorporated | 18,300 | 4,703,283 | |||
| IT services: 12.52% | |||||
| Adyen NV ADR † | 229,500 | 3,451,680 | |||
| Fiserv Incorporated † | 36,794 | 3,925,180 | |||
| MongoDB Incorporated † | 9,700 | 2,077,837 | |||
| PayPal Holdings Incorporated † | 31,700 | 2,583,233 | |||
| Visa Incorporated Class A | 47,328 | 10,895,379 | |||
| 22,933,309 | |||||
| Semiconductors & semiconductor equipment: 1.12% | |||||
| Advanced Micro Devices Incorporated † | 27,400 | 2,059,110 | |||
| Software: 19.44% | |||||
| Atlassian Corporation Class A † | 18,300 | 2,957,646 | |||
| Bill.com Holdings Incorporated † | 23,800 | 2,751,756 | |||
| Cadence Design Systems Incorporated † | 31,200 | 5,704,296 | |||
| Crowdstrike Holdings Incorporated Class A † | 22,500 | 2,382,750 | |||
| Microsoft Corporation | 69,534 | 17,231,221 | |||
| ServiceNow Incorporated † | 10,080 | 4,587,710 | |||
| 35,615,379 | |||||
| Materials: 2.44% | |||||
| Chemicals: 2.44% | |||||
| The Sherwin-Williams Company | 18,850 | 4,459,722 | |||
| Real estate: 2.11% | |||||
| Equity REITs: 2.11% | |||||
| SBA Communications Corporation | 13,000 | 3,867,890 | |||
| Total Common stocks (Cost $98,225,889) | 178,348,060 |
| Yield | |||||
| Short-term investments: 2.46% | |||||
| Investment companies: 2.46% | |||||
| Allspring Government Money Market Fund Select Class ♠∞ | 4.16% | 4,504,996 | 4,504,996 | ||
| Total Short-term investments (Cost $4,504,996) | 4,504,996 | ||||
| Total investments in securities (Cost $102,730,885) | 99.82% | 182,853,056 | |||
| Other assets and liabilities, net | 0.18 | 325,172 | |||
| Total net assets | 100.00% | $183,178,228 |
| † | Non-income-earning security |
| ♠ | The issuer of the security is an affiliated person of the Fund as defined in the Investment Company Act of 1940. |
| ∞ | The rate represents the 7-day annualized yield at period end. |
| Abbreviations: | |
| ADR | American depositary receipt |
| REIT | Real estate investment trust |
| Value, beginning of period | Purchases | Sales proceeds | Net realized gains (losses) | Net change in unrealized gains (losses) | Value, end of period | Shares, end of period | Income from affiliated securities | |||
| Short-term investments | ||||||||||
| Allspring Government Money Market Fund Select Class | $6,229,120 | $24,126,713 | $(25,850,837) | $0 | $0 | $ 4,504,996 | 4,504,996 | $ 46,659 | ||
| Investments in affiliates no longer held at end of period | ||||||||||
| Securities Lending Cash Investments LLC | 0 | 322,650 | (322,650) | 0 | 0 | 0 | 0 | 21 # | ||
| $0 | $0 | $4,504,996 | $46,680 | |||||||
| # | Amount shown represents income before fees and rebates. |
| Assets | |
Investments in unaffiliated securities, at value (cost $98,225,889) | $ 178,348,060 |
Investments in affiliated securities, at value (cost $4,504,996) | 4,504,996 |
Receivable for investments sold | 468,774 |
Receivable for dividends | 37,977 |
Receivable for Fund shares sold | 11,151 |
Prepaid expenses and other assets | 117,185 |
Total assets | 183,488,143 |
| Liabilities | |
Payable for Fund shares redeemed | 160,443 |
Management fee payable | 64,261 |
Administration fees payable | 22,304 |
Shareholder servicing fees payable | 20,028 |
Trustees’ fees and expenses payable | 4,587 |
Distribution fee payable | 1,323 |
Accrued expenses and other liabilities | 36,969 |
Total liabilities | 309,915 |
Total net assets | $183,178,228 |
| Net assets consist of | |
Paid-in capital | $ 105,040,724 |
Total distributable earnings | 78,137,504 |
Total net assets | $183,178,228 |
| Computation of net asset value and offering price per share | |
Net assets – Class A | $ 92,018,049 |
Shares outstanding – Class A1 | 14,453,390 |
Net asset value per share – Class A | $6.37 |
Maximum offering price per share – Class A2 | $6.76 |
Net assets – Class C | $ 2,173,214 |
Shares outstanding – Class C1 | 1,109,637 |
Net asset value per share – Class C | $1.96 |
Net assets – Class R6 | $ 38,673,086 |
Shares outstanding – Class R61 | 4,724,170 |
Net asset value per share – Class R6 | $8.19 |
Net assets – Administrator Class | $ 5,374,384 |
Shares outstanding – Administrator Class1 | 723,681 |
Net asset value per share – Administrator Class | $7.43 |
Net assets – Institutional Class | $ 44,939,495 |
Shares outstanding – Institutional Class1 | 5,517,630 |
Net asset value per share – Institutional Class | $8.14 |
| 1 | The Fund has an unlimited number of authorized shares. |
| 2 | Maximum offering price is computed as 100/94.25 of net asset value. On investments of $50,000 or more, the offering price is reduced. |
| Investment income | |
Dividends (net of foreign withholdings taxes of $3,817) | $ 522,103 |
Income from affiliated securities | 46,680 |
Total investment income | 568,783 |
| Expenses | |
Management fee | 685,899 |
| Administration fees | |
Class A | 97,130 |
Class C | 2,669 |
Class R6 | 5,602 |
Administrator Class | 3,486 |
Institutional Class | 37,841 |
| Shareholder servicing fees | |
Class A | 115,541 |
Class C | 3,134 |
Administrator Class | 6,648 |
| Distribution fee | |
Class C | 9,403 |
Custody and accounting fees | 9,865 |
Professional fees | 25,998 |
Registration fees | 41,322 |
Shareholder report expenses | 18,980 |
Trustees’ fees and expenses | 11,025 |
Other fees and expenses | 17,089 |
Total expenses | 1,091,632 |
| Less: Fee waivers and/or expense reimbursements | |
Fund-level | (234,713) |
Class A | (6,891) |
Class R6 | (3,704) |
Administrator Class | (532) |
Institutional Class | (5,774) |
Net expenses | 840,018 |
Net investment loss | (271,235) |
| Realized and unrealized gains (losses) on investments | |
Net realized gains on investments | 1,050,454 |
Net change in unrealized gains (losses) on investments | (12,383,639) |
Net realized and unrealized gains (losses) on investments | (11,333,185) |
Net decrease in net assets resulting from operations | $(11,604,420) |
| Six months ended January 31, 2023 (unaudited) | Year ended July 31, 2022 | |||
| Operations | ||||
Net investment loss | $ (271,235) | $ (1,117,783) | ||
Net realized gains on investments | 1,050,454 | 32,559,187 | ||
Net change in unrealized gains (losses) on investments | (12,383,639) | (92,425,273) | ||
Net decrease in net assets resulting from operations | (11,604,420) | (60,983,869) | ||
| Distributions to shareholders from | ||||
| Net investment income and net realized gains | ||||
Class A | (10,974,909) | (23,155,876) | ||
Class C | (715,269) | (1,745,947) | ||
Class R6 | (3,654,350) | (5,165,574) | ||
Administrator Class | (556,035) | (1,537,533) | ||
Institutional Class | (5,651,251) | (12,444,118) | ||
Total distributions to shareholders | (21,551,814) | (44,049,048) | ||
| Capital share transactions | Shares | Shares | ||
| Proceeds from shares sold | ||||
Class A | 451,315 | 2,910,253 | 967,499 | 9,750,987 |
Class C | 57,380 | 120,814 | 240,590 | 993,153 |
Class R6 | 565,982 | 4,781,171 | 2,451,711 | 25,577,401 |
Administrator Class | 11,328 | 85,471 | 50,063 | 601,613 |
Institutional Class | 848,650 | 6,953,535 | 1,940,962 | 19,549,872 |
| 14,851,244 | 56,473,026 | |||
| Reinvestment of distributions | ||||
Class A | 1,786,246 | 10,735,336 | 2,215,143 | 22,638,764 |
Class C | 386,632 | 715,269 | 430,036 | 1,745,947 |
Class R6 | 472,749 | 3,654,350 | 406,418 | 5,165,574 |
Administrator Class | 78,917 | 553,210 | 130,906 | 1,531,605 |
Institutional Class | 733,124 | 5,637,727 | 974,855 | 12,351,415 |
| 21,295,892 | 43,433,305 | |||
| Payment for shares redeemed | ||||
Class A | (1,090,491) | (7,251,149) | (2,032,288) | (18,646,650) |
Class C | (360,148) | (864,218) | (664,761) | (2,681,191) |
Class R6 | (541,674) | (4,944,516) | (1,908,298) | (21,891,244) |
Administrator Class | (37,728) | (290,007) | (346,530) | (3,550,440) |
Institutional Class | (3,195,280) | (25,453,132) | (2,871,527) | (32,714,655) |
| (38,803,022) | (79,484,180) | |||
Net increase (decrease) in net assets resulting from capital share transactions | (2,655,886) | 20,422,151 | ||
Total decrease in net assets | (35,812,120) | (84,610,766) | ||
| Net assets | ||||
Beginning of period | 218,990,348 | 303,601,114 | ||
End of period | $183,178,228 | $218,990,348 | ||
| Year ended July 31 | ||||||
| Class A | Six months ended January 31, 2023 (unaudited) | 2022 | 2021 | 2020 | 2019 | 2018 |
Net asset value, beginning of period | $7.65 | $11.65 | $9.62 | $8.33 | $9.43 | $9.09 |
Net investment loss | (0.02) 1 | (0.06) 1 | (0.05) 1 | (0.03) 1 | (0.03) 1 | (0.04) 1 |
Net realized and unrealized gains (losses) on investments | (0.41) | (2.01) | 2.93 | 2.08 | 0.97 | 2.23 |
Total from investment operations | (0.43) | (2.07) | 2.88 | 2.05 | 0.94 | 2.19 |
| Distributions to shareholders from | ||||||
Net realized gains | (0.85) | (1.93) | (0.85) | (0.76) | (2.04) | (1.85) |
Net asset value, end of period | $6.37 | $7.65 | $11.65 | $9.62 | $8.33 | $9.43 |
Total return2 | (4.89)% | (21.94)% | 31.66% | 26.57% | 15.37% | 27.35% |
| Ratios to average net assets (annualized) | ||||||
Gross expenses | 1.29% | 1.26% | 1.25% | 1.26% | 1.30% | 1.25% |
Net expenses | 1.03% | 1.01% | 1.01% | 1.02% | 1.20% | 1.20% |
Net investment loss | (0.45)% | (0.58)% | (0.50)% | (0.30)% | (0.35)% | (0.49)% |
| Supplemental data | ||||||
Portfolio turnover rate | 6% | 27% | 21% | 16% | 20% | 36% |
Net assets, end of period (000s omitted) | $92,018 | $101,833 | $141,657 | $124,271 | $17,940 | $16,301 |
| 1 | Calculated based upon average shares outstanding |
| 2 | Total return calculations do not include any sales charges. Returns for periods of less than one year are not annualized. |
| Year ended July 31 | ||||||
| Class C | Six months ended January 31, 2023 (unaudited) | 2022 | 2021 | 2020 | 2019 | 2018 |
Net asset value, beginning of period | $3.03 | $5.76 | $5.18 | $4.86 | $6.46 | $6.80 |
Net investment loss | (0.02) 1 | (0.06) 1 | (0.07) 1 | (0.05) 1 | (0.06) 1 | (0.08) 1 |
Net realized and unrealized gains (losses) on investments | (0.20) | (0.74) | 1.50 | 1.13 | 0.50 | 1.59 |
Total from investment operations | (0.22) | (0.80) | 1.43 | 1.08 | 0.44 | 1.51 |
| Distributions to shareholders from | ||||||
Net realized gains | (0.85) | (1.93) | (0.85) | (0.76) | (2.04) | (1.85) |
Net asset value, end of period | $1.96 | $3.03 | $5.76 | $5.18 | $4.86 | $6.46 |
Total return2 | (5.43)% | (22.39)% | 30.71% | 25.48% | 14.51% | 26.43% |
| Ratios to average net assets (annualized) | ||||||
Gross expenses | 2.02% | 2.00% | 2.00% | 2.01% | 2.05% | 2.00% |
Net expenses | 1.78% | 1.78% | 1.78% | 1.79% | 1.95% | 1.95% |
Net investment loss | (1.19)% | (1.35)% | (1.26)% | (1.06)% | (1.12)% | (1.22)% |
| Supplemental data | ||||||
Portfolio turnover rate | 6% | 27% | 21% | 16% | 20% | 36% |
Net assets, end of period (000s omitted) | $2,173 | $3,103 | $5,876 | $6,651 | $2,116 | $3,792 |
| 1 | Calculated based upon average shares outstanding |
| 2 | Total return calculations do not include any sales charges. Returns for periods of less than one year are not annualized. |
| Year ended July 31 | ||||
| Class R6 | Six months ended January 31, 2023 (unaudited) | 2022 | 2021 | 2020 1 |
Net asset value, beginning of period | $9.55 | $14.03 | $11.37 | $9.63 |
Net investment income (loss) | (0.00) 2,3 | (0.02) 2 | (0.01) 2 | 0.01 |
Net realized and unrealized gains (losses) on investments | (0.51) | (2.53) | 3.52 | 2.49 |
Total from investment operations | (0.51) | (2.55) | 3.51 | 2.50 |
| Distributions to shareholders from | ||||
Net realized gains | (0.85) | (1.93) | (0.85) | (0.76) |
Net asset value, end of period | $8.19 | $9.55 | $14.03 | $11.37 |
Total return4 | (4.76)% | (21.60)% | 32.36% | 27.68% |
| Ratios to average net assets (annualized) | ||||
Gross expenses | 0.86% | 0.83% | 0.82% | 0.82% |
Net expenses | 0.60% | 0.60% | 0.60% | 0.60% |
Net investment income (loss) | (0.03)% | (0.15)% | (0.09)% | 0.11% |
| Supplemental data | ||||
Portfolio turnover rate | 6% | 27% | 21% | 16% |
Net assets, end of period (000s omitted) | $38,673 | $40,356 | $45,970 | $48,435 |
| 1 | For the period from September 20, 2019 (commencement of class operations) to July 31, 2020 |
| 2 | Calculated based upon average shares outstanding |
| 3 | Amount is more than $(0.005) |
| 4 | Returns for periods of less than one year are not annualized. |
| Year ended July 31 | ||||||
| Administrator Class | Six months ended January 31, 2023 (unaudited) | 2022 | 2021 | 2020 | 2019 | 2018 |
Net asset value, beginning of period | $8.76 | $13.07 | $10.66 | $9.15 | $10.12 | $9.62 |
Net investment loss | (0.01) 1 | (0.06) 1 | (0.05) 1 | (0.02) 1 | (0.01) 1 | (0.03) 1 |
Net realized and unrealized gains (losses) on investments | (0.47) | (2.32) | 3.31 | 2.29 | 1.08 | 2.38 |
Total from investment operations | (0.48) | (2.38) | 3.26 | 2.27 | 1.07 | 2.35 |
| Distributions to shareholders from | ||||||
Net realized gains | (0.85) | (1.93) | (0.85) | (0.76) | (2.04) | (1.85) |
Net asset value, end of period | $7.43 | $8.76 | $13.07 | $10.66 | $9.15 | $10.12 |
Total return2 | (4.84)% | (21.92)% | 32.15% | 26.59% | 15.63% | 27.55% |
| Ratios to average net assets (annualized) | ||||||
Gross expenses | 1.20% | 1.17% | 1.17% | 1.18% | 1.21% | 1.16% |
Net expenses | 0.94% | 0.94% | 0.94% | 0.94% | 1.00% | 1.00% |
Net investment loss | (0.37)% | (0.50)% | (0.43)% | (0.21)% | (0.16)% | (0.28)% |
| Supplemental data | ||||||
Portfolio turnover rate | 6% | 27% | 21% | 16% | 20% | 36% |
Net assets, end of period (000s omitted) | $5,374 | $5,882 | $10,934 | $8,979 | $2,590 | $3,068 |
| 1 | Calculated based upon average shares outstanding |
| 2 | Returns for periods of less than one year are not annualized. |
| Year ended July 31 | ||||||
| Institutional Class | Six months ended January 31, 2023 (unaudited) | 2022 | 2021 | 2020 | 2019 | 2018 |
Net asset value, beginning of period | $9.51 | $13.99 | $11.36 | $9.68 | $10.57 | $9.95 |
Net investment income (loss) | (0.00) 1,2 | (0.03) 1 | (0.02) 1 | 0.01 1 | 0.00 1,3 | (0.01) 1 |
Net realized and unrealized gains (losses) on investments | (0.52) | (2.52) | 3.50 | 2.43 | 1.15 | 2.49 |
Total from investment operations | (0.52) | (2.55) | 3.48 | 2.44 | 1.15 | 2.48 |
| Distributions to shareholders from | ||||||
Net investment income | 0.00 | 0.00 | 0.00 | 0.00 | 0.00 | (0.01) |
Net realized gains | (0.85) | (1.93) | (0.85) | (0.76) | (2.04) | (1.85) |
Total distributions to shareholders | (0.85) | (1.93) | (0.85) | (0.76) | (2.04) | (1.86) |
Net asset value, end of period | $8.14 | $9.51 | $13.99 | $11.36 | $9.68 | $10.57 |
Total return4 | (4.89)% | (21.67)% | 32.11% | 26.91% | 15.76% | 28.01% |
| Ratios to average net assets (annualized) | ||||||
Gross expenses | 0.96% | 0.93% | 0.92% | 0.93% | 0.97% | 0.92% |
Net expenses | 0.70% | 0.70% | 0.70% | 0.72% | 0.80% | 0.80% |
Net investment income (loss) | (0.11)% | (0.27)% | (0.19)% | 0.07% | 0.05% | (0.08)% |
| Supplemental data | ||||||
Portfolio turnover rate | 6% | 27% | 21% | 16% | 20% | 36% |
Net assets, end of period (000s omitted) | $44,939 | $67,816 | $99,164 | $86,407 | $107,670 | $131,655 |
| 1 | Calculated based upon average shares outstanding |
| 2 | Amount is more than $(0.005) |
| 3 | Amount is less than $0.005. |
| 4 | Returns for periods of less than one year are not annualized. |
| Gross unrealized gains | $203,435,902 |
| Gross unrealized losses | (31,467,085) |
| Net unrealized gains | $171,968,817 |
| ■ | Level 1 – quoted prices in active markets for identical securities |
| ■ | Level 2 – other significant observable inputs (including quoted prices for similar securities, interest rates, prepayment speeds, credit risk, etc.) |
| ■ | Level 3 – significant unobservable inputs (including the Fund’s own assumptions in determining the fair value of investments) |
| Quoted prices (Level 1) | Other significant observable inputs (Level 2) | Significant unobservable inputs (Level 3) | Total | |
| Assets | ||||
| Investments in: | ||||
| Common stocks | ||||
| Communication services | $ 18,083,479 | $0 | $0 | $ 18,083,479 |
| Consumer discretionary | 35,131,757 | 0 | 0 | 35,131,757 |
| Financials | 16,236,332 | 0 | 0 | 16,236,332 |
| Health care | 20,295,989 | 0 | 0 | 20,295,989 |
| Industrials | 14,961,810 | 0 | 0 | 14,961,810 |
| Information technology | 65,311,081 | 0 | 0 | 65,311,081 |
| Materials | 4,459,722 | 0 | 0 | 4,459,722 |
| Real estate | 3,867,890 | 0 | 0 | 3,867,890 |
| Short-term investments | ||||
| Investment companies | 4,504,996 | 0 | 0 | 4,504,996 |
| Total assets | $182,853,056 | $0 | $0 | $182,853,056 |
| Average daily net assets | Management fee |
| First $500 million | 0.700% |
| Next $500 million | 0.675 |
| Next $1 billion | 0.650 |
| Next $2 billion | 0.625 |
| Next $1 billion | 0.600 |
| Next $3 billion | 0.590 |
| Next $2 billion | 0.565 |
| Next $2 billion | 0.555 |
| Next $4 billion | 0.530 |
| Over $16 billion | 0.505 |
| Class-level administration fee | |
| Class A | 0.21% |
| Class C | 0.21 |
| Class R6 | 0.03 |
| Administrator Class | 0.13 |
| Institutional Class | 0.13 |
| Expense ratio caps | |
| Class A | 1.03% |
| Class C | 1.78 |
| Class R6 | 0.60 |
| Administrator Class | 0.94 |
| Institutional Class | 0.70 |
| Name and year of birth | Position held and length of service* | Principal occupations during past five years or longer | Current other public company or investment company directorships |
| William R. Ebsworth (Born 1957) | Trustee, since 2015 | Retired. From 1984 to 2013, equities analyst, portfolio manager, research director and chief investment officer at Fidelity Management and Research Company in Boston, Tokyo, and Hong Kong, and retired in 2013 as Chief Investment Officer of Fidelity Strategic Advisers, Inc. where he led a team of investment professionals managing client assets. Prior thereto, Board member of Hong Kong Securities Clearing Co., Hong Kong Options Clearing Corp., the Thailand International Fund, Ltd., Fidelity Investments Life Insurance Company, and Empire Fidelity Investments Life Insurance Company. Audit Committee Chair and Investment Committee Chair of the Vincent Memorial Hospital Foundation (non-profit organization). Mr. Ebsworth is a CFA® charterholder. | N/A |
| Jane A. Freeman (Born 1953) | Trustee, since 2015; Chair Liaison, since 2018 | Retired. From 2012 to 2014 and 1999 to 2008, Chief Financial Officer of Scientific Learning Corporation. From 2008 to 2012, Ms. Freeman provided consulting services related to strategic business projects. Prior to 1999, Portfolio Manager at Rockefeller & Co. and Scudder, Stevens & Clark. Board member of the Harding Loevner Funds from 1996 to 2014, serving as both Lead Independent Director and chair of the Audit Committee. Board member of the Russell Exchange Traded Funds Trust from 2011 to 2012 and the chair of the Audit Committee. Ms. Freeman is also an inactive Chartered Financial Analyst. | N/A |
| Isaiah Harris, Jr. (Born 1952) | Trustee, since 2009; Audit Committee Chair, since 2019 | Retired. Member of the Advisory Board of CEF of East Central Florida. Chairman of the Board of CIGNA Corporation from 2009 to 2021, and Director from 2005 to 2008. From 2003 to 2011, Director of Deluxe Corporation. Prior thereto, President and CEO of BellSouth Advertising and Publishing Corp. from 2005 to 2007, President and CEO of BellSouth Enterprises from 2004 to 2005 and President of BellSouth Consumer Services from 2000 to 2003. Emeritus member of the Iowa State University Foundation Board of Governors. Emeritus Member of the Advisory Board of Iowa State University School of Business. Advisory Board Member, Palm Harbor Academy (private school). Advisory Board Member, Fellowship of Christian Athletes. Mr. Harris is a certified public accountant (inactive status). | N/A |
| David F. Larcker (Born 1950) | Trustee, since 2009 | Distinguished Visiting Fellow at the Hoover Institution since 2022. James Irvin Miller Professor of Accounting at the Graduate School of Business (Emeritus), Stanford University, Director of the Corporate Governance Research Initiative and Senior Faculty of The Rock Center for Corporate Governance since 2006. From 2005 to 2008, Professor of Accounting at the Graduate School of Business, Stanford University. Prior thereto, Ernst & Young Professor of Accounting at The Wharton School, University of Pennsylvania from 1985 to 2005. | N/A |
| Name and year of birth | Position held and length of service* | Principal occupations during past five years or longer | Current other public company or investment company directorships |
| Olivia S. Mitchell (Born 1953) | Trustee, since 2006; Nominating and Governance Committee Chair, since 2018 | International Foundation of Employee Benefit Plans Professor since 1993, Wharton School of the University of Pennsylvania. Director of Wharton’s Pension Research Council and Boettner Center on Pensions & Retirement Research, and Research Associate at the National Bureau of Economic Research. Previously taught at Cornell University from 1978 to 1993. | N/A |
| Timothy J. Penny (Born 1951) | Trustee, since 1996; Chair, since 2018 | President and Chief Executive Officer of Southern Minnesota Initiative Foundation, a non-profit organization, since 2007. Vice Chair of the Economic Club of Minnesota, since 2007. Co-Chair of the Committee for a Responsible Federal Budget, since 1995. Member of the Board of Trustees of NorthStar Education Finance, Inc., a non-profit organization, from 2007-2022. Senior Fellow of the University of Minnesota Humphrey Institute from 1995 to 2017. | N/A |
| James G. Polisson (Born 1959) | Trustee, since 2018 | Retired. Chief Marketing Officer, Source (ETF) UK Services, Ltd, from 2015 to 2017. From 2012 to 2015, Principal of The Polisson Group, LLC, a management consulting, corporate advisory and principal investing company. Chief Executive Officer and Managing Director at Russell Investments, Global Exchange Traded Funds from 2010 to 2012. Managing Director of Barclays Global Investors from 1998 to 2010 and Global Chief Marketing Officer for iShares and Barclays Global Investors from 2000 to 2010. Trustee of the San Francisco Mechanics’ Institute, a non-profit organization, from 2013 to 2015. Board member of the Russell Exchange Traded Fund Trust from 2011 to 2012. Director of Barclays Global Investors Holdings Deutschland GmbH from 2006 to 2009. Mr. Polisson is an attorney and has a retired status with the Massachusetts and District of Columbia Bar Associations. | N/A |
| Pamela Wheelock (Born 1959) | Trustee, since January 2020; previously Trustee from January 2018 to July 2019 | Retired. Executive and Senior Financial leadership positions in the public, private and nonprofit sectors. Interim President and CEO, McKnight Foundation, 2020. Interim Commissioner, Minnesota Department of Human Services, 2019. Chief Operating Officer, Twin Cities Habitat for Humanity, 2017-2019. Vice President for University Services, University of Minnesota, 2012-2016. Interim President and CEO, Blue Cross and Blue Shield of Minnesota, 2011-2012. Executive Vice-President and Chief Financial Officer, Minnesota Wild, 2002-2008. Commissioner, Minnesota Department of Finance, 1999-2002. Chair of the Board of Directors of Destination Medical Center Corporation. Board member of the Minnesota Wild Foundation. | N/A |
| Name and year of birth | Position held and length of service | Principal occupations during past five years or longer |
| Andrew Owen (Born 1960) | President, since 2017 | President and Chief Executive Officer of Allspring Funds Management, LLC since 2017 and Head of Global Fund Governance of Allspring Global Investments since 2022. Prior thereto, co-president of Galliard Capital Management, LLC, an affiliate of Allspring Funds Management, LLC, from 2019 to 2022 and Head of Affiliated Managers, Allspring Global Investments, from 2014 to 2019 and Executive Vice President responsible for marketing, investments and product development for Allspring Funds Management, LLC, from 2009 to 2014. |
| Jeremy DePalma (Born 1974) | Treasurer, since 2012 (for certain funds in the Fund Complex); since 2021 (for the remaining funds in the Fund Complex) | Senior Vice President of Allspring Funds Management, LLC since 2009. Senior Vice President of Evergreen Investment Management Company, LLC from 2008 to 2010 and head of the Fund Reporting and Control Team within Fund Administration from 2005 to 2010. |
| Christopher Baker (Born 1976) | Chief Compliance Officer, since 2022 | Global Chief Compliance Officer for Allspring Global Investments since 2022. Prior thereto, Chief Compliance Officer for State Street Global Advisors from 2018 to 2021. Senior Compliance Officer for the State Street divisions of Alternative Investment Solutions, Sector Solutions, and Global Marketing from 2015 to 2018. From 2010 to 2015 Vice President, Global Head of Investment and Marketing Compliance for State Street Global Advisors. |
| Matthew Prasse (Born 1983) | Chief Legal Officer, since 2022; Secretary, since 2021 | Senior Counsel of the Allspring Legal Department since 2021. Senior Counsel of the Wells Fargo Legal Department from 2018 to 2021. Previously, Counsel for Barings LLC from 2015 to 2018. Prior to joining Barings, Associate at Morgan, Lewis & Bockius LLP from 2008 to 2015. |
P.O. Box 219967
Kansas City, MO 64121-9967

1-800-222-8222 or visit the Fund's website at allspringglobal.com. Read the prospectus carefully before you invest or send money.
SAR4303 01-23


| 1 | The S&P 500 Index consists of 500 stocks chosen for market size, liquidity, and industry group representation. It is a market-value-weighted index with each stock's weight in the index proportionate to its market value. You cannot invest directly in an index. |
| 2 | The Morgan Stanley Capital International (MSCI) All Country World Index (ACWI) ex USA Index (Net) is a free-float-adjusted market-capitalization-weighted index that is designed to measure the equity market performance of developed and emerging markets, excluding the U.S. Source: MSCI. MSCI makes no express or implied warranties or representations and shall have no liability whatsoever with respect to any MSCI data contained herein. The MSCI data may not be further redistributed or used as a basis for other indexes or any securities or financial products. This report is not approved, reviewed, or produced by MSCI. You cannot invest directly in an index. |
| 3 | The MSCI Emerging Markets (EM) Index (Net) (USD) is a free-float-adjusted market-capitalization-weighted index that is designed to measure equity market performance of emerging markets. You cannot invest directly in an index. |
| 4 | The Bloomberg U.S. Aggregate Bond Index is a broad-based benchmark that measures the investment-grade, U.S.-dollar-denominated, fixed-rate taxable bond market, including Treasuries, government-related and corporate securities, mortgage-backed securities (agency fixed-rate and hybrid adjustable-rate mortgage pass-throughs), asset-backed securities, and commercial mortgage-backed securities. You cannot invest directly in an index. |
| 5 | The Bloomberg Global Aggregate ex-USD Index (unhedged) is an unmanaged index that provides a broad-based measure of the global investment-grade fixed-income markets excluding the U.S.-dollar-denominated debt market. You cannot invest directly in an index. |
| 6 | The Bloomberg Municipal Bond Index is an unmanaged index composed of long-term tax-exempt bonds with a minimum credit rating of Baa. You cannot invest directly in an index. |
| 7 | The ICE BofA U.S. High Yield Index is a market-capitalization-weighted index of domestic and Yankee high-yield bonds. The index tracks the performance of high-yield securities traded in the U.S. bond market. You cannot invest directly in an index. Copyright 2023. ICE Data Indices, LLC. All rights reserved. |
| 1 | The Consumer Price Index (CPI) is a measure of the average change over time in the prices paid by urban consumers for a market basket of consumer goods and services. You cannot invest directly in an index. |

President
Allspring Funds
| Investment objective | The Fund seeks long-term capital appreciation. |
| Manager | Allspring Funds Management, LLC |
| Subadviser | Allspring Global Investments, LLC |
| Portfolio managers | Robert Gruendyke, CFA®‡, Thomas C. Ognar, CFA®‡ |
| Average annual total returns (%) as of January 31, 2023 | |||||||||||
| Including sales charge | Excluding sales charge | Expense ratios1 (%) | |||||||||
| Inception date | 1 year | 5 year | 10 year | 1 year | 5 year | 10 year | Gross | Net 2 | |||
| Class A (SGRAX) | 2-24-2000 | -25.83 | 5.50 | 9.81 | -21.31 | 6.75 | 10.46 | 1.17 | 1.16 | ||
| Class C (WGFCX) | 12-26-2002 | -22.56 | 6.37 | 9.96 | -21.56 | 6.37 | 9.96 | 1.92 | 1.91 | ||
| Class R6 (SGRHX)3 | 9-30-2015 | – | – | – | -20.95 | 7.23 | 10.96 | 0.74 | 0.70 | ||
| Administrator Class (SGRKX) | 8-30-2002 | – | – | – | -21.15 | 6.95 | 10.68 | 1.09 | 0.96 | ||
| Institutional Class (SGRNX) | 2-24-2000 | – | – | – | -20.99 | 7.18 | 10.91 | 0.84 | 0.75 | ||
| Russell 3000® Growth Index4 | – | – | – | – | -15.48 | 10.78 | 14.18 | – | – | ||
| 1 | Reflects the expense ratios as stated in the most recent prospectuses. The expense ratios shown are subject to change and may differ from the annualized expense ratios shown in the financial highlights of this report. |
| 2 | The manager has contractually committed through November 30, 2023, to waive fees and/or reimburse expenses to the extent necessary to cap total annual fund operating expenses after fee waivers at 1.16% for Class A, 1.91% for Class C, 0.70% for Class R6, 0.96% for Administrator Class, and 0.75% for Institutional Class. Brokerage commissions, stamp duty fees, interest, taxes, acquired fund fees and expenses (if any), and extraordinary expenses are excluded from the expense caps. Prior to or after the commitment expiration date, the caps may be increased or the commitment to maintain the caps may be terminated only with the approval of the Board of Trustees. Without these caps, the Fund’s returns would have been lower. The expense ratio paid by an investor is the net expense ratio (the total annual fund operating expenses after fee waivers) as stated in the prospectuses. |
| 3 | Historical performance shown for the Class R6 shares prior to their inception reflects the performance of the Institutional Class shares, and includes the higher expenses applicable to the Institutional Class shares. If these expenses had not been included, returns for the Class R6 shares would be higher. |
| 4 | The Russell 3000® Growth Index measures the performance of those Russell 3000® Index companies with higher price/book ratios and higher forecasted growth values. You cannot invest directly in an index. |
| ‡ | CFA® and Chartered Financial Analyst® are trademarks owned by CFA Institute. |
| Ten largest holdings (%) as of January 31, 20231 | |
| Microsoft Corporation | 9.29 |
| Apple Incorporated | 6.60 |
| Alphabet Incorporated Class A | 5.68 |
| Amazon.com Incorporated | 5.62 |
| MasterCard Incorporated Class A | 4.03 |
| Tradeweb Markets Incorporated Class A | 2.94 |
| Copart Incorporated | 2.58 |
| Boston Scientific Corporation | 2.32 |
| Monolithic Power Systems Incorporated | 2.15 |
| Microchip Technology Incorporated | 1.90 |
| 1 | Figures represent the percentage of the Fund's net assets. Holdings are subject to change and may have changed since the date specified. |
| Sector allocation as of January 31, 20231 |
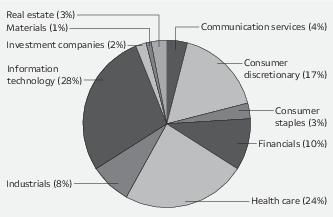
| 1 | Figures represent the percentage of the Fund's long-term investments. Allocations are subject to change and may have changed since the date specified. |
| Beginning account value 8-1-2022 | Ending account value 1-31-2023 | Expenses paid during the period1 | Annualized net expense ratio | |
| Class A | ||||
| Actual | $1,000.00 | $ 944.62 | $5.69 | 1.16% |
| Hypothetical (5% return before expenses) | $1,000.00 | $1,019.36 | $5.90 | 1.16% |
| Class C | ||||
| Actual | $1,000.00 | $ 940.70 | $9.34 | 1.91% |
| Hypothetical (5% return before expenses) | $1,000.00 | $1,015.58 | $9.70 | 1.91% |
| Class R6 | ||||
| Actual | $1,000.00 | $ 947.10 | $3.44 | 0.70% |
| Hypothetical (5% return before expenses) | $1,000.00 | $1,021.68 | $3.57 | 0.70% |
| Administrator Class | ||||
| Actual | $1,000.00 | $ 945.75 | $4.71 | 0.96% |
| Hypothetical (5% return before expenses) | $1,000.00 | $1,020.37 | $4.89 | 0.96% |
| Institutional Class | ||||
| Actual | $1,000.00 | $ 947.01 | $3.68 | 0.75% |
| Hypothetical (5% return before expenses) | $1,000.00 | $1,021.42 | $3.82 | 0.75% |
| Shares | Value | ||||
| Common stocks: 98.42% | |||||
| Communication services: 7.64% | |||||
| Entertainment: 0.36% | |||||
| Live Nation Entertainment Incorporated † | 138,794 | $ 11,171,529 | |||
| Interactive media & services: 7.28% | |||||
| Alphabet Incorporated Class A † | 1,766,620 | 174,612,721 | |||
| Alphabet Incorporated Class C † | 256,224 | 25,589,091 | |||
| ZoomInfo Technologies Incorporated † | 826,329 | 23,327,268 | |||
| 223,529,080 | |||||
| Consumer discretionary: 15.77% | |||||
| Hotels, restaurants & leisure: 3.29% | |||||
| Airbnb Incorporated Class A † | 174,368 | 19,374,028 | |||
| Chipotle Mexican Grill Incorporated † | 21,138 | 34,801,180 | |||
| Papa John's International Incorporated | 205,732 | 18,452,103 | |||
| Planet Fitness Incorporated Class A † | 335,626 | 28,410,741 | |||
| 101,038,052 | |||||
| Internet & direct marketing retail: 5.67% | |||||
| Amazon.com Incorporated † | 1,673,336 | 172,571,142 | |||
| MercadoLibre Incorporated † | 1,294 | 1,529,107 | |||
| 174,100,249 | |||||
| Specialty retail: 5.85% | |||||
| AutoZone Incorporated † | 2,393 | 5,836,168 | |||
| Boot Barn Holdings Incorporated † | 36,972 | 3,086,792 | |||
| Five Below Incorporated † | 186,204 | 36,706,395 | |||
| Floor & Decor Holdings Incorporated Class A † | 351,530 | 31,908,378 | |||
| Leslie's Incorporated † | 2,566,610 | 39,756,789 | |||
| O'Reilly Automotive Incorporated † | 11,169 | 8,849,757 | |||
| Petco Health & Wellness Company † | 1,056,774 | 12,353,688 | |||
| Tractor Supply Company | 13,492 | 3,076,041 | |||
| Ulta Beauty Incorporated † | 74,596 | 38,339,360 | |||
| 179,913,368 | |||||
| Textiles, apparel & luxury goods: 0.96% | |||||
| lululemon athletica Incorporated † | 49,506 | 15,192,401 | |||
| On Holding AG Class A † | 619,236 | 14,366,275 | |||
| 29,558,676 | |||||
| Consumer staples: 1.54% | |||||
| Beverages: 0.65% | |||||
| Constellation Brands Incorporated Class A | 85,972 | 19,904,237 | |||
| Food & staples retailing: 0.65% | |||||
| Sysco Corporation | 258,222 | 20,001,876 | |||
| Personal products: 0.24% | |||||
| The Estee Lauder Companies Incorporated Class A | 26,869 | 7,444,863 |
| Shares | Value | ||||
| Financials: 10.59% | |||||
| Capital markets: 10.28% | |||||
| BlackRock Incorporated | 19,952 | $ 15,147,758 | |||
| CME Group Incorporated | 260,171 | 45,961,809 | |||
| Interactive Brokers Group Incorporated Class A | 287,836 | 23,009,610 | |||
| Intercontinental Exchange Incorporated | 146,816 | 15,790,061 | |||
| LPL Financial Holdings Incorporated | 240,031 | 56,916,151 | |||
| MarketAxess Holdings Incorporated | 86,409 | 31,439,915 | |||
| Raymond James Financial Incorporated | 58,604 | 6,608,773 | |||
| The Charles Schwab Corporation | 396,291 | 30,680,849 | |||
| Tradeweb Markets Incorporated Class A | 1,212,401 | 90,372,371 | |||
| 315,927,297 | |||||
| Insurance: 0.31% | |||||
| Progressive Corporation | 70,484 | 9,610,493 | |||
| Health care: 14.14% | |||||
| Biotechnology: 2.83% | |||||
| Argenx SE † | 11,664 | 4,458,564 | |||
| BioMarin Pharmaceutical Incorporated † | 151,247 | 17,446,341 | |||
| Horizon Therapeutics plc † | 278,442 | 30,550,656 | |||
| Sarepta Therapeutics Incorporated † | 20,067 | 2,507,773 | |||
| Seagen Incorporated † | 80,673 | 11,252,270 | |||
| Vertex Pharmaceuticals Incorporated † | 64,075 | 20,702,633 | |||
| 86,918,237 | |||||
| Health care equipment & supplies: 5.64% | |||||
| Boston Scientific Corporation † | 1,541,041 | 71,273,146 | |||
| Hologic Incorporated † | 313,665 | 25,522,921 | |||
| Insulet Corporation † | 83,443 | 23,974,843 | |||
| Intuitive Surgical Incorporated † | 100,264 | 24,633,862 | |||
| iRhythm Technologies Incorporated † | 60,976 | 5,993,941 | |||
| Penumbra Incorporated † | 25,376 | 6,354,404 | |||
| Stryker Corporation | 61,035 | 15,491,293 | |||
| 173,244,410 | |||||
| Health care providers & services: 2.05% | |||||
| Cardinal Health Incorporated | 116,144 | 8,972,124 | |||
| UnitedHealth Group Incorporated | 108,556 | 54,190,070 | |||
| 63,162,194 | |||||
| Health care technology: 0.78% | |||||
| Veeva Systems Incorporated Class A † | 140,574 | 23,974,896 | |||
| Life sciences tools & services: 1.46% | |||||
| Agilent Technologies Incorporated | 31,902 | 4,851,656 | |||
| Bio-Techne Corporation | 105,415 | 8,397,359 | |||
| Repligen Corporation † | 38,119 | 7,063,451 | |||
| Thermo Fisher Scientific Incorporated | 12,581 | 7,175,322 | |||
| West Pharmaceutical Services Incorporated | 65,218 | 17,321,901 | |||
| 44,809,689 | |||||
| Pharmaceuticals: 1.38% | |||||
| Revance Therapeutics Incorporated † | 549,622 | 19,060,891 |
| Shares | Value | ||||
| Pharmaceuticals (continued) | |||||
| Royalty Pharma plc Class A | 300,548 | $ 11,778,476 | |||
| Zoetis Incorporated | 70,046 | 11,591,913 | |||
| 42,431,280 | |||||
| Industrials: 6.62% | |||||
| Aerospace & defense: 0.17% | |||||
| TransDigm Group Incorporated | 7,098 | 5,094,590 | |||
| Air freight & logistics: 0.54% | |||||
| United Parcel Service Incorporated Class B | 90,316 | 16,729,233 | |||
| Commercial services & supplies: 3.21% | |||||
| Casella Waste Systems Incorporated Class A † | 243,827 | 19,535,419 | |||
| Copart Incorporated † | 1,188,451 | 79,162,721 | |||
| 98,698,140 | |||||
| Electrical equipment: 0.76% | |||||
| Shoals Technologies Group Class A † | 831,846 | 23,200,185 | |||
| Machinery: 0.62% | |||||
| Fortive Corporation | 279,142 | 18,990,030 | |||
| Road & rail: 1.32% | |||||
| J.B. Hunt Transport Services Incorporated | 92,157 | 17,422,281 | |||
| Union Pacific Corporation | 113,866 | 23,250,299 | |||
| 40,672,580 | |||||
| Information technology: 39.40% | |||||
| Electronic equipment, instruments & components: 0.40% | |||||
| Zebra Technologies Corporation Class A † | 38,291 | 12,106,848 | |||
| IT services: 9.32% | |||||
| DigitalOcean Holdings Incorporated † | 475,909 | 13,967,929 | |||
| Flywire Corporation † | 796,910 | 21,492,663 | |||
| MasterCard Incorporated Class A | 333,939 | 123,757,793 | |||
| MongoDB Incorporated † | 135,134 | 28,947,054 | |||
| PayPal Holdings Incorporated † | 394,990 | 32,187,735 | |||
| Thoughtworks Holding Incorporated † | 1,777,647 | 19,198,588 | |||
| Visa Incorporated Class A | 203,108 | 46,757,493 | |||
| 286,309,255 | |||||
| Semiconductors & semiconductor equipment: 7.38% | |||||
| Advanced Micro Devices Incorporated † | 63,923 | 4,803,813 | |||
| Allegro MicroSystems Incorporated † | 1,467,066 | 55,997,909 | |||
| Microchip Technology Incorporated | 753,558 | 58,491,172 | |||
| Monolithic Power Systems Incorporated | 154,830 | 66,044,285 | |||
| NVIDIA Corporation | 148,680 | 29,047,612 | |||
| Qualcomm Incorporated | 93,936 | 12,513,215 | |||
| 226,898,006 | |||||
| Software: 15.70% | |||||
| Black Knight Incorporated † | 378,943 | 22,960,156 | |||
| Crowdstrike Holdings Incorporated Class A † | 89,631 | 9,491,923 | |||
| Dynatrace Incorporated † | 464,421 | 17,847,699 |
| Shares | Value | ||||
| Software (continued) | |||||
| Fair Isaac Corporation † | 40,634 | $ 27,060,212 | |||
| Five9 Incorporated † | 102,311 | 8,060,061 | |||
| Intuit Incorporated | 79,887 | 33,765,838 | |||
| Jamf Holding Corporation † | 152,605 | 3,032,261 | |||
| Microsoft Corporation | 1,151,572 | 285,371,057 | |||
| Palo Alto Networks Incorporated † | 193,962 | 30,770,132 | |||
| Paycom Software Incorporated † | 27,708 | 8,975,730 | |||
| Paycor HCM Incorporated † | 691,476 | 17,362,962 | |||
| ServiceNow Incorporated † | 39,249 | 17,863,397 | |||
| 482,561,428 | |||||
| Technology hardware, storage & peripherals: 6.60% | |||||
| Apple Incorporated | 1,405,726 | 202,832,205 | |||
| Materials: 1.55% | |||||
| Chemicals: 1.55% | |||||
| Linde plc | 143,854 | 47,607,043 | |||
| Real estate: 1.17% | |||||
| Equity REITs: 0.67% | |||||
| Equinix Incorporated | 6,549 | 4,834,013 | |||
| SBA Communications Corporation | 52,695 | 15,678,343 | |||
| 20,512,356 | |||||
| Real estate management & development: 0.50% | |||||
| CBRE Group Incorporated Class A † | 179,310 | 15,332,797 | |||
| Total Common stocks (Cost $1,626,907,133) | 3,024,285,122 |
| Yield | |||||
| Short-term investments: 1.09% | |||||
| Investment companies: 1.09% | |||||
| Allspring Government Money Market Fund Select Class ♠∞ | 4.16% | 33,712,743 | 33,712,743 | ||
| Total Short-term investments (Cost $33,712,743) | 33,712,743 | ||||
| Total investments in securities (Cost $1,660,619,876) | 99.51% | 3,057,997,865 | |||
| Other assets and liabilities, net | 0.49 | 14,920,558 | |||
| Total net assets | 100.00% | $3,072,918,423 |
| † | Non-income-earning security |
| ♠ | The issuer of the security is an affiliated person of the Fund as defined in the Investment Company Act of 1940. |
| ∞ | The rate represents the 7-day annualized yield at period end. |
| Abbreviations: | |
| REIT | Real estate investment trust |
| Value, beginning of period | Purchases | Sales proceeds | Net realized gains (losses) | Net change in unrealized gains (losses) | Value, end of period | Shares, end of period | Income from affiliated securities | |||
| Short-term investments | ||||||||||
| Allspring Government Money Market Fund Select Class | $147,500,432 | $392,372,916 | $(506,160,605) | $ 0 | $0 | $ 33,712,743 | 33,712,743 | $ 1,244,852 | ||
| Investments in affiliates no longer held at end of period | ||||||||||
| Securities Lending Cash Investments LLC | 61,735,900 | 83,253,237 | (144,989,076) | (61) | 0 | 0 | 0 | 300,789 # | ||
| $ (61) | $0 | $33,712,743 | $1,545,641 | |||||||
| # | Amount shown represents income before fees and rebates. |
| Assets | |
Investments in unaffiliated securities, at value (cost $1,626,907,133) | $ 3,024,285,122 |
Investments in affiliated securities, at value (cost $33,712,743) | 33,712,743 |
Cash | 915,244 |
Receivable for investments sold | 38,638,371 |
Receivable for Fund shares sold | 985,756 |
Receivable for dividends | 356,719 |
Prepaid expenses and other assets | 207,270 |
Total assets | 3,099,101,225 |
| Liabilities | |
Payable for investments purchased | 21,374,139 |
Payable for Fund shares redeemed | 1,804,973 |
Management fee payable | 1,615,872 |
Administration fees payable | 403,958 |
Distribution fee payable | 8,749 |
Trustees’ fees and expenses payable | 5,336 |
Accrued expenses and other liabilities | 969,775 |
Total liabilities | 26,182,802 |
Total net assets | $3,072,918,423 |
| Net assets consist of | |
Paid-in capital | $ 1,624,564,782 |
Total distributable earnings | 1,448,353,641 |
Total net assets | $3,072,918,423 |
| Computation of net asset value and offering price per share | |
Net assets – Class A | $ 1,650,609,219 |
Shares outstanding – Class A1 | 69,934,308 |
Net asset value per share – Class A | $23.60 |
Maximum offering price per share – Class A2 | $25.04 |
Net assets – Class C | $ 14,458,776 |
Shares outstanding – Class C1 | 1,170,343 |
Net asset value per share – Class C | $12.35 |
Net assets – Class R6 | $ 356,200,169 |
Shares outstanding – Class R61 | 9,865,582 |
Net asset value per share – Class R6 | $36.11 |
Net assets – Administrator Class | $ 200,497,632 |
Shares outstanding – Administrator Class1 | 6,516,370 |
Net asset value per share – Administrator Class | $30.77 |
Net assets – Institutional Class | $ 851,152,627 |
Shares outstanding – Institutional Class1 | 23,738,323 |
Net asset value per share – Institutional Class | $35.86 |
| 1 | The Fund has an unlimited number of authorized shares. |
| 2 | Maximum offering price is computed as 100/94.25 of net asset value. On investments of $50,000 or more, the offering price is reduced. |
| Investment income | |
Dividends | $ 9,716,935 |
Income from affiliated securities | 1,287,230 |
Total investment income | 11,004,165 |
| Expenses | |
Management fee | 11,467,715 |
| Administration fees | |
Class A | 1,767,478 |
Class C | 16,963 |
Class R6 | 53,291 |
Administrator Class | 167,221 |
Institutional Class | 584,338 |
| Shareholder servicing fees | |
Class A | 2,100,635 |
Class C | 20,123 |
Administrator Class | 319,515 |
| Distribution fee | |
Class C | 60,338 |
Custody and accounting fees | 124,771 |
Professional fees | 27,750 |
Registration fees | 18,464 |
Shareholder report expenses | 62,978 |
Trustees’ fees and expenses | 11,025 |
Other fees and expenses | 60,392 |
Total expenses | 16,862,997 |
| Less: Fee waivers and/or expense reimbursements | |
Fund-level | (518,598) |
Class R6 | (53,291) |
Administrator Class | (153,972) |
Institutional Class | (370,160) |
Net expenses | 15,766,976 |
Net investment loss | (4,762,811) |
| Realized and unrealized gains (losses) on investments | |
| Net realized gains (losses) on | |
Unaffiliated securities | 80,026,584 |
Affiliated securities | (61) |
Net realized gains on investments | 80,026,523 |
Net change in unrealized gains (losses) on investments | (292,464,163) |
Net realized and unrealized gains (losses) on investments | (212,437,640) |
Net decrease in net assets resulting from operations | $(217,200,451) |
| Six months ended January 31, 2023 (unaudited) | Year ended July 31, 2022 | |||
| Operations | ||||
Net investment loss | $ (4,762,811) | $ (34,278,023) | ||
Net realized gains on investments | 80,026,523 | 452,045,114 | ||
Net change in unrealized gains (losses) on investments | (292,464,163) | (2,133,081,244) | ||
Net decrease in net assets resulting from operations | (217,200,451) | (1,715,314,153) | ||
| Distributions to shareholders from | ||||
| Net investment income and net realized gains | ||||
Class A | (108,869,642) | (569,285,399) | ||
Class C | (1,767,487) | (10,976,765) | ||
Class R6 | (15,329,845) | (69,584,122) | ||
Administrator Class | (12,943,905) | (96,628,240) | ||
Institutional Class | (38,192,678) | (256,416,897) | ||
Total distributions to shareholders | (177,103,557) | (1,002,891,423) | ||
| Capital share transactions | Shares | Shares | ||
| Proceeds from shares sold | ||||
Class A | 622,438 | 14,836,878 | 1,587,549 | 56,321,377 |
Class C | 32,427 | 433,189 | 165,557 | 3,406,222 |
Class R6 | 772,868 | 27,620,681 | 2,817,456 | 130,744,052 |
Administrator Class | 340,160 | 10,526,269 | 1,063,551 | 44,787,131 |
Institutional Class | 1,672,446 | 59,882,529 | 3,690,262 | 181,234,986 |
| 113,299,546 | 416,493,768 | |||
| Reinvestment of distributions | ||||
Class A | 4,695,625 | 104,665,476 | 14,811,926 | 547,893,130 |
Class C | 144,818 | 1,691,480 | 485,765 | 10,021,324 |
Class R6 | 416,402 | 14,190,969 | 1,149,664 | 63,197,038 |
Administrator Class | 439,148 | 12,757,242 | 2,018,217 | 95,582,763 |
Institutional Class | 1,098,744 | 37,181,487 | 4,557,460 | 249,019,631 |
| 170,486,654 | 965,713,886 | |||
| Payment for shares redeemed | ||||
Class A | (5,768,566) | (136,257,998) | (11,515,400) | (392,523,025) |
Class C | (292,093) | (3,815,261) | (714,991) | (14,273,738) |
Class R6 | (1,550,220) | (57,061,562) | (1,668,671) | (82,352,828) |
Administrator Class | (3,601,947) | (107,543,938) | (4,956,152) | (205,413,567) |
Institutional Class | (4,914,285) | (173,240,965) | (12,429,230) | (564,164,472) |
| (477,919,724) | (1,258,727,630) | |||
Net increase (decrease) in net assets resulting from capital share transactions | (194,133,524) | 123,480,024 | ||
Total decrease in net assets | (588,437,532) | (2,594,725,552) | ||
| Net assets | ||||
Beginning of period | 3,661,355,955 | 6,256,081,507 | ||
End of period | $3,072,918,423 | $ 3,661,355,955 | ||
| Year ended July 31 | ||||||
| Class A | Six months ended January 31, 2023 (unaudited) | 2022 | 2021 | 2020 | 2019 | 2018 |
Net asset value, beginning of period | $26.80 | $47.16 | $39.86 | $35.56 | $38.67 | $40.38 |
Net investment loss | (0.06) | (0.30) 1 | (0.32) | (0.19) | (0.13) | (0.12) |
Payment from affiliate | 0.00 | 0.00 | 0.00 2 | 0.00 | 0.00 | 0.00 |
Net realized and unrealized gains (losses) on investments | (1.52) | (11.07) | 13.52 | 8.77 | 3.73 | 9.49 |
Total from investment operations | (1.58) | (11.37) | 13.20 | 8.58 | 3.60 | 9.37 |
| Distributions to shareholders from | ||||||
Net realized gains | (1.62) | (8.99) | (5.90) | (4.28) | (6.71) | (11.08) |
Net asset value, end of period | $23.60 | $26.80 | $47.16 | $39.86 | $35.56 | $38.67 |
Total return3 | (5.54)% | (29.35)% | 35.61% 4 | 27.08% | 13.55% | 27.66% |
| Ratios to average net assets (annualized) | ||||||
Gross expenses | 1.19% | 1.16% | 1.16% | 1.17% | 1.18% | 1.18% |
Net expenses | 1.16% | 1.13% | 1.14% | 1.14% | 1.16% | 1.16% |
Net investment loss | (0.48)% | (0.85)% | (0.83)% | (0.59)% | (0.45)% | (0.45)% |
| Supplemental data | ||||||
Portfolio turnover rate | 31% | 43% | 36% | 37% | 39% | 37% |
Net assets, end of period (000s omitted) | $1,650,609 | $1,885,963 | $3,088,763 | $2,443,132 | $2,116,542 | $2,142,855 |
| 1 | Calculated based upon average shares outstanding |
| 2 | Amount is less than $0.005. |
| 3 | Total return calculations do not include any sales charges. Returns for periods of less than one year are not annualized. |
| 4 | During the year ended July 31, 2021, the Fund received a payment from an affiliate which had a 0.01% impact on the total return. |
| Year ended July 31 | ||||||
| Class C | Six months ended January 31, 2023 (unaudited) | 2022 | 2021 | 2020 | 2019 | 2018 |
Net asset value, beginning of period | $14.95 | $30.47 | $27.32 | $25.87 | $30.33 | $34.05 |
Net investment loss | (0.08) 1 | (0.34) 1 | (0.45) 1 | (0.32) 1 | (0.31) 1 | (0.33) |
Payment from affiliate | 0.00 | 0.00 | 1.32 | 0.00 | 0.00 | 0.00 |
Net realized and unrealized gains (losses) on investments | (0.90) | (6.19) | 8.18 | 6.05 | 2.56 | 7.69 |
Total from investment operations | (0.98) | (6.53) | 9.05 | 5.73 | 2.25 | 7.36 |
| Distributions to shareholders from | ||||||
Net realized gains | (1.62) | (8.99) | (5.90) | (4.28) | (6.71) | (11.08) |
Net asset value, end of period | $12.35 | $14.95 | $30.47 | $27.32 | $25.87 | $30.33 |
Total return2 | (5.93)% | (29.54)% 3 | 36.64% 4 | 26.11% | 12.68% | 26.73% |
| Ratios to average net assets (annualized) | ||||||
Gross expenses | 1.94% | 1.89% | 1.91% | 1.92% | 1.93% | 1.93% |
Net expenses | 1.91% | 1.89% | 1.91% | 1.91% | 1.91% | 1.91% |
Net investment loss | (1.22)% | (1.61)% | (1.57)% | (1.35)% | (1.19)% | (1.19)% |
| Supplemental data | ||||||
Portfolio turnover rate | 31% | 43% | 36% | 37% | 39% | 37% |
Net assets, end of period (000s omitted) | $14,459 | $19,208 | $41,094 | $114,123 | $156,056 | $185,346 |
| 1 | Calculated based upon average shares outstanding |
| 2 | Total return calculations do not include any sales charges. Returns for periods of less than one year are not annualized. |
| 3 | During the year ended July 31, 2022, the Fund received payments from a service provider which had a 0.14% impact on the total return. |
| 4 | During the year ended July 31, 2021, the Fund received a payment from an affiliate which had a 5.92% impact on the total return. |
| Year ended July 31 | ||||||
| Class R6 | Six months ended January 31, 2023 (unaudited) | 2022 | 2021 | 2020 | 2019 | 2018 |
Net asset value, beginning of period | $39.94 | $65.50 | $53.17 | $45.84 | $47.53 | $47.13 |
Net investment income (loss) | (0.00) 1,2 | (0.21) 1 | (0.23) | (0.07) | 0.00 1,3 | (0.01) 1 |
Net realized and unrealized gains (losses) on investments | (2.21) | (16.36) | 18.46 | 11.68 | 5.02 | 11.49 |
Total from investment operations | (2.21) | (16.57) | 18.23 | 11.61 | 5.02 | 11.48 |
| Distributions to shareholders from | ||||||
Net realized gains | (1.62) | (8.99) | (5.90) | (4.28) | (6.71) | (11.08) |
Net asset value, end of period | $36.11 | $39.94 | $65.50 | $53.17 | $45.84 | $47.53 |
Total return4 | (5.29)% | (29.05)% | 36.19% | 27.65% | 14.06% | 28.26% |
| Ratios to average net assets (annualized) | ||||||
Gross expenses | 0.76% | 0.73% | 0.73% | 0.74% | 0.75% | 0.75% |
Net expenses | 0.70% | 0.70% | 0.70% | 0.70% | 0.70% | 0.70% |
Net investment income (loss) | (0.02)% | (0.41)% | (0.40)% | (0.15)% | 0.00% | (0.02)% |
| Supplemental data | ||||||
Portfolio turnover rate | 31% | 43% | 36% | 37% | 39% | 37% |
Net assets, end of period (000s omitted) | $356,200 | $408,403 | $519,293 | $391,705 | $337,260 | $242,838 |
| 1 | Calculated based upon average shares outstanding |
| 2 | Amount is more than $(0.005) |
| 3 | Amount is less than $0.005. |
| 4 | Returns for periods of less than one year are not annualized. |
| Year ended July 31 | ||||||
| Administrator Class | Six months ended January 31, 2023 (unaudited) | 2022 | 2021 | 2020 | 2019 | 2018 |
Net asset value, beginning of period | $34.34 | $57.75 | $47.60 | $41.58 | $43.89 | $44.40 |
Net investment loss | (0.04) 1 | (0.31) 1 | (0.29) | (0.16) 1 | (0.10) 1 | (0.11) 1 |
Net realized and unrealized gains (losses) on investments | (1.91) | (14.11) | 16.34 | 10.46 | 4.50 | 10.68 |
Total from investment operations | (1.95) | (14.42) | 16.05 | 10.30 | 4.40 | 10.57 |
| Distributions to shareholders from | ||||||
Net realized gains | (1.62) | (8.99) | (5.90) | (4.28) | (6.71) | (11.08) |
Net asset value, end of period | $30.77 | $34.34 | $57.75 | $47.60 | $41.58 | $43.89 |
Total return2 | (5.43)% | (29.22)% | 35.82% | 27.31% | 13.78% | 27.90% |
| Ratios to average net assets (annualized) | ||||||
Gross expenses | 1.11% | 1.08% | 1.08% | 1.09% | 1.10% | 1.10% |
Net expenses | 0.96% | 0.96% | 0.96% | 0.96% | 0.96% | 0.96% |
Net investment loss | (0.26)% | (0.68)% | (0.65)% | (0.40)% | (0.25)% | (0.24)% |
| Supplemental data | ||||||
Portfolio turnover rate | 31% | 43% | 36% | 37% | 39% | 37% |
Net assets, end of period (000s omitted) | $200,498 | $320,744 | $647,618 | $559,109 | $561,900 | $564,391 |
| 1 | Calculated based upon average shares outstanding |
| 2 | Returns for periods of less than one year are not annualized. |
| Year ended July 31 | ||||||
| Institutional Class | Six months ended January 31, 2023 (unaudited) | 2022 | 2021 | 2020 | 2019 | 2018 |
Net asset value, beginning of period | $39.68 | $65.17 | $52.96 | $45.70 | $47.43 | $47.07 |
Net investment loss | (0.01) 1 | (0.24) 1 | (0.26) 1 | (0.09) 1 | (0.01) 1 | (0.02) 1 |
Net realized and unrealized gains (losses) on investments | (2.19) | (16.26) | 18.37 | 11.63 | 4.99 | 11.46 |
Total from investment operations | (2.20) | (16.50) | 18.11 | 11.54 | 4.98 | 11.44 |
| Distributions to shareholders from | ||||||
Net realized gains | (1.62) | (8.99) | (5.90) | (4.28) | (6.71) | (11.08) |
Net asset value, end of period | $35.86 | $39.68 | $65.17 | $52.96 | $45.70 | $47.43 |
Total return2 | (5.30)% | (29.09)% | 36.10% | 27.58% | 14.00% | 28.21% |
| Ratios to average net assets (annualized) | ||||||
Gross expenses | 0.86% | 0.83% | 0.83% | 0.84% | 0.85% | 0.85% |
Net expenses | 0.75% | 0.75% | 0.75% | 0.75% | 0.75% | 0.75% |
Net investment loss | (0.07)% | (0.47)% | (0.44)% | (0.20)% | (0.03)% | (0.03)% |
| Supplemental data | ||||||
Portfolio turnover rate | 31% | 43% | 36% | 37% | 39% | 37% |
Net assets, end of period (000s omitted) | $851,153 | $1,027,038 | $1,959,313 | $1,607,803 | $1,503,753 | $1,614,575 |
| 1 | Calculated based upon average shares outstanding |
| 2 | Returns for periods of less than one year are not annualized. |
| Gross unrealized gains | $1,446,529,981 |
| Gross unrealized losses | (53,520,014) |
| Net unrealized gains | $1,393,009,967 |
| ■ | Level 1 – quoted prices in active markets for identical securities |
| ■ | Level 2 – other significant observable inputs (including quoted prices for similar securities, interest rates, prepayment speeds, credit risk, etc.) |
| ■ | Level 3 – significant unobservable inputs (including the Fund’s own assumptions in determining the fair value of investments) |
| Quoted prices (Level 1) | Other significant observable inputs (Level 2) | Significant unobservable inputs (Level 3) | Total | |
| Assets | ||||
| Investments in: | ||||
| Common stocks | ||||
| Communication services | $ 234,700,609 | $0 | $0 | $ 234,700,609 |
| Consumer discretionary | 484,610,345 | 0 | 0 | 484,610,345 |
| Consumer staples | 47,350,976 | 0 | 0 | 47,350,976 |
| Financials | 325,537,790 | 0 | 0 | 325,537,790 |
| Health care | 434,540,706 | 0 | 0 | 434,540,706 |
| Industrials | 203,384,758 | 0 | 0 | 203,384,758 |
| Information technology | 1,210,707,742 | 0 | 0 | 1,210,707,742 |
| Materials | 47,607,043 | 0 | 0 | 47,607,043 |
| Real estate | 35,845,153 | 0 | 0 | 35,845,153 |
| Short-term investments | ||||
| Investment companies | 33,712,743 | 0 | 0 | 33,712,743 |
| Total assets | $3,057,997,865 | $0 | $0 | $3,057,997,865 |
| Average daily net assets | Management fee |
| First $500 million | 0.800% |
| Next $500 million | 0.750 |
| Next $1 billion | 0.700 |
| Next $2 billion | 0.675 |
| Next $1 billion | 0.650 |
| Next $3 billion | 0.640 |
| Next $2 billion | 0.615 |
| Next $2 billion | 0.605 |
| Next $4 billion | 0.580 |
| Over $16 billion | 0.555 |
| Class-level administration fee | |
| Class A | 0.21% |
| Class C | 0.21 |
| Class R6 | 0.03 |
| Administrator Class | 0.13 |
| Institutional Class | 0.13 |
| Expense ratio caps | |
| Class A | 1.16% |
| Class C | 1.91 |
| Class R6 | 0.70 |
| Administrator Class | 0.96 |
| Institutional Class | 0.75 |
| Name and year of birth | Position held and length of service* | Principal occupations during past five years or longer | Current other public company or investment company directorships |
| William R. Ebsworth (Born 1957) | Trustee, since 2015 | Retired. From 1984 to 2013, equities analyst, portfolio manager, research director and chief investment officer at Fidelity Management and Research Company in Boston, Tokyo, and Hong Kong, and retired in 2013 as Chief Investment Officer of Fidelity Strategic Advisers, Inc. where he led a team of investment professionals managing client assets. Prior thereto, Board member of Hong Kong Securities Clearing Co., Hong Kong Options Clearing Corp., the Thailand International Fund, Ltd., Fidelity Investments Life Insurance Company, and Empire Fidelity Investments Life Insurance Company. Audit Committee Chair and Investment Committee Chair of the Vincent Memorial Hospital Foundation (non-profit organization). Mr. Ebsworth is a CFA® charterholder. | N/A |
| Jane A. Freeman (Born 1953) | Trustee, since 2015; Chair Liaison, since 2018 | Retired. From 2012 to 2014 and 1999 to 2008, Chief Financial Officer of Scientific Learning Corporation. From 2008 to 2012, Ms. Freeman provided consulting services related to strategic business projects. Prior to 1999, Portfolio Manager at Rockefeller & Co. and Scudder, Stevens & Clark. Board member of the Harding Loevner Funds from 1996 to 2014, serving as both Lead Independent Director and chair of the Audit Committee. Board member of the Russell Exchange Traded Funds Trust from 2011 to 2012 and the chair of the Audit Committee. Ms. Freeman is also an inactive Chartered Financial Analyst. | N/A |
| Isaiah Harris, Jr. (Born 1952) | Trustee, since 2009; Audit Committee Chair, since 2019 | Retired. Member of the Advisory Board of CEF of East Central Florida. Chairman of the Board of CIGNA Corporation from 2009 to 2021, and Director from 2005 to 2008. From 2003 to 2011, Director of Deluxe Corporation. Prior thereto, President and CEO of BellSouth Advertising and Publishing Corp. from 2005 to 2007, President and CEO of BellSouth Enterprises from 2004 to 2005 and President of BellSouth Consumer Services from 2000 to 2003. Emeritus member of the Iowa State University Foundation Board of Governors. Emeritus Member of the Advisory Board of Iowa State University School of Business. Advisory Board Member, Palm Harbor Academy (private school). Advisory Board Member, Fellowship of Christian Athletes. Mr. Harris is a certified public accountant (inactive status). | N/A |
| David F. Larcker (Born 1950) | Trustee, since 2009 | Distinguished Visiting Fellow at the Hoover Institution since 2022. James Irvin Miller Professor of Accounting at the Graduate School of Business (Emeritus), Stanford University, Director of the Corporate Governance Research Initiative and Senior Faculty of The Rock Center for Corporate Governance since 2006. From 2005 to 2008, Professor of Accounting at the Graduate School of Business, Stanford University. Prior thereto, Ernst & Young Professor of Accounting at The Wharton School, University of Pennsylvania from 1985 to 2005. | N/A |
| Name and year of birth | Position held and length of service* | Principal occupations during past five years or longer | Current other public company or investment company directorships |
| Olivia S. Mitchell (Born 1953) | Trustee, since 2006; Nominating and Governance Committee Chair, since 2018 | International Foundation of Employee Benefit Plans Professor since 1993, Wharton School of the University of Pennsylvania. Director of Wharton’s Pension Research Council and Boettner Center on Pensions & Retirement Research, and Research Associate at the National Bureau of Economic Research. Previously taught at Cornell University from 1978 to 1993. | N/A |
| Timothy J. Penny (Born 1951) | Trustee, since 1996; Chair, since 2018 | President and Chief Executive Officer of Southern Minnesota Initiative Foundation, a non-profit organization, since 2007. Vice Chair of the Economic Club of Minnesota, since 2007. Co-Chair of the Committee for a Responsible Federal Budget, since 1995. Member of the Board of Trustees of NorthStar Education Finance, Inc., a non-profit organization, from 2007-2022. Senior Fellow of the University of Minnesota Humphrey Institute from 1995 to 2017. | N/A |
| James G. Polisson (Born 1959) | Trustee, since 2018 | Retired. Chief Marketing Officer, Source (ETF) UK Services, Ltd, from 2015 to 2017. From 2012 to 2015, Principal of The Polisson Group, LLC, a management consulting, corporate advisory and principal investing company. Chief Executive Officer and Managing Director at Russell Investments, Global Exchange Traded Funds from 2010 to 2012. Managing Director of Barclays Global Investors from 1998 to 2010 and Global Chief Marketing Officer for iShares and Barclays Global Investors from 2000 to 2010. Trustee of the San Francisco Mechanics’ Institute, a non-profit organization, from 2013 to 2015. Board member of the Russell Exchange Traded Fund Trust from 2011 to 2012. Director of Barclays Global Investors Holdings Deutschland GmbH from 2006 to 2009. Mr. Polisson is an attorney and has a retired status with the Massachusetts and District of Columbia Bar Associations. | N/A |
| Pamela Wheelock (Born 1959) | Trustee, since January 2020; previously Trustee from January 2018 to July 2019 | Retired. Executive and Senior Financial leadership positions in the public, private and nonprofit sectors. Interim President and CEO, McKnight Foundation, 2020. Interim Commissioner, Minnesota Department of Human Services, 2019. Chief Operating Officer, Twin Cities Habitat for Humanity, 2017-2019. Vice President for University Services, University of Minnesota, 2012-2016. Interim President and CEO, Blue Cross and Blue Shield of Minnesota, 2011-2012. Executive Vice-President and Chief Financial Officer, Minnesota Wild, 2002-2008. Commissioner, Minnesota Department of Finance, 1999-2002. Chair of the Board of Directors of Destination Medical Center Corporation. Board member of the Minnesota Wild Foundation. | N/A |
| Name and year of birth | Position held and length of service | Principal occupations during past five years or longer |
| Andrew Owen (Born 1960) | President, since 2017 | President and Chief Executive Officer of Allspring Funds Management, LLC since 2017 and Head of Global Fund Governance of Allspring Global Investments since 2022. Prior thereto, co-president of Galliard Capital Management, LLC, an affiliate of Allspring Funds Management, LLC, from 2019 to 2022 and Head of Affiliated Managers, Allspring Global Investments, from 2014 to 2019 and Executive Vice President responsible for marketing, investments and product development for Allspring Funds Management, LLC, from 2009 to 2014. |
| Jeremy DePalma (Born 1974) | Treasurer, since 2012 (for certain funds in the Fund Complex); since 2021 (for the remaining funds in the Fund Complex) | Senior Vice President of Allspring Funds Management, LLC since 2009. Senior Vice President of Evergreen Investment Management Company, LLC from 2008 to 2010 and head of the Fund Reporting and Control Team within Fund Administration from 2005 to 2010. |
| Christopher Baker (Born 1976) | Chief Compliance Officer, since 2022 | Global Chief Compliance Officer for Allspring Global Investments since 2022. Prior thereto, Chief Compliance Officer for State Street Global Advisors from 2018 to 2021. Senior Compliance Officer for the State Street divisions of Alternative Investment Solutions, Sector Solutions, and Global Marketing from 2015 to 2018. From 2010 to 2015 Vice President, Global Head of Investment and Marketing Compliance for State Street Global Advisors. |
| Matthew Prasse (Born 1983) | Chief Legal Officer, since 2022; Secretary, since 2021 | Senior Counsel of the Allspring Legal Department since 2021. Senior Counsel of the Wells Fargo Legal Department from 2018 to 2021. Previously, Counsel for Barings LLC from 2015 to 2018. Prior to joining Barings, Associate at Morgan, Lewis & Bockius LLP from 2008 to 2015. |
P.O. Box 219967
Kansas City, MO 64121-9967

1-800-222-8222 or visit the Fund's website at allspringglobal.com. Read the prospectus carefully before you invest or send money.
SAR3009 01-23


| 1 | The S&P 500 Index consists of 500 stocks chosen for market size, liquidity, and industry group representation. It is a market-value-weighted index with each stock's weight in the index proportionate to its market value. You cannot invest directly in an index. |
| 2 | The Morgan Stanley Capital International (MSCI) All Country World Index (ACWI) ex USA Index (Net) is a free-float-adjusted market-capitalization-weighted index that is designed to measure the equity market performance of developed and emerging markets, excluding the U.S. Source: MSCI. MSCI makes no express or implied warranties or representations and shall have no liability whatsoever with respect to any MSCI data contained herein. The MSCI data may not be further redistributed or used as a basis for other indexes or any securities or financial products. This report is not approved, reviewed, or produced by MSCI. You cannot invest directly in an index. |
| 3 | The MSCI Emerging Markets (EM) Index (Net) (USD) is a free-float-adjusted market-capitalization-weighted index that is designed to measure equity market performance of emerging markets. You cannot invest directly in an index. |
| 4 | The Bloomberg U.S. Aggregate Bond Index is a broad-based benchmark that measures the investment-grade, U.S.-dollar-denominated, fixed-rate taxable bond market, including Treasuries, government-related and corporate securities, mortgage-backed securities (agency fixed-rate and hybrid adjustable-rate mortgage pass-throughs), asset-backed securities, and commercial mortgage-backed securities. You cannot invest directly in an index. |
| 5 | The Bloomberg Global Aggregate ex-USD Index (unhedged) is an unmanaged index that provides a broad-based measure of the global investment-grade fixed-income markets excluding the U.S.-dollar-denominated debt market. You cannot invest directly in an index. |
| 6 | The Bloomberg Municipal Bond Index is an unmanaged index composed of long-term tax-exempt bonds with a minimum credit rating of Baa. You cannot invest directly in an index. |
| 7 | The ICE BofA U.S. High Yield Index is a market-capitalization-weighted index of domestic and Yankee high-yield bonds. The index tracks the performance of high-yield securities traded in the U.S. bond market. You cannot invest directly in an index. Copyright 2023. ICE Data Indices, LLC. All rights reserved. |
| 1 | The Consumer Price Index (CPI) is a measure of the average change over time in the prices paid by urban consumers for a market basket of consumer goods and services. You cannot invest directly in an index. |

President
Allspring Funds
| Investment objective | The Fund seeks long-term capital appreciation. |
| Manager | Allspring Funds Management, LLC |
| Subadviser | Allspring Global Investments, LLC |
| Portfolio managers | John R. Campbell, CFA®‡, Vince Fioramonti, CFA®‡ |
| Average annual total returns (%) as of January 31, 2023 | |||||||||||
| Including sales charge | Excluding sales charge | Expense ratios1 (%) | |||||||||
| Inception date | 1 year | 5 year | 10 year | 1 year | 5 year | 10 year | Gross | Net 2 | |||
| Class A (EGOAX) | 12-17-2007 | -10.51 | 5.76 | 10.90 | -5.06 | 7.02 | 11.56 | 1.20 | 1.08 | ||
| Class C (EGOCX) | 12-17-2007 | -6.81 | 6.21 | 10.89 | -5.81 | 6.21 | 10.89 | 1.95 | 1.83 | ||
| Class R (EGOHX)3 | 9-30-2015 | – | – | – | -5.32 | 6.76 | 11.29 | 1.45 | 1.33 | ||
| Class R6 (EGORX)4 | 9-30-2015 | – | – | – | -4.75 | 7.46 | 12.38 | 0.77 | 0.65 | ||
| Administrator Class (WFLLX) | 7-16-2010 | – | – | – | -5.05 | 7.13 | 11.72 | 1.12 | 0.97 | ||
| Institutional Class (EGOIX) | 12-17-2007 | – | – | – | -4.74 | 7.44 | 12.04 | 0.87 | 0.67 | ||
| S&P 500 Index5 | – | – | – | – | -8.22 | 9.54 | 12.68 | – | ��� | ||
| 1 | Reflects the expense ratios as stated in the most recent prospectuses. The expense ratios shown are subject to change and may differ from the annualized expense ratios shown in the financial highlights of this report. |
| 2 | The manager has contractually committed through November 30, 2023, to waive fees and/or reimburse expenses to the extent necessary to cap total annual fund operating expenses after fee waivers at 1.08% for Class A, 1.83% for Class C, 1.33% for Class R, 0.65% for Class R6, 0.97% for Administrator Class, and 0.67% for Institutional Class. Brokerage commissions, stamp duty fees, interest, taxes, acquired fund fees and expenses (if any), and extraordinary expenses are excluded from the expense caps. Prior to or after the commitment expiration date, the caps may be increased or the commitment to maintain the caps may be terminated only with the approval of the Board of Trustees. Without these caps, the Fund’s returns would have been lower. The expense ratio paid by an investor is the net expense ratio (the total annual fund operating expenses after fee waivers) as stated in the prospectuses. |
| 3 | Historical performance shown for the Class R shares prior to their inception reflects the performance of the Administrator Class shares, adjusted to reflect the higher expenses applicable to the Class R shares. |
| 4 | Historical performance shown for the Class R6 shares prior to their inception reflects the performance of the Institutional Class shares, and includes the higher expenses applicable to the Institutional Class shares. If these expenses had not been included, returns for the Class R6 shares would be higher. |
| 5 | The S&P 500 Index consists of 500 stocks chosen for market size, liquidity, and industry group representation. It is a market-value weighted index with each stock’s weight in the index proportionate to its market value. You cannot invest directly in an index. |
| ‡ | CFA® and Chartered Financial Analyst® are trademarks owned by CFA Institute. |
| Ten largest holdings (%) as of January 31, 20231 | |
| Apple Incorporated | 4.76 |
| Microsoft Corporation | 4.61 |
| Alphabet Incorporated Class C | 2.90 |
| Costco Wholesale Corporation | 2.40 |
| EMCOR Group Incorporated | 2.36 |
| Simon Property Group Incorporated | 2.35 |
| Copart Incorporated | 2.23 |
| MasterCard Incorporated Class A | 2.23 |
| Halliburton Company | 2.16 |
| Nucor Corporation | 2.07 |
| 1 | Figures represent the percentage of the Fund's net assets. Holdings are subject to change and may have changed since the date specified. |
| Sector allocation as of January 31, 20231 |

| 1 | Figures represent the percentage of the Fund's long-term investments. Allocations are subject to change and may have changed since the date specified. |
| Beginning account value 8-1-2022 | Ending account value 1-31-2023 | Expenses paid during the period1 | Annualized net expense ratio | |
| Class A | ||||
| Actual | $1,000.00 | $1,023.65 | $5.51 | 1.08% |
| Hypothetical (5% return before expenses) | $1,000.00 | $1,019.76 | $5.50 | 1.08% |
| Class C | ||||
| Actual | $1,000.00 | $1,019.60 | $9.32 | 1.83% |
| Hypothetical (5% return before expenses) | $1,000.00 | $1,015.98 | $9.30 | 1.83% |
| Class R | ||||
| Actual | $1,000.00 | $1,022.09 | $6.78 | 1.33% |
| Hypothetical (5% return before expenses) | $1,000.00 | $1,018.50 | $6.77 | 1.33% |
| Class R6 | ||||
| Actual | $1,000.00 | $1,025.22 | $3.32 | 0.65% |
| Hypothetical (5% return before expenses) | $1,000.00 | $1,021.93 | $3.31 | 0.65% |
| Administrator Class | ||||
| Actual | $1,000.00 | $1,023.90 | $4.95 | 0.97% |
| Hypothetical (5% return before expenses) | $1,000.00 | $1,020.32 | $4.94 | 0.97% |
| Institutional Class | ||||
| Actual | $1,000.00 | $1,025.17 | $3.42 | 0.67% |
| Hypothetical (5% return before expenses) | $1,000.00 | $1,021.83 | $3.41 | 0.67% |
| Shares | Value | ||||
| Common stocks: 99.23% | |||||
| Communication services: 4.61% | |||||
| Entertainment: 1.71% | |||||
| Activision Blizzard Incorporated | 94,703 | $ 7,251,409 | |||
| Interactive media & services: 2.90% | |||||
| Alphabet Incorporated Class C † | 123,122 | 12,296,194 | |||
| Consumer discretionary: 8.67% | |||||
| Household durables: 3.86% | |||||
| Lennar Corporation Class A | 81,443 | 8,339,763 | |||
| PulteGroup Incorporated | 140,632 | 8,000,554 | |||
| 16,340,317 | |||||
| Internet & direct marketing retail: 1.61% | |||||
| Amazon.com Incorporated † | 66,291 | 6,836,592 | |||
| Multiline retail: 1.41% | |||||
| Target Corporation | 34,566 | 5,950,191 | |||
| Specialty retail: 1.79% | |||||
| O'Reilly Automotive Incorporated † | 9,586 | 7,595,467 | |||
| Consumer staples: 4.18% | |||||
| Food & staples retailing: 2.40% | |||||
| Costco Wholesale Corporation | 19,888 | 10,165,552 | |||
| Food products: 1.78% | |||||
| Archer Daniels Midland Company | 91,171 | 7,553,517 | |||
| Energy: 7.99% | |||||
| Energy equipment & services: 2.16% | |||||
| Halliburton Company | 222,313 | 9,163,742 | |||
| Oil, gas & consumable fuels: 5.83% | |||||
| Chevron Corporation | 47,625 | 8,287,703 | |||
| ConocoPhillips | 66,301 | 8,080,103 | |||
| Devon Energy Corporation | 131,420 | 8,311,001 | |||
| 24,678,807 | |||||
| Financials: 10.11% | |||||
| Banks: 5.19% | |||||
| Citigroup Incorporated | 118,140 | 6,169,271 | |||
| Citizens Financial Group Incorporated | 166,675 | 7,220,361 | |||
| JPMorgan Chase & Company | 61,557 | 8,615,518 | |||
| 22,005,150 | |||||
| Capital markets: 4.92% | |||||
| Evercore Partners Incorporated Class A | 58,241 | 7,560,264 | |||
| The Goldman Sachs Group Incorporated | 22,964 | 8,400,461 | |||
| Virtu Financial Incorporated Class A | 252,381 | 4,873,477 | |||
| 20,834,202 |
| Shares | Value | ||||
| Health care: 15.73% | |||||
| Biotechnology: 5.31% | |||||
| AbbVie Incorporated | 47,588 | $ 7,031,127 | |||
| Regeneron Pharmaceuticals Incorporated † | 10,654 | 8,080,739 | |||
| United Therapeutics Corporation † | 28,127 | 7,402,183 | |||
| 22,514,049 | |||||
| Health care equipment & supplies: 1.60% | |||||
| Hologic Incorporated † | 83,337 | 6,781,132 | |||
| Health care providers & services: 5.43% | |||||
| CVS Health Corporation | 86,416 | 7,623,620 | |||
| Elevance Health Incorporated | 15,685 | 7,842,343 | |||
| UnitedHealth Group Incorporated | 15,092 | 7,533,775 | |||
| 22,999,738 | |||||
| Pharmaceuticals: 3.39% | |||||
| Bristol-Myers Squibb Company | 89,729 | 6,518,812 | |||
| Pfizer Incorporated | 178,041 | 7,862,291 | |||
| 14,381,103 | |||||
| Industrials: 10.23% | |||||
| Commercial services & supplies: 2.23% | |||||
| Copart Incorporated † | 141,580 | 9,430,644 | |||
| Construction & engineering: 2.36% | |||||
| EMCOR Group Incorporated | 67,475 | 10,003,169 | |||
| Electrical equipment: 2.02% | |||||
| nVent Electric plc | 215,113 | 8,550,742 | |||
| Machinery: 2.04% | |||||
| AGCO Corporation | 62,739 | 8,666,138 | |||
| Road & rail: 1.58% | |||||
| J.B. Hunt Transport Services Incorporated | 35,486 | 6,708,628 | |||
| Information technology: 27.99% | |||||
| Communications equipment: 1.92% | |||||
| Arista Networks Incorporated † | 64,450 | 8,121,989 | |||
| IT services: 4.05% | |||||
| Accenture plc Class A | 27,701 | 7,729,964 | |||
| MasterCard Incorporated Class A | 25,442 | 9,428,805 | |||
| 17,158,769 | |||||
| Semiconductors & semiconductor equipment: 7.47% | |||||
| Applied Materials Incorporated | 61,557 | 6,862,990 | |||
| Broadcom Incorporated | 14,678 | 8,586,777 | |||
| Microchip Technology Incorporated | 109,673 | 8,512,818 | |||
| Qualcomm Incorporated | 57,768 | 7,695,275 | |||
| 31,657,860 | |||||
| Software: 9.79% | |||||
| Adobe Incorporated † | 14,207 | 5,261,420 |
| Shares | Value | ||||
| Software (continued) | |||||
| Fortinet Incorporated † | 166,006 | $ 8,688,754 | |||
| Microsoft Corporation | 78,839 | 19,537,093 | |||
| Oracle Corporation | 90,677 | 8,021,287 | |||
| 41,508,554 | |||||
| Technology hardware, storage & peripherals: 4.76% | |||||
| Apple Incorporated | 139,662 | 20,151,830 | |||
| Materials: 5.45% | |||||
| Chemicals: 1.55% | |||||
| CF Industries Holdings Incorporated | 77,343 | 6,550,952 | |||
| Metals & mining: 3.90% | |||||
| Nucor Corporation | 51,957 | 8,781,772 | |||
| Reliance Steel & Aluminum Company | 34,134 | 7,763,778 | |||
| 16,545,550 | |||||
| Real estate: 4.27% | |||||
| Equity REITs: 4.27% | |||||
| Simon Property Group Incorporated | 77,655 | 9,975,561 | |||
| Weyerhaeuser Company | 236,045 | 8,127,029 | |||
| 18,102,590 | |||||
| Total Common stocks (Cost $306,014,837) | 420,504,577 |
| Yield | |||||
| Short-term investments: 0.72% | |||||
| Investment companies: 0.72% | |||||
| Allspring Government Money Market Fund Select Class ♠∞ | 4.16% | 3,042,579 | 3,042,579 | ||
| Total Short-term investments (Cost $3,042,579) | 3,042,579 | ||||
| Total investments in securities (Cost $309,057,416) | 99.95% | 423,547,156 | |||
| Other assets and liabilities, net | 0.05 | 207,833 | |||
| Total net assets | 100.00% | $423,754,989 |
| † | Non-income-earning security |
| ♠ | The issuer of the security is an affiliated person of the Fund as defined in the Investment Company Act of 1940. |
| ∞ | The rate represents the 7-day annualized yield at period end. |
| Abbreviations: | |
| REIT | Real estate investment trust |
| Value, beginning of period | Purchases | Sales proceeds | Net realized gains (losses) | Net change in unrealized gains (losses) | Value, end of period | Shares, end of period | Income from affiliated securities | |
| Short-term investments | ||||||||
| Allspring Government Money Market Fund Select Class | $4,015,223 | $37,074,563 | $(38,047,207) | $0 | $0 | $3,042,579 | 3,042,579 | $53,610 |
| Assets | |
Investments in unaffiliated securities, at value (cost $306,014,837) | $ 420,504,577 |
Investments in affiliated securities, at value (cost $3,042,579) | 3,042,579 |
Cash | 395 |
Receivable for dividends | 470,914 |
Receivable for Fund shares sold | 438,068 |
Prepaid expenses and other assets | 77,952 |
Total assets | 424,534,485 |
| Liabilities | |
Payable for Fund shares redeemed | 341,359 |
Management fee payable | 188,493 |
Shareholder servicing fees payable | 69,379 |
Administration fees payable | 67,265 |
Distribution fees payable | 8,568 |
Trustees’ fees and expenses payable | 4,198 |
Accrued expenses and other liabilities | 100,234 |
Total liabilities | 779,496 |
Total net assets | $423,754,989 |
| Net assets consist of | |
Paid-in capital | $ 299,625,960 |
Total distributable earnings | 124,129,029 |
Total net assets | $423,754,989 |
| Computation of net asset value and offering price per share | |
Net assets – Class A | $ 322,115,678 |
Shares outstanding – Class A1 | 22,222,180 |
Net asset value per share – Class A | $14.50 |
Maximum offering price per share – Class A2 | $15.38 |
Net assets – Class C | $ 13,328,775 |
Shares outstanding – Class C1 | 945,398 |
Net asset value per share – Class C | $14.10 |
Net assets – Class R | $ 198,262 |
Shares outstanding – Class R1 | 13,462 |
Net asset value per share – Class R | $14.73 |
Net assets – Class R6 | $ 2,783,899 |
Shares outstanding – Class R61 | 190,651 |
Net asset value per share – Class R6 | $14.60 |
Net assets – Administrator Class | $ 1,577,347 |
Shares outstanding – Administrator Class1 | 106,140 |
Net asset value per share – Administrator Class | $14.86 |
Net assets – Institutional Class | $ 83,751,028 |
Shares outstanding – Institutional Class1 | 5,728,339 |
Net asset value per share – Institutional Class | $14.62 |
| 1 | The Fund has an unlimited number of authorized shares. |
| 2 | Maximum offering price is computed as 100/94.25 of net asset value. On investments of $50,000 or more, the offering price is reduced. |
| Investment income | |
Dividends | $ 3,922,907 |
Income from affiliated securities | 53,610 |
Total investment income | 3,976,517 |
| Expenses | |
Management fee | 1,512,616 |
| Administration fees | |
Class A | 333,821 |
Class C | 16,705 |
Class R | 194 |
Class R6 | 597 |
Administrator Class | 992 |
Institutional Class | 60,223 |
| Shareholder servicing fees | |
Class A | 397,406 |
Class C | 19,815 |
Class R | 231 |
Administrator Class | 1,879 |
| Distribution fees | |
Class C | 59,442 |
Class R | 200 |
Custody and accounting fees | 15,416 |
Professional fees | 27,140 |
Registration fees | 38,000 |
Shareholder report expenses | 25,865 |
Trustees’ fees and expenses | 11,026 |
Other fees and expenses | 6,957 |
Total expenses | 2,528,525 |
| Less: Fee waivers and/or expense reimbursements | |
Fund-level | (281,574) |
Class A | (12,639) |
Class R6 | (140) |
Administrator Class | (264) |
Institutional Class | (39,710) |
Net expenses | 2,194,198 |
Net investment income | 1,782,319 |
| Realized and unrealized gains (losses) on investments | |
Net realized gains on investments | 16,463,601 |
Net change in unrealized gains (losses) on investments | (9,232,620) |
Net realized and unrealized gains (losses) on investments | 7,230,981 |
Net increase in net assets resulting from operations | $ 9,013,300 |
| Six months ended January 31, 2023 (unaudited) | Year ended July 31, 2022 | |||
| Operations | ||||
Net investment income | $ 1,782,319 | $ 2,977,683 | ||
Net realized gains on investments | 16,463,601 | 51,089,392 | ||
Net change in unrealized gains (losses) on investments | (9,232,620) | (71,803,083) | ||
Net increase (decrease) in net assets resulting from operations | 9,013,300 | (17,736,008) | ||
| Distributions to shareholders from | ||||
| Net investment income and net realized gains | ||||
Class A | (33,915,521) | (47,154,331) | ||
Class C | (1,532,255) | (3,108,743) | ||
Class R | (18,398) | (22,264) | ||
Class R6 | (479,983) | (746,242) | ||
Administrator Class | (166,658) | (378,532) | ||
Institutional Class | (9,427,220) | (17,341,089) | ||
Total distributions to shareholders | (45,540,035) | (68,751,201) | ||
| Capital share transactions | Shares | Shares | ||
| Proceeds from shares sold | ||||
Class A | 519,754 | 7,582,972 | 1,097,088 | 19,147,813 |
Class C | 46,075 | 631,426 | 29,275 | 502,832 |
Class R | 3,870 | 60,810 | 2,207 | 40,355 |
Class R6 | 45,331 | 720,429 | 15,663 | 266,817 |
Administrator Class | 14,368 | 208,782 | 59,959 | 1,204,301 |
Institutional Class | 450,118 | 6,514,077 | 1,676,327 | 29,645,655 |
| 15,718,496 | 50,807,773 | |||
| Reinvestment of distributions | ||||
Class A | 2,282,716 | 32,296,341 | 2,550,202 | 44,759,070 |
Class C | 110,947 | 1,517,749 | 179,061 | 3,060,161 |
Class R | 1,288 | 18,398 | 1,260 | 22,264 |
Class R6 | 7,651 | 109,454 | 9,372 | 166,069 |
Administrator Class | 11,421 | 165,760 | 20,990 | 377,210 |
Institutional Class | 638,501 | 9,137,834 | 894,254 | 15,863,211 |
| 43,245,536 | 64,247,985 | |||
| Payment for shares redeemed | ||||
Class A | (1,439,250) | (21,341,808) | (2,328,633) | (40,154,334) |
Class C | (385,767) | (5,508,418) | (574,944) | (10,038,659) |
Class R | (605) | (9,763) | (24,131) | (477,364) |
Class R6 | (146,027) | (2,140,908) | (54,832) | (979,083) |
Administrator Class | (13,848) | (203,655) | (118,858) | (2,102,057) |
Institutional Class | (2,035,892) | (31,193,363) | (2,878,046) | (49,352,502) |
| (60,397,915) | (103,103,999) | |||
Net increase (decrease) in net assets resulting from capital share transactions | (1,433,883) | 11,951,759 | ||
Total decrease in net assets | (37,960,618) | (74,535,450) | ||
| Net assets | ||||
Beginning of period | 461,715,607 | 536,251,057 | ||
End of period | $423,754,989 | $ 461,715,607 | ||
| Year ended July 31 | ||||||
| Class A | Six months ended January 31, 2023 (unaudited) | 2022 | 2021 | 2020 | 2019 | 2018 |
Net asset value, beginning of period | $15.85 | $18.77 | $15.71 | $18.57 | $20.82 | $18.01 |
Net investment income | 0.06 | 0.09 | 0.08 1 | 0.14 | 0.25 | 0.15 |
Net realized and unrealized gains (losses) on investments | 0.26 | (0.55) | 5.33 | 0.51 | (0.29) | 3.01 |
Total from investment operations | 0.32 | (0.46) | 5.41 | 0.65 | (0.04) | 3.16 |
| Distributions to shareholders from | ||||||
Net investment income | (0.12) | (0.04) | (0.15) | (0.29) | (0.16) | (0.13) |
Net realized gains | (1.55) | (2.42) | (2.20) | (3.22) | (2.05) | (0.22) |
Total distributions to shareholders | (1.67) | (2.46) | (2.35) | (3.51) | (2.21) | (0.35) |
Net asset value, end of period | $14.50 | $15.85 | $18.77 | $15.71 | $18.57 | $20.82 |
Total return2 | 2.37% | (3.66)% | 37.90% | 2.86% | 1.10% | 17.66% |
| Ratios to average net assets (annualized) | ||||||
Gross expenses | 1.22% | 1.20% | 1.23% | 1.23% | 1.19% | 1.18% |
Net expenses | 1.08% | 1.06% | 1.06% | 1.06% | 1.08% | 1.10% |
Net investment income | 0.76% | 0.52% | 0.49% | 0.97% | 1.42% | 0.73% |
| Supplemental data | ||||||
Portfolio turnover rate | 13% | 31% | 46% | 28% | 45% | 33% |
Net assets, end of period (000s omitted) | $322,116 | $330,584 | $366,731 | $300,373 | $341,045 | $360,937 |
| 1 | Calculated based upon average shares outstanding |
| 2 | Total return calculations do not include any sales charges. Returns for periods of less than one year are not annualized. |
| Year ended July 31 | ||||||
| Class C | Six months ended January 31, 2023 (unaudited) | 2022 | 2021 | 2020 | 2019 | 2018 |
Net asset value, beginning of period | $15.40 | $18.39 | $15.41 | $18.22 | $20.44 | $17.70 |
Net investment income (loss) | 0.00 1,2 | (0.05) 1 | (0.04) 1 | 0.03 | 0.13 | (0.00) 3 |
Net realized and unrealized gains (losses) on investments | 0.25 | (0.52) | 5.23 | 0.47 | (0.30) | 2.96 |
Total from investment operations | 0.25 | (0.57) | 5.19 | 0.50 | (0.17) | 2.96 |
| Distributions to shareholders from | ||||||
Net investment income | 0.00 | 0.00 | (0.01) | (0.09) | 0.00 | 0.00 |
Net realized gains | (1.55) | (2.42) | (2.20) | (3.22) | (2.05) | (0.22) |
Total distributions to shareholders | (1.55) | (2.42) | (2.21) | (3.31) | (2.05) | (0.22) |
Net asset value, end of period | $14.10 | $15.40 | $18.39 | $15.41 | $18.22 | $20.44 |
Total return4 | 1.96% | (4.39)% | 36.87% | 2.01% | 0.34% | 16.78% |
| Ratios to average net assets (annualized) | ||||||
Gross expenses | 1.96% | 1.94% | 1.98% | 1.97% | 1.94% | 1.93% |
Net expenses | 1.83% | 1.83% | 1.83% | 1.83% | 1.83% | 1.85% |
Net investment income (loss) | 0.01% | (0.27)% | (0.25)% | 0.21% | 0.67% | (0.02)% |
| Supplemental data | ||||||
Portfolio turnover rate | 13% | 31% | 46% | 28% | 45% | 33% |
Net assets, end of period (000s omitted) | $13,329 | $18,081 | $28,335 | $33,405 | $47,649 | $61,529 |
| 1 | Calculated based upon average shares outstanding |
| 2 | Amount is less than $0.005. |
| 3 | Amount is more than $(0.005) |
| 4 | Total return calculations do not include any sales charges. Returns for periods of less than one year are not annualized. |
| Year ended July 31 | ||||||
| Class R | Six months ended January 31, 2023 (unaudited) | 2022 | 2021 | 2020 | 2019 | 2018 |
Net asset value, beginning of period | $15.98 | $18.89 | $15.70 | $18.57 | $20.81 | $18.04 |
Net investment income | 0.04 1 | 0.03 1 | 0.04 1 | 0.11 1 | 0.21 | 0.12 |
Net realized and unrealized gains (losses) on investments | 0.26 | (0.52) | 5.35 | 0.49 | (0.29) | 2.99 |
Total from investment operations | 0.30 | (0.49) | 5.39 | 0.60 | (0.08) | 3.11 |
| Distributions to shareholders from | ||||||
Net investment income | 0.00 | 0.00 | (0.00) 2 | (0.25) | (0.11) | (0.12) |
Net realized gains | (1.55) | (2.42) | (2.20) | (3.22) | (2.05) | (0.22) |
Total distributions to shareholders | (1.55) | (2.42) | (2.20) | (3.47) | (2.16) | (0.34) |
Net asset value, end of period | $14.73 | $15.98 | $18.89 | $15.70 | $18.57 | $20.81 |
Total return3 | 2.21% | (3.81)% | 37.56% | 2.56% | 0.87% | 17.37% |
| Ratios to average net assets (annualized) | ||||||
Gross expenses | 1.43% | 1.40% | 1.47% | 1.47% | 1.44% | 1.43% |
Net expenses | 1.33% | 1.31% | 1.33% | 1.33% | 1.33% | 1.34% |
Net investment income | 0.50% | 0.19% | 0.27% | 0.69% | 1.18% | 0.48% |
| Supplemental data | ||||||
Portfolio turnover rate | 13% | 31% | 46% | 28% | 45% | 33% |
Net assets, end of period (000s omitted) | $198 | $142 | $559 | $910 | $2,043 | $2,042 |
| 1 | Calculated based upon average shares outstanding |
| 2 | Amount is less than $0.005. |
| 3 | Returns for periods of less than one year are not annualized. |
| Year ended July 31 | ||||||
| Class R6 | Six months ended January 31, 2023 (unaudited) | 2022 | 2021 | 2020 | 2019 | 2018 |
Net asset value, beginning of period | $15.99 | $18.91 | $15.81 | $18.68 | $20.92 | $18.09 |
Net investment income | 0.10 | 0.17 | 0.16 | 0.24 1 | 0.34 | 0.22 1 |
Net realized and unrealized gains (losses) on investments | 0.24 | (0.55) | 5.36 | 0.48 | (0.30) | 3.04 |
Total from investment operations | 0.34 | (0.38) | 5.52 | 0.72 | 0.04 | 3.26 |
| Distributions to shareholders from | ||||||
Net investment income | (0.18) | (0.12) | (0.22) | (0.37) | (0.23) | (0.21) |
Net realized gains | (1.55) | (2.42) | (2.20) | (3.22) | (2.05) | (0.22) |
Total distributions to shareholders | (1.73) | (2.54) | (2.42) | (3.59) | (2.28) | (0.43) |
Net asset value, end of period | $14.60 | $15.99 | $18.91 | $15.81 | $18.68 | $20.92 |
Total return2 | 2.52% | (3.25)% | 38.47% | 3.23% | 1.60% | 18.16% |
| Ratios to average net assets (annualized) | ||||||
Gross expenses | 0.79% | 0.77% | 0.80% | 0.79% | 0.75% | 0.75% |
Net expenses | 0.65% | 0.65% | 0.65% | 0.65% | 0.65% | 0.65% |
Net investment income | 1.23% | 0.92% | 0.92% | 1.40% | 1.83% | 1.08% |
| Supplemental data | ||||||
Portfolio turnover rate | 13% | 31% | 46% | 28% | 45% | 33% |
Net assets, end of period (000s omitted) | $2,784 | $4,535 | $5,928 | $6,570 | $13,223 | $15,225 |
| 1 | Calculated based upon average shares outstanding |
| 2 | Returns for periods of less than one year are not annualized. |
| Year ended July 31 | ||||||
| Administrator Class | Six months ended January 31, 2023 (unaudited) | 2022 | 2021 | 2020 | 2019 | 2018 |
Net asset value, beginning of period | $16.22 | $19.16 | $15.96 | $18.82 | $21.05 | $18.21 |
Net investment income | 0.07 1 | 0.10 1 | 0.10 1 | 0.18 1 | 0.29 1 | 0.17 1 |
Net realized and unrealized gains (losses) on investments | 0.26 | (0.55) | 5.43 | 0.49 | (0.30) | 3.05 |
Total from investment operations | 0.33 | (0.45) | 5.53 | 0.67 | (0.01) | 3.22 |
| Distributions to shareholders from | ||||||
Net investment income | (0.14) | (0.07) | (0.13) | (0.31) | (0.17) | (0.16) |
Net realized gains | (1.55) | (2.42) | (2.20) | (3.22) | (2.05) | (0.22) |
Total distributions to shareholders | (1.69) | (2.49) | (2.33) | (3.53) | (2.22) | (0.38) |
Net asset value, end of period | $14.86 | $16.22 | $19.16 | $15.96 | $18.82 | $21.05 |
Total return2 | 2.39% | (3.57)% | 38.04% | 2.90% | 1.26% | 17.81% |
| Ratios to average net assets (annualized) | ||||||
Gross expenses | 1.13% | 1.11% | 1.15% | 1.13% | 1.10% | 1.10% |
Net expenses | 0.97% | 0.97% | 0.97% | 0.97% | 0.97% | 0.98% |
Net investment income | 0.86% | 0.56% | 0.58% | 1.04% | 1.52% | 0.86% |
| Supplemental data | ||||||
Portfolio turnover rate | 13% | 31% | 46% | 28% | 45% | 33% |
Net assets, end of period (000s omitted) | $1,577 | $1,528 | $2,531 | $2,241 | $16,566 | $25,444 |
| 1 | Calculated based upon average shares outstanding |
| 2 | Returns for periods of less than one year are not annualized. |
| Year ended July 31 | ||||||
| Institutional Class | Six months ended January 31, 2023 (unaudited) | 2022 | 2021 | 2020 | 2019 | 2018 |
Net asset value, beginning of period | $16.01 | $18.93 | $15.83 | $18.70 | $20.95 | $18.12 |
Net investment income | 0.09 1 | 0.16 | 0.19 | 0.24 1 | 0.34 | 0.23 |
Net realized and unrealized gains (losses) on investments | 0.25 | (0.55) | 5.33 | 0.48 | (0.30) | 3.03 |
Total from investment operations | 0.34 | (0.39) | 5.52 | 0.72 | 0.04 | 3.26 |
| Distributions to shareholders from | ||||||
Net investment income | (0.18) | (0.11) | (0.22) | (0.37) | (0.24) | (0.21) |
Net realized gains | (1.55) | (2.42) | (2.20) | (3.22) | (2.05) | (0.22) |
Total distributions to shareholders | (1.73) | (2.53) | (2.42) | (3.59) | (2.29) | (0.43) |
Net asset value, end of period | $14.62 | $16.01 | $18.93 | $15.83 | $18.70 | $20.95 |
Total return2 | 2.52% | (3.27)% | 38.42% | 3.22% | 1.56% | 18.16% |
| Ratios to average net assets (annualized) | ||||||
Gross expenses | 0.89% | 0.87% | 0.90% | 0.89% | 0.86% | 0.85% |
Net expenses | 0.67% | 0.67% | 0.67% | 0.67% | 0.67% | 0.68% |
Net investment income | 1.18% | 0.91% | 0.90% | 1.40% | 1.82% | 1.15% |
| Supplemental data | ||||||
Portfolio turnover rate | 13% | 31% | 46% | 28% | 45% | 33% |
Net assets, end of period (000s omitted) | $83,751 | $106,846 | $132,167 | $145,425 | $600,595 | $690,855 |
| 1 | Calculated based upon average shares outstanding |
| 2 | Returns for periods of less than one year are not annualized. |
| Gross unrealized gains | $131,830,759 |
| Gross unrealized losses | (17,378,765) |
| Net unrealized gains | $114,451,994 |
| ■ | Level 1 – quoted prices in active markets for identical securities |
| ■ | Level 2 – other significant observable inputs (including quoted prices for similar securities, interest rates, prepayment speeds, credit risk, etc.) |
| ■ | Level 3 – significant unobservable inputs (including the Fund’s own assumptions in determining the fair value of investments) |
| Quoted prices (Level 1) | Other significant observable inputs (Level 2) | Significant unobservable inputs (Level 3) | Total | |
| Assets | ||||
| Investments in: | ||||
| Common stocks | ||||
| Communication services | $ 19,547,603 | $0 | $0 | $ 19,547,603 |
| Consumer discretionary | 36,722,567 | 0 | 0 | 36,722,567 |
| Consumer staples | 17,719,069 | 0 | 0 | 17,719,069 |
| Energy | 33,842,549 | 0 | 0 | 33,842,549 |
| Financials | 42,839,352 | 0 | 0 | 42,839,352 |
| Health care | 66,676,022 | 0 | 0 | 66,676,022 |
| Industrials | 43,359,321 | 0 | 0 | 43,359,321 |
| Information technology | 118,599,002 | 0 | 0 | 118,599,002 |
| Materials | 23,096,502 | 0 | 0 | 23,096,502 |
| Real estate | 18,102,590 | 0 | 0 | 18,102,590 |
| Short-term investments | ||||
| Investment companies | 3,042,579 | 0 | 0 | 3,042,579 |
| Total assets | $423,547,156 | $0 | $0 | $423,547,156 |
| Average daily net assets | Management fee |
| First $500 million | 0.700% |
| Next $500 million | 0.675 |
| Next $1 billion | 0.650 |
| Next $2 billion | 0.625 |
| Next $1 billion | 0.600 |
| Next $3 billion | 0.590 |
| Next $2 billion | 0.565 |
| Next $2 billion | 0.555 |
| Next $4 billion | 0.530 |
| Over $16 billion | 0.505 |
| Class-level administration fee | |
| Class A | 0.21% |
| Class C | 0.21 |
| Class R | 0.21 |
| Class R6 | 0.03 |
| Administrator Class | 0.13 |
| Institutional Class | 0.13 |
| Expense ratio caps | |
| Class A | 1.08% |
| Class C | 1.83 |
| Class R | 1.33 |
| Class R6 | 0.65 |
| Administrator Class | 0.97 |
| Institutional Class | 0.67 |
| Name and year of birth | Position held and length of service* | Principal occupations during past five years or longer | Current other public company or investment company directorships |
| William R. Ebsworth (Born 1957) | Trustee, since 2015 | Retired. From 1984 to 2013, equities analyst, portfolio manager, research director and chief investment officer at Fidelity Management and Research Company in Boston, Tokyo, and Hong Kong, and retired in 2013 as Chief Investment Officer of Fidelity Strategic Advisers, Inc. where he led a team of investment professionals managing client assets. Prior thereto, Board member of Hong Kong Securities Clearing Co., Hong Kong Options Clearing Corp., the Thailand International Fund, Ltd., Fidelity Investments Life Insurance Company, and Empire Fidelity Investments Life Insurance Company. Audit Committee Chair and Investment Committee Chair of the Vincent Memorial Hospital Foundation (non-profit organization). Mr. Ebsworth is a CFA® charterholder. | N/A |
| Jane A. Freeman (Born 1953) | Trustee, since 2015; Chair Liaison, since 2018 | Retired. From 2012 to 2014 and 1999 to 2008, Chief Financial Officer of Scientific Learning Corporation. From 2008 to 2012, Ms. Freeman provided consulting services related to strategic business projects. Prior to 1999, Portfolio Manager at Rockefeller & Co. and Scudder, Stevens & Clark. Board member of the Harding Loevner Funds from 1996 to 2014, serving as both Lead Independent Director and chair of the Audit Committee. Board member of the Russell Exchange Traded Funds Trust from 2011 to 2012 and the chair of the Audit Committee. Ms. Freeman is also an inactive Chartered Financial Analyst. | N/A |
| Isaiah Harris, Jr. (Born 1952) | Trustee, since 2009; Audit Committee Chair, since 2019 | Retired. Member of the Advisory Board of CEF of East Central Florida. Chairman of the Board of CIGNA Corporation from 2009 to 2021, and Director from 2005 to 2008. From 2003 to 2011, Director of Deluxe Corporation. Prior thereto, President and CEO of BellSouth Advertising and Publishing Corp. from 2005 to 2007, President and CEO of BellSouth Enterprises from 2004 to 2005 and President of BellSouth Consumer Services from 2000 to 2003. Emeritus member of the Iowa State University Foundation Board of Governors. Emeritus Member of the Advisory Board of Iowa State University School of Business. Advisory Board Member, Palm Harbor Academy (private school). Advisory Board Member, Fellowship of Christian Athletes. Mr. Harris is a certified public accountant (inactive status). | N/A |
| David F. Larcker (Born 1950) | Trustee, since 2009 | Distinguished Visiting Fellow at the Hoover Institution since 2022. James Irvin Miller Professor of Accounting at the Graduate School of Business (Emeritus), Stanford University, Director of the Corporate Governance Research Initiative and Senior Faculty of The Rock Center for Corporate Governance since 2006. From 2005 to 2008, Professor of Accounting at the Graduate School of Business, Stanford University. Prior thereto, Ernst & Young Professor of Accounting at The Wharton School, University of Pennsylvania from 1985 to 2005. | N/A |
| Name and year of birth | Position held and length of service* | Principal occupations during past five years or longer | Current other public company or investment company directorships |
| Olivia S. Mitchell (Born 1953) | Trustee, since 2006; Nominating and Governance Committee Chair, since 2018 | International Foundation of Employee Benefit Plans Professor since 1993, Wharton School of the University of Pennsylvania. Director of Wharton’s Pension Research Council and Boettner Center on Pensions & Retirement Research, and Research Associate at the National Bureau of Economic Research. Previously taught at Cornell University from 1978 to 1993. | N/A |
| Timothy J. Penny (Born 1951) | Trustee, since 1996; Chair, since 2018 | President and Chief Executive Officer of Southern Minnesota Initiative Foundation, a non-profit organization, since 2007. Vice Chair of the Economic Club of Minnesota, since 2007. Co-Chair of the Committee for a Responsible Federal Budget, since 1995. Member of the Board of Trustees of NorthStar Education Finance, Inc., a non-profit organization, from 2007-2022. Senior Fellow of the University of Minnesota Humphrey Institute from 1995 to 2017. | N/A |
| James G. Polisson (Born 1959) | Trustee, since 2018 | Retired. Chief Marketing Officer, Source (ETF) UK Services, Ltd, from 2015 to 2017. From 2012 to 2015, Principal of The Polisson Group, LLC, a management consulting, corporate advisory and principal investing company. Chief Executive Officer and Managing Director at Russell Investments, Global Exchange Traded Funds from 2010 to 2012. Managing Director of Barclays Global Investors from 1998 to 2010 and Global Chief Marketing Officer for iShares and Barclays Global Investors from 2000 to 2010. Trustee of the San Francisco Mechanics’ Institute, a non-profit organization, from 2013 to 2015. Board member of the Russell Exchange Traded Fund Trust from 2011 to 2012. Director of Barclays Global Investors Holdings Deutschland GmbH from 2006 to 2009. Mr. Polisson is an attorney and has a retired status with the Massachusetts and District of Columbia Bar Associations. | N/A |
| Pamela Wheelock (Born 1959) | Trustee, since January 2020; previously Trustee from January 2018 to July 2019 | Retired. Executive and Senior Financial leadership positions in the public, private and nonprofit sectors. Interim President and CEO, McKnight Foundation, 2020. Interim Commissioner, Minnesota Department of Human Services, 2019. Chief Operating Officer, Twin Cities Habitat for Humanity, 2017-2019. Vice President for University Services, University of Minnesota, 2012-2016. Interim President and CEO, Blue Cross and Blue Shield of Minnesota, 2011-2012. Executive Vice-President and Chief Financial Officer, Minnesota Wild, 2002-2008. Commissioner, Minnesota Department of Finance, 1999-2002. Chair of the Board of Directors of Destination Medical Center Corporation. Board member of the Minnesota Wild Foundation. | N/A |
| Name and year of birth | Position held and length of service | Principal occupations during past five years or longer |
| Andrew Owen (Born 1960) | President, since 2017 | President and Chief Executive Officer of Allspring Funds Management, LLC since 2017 and Head of Global Fund Governance of Allspring Global Investments since 2022. Prior thereto, co-president of Galliard Capital Management, LLC, an affiliate of Allspring Funds Management, LLC, from 2019 to 2022 and Head of Affiliated Managers, Allspring Global Investments, from 2014 to 2019 and Executive Vice President responsible for marketing, investments and product development for Allspring Funds Management, LLC, from 2009 to 2014. |
| Jeremy DePalma (Born 1974) | Treasurer, since 2012 (for certain funds in the Fund Complex); since 2021 (for the remaining funds in the Fund Complex) | Senior Vice President of Allspring Funds Management, LLC since 2009. Senior Vice President of Evergreen Investment Management Company, LLC from 2008 to 2010 and head of the Fund Reporting and Control Team within Fund Administration from 2005 to 2010. |
| Christopher Baker (Born 1976) | Chief Compliance Officer, since 2022 | Global Chief Compliance Officer for Allspring Global Investments since 2022. Prior thereto, Chief Compliance Officer for State Street Global Advisors from 2018 to 2021. Senior Compliance Officer for the State Street divisions of Alternative Investment Solutions, Sector Solutions, and Global Marketing from 2015 to 2018. From 2010 to 2015 Vice President, Global Head of Investment and Marketing Compliance for State Street Global Advisors. |
| Matthew Prasse (Born 1983) | Chief Legal Officer, since 2022; Secretary, since 2021 | Senior Counsel of the Allspring Legal Department since 2021. Senior Counsel of the Wells Fargo Legal Department from 2018 to 2021. Previously, Counsel for Barings LLC from 2015 to 2018. Prior to joining Barings, Associate at Morgan, Lewis & Bockius LLP from 2008 to 2015. |
P.O. Box 219967
Kansas City, MO 64121-9967

1-800-222-8222 or visit the Fund's website at allspringglobal.com. Read the prospectus carefully before you invest or send money.
SAR4314 01-23


| 1 | The S&P 500 Index consists of 500 stocks chosen for market size, liquidity, and industry group representation. It is a market-value-weighted index with each stock's weight in the index proportionate to its market value. You cannot invest directly in an index. |
| 2 | The Morgan Stanley Capital International (MSCI) All Country World Index (ACWI) ex USA Index (Net) is a free-float-adjusted market-capitalization-weighted index that is designed to measure the equity market performance of developed and emerging markets, excluding the U.S. Source: MSCI. MSCI makes no express or implied warranties or representations and shall have no liability whatsoever with respect to any MSCI data contained herein. The MSCI data may not be further redistributed or used as a basis for other indexes or any securities or financial products. This report is not approved, reviewed, or produced by MSCI. You cannot invest directly in an index. |
| 3 | The MSCI Emerging Markets (EM) Index (Net) (USD) is a free-float-adjusted market-capitalization-weighted index that is designed to measure equity market performance of emerging markets. You cannot invest directly in an index. |
| 4 | The Bloomberg U.S. Aggregate Bond Index is a broad-based benchmark that measures the investment-grade, U.S.-dollar-denominated, fixed-rate taxable bond market, including Treasuries, government-related and corporate securities, mortgage-backed securities (agency fixed-rate and hybrid adjustable-rate mortgage pass-throughs), asset-backed securities, and commercial mortgage-backed securities. You cannot invest directly in an index. |
| 5 | The Bloomberg Global Aggregate ex-USD Index (unhedged) is an unmanaged index that provides a broad-based measure of the global investment-grade fixed-income markets excluding the U.S.-dollar-denominated debt market. You cannot invest directly in an index. |
| 6 | The Bloomberg Municipal Bond Index is an unmanaged index composed of long-term tax-exempt bonds with a minimum credit rating of Baa. You cannot invest directly in an index. |
| 7 | The ICE BofA U.S. High Yield Index is a market-capitalization-weighted index of domestic and Yankee high-yield bonds. The index tracks the performance of high-yield securities traded in the U.S. bond market. You cannot invest directly in an index. Copyright 2023. ICE Data Indices, LLC. All rights reserved. |
| 1 | The Consumer Price Index (CPI) is a measure of the average change over time in the prices paid by urban consumers for a market basket of consumer goods and services. You cannot invest directly in an index. |

President
Allspring Funds
| Investment objective | The Fund seeks long-term capital appreciation. |
| Manager | Allspring Funds Management, LLC |
| Subadviser | Allspring Global Investments, LLC |
| Portfolio managers | Robert Gruendyke, CFA®‡, Thomas C. Ognar, CFA®‡ |
| Average annual total returns (%) as of January 31, 2023 | |||||||||||
| Including sales charge | Excluding sales charge | Expense ratios1 (%) | |||||||||
| Inception date | 1 year | 5 year | 10 year | 1 year | 5 year | 10 year | Gross | Net 2 | |||
| Class A (STAFX) | 7-30-2010 | -22.43 | 5.44 | 10.54 | -17.70 | 6.70 | 11.20 | 1.17 | 1.07 | ||
| Class C (STOFX) | 7-30-2010 | -19.33 | 5.88 | 10.53 | -18.33 | 5.88 | 10.53 | 1.92 | 1.82 | ||
| Class R (STMFX) | 6-15-2012 | – | – | – | -17.90 | 6.43 | 10.92 | 1.42 | 1.32 | ||
| Class R4 (SLGRX) | 11-30-2012 | – | – | – | -17.50 | 6.92 | 11.49 | 0.89 | 0.80 | ||
| Class R6 (STFFX) | 11-30-2012 | – | – | – | -17.37 | 7.13 | 11.68 | 0.74 | 0.65 | ||
| Administrator Class (STDFX) | 7-30-2010 | – | – | – | -17.63 | 6.81 | 11.33 | 1.09 | 0.95 | ||
| Institutional Class (STNFX) | 7-30-2010 | – | – | – | -17.46 | 7.02 | 11.58 | 0.84 | 0.75 | ||
| Russell 1000® Growth Index3 | – | – | – | – | -16.02 | 11.22 | 14.53 | – | – | ||
| 1 | Reflects the expense ratios as stated in the most recent prospectuses. The expense ratios shown are subject to change and may differ from the annualized expense ratios shown in the financial highlights of this report. |
| 2 | The manager has contractually committed through November 30, 2023, to waive fees and/or reimburse expenses to the extent necessary to cap total annual fund operating expenses after fee waivers at 1.07% for Class A, 1.82% for Class C, 1.32% for Class R, 0.80% for Class R4, 0.65% for Class R6, 0.95% for Administrator Class, and 0.75% for Institutional Class. Brokerage commissions, stamp duty fees, interest, taxes, acquired fund fees and expenses (if any), and extraordinary expenses are excluded from the expense caps. Prior to or after the commitment expiration date, the caps may be increased or the commitment to maintain the caps may be terminated only with the approval of the Board of Trustees. Without these caps, the Fund’s returns would have been lower. The expense ratio paid by an investor is the net expense ratio (the total annual fund operating expenses after fee waivers) as stated in the prospectuses. |
| 3 | The Russell 1000® Growth Index measures the performance of those Russell 1000 companies with higher price/book ratios and higher forecasted growth values. You cannot invest directly in an index. |
| ‡ | CFA® and Chartered Financial Analyst® are trademarks owned by CFA Institute. |
| Ten largest holdings (%) as of January 31, 20231 | |
| Microsoft Corporation | 9.81 |
| Apple Incorporated | 8.35 |
| Amazon.com Incorporated | 5.61 |
| Alphabet Incorporated Class A | 5.12 |
| MasterCard Incorporated Class A | 3.95 |
| The TJX Companies Incorporated | 2.72 |
| UnitedHealth Group Incorporated | 2.51 |
| Boston Scientific Corporation | 2.39 |
| Copart Incorporated | 2.28 |
| NVIDIA Corporation | 2.25 |
| 1 | Figures represent the percentage of the Fund's net assets. Holdings are subject to change and may have changed since the date specified. |
| Sector allocation as of January 31, 20231 |
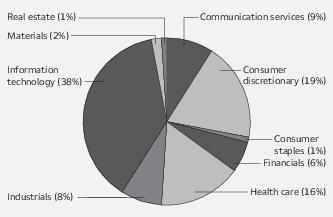
| 1 | Figures represent the percentage of the Fund's long-term investments. Allocations are subject to change and may have changed since the date specified. |
| Beginning account value 8-1-2022 | Ending account value 1-31-2023 | Expenses paid during the period1 | Annualized net expense ratio | |
| Class A | ||||
| Actual | $1,000.00 | $ 959.04 | $5.28 | 1.07% |
| Hypothetical (5% return before expenses) | $1,000.00 | $1,019.81 | $5.45 | 1.07% |
| Class C | ||||
| Actual | $1,000.00 | $ 955.52 | $8.97 | 1.82% |
| Hypothetical (5% return before expenses) | $1,000.00 | $1,016.03 | $9.25 | 1.82% |
| Class R | ||||
| Actual | $1,000.00 | $ 957.76 | $6.51 | 1.32% |
| Hypothetical (5% return before expenses) | $1,000.00 | $1,018.55 | $6.72 | 1.32% |
| Class R4 | ||||
| Actual | $1,000.00 | $ 960.14 | $3.95 | 0.80% |
| Hypothetical (5% return before expenses) | $1,000.00 | $1,021.17 | $4.08 | 0.80% |
| Class R6 | ||||
| Actual | $1,000.00 | $ 961.08 | $3.21 | 0.65% |
| Hypothetical (5% return before expenses) | $1,000.00 | $1,021.93 | $3.31 | 0.65% |
| Administrator Class | ||||
| Actual | $1,000.00 | $ 959.50 | $4.69 | 0.95% |
| Hypothetical (5% return before expenses) | $1,000.00 | $1,020.42 | $4.84 | 0.95% |
| Institutional Class | ||||
| Actual | $1,000.00 | $ 960.70 | $3.71 | 0.75% |
| Hypothetical (5% return before expenses) | $1,000.00 | $1,021.42 | $3.82 | 0.75% |
| Shares | Value | ||||
| Common stocks: 98.18% | |||||
| Communication services: 8.37% | |||||
| Entertainment: 0.47% | |||||
| Netflix Incorporated † | 9,754 | $ 3,451,550 | |||
| Interactive media & services: 7.25% | |||||
| Alphabet Incorporated Class A † | 384,396 | 37,993,701 | |||
| Alphabet Incorporated Class C † | 121,094 | 12,093,658 | |||
| Meta Platforms Incorporated Class A † | 25,145 | 3,745,851 | |||
| 53,833,210 | |||||
| Wireless telecommunication services: 0.65% | |||||
| T-Mobile US Incorporated † | 32,155 | 4,801,063 | |||
| Consumer discretionary: 17.84% | |||||
| Hotels, restaurants & leisure: 3.47% | |||||
| Airbnb Incorporated Class A † | 36,804 | 4,089,292 | |||
| Chipotle Mexican Grill Incorporated † | 9,732 | 16,022,570 | |||
| Starbucks Corporation | 51,389 | 5,608,595 | |||
| 25,720,457 | |||||
| Internet & direct marketing retail: 5.75% | |||||
| Amazon.com Incorporated † | 403,543 | 41,617,390 | |||
| MercadoLibre Incorporated † | 912 | 1,077,701 | |||
| 42,695,091 | |||||
| Specialty retail: 6.85% | |||||
| AutoZone Incorporated † | 1,074 | 2,619,325 | |||
| O'Reilly Automotive Incorporated † | 9,842 | 7,798,309 | |||
| The Home Depot Incorporated | 25,328 | 8,210,578 | |||
| The TJX Companies Incorporated | 246,321 | 20,163,837 | |||
| Ulta Beauty Incorporated † | 23,466 | 12,060,585 | |||
| 50,852,634 | |||||
| Textiles, apparel & luxury goods: 1.77% | |||||
| lululemon athletica Incorporated † | 18,128 | 5,563,121 | |||
| Nike Incorporated Class B | 59,255 | 7,544,939 | |||
| 13,108,060 | |||||
| Consumer staples: 2.72% | |||||
| Beverages: 1.13% | |||||
| Constellation Brands Incorporated Class A | 36,219 | 8,385,423 | |||
| Food & staples retailing: 1.24% | |||||
| Sysco Corporation | 119,179 | 9,231,605 | |||
| Personal products: 0.35% | |||||
| The Estee Lauder Companies Incorporated Class A | 9,338 | 2,587,373 | |||
| Energy: 0.36% | |||||
| Oil, gas & consumable fuels: 0.36% | |||||
| Hess Corporation | 17,847 | 2,679,906 |
| Shares | Value | ||||
| Financials: 5.60% | |||||
| Capital markets: 4.82% | |||||
| BlackRock Incorporated | 8,609 | $ 6,536,039 | |||
| CME Group Incorporated | 71,584 | 12,646,029 | |||
| Intercontinental Exchange Incorporated | 30,239 | 3,252,204 | |||
| The Charles Schwab Corporation | 171,743 | 13,296,343 | |||
| 35,730,615 | |||||
| Insurance: 0.78% | |||||
| Progressive Corporation | 42,490 | 5,793,512 | |||
| Health care: 15.70% | |||||
| Biotechnology: 3.29% | |||||
| Alnylam Pharmaceuticals Incorporated † | 31,599 | 7,154,014 | |||
| BioMarin Pharmaceutical Incorporated † | 40,064 | 4,621,382 | |||
| Seagen Incorporated † | 13,260 | 1,849,505 | |||
| Vertex Pharmaceuticals Incorporated † | 33,392 | 10,788,955 | |||
| 24,413,856 | |||||
| Health care equipment & supplies: 5.72% | |||||
| Abbott Laboratories | 39,836 | 4,403,870 | |||
| Boston Scientific Corporation † | 383,239 | 17,724,804 | |||
| Intuitive Surgical Incorporated † | 23,604 | 5,799,267 | |||
| Stryker Corporation | 57,151 | 14,505,495 | |||
| 42,433,436 | |||||
| Health care providers & services: 3.16% | |||||
| Cardinal Health Incorporated | 62,582 | 4,834,460 | |||
| UnitedHealth Group Incorporated | 37,274 | 18,606,808 | |||
| 23,441,268 | |||||
| Health care technology: 0.75% | |||||
| Veeva Systems Incorporated Class A † | 32,749 | 5,585,342 | |||
| Life sciences tools & services: 1.98% | |||||
| Agilent Technologies Incorporated | 66,896 | 10,173,544 | |||
| Thermo Fisher Scientific Incorporated | 8,020 | 4,574,047 | |||
| 14,747,591 | |||||
| Pharmaceuticals: 0.80% | |||||
| Eli Lilly & Company | 9,487 | 3,264,951 | |||
| Zoetis Incorporated | 16,141 | 2,671,174 | |||
| 5,936,125 | |||||
| Industrials: 8.08% | |||||
| Aerospace & defense: 0.30% | |||||
| TransDigm Group Incorporated | 3,127 | 2,244,404 | |||
| Air freight & logistics: 1.85% | |||||
| United Parcel Service Incorporated Class B | 73,990 | 13,705,168 | |||
| Building products: 0.23% | |||||
| Johnson Controls International plc | 24,785 | 1,724,292 |
| Shares | Value | ||||
| Commercial services & supplies: 2.28% | |||||
| Copart Incorporated † | 253,656 | $ 16,896,026 | |||
| Machinery: 1.11% | |||||
| Fortive Corporation | 121,761 | 8,283,401 | |||
| Road & rail: 2.31% | |||||
| CSX Corporation | 152,282 | 4,708,559 | |||
| J.B. Hunt Transport Services Incorporated | 23,729 | 4,485,967 | |||
| Uber Technologies Incorporated † | 74,048 | 2,290,305 | |||
| Union Pacific Corporation | 27,629 | 5,641,566 | |||
| 17,126,397 | |||||
| Information technology: 36.15% | |||||
| IT services: 7.60% | |||||
| MasterCard Incorporated Class A | 79,022 | 29,285,553 | |||
| PayPal Holdings Incorporated † | 132,441 | 10,792,617 | |||
| Visa Incorporated Class A | 70,711 | 16,278,379 | |||
| 56,356,549 | |||||
| Semiconductors & semiconductor equipment: 5.53% | |||||
| Advanced Micro Devices Incorporated † | 54,083 | 4,064,337 | |||
| Enphase Energy Incorporated † | 2,314 | 512,273 | |||
| Marvell Technology Incorporated | 48,936 | 2,111,588 | |||
| Microchip Technology Incorporated | 167,185 | 12,976,900 | |||
| NVIDIA Corporation | 85,637 | 16,730,901 | |||
| Qualcomm Incorporated | 34,967 | 4,657,954 | |||
| 41,053,953 | |||||
| Software: 14.67% | |||||
| Crowdstrike Holdings Incorporated Class A † | 15,927 | 1,686,669 | |||
| Intuit Incorporated | 21,205 | 8,962,717 | |||
| Microsoft Corporation | 293,907 | 72,833,094 | |||
| Oracle Corporation | 77,763 | 6,878,915 | |||
| Palo Alto Networks Incorporated † | 49,882 | 7,913,280 | |||
| ServiceNow Incorporated † | 17,549 | 7,987,076 | |||
| Workday Incorporated Class A † | 14,502 | 2,631,098 | |||
| 108,892,849 | |||||
| Technology hardware, storage & peripherals: 8.35% | |||||
| Apple Incorporated | 429,448 | 61,965,052 | |||
| Materials: 1.52% | |||||
| Chemicals: 1.52% | |||||
| Linde plc | 34,102 | 11,285,717 | |||
| Real estate: 1.84% | |||||
| Equity REITs: 1.00% | |||||
| Equinix Incorporated | 2,874 | 2,121,386 | |||
| SBA Communications Corporation | 17,958 | 5,343,044 | |||
| 7,464,430 |
| Shares | Value | ||||
| Real estate management & development: 0.84% | |||||
| CBRE Group Incorporated Class A † | 72,651 | $ 6,212,387 | |||
| Total Common stocks (Cost $393,394,802) | 728,638,742 |
| Yield | |||||
| Short-term investments: 0.94% | |||||
| Investment companies: 0.94% | |||||
| Allspring Government Money Market Fund Select Class ♠∞ | 4.16% | 6,986,243 | 6,986,243 | ||
| Total Short-term investments (Cost $6,986,243) | 6,986,243 | ||||
| Total investments in securities (Cost $400,381,045) | 99.12% | 735,624,985 | |||
| Other assets and liabilities, net | 0.88 | 6,555,754 | |||
| Total net assets | 100.00% | $742,180,739 |
| † | Non-income-earning security |
| ♠ | The issuer of the security is an affiliated person of the Fund as defined in the Investment Company Act of 1940. |
| ∞ | The rate represents the 7-day annualized yield at period end. |
| Abbreviations: | |
| REIT | Real estate investment trust |
| Value, beginning of period | Purchases | Sales proceeds | Net realized gains (losses) | Net change in unrealized gains (losses) | Value, end of period | Shares, end of period | Income from affiliated securities | |||
| Short-term investments | ||||||||||
| Allspring Government Money Market Fund Select Class | $13,554,667 | $101,110,019 | $(107,678,443) | $ 0 | $0 | $ 6,986,243 | 6,986,243 | $ 266,142 | ||
| Investments in affiliates no longer held at end of period | ||||||||||
| Securities Lending Cash Investments LLC | 0 | 404,600 | (404,640) | 40 | 0 | 0 | 0 | 233 # | ||
| $40 | $0 | $6,986,243 | $266,375 | |||||||
| # | Amount shown represents income before fees and rebates. |
| Assets | |
Investments in unaffiliated securities, at value (cost $393,394,802) | $ 728,638,742 |
Investments in affiliated securities, at value (cost $6,986,243) | 6,986,243 |
Receivable for investments sold | 10,510,429 |
Receivable for Fund shares sold | 111,810 |
Receivable for dividends | 110,880 |
Prepaid expenses and other assets | 71,479 |
Total assets | 746,429,583 |
| Liabilities | |
Payable for investments purchased | 3,000,995 |
Payable for Fund shares redeemed | 520,295 |
Management fee payable | 346,689 |
Administration fees payable | 91,701 |
Trustees’ fees and expenses payable | 6,837 |
Distribution fees payable | 1,928 |
Accrued expenses and other liabilities | 280,399 |
Total liabilities | 4,248,844 |
Total net assets | $742,180,739 |
| Net assets consist of | |
Paid-in capital | $ 388,814,665 |
Total distributable earnings | 353,366,074 |
Total net assets | $742,180,739 |
| Computation of net asset value and offering price per share | |
Net assets – Class A | $ 445,176,912 |
Shares outstanding – Class A1 | 13,746,833 |
Net asset value per share – Class A | $32.38 |
Maximum offering price per share – Class A2 | $34.36 |
Net assets – Class C | $ 2,453,323 |
Shares outstanding – Class C1 | 95,660 |
Net asset value per share – Class C | $25.65 |
Net assets – Class R | $ 2,102,837 |
Shares outstanding – Class R1 | 69,178 |
Net asset value per share – Class R | $30.40 |
Net assets – Class R4 | $ 15,476 |
Shares outstanding – Class R41 | 450 |
Net asset value per share – Class R4 | $34.39 |
Net assets – Class R6 | $ 206,242,647 |
Shares outstanding – Class R61 | 5,883,218 |
Net asset value per share – Class R6 | $35.06 |
Net assets – Administrator Class | $ 53,847,191 |
Shares outstanding – Administrator Class1 | 1,617,023 |
Net asset value per share – Administrator Class | $33.30 |
Net assets – Institutional Class | $ 32,342,353 |
Shares outstanding – Institutional Class1 | 932,723 |
Net asset value per share – Institutional Class | $34.68 |
| 1 | The Fund has an unlimited number of authorized shares. |
| 2 | Maximum offering price is computed as 100/94.25 of net asset value. On investments of $50,000 or more, the offering price is reduced. |
| Investment income | |
Dividends | $ 3,242,476 |
Income from affiliated securities | 266,304 |
Total investment income | 3,508,780 |
| Expenses | |
Management fee | 2,600,370 |
| Administration fees | |
Class A | 472,459 |
Class C | 2,774 |
Class R | 2,253 |
Class R4 | 6 |
Class R6 | 30,753 |
Administrator Class | 35,686 |
Institutional Class | 24,132 |
| Shareholder servicing fees | |
Class A | 561,496 |
Class C | 3,287 |
Class R | 2,475 |
Class R4 | 8 |
Administrator Class | 68,534 |
| Distribution fees | |
Class C | 9,863 |
Class R | 2,475 |
Custody and accounting fees | 27,733 |
Professional fees | 24,293 |
Registration fees | 46,059 |
Shareholder report expenses | 28,135 |
Trustees’ fees and expenses | 11,026 |
Other fees and expenses | 8,755 |
Total expenses | 3,962,572 |
| Less: Fee waivers and/or expense reimbursements | |
Fund-level | (339,147) |
Class A | (67,232) |
Class C | (331) |
Class R6 | (21,203) |
Administrator Class | (19,082) |
Institutional Class | (3,710) |
Net expenses | 3,511,867 |
Net investment loss | (3,087) |
| Realized and unrealized gains (losses) on investments | |
| Net realized gains on | |
Unaffiliated securities | 23,280,448 |
Affiliated securities | 40 |
Net realized gains on investments | 23,280,488 |
Net change in unrealized gains (losses) on investments | (58,144,973) |
Net realized and unrealized gains (losses) on investments | (34,864,485) |
Net decrease in net assets resulting from operations | $(34,867,572) |
| Six months ended January 31, 2023 (unaudited) | Year ended July 31, 2022 | |||
| Operations | ||||
Net investment loss | $ (3,087) | $ (4,018,264) | ||
Net realized gains on investments | 23,280,488 | 129,735,058 | ||
Net change in unrealized gains (losses) on investments | (58,144,973) | (357,443,950) | ||
Net decrease in net assets resulting from operations | (34,867,572) | (231,727,156) | ||
| Distributions to shareholders from | ||||
| Net investment income and net realized gains | ||||
Class A | (44,292,446) | (94,969,340) | ||
Class C | (313,544) | (885,940) | ||
Class R | (216,039) | (440,556) | ||
Class R4 | (1,433) | (2,756) | ||
Class R6 | (19,033,722) | (47,295,062) | ||
Administrator Class | (5,257,541) | (11,436,683) | ||
Institutional Class | (3,236,556) | (11,138,623) | ||
Total distributions to shareholders | (72,351,281) | (166,168,960) | ||
| Capital share transactions | Shares | Shares | ||
| Proceeds from shares sold | ||||
Class A | 181,287 | 5,775,402 | 208,098 | 9,675,849 |
Class C | 9,010 | 256,587 | 14,823 | 602,775 |
Class R | 4,012 | 131,872 | 24,867 | 948,090 |
Class R6 | 412,433 | 15,680,800 | 279,638 | 13,594,825 |
Administrator Class | 21,421 | 753,664 | 44,131 | 1,918,024 |
Institutional Class | 89,851 | 3,122,944 | 303,730 | 16,712,575 |
| 25,721,269 | 43,452,138 | |||
| Reinvestment of distributions | ||||
Class A | 1,378,131 | 43,052,757 | 1,893,114 | 92,137,889 |
Class C | 12,658 | 313,544 | 22,198 | 885,940 |
Class R | 7,146 | 209,670 | 8,564 | 394,893 |
Class R4 | 43 | 1,433 | 54 | 2,756 |
Class R6 | 543,092 | 18,356,494 | 873,534 | 45,458,706 |
Administrator Class | 163,684 | 5,257,541 | 229,215 | 11,426,420 |
Institutional Class | 93,398 | 3,123,225 | 196,289 | 10,126,530 |
| 70,314,664 | 160,433,134 | |||
| Payment for shares redeemed | ||||
Class A | (910,006) | (30,424,164) | (1,510,134) | (67,884,626) |
Class C | (30,598) | (883,233) | (68,591) | (2,691,286) |
Class R | (16,981) | (604,013) | (14,112) | (558,622) |
Class R6 | (438,360) | (16,021,506) | (2,266,673) | (110,291,919) |
Administrator Class | (127,709) | (4,424,657) | (241,347) | (11,229,775) |
Institutional Class | (343,684) | (12,179,867) | (754,103) | (34,467,686) |
| (64,537,440) | (227,123,914) | |||
Net increase (decrease) in net assets resulting from capital share transactions | 31,498,493 | (23,238,642) | ||
Total decrease in net assets | (75,720,360) | (421,134,758) | ||
| Net assets | ||||
Beginning of period | 817,901,099 | 1,239,035,857 | ||
End of period | $742,180,739 | $ 817,901,099 | ||
| Year ended July 31 | ||||||
| Class A | Six months ended January 31, 2023 (unaudited) | 2022 | 2021 | 2020 | 2019 | 2018 |
Net asset value, beginning of period | $37.58 | $55.05 | $49.63 | $44.23 | $52.01 | $50.10 |
Net investment loss | (0.02) 1 | (0.24) 1 | (0.25) 1 | (0.11) 1 | (0.03) 1 | (0.08) 1 |
Net realized and unrealized gains (losses) on investments | (1.66) | (9.43) | 12.60 | 9.66 | 3.47 | 12.56 |
Total from investment operations | (1.68) | (9.67) | 12.35 | 9.55 | 3.44 | 12.48 |
| Distributions to shareholders from | ||||||
Net realized gains | (3.52) | (7.80) | (6.93) | (4.15) | (11.22) | (10.57) |
Net asset value, end of period | $32.38 | $37.58 | $55.05 | $49.63 | $44.23 | $52.01 |
Total return2 | (4.10)% | (20.79)% | 27.25% | 23.51% | 11.00% | 27.98% |
| Ratios to average net assets (annualized) | ||||||
Gross expenses | 1.19% | 1.17% | 1.17% | 1.18% | 1.18% | 1.17% |
Net expenses | 1.07% | 1.04% | 1.05% | 1.05% | 1.07% | 1.07% |
Net investment loss | (0.14)% | (0.52)% | (0.53)% | (0.24)% | (0.07)% | (0.16)% |
| Supplemental data | ||||||
Portfolio turnover rate | 25% | 43% | 39% | 34% | 43% | 34% |
Net assets, end of period (000s omitted) | $445,177 | $492,177 | $688,523 | $587,771 | $529,110 | $534,694 |
| 1 | Calculated based upon average shares outstanding |
| 2 | Total return calculations do not include any sales charges. Returns for periods of less than one year are not annualized. |
| Year ended July 31 | ||||||
| Class C | Six months ended January 31, 2023 (unaudited) | 2022 | 2021 | 2020 | 2019 | 2018 |
Net asset value, beginning of period | $30.66 | $46.65 | $43.32 | $39.41 | $47.97 | $47.25 |
Net investment loss | (0.12) 1 | (0.49) 1 | (0.56) 1 | (0.38) 1 | (0.32) 1 | (0.31) 1 |
Net realized and unrealized gains (losses) on investments | (1.37) | (7.70) | 10.82 | 8.44 | 2.98 | 11.60 |
Total from investment operations | (1.49) | (8.19) | 10.26 | 8.06 | 2.66 | 11.29 |
| Distributions to shareholders from | ||||||
Net realized gains | (3.52) | (7.80) | (6.93) | (4.15) | (11.22) | (10.57) |
Net asset value, end of period | $25.65 | $30.66 | $46.65 | $43.32 | $39.41 | $47.97 |
Total return2 | (4.45)% | (21.42)% | 26.28% | 22.57% | 10.17% | 27.03% |
| Ratios to average net assets (annualized) | ||||||
Gross expenses | 1.94% | 1.92% | 1.92% | 1.93% | 1.93% | 1.92% |
Net expenses | 1.82% | 1.82% | 1.82% | 1.82% | 1.82% | 1.82% |
Net investment loss | (0.88)% | (1.29)% | (1.29)% | (1.00)% | (0.80)% | (0.90)% |
| Supplemental data | ||||||
Portfolio turnover rate | 25% | 43% | 39% | 34% | 43% | 34% |
Net assets, end of period (000s omitted) | $2,453 | $3,207 | $6,351 | $9,918 | $11,504 | $15,586 |
| 1 | Calculated based upon average shares outstanding |
| 2 | Total return calculations do not include any sales charges. Returns for periods of less than one year are not annualized. |
| Year ended July 31 | ||||||
| Class R | Six months ended January 31, 2023 (unaudited) | 2022 | 2021 | 2020 | 2019 | 2018 |
Net asset value, beginning of period | $35.55 | $52.61 | $47.81 | $42.86 | $50.89 | $49.34 |
Net investment loss | (0.06) 1 | (0.32) 1 | (0.37) 1 | (0.20) 1 | (0.13) 1 | (0.20) 1 |
Net realized and unrealized gains (losses) on investments | (1.57) | (8.94) | 12.10 | 9.30 | 3.32 | 12.32 |
Total from investment operations | (1.63) | (9.26) | 11.73 | 9.10 | 3.19 | 12.12 |
| Distributions to shareholders from | ||||||
Net realized gains | (3.52) | (7.80) | (6.93) | (4.15) | (11.22) | (10.57) |
Net asset value, end of period | $30.40 | $35.55 | $52.61 | $47.81 | $42.86 | $50.89 |
Total return2 | (4.22)% | (20.99)% | 26.97% | 23.16% | 10.74% | 27.65% |
| Ratios to average net assets (annualized) | ||||||
Gross expenses | 1.40% | 1.33% | 1.33% | 1.41% | 1.42% | 1.42% |
Net expenses | 1.32% | 1.28% | 1.29% | 1.32% | 1.32% | 1.32% |
Net investment loss | (0.38)% | (0.75)% | (0.77)% | (0.49)% | (0.29)% | (0.40)% |
| Supplemental data | ||||||
Portfolio turnover rate | 25% | 43% | 39% | 34% | 43% | 34% |
Net assets, end of period (000s omitted) | $2,103 | $2,666 | $2,929 | $3,322 | $4,499 | $5,661 |
| 1 | Calculated based upon average shares outstanding |
| 2 | Returns for periods of less than one year are not annualized. |
| Year ended July 31 | ||||||
| Class R4 | Six months ended January 31, 2023 (unaudited) | 2022 | 2021 | 2020 | 2019 | 2018 |
Net asset value, beginning of period | $39.62 | $57.50 | $51.43 | $45.72 | $53.23 | $50.94 |
Net investment income (loss) | 0.02 1 | (0.13) 1 | (0.15) 1 | 0.02 1 | 0.11 1 | 0.05 1 |
Net realized and unrealized gains (losses) on investments | (1.73) | (9.95) | 13.15 | 9.91 | 3.60 | 12.81 |
Total from investment operations | (1.71) | (10.08) | 13.00 | 9.93 | 3.71 | 12.86 |
| Distributions to shareholders from | ||||||
Net investment income | 0.00 | 0.00 | 0.00 | (0.07) | 0.00 | 0.00 |
Net realized gains | (3.52) | (7.80) | (6.93) | (4.15) | (11.22) | (10.57) |
Total distributions to shareholders | (3.52) | (7.80) | (6.93) | (4.22) | (11.22) | (10.57) |
Net asset value, end of period | $34.39 | $39.62 | $57.50 | $51.43 | $45.72 | $53.23 |
Total return2 | (3.99)% | (20.60)% | 27.56% | 23.59% | 11.32% | 28.31% |
| Ratios to average net assets (annualized) | ||||||
Gross expenses | 0.89% | 0.88% | 0.86% | 0.90% | 0.90% | 0.90% |
Net expenses | 0.80% | 0.80% | 0.80% | 0.80% | 0.80% | 0.80% |
Net investment income (loss) | 0.13% | (0.27)% | (0.28)% | 0.05% | 0.24% | 0.10% |
| Supplemental data | ||||||
Portfolio turnover rate | 25% | 43% | 39% | 34% | 43% | 34% |
Net assets, end of period (000s omitted) | $15 | $16 | $20 | $18 | $896 | $2,089 |
| 1 | Calculated based upon average shares outstanding |
| 2 | Returns for periods of less than one year are not annualized. |
| Year ended July 31 | ||||||
| Class R6 | Six months ended January 31, 2023 (unaudited) | 2022 | 2021 | 2020 | 2019 | 2018 |
Net asset value, beginning of period | $40.28 | $58.26 | $51.95 | $46.06 | $53.49 | $51.12 |
Net investment income (loss) | 0.05 1 | (0.06) 1 | (0.08) 1 | 0.08 1 | 0.16 1 | 0.14 1 |
Net realized and unrealized gains (losses) on investments | (1.75) | (10.12) | 13.32 | 10.09 | 3.65 | 12.85 |
Total from investment operations | (1.70) | (10.18) | 13.24 | 10.17 | 3.81 | 12.99 |
| Distributions to shareholders from | ||||||
Net investment income | 0.00 | 0.00 | 0.00 | (0.13) | (0.02) | (0.05) |
Net realized gains | (3.52) | (7.80) | (6.93) | (4.15) | (11.22) | (10.57) |
Total distributions to shareholders | (3.52) | (7.80) | (6.93) | (4.28) | (11.24) | (10.62) |
Net asset value, end of period | $35.06 | $40.28 | $58.26 | $51.95 | $46.06 | $53.49 |
Total return2 | (3.89)% | (20.49)% | 27.76% | 24.03% | 11.46% | 28.51% |
| Ratios to average net assets (annualized) | ||||||
Gross expenses | 0.76% | 0.74% | 0.74% | 0.75% | 0.75% | 0.75% |
Net expenses | 0.65% | 0.65% | 0.65% | 0.65% | 0.65% | 0.65% |
Net investment income (loss) | 0.28% | (0.13)% | (0.13)% | 0.17% | 0.35% | 0.27% |
| Supplemental data | ||||||
Portfolio turnover rate | 25% | 43% | 39% | 34% | 43% | 34% |
Net assets, end of period (000s omitted) | $206,243 | $216,150 | $377,470 | $327,584 | $326,990 | $327,943 |
| 1 | Calculated based upon average shares outstanding |
| 2 | Returns for periods of less than one year are not annualized. |
| Year ended July 31 | ||||||
| Administrator Class | Six months ended January 31, 2023 (unaudited) | 2022 | 2021 | 2020 | 2019 | 2018 |
Net asset value, beginning of period | $38.51 | $56.18 | $50.47 | $44.87 | $52.54 | $50.46 |
Net investment income (loss) | (0.00) 1,2 | (0.20) | (0.23) | (0.07) | 0.02 | (0.01) |
Net realized and unrealized gains (losses) on investments | (1.69) | (9.67) | 12.87 | 9.83 | 3.53 | 12.66 |
Total from investment operations | (1.69) | (9.87) | 12.64 | 9.76 | 3.55 | 12.65 |
| Distributions to shareholders from | ||||||
Net investment income | 0.00 | 0.00 | 0.00 | (0.01) | 0.00 | 0.00 |
Net realized gains | (3.52) | (7.80) | (6.93) | (4.15) | (11.22) | (10.57) |
Total distributions to shareholders | (3.52) | (7.80) | (6.93) | (4.16) | (11.22) | (10.57) |
Net asset value, end of period | $33.30 | $38.51 | $56.18 | $50.47 | $44.87 | $52.54 |
Total return3 | (4.05)% | (20.72)% | 27.38% | 23.63% | 11.14% | 28.14% |
| Ratios to average net assets (annualized) | ||||||
Gross expenses | 1.11% | 1.09% | 1.09% | 1.10% | 1.10% | 1.09% |
Net expenses | 0.95% | 0.95% | 0.95% | 0.95% | 0.95% | 0.95% |
Net investment income (loss) | (0.02)% | (0.42)% | (0.43)% | (0.14)% | 0.05% | (0.03)% |
| Supplemental data | ||||||
Portfolio turnover rate | 25% | 43% | 39% | 34% | 43% | 34% |
Net assets, end of period (000s omitted) | $53,847 | $60,062 | $85,825 | $79,334 | $67,158 | $79,154 |
| 1 | Calculated based upon average shares outstanding |
| 2 | Amount is more than $(0.005) |
| 3 | Returns for periods of less than one year are not annualized. |
| Year ended July 31 | ||||||
| Institutional Class | Six months ended January 31, 2023 (unaudited) | 2022 | 2021 | 2020 | 2019 | 2018 |
Net asset value, beginning of period | $39.90 | $57.83 | $51.67 | $45.84 | $53.31 | $51.00 |
Net investment income (loss) | 0.03 1 | (0.11) 1 | (0.12) 1 | 0.03 1 | 0.12 1 | 0.10 1 |
Net realized and unrealized gains (losses) on investments | (1.73) | (10.02) | 13.21 | 10.04 | 3.63 | 12.80 |
Total from investment operations | (1.70) | (10.13) | 13.09 | 10.07 | 3.75 | 12.90 |
| Distributions to shareholders from | ||||||
Net investment income | 0.00 | 0.00 | 0.00 | (0.09) | 0.00 | (0.02) |
Net realized gains | (3.52) | (7.80) | (6.93) | (4.15) | (11.22) | (10.57) |
Total distributions to shareholders | (3.52) | (7.80) | (6.93) | (4.24) | (11.22) | (10.59) |
Net asset value, end of period | $34.68 | $39.90 | $57.83 | $51.67 | $45.84 | $53.31 |
Total return2 | (3.93)% | (20.57)% | 27.61% | 23.89% | 11.37% | 28.37% |
| Ratios to average net assets (annualized) | ||||||
Gross expenses | 0.86% | 0.84% | 0.84% | 0.85% | 0.85% | 0.84% |
Net expenses | 0.75% | 0.75% | 0.75% | 0.75% | 0.75% | 0.75% |
Net investment income (loss) | 0.18% | (0.22)% | (0.23)% | 0.07% | 0.26% | 0.18% |
| Supplemental data | ||||||
Portfolio turnover rate | 25% | 43% | 39% | 34% | 43% | 34% |
Net assets, end of period (000s omitted) | $32,342 | $43,622 | $77,917 | $72,681 | $80,194 | $95,809 |
| 1 | Calculated based upon average shares outstanding |
| 2 | Returns for periods of less than one year are not annualized. |
| Gross unrealized gains | $340,101,299 |
| Gross unrealized losses | (4,857,359) |
| Net unrealized gains | $335,243,940 |
| ■ | Level 1 – quoted prices in active markets for identical securities |
| ■ | Level 2 – other significant observable inputs (including quoted prices for similar securities, interest rates, prepayment speeds, credit risk, etc.) |
| ■ | Level 3 – significant unobservable inputs (including the Fund’s own assumptions in determining the fair value of investments) |
| Quoted prices (Level 1) | Other significant observable inputs (Level 2) | Significant unobservable inputs (Level 3) | Total | |
| Assets | ||||
| Investments in: | ||||
| Common stocks | ||||
| Communication services | $ 62,085,823 | $0 | $0 | $ 62,085,823 |
| Consumer discretionary | 132,376,242 | 0 | 0 | 132,376,242 |
| Consumer staples | 20,204,401 | 0 | 0 | 20,204,401 |
| Energy | 2,679,906 | 0 | 0 | 2,679,906 |
| Financials | 41,524,127 | 0 | 0 | 41,524,127 |
| Health care | 116,557,618 | 0 | 0 | 116,557,618 |
| Industrials | 59,979,688 | 0 | 0 | 59,979,688 |
| Information technology | 268,268,403 | 0 | 0 | 268,268,403 |
| Materials | 11,285,717 | 0 | 0 | 11,285,717 |
| Real estate | 13,676,817 | 0 | 0 | 13,676,817 |
| Short-term investments | ||||
| Investment companies | 6,986,243 | 0 | 0 | 6,986,243 |
| Total assets | $735,624,985 | $0 | $0 | $735,624,985 |
| Average daily net assets | Management fee |
| First $500 million | 0.700% |
| Next $500 million | 0.675 |
| Next $1 billion | 0.650 |
| Next $2 billion | 0.625 |
| Next $1 billion | 0.600 |
| Next $3 billion | 0.590 |
| Next $2 billion | 0.565 |
| Next $2 billion | 0.555 |
| Next $4 billion | 0.530 |
| Over $16 billion | 0.505 |
| Class-level administration fee | |
| Class A | 0.21% |
| Class C | 0.21 |
| Class R | 0.21 |
| Class R4 | 0.08 |
| Class R6 | 0.03 |
| Administrator Class | 0.13 |
| Institutional Class | 0.13 |
| Expense ratio caps | |
| Class A | 1.07% |
| Class C | 1.82 |
| Class R | 1.32 |
| Class R4 | 0.80 |
| Class R6 | 0.65 |
| Administrator Class | 0.95 |
| Institutional Class | 0.75 |
| Name and year of birth | Position held and length of service* | Principal occupations during past five years or longer | Current other public company or investment company directorships |
| William R. Ebsworth (Born 1957) | Trustee, since 2015 | Retired. From 1984 to 2013, equities analyst, portfolio manager, research director and chief investment officer at Fidelity Management and Research Company in Boston, Tokyo, and Hong Kong, and retired in 2013 as Chief Investment Officer of Fidelity Strategic Advisers, Inc. where he led a team of investment professionals managing client assets. Prior thereto, Board member of Hong Kong Securities Clearing Co., Hong Kong Options Clearing Corp., the Thailand International Fund, Ltd., Fidelity Investments Life Insurance Company, and Empire Fidelity Investments Life Insurance Company. Audit Committee Chair and Investment Committee Chair of the Vincent Memorial Hospital Foundation (non-profit organization). Mr. Ebsworth is a CFA® charterholder. | N/A |
| Jane A. Freeman (Born 1953) | Trustee, since 2015; Chair Liaison, since 2018 | Retired. From 2012 to 2014 and 1999 to 2008, Chief Financial Officer of Scientific Learning Corporation. From 2008 to 2012, Ms. Freeman provided consulting services related to strategic business projects. Prior to 1999, Portfolio Manager at Rockefeller & Co. and Scudder, Stevens & Clark. Board member of the Harding Loevner Funds from 1996 to 2014, serving as both Lead Independent Director and chair of the Audit Committee. Board member of the Russell Exchange Traded Funds Trust from 2011 to 2012 and the chair of the Audit Committee. Ms. Freeman is also an inactive Chartered Financial Analyst. | N/A |
| Isaiah Harris, Jr. (Born 1952) | Trustee, since 2009; Audit Committee Chair, since 2019 | Retired. Member of the Advisory Board of CEF of East Central Florida. Chairman of the Board of CIGNA Corporation from 2009 to 2021, and Director from 2005 to 2008. From 2003 to 2011, Director of Deluxe Corporation. Prior thereto, President and CEO of BellSouth Advertising and Publishing Corp. from 2005 to 2007, President and CEO of BellSouth Enterprises from 2004 to 2005 and President of BellSouth Consumer Services from 2000 to 2003. Emeritus member of the Iowa State University Foundation Board of Governors. Emeritus Member of the Advisory Board of Iowa State University School of Business. Advisory Board Member, Palm Harbor Academy (private school). Advisory Board Member, Fellowship of Christian Athletes. Mr. Harris is a certified public accountant (inactive status). | N/A |
| David F. Larcker (Born 1950) | Trustee, since 2009 | Distinguished Visiting Fellow at the Hoover Institution since 2022. James Irvin Miller Professor of Accounting at the Graduate School of Business (Emeritus), Stanford University, Director of the Corporate Governance Research Initiative and Senior Faculty of The Rock Center for Corporate Governance since 2006. From 2005 to 2008, Professor of Accounting at the Graduate School of Business, Stanford University. Prior thereto, Ernst & Young Professor of Accounting at The Wharton School, University of Pennsylvania from 1985 to 2005. | N/A |
| Name and year of birth | Position held and length of service* | Principal occupations during past five years or longer | Current other public company or investment company directorships |
| Olivia S. Mitchell (Born 1953) | Trustee, since 2006; Nominating and Governance Committee Chair, since 2018 | International Foundation of Employee Benefit Plans Professor since 1993, Wharton School of the University of Pennsylvania. Director of Wharton’s Pension Research Council and Boettner Center on Pensions & Retirement Research, and Research Associate at the National Bureau of Economic Research. Previously taught at Cornell University from 1978 to 1993. | N/A |
| Timothy J. Penny (Born 1951) | Trustee, since 1996; Chair, since 2018 | President and Chief Executive Officer of Southern Minnesota Initiative Foundation, a non-profit organization, since 2007. Vice Chair of the Economic Club of Minnesota, since 2007. Co-Chair of the Committee for a Responsible Federal Budget, since 1995. Member of the Board of Trustees of NorthStar Education Finance, Inc., a non-profit organization, from 2007-2022. Senior Fellow of the University of Minnesota Humphrey Institute from 1995 to 2017. | N/A |
| James G. Polisson (Born 1959) | Trustee, since 2018 | Retired. Chief Marketing Officer, Source (ETF) UK Services, Ltd, from 2015 to 2017. From 2012 to 2015, Principal of The Polisson Group, LLC, a management consulting, corporate advisory and principal investing company. Chief Executive Officer and Managing Director at Russell Investments, Global Exchange Traded Funds from 2010 to 2012. Managing Director of Barclays Global Investors from 1998 to 2010 and Global Chief Marketing Officer for iShares and Barclays Global Investors from 2000 to 2010. Trustee of the San Francisco Mechanics’ Institute, a non-profit organization, from 2013 to 2015. Board member of the Russell Exchange Traded Fund Trust from 2011 to 2012. Director of Barclays Global Investors Holdings Deutschland GmbH from 2006 to 2009. Mr. Polisson is an attorney and has a retired status with the Massachusetts and District of Columbia Bar Associations. | N/A |
| Pamela Wheelock (Born 1959) | Trustee, since January 2020; previously Trustee from January 2018 to July 2019 | Retired. Executive and Senior Financial leadership positions in the public, private and nonprofit sectors. Interim President and CEO, McKnight Foundation, 2020. Interim Commissioner, Minnesota Department of Human Services, 2019. Chief Operating Officer, Twin Cities Habitat for Humanity, 2017-2019. Vice President for University Services, University of Minnesota, 2012-2016. Interim President and CEO, Blue Cross and Blue Shield of Minnesota, 2011-2012. Executive Vice-President and Chief Financial Officer, Minnesota Wild, 2002-2008. Commissioner, Minnesota Department of Finance, 1999-2002. Chair of the Board of Directors of Destination Medical Center Corporation. Board member of the Minnesota Wild Foundation. | N/A |
| Name and year of birth | Position held and length of service | Principal occupations during past five years or longer |
| Andrew Owen (Born 1960) | President, since 2017 | President and Chief Executive Officer of Allspring Funds Management, LLC since 2017 and Head of Global Fund Governance of Allspring Global Investments since 2022. Prior thereto, co-president of Galliard Capital Management, LLC, an affiliate of Allspring Funds Management, LLC, from 2019 to 2022 and Head of Affiliated Managers, Allspring Global Investments, from 2014 to 2019 and Executive Vice President responsible for marketing, investments and product development for Allspring Funds Management, LLC, from 2009 to 2014. |
| Jeremy DePalma (Born 1974) | Treasurer, since 2012 (for certain funds in the Fund Complex); since 2021 (for the remaining funds in the Fund Complex) | Senior Vice President of Allspring Funds Management, LLC since 2009. Senior Vice President of Evergreen Investment Management Company, LLC from 2008 to 2010 and head of the Fund Reporting and Control Team within Fund Administration from 2005 to 2010. |
| Christopher Baker (Born 1976) | Chief Compliance Officer, since 2022 | Global Chief Compliance Officer for Allspring Global Investments since 2022. Prior thereto, Chief Compliance Officer for State Street Global Advisors from 2018 to 2021. Senior Compliance Officer for the State Street divisions of Alternative Investment Solutions, Sector Solutions, and Global Marketing from 2015 to 2018. From 2010 to 2015 Vice President, Global Head of Investment and Marketing Compliance for State Street Global Advisors. |
| Matthew Prasse (Born 1983) | Chief Legal Officer, since 2022; Secretary, since 2021 | Senior Counsel of the Allspring Legal Department since 2021. Senior Counsel of the Wells Fargo Legal Department from 2018 to 2021. Previously, Counsel for Barings LLC from 2015 to 2018. Prior to joining Barings, Associate at Morgan, Lewis & Bockius LLP from 2008 to 2015. |
P.O. Box 219967
Kansas City, MO 64121-9967

1-800-222-8222 or visit the Fund's website at allspringglobal.com. Read the prospectus carefully before you invest or send money.
SAR3354 01-23

Large Company Value Fund

| 1 | The S&P 500 Index consists of 500 stocks chosen for market size, liquidity, and industry group representation. It is a market-value-weighted index with each stock's weight in the index proportionate to its market value. You cannot invest directly in an index. |
| 2 | The Morgan Stanley Capital International (MSCI) All Country World Index (ACWI) ex USA Index (Net) is a free-float-adjusted market-capitalization-weighted index that is designed to measure the equity market performance of developed and emerging markets, excluding the U.S. Source: MSCI. MSCI makes no express or implied warranties or representations and shall have no liability whatsoever with respect to any MSCI data contained herein. The MSCI data may not be further redistributed or used as a basis for other indexes or any securities or financial products. This report is not approved, reviewed, or produced by MSCI. You cannot invest directly in an index. |
| 3 | The MSCI Emerging Markets (EM) Index (Net) (USD) is a free-float-adjusted market-capitalization-weighted index that is designed to measure equity market performance of emerging markets. You cannot invest directly in an index. |
| 4 | The Bloomberg U.S. Aggregate Bond Index is a broad-based benchmark that measures the investment-grade, U.S.-dollar-denominated, fixed-rate taxable bond market, including Treasuries, government-related and corporate securities, mortgage-backed securities (agency fixed-rate and hybrid adjustable-rate mortgage pass-throughs), asset-backed securities, and commercial mortgage-backed securities. You cannot invest directly in an index. |
| 5 | The Bloomberg Global Aggregate ex-USD Index (unhedged) is an unmanaged index that provides a broad-based measure of the global investment-grade fixed-income markets excluding the U.S.-dollar-denominated debt market. You cannot invest directly in an index. |
| 6 | The Bloomberg Municipal Bond Index is an unmanaged index composed of long-term tax-exempt bonds with a minimum credit rating of Baa. You cannot invest directly in an index. |
| 7 | The ICE BofA U.S. High Yield Index is a market-capitalization-weighted index of domestic and Yankee high-yield bonds. The index tracks the performance of high-yield securities traded in the U.S. bond market. You cannot invest directly in an index. Copyright 2023. ICE Data Indices, LLC. All rights reserved. |
| 1 | The Consumer Price Index (CPI) is a measure of the average change over time in the prices paid by urban consumers for a market basket of consumer goods and services. You cannot invest directly in an index. |

President
Allspring Funds
| Investment objective | The Fund seeks long-term capital appreciation. |
| Manager | Allspring Funds Management, LLC |
| Subadviser | Allspring Global Investments, LLC |
| Portfolio managers | Ryan Brown, CFA®‡, Harindra de Silva, Ph.D., CFA®‡ |
| Average annual total returns (%) as of January 31, 2023 | |||||||||||
| Including sales charge | Excluding sales charge | Expense ratios1 (%) | |||||||||
| Inception date | 1 year | 5 year | 10 year | 1 year | 5 year | 10 year | Gross | Net 2 | |||
| Class A (WLCAX) | 3-31-2008 | -7.70 | 6.16 | 9.01 | -2.04 | 7.43 | 9.65 | 0.96 | 0.83 | ||
| Class C (WFLVX) | 3-31-2008 | -3.78 | 6.62 | 9.00 | -2.78 | 6.62 | 9.00 | 1.71 | 1.58 | ||
| Class R6 (WTLVX)3 | 4-7-2017 | – | – | – | -1.67 | 7.88 | 10.12 | 0.53 | 0.40 | ||
| Administrator Class (WWIDX) | 12-31-2001 | – | – | – | -2.03 | 7.50 | 9.79 | 0.88 | 0.75 | ||
| Institutional Class (WLCIX) | 3-31-2008 | – | – | – | -1.78 | 7.77 | 10.05 | 0.63 | 0.50 | ||
| Russell 1000® Value Index4 | – | – | – | – | -0.43 | 6.94 | 10.15 | – | – | ||
| 1 | Reflects the expense ratios as stated in the most recent prospectuses. The expense ratios shown are subject to change and may differ from the annualized expense ratios shown in the financial highlights of this report. |
| 2 | The manager has contractually committed through November 30, 2023, to waive fees and/or reimburse expenses to the extent necessary to cap total annual fund operating expenses after fee waivers at 0.83% for Class A, 1.58% for Class C, 0.40% for Class R6, 0.75% for Administrator Class, and 0.50% for Institutional Class. Brokerage commissions, stamp duty fees, interest, taxes, acquired fund fees and expenses (if any) from funds in which the affiliated master portfolio invests, and extraordinary expenses are excluded from the expense caps. Prior to or after the commitment expiration date, the caps may be increased or the commitment to maintain the caps may be terminated only with the approval of the Board of Trustees. Without these caps, the Fund’s returns would have been lower. The expense ratio paid by an investor is the net expense ratio (the total annual fund operating expenses after fee waivers) as stated in the prospectuses. |
| 3 | Historical performance shown for the Class R6 shares prior to their inception reflects the performance of the Institutional Class shares, and includes the higher expenses applicable to the Institutional Class shares. If these expenses had not been included, returns for the Class R6 shares would be higher. |
| 4 | The Russell 1000® Value Index measures the performance of those Russell 1000 companies with lower price/book ratios and lower forecasted growth values. You cannot invest directly in an index. |
| ‡ | CFA® and Chartered Financial Analyst® are trademarks owned by CFA Institute. |
| Ten largest holdings (%) as of January 31, 20231 | |
| Berkshire Hathaway Incorporated Class B | 3.76 |
| JPMorgan Chase & Company | 3.00 |
| Exxon Mobil Corporation | 2.99 |
| Linde plc | 2.75 |
| S&P Global Incorporated | 2.75 |
| AT&T Incorporated | 2.53 |
| NextEra Energy Incorporated | 2.49 |
| Bank of America Corporation | 2.29 |
| Realty Income Corporation | 2.28 |
| Elevance Health Incorporated | 2.22 |
| 1 | Figures represent the percentage of the Fund's net assets. Holdings are subject to change and may have changed since the date specified. |
| Sector allocation as of January 31, 20231 |
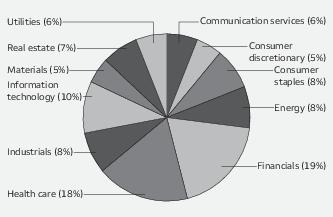
| 1 | Figures represent the percentage of the Fund's long-term investments. Allocations are subject to change and may have changed since the date specified. |
| Beginning account value 8-1-2022 | Ending account value 1-31-2023 | Expenses paid during the period1 | Annualized net expense ratio | |
| Class A | ||||
| Actual | $1,000.00 | $1,034.31 | $4.26 | 0.83% |
| Hypothetical (5% return before expenses) | $1,000.00 | $1,021.02 | $4.23 | 0.83% |
| Class C | ||||
| Actual | $1,000.00 | $1,031.08 | $8.09 | 1.58% |
| Hypothetical (5% return before expenses) | $1,000.00 | $1,017.24 | $8.03 | 1.58% |
| Class R6 | ||||
| Actual | $1,000.00 | $1,036.54 | $2.05 | 0.40% |
| Hypothetical (5% return before expenses) | $1,000.00 | $1,023.19 | $2.04 | 0.40% |
| Administrator Class | ||||
| Actual | $1,000.00 | $1,035.05 | $3.80 | 0.74% |
| Hypothetical (5% return before expenses) | $1,000.00 | $1,021.48 | $3.77 | 0.74% |
| Institutional Class | ||||
| Actual | $1,000.00 | $1,035.91 | $2.57 | 0.50% |
| Hypothetical (5% return before expenses) | $1,000.00 | $1,022.68 | $2.55 | 0.50% |
| Shares | Value | ||||
| Common stocks: 97.70% | |||||
| Communication services: 5.42% | |||||
| Diversified telecommunication services: 2.55% | |||||
| AT&T Incorporated | 288,766 | $ 5,882,163 | |||
| Verizon Communications Incorporated | 1,146 | 47,639 | |||
| 5,929,802 | |||||
| Entertainment: 0.37% | |||||
| Spotify Technology SA † | 996 | 112,269 | |||
| The Walt Disney Company † | 6,871 | 745,435 | |||
| 857,704 | |||||
| Interactive media & services: 0.98% | |||||
| Meta Platforms Incorporated Class A † | 15,218 | 2,267,025 | |||
| Media: 1.09% | |||||
| Comcast Corporation Class A | 55,799 | 2,195,691 | |||
| DISH Network Corporation Class A † | 23,179 | 333,546 | |||
| 2,529,237 | |||||
| Wireless telecommunication services: 0.43% | |||||
| T-Mobile US Incorporated † | 6,668 | 995,599 | |||
| Consumer discretionary: 5.30% | |||||
| Automobiles: 1.29% | |||||
| General Motors Company | 75,858 | 2,982,737 | |||
| Distributors: 0.02% | |||||
| LKQ Corporation | 716 | 42,215 | |||
| Diversified consumer services: 0.20% | |||||
| Graham Holdings Company Class B | 716 | 467,770 | |||
| Hotels, restaurants & leisure: 1.72% | |||||
| Bloomin' Brands Incorporated | 44,784 | 1,086,012 | |||
| Marriott International Incorporated Class A | 14,625 | 2,547,383 | |||
| Travel Leisure Company | 8,478 | 359,213 | |||
| 3,992,608 | |||||
| Internet & direct marketing retail: 0.02% | |||||
| Amazon.com Incorporated † | 452 | 46,615 | |||
| Multiline retail: 0.15% | |||||
| Macy's Incorporated | 14,410 | 340,508 | |||
| Specialty retail: 1.90% | |||||
| Advance Auto Parts Incorporated | 2,589 | 394,253 | |||
| AutoZone Incorporated † | 366 | 892,619 | |||
| O'Reilly Automotive Incorporated † | 3,480 | 2,757,378 | |||
| Signet Jewelers Limited | 4,706 | 361,468 | |||
| 4,405,718 |
| Shares | Value | ||||
| Consumer staples: 8.25% | |||||
| Food & staples retailing: 2.54% | |||||
| Costco Wholesale Corporation | 5,846 | $ 2,988,124 | |||
| The Kroger Company | 2,910 | 129,873 | |||
| Walmart Incorporated | 19,218 | 2,764,894 | |||
| 5,882,891 | |||||
| Food products: 2.22% | |||||
| Cal-Maine Foods Incorporated | 49,861 | 2,853,046 | |||
| General Mills Incorporated | 3,832 | 300,276 | |||
| Mondelez International Incorporated Class A | 28,581 | 1,870,341 | |||
| The Hershey Company | 606 | 136,108 | |||
| 5,159,771 | |||||
| Household products: 0.18% | |||||
| Colgate-Palmolive Company | 5,549 | 413,567 | |||
| Personal products: 0.96% | |||||
| The Estee Lauder Companies Incorporated Class A | 8,034 | 2,226,061 | |||
| Tobacco: 2.35% | |||||
| Altria Group Incorporated | 63,931 | 2,879,452 | |||
| Philip Morris International Incorporated | 19,375 | 2,019,650 | |||
| Vector Group Limited | 41,989 | 543,758 | |||
| 5,442,860 | |||||
| Energy: 7.75% | |||||
| Oil, gas & consumable fuels: 7.75% | |||||
| Chevron Corporation | 18,663 | 3,247,735 | |||
| Delek US Holdings Incorporated | 94,487 | 2,528,472 | |||
| Exxon Mobil Corporation | 59,721 | 6,928,233 | |||
| Hess Corporation | 15,403 | 2,312,914 | |||
| Kinder Morgan Incorporated | 23,680 | 433,344 | |||
| Phillips 66 | 19,545 | 1,959,777 | |||
| Targa Resources Corporation | 7,489 | 561,825 | |||
| 17,972,300 | |||||
| Financials: 18.17% | |||||
| Banks: 7.67% | |||||
| Bank of America Corporation | 149,600 | 5,307,808 | |||
| Bank of N.T. Butterfield & Son Limited | 14,594 | 466,424 | |||
| Citigroup Incorporated | 85,581 | 4,469,040 | |||
| Glacier Bancorp Incorporated | 2,025 | 92,320 | |||
| JPMorgan Chase & Company | 49,614 | 6,943,975 | |||
| Park National Corporation | 623 | 78,031 | |||
| PNC Financial Services Group Incorporated | 2,574 | 425,817 | |||
| 17,783,415 | |||||
| Capital markets: 3.36% | |||||
| Bank of New York Mellon Corporation | 11,558 | 584,488 | |||
| BlackRock Incorporated | 521 | 395,548 |
| Shares | Value | ||||
| Capital markets (continued) | |||||
| Intercontinental Exchange Incorporated | 4,107 | $ 441,708 | |||
| S&P Global Incorporated | 17,032 | 6,385,978 | |||
| 7,807,722 | |||||
| Diversified financial services: 3.92% | |||||
| Berkshire Hathaway Incorporated Class B † | 27,963 | 8,711,034 | |||
| Jackson Financial Incorporation Class A | 8,470 | 373,019 | |||
| 9,084,053 | |||||
| Insurance: 3.22% | |||||
| AFLAC Incorporated | 31,482 | 2,313,927 | |||
| Arthur J. Gallagher & Company | 20,970 | 4,104,248 | |||
| Chubb Limited | 2,245 | 510,715 | |||
| Loews Corporation | 492 | 30,248 | |||
| Progressive Corporation | 355 | 48,404 | |||
| Reinsurance Group of America Incorporated | 2,982 | 452,578 | |||
| 7,460,120 | |||||
| Health care: 17.55% | |||||
| Biotechnology: 3.61% | |||||
| Biogen Incorporated † | 8,347 | 2,428,142 | |||
| Gilead Sciences Incorporated | 35,764 | 3,002,030 | |||
| Neurocrine Biosciences Incorporated † | 19,896 | 2,207,063 | |||
| Sage Therapeutics Incorporated † | 16,696 | 740,301 | |||
| 8,377,536 | |||||
| Health care equipment & supplies: 2.23% | |||||
| Baxter International Incorporated | 618 | 28,236 | |||
| Boston Scientific Corporation † | 11,680 | 540,200 | |||
| GE HealthCare Technology † | 3,996 | 277,802 | |||
| Medtronic plc | 51,600 | 4,318,404 | |||
| 5,164,642 | |||||
| Health care providers & services: 5.11% | |||||
| Cigna Corporation | 9,410 | 2,979,865 | |||
| Elevance Health Incorporated | 10,296 | 5,147,897 | |||
| HCA Healthcare Incorporated | 11,807 | 3,011,611 | |||
| Humana Incorporated | 1,367 | 699,494 | |||
| 11,838,867 | |||||
| Life sciences tools & services: 2.19% | |||||
| Danaher Corporation | 8,570 | 2,265,737 | |||
| Syneos Health Incorporated † | 78,237 | 2,810,273 | |||
| 5,076,010 | |||||
| Pharmaceuticals: 4.41% | |||||
| Eli Lilly & Company | 2,125 | 731,319 | |||
| Johnson & Johnson | 5,640 | 921,689 | |||
| Merck & Company Incorporated | 3,931 | 422,229 | |||
| Organon & Company | 69,145 | 2,083,339 | |||
| Pfizer Incorporated | 62,740 | 2,770,598 | |||
| Viatris Incorporated | 272,153 | 3,309,380 | |||
| 10,238,554 |
| Shares | Value | ||||
| Industrials: 7.66% | |||||
| Aerospace & defense: 2.72% | |||||
| General Dynamics Corporation | 11,911 | $ 2,775,978 | |||
| Northrop Grumman Corporation | 7,902 | 3,540,412 | |||
| 6,316,390 | |||||
| Air freight & logistics: 1.69% | |||||
| United Parcel Service Incorporated Class B | 21,213 | 3,929,284 | |||
| Airlines: 0.52% | |||||
| United Airlines Holdings Incorporated † | 24,634 | 1,206,081 | |||
| Commercial services & supplies: 0.73% | |||||
| ADT Incorporated | 7,483 | 65,775 | |||
| Cintas Corporation | 2,501 | 1,109,794 | |||
| Waste Management Incorporated | 3,303 | 511,073 | |||
| 1,686,642 | |||||
| Electrical equipment: 0.83% | |||||
| Vertiv Holdings Company | 134,788 | 1,916,685 | |||
| Industrial conglomerates: 0.06% | |||||
| Honeywell International Incorporated | 660 | 137,597 | |||
| Professional services: 0.37% | |||||
| Leidos Holdings Incorporated | 5,141 | 508,136 | |||
| TransUnion | 4,737 | 339,880 | |||
| 848,016 | |||||
| Road & rail: 0.74% | |||||
| Norfolk Southern Corporation | 6,963 | 1,711,575 | |||
| Information technology: 9.95% | |||||
| Communications equipment: 2.39% | |||||
| Cisco Systems Incorporated | 89,483 | 4,355,138 | |||
| CommScope Holdings Incorporated † | 141,854 | 1,191,574 | |||
| 5,546,712 | |||||
| Electronic equipment, instruments & components: 1.02% | |||||
| Vishay Intertechnology Incorporated | 81,472 | 1,864,894 | |||
| Vontier Corporation | 22,018 | 507,075 | |||
| 2,371,969 | |||||
| IT services: 1.01% | |||||
| FleetCor Technologies Incorporated † | 5,223 | 1,090,615 | |||
| StoneCo Limited Class A † | 38,438 | 428,968 | |||
| The Western Union Company | 11,857 | 168,014 | |||
| Visa Incorporated Class A | 2,519 | 579,899 | |||
| WEX Incorporated † | 426 | 78,797 | |||
| 2,346,293 | |||||
| Semiconductors & semiconductor equipment: 1.43% | |||||
| Intel Corporation | 60,917 | 1,721,514 |
| Shares | Value | ||||
| Semiconductors & semiconductor equipment (continued) | |||||
| Qorvo Incorporated † | 982 | $ 106,704 | |||
| Skyworks Solutions Incorporated | 13,473 | 1,477,584 | |||
| 3,305,802 | |||||
| Software: 3.27% | |||||
| Autodesk Incorporated † | 8,803 | 1,894,053 | |||
| NCR Corporation † | 34,630 | 949,555 | |||
| Roper Technologies Incorporated | 3,148 | 1,343,409 | |||
| Salesforce.com Incorporated † | 15,914 | 2,673,075 | |||
| Teradata Corporation † | 20,562 | 717,203 | |||
| 7,577,295 | |||||
| Technology hardware, storage & peripherals: 0.83% | |||||
| Apple Incorporated | 13,329 | 1,923,241 | |||
| Materials: 4.85% | |||||
| Chemicals: 4.04% | |||||
| Air Products & Chemicals Incorporated | 9,322 | 2,987,794 | |||
| Linde plc | 19,298 | 6,386,480 | |||
| 9,374,274 | |||||
| Containers & packaging: 0.81% | |||||
| AptarGroup Incorporated | 1,455 | 168,256 | |||
| O-I Glass Incorporated † | 60,333 | 1,161,410 | |||
| WestRock Company | 13,820 | 542,297 | |||
| 1,871,963 | |||||
| Real estate: 6.64% | |||||
| Equity REITs: 6.64% | |||||
| Alexandria Real Estate Equities Incorporated | 21,958 | 3,529,529 | |||
| American Homes 4 Rent Class A | 70,293 | 2,410,347 | |||
| Equinix Incorporated | 739 | 545,478 | |||
| Public Storage Incorporated | 4,261 | 1,296,793 | |||
| Realty Income Corporation | 77,817 | 5,278,327 | |||
| Rexford Industrial Realty Incorporated | 31,622 | 2,007,048 | |||
| Weyerhaeuser Company | 9,419 | 324,296 | |||
| 15,391,818 | |||||
| Utilities: 6.16% | |||||
| Electric utilities: 3.13% | |||||
| American Electric Power Company Incorporated | 717 | 67,369 | |||
| Duke Energy Corporation | 12,969 | 1,328,674 | |||
| NextEra Energy Incorporated | 77,322 | 5,770,541 | |||
| NRG Energy Incorporated | 2,655 | 90,854 | |||
| 7,257,438 | |||||
| Gas utilities: 2.24% | |||||
| Atmos Energy Corporation | 34,707 | 4,079,461 | |||
| Brookfield Infrastructure Corporation Class A | 24,836 | 1,098,248 | |||
| 5,177,709 | |||||
| Independent power & renewable electricity producers: 0.19% | |||||
| Vistra Energy Corporation | 19,416 | 447,733 |
| Shares | Value | ||||
| Multi-utilities: 0.60% | |||||
| Dominion Energy Incorporated | 18,156 | $ 1,155,448 | |||
| Public Service Enterprise Group Incorporated | 3,795 | 235,024 | |||
| 1,390,472 | |||||
| Total Common stocks (Cost $211,286,072) | 226,520,896 |
| Yield | |||||
| Short-term investments: 1.94% | |||||
| Investment companies: 1.94% | |||||
| Allspring Government Money Market Fund Select Class ♠∞ | 4.16% | 4,488,853 | 4,488,853 | ||
| Total Short-term investments (Cost $4,488,853) | 4,488,853 | ||||
| Total investments in securities (Cost $215,774,925) | 99.64% | 231,009,749 | |||
| Other assets and liabilities, net | 0.36 | 845,665 | |||
| Total net assets | 100.00% | $231,855,414 |
| † | Non-income-earning security |
| ♠ | The issuer of the security is an affiliated person of the Fund as defined in the Investment Company Act of 1940. |
| ∞ | The rate represents the 7-day annualized yield at period end. |
| Abbreviations: | |
| REIT | Real estate investment trust |
| Value, beginning of period | Purchases | Sales proceeds | Net realized gains (losses) | Net change in unrealized gains (losses) | Value, end of period | Shares, end of period | Income from affiliated securities | |||
| Short-term investments | ||||||||||
| Allspring Government Money Market Fund Select Class | $6,030,286 | $14,346,071 | $(15,887,504) | $0 | $0 | $ 4,488,853 | 4,488,853 | $ 89,614 | ||
| Investments in affiliates no longer held at end of period | ||||||||||
| Securities Lending Cash Investments LLC | 0 | 927,750 | (927,750) | 0 | 0 | 0 | 0 | 391 # | ||
| $0 | $0 | $4,488,853 | $90,005 | |||||||
| # | Amount shown represents income before fees and rebates. |
| Description | Number of contracts | Expiration date | Notional cost | Notional value | Unrealized gains | Unrealized losses |
| Long | ||||||
| E-Mini S&P 500 Index | 24 | 3-17-2023 | $4,764,504 | $4,908,000 | $143,496 | $0 |
| Assets | |
Investments in unaffiliated securities, at value (cost $211,286,072) | $ 226,520,896 |
Investments in affiliated securities, at value (cost $4,488,853) | 4,488,853 |
Cash | 185 |
Cash at broker segregated for futures contracts | 721,000 |
Receivable for dividends | 268,658 |
Receivable for daily variation margin on open futures contracts | 69,000 |
Receivable for Fund shares sold | 32,335 |
Prepaid expenses and other assets | 89,547 |
Total assets | 232,190,474 |
| Liabilities | |
Payable for Fund shares redeemed | 144,503 |
Management fee payable | 52,923 |
Shareholder servicing fees payable | 47,098 |
Administration fees payable | 39,454 |
Trustees’ fees and expenses payable | 4,575 |
Distribution fee payable | 1,955 |
Accrued expenses and other liabilities | 44,552 |
Total liabilities | 335,060 |
Total net assets | $231,855,414 |
| Net assets consist of | |
Paid-in capital | $ 223,054,154 |
Total distributable earnings | 8,801,260 |
Total net assets | $231,855,414 |
| Computation of net asset value and offering price per share | |
Net assets – Class A | $ 212,318,421 |
Shares outstanding – Class A1 | 17,097,774 |
Net asset value per share – Class A | $12.42 |
Maximum offering price per share – Class A2 | $13.18 |
Net assets – Class C | $ 2,951,420 |
Shares outstanding – Class C1 | 226,735 |
Net asset value per share – Class C | $13.02 |
Net assets – Class R6 | $ 930,015 |
Shares outstanding – Class R61 | 74,418 |
Net asset value per share – Class R6 | $12.50 |
Net assets – Administrator Class | $ 10,562,109 |
Shares outstanding – Administrator Class1 | 838,234 |
Net asset value per share – Administrator Class | $12.60 |
Net assets – Institutional Class | $ 5,093,449 |
Shares outstanding – Institutional Class1 | 406,730 |
Net asset value per share – Institutional Class | $12.52 |
| 1 | The Fund has an unlimited number of authorized shares. |
| 2 | Maximum offering price is computed as 100/94.25 of net asset value. On investments of $50,000 or more, the offering price is reduced. |
| Investment income | |
Dividends (net of foreign withholdings taxes of $541) | $ 2,598,302 |
Income from affiliated securities | 91,028 |
Total investment income | 2,689,330 |
| Expenses | |
Management fee | 447,693 |
| Administration fees | |
Class A | 215,481 |
Class C | 2,736 |
Class R6 | 129 |
Administrator Class | 6,732 |
Institutional Class | 3,123 |
| Shareholder servicing fees | |
Class A | 256,525 |
Class C | 3,257 |
Administrator Class | 12,760 |
| Distribution fee | |
Class C | 9,772 |
Custody and accounting fees | 10,044 |
Professional fees | 24,365 |
Registration fees | 35,381 |
Shareholder report expenses | 21,051 |
Trustees’ fees and expenses | 11,026 |
Other fees and expenses | 8,860 |
Total expenses | 1,068,935 |
| Less: Fee waivers and/or expense reimbursements | |
Fund-level | (144,122) |
Net expenses | 924,813 |
Net investment income | 1,764,517 |
| Realized and unrealized gains (losses) on investments | |
| Net realized gains (losses) on | |
Unaffiliated securities | (631,849) |
Futures contracts | 143,173 |
Net realized losses on investments | (488,676) |
| Net change in unrealized gains (losses) on | |
Unaffiliated securities | 6,763,976 |
Futures contracts | (382,687) |
Net change in unrealized gains (losses) on investments | 6,381,289 |
Net realized and unrealized gains (losses) on investments | 5,892,613 |
Net increase in net assets resulting from operations | $7,657,130 |
| Six months ended January 31, 2023 (unaudited) | Year ended July 31, 2022 | |||
| Operations | ||||
Net investment income | $ 1,764,517 | $ 3,172,177 | ||
Net realized losses on investments | (488,676) | (635,828) | ||
Net change in unrealized gains (losses) on investments | 6,381,289 | (3,281,183) | ||
Net increase (decrease) in net assets resulting from operations | 7,657,130 | (744,834) | ||
| Distributions to shareholders from | ||||
| Net investment income and net realized gains | ||||
Class A | (1,464,281) | (69,443,204) | ||
Class C | (7,817) | (251,171) | ||
Class R6 | (8,107) | (86,276) | ||
Administrator Class | (77,178) | (4,848,775) | ||
Institutional Class | (43,145) | (1,377,309) | ||
Total distributions to shareholders | (1,600,528) | (76,006,735) | ||
| Capital share transactions | Shares | Shares | ||
| Proceeds from shares sold | ||||
Class A | 376,313 | 4,427,639 | 543,328 | 7,419,850 |
Class C | 66,486 | 827,016 | 134,741 | 1,741,851 |
Class R6 | 6,103 | 73,463 | 109,779 | 1,464,312 |
Administrator Class | 18,809 | 228,529 | 33,271 | 527,147 |
Institutional Class | 68,744 | 838,291 | 152,312 | 2,120,636 |
| 6,394,938 | 13,273,796 | |||
| Reinvestment of distributions | ||||
Class A | 128,651 | 1,435,070 | 5,322,527 | 67,769,743 |
Class C | 675 | 7,817 | 18,878 | 251,171 |
Class R6 | 719 | 8,107 | 6,739 | 86,178 |
Administrator Class | 6,497 | 73,566 | 367,797 | 4,755,104 |
Institutional Class | 3,820 | 43,145 | 107,135 | 1,377,163 |
| 1,567,705 | 74,239,359 | |||
| Payment for shares redeemed | ||||
Class A | (746,449) | (8,830,152) | (1,973,957) | (27,390,524) |
Class C | (22,421) | (283,075) | (22,460) | (319,335) |
Class R6 | (1,558) | (18,028) | (60,314) | (772,823) |
Administrator Class | (47,803) | (578,241) | (463,319) | (5,873,746) |
Institutional Class | (46,259) | (556,334) | (112,541) | (1,495,683) |
| (10,265,830) | (35,852,111) | |||
Net increase (decrease) in net assets resulting from capital share transactions | (2,303,187) | 51,661,044 | ||
Total increase (decrease) in net assets | 3,753,415 | (25,090,525) | ||
| Net assets | ||||
Beginning of period | 228,101,999 | 253,192,524 | ||
End of period | $231,855,414 | $228,101,999 | ||
| Year ended July 31 | ||||||
| Class A | Six months ended January 31, 2023 (unaudited) | 2022 | 2021 | 2020 | 2019 | 2018 |
Net asset value, beginning of period | $12.10 | $17.25 | $12.31 | $12.92 | $14.46 | $16.54 |
Net investment income | 0.09 | 0.17 | 0.19 | 0.20 | 0.24 | 0.19 |
Net realized and unrealized gains (losses) on investments | 0.32 | (0.06) | 5.20 | (0.53) | (0.15) | 1.29 |
Total from investment operations | 0.41 | 0.11 | 5.39 | (0.33) | 0.09 | 1.48 |
| Distributions to shareholders from | ||||||
Net investment income | (0.09) | (0.18) | (0.19) | (0.21) | (0.25) | (0.18) |
Net realized gains | 0.00 | (5.08) | (0.26) | (0.07) | (1.38) | (3.38) |
Total distributions to shareholders | (0.09) | (5.26) | (0.45) | (0.28) | (1.63) | (3.56) |
Net asset value, end of period | $12.42 | $12.10 | $17.25 | $12.31 | $12.92 | $14.46 |
Total return1 | 3.43% | (0.51)% | 44.41% | (2.49)% | 1.44% | 9.39% |
| Ratios to average net assets (annualized) | ||||||
Gross expenses | 0.96% | 0.94% | 0.96% | 0.99% | 0.97% | 0.94% |
Net expenses | 0.83% | 0.81% | 0.81% | 0.82% | 0.83% | 0.83% |
Net investment income | 1.57% | 1.28% | 1.23% | 1.63% | 1.84% | 1.28% |
| Supplemental data | ||||||
Portfolio turnover rate | 209% | 365% | 488% | 366% | 221% | 258% |
Net assets, end of period (000s omitted) | $212,318 | $209,748 | $231,930 | $174,028 | $196,075 | $214,247 |
| 1 | Total return calculations do not include any sales charges. Returns for periods of less than one year are not annualized. |
| Year ended July 31 | ||||||
| Class C | Six months ended January 31, 2023 (unaudited) | 2022 | 2021 | 2020 | 2019 | 2018 |
Net asset value, beginning of period | $12.67 | $17.84 | $12.75 | $13.34 | $14.81 | $16.86 |
Net investment income | 0.07 | 0.08 1 | 0.07 1 | 0.12 1 | 0.16 1 | 0.08 |
Net realized and unrealized gains (losses) on investments | 0.32 | (0.09) | 5.40 | (0.56) | (0.15) | 1.30 |
Total from investment operations | 0.39 | (0.01) | 5.47 | (0.44) | 0.01 | 1.38 |
| Distributions to shareholders from | ||||||
Net investment income | (0.04) | (0.08) | (0.12) | (0.08) | (0.10) | (0.05) |
Net realized gains | 0.00 | (5.08) | (0.26) | (0.07) | (1.38) | (3.38) |
Total distributions to shareholders | (0.04) | (5.16) | (0.38) | (0.15) | (1.48) | (3.43) |
Net asset value, end of period | $13.02 | $12.67 | $17.84 | $12.75 | $13.34 | $14.81 |
Total return2 | 3.11% | (1.30)% | 43.33% | (3.27)% | 0.76% | 8.49% |
| Ratios to average net assets (annualized) | ||||||
Gross expenses | 1.71% | 1.69% | 1.70% | 1.74% | 1.71% | 1.69% |
Net expenses | 1.58% | 1.58% | 1.58% | 1.58% | 1.58% | 1.58% |
Net investment income | 0.83% | 0.59% | 0.47% | 0.92% | 1.15% | 0.55% |
| Supplemental data | ||||||
Portfolio turnover rate | 209% | 365% | 488% | 366% | 221% | 258% |
Net assets, end of period (000s omitted) | $2,951 | $2,307 | $907 | $482 | $966 | $2,926 |
| 1 | Calculated based upon average shares outstanding |
| 2 | Total return calculations do not include any sales charges. Returns for periods of less than one year are not annualized. |
| Year ended July 31 | ||||||
| Class R6 | Six months ended January 31, 2023 (unaudited) | 2022 | 2021 | 2020 | 2019 | 2018 |
Net asset value, beginning of period | $12.18 | $17.33 | $12.37 | $13.04 | $14.59 | $16.66 |
Net investment income | 0.12 | 0.24 1 | 0.25 | 0.30 | 0.30 | 0.26 |
Net realized and unrealized gains (losses) on investments | 0.31 | (0.07) | 5.22 | (0.57) | (0.14) | 1.30 |
Total from investment operations | 0.43 | 0.17 | 5.47 | (0.27) | 0.16 | 1.56 |
| Distributions to shareholders from | ||||||
Net investment income | (0.11) | (0.24) | (0.25) | (0.33) | (0.33) | (0.25) |
Net realized gains | 0.00 | (5.08) | (0.26) | (0.07) | (1.38) | (3.38) |
Total distributions to shareholders | (0.11) | (5.32) | (0.51) | (0.40) | (1.71) | (3.63) |
Net asset value, end of period | $12.50 | $12.18 | $17.33 | $12.37 | $13.04 | $14.59 |
Total return2 | 3.65% | (0.10)% | 44.94% | (2.09)% | 1.92% | 9.88% |
| Ratios to average net assets (annualized) | ||||||
Gross expenses | 0.53% | 0.51% | 0.53% | 0.58% | 0.55% | 0.51% |
Net expenses | 0.40% | 0.40% | 0.40% | 0.40% | 0.40% | 0.40% |
Net investment income | 2.00% | 1.79% | 1.65% | 1.69% | 2.26% | 1.73% |
| Supplemental data | ||||||
Portfolio turnover rate | 209% | 365% | 488% | 366% | 221% | 258% |
Net assets, end of period (000s omitted) | $930 | $842 | $224 | $151 | $20 | $23 |
| 1 | Calculated based upon average shares outstanding |
| 2 | Returns for periods of less than one year are not annualized. |
| Year ended July 31 | ||||||
| Administrator Class | Six months ended January 31, 2023 (unaudited) | 2022 | 2021 | 2020 | 2019 | 2018 |
Net asset value, beginning of period | $12.27 | $17.42 | $12.44 | $13.06 | $14.59 | $16.66 |
Net investment income | 0.10 | 0.19 | 0.20 | 0.22 | 0.26 | 0.20 |
Net realized and unrealized gains (losses) on investments | 0.32 | (0.08) | 5.24 | (0.54) | (0.14) | 1.30 |
Total from investment operations | 0.42 | 0.11 | 5.44 | (0.32) | 0.12 | 1.50 |
| Distributions to shareholders from | ||||||
Net investment income | (0.09) | (0.18) | (0.20) | (0.23) | (0.27) | (0.19) |
Net realized gains | 0.00 | (5.08) | (0.26) | (0.07) | (1.38) | (3.38) |
Total distributions to shareholders | (0.09) | (5.26) | (0.46) | (0.30) | (1.65) | (3.57) |
Net asset value, end of period | $12.60 | $12.27 | $17.42 | $12.44 | $13.06 | $14.59 |
Total return1 | 3.51% | (0.49)% | 44.36% | (2.41)% | 1.61% | 9.44% |
| Ratios to average net assets (annualized) | ||||||
Gross expenses | 0.88% | 0.85% | 0.88% | 0.91% | 0.89% | 0.86% |
Net expenses | 0.74% | 0.75% | 0.75% | 0.75% | 0.75% | 0.75% |
Net investment income | 1.65% | 1.31% | 1.30% | 1.71% | 1.93% | 1.37% |
| Supplemental data | ||||||
Portfolio turnover rate | 209% | 365% | 488% | 366% | 221% | 258% |
Net assets, end of period (000s omitted) | $10,562 | $10,564 | $16,080 | $11,813 | $13,854 | $16,744 |
| 1 | Returns for periods of less than one year are not annualized. |
| Year ended July 31 | ||||||
| Institutional Class | Six months ended January 31, 2023 (unaudited) | 2022 | 2021 | 2020 | 2019 | 2018 |
Net asset value, beginning of period | $12.20 | $17.35 | $12.38 | $13.04 | $14.58 | $16.65 |
Net investment income | 0.11 | 0.23 1 | 0.22 | 0.26 | 0.29 1 | 0.24 |
Net realized and unrealized gains (losses) on investments | 0.32 | (0.08) | 5.25 | (0.55) | (0.14) | 1.30 |
Total from investment operations | 0.43 | 0.15 | 5.47 | (0.29) | 0.15 | 1.54 |
| Distributions to shareholders from | ||||||
Net investment income | (0.11) | (0.22) | (0.24) | (0.30) | (0.31) | (0.23) |
Net realized gains | 0.00 | (5.08) | (0.26) | (0.07) | (1.38) | (3.38) |
Total distributions to shareholders | (0.11) | (5.30) | (0.50) | (0.37) | (1.69) | (3.61) |
Net asset value, end of period | $12.52 | $12.20 | $17.35 | $12.38 | $13.04 | $14.58 |
Total return2 | 3.59% | (0.22)% | 44.84% | (2.20)% | 1.86% | 9.77% |
| Ratios to average net assets (annualized) | ||||||
Gross expenses | 0.63% | 0.61% | 0.63% | 0.66% | 0.63% | 0.62% |
Net expenses | 0.50% | 0.50% | 0.50% | 0.50% | 0.50% | 0.50% |
Net investment income | 1.90% | 1.61% | 1.56% | 1.96% | 2.14% | 1.60% |
| Supplemental data | ||||||
Portfolio turnover rate | 209% | 365% | 488% | 366% | 221% | 258% |
Net assets, end of period (000s omitted) | $5,093 | $4,641 | $4,051 | $2,142 | $2,948 | $17,606 |
| 1 | Calculated based upon average shares outstanding |
| 2 | Returns for periods of less than one year are not annualized. |
| Gross unrealized gains | $18,222,483 |
| Gross unrealized losses | (2,151,699) |
| Net unrealized gains | $16,070,784 |
| ■ | Level 1 – quoted prices in active markets for identical securities |
| ■ | Level 2 – other significant observable inputs (including quoted prices for similar securities, interest rates, prepayment speeds, credit risk, etc.) |
| ■ | Level 3 – significant unobservable inputs (including the Fund’s own assumptions in determining the fair value of investments) |
| Quoted prices (Level 1) | Other significant observable inputs (Level 2) | Significant unobservable inputs (Level 3) | Total | |
| Assets | ||||
| Investments in: | ||||
| Common stocks | ||||
| Communication services | $ 12,579,367 | $0 | $0 | $ 12,579,367 |
| Consumer discretionary | 12,278,171 | 0 | 0 | 12,278,171 |
| Consumer staples | 19,125,150 | 0 | 0 | 19,125,150 |
| Energy | 17,972,300 | 0 | 0 | 17,972,300 |
| Financials | 42,135,310 | 0 | 0 | 42,135,310 |
| Health care | 40,695,609 | 0 | 0 | 40,695,609 |
| Industrials | 17,752,270 | 0 | 0 | 17,752,270 |
| Information technology | 23,071,312 | 0 | 0 | 23,071,312 |
| Materials | 11,246,237 | 0 | 0 | 11,246,237 |
| Real estate | 15,391,818 | 0 | 0 | 15,391,818 |
| Utilities | 14,273,352 | 0 | 0 | 14,273,352 |
| Short-term investments | ||||
| Investment companies | 4,488,853 | 0 | 0 | 4,488,853 |
| 231,009,749 | 0 | 0 | 231,009,749 | |
| Futures contracts | 143,496 | 0 | 0 | 143,496 |
| Total assets | $231,153,245 | $0 | $0 | $231,153,245 |
| Average daily net assets | Management fee |
| First $1 billion | 0.400% |
| Next $4 billion | 0.375 |
| Next $5 billion | 0.340 |
| Over $10 billion | 0.330 |
| Class-level administration fee | |
| Class A | 0.21% |
| Class C | 0.21 |
| Class R6 | 0.03 |
| Administrator Class | 0.13 |
| Institutional Class | 0.13 |
| Expense ratio caps | |
| Class A | 0.83% |
| Class C | 1.58 |
| Class R6 | 0.40 |
| Administrator Class | 0.75 |
| Institutional Class | 0.50 |
| Name and year of birth | Position held and length of service* | Principal occupations during past five years or longer | Current other public company or investment company directorships |
| William R. Ebsworth (Born 1957) | Trustee, since 2015 | Retired. From 1984 to 2013, equities analyst, portfolio manager, research director and chief investment officer at Fidelity Management and Research Company in Boston, Tokyo, and Hong Kong, and retired in 2013 as Chief Investment Officer of Fidelity Strategic Advisers, Inc. where he led a team of investment professionals managing client assets. Prior thereto, Board member of Hong Kong Securities Clearing Co., Hong Kong Options Clearing Corp., the Thailand International Fund, Ltd., Fidelity Investments Life Insurance Company, and Empire Fidelity Investments Life Insurance Company. Audit Committee Chair and Investment Committee Chair of the Vincent Memorial Hospital Foundation (non-profit organization). Mr. Ebsworth is a CFA® charterholder. | N/A |
| Jane A. Freeman (Born 1953) | Trustee, since 2015; Chair Liaison, since 2018 | Retired. From 2012 to 2014 and 1999 to 2008, Chief Financial Officer of Scientific Learning Corporation. From 2008 to 2012, Ms. Freeman provided consulting services related to strategic business projects. Prior to 1999, Portfolio Manager at Rockefeller & Co. and Scudder, Stevens & Clark. Board member of the Harding Loevner Funds from 1996 to 2014, serving as both Lead Independent Director and chair of the Audit Committee. Board member of the Russell Exchange Traded Funds Trust from 2011 to 2012 and the chair of the Audit Committee. Ms. Freeman is also an inactive Chartered Financial Analyst. | N/A |
| Isaiah Harris, Jr. (Born 1952) | Trustee, since 2009; Audit Committee Chair, since 2019 | Retired. Member of the Advisory Board of CEF of East Central Florida. Chairman of the Board of CIGNA Corporation from 2009 to 2021, and Director from 2005 to 2008. From 2003 to 2011, Director of Deluxe Corporation. Prior thereto, President and CEO of BellSouth Advertising and Publishing Corp. from 2005 to 2007, President and CEO of BellSouth Enterprises from 2004 to 2005 and President of BellSouth Consumer Services from 2000 to 2003. Emeritus member of the Iowa State University Foundation Board of Governors. Emeritus Member of the Advisory Board of Iowa State University School of Business. Advisory Board Member, Palm Harbor Academy (private school). Advisory Board Member, Fellowship of Christian Athletes. Mr. Harris is a certified public accountant (inactive status). | N/A |
| David F. Larcker (Born 1950) | Trustee, since 2009 | Distinguished Visiting Fellow at the Hoover Institution since 2022. James Irvin Miller Professor of Accounting at the Graduate School of Business (Emeritus), Stanford University, Director of the Corporate Governance Research Initiative and Senior Faculty of The Rock Center for Corporate Governance since 2006. From 2005 to 2008, Professor of Accounting at the Graduate School of Business, Stanford University. Prior thereto, Ernst & Young Professor of Accounting at The Wharton School, University of Pennsylvania from 1985 to 2005. | N/A |
| Name and year of birth | Position held and length of service* | Principal occupations during past five years or longer | Current other public company or investment company directorships |
| Olivia S. Mitchell (Born 1953) | Trustee, since 2006; Nominating and Governance Committee Chair, since 2018 | International Foundation of Employee Benefit Plans Professor since 1993, Wharton School of the University of Pennsylvania. Director of Wharton’s Pension Research Council and Boettner Center on Pensions & Retirement Research, and Research Associate at the National Bureau of Economic Research. Previously taught at Cornell University from 1978 to 1993. | N/A |
| Timothy J. Penny (Born 1951) | Trustee, since 1996; Chair, since 2018 | President and Chief Executive Officer of Southern Minnesota Initiative Foundation, a non-profit organization, since 2007. Vice Chair of the Economic Club of Minnesota, since 2007. Co-Chair of the Committee for a Responsible Federal Budget, since 1995. Member of the Board of Trustees of NorthStar Education Finance, Inc., a non-profit organization, from 2007-2022. Senior Fellow of the University of Minnesota Humphrey Institute from 1995 to 2017. | N/A |
| James G. Polisson (Born 1959) | Trustee, since 2018 | Retired. Chief Marketing Officer, Source (ETF) UK Services, Ltd, from 2015 to 2017. From 2012 to 2015, Principal of The Polisson Group, LLC, a management consulting, corporate advisory and principal investing company. Chief Executive Officer and Managing Director at Russell Investments, Global Exchange Traded Funds from 2010 to 2012. Managing Director of Barclays Global Investors from 1998 to 2010 and Global Chief Marketing Officer for iShares and Barclays Global Investors from 2000 to 2010. Trustee of the San Francisco Mechanics’ Institute, a non-profit organization, from 2013 to 2015. Board member of the Russell Exchange Traded Fund Trust from 2011 to 2012. Director of Barclays Global Investors Holdings Deutschland GmbH from 2006 to 2009. Mr. Polisson is an attorney and has a retired status with the Massachusetts and District of Columbia Bar Associations. | N/A |
| Pamela Wheelock (Born 1959) | Trustee, since January 2020; previously Trustee from January 2018 to July 2019 | Retired. Executive and Senior Financial leadership positions in the public, private and nonprofit sectors. Interim President and CEO, McKnight Foundation, 2020. Interim Commissioner, Minnesota Department of Human Services, 2019. Chief Operating Officer, Twin Cities Habitat for Humanity, 2017-2019. Vice President for University Services, University of Minnesota, 2012-2016. Interim President and CEO, Blue Cross and Blue Shield of Minnesota, 2011-2012. Executive Vice-President and Chief Financial Officer, Minnesota Wild, 2002-2008. Commissioner, Minnesota Department of Finance, 1999-2002. Chair of the Board of Directors of Destination Medical Center Corporation. Board member of the Minnesota Wild Foundation. | N/A |
| Name and year of birth | Position held and length of service | Principal occupations during past five years or longer |
| Andrew Owen (Born 1960) | President, since 2017 | President and Chief Executive Officer of Allspring Funds Management, LLC since 2017 and Head of Global Fund Governance of Allspring Global Investments since 2022. Prior thereto, co-president of Galliard Capital Management, LLC, an affiliate of Allspring Funds Management, LLC, from 2019 to 2022 and Head of Affiliated Managers, Allspring Global Investments, from 2014 to 2019 and Executive Vice President responsible for marketing, investments and product development for Allspring Funds Management, LLC, from 2009 to 2014. |
| Jeremy DePalma (Born 1974) | Treasurer, since 2012 (for certain funds in the Fund Complex); since 2021 (for the remaining funds in the Fund Complex) | Senior Vice President of Allspring Funds Management, LLC since 2009. Senior Vice President of Evergreen Investment Management Company, LLC from 2008 to 2010 and head of the Fund Reporting and Control Team within Fund Administration from 2005 to 2010. |
| Christopher Baker (Born 1976) | Chief Compliance Officer, since 2022 | Global Chief Compliance Officer for Allspring Global Investments since 2022. Prior thereto, Chief Compliance Officer for State Street Global Advisors from 2018 to 2021. Senior Compliance Officer for the State Street divisions of Alternative Investment Solutions, Sector Solutions, and Global Marketing from 2015 to 2018. From 2010 to 2015 Vice President, Global Head of Investment and Marketing Compliance for State Street Global Advisors. |
| Matthew Prasse (Born 1983) | Chief Legal Officer, since 2022; Secretary, since 2021 | Senior Counsel of the Allspring Legal Department since 2021. Senior Counsel of the Wells Fargo Legal Department from 2018 to 2021. Previously, Counsel for Barings LLC from 2015 to 2018. Prior to joining Barings, Associate at Morgan, Lewis & Bockius LLP from 2008 to 2015. |
P.O. Box 219967
Kansas City, MO 64121-9967

1-800-222-8222 or visit the Fund's website at allspringglobal.com. Read the prospectus carefully before you invest or send money.
SAR3325 01-23

Discovery All Cap Growth Fund

| 1 | The S&P 500 Index consists of 500 stocks chosen for market size, liquidity, and industry group representation. It is a market-value-weighted index with each stock's weight in the index proportionate to its market value. You cannot invest directly in an index. |
| 2 | The Morgan Stanley Capital International (MSCI) All Country World Index (ACWI) ex USA Index (Net) is a free-float-adjusted market-capitalization-weighted index that is designed to measure the equity market performance of developed and emerging markets, excluding the U.S. Source: MSCI. MSCI makes no express or implied warranties or representations and shall have no liability whatsoever with respect to any MSCI data contained herein. The MSCI data may not be further redistributed or used as a basis for other indexes or any securities or financial products. This report is not approved, reviewed, or produced by MSCI. You cannot invest directly in an index. |
| 3 | The MSCI Emerging Markets (EM) Index (Net) (USD) is a free-float-adjusted market-capitalization-weighted index that is designed to measure equity market performance of emerging markets. You cannot invest directly in an index. |
| 4 | The Bloomberg U.S. Aggregate Bond Index is a broad-based benchmark that measures the investment-grade, U.S.-dollar-denominated, fixed-rate taxable bond market, including Treasuries, government-related and corporate securities, mortgage-backed securities (agency fixed-rate and hybrid adjustable-rate mortgage pass-throughs), asset-backed securities, and commercial mortgage-backed securities. You cannot invest directly in an index. |
| 5 | The Bloomberg Global Aggregate ex-USD Index (unhedged) is an unmanaged index that provides a broad-based measure of the global investment-grade fixed-income markets excluding the U.S.-dollar-denominated debt market. You cannot invest directly in an index. |
| 6 | The Bloomberg Municipal Bond Index is an unmanaged index composed of long-term tax-exempt bonds with a minimum credit rating of Baa. You cannot invest directly in an index. |
| 7 | The ICE BofA U.S. High Yield Index is a market-capitalization-weighted index of domestic and Yankee high-yield bonds. The index tracks the performance of high-yield securities traded in the U.S. bond market. You cannot invest directly in an index. Copyright 2023. ICE Data Indices, LLC. All rights reserved. |
| 1 | The Consumer Price Index (CPI) is a measure of the average change over time in the prices paid by urban consumers for a market basket of consumer goods and services. You cannot invest directly in an index. |

President
Allspring Funds
| Investment objective | The Fund seeks long-term capital appreciation. |
| Manager | Allspring Funds Management, LLC |
| Subadviser | Allspring Global Investments, LLC |
| Portfolio managers | Michael T. Smith, CFA®‡, Christopher J. Warner, CFA®‡ |
| Average annual total returns (%) as of January 31, 2023 | |||||||||||
| Including sales charge | Excluding sales charge | Expense ratios1 (%) | |||||||||
| Inception date | 1 year | 5 year | 10 year | 1 year | 5 year | 10 year | Gross | Net 2 | |||
| Class A (EKOAX) | 4-29-1968 | -26.24 | 5.54 | 10.37 | -21.74 | 6.80 | 11.02 | 1.26 | 1.26 | ||
| Class C (EKOCX) | 8-2-1993 | -23.30 | 6.07 | 10.39 | -22.30 | 6.07 | 10.39 | 2.01 | 2.01 | ||
| Class R (EKORX) | 10-10-2003 | – | – | – | -21.92 | 6.54 | 10.75 | 1.51 | 1.51 | ||
| Administrator Class (EOMYX) | 1-13-1997 | – | – | – | -21.60 | 6.98 | 11.24 | 1.18 | 1.10 | ||
| Institutional Class (EKONX) | 7-30-2010 | – | – | – | -21.41 | 7.24 | 11.52 | 0.93 | 0.85 | ||
| Russell 3000® Growth Index3 | – | – | – | – | -15.48 | 10.78 | 14.18 | – | – | ||
| 1 | Reflects the expense ratios as stated in the most recent prospectuses. The expense ratios shown are subject to change and may differ from the annualized expense ratios shown in the financial highlights of this report. |
| 2 | The manager has contractually committed through November 30, 2023, to waive fees and/or reimburse expenses to the extent necessary to cap total annual fund operating expenses after fee waivers at 1.26% for Class A, 2.01% for Class C, 1.51% for Class R, 1.10% for Administrator Class, and 0.85% for Institutional Class. Brokerage commissions, stamp duty fees, interest, taxes, acquired fund fees and expenses (if any), and extraordinary expenses are excluded from the expense caps. Prior to or after the commitment expiration date, the caps may be increased or the commitment to maintain the caps may be terminated only with the approval of the Board of Trustees. Without these caps, the Fund’s returns would have been lower. The expense ratio paid by an investor is the net expense ratio (the total annual fund operating expenses after fee waivers) as stated in the prospectuses. |
| 3 | The Russell 3000® Growth Index measures the performance of those Russell 3000® Index companies with higher price/book ratios and higher forecasted growth values. You cannot invest directly in an index. |
| ‡ | CFA® and Chartered Financial Analyst® are trademarks owned by CFA Institute. |
| Ten largest holdings (%) as of January 31, 20231 | |
| Microsoft Corporation | 9.76 |
| Amazon.com Incorporated | 6.10 |
| Alphabet Incorporated Class A | 5.76 |
| Visa Incorporated Class A | 5.60 |
| UnitedHealth Group Incorporated | 2.99 |
| Cadence Design Systems Incorporated | 2.61 |
| Waste Connections Incorporated | 2.30 |
| The Home Depot Incorporated | 2.25 |
| Chipotle Mexican Grill Incorporated | 2.22 |
| MercadoLibre Incorporated | 2.07 |
| 1 | Figures represent the percentage of the Fund's net assets. Holdings are subject to change and may have changed since the date specified. |
| Sector allocation as of January 31, 20231 |
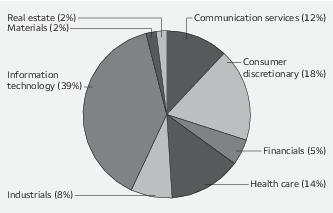
| 1 | Figures represent the percentage of the Fund's long-term investments. Allocations are subject to change and may have changed since the date specified. |
| Beginning account value 8-1-2022 | Ending account value 1-31-2023 | Expenses paid during the period1 | Annualized net expense ratio | |
| Class A | ||||
| Actual | $1,000.00 | $ 949.16 | $ 6.19 | 1.26% |
| Hypothetical (5% return before expenses) | $1,000.00 | $1,018.85 | $ 6.41 | 1.26% |
| Class C | ||||
| Actual | $1,000.00 | $ 945.76 | $ 9.86 | 2.01% |
| Hypothetical (5% return before expenses) | $1,000.00 | $1,015.07 | $10.21 | 2.01% |
| Class R | ||||
| Actual | $1,000.00 | $ 948.09 | $ 7.41 | 1.51% |
| Hypothetical (5% return before expenses) | $1,000.00 | $1,017.59 | $ 7.68 | 1.51% |
| Administrator Class | ||||
| Actual | $1,000.00 | $ 949.93 | $ 5.41 | 1.10% |
| Hypothetical (5% return before expenses) | $1,000.00 | $1,019.66 | $ 5.60 | 1.10% |
| Institutional Class | ||||
| Actual | $1,000.00 | $ 951.16 | $ 4.18 | 0.85% |
| Hypothetical (5% return before expenses) | $1,000.00 | $1,020.92 | $ 4.33 | 0.85% |
| Shares | Value | ||||
| Common stocks: 97.42% | |||||
| Communication services: 11.26% | |||||
| Entertainment: 3.04% | |||||
| Spotify Technology SA † | 86,900 | $ 9,795,368 | |||
| Warner Music Group Corporation Class A | 281,400 | 10,257,030 | |||
| 20,052,398 | |||||
| Interactive media & services: 8.22% | |||||
| Alphabet Incorporated Class A † | 384,140 | 37,968,398 | |||
| Alphabet Incorporated Class C † | 35,400 | 3,535,398 | |||
| Match Group Incorporated † | 122,132 | 6,609,784 | |||
| ZoomInfo Technologies Incorporated † | 214,400 | 6,052,512 | |||
| 54,166,092 | |||||
| Consumer discretionary: 17.37% | |||||
| Auto components: 1.31% | |||||
| Aptiv plc † | 76,300 | 8,628,767 | |||
| Automobiles: 1.73% | |||||
| Ferrari NV | 45,200 | 11,359,212 | |||
| Hotels, restaurants & leisure: 2.22% | |||||
| Chipotle Mexican Grill Incorporated † | 8,900 | 14,652,782 | |||
| Internet & direct marketing retail: 8.62% | |||||
| Amazon.com Incorporated † | 389,980 | 40,218,637 | |||
| Doordash Incorporated † | 51,500 | 2,982,880 | |||
| MercadoLibre Incorporated † | 11,542 | 13,639,066 | |||
| 56,840,583 | |||||
| Specialty retail: 2.25% | |||||
| The Home Depot Incorporated | 45,713 | 14,818,783 | |||
| Textiles, apparel & luxury goods: 1.24% | |||||
| lululemon athletica Incorporated † | 26,700 | 8,193,696 | |||
| Financials: 5.27% | |||||
| Capital markets: 3.33% | |||||
| Intercontinental Exchange Incorporated | 100,730 | 10,833,512 | |||
| MarketAxess Holdings Incorporated | 30,563 | 11,120,348 | |||
| 21,953,860 | |||||
| Insurance: 1.94% | |||||
| Progressive Corporation | 94,000 | 12,816,900 | |||
| Health care: 13.80% | |||||
| Health care equipment & supplies: 6.28% | |||||
| Align Technology Incorporated † | 30,534 | 8,235,936 | |||
| DexCom Incorporated † | 120,600 | 12,915,054 | |||
| Edwards Lifesciences Corporation † | 96,900 | 7,432,230 | |||
| Intuitive Surgical Incorporated † | 52,200 | 12,825,018 | |||
| 41,408,238 |
| Shares | Value | ||||
| Health care providers & services: 4.53% | |||||
| Centene Corporation † | 132,800 | $ 10,124,672 | |||
| UnitedHealth Group Incorporated | 39,469 | 19,702,530 | |||
| 29,827,202 | |||||
| Life sciences tools & services: 2.99% | |||||
| Bio-Techne Corporation | 95,100 | 7,575,666 | |||
| Illumina Incorporated † | 24,200 | 5,183,640 | |||
| Waters Corporation † | 21,200 | 6,965,896 | |||
| 19,725,202 | |||||
| Industrials: 8.04% | |||||
| Commercial services & supplies: 2.30% | |||||
| Waste Connections Incorporated | 114,198 | 15,176,914 | |||
| Machinery: 1.84% | |||||
| Deere & Company | 28,700 | 12,135,508 | |||
| Professional services: 1.86% | |||||
| Equifax Incorporated | 55,200 | 12,265,440 | |||
| Road & rail: 2.04% | |||||
| Union Pacific Corporation | 65,757 | 13,426,922 | |||
| Information technology: 37.98% | |||||
| Communications equipment: 2.06% | |||||
| Motorola Solutions Incorporated | 52,900 | 13,595,829 | |||
| Electronic equipment, instruments & components: 3.27% | |||||
| Teledyne Technologies Incorporated † | 28,100 | 11,921,706 | |||
| Zebra Technologies Corporation Class A † | 30,500 | 9,643,490 | |||
| 21,565,196 | |||||
| IT services: 12.36% | |||||
| Adyen NV ADR † | 618,600 | 9,303,744 | |||
| Fiserv Incorporated † | 97,340 | 10,384,231 | |||
| Globant SA † | 25,500 | 4,135,590 | |||
| MongoDB Incorporated † | 24,100 | 5,162,461 | |||
| PayPal Holdings Incorporated † | 116,238 | 9,472,235 | |||
| Snowflake Incorporated Class A † | 38,900 | 6,085,516 | |||
| Visa Incorporated Class A | 160,499 | 36,948,475 | |||
| 81,492,252 | |||||
| Semiconductors & semiconductor equipment: 2.09% | |||||
| Advanced Micro Devices Incorporated † | 96,900 | 7,282,033 | |||
| Monolithic Power Systems Incorporated | 15,200 | 6,483,712 | |||
| 13,765,745 | |||||
| Software: 18.20% | |||||
| Atlassian Corporation Class A † | 41,800 | 6,755,716 | |||
| Bill.com Holdings Incorporated † | 59,900 | 6,925,638 | |||
| Cadence Design Systems Incorporated † | 94,100 | 17,204,303 | |||
| Crowdstrike Holdings Incorporated Class A † | 56,400 | 5,972,760 | |||
| Datadog Incorporated Class A †« | 69,700 | 5,214,257 |
| Shares | Value | ||||
| Software (continued) | |||||
| Microsoft Corporation | 259,750 | $ 64,368,648 | |||
| ServiceNow Incorporated † | 29,700 | 13,517,361 | |||
| 119,958,683 | |||||
| Materials: 2.00% | |||||
| Chemicals: 2.00% | |||||
| The Sherwin-Williams Company | 55,762 | 13,192,732 | |||
| Real estate: 1.70% | |||||
| Equity REITs: 1.70% | |||||
| SBA Communications Corporation | 37,600 | 11,187,128 | |||
| Total Common stocks (Cost $396,552,568) | 642,206,064 |
| Yield | |||||
| Short-term investments: 3.50% | |||||
| Investment companies: 3.50% | |||||
| Allspring Government Money Market Fund Select Class ♠∞ | 4.16% | 17,871,661 | 17,871,661 | ||
| Securities Lending Cash Investments LLC ♠∩∞ | 4.38 | 5,217,074 | 5,217,074 | ||
| Total Short-term investments (Cost $23,088,695) | 23,088,735 | ||||
| Total investments in securities (Cost $419,641,263) | 100.92% | 665,294,799 | |||
| Other assets and liabilities, net | (0.92) | (6,055,801) | |||
| Total net assets | 100.00% | $659,238,998 |
| † | Non-income-earning security |
| « | All or a portion of this security is on loan. |
| ♠ | The issuer of the security is an affiliated person of the Fund as defined in the Investment Company Act of 1940. |
| ∩ | The investment is a non-registered investment company purchased with cash collateral received from securities on loan. |
| ∞ | The rate represents the 7-day annualized yield at period end. |
| Abbreviations: | |
| ADR | American depositary receipt |
| REIT | Real estate investment trust |
| Value, beginning of period | Purchases | Sales proceeds | Net realized gains (losses) | Net change in unrealized gains (losses) | Value, end of period | Shares, end of period | Income from affiliated securities | |||
| Short-term investments | ||||||||||
| Allspring Government Money Market Fund Select Class | $12,712,088 | $84,412,834 | $(79,253,261) | $0 | $ 0 | $ 17,871,661 | 17,871,661 | $ 207,395 | ||
| Securities Lending Cash Investments LLC | 0 | 13,739,200 | (8,522,166) | 0 | 40 | 5,217,074 | 5,217,074 | 15,643 # | ||
| $0 | $40 | $23,088,735 | $223,038 | |||||||
| # | Amount shown represents income before fees and rebates. |
| Assets | |
Investments in unaffiliated securities (including $5,102,344 of securities loaned), at value (cost $396,552,568) | $ 642,206,064 |
Investments in affiliated securities, at value (cost $23,088,695) | 23,088,735 |
Receivable for dividends | 114,017 |
Receivable for Fund shares sold | 83,010 |
Receivable for securities lending income, net | 864 |
Prepaid expenses and other assets | 76,474 |
Total assets | 665,569,164 |
| Liabilities | |
Payable upon receipt of securities loaned | 5,217,074 |
Payable for Fund shares redeemed | 407,197 |
Management fee payable | 401,852 |
Administration fees payable | 108,853 |
Trustees’ fees and expenses payable | 4,999 |
Distribution fees payable | 3,470 |
Accrued expenses and other liabilities | 186,721 |
Total liabilities | 6,330,166 |
Total net assets | $659,238,998 |
| Net assets consist of | |
Paid-in capital | $ 416,215,471 |
Total distributable earnings | 243,023,527 |
Total net assets | $659,238,998 |
| Computation of net asset value and offering price per share | |
Net assets – Class A | $ 596,170,988 |
Shares outstanding – Class A1 | 13,096,158 |
Net asset value per share – Class A | $45.52 |
Maximum offering price per share – Class A2 | $48.30 |
Net assets – Class C | $ 4,780,283 |
Shares outstanding – Class C1 | 215,146 |
Net asset value per share – Class C | $22.22 |
Net assets – Class R | $ 3,101,489 |
Shares outstanding – Class R1 | 75,357 |
Net asset value per share – Class R | $41.16 |
Net assets – Administrator Class | $ 21,740,695 |
Shares outstanding – Administrator Class1 | 416,658 |
Net asset value per share – Administrator Class | $52.18 |
Net assets – Institutional Class | $ 33,445,543 |
Shares outstanding – Institutional Class1 | 605,833 |
Net asset value per share – Institutional Class | $55.21 |
| 1 | The Fund has an unlimited number of authorized shares. |
| 2 | Maximum offering price is computed as 100/94.25 of net asset value. On investments of $50,000 or more, the offering price is reduced. |
| Investment income | |
Dividends (net of foreign withholdings taxes of $16,832) | $ 1,681,104 |
Income from affiliated securities | 209,036 |
Total investment income | 1,890,140 |
| Expenses | |
Management fee | 2,689,955 |
| Administration fees | |
Class A | 637,300 |
Class C | 5,775 |
Class R | 3,236 |
Administrator Class | 14,261 |
Institutional Class | 30,057 |
| Shareholder servicing fees | |
Class A | 757,369 |
Class C | 6,848 |
Class R | 3,845 |
Administrator Class | 26,445 |
| Distribution fees | |
Class C | 20,275 |
Class R | 3,845 |
Custody and accounting fees | 25,448 |
Professional fees | 20,422 |
Registration fees | 37,205 |
Shareholder report expenses | 36,143 |
Trustees’ fees and expenses | 11,026 |
Other fees and expenses | 8,794 |
Total expenses | 4,338,249 |
| Less: Fee waivers and/or expense reimbursements | |
Fund-level | (734) |
Class A | (82,835) |
Administrator Class | (10,851) |
Institutional Class | (24,300) |
Net expenses | 4,219,529 |
Net investment loss | (2,329,389) |
| Realized and unrealized gains (losses) on investments | |
Net realized gains on investments | 5,052,923 |
| Net change in unrealized gains (losses) on | |
Unaffiliated securities | (45,928,605) |
Affiliated securities | 40 |
Net change in unrealized gains (losses) on investments | (45,928,565) |
Net realized and unrealized gains (losses) on investments | (40,875,642) |
Net decrease in net assets resulting from operations | $(43,205,031) |
| Six months ended January 31, 2023 (unaudited) | Year ended July 31, 2022 | |||
| Operations | ||||
Net investment loss | $ (2,329,389) | $ (8,541,967) | ||
Net realized gains on investments | 5,052,923 | 104,462,254 | ||
Net change in unrealized gains (losses) on investments | (45,928,565) | (409,078,683) | ||
Net decrease in net assets resulting from operations | (43,205,031) | (313,158,396) | ||
| Distributions to shareholders from | ||||
| Net investment income and net realized gains | ||||
Class A | (54,898,486) | (121,148,916) | ||
Class C | (866,613) | (2,406,526) | ||
Class R | (304,370) | (676,869) | ||
Administrator Class | (1,767,086) | (3,927,696) | ||
Institutional Class | (2,699,274) | (11,872,753) | ||
Total distributions to shareholders | (60,535,829) | (140,032,760) | ||
| Capital share transactions | Shares | Shares | ||
| Proceeds from shares sold | ||||
Class A | 80,405 | 3,676,953 | 219,171 | 15,490,689 |
Class C | 8,266 | 200,589 | 28,194 | 1,043,099 |
Class R | 3,827 | 163,839 | 6,255 | 363,627 |
Administrator Class | 3,342 | 174,166 | 11,839 | 836,637 |
Institutional Class | 40,405 | 2,292,503 | 200,533 | 15,639,020 |
| 6,508,050 | 33,373,072 | |||
| Reinvestment of distributions | ||||
Class A | 1,220,643 | 52,719,587 | 1,570,459 | 116,182,478 |
Class C | 41,072 | 866,613 | 60,148 | 2,406,526 |
Class R | 7,773 | 303,617 | 9,970 | 675,390 |
Administrator Class | 34,250 | 1,695,061 | 44,622 | 3,731,324 |
Institutional Class | 50,950 | 2,666,737 | 133,993 | 11,768,627 |
| 58,251,615 | 134,764,345 | |||
| Payment for shares redeemed | ||||
Class A | (861,807) | (39,938,255) | (1,343,090) | (89,808,431) |
Class C | (68,455) | (1,682,087) | (173,239) | (7,232,231) |
Class R | (7,469) | (322,343) | (12,968) | (761,541) |
Administrator Class | (20,081) | (1,047,325) | (57,641) | (4,435,541) |
Institutional Class | (605,224) | (33,625,456) | (413,787) | (29,889,860) |
| (76,615,466) | (132,127,604) | |||
Net increase (decrease) in net assets resulting from capital share transactions | (11,855,801) | 36,009,813 | ||
Total decrease in net assets | (115,596,661) | (417,181,343) | ||
| Net assets | ||||
Beginning of period | 774,835,659 | 1,192,017,002 | ||
End of period | $ 659,238,998 | $ 774,835,659 | ||
| Year ended July 31 | ||||||
| Class A | Six months ended January 31, 2023 (unaudited) | 2022 | 2021 | 2020 | 2019 | 2018 |
Net asset value, beginning of period | $52.95 | $83.33 | $64.95 | $55.19 | $54.77 | $49.43 |
Net investment loss | (0.17) 1 | (0.60) 1 | (0.65) | (0.38) 1 | (0.33) 1 | (0.32) 1 |
Payment from affiliate | 0.00 | 0.00 | 0.00 2 | 0.00 | 0.00 | 0.00 |
Net realized and unrealized gains (losses) on investments | (2.76) | (19.62) | 23.40 | 13.24 | 6.56 | 12.57 |
Total from investment operations | (2.93) | (20.22) | 22.75 | 12.86 | 6.23 | 12.25 |
| Distributions to shareholders from | ||||||
Net realized gains | (4.50) | (10.16) | (4.37) | (3.10) | (5.81) | (6.91) |
Net asset value, end of period | $45.52 | $52.95 | $83.33 | $64.95 | $55.19 | $54.77 |
Total return3 | (5.08)% | (27.73)% | 36.32% 4 | 24.55% | 13.89% | 26.86% |
| Ratios to average net assets (annualized) | ||||||
Gross expenses | 1.29% | 1.26% | 1.26% | 1.28% | 1.28% | 1.28% |
Net expenses | 1.26% | 1.25% | 1.26% | 1.28% | 1.28% | 1.28% |
Net investment loss | (0.71)% | (0.89)% | (0.90)% | (0.68)% | (0.64)% | (0.63)% |
| Supplemental data | ||||||
Portfolio turnover rate | 7% | 27% | 24% | 23% | 39% | 48% |
Net assets, end of period (000s omitted) | $596,171 | $670,221 | $1,017,512 | $800,199 | $714,411 | $662,751 |
| 1 | Calculated based upon average shares outstanding |
| 2 | Amount is less than $0.005. |
| 3 | Total return calculations do not include any sales charges. Returns for periods of less than one year are not annualized. |
| 4 | During the year ended July 31, 2021, the Fund received a payment from an affiliate which had a 0.005% impact on the total return. |
| Year ended July 31 | ||||||
| Class C | Six months ended January 31, 2023 (unaudited) | 2022 | 2021 | 2020 | 2019 | 2018 |
Net asset value, beginning of period | $28.50 | $49.82 | $40.52 | $35.83 | $38.02 | $36.47 |
Net investment loss | (0.18) 1 | (0.63) 1 | (0.72) 1 | (0.50) 1 | (0.48) 1 | (0.50) 1 |
Payment from affiliate | 0.00 | 0.00 | 0.23 | 0.00 | 0.00 | 0.00 |
Net realized and unrealized gains (losses) on investments | (1.60) | (10.53) | 14.16 | 8.29 | 4.10 | 8.96 |
Total from investment operations | (1.78) | (11.16) | 13.67 | 7.79 | 3.62 | 8.46 |
| Distributions to shareholders from | ||||||
Net realized gains | (4.50) | (10.16) | (4.37) | (3.10) | (5.81) | (6.91) |
Net asset value, end of period | $22.22 | $28.50 | $49.82 | $40.52 | $35.83 | $38.02 |
Total return2 | (5.42)% | (28.27)% | 35.74% 3 | 23.61% | 13.04% | 25.88% |
| Ratios to average net assets (annualized) | ||||||
Gross expenses | 2.02% | 1.98% | 2.01% | 2.03% | 2.03% | 2.03% |
Net expenses | 2.01% | 1.98% | 2.01% | 2.03% | 2.03% | 2.03% |
Net investment loss | (1.45)% | (1.62)% | (1.63)% | (1.42)% | (1.40)% | (1.38)% |
| Supplemental data | ||||||
Portfolio turnover rate | 7% | 27% | 24% | 23% | 39% | 48% |
Net assets, end of period (000s omitted) | $4,780 | $6,678 | $15,900 | $22,077 | $26,122 | $62,074 |
| 1 | Calculated based upon average shares outstanding |
| 2 | Total return calculations do not include any sales charges. Returns for periods of less than one year are not annualized. |
| 3 | During the year ended July 31, 2021, the Fund received a payment from an affiliate which had a 0.62% impact on the total return. |
| Year ended July 31 | ||||||
| Class R | Six months ended January 31, 2023 (unaudited) | 2022 | 2021 | 2020 | 2019 | 2018 |
Net asset value, beginning of period | $48.41 | $77.22 | $60.60 | $51.82 | $51.92 | $47.30 |
Net investment loss | (0.21) 1 | (0.70) 1 | (0.76) 1 | (0.47) 1 | (0.43) 1 | (0.43) 1 |
Net realized and unrealized gains (losses) on investments | (2.54) | (17.95) | 21.75 | 12.35 | 6.14 | 11.96 |
Total from investment operations | (2.75) | (18.65) | 20.99 | 11.88 | 5.71 | 11.53 |
| Distributions to shareholders from | ||||||
Net realized gains | (4.50) | (10.16) | (4.37) | (3.10) | (5.81) | (6.91) |
Net asset value, end of period | $41.16 | $48.41 | $77.22 | $60.60 | $51.82 | $51.92 |
Total return2 | (5.19)% | (27.91)% | 36.01% | 24.24% | 13.63% | 26.53% |
| Ratios to average net assets (annualized) | ||||||
Gross expenses | 1.54% | 1.49% | 1.49% | 1.52% | 1.53% | 1.53% |
Net expenses | 1.51% | 1.49% | 1.49% | 1.52% | 1.53% | 1.53% |
Net investment loss | (0.96)% | (1.13)% | (1.12)% | (0.91)% | (0.88)% | (0.88)% |
| Supplemental data | ||||||
Portfolio turnover rate | 7% | 27% | 24% | 23% | 39% | 48% |
Net assets, end of period (000s omitted) | $3,101 | $3,448 | $5,249 | $4,647 | $6,097 | $7,494 |
| 1 | Calculated based upon average shares outstanding |
| 2 | Returns for periods of less than one year are not annualized. |
| Year ended July 31 | ||||||
| Administrator Class | Six months ended January 31, 2023 (unaudited) | 2022 | 2021 | 2020 | 2019 | 2018 |
Net asset value, beginning of period | $59.92 | $92.83 | $71.80 | $60.58 | $59.39 | $52.99 |
Net investment loss | (0.15) 1 | (0.55) | (0.62) | (0.30) 1 | (0.25) 1 | (0.25) 1 |
Net realized and unrealized gains (losses) on investments | (3.09) | (22.20) | 26.02 | 14.62 | 7.25 | 13.56 |
Total from investment operations | (3.24) | (22.75) | 25.40 | 14.32 | 7.00 | 13.31 |
| Distributions to shareholders from | ||||||
Net realized gains | (4.50) | (10.16) | (4.37) | (3.10) | (5.81) | (6.91) |
Net asset value, end of period | $52.18 | $59.92 | $92.83 | $71.80 | $60.58 | $59.39 |
Total return2 | (5.01)% | (27.61)% | 36.55% | 24.78% | 14.12% | 27.07% |
| Ratios to average net assets (annualized) | ||||||
Gross expenses | 1.20% | 1.16% | 1.18% | 1.20% | 1.20% | 1.20% |
Net expenses | 1.10% | 1.09% | 1.09% | 1.09% | 1.10% | 1.10% |
Net investment loss | (0.55)% | (0.73)% | (0.73)% | (0.49)% | (0.45)% | (0.45)% |
| Supplemental data | ||||||
Portfolio turnover rate | 7% | 27% | 24% | 23% | 39% | 48% |
Net assets, end of period (000s omitted) | $21,741 | $23,917 | $37,163 | $28,712 | $26,141 | $24,140 |
| 1 | Calculated based upon average shares outstanding |
| 2 | Returns for periods of less than one year are not annualized. |
| Year ended July 31 | ||||||
| Institutional Class | Six months ended January 31, 2023 (unaudited) | 2022 | 2021 | 2020 | 2019 | 2018 |
Net asset value, beginning of period | $63.03 | $96.91 | $74.62 | $62.69 | $61.10 | $54.21 |
Net investment loss | (0.08) 1 | (0.29) | (0.40) | (0.16) 1 | (0.12) 1 | (0.11) 1 |
Net realized and unrealized gains (losses) on investments | (3.24) | (23.43) | 27.06 | 15.19 | 7.52 | 13.91 |
Total from investment operations | (3.32) | (23.72) | 26.66 | 15.03 | 7.40 | 13.80 |
| Distributions to shareholders from | ||||||
Net realized gains | (4.50) | (10.16) | (4.37) | (3.10) | (5.81) | (6.91) |
Net asset value, end of period | $55.21 | $63.03 | $96.91 | $74.62 | $62.69 | $61.10 |
Total return2 | (4.88)% | (27.44)% | 36.87% | 25.09% | 14.39% | 27.39% |
| Ratios to average net assets (annualized) | ||||||
Gross expenses | 0.96% | 0.93% | 0.93% | 0.95% | 0.95% | 0.95% |
Net expenses | 0.85% | 0.85% | 0.85% | 0.85% | 0.85% | 0.85% |
Net investment loss | (0.26)% | (0.49)% | (0.49)% | (0.25)% | (0.20)% | (0.20)% |
| Supplemental data | ||||||
Portfolio turnover rate | 7% | 27% | 24% | 23% | 39% | 48% |
Net assets, end of period (000s omitted) | $33,446 | $70,572 | $116,193 | $90,900 | $75,456 | $64,792 |
| 1 | Calculated based upon average shares outstanding |
| 2 | Returns for periods of less than one year are not annualized. |
| Gross unrealized gains | $306,248,299 |
| Gross unrealized losses | (61,151,281) |
| Net unrealized gains | $245,097,018 |
| ■ | Level 1 – quoted prices in active markets for identical securities |
| ■ | Level 2 – other significant observable inputs (including quoted prices for similar securities, interest rates, prepayment speeds, credit risk, etc.) |
| ■ | Level 3 – significant unobservable inputs (including the Fund’s own assumptions in determining the fair value of investments) |
| Quoted prices (Level 1) | Other significant observable inputs (Level 2) | Significant unobservable inputs (Level 3) | Total | |
| Assets | ||||
| Investments in: | ||||
| Common stocks | ||||
| Communication services | $ 74,218,490 | $0 | $0 | $ 74,218,490 |
| Consumer discretionary | 114,493,823 | 0 | 0 | 114,493,823 |
| Financials | 34,770,760 | 0 | 0 | 34,770,760 |
| Health care | 90,960,642 | 0 | 0 | 90,960,642 |
| Industrials | 53,004,784 | 0 | 0 | 53,004,784 |
| Information technology | 250,377,705 | 0 | 0 | 250,377,705 |
| Materials | 13,192,732 | 0 | 0 | 13,192,732 |
| Real estate | 11,187,128 | 0 | 0 | 11,187,128 |
| Short-term investments | ||||
| Investment companies | 23,088,735 | 0 | 0 | 23,088,735 |
| Total assets | $665,294,799 | $0 | $0 | $665,294,799 |
| Average daily net assets | Management fee |
| First $500 million | 0.800% |
| Next $500 million | 0.750 |
| Next $1 billion | 0.700 |
| Next $2 billion | 0.675 |
| Next $1 billion | 0.650 |
| Next $3 billion | 0.640 |
| Next $2 billion | 0.615 |
| Next $2 billion | 0.605 |
| Next $4 billion | 0.580 |
| Over $16 billion | 0.555 |
| Class-level administration fee | |
| Class A | 0.21% |
| Class C | 0.21 |
| Class R | 0.21 |
| Administrator Class | 0.13 |
| Institutional Class | 0.13 |
| Expense ratio caps | |
| Class A | 1.26% |
| Class C | 2.01 |
| Class R | 1.51 |
| Administrator Class | 1.10 |
| Institutional Class | 0.85 |
| Counterparty | Value of securities on loan | Collateral received1 | Net Amount |
| National Bank of Canada | $5,102,344 | $(5,102,344) | $0 |
| Name and year of birth | Position held and length of service* | Principal occupations during past five years or longer | Current other public company or investment company directorships |
| William R. Ebsworth (Born 1957) | Trustee, since 2015 | Retired. From 1984 to 2013, equities analyst, portfolio manager, research director and chief investment officer at Fidelity Management and Research Company in Boston, Tokyo, and Hong Kong, and retired in 2013 as Chief Investment Officer of Fidelity Strategic Advisers, Inc. where he led a team of investment professionals managing client assets. Prior thereto, Board member of Hong Kong Securities Clearing Co., Hong Kong Options Clearing Corp., the Thailand International Fund, Ltd., Fidelity Investments Life Insurance Company, and Empire Fidelity Investments Life Insurance Company. Audit Committee Chair and Investment Committee Chair of the Vincent Memorial Hospital Foundation (non-profit organization). Mr. Ebsworth is a CFA® charterholder. | N/A |
| Jane A. Freeman (Born 1953) | Trustee, since 2015; Chair Liaison, since 2018 | Retired. From 2012 to 2014 and 1999 to 2008, Chief Financial Officer of Scientific Learning Corporation. From 2008 to 2012, Ms. Freeman provided consulting services related to strategic business projects. Prior to 1999, Portfolio Manager at Rockefeller & Co. and Scudder, Stevens & Clark. Board member of the Harding Loevner Funds from 1996 to 2014, serving as both Lead Independent Director and chair of the Audit Committee. Board member of the Russell Exchange Traded Funds Trust from 2011 to 2012 and the chair of the Audit Committee. Ms. Freeman is also an inactive Chartered Financial Analyst. | N/A |
| Isaiah Harris, Jr. (Born 1952) | Trustee, since 2009; Audit Committee Chair, since 2019 | Retired. Member of the Advisory Board of CEF of East Central Florida. Chairman of the Board of CIGNA Corporation from 2009 to 2021, and Director from 2005 to 2008. From 2003 to 2011, Director of Deluxe Corporation. Prior thereto, President and CEO of BellSouth Advertising and Publishing Corp. from 2005 to 2007, President and CEO of BellSouth Enterprises from 2004 to 2005 and President of BellSouth Consumer Services from 2000 to 2003. Emeritus member of the Iowa State University Foundation Board of Governors. Emeritus Member of the Advisory Board of Iowa State University School of Business. Advisory Board Member, Palm Harbor Academy (private school). Advisory Board Member, Fellowship of Christian Athletes. Mr. Harris is a certified public accountant (inactive status). | N/A |
| David F. Larcker (Born 1950) | Trustee, since 2009 | Distinguished Visiting Fellow at the Hoover Institution since 2022. James Irvin Miller Professor of Accounting at the Graduate School of Business (Emeritus), Stanford University, Director of the Corporate Governance Research Initiative and Senior Faculty of The Rock Center for Corporate Governance since 2006. From 2005 to 2008, Professor of Accounting at the Graduate School of Business, Stanford University. Prior thereto, Ernst & Young Professor of Accounting at The Wharton School, University of Pennsylvania from 1985 to 2005. | N/A |
| Name and year of birth | Position held and length of service* | Principal occupations during past five years or longer | Current other public company or investment company directorships |
| Olivia S. Mitchell (Born 1953) | Trustee, since 2006; Nominating and Governance Committee Chair, since 2018 | International Foundation of Employee Benefit Plans Professor since 1993, Wharton School of the University of Pennsylvania. Director of Wharton’s Pension Research Council and Boettner Center on Pensions & Retirement Research, and Research Associate at the National Bureau of Economic Research. Previously taught at Cornell University from 1978 to 1993. | N/A |
| Timothy J. Penny (Born 1951) | Trustee, since 1996; Chair, since 2018 | President and Chief Executive Officer of Southern Minnesota Initiative Foundation, a non-profit organization, since 2007. Vice Chair of the Economic Club of Minnesota, since 2007. Co-Chair of the Committee for a Responsible Federal Budget, since 1995. Member of the Board of Trustees of NorthStar Education Finance, Inc., a non-profit organization, from 2007-2022. Senior Fellow of the University of Minnesota Humphrey Institute from 1995 to 2017. | N/A |
| James G. Polisson (Born 1959) | Trustee, since 2018 | Retired. Chief Marketing Officer, Source (ETF) UK Services, Ltd, from 2015 to 2017. From 2012 to 2015, Principal of The Polisson Group, LLC, a management consulting, corporate advisory and principal investing company. Chief Executive Officer and Managing Director at Russell Investments, Global Exchange Traded Funds from 2010 to 2012. Managing Director of Barclays Global Investors from 1998 to 2010 and Global Chief Marketing Officer for iShares and Barclays Global Investors from 2000 to 2010. Trustee of the San Francisco Mechanics’ Institute, a non-profit organization, from 2013 to 2015. Board member of the Russell Exchange Traded Fund Trust from 2011 to 2012. Director of Barclays Global Investors Holdings Deutschland GmbH from 2006 to 2009. Mr. Polisson is an attorney and has a retired status with the Massachusetts and District of Columbia Bar Associations. | N/A |
| Pamela Wheelock (Born 1959) | Trustee, since January 2020; previously Trustee from January 2018 to July 2019 | Retired. Executive and Senior Financial leadership positions in the public, private and nonprofit sectors. Interim President and CEO, McKnight Foundation, 2020. Interim Commissioner, Minnesota Department of Human Services, 2019. Chief Operating Officer, Twin Cities Habitat for Humanity, 2017-2019. Vice President for University Services, University of Minnesota, 2012-2016. Interim President and CEO, Blue Cross and Blue Shield of Minnesota, 2011-2012. Executive Vice-President and Chief Financial Officer, Minnesota Wild, 2002-2008. Commissioner, Minnesota Department of Finance, 1999-2002. Chair of the Board of Directors of Destination Medical Center Corporation. Board member of the Minnesota Wild Foundation. | N/A |
| Name and year of birth | Position held and length of service | Principal occupations during past five years or longer |
| Andrew Owen (Born 1960) | President, since 2017 | President and Chief Executive Officer of Allspring Funds Management, LLC since 2017 and Head of Global Fund Governance of Allspring Global Investments since 2022. Prior thereto, co-president of Galliard Capital Management, LLC, an affiliate of Allspring Funds Management, LLC, from 2019 to 2022 and Head of Affiliated Managers, Allspring Global Investments, from 2014 to 2019 and Executive Vice President responsible for marketing, investments and product development for Allspring Funds Management, LLC, from 2009 to 2014. |
| Jeremy DePalma (Born 1974) | Treasurer, since 2012 (for certain funds in the Fund Complex); since 2021 (for the remaining funds in the Fund Complex) | Senior Vice President of Allspring Funds Management, LLC since 2009. Senior Vice President of Evergreen Investment Management Company, LLC from 2008 to 2010 and head of the Fund Reporting and Control Team within Fund Administration from 2005 to 2010. |
| Christopher Baker (Born 1976) | Chief Compliance Officer, since 2022 | Global Chief Compliance Officer for Allspring Global Investments since 2022. Prior thereto, Chief Compliance Officer for State Street Global Advisors from 2018 to 2021. Senior Compliance Officer for the State Street divisions of Alternative Investment Solutions, Sector Solutions, and Global Marketing from 2015 to 2018. From 2010 to 2015 Vice President, Global Head of Investment and Marketing Compliance for State Street Global Advisors. |
| Matthew Prasse (Born 1983) | Chief Legal Officer, since 2022; Secretary, since 2021 | Senior Counsel of the Allspring Legal Department since 2021. Senior Counsel of the Wells Fargo Legal Department from 2018 to 2021. Previously, Counsel for Barings LLC from 2015 to 2018. Prior to joining Barings, Associate at Morgan, Lewis & Bockius LLP from 2008 to 2015. |
P.O. Box 219967
Kansas City, MO 64121-9967

1-800-222-8222 or visit the Fund's website at allspringglobal.com. Read the prospectus carefully before you invest or send money.
SAR0419 01-23


| 1 | The S&P 500 Index consists of 500 stocks chosen for market size, liquidity, and industry group representation. It is a market-value-weighted index with each stock's weight in the index proportionate to its market value. You cannot invest directly in an index. |
| 2 | The Morgan Stanley Capital International (MSCI) All Country World Index (ACWI) ex USA Index (Net) is a free-float-adjusted market-capitalization-weighted index that is designed to measure the equity market performance of developed and emerging markets, excluding the U.S. Source: MSCI. MSCI makes no express or implied warranties or representations and shall have no liability whatsoever with respect to any MSCI data contained herein. The MSCI data may not be further redistributed or used as a basis for other indexes or any securities or financial products. This report is not approved, reviewed, or produced by MSCI. You cannot invest directly in an index. |
| 3 | The MSCI Emerging Markets (EM) Index (Net) (USD) is a free-float-adjusted market-capitalization-weighted index that is designed to measure equity market performance of emerging markets. You cannot invest directly in an index. |
| 4 | The Bloomberg U.S. Aggregate Bond Index is a broad-based benchmark that measures the investment-grade, U.S.-dollar-denominated, fixed-rate taxable bond market, including Treasuries, government-related and corporate securities, mortgage-backed securities (agency fixed-rate and hybrid adjustable-rate mortgage pass-throughs), asset-backed securities, and commercial mortgage-backed securities. You cannot invest directly in an index. |
| 5 | The Bloomberg Global Aggregate ex-USD Index (unhedged) is an unmanaged index that provides a broad-based measure of the global investment-grade fixed-income markets excluding the U.S.-dollar-denominated debt market. You cannot invest directly in an index. |
| 6 | The Bloomberg Municipal Bond Index is an unmanaged index composed of long-term tax-exempt bonds with a minimum credit rating of Baa. You cannot invest directly in an index. |
| 7 | The ICE BofA U.S. High Yield Index is a market-capitalization-weighted index of domestic and Yankee high-yield bonds. The index tracks the performance of high-yield securities traded in the U.S. bond market. You cannot invest directly in an index. Copyright 2023. ICE Data Indices, LLC. All rights reserved. |
| 1 | The Consumer Price Index (CPI) is a measure of the average change over time in the prices paid by urban consumers for a market basket of consumer goods and services. You cannot invest directly in an index. |

President
Allspring Funds
| Investment objective | The Fund seeks long-term capital appreciation. |
| Manager | Allspring Funds Management, LLC |
| Subadviser | Allspring Global Investments, LLC |
| Portfolio managers | Robert Gruendyke, CFA®‡, Thomas C. Ognar, CFA®‡ |
| Average annual total returns (%) as of January 31, 2023 | |||||||||||
| Including sales charge | Excluding sales charge | Expense ratios1 (%) | |||||||||
| Inception date | 1 year | 5 year | 10 year | 1 year | 5 year | 10 year | Gross | Net 2 | |||
| Class A (EKJAX) | 1-20-1998 | -23.55 | 5.60 | 10.05 | -18.89 | 6.87 | 10.70 | 1.13 | 1.11 | ||
| Class C (EKJCX) | 1-22-1998 | -20.53 | 6.05 | 10.03 | -19.53 | 6.05 | 10.03 | 1.88 | 1.86 | ||
| Class R4 (EKJRX) | 11-30-2012 | – | – | – | -18.53 | 7.22 | 11.05 | 0.85 | 0.80 | ||
| Class R6 (EKJFX) | 11-30-2012 | – | – | – | -18.56 | 7.35 | 11.20 | 0.70 | 0.65 | ||
| Administrator Class (WFPDX) | 7-16-2010 | – | – | – | -18.81 | 6.98 | 10.84 | 1.05 | 1.00 | ||
| Institutional Class (EKJYX) | 6-30-1999 | – | – | – | -18.58 | 7.30 | 11.16 | 0.80 | 0.70 | ||
| Russell 1000® Growth Index | – | – | – | – | -16.02 | 11.22 | 14.53 | – | – | ||
| 1 | Reflects the expense ratios as stated in the most recent prospectuses. The expense ratios shown are subject to change and may differ from the annualized expense ratios shown in the financial highlights of this report. |
| 2 | The manager has contractually committed through November 30, 2023, to waive fees and/or reimburse expenses to the extent necessary to cap total annual fund operating expenses after fee waivers at 1.11% for Class A, 1.86% for Class C, 0.80% for Class R4, 0.65% for Class R6, 1.00% for Administrator Class, and 0.70% for Institutional Class. Brokerage commissions, stamp duty fees, interest, taxes, acquired fund fees and expenses (if any), and extraordinary expenses are excluded from the expense caps. Prior to or after the commitment expiration date, the caps may be increased or the commitment to maintain the caps may be terminated only with the approval of the Board of Trustees. Without these caps, the Fund’s returns would have been lower. The expense ratio paid by an investor is the net expense ratio (the total annual fund operating expenses after fee waivers) as stated in the prospectuses. |
| ‡ | CFA® and Chartered Financial Analyst® are trademarks owned by CFA Institute. |
| Ten largest holdings (%) as of January 31, 20231 | |
| Microsoft Corporation | 8.77 |
| MasterCard Incorporated Class A | 5.54 |
| Apple Incorporated | 4.12 |
| Alphabet Incorporated Class A | 3.86 |
| Amazon.com Incorporated | 3.15 |
| Deckers Outdoor Corporation | 2.32 |
| Visa Incorporated Class A | 1.96 |
| HEICO Corporation | 1.90 |
| NVIDIA Corporation | 1.80 |
| Tradeweb Markets Incorporated Class A | 1.77 |
| 1 | Figures represent the percentage of the Fund's net assets. Holdings are subject to change and may have changed since the date specified. |
| Sector allocation as of January 31, 20231 |

| 1 | Figures represent the percentage of the Fund's long-term investments. Allocations are subject to change and may have changed since the date specified. |
| Beginning account value 8-1-2022 | Ending account value 1-31-2023 | Expenses paid during the period1 | Annualized net expense ratio | |
| Class A | ||||
| Actual | $1,000.00 | $ 934.14 | $5.41 | 1.11% |
| Hypothetical (5% return before expenses) | $1,000.00 | $1,019.61 | $5.65 | 1.11% |
| Class C | ||||
| Actual | $1,000.00 | $ 930.30 | $9.05 | 1.86% |
| Hypothetical (5% return before expenses) | $1,000.00 | $1,015.83 | $9.45 | 1.86% |
| Class R4 | ||||
| Actual | $1,000.00 | $ 934.92 | $3.90 | 0.80% |
| Hypothetical (5% return before expenses) | $1,000.00 | $1,021.17 | $4.08 | 0.80% |
| Class R6 | ||||
| Actual | $1,000.00 | $ 935.86 | $3.17 | 0.65% |
| Hypothetical (5% return before expenses) | $1,000.00 | $1,021.93 | $3.31 | 0.65% |
| Administrator Class | ||||
| Actual | $1,000.00 | $ 934.78 | $4.88 | 1.00% |
| Hypothetical (5% return before expenses) | $1,000.00 | $1,020.16 | $5.09 | 1.00% |
| Institutional Class | ||||
| Actual | $1,000.00 | $ 936.09 | $3.42 | 0.70% |
| Hypothetical (5% return before expenses) | $1,000.00 | $1,021.68 | $3.57 | 0.70% |
| Shares | Value | ||||
| Common stocks: 99.49% | |||||
| Communication services: 9.10% | |||||
| Entertainment: 1.98% | |||||
| Liberty Media Corporation † | 187,800 | $ 13,296,240 | |||
| Live Nation Entertainment Incorporated † | 315,079 | 25,360,709 | |||
| 38,656,949 | |||||
| Interactive media & services: 5.94% | |||||
| Alphabet Incorporated Class A † | 762,725 | 75,387,739 | |||
| Alphabet Incorporated Class C † | 273,158 | 27,280,289 | |||
| ZoomInfo Technologies Incorporated † | 473,957 | 13,379,806 | |||
| 116,047,834 | |||||
| Wireless telecommunication services: 1.18% | |||||
| T-Mobile US Incorporated † | 155,000 | 23,143,050 | |||
| Consumer discretionary: 14.99% | |||||
| Hotels, restaurants & leisure: 2.56% | |||||
| Chipotle Mexican Grill Incorporated † | 15,616 | 25,709,870 | |||
| Hilton Worldwide Holdings Incorporated | 167,338 | 24,279,070 | |||
| 49,988,940 | |||||
| Internet & direct marketing retail: 4.01% | |||||
| Amazon.com Incorporated † | 596,142 | 61,480,124 | |||
| MercadoLibre Incorporated † | 14,234 | 16,820,175 | |||
| 78,300,299 | |||||
| Specialty retail: 4.77% | |||||
| AutoZone Incorporated † | 12,900 | 31,461,165 | |||
| Five Below Incorporated † | 18,133 | 3,574,558 | |||
| Tractor Supply Company | 106,965 | 24,386,950 | |||
| Ulta Beauty Incorporated † | 65,928 | 33,884,355 | |||
| 93,307,028 | |||||
| Textiles, apparel & luxury goods: 3.65% | |||||
| Deckers Outdoor Corporation † | 106,058 | 45,337,674 | |||
| lululemon athletica Incorporated † | 84,866 | 26,043,678 | |||
| 71,381,352 | |||||
| Consumer staples: 1.37% | |||||
| Beverages: 0.15% | |||||
| Monster Beverage Corporation † | 28,100 | 2,924,648 | |||
| Food & staples retailing: 1.22% | |||||
| Costco Wholesale Corporation | 46,555 | 23,796,123 | |||
| Financials: 8.37% | |||||
| Capital markets: 6.63% | |||||
| LPL Financial Holdings Incorporated | 83,200 | 19,728,384 | |||
| MarketAxess Holdings Incorporated | 25,081 | 9,125,722 | |||
| MSCI Incorporated | 34,387 | 18,278,754 | |||
| S&P Global Incorporated | 72,500 | 27,183,150 |
| Shares | Value | ||||
| Capital markets (continued) | |||||
| The Charles Schwab Corporation | 265,254 | $ 20,535,965 | |||
| Tradeweb Markets Incorporated Class A | 464,110 | 34,594,759 | |||
| 129,446,734 | |||||
| Insurance: 1.74% | |||||
| Kinsale Capital Group Incorporated | 49,321 | 13,732,939 | |||
| Progressive Corporation | 149,174 | 20,339,875 | |||
| 34,072,814 | |||||
| Health care: 14.01% | |||||
| Biotechnology: 4.73% | |||||
| Argenx SE † | 41,414 | 15,830,502 | |||
| BioMarin Pharmaceutical Incorporated † | 139,070 | 16,041,725 | |||
| Neurocrine Biosciences Incorporated † | 162,989 | 18,080,370 | |||
| Sarepta Therapeutics Incorporated † | 95,600 | 11,947,132 | |||
| Vertex Pharmaceuticals Incorporated † | 94,321 | 30,475,115 | |||
| 92,374,844 | |||||
| Health care equipment & supplies: 5.44% | |||||
| Boston Scientific Corporation † | 675,792 | 31,255,380 | |||
| DexCom Incorporated † | 102,400 | 10,966,016 | |||
| Hologic Incorporated † | 117,700 | 9,577,249 | |||
| Insulet Corporation † | 106,549 | 30,613,659 | |||
| Penumbra Incorporated † | 95,678 | 23,958,728 | |||
| 106,371,032 | |||||
| Health care providers & services: 1.24% | |||||
| Humana Incorporated | 18,286 | 9,356,946 | |||
| UnitedHealth Group Incorporated | 29,988 | 14,969,710 | |||
| 24,326,656 | |||||
| Health care technology: 0.67% | |||||
| Veeva Systems Incorporated Class A † | 76,594 | 13,063,107 | |||
| Life sciences tools & services: 1.93% | |||||
| Agilent Technologies Incorporated | 121,674 | 18,504,182 | |||
| Repligen Corporation † | 103,373 | 19,155,017 | |||
| 37,659,199 | |||||
| Industrials: 7.53% | |||||
| Aerospace & defense: 1.90% | |||||
| HEICO Corporation | 217,169 | 37,125,041 | |||
| Building products: 2.49% | |||||
| Advanced Drainage Systems Incorporated | 225,975 | 22,787,317 | |||
| Johnson Controls International plc | 245,436 | 17,074,983 | |||
| Trex Company Incorporated † | 166,400 | 8,772,608 | |||
| 48,634,908 | |||||
| Commercial services & supplies: 0.71% | |||||
| Copart Incorporated † | 208,674 | 13,899,775 | |||
| Construction & engineering: 0.61% | |||||
| WillScot Mobile Mini Holdings Corporation † | 244,200 | 11,833,932 |
| Shares | Value | ||||
| Machinery: 1.05% | |||||
| Fortive Corporation | 302,554 | $ 20,582,749 | |||
| Road & rail: 0.77% | |||||
| J.B. Hunt Transport Services Incorporated | 79,271 | 14,986,183 | |||
| Information technology: 41.34% | |||||
| Communications equipment: 0.62% | |||||
| Arista Networks Incorporated † | 96,425 | 12,151,479 | |||
| Electronic equipment, instruments & components: 1.15% | |||||
| Keysight Technologies Incorporated † | 79,962 | 14,341,185 | |||
| Mobileye Global Incorporated Class A † | 212,900 | 8,217,940 | |||
| 22,559,125 | |||||
| IT services: 10.01% | |||||
| Block Incorporated Class A † | 170,800 | 13,957,776 | |||
| Jack Henry & Associates Incorporated | 88,900 | 16,010,001 | |||
| MasterCard Incorporated Class A | 291,879 | 108,170,357 | |||
| PayPal Holdings Incorporated † | 234,065 | 19,073,957 | |||
| Visa Incorporated Class A | 166,600 | 38,352,986 | |||
| 195,565,077 | |||||
| Semiconductors & semiconductor equipment: 8.10% | |||||
| Allegro MicroSystems Incorporated † | 272,334 | 10,394,989 | |||
| Microchip Technology Incorporated | 412,827 | 32,043,632 | |||
| Monolithic Power Systems Incorporated | 76,509 | 32,635,679 | |||
| NVIDIA Corporation | 179,785 | 35,124,595 | |||
| NXP Semiconductors NV | 117,585 | 21,672,091 | |||
| Qualcomm Incorporated | 198,149 | 26,395,428 | |||
| 158,266,414 | |||||
| Software: 17.34% | |||||
| Dynatrace Incorporated † | 573,276 | 22,030,997 | |||
| Fair Isaac Corporation † | 27,676 | 18,430,832 | |||
| Five9 Incorporated † | 218,210 | 17,190,584 | |||
| Intuit Incorporated | 65,433 | 27,656,566 | |||
| Microsoft Corporation | 691,570 | 171,377,962 | |||
| Oracle Corporation | 246,700 | 21,823,082 | |||
| Palo Alto Networks Incorporated † | 145,494 | 23,081,168 | |||
| Paycom Software Incorporated † | 33,100 | 10,722,414 | |||
| ServiceNow Incorporated † | 58,165 | 26,472,636 | |||
| 338,786,241 | |||||
| Technology hardware, storage & peripherals: 4.12% | |||||
| Apple Incorporated | 558,238 | 80,548,161 | |||
| Materials: 1.56% | |||||
| Chemicals: 1.56% | |||||
| Linde plc | 91,855 | 30,398,494 | |||
| Real estate: 1.22% | |||||
| Equity REITs: 0.29% | |||||
| SBA Communications Corporation | 19,274 | 5,734,593 |
| Shares | Value | ||||
| Real estate management & development: 0.93% | |||||
| CBRE Group Incorporated Class A † | 212,500 | $ 18,170,875 | |||
| Total Common stocks (Cost $1,332,196,083) | 1,944,103,656 |
| Yield | |||||
| Short-term investments: 0.71% | |||||
| Investment companies: 0.71% | |||||
| Allspring Government Money Market Fund Select Class ♠∞ | 4.16% | 13,836,619 | 13,836,619 | ||
| Total Short-term investments (Cost $13,836,619) | 13,836,619 | ||||
| Total investments in securities (Cost $1,346,032,702) | 100.20% | 1,957,940,275 | |||
| Other assets and liabilities, net | (0.20) | (3,840,546) | |||
| Total net assets | 100.00% | $1,954,099,729 |
| † | Non-income-earning security |
| ♠ | The issuer of the security is an affiliated person of the Fund as defined in the Investment Company Act of 1940. |
| ∞ | The rate represents the 7-day annualized yield at period end. |
| Abbreviations: | |
| REIT | Real estate investment trust |
| Value, beginning of period | Purchases | Sales proceeds | Net realized gains (losses) | Net change in unrealized gains (losses) | Value, end of period | Shares, end of period | Income from affiliated securities | |
| Short-term investments | ||||||||
| Allspring Government Money Market Fund Select Class | $14,233,380 | $289,849,262 | $(290,246,023) | $0 | $0 | $13,836,619 | 13,836,619 | $411,838 |
| Assets | |
Investments in unaffiliated securities, at value (cost $1,332,196,083) | $ 1,944,103,656 |
Investments in affiliated securities, at value (cost $13,836,619) | 13,836,619 |
Cash | 143 |
Receivable for investments sold | 12,028,468 |
Receivable for Fund shares sold | 482,129 |
Receivable for dividends | 211,898 |
Prepaid expenses and other assets | 163,491 |
Total assets | 1,970,826,404 |
| Liabilities | |
Payable for investments purchased | 13,753,457 |
Payable for Fund shares redeemed | 1,404,766 |
Management fee payable | 959,038 |
Administration fees payable | 204,246 |
Distribution fee payable | 10,622 |
Trustees’ fees and expenses payable | 4,320 |
Accrued expenses and other liabilities | 390,226 |
Total liabilities | 16,726,675 |
Total net assets | $1,954,099,729 |
| Net assets consist of | |
Paid-in capital | $ 1,211,949,688 |
Total distributable earnings | 742,150,041 |
Total net assets | $1,954,099,729 |
| Computation of net asset value and offering price per share | |
Net assets – Class A | $ 872,396,571 |
Shares outstanding – Class A1 | 80,936,654 |
Net asset value per share – Class A | $10.78 |
Maximum offering price per share – Class A2 | $11.44 |
Net assets – Class C | $ 17,467,543 |
Shares outstanding – Class C1 | 2,843,915 |
Net asset value per share – Class C | $6.14 |
Net assets – Class R4 | $ 121,428 |
Shares outstanding – Class R41 | 10,304 |
Net asset value per share – Class R4 | $11.78 |
Net assets – Class R6 | $ 745,658,105 |
Shares outstanding – Class R61 | 61,574,888 |
Net asset value per share – Class R6 | $12.11 |
Net assets – Administrator Class | $ 18,066,480 |
Shares outstanding – Administrator Class1 | 1,616,280 |
Net asset value per share – Administrator Class | $11.18 |
Net assets – Institutional Class | $ 300,389,602 |
Shares outstanding – Institutional Class1 | 25,014,938 |
Net asset value per share – Institutional Class | $12.01 |
| 1 | The Fund has an unlimited number of authorized shares. |
| 2 | Maximum offering price is computed as 100/94.25 of net asset value. On investments of $50,000 or more, the offering price is reduced. |
| Investment income | |
Dividends (net of foreign withholdings taxes of $38,788) | $ 4,880,501 |
Income from affiliated securities | 411,838 |
Total investment income | 5,292,339 |
| Expenses | |
Management fee | 6,812,456 |
| Administration fees | |
Class A | 940,797 |
Class C | 20,407 |
Class R4 | 48 |
Class R6 | 114,819 |
Administrator Class | 12,739 |
Institutional Class | 221,265 |
| Shareholder servicing fees | |
Class A | 1,118,008 |
Class C | 24,196 |
Class R4 | 59 |
Administrator Class | 24,009 |
| Distribution fee | |
Class C | 72,214 |
Custody and accounting fees | 69,860 |
Professional fees | 27,505 |
Registration fees | 36,962 |
Shareholder report expenses | 49,978 |
Trustees’ fees and expenses | 11,026 |
Other fees and expenses | 34,482 |
Total expenses | 9,590,830 |
| Less: Fee waivers and/or expense reimbursements | |
Fund-level | (406,714) |
Class R4 | (18) |
Class R6 | (114,819) |
Administrator Class | (1,960) |
Institutional Class | (136,163) |
Net expenses | 8,931,156 |
Net investment loss | (3,638,817) |
| Realized and unrealized gains (losses) on investments | |
Net realized gains on investments | 149,367,066 |
Net change in unrealized gains (losses) on investments | (300,004,407) |
Net realized and unrealized gains (losses) on investments | (150,637,341) |
Net decrease in net assets resulting from operations | $(154,276,158) |
| Six months ended January 31, 2023 (unaudited) | Year ended July 31, 2022 | |||
| Operations | ||||
Net investment loss | $ (3,638,817) | $ (15,412,403) | ||
Net realized gains on investments | 149,367,066 | 230,342,200 | ||
Net change in unrealized gains (losses) on investments | (300,004,407) | (994,308,831) | ||
Net decrease in net assets resulting from operations | (154,276,158) | (779,379,034) | ||
| Distributions to shareholders from | ||||
| Net investment income and net realized gains | ||||
Class A | 0 | (309,130,200) | ||
Class C | 0 | (15,056,315) | ||
Class R4 | 0 | (291,397) | ||
Class R6 | 0 | (222,688,114) | ||
Administrator Class | 0 | (13,378,433) | ||
Institutional Class | 0 | (126,375,453) | ||
Total distributions to shareholders | 0 | (686,919,912) | ||
| Capital share transactions | Shares | Shares | ||
| Proceeds from shares sold | ||||
Class A | 1,008,604 | 10,572,818 | 3,310,399 | 50,327,381 |
Class C | 125,459 | 744,350 | 223,387 | 2,029,703 |
Class R4 | 176 | 2,023 | 4,488 | 72,140 |
Class R6 | 2,489,322 | 29,398,928 | 8,122,366 | 122,467,136 |
Administrator Class | 46,031 | 513,988 | 198,706 | 3,310,040 |
Institutional Class | 1,307,594 | 15,155,253 | 5,740,987 | 88,249,584 |
| 56,387,360 | 266,455,984 | |||
| Reinvestment of distributions | ||||
Class A | 0 | 0 | 19,056,650 | 289,089,373 |
Class C | 0 | 0 | 1,669,149 | 14,554,977 |
Class R4 | 0 | 0 | 17,671 | 291,397 |
Class R6 | 0 | 0 | 12,933,032 | 219,214,894 |
Administrator Class | 0 | 0 | 824,167 | 12,947,669 |
Institutional Class | 0 | 0 | 6,622,898 | 111,397,139 |
| 0 | 647,495,449 | |||
| Payment for shares redeemed | ||||
Class A | (6,880,010) | (73,003,653) | (13,457,217) | (193,624,038) |
Class C | (790,323) | (4,734,091) | (2,936,526) | (26,914,649) |
Class R4 | (34) | (388) | (82,779) | (1,205,111) |
Class R6 | (7,088,141) | (84,295,581) | (10,939,862) | (168,824,630) |
Administrator Class | (314,554) | (3,469,424) | (2,451,692) | (34,510,357) |
Institutional Class | (8,229,940) | (96,093,206) | (12,833,169) | (192,974,882) |
| (261,596,343) | (618,053,667) | |||
Net increase (decrease) in net assets resulting from capital share transactions | (205,208,983) | 295,897,766 | ||
Total decrease in net assets | (359,485,141) | (1,170,401,180) | ||
| Net assets | ||||
Beginning of period | 2,313,584,870 | 3,483,986,050 | ||
End of period | $1,954,099,729 | $ 2,313,584,870 | ||
| Year ended July 31 | ||||||
| Class A | Six months ended January 31, 2023 (unaudited) | 2022 | 2021 | 2020 | 2019 | 2018 |
Net asset value, beginning of period | $11.54 | $19.28 | $16.08 | $14.19 | $15.10 | $15.34 |
Net investment loss | (0.03) 1 | (0.11) 1 | (0.13) 1 | (0.07) | (0.05) | (0.05) |
Net realized and unrealized gains (losses) on investments | (0.73) | (3.54) | 5.36 | 3.07 | 1.50 | 3.56 |
Total from investment operations | (0.76) | (3.65) | 5.23 | 3.00 | 1.45 | 3.51 |
| Distributions to shareholders from | ||||||
Net realized gains | 0.00 | (4.09) | (2.03) | (1.11) | (2.36) | (3.75) |
Net asset value, end of period | $10.78 | $11.54 | $19.28 | $16.08 | $14.19 | $15.10 |
Total return2 | (6.59)% | (24.02)% | 34.93% | 22.78% | 12.97% | 26.54% |
| Ratios to average net assets (annualized) | ||||||
Gross expenses | 1.15% | 1.13% | 1.13% | 1.14% | 1.15% | 1.15% |
Net expenses | 1.11% | 1.10% | 1.10% | 1.10% | 1.11% | 1.11% |
Net investment loss | (0.59)% | (0.75)% | (0.77)% | (0.52)% | (0.40)% | (0.34)% |
| Supplemental data | ||||||
Portfolio turnover rate | 35% | 54% | 48% | 45% | 60% | 45% |
Net assets, end of period (000s omitted) | $872,397 | $1,001,892 | $1,501,805 | $1,178,453 | $1,050,751 | $1,048,632 |
| 1 | Calculated based upon average shares outstanding |
| 2 | Total return calculations do not include any sales charges. Returns for periods of less than one year are not annualized. |
| Year ended July 31 | ||||||
| Class C | Six months ended January 31, 2023 (unaudited) | 2022 | 2021 | 2020 | 2019 | 2018 |
Net asset value, beginning of period | $6.60 | $12.85 | $11.40 | $10.45 | $11.87 | $12.86 |
Net investment loss | (0.04) 1 | (0.14) 1 | (0.18) 1 | (0.13) 1 | (0.12) 1 | (0.13) 1 |
Net realized and unrealized gains (losses) on investments | (0.42) | (2.02) | 3.66 | 2.19 | 1.06 | 2.89 |
Total from investment operations | (0.46) | (2.16) | 3.48 | 2.06 | 0.94 | 2.76 |
| Distributions to shareholders from | ||||||
Net realized gains | 0.00 | (4.09) | (2.03) | (1.11) | (2.36) | (3.75) |
Net asset value, end of period | $6.14 | $6.60 | $12.85 | $11.40 | $10.45 | $11.87 |
Total return2 | (6.97)% | (24.57)% | 33.80% | 21.87% | 12.09% | 25.68% |
| Ratios to average net assets (annualized) | ||||||
Gross expenses | 1.89% | 1.86% | 1.87% | 1.89% | 1.90% | 1.90% |
Net expenses | 1.86% | 1.85% | 1.86% | 1.86% | 1.86% | 1.86% |
Net investment loss | (1.34)% | (1.51)% | (1.52)% | (1.27)% | (1.14)% | (1.09)% |
| Supplemental data | ||||||
Portfolio turnover rate | 35% | 54% | 48% | 45% | 60% | 45% |
Net assets, end of period (000s omitted) | $17,468 | $23,163 | $58,524 | $111,046 | $153,404 | $201,138 |
| 1 | Calculated based upon average shares outstanding |
| 2 | Total return calculations do not include any sales charges. Returns for periods of less than one year are not annualized. |
| Year ended July 31 | ||||||
| Class R4 | Six months ended January 31, 2023 (unaudited) | 2022 | 2021 | 2020 | 2019 | 2018 |
Net asset value, beginning of period | $12.60 | $20.58 | $17.00 | $14.89 | $15.69 | $15.75 |
Net investment loss | (0.02) 1 | (0.08) 1 | (0.09) 1 | (0.03) 1 | (0.03) | (0.00) 1,2 |
Net realized and unrealized gains (losses) on investments | (0.80) | (3.81) | 5.70 | 3.25 | 1.59 | 3.69 |
Total from investment operations | (0.82) | (3.89) | 5.61 | 3.22 | 1.56 | 3.69 |
| Distributions to shareholders from | ||||||
Net realized gains | 0.00 | (4.09) | (2.03) | (1.11) | (2.36) | (3.75) |
Net asset value, end of period | $11.78 | $12.60 | $20.58 | $17.00 | $14.89 | $15.69 |
Total return3 | (6.51)% | (23.61)% | 35.30% | 23.20% | 13.21% | 27.06% |
| Ratios to average net assets (annualized) | ||||||
Gross expenses | 0.87% | 0.85% | 0.85% | 0.86% | 0.87% | 0.87% |
Net expenses | 0.80% | 0.80% | 0.80% | 0.80% | 0.80% | 0.80% |
Net investment loss | (0.29)% | (0.47)% | (0.47)% | (0.20)% | (0.10)% | (0.02)% |
| Supplemental data | ||||||
Portfolio turnover rate | 35% | 54% | 48% | 45% | 60% | 45% |
Net assets, end of period (000s omitted) | $121 | $128 | $1,457 | $1,129 | $3,940 | $3,727 |
| 1 | Calculated based upon average shares outstanding |
| 2 | Amount is more than $(0.005) |
| 3 | Returns for periods of less than one year are not annualized. |
| Year ended July 31 | ||||||
| Class R6 | Six months ended January 31, 2023 (unaudited) | 2022 | 2021 | 2020 | 2019 | 2018 |
Net asset value, beginning of period | $12.94 | $21.03 | $17.31 | $15.12 | $15.87 | $15.87 |
Net investment income (loss) | (0.01) 1 | (0.05) 1 | (0.06) 1 | (0.01) | (0.00) 1,2 | 0.02 1 |
Net realized and unrealized gains (losses) on investments | (0.82) | (3.95) | 5.81 | 3.31 | 1.61 | 3.73 |
Total from investment operations | (0.83) | (4.00) | 5.75 | 3.30 | 1.61 | 3.75 |
| Distributions to shareholders from | ||||||
Net realized gains | 0.00 | (4.09) | (2.03) | (1.11) | (2.36) | (3.75) |
Net asset value, end of period | $12.11 | $12.94 | $21.03 | $17.31 | $15.12 | $15.87 |
Total return3 | (6.41)% | (23.64)% | 35.49% | 23.39% | 13.40% | 27.27% |
| Ratios to average net assets (annualized) | ||||||
Gross expenses | 0.72% | 0.70% | 0.70% | 0.71% | 0.71% | 0.72% |
Net expenses | 0.65% | 0.65% | 0.65% | 0.65% | 0.65% | 0.65% |
Net investment income (loss) | (0.13)% | (0.30)% | (0.32)% | (0.07)% | (0.02)% | 0.12% |
| Supplemental data | ||||||
Portfolio turnover rate | 35% | 54% | 48% | 45% | 60% | 45% |
Net assets, end of period (000s omitted) | $745,658 | $856,050 | $1,179,098 | $954,852 | $820,383 | $196,934 |
| 1 | Calculated based upon average shares outstanding |
| 2 | Amount is more than $(0.005) |
| 3 | Returns for periods of less than one year are not annualized. |
| Year ended July 31 | ||||||
| Administrator Class | Six months ended January 31, 2023 (unaudited) | 2022 | 2021 | 2020 | 2019 | 2018 |
Net asset value, beginning of period | $11.96 | $19.82 | $16.47 | $14.48 | $15.35 | $15.52 |
Net investment loss | (0.03) 1 | (0.11) 1 | (0.12) 1 | (0.06) 1 | (0.04) 1 | (0.03) 1 |
Net realized and unrealized gains (losses) on investments | (0.75) | (3.66) | 5.50 | 3.16 | 1.53 | 3.61 |
Total from investment operations | (0.78) | (3.77) | 5.38 | 3.10 | 1.49 | 3.58 |
| Distributions to shareholders from | ||||||
Net realized gains | 0.00 | (4.09) | (2.03) | (1.11) | (2.36) | (3.75) |
Net asset value, end of period | $11.18 | $11.96 | $19.82 | $16.47 | $14.48 | $15.35 |
Total return2 | (6.52)% | (23.96)% | 35.02% | 23.02% | 13.02% | 26.70% |
| Ratios to average net assets (annualized) | ||||||
Gross expenses | 1.06% | 1.04% | 1.05% | 1.06% | 1.07% | 1.07% |
Net expenses | 1.00% | 1.00% | 1.00% | 1.00% | 1.00% | 1.00% |
Net investment loss | (0.48)% | (0.68)% | (0.67)% | (0.42)% | (0.29)% | (0.22)% |
| Supplemental data | ||||||
Portfolio turnover rate | 35% | 54% | 48% | 45% | 60% | 45% |
Net assets, end of period (000s omitted) | $18,066 | $22,546 | $65,665 | $54,341 | $49,042 | $57,582 |
| 1 | Calculated based upon average shares outstanding |
| 2 | Returns for periods of less than one year are not annualized. |
| Year ended July 31 | ||||||
| Institutional Class | Six months ended January 31, 2023 (unaudited) | 2022 | 2021 | 2020 | 2019 | 2018 |
Net asset value, beginning of period | $12.83 | $20.90 | $17.22 | $15.06 | $15.82 | $15.84 |
Net investment income (loss) | (0.01) 1 | (0.06) 1 | (0.07) 1 | (0.02) 1 | 0.00 1,2 | 0.01 1 |
Net realized and unrealized gains (losses) on investments | (0.81) | (3.92) | 5.78 | 3.29 | 1.60 | 3.72 |
Total from investment operations | (0.82) | (3.98) | 5.71 | 3.27 | 1.60 | 3.73 |
| Distributions to shareholders from | ||||||
Net realized gains | 0.00 | (4.09) | (2.03) | (1.11) | (2.36) | (3.75) |
Net asset value, end of period | $12.01 | $12.83 | $20.90 | $17.22 | $15.06 | $15.82 |
Total return3 | (6.39)% | (23.70)% | 35.43% | 23.28% | 13.38% | 27.17% |
| Ratios to average net assets (annualized) | ||||||
Gross expenses | 0.82% | 0.80% | 0.80% | 0.81% | 0.82% | 0.82% |
Net expenses | 0.70% | 0.70% | 0.70% | 0.70% | 0.70% | 0.70% |
Net investment income (loss) | (0.18)% | (0.35)% | (0.37)% | (0.12)% | 0.02% | 0.07% |
| Supplemental data | ||||||
Portfolio turnover rate | 35% | 54% | 48% | 45% | 60% | 45% |
Net assets, end of period (000s omitted) | $300,390 | $409,806 | $677,437 | $648,357 | $643,578 | $1,043,161 |
| 1 | Calculated based upon average shares outstanding |
| 2 | Amount is less than $0.005. |
| 3 | Returns for periods of less than one year are not annualized. |
| Gross unrealized gains | $642,424,337 |
| Gross unrealized losses | (30,737,844) |
| Net unrealized gains | $611,686,493 |
| ■ | Level 1 – quoted prices in active markets for identical securities |
| ■ | Level 2 – other significant observable inputs (including quoted prices for similar securities, interest rates, prepayment speeds, credit risk, etc.) |
| ■ | Level 3 – significant unobservable inputs (including the Fund’s own assumptions in determining the fair value of investments) |
| Quoted prices (Level 1) | Other significant observable inputs (Level 2) | Significant unobservable inputs (Level 3) | Total | |
| Assets | ||||
| Investments in: | ||||
| Common stocks | ||||
| Communication services | $ 177,847,833 | $0 | $0 | $ 177,847,833 |
| Consumer discretionary | 292,977,619 | 0 | 0 | 292,977,619 |
| Consumer staples | 26,720,771 | 0 | 0 | 26,720,771 |
| Financials | 163,519,548 | 0 | 0 | 163,519,548 |
| Health care | 273,794,838 | 0 | 0 | 273,794,838 |
| Industrials | 147,062,588 | 0 | 0 | 147,062,588 |
| Information technology | 807,876,497 | 0 | 0 | 807,876,497 |
| Materials | 30,398,494 | 0 | 0 | 30,398,494 |
| Real estate | 23,905,468 | 0 | 0 | 23,905,468 |
| Short-term investments | ||||
| Investment companies | 13,836,619 | 0 | 0 | 13,836,619 |
| Total assets | $1,957,940,275 | $0 | $0 | $1,957,940,275 |
| Average daily net assets | Management fee |
| First $500 million | 0.700% |
| Next $500 million | 0.675 |
| Next $1 billion | 0.650 |
| Next $2 billion | 0.625 |
| Next $1 billion | 0.600 |
| Next $3 billion | 0.590 |
| Next $2 billion | 0.565 |
| Next $2 billion | 0.555 |
| Next $4 billion | 0.530 |
| Over $16 billion | 0.505 |
| Class-level administration fee | |
| Class A | 0.21% |
| Class C | 0.21 |
| Class R4 | 0.08 |
| Class R6 | 0.03 |
| Administrator Class | 0.13 |
| Institutional Class | 0.13 |
| Expense ratio caps | |
| Class A | 1.11% |
| Class C | 1.86 |
| Class R4 | 0.80 |
| Class R6 | 0.65 |
| Administrator Class | 1.00 |
| Institutional Class | 0.70 |
| Name and year of birth | Position held and length of service* | Principal occupations during past five years or longer | Current other public company or investment company directorships |
| William R. Ebsworth (Born 1957) | Trustee, since 2015 | Retired. From 1984 to 2013, equities analyst, portfolio manager, research director and chief investment officer at Fidelity Management and Research Company in Boston, Tokyo, and Hong Kong, and retired in 2013 as Chief Investment Officer of Fidelity Strategic Advisers, Inc. where he led a team of investment professionals managing client assets. Prior thereto, Board member of Hong Kong Securities Clearing Co., Hong Kong Options Clearing Corp., the Thailand International Fund, Ltd., Fidelity Investments Life Insurance Company, and Empire Fidelity Investments Life Insurance Company. Audit Committee Chair and Investment Committee Chair of the Vincent Memorial Hospital Foundation (non-profit organization). Mr. Ebsworth is a CFA® charterholder. | N/A |
| Jane A. Freeman (Born 1953) | Trustee, since 2015; Chair Liaison, since 2018 | Retired. From 2012 to 2014 and 1999 to 2008, Chief Financial Officer of Scientific Learning Corporation. From 2008 to 2012, Ms. Freeman provided consulting services related to strategic business projects. Prior to 1999, Portfolio Manager at Rockefeller & Co. and Scudder, Stevens & Clark. Board member of the Harding Loevner Funds from 1996 to 2014, serving as both Lead Independent Director and chair of the Audit Committee. Board member of the Russell Exchange Traded Funds Trust from 2011 to 2012 and the chair of the Audit Committee. Ms. Freeman is also an inactive Chartered Financial Analyst. | N/A |
| Isaiah Harris, Jr. (Born 1952) | Trustee, since 2009; Audit Committee Chair, since 2019 | Retired. Member of the Advisory Board of CEF of East Central Florida. Chairman of the Board of CIGNA Corporation from 2009 to 2021, and Director from 2005 to 2008. From 2003 to 2011, Director of Deluxe Corporation. Prior thereto, President and CEO of BellSouth Advertising and Publishing Corp. from 2005 to 2007, President and CEO of BellSouth Enterprises from 2004 to 2005 and President of BellSouth Consumer Services from 2000 to 2003. Emeritus member of the Iowa State University Foundation Board of Governors. Emeritus Member of the Advisory Board of Iowa State University School of Business. Advisory Board Member, Palm Harbor Academy (private school). Advisory Board Member, Fellowship of Christian Athletes. Mr. Harris is a certified public accountant (inactive status). | N/A |
| David F. Larcker (Born 1950) | Trustee, since 2009 | Distinguished Visiting Fellow at the Hoover Institution since 2022. James Irvin Miller Professor of Accounting at the Graduate School of Business (Emeritus), Stanford University, Director of the Corporate Governance Research Initiative and Senior Faculty of The Rock Center for Corporate Governance since 2006. From 2005 to 2008, Professor of Accounting at the Graduate School of Business, Stanford University. Prior thereto, Ernst & Young Professor of Accounting at The Wharton School, University of Pennsylvania from 1985 to 2005. | N/A |
| Name and year of birth | Position held and length of service* | Principal occupations during past five years or longer | Current other public company or investment company directorships |
| Olivia S. Mitchell (Born 1953) | Trustee, since 2006; Nominating and Governance Committee Chair, since 2018 | International Foundation of Employee Benefit Plans Professor since 1993, Wharton School of the University of Pennsylvania. Director of Wharton’s Pension Research Council and Boettner Center on Pensions & Retirement Research, and Research Associate at the National Bureau of Economic Research. Previously taught at Cornell University from 1978 to 1993. | N/A |
| Timothy J. Penny (Born 1951) | Trustee, since 1996; Chair, since 2018 | President and Chief Executive Officer of Southern Minnesota Initiative Foundation, a non-profit organization, since 2007. Vice Chair of the Economic Club of Minnesota, since 2007. Co-Chair of the Committee for a Responsible Federal Budget, since 1995. Member of the Board of Trustees of NorthStar Education Finance, Inc., a non-profit organization, from 2007-2022. Senior Fellow of the University of Minnesota Humphrey Institute from 1995 to 2017. | N/A |
| James G. Polisson (Born 1959) | Trustee, since 2018 | Retired. Chief Marketing Officer, Source (ETF) UK Services, Ltd, from 2015 to 2017. From 2012 to 2015, Principal of The Polisson Group, LLC, a management consulting, corporate advisory and principal investing company. Chief Executive Officer and Managing Director at Russell Investments, Global Exchange Traded Funds from 2010 to 2012. Managing Director of Barclays Global Investors from 1998 to 2010 and Global Chief Marketing Officer for iShares and Barclays Global Investors from 2000 to 2010. Trustee of the San Francisco Mechanics’ Institute, a non-profit organization, from 2013 to 2015. Board member of the Russell Exchange Traded Fund Trust from 2011 to 2012. Director of Barclays Global Investors Holdings Deutschland GmbH from 2006 to 2009. Mr. Polisson is an attorney and has a retired status with the Massachusetts and District of Columbia Bar Associations. | N/A |
| Pamela Wheelock (Born 1959) | Trustee, since January 2020; previously Trustee from January 2018 to July 2019 | Retired. Executive and Senior Financial leadership positions in the public, private and nonprofit sectors. Interim President and CEO, McKnight Foundation, 2020. Interim Commissioner, Minnesota Department of Human Services, 2019. Chief Operating Officer, Twin Cities Habitat for Humanity, 2017-2019. Vice President for University Services, University of Minnesota, 2012-2016. Interim President and CEO, Blue Cross and Blue Shield of Minnesota, 2011-2012. Executive Vice-President and Chief Financial Officer, Minnesota Wild, 2002-2008. Commissioner, Minnesota Department of Finance, 1999-2002. Chair of the Board of Directors of Destination Medical Center Corporation. Board member of the Minnesota Wild Foundation. | N/A |
| Name and year of birth | Position held and length of service | Principal occupations during past five years or longer |
| Andrew Owen (Born 1960) | President, since 2017 | President and Chief Executive Officer of Allspring Funds Management, LLC since 2017 and Head of Global Fund Governance of Allspring Global Investments since 2022. Prior thereto, co-president of Galliard Capital Management, LLC, an affiliate of Allspring Funds Management, LLC, from 2019 to 2022 and Head of Affiliated Managers, Allspring Global Investments, from 2014 to 2019 and Executive Vice President responsible for marketing, investments and product development for Allspring Funds Management, LLC, from 2009 to 2014. |
| Jeremy DePalma (Born 1974) | Treasurer, since 2012 (for certain funds in the Fund Complex); since 2021 (for the remaining funds in the Fund Complex) | Senior Vice President of Allspring Funds Management, LLC since 2009. Senior Vice President of Evergreen Investment Management Company, LLC from 2008 to 2010 and head of the Fund Reporting and Control Team within Fund Administration from 2005 to 2010. |
| Christopher Baker (Born 1976) | Chief Compliance Officer, since 2022 | Global Chief Compliance Officer for Allspring Global Investments since 2022. Prior thereto, Chief Compliance Officer for State Street Global Advisors from 2018 to 2021. Senior Compliance Officer for the State Street divisions of Alternative Investment Solutions, Sector Solutions, and Global Marketing from 2015 to 2018. From 2010 to 2015 Vice President, Global Head of Investment and Marketing Compliance for State Street Global Advisors. |
| Matthew Prasse (Born 1983) | Chief Legal Officer, since 2022; Secretary, since 2021 | Senior Counsel of the Allspring Legal Department since 2021. Senior Counsel of the Wells Fargo Legal Department from 2018 to 2021. Previously, Counsel for Barings LLC from 2015 to 2018. Prior to joining Barings, Associate at Morgan, Lewis & Bockius LLP from 2008 to 2015. |
P.O. Box 219967
Kansas City, MO 64121-9967

1-800-222-8222 or visit the Fund's website at allspringglobal.com. Read the prospectus carefully before you invest or send money.
SAR4325 01-23
| ITEM 2. | CODE OF ETHICS |
Not applicable.
| ITEM 3. | AUDIT COMMITTEE FINANCIAL EXPERT |
Not applicable.
| ITEM 4. | PRINCIPAL ACCOUNTANT FEES AND SERVICES |
Not applicable.
| ITEM 5. | AUDIT COMMITTEE OF LISTED REGISTRANTS |
Not applicable.
| ITEM 6. | INVESTMENTS |
A Portfolio of Investments for each series of Allspring Funds Trust is included as part of the report to shareholders filed under Item 1 of this Form.
| ITEM 7. | DISCLOSURE OF PROXY VOTING POLICIES AND PROCEDURES FOR CLOSED-END MANAGEMENT INVESTMENT COMPANIES |
Not applicable.
| ITEM 8. | PORTFOLIO MANAGERS OF CLOSED-END MANAGEMENT INVESTMENT COMPANIES |
Not applicable.
| ITEM 9. | PURCHASES OF EQUITY SECURITIES BY CLOSED-END MANAGEMEENT INVESTMENT COMPANY AND AFFILIATED PURCHASERS |
Not applicable.
| ITEM 10. | SUBMISSION OF MATTERS TO A VOTE OF SECURITY HOLDERS |
There have been no material changes to the procedures by which shareholders may recommend nominees to the registrant’s Board of Trustees that have been implemented since the registrant’s last provided disclosure in response to the requirements of this Item.
| ITEM 11. | CONTROLS AND PROCEDURES |
(a) The President and Treasurer have concluded that the Allspring Funds Trust disclosure controls and procedures (as defined in Rule 30a-3(c) under the Investment Company Act of 1940) provide reasonable assurances that material information relating to the registrant is made known to them by the appropriate persons, based on their evaluation of these controls and procedures as of a date within 90 days of the filing of this report.
(b) There were no significant changes in the registrant’s internal controls over financial reporting (as defined in Rule 30a-3(d) under the Investment Company Act of 1940) that occurred during the most recent fiscal half-year of the period covered by this report that materially affected, or is reasonably likely to materially affect, the registrant’s internal control over financial reporting.
| ITEM 12. | DISCLOSURES OF SECURITIES LENDING ACTIVITES FOR CLOSED-END MANAGEMENT INVESTMENT COMPANIES |
Not applicable.
| ITEM 13. | EXHIBITS |
(a)(1) Not applicable.
(a)(2) Certifications pursuant to Section 302 of the Sarbanes-Oxley Act of 2002.
(b) Certifications pursuant to Section 906 of the Sarbanes-Oxley Act of 2002.
SIGNATURES
Pursuant to the requirements of the Securities Exchange Act of 1934 and the Investment Company Act of 1940, the registrant has duly caused this report to be signed on its behalf by the undersigned, thereunto duly authorized.
Allspring Funds Trust | ||
By: | /s/ Andrew Owen | |
Andrew Owen | ||
President | ||
Date: March 30, 2023 | ||
Pursuant to the requirements of the Securities Exchange Act of 1934 and the Investment Company Act of 1940, this report has been signed below by the following persons on behalf of the registrant and in the capacities and on the date indicated.
| Allspring Funds Trust | ||
| By: | /s/ Andrew Owen | |
| Andrew Owen | ||
| President | ||
| Date: March 30, 2023 | ||
| By: | /s/ Jeremy DePalma | |
| Jeremy DePalma | ||
| Treasurer | ||
| Date: March 30, 2023 | ||