
UNITED STATES
SECURITIES AND EXCHANGE COMMISSION
Washington, D.C. 20549
FORM N-CSRS
CERTIFIED SHAREHOLDER REPORT OF REGISTERED
MANAGEMENT INVESTMENT COMPANIES
Investment Company Act file number: 811-09253
Allspring Funds Trust
(Exact name of registrant as specified in charter)
1415 Vantage Park Drive, 3rd Floor, Charlotte, NC 28203
(Address of principal executive offices) (Zip code)
Matthew Prasse
Allspring Funds Management, LLC
1415 Vantage Park Drive, 3rd Floor, Charlotte, NC 28203
(Name and address of agent for service)
Registrant’s telephone number, including area code: 800-222-8222
Date of fiscal year end: July 31
Registrant is making a filing for 9 of its series: Allspring Disciplined U.S. Core Fund, Allspring Discovery Large Cap Growth Fund, Allspring Discovery All Cap Growth Fund, Allspring Growth Fund, Allspring Large Cap Core Fund, Allspring Large Cap Growth Fund, Allspring Large Company Value Fund, Allspring Premier Large Company Growth Fund and Allspring Special Large Cap Value Fund.
Date of reporting period: January 31, 2024
ITEM 1. REPORT TO STOCKHOLDERS

Allspring Funds

President
Allspring Funds
Notice to Shareholders |
Beginning in July 2024, the Fund will be required by the Securities and Exchange Commission to send shareholders a paper copy of a new tailored shareholder report in place of the full shareholder report that you are now receiving. The tailored shareholder report will contain concise information about the Fund, including certain expense and performance information and fund statistics. If you wish to receive this new tailored shareholder report electronically, please follow the instructions on the back cover of this report. |
Other information that is currently included in the shareholder report, such as the Fund’s financial statements, will be available online and upon request, free of charge, in paper or electronic format. |
Investment objective | The Fund seeks long-term capital appreciation. |
Manager | Allspring Funds Management, LLC |
Subadviser | Allspring Global Investments, LLC |
Portfolio managers | Justin P. Carr, CFA, Robert M. Wicentowski, CFA |
Average annual total returns (%) as of January 31, 2024 | |||||||||
Including sales charge | Excluding sales charge | Expense ratios1 (%) | |||||||
Inception date | 1 year | 5 year | 10 year | 1 year | 5 year | 10 year | Gross | Net2 | |
Class A (EVSAX) | 2-28-1990 | 13.90 | 12.41 | 11.26 | 20.81 | 13.75 | 11.92 | 0.84 | 0.84 |
Class C (EVSTX) | 6-30-1999 | 18.92 | 12.91 | 11.25 | 19.92 | 12.91 | 11.25 | 1.59 | 1.59 |
Class R6 (EVSRX)3 | 9-30-2015 | – | – | – | 21.30 | 14.23 | 12.39 | 0.42 | 0.42 |
Administrator Class (EVSYX) | 2-21-1995 | – | – | – | 20.89 | 13.86 | 12.04 | 0.77 | 0.74 |
Institutional Class (EVSIX) | 7-30-2010 | – | – | – | 21.22 | 14.16 | 12.33 | 0.52 | 0.48 |
S&P 500 Index4 | – | – | – | – | 20.82 | 14.30 | 12.62 | – | – |
1 | Reflects the expense ratios as stated in the most recent prospectuses. The expense ratios shown are subject to change and may differ from the annualized expense ratios shown in the Financial Highlights of this report. |
2 | The manager has contractually committed through November 30, 2024, to waive fees and/or reimburse expenses to the extent necessary to cap total annual fund operating expenses after fee waivers at 0.86% for Class A, 1.61% for Class C, 0.43% for Class R6, 0.74% for Administrator Class and 0.48% for Institutional Class. Brokerage commissions, stamp duty fees, interest, taxes, acquired fund fees and expenses (if any), and extraordinary expenses are excluded from the expense caps. Prior to or after the commitment expiration date, the caps may be increased or the commitment to maintain the caps may be terminated only with the approval of the Board of Trustees. Without these caps, the Fund’s returns would have been lower. The expense ratio paid by an investor is the net expense ratio (the total annual fund operating expenses after fee waivers) as stated in the prospectuses. |
3 | Historical performance shown for the Class R6 shares prior to their inception reflects the performance of the Institutional Class shares, and includes the higher expenses applicable to the Institutional Class shares. If these expenses had not been included, returns for the Class R6 shares would be higher. |
4 | The S&P 500 Index consists of 500 stocks chosen for market size, liquidity, and industry group representation. It is a market-value-weighted index with each stock’s weight in the index proportionate to its market value. You cannot invest directly in an index. |
CFA® and Chartered Financial Analyst® are trademarks owned by CFA Institute. |
Ten largest holdings (%) as of January 31, 20241 | |
Microsoft Corp. | 7.60 |
Apple, Inc. | 6.46 |
NVIDIA Corp. | 3.69 |
Amazon.com, Inc. | 3.36 |
Meta Platforms, Inc. Class A | 2.44 |
Alphabet, Inc. Class C | 2.09 |
Alphabet, Inc. Class A | 1.89 |
Broadcom, Inc. | 1.76 |
Visa, Inc. Class A | 1.59 |
Berkshire Hathaway, Inc. Class B | 1.59 |
1 | Figures represent the percentage of the Fund’s net assets. Holdings are subject to change and may have changed since the date specified. |
Sector allocation as of January 31, 20241 |
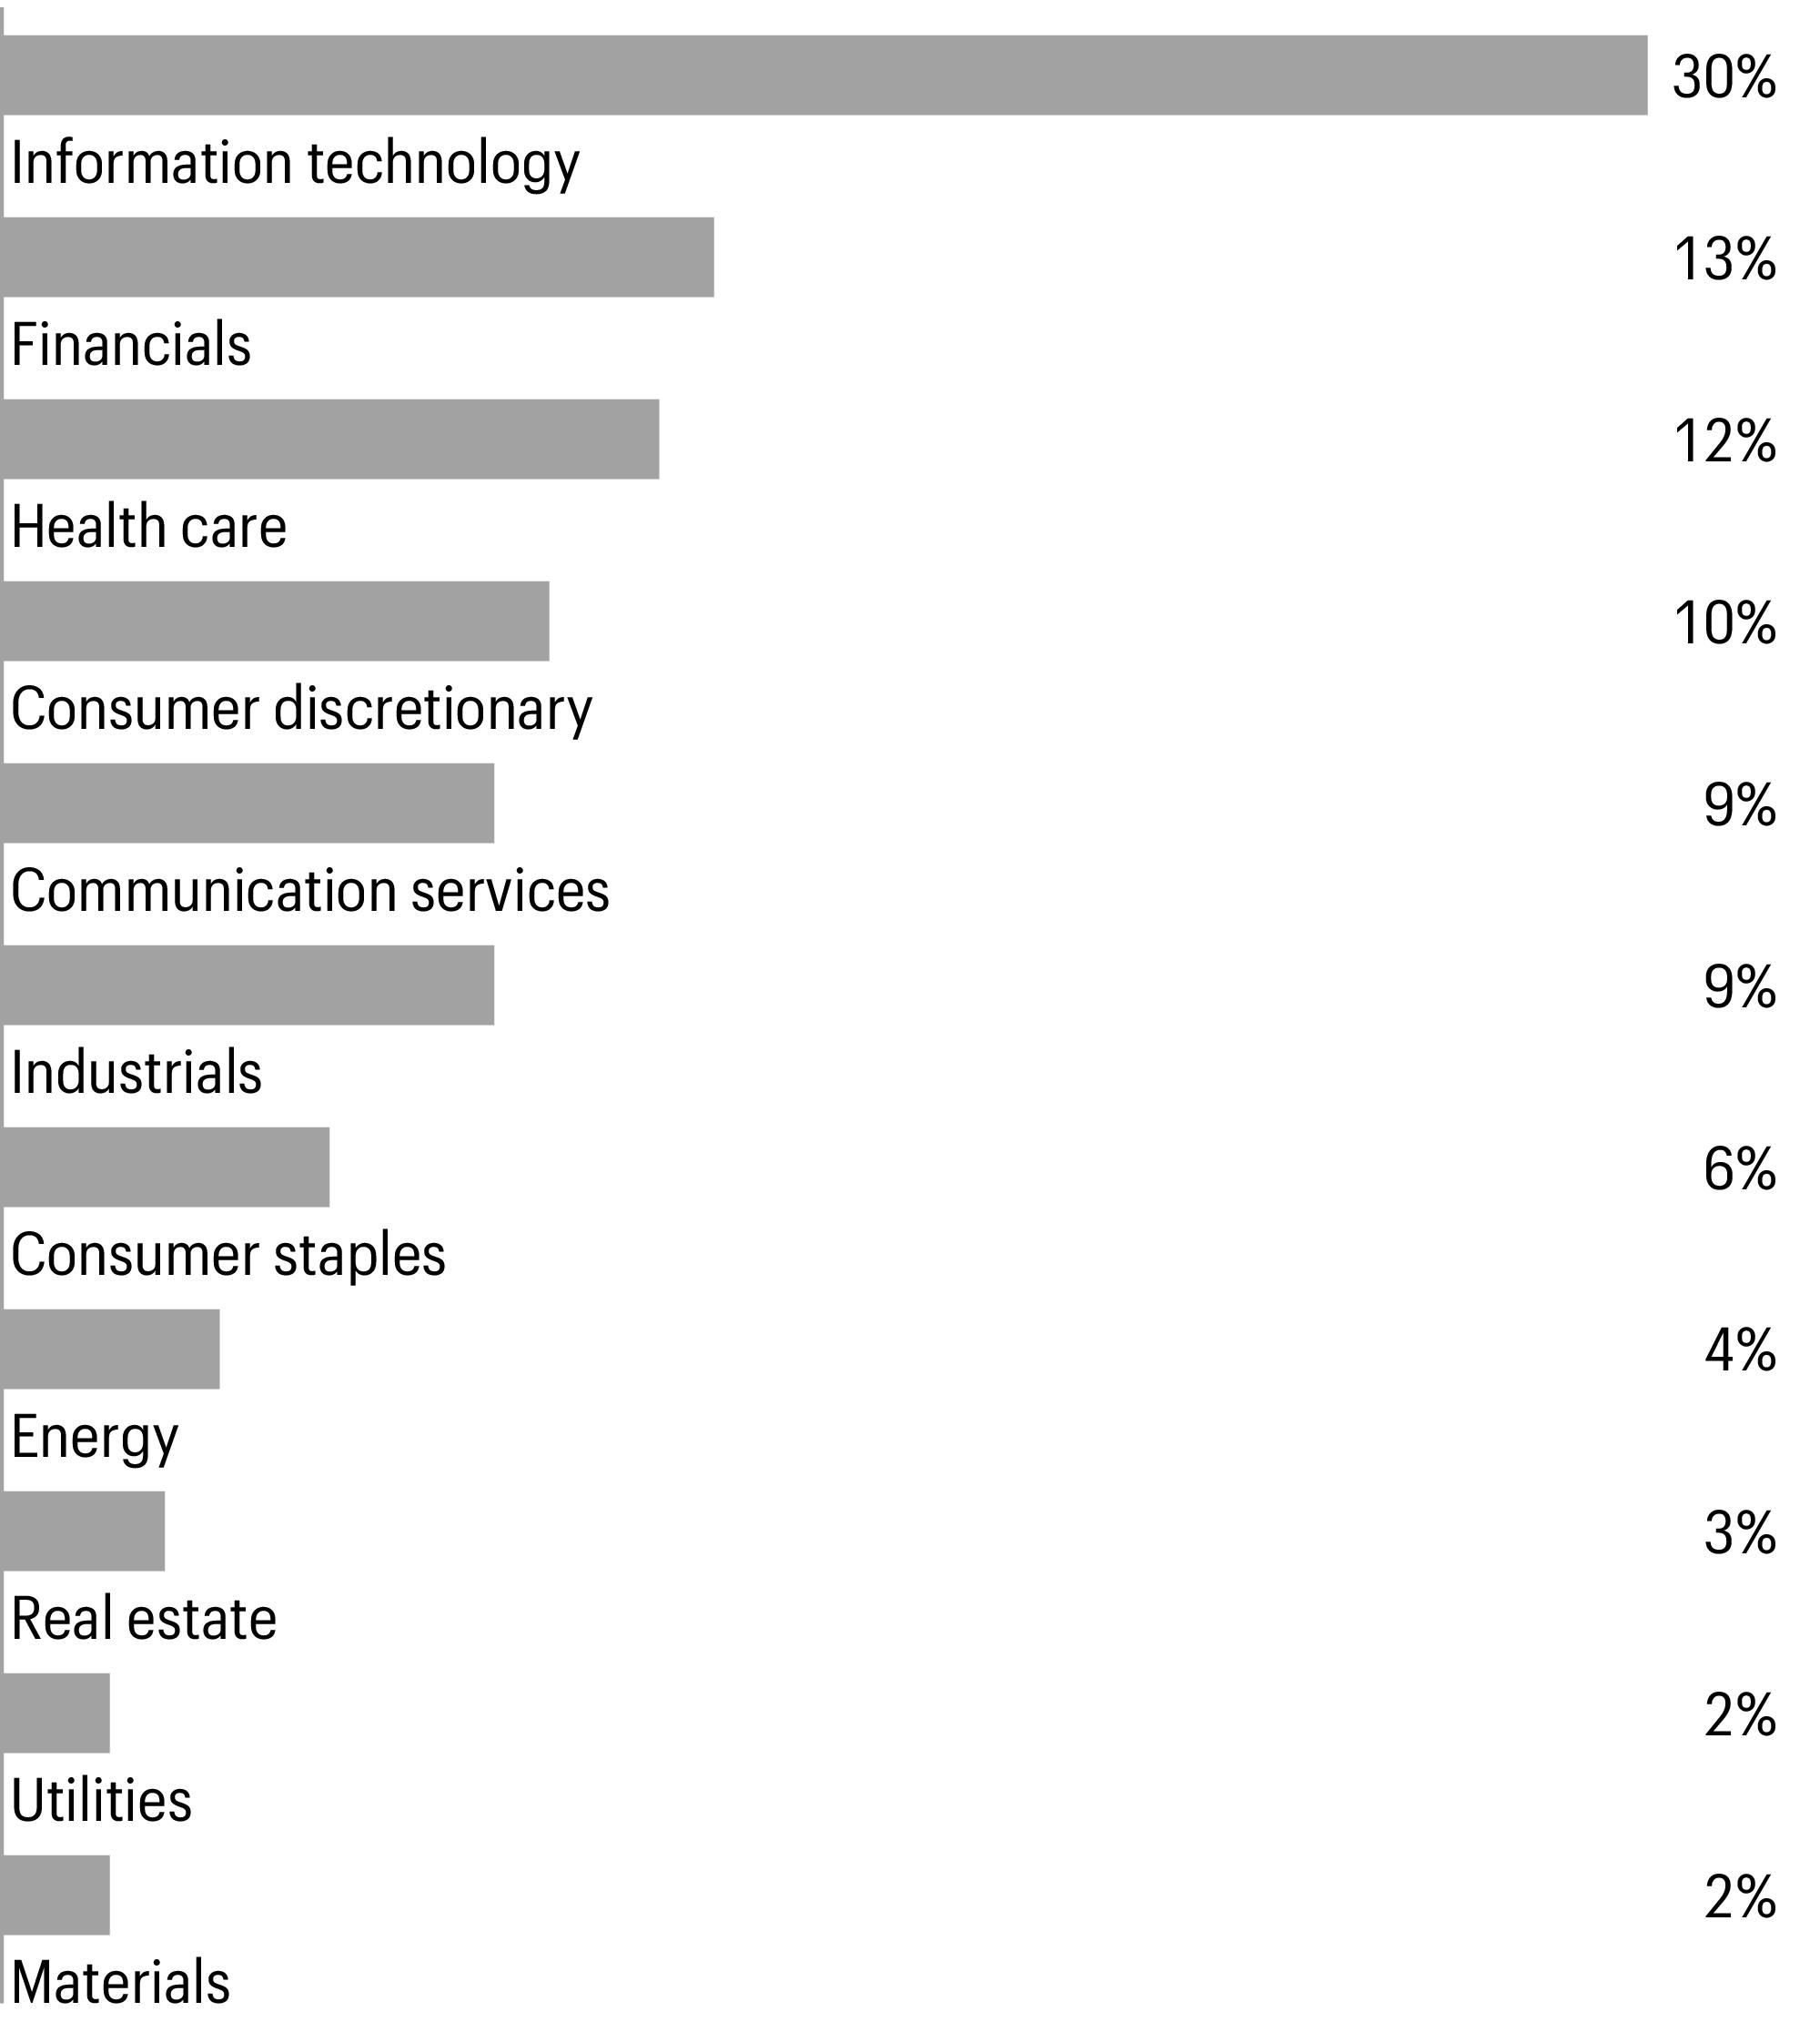
1 | Figures represent the percentage of the Fund’s long-term investments. Allocations are subject to change and may have changed since the date specified. |
Beginning account value 8-1-2023 | Ending account value 1-31-2024 | Expenses paid during the period1 | Annualized net expense ratio | |
Class A | ||||
Actual | $1,000.00 | $1,061.70 | $4.30 | 0.83 % |
Hypothetical (5% return before expenses) | $1,000.00 | $1,020.96 | $4.22 | 0.83 % |
Class C | ||||
Actual | $1,000.00 | $1,057.68 | $8.17 | 1.58 % |
Hypothetical (5% return before expenses) | $1,000.00 | $1,017.19 | $8.01 | 1.58 % |
Class R6 | ||||
Actual | $1,000.00 | $1,063.65 | $2.13 | 0.41 % |
Hypothetical (5% return before expenses) | $1,000.00 | $1,023.08 | $2.08 | 0.41 % |
Administrator Class | ||||
Actual | $1,000.00 | $1,061.88 | $3.84 | 0.74 % |
Hypothetical (5% return before expenses) | $1,000.00 | $1,021.42 | $3.76 | 0.74 % |
Institutional Class | ||||
Actual | $1,000.00 | $1,062.82 | $2.49 | 0.48 % |
Hypothetical (5% return before expenses) | $1,000.00 | $1,022.72 | $2.44 | 0.48 % |
1 | Expenses paid is equal to the annualized net expense ratio of each class multiplied by the average account value over the period, multiplied by 184 divided by 366 (to reflect the one-half-year period). |
Shares | Value | |||||
Common stocks: 97.55% | ||||||
Communication services: 9.14% | ||||||
Diversified telecommunication services: 0.67% | ||||||
AT&T, Inc. | 367,263 | $6,496,882 | ||||
Entertainment: 1.16% | ||||||
Live Nation Entertainment, Inc.† | 10,118 | 898,985 | ||||
Netflix, Inc.† | 18,384 | 10,370,598 | ||||
11,269,583 | ||||||
Interactive media & services: 6.42% | ||||||
Alphabet, Inc. Class A† | 131,131 | 18,371,453 | ||||
Alphabet, Inc. Class C† | 143,769 | 20,386,444 | ||||
Meta Platforms, Inc. Class A† | 60,830 | 23,732,217 | ||||
62,490,114 | ||||||
Media: 0.89% | ||||||
Comcast Corp. Class A | 185,404 | 8,628,702 | ||||
Consumer discretionary: 9.58% | ||||||
Automobiles: 1.65% | ||||||
Ford Motor Co. | 378,201 | 4,432,516 | ||||
Tesla, Inc.† | 62,238 | 11,656,555 | ||||
16,089,071 | ||||||
Broadline retail: 3.61% | ||||||
Amazon.com, Inc.† | 210,597 | 32,684,654 | ||||
eBay, Inc. | 58,874 | 2,417,955 | ||||
35,102,609 | ||||||
Hotels, restaurants & leisure: 1.24% | ||||||
Expedia Group, Inc.† | 27,035 | 4,010,101 | ||||
McDonald’s Corp. | 23,572 | 6,899,996 | ||||
Royal Caribbean Cruises Ltd.† | 8,784 | 1,119,960 | ||||
12,030,057 | ||||||
Household durables: 0.87% | ||||||
Lennar Corp. Class A | 9,559 | 1,432,416 | ||||
PulteGroup, Inc. | 66,732 | 6,977,498 | ||||
8,409,914 | ||||||
Specialty retail: 1.62% | ||||||
Home Depot, Inc. | 26,966 | 9,517,920 | ||||
TJX Cos., Inc. | 27,801 | 2,638,593 | ||||
Ulta Beauty, Inc.† | 7,207 | 3,618,274 | ||||
15,774,787 | ||||||
Textiles, apparel & luxury goods: 0.59% | ||||||
Crocs, Inc.† | 18,525 | 1,879,917 | ||||
Shares | Value | |||||
Textiles, apparel & luxury goods(continued) | ||||||
Deckers Outdoor Corp.† | 2,004 | $1,510,475 | ||||
NIKE, Inc. Class B | 23,068 | 2,342,094 | ||||
5,732,486 | ||||||
Consumer staples: 5.69% | ||||||
Beverages: 0.78% | ||||||
Coca-Cola Co. | 34,084 | 2,027,657 | ||||
PepsiCo, Inc. | 32,612 | 5,496,101 | ||||
7,523,758 | ||||||
Consumer staples distribution & retail: 2.39% | ||||||
Costco Wholesale Corp. | 12,070 | 8,387,202 | ||||
Sysco Corp. | 54,796 | 4,434,640 | ||||
Target Corp. | 25,019 | 3,479,642 | ||||
Walmart, Inc. | 42,039 | 6,946,945 | ||||
23,248,429 | ||||||
Food products: 0.42% | ||||||
Archer-Daniels-Midland Co. | 36,873 | 2,049,401 | ||||
Bunge Global SA | 23,220 | 2,045,450 | ||||
4,094,851 | ||||||
Household products: 1.66% | ||||||
Colgate-Palmolive Co. | 69,020 | 5,811,484 | ||||
Kimberly-Clark Corp. | 37,701 | 4,560,690 | ||||
Procter & Gamble Co. | 36,909 | 5,799,880 | ||||
16,172,054 | ||||||
Tobacco: 0.44% | ||||||
Altria Group, Inc. | 49,462 | 1,984,416 | ||||
Philip Morris International, Inc. | 24,913 | 2,263,346 | ||||
4,247,762 | ||||||
Energy: 3.90% | ||||||
Energy equipment & services: 0.26% | ||||||
Halliburton Co. | 69,629 | 2,482,274 | ||||
Oil, gas & consumable fuels: 3.64% | ||||||
Cheniere Energy, Inc. | 10,327 | 1,693,525 | ||||
Chevron Corp. | 53,892 | 7,945,298 | ||||
Exxon Mobil Corp. | 114,141 | 11,734,836 | ||||
Marathon Petroleum Corp. | 27,639 | 4,577,018 | ||||
Phillips 66 | 29,763 | 4,295,099 | ||||
Valero Energy Corp. | 37,136 | 5,158,190 | ||||
35,403,966 | ||||||
Financials: 13.07% | ||||||
Banks: 3.44% | ||||||
Bank of America Corp. | 134,007 | 4,557,578 | ||||
Shares | Value | |||||
Banks(continued) | ||||||
Citigroup, Inc. | 80,505 | $4,521,966 | ||||
East West Bancorp, Inc. | 40,550 | 2,952,445 | ||||
JPMorgan Chase & Co. | 78,510 | 13,689,003 | ||||
New York Community Bancorp, Inc. | 152,793 | 988,571 | ||||
Wells Fargo & Co. | 134,159 | 6,732,099 | ||||
33,441,662 | ||||||
Capital markets: 1.81% | ||||||
Ameriprise Financial, Inc. | 9,785 | 3,785,131 | ||||
Bank of New York Mellon Corp. | 54,706 | 3,033,995 | ||||
Goldman Sachs Group, Inc. | 14,857 | 5,705,237 | ||||
Interactive Brokers Group, Inc. Class A | 31,499 | 2,795,536 | ||||
S&P Global, Inc. | 5,034 | 2,256,994 | ||||
17,576,893 | ||||||
Consumer finance: 0.40% | ||||||
Capital One Financial Corp. | 28,683 | 3,881,384 | ||||
Financial services: 4.80% | ||||||
Apollo Global Management, Inc. | 57,964 | 5,819,586 | ||||
Berkshire Hathaway, Inc. Class B† | 40,282 | 15,457,815 | ||||
FleetCor Technologies, Inc.† | 6,212 | 1,801,045 | ||||
Mastercard, Inc. Class A | 13,454 | 6,043,940 | ||||
PayPal Holdings, Inc.† | 34,530 | 2,118,415 | ||||
Visa, Inc. Class A | 56,618 | 15,471,435 | ||||
46,712,236 | ||||||
Insurance: 2.62% | ||||||
Arch Capital Group Ltd.† | 7,531 | 620,780 | ||||
Everest Group Ltd. | 13,019 | 5,011,924 | ||||
Hartford Financial Services Group, Inc. | 50,328 | 4,376,523 | ||||
MetLife, Inc. | 59,694 | 4,137,988 | ||||
Progressive Corp. | 13,393 | 2,387,302 | ||||
Reinsurance Group of America, Inc. | 33,404 | 5,808,622 | ||||
W R Berkley Corp. | 38,000 | 3,111,440 | ||||
25,454,579 | ||||||
Health care: 12.09% | ||||||
Biotechnology: 2.38% | ||||||
AbbVie, Inc. | 16,106 | 2,647,826 | ||||
Exelixis, Inc.† | 177,173 | 3,855,285 | ||||
Gilead Sciences, Inc. | 21,886 | 1,712,798 | ||||
Incyte Corp.† | 24,244 | 1,424,820 | ||||
Regeneron Pharmaceuticals, Inc.† | 5,757 | 5,427,584 | ||||
United Therapeutics Corp.† | 13,295 | 2,855,500 | ||||
Vertex Pharmaceuticals, Inc.† | 12,097 | 5,242,598 | ||||
23,166,411 | ||||||
Shares | Value | |||||
Health care equipment & supplies: 2.89% | ||||||
Abbott Laboratories | 55,389 | $6,267,265 | ||||
Boston Scientific Corp.† | 64,331 | 4,069,579 | ||||
Edwards Lifesciences Corp.† | 36,262 | 2,845,479 | ||||
Intuitive Surgical, Inc.† | 5,930 | 2,242,845 | ||||
ResMed, Inc. | 10,689 | 2,033,048 | ||||
Stryker Corp. | 19,807 | 6,644,852 | ||||
Zimmer Biomet Holdings, Inc. | 31,641 | 3,974,110 | ||||
28,077,178 | ||||||
Health care providers & services: 3.12% | ||||||
Cencora, Inc. | 28,060 | 6,529,001 | ||||
Centene Corp.† | 52,803 | 3,976,594 | ||||
CVS Health Corp. | 65,227 | 4,850,932 | ||||
Elevance Health, Inc. | 8,249 | 4,070,387 | ||||
McKesson Corp. | 9,335 | 4,666,473 | ||||
UnitedHealth Group, Inc. | 12,188 | 6,237,087 | ||||
30,330,474 | ||||||
Life sciences tools & services: 0.34% | ||||||
Qiagen NV† | 75,336 | 3,289,171 | ||||
Pharmaceuticals: 3.36% | ||||||
Bristol-Myers Squibb Co. | 45,078 | 2,202,962 | ||||
Eli Lilly & Co. | 18,482 | 11,932,164 | ||||
Jazz Pharmaceuticals PLC† | 10,259 | 1,258,984 | ||||
Johnson & Johnson | 29,006 | 4,609,053 | ||||
Merck & Co., Inc. | 49,279 | 5,951,918 | ||||
Pfizer, Inc. | 185,685 | 5,028,350 | ||||
Zoetis, Inc. | 9,330 | 1,752,267 | ||||
32,735,698 | ||||||
Industrials: 8.51% | ||||||
Aerospace & defense: 1.83% | ||||||
General Dynamics Corp. | 7,063 | 1,871,625 | ||||
Howmet Aerospace, Inc. | 61,297 | 3,448,569 | ||||
Lockheed Martin Corp. | 8,963 | 3,848,802 | ||||
Northrop Grumman Corp. | 6,512 | 2,909,301 | ||||
Textron, Inc. | 67,261 | 5,697,679 | ||||
17,775,976 | ||||||
Air freight & logistics: 0.22% | ||||||
United Parcel Service, Inc. Class B | 15,395 | 2,184,551 | ||||
Building products: 0.69% | ||||||
Carrier Global Corp. | 49,437 | 2,704,698 | ||||
Owens Corning | 26,561 | 4,024,789 | ||||
6,729,487 | ||||||
Commercial services & supplies: 0.43% | ||||||
Waste Management, Inc. | 22,343 | 4,147,531 | ||||
Shares | Value | |||||
Construction & engineering: 0.84% | ||||||
EMCOR Group, Inc. | 20,688 | $4,719,140 | ||||
Quanta Services, Inc. | 17,553 | 3,406,159 | ||||
8,125,299 | ||||||
Electrical equipment: 0.84% | ||||||
Emerson Electric Co. | 62,734 | 5,754,590 | ||||
Vertiv Holdings Co. | 42,479 | 2,392,842 | ||||
8,147,432 | ||||||
Ground transportation: 0.33% | ||||||
CSX Corp. | 90,260 | 3,222,282 | ||||
Machinery: 2.28% | ||||||
AGCO Corp. | 19,919 | 2,436,691 | ||||
Allison Transmission Holdings, Inc. | 47,024 | 2,846,833 | ||||
Caterpillar, Inc. | 12,581 | 3,778,200 | ||||
Cummins, Inc. | 4,037 | 966,054 | ||||
PACCAR, Inc. | 69,894 | 7,016,659 | ||||
Parker-Hannifin Corp. | 11,068 | 5,141,086 | ||||
22,185,523 | ||||||
Passenger airlines: 0.38% | ||||||
United Airlines Holdings, Inc.† | 90,479 | 3,744,021 | ||||
Professional services: 0.45% | ||||||
Automatic Data Processing, Inc. | 10,172 | 2,500,074 | ||||
CACI International, Inc. Class A† | 5,404 | 1,857,517 | ||||
4,357,591 | ||||||
Trading companies & distributors: 0.22% | ||||||
WESCO International, Inc. | 12,312 | 2,136,378 | ||||
Information technology: 29.04% | ||||||
Communications equipment: 0.97% | ||||||
Cisco Systems, Inc. | 189,223 | 9,495,210 | ||||
Electronic equipment, instruments & components: 0.50% | ||||||
Jabil, Inc. | 39,057 | 4,893,451 | ||||
IT services: 1.08% | ||||||
Accenture PLC Class A | 13,086 | 4,761,734 | ||||
Amdocs Ltd. | 28,408 | 2,604,445 | ||||
Okta, Inc.† | 37,650 | 3,111,773 | ||||
10,477,952 | ||||||
Semiconductors & semiconductor equipment: 8.79% | ||||||
Advanced Micro Devices, Inc.† | 38,443 | 6,446,507 | ||||
Applied Materials, Inc. | 46,816 | 7,691,869 | ||||
Broadcom, Inc. | 14,523 | 17,137,140 | ||||
Enphase Energy, Inc.† | 9,623 | 1,002,043 | ||||
Shares | Value | |||||
Semiconductors & semiconductor equipment(continued) | ||||||
KLA Corp. | 12,534 | $7,445,697 | ||||
Lam Research Corp. | 1,623 | 1,339,251 | ||||
Monolithic Power Systems, Inc. | 1,212 | 730,497 | ||||
NVIDIA Corp. | 58,330 | 35,888,699 | ||||
QUALCOMM, Inc. | 52,346 | 7,773,904 | ||||
85,455,607 | ||||||
Software: 11.24% | ||||||
Adobe, Inc.† | 13,130 | 8,111,451 | ||||
Autodesk, Inc.† | 10,324 | 2,620,334 | ||||
Cadence Design Systems, Inc.† | 6,299 | 1,817,010 | ||||
Fortinet, Inc.† | 35,065 | 2,261,342 | ||||
Microsoft Corp. | 185,798 | 73,869,569 | ||||
Oracle Corp. | 13,130 | 1,466,621 | ||||
Salesforce, Inc.† | 32,700 | 9,191,643 | ||||
ServiceNow, Inc.† | 4,072 | 3,116,709 | ||||
Synopsys, Inc.† | 12,754 | 6,802,346 | ||||
109,257,025 | ||||||
Technology hardware, storage & peripherals: 6.46% | ||||||
Apple, Inc. | 340,606 | 62,807,746 | ||||
Materials: 1.82% | ||||||
Chemicals: 0.29% | ||||||
Albemarle Corp. | 4,440 | 509,445 | ||||
CF Industries Holdings, Inc. | 30,541 | 2,306,151 | ||||
2,815,596 | ||||||
Construction materials: 0.29% | ||||||
Eagle Materials, Inc. | 12,620 | 2,855,654 | ||||
Metals & mining: 1.24% | ||||||
Cleveland-Cliffs, Inc.† | 194,551 | 3,900,748 | ||||
Freeport-McMoRan, Inc. | 72,259 | 2,867,960 | ||||
Reliance Steel & Aluminum Co. | 18,358 | 5,239,740 | ||||
12,008,448 | ||||||
Real estate: 2.73% | ||||||
Hotel & resort REITs: 0.31% | ||||||
Host Hotels & Resorts, Inc. | 154,922 | 2,977,601 | ||||
Industrial REITs : 0.77% | ||||||
Prologis, Inc. | 59,363 | 7,520,698 | ||||
Retail REITs : 0.41% | ||||||
Simon Property Group, Inc. | 28,665 | 3,973,256 | ||||
Specialized REITs : 1.24% | ||||||
CubeSmart | 21,260 | 918,857 | ||||
Gaming & Leisure Properties, Inc. | 42,004 | 1,917,482 | ||||
Shares | Value | |||||
Specialized REITs (continued) | ||||||
Public Storage | 14,105 | $3,994,395 | ||||
VICI Properties, Inc. | 174,223 | 5,247,597 | ||||
12,078,331 | ||||||
Utilities: 1.98% | ||||||
Electric utilities: 1.43% | ||||||
American Electric Power Co., Inc. | 36,630 | 2,862,268 | ||||
NextEra Energy, Inc. | 137,603 | 8,067,664 | ||||
PPL Corp. | 112,938 | 2,958,975 | ||||
13,888,907 | ||||||
Multi-utilities: 0.55% | ||||||
Public Service Enterprise Group, Inc. | 93,219 | 5,405,770 | ||||
Total common stocks (Cost $502,992,448) | 948,530,308 | |||||
Yield | ||||||
Short-term investments: 2.49% | ||||||
Investment companies: 2.49% | ||||||
Allspring Government Money Market Fund Select Class♠∞ | 5.27 % | 24,147,055 | 24,147,055 | |||
Total short-term investments (Cost $24,147,055) | 24,147,055 | |||||
Total investments in securities (Cost $527,139,503) | 100.04 % | 972,677,363 | ||||
Other assets and liabilities, net | (0.04 ) | (341,244 ) | ||||
Total net assets | 100.00 % | $972,336,119 | ||||
† | Non-income-earning security |
♠ | The issuer of the security is an affiliated person of the Fund as defined in the Investment Company Act of 1940. |
∞ | The rate represents the 7-day annualized yield at period end. |
Abbreviations: | |
REIT | Real estate investment trust |
Value, beginning of period | Purchases | Sales proceeds | Net realized gains (losses) | Net change in unrealized gains (losses) | Value, end of period | Shares, end of period | Income from affiliated securities | |
Short-term investments | ||||||||
Allspring Government Money Market Fund Select Class | $21,428,630 | $46,877,847 | $(44,159,422 ) | $0 | $0 | $24,147,055 | 24,147,055 | $428,508 |
Description | Number of contracts | Expiration date | Notional cost | Notional value | Unrealized gains | Unrealized losses |
Long | ||||||
E-Mini S&P 500 Index | 90 | 3-15-2024 | $21,586,318 | $21,917,250 | $330,932 | $0 |
Assets | |
Investments in unaffiliated securities, at value (cost $502,992,448) | $948,530,308 |
Investments in affiliated securities, at value (cost $24,147,055) | 24,147,055 |
Cash | 14 |
Cash at broker segregated for futures contracts | 1,367,400 |
Receivable for investments sold | 59,957,992 |
Receivable for dividends | 586,932 |
Receivable for Fund shares sold | 473,548 |
Prepaid expenses and other assets | 293,309 |
Total assets | 1,035,356,558 |
Liabilities | |
Payable for investments purchased | 61,030,152 |
Payable for Fund shares redeemed | 1,041,703 |
Payable for daily variation margin on open futures contracts | 371,867 |
Management fee payable | 279,889 |
Administration fees payable | 113,859 |
Distribution fees payable | 8,419 |
Accrued expenses and other liabilities | 174,550 |
Total liabilities | 63,020,439 |
Total net assets | $972,336,119 |
Net assets consist of | |
Paid-in capital | $489,947,489 |
Total distributable earnings | 482,388,630 |
Total net assets | $972,336,119 |
Computation of net asset value and offering price per share | |
Net assets–Class A | $483,069,002 |
Shares outstanding–Class A1 | 24,858,756 |
Net asset value per share–Class A | $19.43 |
Maximum offering price per share – Class A2 | $20.62 |
Net assets–Class C | $16,126,788 |
Shares outstanding–Class C1 | 932,418 |
Net asset value per share–Class C | $17.30 |
Net assets–Class R6 | $251,580,816 |
Shares outstanding–Class R61 | 12,468,628 |
Net asset value per share–Class R6 | $20.18 |
Net assets–Administrator Class | $47,697,612 |
Shares outstanding–Administrator Class1 | 2,349,806 |
Net asset value per share–Administrator Class | $20.30 |
Net assets–Institutional Class | $173,861,901 |
Shares outstanding–Institutional Class1 | 8,736,423 |
Net asset value per share–Institutional Class | $19.90 |
Investment income | |
Dividends | $6,850,184 |
Income from affiliated securities | 428,508 |
Interest | 30,294 |
Total investment income | 7,308,986 |
Expenses | |
Management fee | 1,609,118 |
Administration fees | |
Class A | 459,730 |
Class C | 16,452 |
Class R6 | 36,484 |
Administrator Class | 30,158 |
Institutional Class | 99,901 |
Shareholder servicing fees | |
Class A | 574,645 |
Class C | 20,480 |
Administrator Class | 54,968 |
Distribution fees | |
Class C | 61,440 |
Custody and accounting fees | 15,004 |
Professional fees | 34,370 |
Registration fees | 44,392 |
Shareholder report expenses | 19,179 |
Trustees’ fees and expenses | 9,759 |
Other fees and expenses | 31,902 |
Total expenses | 3,117,982 |
Less: Fee waivers and/or expense reimbursements | |
Administrator Class | (2,429 ) |
Institutional Class | (26,177 ) |
Net expenses | 3,089,376 |
Net investment income | 4,219,610 |
Realized and unrealized gains (losses) on investments | |
Net realized gains on | |
Unaffiliated securities | 34,103,491 |
Futures contracts | 974,693 |
Net realized gains on investments | 35,078,184 |
Net change in unrealized gains (losses) on | |
Unaffiliated securities | 17,555,397 |
Futures contracts | (364,794 ) |
Net change in unrealized gains (losses) on investments | 17,190,603 |
Net realized and unrealized gains (losses) on investments | 52,268,787 |
Net increase in net assets resulting from operations | $56,488,397 |
Six months ended January 31, 2024 (unaudited) | Year ended July 31, 2023 | |||
Operations | ||||
Net investment income | $4,219,610 | $8,688,185 | ||
Net realized gains on investments | 35,078,184 | 75,797,228 | ||
Net change in unrealized gains (losses) on investments | 17,190,603 | 24,029,500 | ||
Net increase in net assets resulting from operations | 56,488,397 | 108,514,913 | ||
Distributions to shareholders from | ||||
Net investment income and net realized gains | ||||
Class A | (40,486,185 ) | (52,376,607 ) | ||
Class C | (1,449,758 ) | (2,335,076 ) | ||
Class R | N/A | (328,100 )1 | ||
Class R6 | (21,709,229 ) | (31,761,771 ) | ||
Administrator Class | (4,030,698 ) | (5,446,142 ) | ||
Institutional Class | (14,270,995 ) | (16,672,329 ) | ||
Total distributions to shareholders | (81,946,865 ) | (108,920,025 ) | ||
Capital share transactions | Shares | Shares | ||
Proceeds from shares sold | ||||
Class A | 753,792 | 14,397,381 | 1,306,099 | 23,596,061 |
Class C | 67,311 | 1,153,123 | 55,630 | 912,230 |
Class R | N/A | N/A | 12,134 1 | 227,671 1 |
Class R6 | 270,174 | 5,323,713 | 475,719 | 8,763,132 |
Administrator Class | 61,871 | 1,237,888 | 176,890 | 3,369,525 |
Institutional Class | 1,630,476 | 32,216,102 | 1,083,968 | 20,646,549 |
54,328,207 | 57,515,168 | |||
Reinvestment of distributions | ||||
Class A | 2,047,727 | 38,054,256 | 2,876,593 | 49,070,040 |
Class C | 85,411 | 1,401,599 | 150,602 | 2,295,178 |
Class R | N/A | N/A | 19,052 1 | 328,100 1 |
Class R6 | 1,084,643 | 21,005,503 | 1,721,944 | 30,504,254 |
Administrator Class | 183,211 | 3,560,711 | 268,307 | 4,768,503 |
Institutional Class | 691,110 | 13,196,886 | 858,897 | 15,013,566 |
77,218,955 | 101,979,641 | |||
Six months ended January 31, 2024 (unaudited) | Year ended July 31, 2023 | |||
Shares | Shares | |||
Payment for shares redeemed | ||||
Class A | (1,540,354 ) | $(29,478,367 ) | (2,993,140 ) | $(54,567,903 ) |
Class C | (209,210 ) | (3,585,627 ) | (381,282 ) | (6,241,328 ) |
Class R | N/A | N/A | (184,885 )1 | (3,559,889 )1 |
Class R6 | (1,062,444 ) | (21,263,534 ) | (3,304,581 ) | (63,297,124 ) |
Administrator Class | (185,934 ) | (3,689,763 ) | (432,099 ) | (8,110,129 ) |
Institutional Class | (814,857 ) | (16,044,637 ) | (1,614,834 ) | (29,908,563 ) |
(74,061,928 ) | (165,684,936 ) | |||
Net increase (decrease) in net assets resulting from capital share transactions | 57,485,234 | (6,190,127 ) | ||
Total increase (decrease) in net assets | 32,026,766 | (6,595,239 ) | ||
Net assets | ||||
Beginning of period | 940,309,353 | 946,904,592 | ||
End of period | $972,336,119 | $940,309,353 | ||
Six months ended January 31, 2024 (unaudited) | Year ended July 31 | |||||
Class A | 2023 | 2022 | 2021 | 2020 | 2019 | |
Net asset value, beginning of period | $20.05 | $20.25 | $22.77 | $18.22 | $17.29 | $17.70 |
Net investment income | 0.07 1 | 0.13 | 0.16 | 0.14 | 0.23 | 0.25 |
Net realized and unrealized gains (losses) on investments | 1.06 | 2.06 | (0.78 ) | 6.18 | 1.47 | 0.38 |
Total from investment operations | 1.13 | 2.19 | (0.62 ) | 6.32 | 1.70 | 0.63 |
Distributions to shareholders from | ||||||
Net investment income | (0.14 ) | (0.15 ) | (0.16 ) | (0.33 ) | (0.33 ) | (0.19 ) |
Net realized gains | (1.61 ) | (2.24 ) | (1.74 ) | (1.44 ) | (0.44 ) | (0.85 ) |
Total distributions to shareholders | (1.75 ) | (2.39 ) | (1.90 ) | (1.77 ) | (0.77 ) | (1.04 ) |
Net asset value, end of period | $19.43 | $20.05 | $20.25 | $22.77 | $18.22 | $17.29 |
Total return2 | 6.17 % | 13.00 % | (3.60 )% | 36.73 % | 9.97 % | 4.31 % |
Ratios to average net assets (annualized) | ||||||
Gross expenses | 0.83 % | 0.85 % | 0.84 % | 0.85 % | 0.86 % | 0.84 % |
Net expenses | 0.83 % | 0.84 % | 0.84 % | 0.85 % | 0.85 % | 0.84 % |
Net investment income | 0.76 % | 0.82 % | 0.73 % | 0.76 % | 1.25 % | 1.40 % |
Supplemental data | ||||||
Portfolio turnover rate | 24 % | 43 % | 25 % | 36 % | 50 % | 63 % |
Net assets, end of period (000s omitted) | $483,069 | $473,167 | $453,829 | $521,702 | $421,005 | $434,367 |
1 | Calculated based upon average shares outstanding |
2 | Total return calculations do not include any sales charges. Returns for periods of less than one year are not annualized. |
Six months ended January 31, 2024 (unaudited) | Year ended July 31 | |||||
Class C | 2023 | 2022 | 2021 | 2020 | 2019 | |
Net asset value, beginning of period | $17.96 | $18.37 | $20.82 | $16.70 | $15.85 | $16.28 |
Net investment income (loss) | 0.00 1,2 | 0.03 | (0.00 )3 | 0.02 | 0.11 | 0.12 |
Net realized and unrealized gains (losses) on investments | 0.95 | 1.80 | (0.71 ) | 5.64 | 1.32 | 0.35 |
Total from investment operations | 0.95 | 1.83 | (0.71 ) | 5.66 | 1.43 | 0.47 |
Distributions to shareholders from | ||||||
Net investment income | 0.00 | 0.00 | 0.00 | (0.10 ) | (0.14 ) | (0.05 ) |
Net realized gains | (1.61 ) | (2.24 ) | (1.74 ) | (1.44 ) | (0.44 ) | (0.85 ) |
Total distributions to shareholders | (1.61 ) | (2.24 ) | (1.74 ) | (1.54 ) | (0.58 ) | (0.90 ) |
Net asset value, end of period | $17.30 | $17.96 | $18.37 | $20.82 | $16.70 | $15.85 |
Total return4 | 5.77 % | 12.12 % | (4.30 )% | 35.80 % | 9.09 % | 3.59 % |
Ratios to average net assets (annualized) | ||||||
Gross expenses | 1.58 % | 1.60 % | 1.59 % | 1.60 % | 1.60 % | 1.59 % |
Net expenses | 1.58 % | 1.59 % | 1.59 % | 1.60 % | 1.60 % | 1.59 % |
Net investment income (loss) | 0.02 % | 0.08 % | (0.02 )% | 0.02 % | 0.51 % | 0.66 % |
Supplemental data | ||||||
Portfolio turnover rate | 24 % | 43 % | 25 % | 36 % | 50 % | 63 % |
Net assets, end of period (000s omitted) | $16,127 | $17,763 | $21,381 | $27,121 | $29,141 | $38,708 |
1 | Amount is less than $0.005. |
2 | Calculated based upon average shares outstanding |
3 | Amount is more than $(0.005). |
4 | Total return calculations do not include any sales charges. Returns for periods of less than one year are not annualized. |
Six months ended January 31, 2024 (unaudited) | Year ended July 31 | |||||
Class R6 | 2023 | 2022 | 2021 | 2020 | 2019 | |
Net asset value, beginning of period | $20.79 | $20.93 | $23.46 | $18.72 | $17.76 | $18.17 |
Net investment income | 0.12 1 | 0.21 | 0.26 1 | 0.24 | 0.31 | 0.32 |
Net realized and unrealized gains (losses) on investments | 1.11 | 2.14 | (0.80 ) | 6.36 | 1.51 | 0.40 |
Total from investment operations | 1.23 | 2.35 | (0.54 ) | 6.60 | 1.82 | 0.72 |
Distributions to shareholders from | ||||||
Net investment income | (0.23 ) | (0.25 ) | (0.25 ) | (0.42 ) | (0.42 ) | (0.28 ) |
Net realized gains | (1.61 ) | (2.24 ) | (1.74 ) | (1.44 ) | (0.44 ) | (0.85 ) |
Total distributions to shareholders | (1.84 ) | (2.49 ) | (1.99 ) | (1.86 ) | (0.86 ) | (1.13 ) |
Net asset value, end of period | $20.18 | $20.79 | $20.93 | $23.46 | $18.72 | $17.76 |
Total return2 | 6.37 % | 13.44 % | (3.15 )% | 37.35 % | 10.39 % | 4.77 % |
Ratios to average net assets (annualized) | ||||||
Gross expenses | 0.41 % | 0.42 % | 0.41 % | 0.42 % | 0.43 % | 0.41 % |
Net expenses | 0.41 % | 0.42 % | 0.41 % | 0.42 % | 0.42 % | 0.41 % |
Net investment income | 1.18 % | 1.25 % | 1.16 % | 1.18 % | 1.70 % | 1.84 % |
Supplemental data | ||||||
Portfolio turnover rate | 24 % | 43 % | 25 % | 36 % | 50 % | 63 % |
Net assets, end of period (000s omitted) | $251,581 | $253,154 | $277,956 | $340,631 | $253,223 | $340,606 |
1 | Calculated based upon average shares outstanding |
2 | Returns for periods of less than one year are not annualized. |
Six months ended January 31, 2024 (unaudited) | Year ended July 31 | |||||
Administrator Class | 2023 | 2022 | 2021 | 2020 | 2019 | |
Net asset value, beginning of period | $20.88 | $21.00 | $23.55 | $18.78 | $17.80 | $18.17 |
Net investment income | 0.09 1 | 0.15 | 0.19 1 | 0.19 1 | 0.24 1 | 0.26 1 |
Net realized and unrealized gains (losses) on investments | 1.11 | 2.15 | (0.82 ) | 6.37 | 1.53 | 0.41 |
Total from investment operations | 1.20 | 2.30 | (0.63 ) | 6.56 | 1.77 | 0.67 |
Distributions to shareholders from | ||||||
Net investment income | (0.17 ) | (0.18 ) | (0.18 ) | (0.35 ) | (0.35 ) | (0.19 ) |
Net realized gains | (1.61 ) | (2.24 ) | (1.74 ) | (1.44 ) | (0.44 ) | (0.85 ) |
Total distributions to shareholders | (1.78 ) | (2.42 ) | (1.92 ) | (1.79 ) | (0.79 ) | (1.04 ) |
Net asset value, end of period | $20.30 | $20.88 | $21.00 | $23.55 | $18.78 | $17.80 |
Total return2 | 6.19 % | 13.11 % | (3.49 )% | 36.93 % | 10.08 % | 4.43 % |
Ratios to average net assets (annualized) | ||||||
Gross expenses | 0.75 % | 0.76 % | 0.74 % | 0.77 % | 0.77 % | 0.76 % |
Net expenses | 0.74 % | 0.73 % | 0.73 % | 0.74 % | 0.74 % | 0.74 % |
Net investment income | 0.85 % | 0.93 % | 0.85 % | 0.89 % | 1.37 % | 1.50 % |
Supplemental data | ||||||
Portfolio turnover rate | 24 % | 43 % | 25 % | 36 % | 50 % | 63 % |
Net assets, end of period (000s omitted) | $47,698 | $47,833 | $47,831 | $51,271 | $50,655 | $58,808 |
1 | Calculated based upon average shares outstanding |
2 | Returns for periods of less than one year are not annualized. |
Six months ended January 31, 2024 (unaudited) | Year ended July 31 | |||||
Institutional Class | 2023 | 2022 | 2021 | 2020 | 2019 | |
Net asset value, beginning of period | $20.53 | $20.69 | $23.22 | $18.54 | $17.57 | $17.98 |
Net investment income | 0.11 1 | 0.19 | 0.24 | 0.23 1 | 0.29 1 | 0.30 1 |
Net realized and unrealized gains (losses) on investments | 1.09 | 2.12 | (0.80 ) | 6.29 | 1.51 | 0.40 |
Total from investment operations | 1.20 | 2.31 | (0.56 ) | 6.52 | 1.80 | 0.70 |
Distributions to shareholders from | ||||||
Net investment income | (0.22 ) | (0.23 ) | (0.23 ) | (0.40 ) | (0.39 ) | (0.26 ) |
Net realized gains | (1.61 ) | (2.24 ) | (1.74 ) | (1.44 ) | (0.44 ) | (0.85 ) |
Total distributions to shareholders | (1.83 ) | (2.47 ) | (1.97 ) | (1.84 ) | (0.83 ) | (1.11 ) |
Net asset value, end of period | $19.90 | $20.53 | $20.69 | $23.22 | $18.54 | $17.57 |
Total return2 | 6.28 % | 13.40 % | (3.24 )% | 37.26 % | 10.39 % | 4.69 % |
Ratios to average net assets (annualized) | ||||||
Gross expenses | 0.51 % | 0.52 % | 0.51 % | 0.52 % | 0.52 % | 0.51 % |
Net expenses | 0.48 % | 0.48 % | 0.48 % | 0.48 % | 0.48 % | 0.48 % |
Net investment income | 1.11 % | 1.18 % | 1.09 % | 1.14 % | 1.67 % | 1.77 % |
Supplemental data | ||||||
Portfolio turnover rate | 24 % | 43 % | 25 % | 36 % | 50 % | 63 % |
Net assets, end of period (000s omitted) | $173,862 | $148,392 | $142,768 | $163,217 | $146,707 | $285,616 |
1 | Calculated based upon average shares outstanding |
2 | Returns for periods of less than one year are not annualized. |
Gross unrealized gains | $457,673,895 |
Gross unrealized losses | (13,568,626 ) |
Net unrealized gains | $444,105,269 |
Quoted prices (Level 1) | Other significant observable inputs (Level 2) | Significant unobservable inputs (Level 3) | Total | |
Assets | ||||
Investments in: | ||||
Common stocks | ||||
Communication services | $88,885,281 | $0 | $0 | $88,885,281 |
Consumer discretionary | 93,138,924 | 0 | 0 | 93,138,924 |
Consumer staples | 55,286,854 | 0 | 0 | 55,286,854 |
Energy | 37,886,240 | 0 | 0 | 37,886,240 |
Financials | 127,066,754 | 0 | 0 | 127,066,754 |
Health care | 117,598,932 | 0 | 0 | 117,598,932 |
Industrials | 82,756,071 | 0 | 0 | 82,756,071 |
Information technology | 282,386,991 | 0 | 0 | 282,386,991 |
Materials | 17,679,698 | 0 | 0 | 17,679,698 |
Real estate | 26,549,886 | 0 | 0 | 26,549,886 |
Utilities | 19,294,677 | 0 | 0 | 19,294,677 |
Short-term investments | ||||
Investment companies | 24,147,055 | 0 | 0 | 24,147,055 |
972,677,363 | 0 | 0 | 972,677,363 | |
Futures contracts | 330,932 | 0 | 0 | 330,932 |
Total assets | $973,008,295 | $0 | $0 | $973,008,295 |
Average daily net assets | Management fee |
First $1 billion | 0.350 % |
Next $4 billion | 0.325 |
Next $5 billion | 0.290 |
Over $10 billion | 0.280 |
Class-level administration fee | |
Class A | 0.20 % |
Class C | 0.20 |
Class R6 | 0.03 |
Administrator Class | 0.13 |
Institutional Class | 0.13 |
EXPENSE RATIO CAPS | |
Class A | 0.86 % |
Class C | 1.61 |
Class R6 | 0.43 |
Administrator Class | 0.74 |
Institutional Class | 0.48 |
Name and year of birth | Position held and length of service* | Principal occupations during past five years or longer | Current other public company or investment company directorships |
William R. Ebsworth (Born 1957) | Trustee, since 2015 | Retired. From 1984 to 2013, equities analyst, portfolio manager, research director and chief investment officer at Fidelity Management and Research Company in Boston, Tokyo, and Hong Kong, and retired in 2013 as Chief Investment Officer of Fidelity Strategic Advisers, Inc. where he led a team of investment professionals managing client assets. Prior thereto, Board member of Hong Kong Securities Clearing Co., Hong Kong Options Clearing Corp., the Thailand International Fund, Ltd., Fidelity Investments Life Insurance Company, and Empire Fidelity Investments Life Insurance Company. Serves on the Investment Company Institute’s Board of Governors since 2022 and Executive Committee since 2023 as well as the Vice Chairman of the Governing Council of the Independent Directors Council since 2023. Audit Committee Chair and Investment Committee Chair of the Vincent Memorial Hospital Foundation (non-profit organization). Mr. Ebsworth is a CFA charterholder. | N/A |
Jane A. Freeman (Born 1953) | Trustee, since 2015; Chair Liaison, since January 2018# | Retired. From 2012 to 2014 and 1999 to 2008, Chief Financial Officer of Scientific Learning Corporation. From 2008 to 2012, Ms. Freeman provided consulting services related to strategic business projects. Prior to 1999, Portfolio Manager at Rockefeller & Co. and Scudder, Stevens & Clark. Board member of the Harding Loevner Funds from 1996 to 2014, serving as both Lead Independent Director and chair of the Audit Committee. Board member of the Russell Exchange Traded Funds Trust from 2011 to 2012 and the chair of the Audit Committee. Ms. Freeman is also an inactive Chartered Financial Analyst. | N/A |
Isaiah Harris, Jr. (Born 1952) | Trustee, since 2009; Audit Committee Chair, since 2019 | Retired. Member of the Advisory Board of CEF of East Central Florida. Chairman of the Board of CIGNA Corporation from 2009 to 2021, and Director from 2005 to 2008. From 2003 to 2011, Director of Deluxe Corporation. Prior thereto, President and CEO of BellSouth Advertising and Publishing Corp. from 2005 to 2007, President and CEO of BellSouth Enterprises from 2004 to 2005 and President of BellSouth Consumer Services from 2000 to 2003. Emeritus member of the Iowa State University Foundation Board of Governors. Emeritus Member of the Advisory board of Iowa State University School of Business. Advisory Board Member, Palm Harbor Academy (private school). Advisory Board Member, Fellowship of Christian Athletes. Mr. Harris is a certified public accountant (inactive status). | N/A |
David F. Larcker (Born 1950) | Trustee, since 2009 | Distinguished Visiting Fellow at the Hoover Institution since 2022. James Irvin Miller Professor of Accounting at the Graduate School of Business (Emeritus), Stanford University, Director of the Corporate Governance Research Initiative and Senior Faculty of The Rock Center for Corporate Governance since 2006. From 2005 to 2008, Professor of Accounting at the Graduate School of Business, Stanford University. Prior thereto, Ernst & Young Professor of Accounting at The Wharton School, University of Pennsylvania from 1985 to 2005. | N/A |
Olivia S. Mitchell (Born 1953) | Trustee, since 2006 | International Foundation of Employee Benefit Plans Professor since 1993, Wharton School of the University of Pennsylvania. Director of Wharton’s Pension Research Council and Boettner Center on Pensions & Retirement Research, and Research Associate at the National Bureau of Economic Research. Previously taught at Cornell University from 1978 to 1993. | N/A |
Timothy J. Penny (Born 1951) | Trustee, since 1996; Chair, since 2018 | President and Chief Executive Officer of Southern Minnesota Initiative Foundation, a non-profit organization, since 2007. Vice Chair of the Economic Club of Minnesota, since 2007. Co-Chair of the Committee for a Responsible Federal Budget, since 1995. Member of the Board of Trustees of NorthStar Education Finance, Inc., a non-profit organization, from 2007-2022. Senior Fellow of the University of Minnesota Humphrey Institute from 1995 to 2017. | N/A |
Name and year of birth | Position held and length of service* | Principal occupations during past five years or longer | Current other public company or investment company directorships |
James G. Polisson (Born 1959) | Trustee, since 2018; Nominating and Governance Committee Chair, since 2024 | Retired. Chief Marketing Officer, Source (ETF) UK Services, Ltd, from 2015 to 2017. From 2012 to 2015, Principal of The Polisson Group, LLC, a management consulting, corporate advisory and principal investing company. Chief Executive Officer and Managing Director at Russell Investments, Global Exchange Traded Funds from 2010 to 2012. Managing Director of Barclays Global Investors from 1998 to 2010 and Global Chief Marketing Officer for iShares and Barclays Global Investors from 2000 to 2010. Trustee of the San Francisco Mechanics’ Institute, a non- profit organization, from 2013 to 2015. Board member of the Russell Exchange Traded Fund Trust from 2011 to 2012. Director of Barclays Global Investors Holdings Deutschland GmbH from 2006 to 2009. Mr. Polisson is an attorney and has a retired status with the Massachusetts and District of Columbia Bar Associations. | N/A |
Pamela Wheelock (Born 1959) | Trustee, since January 2020; previously Trustee from January 2018 to July 2019# | Retired. Executive and Senior Financial leadership positions in the public, private and nonprofit sectors. Interim President and CEO, McKnight Foundation, 2020. Interim Commissioner, Minnesota Department of Human Services, 2019. Chief Operating Officer, Twin Cities Habitat for Humanity, 2017-2019. Vice President for University Services, University of Minnesota, 2012- 2016. Interim President and CEO, Blue Cross and Blue Shield of Minnesota, 2011-2012. Executive Vice-President and Chief Financial Officer, Minnesota Wild, 2002-2008. Commissioner, Minnesota Department of Finance, 1999-2002. Chair of the Board of Directors of Destination Medical Center Corporation. Board member of the Minnesota Wild Foundation. | N/A |
Name and year of birth | Position held and length of service | Principal occupations during past five years or longer |
Andrew Owen (Born 1960) | President, since 2017 | President and Chief Executive Officer of Allspring Funds Management, LLC since 2017 and Head of Global Fund Governance of Allspring Global Investments since 2022. Prior thereto, co-president of Galliard Capital Management, LLC, an affiliate of Allspring Funds Management, LLC, from 2019 to 2022 and Head of Affiliated Managers, Allspring Global Investments, from 2014 to 2019 and Executive Vice President responsible for marketing, investments and product development for Allspring Funds Management, LLC, from 2009 to 2014. |
Jeremy DePalma (Born 1974) | Treasurer, since 2012 (for certain funds in the Fund Complex); since 2021 (for the remaining funds in the Complex) | Senior Vice President of Allspring Funds Management, LLC since 2009. Senior Vice President of Evergreen Investment Management Company, LLC from 2008 to 2010 and head of the Fund Reporting and Control Team within Fund Administration from 2005 to 2010. |
Christopher Baker (Born 1976) | Chief Compliance Officer, since 2022 | Global Chief Compliance Officer for Allspring Global Investments since 2022. Prior thereto, Chief Compliance Officer for State Street Global Advisors from 2018 to 2021. Senior Compliance Officer for the State Street divisions of Alternative Investment Solutions, Sector Solutions, and Global Marketing from 2015 to 2018. From 2010 to 2015 Vice President, Global Head of Investment and Marketing Compliance for State Street Global Advisors. |
Matthew Prasse (Born 1983) | Chief Legal Officer, since 2022; Secretary, since 2021 | Senior Counsel of the Allspring Legal Department since 2021. Senior Counsel of the Wells Fargo Legal Department from 2018 to 2021. Previously, Counsel for Barings LLC from 2015 to 2018. Prior to joining Barings, Associate at Morgan, Lewis & Bockius LLP from 2008 to 2015. |

P.O. Box 219967
Kansas City, MO 64121-9967

SAR0616 01-24

Allspring Funds

President
Allspring Funds
Notice to Shareholders |
Beginning in July 2024, the Fund will be required by the Securities and Exchange Commission to send shareholders a paper copy of a new tailored shareholder report in place of the full shareholder report that you are now receiving. The tailored shareholder report will contain concise information about the Fund, including certain expense and performance information and fund statistics. If you wish to receive this new tailored shareholder report electronically, please follow the instructions on the back cover of this report. |
Other information that is currently included in the shareholder report, such as the Fund’s financial statements, will be available online and upon request, free of charge, in paper or electronic format. |
Investment objective | The Fund seeks long-term capital appreciation. |
Manager | Allspring Funds Management, LLC |
Subadviser | Allspring Global Investments, LLC |
Portfolio managers | Michael T. Smith, CFA, Christopher J. Warner, CFA |
Average annual total returns (%) as of January 31, 2024 | |||||||||
Including sales charge | Excluding sales charge | Expense ratios1 (%) | |||||||
Inception date | 1 year | 5 year | 10 year | 1 year | 5 year | 10 year | Gross | Net2 | |
Class A (EKOAX) | 4-29-1968 | 18.38 | 10.13 | 10.01 | 25.60 | 11.44 | 10.66 | 1.28 | 1.24 |
Class C (EKOCX) | 8-2-1993 | 23.66 | 10.69 | 10.03 | 24.66 | 10.69 | 10.03 | 2.03 | 1.99 |
Administrator Class (EOMYX) | 1-13-1997 | – | – | – | 25.78 | 11.63 | 10.87 | 1.21 | 1.10 |
Institutional Class (EKONX) | 7-30-2010 | – | – | – | 26.07 | 11.90 | 11.14 | 0.96 | 0.85 |
Russell 3000® Index3 | – | – | – | – | 19.15 | 13.53 | 11.96 | – | – |
Russell 3000® Growth Index4 | – | – | – | – | 33.11 | 17.29 | 14.90 | – | – |
1 | Reflects the expense ratios as stated in the most recent prospectuses. The expense ratios shown are subject to change and may differ from the annualized expense ratios shown in the Financial Highlights of this report. |
2 | The manager has contractually committed through November 30, 2024, to waive fees and/or reimburse expenses to the extent necessary to cap total annual fund operating expenses after fee waivers at 1.24% for Class A, 1.99% for Class C, 1.10% for Administrator Class and 0.85% for Institutional Class. Brokerage commissions, stamp duty fees, interest, taxes, acquired fund fees and expenses (if any), and extraordinary expenses are excluded from the expense caps. Prior to or after the commitment expiration date, the caps may be increased or the commitment to maintain the caps may be terminated only with the approval of the Board of Trustees. Without these caps, the Fund’s returns would have been lower. The expense ratio paid by an investor is the net expense ratio (the total annual fund operating expenses after fee waivers) as stated in the prospectuses. |
3 | The Russell 3000® Index measures the performance of the 3,000 largest U.S. companies based on total market capitalization, which represents approximately 98% of the investable U.S. equity market. You cannot invest directly in an index. |
4 | The Russell 3000® Growth Index measures the performance of those Russell 3000® Index companies with higher price/book ratios and higher forecasted growth values. You cannot invest directly in an index. |
CFA® and Chartered Financial Analyst® are trademarks owned by CFA Institute. |
Ten largest holdings (%) as of January 31, 20241 | |
Microsoft Corp. | 12.12 |
Amazon.com, Inc. | 6.60 |
Alphabet, Inc. Class A | 6.44 |
Visa, Inc. Class A | 5.24 |
UnitedHealth Group, Inc. | 3.16 |
ServiceNow, Inc. | 2.21 |
Chipotle Mexican Grill, Inc. | 2.11 |
Waste Connections, Inc. | 2.08 |
Intuitive Surgical, Inc. | 2.04 |
MercadoLibre, Inc. | 1.99 |
1 | Figures represent the percentage of the Fund’s net assets. Holdings are subject to change and may have changed since the date specified. |
Sector allocation as of January 31, 20241 |
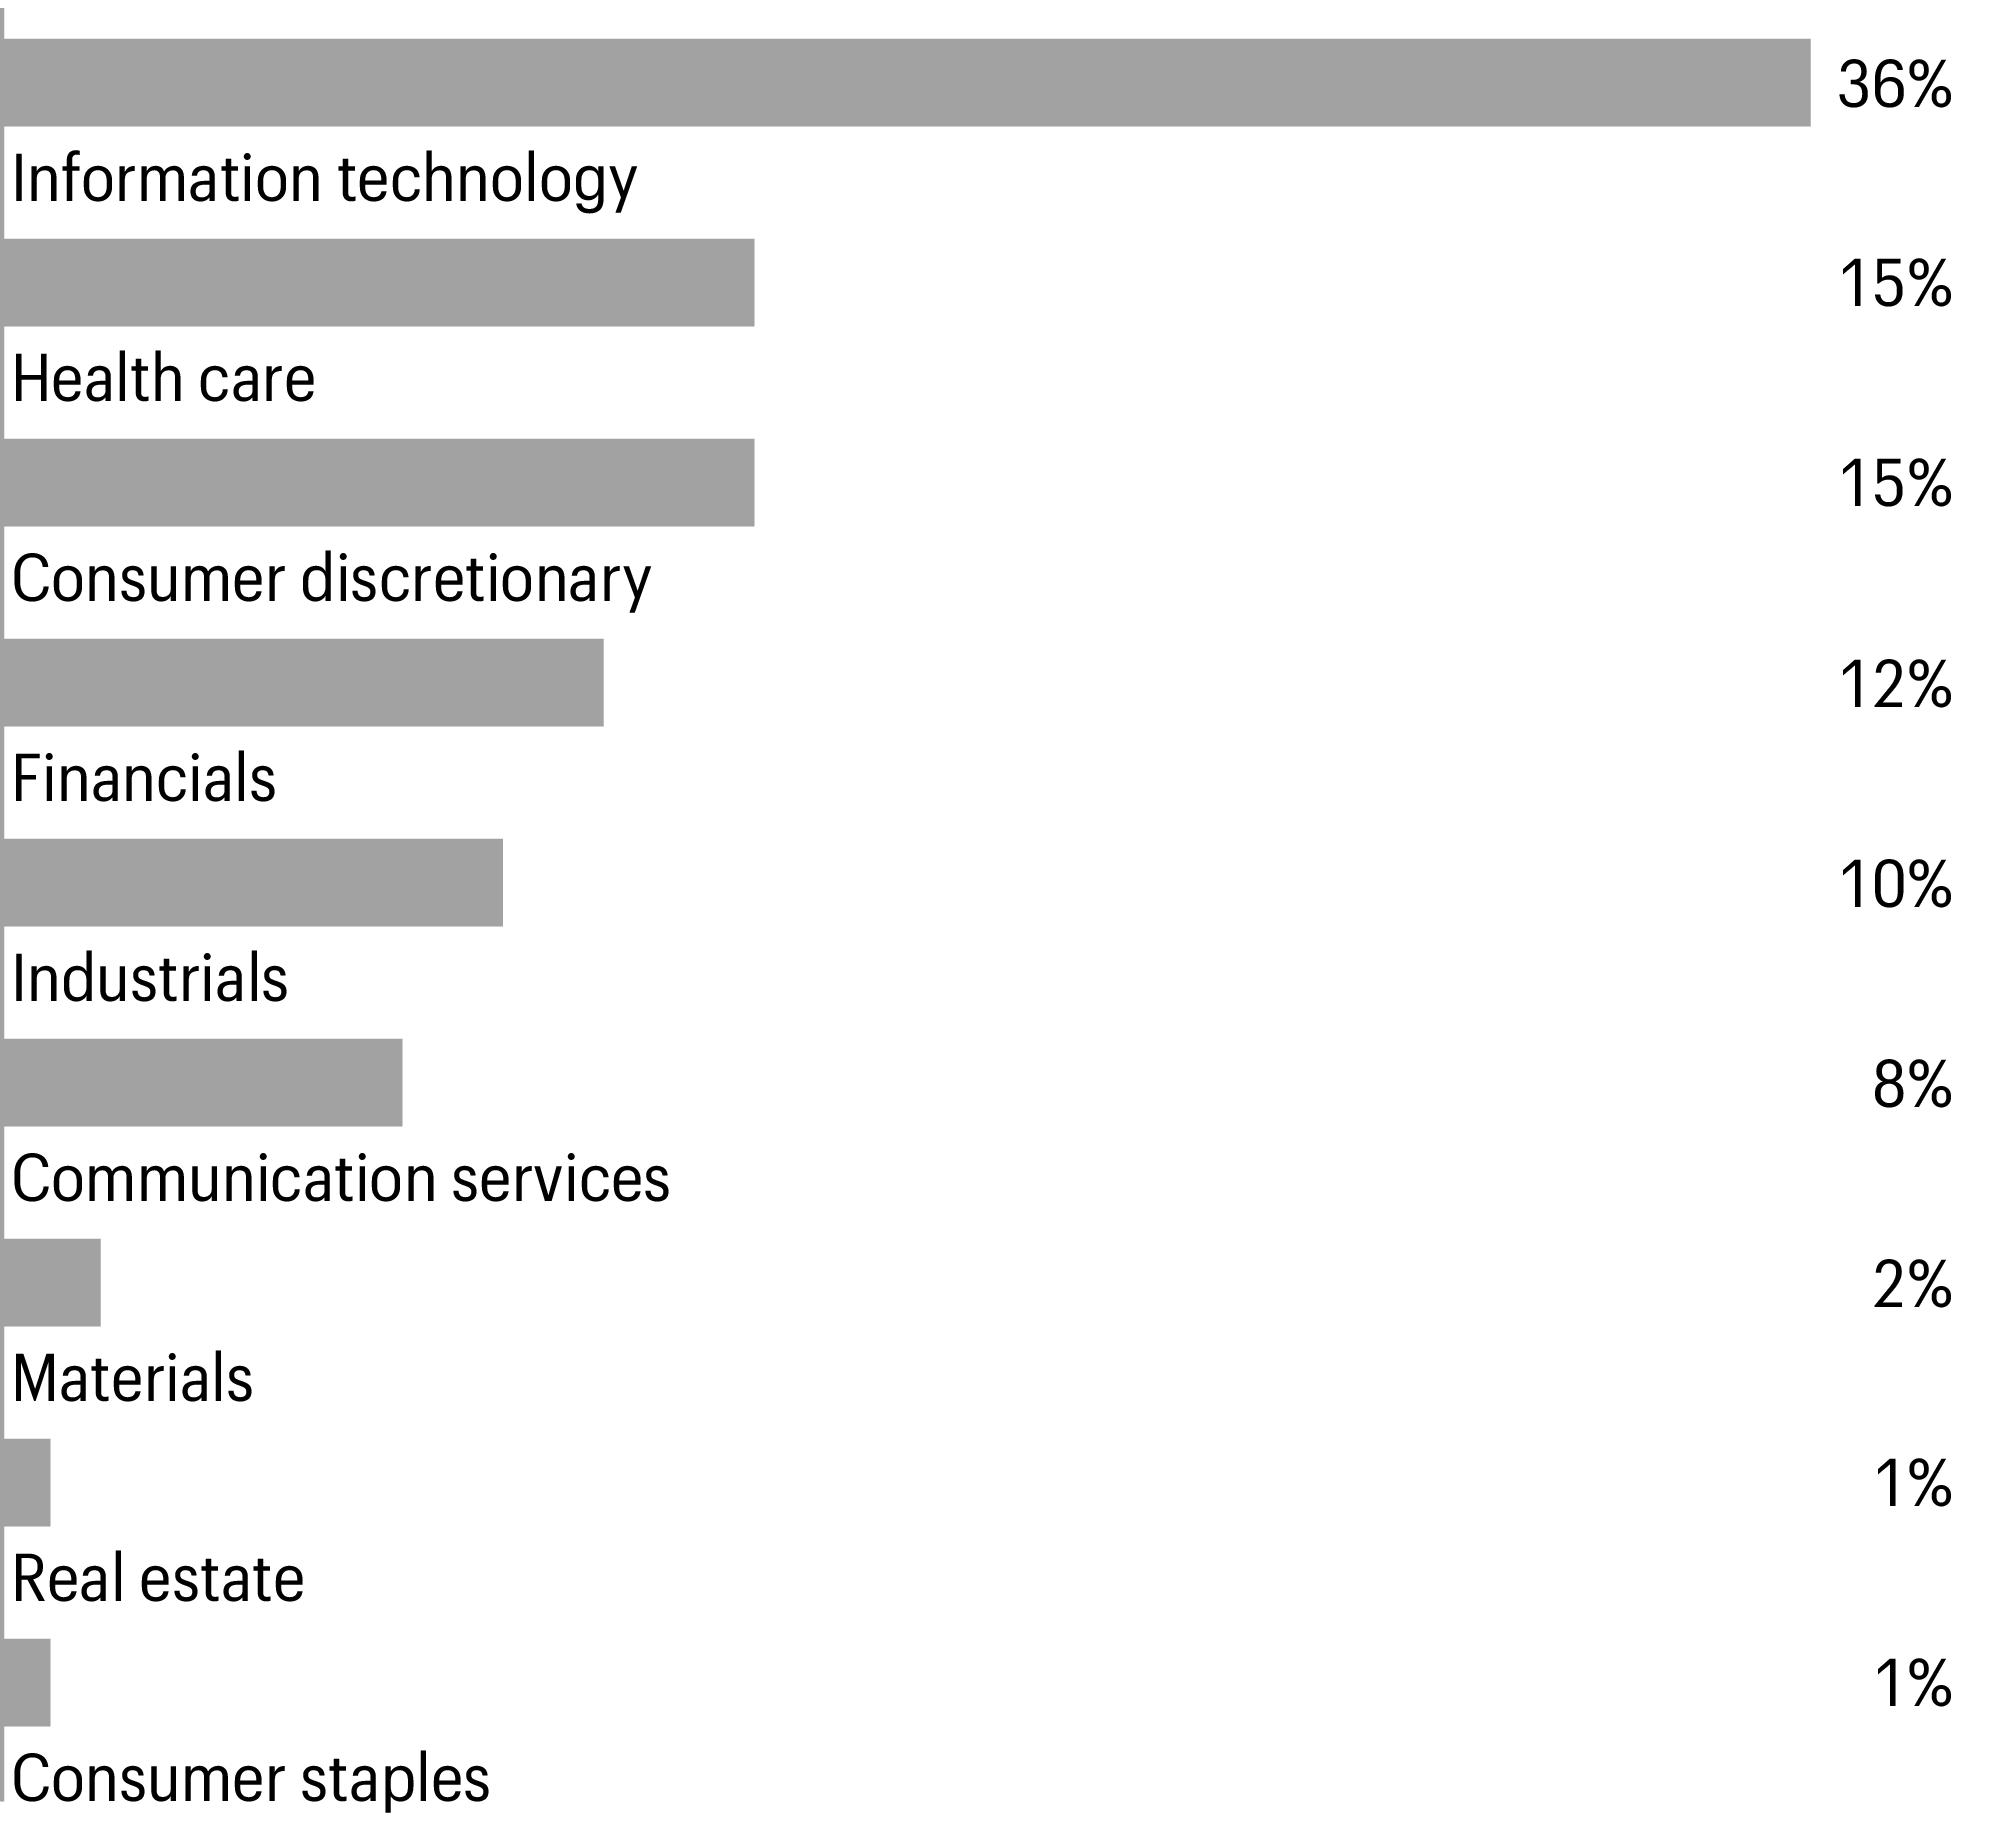
1 | Figures represent the percentage of the Fund’s long-term investments. Allocations are subject to change and may have changed since the date specified. |
Beginning account value 8-1-2023 | Ending account value 1-31-2024 | Expenses paid during the period1 | Annualized net expense ratio | |
Class A | ||||
Actual | $1,000.00 | $1,093.37 | $6.52 | 1.24 % |
Hypothetical (5% return before expenses) | $1,000.00 | $1,018.90 | $6.29 | 1.24 % |
Class C | ||||
Actual | $1,000.00 | $1,089.27 | $10.45 | 1.99 % |
Hypothetical (5% return before expenses) | $1,000.00 | $1,015.13 | $10.08 | 1.99 % |
Administrator Class | ||||
Actual | $1,000.00 | $1,094.07 | $5.79 | 1.10 % |
Hypothetical (5% return before expenses) | $1,000.00 | $1,019.61 | $5.58 | 1.10 % |
Institutional Class | ||||
Actual | $1,000.00 | $1,095.44 | $4.48 | 0.85 % |
Hypothetical (5% return before expenses) | $1,000.00 | $1,020.86 | $4.32 | 0.85 % |
1 | Expenses paid is equal to the annualized net expense ratio of each class multiplied by the average account value over the period, multiplied by 184 divided by 366 (to reflect the one-half-year period). |
Shares | Value | |||||
Common stocks: 99.08% | ||||||
Communication services: 7.87% | ||||||
Entertainment: 1.43% | ||||||
Spotify Technology SA† | 49,336 | $10,624,508 | ||||
Interactive media & services: 6.44% | ||||||
Alphabet, Inc. Class A† | 341,485 | 47,842,048 | ||||
Consumer discretionary: 14.64% | ||||||
Automobiles: 1.23% | ||||||
Ferrari NV | 26,341 | 9,111,879 | ||||
Broadline retail: 8.59% | ||||||
Amazon.com, Inc.† | 315,875 | 49,023,800 | ||||
MercadoLibre, Inc.† | 8,642 | 14,793,462 | ||||
63,817,262 | ||||||
Hotels, restaurants & leisure: 2.11% | ||||||
Chipotle Mexican Grill, Inc.† | 6,500 | 15,657,005 | ||||
Specialty retail: 1.58% | ||||||
Home Depot, Inc. | 33,240 | 11,732,390 | ||||
Textiles, apparel & luxury goods: 1.13% | ||||||
lululemon athletica, Inc.† | 18,483 | 8,387,955 | ||||
Consumer staples: 0.95% | ||||||
Beverages: 0.95% | ||||||
Celsius Holdings, Inc.† | 141,803 | 7,075,970 | ||||
Financials: 11.82% | ||||||
Capital markets: 3.11% | ||||||
Intercontinental Exchange, Inc. | 88,535 | 11,273,161 | ||||
Tradeweb Markets, Inc. Class A | 124,202 | 11,847,629 | ||||
23,120,790 | ||||||
Financial services: 6.74% | ||||||
Fiserv, Inc.† | 78,704 | 11,165,737 | ||||
Visa, Inc. Class A | 142,297 | 38,884,078 | ||||
50,049,815 | ||||||
Insurance: 1.97% | ||||||
Progressive Corp. | 82,242 | 14,659,637 | ||||
Health care: 15.11% | ||||||
Biotechnology: 1.21% | ||||||
Exact Sciences Corp.† | 137,616 | 9,000,086 | ||||
Health care equipment & supplies: 3.77% | ||||||
DexCom, Inc.† | 105,704 | 12,827,181 | ||||
Intuitive Surgical, Inc.† | 40,115 | 15,172,295 | ||||
27,999,476 | ||||||
Shares | Value | |||||
Health care providers & services: 3.16% | ||||||
UnitedHealth Group, Inc. | 45,827 | $23,451,509 | ||||
Health care technology: 1.42% | ||||||
Veeva Systems, Inc. Class A† | 50,924 | 10,562,147 | ||||
Life sciences tools & services: 2.46% | ||||||
Bio-Techne Corp. | 115,551 | 8,125,547 | ||||
Danaher Corp. | 42,275 | 10,142,195 | ||||
18,267,742 | ||||||
Pharmaceuticals: 3.09% | ||||||
Eli Lilly & Co. | 14,500 | 9,361,345 | ||||
Zoetis, Inc. | 72,200 | 13,559,882 | ||||
22,921,227 | ||||||
Industrials: 9.96% | ||||||
Commercial services & supplies: 3.41% | ||||||
Tetra Tech, Inc. | 62,458 | 9,879,607 | ||||
Waste Connections, Inc. | 99,740 | 15,485,632 | ||||
25,365,239 | ||||||
Electrical equipment: 1.06% | ||||||
Vertiv Holdings Co. | 140,504 | 7,914,590 | ||||
Ground transportation: 1.34% | ||||||
Old Dominion Freight Line, Inc. | 25,374 | 9,921,741 | ||||
Industrial conglomerates: 1.57% | ||||||
General Electric Co. | 87,911 | 11,641,175 | ||||
Machinery: 1.56% | ||||||
RBC Bearings, Inc.† | 43,069 | 11,565,749 | ||||
Professional services: 1.02% | ||||||
Paylocity Holding Corp.† | 47,643 | 7,547,128 | ||||
Information technology: 36.02% | ||||||
Communications equipment: 1.99% | ||||||
Motorola Solutions, Inc. | 46,253 | 14,777,834 | ||||
Electronic equipment, instruments & components: 2.17% | ||||||
Teledyne Technologies, Inc.† | 23,186 | 9,702,645 | ||||
Zebra Technologies Corp. Class A† | 26,763 | 6,411,077 | ||||
16,113,722 | ||||||
IT services: 4.18% | ||||||
Gartner, Inc.† | 24,579 | 11,243,418 | ||||
Globant SA† | 58,581 | 13,813,985 | ||||
MongoDB, Inc.† | 14,900 | 5,967,748 | ||||
31,025,151 | ||||||
Shares | Value | |||||
Semiconductors & semiconductor equipment: 5.77% | ||||||
Advanced Micro Devices, Inc.† | 84,727 | $14,207,870 | ||||
Analog Devices, Inc. | 46,849 | 9,011,874 | ||||
KLA Corp. | 16,100 | 9,564,044 | ||||
Monolithic Power Systems, Inc. | 16,700 | 10,065,424 | ||||
42,849,212 | ||||||
Software: 21.91% | ||||||
Bills Holdings, Inc.† | 52,512 | 4,098,562 | ||||
Cadence Design Systems, Inc.† | 50,824 | 14,660,691 | ||||
Crowdstrike Holdings, Inc. Class A† | 39,005 | 11,408,962 | ||||
Datadog, Inc. Class A† | 61,860 | 7,697,858 | ||||
Microsoft Corp. | 226,363 | 89,997,402 | ||||
ServiceNow, Inc.† | 21,500 | 16,456,100 | ||||
Workday, Inc. Class A† | 39,095 | 11,379,382 | ||||
Zscaler, Inc.† | 30,045 | 7,080,705 | ||||
162,779,662 | ||||||
Materials: 1.72% | ||||||
Chemicals: 1.72% | ||||||
Sherwin-Williams Co. | 41,900 | 12,753,522 | ||||
Real estate: 0.99% | ||||||
Specialized REITs : 0.99% | ||||||
SBA Communications Corp. Class A | 32,729 | 7,326,714 | ||||
Total common stocks (Cost $362,705,480) | 735,862,885 | |||||
Yield | ||||||
Short-term investments: 1.03% | ||||||
Investment companies: 1.03% | ||||||
Allspring Government Money Market Fund Select Class♠∞ | 5.27 % | 7,651,638 | 7,651,638 | |||
Total short-term investments (Cost $7,651,638) | 7,651,638 | |||||
Total investments in securities (Cost $370,357,118) | 100.11 % | 743,514,523 | ||||
Other assets and liabilities, net | (0.11 ) | (787,678 ) | ||||
Total net assets | 100.00 % | $742,726,845 | ||||
† | Non-income-earning security |
♠ | The issuer of the security is an affiliated person of the Fund as defined in the Investment Company Act of 1940. |
∞ | The rate represents the 7-day annualized yield at period end. |
Abbreviations: | |
REIT | Real estate investment trust |
Value, beginning of period | Purchases | Sales proceeds | Net realized gains (losses) | Net change in unrealized gains (losses) | Value, end of period | Shares, end of period | Income from affiliated securities | |
Short-term investments | ||||||||
Allspring Government Money Market Fund Select Class | $1,911,117 | $64,486,390 | $(58,745,869 ) | $0 | $0 | $7,651,638 | 7,651,638 | $134,848 |
Assets | |
Investments in unaffiliated securities, at value (cost $362,705,480) | $735,862,885 |
Investments in affiliated securities, at value (cost $7,651,638) | 7,651,638 |
Receivable for Fund shares sold | 155,151 |
Receivable for dividends | 66,683 |
Prepaid expenses and other assets | 67,700 |
Total assets | 743,804,057 |
Liabilities | |
Management fee payable | 468,078 |
Payable for Fund shares redeemed | 268,348 |
Shareholder servicing fees payable | 148,006 |
Administration fees payable | 121,319 |
Distribution fees payable | 2,711 |
Accrued expenses and other liabilities | 68,750 |
Total liabilities | 1,077,212 |
Total net assets | $742,726,845 |
Net assets consist of | |
Paid-in capital | $372,207,632 |
Total distributable earnings | 370,519,213 |
Total net assets | $742,726,845 |
Computation of net asset value and offering price per share | |
Net assets–Class A | $677,740,497 |
Shares outstanding–Class A1 | 12,497,613 |
Net asset value per share–Class A | $54.23 |
Maximum offering price per share – Class A2 | $57.54 |
Net assets–Class C | $4,352,963 |
Shares outstanding–Class C1 | 175,834 |
Net asset value per share–Class C | $24.76 |
Net assets–Administrator Class | $23,115,468 |
Shares outstanding–Administrator Class1 | 368,753 |
Net asset value per share–Administrator Class | $62.69 |
Net assets–Institutional Class | $37,517,917 |
Shares outstanding–Institutional Class1 | 562,813 |
Net asset value per share–Institutional Class | $66.66 |
Investment income | |
Dividends (net of foreign withholdings taxes of $8,006) | $1,615,733 |
Income from affiliated securities | 134,848 |
Interest | 7 |
Total investment income | 1,750,588 |
Expenses | |
Management fee | 2,750,881 |
Administration fees | |
Class A | 636,365 |
Class C | 4,296 |
Administrator Class | 15,242 |
Institutional Class | 23,363 |
Shareholder servicing fees | |
Class A | 795,456 |
Class C | 5,342 |
Administrator Class | 28,236 |
Distribution fees | |
Class C | 15,802 |
Custody and accounting fees | 10,029 |
Professional fees | 34,106 |
Registration fees | 37,481 |
Shareholder report expenses | 15,063 |
Trustees’ fees and expenses | 9,759 |
Other fees and expenses | 18,782 |
Total expenses | 4,400,203 |
Less: Fee waivers and/or expense reimbursements | |
Fund-level | (104,702 ) |
Class A | (5,540 ) |
Administrator Class | (7,156 ) |
Institutional Class | (12,873 ) |
Net expenses | 4,269,932 |
Net investment loss | (2,519,344 ) |
Realized and unrealized gains (losses) on investments | |
Net realized gains (losses) on | |
Unaffiliated securities | 3,343,049 |
Foreign currency and foreign currency translations | (85 ) |
Net realized gains on investments | 3,342,964 |
Net change in unrealized gains (losses) on investments | 62,655,374 |
Net realized and unrealized gains (losses) on investments | 65,998,338 |
Net increase in net assets resulting from operations | $63,478,994 |
Six months ended January 31, 2024 (unaudited) | Year ended July 31, 2023 | |||
Operations | ||||
Net investment loss | $(2,519,344 ) | $(4,369,435 ) | ||
Net realized gains on investments | 3,342,964 | 37,168,601 | ||
Net change in unrealized gains (losses) on investments | 62,655,374 | 18,919,930 | ||
Net increase in net assets resulting from operations | 63,478,994 | 51,719,096 | ||
Distributions to shareholders from | ||||
Net investment income and net realized gains | ||||
Class A | (33,782,466 ) | (54,898,486 ) | ||
Class C | (454,268 ) | (866,613 ) | ||
Class R | N/A | (304,370 )1 | ||
Administrator Class | (1,115,498 ) | (1,767,086 ) | ||
Institutional Class | (1,562,590 ) | (2,699,274 ) | ||
Total distributions to shareholders | (36,914,822 ) | (60,535,829 ) | ||
Capital share transactions | Shares | Shares | ||
Proceeds from shares sold | ||||
Class A | 88,366 | 4,526,641 | 209,822 | 10,097,328 |
Class C | 5,482 | 132,567 | 22,262 | 527,616 |
Class R | N/A | N/A | 6,850 1 | 289,729 1 |
Administrator Class | 5,742 | 331,541 | 5,874 | 315,994 |
Institutional Class | 49,624 | 3,018,433 | 78,084 | 4,468,563 |
8,009,182 | 15,699,230 | |||
Reinvestment of distributions | ||||
Class A | 629,736 | 32,456,610 | 1,220,643 | 52,719,587 |
Class C | 19,290 | 454,268 | 41,072 | 866,613 |
Class R | N/A | N/A | 7,773 1 | 303,617 1 |
Administrator Class | 18,004 | 1,072,507 | 34,251 | 1,695,061 |
Institutional Class | 24,326 | 1,540,328 | 50,950 | 2,666,737 |
35,523,713 | 58,251,615 | |||
Payment for shares redeemed | ||||
Class A | (774,347 ) | (39,486,877 ) | (1,533,524 ) | (71,986,693 ) |
Class C | (30,016 ) | (746,931 ) | (116,519 ) | (2,794,517 ) |
Class R | N/A | N/A | (85,849 )1 | (3,909,469 )1 |
Administrator Class | (56,976 ) | (3,481,524 ) | (37,289 ) | (2,002,644 ) |
Institutional Class | (82,964 ) | (5,192,642 ) | (676,909 ) | (37,738,696 ) |
(48,907,974 ) | (118,432,019 ) | |||
Net decrease in net assets resulting from capital share transactions | (5,375,079 ) | (44,481,174 ) | ||
Total increase (decrease) in net assets | 21,189,093 | (53,297,907 ) | ||
Net assets | ||||
Beginning of period | 721,537,752 | 774,835,659 | ||
End of period | $742,726,845 | $721,537,752 | ||
Six months ended January 31, 2024 (unaudited) | Year ended July 31 | |||||
Class A | 2023 | 2022 | 2021 | 2020 | 2019 | |
Net asset value, beginning of period | $52.29 | $52.95 | $83.33 | $64.95 | $55.19 | $54.77 |
Net investment loss | (0.19 )1 | (0.32 )1 | (0.60 )1 | (0.65 ) | (0.38 )1 | (0.33 )1 |
Payment from affiliate | 0.00 | 0.00 | 0.00 | 0.00 2 | 0.00 | 0.00 |
Net realized and unrealized gains (losses) on investments | 4.93 | 4.16 | (19.62 ) | 23.40 | 13.24 | 6.56 |
Total from investment operations | 4.74 | 3.84 | (20.22 ) | 22.75 | 12.86 | 6.23 |
Distributions to shareholders from | ||||||
Net realized gains | (2.80 ) | (4.50 ) | (10.16 ) | (4.37 ) | (3.10 ) | (5.81 ) |
Net asset value, end of period | $54.23 | $52.29 | $52.95 | $83.33 | $64.95 | $55.19 |
Total return3 | 9.34 % | 9.03 % | (27.73 )% | 36.32 %4 | 24.55 % | 13.89 % |
Ratios to average net assets (annualized) | ||||||
Gross expenses | 1.27 % | 1.29 % | 1.26 % | 1.26 % | 1.28 % | 1.28 % |
Net expenses | 1.24 % | 1.25 % | 1.25 % | 1.26 % | 1.28 % | 1.28 % |
Net investment loss | (0.74 )% | (0.67 )% | (0.89 )% | (0.90 )% | (0.68 )% | (0.64 )% |
Supplemental data | ||||||
Portfolio turnover rate | 18 % | 21 % | 27 % | 24 % | 23 % | 39 % |
Net assets, end of period (000s omitted) | $677,740 | $656,485 | $670,221 | $1,017,512 | $800,199 | $714,411 |
1 | Calculated based upon average shares outstanding |
2 | Amount is less than $0.005. |
3 | Total return calculations do not include any sales charges. Returns for periods of less than one year are not annualized. |
4 | During the year ended July 31, 2021, the Fund received a payment from an affiliate which had a 0.005% impact on the total return. |
Six months ended January 31, 2024 (unaudited) | Year ended July 31 | |||||
Class C | 2023 | 2022 | 2021 | 2020 | 2019 | |
Net asset value, beginning of period | $25.43 | $28.50 | $49.82 | $40.52 | $35.83 | $38.02 |
Net investment loss | (0.18 )1 | (0.34 )1 | (0.63 )1 | (0.72 )1 | (0.50 )1 | (0.48 )1 |
Payment from affiliate | 0.00 | 0.00 | 0.00 | 0.23 | 0.00 | 0.00 |
Net realized and unrealized gains (losses) on investments | 2.31 | 1.77 | (10.53 ) | 14.16 | 8.29 | 4.10 |
Total from investment operations | 2.13 | 1.43 | (11.16 ) | 13.67 | 7.79 | 3.62 |
Distributions to shareholders from | ||||||
Net realized gains | (2.80 ) | (4.50 ) | (10.16 ) | (4.37 ) | (3.10 ) | (5.81 ) |
Net asset value, end of period | $24.76 | $25.43 | $28.50 | $49.82 | $40.52 | $35.83 |
Total return2 | 8.93 % | 8.24 % | (28.27 )% | 35.74 %3 | 23.61 % | 13.04 % |
Ratios to average net assets (annualized) | ||||||
Gross expenses | 2.01 % | 2.02 % | 1.98 % | 2.01 % | 2.03 % | 2.03 % |
Net expenses | 1.99 % | 2.01 % | 1.98 % | 2.01 % | 2.03 % | 2.03 % |
Net investment loss | (1.49 )% | (1.42 )% | (1.62 )% | (1.63 )% | (1.42 )% | (1.40 )% |
Supplemental data | ||||||
Portfolio turnover rate | 18 % | 21 % | 27 % | 24 % | 23 % | 39 % |
Net assets, end of period (000s omitted) | $4,353 | $4,604 | $6,678 | $15,900 | $22,077 | $26,122 |
1 | Calculated based upon average shares outstanding |
2 | Total return calculations do not include any sales charges. Returns for periods of less than one year are not annualized. |
3 | During the year ended July 31, 2021, the Fund received a payment from an affiliate which had a 0.62% impact on the total return. |
Six months ended January 31, 2024 (unaudited) | Year ended July 31 | |||||
Administrator Class | 2023 | 2022 | 2021 | 2020 | 2019 | |
Net asset value, beginning of period | $59.99 | $59.92 | $92.83 | $71.80 | $60.58 | $59.39 |
Net investment loss | (0.18 )1 | (0.28 )1 | (0.55 ) | (0.62 ) | (0.30 )1 | (0.25 )1 |
Net realized and unrealized gains (losses) on investments | 5.68 | 4.85 | (22.20 ) | 26.02 | 14.62 | 7.25 |
Total from investment operations | 5.50 | 4.57 | (22.75 ) | 25.40 | 14.32 | 7.00 |
Distributions to shareholders from | ||||||
Net realized gains | (2.80 ) | (4.50 ) | (10.16 ) | (4.37 ) | (3.10 ) | (5.81 ) |
Net asset value, end of period | $62.69 | $59.99 | $59.92 | $92.83 | $71.80 | $60.58 |
Total return2 | 9.41 % | 9.21 % | (27.61 )% | 36.55 % | 24.78 % | 14.12 % |
Ratios to average net assets (annualized) | ||||||
Gross expenses | 1.19 % | 1.20 % | 1.16 % | 1.18 % | 1.20 % | 1.20 % |
Net expenses | 1.10 % | 1.09 % | 1.09 % | 1.09 % | 1.09 % | 1.10 % |
Net investment loss | (0.60 )% | (0.51 )% | (0.73 )% | (0.73 )% | (0.49 )% | (0.45 )% |
Supplemental data | ||||||
Portfolio turnover rate | 18 % | 21 % | 27 % | 24 % | 23 % | 39 % |
Net assets, end of period (000s omitted) | $23,115 | $24,113 | $23,917 | $37,163 | $28,712 | $26,141 |
1 | Calculated based upon average shares outstanding |
2 | Returns for periods of less than one year are not annualized. |
Six months ended January 31, 2024 (unaudited) | Year ended July 31 | |||||
Institutional Class | 2023 | 2022 | 2021 | 2020 | 2019 | |
Net asset value, beginning of period | $63.54 | $63.03 | $96.91 | $74.62 | $62.69 | $61.10 |
Net investment loss | (0.11 )1 | (0.14 )1 | (0.29 ) | (0.40 ) | (0.16 )1 | (0.12 )1 |
Net realized and unrealized gains (losses) on investments | 6.03 | 5.15 | (23.43 ) | 27.06 | 15.19 | 7.52 |
Total from investment operations | 5.92 | 5.01 | (23.72 ) | 26.66 | 15.03 | 7.40 |
Distributions to shareholders from | ||||||
Net realized gains | (2.80 ) | (4.50 ) | (10.16 ) | (4.37 ) | (3.10 ) | (5.81 ) |
Net asset value, end of period | $66.66 | $63.54 | $63.03 | $96.91 | $74.62 | $62.69 |
Total return2 | 9.54 % | 9.47 % | (27.44 )% | 36.87 % | 25.09 % | 14.39 % |
Ratios to average net assets (annualized) | ||||||
Gross expenses | 0.95 % | 0.96 % | 0.93 % | 0.93 % | 0.95 % | 0.95 % |
Net expenses | 0.85 % | 0.85 % | 0.85 % | 0.85 % | 0.85 % | 0.85 % |
Net investment loss | (0.35 )% | (0.25 )% | (0.49 )% | (0.49 )% | (0.25 )% | (0.20 )% |
Supplemental data | ||||||
Portfolio turnover rate | 18 % | 21 % | 27 % | 24 % | 23 % | 39 % |
Net assets, end of period (000s omitted) | $37,518 | $36,334 | $70,572 | $116,193 | $90,900 | $75,456 |
1 | Calculated based upon average shares outstanding |
2 | Returns for periods of less than one year are not annualized. |
Gross unrealized gains | $389,643,714 |
Gross unrealized losses | (16,749,870 ) |
Net unrealized gains | $372,893,844 |
Quoted prices (Level 1) | Other significant observable inputs (Level 2) | Significant unobservable inputs (Level 3) | Total | |
Assets | ||||
Investments in: | ||||
Common stocks | ||||
Communication services | $58,466,556 | $0 | $0 | $58,466,556 |
Consumer discretionary | 108,706,491 | 0 | 0 | 108,706,491 |
Consumer staples | 7,075,970 | 0 | 0 | 7,075,970 |
Financials | 87,830,242 | 0 | 0 | 87,830,242 |
Health care | 112,202,187 | 0 | 0 | 112,202,187 |
Industrials | 73,955,622 | 0 | 0 | 73,955,622 |
Information technology | 267,545,581 | 0 | 0 | 267,545,581 |
Materials | 12,753,522 | 0 | 0 | 12,753,522 |
Real estate | 7,326,714 | 0 | 0 | 7,326,714 |
Short-term investments | ||||
Investment companies | 7,651,638 | 0 | 0 | 7,651,638 |
Total assets | $743,514,523 | $0 | $0 | $743,514,523 |
Average daily net assets | Management fee |
First $500 million | 0.800 % |
Next $500 million | 0.750 |
Next $1 billion | 0.700 |
Next $2 billion | 0.675 |
Next $1 billion | 0.650 |
Next $3 billion | 0.640 |
Next $2 billion | 0.615 |
Next $2 billion | 0.605 |
Next $4 billion | 0.580 |
Over $16 billion | 0.555 |
Class-level administration fee | |
Class A | 0.20 % |
Class C | 0.20 |
Administrator Class | 0.13 |
Institutional Class | 0.13 |
EXPENSE RATIO CAPS | |
Class A | 1.24 % |
Class C | 1.99 |
Administrator Class | 1.10 |
Institutional Class | 0.85 |
Name and year of birth | Position held and length of service* | Principal occupations during past five years or longer | Current other public company or investment company directorships |
William R. Ebsworth (Born 1957) | Trustee, since 2015 | Retired. From 1984 to 2013, equities analyst, portfolio manager, research director and chief investment officer at Fidelity Management and Research Company in Boston, Tokyo, and Hong Kong, and retired in 2013 as Chief Investment Officer of Fidelity Strategic Advisers, Inc. where he led a team of investment professionals managing client assets. Prior thereto, Board member of Hong Kong Securities Clearing Co., Hong Kong Options Clearing Corp., the Thailand International Fund, Ltd., Fidelity Investments Life Insurance Company, and Empire Fidelity Investments Life Insurance Company. Serves on the Investment Company Institute’s Board of Governors since 2022 and Executive Committee since 2023 as well as the Vice Chairman of the Governing Council of the Independent Directors Council since 2023. Audit Committee Chair and Investment Committee Chair of the Vincent Memorial Hospital Foundation (non-profit organization). Mr. Ebsworth is a CFA charterholder. | N/A |
Jane A. Freeman (Born 1953) | Trustee, since 2015; Chair Liaison, since January 2018# | Retired. From 2012 to 2014 and 1999 to 2008, Chief Financial Officer of Scientific Learning Corporation. From 2008 to 2012, Ms. Freeman provided consulting services related to strategic business projects. Prior to 1999, Portfolio Manager at Rockefeller & Co. and Scudder, Stevens & Clark. Board member of the Harding Loevner Funds from 1996 to 2014, serving as both Lead Independent Director and chair of the Audit Committee. Board member of the Russell Exchange Traded Funds Trust from 2011 to 2012 and the chair of the Audit Committee. Ms. Freeman is also an inactive Chartered Financial Analyst. | N/A |
Isaiah Harris, Jr. (Born 1952) | Trustee, since 2009; Audit Committee Chair, since 2019 | Retired. Member of the Advisory Board of CEF of East Central Florida. Chairman of the Board of CIGNA Corporation from 2009 to 2021, and Director from 2005 to 2008. From 2003 to 2011, Director of Deluxe Corporation. Prior thereto, President and CEO of BellSouth Advertising and Publishing Corp. from 2005 to 2007, President and CEO of BellSouth Enterprises from 2004 to 2005 and President of BellSouth Consumer Services from 2000 to 2003. Emeritus member of the Iowa State University Foundation Board of Governors. Emeritus Member of the Advisory board of Iowa State University School of Business. Advisory Board Member, Palm Harbor Academy (private school). Advisory Board Member, Fellowship of Christian Athletes. Mr. Harris is a certified public accountant (inactive status). | N/A |
David F. Larcker (Born 1950) | Trustee, since 2009 | Distinguished Visiting Fellow at the Hoover Institution since 2022. James Irvin Miller Professor of Accounting at the Graduate School of Business (Emeritus), Stanford University, Director of the Corporate Governance Research Initiative and Senior Faculty of The Rock Center for Corporate Governance since 2006. From 2005 to 2008, Professor of Accounting at the Graduate School of Business, Stanford University. Prior thereto, Ernst & Young Professor of Accounting at The Wharton School, University of Pennsylvania from 1985 to 2005. | N/A |
Olivia S. Mitchell (Born 1953) | Trustee, since 2006 | International Foundation of Employee Benefit Plans Professor since 1993, Wharton School of the University of Pennsylvania. Director of Wharton’s Pension Research Council and Boettner Center on Pensions & Retirement Research, and Research Associate at the National Bureau of Economic Research. Previously taught at Cornell University from 1978 to 1993. | N/A |
Timothy J. Penny (Born 1951) | Trustee, since 1996; Chair, since 2018 | President and Chief Executive Officer of Southern Minnesota Initiative Foundation, a non-profit organization, since 2007. Vice Chair of the Economic Club of Minnesota, since 2007. Co-Chair of the Committee for a Responsible Federal Budget, since 1995. Member of the Board of Trustees of NorthStar Education Finance, Inc., a non-profit organization, from 2007-2022. Senior Fellow of the University of Minnesota Humphrey Institute from 1995 to 2017. | N/A |
Name and year of birth | Position held and length of service* | Principal occupations during past five years or longer | Current other public company or investment company directorships |
James G. Polisson (Born 1959) | Trustee, since 2018; Nominating and Governance Committee Chair, since 2024 | Retired. Chief Marketing Officer, Source (ETF) UK Services, Ltd, from 2015 to 2017. From 2012 to 2015, Principal of The Polisson Group, LLC, a management consulting, corporate advisory and principal investing company. Chief Executive Officer and Managing Director at Russell Investments, Global Exchange Traded Funds from 2010 to 2012. Managing Director of Barclays Global Investors from 1998 to 2010 and Global Chief Marketing Officer for iShares and Barclays Global Investors from 2000 to 2010. Trustee of the San Francisco Mechanics’ Institute, a non- profit organization, from 2013 to 2015. Board member of the Russell Exchange Traded Fund Trust from 2011 to 2012. Director of Barclays Global Investors Holdings Deutschland GmbH from 2006 to 2009. Mr. Polisson is an attorney and has a retired status with the Massachusetts and District of Columbia Bar Associations. | N/A |
Pamela Wheelock (Born 1959) | Trustee, since January 2020; previously Trustee from January 2018 to July 2019# | Retired. Executive and Senior Financial leadership positions in the public, private and nonprofit sectors. Interim President and CEO, McKnight Foundation, 2020. Interim Commissioner, Minnesota Department of Human Services, 2019. Chief Operating Officer, Twin Cities Habitat for Humanity, 2017-2019. Vice President for University Services, University of Minnesota, 2012- 2016. Interim President and CEO, Blue Cross and Blue Shield of Minnesota, 2011-2012. Executive Vice-President and Chief Financial Officer, Minnesota Wild, 2002-2008. Commissioner, Minnesota Department of Finance, 1999-2002. Chair of the Board of Directors of Destination Medical Center Corporation. Board member of the Minnesota Wild Foundation. | N/A |
Name and year of birth | Position held and length of service | Principal occupations during past five years or longer |
Andrew Owen (Born 1960) | President, since 2017 | President and Chief Executive Officer of Allspring Funds Management, LLC since 2017 and Head of Global Fund Governance of Allspring Global Investments since 2022. Prior thereto, co-president of Galliard Capital Management, LLC, an affiliate of Allspring Funds Management, LLC, from 2019 to 2022 and Head of Affiliated Managers, Allspring Global Investments, from 2014 to 2019 and Executive Vice President responsible for marketing, investments and product development for Allspring Funds Management, LLC, from 2009 to 2014. |
Jeremy DePalma (Born 1974) | Treasurer, since 2012 (for certain funds in the Fund Complex); since 2021 (for the remaining funds in the Complex) | Senior Vice President of Allspring Funds Management, LLC since 2009. Senior Vice President of Evergreen Investment Management Company, LLC from 2008 to 2010 and head of the Fund Reporting and Control Team within Fund Administration from 2005 to 2010. |
Christopher Baker (Born 1976) | Chief Compliance Officer, since 2022 | Global Chief Compliance Officer for Allspring Global Investments since 2022. Prior thereto, Chief Compliance Officer for State Street Global Advisors from 2018 to 2021. Senior Compliance Officer for the State Street divisions of Alternative Investment Solutions, Sector Solutions, and Global Marketing from 2015 to 2018. From 2010 to 2015 Vice President, Global Head of Investment and Marketing Compliance for State Street Global Advisors. |
Matthew Prasse (Born 1983) | Chief Legal Officer, since 2022; Secretary, since 2021 | Senior Counsel of the Allspring Legal Department since 2021. Senior Counsel of the Wells Fargo Legal Department from 2018 to 2021. Previously, Counsel for Barings LLC from 2015 to 2018. Prior to joining Barings, Associate at Morgan, Lewis & Bockius LLP from 2008 to 2015. |

P.O. Box 219967
Kansas City, MO 64121-9967

SAR0419 01-24

Allspring Funds

President
Allspring Funds
Notice to Shareholders |
Beginning in July 2024, the Fund will be required by the Securities and Exchange Commission to send shareholders a paper copy of a new tailored shareholder report in place of the full shareholder report that you are now receiving. The tailored shareholder report will contain concise information about the Fund, including certain expense and performance information and fund statistics. If you wish to receive this new tailored shareholder report electronically, please follow the instructions on the back cover of this report. |
Other information that is currently included in the shareholder report, such as the Fund’s financial statements, will be available online and upon request, free of charge, in paper or electronic format. |
Investment objective | The Fund seeks long-term capital appreciation. |
Manager | Allspring Funds Management, LLC |
Subadviser | Allspring Global Investments, LLC |
Portfolio managers | Michael T. Smith, CFA, Christopher J. Warner, CFA |
Average annual total returns (%) as of January 31, 2024 | |||||||||
Including sales charge | Excluding sales charge | Expense ratios1 (%) | |||||||
Inception date | 1 year | 5 year | 10 year | 1 year | 5 year | 10 year | Gross | Net2 | |
Class A (STAEX) | 12-29-2000 | 22.86 | 12.43 | 11.96 | 30.38 | 13.77 | 12.62 | 1.29 | 1.02 |
Class C (WECCX) | 12-29-2000 | 28.24 | 12.86 | 11.93 | 29.24 | 12.86 | 11.93 | 2.04 | 1.77 |
Class R6 (WECRX)3 | 9-20-2019 | – | – | – | 30.83 | 14.21 | 13.08 | 0.87 | 0.60 |
Administrator Class (WECDX) | 4-8-2005 | – | – | – | 30.35 | 13.88 | 12.81 | 1.22 | 0.94 |
Institutional Class (WFCIX) | 4-8-2005 | – | – | – | 30.90 | 14.11 | 13.03 | 0.97 | 0.70 |
Russell 3000® Index4 | – | – | – | – | 19.15 | 13.53 | 11.96 | – | – |
Russell 1000® Growth Index5 | – | – | – | – | 34.99 | 18.04 | 15.48 | – | – |
1 | Reflects the expense ratios as stated in the most recent prospectuses. The expense ratios shown are subject to change and may differ from the annualized expense ratios shown in the Financial Highlights of this report. |
2 | The manager has contractually committed through November 30, 2024, to waive fees and/or reimburse expenses to the extent necessary to cap total annual fund operating expenses after fee waivers at 1.02% for Class A, 1.77% for Class C, 0.60% for Class R6, 0.94% for Administrator Class and 0.70% for Institutional Class. Brokerage commissions, stamp duty fees, interest, taxes, acquired fund fees and expenses (if any), and extraordinary expenses are excluded from the expense caps. Prior to or after the commitment expiration date, the caps may be increased or the commitment to maintain the caps may be terminated only with the approval of the Board of Trustees. Without these caps, the Fund’s returns would have been lower. The expense ratio paid by an investor is the net expense ratio (the total annual fund operating expenses after fee waivers) as stated in the prospectuses. |
3 | Historical performance shown for the Class R6 shares prior to their inception reflects the performance of the Institutional Class shares, and includes the higher expenses applicable to the Institutional Class shares. If these expenses had not been included, returns for the Class R6 shares would be higher. |
4 | The Russell 3000® Index measures the performance of the 3,000 largest U.S. companies based on total market capitalization, which represents approximately 98% of the investable U.S. equity market. You cannot invest directly in an index. |
5 | The Russell 1000® Growth Index measures the performance of those Russell 1000 companies with higher price/book ratios and higher forecasted growth values. You cannot invest directly in an index. |
CFA® and Chartered Financial Analyst® are trademarks owned by CFA Institute. |
Ten largest holdings (%) as of January 31, 20241 | |
Microsoft Corp. | 11.91 |
Amazon.com, Inc. | 7.36 |
Alphabet, Inc. Class A | 6.92 |
Visa, Inc. Class A | 5.36 |
UnitedHealth Group, Inc. | 3.46 |
ServiceNow, Inc. | 2.71 |
Chipotle Mexican Grill, Inc. | 2.50 |
Intuitive Surgical, Inc. | 2.48 |
Progressive Corp. | 2.44 |
Motorola Solutions, Inc. | 2.39 |
1 | Figures represent the percentage of the Fund’s net assets. Holdings are subject to change and may have changed since the date specified. |
Sector allocation as of January 31, 20241 |
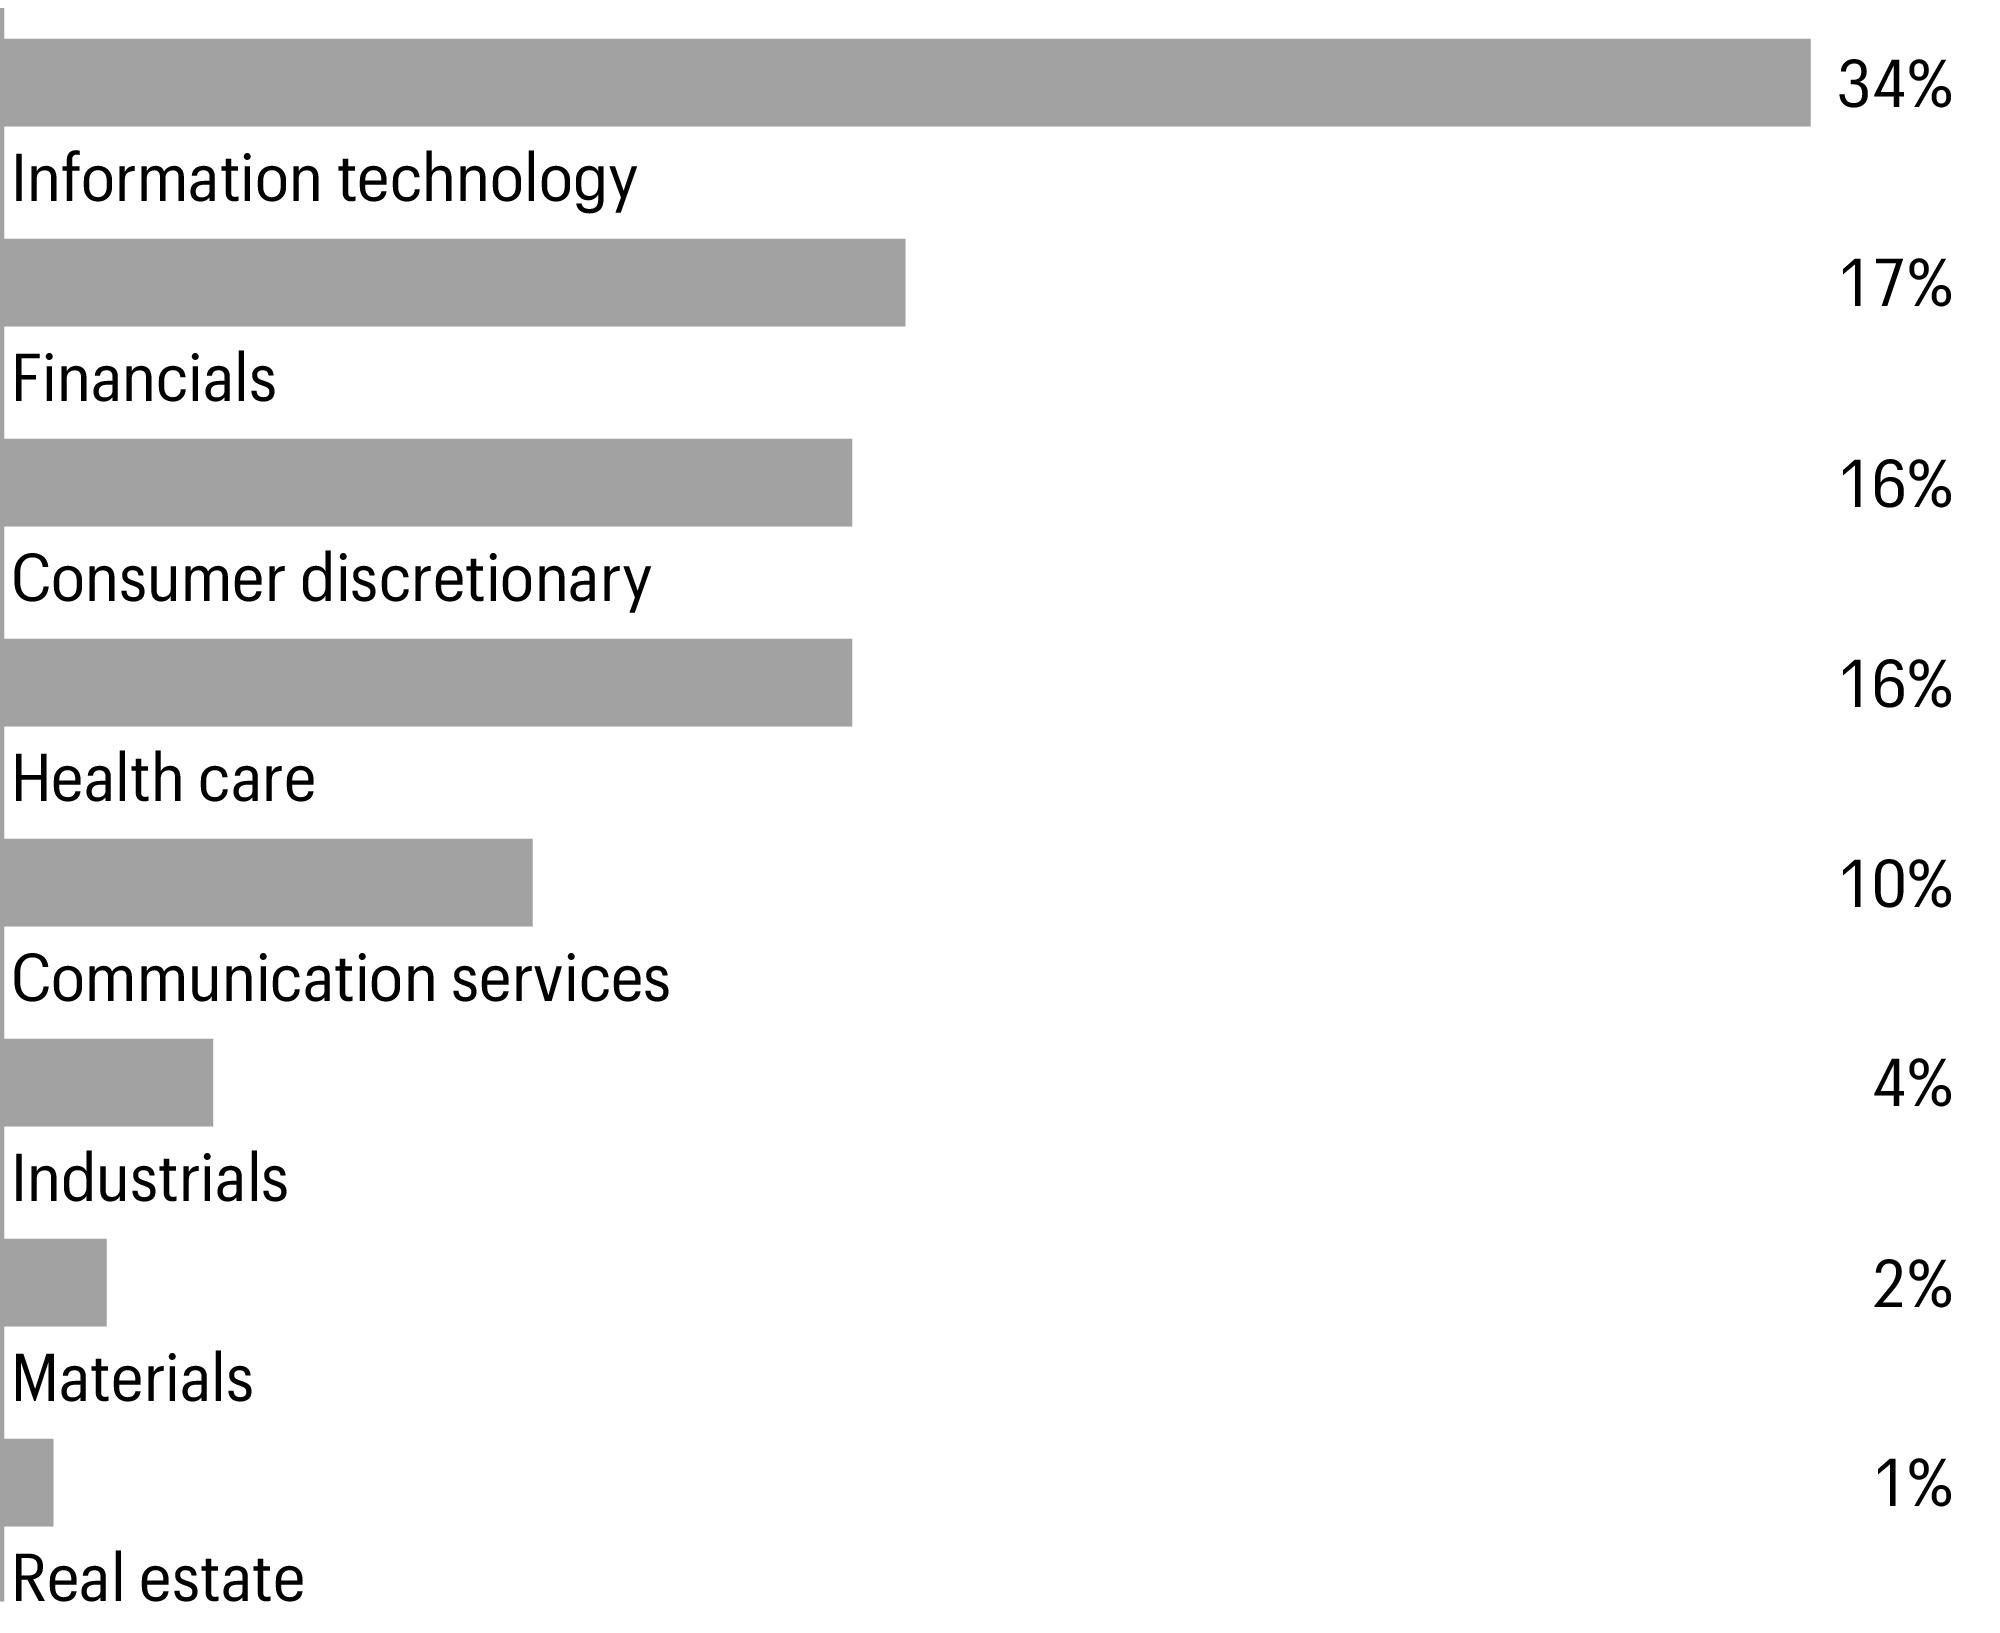
1 | Figures represent the percentage of the Fund’s long-term investments. Allocations are subject to change and may have changed since the date specified. |
Beginning account value 8-1-2023 | Ending account value 1-31-2024 | Expenses paid during the period1 | Annualized net expense ratio | |
Class A | ||||
Actual | $1,000.00 | $1,117.77 | $5.43 | 1.02 % |
Hypothetical (5% return before expenses) | $1,000.00 | $1,020.01 | $5.18 | 1.02 % |
Class C | ||||
Actual | $1,000.00 | $1,111.05 | $9.39 | 1.77 % |
Hypothetical (5% return before expenses) | $1,000.00 | $1,016.24 | $8.97 | 1.77 % |
Class R6 | ||||
Actual | $1,000.00 | $1,119.64 | $3.20 | 0.60 % |
Hypothetical (5% return before expenses) | $1,000.00 | $1,022.12 | $3.05 | 0.60 % |
Administrator Class | ||||
Actual | $1,000.00 | $1,117.03 | $5.00 | 0.94 % |
Hypothetical (5% return before expenses) | $1,000.00 | $1,020.41 | $4.77 | 0.94 % |
Institutional Class | ||||
Actual | $1,000.00 | $1,119.24 | $3.73 | 0.70 % |
Hypothetical (5% return before expenses) | $1,000.00 | $1,021.62 | $3.56 | 0.70 % |
1 | Expenses paid is equal to the annualized net expense ratio of each class multiplied by the average account value over the period, multiplied by 184 divided by 366 (to reflect the one-half-year period). |
Shares | Value | |||||
Common stocks: 99.75% | ||||||
Communication services: 10.47% | ||||||
Entertainment: 1.42% | ||||||
Spotify Technology SA† | 12,719 | $2,739,037 | ||||
Interactive media & services: 6.92% | ||||||
Alphabet, Inc. Class A† | 95,744 | 13,413,735 | ||||
Wireless telecommunication services: 2.13% | ||||||
T-Mobile U.S., Inc. | 25,623 | 4,131,196 | ||||
Consumer discretionary: 15.68% | ||||||
Automobiles: 1.45% | ||||||
Ferrari NV | 8,115 | 2,807,141 | ||||
Broadline retail: 9.50% | ||||||
Amazon.com, Inc.† | 91,903 | 14,263,345 | ||||
MercadoLibre, Inc.† | 2,422 | 4,146,004 | ||||
18,409,349 | ||||||
Hotels, restaurants & leisure: 2.50% | ||||||
Chipotle Mexican Grill, Inc.† | 2,008 | 4,836,810 | ||||
Specialty retail: 2.23% | ||||||
Home Depot, Inc. | 12,255 | 4,325,525 | ||||
Financials: 16.54% | ||||||
Capital markets: 6.42% | ||||||
Intercontinental Exchange, Inc. | 27,338 | 3,480,948 | ||||
S&P Global, Inc. | 10,230 | 4,586,621 | ||||
Tradeweb Markets, Inc. Class A | 45,832 | 4,371,914 | ||||
12,439,483 | ||||||
Financial services: 7.68% | ||||||
Fiserv, Inc.† | 31,729 | 4,501,393 | ||||
Visa, Inc. Class A | 37,989 | 10,380,874 | ||||
14,882,267 | ||||||
Insurance: 2.44% | ||||||
Progressive Corp. | 26,485 | 4,720,951 | ||||
Health care: 15.57% | ||||||
Health care equipment & supplies: 4.69% | ||||||
DexCom, Inc.† | 35,251 | 4,277,709 | ||||
Intuitive Surgical, Inc.† | 12,712 | 4,807,933 | ||||
9,085,642 | ||||||
Health care providers & services: 3.46% | ||||||
UnitedHealth Group, Inc. | 13,083 | 6,695,094 | ||||
Health care technology: 1.91% | ||||||
Veeva Systems, Inc. Class A† | 17,886 | 3,709,735 | ||||
Shares | Value | |||||
Life sciences tools & services: 1.76% | ||||||
Danaher Corp. | 14,213 | $3,409,841 | ||||
Pharmaceuticals: 3.75% | ||||||
Eli Lilly & Co. | 5,130 | 3,311,979 | ||||
Zoetis, Inc. | 21,027 | 3,949,081 | ||||
7,261,060 | ||||||
Industrials: 4.03% | ||||||
Commercial services & supplies: 0.00% | ||||||
Veralto Corp. | 1 | 77 | ||||
Ground transportation: 1.74% | ||||||
Old Dominion Freight Line, Inc. | 8,603 | 3,363,945 | ||||
Industrial conglomerates: 2.29% | ||||||
General Electric Co. | 33,494 | 4,435,275 | ||||
Information technology: 34.00% | ||||||
Communications equipment: 2.39% | ||||||
Motorola Solutions, Inc. | 14,495 | 4,631,153 | ||||
IT services: 5.28% | ||||||
Gartner, Inc.† | 8,700 | 3,979,728 | ||||
Globant SA† | 14,300 | 3,372,083 | ||||
MongoDB, Inc.† | 7,196 | 2,882,142 | ||||
10,233,953 | ||||||
Semiconductors & semiconductor equipment: 4.90% | ||||||
Advanced Micro Devices, Inc.† | 23,333 | 3,912,711 | ||||
Analog Devices, Inc. | 19,359 | 3,723,897 | ||||
Applied Materials, Inc. | 11,300 | 1,856,590 | ||||
9,493,198 | ||||||
Software: 21.43% | ||||||
Cadence Design Systems, Inc.† | 15,440 | 4,453,822 | ||||
Crowdstrike Holdings, Inc. Class A† | 14,721 | 4,305,893 | ||||
Microsoft Corp. | 58,054 | 23,081,109 | ||||
ServiceNow, Inc.† | 6,855 | 5,246,817 | ||||
Workday, Inc. Class A† | 15,200 | 4,424,264 | ||||
41,511,905 | ||||||
Materials: 2.11% | ||||||
Chemicals: 2.11% | ||||||
Sherwin-Williams Co. | 13,460 | 4,096,955 | ||||
Real estate: 1.35% | ||||||
Specialized REITs : 1.35% | ||||||
SBA Communications Corp. Class A | 11,715 | 2,622,520 | ||||
Total common stocks (Cost $86,573,986) | 193,255,847 | |||||
Yield | Shares | Value | ||||
Short-term investments: 0.04% | ||||||
Investment companies: 0.04% | ||||||
Allspring Government Money Market Fund Select Class♠∞ | 5.27 % | 76,926 | $76,926 | |||
Total short-term investments (Cost $76,926) | 76,926 | |||||
Total investments in securities (Cost $86,650,912) | 99.79 % | 193,332,773 | ||||
Other assets and liabilities, net | 0.21 | 415,001 | ||||
Total net assets | 100.00 % | $193,747,774 | ||||
† | Non-income-earning security |
♠ | The issuer of the security is an affiliated person of the Fund as defined in the Investment Company Act of 1940. |
∞ | The rate represents the 7-day annualized yield at period end. |
Abbreviations: | |
REIT | Real estate investment trust |
Value, beginning of period | Purchases | Sales proceeds | Net realized gains (losses) | Net change in unrealized gains (losses) | Value, end of period | Shares, end of period | Income from affiliated securities | |
Short-term investments | ||||||||
Allspring Government Money Market Fund Select Class | $2,819,226 | $19,398,921 | $(22,141,221 ) | $0 | $0 | $76,926 | 76,926 | $47,509 |
Assets | |
Investments in unaffiliated securities, at value (cost $86,573,986) | $193,255,847 |
Investments in affiliated securities, at value (cost $76,926) | 76,926 |
Receivable for investments sold | 617,268 |
Receivable for Fund shares sold | 25,800 |
Receivable for dividends | 18,665 |
Prepaid expenses and other assets | 75,885 |
Total assets | 194,070,391 |
Liabilities | |
Payable for Fund shares redeemed | 155,699 |
Management fee payable | 72,184 |
Administration fees payable | 25,220 |
Shareholder servicing fees payable | 24,372 |
Professional fees payable | 15,799 |
Distribution fee payable | 1,728 |
Accrued expenses and other liabilities | 27,615 |
Total liabilities | 322,617 |
Total net assets | $193,747,774 |
Net assets consist of | |
Paid-in capital | $78,034,908 |
Total distributable earnings | 115,712,866 |
Total net assets | $193,747,774 |
Computation of net asset value and offering price per share | |
Net assets–Class A | $107,443,150 |
Shares outstanding–Class A1 | 13,942,896 |
Net asset value per share–Class A | $7.71 |
Maximum offering price per share – Class A2 | $8.18 |
Net assets–Class C | $2,859,714 |
Shares outstanding–Class C1 | 1,473,907 |
Net asset value per share–Class C | $1.94 |
Net assets–Class R6 | $29,182,444 |
Shares outstanding–Class R61 | 2,883,424 |
Net asset value per share–Class R6 | $10.12 |
Net assets–Administrator Class | $5,772,562 |
Shares outstanding–Administrator Class1 | 634,828 |
Net asset value per share–Administrator Class | $9.09 |
Net assets–Institutional Class | $48,489,904 |
Shares outstanding–Institutional Class1 | 4,822,006 |
Net asset value per share–Institutional Class | $10.06 |
Investment income | |
Dividends (net of foreign withholdings taxes of $1,515) | $491,597 |
Income from affiliated securities | 47,509 |
Interest | 71 |
Total investment income | 539,177 |
Expenses | |
Management fee | 653,296 |
Administration fees | |
Class A | 100,024 |
Class C | 2,543 |
Class R6 | 4,954 |
Administrator Class | 3,548 |
Institutional Class | 29,643 |
Shareholder servicing fees | |
Class A | 125,030 |
Class C | 3,126 |
Administrator Class | 6,771 |
Distribution fee | |
Class C | 9,380 |
Custody and accounting fees | 1,750 |
Professional fees | 32,405 |
Registration fees | 36,528 |
Shareholder report expenses | 14,434 |
Trustees’ fees and expenses | 12,234 |
Other fees and expenses | 20,550 |
Total expenses | 1,056,216 |
Less: Fee waivers and/or expense reimbursements | |
Fund-level | (233,193 ) |
Class A | (3,264 ) |
Class R6 | (932 ) |
Administrator Class | (392 ) |
Institutional Class | (1,459 ) |
Net expenses | 816,976 |
Net investment loss | (277,799 ) |
Realized and unrealized gains (losses) on investments | |
Net realized gains (losses) on | |
Unaffiliated securities | 13,632,784 |
Foreign currency and foreign currency translations | (12 ) |
Net realized gains on investments | 13,632,772 |
Net change in unrealized gains (losses) on investments | 7,174,850 |
Net realized and unrealized gains (losses) on investments | 20,807,622 |
Net increase in net assets resulting from operations | $20,529,823 |
Six months ended January 31, 2024 (unaudited) | Year ended July 31, 2023 | |||
Operations | ||||
Net investment loss | $(277,799 ) | $(402,637 ) | ||
Net realized gains on investments | 13,632,772 | 10,711,783 | ||
Net change in unrealized gains (losses) on investments | 7,174,850 | 7,001,201 | ||
Net increase in net assets resulting from operations | 20,529,823 | 17,310,347 | ||
Distributions to shareholders from | ||||
Net investment income and net realized gains | ||||
Class A | (7,409,262 ) | (10,974,909 ) | ||
Class C | (610,996 ) | (715,269 ) | ||
Class R6 | (1,594,549 ) | (3,654,350 ) | ||
Administrator Class | (339,056 ) | (556,035 ) | ||
Institutional Class | (2,647,589 ) | (5,651,251 ) | ||
Total distributions to shareholders | (12,601,452 ) | (21,551,814 ) | ||
Capital share transactions | Shares | Shares | ||
Proceeds from shares sold | ||||
Class A | 423,207 | 3,130,509 | 791,633 | 5,223,400 |
Class C | 410,005 | 853,844 | 180,427 | 379,430 |
Class R6 | 113,568 | 1,071,316 | 581,616 | 4,923,781 |
Administrator Class | 14,861 | 130,372 | 34,376 | 269,267 |
Institutional Class | 179,853 | 1,680,366 | 986,159 | 8,110,662 |
6,866,407 | 18,906,540 | |||
Reinvestment of distributions | ||||
Class A | 997,526 | 7,271,968 | 1,786,245 | 10,735,336 |
Class C | 332,063 | 610,996 | 386,632 | 715,269 |
Class R6 | 166,620 | 1,594,549 | 472,749 | 3,654,350 |
Administrator Class | 39,273 | 337,749 | 78,918 | 553,210 |
Institutional Class | 277,278 | 2,636,911 | 733,124 | 5,637,727 |
12,452,173 | 21,295,892 | |||
Payment for shares redeemed | ||||
Class A | (1,226,793 ) | (9,021,488 ) | (2,135,242 ) | (14,215,409 ) |
Class C | (341,445 ) | (722,816 ) | (519,548 ) | (1,190,033 ) |
Class R6 | (1,376,354 ) | (13,088,361 ) | (1,301,888 ) | (11,558,098 ) |
Administrator Class | (119,483 ) | (1,016,791 ) | (84,281 ) | (649,854 ) |
Institutional Class | (544,580 ) | (5,142,498 ) | (3,940,964 ) | (31,845,142 ) |
(28,991,954 ) | (59,458,536 ) | |||
Net decrease in net assets resulting from capital share transactions | (9,673,374 ) | (19,256,104 ) | ||
Total decrease in net assets | (1,745,003 ) | (23,497,571 ) | ||
Net assets | ||||
Beginning of period | 195,492,777 | 218,990,348 | ||
End of period | $193,747,774 | $195,492,777 | ||
Six months ended January 31, 2024 (unaudited) | Year ended July 31 | |||||
Class A | 2023 | 2022 | 2021 | 2020 | 2019 | |
Net asset value, beginning of period | $7.43 | $7.65 | $11.65 | $9.62 | $8.33 | $9.43 |
Net investment loss | (0.02 )1 | (0.02 )1 | (0.06 )1 | (0.05 )1 | (0.03 )1 | (0.03 )1 |
Net realized and unrealized gains (losses) on investments | 0.86 | 0.65 | (2.01 ) | 2.93 | 2.08 | 0.97 |
Total from investment operations | 0.84 | 0.63 | (2.07 ) | 2.88 | 2.05 | 0.94 |
Distributions to shareholders from | ||||||
Net realized gains | (0.56 ) | (0.85 ) | (1.93 ) | (0.85 ) | (0.76 ) | (2.04 ) |
Net asset value, end of period | $7.71 | $7.43 | $7.65 | $11.65 | $9.62 | $8.33 |
Total return2 | 11.78 % | 10.93 % | (21.94 )% | 31.66 % | 26.57 % | 15.37 % |
Ratios to average net assets (annualized) | ||||||
Gross expenses | 1.28 % | 1.29 % | 1.26 % | 1.25 % | 1.26 % | 1.30 % |
Net expenses | 1.02 % | 1.00 % | 1.01 % | 1.01 % | 1.02 % | 1.20 % |
Net investment loss | (0.44 )% | (0.37 )% | (0.58 )% | (0.50 )% | (0.30 )% | (0.35 )% |
Supplemental data | ||||||
Portfolio turnover rate | 20 % | 18 % | 27 % | 21 % | 16 % | 20 % |
Net assets, end of period (000s omitted) | $107,443 | $102,157 | $101,833 | $141,657 | $124,271 | $17,940 |
1 | Calculated based upon average shares outstanding |
2 | Total return calculations do not include any sales charges. Returns for periods of less than one year are not annualized. |
Six months ended January 31, 2024 (unaudited) | Year ended July 31 | |||||
Class C | 2023 | 2022 | 2021 | 2020 | 2019 | |
Net asset value, beginning of period | $2.28 | $3.03 | $5.76 | $5.18 | $4.86 | $6.46 |
Net investment loss | (0.01 )1 | (0.03 )1 | (0.06 )1 | (0.07 )1 | (0.05 )1 | (0.06 )1 |
Net realized and unrealized gains (losses) on investments | 0.23 | 0.13 | (0.74 ) | 1.50 | 1.13 | 0.50 |
Total from investment operations | 0.22 | 0.10 | (0.80 ) | 1.43 | 1.08 | 0.44 |
Distributions to shareholders from | ||||||
Net realized gains | (0.56 ) | (0.85 ) | (1.93 ) | (0.85 ) | (0.76 ) | (2.04 ) |
Net asset value, end of period | $1.94 | $2.28 | $3.03 | $5.76 | $5.18 | $4.86 |
Total return2 | 11.11 % | 10.00 % | (22.39 )% | 30.71 % | 25.48 % | 14.51 % |
Ratios to average net assets (annualized) | ||||||
Gross expenses | 2.01 % | 2.03 % | 2.00 % | 2.00 % | 2.01 % | 2.05 % |
Net expenses | 1.77 % | 1.78 % | 1.78 % | 1.78 % | 1.79 % | 1.95 % |
Net investment loss | (1.19 )% | (1.14 )% | (1.35 )% | (1.26 )% | (1.06 )% | (1.12 )% |
Supplemental data | ||||||
Portfolio turnover rate | 20 % | 18 % | 27 % | 21 % | 16 % | 20 % |
Net assets, end of period (000s omitted) | $2,860 | $2,444 | $3,103 | $5,876 | $6,651 | $2,116 |
1 | Calculated based upon average shares outstanding |
2 | Total return calculations do not include any sales charges. Returns for periods of less than one year are not annualized. |
Six months ended January 31, 2024 (unaudited) | Year ended July 31 | ||||
Class R6 | 2023 | 2022 | 2021 | 20201 | |
Net asset value, beginning of period | $9.57 | $9.55 | $14.03 | $11.37 | $9.63 |
Net investment income (loss) | (0.00 )2,3 | 0.00 3,4 | (0.02 )3 | (0.01 )3 | 0.01 |
Net realized and unrealized gains (losses) on investments | 1.11 | 0.87 | (2.53 ) | 3.52 | 2.49 |
Total from investment operations | 1.11 | 0.87 | (2.55 ) | 3.51 | 2.50 |
Distributions to shareholders from | |||||
Net realized gains | (0.56 ) | (0.85 ) | (1.93 ) | (0.85 ) | (0.76 ) |
Net asset value, end of period | $10.12 | $9.57 | $9.55 | $14.03 | $11.37 |
Total return5 | 11.96 % | 11.29 % | (21.60 )% | 32.36 % | 27.68 % |
Ratios to average net assets (annualized) | |||||
Gross expenses | 0.86 % | 0.87 % | 0.83 % | 0.82 % | 0.82 % |
Net expenses | 0.60 % | 0.60 % | 0.60 % | 0.60 % | 0.60 % |
Net investment income (loss) | (0.02 )% | 0.04 % | (0.15 )% | (0.09 )% | 0.11 % |
Supplemental data | |||||
Portfolio turnover rate | 20 % | 18 % | 27 % | 21 % | 16 % |
Net assets, end of period (000s omitted) | $29,182 | $38,092 | $40,356 | $45,970 | $48,435 |
1 | For the period from September 20, 2019 (commencement of class operations) to July 31, 2020 |
2 | Amount is more than $(0.005). |
3 | Calculated based upon average shares outstanding |
4 | Amount is less than $0.005. |
5 | Returns for periods of less than one year are not annualized. |
Six months ended January 31, 2024 (unaudited) | Year ended July 31 | |||||
Administrator Class | 2023 | 2022 | 2021 | 2020 | 2019 | |
Net asset value, beginning of period | $8.67 | $8.76 | $13.07 | $10.66 | $9.15 | $10.12 |
Net investment loss | (0.02 )1 | (0.02 )1 | (0.06 )1 | (0.05 )1 | (0.02 )1 | (0.01 )1 |
Net realized and unrealized gains (losses) on investments | 1.00 | 0.78 | (2.32 ) | 3.31 | 2.29 | 1.08 |
Total from investment operations | 0.98 | 0.76 | (2.38 ) | 3.26 | 2.27 | 1.07 |
Distributions to shareholders from | ||||||
Net realized gains | (0.56 ) | (0.85 ) | (1.93 ) | (0.85 ) | (0.76 ) | (2.04 ) |
Net asset value, end of period | $9.09 | $8.67 | $8.76 | $13.07 | $10.66 | $9.15 |
Total return2 | 11.70 % | 11.04 % | (21.92 )% | 32.15 % | 26.59 % | 15.63 % |
Ratios to average net assets (annualized) | ||||||
Gross expenses | 1.20 % | 1.21 % | 1.17 % | 1.17 % | 1.18 % | 1.21 % |
Net expenses | 0.94 % | 0.94 % | 0.94 % | 0.94 % | 0.94 % | 1.00 % |
Net investment loss | (0.36 )% | (0.30 )% | (0.50 )% | (0.43 )% | (0.21 )% | (0.16 )% |
Supplemental data | ||||||
Portfolio turnover rate | 20 % | 18 % | 27 % | 21 % | 16 % | 20 % |
Net assets, end of period (000s omitted) | $5,773 | $6,070 | $5,882 | $10,934 | $8,979 | $2,590 |
1 | Calculated based upon average shares outstanding |
2 | Returns for periods of less than one year are not annualized. |
Six months ended January 31, 2024 (unaudited) | Year ended July 31 | |||||
Institutional Class | 2023 | 2022 | 2021 | 2020 | 2019 | |
Net asset value, beginning of period | $9.52 | $9.51 | $13.99 | $11.36 | $9.68 | $10.57 |
Net investment income (loss) | (0.01 )1 | (0.01 )1 | (0.03 )1 | (0.02 )1 | 0.01 1 | 0.00 1,2 |
Net realized and unrealized gains (losses) on investments | 1.11 | 0.87 | (2.52 ) | 3.50 | 2.43 | 1.15 |
Total from investment operations | 1.10 | 0.86 | (2.55 ) | 3.48 | 2.44 | 1.15 |
Distributions to shareholders from | ||||||
Net realized gains | (0.56 ) | (0.85 ) | (1.93 ) | (0.85 ) | (0.76 ) | (2.04 ) |
Net asset value, end of period | $10.06 | $9.52 | $9.51 | $13.99 | $11.36 | $9.68 |
Total return3 | 11.92 % | 11.23 % | (21.67 )% | 32.11 % | 26.91 % | 15.76 % |
Ratios to average net assets (annualized) | ||||||
Gross expenses | 0.96 % | 0.96 % | 0.93 % | 0.92 % | 0.93 % | 0.97 % |
Net expenses | 0.70 % | 0.70 % | 0.70 % | 0.70 % | 0.72 % | 0.80 % |
Net investment income (loss) | (0.12 )% | (0.06 )% | (0.27 )% | (0.19 )% | 0.07 % | 0.05 % |
Supplemental data | ||||||
Portfolio turnover rate | 20 % | 18 % | 27 % | 21 % | 16 % | 20 % |
Net assets, end of period (000s omitted) | $48,490 | $46,731 | $67,816 | $99,164 | $86,407 | $107,670 |
1 | Calculated based upon average shares outstanding |
2 | Amount is less than $0.005. |
3 | Returns for periods of less than one year are not annualized. |
Gross unrealized gains | $109,263,760 |
Gross unrealized losses | (3,256,211 ) |
Net unrealized gains | $106,007,549 |
Quoted prices (Level 1) | Other significant observable inputs (Level 2) | Significant unobservable inputs (Level 3) | Total | |
Assets | ||||
Investments in: | ||||
Common stocks | ||||
Communication services | $20,283,968 | $0 | $0 | $20,283,968 |
Consumer discretionary | 30,378,825 | 0 | 0 | 30,378,825 |
Financials | 32,042,701 | 0 | 0 | 32,042,701 |
Health care | 30,161,372 | 0 | 0 | 30,161,372 |
Industrials | 7,799,297 | 0 | 0 | 7,799,297 |
Information technology | 65,870,209 | 0 | 0 | 65,870,209 |
Materials | 4,096,955 | 0 | 0 | 4,096,955 |
Real estate | 2,622,520 | 0 | 0 | 2,622,520 |
Short-term investments | ||||
Investment companies | 76,926 | 0 | 0 | 76,926 |
Total assets | $193,332,773 | $0 | $0 | $193,332,773 |
Average daily net assets | Management fee |
First $500 million | 0.700 % |
Next $500 million | 0.675 |
Next $1 billion | 0.650 |
Next $2 billion | 0.625 |
Next $1 billion | 0.600 |
Next $3 billion | 0.590 |
Next $2 billion | 0.565 |
Next $2 billion | 0.555 |
Next $4 billion | 0.530 |
Over $16 billion | 0.505 |
Class-level administration fee | |
Class A | 0.20 % |
Class C | 0.20 |
Class R6 | 0.03 |
Administrator Class | 0.13 |
Institutional Class | 0.13 |
EXPENSE RATIO CAPS | |
Class A | 1.02 % |
Class C | 1.77 |
Class R6 | 0.60 |
Administrator Class | 0.94 |
Institutional Class | 0.70 |
Name and year of birth | Position held and length of service* | Principal occupations during past five years or longer | Current other public company or investment company directorships |
William R. Ebsworth (Born 1957) | Trustee, since 2015 | Retired. From 1984 to 2013, equities analyst, portfolio manager, research director and chief investment officer at Fidelity Management and Research Company in Boston, Tokyo, and Hong Kong, and retired in 2013 as Chief Investment Officer of Fidelity Strategic Advisers, Inc. where he led a team of investment professionals managing client assets. Prior thereto, Board member of Hong Kong Securities Clearing Co., Hong Kong Options Clearing Corp., the Thailand International Fund, Ltd., Fidelity Investments Life Insurance Company, and Empire Fidelity Investments Life Insurance Company. Serves on the Investment Company Institute’s Board of Governors since 2022 and Executive Committee since 2023 as well as the Vice Chairman of the Governing Council of the Independent Directors Council since 2023. Audit Committee Chair and Investment Committee Chair of the Vincent Memorial Hospital Foundation (non-profit organization). Mr. Ebsworth is a CFA charterholder. | N/A |
Jane A. Freeman (Born 1953) | Trustee, since 2015; Chair Liaison, since January 2018# | Retired. From 2012 to 2014 and 1999 to 2008, Chief Financial Officer of Scientific Learning Corporation. From 2008 to 2012, Ms. Freeman provided consulting services related to strategic business projects. Prior to 1999, Portfolio Manager at Rockefeller & Co. and Scudder, Stevens & Clark. Board member of the Harding Loevner Funds from 1996 to 2014, serving as both Lead Independent Director and chair of the Audit Committee. Board member of the Russell Exchange Traded Funds Trust from 2011 to 2012 and the chair of the Audit Committee. Ms. Freeman is also an inactive Chartered Financial Analyst. | N/A |
Isaiah Harris, Jr. (Born 1952) | Trustee, since 2009; Audit Committee Chair, since 2019 | Retired. Member of the Advisory Board of CEF of East Central Florida. Chairman of the Board of CIGNA Corporation from 2009 to 2021, and Director from 2005 to 2008. From 2003 to 2011, Director of Deluxe Corporation. Prior thereto, President and CEO of BellSouth Advertising and Publishing Corp. from 2005 to 2007, President and CEO of BellSouth Enterprises from 2004 to 2005 and President of BellSouth Consumer Services from 2000 to 2003. Emeritus member of the Iowa State University Foundation Board of Governors. Emeritus Member of the Advisory board of Iowa State University School of Business. Advisory Board Member, Palm Harbor Academy (private school). Advisory Board Member, Fellowship of Christian Athletes. Mr. Harris is a certified public accountant (inactive status). | N/A |
David F. Larcker (Born 1950) | Trustee, since 2009 | Distinguished Visiting Fellow at the Hoover Institution since 2022. James Irvin Miller Professor of Accounting at the Graduate School of Business (Emeritus), Stanford University, Director of the Corporate Governance Research Initiative and Senior Faculty of The Rock Center for Corporate Governance since 2006. From 2005 to 2008, Professor of Accounting at the Graduate School of Business, Stanford University. Prior thereto, Ernst & Young Professor of Accounting at The Wharton School, University of Pennsylvania from 1985 to 2005. | N/A |
Olivia S. Mitchell (Born 1953) | Trustee, since 2006 | International Foundation of Employee Benefit Plans Professor since 1993, Wharton School of the University of Pennsylvania. Director of Wharton’s Pension Research Council and Boettner Center on Pensions & Retirement Research, and Research Associate at the National Bureau of Economic Research. Previously taught at Cornell University from 1978 to 1993. | N/A |
Timothy J. Penny (Born 1951) | Trustee, since 1996; Chair, since 2018 | President and Chief Executive Officer of Southern Minnesota Initiative Foundation, a non-profit organization, since 2007. Vice Chair of the Economic Club of Minnesota, since 2007. Co-Chair of the Committee for a Responsible Federal Budget, since 1995. Member of the Board of Trustees of NorthStar Education Finance, Inc., a non-profit organization, from 2007-2022. Senior Fellow of the University of Minnesota Humphrey Institute from 1995 to 2017. | N/A |
Name and year of birth | Position held and length of service* | Principal occupations during past five years or longer | Current other public company or investment company directorships |
James G. Polisson (Born 1959) | Trustee, since 2018; Nominating and Governance Committee Chair, since 2024 | Retired. Chief Marketing Officer, Source (ETF) UK Services, Ltd, from 2015 to 2017. From 2012 to 2015, Principal of The Polisson Group, LLC, a management consulting, corporate advisory and principal investing company. Chief Executive Officer and Managing Director at Russell Investments, Global Exchange Traded Funds from 2010 to 2012. Managing Director of Barclays Global Investors from 1998 to 2010 and Global Chief Marketing Officer for iShares and Barclays Global Investors from 2000 to 2010. Trustee of the San Francisco Mechanics’ Institute, a non- profit organization, from 2013 to 2015. Board member of the Russell Exchange Traded Fund Trust from 2011 to 2012. Director of Barclays Global Investors Holdings Deutschland GmbH from 2006 to 2009. Mr. Polisson is an attorney and has a retired status with the Massachusetts and District of Columbia Bar Associations. | N/A |
Pamela Wheelock (Born 1959) | Trustee, since January 2020; previously Trustee from January 2018 to July 2019# | Retired. Executive and Senior Financial leadership positions in the public, private and nonprofit sectors. Interim President and CEO, McKnight Foundation, 2020. Interim Commissioner, Minnesota Department of Human Services, 2019. Chief Operating Officer, Twin Cities Habitat for Humanity, 2017-2019. Vice President for University Services, University of Minnesota, 2012- 2016. Interim President and CEO, Blue Cross and Blue Shield of Minnesota, 2011-2012. Executive Vice-President and Chief Financial Officer, Minnesota Wild, 2002-2008. Commissioner, Minnesota Department of Finance, 1999-2002. Chair of the Board of Directors of Destination Medical Center Corporation. Board member of the Minnesota Wild Foundation. | N/A |
Name and year of birth | Position held and length of service | Principal occupations during past five years or longer |
Andrew Owen (Born 1960) | President, since 2017 | President and Chief Executive Officer of Allspring Funds Management, LLC since 2017 and Head of Global Fund Governance of Allspring Global Investments since 2022. Prior thereto, co-president of Galliard Capital Management, LLC, an affiliate of Allspring Funds Management, LLC, from 2019 to 2022 and Head of Affiliated Managers, Allspring Global Investments, from 2014 to 2019 and Executive Vice President responsible for marketing, investments and product development for Allspring Funds Management, LLC, from 2009 to 2014. |
Jeremy DePalma (Born 1974) | Treasurer, since 2012 (for certain funds in the Fund Complex); since 2021 (for the remaining funds in the Complex) | Senior Vice President of Allspring Funds Management, LLC since 2009. Senior Vice President of Evergreen Investment Management Company, LLC from 2008 to 2010 and head of the Fund Reporting and Control Team within Fund Administration from 2005 to 2010. |
Christopher Baker (Born 1976) | Chief Compliance Officer, since 2022 | Global Chief Compliance Officer for Allspring Global Investments since 2022. Prior thereto, Chief Compliance Officer for State Street Global Advisors from 2018 to 2021. Senior Compliance Officer for the State Street divisions of Alternative Investment Solutions, Sector Solutions, and Global Marketing from 2015 to 2018. From 2010 to 2015 Vice President, Global Head of Investment and Marketing Compliance for State Street Global Advisors. |
Matthew Prasse (Born 1983) | Chief Legal Officer, since 2022; Secretary, since 2021 | Senior Counsel of the Allspring Legal Department since 2021. Senior Counsel of the Wells Fargo Legal Department from 2018 to 2021. Previously, Counsel for Barings LLC from 2015 to 2018. Prior to joining Barings, Associate at Morgan, Lewis & Bockius LLP from 2008 to 2015. |

P.O. Box 219967
Kansas City, MO 64121-9967

SAR4303 01-24

Allspring Funds

President
Allspring Funds
Notice to Shareholders |
Beginning in July 2024, the Fund will be required by the Securities and Exchange Commission to send shareholders a paper copy of a new tailored shareholder report in place of the full shareholder report that you are now receiving. The tailored shareholder report will contain concise information about the Fund, including certain expense and performance information and fund statistics. If you wish to receive this new tailored shareholder report electronically, please follow the instructions on the back cover of this report. |
Other information that is currently included in the shareholder report, such as the Fund’s financial statements, will be available online and upon request, free of charge, in paper or electronic format. |
Investment objective | The Fund seeks long-term capital appreciation. |
Manager | Allspring Funds Management, LLC |
Subadviser | Allspring Global Investments, LLC |
Portfolio managers | Robert Gruendyke, CFA, David Nazaret, CFA, Thomas C. Ognar, CFA |
Average annual total returns (%) as of January 31, 2024 | |||||||||
Including sales charge | Excluding sales charge | Expense ratios1 (%) | |||||||
Inception date | 1 year | 5 year | 10 year | 1 year | 5 year | 10 year | Gross | Net2 | |
Class A (SGRAX) | 2-24-2000 | 19.33 | 10.03 | 10.06 | 26.61 | 11.34 | 10.71 | 1.18 | 1.15 |
Class C (WGFCX) | 12-26-2002 | 24.64 | 10.93 | 10.21 | 25.64 | 10.93 | 10.21 | 1.93 | 1.90 |
Class R6 (SGRHX)3 | 9-30-2015 | – | – | – | 27.12 | 11.83 | 11.20 | 0.76 | 0.70 |
Administrator Class (SGRKX) | 8-30-2002 | – | – | – | 26.82 | 11.54 | 10.92 | 1.11 | 0.96 |
Institutional Class (SGRNX) | 2-24-2000 | – | – | – | 27.05 | 11.77 | 11.15 | 0.86 | 0.75 |
Russell 3000® Index4 | – | – | – | – | 19.15 | 13.53 | 11.96 | – | – |
Russell 3000® Growth Index5 | – | – | – | – | 33.11 | 17.29 | 14.90 | – | – |
1 | Reflects the expense ratios as stated in the most recent prospectuses. The expense ratios shown are subject to change and may differ from the annualized expense ratios shown in the Financial Highlights of this report. |
2 | The manager has contractually committed through November 30, 2024, to waive fees and/or reimburse expenses to the extent necessary to cap total annual fund operating expenses after fee waivers at 1.15% for Class A, 1.90% for Class C, 0.70% for Class R6, 0.96% for Administrator Class and 0.75% for Institutional Class. Brokerage commissions, stamp duty fees, interest, taxes, acquired fund fees and expenses (if any), and extraordinary expenses are excluded from the expense caps. Prior to or after the commitment expiration date, the caps may be increased or the commitment to maintain the caps may be terminated only with the approval of the Board of Trustees. Without these caps, the Fund’s returns would have been lower. The expense ratio paid by an investor is the net expense ratio (the total annual fund operating expenses after fee waivers) as stated in the prospectuses. |
3 | Historical performance shown for the Class R6 shares prior to their inception reflects the performance of the Institutional Class shares, and includes the higher expenses applicable to the Institutional Class shares. If these expenses had not been included, returns for the Class R6 shares would be higher. |
4 | The Russell 3000® Index measures the performance of the 3,000 largest U.S. companies based on total market capitalization, which represents approximately 98% of the investable U.S. equity market. You cannot invest directly in an index. |
5 | The Russell 3000® Growth Index measures the performance of those Russell 3000® Index companies with higher price/book ratios and higher forecasted growth values. You cannot invest directly in an index. |
CFA® and Chartered Financial Analyst® are trademarks owned by CFA Institute. |
Ten largest holdings (%) as of January 31, 20241 | |
Microsoft Corp. | 12.29 |
Amazon.com, Inc. | 7.29 |
Apple, Inc. | 6.74 |
NVIDIA Corp. | 6.34 |
Meta Platforms, Inc. Class A | 5.23 |
Alphabet, Inc. Class A | 4.61 |
Mastercard, Inc. Class A | 2.66 |
MongoDB, Inc. | 2.59 |
Visa, Inc. Class A | 1.83 |
Boston Scientific Corp. | 1.74 |
1 | Figures represent the percentage of the Fund’s net assets. Holdings are subject to change and may have changed since the date specified. |
Sector allocation as of January 31, 20241 |
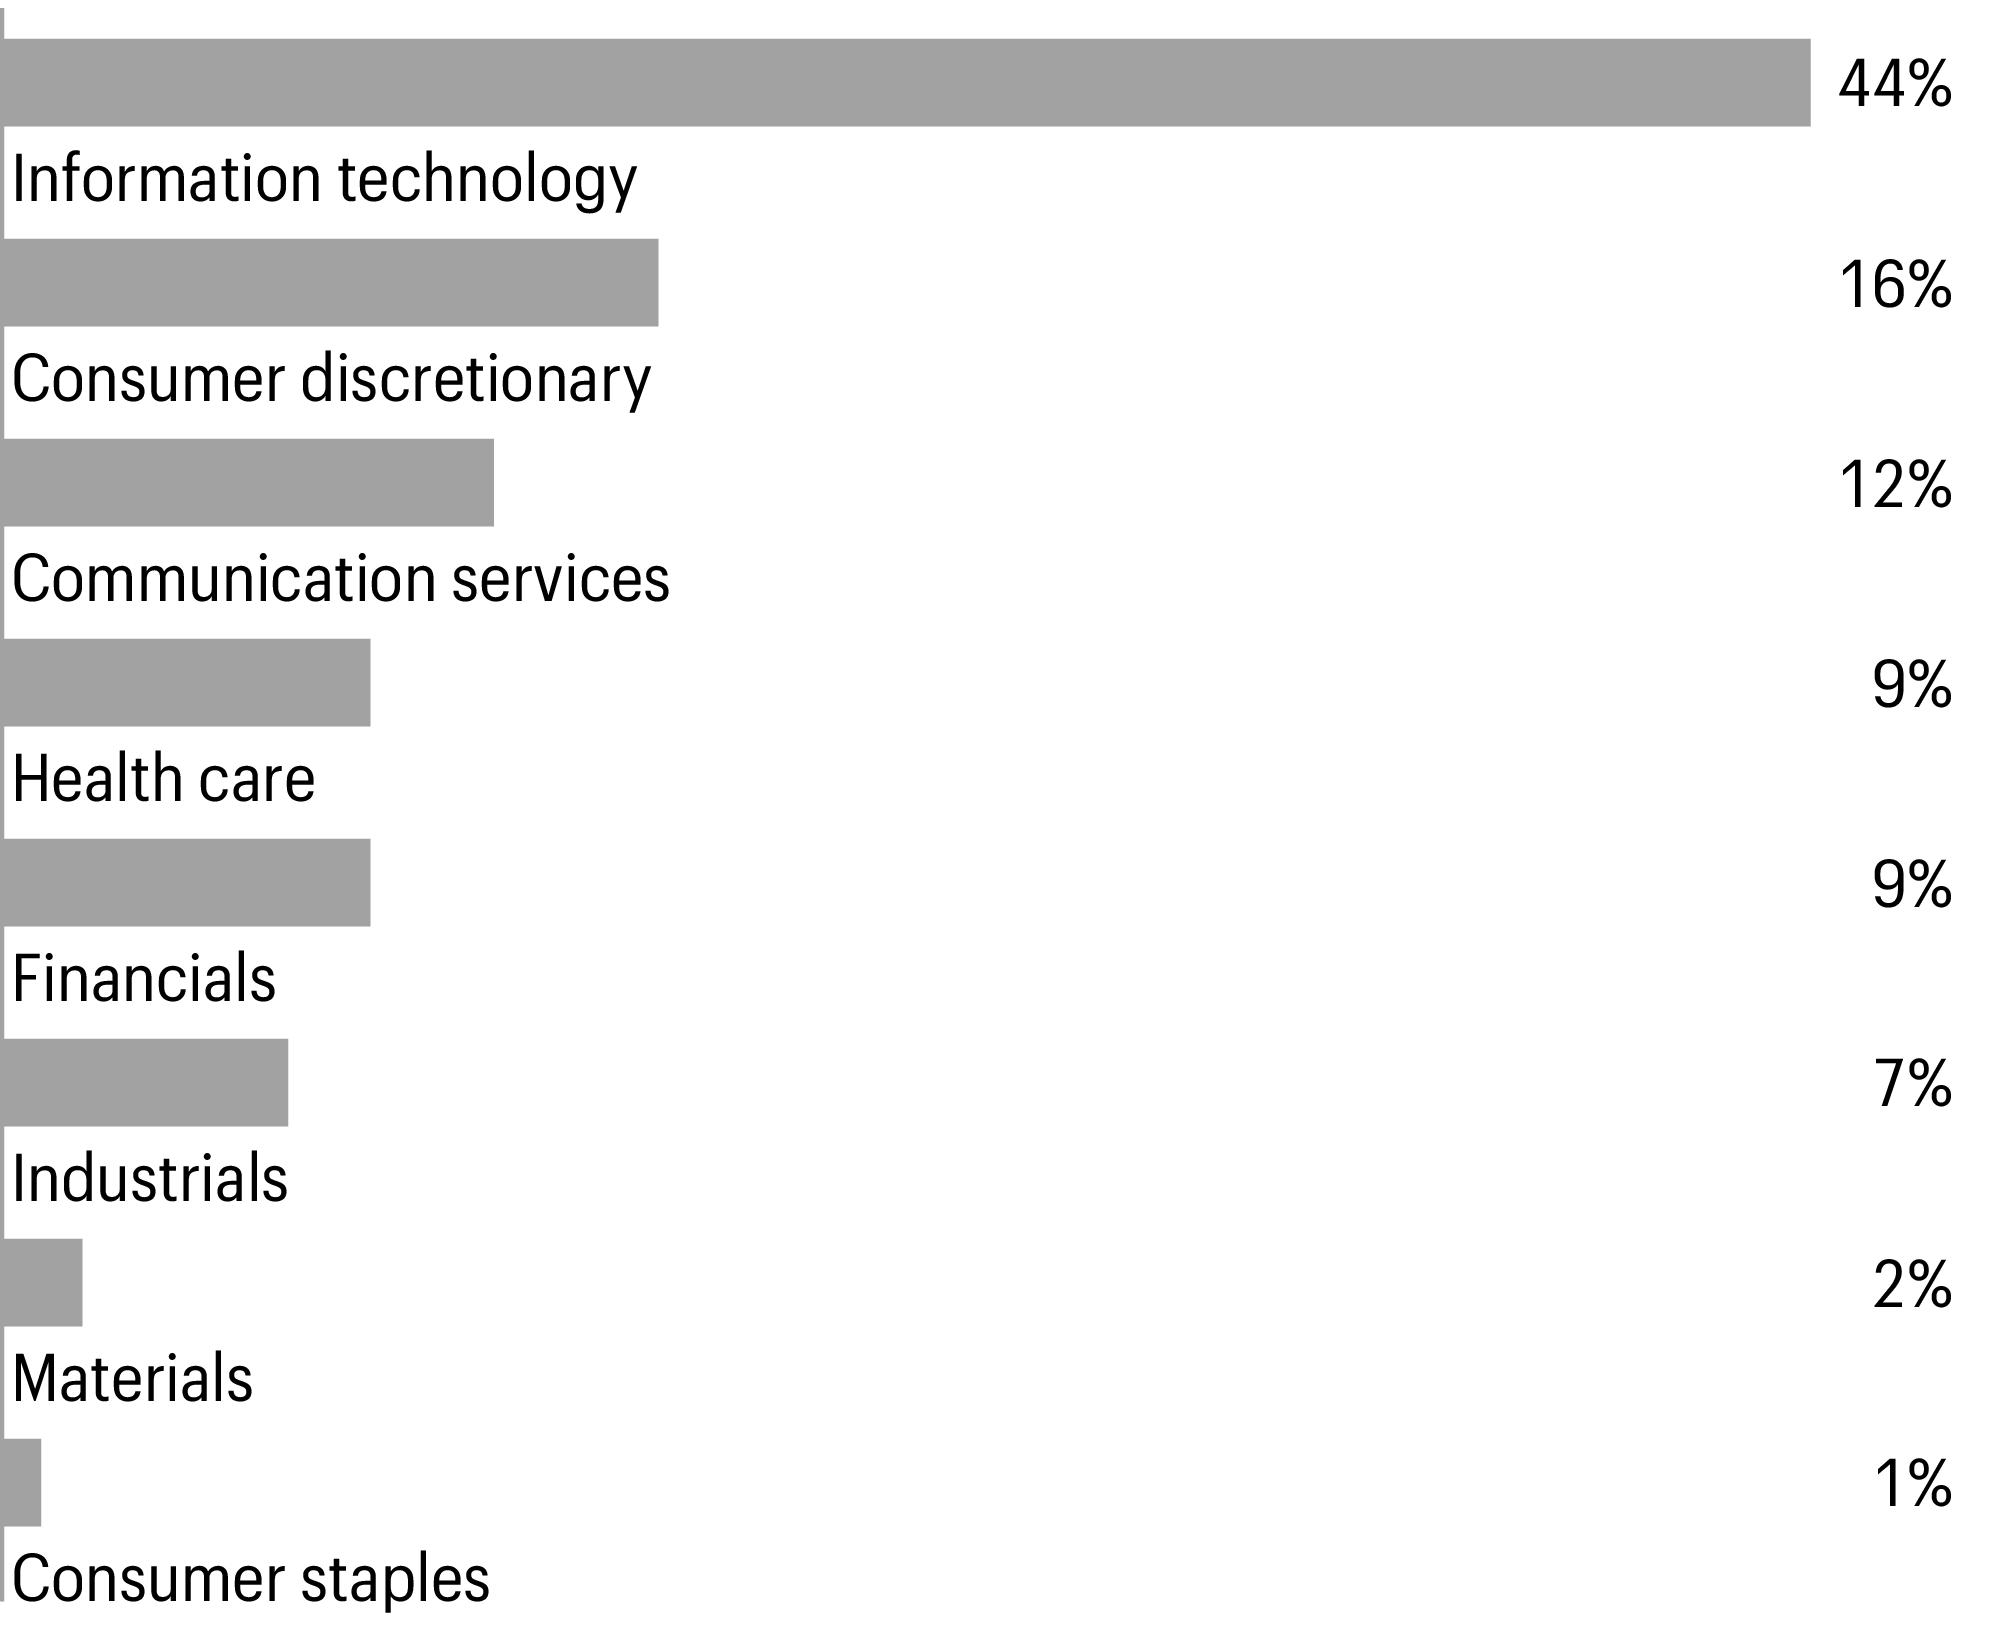
1 | Figures represent the percentage of the Fund’s long-term investments. Allocations are subject to change and may have changed since the date specified. |
Beginning account value 8-1-2023 | Ending account value 1-31-2024 | Expenses paid during the period1 | Annualized net expense ratio | |
Class A | ||||
Actual | $1,000.00 | $1,073.67 | $5.99 | 1.15 % |
Hypothetical (5% return before expenses) | $1,000.00 | $1,019.36 | $5.84 | 1.15 % |
Class C | ||||
Actual | $1,000.00 | $1,069.39 | $9.88 | 1.90 % |
Hypothetical (5% return before expenses) | $1,000.00 | $1,015.59 | $9.63 | 1.90 % |
Class R6 | ||||
Actual | $1,000.00 | $1,075.74 | $3.65 | 0.70 % |
Hypothetical (5% return before expenses) | $1,000.00 | $1,021.62 | $3.56 | 0.70 % |
Administrator Class | ||||
Actual | $1,000.00 | $1,074.66 | $5.01 | 0.96 % |
Hypothetical (5% return before expenses) | $1,000.00 | $1,020.31 | $4.88 | 0.96 % |
Institutional Class | ||||
Actual | $1,000.00 | $1,075.57 | $3.91 | 0.75 % |
Hypothetical (5% return before expenses) | $1,000.00 | $1,021.37 | $3.81 | 0.75 % |
1 | Expenses paid is equal to the annualized net expense ratio of each class multiplied by the average account value over the period, multiplied by 184 divided by 366 (to reflect the one-half-year period). |
Shares | Value | |||||
Common stocks: 99.89% | ||||||
Communication services: 12.05% | ||||||
Entertainment: 1.05% | ||||||
Live Nation Entertainment, Inc.† | 181,424 | $16,119,522 | ||||
Netflix, Inc.† | 27,802 | 15,683,386 | ||||
31,802,908 | ||||||
Interactive media & services: 11.00% | ||||||
Alphabet, Inc. Class A† | 997,045 | 139,686,005 | ||||
Alphabet, Inc. Class C† | 247,848 | 35,144,846 | ||||
Meta Platforms, Inc. Class A† | 406,421 | 158,561,089 | ||||
333,391,940 | ||||||
Consumer discretionary: 15.68% | ||||||
Broadline retail: 8.21% | ||||||
Amazon.com, Inc.† | 1,422,978 | 220,846,186 | ||||
MercadoLibre, Inc.† | 16,274 | 27,857,996 | ||||
248,704,182 | ||||||
Hotels, restaurants & leisure: 2.90% | ||||||
Booking Holdings, Inc.† | 8,436 | 29,589,017 | ||||
Chipotle Mexican Grill, Inc.† | 9,727 | 23,430,106 | ||||
DoorDash, Inc. Class A† | 74,856 | 7,799,995 | ||||
DraftKings, Inc. Class A† | 206,700 | 8,071,635 | ||||
Wingstop, Inc. | 67,964 | 19,105,360 | ||||
87,996,113 | ||||||
Specialty retail: 3.37% | ||||||
AutoZone, Inc.† | 5,208 | 14,385,173 | ||||
Boot Barn Holdings, Inc.† | 289,660 | 20,780,209 | ||||
Five Below, Inc.† | 87,029 | 15,618,224 | ||||
Floor & Decor Holdings, Inc. Class A† | 197,952 | 19,906,053 | ||||
O’Reilly Automotive, Inc.† | 11,040 | 11,294,472 | ||||
Ulta Beauty, Inc.† | 40,223 | 20,193,957 | ||||
102,178,088 | ||||||
Textiles, apparel & luxury goods: 1.20% | ||||||
lululemon athletica, Inc.† | 55,119 | 25,014,104 | ||||
On Holding AG Class A† | 428,678 | 11,385,688 | ||||
36,399,792 | ||||||
Consumer staples: 0.99% | ||||||
Beverages: 0.33% | ||||||
Celsius Holdings, Inc.† | 199,994 | 9,979,701 | ||||
Personal care products: 0.66% | ||||||
BellRing Brands, Inc.† | 133,786 | 7,394,352 | ||||
e.l.f. Beauty, Inc.† | 79,649 | 12,706,405 | ||||
20,100,757 | ||||||
Shares | Value | |||||
Financials: 8.69% | ||||||
Capital markets: 3.95% | ||||||
LPL Financial Holdings, Inc. | 178,157 | $42,613,373 | ||||
S&P Global, Inc. | 58,438 | 26,200,677 | ||||
Tradeweb Markets, Inc. Class A | 534,497 | 50,985,669 | ||||
119,799,719 | ||||||
Financial services: 4.64% | ||||||
Block, Inc.† | 70,000 | 4,550,700 | ||||
Mastercard, Inc. Class A | 179,698 | 80,725,733 | ||||
Visa, Inc. Class A | 202,685 | 55,385,703 | ||||
140,662,136 | ||||||
Insurance: 0.10% | ||||||
Kinsale Capital Group, Inc. | 7,421 | 2,950,367 | ||||
Health care: 9.34% | ||||||
Biotechnology: 0.99% | ||||||
Argenx SE ADR† | 21,292 | 8,101,819 | ||||
Exact Sciences Corp.† | 64,660 | 4,228,764 | ||||
Vertex Pharmaceuticals, Inc.† | 40,455 | 17,532,388 | ||||
29,862,971 | ||||||
Health care equipment & supplies: 5.73% | ||||||
Boston Scientific Corp.† | 832,230 | 52,646,870 | ||||
DexCom, Inc.† | 41,306 | 5,012,483 | ||||
Intuitive Surgical, Inc.† | 65,228 | 24,670,534 | ||||
Penumbra, Inc.† | 170,687 | 43,045,554 | ||||
Shockwave Medical, Inc.† | 165,808 | 37,514,060 | ||||
Stryker Corp. | 23,095 | 7,747,911 | ||||
TransMedics Group, Inc.† | 35,430 | 3,038,831 | ||||
173,676,243 | ||||||
Health care providers & services: 0.14% | ||||||
UnitedHealth Group, Inc. | 8,596 | 4,398,917 | ||||
Health care technology: 1.38% | ||||||
Veeva Systems, Inc. Class A† | 201,653 | 41,824,849 | ||||
Life sciences tools & services: 0.30% | ||||||
Avantor, Inc.† | 150,000 | 3,448,500 | ||||
West Pharmaceutical Services, Inc. | 14,919 | 5,565,234 | ||||
9,013,734 | ||||||
Pharmaceuticals: 0.80% | ||||||
Eli Lilly & Co. | 26,105 | 16,853,649 | ||||
Novo Nordisk AS ADR | 56,899 | 6,528,591 | ||||
Zoetis, Inc. | 4,935 | 926,843 | ||||
24,309,083 | ||||||
Shares | Value | |||||
Industrials: 7.03% | ||||||
Aerospace & defense: 0.36% | ||||||
TransDigm Group, Inc. | 9,939 | $10,860,147 | ||||
Commercial services & supplies: 2.35% | ||||||
Casella Waste Systems, Inc. Class A† | 257,219 | 21,951,069 | ||||
Copart, Inc.† | 1,028,295 | 49,399,292 | ||||
71,350,361 | ||||||
Electrical equipment: 0.81% | ||||||
Array Technologies, Inc.† | 331,074 | 4,383,420 | ||||
NEXTracker, Inc. Class A† | 274,932 | 12,446,172 | ||||
Shoals Technologies Group, Inc. Class A† | 455,291 | 5,996,182 | ||||
Vertiv Holdings Co. | 30,000 | 1,689,900 | ||||
24,515,674 | ||||||
Ground transportation: 1.68% | ||||||
Uber Technologies, Inc.† | 779,000 | 50,845,330 | ||||
Machinery: 0.50% | ||||||
Fortive Corp. | 193,867 | 15,156,522 | ||||
Professional services: 1.33% | ||||||
Legalzoom.com, Inc.† | 874,266 | 9,013,682 | ||||
Paycor HCM, Inc.† | 1,412,668 | 27,448,139 | ||||
Paylocity Holding Corp.† | 25,580 | 4,052,128 | ||||
40,513,949 | ||||||
Information technology: 44.26% | ||||||
Communications equipment: 0.63% | ||||||
Arista Networks, Inc.† | 73,366 | 18,978,317 | ||||
IT services: 3.08% | ||||||
MongoDB, Inc.† | 196,358 | 78,645,306 | ||||
Wix.com Ltd.† | 116,271 | 14,752,465 | ||||
93,397,771 | ||||||
Semiconductors & semiconductor equipment: 12.23% | ||||||
Advanced Micro Devices, Inc.† | 191,131 | 32,050,757 | ||||
Allegro MicroSystems, Inc.† | 1,622,126 | 42,077,948 | ||||
Marvell Technology, Inc. | 151,774 | 10,275,100 | ||||
Microchip Technology, Inc. | 537,596 | 45,792,427 | ||||
Monolithic Power Systems, Inc. | 80,265 | 48,377,321 | ||||
NVIDIA Corp. | 312,565 | 192,311,868 | ||||
370,885,421 | ||||||
Software: 21.58% | ||||||
Clearwater Analytics Holdings, Inc. Class A† | 612,086 | 11,537,821 | ||||
Crowdstrike Holdings, Inc. Class A† | 112,262 | 32,836,635 | ||||
Datadog, Inc. Class A† | 152,304 | 18,952,710 | ||||
DoubleVerify Holdings, Inc.† | 419,864 | 16,798,759 | ||||
Shares | Value | |||||
Software(continued) | ||||||
Dynatrace, Inc.† | 615,449 | $35,080,593 | ||||
Fair Isaac Corp.† | 34,441 | 41,288,904 | ||||
Intuit, Inc. | 31,507 | 19,891,314 | ||||
Microsoft Corp. | 937,422 | 372,700,239 | ||||
Oracle Corp. | 135,275 | 15,110,218 | ||||
Palo Alto Networks, Inc.† | 99,106 | 33,548,372 | ||||
Procore Technologies, Inc.† | 307,988 | 21,987,263 | ||||
Salesforce, Inc.† | 28,808 | 8,097,641 | ||||
ServiceNow, Inc.† | 34,291 | 26,246,331 | ||||
654,076,800 | ||||||
Technology hardware, storage & peripherals: 6.74% | ||||||
Apple, Inc. | 1,107,636 | 204,248,078 | ||||
Materials: 1.48% | ||||||
Chemicals: 1.48% | ||||||
Linde PLC | 110,838 | 44,870,547 | ||||
Real estate: 0.37% | ||||||
Specialized REITs : 0.37% | ||||||
Equinix, Inc. | 13,532 | 11,228,448 | ||||
Total common stocks (Cost $1,249,776,666) | 3,027,978,865 | |||||
Yield | ||||||
Short-term investments: 0.92% | ||||||
Investment companies: 0.92% | ||||||
Allspring Government Money Market Fund Select Class♠∞ | 5.27 % | 27,791,908 | 27,791,908 | |||
Total short-term investments (Cost $27,791,908) | 27,791,908 | |||||
Total investments in securities (Cost $1,277,568,574) | 100.81 % | 3,055,770,773 | ||||
Other assets and liabilities, net | (0.81 ) | (24,463,509 ) | ||||
Total net assets | 100.00 % | $3,031,307,264 | ||||
† | Non-income-earning security |
♠ | The issuer of the security is an affiliated person of the Fund as defined in the Investment Company Act of 1940. |
∞ | The rate represents the 7-day annualized yield at period end. |
Abbreviations: | |
ADR | American depositary receipt |
REIT | Real estate investment trust |
Value, beginning of period | Purchases | Sales proceeds | Net realized gains (losses) | Net change in unrealized gains (losses) | Value, end of period | Shares, end of period | Income from affiliated securities | |
Short-term investments | ||||||||
Allspring Government Money Market Fund Select Class | $15,704,374 | $278,783,278 | $(266,695,744 ) | $0 | $0 | $27,791,908 | 27,791,908 | $329,728 |
Assets | |
Investments in unaffiliated securities, at value (cost $1,249,776,666) | $3,027,978,865 |
Investments in affiliated securities, at value (cost $27,791,908) | 27,791,908 |
Receivable for investments sold | 3,723,677 |
Receivable for Fund shares sold | 1,422,037 |
Receivable for dividends | 180,586 |
Prepaid expenses and other assets | 196,778 |
Total assets | 3,061,293,851 |
Liabilities | |
Payable for Fund shares redeemed | 17,174,990 |
Payable for investments purchased | 9,439,599 |
Management fee payable | 1,690,661 |
Administration fees payable | 414,177 |
Distribution fee payable | 8,449 |
Accrued expenses and other liabilities | 1,258,711 |
Total liabilities | 29,986,587 |
Total net assets | $3,031,307,264 |
Net assets consist of | |
Paid-in capital | $1,113,950,952 |
Total distributable earnings | 1,917,356,312 |
Total net assets | $3,031,307,264 |
Computation of net asset value and offering price per share | |
Net assets–Class A | $1,832,731,399 |
Shares outstanding–Class A1 | 68,549,757 |
Net asset value per share–Class A | $26.74 |
Maximum offering price per share – Class A2 | $28.37 |
Net assets–Class C | $13,350,686 |
Shares outstanding–Class C1 | 1,078,253 |
Net asset value per share–Class C | $12.38 |
Net assets–Class R6 | $329,912,446 |
Shares outstanding–Class R61 | 7,715,202 |
Net asset value per share–Class R6 | $42.76 |
Net assets–Administrator Class | $205,796,544 |
Shares outstanding–Administrator Class1 | 5,736,356 |
Net asset value per share–Administrator Class | $35.88 |
Net assets–Institutional Class | $649,516,189 |
Shares outstanding–Institutional Class1 | 15,310,872 |
Net asset value per share–Institutional Class | $42.42 |
Investment income | |
Dividends | $5,164,660 |
Income from affiliated securities | 329,728 |
Interest | 2,691 |
Total investment income | 5,497,079 |
Expenses | |
Management fee | 10,685,618 |
Administration fees | |
Class A | 1,748,899 |
Class C | 13,414 |
Class R6 | 50,267 |
Administrator Class | 132,211 |
Institutional Class | 441,405 |
Shareholder servicing fees | |
Class A | 2,185,953 |
Class C | 16,746 |
Administrator Class | 253,146 |
Distribution fee | |
Class C | 50,161 |
Custody and accounting fees | 2 |
Professional fees | 35,209 |
Registration fees | 18,464 |
Shareholder report expenses | 35,629 |
Trustees’ fees and expenses | 12,234 |
Other fees and expenses | 83,666 |
Total expenses | 15,763,024 |
Less: Fee waivers and/or expense reimbursements | |
Fund-level | (444,751 ) |
Class R6 | (49,222 ) |
Administrator Class | (120,574 ) |
Institutional Class | (269,085 ) |
Net expenses | 14,879,392 |
Net investment loss | (9,382,313 ) |
Realized and unrealized gains (losses) on investments | |
Net realized gains on investments | 242,920,864 |
Net change in unrealized gains (losses) on investments | (36,914,390 ) |
Net realized and unrealized gains (losses) on investments | 206,006,474 |
Net increase in net assets resulting from operations | $196,624,161 |
Six months ended January 31, 2024 (unaudited) | Year ended July 31, 2023 | |||
Operations | ||||
Net investment loss | $(9,382,313 ) | $(12,037,157 ) | ||
Net realized gains on investments | 242,920,864 | 196,383,515 | ||
Net change in unrealized gains (losses) on investments | (36,914,390 ) | 125,274,437 | ||
Net increase in net assets resulting from operations | 196,624,161 | 309,620,795 | ||
Distributions to shareholders from | ||||
Net investment income and net realized gains | ||||
Class A | (185,583,271 ) | (108,869,642 ) | ||
Class C | (2,679,651 ) | (1,767,487 ) | ||
Class R6 | (23,028,123 ) | (15,329,845 ) | ||
Administrator Class | (16,304,909 ) | (12,943,905 ) | ||
Institutional Class | (45,640,370 ) | (38,192,678 ) | ||
Total distributions to shareholders | (273,236,324 ) | (177,103,557 ) | ||
Capital share transactions | Shares | Shares | ||
Proceeds from shares sold | ||||
Class A | 576,212 | 15,015,674 | 1,146,798 | 28,147,242 |
Class C | 39,367 | 498,570 | 52,604 | 697,566 |
Class R6 | 267,631 | 10,911,321 | 1,983,266 | 76,624,251 |
Administrator Class | 294,145 | 10,151,674 | 620,292 | 19,712,857 |
Institutional Class | 1,062,746 | 42,898,712 | 2,966,448 | 109,317,521 |
79,475,951 | 234,499,437 | |||
Reinvestment of distributions | ||||
Class A | 7,152,606 | 178,242,948 | 4,695,691 | 104,666,950 |
Class C | 222,406 | 2,568,784 | 144,818 | 1,691,480 |
Class R6 | 525,450 | 20,928,674 | 416,402 | 14,190,969 |
Administrator Class | 479,242 | 16,021,049 | 439,148 | 12,757,242 |
Institutional Class | 1,118,859 | 44,217,322 | 1,098,744 | 37,181,487 |
261,978,777 | 170,488,128 | |||
Payment for shares redeemed | ||||
Class A | (5,466,681 ) | (143,072,764 ) | (9,939,680 ) | (241,340,204 ) |
Class C | (199,776 ) | (2,583,345 ) | (466,357 ) | (6,100,134 ) |
Class R6 | (2,286,591 ) | (93,970,967 ) | (3,417,488 ) | (129,288,708 ) |
Administrator Class | (1,110,681 ) | (38,188,328 ) | (4,324,799 ) | (131,201,214 ) |
Institutional Class | (7,637,673 ) | (308,419,068 ) | (9,179,670 ) | (338,231,327 ) |
(586,234,472 ) | (846,161,587 ) | |||
Net decrease in net assets resulting from capital share transactions | (244,779,744 ) | (441,174,022 ) | ||
Total decrease in net assets | (321,391,907 ) | (308,656,784 ) | ||
Net assets | ||||
Beginning of period | 3,352,699,171 | 3,661,355,955 | ||
End of period | $3,031,307,264 | $3,352,699,171 | ||
Six months ended January 31, 2024 (unaudited) | Year ended July 31 | |||||
Class A | 2023 | 2022 | 2021 | 2020 | 2019 | |
Net asset value, beginning of period | $27.83 | $26.80 | $47.16 | $39.86 | $35.56 | $38.67 |
Net investment loss | (0.10 )1 | (0.14 )1 | (0.30 )1 | (0.32 ) | (0.19 ) | (0.13 ) |
Payment from affiliate | 0.00 | 0.00 | 0.00 | 0.00 2 | 0.00 | 0.00 |
Net realized and unrealized gains (losses) on investments | 1.94 | 2.79 | (11.07 ) | 13.52 | 8.77 | 3.73 |
Total from investment operations | 1.84 | 2.65 | (11.37 ) | 13.20 | 8.58 | 3.60 |
Distributions to shareholders from | ||||||
Net realized gains | (2.93 ) | (1.62 ) | (8.99 ) | (5.90 ) | (4.28 ) | (6.71 ) |
Net asset value, end of period | $26.74 | $27.83 | $26.80 | $47.16 | $39.86 | $35.56 |
Total return3 | 7.37 % | 11.39 % | (29.35 )% | 35.61 %4 | 27.08 % | 13.55 % |
Ratios to average net assets (annualized) | ||||||
Gross expenses | 1.18 % | 1.19 % | 1.16 % | 1.16 % | 1.17 % | 1.18 % |
Net expenses | 1.15 % | 1.14 % | 1.13 % | 1.14 % | 1.14 % | 1.16 % |
Net investment loss | (0.78 )% | (0.55 )% | (0.85 )% | (0.83 )% | (0.59 )% | (0.45 )% |
Supplemental data | ||||||
Portfolio turnover rate | 17 % | 58 % | 43 % | 36 % | 37 % | 39 % |
Net assets, end of period (000s omitted) | $1,832,731 | $1,844,845 | $1,885,963 | $3,088,763 | $2,443,132 | $2,116,542 |
1 | Calculated based upon average shares outstanding |
2 | Amount is less than $0.005. |
3 | Total return calculations do not include any sales charges. Returns for periods of less than one year are not annualized. |
4 | During the year ended July 31, 2021, the Fund received a payment from an affiliate which had a 0.01% impact on the total return. |
Six months ended January 31, 2024 (unaudited) | Year ended July 31 | |||||
Class C | 2023 | 2022 | 2021 | 2020 | 2019 | |
Net asset value, beginning of period | $14.51 | $14.95 | $30.47 | $27.32 | $25.87 | $30.33 |
Net investment loss | (0.10 )1 | (0.17 )1 | (0.34 )1 | (0.45 )1 | (0.32 )1 | (0.31 )1 |
Payment from affiliate | 0.00 | 0.00 | 0.00 | 1.32 | 0.00 | 0.00 |
Net realized and unrealized gains (losses) on investments | 0.90 | 1.35 | (6.19 ) | 8.18 | 6.05 | 2.56 |
Total from investment operations | 0.80 | 1.18 | (6.53 ) | 9.05 | 5.73 | 2.25 |
Distributions to shareholders from | ||||||
Net realized gains | (2.93 ) | (1.62 ) | (8.99 ) | (5.90 ) | (4.28 ) | (6.71 ) |
Net asset value, end of period | $12.38 | $14.51 | $14.95 | $30.47 | $27.32 | $25.87 |
Total return2 | 6.94 % | 10.52 % | (29.54 )%3 | 36.64 %4 | 26.11 % | 12.68 % |
Ratios to average net assets (annualized) | ||||||
Gross expenses | 1.93 % | 1.94 % | 1.89 % | 1.91 % | 1.92 % | 1.93 % |
Net expenses | 1.90 % | 1.91 % | 1.89 % | 1.91 % | 1.91 % | 1.91 % |
Net investment loss | (1.53 )% | (1.31 )% | (1.61 )% | (1.57 )% | (1.35 )% | (1.19 )% |
Supplemental data | ||||||
Portfolio turnover rate | 17 % | 58 % | 43 % | 36 % | 37 % | 39 % |
Net assets, end of period (000s omitted) | $13,351 | $14,747 | $19,208 | $41,094 | $114,123 | $156,056 |
1 | Calculated based upon average shares outstanding |
2 | Total return calculations do not include any sales charges. Returns for periods of less than one year are not annualized. |
3 | During the year ended July 31, 2022, the Fund received payments from a service provider which had a 0.14% impact on the total return. |
4 | During the year ended July 31, 2021, the Fund received a payment from an affiliate which had a 5.92% impact on the total return. |
Six months ended January 31, 2024 (unaudited) | Year ended July 31 | |||||
Class R6 | 2023 | 2022 | 2021 | 2020 | 2019 | |
Net asset value, beginning of period | $42.67 | $39.94 | $65.50 | $53.17 | $45.84 | $47.53 |
Net investment loss | (0.07 )1 | (0.04 )1 | (0.21 )1 | (0.23 ) | (0.07 ) | 0.00 1,2 |
Net realized and unrealized gains (losses) on investments | 3.09 | 4.39 | (16.36 ) | 18.46 | 11.68 | 5.02 |
Total from investment operations | 3.02 | 4.35 | (16.57 ) | 18.23 | 11.61 | 5.02 |
Distributions to shareholders from | ||||||
Net realized gains | (2.93 ) | (1.62 ) | (8.99 ) | (5.90 ) | (4.28 ) | (6.71 ) |
Net asset value, end of period | $42.76 | $42.67 | $39.94 | $65.50 | $53.17 | $45.84 |
Total return3 | 7.57 % | 11.92 % | (29.05 )% | 36.19 % | 27.65 % | 14.06 % |
Ratios to average net assets (annualized) | ||||||
Gross expenses | 0.76 % | 0.76 % | 0.73 % | 0.73 % | 0.74 % | 0.75 % |
Net expenses | 0.70 % | 0.70 % | 0.70 % | 0.70 % | 0.70 % | 0.70 % |
Net investment loss | (0.33 )% | (0.11 )% | (0.41 )% | (0.40 )% | (0.15 )% | 0.00 % |
Supplemental data | ||||||
Portfolio turnover rate | 17 % | 58 % | 43 % | 36 % | 37 % | 39 % |
Net assets, end of period (000s omitted) | $329,912 | $392,893 | $408,403 | $519,293 | $391,705 | $337,260 |
1 | Calculated based upon average shares outstanding |
2 | Amount is less than $0.005. |
3 | Returns for periods of less than one year are not annualized. |
Six months ended January 31, 2024 (unaudited) | Year ended July 31 | |||||
Administrator Class | 2023 | 2022 | 2021 | 2020 | 2019 | |
Net asset value, beginning of period | $36.31 | $34.34 | $57.75 | $47.60 | $41.58 | $43.89 |
Net investment loss | (0.10 )1 | (0.11 )1 | (0.31 )1 | (0.29 ) | (0.16 )1 | (0.10 )1 |
Net realized and unrealized gains (losses) on investments | 2.60 | 3.70 | (14.11 ) | 16.34 | 10.46 | 4.50 |
Total from investment operations | 2.50 | 3.59 | (14.42 ) | 16.05 | 10.30 | 4.40 |
Distributions to shareholders from | ||||||
Net realized gains | (2.93 ) | (1.62 ) | (8.99 ) | (5.90 ) | (4.28 ) | (6.71 ) |
Net asset value, end of period | $35.88 | $36.31 | $34.34 | $57.75 | $47.60 | $41.58 |
Total return2 | 7.47 % | 11.60 % | (29.22 )% | 35.82 % | 27.31 % | 13.78 % |
Ratios to average net assets (annualized) | ||||||
Gross expenses | 1.11 % | 1.11 % | 1.08 % | 1.08 % | 1.09 % | 1.10 % |
Net expenses | 0.96 % | 0.96 % | 0.96 % | 0.96 % | 0.96 % | 0.96 % |
Net investment loss | (0.59 )% | (0.35 )% | (0.68 )% | (0.65 )% | (0.40 )% | (0.25 )% |
Supplemental data | ||||||
Portfolio turnover rate | 17 % | 58 % | 43 % | 36 % | 37 % | 39 % |
Net assets, end of period (000s omitted) | $205,797 | $220,544 | $320,744 | $647,618 | $559,109 | $561,900 |
1 | Calculated based upon average shares outstanding |
2 | Returns for periods of less than one year are not annualized. |
Six months ended January 31, 2024 (unaudited) | Year ended July 31 | |||||
Institutional Class | 2023 | 2022 | 2021 | 2020 | 2019 | |
Net asset value, beginning of period | $42.36 | $39.68 | $65.17 | $52.96 | $45.70 | $47.43 |
Net investment loss | (0.08 )1 | (0.06 )1 | (0.24 )1 | (0.26 )1 | (0.09 )1 | (0.01 )1 |
Net realized and unrealized gains (losses) on investments | 3.07 | 4.36 | (16.26 ) | 18.37 | 11.63 | 4.99 |
Total from investment operations | 2.99 | 4.30 | (16.50 ) | 18.11 | 11.54 | 4.98 |
Distributions to shareholders from | ||||||
Net realized gains | (2.93 ) | (1.62 ) | (8.99 ) | (5.90 ) | (4.28 ) | (6.71 ) |
Net asset value, end of period | $42.42 | $42.36 | $39.68 | $65.17 | $52.96 | $45.70 |
Total return2 | 7.56 % | 11.87 % | (29.09 )% | 36.10 % | 27.58 % | 14.00 % |
Ratios to average net assets (annualized) | ||||||
Gross expenses | 0.86 % | 0.86 % | 0.83 % | 0.83 % | 0.84 % | 0.85 % |
Net expenses | 0.75 % | 0.75 % | 0.75 % | 0.75 % | 0.75 % | 0.75 % |
Net investment loss | (0.37 )% | (0.15 )% | (0.47 )% | (0.44 )% | (0.20 )% | (0.03 )% |
Supplemental data | ||||||
Portfolio turnover rate | 17 % | 58 % | 43 % | 36 % | 37 % | 39 % |
Net assets, end of period (000s omitted) | $649,516 | $879,671 | $1,027,038 | $1,959,313 | $1,607,803 | $1,503,753 |
1 | Calculated based upon average shares outstanding |
2 | Returns for periods of less than one year are not annualized. |
Gross unrealized gains | $1,794,626,315 |
Gross unrealized losses | (17,334,394 ) |
Net unrealized gains | $1,777,291,921 |
Quoted prices (Level 1) | Other significant observable inputs (Level 2) | Significant unobservable inputs (Level 3) | Total | |
Assets | ||||
Investments in: | ||||
Common stocks | ||||
Communication services | $365,194,848 | $0 | $0 | $365,194,848 |
Consumer discretionary | 475,278,175 | 0 | 0 | 475,278,175 |
Consumer staples | 30,080,458 | 0 | 0 | 30,080,458 |
Financials | 263,412,222 | 0 | 0 | 263,412,222 |
Health care | 283,085,797 | 0 | 0 | 283,085,797 |
Industrials | 213,241,983 | 0 | 0 | 213,241,983 |
Information technology | 1,341,586,387 | 0 | 0 | 1,341,586,387 |
Materials | 44,870,547 | 0 | 0 | 44,870,547 |
Real estate | 11,228,448 | 0 | 0 | 11,228,448 |
Short-term investments | ||||
Investment companies | 27,791,908 | 0 | 0 | 27,791,908 |
Total assets | $3,055,770,773 | $0 | $0 | $3,055,770,773 |
Average daily net assets | Management fee |
First $500 million | 0.800 % |
Next $500 million | 0.750 |
Next $1 billion | 0.700 |
Next $2 billion | 0.675 |
Next $1 billion | 0.650 |
Next $3 billion | 0.640 |
Next $2 billion | 0.615 |
Next $2 billion | 0.605 |
Next $4 billion | 0.580 |
Over $16 billion | 0.555 |
Class-level administration fee | |
Class A | 0.20 % |
Class C | 0.20 |
Class R6 | 0.03 |
Administrator Class | 0.13 |
Institutional Class | 0.13 |
EXPENSE RATIO CAPS | |
Class A | 1.15 % |
Class C | 1.90 |
Class R6 | 0.70 |
Administrator Class | 0.96 |
Institutional Class | 0.75 |
Name and year of birth | Position held and length of service* | Principal occupations during past five years or longer | Current other public company or investment company directorships |
William R. Ebsworth (Born 1957) | Trustee, since 2015 | Retired. From 1984 to 2013, equities analyst, portfolio manager, research director and chief investment officer at Fidelity Management and Research Company in Boston, Tokyo, and Hong Kong, and retired in 2013 as Chief Investment Officer of Fidelity Strategic Advisers, Inc. where he led a team of investment professionals managing client assets. Prior thereto, Board member of Hong Kong Securities Clearing Co., Hong Kong Options Clearing Corp., the Thailand International Fund, Ltd., Fidelity Investments Life Insurance Company, and Empire Fidelity Investments Life Insurance Company. Serves on the Investment Company Institute’s Board of Governors since 2022 and Executive Committee since 2023 as well as the Vice Chairman of the Governing Council of the Independent Directors Council since 2023. Audit Committee Chair and Investment Committee Chair of the Vincent Memorial Hospital Foundation (non-profit organization). Mr. Ebsworth is a CFA charterholder. | N/A |
Jane A. Freeman (Born 1953) | Trustee, since 2015; Chair Liaison, since January 2018# | Retired. From 2012 to 2014 and 1999 to 2008, Chief Financial Officer of Scientific Learning Corporation. From 2008 to 2012, Ms. Freeman provided consulting services related to strategic business projects. Prior to 1999, Portfolio Manager at Rockefeller & Co. and Scudder, Stevens & Clark. Board member of the Harding Loevner Funds from 1996 to 2014, serving as both Lead Independent Director and chair of the Audit Committee. Board member of the Russell Exchange Traded Funds Trust from 2011 to 2012 and the chair of the Audit Committee. Ms. Freeman is also an inactive Chartered Financial Analyst. | N/A |
Isaiah Harris, Jr. (Born 1952) | Trustee, since 2009; Audit Committee Chair, since 2019 | Retired. Member of the Advisory Board of CEF of East Central Florida. Chairman of the Board of CIGNA Corporation from 2009 to 2021, and Director from 2005 to 2008. From 2003 to 2011, Director of Deluxe Corporation. Prior thereto, President and CEO of BellSouth Advertising and Publishing Corp. from 2005 to 2007, President and CEO of BellSouth Enterprises from 2004 to 2005 and President of BellSouth Consumer Services from 2000 to 2003. Emeritus member of the Iowa State University Foundation Board of Governors. Emeritus Member of the Advisory board of Iowa State University School of Business. Advisory Board Member, Palm Harbor Academy (private school). Advisory Board Member, Fellowship of Christian Athletes. Mr. Harris is a certified public accountant (inactive status). | N/A |
David F. Larcker (Born 1950) | Trustee, since 2009 | Distinguished Visiting Fellow at the Hoover Institution since 2022. James Irvin Miller Professor of Accounting at the Graduate School of Business (Emeritus), Stanford University, Director of the Corporate Governance Research Initiative and Senior Faculty of The Rock Center for Corporate Governance since 2006. From 2005 to 2008, Professor of Accounting at the Graduate School of Business, Stanford University. Prior thereto, Ernst & Young Professor of Accounting at The Wharton School, University of Pennsylvania from 1985 to 2005. | N/A |
Olivia S. Mitchell (Born 1953) | Trustee, since 2006 | International Foundation of Employee Benefit Plans Professor since 1993, Wharton School of the University of Pennsylvania. Director of Wharton’s Pension Research Council and Boettner Center on Pensions & Retirement Research, and Research Associate at the National Bureau of Economic Research. Previously taught at Cornell University from 1978 to 1993. | N/A |
Timothy J. Penny (Born 1951) | Trustee, since 1996; Chair, since 2018 | President and Chief Executive Officer of Southern Minnesota Initiative Foundation, a non-profit organization, since 2007. Vice Chair of the Economic Club of Minnesota, since 2007. Co-Chair of the Committee for a Responsible Federal Budget, since 1995. Member of the Board of Trustees of NorthStar Education Finance, Inc., a non-profit organization, from 2007-2022. Senior Fellow of the University of Minnesota Humphrey Institute from 1995 to 2017. | N/A |
Name and year of birth | Position held and length of service* | Principal occupations during past five years or longer | Current other public company or investment company directorships |
James G. Polisson (Born 1959) | Trustee, since 2018; Nominating and Governance Committee Chair, since 2024 | Retired. Chief Marketing Officer, Source (ETF) UK Services, Ltd, from 2015 to 2017. From 2012 to 2015, Principal of The Polisson Group, LLC, a management consulting, corporate advisory and principal investing company. Chief Executive Officer and Managing Director at Russell Investments, Global Exchange Traded Funds from 2010 to 2012. Managing Director of Barclays Global Investors from 1998 to 2010 and Global Chief Marketing Officer for iShares and Barclays Global Investors from 2000 to 2010. Trustee of the San Francisco Mechanics’ Institute, a non- profit organization, from 2013 to 2015. Board member of the Russell Exchange Traded Fund Trust from 2011 to 2012. Director of Barclays Global Investors Holdings Deutschland GmbH from 2006 to 2009. Mr. Polisson is an attorney and has a retired status with the Massachusetts and District of Columbia Bar Associations. | N/A |
Pamela Wheelock (Born 1959) | Trustee, since January 2020; previously Trustee from January 2018 to July 2019# | Retired. Executive and Senior Financial leadership positions in the public, private and nonprofit sectors. Interim President and CEO, McKnight Foundation, 2020. Interim Commissioner, Minnesota Department of Human Services, 2019. Chief Operating Officer, Twin Cities Habitat for Humanity, 2017-2019. Vice President for University Services, University of Minnesota, 2012- 2016. Interim President and CEO, Blue Cross and Blue Shield of Minnesota, 2011-2012. Executive Vice-President and Chief Financial Officer, Minnesota Wild, 2002-2008. Commissioner, Minnesota Department of Finance, 1999-2002. Chair of the Board of Directors of Destination Medical Center Corporation. Board member of the Minnesota Wild Foundation. | N/A |
Name and year of birth | Position held and length of service | Principal occupations during past five years or longer |
Andrew Owen (Born 1960) | President, since 2017 | President and Chief Executive Officer of Allspring Funds Management, LLC since 2017 and Head of Global Fund Governance of Allspring Global Investments since 2022. Prior thereto, co-president of Galliard Capital Management, LLC, an affiliate of Allspring Funds Management, LLC, from 2019 to 2022 and Head of Affiliated Managers, Allspring Global Investments, from 2014 to 2019 and Executive Vice President responsible for marketing, investments and product development for Allspring Funds Management, LLC, from 2009 to 2014. |
Jeremy DePalma (Born 1974) | Treasurer, since 2012 (for certain funds in the Fund Complex); since 2021 (for the remaining funds in the Complex) | Senior Vice President of Allspring Funds Management, LLC since 2009. Senior Vice President of Evergreen Investment Management Company, LLC from 2008 to 2010 and head of the Fund Reporting and Control Team within Fund Administration from 2005 to 2010. |
Christopher Baker (Born 1976) | Chief Compliance Officer, since 2022 | Global Chief Compliance Officer for Allspring Global Investments since 2022. Prior thereto, Chief Compliance Officer for State Street Global Advisors from 2018 to 2021. Senior Compliance Officer for the State Street divisions of Alternative Investment Solutions, Sector Solutions, and Global Marketing from 2015 to 2018. From 2010 to 2015 Vice President, Global Head of Investment and Marketing Compliance for State Street Global Advisors. |
Matthew Prasse (Born 1983) | Chief Legal Officer, since 2022; Secretary, since 2021 | Senior Counsel of the Allspring Legal Department since 2021. Senior Counsel of the Wells Fargo Legal Department from 2018 to 2021. Previously, Counsel for Barings LLC from 2015 to 2018. Prior to joining Barings, Associate at Morgan, Lewis & Bockius LLP from 2008 to 2015. |

P.O. Box 219967
Kansas City, MO 64121-9967

SAR3009 01-24

Allspring Funds

President
Allspring Funds
Notice to Shareholders |
Beginning in July 2024, the Fund will be required by the Securities and Exchange Commission to send shareholders a paper copy of a new tailored shareholder report in place of the full shareholder report that you are now receiving. The tailored shareholder report will contain concise information about the Fund, including certain expense and performance information and fund statistics. If you wish to receive this new tailored shareholder report electronically, please follow the instructions on the back cover of this report. |
Other information that is currently included in the shareholder report, such as the Fund’s financial statements, will be available online and upon request, free of charge, in paper or electronic format. |
Investment objective | The Fund seeks long-term capital appreciation. |
Manager | Allspring Funds Management, LLC |
Subadviser | Allspring Global Investments, LLC |
Portfolio managers | John R. Campbell, CFA, Vince Fioramonti, CFA |
Average annual total returns (%) as of January 31, 2024 | |||||||||
Including sales charge | Excluding sales charge | Expense ratios1 (%) | |||||||
Inception date | 1 year | 5 year | 10 year | 1 year | 5 year | 10 year | Gross | Net2 | |
Class A (EGOAX) | 12-17-2007 | 13.27 | 11.35 | 10.23 | 20.15 | 12.68 | 10.89 | 1.21 | 1.07 |
Class C (EGOCX) | 12-17-2007 | 18.25 | 11.83 | 10.22 | 19.25 | 11.83 | 10.22 | 1.96 | 1.82 |
Class R6 (EGORX)3 | 9-30-2015 | – | – | – | 20.73 | 13.17 | 11.71 | 0.79 | 0.65 |
Administrator Class (WFLLX) | 7-16-2010 | – | – | – | 20.35 | 12.81 | 11.04 | 1.14 | 0.97 |
Institutional Class (EGOIX) | 12-17-2007 | – | – | – | 20.67 | 13.12 | 11.36 | 0.89 | 0.67 |
S&P 500 Index4 | – | – | – | – | 20.82 | 14.30 | 12.62 | – | – |
1 | Reflects the expense ratios as stated in the most recent prospectuses. The expense ratios shown are subject to change and may differ from the annualized expense ratios shown in the Financial Highlights of this report. |
2 | The manager has contractually committed through November 30, 2024, to waive fees and/or reimburse expenses to the extent necessary to cap total annual fund operating expenses after fee waivers at 1.07% for Class A, 1.82% for Class C, 0.65% for Class R6, 0.97% for Administrator Class and 0.67% for Institutional Class. Brokerage commissions, stamp duty fees, interest, taxes, acquired fund fees and expenses (if any), and extraordinary expenses are excluded from the expense caps. Prior to or after the commitment expiration date, the caps may be increased or the commitment to maintain the caps may be terminated only with the approval of the Board of Trustees. Without these caps, the Fund’s returns would have been lower. The expense ratio paid by an investor is the net expense ratio (the total annual fund operating expenses after fee waivers) as stated in the prospectuses. |
3 | Historical performance shown for the Class R6 shares prior to their inception reflects the performance of the Institutional Class shares, and includes the higher expenses applicable to the Institutional Class shares. If these expenses had not been included, returns for the Class R6 shares would be higher. |
4 | The S&P 500 Index consists of 500 stocks chosen for market size, liquidity, and industry group representation. It is a market-value-weighted index with each stock’s weight in the index proportionate to its market value. You cannot invest directly in an index. |
CFA® and Chartered Financial Analyst® are trademarks owned by CFA Institute. |
Ten largest holdings (%) as of January 31, 20241 | |
Microsoft Corp. | 6.09 |
Apple, Inc. | 4.65 |
Alphabet, Inc. Class C | 3.78 |
Broadcom, Inc. | 3.01 |
Costco Wholesale Corp. | 2.68 |
Amazon.com, Inc. | 2.45 |
Royal Caribbean Cruises Ltd. | 2.33 |
Intuitive Surgical, Inc. | 2.27 |
Arista Networks, Inc. | 2.26 |
Amgen, Inc. | 2.21 |
1 | Figures represent the percentage of the Fund’s net assets. Holdings are subject to change and may have changed since the date specified. |
Sector allocation as of January 31, 20241 |
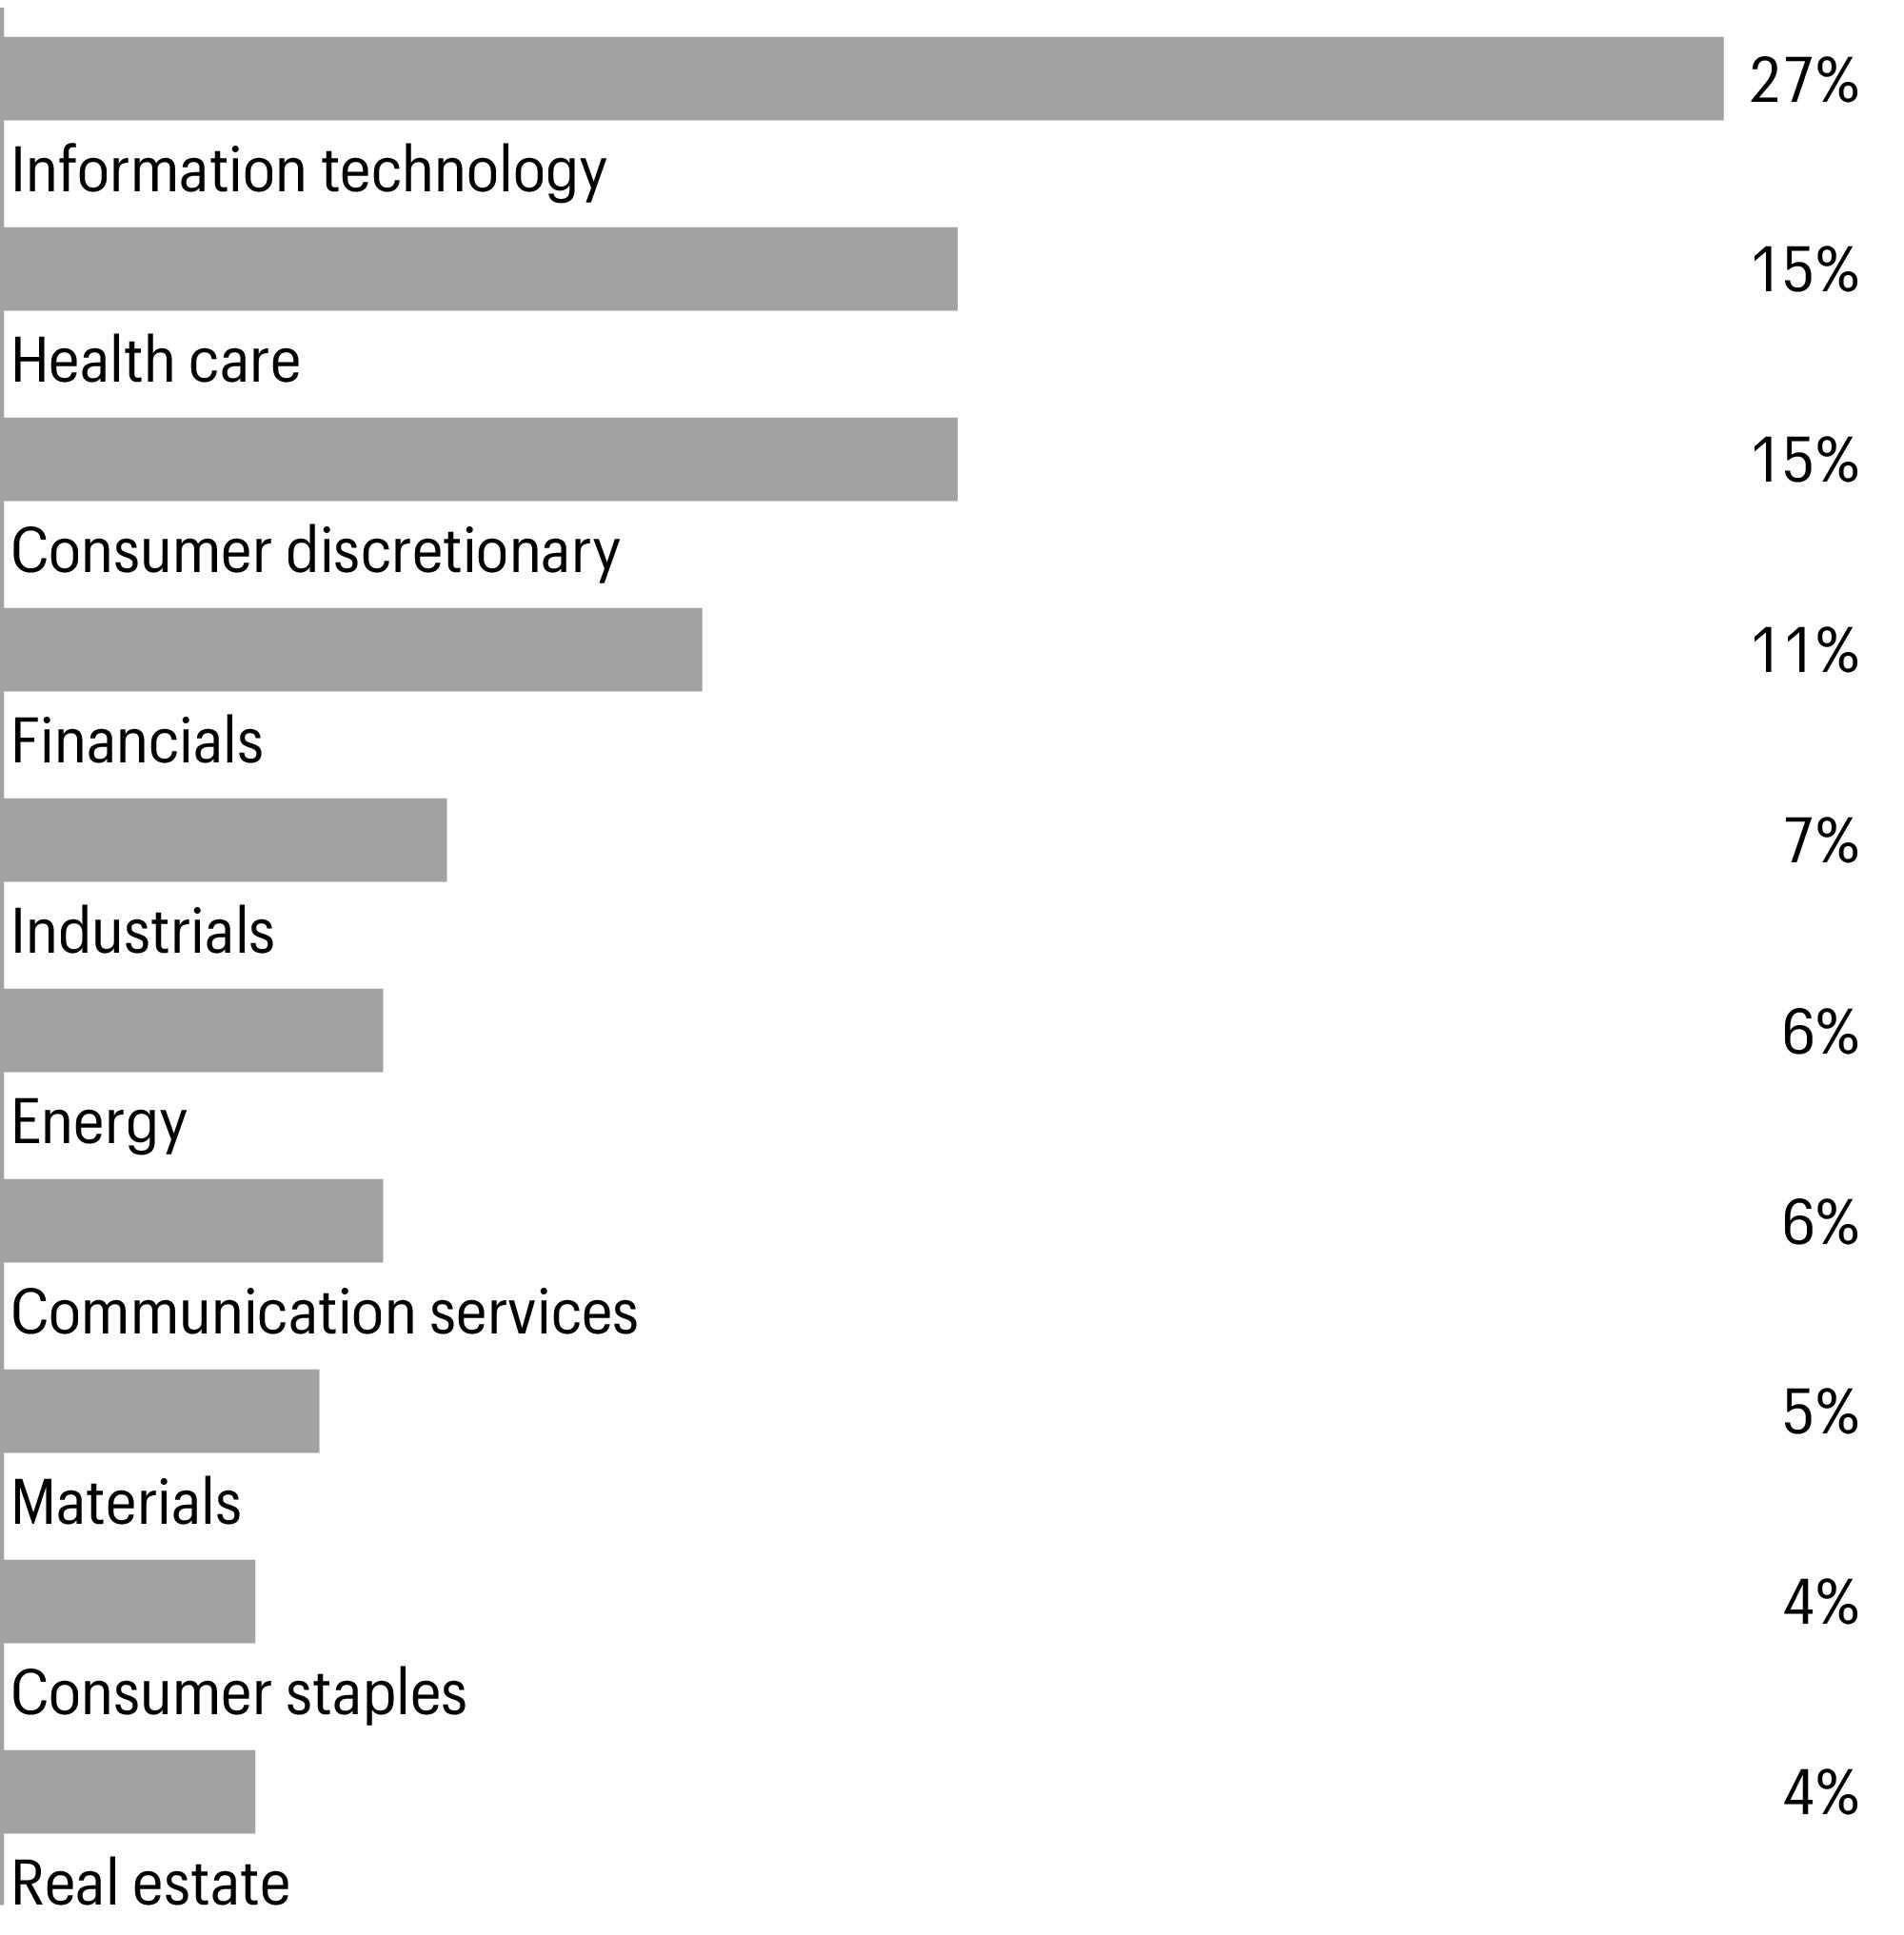
1 | Figures represent the percentage of the Fund’s long-term investments. Allocations are subject to change and may have changed since the date specified. |
Beginning account value 8-1-2023 | Ending account value 1-31-2024 | Expenses paid during the period1 | Annualized net expense ratio | |
Class A | ||||
Actual | $1,000.00 | $1,056.50 | $5.53 | 1.07 % |
Hypothetical (5% return before expenses) | $1,000.00 | $1,019.76 | $5.43 | 1.07 % |
Class C | ||||
Actual | $1,000.00 | $1,052.25 | $9.39 | 1.82 % |
Hypothetical (5% return before expenses) | $1,000.00 | $1,015.99 | $9.22 | 1.82 % |
Class R6 | ||||
Actual | $1,000.00 | $1,058.69 | $3.36 | 0.65 % |
Hypothetical (5% return before expenses) | $1,000.00 | $1,021.87 | $3.30 | 0.65 % |
Administrator Class | ||||
Actual | $1,000.00 | $1,057.63 | $5.02 | 0.97 % |
Hypothetical (5% return before expenses) | $1,000.00 | $1,020.26 | $4.93 | 0.97 % |
Institutional Class | ||||
Actual | $1,000.00 | $1,058.32 | $3.47 | 0.67 % |
Hypothetical (5% return before expenses) | $1,000.00 | $1,021.77 | $3.40 | 0.67 % |
1 | Expenses paid is equal to the annualized net expense ratio of each class multiplied by the average account value over the period, multiplied by 184 divided by 366 (to reflect the one-half-year period). |
Shares | Value | |||||
Common stocks: 98.67% | ||||||
Communication services: 5.48% | ||||||
Interactive media & services: 3.78% | ||||||
Alphabet, Inc. Class C† | 124,632 | $17,672,818 | ||||
Media: 1.70% | ||||||
Fox Corp. Class A | 245,388 | 7,926,032 | ||||
Consumer discretionary: 14.52% | ||||||
Broadline retail: 2.45% | ||||||
Amazon.com, Inc.† | 73,644 | 11,429,549 | ||||
Hotels, restaurants & leisure: 2.33% | ||||||
Royal Caribbean Cruises Ltd.† | 85,296 | 10,875,240 | ||||
Household durables: 4.29% | ||||||
Lennar Corp. Class A | 66,980 | 10,036,953 | ||||
PulteGroup, Inc. | 95,596 | 9,995,518 | ||||
20,032,471 | ||||||
Specialty retail: 5.45% | ||||||
O’Reilly Automotive, Inc.† | 8,168 | 8,356,272 | ||||
Ross Stores, Inc. | 68,182 | 9,564,571 | ||||
Ulta Beauty, Inc.† | 15,020 | 7,540,791 | ||||
25,461,634 | ||||||
Consumer staples: 3.67% | ||||||
Consumer staples distribution & retail : 2.68% | ||||||
Costco Wholesale Corp. | 18,021 | 12,522,433 | ||||
Food products: 0.99% | ||||||
Archer-Daniels-Midland Co. | 83,247 | 4,626,868 | ||||
Energy: 6.30% | ||||||
Energy equipment & services: 1.55% | ||||||
Halliburton Co. | 202,321 | 7,212,744 | ||||
Oil, gas & consumable fuels: 4.75% | ||||||
Chevron Corp. | 47,631 | 7,022,238 | ||||
ConocoPhillips | 66,510 | 7,440,474 | ||||
EOG Resources, Inc. | 67,794 | 7,714,279 | ||||
22,176,991 | ||||||
Financials: 10.72% | ||||||
Banks: 6.13% | ||||||
Citigroup, Inc. | 107,061 | 6,013,616 | ||||
Citizens Financial Group, Inc. | 151,043 | 4,939,106 | ||||
First Citizens BancShares, Inc. Class A | 5,928 | 8,951,280 | ||||
JPMorgan Chase & Co. | 50,060 | 8,728,462 | ||||
28,632,464 | ||||||
Shares | Value | |||||
Capital markets: 2.53% | ||||||
Goldman Sachs Group, Inc. | 20,811 | $7,991,632 | ||||
Virtu Financial, Inc. Class A | 228,710 | 3,840,041 | ||||
11,831,673 | ||||||
Financial services: 2.06% | ||||||
Mastercard, Inc. Class A | 21,366 | 9,598,248 | ||||
Health care: 15.28% | ||||||
Biotechnology: 6.94% | ||||||
AbbVie, Inc. | 43,126 | 7,089,914 | ||||
Amgen, Inc. | 32,790 | 10,304,586 | ||||
Regeneron Pharmaceuticals, Inc.† | 9,654 | 9,101,598 | ||||
United Therapeutics Corp.† | 27,463 | 5,898,503 | ||||
32,394,601 | ||||||
Health care equipment & supplies: 3.87% | ||||||
Edwards Lifesciences Corp.† | 95,238 | 7,473,326 | ||||
Intuitive Surgical, Inc.† | 27,960 | 10,575,031 | ||||
18,048,357 | ||||||
Health care providers & services: 3.54% | ||||||
Cencora, Inc. | 40,760 | 9,484,037 | ||||
UnitedHealth Group, Inc. | 13,731 | 7,026,702 | ||||
16,510,739 | ||||||
Pharmaceuticals: 0.93% | ||||||
Pfizer, Inc. | 161,342 | 4,369,141 | ||||
Industrials: 7.15% | ||||||
Commercial services & supplies: 1.82% | ||||||
Copart, Inc.† | 176,613 | 8,484,488 | ||||
Construction & engineering: 1.89% | ||||||
EMCOR Group, Inc. | 38,742 | 8,837,438 | ||||
Electrical equipment: 1.95% | ||||||
nVent Electric PLC | 151,490 | 9,095,460 | ||||
Machinery: 1.49% | ||||||
AGCO Corp. | 56,856 | 6,955,194 | ||||
Information technology: 27.13% | ||||||
Communications equipment: 2.26% | ||||||
Arista Networks, Inc.† | 40,658 | 10,517,412 | ||||
Semiconductors & semiconductor equipment: 8.35% | ||||||
Applied Materials, Inc. | 55,783 | 9,165,147 | ||||
Broadcom, Inc. | 11,893 | 14,033,740 | ||||
KLA Corp. | 15,793 | 9,381,674 | ||||
ON Semiconductor Corp.† | 90,170 | 6,413,792 | ||||
38,994,353 | ||||||
Shares | Value | |||||
Software: 11.87% | ||||||
Adobe, Inc.† | 12,873 | $7,952,682 | ||||
Cadence Design Systems, Inc.† | 34,206 | 9,867,063 | ||||
Microsoft Corp. | 71,445 | 28,405,103 | ||||
Oracle Corp. | 82,172 | 9,178,612 | ||||
55,403,460 | ||||||
Technology hardware, storage & peripherals: 4.65% | ||||||
Apple, Inc. | 117,768 | 21,716,419 | ||||
Materials: 4.83% | ||||||
Chemicals: 1.15% | ||||||
CF Industries Holdings, Inc. | 71,384 | 5,390,206 | ||||
Metals & mining: 3.68% | ||||||
Nucor Corp. | 48,488 | 9,063,862 | ||||
Reliance Steel & Aluminum Co. | 28,385 | 8,101,646 | ||||
17,165,508 | ||||||
Real estate: 3.59% | ||||||
Retail REITs : 2.09% | ||||||
Simon Property Group, Inc. | 70,372 | 9,754,263 | ||||
Specialized REITs : 1.50% | ||||||
Weyerhaeuser Co. | 213,906 | 7,009,700 | ||||
Total common stocks (Cost $306,865,330) | 460,645,904 | |||||
Yield | ||||||
Short-term investments: 1.11% | ||||||
Investment companies: 1.11% | ||||||
Allspring Government Money Market Fund Select Class♠∞ | 5.27 % | 5,183,479 | 5,183,479 | |||
Total short-term investments (Cost $5,183,479) | 5,183,479 | |||||
Total investments in securities (Cost $312,048,809) | 99.78 % | 465,829,383 | ||||
Other assets and liabilities, net | 0.22 | 1,014,663 | ||||
Total net assets | 100.00 % | $466,844,046 | ||||
† | Non-income-earning security |
♠ | The issuer of the security is an affiliated person of the Fund as defined in the Investment Company Act of 1940. |
∞ | The rate represents the 7-day annualized yield at period end. |
Abbreviations: | |
REIT | Real estate investment trust |
Value, beginning of period | Purchases | Sales proceeds | Net realized gains (losses) | Net change in unrealized gains (losses) | Value, end of period | Shares, end of period | Income from affiliated securities | |
Short-term investments | ||||||||
Allspring Government Money Market Fund Select Class | $4,847,600 | $18,306,231 | $(17,970,352 ) | $0 | $0 | $5,183,479 | 5,183,479 | $168,911 |
Description | Number of contracts | Expiration date | Notional cost | Notional value | Unrealized gains | Unrealized losses |
Long | ||||||
E-Mini S&P 500 Index | 14 | 3-15-2024 | $3,301,495 | $3,409,350 | $107,855 | $0 |
Assets | |
Investments in unaffiliated securities, at value (cost $306,865,330) | $460,645,904 |
Investments in affiliated securities, at value (cost $5,183,479) | 5,183,479 |
Cash at broker segregated for futures contracts | 392,000 |
Receivable for Fund shares sold | 1,050,481 |
Receivable for dividends | 327,549 |
Prepaid expenses and other assets | 86,128 |
Total assets | 467,685,541 |
Liabilities | |
Payable for Fund shares redeemed | 284,989 |
Management fee payable | 215,016 |
Shareholder servicing fees payable | 78,186 |
Administration fees payable | 72,245 |
Payable for daily variation margin on open futures contracts | 62,357 |
Distribution fees payable | 4,754 |
Accrued expenses and other liabilities | 123,948 |
Total liabilities | 841,495 |
Total net assets | $466,844,046 |
Net assets consist of | |
Paid-in capital | $297,886,612 |
Total distributable earnings | 168,957,434 |
Total net assets | $466,844,046 |
Computation of net asset value and offering price per share | |
Net assets–Class A | $363,502,601 |
Shares outstanding–Class A1 | 22,671,128 |
Net asset value per share–Class A | $16.03 |
Maximum offering price per share – Class A2 | $17.01 |
Net assets–Class C | $7,423,030 |
Shares outstanding–Class C1 | 478,171 |
Net asset value per share–Class C | $15.52 |
Net assets–Class R6 | $2,932,609 |
Shares outstanding–Class R61 | 181,404 |
Net asset value per share–Class R6 | $16.17 |
Net assets–Administrator Class | $1,989,672 |
Shares outstanding–Administrator Class1 | 120,763 |
Net asset value per share–Administrator Class | $16.48 |
Net assets–Institutional Class | $90,996,134 |
Shares outstanding–Institutional Class1 | 5,620,225 |
Net asset value per share–Institutional Class | $16.19 |
Investment income | |
Dividends | $3,521,002 |
Income from affiliated securities | 168,911 |
Interest | 9,760 |
Total investment income | 3,699,673 |
Expenses | |
Management fee | 1,561,423 |
Administration fees | |
Class A | 345,311 |
Class C | 8,905 |
Class R6 | 481 |
Administrator Class | 1,266 |
Institutional Class | 56,388 |
Shareholder servicing fees | |
Class A | 431,639 |
Class C | 10,993 |
Administrator Class | 2,409 |
Distribution fees | |
Class C | 32,975 |
Custody and accounting fees | 6,747 |
Professional fees | 34,039 |
Registration fees | 42,997 |
Shareholder report expenses | 16,823 |
Trustees’ fees and expenses | 9,759 |
Other fees and expenses | 8,750 |
Total expenses | 2,570,905 |
Less: Fee waivers and/or expense reimbursements | |
Fund-level | (295,471 ) |
Class A | (13 ) |
Administrator Class | (295 ) |
Institutional Class | (36,206 ) |
Net expenses | 2,238,920 |
Net investment income | 1,460,753 |
Realized and unrealized gains (losses) on investments | |
Net realized gains on | |
Unaffiliated securities | 21,078,758 |
Futures contracts | 193,381 |
Net realized gains on investments | 21,272,139 |
Net change in unrealized gains (losses) on | |
Unaffiliated securities | 2,110,101 |
Futures contracts | (25,806 ) |
Net change in unrealized gains (losses) on investments | 2,084,295 |
Net realized and unrealized gains (losses) on investments | 23,356,434 |
Net increase in net assets resulting from operations | $24,817,187 |
Six months ended January 31, 2024 (unaudited) | Year ended July 31, 2023 | |||
Operations | ||||
Net investment income | $1,460,753 | $3,072,563 | ||
Net realized gains on investments | 21,272,139 | 34,410,415 | ||
Net change in unrealized gains (losses) on investments | 2,084,295 | 28,081,774 | ||
Net increase in net assets resulting from operations | 24,817,187 | 65,564,752 | ||
Distributions to shareholders from | ||||
Net investment income and net realized gains | ||||
Class A | (28,260,966 ) | (33,915,521 ) | ||
Class C | (625,245 ) | (1,532,255 ) | ||
Class R | N/A | (18,398 )1 | ||
Class R6 | (277,421 ) | (479,983 ) | ||
Administrator Class | (157,450 ) | (166,659 ) | ||
Institutional Class | (7,219,152 ) | (9,427,219 ) | ||
Total distributions to shareholders | (36,540,234 ) | (45,540,035 ) | ||
Capital share transactions | Shares | Shares | ||
Proceeds from shares sold | ||||
Class A | 665,884 | 10,489,544 | 870,474 | 12,800,613 |
Class C | 59,257 | 912,210 | 74,538 | 1,031,897 |
Class R | N/A | N/A | 4,193 1 | 65,543 1 |
Class R6 | 9,122 | 145,327 | 99,783 | 1,527,025 |
Administrator Class | 14,827 | 243,213 | 32,969 | 488,099 |
Institutional Class | 391,631 | 6,266,538 | 825,073 | 12,088,888 |
18,056,832 | 28,002,065 | |||
Reinvestment of distributions | ||||
Class A | 1,754,766 | 27,004,387 | 2,282,707 | 32,296,216 |
Class C | 41,929 | 620,970 | 110,947 | 1,517,749 |
Class R | N/A | N/A | 1,288 1 | 18,398 1 |
Class R6 | 2,883 | 44,896 | 7,651 | 109,454 |
Administrator Class | 9,907 | 156,738 | 11,421 | 165,760 |
Institutional Class | 455,501 | 7,102,424 | 638,501 | 9,137,834 |
34,929,415 | 43,245,411 | |||
Six months ended January 31, 2024 (unaudited) | Year ended July 31, 2023 | |||
Shares | Shares | |||
Payment for shares redeemed | ||||
Class A | (1,204,266 ) | $(19,047,963 ) | (2,557,397 ) | $(38,070,679 ) |
Class C | (329,272 ) | (5,042,020 ) | (653,371 ) | (9,360,898 ) |
Class R | N/A | N/A | (14,390 )1 | (227,359 )1 |
Class R6 | (37,373 ) | (586,931 ) | (184,358 ) | (2,705,739 ) |
Administrator Class | (20,939 ) | (336,927 ) | (21,621 ) | (319,966 ) |
Institutional Class | (674,177 ) | (10,744,859 ) | (2,691,916 ) | (40,963,613 ) |
(35,758,700 ) | (91,648,254 ) | |||
Net increase (decrease) in net assets resulting from capital share transactions | 17,227,547 | (20,400,778 ) | ||
Total increase (decrease) in net assets | 5,504,500 | (376,061 ) | ||
Net assets | ||||
Beginning of period | 461,339,546 | 461,715,607 | ||
End of period | $466,844,046 | $461,339,546 | ||
Six months ended January 31, 2024 (unaudited) | Year ended July 31 | |||||
Class A | 2023 | 2022 | 2021 | 2020 | 2019 | |
Net asset value, beginning of period | $16.49 | $15.85 | $18.77 | $15.71 | $18.57 | $20.82 |
Net investment income | 0.05 1 | 0.10 1 | 0.09 | 0.08 1 | 0.14 | 0.25 |
Net realized and unrealized gains (losses) on investments | 0.82 | 2.21 | (0.55 ) | 5.33 | 0.51 | (0.29 ) |
Total from investment operations | 0.87 | 2.31 | (0.46 ) | 5.41 | 0.65 | (0.04 ) |
Distributions to shareholders from | ||||||
Net investment income | (0.09 ) | (0.12 ) | (0.04 ) | (0.15 ) | (0.29 ) | (0.16 ) |
Net realized gains | (1.24 ) | (1.55 ) | (2.42 ) | (2.20 ) | (3.22 ) | (2.05 ) |
Total distributions to shareholders | (1.33 ) | (1.67 ) | (2.46 ) | (2.35 ) | (3.51 ) | (2.21 ) |
Net asset value, end of period | $16.03 | $16.49 | $15.85 | $18.77 | $15.71 | $18.57 |
Total return2 | 5.65 % | 16.41 % | (3.66 )% | 37.90 % | 2.86 % | 1.10 % |
Ratios to average net assets (annualized) | ||||||
Gross expenses | 1.20 % | 1.22 % | 1.20 % | 1.23 % | 1.23 % | 1.19 % |
Net expenses | 1.07 % | 1.05 % | 1.06 % | 1.06 % | 1.06 % | 1.08 % |
Net investment income | 0.59 % | 0.66 % | 0.52 % | 0.49 % | 0.97 % | 1.42 % |
Supplemental data | ||||||
Portfolio turnover rate | 17 % | 26 % | 31 % | 46 % | 28 % | 45 % |
Net assets, end of period (000s omitted) | $363,503 | $353,855 | $330,584 | $366,731 | $300,373 | $341,045 |
1 | Calculated based upon average shares outstanding |
2 | Total return calculations do not include any sales charges. Returns for periods of less than one year are not annualized. |
Six months ended January 31, 2024 (unaudited) | Year ended July 31 | |||||
Class C | 2023 | 2022 | 2021 | 2020 | 2019 | |
Net asset value, beginning of period | $15.98 | $15.40 | $18.39 | $15.41 | $18.22 | $20.44 |
Net investment income (loss) | (0.01 )1 | (0.01 )1 | (0.05 )1 | (0.04 )1 | 0.03 | 0.13 |
Net realized and unrealized gains (losses) on investments | 0.79 | 2.14 | (0.52 ) | 5.23 | 0.47 | (0.30 ) |
Total from investment operations | 0.78 | 2.13 | (0.57 ) | 5.19 | 0.50 | (0.17 ) |
Distributions to shareholders from | ||||||
Net investment income | 0.00 | 0.00 | 0.00 | (0.01 ) | (0.09 ) | 0.00 |
Net realized gains | (1.24 ) | (1.55 ) | (2.42 ) | (2.20 ) | (3.22 ) | (2.05 ) |
Total distributions to shareholders | (1.24 ) | (1.55 ) | (2.42 ) | (2.21 ) | (3.31 ) | (2.05 ) |
Net asset value, end of period | $15.52 | $15.98 | $15.40 | $18.39 | $15.41 | $18.22 |
Total return2 | 5.22 % | 15.55 % | (4.39 )% | 36.87 % | 2.01 % | 0.34 % |
Ratios to average net assets (annualized) | ||||||
Gross expenses | 1.94 % | 1.96 % | 1.94 % | 1.98 % | 1.97 % | 1.94 % |
Net expenses | 1.82 % | 1.83 % | 1.83 % | 1.83 % | 1.83 % | 1.83 % |
Net investment income (loss) | (0.15 )% | (0.07 )% | (0.27 )% | (0.25 )% | 0.21 % | 0.67 % |
Supplemental data | ||||||
Portfolio turnover rate | 17 % | 26 % | 31 % | 46 % | 28 % | 45 % |
Net assets, end of period (000s omitted) | $7,423 | $11,285 | $18,081 | $28,335 | $33,405 | $47,649 |
1 | Calculated based upon average shares outstanding |
2 | Total return calculations do not include any sales charges. Returns for periods of less than one year are not annualized. |
Six months ended January 31, 2024 (unaudited) | Year ended July 31 | |||||
Class R6 | 2023 | 2022 | 2021 | 2020 | 2019 | |
Net asset value, beginning of period | $16.65 | $15.99 | $18.91 | $15.81 | $18.68 | $20.92 |
Net investment income | 0.08 1 | 0.16 1 | 0.17 | 0.16 | 0.24 1 | 0.34 |
Net realized and unrealized gains (losses) on investments | 0.84 | 2.23 | (0.55 ) | 5.36 | 0.48 | (0.30 ) |
Total from investment operations | 0.92 | 2.39 | (0.38 ) | 5.52 | 0.72 | 0.04 |
Distributions to shareholders from | ||||||
Net investment income | (0.16 ) | (0.18 ) | (0.12 ) | (0.22 ) | (0.37 ) | (0.23 ) |
Net realized gains | (1.24 ) | (1.55 ) | (2.42 ) | (2.20 ) | (3.22 ) | (2.05 ) |
Total distributions to shareholders | (1.40 ) | (1.73 ) | (2.54 ) | (2.42 ) | (3.59 ) | (2.28 ) |
Net asset value, end of period | $16.17 | $16.65 | $15.99 | $18.91 | $15.81 | $18.68 |
Total return2 | 5.87 % | 16.92 % | (3.25 )% | 38.47 % | 3.23 % | 1.60 % |
Ratios to average net assets (annualized) | ||||||
Gross expenses | 0.78 % | 0.79 % | 0.77 % | 0.80 % | 0.79 % | 0.75 % |
Net expenses | 0.65 % | 0.65 % | 0.65 % | 0.65 % | 0.65 % | 0.65 % |
Net investment income | 1.02 % | 1.09 % | 0.92 % | 0.92 % | 1.40 % | 1.83 % |
Supplemental data | ||||||
Portfolio turnover rate | 17 % | 26 % | 31 % | 46 % | 28 % | 45 % |
Net assets, end of period (000s omitted) | $2,933 | $3,442 | $4,535 | $5,928 | $6,570 | $13,223 |
1 | Calculated based upon average shares outstanding |
2 | Returns for periods of less than one year are not annualized. |
Six months ended January 31, 2024 (unaudited) | Year ended July 31 | |||||
Administrator Class | 2023 | 2022 | 2021 | 2020 | 2019 | |
Net asset value, beginning of period | $16.91 | $16.22 | $19.16 | $15.96 | $18.82 | $21.05 |
Net investment income | 0.06 1 | 0.11 1 | 0.10 1 | 0.10 1 | 0.18 1 | 0.29 1 |
Net realized and unrealized gains (losses) on investments | 0.85 | 2.27 | (0.55 ) | 5.43 | 0.49 | (0.30 ) |
Total from investment operations | 0.91 | 2.38 | (0.45 ) | 5.53 | 0.67 | (0.01 ) |
Distributions to shareholders from | ||||||
Net investment income | (0.10 ) | (0.14 ) | (0.07 ) | (0.13 ) | (0.31 ) | (0.17 ) |
Net realized gains | (1.24 ) | (1.55 ) | (2.42 ) | (2.20 ) | (3.22 ) | (2.05 ) |
Total distributions to shareholders | (1.34 ) | (1.69 ) | (2.49 ) | (2.33 ) | (3.53 ) | (2.22 ) |
Net asset value, end of period | $16.48 | $16.91 | $16.22 | $19.16 | $15.96 | $18.82 |
Total return2 | 5.76 % | 16.51 % | (3.57 )% | 38.04 % | 2.90 % | 1.26 % |
Ratios to average net assets (annualized) | ||||||
Gross expenses | 1.13 % | 1.14 % | 1.11 % | 1.15 % | 1.13 % | 1.10 % |
Net expenses | 0.97 % | 0.97 % | 0.97 % | 0.97 % | 0.97 % | 0.97 % |
Net investment income | 0.70 % | 0.72 % | 0.56 % | 0.58 % | 1.04 % | 1.52 % |
Supplemental data | ||||||
Portfolio turnover rate | 17 % | 26 % | 31 % | 46 % | 28 % | 45 % |
Net assets, end of period (000s omitted) | $1,990 | $1,978 | $1,528 | $2,531 | $2,241 | $16,566 |
1 | Calculated based upon average shares outstanding |
2 | Returns for periods of less than one year are not annualized. |
Six months ended January 31, 2024 (unaudited) | Year ended July 31 | |||||
Institutional Class | 2023 | 2022 | 2021 | 2020 | 2019 | |
Net asset value, beginning of period | $16.67 | $16.01 | $18.93 | $15.83 | $18.70 | $20.95 |
Net investment income | 0.08 1 | 0.16 1 | 0.16 | 0.19 | 0.24 1 | 0.34 |
Net realized and unrealized gains (losses) on investments | 0.83 | 2.23 | (0.55 ) | 5.33 | 0.48 | (0.30 ) |
Total from investment operations | 0.91 | 2.39 | (0.39 ) | 5.52 | 0.72 | 0.04 |
Distributions to shareholders from | ||||||
Net investment income | (0.15 ) | (0.18 ) | (0.11 ) | (0.22 ) | (0.37 ) | (0.24 ) |
Net realized gains | (1.24 ) | (1.55 ) | (2.42 ) | (2.20 ) | (3.22 ) | (2.05 ) |
Total distributions to shareholders | (1.39 ) | (1.73 ) | (2.53 ) | (2.42 ) | (3.59 ) | (2.29 ) |
Net asset value, end of period | $16.19 | $16.67 | $16.01 | $18.93 | $15.83 | $18.70 |
Total return2 | 5.83 % | 16.89 % | (3.27 )% | 38.42 % | 3.22 % | 1.56 % |
Ratios to average net assets (annualized) | ||||||
Gross expenses | 0.88 % | 0.89 % | 0.87 % | 0.90 % | 0.89 % | 0.86 % |
Net expenses | 0.67 % | 0.67 % | 0.67 % | 0.67 % | 0.67 % | 0.67 % |
Net investment income | 0.99 % | 1.05 % | 0.91 % | 0.90 % | 1.40 % | 1.82 % |
Supplemental data | ||||||
Portfolio turnover rate | 17 % | 26 % | 31 % | 46 % | 28 % | 45 % |
Net assets, end of period (000s omitted) | $90,996 | $90,779 | $106,846 | $132,167 | $145,425 | $600,595 |
1 | Calculated based upon average shares outstanding |
2 | Returns for periods of less than one year are not annualized. |
Gross unrealized gains | $171,275,066 |
Gross unrealized losses | (17,496,150 ) |
Net unrealized gains | $153,778,916 |
Quoted prices (Level 1) | Other significant observable inputs (Level 2) | Significant unobservable inputs (Level 3) | Total | |
Assets | ||||
Investments in: | ||||
Common stocks | ||||
Communication services | $25,598,850 | $0 | $0 | $25,598,850 |
Consumer discretionary | 67,798,894 | 0 | 0 | 67,798,894 |
Consumer staples | 17,149,301 | 0 | 0 | 17,149,301 |
Energy | 29,389,735 | 0 | 0 | 29,389,735 |
Financials | 50,062,385 | 0 | 0 | 50,062,385 |
Health care | 71,322,838 | 0 | 0 | 71,322,838 |
Industrials | 33,372,580 | 0 | 0 | 33,372,580 |
Information technology | 126,631,644 | 0 | 0 | 126,631,644 |
Materials | 22,555,714 | 0 | 0 | 22,555,714 |
Real estate | 16,763,963 | 0 | 0 | 16,763,963 |
Short-term investments | ||||
Investment companies | 5,183,479 | 0 | 0 | 5,183,479 |
465,829,383 | 0 | 0 | 465,829,383 | |
Futures contracts | 107,855 | 0 | 0 | 107,855 |
Total assets | $465,937,238 | $0 | $0 | $465,937,238 |
Average daily net assets | Management fee |
First $500 million | 0.700 % |
Next $500 million | 0.675 |
Next $1 billion | 0.650 |
Next $2 billion | 0.625 |
Next $1 billion | 0.600 |
Next $3 billion | 0.590 |
Next $2 billion | 0.565 |
Next $2 billion | 0.555 |
Next $4 billion | 0.530 |
Over $16 billion | 0.505 |
Class-level administration fee | |
Class A | 0.20 % |
Class C | 0.20 |
Class R6 | 0.03 |
Administrator Class | 0.13 |
Institutional Class | 0.13 |
EXPENSE RATIO CAPS | |
Class A | 1.07 % |
Class C | 1.82 |
Class R6 | 0.65 |
Administrator Class | 0.97 |
Institutional Class | 0.67 |
Name and year of birth | Position held and length of service* | Principal occupations during past five years or longer | Current other public company or investment company directorships |
William R. Ebsworth (Born 1957) | Trustee, since 2015 | Retired. From 1984 to 2013, equities analyst, portfolio manager, research director and chief investment officer at Fidelity Management and Research Company in Boston, Tokyo, and Hong Kong, and retired in 2013 as Chief Investment Officer of Fidelity Strategic Advisers, Inc. where he led a team of investment professionals managing client assets. Prior thereto, Board member of Hong Kong Securities Clearing Co., Hong Kong Options Clearing Corp., the Thailand International Fund, Ltd., Fidelity Investments Life Insurance Company, and Empire Fidelity Investments Life Insurance Company. Serves on the Investment Company Institute’s Board of Governors since 2022 and Executive Committee since 2023 as well as the Vice Chairman of the Governing Council of the Independent Directors Council since 2023. Audit Committee Chair and Investment Committee Chair of the Vincent Memorial Hospital Foundation (non-profit organization). Mr. Ebsworth is a CFA charterholder. | N/A |
Jane A. Freeman (Born 1953) | Trustee, since 2015; Chair Liaison, since January 2018# | Retired. From 2012 to 2014 and 1999 to 2008, Chief Financial Officer of Scientific Learning Corporation. From 2008 to 2012, Ms. Freeman provided consulting services related to strategic business projects. Prior to 1999, Portfolio Manager at Rockefeller & Co. and Scudder, Stevens & Clark. Board member of the Harding Loevner Funds from 1996 to 2014, serving as both Lead Independent Director and chair of the Audit Committee. Board member of the Russell Exchange Traded Funds Trust from 2011 to 2012 and the chair of the Audit Committee. Ms. Freeman is also an inactive Chartered Financial Analyst. | N/A |
Isaiah Harris, Jr. (Born 1952) | Trustee, since 2009; Audit Committee Chair, since 2019 | Retired. Member of the Advisory Board of CEF of East Central Florida. Chairman of the Board of CIGNA Corporation from 2009 to 2021, and Director from 2005 to 2008. From 2003 to 2011, Director of Deluxe Corporation. Prior thereto, President and CEO of BellSouth Advertising and Publishing Corp. from 2005 to 2007, President and CEO of BellSouth Enterprises from 2004 to 2005 and President of BellSouth Consumer Services from 2000 to 2003. Emeritus member of the Iowa State University Foundation Board of Governors. Emeritus Member of the Advisory board of Iowa State University School of Business. Advisory Board Member, Palm Harbor Academy (private school). Advisory Board Member, Fellowship of Christian Athletes. Mr. Harris is a certified public accountant (inactive status). | N/A |
David F. Larcker (Born 1950) | Trustee, since 2009 | Distinguished Visiting Fellow at the Hoover Institution since 2022. James Irvin Miller Professor of Accounting at the Graduate School of Business (Emeritus), Stanford University, Director of the Corporate Governance Research Initiative and Senior Faculty of The Rock Center for Corporate Governance since 2006. From 2005 to 2008, Professor of Accounting at the Graduate School of Business, Stanford University. Prior thereto, Ernst & Young Professor of Accounting at The Wharton School, University of Pennsylvania from 1985 to 2005. | N/A |
Olivia S. Mitchell (Born 1953) | Trustee, since 2006 | International Foundation of Employee Benefit Plans Professor since 1993, Wharton School of the University of Pennsylvania. Director of Wharton’s Pension Research Council and Boettner Center on Pensions & Retirement Research, and Research Associate at the National Bureau of Economic Research. Previously taught at Cornell University from 1978 to 1993. | N/A |
Timothy J. Penny (Born 1951) | Trustee, since 1996; Chair, since 2018 | President and Chief Executive Officer of Southern Minnesota Initiative Foundation, a non-profit organization, since 2007. Vice Chair of the Economic Club of Minnesota, since 2007. Co-Chair of the Committee for a Responsible Federal Budget, since 1995. Member of the Board of Trustees of NorthStar Education Finance, Inc., a non-profit organization, from 2007-2022. Senior Fellow of the University of Minnesota Humphrey Institute from 1995 to 2017. | N/A |
Name and year of birth | Position held and length of service* | Principal occupations during past five years or longer | Current other public company or investment company directorships |
James G. Polisson (Born 1959) | Trustee, since 2018; Nominating and Governance Committee Chair, since 2024 | Retired. Chief Marketing Officer, Source (ETF) UK Services, Ltd, from 2015 to 2017. From 2012 to 2015, Principal of The Polisson Group, LLC, a management consulting, corporate advisory and principal investing company. Chief Executive Officer and Managing Director at Russell Investments, Global Exchange Traded Funds from 2010 to 2012. Managing Director of Barclays Global Investors from 1998 to 2010 and Global Chief Marketing Officer for iShares and Barclays Global Investors from 2000 to 2010. Trustee of the San Francisco Mechanics’ Institute, a non- profit organization, from 2013 to 2015. Board member of the Russell Exchange Traded Fund Trust from 2011 to 2012. Director of Barclays Global Investors Holdings Deutschland GmbH from 2006 to 2009. Mr. Polisson is an attorney and has a retired status with the Massachusetts and District of Columbia Bar Associations. | N/A |
Pamela Wheelock (Born 1959) | Trustee, since January 2020; previously Trustee from January 2018 to July 2019# | Retired. Executive and Senior Financial leadership positions in the public, private and nonprofit sectors. Interim President and CEO, McKnight Foundation, 2020. Interim Commissioner, Minnesota Department of Human Services, 2019. Chief Operating Officer, Twin Cities Habitat for Humanity, 2017-2019. Vice President for University Services, University of Minnesota, 2012- 2016. Interim President and CEO, Blue Cross and Blue Shield of Minnesota, 2011-2012. Executive Vice-President and Chief Financial Officer, Minnesota Wild, 2002-2008. Commissioner, Minnesota Department of Finance, 1999-2002. Chair of the Board of Directors of Destination Medical Center Corporation. Board member of the Minnesota Wild Foundation. | N/A |
Name and year of birth | Position held and length of service | Principal occupations during past five years or longer |
Andrew Owen (Born 1960) | President, since 2017 | President and Chief Executive Officer of Allspring Funds Management, LLC since 2017 and Head of Global Fund Governance of Allspring Global Investments since 2022. Prior thereto, co-president of Galliard Capital Management, LLC, an affiliate of Allspring Funds Management, LLC, from 2019 to 2022 and Head of Affiliated Managers, Allspring Global Investments, from 2014 to 2019 and Executive Vice President responsible for marketing, investments and product development for Allspring Funds Management, LLC, from 2009 to 2014. |
Jeremy DePalma (Born 1974) | Treasurer, since 2012 (for certain funds in the Fund Complex); since 2021 (for the remaining funds in the Complex) | Senior Vice President of Allspring Funds Management, LLC since 2009. Senior Vice President of Evergreen Investment Management Company, LLC from 2008 to 2010 and head of the Fund Reporting and Control Team within Fund Administration from 2005 to 2010. |
Christopher Baker (Born 1976) | Chief Compliance Officer, since 2022 | Global Chief Compliance Officer for Allspring Global Investments since 2022. Prior thereto, Chief Compliance Officer for State Street Global Advisors from 2018 to 2021. Senior Compliance Officer for the State Street divisions of Alternative Investment Solutions, Sector Solutions, and Global Marketing from 2015 to 2018. From 2010 to 2015 Vice President, Global Head of Investment and Marketing Compliance for State Street Global Advisors. |
Matthew Prasse (Born 1983) | Chief Legal Officer, since 2022; Secretary, since 2021 | Senior Counsel of the Allspring Legal Department since 2021. Senior Counsel of the Wells Fargo Legal Department from 2018 to 2021. Previously, Counsel for Barings LLC from 2015 to 2018. Prior to joining Barings, Associate at Morgan, Lewis & Bockius LLP from 2008 to 2015. |

P.O. Box 219967
Kansas City, MO 64121-9967

SAR4314 01-24

Allspring Funds

President
Allspring Funds
Notice to Shareholders |
Beginning in July 2024, the Fund will be required by the Securities and Exchange Commission to send shareholders a paper copy of a new tailored shareholder report in place of the full shareholder report that you are now receiving. The tailored shareholder report will contain concise information about the Fund, including certain expense and performance information and fund statistics. If you wish to receive this new tailored shareholder report electronically, please follow the instructions on the back cover of this report. |
Other information that is currently included in the shareholder report, such as the Fund’s financial statements, will be available online and upon request, free of charge, in paper or electronic format. |
Investment objective | The Fund seeks long-term capital appreciation. |
Manager | Allspring Funds Management, LLC |
Subadviser | Allspring Global Investments, LLC |
Portfolio managers | Robert Gruendyke, CFA, David Nazaret, CFA, Thomas C. Ognar, CFA |
Average annual total returns (%) as of January 31, 2024 | |||||||||
Including sales charge | Excluding sales charge | Expense ratios1 (%) | |||||||
Inception date | 1 year | 5 year | 10 year | 1 year | 5 year | 10 year | Gross | Net2 | |
Class A (STAFX) | 7-30-2010 | 29.81 | 12.16 | 11.50 | 37.73 | 13.50 | 12.16 | 1.18 | 1.07 |
Class C (STOFX) | 7-30-2010 | 35.69 | 12.63 | 11.48 | 36.69 | 12.63 | 11.48 | 1.93 | 1.82 |
Class R6 (STFFX) | 11-30-2012 | – | – | – | 38.31 | 13.96 | 12.64 | 0.76 | 0.65 |
Administrator Class (STDFX) | 7-30-2010 | – | – | – | 37.90 | 13.62 | 12.29 | 1.11 | 0.95 |
Institutional Class (STNFX) | 7-30-2010 | – | – | – | 38.15 | 13.84 | 12.53 | 0.86 | 0.75 |
Russell 3000® Index3 | – | – | – | – | 19.15 | 13.53 | 11.96 | – | – |
Russell 1000® Growth Index4 | – | – | – | – | 34.99 | 18.04 | 15.48 | – | – |
1 | Reflects the expense ratios as stated in the most recent prospectuses. The expense ratios shown are subject to change and may differ from the annualized expense ratios shown in the Financial Highlights of this report. |
2 | The manager has contractually committed through November 30, 2024, to waive fees and/or reimburse expenses to the extent necessary to cap total annual fund operating expenses after fee waivers at 1.07% for Class A, 1.82% for Class C, 0.65% for Class R6, 0.95% for Administrator Class and 0.75% for Institutional Class. Brokerage commissions, stamp duty fees, interest, taxes, acquired fund fees and expenses (if any), and extraordinary expenses are excluded from the expense caps. Prior to or after the commitment expiration date, the caps may be increased or the commitment to maintain the caps may be terminated only with the approval of the Board of Trustees. Without these caps, the Fund’s returns would have been lower. The expense ratio paid by an investor is the net expense ratio (the total annual fund operating expenses after fee waivers) as stated in the prospectuses. |
3 | The Russell 3000® Index measures the performance of the 3,000 largest U.S. companies based on total market capitalization, which represents approximately 98% of the investable U.S. equity market. You cannot invest directly in an index. |
4 | The Russell 1000® Growth Index measures the performance of those Russell 1000 companies with higher price/book ratios and higher forecasted growth values. You cannot invest directly in an index. |
CFA® and Chartered Financial Analyst® are trademarks owned by CFA Institute. |
Ten largest holdings (%) as of January 31, 20241 | |
Microsoft Corp. | 11.06 |
Apple, Inc. | 7.76 |
Amazon.com, Inc. | 7.17 |
NVIDIA Corp. | 6.76 |
Meta Platforms, Inc. Class A | 5.58 |
Alphabet, Inc. Class A | 3.51 |
Mastercard, Inc. Class A | 2.79 |
Advanced Micro Devices, Inc. | 2.37 |
Visa, Inc. Class A | 2.21 |
Eli Lilly & Co. | 2.21 |
1 | Figures represent the percentage of the Fund’s net assets. Holdings are subject to change and may have changed since the date specified. |
Sector allocation as of January 31, 20241 |

1 | Figures represent the percentage of the Fund’s long-term investments. Allocations are subject to change and may have changed since the date specified. |
Beginning account value 8-1-2023 | Ending account value 1-31-2024 | Expenses paid during the period1 | Annualized net expense ratio | |
Class A | ||||
Actual | $1,000.00 | $1,140.04 | $5.76 | 1.07 % |
Hypothetical (5% return before expenses) | $1,000.00 | $1,019.76 | $5.43 | 1.07 % |
Class C | ||||
Actual | $1,000.00 | $1,135.76 | $9.77 | 1.82 % |
Hypothetical (5% return before expenses) | $1,000.00 | $1,015.99 | $9.22 | 1.82 % |
Class R6 | ||||
Actual | $1,000.00 | $1,142.35 | $3.50 | 0.65 % |
Hypothetical (5% return before expenses) | $1,000.00 | $1,021.87 | $3.30 | 0.65 % |
Administrator Class | ||||
Actual | $1,000.00 | $1,140.60 | $5.11 | 0.95 % |
Hypothetical (5% return before expenses) | $1,000.00 | $1,020.36 | $4.82 | 0.95 % |
Institutional Class | ||||
Actual | $1,000.00 | $1,141.83 | $4.04 | 0.75 % |
Hypothetical (5% return before expenses) | $1,000.00 | $1,021.37 | $3.81 | 0.75 % |
1 | Expenses paid is equal to the annualized net expense ratio of each class multiplied by the average account value over the period, multiplied by 184 divided by 366 (to reflect the one-half-year period). |
Shares | Value | |||||
Common stocks: 99.09% | ||||||
Communication services: 12.54% | ||||||
Entertainment: 1.55% | ||||||
Netflix, Inc.† | 19,848 | $11,196,455 | ||||
Interactive media & services: 10.99% | ||||||
Alphabet, Inc. Class A† | 180,296 | 25,259,470 | ||||
Alphabet, Inc. Class C† | 96,493 | 13,682,708 | ||||
Meta Platforms, Inc. Class A† | 103,095 | 40,221,483 | ||||
79,163,661 | ||||||
Consumer discretionary: 18.27% | ||||||
Broadline retail: 7.90% | ||||||
Amazon.com, Inc.† | 332,774 | 51,646,525 | ||||
MercadoLibre, Inc.† | 3,089 | 5,287,781 | ||||
56,934,306 | ||||||
Hotels, restaurants & leisure: 3.76% | ||||||
Airbnb, Inc. Class A† | 18,878 | 2,721,075 | ||||
Booking Holdings, Inc.† | 3,444 | 12,079,727 | ||||
Chipotle Mexican Grill, Inc.† | 3,740 | 9,008,800 | ||||
Starbucks Corp. | 35,370 | 3,290,471 | ||||
27,100,073 | ||||||
Specialty retail: 5.11% | ||||||
AutoZone, Inc.† | 1,827 | 5,046,411 | ||||
Home Depot, Inc. | 7,217 | 2,547,312 | ||||
O’Reilly Automotive, Inc.† | 8,338 | 8,530,191 | ||||
TJX Cos., Inc. | 137,638 | 13,063,223 | ||||
Ulta Beauty, Inc.† | 15,094 | 7,577,943 | ||||
36,765,080 | ||||||
Textiles, apparel & luxury goods: 1.50% | ||||||
lululemon athletica, Inc.† | 18,525 | 8,407,015 | ||||
NIKE, Inc. Class B | 23,484 | 2,384,331 | ||||
10,791,346 | ||||||
Consumer staples: 0.35% | ||||||
Beverages: 0.35% | ||||||
Constellation Brands, Inc. Class A | 10,244 | 2,510,600 | ||||
Financials: 7.20% | ||||||
Capital markets: 2.10% | ||||||
BlackRock, Inc. | 6,929 | 5,365,194 | ||||
Moody’s Corp. | 3,032 | 1,188,665 | ||||
S&P Global, Inc. | 19,206 | 8,611,010 | ||||
15,164,869 | ||||||
Financial services: 5.10% | ||||||
Block, Inc.† | 11,000 | 715,110 | ||||
Shares | Value | |||||
Financial services(continued) | ||||||
Mastercard, Inc. Class A | 44,659 | $20,062,163 | ||||
Visa, Inc. Class A | 58,377 | 15,952,099 | ||||
36,729,372 | ||||||
Health care: 9.98% | ||||||
Biotechnology: 1.13% | ||||||
Vertex Pharmaceuticals, Inc.† | 18,805 | 8,149,711 | ||||
Health care equipment & supplies: 3.75% | ||||||
Boston Scientific Corp.† | 201,797 | 12,765,678 | ||||
DexCom, Inc.† | 9,000 | 1,092,150 | ||||
Intuitive Surgical, Inc.† | 13,634 | 5,156,652 | ||||
Stryker Corp. | 23,821 | 7,991,469 | ||||
27,005,949 | ||||||
Health care providers & services: 0.33% | ||||||
UnitedHealth Group, Inc. | 4,679 | 2,394,431 | ||||
Health care technology: 1.75% | ||||||
Veeva Systems, Inc. Class A† | 60,817 | 12,614,054 | ||||
Pharmaceuticals: 3.02% | ||||||
Eli Lilly & Co. | 24,601 | 15,882,651 | ||||
Novo Nordisk AS ADR | 26,000 | 2,983,240 | ||||
Zoetis, Inc. | 15,202 | 2,855,088 | ||||
21,720,979 | ||||||
Industrials: 5.18% | ||||||
Aerospace & defense: 0.74% | ||||||
TransDigm Group, Inc. | 4,869 | 5,320,259 | ||||
Commercial services & supplies: 1.70% | ||||||
Copart, Inc.† | 254,890 | 12,244,915 | ||||
Ground transportation: 1.97% | ||||||
Uber Technologies, Inc.† | 217,714 | 14,210,193 | ||||
Machinery: 0.77% | ||||||
Fortive Corp. | 70,445 | 5,507,390 | ||||
Information technology: 43.32% | ||||||
Communications equipment: 1.21% | ||||||
Arista Networks, Inc.† | 33,710 | 8,720,103 | ||||
IT services: 0.31% | ||||||
MongoDB, Inc.† | 5,600 | 2,242,912 | ||||
Semiconductors & semiconductor equipment: 12.15% | ||||||
Advanced Micro Devices, Inc.† | 101,823 | 17,074,699 | ||||
Broadcom, Inc. | 3,185 | 3,758,300 | ||||
Marvell Technology, Inc. | 101,952 | 6,902,150 | ||||
Shares | Value | |||||
Semiconductors & semiconductor equipment(continued) | ||||||
Microchip Technology, Inc. | 130,178 | $11,088,562 | ||||
NVIDIA Corp. | 79,162 | 48,706,004 | ||||
87,529,715 | ||||||
Software: 21.89% | ||||||
Adobe, Inc.† | 10,923 | 6,748,011 | ||||
Cadence Design Systems, Inc.† | 4,000 | 1,153,840 | ||||
Check Point Software Technologies Ltd.† | 11,400 | 1,811,802 | ||||
Crowdstrike Holdings, Inc. Class A† | 39,706 | 11,614,005 | ||||
Intuit, Inc. | 14,513 | 9,162,492 | ||||
Microsoft Corp. | 200,462 | 79,699,682 | ||||
Oracle Corp. | 124,704 | 13,929,437 | ||||
Palo Alto Networks, Inc.† | 26,243 | 8,883,518 | ||||
Salesforce, Inc.† | 22,105 | 6,213,494 | ||||
ServiceNow, Inc.† | 15,573 | 11,919,574 | ||||
Workday, Inc. Class A† | 22,570 | 6,569,450 | ||||
157,705,305 | ||||||
Technology hardware, storage & peripherals: 7.76% | ||||||
Apple, Inc. | 303,265 | 55,922,066 | ||||
Materials: 1.61% | ||||||
Chemicals: 1.61% | ||||||
Linde PLC | 28,646 | 11,596,760 | ||||
Real estate: 0.64% | ||||||
Specialized REITs : 0.64% | ||||||
Equinix, Inc. | 5,568 | 4,620,159 | ||||
Total common stocks (Cost $264,095,733) | 713,860,663 | |||||
Yield | ||||||
Short-term investments: 1.08% | ||||||
Investment companies: 1.08% | ||||||
Allspring Government Money Market Fund Select Class♠∞ | 5.27 % | 7,766,611 | 7,766,611 | |||
Total short-term investments (Cost $7,766,611) | 7,766,611 | |||||
Total investments in securities (Cost $271,862,344) | 100.17 % | 721,627,274 | ||||
Other assets and liabilities, net | (0.17 ) | (1,195,745 ) | ||||
Total net assets | 100.00 % | $720,431,529 | ||||
† | Non-income-earning security |
♠ | The issuer of the security is an affiliated person of the Fund as defined in the Investment Company Act of 1940. |
∞ | The rate represents the 7-day annualized yield at period end. |
Abbreviations: | |
ADR | American depositary receipt |
REIT | Real estate investment trust |
Value, beginning of period | Purchases | Sales proceeds | Net realized gains (losses) | Net change in unrealized gains (losses) | Value, end of period | Shares, end of period | Income from affiliated securities | |
Short-term investments | ||||||||
Allspring Government Money Market Fund Select Class | $2,449,356 | $65,975,194 | $(60,657,939 ) | $0 | $0 | $7,766,611 | 7,766,611 | $141,092 |
Assets | |
Investments in unaffiliated securities, at value (cost $264,095,733) | $713,860,663 |
Investments in affiliated securities, at value (cost $7,766,611) | 7,766,611 |
Receivable for investments sold | 933,362 |
Receivable for Fund shares sold | 209,556 |
Receivable for dividends | 55,179 |
Prepaid expenses and other assets | 51,354 |
Total assets | 722,876,725 |
Liabilities | |
Payable for investments purchased | 1,075,031 |
Payable for Fund shares redeemed | 480,591 |
Management fee payable | 343,068 |
Shareholder servicing fees payable | 129,369 |
Administration fees payable | 104,639 |
Distribution fees payable | 2,114 |
Accrued expenses and other liabilities | 310,384 |
Total liabilities | 2,445,196 |
Total net assets | $720,431,529 |
Net assets consist of | |
Paid-in capital | $252,779,197 |
Total distributable earnings | 467,652,332 |
Total net assets | $720,431,529 |
Computation of net asset value and offering price per share | |
Net assets–Class A | $555,585,443 |
Shares outstanding–Class A1 | 15,055,817 |
Net asset value per share–Class A | $36.90 |
Maximum offering price per share – Class A2 | $39.15 |
Net assets–Class C | $3,173,655 |
Shares outstanding–Class C1 | 115,985 |
Net asset value per share–Class C | $27.36 |
Net assets–Class R6 | $63,108,384 |
Shares outstanding–Class R61 | 1,547,404 |
Net asset value per share–Class R6 | $40.78 |
Net assets–Administrator Class | $66,636,387 |
Shares outstanding–Administrator Class1 | 1,743,834 |
Net asset value per share–Administrator Class | $38.21 |
Net assets–Institutional Class | $31,927,660 |
Shares outstanding–Institutional Class1 | 794,163 |
Net asset value per share–Institutional Class | $40.20 |
Investment income | |
Dividends (net of foreign withholdings taxes of $1,681) | $1,718,875 |
Income from affiliated securities | 141,092 |
Interest | 1,674 |
Total investment income | 1,861,641 |
Expenses | |
Management fee | 2,316,012 |
Administration fees | |
Class A | 512,341 |
Class C | 3,176 |
Class R6 | 8,607 |
Administrator Class | 40,038 |
Institutional Class | 21,523 |
Shareholder servicing fees | |
Class A | 640,376 |
Class C | 3,846 |
Administrator Class | 76,996 |
Distribution fees | |
Class C | 11,540 |
Custody and accounting fees | 6,320 |
Professional fees | 32,849 |
Registration fees | 46,059 |
Shareholder report expenses | 17,535 |
Trustees’ fees and expenses | 12,234 |
Other fees and expenses | 17,394 |
Total expenses | 3,766,846 |
Less: Fee waivers and/or expense reimbursements | |
Fund-level | (377,238 ) |
Administrator Class | (16,455 ) |
Net expenses | 3,373,153 |
Net investment loss | (1,511,512 ) |
Realized and unrealized gains (losses) on investments | |
Net realized gains on investments | 32,482,043 |
Net change in unrealized gains (losses) on investments | 58,673,289 |
Net realized and unrealized gains (losses) on investments | 91,155,332 |
Net increase in net assets resulting from operations | $89,643,820 |
Six months ended January 31, 2024 (unaudited) | Year ended July 31, 2023 | |||
Operations | ||||
Net investment loss | $(1,511,512 ) | $(724,275 ) | ||
Net realized gains on investments | 32,482,043 | 108,891,430 | ||
Net change in unrealized gains (losses) on investments | 58,673,289 | (2,297,272 ) | ||
Net increase in net assets resulting from operations | 89,643,820 | 105,869,883 | ||
Distributions to shareholders from | ||||
Net investment income and net realized gains | ||||
Class A | (91,328,270 ) | (44,292,446 ) | ||
Class C | (877,665 ) | (313,544 ) | ||
Class R | N/A | (216,039 )1 | ||
Class R4 | N/A | (1,433 )2 | ||
Class R6 | (9,452,040 ) | (19,033,722 ) | ||
Administrator Class | (10,630,905 ) | (5,257,541 ) | ||
Institutional Class | (5,273,115 ) | (3,236,556 ) | ||
Total distributions to shareholders | (117,561,995 ) | (72,351,281 ) | ||
Capital share transactions | Shares | Shares | ||
Proceeds from shares sold | ||||
Class A | 186,729 | 7,054,647 | 345,590 | 11,769,274 |
Class C | 40,052 | 1,201,391 | 31,434 | 905,859 |
Class R | N/A | N/A | 7,149 1 | 234,197 1 |
Class R6 | 93,629 | 3,909,555 | 704,748 | 26,485,348 |
Administrator Class | 26,090 | 1,010,007 | 42,005 | 1,506,022 |
Institutional Class | 88,232 | 3,575,995 | 124,960 | 4,416,225 |
16,751,595 | 45,316,925 | |||
Reinvestment of distributions | ||||
Class A | 2,593,945 | 88,686,986 | 1,378,122 | 43,052,457 |
Class C | 34,581 | 877,665 | 12,658 | 313,544 |
Class R | N/A | N/A | 7,146 1 | 209,670 1 |
Class R4 | N/A | N/A | 43 2 | 1,433 2 |
Class R6 | 223,823 | 8,453,801 | 543,092 | 18,356,494 |
Administrator Class | 300,308 | 10,630,905 | 163,684 | 5,257,541 |
Institutional Class | 137,074 | 5,104,635 | 93,398 | 3,123,225 |
113,753,992 | 70,314,364 | |||
Six months ended January 31, 2024 (unaudited) | Year ended July 31, 2023 | |||
Shares | Shares | |||
Payment for shares redeemed | ||||
Class A | (929,964 ) | $(34,444,388 ) | (1,616,026 ) | $(55,221,209 ) |
Class C | (59,369 ) | (1,568,805 ) | (47,961 ) | (1,356,642 ) |
Class R | N/A | N/A | (89,296 )1 | (3,152,620 )1 |
Class R4 | N/A | N/A | (450 )2 | (18,118 )2 |
Class R6 | (126,455 ) | (5,239,523 ) | (5,257,486 ) | (207,776,674 ) |
Administrator Class | (123,988 ) | (4,751,055 ) | (223,892 ) | (7,890,925 ) |
Institutional Class | (266,484 ) | (10,729,520 ) | (476,175 ) | (17,057,394 ) |
(56,733,291 ) | (292,473,582 ) | |||
Net increase (decrease) in net assets resulting from capital share transactions | 73,772,296 | (176,842,293 ) | ||
Total increase (decrease) in net assets | 45,854,121 | (143,323,691 ) | ||
Net assets | ||||
Beginning of period | 674,577,408 | 817,901,099 | ||
End of period | $720,431,529 | $674,577,408 | ||
Six months ended January 31, 2024 (unaudited) | Year ended July 31 | |||||
Class A | 2023 | 2022 | 2021 | 2020 | 2019 | |
Net asset value, beginning of period | $39.13 | $37.58 | $55.05 | $49.63 | $44.23 | $52.01 |
Net investment loss | (0.10 )1 | (0.08 )1 | (0.24 )1 | (0.25 ) | (0.11 )1 | (0.03 )1 |
Net realized and unrealized gains (losses) on investments | 5.01 | 5.15 | (9.43 ) | 12.60 | 9.66 | 3.47 |
Total from investment operations | 4.91 | 5.07 | (9.67 ) | 12.35 | 9.55 | 3.44 |
Distributions to shareholders from | ||||||
Net realized gains | (7.14 ) | (3.52 ) | (7.80 ) | (6.93 ) | (4.15 ) | (11.22 ) |
Net asset value, end of period | $36.90 | $39.13 | $37.58 | $55.05 | $49.63 | $44.23 |
Total return2 | 14.00 % | 15.86 % | (20.79 )% | 27.25 % | 23.51 % | 11.00 % |
Ratios to average net assets (annualized) | ||||||
Gross expenses | 1.18 % | 1.19 % | 1.17 % | 1.17 % | 1.18 % | 1.18 % |
Net expenses | 1.07 % | 1.06 % | 1.04 % | 1.05 % | 1.05 % | 1.07 % |
Net investment loss | (0.51 )% | (0.24 )% | (0.52 )% | (0.53 )% | (0.24 )% | (0.07 )% |
Supplemental data | ||||||
Portfolio turnover rate | 11 % | 51 % | 43 % | 39 % | 34 % | 43 % |
Net assets, end of period (000s omitted) | $555,585 | $516,771 | $492,177 | $688,523 | $587,771 | $529,110 |
1 | Calculated based upon average shares outstanding |
2 | Total return calculations do not include any sales charges. Returns for periods of less than one year are not annualized. |
Six months ended January 31, 2024 (unaudited) | Year ended July 31 | |||||
Class C | 2023 | 2022 | 2021 | 2020 | 2019 | |
Net asset value, beginning of period | $30.87 | $30.66 | $46.65 | $43.32 | $39.41 | $47.97 |
Net investment loss | (0.18 )1 | (0.28 )1 | (0.49 )1 | (0.56 )1 | (0.38 )1 | (0.32 )1 |
Net realized and unrealized gains (losses) on investments | 3.81 | 4.01 | (7.70 ) | 10.82 | 8.44 | 2.98 |
Total from investment operations | 3.63 | 3.73 | (8.19 ) | 10.26 | 8.06 | 2.66 |
Distributions to shareholders from | ||||||
Net realized gains | (7.14 ) | (3.52 ) | (7.80 ) | (6.93 ) | (4.15 ) | (11.22 ) |
Net asset value, end of period | $27.36 | $30.87 | $30.66 | $46.65 | $43.32 | $39.41 |
Total return2 | 13.58 % | 15.00 % | (21.42 )% | 26.28 % | 22.57 % | 10.17 % |
Ratios to average net assets (annualized) | ||||||
Gross expenses | 1.90 % | 1.91 % | 1.92 % | 1.92 % | 1.93 % | 1.93 % |
Net expenses | 1.82 % | 1.82 % | 1.82 % | 1.82 % | 1.82 % | 1.82 % |
Net investment loss | (1.27 )% | (1.00 )% | (1.29 )% | (1.29 )% | (1.00 )% | (0.80 )% |
Supplemental data | ||||||
Portfolio turnover rate | 11 % | 51 % | 43 % | 39 % | 34 % | 43 % |
Net assets, end of period (000s omitted) | $3,174 | $3,110 | $3,207 | $6,351 | $9,918 | $11,504 |
1 | Calculated based upon average shares outstanding |
2 | Total return calculations do not include any sales charges. Returns for periods of less than one year are not annualized. |
Six months ended January 31, 2024 (unaudited) | Year ended July 31 | |||||
Class R6 | 2023 | 2022 | 2021 | 2020 | 2019 | |
Net asset value, beginning of period | $42.45 | $40.28 | $58.26 | $51.95 | $46.06 | $53.49 |
Net investment income (loss) | (0.02 )1 | 0.09 1 | (0.06 )1 | (0.08 )1 | 0.08 1 | 0.16 1 |
Net realized and unrealized gains (losses) on investments | 5.49 | 5.60 | (10.12 ) | 13.32 | 10.09 | 3.65 |
Total from investment operations | 5.47 | 5.69 | (10.18 ) | 13.24 | 10.17 | 3.81 |
Distributions to shareholders from | ||||||
Net investment income | 0.00 | 0.00 | 0.00 | 0.00 | (0.13 ) | (0.02 ) |
Net realized gains | (7.14 ) | (3.52 ) | (7.80 ) | (6.93 ) | (4.15 ) | (11.22 ) |
Total distributions to shareholders | (7.14 ) | (3.52 ) | (7.80 ) | (6.93 ) | (4.28 ) | (11.24 ) |
Net asset value, end of period | $40.78 | $42.45 | $40.28 | $58.26 | $51.95 | $46.06 |
Total return2 | 14.24 % | 16.37 % | (20.49 )% | 27.76 % | 24.03 % | 11.46 % |
Ratios to average net assets (annualized) | ||||||
Gross expenses | 0.76 % | 0.76 % | 0.74 % | 0.74 % | 0.75 % | 0.75 % |
Net expenses | 0.65 % | 0.65 % | 0.65 % | 0.65 % | 0.65 % | 0.65 % |
Net investment income (loss) | (0.09 )% | 0.24 % | (0.13 )% | (0.13 )% | 0.17 % | 0.35 % |
Supplemental data | ||||||
Portfolio turnover rate | 11 % | 51 % | 43 % | 39 % | 34 % | 43 % |
Net assets, end of period (000s omitted) | $63,108 | $57,583 | $216,150 | $377,470 | $327,584 | $326,990 |
1 | Calculated based upon average shares outstanding |
2 | Returns for periods of less than one year are not annualized. |
Six months ended January 31, 2024 (unaudited) | Year ended July 31 | |||||
Administrator Class | 2023 | 2022 | 2021 | 2020 | 2019 | |
Net asset value, beginning of period | $40.26 | $38.51 | $56.18 | $50.47 | $44.87 | $52.54 |
Net investment income (loss) | (0.08 )1 | (0.05 )1 | (0.20 ) | (0.23 ) | (0.07 ) | 0.02 |
Net realized and unrealized gains (losses) on investments | 5.17 | 5.32 | (9.67 ) | 12.87 | 9.83 | 3.53 |
Total from investment operations | 5.09 | 5.27 | (9.87 ) | 12.64 | 9.76 | 3.55 |
Distributions to shareholders from | ||||||
Net investment income | 0.00 | 0.00 | 0.00 | 0.00 | (0.01 ) | 0.00 |
Net realized gains | (7.14 ) | (3.52 ) | (7.80 ) | (6.93 ) | (4.15 ) | (11.22 ) |
Total distributions to shareholders | (7.14 ) | (3.52 ) | (7.80 ) | (6.93 ) | (4.16 ) | (11.22 ) |
Net asset value, end of period | $38.21 | $40.26 | $38.51 | $56.18 | $50.47 | $44.87 |
Total return2 | 14.06 % | 16.00 % | (20.72 )% | 27.38 % | 23.63 % | 11.14 % |
Ratios to average net assets (annualized) | ||||||
Gross expenses | 1.11 % | 1.11 % | 1.09 % | 1.09 % | 1.10 % | 1.10 % |
Net expenses | 0.95 % | 0.95 % | 0.95 % | 0.95 % | 0.95 % | 0.95 % |
Net investment income (loss) | (0.39 )% | (0.13 )% | (0.42 )% | (0.43 )% | (0.14 )% | 0.05 % |
Supplemental data | ||||||
Portfolio turnover rate | 11 % | 51 % | 43 % | 39 % | 34 % | 43 % |
Net assets, end of period (000s omitted) | $66,636 | $62,059 | $60,062 | $85,825 | $79,334 | $67,158 |
1 | Calculated based upon average shares outstanding |
2 | Returns for periods of less than one year are not annualized. |
Six months ended January 31, 2024 (unaudited) | Year ended July 31 | |||||
Institutional Class | 2023 | 2022 | 2021 | 2020 | 2019 | |
Net asset value, beginning of period | $41.96 | $39.90 | $57.83 | $51.67 | $45.84 | $53.31 |
Net investment income (loss) | (0.04 )1 | 0.03 1 | (0.11 )1 | (0.12 )1 | 0.03 1 | 0.12 1 |
Net realized and unrealized gains (losses) on investments | 5.42 | 5.55 | (10.02 ) | 13.21 | 10.04 | 3.63 |
Total from investment operations | 5.38 | 5.58 | (10.13 ) | 13.09 | 10.07 | 3.75 |
Distributions to shareholders from | ||||||
Net investment income | 0.00 | 0.00 | 0.00 | 0.00 | (0.09 ) | 0.00 |
Net realized gains | (7.14 ) | (3.52 ) | (7.80 ) | (6.93 ) | (4.15 ) | (11.22 ) |
Total distributions to shareholders | (7.14 ) | (3.52 ) | (7.80 ) | (6.93 ) | (4.24 ) | (11.22 ) |
Net asset value, end of period | $40.20 | $41.96 | $39.90 | $57.83 | $51.67 | $45.84 |
Total return2 | 14.18 % | 16.24 % | (20.57 )% | 27.61 % | 23.89 % | 11.37 % |
Ratios to average net assets (annualized) | ||||||
Gross expenses | 0.86 % | 0.86 % | 0.84 % | 0.84 % | 0.85 % | 0.85 % |
Net expenses | 0.75 % | 0.75 % | 0.75 % | 0.75 % | 0.75 % | 0.75 % |
Net investment income (loss) | (0.19 )% | 0.08 % | (0.22 )% | (0.23 )% | 0.07 % | 0.26 % |
Supplemental data | ||||||
Portfolio turnover rate | 11 % | 51 % | 43 % | 39 % | 34 % | 43 % |
Net assets, end of period (000s omitted) | $31,928 | $35,055 | $43,622 | $77,917 | $72,681 | $80,194 |
1 | Calculated based upon average shares outstanding |
2 | Returns for periods of less than one year are not annualized. |
Gross unrealized gains | $451,709,327 |
Gross unrealized losses | (2,124,542 ) |
Net unrealized gains | $449,584,785 |
Quoted prices (Level 1) | Other significant observable inputs (Level 2) | Significant unobservable inputs (Level 3) | Total | |
Assets | ||||
Investments in: | ||||
Common stocks | ||||
Communication services | $90,360,116 | $0 | $0 | $90,360,116 |
Consumer discretionary | 131,590,805 | 0 | 0 | 131,590,805 |
Consumer staples | 2,510,600 | 0 | 0 | 2,510,600 |
Financials | 51,894,241 | 0 | 0 | 51,894,241 |
Health care | 71,885,124 | 0 | 0 | 71,885,124 |
Industrials | 37,282,757 | 0 | 0 | 37,282,757 |
Information technology | 312,120,101 | 0 | 0 | 312,120,101 |
Materials | 11,596,760 | 0 | 0 | 11,596,760 |
Real estate | 4,620,159 | 0 | 0 | 4,620,159 |
Short-term investments | ||||
Investment companies | 7,766,611 | 0 | 0 | 7,766,611 |
Total assets | $721,627,274 | $0 | $0 | $721,627,274 |
Average daily net assets | Management fee |
First $500 million | 0.700 % |
Next $500 million | 0.675 |
Next $1 billion | 0.650 |
Next $2 billion | 0.625 |
Next $1 billion | 0.600 |
Next $3 billion | 0.590 |
Next $2 billion | 0.565 |
Next $2 billion | 0.555 |
Next $4 billion | 0.530 |
Over $16 billion | 0.505 |
Class-level administration fee | |
Class A | 0.20 % |
Class C | 0.20 |
Class R6 | 0.03 |
Administrator Class | 0.13 |
Institutional Class | 0.13 |
EXPENSE RATIO CAPS | |
Class A | 1.07 % |
Class C | 1.82 |
Class R6 | 0.65 |
Administrator Class | 0.95 |
Institutional Class | 0.75 |
Name and year of birth | Position held and length of service* | Principal occupations during past five years or longer | Current other public company or investment company directorships |
William R. Ebsworth (Born 1957) | Trustee, since 2015 | Retired. From 1984 to 2013, equities analyst, portfolio manager, research director and chief investment officer at Fidelity Management and Research Company in Boston, Tokyo, and Hong Kong, and retired in 2013 as Chief Investment Officer of Fidelity Strategic Advisers, Inc. where he led a team of investment professionals managing client assets. Prior thereto, Board member of Hong Kong Securities Clearing Co., Hong Kong Options Clearing Corp., the Thailand International Fund, Ltd., Fidelity Investments Life Insurance Company, and Empire Fidelity Investments Life Insurance Company. Serves on the Investment Company Institute’s Board of Governors since 2022 and Executive Committee since 2023 as well as the Vice Chairman of the Governing Council of the Independent Directors Council since 2023. Audit Committee Chair and Investment Committee Chair of the Vincent Memorial Hospital Foundation (non-profit organization). Mr. Ebsworth is a CFA charterholder. | N/A |
Jane A. Freeman (Born 1953) | Trustee, since 2015; Chair Liaison, since January 2018# | Retired. From 2012 to 2014 and 1999 to 2008, Chief Financial Officer of Scientific Learning Corporation. From 2008 to 2012, Ms. Freeman provided consulting services related to strategic business projects. Prior to 1999, Portfolio Manager at Rockefeller & Co. and Scudder, Stevens & Clark. Board member of the Harding Loevner Funds from 1996 to 2014, serving as both Lead Independent Director and chair of the Audit Committee. Board member of the Russell Exchange Traded Funds Trust from 2011 to 2012 and the chair of the Audit Committee. Ms. Freeman is also an inactive Chartered Financial Analyst. | N/A |
Isaiah Harris, Jr. (Born 1952) | Trustee, since 2009; Audit Committee Chair, since 2019 | Retired. Member of the Advisory Board of CEF of East Central Florida. Chairman of the Board of CIGNA Corporation from 2009 to 2021, and Director from 2005 to 2008. From 2003 to 2011, Director of Deluxe Corporation. Prior thereto, President and CEO of BellSouth Advertising and Publishing Corp. from 2005 to 2007, President and CEO of BellSouth Enterprises from 2004 to 2005 and President of BellSouth Consumer Services from 2000 to 2003. Emeritus member of the Iowa State University Foundation Board of Governors. Emeritus Member of the Advisory board of Iowa State University School of Business. Advisory Board Member, Palm Harbor Academy (private school). Advisory Board Member, Fellowship of Christian Athletes. Mr. Harris is a certified public accountant (inactive status). | N/A |
David F. Larcker (Born 1950) | Trustee, since 2009 | Distinguished Visiting Fellow at the Hoover Institution since 2022. James Irvin Miller Professor of Accounting at the Graduate School of Business (Emeritus), Stanford University, Director of the Corporate Governance Research Initiative and Senior Faculty of The Rock Center for Corporate Governance since 2006. From 2005 to 2008, Professor of Accounting at the Graduate School of Business, Stanford University. Prior thereto, Ernst & Young Professor of Accounting at The Wharton School, University of Pennsylvania from 1985 to 2005. | N/A |
Olivia S. Mitchell (Born 1953) | Trustee, since 2006 | International Foundation of Employee Benefit Plans Professor since 1993, Wharton School of the University of Pennsylvania. Director of Wharton’s Pension Research Council and Boettner Center on Pensions & Retirement Research, and Research Associate at the National Bureau of Economic Research. Previously taught at Cornell University from 1978 to 1993. | N/A |
Timothy J. Penny (Born 1951) | Trustee, since 1996; Chair, since 2018 | President and Chief Executive Officer of Southern Minnesota Initiative Foundation, a non-profit organization, since 2007. Vice Chair of the Economic Club of Minnesota, since 2007. Co-Chair of the Committee for a Responsible Federal Budget, since 1995. Member of the Board of Trustees of NorthStar Education Finance, Inc., a non-profit organization, from 2007-2022. Senior Fellow of the University of Minnesota Humphrey Institute from 1995 to 2017. | N/A |
Name and year of birth | Position held and length of service* | Principal occupations during past five years or longer | Current other public company or investment company directorships |
James G. Polisson (Born 1959) | Trustee, since 2018; Nominating and Governance Committee Chair, since 2024 | Retired. Chief Marketing Officer, Source (ETF) UK Services, Ltd, from 2015 to 2017. From 2012 to 2015, Principal of The Polisson Group, LLC, a management consulting, corporate advisory and principal investing company. Chief Executive Officer and Managing Director at Russell Investments, Global Exchange Traded Funds from 2010 to 2012. Managing Director of Barclays Global Investors from 1998 to 2010 and Global Chief Marketing Officer for iShares and Barclays Global Investors from 2000 to 2010. Trustee of the San Francisco Mechanics’ Institute, a non- profit organization, from 2013 to 2015. Board member of the Russell Exchange Traded Fund Trust from 2011 to 2012. Director of Barclays Global Investors Holdings Deutschland GmbH from 2006 to 2009. Mr. Polisson is an attorney and has a retired status with the Massachusetts and District of Columbia Bar Associations. | N/A |
Pamela Wheelock (Born 1959) | Trustee, since January 2020; previously Trustee from January 2018 to July 2019# | Retired. Executive and Senior Financial leadership positions in the public, private and nonprofit sectors. Interim President and CEO, McKnight Foundation, 2020. Interim Commissioner, Minnesota Department of Human Services, 2019. Chief Operating Officer, Twin Cities Habitat for Humanity, 2017-2019. Vice President for University Services, University of Minnesota, 2012- 2016. Interim President and CEO, Blue Cross and Blue Shield of Minnesota, 2011-2012. Executive Vice-President and Chief Financial Officer, Minnesota Wild, 2002-2008. Commissioner, Minnesota Department of Finance, 1999-2002. Chair of the Board of Directors of Destination Medical Center Corporation. Board member of the Minnesota Wild Foundation. | N/A |
Name and year of birth | Position held and length of service | Principal occupations during past five years or longer |
Andrew Owen (Born 1960) | President, since 2017 | President and Chief Executive Officer of Allspring Funds Management, LLC since 2017 and Head of Global Fund Governance of Allspring Global Investments since 2022. Prior thereto, co-president of Galliard Capital Management, LLC, an affiliate of Allspring Funds Management, LLC, from 2019 to 2022 and Head of Affiliated Managers, Allspring Global Investments, from 2014 to 2019 and Executive Vice President responsible for marketing, investments and product development for Allspring Funds Management, LLC, from 2009 to 2014. |
Jeremy DePalma (Born 1974) | Treasurer, since 2012 (for certain funds in the Fund Complex); since 2021 (for the remaining funds in the Complex) | Senior Vice President of Allspring Funds Management, LLC since 2009. Senior Vice President of Evergreen Investment Management Company, LLC from 2008 to 2010 and head of the Fund Reporting and Control Team within Fund Administration from 2005 to 2010. |
Christopher Baker (Born 1976) | Chief Compliance Officer, since 2022 | Global Chief Compliance Officer for Allspring Global Investments since 2022. Prior thereto, Chief Compliance Officer for State Street Global Advisors from 2018 to 2021. Senior Compliance Officer for the State Street divisions of Alternative Investment Solutions, Sector Solutions, and Global Marketing from 2015 to 2018. From 2010 to 2015 Vice President, Global Head of Investment and Marketing Compliance for State Street Global Advisors. |
Matthew Prasse (Born 1983) | Chief Legal Officer, since 2022; Secretary, since 2021 | Senior Counsel of the Allspring Legal Department since 2021. Senior Counsel of the Wells Fargo Legal Department from 2018 to 2021. Previously, Counsel for Barings LLC from 2015 to 2018. Prior to joining Barings, Associate at Morgan, Lewis & Bockius LLP from 2008 to 2015. |

P.O. Box 219967
Kansas City, MO 64121-9967

SAR3354 01-24

Allspring Funds

President
Allspring Funds
Notice to Shareholders |
Beginning in July 2024, the Fund will be required by the Securities and Exchange Commission to send shareholders a paper copy of a new tailored shareholder report in place of the full shareholder report that you are now receiving. The tailored shareholder report will contain concise information about the Fund, including certain expense and performance information and fund statistics. If you wish to receive this new tailored shareholder report electronically, please follow the instructions on the back cover of this report. |
Other information that is currently included in the shareholder report, such as the Fund’s financial statements, will be available online and upon request, free of charge, in paper or electronic format. |
Investment objective | The Fund seeks long-term capital appreciation. |
Manager | Allspring Funds Management, LLC |
Subadviser | Allspring Global Investments, LLC |
Portfolio managers | Ryan Brown, CFA, Harindra de Silva, Ph.D. CFA |
Average annual total returns (%) as of January 31, 2024 | |||||||||
Including sales charge | Excluding sales charge | Expense ratios1 (%) | |||||||
Inception date | 1 year | 5 year | 10 year | 1 year | 5 year | 10 year | Gross | Net2 | |
Class A (WLCAX) | 3-31-2008 | -0.75 | 8.88 | 7.41 | 5.33 | 10.18 | 8.05 | 0.96 | 0.82 |
Class C (WFLVX) | 3-31-2008 | 3.50 | 9.34 | 7.41 | 4.50 | 9.34 | 7.41 | 1.71 | 1.57 |
Class R6 (WTLVX)3 | 4-7-2017 | – | – | – | 5.71 | 10.62 | 8.50 | 0.54 | 0.40 |
Administrator Class (WWIDX) | 12-31-2001 | – | – | – | 5.38 | 10.25 | 8.17 | 0.89 | 0.75 |
Institutional Class (WLCIX) | 3-31-2008 | – | – | – | 5.68 | 10.52 | 8.43 | 0.64 | 0.50 |
Russell 3000® Index4 | – | – | – | – | 19.15 | 13.53 | 11.96 | – | – |
Russell 1000® Value Index5 | – | – | – | – | 6.08 | 9.28 | 8.80 | – | – |
1 | Reflects the expense ratios as stated in the most recent prospectuses. The expense ratios shown are subject to change and may differ from the annualized expense ratios shown in the Financial Highlights of this report. |
2 | The manager has contractually committed through November 30, 2024, to waive fees and/or reimburse expenses to the extent necessary to cap total annual fund operating expenses after fee waivers at 0.82% for Class A, 1.57% for Class C, 0.40% for Class R6, 0.75% for Administrator Class and 0.50% for Institutional Class. Brokerage commissions, stamp duty fees, interest, taxes, acquired fund fees and expenses (if any) from funds in which the affiliated master portfolio invests, and extraordinary expenses are excluded from the expense caps. Prior to or after the commitment expiration date, the caps may be increased or the commitment to maintain the caps may be terminated only with the approval of the Board of Trustees. Without these caps, the Fund’s returns would have been lower. The expense ratio paid by an investor is the net expense ratio (the total annual fund operating expenses after fee waivers) as stated in the prospectuses. |
3 | Historical performance shown for the Class R6 shares prior to their inception reflects the performance of the Institutional Class shares, and includes the higher expenses applicable to the Institutional Class shares. If these expenses had not been included, returns for the Class R6 shares would be higher. |
4 | The Russell 3000® Index measures the performance of the 3,000 largest U.S. companies based on total market capitalization, which represents approximately 98% of the investable U.S. equity market. You cannot invest directly in an index. |
5 | The Russell 1000® Value Index measures the performance of those Russell 1000 companies with lower price/book ratios and lower forecasted growth values. You cannot invest directly in an index. |
CFA® and Chartered Financial Analyst® are trademarks owned by CFA Institute. |
Ten largest holdings (%) as of January 31, 20241 | |
General Electric Co. | 2.82 |
Citigroup, Inc. | 2.65 |
Bristol-Myers Squibb Co. | 2.35 |
General Dynamics Corp. | 2.33 |
Cigna Group | 2.32 |
Progressive Corp. | 2.31 |
QUALCOMM, Inc. | 2.27 |
Marathon Petroleum Corp. | 2.26 |
Southern Co. | 2.22 |
TJX Cos., Inc. | 2.07 |
1 | Figures represent the percentage of the Fund’s net assets. Holdings are subject to change and may have changed since the date specified. |
Sector allocation as of January 31, 20241 |
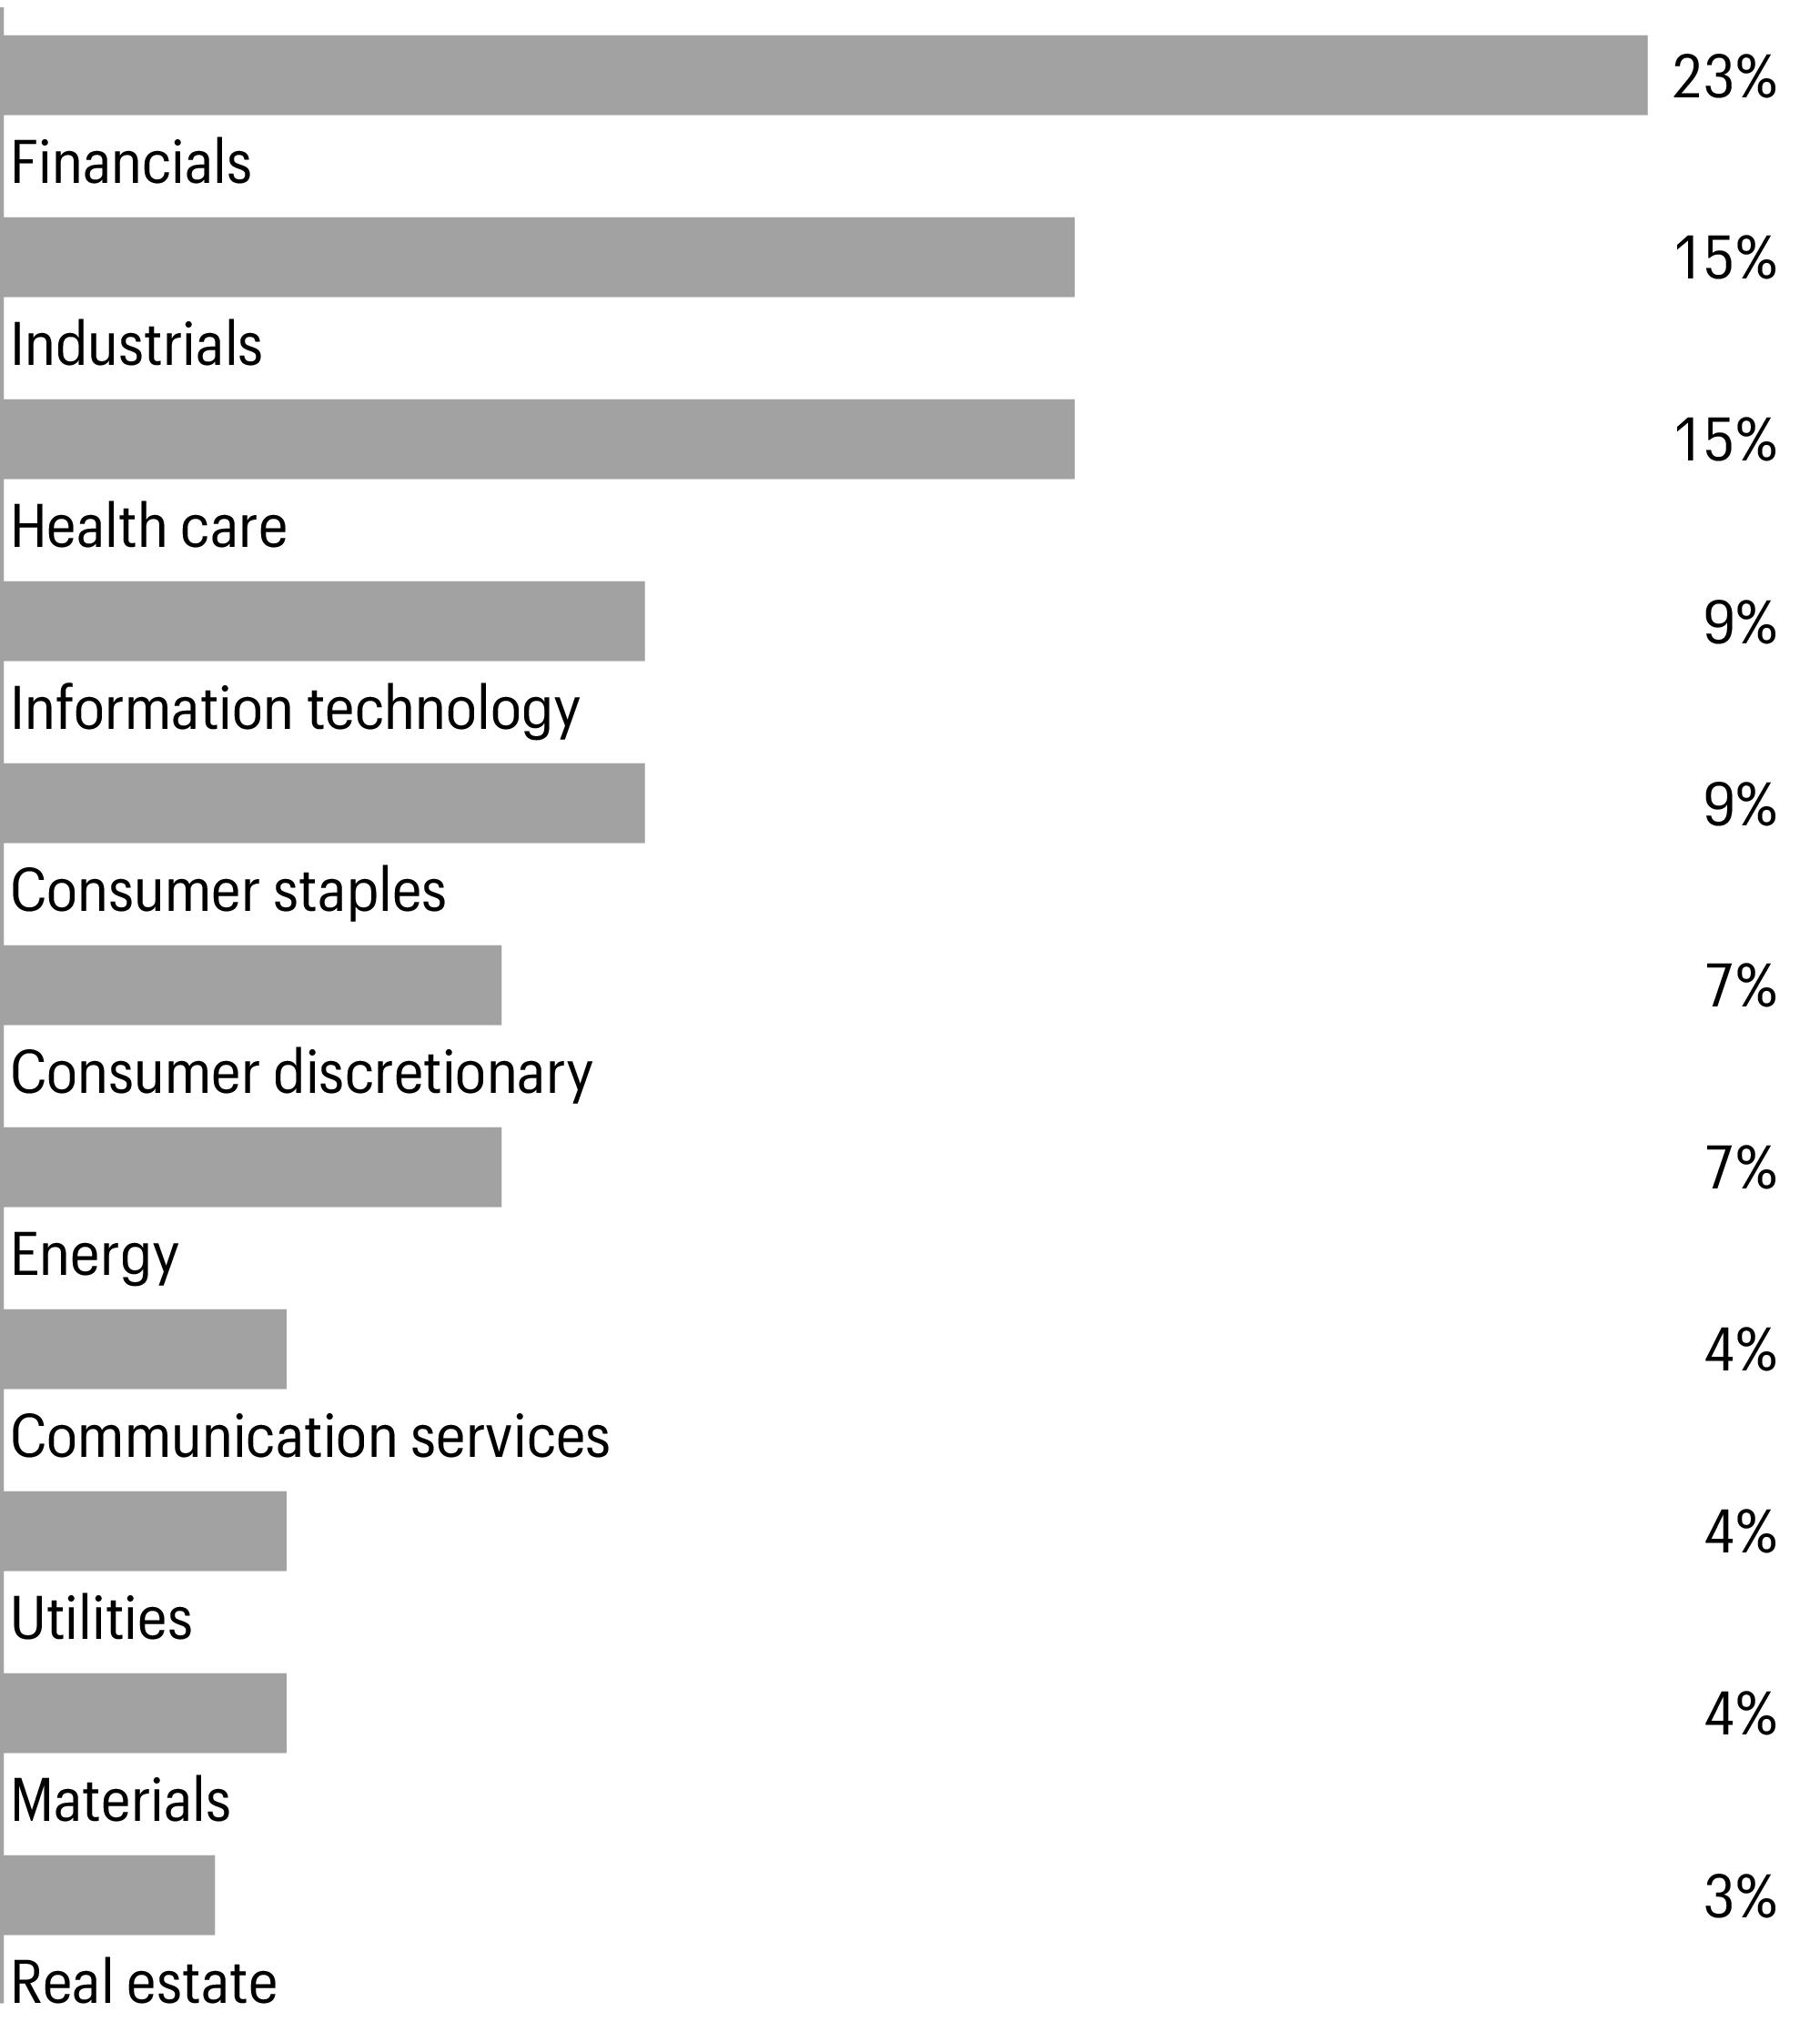
1 | Figures represent the percentage of the Fund’s long-term investments. Allocations are subject to change and may have changed since the date specified. |
Beginning account value 8-1-2023 | Ending account value 1-31-2024 | Expenses paid during the period1 | Annualized net expense ratio | |
Class A | ||||
Actual | $1,000.00 | $1,030.70 | $4.19 | 0.82 % |
Hypothetical (5% return before expenses) | $1,000.00 | $1,021.01 | $4.17 | 0.82 % |
Class C | ||||
Actual | $1,000.00 | $1,026.59 | $8.00 | 1.57 % |
Hypothetical (5% return before expenses) | $1,000.00 | $1,017.24 | $7.96 | 1.57 % |
Class R6 | ||||
Actual | $1,000.00 | $1,032.55 | $2.04 | 0.40 % |
Hypothetical (5% return before expenses) | $1,000.00 | $1,023.13 | $2.03 | 0.40 % |
Administrator Class | ||||
Actual | $1,000.00 | $1,030.42 | $3.83 | 0.75 % |
Hypothetical (5% return before expenses) | $1,000.00 | $1,021.37 | $3.81 | 0.75 % |
Institutional Class | ||||
Actual | $1,000.00 | $1,031.95 | $2.55 | 0.50 % |
Hypothetical (5% return before expenses) | $1,000.00 | $1,022.62 | $2.54 | 0.50 % |
1 | Expenses paid is equal to the annualized net expense ratio of each class multiplied by the average account value over the period, multiplied by 184 divided by 366 (to reflect the one-half-year period). |
Shares | Value | |||||
Common stocks: 98.56% | ||||||
Communication services: 4.13% | ||||||
Diversified telecommunication services: 1.03% | ||||||
Verizon Communications, Inc. | 53,253 | $2,255,265 | ||||
Interactive media & services: 0.15% | ||||||
Meta Platforms, Inc. Class A† | 873 | 340,592 | ||||
Media: 1.13% | ||||||
Comcast Corp. Class A | 53,018 | 2,467,458 | ||||
Wireless telecommunication services: 1.82% | ||||||
T-Mobile U.S., Inc. | 24,693 | 3,981,252 | ||||
Consumer discretionary: 7.04% | ||||||
Broadline retail: 1.39% | ||||||
Amazon.com, Inc.† | 13,684 | 2,123,757 | ||||
Coupang, Inc.† | 65,378 | 915,292 | ||||
3,039,049 | ||||||
Distributors: 1.06% | ||||||
Genuine Parts Co. | 16,514 | 2,315,758 | ||||
Hotels, restaurants & leisure: 2.16% | ||||||
Booking Holdings, Inc.† | 269 | 943,509 | ||||
Chipotle Mexican Grill, Inc.† | 1,094 | 2,635,194 | ||||
Starbucks Corp. | 12,424 | 1,155,805 | ||||
4,734,508 | ||||||
Specialty retail: 2.43% | ||||||
ODP Corp.† | 15,591 | 797,324 | ||||
TJX Cos., Inc. | 47,774 | 4,534,230 | ||||
5,331,554 | ||||||
Consumer staples: 8.69% | ||||||
Beverages: 1.66% | ||||||
Coca-Cola Consolidated, Inc. | 3,122 | 2,689,260 | ||||
PepsiCo, Inc. | 5,666 | 954,891 | ||||
3,644,151 | ||||||
Consumer staples distribution & retail: 3.62% | ||||||
Andersons, Inc. | 40,367 | 2,127,744 | ||||
Kroger Co. | 2,126 | 98,094 | ||||
Target Corp. | 25,149 | 3,497,723 | ||||
Walmart, Inc. | 13,313 | 2,199,973 | ||||
7,923,534 | ||||||
Food products: 1.32% | ||||||
Archer-Daniels-Midland Co. | 17,031 | 946,583 | ||||
Bunge Global SA | 1,580 | 139,182 | ||||
Cal-Maine Foods, Inc. | 1,283 | 71,104 | ||||
Shares | Value | |||||
Food products(continued) | ||||||
Ingredion, Inc. | 2,394 | $257,523 | ||||
Mondelez International, Inc. Class A | 19,598 | 1,475,141 | ||||
2,889,533 | ||||||
Household products: 1.50% | ||||||
Colgate-Palmolive Co. | 2,245 | 189,029 | ||||
Procter & Gamble Co. | 19,753 | 3,103,986 | ||||
3,293,015 | ||||||
Tobacco: 0.59% | ||||||
Altria Group, Inc. | 32,034 | 1,285,204 | ||||
Energy: 6.88% | ||||||
Oil, gas & consumable fuels: 6.88% | ||||||
Chevron Corp. | 29,481 | 4,346,384 | ||||
CONSOL Energy, Inc. | 1,507 | 142,562 | ||||
EOG Resources, Inc. | 4,469 | 508,527 | ||||
Exxon Mobil Corp. | 16,852 | 1,732,554 | ||||
Marathon Petroleum Corp. | 29,861 | 4,944,982 | ||||
PBF Energy, Inc. Class A | 52,739 | 2,663,847 | ||||
Phillips 66 | 5,009 | 722,849 | ||||
15,061,705 | ||||||
Financials: 22.67% | ||||||
Banks: 5.05% | ||||||
Bank of America Corp. | 18,018 | 612,792 | ||||
Bank of NT Butterfield & Son Ltd. | 14,594 | 442,636 | ||||
Citigroup, Inc. | 103,422 | 5,809,214 | ||||
JPMorgan Chase & Co. | 4,850 | 845,646 | ||||
Truist Financial Corp. | 85,734 | 3,177,302 | ||||
U.S. Bancorp | 3,881 | 161,217 | ||||
11,048,807 | ||||||
Capital markets: 3.83% | ||||||
Affiliated Managers Group, Inc. | 540 | 80,374 | ||||
BlackRock, Inc. | 343 | 265,588 | ||||
Charles Schwab Corp. | 16,420 | 1,033,147 | ||||
CME Group, Inc. | 769 | 158,291 | ||||
Goldman Sachs Group, Inc. | 6,526 | 2,506,049 | ||||
Intercontinental Exchange, Inc. | 6,001 | 764,107 | ||||
KKR & Co., Inc. | 2,330 | 201,731 | ||||
Morgan Stanley | 5,711 | 498,228 | ||||
S&P Global, Inc. | 2,997 | 1,343,705 | ||||
StoneX Group, Inc.† | 23,419 | 1,539,799 | ||||
8,391,019 | ||||||
Consumer finance: 2.94% | ||||||
American Express Co. | 9,154 | 1,837,574 | ||||
Shares | Value | |||||
Consumer finance(continued) | ||||||
Discover Financial Services | 24,874 | $2,624,704 | ||||
PROG Holdings, Inc.† | 64,637 | 1,980,478 | ||||
6,442,756 | ||||||
Financial services: 4.53% | ||||||
Berkshire Hathaway, Inc. Class B† | 8,010 | 3,073,758 | ||||
Fiserv, Inc.† | 21,606 | 3,065,243 | ||||
PayPal Holdings, Inc.† | 61,501 | 3,773,086 | ||||
9,912,087 | ||||||
Insurance: 6.11% | ||||||
Allstate Corp. | 9,291 | 1,442,428 | ||||
American Financial Group, Inc. | 1,064 | 128,106 | ||||
American International Group, Inc. | 33,126 | 2,302,588 | ||||
Aon PLC Class A | 1,636 | 488,231 | ||||
Chubb Ltd. | 7,697 | 1,885,765 | ||||
Hanover Insurance Group, Inc. | 2,694 | 355,635 | ||||
Progressive Corp. | 28,294 | 5,043,405 | ||||
Reinsurance Group of America, Inc. | 9,959 | 1,731,771 | ||||
13,377,929 | ||||||
Mortgage real estate investment trusts (REITs): 0.21% | ||||||
Arbor Realty Trust, Inc. | 35,226 | 468,506 | ||||
Health care: 14.60% | ||||||
Biotechnology: 2.32% | ||||||
Catalyst Pharmaceuticals, Inc.† | 18,973 | 273,211 | ||||
Gilead Sciences, Inc. | 18,851 | 1,475,279 | ||||
Regeneron Pharmaceuticals, Inc.† | 2,120 | 1,998,694 | ||||
Vertex Pharmaceuticals, Inc.† | 3,048 | 1,320,942 | ||||
5,068,126 | ||||||
Health care equipment & supplies: 2.04% | ||||||
Abbott Laboratories | 874 | 98,893 | ||||
Intuitive Surgical, Inc.† | 8,409 | 3,180,452 | ||||
Medtronic PLC | 11,305 | 989,640 | ||||
Stryker Corp. | 606 | 203,301 | ||||
4,472,286 | ||||||
Health care providers & services: 4.51% | ||||||
Cigna Group | 16,918 | 5,091,472 | ||||
CVS Health Corp. | 6,129 | 455,814 | ||||
Elevance Health, Inc. | 3,686 | 1,818,820 | ||||
Humana, Inc. | 6,644 | 2,511,830 | ||||
9,877,936 | ||||||
Pharmaceuticals: 5.73% | ||||||
Bristol-Myers Squibb Co. | 105,434 | 5,152,560 | ||||
Merck & Co., Inc. | 28,356 | 3,424,838 | ||||
Shares | Value | |||||
Pharmaceuticals(continued) | ||||||
Pfizer, Inc. | 134,167 | $3,633,242 | ||||
Viatris, Inc. | 28,009 | 329,666 | ||||
12,540,306 | ||||||
Industrials: 15.37% | ||||||
Aerospace & defense: 3.84% | ||||||
General Dynamics Corp. | 19,277 | 5,108,212 | ||||
Lockheed Martin Corp. | 1,700 | 729,997 | ||||
Northrop Grumman Corp. | 5,731 | 2,560,382 | ||||
8,398,591 | ||||||
Air freight & logistics: 2.31% | ||||||
FedEx Corp. | 13,987 | 3,374,923 | ||||
United Parcel Service, Inc. Class B | 11,909 | 1,689,887 | ||||
5,064,810 | ||||||
Building products: 0.19% | ||||||
Carrier Global Corp. | 5,084 | 278,146 | ||||
Owens Corning | 904 | 136,983 | ||||
415,129 | ||||||
Construction & engineering: 1.75% | ||||||
Comfort Systems USA, Inc. | 487 | 105,908 | ||||
EMCOR Group, Inc. | 14,027 | 3,199,699 | ||||
Fluor Corp.† | 13,761 | 518,927 | ||||
3,824,534 | ||||||
Electrical equipment: 1.05% | ||||||
Emerson Electric Co. | 25,043 | 2,297,194 | ||||
Industrial conglomerates: 2.82% | ||||||
General Electric Co. | 46,565 | 6,166,137 | ||||
Machinery: 1.59% | ||||||
Mueller Industries, Inc. | 6,561 | 314,928 | ||||
Parker-Hannifin Corp. | 3,251 | 1,510,090 | ||||
Terex Corp. | 27,124 | 1,666,227 | ||||
3,491,245 | ||||||
Passenger airlines: 1.53% | ||||||
Delta Air Lines, Inc. | 52,364 | 2,049,527 | ||||
United Airlines Holdings, Inc.† | 31,663 | 1,310,215 | ||||
3,359,742 | ||||||
Trading companies & distributors: 0.29% | ||||||
Ferguson PLC | 3,237 | 608,103 | ||||
Herc Holdings, Inc. | 251 | 37,020 | ||||
645,123 | ||||||
Shares | Value | |||||
Information technology: 8.95% | ||||||
IT services: 1.30% | ||||||
Accenture PLC Class A | 5,351 | $1,947,122 | ||||
Cognizant Technology Solutions Corp. Class A | 2,420 | 186,630 | ||||
DXC Technology Co.† | 33,147 | 722,605 | ||||
2,856,357 | ||||||
Semiconductors & semiconductor equipment: 6.02% | ||||||
Allegro MicroSystems, Inc.† | 49,842 | 1,292,901 | ||||
Analog Devices, Inc. | 14,169 | 2,725,549 | ||||
Axcelis Technologies, Inc.† | 2,408 | 313,160 | ||||
Diodes, Inc.† | 4,100 | 276,012 | ||||
NVIDIA Corp. | 4,858 | 2,988,982 | ||||
QUALCOMM, Inc. | 33,446 | 4,967,065 | ||||
Skyworks Solutions, Inc. | 5,999 | 626,656 | ||||
13,190,325 | ||||||
Software: 1.27% | ||||||
Cadence Design Systems, Inc.† | 1,738 | 501,343 | ||||
InterDigital, Inc. | 783 | 82,254 | ||||
LiveRamp Holdings, Inc.† | 19,012 | 750,594 | ||||
NCR Voyix Corp.† | 5,372 | 78,968 | ||||
Salesforce, Inc.† | 3,764 | 1,058,023 | ||||
Synopsys, Inc.† | 562 | 299,743 | ||||
2,770,925 | ||||||
Technology hardware, storage & peripherals: 0.36% | ||||||
Hewlett Packard Enterprise Co. | 11,811 | 180,590 | ||||
Super Micro Computer, Inc.† | 1,127 | 596,871 | ||||
777,461 | ||||||
Materials: 3.67% | ||||||
Chemicals: 0.71% | ||||||
Air Products & Chemicals, Inc. | 2,888 | 738,490 | ||||
Cabot Corp. | 1,743 | 125,670 | ||||
Sherwin-Williams Co. | 2,223 | 676,637 | ||||
1,540,797 | ||||||
Construction materials: 0.15% | ||||||
Knife River Corp.† | 4,985 | 326,468 | ||||
Metals & mining: 2.81% | ||||||
Arch Resources, Inc. | 4,664 | 825,342 | ||||
Freeport-McMoRan, Inc. | 108,041 | 4,288,147 | ||||
Materion Corp. | 4,830 | 564,965 | ||||
Newmont Corp. | 6,803 | 234,772 | ||||
Steel Dynamics, Inc. | 2,044 | 246,690 | ||||
6,159,916 | ||||||
Shares | Value | |||||
Real estate: 2.80% | ||||||
Hotel & resort REITs: 0.63% | ||||||
Park Hotels & Resorts, Inc. | 91,797 | $1,384,299 | ||||
Industrial REITs : 0.87% | ||||||
Prologis, Inc. | 15,102 | 1,913,272 | ||||
Real estate management & development: 0.35% | ||||||
Jones Lang LaSalle, Inc.† | 4,309 | 762,952 | ||||
Specialized REITs : 0.95% | ||||||
Weyerhaeuser Co. | 63,365 | 2,076,471 | ||||
Utilities: 3.76% | ||||||
Electric utilities: 3.13% | ||||||
Duke Energy Corp. | 18,258 | 1,749,664 | ||||
NRG Energy, Inc. | 4,749 | 251,887 | ||||
Southern Co. | 69,819 | 4,853,817 | ||||
6,855,368 | ||||||
Independent power and renewable electricity producers: 0.05% | ||||||
Vistra Corp. | 2,668 | 109,468 | ||||
Multi-utilities: 0.58% | ||||||
Black Hills Corp. | 24,251 | 1,255,232 | ||||
Total common stocks (Cost $201,011,148) | 215,804,152 | |||||
Yield | ||||||
Short-term investments: 1.11% | ||||||
Investment companies: 1.11% | ||||||
Allspring Government Money Market Fund Select Class♠∞ | 5.27 % | 2,444,952 | 2,444,952 | |||
Total short-term investments (Cost $2,444,952) | 2,444,952 | |||||
Total investments in securities (Cost $203,456,100) | 99.67 % | 218,249,104 | ||||
Other assets and liabilities, net | 0.33 | 713,657 | ||||
Total net assets | 100.00 % | $218,962,761 | ||||
† | Non-income-earning security |
♠ | The issuer of the security is an affiliated person of the Fund as defined in the Investment Company Act of 1940. |
∞ | The rate represents the 7-day annualized yield at period end. |
Abbreviations: | |
REIT | Real estate investment trust |
Value, beginning of period | Purchases | Sales proceeds | Net realized gains (losses) | Net change in unrealized gains (losses) | Value, end of period | Shares, end of period | Income from affiliated securities | |
Short-term investments | ||||||||
Allspring Government Money Market Fund Select Class | $4,216,993 | $10,825,040 | $(12,597,081 ) | $0 | $0 | $2,444,952 | 2,444,952 | $117,557 |
Description | Number of contracts | Expiration date | Notional cost | Notional value | Unrealized gains | Unrealized losses |
Long | ||||||
E-Mini S&P 500 Index | 11 | 3-15-2024 | $2,579,201 | $2,678,775 | $99,574 | $0 |
Assets | |
Investments in unaffiliated securities, at value (cost $201,011,148) | $215,804,152 |
Investments in affiliated securities, at value (cost $2,444,952) | 2,444,952 |
Cash | 6 |
Cash at broker segregated for futures contracts | 721,000 |
Receivable for dividends | 313,616 |
Receivable for Fund shares sold | 901 |
Prepaid expenses and other assets | 76,648 |
Total assets | 219,361,275 |
Liabilities | |
Payable for Fund shares redeemed | 170,024 |
Payable for daily variation margin on open futures contracts | 48,040 |
Management fee payable | 47,923 |
Shareholder servicing fees payable | 45,114 |
Administration fees payable | 36,111 |
Distribution fee payable | 1,275 |
Accrued expenses and other liabilities | 50,027 |
Total liabilities | 398,514 |
Total net assets | $218,962,761 |
Net assets consist of | |
Paid-in capital | $202,802,719 |
Total distributable earnings | 16,160,042 |
Total net assets | $218,962,761 |
Computation of net asset value and offering price per share | |
Net assets–Class A | $202,036,089 |
Shares outstanding–Class A1 | 15,684,905 |
Net asset value per share–Class A | $12.88 |
Maximum offering price per share – Class A2 | $13.67 |
Net assets–Class C | $1,922,046 |
Shares outstanding–Class C1 | 142,142 |
Net asset value per share–Class C | $13.52 |
Net assets–Class R6 | $1,073,726 |
Shares outstanding–Class R61 | 82,819 |
Net asset value per share–Class R6 | $12.96 |
Net assets–Administrator Class | $9,226,412 |
Shares outstanding–Administrator Class1 | 705,690 |
Net asset value per share–Administrator Class | $13.07 |
Net assets–Institutional Class | $4,704,488 |
Shares outstanding–Institutional Class1 | 362,110 |
Net asset value per share–Institutional Class | $12.99 |
Investment income | |
Dividends | $2,342,156 |
Income from affiliated securities | 117,557 |
Interest | 18,431 |
Total investment income | 2,478,144 |
Expenses | |
Management fee | 427,443 |
Administration fees | |
Class A | 197,215 |
Class C | 2,018 |
Class R6 | 148 |
Administrator Class | 5,857 |
Institutional Class | 2,918 |
Shareholder servicing fees | |
Class A | 246,519 |
Class C | 2,523 |
Administrator Class | 11,109 |
Distribution fee | |
Class C | 7,569 |
Custody and accounting fees | 6,366 |
Professional fees | 30,366 |
Registration fees | 36,165 |
Shareholder report expenses | 14,949 |
Trustees’ fees and expenses | 12,234 |
Other fees and expenses | 12,026 |
Total expenses | 1,015,425 |
Less: Fee waivers and/or expense reimbursements | |
Fund-level | (143,983 ) |
Class R6 | (28 ) |
Net expenses | 871,414 |
Net investment income | 1,606,730 |
Realized and unrealized gains (losses) on investments | |
Net realized gains on | |
Unaffiliated securities | 5,607,475 |
Futures contracts | 240,998 |
Net realized gains on investments | 5,848,473 |
Net change in unrealized gains (losses) on | |
Unaffiliated securities | (1,100,628 ) |
Futures contracts | (121,391 ) |
Net change in unrealized gains (losses) on investments | (1,222,019 ) |
Net realized and unrealized gains (losses) on investments | 4,626,454 |
Net increase in net assets resulting from operations | $6,233,184 |
Six months ended January 31, 2024 (unaudited) | Year ended July 31, 2023 | |||
Operations | ||||
Net investment income | $1,606,730 | $3,348,710 | ||
Net realized gains on investments | 5,848,473 | 1,613,629 | ||
Net change in unrealized gains (losses) on investments | (1,222,019 ) | 7,117,566 | ||
Net increase in net assets resulting from operations | 6,233,184 | 12,079,905 | ||
Distributions to shareholders from | ||||
Net investment income and net realized gains | ||||
Class A | (1,313,985 ) | (3,184,439 ) | ||
Class C | (3,128 ) | (20,261 ) | ||
Class R6 | (8,520 ) | (17,837 ) | ||
Administrator Class | (60,630 ) | (161,523 ) | ||
Institutional Class | (36,672 ) | (90,710 ) | ||
Total distributions to shareholders | (1,422,935 ) | (3,474,770 ) | ||
Capital share transactions | Shares | Shares | ||
Proceeds from shares sold | ||||
Class A | 158,064 | 1,904,160 | 488,305 | 5,752,991 |
Class C | 7,419 | 93,398 | 76,220 | 948,225 |
Class R6 | 8,259 | 101,249 | 36,743 | 443,010 |
Administrator Class | 1,590 | 19,566 | 25,741 | 310,501 |
Institutional Class | 37,054 | 450,500 | 119,580 | 1,448,377 |
2,568,873 | 8,903,104 | |||
Reinvestment of distributions | ||||
Class A | 105,695 | 1,285,121 | 274,347 | 3,121,115 |
Class C | 248 | 3,128 | 1,701 | 20,261 |
Class R6 | 694 | 8,520 | 1,556 | 17,837 |
Administrator Class | 4,450 | 54,964 | 13,196 | 152,196 |
Institutional Class | 2,984 | 36,672 | 7,895 | 90,710 |
1,388,405 | 3,402,119 | |||
Payment for shares redeemed | ||||
Class A | (1,073,868 ) | (13,141,304 ) | (1,606,897 ) | (19,031,181 ) |
Class C | (47,815 ) | (603,067 ) | (77,626 ) | (971,262 ) |
Class R6 | (4,178 ) | (52,333 ) | (29,409 ) | (347,088 ) |
Administrator Class | (42,068 ) | (525,459 ) | (157,950 ) | (1,906,201 ) |
Institutional Class | (49,829 ) | (608,445 ) | (135,999 ) | (1,630,783 ) |
(14,930,608 ) | (23,886,515 ) | |||
Net decrease in net assets resulting from capital share transactions | (10,973,330 ) | (11,581,292 ) | ||
Total decrease in net assets | (6,163,081 ) | (2,976,157 ) | ||
Net assets | ||||
Beginning of period | 225,125,842 | 228,101,999 | ||
End of period | $218,962,761 | $225,125,842 | ||
Six months ended January 31, 2024 (unaudited) | Year ended July 31 | |||||
Class A | 2023 | 2022 | 2021 | 2020 | 2019 | |
Net asset value, beginning of period | $12.58 | $12.10 | $17.25 | $12.31 | $12.92 | $14.46 |
Net investment income | 0.09 1 | 0.18 1 | 0.17 | 0.19 | 0.20 | 0.24 |
Net realized and unrealized gains (losses) on investments | 0.29 | 0.49 | (0.06 ) | 5.20 | (0.53 ) | (0.15 ) |
Total from investment operations | 0.38 | 0.67 | 0.11 | 5.39 | (0.33 ) | 0.09 |
Distributions to shareholders from | ||||||
Net investment income | (0.08 ) | (0.19 ) | (0.18 ) | (0.19 ) | (0.21 ) | (0.25 ) |
Net realized gains | 0.00 | 0.00 | (5.08 ) | (0.26 ) | (0.07 ) | (1.38 ) |
Total distributions to shareholders | (0.08 ) | (0.19 ) | (5.26 ) | (0.45 ) | (0.28 ) | (1.63 ) |
Net asset value, end of period | $12.88 | $12.58 | $12.10 | $17.25 | $12.31 | $12.92 |
Total return2 | 3.07 % | 5.70 % | (0.51 )% | 44.41 % | (2.49 )% | 1.44 % |
Ratios to average net assets (annualized) | ||||||
Gross expenses | 0.95 % | 0.97 % | 0.94 % | 0.96 % | 0.99 % | 0.97 % |
Net expenses | 0.82 % | 0.81 % | 0.81 % | 0.81 % | 0.82 % | 0.83 % |
Net investment income | 1.50 % | 1.52 % | 1.28 % | 1.23 % | 1.63 % | 1.84 % |
Supplemental data | ||||||
Portfolio turnover rate | 146 % | 476 % | 365 % | 488 % | 366 % | 221 % |
Net assets, end of period (000s omitted) | $202,036 | $207,545 | $209,748 | $231,930 | $174,028 | $196,075 |
1 | Calculated based upon average shares outstanding |
2 | Total return calculations do not include any sales charges. Returns for periods of less than one year are not annualized. |
Six months ended January 31, 2024 (unaudited) | Year ended July 31 | |||||
Class C | 2023 | 2022 | 2021 | 2020 | 2019 | |
Net asset value, beginning of period | $13.19 | $12.67 | $17.84 | $12.75 | $13.34 | $14.81 |
Net investment income | 0.05 1 | 0.09 1 | 0.08 1 | 0.07 1 | 0.12 1 | 0.16 1 |
Net realized and unrealized gains (losses) on investments | 0.30 | 0.53 | (0.09 ) | 5.40 | (0.56 ) | (0.15 ) |
Total from investment operations | 0.35 | 0.62 | (0.01 ) | 5.47 | (0.44 ) | 0.01 |
Distributions to shareholders from | ||||||
Net investment income | (0.02 ) | (0.10 ) | (0.08 ) | (0.12 ) | (0.08 ) | (0.10 ) |
Net realized gains | 0.00 | 0.00 | (5.08 ) | (0.26 ) | (0.07 ) | (1.38 ) |
Total distributions to shareholders | (0.02 ) | (0.10 ) | (5.16 ) | (0.38 ) | (0.15 ) | (1.48 ) |
Net asset value, end of period | $13.52 | $13.19 | $12.67 | $17.84 | $12.75 | $13.34 |
Total return2 | 2.66 % | 4.96 % | (1.30 )% | 43.33 % | (3.27 )% | 0.76 % |
Ratios to average net assets (annualized) | ||||||
Gross expenses | 1.70 % | 1.72 % | 1.69 % | 1.70 % | 1.74 % | 1.71 % |
Net expenses | 1.57 % | 1.58 % | 1.58 % | 1.58 % | 1.58 % | 1.58 % |
Net investment income | 0.74 % | 0.76 % | 0.59 % | 0.47 % | 0.92 % | 1.15 % |
Supplemental data | ||||||
Portfolio turnover rate | 146 % | 476 % | 365 % | 488 % | 366 % | 221 % |
Net assets, end of period (000s omitted) | $1,922 | $2,405 | $2,307 | $907 | $482 | $966 |
1 | Calculated based upon average shares outstanding |
2 | Total return calculations do not include any sales charges. Returns for periods of less than one year are not annualized. |
Six months ended January 31, 2024 (unaudited) | Year ended July 31 | |||||
Class R6 | 2023 | 2022 | 2021 | 2020 | 2019 | |
Net asset value, beginning of period | $12.66 | $12.18 | $17.33 | $12.37 | $13.04 | $14.59 |
Net investment income | 0.12 1 | 0.23 1 | 0.24 1 | 0.25 | 0.30 | 0.30 |
Net realized and unrealized gains (losses) on investments | 0.29 | 0.49 | (0.07 ) | 5.22 | (0.57 ) | (0.14 ) |
Total from investment operations | 0.41 | 0.72 | 0.17 | 5.47 | (0.27 ) | 0.16 |
Distributions to shareholders from | ||||||
Net investment income | (0.11 ) | (0.24 ) | (0.24 ) | (0.25 ) | (0.33 ) | (0.33 ) |
Net realized gains | 0.00 | 0.00 | (5.08 ) | (0.26 ) | (0.07 ) | (1.38 ) |
Total distributions to shareholders | (0.11 ) | (0.24 ) | (5.32 ) | (0.51 ) | (0.40 ) | (1.71 ) |
Net asset value, end of period | $12.96 | $12.66 | $12.18 | $17.33 | $12.37 | $13.04 |
Total return2 | 3.26 % | 6.12 % | (0.10 )% | 44.94 % | (2.09 )% | 1.92 % |
Ratios to average net assets (annualized) | ||||||
Gross expenses | 0.54 % | 0.54 % | 0.51 % | 0.53 % | 0.58 % | 0.55 % |
Net expenses | 0.40 % | 0.40 % | 0.40 % | 0.40 % | 0.40 % | 0.40 % |
Net investment income | 1.92 % | 1.91 % | 1.79 % | 1.65 % | 1.69 % | 2.26 % |
Supplemental data | ||||||
Portfolio turnover rate | 146 % | 476 % | 365 % | 488 % | 366 % | 221 % |
Net assets, end of period (000s omitted) | $1,074 | $988 | $842 | $224 | $151 | $20 |
1 | Calculated based upon average shares outstanding |
2 | Returns for periods of less than one year are not annualized. |
Six months ended January 31, 2024 (unaudited) | Year ended July 31 | |||||
Administrator Class | 2023 | 2022 | 2021 | 2020 | 2019 | |
Net asset value, beginning of period | $12.77 | $12.27 | $17.42 | $12.44 | $13.06 | $14.59 |
Net investment income | 0.10 1 | 0.19 1 | 0.19 | 0.20 | 0.22 | 0.26 |
Net realized and unrealized gains (losses) on investments | 0.28 | 0.51 | (0.08 ) | 5.24 | (0.54 ) | (0.14 ) |
Total from investment operations | 0.38 | 0.70 | 0.11 | 5.44 | (0.32 ) | 0.12 |
Distributions to shareholders from | ||||||
Net investment income | (0.08 ) | (0.20 ) | (0.18 ) | (0.20 ) | (0.23 ) | (0.27 ) |
Net realized gains | 0.00 | 0.00 | (5.08 ) | (0.26 ) | (0.07 ) | (1.38 ) |
Total distributions to shareholders | (0.08 ) | (0.20 ) | (5.26 ) | (0.46 ) | (0.30 ) | (1.65 ) |
Net asset value, end of period | $13.07 | $12.77 | $12.27 | $17.42 | $12.44 | $13.06 |
Total return2 | 3.04 % | 5.86 % | (0.49 )% | 44.36 % | (2.41 )% | 1.61 % |
Ratios to average net assets (annualized) | ||||||
Gross expenses | 0.88 % | 0.88 % | 0.85 % | 0.88 % | 0.91 % | 0.89 % |
Net expenses | 0.75 % | 0.74 % | 0.75 % | 0.75 % | 0.75 % | 0.75 % |
Net investment income | 1.57 % | 1.59 % | 1.31 % | 1.30 % | 1.71 % | 1.93 % |
Supplemental data | ||||||
Portfolio turnover rate | 146 % | 476 % | 365 % | 488 % | 366 % | 221 % |
Net assets, end of period (000s omitted) | $9,226 | $9,470 | $10,564 | $16,080 | $11,813 | $13,854 |
1 | Calculated based upon average shares outstanding |
2 | Returns for periods of less than one year are not annualized. |
Six months ended January 31, 2024 (unaudited) | Year ended July 31 | |||||
Institutional Class | 2023 | 2022 | 2021 | 2020 | 2019 | |
Net asset value, beginning of period | $12.69 | $12.20 | $17.35 | $12.38 | $13.04 | $14.58 |
Net investment income | 0.11 1 | 0.22 1 | 0.23 1 | 0.22 | 0.26 | 0.29 1 |
Net realized and unrealized gains (losses) on investments | 0.29 | 0.50 | (0.08 ) | 5.25 | (0.55 ) | (0.14 ) |
Total from investment operations | 0.40 | 0.72 | 0.15 | 5.47 | (0.29 ) | 0.15 |
Distributions to shareholders from | ||||||
Net investment income | (0.10 ) | (0.23 ) | (0.22 ) | (0.24 ) | (0.30 ) | (0.31 ) |
Net realized gains | 0.00 | 0.00 | (5.08 ) | (0.26 ) | (0.07 ) | (1.38 ) |
Total distributions to shareholders | (0.10 ) | (0.23 ) | (5.30 ) | (0.50 ) | (0.37 ) | (1.69 ) |
Net asset value, end of period | $12.99 | $12.69 | $12.20 | $17.35 | $12.38 | $13.04 |
Total return2 | 3.19 % | 6.09 % | (0.22 )% | 44.84 % | (2.20 )% | 1.86 % |
Ratios to average net assets (annualized) | ||||||
Gross expenses | 0.63 % | 0.64 % | 0.61 % | 0.63 % | 0.66 % | 0.63 % |
Net expenses | 0.50 % | 0.50 % | 0.50 % | 0.50 % | 0.50 % | 0.50 % |
Net investment income | 1.81 % | 1.83 % | 1.61 % | 1.56 % | 1.96 % | 2.14 % |
Supplemental data | ||||||
Portfolio turnover rate | 146 % | 476 % | 365 % | 488 % | 366 % | 221 % |
Net assets, end of period (000s omitted) | $4,704 | $4,719 | $4,641 | $4,051 | $2,142 | $2,948 |
1 | Calculated based upon average shares outstanding |
2 | Returns for periods of less than one year are not annualized. |
Gross unrealized gains | $20,214,313 |
Gross unrealized losses | (8,123,662 ) |
Net unrealized gains | $12,090,651 |
Quoted prices (Level 1) | Other significant observable inputs (Level 2) | Significant unobservable inputs (Level 3) | Total | |
Assets | ||||
Investments in: | ||||
Common stocks | ||||
Communication services | $9,044,567 | $0 | $0 | $9,044,567 |
Consumer discretionary | 15,420,869 | 0 | 0 | 15,420,869 |
Consumer staples | 19,035,437 | 0 | 0 | 19,035,437 |
Energy | 15,061,705 | 0 | 0 | 15,061,705 |
Financials | 49,641,104 | 0 | 0 | 49,641,104 |
Health care | 31,958,654 | 0 | 0 | 31,958,654 |
Industrials | 33,662,505 | 0 | 0 | 33,662,505 |
Information technology | 19,595,068 | 0 | 0 | 19,595,068 |
Materials | 8,027,181 | 0 | 0 | 8,027,181 |
Real estate | 6,136,994 | 0 | 0 | 6,136,994 |
Utilities | 8,220,068 | 0 | 0 | 8,220,068 |
Short-term investments | ||||
Investment companies | 2,444,952 | 0 | 0 | 2,444,952 |
218,249,104 | 0 | 0 | 218,249,104 | |
Futures contracts | 99,574 | 0 | 0 | 99,574 |
Total assets | $218,348,678 | $0 | $0 | $218,348,678 |
Average daily net assets | Management fee |
First $1 billion | 0.400 % |
Next $4 billion | 0.375 |
Next $5 billion | 0.340 |
Over $10 billion | 0.330 |
Class-level administration fee | |
Class A | 0.20 % |
Class C | 0.20 |
Class R6 | 0.03 |
Administrator Class | 0.13 |
Institutional Class | 0.13 |
EXPENSE RATIO CAPS | |
Class A | 0.82 % |
Class C | 1.57 |
Class R6 | 0.40 |
Administrator Class | 0.75 |
Institutional Class | 0.50 |
Name and year of birth | Position held and length of service* | Principal occupations during past five years or longer | Current other public company or investment company directorships |
William R. Ebsworth (Born 1957) | Trustee, since 2015 | Retired. From 1984 to 2013, equities analyst, portfolio manager, research director and chief investment officer at Fidelity Management and Research Company in Boston, Tokyo, and Hong Kong, and retired in 2013 as Chief Investment Officer of Fidelity Strategic Advisers, Inc. where he led a team of investment professionals managing client assets. Prior thereto, Board member of Hong Kong Securities Clearing Co., Hong Kong Options Clearing Corp., the Thailand International Fund, Ltd., Fidelity Investments Life Insurance Company, and Empire Fidelity Investments Life Insurance Company. Serves on the Investment Company Institute’s Board of Governors since 2022 and Executive Committee since 2023 as well as the Vice Chairman of the Governing Council of the Independent Directors Council since 2023. Audit Committee Chair and Investment Committee Chair of the Vincent Memorial Hospital Foundation (non-profit organization). Mr. Ebsworth is a CFA charterholder. | N/A |
Jane A. Freeman (Born 1953) | Trustee, since 2015; Chair Liaison, since January 2018# | Retired. From 2012 to 2014 and 1999 to 2008, Chief Financial Officer of Scientific Learning Corporation. From 2008 to 2012, Ms. Freeman provided consulting services related to strategic business projects. Prior to 1999, Portfolio Manager at Rockefeller & Co. and Scudder, Stevens & Clark. Board member of the Harding Loevner Funds from 1996 to 2014, serving as both Lead Independent Director and chair of the Audit Committee. Board member of the Russell Exchange Traded Funds Trust from 2011 to 2012 and the chair of the Audit Committee. Ms. Freeman is also an inactive Chartered Financial Analyst. | N/A |
Isaiah Harris, Jr. (Born 1952) | Trustee, since 2009; Audit Committee Chair, since 2019 | Retired. Member of the Advisory Board of CEF of East Central Florida. Chairman of the Board of CIGNA Corporation from 2009 to 2021, and Director from 2005 to 2008. From 2003 to 2011, Director of Deluxe Corporation. Prior thereto, President and CEO of BellSouth Advertising and Publishing Corp. from 2005 to 2007, President and CEO of BellSouth Enterprises from 2004 to 2005 and President of BellSouth Consumer Services from 2000 to 2003. Emeritus member of the Iowa State University Foundation Board of Governors. Emeritus Member of the Advisory board of Iowa State University School of Business. Advisory Board Member, Palm Harbor Academy (private school). Advisory Board Member, Fellowship of Christian Athletes. Mr. Harris is a certified public accountant (inactive status). | N/A |
David F. Larcker (Born 1950) | Trustee, since 2009 | Distinguished Visiting Fellow at the Hoover Institution since 2022. James Irvin Miller Professor of Accounting at the Graduate School of Business (Emeritus), Stanford University, Director of the Corporate Governance Research Initiative and Senior Faculty of The Rock Center for Corporate Governance since 2006. From 2005 to 2008, Professor of Accounting at the Graduate School of Business, Stanford University. Prior thereto, Ernst & Young Professor of Accounting at The Wharton School, University of Pennsylvania from 1985 to 2005. | N/A |
Olivia S. Mitchell (Born 1953) | Trustee, since 2006 | International Foundation of Employee Benefit Plans Professor since 1993, Wharton School of the University of Pennsylvania. Director of Wharton’s Pension Research Council and Boettner Center on Pensions & Retirement Research, and Research Associate at the National Bureau of Economic Research. Previously taught at Cornell University from 1978 to 1993. | N/A |
Timothy J. Penny (Born 1951) | Trustee, since 1996; Chair, since 2018 | President and Chief Executive Officer of Southern Minnesota Initiative Foundation, a non-profit organization, since 2007. Vice Chair of the Economic Club of Minnesota, since 2007. Co-Chair of the Committee for a Responsible Federal Budget, since 1995. Member of the Board of Trustees of NorthStar Education Finance, Inc., a non-profit organization, from 2007-2022. Senior Fellow of the University of Minnesota Humphrey Institute from 1995 to 2017. | N/A |
Name and year of birth | Position held and length of service* | Principal occupations during past five years or longer | Current other public company or investment company directorships |
James G. Polisson (Born 1959) | Trustee, since 2018; Nominating and Governance Committee Chair, since 2024 | Retired. Chief Marketing Officer, Source (ETF) UK Services, Ltd, from 2015 to 2017. From 2012 to 2015, Principal of The Polisson Group, LLC, a management consulting, corporate advisory and principal investing company. Chief Executive Officer and Managing Director at Russell Investments, Global Exchange Traded Funds from 2010 to 2012. Managing Director of Barclays Global Investors from 1998 to 2010 and Global Chief Marketing Officer for iShares and Barclays Global Investors from 2000 to 2010. Trustee of the San Francisco Mechanics’ Institute, a non- profit organization, from 2013 to 2015. Board member of the Russell Exchange Traded Fund Trust from 2011 to 2012. Director of Barclays Global Investors Holdings Deutschland GmbH from 2006 to 2009. Mr. Polisson is an attorney and has a retired status with the Massachusetts and District of Columbia Bar Associations. | N/A |
Pamela Wheelock (Born 1959) | Trustee, since January 2020; previously Trustee from January 2018 to July 2019# | Retired. Executive and Senior Financial leadership positions in the public, private and nonprofit sectors. Interim President and CEO, McKnight Foundation, 2020. Interim Commissioner, Minnesota Department of Human Services, 2019. Chief Operating Officer, Twin Cities Habitat for Humanity, 2017-2019. Vice President for University Services, University of Minnesota, 2012- 2016. Interim President and CEO, Blue Cross and Blue Shield of Minnesota, 2011-2012. Executive Vice-President and Chief Financial Officer, Minnesota Wild, 2002-2008. Commissioner, Minnesota Department of Finance, 1999-2002. Chair of the Board of Directors of Destination Medical Center Corporation. Board member of the Minnesota Wild Foundation. | N/A |
Name and year of birth | Position held and length of service | Principal occupations during past five years or longer |
Andrew Owen (Born 1960) | President, since 2017 | President and Chief Executive Officer of Allspring Funds Management, LLC since 2017 and Head of Global Fund Governance of Allspring Global Investments since 2022. Prior thereto, co-president of Galliard Capital Management, LLC, an affiliate of Allspring Funds Management, LLC, from 2019 to 2022 and Head of Affiliated Managers, Allspring Global Investments, from 2014 to 2019 and Executive Vice President responsible for marketing, investments and product development for Allspring Funds Management, LLC, from 2009 to 2014. |
Jeremy DePalma (Born 1974) | Treasurer, since 2012 (for certain funds in the Fund Complex); since 2021 (for the remaining funds in the Complex) | Senior Vice President of Allspring Funds Management, LLC since 2009. Senior Vice President of Evergreen Investment Management Company, LLC from 2008 to 2010 and head of the Fund Reporting and Control Team within Fund Administration from 2005 to 2010. |
Christopher Baker (Born 1976) | Chief Compliance Officer, since 2022 | Global Chief Compliance Officer for Allspring Global Investments since 2022. Prior thereto, Chief Compliance Officer for State Street Global Advisors from 2018 to 2021. Senior Compliance Officer for the State Street divisions of Alternative Investment Solutions, Sector Solutions, and Global Marketing from 2015 to 2018. From 2010 to 2015 Vice President, Global Head of Investment and Marketing Compliance for State Street Global Advisors. |
Matthew Prasse (Born 1983) | Chief Legal Officer, since 2022; Secretary, since 2021 | Senior Counsel of the Allspring Legal Department since 2021. Senior Counsel of the Wells Fargo Legal Department from 2018 to 2021. Previously, Counsel for Barings LLC from 2015 to 2018. Prior to joining Barings, Associate at Morgan, Lewis & Bockius LLP from 2008 to 2015. |

P.O. Box 219967
Kansas City, MO 64121-9967

SAR3325 01-24

Allspring Funds

President
Allspring Funds
Notice to Shareholders |
Beginning in July 2024, the Fund will be required by the Securities and Exchange Commission to send shareholders a paper copy of a new tailored shareholder report in place of the full shareholder report that you are now receiving. The tailored shareholder report will contain concise information about the Fund, including certain expense and performance information and fund statistics. If you wish to receive this new tailored shareholder report electronically, please follow the instructions on the back cover of this report. |
Other information that is currently included in the shareholder report, such as the Fund’s financial statements, will be available online and upon request, free of charge, in paper or electronic format. |
Investment objective | The Fund seeks long-term capital appreciation. |
Manager | Allspring Funds Management, LLC |
Subadviser | Allspring Global Investments, LLC |
Portfolio managers | Robert Gruendyke, CFA, David Nazaret, CFA, Thomas C. Ognar, CFA |
Average annual total returns (%) as of January 31, 2024 | |||||||||
Including sales charge | Excluding sales charge | Expense ratios1 (%) | |||||||
Inception date | 1 year | 5 year | 10 year | 1 year | 5 year | 10 year | Gross | Net2 | |
Class A (EKJAX) | 1-20-1998 | 21.49 | 10.68 | 10.45 | 28.93 | 11.99 | 11.11 | 1.14 | 1.10 |
Class C (EKJCX) | 1-22-1998 | 27.08 | 11.14 | 10.44 | 28.08 | 11.14 | 10.44 | 1.89 | 1.85 |
Class R6 (EKJFX) | 11-30-2012 | – | – | – | 29.50 | 12.50 | 11.62 | 0.72 | 0.65 |
Administrator Class (WFPDX) | 7-16-2010 | – | – | – | 28.94 | 12.09 | 11.23 | 1.07 | 1.00 |
Institutional Class (EKJYX) | 6-30-1999 | – | – | – | 29.40 | 12.44 | 11.56 | 0.82 | 0.70 |
Russell 3000® Index3 | – | – | – | – | 19.15 | 13.53 | 11.96 | – | – |
Russell 1000® Growth Index4 | – | – | – | – | 34.99 | 18.04 | 15.48 | – | – |
1 | Reflects the expense ratios as stated in the most recent prospectuses. The expense ratios shown are subject to change and may differ from the annualized expense ratios shown in the Financial Highlights of this report. |
2 | The manager has contractually committed through November 30, 2024, to waive fees and/or reimburse expenses to the extent necessary to cap total annual fund operating expenses after fee waivers at 1.10% for Class A, 1.85% for Class C, 0.65% for Class R6, 1.00% for Administrator Class and 0.70% for Institutional Class. Brokerage commissions, stamp duty fees, interest, taxes, acquired fund fees and expenses (if any), and extraordinary expenses are excluded from the expense caps. Prior to or after the commitment expiration date, the caps may be increased or the commitment to maintain the caps may be terminated only with the approval of the Board of Trustees. Without these caps, the Fund’s returns would have been lower. The expense ratio paid by an investor is the net expense ratio (the total annual fund operating expenses after fee waivers) as stated in the prospectuses. |
3 | The Russell 3000® Index measures the performance of the 3,000 largest U.S. companies based on total market capitalization, which represents approximately 98% of the investable U.S. equity market. You cannot invest directly in an index. |
4 | The Russell 1000® Growth Index measures the performance of those Russell 1000 companies with higher price/book ratios and higher forecasted growth values. You cannot invest directly in an index. |
CFA® and Chartered Financial Analyst® are trademarks owned by CFA Institute. |
Ten largest holdings (%) as of January 31, 20241 | |
Microsoft Corp. | 11.70 |
NVIDIA Corp. | 6.96 |
Amazon.com, Inc. | 5.26 |
Meta Platforms, Inc. Class A | 4.72 |
Apple, Inc. | 4.33 |
Eli Lilly & Co. | 3.36 |
Palo Alto Networks, Inc. | 2.33 |
S&P Global, Inc. | 2.16 |
Mastercard, Inc. Class A | 2.12 |
Fair Isaac Corp. | 2.11 |
1 | Figures represent the percentage of the Fund’s net assets. Holdings are subject to change and may have changed since the date specified. |
Sector allocation as of January 31, 20241 |
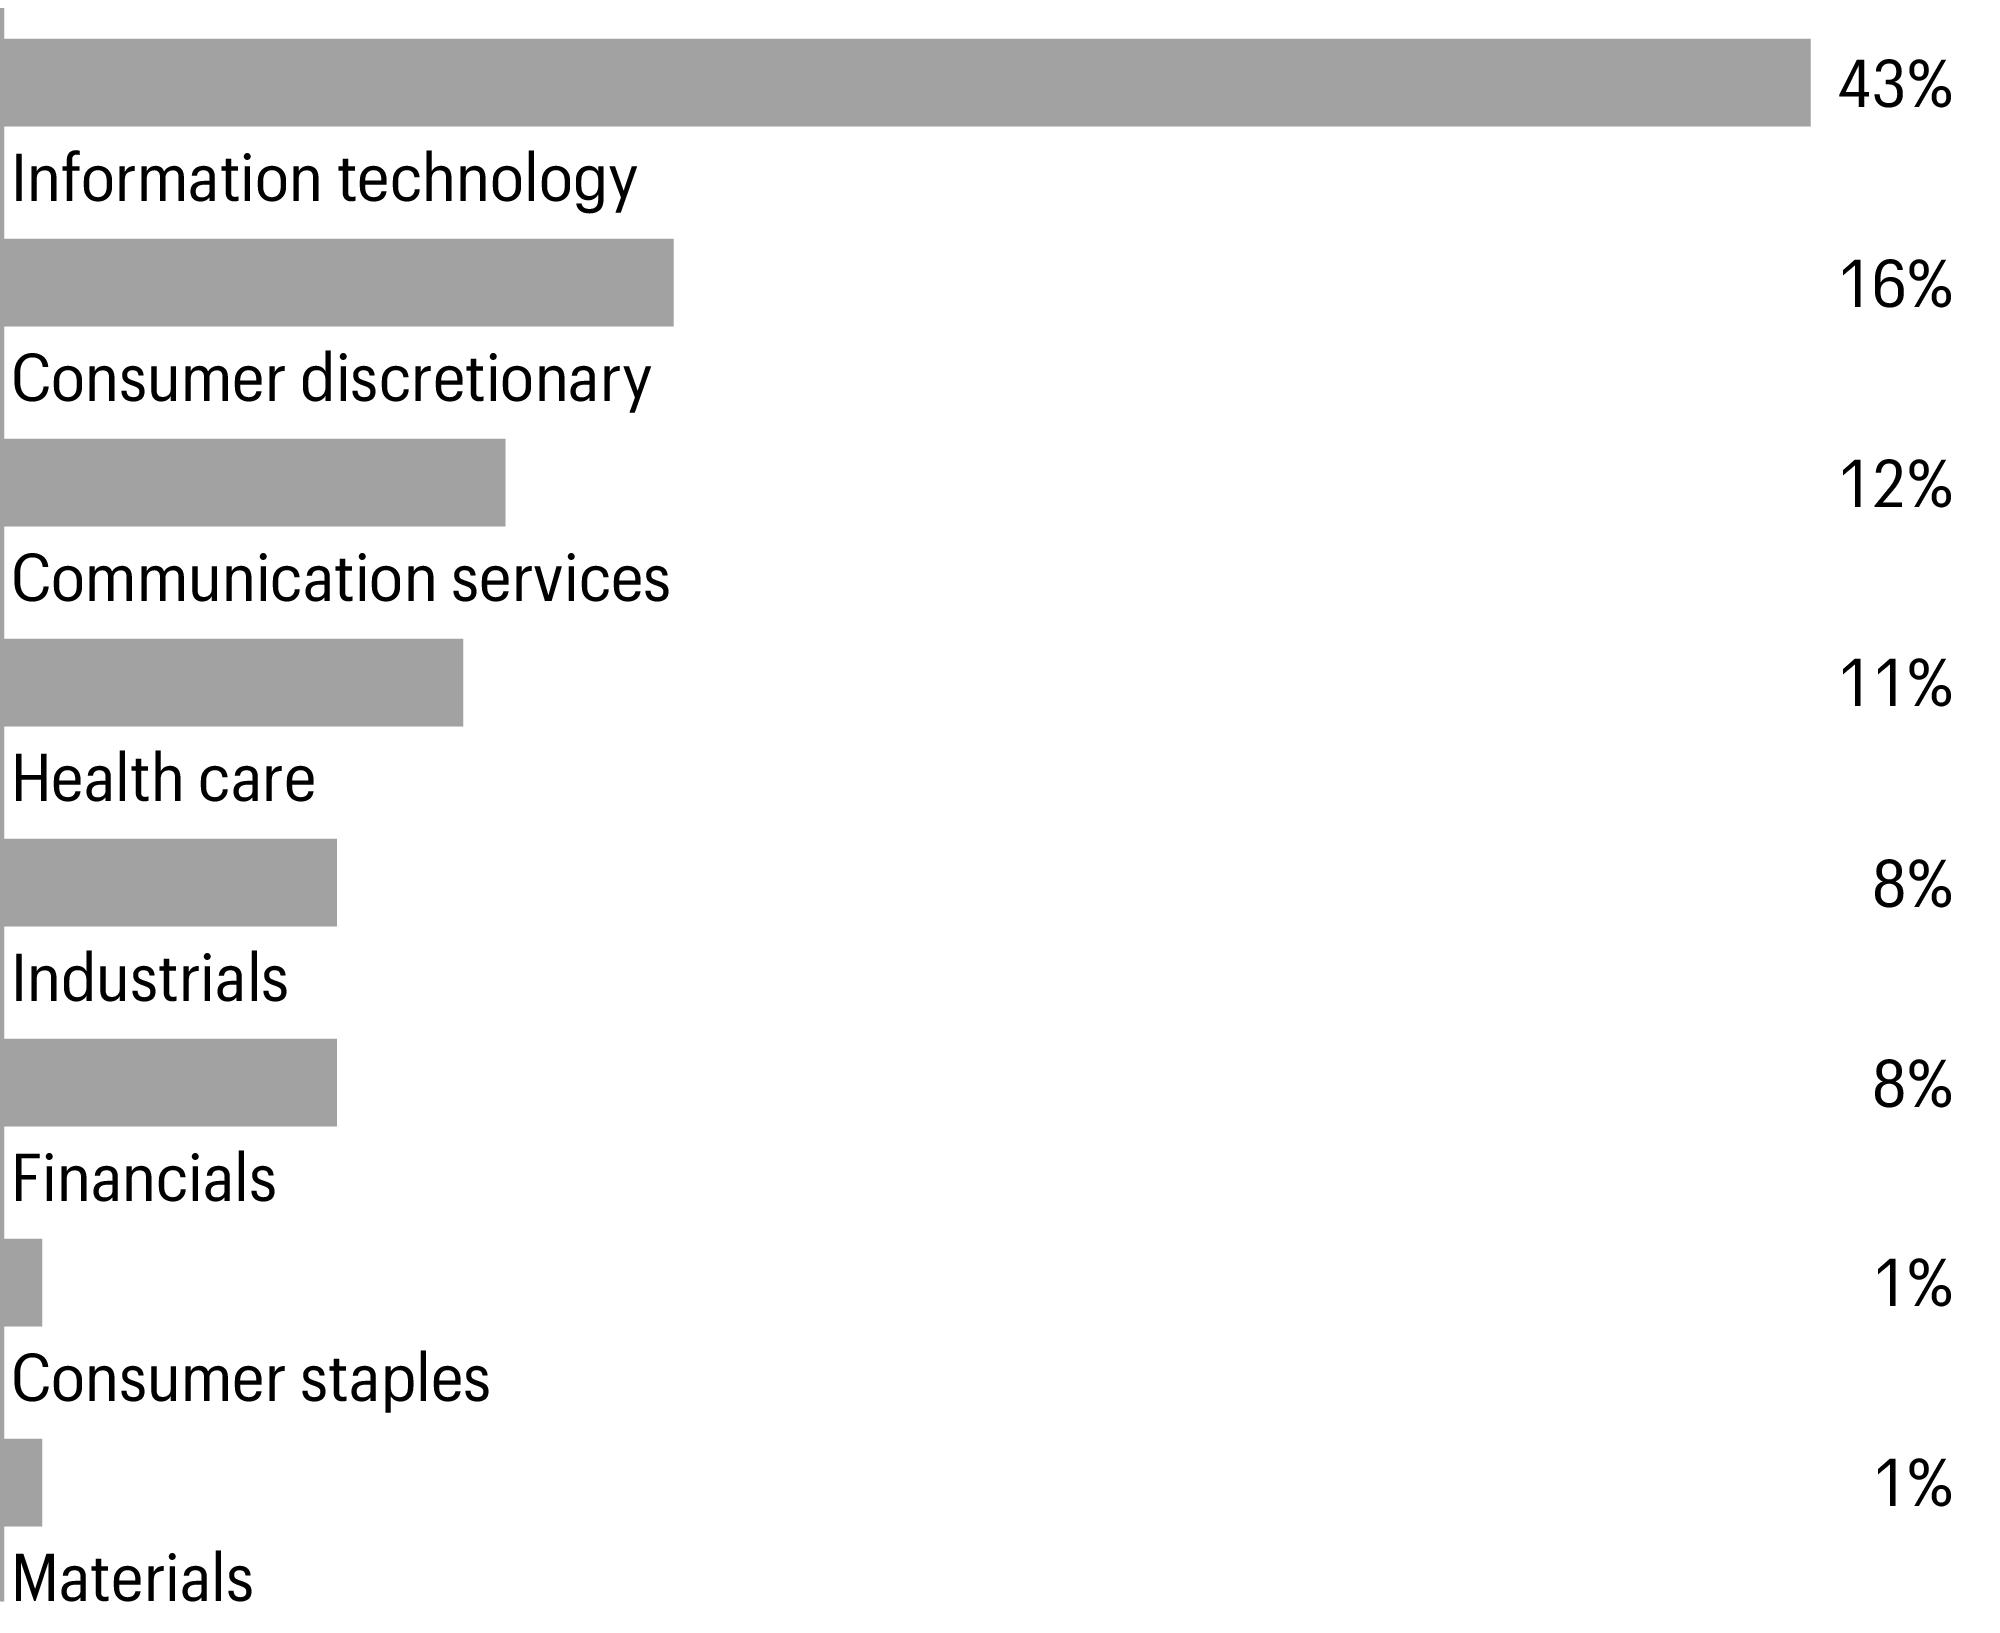
1 | Figures represent the percentage of the Fund’s long-term investments. Allocations are subject to change and may have changed since the date specified. |
Beginning account value 8-1-2023 | Ending account value 1-31-2024 | Expenses paid during the period1 | Annualized net expense ratio | |
Class A | ||||
Actual | $1,000.00 | $1,107.47 | $5.83 | 1.10 % |
Hypothetical (5% return before expenses) | $1,000.00 | $1,019.61 | $5.58 | 1.10 % |
Class C | ||||
Actual | $1,000.00 | $1,104.49 | $9.79 | 1.85 % |
Hypothetical (5% return before expenses) | $1,000.00 | $1,015.84 | $9.37 | 1.85 % |
Class R6 | ||||
Actual | $1,000.00 | $1,109.85 | $3.45 | 0.65 % |
Hypothetical (5% return before expenses) | $1,000.00 | $1,021.87 | $3.30 | 0.65 % |
Administrator Class | ||||
Actual | $1,000.00 | $1,107.21 | $5.30 | 1.00 % |
Hypothetical (5% return before expenses) | $1,000.00 | $1,020.11 | $5.08 | 1.00 % |
Institutional Class | ||||
Actual | $1,000.00 | $1,109.31 | $3.71 | 0.70 % |
Hypothetical (5% return before expenses) | $1,000.00 | $1,021.62 | $3.56 | 0.70 % |
1 | Expenses paid is equal to the annualized net expense ratio of each class multiplied by the average account value over the period, multiplied by 184 divided by 366 (to reflect the one-half-year period). |
Shares | Value | |||||
Common stocks: 100.47% | ||||||
Communication services: 11.52% | ||||||
Entertainment: 2.50% | ||||||
Live Nation Entertainment, Inc.† | 153,141 | $13,606,578 | ||||
Take-Two Interactive Software, Inc.† | 107,615 | 17,748,942 | ||||
31,355,520 | ||||||
Interactive media & services: 8.43% | ||||||
Alphabet, Inc. Class A† | 173,552 | 24,314,635 | ||||
Alphabet, Inc. Class C† | 156,828 | 22,238,211 | ||||
Meta Platforms, Inc. Class A† | 151,509 | 59,109,721 | ||||
105,662,567 | ||||||
Media: 0.59% | ||||||
Trade Desk, Inc. Class A† | 108,225 | 7,405,836 | ||||
Consumer discretionary: 15.65% | ||||||
Broadline retail: 6.49% | ||||||
Amazon.com, Inc.† | 425,623 | 66,056,690 | ||||
MercadoLibre, Inc.† | 9,003 | 15,411,425 | ||||
81,468,115 | ||||||
Hotels, restaurants & leisure: 3.91% | ||||||
Booking Holdings, Inc.† | 3,900 | 13,679,133 | ||||
DoorDash, Inc. Class A† | 105,000 | 10,941,000 | ||||
DraftKings, Inc. Class A† | 198,400 | 7,747,520 | ||||
Hilton Worldwide Holdings, Inc. | 87,181 | 16,648,084 | ||||
49,015,737 | ||||||
Specialty retail: 2.25% | ||||||
AutoZone, Inc.† | 6,066 | 16,755,081 | ||||
Ulta Beauty, Inc.† | 22,779 | 11,436,197 | ||||
28,191,278 | ||||||
Textiles, apparel & luxury goods: 3.00% | ||||||
Deckers Outdoor Corp.† | 29,663 | 22,357,893 | ||||
lululemon athletica, Inc.† | 33,660 | 15,275,581 | ||||
37,633,474 | ||||||
Consumer staples: 1.38% | ||||||
Beverages: 0.57% | ||||||
Celsius Holdings, Inc.† | 143,065 | 7,138,944 | ||||
Personal care products: 0.81% | ||||||
BellRing Brands, Inc.† | 184,563 | 10,200,797 | ||||
Financials: 7.81% | ||||||
Capital markets: 4.82% | ||||||
MSCI, Inc. Class A | 15,000 | 8,979,300 | ||||
Shares | Value | |||||
Capital markets(continued) | ||||||
S&P Global, Inc. | 60,369 | $27,066,441 | ||||
Tradeweb Markets, Inc. Class A | 256,355 | 24,453,704 | ||||
60,499,445 | ||||||
Financial services: 2.12% | ||||||
Mastercard, Inc. Class A | 59,090 | 26,545,001 | ||||
Insurance: 0.87% | ||||||
Kinsale Capital Group, Inc. | 27,406 | 10,895,803 | ||||
Health care: 11.50% | ||||||
Biotechnology: 1.97% | ||||||
Argenx SE ADR† | 31,578 | 12,015,745 | ||||
Exact Sciences Corp.† | 38,568 | 2,522,347 | ||||
Karuna Therapeutics, Inc.† | 7,703 | 2,414,274 | ||||
Sarepta Therapeutics, Inc.† | 65,446 | 7,787,420 | ||||
24,739,786 | ||||||
Health care equipment & supplies: 4.42% | ||||||
Boston Scientific Corp.† | 328,865 | 20,804,000 | ||||
Intuitive Surgical, Inc.† | 45,916 | 17,366,349 | ||||
Penumbra, Inc.† | 36,978 | 9,325,482 | ||||
Shockwave Medical, Inc.† | 35,008 | 7,920,560 | ||||
55,416,391 | ||||||
Life sciences tools & services: 0.70% | ||||||
Avantor, Inc.† | 168,200 | 3,866,918 | ||||
Thermo Fisher Scientific, Inc. | 9,100 | 4,904,718 | ||||
8,771,636 | ||||||
Pharmaceuticals: 4.41% | ||||||
Eli Lilly & Co. | 65,252 | 42,127,344 | ||||
Novo Nordisk AS ADR | 114,617 | 13,151,154 | ||||
55,278,498 | ||||||
Industrials: 8.16% | ||||||
Aerospace & defense: 1.21% | ||||||
HEICO Corp. | 84,212 | 15,123,633 | ||||
Building products: 0.59% | ||||||
Trex Co., Inc.† | 90,809 | 7,399,117 | ||||
Commercial services & supplies: 1.17% | ||||||
Copart, Inc.† | 305,265 | 14,664,931 | ||||
Construction & engineering: 1.27% | ||||||
Quanta Services, Inc. | 82,389 | 15,987,585 | ||||
Shares | Value | |||||
Electrical equipment: 1.56% | ||||||
Eaton Corp. PLC | 52,285 | $12,866,293 | ||||
Vertiv Holdings Co. | 118,900 | 6,697,637 | ||||
19,563,930 | ||||||
Ground transportation: 1.75% | ||||||
Uber Technologies, Inc.† | 335,500 | 21,898,085 | ||||
Machinery: 0.61% | ||||||
Fortive Corp. | 98,381 | 7,691,427 | ||||
Information technology: 43.08% | ||||||
Communications equipment: 1.76% | ||||||
Arista Networks, Inc.† | 85,487 | 22,113,777 | ||||
IT services: 3.28% | ||||||
EPAM Systems, Inc.† | 43,889 | 12,205,970 | ||||
MongoDB, Inc.† | 41,740 | 16,717,705 | ||||
Shopify, Inc. Class A† | 152,793 | 12,234,135 | ||||
41,157,810 | ||||||
Semiconductors & semiconductor equipment: 9.68% | ||||||
Microchip Technology, Inc. | 180,282 | 15,356,421 | ||||
Monolithic Power Systems, Inc. | 31,059 | 18,719,880 | ||||
NVIDIA Corp. | 141,793 | 87,240,979 | ||||
121,317,280 | ||||||
Software: 24.03% | ||||||
Atlassian Corp. Class A† | 27,700 | 6,918,629 | ||||
Cadence Design Systems, Inc.† | 71,857 | 20,727,870 | ||||
Datadog, Inc. Class A† | 110,941 | 13,805,498 | ||||
Dynatrace, Inc.† | 200,132 | 11,407,524 | ||||
Fair Isaac Corp.† | 22,108 | 26,503,734 | ||||
Microsoft Corp. | 369,065 | 146,732,863 | ||||
Palo Alto Networks, Inc.† | 86,330 | 29,223,568 | ||||
ServiceNow, Inc.† | 28,912 | 22,129,245 | ||||
Tyler Technologies, Inc.† | 27,120 | 11,464,980 | ||||
Zscaler, Inc.† | 52,682 | 12,415,567 | ||||
301,329,478 | ||||||
Technology hardware, storage & peripherals: 4.33% | ||||||
Apple, Inc. | 294,645 | 54,332,538 | ||||
Materials: 1.37% | ||||||
Chemicals: 1.37% | ||||||
Linde PLC | 42,359 | 17,148,194 | ||||
Total common stocks (Cost $649,618,195) | 1,259,946,613 | |||||
Yield | Shares | Value | ||||
Short-term investments: 0.15% | ||||||
Investment companies: 0.15% | ||||||
Allspring Government Money Market Fund Select Class♠∞ | 5.27 % | 1,879,551 | $1,879,551 | |||
Total short-term investments (Cost $1,879,551) | 1,879,551 | |||||
Total investments in securities (Cost $651,497,746) | 100.62 % | 1,261,826,164 | ||||
Other assets and liabilities, net | (0.62 ) | (7,769,638 ) | ||||
Total net assets | 100.00 % | $1,254,056,526 | ||||
† | Non-income-earning security |
♠ | The issuer of the security is an affiliated person of the Fund as defined in the Investment Company Act of 1940. |
∞ | The rate represents the 7-day annualized yield at period end. |
Abbreviations: | |
ADR | American depositary receipt |
Value, beginning of period | Purchases | Sales proceeds | Net realized gains (losses) | Net change in unrealized gains (losses) | Value, end of period | Shares, end of period | Income from affiliated securities | |
Short-term investments | ||||||||
Allspring Government Money Market Fund Select Class | $14,213,422 | $169,648,797 | $(181,982,668 ) | $0 | $0 | $1,879,551 | 1,879,551 | $126,693 |
Assets | |
Investments in unaffiliated securities, at value (cost $649,618,195) | $1,259,946,613 |
Investments in affiliated securities, at value (cost $1,879,551) | 1,879,551 |
Cash | 132 |
Receivable for investments sold | 3,376,657 |
Receivable for Fund shares sold | 113,478 |
Receivable for dividends | 62,144 |
Prepaid expenses and other assets | 87,206 |
Total assets | 1,265,465,781 |
Liabilities | |
Payable for Fund shares redeemed | 6,018,176 |
Payable for investments purchased | 4,170,621 |
Management fee payable | 635,804 |
Administration fees payable | 187,772 |
Distribution fee payable | 8,227 |
Trustees’ fees and expenses payable | 836 |
Accrued expenses and other liabilities | 387,819 |
Total liabilities | 11,409,255 |
Total net assets | $1,254,056,526 |
Net assets consist of | |
Paid-in capital | $579,067,011 |
Total distributable earnings | 674,989,515 |
Total net assets | $1,254,056,526 |
Computation of net asset value and offering price per share | |
Net assets–Class A | $952,580,769 |
Shares outstanding–Class A1 | 97,348,155 |
Net asset value per share–Class A | $9.79 |
Maximum offering price per share – Class A2 | $10.39 |
Net assets–Class C | $13,295,325 |
Shares outstanding–Class C1 | 3,539,559 |
Net asset value per share–Class C | $3.76 |
Net assets–Class R6 | $64,974,568 |
Shares outstanding–Class R61 | 5,617,765 |
Net asset value per share–Class R6 | $11.57 |
Net assets–Administrator Class | $20,190,269 |
Shares outstanding–Administrator Class1 | 1,957,880 |
Net asset value per share–Administrator Class | $10.31 |
Net assets–Institutional Class | $203,015,595 |
Shares outstanding–Institutional Class1 | 17,766,705 |
Net asset value per share–Institutional Class | $11.43 |
Investment income | |
Dividends | $2,311,707 |
Income from affiliated securities | 126,693 |
Interest (net of foreign withholding taxes of $7,217) | 42,339 |
Total investment income | 2,480,739 |
Expenses | |
Management fee | 4,839,658 |
Administration fees | |
Class A | 912,859 |
Class C | 14,340 |
Class R6 | 38,409 |
Administrator Class | 12,528 |
Institutional Class | 148,694 |
Shareholder servicing fees | |
Class A | 1,140,581 |
Class C | 17,870 |
Administrator Class | 23,703 |
Distribution fee | |
Class C | 53,119 |
Custody and accounting fees | 19,923 |
Professional fees | 35,758 |
Registration fees | 36,962 |
Shareholder report expenses | 41,141 |
Trustees’ fees and expenses | 7,915 |
Other fees and expenses | 37,549 |
Total expenses | 7,381,009 |
Less: Fee waivers and/or expense reimbursements | |
Fund-level | (357,246 ) |
Class A | (18,010 ) |
Class R6 | (26,576 ) |
Administrator Class | (2,891 ) |
Institutional Class | (93,701 ) |
Net expenses | 6,882,585 |
Net investment loss | (4,401,846 ) |
Realized and unrealized gains (losses) on investments | |
Net realized gains (losses) on | |
Unaffiliated securities | 304,348,880 |
Foreign currency and foreign currency translations | (10 ) |
Net realized gains on investments | 304,348,870 |
Net change in unrealized gains (losses) on investments | (198,250,594 ) |
Net realized and unrealized gains (losses) on investments | 106,098,276 |
Net increase in net assets resulting from operations | $101,696,430 |
Six months ended January 31, 2024 (unaudited) | Year ended July 31, 2023 | |||
Operations | ||||
Net investment loss | $(4,401,846 ) | $(7,816,992 ) | ||
Net realized gains on investments | 304,348,870 | 264,655,041 | ||
Net change in unrealized gains (losses) on investments | (198,250,594 ) | (103,332,968 ) | ||
Net increase in net assets resulting from operations | 101,696,430 | 153,505,081 | ||
Distributions to shareholders from | ||||
Net investment income and net realized gains | ||||
Class A | (298,255,447 ) | 0 | ||
Class C | (8,797,555 ) | 0 | ||
Class R6 | (106,478,877 ) | 0 | ||
Administrator Class | (6,069,326 ) | 0 | ||
Institutional Class | (66,503,353 ) | 0 | ||
Total distributions to shareholders | (486,104,558 ) | 0 | ||
Capital share transactions | Shares | Shares | ||
Proceeds from shares sold | ||||
Class A | 2,124,496 | 21,633,654 | 1,581,286 | 17,119,149 |
Class C | 106,673 | 537,891 | 173,414 | 1,054,752 |
Class R4 | N/A | N/A | 260 1 | 3,038 1 |
Class R6 | 1,179,350 | 15,022,771 | 5,084,518 | 62,941,438 |
Administrator Class | 41,986 | 443,959 | 98,765 | 1,119,557 |
Institutional Class | 1,053,070 | 12,225,034 | 2,259,612 | 27,341,855 |
49,863,309 | 109,579,789 | |||
Reinvestment of distributions | ||||
Class A | 28,893,055 | 280,519,318 | 0 | 0 |
Class C | 2,102,349 | 8,572,065 | 0 | 0 |
Class R6 | 8,472,343 | 102,900,619 | 0 | 0 |
Administrator Class | 565,128 | 5,768,444 | 0 | 0 |
Institutional Class | 5,324,748 | 59,936,119 | 0 | 0 |
457,696,565 | 0 | |||
Payment for shares redeemed | ||||
Class A | (9,651,383 ) | (98,017,028 ) | (12,407,359 ) | (135,983,194 ) |
Class C | (1,052,975 ) | (5,210,309 ) | (1,298,681 ) | (8,021,717 ) |
Class R4 | N/A | N/A | (10,422 )1 | (139,036 )1 |
Class R6 | (63,481,028 ) | (771,081,632 ) | (11,811,125 ) | (144,843,850 ) |
Administrator Class | (214,893 ) | (2,271,524 ) | (417,909 ) | (4,693,155 ) |
Institutional Class | (7,666,723 ) | (90,234,355 ) | (15,141,286 ) | (185,269,160 ) |
(966,814,848 ) | (478,950,112 ) | |||
Net decrease in net assets resulting from capital share transactions | (459,254,974 ) | (369,370,323 ) | ||
Total decrease in net assets | (843,663,102 ) | (215,865,242 ) | ||
Net assets | ||||
Beginning of period | 2,097,719,628 | 2,313,584,870 | ||
End of period | $1,254,056,526 | $2,097,719,628 | ||
Six months ended January 31, 2024 (unaudited) | Year ended July 31 | |||||
Class A | 2023 | 2022 | 2021 | 2020 | 2019 | |
Net asset value, beginning of period | $12.55 | $11.54 | $19.28 | $16.08 | $14.19 | $15.10 |
Net investment loss | (0.04 )1 | (0.07 )1 | (0.11 )1 | (0.13 )1 | (0.07 ) | (0.05 ) |
Net realized and unrealized gains (losses) on investments | 1.03 | 1.08 | (3.54 ) | 5.36 | 3.07 | 1.50 |
Total from investment operations | 0.99 | 1.01 | (3.65 ) | 5.23 | 3.00 | 1.45 |
Distributions to shareholders from | ||||||
Net realized gains | (3.75 ) | 0.00 | (4.09 ) | (2.03 ) | (1.11 ) | (2.36 ) |
Net asset value, end of period | $9.79 | $12.55 | $11.54 | $19.28 | $16.08 | $14.19 |
Total return2 | 10.75 % | 8.75 % | (24.02 )% | 34.93 % | 22.78 % | 12.97 % |
Ratios to average net assets (annualized) | ||||||
Gross expenses | 1.15 % | 1.15 % | 1.13 % | 1.13 % | 1.14 % | 1.15 % |
Net expenses | 1.10 % | 1.09 % | 1.10 % | 1.10 % | 1.10 % | 1.11 % |
Net investment loss | (0.78 )% | (0.61 )% | (0.75 )% | (0.77 )% | (0.52 )% | (0.40 )% |
Supplemental data | ||||||
Portfolio turnover rate | 23 % | 76 % | 54 % | 48 % | 45 % | 60 % |
Net assets, end of period (000s omitted) | $952,581 | $953,527 | $1,001,892 | $1,501,805 | $1,178,453 | $1,050,751 |
1 | Calculated based upon average shares outstanding |
2 | Total return calculations do not include any sales charges. Returns for periods of less than one year are not annualized. |
Six months ended January 31, 2024 (unaudited) | Year ended July 31 | |||||
Class C | 2023 | 2022 | 2021 | 2020 | 2019 | |
Net asset value, beginning of period | $7.12 | $6.60 | $12.85 | $11.40 | $10.45 | $11.87 |
Net investment loss | (0.04 )1 | (0.09 )1 | (0.14 )1 | (0.18 )1 | (0.13 )1 | (0.12 )1 |
Net realized and unrealized gains (losses) on investments | 0.43 | 0.61 | (2.02 ) | 3.66 | 2.19 | 1.06 |
Total from investment operations | 0.39 | 0.52 | (2.16 ) | 3.48 | 2.06 | 0.94 |
Distributions to shareholders from | ||||||
Net realized gains | (3.75 ) | 0.00 | (4.09 ) | (2.03 ) | (1.11 ) | (2.36 ) |
Net asset value, end of period | $3.76 | $7.12 | $6.60 | $12.85 | $11.40 | $10.45 |
Total return2 | 10.45 % | 7.88 % | (24.57 )% | 33.80 % | 21.87 % | 12.09 % |
Ratios to average net assets (annualized) | ||||||
Gross expenses | 1.89 % | 1.89 % | 1.86 % | 1.87 % | 1.89 % | 1.90 % |
Net expenses | 1.85 % | 1.86 % | 1.85 % | 1.86 % | 1.86 % | 1.86 % |
Net investment loss | (1.52 )% | (1.37 )% | (1.51 )% | (1.52 )% | (1.27 )% | (1.14 )% |
Supplemental data | ||||||
Portfolio turnover rate | 23 % | 76 % | 54 % | 48 % | 45 % | 60 % |
Net assets, end of period (000s omitted) | $13,295 | $16,979 | $23,163 | $58,524 | $111,046 | $153,404 |
1 | Calculated based upon average shares outstanding |
2 | Total return calculations do not include any sales charges. Returns for periods of less than one year are not annualized. |
Six months ended January 31, 2024 (unaudited) | Year ended July 31 | |||||
Class R6 | 2023 | 2022 | 2021 | 2020 | 2019 | |
Net asset value, beginning of period | $14.13 | $12.94 | $21.03 | $17.31 | $15.12 | $15.87 |
Net investment loss | (0.01 )1 | (0.02 )1 | (0.05 )1 | (0.06 )1 | (0.01 ) | (0.00 )1,2 |
Net realized and unrealized gains (losses) on investments | 1.20 | 1.21 | (3.95 ) | 5.81 | 3.31 | 1.61 |
Total from investment operations | 1.19 | 1.19 | (4.00 ) | 5.75 | 3.30 | 1.61 |
Distributions to shareholders from | ||||||
Net realized gains | (3.75 ) | 0.00 | (4.09 ) | (2.03 ) | (1.11 ) | (2.36 ) |
Net asset value, end of period | $11.57 | $14.13 | $12.94 | $21.03 | $17.31 | $15.12 |
Total return3 | 10.99 % | 9.20 % | (23.64 )% | 35.49 % | 23.39 % | 13.40 % |
Ratios to average net assets (annualized) | ||||||
Gross expenses | 0.72 % | 0.72 % | 0.70 % | 0.70 % | 0.71 % | 0.71 % |
Net expenses | 0.65 % | 0.65 % | 0.65 % | 0.65 % | 0.65 % | 0.65 % |
Net investment loss | (0.20 )% | (0.17 )% | (0.30 )% | (0.32 )% | (0.07 )% | (0.02 )% |
Supplemental data | ||||||
Portfolio turnover rate | 23 % | 76 % | 54 % | 48 % | 45 % | 60 % |
Net assets, end of period (000s omitted) | $64,975 | $839,917 | $856,050 | $1,179,098 | $954,852 | $820,383 |
1 | Calculated based upon average shares outstanding |
2 | Amount is more than $(0.005). |
3 | Returns for periods of less than one year are not annualized. |
Six months ended January 31, 2024 (unaudited) | Year ended July 31 | |||||
Administrator Class | 2023 | 2022 | 2021 | 2020 | 2019 | |
Net asset value, beginning of period | $13.02 | $11.96 | $19.82 | $16.47 | $14.48 | $15.35 |
Net investment loss | (0.04 )1 | (0.06 )1 | (0.11 )1 | (0.12 )1 | (0.06 )1 | (0.04 )1 |
Net realized and unrealized gains (losses) on investments | 1.08 | 1.12 | (3.66 ) | 5.50 | 3.16 | 1.53 |
Total from investment operations | 1.04 | 1.06 | (3.77 ) | 5.38 | 3.10 | 1.49 |
Distributions to shareholders from | ||||||
Net realized gains | (3.75 ) | 0.00 | (4.09 ) | (2.03 ) | (1.11 ) | (2.36 ) |
Net asset value, end of period | $10.31 | $13.02 | $11.96 | $19.82 | $16.47 | $14.48 |
Total return2 | 10.72 % | 8.86 % | (23.96 )% | 35.02 % | 23.02 % | 13.02 % |
Ratios to average net assets (annualized) | ||||||
Gross expenses | 1.08 % | 1.06 % | 1.04 % | 1.05 % | 1.06 % | 1.07 % |
Net expenses | 1.00 % | 1.00 % | 1.00 % | 1.00 % | 1.00 % | 1.00 % |
Net investment loss | (0.68 )% | (0.52 )% | (0.68 )% | (0.67 )% | (0.42 )% | (0.29 )% |
Supplemental data | ||||||
Portfolio turnover rate | 23 % | 76 % | 54 % | 48 % | 45 % | 60 % |
Net assets, end of period (000s omitted) | $20,190 | $20,383 | $22,546 | $65,665 | $54,341 | $49,042 |
1 | Calculated based upon average shares outstanding |
2 | Returns for periods of less than one year are not annualized. |
Six months ended January 31, 2024 (unaudited) | Year ended July 31 | |||||
Institutional Class | 2023 | 2022 | 2021 | 2020 | 2019 | |
Net asset value, beginning of period | $14.01 | $12.83 | $20.90 | $17.22 | $15.06 | $15.82 |
Net investment income (loss) | (0.02 )1 | (0.03 )1 | (0.06 )1 | (0.07 )1 | (0.02 )1 | 0.00 1,2 |
Net realized and unrealized gains (losses) on investments | 1.19 | 1.21 | (3.92 ) | 5.78 | 3.29 | 1.60 |
Total from investment operations | 1.17 | 1.18 | (3.98 ) | 5.71 | 3.27 | 1.60 |
Distributions to shareholders from | ||||||
Net realized gains | (3.75 ) | 0.00 | (4.09 ) | (2.03 ) | (1.11 ) | (2.36 ) |
Net asset value, end of period | $11.43 | $14.01 | $12.83 | $20.90 | $17.22 | $15.06 |
Total return3 | 10.93 % | 9.20 % | (23.70 )% | 35.43 % | 23.28 % | 13.38 % |
Ratios to average net assets (annualized) | ||||||
Gross expenses | 0.83 % | 0.82 % | 0.80 % | 0.80 % | 0.81 % | 0.82 % |
Net expenses | 0.70 % | 0.70 % | 0.70 % | 0.70 % | 0.70 % | 0.70 % |
Net investment income (loss) | (0.37 )% | (0.21 )% | (0.35 )% | (0.37 )% | (0.12 )% | 0.02 % |
Supplemental data | ||||||
Portfolio turnover rate | 23 % | 76 % | 54 % | 48 % | 45 % | 60 % |
Net assets, end of period (000s omitted) | $203,016 | $266,914 | $409,806 | $677,437 | $648,357 | $643,578 |
1 | Calculated based upon average shares outstanding |
2 | Amount is less than $0.005. |
3 | Returns for periods of less than one year are not annualized. |
Gross unrealized gains | $615,661,241 |
Gross unrealized losses | (3,624,077 ) |
Net unrealized gains | $612,037,164 |
Quoted prices (Level 1) | Other significant observable inputs (Level 2) | Significant unobservable inputs (Level 3) | Total | |
Assets | ||||
Investments in: | ||||
Common stocks | ||||
Communication services | $144,423,923 | $0 | $0 | $144,423,923 |
Consumer discretionary | 196,308,604 | 0 | 0 | 196,308,604 |
Consumer staples | 17,339,741 | 0 | 0 | 17,339,741 |
Financials | 97,940,249 | 0 | 0 | 97,940,249 |
Health care | 144,206,311 | 0 | 0 | 144,206,311 |
Industrials | 102,328,708 | 0 | 0 | 102,328,708 |
Information technology | 540,250,883 | 0 | 0 | 540,250,883 |
Materials | 17,148,194 | 0 | 0 | 17,148,194 |
Short-term investments | ||||
Investment companies | 1,879,551 | 0 | 0 | 1,879,551 |
Total assets | $1,261,826,164 | $0 | $0 | $1,261,826,164 |
Average daily net assets | Management fee |
First $500 million | 0.700 % |
Next $500 million | 0.675 |
Next $1 billion | 0.650 |
Next $2 billion | 0.625 |
Next $1 billion | 0.600 |
Next $3 billion | 0.590 |
Next $2 billion | 0.565 |
Next $2 billion | 0.555 |
Next $4 billion | 0.530 |
Over $16 billion | 0.505 |
Class-level administration fee | |
Class A | 0.20 % |
Class C | 0.20 |
Class R6 | 0.03 |
Administrator Class | 0.13 |
Institutional Class | 0.13 |
EXPENSE RATIO CAPS | |
Class A | 1.10 % |
Class C | 1.85 |
Class R6 | 0.65 |
Administrator Class | 1.00 |
Institutional Class | 0.70 |
Name and year of birth | Position held and length of service* | Principal occupations during past five years or longer | Current other public company or investment company directorships |
William R. Ebsworth (Born 1957) | Trustee, since 2015 | Retired. From 1984 to 2013, equities analyst, portfolio manager, research director and chief investment officer at Fidelity Management and Research Company in Boston, Tokyo, and Hong Kong, and retired in 2013 as Chief Investment Officer of Fidelity Strategic Advisers, Inc. where he led a team of investment professionals managing client assets. Prior thereto, Board member of Hong Kong Securities Clearing Co., Hong Kong Options Clearing Corp., the Thailand International Fund, Ltd., Fidelity Investments Life Insurance Company, and Empire Fidelity Investments Life Insurance Company. Serves on the Investment Company Institute’s Board of Governors since 2022 and Executive Committee since 2023 as well as the Vice Chairman of the Governing Council of the Independent Directors Council since 2023. Audit Committee Chair and Investment Committee Chair of the Vincent Memorial Hospital Foundation (non-profit organization). Mr. Ebsworth is a CFA charterholder. | N/A |
Jane A. Freeman (Born 1953) | Trustee, since 2015; Chair Liaison, since January 2018# | Retired. From 2012 to 2014 and 1999 to 2008, Chief Financial Officer of Scientific Learning Corporation. From 2008 to 2012, Ms. Freeman provided consulting services related to strategic business projects. Prior to 1999, Portfolio Manager at Rockefeller & Co. and Scudder, Stevens & Clark. Board member of the Harding Loevner Funds from 1996 to 2014, serving as both Lead Independent Director and chair of the Audit Committee. Board member of the Russell Exchange Traded Funds Trust from 2011 to 2012 and the chair of the Audit Committee. Ms. Freeman is also an inactive Chartered Financial Analyst. | N/A |
Isaiah Harris, Jr. (Born 1952) | Trustee, since 2009; Audit Committee Chair, since 2019 | Retired. Member of the Advisory Board of CEF of East Central Florida. Chairman of the Board of CIGNA Corporation from 2009 to 2021, and Director from 2005 to 2008. From 2003 to 2011, Director of Deluxe Corporation. Prior thereto, President and CEO of BellSouth Advertising and Publishing Corp. from 2005 to 2007, President and CEO of BellSouth Enterprises from 2004 to 2005 and President of BellSouth Consumer Services from 2000 to 2003. Emeritus member of the Iowa State University Foundation Board of Governors. Emeritus Member of the Advisory board of Iowa State University School of Business. Advisory Board Member, Palm Harbor Academy (private school). Advisory Board Member, Fellowship of Christian Athletes. Mr. Harris is a certified public accountant (inactive status). | N/A |
David F. Larcker (Born 1950) | Trustee, since 2009 | Distinguished Visiting Fellow at the Hoover Institution since 2022. James Irvin Miller Professor of Accounting at the Graduate School of Business (Emeritus), Stanford University, Director of the Corporate Governance Research Initiative and Senior Faculty of The Rock Center for Corporate Governance since 2006. From 2005 to 2008, Professor of Accounting at the Graduate School of Business, Stanford University. Prior thereto, Ernst & Young Professor of Accounting at The Wharton School, University of Pennsylvania from 1985 to 2005. | N/A |
Olivia S. Mitchell (Born 1953) | Trustee, since 2006 | International Foundation of Employee Benefit Plans Professor since 1993, Wharton School of the University of Pennsylvania. Director of Wharton’s Pension Research Council and Boettner Center on Pensions & Retirement Research, and Research Associate at the National Bureau of Economic Research. Previously taught at Cornell University from 1978 to 1993. | N/A |
Timothy J. Penny (Born 1951) | Trustee, since 1996; Chair, since 2018 | President and Chief Executive Officer of Southern Minnesota Initiative Foundation, a non-profit organization, since 2007. Vice Chair of the Economic Club of Minnesota, since 2007. Co-Chair of the Committee for a Responsible Federal Budget, since 1995. Member of the Board of Trustees of NorthStar Education Finance, Inc., a non-profit organization, from 2007-2022. Senior Fellow of the University of Minnesota Humphrey Institute from 1995 to 2017. | N/A |
Name and year of birth | Position held and length of service* | Principal occupations during past five years or longer | Current other public company or investment company directorships |
James G. Polisson (Born 1959) | Trustee, since 2018; Nominating and Governance Committee Chair, since 2024 | Retired. Chief Marketing Officer, Source (ETF) UK Services, Ltd, from 2015 to 2017. From 2012 to 2015, Principal of The Polisson Group, LLC, a management consulting, corporate advisory and principal investing company. Chief Executive Officer and Managing Director at Russell Investments, Global Exchange Traded Funds from 2010 to 2012. Managing Director of Barclays Global Investors from 1998 to 2010 and Global Chief Marketing Officer for iShares and Barclays Global Investors from 2000 to 2010. Trustee of the San Francisco Mechanics’ Institute, a non- profit organization, from 2013 to 2015. Board member of the Russell Exchange Traded Fund Trust from 2011 to 2012. Director of Barclays Global Investors Holdings Deutschland GmbH from 2006 to 2009. Mr. Polisson is an attorney and has a retired status with the Massachusetts and District of Columbia Bar Associations. | N/A |
Pamela Wheelock (Born 1959) | Trustee, since January 2020; previously Trustee from January 2018 to July 2019# | Retired. Executive and Senior Financial leadership positions in the public, private and nonprofit sectors. Interim President and CEO, McKnight Foundation, 2020. Interim Commissioner, Minnesota Department of Human Services, 2019. Chief Operating Officer, Twin Cities Habitat for Humanity, 2017-2019. Vice President for University Services, University of Minnesota, 2012- 2016. Interim President and CEO, Blue Cross and Blue Shield of Minnesota, 2011-2012. Executive Vice-President and Chief Financial Officer, Minnesota Wild, 2002-2008. Commissioner, Minnesota Department of Finance, 1999-2002. Chair of the Board of Directors of Destination Medical Center Corporation. Board member of the Minnesota Wild Foundation. | N/A |
Name and year of birth | Position held and length of service | Principal occupations during past five years or longer |
Andrew Owen (Born 1960) | President, since 2017 | President and Chief Executive Officer of Allspring Funds Management, LLC since 2017 and Head of Global Fund Governance of Allspring Global Investments since 2022. Prior thereto, co-president of Galliard Capital Management, LLC, an affiliate of Allspring Funds Management, LLC, from 2019 to 2022 and Head of Affiliated Managers, Allspring Global Investments, from 2014 to 2019 and Executive Vice President responsible for marketing, investments and product development for Allspring Funds Management, LLC, from 2009 to 2014. |
Jeremy DePalma (Born 1974) | Treasurer, since 2012 (for certain funds in the Fund Complex); since 2021 (for the remaining funds in the Complex) | Senior Vice President of Allspring Funds Management, LLC since 2009. Senior Vice President of Evergreen Investment Management Company, LLC from 2008 to 2010 and head of the Fund Reporting and Control Team within Fund Administration from 2005 to 2010. |
Christopher Baker (Born 1976) | Chief Compliance Officer, since 2022 | Global Chief Compliance Officer for Allspring Global Investments since 2022. Prior thereto, Chief Compliance Officer for State Street Global Advisors from 2018 to 2021. Senior Compliance Officer for the State Street divisions of Alternative Investment Solutions, Sector Solutions, and Global Marketing from 2015 to 2018. From 2010 to 2015 Vice President, Global Head of Investment and Marketing Compliance for State Street Global Advisors. |
Matthew Prasse (Born 1983) | Chief Legal Officer, since 2022; Secretary, since 2021 | Senior Counsel of the Allspring Legal Department since 2021. Senior Counsel of the Wells Fargo Legal Department from 2018 to 2021. Previously, Counsel for Barings LLC from 2015 to 2018. Prior to joining Barings, Associate at Morgan, Lewis & Bockius LLP from 2008 to 2015. |

P.O. Box 219967
Kansas City, MO 64121-9967

SAR4325 01-24

Allspring Funds

President
Allspring Funds
Notice to Shareholders |
Beginning in July 2024, the Fund will be required by the Securities and Exchange Commission to send shareholders a paper copy of a new tailored shareholder report in place of the full shareholder report that you are now receiving. The tailored shareholder report will contain concise information about the Fund, including certain expense and performance information and fund statistics. If you wish to receive this new tailored shareholder report electronically, please follow the instructions on the back cover of this report. |
Other information that is currently included in the shareholder report, such as the Fund’s financial statements, will be available online and upon request, free of charge, in paper or electronic format. |
Investment objective | The Fund seeks long-term capital appreciation. |
Manager | Allspring Funds Management, LLC |
Subadviser | Allspring Global Investments, LLC |
Portfolio managers | James M. Tringas, CFA, Bryant VanCronkhite, CFA, CPA, Shane Zweck, CFA |
Average annual total returns (%) as of January 31, 2024 | |||||||||
Including sales charge | Excluding sales charge | Expense ratios1 (%) | |||||||
Inception date | 1 year | 5 year | 10 year | 1 year | 5 year | 10 year | Gross | Net2 | |
Class A (EIVAX) | 8-1-2006 | 4.18 | 9.12 | 8.30 | 10.53 | 10.42 | 8.95 | 1.17 | 1.01 |
Class C (EIVCX) | 8-1-2006 | 8.67 | 9.61 | 8.31 | 9.67 | 9.61 | 8.31 | 1.92 | 1.76 |
Class R6 (EIVFX) | 11-30-2012 | – | – | – | 10.98 | 10.91 | 9.48 | 0.75 | 0.59 |
Administrator Class (EIVDX) | 7-30-2010 | – | – | – | 10.69 | 10.59 | 9.13 | 1.10 | 0.94 |
Institutional Class (EIVIX) | 8-1-2006 | – | – | – | 10.94 | 10.84 | 9.39 | 0.85 | 0.69 |
Russell 3000® Index3 | – | – | – | – | 19.15 | 13.53 | 11.96 | – | – |
Russell 1000® Value Index4 | – | – | – | – | 6.08 | 9.28 | 8.80 | – | – |
1 | Reflects the expense ratios as stated in the most recent prospectuses. The expense ratios shown are subject to change and may differ from the annualized expense ratios shown in the Financial Highlights of this report. |
2 | The manager has contractually committed through November 30, 2024, to waive fees and/or reimburse expenses to the extent necessary to cap total annual fund operating expenses after fee waivers at 1.01% for Class A, 1.76% for Class C, 0.59% for Class R6, 0.94% for Administrator Class and 0.69% for Institutional Class. Brokerage commissions, stamp duty fees, interest, taxes, acquired fund fees and expenses (if any), and extraordinary expenses are excluded from the expense caps. Prior to or after the commitment expiration date, the caps may be increased or the commitment to maintain the caps may be terminated only with the approval of the Board of Trustees. Without these caps, the Fund’s returns would have been lower. The expense ratio paid by an investor is the net expense ratio (the total annual fund operating expenses after fee waivers) as stated in the prospectuses. |
3 | The Russell 3000® Index measures the performance of the 3,000 largest U.S. companies based on total market capitalization, which represents approximately 98% of the investable U.S. equity market. You cannot invest directly in an index. |
4 | The Russell 1000® Value Index measures the performance of those Russell 1000 companies with lower price/book ratios and lower forecasted growth values. You cannot invest directly in an index. |
CFA® and Chartered Financial Analyst® are trademarks owned by CFA Institute. |
Ten largest holdings (%) as of January 31, 20241 | |
AerCap Holdings NV | 3.99 |
Berkshire Hathaway, Inc. Class B | 3.61 |
Alphabet, Inc. Class C | 3.34 |
NextEra Energy, Inc. | 3.31 |
Intercontinental Exchange, Inc. | 3.17 |
JPMorgan Chase & Co. | 3.05 |
Cigna Group | 3.00 |
Bank of America Corp. | 2.98 |
Citigroup, Inc. | 2.97 |
Walmart, Inc. | 2.94 |
1 | Figures represent the percentage of the Fund’s net assets. Holdings are subject to change and may have changed since the date specified. |
Sector allocation as of January 31, 20241 |
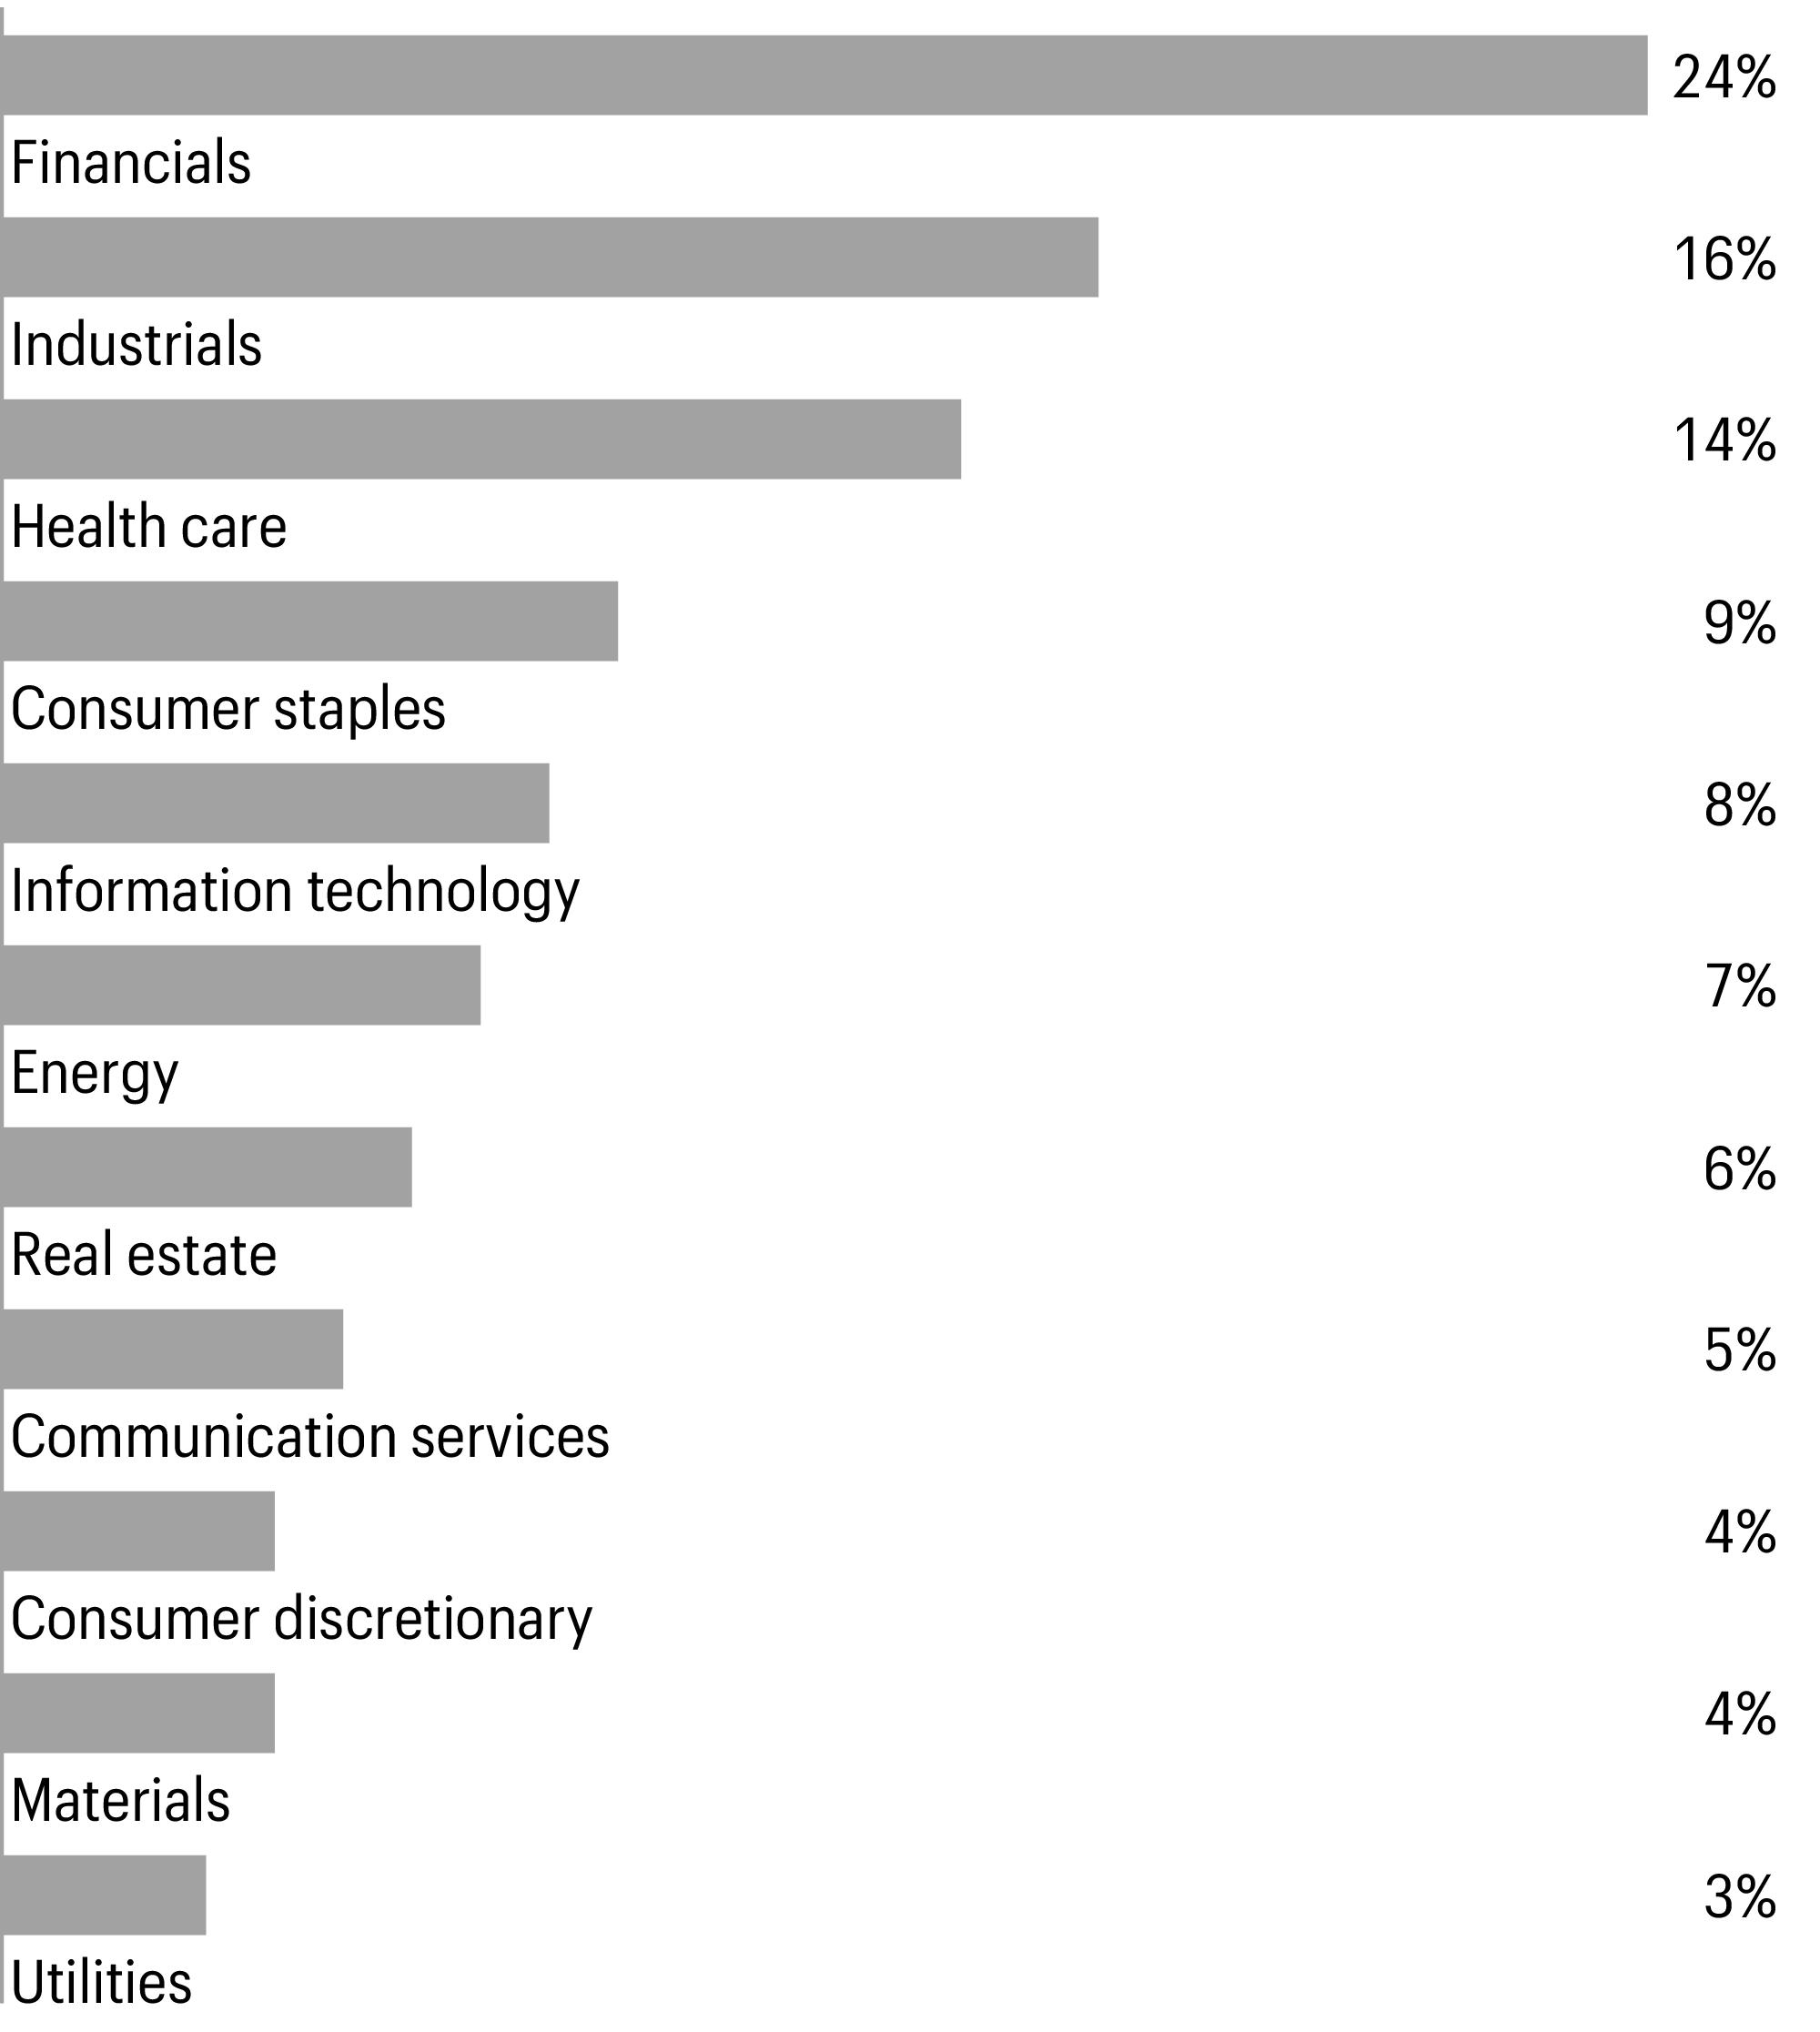
1 | Figures represent the percentage of the Fund’s long-term investments. Allocations are subject to change and may have changed since the date specified. |
Beginning account value 8-1-2023 | Ending account value 1-31-2024 | Expenses paid during the period1 | Annualized net expense ratio | |
Class A | ||||
Actual | $1,000.00 | $1,052.70 | $5.68 | 1.10 % |
Hypothetical (5% return before expenses) | $1,000.00 | $1,019.61 | $5.58 | 1.10 % |
Class C | ||||
Actual | $1,000.00 | $1,048.21 | $9.52 | 1.85 % |
Hypothetical (5% return before expenses) | $1,000.00 | $1,015.84 | $9.37 | 1.85 % |
Class R6 | ||||
Actual | $1,000.00 | $1,055.71 | $3.36 | 0.65 % |
Hypothetical (5% return before expenses) | $1,000.00 | $1,021.87 | $3.30 | 0.65 % |
Administrator Class | ||||
Actual | $1,000.00 | $1,053.65 | $4.90 | 0.95 % |
Hypothetical (5% return before expenses) | $1,000.00 | $1,020.36 | $4.82 | 0.95 % |
Institutional Class | ||||
Actual | $1,000.00 | $1,054.46 | $3.61 | 0.70 % |
Hypothetical (5% return before expenses) | $1,000.00 | $1,021.62 | $3.56 | 0.70 % |
1 | Expenses paid is equal to the annualized net expense ratio of each class multiplied by the average account value over the period, multiplied by 184 divided by 366 (to reflect the one-half-year period). |
Shares | Value | |||||
Common stocks: 98.03% | ||||||
Communication services: 4.81% | ||||||
Interactive media & services: 3.34% | ||||||
Alphabet, Inc. Class C† | 278,145 | $39,440,961 | ||||
Media: 1.47% | ||||||
Comcast Corp. Class A | 374,328 | 17,421,225 | ||||
Consumer discretionary: 3.82% | ||||||
Automobiles: 2.80% | ||||||
General Motors Co. | 851,964 | 33,056,203 | ||||
Household durables: 1.02% | ||||||
D.R. Horton, Inc. | 84,643 | 12,096,331 | ||||
Consumer staples: 8.84% | ||||||
Beverages: 2.13% | ||||||
Keurig Dr Pepper, Inc. | 801,712 | 25,205,825 | ||||
Consumer staples distribution & retail : 2.94% | ||||||
Walmart, Inc. | 210,001 | 34,702,665 | ||||
Personal care products: 3.77% | ||||||
Kenvue, Inc. | 776,725 | 16,124,811 | ||||
Unilever PLC ADR | 584,097 | 28,439,683 | ||||
44,564,494 | ||||||
Energy: 7.10% | ||||||
Oil, gas & consumable fuels: 7.10% | ||||||
ConocoPhillips | 280,257 | 31,352,351 | ||||
EOG Resources, Inc. | 221,999 | 25,261,266 | ||||
Exxon Mobil Corp. | 264,655 | 27,209,180 | ||||
83,822,797 | ||||||
Financials: 23.36% | ||||||
Banks: 9.00% | ||||||
Bank of America Corp. | 1,034,061 | 35,168,415 | ||||
Citigroup, Inc. | 625,036 | 35,108,272 | ||||
JPMorgan Chase & Co. | 206,758 | 36,050,325 | ||||
106,327,012 | ||||||
Capital markets: 3.17% | ||||||
Intercontinental Exchange, Inc. | 294,186 | 37,458,703 | ||||
Financial services: 7.75% | ||||||
Berkshire Hathaway, Inc. Class B† | 111,102 | 42,634,282 | ||||
Fiserv, Inc.† | 189,422 | 26,873,299 | ||||
Visa, Inc. Class A | 80,624 | 22,031,314 | ||||
91,538,895 | ||||||
Shares | Value | |||||
Insurance: 3.44% | ||||||
Allstate Corp. | 76,041 | $11,805,365 | ||||
American International Group, Inc. | 415,465 | 28,878,972 | ||||
40,684,337 | ||||||
Health care: 13.84% | ||||||
Biotechnology: 1.61% | ||||||
Vertex Pharmaceuticals, Inc.† | 43,964 | 19,053,118 | ||||
Health care equipment & supplies: 3.47% | ||||||
Globus Medical, Inc. Class A† | 273,471 | 14,436,534 | ||||
Medtronic PLC | 303,451 | 26,564,101 | ||||
41,000,635 | ||||||
Health care providers & services: 5.99% | ||||||
Cigna Group | 117,750 | 35,436,863 | ||||
Humana, Inc. | 48,471 | 18,324,946 | ||||
Laboratory Corp. of America Holdings | 76,720 | 17,054,856 | ||||
70,816,665 | ||||||
Pharmaceuticals: 2.77% | ||||||
Merck & Co., Inc. | 270,754 | 32,701,668 | ||||
Industrials: 15.66% | ||||||
Aerospace & defense: 3.57% | ||||||
L3Harris Technologies, Inc. | 111,574 | 23,254,253 | ||||
RTX Corp. | 207,846 | 18,938,928 | ||||
42,193,181 | ||||||
Commercial services & supplies: 2.47% | ||||||
Waste Management, Inc. | 157,296 | 29,198,856 | ||||
Ground transportation: 2.66% | ||||||
Canadian Pacific Kansas City Ltd. | 390,408 | 31,416,132 | ||||
Industrial conglomerates: 1.46% | ||||||
Honeywell International, Inc. | 85,386 | 17,270,172 | ||||
Machinery: 1.02% | ||||||
Caterpillar, Inc. | 40,096 | 12,041,230 | ||||
Trading companies & distributors: 4.48% | ||||||
AerCap Holdings NV† | 615,406 | 47,115,483 | ||||
Ferguson PLC | 31,152 | 5,852,215 | ||||
52,967,698 | ||||||
Information technology: 8.10% | ||||||
IT services: 2.32% | ||||||
Accenture PLC Class A | 75,441 | 27,451,471 | ||||
Semiconductors & semiconductor equipment: 2.28% | ||||||
NXP Semiconductors NV | 127,863 | 26,924,112 | ||||
Shares | Value | |||||
Software: 3.50% | ||||||
Cadence Design Systems, Inc.† | 49,247 | $14,205,790 | ||||
Microsoft Corp. | 68,226 | 27,125,293 | ||||
41,331,083 | ||||||
Materials: 3.77% | ||||||
Chemicals: 2.29% | ||||||
Sherwin-Williams Co. | 88,831 | 27,038,380 | ||||
Construction materials: 1.48% | ||||||
Vulcan Materials Co. | 77,656 | 17,551,032 | ||||
Real estate: 5.42% | ||||||
Office REITs : 1.03% | ||||||
Boston Properties, Inc. | 183,776 | 12,221,104 | ||||
Real estate management & development: 2.86% | ||||||
CBRE Group, Inc. Class A† | 391,431 | 33,784,410 | ||||
Specialized REITs : 1.53% | ||||||
Public Storage | 63,706 | 18,040,902 | ||||
Utilities: 3.31% | ||||||
Electric utilities: 3.31% | ||||||
NextEra Energy, Inc. | 667,352 | 39,126,848 | ||||
Total common stocks (Cost $905,605,324) | 1,158,448,145 | |||||
Yield | ||||||
Short-term investments: 2.00% | ||||||
Investment companies: 2.00% | ||||||
Allspring Government Money Market Fund Select Class♠∞ | 5.27 % | 23,666,235 | 23,666,235 | |||
Total short-term investments (Cost $23,666,235) | 23,666,235 | |||||
Total investments in securities (Cost $929,271,559) | 100.03 % | 1,182,114,380 | ||||
Other assets and liabilities, net | (0.03 ) | (387,758 ) | ||||
Total net assets | 100.00 % | $1,181,726,622 | ||||
† | Non-income-earning security |
♠ | The issuer of the security is an affiliated person of the Fund as defined in the Investment Company Act of 1940. |
∞ | The rate represents the 7-day annualized yield at period end. |
Abbreviations: | |
ADR | American depositary receipt |
REIT | Real estate investment trust |
Value, beginning of period | Purchases | Sales proceeds | Net realized gains (losses) | Net change in unrealized gains (losses) | Value, end of period | Shares, end of period | Income from affiliated securities | |
Short-term investments | ||||||||
Allspring Government Money Market Fund Select Class | $33,357,878 | $118,218,767 | $(127,910,410 ) | $0 | $0 | $23,666,235 | 23,666,235 | $780,834 |
Assets | |
Investments in unaffiliated securities, at value (cost $905,605,324) | $1,158,448,145 |
Investments in affiliated securities, at value (cost $23,666,235) | 23,666,235 |
Cash | 160 |
Receivable for investments sold | 6,465,927 |
Receivable for Fund shares sold | 1,040,950 |
Receivable for dividends | 330,760 |
Prepaid expenses and other assets | 126,436 |
Total assets | 1,190,078,613 |
Liabilities | |
Payable for investments purchased | 6,255,957 |
Payable for Fund shares redeemed | 1,050,364 |
Management fee payable | 570,055 |
Administration fees payable | 142,440 |
Trustees’ fees and expenses payable | 3,530 |
Distribution fees payable | 665 |
Accrued expenses and other liabilities | 328,980 |
Total liabilities | 8,351,991 |
Total net assets | $1,181,726,622 |
Net assets consist of | |
Paid-in capital | $914,528,313 |
Total distributable earnings | 267,198,309 |
Total net assets | $1,181,726,622 |
Computation of net asset value and offering price per share | |
Net assets–Class A | $253,228,660 |
Shares outstanding–Class A1 | 20,328,188 |
Net asset value per share–Class A | $12.46 |
Maximum offering price per share – Class A2 | $13.22 |
Net assets–Class C | $1,046,641 |
Shares outstanding–Class C1 | 86,772 |
Net asset value per share–Class C | $12.06 |
Net assets–Class R6 | $41,223,831 |
Shares outstanding–Class R61 | 3,393,586 |
Net asset value per share–Class R6 | $12.15 |
Net assets–Administrator Class | $456,778,241 |
Shares outstanding–Administrator Class1 | 34,087,414 |
Net asset value per share–Administrator Class | $13.40 |
Net assets–Institutional Class | $429,449,249 |
Shares outstanding–Institutional Class1 | 34,161,392 |
Net asset value per share–Institutional Class | $12.57 |
Investment income | |
Dividends (net of foreign withholdings taxes of $38,285) | $9,740,546 |
Income from affiliated securities | 780,834 |
Interest | 1,705 |
Total investment income | 10,523,085 |
Expenses | |
Management fee | 3,731,568 |
Administration fees | |
Class A | 244,980 |
Class C | 1,177 |
Class R6 | 6,033 |
Administrator Class | 286,315 |
Institutional Class | 236,168 |
Shareholder servicing fees | |
Class A | 299,296 |
Class C | 1,469 |
Administrator Class | 546,251 |
Distribution fees | |
Class C | 4,407 |
Custody and accounting fees | 11,840 |
Professional fees | 32,492 |
Registration fees | 37,836 |
Shareholder report expenses | 20,678 |
Trustees’ fees and expenses | 10,491 |
Other fees and expenses | 16,068 |
Total expenses | 5,487,069 |
Less: Fee waivers and/or expense reimbursements | |
Fund-level | (317,981 ) |
Class R6 | (5,677 ) |
Administrator Class | (168,201 ) |
Institutional Class | (142,268 ) |
Net expenses | 4,852,942 |
Net investment income | 5,670,143 |
Realized and unrealized gains (losses) on investments | |
Net realized gains (losses) on | |
Unaffiliated securities | 19,400,280 |
Foreign currency and foreign currency translations | (1,784 ) |
Net realized gains on investments | 19,398,496 |
Net change in unrealized gains (losses) on investments | 39,463,225 |
Net realized and unrealized gains (losses) on investments | 58,861,721 |
Net increase in net assets resulting from operations | $64,531,864 |
Six months ended January 31, 2024 (unaudited) | Year ended July 31, 2023 | |||
Operations | ||||
Net investment income | $5,670,143 | $10,307,671 | ||
Net realized gains on investments | 19,398,496 | 17,581,384 | ||
Net change in unrealized gains (losses) on investments | 39,463,225 | 98,845,969 | ||
Net increase in net assets resulting from operations | 64,531,864 | 126,735,024 | ||
Distributions to shareholders from | ||||
Net investment income and net realized gains | ||||
Class A | (6,979,591 ) | (21,506,191 ) | ||
Class C | (23,792 ) | (109,116 ) | ||
Class R | N/A | (9,285 )1 | ||
Class R6 | (1,352,009 ) | (3,760,345 ) | ||
Administrator Class | (12,699,409 ) | (36,706,544 ) | ||
Institutional Class | (12,992,850 ) | (4,220,939 ) | ||
Total distributions to shareholders | (34,047,651 ) | (66,312,420 ) | ||
Capital share transactions | Shares | Shares | ||
Proceeds from shares sold | ||||
Class A | 69,933 | 839,947 | 311,686 | 3,560,860 |
Class C | 4,000 | 45,731 | 24,270 | 264,005 |
Class R | N/A | N/A | 645 1 | 7,461 1 |
Class R6 | 58,963 | 679,667 | 311,122 | 3,388,387 |
Administrator Class | 29,362 | 375,925 | 109,729 | 1,344,715 |
Institutional Class | 11,720,330 | 138,882,414 | 24,596,271 | 278,031,309 |
140,823,684 | 286,596,737 | |||
Reinvestment of distributions | ||||
Class A | 558,881 | 6,691,648 | 1,821,930 | 20,569,076 |
Class C | 2,076 | 23,792 | 10,047 | 109,116 |
Class R | N/A | N/A | 814 1 | 9,285 1 |
Class R6 | 115,420 | 1,352,009 | 340,628 | 3,760,345 |
Administrator Class | 933,421 | 12,045,524 | 2,870,257 | 34,825,950 |
Institutional Class | 1,071,017 | 12,984,694 | 366,284 | 4,179,246 |
33,097,667 | 63,453,018 | |||
Six months ended January 31, 2024 (unaudited) | Year ended July 31, 2023 | |||
Shares | Shares | |||
Payment for shares redeemed | ||||
Class A | (1,243,390 ) | $(14,752,865 ) | (2,567,327 ) | $(29,598,511 ) |
Class C | (33,351 ) | (385,607 ) | (90,844 ) | (1,023,853 ) |
Class R | N/A | N/A | (10,306 )1 | (121,714 )1 |
Class R6 | (308,551 ) | (3,604,144 ) | (879,014 ) | (9,974,847 ) |
Administrator Class | (1,708,835 ) | (21,804,393 ) | (3,143,649 ) | (38,738,087 ) |
Institutional Class | (4,777,793 ) | (58,201,557 ) | (3,188,483 ) | (36,891,392 ) |
(98,748,566 ) | (116,348,404 ) | |||
Net increase in net assets resulting from capital share transactions | 75,172,785 | 233,701,351 | ||
Total increase in net assets | 105,656,998 | 294,123,955 | ||
Net assets | ||||
Beginning of period | 1,076,069,624 | 781,945,669 | ||
End of period | $1,181,726,622 | $1,076,069,624 | ||
Six months ended January 31, 2024 (unaudited) | Year ended July 31 | |||||
Class A | 2023 | 2022 | 2021 | 2020 | 2019 | |
Net asset value, beginning of period | $12.18 | $11.66 | $14.98 | $11.35 | $13.13 | $13.05 |
Net investment income | 0.05 1 | 0.12 1 | 0.06 | 0.11 | 0.14 | 0.10 |
Payment from affiliate | 0.00 | 0.00 | 0.00 | 0.00 2 | 0.00 | 0.00 |
Net realized and unrealized gains (losses) on investments | 0.57 | 1.44 | (0.59 ) | 3.66 | (0.58 ) | 0.94 |
Total from investment operations | 0.62 | 1.56 | (0.53 ) | 3.77 | (0.44 ) | 1.04 |
Distributions to shareholders from | ||||||
Net investment income | (0.09 ) | (0.10 ) | (0.09 ) | (0.14 ) | (0.10 ) | (0.12 ) |
Net realized gains | (0.25 ) | (0.94 ) | (2.70 ) | 0.00 | (1.24 ) | (0.84 ) |
Total distributions to shareholders | (0.34 ) | (1.04 ) | (2.79 ) | (0.14 ) | (1.34 ) | (0.96 ) |
Net asset value, end of period | $12.46 | $12.18 | $11.66 | $14.98 | $11.35 | $13.13 |
Total return3 | 5.27 %4 | 14.17 % | (5.29 )% | 33.49 %4 | (4.25 )% | 9.03 % |
Ratios to average net assets (annualized) | ||||||
Gross expenses | 1.15 % | 1.17 % | 1.17 % | 1.18 % | 1.18 % | 1.18 % |
Net expenses | 1.10 % | 1.09 % | 1.09 % | 1.09 % | 1.10 % | 1.10 % |
Net investment income | 0.84 % | 1.02 % | 0.52 % | 0.77 % | 1.20 % | 0.81 % |
Supplemental data | ||||||
Portfolio turnover rate | 16 % | 42 % | 40 % | 46 % | 34 % | 27 % |
Net assets, end of period (000s omitted) | $253,229 | $254,988 | $249,213 | $294,248 | $245,977 | $291,111 |
1 | Calculated based upon average shares outstanding |
2 | Amount is less than $0.005. |
3 | Total return calculations do not include any sales charges. Returns for periods of less than one year are not annualized. |
4 | During the year ended July 31, 2021, the Fund received a payment from an affiliate that had an impact of less than 0.005% on total return. |
Six months ended January 31, 2024 (unaudited) | Year ended July 31 | |||||
Class C | 2023 | 2022 | 2021 | 2020 | 2019 | |
Net asset value, beginning of period | $11.76 | $11.28 | $14.59 | $10.99 | $12.75 | $12.69 |
Net investment income (loss) | 0.01 1 | 0.03 1 | (0.03 )1 | 0.01 1 | 0.05 1 | 0.00 1,2 |
Payment from affiliate | 0.00 | 0.00 | 0.00 | 0.05 | 0.00 | 0.00 |
Net realized and unrealized gains (losses) on investments | 0.54 | 1.39 | (0.58 ) | 3.54 | (0.57 ) | 0.92 |
Total from investment operations | 0.55 | 1.42 | (0.61 ) | 3.60 | (0.52 ) | 0.92 |
Distributions to shareholders from | ||||||
Net investment income | 0.00 | 0.00 | 0.00 | 0.00 | 0.00 | (0.02 ) |
Net realized gains | (0.25 ) | (0.94 ) | (2.70 ) | 0.00 | (1.24 ) | (0.84 ) |
Total distributions to shareholders | (0.25 ) | (0.94 ) | (2.70 ) | 0.00 | (1.24 ) | (0.86 ) |
Net asset value, end of period | $12.06 | $11.76 | $11.28 | $14.59 | $10.99 | $12.75 |
Total return3 | 4.82 % | 13.30 % | (5.99 )% | 32.76 %4 | (4.99 )% | 8.16 % |
Ratios to average net assets (annualized) | ||||||
Gross expenses | 1.91 % | 1.93 % | 1.92 % | 1.93 % | 1.94 % | 1.94 % |
Net expenses | 1.85 % | 1.86 % | 1.86 % | 1.86 % | 1.86 % | 1.86 % |
Net investment income (loss) | 0.12 % | 0.27 % | (0.24 )% | 0.05 % | 0.44 % | 0.03 % |
Supplemental data | ||||||
Portfolio turnover rate | 16 % | 42 % | 40 % | 46 % | 34 % | 27 % |
Net assets, end of period (000s omitted) | $1,047 | $1,341 | $1,923 | $2,356 | $4,401 | $7,370 |
1 | Calculated based upon average shares outstanding |
2 | Amount is less than $0.005. |
3 | Total return calculations do not include any sales charges. Returns for periods of less than one year are not annualized. |
4 | During the year ended July 31, 2021, the Fund received a payment from an affiliate that had a 0.50% impact on the total return. |
Six months ended January 31, 2024 (unaudited) | Year ended July 31 | |||||
Class R6 | 2023 | 2022 | 2021 | 2020 | 2019 | |
Net asset value, beginning of period | $11.90 | $11.42 | $14.73 | $11.16 | $12.93 | $12.92 |
Net investment income | 0.08 1 | 0.16 1 | 0.18 | 0.16 | 0.19 1 | 0.16 1 |
Net realized and unrealized gains (losses) on investments | 0.56 | 1.41 | (0.64 ) | 3.60 | (0.57 ) | 1.00 |
Total from investment operations | 0.64 | 1.57 | (0.46 ) | 3.76 | (0.38 ) | 1.16 |
Distributions to shareholders from | ||||||
Net investment income | (0.14 ) | (0.15 ) | (0.15 ) | (0.19 ) | (0.15 ) | (0.31 ) |
Net realized gains | (0.25 ) | (0.94 ) | (2.70 ) | 0.00 | (1.24 ) | (0.84 ) |
Total distributions to shareholders | (0.39 ) | (1.09 ) | (2.85 ) | (0.19 ) | (1.39 ) | (1.15 ) |
Net asset value, end of period | $12.15 | $11.90 | $11.42 | $14.73 | $11.16 | $12.93 |
Total return2 | 5.57 % | 14.61 % | (4.86 )% | 34.05 % | (3.87 )% | 10.38 % |
Ratios to average net assets (annualized) | ||||||
Gross expenses | 0.74 % | 0.75 % | 0.75 % | 0.76 % | 0.76 % | 0.76 % |
Net expenses | 0.65 % | 0.65 % | 0.65 % | 0.65 % | 0.65 % | 0.65 % |
Net investment income | 1.29 % | 1.47 % | 0.97 % | 1.22 % | 1.67 % | 1.27 % |
Supplemental data | ||||||
Portfolio turnover rate | 16 % | 42 % | 40 % | 46 % | 34 % | 27 % |
Net assets, end of period (000s omitted) | $41,224 | $41,991 | $42,878 | $15,313 | $11,552 | $4,231 |
1 | Calculated based upon average shares outstanding |
2 | Returns for periods of less than one year are not annualized. |
Six months ended January 31, 2024 (unaudited) | Year ended July 31 | |||||
Administrator Class | 2023 | 2022 | 2021 | 2020 | 2019 | |
Net asset value, beginning of period | $13.09 | $12.47 | $15.83 | $11.99 | $13.81 | $13.68 |
Net investment income | 0.06 1 | 0.15 1 | 0.09 | 0.13 | 0.17 | 0.12 |
Payment from affiliate | 0.00 | 0.00 | 0.00 | 0.00 2 | 0.00 | 0.00 |
Net realized and unrealized gains (losses) on investments | 0.62 | 1.54 | (0.63 ) | 3.88 | (0.62 ) | 1.00 |
Total from investment operations | 0.68 | 1.69 | (0.54 ) | 4.01 | (0.45 ) | 1.12 |
Distributions to shareholders from | ||||||
Net investment income | (0.12 ) | (0.13 ) | (0.12 ) | (0.17 ) | (0.13 ) | (0.15 ) |
Net realized gains | (0.25 ) | (0.94 ) | (2.70 ) | 0.00 | (1.24 ) | (0.84 ) |
Total distributions to shareholders | (0.37 ) | (1.07 ) | (2.82 ) | (0.17 ) | (1.37 ) | (0.99 ) |
Net asset value, end of period | $13.40 | $13.09 | $12.47 | $15.83 | $11.99 | $13.81 |
Total return3 | 5.37 % | 14.32 % | (5.07 )% | 33.75 %4 | (4.15 )% | 9.21 % |
Ratios to average net assets (annualized) | ||||||
Gross expenses | 1.09 % | 1.10 % | 1.09 % | 1.11 % | 1.11 % | 1.11 % |
Net expenses | 0.95 % | 0.92 % | 0.92 % | 0.92 % | 0.93 % | 0.95 % |
Net investment income | 0.99 % | 1.20 % | 0.70 % | 0.94 % | 1.37 % | 0.96 % |
Supplemental data | ||||||
Portfolio turnover rate | 16 % | 42 % | 40 % | 46 % | 34 % | 27 % |
Net assets, end of period (000s omitted) | $456,778 | $455,987 | $436,335 | $499,628 | $402,567 | $464,041 |
1 | Calculated based upon average shares outstanding |
2 | Amount is less than $0.005. |
3 | Returns for periods of less than one year are not annualized. |
4 | During the year ended July 31, 2021, the Fund received a payment from an affiliate that had a 0.03% impact on the total return. |
Six months ended January 31, 2024 (unaudited) | Year ended July 31 | |||||
Institutional Class | 2023 | 2022 | 2021 | 2020 | 2019 | |
Net asset value, beginning of period | $12.31 | $11.77 | $15.10 | $11.44 | $13.22 | $13.14 |
Net investment income | 0.07 1 | 0.15 1 | 0.12 1 | 0.16 1 | 0.19 1 | 0.15 1 |
Net realized and unrealized gains (losses) on investments | 0.58 | 1.48 | (0.61 ) | 3.70 | (0.58 ) | 0.94 |
Total from investment operations | 0.65 | 1.63 | (0.49 ) | 3.86 | (0.39 ) | 1.09 |
Distributions to shareholders from | ||||||
Net investment income | (0.14 ) | (0.15 ) | (0.14 ) | (0.20 ) | (0.15 ) | (0.17 ) |
Net realized gains | (0.25 ) | (0.94 ) | (2.70 ) | 0.00 | (1.24 ) | (0.84 ) |
Total distributions to shareholders | (0.39 ) | (1.09 ) | (2.84 ) | (0.20 ) | (1.39 ) | (1.01 ) |
Net asset value, end of period | $12.57 | $12.31 | $11.77 | $15.10 | $11.44 | $13.22 |
Total return2 | 5.45 % | 14.69 % | (4.96 )% | 34.01 % | (3.86 )% | 9.44 % |
Ratios to average net assets (annualized) | ||||||
Gross expenses | 0.84 % | 0.85 % | 0.85 % | 0.86 % | 0.86 % | 0.86 % |
Net expenses | 0.70 % | 0.70 % | 0.70 % | 0.70 % | 0.70 % | 0.70 % |
Net investment income | 1.21 % | 1.34 % | 0.92 % | 1.22 % | 1.59 % | 1.22 % |
Supplemental data | ||||||
Portfolio turnover rate | 16 % | 42 % | 40 % | 46 % | 34 % | 27 % |
Net assets, end of period (000s omitted) | $429,449 | $321,762 | $51,492 | $62,796 | $84,544 | $106,869 |
1 | Calculated based upon average shares outstanding |
2 | Returns for periods of less than one year are not annualized. |
Gross unrealized gains | $272,259,588 |
Gross unrealized losses | (19,070,594 ) |
Net unrealized gains | $253,188,994 |
Quoted prices (Level 1) | Other significant observable inputs (Level 2) | Significant unobservable inputs (Level 3) | Total | |
Assets | ||||
Investments in: | ||||
Common stocks | ||||
Communication services | $56,862,186 | $0 | $0 | $56,862,186 |
Consumer discretionary | 45,152,534 | 0 | 0 | 45,152,534 |
Consumer staples | 104,472,984 | 0 | 0 | 104,472,984 |
Energy | 83,822,797 | 0 | 0 | 83,822,797 |
Financials | 276,008,947 | 0 | 0 | 276,008,947 |
Health care | 163,572,086 | 0 | 0 | 163,572,086 |
Industrials | 185,087,269 | 0 | 0 | 185,087,269 |
Information technology | 95,706,666 | 0 | 0 | 95,706,666 |
Materials | 44,589,412 | 0 | 0 | 44,589,412 |
Real estate | 64,046,416 | 0 | 0 | 64,046,416 |
Utilities | 39,126,848 | 0 | 0 | 39,126,848 |
Short-term investments | ||||
Investment companies | 23,666,235 | 0 | 0 | 23,666,235 |
Total assets | $1,182,114,380 | $0 | $0 | $1,182,114,380 |
Average daily net assets | Management fee |
First $500 million | 0.700 % |
Next $500 million | 0.675 |
Next $1 billion | 0.650 |
Next $2 billion | 0.625 |
Next $1 billion | 0.600 |
Next $3 billion | 0.590 |
Next $2 billion | 0.565 |
Next $2 billion | 0.555 |
Next $4 billion | 0.530 |
Over $16 billion | 0.505 |
Class-level administration fee | |
Class A | 0.20 % |
Class C | 0.20 |
Class R6 | 0.03 |
Administrator Class | 0.13 |
Institutional Class | 0.13 |
EXPENSE RATIO CAPS | |
Class A | 1.10 % |
Class C | 1.85 |
Class R6 | 0.65 |
Administrator Class | 0.95 |
Institutional Class | 0.70 |
Name and year of birth | Position held and length of service* | Principal occupations during past five years or longer | Current other public company or investment company directorships |
William R. Ebsworth (Born 1957) | Trustee, since 2015 | Retired. From 1984 to 2013, equities analyst, portfolio manager, research director and chief investment officer at Fidelity Management and Research Company in Boston, Tokyo, and Hong Kong, and retired in 2013 as Chief Investment Officer of Fidelity Strategic Advisers, Inc. where he led a team of investment professionals managing client assets. Prior thereto, Board member of Hong Kong Securities Clearing Co., Hong Kong Options Clearing Corp., the Thailand International Fund, Ltd., Fidelity Investments Life Insurance Company, and Empire Fidelity Investments Life Insurance Company. Serves on the Investment Company Institute’s Board of Governors since 2022 and Executive Committee since 2023 as well as the Vice Chairman of the Governing Council of the Independent Directors Council since 2023. Audit Committee Chair and Investment Committee Chair of the Vincent Memorial Hospital Foundation (non-profit organization). Mr. Ebsworth is a CFA charterholder. | N/A |
Jane A. Freeman (Born 1953) | Trustee, since 2015; Chair Liaison, since January 2018# | Retired. From 2012 to 2014 and 1999 to 2008, Chief Financial Officer of Scientific Learning Corporation. From 2008 to 2012, Ms. Freeman provided consulting services related to strategic business projects. Prior to 1999, Portfolio Manager at Rockefeller & Co. and Scudder, Stevens & Clark. Board member of the Harding Loevner Funds from 1996 to 2014, serving as both Lead Independent Director and chair of the Audit Committee. Board member of the Russell Exchange Traded Funds Trust from 2011 to 2012 and the chair of the Audit Committee. Ms. Freeman is also an inactive Chartered Financial Analyst. | N/A |
Isaiah Harris, Jr. (Born 1952) | Trustee, since 2009; Audit Committee Chair, since 2019 | Retired. Member of the Advisory Board of CEF of East Central Florida. Chairman of the Board of CIGNA Corporation from 2009 to 2021, and Director from 2005 to 2008. From 2003 to 2011, Director of Deluxe Corporation. Prior thereto, President and CEO of BellSouth Advertising and Publishing Corp. from 2005 to 2007, President and CEO of BellSouth Enterprises from 2004 to 2005 and President of BellSouth Consumer Services from 2000 to 2003. Emeritus member of the Iowa State University Foundation Board of Governors. Emeritus Member of the Advisory board of Iowa State University School of Business. Advisory Board Member, Palm Harbor Academy (private school). Advisory Board Member, Fellowship of Christian Athletes. Mr. Harris is a certified public accountant (inactive status). | N/A |
David F. Larcker (Born 1950) | Trustee, since 2009 | Distinguished Visiting Fellow at the Hoover Institution since 2022. James Irvin Miller Professor of Accounting at the Graduate School of Business (Emeritus), Stanford University, Director of the Corporate Governance Research Initiative and Senior Faculty of The Rock Center for Corporate Governance since 2006. From 2005 to 2008, Professor of Accounting at the Graduate School of Business, Stanford University. Prior thereto, Ernst & Young Professor of Accounting at The Wharton School, University of Pennsylvania from 1985 to 2005. | N/A |
Olivia S. Mitchell (Born 1953) | Trustee, since 2006 | International Foundation of Employee Benefit Plans Professor since 1993, Wharton School of the University of Pennsylvania. Director of Wharton’s Pension Research Council and Boettner Center on Pensions & Retirement Research, and Research Associate at the National Bureau of Economic Research. Previously taught at Cornell University from 1978 to 1993. | N/A |
Timothy J. Penny (Born 1951) | Trustee, since 1996; Chair, since 2018 | President and Chief Executive Officer of Southern Minnesota Initiative Foundation, a non-profit organization, since 2007. Vice Chair of the Economic Club of Minnesota, since 2007. Co-Chair of the Committee for a Responsible Federal Budget, since 1995. Member of the Board of Trustees of NorthStar Education Finance, Inc., a non-profit organization, from 2007-2022. Senior Fellow of the University of Minnesota Humphrey Institute from 1995 to 2017. | N/A |
Name and year of birth | Position held and length of service* | Principal occupations during past five years or longer | Current other public company or investment company directorships |
James G. Polisson (Born 1959) | Trustee, since 2018; Nominating and Governance Committee Chair, since 2024 | Retired. Chief Marketing Officer, Source (ETF) UK Services, Ltd, from 2015 to 2017. From 2012 to 2015, Principal of The Polisson Group, LLC, a management consulting, corporate advisory and principal investing company. Chief Executive Officer and Managing Director at Russell Investments, Global Exchange Traded Funds from 2010 to 2012. Managing Director of Barclays Global Investors from 1998 to 2010 and Global Chief Marketing Officer for iShares and Barclays Global Investors from 2000 to 2010. Trustee of the San Francisco Mechanics’ Institute, a non- profit organization, from 2013 to 2015. Board member of the Russell Exchange Traded Fund Trust from 2011 to 2012. Director of Barclays Global Investors Holdings Deutschland GmbH from 2006 to 2009. Mr. Polisson is an attorney and has a retired status with the Massachusetts and District of Columbia Bar Associations. | N/A |
Pamela Wheelock (Born 1959) | Trustee, since January 2020; previously Trustee from January 2018 to July 2019# | Retired. Executive and Senior Financial leadership positions in the public, private and nonprofit sectors. Interim President and CEO, McKnight Foundation, 2020. Interim Commissioner, Minnesota Department of Human Services, 2019. Chief Operating Officer, Twin Cities Habitat for Humanity, 2017-2019. Vice President for University Services, University of Minnesota, 2012- 2016. Interim President and CEO, Blue Cross and Blue Shield of Minnesota, 2011-2012. Executive Vice-President and Chief Financial Officer, Minnesota Wild, 2002-2008. Commissioner, Minnesota Department of Finance, 1999-2002. Chair of the Board of Directors of Destination Medical Center Corporation. Board member of the Minnesota Wild Foundation. | N/A |
Name and year of birth | Position held and length of service | Principal occupations during past five years or longer |
Andrew Owen (Born 1960) | President, since 2017 | President and Chief Executive Officer of Allspring Funds Management, LLC since 2017 and Head of Global Fund Governance of Allspring Global Investments since 2022. Prior thereto, co-president of Galliard Capital Management, LLC, an affiliate of Allspring Funds Management, LLC, from 2019 to 2022 and Head of Affiliated Managers, Allspring Global Investments, from 2014 to 2019 and Executive Vice President responsible for marketing, investments and product development for Allspring Funds Management, LLC, from 2009 to 2014. |
Jeremy DePalma (Born 1974) | Treasurer, since 2012 (for certain funds in the Fund Complex); since 2021 (for the remaining funds in the Complex) | Senior Vice President of Allspring Funds Management, LLC since 2009. Senior Vice President of Evergreen Investment Management Company, LLC from 2008 to 2010 and head of the Fund Reporting and Control Team within Fund Administration from 2005 to 2010. |
Christopher Baker (Born 1976) | Chief Compliance Officer, since 2022 | Global Chief Compliance Officer for Allspring Global Investments since 2022. Prior thereto, Chief Compliance Officer for State Street Global Advisors from 2018 to 2021. Senior Compliance Officer for the State Street divisions of Alternative Investment Solutions, Sector Solutions, and Global Marketing from 2015 to 2018. From 2010 to 2015 Vice President, Global Head of Investment and Marketing Compliance for State Street Global Advisors. |
Matthew Prasse (Born 1983) | Chief Legal Officer, since 2022; Secretary, since 2021 | Senior Counsel of the Allspring Legal Department since 2021. Senior Counsel of the Wells Fargo Legal Department from 2018 to 2021. Previously, Counsel for Barings LLC from 2015 to 2018. Prior to joining Barings, Associate at Morgan, Lewis & Bockius LLP from 2008 to 2015. |

P.O. Box 219967
Kansas City, MO 64121-9967

SAR4302 01-24
ITEM 2. CODE OF ETHICS
Not applicable.
ITEM 3. AUDIT COMMITTEE FINANCIAL EXPERT
Not applicable.
ITEM 4. PRINCIPAL ACCOUNTANT FEES AND SERVICES
Not applicable.
ITEM 5. AUDIT COMMITTEE OF LISTED REGISTRANTS
Not applicable.
ITEM 6. INVESTMENTS
A Portfolio of Investments for the series of Allspring Funds Trust is included as part of the report to shareholders filed under Item 1 of this Form.
ITEM 7. DISCLOSURE OF PROXY VOTING POLICIES AND PROCEDURES FOR CLOSED-END MANAGEMENT INVESTMENT COMPANIES
Not applicable.
ITEM 8. PORTFOLIO MANAGERS OF CLOSED-END MANAGEMENT INVESTMENT COMPANIES
Not applicable.
ITEM 9. PURCHASES OF EQUITY SECURITIES BY CLOSED-END MANAGEMEENT INVESTMENT COMPANY AND AFFILIATED PURCHASERS
Not applicable.
ITEM 10. SUBMISSION OF MATTERS TO A VOTE OF SECURITY HOLDERS
There have been no material changes to the procedures by which shareholders may recommend nominees to the registrant’s Board of Trustees that have been implemented since the registrant’s last provided disclosure in response to the requirements of this Item.
ITEM 11. CONTROLS AND PROCEDURES
(a) The President and Treasurer have concluded that the Allspring Funds Trust disclosure controls and procedures (as defined in Rule 30a-3(c) under the Investment Company Act of 1940) provide reasonable assurances that material information relating to the registrant is made known to them by the appropriate persons, based on their evaluation of these controls and procedures as of a date within 90 days of the filing of this report.
(b) There were no significant changes in the registrant’s internal control over financial reporting (as defined in Rule 30a-3(d) under the Investment Company Act of 1940) that occurred during the period covered by this report that materially affected, or is reasonably likely to materially affect, the registrant’s internal control over financial reporting.
ITEM 12. DISCLOSURES OF SECURITIES LENDING ACTIVITES FOR CLOSED-END MANAGEMENT INVESTMENT COMPANIES
Not applicable.
ITEM 13. EXHIBITS
(a)(1) Not applicable.
(a)(2) Certifications pursuant to Section 302 of the Sarbanes-Oxley Act of 2002.
(a)(3) Not applicable.
(a)(4) Not applicable.
(b) Certifications pursuant to Section 906 of the Sarbanes-Oxley Act of 2002.
SIGNATURES
Pursuant to the requirements of the Securities Exchange Act of 1934 and the Investment Company Act of 1940, the registrant has duly caused this report to be signed on its behalf by the undersigned, thereunto duly authorized.
| Allspring Funds Trust | ||
| By: | /s/ Andrew Owen | |
| Andrew Owen | ||
| President | ||
| Date: March 27, 2024 | ||
Pursuant to the requirements of the Securities Exchange Act of 1934 and the Investment Company Act of 1940, this report has been signed below by the following persons on behalf of the registrant and in the capacities and on the date indicated.
| Allspring Funds Trust | ||
| By: | /s/ Andrew Owen | |
| Andrew Owen | ||
| President | ||
| Date: March 27, 2024 | ||
| By: | /s/ Jeremy DePalma | |
| Jeremy DePalma | ||
| Treasurer | ||
| Date: March 27, 2024 | ||