UNITED STATES |
July 23, 2004 | ALIMENTATION COUCHE-TARD INC. By:/s/ Brigitte Catellier Brigitte Catellier Corporate Secretary |
ALIMENTATION COUCHE-TARD INC.NOTICE OF ANNUAL GENERAL AND SPECIAL MEETING OF SHAREHOLDERS |
| NOTICE IS HEREBY GIVEN THAT the annual general and special meeting (the “Meeting”) of shareholders of Alimentation Couche-Tard Inc. (the “Company”) will be held at the Château Royal, 3500 du Souvenir Blvd, in the City of Laval, Province of Quebec, on Wednesday, September 8, 2004, at 11:00 a.m. (local time), for the following purposes: |
| 1) | receiving the consolidated financial statements of the Company for the fiscal year ended April 25, 2004, together with the auditors’ report thereon; |
| 2) | electing the directors of the Company and authorize the Board to fix their remuneration; |
| 3) | appointing the auditors of the Company; |
| 4) | considering, and if deemed appropriate, adopting a resolution confirming the enactment of By-laws 2003-1 and 2004-1 amending certain provisions of By-law no. 1, being the general by-laws of the Company (the full text of the resolution and of the By-laws are respectively reproduced on page 17 and in Appendix B hereto); and |
| 5) | to transact such other business as may properly come before the Meeting or any adjournment thereof. |
| The Management Proxy Circular, a form of proxy for the Meeting a consent to electronic delivery of documents and a registration form for the Company’s shareholder supplemental list are enclosed with this notice. |
| If you are unable to attend the Meeting, please exercise your right to vote by signing and returning the enclosed form of proxy in the enclosed envelope. Proxies may also be deposited with the Secretary of the Meeting, immediately prior to the commencement of the Meeting. |
| BY ORDER OF THE BOARD OF DIRECTORS Brigitte K. Catellier Corporate Secretary |
Laval, July 13, 2004 1 |
DIRECTIONS TO CHÂTEAU ROYALFROM CHAMPLAIN BRIDGEOPTION 1 -EXITING CHAMPLAIN BRIDGE, FOLLOW THE DIRECTIONS FOR DECARIE BLVD OR HWY 15 NORTH (STAY IN CENTER LANE ON DECARIE BLVD.) |
| ( 5 MINUTES ) - | FOLLOW THE INDICATIONS FOR MARCEL LAURIN BLVD. |
| ( 10 MINUTES ) - | FOLLOW THE INDICATIONS FOR LACHAPELLE BRIDGE AFTER CROSSING LACHAPELLE BRIDGE YOU ARE ON CHOMEDEY BLVD. |
| ( 5 MINUTES ) - | GO STRAIGHT UNTIL DU SOUVENIR BLVD. ( 7 TRAFFIC LIGHTS ) TURN LEFT ON DU SOUVENIR BLVD THE CHATEAU ROYAL IS ALMOST AT THE CORNER ON YOUR LEFT. |
option 2 -EXITING CHAMPLAIN BRIDGE, FOLLOW THE DIRECTIONS FOR DECARIE BLVD. OR HWY 15 NORTH. |
| ( 5 MINUTES ) - | TAKE THE HIGHWAY 40 EAST EXIT |
| ( 10 MINUTES ) - | TAKE THE HIGHWAY 15 NORTH EXIT ( LEFT HAND SIDE EXIT FROM HWY 40 ) |
| ( 8 MINUTES ) - | TAKE EXIT #8 ( ST-MARTIN BLVD. ) AT THE TRAFFIC LIGHT TURN LEFT ( WEST ) |
| ( 3 MINUTES ) - | UP TO CHOMEDEY BLVD ( 4 TRAFFIC LIGHTS ) TURN LEFT ON CHOMEDEY BLVD ( SOUTH ) |
| ( 1 MINUTE ) - | UP TO DU SOUVENIR BLVD. ( 3 TRAFFIC LIGHTS ) TURN RIGHT ON DU SOUVENIR BLVD. THE CHATEAU ROYAL IS ALMOST AT THE CORNER ON YOUR LEFT |
*FROM HIGHWAY 13 |
| ( 10 MINUTES ) - | TAKE THE HIGHWAY 440 EAST EXIT ( STAY ON SERVICE ROAD ) |
| ( 5 MINUTES ) - | EXIT ON CHOMEDEY BLVD. ( SOUTH ) |
| ( 8 MINUTES ) - | UNTIL DU SOUVENIR BLVD.( 6 TRAFFIC LIGHTS ) TURN RIGHT ON DU SOUVENIR BLVD. THE CHATEAU ROYAL IS ALMOST AT THE CORNER ON YOUR LEFT |
*FROM LOUIS-HIPPOLYTE LAFONTAINE TUNNELEXITING THE TUNNEL FOLLOW THE DIRECTIONS FOR HIGHWAY 40 WEST. |
| ( 5 MINUTES ) - | TAKE THE HIGHWAY 40 WEST EXIT |
| ( 15 MINUTES ) - | TAKE THE HIGHWAY 15 NORTH EXIT |
| ( 8 MINUTES ) - | TAKE EXIT # 8 ( ST-MARTIN BLVD. ) AT THE TRAFFIC LIGHT, TURN LEFT ( WEST ) |
| ( 3 MINUTES ) - | UP TO CHOMEDEY BLVD. ( 4 TRAFFIC LIGHTS ) TURN LEFT ON CHOMEDEY BLVD. ( SOUTH ) |
| ( 1 MINUTE ) - | UP TO DU SOUVENIR BLVD. ( 3 TRAFFIC LIGHTS ) TURN RIGHT ON DU SOUVENIR BLVD. THE CHATEAU ROYAL IS ALMOST AT THE CORNER ON YOUR LEFT |
ALIMENTATION COUCHE-TARD INC. |
Non-registered shareholders who wish to vote their shares in person at the Meeting must insert their own name in the space provided on the request for voting instructions in order to appoint themselves as proxyholders and follow the signature and return instructions provided by their nominees. Non-registered shareholders should not complete the remainder of the form sent to them by their nominees as their votes will be taken and counted at the Meeting. Voting SharesThe voting shares of the Company are its Class A Multiple Voting Shares (the “Multiple Voting Shares”) and its Class B Subordinate Voting Shares (the “Subordinate Voting Shares”). As at June 30, 2004, 28,520,561 Multiple Voting Shares and 72,109,356 Subordinate Voting Shares of the Company were issued and outstanding. Each Multiple Voting Share carries 10 votes and each Subordinate Voting Share carries one vote with respect to all matters coming before the Meeting. Conversion Rights Each Multiple Voting Share is convertible at any time at the holder’s option into one fully paid and non-assessable Subordinate Voting Share. Upon the earliest to occur of: (i) the day upon which all of the Majority Holders (defined in the Articles of the Company as being Messrs. Alain Bouchard, Richard Fortin, Réal Plourde and Jacques D’Amours) will have reached the age of 65, or (ii) the day when the Majority Holders hold, directly or indirectly, collectively less than 50% of the voting rights attaching to all outstanding voting shares of the Company, each Subordinate Voting Share shall be automatically converted into one fully paid and non-assessable Multiple Voting Share. Take-Over Bid Protection In the event that an offer as defined in the Articles of the Company (an “Offer”) is made to holders of Multiple Voting Shares, each Subordinate Voting Share shall become convertible at the holder’s option into one Multiple Voting Share, for the sole purpose of allowing the holder to accept the Offer. The term “Offer” is defined in the Articles of the Company as an offer in respect of the Multiple Voting Shares which, if addressed to holders resident in Québec, would constitute a take-over bid, a securities exchange bid or an issuer bid under theSecurities Act (Québec) (as presently in force or as it may be subsequently amended or readopted), except that an Offer shall not include: (a) an offer which is made at the same time for the same price and on the same terms to all holders of Subordinate Voting Shares; and (b) an offer which, by reason of an exemption or exemptions obtained under theSecurities Act (Québec), does not have to be made to all holders of Multiple Voting Shares; provided that, if the offer is made by a person other than a Majority Holder or by a Majority Holder to a person other than a Majority Holder, in reliance on the block purchase exemption set forth in section 123 of theSecurities Act (Québec), the offer price does not exceed 115% of the lower of the average market price of the Multiple Voting Shares and the average market price of the Subordinate Voting Shares as established with the formula provided by theRegulation Respecting Securities (Québec). The conversion right attached to the Subordinate Voting Shares is subject to the condition that if, on the expiry date of an Offer, any of the Subordinate Voting Shares converted into Multiple Voting Shares are not taken up and paid for, such Subordinate Voting Shares shall be deemed never to have been so converted and to have always remained Subordinate Voting Shares. The Articles of the Company contain provisions concerning the conversion procedure to be followed in the event of an Offer. Holders of Multiple Voting Shares and holders of Subordinate Voting Shares listed as shareholders at the close of business on July 20, 2004 (“Record Date”) will be entitled to vote at the Meeting in respect of all matters which may properly come before the Meeting.In order to be entitled to vote, a holder of Multiple Voting Shares or of Subordinate Voting Shares who has acquired his shares after this date must, at least 10 days before the Meeting, request that the Company enter his name on the list of shareholders entitled to vote. If two or more persons are joint holders of shares, those among such holders attending the Meeting may, in the absence of the others, vote such shares. However, if two or more joint holders are present in person or represented by proxy at the Meeting and wish to vote thereat, they may do so only as one and the same person. If more than one joint holder are present or represented by proxy, the vote must be made jointly and in unison. 2 |
An affiliate of Metro Inc. (“Metro”), predecessors to Developpements Orano Inc. (the “holding company”), and each of Messrs. Alain Bouchard, Richard Fortin and Jacques D’Amours were parties to a shareholders’ agreement with respect to their shareholdings in a predecessor of Alimentation Couche-Tard Inc. The rights and obligations of the parties under that shareholders’ agreement were principally as follows: |
| (i) | Metro and the holding company had a reciprocal right of first refusal on the sale and transfer of the shares of the predecessor company held by them, subject to certain exceptions for transfers to permitted assignees (including to any of Messrs. Alain Bouchard, Richard Fortin and Jacques D’Amours); |
| (ii) | Metro had a pre-emptive right to participate in new issues of shares to maintain its then existing equity ownership percentage of the predecessor company; |
| (iii) | Metro had the right to nominate one person for election to the board of directors of the predecessor company; |
| (iv) | Metro had also agreed not to purchase additional shares of capital stock of the predecessor company, otherwise than in accordance with the terms of the shareholders’ agreement; and |
| (v) | in the event of a change of control of the holding company, Metro had the right to purchase the shares of the predecessor company held by the holding company or to cause the holding company to purchase the shares of the predecessor company held by Metro, at a price based on the then market price for such shares. |
This agreement provided that it terminated either (i) if Metro no longer held at least 10% or (ii) the holding company no longer held at least 20%, of the issued and outstanding capital stock of the predecessor company. Alimentation Couche-Tard Inc. and the holding company are currently reviewing the applicability of that agreement to the current situation. In 2000, Metro Inc. and Alimentation Couche-Tard Inc. entered into an agreement providing, amongst other things, that so long as Metro Inc. holds shares representing at least 10% of the issued and outstanding capital stock of Alimentation Couche-Tard Inc., it will have the right to nominate one person for election to the board of directors of Alimentation Couche-Tard Inc. (the “Board of Directors”). The representative currently designated by Metro Inc. on the Board of Directors is Mr. Jean Élie. Principal Holders of SecuritiesTo the knowledge of the officers and directors of the Company, the only persons who beneficially own or exercise control or direction over shares carrying more than 10% of the votes attached to each class of voting shares outstanding of the Company are: |
| Name | Number of Multiple Voting Shares beneficially owned, controlled or directed | Percentage of Multiple Voting Shares outstanding | Number of Subordinate Voting Shares beneficially owned, controlled or directed | Percentage of Subordinate Voting Shares outstanding | |||||
|---|---|---|---|---|---|---|---|---|---|
| Developpements | |||||||||
| Orano Inc. | 14,973,132 | (1) | 52.45 | % | — | — | |||
| Metro Inc. | 7,509,340 | 26.30 | % | 2,861,834 | 3.97 | % | |||
| Fidelity Management | 923,200 | 3.23 | % | 10,136,877 | 14.53 | % | |||
| & Research | |||||||||
| Company, Fidelity | |||||||||
| Management Trust | |||||||||
| Company & Fidelity | |||||||||
| International | |||||||||
| Limited | |||||||||
| Franklin Templeton | — | — | 6,233,455 | 11.10 | % | ||||
| Investments Corp. | |||||||||
Note: |
| 1) | The voting shares of Développements Orano Inc.are held in the following respective percentages: Alain Bouchard: 57.82%, Richard Fortin: 13.63%, Réal Plourde: 1.64%, and Jacques D’Amours: 26.91%. Consequently, Mr. Alain Bouchard, through its holding of shares of Développements Orano Inc. and of the Company, may be considered to exercise control or direction over shares carrying more than 10% of the votes attached to the outstanding voting shares of the Company. |
3 |
Election of DirectorsThe Board of Directors must be composed of a minimum of three and of a maximum of 20 directors. Pursuant to a resolution of the Board of Directors, 11 persons are to be elected as directors for the current fiscal year, each to hold office until the next annual meeting of shareholders or until such person’s successor is elected or appointed. Management proposes the election, at the Meeting, of the following eleven nominees, who are all currently members of the Board of Directors. Management does not contemplate that any of the nominees will be unable to serve as a director but, if that should occur for any reason prior to the Meeting, the persons named in the enclosed form of proxy reserve the right to vote for another nominee in their discretion unless the shareholder has specified in the proxy that his shares are to be withheld from voting in the election of directors. Unless otherwise specified by the shareholders, the shares represented by any proxy enclosed herewith will be voted FOR the election of the eleven persons hereinafter named, each of whom will be nominated for election as a director. |
| Name, municipality of residence and office held with the Company | Principal occupation | Director since | Number of Multiple Voting Shares beneficially owned or over which control or direction is exercised (1) | Number of Subordinate Voting Shares beneficially owned or over which control or direction is exercised (1) | ||||||
|---|---|---|---|---|---|---|---|---|---|---|
| Alain Bouchard (4) | Chairman of the Board, President and Chief Executive Officer of the Company | 1988 | 16,270,160 (2) | 601,984 (3) | ||||||
| Lorraine, Québec Chairman of the Board, President and Chief Executive Officer | ||||||||||
Member of the Board of Directors and Human Resources Committee of Québecor inc. (communications holding company) and Atrium Biotechnologies Inc. (development and marketing of cosmetic and nutritional ingredients); member of the Board of Directors, Audit Committee and Human Resources and Compensation Committee of RONA inc.(hardware stores retailer) | ||||||||||
| Robert Brunet (6),(7) | President, Socoro Inc. (management consulting firm) | 1991 | — | 102,000 | ||||||
| Bolton Centre, Québec | ||||||||||
| Jacques D’Amours (4) | Vice-President, Administration of the Company | 1988 | 1,421,760 | 387,600 (3) | ||||||
| Lorraine, Québec Vice-President, Administration | ||||||||||
4 |
| Name, municipality of residence and office held with the Company | Principal occupation | Director since | Number of Multiple Voting Shares beneficially owned or over which control or direction is exercised (1) | Number of Subordinate Voting Shares beneficially owned or over which control or direction is exercised (1) | |||||||||
|---|---|---|---|---|---|---|---|---|---|---|---|---|---|
| Roger Desrosiers, FCA(6) | Corporate Director | 2003 | — | 4,000 | |||||||||
| Montréal, Québec | |||||||||||||
| Chairman of the Audit | Member of the Board of | ||||||||||||
| Committee | Directors and Chairman | ||||||||||||
| of the Audit Committee | |||||||||||||
| of Desjardins, Groupe | |||||||||||||
| d’Assurances Générales | |||||||||||||
| and its subsidiaries, La | |||||||||||||
| Sécurité, Compagnie | |||||||||||||
| d’Assurances, the | |||||||||||||
| Securities Insurance | |||||||||||||
| Company, PG Mensys | |||||||||||||
| Systemés d’Information | |||||||||||||
| Inc. and Certas Inc. | |||||||||||||
| Also member of the Board | |||||||||||||
| of Directors of M3K Inc. | |||||||||||||
| Jean Élie(5) | Corporate Director | 1999 | — | 17,700 | |||||||||
| Montréal, Québec | |||||||||||||
| Richard Fortin (4) | Executive Vice-President | 1988 | 966,140 | 403,600(3) | |||||||||
| Longueuil, Québec | and Chief Financial | ||||||||||||
| Executive Vice-President | Officer of the Company | ||||||||||||
| and Chief Financial Officer | |||||||||||||
| Member of the Board of | |||||||||||||
| Directors and Audit | |||||||||||||
| Committee of | |||||||||||||
| Transcontinental inc. | |||||||||||||
| (commercial printer) | |||||||||||||
| Josée Goulet | Director of marketing | 2000 | — | — (3) | |||||||||
| Montréal, Québec | services, Bell Canada | ||||||||||||
| (telecommunications | |||||||||||||
| company) | |||||||||||||
| Roger Longpré (5),(6) | President, Mergerac Inc. | 2001 | — | 8,000(3) | |||||||||
| Brossard, Québec | (consultants in mergers | ||||||||||||
| Chairman of the Human | and acquisitions) | ||||||||||||
| Resources and Corporate | |||||||||||||
| Governance Committee | |||||||||||||
| Real Plourde (4) | Executive | 1988 | 350,256 | 646,800 | |||||||||
| Montréal, Québec | Vice-President and | ||||||||||||
| Executive Vice-President | Chief Operating Officer | ||||||||||||
| and Chief Operating Officer | of the Company | ||||||||||||
| Member of the Board of | |||||||||||||
| Directors and of the | |||||||||||||
| Compensation Committee | |||||||||||||
| of Bouclair inc. | |||||||||||||
| (fabric retailer) | |||||||||||||
| Jean-Pierre Sauriol (5) | President and Chief | 2003 | — | 2,000 | |||||||||
| Laval, Québec | Executive Officer, | ||||||||||||
| Dessau-Soprin inc. | |||||||||||||
| (engineering- | |||||||||||||
| construction company) | |||||||||||||
| Member of the Board of | |||||||||||||
| Directors of | |||||||||||||
| Dessau-Soprin inc. and | |||||||||||||
| Camoplast inc. | |||||||||||||
| (industrial manufacturer) | |||||||||||||
5 |
| Name, municipality of residence and office held with the Company | Principal occupation | Director since | Number of Multiple Voting Shares beneficially owned or over which control or direction is exercised (1) | Number of Subordinate Voting Shares beneficially owned or over which control or direction is exercised (1) | |||||||||
|---|---|---|---|---|---|---|---|---|---|---|---|---|---|
| Jean Turmel | President – Financial | 2002 | — | 8,000 (3) | |||||||||
| Montréal, Québec | Markets, Treasury and | ||||||||||||
| Investment of a | |||||||||||||
| Canadian chartered bank | |||||||||||||
| Member of the Board of | |||||||||||||
| Directors of a Canadian | |||||||||||||
| chartered bank; member | |||||||||||||
| of the Board of | |||||||||||||
| Directors and Chairman | |||||||||||||
| of National Bank | |||||||||||||
| Financial Inc. and | |||||||||||||
| Natcan Investment | |||||||||||||
| Management Inc. | |||||||||||||
| (financial services)and | |||||||||||||
| also of the Montreal | |||||||||||||
| Exchange | |||||||||||||
Notes: |
| 1) | The information as to the shares beneficially owned, controlled or directed, not being within the knowledge of the Company, has been furnished by the respective candidates individually. |
| 2) | Of this number, 14,973,132 shares are held through Développements Orano Inc. |
| 3) | Messrs. Alain Bouchard, Richard Fortin, Réal Plourde and Jacques D’Amours also hold options granting them the right to purchase 1,600,000, 710,000, 710,000 and 4,000 Subordinate Voting Shares, respectively. Mrs. Josée Goulet, Messrs. Roger Longpré and Jean Turmel hold options granting them the right to purchase 40,000, 20,000 and 10,000 Subordinate Voting Shares, respectively. |
| 4) | Member of the Executive Committee. |
| 5) | Member of the Human Resources and Corporate Governance Committee. |
| 6) | Member of the Audit Committee. |
| 7) | Lead director. |
The Board of Directors met eight times during the fiscal year ended April 25, 2004, with full attendance at six of the eight meetings and one absence at the other two meetings (Mrs. Josée Goulet was absent at one meeting and Mr. Jean Élie was absent at another meeting). The Audit Committee met five times and the Human Resources and Corporate Governance Committee met twice during the fiscal year ended April 25, 2004, with full attendance at each Board committee meeting. Compensation of DirectorsDuring the fiscal year ended April 25, 2004, the Company paid to the seven directors who were not officers of the Company, an aggregate amount of $234,000. Each of these directors received an annual retainer fee of $15,000 and an attendance fee of $1,200 per meeting of the Board of Directors or of one of its committees. The Chairman of a committee and each committee member received additional annual fees of $3,000 and $1,000, respectively. In his capacity as lead director, Mr. Brunet was paid an additional annual fee of $15,000. During the fiscal year ended April 25, 2004, the Company did not grant any stock options to directors who were not officers of the Company. On July 13, 2004, the Board of Directors adopted a Director Compensation Policy, which provides as follows: |
| • | the Company will no longer grant any stock options to directors who are not officers of the Company, but instead will grant deferred share units in accordance with the Company’s Deferred Share Unit Plan; |
| • | at least 50% and up to 100% of the annual retainer fee will be paid in deferred share units; and |
| • | directors who are not officers of the Company must hold at least 5,000 shares or deferred share units within three years after the latest of July 13, 2004 and their election to the Board. |
6 |
Executive CompensationSummary Compensation TableThe following table details compensation information for the fiscal years ended April 25, 2004, April 27, 2003 and April 28, 2002, for the Chief Executive Officer, the Chief Financial Officer and the three other most highly compensated executive officers of the Company as at April 25, 2004 (collectively, the “Named Executive Officers”). |
| Annual Compensation (2) | Long Term Compensation | |||||||||||
|---|---|---|---|---|---|---|---|---|---|---|---|---|
| Name and Principal Position | Fiscal Year | Salary ($) | Bonus ($) | Subordinate Voting Shares Under Options Granted (#) | ||||||||
| Alain Bouchard | ||||||||||||
| Chairman of the Board, President | 2004 | 586,000 | 424,307 | (4) | 200,000 | |||||||
| and Chief Executive Officer | 2003 | 547,722 | 335,480 | — | ||||||||
| 2002 | 476,280 | 322,084 | 900,000 | |||||||||
| Richard Fortin | 2004 | 305,000 | 294,818 | (4) | 100,000 | |||||||
| Executive Vice-President and | 2003 | 288,230 | 176,541 | — | ||||||||
| Chief Financial Officer | 2002 | 250,635 | 169,962 | 410,000 | ||||||||
| Réal Plourde | 2004 | 305,000 | 276,756 | (4) | 100,000 | |||||||
| Executive Vice-President and | 2003 | 288,230 | 257,166 | — | ||||||||
| Chief Operating Officer | 2002 | 250,635 | 167,612 | 410,000 | ||||||||
| Brian Hannasch (1) | 2004 | 186,600 | (3) | 190,874 | (3),(4) | 55,000 | ||||||
| Vice-President, Integration | 2003 | 173,846 | (3) | 114,755 | (3) | 50,000 | ||||||
| 2002 | 126,922 | (3) | 61,051 | (3) | 200,000 | |||||||
| Kim Trowbridge | 2004 | 180,000 | 81,280 | 35,000 | ||||||||
| Vice-President Operations, | 2003 | 174,900 | 81,980 | 20,000 | ||||||||
| Western Canada | 2002 | 168,100 | 79,137 | 20,000 | ||||||||
Notes : |
| 1) | Mr. Hannasch was Vice-President Operations, U.S. Midwest until December 17, 2003 when he was appointed Vice-President, Integration in connection with the acquisition of The Circle K Corp. |
| 2) | Aggregate perquisites and other personal benefits received by or earned by each of the Named Executive Officers did not exceed the lesser of $50,000 and 10% of the total of his salary and bonus for the year. |
| 3) | These amounts are in US dollars. The average exchange rates for fiscal 2002, 2003 and 2004 were $1.5681, $1.5316 and $1.3438, respectively. |
| 4) | These bonuses for fiscal 2004 include a special performance bonus and an exceptional bonus in connection with the successful acquisition of The Circle K Corp. and the financing of the acquisition. |
Stock Option Plan of the CompanyThe Company has adopted the 1999 Stock Incentive Plan (the “Plan”). The Plan provides that the number of Subordinate Voting Shares issuable pursuant to the Plan is 8,446,000. Pursuant to the provisions of the Plan, the Company may grant options to purchase Subordinate Voting Shares to full-time employees, officers or directors of the Company or of any of its subsidiaries. The aggregate number of Subordinate Voting Shares reserved for issuance at any time to any one optionee shall not exceed 5% of the aggregate number of Multiple Voting Shares and Subordinate Voting Shares outstanding on a non-diluted basis at such time, less the total of all shares reserved for issuance to such optionee pursuant to any other share compensation arrangement of the Company. Options may be granted for a term of up to 10 years and the terms during which such options may be exercised are determined by the Board of Directors at the time of each grant of options. The conditions of vesting and exercise of the options are established by the Board of Directors when such options are granted and the option price, as established by the Board of Directors, shall not be less than the weighted average closing price for a board lot of the Subordinate Voting Shares for the five days preceding the date of grant. 7 |
Options granted under the Plan are personal to the optionees and cannot be assigned or transferred, except by will or by the applicable laws of succession. Upon an optionee’s employment with the Company being terminated for cause or upon an optionee being removed from office as a director or becoming disqualified from being a director by law, any option or the unexercised portion thereof shall terminate forthwith. If an optionee’s employment with the Company is terminated otherwise than by reason of death or termination for cause, or if any optionee ceases to be a director other than by reason of death, removal or disqualification by law, any option or the unexercised portion thereof may be exercised by the optionee for that number of shares only which he was entitled to acquire under the option at the time of such termination or cessation, provided that such option shall only be exercisable within 90 days after such termination or cessation or prior to the expiration of the term of the option, whichever occurs earlier. If an optionee dies while employed by the Company or while serving as a director, any option or the unexercised portion thereof may be exercised by the person to whom the option is transferred by will or the applicable laws of succession for that number of shares only which the optionee was entitled to acquire under the option at the time of death, provided that such option shall only be exercisable within 180 days following the date of death or prior to the expiration of the term of the option, whichever occurs earlier. Securities Authorized for Issuance under Equity Compensation PlansThe following table sets out information as of April 25, 2004 (unless otherwise provided) with respect to the Plan. The Plan was approved by the Company’s shareholders at the annual and special meeting held on September 21, 1999 and amendments to the Plan were approved by the Company’s shareholders at the annual and special meeting held on September 25, 2002. |
| Number of Subordinate Voting Shares to be issued upon exercise of outstanding options | Weighted-average exercise price of outstanding options | Number of Subordinate Voting Shares remaining available for future issuance under the Plan | ||||||
|---|---|---|---|---|---|---|---|---|
| 1999 Stock Incentive Plan | 4,523,100(1) | $11.97 | 4,327,500 | |||||
Note: |
| 1) | Does not include 1,790,000 options with an expiry date of May 25, 2004 that were exercised in May 2004. |
Option Grants During Fiscal 2004The following table provides details as to the stock options granted to the Named Executive Officers by the Company under the Plan during fiscal 2004. |
| Name | Subordinate Voting Shares Under Options Granted (#) | % of Total Options Granted to Employees in Fiscal Year | Exercise Price ($/Subordinate Voting Share) | Market Value of Subordinate Voting Shares Underlying Options on the Date of Grant ($/Subordinate Voting Share) | Expiration Date | |||||||
|---|---|---|---|---|---|---|---|---|---|---|---|---|
| Alain Bouchard | 200,000 | 23.80 | 20.20 | 20.20 | October 15, 2013 | |||||||
| Richard Fortin | 100,000 | 11.90 | 20.20 | 20.20 | October 15, 2013 | |||||||
| Real Plourde | 100,000 | 11.90 | 20.20 | 20.20 | October 15, 2013 | |||||||
| Brian Hannasch | 15,000 | 1.79 | 13.99 | 13.99 | June 20, 2013 | |||||||
| 40,000 | 4.76 | 22.26 | 22.26 | November 18, 2013 | ||||||||
| Kim Trowbridge | 5,000 | 0.006 | 13.99 | 13.99 | June 20, 2013 | |||||||
| 30,000 | 3.57 | 24.12 | 24.12 | April 23, 2014 | ||||||||
8 |
Aggregated Option Exercises During Fiscal 2004 and Fiscal Year-End Option ValuesThe following table indicates for each of the Named Executive Officers the details as to the stock options exercised during fiscal 2004 and as to the total number of unexercised options to acquire Subordinate Voting Shares held at April 25, 2004 (unless otherwise provided) and the value of in-the-money unexercised options at that date. |
| Name | Subordinate Voting Shares Acquired on Exercise (#) | Aggregate Value Realized ($) | Unexercised Options at April 25, 2004 Exercisable / Unexercisable (#) | Value of Unexercised in-the-Money Options at April 25, 2004 Exercisable / Unexercisable ($)(1) | ||||||||
|---|---|---|---|---|---|---|---|---|---|---|---|---|
| Alain Bouchard | 600,000(2) | 10,744,500 | 980,000/620,000 | 12,815,100 / 5,861,900 | ||||||||
| Richard Fortin | 400,000(3) | 7,083,000 | 426,000/284,000 | 5,496,690 / 2,635,460 | ||||||||
| Réal Plourde | 400,000(3) | 7,083,000 | 426,000/284,000 | 5,496,690 / 2,635,460 | ||||||||
| Brian Hannasch | — | — | 191,000/154,000 | 2,663,820 / 1,626,230 | ||||||||
| Kim Trowbridge | 70,000 | 1,274,525 | 107,000/68,000 | 1,770,220 / 363,080 | ||||||||
| 70,000(3) | 1,239,525 | |||||||||||
Notes: |
| 1) | Value of unexercised in-the-money options at financial year-end is the difference between the closing price of the Subordinate Voting Shares on the Toronto Stock Exchange at fiscal year-end ($23.47) and the exercise price. |
| 2) | These options were exercised on May 19, 2004 and had an exercise price of $5.3425 and an expiry date of May 25, 2004. The shares acquired upon exercise were not sold on the market. |
| 3) | These options were exercised on May 12, 2004 and had an exercise price of $5.3425 and an expiry date of May 25, 2004. The shares acquired upon exercise were not sold on the market. |
Pension PlanMessrs Bouchard, Fortin, Plourde and Trowbridge participate in the Company’s Canadian basic pension plan and supplemental plan, which are defined benefit plans. The purpose of these plans is to offer these officers, upon retirement, income equal to 2% per year of service, multiplied by the final average compensation of the officer’s three best years, with no offset for any payment from the Canada and Quebec pension plans. The normal retirement age is 65, with an optional early retirement age of 55. The following table shows estimated annual benefits payable at the normal retirement age based on the admissible earnings and years of credited service corresponding to the categories shown in the table. |
| Earnings($) | Years of Service | ||||||||||||||||
|---|---|---|---|---|---|---|---|---|---|---|---|---|---|---|---|---|---|
| 15 | 20 | 25 | 30 | 35 | |||||||||||||
| 150,000 | 45,000 | 60,000 | 75,000 | 90,000 | 105,000 | ||||||||||||
| 200,000 | 60,000 | 80,000 | 100,000 | 120,000 | 140,000 | ||||||||||||
| 300,000 | 90,000 | 120,000 | 150,000 | 180,000 | 210,000 | ||||||||||||
| 400,000 | 120,000 | 160,000 | 200,000 | 240,000 | 280,000 | ||||||||||||
| 500,000 | 150,000 | 200,000 | 250,000 | 300,000 | 350,000 | ||||||||||||
| 600,000 | 180,000 | 240,000 | 300,000 | 360,000 | 420,000 | ||||||||||||
| 700,000 | 210,000 | 280,000 | 350,000 | 420,000 | 490,000 | ||||||||||||
Messrs Bouchard, Fortin, Plourde and Trowbridge had, respectively, 25.25, 20.58, 20.33 and 18.58 years of credited service as at April 25, 2004. Mr. Hannasch participated in the Company’s new 401k Plan as of March 2004. Under this 401k Plan rules, participants can contribute annually up to a maximum of 2% of their base salary. The Company contributes an amount equal to 50% of the employee’s contribution up to 1% of the employee’s base salary. The benefits that the participant will receive upon retirement depend on the capital and interest accumulated during the years he contributed to the Plan. 9 |
Since March 2004, Mr. Hannasch also participates in the Company’s Non-Qualified Deferred Compensation Plan. Under this Plan, participants can contribute up to 25% of base salary and up to 100% of their annual bonus pre-tax. The Company will match 100% of the first 6% of base salary. There is also a profit-sharing component to this Plan that will pay 0 to 3% of base salary to the participant if the Company meets or exceeds targeted profitability. Report on Executive CompensationAs at April 25, 2004, the Company’s Human Resources and Corporate Governance Committee was comprised of three unrelated, independent directors, namely Roger Longpré (Chairman), Jean Élie and Jean-Pierre Sauriol. The lead director also attends meetings of this Committee. The Chairman of the Board, President and Chief Executive Officer makes recommendations to the Human Resources and Corporate Governance Committee as to the compensation of each of the Company’s executive officers, other than himself. The Committee reviews the compensation of executive officers and reports thereon to the Board of Directors. The Company’s compensation policy focuses on financial performance, both at the corporate and divisional levels, while providing its executive officers the necessary incentives to further the development of the Company, in line with its strategy and values. In determining compensation for executive officers, the Committee reviews a survey of compensation practices of a peer group of Canadian and U.S. companies in the retail and manufacturing (food) industries, to benchmark compensation against the median (50th percentile) of the peer group. This analysis is done with external consultants retained by the Company. The compensation of the Company’s executive officers includes a base salary, an annual bonus and stock options, with more weight given to the long-term incentive component. The annual bonus is determined based on preset corporate and divisional financial objectives and on the achievement of individual performance objectives. The amounts payable are calculated on the basis of a percentage that reflects the executive officer’s position and responsibilities. The award of stock options also reflects the executive officer’s position and responsibilities as well as expected performance over the long term. (See “Stock Option Plan”.) The compensation of the Chairman of the Board, President and Chief Executive Officer is based on the same principles as those governing the compensation of the Company’s other executive officers as set forth above. Submitted on July 13, 2004 by the Human Resources and Corporate Governance Committee: – Roger Longpré, Chairman – Jean Élie – Jean-Pierre Sauriol Performance GraphIn June 1995, the outstanding common shares of the Company were changed into Multiple Voting Shares and Subordinate Voting Shares. The Multiple Voting Shares and the Subordinate Voting Shares traded on the Montreal Exchange until December 3, 1999 and commenced trading on the Toronto Stock Exchange on December 6, 1999. The following graph compares the cumulative total shareholder return on $100 invested at the end of April 1999 in Multiple Voting Shares and Subordinate Voting Shares of the Company with the cumulative total shareholder return on the Toronto S&P/TSX Composite Index. 10 |
 |
| APRIL 99 | APRIL 00 | APRIL 01 | APRIL 02 | APRIL 03 | APRIL 04 | |||||||||||||||
| Alimentation Couche-Tard Inc. | $ | 100.00 | $ | 131.82 | $ | 131.82 | $ | 372.73 | $ | 254.55 | $ | 444.55 | ||||||||
| Multiple Voting Shares | ||||||||||||||||||||
| Alimentation Couche-Tard Inc. | $ | 100.00 | $ | 95.57 | $ | 126.36 | $ | 318.31 | $ | 263.38 | $ | 480.89 | ||||||||
| Subordinate Voting Shares | ||||||||||||||||||||
| S&P/TSX Composite Index | $ | 100.00 | $ | 135.14 | $ | 116.30 | $ | 113.48 | $ | 98.94 | $ | 133.84 | ||||||||
Corporate GovernanceIn 1995, the Toronto Stock Exchange adopted new policies and guidelines on corporate governance. The Board of Directors established a Special Committee on corporate governance, composed of three unrelated directors, in order to review the guidelines and their application to the Company. At its June 26, 1996 meeting, the Board of Directors adopted the report of the Special Committee. In 2002, the Toronto Stock Exchange recommended certain amendments to its guidelines on corporate governance.The Board of Directors delegated responsibility for reviewing the amendments, and their application to the Company, to the Human Resources Committee (subsequently renamed the Human Resources and Corporate Governance Committee). The committee conducted a detailed analysis of the amended guidelines and also reviewed the corporate governance policies of various companies reputed to have the highest corporate governance standards. The committee then submitted its recommendations to the Board of Directors.With a view to adhering to the Toronto Stock Exchange guidelines and the amendments thereto, the Board of Directors adopted various amendments to the Company’s corporate governance policy at its July 3, 2003 meeting. A description of the Company’s corporate governance practices in relation to the Toronto Stock Exchange’s guidelines on corporate governance, as amended, is attached hereto as Schedule A. Following the acquisition of The Circle K Corporation in December 2003, the Human Resources and Corporate Governance Committee also reviewed the Company’s corporate governance practices to comply with the U.S. Sarbanes-Oxley Act of 2002 and applicable rules of the U.S. Securities and Exchange Commission. Furthermore, the committee reviewed the new audit committee rules adopted by the Canadian Securities Administrators effective March 30, 2004. The committee then submitted its recommendations to the Board of Directors in compliance with these new rules and the Board of Directors adopted new policies and procedures which are also disclosed in Schedule A. |
| a) Mandate of the Board of Directors |
| The Board of Directors oversees the Company’s management of its commercial activities and internal affairs with a view to increasing the long-term return on shareholder equity. The Board makes major policy decisions and reviews the performance and efficiency of the management team entrusted with the responsibility for administering the Company’s day-to-day business. |
11 |
In accordance with the Toronto Stock Exchange Guidelines, the Board of Directors has overall responsibility for the strategic planning process and the general management of the Company. The strategic planning process of the Company corresponds to its annual business plan, which is submitted to the Board of Directors for review and approval along with the annual budget. The business plan is then monitored at the quarterly meetings of the Board of Directors. b) Composition of the Board of Directors The Board of Directors is currently composed of eleven directors. The Board of Directors considers six of its current directors to be “unrelated” to the Company. Messrs. Alain Bouchard, Richard Fortin, Réal Plourde and Jacques D’Amours are related directors, each being a senior officer of the Company. Mr. Jean Turmel is related to the Company’s principal banker and is therefore considered by the Board of Directors to be a related director. Mr. Jean Élie was nominated by Métro Inc., a significant shareholder, but is not otherwise related to the Company. The Board does not consider Mr. Élie to be a related director given that the Company does not have significant business dealings with Métro Inc. and that Métro Inc. does not control the Company. The five other directors, Messrs. Brunet, Desrosiers, Longpréand Sauriol and Mrs. Goulet, are unrelated directors given that they do not have any business interests or other relationships with the Company or its principal shareholders. c) Mandate and Composition of Board Committees The Company has established three Committees of the Board of Directors: |
| – | the Executive Committee; |
| – | the Audit Committee; and |
| – | the Human Resources and Corporate Governance Committee. |
| i) Mandate and composition of the Executive Committee: |
| Powers of the Executive Committee |
| The Executive Committee has the authority to exercise, from time to time, all the powers of the Board of Directors, except the powers that may not be delegated to a committee pursuant to the laws governing the Company and subject to any restrictions imposed by the Board of Directors, within the limits of the mandates and responsibilities of other committees of the Board of Directors in accordance with current corporate governance guidelines. The Executive Committee must also advise the Board of all decisions of a strategic nature. |
| Composition of the Executive Committee |
| The Executive Committee is composed of Messrs. Alain Bouchard, Richard Fortin, Real Plourde and Jacques D’Amours, all senior officers of the Company. |
| ii) Mandate and composition of the Audit Committee: |
| Powers of the Audit Committee |
| The Audit Committee assists the Board of Directors in its task of supervising the Company’s accounting and financial procedures and financial reporting in order to enhance its integrity and ensure compliance with all legal requirements. The Audit Committee also ensures that the Company respects its financial commitments and complies with legal and regulatory requirements governing financial reporting and the management of financial risk. |
| The Audit Committee has the following responsibilities with respect to the reporting of financial information and the Chairman of the Committee reports thereon to the Board of Directors: |
12 |
| 1. | Review, together with management and the external auditors, the annual financial statements and the related notes, the external auditors’ report thereon and the accompanying press release and obtain explanations from management on any significant discrepancies with the corresponding periods before recommending their approval by the board and publication. |
| 2. | Review, together with management, the quarterly financial statements and accompanying press releases before recommending their approval by the board and publication. |
| 3. | Review the financial information contained in the annual information form, the financial information contained in the annual report, management’s analysis of the financial position and the operating results, and the financial information contained in the prospectus and other documents containing similar financial information before their disclosure to the public or filing with Canadian regulatory authorities. |
| 4. | Review on an annual basis, together with management and the external auditors, the quality and not just acceptability of the Corporation’s new accounting policies and review the disclosure and impact of contingencies and the reasonableness of provisions, reserves and estimations which may have a material impact on the reporting of financial information. |
| 5. | Review, together with the external auditors, the problems and difficulties in connection with the audit and measures adopted in this regard by management and find a solution to disagreements between management and the external auditors on the reporting of financial information. |
The Audit Committee has the following responsibilities with respect to risk management and external controls and the Chairman of the Committee reports thereon to the Board of Directors: |
| 1. | Monitor the quality and integrity of the corporation’s internal control and management information systems through discussions with management, the external auditors and the internal auditors, where applicable. |
| 2. | Ensure effective coordination between the internal and external auditors. |
| 3. | Oversee the reporting of information by management on internal control. |
| 4. | Review on an annual basis and monitor the Corporation’s risk assessment and management policies. |
| 5. | At least once per year, review an internal auditors report describing the internal quality control procedures, the material issues raised in the course of the latest reviews of the internal control and management information systems, or as a result of an inquiry by government or professional authorities, as well as the recommendations made and measures adopted with respect thereto. |
| 6. | Assist the board in discharging its responsibility for ensuring that the Corporation complies with the applicable legal and regulatory requirements. |
The Audit Committee has the following responsibilities with respect to the internal auditor and the Chairman of the Committee reports thereon to the Board of Directors: |
| 1. | Approve the internal audit plan. |
| 2. | Ensure that the internal auditor reports the results of his work to the Audit Committee on a semi-annual basis. |
13 |
The Audit Committee has the following responsibilities with respect to the external auditors and the Chairman of the Committee reports thereon to the Board of Directors: |
| 1. | Review the written annual declaration of the external auditors concerning all their connections with the Corporation and discuss the connections or services which may have an impact on their objectivity or ability to function independently. |
| 2. | Approve the appointment and, if necessary, the non-renewal of the mandate (in both cases, subject to shareholder approval) of the external auditors and review their competence, performance and ability to function independently. |
| 3. | Approve all audit services and determine which services other than audit services the auditors are not authorized to perform. |
| 4. | Ensure that the fees charged by the external auditors both for audit services and other authorized services are reasonable. |
| 5. | Review the audit plan with the external auditors and management and approve its schedule. |
| 6. | Establish a policy concerning the hiring of current or past employees of the external auditors. |
| 7. | Ensure that the external auditors always report to the Audit Committee and the board as representatives of the shareholders. |
| 8. | The Audit Committee always has direct lines of communication with the external auditors. |
| 9. | The Audit Committee may meet, as appropriate, without management or the external auditors present, subject to prior approval by the lead director and the chair of the board. |
| 10. | The Audit Committee shall hold separate meetings with management and the external auditors at least once a year or more often as appropriate. |
At its meeting held on March 15, 2004, the Audit Committee approved a Code of ethics for the CEO, CFO and senior financial officers in accordance with the U.S. Sarbanes–Oxley Act and the applicable rules of the U.S. Securities and Exchange Commission. Composition of the Audit Committee The Audit Committee is currently composed of three unrelated independent directors, namely Messrs. Roger Desrosiers (Chairman), Robert Brunet and Roger Longpré. The Chairman of the Audit Committee is a chartered accountant and the other two members are financially literate. The Chairman of the Audit Committee is a financial expert in accordance with the U.S. Sarbanes–Oxley Act and the applicable rules of the U.S. Securities and Exchange Commission. The disclosure required by Form F2-110F1 can be found in the Annual Information Form of the Company for the fiscal year ended April 25, 2004 under the heading “Audit Committee Disclosure” beginning on page 29. The Annual Information Form relating to the Company is available on SEDAR at www.sedar.com. |
14 |
| iii) Mandate and composition of the Human Resources and Corporate Governance Committee: |
| The Human Resources and Corporate Governance Committee assists the Board of Directors in fulfilling its human resources responsibilities, including the task of proposing new nominees to the Board of Directors and to senior management. The committee also assists the Board of Directors in its responsibilities regarding corporate governance and ethics. |
| Powers of the Human Resources and Corporate Governance Committee |
| 1. | Periodically review the Company’s organizational chart, its principal programs for reorganization and the main elements of the succession plan for senior management; |
| 2. | Establish compensation guidelines; |
| 3. | Review the compensation of senior officers; |
| 4. | Review annually or more frequently if required and approve, if necessary, the following: |
| – | the career plan for senior officers; |
| – | management and lines of communication; and |
| – | contingency plans in the event of the incapacity of key senior officers. |
| 5. | Oversee the Company’s corporate governance practices and submit recommendations regarding such practices, including the implementation and effectiveness thereof, to the Board of Directors, and monitor such practices. |
| 6. | The committee periodically reviews the mandate of each Board committee and the policies concerning the size, structure and composition of the Board of Directors and submits recommendations in respect thereof; |
| 7. | Review the manner in which the Company implements the Toronto Stock Exchange Guidelines; |
| 8. | Review the rules of ethics applicable to directors and senior officers and monitor compliance therewith. |
| 9. | Review the indemnification procedures regarding directors’ liability and the adequacy of liability insurance in respect thereof. |
| Composition of the Human Resources and Corporate Governance Committee |
The Human Resources and Corporate Governance Committee is currently composed of three unrelated independent directors, namely Messrs. Roger Longpré (Chairman), Jean Élie and Jean-Pierre Sauriol. Appointment and Remuneration of AuditorsRaymond Chabot Grant Thornton, chartered accountants, Montreal, have served as the Company’s auditors since1990. For the fiscal years ended on April 25, 2004 and on April 27, 2003, fees billed for audit, audit-related, tax and all other services provided to the Company by Raymond Chabot Grant Thornton were the following: 15 |
| 2004 | 2003 | |||||
|---|---|---|---|---|---|---|
| Audit Fees(1) | $ | 1 388 010 | $ | 363 021 | ||
| Audit-Related Fees(2) | $ | 142 111 | $ | 54 314 | ||
| Tax Fees(3) | $ | 19 030 | $ | 47 230 | ||
| All Other Fees | NIL | NIL | ||||
| TOTAL | $ | 1 549 151 | $ | 464 565 | ||
| Notes: | ||||||
| (1) | Audit services are professional services rendered for the audit of an issuer’s annual financial statements and, if applicable, for the reviews of an issuer’s financial statements included in the issuer’s quarterly reports and services that are normally provided by the accountant in connection with an engagement to audit the financial statements of an issuer — for example: |
| – | attendance at audit committee meetings at which matters related to the audits or reviews are discussed; |
| – | consultations on specific audit or accounting matters that arise during or as a result of an audit or review; |
| – | preparation of a management letter; |
| – | time incurred in connection with the audit of the income tax accrual; |
| – | services in connection with the issuer’s annual and quarterly reports, prospectuses and other filings with Canadian, US or other securities commissions, including an amount of $899,973 billed in 2004 for services rendered from October 2003 to April 2004 in connection with the offering memorandum and registration statement for the financing of the Circle K acquisition. |
| (2) | Audit-related services (the Canadian term) are assurance and related services traditionally performed by an independent auditor – for example: |
| – | employee benefit plan audits; |
| – | accounting work related to mergers and acquisitions, including special audits, due diligence and accounting consultations (including an amount of $117,111 billed in 2004 for due diligence services in connection with the Circle K acquisition); |
| – | internal control reviews; |
| – | assurance engagements that are not required by statute or regulation; |
| – | general advice on accounting standards. |
| (3) | This category includes tax services other than time incurred in connection with the audit of the income tax accrual. |
At its meeting held on March 16, 2004, the Board of Directors adopted a policy and procedures on the pre-approval of non-audit services by the Company’s auditors. This policy prohibits the Company from engaging the auditors to provide certain non-audit services to the Company and its subsidiaries, including bookkeeping or other services related to the accounting records or financial statements, financial information systems design and implementation, appraisal or valuation services, actuarial services, internal audit services, investment banking services, management functions or human resources functions, legal services and expert services unrelated to the audit. The policy allows the Company to engage the auditors to provide non-audit services, other than the prohibited services, only if the services have specifically been pre-approved by the Audit Committee. The Board of Directors is recommending thatRaymond Chabot Grant Thornton, chartered accountants, Montreal, be appointed to serve as the Company’s auditors until the next annual general meeting of shareholders. Unless otherwise specified by the shareholders, the shares represented by any proxy enclosed herewith will be voted FOR the appointment of Raymond Chabot Grant Thornton, chartered accountants, Montreal, as auditors of the Company until the next annual general meeting of the shareholders and authorizing the Board of Directors to fix their remuneration. Approval of By-laws 2003-1 and 2004-1At its meetings held on December 11, 2003 and July 13, 2004, the Board of Directors adopted resolutions, subject to shareholder confirmation, to enact By-laws 2003-1 and 2004-1 amending certain provisions of By-law no. 1, as amended, being the general by-laws of the Company, in order to clarify certain provisions and provide additional flexibility. By-law 2003-1 specifies that the Company’s financial year shall end on the last Sunday of April, and not on the Sunday closest to April 30th. By-law 2004-1 specifies that the annual general meeting of shareholders of the Company can be held at such time in each year and place as the board or failing it, the chairman of the board, may from time to time determine. The By-laws do not entail any substantive changes in the business of the Company. 16 |
At the Meeting, shareholders will be asked to consider, and if deemed appropriate, adopt an ordinary resolution confirming By-laws 2003-1 and 2004-1, the text of which is set out in Appendix B to this Management Proxy Circular. The Board of Directors and management are recommending that shareholders vote FOR the approval of the following resolution that requires an affirmative vote of a majority of the votes cast in order to be adopted.Unless otherwise specified by the shareholders, the shares represented by any proxy enclosed herewith will be voted FOR the approval of the following resolution. |
| “RESOLVED: |
| THAT By-laws 2003-1 and 2004-1, enacted by the Board of Directors at its meetings held on December 11, 2003 and July 13, 2004, respectively, are hereby confirmed as by-laws of the Company.” |
Other BusinessManagement of the Company knows of no amendment or variation to the matters identified in the Notice, nor of any other matter to be discussed other than those identified in the Notice.However, the enclosed form of proxy confers discretionary authority upon the persons named therein to vote on any such amendments or variations or other matters. Additional InformationAdditional information relating to the Company is available on SEDAR at www.sedar.com. Copies of the Company’s latest annual information form, financial statements and MD&A filed with the Canadian and U.S. securities regulators may be obtained, without charge, on request from the Corporate Secretary of the Company. Approval by DirectorsThe Board of Directors of the Company has approved the contents of this Management Proxy Circular and its sending to the shareholders of the Company. |
| Brigitte K. Catellier Corporate Secretary |
Laval, July 13, 2004 17 |
APPENDIX A |
| TSX GUIDELINES | CORPORATE GOVERNANCE PRACTICES AT THE COMPANY | ||||||
| 1. | The Board of Directors should explicitly | 1. | The Company complies. On July 3, 2003, the Board of | ||||
| assume responsibility for the stewardship of the | Directors approved a Board mandate which states that | ||||||
| Company and, as part of the overall stewardship | the role of the Board is to supervise the management of | ||||||
| responsibility, should assume responsibility for | the Company’s business and affairs, with the objective | ||||||
| the following matters: | of increasing shareholder value. | ||||||
| (a) | adoption of a strategic planning process; | 1. (a) | The Company complies. In addition to making decisions | ||||
| that are within its power under the law, the Board of | |||||||
| Director’s main responsibilities are to review and | |||||||
| approve the Company’s strategic plan and priorities. | |||||||
| This review is done on an annual basis and takes into | |||||||
| account the risks and opportunities of the business. | |||||||
| The Board of Directors is then regularly updated on the | |||||||
| Company’s progress on management’s implementation of | |||||||
| the strategic plan. | |||||||
| (b) | identification of the principal risks of the | 1. (b) | The Company complies. The Board of Directors reviews | ||||
| Company’s business and overseeing the | the principal risks of the Company’s business, as | ||||||
| implementation of appropriate systems to manage | identified by management, as part of the review of the | ||||||
| these risks; | strategic plan. The Board has delegated responsibility | ||||||
| to monitor these risks to the Audit Committee as part | |||||||
| of its review of quarterly and annual MD&A. The Audit | |||||||
| Committee reports thereon to the Board of Directors. | |||||||
| (c) | Succession planning, including appointing and | 1. (c) | The Company complies. The Board of Directors has | ||||
| monitoring senior management; | delegated the responsibility for planning the | ||||||
| succession of the Company’s senior officers, including | |||||||
| appointments and compensation, to its Human Resources | |||||||
| and Corporate Governance Committee. | |||||||
| The Board of Directors attaches a great deal of | |||||||
| importance to succession planning and has asked to be | |||||||
| informed on a regular basis of the actions taken in | |||||||
| this regard by management. | |||||||
| (d) | Communications policy; | 1. (d) | The Company complies. The Board of Directors has | ||||
| adopted a communications policy aimed at providing | |||||||
| complete disclosure of any material issue related to | |||||||
| its business. This policy also provides for the manner | |||||||
| in which the Company interacts with analysts and the | |||||||
| public, and provides for measures to avoid the | |||||||
| selective disclosure of information. The Board of | |||||||
| Directors also ensures that appropriate measures are | |||||||
| implemented to promote communication with clients, | |||||||
| shareholders, investors, and the public. The Company | |||||||
| communicates with its stakeholders through a number of | |||||||
| channels, including press releases, financial reports | |||||||
| and its website. | |||||||
18 |
| TSX GUIDELINES | CORPORATE GOVERNANCE PRACTICES AT THE COMPANY | ||||
| The Board of Directors reviews and approves the | |||||
| contents of significant information documents, | |||||
| including quarterly and annual reports, the annual | |||||
| information form and the management proxy circular. | |||||
| (e) | Integrity of internal control and management | 1. (e) | The Company complies. The Audit Committee, together | ||
| information systems; | with management, ensures the effectiveness of the | ||||
| internal control and management information systems. | |||||
| The Committee meets with the Director, Internal | |||||
| controls on a quarterly basis to approve and monitor | |||||
| the internal audit plan. | |||||
| The Audit Committee then reports to the Board of | |||||
| Directors at its next meeting. | |||||
| 2. | The Board of Directors should be constituted with | 2. | The Company complies. The Board of Directors is | ||
| a majority of individuals who qualify as unrelated | currently composed of eleven (11) members, including | ||||
| directors. | six (6) unrelated directors, namely, Robert Brunet, | ||||
| Roger Longpré, Jean Élie, Jean-Pierre Sauriol, Roger | |||||
| Desrosiers, and Josée Goulet. “See also “Corporate | |||||
| Governance – Composition of the Board of Directors | |||||
| above.”) | |||||
| 3. | The Board of Directors should specify whether each | 3. | The Company complies. The Human Resources and Corporate | ||
| director is related or unrelated and should | Governance Committee develops clear standards to | ||||
| specify the basis for drawing this conclusion. | establish the independence of the members of the Board | ||||
| and its committees, which are in addition to the | |||||
| standards concerning the concepts of “affiliates” and | |||||
| related director. | |||||
| The four (4) directors who are senior officers of the | |||||
| Company are related directors. | |||||
| Mr. Jean Turmel is also a related director as he is | |||||
| related to the Company’s principal banker. The six (6) | |||||
| other members of the Board of Directors are unrelated | |||||
| directors. (See also “Corporate Governance – | |||||
| Composition of the Board of Directors above.”) | |||||
| 4. | The Board of Directors should appoint a | 4. | The Company complies. The Board of Directors has | ||
| committee of directors, composed exclusively of | delegated to the Human Resources and Corporate | ||||
| directors who are not members of management, the | Governance Committee, the task of evaluating and | ||||
| majority of whom are unrelated, to appoint and | recommending to the Board of Directors, together with | ||||
| assess directors. | the Chairman of the Board of Directors, new nominees | ||||
| for the position of Director. | |||||
19 |
| TSX GUIDELINES | CORPORATE GOVERNANCE PRACTICES AT THE COMPANY | ||||
| The committee determines the skills, abilities and | |||||
| personal attributes required of new directors with a | |||||
| view to creating value for shareholders. | |||||
| The Human Resources and Corporate Governance Committee | |||||
| is exclusively composed of outside unrelated directors. | |||||
| 5. | The Board of Directors should implement a process | 5. | The Company complies. The Human Resources and Corporate | ||
| to be carried out by the appropriate committee for | Governance Committee examines on an annual basis, | ||||
| assessing the effectiveness of the Board of | together with the Chairman of the Board and the Lead | ||||
| Directors, the committees of the Board of | Director, the performance and contribution of directors | ||||
| Directors and the contribution of individual | nominated for re-election and ensures that they are | ||||
| directors. | still eligible pursuant to applicable laws. In | ||||
| addition, they assess the effectiveness of the Board as | |||||
| a whole, and of its committees, on an annual basis. The | |||||
| committee assesses the operation of the Board and | |||||
| committees, the participation of individual directors, | |||||
| the adequacy of information given to directors and | |||||
| communication between the Board and management. | |||||
| 6. | As an integral element of the process for | 6. | The Company complies. The Company has developed and | ||
| appointing new directors , the Company should | updates a director’s guide for new members of the Board | ||||
| provide an orientation and education program for | of Directors as well as for existing members. | ||||
| new members of the Board. | |||||
| New members of the Board of Directors receive training | |||||
| in the form of presentations and up-to-date | |||||
| documentation containing basic information on the | |||||
| Company and its industry. | |||||
| Management will make presentations on various aspects | |||||
| of the Company’s business to the Board of Directors on | |||||
| a regular basis. The Board also visits Company | |||||
| facilities on an annual basis. | |||||
| 7. | The Board of Directors should examine its size | 7. | The Company complies. The Human Resources and | ||
| and, with a view to determining the impact of the | Corporate Governance Committee reviews the size of the | ||||
| number upon effectiveness, undertake where | Board on a annual basis and reports to the Board. In | ||||
| appropriate, a program to establish a number of | 2003, the committee recommended that the Board be | ||||
| directors which facilitates effective | increased from 10 to 11 members. The committee and the | ||||
| decision-making. | Board of Directors consider that the current size and | ||||
| composition of the Board are adequate to maximize its | |||||
| effectiveness and the representation of shareholders. | |||||
20 |
| 8. | The Board of Directors should review the adequacy | 8. | The Company complies. The Human Resources and Corporate | ||||
| and form of the compensation of directors and | Governance Committee, together with the Lead Director | ||||||
| ensure the compensation realistically reflects the | and the Chairman of the Board of Directors, is | ||||||
| responsibilities and risks involved in being an | responsible for studying and proposing policies and | ||||||
| effective director. | practices for the compensation of directors to ensure | ||||||
| that compensation realistically reflects the | |||||||
| responsibilities and risks involved in carrying out | |||||||
| their mandate as directors, as well as means for | |||||||
| encouraging directors to hold shares in the Company. | |||||||
| The committee takes into account, in particular, the | |||||||
| work load and comparative figures on the compensation | |||||||
| of board members of a group of comparable Canadian | |||||||
| companies with North American operations. In 2004, the | |||||||
| committee retained the services of an outside | |||||||
| consultant to review Board compensation and to | |||||||
| recommend a Board compensation policy, which was | |||||||
| approved by the Board. (See “Compensation of | |||||||
| Directors”). | |||||||
| 9. | Committees of the Board of Directors should | 9. | The Company complies. The Company has three Committees | ||||
| generally be composed of outside directors, a | of the Board of Directors, namely, the Executive | ||||||
| majority of whom are unrelated directors, although | Committee, the Audit Committee, and the Human Resources | ||||||
| some board committees, such as the executive | and Corporate Governance Committee, the latter two | ||||||
| committee, may include one or more insider | committees being entirely composed of outside and | ||||||
| directors. | unrelated directors. A summary of the mandates and | ||||||
| composition of the committees is found above under the | |||||||
| heading “Description of Committees of the Board of | |||||||
| Directors, their Mandate, and their Responsibilities.” | |||||||
| 10. | The Board of Directors should expressly assume | 10. | The Company complies. The Board of Directors has | ||||
| responsibility for, or assign to a committee of | delegated the responsibility of corporate governance to | ||||||
| directors the general responsibility for, | the Human Resources and Corporate Governance Committee. | ||||||
| developing the Company’s approach to governance | |||||||
| issues and the Company’s response to the TSX | The Human Resources and Corporate Governance Committee | ||||||
| Guidelines. | oversees the corporate governance of the Company. This | ||||||
| committee is regularly updated on recent corporate | |||||||
| governance developments and makes recommendations in | |||||||
| this regard to the Board of Directors, including with | |||||||
| regard to the implementation and effectiveness of the | |||||||
| Company’s corporate governance practices, the mandate o | |||||||
| every committee of the Board, and the policies | |||||||
| concerning the size, structure, and composition of the | |||||||
| Board of Directors. | |||||||
| The Human Resources and Corporate Governance Committee | |||||||
| and the Board of Directors have reviewed the Company’s | |||||||
| responses to the TSX guidelines. | |||||||
21 |
| 11. | The Board of Directors, together with the CEO, | 11. | The Company complies. The description of the mandate of | ||||
| should develop position descriptions for the Board | the Board of Directors and the Committees of the Board | ||||||
| and for the CEO, involving the definition of the | of Directors are found above under the heading | ||||||
| limits to management’s responsibilities. In | “Corporate Governance.” The mandate of the Chairman of | ||||||
| addition, the Board should develop the corporate | the Board of Directors, the Lead Director, and the | ||||||
| objectives which the CEO is responsible for | President and Chief Executive Officer, are also clearly | ||||||
| meeting. | and accurately defined so as to provide a concise | ||||||
| description of duties and responsibilities. In addition | |||||||
| as part of its review and discussion of the strategic | |||||||
| plan, the Board develops the corporate objectives which | |||||||
| the CEO is responsible for meeting. These objectives ar | |||||||
| reviewed and monitored by the Human Resources and | |||||||
| Corporate Governance Committee. | |||||||
| 12. | Establish procedures that enable the Board of | 12. | The Company complies. The Board of Directors has | ||||
| Directors to function independently of management. | established procedures enabling it to function | ||||||
| independently of management, including the appointment | |||||||
| of an unrelated director to act as Lead Director. | |||||||
| Moreover, the majority of the members of the Board of | |||||||
| Directors are unrelated directors and all of the members | |||||||
| of its Audit Committee and Human Resources and | |||||||
| Corporate Governance Committee are unrelated directors. | |||||||
| The Lead Director’s responsibilities include the | |||||||
| following: | |||||||
| >> | To ensure that the responsibilities of the Board of | ||||||
| Directors are well understood by both the Board of | |||||||
| Directors itself and management, and that the | |||||||
| boundaries between the responsibilities of each are | |||||||
| clearly understood and observed. | |||||||
| >> | Ensure that the resources available to the Board of | ||||||
| Directors (especially up-to-date and relevant | |||||||
| information) are adequate and enable it to perform its | |||||||
| work. | |||||||
| >> | Adopt, together with the Chairman of the Board of | ||||||
| Directors, procedures and meeting schedules so that the | |||||||
| Board of Directors and its committees can effectively | |||||||
| and efficiently accomplish their work. | |||||||
| >> | Ensure that duties assigned to the competent | ||||||
| committees are effectively carried out and that the | |||||||
| results are communicated to the Board of Directors. | |||||||
22 |
| 13.(a) | The Audit Committee should only be composed of | 13.(a) | The Company complies. The Audit Committee is | ||
| outside directors | currently composed of three unrelated outside directors. | ||||
| The Chairman of the Audit Committee is a chartered | |||||
| accountant and the other two members are financially | |||||
| literate. The Chairman of the Audit Committee is a | |||||
| financial expert in accordance with the U.S. | |||||
| Sarbanes-Oxley Act and the applicable rules of the U.S. | |||||
| Securities and Exchange Commission. | |||||
| 13.(b) | The mandate of the Audit Committee should be | 13.(b) | The Company complies. The mandate of the Audit | ||
| expressly defined. | Committee is defined in an express, clear, and concise | ||||
| manner. A summary of this mandate is found above under | |||||
| the heading “Corporate Governance” As part of its | |||||
| mandate, the Audit Committee communicates directly with | |||||
| the external auditors and the Director, Internal | |||||
| controls. The Audit Committee approves all non-audit | |||||
| work performed by the external auditors and has adopted | |||||
| a policy and procedures in connection therewith. The | |||||
| Audit Committee also is responsible for overseeing | |||||
| management reporting and internal controls systems. | |||||
| 14. | The Board of Directors should implement a system | 14. | The Company complies. A director may retain the services | ||
| enabling a director to hire an outside adviser at | of an outside adviser at the Company’s expense in | ||||
| the Company’s expense in appropriate | appropriate circumstances, subject to prior approval by | ||||
| circumstances. The hiring of an outside adviser | the Lead Director and the Chairman of the Board. | ||||
| should be submitted for the approval by the | |||||
| relevant committee of the Board of Directors. | |||||
23 |
APPENDIX BBY-LAW 2003-1 being a by-law amending section 1 of Article XI of Règlement Numéro 1, being the general by-laws of the Company, |
| 1. | THAT SECTION 1 of Article XI of Règlement Numéro 1, being the general by laws of the Company and BY-LAW 1995-2, be and is hereby deleted and replaced by the following: |
“1.Financial Year The Company’s financial year shall end each year on the last Sunday in April.” |
| 2. | THAT any one of the directors or officers of the Company be and is hereby authorized to do all things and sign all documents and forms necessary or incidental for the due carrying out of the foregoing. |
BY-LAW 2004-1 being a by-law amending section 1 of Article III of Règlement Numéro 1, being the general by-laws of the Company, |
| 1. | THAT SECTION 1 of Article III of Règlement Numéro 1, being the general by laws of the Company, be and is hereby deleted and replaced by the following: |
“1. Annual General Meeting |
| Subject to the Companies Act (Quebec), the annual meeting of shareholders of the Company shall be held at such time in each year and place as the board or failing it, the chairman of the board, may from time to time determine, for the purpose of considering the financial statements and reports required by the Act to be submitted to the Company at the annual meeting, electing directors, appointing auditors and for the transaction of such other business as may properly be brought before the meeting.” |
| 2. | THAT any one of the directors or officers of the Company be and is hereby authorized to do all things and sign all documents and forms necessary or incidental for the due carrying out of the foregoing.” |
24 |
ALIMENTATION COUCHE-TARD INC.NOTICE OF ANNUAL GENERAL AND SPECIAL MEETING OF SHAREHOLDERS |
| NOTICE IS HEREBY GIVEN THAT the annual general and special meeting (the “Meeting”) of shareholders of Alimentation Couche-Tard Inc. (the “Company”) will be held at the Château Royal, 3500 du Souvenir Blvd, in the City of Laval, Province of Quebec, on Wednesday, September 8, 2004, at 11:00 a.m. (local time), for the following purposes: |
| 1) | receiving the consolidated financial statements of the Company for the fiscal year ended April 25, 2004, together with the auditors’ report thereon; |
| 2) | electing the directors of the Company and authorize the Board to fix their remuneration; |
| 3) | appointing the auditors of the Company; |
| 4) | considering, and if deemed appropriate, adopting a resolution confirming the enactment of By-laws 2003-1 and 2004-1 amending certain provisions of By-law no. 1, being the general by-laws of the Company (the full text of the resolution and of the By-laws are respectively reproduced on page 17 and in Appendix B hereto); and |
| 5) | to transact such other business as may properly come before the Meeting or any adjournment thereof. |
| The Management Proxy Circular, a form of proxy for the Meeting a consent to electronic delivery of documents and a registration form for the Company’s shareholder supplemental list are enclosed with this notice. |
| If you are unable to attend the Meeting, please exercise your right to vote by signing and returning the enclosed form of proxy in the enclosed envelope. Proxies may also be deposited with the Secretary of the Meeting, immediately prior to the commencement of the Meeting. |
| BY ORDER OF THE BOARD OF DIRECTORS Brigitte K. Catellier Corporate Secretary |
Laval, July 13, 2004
ALIMENTATION COUCHE-TARD INC.PROXY |
| The said nominee is specifically directed to vote or withhold from voting as follows : |
TO ELECT THE DIRECTORS RECOMMENDED BY MANAGEMENT __ FOR __ WITHHOLD TO APPOINT RAYMOND CHABOT GRANT THORNTON AS AUDITORS __ FOR AND AUTHORIZE THE BOARD TO FIX THEIR REMUNERATION __ WITHHOLD TO ADOPT A RESOLUTION CONFIRMING THE ENACTMENT OF __ FOR BY-LAWS 2003-1 AND 2004-1 __ AGAINST
The shares represented by this proxy will be voted as specified. However, if no such specification is made in respect of any matter, this proxy shall be deemed to grant authority to vote FOR each matter not so specified. Management of the Company knows of no amendment or variation to the matters identified in the notice, nor of any other matter to be discussed other than those identified in the notice. However, this proxy confers discretionary authority upon the persons named therein to vote on any such amendments or variations or other matters. Pleasesignexactlyasthenameappearshereonandinwhichthesharesare registered.Iftheshareholderisacorporation,pleaseaffixthecorporate seal.Ifthisproxyisnotdatedinthespaceprovided,theproxyshallbe deemedtobearthedateonwhichitwasmailedtotheshareholder. Dated ___________________________ ________________________________ |
Contents |
1 | ||||
2 | ||||
4 | ||||
7 | ||||
8 | ||||
16 | ||||
| Canadian Markets |
| ||
| • | 18 | ||
| • | 20 | ||
| • | 22 | ||
| U.S. Markets |
| ||
| • | 24 | ||
| • | 27 | ||
| • | 29 | ||
| • | 30 | ||
| • | 31 | ||
| • | 32 | ||
| • | 33 | ||
34 | ||||
36 | ||||
55 | ||||
56 | ||||
59 | ||||
74 | ||||
| ||||
Annual General and Special Meeting of Shareholders
Wednesday, September 8, 2004 at 11:00 a.m.
Château Royal, 3500 du Souvenir Boulevard, Laval, Quebec
Our Specialty: Convenience Retailing
Welcoming some 25 million visitors every week, our stores offer a broad mix of food products, beverages, other merchandise and services and motor fuel. Grouped under three main brands: Couche-Tard®, Mac’s ® and Circle K®, our neighbourhood stores feature a friendly modern setting, and most of them are open 24 hours a day, seven days a week.
Our Positioning: No. 1 in Canada • No. 2 in North America
We are the second largest independent convenience store operator (not integrated with a petroleum company) in North America, and the industry leader in Canada. We owe this foremost positioning to the 34,000 people working in our stores and executive offices.
Our Network: 6 Canadian Provinces • 23 American States • 7 Other Regions Worldwide
Our chain has a total of 4,881 stores including 1,261 affiliates, 3,079 of which sell motor fuel. These stores are located in three geographic markets (East, Centre and West) across Canada, and in five major markets covering 23 American states (Midwest, Southeast, Florida and Gulf Region, Arizona Region and West Coast) in the United States. In addition, a network of more than 4,000 licensees extends into seven other regions worldwide (Japan, Taiwan, Hong Kong, Indonesia, Mexico, China (PRC), Guam).
Leadership
| • | Scope and geographic distribution of North American network | |
| ||
| • | Strong brand awareness of Couche-Tard, Mac’s and Circle K | |
| ||
| • | Several decades of experience in convenience store management | |
| ||
| • | Expertise in supply and merchandising, business acquisitions and integration |
Successful Merchandising
| • | Integrated information system | |
| ||
| • | Micro-marketing — store and product mix tailored to local market | |
| ||
| • | Focus on merchandise and QSR sales growth |
Decentralized Business Model
| • | Decentralized operational structure and entrepreneurial culture | |
| ||
| • | Training and professional development |
![]()
1 |
Acquisitions and partnership
2003-2004 |
|
|
|
| |
|
|
|
| ||
| Circle K | 2,290 |
| 16 American states |
| |
|
|
|
| ||
|
|
|
| ||
Dunkin’ Donuts master franchise | 94 |
| Quebec |
| |
| Clark Retail Entreprises, Inc. | 43 |
| Illinois, Indiana, Iowa, Michigan, Ohio |
| |
|
|
|
| ||
2002-2003 |
|
|
|
| |
|
|
|
| ||
| Handy Andy Food Stores | 16 |
| Indiana |
| |
| Dairy Mart | 285 |
| Ohio, Kentucky, Pennsylvania, Michigan, Indiana |
| |
| Tabatout | 30 |
| Quebec |
| |
| Dairy Mart | 119 |
| Ohio, Kentucky, Pennsylvania, Michigan, Indiana |
| |
|
|
|
| ||
2001-2002 |
|
|
|
| |
|
|
|
| ||
| R-Con Centres | 31 |
| Manitoba |
| |
| Bruce Miller Oil | 12 |
| Indiana, Ohio |
| |
| BP Amoco | 6 |
| Indiana |
| |
|
|
|
| ||
2000-2001 |
|
|
|
| |
|
|
|
| ||
| Johnson Oil | 225 |
| Illinois, Indiana, Kentucky |
| |
| Irving Oil Partnership | 56 |
| Eastern Canada |
| |
|
|
|
| ||
1998-1999 |
|
|
|
| |
|
|
|
| ||
| Silcorp | 980 |
| Ontario, Western Canada |
| |
|
|
|
| ||
1997- 1998 |
|
|
|
| |
|
|
|
| ||
| C-Corp | 295 |
| Quebec, Ontario, Western Canada |
|
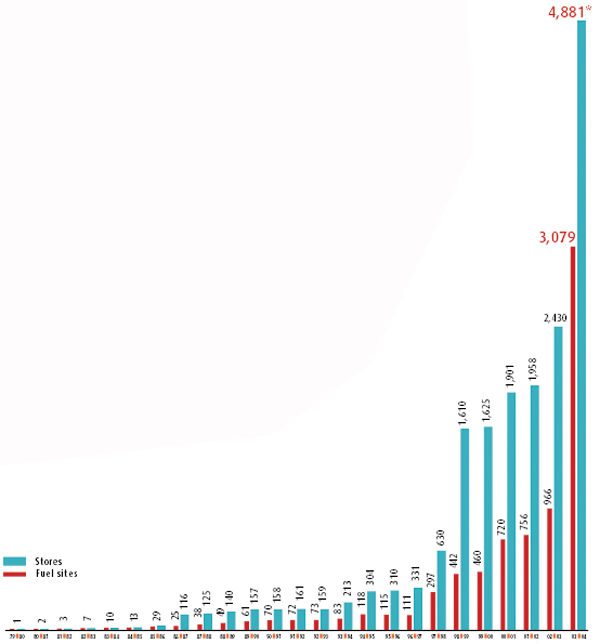
* As at April 25, 2004
2 |
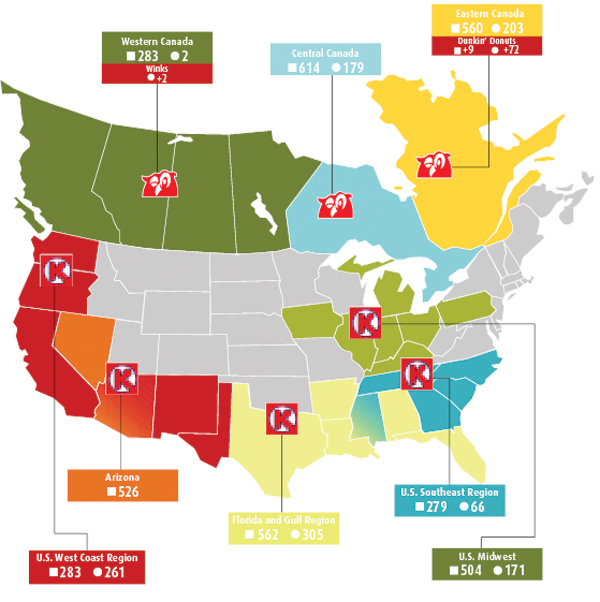
 Corporate stores
  Licensed and franchised stores
3 |
1st quarter ended July 20, 2003
| • | Increases of 32.0% in sales and 19.9% in net earnings | |
| ||
| • | Opening of 13 stores and implementation ofStore 2000 concept in 47 sites |
2nd quarter ended October 12, 2003
| • | Increases of 18.4% in sales and 23.9% in net earnings | |
| ||
| • | Opening of 4 stores and implementation ofStore 2000 concept in 57 sites | |
| ||
| • | Acquisition of master franchise to Dunkin’ Donuts banner for 94 restaurants in Quebec28-08-2003 | |
| ||
| • | Acquisition of 43 stores from Clark Retail Entreprises, Inc. (Illinois)04-09-2003 | |
| ||
| • | Agreement with ConocoPhillips Company to acquire all the outstanding shares of The Circle K Corporation (Circle K)06-10-2003 |
3rd quarter ended February 1, 2004
| • | Increase of 69.7% in sales and net earnings of $8.8 million | |
| ||
| • | Opening of 21 stores and implementation ofStore 2000 concept in 37 sites | |
| ||
| • | Closing of the acquisition of Circle K17-12-2003. Couche-Tard acquires a chain of 1,663 Circle K stores in 16 American states plus 627 licensees and franchisees. Implementation of integration plan As part of the financing of the acquisition: issue of 7.5% senior subordinated unsecured notes maturing in 2014, for a total of US$350 million — issue of 13.6 million Class “B” subordinate voting shares for proceeds of $223.7 million — refinancing of most of long-term debt and arrangement of credit facilities |
4th quarter ended April 25, 2004
| • | Increases of 180.6% in sales and 86.4% in net earnings | |
| ||
| • | Opening of 13 stores and implementation ofStore 2000 concept in 32 sites | |
| ||
| • | Sale-leaseback transactions for 322 Circle K properties — net proceeds from sale: US$252.9 million, used for the repayment of a portion of long-term debt. | |
| ||
| • | Further integration of Circle K — implementation of decentralized business model |
4 |
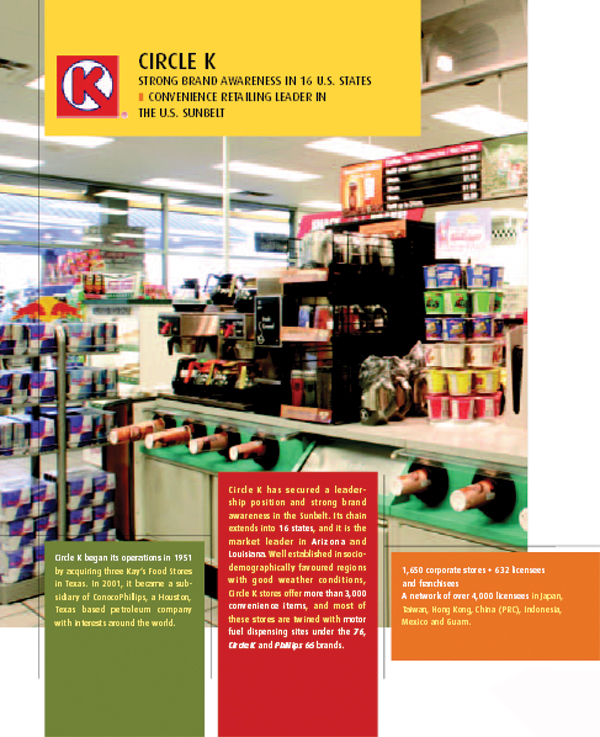
5 |
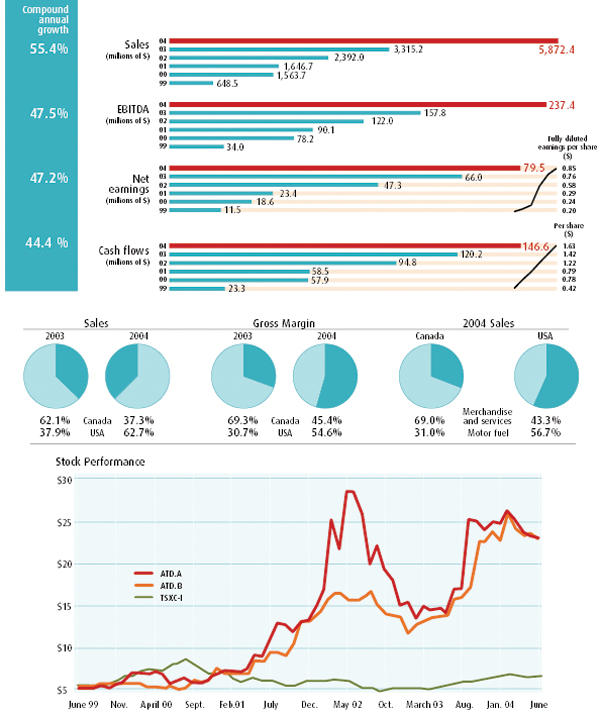
6 |
Year ended April 25, 2004
(in thousands of canadian dollars except per share amounts, ratios, litres and gallons)
| 2004 |
| 2003 |
| 2002 |
| 2001 |
| 2000 |
| 1999 |
| ||||||
|
|
|
|
|
|
| ||||||||||||
| $ |
| $ |
| $ |
| $ |
| $ |
| $ |
| ||||||
Consolidated Results |
|
|
|
|
|
|
|
|
|
|
|
| ||||||
| Sales |
| 5 872,394 |
| 3,315,194 |
| 2,391,999 |
| 1,646,689 |
| 1,563,712 |
| 648,517 |
| |||||
| EBITDA |
| 237,443 |
| 157,825 |
| 121,963 |
| 90,134 |
| 78,197 |
| 33,981 |
| |||||
| Net earnings |
| 79,505 |
| 66,041 |
| 47,337 |
| 23,372 |
| 18,562 |
| 11,480 |
| |||||
| Cash flows |
| 146,564 |
| 120,248 |
| 94,761 |
| 58,494 |
| 57,881 |
| 23,344 |
| |||||
Per Share |
|
|
|
|
|
|
|
|
|
|
|
| ||||||
| Earnings |
|
|
|
|
|
|
|
|
|
|
|
|
| |||||
| Basic |
| 0.89 |
| 0.78 |
| 0.61 |
| 0.31 |
| 0.25 |
| 0.21 |
| |||||
| Fully diluted |
| 0.85 |
| 0.76 |
| 0.58 |
| 0.29 |
| 0.24 |
| 0.20 |
| |||||
| Cash flows |
| 1.63 |
| 1.42 |
| 1.22 |
| 0.79 |
| 0.78 |
| 0.42 |
| |||||
| Book value |
| 7.56 |
| 5.21 |
| 4.49 |
| 3.03 |
| 2.72 |
| 2.50 |
| |||||
Financial Position |
|
|
|
|
|
|
|
|
|
|
|
| ||||||
| Total assets |
| 2,233,493 |
| 1,071,178 |
| 782,693 |
| 557,436 |
| 540,052 |
| 517,846 |
| |||||
| Fixed assets |
| 898,483 |
| 441,259 |
| 315,018 |
| 213,492 |
| 202,076 |
| 175,413 |
| |||||
| Interest-bearing debt |
| 730,532 |
| 296,313 |
| 180,653 |
| 148,997 |
| 183,669 |
| 199,645 |
| |||||
| Shareholders’ equity |
| 746,826 |
| 440,649 |
| 372,650 |
| 225,628 |
| 201,951 |
| 182,301 |
| |||||
Ratios |
|
|
|
|
|
|
|
|
|
|
|
| ||||||
| Interest-bearing net debt/total capitalization |
| 0.41:1 |
| 0.36:1 |
| 0.31:1 |
| 0.39:1 |
| 0.46:1 |
| 0.51:1 |
| |||||
| Interest-bearing net debt/EBITDA |
| 2.20:1 |
| 1.57:1 |
| 1.38:1 |
| 1.57:1 |
| 2.22:1 |
| 5.67:1 |
| |||||
|
|
|
|
|
|
|
|
|
|
|
|
| ||||||
Information on Major Product Categories (Canada — United States) |
|
|
|
|
|
|
|
|
|
|
|
| ||||||
| (in thousands) |
|
|
|
|
|
|
|
|
|
|
|
| ||||||
|
|
|
|
|
|
|
|
|
|
|
| |||||||
Sales |
|
|
|
|
|
|
|
|
|
|
|
| ||||||
| • Merchandise and services |
|
|
|
|
|
|
|
|
|
|
|
|
| |||||
| — Canada |
| 1,510,589 |
| 1,428,646 |
| 1,298,603 |
| 1,187,318 |
| 1,175,482 |
| 468,158 |
| |||||
| — U.S. |
| 1,597,085 |
| 514,660 |
| 204,519 |
|
|
|
|
|
|
| |||||
| • Motor fuel |
|
|
|
|
|
|
|
|
|
|
|
|
| |||||
| — Canada |
| 677,507 |
| 630,144 |
| 532,203 |
| 459,371 |
| 388,230 |
| 180,359 |
| |||||
| (litres) (2) |
| 1,329,229 |
| 1,239,241 |
| 1,177,271 |
| 1,023,825 |
| 1,002,879 |
| 656,986 |
| |||||
| — U.S. |
| 2,087,213 |
| 741,744 |
| 356,674 |
|
|
|
|
|
|
| |||||
| (gallons)(2) |
| 996,063 |
| 355,478 |
| 187,872 |
|
|
|
|
|
|
| |||||
|
|
|
|
|
|
|
|
|
|
|
| |||||||
Gross Margin (in %) |
|
|
|
|
|
|
|
|
|
|
|
| ||||||
| • Merchandise and services |
|
|
|
|
|
|
|
|
|
|
|
|
| |||||
| — Canada |
| 32.52 | % | 32.37 | % | 32.85 | % | 33.34 | % | 32.22 | %(2) | 28.18 | %(2) | |||||
| — U.S. |
| 32.63 | % | 32.96 | % | 31.80 | % |
|
|
|
|
|
| |||||
| • Motor fuel (1) |
|
|
|
|
|
|
|
|
|
|
|
|
| |||||
| — Canada (cents/litre) (2) |
| 4.77 |
| 4.64 |
| 4.63 |
| 4.29 |
| 4.54 |
| 4.15 |
| |||||
| — U.S. (cents U.S./gallon)(2) |
| 11.57 |
| 12.23 |
| 13.86 |
|
|
|
|
|
|
| |||||
(1) Corporate stores
(2) Unaudited
7 |

Alain Bouchard
Chairman of the Board, President and Chief Executive Officer
8 |
Fiscal 2003-2004 was an outstanding year, highlighted by the acquisition of Circle K, the largest transaction in our 25-year history. Our U.S. operations gain a solid and profitable chain with strong brand awareness in dynamic markets. We have thereby doubled our North American network for the third time in seven years.
Remember that we first penetrated the U.S. market in June 2001 by purchasing 225 stores in the Midwest, where we subsequently acquired more than 400 sites. By acquiring Circle K in December 2003, we established a strong presence and mapped out four major geographic markets in 16 southern states, adding to our Midwest market. After just three years, our U.S. network has grown to a total of 2,154 stores and 803 affiliates in 23 states. It will account for some 75% of our total sales and offers great potential.
The Circle K acquisition made us the second largest independent convenience store operator in North America, and opens up many opportunities to enhance our operational and financial performance and achieve further growth. While our positioning has changed considerably, our business culture remains the same. As with the integration of previous acquisitions, we continue to improve our decentralized business model, while applying it to Circle K.
This year also gave rise to a record performance by our U.S. operations and solid growth by most of our Canadian markets. Our internal growth remains driven by our ever-evolving differentiation strategy, which is rooted in innovation, a cutting-edge information system and merchandising tailored to local markets. For instance, our Western Canada market has started to develop a concept for a new-generation store to ensure our customers are always pleasantly surprised and to reinforce our differentiation strategy. While integrating Circle K, we are preparing for the future every day.
9 |
FAST-TRACK EXPANSION, SECURED BY SOLID FUNDAMENTALS
Our acquisitions in recent years have greatly stimulated our growth. Since 1999, sales and net earnings have posted average annual growth of 55.4% and 47.2%, including the increases of 77.1% in sales and 20.4% in net earnings in 2003-2004. Overall, the quality and benefits of this expansion have been appreciated by the stock market. Couche-Tard’s shares (ATD.B) have yielded a 36.9% annual return over the last five years, far outperforming the S&P/TSX composite Index and other major companies in our industry.
This fast-track expansion would not have been possible without our solid fundamentals. Our results have grown year after year over the past decade — whereas our industry has experienced many upheavals, and our business has become more challenging because of much greater competition and motor fuel and tobacco margin pressures. That highlights the strength of our network and organization, which arises from the know-how of teams who share our vision and drive us to meet new challenges. It is because we can bank on broad convenience store management experience, complementary skills and autonomous teams that we can seize the best opportunities and integrate our acquisitions while further innovating and consolidating our bases.
Developing expertise specific to Couche-Tard was a priority from the outset. We have set up our own training centres for our Canadian and U.S. markets, and commit some 3% of our total annual payroll to the training and professional development of our new employees.
As underscored by the theme of this annual report, all our acquisitions were carefully prepared and integrated. They all focused on strengthening the Company and increasing its long-term value by adding profitable networks and highly skilled local teams.
10 |
A DECENTRALIZED BUSINESS MODEL, TO BETTER SERVE OUR CUSTOMERS, INCREASE STORE SALES AND PROFITABILITY, AND REALIZE OUR MARKET POTENTIAL
As we expand, we are fine-tuning our business model and differentiation strategy, and focusing increasingly on entrepreneurship. Our new teams have all welcomed our decentralized approach, which has had a significant impact on employee turnover, productivity and profitability.
About our decentralized model, here is the opinion of Circle K’s new vice-presidents, operations, as voiced by one of them:
“Couche-Tard’s unique operational approach combines the strengths of a large organization and the advantages of benchmarking with the benefits of local management and entrepreneurship in each store. So Couche-Tard is a family of autonomous business units that prosper by showcasing their brands while leveraging the critical mass of the parent company. With such a structure, we can compete with the smallest chains through a personalized approach to better seize local opportunities and minimize costs. Similarly, we outperform other chains by developing operational systems that maximize efficiency, by investing in new marketing concepts that improve profit margins, and by benefiting from supply synergies to lower product costs.”
Convenience store retailing requires in-depth knowledge of customers’ needs and the quality of service they seek. But above all, consumers must be pleasantly surprised so they want to come back to our stores: they must enjoy going there.
That is why, more than ever, setting up a store concept with an optimal product mix requires a skilled multidisciplinary team that banks on accurate socio-demographic and local knowledge, and leaves nothing to chance.
That is specifically the case of ourStore 2000 differentiation concept, which we have now established in more than 1,000 stores and are further implementing. Focused on a friendly welcome, store designs, a diversified high-quality foodservice offering, our proprietary brands and co-branding with quick-service restaurants (QSRs), this concept improves our profit margins and drives our internal growth.
11 |
TheStore 2000 concept could not exist without our investment in ongoing technological improvements. That involves point-of-sale optical scanners integrated with an information system whose data are regularly and skilfully analyzed and used for micro-marketing. Our differentiation strategy also depends on product category managers in each market, who have thorough knowledge about a category’s features and use it to provide appropriate local merchandising. We have invested some $38.1 million in technological improvements over the past five fiscal years.
Unlike many competing chains owned by petroleum companies, Couche-Tard specialized in convenience retailing from the outset. We took the lead through a focus on differentiating our stores with a merchandise mix and QSRs that target each one’s needs, enabling us to further benefit from the additional customer business from our motor fuel dispensing sites.
Decentralization will remain the cornerstone of our operations, to properly identify and optimize the potential in each market.
THE INTEGRATION OF CIRCLE K, PLANNED TO IMPROVE THE OPERATIONAL AND FINANCIAL PERFORMANCE AND LEVERAGE THE FULL POTENTIAL OF THE FOUR NEW GEOGRAPHIC MARKETS
During the year, careful attention was paid to every stage of the acquisition, which involved visiting more than 400 Circle K stores based on specific criterias.
A committee was formed to develop and implement the integration plan, which has two major objectives:
| 1. | achieve economies of scale and synergies, and | |
| ||
| 2. | optimize the Circle K network’s potential. |
Over US$50 million in synergies are expected to result from this integration plan. Some stages are already accomplished, others are progressing well, and everything indicates these synergies will be achieved faster than expected. Within the 130 days between the closing of the acquisition and our fiscal year-end, we realized a total of about US$10 million in synergies.
12 |
OUR PRIORITIES IN 2004-2005: ACHIEVE OUR INTEGRATION OBJECTIVES AND CONTINUE TO INNOVATE FOR NEW REVENUE AND PROFIT STREAMS
The integration of Circle K increases the proportion of our revenue mix from motor fuel sales, so we are faced with more volatile motor fuel profit margins in some of our U.S. markets.
However, we are less vulnerable to this factor than most U.S. convenience store operators, for two reasons. First, our network extends into regions in Canada and the United States where motor fuel profit margin pressures are not as significant. Secondly, convenience retailing has strategically been our specialty from the start, contrary to many chains owned by petroleum companies. This industry-wide volatility is to some extent affecting all retail chains that sell motor fuel in the United States.
We are confident the new supply synergies associated with merchandise purchases will improve our profit margin over the next year. Gradually optimizing Circle K’s product mix with higher-margin merchandise will minimize the effects of volatile motor fuel margins, which will have a positive impact on our total gross profit.
Innovation, which creates new revenue and profit streams, will remain a priority for 2004-2005. We will step up the implementation of ourStore 2000 concept in our Canadian and U.S. markets to have it in over one-third of the network. We plan to convert about 300 stores during the year, while also launching new products and services.
We will focus on increasing the number of QSRs in our sites, as we intend to open 75 during the next year. That will bring the number of co-branded units to 320, accounting for 9% of our North American corporate network.
We will further expand by opening more than 70 new stores, and studies are under way to acquire several more small chains. We will consolidate the network in some U.S. markets by divesting or closing about 100 stores.
Our goal is to develop some U.S. markets more intensely in the medium and long term, especially the West Coast, where our Vice-President, Development, in collaboration with the local team, has been mandated to conduct an in-depth evaluation of the California market considering its importance and potential, and to propose a development plan.
As Circle K enjoys strong brand awareness that extends beyond its market, we will build on its excellent reputation across the United States to rebrand all our Midwestern stores over the next 24 months.
These initiatives will enable us to achieve solid growth in the coming year. We will moreover benefit from Circle K’s contribution for the full 12-month period in fiscal 2004-2005.
13 |
We are proud to welcome Circle K’s great team, who can count on our full cooperation. Creativity and professionalism set our Canadian and U.S. teams apart from the competition. We express our appreciation for the challenges they meet and their day-today results. Without these human resources, we could not earn such customer loyalty and achieve such strong growth.
We sincerely thank our Board members for their wise counsel. Finally, we assure our ever-increasing shareholder base that the Company’s potential continues to grow and that all our skills and energies are focused on Couche-Tard’s continued success.
14 |

15 |
Leading Network Leading Expertise
Réal Plourde
Executive Vice-President and Chief Operating Officer
16 |
Couche-Tard’s network has grown from 331 stores in 1996-1997 to 4,881 stores today, and its market has expanded from Quebec across Canada and 23 American states. Our skilled human resources and efficient management tools have been the key to this successful expansion. Our employees are our primary source of added value and the most effective means of optimizing our know-how is to:
| 1. maintain a lean, decentralized operational structure, |
|
|
| 2. count on autonomous teams, |
|
|
| 3. support local markets with executive office expertise, |
|
|
| 4. use the latest integrated information systems, |
|
|
| 5. create a working climate conducive to innovation, |
|
|
| 6. recognize results, and |
|
|
| 7. provide ongoing training. |
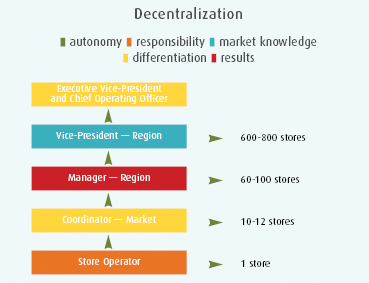
Every store is run as an autonomous business unit under the leadership of a store operator who must meet specific objectives. Our store operators are given continuous support • with the cooperation of a team experienced in every aspect of our business • with high-performance management and marketing tools • with training and professional development programs • with efficient distribution logistics • and with an ongoing benchmarking process. This support enables each store to obtain purchasing and selling conditions that give it a real competitive edge in its market.
Our vice-presidents, operations have an average of 17 years of experience in the industry.
Our business model enables us to retain our best human resources. Several employees moved into managerial or executive positions after working for many years at various levels Company-wide. Others joined us as a result of acquisitions with diversified skills that enhanced our know-how. In integrating Circle K, we welcome an experienced team with in-depth knowledge of its market.
17 |
Jean-Luc Meunier
Vice-President, Operations, Eastern Canada
A member of Couche-Tard’s team since 1999, Jean-Luc Meunier was appointed Vice-President, Operations, Eastern Canada in 2004 — after holding various positions such as Operations Manager, Real Estate Manager and Technical Services Manager. Mr. Meunier also acquired some eight years of experience in project engineering, consulting, analysis and management at Shell Canada.
Our team in Eastern Canada had an excellent year, even though conditions were challenging for the entire retail sector. We continued to expand our network, maintained our market share, increased our profit margins and further improved our management practices. Highlights included:
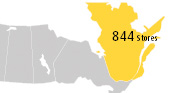
• | Acquisition of the master franchise to the Dunkin’ Donuts banner for 94 restaurants in Quebec on August 28, 2003. Over the ensuing eight-month period, we mapped out and implemented a program to revitalize this chain. The initial steps involved consolidating the network, drawing up and executing an expansion, marketing and product development plan, and repositioning the Dunkin’ Donuts brand. We are pleased with this agreement and will continue to revitalize this brand through further innovation and by opening about 60 QSRs over the next five years. |
18 |

• | Expansion of the network of restaurants in our stores, by setting up 25 QSRs under the Dunkin’ Donuts, Subway and Café Dépôt brands. We also opened 22 Couche-Tard stores and acquired or renovated a dozen motor fuel dispensing sites. |
|
|
• | Implementation of a perpetual store inventory and assisted-ordering system. This technology ensures optimal point-of-sale supply of merchandise, allowing stores to provide customers with the right product, at the right time, in the right quantities. That enables store operators to spend less time performing administrative tasks and more time serving customers. Training programs have been set up for the users of this new module. |
|
|
• | Transfer of the delivery of all fresh and dairy products to the Quebec distribution centre and more frequent store deliveries, which have been increased to twice weekly. |
• | Launch of new products and marketing programs in various categories, including several in our |
Based on our 2004-2005 business plan, we will convert some 40 locations to theStore 2000 concept, open 15 QSRs and a dozen stores, and upgrade various motor fuel dispensing sites. We will focus on innovation in our product mix through greater penetration of our proprietary brands —![]() ® with the launch of several new products — and
® with the launch of several new products — and ![]() ® with new flavours and candy varieties. Finally, we will make further technological improvements, such as robotizing our distribution centre.
® with new flavours and candy varieties. Finally, we will make further technological improvements, such as robotizing our distribution centre.
19 |

Stéphane Gonthier
Vice-President, Operations, Central Canada
Stéphane Gonthier has been a member of Couche-Tard’s team since 1998, when he joined us as Vice-President, Legal Affairs, Petroleum Operations and Secretary. From 1999 to 2004, Mr. Gonthier was Vice-President, Operations, Eastern Canada, and secretary before his appointment as Vice-President, Operations, Central Canada.
In 2003-2004, our Central Canada team had to redouble its efforts because of particularly difficult business conditions, including intensified competition, a decline in the number of tourists under the impact of SARS, and reduced exports due to the exchange rate.
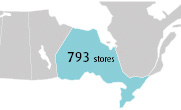
• | During the year, 17 stores were opened or acquired and 92 locations were converted to theStore 2000 concept. |
|
|
• | Our network of QSRs continued to grow with the opening of 17 in-store restaurants and specialty shops co-branded mainly with Subway and M&M. |
|
|
• | We stepped up the development of our Sunshine Joe® private brand by launching new beverages. |

20 |
• | As in other Canadian markets, in-store technological improvements were a priority. We further renewed our processes with an integrated point-of-sale system, including the installation of touch screens in all Mac’s® stores, which accelerated the point-of-sale processing of transactions and improved the management system. |
In 2004-2005, while converting our remaining stores to the Mac’s® brand:
• | we will focus on developing new stores in urban areas; |
|
|
• | we will open about 20 new locations and a dozen in-store QSRs and will implement ourStore 2000 concept in some 60 stores; |
|
|
• | we will invest substantially in ourFroster® program; and |
|
|
• | we will take several other initiatives to improve store efficiency and profitability. |

21 |
Kim J. Trowbridge
Vice-President, Operations, Western Canada
A member of Couche-Tard’s team since 1999, Kim J. Trowbridge was previously Vice-President, Operations, Western Canada Division of Mac’s Convenience Stores Inc. Mr. Trowbridge is Chairman of theAlberta Food Processors Association and the President and a director of theWestern Convenience Store Association. He has more than 20 years of experience in the convenience store industry.
The past year was excellent for the Western Canada market, with one of our best performances ever. The year was moreover highlighted by significant innovation, which has been our market feature from the beginning. We renewed our differentiation concept to maintain our lead over the competition, further increase our market share and improve our store profitability. We believe we were successful, based on our marketing tests.

Major achievements included the following:
• | We updated ourStore 2000 concept while restructuring and expanding our foodservice and QSR offering. We developed new programs and products and added new branded partners. We renewed our exclusive supply agreement withSeattle’s Best Coffee and signed an exclusive distribution contract with Pepsi for ourFroster® offering. The success of theGoode & Dunn™ QSRs set up early in the year encourages us to introduce new products under this brand name. The network ofWinks® affiliates, which we started to develop just over a year ago, is expected to total about 30 by the end of 2004-2005. Another innovation was our launch of a specialized Web-based kiosk program in cooperation with Telus, which also provides access to other e-services. |
22 |
• | Our network continued to expand with the opening of 4 locations, primarily in British Columbia and Alberta. We also converted 10 sites to theStore 2000concept, bringing the network to a completion rate of 90%. |
|
|
• | Training was a major priority during the year to provide users of the newly implemented technology with the right support. |
In addition, we drew up a specific program to train in-store people for the upcoming implementation of our new differentiation concept in order to leverage its potential.
Among our key performance drivers for 2004-2005, we will convert a dozen stores to our new differentiation concept and open about 20 sites and about 10 QSRs.
We will continue to expand our foodservice offering and focus on developing our proprietary brands and co-branding. On the strength of our success in recent years, we will continue to build on our team’s innovativeness in order to contribute to renewing the convenience store concept in North America.
23 |
Michel Bernard
Vice-President, Operations, Midwest Region
Michel Bernard was appointed Vice-President, Operations, Midwest Region in 2003. He has served in a variety of operations and marketing-related positions during his 24-year supermarket and convenience store career, including more than 13 years at Couche-Tard.
Fiscal 2003-2004 was tremendous for the American Midwest. This market outperformed its sales and profit objectives, despite fuel margin instability and a general decline in demand due to a weak U.S. economy.
• | One of the year’s highlights was the September 2003 acquisition of 43 Clark stores, most of which are in Illinois. They were rapidly integrated with our existing operations and various improvements are under way, mainly to optimize their product mix. |
|
|
• | We converted 58 sites to theStore 2000concept and the Mac’s®brand, which had an immediate impact on store sales and profits. |
|
|
• | We added 44 stores to our network and opened nine in-store QSRs during the year. |
|
|
• | Our team also focused on improving customer service, controlling operating costs and trimming inventory loss. |
24 |
The integration of our business culture is progressing well, which has greatly reduced employee and management turnover and led to a significant improvement in productivity and operating profitability.
Fiscal 2004-2005 will be the year of integration and network optimization for the Midwest market. The last three years have given rise to numerous developments and several acquisitions, resulting in diversified brands, locations and operating systems. These will be completely harmonized this year to derive the maximum benefits. After analyzing each of our sites, we intend to consolidate our network and transfer some corporate stores to an affiliated banner. We will also open approximately 10 new locations and about 20 QSRs.
We will focus on integrating our most differentiated brands network-wide, backed by solid communications and marketing plans and appropriate training programs. Concurrently, we will start to convert our stores to the Circle K banner, beginning with 200 sites, mostly in Ohio and Illinois. Finally, we will implement ourStore 2000concept in more than 80 sites to further improve store sales and profit margins. We are confident we will achieve solid growth in 2004-2005.
25 |
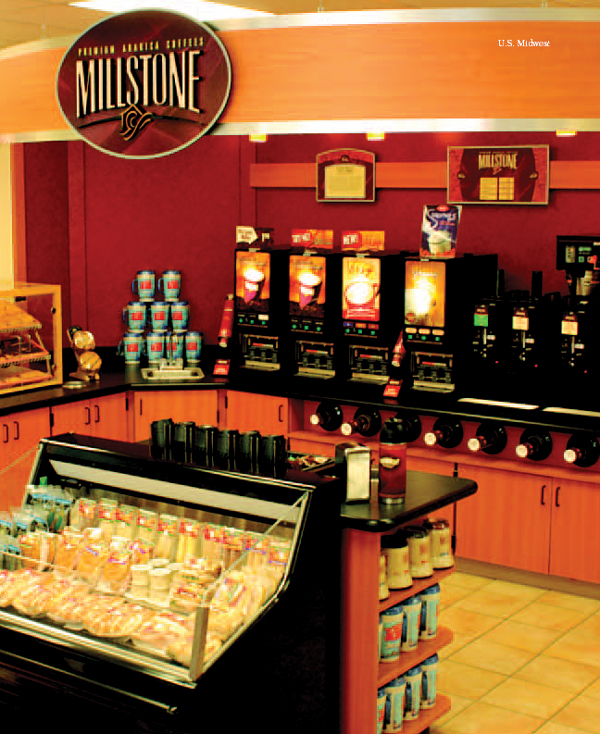
26 |
PLANNED TO IMPROVE THE OPERATIONAL AND FINANCIAL
PERFORMANCE AND LEVERAGE THE POTENTIAL OF THE FOUR
NEW GEOGRAPHIC MARKETS

Brian Hannasch
Vice-President, Integration
Before being appointed Vice-President in charge of integrating Circle K, Brian Hannasch held the position of Vice-President, Operations, Midwest Region. Formerly Vice-President of Operations for Bigfoot Food Stores LLC, a 225-unit convenience store chain acquired by Couche-Tard in 2001, Mr. Hannasch also held various positions at BP Amoco, including Vice-President of Marketing for the Midwest Business Unit. He has solid market and operational knowledge and diversified managerial experience.

Bryant Santini
Senior Director,
Information Technology

Paul Murphy
Senior Director,
Finance
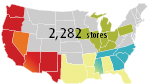
Upon the closing of the Circle K acquisition on December 17, 2003, the integration committee put every effort into the various stages of the integration plan in order to achieve potential synergies and leverage the Circle K network. That involved:
| • | Establishing our business model with a decentralized operational structure — which we did right after closing the acquisition by mapping out four Circle K geographic markets under four regional offices. After analyzing the various functions and qualifications, we formed a team of experienced Circle K managers who have all the necessary skills and extensive market knowledge to be successful in each region. We then transferred several of Circle K’s head office departments such as marketing, purchasing, human resources, construction and maintenance to these regional offices. |
27 |
• | Implementing an ongoing benchmarking process — which we also did without delay. Each of Circle K’s four big markets was matched with one of our existing markets to harmonize their operations. Benchmarking will be extended to all important aspects of sales and supply transactions, including the distribution of products to stores. In this regard, both Circle K’s distribution centre in Arizona and Couche-Tard’s Quebec centre offer great advantages. We will also analyze different distribution models in North America to ensure we provide each geographic market with the most appropriate logistics for the coming years. |
|
|
• | Negotiating more favourable supply conditions — which we started and will continue to do in 2004-2005. Renegotiating several motor fuel and merchandise supply agreements will yield substantial savings thanks to our increased purchasing power. |
|
|
• | Installing point-of-sale security systems and optical scanners in stores that lack them, namely more than 65% of the Circle K network — before undertaking this project, we are studying various options to select the most appropriate and best-performing technology. We expect to complete the implementation of optical scanners throughout the Circle K network by the end of 2005. |
|
|
• | Preparing 2004-2005 budgets based on a new decentralized approach for Circle K, which has now been done. |
|
|
• | Restructuring the store support groups, IT infrastructure, communications networks and payment processes to yield significant savings while increasing service levels to our stores. |
|
|
• | Conducting an environmental audit of motor fuel dispensing sites — which was started and completed in recent months. Based on our agreement with ConocoPhillips as part of the acquisition, the decontamination and various adjustments required at certain sites in compliance with current environmental legislation will be efficiently carried out. |
|
|
• | Converting more than 100 Circle K sites toStore 2000— we will start testing our differentiation concept in 2004-2005, with a broader foodser-vice offering and QSRs. Converting a location toStore 2000generally yields immediate results. In the meantime, further initiatives are under way at Circle K stores, such as setting up coffee bars and ATMs. |
|
|
• | Performing an exhaustive evaluation of the Circle K chain — which will be done over the next two or three years, to identify each store’s optimal potential and draw up an appropriate investment plan. The Circle K network has great potential, which will gradually be achieved as the various phases of the integration and investment plan are completed, yielding benefits in the future. |
28 |
Robert G. Campau
Vice-President, Operations, Southeast Region
Robert G. Campau was appointed Vice-President, Operations, Southeast Region on the closing of the Circle K acquisition, having held executive positions at ConocoPhillips. Mr. Campau has some 30 years of experience in the convenience store industry. After beginning his career at Southland Corporation (7-Eleven) in 1974, he joined Circle K in 1979 and has held various key positions in operations within the corporation.
Our team is excited about the integration’s potential and ready to meet the challenges of strengthening the network and improving its overall performance. It has the know-how and enthusiasm needed to successfully complete the planned stages of the integration and to achieve our growth objectives for the coming year.
To consolidate our bases, we will start to streamline the network by divesting 25 stores that do not match our growth criteria, and we will evaluate the performance at 25 other sites between now and the end of 2004-2005. This year, we also plan to expand our network by opening new locations and acquiring small convenience store chains. Furthermore, our goal is to bring our network to a total of 500 stores in the medium term.
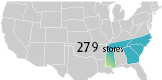
Our stores will have two key priorities in 2004-2005: first, to increase their sales of merchandise by focusing on a value-added product mix and quality brands, including QSRs — and secondly, to bank on better cost controls, operational excellence and achieving supply synergies in order to improve their profitability.
Each store’s product mix will be fine-tuned to have a more balanced product and services offering in order to better target local needs. We intend to develop our QSR network with new brands such as Subway, Quiznos and Noble Romans. We will also carry on with the planned upgrades at our motor fuel dispensing sites, as selling motor fuel attracts an average of more than 10,000 customers monthly to each store.
We are confident these various initiatives will enable us to grow our sales and improve our profit margins.
29 |
Charles M. Parker
Vice-President, Operations, Florida and Gulf Region
Charles M. Parker was appointed Vice-President, Operations, Florida and Gulf Region on the closing of the Circle K acquisition. Mr. Parker brings more than 20 years of experience in the convenience store industry, where he began his career at Southland Corporation (7-Eleven). He subsequently held various management positions in several Circle K divisions, including Chief Operating Officer.
Driven by a favourable economy with a positive outlook for all our regions and the new momentum resulting from the integration, our 2004-2005 business plan will focus on growing our sales of merchandise and improving our profit margins.
We face particularly fierce competition in the Florida region, which is dominated by major convenience store chains and petroleum operators. Conversely, the Louisiana market consists mostly of independent retailers and small chains, and Circle K has by far the largest network with over 150 locations.
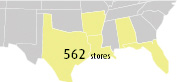
Our team will pool all its resources to successfully carry out the stages of the integration planned for this year, while upholding its mission of making Circle K Florida-Gulf a great place to work and shop.
Our priorities for 2004-2005 are to:
• | develop an entrepreneurial culture in all our stores; |
|
|
• | analyze each site’s performance to consolidate the network, optimize its strengths and continue to expand by opening new stores and acquiring small networks; |
|
|
• | modernize about 75 locations; |
|
|
• | further emphasize merchandising programs targeted to local needs in each of our regions with an enhanced product mix; |
|
|
• | build synergies; |
|
|
• | improve operations in our quick-service restaurants and open a dozen new QSRs; |
|
|
• | pursue our technological upgrading plan; and |
|
|
• | increase our business process efficiency to improve the quality of customer service and lower operating costs. |
30 |
Geoffrey C. Haxel
Vice-President, Operations, Arizona Region
Geoffrey C. Haxel was appointed Vice-President, Operations, Arizona Region on the closing of the Circle K acquisition, when he was responsible for more than 600 sites in a four-state territory. Mr. Haxel has 16 years of experience in the industry, having worked as Sales Manager, Product Category Manager and Division Manager at Circle K.
Our team has accomplished a great deal over the past few months, paving the way for an outstanding year in 2004-2005. While managing our day-to-day operations, we have:
• | designed and staffed a new decentralized organization; |
|
|
• | completed a budget at the store and market levels; |
|
|
• | finalized a per-store strategic evaluation to map out a capital expenditure and asset divestment program; |
|
|
• | reviewed our motor fuel pricing strategy, training programs and lease administration; and |
|
|
• | identified synergies at various levels. |
Integration will drive our future growth, particularly since we are well established and active in a region favoured by excellent weather conditions and benefiting from a flourishing tourism industry, especially in our three major markets.
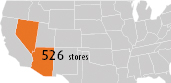
Phoenix is the sixth largest city in the United States with a population approaching 1.3 million, while Tucson, with approximately 900,000 residents, is the home of the University of Arizona and Davis-Monthan Air Force Base. As for Las Vegas, it welcomes 36 million visitors every year.
Now our team’s priorities are to:
• | build an entrepreneurial culture at all operational levels; |
|
|
• | greatly reduce operating costs, by creating merchandising and marketing synergies; |
|
|
• | improve the technology in our stores; |
|
|
• | improve the store product mix and convert five locations toStore 2000with QSRs; |
|
|
• | develop proprietary brands, especially for water and other beverages; and |
|
|
• | continue to expand by opening new stores and acquiring small networks. |
31 |

Joy A. Powell
Vice-President, Operations, West Coast Region
Joy A. Powell was appointed Vice-President, Operations, West Coast Region on the closing of the Circle K acquisition, when she served as Regional Manager with overall responsibility for approximately 450 sites in a six-state territory. A member of Circle K’s team since 1992, Ms. Powell has 19 years of experience in the convenience store industry where she started her career with Southland Corporation (7-Eleven).
The integration gives renewed momentum to the West Coast’s team. Given its potential but aware of the challenges involved, we will rapidly adapt to this new culture and decentralized organization. The business climate looks more promising for this year, as the region’s economy is turning around after several difficult periods. The region’s population is growing, especially the Hispanic community, and we are positioning our sites to respond to its needs. While competition from major retail and convenience store chains continues to intensify, our network benefits from strong brand awareness.
We have a competitive edge in the Yuma (Arizona), El Paso (Texas) and Albuquerque (New Mexico) markets. As for the California, Oregon and Washington markets where our presence is still limited, they offer strong growth potential. Our goal is to establish a 500-company-operated-store platform in the medium term.
We have two key objectives for 2004-2005:
• | implementing various levels of responsibility according to the new decentralized structure, while developing an in-store entrepreneurial culture and at the market management level; and |
|
|
• | improving our operating profitability. |

Over the next year, we intend to divest eight sites that do not match our profit criteria. We also plan to set up a new store co-branded with a QSR in Yuma and to convert two stores in Southern California to a single modern site coupled with a QSR. Fiscal 2005 will feature the start of an aggressive differentiation program. We aim to gradually convert about 20 sites by developing higher-margin categories and a food-service offering, including snacks, beverages, candy and various services.
We will enhance the profitability of our motor fuel dispensing business by lowering supply costs and rebranding, especially in California. Furthermore, 125 of our stores are not yet equipped with optical scanning technology. We will therefore pursue our technological upgrades and are confident these measures will sustain our efforts to improve our profitability over the medium and long term.
32 |
NETWORK OF CIRCLE K FRANCHISEES AND LICENSEES

Rick Hamlin
Senior Director,
Franchise Operations
Rick Hamlin was appointed Senior Director, Franchise Operations, following the acquisition of Circle K. Mr. Hamlin has more than 25 years of experience in convenience retailing and franchise operations. Prior to joining Circle K in 1992, he held various field management positions at Southland Corporation (7-Eleven). He has held several responsibilities at Circle K, including Division President in Southern Arizona, Director and Vice-President of Worldwide Franchise.
The Circle K acquisition also provides Couche-Tard with a network of 632 Circle K franchises/licensed stores in three major U.S. geographic markets: 305 stores in the Florida and Gulf Region, 261 on the West Coast and 66 in the Southeast Region.
In addition, there are 4,003 Circle K licensed stores in seven other regions worldwide. The first licensed store opened back in 1980 in Japan, where the network then expanded considerably to include 2,934 stores, followed by Taiwan, Hong Kong, Indonesia, Mexico, China and Guam.
The integration of Circle K marks the beginning of a new era for these networks, which will benefit from synergies to optimize their operations, combined with the growth leverage of Couche-Tard’s convenience store management expertise.
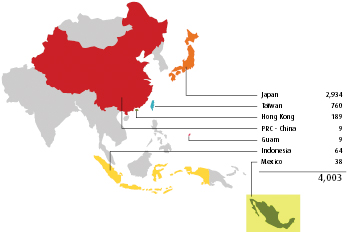
33 |
In the interest of all its shareholders, Couche-Tard is committed to fully complying with stringent corporate governance standards.
Our Board of Directors has complied with stringent corporate governance standards for many years. In 1995, the Toronto Stock Exchange adopted new policies and guidelines on corporate governance. The Board of Directors established a Special Committee on corporate governance, composed of three unrelated directors, and at its June 26, 1996 meeting, adopted a corporate governance policy. In 2002, the Company created a permanent Corporate Governance Comittee comprised entirely of independent members. Also in 2002, the Toronto Stock Exchange recommended certain amendments to its current guidelines on corporate governance. With a view to adhering to these amendments, the Board of Directors adopted various amendments to the Company’s corporate governance policy at its July 3, 2003 meeting. More recently, the Human Resources and Corporate Governance Committee examined our corporate governance practices in light of the U.S. Sarbanes-Oxley Act.
This Committee also reviewed the regulations recently adopted by Canadian securities authorities, more particularly those on audit committees and the proposals to implement corporate governance standards.
Our Board of Directors then adopted various practices and procedures recommended by the Human Resources and Corporate Governance Committee. As new regulations progressively come into effect, this Committee and our Board will continue to examine our corporate governance practices and will make the necessary amendments.
The Company fully complies with applicable Canadian and U.S. corporate governance rules. A majority of its Board members and all of the members of the Audit Committee and Human Resources and Corporate Governance Committee are independent and unrelated to the Company. Our Board has appointed an independent and unrelated lead director. The Company no longer grants stock options to its external directors and the Board has adopted stock ownership guidelines for its members. The Board and its Committees have clearly defined mandates. Our Audit Committee is chaired by a financial expert and its other two members are financially literate.
This Committee reviews annual and quarterly reports, including the MD&A, press release and the certification process. Recently, it adopted a policy on the approval of non-audit services by our external auditors as well as a Code of Ethics for Financial Officers. Our Human Resources and Corporate Governance Committee has adopted our corporate governance policies and a Communications Policy, and is implementing the Board performance evaluation process, as well as an orientation and continuous education program for Board members.
Shareholders can find a description of the Company’s corporate governance practices in relation to the Toronto Stock Exchange’s current guidelines on corporate governance, as well as the mandate of the Board of Directors and Board committees, in the Management Proxy Circular, which is available on the Web at www.couche-tard.com.
34 |
ENVIRONMENT
Couche-Tard is committed to complying with the environmental legislation imposed by the various levels of government in both Canada and the United States. The Company continues to incur the capital expenditures required for compliance with such legislation, notably in regard to storing fuel in underground storage tanks.
SOCIAL COMMITMENT
Couche-Tard focuses its social commitment mainly on young people, but it also dedicates some consideration to other humanitarian causes. This social commitment is met primarily by the various markets through significant fund-raisings and many volunteer local events. For instance, one of them raised more than a half-million U.S. dollars in a year and 1.2 million U.S. dollars over five years for the benefit of children’s hospitals, which is outstanding in the convenience retailing industry.
To reinforce this commitment, the Couche-Tard Foundation was established in 2004 with a mission to encourage youth development by supporting non-profit projects in education, assistance and rehabilitation of young people faced with temporary difficulties or problems associated with an illness. Through subsidies or bursaries, the Foundation helps young individuals achieve their academic goals, as well as charities that provide creative yet realistic solutions to the problems encountered by young people.
These people and organizations appreciate the Foundation as a true partner. A non-profit organization headed by a five-member Board of Directors, all of whom are volunteers and are committed to young people’s well-being, the Couche-Tard Foundation fulfills its mission through financing campaigns and fund-raising aimed at its business partners, staff and the general population.
CORPORATE TAXES
As at April 25, 2004 (unaudited) |
| Canada |
| United States |
| Total |
| |||
|
|
|
| |||||||
| Payroll tax |
| $ | 14.4 million |
| $ | 26.3 million |
| $ | 40.7 million |
|
|
|
|
|
|
|
|
|
|
|
|
| Property taxes and permits |
| $ | 15.3 million |
| $ | 18.6 million |
| $ | 33.9 million |
|
|
|
|
|
|
|
|
|
|
|
|
| Income taxes |
| $ | 29.2 million |
| $ | 25.6 million |
| $ | 54.8 million |
|
|
|
|
|
|
|
|
|
|
|
|
Total |
| $ | 58.9 million |
| $ | 70.5 million |
| $ | 129.4 million |
|
35 |
Management’s Discussion and Analysis of Results and Financial Position

Richard Fortin
Executive Vice-President and Chief Financial Officer
36 |
Management’s discussion and analysis relates to the financial condition and results of operations of Alimentation Couche-Tard Inc. (Couche-Tard) together with its wholly owned subsidiaries, including The Circle K Corporation (Circle K) as of December 18, 2003. Couche-Tard consolidated Circle K as of December 18, 2003, following completion of the acquisition of all of the outstanding shares of Circle K (the Acquisition). Accordingly, Couche-Tard’s results of operations for the year ended April 25, 2004 include the results of operations of Circle K as of December 18, 2003 and the results of operations for the previous years exclude the results of operations of Circle K. “We”, “our” and “us” refer collectively to Couche-Tard and its subsidiaries, including Circle K.
Except where otherwise indicated, all financial information reflected herein is expressed in Canadian dollars and determined on the basis of Canadian generally accepted accounting principles. You should read the following discussion in conjunction with the annual consolidated financial statements and related notes included in this 2004 Annual Report. Additional information relating to Couche-Tard, including the Annual Information Form, is available on SEDAR at www.sedar.com.
Forward-Looking Statements
This report includes certain statements that are “forward-looking statements” within the meaning of the U.S. Private Securities Litigation Reform Act of 1995. Any statement in this report that is not a statement of historical fact may be deemed to be a forward-looking statement. When used in this report, the words “believe,” “intend,” “expect,” “estimate” and other similar expressions are generally intended to identify forward-looking statements. These forward-looking statements are not guarantees of future performance of Couche-Tard or its industry and involve known and unknown risks and uncertainties which may cause the outlook, the actual results or performance of Couche-Tard or of its industry to be materially different from any future results or performance expressed or implied by such statements. Such risks and uncertainties include the risks set forth below under “Business Risks” as well as other risks detailed from time to time in reports filed by Couche-Tard with securities regulators in Canada and the United States.
Our Business
We are the leader in the Canadian convenience store industry. We are the fourth largest convenience store operator in North America and the second largest independent (not integrated with a petroleum company) convenience store operator in North America. As at April 25, 2004, our network consisted of 4,881 convenience stores, 3,079 of which include motor fuel dispensing, located in eight large geographic markets, including three in Canada and five in the United States, which cover 23 American states.
We sell food and beverage items, motor fuel and other products and services targeted to meet our customers’ demand for convenience and quality in a clean and welcoming environment. We believe that our business model has differentiated Couche-Tard from its competition through its decentralized management structure, commitment to operational expertise, focus on in-store merchandise particularly the higher growth and higher margin foodservice category and continued investment in store modernization and technology.
We conduct our business through different modes of operations including company operated stores and our affiliate program, which includes franchised and licensed locations. The amount of earnings before interest and taxes (EBIT) generated from the affiliates amounted to $12.7 million or 7.8% of our total EBIT for fiscal 2004.
The convenience store industry is fragmented, with the top 10 operators representing only approximately 24% of the estimated total of 132,400 stores in the United States. Industry consolidation by highly leveraged operators in the 1990’s, combined with competition and fluctuations in motor fuel margins, has led to numerous corporate restructurings and rationalizations in recent years. As a result, we believe the opportunity exists for well-capitalized, established industry participants to grow through mergers and acquisitions.
37 |
2004 Overview
In August 2003, we entered into an agreement with Allied Domecq Quick Service Restaurants whereby we acquired the master franchisee rights for the Dunkin’Donuts banner in Quebec. Thus, the 94 Dunkin’Donuts stores already established in Quebec became franchisees of the Company, which is now responsible for the implementation of all aspects of the Dunkin’Donuts system in Quebec.
On September 4, 2003, we acquired certain assets of Clark Retail Enterprises, Inc. (Clark) for total cash consideration of $41.0 million. In this transaction, we acquired 43 convenience stores, 33 of which are located in Illinois, with the remainder in Indiana, Iowa, Michigan and Ohio. All of the stores sell motor fuel. We acquired the buildings and land at 31 of these sites, with the remaining 12 being leased. On October 30, 2003, we completed a sale and leaseback transaction with respect to 19 of the Clark stores and received proceeds of approximately US$15 million.
This year’s major event was the Acquisition on December 17, 2003, for a total consideration of $1.1 billion, with the takeover of 1,663 Circle K company-operated stores in 16 American states, plus 627 affiliates. Due to the closing date, our annual results reflect the impact of the Acquisition for a 130-day period. We believe we will improve our overall financial performance by applying the Couche-Tard business model to our Circle K operations. We also believe that we can produce the previously announced synergies of US$50 million well within 18 to 24 months from the closing of the Acquisition. As at April 25, 2004, we have achieved synergies of approximately US$10 million, of which approximately 92% is represented by reductions in selling, general and administrative costs, with the balance generated by purchasing efficiencies. In addition, we believe we can improve Circle K’s store level operations by completing within the next 12 months the installation of POS systems, including scanning, in all of Circle K’s company-operated stores that do not currently have such technology and by implementing our Store 2000 Concept in certain Circle K stores. There can be no assurance that such cost savings or operating improvements will be realized or that there will not be delays in achieving such synergies or cost savings.
During the year, we completed the financing of the Acquisition with the issuance of Senior Subordinated Notes due 2013, borrowings under our new senior credit facility and the issuance of Class “B” subordinate voting shares of Alimentation Couche-Tard Inc. In connection with the Acquisition, we refinanced the majority of our long-term debt, as described herein under “Liquidity and Capital Resources”.
Summary of Fourth Quarter Results: 12-Week Period Ended April 25, 2004 and 12-Week Period Ended April 27, 2003
During the 12-week period ended April 25, 2004, Couche-Tard opened 13 new locations and 11 quick service restaurants, and reconfigured 32 stores with its Store 2000 Concept.
| The following is selected information from the statement of earnings |
| 12-week periods ended |
| ||
|
|
|
| |||
| ($ millions unless otherwise stated) |
| April 25, 2004 |
| April 27, 2003 |
|
|
|
|
|
| ||
| Total sales |
| 2,289.0 |
| 815.8 |
|
| Operating income |
| 55.0 |
| 20.0 |
|
|
|
|
|
| ||
| Net earnings |
| 21.1 |
| 11.3 |
|
|
|
|
|
| ||
Our fourth quarter 2004 included the results of Circle K for the entire period. The results are a significant increase over the same period in the previous year, which increase is primarily due to our US operations, particularly the Circle K business. Consolidated sales at $2.29 billion were $1.47 billion over last year, and operating income at $55.0 million was more than double last year, up $35.0 million from $20.0 million in the previous year. Net earnings of $21.1 million was $9.8 million or 86.4% over the prior year. During this quarter, we sold 322 Circle K properties under sale and leaseback agreements, generating US$252.9 net of costs, which was used to repay a portion of our long-term debt. Additionally, we repaid US$79.0 million of our long-term debt from excess cash. As a result, our net interest bearing debt to total capitalization is 0.41:1 as at April 25, 2004.
As of April 25, 2004, Alimentation Couche-Tard Inc. had 28,520,861 Class “A” multiple voting shares and 70,288,989 Class “B” subordinate voting shares issued and outstanding.
38 |
Income Statement Categories
Merchandise and Service Sales.In-store merchandise sales are comprised primarily of the sale of tobacco products, grocery items, candy and snacks, beer/wine and fresh food offerings, including quick service restaurants (QSRs). Service sales include the commission on sale of lottery tickets and issuance of money orders, fees from automatic teller machines and sales of postage stamps, calling card commissions and bus tickets. Merchandise and service sales also include franchise fees, license fees, royalties from franchisees and licensees and a portion of vendor rebates related to certain purchases by franchisees, affiliates and licensees.
Motor Fuel Sales.Couche-Tard includes in its sales the total dollar amount of motor fuel sales, including any imbedded taxes, if Couche-Tard takes ownership of the motor fuel inventory. In the United States, Couche-Tard purchases motor fuel and sells it to 94 independent store operators at cost plus a mark up. Couche-Tard records the full value of these sales (cost plus the mark up) as motor fuel sales. Where Couche-Tard acts as a selling agent for a petroleum distributor, only the commission earned by Couche-Tard is recorded as sales. Gross profit from motor fuel is derived by deducting the cost of the motor fuel from the motor fuel sales, except for commission locations, where the gross profit is equal to the recorded commission from the sale.
Gross Profit. Gross profit consists primarily of sales less the related cost of the inventories: for in-store merchandise, the cost of inventory is generally determined using the retail method (retail price less normal margin), and for motor fuel, it is determined using the average cost method.
Operating Expenses. The primary components of operating expenses are wages and salaries, commissions to dealers, occupancy costs, corporate support costs and head office operations.
Key performance indicators used by management, which can be found under “Results of Operations-Other Operating Data”, are Merchandise and service gross margin, Growth of average merchandise sales per store, Motor fuel gross margin and Growth of average motor fuel volume per store.
Exchange Rate Data
Our U.S. subsidiaries’ assets and liabilities are translated into Canadian dollars using the exchange rate in effect at the balance sheet date. Sales and expenses are translated at the average rate in effect during the year. The following table sets forth information about exchange rates based upon the Bank of Canada closing rates set forth as Canadian dollars per US$1.00.
|
|
| 52-week periods ended |
| ||||
|
|
|
| |||||
|
|
| April 25, 2004 |
| April 27, 2003 |
| April 28, 2002 |
|
|
|
|
|
|
| |||
| Average for the period (1) |
| 1.3438 |
| 1.5399 |
| 1.5669 |
|
| Period end |
| 1.3607 |
| 1.4481 |
| 1.5617 |
|
(1) Calculated by taking the average of the closing exchange rates of each day in the applicable period.
39 |
Results of Operations
The following table highlights certain information regarding our operations for the 52-week periods ended April 25, 2004, April 27, 2003 and April 28, 2002.
| ($ millions unless otherwise stated) |
| 52-week periods ended |
| |||||
|
|
|
| ||||||
|
|
| April 25, 2004 |
| April 27, 2003 |
| April 28, 2002 |
| |
|
|
|
|
|
| ||||
| Statement of Operations Data: |
|
|
|
|
|
|
| |
| Merchandise and service sales (1): |
|
|
|
|
|
|
| |
|
| Canada |
| 1,510.6 |
| 1,428.6 |
| 1,298.6 |
|
|
| United States |
| 1,597.1 |
| 514.7 |
| 204.5 |
|
|
|
|
|
|
| ||||
|
| Total merchandise and service sales |
| 3,107.7 |
| 1,943.3 |
| 1,503.1 |
|
|
|
|
|
|
| ||||
| Motor fuel sales |
|
|
|
|
|
|
| |
|
| Canada |
| 677.5 |
| 630.2 |
| 532.2 |
|
|
| United States |
| 2,087.2 |
| 741.7 |
| 356.7 |
|
|
|
|
|
|
| ||||
|
| Total motor fuel sales |
| 2,764.7 |
| 1,371.9 |
| 888.9 |
|
|
|
|
|
|
| ||||
|
| Total sales |
| 5,872.4 |
| 3,315.2 |
| 2,392.0 |
|
|
|
|
|
|
| ||||
| Merchandise and service gross profit (1): |
|
|
|
|
|
|
| |
|
| Canada |
| 491.3 |
| 462.5 |
| 426.6 |
|
|
| United States |
| 521.2 |
| 169.7 |
| 65.0 |
|
|
|
|
|
|
| ||||
| Total merchandise and service gross profit |
| 1,012.5 |
| 632.2 |
| 491.6 |
| |
|
|
|
|
|
| ||||
| Motor fuel gross profit: |
|
|
|
|
|
|
| |
|
| Canada |
| 63.3 |
| 57.5 |
| 54.5 |
|
|
| United States |
| 147.2 |
| 60.2 |
| 36.7 |
|
|
|
|
|
|
| ||||
|
| Total motor fuel gross profit |
| 210.5 |
| 117.7 |
| 91.2 |
|
|
|
|
|
|
| ||||
|
| Total gross profit |
| 1,223.0 |
| 749.9 |
| 582.8 |
|
| Operating, selling, administrative and general expenses |
| 985.5 |
| 592.2 |
| 460.9 |
| |
| Depreciation and amortization of fixed and other assets |
| 74.5 |
| 44.9 |
| 33.7 |
| |
|
|
|
|
|
| ||||
| Operating income |
| 163.0 |
| 112.8 |
| 88.2 |
| |
| Financial Expenses |
| 31.1 |
| 14.9 |
| 15.1 |
| |
| Write-off of financial expenses |
| 12.5 |
| — |
| — |
| |
|
|
|
|
|
| ||||
| Earnings before income taxes |
| 119.4 |
| 97.9 |
| 73.1 |
| |
| Income taxes |
| 39.9 |
| 31.9 |
| 25.8 |
| |
|
|
|
|
|
| ||||
| Net earnings |
| 79.5 |
| 66.0 |
| 47.3 |
| |
|
|
|
|
|
| ||||
| Other Operating Data: |
|
|
|
|
|
|
| |
| Merchandise and service gross margin (1): |
|
|
|
|
|
|
| |
|
| Canada |
| 32.5 | % | 32.4 | % | 32.8 | % |
|
| United States |
| 32.6 | % | 33.0 | % | 31.8 | % |
| Growth of average merchandise sales per store (2): |
|
|
|
|
|
|
| |
|
| Canada |
| 3.1 | % | 9.6 | % | 6.3 | % |
|
| United States – excluding the Acquisition |
| 3.9 | % | 7.9 | % | — |
|
| Motor fuel gross margin: |
|
|
|
|
|
|
| |
|
| Canada (cents per litre) |
| 4.77 |
| 4.64 |
| 4.63 |
|
|
| United States (U.S. cents per gallon) (3) |
| 11.57 |
| 12.23 |
| 13.86 |
|
| Volume of motor fuel sold: |
|
|
|
|
|
|
| |
|
| Canada (millions of litres) |
| 1,329.2 |
| 1,239.2 |
| 1,177.3 |
|
|
| United States (millions of gallons) |
| 996.1 |
| 355.5 |
| 187.9 |
|
| Growth of average motor fuel volume per store: |
|
|
|
|
|
|
| |
|
| Canada |
| 6.7 | % | 4.7 | % | 4.7 | % |
|
| United States – excluding the Acquisition |
| 6.4 | % | 1.4 | % | — |
|
| ||
| (1) | Includes other sales derived from franchise fees, royalties and rebates on some purchases by franchisees and licensees. |
| (2) | Does not include services and other sales (as described in footnote 1) and is based on the average number of stores open during each four-week period of the fiscal period. |
| (3) | For company-operated stores only. |
40 |
52-Week Period Ended April 25, 2004 Compared to the 52-Week Period Ended April 27, 2003
During the 52-week period ended April 25, 2004, Couche-Tard completed two aquisitions for a total of 2,333 locations, opened 51 new locations and 47 quick service restaurants, and reconfigured 173 stores with its Store 2000 Concept.
For the 52-week period ended April 25, 2004,Couche-Tard achievedsalesof $5.87 billion, compared with $3.32 billion in 2003, a major increase of 77.1% or $2.56 billion, including $2.02 billion or 78.9%, which came from Circle K for the 130 days period from December 18, 2003 to April 25, 2004. The Company recorded 62.7% of its sales in the United States, up from 37.9% in the previous fiscal year.
During the year, the Company adopted two changes in its accounting policy and has applied both changes on a retroactive basis for all amounts included herein. The first change relates to the recording of telephone calling card revenue. Rather than recording the total value of the transaction as a sale, the Company adopted the policy of recording the commission or net amount earned from such transaction, consistent with recording the commissions on our sales of other services such as the sale of lottery tickets. On a retroactive basis, sales are adjusted downward by a relatively small amount each period, with the gross profit remaining unchanged. The result is a slight increase in gross margin as a percentage of sales of up to approximately one percentage point.
On January 30, 2004, the Company retroactively adopted by anticipation the new recommendation of the Canadian Institute of Chartered Accountants (“CICA”) on accounting for consideration received from a vendor. This could result in an increase or decrease in the Company’s merchandise and service gross profit and related gross margin depending on the fluctuations in the related inventories. The impact on the Company’s gross profit for each of the last three fiscal years ended April 25, 2004, April 27, 2003 and April 28, 2002 brought about decreases in gross profit of $1.03 million, $0.29 million and $2.85 million, respectively.
• | In the United States, salestotalled $3.68 billion, an increase of $2.43 billion reflecting mainly the contribution of Circle K results from December 18, 2003 as well as the impact of the acquisition of the Dairy Mart Stores, the 43 Clark stores acquired in September 2003, the stores opened during the year and internal growth in the American network. Growth of average merchandise sales per store (excluding Circle K for comparative purposes) was 3.9% over the prior year while growth of average motor fuel volume per store (excluding Circle K) was 6.4% over the prior year. |
|
|
• | In Canada, salesamounted to $2.19 billion, up 6.3%, or $129.3 million. Growth of average merchandise sales per store was 3.1% compared with the previous year. Growth of average motor fuel volume per store was 6.7% over the previous year. Overall, Canadian markets performed well in difficult business conditions, inluding a decline in the number of tourists under the impact of SARS and reduced exports due to the exchange rate. |
|
|
Gross profitgrew by 63.1% or $473.1 million to $1.22 billion, compared with $749.9 million for the previous year. This increase is mainly due to higher sales, particularly as following the Acquisition, a higher motor fuel gross margin in Canada — somewhat offset by a decline in motor fuel gross margin in the United States. | |
| |
• | Consolidated merchandise and service gross marginwas 32.6% (including the Circle K results), reflecting the lower gross margin of Circle K due to its different product mix. |
|
|
• | Motor fuel gross marginincreased to 4.77¢ per litre in Canada, up from 4.64¢ per litre for the previous year. Motor fuel gross margin in the United States declined to 11.57¢US per gallon from 12.23¢US per gallon in the previous year. This decrease is attributable to the lower motor fuel margins experienced by Circle K in the first 45 days of the integration and the pressure on margins in the Midwest in the fourth quarter and a price war by two gasoline marketers in Kentucky. |
Operating expensesincreased by $393.5 million or 66.5% over the previous year. The increase is primarily attributable to the Acquisition and, to a lesser extent, the Clark stores, the full impact of the Dairy Mart stores and the growth in the Canadian network. As a percentage of total sales, operating expenses declined by 1.1% due to lower operating costs associated with higher motor fuel sales, which account for a larger proportion of total revenues.
41 |
Depreciation and amortizationgrew by 65.7% to $74.5 million in fiscal 2004. This increase is due mainly to Circle K, the Clark stores, the full impact of the acquisition of Dairy Mart and store renovations.
Financial expensestotalled $31.1 million, up $16.2 million or 109.1% over last year due to the higher borrowings to finance the Acquisition. In addition, the Company recorded a pre-tax write-off of financial expenses of $12.5 million related to the refinancing of existing debt in connection with the Acquisition ($2.8 million) and to the repayment of a portion of the new debt from the proceeds of the sale/leaseback transactions completed in March and April 2004 and from the use of a portion of cash surplus ($9.7 million).
Income taxesincreased by $7.9 million, or 24.8%, to $39.9 million. The increase is due to a combination of an increase in pre-tax earnings, a rise in the provincial income tax rate in Ontario and a greater portion of pretax income coming from the U.S. operations which have a higher tax rate than Canada.
Net earningsincreased by $13.5 million, or 20.4%, to $79.5 million or $0.89 per share ($0.85 fully diluted), compared with $66.0 million or $0.78 per share ($0.76 fully diluted) in the previous year.
Net earnings for fiscal 2004 was affected by the following unusual or uncontrollable items, which are presented on an after-tax basis:
• | a write-off of financial expenses of $8.3 million or $0.09 fully diluted per share, related to the refinancing of existing debt in connection with the Circle K acquisition and the repayment of a portion of the new debt, |
|
|
• | the rise in the corporate tax rate in Ontario, entailing an adjustment of future income taxes totalling $1.1 million and equivalent to $0.01 fully diluted per share, |
|
|
• | and the negative impact of approximately $3.1 million of the increase in the Canadian dollar, or $0.03 fully diluted per share. |
Balance Sheet
Our totalconsolidated assetswere $2.23 billion as at April 25, 2004, compared to $1.07 billion as at April 27, 2003, representing an increase of $1.16 billion. The increase is primarily due to the asset base of the Acquisition, which amounted to $1.1 billion as at April 25, 2004, including $201.9 million assigned to the Circle K trade name. Total accounts receivable amounted to $128.5 million as at April 25, 2004, including $56.2 million from Circle K. The balance, $72.3 million, decreased by $35.7 million from $108.0 million as at April 27, 2003, which is attributable to the receipt of sales tax credits after April 27, 2003. Total inventories as at April 25, 2004 amounted to $374.8 million, an increase of $194.9 million, compared to $179.9 million as at April 27, 2003. Circle K accounted for $173.4 million, with the remaining increase of $21.5 million primarily relating to new stores, and the higher cost of motor fuel offset somewhat by the lower exchange rate. Fixed assets as at April 25, 2004 totalled $898.5 million compared to $441.3 million as at April 27, 2003, representing an increase of 457.2 million. This increase results mainly from fixed assets acquired in connection with the Acquisition and the 43 stores purchased from Clark Retail Enterprises Inc. ($808.7 million), the purchase of fixed assets of $115.2 million, net of depreciation and amortization ($74.0 million) and the reduction of fixed assets resulting from the sale and leaseback of 369 properties.
Accounts payable and accrued liabilities were $657.9 million as at April 25, 2004, an increase of $364.1 million compared to $293.8 million as at April 27, 2003. The accounts payable and accrued liabilities of Circle K accounted for $327.4 million of this increase, with the balance primarily represented by increases in trade accounts payable related to inventory purchases in April 2004 and the accounts payable relating to the higher cost of motor fuel compared with the previous year.Long-term debt(including the current portion due in one year) as at April 25, 2004 increased by $434.2 million during the year from $296.3 million as at April 27, 2003 to $730.5 million as at April 25, 2004. This increase is attributable to the debt raised in connection with the Acquisition, net of a subsequent repayment of US$331.9 million from the net proceeds of sale and leaseback transactions with respect to 322 Circle K sites and from the use of a portion of excess cash.
Shareholders’ equityincreased by $306.2 million during the fiscal year from $440.6 million as at April 27, 2003 to $746.8 million as at April 25, 2004. The increase is primarily attributable to the shares issued during the year for $223.7 million in connection with the Acquisition and the net earnings of $79.5 million for the year.

42 |
Liquidity and Capital Resources
Our principal source of liquidity is cash flow generated from operations and borrowings under our revolving credit facilities. Our principal uses of cash are to meet debt service requirements, finance our capital expenditures, make acquisitions and provide for working capital. We expect that cash available from operations together with borrowings available under our revolving credit facilities will be adequate to meet our liquidity needs in the foreseeable future.
The Acquisition was financed through the proceeds from the issuance of US$350 million 7 ½% Senior Subordinated Notes due 2013, borrowings under our senior credit facility and the net proceeds of $220.5 million from the issuance of 13.6 million Class “B” subordinate voting shares of Alimentation Couche-Tard Inc. The majority of our long-term debt was refinanced in connection with the Acquisition.
As at April 25, 2004, our total debt was $730.5 million (of which $476.2 million consisted of notes, $242.1 million consisted of borrowings under our senior credit facility and $12.2 million consisted of other long-term debt).
In addition to the above, the Company entered into interest rate swap agreements with three banks under which the Company will incur interest on US$350 million at a rate of LIBOR plus an aggregate average interest rate factor of 2.95%. The interest rate will be reset every six months over the term of the agreements. Based on the Company’s policy, it designates each derivative financial instrument as a hedge against a recognized loan instrument. The agreements, which expire on December 15, 2013, provide that, after December 15, 2008, each Bank has the right to terminate its arrangement with the payment of a termination fee if terminated before December 15, 2011 and, if after that date, without payment of a termination fee. In addition, both parties to each agreement have a mutual right to terminate the arrangement on the 5thanniversary date of the effective date of each of the three agreements. If such right were exercised by either party, one party would be required to pay the other party the mark to market value of the interest rate swap.
Capital Expenditures. Capital expenditures are planned for the installation of POS systems, including scanning, at the Circle K company-operated stores that do not currently have this technology, the implementation of our Store 2000 Concept at certain stores, new stores including a small number of existing stores, and the replacement of equipment in some of our stores, including upgrading of petroleum equipment at a number of locations. In connection with the Acquisition, we expect to make certain capital improvements of up to US$18.6 million at the Circle K stores between June 2004 and December 2008 in connection with the settlement of litigation brought against Circle K under the Americans with Disabilities Act. In addition, we have a commitment to purchase certain equipment for an amount of $1.5 million in the coming year. We expect to fund these commitments with cash flows generated from operations.
Over the past number of years, the Company has expended funds for maintaining the stores to operating standards, renovated certain stores with our new Store 2000 Concept, opened new stores and invested in small acquisitions.
The Company has funded these expenditures from cash flows from operating activities. Over the past five fiscal years, total cash flows from operating activities amounted to approximately $700 million and capital expenditures and investment in small acquisitions amounted to approximately $460 million over this period. We believe that we will be able to continue to fund future expenditures of this nature from cash flows from operating activities. Major acquisitions will be financed through a combination of debt and equity.
Credit Facilities. We have five-year revolving credit facilities in the amount of $50 million available in Canadian dollars or U.S. dollars to the Canadian borrowers and in the amount of US$75 million available in U.S. dollars to the U.S. borrowers, which bear interest at the Canadian prime rate, or the Canadian or U.S. base rate (as applicable) or LIBOR, plus a certain margin varying on the basis of our leverage ratio. The revolving facilities are also available in the form of bankers’ acceptances (for Canadian dollar advances) and in the form of letters of credit (not to exceed $10 million or the U.S. dollar equivalent) in respect of the Canadian facility and US$30 million in respect of the U.S. facility). As of April 25, 2004, the facilities are undrawn, except for letters of credit of approximately $1.2 million and US$4.8 million.
Our senior credit facility is secured by virtually all the asset of the Company. The Company must meet certain commitments and achieve certain financial ratios under the new credit agreement. In addition, the new credit agreement limits the amount of fixed assets that the Company may acquire, the business acquisitions the Company may take part in, the amount of the repayments of term loan ‘A’ and ‘B’ that the Company may make as well as dividend payments. As well, the indenture governing the subordinated debt also contains certain restrictions, including the achievement of a financial ratio, on our ability to incur additional debt, pay dividends or make other restricted payments and enter into certain transactions.
43 |
Cash Flows from Operating Activities. Cash provided from operating activities more than doubled to $314.2 million in fiscal 2004 compared with $141.4 million in 2003, an increase of $172.8 million, reflecting largely the contribution of Circle K for 130 days of operation.
Cash Flows from Investing Activities. Net cash used in investing activities for the year ended April 25, 2004 amounted to $761.1 million, including $984.3 million for the purchase of Circle K and $41.0 million for the purchase of 43 stores from Clark. In addition, capital expenditures of $115.2 million were made in fiscal 2004, compared with $86.7 million for the same period in 2003. These capital expenditures were primarily for existing store improvements and equipment, store openings and acquisitions, information systems and expenditures related to gasoline facilities in compliance with regulatory requirements.
During fiscal 2004, we entered into five separate agreements to sell 369 sites under sale and leaseback arrangements for total aggregate net proceeds of approximately $379.5 million. Under these arrangements, the properties are leased back with primary terms of: 103 sites for 15 years, 116 sites for 16 years, 122 sites for 17 years, 28 sites for 20 years. All agreements provide for several renewal periods.
Included in the above are 322 Circle K sites sold under two sale and leaseback agreements for an aggregate of US$252.9 million net of costs. Minimum lease payments under the leases total approximately US$24.7 million per year subject to indexation features.
Cash Flows from Financing Activities. Cash generated from financing activities was $605.6 million for fiscal 2004 compared with $136.4 million for the same period last year. We borrowed $1.12 billion in new long-term debt and raised an additional $220.5 million net of expenses from the issue of 13.6 million Class “B” subordinate voting shares. The total proceeds were used to repay $239.3 million of the then existing long-term debt and finance the Circle K acquisition. Additionally, we used the net proceeds of US$252.9 million from the sale-leaseback transactions of 322 Circle K properties and a portion of a cash surplus to repay a substantial $442.1 million in long-term debt. Unamortized financing expenses related to the refinancing of the existing debt at the time of the acquisition and to the repayment of a portion of the new debt was written off and disclosed in a separate line in the statement of earnings as “Write-off of financial expenses”.
Contractual Obligations and Commercial Commitments
Set out below is a summary of our material contractual cash obligations as of April 25, 2004:
|
|
| 2005 |
| 2006 |
| 2007 |
| 2008 |
| 2009 |
| Thereafter |
| Total |
|
|
|
|
|
|
|
|
|
|
| |||||||
|
|
| (in thousands of dollars) |
| ||||||||||||
|
|
|
| |||||||||||||
| Long-term debt |
| 5,422 |
| 9,243 |
| 10,924 |
| 11,906 |
| 12,889 |
| 676,244 |
| 726,628 |
|
| Capital lease obligations |
| 1,249 |
| 1,042 |
| 898 |
| 701 |
| 598 |
| 3,192 |
| 7,680 |
|
| Operating lease obligations |
| 187,698 |
| 176,087 |
| 163,342 |
| 142,356 |
| 114,250 |
| 1,025,301 |
| 1,809,034 |
|
| Purchase commitments |
| 2,061 |
| 560 |
| 560 |
| 560 |
| 700 |
| 2,800 |
| 7,241 |
|
|
|
|
|
|
|
|
|
|
| |||||||
| Total |
| 196,430 |
| 186,932 |
| 175,724 |
| 155,523 |
| 128,437 |
| 1,707,537 |
| 2,550,583 |
|
|
|
|
|
|
|
|
|
|
| |||||||
Long-Term Debt. The majority of Couche-Tard’s long-term debt was refinanced in connection with the Acquisition. See “Liquidity and Capital Resources”. Couche-Tard’s long-term debt consists of (i) $476.2 (US$350) million 7 ½% Senior Subordinated Notes due 2013; (ii) a five-year $38.1 (US$28.0) million Term Loan A secured facility that bears interest at the Canadian base rate or LIBOR, plus a certain margin varying on a basis of our leverage ratio; and (iii) a seven-year $204.1 (US$150.0) million Term Loan B secured facility that bears interest at the U.S. base rate or LIBOR, plus a fixed margin; and (iv) Circle K’s 8.75% note payable of approximately $7.5(US$5.5) million outstanding as of April 25, 2004, that is collateralized by certain stores in Florida. The note requires principal and interest payments throughout its term. The final payment is due on December 1, 2019.
44 |
Capital Lease Obligations. Couche-Tard has generally not used capital leases as a means of financing; however several capital leases were assumed in connection with certain acquisitions. We do not expect to use capital leases as a means of financing in the future. These obligations and related assets are included in our Consolidated Balance Sheet.
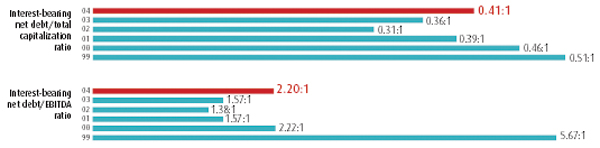
Operating Lease Obligations. We lease a substantial portion of our real estate using conventional operating leases. Generally our real estate leases in Canada are for primary terms of five to 10 years and in the United States are for 10 to 20 years, in both cases, with options to renew. These obligations and related assets are not included in our Consolidated Balance Sheet. Under certain of the store leases, we are subject to additional rentals based on store sales as well as escalations in the minimum future lease amount.
Purchase commitments. During fiscal 2004, we have concluded certain agreements to acquire equipment and franchise rights.
Contingencies. There are various legal proceedings and claims pending against us that are common to our operations for which, in some instances, no provision has been made. While it is not feasible to predict or determine the ultimate outcome of these matters, it is the opinion of management that these suits will not result in monetary damages not covered by insurance that in the aggregate would be material and adverse to our business or operations.
We are covered by insurance policies that have significant deductibles. At this time, we believe that we are adequately covered through the combination of insurance policies and self-insurance. Future losses which exceed insurance policy limits or, under adverse interpretations, are excluded from coverage would have to be paid out of general corporate funds. In association with our workers’ compensation policies, we issue letters of credit as collateral for certain policies.
�� We also issue surety bonds for a variety of business purposes, including bonds for taxes, lottery sales, wholesale distribution and alcoholic beverage sales. In most cases, the surety bonds are required by a municipality or state governmental agency as a condition of operating a store in that area.
Off-Balance Sheet Arrangements
In the normal course of business, we finance certain of our activities off-balance sheet through operating leases for properties on which we conduct our retail business. The future commitments are included under “Operating lease obligations” in the table above.
45 |
Selected Quarterly Financial Information (Unaudited)
The Company’s 52-week reporting cycle is divided into four quarters of 12 weeks each except for the third quarter, which comprises 16 weeks. When a fiscal year, such as 2000, contains 53 weeks, the fourth quarter comprises 13 weeks. The following is a summary of selected consolidated financial information derived from the Company’s unaudited interim consolidated financial statements for each of the eight most recently completed quarters. This information was prepared in accordance with Canadian GAAP and is reported in Canadian dollars.
| ($ millions except for per-share data) |
| 52 weeks ended April 25, 2004 |
| 52 weeks ended April 27, 2003 |
| |||||||||||||||||||||
|
|
|
|
| |||||||||||||||||||||||
| Quarter |
|
| 4th |
|
| 3rd |
|
| 2nd |
|
| 1st |
|
| 4th |
|
| 3rd |
|
| 2nd |
|
| 1st |
| |
| Weeks |
|
| 12 weeks |
|
| 16 weeks |
|
| 12 weeks |
|
| 12 weeks |
|
| 12 weeks |
|
| 16 weeks |
|
| 12 weeks |
|
| 12 weeks |
| |
|
|
|
|
|
|
|
|
|
|
| |||||||||||||||||
| Sales |
|
| 2,289.0 |
|
| 1,765.0 |
|
| 937.5 |
|
| 880.9 |
|
| 815.8 |
|
| 1,040.3 |
|
| 791.6 |
|
| 667.5 |
| |
|
|
|
|
|
|
|
|
|
|
| |||||||||||||||||
| Income before depreciation |
|
| 81.1 |
|
| 53.8 |
|
| 53.8 |
|
| 48.7 |
|
| 31.1 |
|
| 39.8 |
|
| 46.4 |
|
| 40.5 |
| |
| Depreciation and amortization |
|
| 26.1 |
|
| 24.9 |
|
| 12.0 |
|
| 11.5 |
|
| 11.1 |
|
| 15.0 |
|
| 10.5 |
|
| 8.3 |
| |
|
|
|
|
|
|
|
|
|
|
| |||||||||||||||||
| Operating income |
|
| 55.0 |
|
| 28.9 |
|
| 41.8 |
|
| 37.2 |
|
| 20.0 |
|
| 24.8 |
|
| 35.9 |
|
| 32.2 |
| |
|
|
|
|
|
|
|
|
|
|
| |||||||||||||||||
| Financial expenses |
|
| 12.8 |
|
| 11.7 |
|
| 3.0 |
|
| 3.6 |
|
| 3.8 |
|
| 4.6 |
|
| 3.5 |
|
| 3.0 |
| |
| Write-off of financial expenses |
|
| 9.7 |
|
| 2.8 |
|
| — |
|
| — |
|
| — |
|
| — |
|
| — |
|
| — |
| |
|
|
|
|
|
|
|
|
|
|
| |||||||||||||||||
| Total financial expenses |
|
| 22.5 |
|
| 14.5 |
|
| 3.0 |
|
| 3.6 |
|
| 3.8 |
|
| 4.6 |
|
| 3.5 |
|
| 3.0 |
| |
|
|
|
|
|
|
|
|
|
|
| |||||||||||||||||
| Net earnings |
|
| 21.1 |
|
| 8.8 |
|
| 26.5 |
|
| 23.1 |
|
| 11.3 |
|
| 14.1 |
|
| 21.4 |
|
| 19.2 |
| |
|
|
|
|
|
|
|
|
|
|
| |||||||||||||||||
| Earnings per share |
|
|
|
|
|
|
|
|
|
|
|
|
|
|
|
|
|
|
|
|
|
|
|
|
| |
|
| Basic |
| $ | 0.21 |
| $ | 0.10 |
| $ | 0.31 |
| $ | 0.27 |
| $ | 0.13 |
| $ | 0.17 |
| $ | 0.25 |
| $ | 0.23 |
|
|
| Fully diluted |
| $ | 0.21 |
| $ | 0.09 |
| $ | 0.30 |
| $ | 0.26 |
| $ | 0.13 |
| $ | 0.16 |
| $ | 0.24 |
| $ | 0.22 |
|
The quarterly financial information has been restated to reflect the impact of the two changes in its accounting policies, the first one being the change in accounting for revenues from telephone calling cards and the other one relating to the adoption of the CICA recommendation for certain consideration received from a vendor — both as described in the section “52-Week Period Ended April 25, 2004 Compared to the 52-Week Period Ended April 27, 2003”.
Net earnings have substantially increased generally in tandem with the Company’s major acquisitions, with the exception of the third quarter 2004 which was impacted by the write-off of certain financial expenses associated with the refinancing of long-term debt, additional interest expense associated with new debt incurred in connection with the Acquisition, relatively lower motor fuel gross margins in the Circle K business for the period from the effective date of the Acquisition on December 18, 2003 to February 1, 2004, and difficult business conditions, including a decline in the number of tourists under the impact of SARS and reduced exports due to exchange rate.
The fourth quarter, although impacted by the conditions referred to above, included significant increases primarily related to the Acquisition. While merchandise and service gross margins remained relatively stable over the eight quarters, total gross profits were impacted by the variability in motor fuel gross margins. The fourth quarter also included a $9.7 million write-off of financial expenses relating to the repayment of a portion of new long-term debt.
52-Week Period Ended April 27, 2003 Compared to the 52-week Period Ended April 28, 2002
During 2003, Couche-Tard acquired 420 stores in the United States and 30 stores in Canada. Couche-Tard also opened 46 new stores and reconfigured 220 locations with its Store 2000 Concept.
For the 52-week period ended April 27, 2003, Couche-Tard announcedsalesof $3.32 billion, up from $2.39 billion for the same period a year earlier, an increase of 38.6% or $923.2 million. This increase was primarily due to acquisitions made in fiscal 2003, the inclusion of a full year of results for the acquisitions made in fiscal 2002, the opening of 46 new stores and growth in average merchandise revenues and in average motor fuel volume per store.
| • | In the United States, salestotalled $1.26 billion, an increase of $695.2 million, reflecting the impact of the 420 stores acquired in the early part of fiscal 2003 and growth in average merchandise sales per store of 7.9% as well as a 1.4% increase in average motor fuel volume per store. |
|
|
|
| • | In Canada, salesincreased by 12.5% or $228.0 million, including sales from the 30 stores acquired in the year, to $2.06 billion. Growth of average merchandise sales per store was 9.6% compared with the same period a year earlier and growth of average motor fuel volume was 4.7% over the prior year. |
46 |
Gross profitgrew by 28.7% or $167.1 million to $749.9 million. The increase is due primarily to the higher sales, offset by a slightly lower gross margin in Canada. | ||
| ||
| • | Consolidated merchandise and service gross marginstood at 32.5% compared to 32.7% for the prior year, which is attributable to the slightly lower merchandise and service gross margin in Canada resulting from the inability to maintain the full gross margin on the higher retail price of tobacco products resulting from a tobacco tax increase in June 2002. In the United States, the Midwest network’s gross margin increased from 31.8% in 2002 to 33.0% in 2003. |
|
|
|
| • | Motor fuel gross marginincreased slightly to 4.64¢ per litre in Canada from 4.63¢ per litre in the prior year. In the United States, the Midwest network’s motor fuel gross profit was $60.2 million, an increase of $23.5 million, due to higher volumes and sales, offset by a decrease in motor fuel gross margin from 13.86¢US per gallon in 2002 to 12.23¢US per gallon in 2003. |
Operating Expenses. Operating expenses increased by $131.3 million, or 28.5%, from $460.9 million in 2002 to $592.2 million in 2003. The increase was primarily due to the increased costs related to a larger store base. As a percentage of total revenues, operating expenses decreased from 19.3% to 17.9%, due to the combination of operating leverage and lower operating costs associated with the increase of motor fuel revenues, which represented a higher percentage of total revenues.
Depreciation and Amortization. Depreciation and amortization increased by $11.2 million, or 33.2%, from $33.7 million in 2002 to $44.9 million in 2003. The increase was primarily due to a combination of the acquisitions in the United States and investments made in equipment in connection with store renovations in the Canadian store network.
Financial Expenses. Financial expenses decreased by $0.2 million from $15.1 million in 2002 to $14.9 million in 2003. The decrease is due to lower interest rates.
Income Tax Expense. Income tax expense increased by $6.1 million, or 23.6%, from $25.8 million in 2002 to $31.9 million in 2003. The increase is due to higher pre-tax income offset by a slightly lower effective tax rate. The combined statutory tax rate in Canada decreased in 2003 to 37.6%, compared to 39.9% in 2002.
Net earningsamounted to $66.0 million in 2003 or $0.78 per share ($0.76 fully diluted), compared with $47.3 million or $0.61 per share ($0.58 fully diluted) for the prior year.
Critical Accounting Policies and Estimates
Estimates. This discussion and analysis of financial condition and results of operations is based on Couche-Tard’s consolidated financial statements, which have been prepared in accordance with Canadian generally accepted accounting principles. The reported amounts of sales and operating expenses, and of assets and liabilities and the related disclosure of contingent assets and liabilities are based on estimates and judgments made by Couche-Tard. Couche-Tard bases its estimates on assumptions that it believes to be reasonable, including, for example, ones derived from historical experience. On an ongoing basis, Couche-Tard reviews its estimates and assumptions based upon currently available information. Actual results could differ from the estimates and assumptions used.
Inventory. Couche-Tard’s inventory is comprised mainly of products purchased for resale including grocery items, tobacco products, packaged and fresh food products, motor fuel and lottery tickets. Inventories are valued either on the first-in, first-out basis or at the lower of cost and net realizable value. Cost is generally determined by the retail method for in-store merchandise, the average cost method for motor fuel inventory and cost for warehouse inventory. Inherent in the determination of gross profit margins are certain management judgments and estimates, which could affect ending inventory valuations and results of operations.
Depreciation and Amortization. Assets that are expected to be consumed in the conduct of Couche-Tard’s business with a probability of having to be replaced in a future year are amortized on a basis that will reduce the asset to a nominal value over its expected useful life. The depreciation methods and associated periods or rates are based on Couche-Tard’s experience in prior years. The use of different assumptions could have resulted in different amounts expensed compared to those recorded.
Because the depreciation methods and rates used in Circle K differ from those used by Couche-Tard and in light of the number of acquisitions recently completed in the United States, we will be undertaking an analysis of the expected useful lives of our fixed assets and such process could result in modifications to existing depreciation and amortization policies in fiscal 2005.
47 |
Goodwill.Goodwill is tested for impairment annually or whenever events or changes in circumstances indicate that the carrying value may not be recoverable. Factors that could trigger an impairment review include significant underperformance relative to expected historical or projected future operating results, significant changes in the manner of use of acquired assets or the strategy for the overall business, and significant negative industry or economic trends. Couche-Tard’s goodwill impairment analysis uses estimates and assumptions in order to determine the fair value of its reporting units. If assumptions are incorrect, the carrying value of our goodwill may be overstated. Couche-Tard’s annual impairment test is performed in the first quarter of each fiscal year.
Trademarks, licenses and other assets.Trademarks, licenses and permits are recorded at cost and not amortized; rather, they are tested for impairment annually, or more frequently, if events or circumstances indicate that the asset might be impaired.
Other assets include trademarks, licenses and permits recorded at cost, deferred costs at amortized cost and other expenses at cost.
Deferred expenses are mainly financing costs amortized using the current interest rate method over the period of the corresponding debt, and costs incurred in connection with the analysis and signing of operating lease agreements which are deferred are amortized over the lease term. Other deferred charges are amortized on a straight-line basis over a period of five to seven years.
Environmental Matters.Couche-Tard makes estimates of its liabilities in order to accrue for the future costs of environmental remediation related to its operating and non-operating properties where releases of regulated substances have been detected. The estimates of the anticipated future costs for environmental remediation are based on historical experience and evaluations provided by environmental consultants. Couche-Tard establishes reserves on a site-by-site basis and updates its reserves annually. In cases where it is probable that corrective action will be required, if remediation costs can be reasonably estimated, Couche-Tard records such costs as a liability described as a reserve for site restoration. Based on currently available information, Couche-Tard believes that it has adequately provided for environmental exposures. However, should these matters be unfavorably resolved with respect to Couche-Tard, they could have a material adverse effect on its financial condition and results of operations.
Some U.S. states have trust funds and reimbursement programs for environmental remediation of motor fuel releases from underground store tanks. A portion of the outlays for environmental remediation in such states may be reimbursable to Couche-Tard under these programs. When Couche-Tard records a liability arising from environmental remediation, it records an asset consisting of the related expected receivable. Most of the trust funds and reimbursement programs have eligibility requirements, caps on reimbursement or payment restrictions, which make recovery uncertain in some circumstances, and those uncertainties are reflected in the amount of the receivable asset established. Historical collection experience, the financial capability of the trust fund, priority for payment and the expected year of receipt of reimbursement are also considered. Because governmental requirements and state reimbursement programs continue to be implemented and revised, Couche-Tard’s estimated future remediation expenditures and related state reimbursement amounts could change, and may also be affected by changes in governmental enforcement policies and newly discovered information. Such revisions could have a material impact on its operations and financial conditions.
Couche-Tard also receives occasional claims for alleged damage to neighbouring properties or the groundwater or other natural resources on such properties from regulated substances released from its current and past properties. As well, it is possible for personal injury claims to be made alleging injuries from regulated substances released from its properties, although we have not received this type of claim to date. The consequences of the property and personal injury claims described in this paragraph, if received, could be material to Couche-Tard’s financial condition.
In the United States, Couche-Tard is required in some states to obtain insurance or otherwise establish its financial responsibility for third party claims. Couche-Tard cannot provide assurances that the insurance it obtains will be available on terms that do not adversely affect its financial condition. Despite the availability of trust funds and reimbursement programs for petroleum releases in certain states, these funds are limited in coverage and in some cases slow to pay.
Insurance and Workers’ Compensation.Couche-Tard uses a combination of insurance, self-insured retention, and self-insurance for a number of risks including workers’ compensation (in certain states), property damage, and general liability claims. Accruals for loss incidences are made based on Couche-Tard’s claims experience and actuarial assumptions followed in the insurance industry. A material revision to Couche-Tard’s liability could result from a significant change to its claims experience or the actuarial assumptions of its insurers. Actual losses could differ from accrued amounts. Workers’ compensation is covered by government-imposed insurance in Canada and by third-party insurance in our United States operations, except in certain states where Couche-Tard is self-insured. The coverages in Canada are determined by each provincial regulatory authority and provide for premiums, which can vary, year-to-year based on industry claims experience. The cost can also increase or decrease in any one year based on claims’ experience within each province as assessed by each provincial regulatory authority. With respect to the third-party insurance in the United States, independent actuarial estimates of the aggregate liabilities for claims incurred serve as a basis for Couche-Tard’s share of workers’ compensation losses.
48 |
Operating Leases.In the normal course of business, Couche-Tard enters into leases for land and buildings associated with its convenience stores sites. In connection with certain acquisitions, Couche-Tard has entered into sale-leaseback transactions with respect to certain store properties. Theses transactions are a source of funding for new store growth and Couche-Tard expects to continue this strategy in connection with future acquisitions.
Vendor Allowances, Rebates and Other Vendor Payments.On January 30, 2004, the Company retroactively adopted by anticipation the new recommendations of Abstract 144 of the Emerging Issues Committee (“EIC-144”) entitledAccounting by a Customer (Including a Reseller) for Certain Consideration Received From a Vendor.(See Note 2 to the consolidated annual financial statements herein below.)
Franchise and License Fees.Fees received in connection with a franchise or license agreement, or renewal thereof, are recognized in sales over the period of the agreement to which the fees relate.
Store Closings and Asset Impairment.Property and equipment used in operations are assessed for impairment whenever changes in facts and circumstances indicate a possible significant deterioration in the future cash flows expected to be generated by an asset group. If, upon review, the sum of the undiscounted pretax cash flows is less than the carrying value of the asset group, the carrying value is written down to estimated fair value. Individual assets are grouped for impairment purposes at the lowest level for which there are identifiable cash flows that are largely independent of the cash flows of other groups of assets. The fair value of impaired assets is determined based on quoted market prices in active markets, if available, or upon the present values of expected future cash flows using discount rates commensurate with the risks involved in the asset group. Long-lived assets committed by management for disposal within one year are accounted for at the lower of amortized cost or fair value, less cost to sell.
Recently Issued Accounting Standards
In January 2003, the CICA issued Accounting Guideline No. 15, “Consolidation of Variable Interest Entities” (“AcG-15”) which harmonizes with FASB Interpretation No. 46, “Consolidation of Variable Interest Entities”, and provides guidance for applying the principles in Section 1590, “Subsidiaries”, to certain special purpose entities. AcG-15 requires enterprises to identify variable interest entities in which they have an interest, determine whether they are the primary beneficiary of such entities and, if so, to consolidate them. In January 2004 the CICA Accounting Standards Board (“AcSB”) suspended the January 1, 2004 effective date for disclosure requirements in AcG-15 and in March 2004, a draft guideline was published proposing that disclosures be made for fiscal years ending on or after October 31, 2004. We expect that this pronouncement will not have a material impact on our results of operations and financial condition.
In March 2003, the CICA issued new Handbook Section 3110, “Asset Retirement Obligations” that established standards for recognition and measurement of a liability for an asset retirement obligation and the associated asset retirement cost. The section provides for an initial recognition of the fair value of a liability for an asset retirement obligation in the period in which it is incurred when a reasonable estimate of fair value can be made. The asset retirement obligation is recorded as a liability with a corresponding increase to the carrying amount of the related long-lived asset. Subsequently, the asset retirement cost is allocated to expenses using a systematic and rational allocation method and is adjusted to reflect period-to-period changes in the liability resulting from passage of time and revisions to either timing or the amount of the original estimate of the undiscounted cash flow. The section is effective for fiscal years beginning on or after January 1, 2004. Section 3110 harmonizes Canadian standards with the requirements of SFAS 143 that Couche-Tard adopted on April 28, 2003. We adopted Section 3110 on April 26, 2004 under Canadian GAAP.
In September and November 2003, the AcSB made amendments to CICA Handbook Section 3870 in respect of Stock-based Compensation and Other Stock-based Payments requiring that the fair-value based method be applied to awards granted to employees, which previously had not been accounted for at fair value. We adopted the fair value method for our stock-based compensation program commencing at the beginning of our 2005 fiscal year.
In December 2003, the CICA Emerging Issues Committee issued Abstracts No. 141 “Revenue Recognition” and No. 142 “Revenue Arrangements with Multiple Deliverables”. The latter is based on Issue No. 06-21 entitled “Revenue Arrangements with Multiple Deliverables issued in May 2003 by the Emerging Issues Task Force of the Financial Accounting Standards Board (FASB) in the United States. EIC’s 141 and 142 provide clarification guidelines for determining when revenue from the sale of goods must be recognized. We already comply with these guidelines and therefore we do not believe EIC 141 and 142 will have any impact on the Company.
49 |
Business Risks
Increases and volatility in crude oil prices and volatility in wholesale petroleum pricing and supply could affect our sales and gross profit.As a result of our expansion in the United States, our motor fuel sales have become a greater component of total sales. For the 52 weeks ending April 25, 2004, our motor fuel sales represented approximately 47% of total sales and our motor fuel gross profit accounted for approximately 17% of our total gross profit. Crude oil and domestic wholesale petroleum markets display significant volatility. Since we typically have no more than a four to five-day supply of motor fuel, we are susceptible to interruptions in the supply of motor fuel at our facilities. General political conditions and instability in oil producing regions, particularly in the Middle East and South America, could significantly and adversely affect crude oil supplies and wholesale petroleum costs. Local supply interruptions may also occur. For example, in August of 2003, a cracked pipeline interrupted the supply of motor fuel to the greater Phoenix area. In addition, any new standards that the U.S. Environmental Protection Agency may impose on petroleum refining that would necessitate changes in the refining process could limit the volume of petroleum products available from refiners in the future. Volatility in wholesale petroleum supply and costs could result in significant changes in the retail price of petroleum products and, if we are unable to fully pass on increases to our customers or if we are required to lower our retail motor fuel prices, in lower fuel gross margin per gallon or litre. In addition, changes in the retail price of petroleum products could dampen consumer demand for motor fuel. These factors could materially influence our motor fuel volume, motor fuel gross profit and overall customer traffic, which, in turn, could have a material adverse effect on our operating results and financial condition.
The convenience store and retail motor fuel industries are highly competitive and affected by new entrants.The industries and geographic areas in which we operate are highly competitive and marked by ease of entry and constant change in terms of the number and type of retailers offering the products and services found in our stores. We compete with other convenience store chains, independent convenience stores, gas station operators, large and small food retailers, local pharmacies and pharmaceutical chains, discount stores, club stores and mass merchants, many of which are well-established companies. In recent years, several non-traditional retail segments have entered the motor fuel retail business, including supermarkets, club stores and mass merchants, and this additional competition has had a negative impact on motor fuel profit margins in the convenience store industry. These non-traditional motor fuel retailers have obtained a significant share of the motor fuel market and their market share is expected to grow. In some of our markets, our competitors have been in existence longer and have greater financial, marketing and other resources than we do. As a result, our competitors may be able to respond better to changes in the economy and new opportunities within the industry. We may not be able to compete successfully against current and future competitors, and competitive pressures faced by us could materially and adversely affect our business, results of operations and financial condition.
We are subject to federal, provincial, state and local environmental laws, and the costs of compliance could require substantial capital expenditures.Our operations are subject to a variety of environmental laws and regulations, including those relating to emissions to the air, discharges into water, releases of hazardous and toxic substances, and remediation of contaminated sites. Under various federal, provincial, state and local laws and regulations, we may, as the owner or operator, be liable for the costs of removal or remediation of contamination at our current locations or our former locations, whether or not we knew of, or were responsible for, the presence of such contamination. In particular, as an owner and operator of motor fuelling stations, we face risks relating to petroleum product contamination, which other convenience store operators not engaged in such activities would not face. The remediation costs and other costs required to clean up or treat contaminated sites could be substantial. Contamination on and from our current or former locations may subject us to liability to third parties or governmental authorities for injuries to persons, property or natural resources and may adversely affect our ability to sell or rent our properties or to borrow money using such properties as collateral.
In the United States, persons who dispose of or arrange for the disposal or treatment of hazardous or toxic substances away from locations used in a business may also be liable for the costs of removal or remediation of such substances at the disposal sites although such sites are not owned by such persons. Although we do not typically arrange for the treatment or disposal of large quantities of hazardous or toxic substances from any location, our current and historic operation of many locations and the disposal of contaminated soil and groundwater wastes generated during cleanups of contamination at such locations could expose us to such liability.
50 |
We are subject to extensive environmental laws and regulations regulating underground storage tanks and vapour recovery systems. Compliance with existing and future environmental laws regulating such tanks and systems may require significant expenditures. In the United States, we pay fees to state “leaking underground storage tank” trust funds in states where they exist. These state trust funds are expected to pay or reimburse us for remediation expenses related to contamination associated with underground storage tanks subject to their jurisdiction. Such payments are always subject to a deductible paid by us, specified per incident caps and specified maximum annual payments which vary among the funds. As well, such funds may have eligibility requirements, which not all of our sites will meet. To the extent state funds, or other responsible parties do not pay or delay payments for remediation, we will be obligated to make these payments, which could materially adversely affect our financial condition and results of operations. We cannot assure you that these funds or responsible third parties are or will continue to remain viable.
The nature of our motor fuel operations and those we acquire present risks of soil and groundwater contamination. In the future, we may incur substantial expenditures for remediation of contamination that has not been discovered at existing locations or locations, which we may acquire. We believe that a significant number of our current locations may be contaminated and expect to discover that contamination through the normal operation of our business in the future. We regularly monitor our facilities for environmental contamination and take reserves on our financial statements to cover potential environmental remediation and compliance costs, as we consider appropriate. However, we cannot assure you that the liabilities for which we have taken reserves are the only environmental liabilities relating to our current and former locations, that material environmental conditions not known to us do not exist, that future laws or regulations will not impose material environmental liability on us or that our actual environmental liabilities will not exceed our reserves. In addition, failure to comply with any environmental regulations or an increase in regulations could materially and adversely affect our operating results and financial condition.
Future tobacco legislation, campaigns to discourage smoking, increases in tobacco taxes and wholesale cost increases of tobacco products could have a material adverse impact on our sales and profit.Tobacco products represent our largest product category of merchandise and service sales. For Couche-Tard’s fiscal year ended April 25, 2004, sales of tobacco products were approximately 38% of total merchandise and service sales. Significant increases in wholesale cigarettes costs and tax increase on tobacco products, as well as future legislation and national and local campaigns to discourage smoking in the United States and Canada, may have an adverse effect on the demand for tobacco products, and therefore reduce our sales and profits.
Competitive pressures in our markets can make it difficult to pass price increases on to our customers. These factors could materially and adversely affect our retail price of cigarettes, cigarette unit volume and sales, merchandise gross profit and overall customer traffic. Because we derive a large percentage of our sales from tobacco products, reduced sales of tobacco products or smaller margins on the sales we make could have a material adverse effect on our operating results and financial condition.
We may face some challenges integrating Circle K and may not realize anticipated cost savings in a timely fashion or at all.The full benefits of a business combination of Couche-Tard and Circle K requires the integration of each company’s administrative, finance, sales and marketing organizations, and the implementation of appropriate operations, financial and management systems and controls in order to capture the efficiencies and the cost reductions that are anticipated to result from the Acquisition. This requires substantial attention from our management team. The diversion of management attention, as well as any other difficulties which may be encountered in the transition and integration process, could have an adverse impact on our sales and operating results. There can be no assurance that we will be able to successfully integrate Couche-Tard’s operations and the operations of Circle K. Moreover, in order to obtain the cost savings that integration may provide, we may be required to make capital expenditures. Any savings that we may achieve may not be recognized during the same period in which capital expenditures are made.
Because we depend on the experience and industry knowledge of our management, we would be adversely affected if members of our management team left us.Our senior management team, including Mr. Alain Bouchard, our Chairman, President and Chief Executive Officer, Mr. Richard Fortin, Executive Vice-President and Chief Financial Officer, Mr. Réal Plourde, Executive Vice-President and Chief Operating Officer, Mr. Jacques D’Amours, Vice-President of Administration and the heads of our operating divisions, including our nine operational vice-presidents, who are principally responsible for our operations under our decentralized management structure, are integral parts of our management team and are key elements of our business operations. Our future success depends on our ability to retain this team. If, for any reason, our senior executives and divisional vice-presidents do not continue to be active in management, our business, financial condition or results of operations could be adversely affected. We do not enter into employment agreements or non-competition agreements with our officers. Although we believe that current management will remain active in the business and that we will continue to be able to attract and retain other talented personnel and replace key personnel should the need arise, competition in recruiting replacement personnel could be significant. If we are not successful in retaining our key personnel or replacing them, our business, financial condition or results of operations could be adversely affected. In particular, although we intend to retain a significant portion of Circle K’s operational management personnel, no assurances can be given that we will be successful in employing or retaining such persons.
51 |
Acquisitions have been a substantial part, and are expected to continue to be a part, of our growth strategy, which could expose us to significant business risks.Acquisitions have been a significant part of our growth strategy. We expect to continue to selectively seek strategic acquisitions in the future. Our ability to consummate and to integrate effectively any future acquisitions on terms that are favorable to us may be limited by the number of attractive acquisition targets, internal demands on our resources and, to the extent necessary, our ability to obtain financing on satisfactory terms for larger acquisitions, if at all. Acquisitions may expose us to additional risks, including:
| • | difficulties in integrating administrative, financial reporting, operational and information systems and managing newly-acquired operations and improving their operating efficiency; |
|
|
|
| • | difficulties in maintaining uniform standards, controls, procedures and policies across all of our businesses; |
|
|
|
| • | entry into markets in which we have little or no direct prior experience; |
|
|
|
| • | difficulties in retaining key employees of the acquired operations; |
|
|
|
| • | disruptions to our ongoing business; and |
|
|
|
| • | diversion of management time and resources. |
In addition, future acquisitions could result in the incurrence of additional debt, costs, and contingent liabilities. We may also incur costs and divert management attention for potential acquisitions, which are never consummated. For acquisitions we do consummate, expected synergies may not materialize. Our failure to effectively address any of these issues could adversely affect our results of operations, financial condition and ability to service debt, including the notes.
Although we have historically performed a due diligence investigation of the businesses or assets that we acquire, and anticipate continuing to do so for future acquisitions, there may be liabilities of the acquired business or assets that we fail or are unable to uncover during our due diligence investigation and for which we, as a successor owner, may be responsible. When feasible, we seek to minimize the impact of these types of potential liabilities by obtaining indemnities and warranties from the seller, which may in some instances be supported by deferring payment of a portion of the purchase price. However, these indemnities and warranties, if obtained, may not fully cover the liabilities because of their limited scope, amount or duration, the financial resources of the indemnitor or warrantor or other reasons.
We may experience difficulties in executing key aspects of our business strategy or in differentiating ourselves from our competitors.The future success of our business is highly dependent upon effectively implementing our business strategy and differentiating ourselves from our competitors. We may experience difficulties in executing key aspects of our business strategy. For example, we may be limited in our ability to implement our Store 2000 Concept in additional stores because of a number of factors, including limited capital expenditure resources and restrictions contained in our senior credit facility. In addition, our in-store branding strategies may be less successful than we anticipate in increasing our profit margins. We may be unable to obtain new QSR franchises, and it is possible that our existing QSR franchises would be cancelled. We may also be less successful than anticipated in achieving volume-purchasing benefits. Furthermore, we may experience difficulty in differentiating ourselves from our competitors if our competitors are able to successfully employ business strategies similar to ours or if market conditions or demographics reduce what we believe to be our competitive advantages. While each of these factors applies to our Couche-Tard stores, the risks particularly apply to our Circle K stores because of potential complications in integrating the Circle K stores into our operations and because the Circle K stores are located in markets in which we have not previously operated.
We are subject to government regulations relating to, among other things, alcohol, tobacco and minimum wage.Our business and properties are subject to governmental laws and regulations including, but not limited to, employment laws and regulations, regulations governing the sale of alcohol and tobacco, minimum wage requirements and other laws and regulations.
In certain areas where our stores are located, provincial, state or local laws limit the stores’ hours of operation or their sale of alcoholic beverages, tobacco products, possible inhalants and lottery tickets, in particular to minors. Failure to comply with these laws could adversely affect our sales and results of operations because these state and local regulatory agencies have the power to revoke, suspend or deny applications for and renewals of permits and licenses relating to the sale of these products or to seek other remedies.
Regulations related to wages also affect our business. Any appreciable increase in the statutory minimum wage would result in an increase in our labor costs and such cost increase, or the penalties for failing to comply with such statutory minimums, could adversely affect our business, financial condition and results of operations.
52 |
Any change in the legislation or regulations described above that is adverse to us and our properties could affect our operating and financial performance. In addition, new regulations are proposed from time to time which, if adopted, could have a material adverse effect on our operating results and financial condition.
We are subject to short term interest rate fluctuations.Since approximatly 98% of our long-term debt is directly or indirectly (through interest rate swaps) based on variable interest rate of no longer than six months in duration, the Company can experience interest expense variances solely based on changes in short term interest rates.
We are subject to currency exchange risk.A substantial portion of our sales is expected to be made in the United States. In our consolidated financial statements, we translate our local currency financial results into Canadian dollars based on average exchange rates prevailing during a reporting period or the exchange rate at the end of the period. During times of a strengthening Canadian dollar, at a constant level of business, our reported U.S. sales and earnings will be reduced because the local currency will translate into fewer Canadian
Substantially all of our indebtedness is denominated in U.S. dollars, while a significant portion of our revenue and cash flow is expected to be generated from our Canadian operations. To the extent that the cash flow generated from our U.S. operations is not sufficient to satisfy the ongoing payment obligations under our U.S. dollar denominated debt, we will need to convert Canadian dollars into U.S. dollars in order to make the necessary payments. Accordingly, a strengthening of the U.S. dollar against the Canadian dollar could make it more difficult for us to repay our indebtedness.
Given the volatility of exchange rates, we may not be able to manage our currency risks effectively, which could have a material adverse effect on our financial condition or results of operations.
Lawsuits relating to tobacco products.We sell cigarettes and other tobacco-related products at all of our convenience stores. In addition, Couche-Tard sells a brand of cigarettes that is manufactured to be sold by it on an exclusive basis, and Circle K has its own private label brand of cigarettes. We are not currently a named party in any health-related tobacco litigation. However, various health-related legal actions, proceedings and claims arising out of the sale, distribution, manufacture, development, advertising and marketing of cigarettes have been brought against vendors of tobacco products and may be instituted against us in the future. Damages in amounts escalating into the hundreds of millions and even billions of dollars have been pleaded in suits brought against vendors of cigarettes. An unfavorable verdict against us in any health-related suit could adversely affect our financial condition and ability to pay interest and principal on the notes. Moreover, we have not established any reserves for the payment of expenses or adverse results related to any potential health-related litigation.
Changes in regional economic conditions may influence the retail industry, consumer preferences and spending patterns.Our sales may be negatively influenced by changes in regional or local economic variables and consumer confidence. External factors that affect economic variables and consumer confidence and over which we exercise no influence include unemployment rates, levels of personal disposable income and regional or local economic conditions. Changes in economic conditions could adversely affect consumer spending patterns, travel and tourism in certain of our market areas. Some of our stores are located in coastal, resort or tourist destinations and, historically, travel and consumer behavior in such markets is more severely affected by weak economic conditions.
We may be subject to losses that might not be covered in whole or in part by our insurance coverage.We carry comprehensive liability, fire and extended coverage insurance on most of our facilities, with policy specifications and insured limits customarily carried in our industry for similar properties. The cost of our insurance policies has increased recently. In addition, some types of losses, such as losses resulting from wars, acts of terrorism, or natural disasters, generally are not insured because they are either uninsurable or not economically practical. Moreover, insurers recently have become more reluctant to insure against these types of events. Should an uninsured loss or a loss in excess of insured limits occur, we could lose capital invested in that property, as well as the anticipated future sales derived from the retailing activities conducted at that property, while remaining obligated for any mortgage debt or other financial obligations related to the property. Any such loss could adversely affect our business, results of operations or financial condition.
Acts of war and terrorism could impact our business.Acts of war and terrorism could impact general economic conditions and the supply and price of crude oil. In addition, these events may cause damage to our retail facilities and disrupt the supply of the products and services we offer in our locations. In times of uncertainty, people also tend to travel less and spend more time at home. All these factors could impact our sales, operating results and financial condition.
53 |
Other risks and Outlook
Interest Rate Risk.We are exposed to market risk relating to changes in interest rates relating to our variable rate debt. We have a significant amount of debt, $718.4 million of which, in effect, bears interest at floating rates, including $476.2 million 71/2% notes that are subject to the interest rate swap. Our total annual interest expense, assuming interest rates as they were in effect on April 25, 2004, would be approximately $28.8 million. A one-percentage point increase in interest rates would increase our total annual interest expense by $7.2 million.
Foreign Exchange Risk.Our investment in assets in the United States has been financed, for the most part, by U.S. dollar denominated debt. This strategy reduces the impact on our net U.S. assets relating to fluctuations in the value of the Canadian dollar relative to the U.S. dollar. The foreign exchange exposure as of April 25, 2004 is set out below (in thousands):
| Net U.S. assets in U.S. dollars |
|
| US$ | 736,771 |
|
| Interest bearing debt denominated in U.S. dollars |
|
| US$ | 534,531 |
|
| Net U.S. assets less interest bearing debt denominated in U.S. dollars |
|
| US$ | 202,240 |
|
There was a negative impact of approximately $3.1 million to our 2004 net earnings due to the increase in the Canadian dollar relative to the U.S. dollar.
Seasonality.Weather conditions can have an impact on our sales as historical purchase patterns indicate that our customers increase their transactions and also purchase higher margin items when weather conditions are favorable. Consequently, our results are seasonal and typically more profitable during the summer months. Motor fuel volumes and margins are also seasonal as volumes increase during the summer driving season as well as margins. Motor fuel margins are subject to fluctuation due to supply changes and can differ from historical norms.
Outlook
Integrating Circle K is a major priority for 2004-2005. However, we will also focus on innovation to remain leaders in terms of differentiation in the North American market. We will step up the implementation of our Store 2000 Concept, which is now in place in some 1,000 of our stores. We will thus convert about 300 stores during the year, while launching new products and services and developing our successful brands. Expanding and diversifying our QSRs is also a priority, and we plan to set up an additional 75 restaurants co-branded with our stores, bringing our network to 320 QSRs or 9% of the chain. We will continue to expand by opening 70 new stores, and acquiring small networks. We are confident we will achieve solid sales and earnings growth in 2004-2005, due partly to the fact we will benefit from the impact of Circle K for the full year.
July 12, 2004
54 |
The consolidated financial statements of Alimentation Couche-Tard Inc. and financial information contained in this Annual Report are the responsibility of management. This responsibility is based on a judicious choice of accounting procedures and principles, the application of which requires the informed judgment of management. The consolidated financial statements were prepared according to generally accepted accounting principles in Canada and were approved by the Board of Directors. In addition, the financial information included in the Annual Report is consistent with the consolidated financial statements.
Alimentation Couche-Tard Inc. maintains accounting and administrative control systems which, in the opinion of management, ensure reasonable accuracy, relevance and reliability of financial information and well-ordered, efficient management of the Company’s affairs.
The Board of Directors is responsible for approving the consolidated financial statements included in this Annual Report, primarily through its Audit Committee. This Committee, which holds periodic meetings with members of management as well external auditors, reviewed the consolidated financial statements of Alimentation Couche-Tard Inc. and recommended their approval to the Board of Directors.
The enclosed consolidated financial statements were audited by Raymond Chabot Grant Thornton, Chartered Accountants, and their report indicates the extent of their audit and their opinion on the consolidated financial statements.
| Chairman of the Board, |
| Executive Vice-President |
|
|
|
|
| “Alain Bouchard” |
| “Richard Fortin” |
| (signed) |
| (signed) |
|
|
|
|
| Alain Bouchard |
| Richard Fortin |
AUDITORS’ REPORT
To the Shareholders of
Alimentation Couche-Tard Inc.
We have audited the consolidated balance sheets of Alimentation Couche-Tard Inc. as at April 25, 2004 and April 27, 2003 and the consolidated statements of earnings, retained earnings and cash flows for each of the years in the three-year period ended April 25, 2004. These financial statements are the responsibility of the Company’s management. Our responsibility is to express an opinion on these financial statements based on our audits.
We conducted our audits in accordance with Canadian generally accepted auditing standards. Those standards require that we plan and perform an audit to obtain reasonable assurance whether the financial statements are free of material misstatement. An audit includes examining, on a test basis, evidence supporting the amounts and disclosures in the financial statements. An audit also includes assessing the accounting principles used and significant estimates made by management, as well as evaluating the overall financial statement presentation.
In our opinion, these consolidated financial statements present fairly, in all material respects, the financial position of the Company as at April 25, 2004 and April 27, 2003 and the results of its operations and its cash flows for each of the years in the three-year period ended April 25, 2004 in accordance with Canadian generally accepted accounting principles.
| “Raymond Chabot Grant Thornton” |
| (signed) |
|
|
| Chartered Accountants |
| General Partnership |
|
|
| Montréal, Canada |
| June 11, 2004 |
55 |
CONSOLIDATED EARNINGS |
|
|
| 2004 (a) |
| 2003 |
| 2002 |
| ||||
|
|
|
|
| |||||||
|
|
| $ |
|
| $ |
|
| $ |
| |
|
|
|
|
|
|
|
|
|
|
| |
Revenues |
|
| 5,872,394 |
|
| 3,315,194 |
|
| 2,391,999 |
| |
| Cost of sales |
|
| 4,649,420 |
|
| 2,565,317 |
|
| 1,809,213 |
| |
|
|
|
|
| |||||||
Gross profit |
|
| 1,222,974 |
|
| 749,877 |
|
| 582,786 |
| |
|
|
|
|
| |||||||
|
|
|
|
|
|
|
|
|
|
| |
| Operating, selling, administrative and general expenses |
|
| 985,531 |
|
| 592,052 |
|
| 460,823 |
| |
| Depreciation and amortization of fixed and other assets (Note 5) |
|
| 74,466 |
|
| 44,948 |
|
| 33,725 |
| |
|
|
|
|
| |||||||
|
|
| 1,059,997 |
|
| 637,000 |
|
| 494,548 |
| |
|
|
|
|
| |||||||
| Operating income |
|
| 162,977 |
|
| 112,877 |
|
| 88,238 |
| |
| Financial expenses (Note 5) |
|
| 31,137 |
|
| 14,894 |
|
| 15,067 |
| |
|
|
|
|
| |||||||
| Earnings before income taxes and write-off of financial expenses |
|
| 131,840 |
|
| 97,983 |
|
| 73,171 |
| |
| Write-off of financial expenses (Note 4) |
|
| 12,463 |
|
| — |
|
| — |
| |
|
|
|
|
| |||||||
| Earnings before income taxes |
|
| 119,377 |
|
| 97,983 |
|
| 73,171 |
| |
| Income taxes (Note 6) |
|
| 39,872 |
|
| 31,942 |
|
| 25,834 |
| |
|
|
|
|
| |||||||
Net earnings |
|
| 79,505 |
|
| 66,041 |
|
| 47,337 |
| |
|
|
|
|
| |||||||
|
|
|
|
|
|
|
|
|
|
| |
| Earnings per share (Note 7) |
|
|
|
|
|
|
|
|
|
| |
| Basic |
|
| 0.89 |
|
| 0.78 |
|
| 0.61 |
|
| Fully diluted |
|
| 0.85 |
|
| 0.76 |
|
| 0.58 |
|
The accompanying notes are an integral part of the consolidated financial statements.
(a) | For the year ended April 25, 2004, the Company modified the presentation of certain direct costs, related mainly to the sale of telephone cards. Costs in the amount of $59,269 in 2003 and $51,593 in 2002 that were presented in cost of sales were reclassified and are now presented as a decrease in revenues. As well, the Company modified its presentation of operating income. Under the new presentation, the operating income includes the depreciation and amortization of fixed and other assets. Furthermore, the amortization related to financial expenses is now presented under the financial expenses heading. The amortization of these items was formerly presented under the depreciation and amortization of fixed and other assets heading. |
CONSOLIDATED RETAINED EARNINGS |
|
|
| 2004 |
| 2003 |
| 2002 |
| |||
|
|
|
|
| ||||||
|
| $ |
| $ |
| $ |
| |||
|
|
|
|
|
|
|
|
|
|
|
| Balance at the beginning, as restated (Note 2) |
|
| 183,517 |
|
| 117,476 |
|
| 73,175 |
|
| Net earnings |
|
| 79,505 |
|
| 66,041 |
|
| 47,337 |
|
|
|
|
|
| ||||||
|
|
| 263,022 |
|
| 183,517 |
|
| 120,512 |
|
| Share issue expenses (net of future income taxes of $970 in 2004 and $1,524 in 2002) |
|
| 2,157 |
|
| — |
|
| 3,036 |
|
|
|
|
|
| ||||||
| Balance at the end |
|
| 260,865 |
|
| 183,517 |
|
| 117,476 |
|
|
|
|
|
| ||||||
The accompanying notes are an integral part of the consolidated financial statements.
56 |
CONSOLIDATED CASH FLOWS |
|
|
| 2004 |
| 2003 |
| 2002 |
| ||||
|
|
|
|
| |||||||
|
| $ |
| $ |
| $ |
| ||||
|
|
|
|
|
|
|
|
|
|
| |
Operating activities |
|
|
|
|
|
|
|
|
|
| |
| Net earnings |
|
| 79,505 |
|
| 66,041 |
|
| 47,337 |
| |
| Non-cash items |
|
|
|
|
|
|
|
|
|
| |
| Depreciation and amortization |
|
| 66,802 |
|
| 42,437 |
|
| 29,965 |
|
| Write-off of financial expenses |
|
| 12,463 |
|
| — |
|
| — |
|
| Loss on disposal of fixed assets and other assets |
|
| 2,724 |
|
| 2,051 |
|
| 1,468 |
|
| Future income taxes |
|
| (14,930 | ) |
| 9,719 |
|
| 15,991 |
|
|
|
|
|
| |||||||
|
|
| 146,564 |
|
| 120,248 |
|
| 94,761 |
| |
| Deferred revenues |
|
| 12,148 |
|
| 899 |
|
| 2,056 |
|
| Provision for site restoration costs |
|
| (409 | ) |
| (15 | ) |
| (1,276 | ) |
| Deferred pension expense |
|
| (516 | ) |
| (339 | ) |
| (1,286 | ) |
| Other liabilities |
|
| (2,619 | ) |
| — |
|
| — |
|
| Changes in working capital items (Note 8) |
|
| 158,987 |
|
| 20,585 |
|
| (16,822 | ) |
|
|
|
|
| |||||||
| Cash flows from operating activities |
|
| 314,155 |
|
| 141,378 |
|
| 77,433 |
| |
|
|
|
|
| |||||||
|
|
|
|
|
|
|
|
|
|
| |
Investing activities |
|
|
|
|
|
|
|
|
|
| |
| Business acquisitions (Note 4) |
|
| (1,025,340 | ) |
| (156,248 | ) |
| (128,139 | ) | |
| Liabilities assumed on business acquisitions |
|
| (2,246 | ) |
| — |
|
| — |
| |
| Fixed assets |
|
| (115,208 | ) |
| (86,746 | ) |
| (77,164 | ) | |
| Proceeds from sale and leaseback transactions |
|
| 379,497 |
|
| — |
|
| — |
| |
| Disposal of fixed assets and other assets |
|
| 5,271 |
|
| 3,528 |
|
| 12,077 |
| |
| Goodwill and other assets |
|
| (3,136 | ) |
| (3,503 | ) |
| (3,098 | ) | |
|
|
|
|
| |||||||
| Cash flows from investing activities |
|
| (761,162 | ) |
| (242,969 | ) |
| (196,324 | ) | |
|
|
|
|
| |||||||
|
|
|
|
|
|
|
|
|
|
| |
Financing activities |
|
|
|
|
|
|
|
|
|
| |
| Bank indebtedness |
|
| — |
|
| (7,512 | ) |
| 5,495 |
| |
| Long-term debt net of financing expenses |
|
| 1,123,506 |
|
| 180,233 |
|
| 116,362 |
| |
| Repayment of long-term debt |
|
| (741,909 | ) |
| (40,743 | ) |
| (95,732 | ) | |
| Share issue net of related expenses |
|
| 224,026 |
|
| 4,453 |
|
| 98,292 |
| |
|
|
|
|
| |||||||
| Cash flows from financing activities |
|
| 605,623 |
|
| 136,431 |
|
| 124,417 |
| |
|
|
|
|
| |||||||
| Effect of exchange rate fluctuations on cash and cash equivalents |
|
| 2,302 |
|
| 692 |
|
| (137 | ) | |
|
|
|
|
| |||||||
Net increase in cash and cash equivalents |
|
| 160,918 |
|
| 35,532 |
|
| 5,389 |
| |
| Cash and cash equivalents at the beginning |
|
| 48,404 |
|
| 12,872 |
|
| 7,483 |
| |
|
|
|
|
| |||||||
| Cash and cash equivalents at the end |
|
| 209,322 |
|
| 48,404 |
|
| 12,872 |
| |
|
|
|
|
| |||||||
The accompanying notes are an integral part of the consolidated financial statements.
57 |
CONSOLIDATED BALANCE SHEETS |
|
|
| 2004 |
| 2003 |
| |||
|
|
|
| |||||
|
| $ |
| $ |
| |||
|
|
|
|
|
|
|
| |
Assets |
|
|
|
|
|
|
| |
| Current assets |
|
|
|
|
|
|
| |
| Cash and cash equivalents |
|
| 209,322 |
|
| 48,404 |
|
| Accounts receivable (Note 9) |
|
| 128,518 |
|
| 108,008 |
|
| Inventories (Note 10) |
|
| 374,843 |
|
| 179,874 |
|
| Prepaid expenses |
|
| 16,413 |
|
| 3,487 |
|
| Future income taxes |
|
| 26,539 |
|
| 2,850 |
|
|
|
|
| |||||
|
|
| 755,635 |
|
| 342,623 |
| |
| Fixed assets (Note 11) |
|
| 898,483 |
|
| 441,259 |
| |
| Trademarks, licenses and permits |
|
| 214,474 |
|
| — |
| |
| Goodwill |
|
| 278,911 |
|
| 269,527 |
| |
| Other assets (Note 12) |
|
| 53,275 |
|
| 16,167 |
| |
| Future income taxes |
|
| 32,715 |
|
| 1,602 |
| |
|
|
|
| |||||
|
|
| 2,233,493 |
|
| 1,071,178 |
| |
|
|
|
| |||||
|
|
|
|
|
|
|
| |
Liabilities |
|
|
|
|
|
|
| |
| Current liabilities |
|
|
|
|
|
|
| |
| Accounts payable (Note 14) |
|
| 657,865 |
|
| 293,763 |
|
| Income taxes payable |
|
| 36,548 |
|
| 10,407 |
|
| Future income taxes |
|
| — |
|
| 8,128 |
|
| Instalments on long-term debt |
|
| 6,032 |
|
| 17,986 |
|
|
|
|
| |||||
|
|
| 700,445 |
|
| 330,284 |
| |
| Long-term debt (Note 15) |
|
| 724,500 |
|
| 278,327 |
| |
| Deferred revenues and other liabilities (Note 16) |
|
| 40,077 |
|
| 8,965 |
| |
| Future income taxes |
|
| 21,645 |
|
| 12,953 |
| |
|
|
|
| |||||
|
|
| 1,486,667 |
|
| 630,529 |
| |
|
|
|
| |||||
|
|
|
|
|
|
|
| |
Shareholders’ equity |
|
|
|
|
|
|
| |
| Capital stock (Note 17) |
|
| 485,689 |
|
| 258,536 |
| |
| Contributed surplus |
|
| 1,222 |
|
| 1,222 |
| |
| Retained earnings |
|
| 260,865 |
|
| 183,517 |
| |
| Cumulative translation adjustments (Note 19) |
|
| (950 | ) |
| (2,626 | ) | |
|
|
|
| |||||
|
|
| 746,826 |
|
| 440,649 |
| |
|
|
|
| |||||
|
|
| 2,233,493 |
|
| 1,071,178 |
| |
|
|
|
| |||||
The accompanying notes are an integral part of the consolidated financial statements.
| On behalf of the Board, |
|
|
|
“Alain Bouchard” | “Richard Fortin” |
(signed) | (signed) |
|
|
Alain Bouchard | Richard Fortin |
| Director | Director |
58 |
NOTES TO CONSOLIDATED FINANCIAL STATEMENTS |
|
1 - | GOVERNING STATUTES, NATURE OF OPERATIONS AND YEAR-END DATE |
The Company, incorporated under Part IA of the Companies Act (Québec), operates a network of convenience stores. The Company’s year-end corresponds to the last Sunday of April of each fiscal year.
The Company operates approximately 4,900 convenience stores from which it generates primarily sales of food products, tobacco, beverages, motor fuel and other products. These stores are located in Canada and the United States.
2 - | CHANGES IN ACCOUNTING POLICIES |
Year ended April 25, 2004
Recording of certain considerations received by a vendor
In January 2004, the Emerging Issues Committee of the Canadian Institute of Chartered Accountants (“CICA”) released Abstract 144 (“EIC-144”), “Accounting by a Customer (Including a Reseller) for Certain Consideration Received From a Vendor”.
EIC-144 specifies the accounting methods to be applied to certain considerations received from a vendor. EIC-144 should be applied retroactively to all financial statements for annual and interim periods ending after August 15, 2004. The Company adopted these new recommendations both early and retroactively on January 30, 2004.
EIC-144 stipulates that cash consideration received by a company from a vendor is presumed to be a reduction of the prices of the vendor’s products or services and should, therefore, be accounted for as a reduction of cost of sales and related inventory when recognized in the company’s income statement and balance sheet.
However, that presumption is overcome when:
i) | The consideration is either a payment for assets or services delivered to the vendor, in which case the cash consideration should be accounted for as revenue in the income statement. However, any amount in excess of the estimated fair value of the assets or services delivered should be accounted for as a reduction of cost of sales and related inventory when recognized in the company’s income statement and balance sheet. |
|
|
ii) | The consideration is a reimbursement of costs incurred by the Company to sell the vendor’s products, in which case the cash consideration should be accounted for as a reduction of costs when recognized in the company’s income statement. However, any amount in excess of costs that is reimbursed should be accounted for as a reduction of cost of sales and of related inventories. |
For the year ended April 25, 2004, application of EIC-144 resulted in a $1,025 increase ($287 in 2003 and $2,849 in 2002) in the cost of goods sold and a decrease in net earnings of $711 ($193 in 2003 and $1,725 in 2002).
The following tables illustrate the impact of applying EIC-144 for previous years:
Consolidated earnings and consolidated retained earnings
|
| 2003 |
| 2002 |
| ||||||||||||
|
|
|
| ||||||||||||||
|
| As reported |
| As restated |
| As reported |
| As restated |
| ||||||||
|
|
|
|
|
| ||||||||||||
|
| $ |
| $ |
| $ |
| $ |
| ||||||||
|
|
|
|
|
|
|
|
|
|
|
|
|
|
|
|
|
|
| Operating income |
|
| 113,164 |
|
|
| 112,877 |
|
|
| 91,087 |
|
|
| 88,238 |
|
|
| Income taxes |
|
| 32,036 |
|
|
| 31,942 |
|
|
| 26,958 |
|
|
| 25,834 |
|
|
| Net earnings |
|
| 66,234 |
|
|
| 66,041 |
|
|
| 49,062 |
|
|
| 47,337 |
|
|
| Retained earnings, beginning of year |
|
| 121,924 |
|
|
| 117,476 |
|
|
| 75,898 |
|
|
| 73,175 |
|
|
| Basic net earnings per share |
|
| 0.78 |
|
|
| 0.78 |
|
|
| 0.63 |
|
|
| 0.61 |
|
|
| Diluted net earnings per share |
|
| 0.76 |
|
|
| 0.76 |
|
|
| 0.60 |
|
|
| 0.58 |
|
|
Consolidated cash flows
|
| 2003 |
| 2002 |
| ||||||||||||
|
|
|
| ||||||||||||||
|
| As reported |
| As restated |
| As reported |
| As restated |
| ||||||||
|
|
|
|
|
| ||||||||||||
|
| $ |
| $ |
| $ |
| $ |
| ||||||||
|
|
|
|
|
|
|
|
|
|
|
|
|
|
|
|
|
|
| Net earnings |
|
| 66,234 |
|
|
| 66,041 |
|
|
| 49,062 |
|
|
| 47,337 |
|
|
| Future income taxes |
|
| 9,813 |
|
|
| 9,719 |
|
|
| 17,115 |
|
|
| 15,991 |
|
|
| Changes in working capital items |
|
| 20,298 |
|
|
| 20,585 |
|
|
| (19,671 | ) |
|
| (16,822 | ) |
|
Consolidated balance sheet
|
|
|
|
|
|
|
|
|
| 2003 |
| ||||||
|
|
|
|
|
|
|
|
|
|
| |||||||
|
|
|
|
|
|
|
|
|
| As reported |
| As restated |
| ||||
|
|
|
|
|
|
|
|
|
|
|
| ||||||
|
|
|
|
|
|
|
|
|
| $ |
| $ |
| ||||
| Inventories |
|
|
|
|
|
|
|
|
|
| 188,848 |
|
|
| 179,874 |
|
|
| Future income taxes (current assets) |
|
|
|
|
|
|
|
|
|
| 1,647 |
|
|
| 2,850 |
|
|
| Goodwill |
|
|
|
|
|
|
|
|
|
| 268,612 |
|
|
| 269,527 |
|
|
| Future income taxes (current liabilities) |
|
|
|
|
|
|
|
|
|
| 10,463 |
|
|
| 8,128 |
|
|
| Retained earnings |
|
|
|
|
|
|
|
|
|
| 188,158 |
|
|
| 183,517 |
|
|
| Cumulative translation adjustments |
|
|
|
|
|
|
|
|
|
| (2,746 | ) |
|
| (2,626 | ) |
|
59 |
NOTES TO CONSOLIDATED FINANCIAL STATEMENTS | |
| |
2 - | CHANGES IN ACCOUNTING POLICIES (continued) |
Impairment of long-lived assets
In December 2002, the CICA issued a new Handbook section 3063 entitled “Impairment of Long-lived Assets”. This section sets out standards for recognizing, measuring and reporting the impairment of long-lived assets. It supersedes the write-down provisions included in Section 3061, “Property, Plant and Equipment”. This new section requires that the Company recognize an impairment loss for long-lived assets to be kept and used when events or changes in circumstances result in their carrying amount exceeding the sum of the undiscounted cash flows expected to result from their use and eventual disposition. The impairment loss is equivalent to the amount by which the asset’s carrying amount exceeds its fair value. In accordance with the new CICA Handbook recommendations, Section 3063 applies prospectively for years beginning on or after April 1, 2003.
This modification of accounting principles was applied prospectively beginning April 28, 2003 and had no material impact on the carrying amount of the Company’s tangible assets.
Guarantees
In February 2003, the CICA issued Accounting Guideline number 14 (AcG-14), ‘‘Disclosure of Guarantees’’. This guideline provides information related to disclosures to be provided under certain guarantees. The Company adopted these new recommendations as at April 28, 2003.
In the normal course of its activities, the Company enters into various agreements as per the definition of a guarantee set out in AcG-14. AcG-14 stipulates that a guarantee (or indemnification) eventually requires the Company to make payments to a third party based on (i) changes in an underlying related to an asset, liability, or an equity security of the indemnified party, or (ii) another entity’s failure to perform under an obligating agreement, or (iii) failure of a third party to make payment for a debt that has reached maturity.
As at April 25, 2004, there are no material guarantees, as per the definition of AcG-14 issued by the Company.
Year ended April 27, 2003
Stock-based compensation and other stock-based payments
On April 29, 2002, the Company adopted prospectively the new recommendations of the CICA Handbook, Section 3870, entitled “Stock-based Compensation and Other Stock-based Payments”. This section defines notably recognition, measurement and disclosure standards for stock-based compensation to employees. These standards define a fair value-based method of accounting and encourage entities to adopt this method of accounting for its stock-based employee compensation plans. Under this method, compensation cost should be measured at the grant date based on the fair value of the award and should be recognized over the related service period. An entity that does not adopt the fair value method of accounting for its awards granted to employees is required to include in its financial statements pro forma disclosures of net income and earnings per share as if the fair value method of accounting had been applied. The Company has adopted the latter alternative treatment (See Note 18).
According to the transitional provisions in Section 3870, the Company must, as of its fiscal year beginning on April 26, 2004, apply the compensation cost related to the options granted after April 28, 2002 directly to earnings.
Year ended April 28, 2002
Earnings per share
During the year ended April 28, 2002, the Company adopted, on a retroactive basis, the new recommendations of the CICA Handbook, Section 3500, regarding the calculation and presentation of earnings per share information. According to the new recommendations, the treasury stock method should be used instead of the imputed earnings approach to determine the dilutive effect of warrants and stock options for the purpose of calculating diluted earnings per share. The adoption of these new recommendations had a negligible impact on diluted earnings per share calculation.
Goodwill and other intangible assets
During the year ended April 28, 2002, the Company adopted, on a prospective basis, the new recommendations issued by the CICA Handbook, Section 3062, entitled “Goodwill and Other Intangible Assets” with respect to goodwill and other intangible assets. According to the new recommendations, goodwill and other intangible assets with a useful life determined to be indefinite are no longer amortized and are tested for impairment, either annually or more frequently if events or situations indicate possible impairment.
3 - | ACCOUNTING POLICIES |
Accounting estimates
The preparation of financial statements in accordance with Canadian generally accepted accounting principles requires management to make estimates and assumptions that affect the amounts recorded in the financial statements and notes to financial statements. These estimates are based on management’s best knowledge of current events and actions that the Company may undertake in the future. Actual results may differ from those estimates.
Principles of consolidation
The consolidated financial statements include the accounts of the Company and of its subsidiaries, all of which are wholly owned.
60 |
NOTES TO CONSOLIDATED FINANCIAL STATEMENTS | |
| |
3 - | ACCOUNTING POLICIES (continued) |
Foreign currency translation
The U.S. subsidiaries’ assets and liabilities are translated into Canadian dollars using the exchange rate in effect at the balance sheet date since these subsidiaries are considered to be self-sustaining from a financial and operational standpoint. Revenues and expenses are translated at the average rate in effect during the year. Gains and losses are shown under the cumulative translation adjustments account in the shareholders’ equity.
The Company has designated its entire long-term debt denominated in U.S. dollars as a hedge of its net investment in its self-sustaining foreign subsidiaries. Accordingly, the related exchange gains or losses are also presented under the cumulative translation adjustments account.
Earnings per share
Basic earnings per share is calculated by dividing the net earnings available to Class “A” and Class “B” shareholders by the weighted average number of Class “A” and Class “B” shares outstanding during the year. Diluted earnings per share is calculated using the treasury stock method which assumes that all stock options with an exercise price that is lower than the average market price will be exercised and that proceeds from these options will be used to repurchase Class “B” shares of the Company at their average market price during the year.
Revenue recognition
The Company recognizes revenue at the time of sale in stores.
Operating, selling, administrative and general expenses
The main items representing operating, selling, administrative and general expenses are labour expenses building occupancy expenses and head office expenses.
Operating, selling, administrative and general expenses also include advertising expenses that are charged as incurred and that totalled $18,367 in 2004, $10,679 in 2003, and $8,214 in 2002.
Cash and cash equivalents
Cash includes cash and demand deposits. Cash equivalents include highly liquid investments that can be converted into cash for a set amount and that mature less than three months from the date of acquisition.
Allowance for doubtful accounts
Allowance for doubtful accounts provides for estimated losses on accounts receivable. The allowance is established based upon a review of the aggregate accounts, loss experience, economic conditions and other pertinent factors. Account losses are charged and recoveries are credited to the allowance for doubtful accounts. The collection policies and procedures of the Company vary by type of account receivable and prior payment history.
Inventory valuation
Inventory is valued at the lesser of cost and the net realization value. Cost of merchandise — distribution centres is determined according to the first in first out method, the cost of merchandise — retail is valued based on the retail price less the normal margin and the cost of motor fuel inventory is determined according to the average cost method.
Supplier rebates
Amounts collected pursuant to agreements with suppliers, before the revenue recognition criteria is satisfied, are deferred. Under EIC-144, as mentioned in Note 2, these amounts are included in the calculation of operating income either at the time of sale or based on the term of the supplier agreement, as specified in each agreement.
Income taxes
The Company uses the tax liability method to account for income taxes. Under this method, future tax assets and liabilities are determined according to differences between the carrying amounts and tax bases of assets and liabilities. They are measured by applying enacted or substantively enacted tax rates and laws at the date of the financial statements for the years in which the temporary differences are expected to reverse. It is more likely than not that all of the future income tax assets will be realized.
Depreciation
Fixed assets are depreciated over their useful lives. With the exception of the periods and annual rates relating to the fixed assets acquired from Circle K which are described below, the fixed assets are depreciated according to the following period and annual rates:
| Methods |
| Period |
|
| ||
| Buildings and parking lots | Diminishing balance |
| 5% |
|
|
|
|
| Petroleum infrastructure and leasehold improvements | Straight-line |
| 7% |
|
|
|
|
| Equipment | Diminishing balance |
| 15% to 30% |
|
|
|
|
| Signs | Diminishing balance |
| 20% |
|
|
|
|
Buildings under capital leases | Straight-line |
| Lease term |
61 |
NOTES TO CONSOLIDATED FINANCIAL STATEMENTS | |
| |
3 - | ACCOUNTING POLICIES (continued) |
Depreciation (continued)
Fixed assets relating to the operations acquired from Circle K (see Note 4) are amortized according to the straight-line method and the following periods:
| Period |
| |
| Buildings and parking lots | 3 to 40 years |
| Petroleum infrastructures and leasehold improvements | 3 to 40 years |
| Equipment | 1 to 15 years |
| Signs | 3 to 7 years |
| Buildings under capital leases | 1 to 15 years |
Given that Circle K uses different methods and rates for amortizing fixed assets, as is explained above, and given the large number of acquisitions which have been made recently in the U.S., the Company will perform an analysis of the estimated useful lives of all of its fixed assets. This could result in amendments being made to the amortization methods currently being used.
Goodwill
Goodwill is the excess of the purchase price of an acquired business over the fair value of underlying net assets acquired at the time of acquisition. Goodwill is not amortized. It is rather tested for impairment annually, or more frequently if events or changes in circumstances indicate that it might be impaired. The impairment test consists of a comparison of the fair value of the Company’s reporting units with their carrying amount. The fair value of the reporting units is determined according to an estimate of future discounted cash flows. When the carrying amount of a reporting unit is greater than its fair value, the Company compares the fair value of the goodwill related to the reporting units with its carrying amount. Any impairment in the carrying amount of goodwill is charged to income.
Trademarks, licenses and other assets
Trademarks, licenses and permits are recorded at cost and are not amortized; rather, they are tested for impairment annually, or more frequently, if events or circumstances indicate that the asset might be impaired.
Other assets include deferred charges at amortized cost and deposits.
Deferred charges are mainly financing costs amortized using the current interest rate method over the period of the corresponding debt and expenses incurred in connection with the analysis and signing of operating leases which are deferred are amortized over the lease term. Other deferred charges are amortized on a straight-line basis over a period of five to seven years.
Employee future benefits
The Company accrues its obligations under employee pension plans and the related costs, net of plan assets. The Company has adopted the following policies with respect to the defined benefit plans:
• | The cost of pension benefits earned by employees is actuarially determined using the projected benefit method prorated on service and is recorded in income as the services are rendered by employees. The calculations reflect management’s best estimate of expected plan investment performance, salary escalation and retirement ages of employees. |
|
|
• | For the purpose of calculating the expected return on plan assets, those assets are valued at fair value. |
|
|
• | The excess of the net actuarial gain (loss) over 10% of the greater of the benefit obligation and the fair value of plan assets is amortized over the average remaining service period of active employees. |
The pension costs recorded in earnings for the defined contribution plan is equivalent to the contributions which the Company is required to pay in exchange for services provided by employees.
Environmental costs
Allowances for site restoration costs represent the estimated future cost of ensuring that the soil and sub-soil meet government standards for sites for which it is the Company’s responsibility to restore. The obligation is recognized on the earlier of the following dates: the date on which the contaminant is discovered or the date on which operations on the site are discontinued. The estimated amount of future restoration costs is reviewed regularly based on available information and governing legislation. Where the forecast restoration costs, less any amount to be recovered from third parties, exceed existing provisions, an expense is recognized in the year during which the shortfall has been identified.
Stock-based compensation plan
The Company offers a stock option plan as described in Note 18. No amount is recognized for this plan when the share purchase options are issued to employees, managers and directors. Any consideration received when holders exercise their options is credited to capital stock. Since the Company does not account for stock options awarded to employees using the fair value based method, it discloses pro forma information regarding net earnings and earnings per share which are calculated as if the fair value based accounting method had been used to account for stock options awarded (See Note 18).
62 |
NOTES TO CONSOLIDATED FINANCIAL STATEMENTS | |
| |
3 - | ACCOUNTING POLICIES (continued) |
Financial instruments
The Company uses derivative financial instruments by way of interest “swaps” to manage current and forecast risks related to interest rate fluctuations associated with the Company’s debt. The Company does not use speculative derivative financial instruments.
Accordingly, the Company adheres to AcG-13 regarding the identification, designation, documentation and effectiveness of hedge relationships for the purposes of applying hedge accounting.
Based on the Company’s policy, it designates each derivative financial instrument as a hedge against a recognized loan instrument. The Company estimates that derivative financial instruments are efficient hedges, at the time of the establishment of the hedge and the duration of the instrument, since the date to maturity, the reference amount and interest rate of the instruments corresponds to all the conditions of a loan instrument.
The Company uses interest rate swaps as part of its program for managing the combination of fixed and variable interest rates of its debt and the corresponding aggregate loan rate. Interest rate swaps result in an exchange of interest payments without an exchange of principal underlying the interest payments. They are accounted for as an adjustment of accrued interest expense on loan instruments. The corresponding amount to be paid to counterparties or to be received from counterparties is accounted for as an adjustment of accrued interest.
Gains and losses on interest rate swaps, when completed, will be recognized under other current assets or liabilities or under long-term assets or liabilities in the balance sheet and are amortized as an adjustment of accrued interest related to the obligation over the period corresponding to the remaining initial life of the completed swap. In the event of early extinguishment of the debt, any realized or unrealized gains or losses related to the swap will be recognized in the consolidated earnings at the time of the extinguishment of the debt.
4 - | BUSINESS ACQUISITIONS |
During the past three fiscal years, the Company has realized business acquisitions that were recorded using the acquisition method. Income from business acquisitions is included in the consolidated financial statements as of the date of acquisition.
Year ended April 25, 2004
On December 17, 2003, the Company acquired all of the outstanding shares of The Circle K Corporation (Circle K) from ConocoPhillips Company and became the owner of a chain of 1,663 stores in 16 U.S. states, mainly in the southern United States. Circle K also holds franchise or licensing agreements with 627 stores in the United States and 4,003 international license agreements.
Considering the acquisition costs and the amounts payable in accordance with a price adjustment clause, based on the working capital acquired, this acquisition was made for a total consideration of US$831,767 (CA$1,102,507). The transaction was financed in part by issuing 13,555,538 new Class “B” subordinate voting shares (see Note 17), by issuing unsecured subordinate notes maturing in 2014 totalling US$350,000, by new secured credit facilities comprising of revolving term credit of $50,000 and US$75,000, as well as a five-year US$265,000 term loan and a seven-year US$245,000 term loan. These credit facilities replaced the preceding ones in effect as at December 17, 2003. The deferred financing costs relating to the former credit facilities have been written off.
On September 4, 2003, the Company concluded the acquisition of assets of Clark Retail Enterprises Inc. and became the owner of 43 stores in the states of Illinois, Indiana, Iowa, Michigan and Ohio.
Considering the transaction costs, this acquisition was made for a total cash consideration of $41,017. The transaction was financed along with the Company’s existing credit facilities.
Most of the goodwill related to this transaction is expected to be deductible for tax purposes.
The preliminary allocations of the purchase prices of the acquisitions which follow were established based on information available and on the basis of preliminary evaluations. These allocations are subject to change should new information become available and that the strategies of integrating and restructuring assets have been completed. Furthermore, tax consequences of the assets acquired are also preliminary.
|
| Circle K |
| Clark |
| Total |
| |||||
|
|
|
|
| ||||||||
|
| $ |
| $ |
| $ |
| |||||
|
|
|
|
|
|
|
|
|
|
| ||
| Current assets |
|
| 314,603 |
|
|
| 4,943 |
|
| 319,546 |
|
|
| Fixed assets |
|
| 778,812 |
|
|
| 29,900 |
|
| 808,712 |
|
|
| Goodwill |
|
| — |
|
|
| 7,312 |
|
| 7,312 |
|
|
| Trademarks, licenses, permits and other assets |
|
| 210,966 |
|
|
| — |
|
| 210,966 |
|
|
| Future income taxes |
|
| 37,004 |
|
|
| 88 |
|
| 37,092 |
|
|
|
|
|
|
|
|
| ||||||
|
|
| 1,341,385 |
|
|
| 42,243 |
|
| 1,383,628 |
|
|
|
|
|
|
|
|
| ||||||
| Current liabilities assumed |
|
| 218,315 |
|
|
| 632 |
|
| 218,947 |
|
|
| Long-term debt assumed |
|
| 8,913 |
|
|
| — |
|
| 8,913 |
|
|
| Deferred revenues and other liabilities assumed |
|
| 11,650 |
|
|
| 594 |
|
| 12,244 |
|
|
|
|
|
|
|
|
| ||||||
|
|
| 238,878 |
|
|
| 1,226 |
|
| 240,104 |
|
|
|
|
|
|
|
|
| ||||||
| Net assets and total consideration |
|
| 1,102,507 |
|
|
| 41,017 |
|
| 1,143,524 |
|
|
| Less: Cash from the acquisition |
|
| 106,770 |
|
|
| — |
|
| 106,770 |
|
|
|
|
|
|
|
|
| ||||||
| Net assets excluding cash from the acquisition |
|
| 995,737 |
|
|
| 41,017 |
|
| 1,036,754 |
|
|
| Less: Balance to be paid to vendors |
|
| 11,414 |
|
|
| — |
|
| 11,414 |
|
|
|
|
|
|
|
|
| ||||||
| Cash consideration |
|
| 984,323 |
|
|
| 41,017 |
|
| 1,025,340 |
|
|
|
|
|
|
|
|
| ||||||
63 |
NOTES TO CONSOLIDATED FINANCIAL STATEMENTS | |
| |
4 - | BUSINESS ACQUISITIONS (continued) |
Circle K was acquired by paying amounts totalling US$823,156. As at April 25, 2004, an amount of US$8,611 remains payable to vendors.
Clark was acquired by paying the total consideration in cash at the date of acquisition.
Subsequent to the acquisitions of Circle K and Clark, the Company entered into sale leaseback agreements under which certain property, plant and equipment acquired were sold to financial institutions and re-leased to the Company under long-term leases. Most of these long-term leases are for periods of 15 to 17 years, with the possibility of renewal. Minimum lease payments under the leases amount to approximately US$25,500 per year, subject to indexation clauses.
These transactions did not result in any gains or losses for the Company. Proceeds related to these transactions totalled US$267,695, net of related expenses, and was used to repay a portion of the long-term debt incurred for the acquisitions. The portion of deferred financing costs relating to the repaid debt was written off.
Year ended April 27, 2003
On August 20, 2002, the Company acquired certain assets of Dairy Mart Convenience Stores Inc. (“Dairy Mart”) and became the owner of a chain of 285 stores in the states of Ohio, Kentucky, Pennsylvania, Michigan and Indiana. Taking acquisition costs into account, this acquisition was for a total cash consideration of $120,152. The full amount of the transaction was financed through bank loans subsequent to changes in the Company’s long-term credit agreement.
This transaction included a one-year management agreement for 169 additional stores in this network, some of which could, under certain conditions, be acquired by the Company in the months following the acquisition, sold on behalf of Dairy Mart Convenience Stores Inc. or closed. Given the temporary nature of the management agreement, the net amount of sales, cost of sales and other operating costs associated with this agreement are shown under operating, selling, administrative and general expenses. For the year ended April 27, 2003, the management agreement generated sales of $129,344 and operating income of $852.
During the year, the Company made four acquisitions of other store networks in Canada and the United States, for a cash consideration of $36,822 including certain stores managed under the above-mentioned management agreement.
All of these acquisitions, except for the Dairy Mart acquisition, are shown under “Other” in the following table.
Most of the goodwill related to these transactions is expected to be deductible for tax purposes.
The allocation of the purchase price of the above-mentioned acquisitions was determined as follows:
|
| Dairy Mart |
| Other |
| Total |
| ||||
|
|
|
|
| |||||||
|
| $ |
| $ |
| $ |
| ||||
|
|
|
|
|
|
|
| ||||
| Current assets |
|
| 18,814 |
|
|
| 1,628 |
|
| 20,442 |
|
| Fixed assets |
|
| 73,174 |
|
|
| 27,597 |
|
| 100,771 |
|
| Goodwill |
|
| 31,342 |
|
|
| 7,963 |
|
| 39,305 |
|
| Other assets |
|
| — |
|
|
| 308 |
|
| 308 |
|
| Future income taxes |
|
| 590 |
|
|
| — |
|
| 590 |
|
|
|
|
|
|
| ||||||
|
|
| 123,920 |
|
|
| 37,496 |
|
| 161,416 |
|
|
|
|
|
|
| ||||||
| Current liabilities assumed |
|
| 3,768 |
|
|
| 674 |
|
| 4,442 |
|
|
|
|
|
|
| ||||||
| Net assets |
|
| 120,152 |
|
|
| 36,822 |
|
| 156,974 |
|
| Less: Cash from the acquisition |
|
| 627 |
|
|
| 99 |
|
| 726 |
|
|
|
|
|
|
| ||||||
| Cash consideration |
|
| 119,525 |
|
|
| 36,723 |
|
| 156,248 |
|
|
|
|
|
|
| ||||||
Year ended April 28, 2002
On June 22, 2001, the Company acquired some of the operating assets of Johnson Oil Company Inc., which operates a network of convenience stores under the Bigfoot banner in the states of Indiana, Kentucky and Illinois. Considering the transaction costs, this acquisition was made for a total cash consideration of $119,324.
In addition, during the year ended April 28, 2002, the Company acquired three other networks for a cash consideration of $8,815.
All of these acquisitions mentioned above, except the June 22, 2001 acquisition, are shown under “Other” in the following table:
|
| Johnson Oil |
| Other |
| Total |
| |||||
|
|
|
|
| ||||||||
|
| $ |
| $ |
| $ |
| |||||
|
|
|
|
|
|
|
| |||||
| Current assets |
|
|
| 36,961 |
|
|
| 2,647 |
|
| 39,608 |
|
| Fixed assets |
|
|
| 60,137 |
|
|
| 7,779 |
|
| 67,916 |
|
| Goodwill |
|
|
| 57,312 |
|
|
| 1,907 |
|
| 59,219 |
|
|
|
|
|
|
|
| ||||||
|
|
|
| 154,410 |
|
|
| 12,333 |
|
| 166,743 |
|
|
|
|
|
|
|
| ||||||
| Current liabilities assumed |
|
|
| 34,638 |
|
|
| 3,206 |
|
| 37,844 |
|
| Note payable |
|
|
| 448 |
|
|
| 312 |
|
| 760 |
|
|
|
|
|
|
|
| ||||||
|
|
|
| 35,086 |
|
|
| 3,518 |
|
| 38,604 |
|
|
|
|
|
|
|
| ||||||
| Net assets acquired and cash consideration |
|
|
| 119,324 |
|
|
| 8,815 |
|
| 128,139 |
|
|
|
|
|
|
|
| ||||||
In connection with the Johnson Oil Company Inc. acquisition, the Company has signed leases for the rental of commercial space and petroleum facilities. Under these leases, the Company is required to pay approximately US$11,300 annually over 20 years. The leases include clauses for an annual indexation of 2%.
64 |
NOTES TO CONSOLIDATED FINANCIAL STATEMENTS
as at April 25, 2004, April 27, 2003 and April 28, 2002
(in thousands of Canadian dollars, except per share amounts)
5 - | INFORMATION INCLUDED IN THE CONSOLIDATED STATEMENT OF EARNINGS |
| 2004 |
| 2003 |
| 2002 |
| ||
|
|
|
| |||||
|
| $ |
| $ |
| $ |
| |
|
|
|
|
|
|
|
| |
| Depreciation and amortization of fixed and other assets |
|
|
|
|
|
| ||
| Fixed assets |
| 74,026 |
| 44,108 |
| 33,195 |
| |
| Other assets |
| 440 |
| 840 |
| 530 |
| |
|
|
| ||||||
74,466 |
| 44,948 |
| 33,725 |
| |||
|
|
| ||||||
|
|
|
|
|
| |||
| Financial expenses |
|
|
|
|
|
| ||
| Interest on long-term debt |
| 27,440 |
| 12,669 |
| 13,700 |
| |
| Interest on short-term debt |
| 782 |
| 1,228 |
| 755 |
| |
| Depreciation of deferred financing cost |
| 2,915 |
| 997 |
| 612 |
| |
|
|
| ||||||
31,137 |
| 14,894 |
| 15,067 |
| |||
|
|
| ||||||
Interest expenses
Interest expenses on long-term debt are net of interest income. Interest income totalled $477 in 2004, $51 in 2003 and $360 in 2002. |
Supplementary information related to the rental expenses included in operating, selling, administrative and general expenses.
| 2004 |
| 2003 |
| 2002 |
| ||
|
|
|
| |||||
|
| $ |
| $ |
| $ |
| |
|
|
|
|
|
|
|
| |
| Rent expenses |
|
|
|
|
|
| ||
| Rent expenses |
| 127,207 |
| 93,313 |
| 72,670 |
| |
| Sub-leasing income |
| 9,265 |
| 3,781 |
| 2,440 |
| |
|
|
| ||||||
117,942 |
| 89,532 |
| 70,230 |
| |||
|
|
| ||||||
6 - | INCOME TAXES |
| 2004 |
| 2003 |
| 2002 |
| ||
|
|
|
| |||||
| $ |
| $ |
| $ |
| ||
|
|
|
|
|
|
| ||
| Current income taxes | 54,802 |
| 22,223 |
| 9,843 |
| ||
| Future income taxes | (14,930 | ) | 9,719 |
| 15,991 |
| ||
|
|
| ||||||
39,872 |
| 31,942 |
| 25,834 |
| |||
|
|
| ||||||
| Earnings before income taxes |
|
|
|
|
|
| ||
| Domestic |
| 57,538 |
| 81,725 |
| 66,901 |
| |
| Foreign |
| 61,839 |
| 16,258 |
| 6,270 |
| |
|
|
| ||||||
119,377 |
| 97,983 |
| 73,171 |
| |||
|
|
| ||||||
|
|
|
|
|
| |||
|
| 2004 |
| 2003 |
| 2002 |
| |
|
|
|
|
| ||||
| $ |
| $ |
| $ |
| ||
|
|
|
|
|
|
| ||
| Current income taxes |
|
|
|
|
|
| ||
| Domestic |
| 29,190 |
| 19,718 |
| 7,392 |
| |
| Foreign |
| 25,612 |
| 2,505 |
| 2,451 |
| |
|
|
| ||||||
54,802 |
| 22,223 |
| 9,843 |
| |||
|
|
| ||||||
| Future income taxes |
|
|
|
|
|
| ||
| Domestic |
| (10,612 | ) | 5,021 |
| 16,280 |
| |
| Foreign |
| (4,318 | ) | 4,698 |
| (289 | ) | |
|
|
| ||||||
(14,930 | ) | 9,719 |
| 15,991 |
| |||
|
|
| ||||||
The principal items which resulted in differences between the Company’s effective income tax rates and the combined statutory rates in Canada are detailed as follows:
| 2004 |
| 2003 |
| 2002 |
| |
|
|
|
| ||||
| % |
| % |
| % |
| |
|
|
|
|
|
|
| |
| Combined statutory income tax rate in Canada (a) | 35.70 |
| 37.62 |
| 39.90 |
| |
| Impact of the announced tax rate increases (reductions) | 0.22 |
| (1.19 | ) | (2.99 | ) | |
| Other permanent differences | (2.52 | ) | (3.83 | ) | (1.60 | ) | |
|
|
| |||||
| Effective income tax rate | 33.40 |
| 32.60 |
| 35.31 |
| |
|
|
|
| (a) | The Company’s combined statutory income tax rate in Canada includes the appropriate provincial income tax rates. |
The components of future tax assets (liabilities) are as follows:
| 2004 |
| 2003 |
| ||
|
|
| ||||
| $ |
| $ |
| ||
|
|
|
|
| ||
| Short-term future tax assets (liabilities) |
|
|
|
| ||
| Expenses deductible in future years |
| 21,952 |
| 5,997 |
| |
| Deferral of GST and QST receivable |
| — |
| (16,614 | ) | |
| Deferred revenues |
| 835 |
| 500 |
| |
| Non-capital losses |
| — |
| 1,301 |
| |
| Other |
| 3,752 |
| 3,538 |
| |
|
| |||||
26,539 |
| (5,278 | ) | |||
|
| |||||
| Long-term future tax assets (liabilities) |
|
|
|
| ||
| Fixed assets |
| (9,315 | ) | (20,649 | ) | |
| Non-capital losses |
| 2,267 |
| 800 |
| |
| Deferred revenues |
| 4,757 |
| 2,050 |
| |
| Borrowing and share issue costs |
| 4,580 |
| 448 |
| |
| Goodwill |
| 5,253 |
| 8,645 |
| |
| Other assets |
| (2,320 | ) | (2,645 | ) | |
| Other |
| 5,848 |
| — |
| |
|
| |||||
11,070 |
| (11,351 | ) | |||
|
| |||||
65 |
NOTES TO CONSOLIDATED FINANCIAL STATEMENTS | |
|
|
7 - | EARNINGS PER SHARE |
| 2004 |
| 2003 |
| 2002 |
| |
|
|
|
| ||||
|
| $ |
| $ |
| $ |
|
|
|
|
|
|
|
|
|
| Basic earnings attributable to Class “A” and “B” shareholders | 79,505 |
| 66,041 |
| 47,337 |
| |
|
|
| |||||
| Weighted average number of shares (in thousands) | 89,702 |
| 84,525 |
| 77,580 |
| |
| Dilutive effect of stock-based compensation (in thousands) | 4,030 |
| 2,757 |
| 3,797 |
| |
|
|
| |||||
| Weighted average number of diluted shares (in thousands) | 93,732 |
| 87,282 |
| 81,377 |
| |
|
|
| |||||
| Basic net earnings per share available for Class “A” and “B” shareholders | 0.89 |
| 0.78 |
| 0.61 |
| |
|
|
| |||||
| Diluted net earnings available for Class “A” and “B” shareholders | 0.85 |
| 0.76 |
| 0.58 |
| |
|
|
|
In calculating diluted earnings per share for 2004, 0 stock options (1,725,000 in 2003 and 0 in 2002) were excluded due to their antidilutive effect.
8 - | INFORMATION INCLUDED IN THE CONSOLIDATED STATEMENT OF CASH FLOWS |
The changes in working capital items are detailed as follows:
2004 |
| 2003 |
| 2002 |
| ||
|
|
| |||||
$ |
| $ |
| $ |
| ||
|
|
|
|
|
| ||
| Accounts receivable | 8,049 |
| (59,423 | ) | (7,062 | ) | |
| Inventories | (10,195 | ) | (27,754 | ) | (13,019 | ) | |
| Prepaid expenses | (8,693 | ) | (1,831 | ) | 2,291 |
| |
| Accounts payable | 143,529 |
| 100,066 |
| 10,708 |
| |
| Income taxes payable | 26,297 |
| 9,527 |
| (9,740 | ) | |
|
|
| |||||
158,987 |
| 20,585 |
| (16,822 | ) | ||
|
|
|
Cash flows relating to interest and income taxes of operating activities are detailed as follows:
2004 |
| 2003 |
| 2002 |
| ||
|
|
| |||||
$ |
| $ |
| $ |
| ||
|
|
|
|
|
| ||
| Interest paid | 17,727 |
| 12,591 |
| 12,280 |
| |
|
|
|
|
|
| ||
| Income taxes paid | 31,895 |
| 11,570 |
| 18,556 |
|
9 – | ACCOUNTS RECEIVABLE |
2004 |
| 2003 |
| ||
|
| ||||
$ |
| $ |
| ||
|
|
|
| ||
| Trade accounts receivable and supplier discounts receivable | 75,617 |
| 44,511 |
| |
| Credit card receivable | 37,011 |
| 12,399 |
| |
| Environmental costs receivable | 1,420 |
| 2,482 |
| |
| Sales tax receivable | — |
| 42,820 |
| |
| Other accounts receivable | 14,470 |
| 5,796 |
| |
|
| ||||
128,518 |
| 108,008 |
| ||
|
|
10 – | INVENTORIES |
|
| 2004 |
| 2003 |
|
|
|
|
| ||
|
| $ |
| $ |
|
|
|
|
|
|
|
| Merchandise - distribution centers | 36,553 |
| 10,659 |
| |
| Merchandise - retail | 273,814 |
| 147,023 |
| |
| Motor fuel | 64,476 |
| 22,192 |
| |
|
| ||||
374,843 |
| 179,874 |
| ||
|
|
11 - | FIXED ASSETS |
2004 |
| ||||||||
| |||||||||
Cost |
| Accumulated |
| Net |
| ||||
|
|
| |||||||
$ |
| $ |
| $ |
| ||||
|
|
|
|
|
| ||||
| Land | 240,015 |
|
| — |
|
| 240,015 |
| |
| Buildings and parking lots | 167,415 |
|
| 33,583 |
|
| 133,832 |
| |
| Leasehold improvements | 160,979 |
|
| 46,257 |
|
| 114,722 |
| |
| Petroleum infrastructure | 123,004 |
|
| 26,309 |
|
| 96,695 |
| |
| Equipment | 464,452 |
|
| 170,983 |
|
| 293,469 |
| |
| Signs | 29,331 |
|
| 10,561 |
|
| 18,770 |
| |
|
|
|
|
| |||||
1,185,196 |
|
| 287,693 |
|
| 897,503 |
| ||
| Buildings under capital lease | 4,607 |
|
| 3,627 |
|
| 980 |
| |
|
|
|
|
| |||||
1,189,803 |
|
| 291,320 |
|
| 898,483 |
| ||
|
|
|
|
| |||||
|
| 2003 |
| ||||||
|
|
| |||||||
|
| Cost |
| Accumulated |
| Net |
| ||
|
|
|
|
| |||||
|
| $ |
| $ |
| $ |
| ||
|
|
|
|
|
|
|
| ||
| Land | 42,400 |
|
| — |
|
| 42,400 |
| |
| Buildings and parking lots | 90,051 |
|
| 29,687 |
|
| 60,364 |
| |
| Leasehold improvements | 142,137 |
|
| 37,890 |
|
| 104,247 |
| |
| Petroleum infrastructure | 73,945 |
|
| 19,307 |
|
| 54,638 |
| |
| Equipment | 303,592 |
|
| 131,896 |
| �� | 171,696 |
| |
| Signs | 15,430 |
|
| 8,504 |
|
| 6,926 |
| |
|
|
|
|
| |||||
667,555 |
|
| 227,284 |
|
| 440,271 |
| ||
| Buildings under capital lease | 4,533 |
|
| 3,545 |
|
| 988 |
| |
|
|
|
|
| |||||
672,088 |
|
| 230,829 |
|
| 441,259 |
| ||
|
|
|
|
| |||||
66 |
NOTES TO CONSOLIDATED FINANCIAL STATEMENTS | ||
12 - | OTHER ASSETS | |
| 2004 |
| 2003 |
| |
|
|
| |||
| $ |
| $ |
| |
|
|
|
|
| |
| Deferred charges, at unamortized cost | 43,808 |
| 8,619 |
| |
| Deferred pension expense | 3,218 |
| 3,905 |
| |
| Deposits | 2,917 |
| 2,512 |
| |
| Other, at cost | 3,332 |
| 1,131 |
| |
|
| ||||
53,275 |
| 16,167 |
| ||
|
|
13 - | BANK INDEBTEDNESS |
Bank indebtedness reflects the used portion of the credit facilities available to the Company. Available credit facilities were unused as at April 25, 2004, with the exception of certain letters of guarantee.
On December 17, 2003, the Company implemented a new credit agreement consisting of a 5-year renewable operating credit, maturing in December 2008, in the amount of CA$50,000 available in Canadian or U.S. dollars or as letters of guarantee not exceeding CA$10,000 or the equivalent in U.S. dollars bearing interest at the Canadian or U.S. prime rate plus 0.75% to 1.50% or at LIBOR plus 1.75% to 2.50%, depending on whether certain financial ratios are achieved. The operating credit is also available in the form of bankers’ acceptances with stamping fees of 1.75% to 2.50%, depending on whether certain financial ratios are achieved. As at April 25, 2004, an amount of CA$48,782 was available under this operating credit and the effective interest rate was 3.63%. The credit agreement also provides for a 5-year renewable operating credit, maturing in December 2008, in the amount of US$75,000 available in U.S. dollars and as letters of guarantee not exceeding US$30,000, bearing interest at the U.S. prime rate plus 0.75% to 1.50% or at LIBOR plus 1.75% to 2.50% depending on whether certain financial ratios are achieved. As at April 25, 2004, an amount of US$70,160 was available under this operating credit and the effective interest rate was 3.63%. These credit facilities are subject to the same guarantees and restrictive covenants which apply to the term loans described in Note 15.
As at April 27, 2003, the Company had a renewable operating credit in the amount of CA$60,000 available in Canadian or U.S. dollars or as letters of guarantee bearing interest at the Canadian or U.S. prime rate plus 0% to 0.50% or at LIBOR plus 0.75% to 1.50%, depending on whether certain financial ratios were achieved. The operating credit was also available in the form of bankers’ acceptances with stamping fees of 0.75% to 1.50%, depending on whether certain financial ratios were achieved. As at April 27, 2003, an amount of $59,644 was available under this credit facility and the effective interest rate was 2.31%. Furthermore, the Company had access to a margin of credit totalling US$3,000 bearing interest at the U.S. prime rate. As at April 27, 2003, an amount of US$3,000 was available under this facility and the effective interest rate was 4.25%.
14 – | ACCOUNTS PAYABLE |
| 2004 |
| 2003 |
| |
|
|
| |||
$ |
| $ |
| ||
|
|
|
| ||
| Accounts payable and accrued expenses | 474,960 |
| 213,518 |
| |
| Taxes payable | 52,703 |
| 42,168 |
| |
| Environmental expenses payable | 1,858 |
| 2,266 |
| |
| Salaries and social benefits | 45,745 |
| 14,312 |
| |
| Deferred revenues | 10,862 |
| 4,349 |
| |
| Other | 71,737 |
| 17,150 |
| |
|
| ||||
657,865 |
| 293,763 |
| ||
|
|
15 - | LONG-TERM DEBT |
| 2004 |
| 2003 |
| ||||
|
|
| ||||||
| $ |
| $ |
| ||||
|
|
|
|
| ||||
| Subordinated unsecured debt (a) | 476,245 |
| — |
| ||||
| Secured term loans granted under the new credit arrangement (b) |
|
|
|
| ||||
| Term loan “A” (US$27, 977 as at April 25, 2004) |
| 38,069 |
| — |
| |||
| Term loan “B” (US$149, 976 as at April 25, 2004) |
| 204,072 |
| — |
| |||
| Note payable, secured by the assets of certain stores, 8.75%, repayable in monthly instalments maturing in 2019 | 7,469 |
| — |
| ||||
| Note payable without interest, repayable in two equal instalments in May 2004 and 2005 | 500 |
| — |
| ||||
| Mortgage loans secured by land and buildings,rates varying from 7% to 13.25% (7% to 13.25% in 2003), payable in monthly instalments, maturing on various dates until 2016 | 273 |
| 335 |
| ||||
| Note payable, 9% |
|
| 249 |
| ||||
| Obligations related to buildings under capital lease,rates varying between 8.18% to 13.25% (8.18% and 13.25% for 2003), payable on various dates until 2018 | 3,904 |
| 2,968 |
| ||||
| Unsecured term loans granted under the previous credit arrangement (c) |
|
|
|
| ||||
| Credit A (including US$23,000 as at April 27, 2003) |
| — |
| 53,306 |
| |||
| Credit B |
| — |
| 50,000 |
| |||
| Credit C (US$98,226 as at April 27, 2003) |
| — |
| 142,241 |
| |||
| Credit D (US$32,604 as at April 27, 2003) |
| — |
| 47,214 |
| |||
|
| |||||||
730,532 |
| 296,313 |
| |||||
| Short-term instalments | 6,032 |
| 17,986 |
| ||||
|
| |||||||
724,500 |
| 278,327 |
| |||||
|
| |||||||
67 |
NOTES TO CONSOLIDATED FINANCIAL STATEMENTS | |
|
|
15 - | LONG-TERM DEBT (continued) |
(a) | Subordinated debt | |
|
| |
| Unsecured subordinated debt of US$350,000, maturing December 15, 2013, bearing interest at a rate of 7.5%. Redeemable under certain conditions as of December 15, 2008. | |
|
| |
| The total amount of the loan is subject to interest rate swaps (See Note 22). | |
|
| |
(b) | Loans granted under the new credit agreement | |
|
| |
| • | Term loan A: |
|
|
|
|
| US$27,997 maximum authorized term loan maturing on December 17, 2008, payable in quarterly instalments increasing gradually from 2.5% of the balance to 7.5% as of July, 2008, bearing interest at the Canadian prime rate plus 0.75% to 1.5% or the LIBOR rate plus 1.75% to 2.5%, depending on whether certain financial ratios have been achieved. As at April 25, 2004, the effective interest rate was 3.63% |
|
|
|
| • | Term loan B: |
|
|
|
|
| US$149,976 maximum authorized term loan maturing on December 17, 2010, payable in quarterly instalments of 0.25% of the balance of the loan for the six first years and 23.50% for the seventh year, of the balance bearing interest at the prime U.S. rate plus 1.25% or the LIBOR rate plus 2.25%. As at April 25, 2004, the effective interest rate was 3.38%. |
|
|
|
|
| Substantially all of the Company’s assets have been pledged to secure these term loans. |
Under the new credit agreement, the Company must meet certain commitments and achieve certain financial ratios. Furthermore, the new credit agreement limits notably the amount of fixed assets that the Company may acquire, the business acquisitions the Company may take part in, the amount of the repayments of term loan “A” and “B” that the Company may make as well as dividend payments.
As well, the subordinated debt limits notably the business acquisitions that the Company may make and dividend payments.
| (c) | Loans granted under the previous credit arrangement: |
| • | Credit A: | |
| ||
Revolving credit for a maximum authorized amount of CA$80,000 available in Canadian or U.S. dollars, maturing on April 23, 2005, bearing interest at the Canadian or U.S. prime rate plus 0.75% to 1.50%, or LIBOR plus 1.75% to 2.50%, depending on whether certain financial ratios are achieved. This credit was also available in the form of bankers’ acceptances with stamping fees of 1.75% to 2.50% depending on whether certain financial ratios are achieved. As at April 27, 2003, the effective rate was 4.08%; | ||
| • | Credit B: | |
| ||
Term credit for a maximum authorized amount of CA$50,000 maturing on April 16, 2006 and bearing interest at the prime rate plus 2.75% or the bankers’ acceptances rate with stamping fees of 3.75%. As at April 27, 2003, the effective rate was 6.66%; | ||
| ||
An amount of $25,000 of Credit B was subject to an interest rate swap in order to establish the annual rate for the related bankers’ acceptances at 5.25% until May 2004. This agreement was cancelled following the repayment of the debt in December 2003. | ||
| ||
| • | Credit C: | |
| ||
Term credit for a maximum authorized amount of US$98,226 payable in annual instalments of US$12,000 as of May 1, 2003 with the balance payable on May 1, 2006. This credit was available in Canadian or U.S. dollars in the form of advances or bankers’ acceptances according to the same rates as Credit A. As at April 27, 2003, the effective interest rate was 3.38%; | ||
| ||
| • | Credit D: | |
| ||
Term credit for a maximum authorized amount of US$32,604 maturing on June 20, 2007, bearing interest at the U.S. prime rate plus 2% or at LIBOR plus 3%. As at April 27, 2003, the effective interest rate was 4.38%. | ||
Instalments on long-term debt for the next years are as follows:
| Obligations |
| Others |
| |||
|
|
| |||||
| $ |
| $ |
| |||
|
|
|
|
|
|
| |
| 2005 |
| 1,249 |
|
| 5,422 |
| |
| 2006 |
| 1,042 |
|
| 9,243 |
| |
| 2007 |
| 898 |
|
| 10,924 |
| |
| 2008 |
| 701 |
|
| 11,906 |
| |
| 2009 |
| 598 |
|
| 12,889 |
| |
| 2010 and subsequent years |
| 3,192 |
|
| 676,244 |
| |
|
|
|
|
| |||
| 7,680 |
|
|
|
| ||
| Interest expense included in minimum lease payments |
| 3,776 |
|
|
|
| |
|
|
|
|
| |||
| 3,904 |
|
|
|
| ||
|
|
|
|
| |||
68 |
NOTES TO CONSOLIDATED FINANCIAL STATEMENTS | ||
16 - | DEFERRED REVENUES AND OTHER LIABILITIES | |
| 2004 |
| 2003 |
| |
|
|
| |||
| $ |
| $ |
| |
|
|
|
|
| |
| Deferred revenues | 17,097 |
| 7,957 |
| |
| Provision for site restoration costs | 4,441 |
| 1,008 |
| |
| Provision for workers’ compensation | 5,710 |
| — |
| |
| Other liabilities | 12,829 |
| — |
| |
|
| ||||
40,077 |
| 8,965 |
| ||
|
|
17 - | CAPITAL STOCK |
Authorized
Unlimited number of shares without par value
| First and second preferred shares issuable in series, ranking prior to other classes of shares with respect to dividends and payment of capital upon dissolution, non-voting. The Board of Directors is authorized to determine the designation, rights, privileges, conditions and restrictions relating to each series of shares prior to their issuance. |
|
|
| Class “A” multiple voting and participating shares, ten votes per share except for certain situations which provide for only one vote per share, convertible into Class “B” subordinate voting shares on a share-for-share basis at the holder’s option. Under the articles of amendment, no new Class “A” multiple voting share can be issued. |
|
|
| Class “B” subordinate voting and participating shares, convertible automatically into Class “A” multiple voting shares on a share-for-share basis upon the occurrence of certain events. |
The order of priority for the payment of dividends is as follows:
• | First preferred shares; |
|
|
• | Second preferred shares; |
|
|
• | Class “B” subordinate voting shares and Class “A” multiple voting shares, ranking pari passu. |
Issued and fully paid |
| The number of shares outstanding changed as follows: |
| 2004 |
| 2003 |
| ||||||
|
|
| ||||||||
| Number of |
| $ |
| Number of |
| $ |
| ||
|
|
|
|
| ||||||
Class “A” multiple voting shares |
|
|
|
|
|
|
|
| ||
| Balance, beginning of year |
| 28,548,824 |
| 12,029 |
| 28,548,824 |
| 12,029 |
| |
| Conversion into Class “B”shares |
| (27,963 | ) | (12 | ) | — |
| — |
| |
|
|
|
| |||||||
28,520,861 |
| 12,017 |
| 28,548,824 |
| 12,029 |
| |||
|
|
|
| |||||||
|
|
|
|
|
|
|
| |||
Class “B” subordinate voting shares |
|
|
|
|
|
|
|
| ||
| Balance, beginning of year |
| 56,046,088 |
| 246,507 |
| 54,383,088 |
| 242,054 |
| |
| Issued as part of the acquisition of Circle K |
| 13,555,538 |
| 223,666 |
| — |
| — |
| |
| Issued on conversion of Class “A”shares |
| 27,963 |
| 12 |
| — |
| — |
| |
| Stock options exercised for cash |
| 659,400 |
| 3,487 |
| 1,663,000 |
| 4,453 |
| |
|
|
|
| |||||||
70,288,989 |
| 473,672 |
| 56,046,088 |
| 246,507 |
| |||
|
|
|
| |||||||
| Total issued and fully paid |
|
| 485,689 |
|
|
| 258,536 |
| ||
|
|
|
|
|
| |||||
69 |
NOTES TO CONSOLIDATED FINANCIAL STATEMENTS | |
| |
17 - | CAPITAL STOCK (continued) |
| 2002 |
| ||||
|
| |||||
| Number of |
| $ |
| ||
|
|
| ||||
Class “A” multiple voting shares |
|
|
|
| ||
| Balance, beginning of year |
| 28,549,224 |
| 12,029 |
| |
| Conversion into Class “B” shares |
| (400 | ) | — |
| |
|
| |||||
28,548,824 |
| 12,029 |
| |||
|
| |||||
Class “B” subordinate voting shares |
|
|
|
| ||
| Balance, beginning of year |
| 45,973,688 |
| 139,202 |
| |
| Issuance |
| 8,000,000 |
| 101,600 |
| |
| Issued on conversion of Class “A” shares |
| 400 |
| — |
| |
| Stock options exercised for cash |
| 409,000 |
| 1,252 |
| |
|
| |||||
54,383,088 |
| 242,054 |
| |||
|
| |||||
| Total issued and fully paid |
|
| 254,083 |
| ||
|
|
| ||||
On December 17, 2003, the Company exchanged 13,555,538 warrants for Class ‘’B’’ subordinate voting shares on a share-for-share basis. These warrants were issued on October 6, 2003 at a price of $16.50 each for a total consideration of $223,666. The issue costs, net of related future income taxes, amount to $2,157.
During the year ended April 27, 2003 and the year ended April 28, 2002, the Company split all of its shares on a two-for-one basis. All share and per-share information in these consolidated financial statements has been adjusted retroactively to reflect both stock splits.
On December 20, 2001, the Company issued 8,000,000 Class “B” subordinate voting shares for $12.70 per share, for total gross proceeds of $101,600. The share issue expenses, net of the related future income taxes, total $3,036.
18 - | STOCK-BASED COMPENSATION |
During the year ended April 27, 2003, the Company amended its two existing stock-based compensation plans by merging them into a single plan. The plan provides for granting stock options for the purchase of Class “B” subordinate voting shares. As at April 25, 2004, 10,640,600 subordinate shares were reserved for issue and a total of 4,327,500 subordinate shares were available for issuance as stock options. The conditions governing the granting and exercise of the options are established by the Board of Directors, as is the term of the options, which cannot exceed 10 years. The options granted can generally be exercised as follows: 20% on the day following the grant, the remaining options, 20% on each anniversary of the grant date, over the next four years. The options cannot be granted at a price that is less than the market price on the grant date.
The table below presents the status of the Company’s stock option plan as at April 25, 2004, April 27, 2003 and April 28, 2002 and the changes therein during the years then ended.
| 2004 |
| 2003 |
| |||||||
|
|
| |||||||||
| Number of |
| Weighted |
| Number of |
| Weighted |
| |||
|
|
|
|
| |||||||
|
|
| $ |
|
|
| $ |
| |||
|
|
|
|
|
|
|
| ||||
| Balance, beginning of year | 6,156,500 |
| 8.14 |
|
| 7,563,000 |
| 6.70 |
|
| |
| Granted | 840,000 |
| 20.57 |
|
| 265,000 |
| 14.79 |
|
| |
| Options exercised | (659,400 | ) | 5.29 |
|
| (1,663,000 | ) | 2.68 |
|
| |
| Cancelled | (24,000 | ) | 8.07 |
|
| (8,500 | ) | 5.93 |
|
| |
|
|
|
|
|
|
|
| ||||
| Balance, end of year | 6,313,100 |
| 10.09 |
|
| 6,156,500 |
| 8.14 |
|
| |
|
|
|
|
|
|
|
| ||||
| Exercisable options at end of year | 4,371,320 |
|
|
|
| 3,652,900 |
|
|
|
| |
|
|
|
|
|
|
|
| ||||
|
| 2002 |
| |||
|
|
| ||||
|
| Number of |
| Weighted |
| |
|
|
|
| |||
|
| $ |
| |||
| Balance, beginning of year | 5,788,000 |
| 4.27 |
|
| |
| Granted | 2,200,000 |
| 12.42 |
|
| |
| Options exercised | (409,000 | ) | 3.06 |
|
| |
| Cancelled | (16,000 | ) | 5.34 |
|
| |
|
|
|
| |||
| Balance, end of year | 7,563,000 |
| 6.70 |
|
| |
|
|
|
| |||
| Exercisable options at end of year | 3,975,000 |
|
|
|
| |
|
|
|
| |||
The following table presents information on the stock options outstanding as at April 25, 2004:
| Options outstanding |
| |||||||||
|
| ||||||||||
Range of exercise prices |
| Number of |
| Weighted |
| Weighted |
| ||||
|
|
|
| ||||||||
|
|
|
|
|
| $ |
| ||||
| $4 - $6 |
| 3,070,000 |
|
| 2.55 |
|
| 5.11 |
|
| |
| $6 - $9 |
| 620,000 |
|
| 7.09 |
|
| 7.21 |
|
| |
| $12 -$16 |
| 1,893,100 |
|
| 8.04 |
|
| 14.70 |
|
| |
| $20 -$25 |
| 730,000 |
|
| 9.60 |
|
| 21.56 |
|
| |
|
|
|
|
|
|
|
|
| |||
| 6,313,100 |
|
|
|
|
|
|
|
| ||
|
|
|
|
|
|
|
|
| |||
70 |
NOTES TO CONSOLIDATED FINANCIAL STATEMENTS | ||
18 - | STOCK-BASED COMPENSATION (continued) | |
|
| Options exercisable |
| |||||
|
|
| ||||||
| Range of exercise prices |
| Number of |
| Weighted |
| |||
|
|
| ||||||
|
|
|
| $ |
| |||
| $4 - $6 |
|
| 2,814,000 |
|
| 5.14 |
|
|
| $6 - $9 |
|
| 372,000 |
|
| 7.21 |
|
|
| $12 - $16 |
|
| 1,039,320 |
|
| 14.71 |
|
|
| $20 - $25 |
|
| 146,000 |
|
| 21.56 |
|
|
|
|
|
|
|
|
|
| |
|
|
| 4,371,320 |
|
|
|
|
|
|
|
|
|
|
|
|
| |
On May 25, 2004, subsequent to year-end, 1,790,000 options were exercised for a total consideration of $9,563.
The Company does not record any compensation cost. If the compensation cost had been determined using the fair value method at the date of attribution of stock options granted beginning on April 29, 2002 to employees, net earnings and earnings per share information would have been reduced to the pro forma amounts shown in the following table:
| 2004 |
| 2003 |
| |||||||||
|
|
| |||||||||||
| Disclosed |
| Pro forma |
| Disclosed |
| Pro forma |
| |||||
|
|
|
|
| |||||||||
|
| $ |
| $ |
| $ |
| $ |
| ||||
|
|
|
|
|
|
|
|
|
| ||||
| Net earnings | 79,505 |
|
| 76,907 |
|
| 66,041 |
|
| 65,408 |
|
| |
| Earnings per share | 0.89 |
|
| 0.86 |
|
| 0.78 |
|
| 0.77 |
|
| |
| Diluted earnings per share | 0.85 |
|
| 0.82 |
|
| 0.76 |
|
| 0.75 |
|
| |
For purposes of calculating the compensation cost, the fair value of stock options is recognized using the straight-line method over the vesting period of the stock options.
The pro forma impact on net earnings for the period is not representative of the pro forma net earnings of future periods because it does not take into account the pro forma compensation relating to options granted prior to April 29, 2002.
The fair value of options granted is estimated at the attribution date using the Black-Scholes options pricing model on the basis of the following assumptions for attributions granted during the year:
| 2004 |
| 2003 |
| |
|
|
| |||
| Expected dividend on shares | None |
| None |
| |
| Expected average volatility | 30 | % | 30 | % | |
| Weighted average risk-free interest rate | 4.45 |
| 5.26 |
| |
| Expected life | 8 years |
| 8 years |
|
The weighted average fair value of options granted in the year ended April 25, 2004 is $9.22 ($7.03 in 2003).
19 - | CUMULATIVE TRANSLATION ADJUSTMENTS |
| 2004 |
| 2003 |
| ||
|
|
| ||||
| $ |
| $ |
| ||
|
|
|
|
| ||
| Balance, beginning of year | (2,626 | ) | (106 | ) | ||
| Effect of change in exchange rate during the year |
|
|
|
| ||
| On the net investment in the self-sustaining foreign subsidiaries |
| 4,264 |
| (18,416 | ) | |
| On the long-term debt denominated in U.S. dollars designated as a hedge of the net investment in the self-sustaining foreign subsidiaries |
| (2,588 | ) | 15,896 |
| |
|
| |||||
| Balance, end of year | (950 | ) | (2,626 | ) | ||
|
| |||||
20 - | EMPLOYEE FUTURE BENEFITS |
The Company has defined benefit pension plans and a defined contribution pension plan for certain employees.
Information about the Company’s defined benefit plans, in aggregate, is as follows:
| 2004 |
| 2003 |
| |||
|
|
| |||||
| $ |
| $ |
| |||
|
|
|
|
| |||
Accrued benefit obligations |
|
|
|
| |||
| Balance, beginning of year |
| 29,606 |
| 30,766 |
| ||
| Current service cost |
| 662 |
| 586 |
| ||
| Past service cost |
| — |
| 3,215 |
| ||
| Interest cost |
| 1,890 |
| 1,916 |
| ||
| Benefits paid |
| (2,387 | ) | (2,251 | ) | ||
| Actuarial (gains) losses |
| 1,670 |
| (4,626 | ) | ||
|
|
| |||||
| Balance, end of year |
| 31,441 |
| 29,606 |
| ||
|
|
| |||||
| 2004 |
| 2003 |
| ||
|
|
| ||||
| $ |
| $ |
| ||
Plan assets |
|
|
|
| ||
| Fair value, beginning of year |
| 25,077 |
| 30,288 |
| |
| Actual return on plan assets |
| 3,369 |
| (3,588 | ) | |
| Employees contributions |
| 108 |
| 112 |
| |
| Benefits paid |
| (1,871 | ) | (1,735 | ) | |
|
|
| ||||
| Fair value, end of year |
| 26,683 |
| 25,077 |
| |
|
| |||||
| Funded status-plan deficit |
| (4,758 | ) | (4,529 | ) | |
| Unamortized net actuarial loss |
| 9,350 |
| 10,051 |
| |
| Unamortized transitional net asset |
| (3,943 | ) | (4,509 | ) | |
| Unamortized past service cost |
| 2,569 |
| 2,892 |
| |
|
|
| ||||
| Accrued benefit asset | 3,218 |
| 3,905 |
| ||
|
| |||||
71 |
NOTES TO CONSOLIDATED FINANCIAL STATEMENTS | |
20 - | EMPLOYEE FUTURE BENEFITS (continued) |
As at April 25, 2004, the accrued benefit obligation for pension plans with a funding deficit amounted to $10,754 ($9,715 in 2003). These plans are not funded and, accordingly, there are no assets.
Information about pension expense (income) for the Company’s defined benefit plan for the year is as follows:
| 2004 |
| 2003 |
| 2002 |
| ||
|
|
|
| |||||
| $ |
| $ |
| $ |
| ||
|
|
|
|
|
|
| ||
Pension expense (income) |
|
|
|
|
|
| ||
| Current service cost, net of employee contributions |
| 554 |
| 474 |
| 436 |
| |
| Interest cost |
| 1,890 |
| 1,916 |
| 2,080 |
| |
| Expected return on plan assets |
| (1,694 | ) | (2,063 | ) | (2,721 | ) | |
| Amortized transitional asset |
| (566 | ) | (566 | ) | (565 | ) | |
| Amortized net actuarial loss |
| 696 |
| 93 |
| — |
| |
| Amortized past service cost |
| 323 |
| 323 |
| — |
| |
|
|
| ||||||
| Pension expense (income) for the year | 1,203 |
| 177 |
| (770 | ) | ||
|
|
| ||||||
The significant actuarial assumptions which management considers the most likely to be used to determine the accrued benefit obligation are the following:
| 2004 |
| 2003 |
| 2002 |
| |
|
|
|
| ||||
| % |
| % |
| % |
| |
|
|
|
|
|
|
| |
| Discount rate | 6.25 |
| 6.50 |
| 6.75 |
| |
| Expected rate of return on plan assets | 7.00 |
| 7.00 |
| 8.00 |
| |
| Rate of compensation increase | 4.00 |
| 4.00 |
| 4.00 |
|
The Company’s total pension expense under its defined contribution plan for the year 2004 is $1,005 ($870 in 2003 and $655 in 2002).
21 - | ENVIRONMENT |
The Company is subject to Canadian and American legislation governing the storage, handling and sale of gasoline and related products. The Company considers that it is generally in compliance with current environmental legislation.
The Company has an on-going training program for its employees on environmental issues which includes preventive site testing and site restoration in cooperation with regulatory authorities. The Company also examines its gasoline equipment annually to make the necessary investments. In connection with the closure of certain business locations, the Company is required to remove its petroleum equipment.
In all U.S. states in which the Company operates, except Michigan, Florida, Texas and Washington, there is a state fund to cover the cost of certain rehabilitation and removing of gasoline tanks. These state funds provide insurance for gasoline facilities operations to cover the cost of cleaning up damage to the environment caused by the usage of underground gasoline equipment. Gasoline equipment tank registration fees and a gasoline tax in each of the states finance the trust funds. The Company paid the registration fees and remits the sales tax to the states where it is a member of the trust fund. Insurance coverage is different in the various states and can be as much as US$1,000 per site. The Company’s deductible ranges from US$15 to US$55. There is no trust fund in the states of Michigan, Florida, Texas and Washington.
In order to provide for the above-mentioned restoration costs, the Company has recorded a $6,299 allowance for environmental costs as at April 25, 2004 ($3,274 as at April 27, 2003). Of this amount, $1,858 ($2,266 as at April 27, 2003) has been presented on a current basis.
22 - | FINANCIAL INSTRUMENTS |
a) Description of derivative financial instruments
Management of interest rate risk
The Company has entered into interest rate swaps to manage interest rate fluctuations. It has agreed to swap the amount of the difference between the variable interest rate and the fixed rate, calculated based on the reference amounts.
The amounts outstanding at year-end, classified by subsidiary and by currency, are as follows:
Maturity(i) |
| Reference |
| Pays/receives |
| Fixed rate |
| Variable rate | ||
|
|
|
| |||||||
|
| US$ |
|
|
| % |
|
| ||
| December 2013 | 100,000 |
|
| pays variable receives fixed |
| 7.50 |
|
| LIBOR 6 months plus 3.0% | |
| December 2013 | 100,000 |
|
| pays variable receives fixed |
| 7.50 |
|
| LIBOR 6 months plus 2.98% | |
| December 2013 | 150,000 |
|
| pays variable receives fixed |
| 7.50 |
|
| LIBOR 6 months plus 2.89% | |
(i) Under certain conditions, the maturity date of the swaps can be altered to correspond with the repurchase conditions of the corresponding subordinated notes.
b) Fair value of financial instruments
The fair value of cash and cash equivalents, accounts receivable and accounts payable is comparable to their carrying amount given that they will mature in less than one year.
72 |
NOTES TO CONSOLIDATED FINANCIAL STATEMENTS | ||
22 - | FINANCIAL INSTRUMENTS (continued) | |
b) Fair value of financial instruments (continued)
With the exception of the unsecured subordinated debt, there is no material difference between the fair value and the carrying amount of the Company’s long-term debt as at April 25, 2004 and April 27, 2003, given that the largest loans bear interest at the floating rate.
The fair value of the unsecured subordinated debt was $496,485 as at April 25, 2004.
The fair value of the interest rate swap, as determined by the Company’s bank based on quoted market prices for similar instruments was $27,175 payable by the Company ($577 payable by the Company in 2003).
23 - | CONTRACTUAL OBLIGATIONS |
As at April 25, 2004, the Company has entered into lease agreements expiring on various dates until 2027 which call for the payment of $1,809,034 for the rental of commercial space, equipment and a warehouse. Several of these leases contain renewal options and certain sites are subleased to franchise-holders. The minimum lease payments for the next five years are $187,698 in 2005, $176,087 in 2006, $163,342 in 2007, $142,356 in 2008 and $114,250 in 2009.
Moreover, the Company has concluded agreements to acquire equipment and franchise rights which call for the payment of $7,241. The minimum payments for the next five years are $2,061 in 2005, $560 from 2006 to 2008 and $700 in 2009.
24 - | CONTINGENCIES |
Various claims and legal proceedings have been initiated against the Company in the normal course of its operations that relate to human resources and the environment. In management’s opinion, these claims and proceedings are unfounded. Although the outcome of these proceedings cannot be determined with certainty, management estimates that any payments resulting from their outcome are not likely to have a substantial negative impact on the Company’s results and financial position.
25 - | SEGMENTED INFORMATION |
The Company essentially operates in one reportable segment, the sale of goods for immediate consumption and motor fuel through corporate stores or franchise operations. It operates a convenience store chain under several banners, including Couche-Tard, Mac’s, Bigfoot, Dairy Mart and Circle K. Revenues from outside sources mainly fall into two categories: merchandise and motor fuel. The Company operates convenience stores in Canada and, since June 2001, in the United States.
Information on the principal revenue classes as well as geographic information is as follows:
| 2004 |
| 2003 |
| |||||||||
|
|
| |||||||||||
| Canada |
| U.S. |
| Total |
| Canada |
| U.S. |
| Total |
| |
|
|
|
|
|
|
| |||||||
| $ |
| $ |
| $ |
| $ |
| $ |
| $ |
| |
|
|
|
|
|
|
|
|
|
|
|
| ||
External customer revenues (a) |
|
|
|
|
|
|
|
|
|
|
|
| |
| Merchandise and services | 1,510,589 |
| 1,597,085 |
| 3,107,674 |
| 1,428,646 |
| 514,660 |
| 1,943,306 |
| |
| Motor fuel | 677,507 |
| 2,087,213 |
| 2,764,720 |
| 630,144 |
| 741,744 |
| 1,371,888 |
| |
|
|
|
|
|
| ||||||||
2,188,096 |
| 3,684,298 |
| 5,872,394 |
| 2,058,790 |
| 1,256,404 |
| 3,315,194 |
| ||
|
|
|
|
|
| ||||||||
|
|
|
|
|
|
|
|
|
|
|
| ||
Gross margin |
|
|
|
|
|
|
|
|
|
|
|
| |
| Merchandise and services | 491,283 |
| 521,156 |
| 1,012,439 |
| 462,503 |
| 169,639 |
| 632,142 |
| |
| Motor fuel | 63,351 |
| 147,184 |
| 210,535 |
| 57,499 |
| 60,236 |
| 117,735 |
| |
|
|
|
|
|
| ||||||||
554,634 |
| 668,340 |
| 1,222,974 |
| 520,002 |
| 229,875 |
| 749,877 |
| ||
|
|
|
|
|
| ||||||||
|
|
|
|
|
|
|
|
|
|
|
| ||
Fixed assets and goodwill (a) | 484,785 |
| 692,609 |
| 1,177,394 |
| 459,756 |
| 251,030 |
| 710,786 |
| |
|
|
|
|
|
| ||||||||
| 2002 |
| |||||
|
| ||||||
| Canada |
| U.S. |
| Total |
| |
|
|
|
| ||||
| $ |
| $ |
| $ |
| |
External customer revenues (a) |
|
|
|
|
|
| |
| Merchandise and services | 1,298,603 |
| 204,519 |
| 1,503,122 |
| |
| Motor fuel | 532,203 |
| 356,674 |
| 888,877 |
| |
|
|
| |||||
1,830,806 |
| 561,193 |
| 2,391,999 |
| ||
|
|
| |||||
Gross margin |
|
|
|
|
|
| |
| Merchandise and services | 426,538 |
| 65,029 |
| 491,567 |
| |
| Motor fuel | 54,484 |
| 36,735 |
| 91,219 |
| |
|
|
| |||||
481,022 |
| 101,764 |
| 582,786 |
| ||
|
|
| |||||
|
|
|
|
|
| ||
Fixed assets and goodwill (a) | 428,018 |
| 122,696 |
| 550,714 |
| |
|
|
| |||||
(a) | Geographic areas are determined according to where the Company generates operating income (where the sale takes place) and according to the location of the fixed assets and goodwill. |
The Company is not dependent on one major customer as a revenue source.
26 - | COMPARATIVE FIGURES |
Certain comparative figures have been reclassified to conform with the presentation adopted in the current year.
73 |
DIRECTORS |
|
Alain Bouchard(1) |
Chairman of the Board |
President and Chief Executive Officer |
|
Richard Fortin(1) |
Executive Vice-President |
|
|
Réal Plourde(1) |
Executive Vice-President |
|
Jacques D’Amours(1) |
Vice-President, Administration |
|
Robert Brunet(3) (4) |
President |
Socoro (Robert Brunet Consulting) |
|
Roger Desrosiers, F.C.A.(3) |
Corporate Director |
|
Jean Élie(2) |
Corporate Director |
|
Josée Goulet |
Director of Marketing Services |
Bell Canada |
|
Roger Longpré(2) (3) |
President |
Mergerac Inc. |
|
Jean-Pierre Sauriol, Eng.(2) |
President and Chief Executive Officer |
Dessau-Soprin Inc. |
|
Jean Turmel |
President |
Financial Markets |
Treasury and Investment |
National Bank of Canada |
(1) | Member of the Executive Committee |
(2) | Member of the Human Resources and Corporate Governance Committee |
(3) | Member of the Audit Committee |
(4) | Lead Director |
|
OFFICERS |
|
Alain Bouchard |
Chairman of the Board |
President and Chief Executive Officer |
|
Richard Fortin |
Executive Vice-President |
|
Réal Plourde |
Executive Vice-President |
|
Jacques D’Amours |
Vice-President, Administration |
|
Canadian Operations |
|
Stéphane Gonthier |
Vice-President, Operations |
Central Canada |
|
Jean-Luc Meunier |
Vice-President, Operations |
Eastern Canada |
|
Kim J. Trowbridge |
Vice-President, Operations |
Western Canada |
|
U.S. Operations |
|
Brian P. Hannasch |
Vice-President, Integration |
|
Michel Bernard |
Vice-President, Operations |
U.S. Midwest Region |
|
Robert G. Campau |
Vice-President, Operations |
U.S. Southeast Region |
|
Geoffrey C. Haxel |
Vice-President, Operations |
Arizona Region |
|
Charles M. Parker |
Vice-President, Operations |
Florida and Gulf Region |
|
Joy A. Powell |
Vice-President, Operations |
U.S. West Coast Region |
|
Brigitte K. Catellier |
Corporate Secretary |
|
Michael Guinard |
Vice-President, Development |
|
Dale Pettit |
Vice-President and Treasurer |
74 |
Head Office |
1600 Saint-Martin Boulevard East |
Tower B, Suite 200 |
Laval, Quebec H7G 4S7 |
Telephone: (450) 662-3272 |
Fax: (450) 662-6648 |
|
Auditors |
Raymond Chabot Grant Thornton |
600 de la Gauchetière West |
Suite 1900 |
Montreal, Quebec H3B 4L8 |
|
Transfer Agent |
National Bank Trust |
1100 University Street |
Suite 900 |
Montreal, Quebec |
H3B 2G7 |
|
Investor Relations |
|
Richard Fortin |
Executive Vice-President |
|
For any additional information about Alimentation Couche-Tard Inc., shareholders, investors and analysts are requested to contact the Corporate Secretary at the head office address or to use the following e-mail address. |
|
E-mail: |
info@couche-tard.qc.ca |
|
www.couche-tard.com |
Lefebvre Financial Communications Inc.
Design: Susan Séguin
Graphic production: Kathy Nadal and Denis Michaud
Officers’ photos: François Roy