UNITED STATES
SECURITIES AND EXCHANGE COMMISSION
Washington, D.C. 20549
FORM N-CSR
CERTIFIED SHAREHOLDER REPORT OF REGISTERED MANAGEMENT INVESTMENT COMPANIES
Investment Company Act file number 811-09645
Columbia Funds Series Trust
(Exact name of registrant as specified in charter)
290 Congress Street
Boston, MA 02210
(Address of principal executive offices) (Zip code)
Daniel J. Beckman
c/o Columbia Management Investment Advisers, LLC
290 Congress Street
Boston, MA 02210
Ryan C. Larrenaga, Esq.
c/o Columbia Management Investment Advisers, LLC
Boston, MA 02210
(Name and address of agent for service)
Registrant's telephone number, including area code: (800) 345-6611
Date of fiscal year end: February 28
Date of reporting period: August 31, 2022
Form N-CSR is to be used by management investment companies to file reports with the Commission not later than 10 days after the transmission to stockholders of any report that is required to be transmitted to stockholders under Rule 30e-1 under the Investment Company Act of 1940 (17 CFR 270.30e-1). The Commission may use the information provided on Form N-CSR in its regulatory, disclosure review, inspection, and policymaking roles.
A registrant is required to disclose the information specified by Form N-CSR, and the Commission will make this information public. A registrant is not required to respond to the collection of information contained in Form N-CSR unless the Form displays a currently valid Office of Management and Budget ("OMB") control number. Please direct comments concerning the accuracy of the information collection burden estimate and any suggestions for reducing the burden to Secretary, Securities and Exchange Commission, 100 F Street, NE, Washington, DC 20549. The OMB has reviewed this collection of information under the clearance requirements of 44 U.S.C. § 3507.
Item 1. Reports to Stockholders.

August 31, 2022 (Unaudited)

(Unaudited)
| Average annual total returns (%) (for the period ended August 31, 2022) | ||||||
| Inception | 6 Months cumulative | 1 Year | 5 Years | 10 Years | ||
| Class A | Excluding sales charges | 09/25/87 | -9.08 | -17.00 | 10.86 | 10.79 |
| Including sales charges | -14.32 | -21.78 | 9.55 | 10.14 | ||
| Advisor Class* | 11/08/12 | -8.96 | -16.76 | 11.14 | 11.07 | |
| Class C | Excluding sales charges | 10/21/96 | -9.39 | -17.62 | 10.04 | 9.96 |
| Including sales charges | -10.22 | -18.29 | 10.04 | 9.96 | ||
| Institutional Class | 05/21/99 | -8.94 | -16.77 | 11.14 | 11.07 | |
| Institutional 2 Class* | 11/08/12 | -8.94 | -16.73 | 11.21 | 11.16 | |
| Institutional 3 Class* | 10/01/14 | -8.91 | -16.69 | 11.26 | 11.12 | |
| Class R | 11/16/11 | -9.19 | -17.21 | 10.57 | 10.51 | |
| ICE BofA US Convertible Index | -8.96 | -16.35 | 10.93 | 11.02 | ||
| * | The returns shown for periods prior to the share class inception date (including returns for the Life of the Fund, if shown, which are since Fund inception) include the returns of the Fund’s oldest share class. These returns are adjusted to reflect any higher class-related operating expenses of the newer share classes, as applicable. Please visit columbiathreadneedleus.com/investor/investment-products/mutual-funds/appended-performance for more information. |
| Columbia Convertible Securities Fund | Semiannual Report 2022 | 3 |
(Unaudited)
| Portfolio breakdown (%) (at August 31, 2022) | |
| Common Stocks | 6.3 |
| Convertible Bonds | 77.3 |
| Convertible Preferred Stocks | 14.6 |
| Money Market Funds | 1.8 |
| Total | 100.0 |
| Equity sector breakdown (%) (at August 31, 2022) | |
| Communication Services | 4.8 |
| Consumer Discretionary | 3.3 |
| Energy | 12.2 |
| Financials | 11.2 |
| Health Care | 16.8 |
| Industrials | 7.2 |
| Information Technology | 15.4 |
| Utilities | 29.1 |
| Total | 100.0 |
| 4 | Columbia Convertible Securities Fund | Semiannual Report 2022 |
(Unaudited)
| March 1, 2022 — August 31, 2022 | |||||||
| Account value at the beginning of the period ($) | Account value at the end of the period ($) | Expenses paid during the period ($) | Fund’s annualized expense ratio (%) | ||||
| Actual | Hypothetical | Actual | Hypothetical | Actual | Hypothetical | Actual | |
| Class A | 1,000.00 | 1,000.00 | 909.20 | 1,019.56 | 5.39 | 5.70 | 1.12 |
| Advisor Class | 1,000.00 | 1,000.00 | 910.40 | 1,020.82 | 4.19 | 4.43 | 0.87 |
| Class C | 1,000.00 | 1,000.00 | 906.10 | 1,015.78 | 8.98 | 9.50 | 1.87 |
| Institutional Class | 1,000.00 | 1,000.00 | 910.60 | 1,020.82 | 4.19 | 4.43 | 0.87 |
| Institutional 2 Class | 1,000.00 | 1,000.00 | 910.60 | 1,021.12 | 3.90 | 4.13 | 0.81 |
| Institutional 3 Class | 1,000.00 | 1,000.00 | 910.90 | 1,021.32 | 3.71 | 3.92 | 0.77 |
| Class R | 1,000.00 | 1,000.00 | 908.10 | 1,018.30 | 6.59 | 6.97 | 1.37 |
| Columbia Convertible Securities Fund | Semiannual Report 2022 | 5 |
August 31, 2022 (Unaudited)
| Common Stocks 6.2% | ||
| Issuer | Shares | Value ($) |
| Energy 2.5% | ||
| Oil, Gas & Consumable Fuels 2.5% | ||
| Ascent Resources, Class B(a),(b),(c),(d) | 10,248,729 | 2,295,715 |
| EQT Corp. | 250,000 | 11,950,000 |
| Pioneer Natural Resources Co. | 100,000 | 25,322,000 |
| Total | 39,567,715 | |
| Total Energy | 39,567,715 | |
| Financials 0.6% | ||
| Mortgage Real Estate Investment Trusts (REITS) 0.6% | ||
| Blackstone Mortgage Trust, Inc. | 325,500 | 9,432,990 |
| Total Financials | 9,432,990 | |
| Health Care 0.5% | ||
| Health Care Providers & Services 0.5% | ||
| Elevance Health, Inc. | 17,000 | 8,246,870 |
| Total Health Care | 8,246,870 | |
| Information Technology 2.6% | ||
| Semiconductors & Semiconductor Equipment 2.6% | ||
| Broadcom, Inc. | 60,500 | 30,196,155 |
| Microchip Technology, Inc. | 150,000 | 9,787,500 |
| Total | 39,983,655 | |
| Total Information Technology | 39,983,655 | |
| Total Common Stocks (Cost $62,856,468) | 97,231,230 | |
| Convertible Bonds(e) 76.5% | ||||
| Issuer | Coupon Rate | Principal Amount ($) | Value ($) | |
| Airlines 1.4% | ||||
| American Airlines Group, Inc. | ||||
| 07/01/2025 | 6.500% | 9,850,000 | 10,657,700 | |
| Southwest Airlines Co. | ||||
| 05/01/2025 | 1.250% | 9,320,000 | 11,645,340 | |
| Total | 22,303,040 | |||
| Automotive 1.2% | ||||
| Arrival SA(f) | ||||
| 12/01/2026 | 3.500% | 6,898,000 | 2,230,943 | |
| Ford Motor Co.(g) | ||||
| 03/15/2026 | 0.000% | 7,800,000 | 8,486,400 | |
| Convertible Bonds(e) (continued) | ||||
| Issuer | Coupon Rate | Principal Amount ($) | Value ($) | |
| Lucid Group, Inc.(f) | ||||
| 12/15/2026 | 1.250% | 12,890,000 | 8,153,160 | |
| Total | 18,870,503 | |||
| Building Materials 0.7% | ||||
| Patrick Industries, Inc.(f) | ||||
| 12/01/2028 | 1.750% | 12,850,000 | 10,392,437 | |
| Cable and Satellite 5.1% | ||||
| Cable One, Inc. | ||||
| 03/15/2028 | 1.125% | 12,000,000 | 9,720,000 | |
| DISH Network Corp. | ||||
| Subordinated | ||||
| 08/15/2026 | 3.375% | 33,800,000 | 24,321,173 | |
| Liberty Broadband Corp.(f) | ||||
| 09/30/2050 | 2.750% | 16,700,000 | 16,173,354 | |
| Liberty Media Corp.(f) | ||||
| 12/01/2050 | 0.500% | 18,250,000 | 21,140,261 | |
| Liberty Media Corp-Liberty Formula One(f) | ||||
| 08/15/2027 | 2.250% | 7,930,000 | 7,894,315 | |
| Total | 79,249,103 | |||
| Consumer Cyclical Services 4.8% | ||||
| Airbnb, Inc.(g) | ||||
| 03/15/2026 | 0.000% | 25,880,000 | 22,192,100 | |
| Alarm.com Holdings, Inc.(g) | ||||
| 01/15/2026 | 0.000% | 15,000,000 | 12,532,500 | |
| Lyft, Inc. | ||||
| 05/15/2025 | 1.500% | 12,350,000 | 10,818,600 | |
| Match Group FinanceCo 3, Inc.(f) | ||||
| 01/15/2030 | 2.000% | 13,320,000 | 13,224,275 | |
| Zillow Group, Inc. | ||||
| 05/15/2025 | 2.750% | 17,754,000 | 17,221,380 | |
| Total | 75,988,855 | |||
| Consumer Products 1.2% | ||||
| Beauty Health Co. (The)(f) | ||||
| 10/01/2026 | 1.250% | 13,850,000 | 11,253,125 | |
| Callaway Golf Co. | ||||
| 05/01/2026 | 2.750% | 5,510,000 | 7,910,294 | |
| Total | 19,163,419 | |||
| Diversified Manufacturing 2.5% | ||||
| Array Technologies, Inc.(f) | ||||
| 12/01/2028 | 1.000% | 10,900,000 | 11,695,700 | |
| 6 | Columbia Convertible Securities Fund | Semiannual Report 2022 |
August 31, 2022 (Unaudited)
| Convertible Bonds(e) (continued) | ||||
| Issuer | Coupon Rate | Principal Amount ($) | Value ($) | |
| Bloom Energy Corp. | ||||
| 08/15/2025 | 2.500% | 5,430,000 | 9,215,132 | |
| Enphase Energy, Inc.(g) | ||||
| 03/01/2028 | 0.000% | 8,079,000 | 9,925,051 | |
| Greenbrier Companies, Inc. (The) | ||||
| 04/15/2028 | 2.875% | 9,518,000 | 8,147,408 | |
| Total | 38,983,291 | |||
| Electric 1.2% | ||||
| NRG Energy, Inc. | ||||
| 06/01/2048 | 2.750% | 7,430,000 | 8,336,460 | |
| Sunnova Energy International, Inc.(f) | ||||
| 02/15/2028 | 2.625% | 10,820,000 | 10,630,650 | |
| Total | 18,967,110 | |||
| Food and Beverage 1.6% | ||||
| Chefs’ Warehouse, Inc. (The) | ||||
| 12/01/2024 | 1.875% | 7,510,000 | 7,806,645 | |
| MGP Ingredients, Inc.(f) | ||||
| 11/15/2041 | 1.875% | 4,905,000 | 6,287,733 | |
| Post Holdings, Inc.(f) | ||||
| 08/15/2027 | 2.500% | 9,910,000 | 10,301,445 | |
| Total | 24,395,823 | |||
| Health Care 5.8% | ||||
| CONMED Corp.(f) | ||||
| 06/15/2027 | 2.250% | 14,367,000 | 13,181,722 | |
| DexCom, Inc. | ||||
| 12/01/2023 | 0.750% | 6,910,000 | 13,961,655 | |
| Exact Sciences Corp. | ||||
| 03/01/2028 | 0.375% | 23,980,000 | 16,378,340 | |
| Insulet Corp. | ||||
| 09/01/2026 | 0.375% | 9,830,000 | 12,518,505 | |
| Invacare Corp. | ||||
| 11/15/2024 | 5.000% | 2,257,000 | 1,938,086 | |
| Natera, Inc. | ||||
| 05/01/2027 | 2.250% | 7,880,000 | 11,711,650 | |
| NeoGenomics, Inc. | ||||
| 05/01/2025 | 1.250% | 12,830,000 | 11,239,080 | |
| Tandem Diabetes Care, Inc.(f) | ||||
| 05/01/2025 | 1.500% | 10,850,000 | 9,805,688 | |
| Total | 90,734,726 | |||
| Independent Energy 0.0% | ||||
| Chesapeake Energy Escrow | ||||
| 09/15/2026 | 5.500% | 10,200,000 | 204,000 | |
| Convertible Bonds(e) (continued) | ||||
| Issuer | Coupon Rate | Principal Amount ($) | Value ($) | |
| Leisure 2.3% | ||||
| NCL Corp Ltd.(f) | ||||
| 02/15/2027 | 2.500% | 33,550,000 | 24,357,300 | |
| Royal Caribbean Cruises Ltd.(f) | ||||
| 08/15/2025 | 6.000% | 10,900,000 | 12,109,900 | |
| Total | 36,467,200 | |||
| Media and Entertainment 3.4% | ||||
| Bilibili, Inc.(f) | ||||
| 12/01/2026 | 0.500% | 21,700,000 | 15,135,750 | |
| fuboTV, Inc. | ||||
| 02/15/2026 | 3.250% | 18,000,000 | 8,154,000 | |
| Snap, Inc.(f) | ||||
| 03/01/2028 | 0.125% | 44,400,000 | 30,745,605 | |
| Total | 54,035,355 | |||
| Metals and Mining 2.8% | ||||
| Allegheny Technologies, Inc. | ||||
| 06/15/2025 | 3.500% | 3,930,000 | 7,975,935 | |
| Ivanhoe Mines Ltd.(f) | ||||
| 04/15/2026 | 2.500% | 9,725,000 | 10,677,401 | |
| Lithium Americas Corp.(f) | ||||
| 01/15/2027 | 1.750% | 16,780,000 | 15,261,410 | |
| Peabody Energy Corp.(f) | ||||
| 03/01/2028 | 3.250% | 6,895,000 | 10,135,650 | |
| Total | 44,050,396 | |||
| Other Financial Institutions 1.1% | ||||
| MP Materials Corp.(f) | ||||
| 04/01/2026 | 0.250% | 9,870,000 | 10,258,631 | |
| Virgin Galactic Holdings, Inc.(f) | ||||
| 02/01/2027 | 2.500% | 11,850,000 | 7,719,401 | |
| Total | 17,978,032 | |||
| Other Industry 0.5% | ||||
| KBR, Inc. | ||||
| 11/01/2023 | 2.500% | 4,040,000 | 7,797,200 | |
| Other REIT 0.8% | ||||
| Pebblebrook Hotel Trust | ||||
| 12/15/2026 | 1.750% | 13,000,000 | 12,303,599 | |
| Pharmaceuticals 9.0% | ||||
| Aerie Pharmaceuticals, Inc. | ||||
| 10/01/2024 | 1.500% | 14,000,000 | 13,763,655 | |
| BridgeBio Pharma, Inc. | ||||
| 02/01/2029 | 2.250% | 22,700,000 | 10,289,910 | |
| Columbia Convertible Securities Fund | Semiannual Report 2022 | 7 |
August 31, 2022 (Unaudited)
| Convertible Bonds(e) (continued) | ||||
| Issuer | Coupon Rate | Principal Amount ($) | Value ($) | |
| Canopy Growth Corp.(f) | ||||
| 07/15/2023 | 4.250% | CAD | 13,000,000 | 9,271,836 |
| Clovis Oncology, Inc. | ||||
| 05/01/2025 | 1.250% | 21,000,000 | 14,700,823 | |
| Cytokinetics, Inc.(f) | ||||
| 07/01/2027 | 3.500% | 9,420,000 | 12,038,760 | |
| Esperion Therapeutics, Inc. | ||||
| 11/15/2025 | 4.000% | 15,900,000 | 8,884,125 | |
| Guardant Health, Inc.(g) | ||||
| 11/15/2027 | 0.000% | 13,790,000 | 10,141,203 | |
| Halozyme Therapeutics, Inc.(f) | ||||
| 08/15/2028 | 1.000% | 10,910,000 | 10,698,619 | |
| Insmed, Inc. | ||||
| 06/01/2028 | 0.750% | 21,000,000 | 20,653,500 | |
| Ionis Pharmaceuticals, Inc.(g) | ||||
| 04/01/2026 | 0.000% | 15,800,000 | 15,661,750 | |
| Jazz Investments I Ltd. | ||||
| 06/15/2026 | 2.000% | 13,080,000 | 15,450,750 | |
| Total | 141,554,931 | |||
| Retail REIT 0.7% | ||||
| Kite Realty Group LP(f) | ||||
| 04/01/2027 | 0.750% | 12,500,000 | 11,379,945 | |
| Retailers 3.7% | ||||
| Dick’s Sporting Goods, Inc. | ||||
| 04/15/2025 | 3.250% | 2,505,000 | 8,221,584 | |
| Etsy, Inc. | ||||
| 06/15/2028 | 0.250% | 29,600,000 | 24,553,200 | |
| Farfetch Ltd. | ||||
| 05/01/2027 | 3.750% | 10,380,000 | 10,457,850 | |
| Wayfair, Inc. | ||||
| 08/15/2026 | 1.000% | 20,715,000 | 14,697,292 | |
| Total | 57,929,926 | |||
| Technology 26.0% | ||||
| 2U, Inc. | ||||
| 05/01/2025 | 2.250% | 18,750,000 | 13,500,000 | |
| Akamai Technologies, Inc. | ||||
| 09/01/2027 | 0.375% | 15,750,000 | 15,805,125 | |
| Avalara, Inc. | ||||
| 08/01/2026 | 0.250% | 20,699,000 | 19,902,089 | |
| Bandwidth, Inc. | ||||
| 03/01/2026 | 0.250% | 20,700,000 | 13,993,200 | |
| Bentley Systems, Inc. | ||||
| 07/01/2027 | 0.375% | 15,750,000 | 12,915,000 | |
| Convertible Bonds(e) (continued) | ||||
| Issuer | Coupon Rate | Principal Amount ($) | Value ($) | |
| BigCommerce Holdings, Inc.(f) | ||||
| 10/01/2026 | 0.250% | 16,780,000 | 12,329,284 | |
| Bill.com Holdings, Inc.(g) | ||||
| 12/01/2025 | 0.000% | 11,060,000 | 13,747,580 | |
| Coupa Software, Inc. | ||||
| 06/15/2026 | 0.375% | 14,850,000 | 11,701,800 | |
| Datadog, Inc. | ||||
| 06/15/2025 | 0.125% | 7,033,000 | 9,402,566 | |
| Dropbox, Inc.(g) | ||||
| 03/01/2028 | 0.000% | 20,500,000 | 18,116,875 | |
| Everbridge, Inc. | ||||
| 12/15/2024 | 0.125% | 10,850,000 | 10,093,427 | |
| Infinera Corp.(f) | ||||
| 08/01/2028 | 3.750% | 9,910,000 | 10,628,475 | |
| Lumentum Holdings, Inc.(f) | ||||
| 06/15/2028 | 0.500% | 27,137,000 | 24,206,204 | |
| MACOM Technology Solutions Holdings, Inc. | ||||
| 03/15/2026 | 0.250% | 18,851,000 | 18,120,524 | |
| Marathon Digital Holdings, Inc.(f) | ||||
| 12/01/2026 | 1.000% | 17,780,000 | 6,543,040 | |
| MongoDB, Inc. | ||||
| 01/15/2026 | 0.250% | 6,400,000 | 10,524,800 | |
| Okta, Inc. | ||||
| 06/15/2026 | 0.375% | 29,000,000 | 24,447,000 | |
| ON Semiconductor Corp.(g) | ||||
| 05/01/2027 | 0.000% | 8,850,000 | 12,673,200 | |
| Palo Alto Networks, Inc. | ||||
| 06/01/2025 | 0.375% | 29,177,000 | 55,377,946 | |
| Shift4 Payments, Inc. | ||||
| 08/01/2027 | 0.500% | 28,230,000 | 22,372,275 | |
| SMART Global Holdings, Inc. | ||||
| 02/15/2026 | 2.250% | 7,990,000 | 8,924,830 | |
| Square, Inc. | ||||
| 03/01/2025 | 0.125% | 18,260,000 | 18,054,575 | |
| Tyler Technologies, Inc. | ||||
| 03/15/2026 | 0.250% | 10,850,000 | 10,806,600 | |
| Wolfspeed, Inc.(f) | ||||
| 02/15/2028 | 0.250% | 20,230,000 | 22,910,475 | |
| Zscaler, Inc. | ||||
| 07/01/2025 | 0.125% | 8,590,000 | 10,784,745 | |
| Total | 407,881,635 | |||
| Transportation Services 0.7% | ||||
| CryoPort, Inc.(f) | ||||
| 12/01/2026 | 0.750% | 13,850,000 | 10,813,196 | |
| Total Convertible Bonds (Cost $1,326,019,988) | 1,201,443,722 | |||
| 8 | Columbia Convertible Securities Fund | Semiannual Report 2022 |
August 31, 2022 (Unaudited)
| Convertible Preferred Stocks 14.5% | |||
| Issuer | Shares | Value ($) | |
| Communication Services 1.0% | |||
| Diversified Telecommunication Services 1.0% | |||
| 2020 Cash Mandatory Exchangeable Trust(f) | 5.250% | 13,000 | 15,490,540 |
| Total Communication Services | 15,490,540 | ||
| Consumer Discretionary 0.7% | |||
| Auto Components 0.7% | |||
| Aptiv PLC | 5.500% | 99,950 | 10,836,579 |
| Total Consumer Discretionary | 10,836,579 | ||
| Financials 1.7% | |||
| Banks 0.9% | |||
| Bank of America Corp. | 7.250% | 11,850 | 14,535,091 |
| Capital Markets 0.8% | |||
| KKR & Co., Inc. | 6.000% | 200,000 | 12,448,000 |
| Total Financials | 26,983,091 | ||
| Health Care 3.0% | |||
| Health Care Equipment & Supplies 2.2% | |||
| Becton Dickinson and Co. | 6.000% | 335,000 | 16,917,500 |
| Boston Scientific Corp. | 5.500% | 158,000 | 16,724,300 |
| Total | 33,641,800 | ||
| Life Sciences Tools & Services 0.8% | |||
| Danaher Corp. | 5.000% | 9,000 | 12,646,491 |
| Total Health Care | 46,288,291 | ||
| Industrials 1.5% | |||
| Construction & Engineering 0.7% | |||
| Fluor Corp. | 6.500% | 8,880 | 11,689,928 |
| Professional Services 0.8% | |||
| Clarivate PLC | 5.250% | 236,800 | 11,726,336 |
| Total Industrials | 23,416,264 | ||
| Convertible Preferred Stocks (continued) | |||
| Issuer | Shares | Value ($) | |
| Information Technology 0.6% | |||
| Electronic Equipment, Instruments & Components 0.6% | |||
| II-VI, Inc. | 6.000% | 50,000 | 10,155,500 |
| Total Information Technology | 10,155,500 | ||
| Utilities 6.0% | |||
| Electric Utilities 3.2% | |||
| American Electric Power Co., Inc. | 6.125% | 415,000 | 22,683,900 |
| NextEra Energy, Inc. | 6.219% | 520,000 | 27,232,400 |
| Total | 49,916,300 | ||
| Multi-Utilities 2.8% | |||
| CenterPoint Energy, Inc.(h) | 4.516% | 286,500 | 11,631,900 |
| DTE Energy Co. | 6.250% | 200,000 | 10,266,000 |
| NiSource, Inc. | 7.750% | 200,000 | 22,688,000 |
| Total | 44,585,900 | ||
| Total Utilities | 94,502,200 | ||
| Total Convertible Preferred Stocks (Cost $226,119,946) | 227,672,465 | ||
| Money Market Funds 1.8% | ||
| Shares | Value ($) | |
| Columbia Short-Term Cash Fund, 2.366%(i),(j) | 27,607,693 | 27,593,889 |
| Total Money Market Funds (Cost $27,592,898) | 27,593,889 | |
| Total Investments in Securities (Cost: $1,642,589,300) | 1,553,941,306 | |
| Other Assets & Liabilities, Net | 16,042,249 | |
| Net Assets | 1,569,983,555 | |
| Columbia Convertible Securities Fund | Semiannual Report 2022 | 9 |
August 31, 2022 (Unaudited)
| (a) | Represents fair value as determined in good faith under procedures approved by the Board of Trustees. At August 31, 2022, the total value of these securities amounted to $2,295,715, which represents 0.15% of total net assets. |
| (b) | Non-income producing investment. |
| (c) | Denotes a restricted security, which is subject to legal or contractual restrictions on resale under federal securities laws. Disposal of a restricted investment may involve time-consuming negotiations and expenses, and prompt sale at an acceptable price may be difficult to achieve. Private placement securities are generally considered to be restricted, although certain of those securities may be traded between qualified institutional investors under the provisions of Section 4(a)(2) and Rule 144A. The Fund will not incur any registration costs upon such a trade. These securities are valued at fair value determined in good faith under consistently applied procedures established by the Fund’s Board of Trustees. At August 31, 2022, the total market value of these securities amounted to $2,295,715, which represents 0.15% of total net assets. Additional information on these securities is as follows: |
| Security | Acquisition Dates | Shares | Cost ($) | Value ($) |
| Ascent Resources, Class B | 02/20/2014–11/15/2016 | 10,248,729 | 358,011 | 2,295,715 |
| (d) | Valuation based on significant unobservable inputs. |
| (e) | Principal amounts are denominated in United States Dollars unless otherwise noted. |
| (f) | Represents privately placed and other securities and instruments exempt from Securities and Exchange Commission registration (collectively, private placements), such as Section 4(a)(2) and Rule 144A eligible securities, which are often sold only to qualified institutional buyers. At August 31, 2022, the total value of these securities amounted to $435,076,230, which represents 27.71% of total net assets. |
| (g) | Zero coupon bond. |
| (h) | Represents a variable rate security with a step coupon where the rate adjusts according to a schedule for a series of periods, typically lower for an initial period and then increasing to a higher coupon rate thereafter. The interest rate shown was the current rate as of August 31, 2022. |
| (i) | The rate shown is the seven-day current annualized yield at August 31, 2022. |
| (j) | As defined in the Investment Company Act of 1940, as amended, an affiliated company is one in which the Fund owns 5% or more of the company’s outstanding voting securities, or a company which is under common ownership or control with the Fund. The value of the holdings and transactions in these affiliated companies during the period ended August 31, 2022 are as follows: |
| Affiliated issuers | Beginning of period($) | Purchases($) | Sales($) | Net change in unrealized appreciation (depreciation)($) | End of period($) | Realized gain (loss)($) | Dividends($) | End of period shares |
| Columbia Short-Term Cash Fund, 2.366% | ||||||||
| 665,824 | 347,362,750 | (320,435,609) | 924 | 27,593,889 | 94 | 114,033 | 27,607,693 | |
| CAD | Canada Dollar |
| ■ | Level 1 — Valuations based on quoted prices for investments in active markets that the Fund has the ability to access at the measurement date. Valuation adjustments are not applied to Level 1 investments. |
| ■ | Level 2 — Valuations based on other significant observable inputs (including quoted prices for similar securities, interest rates, prepayment speeds, credit risks, etc.). |
| ■ | Level 3 — Valuations based on significant unobservable inputs (including the Fund’s own assumptions and judgment in determining the fair value of investments). |
| 10 | Columbia Convertible Securities Fund | Semiannual Report 2022 |
August 31, 2022 (Unaudited)
Investments falling into the Level 3 category are primarily supported by quoted prices from brokers and dealers participating in the market for those investments. However, these may be classified as Level 3 investments due to lack of market transparency and corroboration to support these quoted prices. Additionally, valuation models may be used as the pricing source for any remaining investments classified as Level 3. These models may rely on one or more significant unobservable inputs and/or significant assumptions by the Investment Manager. Inputs used in valuations may include, but are not limited to, financial statement analysis, capital account balances, discount rates and estimated cash flows, and comparable company data.
| Level 1 ($) | Level 2 ($) | Level 3 ($) | Total ($) | |
| Investments in Securities | ||||
| Common Stocks | ||||
| Energy | 37,272,000 | — | 2,295,715 | 39,567,715 |
| Financials | 9,432,990 | — | — | 9,432,990 |
| Health Care | 8,246,870 | — | — | 8,246,870 |
| Information Technology | 39,983,655 | — | — | 39,983,655 |
| Total Common Stocks | 94,935,515 | — | 2,295,715 | 97,231,230 |
| Convertible Bonds | — | 1,201,443,722 | — | 1,201,443,722 |
| Convertible Preferred Stocks | ||||
| Communication Services | — | 15,490,540 | — | 15,490,540 |
| Consumer Discretionary | — | 10,836,579 | — | 10,836,579 |
| Financials | — | 26,983,091 | — | 26,983,091 |
| Health Care | — | 46,288,291 | — | 46,288,291 |
| Industrials | — | 23,416,264 | — | 23,416,264 |
| Information Technology | — | 10,155,500 | — | 10,155,500 |
| Utilities | — | 94,502,200 | — | 94,502,200 |
| Total Convertible Preferred Stocks | — | 227,672,465 | — | 227,672,465 |
| Money Market Funds | 27,593,889 | — | — | 27,593,889 |
| Total Investments in Securities | 122,529,404 | 1,429,116,187 | 2,295,715 | 1,553,941,306 |
| Columbia Convertible Securities Fund | Semiannual Report 2022 | 11 |
August 31, 2022 (Unaudited)
| Assets | |
| Investments in securities, at value | |
| Unaffiliated issuers (cost $1,614,996,402) | $1,526,347,417 |
| Affiliated issuers (cost $27,592,898) | 27,593,889 |
| Receivable for: | |
| Investments sold | 12,044,203 |
| Capital shares sold | 890,401 |
| Dividends | 2,190,179 |
| Interest | 3,375,617 |
| Expense reimbursement due from Investment Manager | 1,211 |
| Prepaid expenses | 22,247 |
| Other assets | 34,900 |
| Total assets | 1,572,500,064 |
| Liabilities | |
| Payable for: | |
| Capital shares purchased | 2,110,039 |
| Management services fees | 33,021 |
| Distribution and/or service fees | 4,030 |
| Transfer agent fees | 150,452 |
| Compensation of board members | 164,542 |
| Compensation of chief compliance officer | 165 |
| Other expenses | 54,260 |
| Total liabilities | 2,516,509 |
| Net assets applicable to outstanding capital stock | $1,569,983,555 |
| Represented by | |
| Paid in capital | 1,707,452,288 |
| Total distributable earnings (loss) | (137,468,733) |
| Total - representing net assets applicable to outstanding capital stock | $1,569,983,555 |
| 12 | Columbia Convertible Securities Fund | Semiannual Report 2022 |
August 31, 2022 (Unaudited)
| Class A | |
| Net assets | $351,933,501 |
| Shares outstanding | 17,747,063 |
| Net asset value per share | $19.83 |
| Maximum sales charge | 5.75% |
| Maximum offering price per share (calculated by dividing the net asset value per share by 1.0 minus the maximum sales charge for Class A shares) | $21.04 |
| Advisor Class | |
| Net assets | $133,767,272 |
| Shares outstanding | 6,639,602 |
| Net asset value per share | $20.15 |
| Class C | |
| Net assets | $58,086,235 |
| Shares outstanding | 2,945,838 |
| Net asset value per share | $19.72 |
| Institutional Class | |
| Net assets | $756,892,582 |
| Shares outstanding | 38,075,492 |
| Net asset value per share | $19.88 |
| Institutional 2 Class | |
| Net assets | $144,670,430 |
| Shares outstanding | 7,193,639 |
| Net asset value per share | $20.11 |
| Institutional 3 Class | |
| Net assets | $123,492,581 |
| Shares outstanding | 6,065,615 |
| Net asset value per share | $20.36 |
| Class R | |
| Net assets | $1,140,954 |
| Shares outstanding | 57,614 |
| Net asset value per share | $19.80 |
| Columbia Convertible Securities Fund | Semiannual Report 2022 | 13 |
Six Months Ended August 31, 2022 (Unaudited)
| Net investment income | |
| Income: | |
| Dividends — unaffiliated issuers | $10,533,593 |
| Dividends — affiliated issuers | 114,033 |
| Interest | 12,968,800 |
| Interfund lending | 79 |
| Total income | 23,616,505 |
| Expenses: | |
| Management services fees | 6,706,115 |
| Distribution and/or service fees | |
| Class A | 463,293 |
| Class C | 327,306 |
| Class R | 2,998 |
| Transfer agent fees | |
| Class A | 188,568 |
| Advisor Class | 74,664 |
| Class C | 33,267 |
| Institutional Class | 488,099 |
| Institutional 2 Class | 42,847 |
| Institutional 3 Class | 2,909 |
| Class R | 611 |
| Compensation of board members | 7,273 |
| Custodian fees | 6,865 |
| Printing and postage fees | 58,180 |
| Registration fees | 81,946 |
| Audit fees | 15,022 |
| Legal fees | 15,272 |
| Interest on interfund lending | 19 |
| Compensation of chief compliance officer | 156 |
| Other | 21,128 |
| Total expenses | 8,536,538 |
| Fees waived or expenses reimbursed by Investment Manager and its affiliates | (89,568) |
| Fees waived by transfer agent | |
| Institutional 2 Class | (9,000) |
| Institutional 3 Class | (1,911) |
| Total net expenses | 8,436,059 |
| Net investment income | 15,180,446 |
| Realized and unrealized gain (loss) — net | |
| Net realized gain (loss) on: | |
| Investments — unaffiliated issuers | (20,558,943) |
| Investments — affiliated issuers | 94 |
| Foreign currency translations | (4,259) |
| Net realized loss | (20,563,108) |
| Net change in unrealized appreciation (depreciation) on: | |
| Investments — unaffiliated issuers | (191,590,480) |
| Investments — affiliated issuers | 924 |
| Foreign currency translations | (1,009) |
| Net change in unrealized appreciation (depreciation) | (191,590,565) |
| Net realized and unrealized loss | (212,153,673) |
| Net decrease in net assets resulting from operations | $(196,973,227) |
| 14 | Columbia Convertible Securities Fund | Semiannual Report 2022 |
| Six Months Ended August 31, 2022 (Unaudited) | Year Ended February 28, 2022 | |
| Operations | ||
| Net investment income | $15,180,446 | $25,553,826 |
| Net realized gain (loss) | (20,563,108) | 347,910,870 |
| Net change in unrealized appreciation (depreciation) | (191,590,565) | (597,684,416) |
| Net decrease in net assets resulting from operations | (196,973,227) | (224,219,720) |
| Distributions to shareholders | ||
| Net investment income and net realized gains | ||
| Class A | (26,827,110) | (99,541,078) |
| Advisor Class | (10,403,505) | (42,828,942) |
| Class C | (4,481,588) | (17,238,856) |
| Institutional Class | (71,541,500) | (257,850,064) |
| Institutional 2 Class | (9,839,556) | (45,510,274) |
| Institutional 3 Class | (5,179,759) | (24,603,005) |
| Class R | (87,230) | (316,475) |
| Total distributions to shareholders | (128,360,248) | (487,888,694) |
| Increase (decrease) in net assets from capital stock activity | (149,944,591) | 64,917,630 |
| Total decrease in net assets | (475,278,066) | (647,190,784) |
| Net assets at beginning of period | 2,045,261,621 | 2,692,452,405 |
| Net assets at end of period | $1,569,983,555 | $2,045,261,621 |
| Columbia Convertible Securities Fund | Semiannual Report 2022 | 15 |
| Six Months Ended | Year Ended | |||
| August 31, 2022 (Unaudited) | February 28, 2022 | |||
| Shares | Dollars ($) | Shares | Dollars ($) | |
| Capital stock activity | ||||
| Class A | ||||
| Subscriptions | 2,058,340 | 43,973,843 | 3,228,830 | 92,003,782 |
| Distributions reinvested | 1,055,279 | 19,521,075 | 2,846,504 | 75,156,224 |
| Redemptions | (2,768,940) | (58,573,595) | (6,914,880) | (191,621,486) |
| Net increase (decrease) | 344,679 | 4,921,323 | (839,546) | (24,461,480) |
| Advisor Class | ||||
| Subscriptions | 1,389,368 | 29,679,696 | 3,734,410 | 109,600,435 |
| Distributions reinvested | 550,594 | 10,377,003 | 1,602,315 | 42,763,655 |
| Redemptions | (2,644,243) | (57,149,350) | (5,156,959) | (145,063,892) |
| Net increase (decrease) | (704,281) | (17,092,651) | 179,766 | 7,300,198 |
| Class C | ||||
| Subscriptions | 138,960 | 2,874,757 | 539,063 | 15,538,783 |
| Distributions reinvested | 219,918 | 4,027,533 | 592,034 | 15,484,137 |
| Redemptions | (713,648) | (15,057,822) | (970,376) | (26,782,063) |
| Net increase (decrease) | (354,770) | (8,155,532) | 160,721 | 4,240,857 |
| Institutional Class | ||||
| Subscriptions | 7,534,720 | 165,409,693 | 13,759,425 | 391,569,803 |
| Distributions reinvested | 3,212,551 | 59,694,187 | 8,000,005 | 211,130,201 |
| Redemptions | (18,668,151) | (385,902,595) | (19,464,113) | (535,994,990) |
| Net increase (decrease) | (7,920,880) | (160,798,715) | 2,295,317 | 66,705,014 |
| Institutional 2 Class | ||||
| Subscriptions | 2,944,103 | 63,817,414 | 3,662,138 | 106,043,960 |
| Distributions reinvested | 461,703 | 8,699,473 | 1,571,227 | 41,882,441 |
| Redemptions | (3,703,550) | (78,942,033) | (5,017,678) | (137,042,082) |
| Net increase (decrease) | (297,744) | (6,425,146) | 215,687 | 10,884,319 |
| Institutional 3 Class | ||||
| Subscriptions | 3,760,592 | 78,040,446 | 1,091,018 | 31,642,676 |
| Distributions reinvested | 266,844 | 5,092,913 | 904,559 | 24,378,433 |
| Redemptions | (2,142,056) | (45,596,993) | (2,002,471) | (55,368,594) |
| Net increase (decrease) | 1,885,380 | 37,536,366 | (6,894) | 652,515 |
| Class R | ||||
| Subscriptions | 4,727 | 98,059 | 24,002 | 659,851 |
| Distributions reinvested | 4,452 | 82,117 | 8,976 | 236,924 |
| Redemptions | (5,420) | (110,412) | (45,984) | (1,300,568) |
| Net increase (decrease) | 3,759 | 69,764 | (13,006) | (403,793) |
| Total net increase (decrease) | (7,043,857) | (149,944,591) | 1,992,045 | 64,917,630 |
| 16 | Columbia Convertible Securities Fund | Semiannual Report 2022 |
| Net asset value, beginning of period | Net investment income | Net realized and unrealized gain (loss) | Total from investment operations | Distributions from net investment income | Distributions from net realized gains | Total distributions to shareholders | |
| Class A | |||||||
| Six Months Ended 8/31/2022 (Unaudited) | $23.74 | 0.17 | (2.45) | (2.28) | (0.19) | (1.44) | (1.63) |
| Year Ended 2/28/2022 | $32.01 | 0.24 | (2.84) | (2.60) | (0.22) | (5.45) | (5.67) |
| Year Ended 2/28/2021 | $22.09 | 0.34 | 11.92 | 12.26 | (0.44) | (1.90) | (2.34) |
| Year Ended 2/29/2020 | $20.92 | 0.39 | 2.18 | 2.57 | (0.50) | (0.90) | (1.40) |
| Year Ended 2/28/2019 | $20.41 | 0.39 | 1.11 | 1.50 | (0.40) | (0.59) | (0.99) |
| Year Ended 2/28/2018 | $18.64 | 0.43 | 1.89 | 2.32 | (0.55) | — | (0.55) |
| Advisor Class | |||||||
| Six Months Ended 8/31/2022 (Unaudited) | $24.09 | 0.19 | (2.47) | (2.28) | (0.22) | (1.44) | (1.66) |
| Year Ended 2/28/2022 | $32.40 | 0.32 | (2.89) | (2.57) | (0.29) | (5.45) | (5.74) |
| Year Ended 2/28/2021 | $22.34 | 0.41 | 12.06 | 12.47 | (0.51) | (1.90) | (2.41) |
| Year Ended 2/29/2020 | $21.14 | 0.45 | 2.20 | 2.65 | (0.55) | (0.90) | (1.45) |
| Year Ended 2/28/2019 | $20.61 | 0.44 | 1.13 | 1.57 | (0.45) | (0.59) | (1.04) |
| Year Ended 2/28/2018 | $18.82 | 0.48 | 1.90 | 2.38 | (0.59) | — | (0.59) |
| Class C | |||||||
| Six Months Ended 8/31/2022 (Unaudited) | $23.60 | 0.08 | (2.42) | (2.34) | (0.10) | (1.44) | (1.54) |
| Year Ended 2/28/2022 | $31.88 | 0.03 | (2.85) | (2.82) | (0.01) | (5.45) | (5.46) |
| Year Ended 2/28/2021 | $22.00 | 0.15 | 11.89 | 12.04 | (0.26) | (1.90) | (2.16) |
| Year Ended 2/29/2020 | $20.84 | 0.23 | 2.17 | 2.40 | (0.34) | (0.90) | (1.24) |
| Year Ended 2/28/2019 | $20.33 | 0.23 | 1.12 | 1.35 | (0.25) | (0.59) | (0.84) |
| Year Ended 2/28/2018 | $18.57 | 0.29 | 1.87 | 2.16 | (0.40) | — | (0.40) |
| Institutional Class | |||||||
| Six Months Ended 8/31/2022 (Unaudited) | $23.79 | 0.19 | (2.44) | (2.25) | (0.22) | (1.44) | (1.66) |
| Year Ended 2/28/2022 | $32.08 | 0.31 | (2.86) | (2.55) | (0.29) | (5.45) | (5.74) |
| Year Ended 2/28/2021 | $22.13 | 0.41 | 11.95 | 12.36 | (0.51) | (1.90) | (2.41) |
| Year Ended 2/29/2020 | $20.96 | 0.45 | 2.17 | 2.62 | (0.55) | (0.90) | (1.45) |
| Year Ended 2/28/2019 | $20.44 | 0.44 | 1.12 | 1.56 | (0.45) | (0.59) | (1.04) |
| Year Ended 2/28/2018 | $18.67 | 0.48 | 1.88 | 2.36 | (0.59) | — | (0.59) |
| Institutional 2 Class | |||||||
| Six Months Ended 8/31/2022 (Unaudited) | $24.05 | 0.20 | (2.47) | (2.27) | (0.23) | (1.44) | (1.67) |
| Year Ended 2/28/2022 | $32.36 | 0.33 | (2.88) | (2.55) | (0.31) | (5.45) | (5.76) |
| Year Ended 2/28/2021 | $22.31 | 0.43 | 12.04 | 12.47 | (0.52) | (1.90) | (2.42) |
| Year Ended 2/29/2020 | $21.12 | 0.47 | 2.18 | 2.65 | (0.56) | (0.90) | (1.46) |
| Year Ended 2/28/2019 | $20.59 | 0.45 | 1.14 | 1.59 | (0.47) | (0.59) | (1.06) |
| Year Ended 2/28/2018 | $18.80 | 0.50 | 1.90 | 2.40 | (0.61) | — | (0.61) |
| 18 | Columbia Convertible Securities Fund | Semiannual Report 2022 |
| Net asset value, end of period | Total return | Total gross expense ratio to average net assets(a) | Total net expense ratio to average net assets(a),(b) | Net investment income ratio to average net assets | Portfolio turnover | Net assets, end of period (000’s) | |
| Class A | |||||||
| Six Months Ended 8/31/2022 (Unaudited) | $19.83 | (9.08%) | 1.13%(c),(d) | 1.12%(c),(d) | 1.55%(c) | 26% | $351,934 |
| Year Ended 2/28/2022 | $23.74 | (9.04%) | 1.10%(d) | 1.10%(d),(e) | 0.83% | 92% | $413,074 |
| Year Ended 2/28/2021 | $32.01 | 58.37% | 1.12%(d) | 1.12%(d),(e) | 1.32% | 98% | $584,015 |
| Year Ended 2/29/2020 | $22.09 | 12.55% | 1.17%(d) | 1.12%(d),(e) | 1.81% | 74% | $317,365 |
| Year Ended 2/28/2019 | $20.92 | 7.70% | 1.20%(d) | 1.13%(d),(e) | 1.88% | 60% | $286,075 |
| Year Ended 2/28/2018 | $20.41 | 12.65% | 1.22% | 1.12%(e) | 2.21% | 67% | $248,052 |
| Advisor Class | |||||||
| Six Months Ended 8/31/2022 (Unaudited) | $20.15 | (8.96%) | 0.88%(c),(d) | 0.87%(c),(d) | 1.78%(c) | 26% | $133,767 |
| Year Ended 2/28/2022 | $24.09 | (8.82%) | 0.85%(d) | 0.85%(d),(e) | 1.08% | 92% | $176,880 |
| Year Ended 2/28/2021 | $32.40 | 58.75% | 0.88%(d) | 0.88%(d),(e) | 1.55% | 98% | $232,118 |
| Year Ended 2/29/2020 | $22.34 | 12.84% | 0.92%(d) | 0.87%(d),(e) | 2.06% | 74% | $94,945 |
| Year Ended 2/28/2019 | $21.14 | 7.99% | 0.95%(d) | 0.88%(d),(e) | 2.15% | 60% | $51,487 |
| Year Ended 2/28/2018 | $20.61 | 12.91% | 0.97% | 0.87%(e) | 2.43% | 67% | $18,432 |
| Class C | |||||||
| Six Months Ended 8/31/2022 (Unaudited) | $19.72 | (9.39%) | 1.88%(c),(d) | 1.87%(c),(d) | 0.78%(c) | 26% | $58,086 |
| Year Ended 2/28/2022 | $23.60 | (9.76%) | 1.85%(d) | 1.85%(d),(e) | 0.09% | 92% | $77,910 |
| Year Ended 2/28/2021 | $31.88 | 57.20% | 1.87%(d) | 1.87%(d),(e) | 0.59% | 98% | $100,101 |
| Year Ended 2/29/2020 | $22.00 | 11.71% | 1.92%(d) | 1.87%(d),(e) | 1.06% | 74% | $62,313 |
| Year Ended 2/28/2019 | $20.84 | 6.92% | 1.95%(d) | 1.88%(d),(e) | 1.14% | 60% | $44,035 |
| Year Ended 2/28/2018 | $20.33 | 11.80% | 1.97% | 1.87%(e) | 1.47% | 67% | $40,419 |
| Institutional Class | |||||||
| Six Months Ended 8/31/2022 (Unaudited) | $19.88 | (8.94%) | 0.88%(c),(d) | 0.87%(c),(d) | 1.78%(c) | 26% | $756,893 |
| Year Ended 2/28/2022 | $23.79 | (8.84%) | 0.85%(d) | 0.85%(d),(e) | 1.09% | 92% | $1,094,312 |
| Year Ended 2/28/2021 | $32.08 | 58.81% | 0.88%(d) | 0.88%(d),(e) | 1.57% | 98% | $1,401,886 |
| Year Ended 2/29/2020 | $22.13 | 12.81% | 0.92%(d) | 0.87%(d),(e) | 2.06% | 74% | $733,400 |
| Year Ended 2/28/2019 | $20.96 | 8.00% | 0.95%(d) | 0.88%(d),(e) | 2.13% | 60% | $544,140 |
| Year Ended 2/28/2018 | $20.44 | 12.91% | 0.97% | 0.87%(e) | 2.49% | 67% | $393,240 |
| Institutional 2 Class | |||||||
| Six Months Ended 8/31/2022 (Unaudited) | $20.11 | (8.94%) | 0.83%(c),(d) | 0.81%(c),(d) | 1.85%(c) | 26% | $144,670 |
| Year Ended 2/28/2022 | $24.05 | (8.77%) | 0.80%(d) | 0.79%(d) | 1.14% | 92% | $180,150 |
| Year Ended 2/28/2021 | $32.36 | 58.89% | 0.83%(d) | 0.81%(d) | 1.62% | 98% | $235,448 |
| Year Ended 2/29/2020 | $22.31 | 12.88% | 0.87%(d) | 0.81%(d) | 2.13% | 74% | $92,233 |
| Year Ended 2/28/2019 | $21.12 | 8.07% | 0.89%(d) | 0.81%(d) | 2.19% | 60% | $80,367 |
| Year Ended 2/28/2018 | $20.59 | 13.02% | 0.90% | 0.80% | 2.54% | 67% | $49,709 |
| Columbia Convertible Securities Fund | Semiannual Report 2022 | 19 |
| Net asset value, beginning of period | Net investment income | Net realized and unrealized gain (loss) | Total from investment operations | Distributions from net investment income | Distributions from net realized gains | Total distributions to shareholders | |
| Institutional 3 Class | |||||||
| Six Months Ended 8/31/2022 (Unaudited) | $24.32 | 0.22 | (2.51) | (2.29) | (0.23) | (1.44) | (1.67) |
| Year Ended 2/28/2022 | $32.66 | 0.35 | (2.92) | (2.57) | (0.32) | (5.45) | (5.77) |
| Year Ended 2/28/2021 | $22.50 | 0.45 | 12.14 | 12.59 | (0.53) | (1.90) | (2.43) |
| Year Ended 2/29/2020 | $21.28 | 0.48 | 2.21 | 2.69 | (0.57) | (0.90) | (1.47) |
| Year Ended 2/28/2019 | $20.74 | 0.47 | 1.14 | 1.61 | (0.48) | (0.59) | (1.07) |
| Year Ended 2/28/2018 | $18.94 | 0.51 | 1.91 | 2.42 | (0.62) | — | (0.62) |
| Class R | |||||||
| Six Months Ended 8/31/2022 (Unaudited) | $23.70 | 0.14 | (2.44) | (2.30) | (0.16) | (1.44) | (1.60) |
| Year Ended 2/28/2022 | $31.98 | 0.16 | (2.85) | (2.69) | (0.14) | (5.45) | (5.59) |
| Year Ended 2/28/2021 | $22.06 | 0.29 | 11.91 | 12.20 | (0.38) | (1.90) | (2.28) |
| Year Ended 2/29/2020 | $20.90 | 0.34 | 2.16 | 2.50 | (0.44) | (0.90) | (1.34) |
| Year Ended 2/28/2019 | $20.39 | 0.33 | 1.12 | 1.45 | (0.35) | (0.59) | (0.94) |
| Year Ended 2/28/2018 | $18.62 | 0.38 | 1.89 | 2.27 | (0.50) | — | (0.50) |
| Notes to Financial Highlights | |
| (a) | In addition to the fees and expenses that the Fund bears directly, the Fund indirectly bears a pro rata share of the fees and expenses of any other funds in which it invests. Such indirect expenses are not included in the Fund’s reported expense ratios. |
| (b) | Total net expenses include the impact of certain fee waivers/expense reimbursements made by the Investment Manager and certain of its affiliates, if applicable. |
| (c) | Annualized. |
| (d) | Ratios include interfund lending expense which is less than 0.01%. |
| (e) | The benefits derived from expense reductions had an impact of less than 0.01%. |
| 20 | Columbia Convertible Securities Fund | Semiannual Report 2022 |
| Net asset value, end of period | Total return | Total gross expense ratio to average net assets(a) | Total net expense ratio to average net assets(a),(b) | Net investment income ratio to average net assets | Portfolio turnover | Net assets, end of period (000’s) | |
| Institutional 3 Class | |||||||
| Six Months Ended 8/31/2022 (Unaudited) | $20.36 | (8.91%) | 0.79%(c),(d) | 0.77%(c),(d) | 1.96%(c) | 26% | $123,493 |
| Year Ended 2/28/2022 | $24.32 | (8.74%) | 0.75%(d) | 0.75%(d) | 1.18% | 92% | $101,658 |
| Year Ended 2/28/2021 | $32.66 | 58.95% | 0.78%(d) | 0.77%(d) | 1.74% | 98% | $136,747 |
| Year Ended 2/29/2020 | $22.50 | 12.97% | 0.82%(d) | 0.77%(d) | 2.17% | 74% | $128,319 |
| Year Ended 2/28/2019 | $21.28 | 8.11% | 0.84%(d) | 0.76%(d) | 2.25% | 60% | $100,142 |
| Year Ended 2/28/2018 | $20.74 | 13.03% | 0.85% | 0.75% | 2.58% | 67% | $90,655 |
| Class R | |||||||
| Six Months Ended 8/31/2022 (Unaudited) | $19.80 | (9.19%) | 1.38%(c),(d) | 1.37%(c),(d) | 1.31%(c) | 26% | $1,141 |
| Year Ended 2/28/2022 | $23.70 | (9.32%) | 1.35%(d) | 1.35%(d),(e) | 0.57% | 92% | $1,277 |
| Year Ended 2/28/2021 | $31.98 | 58.04% | 1.37%(d) | 1.37%(d),(e) | 1.13% | 98% | $2,138 |
| Year Ended 2/29/2020 | $22.06 | 12.23% | 1.42%(d) | 1.37%(d),(e) | 1.56% | 74% | $1,900 |
| Year Ended 2/28/2019 | $20.90 | 7.44% | 1.45%(d) | 1.38%(d),(e) | 1.63% | 60% | $2,337 |
| Year Ended 2/28/2018 | $20.39 | 12.38% | 1.47% | 1.37%(e) | 1.97% | 67% | $3,031 |
| Columbia Convertible Securities Fund | Semiannual Report 2022 | 21 |
August 31, 2022 (Unaudited)
| 22 | Columbia Convertible Securities Fund | Semiannual Report 2022 |
August 31, 2022 (Unaudited)
| Columbia Convertible Securities Fund | Semiannual Report 2022 | 23 |
August 31, 2022 (Unaudited)
| 24 | Columbia Convertible Securities Fund | Semiannual Report 2022 |
August 31, 2022 (Unaudited)
| Effective rate (%) | |
| Class A | 0.10 |
| Advisor Class | 0.10 |
| Class C | 0.10 |
| Institutional Class | 0.10 |
| Institutional 2 Class | 0.04 |
| Institutional 3 Class | 0.00 |
| Class R | 0.10 |
| Columbia Convertible Securities Fund | Semiannual Report 2022 | 25 |
August 31, 2022 (Unaudited)
| Front End (%) | CDSC (%) | Amount ($) | |
| Class A | 5.75 | 0.50 - 1.00(a) | 97,187 |
| Class C | — | 1.00(b) | 3,056 |
| (a) | This charge is imposed on certain investments of between $1 million and $50 million redeemed within 18 months after purchase, as follows: 1.00% if redeemed within 12 months after purchase, and 0.50% if redeemed more than 12, but less than 18, months after purchase, with certain limited exceptions. |
| (b) | This charge applies to redemptions within 12 months after purchase, with certain limited exceptions. |
| July 1, 2022 through June 30, 2023 | Prior to July 1, 2022 | |
| Class A | 1.12% | 1.12% |
| Advisor Class | 0.87 | 0.87 |
| Class C | 1.87 | 1.87 |
| Institutional Class | 0.87 | 0.87 |
| Institutional 2 Class | 0.82 | 0.81 |
| Institutional 3 Class | 0.78 | 0.77 |
| Class R | 1.37 | 1.37 |
| 26 | Columbia Convertible Securities Fund | Semiannual Report 2022 |
August 31, 2022 (Unaudited)
| Federal tax cost ($) | Gross unrealized appreciation ($) | Gross unrealized (depreciation) ($) | Net unrealized (depreciation) ($) |
| 1,642,589,000 | 124,836,000 | (213,484,000) | (88,648,000) |
| Late year ordinary losses ($) | Post-October capital losses ($) |
| — | 26,962,597 |
| Columbia Convertible Securities Fund | Semiannual Report 2022 | 27 |
August 31, 2022 (Unaudited)
| Borrower or lender | Average loan balance ($) | Weighted average interest rate (%) | Number of days with outstanding loans |
| Borrower | 500,000 | 1.35 | 1 |
| Lender | 1,000,000 | 2.85 | 1 |
| 28 | Columbia Convertible Securities Fund | Semiannual Report 2022 |
August 31, 2022 (Unaudited)
| Columbia Convertible Securities Fund | Semiannual Report 2022 | 29 |
August 31, 2022 (Unaudited)
| 30 | Columbia Convertible Securities Fund | Semiannual Report 2022 |
| • | the Fund had sufficient liquidity to both meet redemptions and operate effectively on behalf of shareholders; |
| • | there were no material changes to the Program during the period; |
| • | the implementation of the Program was effective to manage the Fund’s liquidity risk; and |
| • | the Program operated adequately during the period. |
| Columbia Convertible Securities Fund | Semiannual Report 2022 | 31 |
(Unaudited)
| • | Information on the investment performance of the Fund relative to the performance of a group of mutual funds determined to be comparable to the Fund by Broadridge, as well as performance relative to benchmarks; |
| • | Information on the Fund’s management fees and total expenses, including information comparing the Fund’s expenses to those of a group of comparable mutual funds, as determined by Broadridge; |
| • | The Investment Manager’s agreement to contractually limit or cap total operating expenses for the Fund so that total operating expenses (excluding certain fees and expenses, such as transaction costs and certain other investment related expenses, interest, taxes, acquired fund fees and expenses and infrequent and/or unusual expenses) would not exceed a specified annual rate, as a percentage of the Fund’s net assets; |
| • | Terms of the Management Agreement; |
| • | Descriptions of other agreements and arrangements with affiliates of the Investment Manager relating to the operations of the Fund, including agreements with respect to the provision of transfer agency and shareholder services to the Fund; |
| • | Descriptions of various services performed by the Investment Manager under the Management Agreement, including portfolio management and portfolio trading practices; |
| • | Information regarding any recently negotiated management fees of similarly-managed portfolios of other institutional clients of the Investment Manager; |
| • | Information regarding the resources of the Investment Manager, including information regarding senior management, portfolio managers and other personnel; |
| • | Information regarding the capabilities of the Investment Manager with respect to compliance monitoring services; |
| • | The profitability to the Investment Manager and its affiliates from their relationships with the Fund; and |
| • | Report provided by the Board’s independent fee consultant, JDL Consultants, LLC (JDL). |
| 32 | Columbia Convertible Securities Fund | Semiannual Report 2022 |
(Unaudited)
into account the organization and strength of the Fund’s and its service providers’ compliance programs. The Board also reviewed the financial condition of the Investment Manager and its affiliates and each entity’s ability to carry out its responsibilities under the Management Agreement and the Fund’s other service agreements.
| Columbia Convertible Securities Fund | Semiannual Report 2022 | 33 |
(Unaudited)
considered 2020 profitability and that the 2022 information showed that the profitability generated by the Investment Manager in 2021 increased from 2020 levels, due to a variety of factors, including the increased assets under management of the Funds. It also took into account the indirect economic benefits flowing to the Investment Manager or its affiliates in connection with managing or distributing the Funds, such as the enhanced ability to offer various other financial products to Ameriprise Financial customers, soft dollar benefits and overall reputational advantages. The Board noted that the fees paid by the Fund should permit the Investment Manager to offer competitive compensation to its personnel, make necessary investments in its business and earn an appropriate profit. After reviewing these and related factors, the Board concluded, within the context of their overall conclusions, that the costs of services provided and the profitability to the Investment Manager and its affiliates from their relationships with the Fund supported the continuation of the Management Agreement.
| 34 | Columbia Convertible Securities Fund | Semiannual Report 2022 |
columbiathreadneedleus.com/investor/. The Fund is distributed by Columbia Management Investment Distributors, Inc., member FINRA, and managed by Columbia Management Investment Advisers, LLC.

August 31, 2022 (Unaudited)

(Unaudited)

| Average annual total returns (%) (for the period ended August 31, 2022) | ||||||
| Inception | 6 Months cumulative | 1 Year | 5 Years | 10 Years | ||
| Class A | Excluding sales charges | 08/02/99 | -10.11 | -12.53 | 10.91 | 12.54 |
| Including sales charges | -15.29 | -17.55 | 9.61 | 11.88 | ||
| Advisor Class* | 07/05/17 | -9.95 | -12.28 | 11.18 | 12.82 | |
| Class C | Excluding sales charges | 08/02/99 | -10.47 | -13.20 | 10.07 | 11.70 |
| Including sales charges | -11.32 | -13.98 | 10.07 | 11.70 | ||
| Institutional Class | 10/02/98 | -9.95 | -12.31 | 11.18 | 12.82 | |
| Institutional 2 Class* | 11/08/12 | -9.98 | -12.25 | 11.27 | 12.92 | |
| Institutional 3 Class* | 03/01/17 | -9.94 | -12.22 | 11.32 | 12.90 | |
| S&P 500 Index | -8.84 | -11.23 | 11.82 | 13.08 | ||
| * | The returns shown for periods prior to the share class inception date (including returns for the Life of the Fund, if shown, which are since Fund inception) include the returns of the Fund’s oldest share class. These returns are adjusted to reflect any higher class-related operating expenses of the newer share classes, as applicable. Please visit columbiathreadneedleus.com/investor/investment-products/mutual-funds/appended-performance for more information. |
| Columbia Select Large Cap Equity Fund | Semiannual Report 2022 | 3 |
(Unaudited)
| Portfolio breakdown (%) (at August 31, 2022) | |
| Common Stocks | 98.3 |
| Money Market Funds | 1.7 |
| Total | 100.0 |
| Equity sector breakdown (%) (at August 31, 2022) | |
| Communication Services | 9.6 |
| Consumer Discretionary | 10.0 |
| Consumer Staples | 5.8 |
| Energy | 3.8 |
| Financials | 10.2 |
| Health Care | 16.3 |
| Industrials | 10.5 |
| Information Technology | 27.9 |
| Real Estate | 2.4 |
| Utilities | 3.5 |
| Total | 100.0 |
| 4 | Columbia Select Large Cap Equity Fund | Semiannual Report 2022 |
(Unaudited)
| March 1, 2022 — August 31, 2022 | |||||||
| Account value at the beginning of the period ($) | Account value at the end of the period ($) | Expenses paid during the period ($) | Fund’s annualized expense ratio (%) | ||||
| Actual | Hypothetical | Actual | Hypothetical | Actual | Hypothetical | Actual | |
| Class A | 1,000.00 | 1,000.00 | 898.90 | 1,021.22 | 3.78 | 4.02 | 0.79 |
| Advisor Class | 1,000.00 | 1,000.00 | 900.50 | 1,022.48 | 2.59 | 2.75 | 0.54 |
| Class C | 1,000.00 | 1,000.00 | 895.30 | 1,017.44 | 7.36 | 7.83 | 1.54 |
| Institutional Class | 1,000.00 | 1,000.00 | 900.50 | 1,022.48 | 2.59 | 2.75 | 0.54 |
| Institutional 2 Class | 1,000.00 | 1,000.00 | 900.20 | 1,022.79 | 2.30 | 2.45 | 0.48 |
| Institutional 3 Class | 1,000.00 | 1,000.00 | 900.60 | 1,023.04 | 2.06 | 2.19 | 0.43 |
| Columbia Select Large Cap Equity Fund | Semiannual Report 2022 | 5 |
August 31, 2022 (Unaudited)
| Common Stocks 98.0% | ||
| Issuer | Shares | Value ($) |
| Communication Services 9.4% | ||
| Diversified Telecommunication Services 1.4% | ||
| AT&T, Inc. | 1,004,534 | 17,619,526 |
| Entertainment 1.4% | ||
| Electronic Arts, Inc. | 139,474 | 17,695,067 |
| Interactive Media & Services 4.9% | ||
| Alphabet, Inc., Class C(a) | 567,760 | 61,971,004 |
| Media 1.7% | ||
| Comcast Corp., Class A | 574,336 | 20,785,220 |
| Total Communication Services | 118,070,817 | |
| Consumer Discretionary 9.8% | ||
| Automobiles 0.9% | ||
| Tesla, Inc.(a) | 40,230 | 11,087,790 |
| Hotels, Restaurants & Leisure 1.3% | ||
| Hilton Worldwide Holdings, Inc. | 125,555 | 15,990,685 |
| Internet & Direct Marketing Retail 4.4% | ||
| Amazon.com, Inc.(a) | 434,228 | 55,047,084 |
| Multiline Retail 1.3% | ||
| Target Corp. | 98,379 | 15,774,089 |
| Specialty Retail 1.9% | ||
| Home Depot, Inc. (The) | 83,577 | 24,105,278 |
| Total Consumer Discretionary | 122,004,926 | |
| Consumer Staples 5.7% | ||
| Beverages 1.7% | ||
| Constellation Brands, Inc., Class A | 83,497 | 20,544,437 |
| Food Products 1.6% | ||
| Hershey Co. (The) | 90,465 | 20,324,771 |
| Household Products 2.4% | ||
| Procter & Gamble Co. (The) | 218,472 | 30,136,028 |
| Total Consumer Staples | 71,005,236 | |
| Common Stocks (continued) | ||
| Issuer | Shares | Value ($) |
| Energy 3.7% | ||
| Oil, Gas & Consumable Fuels 3.7% | ||
| ConocoPhillips Co. | 247,987 | 27,142,177 |
| Valero Energy Corp. | 168,606 | 19,747,135 |
| Total | 46,889,312 | |
| Total Energy | 46,889,312 | |
| Financials 10.0% | ||
| Banks 2.6% | ||
| Bank of America Corp. | 708,069 | 23,798,199 |
| Popular, Inc. | 108,912 | 8,410,185 |
| Total | 32,208,384 | |
| Capital Markets 4.4% | ||
| Morgan Stanley | 255,692 | 21,790,072 |
| S&P Global, Inc. | 50,628 | 17,830,169 |
| State Street Corp. | 232,752 | 15,908,599 |
| Total | 55,528,840 | |
| Consumer Finance 1.3% | ||
| Discover Financial Services | 161,708 | 16,250,037 |
| Insurance 1.7% | ||
| MetLife, Inc. | 334,064 | 21,490,337 |
| Total Financials | 125,477,598 | |
| Health Care 16.0% | ||
| Biotechnology 3.4% | ||
| AbbVie, Inc. | 164,615 | 22,134,133 |
| BioMarin Pharmaceutical, Inc.(a) | 93,305 | 8,322,806 |
| Vertex Pharmaceuticals, Inc.(a) | 42,491 | 11,972,264 |
| Total | 42,429,203 | |
| Health Care Equipment & Supplies 2.5% | ||
| Boston Scientific Corp.(a) | 382,301 | 15,410,553 |
| Stryker Corp. | 76,505 | 15,698,826 |
| Total | 31,109,379 | |
| Health Care Providers & Services 3.9% | ||
| Elevance Health, Inc. | 35,982 | 17,455,228 |
| UnitedHealth Group, Inc. | 60,329 | 31,330,660 |
| Total | 48,785,888 | |
| 6 | Columbia Select Large Cap Equity Fund | Semiannual Report 2022 |
August 31, 2022 (Unaudited)
| Common Stocks (continued) | ||
| Issuer | Shares | Value ($) |
| Life Sciences Tools & Services 1.1% | ||
| IQVIA Holdings, Inc.(a) | 64,381 | 13,691,264 |
| Pharmaceuticals 5.1% | ||
| Eli Lilly & Co. | 68,354 | 20,590,275 |
| Johnson & Johnson | 182,656 | 29,469,719 |
| Zoetis, Inc. | 88,681 | 13,881,237 |
| Total | 63,941,231 | |
| Total Health Care | 199,956,965 | |
| Industrials 10.3% | ||
| Aerospace & Defense 1.5% | ||
| Raytheon Technologies Corp. | 214,724 | 19,271,479 |
| Air Freight & Logistics 1.5% | ||
| United Parcel Service, Inc., Class B | 96,085 | 18,689,493 |
| Building Products 1.2% | ||
| Trane Technologies PLC | 94,224 | 14,517,092 |
| Commercial Services & Supplies 2.4% | ||
| Cintas Corp. | 33,728 | 13,721,899 |
| Republic Services, Inc. | 111,519 | 15,915,992 |
| Total | 29,637,891 | |
| Construction & Engineering 1.0% | ||
| MasTec, Inc.(a) | 162,268 | 13,062,574 |
| Machinery 1.1% | ||
| Parker-Hannifin Corp. | 53,047 | 14,057,455 |
| Road & Rail 1.6% | ||
| Union Pacific Corp. | 87,120 | 19,559,311 |
| Total Industrials | 128,795,295 | |
| Information Technology 27.3% | ||
| Communications Equipment 1.8% | ||
| Cisco Systems, Inc. | 492,872 | 22,041,236 |
| Electronic Equipment, Instruments & Components 1.3% | ||
| TE Connectivity Ltd. | 127,644 | 16,109,949 |
| IT Services 1.9% | ||
| MasterCard, Inc., Class A | 73,661 | 23,893,419 |
| Semiconductors & Semiconductor Equipment 4.3% | ||
| Applied Materials, Inc. | 168,182 | 15,820,881 |
| Common Stocks (continued) | ||
| Issuer | Shares | Value ($) |
| Broadcom, Inc. | 38,101 | 19,016,590 |
| NVIDIA Corp. | 127,395 | 19,229,001 |
| Total | 54,066,472 | |
| Software 12.3% | ||
| Adobe, Inc.(a) | 50,999 | 19,045,067 |
| Intuit, Inc. | 39,716 | 17,148,574 |
| Microsoft Corp. | 334,737 | 87,523,683 |
| Palo Alto Networks, Inc.(a) | 26,065 | 14,513,253 |
| ServiceNow, Inc.(a) | 36,547 | 15,884,057 |
| Total | 154,114,634 | |
| Technology Hardware, Storage & Peripherals 5.7% | ||
| Apple, Inc.(b) | 453,784 | 71,343,921 |
| Total Information Technology | 341,569,631 | |
| Real Estate 2.4% | ||
| Equity Real Estate Investment Trusts (REITS) 2.4% | ||
| Extra Space Storage, Inc. | 78,747 | 15,649,391 |
| Invitation Homes, Inc. | 381,734 | 13,849,310 |
| Total | 29,498,701 | |
| Total Real Estate | 29,498,701 | |
| Utilities 3.4% | ||
| Electric Utilities 1.8% | ||
| American Electric Power Co., Inc. | 223,368 | 22,381,474 |
| Multi-Utilities 1.6% | ||
| Ameren Corp. | 221,841 | 20,546,913 |
| Total Utilities | 42,928,387 | |
| Total Common Stocks (Cost $933,838,270) | 1,226,196,868 | |
| Money Market Funds 1.7% | ||
| Shares | Value ($) | |
| Columbia Short-Term Cash Fund, 2.366%(c),(d) | 21,255,191 | 21,244,563 |
| Total Money Market Funds (Cost $21,240,402) | 21,244,563 | |
| Total Investments in Securities (Cost: $955,078,672) | 1,247,441,431 | |
| Other Assets & Liabilities, Net | 3,700,926 | |
| Net Assets | 1,251,142,357 | |
| Columbia Select Large Cap Equity Fund | Semiannual Report 2022 | 7 |
August 31, 2022 (Unaudited)
| Long futures contracts | ||||||
| Description | Number of contracts | Expiration date | Trading currency | Notional amount | Value/Unrealized appreciation ($) | Value/Unrealized depreciation ($) |
| S&P 500 Index E-mini | 16 | 09/2022 | USD | 3,165,200 | 46,540 | — |
| (a) | Non-income producing investment. |
| (b) | This security or a portion of this security has been pledged as collateral in connection with derivative contracts. |
| (c) | The rate shown is the seven-day current annualized yield at August 31, 2022. |
| (d) | As defined in the Investment Company Act of 1940, as amended, an affiliated company is one in which the Fund owns 5% or more of the company’s outstanding voting securities, or a company which is under common ownership or control with the Fund. The value of the holdings and transactions in these affiliated companies during the period ended August 31, 2022 are as follows: |
| Affiliated issuers | Beginning of period($) | Purchases($) | Sales($) | Net change in unrealized appreciation (depreciation)($) | End of period($) | Realized gain (loss)($) | Dividends($) | End of period shares |
| Columbia Short-Term Cash Fund, 2.366% | ||||||||
| 13,299,610 | 189,044,996 | (181,103,040) | 2,997 | 21,244,563 | (605) | 131,057 | 21,255,191 | |
| USD | US Dollar |
| ■ | Level 1 — Valuations based on quoted prices for investments in active markets that the Fund has the ability to access at the measurement date. Valuation adjustments are not applied to Level 1 investments. |
| ■ | Level 2 — Valuations based on other significant observable inputs (including quoted prices for similar securities, interest rates, prepayment speeds, credit risks, etc.). |
| ■ | Level 3 — Valuations based on significant unobservable inputs (including the Fund’s own assumptions and judgment in determining the fair value of investments). |
| 8 | Columbia Select Large Cap Equity Fund | Semiannual Report 2022 |
August 31, 2022 (Unaudited)
additional valuation matters, which may include the need to review back-testing results, review time-sensitive information or approve related valuation actions. The Committee reports to the Board, with members of the Committee meeting with the Board at each of its regularly scheduled meetings to discuss valuation matters and actions during the period, similar to those described earlier.
| Level 1 ($) | Level 2 ($) | Level 3 ($) | Total ($) | |
| Investments in Securities | ||||
| Common Stocks | ||||
| Communication Services | 118,070,817 | — | — | 118,070,817 |
| Consumer Discretionary | 122,004,926 | — | — | 122,004,926 |
| Consumer Staples | 71,005,236 | — | — | 71,005,236 |
| Energy | 46,889,312 | — | — | 46,889,312 |
| Financials | 125,477,598 | — | — | 125,477,598 |
| Health Care | 199,956,965 | — | — | 199,956,965 |
| Industrials | 128,795,295 | — | — | 128,795,295 |
| Information Technology | 341,569,631 | — | — | 341,569,631 |
| Real Estate | 29,498,701 | — | — | 29,498,701 |
| Utilities | 42,928,387 | — | — | 42,928,387 |
| Total Common Stocks | 1,226,196,868 | — | — | 1,226,196,868 |
| Money Market Funds | 21,244,563 | — | — | 21,244,563 |
| Total Investments in Securities | 1,247,441,431 | — | — | 1,247,441,431 |
| Investments in Derivatives | ||||
| Asset | ||||
| Futures Contracts | 46,540 | — | — | 46,540 |
| Total | 1,247,487,971 | — | — | 1,247,487,971 |
| Columbia Select Large Cap Equity Fund | Semiannual Report 2022 | 9 |
August 31, 2022 (Unaudited)
| Assets | |
| Investments in securities, at value | |
| Unaffiliated issuers (cost $933,838,270) | $1,226,196,868 |
| Affiliated issuers (cost $21,240,402) | 21,244,563 |
| Receivable for: | |
| Investments sold | 5,962,724 |
| Capital shares sold | 233,900 |
| Dividends | 2,279,048 |
| Expense reimbursement due from Investment Manager | 11,130 |
| Prepaid expenses | 15,855 |
| Other assets | 33,328 |
| Total assets | 1,255,977,416 |
| Liabilities | |
| Payable for: | |
| Investments purchased | 3,352,107 |
| Capital shares purchased | 1,168,087 |
| Variation margin for futures contracts | 24,800 |
| Management services fees | 25,224 |
| Distribution and/or service fees | 1,639 |
| Transfer agent fees | 72,286 |
| Compensation of board members | 159,052 |
| Compensation of chief compliance officer | 117 |
| Other expenses | 31,747 |
| Total liabilities | 4,835,059 |
| Net assets applicable to outstanding capital stock | $1,251,142,357 |
| Represented by | |
| Paid in capital | 969,777,948 |
| Total distributable earnings (loss) | 281,364,409 |
| Total - representing net assets applicable to outstanding capital stock | $1,251,142,357 |
| Class A | |
| Net assets | $206,992,221 |
| Shares outstanding | 12,905,924 |
| Net asset value per share | $16.04 |
| Maximum sales charge | 5.75% |
| Maximum offering price per share (calculated by dividing the net asset value per share by 1.0 minus the maximum sales charge for Class A shares) | $17.02 |
| Advisor Class | |
| Net assets | $1,712,170 |
| Shares outstanding | 108,308 |
| Net asset value per share | $15.81 |
| Class C | |
| Net assets | $7,615,710 |
| Shares outstanding | 536,956 |
| Net asset value per share | $14.18 |
| Institutional Class | |
| Net assets | $280,656,713 |
| Shares outstanding | 17,654,928 |
| Net asset value per share | $15.90 |
| Institutional 2 Class | |
| Net assets | $159,713,147 |
| Shares outstanding | 9,656,867 |
| Net asset value per share | $16.54 |
| Institutional 3 Class | |
| Net assets | $594,452,396 |
| Shares outstanding | 38,100,781 |
| Net asset value per share | $15.60 |
| 10 | Columbia Select Large Cap Equity Fund | Semiannual Report 2022 |
Six Months Ended August 31, 2022 (Unaudited)
| Net investment income | |
| Income: | |
| Dividends — unaffiliated issuers | $10,161,180 |
| Dividends — affiliated issuers | 131,057 |
| Interfund lending | 1,830 |
| Foreign taxes withheld | (13,568) |
| Total income | 10,280,499 |
| Expenses: | |
| Management services fees | 4,794,663 |
| Distribution and/or service fees | |
| Class A | 275,241 |
| Class C | 40,476 |
| Transfer agent fees | |
| Class A | 130,976 |
| Advisor Class | 1,093 |
| Class C | 4,815 |
| Institutional Class | 157,750 |
| Institutional 2 Class | 50,729 |
| Institutional 3 Class | 18,678 |
| Compensation of board members | 4,399 |
| Custodian fees | 6,945 |
| Printing and postage fees | 20,715 |
| Registration fees | 60,596 |
| Audit fees | 15,021 |
| Legal fees | 12,495 |
| Interest on collateral | 137 |
| Compensation of chief compliance officer | 113 |
| Other | 13,127 |
| Total expenses | 5,607,969 |
| Fees waived or expenses reimbursed by Investment Manager and its affiliates | (2,137,668) |
| Total net expenses | 3,470,301 |
| Net investment income | 6,810,198 |
| Realized and unrealized gain (loss) — net | |
| Net realized gain (loss) on: | |
| Investments — unaffiliated issuers | (16,121,493) |
| Investments — affiliated issuers | (605) |
| Foreign currency translations | (21) |
| Futures contracts | 451,449 |
| Net realized loss | (15,670,670) |
| Net change in unrealized appreciation (depreciation) on: | |
| Investments — unaffiliated issuers | (128,378,605) |
| Investments — affiliated issuers | 2,997 |
| Futures contracts | 224,172 |
| Net change in unrealized appreciation (depreciation) | (128,151,436) |
| Net realized and unrealized loss | (143,822,106) |
| Net decrease in net assets resulting from operations | $(137,011,908) |
| Columbia Select Large Cap Equity Fund | Semiannual Report 2022 | 11 |
| Six Months Ended August 31, 2022 (Unaudited) | Year Ended February 28, 2022 | |
| Operations | ||
| Net investment income | $6,810,198 | $11,293,219 |
| Net realized gain (loss) | (15,670,670) | 116,395,404 |
| Net change in unrealized appreciation (depreciation) | (128,151,436) | 84,398,691 |
| Net increase (decrease) in net assets resulting from operations | (137,011,908) | 212,087,314 |
| Distributions to shareholders | ||
| Net investment income and net realized gains | ||
| Class A | (10,215,614) | (17,789,878) |
| Advisor Class | (85,966) | (174,654) |
| Class C | (415,101) | (637,088) |
| Institutional Class | (14,200,493) | (16,826,301) |
| Institutional 2 Class | (6,994,160) | (12,046,628) |
| Institutional 3 Class | (31,072,659) | (57,623,422) |
| Total distributions to shareholders | (62,983,993) | (105,097,971) |
| Increase in net assets from capital stock activity | 91,588,922 | 31,469,851 |
| Total increase (decrease) in net assets | (108,406,979) | 138,459,194 |
| Net assets at beginning of period | 1,359,549,336 | 1,221,090,142 |
| Net assets at end of period | $1,251,142,357 | $1,359,549,336 |
| 12 | Columbia Select Large Cap Equity Fund | Semiannual Report 2022 |
| Six Months Ended | Year Ended | |||
| August 31, 2022 (Unaudited) | February 28, 2022 | |||
| Shares | Dollars ($) | Shares | Dollars ($) | |
| Capital stock activity | ||||
| Class A | ||||
| Subscriptions | 678,145 | 11,021,993 | 1,275,138 | 24,825,167 |
| Distributions reinvested | 257,892 | 3,938,013 | 338,444 | 6,673,124 |
| Redemptions | (539,563) | (9,290,008) | (1,605,606) | (31,071,032) |
| Net increase | 396,474 | 5,669,998 | 7,976 | 427,259 |
| Advisor Class | ||||
| Subscriptions | 4,669 | 85,985 | 57,976 | 1,077,177 |
| Distributions reinvested | 5,702 | 85,813 | 8,984 | 174,378 |
| Redemptions | (6,311) | (106,905) | (61,135) | (1,178,243) |
| Net increase | 4,060 | 64,893 | 5,825 | 73,312 |
| Class C | ||||
| Subscriptions | 52,183 | 809,233 | 105,380 | 1,870,662 |
| Distributions reinvested | 28,435 | 384,726 | 31,956 | 563,770 |
| Redemptions | (64,524) | (991,654) | (110,967) | (1,935,215) |
| Net increase | 16,094 | 202,305 | 26,369 | 499,217 |
| Institutional Class | ||||
| Subscriptions | 6,529,661 | 112,876,728 | 2,429,962 | 46,730,851 |
| Distributions reinvested | 899,751 | 13,613,227 | 807,948 | 15,787,253 |
| Redemptions | (1,263,659) | (21,383,437) | (1,642,468) | (31,747,662) |
| Net increase | 6,165,753 | 105,106,518 | 1,595,442 | 30,770,442 |
| Institutional 2 Class | ||||
| Subscriptions | 1,519,191 | 25,689,605 | 5,530,357 | 109,586,321 |
| Distributions reinvested | 444,353 | 6,994,123 | 592,170 | 12,046,628 |
| Redemptions | (2,590,936) | (44,088,266) | (1,597,524) | (32,564,052) |
| Net increase (decrease) | (627,392) | (11,404,538) | 4,525,003 | 89,068,897 |
| Institutional 3 Class | ||||
| Subscriptions | 259,813 | 4,192,876 | 2,765,887 | 53,592,290 |
| Distributions reinvested | 1,949,258 | 28,946,481 | 2,732,037 | 52,418,462 |
| Redemptions | (2,384,599) | (41,189,611) | (10,204,800) | (195,380,028) |
| Net decrease | (175,528) | (8,050,254) | (4,706,876) | (89,369,276) |
| Total net increase | 5,779,461 | 91,588,922 | 1,453,739 | 31,469,851 |
| Columbia Select Large Cap Equity Fund | Semiannual Report 2022 | 13 |
| Net asset value, beginning of period | Net investment income (loss) | Net realized and unrealized gain (loss) | Total from investment operations | Distributions from net investment income | Distributions from net realized gains | Total distributions to shareholders | |
| Class A | |||||||
| Six Months Ended 8/31/2022 (Unaudited) | $18.81 | 0.07 | (2.01) | (1.94) | (0.03) | (0.80) | (0.83) |
| Year Ended 2/28/2022 | $17.28 | 0.11 | 2.88 | 2.99 | (0.15) | (1.31) | (1.46) |
| Year Ended 2/28/2021 | $14.22 | 0.14 | 4.08 | 4.22 | (0.21) | (0.95) | (1.16) |
| Year Ended 2/29/2020 | $13.95 | 0.24 | 0.77 | 1.01 | (0.12) | (0.62) | (0.74) |
| Year Ended 2/28/2019 | $14.82 | 0.16 | 0.33 | 0.49 | (0.14) | (1.22) | (1.36) |
| Year Ended 2/28/2018 | $13.16 | 0.09 | 2.36 | 2.45 | (0.08) | (0.71) | (0.79) |
| Advisor Class | |||||||
| Six Months Ended 8/31/2022 (Unaudited) | $18.53 | 0.09 | (1.98) | (1.89) | (0.03) | (0.80) | (0.83) |
| Year Ended 2/28/2022 | $17.04 | 0.15 | 2.84 | 2.99 | (0.19) | (1.31) | (1.50) |
| Year Ended 2/28/2021 | $14.04 | 0.18 | 4.02 | 4.20 | (0.25) | (0.95) | (1.20) |
| Year Ended 2/29/2020 | $13.78 | 0.26 | 0.78 | 1.04 | (0.16) | (0.62) | (0.78) |
| Year Ended 2/28/2019 | $14.66 | 0.20 | 0.33 | 0.53 | (0.19) | (1.22) | (1.41) |
| Year Ended 2/28/2018(f) | $13.61 | 0.11 | 1.63 | 1.74 | (0.10) | (0.59) | (0.69) |
| Class C | |||||||
| Six Months Ended 8/31/2022 (Unaudited) | $16.78 | 0.00(g) | (1.80) | (1.80) | (0.00)(g) | (0.80) | (0.80) |
| Year Ended 2/28/2022 | $15.58 | (0.04) | 2.60 | 2.56 | (0.05) | (1.31) | (1.36) |
| Year Ended 2/28/2021 | $12.92 | 0.03 | 3.69 | 3.72 | (0.11) | (0.95) | (1.06) |
| Year Ended 2/29/2020 | $12.74 | 0.11 | 0.71 | 0.82 | (0.02) | (0.62) | (0.64) |
| Year Ended 2/28/2019 | $13.64 | 0.05 | 0.31 | 0.36 | (0.04) | (1.22) | (1.26) |
| Year Ended 2/28/2018 | $12.18 | (0.02) | 2.19 | 2.17 | — | (0.71) | (0.71) |
| Institutional Class | |||||||
| Six Months Ended 8/31/2022 (Unaudited) | $18.63 | 0.09 | (1.99) | (1.90) | (0.03) | (0.80) | (0.83) |
| Year Ended 2/28/2022 | $17.13 | 0.15 | 2.85 | 3.00 | (0.19) | (1.31) | (1.50) |
| Year Ended 2/28/2021 | $14.10 | 0.18 | 4.05 | 4.23 | (0.25) | (0.95) | (1.20) |
| Year Ended 2/29/2020 | $13.84 | 0.26 | 0.78 | 1.04 | (0.16) | (0.62) | (0.78) |
| Year Ended 2/28/2019 | $14.71 | 0.19 | 0.34 | 0.53 | (0.18) | (1.22) | (1.40) |
| Year Ended 2/28/2018 | $13.06 | 0.12 | 2.35 | 2.47 | (0.11) | (0.71) | (0.82) |
| Institutional 2 Class | |||||||
| Six Months Ended 8/31/2022 (Unaudited) | $19.35 | 0.10 | (2.07) | (1.97) | (0.04) | (0.80) | (0.84) |
| Year Ended 2/28/2022 | $17.73 | 0.17 | 2.97 | 3.14 | (0.21) | (1.31) | (1.52) |
| Year Ended 2/28/2021 | $14.55 | 0.21 | 4.18 | 4.39 | (0.26) | (0.95) | (1.21) |
| Year Ended 2/29/2020 | $14.26 | 0.29 | 0.79 | 1.08 | (0.17) | (0.62) | (0.79) |
| Year Ended 2/28/2019 | $15.11 | 0.22 | 0.34 | 0.56 | (0.19) | (1.22) | (1.41) |
| Year Ended 2/28/2018 | $13.41 | 0.13 | 2.40 | 2.53 | (0.12) | (0.71) | (0.83) |
| 14 | Columbia Select Large Cap Equity Fund | Semiannual Report 2022 |
| Net asset value, end of period | Total return | Total gross expense ratio to average net assets(a) | Total net expense ratio to average net assets(a),(b) | Net investment income (loss) ratio to average net assets | Portfolio turnover | Net assets, end of period (000’s) | |
| Class A | |||||||
| Six Months Ended 8/31/2022 (Unaudited) | $16.04 | (10.11%) | 1.12%(c),(d) | 0.79%(c),(d) | 0.77%(c) | 25% | $206,992 |
| Year Ended 2/28/2022 | $18.81 | 17.04% | 1.12%(d) | 0.79%(d),(e) | 0.54% | 58% | $235,276 |
| Year Ended 2/28/2021 | $17.28 | 30.70% | 1.16%(d) | 0.79%(d),(e) | 0.92% | 64% | $216,047 |
| Year Ended 2/29/2020 | $14.22 | 7.30% | 1.18% | 0.80%(e) | 1.63% | 46% | $155,699 |
| Year Ended 2/28/2019 | $13.95 | 3.61% | 1.19% | 0.80%(e) | 1.10% | 62% | $151,703 |
| Year Ended 2/28/2018 | $14.82 | 18.87% | 1.19% | 1.13%(e) | 0.61% | 45% | $149,489 |
| Advisor Class | |||||||
| Six Months Ended 8/31/2022 (Unaudited) | $15.81 | (9.95%) | 0.87%(c),(d) | 0.54%(c),(d) | 1.01%(c) | 25% | $1,712 |
| Year Ended 2/28/2022 | $18.53 | 17.31% | 0.87%(d) | 0.54%(d),(e) | 0.79% | 58% | $1,932 |
| Year Ended 2/28/2021 | $17.04 | 30.96% | 0.91%(d) | 0.54%(d),(e) | 1.18% | 64% | $1,678 |
| Year Ended 2/29/2020 | $14.04 | 7.58% | 0.93% | 0.55%(e) | 1.81% | 46% | $3,294 |
| Year Ended 2/28/2019 | $13.78 | 3.88% | 0.94% | 0.55%(e) | 1.45% | 62% | $3,143 |
| Year Ended 2/28/2018(f) | $14.66 | 12.96% | 0.97%(c) | 0.69%(c),(e) | 1.17%(c) | 45% | $240 |
| Class C | |||||||
| Six Months Ended 8/31/2022 (Unaudited) | $14.18 | (10.47%) | 1.87%(c),(d) | 1.54%(c),(d) | 0.02%(c) | 25% | $7,616 |
| Year Ended 2/28/2022 | $16.78 | 16.13% | 1.87%(d) | 1.54%(d),(e) | (0.21%) | 58% | $8,739 |
| Year Ended 2/28/2021 | $15.58 | 29.82% | 1.91%(d) | 1.54%(d),(e) | 0.18% | 64% | $7,703 |
| Year Ended 2/29/2020 | $12.92 | 6.45% | 1.93% | 1.55%(e) | 0.83% | 46% | $6,040 |
| Year Ended 2/28/2019 | $12.74 | 2.85% | 1.94% | 1.55%(e) | 0.34% | 62% | $7,783 |
| Year Ended 2/28/2018 | $13.64 | 18.03% | 1.94% | 1.87%(e) | (0.15%) | 45% | $8,199 |
| Institutional Class | |||||||
| Six Months Ended 8/31/2022 (Unaudited) | $15.90 | (9.95%) | 0.87%(c),(d) | 0.54%(c),(d) | 1.03%(c) | 25% | $280,657 |
| Year Ended 2/28/2022 | $18.63 | 17.28% | 0.87%(d) | 0.54%(d),(e) | 0.79% | 58% | $214,100 |
| Year Ended 2/28/2021 | $17.13 | 31.04% | 0.91%(d) | 0.54%(d),(e) | 1.18% | 64% | $169,476 |
| Year Ended 2/29/2020 | $14.10 | 7.54% | 0.93% | 0.55%(e) | 1.76% | 46% | $125,623 |
| Year Ended 2/28/2019 | $13.84 | 3.90% | 0.94% | 0.55%(e) | 1.34% | 62% | $158,057 |
| Year Ended 2/28/2018 | $14.71 | 19.21% | 0.94% | 0.88%(e) | 0.86% | 45% | $170,394 |
| Institutional 2 Class | |||||||
| Six Months Ended 8/31/2022 (Unaudited) | $16.54 | (9.98%) | 0.80%(c),(d) | 0.48%(c),(d) | 1.07%(c) | 25% | $159,713 |
| Year Ended 2/28/2022 | $19.35 | 17.45% | 0.80%(d) | 0.47%(d) | 0.85% | 58% | $198,955 |
| Year Ended 2/28/2021 | $17.73 | 31.20% | 0.83%(d) | 0.46%(d) | 1.26% | 64% | $102,131 |
| Year Ended 2/29/2020 | $14.55 | 7.61% | 0.85% | 0.46% | 1.97% | 46% | $22,676 |
| Year Ended 2/28/2019 | $14.26 | 4.01% | 0.84% | 0.46% | 1.53% | 62% | $19,466 |
| Year Ended 2/28/2018 | $15.11 | 19.15% | 0.86% | 0.80% | 0.90% | 45% | $10,777 |
| Columbia Select Large Cap Equity Fund | Semiannual Report 2022 | 15 |
| Net asset value, beginning of period | Net investment income (loss) | Net realized and unrealized gain (loss) | Total from investment operations | Distributions from net investment income | Distributions from net realized gains | Total distributions to shareholders | |
| Institutional 3 Class | |||||||
| Six Months Ended 8/31/2022 (Unaudited) | $18.30 | 0.10 | (1.96) | (1.86) | (0.04) | (0.80) | (0.84) |
| Year Ended 2/28/2022 | $16.85 | 0.17 | 2.81 | 2.98 | (0.22) | (1.31) | (1.53) |
| Year Ended 2/28/2021 | $13.88 | 0.20 | 3.98 | 4.18 | (0.26) | (0.95) | (1.21) |
| Year Ended 2/29/2020 | $13.63 | 0.29 | 0.76 | 1.05 | (0.18) | (0.62) | (0.80) |
| Year Ended 2/28/2019 | $14.51 | 0.21 | 0.33 | 0.54 | (0.20) | (1.22) | (1.42) |
| Year Ended 2/28/2018(h) | $13.08 | 0.14 | 2.13 | 2.27 | (0.13) | (0.71) | (0.84) |
| Notes to Financial Highlights | |
| (a) | In addition to the fees and expenses that the Fund bears directly, the Fund indirectly bears a pro rata share of the fees and expenses of any other funds in which it invests. Such indirect expenses are not included in the Fund’s reported expense ratios. |
| (b) | Total net expenses include the impact of certain fee waivers/expense reimbursements made by the Investment Manager and certain of its affiliates, if applicable. |
| (c) | Annualized. |
| (d) | Ratios include interest on collateral expense which is less than 0.01%. |
| (e) | The benefits derived from expense reductions had an impact of less than 0.01%. |
| (f) | Advisor Class shares commenced operations on July 5, 2017. Per share data and total return reflect activity from that date. |
| (g) | Rounds to zero. |
| (h) | Institutional 3 Class shares commenced operations on March 1, 2017. Per share data and total return reflect activity from that date. |
| 16 | Columbia Select Large Cap Equity Fund | Semiannual Report 2022 |
| Net asset value, end of period | Total return | Total gross expense ratio to average net assets(a) | Total net expense ratio to average net assets(a),(b) | Net investment income (loss) ratio to average net assets | Portfolio turnover | Net assets, end of period (000’s) | |
| Institutional 3 Class | |||||||
| Six Months Ended 8/31/2022 (Unaudited) | $15.60 | (9.94%) | 0.75%(c),(d) | 0.43%(c),(d) | 1.13%(c) | 25% | $594,452 |
| Year Ended 2/28/2022 | $18.30 | 17.40% | 0.75%(d) | 0.42%(d) | 0.92% | 58% | $700,548 |
| Year Ended 2/28/2021 | $16.85 | 31.26% | 0.78%(d) | 0.41%(d) | 1.29% | 64% | $724,055 |
| Year Ended 2/29/2020 | $13.88 | 7.72% | 0.80% | 0.42% | 2.04% | 46% | $364,432 |
| Year Ended 2/28/2019 | $13.63 | 4.02% | 0.80% | 0.43% | 1.48% | 62% | $340,760 |
| Year Ended 2/28/2018(h) | $14.51 | 17.63% | 0.81% | 0.76% | 0.98% | 45% | $330,311 |
| Columbia Select Large Cap Equity Fund | Semiannual Report 2022 | 17 |
August 31, 2022 (Unaudited)
| 18 | Columbia Select Large Cap Equity Fund | Semiannual Report 2022 |
August 31, 2022 (Unaudited)
| Columbia Select Large Cap Equity Fund | Semiannual Report 2022 | 19 |
August 31, 2022 (Unaudited)
| 20 | Columbia Select Large Cap Equity Fund | Semiannual Report 2022 |
August 31, 2022 (Unaudited)
| Asset derivatives | ||
| Risk exposure category | Statement of assets and liabilities location | Fair value ($) |
| Equity risk | Component of total distributable earnings (loss) — unrealized appreciation on futures contracts | 46,540* |
| * | Includes cumulative appreciation (depreciation) as reported in the tables following the Portfolio of Investments. Only the current day’s variation margin is reported in receivables or payables in the Statement of Assets and Liabilities. |
| Amount of realized gain (loss) on derivatives recognized in income | |
| Risk exposure category | Futures contracts ($) |
| Equity risk | 451,449 |
| Change in unrealized appreciation (depreciation) on derivatives recognized in income | |
| Risk exposure category | Futures contracts ($) |
| Equity risk | 224,172 |
| Derivative instrument | Average notional amounts ($)* |
| Futures contracts — long | 7,676,194 |
| * | Based on the ending quarterly outstanding amounts for the six months ended August 31, 2022. |
| Columbia Select Large Cap Equity Fund | Semiannual Report 2022 | 21 |
August 31, 2022 (Unaudited)
| 22 | Columbia Select Large Cap Equity Fund | Semiannual Report 2022 |
August 31, 2022 (Unaudited)
| Columbia Select Large Cap Equity Fund | Semiannual Report 2022 | 23 |
August 31, 2022 (Unaudited)
| Effective rate (%) | |
| Class A | 0.12 |
| Advisor Class | 0.12 |
| Class C | 0.12 |
| Institutional Class | 0.12 |
| Institutional 2 Class | 0.06 |
| Institutional 3 Class | 0.01 |
| Front End (%) | CDSC (%) | Amount ($) | |
| Class A | 5.75 | 0.50 - 1.00(a) | 37,411 |
| Class C | — | 1.00(b) | 322 |
| (a) | This charge is imposed on certain investments of between $1 million and $50 million redeemed within 18 months after purchase, as follows: 1.00% if redeemed within 12 months after purchase, and 0.50% if redeemed more than 12, but less than 18, months after purchase, with certain limited exceptions. |
| (b) | This charge applies to redemptions within 12 months after purchase, with certain limited exceptions. |
| 24 | Columbia Select Large Cap Equity Fund | Semiannual Report 2022 |
August 31, 2022 (Unaudited)
| July 1, 2022 through June 30, 2023 | Prior to July 1, 2022 | |
| Class A | 0.80% | 0.80% |
| Advisor Class | 0.55 | 0.55 |
| Class C | 1.55 | 1.55 |
| Institutional Class | 0.55 | 0.55 |
| Institutional 2 Class | 0.49 | 0.48 |
| Institutional 3 Class | 0.44 | 0.43 |
| Federal tax cost ($) | Gross unrealized appreciation ($) | Gross unrealized (depreciation) ($) | Net unrealized appreciation ($) |
| 955,079,000 | 336,815,000 | (44,406,000) | 292,409,000 |
| Columbia Select Large Cap Equity Fund | Semiannual Report 2022 | 25 |
August 31, 2022 (Unaudited)
| Borrower or lender | Average loan balance ($) | Weighted average interest rate (%) | Number of days with outstanding loans |
| Lender | 16,300,000 | 1.35 | 3 |
| 26 | Columbia Select Large Cap Equity Fund | Semiannual Report 2022 |
August 31, 2022 (Unaudited)
| Columbia Select Large Cap Equity Fund | Semiannual Report 2022 | 27 |
August 31, 2022 (Unaudited)
| 28 | Columbia Select Large Cap Equity Fund | Semiannual Report 2022 |
| • | the Fund had sufficient liquidity to both meet redemptions and operate effectively on behalf of shareholders; |
| • | there were no material changes to the Program during the period; |
| • | the implementation of the Program was effective to manage the Fund’s liquidity risk; and |
| • | the Program operated adequately during the period. |
| Columbia Select Large Cap Equity Fund | Semiannual Report 2022 | 29 |
(Unaudited)
| • | Information on the investment performance of the Fund relative to the performance of a group of mutual funds determined to be comparable to the Fund by Broadridge, as well as performance relative to benchmarks; |
| • | Information on the Fund’s management fees and total expenses, including information comparing the Fund’s expenses to those of a group of comparable mutual funds, as determined by Broadridge; |
| • | The Investment Manager’s agreement to contractually limit or cap total operating expenses for the Fund so that total operating expenses (excluding certain fees and expenses, such as transaction costs and certain other investment related expenses, interest, taxes, acquired fund fees and expenses and infrequent and/or unusual expenses) would not exceed a specified annual rate, as a percentage of the Fund’s net assets; |
| • | Terms of the Management Agreement; |
| • | Descriptions of other agreements and arrangements with affiliates of the Investment Manager relating to the operations of the Fund, including agreements with respect to the provision of transfer agency and shareholder services to the Fund; |
| • | Descriptions of various services performed by the Investment Manager under the Management Agreement, including portfolio management and portfolio trading practices; |
| • | Information regarding any recently negotiated management fees of similarly-managed portfolios of other institutional clients of the Investment Manager; |
| • | Information regarding the resources of the Investment Manager, including information regarding senior management, portfolio managers and other personnel; |
| • | Information regarding the capabilities of the Investment Manager with respect to compliance monitoring services; |
| • | The profitability to the Investment Manager and its affiliates from their relationships with the Fund; and |
| • | Report provided by the Board’s independent fee consultant, JDL Consultants, LLC (JDL). |
| 30 | Columbia Select Large Cap Equity Fund | Semiannual Report 2022 |
(Unaudited)
into account the organization and strength of the Fund’s and its service providers’ compliance programs. The Board also reviewed the financial condition of the Investment Manager and its affiliates and each entity’s ability to carry out its responsibilities under the Management Agreement and the Fund’s other service agreements.
| Columbia Select Large Cap Equity Fund | Semiannual Report 2022 | 31 |
(Unaudited)
Manager in 2021 increased from 2020 levels, due to a variety of factors, including the increased assets under management of the Funds. It also took into account the indirect economic benefits flowing to the Investment Manager or its affiliates in connection with managing or distributing the Funds, such as the enhanced ability to offer various other financial products to Ameriprise Financial customers, soft dollar benefits and overall reputational advantages. The Board noted that the fees paid by the Fund should permit the Investment Manager to offer competitive compensation to its personnel, make necessary investments in its business and earn an appropriate profit. After reviewing these and related factors, the Board concluded, within the context of their overall conclusions, that the costs of services provided and the profitability to the Investment Manager and its affiliates from their relationships with the Fund supported the continuation of the Management Agreement.
| 32 | Columbia Select Large Cap Equity Fund | Semiannual Report 2022 |
columbiathreadneedleus.com/investor/. The Fund is distributed by Columbia Management Investment Distributors, Inc., member FINRA, and managed by Columbia Management Investment Advisers, LLC.

August 31, 2022 (Unaudited)

(Unaudited)

| Average annual total returns (%) (for the period ended August 31, 2022) | ||||||
| Inception | 6 Months cumulative | 1 Year | 5 Years | 10 Years | ||
| Class A | 10/10/95 | -9.04 | -11.61 | 11.32 | 12.57 | |
| Institutional Class | 12/15/93 | -8.93 | -11.41 | 11.60 | 12.85 | |
| Institutional 2 Class* | 11/08/12 | -8.92 | -11.41 | 11.59 | 12.85 | |
| Institutional 3 Class* | 03/01/17 | -8.93 | -11.40 | 11.60 | 12.85 | |
| S&P 500 Index | -8.84 | -11.23 | 11.82 | 13.08 | ||
| * | The returns shown for periods prior to the share class inception date (including returns for the Life of the Fund, if shown, which are since Fund inception) include the returns of the Fund’s oldest share class. These returns are adjusted to reflect any higher class-related operating expenses of the newer share classes, as applicable. Please visit columbiathreadneedleus.com/investor/investment-products/mutual-funds/appended-performance for more information. |
| Columbia Large Cap Index Fund | Semiannual Report 2022 | 3 |
(Unaudited)
| Portfolio breakdown (%) (at August 31, 2022) | |
| Common Stocks | 99.2 |
| Money Market Funds | 0.8 |
| Total | 100.0 |
| Equity sector breakdown (%) (at August 31, 2022) | |
| Communication Services | 8.4 |
| Consumer Discretionary | 11.4 |
| Consumer Staples | 6.8 |
| Energy | 4.7 |
| Financials | 10.9 |
| Health Care | 14.1 |
| Industrials | 7.9 |
| Information Technology | 27.3 |
| Materials | 2.5 |
| Real Estate | 2.9 |
| Utilities | 3.1 |
| Total | 100.0 |
| 4 | Columbia Large Cap Index Fund | Semiannual Report 2022 |
(Unaudited)
| March 1, 2022 — August 31, 2022 | |||||||
| Account value at the beginning of the period ($) | Account value at the end of the period ($) | Expenses paid during the period ($) | Fund’s annualized expense ratio (%) | ||||
| Actual | Hypothetical | Actual | Hypothetical | Actual | Hypothetical | Actual | |
| Class A | 1,000.00 | 1,000.00 | 909.60 | 1,022.94 | 2.17 | 2.29 | 0.45 |
| Institutional Class | 1,000.00 | 1,000.00 | 910.70 | 1,024.20 | 0.96 | 1.02 | 0.20 |
| Institutional 2 Class | 1,000.00 | 1,000.00 | 910.80 | 1,024.20 | 0.96 | 1.02 | 0.20 |
| Institutional 3 Class | 1,000.00 | 1,000.00 | 910.70 | 1,024.20 | 0.96 | 1.02 | 0.20 |
| Columbia Large Cap Index Fund | Semiannual Report 2022 | 5 |
August 31, 2022 (Unaudited)
| Common Stocks 97.7% | ||
| Issuer | Shares | Value ($) |
| Communication Services 8.2% | ||
| Diversified Telecommunication Services 0.9% | ||
| AT&T, Inc. | 633,198 | 11,106,293 |
| Lumen Technologies, Inc. | 82,234 | 819,051 |
| Verizon Communications, Inc. | 371,450 | 15,530,324 |
| Total | 27,455,668 | |
| Entertainment 1.4% | ||
| Activision Blizzard, Inc. | 69,156 | 5,428,054 |
| Electronic Arts, Inc. | 24,873 | 3,155,638 |
| Live Nation Entertainment, Inc.(a) | 12,112 | 1,094,440 |
| Netflix, Inc.(a) | 39,295 | 8,784,790 |
| Take-Two Interactive Software, Inc.(a) | 13,983 | 1,713,757 |
| Walt Disney Co. (The)(a) | 161,106 | 18,056,761 |
| Warner Bros Discovery, Inc.(a) | 195,331 | 2,586,182 |
| Total | 40,819,622 | |
| Interactive Media & Services 4.9% | ||
| Alphabet, Inc., Class A(a) | 532,039 | 57,577,261 |
| Alphabet, Inc., Class C(a) | 487,827 | 53,246,317 |
| Match Group, Inc.(a) | 25,260 | 1,427,948 |
| Meta Platforms, Inc., Class A(a) | 202,857 | 33,051,491 |
| Twitter, Inc.(a) | 67,466 | 2,614,307 |
| Total | 147,917,324 | |
| Media 0.8% | ||
| Charter Communications, Inc., Class A(a) | 10,244 | 4,226,982 |
| Comcast Corp., Class A | 395,412 | 14,309,960 |
| DISH Network Corp., Class A(a) | 22,178 | 384,788 |
| Fox Corp., Class A | 27,568 | 942,274 |
| Fox Corp., Class B | 12,789 | 404,388 |
| Interpublic Group of Companies, Inc. (The) | 34,819 | 962,397 |
| News Corp., Class A | 34,359 | 581,354 |
| News Corp., Class B | 10,644 | 183,503 |
| Omnicom Group, Inc. | 18,197 | 1,217,380 |
| Paramount Global, Class B | 53,811 | 1,258,639 |
| Total | 24,471,665 | |
| Common Stocks (continued) | ||
| Issuer | Shares | Value ($) |
| Wireless Telecommunication Services 0.2% | ||
| T-Mobile US, Inc.(a) | 52,112 | 7,502,044 |
| Total Communication Services | 248,166,323 | |
| Consumer Discretionary 11.2% | ||
| Auto Components 0.1% | ||
| Aptiv PLC(a) | 23,963 | 2,238,863 |
| BorgWarner, Inc. | 21,190 | 798,863 |
| Total | 3,037,726 | |
| Automobiles 2.4% | ||
| Ford Motor Co. | 349,273 | 5,322,921 |
| General Motors Co. | 128,959 | 4,927,523 |
| Tesla, Inc.(a) | 222,668 | 61,369,527 |
| Total | 71,619,971 | |
| Distributors 0.1% | ||
| Genuine Parts Co. | 12,524 | 1,953,869 |
| LKQ Corp. | 23,015 | 1,224,858 |
| Pool Corp. | 3,544 | 1,202,090 |
| Total | 4,380,817 | |
| Hotels, Restaurants & Leisure 1.8% | ||
| Booking Holdings, Inc.(a) | 3,593 | 6,739,785 |
| Caesars Entertainment, Inc.(a) | 18,960 | 817,555 |
| Carnival Corp.(a) | 86,335 | 816,729 |
| Chipotle Mexican Grill, Inc.(a) | 2,473 | 3,948,886 |
| Darden Restaurants, Inc. | 11,032 | 1,364,769 |
| Domino’s Pizza, Inc. | 3,188 | 1,185,490 |
| Expedia Group, Inc.(a) | 13,406 | 1,376,126 |
| Hilton Worldwide Holdings, Inc. | 24,618 | 3,135,349 |
| Las Vegas Sands Corp.(a) | 30,413 | 1,144,441 |
| Marriott International, Inc., Class A | 24,317 | 3,738,496 |
| McDonald’s Corp. | 65,411 | 16,501,887 |
| MGM Resorts International | 31,277 | 1,020,881 |
| Norwegian Cruise Line Holdings Ltd.(a) | 37,069 | 484,863 |
| Penn Entertainment, Inc.(a) | 14,458 | 451,523 |
| Royal Caribbean Cruises Ltd.(a) | 19,844 | 810,627 |
| Starbucks Corp. | 101,441 | 8,528,145 |
| 6 | Columbia Large Cap Index Fund | Semiannual Report 2022 |
August 31, 2022 (Unaudited)
| Common Stocks (continued) | ||
| Issuer | Shares | Value ($) |
| Wynn Resorts Ltd.(a) | 9,334 | 565,547 |
| Yum! Brands, Inc. | 25,222 | 2,805,695 |
| Total | 55,436,794 | |
| Household Durables 0.3% | ||
| D.R. Horton, Inc. | 28,334 | 2,015,964 |
| Garmin Ltd. | 13,494 | 1,194,084 |
| Lennar Corp., Class A | 22,874 | 1,771,591 |
| Mohawk Industries, Inc.(a) | 4,552 | 502,359 |
| Newell Brands, Inc. | 32,550 | 581,018 |
| NVR, Inc.(a) | 274 | 1,134,376 |
| PulteGroup, Inc. | 21,018 | 854,592 |
| Whirlpool Corp. | 4,971 | 778,459 |
| Total | 8,832,443 | |
| Internet & Direct Marketing Retail 3.4% | ||
| Amazon.com, Inc.(a) | 773,917 | 98,109,458 |
| eBay, Inc. | 49,517 | 2,185,185 |
| Etsy, Inc.(a) | 11,243 | 1,187,373 |
| Total | 101,482,016 | |
| Leisure Products 0.0% | ||
| Hasbro, Inc. | 11,593 | 913,760 |
| Multiline Retail 0.5% | ||
| Dollar General Corp. | 20,236 | 4,804,431 |
| Dollar Tree, Inc.(a) | 19,911 | 2,701,525 |
| Target Corp. | 40,900 | 6,557,906 |
| Total | 14,063,862 | |
| Specialty Retail 2.1% | ||
| Advance Auto Parts, Inc. | 5,403 | 911,162 |
| AutoZone, Inc.(a) | 1,756 | 3,721,333 |
| Bath & Body Works, Inc. | 21,094 | 787,439 |
| Best Buy Co., Inc. | 17,908 | 1,265,916 |
| CarMax, Inc.(a) | 14,199 | 1,255,760 |
| Home Depot, Inc. (The) | 91,399 | 26,361,300 |
| Lowe’s Companies, Inc. | 58,475 | 11,352,336 |
| O’Reilly Automotive, Inc.(a) | 5,813 | 4,052,359 |
| Ross Stores, Inc. | 31,080 | 2,681,272 |
| TJX Companies, Inc. (The) | 103,876 | 6,476,669 |
| Common Stocks (continued) | ||
| Issuer | Shares | Value ($) |
| Tractor Supply Co. | 9,896 | 1,832,244 |
| Ulta Beauty, Inc.(a) | 4,619 | 1,939,379 |
| Total | 62,637,169 | |
| Textiles, Apparel & Luxury Goods 0.5% | ||
| NIKE, Inc., Class B | 112,219 | 11,945,713 |
| PVH Corp. | 5,972 | 335,925 |
| Ralph Lauren Corp. | 4,094 | 373,905 |
| Tapestry, Inc. | 22,271 | 773,472 |
| VF Corp. | 28,550 | 1,183,397 |
| Total | 14,612,412 | |
| Total Consumer Discretionary | 337,016,970 | |
| Consumer Staples 6.6% | ||
| Beverages 1.7% | ||
| Brown-Forman Corp., Class B | 16,166 | 1,175,268 |
| Coca-Cola Co. (The) | 345,082 | 21,295,010 |
| Constellation Brands, Inc., Class A | 14,396 | 3,542,136 |
| Keurig Dr. Pepper, Inc. | 65,243 | 2,487,063 |
| Molson Coors Beverage Co., Class B | 16,658 | 860,719 |
| Monster Beverage Corp.(a) | 33,262 | 2,954,663 |
| PepsiCo, Inc. | 122,295 | 21,067,760 |
| Total | 53,382,619 | |
| Food & Staples Retailing 1.5% | ||
| Costco Wholesale Corp. | 39,202 | 20,467,364 |
| Kroger Co. (The) | 58,027 | 2,781,814 |
| Sysco Corp. | 45,062 | 3,704,998 |
| Walgreens Boots Alliance, Inc. | 63,411 | 2,223,190 |
| Walmart, Inc. | 124,174 | 16,459,264 |
| Total | 45,636,630 | |
| Food Products 1.1% | ||
| Archer-Daniels-Midland Co. | 49,770 | 4,374,285 |
| Campbell Soup Co. | 17,879 | 900,744 |
| ConAgra Foods, Inc. | 42,444 | 1,459,225 |
| General Mills, Inc. | 53,264 | 4,090,675 |
| Hershey Co. (The) | 12,913 | 2,901,164 |
| Hormel Foods Corp. | 25,066 | 1,260,319 |
| JM Smucker Co. (The) | 9,593 | 1,342,924 |
| Kellogg Co. | 22,413 | 1,630,322 |
| Kraft Heinz Co. (The) | 62,788 | 2,348,271 |
| Columbia Large Cap Index Fund | Semiannual Report 2022 | 7 |
August 31, 2022 (Unaudited)
| Common Stocks (continued) | ||
| Issuer | Shares | Value ($) |
| Lamb Weston Holdings, Inc. | 12,776 | 1,016,075 |
| McCormick & Co., Inc. | 22,132 | 1,860,637 |
| Mondelez International, Inc., Class A | 122,405 | 7,571,973 |
| Tyson Foods, Inc., Class A | 25,786 | 1,943,749 |
| Total | 32,700,363 | |
| Household Products 1.4% | ||
| Church & Dwight Co., Inc. | 21,473 | 1,797,505 |
| Clorox Co. (The) | 10,886 | 1,571,285 |
| Colgate-Palmolive Co. | 74,114 | 5,796,456 |
| Kimberly-Clark Corp. | 29,800 | 3,800,096 |
| Procter & Gamble Co. (The) | 212,213 | 29,272,661 |
| Total | 42,238,003 | |
| Personal Products 0.2% | ||
| Estee Lauder Companies, Inc. (The), Class A | 20,503 | 5,215,553 |
| Tobacco 0.7% | ||
| Altria Group, Inc. | 160,140 | 7,225,517 |
| Philip Morris International, Inc. | 137,104 | 13,092,061 |
| Total | 20,317,578 | |
| Total Consumer Staples | 199,490,746 | |
| Energy 4.6% | ||
| Energy Equipment & Services 0.3% | ||
| Baker Hughes Co. | 82,729 | 2,089,734 |
| Halliburton Co. | 79,778 | 2,403,711 |
| Schlumberger NV | 125,018 | 4,769,437 |
| Total | 9,262,882 | |
| Oil, Gas & Consumable Fuels 4.3% | ||
| APA Corp. | 29,916 | 1,170,015 |
| Chevron Corp. | 173,784 | 27,468,299 |
| ConocoPhillips Co. | 114,403 | 12,521,408 |
| Coterra Energy, Inc. | 71,272 | 2,203,018 |
| Devon Energy Corp. | 54,289 | 3,833,889 |
| Diamondback Energy, Inc. | 15,115 | 2,014,527 |
| EOG Resources, Inc. | 51,805 | 6,283,947 |
| Exxon Mobil Corp.(b) | 372,590 | 35,615,878 |
| Hess Corp. | 24,502 | 2,959,352 |
| Kinder Morgan, Inc. | 172,476 | 3,159,760 |
| Marathon Oil Corp. | 62,594 | 1,601,780 |
| Marathon Petroleum Corp. | 47,850 | 4,820,888 |
| Common Stocks (continued) | ||
| Issuer | Shares | Value ($) |
| Occidental Petroleum Corp. | 78,748 | 5,591,108 |
| ONEOK, Inc. | 39,502 | 2,418,707 |
| Phillips 66 | 42,552 | 3,806,702 |
| Pioneer Natural Resources Co. | 19,903 | 5,039,838 |
| Valero Energy Corp. | 36,095 | 4,227,446 |
| Williams Companies, Inc. (The) | 107,731 | 3,666,086 |
| Total | 128,402,648 | |
| Total Energy | 137,665,530 | |
| Financials 10.6% | ||
| Banks 3.6% | ||
| Bank of America Corp. | 627,100 | 21,076,831 |
| Citigroup, Inc. | 171,759 | 8,383,557 |
| Citizens Financial Group, Inc. | 43,383 | 1,591,288 |
| Comerica, Inc. | 11,565 | 928,670 |
| Fifth Third Bancorp | 60,683 | 2,072,324 |
| First Republic Bank | 15,874 | 2,410,149 |
| Huntington Bancshares, Inc. | 127,292 | 1,705,713 |
| JPMorgan Chase & Co. | 259,776 | 29,544,324 |
| KeyCorp | 82,475 | 1,458,983 |
| M&T Bank Corp. | 15,869 | 2,884,667 |
| PNC Financial Services Group, Inc. (The) | 36,580 | 5,779,640 |
| Regions Financial Corp. | 82,655 | 1,791,134 |
| Signature Bank | 5,566 | 970,488 |
| SVB Financial Group(a) | 5,205 | 2,115,937 |
| Truist Financial Corp. | 117,761 | 5,515,925 |
| U.S. Bancorp | 119,584 | 5,454,226 |
| Wells Fargo & Co. | 335,249 | 14,653,734 |
| Zions Bancorp | 13,387 | 736,687 |
| Total | 109,074,277 | |
| Capital Markets 2.9% | ||
| Ameriprise Financial, Inc.(c) | 9,721 | 2,605,325 |
| Bank of New York Mellon Corp. (The) | 65,732 | 2,729,850 |
| BlackRock, Inc. | 12,596 | 8,393,848 |
| Cboe Global Markets, Inc. | 9,392 | 1,107,974 |
| Charles Schwab Corp. (The) | 133,393 | 9,464,233 |
| CME Group, Inc. | 31,790 | 6,218,442 |
| Factset Research Systems, Inc. | 3,352 | 1,452,556 |
| Franklin Resources, Inc. | 24,762 | 645,545 |
| Goldman Sachs Group, Inc. (The) | 30,377 | 10,105,517 |
| 8 | Columbia Large Cap Index Fund | Semiannual Report 2022 |
August 31, 2022 (Unaudited)
| Common Stocks (continued) | ||
| Issuer | Shares | Value ($) |
| Intercontinental Exchange, Inc. | 49,377 | 4,979,670 |
| Invesco Ltd. | 29,782 | 490,510 |
| MarketAxess Holdings, Inc. | 3,338 | 829,793 |
| Moody’s Corp. | 14,197 | 4,039,330 |
| Morgan Stanley | 123,776 | 10,548,191 |
| MSCI, Inc. | 7,175 | 3,223,297 |
| Nasdaq, Inc. | 30,587 | 1,820,844 |
| Northern Trust Corp. | 18,431 | 1,752,604 |
| Raymond James Financial, Inc. | 17,194 | 1,794,538 |
| S&P Global, Inc. | 30,700 | 10,811,928 |
| State Street Corp. | 32,471 | 2,219,393 |
| T. Rowe Price Group, Inc. | 20,104 | 2,412,480 |
| Total | 87,645,868 | |
| Consumer Finance 0.5% | ||
| American Express Co. | 53,951 | 8,200,552 |
| Capital One Financial Corp. | 34,765 | 3,678,832 |
| Discover Financial Services | 24,851 | 2,497,277 |
| Synchrony Financial | 44,356 | 1,452,659 |
| Total | 15,829,320 | |
| Diversified Financial Services 1.5% | ||
| Berkshire Hathaway, Inc., Class B(a) | 160,018 | 44,933,055 |
| Insurance 2.1% | ||
| Aflac, Inc. | 52,417 | 3,114,619 |
| Allstate Corp. (The) | 24,322 | 2,930,801 |
| American International Group, Inc. | 70,068 | 3,626,019 |
| Aon PLC, Class A | 18,785 | 5,245,899 |
| Arthur J Gallagher & Co. | 18,580 | 3,373,571 |
| Assurant, Inc. | 4,784 | 758,216 |
| Brown & Brown, Inc. | 20,722 | 1,306,315 |
| Chubb Ltd. | 37,476 | 7,084,838 |
| Cincinnati Financial Corp. | 13,190 | 1,278,902 |
| Everest Re Group Ltd. | 3,488 | 938,446 |
| Globe Life, Inc. | 8,023 | 779,755 |
| Hartford Financial Services Group, Inc. (The) | 29,087 | 1,870,585 |
| Lincoln National Corp. | 14,296 | 658,474 |
| Loews Corp. | 17,197 | 951,166 |
| Marsh & McLennan Companies, Inc. | 44,393 | 7,163,699 |
| MetLife, Inc. | 61,137 | 3,932,943 |
| Common Stocks (continued) | ||
| Issuer | Shares | Value ($) |
| Principal Financial Group, Inc. | 20,785 | 1,553,887 |
| Progressive Corp. (The) | 51,731 | 6,344,807 |
| Prudential Financial, Inc. | 33,168 | 3,175,836 |
| Travelers Companies, Inc. (The) | 21,224 | 3,430,647 |
| Willis Towers Watson PLC | 9,861 | 2,039,551 |
| WR Berkley Corp. | 18,530 | 1,200,744 |
| Total | 62,759,720 | |
| Total Financials | 320,242,240 | |
| Health Care 13.7% | ||
| Biotechnology 2.0% | ||
| AbbVie, Inc. | 156,297 | 21,015,694 |
| Amgen, Inc. | 47,249 | 11,353,935 |
| Biogen, Inc.(a) | 12,953 | 2,530,757 |
| Gilead Sciences, Inc. | 110,941 | 7,041,425 |
| Incyte Corp.(a) | 16,653 | 1,172,871 |
| Moderna, Inc.(a) | 30,607 | 4,048,388 |
| Regeneron Pharmaceuticals, Inc.(a) | 9,555 | 5,552,028 |
| Vertex Pharmaceuticals, Inc.(a) | 22,621 | 6,373,693 |
| Total | 59,088,791 | |
| Health Care Equipment & Supplies 2.5% | ||
| Abbott Laboratories | 154,867 | 15,897,098 |
| ABIOMED, Inc.(a) | 4,030 | 1,044,898 |
| Align Technology, Inc.(a) | 6,482 | 1,579,663 |
| Baxter International, Inc. | 44,536 | 2,559,039 |
| Becton Dickinson and Co. | 25,213 | 6,364,265 |
| Boston Scientific Corp.(a) | 126,443 | 5,096,917 |
| Cooper Companies, Inc. (The) | 4,361 | 1,253,526 |
| Dentsply Sirona, Inc. | 19,056 | 624,465 |
| DexCom, Inc.(a) | 34,716 | 2,854,002 |
| Edwards Lifesciences Corp.(a) | 54,993 | 4,954,869 |
| Hologic, Inc.(a) | 22,057 | 1,490,171 |
| IDEXX Laboratories, Inc.(a) | 7,430 | 2,582,817 |
| Intuitive Surgical, Inc.(a) | 31,749 | 6,532,039 |
| Medtronic PLC | 118,656 | 10,432,236 |
| ResMed, Inc. | 12,939 | 2,845,545 |
| STERIS PLC | 8,856 | 1,783,421 |
| Stryker Corp. | 29,768 | 6,108,394 |
| Columbia Large Cap Index Fund | Semiannual Report 2022 | 9 |
August 31, 2022 (Unaudited)
| Common Stocks (continued) | ||
| Issuer | Shares | Value ($) |
| Teleflex, Inc. | 4,148 | 938,527 |
| Zimmer Biomet Holdings, Inc. | 18,537 | 1,970,854 |
| Total | 76,912,746 | |
| Health Care Providers & Services 3.4% | ||
| AmerisourceBergen Corp. | 13,339 | 1,954,964 |
| Cardinal Health, Inc. | 24,096 | 1,704,069 |
| Centene Corp.(a) | 51,732 | 4,642,430 |
| Cigna Corp. | 28,062 | 7,954,174 |
| CVS Health Corp. | 115,982 | 11,383,633 |
| DaVita, Inc.(a) | 5,355 | 456,728 |
| Elevance Health, Inc. | 21,323 | 10,344,000 |
| HCA Healthcare, Inc. | 20,124 | 3,981,936 |
| Henry Schein, Inc.(a) | 12,210 | 896,336 |
| Humana, Inc. | 11,188 | 5,390,155 |
| Laboratory Corp. of America Holdings | 8,199 | 1,846,989 |
| McKesson Corp. | 12,857 | 4,718,519 |
| Molina Healthcare, Inc.(a) | 5,192 | 1,751,625 |
| Quest Diagnostics, Inc. | 10,381 | 1,300,843 |
| UnitedHealth Group, Inc. | 82,979 | 43,093,484 |
| Universal Health Services, Inc., Class B | 5,937 | 580,876 |
| Total | 102,000,761 | |
| Life Sciences Tools & Services 1.8% | ||
| Agilent Technologies, Inc. | 26,544 | 3,404,268 |
| Bio-Rad Laboratories, Inc., Class A(a) | 1,914 | 928,366 |
| Bio-Techne Corp. | 3,470 | 1,151,381 |
| Charles River Laboratories International, Inc.(a) | 4,494 | 922,393 |
| Danaher Corp. | 57,234 | 15,448,029 |
| Illumina, Inc.(a) | 13,895 | 2,801,788 |
| IQVIA Holdings, Inc.(a) | 16,741 | 3,560,141 |
| Mettler-Toledo International, Inc.(a) | 2,006 | 2,432,195 |
| PerkinElmer, Inc. | 11,158 | 1,506,999 |
| Thermo Fisher Scientific, Inc. | 34,624 | 18,881,160 |
| Waters Corp.(a) | 5,328 | 1,590,941 |
| West Pharmaceutical Services, Inc. | 6,552 | 1,943,913 |
| Total | 54,571,574 | |
| Common Stocks (continued) | ||
| Issuer | Shares | Value ($) |
| Pharmaceuticals 4.0% | ||
| Bristol-Myers Squibb Co. | 188,311 | 12,694,045 |
| Catalent, Inc.(a) | 15,851 | 1,394,888 |
| Eli Lilly & Co. | 69,753 | 21,011,696 |
| Johnson & Johnson | 232,742 | 37,550,594 |
| Merck & Co., Inc. | 223,667 | 19,092,215 |
| Organon & Co. | 22,434 | 640,042 |
| Pfizer, Inc. | 496,272 | 22,446,383 |
| Viatris, Inc. | 107,228 | 1,024,027 |
| Zoetis, Inc. | 41,626 | 6,515,718 |
| Total | 122,369,608 | |
| Total Health Care | 414,943,480 | |
| Industrials 7.7% | ||
| Aerospace & Defense 1.6% | ||
| Boeing Co. (The)(a) | 49,189 | 7,882,537 |
| General Dynamics Corp. | 20,387 | 4,667,196 |
| Howmet Aerospace, Inc. | 33,267 | 1,178,650 |
| Huntington Ingalls Industries, Inc. | 3,542 | 815,581 |
| L3Harris Technologies, Inc. | 17,059 | 3,892,693 |
| Lockheed Martin Corp. | 20,948 | 8,800,464 |
| Northrop Grumman Corp. | 12,924 | 6,177,543 |
| Raytheon Technologies Corp. | 131,541 | 11,805,805 |
| Textron, Inc. | 19,024 | 1,186,717 |
| TransDigm Group, Inc. | 4,587 | 2,753,989 |
| Total | 49,161,175 | |
| Air Freight & Logistics 0.6% | ||
| CH Robinson Worldwide, Inc. | 11,256 | 1,284,872 |
| Expeditors International of Washington, Inc. | 14,837 | 1,526,579 |
| FedEx Corp. | 21,090 | 4,445,983 |
| United Parcel Service, Inc., Class B | 64,959 | 12,635,175 |
| Total | 19,892,609 | |
| Airlines 0.2% | ||
| Alaska Air Group, Inc.(a) | 11,153 | 485,825 |
| American Airlines Group, Inc.(a) | 57,448 | 746,249 |
| Delta Air Lines, Inc.(a) | 56,700 | 1,761,669 |
| Southwest Airlines Co.(a) | 52,446 | 1,924,768 |
| United Airlines Holdings, Inc.(a) | 28,899 | 1,011,754 |
| Total | 5,930,265 | |
| 10 | Columbia Large Cap Index Fund | Semiannual Report 2022 |
August 31, 2022 (Unaudited)
| Common Stocks (continued) | ||
| Issuer | Shares | Value ($) |
| Building Products 0.4% | ||
| Allegion PLC | 7,766 | 738,547 |
| AO Smith Corp. | 11,501 | 649,232 |
| Carrier Global Corp. | 75,025 | 2,934,978 |
| Fortune Brands Home & Security, Inc. | 11,570 | 710,745 |
| Johnson Controls International PLC | 61,530 | 3,331,234 |
| Masco Corp. | 20,868 | 1,061,555 |
| Trane Technologies PLC | 20,684 | 3,186,784 |
| Total | 12,613,075 | |
| Commercial Services & Supplies 0.5% | ||
| Cintas Corp. | 7,693 | 3,129,820 |
| Copart, Inc.(a) | 18,905 | 2,261,983 |
| Republic Services, Inc. | 18,440 | 2,631,757 |
| Rollins, Inc. | 20,036 | 676,415 |
| Waste Management, Inc. | 33,786 | 5,710,848 |
| Total | 14,410,823 | |
| Construction & Engineering 0.1% | ||
| Quanta Services, Inc. | 12,711 | 1,796,064 |
| Electrical Equipment 0.5% | ||
| AMETEK, Inc. | 20,423 | 2,454,028 |
| Eaton Corp. PLC | 35,291 | 4,822,162 |
| Emerson Electric Co. | 52,538 | 4,294,456 |
| Generac Holdings, Inc.(a) | 5,646 | 1,244,435 |
| Rockwell Automation, Inc. | 10,283 | 2,436,454 |
| Total | 15,251,535 | |
| Industrial Conglomerates 0.8% | ||
| 3M Co. | 50,332 | 6,258,784 |
| General Electric Co. | 97,351 | 7,149,458 |
| Honeywell International, Inc. | 60,209 | 11,400,574 |
| Total | 24,808,816 | |
| Machinery 1.6% | ||
| Caterpillar, Inc. | 47,176 | 8,713,879 |
| Cummins, Inc. | 12,480 | 2,687,818 |
| Deere & Co. | 24,692 | 9,018,753 |
| Dover Corp. | 12,751 | 1,593,365 |
| Fortive Corp. | 31,704 | 2,007,814 |
| IDEX Corp. | 6,723 | 1,352,735 |
| Illinois Tool Works, Inc. | 25,067 | 4,883,804 |
| Common Stocks (continued) | ||
| Issuer | Shares | Value ($) |
| Ingersoll Rand, Inc. | 35,904 | 1,700,772 |
| Nordson Corp. | 4,766 | 1,082,692 |
| Otis Worldwide Corp. | 37,395 | 2,700,667 |
| PACCAR, Inc. | 30,752 | 2,691,108 |
| Parker-Hannifin Corp. | 11,354 | 3,008,810 |
| Pentair PLC | 14,629 | 650,990 |
| Snap-On, Inc. | 4,721 | 1,028,517 |
| Stanley Black & Decker, Inc. | 13,353 | 1,176,399 |
| Westinghouse Air Brake Technologies Corp. | 16,155 | 1,415,986 |
| Xylem, Inc. | 15,929 | 1,451,132 |
| Total | 47,165,241 | |
| Professional Services 0.3% | ||
| Equifax, Inc. | 10,820 | 2,042,275 |
| Jacobs Solutions, Inc. | 11,377 | 1,417,347 |
| Leidos Holdings, Inc. | 12,087 | 1,148,869 |
| Nielsen Holdings PLC | 31,814 | 885,702 |
| Robert Half International, Inc. | 9,775 | 752,382 |
| Verisk Analytics, Inc. | 13,966 | 2,613,876 |
| Total | 8,860,451 | |
| Road & Rail 0.9% | ||
| CSX Corp. | 192,309 | 6,086,580 |
| JB Hunt Transport Services, Inc. | 7,414 | 1,290,184 |
| Norfolk Southern Corp. | 21,080 | 5,125,180 |
| Old Dominion Freight Line, Inc. | 8,121 | 2,204,121 |
| Union Pacific Corp. | 55,547 | 12,470,857 |
| Total | 27,176,922 | |
| Trading Companies & Distributors 0.2% | ||
| Fastenal Co. | 50,911 | 2,562,351 |
| United Rentals, Inc.(a) | 6,334 | 1,849,781 |
| W.W. Grainger, Inc. | 3,797 | 2,107,107 |
| Total | 6,519,239 | |
| Total Industrials | 233,586,215 | |
| Columbia Large Cap Index Fund | Semiannual Report 2022 | 11 |
August 31, 2022 (Unaudited)
| Common Stocks (continued) | ||
| Issuer | Shares | Value ($) |
| Information Technology 26.7% | ||
| Communications Equipment 0.8% | ||
| Arista Networks, Inc.(a) | 19,904 | 2,386,092 |
| Cisco Systems, Inc. | 367,427 | 16,431,335 |
| F5, Inc.(a) | 5,349 | 840,114 |
| Juniper Networks, Inc. | 28,577 | 812,158 |
| Motorola Solutions, Inc. | 14,797 | 3,601,738 |
| Total | 24,071,437 | |
| Electronic Equipment, Instruments & Components 0.6% | ||
| Amphenol Corp., Class A | 52,816 | 3,883,560 |
| CDW Corp. | 11,951 | 2,040,036 |
| Corning, Inc. | 67,234 | 2,307,471 |
| Keysight Technologies, Inc.(a) | 16,095 | 2,637,810 |
| TE Connectivity Ltd. | 28,496 | 3,596,480 |
| Teledyne Technologies, Inc.(a) | 4,143 | 1,526,115 |
| Trimble Navigation Ltd.(a) | 22,125 | 1,399,406 |
| Zebra Technologies Corp., Class A(a) | 4,645 | 1,401,118 |
| Total | 18,791,996 | |
| IT Services 4.3% | ||
| Accenture PLC, Class A | 56,023 | 16,160,395 |
| Akamai Technologies, Inc.(a) | 14,179 | 1,280,080 |
| Automatic Data Processing, Inc. | 36,949 | 9,030,705 |
| Broadridge Financial Solutions, Inc. | 10,368 | 1,774,691 |
| Cognizant Technology Solutions Corp., Class A | 46,097 | 2,911,947 |
| DXC Technology Co.(a) | 21,624 | 535,843 |
| EPAM Systems, Inc.(a) | 5,055 | 2,155,958 |
| Fidelity National Information Services, Inc. | 54,021 | 4,935,899 |
| Fiserv, Inc.(a) | 51,455 | 5,206,731 |
| FleetCor Technologies, Inc.(a) | 6,841 | 1,453,918 |
| Gartner, Inc.(a) | 7,124 | 2,032,620 |
| Global Payments, Inc. | 24,902 | 3,093,575 |
| International Business Machines Corp. | 79,553 | 10,218,583 |
| Jack Henry & Associates, Inc. | 6,444 | 1,238,537 |
| MasterCard, Inc., Class A | 75,957 | 24,638,172 |
| Paychex, Inc. | 28,419 | 3,505,199 |
| PayPal Holdings, Inc.(a) | 102,426 | 9,570,685 |
| Common Stocks (continued) | ||
| Issuer | Shares | Value ($) |
| VeriSign, Inc.(a) | 8,429 | 1,535,932 |
| Visa, Inc., Class A | 145,560 | 28,924,228 |
| Total | 130,203,698 | |
| Semiconductors & Semiconductor Equipment 5.0% | ||
| Advanced Micro Devices, Inc.(a) | 143,330 | 12,164,417 |
| Analog Devices, Inc. | 46,286 | 7,013,718 |
| Applied Materials, Inc. | 78,134 | 7,350,065 |
| Broadcom, Inc. | 36,112 | 18,023,860 |
| Enphase Energy, Inc.(a) | 11,943 | 3,420,953 |
| Intel Corp. | 361,663 | 11,544,283 |
| KLA Corp. | 13,200 | 4,542,516 |
| Lam Research Corp. | 12,269 | 5,372,718 |
| Microchip Technology, Inc. | 49,176 | 3,208,734 |
| Micron Technology, Inc. | 98,767 | 5,583,298 |
| Monolithic Power Systems, Inc. | 3,878 | 1,757,432 |
| NVIDIA Corp. | 221,475 | 33,429,436 |
| NXP Semiconductors NV | 23,223 | 3,822,041 |
| ON Semiconductor Corp.(a) | 38,431 | 2,642,900 |
| Qorvo, Inc.(a) | 9,591 | 861,080 |
| QUALCOMM, Inc. | 99,062 | 13,102,931 |
| Skyworks Solutions, Inc. | 14,234 | 1,402,761 |
| SolarEdge Technologies, Inc.(a) | 4,899 | 1,351,977 |
| Teradyne, Inc. | 14,170 | 1,199,349 |
| Texas Instruments, Inc. | 81,561 | 13,474,693 |
| Total | 151,269,162 | |
| Software 8.6% | ||
| Adobe, Inc.(a) | 41,792 | 15,606,804 |
| ANSYS, Inc.(a) | 7,694 | 1,910,420 |
| Autodesk, Inc.(a) | 19,240 | 3,881,478 |
| Cadence Design Systems, Inc.(a) | 24,390 | 4,238,250 |
| Ceridian HCM Holding, Inc.(a) | 12,151 | 724,686 |
| Citrix Systems, Inc. | 11,031 | 1,133,656 |
| Fortinet, Inc.(a) | 58,923 | 2,868,961 |
| Intuit, Inc. | 25,014 | 10,800,545 |
| Microsoft Corp. | 661,505 | 172,963,712 |
| NortonLifeLock, Inc. | 51,464 | 1,162,572 |
| Oracle Corp. | 139,236 | 10,324,349 |
| Paycom Software, Inc.(a) | 4,259 | 1,495,761 |
| PTC, Inc.(a) | 9,312 | 1,069,856 |
| 12 | Columbia Large Cap Index Fund | Semiannual Report 2022 |
August 31, 2022 (Unaudited)
| Common Stocks (continued) | ||
| Issuer | Shares | Value ($) |
| Roper Technologies, Inc. | 9,368 | 3,771,369 |
| Salesforce, Inc.(a) | 87,875 | 13,719,045 |
| ServiceNow, Inc.(a) | 17,730 | 7,705,813 |
| Synopsys, Inc.(a) | 13,541 | 4,685,457 |
| Tyler Technologies, Inc.(a) | 3,668 | 1,362,699 |
| Total | 259,425,433 | |
| Technology Hardware, Storage & Peripherals 7.4% | ||
| Apple, Inc. | 1,359,968 | 213,814,169 |
| Hewlett Packard Enterprise Co. | 114,994 | 1,563,918 |
| HP, Inc. | 93,168 | 2,674,853 |
| NetApp, Inc. | 19,683 | 1,419,735 |
| Seagate Technology Holdings PLC | 17,482 | 1,170,595 |
| Western Digital Corp.(a) | 27,699 | 1,170,560 |
| Total | 221,813,830 | |
| Total Information Technology | 805,575,556 | |
| Materials 2.5% | ||
| Chemicals 1.8% | ||
| Air Products & Chemicals, Inc. | 19,615 | 4,951,807 |
| Albemarle Corp. | 10,358 | 2,775,530 |
| Celanese Corp., Class A | 9,580 | 1,062,039 |
| CF Industries Holdings, Inc. | 18,450 | 1,908,837 |
| Corteva, Inc. | 64,010 | 3,932,134 |
| Dow, Inc. | 64,399 | 3,284,349 |
| DuPont de Nemours, Inc. | 44,978 | 2,502,576 |
| Eastman Chemical Co. | 11,399 | 1,037,309 |
| Ecolab, Inc. | 21,981 | 3,601,147 |
| FMC Corp. | 11,139 | 1,203,903 |
| International Flavors & Fragrances, Inc. | 22,540 | 2,490,219 |
| Linde PLC | 44,514 | 12,591,230 |
| LyondellBasell Industries NV, Class A | 22,892 | 1,900,036 |
| Mosaic Co. (The) | 32,018 | 1,724,810 |
| PPG Industries, Inc. | 20,891 | 2,652,739 |
| Sherwin-Williams Co. (The) | 21,167 | 4,912,861 |
| Total | 52,531,526 | |
| Construction Materials 0.1% | ||
| Martin Marietta Materials, Inc. | 5,516 | 1,917,968 |
| Vulcan Materials Co. | 11,754 | 1,956,924 |
| Total | 3,874,892 | |
| Common Stocks (continued) | ||
| Issuer | Shares | Value ($) |
| Containers & Packaging 0.3% | ||
| Amcor PLC | 132,917 | 1,596,333 |
| Avery Dennison Corp. | 7,227 | 1,327,022 |
| Ball Corp. | 28,285 | 1,578,586 |
| International Paper Co. | 32,781 | 1,364,345 |
| Packaging Corp. of America | 8,288 | 1,134,793 |
| Sealed Air Corp. | 12,921 | 695,279 |
| WestRock Co. | 22,541 | 914,939 |
| Total | 8,611,297 | |
| Metals & Mining 0.3% | ||
| Freeport-McMoRan, Inc. | 128,184 | 3,794,246 |
| Newmont Corp. | 70,197 | 2,903,348 |
| Nucor Corp. | 23,533 | 3,128,477 |
| Total | 9,826,071 | |
| Total Materials | 74,843,786 | |
| Real Estate 2.8% | ||
| Equity Real Estate Investment Trusts (REITS) 2.7% | ||
| Alexandria Real Estate Equities, Inc. | 13,137 | 2,015,216 |
| American Tower Corp. | 41,101 | 10,441,709 |
| AvalonBay Communities, Inc. | 12,367 | 2,484,654 |
| Boston Properties, Inc. | 12,613 | 1,001,850 |
| Camden Property Trust | 9,422 | 1,210,821 |
| Crown Castle Corp. | 38,301 | 6,542,960 |
| Digital Realty Trust, Inc. | 25,179 | 3,112,880 |
| Duke Realty Corp. | 34,004 | 2,001,135 |
| Equinix, Inc. | 8,051 | 5,292,486 |
| Equity Residential | 30,267 | 2,214,939 |
| Essex Property Trust, Inc. | 5,779 | 1,531,782 |
| Extra Space Storage, Inc. | 11,877 | 2,360,316 |
| Federal Realty Investment Trust | 6,322 | 640,229 |
| Healthpeak Properties, Inc. | 47,723 | 1,252,729 |
| Host Hotels & Resorts, Inc. | 63,221 | 1,123,437 |
| Iron Mountain, Inc. | 25,700 | 1,352,077 |
| Kimco Realty Corp. | 54,661 | 1,152,254 |
| Mid-America Apartment Communities, Inc. | 10,209 | 1,691,325 |
| Prologis, Inc. | 65,475 | 8,152,292 |
| Public Storage | 13,507 | 4,468,521 |
| Realty Income Corp. | 53,210 | 3,633,179 |
| Columbia Large Cap Index Fund | Semiannual Report 2022 | 13 |
August 31, 2022 (Unaudited)
| Common Stocks (continued) | ||
| Issuer | Shares | Value ($) |
| Regency Centers Corp. | 13,721 | 834,786 |
| SBA Communications Corp. | 9,537 | 3,101,909 |
| Simon Property Group, Inc. | 29,041 | 2,961,601 |
| UDR, Inc. | 26,472 | 1,187,798 |
| Ventas, Inc. | 35,352 | 1,691,947 |
| VICI Properties, Inc. | 85,175 | 2,809,923 |
| Vornado Realty Trust | 14,076 | 369,073 |
| Welltower, Inc. | 40,152 | 3,077,651 |
| Weyerhaeuser Co. | 65,849 | 2,249,402 |
| Total | 81,960,881 | |
| Real Estate Management & Development 0.1% | ||
| CBRE Group, Inc., Class A(a) | 28,910 | 2,282,734 |
| Total Real Estate | 84,243,615 | |
| Utilities 3.1% | ||
| Electric Utilities 2.0% | ||
| Alliant Energy Corp. | 22,184 | 1,354,111 |
| American Electric Power Co., Inc. | 45,422 | 4,551,285 |
| Constellation Energy Corp. | 28,896 | 2,357,625 |
| Duke Energy Corp. | 68,096 | 7,280,143 |
| Edison International | 33,716 | 2,284,933 |
| Entergy Corp. | 17,988 | 2,074,017 |
| Evergy, Inc. | 20,297 | 1,390,954 |
| Eversource Energy | 30,504 | 2,735,904 |
| Exelon Corp. | 86,697 | 3,806,865 |
| FirstEnergy Corp. | 50,498 | 1,997,196 |
| NextEra Energy, Inc. | 173,756 | 14,779,685 |
| NRG Energy, Inc. | 20,987 | 866,343 |
| Pinnacle West Capital Corp. | 9,995 | 753,123 |
| PPL Corp. | 65,089 | 1,892,788 |
| Southern Co. (The) | 93,978 | 7,242,885 |
| Xcel Energy, Inc. | 48,173 | 3,576,845 |
| Total | 58,944,702 | |
| Common Stocks (continued) | ||
| Issuer | Shares | Value ($) |
| Gas Utilities 0.0% | ||
| Atmos Energy Corp. | 12,296 | 1,394,120 |
| Independent Power and Renewable Electricity Producers 0.1% | ||
| AES Corp. (The) | 59,071 | 1,503,357 |
| Multi-Utilities 0.9% | ||
| Ameren Corp. | 22,840 | 2,115,441 |
| CenterPoint Energy, Inc. | 55,673 | 1,755,370 |
| CMS Energy Corp. | 25,661 | 1,733,144 |
| Consolidated Edison, Inc. | 31,337 | 3,062,878 |
| Dominion Energy, Inc. | 71,755 | 5,869,559 |
| DTE Energy Co. | 17,136 | 2,233,506 |
| NiSource, Inc. | 35,892 | 1,059,173 |
| Public Service Enterprise Group, Inc. | 44,158 | 2,842,009 |
| Sempra Energy | 27,800 | 4,586,166 |
| WEC Energy Group, Inc. | 27,900 | 2,877,606 |
| Total | 28,134,852 | |
| Water Utilities 0.1% | ||
| American Water Works Co., Inc. | 16,076 | 2,386,482 |
| Total Utilities | 92,363,513 | |
| Total Common Stocks (Cost $855,059,282) | 2,948,137,974 | |
| Money Market Funds 0.8% | ||
| Shares | Value ($) | |
| Columbia Short-Term Cash Fund, 2.366%(c),(d) | 23,797,037 | 23,785,138 |
| Total Money Market Funds (Cost $23,785,138) | 23,785,138 | |
| Total Investments in Securities (Cost: $878,844,420) | 2,971,923,112 | |
| Other Assets & Liabilities, Net | 44,842,669 | |
| Net Assets | 3,016,765,781 | |
| 14 | Columbia Large Cap Index Fund | Semiannual Report 2022 |
August 31, 2022 (Unaudited)
| Long futures contracts | ||||||
| Description | Number of contracts | Expiration date | Trading currency | Notional amount | Value/Unrealized appreciation ($) | Value/Unrealized depreciation ($) |
| S&P 500 Index E-mini | 38 | 09/2022 | USD | 7,517,350 | 410,251 | — |
| S&P 500 Index E-mini | 308 | 09/2022 | USD | 60,930,100 | — | (1,274,600) |
| Total | 410,251 | (1,274,600) | ||||
| (a) | Non-income producing investment. |
| (b) | This security or a portion of this security has been pledged as collateral in connection with derivative contracts. |
| (c) | As defined in the Investment Company Act of 1940, as amended, an affiliated company is one in which the Fund owns 5% or more of the company’s outstanding voting securities, or a company which is under common ownership or control with the Fund. The value of the holdings and transactions in these affiliated companies during the period ended August 31, 2022 are as follows: |
| Affiliated issuers | Beginning of period($) | Purchases($) | Sales($) | Net change in unrealized appreciation (depreciation)($) | End of period($) | Realized gain (loss)($) | Dividends($) | End of period shares |
| Ameriprise Financial, Inc. | ||||||||
| 3,106,724 | 88,138 | (101,473) | (488,064) | 2,605,325 | 164,487 | 25,538 | 9,721 | |
| Columbia Short-Term Cash Fund, 2.366% | ||||||||
| 48,487,871 | 363,947,764 | (388,652,857) | 2,360 | 23,785,138 | (12,004) | 174,539 | 23,797,037 | |
| Total | 51,594,595 | (485,704) | 26,390,463 | 152,483 | 200,077 | |||
| (d) | The rate shown is the seven-day current annualized yield at August 31, 2022. |
| USD | US Dollar |
| ■ | Level 1 — Valuations based on quoted prices for investments in active markets that the Fund has the ability to access at the measurement date. Valuation adjustments are not applied to Level 1 investments. |
| ■ | Level 2 — Valuations based on other significant observable inputs (including quoted prices for similar securities, interest rates, prepayment speeds, credit risks, etc.). |
| ■ | Level 3 — Valuations based on significant unobservable inputs (including the Fund’s own assumptions and judgment in determining the fair value of investments). |
| Columbia Large Cap Index Fund | Semiannual Report 2022 | 15 |
August 31, 2022 (Unaudited)
The Committee meets at least monthly to review and approve valuation matters, which may include a description of specific valuation determinations, data regarding pricing information received from approved pricing vendors and brokers and the results of Board-approved valuation control policies and procedures (the Policies). The Policies address, among other things, instances when market quotations are or are not readily available, including recommendations of third party pricing vendors and a determination of appropriate pricing methodologies; events that require specific valuation determinations and assessment of fair value techniques; securities with a potential for stale pricing, including those that are illiquid, restricted, or in default; and the effectiveness of third party pricing vendors, including periodic reviews of vendors. The Committee meets more frequently, as needed, to discuss additional valuation matters, which may include the need to review back-testing results, review time-sensitive information or approve related valuation actions. The Committee reports to the Board, with members of the Committee meeting with the Board at each of its regularly scheduled meetings to discuss valuation matters and actions during the period, similar to those described earlier.
| Level 1 ($) | Level 2 ($) | Level 3 ($) | Total ($) | |
| Investments in Securities | ||||
| Common Stocks | ||||
| Communication Services | 248,166,323 | — | — | 248,166,323 |
| Consumer Discretionary | 337,016,970 | — | — | 337,016,970 |
| Consumer Staples | 199,490,746 | — | — | 199,490,746 |
| Energy | 137,665,530 | — | — | 137,665,530 |
| Financials | 320,242,240 | — | — | 320,242,240 |
| Health Care | 414,943,480 | — | — | 414,943,480 |
| Industrials | 233,586,215 | — | — | 233,586,215 |
| Information Technology | 805,575,556 | — | — | 805,575,556 |
| Materials | 74,843,786 | — | — | 74,843,786 |
| Real Estate | 84,243,615 | — | — | 84,243,615 |
| Utilities | 92,363,513 | — | — | 92,363,513 |
| Total Common Stocks | 2,948,137,974 | — | — | 2,948,137,974 |
| Money Market Funds | 23,785,138 | — | — | 23,785,138 |
| Total Investments in Securities | 2,971,923,112 | — | — | 2,971,923,112 |
| Investments in Derivatives | ||||
| Asset | ||||
| Futures Contracts | 410,251 | — | — | 410,251 |
| Liability | ||||
| Futures Contracts | (1,274,600) | — | — | (1,274,600) |
| Total | 2,971,058,763 | — | — | 2,971,058,763 |
| 16 | Columbia Large Cap Index Fund | Semiannual Report 2022 |
August 31, 2022 (Unaudited)
| Assets | |
| Investments in securities, at value | |
| Unaffiliated issuers (cost $854,857,374) | $2,945,532,649 |
| Affiliated issuers (cost $23,987,046) | 26,390,463 |
| Receivable for: | |
| Investments sold | 39,960,998 |
| Capital shares sold | 1,248,300 |
| Dividends | 5,035,057 |
| Variation margin for futures contracts | 969 |
| Expense reimbursement due from Investment Manager | 108 |
| Total assets | 3,018,168,544 |
| Liabilities | |
| Due to custodian | 21,772 |
| Payable for: | |
| Capital shares purchased | 856,318 |
| Variation margin for futures contracts | 220,100 |
| Management services fees | 16,660 |
| Distribution and/or service fees | 3,261 |
| Compensation of board members | 284,652 |
| Total liabilities | 1,402,763 |
| Net assets applicable to outstanding capital stock | $3,016,765,781 |
| Represented by | |
| Paid in capital | 807,372,668 |
| Total distributable earnings (loss) | 2,209,393,113 |
| Total - representing net assets applicable to outstanding capital stock | $3,016,765,781 |
| Class A | |
| Net assets | $472,797,011 |
| Shares outstanding | 9,704,512 |
| Net asset value per share | $48.72 |
| Institutional Class | |
| Net assets | $2,167,574,753 |
| Shares outstanding | 44,061,193 |
| Net asset value per share | $49.19 |
| Institutional 2 Class | |
| Net assets | $319,527,450 |
| Shares outstanding | 6,353,491 |
| Net asset value per share | $50.29 |
| Institutional 3 Class | |
| Net assets | $56,866,567 |
| Shares outstanding | 1,183,070 |
| Net asset value per share | $48.07 |
| Columbia Large Cap Index Fund | Semiannual Report 2022 | 17 |
Six Months Ended August 31, 2022 (Unaudited)
| Net investment income | |
| Income: | |
| Dividends — unaffiliated issuers | $26,763,748 |
| Dividends — affiliated issuers | 200,077 |
| Interfund lending | 404 |
| Foreign taxes withheld | (6,306) |
| Total income | 26,957,923 |
| Expenses: | |
| Management services fees | 3,318,533 |
| Distribution and/or service fees | |
| Class A | 625,659 |
| Compensation of board members | 6,480 |
| Interest on collateral | 395 |
| Interest on interfund lending | 286 |
| Total expenses | 3,951,353 |
| Fees waived or expenses reimbursed by Investment Manager and its affiliates | (6,818) |
| Total net expenses | 3,944,535 |
| Net investment income | 23,013,388 |
| Realized and unrealized gain (loss) — net | |
| Net realized gain (loss) on: | |
| Investments — unaffiliated issuers | 120,297,848 |
| Investments — affiliated issuers | 152,483 |
| Foreign currency translations | (234) |
| Futures contracts | (6,114,318) |
| Net realized gain | 114,335,779 |
| Net change in unrealized appreciation (depreciation) on: | |
| Investments — unaffiliated issuers | (437,624,492) |
| Investments — affiliated issuers | (485,704) |
| Futures contracts | (265,272) |
| Net change in unrealized appreciation (depreciation) | (438,375,468) |
| Net realized and unrealized loss | (324,039,689) |
| Net decrease in net assets resulting from operations | $(301,026,301) |
| 18 | Columbia Large Cap Index Fund | Semiannual Report 2022 |
| Six Months Ended August 31, 2022 (Unaudited) | Year Ended February 28, 2022 | |
| Operations | ||
| Net investment income | $23,013,388 | $42,875,976 |
| Net realized gain | 114,335,779 | 570,948,235 |
| Net change in unrealized appreciation (depreciation) | (438,375,468) | (28,128,125) |
| Net increase (decrease) in net assets resulting from operations | (301,026,301) | 585,696,086 |
| Distributions to shareholders | ||
| Net investment income and net realized gains | ||
| Class A | (22,280,102) | (91,728,044) |
| Institutional Class | (104,886,442) | (419,937,711) |
| Institutional 2 Class | (15,597,536) | (64,117,563) |
| Institutional 3 Class | (7,829,070) | (12,469,784) |
| Total distributions to shareholders | (150,593,150) | (588,253,102) |
| Decrease in net assets from capital stock activity | (10,670,396) | (217,347,737) |
| Total decrease in net assets | (462,289,847) | (219,904,753) |
| Net assets at beginning of period | 3,479,055,628 | 3,698,960,381 |
| Net assets at end of period | $3,016,765,781 | $3,479,055,628 |
| Six Months Ended | Year Ended | |||
| August 31, 2022 (Unaudited) | February 28, 2022 | |||
| Shares | Dollars ($) | Shares | Dollars ($) | |
| Capital stock activity | ||||
| Class A | ||||
| Subscriptions | 787,897 | 40,948,720 | 1,943,795 | 118,991,557 |
| Distributions reinvested | 447,874 | 20,696,246 | 1,396,652 | 84,972,068 |
| Redemptions | (926,196) | (48,813,286) | (4,258,462) | (263,267,391) |
| Net increase (decrease) | 309,575 | 12,831,680 | (918,015) | (59,303,766) |
| Institutional Class | ||||
| Subscriptions | 3,250,917 | 170,342,586 | 4,162,816 | 257,012,616 |
| Distributions reinvested | 1,968,680 | 91,819,258 | 5,816,571 | 356,591,794 |
| Redemptions | (5,109,658) | (269,486,342) | (8,482,728) | (535,721,305) |
| Net increase (decrease) | 109,939 | (7,324,498) | 1,496,659 | 77,883,105 |
| Institutional 2 Class | ||||
| Subscriptions | 457,219 | 24,936,913 | 1,169,174 | 75,340,440 |
| Distributions reinvested | 323,161 | 15,408,303 | 1,010,920 | 63,261,083 |
| Redemptions | (973,719) | (51,244,575) | (2,185,803) | (141,189,263) |
| Net decrease | (193,339) | (10,899,359) | (5,709) | (2,587,740) |
| Institutional 3 Class | ||||
| Subscriptions | 2,255,147 | 113,330,401 | 224,600 | 13,353,125 |
| Distributions reinvested | 168,529 | 7,679,886 | 201,551 | 12,095,264 |
| Redemptions | (2,546,587) | (126,288,506) | (4,160,725) | (258,787,725) |
| Net decrease | (122,911) | (5,278,219) | (3,734,574) | (233,339,336) |
| Total net increase (decrease) | 103,264 | (10,670,396) | (3,161,639) | (217,347,737) |
| Columbia Large Cap Index Fund | Semiannual Report 2022 | 19 |
| Net asset value, beginning of period | Net investment income | Net realized and unrealized gain (loss) | Total from investment operations | Distributions from net investment income | Distributions from net realized gains | Total distributions to shareholders | |
| Class A | |||||||
| Six Months Ended 8/31/2022 (Unaudited) | $56.34 | 0.31 | (5.53) | (5.22) | (0.08) | (2.32) | (2.40) |
| Year Ended 2/28/2022 | $57.11 | 0.58 | 8.97 | 9.55 | (0.62) | (9.70) | (10.32) |
| Year Ended 2/28/2021 | $47.14 | 0.73 | 13.20 | 13.93 | (0.78) | (3.18) | (3.96) |
| Year Ended 2/29/2020 | $48.30 | 0.84 | 2.97 | 3.81 | (0.88) | (4.09) | (4.97) |
| Year Ended 2/28/2019 | $50.42 | 0.81 | 1.18 | 1.99 | (0.83) | (3.28) | (4.11) |
| Year Ended 2/28/2018 | $45.16 | 0.73 | 6.65 | 7.38 | (0.77) | (1.35) | (2.12) |
| Institutional Class | |||||||
| Six Months Ended 8/31/2022 (Unaudited) | $56.82 | 0.38 | (5.59) | (5.21) | (0.10) | (2.32) | (2.42) |
| Year Ended 2/28/2022 | $57.52 | 0.74 | 9.04 | 9.78 | (0.78) | (9.70) | (10.48) |
| Year Ended 2/28/2021 | $47.44 | 0.86 | 13.31 | 14.17 | (0.91) | (3.18) | (4.09) |
| Year Ended 2/29/2020 | $48.57 | 0.98 | 2.98 | 3.96 | (1.00) | (4.09) | (5.09) |
| Year Ended 2/28/2019 | $50.68 | 0.94 | 1.18 | 2.12 | (0.95) | (3.28) | (4.23) |
| Year Ended 2/28/2018 | $45.38 | 0.85 | 6.69 | 7.54 | (0.89) | (1.35) | (2.24) |
| Institutional 2 Class | |||||||
| Six Months Ended 8/31/2022 (Unaudited) | $58.02 | 0.39 | (5.70) | (5.31) | (0.10) | (2.32) | (2.42) |
| Year Ended 2/28/2022 | $58.55 | 0.75 | 9.20 | 9.95 | (0.78) | (9.70) | (10.48) |
| Year Ended 2/28/2021 | $48.23 | 0.88 | 13.53 | 14.41 | (0.91) | (3.18) | (4.09) |
| Year Ended 2/29/2020 | $49.30 | 0.99 | 3.03 | 4.02 | (1.00) | (4.09) | (5.09) |
| Year Ended 2/28/2019 | $51.38 | 0.95 | 1.20 | 2.15 | (0.95) | (3.28) | (4.23) |
| Year Ended 2/28/2018 | $45.98 | 0.87 | 6.77 | 7.64 | (0.89) | (1.35) | (2.24) |
| Institutional 3 Class | |||||||
| Six Months Ended 8/31/2022 (Unaudited) | $55.59 | 0.37 | (5.47) | (5.10) | (0.10) | (2.32) | (2.42) |
| Year Ended 2/28/2022 | $56.45 | 0.68 | 8.94 | 9.62 | (0.78) | (9.70) | (10.48) |
| Year Ended 2/28/2021 | $46.63 | 0.83 | 13.08 | 13.91 | (0.91) | (3.18) | (4.09) |
| Year Ended 2/29/2020 | $47.81 | 0.98 | 2.93 | 3.91 | (1.00) | (4.09) | (5.09) |
| Year Ended 2/28/2019 | $49.95 | 0.92 | 1.17 | 2.09 | (0.95) | (3.28) | (4.23) |
| Year Ended 2/28/2018(g) | $45.37 | 0.98 | 5.84 | 6.82 | (0.89) | (1.35) | (2.24) |
| Notes to Financial Highlights | |
| (a) | In addition to the fees and expenses that the Fund bears directly, the Fund indirectly bears a pro rata share of the fees and expenses of any other funds in which it invests. Such indirect expenses are not included in the Fund’s reported expense ratios. |
| (b) | Total net expenses include the impact of certain fee waivers/expense reimbursements made by the Investment Manager and certain of its affiliates, if applicable. |
| (c) | Annualized. |
| (d) | Ratios include interest on collateral expense which is less than 0.01%. |
| (e) | Ratios include interfund lending expense which is less than 0.01%. |
| (f) | The benefits derived from expense reductions had an impact of less than 0.01%. |
| (g) | Institutional 3 Class shares commenced operations on March 1, 2017. Per share data and total return reflect activity from that date. |
| 20 | Columbia Large Cap Index Fund | Semiannual Report 2022 |
| Net asset value, end of period | Total return | Total gross expense ratio to average net assets(a) | Total net expense ratio to average net assets(a),(b) | Net investment income ratio to average net assets | Portfolio turnover | Net assets, end of period (000’s) | |
| Class A | |||||||
| Six Months Ended 8/31/2022 (Unaudited) | $48.72 | (9.04%) | 0.45%(c),(d),(e) | 0.45%(c),(d),(e) | 1.17%(c) | 4% | $472,797 |
| Year Ended 2/28/2022 | $56.34 | 15.86% | 0.45%(d) | 0.45%(d),(f) | 0.92% | 2% | $529,310 |
| Year Ended 2/28/2021 | $57.11 | 30.69% | 0.45%(d) | 0.45%(d),(f) | 1.43% | 11% | $588,972 |
| Year Ended 2/29/2020 | $47.14 | 7.70% | 0.45% | 0.45%(f) | 1.68% | 7% | $579,726 |
| Year Ended 2/28/2019 | $48.30 | 4.19% | 0.45%(e) | 0.45%(e),(f) | 1.64% | 6% | $726,445 |
| Year Ended 2/28/2018 | $50.42 | 16.59% | 0.45% | 0.45%(f) | 1.53% | 2% | $954,529 |
| Institutional Class | |||||||
| Six Months Ended 8/31/2022 (Unaudited) | $49.19 | (8.93%) | 0.20%(c),(d),(e) | 0.20%(c),(d),(e) | 1.42%(c) | 4% | $2,167,575 |
| Year Ended 2/28/2022 | $56.82 | 16.15% | 0.20%(d) | 0.20%(d),(f) | 1.17% | 2% | $2,497,279 |
| Year Ended 2/28/2021 | $57.52 | 31.02% | 0.20%(d) | 0.20%(d),(f) | 1.67% | 11% | $2,441,779 |
| Year Ended 2/29/2020 | $47.44 | 7.97% | 0.20% | 0.20%(f) | 1.94% | 7% | $2,136,890 |
| Year Ended 2/28/2019 | $48.57 | 4.46% | 0.20%(e) | 0.20%(e),(f) | 1.89% | 6% | $2,134,512 |
| Year Ended 2/28/2018 | $50.68 | 16.88% | 0.20% | 0.20%(f) | 1.78% | 2% | $2,390,677 |
| Institutional 2 Class | |||||||
| Six Months Ended 8/31/2022 (Unaudited) | $50.29 | (8.92%) | 0.20%(c),(d),(e) | 0.20%(c),(d),(e) | 1.42%(c) | 4% | $319,527 |
| Year Ended 2/28/2022 | $58.02 | 16.15% | 0.20%(d) | 0.20%(d) | 1.17% | 2% | $379,872 |
| Year Ended 2/28/2021 | $58.55 | 31.01% | 0.20%(d) | 0.20%(d) | 1.67% | 11% | $383,658 |
| Year Ended 2/29/2020 | $48.23 | 7.97% | 0.20% | 0.20% | 1.93% | 7% | $311,674 |
| Year Ended 2/28/2019 | $49.30 | 4.45% | 0.20%(e) | 0.20%(e) | 1.89% | 6% | $336,271 |
| Year Ended 2/28/2018 | $51.38 | 16.87% | 0.20% | 0.20% | 1.78% | 2% | $372,379 |
| Institutional 3 Class | |||||||
| Six Months Ended 8/31/2022 (Unaudited) | $48.07 | (8.93%) | 0.20%(c),(d),(e) | 0.20%(c),(d),(e) | 1.45%(c) | 4% | $56,867 |
| Year Ended 2/28/2022 | $55.59 | 16.17% | 0.20%(d) | 0.20%(d) | 1.10% | 2% | $72,594 |
| Year Ended 2/28/2021 | $56.45 | 31.00% | 0.20%(d) | 0.20%(d) | 1.63% | 11% | $284,552 |
| Year Ended 2/29/2020 | $46.63 | 7.99% | 0.20% | 0.20% | 1.98% | 7% | $51,264 |
| Year Ended 2/28/2019 | $47.81 | 4.46% | 0.20%(e) | 0.20%(e) | 1.91% | 6% | $45,493 |
| Year Ended 2/28/2018(g) | $49.95 | 15.29% | 0.21% | 0.20% | 2.01% | 2% | $552 |
| Columbia Large Cap Index Fund | Semiannual Report 2022 | 21 |
August 31, 2022 (Unaudited)
| 22 | Columbia Large Cap Index Fund | Semiannual Report 2022 |
August 31, 2022 (Unaudited)
| Columbia Large Cap Index Fund | Semiannual Report 2022 | 23 |
August 31, 2022 (Unaudited)
| 24 | Columbia Large Cap Index Fund | Semiannual Report 2022 |
August 31, 2022 (Unaudited)
| Asset derivatives | ||
| Risk exposure category | Statement of assets and liabilities location | Fair value ($) |
| Equity risk | Component of total distributable earnings (loss) — unrealized appreciation on futures contracts | 410,251* |
| Liability derivatives | ||
| Risk exposure category | Statement of assets and liabilities location | Fair value ($) |
| Equity risk | Component of total distributable earnings (loss) — unrealized depreciation on futures contracts | 1,274,600* |
| * | Includes cumulative appreciation (depreciation) as reported in the tables following the Portfolio of Investments. Only the current day’s variation margin is reported in receivables or payables in the Statement of Assets and Liabilities. |
| Amount of realized gain (loss) on derivatives recognized in income | |
| Risk exposure category | Futures contracts ($) |
| Equity risk | (6,114,318) |
| Change in unrealized appreciation (depreciation) on derivatives recognized in income | |
| Risk exposure category | Futures contracts ($) |
| Equity risk | (265,272) |
| Derivative instrument | Average notional amounts ($)* |
| Futures contracts — long | 55,293,100 |
| * | Based on the ending quarterly outstanding amounts for the six months ended August 31, 2022. |
| Columbia Large Cap Index Fund | Semiannual Report 2022 | 25 |
August 31, 2022 (Unaudited)
| 26 | Columbia Large Cap Index Fund | Semiannual Report 2022 |
August 31, 2022 (Unaudited)
| Columbia Large Cap Index Fund | Semiannual Report 2022 | 27 |
August 31, 2022 (Unaudited)
| Fee rate(s) contractual through June 30, 2023 | |
| Class A | 0.45% |
| Institutional Class | 0.20 |
| Institutional 2 Class | 0.20 |
| Institutional 3 Class | 0.20 |
| Federal tax cost ($) | Gross unrealized appreciation ($) | Gross unrealized (depreciation) ($) | Net unrealized appreciation ($) |
| 878,844,000 | 2,133,968,000 | (41,753,000) | 2,092,215,000 |
| 28 | Columbia Large Cap Index Fund | Semiannual Report 2022 |
August 31, 2022 (Unaudited)
| Borrower or lender | Average loan balance ($) | Weighted average interest rate (%) | Number of days with outstanding loans |
| Borrower | 3,600,000 | 2.86 | 1 |
| Lender | 10,800,000 | 1.35 | 1 |
| Columbia Large Cap Index Fund | Semiannual Report 2022 | 29 |
August 31, 2022 (Unaudited)
| 30 | Columbia Large Cap Index Fund | Semiannual Report 2022 |
August 31, 2022 (Unaudited)
| Columbia Large Cap Index Fund | Semiannual Report 2022 | 31 |
August 31, 2022 (Unaudited)
| 32 | Columbia Large Cap Index Fund | Semiannual Report 2022 |
| • | the Fund had sufficient liquidity to both meet redemptions and operate effectively on behalf of shareholders; |
| • | there were no material changes to the Program during the period; |
| • | the implementation of the Program was effective to manage the Fund’s liquidity risk; and |
| • | the Program operated adequately during the period. |
| Columbia Large Cap Index Fund | Semiannual Report 2022 | 33 |
(Unaudited)
| • | Information on the investment performance of the Fund relative to the performance of a group of mutual funds determined to be comparable to the Fund by Broadridge, as well as performance relative to benchmarks; |
| • | Information on the Fund’s management fees and total expenses, including information comparing the Fund’s expenses to those of a group of comparable mutual funds, as determined by Broadridge; |
| • | The Investment Manager’s agreement to contractually limit or cap total operating expenses for the Fund so that total operating expenses (excluding certain fees and expenses, such as transaction costs and certain other investment related expenses, interest, taxes, acquired fund fees and expenses and infrequent and/or unusual expenses) would not exceed a specified annual rate, as a percentage of the Fund’s net assets; |
| • | Terms of the Management Agreement; |
| • | Descriptions of other agreements and arrangements with affiliates of the Investment Manager relating to the operations of the Fund, including agreements with respect to the provision of transfer agency and shareholder services to the Fund; |
| • | Descriptions of various services performed by the Investment Manager under the Management Agreement, including portfolio management and portfolio trading practices; |
| • | Information regarding any recently negotiated management fees of similarly-managed portfolios of other institutional clients of the Investment Manager; |
| • | Information regarding the resources of the Investment Manager, including information regarding senior management, portfolio managers and other personnel; |
| • | Information regarding the capabilities of the Investment Manager with respect to compliance monitoring services; |
| • | The profitability to the Investment Manager and its affiliates from their relationships with the Fund; and |
| • | Report provided by the Board’s independent fee consultant, JDL Consultants, LLC (JDL). |
| 34 | Columbia Large Cap Index Fund | Semiannual Report 2022 |
(Unaudited)
into account the organization and strength of the Fund’s and its service providers’ compliance programs. The Board also reviewed the financial condition of the Investment Manager and its affiliates and each entity’s ability to carry out its responsibilities under the Management Agreement and the Fund’s other service agreements.
| Columbia Large Cap Index Fund | Semiannual Report 2022 | 35 |
(Unaudited)
of the Funds. It also took into account the indirect economic benefits flowing to the Investment Manager or its affiliates in connection with managing or distributing the Funds, such as the enhanced ability to offer various other financial products to Ameriprise Financial customers, soft dollar benefits and overall reputational advantages. The Board noted that the fees paid by the Fund should permit the Investment Manager to offer competitive compensation to its personnel, make necessary investments in its business and earn an appropriate profit. After reviewing these and related factors, the Board concluded, within the context of their overall conclusions, that the costs of services provided and the profitability to the Investment Manager and its affiliates from their relationships with the Fund supported the continuation of the Management Agreement.
| 36 | Columbia Large Cap Index Fund | Semiannual Report 2022 |
columbiathreadneedleus.com/investor/. The Fund is distributed by Columbia Management Investment Distributors, Inc., member FINRA, and managed by Columbia Management Investment Advisers, LLC.

August 31, 2022 (Unaudited)

(Unaudited)

| Average annual total returns (%) (for the period ended August 31, 2022) | ||||||
| Inception | 6 Months cumulative | 1 Year | 5 Years | 10 Years | ||
| Class A | Excluding sales charges | 12/31/97 | -15.84 | -25.55 | 11.00 | 12.71 |
| Including sales charges | -20.67 | -29.83 | 9.69 | 12.04 | ||
| Advisor Class* | 11/08/12 | -15.75 | -25.40 | 11.27 | 12.98 | |
| Class C | Excluding sales charges | 12/31/97 | -16.16 | -26.12 | 10.17 | 11.87 |
| Including sales charges | -16.62 | -26.35 | 10.17 | 11.87 | ||
| Institutional Class | 12/31/97 | -15.73 | -25.38 | 11.28 | 12.99 | |
| Institutional 2 Class* | 12/11/13 | -15.74 | -25.36 | 11.35 | 13.04 | |
| Institutional 3 Class* | 03/01/17 | -15.71 | -25.30 | 11.40 | 12.94 | |
| Class R* | 10/26/16 | -15.98 | -25.76 | 10.72 | 12.43 | |
| Russell 1000 Growth Index | -12.25 | -19.06 | 14.78 | 15.09 | ||
| * | The returns shown for periods prior to the share class inception date (including returns for the Life of the Fund, if shown, which are since Fund inception) include the returns of the Fund’s oldest share class. Since the Fund launched more than one class of shares at its inception, Class A shares were used. These returns are adjusted to reflect any higher class-related operating expenses of the newer share classes, as applicable. Please visit columbiathreadneedleus.com/investor/investment-products/mutual-funds/appended-performance for more information. |
| Columbia Large Cap Growth Opportunity Fund | Semiannual Report 2022 | 3 |
(Unaudited)
| Portfolio breakdown (%) (at August 31, 2022) | |
| Common Stocks | 99.3 |
| Money Market Funds | 0.7 |
| Total | 100.0 |
| Equity sector breakdown (%) (at August 31, 2022) | |
| Communication Services | 14.5 |
| Consumer Discretionary | 5.8 |
| Consumer Staples | 6.0 |
| Energy | 2.2 |
| Financials | 4.7 |
| Health Care | 12.4 |
| Industrials | 12.3 |
| Information Technology | 40.8 |
| Materials | 1.3 |
| Total | 100.0 |
| Equity sub-industry breakdown (%) (at August 31, 2022) | |
| Information Technology | |
| Application Software | 11.1 |
| Data Processing & Outsourced Services | 1.0 |
| Electronic Equipment & Instruments | 3.9 |
| Internet Services & Infrastructure | 0.2 |
| Semiconductor Equipment | 5.3 |
| Semiconductors | 10.9 |
| Systems Software | 8.4 |
| Total | 40.8 |
| 4 | Columbia Large Cap Growth Opportunity Fund | Semiannual Report 2022 |
(Unaudited)
| March 1, 2022 — August 31, 2022 | |||||||
| Account value at the beginning of the period ($) | Account value at the end of the period ($) | Expenses paid during the period ($) | Fund’s annualized expense ratio (%) | ||||
| Actual | Hypothetical | Actual | Hypothetical | Actual | Hypothetical | Actual | |
| Class A | 1,000.00 | 1,000.00 | 841.60 | 1,019.91 | 4.87 | 5.35 | 1.05 |
| Advisor Class | 1,000.00 | 1,000.00 | 842.50 | 1,021.17 | 3.72 | 4.08 | 0.80 |
| Class C | 1,000.00 | 1,000.00 | 838.40 | 1,016.13 | 8.34 | 9.15 | 1.80 |
| Institutional Class | 1,000.00 | 1,000.00 | 842.70 | 1,021.17 | 3.72 | 4.08 | 0.80 |
| Institutional 2 Class | 1,000.00 | 1,000.00 | 842.60 | 1,021.48 | 3.44 | 3.77 | 0.74 |
| Institutional 3 Class | 1,000.00 | 1,000.00 | 842.90 | 1,021.68 | 3.25 | 3.57 | 0.70 |
| Class R | 1,000.00 | 1,000.00 | 840.20 | 1,018.65 | 6.03 | 6.61 | 1.30 |
| Columbia Large Cap Growth Opportunity Fund | Semiannual Report 2022 | 5 |
August 31, 2022 (Unaudited)
| Common Stocks 99.3% | ||
| Issuer | Shares | Value ($) |
| Communication Services 14.4% | ||
| Entertainment 9.5% | ||
| Electronic Arts, Inc. | 592,877 | 75,218,305 |
| Endeavor Group Holdings, Inc., Class A(a) | 791,208 | 17,897,125 |
| Take-Two Interactive Software, Inc.(a) | 201,543 | 24,701,110 |
| Total | 117,816,540 | |
| Interactive Media & Services 4.9% | ||
| Alphabet, Inc., Class A(a) | 560,955 | 60,706,550 |
| Total Communication Services | 178,523,090 | |
| Consumer Discretionary 5.8% | ||
| Hotels, Restaurants & Leisure 2.0% | ||
| Hilton Worldwide Holdings, Inc. | 193,866 | 24,690,774 |
| Multiline Retail 1.1% | ||
| Target Corp. | 85,249 | 13,668,824 |
| Specialty Retail 2.7% | ||
| TJX Companies, Inc. (The) | 544,528 | 33,951,321 |
| Total Consumer Discretionary | 72,310,919 | |
| Consumer Staples 6.0% | ||
| Beverages 3.6% | ||
| Coca-Cola Co. (The) | 723,225 | 44,630,215 |
| Food Products 2.4% | ||
| Darling Ingredients, Inc.(a) | 266,213 | 20,248,161 |
| Kellogg Co. | 132,461 | 9,635,213 |
| Total | 29,883,374 | |
| Total Consumer Staples | 74,513,589 | |
| Energy 2.1% | ||
| Energy Equipment & Services 2.1% | ||
| NOV, Inc. | 1,509,285 | 26,669,066 |
| Total Energy | 26,669,066 | |
| Financials 4.7% | ||
| Banks 2.6% | ||
| SVB Financial Group(a) | 80,340 | 32,659,817 |
| Capital Markets 2.1% | ||
| Northern Trust Corp. | 270,755 | 25,746,093 |
| Total Financials | 58,405,910 | |
| Common Stocks (continued) | ||
| Issuer | Shares | Value ($) |
| Health Care 12.3% | ||
| Biotechnology 6.9% | ||
| Exact Sciences Corp.(a) | 150,652 | 5,355,678 |
| Horizon Therapeutics PLC(a) | 195,051 | 11,548,970 |
| Mirati Therapeutics, Inc.(a) | 223,540 | 18,113,446 |
| Vertex Pharmaceuticals, Inc.(a) | 181,617 | 51,172,406 |
| Total | 86,190,500 | |
| Health Care Equipment & Supplies 2.7% | ||
| Intuitive Surgical, Inc.(a) | 160,279 | 32,975,802 |
| Health Care Technology 0.7% | ||
| Doximity, Inc., Class A(a) | 271,096 | 8,997,676 |
| Pharmaceuticals 2.0% | ||
| Eli Lilly & Co. | 83,039 | 25,013,838 |
| Total Health Care | 153,177,816 | |
| Industrials 12.2% | ||
| Aerospace & Defense 1.3% | ||
| Howmet Aerospace, Inc. | 458,734 | 16,252,946 |
| Air Freight & Logistics 6.7% | ||
| United Parcel Service, Inc., Class B | 427,736 | 83,198,929 |
| Electrical Equipment 1.3% | ||
| Generac Holdings, Inc.(a) | 71,482 | 15,755,348 |
| Machinery 1.0% | ||
| AGCO Corp. | 108,718 | 11,818,734 |
| Professional Services 0.8% | ||
| Equifax, Inc. | 54,262 | 10,241,952 |
| Road & Rail 1.1% | ||
| Lyft, Inc., Class A(a) | 440,463 | 6,488,020 |
| Uber Technologies, Inc.(a) | 267,260 | 7,686,397 |
| Total | 14,174,417 | |
| Total Industrials | 151,442,326 | |
| Information Technology 40.5% | ||
| Electronic Equipment, Instruments & Components 3.9% | ||
| Zebra Technologies Corp., Class A(a) | 161,006 | 48,565,850 |
| 6 | Columbia Large Cap Growth Opportunity Fund | Semiannual Report 2022 |
August 31, 2022 (Unaudited)
| Common Stocks (continued) | ||
| Issuer | Shares | Value ($) |
| IT Services 1.2% | ||
| Shopify, Inc., Class A(a) | 68,355 | 2,163,436 |
| Visa, Inc., Class A | 62,508 | 12,420,964 |
| Total | 14,584,400 | |
| Semiconductors & Semiconductor Equipment 16.0% | ||
| Advanced Micro Devices, Inc.(a) | 187,106 | 15,879,686 |
| Cirrus Logic, Inc.(a) | 275,798 | 21,150,949 |
| GlobalFoundries, Inc.(a) | 341,452 | 20,425,659 |
| Lam Research Corp. | 134,608 | 58,946,189 |
| QUALCOMM, Inc. | 577,783 | 76,423,357 |
| Teradyne, Inc. | 74,965 | 6,345,038 |
| Total | 199,170,878 | |
| Software 19.4% | ||
| Adobe, Inc.(a) | 68,229 | 25,479,438 |
| Aspen Technology, Inc.(a) | 51,760 | 10,900,656 |
| Atlassian Corp. PLC, Class A(a) | 70,725 | 17,515,753 |
| Bill.com Holdings, Inc.(a) | 70,791 | 11,459,647 |
| Cadence Design Systems, Inc.(a) | 131,244 | 22,806,270 |
| Crowdstrike Holdings, Inc., Class A(a) | 174,646 | 31,892,106 |
| Microsoft Corp. | 164,474 | 43,005,017 |
| nCino, Inc.(a) | 148,723 | 4,690,723 |
| Common Stocks (continued) | ||
| Issuer | Shares | Value ($) |
| Salesforce, Inc.(a) | 96,474 | 15,061,521 |
| ServiceNow, Inc.(a) | 28,290 | 12,295,400 |
| Teradata Corp.(a) | 514,006 | 16,910,797 |
| Zendesk, Inc.(a) | 377,928 | 29,013,533 |
| Total | 241,030,861 | |
| Total Information Technology | 503,351,989 | |
| Materials 1.3% | ||
| Chemicals 1.3% | ||
| Albemarle Corp. | 58,125 | 15,575,175 |
| Total Materials | 15,575,175 | |
| Total Common Stocks (Cost $1,250,317,903) | 1,233,969,880 | |
| Money Market Funds 0.7% | ||
| Shares | Value ($) | |
| Columbia Short-Term Cash Fund, 2.366%(b),(c) | 9,063,666 | 9,059,134 |
| Total Money Market Funds (Cost $9,059,127) | 9,059,134 | |
| Total Investments in Securities (Cost: $1,259,377,030) | 1,243,029,014 | |
| Other Assets & Liabilities, Net | 504,939 | |
| Net Assets | 1,243,533,953 | |
| (a) | Non-income producing investment. |
| (b) | The rate shown is the seven-day current annualized yield at August 31, 2022. |
| (c) | As defined in the Investment Company Act of 1940, as amended, an affiliated company is one in which the Fund owns 5% or more of the company’s outstanding voting securities, or a company which is under common ownership or control with the Fund. The value of the holdings and transactions in these affiliated companies during the period ended August 31, 2022 are as follows: |
| Affiliated issuers | Beginning of period($) | Purchases($) | Sales($) | Net change in unrealized appreciation (depreciation)($) | End of period($) | Realized gain (loss)($) | Dividends($) | End of period shares |
| Columbia Short-Term Cash Fund, 2.366% | ||||||||
| 15,277,661 | 294,641,453 | (300,859,966) | (14) | 9,059,134 | (20,806) | 127,831 | 9,063,666 | |
| Columbia Large Cap Growth Opportunity Fund | Semiannual Report 2022 | 7 |
August 31, 2022 (Unaudited)
| ■ | Level 1 — Valuations based on quoted prices for investments in active markets that the Fund has the ability to access at the measurement date. Valuation adjustments are not applied to Level 1 investments. |
| ■ | Level 2 — Valuations based on other significant observable inputs (including quoted prices for similar securities, interest rates, prepayment speeds, credit risks, etc.). |
| ■ | Level 3 — Valuations based on significant unobservable inputs (including the Fund’s own assumptions and judgment in determining the fair value of investments). |
| Level 1 ($) | Level 2 ($) | Level 3 ($) | Total ($) | |
| Investments in Securities | ||||
| Common Stocks | ||||
| Communication Services | 178,523,090 | — | — | 178,523,090 |
| Consumer Discretionary | 72,310,919 | — | — | 72,310,919 |
| Consumer Staples | 74,513,589 | — | — | 74,513,589 |
| Energy | 26,669,066 | — | — | 26,669,066 |
| Financials | 58,405,910 | — | — | 58,405,910 |
| Health Care | 153,177,816 | — | — | 153,177,816 |
| Industrials | 151,442,326 | — | — | 151,442,326 |
| Information Technology | 503,351,989 | — | — | 503,351,989 |
| Materials | 15,575,175 | — | — | 15,575,175 |
| Total Common Stocks | 1,233,969,880 | — | — | 1,233,969,880 |
| Money Market Funds | 9,059,134 | — | — | 9,059,134 |
| Total Investments in Securities | 1,243,029,014 | — | — | 1,243,029,014 |
| 8 | Columbia Large Cap Growth Opportunity Fund | Semiannual Report 2022 |
August 31, 2022 (Unaudited)
| Assets | |
| Investments in securities, at value | |
| Unaffiliated issuers (cost $1,250,317,903) | $1,233,969,880 |
| Affiliated issuers (cost $9,059,127) | 9,059,134 |
| Receivable for: | |
| Capital shares sold | 218,805 |
| Dividends | 1,824,385 |
| Expense reimbursement due from Investment Manager | 2,411 |
| Prepaid expenses | 18,482 |
| Total assets | 1,245,093,097 |
| Liabilities | |
| Payable for: | |
| Capital shares purchased | 822,556 |
| Management services fees | 25,030 |
| Distribution and/or service fees | 6,275 |
| Transfer agent fees | 155,025 |
| Compensation of board members | 491,436 |
| Compensation of chief compliance officer | 130 |
| Other expenses | 58,692 |
| Total liabilities | 1,559,144 |
| Net assets applicable to outstanding capital stock | $1,243,533,953 |
| Represented by | |
| Paid in capital | 1,263,835,536 |
| Total distributable earnings (loss) | (20,301,583) |
| Total - representing net assets applicable to outstanding capital stock | $1,243,533,953 |
| Class A | |
| Net assets | $843,633,382 |
| Shares outstanding | 74,139,417 |
| Net asset value per share | $11.38 |
| Maximum sales charge | 5.75% |
| Maximum offering price per share (calculated by dividing the net asset value per share by 1.0 minus the maximum sales charge for Class A shares) | $12.07 |
| Advisor Class | |
| Net assets | $16,964,948 |
| Shares outstanding | 1,164,200 |
| Net asset value per share | $14.57 |
| Class C | |
| Net assets | $8,897,101 |
| Shares outstanding | 2,798,086 |
| Net asset value per share | $3.18 |
| Institutional Class | |
| Net assets | $334,120,250 |
| Shares outstanding | 24,421,141 |
| Net asset value per share | $13.68 |
| Institutional 2 Class | |
| Net assets | $22,977,094 |
| Shares outstanding | 1,542,005 |
| Net asset value per share | $14.90 |
| Institutional 3 Class | |
| Net assets | $1,437,835 |
| Shares outstanding | 103,666 |
| Net asset value per share | $13.87 |
| Class R | |
| Net assets | $15,503,343 |
| Shares outstanding | 1,353,900 |
| Net asset value per share | $11.45 |
| Columbia Large Cap Growth Opportunity Fund | Semiannual Report 2022 | 9 |
Six Months Ended August 31, 2022 (Unaudited)
| Net investment income | |
| Income: | |
| Dividends — unaffiliated issuers | $6,185,027 |
| Dividends — affiliated issuers | 127,831 |
| Interfund lending | 480 |
| Total income | 6,313,338 |
| Expenses: | |
| Management services fees | 5,106,937 |
| Distribution and/or service fees | |
| Class A | 1,181,782 |
| Class C | 55,375 |
| Class R | 43,641 |
| Transfer agent fees | |
| Class A | 525,964 |
| Advisor Class | 11,040 |
| Class C | 6,150 |
| Institutional Class | 217,870 |
| Institutional 2 Class | 7,328 |
| Institutional 3 Class | 99 |
| Class R | 9,710 |
| Compensation of board members | (19,085) |
| Custodian fees | 5,137 |
| Printing and postage fees | 40,972 |
| Registration fees | 64,715 |
| Audit fees | 16,094 |
| Legal fees | 13,220 |
| Interest on interfund lending | 32 |
| Compensation of chief compliance officer | 124 |
| Other | 16,632 |
| Total expenses | 7,303,737 |
| Fees waived or expenses reimbursed by Investment Manager and its affiliates | (376,677) |
| Total net expenses | 6,927,060 |
| Net investment loss | (613,722) |
| Realized and unrealized gain (loss) — net | |
| Net realized gain (loss) on: | |
| Investments — unaffiliated issuers | 27,401,219 |
| Investments — affiliated issuers | (20,806) |
| Net realized gain | 27,380,413 |
| Net change in unrealized appreciation (depreciation) on: | |
| Investments — unaffiliated issuers | (281,369,485) |
| Investments — affiliated issuers | (14) |
| Net change in unrealized appreciation (depreciation) | (281,369,499) |
| Net realized and unrealized loss | (253,989,086) |
| Net decrease in net assets resulting from operations | $(254,602,808) |
| 10 | Columbia Large Cap Growth Opportunity Fund | Semiannual Report 2022 |
| Six Months Ended August 31, 2022 (Unaudited) | Year Ended February 28, 2022 | |
| Operations | ||
| Net investment loss | $(613,722) | $(6,040,143) |
| Net realized gain | 27,380,413 | 667,650,108 |
| Net change in unrealized appreciation (depreciation) | (281,369,499) | (590,491,987) |
| Net increase (decrease) in net assets resulting from operations | (254,602,808) | 71,117,978 |
| Distributions to shareholders | ||
| Net investment income and net realized gains | ||
| Class A | (160,896,679) | (421,064,836) |
| Advisor Class | (2,753,786) | (7,670,849) |
| Class C | (4,377,770) | (10,858,622) |
| Institutional Class | (56,728,449) | (167,409,437) |
| Institutional 2 Class | (3,551,291) | (10,606,828) |
| Institutional 3 Class | (275,220) | (503,226) |
| Class R | (2,882,742) | (8,113,395) |
| Total distributions to shareholders | (231,465,937) | (626,227,193) |
| Increase in net assets from capital stock activity | 76,412,275 | 359,328,810 |
| Total decrease in net assets | (409,656,470) | (195,780,405) |
| Net assets at beginning of period | 1,653,190,423 | 1,848,970,828 |
| Net assets at end of period | $1,243,533,953 | $1,653,190,423 |
| Columbia Large Cap Growth Opportunity Fund | Semiannual Report 2022 | 11 |
| Six Months Ended | Year Ended | |||
| August 31, 2022 (Unaudited) | February 28, 2022 | |||
| Shares | Dollars ($) | Shares | Dollars ($) | |
| Capital stock activity | ||||
| Class A | ||||
| Subscriptions | 4,542,838 | 50,511,873 | 6,956,448 | 143,180,568 |
| Distributions reinvested | 10,204,507 | 110,514,809 | 14,401,962 | 288,079,087 |
| Redemptions | (5,989,045) | (80,891,117) | (7,191,823) | (156,275,823) |
| Net increase | 8,758,300 | 80,135,565 | 14,166,587 | 274,983,832 |
| Advisor Class | ||||
| Subscriptions | 72,832 | 1,243,002 | 110,541 | 2,961,031 |
| Distributions reinvested | 198,370 | 2,749,415 | 315,936 | 7,659,342 |
| Redemptions | (227,076) | (3,747,633) | (221,140) | (5,635,233) |
| Net increase | 44,126 | 244,784 | 205,337 | 4,985,140 |
| Class C | ||||
| Subscriptions | 124,807 | 575,921 | 146,191 | 1,648,532 |
| Distributions reinvested | 1,410,005 | 4,272,314 | 1,170,598 | 10,506,512 |
| Redemptions | (750,293) | (3,587,345) | (1,479,921) | (18,661,446) |
| Net increase (decrease) | 784,519 | 1,260,890 | (163,132) | (6,506,402) |
| Institutional Class | ||||
| Subscriptions | 1,009,837 | 14,591,357 | 1,926,649 | 46,905,979 |
| Distributions reinvested | 3,638,896 | 47,342,044 | 6,036,812 | 139,332,423 |
| Redemptions | (4,317,933) | (69,044,083) | (4,471,485) | (109,509,867) |
| Net increase (decrease) | 330,800 | (7,110,682) | 3,491,976 | 76,728,535 |
| Institutional 2 Class | ||||
| Subscriptions | 53,751 | 989,506 | 152,604 | 4,255,802 |
| Distributions reinvested | 250,620 | 3,551,291 | 429,597 | 10,606,828 |
| Redemptions | (246,512) | (4,265,856) | (340,250) | (8,709,668) |
| Net increase | 57,859 | 274,941 | 241,951 | 6,152,962 |
| Institutional 3 Class | ||||
| Subscriptions | 77,186 | 1,382,111 | 3,546 | 94,111 |
| Distributions reinvested | 19,494 | 257,121 | 19,395 | 453,005 |
| Redemptions | (64,495) | (1,082,953) | (13,037) | (329,525) |
| Net increase | 32,185 | 556,279 | 9,904 | 217,591 |
| Class R | ||||
| Subscriptions | 71,134 | 1,019,682 | 144,845 | 3,261,279 |
| Distributions reinvested | 264,472 | 2,882,741 | 402,512 | 8,113,395 |
| Redemptions | (197,653) | (2,851,925) | (393,500) | (8,607,522) |
| Net increase | 137,953 | 1,050,498 | 153,857 | 2,767,152 |
| Total net increase | 10,145,742 | 76,412,275 | 18,106,480 | 359,328,810 |
| 12 | Columbia Large Cap Growth Opportunity Fund | Semiannual Report 2022 |
| Columbia Large Cap Growth Opportunity Fund | Semiannual Report 2022 | 13 |
| Net asset value, beginning of period | Net investment income (loss) | Net realized and unrealized gain (loss) | Total from investment operations | Distributions from net realized gains | Total distributions to shareholders | |
| Class A | ||||||
| Six Months Ended 8/31/2022 (Unaudited) | $16.74 | (0.01) | (2.77) | (2.78) | (2.58) | (2.58) |
| Year Ended 2/28/2022 | $23.37 | (0.09) | 1.57 | 1.48 | (8.11) | (8.11) |
| Year Ended 2/28/2021 | $17.67 | (0.03) | 8.53 | 8.50 | (2.80) | (2.80) |
| Year Ended 2/29/2020 | $17.18 | (0.03) | 2.34 | 2.31 | (1.82) | (1.82) |
| Year Ended 2/28/2019 | $18.33 | (0.03) | 0.75 | 0.72 | (1.87) | (1.87) |
| Year Ended 2/28/2018 | $15.74 | (0.01) | 3.66 | 3.65 | (1.06) | (1.06) |
| Advisor Class | ||||||
| Six Months Ended 8/31/2022 (Unaudited) | $20.51 | 0.01 | (3.37) | (3.36) | (2.58) | (2.58) |
| Year Ended 2/28/2022 | $27.08 | (0.04) | 1.69 | 1.65 | (8.22) | (8.22) |
| Year Ended 2/28/2021 | $20.07 | 0.02 | 9.79 | 9.81 | (2.80) | (2.80) |
| Year Ended 2/29/2020 | $19.26 | 0.02 | 2.61 | 2.63 | (1.82) | (1.82) |
| Year Ended 2/28/2019 | $20.27 | 0.02 | 0.85 | 0.87 | (1.88) | (1.88) |
| Year Ended 2/28/2018 | $17.30 | 0.03 | 4.03 | 4.06 | (1.09) | (1.09) |
| Class C | ||||||
| Six Months Ended 8/31/2022 (Unaudited) | $7.02 | (0.02) | (1.24) | (1.26) | (2.58) | (2.58) |
| Year Ended 2/28/2022 | $13.72 | (0.14) | 1.24 | 1.10 | (7.80) | (7.80) |
| Year Ended 2/28/2021 | $11.35 | (0.11) | 5.28 | 5.17 | (2.80) | (2.80) |
| Year Ended 2/29/2020 | $11.70 | (0.11) | 1.58 | 1.47 | (1.82) | (1.82) |
| Year Ended 2/28/2019 | $13.14 | (0.12) | 0.53 | 0.41 | (1.85) | (1.85) |
| Year Ended 2/28/2018 | $11.58 | (0.10) | 2.66 | 2.56 | (1.00) | (1.00) |
| Institutional Class | ||||||
| Six Months Ended 8/31/2022 (Unaudited) | $19.45 | 0.01 | (3.20) | (3.19) | (2.58) | (2.58) |
| Year Ended 2/28/2022 | $26.05 | (0.03) | 1.65 | 1.62 | (8.22) | (8.22) |
| Year Ended 2/28/2021 | $19.39 | 0.02 | 9.44 | 9.46 | (2.80) | (2.80) |
| Year Ended 2/29/2020 | $18.66 | 0.02 | 2.53 | 2.55 | (1.82) | (1.82) |
| Year Ended 2/28/2019 | $19.70 | 0.02 | 0.82 | 0.84 | (1.88) | (1.88) |
| Year Ended 2/28/2018 | $16.84 | 0.03 | 3.92 | 3.95 | (1.09) | (1.09) |
| Institutional 2 Class | ||||||
| Six Months Ended 8/31/2022 (Unaudited) | $20.90 | 0.01 | (3.43) | (3.42) | (2.58) | (2.58) |
| Year Ended 2/28/2022 | $27.46 | (0.02) | 1.70 | 1.68 | (8.24) | (8.24) |
| Year Ended 2/28/2021 | $20.31 | 0.04 | 9.91 | 9.95 | (2.80) | (2.80) |
| Year Ended 2/29/2020 | $19.46 | 0.03 | 2.64 | 2.67 | (1.82) | (1.82) |
| Year Ended 2/28/2019 | $20.45 | 0.03 | 0.86 | 0.89 | (1.88) | (1.88) |
| Year Ended 2/28/2018 | $17.44 | 0.05 | 4.06 | 4.11 | (1.10) | (1.10) |
| 14 | Columbia Large Cap Growth Opportunity Fund | Semiannual Report 2022 |
| Net asset value, end of period | Total return | Total gross expense ratio to average net assets(a) | Total net expense ratio to average net assets(a),(b) | Net investment income (loss) ratio to average net assets | Portfolio turnover | Net assets, end of period (000’s) | |
| Class A | |||||||
| Six Months Ended 8/31/2022 (Unaudited) | $11.38 | (15.84%) | 1.10%(c),(d) | 1.05%(c),(d) | (0.16%)(c) | 28% | $843,633 |
| Year Ended 2/28/2022 | $16.74 | 2.77% | 1.08%(d) | 1.04%(d),(e) | (0.38%) | 93% | $1,094,509 |
| Year Ended 2/28/2021 | $23.37 | 50.88% | 1.11%(d) | 1.04%(d),(e) | (0.15%) | 44% | $1,197,121 |
| Year Ended 2/29/2020 | $17.67 | 13.54% | 1.12% | 1.04%(e) | (0.16%) | 42% | $913,905 |
| Year Ended 2/28/2019 | $17.18 | 4.19% | 1.12% | 1.08%(e) | (0.16%) | 23% | $929,808 |
| Year Ended 2/28/2018 | $18.33 | 23.65% | 1.12% | 1.12%(e) | (0.07%) | 37% | $850,411 |
| Advisor Class | |||||||
| Six Months Ended 8/31/2022 (Unaudited) | $14.57 | (15.75%) | 0.85%(c),(d) | 0.80%(c),(d) | 0.09%(c) | 28% | $16,965 |
| Year Ended 2/28/2022 | $20.51 | 3.00% | 0.83%(d) | 0.79%(d),(e) | (0.13%) | 93% | $22,974 |
| Year Ended 2/28/2021 | $27.08 | 51.34% | 0.86%(d) | 0.79%(d),(e) | 0.10% | 44% | $24,768 |
| Year Ended 2/29/2020 | $20.07 | 13.75% | 0.87% | 0.79%(e) | 0.09% | 42% | $17,809 |
| Year Ended 2/28/2019 | $19.26 | 4.53% | 0.87% | 0.83%(e) | 0.09% | 23% | $26,286 |
| Year Ended 2/28/2018 | $20.27 | 23.93% | 0.87% | 0.87%(e) | 0.18% | 37% | $27,793 |
| Class C | |||||||
| Six Months Ended 8/31/2022 (Unaudited) | $3.18 | (16.16%) | 1.85%(c),(d) | 1.80%(c),(d) | (0.91%)(c) | 28% | $8,897 |
| Year Ended 2/28/2022 | $7.02 | 1.97% | 1.83%(d) | 1.79%(d),(e) | (1.14%) | 93% | $14,135 |
| Year Ended 2/28/2021 | $13.72 | 49.77% | 1.86%(d) | 1.79%(d),(e) | (0.90%) | 44% | $29,863 |
| Year Ended 2/29/2020 | $11.35 | 12.66% | 1.87% | 1.80%(e) | (0.91%) | 42% | $37,004 |
| Year Ended 2/28/2019 | $11.70 | 3.46% | 1.86% | 1.84%(e) | (0.96%) | 23% | $57,316 |
| Year Ended 2/28/2018 | $13.14 | 22.74% | 1.87% | 1.87%(e) | (0.79%) | 37% | $291,221 |
| Institutional Class | |||||||
| Six Months Ended 8/31/2022 (Unaudited) | $13.68 | (15.73%) | 0.85%(c),(d) | 0.80%(c),(d) | 0.09%(c) | 28% | $334,120 |
| Year Ended 2/28/2022 | $19.45 | 2.99% | 0.83%(d) | 0.79%(d),(e) | (0.14%) | 93% | $468,670 |
| Year Ended 2/28/2021 | $26.05 | 51.34% | 0.86%(d) | 0.79%(d),(e) | 0.10% | 44% | $536,602 |
| Year Ended 2/29/2020 | $19.39 | 13.76% | 0.87% | 0.79%(e) | 0.09% | 42% | $410,156 |
| Year Ended 2/28/2019 | $18.66 | 4.51% | 0.87% | 0.83%(e) | 0.09% | 23% | $472,922 |
| Year Ended 2/28/2018 | $19.70 | 23.93% | 0.87% | 0.87%(e) | 0.19% | 37% | $537,229 |
| Institutional 2 Class | |||||||
| Six Months Ended 8/31/2022 (Unaudited) | $14.90 | (15.74%) | 0.80%(c),(d) | 0.74%(c),(d) | 0.15%(c) | 28% | $22,977 |
| Year Ended 2/28/2022 | $20.90 | 3.09% | 0.77%(d) | 0.74%(d) | (0.08%) | 93% | $31,012 |
| Year Ended 2/28/2021 | $27.46 | 51.43% | 0.79%(d) | 0.73%(d) | 0.15% | 44% | $34,108 |
| Year Ended 2/29/2020 | $20.31 | 13.81% | 0.80% | 0.73% | 0.16% | 42% | $19,798 |
| Year Ended 2/28/2019 | $19.46 | 4.60% | 0.80% | 0.76% | 0.17% | 23% | $12,349 |
| Year Ended 2/28/2018 | $20.45 | 24.04% | 0.80% | 0.80% | 0.26% | 37% | $9,310 |
| Columbia Large Cap Growth Opportunity Fund | Semiannual Report 2022 | 15 |
| Net asset value, beginning of period | Net investment income (loss) | Net realized and unrealized gain (loss) | Total from investment operations | Distributions from net realized gains | Total distributions to shareholders | |
| Institutional 3 Class | ||||||
| Six Months Ended 8/31/2022 (Unaudited) | $19.67 | 0.02 | (3.24) | (3.22) | (2.58) | (2.58) |
| Year Ended 2/28/2022 | $26.27 | (0.01) | 1.67 | 1.66 | (8.26) | (8.26) |
| Year Ended 2/28/2021 | $19.52 | 0.05 | 9.50 | 9.55 | (2.80) | (2.80) |
| Year Ended 2/29/2020 | $18.75 | 0.04 | 2.55 | 2.59 | (1.82) | (1.82) |
| Year Ended 2/28/2019 | $19.77 | 0.04 | 0.82 | 0.86 | (1.88) | (1.88) |
| Year Ended 2/28/2018(f) | $17.10 | 0.04 | 3.74 | 3.78 | (1.11) | (1.11) |
| Class R | ||||||
| Six Months Ended 8/31/2022 (Unaudited) | $16.85 | (0.03) | (2.79) | (2.82) | (2.58) | (2.58) |
| Year Ended 2/28/2022 | $23.44 | (0.15) | 1.57 | 1.42 | (8.01) | (8.01) |
| Year Ended 2/28/2021 | $17.75 | (0.08) | 8.57 | 8.49 | (2.80) | (2.80) |
| Year Ended 2/29/2020 | $17.30 | (0.07) | 2.34 | 2.27 | (1.82) | (1.82) |
| Year Ended 2/28/2019 | $18.47 | (0.07) | 0.76 | 0.69 | (1.86) | (1.86) |
| Year Ended 2/28/2018 | $15.87 | (0.05) | 3.67 | 3.62 | (1.02) | (1.02) |
| Notes to Financial Highlights | |
| (a) | In addition to the fees and expenses that the Fund bears directly, the Fund indirectly bears a pro rata share of the fees and expenses of any other funds in which it invests. Such indirect expenses are not included in the Fund’s reported expense ratios. |
| (b) | Total net expenses include the impact of certain fee waivers/expense reimbursements made by the Investment Manager and certain of its affiliates, if applicable. |
| (c) | Annualized. |
| (d) | Ratios include interfund lending expense which is less than 0.01%. |
| (e) | The benefits derived from expense reductions had an impact of less than 0.01%. |
| (f) | Institutional 3 Class shares commenced operations on March 1, 2017. Per share data and total return reflect activity from that date. |
| 16 | Columbia Large Cap Growth Opportunity Fund | Semiannual Report 2022 |
| Net asset value, end of period | Total return | Total gross expense ratio to average net assets(a) | Total net expense ratio to average net assets(a),(b) | Net investment income (loss) ratio to average net assets | Portfolio turnover | Net assets, end of period (000’s) | |
| Institutional 3 Class | |||||||
| Six Months Ended 8/31/2022 (Unaudited) | $13.87 | (15.71%) | 0.76%(c),(d) | 0.70%(c),(d) | 0.23%(c) | 28% | $1,438 |
| Year Ended 2/28/2022 | $19.67 | 3.14% | 0.73%(d) | 0.69%(d) | (0.03%) | 93% | $1,406 |
| Year Ended 2/28/2021 | $26.27 | 51.47% | 0.75%(d) | 0.69%(d) | 0.20% | 44% | $1,618 |
| Year Ended 2/29/2020 | $19.52 | 13.91% | 0.76% | 0.69% | 0.20% | 42% | $875 |
| Year Ended 2/28/2019 | $18.75 | 4.61% | 0.77% | 0.71% | 0.24% | 23% | $780 |
| Year Ended 2/28/2018(f) | $19.77 | 22.55% | 0.76% | 0.76% | 0.19% | 37% | $262 |
| Class R | |||||||
| Six Months Ended 8/31/2022 (Unaudited) | $11.45 | (15.98%) | 1.35%(c),(d) | 1.30%(c),(d) | (0.41%)(c) | 28% | $15,503 |
| Year Ended 2/28/2022 | $16.85 | 2.50% | 1.33%(d) | 1.29%(d),(e) | (0.64%) | 93% | $20,484 |
| Year Ended 2/28/2021 | $23.44 | 50.57% | 1.36%(d) | 1.29%(d),(e) | (0.40%) | 44% | $24,892 |
| Year Ended 2/29/2020 | $17.75 | 13.20% | 1.37% | 1.30%(e) | (0.41%) | 42% | $21,006 |
| Year Ended 2/28/2019 | $17.30 | 4.00% | 1.37% | 1.33%(e) | (0.41%) | 23% | $24,324 |
| Year Ended 2/28/2018 | $18.47 | 23.28% | 1.37% | 1.37%(e) | (0.31%) | 37% | $24,453 |
| Columbia Large Cap Growth Opportunity Fund | Semiannual Report 2022 | 17 |
August 31, 2022 (Unaudited)
| 18 | Columbia Large Cap Growth Opportunity Fund | Semiannual Report 2022 |
August 31, 2022 (Unaudited)
| Columbia Large Cap Growth Opportunity Fund | Semiannual Report 2022 | 19 |
August 31, 2022 (Unaudited)
| 20 | Columbia Large Cap Growth Opportunity Fund | Semiannual Report 2022 |
August 31, 2022 (Unaudited)
| Effective rate (%) | |
| Class A | 0.11 |
| Advisor Class | 0.11 |
| Class C | 0.11 |
| Institutional Class | 0.11 |
| Institutional 2 Class | 0.06 |
| Institutional 3 Class | 0.01 |
| Class R | 0.11 |
| Columbia Large Cap Growth Opportunity Fund | Semiannual Report 2022 | 21 |
August 31, 2022 (Unaudited)
| Front End (%) | CDSC (%) | Amount ($) | |
| Class A | 5.75 | 0.50 - 1.00(a) | 37,300 |
| Class C | — | 1.00(b) | 79 |
| (a) | This charge is imposed on certain investments of between $1 million and $50 million redeemed within 18 months after purchase, as follows: 1.00% if redeemed within 12 months after purchase, and 0.50% if redeemed more than 12, but less than 18, months after purchase, with certain limited exceptions. |
| (b) | This charge applies to redemptions within 12 months after purchase, with certain limited exceptions. |
| July 1, 2022 through June 30, 2023 | Prior to July 1, 2022 | |
| Class A | 1.05% | 1.05% |
| Advisor Class | 0.80 | 0.80 |
| Class C | 1.80 | 1.80 |
| Institutional Class | 0.80 | 0.80 |
| Institutional 2 Class | 0.74 | 0.75 |
| Institutional 3 Class | 0.70 | 0.70 |
| Class R | 1.30 | 1.30 |
| 22 | Columbia Large Cap Growth Opportunity Fund | Semiannual Report 2022 |
August 31, 2022 (Unaudited)
| Federal tax cost ($) | Gross unrealized appreciation ($) | Gross unrealized (depreciation) ($) | Net unrealized (depreciation) ($) |
| 1,259,377,000 | 162,132,000 | (178,480,000) | (16,348,000) |
| Late year ordinary losses ($) | Post-October capital losses ($) |
| 796,496 | 27,577,812 |
| Columbia Large Cap Growth Opportunity Fund | Semiannual Report 2022 | 23 |
August 31, 2022 (Unaudited)
| Borrower or lender | Average loan balance ($) | Weighted average interest rate (%) | Number of days with outstanding loans |
| Borrower | 400,000 | 2.85 | 1 |
| Lender | 6,800,000 | 1.10 | 2 |
| 24 | Columbia Large Cap Growth Opportunity Fund | Semiannual Report 2022 |
August 31, 2022 (Unaudited)
| Columbia Large Cap Growth Opportunity Fund | Semiannual Report 2022 | 25 |
August 31, 2022 (Unaudited)
| 26 | Columbia Large Cap Growth Opportunity Fund | Semiannual Report 2022 |
| • | the Fund had sufficient liquidity to both meet redemptions and operate effectively on behalf of shareholders; |
| • | there were no material changes to the Program during the period; |
| • | the implementation of the Program was effective to manage the Fund’s liquidity risk; and |
| • | the Program operated adequately during the period. |
| Columbia Large Cap Growth Opportunity Fund | Semiannual Report 2022 | 27 |
(Unaudited)
| • | Information on the investment performance of the Fund relative to the performance of a group of mutual funds determined to be comparable to the Fund by Broadridge, as well as performance relative to benchmarks; |
| • | Information on the Fund’s management fees and total expenses, including information comparing the Fund’s expenses to those of a group of comparable mutual funds, as determined by Broadridge; |
| • | The Investment Manager’s agreement to contractually limit or cap total operating expenses for the Fund so that total operating expenses (excluding certain fees and expenses, such as transaction costs and certain other investment related expenses, interest, taxes, acquired fund fees and expenses and infrequent and/or unusual expenses) would not exceed a specified annual rate, as a percentage of the Fund’s net assets; |
| • | Terms of the Management Agreement; |
| • | Descriptions of other agreements and arrangements with affiliates of the Investment Manager relating to the operations of the Fund, including agreements with respect to the provision of transfer agency and shareholder services to the Fund; |
| • | Descriptions of various services performed by the Investment Manager under the Management Agreement, including portfolio management and portfolio trading practices; |
| • | Information regarding any recently negotiated management fees of similarly-managed portfolios of other institutional clients of the Investment Manager; |
| • | Information regarding the resources of the Investment Manager, including information regarding senior management, portfolio managers and other personnel; |
| • | Information regarding the capabilities of the Investment Manager with respect to compliance monitoring services; |
| • | The profitability to the Investment Manager and its affiliates from their relationships with the Fund; and |
| • | Report provided by the Board’s independent fee consultant, JDL Consultants, LLC (JDL). |
| 28 | Columbia Large Cap Growth Opportunity Fund | Semiannual Report 2022 |
(Unaudited)
into account the organization and strength of the Fund’s and its service providers’ compliance programs. The Board also reviewed the financial condition of the Investment Manager and its affiliates and each entity’s ability to carry out its responsibilities under the Management Agreement and the Fund’s other service agreements.
| Columbia Large Cap Growth Opportunity Fund | Semiannual Report 2022 | 29 |
(Unaudited)
of the Funds. It also took into account the indirect economic benefits flowing to the Investment Manager or its affiliates in connection with managing or distributing the Funds, such as the enhanced ability to offer various other financial products to Ameriprise Financial customers, soft dollar benefits and overall reputational advantages. The Board noted that the fees paid by the Fund should permit the Investment Manager to offer competitive compensation to its personnel, make necessary investments in its business and earn an appropriate profit. After reviewing these and related factors, the Board concluded, within the context of their overall conclusions, that the costs of services provided and the profitability to the Investment Manager and its affiliates from their relationships with the Fund supported the continuation of the Management Agreement.
| 30 | Columbia Large Cap Growth Opportunity Fund | Semiannual Report 2022 |
columbiathreadneedleus.com/investor/. The Fund is distributed by Columbia Management Investment Distributors, Inc., member FINRA, and managed by Columbia Management Investment Advisers, LLC.

August 31, 2022 (Unaudited)

(Unaudited)

| Average annual total returns (%) (for the period ended August 31, 2022) | ||||||
| Inception | 6 Months cumulative | 1 Year | 5 Years | 10 Years | ||
| Class A | 05/31/00 | -8.08 | -10.78 | 8.20 | 10.79 | |
| Institutional Class | 03/31/00 | -7.96 | -10.54 | 8.47 | 11.07 | |
| Institutional 2 Class* | 11/08/12 | -7.96 | -10.52 | 8.48 | 11.09 | |
| Institutional 3 Class* | 03/01/17 | -7.97 | -10.50 | 8.47 | 11.08 | |
| S&P MidCap 400 Index | -7.89 | -10.37 | 8.71 | 11.32 | ||
| * | The returns shown for periods prior to the share class inception date (including returns for the Life of the Fund, if shown, which are since Fund inception) include the returns of the Fund’s oldest share class. These returns are adjusted to reflect any higher class-related operating expenses of the newer share classes, as applicable. Please visit columbiathreadneedleus.com/investor/investment-products/mutual-funds/appended-performance for more information. |
| Columbia Mid Cap Index Fund | Semiannual Report 2022 | 3 |
(Unaudited)
| Portfolio breakdown (%) (at August 31, 2022) | |
| Common Stocks | 99.4 |
| Money Market Funds | 0.6 |
| Total | 100.0 |
| Equity sector breakdown (%) (at August 31, 2022) | |
| Communication Services | 1.5 |
| Consumer Discretionary | 13.7 |
| Consumer Staples | 4.2 |
| Energy | 4.9 |
| Financials | 14.7 |
| Health Care | 10.1 |
| Industrials | 18.6 |
| Information Technology | 12.5 |
| Materials | 7.2 |
| Real Estate | 8.5 |
| Utilities | 4.1 |
| Total | 100.0 |
| 4 | Columbia Mid Cap Index Fund | Semiannual Report 2022 |
(Unaudited)
| March 1, 2022 — August 31, 2022 | |||||||
| Account value at the beginning of the period ($) | Account value at the end of the period ($) | Expenses paid during the period ($) | Fund’s annualized expense ratio (%) | ||||
| Actual | Hypothetical | Actual | Hypothetical | Actual | Hypothetical | Actual | |
| Class A | 1,000.00 | 1,000.00 | 919.20 | 1,022.94 | 2.18 | 2.29 | 0.45 |
| Institutional Class | 1,000.00 | 1,000.00 | 920.40 | 1,024.20 | 0.97 | 1.02 | 0.20 |
| Institutional 2 Class | 1,000.00 | 1,000.00 | 920.40 | 1,024.20 | 0.97 | 1.02 | 0.20 |
| Institutional 3 Class | 1,000.00 | 1,000.00 | 920.30 | 1,024.20 | 0.97 | 1.02 | 0.20 |
| Columbia Mid Cap Index Fund | Semiannual Report 2022 | 5 |
August 31, 2022 (Unaudited)
| Common Stocks 98.5% | ||
| Issuer | Shares | Value ($) |
| Communication Services 1.5% | ||
| Diversified Telecommunication Services 0.3% | ||
| Iridium Communications, Inc.(a) | 159,265 | 7,069,774 |
| Entertainment 0.1% | ||
| World Wrestling Entertainment, Inc., Class A | 53,813 | 3,659,822 |
| Interactive Media & Services 0.3% | ||
| TripAdvisor, Inc.(a) | 124,667 | 2,967,075 |
| Ziff Davis, Inc.(a) | 58,852 | 4,548,082 |
| Total | 7,515,157 | |
| Media 0.8% | ||
| Cable One, Inc. | 6,115 | 6,940,525 |
| John Wiley & Sons, Inc., Class A | 54,008 | 2,485,988 |
| New York Times Co. (The), Class A | 207,431 | 6,324,571 |
| TEGNA, Inc. | 275,349 | 5,892,469 |
| Total | 21,643,553 | |
| Total Communication Services | 39,888,306 | |
| Consumer Discretionary 13.5% | ||
| Auto Components 1.5% | ||
| Adient PLC(a) | 117,977 | 3,916,836 |
| Dana, Inc. | 178,356 | 2,759,167 |
| Fox Factory Holding Corp.(a) | 52,448 | 4,888,678 |
| Gentex Corp. | 291,746 | 7,961,748 |
| Goodyear Tire & Rubber Co. (The)(a) | 351,482 | 4,931,293 |
| Lear Corp. | 74,384 | 10,312,598 |
| Visteon Corp.(a) | 34,980 | 4,191,654 |
| Total | 38,961,974 | |
| Automobiles 0.5% | ||
| Harley-Davidson, Inc. | 183,388 | 7,073,275 |
| Thor Industries, Inc. | 68,476 | 5,547,241 |
| Total | 12,620,516 | |
| Diversified Consumer Services 1.0% | ||
| Graham Holdings Co., Class B | 4,875 | 2,756,471 |
| Grand Canyon Education, Inc.(a) | 40,216 | 3,272,778 |
| H&R Block, Inc. | 198,589 | 8,936,505 |
| Service Corp. International | 197,521 | 12,189,021 |
| Total | 27,154,775 | |
| Common Stocks (continued) | ||
| Issuer | Shares | Value ($) |
| Hotels, Restaurants & Leisure 2.5% | ||
| Boyd Gaming Corp. | 99,543 | 5,418,126 |
| Choice Hotels International, Inc. | 40,944 | 4,696,686 |
| Churchill Downs, Inc. | 42,584 | 8,392,881 |
| Cracker Barrel Old Country Store, Inc. | 28,901 | 3,119,574 |
| Light & Wonder, Inc.(a) | 119,040 | 5,860,339 |
| Marriott Vacations Worldwide Corp. | 51,555 | 7,342,463 |
| Papa John’s International, Inc. | 39,642 | 3,204,263 |
| Texas Roadhouse, Inc. | 84,824 | 7,528,978 |
| Travel + Leisure Co. | 106,286 | 4,506,526 |
| Wendy’s Co. (The) | 213,277 | 4,090,653 |
| Wingstop, Inc. | 37,177 | 4,232,973 |
| Wyndham Hotels & Resorts, Inc. | 114,604 | 7,488,225 |
| Total | 65,881,687 | |
| Household Durables 1.4% | ||
| Helen of Troy Ltd.(a) | 29,668 | 3,667,855 |
| KB Home | 107,943 | 3,092,567 |
| Leggett & Platt, Inc. | 166,194 | 6,351,935 |
| Taylor Morrison Home Corp., Class A(a) | 148,871 | 3,738,151 |
| Tempur Sealy International, Inc. | 218,436 | 5,463,084 |
| Toll Brothers, Inc. | 137,202 | 6,008,075 |
| TopBuild Corp.(a) | 40,787 | 7,495,019 |
| Total | 35,816,686 | |
| Leisure Products 1.2% | ||
| Brunswick Corp. | 94,234 | 7,040,222 |
| Callaway Golf Co.(a) | 144,789 | 3,204,180 |
| Mattel, Inc.(a) | 438,622 | 9,702,319 |
| Polaris, Inc. | 69,592 | 7,882,686 |
| YETI Holdings, Inc.(a) | 107,212 | 3,955,051 |
| Total | 31,784,458 | |
| Multiline Retail 0.6% | ||
| Kohl’s Corp. | 160,011 | 4,547,513 |
| Macy’s, Inc. | 354,464 | 6,139,316 |
| Nordstrom, Inc. | 138,842 | 2,375,587 |
| Ollie’s Bargain Outlet Holdings, Inc.(a) | 72,595 | 4,015,229 |
| Total | 17,077,645 | |
| 6 | Columbia Mid Cap Index Fund | Semiannual Report 2022 |
August 31, 2022 (Unaudited)
| Common Stocks (continued) | ||
| Issuer | Shares | Value ($) |
| Specialty Retail 3.0% | ||
| American Eagle Outfitters, Inc. | 191,668 | 2,158,182 |
| AutoNation, Inc.(a) | 44,271 | 5,516,166 |
| Dick’s Sporting Goods, Inc. | 72,236 | 7,683,743 |
| Five Below, Inc.(a) | 69,076 | 8,833,439 |
| Foot Locker, Inc. | 104,025 | 3,832,281 |
| GameStop Corp., Class A(a) | 307,773 | 8,814,619 |
| Gap, Inc. (The) | 262,279 | 2,397,230 |
| Lithia Motors, Inc., Class A | 36,004 | 9,556,902 |
| Murphy U.S.A., Inc. | 27,706 | 8,039,450 |
| Restoration Hardware Holdings, Inc.(a) | 21,881 | 5,599,567 |
| Victoria’s Secret & Co.(a) | 84,513 | 2,826,115 |
| Williams-Sonoma, Inc. | 87,142 | 12,962,372 |
| Total | 78,220,066 | |
| Textiles, Apparel & Luxury Goods 1.8% | ||
| Capri Holdings Ltd.(a) | 183,683 | 8,666,164 |
| Carter’s, Inc. | 50,137 | 3,702,618 |
| Columbia Sportswear Co. | 41,462 | 2,953,753 |
| Crocs, Inc.(a) | 76,620 | 5,646,894 |
| Deckers Outdoor Corp.(a) | 33,897 | 10,900,258 |
| Hanesbrands, Inc. | 433,996 | 3,780,105 |
| Skechers U.S.A., Inc., Class A(a) | 167,839 | 6,344,314 |
| Under Armour, Inc., Class A(a) | 234,768 | 1,976,747 |
| Under Armour, Inc., Class C(a) | 252,253 | 1,914,600 |
| Total | 45,885,453 | |
| Total Consumer Discretionary | 353,403,260 | |
| Consumer Staples 4.1% | ||
| Beverages 0.4% | ||
| Boston Beer Co., Inc. (The), Class A(a) | 11,695 | 3,942,151 |
| Celsius Holdings, Inc.(a) | 47,826 | 4,949,513 |
| Coca-Cola Bottling Co. Consolidated | 5,728 | 2,716,962 |
| Total | 11,608,626 | |
| Common Stocks (continued) | ||
| Issuer | Shares | Value ($) |
| Food & Staples Retailing 1.5% | ||
| BJ’s Wholesale Club Holdings, Inc.(a) | 167,870 | 12,504,636 |
| Casey’s General Stores, Inc. | 46,179 | 9,871,685 |
| Grocery Outlet Holding Corp.(a) | 109,121 | 4,377,935 |
| Performance Food Group, Inc.(a) | 192,875 | 9,639,892 |
| Sprouts Farmers Market, Inc.(a) | 136,408 | 3,942,191 |
| Total | 40,336,339 | |
| Food Products 1.7% | ||
| Darling Ingredients, Inc.(a) | 200,978 | 15,286,386 |
| Flowers Foods, Inc. | 248,009 | 6,770,646 |
| Hain Celestial Group, Inc. (The)(a) | 111,738 | 2,263,812 |
| Ingredion, Inc. | 82,400 | 7,174,568 |
| Lancaster Colony Corp. | 24,658 | 4,156,106 |
| Pilgrim’s Pride Corp.(a) | 59,810 | 1,702,791 |
| Post Holdings, Inc.(a) | 69,540 | 6,172,370 |
| Total | 43,526,679 | |
| Household Products 0.1% | ||
| Energizer Holdings, Inc. | 81,566 | 2,292,005 |
| Personal Products 0.4% | ||
| BellRing Brands, Inc.(a) | 153,503 | 3,636,486 |
| Coty, Inc., Class A(a) | 428,138 | 3,215,316 |
| Nu Skin Enterprises, Inc., Class A | 62,476 | 2,557,768 |
| Total | 9,409,570 | |
| Total Consumer Staples | 107,173,219 | |
| Energy 4.8% | ||
| Energy Equipment & Services 0.6% | ||
| ChampionX Corp. | 253,100 | 5,520,111 |
| NOV, Inc. | 488,773 | 8,636,619 |
| Total | 14,156,730 | |
| Oil, Gas & Consumable Fuels 4.2% | ||
| Antero Midstream Corp. | 404,830 | 4,076,638 |
| CNX Resources Corp.(a) | 242,713 | 4,288,739 |
| DT Midstream, Inc. | 120,370 | 6,645,628 |
| EQT Corp. | 367,862 | 17,583,803 |
| Equitrans Midstream Corp. | 506,194 | 4,692,418 |
| HF Sinclair Corp. | 186,108 | 9,794,864 |
| Matador Resources Co. | 138,168 | 8,234,813 |
| Murphy Oil Corp. | 181,735 | 7,082,213 |
| Columbia Mid Cap Index Fund | Semiannual Report 2022 | 7 |
August 31, 2022 (Unaudited)
| Common Stocks (continued) | ||
| Issuer | Shares | Value ($) |
| PDC Energy, Inc. | 118,746 | 8,064,041 |
| Range Resources Corp.(a) | 322,528 | 10,598,270 |
| Southwestern Energy Co.(a) | 1,388,902 | 10,402,876 |
| Targa Resources Corp. | 283,694 | 19,356,442 |
| Total | 110,820,745 | |
| Total Energy | 124,977,475 | |
| Financials 14.5% | ||
| Banks 7.0% | ||
| Associated Banc-Corp. | 186,706 | 3,741,588 |
| Bank of Hawaii Corp. | 50,133 | 3,911,377 |
| Bank OZK | 140,498 | 5,694,384 |
| Cadence Bank | 228,322 | 5,817,645 |
| Cathay General Bancorp | 93,511 | 3,921,851 |
| Commerce Bancshares, Inc. | 136,713 | 9,401,753 |
| Cullen/Frost Bankers, Inc. | 70,985 | 9,225,211 |
| East West Bancorp, Inc. | 176,582 | 12,743,923 |
| First Financial Bankshares, Inc. | 159,832 | 6,794,458 |
| First Horizon Corp. | 665,567 | 15,055,125 |
| FNB Corp. | 419,854 | 5,004,660 |
| Fulton Financial Corp. | 207,747 | 3,371,734 |
| Glacier Bancorp, Inc. | 135,070 | 6,845,348 |
| Hancock Whitney Corp. | 107,472 | 5,183,375 |
| Home Bancshares, Inc. | 235,414 | 5,539,291 |
| International Bancshares Corp. | 66,030 | 2,755,432 |
| Old National Bancorp | 364,540 | 6,084,173 |
| PacWest Bancorp | 146,144 | 3,847,971 |
| Pinnacle Financial Partners, Inc. | 95,049 | 7,671,405 |
| Prosperity Bancshares, Inc. | 114,706 | 8,130,361 |
| Synovus Financial Corp. | 180,853 | 7,263,056 |
| Texas Capital Bancshares, Inc.(a) | 63,117 | 3,725,796 |
| UMB Financial Corp. | 53,606 | 4,796,129 |
| Umpqua Holdings Corp. | 270,079 | 4,791,201 |
| United Bankshares, Inc. | 168,878 | 6,265,374 |
| Valley National Bancorp | 522,912 | 6,076,237 |
| Washington Federal, Inc. | 81,265 | 2,601,293 |
| Webster Financial Corp. | 221,616 | 10,427,033 |
| Wintrust Financial Corp. | 74,994 | 6,324,994 |
| Total | 183,012,178 | |
| Common Stocks (continued) | ||
| Issuer | Shares | Value ($) |
| Capital Markets 1.9% | ||
| Affiliated Managers Group, Inc. | 48,125 | 6,129,200 |
| Evercore, Inc., Class A | 50,514 | 4,732,657 |
| Federated Hermes, Inc., Class B | 114,064 | 3,885,020 |
| Interactive Brokers Group, Inc., Class A | 108,821 | 6,702,285 |
| Janus Henderson Group PLC | 208,785 | 4,885,569 |
| Jefferies Financial Group, Inc. | 238,420 | 7,650,898 |
| SEI Investments Co. | 129,812 | 7,100,716 |
| Stifel Financial Corp. | 132,618 | 7,865,574 |
| Total | 48,951,919 | |
| Consumer Finance 0.5% | ||
| Bread Financial Holdings, Inc. | 61,938 | 2,380,277 |
| FirstCash Holdings, Inc. | 49,021 | 3,821,677 |
| Navient Corp. | 184,025 | 2,832,145 |
| SLM Corp. | 334,993 | 5,118,693 |
| Total | 14,152,792 | |
| Diversified Financial Services 0.3% | ||
| Voya Financial, Inc. | 127,140 | 7,822,924 |
| Insurance 4.2% | ||
| Alleghany Corp.(a) | 16,743 | 14,083,877 |
| American Financial Group, Inc. | 82,599 | 10,546,240 |
| Brighthouse Financial, Inc.(a) | 93,194 | 4,431,375 |
| CNO Financial Group, Inc. | 144,205 | 2,654,814 |
| First American Financial Corp. | 133,648 | 7,150,168 |
| Hanover Insurance Group, Inc. (The) | 44,286 | 5,730,166 |
| Kemper Corp. | 74,627 | 3,432,842 |
| Kinsale Capital Group, Inc. | 26,795 | 6,794,676 |
| Mercury General Corp. | 33,072 | 1,054,997 |
| Old Republic International Corp. | 356,779 | 7,792,053 |
| Primerica, Inc. | 47,883 | 6,069,170 |
| Reinsurance Group of America, Inc. | 83,358 | 10,449,759 |
| RenaissanceRe Holdings Ltd. | 54,986 | 7,437,406 |
| RLI Corp. | 49,622 | 5,446,511 |
| Selective Insurance Group, Inc. | 75,100 | 5,964,442 |
| Unum Group | 250,230 | 9,471,205 |
| Total | 108,509,701 | |
| 8 | Columbia Mid Cap Index Fund | Semiannual Report 2022 |
August 31, 2022 (Unaudited)
| Common Stocks (continued) | ||
| Issuer | Shares | Value ($) |
| Thrifts & Mortgage Finance 0.6% | ||
| Essent Group Ltd. | 133,892 | 5,354,341 |
| MGIC Investment Corp. | 385,249 | 5,505,208 |
| New York Community Bancorp, Inc. | 581,154 | 5,689,498 |
| Total | 16,549,047 | |
| Total Financials | 378,998,561 | |
| Health Care 9.9% | ||
| Biotechnology 1.7% | ||
| Arrowhead Pharmaceuticals, Inc.(a) | 131,571 | 5,224,684 |
| Exelixis, Inc.(a) | 399,110 | 7,080,211 |
| Halozyme Therapeutics, Inc.(a) | 171,657 | 6,991,590 |
| Neurocrine Biosciences, Inc.(a) | 118,930 | 12,443,646 |
| United Therapeutics Corp.(a) | 56,369 | 12,774,343 |
| Total | 44,514,474 | |
| Health Care Equipment & Supplies 3.5% | ||
| Enovis Corp.(a) | 58,493 | 2,962,670 |
| Envista Holdings Corp.(a) | 202,352 | 7,505,236 |
| Globus Medical, Inc., Class A(a) | 98,674 | 5,840,514 |
| Haemonetics Corp.(a) | 63,601 | 4,771,983 |
| ICU Medical, Inc.(a) | 24,977 | 3,971,343 |
| Inari Medical, Inc.(a) | 42,308 | 2,934,060 |
| Integra LifeSciences Holdings Corp.(a) | 88,965 | 4,244,520 |
| LivaNova PLC(a) | 66,499 | 3,740,569 |
| Masimo Corp.(a) | 63,541 | 9,333,537 |
| Neogen Corp.(a) | 134,162 | 2,803,986 |
| NuVasive, Inc.(a) | 64,757 | 2,752,820 |
| Omnicell, Inc.(a) | 54,997 | 5,625,643 |
| Penumbra, Inc.(a) | 44,071 | 7,235,136 |
| QuidelOrtho Corp.(a) | 62,245 | 4,933,539 |
| Shockwave Medical, Inc.(a) | 44,537 | 13,221,254 |
| STAAR Surgical Co.(a) | 59,493 | 5,627,443 |
| Tandem Diabetes Care, Inc.(a) | 79,592 | 3,640,538 |
| Total | 91,144,791 | |
| Health Care Providers & Services 2.5% | ||
| Acadia Healthcare Co., Inc.(a) | 112,646 | 9,229,087 |
| Amedisys, Inc.(a) | 40,532 | 4,801,015 |
| Chemed Corp. | 18,625 | 8,869,039 |
| Encompass Health Corp. | 124,189 | 6,031,860 |
| Common Stocks (continued) | ||
| Issuer | Shares | Value ($) |
| HealthEquity, Inc.(a) | 104,979 | 6,937,012 |
| LHC Group, Inc.(a) | 38,611 | 6,234,518 |
| Option Care Health, Inc.(a) | 185,958 | 5,757,260 |
| Patterson Companies, Inc. | 108,113 | 3,015,272 |
| Progyny, Inc.(a) | 88,095 | 3,542,300 |
| R1 RCM, Inc.(a) | 167,063 | 3,650,326 |
| Tenet Healthcare Corp.(a) | 134,044 | 7,573,486 |
| Total | 65,641,175 | |
| Life Sciences Tools & Services 1.5% | ||
| Azenta, Inc. | 93,306 | 4,918,159 |
| Bruker Corp. | 124,435 | 6,968,360 |
| Medpace Holdings, Inc.(a) | 33,495 | 4,944,197 |
| Repligen Corp.(a) | 64,149 | 14,072,366 |
| Sotera Health Co.(a) | 123,172 | 2,082,839 |
| Syneos Health, Inc.(a) | 127,638 | 7,672,320 |
| Total | 40,658,241 | |
| Pharmaceuticals 0.7% | ||
| Jazz Pharmaceuticals PLC(a) | 77,546 | 12,036,690 |
| Perrigo Co. PLC | 167,428 | 6,265,156 |
| Total | 18,301,846 | |
| Total Health Care | 260,260,527 | |
| Industrials 18.4% | ||
| Aerospace & Defense 1.3% | ||
| Axon Enterprise, Inc.(a) | 88,362 | 10,310,078 |
| Curtiss-Wright Corp. | 47,839 | 7,041,422 |
| Hexcel Corp. | 104,588 | 6,136,178 |
| Mercury Systems, Inc.(a) | 71,765 | 3,454,050 |
| Woodward, Inc. | 75,463 | 7,023,341 |
| Total | 33,965,069 | |
| Air Freight & Logistics 0.2% | ||
| GXO Logistics, Inc.(a) | 126,619 | 5,619,351 |
| Airlines 0.1% | ||
| JetBlue Airways Corp.(a) | 399,170 | 3,109,534 |
| Building Products 2.4% | ||
| Builders FirstSource, Inc.(a) | 214,977 | 12,599,802 |
| Carlisle Companies, Inc. | 64,330 | 19,019,808 |
| Lennox International, Inc. | 41,108 | 9,870,853 |
| Owens Corning | 120,798 | 9,872,820 |
| Columbia Mid Cap Index Fund | Semiannual Report 2022 | 9 |
August 31, 2022 (Unaudited)
| Common Stocks (continued) | ||
| Issuer | Shares | Value ($) |
| Simpson Manufacturing Co., Inc. | 53,706 | 4,975,324 |
| Trex Company, Inc.(a) | 140,858 | 6,590,746 |
| Total | 62,929,353 | |
| Commercial Services & Supplies 1.5% | ||
| Brink’s Co. (The) | 58,513 | 3,234,599 |
| Clean Harbors, Inc.(a) | 62,311 | 7,316,558 |
| IAA, Inc.(a) | 166,750 | 6,213,105 |
| MillerKnoll, Inc. | 94,312 | 2,610,556 |
| MSA Safety, Inc. | 45,521 | 5,410,626 |
| Stericycle, Inc.(a) | 114,589 | 5,739,763 |
| Tetra Tech, Inc. | 66,800 | 9,072,108 |
| Total | 39,597,315 | |
| Construction & Engineering 1.9% | ||
| AECOM | 175,879 | 12,865,549 |
| Dycom Industries, Inc.(a) | 36,869 | 4,133,752 |
| EMCOR Group, Inc. | 63,638 | 7,567,831 |
| Fluor Corp.(a) | 176,707 | 4,672,133 |
| MasTec, Inc.(a) | 71,107 | 5,724,113 |
| MDU Resources Group, Inc. | 253,038 | 7,629,096 |
| Valmont Industries, Inc. | 26,518 | 7,340,713 |
| Total | 49,933,187 | |
| Electrical Equipment 2.0% | ||
| Acuity Brands, Inc. | 43,029 | 7,053,744 |
| EnerSys | 51,329 | 3,201,390 |
| Hubbell, Inc. | 66,772 | 13,775,064 |
| nVent Electric PLC | 206,992 | 6,822,456 |
| Regal Rexnord Corp. | 83,376 | 11,471,704 |
| Sunrun, Inc.(a) | 261,452 | 8,635,759 |
| Vicor Corp.(a) | 26,853 | 1,910,322 |
| Total | 52,870,439 | |
| Machinery 4.3% | ||
| AGCO Corp. | 76,062 | 8,268,700 |
| Chart Industries, Inc.(a) | 44,615 | 8,649,064 |
| Crane Holdings Co. | 59,288 | 5,594,416 |
| Donaldson Co., Inc. | 153,748 | 7,894,960 |
| Esab Corp. | 56,774 | 2,332,844 |
| Flowserve Corp. | 162,567 | 4,953,416 |
| Graco, Inc. | 210,576 | 13,443,172 |
| Common Stocks (continued) | ||
| Issuer | Shares | Value ($) |
| ITT, Inc. | 103,902 | 7,536,012 |
| Kennametal, Inc. | 102,830 | 2,410,335 |
| Lincoln Electric Holdings, Inc. | 72,292 | 9,881,593 |
| Middleby Corp. (The)(a) | 67,680 | 9,733,738 |
| Oshkosh Corp. | 81,871 | 6,530,031 |
| Terex Corp. | 86,233 | 2,864,660 |
| Timken Co. (The) | 83,942 | 5,287,507 |
| Toro Co. (The) | 130,081 | 10,787,617 |
| Watts Water Technologies, Inc., Class A | 34,130 | 4,727,688 |
| Total | 110,895,753 | |
| Marine 0.2% | ||
| Kirby Corp.(a) | 75,034 | 5,031,780 |
| Professional Services 1.8% | ||
| ASGN, Inc.(a) | 63,586 | 6,148,766 |
| CACI International, Inc., Class A(a) | 29,134 | 8,182,867 |
| FTI Consulting, Inc.(a) | 42,892 | 6,888,455 |
| Insperity, Inc. | 44,331 | 4,832,966 |
| KBR, Inc. | 173,660 | 8,387,778 |
| ManpowerGroup, Inc. | 65,626 | 4,811,698 |
| Science Applications International Corp. | 69,458 | 6,325,540 |
| Total | 45,578,070 | |
| Road & Rail 1.7% | ||
| Avis Budget Group, Inc.(a) | 42,661 | 7,140,598 |
| Knight-Swift Transportation Holdings, Inc. | 203,534 | 10,280,502 |
| Landstar System, Inc. | 46,199 | 6,774,160 |
| Ryder System, Inc. | 63,632 | 4,864,030 |
| Saia, Inc.(a) | 32,860 | 6,796,434 |
| Werner Enterprises, Inc. | 73,668 | 2,931,250 |
| XPO Logistics, Inc.(a) | 123,084 | 6,452,063 |
| Total | 45,239,037 | |
| Trading Companies & Distributors 1.0% | ||
| GATX Corp. | 44,298 | 4,279,630 |
| MSC Industrial Direct Co., Inc., Class A | 58,718 | 4,651,053 |
| Univar, Inc.(a) | 210,582 | 5,310,878 |
| Watsco, Inc. | 41,268 | 11,226,134 |
| Total | 25,467,695 | |
| Total Industrials | 480,236,583 | |
| 10 | Columbia Mid Cap Index Fund | Semiannual Report 2022 |
August 31, 2022 (Unaudited)
| Common Stocks (continued) | ||
| Issuer | Shares | Value ($) |
| Information Technology 12.3% | ||
| Communications Equipment 0.9% | ||
| Calix, Inc.(a) | 69,143 | 4,069,066 |
| Ciena Corp.(a) | 189,296 | 9,604,879 |
| Lumentum Holdings, Inc.(a) | 85,859 | 7,173,519 |
| Viasat, Inc.(a) | 92,625 | 3,517,897 |
| Total | 24,365,361 | |
| Electronic Equipment, Instruments & Components 3.1% | ||
| Arrow Electronics, Inc.(a) | 82,172 | 8,612,447 |
| Avnet, Inc. | 121,550 | 5,334,830 |
| Belden, Inc. | 55,069 | 3,605,918 |
| Cognex Corp. | 216,189 | 9,103,719 |
| II-VI, Inc.(a) | 160,564 | 7,583,438 |
| IPG Photonics Corp.(a) | 43,247 | 3,917,746 |
| Jabil, Inc. | 175,721 | 10,595,976 |
| Littelfuse, Inc. | 30,784 | 7,302,580 |
| National Instruments Corp. | 163,225 | 6,489,826 |
| Novanta, Inc.(a) | 44,428 | 5,939,579 |
| TD SYNNEX Corp. | 51,422 | 4,950,910 |
| Vishay Intertechnology, Inc. | 164,161 | 3,229,047 |
| Vontier Corp. | 200,347 | 4,391,606 |
| Total | 81,057,622 | |
| IT Services 1.9% | ||
| Concentrix Corp. | 53,537 | 6,733,884 |
| Euronet Worldwide, Inc.(a) | 62,903 | 5,576,980 |
| Genpact Ltd. | 211,957 | 9,957,740 |
| Kyndryl Holdings, Inc.(a) | 223,533 | 2,329,214 |
| MAXIMUS, Inc. | 76,419 | 4,630,227 |
| Sabre Corp.(a) | 406,141 | 2,920,154 |
| Western Union Co. (The) | 480,357 | 7,118,890 |
| WEX, Inc.(a) | 55,983 | 8,635,378 |
| Total | 47,902,467 | |
| Semiconductors & Semiconductor Equipment 3.5% | ||
| Amkor Technology, Inc. | 124,881 | 2,513,855 |
| Cirrus Logic, Inc.(a) | 71,279 | 5,466,387 |
| First Solar, Inc.(a) | 123,343 | 15,732,400 |
| Lattice Semiconductor Corp.(a) | 171,235 | 9,229,566 |
| MACOM Technology Solutions Holdings, Inc.(a) | 60,878 | 3,357,422 |
| Common Stocks (continued) | ||
| Issuer | Shares | Value ($) |
| MKS Instruments, Inc. | 71,063 | 7,078,585 |
| Power Integrations, Inc. | 72,555 | 5,189,859 |
| Semtech Corp.(a) | 78,974 | 3,647,809 |
| Silicon Laboratories, Inc.(a) | 45,519 | 5,704,896 |
| SiTime Corp.(a) | 19,376 | 2,061,800 |
| SunPower Corp.(a) | 103,845 | 2,492,280 |
| Synaptics, Inc.(a),(b) | 49,285 | 5,697,839 |
| Universal Display Corp. | 54,050 | 6,039,006 |
| Wolfspeed, Inc.(a) | 153,844 | 17,456,679 |
| Total | 91,668,383 | |
| Software 2.8% | ||
| ACI Worldwide, Inc.(a) | 142,834 | 3,385,166 |
| Aspen Technology, Inc.(a) | 34,839 | 7,337,094 |
| Blackbaud, Inc.(a) | 56,656 | 2,963,109 |
| CommVault Systems, Inc.(a) | 55,501 | 3,013,149 |
| Envestnet, Inc.(a) | 68,671 | 3,596,300 |
| Fair Isaac Corp.(a) | 32,268 | 14,501,239 |
| Manhattan Associates, Inc.(a) | 78,535 | 11,093,854 |
| NCR Corp.(a) | 169,977 | 5,277,786 |
| Paylocity Holding Corp.(a) | 49,388 | 11,902,508 |
| Qualys, Inc.(a) | 41,557 | 6,312,508 |
| Teradata Corp.(a) | 130,282 | 4,286,278 |
| Total | 73,668,991 | |
| Technology Hardware, Storage & Peripherals 0.1% | ||
| Xerox Holdings Corp. | 148,380 | 2,466,076 |
| Total Information Technology | 321,128,900 | |
| Materials 7.1% | ||
| Chemicals 2.7% | ||
| Ashland, Inc. | 63,109 | 6,421,972 |
| Avient Corp. | 113,765 | 4,986,320 |
| Cabot Corp. | 70,223 | 5,053,949 |
| Chemours Co. LLC (The) | 193,456 | 6,525,271 |
| Ingevity Corp.(a) | 48,219 | 3,382,081 |
| Minerals Technologies, Inc. | 41,021 | 2,389,883 |
| NewMarket Corp. | 8,422 | 2,418,883 |
| Olin Corp. | 172,699 | 9,439,727 |
| RPM International, Inc. | 161,137 | 15,011,523 |
| Scotts Miracle-Gro Co. (The), Class A | 50,316 | 3,368,656 |
| Columbia Mid Cap Index Fund | Semiannual Report 2022 | 11 |
August 31, 2022 (Unaudited)
| Common Stocks (continued) | ||
| Issuer | Shares | Value ($) |
| Sensient Technologies Corp. | 52,303 | 4,166,980 |
| Valvoline, Inc. | 221,739 | 6,445,953 |
| Total | 69,611,198 | |
| Construction Materials 0.2% | ||
| Eagle Materials, Inc. | 49,158 | 5,880,280 |
| Containers & Packaging 0.9% | ||
| AptarGroup, Inc. | 81,595 | 8,388,782 |
| Greif, Inc., Class A | 33,103 | 2,219,556 |
| Silgan Holdings, Inc. | 104,783 | 4,772,866 |
| Sonoco Products Co. | 121,314 | 7,645,208 |
| Total | 23,026,412 | |
| Metals & Mining 3.1% | ||
| Alcoa Corp. | 229,517 | 11,356,501 |
| Cleveland-Cliffs, Inc.(a) | 594,185 | 10,261,575 |
| Commercial Metals Co. | 151,182 | 6,124,383 |
| MP Materials Corp.(a) | 92,780 | 3,246,372 |
| Reliance Steel & Aluminum Co. | 77,084 | 14,490,250 |
| Royal Gold, Inc. | 81,677 | 7,506,116 |
| Steel Dynamics, Inc. | 223,055 | 18,005,000 |
| United States Steel Corp. | 324,318 | 7,417,153 |
| Worthington Industries, Inc. | 39,923 | 2,035,674 |
| Total | 80,443,024 | |
| Paper & Forest Products 0.2% | ||
| Louisiana-Pacific Corp. | 102,184 | 5,541,438 |
| Total Materials | 184,502,352 | |
| Real Estate 8.3% | ||
| Equity Real Estate Investment Trusts (REITS) 7.9% | ||
| Apartment Income REIT Corp. | 195,482 | 7,985,440 |
| Brixmor Property Group, Inc. | 372,722 | 8,006,068 |
| Corporate Office Properties Trust | 139,882 | 3,614,551 |
| Cousins Properties, Inc. | 185,113 | 4,970,284 |
| Douglas Emmett, Inc. | 218,735 | 4,269,707 |
| EastGroup Properties, Inc. | 51,864 | 8,559,116 |
| EPR Properties | 93,288 | 4,057,095 |
| First Industrial Realty Trust, Inc. | 164,254 | 8,324,393 |
| Healthcare Realty Trust, Inc. | 473,696 | 11,520,287 |
| Highwoods Properties, Inc. | 130,847 | 3,979,057 |
| Hudson Pacific Properties, Inc. | 179,963 | 2,377,311 |
| Common Stocks (continued) | ||
| Issuer | Shares | Value ($) |
| Independence Realty Trust, Inc. | 274,874 | 5,346,299 |
| JBG SMITH Properties | 135,287 | 2,972,255 |
| Kilroy Realty Corp. | 130,711 | 6,374,775 |
| Kite Realty Group Trust | 272,560 | 5,276,762 |
| Lamar Advertising Co., Class A | 108,335 | 10,171,573 |
| Life Storage, Inc. | 104,979 | 13,358,578 |
| Macerich Co. (The) | 267,091 | 2,556,061 |
| Medical Properties Trust, Inc. | 746,728 | 10,909,696 |
| National Retail Properties, Inc. | 218,893 | 9,828,296 |
| National Storage Affiliates Trust | 104,705 | 5,289,697 |
| Omega Healthcare Investors, Inc. | 292,690 | 9,559,255 |
| Park Hotels & Resorts, Inc. | 290,391 | 4,065,474 |
| Pebblebrook Hotel Trust | 163,445 | 2,879,901 |
| Physicians Realty Trust | 280,345 | 4,670,548 |
| PotlatchDeltic Corp. | 86,322 | 4,007,067 |
| Rayonier, Inc. | 182,038 | 6,465,990 |
| Rexford Industrial Realty, Inc. | 205,342 | 12,774,326 |
| Sabra Health Care REIT, Inc. | 287,386 | 4,302,168 |
| SL Green Realty Corp. | 79,792 | 3,524,413 |
| Spirit Realty Capital, Inc. | 167,125 | 6,827,056 |
| STORE Capital Corp. | 314,209 | 8,477,359 |
| Total | 207,300,858 | |
| Real Estate Management & Development 0.4% | ||
| Jones Lang LaSalle, Inc.(a) | 60,802 | 10,518,746 |
| Total Real Estate | 217,819,604 | |
| Utilities 4.1% | ||
| Electric Utilities 1.4% | ||
| Allete, Inc. | 70,914 | 4,196,691 |
| Hawaiian Electric Industries, Inc. | 136,169 | 5,326,931 |
| IDACORP, Inc. | 62,913 | 6,872,616 |
| OGE Energy Corp. | 249,120 | 10,099,325 |
| PNM Resources, Inc. | 106,808 | 5,065,903 |
| Portland General Electric Co. | 111,025 | 5,736,662 |
| Total | 37,298,128 | |
| 12 | Columbia Mid Cap Index Fund | Semiannual Report 2022 |
August 31, 2022 (Unaudited)
| Common Stocks (continued) | ||
| Issuer | Shares | Value ($) |
| Gas Utilities 1.5% | ||
| National Fuel Gas Co. | 113,802 | 8,110,668 |
| New Jersey Resources Corp. | 119,647 | 5,281,218 |
| ONE Gas, Inc. | 67,306 | 5,268,041 |
| Southwest Gas Holdings, Inc. | 83,187 | 6,476,108 |
| Spire, Inc. | 64,857 | 4,532,856 |
| UGI Corp. | 261,302 | 10,321,429 |
| Total | 39,990,320 | |
| Independent Power and Renewable Electricity Producers 0.2% | ||
| Ormat Technologies, Inc. | 55,818 | 5,217,867 |
| Multi-Utilities 0.4% | ||
| Black Hills Corp. | 80,674 | 6,089,273 |
| NorthWestern Corp. | 67,367 | 3,569,104 |
| Total | 9,658,377 | |
| Common Stocks (continued) | ||
| Issuer | Shares | Value ($) |
| Water Utilities 0.6% | ||
| Essential Utilities, Inc. | 286,500 | 14,081,475 |
| Total Utilities | 106,246,167 | |
| Total Common Stocks (Cost $1,739,654,363) | 2,574,634,954 | |
| Money Market Funds 0.6% | ||
| Shares | Value ($) | |
| Columbia Short-Term Cash Fund, 2.366%(c),(d) | 16,552,641 | 16,544,365 |
| Total Money Market Funds (Cost $16,541,492) | 16,544,365 | |
| Total Investments in Securities (Cost: $1,756,195,855) | 2,591,179,319 | |
| Other Assets & Liabilities, Net | 23,319,428 | |
| Net Assets | 2,614,498,747 | |
| Long futures contracts | ||||||
| Description | Number of contracts | Expiration date | Trading currency | Notional amount | Value/Unrealized appreciation ($) | Value/Unrealized depreciation ($) |
| S&P Mid 400 Index E-mini | 88 | 09/2022 | USD | 21,386,640 | 1,521,704 | — |
| S&P Mid 400 Index E-mini | 81 | 09/2022 | USD | 19,685,430 | — | (5,331) |
| Total | 1,521,704 | (5,331) | ||||
| (a) | Non-income producing investment. |
| (b) | This security or a portion of this security has been pledged as collateral in connection with derivative contracts. |
| (c) | The rate shown is the seven-day current annualized yield at August 31, 2022. |
| (d) | As defined in the Investment Company Act of 1940, as amended, an affiliated company is one in which the Fund owns 5% or more of the company’s outstanding voting securities, or a company which is under common ownership or control with the Fund. The value of the holdings and transactions in these affiliated companies during the period ended August 31, 2022 are as follows: |
| Affiliated issuers | Beginning of period($) | Purchases($) | Sales($) | Net change in unrealized appreciation (depreciation)($) | End of period($) | Realized gain (loss)($) | Dividends($) | End of period shares |
| Columbia Short-Term Cash Fund, 2.366% | ||||||||
| 38,054,664 | 217,197,413 | (238,709,889) | 2,177 | 16,544,365 | (4,364) | 130,726 | 16,552,641 | |
| USD | US Dollar |
| Columbia Mid Cap Index Fund | Semiannual Report 2022 | 13 |
August 31, 2022 (Unaudited)
| ■ | Level 1 — Valuations based on quoted prices for investments in active markets that the Fund has the ability to access at the measurement date. Valuation adjustments are not applied to Level 1 investments. |
| ■ | Level 2 — Valuations based on other significant observable inputs (including quoted prices for similar securities, interest rates, prepayment speeds, credit risks, etc.). |
| ■ | Level 3 — Valuations based on significant unobservable inputs (including the Fund’s own assumptions and judgment in determining the fair value of investments). |
| Level 1 ($) | Level 2 ($) | Level 3 ($) | Total ($) | |
| Investments in Securities | ||||
| Common Stocks | ||||
| Communication Services | 39,888,306 | — | — | 39,888,306 |
| Consumer Discretionary | 353,403,260 | — | — | 353,403,260 |
| Consumer Staples | 107,173,219 | — | — | 107,173,219 |
| Energy | 124,977,475 | — | — | 124,977,475 |
| Financials | 378,998,561 | — | — | 378,998,561 |
| Health Care | 260,260,527 | — | — | 260,260,527 |
| Industrials | 480,236,583 | — | — | 480,236,583 |
| Information Technology | 321,128,900 | — | — | 321,128,900 |
| Materials | 184,502,352 | — | — | 184,502,352 |
| Real Estate | 217,819,604 | — | — | 217,819,604 |
| Utilities | 106,246,167 | — | — | 106,246,167 |
| Total Common Stocks | 2,574,634,954 | — | — | 2,574,634,954 |
| Money Market Funds | 16,544,365 | — | — | 16,544,365 |
| Total Investments in Securities | 2,591,179,319 | — | — | 2,591,179,319 |
| Investments in Derivatives | ||||
| Asset | ||||
| Futures Contracts | 1,521,704 | — | — | 1,521,704 |
| Liability | ||||
| Futures Contracts | (5,331) | — | — | (5,331) |
| Total | 2,592,695,692 | — | — | 2,592,695,692 |
| 14 | Columbia Mid Cap Index Fund | Semiannual Report 2022 |
August 31, 2022 (Unaudited)
See the Portfolio of Investments for all investment classifications not indicated in the table.
| Columbia Mid Cap Index Fund | Semiannual Report 2022 | 15 |
August 31, 2022 (Unaudited)
| Assets | |
| Investments in securities, at value | |
| Unaffiliated issuers (cost $1,739,654,363) | $2,574,634,954 |
| Affiliated issuers (cost $16,541,492) | 16,544,365 |
| Receivable for: | |
| Investments sold | 22,297,350 |
| Capital shares sold | 1,332,075 |
| Dividends | 4,211,863 |
| Expense reimbursement due from Investment Manager | 8,263 |
| Prepaid expenses | 28,987 |
| Total assets | 2,619,057,857 |
| Liabilities | |
| Payable for: | |
| Investments purchased | 566 |
| Capital shares purchased | 3,688,520 |
| Variation margin for futures contracts | 156,691 |
| Management services fees | 14,442 |
| Distribution and/or service fees | 4,526 |
| Transfer agent fees | 356,014 |
| Compensation of board members | 272,378 |
| Compensation of chief compliance officer | 249 |
| Other expenses | 65,724 |
| Total liabilities | 4,559,110 |
| Net assets applicable to outstanding capital stock | $2,614,498,747 |
| Represented by | |
| Paid in capital | 1,689,672,820 |
| Total distributable earnings (loss) | 924,825,927 |
| Total - representing net assets applicable to outstanding capital stock | $2,614,498,747 |
| Class A | |
| Net assets | $655,750,998 |
| Shares outstanding | 46,767,010 |
| Net asset value per share | $14.02 |
| Institutional Class | |
| Net assets | $1,306,662,494 |
| Shares outstanding | 93,740,878 |
| Net asset value per share | $13.94 |
| Institutional 2 Class | |
| Net assets | $554,683,843 |
| Shares outstanding | 38,556,369 |
| Net asset value per share | $14.39 |
| Institutional 3 Class | |
| Net assets | $97,401,412 |
| Shares outstanding | 7,178,394 |
| Net asset value per share | $13.57 |
| 16 | Columbia Mid Cap Index Fund | Semiannual Report 2022 |
Six Months Ended August 31, 2022 (Unaudited)
| Net investment income | |
| Income: | |
| Dividends — unaffiliated issuers | $24,652,109 |
| Dividends — affiliated issuers | 130,726 |
| Total income | 24,782,835 |
| Expenses: | |
| Management services fees | 2,780,104 |
| Distribution and/or service fees | |
| Class A | 876,657 |
| Transfer agent fees | |
| Class A | 400,257 |
| Institutional Class | 797,086 |
| Institutional 2 Class | 183,635 |
| Institutional 3 Class | 4,282 |
| Compensation of board members | 4,127 |
| Custodian fees | 13,994 |
| Printing and postage fees | 39,314 |
| Registration fees | 45,243 |
| Licensing fees and expenses | 15,984 |
| Audit fees | 15,948 |
| Legal fees | 20,475 |
| Interest on collateral | 332 |
| Compensation of chief compliance officer | 240 |
| Other | 24,130 |
| Total expenses | 5,221,808 |
| Fees waived or expenses reimbursed by Investment Manager and its affiliates | (1,564,716) |
| Total net expenses | 3,657,092 |
| Net investment income | 21,125,743 |
| Realized and unrealized gain (loss) — net | |
| Net realized gain (loss) on: | |
| Investments — unaffiliated issuers | 80,401,738 |
| Investments — affiliated issuers | (4,364) |
| Foreign currency translations | (47) |
| Futures contracts | (2,820,322) |
| Net realized gain | 77,577,005 |
| Net change in unrealized appreciation (depreciation) on: | |
| Investments — unaffiliated issuers | (339,504,696) |
| Investments — affiliated issuers | 2,177 |
| Futures contracts | 1,015,296 |
| Net change in unrealized appreciation (depreciation) | (338,487,223) |
| Net realized and unrealized loss | (260,910,218) |
| Net decrease in net assets resulting from operations | $(239,784,475) |
| Columbia Mid Cap Index Fund | Semiannual Report 2022 | 17 |
| Six Months Ended August 31, 2022 (Unaudited) | Year Ended February 28, 2022 | |
| Operations | ||
| Net investment income | $21,125,743 | $32,683,259 |
| Net realized gain | 77,577,005 | 522,548,847 |
| Net change in unrealized appreciation (depreciation) | (338,487,223) | (281,873,024) |
| Net increase (decrease) in net assets resulting from operations | (239,784,475) | 273,359,082 |
| Distributions to shareholders | ||
| Net investment income and net realized gains | ||
| Class A | (33,759,023) | (135,070,252) |
| Institutional Class | (68,321,030) | (273,707,103) |
| Institutional 2 Class | (27,398,121) | (116,221,827) |
| Institutional 3 Class | (5,148,183) | (12,289,676) |
| Total distributions to shareholders | (134,626,357) | (537,288,858) |
| Decrease in net assets from capital stock activity | (18,808,618) | (180,940,391) |
| Total decrease in net assets | (393,219,450) | (444,870,167) |
| Net assets at beginning of period | 3,007,718,197 | 3,452,588,364 |
| Net assets at end of period | $2,614,498,747 | $3,007,718,197 |
| Six Months Ended | Year Ended | |||
| August 31, 2022 (Unaudited) | February 28, 2022 | |||
| Shares | Dollars ($) | Shares | Dollars ($) | |
| Capital stock activity | ||||
| Class A | ||||
| Subscriptions | 4,062,563 | 58,825,635 | 10,500,248 | 189,096,084 |
| Distributions reinvested | 1,993,242 | 25,712,827 | 5,983,974 | 104,160,218 |
| Redemptions | (6,919,797) | (102,619,125) | (19,766,784) | (360,095,460) |
| Net decrease | (863,992) | (18,080,663) | (3,282,562) | (66,839,158) |
| Institutional Class | ||||
| Subscriptions | 6,449,099 | 94,099,038 | 10,884,215 | 193,765,369 |
| Distributions reinvested | 3,882,330 | 49,771,468 | 10,834,133 | 187,145,079 |
| Redemptions | (12,306,896) | (184,963,416) | (19,167,274) | (347,443,155) |
| Net increase (decrease) | (1,975,467) | (41,092,910) | 2,551,074 | 33,467,293 |
| Institutional 2 Class | ||||
| Subscriptions | 4,628,268 | 69,070,994 | 11,582,940 | 213,043,448 |
| Distributions reinvested | 1,564,594 | 20,699,573 | 5,016,559 | 89,542,477 |
| Redemptions | (6,062,954) | (91,959,536) | (24,818,436) | (462,546,284) |
| Net increase (decrease) | 129,908 | (2,188,969) | (8,218,937) | (159,960,359) |
| Institutional 3 Class | ||||
| Subscriptions | 3,639,461 | 56,360,704 | 1,857,561 | 32,795,913 |
| Distributions reinvested | 327,340 | 4,085,202 | 518,830 | 8,757,949 |
| Redemptions | (1,265,046) | (17,891,982) | (1,652,664) | (29,162,029) |
| Net increase | 2,701,755 | 42,553,924 | 723,727 | 12,391,833 |
| Total net decrease | (7,796) | (18,808,618) | (8,226,698) | (180,940,391) |
| 18 | Columbia Mid Cap Index Fund | Semiannual Report 2022 |
| Net asset value, beginning of period | Net investment income | Net realized and unrealized gain (loss) | Total from investment operations | Distributions from net investment income | Distributions from net realized gains | Total distributions to shareholders | |
| Class A | |||||||
| Six Months Ended 8/31/2022 (Unaudited) | $16.13 | 0.10 | (1.47) | (1.37) | (0.02) | (0.72) | (0.74) |
| Year Ended 2/28/2022 | $17.72 | 0.14(e) | 1.30 | 1.44 | (0.13) | (2.90) | (3.03) |
| Year Ended 2/28/2021 | $14.07 | 0.14 | 5.02 | 5.16 | (0.16) | (1.35) | (1.51) |
| Year Ended 2/29/2020 | $15.47 | 0.18 | (0.71) | (0.53) | (0.19) | (0.68) | (0.87) |
| Year Ended 2/28/2019 | $16.25 | 0.18 | 0.36 | 0.54 | (0.17) | (1.15) | (1.32) |
| Year Ended 2/28/2018 | $16.05 | 0.17 | 1.26 | 1.43 | (0.16) | (1.07) | (1.23) |
| Institutional Class | |||||||
| Six Months Ended 8/31/2022 (Unaudited) | $16.03 | 0.12 | (1.46) | (1.34) | (0.03) | (0.72) | (0.75) |
| Year Ended 2/28/2022 | $17.63 | 0.19(e) | 1.29 | 1.48 | (0.18) | (2.90) | (3.08) |
| Year Ended 2/28/2021 | $14.00 | 0.18 | 4.99 | 5.17 | (0.19) | (1.35) | (1.54) |
| Year Ended 2/29/2020 | $15.39 | 0.22 | (0.70) | (0.48) | (0.23) | (0.68) | (0.91) |
| Year Ended 2/28/2019 | $16.18 | 0.22 | 0.35 | 0.57 | (0.21) | (1.15) | (1.36) |
| Year Ended 2/28/2018 | $15.99 | 0.21 | 1.25 | 1.46 | (0.20) | (1.07) | (1.27) |
| Institutional 2 Class | |||||||
| Six Months Ended 8/31/2022 (Unaudited) | $16.52 | 0.12 | (1.50) | (1.38) | (0.03) | (0.72) | (0.75) |
| Year Ended 2/28/2022 | $18.08 | 0.19(e) | 1.33 | 1.52 | (0.18) | (2.90) | (3.08) |
| Year Ended 2/28/2021 | $14.32 | 0.18 | 5.12 | 5.30 | (0.19) | (1.35) | (1.54) |
| Year Ended 2/29/2020 | $15.73 | 0.22 | (0.72) | (0.50) | (0.23) | (0.68) | (0.91) |
| Year Ended 2/28/2019 | $16.50 | 0.22 | 0.37 | 0.59 | (0.21) | (1.15) | (1.36) |
| Year Ended 2/28/2018 | $16.28 | 0.22 | 1.27 | 1.49 | (0.20) | (1.07) | (1.27) |
| 20 | Columbia Mid Cap Index Fund | Semiannual Report 2022 |
| Net asset value, end of period | Total return | Total gross expense ratio to average net assets(a) | Total net expense ratio to average net assets(a),(b) | Net investment income ratio to average net assets | Portfolio turnover | Net assets, end of period (000’s) | |
| Class A | |||||||
| Six Months Ended 8/31/2022 (Unaudited) | $14.02 | (8.08%) | 0.58%(c),(d) | 0.45%(c),(d) | 1.33%(c) | 6% | $655,751 |
| Year Ended 2/28/2022 | $16.13 | 7.48% | 0.58%(d),(f) | 0.45%(d),(f),(g) | 0.78% | 16% | $768,487 |
| Year Ended 2/28/2021 | $17.72 | 39.13% | 0.58%(f) | 0.45%(f),(g) | 1.01% | 14% | $902,341 |
| Year Ended 2/29/2020 | $14.07 | (3.88%) | 0.58%(f) | 0.45%(f),(g) | 1.16% | 14% | $986,055 |
| Year Ended 2/28/2019 | $15.47 | 3.66% | 0.58% | 0.45%(g) | 1.08% | 17% | $1,351,153 |
| Year Ended 2/28/2018 | $16.25 | 8.99% | 0.58% | 0.45%(g) | 1.05% | 23% | $1,543,057 |
| Institutional Class | |||||||
| Six Months Ended 8/31/2022 (Unaudited) | $13.94 | (7.96%) | 0.33%(c),(d) | 0.20%(c),(d) | 1.58%(c) | 6% | $1,306,662 |
| Year Ended 2/28/2022 | $16.03 | 7.72% | 0.33%(d),(f) | 0.20%(d),(f),(g) | 1.03% | 16% | $1,534,550 |
| Year Ended 2/28/2021 | $17.63 | 39.49% | 0.34%(f) | 0.20%(f),(g) | 1.25% | 14% | $1,642,259 |
| Year Ended 2/29/2020 | $14.00 | (3.59%) | 0.33%(f) | 0.20%(f),(g) | 1.40% | 14% | $1,579,863 |
| Year Ended 2/28/2019 | $15.39 | 3.89% | 0.33% | 0.20%(g) | 1.33% | 17% | $1,979,350 |
| Year Ended 2/28/2018 | $16.18 | 9.22% | 0.33% | 0.20%(g) | 1.30% | 23% | $2,229,366 |
| Institutional 2 Class | |||||||
| Six Months Ended 8/31/2022 (Unaudited) | $14.39 | (7.96%) | 0.28%(c),(d) | 0.20%(c),(d) | 1.58%(c) | 6% | $554,684 |
| Year Ended 2/28/2022 | $16.52 | 7.75% | 0.27%(d),(f) | 0.20%(d),(f) | 1.03% | 16% | $634,732 |
| Year Ended 2/28/2021 | $18.08 | 39.52% | 0.28%(f) | 0.20%(f) | 1.24% | 14% | $843,249 |
| Year Ended 2/29/2020 | $14.32 | (3.65%) | 0.28%(f) | 0.20%(f) | 1.40% | 14% | $663,451 |
| Year Ended 2/28/2019 | $15.73 | 3.94% | 0.27% | 0.20% | 1.33% | 17% | $798,386 |
| Year Ended 2/28/2018 | $16.50 | 9.24% | 0.28% | 0.20% | 1.30% | 23% | $893,473 |
| Columbia Mid Cap Index Fund | Semiannual Report 2022 | 21 |
| Net asset value, beginning of period | Net investment income | Net realized and unrealized gain (loss) | Total from investment operations | Distributions from net investment income | Distributions from net realized gains | Total distributions to shareholders | |
| Institutional 3 Class | |||||||
| Six Months Ended 8/31/2022 (Unaudited) | $15.63 | 0.11 | (1.42) | (1.31) | (0.03) | (0.72) | (0.75) |
| Year Ended 2/28/2022 | $17.25 | 0.18(e) | 1.28 | 1.46 | (0.18) | (2.90) | (3.08) |
| Year Ended 2/28/2021 | $13.73 | 0.17 | 4.89 | 5.06 | (0.19) | (1.35) | (1.54) |
| Year Ended 2/29/2020 | $15.11 | 0.21 | (0.68) | (0.47) | (0.23) | (0.68) | (0.91) |
| Year Ended 2/28/2019 | $15.91 | 0.22 | 0.34 | 0.56 | (0.21) | (1.15) | (1.36) |
| Year Ended 2/28/2018(h) | $16.00 | 0.21 | 0.97 | 1.18 | (0.20) | (1.07) | (1.27) |
| Notes to Financial Highlights | |
| (a) | In addition to the fees and expenses that the Fund bears directly, the Fund indirectly bears a pro rata share of the fees and expenses of any other funds in which it invests. Such indirect expenses are not included in the Fund’s reported expense ratios. |
| (b) | Total net expenses include the impact of certain fee waivers/expense reimbursements made by the Investment Manager and certain of its affiliates, if applicable. |
| (c) | Annualized. |
| (d) | Ratios include interest on collateral expense which is less than 0.01%. |
| (e) | Net investment income per share includes special dividends. The per share effect of these dividends amounted to: |
| Year Ended | Class A | Institutional Class | Institutional 2 Class | Institutional 3 Class |
| 02/28/2022 | $0.01 | $0.01 | $0.01 | $0.01 |
| (f) | Ratios include interfund lending expense which is less than 0.01%. |
| (g) | The benefits derived from expense reductions had an impact of less than 0.01%. |
| (h) | Institutional 3 Class shares commenced operations on March 1, 2017. Per share data and total return reflect activity from that date. |
| 22 | Columbia Mid Cap Index Fund | Semiannual Report 2022 |
| Net asset value, end of period | Total return | Total gross expense ratio to average net assets(a) | Total net expense ratio to average net assets(a),(b) | Net investment income ratio to average net assets | Portfolio turnover | Net assets, end of period (000’s) | |
| Institutional 3 Class | |||||||
| Six Months Ended 8/31/2022 (Unaudited) | $13.57 | (7.97%) | 0.22%(c),(d) | 0.20%(c),(d) | 1.57%(c) | 6% | $97,401 |
| Year Ended 2/28/2022 | $15.63 | 7.78% | 0.22%(d),(f) | 0.20%(d),(f) | 1.04% | 16% | $69,950 |
| Year Ended 2/28/2021 | $17.25 | 39.46% | 0.23%(f) | 0.20%(f) | 1.23% | 14% | $64,740 |
| Year Ended 2/29/2020 | $13.73 | (3.59%) | 0.23%(f) | 0.20%(f) | 1.41% | 14% | $37,706 |
| Year Ended 2/28/2019 | $15.11 | 3.89% | 0.23% | 0.20% | 1.38% | 17% | $25,066 |
| Year Ended 2/28/2018(h) | $15.91 | 7.47% | 0.22% | 0.20% | 1.33% | 23% | $8,094 |
| Columbia Mid Cap Index Fund | Semiannual Report 2022 | 23 |
August 31, 2022 (Unaudited)
| 24 | Columbia Mid Cap Index Fund | Semiannual Report 2022 |
August 31, 2022 (Unaudited)
| Columbia Mid Cap Index Fund | Semiannual Report 2022 | 25 |
August 31, 2022 (Unaudited)
| 26 | Columbia Mid Cap Index Fund | Semiannual Report 2022 |
August 31, 2022 (Unaudited)
| Asset derivatives | ||
| Risk exposure category | Statement of assets and liabilities location | Fair value ($) |
| Equity risk | Component of total distributable earnings (loss) — unrealized appreciation on futures contracts | 1,521,704* |
| Liability derivatives | ||
| Risk exposure category | Statement of assets and liabilities location | Fair value ($) |
| Equity risk | Component of total distributable earnings (loss) — unrealized depreciation on futures contracts | 5,331* |
| * | Includes cumulative appreciation (depreciation) as reported in the tables following the Portfolio of Investments. Only the current day’s variation margin is reported in receivables or payables in the Statement of Assets and Liabilities. |
| Amount of realized gain (loss) on derivatives recognized in income | |
| Risk exposure category | Futures contracts ($) |
| Equity risk | (2,820,322) |
| Change in unrealized appreciation (depreciation) on derivatives recognized in income | |
| Risk exposure category | Futures contracts ($) |
| Equity risk | 1,015,296 |
| Derivative instrument | Average notional amounts ($)* |
| Futures contracts — long | 31,217,135 |
| * | Based on the ending quarterly outstanding amounts for the six months ended August 31, 2022. |
| Columbia Mid Cap Index Fund | Semiannual Report 2022 | 27 |
August 31, 2022 (Unaudited)
| 28 | Columbia Mid Cap Index Fund | Semiannual Report 2022 |
August 31, 2022 (Unaudited)
| Effective rate (%) | |
| Class A | 0.11 |
| Institutional Class | 0.11 |
| Institutional 2 Class | 0.06 |
| Institutional 3 Class | 0.01 |
| Columbia Mid Cap Index Fund | Semiannual Report 2022 | 29 |
August 31, 2022 (Unaudited)
| Fee rate(s) contractual through June 30, 2023 | |
| Class A | 0.45% |
| Institutional Class | 0.20 |
| Institutional 2 Class | 0.20 |
| Institutional 3 Class | 0.20 |
| Federal tax cost ($) | Gross unrealized appreciation ($) | Gross unrealized (depreciation) ($) | Net unrealized appreciation ($) |
| 1,756,196,000 | 1,000,027,000 | (163,527,000) | 836,500,000 |
| 30 | Columbia Mid Cap Index Fund | Semiannual Report 2022 |
August 31, 2022 (Unaudited)
| Columbia Mid Cap Index Fund | Semiannual Report 2022 | 31 |
August 31, 2022 (Unaudited)
| 32 | Columbia Mid Cap Index Fund | Semiannual Report 2022 |
August 31, 2022 (Unaudited)
| Columbia Mid Cap Index Fund | Semiannual Report 2022 | 33 |
| • | the Fund had sufficient liquidity to both meet redemptions and operate effectively on behalf of shareholders; |
| • | there were no material changes to the Program during the period; |
| • | the implementation of the Program was effective to manage the Fund’s liquidity risk; and |
| • | the Program operated adequately during the period. |
| 34 | Columbia Mid Cap Index Fund | Semiannual Report 2022 |
(Unaudited)
| • | Information on the investment performance of the Fund relative to the performance of a group of mutual funds determined to be comparable to the Fund by Broadridge, as well as performance relative to benchmarks; |
| • | Information on the Fund’s management fees and total expenses, including information comparing the Fund’s expenses to those of a group of comparable mutual funds, as determined by Broadridge; |
| • | The Investment Manager’s agreement to contractually limit or cap total operating expenses for the Fund so that total operating expenses (excluding certain fees and expenses, such as transaction costs and certain other investment related expenses, interest, taxes, acquired fund fees and expenses and infrequent and/or unusual expenses) would not exceed a specified annual rate, as a percentage of the Fund’s net assets; |
| • | Terms of the Management Agreement; |
| • | Descriptions of other agreements and arrangements with affiliates of the Investment Manager relating to the operations of the Fund, including agreements with respect to the provision of transfer agency and shareholder services to the Fund; |
| • | Descriptions of various services performed by the Investment Manager under the Management Agreement, including portfolio management and portfolio trading practices; |
| • | Information regarding any recently negotiated management fees of similarly-managed portfolios of other institutional clients of the Investment Manager; |
| • | Information regarding the resources of the Investment Manager, including information regarding senior management, portfolio managers and other personnel; |
| • | Information regarding the capabilities of the Investment Manager with respect to compliance monitoring services; |
| • | The profitability to the Investment Manager and its affiliates from their relationships with the Fund; and |
| • | Report provided by the Board’s independent fee consultant, JDL Consultants, LLC (JDL). |
| Columbia Mid Cap Index Fund | Semiannual Report 2022 | 35 |
(Unaudited)
into account the organization and strength of the Fund’s and its service providers’ compliance programs. The Board also reviewed the financial condition of the Investment Manager and its affiliates and each entity’s ability to carry out its responsibilities under the Management Agreement and the Fund’s other service agreements.
| 36 | Columbia Mid Cap Index Fund | Semiannual Report 2022 |
(Unaudited)
Manager in 2021 increased from 2020 levels, due to a variety of factors, including the increased assets under management of the Funds. It also took into account the indirect economic benefits flowing to the Investment Manager or its affiliates in connection with managing or distributing the Funds, such as the enhanced ability to offer various other financial products to Ameriprise Financial customers, soft dollar benefits and overall reputational advantages. The Board noted that the fees paid by the Fund should permit the Investment Manager to offer competitive compensation to its personnel, make necessary investments in its business and earn an appropriate profit. After reviewing these and related factors, the Board concluded, within the context of their overall conclusions, that the costs of services provided and the profitability to the Investment Manager and its affiliates from their relationships with the Fund supported the continuation of the Management Agreement.
| Columbia Mid Cap Index Fund | Semiannual Report 2022 | 37 |
columbiathreadneedleus.com/investor/. The Fund is distributed by Columbia Management Investment Distributors, Inc., member FINRA, and managed by Columbia Management Investment Advisers, LLC.

August 31, 2022 (Unaudited)

(Unaudited)

| Average annual total returns (%) (for the period ended August 31, 2022) | ||||||
| Inception | 6 Months cumulative | 1 Year | 5 Years | 10 Years | ||
| Class A | Excluding sales charges | 11/20/01 | -7.55 | -1.70 | 9.26 | 10.85 |
| Including sales charges | -12.89 | -7.38 | 7.98 | 10.19 | ||
| Advisor Class* | 11/08/12 | -7.38 | -1.45 | 9.54 | 11.12 | |
| Class C | Excluding sales charges | 11/20/01 | -7.95 | -2.45 | 8.45 | 10.02 |
| Including sales charges | -8.83 | -3.31 | 8.45 | 10.02 | ||
| Institutional Class | 11/20/01 | -7.40 | -1.43 | 9.53 | 11.12 | |
| Institutional 2 Class* | 11/08/12 | -7.40 | -1.35 | 9.65 | 11.25 | |
| Institutional 3 Class | 07/15/09 | -7.36 | -1.29 | 9.70 | 11.31 | |
| Class R | 01/23/06 | -7.73 | -1.97 | 8.98 | 10.57 | |
| Russell Midcap Value Index | -7.44 | -7.80 | 7.49 | 10.81 | ||
| * | The returns shown for periods prior to the share class inception date (including returns for the Life of the Fund, if shown, which are since Fund inception) include the returns of the Fund’s oldest share class. Since the Fund launched more than one share class at its inception, Class A shares were used. These returns are adjusted to reflect any higher class-related operating expenses of the newer share classes, as applicable. Please visit columbiathreadneedleus.com/investor/investment-products/mutual-funds/appended-performance for more information. |
| Columbia Select Mid Cap Value Fund | Semiannual Report 2022 | 3 |
(Unaudited)
| Portfolio breakdown (%) (at August 31, 2022) | |
| Common Stocks | 97.7 |
| Money Market Funds | 2.3 |
| Total | 100.0 |
| Equity sector breakdown (%) (at August 31, 2022) | |
| Communication Services | 5.8 |
| Consumer Discretionary | 10.5 |
| Consumer Staples | 3.4 |
| Energy | 5.3 |
| Financials | 17.2 |
| Health Care | 8.6 |
| Industrials | 14.1 |
| Information Technology | 8.7 |
| Materials | 7.9 |
| Real Estate | 9.6 |
| Utilities | 8.9 |
| Total | 100.0 |
| 4 | Columbia Select Mid Cap Value Fund | Semiannual Report 2022 |
(Unaudited)
| March 1, 2022 — August 31, 2022 | |||||||
| Account value at the beginning of the period ($) | Account value at the end of the period ($) | Expenses paid during the period ($) | Fund’s annualized expense ratio (%) | ||||
| Actual | Hypothetical | Actual | Hypothetical | Actual | Hypothetical | Actual | |
| Class A | 1,000.00 | 1,000.00 | 924.50 | 1,019.56 | 5.43 | 5.70 | 1.12 |
| Advisor Class | 1,000.00 | 1,000.00 | 926.20 | 1,020.82 | 4.22 | 4.43 | 0.87 |
| Class C | 1,000.00 | 1,000.00 | 920.50 | 1,015.78 | 9.05 | 9.50 | 1.87 |
| Institutional Class | 1,000.00 | 1,000.00 | 926.00 | 1,020.82 | 4.22 | 4.43 | 0.87 |
| Institutional 2 Class | 1,000.00 | 1,000.00 | 926.00 | 1,021.32 | 3.74 | 3.92 | 0.77 |
| Institutional 3 Class | 1,000.00 | 1,000.00 | 926.40 | 1,021.53 | 3.54 | 3.72 | 0.73 |
| Class R | 1,000.00 | 1,000.00 | 922.70 | 1,018.30 | 6.64 | 6.97 | 1.37 |
| Columbia Select Mid Cap Value Fund | Semiannual Report 2022 | 5 |
August 31, 2022 (Unaudited)
| Common Stocks 97.8% | ||
| Issuer | Shares | Value ($) |
| Communication Services 5.6% | ||
| Entertainment 3.4% | ||
| Live Nation Entertainment, Inc.(a) | 478,651 | 43,250,905 |
| Take-Two Interactive Software, Inc.(a) | 362,977 | 44,486,461 |
| Total | 87,737,366 | |
| Media 2.2% | ||
| Nexstar Media Group, Inc., Class A | 292,239 | 55,911,165 |
| Total Communication Services | 143,648,531 | |
| Consumer Discretionary 10.3% | ||
| Hotels, Restaurants & Leisure 2.1% | ||
| Hyatt Hotels Corp., Class A(a) | 606,205 | 54,328,092 |
| Household Durables 1.3% | ||
| D.R. Horton, Inc. | 450,385 | 32,044,893 |
| Multiline Retail 1.7% | ||
| Dollar Tree, Inc.(a) | 320,215 | 43,446,771 |
| Specialty Retail 3.8% | ||
| Burlington Stores, Inc.(a) | 279,786 | 39,223,200 |
| O’Reilly Automotive, Inc.(a) | 83,159 | 57,971,802 |
| Total | 97,195,002 | |
| Textiles, Apparel & Luxury Goods 1.4% | ||
| Capri Holdings Ltd.(a) | 757,635 | 35,745,219 |
| Total Consumer Discretionary | 262,759,977 | |
| Consumer Staples 3.3% | ||
| Food & Staples Retailing 1.5% | ||
| U.S. Foods Holding Corp.(a) | 1,285,533 | 39,363,020 |
| Food Products 1.8% | ||
| Tyson Foods, Inc., Class A | 599,541 | 45,193,401 |
| Total Consumer Staples | 84,556,421 | |
| Energy 5.2% | ||
| Oil, Gas & Consumable Fuels 5.2% | ||
| Devon Energy Corp. | 985,569 | 69,600,883 |
| Marathon Petroleum Corp. | 621,255 | 62,591,441 |
| Total | 132,192,324 | |
| Total Energy | 132,192,324 | |
| Common Stocks (continued) | ||
| Issuer | Shares | Value ($) |
| Financials 16.8% | ||
| Banks 6.8% | ||
| Popular, Inc. | 742,942 | 57,369,981 |
| Regions Financial Corp. | 3,031,421 | 65,690,893 |
| SVB Financial Group(a) | 123,126 | 50,053,182 |
| Total | 173,114,056 | |
| Consumer Finance 2.3% | ||
| Discover Financial Services | 587,491 | 59,036,971 |
| Diversified Financial Services 2.0% | ||
| Voya Financial, Inc. | 809,299 | 49,796,167 |
| Insurance 5.7% | ||
| Hanover Insurance Group, Inc. (The) | 367,725 | 47,579,938 |
| Lincoln National Corp. | 864,195 | 39,804,822 |
| Reinsurance Group of America, Inc. | 469,290 | 58,830,194 |
| Total | 146,214,954 | |
| Total Financials | 428,162,148 | |
| Health Care 8.5% | ||
| Health Care Equipment & Supplies 1.9% | ||
| Zimmer Biomet Holdings, Inc. | 451,071 | 47,957,869 |
| Health Care Providers & Services 3.6% | ||
| Centene Corp.(a) | 607,509 | 54,517,858 |
| Quest Diagnostics, Inc. | 302,175 | 37,865,549 |
| Total | 92,383,407 | |
| Life Sciences Tools & Services 3.0% | ||
| Agilent Technologies, Inc. | 269,595 | 34,575,559 |
| Syneos Health, Inc.(a) | 675,979 | 40,633,097 |
| Total | 75,208,656 | |
| Total Health Care | 215,549,932 | |
| Industrials 13.8% | ||
| Airlines 1.8% | ||
| Southwest Airlines Co.(a) | 1,243,256 | 45,627,495 |
| Building Products 2.7% | ||
| Trane Technologies PLC | 438,362 | 67,538,433 |
| Electrical Equipment 2.8% | ||
| AMETEK, Inc. | 601,178 | 72,237,549 |
| 6 | Columbia Select Mid Cap Value Fund | Semiannual Report 2022 |
August 31, 2022 (Unaudited)
| Common Stocks (continued) | ||
| Issuer | Shares | Value ($) |
| Machinery 4.6% | ||
| Ingersoll Rand, Inc. | 1,258,570 | 59,618,461 |
| ITT, Inc. | 793,111 | 57,524,341 |
| Total | 117,142,802 | |
| Professional Services 1.9% | ||
| CACI International, Inc., Class A(a) | 170,986 | 48,024,838 |
| Total Industrials | 350,571,117 | |
| Information Technology 8.5% | ||
| Communications Equipment 2.4% | ||
| Motorola Solutions, Inc. | 247,711 | 60,295,334 |
| Electronic Equipment, Instruments & Components 2.1% | ||
| Corning, Inc. | 1,578,311 | 54,167,634 |
| Semiconductors & Semiconductor Equipment 4.0% | ||
| Marvell Technology, Inc. | 542,418 | 25,396,011 |
| ON Semiconductor Corp.(a) | 607,536 | 41,780,250 |
| Teradyne, Inc. | 403,861 | 34,182,795 |
| Total | 101,359,056 | |
| Total Information Technology | 215,822,024 | |
| Materials 7.7% | ||
| Chemicals 4.5% | ||
| Chemours Co. LLC (The) | 1,122,000 | 37,845,060 |
| Eastman Chemical Co. | 283,462 | 25,795,042 |
| FMC Corp. | 480,686 | 51,952,543 |
| Total | 115,592,645 | |
| Metals & Mining 3.2% | ||
| ATI, Inc.(a) | 1,400,539 | 41,918,132 |
| Freeport-McMoRan, Inc. | 1,342,069 | 39,725,242 |
| Total | 81,643,374 | |
| Total Materials | 197,236,019 | |
| Common Stocks (continued) | ||
| Issuer | Shares | Value ($) |
| Real Estate 9.4% | ||
| Equity Real Estate Investment Trusts (REITS) 9.4% | ||
| First Industrial Realty Trust, Inc. | 1,263,379 | 64,028,048 |
| Gaming and Leisure Properties, Inc. | 1,186,569 | 57,275,686 |
| Lamar Advertising Co., Class A | 595,861 | 55,945,389 |
| Welltower, Inc. | 820,291 | 62,875,305 |
| Total | 240,124,428 | |
| Total Real Estate | 240,124,428 | |
| Utilities 8.7% | ||
| Electric Utilities 2.7% | ||
| Entergy Corp. | 589,874 | 68,012,472 |
| Independent Power and Renewable Electricity Producers 2.7% | ||
| AES Corp. (The) | 2,714,216 | 69,076,797 |
| Multi-Utilities 3.3% | ||
| Ameren Corp. | 904,560 | 83,780,348 |
| Total Utilities | 220,869,617 | |
| Total Common Stocks (Cost $1,872,680,808) | 2,491,492,538 | |
| Money Market Funds 2.2% | ||
| Shares | Value ($) | |
| Columbia Short-Term Cash Fund, 2.366%(b),(c) | 57,625,892 | 57,597,079 |
| Total Money Market Funds (Cost $57,588,550) | 57,597,079 | |
| Total Investments in Securities (Cost: $1,930,269,358) | 2,549,089,617 | |
| Other Assets & Liabilities, Net | (651,931) | |
| Net Assets | 2,548,437,686 | |
| Columbia Select Mid Cap Value Fund | Semiannual Report 2022 | 7 |
August 31, 2022 (Unaudited)
| (a) | Non-income producing investment. |
| (b) | The rate shown is the seven-day current annualized yield at August 31, 2022. |
| (c) | As defined in the Investment Company Act of 1940, as amended, an affiliated company is one in which the Fund owns 5% or more of the company’s outstanding voting securities, or a company which is under common ownership or control with the Fund. The value of the holdings and transactions in these affiliated companies during the period ended August 31, 2022 are as follows: |
| Affiliated issuers | Beginning of period($) | Purchases($) | Sales($) | Net change in unrealized appreciation (depreciation)($) | End of period($) | Realized gain (loss)($) | Dividends($) | End of period shares |
| Columbia Short-Term Cash Fund, 2.366% | ||||||||
| 89,652,798 | 234,074,727 | (266,142,759) | 12,313 | 57,597,079 | (28,957) | 365,729 | 57,625,892 | |
| ■ | Level 1 — Valuations based on quoted prices for investments in active markets that the Fund has the ability to access at the measurement date. Valuation adjustments are not applied to Level 1 investments. |
| ■ | Level 2 — Valuations based on other significant observable inputs (including quoted prices for similar securities, interest rates, prepayment speeds, credit risks, etc.). |
| ■ | Level 3 — Valuations based on significant unobservable inputs (including the Fund’s own assumptions and judgment in determining the fair value of investments). |
| Level 1 ($) | Level 2 ($) | Level 3 ($) | Total ($) | |
| Investments in Securities | ||||
| Common Stocks | ||||
| Communication Services | 143,648,531 | — | — | 143,648,531 |
| Consumer Discretionary | 262,759,977 | — | — | 262,759,977 |
| Consumer Staples | 84,556,421 | — | — | 84,556,421 |
| Energy | 132,192,324 | — | — | 132,192,324 |
| Financials | 428,162,148 | — | — | 428,162,148 |
| Health Care | 215,549,932 | — | — | 215,549,932 |
| 8 | Columbia Select Mid Cap Value Fund | Semiannual Report 2022 |
August 31, 2022 (Unaudited)
| Level 1 ($) | Level 2 ($) | Level 3 ($) | Total ($) | |
| Industrials | 350,571,117 | — | — | 350,571,117 |
| Information Technology | 215,822,024 | — | — | 215,822,024 |
| Materials | 197,236,019 | — | — | 197,236,019 |
| Real Estate | 240,124,428 | — | — | 240,124,428 |
| Utilities | 220,869,617 | — | — | 220,869,617 |
| Total Common Stocks | 2,491,492,538 | — | — | 2,491,492,538 |
| Money Market Funds | 57,597,079 | — | — | 57,597,079 |
| Total Investments in Securities | 2,549,089,617 | — | — | 2,549,089,617 |
| Columbia Select Mid Cap Value Fund | Semiannual Report 2022 | 9 |
August 31, 2022 (Unaudited)
| Assets | |
| Investments in securities, at value | |
| Unaffiliated issuers (cost $1,872,680,808) | $2,491,492,538 |
| Affiliated issuers (cost $57,588,550) | 57,597,079 |
| Receivable for: | |
| Investments sold | 13,111,924 |
| Capital shares sold | 1,242,041 |
| Dividends | 2,629,213 |
| Expense reimbursement due from Investment Manager | 1,256 |
| Prepaid expenses | 24,227 |
| Other assets | 2,258 |
| Total assets | 2,566,100,536 |
| Liabilities | |
| Payable for: | |
| Investments purchased | 15,460,953 |
| Capital shares purchased | 1,258,006 |
| Management services fees | 51,169 |
| Distribution and/or service fees | 7,620 |
| Transfer agent fees | 445,999 |
| Compensation of board members | 383,781 |
| Compensation of chief compliance officer | 237 |
| Other expenses | 55,085 |
| Total liabilities | 17,662,850 |
| Net assets applicable to outstanding capital stock | $2,548,437,686 |
| Represented by | |
| Paid in capital | 1,913,885,777 |
| Total distributable earnings (loss) | 634,551,909 |
| Total - representing net assets applicable to outstanding capital stock | $2,548,437,686 |
| 10 | Columbia Select Mid Cap Value Fund | Semiannual Report 2022 |
August 31, 2022 (Unaudited)
| Class A | |
| Net assets | $1,014,199,523 |
| Shares outstanding | 84,683,339 |
| Net asset value per share | $11.98 |
| Maximum sales charge | 5.75% |
| Maximum offering price per share (calculated by dividing the net asset value per share by 1.0 minus the maximum sales charge for Class A shares) | $12.71 |
| Advisor Class | |
| Net assets | $151,866,834 |
| Shares outstanding | 12,086,224 |
| Net asset value per share | $12.57 |
| Class C | |
| Net assets | $10,553,631 |
| Shares outstanding | 1,007,815 |
| Net asset value per share | $10.47 |
| Institutional Class | |
| Net assets | $830,428,882 |
| Shares outstanding | 69,057,139 |
| Net asset value per share | $12.03 |
| Institutional 2 Class | |
| Net assets | $115,893,551 |
| Shares outstanding | 9,219,519 |
| Net asset value per share | $12.57 |
| Institutional 3 Class | |
| Net assets | $401,816,977 |
| Shares outstanding | 33,576,950 |
| Net asset value per share | $11.97 |
| Class R | |
| Net assets | $23,678,288 |
| Shares outstanding | 1,989,346 |
| Net asset value per share | $11.90 |
| Columbia Select Mid Cap Value Fund | Semiannual Report 2022 | 11 |
Six Months Ended August 31, 2022 (Unaudited)
| Net investment income | |
| Income: | |
| Dividends — unaffiliated issuers | $23,098,349 |
| Dividends — affiliated issuers | 365,729 |
| Interfund lending | 1,223 |
| Foreign taxes withheld | (81,724) |
| Total income | 23,383,577 |
| Expenses: | |
| Management services fees | 9,704,342 |
| Distribution and/or service fees | |
| Class A | 1,338,898 |
| Class C | 58,381 |
| Class R | 64,213 |
| Transfer agent fees | |
| Class A | 765,282 |
| Advisor Class | 118,160 |
| Class C | 8,334 |
| Institutional Class | 602,952 |
| Institutional 2 Class | 37,070 |
| Institutional 3 Class | 14,513 |
| Class R | 18,347 |
| Compensation of board members | (5,609) |
| Custodian fees | 9,034 |
| Printing and postage fees | 85,498 |
| Registration fees | 72,405 |
| Audit fees | 16,369 |
| Legal fees | 19,830 |
| Compensation of chief compliance officer | 229 |
| Other | 20,989 |
| Total expenses | 12,949,237 |
| Fees waived or expenses reimbursed by Investment Manager and its affiliates | (177,492) |
| Fees waived by transfer agent | |
| Institutional 2 Class | (12,290) |
| Institutional 3 Class | (14,513) |
| Total net expenses | 12,744,942 |
| Net investment income | 10,638,635 |
| Realized and unrealized gain (loss) — net | |
| Net realized gain (loss) on: | |
| Investments — unaffiliated issuers | 32,969,310 |
| Investments — affiliated issuers | (28,957) |
| Net realized gain | 32,940,353 |
| Net change in unrealized appreciation (depreciation) on: | |
| Investments — unaffiliated issuers | (253,563,869) |
| Investments — affiliated issuers | 12,313 |
| Net change in unrealized appreciation (depreciation) | (253,551,556) |
| Net realized and unrealized loss | (220,611,203) |
| Net decrease in net assets resulting from operations | $(209,972,568) |
| 12 | Columbia Select Mid Cap Value Fund | Semiannual Report 2022 |
| Six Months Ended August 31, 2022 (Unaudited) | Year Ended February 28, 2022 | |
| Operations | ||
| Net investment income | $10,638,635 | $13,442,762 |
| Net realized gain | 32,940,353 | 277,010,533 |
| Net change in unrealized appreciation (depreciation) | (253,551,556) | 141,071,634 |
| Net increase (decrease) in net assets resulting from operations | (209,972,568) | 431,524,929 |
| Distributions to shareholders | ||
| Net investment income and net realized gains | ||
| Class A | (41,049,971) | (95,776,131) |
| Advisor Class | (6,220,669) | (13,763,048) |
| Class C | (466,707) | (1,171,441) |
| Institutional Class | (33,692,341) | (73,036,294) |
| Institutional 2 Class | (4,769,728) | (10,768,053) |
| Institutional 3 Class | (18,306,059) | (36,507,016) |
| Class R | (955,370) | (2,487,239) |
| Total distributions to shareholders | (105,460,845) | (233,509,222) |
| Increase in net assets from capital stock activity | 77,000,743 | 216,032,102 |
| Total increase (decrease) in net assets | (238,432,670) | 414,047,809 |
| Net assets at beginning of period | 2,786,870,356 | 2,372,822,547 |
| Net assets at end of period | $2,548,437,686 | $2,786,870,356 |
| Columbia Select Mid Cap Value Fund | Semiannual Report 2022 | 13 |
| Six Months Ended | Year Ended | |||
| August 31, 2022 (Unaudited) | February 28, 2022 | |||
| Shares | Dollars ($) | Shares | Dollars ($) | |
| Capital stock activity | ||||
| Class A | ||||
| Subscriptions | 2,821,569 | 35,367,567 | 5,909,633 | 80,584,016 |
| Fund reorganization | — | — | 2,451,935 | 32,338,454 |
| Distributions reinvested | 3,523,520 | 39,128,474 | 6,609,810 | 90,795,130 |
| Redemptions | (6,025,897) | (75,539,373) | (10,825,461) | (147,526,000) |
| Net increase (decrease) | 319,192 | (1,043,332) | 4,145,917 | 56,191,600 |
| Advisor Class | ||||
| Subscriptions | 1,243,489 | 16,651,225 | 3,163,318 | 44,985,786 |
| Fund reorganization | — | — | 185,751 | 2,564,607 |
| Distributions reinvested | 527,977 | 6,167,348 | 949,858 | 13,638,294 |
| Redemptions | (2,258,711) | (29,562,853) | (3,445,998) | (49,245,622) |
| Net increase (decrease) | (487,245) | (6,744,280) | 852,929 | 11,943,065 |
| Class C | ||||
| Subscriptions | 76,685 | 857,108 | 308,952 | 3,755,602 |
| Distributions reinvested | 47,130 | 456,221 | 94,008 | 1,141,080 |
| Redemptions | (192,644) | (2,144,543) | (451,667) | (5,490,415) |
| Net decrease | (68,829) | (831,214) | (48,707) | (593,733) |
| Institutional Class | ||||
| Subscriptions | 8,591,312 | 109,881,581 | 12,670,719 | 172,324,656 |
| Distributions reinvested | 2,809,742 | 31,386,823 | 4,943,198 | 68,113,102 |
| Redemptions | (5,734,582) | (72,577,668) | (10,255,528) | (140,960,727) |
| Net increase | 5,666,472 | 68,690,736 | 7,358,389 | 99,477,031 |
| Institutional 2 Class | ||||
| Subscriptions | 854,234 | 11,362,068 | 3,076,208 | 43,814,292 |
| Distributions reinvested | 377,513 | 4,412,626 | 676,436 | 9,713,445 |
| Redemptions | (1,204,338) | (15,691,474) | (2,482,935) | (35,578,309) |
| Net increase | 27,409 | 83,220 | 1,269,709 | 17,949,428 |
| Institutional 3 Class | ||||
| Subscriptions | 6,994,900 | 88,046,283 | 11,762,304 | 161,202,450 |
| Fund reorganization | — | — | 83,061 | 1,094,384 |
| Distributions reinvested | 1,425,337 | 15,837,126 | 2,306,416 | 31,617,245 |
| Redemptions | (6,923,602) | (85,977,781) | (11,648,122) | (159,945,955) |
| Net increase | 1,496,635 | 17,905,628 | 2,503,659 | 33,968,124 |
| Class R | ||||
| Subscriptions | 177,412 | 2,227,770 | 672,334 | 9,048,538 |
| Distributions reinvested | 86,713 | 954,987 | 181,931 | 2,485,764 |
| Redemptions | (339,787) | (4,242,772) | (1,062,609) | (14,437,715) |
| Net decrease | (75,662) | (1,060,015) | (208,344) | (2,903,413) |
| Total net increase | 6,877,972 | 77,000,743 | 15,873,552 | 216,032,102 |
| 14 | Columbia Select Mid Cap Value Fund | Semiannual Report 2022 |
| Net asset value, beginning of period | Net investment income (loss) | Net realized and unrealized gain (loss) | Total from investment operations | Distributions from net investment income | Distributions from net realized gains | Total distributions to shareholders | |
| Class A | |||||||
| Six Months Ended 8/31/2022 (Unaudited) | $13.54 | 0.04 | (1.10) | (1.06) | (0.04) | (0.46) | (0.50) |
| Year Ended 2/28/2022 | $12.50 | 0.05 | 2.22 | 2.27 | (0.04) | (1.19) | (1.23) |
| Year Ended 2/28/2021 | $9.76 | 0.05 | 3.04 | 3.09 | (0.07) | (0.28) | (0.35) |
| Year Ended 2/29/2020 | $10.34 | 0.10 | (0.32) | (0.22) | (0.10) | (0.26) | (0.36) |
| Year Ended 2/28/2019 | $13.27 | 0.07 | 0.18 | 0.25 | (0.07) | (3.11) | (3.18) |
| Year Ended 2/28/2018 | $15.19 | 0.13 | 0.80 | 0.93 | (0.14) | (2.71) | (2.85) |
| Advisor Class | |||||||
| Six Months Ended 8/31/2022 (Unaudited) | $14.17 | 0.06 | (1.15) | (1.09) | (0.05) | (0.46) | (0.51) |
| Year Ended 2/28/2022 | $13.04 | 0.09 | 2.30 | 2.39 | (0.07) | (1.19) | (1.26) |
| Year Ended 2/28/2021 | $10.17 | 0.07 | 3.17 | 3.24 | (0.09) | (0.28) | (0.37) |
| Year Ended 2/29/2020 | $10.75 | 0.13 | (0.33) | (0.20) | (0.12) | (0.26) | (0.38) |
| Year Ended 2/28/2019 | $13.67 | 0.10 | 0.19 | 0.29 | (0.10) | (3.11) | (3.21) |
| Year Ended 2/28/2018 | $15.57 | 0.17 | 0.82 | 0.99 | (0.18) | (2.71) | (2.89) |
| Class C | |||||||
| Six Months Ended 8/31/2022 (Unaudited) | $11.92 | (0.01) | (0.98) | (0.99) | — | (0.46) | (0.46) |
| Year Ended 2/28/2022 | $11.18 | (0.05) | 1.98 | 1.93 | — | (1.19) | (1.19) |
| Year Ended 2/28/2021 | $8.76 | (0.01) | 2.72 | 2.71 | (0.01) | (0.28) | (0.29) |
| Year Ended 2/29/2020 | $9.30 | 0.02 | (0.28) | (0.26) | (0.02) | (0.26) | (0.28) |
| Year Ended 2/28/2019 | $12.29 | (0.02) | 0.14 | 0.12 | — | (3.11) | (3.11) |
| Year Ended 2/28/2018 | $14.29 | 0.01 | 0.75 | 0.76 | (0.05) | (2.71) | (2.76) |
| Institutional Class | |||||||
| Six Months Ended 8/31/2022 (Unaudited) | $13.59 | 0.06 | (1.11) | (1.05) | (0.05) | (0.46) | (0.51) |
| Year Ended 2/28/2022 | $12.55 | 0.08 | 2.22 | 2.30 | (0.07) | (1.19) | (1.26) |
| Year Ended 2/28/2021 | $9.80 | 0.09 | 3.03 | 3.12 | (0.09) | (0.28) | (0.37) |
| Year Ended 2/29/2020 | $10.38 | 0.13 | (0.33) | (0.20) | (0.12) | (0.26) | (0.38) |
| Year Ended 2/28/2019 | $13.31 | 0.10 | 0.18 | 0.28 | (0.10) | (3.11) | (3.21) |
| Year Ended 2/28/2018 | $15.23 | 0.18 | 0.79 | 0.97 | (0.18) | (2.71) | (2.89) |
| Institutional 2 Class | |||||||
| Six Months Ended 8/31/2022 (Unaudited) | $14.18 | 0.07 | (1.16) | (1.09) | (0.06) | (0.46) | (0.52) |
| Year Ended 2/28/2022 | $13.05 | 0.10 | 2.31 | 2.41 | (0.09) | (1.19) | (1.28) |
| Year Ended 2/28/2021 | $10.17 | 0.10 | 3.17 | 3.27 | (0.11) | (0.28) | (0.39) |
| Year Ended 2/29/2020 | $10.76 | 0.14 | (0.33) | (0.19) | (0.14) | (0.26) | (0.40) |
| Year Ended 2/28/2019 | $13.67 | 0.11 | 0.20 | 0.31 | (0.11) | (3.11) | (3.22) |
| Year Ended 2/28/2018 | $15.57 | 0.18 | 0.83 | 1.01 | (0.20) | (2.71) | (2.91) |
| 16 | Columbia Select Mid Cap Value Fund | Semiannual Report 2022 |
| Net asset value, end of period | Total return | Total gross expense ratio to average net assets(a) | Total net expense ratio to average net assets(a),(b) | Net investment income (loss) ratio to average net assets | Portfolio turnover | Net assets, end of period (000’s) | |
| Class A | |||||||
| Six Months Ended 8/31/2022 (Unaudited) | $11.98 | (7.55%) | 1.14%(c) | 1.12%(c) | 0.63%(c) | 18% | $1,014,200 |
| Year Ended 2/28/2022 | $13.54 | 18.15% | 1.13% | 1.13%(d) | 0.35% | 37% | $1,142,075 |
| Year Ended 2/28/2021 | $12.50 | 33.20% | 1.18% | 1.15%(d) | 0.54% | 44% | $1,003,004 |
| Year Ended 2/29/2020 | $9.76 | (2.47%) | 1.21% | 1.16%(d) | 0.91% | 28% | $479,921 |
| Year Ended 2/28/2019 | $10.34 | 3.57% | 1.20% | 1.17%(d) | 0.57% | 79% | $575,861 |
| Year Ended 2/28/2018 | $13.27 | 5.96% | 1.18% | 1.18%(d) | 0.86% | 59% | $692,641 |
| Advisor Class | |||||||
| Six Months Ended 8/31/2022 (Unaudited) | $12.57 | (7.38%) | 0.89%(c) | 0.87%(c) | 0.88%(c) | 18% | $151,867 |
| Year Ended 2/28/2022 | $14.17 | 18.36% | 0.89% | 0.88%(d) | 0.60% | 37% | $178,228 |
| Year Ended 2/28/2021 | $13.04 | 33.49% | 0.93% | 0.90%(d) | 0.66% | 44% | $152,860 |
| Year Ended 2/29/2020 | $10.17 | (2.14%) | 0.96% | 0.91%(d) | 1.16% | 28% | $20,433 |
| Year Ended 2/28/2019 | $10.75 | 3.79% | 0.95% | 0.92%(d) | 0.78% | 79% | $21,857 |
| Year Ended 2/28/2018 | $13.67 | 6.20% | 0.93% | 0.92%(d) | 1.10% | 59% | $69,624 |
| Class C | |||||||
| Six Months Ended 8/31/2022 (Unaudited) | $10.47 | (7.95%) | 1.88%(c) | 1.87%(c) | (0.12%)(c) | 18% | $10,554 |
| Year Ended 2/28/2022 | $11.92 | 17.19% | 1.88% | 1.88%(d) | (0.39%) | 37% | $12,830 |
| Year Ended 2/28/2021 | $11.18 | 32.30% | 1.94% | 1.90%(d) | (0.12%) | 44% | $12,577 |
| Year Ended 2/29/2020 | $8.76 | (3.11%) | 1.96% | 1.92%(d) | 0.17% | 28% | $12,726 |
| Year Ended 2/28/2019 | $9.30 | 2.78% | 1.95% | 1.92%(d) | (0.20%) | 79% | $20,763 |
| Year Ended 2/28/2018 | $12.29 | 5.09% | 1.93% | 1.92%(d) | 0.10% | 59% | $69,670 |
| Institutional Class | |||||||
| Six Months Ended 8/31/2022 (Unaudited) | $12.03 | (7.40%) | 0.89%(c) | 0.87%(c) | 0.88%(c) | 18% | $830,429 |
| Year Ended 2/28/2022 | $13.59 | 18.36% | 0.89% | 0.88%(d) | 0.60% | 37% | $861,576 |
| Year Ended 2/28/2021 | $12.55 | 33.52% | 0.94% | 0.90%(d) | 0.91% | 44% | $703,152 |
| Year Ended 2/29/2020 | $9.80 | (2.22%) | 0.96% | 0.91%(d) | 1.16% | 28% | $605,614 |
| Year Ended 2/28/2019 | $10.38 | 3.84% | 0.95% | 0.92%(d) | 0.82% | 79% | $694,941 |
| Year Ended 2/28/2018 | $13.31 | 6.21% | 0.93% | 0.93%(d) | 1.20% | 59% | $837,610 |
| Institutional 2 Class | |||||||
| Six Months Ended 8/31/2022 (Unaudited) | $12.57 | (7.40%) | 0.80%(c) | 0.77%(c) | 0.98%(c) | 18% | $115,894 |
| Year Ended 2/28/2022 | $14.18 | 18.47% | 0.80% | 0.78% | 0.70% | 37% | $130,351 |
| Year Ended 2/28/2021 | $13.05 | 33.75% | 0.84% | 0.79% | 0.96% | 44% | $103,360 |
| Year Ended 2/29/2020 | $10.17 | (2.12%) | 0.85% | 0.80% | 1.27% | 28% | $62,808 |
| Year Ended 2/28/2019 | $10.76 | 3.99% | 0.83% | 0.80% | 0.89% | 79% | $70,379 |
| Year Ended 2/28/2018 | $13.67 | 6.33% | 0.82% | 0.82% | 1.17% | 59% | $82,174 |
| Columbia Select Mid Cap Value Fund | Semiannual Report 2022 | 17 |
| Net asset value, beginning of period | Net investment income (loss) | Net realized and unrealized gain (loss) | Total from investment operations | Distributions from net investment income | Distributions from net realized gains | Total distributions to shareholders | |
| Institutional 3 Class | |||||||
| Six Months Ended 8/31/2022 (Unaudited) | $13.53 | 0.06 | (1.10) | (1.04) | (0.06) | (0.46) | (0.52) |
| Year Ended 2/28/2022 | $12.50 | 0.10 | 2.21 | 2.31 | (0.09) | (1.19) | (1.28) |
| Year Ended 2/28/2021 | $9.76 | 0.09 | 3.04 | 3.13 | (0.11) | (0.28) | (0.39) |
| Year Ended 2/29/2020 | $10.34 | 0.14 | (0.32) | (0.18) | (0.14) | (0.26) | (0.40) |
| Year Ended 2/28/2019 | $13.27 | 0.12 | 0.18 | 0.30 | (0.12) | (3.11) | (3.23) |
| Year Ended 2/28/2018 | $15.20 | 0.14 | 0.84 | 0.98 | (0.20) | (2.71) | (2.91) |
| Class R | |||||||
| Six Months Ended 8/31/2022 (Unaudited) | $13.46 | 0.02 | (1.10) | (1.08) | (0.02) | (0.46) | (0.48) |
| Year Ended 2/28/2022 | $12.44 | 0.01 | 2.21 | 2.22 | (0.01) | (1.19) | (1.20) |
| Year Ended 2/28/2021 | $9.71 | 0.04 | 3.02 | 3.06 | (0.05) | (0.28) | (0.33) |
| Year Ended 2/29/2020 | $10.29 | 0.07 | (0.32) | (0.25) | (0.07) | (0.26) | (0.33) |
| Year Ended 2/28/2019 | $13.22 | 0.04 | 0.18 | 0.22 | (0.04) | (3.11) | (3.15) |
| Year Ended 2/28/2018 | $15.14 | 0.09 | 0.80 | 0.89 | (0.10) | (2.71) | (2.81) |
| Notes to Financial Highlights | |
| (a) | In addition to the fees and expenses that the Fund bears directly, the Fund indirectly bears a pro rata share of the fees and expenses of any other funds in which it invests. Such indirect expenses are not included in the Fund’s reported expense ratios. |
| (b) | Total net expenses include the impact of certain fee waivers/expense reimbursements made by the Investment Manager and certain of its affiliates, if applicable. |
| (c) | Annualized. |
| (d) | The benefits derived from expense reductions had an impact of less than 0.01%. |
| 18 | Columbia Select Mid Cap Value Fund | Semiannual Report 2022 |
| Net asset value, end of period | Total return | Total gross expense ratio to average net assets(a) | Total net expense ratio to average net assets(a),(b) | Net investment income (loss) ratio to average net assets | Portfolio turnover | Net assets, end of period (000’s) | |
| Institutional 3 Class | |||||||
| Six Months Ended 8/31/2022 (Unaudited) | $11.97 | (7.36%) | 0.75%(c) | 0.73%(c) | 1.02%(c) | 18% | $401,817 |
| Year Ended 2/28/2022 | $13.53 | 18.53% | 0.75% | 0.74% | 0.73% | 37% | $434,024 |
| Year Ended 2/28/2021 | $12.50 | 33.80% | 0.79% | 0.75% | 0.94% | 44% | $369,599 |
| Year Ended 2/29/2020 | $9.76 | (2.07%) | 0.80% | 0.75% | 1.32% | 28% | $140,100 |
| Year Ended 2/28/2019 | $10.34 | 4.02% | 0.78% | 0.76% | 0.97% | 79% | $153,442 |
| Year Ended 2/28/2018 | $13.27 | 6.34% | 0.77% | 0.77% | 0.98% | 59% | $239,180 |
| Class R | |||||||
| Six Months Ended 8/31/2022 (Unaudited) | $11.90 | (7.73%) | 1.39%(c) | 1.37%(c) | 0.38%(c) | 18% | $23,678 |
| Year Ended 2/28/2022 | $13.46 | 17.79% | 1.38% | 1.38%(d) | 0.10% | 37% | $27,787 |
| Year Ended 2/28/2021 | $12.44 | 32.90% | 1.44% | 1.40%(d) | 0.39% | 44% | $28,271 |
| Year Ended 2/29/2020 | $9.71 | (2.72%) | 1.46% | 1.41%(d) | 0.66% | 28% | $23,646 |
| Year Ended 2/28/2019 | $10.29 | 3.34% | 1.45% | 1.42%(d) | 0.32% | 79% | $31,097 |
| Year Ended 2/28/2018 | $13.22 | 5.71% | 1.43% | 1.42%(d) | 0.61% | 59% | $41,290 |
| Columbia Select Mid Cap Value Fund | Semiannual Report 2022 | 19 |
August 31, 2022 (Unaudited)
| 20 | Columbia Select Mid Cap Value Fund | Semiannual Report 2022 |
August 31, 2022 (Unaudited)
| Columbia Select Mid Cap Value Fund | Semiannual Report 2022 | 21 |
August 31, 2022 (Unaudited)
| 22 | Columbia Select Mid Cap Value Fund | Semiannual Report 2022 |
August 31, 2022 (Unaudited)
| Effective rate (%) | |
| Class A | 0.14 |
| Advisor Class | 0.14 |
| Class C | 0.14 |
| Institutional Class | 0.14 |
| Institutional 2 Class | 0.04 |
| Institutional 3 Class | 0.00 |
| Class R | 0.14 |
| Columbia Select Mid Cap Value Fund | Semiannual Report 2022 | 23 |
August 31, 2022 (Unaudited)
| Front End (%) | CDSC (%) | Amount ($) | |
| Class A | 5.75 | 0.50 - 1.00(a) | 129,345 |
| Class C | — | 1.00(b) | 379 |
| (a) | This charge is imposed on certain investments of between $1 million and $50 million redeemed within 18 months after purchase, as follows: 1.00% if redeemed within 12 months after purchase, and 0.50% if redeemed more than 12, but less than 18, months after purchase, with certain limited exceptions. |
| (b) | This charge applies to redemptions within 12 months after purchase, with certain limited exceptions. |
| Fee rate(s) contractual through June 30, 2024 | |
| Class A | 1.13 |
| Advisor Class | 0.88 |
| Class C | 1.88 |
| Institutional Class | 0.88 |
| Institutional 2 Class | 0.78 |
| Institutional 3 Class | 0.73 |
| Class R | 1.38 |
| 24 | Columbia Select Mid Cap Value Fund | Semiannual Report 2022 |
August 31, 2022 (Unaudited)
| Federal tax cost ($) | Gross unrealized appreciation ($) | Gross unrealized (depreciation) ($) | Net unrealized appreciation ($) |
| 1,930,269,000 | 658,840,000 | (40,019,000) | 618,821,000 |
| Borrower or lender | Average loan balance ($) | Weighted average interest rate (%) | Number of days with outstanding loans |
| Lender | 3,677,778 | 1.13 | 9 |
| Columbia Select Mid Cap Value Fund | Semiannual Report 2022 | 25 |
August 31, 2022 (Unaudited)
| Shares | |
| Class A | 2,451,935 |
| Advisor Class | 185,751 |
| Institutional 3 Class | 83,061 |
| 26 | Columbia Select Mid Cap Value Fund | Semiannual Report 2022 |
August 31, 2022 (Unaudited)
| ($) | |
| Net investment income | 13,725,000 |
| Net realized gain | 296,199,000 |
| Net change in unrealized appreciation/(depreciation) | 129,758,000 |
| Net increase in net assets from operations | 439,682,000 |
| Columbia Select Mid Cap Value Fund | Semiannual Report 2022 | 27 |
August 31, 2022 (Unaudited)
| 28 | Columbia Select Mid Cap Value Fund | Semiannual Report 2022 |
| • | the Fund had sufficient liquidity to both meet redemptions and operate effectively on behalf of shareholders; |
| • | there were no material changes to the Program during the period; |
| • | the implementation of the Program was effective to manage the Fund’s liquidity risk; and |
| • | the Program operated adequately during the period. |
| Columbia Select Mid Cap Value Fund | Semiannual Report 2022 | 29 |
(Unaudited)
| • | Information on the investment performance of the Fund relative to the performance of a group of mutual funds determined to be comparable to the Fund by Broadridge, as well as performance relative to benchmarks; |
| • | Information on the Fund’s management fees and total expenses, including information comparing the Fund’s expenses to those of a group of comparable mutual funds, as determined by Broadridge; |
| • | The Investment Manager’s agreement to contractually limit or cap total operating expenses for the Fund so that total operating expenses (excluding certain fees and expenses, such as transaction costs and certain other investment related expenses, interest, taxes, acquired fund fees and expenses and infrequent and/or unusual expenses) would not exceed a specified annual rate, as a percentage of the Fund’s net assets; |
| • | Terms of the Management Agreement; |
| • | Descriptions of other agreements and arrangements with affiliates of the Investment Manager relating to the operations of the Fund, including agreements with respect to the provision of transfer agency and shareholder services to the Fund; |
| • | Descriptions of various services performed by the Investment Manager under the Management Agreement, including portfolio management and portfolio trading practices; |
| • | Information regarding any recently negotiated management fees of similarly-managed portfolios of other institutional clients of the Investment Manager; |
| • | Information regarding the resources of the Investment Manager, including information regarding senior management, portfolio managers and other personnel; |
| • | Information regarding the capabilities of the Investment Manager with respect to compliance monitoring services; |
| • | The profitability to the Investment Manager and its affiliates from their relationships with the Fund; and |
| • | Report provided by the Board’s independent fee consultant, JDL Consultants, LLC (JDL). |
| 30 | Columbia Select Mid Cap Value Fund | Semiannual Report 2022 |
(Unaudited)
into account the organization and strength of the Fund’s and its service providers’ compliance programs. The Board also reviewed the financial condition of the Investment Manager and its affiliates and each entity’s ability to carry out its responsibilities under the Management Agreement and the Fund’s other service agreements.
| Columbia Select Mid Cap Value Fund | Semiannual Report 2022 | 31 |
(Unaudited)
Manager in 2021 increased from 2020 levels, due to a variety of factors, including the increased assets under management of the Funds. It also took into account the indirect economic benefits flowing to the Investment Manager or its affiliates in connection with managing or distributing the Funds, such as the enhanced ability to offer various other financial products to Ameriprise Financial customers, soft dollar benefits and overall reputational advantages. The Board noted that the fees paid by the Fund should permit the Investment Manager to offer competitive compensation to its personnel, make necessary investments in its business and earn an appropriate profit. After reviewing these and related factors, the Board concluded, within the context of their overall conclusions, that the costs of services provided and the profitability to the Investment Manager and its affiliates from their relationships with the Fund supported the continuation of the Management Agreement.
| 32 | Columbia Select Mid Cap Value Fund | Semiannual Report 2022 |
columbiathreadneedleus.com/investor/. The Fund is distributed by Columbia Management Investment Distributors, Inc., member FINRA, and managed by Columbia Management Investment Advisers, LLC.

August 31, 2022 (Unaudited)

(Unaudited)

| Average annual total returns (%) (for the period ended August 31, 2022) | ||||||
| Inception | 6 Months cumulative | 1 Year | 5 Years | 10 Years | ||
| Class A | 10/15/96 | -9.51 | -12.57 | 8.15 | 10.98 | |
| Institutional Class | 10/15/96 | -9.42 | -12.36 | 8.43 | 11.26 | |
| Institutional 2 Class* | 11/08/12 | -9.41 | -12.36 | 8.42 | 11.26 | |
| Institutional 3 Class* | 03/01/17 | -9.43 | -12.36 | 8.42 | 11.14 | |
| S&P SmallCap 600 Index | -9.33 | -12.12 | 8.65 | 11.50 | ||
| * | The returns shown for periods prior to the share class inception date (including returns for the Life of the Fund, if shown, which are since Fund inception) include the returns of the Fund’s oldest share class. Since the Fund launched more than one share class at its inception, Class A shares were used. These returns are adjusted to reflect any higher class-related operating expenses of the newer share classes, as applicable. Please visit columbiathreadneedleus.com/investor/investment-products/mutual-funds/appended-performance for more information. |
| Columbia Small Cap Index Fund | Semiannual Report 2022 | 3 |
(Unaudited)
| Portfolio breakdown (%) (at August 31, 2022) | |
| Common Stocks | 98.1 |
| Exchange-Traded Equity Funds | 1.0 |
| Money Market Funds | 0.9 |
| Total | 100.0 |
| Equity sector breakdown (%) (at August 31, 2022) | |
| Communication Services | 2.2 |
| Consumer Discretionary | 12.6 |
| Consumer Staples | 4.8 |
| Energy | 4.8 |
| Financials | 18.5 |
| Health Care | 12.0 |
| Industrials | 16.4 |
| Information Technology | 13.3 |
| Materials | 5.6 |
| Real Estate | 7.6 |
| Utilities | 2.2 |
| Total | 100.0 |
| 4 | Columbia Small Cap Index Fund | Semiannual Report 2022 |
(Unaudited)
| March 1, 2022 — August 31, 2022 | |||||||
| Account value at the beginning of the period ($) | Account value at the end of the period ($) | Expenses paid during the period ($) | Fund’s annualized expense ratio (%) | ||||
| Actual | Hypothetical | Actual | Hypothetical | Actual | Hypothetical | Actual | |
| Class A | 1,000.00 | 1,000.00 | 904.90 | 1,022.94 | 2.16 | 2.29 | 0.45 |
| Institutional Class | 1,000.00 | 1,000.00 | 905.80 | 1,024.20 | 0.96 | 1.02 | 0.20 |
| Institutional 2 Class | 1,000.00 | 1,000.00 | 905.90 | 1,024.20 | 0.96 | 1.02 | 0.20 |
| Institutional 3 Class | 1,000.00 | 1,000.00 | 905.70 | 1,024.20 | 0.96 | 1.02 | 0.20 |
| Columbia Small Cap Index Fund | Semiannual Report 2022 | 5 |
August 31, 2022 (Unaudited)
| Common Stocks 98.2% | ||
| Issuer | Shares | Value ($) |
| Communication Services 2.1% | ||
| Diversified Telecommunication Services 0.4% | ||
| ATN International, Inc. | 42,535 | 1,992,765 |
| Cogent Communications Holdings, Inc. | 167,032 | 8,894,454 |
| Consolidated Communications Holdings, Inc.(a) | 284,635 | 1,633,805 |
| Total | 12,521,024 | |
| Entertainment 0.2% | ||
| Cinemark Holdings, Inc.(a) | 419,710 | 5,909,517 |
| Marcus Corp. (The) | 86,324 | 1,388,953 |
| Total | 7,298,470 | |
| Interactive Media & Services 0.5% | ||
| Cars.com, Inc.(a) | 255,752 | 3,260,838 |
| QuinStreet, Inc.(a) | 197,415 | 2,370,954 |
| Shutterstock, Inc. | 90,801 | 5,031,284 |
| Yelp, Inc.(a) | 260,783 | 8,910,955 |
| Total | 19,574,031 | |
| Media 0.6% | ||
| AMC Networks, Inc., Class A(a) | 116,918 | 3,132,233 |
| EW Scripps Co. (The), Class A(a) | 226,300 | 3,383,185 |
| Gannett Co, Inc.(a) | 573,937 | 1,331,534 |
| Scholastic Corp. | 119,299 | 5,477,017 |
| TechTarget, Inc.(a) | 104,125 | 6,757,712 |
| Thryv Holdings, Inc.(a) | 67,027 | 1,714,551 |
| Total | 21,796,232 | |
| Wireless Telecommunication Services 0.4% | ||
| Gogo(a) | 267,493 | 3,974,946 |
| Shenandoah Telecommunications Co. | 195,980 | 4,368,394 |
| Telephone and Data Systems, Inc. | 386,294 | 6,285,003 |
| Total | 14,628,343 | |
| Total Communication Services | 75,818,100 | |
| Consumer Discretionary 12.3% | ||
| Auto Components 1.3% | ||
| American Axle & Manufacturing Holdings, Inc.(a) | 448,238 | 4,639,263 |
| Dorman Products, Inc.(a) | 110,813 | 10,045,198 |
| Gentherm, Inc.(a) | 129,719 | 7,770,168 |
| LCI Industries | 99,505 | 11,529,644 |
| Common Stocks (continued) | ||
| Issuer | Shares | Value ($) |
| Motorcar Parts of America, Inc.(a) | 74,789 | 1,111,365 |
| Patrick Industries, Inc. | 85,566 | 4,532,431 |
| Standard Motor Products, Inc. | 74,358 | 2,728,939 |
| XPEL, Inc.(a) | 64,867 | 4,445,336 |
| Total | 46,802,344 | |
| Automobiles 0.2% | ||
| Winnebago Industries, Inc. | 128,325 | 7,388,953 |
| Diversified Consumer Services 0.9% | ||
| Adtalem Global Education, Inc.(a) | 176,749 | 6,661,670 |
| American Public Education, Inc.(a) | 73,825 | 762,612 |
| frontdoor, Inc.(a) | 322,058 | 7,561,922 |
| Perdoceo Education Corp.(a) | 269,285 | 3,118,320 |
| Strategic Education, Inc. | 89,895 | 5,816,207 |
| Stride, Inc.(a) | 167,388 | 6,384,178 |
| WW International, Inc.(a) | 209,275 | 1,092,416 |
| Total | 31,397,325 | |
| Hotels, Restaurants & Leisure 1.7% | ||
| BJ’s Restaurants, Inc.(a) | 91,769 | 2,301,567 |
| Bloomin’ Brands, Inc. | 316,036 | 6,390,248 |
| Brinker International, Inc.(a) | 171,647 | 4,207,068 |
| Cheesecake Factory, Inc. (The) | 192,202 | 5,885,225 |
| Chuy’s Holdings, Inc.(a) | 74,147 | 1,655,702 |
| Dave & Buster’s Entertainment, Inc.(a) | 152,412 | 6,300,712 |
| Dine Brands Global, Inc. | 65,584 | 4,367,894 |
| El Pollo Loco Holdings, Inc.(a) | 76,263 | 690,180 |
| Golden Entertainment, Inc.(a) | 79,424 | 3,038,762 |
| Jack in the Box, Inc. | 82,388 | 6,579,506 |
| Monarch Casino & Resort, Inc.(a) | 51,730 | 3,123,975 |
| Ruth’s Hospitality Group, Inc. | 122,573 | 2,233,280 |
| Shake Shack, Inc., Class A(a) | 153,571 | 7,319,194 |
| Six Flags Entertainment Corp.(a) | 304,599 | 6,746,868 |
| Total | 60,840,181 | |
| 6 | Columbia Small Cap Index Fund | Semiannual Report 2022 |
August 31, 2022 (Unaudited)
| Common Stocks (continued) | ||
| Issuer | Shares | Value ($) |
| Household Durables 2.4% | ||
| Cavco Industries, Inc.(a) | 33,368 | 7,808,446 |
| Century Communities, Inc. | 113,436 | 5,296,327 |
| Ethan Allen Interiors, Inc. | 86,253 | 2,050,234 |
| Green Brick Partners, Inc.(a) | 180,134 | 4,388,064 |
| Installed Building Products, Inc. | 90,613 | 8,205,913 |
| iRobot Corp.(a) | 106,165 | 6,250,995 |
| La-Z-Boy, Inc. | 169,224 | 4,465,821 |
| LGI Homes, Inc.(a) | 81,539 | 7,738,867 |
| M/I Homes, Inc.(a) | 110,758 | 4,789,176 |
| MDC Holdings, Inc. | 222,892 | 6,927,484 |
| Meritage Homes Corp.(a) | 143,669 | 11,256,466 |
| Sonos, Inc.(a) | 500,714 | 7,530,739 |
| Tri Pointe Homes, Inc.(a) | 404,995 | 7,018,563 |
| Tupperware Brands Corp.(a) | 179,493 | 2,017,501 |
| Universal Electronics, Inc.(a) | 49,449 | 1,099,251 |
| Total | 86,843,847 | |
| Internet & Direct Marketing Retail 0.1% | ||
| Liquidity Services, Inc.(a) | 104,466 | 1,827,110 |
| PetMed Express, Inc. | 82,137 | 1,689,558 |
| Total | 3,516,668 | |
| Leisure Products 0.3% | ||
| Sturm Ruger & Co., Inc. | 68,947 | 3,602,481 |
| Vista Outdoor, Inc.(a) | 219,617 | 6,175,630 |
| Total | 9,778,111 | |
| Multiline Retail 0.1% | ||
| Big Lots, Inc. | 111,811 | 2,299,952 |
| Specialty Retail 4.3% | ||
| Aaron’s Co., Inc. (The) | 120,233 | 1,430,773 |
| Abercrombie & Fitch Co., Class A(a) | 197,386 | 2,840,385 |
| Academy Sports & Outdoors, Inc. | 334,369 | 14,404,617 |
| America’s Car-Mart, Inc.(a) | 23,449 | 1,890,224 |
| Asbury Automotive Group, Inc.(a) | 86,648 | 15,118,343 |
| Bed Bath & Beyond, Inc.(a) | 312,615 | 2,979,221 |
| Boot Barn Holdings, Inc.(a) | 116,427 | 7,756,367 |
| Buckle, Inc. (The) | 115,719 | 3,735,409 |
| Caleres, Inc. | 148,661 | 3,793,829 |
| Cato Corp. (The), Class A | 68,557 | 741,101 |
| Common Stocks (continued) | ||
| Issuer | Shares | Value ($) |
| Chico’s FAS, Inc.(a) | 489,959 | 2,782,967 |
| Children’s Place, Inc. (The)(a) | 50,395 | 2,125,661 |
| Conn’s, Inc.(a) | 60,535 | 581,741 |
| Designer Brands, Inc. | 237,571 | 4,052,961 |
| Genesco, Inc.(a) | 50,527 | 2,858,818 |
| Group 1 Automotive, Inc. | 64,977 | 11,604,242 |
| Guess?, Inc. | 140,405 | 2,452,875 |
| Haverty Furniture Companies, Inc. | 54,335 | 1,457,265 |
| Hibbett, Inc. | 47,741 | 2,797,623 |
| LL Flooring Holdings, Inc.(a) | 116,591 | 949,051 |
| MarineMax, Inc.(a) | 84,303 | 3,063,571 |
| Monro, Inc. | 131,340 | 6,082,355 |
| National Vision Holdings, Inc.(a) | 318,785 | 10,593,226 |
| ODP Corp. (The)(a) | 171,429 | 6,128,587 |
| Rent-A-Center, Inc. | 210,718 | 5,444,953 |
| Sally Beauty Holdings, Inc.(a) | 418,933 | 6,233,723 |
| Shoe Carnival, Inc. | 66,966 | 1,593,121 |
| Signet Jewelers Ltd. | 185,546 | 12,129,142 |
| Sleep Number Corp.(a) | 87,043 | 3,606,191 |
| Sonic Automotive, Inc., Class A | 76,528 | 4,070,524 |
| Urban Outfitters, Inc.(a) | 250,941 | 5,051,442 |
| Zumiez, Inc.(a) | 64,682 | 1,679,145 |
| Total | 152,029,453 | |
| Textiles, Apparel & Luxury Goods 1.0% | ||
| Fossil Group, Inc.(a) | 184,438 | 780,173 |
| G-III Apparel Group Ltd.(a) | 168,838 | 3,557,417 |
| Kontoor Brands, Inc. | 182,058 | 6,778,019 |
| Movado Group, Inc. | 63,055 | 2,010,824 |
| Oxford Industries, Inc. | 60,155 | 6,420,343 |
| Steven Madden Ltd. | 293,928 | 8,556,244 |
| Unifi, Inc.(a) | 54,259 | 616,382 |
| Wolverine World Wide, Inc. | 316,092 | 6,176,438 |
| Total | 34,895,840 | |
| Total Consumer Discretionary | 435,792,674 | |
| Consumer Staples 4.7% | ||
| Beverages 0.3% | ||
| MGP Ingredients, Inc. | 49,066 | 5,370,765 |
| National Beverage Corp. | 91,357 | 5,066,659 |
| Total | 10,437,424 | |
| Columbia Small Cap Index Fund | Semiannual Report 2022 | 7 |
August 31, 2022 (Unaudited)
| Common Stocks (continued) | ||
| Issuer | Shares | Value ($) |
| Food & Staples Retailing 0.8% | ||
| Andersons, Inc. (The) | 123,180 | 4,561,355 |
| PriceSmart, Inc. | 94,285 | 5,965,412 |
| SpartanNash Co. | 141,524 | 4,306,575 |
| The Chefs’ Warehouse(a) | 128,731 | 4,291,892 |
| United Natural Foods, Inc.(a) | 228,121 | 10,055,574 |
| Total | 29,180,808 | |
| Food Products 2.0% | ||
| B&G Foods, Inc. | 269,700 | 5,841,702 |
| Calavo Growers, Inc. | 69,362 | 2,915,978 |
| Cal-Maine Foods, Inc. | 146,895 | 7,875,041 |
| Fresh Del Monte Produce, Inc. | 131,055 | 3,583,044 |
| Hostess Brands, Inc.(a) | 541,425 | 12,550,232 |
| J&J Snack Foods Corp. | 58,558 | 8,726,899 |
| John B. Sanfilippo & Son, Inc. | 34,959 | 2,822,240 |
| Seneca Foods Corp., Class A(a) | 23,736 | 1,253,973 |
| Simply Good Foods Co. (The)(a) | 345,815 | 10,564,648 |
| Tootsie Roll Industries, Inc. | 69,747 | 2,499,035 |
| TreeHouse Foods, Inc.(a) | 219,327 | 10,220,638 |
| Total | 68,853,430 | |
| Household Products 0.5% | ||
| Central Garden & Pet Co.(a) | 38,169 | 1,523,706 |
| Central Garden & Pet Co., Class A(a) | 155,051 | 5,854,726 |
| WD-40 Co. | 53,486 | 10,117,412 |
| Total | 17,495,844 | |
| Personal Products 0.8% | ||
| Edgewell Personal Care Co. | 206,732 | 8,054,279 |
| elf Beauty, Inc.(a) | 187,740 | 7,158,526 |
| Inter Parfums, Inc. | 69,821 | 5,482,345 |
| Medifast, Inc. | 45,080 | 5,656,638 |
| Usana Health Sciences, Inc.(a) | 45,075 | 2,908,239 |
| Total | 29,260,027 | |
| Tobacco 0.3% | ||
| Universal Corp. | 96,346 | 4,917,500 |
| Vector Group Ltd. | 515,624 | 5,053,115 |
| Total | 9,970,615 | |
| Total Consumer Staples | 165,198,148 | |
| Common Stocks (continued) | ||
| Issuer | Shares | Value ($) |
| Energy 4.7% | ||
| Energy Equipment & Services 1.8% | ||
| Archrock, Inc. | 528,700 | 3,907,093 |
| Bristow Group, Inc.(a) | 90,863 | 2,635,936 |
| Core Laboratories NV | 181,306 | 2,928,092 |
| DMC Global Inc(a) | 76,335 | 1,703,797 |
| Dril-Quip, Inc.(a) | 135,150 | 2,990,870 |
| Helix Energy Solutions Group, Inc.(a) | 558,123 | 2,411,091 |
| Helmerich & Payne, Inc. | 412,222 | 17,622,491 |
| Nabors Industries Ltd.(a) | 34,639 | 4,590,014 |
| Oceaneering International, Inc.(a) | 392,517 | 3,473,775 |
| Oil States International, Inc.(a) | 242,317 | 1,187,353 |
| Patterson-UTI Energy, Inc. | 846,875 | 12,618,438 |
| ProPetro Holding Corp.(a) | 334,664 | 3,065,522 |
| RPC, Inc. | 275,643 | 2,191,362 |
| US Silica Holdings, Inc.(a) | 295,509 | 4,145,991 |
| Total | 65,471,825 | |
| Oil, Gas & Consumable Fuels 2.9% | ||
| Callon Petroleum Co.(a) | 185,978 | 7,915,224 |
| Civitas Resources, Inc. | 282,765 | 18,998,980 |
| CONSOL Energy, Inc. | 125,400 | 9,001,212 |
| Dorian LPG Ltd. | 108,436 | 1,577,744 |
| Green Plains, Inc.(a) | 210,725 | 7,718,857 |
| Laredo Petroleum, Inc.(a) | 56,906 | 4,416,475 |
| Par Pacific Holdings, Inc.(a) | 178,891 | 3,363,151 |
| PBF Energy, Inc., Class A(a) | 373,724 | 12,766,412 |
| Ranger Oil Corp. | 82,858 | 3,230,633 |
| REX American Resources Corp.(a) | 61,190 | 1,854,057 |
| SM Energy Co. | 477,125 | 21,026,899 |
| Talos Energy, Inc.(a) | 161,572 | 3,349,387 |
| World Fuel Services Corp. | 246,718 | 6,365,324 |
| Total | 101,584,355 | |
| Total Energy | 167,056,180 | |
| 8 | Columbia Small Cap Index Fund | Semiannual Report 2022 |
August 31, 2022 (Unaudited)
| Common Stocks (continued) | ||
| Issuer | Shares | Value ($) |
| Financials 18.2% | ||
| Banks 10.3% | ||
| Allegiance Bancshares, Inc. | 74,200 | 3,143,112 |
| Ameris Bancorp | 258,265 | 12,055,810 |
| Banc of California, Inc. | 207,485 | 3,502,347 |
| BancFirst Corp. | 74,329 | 8,017,126 |
| Bancorp, Inc. (The)(a) | 221,492 | 5,253,790 |
| BankUnited, Inc. | 320,214 | 11,863,929 |
| Banner Corp. | 134,590 | 8,177,688 |
| Berkshire Hills Bancorp, Inc. | 185,280 | 5,226,749 |
| Brookline Bancorp, Inc. | 303,297 | 3,782,114 |
| Central Pacific Financial Corp. | 107,872 | 2,350,531 |
| City Holding Co. | 58,587 | 4,980,481 |
| Columbia Banking System, Inc. | 304,810 | 9,129,059 |
| Community Bank System, Inc. | 211,070 | 13,799,757 |
| Customers Bancorp, Inc.(a) | 118,798 | 4,121,103 |
| CVB Financial Corp. | 519,134 | 13,622,076 |
| Dime Community Bancshares, Inc. | 125,992 | 3,938,510 |
| Eagle Bancorp, Inc. | 125,600 | 6,095,368 |
| FB Financial Corp. | 138,702 | 5,495,373 |
| First BanCorp | 773,312 | 11,058,362 |
| First BanCorp | 135,352 | 4,928,166 |
| First Commonwealth Financial Corp. | 369,272 | 4,977,787 |
| First Financial Bancorp | 369,765 | 7,979,529 |
| First Hawaiian, Inc. | 501,391 | 12,890,763 |
| Hanmi Financial Corp. | 119,285 | 2,948,725 |
| Heritage Financial Corp. | 137,432 | 3,571,858 |
| Hilltop Holdings, Inc. | 194,640 | 5,138,496 |
| HomeStreet, Inc. | 73,219 | 2,548,753 |
| Hope Bancorp, Inc. | 471,377 | 6,820,825 |
| Independent Bank Corp. | 183,150 | 14,327,824 |
| Independent Bank Group, Inc. | 142,340 | 9,588,022 |
| Lakeland Financial Corp. | 99,235 | 7,476,365 |
| Meta Financial Group, Inc. | 114,971 | 3,789,444 |
| National Bank Holdings Corp., Class A | 117,649 | 4,721,254 |
| NBT Bancorp, Inc. | 167,673 | 6,502,359 |
| Northwest Bancshares, Inc. | 496,098 | 6,980,099 |
| OFG Bancorp | 190,288 | 5,175,834 |
| Pacific Premier Bancorp, Inc. | 371,672 | 12,175,975 |
| Common Stocks (continued) | ||
| Issuer | Shares | Value ($) |
| Park National Corp. | 56,620 | 7,464,215 |
| Preferred Bank | 53,310 | 3,616,550 |
| Renasant Corp. | 218,861 | 7,296,826 |
| S&T Bancorp, Inc. | 153,911 | 4,561,922 |
| Seacoast Banking Corp. of Florida | 239,764 | 7,749,172 |
| ServisFirst Bancshares, Inc. | 191,302 | 16,138,237 |
| Simmons First National Corp., Class A | 496,193 | 11,705,193 |
| Southside Bancshares, Inc. | 125,765 | 4,738,825 |
| Tompkins Financial Corp. | 46,060 | 3,299,738 |
| Triumph Bancorp, Inc.(a) | 92,242 | 5,710,702 |
| Trustmark Corp. | 240,645 | 7,589,943 |
| United Community Banks, Inc. | 410,968 | 13,779,757 |
| Veritex Holdings, Inc. | 211,097 | 6,356,131 |
| Westamerica BanCorp | 105,261 | 5,889,353 |
| Total | 364,051,927 | |
| Capital Markets 1.0% | ||
| B Riley Financial, Inc. | 63,420 | 3,156,413 |
| Blucora, Inc.(a) | 184,987 | 3,714,539 |
| BrightSphere Investment Group, Inc. | 126,507 | 2,162,005 |
| Donnelley Financial Solutions, Inc.(a) | 109,529 | 4,649,506 |
| Piper Sandler Companies | 55,381 | 6,345,001 |
| StoneX Group, Inc.(a) | 67,188 | 6,237,734 |
| Virtus Investment Partners, Inc. | 27,503 | 5,259,949 |
| WisdomTree Investments, Inc. | 430,361 | 2,156,108 |
| Total | 33,681,255 | |
| Consumer Finance 0.8% | ||
| Encore Capital Group, Inc.(a) | 94,979 | 5,193,452 |
| Enova International, Inc.(a) | 127,484 | 4,454,291 |
| Ezcorp, Inc., Class A(a) | 210,189 | 1,839,154 |
| Green Dot Corp., Class A(a) | 212,252 | 4,306,593 |
| LendingTree, Inc.(a) | 42,984 | 1,310,582 |
| PRA Group, Inc.(a) | 155,787 | 5,754,772 |
| PROG Holdings, Inc.(a) | 211,590 | 3,922,878 |
| World Acceptance Corp.(a) | 14,306 | 1,662,929 |
| Total | 28,444,651 | |
| Columbia Small Cap Index Fund | Semiannual Report 2022 | 9 |
August 31, 2022 (Unaudited)
| Common Stocks (continued) | ||
| Issuer | Shares | Value ($) |
| Insurance 3.0% | ||
| Ambac Financial Group, Inc.(a) | 176,342 | 2,661,001 |
| American Equity Investment Life Holding Co. | 302,421 | 11,491,998 |
| AMERISAFE, Inc. | 75,642 | 3,617,200 |
| Assured Guaranty Ltd. | 250,942 | 12,815,608 |
| eHealth, Inc.(a) | 94,562 | 605,197 |
| Employers Holdings, Inc. | 108,600 | 4,252,776 |
| Genworth Financial, Inc., Class A(a) | 1,998,741 | 8,434,687 |
| HCI Group, Inc. | 30,905 | 1,476,950 |
| Horace Mann Educators Corp. | 162,212 | 5,802,323 |
| James River Group Holdings Ltd. | 146,625 | 3,483,810 |
| Mr. Cooper Group, Inc.(a) | 289,359 | 12,239,886 |
| Palomar Holdings, Inc.(a) | 93,656 | 7,425,984 |
| ProAssurance Corp. | 211,610 | 4,526,338 |
| Safety Insurance Group, Inc. | 54,832 | 4,937,622 |
| Selectquote, Inc.(a) | 489,190 | 543,001 |
| SiriusPoint Ltd.(a) | 338,732 | 1,514,132 |
| Stewart Information Services Corp. | 105,778 | 5,356,598 |
| Trupanion, Inc.(a) | 135,514 | 9,564,578 |
| United Fire Group, Inc. | 84,605 | 2,489,925 |
| Universal Insurance Holdings, Inc. | 109,044 | 1,301,985 |
| Total | 104,541,599 | |
| Mortgage Real Estate Investment Trusts (REITS) 1.3% | ||
| Apollo Commercial Real Estate Finance, Inc. | 517,419 | 6,027,931 |
| ARMOUR Residential REIT, Inc. | 403,934 | 2,867,931 |
| Ellington Financial, Inc. | 221,911 | 3,257,654 |
| Franklin BSP Realty Trust, Inc. | 327,669 | 4,226,930 |
| Granite Point Mortgage Trust, Inc. | 210,858 | 1,986,282 |
| Invesco Mortgage Capital, Inc. | 129,171 | 2,052,527 |
| KKR Real Estate Finance Trust, Inc. | 194,163 | 3,739,579 |
| New York Mortgage Trust, Inc. | 1,492,675 | 4,179,490 |
| PennyMac Mortgage Investment Trust | 360,021 | 5,346,312 |
| Ready Capital Corp. | 263,441 | 3,451,077 |
| Redwood Trust, Inc. | 470,982 | 3,650,111 |
| Two Harbors Investment Corp. | 1,347,397 | 6,534,876 |
| Total | 47,320,700 | |
| Common Stocks (continued) | ||
| Issuer | Shares | Value ($) |
| Thrifts & Mortgage Finance 1.8% | ||
| Axos Financial, Inc.(a) | 210,235 | 8,783,618 |
| Capitol Federal Financial, Inc. | 505,593 | 4,580,673 |
| Flagstar Bancorp, Inc. | 208,470 | 8,032,349 |
| NMI Holdings, Inc., Class A(a) | 337,019 | 6,919,000 |
| Northfield Bancorp, Inc. | 168,473 | 2,483,292 |
| Provident Financial Services, Inc. | 294,895 | 6,850,411 |
| TrustCo Bank Corp. | 75,161 | 2,505,868 |
| Walker & Dunlop, Inc. | 119,334 | 11,988,294 |
| WSFS Financial Corp. | 253,452 | 12,254,404 |
| Total | 64,397,909 | |
| Total Financials | 642,438,041 | |
| Health Care 11.8% | ||
| Biotechnology 2.7% | ||
| Anika Therapeutics, Inc.(a) | 56,943 | 1,286,912 |
| Arcus Biosciences, Inc.(a) | 182,517 | 4,395,009 |
| Avid Bioservices, Inc.(a) | 241,742 | 4,162,797 |
| Coherus Biosciences, Inc.(a) | 251,597 | 2,812,854 |
| Cytokinetics, Inc.(a) | 335,347 | 17,759,977 |
| Dynavax Technologies Corp.(a) | 459,922 | 5,275,305 |
| Eagle Pharmaceuticals, Inc.(a) | 43,753 | 1,433,786 |
| Emergent BioSolutions, Inc.(a) | 175,078 | 4,205,374 |
| Enanta Pharmaceuticals, Inc.(a) | 72,175 | 4,394,014 |
| Ironwood Pharmaceuticals, Inc.(a) | 602,310 | 6,480,856 |
| iTeos Therapeutics, Inc.(a) | 79,316 | 1,759,229 |
| Ligand Pharmaceuticals, Inc.(a) | 66,015 | 6,099,126 |
| Myriad Genetics, Inc.(a) | 314,561 | 7,027,293 |
| Organogenesis Holdings, Inc.(a) | 247,731 | 889,354 |
| REGENXBIO, Inc.(a) | 148,614 | 4,384,113 |
| uniQure NV(a) | 142,457 | 2,783,610 |
| Vanda Pharmaceuticals, Inc.(a) | 221,171 | 2,339,989 |
| Vericel Corp.(a) | 184,485 | 4,602,901 |
| Vir Biotechnology, Inc.(a) | 290,238 | 6,893,153 |
| Xencor, Inc.(a) | 233,124 | 6,152,142 |
| Total | 95,137,794 | |
| 10 | Columbia Small Cap Index Fund | Semiannual Report 2022 |
August 31, 2022 (Unaudited)
| Common Stocks (continued) | ||
| Issuer | Shares | Value ($) |
| Health Care Equipment & Supplies 3.3% | ||
| Angiodynamics, Inc.(a) | 151,832 | 3,361,560 |
| Artivion, Inc.(a) | 157,400 | 3,487,984 |
| Avanos Medical, Inc.(a) | 185,288 | 4,563,643 |
| BioLife Solutions, Inc.(a) | 119,552 | 2,822,623 |
| Cardiovascular Systems, Inc.(a) | 159,682 | 2,109,399 |
| CONMED Corp. | 115,601 | 10,238,781 |
| Cutera, Inc.(a) | 64,712 | 3,089,998 |
| Embecta Corp. | 226,292 | 7,223,241 |
| Glaukos Corp.(a) | 185,323 | 8,997,432 |
| Heska Corp.(a) | 42,249 | 3,847,616 |
| Inogen, Inc.(a) | 80,467 | 2,303,770 |
| Integer Holdings Corp.(a) | 129,606 | 8,174,250 |
| Lantheus Holdings, Inc.(a) | 268,717 | 21,174,900 |
| LeMaitre Vascular, Inc. | 75,633 | 3,734,758 |
| Meridian Bioscience, Inc.(a) | 170,606 | 5,560,050 |
| Merit Medical Systems, Inc.(a) | 199,727 | 11,829,830 |
| Mesa Laboratories, Inc. | 20,618 | 3,522,792 |
| OraSure Technologies, Inc.(a) | 283,681 | 1,160,255 |
| Orthofix Medical, Inc.(a) | 77,960 | 1,551,404 |
| SurModics, Inc.(a) | 54,774 | 1,845,336 |
| Varex Imaging Corp.(a) | 155,826 | 3,286,370 |
| Zimvie, Inc.(a) | 81,687 | 1,243,276 |
| Zynex, Inc. | 87,139 | 779,020 |
| Total | 115,908,288 | |
| Health Care Providers & Services 3.5% | ||
| AdaptHealth Corp.(a) | 383,813 | 6,897,120 |
| Addus HomeCare Corp.(a) | 62,922 | 5,613,901 |
| AMN Healthcare Services, Inc.(a) | 175,081 | 17,970,314 |
| Apollo Medical Holdings, Inc.(a) | 149,222 | 6,435,945 |
| Community Health Systems, Inc.(a) | 495,716 | 1,318,605 |
| Corvel Corp.(a) | 36,565 | 5,681,470 |
| Covetrus, Inc.(a) | 409,354 | 8,543,218 |
| Cross Country Healthcare, Inc.(a) | 139,143 | 3,531,449 |
| Enhabit, Inc.(a) | 195,376 | 3,243,242 |
| Ensign Group, Inc. (The) | 206,345 | 17,601,228 |
| Fulgent Genetics, Inc.(a) | 77,179 | 3,354,971 |
| Hanger, Inc.(a) | 145,167 | 2,704,461 |
| Joint Corp. (The)(a) | 56,618 | 1,032,712 |
| Common Stocks (continued) | ||
| Issuer | Shares | Value ($) |
| ModivCare, Inc.(a) | 48,397 | 5,242,363 |
| Owens & Minor, Inc. | 297,984 | 8,793,508 |
| Pediatrix Medical Group, Inc.(a) | 337,171 | 6,008,387 |
| Pennant Group, Inc. (The)(a) | 106,131 | 1,663,073 |
| RadNet, Inc.(a) | 182,691 | 3,670,262 |
| Select Medical Holdings Corp. | 404,033 | 10,359,406 |
| U.S. Physical Therapy, Inc. | 50,863 | 4,201,792 |
| Total | 123,867,427 | |
| Health Care Technology 0.6% | ||
| Allscripts Healthcare Solutions, Inc.(a) | 454,244 | 7,722,148 |
| Computer Programs & Systems, Inc.(a) | 57,804 | 1,763,600 |
| HealthStream, Inc.(a) | 95,193 | 2,106,621 |
| NextGen Healthcare, Inc.(a) | 219,905 | 3,769,172 |
| OptimizeRx Corp.(a) | 71,069 | 1,127,865 |
| Simulations Plus, Inc. | 61,710 | 3,705,685 |
| Total | 20,195,091 | |
| Life Sciences Tools & Services 0.1% | ||
| NeoGenomics, Inc.(a) | 488,456 | 4,908,983 |
| Pharmaceuticals 1.6% | ||
| Amphastar Pharmaceuticals, Inc.(a) | 147,209 | 4,357,386 |
| ANI Pharmaceuticals, Inc.(a) | 51,287 | 1,891,977 |
| Cara Therapeutics, Inc.(a) | 165,758 | 1,710,623 |
| Collegium Pharmaceutical, Inc.(a) | 133,012 | 2,338,351 |
| Corcept Therapeutics, Inc.(a) | 374,397 | 9,666,931 |
| Harmony Biosciences Holdings, Inc.(a) | 90,163 | 3,959,057 |
| Innoviva, Inc.(a) | 245,598 | 3,232,070 |
| Nektar Therapeutics(a) | 729,304 | 2,873,458 |
| Pacira Pharmaceuticals, Inc.(a) | 177,896 | 9,335,982 |
| Phibro Animal Health Corp., Class A | 79,628 | 1,179,291 |
| Prestige Consumer Healthcare, Inc.(a) | 196,854 | 9,956,875 |
| Supernus Pharmaceuticals, Inc.(a) | 209,124 | 7,158,314 |
| Total | 57,660,315 | |
| Total Health Care | 417,677,898 | |
| Columbia Small Cap Index Fund | Semiannual Report 2022 | 11 |
August 31, 2022 (Unaudited)
| Common Stocks (continued) | ||
| Issuer | Shares | Value ($) |
| Industrials 16.2% | ||
| Aerospace & Defense 1.3% | ||
| AAR Corp.(a) | 129,536 | 5,554,504 |
| Aerojet Rocketdyne Holdings, Inc.(a) | 292,997 | 12,619,381 |
| Aerovironment, Inc.(a) | 90,716 | 8,041,973 |
| Kaman Corp. | 109,540 | 3,474,609 |
| Moog, Inc., Class A | 113,549 | 8,513,904 |
| National Presto Industries, Inc. | 19,885 | 1,356,555 |
| Park Aerospace Corp. | 76,093 | 875,830 |
| Triumph Group, Inc.(a) | 253,029 | 3,286,847 |
| Total | 43,723,603 | |
| Air Freight & Logistics 0.9% | ||
| Atlas Air Worldwide Holdings, Inc.(a) | 102,644 | 10,256,188 |
| Forward Air Corp. | 105,171 | 10,205,794 |
| HUB Group, Inc., Class A(a) | 133,110 | 10,623,509 |
| Total | 31,085,491 | |
| Airlines 0.4% | ||
| Allegiant Travel Co.(a) | 59,583 | 5,749,760 |
| Hawaiian Holdings, Inc.(a) | 200,957 | 3,012,345 |
| Skywest, Inc.(a) | 197,805 | 4,211,268 |
| Sun Country Airlines Holdings, Inc.(a) | 122,604 | 2,442,272 |
| Total | 15,415,645 | |
| Building Products 2.0% | ||
| AAON, Inc. | 164,150 | 9,435,342 |
| American Woodmark Corp.(a) | 64,879 | 3,362,679 |
| Apogee Enterprises, Inc. | 86,902 | 3,549,078 |
| Gibraltar Industries, Inc.(a) | 128,392 | 5,373,205 |
| Griffon Corp. | 187,566 | 5,880,194 |
| Insteel Industries, Inc. | 76,108 | 2,199,521 |
| PGT, Inc.(a) | 234,596 | 4,907,748 |
| Quanex Building Products Corp. | 130,718 | 2,915,011 |
| Resideo Technologies, Inc.(a) | 569,274 | 11,852,285 |
| UFP Industries, Inc. | 245,618 | 19,499,613 |
| Total | 68,974,676 | |
| Common Stocks (continued) | ||
| Issuer | Shares | Value ($) |
| Commercial Services & Supplies 2.1% | ||
| ABM Industries, Inc. | 261,807 | 12,147,845 |
| Brady Corp., Class A | 188,189 | 8,758,316 |
| CoreCivic, Inc.(a) | 476,064 | 4,536,890 |
| Deluxe Corp. | 168,319 | 3,238,457 |
| GEO Group, Inc. (The)(a) | 485,864 | 3,974,367 |
| Harsco Corp.(a) | 310,939 | 1,763,024 |
| Healthcare Services Group, Inc. | 289,868 | 4,078,443 |
| HNI Corp. | 165,947 | 5,310,304 |
| Interface, Inc. | 232,827 | 2,600,678 |
| KAR Auction Services, Inc.(a) | 475,829 | 6,947,103 |
| Matthews International Corp., Class A | 122,570 | 3,065,476 |
| Pitney Bowes, Inc. | 638,284 | 1,844,641 |
| Unifirst Corp. | 59,437 | 10,714,114 |
| Viad Corp.(a) | 80,618 | 3,077,995 |
| Total | 72,057,653 | |
| Construction & Engineering 1.2% | ||
| Arcosa, Inc. | 189,188 | 11,058,039 |
| Comfort Systems U.S.A., Inc. | 140,882 | 14,136,100 |
| Granite Construction, Inc. | 177,610 | 5,324,748 |
| MYR Group, Inc.(a) | 66,574 | 6,187,387 |
| NV5 Global, Inc.(a) | 46,713 | 6,575,322 |
| Total | 43,281,596 | |
| Electrical Equipment 0.4% | ||
| AZZ, Inc. | 96,659 | 4,118,640 |
| Encore Wire Corp. | 77,240 | 10,048,924 |
| Powell Industries, Inc. | 35,516 | 875,825 |
| Total | 15,043,389 | |
| Machinery 4.4% | ||
| Alamo Group, Inc. | 38,862 | 5,081,595 |
| Albany International Corp., Class A | 123,330 | 10,876,473 |
| Astec Industries, Inc. | 89,432 | 3,414,514 |
| Barnes Group, Inc. | 182,618 | 5,670,289 |
| CIRCOR International, Inc.(a) | 79,315 | 1,292,834 |
| Enerpac Tool Group Corp. | 237,071 | 4,599,177 |
| EnPro Industries, Inc. | 81,437 | 7,374,935 |
| ESCO Technologies, Inc. | 101,212 | 8,241,693 |
| Federal Signal Corp. | 237,310 | 9,461,550 |
| 12 | Columbia Small Cap Index Fund | Semiannual Report 2022 |
August 31, 2022 (Unaudited)
| Common Stocks (continued) | ||
| Issuer | Shares | Value ($) |
| Franklin Electric Co., Inc. | 152,314 | 13,228,471 |
| Greenbrier Companies, Inc. (The) | 127,589 | 3,637,562 |
| Hillenbrand, Inc. | 280,772 | 11,699,769 |
| John Bean Technologies Corp. | 124,441 | 12,849,778 |
| Lindsay Corp. | 42,981 | 6,892,433 |
| Mueller Industries, Inc. | 222,788 | 14,073,518 |
| Proto Labs, Inc.(a) | 107,653 | 4,133,875 |
| SPX Technologies, Inc.(a) | 179,259 | 10,228,518 |
| Standex International Corp. | 47,257 | 4,272,505 |
| Tennant Co. | 72,745 | 4,390,161 |
| Titan International, Inc.(a) | 201,159 | 2,822,261 |
| Trinity Industries, Inc. | 274,094 | 6,682,412 |
| Wabash National Corp. | 191,975 | 3,157,989 |
| Total | 154,082,312 | |
| Marine 0.3% | ||
| Matson, Inc. | 158,727 | 11,691,831 |
| Professional Services 1.5% | ||
| Exponent, Inc. | 202,895 | 19,043,725 |
| Forrester Research, Inc.(a) | 42,864 | 1,782,714 |
| Heidrick & Struggles International, Inc. | 77,200 | 2,197,112 |
| Kelly Services, Inc., Class A | 135,314 | 2,179,908 |
| Korn/Ferry International | 211,042 | 12,856,679 |
| Mantech International Corp., Class A | 107,848 | 10,343,702 |
| Resources Connection, Inc. | 121,837 | 2,380,695 |
| TrueBlue, Inc.(a) | 130,267 | 2,675,684 |
| Total | 53,460,219 | |
| Road & Rail 0.4% | ||
| ArcBest Corp. | 95,860 | 7,719,606 |
| Heartland Express, Inc. | 182,334 | 2,762,360 |
| Marten Transport Ltd. | 231,003 | 4,576,169 |
| Total | 15,058,135 | |
| Trading Companies & Distributors 1.3% | ||
| Applied Industrial Technologies, Inc. | 150,517 | 15,957,812 |
| Boise Cascade Co. | 154,444 | 9,626,495 |
| DXP Enterprises, Inc.(a) | 67,152 | 1,784,900 |
| GMS, Inc.(a) | 168,515 | 8,122,423 |
| Common Stocks (continued) | ||
| Issuer | Shares | Value ($) |
| NOW, Inc.(a) | 433,451 | 5,253,426 |
| Veritiv Corp.(a) | 54,628 | 6,511,111 |
| Total | 47,256,167 | |
| Total Industrials | 571,130,717 | |
| Information Technology 13.0% | ||
| Communications Equipment 1.7% | ||
| ADTRAN Holdings, Inc. | 301,921 | 7,016,644 |
| CalAmp Corp.(a) | 141,175 | 872,461 |
| Clearfield, Inc.(a) | 44,754 | 5,196,387 |
| Comtech Telecommunications Corp. | 103,816 | 1,172,083 |
| Digi International, Inc.(a) | 137,444 | 4,550,771 |
| Extreme Networks, Inc.(a) | 512,252 | 7,340,571 |
| Harmonic, Inc.(a) | 409,098 | 4,606,443 |
| InterDigital, Inc. | 120,863 | 6,062,488 |
| NETGEAR, Inc.(a) | 112,645 | 2,657,296 |
| Netscout Systems, Inc.(a) | 289,061 | 9,174,796 |
| Viavi Solutions, Inc.(a) | 892,009 | 12,559,487 |
| Total | 61,209,427 | |
| Electronic Equipment, Instruments & Components 4.1% | ||
| Advanced Energy Industries, Inc. | 147,052 | 13,203,799 |
| Arlo Technologies, Inc.(a) | 340,080 | 2,071,087 |
| Badger Meter, Inc. | 114,595 | 10,851,001 |
| Benchmark Electronics, Inc. | 137,554 | 3,775,857 |
| CTS Corp. | 125,632 | 5,316,746 |
| ePlus, Inc.(a) | 105,269 | 4,960,275 |
| Fabrinet(a) | 144,022 | 14,811,223 |
| FARO Technologies, Inc.(a) | 71,496 | 2,398,691 |
| Insight Enterprises, Inc.(a) | 137,323 | 12,512,872 |
| Itron, Inc.(a) | 176,428 | 8,394,444 |
| Knowles Corp.(a) | 359,241 | 5,442,501 |
| Methode Electronics, Inc. | 144,589 | 5,850,071 |
| OSI Systems, Inc.(a) | 62,060 | 5,170,839 |
| PC Connection, Inc. | 43,193 | 2,145,828 |
| Plexus Corp.(a) | 108,542 | 10,173,642 |
| Rogers Corp.(a) | 73,332 | 18,371,133 |
| Sanmina Corp.(a) | 238,218 | 11,558,338 |
| Scansource, Inc.(a) | 98,789 | 2,861,917 |
| TTM Technologies, Inc.(a) | 395,485 | 6,220,979 |
| Total | 146,091,243 | |
| Columbia Small Cap Index Fund | Semiannual Report 2022 | 13 |
August 31, 2022 (Unaudited)
| Common Stocks (continued) | ||
| Issuer | Shares | Value ($) |
| IT Services 1.5% | ||
| CSG Systems International, Inc. | 121,803 | 7,046,303 |
| EVERTEC, Inc. | 254,843 | 8,562,725 |
| ExlService Holdings, Inc.(a) | 130,322 | 21,856,303 |
| Perficient, Inc.(a) | 135,659 | 10,594,968 |
| TTEC Holdings, Inc. | 71,821 | 3,759,829 |
| Unisys Corp.(a) | 264,818 | 2,465,456 |
| Total | 54,285,584 | |
| Semiconductors & Semiconductor Equipment 3.1% | ||
| Alpha & Omega Semiconductor Ltd.(a) | 84,785 | 3,277,788 |
| Axcelis Technologies, Inc.(a) | 129,281 | 8,654,070 |
| Ceva, Inc.(a) | 90,861 | 2,659,501 |
| Cohu, Inc.(a) | 190,413 | 5,108,781 |
| Diodes, Inc.(a) | 177,152 | 12,607,908 |
| Formfactor, Inc.(a) | 305,638 | 8,949,081 |
| Ichor Holdings Ltd.(a) | 112,093 | 3,443,497 |
| Kulicke & Soffa Industries, Inc. | 231,507 | 9,732,554 |
| MaxLinear, Inc., Class A(a) | 278,633 | 10,011,284 |
| Onto Innovation, Inc.(a) | 194,027 | 13,773,977 |
| PDF Solutions, Inc.(a) | 115,753 | 3,053,564 |
| Photronics, Inc.(a) | 241,683 | 4,060,274 |
| Rambus, Inc.(a) | 431,599 | 11,130,938 |
| SMART Global Holdings, Inc.(a) | 185,099 | 3,396,567 |
| Ultra Clean Holdings, Inc.(a) | 176,577 | 5,168,409 |
| Veeco Instruments, Inc.(a) | 200,628 | 4,241,276 |
| Total | 109,269,469 | |
| Software 2.2% | ||
| 8x8, Inc.(a) | 463,292 | 2,413,751 |
| A10 Networks, Inc. | 228,591 | 3,177,415 |
| Agilysys, Inc.(a) | 76,487 | 3,959,732 |
| Alarm.com Holdings, Inc.(a) | 180,414 | 12,015,572 |
| Cerence, Inc.(a) | 153,888 | 3,079,299 |
| Consensus Cloud Solutions, Inc.(a) | 62,631 | 3,153,471 |
| Digital Turbine, Inc.(a) | 345,458 | 6,380,609 |
| Ebix, Inc. | 93,170 | 2,424,283 |
| LivePerson, Inc.(a) | 271,084 | 3,144,574 |
| LiveRamp Holdings, Inc.(a) | 266,928 | 5,298,521 |
| OneSpan, Inc.(a) | 134,754 | 1,551,019 |
| Common Stocks (continued) | ||
| Issuer | Shares | Value ($) |
| Progress Software Corp. | 171,354 | 8,247,268 |
| SPS Commerce, Inc.(a) | 141,320 | 17,257,999 |
| Xperi Holding Corp. | 406,991 | 6,475,227 |
| Total | 78,578,740 | |
| Technology Hardware, Storage & Peripherals 0.4% | ||
| 3D Systems Corp.(a) | 510,302 | 5,169,359 |
| Avid Technology, Inc.(a) | 138,949 | 3,800,255 |
| Corsair Gaming, Inc.(a) | 130,729 | 2,011,919 |
| Diebold, Inc.(a) | 287,539 | 1,000,636 |
| Total | 11,982,169 | |
| Total Information Technology | 461,416,632 | |
| Materials 5.5% | ||
| Chemicals 3.0% | ||
| AdvanSix, Inc. | 110,030 | 3,989,688 |
| American Vanguard Corp. | 104,957 | 2,091,793 |
| Balchem Corp. | 125,741 | 16,575,179 |
| FutureFuel Corp. | 101,092 | 736,961 |
| GCP Applied Technologies(a) | 211,317 | 6,639,580 |
| Hawkins, Inc. | 73,580 | 2,819,585 |
| HB Fuller Co. | 207,714 | 13,472,330 |
| Innospec, Inc. | 97,156 | 9,080,200 |
| Koppers Holdings, Inc. | 82,780 | 1,889,867 |
| Livent Corp.(a),(b) | 633,268 | 20,378,564 |
| Mativ Holdings, Inc. | 214,065 | 5,056,215 |
| Quaker Chemical Corp. | 52,597 | 9,168,709 |
| Rayonier Advanced Materials, Inc.(a) | 249,983 | 1,129,923 |
| Stepan Co. | 83,182 | 8,670,060 |
| Tredegar Corp. | 100,732 | 1,028,474 |
| Trinseo PLC | 141,539 | 3,755,030 |
| Total | 106,482,158 | |
| Containers & Packaging 0.3% | ||
| Myers Industries, Inc. | 142,295 | 2,749,140 |
| O-I Glass, Inc.(a) | 611,621 | 7,957,189 |
| Total | 10,706,329 | |
| 14 | Columbia Small Cap Index Fund | Semiannual Report 2022 |
August 31, 2022 (Unaudited)
| Common Stocks (continued) | ||
| Issuer | Shares | Value ($) |
| Metals & Mining 1.8% | ||
| Arconic Corp.(a) | 414,168 | 10,441,175 |
| ATI, Inc.(a) | 486,008 | 14,546,219 |
| Carpenter Technology Corp. | 189,023 | 6,421,111 |
| Century Aluminum Co.(a) | 200,028 | 1,544,216 |
| Compass Minerals International, Inc. | 133,697 | 5,413,392 |
| Haynes International, Inc. | 48,780 | 1,936,078 |
| Kaiser Aluminum Corp. | 62,268 | 4,468,352 |
| Materion Corp. | 80,305 | 6,931,125 |
| Olympic Steel, Inc. | 36,598 | 963,259 |
| SunCoke Energy, Inc. | 326,455 | 2,151,339 |
| TimkenSteel Corp.(a) | 162,471 | 2,492,305 |
| Warrior Met Coal, Inc. | 202,233 | 6,582,684 |
| Total | 63,891,255 | |
| Paper & Forest Products 0.4% | ||
| Clearwater Paper Corp.(a) | 66,116 | 2,812,575 |
| Glatfelter Corp. | 175,089 | 852,683 |
| Mercer International, Inc. | 157,942 | 2,561,819 |
| Sylvamo Corp. | 138,164 | 6,140,008 |
| Total | 12,367,085 | |
| Total Materials | 193,446,827 | |
| Real Estate 7.5% | ||
| Equity Real Estate Investment Trusts (REITS) 7.0% | ||
| Acadia Realty Trust | 371,496 | 5,917,931 |
| Agree Realty Corp. | 294,323 | 22,168,408 |
| Alexander & Baldwin, Inc. | 284,558 | 5,329,771 |
| American Assets Trust, Inc. | 206,153 | 5,722,807 |
| Armada Hoffler Properties, Inc. | 265,088 | 3,480,605 |
| Brandywine Realty Trust | 671,007 | 5,388,186 |
| CareTrust REIT, Inc. | 379,890 | 8,182,831 |
| Centerspace | 60,157 | 4,534,635 |
| Chatham Lodging Trust(a) | 191,083 | 2,323,569 |
| Community Healthcare Trust, Inc. | 92,273 | 3,403,951 |
| DiamondRock Hospitality Co.(a) | 825,568 | 7,207,209 |
| Diversified Healthcare Trust | 935,692 | 1,366,110 |
| Easterly Government Properties, Inc. | 355,424 | 6,379,861 |
| Essential Properties Realty Trust, Inc. | 543,245 | 12,299,067 |
| Four Corners Property Trust, Inc. | 314,643 | 8,460,750 |
| Common Stocks (continued) | ||
| Issuer | Shares | Value ($) |
| Franklin Street Properties Corp. | 363,477 | 1,021,370 |
| Getty Realty Corp. | 159,184 | 4,788,255 |
| Global Net Lease, Inc. | 405,723 | 5,586,806 |
| Hersha Hospitality Trust(a) | 129,430 | 1,255,471 |
| Industrial Logistics Properties Trust | 256,071 | 1,917,972 |
| Innovative Industrial Properties, Inc. | 109,513 | 10,044,532 |
| iStar, Inc. | 324,368 | 4,466,547 |
| LTC Properties, Inc. | 154,503 | 6,935,640 |
| LXP Industrial Trust | 1,122,295 | 11,290,288 |
| NexPoint Residential Trust, Inc. | 90,559 | 4,783,326 |
| Office Properties Income Trust | 189,595 | 3,331,184 |
| Orion Office REIT, Inc. | 221,703 | 2,188,209 |
| Retail Opportunity Investments Corp. | 486,283 | 8,145,240 |
| RPT Realty | 333,229 | 3,208,995 |
| Safehold, Inc. | 60,629 | 2,305,721 |
| Saul Centers, Inc. | 51,466 | 2,279,429 |
| Service Properties Trust | 646,368 | 4,421,157 |
| SITE Centers Corp. | 711,600 | 9,222,336 |
| Summit Hotel Properties, Inc. | 419,183 | 3,294,778 |
| Sunstone Hotel Investors, Inc.(a) | 842,595 | 9,175,860 |
| Tanger Factory Outlet Centers, Inc. | 408,726 | 6,302,555 |
| Uniti Group, Inc. | 928,323 | 8,716,953 |
| Universal Health Realty Income Trust | 50,197 | 2,554,525 |
| Urban Edge Properties | 432,168 | 6,798,003 |
| Urstadt Biddle Properties, Inc., Class A | 118,087 | 1,974,415 |
| Veris Residential, Inc.(a) | 313,638 | 4,215,295 |
| Washington Real Estate Investment Trust | 342,292 | 6,712,346 |
| Whitestone REIT | 180,876 | 1,779,820 |
| Xenia Hotels & Resorts, Inc.(a) | 447,718 | 7,100,808 |
| Total | 247,983,527 | |
| Real Estate Management & Development 0.5% | ||
| Anywhere Real Estate, Inc.(a) | 462,615 | 4,519,748 |
| Douglas Elliman, Inc. | 270,349 | 1,246,309 |
| Marcus & Millichap, Inc. | 95,926 | 3,585,714 |
| RE/MAX Holdings, Inc., Class A | 75,431 | 1,716,810 |
| St. Joe Co. (The) | 129,168 | 4,934,218 |
| Total | 16,002,799 | |
| Total Real Estate | 263,986,326 | |
| Columbia Small Cap Index Fund | Semiannual Report 2022 | 15 |
August 31, 2022 (Unaudited)
| Common Stocks (continued) | ||
| Issuer | Shares | Value ($) |
| Utilities 2.2% | ||
| Gas Utilities 0.9% | ||
| Chesapeake Utilities Corp. | 69,405 | 8,765,852 |
| Northwest Natural Holding Co. | 134,120 | 6,385,453 |
| South Jersey Industries, Inc. | 479,251 | 16,222,646 |
| Total | 31,373,951 | |
| Multi-Utilities 0.4% | ||
| Avista Corp. | 283,619 | 11,523,440 |
| Unitil Corp. | 62,765 | 3,269,429 |
| Total | 14,792,869 | |
| Water Utilities 0.9% | ||
| American States Water Co. | 144,691 | 12,005,012 |
| California Water Service Group | 210,533 | 12,322,497 |
| Middlesex Water Co. | 68,747 | 6,102,671 |
| Total | 30,430,180 | |
| Total Utilities | 76,597,000 | |
| Total Common Stocks (Cost $2,484,007,393) | 3,470,558,543 | |
| Exchange-Traded Equity Funds 1.0% | ||
| Shares | Value ($) | |
| U.S. Small Cap 1.0% | ||
| iShares Core S&P Small-Cap ETF | 360,249 | 35,016,203 |
| Total Exchange-Traded Equity Funds (Cost $12,652,669) | 35,016,203 | |
| Money Market Funds 0.9% | ||
| Columbia Short-Term Cash Fund, 2.366%(c),(d) | 31,608,973 | 31,593,168 |
| Total Money Market Funds (Cost $31,590,596) | 31,593,168 | |
| Total Investments in Securities (Cost: $2,528,250,658) | 3,537,167,914 | |
| Other Assets & Liabilities, Net | (3,905,589) | |
| Net Assets | 3,533,262,325 | |
| Long futures contracts | ||||||
| Description | Number of contracts | Expiration date | Trading currency | Notional amount | Value/Unrealized appreciation ($) | Value/Unrealized depreciation ($) |
| Russell 2000 Index E-mini | 328 | 09/2022 | USD | 30,251,440 | 1,218,165 | — |
| (a) | Non-income producing investment. |
| (b) | This security or a portion of this security has been pledged as collateral in connection with derivative contracts. |
| (c) | The rate shown is the seven-day current annualized yield at August 31, 2022. |
| (d) | As defined in the Investment Company Act of 1940, as amended, an affiliated company is one in which the Fund owns 5% or more of the company’s outstanding voting securities, or a company which is under common ownership or control with the Fund. The value of the holdings and transactions in these affiliated companies during the period ended August 31, 2022 are as follows: |
| Affiliated issuers | Beginning of period($) | Purchases($) | Sales($) | Net change in unrealized appreciation (depreciation)($) | End of period($) | Realized gain (loss)($) | Dividends($) | End of period shares |
| Columbia Short-Term Cash Fund, 2.366% | ||||||||
| 28,841,820 | 333,567,368 | (330,816,727) | 707 | 31,593,168 | (6,610) | 151,918 | 31,608,973 | |
| 16 | Columbia Small Cap Index Fund | Semiannual Report 2022 |
August 31, 2022 (Unaudited)
| USD | US Dollar |
| ■ | Level 1 — Valuations based on quoted prices for investments in active markets that the Fund has the ability to access at the measurement date. Valuation adjustments are not applied to Level 1 investments. |
| ■ | Level 2 — Valuations based on other significant observable inputs (including quoted prices for similar securities, interest rates, prepayment speeds, credit risks, etc.). |
| ■ | Level 3 — Valuations based on significant unobservable inputs (including the Fund’s own assumptions and judgment in determining the fair value of investments). |
| Level 1 ($) | Level 2 ($) | Level 3 ($) | Total ($) | |
| Investments in Securities | ||||
| Common Stocks | ||||
| Communication Services | 75,818,100 | — | — | 75,818,100 |
| Consumer Discretionary | 435,792,674 | — | — | 435,792,674 |
| Consumer Staples | 165,198,148 | — | — | 165,198,148 |
| Energy | 167,056,180 | — | — | 167,056,180 |
| Financials | 642,438,041 | — | — | 642,438,041 |
| Health Care | 417,677,898 | — | — | 417,677,898 |
| Industrials | 571,130,717 | — | — | 571,130,717 |
| Information Technology | 461,416,632 | — | — | 461,416,632 |
| Materials | 193,446,827 | — | — | 193,446,827 |
| Real Estate | 263,986,326 | — | — | 263,986,326 |
| Utilities | 76,597,000 | — | — | 76,597,000 |
| Total Common Stocks | 3,470,558,543 | — | — | 3,470,558,543 |
| Exchange-Traded Equity Funds | 35,016,203 | — | — | 35,016,203 |
| Money Market Funds | 31,593,168 | — | — | 31,593,168 |
| Total Investments in Securities | 3,537,167,914 | — | — | 3,537,167,914 |
| Investments in Derivatives |
| Columbia Small Cap Index Fund | Semiannual Report 2022 | 17 |
August 31, 2022 (Unaudited)
| Level 1 ($) | Level 2 ($) | Level 3 ($) | Total ($) | |
| Asset | ||||
| Futures Contracts | 1,218,165 | — | — | 1,218,165 |
| Total | 3,538,386,079 | — | — | 3,538,386,079 |
| 18 | Columbia Small Cap Index Fund | Semiannual Report 2022 |
August 31, 2022 (Unaudited)
| Assets | |
| Investments in securities, at value | |
| Unaffiliated issuers (cost $2,496,660,062) | $3,505,574,746 |
| Affiliated issuers (cost $31,590,596) | 31,593,168 |
| Receivable for: | |
| Capital shares sold | 1,350,720 |
| Dividends | 2,681,202 |
| Variation margin for futures contracts | 7,408 |
| Expense reimbursement due from Investment Manager | 119 |
| Total assets | 3,541,207,363 |
| Liabilities | |
| Payable for: | |
| Investments purchased | 3,800,255 |
| Capital shares purchased | 3,657,801 |
| Variation margin for futures contracts | 181,935 |
| Management services fees | 19,568 |
| Distribution and/or service fees | 6,323 |
| Compensation of board members | 279,156 |
| Total liabilities | 7,945,038 |
| Net assets applicable to outstanding capital stock | $3,533,262,325 |
| Represented by | |
| Paid in capital | 2,384,209,114 |
| Total distributable earnings (loss) | 1,149,053,211 |
| Total - representing net assets applicable to outstanding capital stock | $3,533,262,325 |
| Class A | |
| Net assets | $913,470,716 |
| Shares outstanding | 37,887,767 |
| Net asset value per share | $24.11 |
| Institutional Class | |
| Net assets | $1,439,886,228 |
| Shares outstanding | 59,103,469 |
| Net asset value per share | $24.36 |
| Institutional 2 Class | |
| Net assets | $1,083,740,322 |
| Shares outstanding | 43,230,554 |
| Net asset value per share | $25.07 |
| Institutional 3 Class | |
| Net assets | $96,165,059 |
| Shares outstanding | 4,077,786 |
| Net asset value per share | $23.58 |
| Columbia Small Cap Index Fund | Semiannual Report 2022 | 19 |
Six Months Ended August 31, 2022 (Unaudited)
| Net investment income | |
| Income: | |
| Dividends — unaffiliated issuers | $30,795,521 |
| Dividends — affiliated issuers | 151,918 |
| Interfund lending | 562 |
| Foreign taxes withheld | (25,444) |
| Total income | 30,922,557 |
| Expenses: | |
| Management services fees | 3,822,757 |
| Distribution and/or service fees | |
| Class A | 1,227,149 |
| Compensation of board members | 9,949 |
| Interest on collateral | 345 |
| Other | 542 |
| Total expenses | 5,060,742 |
| Fees waived or expenses reimbursed by Investment Manager and its affiliates | (10,490) |
| Total net expenses | 5,050,252 |
| Net investment income | 25,872,305 |
| Realized and unrealized gain (loss) — net | |
| Net realized gain (loss) on: | |
| Investments — unaffiliated issuers | 152,266,102 |
| Investments — affiliated issuers | (6,610) |
| Foreign currency translations | (64) |
| Futures contracts | (4,754,761) |
| Net realized gain | 147,504,667 |
| Net change in unrealized appreciation (depreciation) on: | |
| Investments — unaffiliated issuers | (557,829,306) |
| Investments — affiliated issuers | 707 |
| Futures contracts | 639,083 |
| Net change in unrealized appreciation (depreciation) | (557,189,516) |
| Net realized and unrealized loss | (409,684,849) |
| Net decrease in net assets resulting from operations | $(383,812,544) |
| 20 | Columbia Small Cap Index Fund | Semiannual Report 2022 |
| Six Months Ended August 31, 2022 (Unaudited) | Year Ended February 28, 2022 | |
| Operations | ||
| Net investment income | $25,872,305 | $45,699,215 |
| Net realized gain | 147,504,667 | 319,392,353 |
| Net change in unrealized appreciation (depreciation) | (557,189,516) | (183,269,121) |
| Net increase (decrease) in net assets resulting from operations | (383,812,544) | 181,822,447 |
| Distributions to shareholders | ||
| Net investment income and net realized gains | ||
| Class A | (27,710,681) | (90,877,215) |
| Institutional Class | (45,663,430) | (151,339,217) |
| Institutional 2 Class | (30,952,086) | (97,402,387) |
| Institutional 3 Class | (2,864,438) | (7,395,880) |
| Total distributions to shareholders | (107,190,635) | (347,014,699) |
| Decrease in net assets from capital stock activity | (100,822,624) | (122,118,941) |
| Total decrease in net assets | (591,825,803) | (287,311,193) |
| Net assets at beginning of period | 4,125,088,128 | 4,412,399,321 |
| Net assets at end of period | $3,533,262,325 | $4,125,088,128 |
| Six Months Ended | Year Ended | |||
| August 31, 2022 (Unaudited) | February 28, 2022 | |||
| Shares | Dollars ($) | Shares | Dollars ($) | |
| Capital stock activity | ||||
| Class A | ||||
| Subscriptions | 2,579,592 | 65,602,944 | 6,871,306 | 203,973,849 |
| Distributions reinvested | 1,046,455 | 23,566,157 | 2,667,184 | 78,041,984 |
| Redemptions | (4,647,702) | (118,823,050) | (11,669,698) | (345,770,746) |
| Net decrease | (1,021,655) | (29,653,949) | (2,131,208) | (63,754,913) |
| Institutional Class | ||||
| Subscriptions | 3,626,778 | 92,917,120 | 8,209,632 | 245,235,326 |
| Distributions reinvested | 1,588,818 | 36,129,733 | 3,953,756 | 116,597,000 |
| Redemptions | (9,610,700) | (245,173,965) | (14,989,733) | (448,800,004) |
| Net decrease | (4,395,104) | (116,127,112) | (2,826,345) | (86,967,678) |
| Institutional 2 Class | ||||
| Subscriptions | 5,745,548 | 150,471,230 | 13,891,385 | 427,539,854 |
| Distributions reinvested | 1,222,263 | 28,600,962 | 2,970,935 | 89,977,964 |
| Redemptions | (5,770,310) | (152,183,747) | (16,428,592) | (508,690,062) |
| Net increase | 1,197,501 | 26,888,445 | 433,728 | 8,827,756 |
| Institutional 3 Class | ||||
| Subscriptions | 1,069,997 | 27,429,691 | 1,704,017 | 49,590,547 |
| Distributions reinvested | 96,534 | 2,124,703 | 193,333 | 5,532,686 |
| Redemptions | (468,203) | (11,484,402) | (1,212,485) | (35,347,339) |
| Net increase | 698,328 | 18,069,992 | 684,865 | 19,775,894 |
| Total net decrease | (3,520,930) | (100,822,624) | (3,838,960) | (122,118,941) |
| Columbia Small Cap Index Fund | Semiannual Report 2022 | 21 |
| Net asset value, beginning of period | Net investment income | Net realized and unrealized gain (loss) | Total from investment operations | Distributions from net investment income | Distributions from net realized gains | Total distributions to shareholders | |
| Class A | |||||||
| Six Months Ended 8/31/2022 (Unaudited) | $27.52 | 0.15 | (2.82) | (2.67) | — | (0.74) | (0.74) |
| Year Ended 2/28/2022 | $28.74 | 0.25 | 0.90 | 1.15 | (0.27) | (2.10) | (2.37) |
| Year Ended 2/28/2021 | $20.32 | 0.18 | 8.97 | 9.15 | (0.22) | (0.51) | (0.73) |
| Year Ended 2/29/2020 | $23.54 | 0.24 | (2.00) | (1.76) | (0.26) | (1.20) | (1.46) |
| Year Ended 2/28/2019 | $24.33 | 0.23 | 1.32 | 1.55 | (0.23) | (2.11) | (2.34) |
| Year Ended 2/28/2018 | $23.83 | 0.21 | 2.11 | 2.32 | (0.22) | (1.60) | (1.82) |
| Institutional Class | |||||||
| Six Months Ended 8/31/2022 (Unaudited) | $27.77 | 0.18 | (2.85) | (2.67) | — | (0.74) | (0.74) |
| Year Ended 2/28/2022 | $28.96 | 0.33 | 0.91 | 1.24 | (0.33) | (2.10) | (2.43) |
| Year Ended 2/28/2021 | $20.47 | 0.24 | 9.03 | 9.27 | (0.27) | (0.51) | (0.78) |
| Year Ended 2/29/2020 | $23.69 | 0.30 | (2.02) | (1.72) | (0.30) | (1.20) | (1.50) |
| Year Ended 2/28/2019 | $24.47 | 0.29 | 1.33 | 1.62 | (0.29) | (2.11) | (2.40) |
| Year Ended 2/28/2018 | $23.96 | 0.27 | 2.12 | 2.39 | (0.28) | (1.60) | (1.88) |
| Institutional 2 Class | |||||||
| Six Months Ended 8/31/2022 (Unaudited) | $28.55 | 0.19 | (2.93) | (2.74) | — | (0.74) | (0.74) |
| Year Ended 2/28/2022 | $29.71 | 0.34 | 0.93 | 1.27 | (0.33) | (2.10) | (2.43) |
| Year Ended 2/28/2021 | $20.98 | 0.25 | 9.26 | 9.51 | (0.27) | (0.51) | (0.78) |
| Year Ended 2/29/2020 | $24.25 | 0.30 | (2.07) | (1.77) | (0.30) | (1.20) | (1.50) |
| Year Ended 2/28/2019 | $24.99 | 0.30 | 1.36 | 1.66 | (0.29) | (2.11) | (2.40) |
| Year Ended 2/28/2018 | $24.43 | 0.28 | 2.16 | 2.44 | (0.28) | (1.60) | (1.88) |
| Institutional 3 Class | |||||||
| Six Months Ended 8/31/2022 (Unaudited) | $26.91 | 0.18 | (2.77) | (2.59) | — | (0.74) | (0.74) |
| Year Ended 2/28/2022 | $28.13 | 0.32 | 0.89 | 1.21 | (0.33) | (2.10) | (2.43) |
| Year Ended 2/28/2021 | $19.91 | 0.23 | 8.77 | 9.00 | (0.27) | (0.51) | (0.78) |
| Year Ended 2/29/2020 | $23.08 | 0.29 | (1.96) | (1.67) | (0.30) | (1.20) | (1.50) |
| Year Ended 2/28/2019 | $23.90 | 0.29 | 1.29 | 1.58 | (0.29) | (2.11) | (2.40) |
| Year Ended 2/28/2018(g) | $23.87 | 0.24 | 1.67 | 1.91 | (0.28) | (1.60) | (1.88) |
| Notes to Financial Highlights | |
| (a) | In addition to the fees and expenses that the Fund bears directly, the Fund indirectly bears a pro rata share of the fees and expenses of any other funds in which it invests. Such indirect expenses are not included in the Fund’s reported expense ratios. |
| (b) | Total net expenses include the impact of certain fee waivers/expense reimbursements made by the Investment Manager and certain of its affiliates, if applicable. |
| (c) | Annualized. |
| (d) | Ratios include interest on collateral expense which is less than 0.01%. |
| (e) | The benefits derived from expense reductions had an impact of less than 0.01%. |
| (f) | Ratios include interfund lending expense which is less than 0.01%. |
| (g) | Institutional 3 Class shares commenced operations on March 1, 2017. Per share data and total return reflect activity from that date. |
| 22 | Columbia Small Cap Index Fund | Semiannual Report 2022 |
| Net asset value, end of period | Total return | Total gross expense ratio to average net assets(a) | Total net expense ratio to average net assets(a),(b) | Net investment income ratio to average net assets | Portfolio turnover | Net assets, end of period (000’s) | |
| Class A | |||||||
| Six Months Ended 8/31/2022 (Unaudited) | $24.11 | (9.51%) | 0.45%(c),(d) | 0.45%(c),(d) | 1.17%(c) | 9% | $913,471 |
| Year Ended 2/28/2022 | $27.52 | 3.62% | 0.45%(d) | 0.45%(d),(e) | 0.84% | 13% | $1,070,943 |
| Year Ended 2/28/2021 | $28.74 | 46.15% | 0.45%(f) | 0.45%(e),(f) | 0.89% | 24% | $1,179,484 |
| Year Ended 2/29/2020 | $20.32 | (8.08%) | 0.45%(f) | 0.45%(e),(f) | 1.04% | 17% | $1,032,677 |
| Year Ended 2/28/2019 | $23.54 | 6.70% | 0.45% | 0.45%(e) | 0.89% | 22% | $1,440,665 |
| Year Ended 2/28/2018 | $24.33 | 9.86% | 0.45% | 0.45%(e) | 0.88% | 16% | $1,488,143 |
| Institutional Class | |||||||
| Six Months Ended 8/31/2022 (Unaudited) | $24.36 | (9.42%) | 0.20%(c),(d) | 0.20%(c),(d) | 1.42%(c) | 9% | $1,439,886 |
| Year Ended 2/28/2022 | $27.77 | 3.92% | 0.20%(d) | 0.20%(d),(e) | 1.09% | 13% | $1,763,233 |
| Year Ended 2/28/2021 | $28.96 | 46.46% | 0.20%(f) | 0.20%(e),(f) | 1.14% | 24% | $1,920,981 |
| Year Ended 2/29/2020 | $20.47 | (7.85%) | 0.20%(f) | 0.20%(e),(f) | 1.29% | 17% | $1,603,859 |
| Year Ended 2/28/2019 | $23.69 | 6.99% | 0.20% | 0.20%(e) | 1.14% | 22% | $2,026,925 |
| Year Ended 2/28/2018 | $24.47 | 10.11% | 0.20% | 0.20%(e) | 1.12% | 16% | $1,866,835 |
| Institutional 2 Class | |||||||
| Six Months Ended 8/31/2022 (Unaudited) | $25.07 | (9.41%) | 0.20%(c),(d) | 0.20%(c),(d) | 1.42%(c) | 9% | $1,083,740 |
| Year Ended 2/28/2022 | $28.55 | 3.92% | 0.20%(d) | 0.20%(d) | 1.09% | 13% | $1,199,980 |
| Year Ended 2/28/2021 | $29.71 | 46.48% | 0.20%(f) | 0.20%(f) | 1.12% | 24% | $1,236,122 |
| Year Ended 2/29/2020 | $20.98 | (7.87%) | 0.20%(f) | 0.20%(f) | 1.29% | 17% | $638,046 |
| Year Ended 2/28/2019 | $24.25 | 7.01% | 0.20% | 0.20% | 1.14% | 22% | $748,749 |
| Year Ended 2/28/2018 | $24.99 | 10.12% | 0.20% | 0.20% | 1.12% | 16% | $584,472 |
| Institutional 3 Class | |||||||
| Six Months Ended 8/31/2022 (Unaudited) | $23.58 | (9.43%) | 0.20%(c),(d) | 0.20%(c),(d) | 1.41%(c) | 9% | $96,165 |
| Year Ended 2/28/2022 | $26.91 | 3.93% | 0.20%(d) | 0.20%(d) | 1.09% | 13% | $90,933 |
| Year Ended 2/28/2021 | $28.13 | 46.41% | 0.20%(f) | 0.20%(f) | 1.16% | 24% | $75,812 |
| Year Ended 2/29/2020 | $19.91 | (7.84%) | 0.20%(f) | 0.20%(f) | 1.30% | 17% | $82,471 |
| Year Ended 2/28/2019 | $23.08 | 6.99% | 0.20% | 0.20% | 1.16% | 22% | $70,934 |
| Year Ended 2/28/2018(g) | $23.90 | 8.14% | 0.21% | 0.20% | 1.01% | 16% | $4,327 |
| Columbia Small Cap Index Fund | Semiannual Report 2022 | 23 |
August 31, 2022 (Unaudited)
| 24 | Columbia Small Cap Index Fund | Semiannual Report 2022 |
August 31, 2022 (Unaudited)
| Columbia Small Cap Index Fund | Semiannual Report 2022 | 25 |
August 31, 2022 (Unaudited)
| 26 | Columbia Small Cap Index Fund | Semiannual Report 2022 |
August 31, 2022 (Unaudited)
| Asset derivatives | ||
| Risk exposure category | Statement of assets and liabilities location | Fair value ($) |
| Equity risk | Component of total distributable earnings (loss) — unrealized appreciation on futures contracts | 1,218,165* |
| * | Includes cumulative appreciation (depreciation) as reported in the tables following the Portfolio of Investments. Only the current day’s variation margin is reported in receivables or payables in the Statement of Assets and Liabilities. |
| Amount of realized gain (loss) on derivatives recognized in income | |
| Risk exposure category | Futures contracts ($) |
| Equity risk | (4,754,761) |
| Change in unrealized appreciation (depreciation) on derivatives recognized in income | |
| Risk exposure category | Futures contracts ($) |
| Equity risk | 639,083 |
| Derivative instrument | Average notional amounts ($)* |
| Futures contracts — long | 32,115,558 |
| * | Based on the ending quarterly outstanding amounts for the six months ended August 31, 2022. |
| Columbia Small Cap Index Fund | Semiannual Report 2022 | 27 |
August 31, 2022 (Unaudited)
| 28 | Columbia Small Cap Index Fund | Semiannual Report 2022 |
August 31, 2022 (Unaudited)
| Columbia Small Cap Index Fund | Semiannual Report 2022 | 29 |
August 31, 2022 (Unaudited)
| Fee rate(s) contractual through June 30, 2023 | |
| Class A | 0.45% |
| Institutional Class | 0.20 |
| Institutional 2 Class | 0.20 |
| Institutional 3 Class | 0.20 |
| Federal tax cost ($) | Gross unrealized appreciation ($) | Gross unrealized (depreciation) ($) | Net unrealized appreciation ($) |
| 2,528,251,000 | 1,373,919,000 | (363,784,000) | 1,010,135,000 |
| 30 | Columbia Small Cap Index Fund | Semiannual Report 2022 |
August 31, 2022 (Unaudited)
| Borrower or lender | Average loan balance ($) | Weighted average interest rate (%) | Number of days with outstanding loans |
| Lender | 3,550,000 | 2.85 | 2 |
| Columbia Small Cap Index Fund | Semiannual Report 2022 | 31 |
August 31, 2022 (Unaudited)
| 32 | Columbia Small Cap Index Fund | Semiannual Report 2022 |
August 31, 2022 (Unaudited)
| Columbia Small Cap Index Fund | Semiannual Report 2022 | 33 |
| • | the Fund had sufficient liquidity to both meet redemptions and operate effectively on behalf of shareholders; |
| • | there were no material changes to the Program during the period; |
| • | the implementation of the Program was effective to manage the Fund’s liquidity risk; and |
| • | the Program operated adequately during the period. |
| 34 | Columbia Small Cap Index Fund | Semiannual Report 2022 |
(Unaudited)
| • | Information on the investment performance of the Fund relative to the performance of a group of mutual funds determined to be comparable to the Fund by Broadridge, as well as performance relative to benchmarks; |
| • | Information on the Fund’s management fees and total expenses, including information comparing the Fund’s expenses to those of a group of comparable mutual funds, as determined by Broadridge; |
| • | The Investment Manager’s agreement to contractually limit or cap total operating expenses for the Fund so that total operating expenses (excluding certain fees and expenses, such as transaction costs and certain other investment related expenses, interest, taxes, acquired fund fees and expenses and infrequent and/or unusual expenses) would not exceed a specified annual rate, as a percentage of the Fund’s net assets; |
| • | Terms of the Management Agreement; |
| • | Descriptions of other agreements and arrangements with affiliates of the Investment Manager relating to the operations of the Fund, including agreements with respect to the provision of transfer agency and shareholder services to the Fund; |
| • | Descriptions of various services performed by the Investment Manager under the Management Agreement, including portfolio management and portfolio trading practices; |
| • | Information regarding any recently negotiated management fees of similarly-managed portfolios of other institutional clients of the Investment Manager; |
| • | Information regarding the resources of the Investment Manager, including information regarding senior management, portfolio managers and other personnel; |
| • | Information regarding the capabilities of the Investment Manager with respect to compliance monitoring services; |
| • | The profitability to the Investment Manager and its affiliates from their relationships with the Fund; and |
| • | Report provided by the Board’s independent fee consultant, JDL Consultants, LLC (JDL). |
| Columbia Small Cap Index Fund | Semiannual Report 2022 | 35 |
(Unaudited)
into account the organization and strength of the Fund’s and its service providers’ compliance programs. The Board also reviewed the financial condition of the Investment Manager and its affiliates and each entity’s ability to carry out its responsibilities under the Management Agreement and the Fund’s other service agreements.
| 36 | Columbia Small Cap Index Fund | Semiannual Report 2022 |
(Unaudited)
of the Funds. It also took into account the indirect economic benefits flowing to the Investment Manager or its affiliates in connection with managing or distributing the Funds, such as the enhanced ability to offer various other financial products to Ameriprise Financial customers, soft dollar benefits and overall reputational advantages. The Board noted that the fees paid by the Fund should permit the Investment Manager to offer competitive compensation to its personnel, make necessary investments in its business and earn an appropriate profit. After reviewing these and related factors, the Board concluded, within the context of their overall conclusions, that the costs of services provided and the profitability to the Investment Manager and its affiliates from their relationships with the Fund supported the continuation of the Management Agreement.
| Columbia Small Cap Index Fund | Semiannual Report 2022 | 37 |
Like the Advisory Agreement, the Administrative Services Agreement will terminate with respect to the Fund once the Management Agreement is effective for the Fund.
columbiathreadneedleus.com/investor/. The Fund is distributed by Columbia Management Investment Distributors, Inc., member FINRA, and managed by Columbia Management Investment Advisers, LLC.

August 31, 2022 (Unaudited)

(Unaudited)
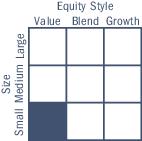
| Average annual total returns (%) (for the period ended August 31, 2022) | ||||||
| Inception | 6 Months cumulative | 1 Year | 5 Years | 10 Years | ||
| Class A | Excluding sales charges | 05/01/02 | -10.30 | -7.47 | 6.79 | 9.94 |
| Including sales charges | -15.47 | -12.80 | 5.54 | 9.29 | ||
| Advisor Class* | 11/08/12 | -10.24 | -7.22 | 7.05 | 10.20 | |
| Class C | Excluding sales charges | 05/01/02 | -10.62 | -8.13 | 5.99 | 9.12 |
| Including sales charges | -11.48 | -8.92 | 5.99 | 9.12 | ||
| Institutional Class | 05/01/02 | -10.23 | -7.22 | 7.05 | 10.21 | |
| Institutional 2 Class* | 11/08/12 | -10.15 | -7.07 | 7.22 | 10.37 | |
| Institutional 3 Class* | 11/08/12 | -10.11 | -7.05 | 7.27 | 10.43 | |
| Class R | 01/23/06 | -10.46 | -7.70 | 6.52 | 9.66 | |
| Russell 2000 Value Index | -8.25 | -10.18 | 6.56 | 9.49 | ||
| * | The returns shown for periods prior to the share class inception date (including returns for the Life of the Fund, if shown, which are since Fund inception) include the returns of the Fund’s oldest share class. Since the Fund launched more than one share class at its inception, Class A shares were used. These returns are adjusted to reflect any higher class-related operating expenses of the newer share classes, as applicable. Please visit columbiathreadneedleus.com/investor/investment-products/mutual-funds/appended-performance for more information. |
| Columbia Small Cap Value Fund II | Semiannual Report 2022 | 3 |
(Unaudited)
| Portfolio breakdown (%) (at August 31, 2022) | |
| Common Stocks | 95.1 |
| Exchange-Traded Equity Funds | 0.8 |
| Money Market Funds | 4.1 |
| Total | 100.0 |
| Equity sector breakdown (%) (at August 31, 2022) | |
| Communication Services | 1.8 |
| Consumer Discretionary | 7.9 |
| Consumer Staples | 4.8 |
| Energy | 5.1 |
| Financials | 28.4 |
| Health Care | 8.8 |
| Industrials | 17.9 |
| Information Technology | 4.7 |
| Materials | 6.8 |
| Real Estate | 8.4 |
| Utilities | 5.4 |
| Total | 100.0 |
| 4 | Columbia Small Cap Value Fund II | Semiannual Report 2022 |
(Unaudited)
| March 1, 2022 — August 31, 2022 | |||||||
| Account value at the beginning of the period ($) | Account value at the end of the period ($) | Expenses paid during the period ($) | Fund’s annualized expense ratio (%) | ||||
| Actual | Hypothetical | Actual | Hypothetical | Actual | Hypothetical | Actual | |
| Class A | 1,000.00 | 1,000.00 | 897.00 | 1,018.80 | 6.07 | 6.46 | 1.27 |
| Advisor Class | 1,000.00 | 1,000.00 | 897.60 | 1,020.06 | 4.88 | 5.19 | 1.02 |
| Class C | 1,000.00 | 1,000.00 | 893.80 | 1,015.02 | 9.64 | 10.26 | 2.02 |
| Institutional Class | 1,000.00 | 1,000.00 | 897.70 | 1,020.06 | 4.88 | 5.19 | 1.02 |
| Institutional 2 Class | 1,000.00 | 1,000.00 | 898.50 | 1,020.77 | 4.21 | 4.48 | 0.88 |
| Institutional 3 Class | 1,000.00 | 1,000.00 | 898.90 | 1,021.02 | 3.97 | 4.23 | 0.83 |
| Class R | 1,000.00 | 1,000.00 | 895.40 | 1,017.54 | 7.26 | 7.73 | 1.52 |
| Columbia Small Cap Value Fund II | Semiannual Report 2022 | 5 |
August 31, 2022 (Unaudited)
| Common Stocks 95.0% | ||
| Issuer | Shares | Value ($) |
| Communication Services 1.7% | ||
| Interactive Media & Services 0.4% | ||
| Ziff Davis, Inc.(a) | 60,800 | 4,698,624 |
| Media 1.3% | ||
| Nexstar Media Group, Inc., Class A | 87,400 | 16,721,368 |
| Total Communication Services | 21,419,992 | |
| Consumer Discretionary 7.6% | ||
| Hotels, Restaurants & Leisure 1.9% | ||
| International Game Technology PLC | 646,200 | 11,592,828 |
| Light & Wonder, Inc.(a) | 122,200 | 6,015,906 |
| Red Rock Resorts, Inc., Class A | 159,431 | 6,093,453 |
| Total | 23,702,187 | |
| Household Durables 0.4% | ||
| KB Home | 156,861 | 4,494,068 |
| Multiline Retail 0.8% | ||
| Macy’s, Inc. | 587,300 | 10,172,036 |
| Specialty Retail 3.1% | ||
| Genesco, Inc.(a) | 174,700 | 9,884,526 |
| Group 1 Automotive, Inc. | 42,600 | 7,607,934 |
| Hibbett, Inc. | 98,800 | 5,789,680 |
| Petco Health & Wellness Co., Inc.(a) | 527,400 | 7,868,808 |
| Signet Jewelers Ltd. | 111,100 | 7,262,607 |
| Total | 38,413,555 | |
| Textiles, Apparel & Luxury Goods 1.4% | ||
| Crocs, Inc.(a) | 165,000 | 12,160,500 |
| Rocky Brands, Inc. | 193,234 | 5,049,204 |
| Total | 17,209,704 | |
| Total Consumer Discretionary | 93,991,550 | |
| Consumer Staples 4.5% | ||
| Food & Staples Retailing 2.9% | ||
| BJ’s Wholesale Club Holdings, Inc.(a) | 98,100 | 7,307,469 |
| The Chefs’ Warehouse(a) | 340,013 | 11,336,033 |
| United Natural Foods, Inc.(a) | 413,400 | 18,222,672 |
| Total | 36,866,174 | |
| Food Products 1.2% | ||
| TreeHouse Foods, Inc.(a) | 318,900 | 14,860,740 |
| Common Stocks (continued) | ||
| Issuer | Shares | Value ($) |
| Personal Products 0.4% | ||
| BellRing Brands, Inc.(a) | 201,240 | 4,767,376 |
| Total Consumer Staples | 56,494,290 | |
| Energy 4.8% | ||
| Energy Equipment & Services 0.6% | ||
| Helmerich & Payne, Inc. | 178,500 | 7,630,875 |
| Oil, Gas & Consumable Fuels 4.2% | ||
| Antero Resources Corp.(a) | 334,000 | 13,386,720 |
| Chesapeake Energy Corp. | 133,930 | 13,458,626 |
| Clean Energy Fuels Corp.(a) | 657,500 | 4,418,400 |
| Equitrans Midstream Corp. | 772,500 | 7,161,075 |
| Golar LNG Ltd.(a) | 512,900 | 13,986,783 |
| Total | 52,411,604 | |
| Total Energy | 60,042,479 | |
| Financials 26.9% | ||
| Banks 15.5% | ||
| Ameris Bancorp | 332,007 | 15,498,087 |
| Atlantic Union Bankshares Corp. | 445,575 | 14,458,909 |
| Bancorp, Inc. (The)(a) | 556,000 | 13,188,320 |
| Cathay General Bancorp | 397,400 | 16,666,956 |
| Community Bank System, Inc. | 203,711 | 13,318,625 |
| Hancock Whitney Corp. | 349,699 | 16,865,983 |
| Independent Bank Corp. | 156,268 | 12,224,846 |
| Independent Bank Group, Inc. | 203,217 | 13,688,697 |
| Pacific Premier Bancorp, Inc. | 274,964 | 9,007,821 |
| Popular, Inc. | 199,000 | 15,366,780 |
| Renasant Corp. | 223,019 | 7,435,453 |
| Sandy Spring Bancorp, Inc. | 360,670 | 13,893,008 |
| Silvergate Capital Corp., Class A(a) | 73,400 | 6,688,208 |
| Triumph Bancorp, Inc.(a) | 124,755 | 7,723,582 |
| UMB Financial Corp. | 190,862 | 17,076,423 |
| Total | 193,101,698 | |
| 6 | Columbia Small Cap Value Fund II | Semiannual Report 2022 |
August 31, 2022 (Unaudited)
| Common Stocks (continued) | ||
| Issuer | Shares | Value ($) |
| Capital Markets 2.7% | ||
| Focus Financial Partners, Inc., Class A(a) | 303,100 | 11,866,365 |
| Houlihan Lokey, Inc., Class A | 151,500 | 11,892,750 |
| Stifel Financial Corp. | 160,005 | 9,489,897 |
| Total | 33,249,012 | |
| Consumer Finance 0.8% | ||
| SLM Corp. | 698,805 | 10,677,740 |
| Insurance 1.1% | ||
| AMERISAFE, Inc. | 171,489 | 8,200,604 |
| Argo Group International Holdings Ltd. | 269,836 | 5,296,881 |
| Total | 13,497,485 | |
| Mortgage Real Estate Investment Trusts (REITS) 2.7% | ||
| Blackstone Mortgage Trust, Inc. | 474,634 | 13,754,893 |
| Hannon Armstrong Sustainable Infrastructure Capital, Inc. | 316,300 | 12,500,176 |
| Starwood Property Trust, Inc. | 339,123 | 7,776,091 |
| Total | 34,031,160 | |
| Thrifts & Mortgage Finance 4.1% | ||
| Axos Financial, Inc.(a) | 348,000 | 14,539,440 |
| MGIC Investment Corp. | 853,688 | 12,199,201 |
| Radian Group, Inc. | 513,380 | 10,837,452 |
| WSFS Financial Corp. | 280,609 | 13,567,445 |
| Total | 51,143,538 | |
| Total Financials | 335,700,633 | |
| Health Care 8.4% | ||
| Biotechnology 3.4% | ||
| Alkermes PLC(a) | 121,000 | 2,864,070 |
| Arcutis Biotherapeutics, Inc.(a) | 210,467 | 5,672,086 |
| Cytokinetics, Inc.(a) | 74,100 | 3,924,336 |
| Exelixis, Inc.(a) | 134,400 | 2,384,256 |
| Insmed, Inc.(a) | 129,800 | 3,195,676 |
| Iovance Biotherapeutics, Inc.(a) | 279,226 | 2,993,303 |
| iTeos Therapeutics, Inc.(a) | 115,700 | 2,566,226 |
| Myriad Genetics, Inc.(a) | 241,765 | 5,401,030 |
| Sage Therapeutics, Inc.(a) | 136,300 | 5,133,058 |
| Syndax Pharmaceuticals, Inc.(a) | 175,400 | 4,141,194 |
| Vir Biotechnology, Inc.(a) | 172,400 | 4,094,500 |
| Total | 42,369,735 | |
| Common Stocks (continued) | ||
| Issuer | Shares | Value ($) |
| Health Care Equipment & Supplies 2.6% | ||
| Haemonetics Corp.(a) | 171,300 | 12,852,639 |
| Integer Holdings Corp.(a) | 36,100 | 2,276,827 |
| Merit Medical Systems, Inc.(a) | 241,263 | 14,290,008 |
| Varex Imaging Corp.(a) | 157,849 | 3,329,035 |
| Total | 32,748,509 | |
| Health Care Providers & Services 1.7% | ||
| AdaptHealth Corp.(a) | 506,000 | 9,092,820 |
| Tenet Healthcare Corp.(a) | 207,376 | 11,716,744 |
| Total | 20,809,564 | |
| Pharmaceuticals 0.7% | ||
| Prestige Consumer Healthcare, Inc.(a) | 168,300 | 8,512,614 |
| Total Health Care | 104,440,422 | |
| Industrials 17.0% | ||
| Aerospace & Defense 1.9% | ||
| Moog, Inc., Class A | 161,565 | 12,114,144 |
| Parsons Corp.(a) | 265,882 | 11,002,197 |
| Total | 23,116,341 | |
| Commercial Services & Supplies 0.8% | ||
| ABM Industries, Inc. | 216,000 | 10,022,400 |
| Construction & Engineering 2.0% | ||
| API Group Corp.(a) | 712,900 | 11,085,595 |
| EMCOR Group, Inc. | 117,469 | 13,969,413 |
| Total | 25,055,008 | |
| Electrical Equipment 2.0% | ||
| Bloom Energy Corp., Class A(a) | 494,900 | 12,575,409 |
| Sunrun, Inc.(a) | 385,700 | 12,739,671 |
| Total | 25,315,080 | |
| Machinery 0.6% | ||
| Evoqua Water Technologies Corp.(a) | 211,026 | 7,402,792 |
| Professional Services 4.4% | ||
| ICF International, Inc. | 177,914 | 18,068,946 |
| KBR, Inc. | 290,100 | 14,011,830 |
| Kforce, Inc. | 184,005 | 10,068,753 |
| Science Applications International Corp. | 144,700 | 13,177,829 |
| Total | 55,327,358 | |
| Columbia Small Cap Value Fund II | Semiannual Report 2022 | 7 |
August 31, 2022 (Unaudited)
| Common Stocks (continued) | ||
| Issuer | Shares | Value ($) |
| Road & Rail 1.1% | ||
| ArcBest Corp. | 168,524 | 13,571,238 |
| Trading Companies & Distributors 4.2% | ||
| Beacon Roofing Supply, Inc.(a) | 222,096 | 12,195,292 |
| Core & Main, Inc., Class A(a) | 316,888 | 7,469,050 |
| Herc Holdings Inc | 90,400 | 10,172,712 |
| Triton International Ltd. | 260,841 | 15,543,515 |
| Univar, Inc.(a) | 253,500 | 6,393,270 |
| Total | 51,773,839 | |
| Total Industrials | 211,584,056 | |
| Information Technology 4.5% | ||
| Communications Equipment 0.5% | ||
| Extreme Networks, Inc.(a) | 443,600 | 6,356,788 |
| IT Services 1.3% | ||
| ExlService Holdings, Inc.(a) | 95,000 | 15,932,450 |
| Semiconductors & Semiconductor Equipment 2.7% | ||
| Diodes, Inc.(a) | 142,628 | 10,150,835 |
| MagnaChip Semiconductor Corp.(a) | 669,500 | 7,833,150 |
| SMART Global Holdings, Inc.(a) | 444,000 | 8,147,400 |
| Ultra Clean Holdings, Inc.(a) | 239,200 | 7,001,384 |
| Total | 33,132,769 | |
| Total Information Technology | 55,422,007 | |
| Materials 6.4% | ||
| Chemicals 3.5% | ||
| Ashland, Inc. | 136,500 | 13,890,240 |
| Avient Corp. | 153,700 | 6,736,671 |
| Cabot Corp. | 179,800 | 12,940,206 |
| HB Fuller Co. | 158,245 | 10,263,771 |
| Total | 43,830,888 | |
| Containers & Packaging 0.9% | ||
| O-I Glass, Inc.(a) | 899,200 | 11,698,592 |
| Metals & Mining 2.0% | ||
| ATI, Inc.(a) | 402,678 | 12,052,152 |
| Materion Corp. | 145,726 | 12,577,611 |
| Total | 24,629,763 | |
| Total Materials | 80,159,243 | |
| Common Stocks (continued) | ||
| Issuer | Shares | Value ($) |
| Real Estate 8.0% | ||
| Equity Real Estate Investment Trusts (REITS) 8.0% | ||
| American Assets Trust, Inc. | 424,620 | 11,787,451 |
| Apple Hospitality REIT, Inc. | 725,300 | 11,539,523 |
| Centerspace | 166,448 | 12,546,850 |
| First Industrial Realty Trust, Inc. | 184,900 | 9,370,732 |
| Independence Realty Trust, Inc. | 401,500 | 7,809,175 |
| NetSTREIT Corp. | 301,465 | 5,926,802 |
| PotlatchDeltic Corp. | 247,700 | 11,498,234 |
| Sabra Health Care REIT, Inc. | 934,400 | 13,987,968 |
| Tanger Factory Outlet Centers, Inc. | 1,006,002 | 15,512,551 |
| Total | 99,979,286 | |
| Total Real Estate | 99,979,286 | |
| Utilities 5.2% | ||
| Electric Utilities 1.4% | ||
| Portland General Electric Co. | 336,257 | 17,374,399 |
| Gas Utilities 2.5% | ||
| New Jersey Resources Corp. | 361,600 | 15,961,024 |
| ONE Gas, Inc. | 192,515 | 15,068,149 |
| Total | 31,029,173 | |
| Independent Power and Renewable Electricity Producers 1.3% | ||
| Clearway Energy, Inc., Class C | 436,000 | 16,175,600 |
| Total Utilities | 64,579,172 | |
| Total Common Stocks (Cost $921,062,391) | 1,183,813,130 | |
| Exchange-Traded Equity Funds 0.8% | ||
| Shares | Value ($) | |
| Sector 0.8% | ||
| SPDR S&P Biotech ETF(a) | 123,400 | 10,328,580 |
| Total Exchange-Traded Equity Funds (Cost $11,369,084) | 10,328,580 | |
| 8 | Columbia Small Cap Value Fund II | Semiannual Report 2022 |
August 31, 2022 (Unaudited)
| Money Market Funds 4.0% | ||
| Shares | Value ($) | |
| Columbia Short-Term Cash Fund, 2.366%(b),(c) | 50,439,502 | 50,414,282 |
| Total Money Market Funds (Cost $50,410,179) | 50,414,282 | |
| Total Investments in Securities (Cost: $982,841,654) | 1,244,555,992 | |
| Other Assets & Liabilities, Net | 2,253,565 | |
| Net Assets | 1,246,809,557 | |
| (a) | Non-income producing investment. |
| (b) | The rate shown is the seven-day current annualized yield at August 31, 2022. |
| (c) | As defined in the Investment Company Act of 1940, as amended, an affiliated company is one in which the Fund owns 5% or more of the company’s outstanding voting securities, or a company which is under common ownership or control with the Fund. The value of the holdings and transactions in these affiliated companies during the period ended August 31, 2022 are as follows: |
| Affiliated issuers | Beginning of period($) | Purchases($) | Sales($) | Net change in unrealized appreciation (depreciation)($) | End of period($) | Realized gain (loss)($) | Dividends($) | End of period shares |
| Columbia Short-Term Cash Fund, 2.366% | ||||||||
| 61,955,773 | 268,264,699 | (279,811,056) | 4,866 | 50,414,282 | (7,738) | 189,018 | 50,439,502 | |
| ■ | Level 1 — Valuations based on quoted prices for investments in active markets that the Fund has the ability to access at the measurement date. Valuation adjustments are not applied to Level 1 investments. |
| ■ | Level 2 — Valuations based on other significant observable inputs (including quoted prices for similar securities, interest rates, prepayment speeds, credit risks, etc.). |
| ■ | Level 3 — Valuations based on significant unobservable inputs (including the Fund’s own assumptions and judgment in determining the fair value of investments). |
| Columbia Small Cap Value Fund II | Semiannual Report 2022 | 9 |
August 31, 2022 (Unaudited)
additional valuation matters, which may include the need to review back-testing results, review time-sensitive information or approve related valuation actions. The Committee reports to the Board, with members of the Committee meeting with the Board at each of its regularly scheduled meetings to discuss valuation matters and actions during the period, similar to those described earlier.
| Level 1 ($) | Level 2 ($) | Level 3 ($) | Total ($) | |
| Investments in Securities | ||||
| Common Stocks | ||||
| Communication Services | 21,419,992 | — | — | 21,419,992 |
| Consumer Discretionary | 93,991,550 | — | — | 93,991,550 |
| Consumer Staples | 56,494,290 | — | — | 56,494,290 |
| Energy | 60,042,479 | — | — | 60,042,479 |
| Financials | 335,700,633 | — | — | 335,700,633 |
| Health Care | 104,440,422 | — | — | 104,440,422 |
| Industrials | 211,584,056 | — | — | 211,584,056 |
| Information Technology | 55,422,007 | — | — | 55,422,007 |
| Materials | 80,159,243 | — | — | 80,159,243 |
| Real Estate | 99,979,286 | — | — | 99,979,286 |
| Utilities | 64,579,172 | — | — | 64,579,172 |
| Total Common Stocks | 1,183,813,130 | — | — | 1,183,813,130 |
| Exchange-Traded Equity Funds | 10,328,580 | — | — | 10,328,580 |
| Money Market Funds | 50,414,282 | — | — | 50,414,282 |
| Total Investments in Securities | 1,244,555,992 | — | — | 1,244,555,992 |
| 10 | Columbia Small Cap Value Fund II | Semiannual Report 2022 |
August 31, 2022 (Unaudited)
| Assets | |
| Investments in securities, at value | |
| Unaffiliated issuers (cost $932,431,475) | $1,194,141,710 |
| Affiliated issuers (cost $50,410,179) | 50,414,282 |
| Receivable for: | |
| Investments sold | 1,483,451 |
| Capital shares sold | 1,223,051 |
| Dividends | 1,368,991 |
| Expense reimbursement due from Investment Manager | 1,741 |
| Prepaid expenses | 16,091 |
| Other assets | 24,373 |
| Total assets | 1,248,673,690 |
| Liabilities | |
| Payable for: | |
| Investments purchased | 567,679 |
| Capital shares purchased | 788,440 |
| Management services fees | 28,526 |
| Distribution and/or service fees | 635 |
| Transfer agent fees | 268,885 |
| Compensation of board members | 164,071 |
| Compensation of chief compliance officer | 123 |
| Other expenses | 45,774 |
| Total liabilities | 1,864,133 |
| Net assets applicable to outstanding capital stock | $1,246,809,557 |
| Represented by | |
| Paid in capital | 890,480,514 |
| Total distributable earnings (loss) | 356,329,043 |
| Total - representing net assets applicable to outstanding capital stock | $1,246,809,557 |
| Columbia Small Cap Value Fund II | Semiannual Report 2022 | 11 |
August 31, 2022 (Unaudited)
| Class A | |
| Net assets | $82,216,233 |
| Shares outstanding | 5,140,701 |
| Net asset value per share | $15.99 |
| Maximum sales charge | 5.75% |
| Maximum offering price per share (calculated by dividing the net asset value per share by 1.0 minus the maximum sales charge for Class A shares) | $16.97 |
| Advisor Class | |
| Net assets | $76,608,977 |
| Shares outstanding | 4,537,533 |
| Net asset value per share | $16.88 |
| Class C | |
| Net assets | $1,352,351 |
| Shares outstanding | 104,045 |
| Net asset value per share | $13.00 |
| Institutional Class | |
| Net assets | $394,798,591 |
| Shares outstanding | 24,095,852 |
| Net asset value per share | $16.38 |
| Institutional 2 Class | |
| Net assets | $185,016,135 |
| Shares outstanding | 10,907,005 |
| Net asset value per share | $16.96 |
| Institutional 3 Class | |
| Net assets | $504,516,593 |
| Shares outstanding | 29,608,922 |
| Net asset value per share | $17.04 |
| Class R | |
| Net assets | $2,300,677 |
| Shares outstanding | 148,052 |
| Net asset value per share | $15.54 |
| 12 | Columbia Small Cap Value Fund II | Semiannual Report 2022 |
Six Months Ended August 31, 2022 (Unaudited)
| Net investment income | |
| Income: | |
| Dividends — unaffiliated issuers | $12,703,201 |
| Dividends — affiliated issuers | 189,018 |
| Interfund lending | 232 |
| Foreign taxes withheld | (25,813) |
| Total income | 12,866,638 |
| Expenses: | |
| Management services fees | 5,613,390 |
| Distribution and/or service fees | |
| Class A | 108,029 |
| Class C | 7,117 |
| Class R | 6,330 |
| Transfer agent fees | |
| Class A | 96,336 |
| Advisor Class | 114,439 |
| Class C | 1,586 |
| Institutional Class | 480,004 |
| Institutional 2 Class | 58,033 |
| Institutional 3 Class | 19,932 |
| Class R | 2,830 |
| Compensation of board members | 4,170 |
| Custodian fees | 6,172 |
| Printing and postage fees | 79,100 |
| Registration fees | 74,524 |
| Audit fees | 17,297 |
| Legal fees | 12,897 |
| Compensation of chief compliance officer | 118 |
| Other | 14,176 |
| Total expenses | 6,716,480 |
| Fees waived or expenses reimbursed by Investment Manager and its affiliates | (321,169) |
| Total net expenses | 6,395,311 |
| Net investment income | 6,471,327 |
| Realized and unrealized gain (loss) — net | |
| Net realized gain (loss) on: | |
| Investments — unaffiliated issuers | 103,280,399 |
| Investments — affiliated issuers | (7,738) |
| Net realized gain | 103,272,661 |
| Net change in unrealized appreciation (depreciation) on: | |
| Investments — unaffiliated issuers | (256,965,942) |
| Investments — affiliated issuers | 4,866 |
| Net change in unrealized appreciation (depreciation) | (256,961,076) |
| Net realized and unrealized loss | (153,688,415) |
| Net decrease in net assets resulting from operations | $(147,217,088) |
| Columbia Small Cap Value Fund II | Semiannual Report 2022 | 13 |
| Six Months Ended August 31, 2022 (Unaudited) | Year Ended February 28, 2022 | |
| Operations | ||
| Net investment income | $6,471,327 | $3,918,259 |
| Net realized gain | 103,272,661 | 180,509,539 |
| Net change in unrealized appreciation (depreciation) | (256,961,076) | (17,518,707) |
| Net increase (decrease) in net assets resulting from operations | (147,217,088) | 166,909,091 |
| Distributions to shareholders | ||
| Net investment income and net realized gains | ||
| Class A | (2,722,607) | (11,132,679) |
| Advisor Class | (2,161,274) | (15,473,174) |
| Class C | (55,556) | (172,699) |
| Institutional Class | (13,488,148) | (54,172,778) |
| Institutional 2 Class | (6,163,988) | (27,431,969) |
| Institutional 3 Class | (15,154,240) | (86,013,104) |
| Class R | (70,766) | (505,702) |
| Total distributions to shareholders | (39,816,579) | (194,902,105) |
| Increase (decrease) in net assets from capital stock activity | (169,168,699) | 295,265,372 |
| Total increase (decrease) in net assets | (356,202,366) | 267,272,358 |
| Net assets at beginning of period | 1,603,011,923 | 1,335,739,565 |
| Net assets at end of period | $1,246,809,557 | $1,603,011,923 |
| 14 | Columbia Small Cap Value Fund II | Semiannual Report 2022 |
| Six Months Ended | Year Ended | |||
| August 31, 2022 (Unaudited) | February 28, 2022 | |||
| Shares | Dollars ($) | Shares | Dollars ($) | |
| Capital stock activity | ||||
| Class A | ||||
| Subscriptions | 758,201 | 12,921,040 | 1,904,995 | 37,448,934 |
| Fund reorganization | — | — | 102,798 | 1,822,064 |
| Distributions reinvested | 161,065 | 2,424,023 | 515,548 | 10,020,650 |
| Redemptions | (713,647) | (12,129,262) | (1,280,388) | (25,009,568) |
| Net increase | 205,619 | 3,215,801 | 1,242,953 | 24,282,080 |
| Advisor Class | ||||
| Subscriptions | 1,672,717 | 30,916,738 | 3,499,219 | 71,418,698 |
| Fund reorganization | — | — | 4,247,560 | 79,222,767 |
| Distributions reinvested | 108,786 | 1,727,527 | 669,131 | 13,759,766 |
| Redemptions | (6,423,523) | (120,246,739) | (6,142,833) | (124,064,664) |
| Net increase (decrease) | (4,642,020) | (87,602,474) | 2,273,077 | 40,336,567 |
| Class C | ||||
| Subscriptions | 14,242 | 203,200 | 70,460 | 1,155,402 |
| Distributions reinvested | 4,464 | 54,684 | 10,663 | 171,009 |
| Redemptions | (11,375) | (162,324) | (20,474) | (333,741) |
| Net increase | 7,331 | 95,560 | 60,649 | 992,670 |
| Institutional Class | ||||
| Subscriptions | 6,754,264 | 122,739,915 | 8,709,443 | 176,726,803 |
| Distributions reinvested | 785,226 | 12,100,334 | 2,485,306 | 49,323,735 |
| Redemptions | (5,947,074) | (103,225,766) | (6,068,437) | (120,323,290) |
| Net increase | 1,592,416 | 31,614,483 | 5,126,312 | 105,727,248 |
| Institutional 2 Class | ||||
| Subscriptions | 2,026,766 | 36,842,177 | 4,554,026 | 92,890,951 |
| Distributions reinvested | 386,310 | 6,161,646 | 1,337,272 | 27,417,036 |
| Redemptions | (2,953,583) | (53,146,330) | (5,903,551) | (123,227,966) |
| Net decrease | (540,507) | (10,142,507) | (12,253) | (2,919,979) |
| Institutional 3 Class | ||||
| Subscriptions | 8,513,374 | 153,244,248 | 12,888,406 | 267,021,479 |
| Fund reorganization | — | — | 50,335 | 946,037 |
| Distributions reinvested | 816,788 | 13,084,936 | 3,709,447 | 76,346,220 |
| Redemptions | (14,361,666) | (271,653,844) | (10,429,093) | (215,750,681) |
| Net increase (decrease) | (5,031,504) | (105,324,660) | 6,219,095 | 128,563,055 |
| Class R | ||||
| Subscriptions | 35,065 | 548,366 | 43,521 | 857,511 |
| Distributions reinvested | 4,837 | 70,766 | 26,625 | 505,702 |
| Redemptions | (93,599) | (1,644,034) | (161,147) | (3,079,482) |
| Net decrease | (53,697) | (1,024,902) | (91,001) | (1,716,269) |
| Total net increase (decrease) | (8,462,362) | (169,168,699) | 14,818,832 | 295,265,372 |
| Columbia Small Cap Value Fund II | Semiannual Report 2022 | 15 |
| Net asset value, beginning of period | Net investment income (loss) | Net realized and unrealized gain (loss) | Total from investment operations | Distributions from net investment income | Distributions from net realized gains | Total distributions to shareholders | |
| Class A | |||||||
| Six Months Ended 8/31/2022 (Unaudited) | $18.48 | 0.05 | (1.99) | (1.94) | — | (0.55) | (0.55) |
| Year Ended 2/28/2022 | $18.85 | (0.02) | 2.33 | 2.31 | (0.03) | (2.65) | (2.68) |
| Year Ended 2/28/2021 | $12.89 | 0.03 | 6.04 | 6.07 | (0.05) | (0.06) | (0.11) |
| Year Ended 2/29/2020 | $15.11 | 0.06 | (1.76) | (1.70) | (0.09) | (0.43) | (0.52) |
| Year Ended 2/28/2019 | $17.11 | 0.03 | (0.10) | (0.07) | (0.01) | (1.92) | (1.93) |
| Year Ended 2/28/2018 | $18.01 | 0.01 | 0.75 | 0.76 | (0.01) | (1.65) | (1.66) |
| Advisor Class | |||||||
| Six Months Ended 8/31/2022 (Unaudited) | $19.46 | 0.08 | (2.11) | (2.03) | — | (0.55) | (0.55) |
| Year Ended 2/28/2022 | $19.71 | 0.03 | 2.45 | 2.48 | (0.08) | (2.65) | (2.73) |
| Year Ended 2/28/2021 | $13.46 | 0.06 | 6.33 | 6.39 | (0.08) | (0.06) | (0.14) |
| Year Ended 2/29/2020 | $15.75 | 0.10 | (1.83) | (1.73) | (0.13) | (0.43) | (0.56) |
| Year Ended 2/28/2019 | $17.75 | 0.07 | (0.11) | (0.04) | (0.04) | (1.92) | (1.96) |
| Year Ended 2/28/2018 | $18.61 | 0.05 | 0.79 | 0.84 | (0.05) | (1.65) | (1.70) |
| Class C | |||||||
| Six Months Ended 8/31/2022 (Unaudited) | $15.20 | (0.01) | (1.64) | (1.65) | — | (0.55) | (0.55) |
| Year Ended 2/28/2022 | $16.01 | (0.13) | 1.97 | 1.84 | — | (2.65) | (2.65) |
| Year Ended 2/28/2021 | $11.00 | (0.06) | 5.13 | 5.07 | — | (0.06) | (0.06) |
| Year Ended 2/29/2020 | $12.96 | (0.04) | (1.51) | (1.55) | — | (0.41) | (0.41) |
| Year Ended 2/28/2019 | $15.06 | (0.11) | (0.07) | (0.18) | — | (1.92) | (1.92) |
| Year Ended 2/28/2018 | $16.13 | (0.11) | 0.68 | 0.57 | — | (1.64) | (1.64) |
| Institutional Class | |||||||
| Six Months Ended 8/31/2022 (Unaudited) | $18.90 | 0.07 | (2.04) | (1.97) | — | (0.55) | (0.55) |
| Year Ended 2/28/2022 | $19.21 | 0.04 | 2.38 | 2.42 | (0.08) | (2.65) | (2.73) |
| Year Ended 2/28/2021 | $13.12 | 0.07 | 6.16 | 6.23 | (0.08) | (0.06) | (0.14) |
| Year Ended 2/29/2020 | $15.37 | 0.10 | (1.79) | (1.69) | (0.13) | (0.43) | (0.56) |
| Year Ended 2/28/2019 | $17.37 | 0.07 | (0.11) | (0.04) | (0.04) | (1.92) | (1.96) |
| Year Ended 2/28/2018 | $18.25 | 0.05 | 0.77 | 0.82 | (0.05) | (1.65) | (1.70) |
| Institutional 2 Class | |||||||
| Six Months Ended 8/31/2022 (Unaudited) | $19.53 | 0.09 | (2.11) | (2.02) | — | (0.55) | (0.55) |
| Year Ended 2/28/2022 | $19.77 | 0.06 | 2.45 | 2.51 | (0.10) | (2.65) | (2.75) |
| Year Ended 2/28/2021 | $13.48 | 0.09 | 6.35 | 6.44 | (0.09) | (0.06) | (0.15) |
| Year Ended 2/29/2020 | $15.78 | 0.12 | (1.84) | (1.72) | (0.15) | (0.43) | (0.58) |
| Year Ended 2/28/2019 | $17.78 | 0.10 | (0.11) | (0.01) | (0.07) | (1.92) | (1.99) |
| Year Ended 2/28/2018 | $18.63 | 0.08 | 0.79 | 0.87 | (0.07) | (1.65) | (1.72) |
| 16 | Columbia Small Cap Value Fund II | Semiannual Report 2022 |
| Net asset value, end of period | Total return | Total gross expense ratio to average net assets(a) | Total net expense ratio to average net assets(a),(b) | Net investment income (loss) ratio to average net assets | Portfolio turnover | Net assets, end of period (000’s) | |
| Class A | |||||||
| Six Months Ended 8/31/2022 (Unaudited) | $15.99 | (10.30%) | 1.33%(c) | 1.27%(c) | 0.61%(c) | 31% | $82,216 |
| Year Ended 2/28/2022 | $18.48 | 11.94% | 1.34% | 1.28%(d) | (0.08%) | 50% | $91,223 |
| Year Ended 2/28/2021 | $18.85 | 47.45% | 1.37% | 1.29%(d) | 0.27% | 55% | $69,591 |
| Year Ended 2/29/2020 | $12.89 | (11.58%) | 1.36% | 1.28%(d) | 0.40% | 27% | $99,356 |
| Year Ended 2/28/2019 | $15.11 | (0.15%) | 1.35% | 1.27%(d) | 0.17% | 38% | $144,155 |
| Year Ended 2/28/2018 | $17.11 | 4.45% | 1.33% | 1.29%(d) | 0.04% | 45% | $165,419 |
| Advisor Class | |||||||
| Six Months Ended 8/31/2022 (Unaudited) | $16.88 | (10.24%) | 1.08%(c) | 1.02%(c) | 0.89%(c) | 31% | $76,609 |
| Year Ended 2/28/2022 | $19.46 | 12.26% | 1.09% | 1.03%(d) | 0.15% | 50% | $178,599 |
| Year Ended 2/28/2021 | $19.71 | 47.83% | 1.12% | 1.05%(d) | 0.44% | 55% | $136,110 |
| Year Ended 2/29/2020 | $13.46 | (11.34%) | 1.11% | 1.03%(d) | 0.64% | 27% | $57,400 |
| Year Ended 2/28/2019 | $15.75 | 0.09% | 1.10% | 1.02%(d) | 0.42% | 38% | $85,978 |
| Year Ended 2/28/2018 | $17.75 | 4.73% | 1.08% | 1.04%(d) | 0.30% | 45% | $71,415 |
| Class C | |||||||
| Six Months Ended 8/31/2022 (Unaudited) | $13.00 | (10.62%) | 2.08%(c) | 2.02%(c) | (0.14%)(c) | 31% | $1,352 |
| Year Ended 2/28/2022 | $15.20 | 11.10% | 2.09% | 2.03%(d) | (0.81%) | 50% | $1,470 |
| Year Ended 2/28/2021 | $16.01 | 46.38% | 2.12% | 2.05%(d) | (0.55%) | 55% | $577 |
| Year Ended 2/29/2020 | $11.00 | (12.27%) | 2.11% | 2.03%(d) | (0.33%) | 27% | $315 |
| Year Ended 2/28/2019 | $12.96 | (0.93%) | 2.09% | 2.02%(d) | (0.71%) | 38% | $611 |
| Year Ended 2/28/2018 | $15.06 | 3.72% | 2.07% | 2.04%(d) | (0.72%) | 45% | $7,785 |
| Institutional Class | |||||||
| Six Months Ended 8/31/2022 (Unaudited) | $16.38 | (10.23%) | 1.08%(c) | 1.02%(c) | 0.84%(c) | 31% | $394,799 |
| Year Ended 2/28/2022 | $18.90 | 12.27% | 1.09% | 1.03%(d) | 0.18% | 50% | $425,250 |
| Year Ended 2/28/2021 | $19.21 | 47.85% | 1.12% | 1.04%(d) | 0.51% | 55% | $333,786 |
| Year Ended 2/29/2020 | $13.12 | (11.36%) | 1.11% | 1.03%(d) | 0.66% | 27% | $350,469 |
| Year Ended 2/28/2019 | $15.37 | 0.09% | 1.10% | 1.02%(d) | 0.42% | 38% | $545,568 |
| Year Ended 2/28/2018 | $17.37 | 4.71% | 1.07% | 1.04%(d) | 0.28% | 45% | $727,418 |
| Institutional 2 Class | |||||||
| Six Months Ended 8/31/2022 (Unaudited) | $16.96 | (10.15%) | 0.91%(c) | 0.88%(c) | 1.01%(c) | 31% | $185,016 |
| Year Ended 2/28/2022 | $19.53 | 12.41% | 0.91% | 0.88% | 0.30% | 50% | $223,545 |
| Year Ended 2/28/2021 | $19.77 | 48.19% | 0.94% | 0.90% | 0.62% | 55% | $226,504 |
| Year Ended 2/29/2020 | $13.48 | (11.26%) | 0.92% | 0.89% | 0.79% | 27% | $144,260 |
| Year Ended 2/28/2019 | $15.78 | 0.22% | 0.91% | 0.88% | 0.60% | 38% | $118,654 |
| Year Ended 2/28/2018 | $17.78 | 4.90% | 0.90% | 0.89% | 0.44% | 45% | $78,479 |
| Columbia Small Cap Value Fund II | Semiannual Report 2022 | 17 |
| Net asset value, beginning of period | Net investment income (loss) | Net realized and unrealized gain (loss) | Total from investment operations | Distributions from net investment income | Distributions from net realized gains | Total distributions to shareholders | |
| Institutional 3 Class | |||||||
| Six Months Ended 8/31/2022 (Unaudited) | $19.61 | 0.10 | (2.12) | (2.02) | — | (0.55) | (0.55) |
| Year Ended 2/28/2022 | $19.84 | 0.08 | 2.45 | 2.53 | (0.11) | (2.65) | (2.76) |
| Year Ended 2/28/2021 | $13.53 | 0.09 | 6.38 | 6.47 | (0.10) | (0.06) | (0.16) |
| Year Ended 2/29/2020 | $15.84 | 0.13 | (1.85) | (1.72) | (0.16) | (0.43) | (0.59) |
| Year Ended 2/28/2019 | $17.84 | 0.11 | (0.12) | (0.01) | (0.07) | (1.92) | (1.99) |
| Year Ended 2/28/2018 | $18.68 | 0.09 | 0.80 | 0.89 | (0.08) | (1.65) | (1.73) |
| Class R | |||||||
| Six Months Ended 8/31/2022 (Unaudited) | $18.01 | 0.03 | (1.95) | (1.92) | — | (0.55) | (0.55) |
| Year Ended 2/28/2022 | $18.44 | (0.07) | 2.29 | 2.22 | — | (2.65) | (2.65) |
| Year Ended 2/28/2021 | $12.62 | (0.00)(e) | 5.91 | 5.91 | (0.03) | (0.06) | (0.09) |
| Year Ended 2/29/2020 | $14.80 | 0.02 | (1.71) | (1.69) | (0.06) | (0.43) | (0.49) |
| Year Ended 2/28/2019 | $16.84 | (0.01) | (0.11) | (0.12) | — | (1.92) | (1.92) |
| Year Ended 2/28/2018 | $17.77 | (0.04) | 0.75 | 0.71 | — | (1.64) | (1.64) |
| Notes to Financial Highlights | |
| (a) | In addition to the fees and expenses that the Fund bears directly, the Fund indirectly bears a pro rata share of the fees and expenses of any other funds in which it invests. Such indirect expenses are not included in the Fund’s reported expense ratios. |
| (b) | Total net expenses include the impact of certain fee waivers/expense reimbursements made by the Investment Manager and certain of its affiliates, if applicable. |
| (c) | Annualized. |
| (d) | The benefits derived from expense reductions had an impact of less than 0.01%. |
| (e) | Rounds to zero. |
| 18 | Columbia Small Cap Value Fund II | Semiannual Report 2022 |
| Net asset value, end of period | Total return | Total gross expense ratio to average net assets(a) | Total net expense ratio to average net assets(a),(b) | Net investment income (loss) ratio to average net assets | Portfolio turnover | Net assets, end of period (000’s) | |
| Institutional 3 Class | |||||||
| Six Months Ended 8/31/2022 (Unaudited) | $17.04 | (10.11%) | 0.86%(c) | 0.83%(c) | 1.09%(c) | 31% | $504,517 |
| Year Ended 2/28/2022 | $19.61 | 12.46% | 0.86% | 0.83% | 0.37% | 50% | $679,291 |
| Year Ended 2/28/2021 | $19.84 | 48.20% | 0.89% | 0.85% | 0.67% | 55% | $563,772 |
| Year Ended 2/29/2020 | $13.53 | (11.23%) | 0.87% | 0.84% | 0.84% | 27% | $393,074 |
| Year Ended 2/28/2019 | $15.84 | 0.27% | 0.85% | 0.83% | 0.62% | 38% | $487,282 |
| Year Ended 2/28/2018 | $17.84 | 4.98% | 0.86% | 0.84% | 0.52% | 45% | $478,580 |
| Class R | |||||||
| Six Months Ended 8/31/2022 (Unaudited) | $15.54 | (10.46%) | 1.57%(c) | 1.52%(c) | 0.41%(c) | 31% | $2,301 |
| Year Ended 2/28/2022 | $18.01 | 11.73% | 1.59% | 1.53%(d) | (0.34%) | 50% | $3,633 |
| Year Ended 2/28/2021 | $18.44 | 47.11% | 1.62% | 1.55%(d) | (0.00%)(e) | 55% | $5,399 |
| Year Ended 2/29/2020 | $12.62 | (11.79%) | 1.61% | 1.53%(d) | 0.15% | 27% | $4,796 |
| Year Ended 2/28/2019 | $14.80 | (0.46%) | 1.60% | 1.52%(d) | (0.08%) | 38% | $6,104 |
| Year Ended 2/28/2018 | $16.84 | 4.19% | 1.58% | 1.54%(d) | (0.21%) | 45% | $8,302 |
| Columbia Small Cap Value Fund II | Semiannual Report 2022 | 19 |
August 31, 2022 (Unaudited)
| 20 | Columbia Small Cap Value Fund II | Semiannual Report 2022 |
August 31, 2022 (Unaudited)
| Columbia Small Cap Value Fund II | Semiannual Report 2022 | 21 |
August 31, 2022 (Unaudited)
| 22 | Columbia Small Cap Value Fund II | Semiannual Report 2022 |
August 31, 2022 (Unaudited)
| Effective rate (%) | |
| Class A | 0.22 |
| Advisor Class | 0.23 |
| Class C | 0.22 |
| Institutional Class | 0.22 |
| Institutional 2 Class | 0.06 |
| Institutional 3 Class | 0.01 |
| Class R | 0.22 |
| Columbia Small Cap Value Fund II | Semiannual Report 2022 | 23 |
August 31, 2022 (Unaudited)
| Front End (%) | CDSC (%) | Amount ($) | |
| Class A | 5.75 | 0.50 - 1.00(a) | 46,566 |
| Class C | — | 1.00(b) | 305 |
| (a) | This charge is imposed on certain investments of between $1 million and $50 million redeemed within 18 months after purchase, as follows: 1.00% if redeemed within 12 months after purchase, and 0.50% if redeemed more than 12, but less than 18, months after purchase, with certain limited exceptions. |
| (b) | This charge applies to redemptions within 12 months after purchase, with certain limited exceptions. |
| Fee rate(s) contractual through June 30, 2024 | |
| Class A | 1.27 |
| Advisor Class | 1.02 |
| Class C | 2.02 |
| Institutional Class | 1.02 |
| Institutional 2 Class | 0.88 |
| Institutional 3 Class | 0.83 |
| Class R | 1.52 |
| Federal tax cost ($) | Gross unrealized appreciation ($) | Gross unrealized (depreciation) ($) | Net unrealized appreciation ($) |
| 982,842,000 | 308,735,000 | (47,021,000) | 261,714,000 |
| 24 | Columbia Small Cap Value Fund II | Semiannual Report 2022 |
August 31, 2022 (Unaudited)
| Late year ordinary losses ($) | Post-October capital losses ($) |
| 373,541 | 10,440,056 |
| Columbia Small Cap Value Fund II | Semiannual Report 2022 | 25 |
August 31, 2022 (Unaudited)
| Borrower or lender | Average loan balance ($) | Weighted average interest rate (%) | Number of days with outstanding loans |
| Lender | 1,566,667 | 1.41 | 3 |
| Shares | |
| Class A | 102,798 |
| Advisor Class | 4,247,560 |
| Institutional 3 Class | 50,335 |
| 26 | Columbia Small Cap Value Fund II | Semiannual Report 2022 |
August 31, 2022 (Unaudited)
| ($) | |
| Net investment income | 4,488,000 |
| Net realized gain | 206,826,000 |
| Net change in unrealized appreciation/(depreciation) | (31,844,000) |
| Net increase in net assets from operations | 179,470,000 |
| Columbia Small Cap Value Fund II | Semiannual Report 2022 | 27 |
August 31, 2022 (Unaudited)
| 28 | Columbia Small Cap Value Fund II | Semiannual Report 2022 |
August 31, 2022 (Unaudited)
| Columbia Small Cap Value Fund II | Semiannual Report 2022 | 29 |
| • | the Fund had sufficient liquidity to both meet redemptions and operate effectively on behalf of shareholders; |
| • | there were no material changes to the Program during the period; |
| • | the implementation of the Program was effective to manage the Fund’s liquidity risk; and |
| • | the Program operated adequately during the period. |
| 30 | Columbia Small Cap Value Fund II | Semiannual Report 2022 |
(Unaudited)
| • | Information on the investment performance of the Fund relative to the performance of a group of mutual funds determined to be comparable to the Fund by Broadridge, as well as performance relative to benchmarks; |
| • | Information on the Fund’s management fees and total expenses, including information comparing the Fund’s expenses to those of a group of comparable mutual funds, as determined by Broadridge; |
| • | The Investment Manager’s agreement to contractually limit or cap total operating expenses for the Fund so that total operating expenses (excluding certain fees and expenses, such as transaction costs and certain other investment related expenses, interest, taxes, acquired fund fees and expenses and infrequent and/or unusual expenses) would not exceed a specified annual rate, as a percentage of the Fund’s net assets; |
| • | Terms of the Management Agreement; |
| • | Descriptions of other agreements and arrangements with affiliates of the Investment Manager relating to the operations of the Fund, including agreements with respect to the provision of transfer agency and shareholder services to the Fund; |
| • | Descriptions of various services performed by the Investment Manager under the Management Agreement, including portfolio management and portfolio trading practices; |
| • | Information regarding any recently negotiated management fees of similarly-managed portfolios of other institutional clients of the Investment Manager; |
| • | Information regarding the resources of the Investment Manager, including information regarding senior management, portfolio managers and other personnel; |
| • | Information regarding the capabilities of the Investment Manager with respect to compliance monitoring services; |
| • | The profitability to the Investment Manager and its affiliates from their relationships with the Fund; and |
| • | Report provided by the Board’s independent fee consultant, JDL Consultants, LLC (JDL). |
| Columbia Small Cap Value Fund II | Semiannual Report 2022 | 31 |
(Unaudited)
into account the organization and strength of the Fund’s and its service providers’ compliance programs. The Board also reviewed the financial condition of the Investment Manager and its affiliates and each entity’s ability to carry out its responsibilities under the Management Agreement and the Fund’s other service agreements.
| 32 | Columbia Small Cap Value Fund II | Semiannual Report 2022 |
(Unaudited)
considered 2020 profitability and that the 2022 information showed that the profitability generated by the Investment Manager in 2021 increased from 2020 levels, due to a variety of factors, including the increased assets under management of the Funds. It also took into account the indirect economic benefits flowing to the Investment Manager or its affiliates in connection with managing or distributing the Funds, such as the enhanced ability to offer various other financial products to Ameriprise Financial customers, soft dollar benefits and overall reputational advantages. The Board noted that the fees paid by the Fund should permit the Investment Manager to offer competitive compensation to its personnel, make necessary investments in its business and earn an appropriate profit. After reviewing these and related factors, the Board concluded, within the context of their overall conclusions, that the costs of services provided and the profitability to the Investment Manager and its affiliates from their relationships with the Fund supported the continuation of the Management Agreement.
| Columbia Small Cap Value Fund II | Semiannual Report 2022 | 33 |
columbiathreadneedleus.com/investor/. The Fund is distributed by Columbia Management Investment Distributors, Inc., member FINRA, and managed by Columbia Management Investment Advisers, LLC.

August 31, 2022 (Unaudited)

(Unaudited)

| Average annual total returns (%) (for the period ended August 31, 2022) | ||||||
| Inception | 6 Months cumulative | 1 Year | 5 Years | 10 Years | ||
| Class A* | Excluding sales charges | 02/28/13 | -12.06 | -14.98 | 0.83 | 5.21 |
| Including sales charges | -17.14 | -19.89 | -0.35 | 4.59 | ||
| Advisor Class* | 07/01/15 | -11.90 | -14.73 | 1.09 | 5.49 | |
| Class C* | Excluding sales charges | 02/28/13 | -12.36 | -15.61 | 0.08 | 4.42 |
| Including sales charges | -13.23 | -16.43 | 0.08 | 4.42 | ||
| Institutional Class | 03/31/08 | -11.94 | -14.75 | 1.09 | 5.48 | |
| Institutional 2 Class* | 07/01/15 | -11.91 | -14.68 | 1.18 | 5.57 | |
| Institutional 3 Class* | 07/01/15 | -11.90 | -14.63 | 1.22 | 5.61 | |
| Class R* | 03/01/16 | -12.09 | -15.11 | 0.59 | 4.97 | |
| MSCI EAFE Value Index (Net) | -13.02 | -13.91 | -0.29 | 3.70 | ||
| * | The returns shown for periods prior to the share class inception date (including returns for the Life of the Fund, if shown, which are since Fund inception) include the returns of the Fund’s oldest share class. These returns are adjusted to reflect any higher class-related operating expenses of the newer share classes, as applicable. Please visit columbiathreadneedleus.com/investor/investment-products/mutual-funds/appended-performance for more information. |
| Columbia Overseas Value Fund | Semiannual Report 2022 | 3 |
(Unaudited)
| Equity sector breakdown (%) (at August 31, 2022) | |
| Communication Services | 7.8 |
| Consumer Discretionary | 4.7 |
| Consumer Staples | 13.3 |
| Energy | 13.3 |
| Financials | 23.0 |
| Health Care | 11.5 |
| Industrials | 10.2 |
| Information Technology | 3.6 |
| Materials | 8.6 |
| Real Estate | 1.0 |
| Utilities | 3.0 |
| Total | 100.0 |
| Country breakdown (%) (at August 31, 2022) | |
| Australia | 1.1 |
| Brazil | 0.9 |
| Canada | 6.6 |
| China | 0.8 |
| Finland | 2.1 |
| France | 11.2 |
| Germany | 4.5 |
| Greece | 0.5 |
| Hong Kong | 1.7 |
| Ireland | 1.9 |
| Israel | 1.1 |
| Japan | 19.5 |
| Netherlands | 10.3 |
| Norway | 1.2 |
| Russian Federation | 0.0 |
| Singapore | 2.8 |
| South Africa | 0.5 |
| South Korea | 0.9 |
| Spain | 3.6 |
| Sweden | 0.8 |
| Switzerland | 2.3 |
| Taiwan | 1.2 |
| United Kingdom | 15.7 |
| United States | 8.8 |
| Total | 100.0 |
| 4 | Columbia Overseas Value Fund | Semiannual Report 2022 |
(Unaudited)
| March 1, 2022 — August 31, 2022 | |||||||
| Account value at the beginning of the period ($) | Account value at the end of the period ($) | Expenses paid during the period ($) | Fund’s annualized expense ratio (%) | ||||
| Actual | Hypothetical | Actual | Hypothetical | Actual | Hypothetical | Actual | |
| Class A | 1,000.00 | 1,000.00 | 879.40 | 1,019.36 | 5.50 | 5.90 | 1.16 |
| Advisor Class | 1,000.00 | 1,000.00 | 881.00 | 1,020.62 | 4.31 | 4.63 | 0.91 |
| Class C | 1,000.00 | 1,000.00 | 876.40 | 1,015.58 | 9.03 | 9.70 | 1.91 |
| Institutional Class | 1,000.00 | 1,000.00 | 880.60 | 1,020.62 | 4.31 | 4.63 | 0.91 |
| Institutional 2 Class | 1,000.00 | 1,000.00 | 880.90 | 1,021.07 | 3.89 | 4.18 | 0.82 |
| Institutional 3 Class | 1,000.00 | 1,000.00 | 881.00 | 1,021.32 | 3.65 | 3.92 | 0.77 |
| Class R | 1,000.00 | 1,000.00 | 879.10 | 1,018.10 | 6.68 | 7.17 | 1.41 |
| Columbia Overseas Value Fund | Semiannual Report 2022 | 5 |
August 31, 2022 (Unaudited)
| Common Stocks 97.0% | ||
| Issuer | Shares | Value ($) |
| Australia 1.1% | ||
| Northern Star Resources Ltd. | 5,116,834 | 27,043,714 |
| Brazil 0.9% | ||
| Azul SA, ADR(a) | 1,064,821 | 9,956,076 |
| JBS SA | 1,800,409 | 10,240,294 |
| Total | 20,196,370 | |
| Canada 6.6% | ||
| Alimentation Couche-Tard, Inc. | 1,067,854 | 45,890,037 |
| Cameco Corp.(b) | 1,204,696 | 35,116,889 |
| Energy Fuels, Inc.(a) | 758,128 | 6,155,999 |
| Nutrien Ltd. | 182,505 | 16,748,484 |
| Teck Resources Ltd., Class B | 722,873 | 24,469,251 |
| Teekay Tankers Ltd., Class A(a),(b) | 342,404 | 8,423,138 |
| West Fraser Timber Co., Ltd. | 195,900 | 17,526,364 |
| Total | 154,330,162 | |
| China 0.8% | ||
| Guangdong Investment Ltd. | 20,554,000 | 18,830,596 |
| Finland 2.1% | ||
| UPM-Kymmene OYJ | 1,435,820 | 48,780,951 |
| France 11.1% | ||
| AXA SA | 2,590,039 | 60,999,605 |
| BNP Paribas SA | 930,778 | 43,253,428 |
| DBV Technologies SA, ADR(a) | 333,082 | 669,495 |
| Eiffage SA | 384,610 | 33,828,358 |
| Sanofi | 596,921 | 48,798,196 |
| TotalEnergies SE | 1,484,392 | 75,154,333 |
| Total | 262,703,415 | |
| Germany 4.5% | ||
| Aroundtown SA | 2,100,091 | 6,125,104 |
| Bayer AG, Registered Shares | 294,363 | 15,568,269 |
| Covestro AG | 488,318 | 14,723,731 |
| Duerr AG | 739,438 | 16,287,473 |
| E.ON SE | 3,159,366 | 26,948,098 |
| KION Group AG | 339,690 | 13,572,946 |
| Mercedes-Benz Group AG, Registered Shares | 227,441 | 12,751,635 |
| Total | 105,977,256 | |
| Common Stocks (continued) | ||
| Issuer | Shares | Value ($) |
| Greece 0.5% | ||
| Piraeus Financial Holdings SA(a) | 10,612,905 | 11,107,521 |
| Hong Kong 1.7% | ||
| WH Group Ltd. | 59,256,830 | 40,373,065 |
| Ireland 1.8% | ||
| Amarin Corp. PLC, ADR(a) | 309,715 | 365,464 |
| Bank of Ireland Group PLC | 3,920,412 | 24,155,808 |
| Flutter Entertainment PLC(a) | 151,105 | 18,933,304 |
| Total | 43,454,576 | |
| Israel 1.1% | ||
| Bezeq Israeli Telecommunication Corp., Ltd. | 14,916,844 | 25,148,488 |
| Japan 19.4% | ||
| BayCurrent Consulting, Inc. | 43,800 | 12,871,506 |
| Dai-ichi Life Holdings, Inc. | 1,707,700 | 29,505,661 |
| Daiwabo Holdings Co., Ltd. | 2,102,400 | 29,595,824 |
| Invincible Investment Corp. | 24,058 | 7,398,309 |
| ITOCHU Corp. | 1,749,600 | 48,150,253 |
| Kinden Corp. | 1,244,300 | 13,130,080 |
| Koito Manufacturing Co., Ltd. | 464,000 | 15,852,298 |
| Marubeni Corp. | 2,266,900 | 23,626,271 |
| MatsukiyoCocokara & Co. | 1,187,200 | 47,105,433 |
| Nippon Telegraph & Telephone Corp. | 1,149,800 | 31,164,513 |
| ORIX Corp. | 2,984,800 | 49,062,317 |
| Ship Healthcare Holdings, Inc. | 1,247,800 | 23,328,089 |
| Sumitomo Mitsui Financial Group, Inc. | 1,258,300 | 37,954,434 |
| Takeda Pharmaceutical Co., Ltd. | 1,596,900 | 44,138,402 |
| Takuma Co., Ltd. | 819,545 | 8,233,892 |
| Toyota Motor Corp. | 2,385,700 | 35,702,164 |
| Total | 456,819,446 | |
| Netherlands 10.2% | ||
| ABN AMRO Bank NV | 1,539,552 | 14,790,308 |
| ASR Nederland NV | 1,210,132 | 49,390,622 |
| ING Groep NV | 5,215,381 | 45,709,890 |
| Koninklijke Ahold Delhaize NV | 1,987,016 | 54,656,486 |
| Shell PLC | 2,869,495 | 75,949,886 |
| Total | 240,497,192 | |
| 6 | Columbia Overseas Value Fund | Semiannual Report 2022 |
August 31, 2022 (Unaudited)
| Common Stocks (continued) | ||
| Issuer | Shares | Value ($) |
| Norway 1.2% | ||
| Leroy Seafood Group ASA | 4,271,391 | 28,540,167 |
| Russian Federation —% | ||
| Lukoil PJSC(c),(d),(e) | 106,132 | — |
| Singapore 2.8% | ||
| BW LPG Ltd. | 2,188,518 | 14,226,016 |
| Venture Corp., Ltd. | 3,927,500 | 51,312,182 |
| Total | 65,538,198 | |
| South Africa 0.5% | ||
| Sibanye Stillwater Ltd., ADR | 1,334,987 | 11,988,183 |
| South Korea 0.9% | ||
| GS Retail Co., Ltd. | 20,850 | 394,138 |
| Hyundai Home Shopping Network Corp. | 127,647 | 4,754,880 |
| Youngone Corp. | 476,470 | 15,775,580 |
| Total | 20,924,598 | |
| Spain 3.6% | ||
| ACS Actividades de Construccion y Servicios SA | 628,896 | 14,011,536 |
| Banco Santander SA | 18,615,120 | 45,061,555 |
| Endesa SA | 1,363,434 | 23,385,635 |
| Tecnicas Reunidas SA(a) | 504,533 | 3,125,855 |
| Total | 85,584,581 | |
| Sweden 0.8% | ||
| Samhallsbyggnadsbolaget i Norden AB | 4,877,710 | 7,831,501 |
| Stillfront Group AB(a) | 5,067,920 | 10,785,084 |
| Total | 18,616,585 | |
| Switzerland 2.3% | ||
| Novartis AG, Registered Shares | 676,361 | 54,709,536 |
| Taiwan 1.2% | ||
| Fubon Financial Holding Co., Ltd. | 14,676,300 | 27,518,779 |
| United Kingdom 15.6% | ||
| AstraZeneca PLC, ADR | 323,449 | 20,176,749 |
| Barclays Bank PLC | 9,262,815 | 17,661,328 |
| BP PLC | 8,799,794 | 44,966,283 |
| British American Tobacco PLC | 1,922,282 | 76,992,660 |
| BT Group PLC | 13,133,631 | 22,974,669 |
| Crest Nicholson Holdings PLC | 1,610,810 | 4,377,724 |
| Common Stocks (continued) | ||
| Issuer | Shares | Value ($) |
| DCC PLC | 589,387 | 33,921,796 |
| John Wood Group PLC(a) | 2,191,365 | 3,280,800 |
| Just Group PLC | 25,856,580 | 21,591,319 |
| Liberty Global PLC, Class C(a) | 1,667,521 | 35,534,873 |
| Royal Mail PLC | 1,944,190 | 6,203,213 |
| TP Icap Group PLC | 14,575,122 | 25,992,782 |
| Vodafone Group PLC | 39,675,419 | 53,119,525 |
| Total | 366,793,721 | |
| United States 6.3% | ||
| Burford Capital Ltd. | 2,225,608 | 20,787,179 |
| Diversified Energy Co. PLC | 24,401,629 | 37,531,921 |
| Insmed, Inc.(a) | 201,234 | 4,954,381 |
| Jazz Pharmaceuticals PLC(a) | 306,978 | 47,649,125 |
| Livent Corp.(a),(b) | 1,103,456 | 35,509,214 |
| Quotient Ltd.(a) | 904,823 | 175,807 |
| Sage Therapeutics, Inc.(a) | 61,261 | 2,307,089 |
| Total | 148,914,716 | |
| Total Common Stocks (Cost $2,573,916,097) | 2,284,391,816 | |
| Exchange-Traded Equity Funds 1.0% | ||
| Shares | Value ($) | |
| United States 1.0% | ||
| iShares MSCI EAFE Value ETF | 581,230 | 24,574,404 |
| Total Exchange-Traded Equity Funds (Cost $25,464,708) | 24,574,404 | |
| Options Purchased Calls 0.0% | |||||
| Value ($) | |||||
| (Cost $791,069) | 896,700 | ||||
| Money Market Funds 1.3% | ||
| Shares | Value ($) | |
| Columbia Short-Term Cash Fund, 2.366%(f),(g) | 30,740,655 | 30,725,285 |
| Total Money Market Funds (Cost $30,722,997) | 30,725,285 | |
| Total Investments in Securities (Cost $2,630,894,871) | 2,340,588,205 | |
| Other Assets & Liabilities, Net | 15,781,409 | |
| Net Assets | $2,356,369,614 | |
| Columbia Overseas Value Fund | Semiannual Report 2022 | 7 |
August 31, 2022 (Unaudited)
| Forward foreign currency exchange contracts | |||||
| Currency to be sold | Currency to be purchased | Counterparty | Settlement date | Unrealized appreciation ($) | Unrealized depreciation ($) |
| 147,102,000 AUD | 102,441,833 USD | Goldman Sachs International | 09/01/2022 | 1,787,289 | — |
| 16,716,000 AUD | 11,338,579 USD | Goldman Sachs International | 09/01/2022 | — | (99,344) |
| 139,697,000 CAD | 107,713,122 USD | Goldman Sachs International | 09/01/2022 | 1,346,197 | — |
| 24,160,000 CHF | 24,949,286 USD | Goldman Sachs International | 09/01/2022 | 233,173 | — |
| 66,017,000 DKK | 8,849,464 USD | Goldman Sachs International | 09/01/2022 | — | (70,848) |
| 6,974,000 EUR | 6,948,873 USD | Goldman Sachs International | 09/01/2022 | — | (59,649) |
| 9,509,000 GBP | 11,400,197 USD | Goldman Sachs International | 09/01/2022 | 353,592 | — |
| 2,767,250,000 JPY | 20,369,248 USD | Goldman Sachs International | 09/01/2022 | 450,227 | — |
| 26,608,841,000 KRW | 20,452,606 USD | Goldman Sachs International | 09/01/2022 | 558,890 | — |
| 91,999,000 NOK | 9,686,501 USD | Goldman Sachs International | 09/01/2022 | 429,067 | — |
| 137,398,000 NOK | 13,561,461 USD | Goldman Sachs International | 09/01/2022 | — | (264,266) |
| 58,883,000 NZD | 36,631,114 USD | Goldman Sachs International | 09/01/2022 | 603,551 | — |
| 620,670,000 SEK | 59,613,391 USD | Goldman Sachs International | 09/01/2022 | 1,389,188 | — |
| 38,230,000 SGD | 27,501,619 USD | Goldman Sachs International | 09/01/2022 | 144,647 | — |
| 875,855,000 TWD | 29,504,969 USD | Goldman Sachs International | 09/01/2022 | 729,445 | — |
| 100,212,793 USD | 146,747,000 AUD | Goldman Sachs International | 09/01/2022 | 198,842 | — |
| 11,965,963 USD | 17,071,000 AUD | Goldman Sachs International | 09/01/2022 | — | (285,131) |
| 108,184,450 USD | 139,697,000 CAD | Goldman Sachs International | 09/01/2022 | — | (1,817,526) |
| 25,053,893 USD | 24,160,000 CHF | Goldman Sachs International | 09/01/2022 | — | (337,780) |
| 9,074,947 USD | 66,017,000 DKK | Goldman Sachs International | 09/01/2022 | — | (154,635) |
| 7,204,095 USD | 6,974,000 EUR | Goldman Sachs International | 09/01/2022 | — | (195,574) |
| 11,653,926 USD | 9,509,000 GBP | Goldman Sachs International | 09/01/2022 | — | (607,321) |
| 20,212,183 USD | 2,767,250,000 JPY | Goldman Sachs International | 09/01/2022 | — | (293,162) |
| 19,924,254 USD | 26,608,841,000 KRW | Goldman Sachs International | 09/01/2022 | — | (30,537) |
| 9,099,200 USD | 92,422,000 NOK | Goldman Sachs International | 09/01/2022 | 200,799 | — |
| 14,164,943 USD | 136,975,000 NOK | Goldman Sachs International | 09/01/2022 | — | (381,781) |
| 36,321,095 USD | 58,883,000 NZD | Goldman Sachs International | 09/01/2022 | — | (293,532) |
| 59,025,420 USD | 620,670,000 SEK | Goldman Sachs International | 09/01/2022 | — | (801,217) |
| 27,288,320 USD | 38,230,000 SGD | Goldman Sachs International | 09/01/2022 | 68,652 | — |
| 28,977,834 USD | 875,855,000 TWD | Goldman Sachs International | 09/01/2022 | — | (202,309) |
| 156,646,000 CAD | 121,072,483 USD | Goldman Sachs International | 10/20/2022 | 1,837,433 | — |
| 74,923,000 EUR | 74,905,018 USD | Goldman Sachs International | 10/20/2022 | — | (636,096) |
| 1,971,311,000 JPY | 14,457,939 USD | Goldman Sachs International | 10/20/2022 | 210,069 | — |
| 25,822,931,000 KRW | 19,343,454 USD | Goldman Sachs International | 10/20/2022 | 96,720 | — |
| 93,409,000 NOK | 9,667,067 USD | Goldman Sachs International | 10/20/2022 | 259,800 | — |
| 872,347,000 TWD | 28,919,178 USD | Goldman Sachs International | 10/20/2022 | 137,660 | — |
| 104,643,231 USD | 150,165,000 AUD | Goldman Sachs International | 10/20/2022 | — | (1,820,150) |
| 4,829,831 USD | 4,639,000 CHF | Goldman Sachs International | 10/20/2022 | — | (65,524) |
| 12,088,837 USD | 89,866,000 DKK | Goldman Sachs International | 10/20/2022 | 93,816 | — |
| 16,903,394 USD | 14,302,000 GBP | Goldman Sachs International | 10/20/2022 | — | (272,771) |
| 38,853,553 USD | 62,461,000 NZD | Goldman Sachs International | 10/20/2022 | — | (641,037) |
| 31,425,046 USD | 332,367,000 SEK | Goldman Sachs International | 10/20/2022 | — | (174,687) |
| 21,760,718 USD | 30,240,000 SGD | Goldman Sachs International | 10/20/2022 | — | (115,820) |
| Total | 11,129,057 | (9,620,697) | |||
| Call option contracts purchased | ||||||||
| Description | Counterparty | Trading currency | Notional amount | Number of contracts | Exercise price/Rate | Expiration date | Cost ($) | Value ($) |
| CBOE Volatility Index | Morgan Stanley | USD | 9,468,420 | 3,660 | 25.00 | 09/21/2022 | 791,069 | 896,700 |
| 8 | Columbia Overseas Value Fund | Semiannual Report 2022 |
August 31, 2022 (Unaudited)
| Call option contracts written | ||||||||
| Description | Counterparty | Trading currency | Notional amount | Number of contracts | Exercise price/Rate | Expiration date | Premium received ($) | Value ($) |
| Cameco Corp. | Morgan Stanley | USD | (12,493,690) | (4,286) | 34.00 | 9/16/2022 | (156,396) | (122,151) |
| Livent Corp. | Morgan Stanley | USD | (12,601,688) | (3,916) | 35.00 | 9/16/2022 | (179,391) | (264,330) |
| Livent Corp. | Morgan Stanley | USD | (12,611,342) | (3,919) | 32.50 | 9/16/2022 | (273,632) | (607,445) |
| Teekay Tankers Ltd. | Morgan Stanley | USD | (8,423,040) | (3,424) | 30.00 | 9/16/2022 | (33,831) | (34,240) |
| Total | (643,250) | (1,028,166) | ||||||
| (a) | Non-income producing investment. |
| (b) | This security or a portion of this security has been pledged as collateral in connection with derivative contracts. |
| (c) | Represents fair value as determined in good faith under procedures approved by the Board of Trustees. At August 31, 2022, the total value of these securities amounted to $0, which represents less than 0.01% of total net assets. |
| (d) | Denotes a restricted security, which is subject to legal or contractual restrictions on resale under federal securities laws. Disposal of a restricted investment may involve time-consuming negotiations and expenses, and prompt sale at an acceptable price may be difficult to achieve. Private placement securities are generally considered to be restricted, although certain of those securities may be traded between qualified institutional investors under the provisions of Section 4(a)(2) and Rule 144A. The Fund will not incur any registration costs upon such a trade. These securities are valued at fair value determined in good faith under consistently applied procedures established by the Fund’s Board of Trustees. At August 31, 2022, the total market value of these securities amounted to $0, which represents less than 0.01% of total net assets. Additional information on these securities is as follows: |
| Security | Acquisition Dates | Shares | Cost ($) | Value ($) |
| Lukoil PJSC | 01/25/2022-01/26/2022 | 106,132 | 8,693,219 | — |
| (e) | Valuation based on significant unobservable inputs. |
| (f) | The rate shown is the seven-day current annualized yield at August 31, 2022. |
| (g) | As defined in the Investment Company Act of 1940, as amended, an affiliated company is one in which the Fund owns 5% or more of the company’s outstanding voting securities, or a company which is under common ownership or control with the Fund. The value of the holdings and transactions in these affiliated companies during the period ended August 31, 2022 are as follows: |
| Affiliated issuers | Beginning of period($) | Purchases($) | Sales($) | Net change in unrealized appreciation (depreciation)($) | End of period($) | Realized gain (loss)($) | Dividends($) | End of period shares |
| Columbia Short-Term Cash Fund, 2.366% | ||||||||
| 11,100,869 | 303,673,261 | (284,050,551) | 1,706 | 30,725,285 | (507) | 105,413 | 30,740,655 | |
| ADR | American Depositary Receipt |
| AUD | Australian Dollar |
| CAD | Canada Dollar |
| CHF | Swiss Franc |
| DKK | Danish Krone |
| EUR | Euro |
| GBP | British Pound |
| JPY | Japanese Yen |
| KRW | South Korean Won |
| NOK | Norwegian Krone |
| NZD | New Zealand Dollar |
| SEK | Swedish Krona |
| SGD | Singapore Dollar |
| TWD | New Taiwan Dollar |
| Columbia Overseas Value Fund | Semiannual Report 2022 | 9 |
August 31, 2022 (Unaudited)
| USD | US Dollar |
| ■ | Level 1 — Valuations based on quoted prices for investments in active markets that the Fund has the ability to access at the measurement date. Valuation adjustments are not applied to Level 1 investments. |
| ■ | Level 2 — Valuations based on other significant observable inputs (including quoted prices for similar securities, interest rates, prepayment speeds, credit risks, etc.). |
| ■ | Level 3 — Valuations based on significant unobservable inputs (including the Fund’s own assumptions and judgment in determining the fair value of investments). |
| Level 1 ($) | Level 2 ($) | Level 3 ($) | Total ($) | |
| Investments in Securities | ||||
| Common Stocks | ||||
| Australia | — | 27,043,714 | — | 27,043,714 |
| Brazil | 20,196,370 | — | — | 20,196,370 |
| Canada | 154,330,162 | — | — | 154,330,162 |
| China | — | 18,830,596 | — | 18,830,596 |
| Finland | — | 48,780,951 | — | 48,780,951 |
| France | 669,495 | 262,033,920 | — | 262,703,415 |
| Germany | — | 105,977,256 | — | 105,977,256 |
| Greece | — | 11,107,521 | — | 11,107,521 |
| Hong Kong | — | 40,373,065 | — | 40,373,065 |
| Ireland | 365,464 | 43,089,112 | — | 43,454,576 |
| Israel | — | 25,148,488 | — | 25,148,488 |
| Japan | — | 456,819,446 | — | 456,819,446 |
| Netherlands | — | 240,497,192 | — | 240,497,192 |
| Norway | — | 28,540,167 | — | 28,540,167 |
| 10 | Columbia Overseas Value Fund | Semiannual Report 2022 |
August 31, 2022 (Unaudited)
| Level 1 ($) | Level 2 ($) | Level 3 ($) | Total ($) | |
| Russian Federation | — | — | 0* | — |
| Singapore | — | 65,538,198 | — | 65,538,198 |
| South Africa | 11,988,183 | — | — | 11,988,183 |
| South Korea | — | 20,924,598 | — | 20,924,598 |
| Spain | — | 85,584,581 | — | 85,584,581 |
| Sweden | — | 18,616,585 | — | 18,616,585 |
| Switzerland | — | 54,709,536 | — | 54,709,536 |
| Taiwan | — | 27,518,779 | — | 27,518,779 |
| United Kingdom | 55,711,622 | 311,082,099 | — | 366,793,721 |
| United States | 111,382,795 | 37,531,921 | — | 148,914,716 |
| Total Common Stocks | 354,644,091 | 1,929,747,725 | 0* | 2,284,391,816 |
| Exchange-Traded Equity Funds | 24,574,404 | — | — | 24,574,404 |
| Options Purchased Calls | 896,700 | — | — | 896,700 |
| Money Market Funds | 30,725,285 | — | — | 30,725,285 |
| Total Investments in Securities | 410,840,480 | 1,929,747,725 | 0* | 2,340,588,205 |
| Investments in Derivatives | ||||
| Asset | ||||
| Forward Foreign Currency Exchange Contracts | — | 11,129,057 | — | 11,129,057 |
| Liability | ||||
| Forward Foreign Currency Exchange Contracts | — | (9,620,697) | — | (9,620,697) |
| Options Contracts Written | (1,028,166) | — | — | (1,028,166) |
| Total | 409,812,314 | 1,931,256,085 | — | 2,341,068,399 |
| * | Rounds to zero. |
| Columbia Overseas Value Fund | Semiannual Report 2022 | 11 |
August 31, 2022 (Unaudited)
| Assets | |
| Investments in securities, at value | |
| Unaffiliated issuers (cost $2,599,380,805) | $2,308,966,220 |
| Affiliated issuers (cost $30,722,997) | 30,725,285 |
| Options purchased (cost $791,069) | 896,700 |
| Unrealized appreciation on forward foreign currency exchange contracts | 11,129,057 |
| Receivable for: | |
| Investments sold | 14,666,483 |
| Capital shares sold | 1,440,476 |
| Dividends | 5,561,976 |
| Foreign tax reclaims | 3,970,747 |
| Expense reimbursement due from Investment Manager | 4,052 |
| Prepaid expenses | 21,892 |
| Other assets | 31,148 |
| Total assets | 2,377,414,036 |
| Liabilities | |
| Option contracts written, at value (premiums received $643,250) | 1,028,166 |
| Due to custodian | 2,139 |
| Unrealized depreciation on forward foreign currency exchange contracts | 9,620,697 |
| Payable for: | |
| Investments purchased | 4,565,317 |
| Capital shares purchased | 5,089,754 |
| Management services fees | 50,889 |
| Distribution and/or service fees | 2,593 |
| Transfer agent fees | 227,194 |
| Compensation of board members | 237,697 |
| Compensation of chief compliance officer | 232 |
| Other expenses | 219,744 |
| Total liabilities | 21,044,422 |
| Net assets applicable to outstanding capital stock | $2,356,369,614 |
| Represented by | |
| Paid in capital | 2,952,815,303 |
| Total distributable earnings (loss) | (596,445,689) |
| Total - representing net assets applicable to outstanding capital stock | $2,356,369,614 |
| 12 | Columbia Overseas Value Fund | Semiannual Report 2022 |
August 31, 2022 (Unaudited)
| Class A | |
| Net assets | $289,331,636 |
| Shares outstanding | 32,912,020 |
| Net asset value per share | $8.79 |
| Maximum sales charge | 5.75% |
| Maximum offering price per share (calculated by dividing the net asset value per share by 1.0 minus the maximum sales charge for Class A shares) | $9.33 |
| Advisor Class | |
| Net assets | $368,378,667 |
| Shares outstanding | 41,956,499 |
| Net asset value per share | $8.78 |
| Class C | |
| Net assets | $15,310,500 |
| Shares outstanding | 1,761,427 |
| Net asset value per share | $8.69 |
| Institutional Class | |
| Net assets | $426,576,718 |
| Shares outstanding | 48,365,187 |
| Net asset value per share | $8.82 |
| Institutional 2 Class | |
| Net assets | $563,751,937 |
| Shares outstanding | 64,283,370 |
| Net asset value per share | $8.77 |
| Institutional 3 Class | |
| Net assets | $680,184,012 |
| Shares outstanding | 77,436,248 |
| Net asset value per share | $8.78 |
| Class R | |
| Net assets | $12,836,144 |
| Shares outstanding | 1,501,559 |
| Net asset value per share | $8.55 |
| Columbia Overseas Value Fund | Semiannual Report 2022 | 13 |
Six Months Ended August 31, 2022 (Unaudited)
| Net investment income | |
| Income: | |
| Dividends — unaffiliated issuers | $72,455,352 |
| Dividends — affiliated issuers | 105,413 |
| European Union tax reclaim | 262,654 |
| Foreign taxes withheld | (10,802,559) |
| Total income | 62,020,860 |
| Expenses: | |
| Management services fees | 9,849,498 |
| Distribution and/or service fees | |
| Class A | 391,800 |
| Class C | 86,448 |
| Class R | 34,728 |
| Transfer agent fees | |
| Class A | 227,803 |
| Advisor Class | 282,079 |
| Class C | 12,549 |
| Institutional Class | 340,646 |
| Institutional 2 Class | 176,672 |
| Institutional 3 Class | 24,635 |
| Class R | 10,089 |
| Compensation of board members | 5,964 |
| Custodian fees | 160,476 |
| Printing and postage fees | 129,225 |
| Registration fees | 84,808 |
| Audit fees | 30,525 |
| Legal fees | 19,468 |
| Interest on collateral | 3,428 |
| Interest on interfund lending | 48 |
| Compensation of chief compliance officer | 224 |
| Other | 37,409 |
| Total expenses | 11,908,522 |
| Fees waived or expenses reimbursed by Investment Manager and its affiliates | (716,453) |
| Total net expenses | 11,192,069 |
| Net investment income | 50,828,791 |
| Realized and unrealized gain (loss) — net | |
| Net realized gain (loss) on: | |
| Investments — unaffiliated issuers | (45,455,008) |
| Investments — affiliated issuers | (507) |
| Foreign currency translations | (1,557,460) |
| Forward foreign currency exchange contracts | (4,158,819) |
| Options purchased | 248,888 |
| Options contracts written | 2,198,963 |
| Net realized loss | (48,723,943) |
| Net change in unrealized appreciation (depreciation) on: | |
| Investments — unaffiliated issuers | (323,155,626) |
| Investments — affiliated issuers | 1,706 |
| Foreign currency translations | (461,576) |
| Forward foreign currency exchange contracts | (568,667) |
| Options purchased | 105,631 |
| Options contracts written | 375,698 |
| Net change in unrealized appreciation (depreciation) | (323,702,834) |
| Net realized and unrealized loss | (372,426,777) |
| Net decrease in net assets resulting from operations | $(321,597,986) |
| 14 | Columbia Overseas Value Fund | Semiannual Report 2022 |
| Six Months Ended August 31, 2022 (Unaudited) | Year Ended February 28, 2022 | |
| Operations | ||
| Net investment income | $50,828,791 | $63,111,953 |
| Net realized gain (loss) | (48,723,943) | 70,828,967 |
| Net change in unrealized appreciation (depreciation) | (323,702,834) | (45,067,529) |
| Net increase (decrease) in net assets resulting from operations | (321,597,986) | 88,873,391 |
| Distributions to shareholders | ||
| Net investment income and net realized gains | ||
| Class A | (3,330,850) | (11,067,794) |
| Advisor Class | (4,147,623) | (11,757,755) |
| Class C | (184,907) | (504,315) |
| Institutional Class | (4,931,467) | (17,975,864) |
| Institutional 2 Class | (6,473,754) | (26,006,694) |
| Institutional 3 Class | (7,611,135) | (27,502,053) |
| Class R | (149,267) | (484,871) |
| Total distributions to shareholders | (26,829,003) | (95,299,346) |
| Increase (decrease) in net assets from capital stock activity | (29,950,925) | 740,751,097 |
| Total increase (decrease) in net assets | (378,377,914) | 734,325,142 |
| Net assets at beginning of period | 2,734,747,528 | 2,000,422,386 |
| Net assets at end of period | $2,356,369,614 | $2,734,747,528 |
| Columbia Overseas Value Fund | Semiannual Report 2022 | 15 |
| Six Months Ended | Year Ended | |||
| August 31, 2022 (Unaudited) | February 28, 2022 | |||
| Shares | Dollars ($) | Shares | Dollars ($) | |
| Capital stock activity | ||||
| Class A | ||||
| Subscriptions | 1,781,974 | 16,721,479 | 6,233,691 | 66,476,786 |
| Fund reorganization | — | — | 4,285 | 44,736 |
| Distributions reinvested | 363,151 | 3,228,413 | 1,059,055 | 10,705,814 |
| Redemptions | (2,722,710) | (25,691,258) | (5,913,875) | (62,548,415) |
| Net increase (decrease) | (577,585) | (5,741,366) | 1,383,156 | 14,678,921 |
| Advisor Class | ||||
| Subscriptions | 7,325,218 | 68,307,727 | 17,797,576 | 190,309,034 |
| Fund reorganization | — | — | 4,039,099 | 42,049,576 |
| Distributions reinvested | 466,240 | 4,135,548 | 1,162,793 | 11,726,703 |
| Redemptions | (5,991,693) | (55,932,971) | (11,769,913) | (123,972,382) |
| Net increase | 1,799,765 | 16,510,304 | 11,229,555 | 120,112,931 |
| Class C | ||||
| Subscriptions | 79,636 | 764,074 | 188,106 | 1,978,112 |
| Distributions reinvested | 20,974 | 184,573 | 50,165 | 503,448 |
| Redemptions | (257,088) | (2,391,244) | (583,560) | (6,147,866) |
| Net decrease | (156,478) | (1,442,597) | (345,289) | (3,666,306) |
| Institutional Class | ||||
| Subscriptions | 8,345,593 | 79,187,450 | 21,464,914 | 228,595,718 |
| Distributions reinvested | 539,333 | 4,805,455 | 1,714,711 | 17,352,111 |
| Redemptions | (11,760,385) | (110,643,662) | (12,203,529) | (128,865,133) |
| Net increase (decrease) | (2,875,459) | (26,650,757) | 10,976,096 | 117,082,696 |
| Institutional 2 Class | ||||
| Subscriptions | 13,608,181 | 130,005,641 | 44,433,415 | 467,540,027 |
| Distributions reinvested | 729,079 | 6,459,638 | 2,583,941 | 25,998,838 |
| Redemptions | (21,234,053) | (204,080,327) | (30,847,596) | (326,703,923) |
| Net increase (decrease) | (6,896,793) | (67,615,048) | 16,169,760 | 166,834,942 |
| Institutional 3 Class | ||||
| Subscriptions | 14,396,313 | 134,946,980 | 49,017,595 | 518,942,169 |
| Distributions reinvested | 705,934 | 6,261,637 | 1,924,294 | 19,356,884 |
| Redemptions | (9,196,790) | (85,465,503) | (20,635,911) | (219,964,259) |
| Net increase | 5,905,457 | 55,743,114 | 30,305,978 | 318,334,794 |
| Class R | ||||
| Subscriptions | 174,244 | 1,597,438 | 1,098,288 | 11,569,685 |
| Distributions reinvested | 17,226 | 149,008 | 49,177 | 483,756 |
| Redemptions | (271,154) | (2,501,021) | (452,156) | (4,680,322) |
| Net increase (decrease) | (79,684) | (754,575) | 695,309 | 7,373,119 |
| Total net increase (decrease) | (2,880,777) | (29,950,925) | 70,414,565 | 740,751,097 |
| 16 | Columbia Overseas Value Fund | Semiannual Report 2022 |
| Net asset value, beginning of period | Net investment income | Net realized and unrealized gain (loss) | Total from investment operations | Distributions from net investment income | Distributions from net realized gains | Total distributions to shareholders | |
| Class A | |||||||
| Six Months Ended 8/31/2022 (Unaudited) | $10.11 | 0.18 | (1.40) | (1.22) | — | (0.10) | (0.10) |
| Year Ended 2/28/2022 | $9.99 | 0.23 | 0.23 | 0.46 | (0.27) | (0.07) | (0.34) |
| Year Ended 2/28/2021 | $8.55 | 0.14 | 1.44 | 1.58 | (0.10) | (0.04) | (0.14) |
| Year Ended 2/29/2020 | $9.24 | 0.22 | (0.56) | (0.34) | (0.33) | (0.02) | (0.35) |
| Year Ended 2/28/2019 | $10.37 | 0.27 | (1.10) | (0.83) | (0.13) | (0.17) | (0.30) |
| Year Ended 2/28/2018 | $8.52 | 0.14 | 2.04 | 2.18 | (0.15) | (0.18) | (0.33) |
| Advisor Class | |||||||
| Six Months Ended 8/31/2022 (Unaudited) | $10.08 | 0.19 | (1.39) | (1.20) | — | (0.10) | (0.10) |
| Year Ended 2/28/2022 | $9.96 | 0.25 | 0.24 | 0.49 | (0.30) | (0.07) | (0.37) |
| Year Ended 2/28/2021 | $8.53 | 0.16 | 1.43 | 1.59 | (0.12) | (0.04) | (0.16) |
| Year Ended 2/29/2020 | $9.21 | 0.22 | (0.52) | (0.30) | (0.36) | (0.02) | (0.38) |
| Year Ended 2/28/2019 | $10.35 | 0.28 | (1.10) | (0.82) | (0.15) | (0.17) | (0.32) |
| Year Ended 2/28/2018 | $8.49 | 0.15 | 2.06 | 2.21 | (0.17) | (0.18) | (0.35) |
| Class C | |||||||
| Six Months Ended 8/31/2022 (Unaudited) | $10.03 | 0.14 | (1.38) | (1.24) | — | (0.10) | (0.10) |
| Year Ended 2/28/2022 | $9.91 | 0.16 | 0.22 | 0.38 | (0.19) | (0.07) | (0.26) |
| Year Ended 2/28/2021 | $8.50 | 0.08 | 1.41 | 1.49 | (0.04) | (0.04) | (0.08) |
| Year Ended 2/29/2020 | $9.20 | 0.16 | (0.57) | (0.41) | (0.27) | (0.02) | (0.29) |
| Year Ended 2/28/2019 | $10.31 | 0.20 | (1.09) | (0.89) | (0.05) | (0.17) | (0.22) |
| Year Ended 2/28/2018 | $8.48 | 0.06 | 2.04 | 2.10 | (0.09) | (0.18) | (0.27) |
| Institutional Class | |||||||
| Six Months Ended 8/31/2022 (Unaudited) | $10.13 | 0.19 | (1.40) | (1.21) | — | (0.10) | (0.10) |
| Year Ended 2/28/2022 | $10.01 | 0.26 | 0.23 | 0.49 | (0.30) | (0.07) | (0.37) |
| Year Ended 2/28/2021 | $8.57 | 0.16 | 1.44 | 1.60 | (0.12) | (0.04) | (0.16) |
| Year Ended 2/29/2020 | $9.25 | 0.24 | (0.54) | (0.30) | (0.36) | (0.02) | (0.38) |
| Year Ended 2/28/2019 | $10.38 | 0.29 | (1.10) | (0.81) | (0.15) | (0.17) | (0.32) |
| Year Ended 2/28/2018 | $8.53 | 0.15 | 2.05 | 2.20 | (0.17) | (0.18) | (0.35) |
| Institutional 2 Class | |||||||
| Six Months Ended 8/31/2022 (Unaudited) | $10.07 | 0.20 | (1.40) | (1.20) | — | (0.10) | (0.10) |
| Year Ended 2/28/2022 | $9.95 | 0.27 | 0.23 | 0.50 | (0.31) | (0.07) | (0.38) |
| Year Ended 2/28/2021 | $8.52 | 0.16 | 1.44 | 1.60 | (0.13) | (0.04) | (0.17) |
| Year Ended 2/29/2020 | $9.20 | 0.25 | (0.54) | (0.29) | (0.37) | (0.02) | (0.39) |
| Year Ended 2/28/2019 | $10.33 | 0.30 | (1.10) | (0.80) | (0.16) | (0.17) | (0.33) |
| Year Ended 2/28/2018 | $8.48 | 0.18 | 2.03 | 2.21 | (0.18) | (0.18) | (0.36) |
| 18 | Columbia Overseas Value Fund | Semiannual Report 2022 |
| Net asset value, end of period | Total return | Total gross expense ratio to average net assets(a) | Total net expense ratio to average net assets(a),(b) | Net investment income ratio to average net assets | Portfolio turnover | Net assets, end of period (000’s) | |
| Class A | |||||||
| Six Months Ended 8/31/2022 (Unaudited) | $8.79 | (12.06%) | 1.21%(c),(d),(e) | 1.16%(c),(d),(e) | 3.76%(c) | 19% | $289,332 |
| Year Ended 2/28/2022 | $10.11 | 4.65% | 1.21%(d) | 1.15%(d),(f) | 2.20% | 43% | $338,513 |
| Year Ended 2/28/2021 | $9.99 | 18.68% | 1.28%(d),(e) | 1.18%(d),(e),(f) | 1.65% | 54% | $320,615 |
| Year Ended 2/29/2020 | $8.55 | (4.10%) | 1.24%(d) | 1.22%(d),(f) | 2.35% | 35% | $309,065 |
| Year Ended 2/28/2019 | $9.24 | (7.96%) | 1.29%(d),(e) | 1.25%(d),(e),(f) | 2.80% | 58% | $341,198 |
| Year Ended 2/28/2018 | $10.37 | 25.72% | 1.36%(g) | 1.36%(f),(g) | 1.41% | 47% | $363,817 |
| Advisor Class | |||||||
| Six Months Ended 8/31/2022 (Unaudited) | $8.78 | (11.90%) | 0.96%(c),(d),(e) | 0.91%(c),(d),(e) | 4.00%(c) | 19% | $368,379 |
| Year Ended 2/28/2022 | $10.08 | 4.93% | 0.96%(d) | 0.90%(d),(f) | 2.37% | 43% | $404,891 |
| Year Ended 2/28/2021 | $9.96 | 18.86% | 1.03%(d),(e) | 0.93%(d),(e),(f) | 1.85% | 54% | $288,182 |
| Year Ended 2/29/2020 | $8.53 | (3.78%) | 0.99%(d) | 0.97%(d),(f) | 2.41% | 35% | $210,152 |
| Year Ended 2/28/2019 | $9.21 | (7.80%) | 1.04%(d),(e) | 0.99%(d),(e),(f) | 2.96% | 58% | $161,150 |
| Year Ended 2/28/2018 | $10.35 | 26.18% | 1.11%(g) | 1.10%(f),(g) | 1.47% | 47% | $78,634 |
| Class C | |||||||
| Six Months Ended 8/31/2022 (Unaudited) | $8.69 | (12.36%) | 1.96%(c),(d),(e) | 1.91%(c),(d),(e) | 3.04%(c) | 19% | $15,311 |
| Year Ended 2/28/2022 | $10.03 | 3.88% | 1.96%(d) | 1.90%(d),(f) | 1.50% | 43% | $19,243 |
| Year Ended 2/28/2021 | $9.91 | 17.66% | 2.03%(d),(e) | 1.93%(d),(e),(f) | 0.98% | 54% | $22,436 |
| Year Ended 2/29/2020 | $8.50 | (4.81%) | 1.99%(d) | 1.97%(d),(f) | 1.73% | 35% | $28,608 |
| Year Ended 2/28/2019 | $9.20 | (8.60%) | 2.04%(d),(e) | 2.00%(d),(e),(f) | 2.09% | 58% | $42,165 |
| Year Ended 2/28/2018 | $10.31 | 24.87% | 2.11%(g) | 2.10%(f),(g) | 0.61% | 47% | $44,594 |
| Institutional Class | |||||||
| Six Months Ended 8/31/2022 (Unaudited) | $8.82 | (11.94%) | 0.96%(c),(d),(e) | 0.91%(c),(d),(e) | 4.00%(c) | 19% | $426,577 |
| Year Ended 2/28/2022 | $10.13 | 4.91% | 0.96%(d) | 0.90%(d),(f) | 2.40% | 43% | $518,966 |
| Year Ended 2/28/2021 | $10.01 | 18.89% | 1.03%(d),(e) | 0.93%(d),(e),(f) | 1.93% | 54% | $402,868 |
| Year Ended 2/29/2020 | $8.57 | (3.76%) | 0.99%(d) | 0.97%(d),(f) | 2.54% | 35% | $443,217 |
| Year Ended 2/28/2019 | $9.25 | (7.69%) | 1.04%(d),(e) | 1.00%(d),(e),(f) | 3.05% | 58% | $432,061 |
| Year Ended 2/28/2018 | $10.38 | 25.94% | 1.11%(g) | 1.10%(f),(g) | 1.46% | 47% | $309,845 |
| Institutional 2 Class | |||||||
| Six Months Ended 8/31/2022 (Unaudited) | $8.77 | (11.91%) | 0.87%(c),(d),(e) | 0.82%(c),(d),(e) | 4.15%(c) | 19% | $563,752 |
| Year Ended 2/28/2022 | $10.07 | 5.02% | 0.88%(d) | 0.82%(d) | 2.52% | 43% | $716,539 |
| Year Ended 2/28/2021 | $9.95 | 18.99% | 0.93%(d),(e) | 0.84%(d),(e) | 1.92% | 54% | $547,159 |
| Year Ended 2/29/2020 | $8.52 | (3.68%) | 0.90%(d) | 0.86%(d) | 2.70% | 35% | $493,226 |
| Year Ended 2/28/2019 | $9.20 | (7.61%) | 0.96%(d),(e) | 0.88%(d),(e) | 3.39% | 58% | $533,584 |
| Year Ended 2/28/2018 | $10.33 | 26.23% | 0.99%(g) | 0.98%(g) | 1.82% | 47% | $68,822 |
| Columbia Overseas Value Fund | Semiannual Report 2022 | 19 |
| Net asset value, beginning of period | Net investment income | Net realized and unrealized gain (loss) | Total from investment operations | Distributions from net investment income | Distributions from net realized gains | Total distributions to shareholders | |
| Institutional 3 Class | |||||||
| Six Months Ended 8/31/2022 (Unaudited) | $10.08 | 0.19 | (1.39) | (1.20) | — | (0.10) | (0.10) |
| Year Ended 2/28/2022 | $9.96 | 0.26 | 0.24 | 0.50 | (0.31) | (0.07) | (0.38) |
| Year Ended 2/28/2021 | $8.53 | 0.16 | 1.44 | 1.60 | (0.13) | (0.04) | (0.17) |
| Year Ended 2/29/2020 | $9.21 | 0.25 | (0.54) | (0.29) | (0.37) | (0.02) | (0.39) |
| Year Ended 2/28/2019 | $10.35 | 0.30 | (1.10) | (0.80) | (0.17) | (0.17) | (0.34) |
| Year Ended 2/28/2018 | $8.49 | 0.21 | 2.02 | 2.23 | (0.19) | (0.18) | (0.37) |
| Class R | |||||||
| Six Months Ended 8/31/2022 (Unaudited) | $9.84 | 0.16 | (1.35) | (1.19) | — | (0.10) | (0.10) |
| Year Ended 2/28/2022 | $9.73 | 0.19 | 0.24 | 0.43 | (0.25) | (0.07) | (0.32) |
| Year Ended 2/28/2021 | $8.34 | 0.11 | 1.40 | 1.51 | (0.08) | (0.04) | (0.12) |
| Year Ended 2/29/2020 | $9.02 | 0.18 | (0.53) | (0.35) | (0.31) | (0.02) | (0.33) |
| Year Ended 2/28/2019 | $10.13 | 0.23 | (1.07) | (0.84) | (0.10) | (0.17) | (0.27) |
| Year Ended 2/28/2018 | $8.33 | 0.08 | 2.03 | 2.11 | (0.13) | (0.18) | (0.31) |
| Notes to Financial Highlights | |
| (a) | In addition to the fees and expenses that the Fund bears directly, the Fund indirectly bears a pro rata share of the fees and expenses of any other funds in which it invests. Such indirect expenses are not included in the Fund’s reported expense ratios. |
| (b) | Total net expenses include the impact of certain fee waivers/expense reimbursements made by the Investment Manager and certain of its affiliates, if applicable. |
| (c) | Annualized. |
| (d) | Ratios include interest on collateral expense which is less than 0.01%. |
| (e) | Ratios include interfund lending expense which is less than 0.01%. |
| (f) | The benefits derived from expense reductions had an impact of less than 0.01%. |
| (g) | Ratios include line of credit interest expense which is less than 0.01%. |
| 20 | Columbia Overseas Value Fund | Semiannual Report 2022 |
| Net asset value, end of period | Total return | Total gross expense ratio to average net assets(a) | Total net expense ratio to average net assets(a),(b) | Net investment income ratio to average net assets | Portfolio turnover | Net assets, end of period (000’s) | |
| Institutional 3 Class | |||||||
| Six Months Ended 8/31/2022 (Unaudited) | $8.78 | (11.90%) | 0.82%(c),(d),(e) | 0.77%(c),(d),(e) | 4.10%(c) | 19% | $680,184 |
| Year Ended 2/28/2022 | $10.08 | 5.07% | 0.83%(d) | 0.77%(d) | 2.46% | 43% | $721,028 |
| Year Ended 2/28/2021 | $9.96 | 19.00% | 0.88%(d),(e) | 0.79%(d),(e) | 1.93% | 54% | $410,541 |
| Year Ended 2/29/2020 | $8.53 | (3.65%) | 0.85%(d) | 0.83%(d) | 2.67% | 35% | $260,599 |
| Year Ended 2/28/2019 | $9.21 | (7.64%) | 0.89%(d),(e) | 0.85%(d),(e) | 3.11% | 58% | $248,248 |
| Year Ended 2/28/2018 | $10.35 | 26.37% | 0.94%(g) | 0.93%(g) | 2.08% | 47% | $340,651 |
| Class R | |||||||
| Six Months Ended 8/31/2022 (Unaudited) | $8.55 | (12.09%) | 1.46%(c),(d),(e) | 1.41%(c),(d),(e) | 3.51%(c) | 19% | $12,836 |
| Year Ended 2/28/2022 | $9.84 | 4.40% | 1.47%(d) | 1.40%(d),(f) | 1.84% | 43% | $15,567 |
| Year Ended 2/28/2021 | $9.73 | 18.29% | 1.53%(d),(e) | 1.43%(d),(e),(f) | 1.36% | 54% | $8,621 |
| Year Ended 2/29/2020 | $8.34 | (4.30%) | 1.49%(d) | 1.47%(d),(f) | 2.00% | 35% | $7,209 |
| Year Ended 2/28/2019 | $9.02 | (8.20%) | 1.55%(d),(e) | 1.49%(d),(e),(f) | 2.47% | 58% | $5,864 |
| Year Ended 2/28/2018 | $10.13 | 25.46% | 1.61%(g) | 1.59%(f),(g) | 0.80% | 47% | $3,099 |
| Columbia Overseas Value Fund | Semiannual Report 2022 | 21 |
August 31, 2022 (Unaudited)
| 22 | Columbia Overseas Value Fund | Semiannual Report 2022 |
August 31, 2022 (Unaudited)
| Columbia Overseas Value Fund | Semiannual Report 2022 | 23 |
August 31, 2022 (Unaudited)
| 24 | Columbia Overseas Value Fund | Semiannual Report 2022 |
August 31, 2022 (Unaudited)
| Asset derivatives | ||
| Risk exposure category | Statement of assets and liabilities location | Fair value ($) |
| Equity risk | Investments, at value — Options Purchased | 896,700 |
| Foreign exchange risk | Unrealized appreciation on forward foreign currency exchange contracts | 11,129,057 |
| Total | 12,025,757 |
| Columbia Overseas Value Fund | Semiannual Report 2022 | 25 |
August 31, 2022 (Unaudited)
| Liability derivatives | ||
| Risk exposure category | Statement of assets and liabilities location | Fair value ($) |
| Equity risk | Options contracts written, at value | 1,028,166 |
| Foreign exchange risk | Unrealized depreciation on forward foreign currency exchange contracts | 9,620,697 |
| Total | 10,648,863 |
| Amount of realized gain (loss) on derivatives recognized in income | ||||
| Risk exposure category | Forward foreign currency exchange contracts ($) | Options contracts written ($) | Options contracts purchased ($) | Total ($) |
| Equity risk | — | 2,198,963 | 248,888 | 2,447,851 |
| Foreign exchange risk | (4,158,819) | — | — | (4,158,819) |
| Total | (4,158,819) | 2,198,963 | 248,888 | (1,710,968) |
| Change in unrealized appreciation (depreciation) on derivatives recognized in income | ||||
| Risk exposure category | Forward foreign currency exchange contracts ($) | Options contracts written ($) | Options contracts purchased ($) | Total ($) |
| Equity risk | — | 375,698 | 105,631 | 481,329 |
| Foreign exchange risk | (568,667) | — | — | (568,667) |
| Total | (568,667) | 375,698 | 105,631 | (87,338) |
| Derivative instrument | Average value ($)* |
| Options contracts — purchased | 448,350 |
| Options contracts — written | (814,126) |
| Derivative instrument | Average unrealized appreciation ($)* | Average unrealized depreciation ($)* |
| Forward foreign currency exchange contracts | 7,669,884 | (6,081,095) |
| * | Based on the ending quarterly outstanding amounts for the six months ended August 31, 2022. |
| 26 | Columbia Overseas Value Fund | Semiannual Report 2022 |
August 31, 2022 (Unaudited)
| Goldman Sachs International ($) | Morgan Stanley ($) | Total ($) | |
| Assets | |||
| Forward foreign currency exchange contracts | 11,129,057 | - | 11,129,057 |
| Options purchased calls | - | 896,700 | 896,700 |
| Total Assets | 11,129,057 | 896,700 | 12,025,757 |
| Liabilities | |||
| Forward foreign currency exchange contracts | 9,620,697 | - | 9,620,697 |
| Options contracts written | - | 1,028,166 | 1,028,166 |
| Total liabilities | 9,620,697 | 1,028,166 | 10,648,863 |
| Total financial and derivative net assets | 1,508,360 | (131,466) | 1,376,894 |
| Total collateral received (pledged) (a) | 1,370,000 | (131,466) | 1,238,534 |
| Net amount (b) | 138,360 | - | 138,360 |
| (a) | In some instances, the actual collateral received and/or pledged may be more than the amount shown due to overcollateralization. |
| (b) | Represents the net amount due from/(to) counterparties in the event of default. |
| Columbia Overseas Value Fund | Semiannual Report 2022 | 27 |
August 31, 2022 (Unaudited)
| 28 | Columbia Overseas Value Fund | Semiannual Report 2022 |
August 31, 2022 (Unaudited)
| Effective rate (%) | |
| Class A | 0.15 |
| Advisor Class | 0.15 |
| Class C | 0.15 |
| Institutional Class | 0.15 |
| Institutional 2 Class | 0.06 |
| Institutional 3 Class | 0.01 |
| Class R | 0.15 |
| Columbia Overseas Value Fund | Semiannual Report 2022 | 29 |
August 31, 2022 (Unaudited)
| Front End (%) | CDSC (%) | Amount ($) | |
| Class A | 5.75 | 0.50 - 1.00(a) | 51,095 |
| Class C | — | 1.00(b) | 31 |
| (a) | This charge is imposed on certain investments of between $1 million and $50 million redeemed within 18 months after purchase, as follows: 1.00% if redeemed within 12 months after purchase, and 0.50% if redeemed more than 12, but less than 18, months after purchase, with certain limited exceptions. |
| (b) | This charge applies to redemptions within 12 months after purchase, with certain limited exceptions. |
| Fee rate(s) contractual through June 30, 2024 | |
| Class A | 1.16% |
| Advisor Class | 0.91 |
| Class C | 1.91 |
| Institutional Class | 0.91 |
| Institutional 2 Class | 0.82 |
| Institutional 3 Class | 0.77 |
| Class R | 1.41 |
| 30 | Columbia Overseas Value Fund | Semiannual Report 2022 |
August 31, 2022 (Unaudited)
| Federal tax cost ($) | Gross unrealized appreciation ($) | Gross unrealized (depreciation) ($) | Net unrealized (depreciation) ($) |
| 2,630,252,000 | 158,150,000 | (447,334,000) | (289,184,000) |
| No expiration short-term ($) | No expiration long-term ($) | Total ($) |
| — | (274,747,450) | (274,747,450) |
| Late year ordinary losses ($) | Post-October capital losses ($) |
| 2,435,594 | — |
| Columbia Overseas Value Fund | Semiannual Report 2022 | 31 |
August 31, 2022 (Unaudited)
| Borrower or lender | Average loan balance ($) | Weighted average interest rate (%) | Number of days with outstanding loans |
| Borrower | 1,300,000 | 1.32 | 1 |
| 32 | Columbia Overseas Value Fund | Semiannual Report 2022 |
August 31, 2022 (Unaudited)
| Shares | |
| Class A | 4,285 |
| Advisor Class | 4,039,099 |
| ($) | |
| Net investment income | 64,507,000 |
| Net realized gain | 81,877,000 |
| Net change in unrealized appreciation/(depreciation) | (52,161,000) |
| Net increase in net assets from operations | 94,223,000 |
| Columbia Overseas Value Fund | Semiannual Report 2022 | 33 |
August 31, 2022 (Unaudited)
| 34 | Columbia Overseas Value Fund | Semiannual Report 2022 |
August 31, 2022 (Unaudited)
| Columbia Overseas Value Fund | Semiannual Report 2022 | 35 |
| • | the Fund had sufficient liquidity to both meet redemptions and operate effectively on behalf of shareholders; |
| • | there were no material changes to the Program during the period; |
| • | the implementation of the Program was effective to manage the Fund’s liquidity risk; and |
| • | the Program operated adequately during the period. |
| 36 | Columbia Overseas Value Fund | Semiannual Report 2022 |
(Unaudited)
| • | Information on the investment performance of the Fund relative to the performance of a group of mutual funds determined to be comparable to the Fund by Broadridge, as well as performance relative to benchmarks; |
| • | Information on the Fund’s management fees and total expenses, including information comparing the Fund’s expenses to those of a group of comparable mutual funds, as determined by Broadridge; |
| • | The Investment Manager’s agreement to contractually limit or cap total operating expenses for the Fund so that total operating expenses (excluding certain fees and expenses, such as transaction costs and certain other investment related expenses, interest, taxes, acquired fund fees and expenses and infrequent and/or unusual expenses) would not exceed a specified annual rate, as a percentage of the Fund’s net assets; |
| • | Terms of the Management Agreement; |
| • | Descriptions of other agreements and arrangements with affiliates of the Investment Manager relating to the operations of the Fund, including agreements with respect to the provision of transfer agency and shareholder services to the Fund; |
| • | Descriptions of various services performed by the Investment Manager under the Management Agreement, including portfolio management and portfolio trading practices; |
| • | Information regarding any recently negotiated management fees of similarly-managed portfolios of other institutional clients of the Investment Manager; |
| • | Information regarding the resources of the Investment Manager, including information regarding senior management, portfolio managers and other personnel; |
| • | Information regarding the capabilities of the Investment Manager with respect to compliance monitoring services; |
| • | The profitability to the Investment Manager and its affiliates from their relationships with the Fund; and |
| • | Report provided by the Board’s independent fee consultant, JDL Consultants, LLC (JDL). |
| Columbia Overseas Value Fund | Semiannual Report 2022 | 37 |
(Unaudited)
into account the organization and strength of the Fund’s and its service providers’ compliance programs. The Board also reviewed the financial condition of the Investment Manager and its affiliates and each entity’s ability to carry out its responsibilities under the Management Agreement and the Fund’s other service agreements.
| 38 | Columbia Overseas Value Fund | Semiannual Report 2022 |
(Unaudited)
Ameriprise Financial from managing, operating and distributing the Funds. The Board considered that in 2021 the Board had considered 2020 profitability and that the 2022 information showed that the profitability generated by the Investment Manager in 2021 increased from 2020 levels, due to a variety of factors, including the increased assets under management of the Funds. It also took into account the indirect economic benefits flowing to the Investment Manager or its affiliates in connection with managing or distributing the Funds, such as the enhanced ability to offer various other financial products to Ameriprise Financial customers, soft dollar benefits and overall reputational advantages. The Board noted that the fees paid by the Fund should permit the Investment Manager to offer competitive compensation to its personnel, make necessary investments in its business and earn an appropriate profit. After reviewing these and related factors, the Board concluded, within the context of their overall conclusions, that the costs of services provided and the profitability to the Investment Manager and its affiliates from their relationships with the Fund supported the continuation of the Management Agreement.
| Columbia Overseas Value Fund | Semiannual Report 2022 | 39 |
columbiathreadneedleus.com/investor/. The Fund is distributed by Columbia Management Investment Distributors, Inc., member FINRA, and managed by Columbia Management Investment Advisers, LLC.

August 31, 2022 (Unaudited)

(Unaudited)
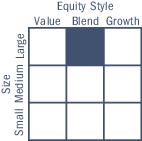
| Average annual total returns (%) (for the period ended August 31, 2022) | ||||||
| Inception | 6 Months cumulative | 1 Year | 5 Years | 10 Years | ||
| Class A | 07/31/96 | -9.34 | -10.18 | 10.99 | 12.50 | |
| Advisor Class* | 07/01/15 | -9.25 | -9.97 | 11.26 | 12.70 | |
| Institutional Class | 07/31/96 | -9.27 | -9.98 | 11.26 | 12.78 | |
| Institutional 2 Class* | 06/25/14 | -9.18 | -9.85 | 11.39 | 12.83 | |
| Institutional 3 Class | 07/15/09 | -9.15 | -9.81 | 11.45 | 12.95 | |
| Class R | 01/23/06 | -9.46 | -10.43 | 10.71 | 12.22 | |
| S&P 500 Index | -8.84 | -11.23 | 11.82 | 13.08 | ||
| * | The returns shown for periods prior to the share class inception date (including returns for the Life of the Fund, if shown, which are since Fund inception) include the returns of the Fund’s oldest share class. Since the Fund launched more than one share class at its inception, Class A shares were used. These returns are adjusted to reflect any higher class-related operating expenses of the newer share classes, as applicable. Please visit columbiathreadneedleus.com/investor/investment-products/mutual-funds/appended-performance for more information. |
| Columbia Large Cap Enhanced Core Fund | Semiannual Report 2022 | 3 |
(Unaudited)
| Portfolio breakdown (%) (at August 31, 2022) | |
| Common Stocks | 98.4 |
| Money Market Funds | 1.6 |
| Total | 100.0 |
| Equity sector breakdown (%) (at August 31, 2022) | |
| Communication Services | 8.7 |
| Consumer Discretionary | 11.2 |
| Consumer Staples | 6.6 |
| Energy | 4.3 |
| Financials | 10.7 |
| Health Care | 14.6 |
| Industrials | 8.0 |
| Information Technology | 27.6 |
| Materials | 2.8 |
| Real Estate | 2.7 |
| Utilities | 2.8 |
| Total | 100.0 |
| 4 | Columbia Large Cap Enhanced Core Fund | Semiannual Report 2022 |
(Unaudited)
| March 1, 2022 — August 31, 2022 | |||||||
| Account value at the beginning of the period ($) | Account value at the end of the period ($) | Expenses paid during the period ($) | Fund’s annualized expense ratio (%) | ||||
| Actual | Hypothetical | Actual | Hypothetical | Actual | Hypothetical | Actual | |
| Class A | 1,000.00 | 1,000.00 | 906.60 | 1,021.02 | 3.99 | 4.23 | 0.83 |
| Advisor Class | 1,000.00 | 1,000.00 | 907.50 | 1,022.28 | 2.79 | 2.96 | 0.58 |
| Institutional Class | 1,000.00 | 1,000.00 | 907.30 | 1,022.28 | 2.79 | 2.96 | 0.58 |
| Institutional 2 Class | 1,000.00 | 1,000.00 | 908.20 | 1,022.94 | 2.16 | 2.29 | 0.45 |
| Institutional 3 Class | 1,000.00 | 1,000.00 | 908.50 | 1,023.19 | 1.92 | 2.04 | 0.40 |
| Class R | 1,000.00 | 1,000.00 | 905.40 | 1,019.76 | 5.19 | 5.50 | 1.08 |
| Columbia Large Cap Enhanced Core Fund | Semiannual Report 2022 | 5 |
August 31, 2022 (Unaudited)
| Common Stocks 98.4% | ||
| Issuer | Shares | Value ($) |
| Communication Services 8.5% | ||
| Diversified Telecommunication Services 0.4% | ||
| Verizon Communications, Inc. | 32,431 | 1,355,940 |
| Entertainment 0.9% | ||
| Activision Blizzard, Inc. | 7,972 | 625,722 |
| Electronic Arts, Inc. | 20,153 | 2,556,811 |
| Total | 3,182,533 | |
| Interactive Media & Services 5.9% | ||
| Alphabet, Inc., Class A(a) | 137,409 | 14,870,402 |
| Meta Platforms, Inc., Class A(a) | 35,573 | 5,795,909 |
| Total | 20,666,311 | |
| Media 1.3% | ||
| Interpublic Group of Companies, Inc. (The) | 76,892 | 2,125,295 |
| Omnicom Group, Inc. | 37,031 | 2,477,374 |
| Total | 4,602,669 | |
| Total Communication Services | 29,807,453 | |
| Consumer Discretionary 11.0% | ||
| Automobiles 1.4% | ||
| Tesla, Inc.(a) | 17,430 | 4,803,882 |
| Distributors 0.4% | ||
| Genuine Parts Co. | 9,000 | 1,404,090 |
| Hotels, Restaurants & Leisure 1.4% | ||
| Booking Holdings, Inc.(a) | 1,551 | 2,909,381 |
| Expedia Group, Inc.(a) | 19,874 | 2,040,066 |
| Total | 4,949,447 | |
| Household Durables 1.8% | ||
| Lennar Corp., Class A | 32,091 | 2,485,448 |
| NVR, Inc.(a) | 504 | 2,086,590 |
| PulteGroup, Inc. | 45,388 | 1,845,476 |
| Total | 6,417,514 | |
| Internet & Direct Marketing Retail 2.8% | ||
| Amazon.com, Inc.(a) | 76,215 | 9,661,776 |
| Common Stocks (continued) | ||
| Issuer | Shares | Value ($) |
| Specialty Retail 2.4% | ||
| AutoZone, Inc.(a) | 1,113 | 2,358,681 |
| Home Depot, Inc. (The) | 5,327 | 1,536,413 |
| O’Reilly Automotive, Inc.(a) | 3,664 | 2,554,248 |
| Ulta Beauty, Inc.(a) | 5,147 | 2,161,071 |
| Total | 8,610,413 | |
| Textiles, Apparel & Luxury Goods 0.8% | ||
| NIKE, Inc., Class B | 9,768 | 1,039,804 |
| PVH Corp. | 30,097 | 1,692,956 |
| Total | 2,732,760 | |
| Total Consumer Discretionary | 38,579,882 | |
| Consumer Staples 6.5% | ||
| Beverages 0.2% | ||
| Coca-Cola Co. (The) | 10,831 | 668,381 |
| Food & Staples Retailing 0.7% | ||
| Kroger Co. (The) | 56,202 | 2,694,324 |
| Food Products 2.0% | ||
| General Mills, Inc. | 37,775 | 2,901,120 |
| JM Smucker Co. (The) | 6,739 | 943,393 |
| Kraft Heinz Co. (The) | 24,300 | 908,820 |
| Tyson Foods, Inc., Class A | 29,024 | 2,187,829 |
| Total | 6,941,162 | |
| Household Products 1.6% | ||
| Procter & Gamble Co. (The) | 40,235 | 5,550,016 |
| Tobacco 2.0% | ||
| Altria Group, Inc. | 71,906 | 3,244,399 |
| Philip Morris International, Inc. | 39,266 | 3,749,510 |
| Total | 6,993,909 | |
| Total Consumer Staples | 22,847,792 | |
| 6 | Columbia Large Cap Enhanced Core Fund | Semiannual Report 2022 |
August 31, 2022 (Unaudited)
| Common Stocks (continued) | ||
| Issuer | Shares | Value ($) |
| Energy 4.3% | ||
| Oil, Gas & Consumable Fuels 4.3% | ||
| Chevron Corp. | 6,205 | 980,763 |
| ConocoPhillips Co. | 22,616 | 2,475,321 |
| Exxon Mobil Corp. | 69,741 | 6,666,542 |
| Marathon Petroleum Corp. | 29,251 | 2,947,038 |
| Phillips 66 | 21,463 | 1,920,080 |
| Total | 14,989,744 | |
| Total Energy | 14,989,744 | |
| Financials 10.5% | ||
| Banks 2.8% | ||
| Bank of America Corp. | 20,691 | 695,425 |
| Comerica, Inc. | 27,203 | 2,184,401 |
| JPMorgan Chase & Co. | 13,451 | 1,529,782 |
| Wells Fargo & Co. | 90,133 | 3,939,713 |
| Zions Bancorp | 26,322 | 1,448,500 |
| Total | 9,797,821 | |
| Capital Markets 2.1% | ||
| Cboe Global Markets, Inc. | 14,796 | 1,745,484 |
| CME Group, Inc. | 14,178 | 2,773,358 |
| Morgan Stanley | 32,285 | 2,751,328 |
| Total | 7,270,170 | |
| Consumer Finance 1.4% | ||
| Capital One Financial Corp. | 23,064 | 2,440,632 |
| Discover Financial Services | 10,250 | 1,030,023 |
| Synchrony Financial | 43,773 | 1,433,566 |
| Total | 4,904,221 | |
| Diversified Financial Services 0.9% | ||
| Berkshire Hathaway, Inc., Class B(a) | 10,740 | 3,015,792 |
| Insurance 3.3% | ||
| Aon PLC, Class A | 7,775 | 2,171,246 |
| Lincoln National Corp. | 50,209 | 2,312,627 |
| Marsh & McLennan Companies, Inc. | 21,208 | 3,422,335 |
| MetLife, Inc. | 43,788 | 2,816,882 |
| Prudential Financial, Inc. | 10,495 | 1,004,896 |
| Total | 11,727,986 | |
| Total Financials | 36,715,990 | |
| Common Stocks (continued) | ||
| Issuer | Shares | Value ($) |
| Health Care 14.4% | ||
| Biotechnology 2.4% | ||
| AbbVie, Inc. | 27,678 | 3,721,584 |
| Amgen, Inc. | 3,356 | 806,447 |
| Gilead Sciences, Inc. | 9,718 | 616,801 |
| Regeneron Pharmaceuticals, Inc.(a) | 1,947 | 1,131,324 |
| Vertex Pharmaceuticals, Inc.(a) | 7,312 | 2,060,229 |
| Total | 8,336,385 | |
| Health Care Equipment & Supplies 2.5% | ||
| Abbott Laboratories | 38,747 | 3,977,379 |
| Hologic, Inc.(a) | 34,857 | 2,354,939 |
| Zimmer Biomet Holdings, Inc. | 23,224 | 2,469,176 |
| Total | 8,801,494 | |
| Health Care Providers & Services 4.0% | ||
| Cardinal Health, Inc. | 20,200 | 1,428,544 |
| CVS Health Corp. | 38,599 | 3,788,492 |
| Elevance Health, Inc. | 2,204 | 1,069,183 |
| McKesson Corp. | 7,455 | 2,735,985 |
| Molina Healthcare, Inc.(a) | 6,382 | 2,153,095 |
| UnitedHealth Group, Inc. | 5,477 | 2,844,370 |
| Total | 14,019,669 | |
| Life Sciences Tools & Services 0.8% | ||
| IQVIA Holdings, Inc.(a) | 12,360 | 2,628,478 |
| Pharmaceuticals 4.7% | ||
| Bristol-Myers Squibb Co. | 55,626 | 3,749,748 |
| Eli Lilly & Co. | 4,773 | 1,437,771 |
| Johnson & Johnson | 14,039 | 2,265,052 |
| Merck & Co., Inc. | 25,711 | 2,194,691 |
| Pfizer, Inc. | 102,778 | 4,648,649 |
| Viatris, Inc. | 214,085 | 2,044,512 |
| Total | 16,340,423 | |
| Total Health Care | 50,126,449 | |
| Industrials 7.9% | ||
| Aerospace & Defense 2.5% | ||
| General Dynamics Corp. | 13,391 | 3,065,602 |
| Lockheed Martin Corp. | 8,208 | 3,448,263 |
| Textron, Inc. | 37,161 | 2,318,103 |
| Total | 8,831,968 | |
| Columbia Large Cap Enhanced Core Fund | Semiannual Report 2022 | 7 |
August 31, 2022 (Unaudited)
| Common Stocks (continued) | ||
| Issuer | Shares | Value ($) |
| Airlines 0.2% | ||
| Southwest Airlines Co.(a) | 13,589 | 498,716 |
| Building Products 0.7% | ||
| Masco Corp. | 48,773 | 2,481,083 |
| Commercial Services & Supplies 1.3% | ||
| Cintas Corp. | 6,175 | 2,512,237 |
| Republic Services, Inc. | 15,131 | 2,159,496 |
| Total | 4,671,733 | |
| Electrical Equipment 0.3% | ||
| Emerson Electric Co. | 12,429 | 1,015,946 |
| Industrial Conglomerates 0.8% | ||
| 3M Co. | 21,810 | 2,712,074 |
| Machinery 0.2% | ||
| Snap-On, Inc. | 3,289 | 716,542 |
| Road & Rail 1.9% | ||
| CSX Corp. | 89,837 | 2,843,341 |
| Union Pacific Corp. | 16,885 | 3,790,851 |
| Total | 6,634,192 | |
| Total Industrials | 27,562,254 | |
| Information Technology 27.2% | ||
| Communications Equipment 1.2% | ||
| Cisco Systems, Inc. | 88,987 | 3,979,499 |
| IT Services 2.9% | ||
| Gartner, Inc.(a) | 4,893 | 1,396,071 |
| MasterCard, Inc., Class A | 15,755 | 5,110,449 |
| Visa, Inc., Class A | 18,873 | 3,750,254 |
| Total | 10,256,774 | |
| Semiconductors & Semiconductor Equipment 4.4% | ||
| Advanced Micro Devices, Inc.(a) | 38,920 | 3,303,140 |
| Applied Materials, Inc. | 7,159 | 673,447 |
| Lam Research Corp. | 4,370 | 1,913,667 |
| NVIDIA Corp. | 39,050 | 5,894,207 |
| QUALCOMM, Inc. | 28,082 | 3,714,406 |
| Total | 15,498,867 | |
| Common Stocks (continued) | ||
| Issuer | Shares | Value ($) |
| Software 10.4% | ||
| Adobe, Inc.(a) | 9,078 | 3,390,088 |
| Autodesk, Inc.(a) | 13,798 | 2,783,609 |
| Cadence Design Systems, Inc.(a) | 15,690 | 2,726,451 |
| Fortinet, Inc.(a) | 44,316 | 2,157,746 |
| Microsoft Corp.(b) | 85,287 | 22,299,992 |
| Synopsys, Inc.(a) | 8,894 | 3,077,502 |
| Total | 36,435,388 | |
| Technology Hardware, Storage & Peripherals 8.3% | ||
| Apple, Inc. | 172,948 | 27,190,885 |
| HP, Inc. | 57,462 | 1,649,734 |
| Total | 28,840,619 | |
| Total Information Technology | 95,011,147 | |
| Materials 2.8% | ||
| Chemicals 2.1% | ||
| Celanese Corp., Class A | 16,272 | 1,803,914 |
| CF Industries Holdings, Inc. | 15,161 | 1,568,557 |
| Dow, Inc. | 45,181 | 2,304,231 |
| LyondellBasell Industries NV, Class A | 16,901 | 1,402,783 |
| Total | 7,079,485 | |
| Metals & Mining 0.7% | ||
| Nucor Corp. | 18,861 | 2,507,381 |
| Total Materials | 9,586,866 | |
| Real Estate 2.6% | ||
| Equity Real Estate Investment Trusts (REITS) 2.6% | ||
| Host Hotels & Resorts, Inc. | 132,341 | 2,351,700 |
| SBA Communications Corp. | 8,201 | 2,667,375 |
| Simon Property Group, Inc. | 16,997 | 1,733,354 |
| Weyerhaeuser Co. | 71,195 | 2,432,021 |
| Total | 9,184,450 | |
| Total Real Estate | 9,184,450 | |
| 8 | Columbia Large Cap Enhanced Core Fund | Semiannual Report 2022 |
August 31, 2022 (Unaudited)
| Common Stocks (continued) | ||
| Issuer | Shares | Value ($) |
| Utilities 2.7% | ||
| Electric Utilities 2.7% | ||
| American Electric Power Co., Inc. | 29,458 | 2,951,691 |
| Entergy Corp. | 19,204 | 2,214,221 |
| Evergy, Inc. | 28,341 | 1,942,209 |
| Pinnacle West Capital Corp. | 31,871 | 2,401,480 |
| Total | 9,509,601 | |
| Total Utilities | 9,509,601 | |
| Total Common Stocks (Cost $238,312,267) | 343,921,628 | |
| Money Market Funds 1.6% | ||
| Shares | Value ($) | |
| Columbia Short-Term Cash Fund, 2.366%(c),(d) | 5,766,457 | 5,763,574 |
| Total Money Market Funds (Cost $5,762,565) | 5,763,574 | |
| Total Investments in Securities (Cost: $244,074,832) | 349,685,202 | |
| Other Assets & Liabilities, Net | (169,770) | |
| Net Assets | 349,515,432 | |
| Long futures contracts | ||||||
| Description | Number of contracts | Expiration date | Trading currency | Notional amount | Value/Unrealized appreciation ($) | Value/Unrealized depreciation ($) |
| S&P 500 Index E-mini | 33 | 09/2022 | USD | 6,528,225 | 226,277 | — |
| (a) | Non-income producing investment. |
| (b) | This security or a portion of this security has been pledged as collateral in connection with derivative contracts. |
| (c) | The rate shown is the seven-day current annualized yield at August 31, 2022. |
| (d) | As defined in the Investment Company Act of 1940, as amended, an affiliated company is one in which the Fund owns 5% or more of the company’s outstanding voting securities, or a company which is under common ownership or control with the Fund. The value of the holdings and transactions in these affiliated companies during the period ended August 31, 2022 are as follows: |
| Affiliated issuers | Beginning of period($) | Purchases($) | Sales($) | Net change in unrealized appreciation (depreciation)($) | End of period($) | Realized gain (loss)($) | Dividends($) | End of period shares |
| Columbia Short-Term Cash Fund, 2.366% | ||||||||
| 10,064,564 | 62,587,453 | (66,889,929) | 1,486 | 5,763,574 | (1,301) | 35,908 | 5,766,457 | |
| USD | US Dollar |
| Columbia Large Cap Enhanced Core Fund | Semiannual Report 2022 | 9 |
August 31, 2022 (Unaudited)
| ■ | Level 1 — Valuations based on quoted prices for investments in active markets that the Fund has the ability to access at the measurement date. Valuation adjustments are not applied to Level 1 investments. |
| ■ | Level 2 — Valuations based on other significant observable inputs (including quoted prices for similar securities, interest rates, prepayment speeds, credit risks, etc.). |
| ■ | Level 3 — Valuations based on significant unobservable inputs (including the Fund’s own assumptions and judgment in determining the fair value of investments). |
| Level 1 ($) | Level 2 ($) | Level 3 ($) | Total ($) | |
| Investments in Securities | ||||
| Common Stocks | ||||
| Communication Services | 29,807,453 | — | — | 29,807,453 |
| Consumer Discretionary | 38,579,882 | — | — | 38,579,882 |
| Consumer Staples | 22,847,792 | — | — | 22,847,792 |
| Energy | 14,989,744 | — | — | 14,989,744 |
| Financials | 36,715,990 | — | — | 36,715,990 |
| Health Care | 50,126,449 | — | — | 50,126,449 |
| Industrials | 27,562,254 | — | — | 27,562,254 |
| Information Technology | 95,011,147 | — | — | 95,011,147 |
| Materials | 9,586,866 | — | — | 9,586,866 |
| Real Estate | 9,184,450 | — | — | 9,184,450 |
| Utilities | 9,509,601 | — | — | 9,509,601 |
| Total Common Stocks | 343,921,628 | — | — | 343,921,628 |
| Money Market Funds | 5,763,574 | — | — | 5,763,574 |
| Total Investments in Securities | 349,685,202 | — | — | 349,685,202 |
| Investments in Derivatives | ||||
| Asset | ||||
| Futures Contracts | 226,277 | — | — | 226,277 |
| Total | 349,911,479 | — | — | 349,911,479 |
| 10 | Columbia Large Cap Enhanced Core Fund | Semiannual Report 2022 |
August 31, 2022 (Unaudited)
| Assets | |
| Investments in securities, at value | |
| Unaffiliated issuers (cost $238,312,267) | $343,921,628 |
| Affiliated issuers (cost $5,762,565) | 5,763,574 |
| Receivable for: | |
| Capital shares sold | 196,948 |
| Dividends | 734,171 |
| Expense reimbursement due from Investment Manager | 3,956 |
| Prepaid expenses | 10,143 |
| Other assets | 18,323 |
| Total assets | 350,648,743 |
| Liabilities | |
| Payable for: | |
| Capital shares purchased | 881,052 |
| Variation margin for futures contracts | 51,150 |
| Management services fees | 7,254 |
| Distribution and/or service fees | 986 |
| Transfer agent fees | 45,183 |
| Compensation of board members | 122,931 |
| Compensation of chief compliance officer | 36 |
| Other expenses | 24,719 |
| Total liabilities | 1,133,311 |
| Net assets applicable to outstanding capital stock | $349,515,432 |
| Represented by | |
| Paid in capital | 237,744,692 |
| Total distributable earnings (loss) | 111,770,740 |
| Total - representing net assets applicable to outstanding capital stock | $349,515,432 |
| Class A | |
| Net assets | $53,820,841 |
| Shares outstanding | 2,450,153 |
| Net asset value per share | $21.97 |
| Advisor Class | |
| Net assets | $7,576,105 |
| Shares outstanding | 350,923 |
| Net asset value per share | $21.59 |
| Institutional Class | |
| Net assets | $71,640,125 |
| Shares outstanding | 3,266,247 |
| Net asset value per share | $21.93 |
| Institutional 2 Class | |
| Net assets | $5,482,224 |
| Shares outstanding | 251,389 |
| Net asset value per share | $21.81 |
| Institutional 3 Class | |
| Net assets | $166,435,955 |
| Shares outstanding | 7,577,312 |
| Net asset value per share | $21.97 |
| Class R | |
| Net assets | $44,560,182 |
| Shares outstanding | 2,038,544 |
| Net asset value per share | $21.86 |
| Columbia Large Cap Enhanced Core Fund | Semiannual Report 2022 | 11 |
Six Months Ended August 31, 2022 (Unaudited)
| Net investment income | |
| Income: | |
| Dividends — unaffiliated issuers | $3,430,351 |
| Dividends — affiliated issuers | 35,908 |
| Interfund lending | 277 |
| Total income | 3,466,536 |
| Expenses: | |
| Management services fees | 1,490,444 |
| Distribution and/or service fees | |
| Class A | 71,662 |
| Class R | 119,936 |
| Transfer agent fees | |
| Class A | 51,585 |
| Advisor Class | 7,314 |
| Institutional Class | 71,225 |
| Institutional 2 Class | 1,661 |
| Institutional 3 Class | 6,424 |
| Class R | 43,163 |
| Compensation of board members | 1,571 |
| Custodian fees | 3,862 |
| Printing and postage fees | 8,823 |
| Registration fees | 47,329 |
| Audit fees | 15,948 |
| Legal fees | 7,545 |
| Interest on collateral | 46 |
| Compensation of chief compliance officer | 34 |
| Other | 7,807 |
| Total expenses | 1,956,379 |
| Fees waived or expenses reimbursed by Investment Manager and its affiliates | (789,358) |
| Fees waived by transfer agent | |
| Institutional 2 Class | (270) |
| Institutional 3 Class | (6,424) |
| Total net expenses | 1,160,327 |
| Net investment income | 2,306,209 |
| Realized and unrealized gain (loss) — net | |
| Net realized gain (loss) on: | |
| Investments — unaffiliated issuers | 5,922,823 |
| Investments — affiliated issuers | (1,301) |
| Foreign currency translations | (40) |
| Futures contracts | (707,876) |
| Net realized gain | 5,213,606 |
| Net change in unrealized appreciation (depreciation) on: | |
| Investments — unaffiliated issuers | (43,910,266) |
| Investments — affiliated issuers | 1,486 |
| Futures contracts | 447,801 |
| Net change in unrealized appreciation (depreciation) | (43,460,979) |
| Net realized and unrealized loss | (38,247,373) |
| Net decrease in net assets resulting from operations | $(35,941,164) |
| 12 | Columbia Large Cap Enhanced Core Fund | Semiannual Report 2022 |
| Six Months Ended August 31, 2022 (Unaudited) | Year Ended February 28, 2022 | |
| Operations | ||
| Net investment income | $2,306,209 | $4,906,725 |
| Net realized gain | 5,213,606 | 116,268,095 |
| Net change in unrealized appreciation (depreciation) | (43,460,979) | (29,223,494) |
| Net increase (decrease) in net assets resulting from operations | (35,941,164) | 91,951,326 |
| Distributions to shareholders | ||
| Net investment income and net realized gains | ||
| Class A | (2,972,271) | (15,720,116) |
| Advisor Class | (437,486) | (2,090,505) |
| Institutional Class | (4,115,439) | (22,298,922) |
| Institutional 2 Class | (292,612) | (1,892,219) |
| Institutional 3 Class | (12,334,637) | (53,752,772) |
| Class R | (2,452,426) | (13,055,006) |
| Total distributions to shareholders | (22,604,871) | (108,809,540) |
| Decrease in net assets from capital stock activity | (955,142) | (61,711,493) |
| Total decrease in net assets | (59,501,177) | (78,569,707) |
| Net assets at beginning of period | 409,016,609 | 487,586,316 |
| Net assets at end of period | $349,515,432 | $409,016,609 |
| Columbia Large Cap Enhanced Core Fund | Semiannual Report 2022 | 13 |
| Six Months Ended | Year Ended | |||
| August 31, 2022 (Unaudited) | February 28, 2022 | |||
| Shares | Dollars ($) | Shares | Dollars ($) | |
| Capital stock activity | ||||
| Class A | ||||
| Subscriptions | 186,889 | 4,292,928 | 324,168 | 9,387,862 |
| Distributions reinvested | 111,413 | 2,327,425 | 454,796 | 12,508,794 |
| Redemptions | (221,265) | (5,196,364) | (545,889) | (15,786,572) |
| Net increase | 77,037 | 1,423,989 | 233,075 | 6,110,084 |
| Advisor Class | ||||
| Subscriptions | 19,426 | 463,316 | 47,974 | 1,440,214 |
| Distributions reinvested | 21,320 | 437,486 | 77,442 | 2,090,505 |
| Redemptions | (24,452) | (540,258) | (86,688) | (2,528,250) |
| Net increase | 16,294 | 360,544 | 38,728 | 1,002,469 |
| Institutional Class | ||||
| Subscriptions | 186,476 | 4,330,314 | 477,447 | 13,232,520 |
| Distributions reinvested | 169,340 | 3,530,731 | 697,927 | 19,154,056 |
| Redemptions | (520,316) | (12,293,288) | (876,756) | (25,332,187) |
| Net increase (decrease) | (164,500) | (4,432,243) | 298,618 | 7,054,389 |
| Institutional 2 Class | ||||
| Subscriptions | 33,161 | 785,735 | 67,414 | 1,975,397 |
| Distributions reinvested | 13,654 | 282,913 | 67,519 | 1,846,529 |
| Redemptions | (55,251) | (1,329,733) | (197,380) | (5,849,287) |
| Net decrease | (8,436) | (261,085) | (62,447) | (2,027,361) |
| Institutional 3 Class | ||||
| Subscriptions | 2,901,429 | 67,699,983 | 700,226 | 20,034,893 |
| Distributions reinvested | 375,389 | 7,834,361 | 951,957 | 26,126,306 |
| Redemptions | (3,227,827) | (73,908,069) | (3,806,575) | (114,838,980) |
| Net increase (decrease) | 48,991 | 1,626,275 | (2,154,392) | (68,677,781) |
| Class R | ||||
| Subscriptions | 225,837 | 5,386,691 | 473,731 | 13,757,874 |
| Distributions reinvested | 115,059 | 2,393,236 | 461,727 | 12,684,637 |
| Redemptions | (314,815) | (7,452,549) | (1,060,505) | (31,615,804) |
| Net increase (decrease) | 26,081 | 327,378 | (125,047) | (5,173,293) |
| Total net decrease | (4,533) | (955,142) | (1,771,465) | (61,711,493) |
| 14 | Columbia Large Cap Enhanced Core Fund | Semiannual Report 2022 |
| Columbia Large Cap Enhanced Core Fund | Semiannual Report 2022 | 15 |
| Net asset value, beginning of period | Net investment income | Net realized and unrealized gain (loss) | Total from investment operations | Distributions from net investment income | Distributions from net realized gains | Total distributions to shareholders | |
| Class A | |||||||
| Six Months Ended 8/31/2022 (Unaudited) | $25.71 | 0.11 | (2.58) | (2.47) | (0.02) | (1.25) | (1.27) |
| Year Ended 2/28/2022 | $27.58 | 0.25 | 5.49 | 5.74 | (0.26) | (7.35) | (7.61) |
| Year Ended 2/28/2021 | $23.11 | 0.25 | 6.18 | 6.43 | (0.26) | (1.70) | (1.96) |
| Year Ended 2/29/2020 | $23.52 | 0.27 | 0.32 | 0.59 | (0.24) | (0.76) | (1.00) |
| Year Ended 2/28/2019 | $25.12 | 0.28 | 0.69 | 0.97 | (0.24) | (2.33) | (2.57) |
| Year Ended 2/28/2018 | $23.81 | 0.32 | 4.16 | 4.48 | (0.32) | (2.85) | (3.17) |
| Advisor Class | |||||||
| Six Months Ended 8/31/2022 (Unaudited) | $25.28 | 0.14 | (2.55) | (2.41) | (0.03) | (1.25) | (1.28) |
| Year Ended 2/28/2022 | $27.21 | 0.31 | 5.44 | 5.75 | (0.33) | (7.35) | (7.68) |
| Year Ended 2/28/2021 | $22.83 | 0.31 | 6.09 | 6.40 | (0.32) | (1.70) | (2.02) |
| Year Ended 2/29/2020 | $23.23 | 0.33 | 0.32 | 0.65 | (0.29) | (0.76) | (1.05) |
| Year Ended 2/28/2019 | $24.85 | 0.36 | 0.65 | 1.01 | (0.30) | (2.33) | (2.63) |
| Year Ended 2/28/2018 | $23.58 | 0.37 | 4.13 | 4.50 | (0.38) | (2.85) | (3.23) |
| Institutional Class | |||||||
| Six Months Ended 8/31/2022 (Unaudited) | $25.66 | 0.14 | (2.59) | (2.45) | (0.03) | (1.25) | (1.28) |
| Year Ended 2/28/2022 | $27.53 | 0.32 | 5.49 | 5.81 | (0.33) | (7.35) | (7.68) |
| Year Ended 2/28/2021 | $23.07 | 0.31 | 6.17 | 6.48 | (0.32) | (1.70) | (2.02) |
| Year Ended 2/29/2020 | $23.47 | 0.32 | 0.33 | 0.65 | (0.29) | (0.76) | (1.05) |
| Year Ended 2/28/2019 | $25.07 | 0.34 | 0.69 | 1.03 | (0.30) | (2.33) | (2.63) |
| Year Ended 2/28/2018 | $23.77 | 0.38 | 4.15 | 4.53 | (0.38) | (2.85) | (3.23) |
| Institutional 2 Class | |||||||
| Six Months Ended 8/31/2022 (Unaudited) | $25.51 | 0.16 | (2.57) | (2.41) | (0.04) | (1.25) | (1.29) |
| Year Ended 2/28/2022 | $27.40 | 0.36 | 5.48 | 5.84 | (0.38) | (7.35) | (7.73) |
| Year Ended 2/28/2021 | $22.97 | 0.34 | 6.14 | 6.48 | (0.35) | (1.70) | (2.05) |
| Year Ended 2/29/2020 | $23.37 | 0.35 | 0.32 | 0.67 | (0.31) | (0.76) | (1.07) |
| Year Ended 2/28/2019 | $24.98 | 0.37 | 0.68 | 1.05 | (0.33) | (2.33) | (2.66) |
| Year Ended 2/28/2018 | $23.69 | 0.40 | 4.14 | 4.54 | (0.40) | (2.85) | (3.25) |
| Institutional 3 Class | |||||||
| Six Months Ended 8/31/2022 (Unaudited) | $25.68 | 0.16 | (2.58) | (2.42) | (0.04) | (1.25) | (1.29) |
| Year Ended 2/28/2022 | $27.54 | 0.37 | 5.51 | 5.88 | (0.39) | (7.35) | (7.74) |
| Year Ended 2/28/2021 | $23.08 | 0.35 | 6.17 | 6.52 | (0.36) | (1.70) | (2.06) |
| Year Ended 2/29/2020 | $23.47 | 0.38 | 0.31 | 0.69 | (0.32) | (0.76) | (1.08) |
| Year Ended 2/28/2019 | $25.07 | 0.38 | 0.69 | 1.07 | (0.34) | (2.33) | (2.67) |
| Year Ended 2/28/2018 | $23.77 | 0.44 | 4.13 | 4.57 | (0.42) | (2.85) | (3.27) |
| 16 | Columbia Large Cap Enhanced Core Fund | Semiannual Report 2022 |
| Net asset value, end of period | Total return | Total gross expense ratio to average net assets(a) | Total net expense ratio to average net assets(a),(b) | Net investment income ratio to average net assets | Portfolio turnover | Net assets, end of period (000’s) | |
| Class A | |||||||
| Six Months Ended 8/31/2022 (Unaudited) | $21.97 | (9.34%) | 1.23%(c),(d) | 0.83%(c),(d) | 0.92%(c) | 47% | $53,821 |
| Year Ended 2/28/2022 | $25.71 | 20.15% | 1.23%(d) | 0.84%(d),(e) | 0.83% | 67% | $61,024 |
| Year Ended 2/28/2021 | $27.58 | 29.53% | 1.25%(d) | 0.85%(d),(e) | 1.02% | 81% | $59,015 |
| Year Ended 2/29/2020 | $23.11 | 2.33% | 1.20% | 0.88%(e) | 1.11% | 77% | $56,439 |
| Year Ended 2/28/2019 | $23.52 | 4.14% | 1.21% | 0.89% | 1.17% | 99% | $75,497 |
| Year Ended 2/28/2018 | $25.12 | 19.81% | 1.23% | 0.89% | 1.31% | 70% | $60,502 |
| Advisor Class | |||||||
| Six Months Ended 8/31/2022 (Unaudited) | $21.59 | (9.25%) | 0.98%(c),(d) | 0.58%(c),(d) | 1.17%(c) | 47% | $7,576 |
| Year Ended 2/28/2022 | $25.28 | 20.50% | 0.98%(d) | 0.58%(d),(e) | 1.08% | 67% | $8,459 |
| Year Ended 2/28/2021 | $27.21 | 29.79% | 1.00%(d) | 0.61%(d),(e) | 1.29% | 81% | $8,052 |
| Year Ended 2/29/2020 | $22.83 | 2.60% | 0.95% | 0.63%(e) | 1.38% | 77% | $12,021 |
| Year Ended 2/28/2019 | $23.23 | 4.38% | 0.96% | 0.64% | 1.53% | 99% | $5,222 |
| Year Ended 2/28/2018 | $24.85 | 20.12% | 0.98% | 0.64% | 1.48% | 70% | $663 |
| Institutional Class | |||||||
| Six Months Ended 8/31/2022 (Unaudited) | $21.93 | (9.27%) | 0.98%(c),(d) | 0.58%(c),(d) | 1.16%(c) | 47% | $71,640 |
| Year Ended 2/28/2022 | $25.66 | 20.49% | 0.98%(d) | 0.59%(d),(e) | 1.08% | 67% | $88,028 |
| Year Ended 2/28/2021 | $27.53 | 29.83% | 1.00%(d) | 0.60%(d),(e) | 1.27% | 81% | $86,219 |
| Year Ended 2/29/2020 | $23.07 | 2.58% | 0.94% | 0.63%(e) | 1.34% | 77% | $97,348 |
| Year Ended 2/28/2019 | $23.47 | 4.42% | 0.96% | 0.64% | 1.41% | 99% | $329,587 |
| Year Ended 2/28/2018 | $25.07 | 20.08% | 0.98% | 0.64% | 1.56% | 70% | $260,985 |
| Institutional 2 Class | |||||||
| Six Months Ended 8/31/2022 (Unaudited) | $21.81 | (9.18%) | 0.86%(c),(d) | 0.45%(c),(d) | 1.30%(c) | 47% | $5,482 |
| Year Ended 2/28/2022 | $25.51 | 20.67% | 0.85%(d) | 0.45%(d) | 1.21% | 67% | $6,628 |
| Year Ended 2/28/2021 | $27.40 | 29.96% | 0.86%(d) | 0.48%(d) | 1.40% | 81% | $8,831 |
| Year Ended 2/29/2020 | $22.97 | 2.66% | 0.85% | 0.54% | 1.46% | 77% | $11,538 |
| Year Ended 2/28/2019 | $23.37 | 4.50% | 0.87% | 0.54% | 1.56% | 99% | $26,349 |
| Year Ended 2/28/2018 | $24.98 | 20.20% | 0.87% | 0.55% | 1.63% | 70% | $11,486 |
| Institutional 3 Class | |||||||
| Six Months Ended 8/31/2022 (Unaudited) | $21.97 | (9.15%) | 0.80%(c),(d) | 0.40%(c),(d) | 1.34%(c) | 47% | $166,436 |
| Year Ended 2/28/2022 | $25.68 | 20.73% | 0.80%(d) | 0.40%(d) | 1.25% | 67% | $193,329 |
| Year Ended 2/28/2021 | $27.54 | 30.01% | 0.81%(d) | 0.43%(d) | 1.44% | 81% | $266,693 |
| Year Ended 2/29/2020 | $23.08 | 2.73% | 0.81% | 0.49% | 1.59% | 77% | $173,757 |
| Year Ended 2/28/2019 | $23.47 | 4.58% | 0.81% | 0.49% | 1.61% | 99% | $55,689 |
| Year Ended 2/28/2018 | $25.07 | 20.24% | 0.82% | 0.50% | 1.77% | 70% | $28,180 |
| Columbia Large Cap Enhanced Core Fund | Semiannual Report 2022 | 17 |
| Net asset value, beginning of period | Net investment income | Net realized and unrealized gain (loss) | Total from investment operations | Distributions from net investment income | Distributions from net realized gains | Total distributions to shareholders | |
| Class R | |||||||
| Six Months Ended 8/31/2022 (Unaudited) | $25.61 | 0.08 | (2.57) | (2.49) | (0.01) | (1.25) | (1.26) |
| Year Ended 2/28/2022 | $27.50 | 0.17 | 5.47 | 5.64 | (0.18) | (7.35) | (7.53) |
| Year Ended 2/28/2021 | $23.05 | 0.19 | 6.16 | 6.35 | (0.20) | (1.70) | (1.90) |
| Year Ended 2/29/2020 | $23.48 | 0.21 | 0.31 | 0.52 | (0.19) | (0.76) | (0.95) |
| Year Ended 2/28/2019 | $25.08 | 0.22 | 0.69 | 0.91 | (0.18) | (2.33) | (2.51) |
| Year Ended 2/28/2018 | $23.78 | 0.26 | 4.15 | 4.41 | (0.26) | (2.85) | (3.11) |
| Notes to Financial Highlights | |
| (a) | In addition to the fees and expenses that the Fund bears directly, the Fund indirectly bears a pro rata share of the fees and expenses of any other funds in which it invests. Such indirect expenses are not included in the Fund’s reported expense ratios. |
| (b) | Total net expenses include the impact of certain fee waivers/expense reimbursements made by the Investment Manager and certain of its affiliates, if applicable. |
| (c) | Annualized. |
| (d) | Ratios include interest on collateral expense which is less than 0.01%. |
| (e) | The benefits derived from expense reductions had an impact of less than 0.01%. |
| 18 | Columbia Large Cap Enhanced Core Fund | Semiannual Report 2022 |
| Net asset value, end of period | Total return | Total gross expense ratio to average net assets(a) | Total net expense ratio to average net assets(a),(b) | Net investment income ratio to average net assets | Portfolio turnover | Net assets, end of period (000’s) | |
| Class R | |||||||
| Six Months Ended 8/31/2022 (Unaudited) | $21.86 | (9.46%) | 1.48%(c),(d) | 1.08%(c),(d) | 0.66%(c) | 47% | $44,560 |
| Year Ended 2/28/2022 | $25.61 | 19.85% | 1.48%(d) | 1.09%(d),(e) | 0.57% | 67% | $51,549 |
| Year Ended 2/28/2021 | $27.50 | 29.22% | 1.50%(d) | 1.10%(d),(e) | 0.77% | 81% | $58,775 |
| Year Ended 2/29/2020 | $23.05 | 2.04% | 1.45% | 1.13%(e) | 0.86% | 77% | $51,362 |
| Year Ended 2/28/2019 | $23.48 | 3.88% | 1.46% | 1.14% | 0.93% | 99% | $53,131 |
| Year Ended 2/28/2018 | $25.08 | 19.51% | 1.48% | 1.14% | 1.06% | 70% | $38,251 |
| Columbia Large Cap Enhanced Core Fund | Semiannual Report 2022 | 19 |
August 31, 2022 (Unaudited)
| 20 | Columbia Large Cap Enhanced Core Fund | Semiannual Report 2022 |
August 31, 2022 (Unaudited)
| Columbia Large Cap Enhanced Core Fund | Semiannual Report 2022 | 21 |
August 31, 2022 (Unaudited)
| 22 | Columbia Large Cap Enhanced Core Fund | Semiannual Report 2022 |
August 31, 2022 (Unaudited)
| Asset derivatives | ||
| Risk exposure category | Statement of assets and liabilities location | Fair value ($) |
| Equity risk | Component of total distributable earnings (loss) — unrealized appreciation on futures contracts | 226,277* |
| * | Includes cumulative appreciation (depreciation) as reported in the tables following the Portfolio of Investments. Only the current day’s variation margin is reported in receivables or payables in the Statement of Assets and Liabilities. |
| Amount of realized gain (loss) on derivatives recognized in income | ||||||
| Risk exposure category | Futures contracts ($) | |||||
| Equity risk | (707,876) | |||||
| Total | (707,876) | |||||
| Change in unrealized appreciation (depreciation) on derivatives recognized in income | ||||||
| Risk exposure category | Futures contracts ($) | |||||
| Equity risk | 447,801 | |||||
| Derivative instrument | Average notional amounts ($)* |
| Futures contracts — long | 7,085,519 |
| * | Based on the ending quarterly outstanding amounts for the six months ended August 31, 2022. |
| Columbia Large Cap Enhanced Core Fund | Semiannual Report 2022 | 23 |
August 31, 2022 (Unaudited)
| 24 | Columbia Large Cap Enhanced Core Fund | Semiannual Report 2022 |
August 31, 2022 (Unaudited)
| Effective rate (%) | |
| Class A | 0.18 |
| Advisor Class | 0.18 |
| Institutional Class | 0.18 |
| Institutional 2 Class | 0.05 |
| Institutional 3 Class | 0.00 |
| Class R | 0.18 |
| Columbia Large Cap Enhanced Core Fund | Semiannual Report 2022 | 25 |
August 31, 2022 (Unaudited)
| July 1, 2022 through June 30, 2023 | Prior to July 1, 2022 | |
| Class A | 0.83% | 0.84% |
| Advisor Class | 0.58 | 0.59 |
| Institutional Class | 0.58 | 0.59 |
| Institutional 2 Class | 0.45 | 0.45 |
| Institutional 3 Class | 0.40 | 0.40 |
| Class R | 1.08 | 1.09 |
| 26 | Columbia Large Cap Enhanced Core Fund | Semiannual Report 2022 |
August 31, 2022 (Unaudited)
| Federal tax cost ($) | Gross unrealized appreciation ($) | Gross unrealized (depreciation) ($) | Net unrealized appreciation ($) |
| 244,075,000 | 114,620,000 | (8,784,000) | 105,836,000 |
| Borrower or lender | Average loan balance ($) | Weighted average interest rate (%) | Number of days with outstanding loans |
| Lender | 7,400,000 | 1.35 | 1 |
| Columbia Large Cap Enhanced Core Fund | Semiannual Report 2022 | 27 |
August 31, 2022 (Unaudited)
| 28 | Columbia Large Cap Enhanced Core Fund | Semiannual Report 2022 |
August 31, 2022 (Unaudited)
| Columbia Large Cap Enhanced Core Fund | Semiannual Report 2022 | 29 |
August 31, 2022 (Unaudited)
| 30 | Columbia Large Cap Enhanced Core Fund | Semiannual Report 2022 |
| • | the Fund had sufficient liquidity to both meet redemptions and operate effectively on behalf of shareholders; |
| • | there were no material changes to the Program during the period; |
| • | the implementation of the Program was effective to manage the Fund’s liquidity risk; and |
| • | the Program operated adequately during the period. |
| Columbia Large Cap Enhanced Core Fund | Semiannual Report 2022 | 31 |
(Unaudited)
| • | Information on the investment performance of the Fund relative to the performance of a group of mutual funds determined to be comparable to the Fund by Broadridge, as well as performance relative to benchmarks; |
| • | Information on the Fund’s management fees and total expenses, including information comparing the Fund’s expenses to those of a group of comparable mutual funds, as determined by Broadridge; |
| • | The Investment Manager’s agreement to contractually limit or cap total operating expenses for the Fund so that total operating expenses (excluding certain fees and expenses, such as transaction costs and certain other investment related expenses, interest, taxes, acquired fund fees and expenses and infrequent and/or unusual expenses) would not exceed a specified annual rate, as a percentage of the Fund’s net assets; |
| • | Terms of the Management Agreement; |
| • | Descriptions of other agreements and arrangements with affiliates of the Investment Manager relating to the operations of the Fund, including agreements with respect to the provision of transfer agency and shareholder services to the Fund; |
| • | Descriptions of various services performed by the Investment Manager under the Management Agreement, including portfolio management and portfolio trading practices; |
| • | Information regarding any recently negotiated management fees of similarly-managed portfolios of other institutional clients of the Investment Manager; |
| • | Information regarding the resources of the Investment Manager, including information regarding senior management, portfolio managers and other personnel; |
| • | Information regarding the capabilities of the Investment Manager with respect to compliance monitoring services; |
| • | The profitability to the Investment Manager and its affiliates from their relationships with the Fund; and |
| • | Report provided by the Board’s independent fee consultant, JDL Consultants, LLC (JDL). |
| 32 | Columbia Large Cap Enhanced Core Fund | Semiannual Report 2022 |
(Unaudited)
into account the organization and strength of the Fund’s and its service providers’ compliance programs. The Board also reviewed the financial condition of the Investment Manager and its affiliates and each entity’s ability to carry out its responsibilities under the Management Agreement and the Fund’s other service agreements.
| Columbia Large Cap Enhanced Core Fund | Semiannual Report 2022 | 33 |
(Unaudited)
Manager in 2021 increased from 2020 levels, due to a variety of factors, including the increased assets under management of the Funds. It also took into account the indirect economic benefits flowing to the Investment Manager or its affiliates in connection with managing or distributing the Funds, such as the enhanced ability to offer various other financial products to Ameriprise Financial customers, soft dollar benefits and overall reputational advantages. The Board noted that the fees paid by the Fund should permit the Investment Manager to offer competitive compensation to its personnel, make necessary investments in its business and earn an appropriate profit. After reviewing these and related factors, the Board concluded, within the context of their overall conclusions, that the costs of services provided and the profitability to the Investment Manager and its affiliates from their relationships with the Fund supported the continuation of the Management Agreement.
| 34 | Columbia Large Cap Enhanced Core Fund | Semiannual Report 2022 |
columbiathreadneedleus.com/investor/. The Fund is distributed by Columbia Management Investment Distributors, Inc., member FINRA, and managed by Columbia Management Investment Advisers, LLC.
Item 2. Code of Ethics.
Not applicable for semiannual reports.
Item 3. Audit Committee Financial Expert.
Not applicable for semiannual reports.
Item 4. Principal Accountant Fees and Services.
Not applicable for semiannual reports.
Item 5. Audit Committee of Listed Registrants.
Not applicable.
Item 6. Investments
(a) | The registrant’s “Schedule I – Investments in securities of unaffiliated issuers” (as set forth in 17 CFR 210.12-12) is included in Item 1 of this Form N-CSR. |
(b) | Not applicable. |
Item 7. Disclosure of Proxy Voting Policies and Procedures for Closed-End Management Investment Companies.
Not applicable.
Item 8. Portfolio Managers of Closed-End Management Investment Companies.
Not applicable.
Item 9. Purchases of Equity Securities by Closed-End Management Investment Company and Affiliated Purchasers.
Not applicable.
Item 10. Submission of Matters to a Vote of Security Holders.
There were no material changes to the procedures by which shareholders may recommend nominees to the registrant's board of directors.
Item 11. Controls and Procedures.
(c) |
The registrant’s principal executive officer and principal financial officer, based on their evaluation of the registrant’s disclosure controls and procedures as of a date within 90 days of the filing of this report, have concluded that such controls and procedures are adequately designed to ensure that information required to be disclosed by the registrant in Form N-CSR is accumulated and communicated to the registrant’s management, including the principal executive officer and principal financial officer, or persons performing similar functions, as appropriate to allow timely decisions regarding required disclosure. |
(d) | There was no change in the registrant’s internal control over financial reporting that occurred during the period covered by this report that has materially affected, or is reasonably likely to materially affect, the registrant’s internal control over financial reporting. |
Item 12. Disclosure of Securities Lending Activities for Closed-End Management Investment Companies
Not applicable.
Item 13. Exhibits.
(a)(1) Code of ethics required to be disclosed under Item 2 of Form N-CSR: Not applicable for semiannual reports.
SIGNATURES
Pursuant to the requirements of the Securities Exchange Act of 1934 and the Investment Company Act of 1940, the registrant has duly caused this report to be signed on its behalf by the undersigned, thereunto duly
authorized. |
|
| ||
(registrant) |
| Columbia Funds Series Trust |
| |
By (Signature and Title) | /s/ Daniel J. Beckman |
| ||
|
|
| Daniel J. Beckman, President and Principal Executive Officer |
|
Date |
| October 24, 2022 |
| |
Pursuant to the requirements of the Securities Exchange Act of 1934 and the Investment Company Act of 1940, this report has been signed below by the following persons on behalf of the registrant and in the capacities and on the dates indicated.
By (Signature and Title) | /s/ Daniel J. Beckman | |||
|
| Daniel J. Beckman, President and Principal Executive Officer | ||
Date |
| October 24, 2022 |
| |
By (Signature and Title) | /s/ Michael G. Clarke | |||
|
| Michael G. Clarke, Chief Financial Officer, Principal Financial Officer | ||
|
| and Senior Vice President | ||
Date |
| October 24, 2022 |
| |
By (Signature and Title) | /s/ Joseph Beranek | |||
|
| Joseph Beranek, Treasurer, Chief Accounting Officer and Principal | ||
|
| Financial Officer | ||
Date |
| October 24, 2022 |
| |