
Alliance DataFourth Quarter & Full Year 2021 Results Perry BebermanEVP & CFO January 27, 2022 Ralph AndrettaPresident & CEO © 2022 ADS Alliance Data Systems, Inc. Exhibit 99.2

Forward-Looking Statements 2 © 2022 ADS Alliance Data Systems, Inc. Non-GAAP Financial Measures This release contains forward-looking statements within the meaning of Section 27A of the Securities Act of 1933 and Section 21E of the Securities Exchange Act of 1934. Forward-looking statements give our expectations or forecasts of future events and can generally be identified by the use of words such as "believe," "expect," "anticipate," "estimate," "intend," "project," "plan," "likely," "may," "should" or other words or phrases of similar import. Similarly, statements that describe our business strategy, outlook, objectives, plans, intentions or goals also are forward-looking statements. Examples of forward-looking statements include, but are not limited to, statements we make regarding, and the guidance we give with respect to, our anticipated operating or financial results, initiation or completion of strategic initiatives including our ability to realize the intended benefits of the spinoff of the LoyaltyOne® segment, future dividend declarations, and future economic conditions, including, but not limited to, market conditions and COVID-19 impacts related to relief measures for impacted borrowers and depositors, labor shortages due to quarantine and reduction in demand from clients.We believe that our expectations are based on reasonable assumptions. Forward-looking statements, however, are subject to a number of risks and uncertainties that could cause actual results to differ materially from the projections, anticipated results or other expectations expressed in this release, and no assurances can be given that our expectations will prove to have been correct. These risks and uncertainties include, but are not limited to, factors set forth in the Risk Factors section in our Annual Report on Form 10-K for the most recently ended fiscal year, which may be updated in Item 1A of, or elsewhere in, our Quarterly Reports on Form 10-Q filed for periods subsequent to such Form 10-K. Our forward-looking statements speak only as of the date made, and we undertake no obligation, other than as required by applicable law, to update or revise any forward-looking statements, whether as a result of new information, subsequent events, anticipated or unanticipated circumstances or otherwise. We prepare our Consolidated Financial Statements in accordance with accounting principles generally accepted in the United States of America (“GAAP”). However, certain information included within this presentation, constitutes non-GAAP financial measures. Our calculations of non-GAAP financial measures may differ from the calculations of similarly titled measures by other companies. In particular, Pre-tax pre-provision earnings is calculated by increasing Income from continuing operations before income taxes by Provision for credit losses. Pre-tax pre-provision earnings less gain on portfolio sale is calculated by decreasing Pre-tax pre-provision earnings by gains recognized on loan portfolio sales. We believe the use of these non-GAAP financial measures provides additional clarity in understanding our results of operations and trends. For a reconciliation of these non-GAAP financial measures to the most directly comparable GAAP measures, please see the financial tables and information that follows.

Our Business Transformation 3 © 2022 ADS Alliance Data Systems, Inc. Leading provider of tech-forward payment and lending solutions Expanding our Product Suite & Developing Strategic Relationships Improving our Capital Ratios and Reducing our Leverage Enhancing our Core Technology & Advancing Digital Capabilities Increasing Prioritization of ESG Simplifying our Business Model

Credit Sales UpdateCredit sales held strong in the fourth quarter, up 15% year-over-yearHoliday sales were strong with beauty and jewelry each up 30% from 4Q20In-store credit transactions increased year-over-year Business Development and Product UpdateLeveraged strong pipeline & robust business development & renewal activitiesFurther diversified mix of portfolios and productsContinued investment in digital capabilities to scale for growthExpanded growth opportunities with strategic platform business relationships Key Highlights Financial Targets Performance UpdateExceeded 2021 financial guidanceDrove stronger than expected receivables growthPositive credit performance with full year net loss rate near historical lows, reflective of disciplined risk management & environment 4 © 2022 ADS Alliance Data Systems, Inc.
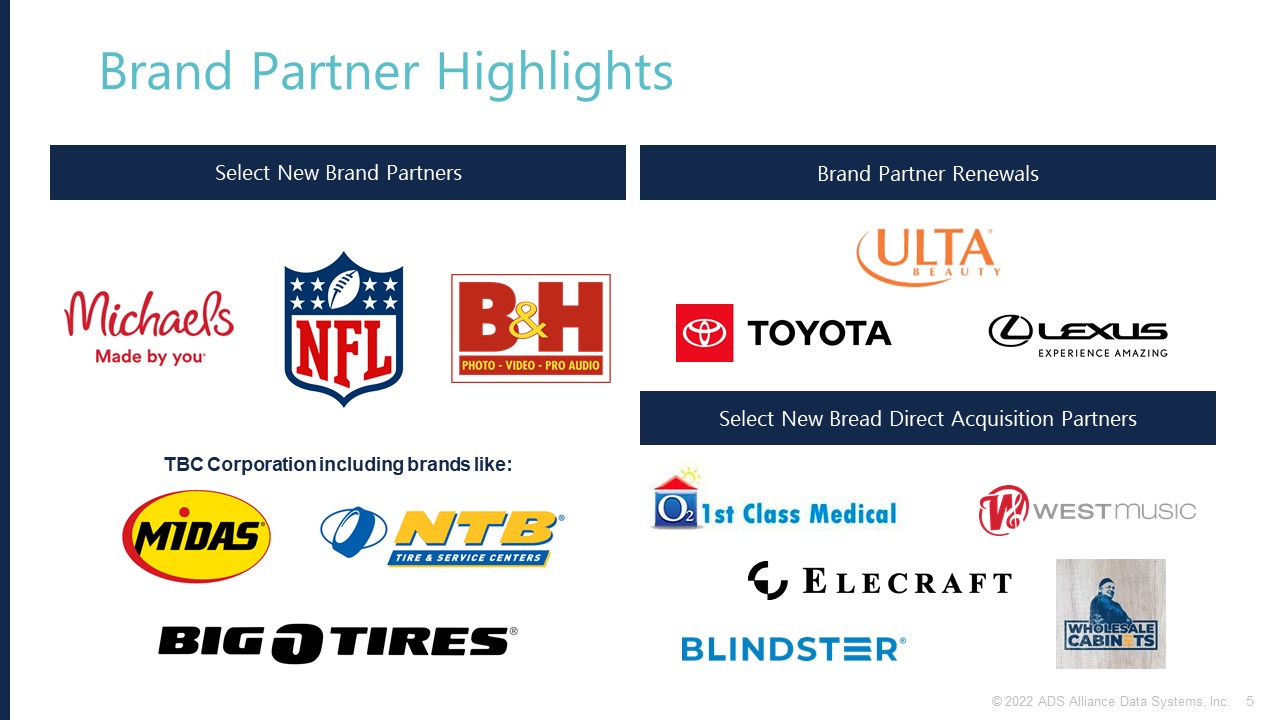
Brand Partner Highlights Select New Brand Partners Brand Partner Renewals Select New Bread Direct Acquisition Partners TBC Corporation including brands like: 5 © 2022 ADS Alliance Data Systems, Inc.

Financial Results ($ in millions, except per share) 4Q21 4Q20 % Change FY21 FY20 % Change Income from continuing operations, net of taxes $61 $74 (18) % $797 $208 283 % (Loss) income from discontinued operations, net of taxes (44) (62) (30) 4 6 (38) Net income $17 $12 42 % $801 $214 275 % *********************************************************************************************************************************************************** Net income per diluted share from continuing operations $1.21 $1.54 (21) % $15.95 $4.35 267 % Net (loss) income per diluted share from discontinued operations (0.87) (1.29) (33) 0.07 0.11 (36) Net income per diluted share $0.34 $0.25 36 % $16.02 $4.46 259 % Weighted average shares outstanding – diluted (in millions) 50.0 48.4 50.0 47.9 6 © 2022 ADS Alliance Data Systems, Inc.
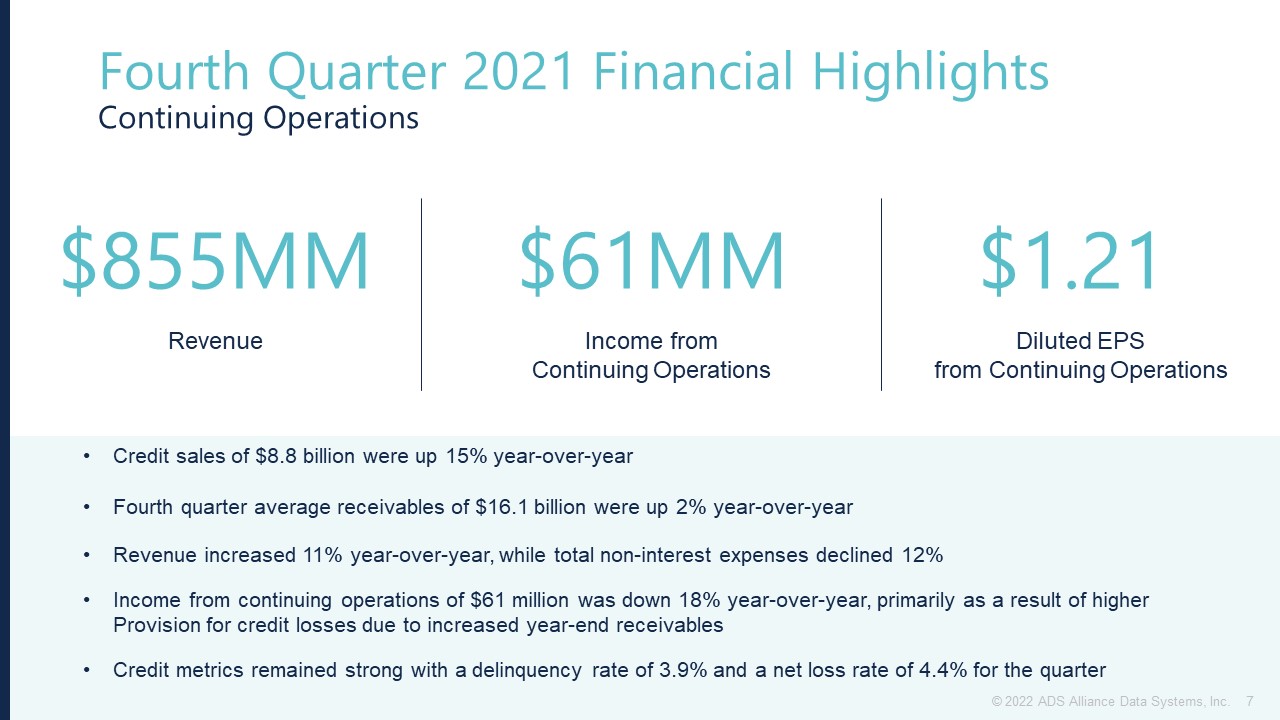
Fourth Quarter 2021 Financial HighlightsContinuing Operations Credit sales of $8.8 billion were up 15% year-over-yearFourth quarter average receivables of $16.1 billion were up 2% year-over-year Revenue increased 11% year-over-year, while total non-interest expenses declined 12%Income from continuing operations of $61 million was down 18% year-over-year, primarily as a result of higher Provision for credit losses due to increased year-end receivablesCredit metrics remained strong with a delinquency rate of 3.9% and a net loss rate of 4.4% for the quarter $855MM Revenue $61MM Income from Continuing Operations $1.21 Diluted EPSfrom Continuing Operations 7 © 2022 ADS Alliance Data Systems, Inc.

Full Year 2021 Financial HighlightsContinuing Operations Credit sales of $29.6 billion were up 20% year-over-yearFull year average receivables of $15.7 billion were down 4% year-over-year, with end-of-period receivables up 4%Revenue was nearly flat year-over-year, while total non-interest expenses declined 3%Income from continuing operations of $797 million was up 283% year-over-year, primarily as a result of lower Provision for credit losses reflecting a lower reserve rate at year-end 2021Credit metrics remained strong with a delinquency rate of 3.9% and a net loss rate of 4.6% for the year $3.3BN Revenue $797MM Income from Continuing Operations $15.95 Diluted EPSfrom Continuing Operations 8 © 2022 ADS Alliance Data Systems, Inc.
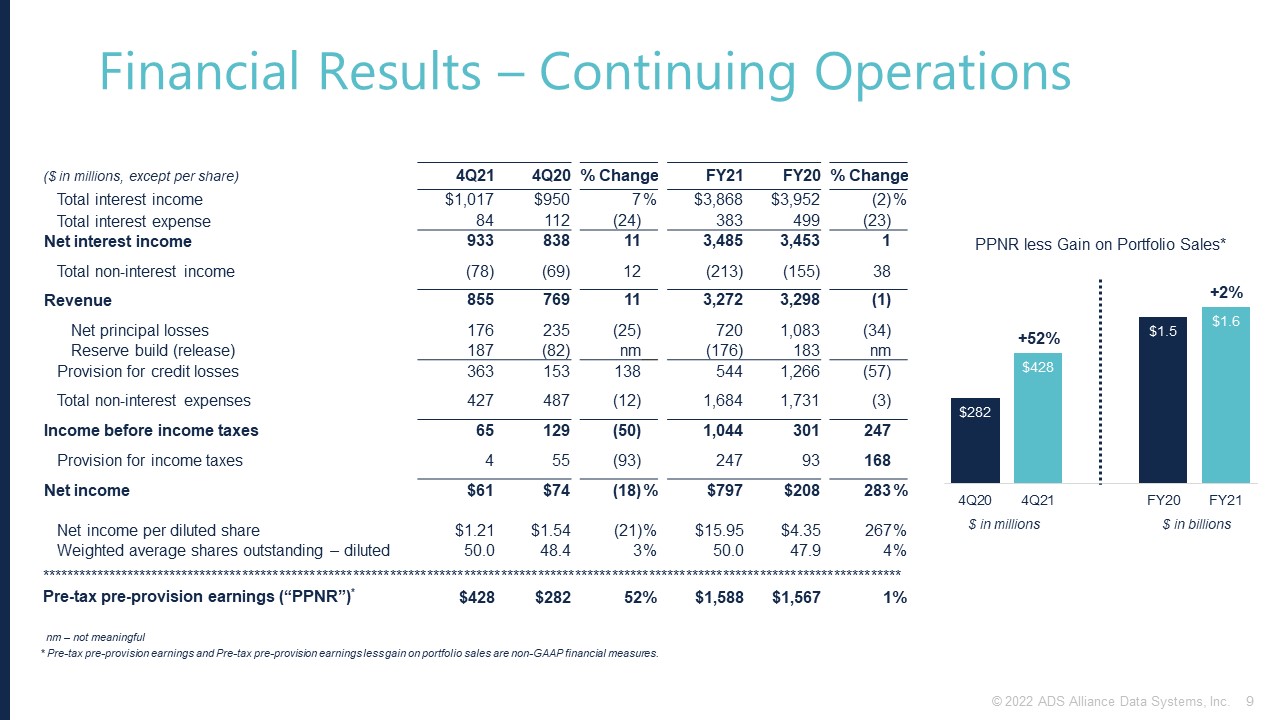
Financial Results – Continuing Operations ($ in millions, except per share) 4Q21 4Q20 % Change FY21 FY20 % Change Total interest income $1,017 $950 7 % $3,868 $3,952 (2) % Total interest expense 84 112 (24) 383 499 (23) Net interest income 933 838 11 3,485 3,453 1 Total non-interest income (78) (69) 12 (213) (155) 38 Revenue 855 769 11 3,272 3,298 (1) Net principal losses 176 235 (25) 720 1,083 (34) Reserve build (release) 187 (82) nm (176) 183 nm Provision for credit losses 363 153 138 544 1,266 (57) Total non-interest expenses 427 487 (12) 1,684 1,731 (3) Income before income taxes 65 129 (50) 1,044 301 247 Provision for income taxes 4 55 (93) 247 93 168 Net income $61 $74 (18) % $797 $208 283 % Net income per diluted share $1.21 $1.54 (21) % $15.95 $4.35 267 % Weighted average shares outstanding – diluted 50.0 48.4 3 % 50.0 47.9 4 % ******************************************************************************************************************************************** Pre-tax pre-provision earnings (“PPNR”)* $428 $282 52 % $1,588 $1,567 1 % $ in millions $ in billions +52% +2% * Pre-tax pre-provision earnings and Pre-tax pre-provision earnings less gain on portfolio sales are non-GAAP financial measures. nm – not meaningful 9 © 2022 ADS Alliance Data Systems, Inc.
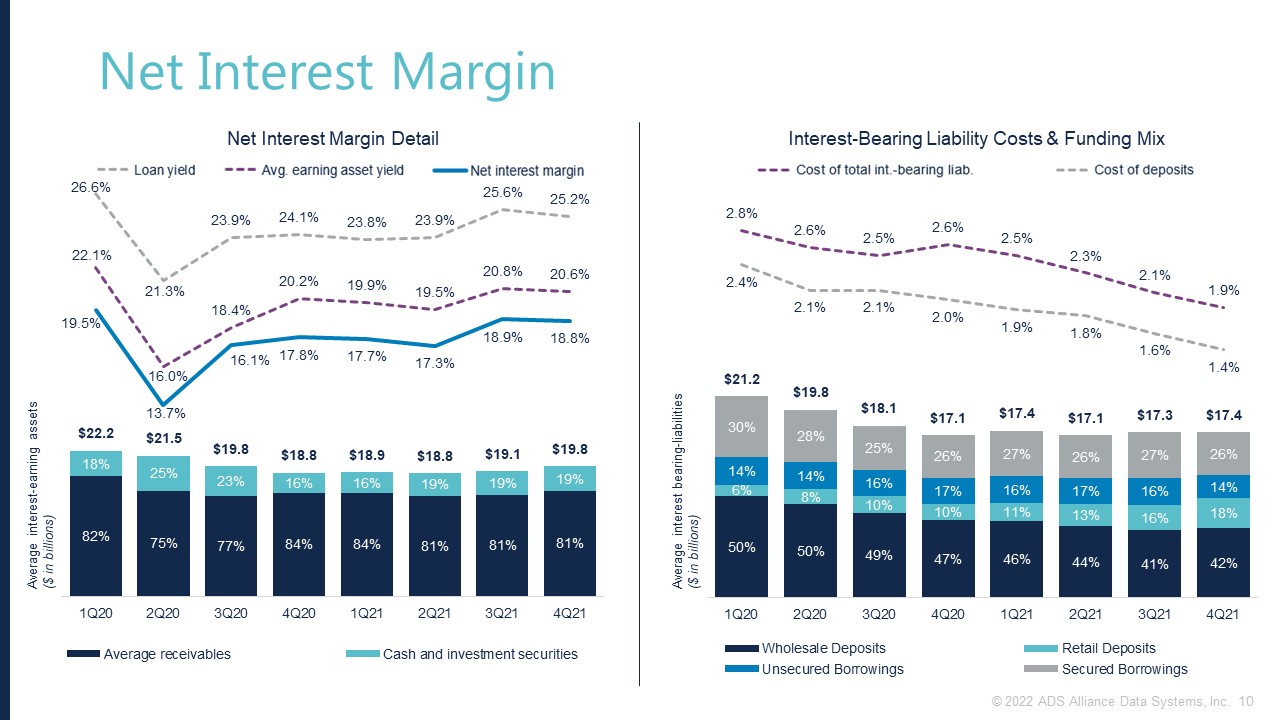
Net Interest Margin Average interest-earning assets($ in billions) Average interest bearing-liabilities ($ in billions) 10 © 2022 ADS Alliance Data Systems, Inc.
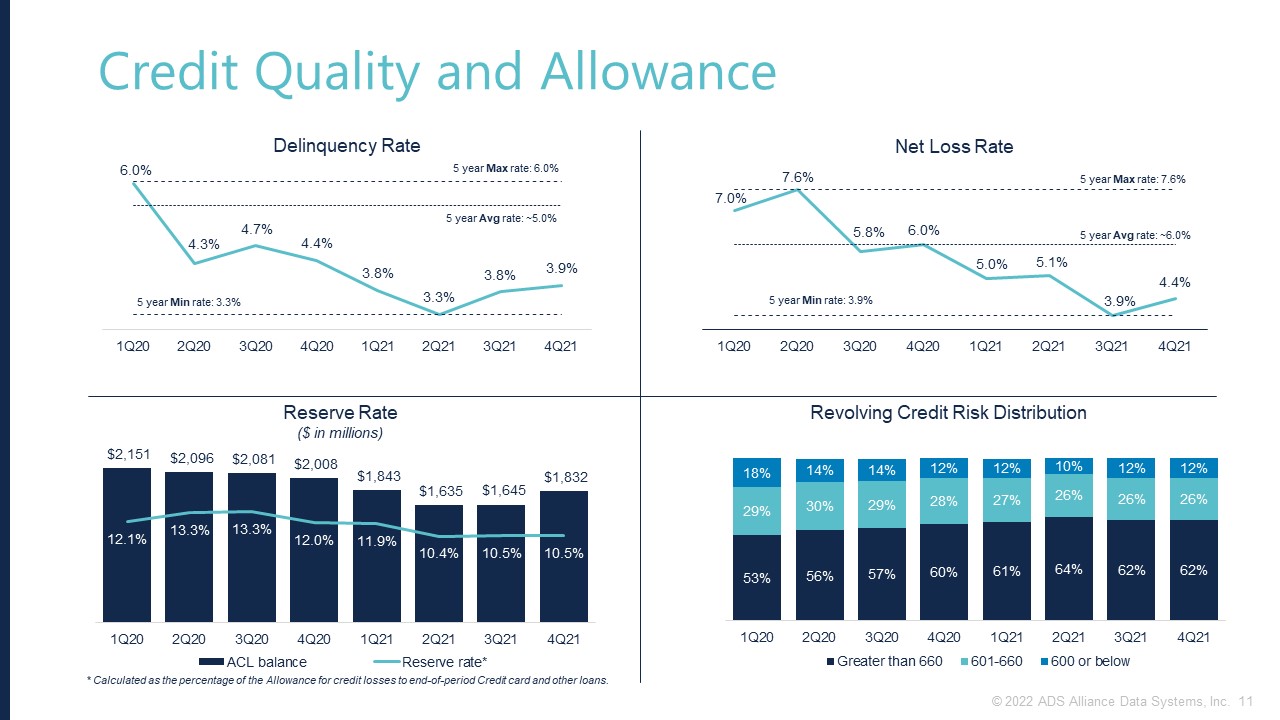
Credit Quality and Allowance Reserve Rate ($ in millions) Net Loss Rate Delinquency Rate 5 year Max rate: 7.6% 5 year Min rate: 3.9% 5 year Avg rate: ~6.0% * Calculated as the percentage of the Allowance for credit losses to end-of-period Credit card and other loans. Revolving Credit Risk Distribution 5 year Max rate: 6.0% 5 year Avg rate: ~5.0% 5 year Min rate: 3.3% 11 © 2022 ADS Alliance Data Systems, Inc.

Full Year 2021Actuals Full Year 2022Outlook Commentary Average receivables $15,656 million Up high-single to low-double digits Continued sales momentum and net partner additions driving strong growthExpect year-end receivables growth year-over-year to be slightly stronger than full year average receivables growth year-over-yearOutlook includes soon-to-be-announced brand partner additions & assumes BJ’s non-renewal Revenue$3,272 million Aligned with receivables growth Net interest income growth is expected to be slightly favorable to full year average receivables growth year-over-year as the net interest margin benefits from lower cost of funding in 2022Outlook assumes four fed rate increases in 2022 with a nominal benefit to Net interest incomeNon-interest income year-over-year change is expected to offset the favorability in Net interest income (potential gain on investment in LVI and portfolio sales not included in outlook) Total non-interest expenses$1,684 million Positive operating leverage Includes a planned incremental strategic investment of more than $125 million in technology modernization, digital advancement, marketing, and product innovation driving future growth and efficienciesWe will manage the pace of our investments to align with our revenue & growth outlook Net loss rate4.6% Low-to-mid 5% range Expect credit metrics to normalize in 2022 off of historically low rates, yet remain below our historic through-the-cycle average of ~6.0% 2022 Financial Outlook 12 © 2022 ADS Alliance Data Systems, Inc.
Appendix © 2022 ADS Alliance Data Systems, Inc.

Average Receivables and Credit Sales ($ in billions) Receivables continue to inflect higher with strengthening credit sales providing momentum entering 2022 14 © 2022 ADS Alliance Data Systems, Inc.

Total Non-Interest Expenses $ in millions $ in billions -12% -3% Total non-interest expenses were down 12% versus 4Q20Employee compensation and benefit costs increased 15% primarily driven by continued digital and technology modernization-related hiring, as well as higher volume-related staffing levels.Marketing expenses decreased primarily due to higher marketing costs related to card program enhancements in 2020.Depreciation and amortization costs decreased primarily due to $25 million in charges related to real estate optimization activities in 2020.Other expenses decreased primarily due to $45 million in charges related to real estate optimization activities, and settlement and other remediation costs in 2020. -13% -1% ($ in millions) (4)% 15% 15% (18)% (47)% (59)% 15 © 2022 ADS Alliance Data Systems, Inc.

($ in millions) 4Q21 4Q20 4Q21 vs 3Q21 4Q21 vs FY21 FY20 FY21 vs 4Q20 3Q21 FY20 Credit sales $8,778 $7,657 15% $7,380 19% $29,603 $24,707 20% Average receivables $16,086 $15,759 2% $15,471 4% $15,656 $16,367 (4)% End-of-period receivables $17,399 $16,784 4% $15,690 11% $17,399 $16,784 4% End-of-period direct-to-consumer deposits $3,180 $1,700 87% $3,052 4% $3,180 $1,700 87% Return on average assets(1) 1.1% 1.4% (0.3)% 3.7% (2.6)% 3.6% 0.9% 2.7% Return on average equity(2) 11.1% 21.3% (10.2)% 38.0% (26.9)% 40.7% 16.7% 24.0% Net interest margin(3) 18.8% 17.8% 1.0% 18.9% (0.1)% 18.2% 16.8% 1.4% Loan yield(4) 25.2% 24.1% 1.1% 25.6% (0.4)% 24.7% 24.0% 0.7% Risk-adjusted loan yield(5) 20.9% 18.1% 2.8% 21.7% (0.8)% 20.1% 17.4% 2.7% Efficiency ratio(6) 50.0% 63.4% (13.4)% 50.6% (0.6)% 51.5% 52.5% (1.0)% Tangible book value per common share(7) $28.09 $16.34 71.9% $31.18 (9.9)% $28.09 $16.34 71.9% Tangible common equity / tangible assets ratio (TCE/TA) (8) 6.6% 3.7% 2.9% 7.2% (0.6)% 6.6% 3.7% 2.9% Cash dividend declared per common share $0.21 $0.21 —% $0.21 —% $0.84 $1.26 (33.3)% Net loss rate 4.4% 6.0% (1.6)% 3.9% 0.5% 4.6% 6.6% (2.0)% 30+ day delinquency rate 3.9% 4.4% (0.5)% 3.8% 0.1% 3.9% 4.4% (0.5)% Reserve rate 10.5% 12.0% (1.5)% 10.5% —% 10.5% 12.0% (1.5)% (1) Return on average assets represents Income from continuing operations divided by average Total assets. (2) Return on average equity represents Income from continuing operations divided by average Total stockholders’ equity. (3) Net interest margin represents Net interest income divided by average total interest-earning assets. (4) Loan yield represents Interest and fees on loans divided by Average receivables. (5) Risk-adjusted loan yield represents Loan yield less Net loss rate. (6) Efficiency ratio represents Total non-interest expenses divided by Total net interest and non-interest income. (7) Tangible book value per common share represents Total stockholders’ equity less Intangible assets, net, and Goodwill divided by shares outstanding. (8)Tangible common equity represents Total stockholders’ equity less Intangible assets, net, and Goodwill. Tangible assets represents Total assets less Intangible assets, net, and Goodwill. 16 © 2022 ADS Alliance Data Systems, Inc. Summary Financial Highlights- Continuing Operations
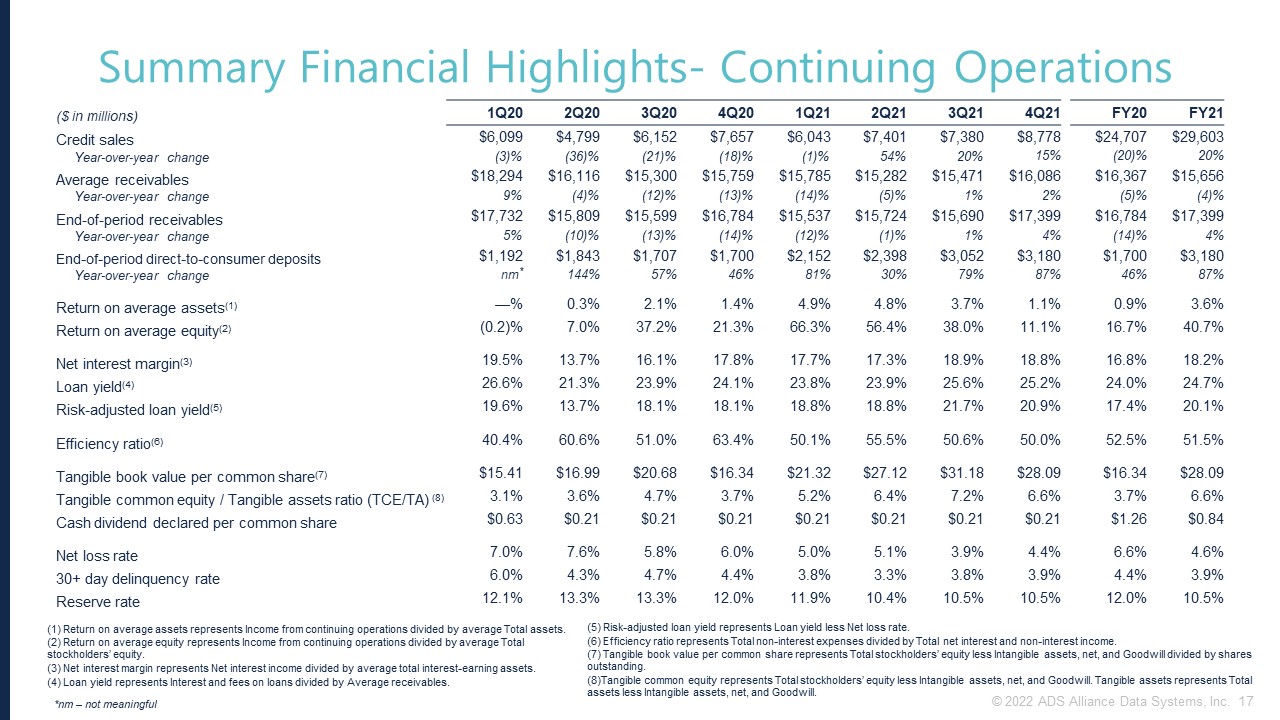
($ in millions) 1Q20 2Q20 3Q20 4Q20 1Q21 2Q21 3Q21 4Q21 FY20 FY21 Credit sales $6,099 $4,799 $6,152 $7,657 $6,043 $7,401 $7,380 $8,778 $24,707 $29,603 Year-over-year change (3)% (36)% (21)% (18)% (1)% 54% 20% 15% (20)% 20% Average receivables $18,294 $16,116 $15,300 $15,759 $15,785 $15,282 $15,471 $16,086 $16,367 $15,656 Year-over-year change 9% (4)% (12)% (13)% (14)% (5)% 1% 2% (5)% (4)% End-of-period receivables $17,732 $15,809 $15,599 $16,784 $15,537 $15,724 $15,690 $17,399 $16,784 $17,399 Year-over-year change 5% (10)% (13)% (14)% (12)% (1)% 1% 4% (14)% 4% End-of-period direct-to-consumer deposits $1,192 $1,843 $1,707 $1,700 $2,152 $2,398 $3,052 $3,180 $1,700 $3,180 Year-over-year change nm* 144% 57% 46% 81% 30% 79% 87% 46% 87% Return on average assets(1) —% 0.3% 2.1% 1.4% 4.9% 4.8% 3.7% 1.1% 0.9% 3.6% Return on average equity(2) (0.2)% 7.0% 37.2% 21.3% 66.3% 56.4% 38.0% 11.1% 16.7% 40.7% Net interest margin(3) 19.5% 13.7% 16.1% 17.8% 17.7% 17.3% 18.9% 18.8% 16.8% 18.2% Loan yield(4) 26.6% 21.3% 23.9% 24.1% 23.8% 23.9% 25.6% 25.2% 24.0% 24.7% Risk-adjusted loan yield(5) 19.6% 13.7% 18.1% 18.1% 18.8% 18.8% 21.7% 20.9% 17.4% 20.1% Efficiency ratio(6) 40.4% 60.6% 51.0% 63.4% 50.1% 55.5% 50.6% 50.0% 52.5% 51.5% Tangible book value per common share(7) $15.41 $16.99 $20.68 $16.34 $21.32 $27.12 $31.18 $28.09 $16.34 $28.09 Tangible common equity / Tangible assets ratio (TCE/TA) (8) 3.1% 3.6% 4.7% 3.7% 5.2% 6.4% 7.2% 6.6% 3.7% 6.6% Cash dividend declared per common share $0.63 $0.21 $0.21 $0.21 $0.21 $0.21 $0.21 $0.21 $1.26 $0.84 Net loss rate 7.0% 7.6% 5.8% 6.0% 5.0% 5.1% 3.9% 4.4% 6.6% 4.6% 30+ day delinquency rate 6.0% 4.3% 4.7% 4.4% 3.8% 3.3% 3.8% 3.9% 4.4% 3.9% Reserve rate 12.1% 13.3% 13.3% 12.0% 11.9% 10.4% 10.5% 10.5% 12.0% 10.5% *nm – not meaningful (1) Return on average assets represents Income from continuing operations divided by average Total assets. (2) Return on average equity represents Income from continuing operations divided by average Total stockholders’ equity. (3) Net interest margin represents Net interest income divided by average total interest-earning assets. (4) Loan yield represents Interest and fees on loans divided by Average receivables. (5) Risk-adjusted loan yield represents Loan yield less Net loss rate. (6) Efficiency ratio represents Total non-interest expenses divided by Total net interest and non-interest income. (7) Tangible book value per common share represents Total stockholders’ equity less Intangible assets, net, and Goodwill divided by shares outstanding. (8)Tangible common equity represents Total stockholders’ equity less Intangible assets, net, and Goodwill. Tangible assets represents Total assets less Intangible assets, net, and Goodwill. 17 © 2022 ADS Alliance Data Systems, Inc. Summary Financial Highlights- Continuing Operations

($ in millions, except per share) 1Q20 2Q20 3Q20 4Q20 1Q21 2Q21 3Q21 4Q21 FY20 FY21 Total interest income $1,227 $860 $915 $950 $942 $915 $994 $1,017 $3,952 $3,868 Total interest expense 146 127 114 112 107 100 92 84 499 383 Net interest income 1,081 733 801 838 835 815 902 933 3,453 3,485 Total non-interest income (11) (28) (47) (69) (33) (51) (51) (78) (155) (213) Revenue 1,070 705 754 769 802 764 851 855 3,298 3,272 Net principal losses 320 305 223 235 198 194 152 176 1,083 720 Reserve build (release) 336 (55) (16) (82) (164) (208) 9 187 183 (176) Provision for credit losses 656 250 207 153 34 (14) 161 363 1,266 544 Total non-interest expenses 432 427 385 487 402 424 431 427 1,731 1,684 (Loss) income before income taxes (18) 28 162 129 366 354 259 65 301 1,044 (Benefit) provision for income taxes (17) 8 47 55 99 91 53 4 93 247 Net (loss) income $(1) $20 $115 $74 $267 $263 $206 $61 $208 $797 Net (loss) income per diluted share $(0.01) $0.41 $2.41 $1.54 $5.38 $5.25 $4.11 $1.21 $4.35 $15.95 Weighted average shares outstanding – diluted 47.7 47.7 47.8 48.4 49.8 50.0 50.0 50.0 47.9 50.0 *************************************************************************************************************************************************************************************** Reconciliation of GAAP to Non-GAAP Financial Measures: (Loss) income before income taxes $(18) $28 $162 $129 $366 $354 $259 $65 $301 $1,044 Provision for credit losses 656 250 207 153 34 (14) 161 363 1,266 544 Pre-tax pre-provision earnings (“PPNR”)* $638 $278 $369 $282 $400 $340 $420 $428 $1,567 $1,588 Gain on portfolio sales 20 — — — — — 10 — 20 10 PPNR less gain on portfolio sales* $618 $278 $369 $282 $400 $340 $410 $428 $1,547 $1,578 * Pre-tax pre-provision earnings and Pre-tax pre-provision earnings less gain on portfolio sales are non-GAAP financial measures. 18 © 2022 ADS Alliance Data Systems, Inc. Financial Results – Continuing Operations
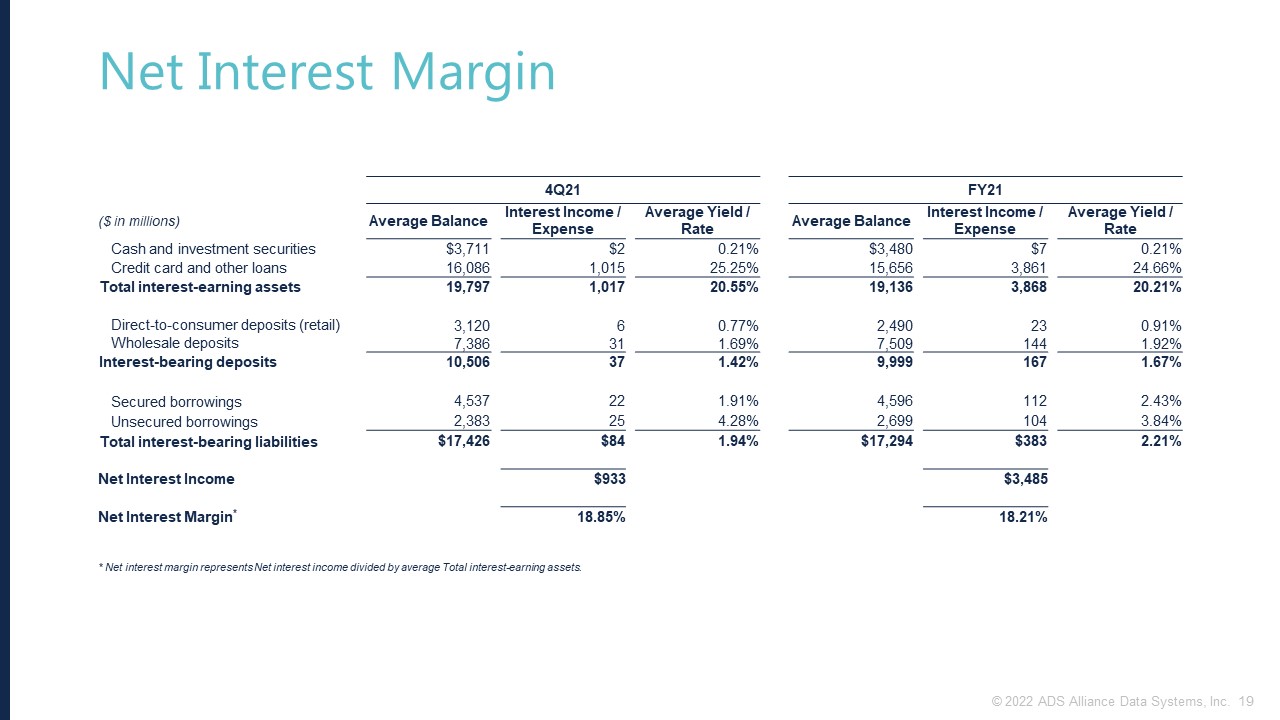
Net Interest Margin 4Q21 FY21 ($ in millions) Average Balance Interest Income / Expense Average Yield / Rate Average Balance Interest Income / Expense Average Yield / Rate Cash and investment securities $3,711 $2 0.21% $3,480 $7 0.21% Credit card and other loans 16,086 1,015 25.25% 15,656 3,861 24.66% Total interest-earning assets 19,797 1,017 20.55% 19,136 3,868 20.21% Direct-to-consumer deposits (retail) 3,120 6 0.77% 2,490 23 0.91% Wholesale deposits 7,386 31 1.69% 7,509 144 1.92% ��Interest-bearing deposits 10,506 37 1.42% 9,999 167 1.67% Secured borrowings 4,537 22 1.91% 4,596 112 2.43% Unsecured borrowings 2,383 25 4.28% 2,699 104 3.84% Total interest-bearing liabilities $17,426 $84 1.94% $17,294 $383 2.21% Net Interest Income $933 $3,485 Net Interest Margin* 18.85% 18.21% * Net interest margin represents Net interest income divided by average Total interest-earning assets. 19 © 2022 ADS Alliance Data Systems, Inc.
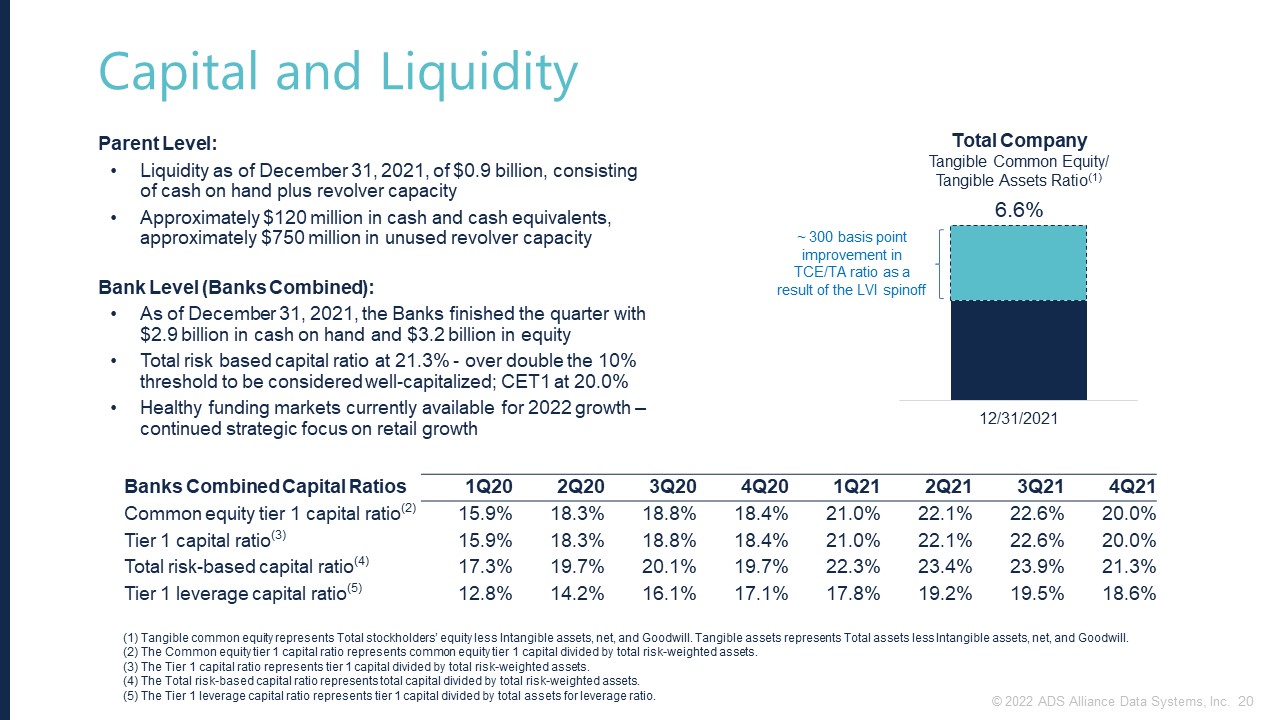
Capital and Liquidity Banks Combined Capital Ratios 1Q20 2Q20 3Q20 4Q20 1Q21 2Q21 3Q21 4Q21 Common equity tier 1 capital ratio(2) 15.9% 18.3% 18.8% 18.4% 21.0% 22.1% 22.6% 20.0% Tier 1 capital ratio(3) 15.9% 18.3% 18.8% 18.4% 21.0% 22.1% 22.6% 20.0% Total risk-based capital ratio(4) 17.3% 19.7% 20.1% 19.7% 22.3% 23.4% 23.9% 21.3% Tier 1 leverage capital ratio(5) 12.8% 14.2% 16.1% 17.1% 17.8% 19.2% 19.5% 18.6% Total Company Tangible Common Equity/Tangible Assets Ratio(1) 6.6% ~ 300 basis point improvement in TCE/TA ratio as a result of the LVI spinoff Parent Level:Liquidity as of December 31, 2021, of $0.9 billion, consisting of cash on hand plus revolver capacity Approximately $120 million in cash and cash equivalents, approximately $750 million in unused revolver capacityBank Level (Banks Combined):As of December 31, 2021, the Banks finished the quarter with $2.9 billion in cash on hand and $3.2 billion in equityTotal risk based capital ratio at 21.3% - over double the 10% threshold to be considered well-capitalized; CET1 at 20.0%Healthy funding markets currently available for 2022 growth – continued strategic focus on retail growth (1) Tangible common equity represents Total stockholders’ equity less Intangible assets, net, and Goodwill. Tangible assets represents Total assets less Intangible assets, net, and Goodwill.(2) The Common equity tier 1 capital ratio represents common equity tier 1 capital divided by total risk-weighted assets.(3) The Tier 1 capital ratio represents tier 1 capital divided by total risk-weighted assets.(4) The Total risk-based capital ratio represents total capital divided by total risk-weighted assets. (5) The Tier 1 leverage capital ratio represents tier 1 capital divided by total assets for leverage ratio. 20 © 2022 ADS Alliance Data Systems, Inc.

Sales and New Account Data In-store vs. digital sales Digital includes all non-store new accounts and Bread $ in billions In-store vs. digital new accounts in millions 21 © 2022 ADS Alliance Data Systems, Inc.