
May 9, 2019 Second Quarter of Fiscal 2019Earnings Call

2 Safe Harbor Statement The information contained in and discussed during this presentation may include “forward-looking statements” within the meaning of federal securities regulations. These forward-looking statements involve a number of risks, uncertainties, and other factors, including those described in Cabot Microelectronics’ filings with the Securities and Exchange Commission (SEC), that could cause actual results to differ materially from those described by these forward-looking statements. Cabot Microelectronics Corporation assumes no obligation to update this forward-looking information.

Second Quarter Highlights 3 Record Revenue of $265M; exceeded prior year revenue by $122M, or 86%Driven by acquisition of KMG Chemicals, Inc. (“KMG”), and growth in CMP pads businessAdjusted Pro Forma Revenue* exceeded prior year by $6M, or 2%Driven by growth in CMP pads, electronic chemicals and pipeline performance productsCMP slurries revenue declined due to challenging market conditions for memory and foundry customersNet Income of $27M Adjusted Pro Forma Net Income* of $46M, up $5M, or 13%, over prior year, and represents 17% of revenueDiluted EPS of $0.92Adjusted Pro Forma EPS* of $1.55, up $0.17, or 12%, over prior year Adjusted Pro Forma EBITDA* of $86M, up $11M, or 16%, and represents 32% of revenue Data reflects rounded values*Adjusted pro forma results are presented as if the KMG acquisition had been consummated on October 1, 2017 and exclude the impact of non-recurring acquisition and integration related costs, acquisition related amortization expenses, and the effect of the enactment of the Tax Cuts and Jobs Act in December 2017 in the United States (“tax act”)Reference Appendix for Pro Forma to Adjusted Pro Forma reconciliation

GAAP Results Adjusted Pro Forma Results* Comments on Adjusted Results 2019 Q2 2018 Q2 2019 Q2 2018 Q2 Revenue $265.4M $143.0M $265.4M $259.4M Driven by growth in CMP pads, electronic chemicals, and pipeline performance products Gross Margin 43.3% 52.5% 46.3% 44.4% Net Income $27.1M $29.7M $45.8M $40.6M Increases were driven by: Improved gross margin Lower selling, general and administrative expenses, primarily from synergies Operating leverage Diluted EPS $0.92 $1.14 $1.55 $1.38 EBITDA -------- -------- $85.5M $74.0M EBITDA Margin -------- -------- 32.2% 28.5% Financial Details 4 Data reflects rounded values*Adjusted pro forma results are presented as if the KMG acquisition had been consummated on October 1, 2017 and exclude the impact of non-recurring acquisition and integration related costs, acquisition related amortization expenses, and the effect of the enactment of the Tax Cuts and Jobs Act in December 2017 in the United States (“tax act”)Reference Appendix for Pro Forma to Adjusted Pro Forma reconciliation
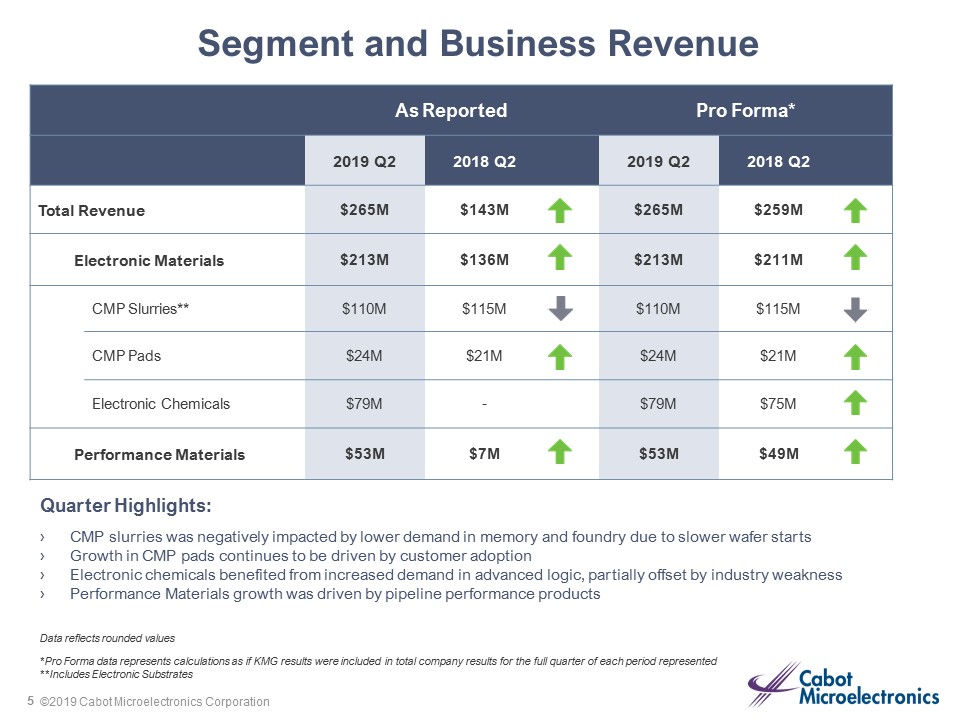
Segment and Business Revenue 5 As Reported Pro Forma* 2019 Q2 2018 Q2 2019 Q2 2018 Q2 Total Revenue $265M $143M $265M $259M Electronic Materials $213M $136M $213M $211M CMP Slurries** $110M $115M $110M $115M CMP Pads $24M $21M $24M $21M Electronic Chemicals $79M - $79M $75M Performance Materials $53M $7M $53M $49M Data reflects rounded values*Pro Forma data represents calculations as if KMG results were included in total company results for the full quarter of each period represented**Includes Electronic Substrates Quarter Highlights:CMP slurries was negatively impacted by lower demand in memory and foundry due to slower wafer startsGrowth in CMP pads continues to be driven by customer adoption Electronic chemicals benefited from increased demand in advanced logic, partially offset by industry weakness Performance Materials growth was driven by pipeline performance products

Segment Financial Details 6 2019 Q2 Electronic Materials Revenue $213M Adjusted EBITDA* $75M Adjusted EBITDA Margin 35% Performance Materials Revenue $53M Adjusted EBITDA* $23M Adjusted EBITDA Margin 43% Data reflects rounded values*Adjusted EBITDA for the Electronic Materials and Performance Materials segments is presented in conformity with Accounting Standards Codification Topic 280, Segment Reporting. This measure is reported to the chief operating decision maker for purposes of making decisions about allocating resources to the segments and assessing their performance. For these reasons, this measure is excluded from the definition of non-GAAP financial measures under the SEC’s Regulation G and Item 10(e) of Regulation S-K.

Balance Sheet and Cash Flowas of March 31, 2019 (unless stated otherwise) 7 Cash balance of $192MYear-to-date Operating Cash Flow was $54MYear-to-Date Capital Expenditures were $19MTherefore, Year-to-Date Free Cash Flow was $35MPrepaid $45M of Debt in MarchPrepaid an additional $55M of debt at the end of AprilContinued appropriate deleveraging of the balance sheet remains a priorityTargeting 2x Debt/EBITDA by the end of FY2020 Data reflects rounded values

Closing Remarks 8 Adjusted Pro Forma Revenue* of $265M increased $6M, or 2%, from last yearDriven by growth in CMP pads, electronic chemicals, and pipeline performance productsCMP slurries revenue was negatively impacted by weakness in memory and foundryAdjusted Pro Forma Gross Margin* of 46.3% increased 190 bps from last yearAdjusted Pro Forma Net Income* of $46M increased $5M, or 13%, from last yearActivities taken through April 2019 to achieve the synergies are expected to deliver $20M annually on a run-rate basisDelivered $3.5M in synergies to the second quarter P&LOn track to meet our goal of $25M of synergies on a run-rate basis at the end of the second year following the transaction Data reflects rounded values*Adjusted pro forma results are presented as if the KMG acquisition had been consummated on October 1, 2017 and exclude the impact of non-recurring acquisition and integration related costs, acquisition related amortization expenses, and the effect of the enactment of the Tax Cuts and Jobs Act in December 2017 in the United States (“tax act”)Reference Appendix for Pro Forma to Adjusted Pro Forma reconciliation

9 Current Financial Guidance Data reflects rounded values*Based on sequential changes compared to second quarter of fiscal 2019 **Excludes approximately $60 million in amortization of intangibles related to acquisitions***Excludes tax impact from acquisitions-related expenses 2019 Q3 FY2019 Segment Electronic Materials Revenue Approximately flat* Performance Materials Revenue Up mid single digit %* Total Company Revenue Approximately flat to up low single digit %* Adjusted EBITDA $325M-$345M Depreciation and Amortization** $35M-$45M Interest Expense ~$13M $45M-$47M Tax Rate*** 23%-26% Capital Spending $45M-$55M

Appendix
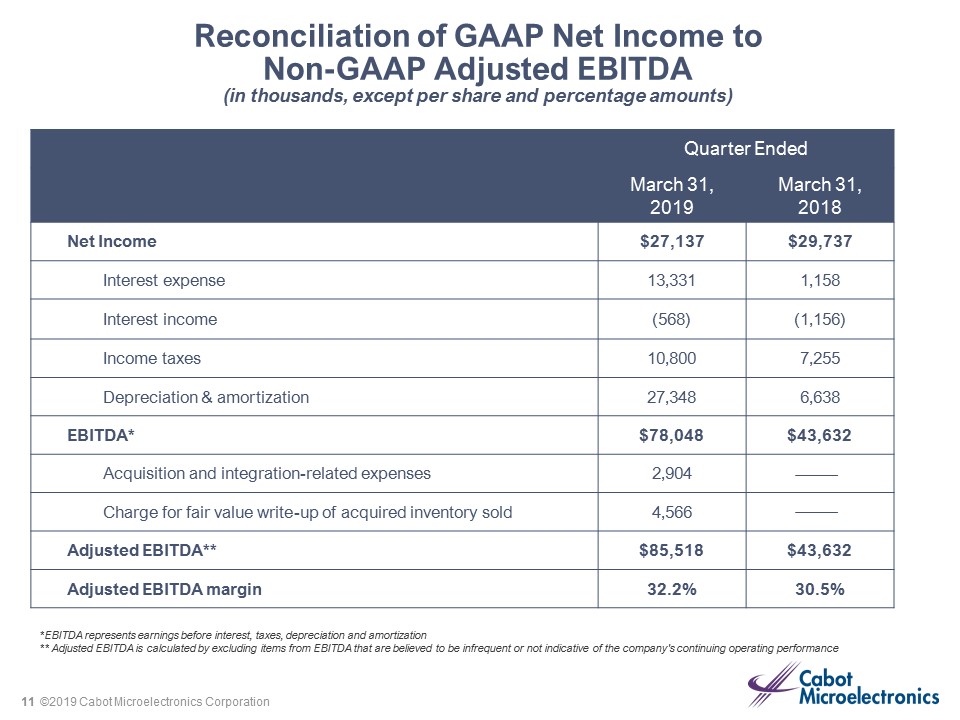
11 Reconciliation of GAAP Net Income to Non-GAAP Adjusted EBITDA(in thousands, except per share and percentage amounts) Quarter Ended March 31, 2019 March 31, 2018 Net Income $27,137 $29,737 Interest expense 13,331 1,158 Interest income (568) (1,156) Income taxes 10,800 7,255 Depreciation & amortization 27,348 6,638 EBITDA* $78,048 $43,632 Acquisition and integration-related expenses 2,904 Charge for fair value write-up of acquired inventory sold 4,566 Adjusted EBITDA** $85,518 $43,632 Adjusted EBITDA margin 32.2% 30.5% *EBITDA represents earnings before interest, taxes, depreciation and amortization** Adjusted EBITDA is calculated by excluding items from EBITDA that are believed to be infrequent or not indicative of the company's continuing operating performance
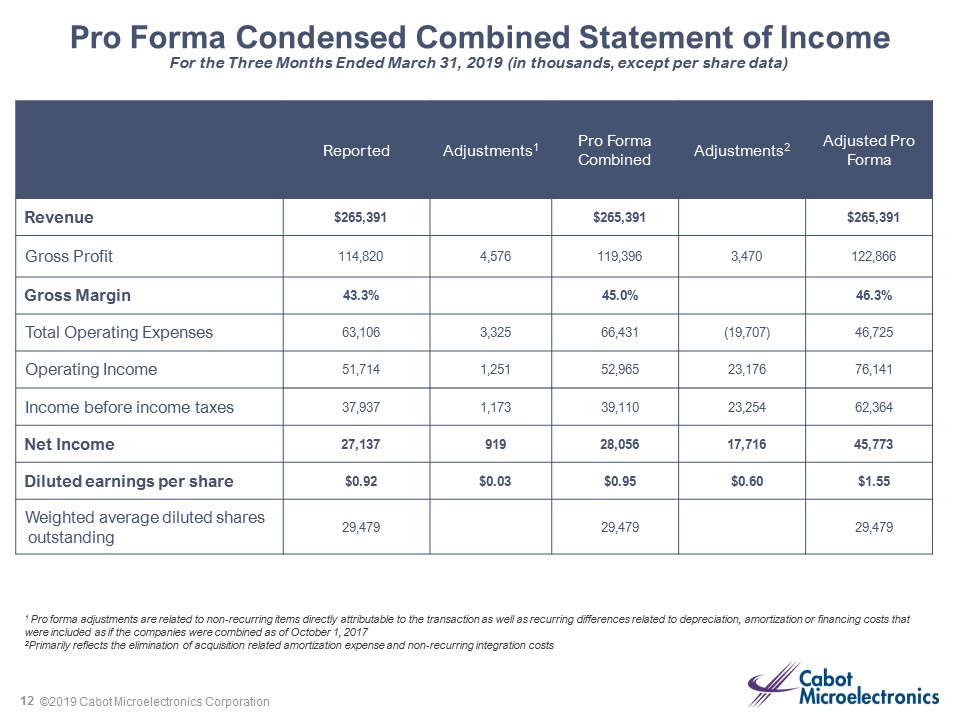
12 Pro Forma Condensed Combined Statement of IncomeFor the Three Months Ended March 31, 2019 (in thousands, except per share data) Reported Adjustments1 Pro Forma Combined Adjustments2 Adjusted Pro Forma Revenue $265,391 $265,391 $265,391 Gross Profit 114,820 4,576 119,396 3,470 122,866 Gross Margin 43.3% 45.0% 46.3% Total Operating Expenses 63,106 3,325 66,431 (19,707) 46,725 Operating Income 51,714 1,251 52,965 23,176 76,141 Income before income taxes 37,937 1,173 39,110 23,254 62,364 Net Income 27,137 919 28,056 17,716 45,773 Diluted earnings per share $0.92 $0.03 $0.95 $0.60 $1.55 Weighted average diluted shares outstanding 29,479 29,479 29,479 1 Pro forma adjustments are related to non-recurring items directly attributable to the transaction as well as recurring differences related to depreciation, amortization or financing costs that were included as if the companies were combined as of October 1, 20172Primarily reflects the elimination of acquisition related amortization expense and non-recurring integration costs

13 Pro Forma Condensed Combined Statement of IncomeFor the Three Months Ended March 31, 2018 (in thousands, except per share data) Cabot Microelectronics Reported KMGReported Adjustments1 Pro Forma Combined Adjustments2 Adjusted Pro Forma Revenue $142,978 $116,394 $259,372 $259,372 Gross Profit 75,045 48,898 (12,298) 111,645 3,469 115,114 Gross Margin 52.5% 42.0% 43.0% 44.4% Total Operating Expenses 37,957 27,422 (1,427) 63,952 (13,453) 50,499 Operating Income 37,088 21,476 (10,871) 47,693 16,922 64,615 Income before income taxes 36,992 17,687 (21,168) 33,511 16,922 50,433 Net Income 29,737 14,423 (16,211) 27,949 12,681 40,630 Diluted earnings per share $1.14 $0.91 $0.95 $0.43 $1.38 Weighted average diluted shares outstanding 26,161 15,903 29,398 29,398 1 Pro forma adjustments are related to the reclassification of KMG distribution expenses from operating expenses to cost of sales, in order to conform with Cabot Microelectronics’ accounting policies. In addition, depreciation, amortization, financing and share-based compensation costs were adjusted as if the companies were combined as of October 1, 20172Primarily reflects the elimination of acquisition related amortization expense and an incremental tax adjustment related to the U.S. Tax Act
investor_relations@cabotcmp.com630.499.2600 Thank you for your interest in Cabot Microelectronics Corporation For additional information, please contact: