UNITED STATES
SECURITIES AND EXCHANGE COMMISSION
WASHINGTON, D.C. 20549 |
CERTIFIED SHAREHOLDER REPORT OF REGISTERED MANAGEMENT
INVESTMENT COMPANIES
Investment Company Act file number 811-09781
PFS Funds
(Exact name of registrant as specified in charter) |
480 N. Magnolia Avenue, Suite 103, El Cajon, CA 92020
(Address of principal executive offices) (Zip code)
Ross C. Provence
480 N. Magnolia Avenue, Suite 103, El Cajon, CA 92020
(Name and address of agent for service) |
Registrant's telephone number, including area code: (619) 588-9700
Date of fiscal year end: December 31
Date of reporting period: December 31, 2010
Form N-CSR is to be used by management investment companies to file reports with the Commission not later than 10 days after the transmission to stockholders of any report that is required to be transmitted to stockholders under Rule 30e-1 under the Investment Company Act of 1940 (17 CFR 270.30e -1). The Commission may use the information provided on Form N-CSR in its regulatory, disclosure review, inspection and policymaking roles.
A registrant is required to disclose the information specified by Form N-CSR, and the Commission will make this information public. A registrant is not required to respond to the collection of information contained in Form N-CSR unless the Form displays a currently valid Office of Management and Budget ("OMB") control number. Please direct comments concerning the accuracy of the information collection burden estimate and any suggestions for reducing the burden to Secretary, Securities and Exchange Commission, 450 Fifth Street, NW, Washington, DC 20549-0609. The OMB has reviewed this collection of information under the clearance requirements of 44 U.S.C. § 3507.
Item 1. Reports to Stockholders.

Annual Report
December 31, 2010
BRTNX |
February 24, 2011
Dear Fellow Shareholders:
The Bretton Fund's net asset value per share (NAV) as of December 31, 2010, was $15.92, and the total return for the fund since its inception on September 30, 2010, was 6.13% . Over the same period of time, the total return for the S&P 500 Index was 10.76% and the total return for the broader Wilshire 5000 Total Market Index was 11.59% . Considering we spent much of the quarter putting cash to work for the new fund, our return wasn't too shabby on a risk-adjusted basis, though obviously not spectacular.
Shareholders should note well that the Bretton Fund is a long-term investment vehicle, and one can't draw too strong of a conclusion—one way or another—from three months of stock price movements. Next year's annual report will have a full year to review and won't be an “annual report” covering just an inaugural three months.
Fund Performance
Total Return as of December 31, 2010
| | |
| | Since 9/30/10 Inception(A) | |
| Bretton Fund | 6.13% | |
| S&P 500 Index(B) | 10.76% | |
| Wilshire 5000 Total Market Index(C) | 11.59% | |
(A)Since Inception returns include change in share prices, and in each case, include reinvestment of any dividends and capital gain distributions. The inception date of the Bretton Fund was September 30, 2010.
(B)The S&P 500 is a broad market-weighted average dominated by blue-chip stocks and is an unmanaged group of stocks whose composition is different from the Fund.
(C)The Wilshire 5000 Total Market Index is a market-capitalization-weighted index of the market value of all stocks actively traded in the United States.
Performance data quoted represents past performance. Past performance does not guarantee future results. The investment return and principal value of an investment will fluctuate so that an investor’s shares, when redeemed, may be worth more or less than their original cost. All returns include change in share prices, and reinvestment of any dividends and capital gains distributions. Current performance may be lower or higher than the performance data quoted. Indices shown are broad-based, unmanaged indices commonly used to measure performance of US stocks. These indices do not incur expenses and are not available for investment. You may obtain performance data current to the most recent month-end by calling 800.231.2901. The fund’s expense ratio is 1.50% . An investment in the fund is subject to investment risks, including the possible loss of the principal amount invested. The fund's distributor is Rafferty Capital Markets, LLC.
Contributors to Performance
The stock that contributed the largest effect to NAV, for an increase of 39¢, was CapitalSource, now the fund's largest holding, which ended the year valued 22% over our average cost of $5.80.
The only investment that ended the year valued below our original cost was Apollo Group. The company's stock price declined 11% from our average cost per share of $44.42, causing a negative impact of 19¢ on the fund's NAV.
2010 Annual Report 1
Other major contributors were Ross Stores, which added 18¢ to the NAV by increasing 12% over our average cost, and Aflac, which rose 6% over our average cost, adding 10¢ to the NAV.
| Portfolio | |
| |
| Security | % Net Assets |
| CapitalSource Inc. | 13.5% |
| Aflac Inc. | 12.2% |
| Ross Stores Inc. | 10.3% |
| Apollo Group Inc. | 9.6% |
| Federated Investors Inc. | 4.3% |
| CSX Corp. | 4.2% |
| Carter's Inc. | 4.2% |
| Norfolk Southern Corp. | 4.1% |
| American Express Co. | 4.0% |
| Kaiser Federal Financial Group, Inc. | 3.8% |
| Union Pacific Corp. | 3.5% |
| Standard Financial Corp. | 0.4% |
| Cash* | 25.9% |
| |
| Total | 100.0% |
*Cash represents cash equivalents less liabilities in excess of other assets.
One of the core tenets of the Bretton Fund is that we will invest only in what I believe to be the best investment opportunities. We do not attempt to mimic market indices or invest across all industries. Surprisingly, this makes us a rather atypical mutual fund. A more conventional fund will invest in a wide variety of stocks, rarely owning any security greater than 5% of assets. And it's designed to not look too different from the rest of the market, a strategy that may be great for marketing the fund and building assets, but not ideal for shareholders seeking excellent long-term results.
The Bretton Fund is set up for investors who don't mind a little lumpiness in their returns in the short term if they can achieve attractive performance over the long run. We are investors, not traders. Given our long time horizon and portfolio selectivity, our investing approach has more in common with a private equity investor or a venture capital fund than it does with a hedge fund.
Our largest holding is CapitalSource, a finance company that lends to the healthcare industry (think nursing homes, hospitals) and ran into problems when its real estate investments, which weren't really core to its original business, started deteriorating when commercial real estate prices started dropping in 2008. At the peak of the financial crisis, the market valued CapitalSource as if it were teetering on the brink of bankruptcy or would be forced to raise capital that would wipe out existing shareholders. CapitalSource solidified itself by selling off its poor investments and acquiring the assets of a failed bank on the cheap. This has refocused the firm on lending and gives it a source of stable, low-cost deposits to fund its loans. Its focus on the large, but specialized, healthcare industry gives it industry know-how that allows it to make attractive loans more ably than larger banks lacking that expertise. Most important, CapitalSource is well capitalized: Its r atio of tangible equity to assets, a measure of how much “cushion” a bank has, is about
2010 Annual Report 2
20%, compared to the average bank's ratio of 7%. We purchased CapitalSource shares below their book value.
Another significant holding, and our poorest performer to date, is Apollo Group, better known as the parent company of the University of Phoenix, the ubiquitously marketed for-profit university. I believe the long-term economic trends for Apollo Group are strongly in its favor. Fifty years ago, a student in the United States could graduate high school with minimal technical skills besides literacy and basic math and easily find a job that would support a middle class lifestyle for the rest of his life. Whether he was working at an auto plant or as a bank teller, he could pretty easily pick up the skills he needed for the job within a few months. This is no longer possible. Our economy trends toward greater complexity; we need more advanced skills that change more frequently. The same student graduating high school now can't expect the same quality of life without acquiring additional skills.
The University of Phoenix and other for-profit universities are not alternatives for those students who will attend elite, liberal-arts colleges; they're places where people who wouldn't have gone to college in the first place can learn a profession. University of Phoenix provides tangible, technical skills (e.g., accounting, nursing, tech support) that help make a high school graduate employable. Community colleges can often provide some of the same benefits at a lower cost, but for-profit schools have been more responsive to changing requirements in the economy. They can also deliver the education in ways that better suit the working student, including online courses and classes that have rolling start dates.
The stock price declined in October due to concerns that the US Department of Education's stricter proposed rules on their funding of student loans, which account for most of Apollo's revenue, will impair its business model. There have been ethical violations by some aggressive University of Phoenix recruiters who exaggerated the value of a University of Phoenix degree and misled students. This isn't good. This isn't good from either a societal benefit standpoint or an investor's perspective. From what I can tell, management has treated these missteps seriously and has reacted decisively to stop deceptive recruiting practices. Even before the Department of Education's rules have been finalized, Apollo removed all financial incentives for enrollment quotas for their recruiters and voluntarily instituted a free, three-week screening/orientation process to weed out students who might drop out or not benefit from the university. They also more closely monitor their recruiters ' communications. These steps, combined with the upcoming student-loan rules, will lead to much lower enrollment numbers in the near term, and the market reacted negatively to this news. I believe the market overreacted. It has a tendency to do that. Overreactions like these to short-term events create great return opportunities for investors with a long time horizon.
At the end of the year, Apollo's shares were selling for about $40 a share. The company has over $6 per share in net cash that it doesn't need, which will likely be distributed to shareholders over time. Factoring in that excess cash, an investor at this price is paying less than $34 per share for a business that I expect will earn well over $4 per share per year, even factoring in the lower student enrollments (it earned $1.61 per share the past three months). I believe the long-term economic trends and valuation at these levels make this an attractive investment. I also believe that, while it made mistakes in enrolling students who should not have been enrolling, overall, Apollo provides a net benefit to its students. The major risk to this investment is if the Department of Education or Congress
2010 Annual Report 3
pass even greater restrictions on student loans, well beyond the most stringent version of the current proposal.
As a whole, our three railroad investments (CSX, Norfolk Southern, and Union Pacific) make up about 12% of the fund. The volume of rail traffic is inextricably linked to the US economy. Warren Buffett has said railcar loadings are his favorite economic indicator. The wonderful thing about railroads, as opposed to other transportation businesses such as airlines or trucking, is that there are typically only two major railroads for a given route. It is prohibitively expensive for a new company to build a network of railroad tracks from scratch, and this allows rail companies to raise prices a few percentage points each year. Railway traffic is up significantly from its trough in 2009, though is still well below its 2006–2007 peak. Given its inexorable relationship with the economy, it is only a matter of time before rail volumes reach these levels and eventually surpass them as our economy grows. The volumes of 2006–2007 applied at today's higher rail prices would mean materially greater earnings for railroads, and I believe we'll be rewarded given the prices at which we bought our shares.
There have been no sales yet in the portfolio since the fund's inception.
Investing, Not Trading
If you ask an intelligent businessperson to buy ownership stakes in privately held businesses, he'll likely evaluate those businesses with some basic questions: How much money does the business make? How tough is competition? What are the expansion opportunities? Is it a well-run business? And most important, how much is this business worth?
But if you take that same businessperson and ask him to invest in the stock market, he starts thinking about all kinds of other questions: How's the stock market doing? What's the S&P 500 at? How's the market going to do this year? When will the Fed raise rates? Are growth stocks going to make a comeback? How much will China let the yuan float this year? Will investor sentiment sour on silver in the second quarter, causing a rush to, or panic from, gold? Would that cause a contango in oil futures?
You get the idea.
Buying a piece of a small, private business is the same economic transaction as buying shares of a company traded on the stock market. There's something about liquidity and constant pricing information that turn thoughtful investors into rabid traders.
Our goal is to approach investing that first way, in an environment where it seems like most people are approaching it that second way. Insight into a few businesses and patience are our primary tools.
Market Outlook in 2011
I occasionally get the question, “What's the market going to do this year?” I have no idea. I submit that the question is even a little silly because it's really asking, “By what percentage will the quoted prices of the 500 largest, publicly-traded companies change, on a market-capitalization-weighted basis, between January 1, 2011, and December 31, 2011?” This is not a question based on long-term economic analysis. While stock prices gravitate toward their underlying value, there are a myriad of arbitrary variables that determine stock prices on a given day, not the least of which is the mood and sentiment
2010 Annual Report 4
of traders that day. I believe these types of questions are impossible to get right in any meaningful way consistently, and I'm skeptical of any investment strategy predicated on answering them correctly.
The questions I believe that are more relevant are ones like “Will Ross Stores be able to open new stores in the Northeast and the Midwest? Will people keep shopping at Ross?” Or “Will consumers and businesses continue to use American Express cards?” Because the answers to these questions rely on dramatically less variables, we have a better chance of reaching the correct conclusions and making stronger investing choices for our portfolio.
Thanks
I'd like to thank you for being a shareholder, especially in these early days. If you have questions about the Bretton Fund or want to reach me, e-mail me at stephen.dodson@brettonfund.com.
Thank you for investing,
Stephen J. Dodson
President
Bretton Capital Management |
2010 Annual Report 5
Bretton Fund by Sectors
(as a percentage of Net Assets)
(Unaudited) |
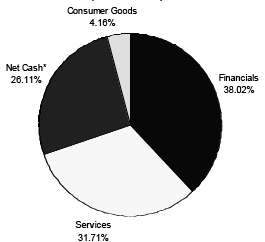
* Net Cash represents cash equivalents and other assets less liabilities.
________________________________________________________________________________________________________________________________________
Disclosure of Expenses (Unaudited)
As a shareholder of the Fund, you incur two types of costs: (1) transaction costs, including sales charges (loads) on purchase payments; and (2) ongoing costs, including management fees; and other Fund expenses. This Example is intended to help you understand your ongoing costs (in dollars) of investing in the Fund and to compare these costs with the ongoing costs of investing in other mutual funds.
The Example is based on an investment of $1,000 invested in the Fund on September 30, 2010, and held through December 31, 2010.
Actual Expenses
The first line of the table below provides information about actual account values and actual expenses. You may use the information in this line, together with the amount you invested, to estimate the expenses that you paid over the period. Simply divide your account value by $1,000 (for example, an $8,600 account value divided by $1,000 = 8.6), then multiply the result by the number in the first line under the heading entitled "Expenses Paid During Period" to estimate the expenses you paid on your account during this period.
Hypothetical Example for Comparison Purposes
The second line of the table below provides information about hypothetical account values and hypothetical expenses based on the Fund's actual expense ratio and an assumed rate of return of 5% per year before expenses, which is not the Fund's actual return. The hypothetical account values and expenses may not be used to estimate the actual ending account balance or expenses you paid for the period. You may use this information to compare the ongoing costs of investing in this Fund and other funds. To do so, compare this 5% hypothetical example with the 5% hypothetical examples that appear in the shareholder reports of the other funds.
Please note that the expenses shown in the table are meant to highlight your ongoing costs only and do not reflect any transactional costs, such as sales charges (loads). Therefore, the second line of the table is useful in comparing ongoing costs only, and will not help you determine the relative cost of owning different funds. In addition, if these transactional costs were included, your cost could have been higher.
| | | | |
| | | | Expenses Paid | |
| | Beginning | Ending | During the Period | |
| | Account Value | Account Value | September 30, 2010 to | |
| | September 30, 2010 | December 31, 2010 | December 31, 2010 | |
| |
| Actual | $1,000.00 | $1,061.33 | $3.98* | |
| |
| Hypothetical** | $1,000.00 | $1,017.55 | $7.59 | |
| (5% annual return | | | |
| before expenses) | | | | |
| | * Expenses are equal to the Fund’s annualized expense ratio of 1.50%, multiplied by the average
account value over the period, multiplied by 93/365 (to reflect the partial period).
** The hypothetical example is calculated assuming that the Fund has been in operation for the
full six-month period from July 1, 2010 to December 31, 2010. As a result, expenses shown in
this row are equal to the Fund’s annualized expense ratio of 1.50%, multiplied by the average
account value over the period, multiplied by 184/365 (to reflect the one-half year period). |
2010 Annual Report 6
| | | | | | |
| Bretton Fund | | | | | |
| |
| | | | | Schedule of Investments |
| | | | | December 31, 2010 |
| Shares/Principal Amount | Cost | | Fair Value | | % of Net Assets |
| COMMON STOCKS | | | | | |
| Accident & Health Insurance | | | | | |
| 4,000 | AFLAC Inc. | $ 214,674 | | $ 225,720 | | 12.23% |
| Apparel & Other Finished Products of Fabrics & Similar Material | | | | | |
| 2,600 | Carter's, Inc. * | 68,311 | | 76,726 | | 4.16% |
| Finance Services | | | | | |
| 1,700 | American Express Company | 68,187 | | 72,964 | | 3.95% |
| Investment Advice | | | | | |
| 3,000 | Federated Investors, Inc. | 69,561 | | 78,510 | | 4.25% |
| Miscellaneous Business Credit Institution | | | | | |
| 35,000 | CapitalSource, Inc. | 203,056 | | 248,500 | | 13.45% |
| Railroad, Line-Haul Operating | | | | | |
| 1,200 | CSX Corp. | 73,152 | | 77,532 | | |
| 1,200 | Norfolk Southern Corp. | 71,135 | | 75,384 | | |
| 700 | Union Pacific Corporation | 55,944 | | 64,862 | | |
| | | 200,231 | | 217,778 | | 11.80% |
| Retail - Family Clothing Stores | | | | | |
| 3,000 | Ross Stores Inc. | 169,522 | | 189,750 | | 10.28% |
| Saving Institution, Federally Chartered | | | | | |
| 6,000 | Kaiser Federal Financial Group, Inc. | 62,974 | | 69,480 | | 3.76% |
| Services - Educational Services | | | | | |
| 4,500 | Apollo Group Inc. Class A * | 199,870 | | 177,705 | | 9.63% |
| State Commercial Banks | | | | | |
| 500 | Standard Financial Corp. * | 6,905 | | 6,925 | | 0.38% |
| Total for Common Stock | $ 1,263,291 | | $ 1,364,058 | | 73.89% |
| Total Investment Securities | $ 1,263,291 | | $ 1,364,058 | | 73.89% |
| Other Assets in Excess of Liabilities | | | $ 481,909 | | 26.11% |
| Net Assets | | | | $ 1,845,967 | | 100.00% |
* Non-Income Producing Securities.
The accompanying notes are an integral part of these
financial statements. |
2010 Annual Report 7
| |
| Bretton Fund |
| |
| |
| Statement of Assets and Liabilities | |
| December 31, 2010 | |
| |
| Assets: | |
| Investment Securities at Fair Value | $ 1,364,058 |
| (Cost $1,263,291) | |
| Cash | 480,942 |
| Receivable for Shares Sold | 3,000 |
| Dividend Receivable | 266 |
Total Assets | 1,848,266 |
| Liabilities: | |
| Payable to Adviser (Note 4) | 2,299 |
Total Liabilities | 2,299 |
| Net Assets | $ 1,845,967 |
| |
| Net Assets Consist of: | |
| Paid In Capital (Note 5) | $ 1,745,200 |
| Unrealized Appreciation in Value of Investments | |
| Based on Identified Cost - Net | 100,767 |
| Net Assets, for 115,945 Shares Outstanding | $ 1,845,967 |
| (Unlimited shares authorized) | |
| Net Asset Value and Offering Price Per Share | |
| ($1,845,967/115,945 shares) | $ 15.92 |
| |
| Statement of Operations | |
| For the period September 30, 2010*, through December 31, 2010 | |
| |
| Investment Income: | |
| Dividends | $ 3,640 |
| Total Investment Income | 3,640 |
| Expenses: | |
| Management Fees (Note 4) | 5,803 |
| Total Expenses | 5,803 |
| |
| Net Investment Loss | (2,163) |
| |
| Realized and Unrealized Gain (Loss) on Investments: | |
| Realized Gain/(Loss) on Investments | - |
| Net Change in Unrealized Appreciation on Investments | 100,767 |
| Net Realized and Unrealized Gain on Investments | 100,767 |
| |
| Net Increase in Net Assets from Operations | $ 98,604 |
| | * Commencement of Operations.
The accompanying notes are an integral part of these
financial statements. |
2010 Annual Report 8
| | |
| Bretton Fund |
| |
| |
| Statement of Changes in Net Assets | | |
| | 9/30/2010* | |
| | to | |
| | 12/31/2010 | |
| From Operations: | | |
| Net Investment Loss | $ (2,163) | |
| Net Realized Gain (Loss) on Investments | - | |
| Change in Net Unrealized Appreciation | 100,767 | |
| Increase/(Decrease) in Net Assets from Operations | 98,604 | |
| From Distributions to Shareholders: | | |
| Net Investment Income | - | |
| Net Realized Gain from Security Transactions | - | |
| Change in Net Assets from Distributions | - | |
| From Capital Share Transactions: | | |
| Proceeds From Sale of Shares | 1,747,363 | |
| Shares Issued on Reinvestment of Dividends | - | |
| Cost of Shares Redeemed | - | |
| Net Increase (Decrease) from Shareholder Activity | 1,747,363 | |
| |
| Net Increase (Decrease) in Net Assets | 1,845,967 | |
| |
| Net Assets at Beginning of Period | - | |
| Net Assets at End of Period (Including Accumulated Undistributed | | |
| Net Investment Income of $0) | $ 1,845,967 | |
| |
| Share Transactions: | | |
| Issued | 115,945 | |
| Reinvested | - | |
| Redeemed | - | |
| Net Increase in Shares | 115,945 | |
| Shares Outstanding Beginning of Period | - | |
| Shares Outstanding End of Period | 115,945 | |
| |
| Financial Highlights | | |
| Selected data for a share outstanding throughout the period: | | |
| | 9/30/2010* | |
| | to | |
| | 12/31/2010 | |
| Net Asset Value - | | |
| Beginning of Period | $ 15.00 | |
| Net Investment Loss(a) | (0.02) | |
| Net Gain (Loss) on Securities | | |
| (Realized and Unrealized) | 0.94 | |
| Total from Investment Operations | 0.92 | |
| |
| Distributions (From Net Investment Income) | - | |
| Distributions (From Realized Capital Gains) | - | |
| Total Distributions | - | |
| |
| Net Asset Value - | | |
| End of Period | $ 15.92 | |
| Total Return(b) | 6.13% | *** |
| Ratios/Supplemental Data | | |
| Net Assets - End of Period (Thousands) | $ 1,846 | |
| Ratio of Expenses to Average Net Assets | 1.50% | ** |
| Ratio of Net Investment Income (Loss) to Average Net Assets | (0.56)% | ** |
| Portfolio Turnover Rate | 0.00% | *** |
* Commencement of Operations. ** Annualized. *** Not Annualized.
(a) Per share amounts were calculated using the average shares method.
(b) Total return in the above table represents the rate that the investor would have earned
or lost on an investment in the Fund assuming reinvestment of dividends and distributions. |
The accompanying notes are an integral part of these
financial statements. |
2010 Annual Report 9
Notes to Financial Statements
Bretton Fund
December 31, 2010
1.) ORGANIZATION:
Bretton Fund (the “Fund”) was organized as a non-diversified series of the PFS Funds (the “Trust”) on September 21, 2010. The Trust was established under the laws of Massachusetts by an Agreement and Declaration of Trust dated January 13, 2000. Prior to March 5, 2010, the Trust was named Wireless Fund. The Trust is registered as an open-end investment company under the Investment Company Act of 1940, as amended. The Trust may offer an unlimited number of shares of beneficial interest in a number of separate series, each series representing a distinct fund with its own investment objectives and policies. As of December 31, 2010, there were three series authorized by the Trust. The Fund commenced operations on September 30, 2010. The Fund's investment objective is to seek long-term capital appreciation. The investment adviser to the Fund is Bretton Capital Management, LLC (the “Adviser”).
2.) SIGNIFICANT ACCOUNTING POLICIES
SECURITY VALUATION:
All investments in securities are recorded at their estimated fair value, as described in Note 3.
FEDERAL INCOME TAXES:
The Fund’s policy is to continue to comply with the requirements of the Internal Revenue Code that are applicable to regulated investment companies and to distribute all of its taxable income to shareholders. Therefore, no federal income tax provision is required. It is the Fund’s policy to distribute annually, prior to the end of the calendar year, dividends sufficient to satisfy excise tax requirements of the Internal Revenue Code. This Internal Revenue Code requirement may cause an excess of distributions over the book year-end accumulated income. In addition, it is the Fund’s policy to distribute annually, after the end of the fiscal year, any remaining net investment income and net realized capital gains.
The Fund recognizes the tax benefits of certain tax positions only where the position is “more likely than not” to be sustained assuming examination by tax authorities. Management has analyzed the Fund’s tax positions, and has concluded that no liability for unrecognized tax benefits should be recorded related to uncertain tax positions expected to be taken in the Fund’s 2010 tax returns. The Fund identifies its major tax jurisdictions as U.S. Federal and State tax authorities; however, the Fund is not aware of any tax positions for which it is reasonably possible that the total amounts of unrecognized tax benefits will change materially in the next 12 months.
DISTRIBUTIONS TO SHAREHOLDERS:
Distributions to shareholders, which are determined in accordance with income tax regulations, are recorded on the ex-dividend date.
The treatment for financial reporting purposes of distributions made to shareholders during the period from net investment income or net realized capital gains may differ from their ultimate treatment for federal income tax purposes. These differences are caused primarily by differences in the timing of the recognition of certain components of income, expense, or realized capital gain for federal income tax purposes. Where such differences are permanent in nature, they are reclassified in the components of the net assets based on their ultimate characterization for federal income tax purposes. Any such reclassifications will have no effect on net assets, results of operations, or net asset value per share of the Fund. As of December 31, 2010, net investment loss in the amount of $2,163 was reclassified to paid in capital.
USE OF ESTIMATES:
The preparation of financial statements in conformity with accounting principles generally accepted in the United States of America (“GAAP”) requires management to make estimates and assumptions that affect the reported amounts of assets and liabilities and disclosure of contingent assets and liabilities at the date of the financial statements and the reported amounts of increases and decreases in net assets from operations during the reporting period. Actual results could differ from those estimates.
OTHER:
The Fund records security transactions based on the trade date. Dividend income is recognized on the ex-dividend date. Interest income is recognized on an accrual basis. The Fund uses the specific identification method in computing gain or loss on sales of investment securities. Discounts and premiums on securities purchased are amortized over the life of the respective securities.
2010 Annual Report 10
Notes to the Financial Statements - continued
Withholding taxes on foreign dividends have been provided for in accordance with the Fund’s understanding of the applicable country’s tax rules and rates.
3.) SECURITIES VALUATIONS
As described in Note 2, the Fund utilizes various methods to measure the fair value of most of its investments on a recurring basis. GAAP establishes a hierarchy that prioritizes inputs to valuation methods. The three levels of inputs are:
Level 1 - Unadjusted quoted prices in active markets for identical assets or liabilities that the Fund has the ability to access.
Level 2 - Observable inputs other than quoted prices included in level 1 that are observable for the asset or liability, either directly or indirectly. These inputs may include quoted prices for the identical instrument on an inactive market, prices for similar instruments, interest rates, prepayment speeds, credit risk, yield curves, default rates, and similar data.
Level 3 - Unobservable inputs for the asset or liability, to the extent relevant observable inputs are not available, representing the Fund’s own assumptions about the assumptions a market participant would use in valuating the asset or liability, and would be based on the best information available.
The availability of observable inputs can vary from security to security and is affected by a wide variety of factors, including, for example, the type of security, whether the security is new and not yet established in the marketplace, the liquidity of markets, and other characteristics particular to the security. To the extent that valuation is based on models or inputs that are less observable or unobservable in the market, the determination of fair value requires more judgment. Accordingly, the degree of judgment exercised in determining fair value is greatest for instruments categorized in level 3.
The inputs used to measure fair value may fall into different levels of the fair value hierarchy. In such cases, for disclosure purposes, the level in the fair value hierarchy within which the fair value measurement falls in its entirety, is determined based on the lowest level input that is significant to the fair value measurement in its entirety.
FAIR VALUE MEASUREMENTS
A description of the valuation techniques applied to the Fund’s major categories of assets and liabilities measured at fair value on a recurring basis follows.
Equity securities (common stock). Equity securities generally are valued by using market quotations, but may be valued on the basis of prices furnished by a pricing service when the Adviser believes such prices more accurately reflect the fair value of such securities. Securities that are traded on any stock exchange or on the NASDAQ over-the-counter market are generally valued by the pricing service at the last quoted sale price. Lacking a last sale price, an equity security is generally valued by the pricing service at its last bid price. To the extent these securities are actively traded and valuation adjustments are not applied, they are classified in level 1 of the fair value hierarchy. When market quotations are not readily available, when the Adviser determines that the market quotation or the price provided by the pricing service does not accurately reflect the current fair value, or when restricted or illiquid securities are bein g valued, such securities are valued as determined in good faith by the Adviser, in conformity with guidelines adopted by and subject to review of the Board of Trustees of the Trust, and are categorized in level 2 or level 3, when appropriate.
Fixed income securities. Fixed income securities generally are valued by using market quotations, but may be valued on the basis of prices furnished by a pricing service when the Adviser believes such prices accurately reflect the fair market value of such securities. A pricing service utilizes electronic data processing techniques based on yield spreads relating to securities with similar characteristics to determine prices for normal institutional-size trading units of debt securities without regard to sale or bid prices. If the Adviser decides that a price provided by the pricing service does not accurately reflect the fair value of the securities, when prices are not readily available from a pricing service, or when restricted or illiquid securities are being valued, securities are valued at fair value as determined in good faith by the Adviser, subject to review of the Board of Trustees. Short term investments in fixed income securit ies with maturities of less than 60 days when acquired, or which subsequently are within 60 days of maturity, are valued by using the amortized cost method of valuation, which the Board has determined will represent fair value. Generally, fixed income securities are categorized as level 2.
2010 Annual Report 11
Notes to the Financial Statements - continued
In accordance with the Trust's good faith pricing guidelines, the Adviser is required to consider all appropriate factors relevant to the value of securities for which it has determined other pricing sources are not available or reliable as described above. There is no single standard for determining fair value controls, since fair value depends upon the circumstances of each individual case. As a general principle, the current fair value of an issue of securities being valued by the Adviser would appear to be the amount which the owner might reasonably expect to receive for them upon their current sale. Methods which are in accordance with this principle may, for example, be based on (i) a multiple of earnings; (ii) a discount from market of a similar freely traded security (including a derivative security or a basket of securities traded on other markets, exchanges or among dealers); or (iii) yield to maturity with respect to debt issues, or a combination of these and o ther methods.
The following table summarizes the inputs used to value the Fund’s assets measured at fair value as of December 31, 2010:
| | | | |
| Valuation Inputs of Assets | Level 1 | Level 2 | Level 3 | Total |
| Common Stock | $1,364,058 | $0 | $0 | $1,364,058 |
| Total | $1,364,058 | $0 | $0 | $1,364,058 |
The Fund did not hold any level 3 assets during the period September 30, 2010, through December 31, 2010. There were no transfers into or out of level 1 or level 2 during the period September 30, 2010, through December 31, 2010. It is the Fund’s policy to consider transfers into or out of level 1 and level 2 as of the end of the reporting period.
4.) INVESTMENT ADVISORY AGREEMENT AND RELATED PARTY TRANSACTIONS
The Fund has entered into an investment advisory agreement (“Management Agreement”) with the Adviser. The Adviser manages the investment portfolio of the Fund, subject to policies adopted by the Trust's Board of Trustees, and, at its own expense and without reimbursement from the Fund, furnishes office space and all necessary office facilities, equipment, and executive personnel necessary for managing the Fund. The Adviser pays the expenses of the Fund except for all brokerage fees and commissions, taxes, borrowing costs (such as (a) interest and (b) dividend expenses on securities sold short), fees and expenses of acquired funds, extraordinary or non-recurring expenses as may arise, including litigation to which the Fund may be a party and indemnification of the Trust’s Trustees and officers with respect thereto. For its services, the Adviser receives an investment management fee equal to 1.50% of the average daily net assets of the Fund.
For the period September 30, 2010, through December 31, 2010, the Adviser earned management fees totaling $5,803, of which $2,299 was due to the Adviser at December 31, 2010.
5.) CAPITAL SHARES
The Trust is authorized to issue an unlimited number of shares of beneficial interest. Paid-in capital at December 31, 2010, was $1,745,200 representing 115,945 shares outstanding.
6.) RELATED PARTY TRANSACTIONS
A control person of Premier Fund Solutions, Inc. (the “Administrator”) also serves as trustee/officer of the Fund. This individual receives benefits from the Administrator resulting from administration fees paid to the Administrator of the Fund by the Adviser.
The Trustees who are not interested persons of the Fund received a total of $0 in Trustees’ fees plus travel and related expenses for the period September 30, 2010, through December 31, 2010. Under the Management Agreement, the Adviser pays these fees.
7.) PURCHASES AND SALES OF SECURITIES
For the period September 30, 2010, through December 31, 2010, purchases and sales of investment securities other than U.S. Government obligations and short-term investments aggregated $1,263,291 and $0, respectively. Purchases and sales of U.S. Government obligations aggregated $0 and $0, respectively.
8.) SECURITY TRANSACTIONS
For Federal income tax purposes, the cost of investments owned at December 31, 2010, was $1,263,291. At December 31, 2010, the composition of unrealized appreciation (the excess of value over tax cost) and depreciation (the excess of tax cost over value) was as follows:
2010 Annual Report 12
Notes to the Financial Statements - continued
| | | |
| | Appreciation | (Depreciation) | Net Appreciation (Depreciation) |
| | $128,472 | ($27,705) | $100,767 |
9.) CONTROL OWNERSHIP
The beneficial ownership, either directly or indirectly, of more than 25% of the voting shares of a fund creates a presumption of control of the Fund, under Section 2(a)(9) of the Investment Company Act of 1940. As of December 31, 2010, Stephen Dodson and family members held, in aggregate, approximately 86% of the Fund and therefore, may be deemed to control the Fund. Stephen Dodson is the control person of the Adviser.
10.) DISTRIBUTIONS TO SHAREHOLDERS
There were no distributions paid during the period September 30, 2010, through December 31, 2010.
As of December 31, 2010, the components of distributable earnings (accumulated losses) on a tax basis were as follows:
| | |
| Undistributed ordinary income/(accumulated losses) | | $ 0 |
| Undistributed long-term capital gain/(accumulated losses) | | 0 |
| Unrealized appreciation/(depreciation) | | 100,767 |
| | | $ 100,767 |
There were no differences between book basis and tax basis unrealized appreciation.
2010 Annual Report 13
Additional Information
December 31, 2010
(Unaudited) |
1.) APPROVAL OF MANAGEMENT AGREEMENT
On September 21, 2010, the Board of Trustees (the “Board”) considered the approval of the Management Agreement (the “Agreement”) between Bretton Capital Management, LLC (the “Adviser”) and the Bretton Fund. In reviewing the Agreement, the Trustees considered and evaluated the following factors: (i) the nature, extent, and quality of the services provided by the Adviser to the Fund; (ii) the investment performance of the Fund and the Adviser; (iii) the cost of the services to be provided and the profits to be realized by the Adviser and its affiliates from the relationship with the Fund; (iv) the extent to which economies of scale will be realized as the Fund grows; (v) brokerage and portfolio transactions; and (vi) possible conflicts of interest.
The Board discussed the arrangements between the Adviser and the Trust with respect to the Bretton Fund. The Board reflected on its discussions with the Adviser regarding the proposed Agreement and the manner in which the Fund was to be managed. The Board referred to the Meeting Materials, which included, among other things, a memorandum from Counsel addressing the duties of Trustees regarding the approval of the proposed Advisory Agreement, a letter dated July 16, 2010 from Counsel to the Adviser and the Adviser's responses to that letter, a copy of the Adviser's financial statements, a copy of the Adviser's Form ADV, and a fee comparison analysis of the Bretton Fund and comparable mutual funds. The Board reviewed the memorandum from Counsel and the proposed Agreement and outlined the various factors the Board should consider in deciding whether to approve the Agreement.
In regard to the nature, extent, and quality of the services to be provided by the Adviser, the Board considered the responsibilities the Adviser would have under the Agreement. The Board reviewed the services to be provided by the Adviser to the Bretton Fund including, without limitation: the procedures for formulating investment recommendations and assuring compliance with the Fund's investment objectives and limitations; the efforts of the Adviser during the Bretton Fund's start-up phase, its coordination of services for the Bretton Fund among the Bretton Fund's service providers, and the anticipated efforts of the Adviser to promote the Bretton Fund and grow its assets. The Board considered: the Adviser's staffing, personnel, and methods of operating; the education and experience of its personnel; and its compliance programs, policies, and procedures. After reviewing the foregoing and further information from the Adviser, the Board concluded that the quality, extent, and nature of the services to be provided by the Adviser were satisfactory and adequate for the Bretton Fund.
In regard to the Investment Performance of the Bretton Fund and the Adviser, the Board noted that the Bretton Fund had not commenced operations and thus did not have investment performance information to review. The Board noted that the Fund would be the first client of the Adviser. The Board discussed the education and investment management experience of the Adviser's personnel. The Board discussed performance return information for similar funds for the one-year period ended June 30, 2010.
In regard to the costs of the services to be provided and profits to be realized by the Adviser from the relationship with the Bretton Fund, the Board considered: the financial condition of the Adviser and the level of commitment to the Bretton Fund by the Adviser's principals; the Adviser's payment of startup costs for the Bretton Fund; the projected asset levels of the Bretton Fund; and the overall anticipated expenses of the Bretton Fund, including the expected nature and frequency of advisory fee payments. The Board also considered potential benefits for the Adviser managing the Bretton Fund. The Board compared the expected fees and expenses of the Bretton Fund (including the management fee) to other funds comparable to it in terms of the type of fund, the style of investment management, the anticipated size of the fund, and the nature of the investment strategy and markets invested in, among other factors. The Board determined that the Bretton Fund's anticipated expe nse ratio was generally comparable to those of similar funds. Following this comparison and upon further consideration and discussion of the foregoing, the Board concluded that the fees to be paid to the Adviser by the Bretton Fund were fair and reasonable.
In regard to the extent to which economies of scale would be realized as the Bretton Fund grows and whether advisory fee levels reflect these economies of scale for the benefit of the Bretton Fund's investors, the Board considered the Bretton Fund's fee arrangements with the Adviser. The Board noted that the management fee would stay the same as asset levels increased. Following further discussion of the Bretton Fund's projected asset levels, expectations for growth, and levels
2010 Annual Report 14
Additional Information (Unaudited) - continued
of fees, the Board determined that the Bretton Fund's fee arrangements with the Adviser were fair and reasonable in relation to the nature and quality of the services to be provided by the Adviser.
In regard to brokerage and portfolio transaction, the Board considered the Adviser's standards for seeking best execution and the relevancy of those standards to the strategies that would be employed in managing the Bretton Fund. It was noted that the Adviser does not plan to use soft dollars and, as such, brokerage commissions for the Fund may be less. After further review, the Board determined that the Adviser's practices regarding brokerage and portfolio transactions were satisfactory.
In evaluating the possibility for conflicts of interest, the Board considered such matters as: the experience and ability of the advisory personnel assigned to the Bretton Fund; the basis of decisions to buy or sell securities for the Bretton Fund; the method for bunching of portfolio securities transactions; the substance and administration of the Adviser's code of ethics; and other relevant policies described in the Adviser's Form ADV. Following further consideration and discussion, the Board indicated that the Adviser's standards and practices relating to the identification and mitigation of potential conflicts of interests were satisfactory.
Next, the Independent Trustees met in executive session to discuss the approval of the Agreement. The officers of the Trust were excused during this discussion. Upon reconvening, it was the Board’s consensus (including a majority of the independent Trustees) that the fee to be paid to the Adviser, pursuant to the Agreement, was reasonable, that the overall arrangement provided under the terms of the Agreement was a reasonable business arrangement, and that the approval of the Agreement was in the best interest of the Fund's shareholders.
2.) AVAILABILITY OF QUARTERLY SCHEDULE OF INVESTMENTS
The Fund files its complete schedule of portfolio holdings with the Securities and Exchange Commission ("SEC") for the first and third quarters of each fiscal year on Form N-Q. The Fund’s Form N-Q is available on the SEC's website at http://www.sec.gov. The Fund’s Form N-Q may also be reviewed and copied at the SEC's Public Reference Room in Washington, DC. Information on the operation of the Public Reference Room may be obtained by calling 800.SEC.0330.
3.) PROXY VOTING GUIDELINES
Bretton Capital Management, LLC, the Fund’s investment adviser (“Adviser”), is responsible for exercising the voting rights associated with the securities held by the Fund. A description of the policies and procedures used by the Adviser in fulfilling this responsibility is available without charge by calling our toll free number (800.231.2901) . It is also included in the Fund’s Statement of Additional Information, which is available on the SEC’s website at http://www.sec.gov.
Information regarding how the Fund voted proxies, Form N-PX, relating to portfolio securities during the most recent 12-month period ended June 30, is available without charge, upon request, by calling our toll free number (800.231.2901) . This information is also available on the SEC’s website at http://www.sec.gov.
2010 Annual Report 15
| |
Cohen Fund Audit Services, Ltd.
Certified Public Accountants | 800 Westpoint Pkwy, Ste 1100
Westlake, Ohio 44145
Phone: (440) 835-8500
Fax: (440) 835-1093
www.cohenfund.com |
REPORT OF INDEPENDENT REGISTERED PUBLIC ACCOUNTING FIRM
To the Shareholders and Board of Trustees
Bretton Fund
(a series of PFS Funds)
We have audited the accompanying statement of assets and liabilities, including the schedule of investments, of Bretton Fund (the "Fund"), a series of PFS Funds, as of December 31, 2010, and the related statement of operations, the statement of changes in net assets, and the financial highlights for the period of September 30, 2010 (commencement of operations) through December 31, 2010. These financial statements and financial highlights are the responsibility of Fund management. Our responsibility is to express an opinion on these financial statements and financial highlights based on our audit.
We conducted our audit in accordance with the standards of the Public Company Accounting Oversight Board (United States). Those standards require that we plan and perform the audit to obtain reasonable assurance about whether the financial statements and financial highlights are free of material misstatement. An audit includes examining, on a test basis, evidence supporting the amounts and disclosures in the financial statements. Our procedures included confirmation of securities owned as of December 31, 2010 by correspondence with the custodian. An audit also includes assessing the accounting principles used and significant estimates made by management, as well as evaluating the overall financial statement presentation. We believe that our audit provides a reasonable basis for our opinion.
In our opinion, the financial statements and financial highlights referred to above present fairly, in all material respects, the financial position of Bretton Fund as of December 31, 2010, the results of its operations, the changes in its net assets, and the financial highlights for the period of September 30, 2010 (commencement of operations) through December 31, 2010, in conformity with accounting principles generally accepted in the United States of America.

COHEN FUND AUDIT SERVICES, LTD.
Westlake, Ohio
February 28, 2011 |
2010 Annual Report 16
Trustees and Officers
(Unaudited) |
The Board of Trustees supervises the business activities of the Trust. The names of the Trustees and executive officers of the Trust are shown below. For more information regarding the Trustees, please refer to the Statement of Additional Information, which is available upon request by calling 800.590.0898. Each Trustee serves until the Trustee sooner dies, resigns, retires, or is removed.
The Trustees and Officers of the Trust and their principal business activities during the past five years are:
Interested Trustees and Officers
| | | | | |
| | | | | Number of | Other |
| | | | Principal | Portfolios In | Directorships |
| Name, | Position(s) | Term of Office | Occupation(s) | Fund | Held By |
| Address(1), | Held With | and Length of | During | Complex | Trustee or |
| and Year of Birth | the Trust | Time Served | Past 5 Years | Overseen By | Officer |
| | | | | Trustee | |
| |
| Ross C. Provence(2), | Trustee | Indefinite Term; | General Partner and Portfolio | 4 | Blue Chip |
| Year of Birth: 1938 | and | Since 2000 | Manager for Value Trend Capital | | Investor Funds |
| | President | | Management, LP (1995 to current). | | |
| | | | Estate planning attorney (1963 to | | |
| current). |
| |
| Jeffrey R. Provence(2), | Trustee, | Indefinite Term; | General Partner and Portfolio | 4 | Blue Chip |
| Year of Birth:1969 | Secretary | Since 2000 | Manager for Value Trend Capital | | Investor Funds, |
| | and | | Management, LP (1995 to current). | | Sycuan Funds, |
| | Treasurer | | CEO, Premier Fund Solutions, Inc. | | Private Asset |
| | | | (2001 to current). | | Management |
| | | | | | Fund |
| Julian G. Winters, | Chief | Chief | Managing Member, Watermark | | |
| Year of Birth: 1968 | Compliance | Compliance | Solutions LLC (investment compli- | N/A | N/A |
| | Officer | Officer Since | ance and consulting) since 3/07; | | |
| | | 2010 | previously, Vice President of | | |
| | | | Compliance Administration, The | | |
| | | | Nottingham Company (investment | | |
| | | | company administrator and fund | | |
| | | | accountant), 3/98-3/07. | | |
(1) The address of each trustee and officer is c/o PFS Funds, 480 North Magnolia Ave., Suite 103, El Cajon, California 92020.
(2) Trustees who are considered "interested persons" as defined in Section 2(a)(19) of the Investment Company Act of 1940 by virtue of their affiliation with the Investment Adviser.
Independent Trustees
| | | | | |
| | | | | Number of | Other |
| | | | Principal | Portfolios In | Directorships |
| Name, | Position | Term of Office | Occupation(s) | Fund | Held By |
| Address(1), | Held With | and Length of | During | Complex | Trustee or |
| and Year of Birth | the Trust | Time Served | Past 5 Years | Overseen By | Officer |
| | | | | Trustee | |
| |
| Thomas H. Addis III, | Independent | Indefinite Term; | Executive Director/CEO, Southern | 4 | None |
| Year of Birth: 1945 | Trustee | Since 2000 | California PGA (2006 to current). | | |
| | | | President, Medallion Golf | | |
| | | | Management (1999 to 2006). | | |
| | | | | | Blue Chip |
| Allen C. Brown, | Independent | Indefinite Term; | Co-owner of Stebleton & Brown | 4 | Investor Funds, |
| Year of Birth: 1943 | Trustee | Since 2000 | (1994 to Current). Estate planning | | Sycuan Funds |
| | | | and business attorney (1970 to cur- | | |
| rent). |
| | | | | | Blue Chip |
| George Cossolias, CPA, | Independent | Indefinite Term; | Owner of George Cossolias & | 4 | Investor Funds, |
| Year of Birth: 1935 | Trustee | Since 2000 | Company, CPAs (1972 to current). | | Sycuan Funds, |
| | | | President of Lubrication Specialists, | | Temecula |
| | | | Inc. (1996 to current). | | Valley Bank |
(1) The address of each trustee and officer is c/o PFS Funds, 480 North Magnolia Ave., Suite 103, El Cajon, California 92020.

Investment Adviser
Bretton Capital Management, LLC
Legal Counsel
The Law Offices of John H. Lively & Associates, Inc.
A Member Firm of the 1940 Act
Custodian
US Bank N.A.
Dividend Paying Agent,
Shareholders' Servicing Agent,
Transfer Agent
Mutual Shareholder Services, LLC
Fund Administrator
Premier Fund Solutions, Inc.
Independent Registered Public Accounting Firm
Cohen Fund Audit Services, Ltd. |
This report is provided for the general information of the shareholders of the Bretton
Fund. This report is not intended for distribution to prospective investors in the Fund,
unless preceded or accompanied by an effective prospectus. |
Item 2. Code of Ethics.
The registrant has adopted a code of ethics that applies to the registrant’s principal executive officer and the principal financial officer. The registrant has not made any amendments to its code of ethics during the covered period. The registrant has not granted any waivers from any provisions of the code of ethics during the covered period. A copy of the registrant’s Code of Ethics is filed herewith.
Item 3. Audit Committee Financial Expert.
The registrant’s Board of Trustees has determined that George Cossolias is an audit committee finical expert. Mr. Cossolias is independent for purposes of this Item 3.
Item 4. Principal Accountant Fees and Services.
(a-d) The following table details the aggregate fees billed for each of the last two fiscal years for audit fees, audit-related fees, tax fees and other fees by the principal accountant to the registrant. The principal accountant has provided no services to the adviser or any entity controlled by, or under common control with the adviser that provides ongoing services to the registrant.
| | |
| | | FYE 12/31/10 |
| Audit Fees | | $10,000 |
| Audit-Related Fees | | $0 |
| Tax Fees | | $2,000 |
| All Other Fees | | $0 |
Nature of Tax Fees: preparation of Excise Tax Statement and 1120 RIC.
(e) (1) The audit committee approves all audit and non-audit related services and, therefore, has not adopted pre-approval policies and procedures described in paragraph (c)(7) of Rule 2-01 of Regulation S-X.
(e) (2) None of the services described in paragraph (b) through (d) of this Item were approved by the audit committee pursuant to paragraph (c)(7)(i)(C) of Rule 2-01 of Regulation S-X.
(f) All of the principal accountant’s hours spent on auditing the registrant’s financial statements were attributed to work performed by full-time permanent employees of the principal accountant.
(g) The following table indicates the aggregate non-audit fees billed by the registrant’s principal accountant for services to the registrant , the registrant’s investment adviser (not sub-adviser), and any entity controlling, controlled by, or under common control with the adviser that provides ongoing services to the registrant, for the last two years.
| | |
| Non-Audit Fees | | FYE 12/31/10 |
| Registrant | | $2,000 |
| Registrant’s Investment Adviser | | $0 |
(h) The principal accountant provided no services to the investment adviser or any entity controlling, controlled by, or under common control with the adviser that provides ongoing services to the registrant.
Item 5. Audit Committee of Listed Companies. Not applicable.
Item 6. Schedule of Investments. Schedule filed with Item 1.
Item 7. Disclosure of Proxy Voting Policies and Procedures for Closed-End Management Investment Companies. Not applicable.
Item 8. Portfolio Managers of Closed End Management Investment Companies. Not applicable.
Item 9. Purchases of Equity Securities by Closed-End Management Investment Companies and Affiliated Purchasers. Not applicable.
Item 10. Submission of Matters to a Vote of Security Holders.
The registrant has not adopted procedures by which shareholders may recommend nominees to the registrant’s board of trustees.
Item 11. Controls and Procedures.
(a) The registrant’s president and chief financial officer concluded that the disclosure controls and procedures (as defined in Rule 30a-3(c) under the Investment Company Act of 1940 (the “Act”)) were effective as of a date within 90 days of the filing date of this report, based on the evaluation of these controls and procedures required by Rule 30a-3(b) under the Act.
(b) There were no changes in the registrant’s internal control over financial reporting (as defined in Rule 30a-3(d) under the Act) that occurred during the registrant’s second fiscal quarter of the period covered by this report that have materially affected, or are reasonably likely to materially affect, the registrant’s internal control over financial reporting.
Item 12. Exhibits.
(a)(1) Code of Ethics. Filed herewith.
(a)(2) Certifications pursuant to Section 302 of the Sarbanes-Oxley Act of 2002. Filed herewith.
(b) Certification pursuant to Section 906 Certification of the Sarbanes-Oxley Act of 2002. Filed herewith.
Pursuant to the requirements of the Securities Exchange Act of 1934 and the Investment Company Act of 1940, the registrant has duly caused this report to be signed on its behalf by the undersigned, thereunto duly authorized.
| | By: /s/ Ross C. Provence
Ross C. Provence
President |
Pursuant to the requirements of the Securities Exchange Act of 1934 and the Investment Company Act of 1940, this report has been signed below by the following persons on behalf of the registrant and in the capacities and on the dates indicated.
| | By: /s/ Ross C. Provence
Ross C. Provence
President |
| | By: /s/ Jeffrey R. Provence
Jeffrey R. Provence
Chief Financial Officer |