UNITED STATES
SECURITIES AND EXCHANGE COMMISSION
WASHINGTON, D.C. 20549
FORM N-CSR
CERTIFIED SHAREHOLDER REPORT OF REGISTERED MANAGEMENT
INVESTMENT COMPANIES
Investment Company Act file number 811-09781
PFS Funds
(Exact name of registrant as specified in charter)
1939 Friendship Drive, Suite C, El Cajon, CA 92020
(Address of principal executive offices) (Zip code)
Ross C. Provence
1939 Friendship Drive, Suite C, El Cajon, CA 92020
(Name and address of agent for service)
Registrant's telephone number, including area code: (619) 588-9700
Date of fiscal year end: March 31
Date of reporting period: March 31, 2011
Form N-CSR is to be used by management investment companies to file reports with the Commission not later than 10 days after the transmission to stockholders of any report that is required to be transmitted to stockholders under Rule 30e-1 under the Investment Company Act of 1940 (17 CFR 270.30e -1). The Commission may use the information provided on Form N-CSR in its regulatory, disclosure review, inspection and policymaking roles.
A registrant is required to disclose the information specified by Form N-CSR, and the Commission will make this information public. A registrant is not required to respond to the collection of information contained in Form N-CSR unless the Form displays a currently valid Office of Management and Budget ("OMB") control number. Please direct comments concerning the accuracy of the information collection burden estimate and any suggestions for reducing the burden to Secretary, Securities and Exchange Commission, 450 Fifth Street, NW, Washington, DC 20549-0609. The OMB has reviewed this collection of information under the clearance requirements of 44 U.S.C. § 3507.
Item 1. Reports to Stockholders.
Wireless FundTM
Annual Report
March 31, 2011
Letter To Shareholders, May 2011
Our Insatiable Appetite for Data
Every time you start up your iPhone, iPad, XOOM or any other wireless device from your home, car, coffee shop, airport or at the beach, it runs over the electromagnetic spectrum. Our insatiable appetite for data is booming with the development of fantastic gadgets that guide us through cyberspace. Dallas-based AT&T has noted that mobile data traffic on its network increased 8,000 percent in the past four years and predicts that by 2015, it will transmit as much data over its wireless network every six weeks as it did in all of 2010. Carriers such as Verizon are pushing for access to more wireless spectrum, which can help them accommodate more users and applications that take up more space on the network, such as video streaming. Wireless spectrum is similar to the limited supply of oil, as it takes time to drill for oil, it takes time to build out and provide wireless spectrum. The last major wireless auction for the 700MHz band of spectrum, was only a few years ago. For wireless operators all the good spectrum has already been bought. Until the Federal Communications Commission ("FCC") can free up more spectrum for auction, the short term solution for operators to get more spectrum is to buy it through acquisitions and mergers. Be on the lookout over the next several years for mergers and acquisitions until the FCC opens up the spectrum floodgates.
Fund Discussion
For the twelve month period ended March 31, 2011, the Wireless Fund posted a total return of 12.48% . For comparative purposes, the S&P 500 Index was up 15.66% and the NASDAQ Composite Index ("NASDAQ") rose by 17.20% . The major factors that contributed to the performance of the Fund during the fiscal year were the relatively strong markets as a whole during the period as well as a generally strong technology environment. Several of the our top holdings had substantial returns, such as Apple Inc. (NASDAQ: AAPL) - the Fund’s largest holding at 7.32% and Texas Instruments (NYSE:TXN) - the Fund's second largest holding at 6.68% . Despite relatively good performance in many of our holdings we had several stocks that underperformed the general markets during the period that held back the performance. For example, several of our international holdings didn't help the Fund's fiscal 2011 returns. Specifically, China Mobile Limited (NYSE: CHL) and Research In Motion Limited (NASDAQ: RIMM) were a drag on the Fund's performance.
The Radiotelephone Communications sector represented the largest percentage of the Fund at 35.35% . MetroPCS Communications, Inc. (NYSE: PCS) was the largest holding in the Radiotelephone Communications sector. MetroPCS Communications, Inc., a wireless telecommunications carrier, offers wireless broadband mobile services in the United States. As of
2011 Annual Report 1
December 31, 2009, it operated approximately 153 retail stores in the metropolitan areas of Atlanta, Boston, Dallas/Ft. Worth, Detroit, Las Vegas, Los Angeles, Miami, New York, Orlando/Jacksonville, Philadelphia, Sacramento, San Francisco, and Tampa/Sarasota. The second largest holding in the Radiotelephone Communications sector was Vodafone Group plc (NYSE: VOD). Vodafone Group plc provides mobile communications in Europe, Africa, the Asia Pacific, the Middle East, and the United States. The company offers various handsets; voice and messaging services; data services comprising internet, email, music, games, and television; and fixed services, including fixed voice and fixed broadband solutions. The company has approximately 341.1 million mobile customers.
The Semiconductors and Related Devices sector represented the second largest percentage of the portfolio at 21.90% . Texas Instruments Inc. (NYSE: TXN) and Intel Corporation (NASDAQ: INTC) were the two largest holdings in the Semiconductors and Related Devices sector. Texas Instruments Incorporated engages in the design and sale of semiconductors to electronics designers and manufacturers worldwide. The company's Wireless segment designs, manufactures, and sells application processors and connectivity products. Intel Corporation engages in the design, manufacture, and sale of integrated circuits for computing and communications industries worldwide. Intel's wireless products include wireless connectivity products consisting of network adapters and embedded wireless cards used to translate and transmit data across networks.
The Telephone Communications (No Radiotelephone) sector represented the third largest percentage of the Fund at 12.11% . China Mobile Limited (NYSE: CHL) and America Movil (NYSE:AMX) were the two largest holdings in the Telephone Communications (No Radiotelephone) sector. China Mobile Limited provides mobile telecommunications and related services primarily in Mainland China. America Movil offers wireless services, including prepaid wireless voice and data services; and data-based wireless services, group messaging, infotain-ment, content download, video streaming, location-based services, vehicle location, and Internet access services in Mexico, Guatemala, Nicaragua, Ecuador, El Salvador, Brazil, Argentina, Colombia, the United States, Honduras, Chile, Peru, Paraguay, Uruguay, the Dominican Republic, Puerto Rico, Jamaica, and Panama.
As always, we appreciate your confidence in our abilities and thank you for your investment in the Wireless Fund.
Sincerely,
Jeffrey R. Provence
2011 Annual Report 2
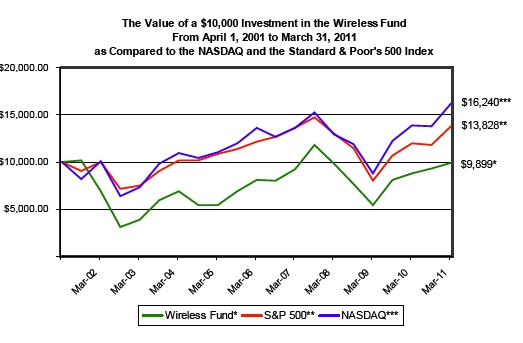
Average annual total returns for the periods ended 3/31/11
3/31/11 NAV $5.86
| | | | | | | | |
| | 1 Year* | | 3 Year* | | 5 Year* | | 10 Year* | |
| Wireless Fund | 12.48% | | 0.29% | | 4.11% | | -0.10% | |
| NASDAQ** | 17.20% | | 7.93% | | 4.45% | | 4.96% | |
| Standard & Poor’s 500 Index*** | 15.66% | | 2.36% | | 2.63% | | 3.29% | |
Fund's Expense Ratio (from 08/02/10 Prospectus): 1.97%
The Fund's expense ratio for the period ended March 31, 2011 can be found in the financial highlights included within this report.
*1 Year, 3 Year, 5 Year and 10 Year returns include change in share prices and in each case includes reinvestment of any dividends and capital gain distributions. The returns shown do not reflect the deduction of taxes that a shareholder would pay on Fund distributions or the redemption of Fund shares.
**The NASDAQ Composite (NASDAQ) is a capitalization-weighted index of all common stocks listed on NASDAQ and is an unmanaged group of stocks whose composition is different from the Fund.
***The Standard & Poor’s 500 Index is a broad market-weighted average dominated by blue-chip stocks and is an unmanaged group of stocks whose composition is different from the Fund.
PAST PERFORMANCE DOES NOT GUARANTEE FUTURE RESULTS. INVESTMENT RETURN AND PRINCIPAL VALUE WILL FLUCTUATE SO THAT SHARES, WHEN REDEEMED, MAY BE WORTH MORE OR LESS THAN THEIR ORIGINAL COST. CURRENT PERFORMANCE MAY BE LOWER OR HIGHER THAN THE PERFORMANCE DATA QUOTED. TO OBTAIN PERFORMANCE DATA CURRENT TO THE MOST RECENT MONTH END, PLEASE CALL 1-800-590-0898.
2011 Annual Report 3
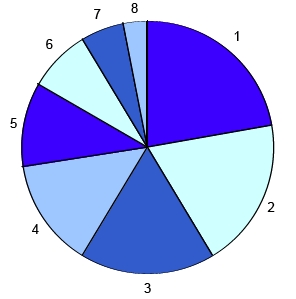
| | Wireless Fund Sector Distribution (Unaudited)
(As a Percentage of Net Assets) |
| |
| Industry Sector | Percentage of Net Assets |
| 1. Radiotelephone Communications | 35.35% |
| 2. Semiconductors and Related Devices | 21.90% |
| 3. Telephone Communications (No Radiotelephone) | 12.11% |
| 4. Communications Services | 8.83% |
| 5. Radio & TV Broadcasting & Communications Equipment | 8.35% |
| 6. Electronic Computers | 7.32% |
| 7. Telephone & Telegraph Apparatus | 3.39% |
| 8. Cash Equivalents Less Liabilities in Excess of Other Asset | 2.75% |
PROXY VOTING GUIDELINES
Value Trend Capital Management, LP, the Fund’s Adviser, is responsible for exercising the voting rights associated with the securities held by the Fund. A description of the policies and procedures used by the Adviser in fulfilling this responsibility is available without charge on the Fund’s website at www.wireless-fund.com. It is also included in the Fund’s Statement of Additional Information, which is available on the Securities and Exchange Commission’s website at http://www.sec.gov.
Information regarding how the Fund voted proxies, Form N-PX, relating to portfolio securities during the most recent 12-month period ended June 30 is available without charge, upon request, by calling our toll free number (1-800-590-0898). This information is also available on the Securities and Exchange Commission’s website at http://www.sec.gov.
2011 Annual Report 4
Availability of Quarterly Schedule of Investments (Unaudited)
The Fund files its complete schedule of portfolio holdings with the Securities and Exchange Commission ("SEC") for the first and third quarters of each fiscal year on Form N-Q. The Fund’s Forms N-Q are available on the SEC's Web site at http://www.sec.gov. The Fund’s Forms N-Q may also be reviewed and copied at the SEC's Public Reference Room in Washington, DC. Information on the operation of the Public Reference Room may be obtained by calling 1-800-SEC-0330.
Disclosure of Expenses (Unaudited)
Shareholders of this Fund incur ongoing operating expenses consisting of management fees. The following example is intended to help you understand your ongoing expenses of investing in the Fund and to compare these expenses with similar costs of investing in other mutual funds. The example is based on an investment of $1,000 (for example, an $8,600 account value divided by $1,000 = 8.6) invested in the Fund on October 1, 2010 and held through March 31, 2011.
The first line of the table below provides information about actual account values and actual expenses. In order to estimate the expenses a shareholder paid during the period covered by this report, shareholders can divide their account value by $1,000 and then multiply the result by the number in the first line under the heading entitled "Expenses Paid During the Period."
The second line of the table below provides information about hypothetical account values and hypothetical expenses based on the Fund's actual expense ratio and an assumed rate of return of 5% per year before expenses, which is not the Fund’s actual return. The hypothetical account values and expenses may not be used to estimate the actual ending account balance or expenses paid by a shareholder for the period. In order to assist shareholders in comparing the ongoing expenses of investing in this Fund and other funds, compare the 5% hypothetical example with the 5% hypothetical examples that appear in other funds' shareholder reports.
| | | | | | |
| | | | | | | Expenses Paid |
| | | Beginning | | Ending | | During the Period* |
| | | Account Value | | Account Value | | October 1, 2010 |
| | | October 1, 2010 | | March 31, 2011 | | to March 31, 2011 |
| |
| Actual | | $1,000 | | $1,063.52 | | $10.03 |
| |
| Hypothetical | | $1,000 | | $1,015.21 | | $9.80 |
| (5% annual return | | | | | | |
| before expenses) | | | | | | |
* Expenses are equal to the Fund’s annualized expense ratio of 1.95%, multiplied
by the average account value over the period, multiplied by 182/365 (to reflect the
one-half year period). |
2011 Annual Report 5
| | | | | | |
| SCHEDULE OF INVESTMENTS - WIRELESS FUND |
| |
| MARCH 31, 2011 |
| |
| |
| Shares/Principal Amount | | Fair Value | | % of Net Assets | |
| COMMON STOCKS | | | | | |
| Communications Services | | | | | |
| 2,500 | American Tower Corp. * | | $ 129,550 | | | |
| 3,200 | Crown Castle International Corp. * | | 136,160 | | | |
| 3,900 | SBA Communications Corp. * | | 154,752 | | | |
| | | | 420,462 | | 8.83 | % |
| Electronic Computers | | | | | |
| 1,000 | Apple Inc. * | | 348,508 | | 7.32 | % |
| Radiotelephone Communications | | | | | |
| 3,000 | Cellcom Israel Ltd. (Israel) | | 99,360 | | | |
| 14,000 | China Unicom Ltd. ** | | 232,400 | | | |
| 16,800 | MetroPCS Communications Inc. * | | 272,832 | | | |
| 1,350 | Millicom International Cellular SA (Luxembourg) | | 129,830 | | | |
| 10,250 | Mobile Telesystems OJSC ** | | 217,607 | | | |
| 3,600 | NII Holdings Inc. * | | 150,012 | | | |
| 6,000 | Tele Norte Leste Participacoes S.A. ** | | 105,180 | | | |
| 14,800 | Vimpel-Communications ** | | 208,976 | | | |
| 9,300 | Vodafone Group plc ** | | 267,375 | | | |
| | | | 1,683,572 | | 35.35 | % |
| Radio & TV Broadcasting & Communications Equipment | | | | | |
| 10,000 | Nokia Corporation | | 85,100 | | | |
| 5,700 | QUALCOMM Inc. | | 312,531 | | | |
| | | | 397,631 | | 8.35 | % |
| Semiconductors and Related Devices | | | | | |
| 11,000 | Atmel Corporation * | | 149,930 | | | |
| 2,800 | Broadcom Corp. | | 110,264 | | | |
| 11,000 | Intel Corporation | | 221,980 | | | |
| 5,600 | NVIDIA Corporation * | | 103,376 | | | |
| 4,300 | Skyworks Solutions Inc. * | | 139,320 | | | |
| 9,200 | Texas Instruments Inc. | | 317,952 | | | |
| | | | 1,042,822 | | 21.90 | % |
| Telephone Communications (No Radiotelephone) | | | | | |
| 3,550 | America Movil SA de CV ** | | 206,255 | | | |
| 5,000 | China Mobile Limited ** | | 231,250 | | | |
| 30,000 | Sprint Nextel Corp. * | | 139,200 | | | |
| | | | 576,705 | | 12.11 | % |
| Telephone & Telegraph Apparatus | | | | | |
| 2,850 | Research In Motion Ltd. * | | 161,139 | | 3.39 | % |
| |
| Total for Common Stock (Cost $3,367,950) | | 4,630,839 | | 97.25 | % |
| Money Market Funds | | | | | |
| 149,929 | First American Treasury Obligation Fund Cl Y Rate 0.00% *** | | 149,929 | | 3.15 | % |
| | (Cost - $149,929) | | | | | |
| | Total Investments | | | | | |
| | (Cost - $3,517,879) | | 4,780,768 | | 100.40 | % |
| | Liabilities In Excess of Other Assets | | (18,856 | ) | -0.40 | % |
| | Net Assets | | $ 4,761,912 | | 100.00 | % |
* Non-Income producing securities.
** ADR - American Depositary Receipt.
*** Variable rate security; the yield rate shown represents
the rate at March 31, 2011.
The accompanying notes are an integral part of the financial
statements. |
2011 Annual Report 6
| | | |
| WIRELESS FUND |
| |
| Statement of Assets and Liabilities | | | |
| March 31, 2011 | | | |
| |
| Assets: | | | |
| Investment Securities at Fair Value | | $ 4,780,768 | |
| (Cost - $3,517,879) | | | |
| Receivables: | | | |
| Shareholder Purchases | | 1,011 | |
| Total Assets | | 4,781,779 | |
| Liabilities: | | | |
| Payables: | | | |
| Shareholder Redemptions | | 11,915 | |
| Advisory Fees | | 7,952 | |
| Total Liabilities | | 19,867 | |
| |
| Net Assets | | $ 4,761,912 | |
| Net Assets Consist of: | | | |
| Paid In Capital | | 9,760,296 | |
| Realized Gain (Loss) on Investments - Net | | (6,261,273 | ) |
| Unrealized Appreciation in Value | | | |
| of Investments Based on Identified Cost - Net | | 1,262,889 | |
| Net Assets, for 812,209 Shares Outstanding | | $ 4,761,912 | |
| (Unlimited number of shares authorized without par value) | | | |
| Net Asset Value and Offering Price | | | |
| Per Share ($4,761,912/812,209 shares) | | $ 5.86 | |
| Minimum Redemption Price Per Share ($5.86 * 0.98) | | $ 5.74 | |
| |
| |
| Statement of Operations | | | |
| For the fiscal year ended March 31, 2011 | | | |
| Investment Income: | | | |
| Interest | | $ 9 | |
| Dividends (Net of foreign withholding tax and fees of $2,973) | | 100,160 | |
| Total Investment Income | | 100,169 | |
| Expenses: | | | |
| Management Fees | | 100,944 | |
| Total Expenses | | 100,944 | |
| |
| Net Investment Loss | | (775 | ) |
| |
| Realized and Unrealized Gain on Investments: | | | |
| Realized Gain on Investments | | 550,596 | |
| Change In Unrealized Appreciation on Investments | | 25,619 | |
| Net Realized and Unrealized Gain on Investments | | 576,215 | |
| |
| Net Increase in Net Assets from Operations | | $ 575,440 | |
The accompanying notes are an integral part of the financial
statements. |
2011 Annual Report 7
| | | | | |
| WIRELESS FUND |
| |
| Statements of Changes in Net Assets | | | | | |
| | | 4/1/2010 | | 4/1/2009 | |
| | | to | | to | |
| | | 3/31/2011 | | 3/31/2010 | |
| From Operations: | | | | | |
| Net Investment Income (Loss) | | $ (775 | ) | $ (18,444 | ) |
| Net Realized Gain/(Loss) on Investments | | 550,596 | | 255,949 | |
| Change In Net Unrealized Appreciation (Depreciation) | | 25,619 | | 1,934,923 | |
| Increase (Decrease) in Net Assets from Operations | | 575,440 | | 2,172,428 | |
| From Capital Share Transactions: | | | | | |
| Proceeds From Sale of Shares | | 565,761 | | 1,488,842 | |
| Proceeds From Redemption Fees (Note 2) | | 4,712 | | 533 | |
| Shares Issued on Reinvestment of Dividends | | - | | - | |
| Cost of Shares Redeemed | | (1,912,311 | ) | (1,732,348 | ) |
| Net Increase (Decrease) from Shareholder Activity | | (1,341,838 | ) | (242,973 | ) |
| |
| Net Increase (Decrease) in Net Assets | | (766,398 | ) | 1,929,455 | |
| |
| Net Assets at Beginning of Period | | 5,528,310 | | 3,598,855 | |
| Net Assets at End of Period (Including Accumulated Undistributed | | $ 4,761,912 | | $ 5,528,310 | |
| Net Investment Income of $0 and $0, respectively) | | | | | |
| |
| Share Transactions: | | | | | |
| Issued | | 108,713 | | 315,157 | |
| Reinvested | | - | | - | |
| Redeemed | | (356,981 | ) | (368,686 | ) |
| Net Increase (Decrease) in Shares | | (248,268 | ) | (53,529 | ) |
| Shares Outstanding, Beginning of Period | | 1,060,477 | | 1,114,006 | |
| Shares Outstanding, End of Period | | 812,209 | | 1,060,477 | |
| | | | | | | | | | |
| Financial Highlights | | | | | | | | | | |
| Selected data for a share outstanding | 4/1/2010 | | 4/1/2009 | | 4/1/2008 | | 4/1/2007 | | 4/1/2006 | |
| throughout the period: | to | | to | | to | | to | | to | |
| | 3/31/2011 | | 3/31/2010 | | 3/31/2009 | | 3/31/2008 | | 3/31/2007 | |
| Net Asset Value - | | | | | | | | | | |
| Beginning of Period | $5.21 | | $3.23 | | $5.81 | | $5.44 | | $4.79 | |
| Net Investment Income/(Loss) (a) | (0.00 | ) * | (0.02 | ) | (0.01 | ) | (0.04 | ) | (0.05 | ) |
| Net Gains or Losses on Investments | | | | | | | | | | |
| (realized and unrealized) (b) | 0.65 | | 2.00 | | (2.57 | ) | 0.40 | | 0.70 | |
| Total from Investment Operations | 0.65 | | 1.98 | | (2.58 | ) | 0.36 | | 0.65 | |
| Proceeds from Redemption Fees | - | * | - | * | - | * | 0.01 | | - | * |
| Net Asset Value - | | | | | | | | | | |
| End of Period | $5.86 | | $5.21 | | $3.23 | | $5.81 | | $5.44 | |
| Total Return (c) | 12.48% | | 61.30% | | (44.41)% | | 6.80% | | 13.57% | |
| Ratios/Supplemental Data | | | | | | | | | | |
| Net Assets - End of Period (Thousands) | $4,762 | | $5,528 | | $3,599 | | $8,116 | | $6,532 | |
| |
| Ratio of Expenses to Average Net Assets | 1.95% | | 1.95% | | 1.95% | | 1.95% | | 1.95% | |
| Ratio of Net Investment Income/(Loss) to | | | | | | | | | | |
| Average Net Assets | -0.01% | | -0.36% | | -0.12% | | -0.71% | | -1.05% | |
| Portfolio Turnover Rate | 12.60% | | 25.29% | | 12.02% | | 81.16% | | 17.13% | |
* Amounts were less than $0.005 per share.
(a) Per Share amounts calculated using Average Shares Outstanding method.
(b) Realized and unrealized gains and losses per share in this caption are balancing amounts necessary to reconcile the
change in net asset value per share for the period, and may not reconcile with the aggregate gains and losses in the Statement
of Operations due to share transactions for the period.
(c) Total Returns in the above table represent the rate that the investor would have earned or lost on an investment in the Fund
assuming reinvestment of dividends. Total return calculation does not reflect redemption fee. |
| | The accompanying notes are an integral part of the financial
statements. |
2011 Annual Report 8
NOTES TO THE FINANCIAL STATEMENTS - WIRELESS FUND
March 31, 2011
1.) ORGANIZATION
Wireless Fund (the"Fund") is a non-diversified series of the PFS Funds (the "Trust"), an open-ended management investment company. Prior to March 5, 2010 the Trust was named Wireless Fund. The Trust was organized in Massachusetts as a business trust on January 13, 2000 and may offer shares of beneficial interest in a number of separate series, each series representing a distinct fund with its own investment objectives and policies. As of March 31, 2011, there were four series operating in the Trust. The Fund's primary investment objective is to seek long-term growth of capital. Significant accounting policies of the Fund are presented below:
2.) SIGNIFICANT ACCOUNTING POLICIES
SECURITY VALUATION:
The Fund, under normal market conditions, invests at least 80% of its assets in the securities of companies engaged in the development, production, or distribution of wireless related products or services. All investments in securities are recorded at their estimated fair value, as described in Note 3.
SHARE VALUATION:
The net asset value (the “NAV”) is generally calculated as of the close of trading on the New York Stock Exchange (normally 4:00 p.m. Eastern time) every day the Exchange is open. The NAV is calculated by taking the total value of the Fund’s assets, subtracting its liabilities, and then dividing by the total number of shares outstanding, rounded to the nearest cent. The offering price and redemption price per share is equal to the net asset value per share, except that shares of the Fund are subject to a redemption fee of 2% if redeemed within 90 days of purchase. During the fiscal year ended March 31, 2011, proceeds from redemption fees were $4,712.
DISTRIBUTIONS TO SHAREHOLDERS:
Distributions to shareholders, which are determined in accordance with income tax regulations, are recorded on the ex-dividend date. The treatment for financial reporting purposes of distributions made to shareholders during the year from net investment income or net realized capital gains may differ from their ultimate treatment for federal income tax purposes. These differences are caused primarily by differences in the timing of the recognition of certain components of income, expense, or realized capital gain for federal income tax purposes. Where such differences are permanent in nature, they are reclassified in the components of the net assets based on their ultimate characterization for federal income tax purposes. Any such reclassifications will have no effect on net assets, results of operations, or net asset values per share of the Fund. For the year ended March 31, 2011, $775 of net investment loss and $649,719 of expired capital loss carryforwards were reclassified to paid in capital.
FEDERAL INCOME TAXES:
The Fund’s policy is to continue to comply with the requirements of the Internal Revenue Code that are applicable to regulated investment companies and to distribute all of its taxable income to shareholders. Therefore, no federal income tax provision is required. It is the Fund’s policy to distribute annually, prior to the end of the calendar year, dividends sufficient to satisfy excise tax requirements of the Internal Revenue Code. This Internal Revenue Code requirement may cause an excess of distributions over the book year-end accumulated income. In addition, it is the Fund’s policy to distribute annually, after the end of the fiscal year, any remaining net investment income and net realized capital gains.
The Fund recognizes the tax benefits of certain tax positions only where the position is “more likely than not” to be sustained assuming examination by tax authorities. Management has analyzed the Fund’s tax positions, and has concluded that no liability for unrecognized tax benefits should be recorded related to uncertain tax positions taken on returns filed for open tax years (2007-2009), or expected to be taken on the Fund’s 2010 tax return. The Fund identifies its major tax jurisdictions as U.S. Federal and State tax authorities; however the Fund is not aware of any tax positions for which it is reasonably possible that the total amounts of unrecognized tax benefits will change materially in the next twelve months. The Fund recognizes interest and penalties, if any, related to unrecognized tax benefits as income tax expense in the Statement of Operations. During the year, the Fund did not incur any interest or penalties.
2011 Annual Report 9
Notes to the Financial Statements - continued
USE OF ESTIMATES:
The preparation of financial statements in conformity with accounting principles generally accepted in the United States of America (“GAAP”) requires management to make estimates and assumptions that affect the reported amounts of assets and liabilities and disclosure of contingent assets and liabilities at the date of the financial statements and the reported amounts of increases and decreases in net assets from operations during the reporting period. Actual results could differ from those estimates.
OTHER:
The Fund records security transactions based on a trade date. Dividend income is recognized on the ex-dividend date, and interest income is recognized on an accrual basis. Discounts and premiums on securities purchased are amortized, over the lives of the respective securities. Withholding taxes on foreign dividends have been provided for in accordance with the Fund’s understanding of the applicable country’s tax rules and rates.
3.) SECURITIES VALUATIONS
As described in Note 2, the Fund utilizes various methods to measure the fair value of most of its investments on a recurring basis. GAAP establishes a hierarchy that prioritizes inputs to valuation methods. The three levels of inputs are:
Level 1 - Unadjusted quoted prices in active markets for identical assets or liabilities that the Fund has the ability to access.
Level 2 - Observable inputs other than quoted prices in active markets included in level 1 that are observable for the asset or liability, either directly or indirectly. These inputs may include quoted prices for the identical instrument on an inactive market, prices for similar instruments, interest rates, prepayment speeds, credit risk, yield curves, default rates and similar data.
Level 3 - Unobservable inputs for the asset or liability, to the extent relevant observable inputs are not available, representing the Fund’s own assumptions about the assumptions a market participant would use in valuating the asset or liability, and would be based on the best information available.
The availability of observable inputs can vary from security to security and is affected by a wide variety of factors, including, for example, the type of security, whether the security is new and not yet established in the marketplace, the liquidity of markets, and other characteristics particular to the security. To the extent that valuation is based on models or inputs that are less observable or unobservable in the market, the determination of fair value requires more judgment. Accordingly, the degree of judgment exercised in determining fair value is greatest for instruments categorized in level 3.
The inputs used to measure fair value may fall into different levels of the fair value hierarchy. In such cases, for disclosure purposes, the level in the fair value hierarchy within which the fair value measurement falls in its entirety, is determined based on the lowest level input that is significant to the fair value measurement in its entirety.
FAIR VALUE MEASUREMENTS
A description of the valuation techniques applied to the Fund’s major categories of assets and liabilities measured at fair value on a recurring basis follows.
Equity securities (common stock, including ADRs). Equity securities are generally valued by using market quotations. The market quotation used for common stocks, including those listed on the NASDAQ National Market System, is the last sale price on the date on which the valuation is made or, in the absence of sales, at the closing bid price. Over-the-counter securities will be valued on the basis of the bid price at the close of each business day. Generally, if the security is traded in an active market and is valued at the last sale price, the security is categorized as a level 1 security. When the security position is not considered to be part of an active market or when the security is valued at the bid price, the position is generally categorized as level 2. When market quotations are not readily available, when the Adviser determines the last bid price does not accurately reflect the current value or when restricted securities are being valued, such securities are valued as determined in good faith by the Adviser, in conformity with guidelines adopted by and subject to review of the Board of Trustees (the “Trustees”) and are categorized in level 2 or level 3, when appropriate.
2011 Annual Report 10
Notes to the Financial Statements - continued
Money markets. Money market securities are valued at a net asset value of $1.00 and are classified in level 1 of the fair value hierarchy.
Fixed income securities. Fixed income securities generally are valued by using market quotations, but may be valued on the basis of prices furnished by a pricing service when the Adviser believes such prices accurately reflect the fair market value of such securities. A pricing service utilizes electronic data processing techniques based on yield spreads relating to securities with similar characteristics to determine prices for normal institutional-size trading units of debt securities without regard to sale or bid prices. When prices are not readily available from a pricing service, or when restricted or illiquid securities are being valued, securities are valued at fair value as determined in good faith by the Adviser, subject to review of the Trustees. Short-term investments in fixed income securities with maturities of less than 60 days when acquired, or which subsequently are within 60 days of maturity, are valued by using the amortized cost method of valuation. Generally, fixed income securities are categorized as level 2.
In accordance with the Trust's good faith pricing guidelines, the Adviser is required to consider all appropriate factors relevant to the value of securities for which it has determined other pricing sources are not available or reliable as described above. There is no single standard for determining fair value, since fair value depends upon the circumstances of each individual case. As a general principle, the current fair value of an issue of securities being valued by the Adviser would appear to be the amount which the owner might reasonably expect to receive for them upon their current sale. Methods which are in accordance with this principle may, for example, be based on (i) a multiple of earnings; (ii) a discount from market of a similar freely traded security (including a derivative security or a basket of securities traded on other markets, exchanges or among dealers); or (iii) yield to maturity with respect to debt issues, or a combination of these and other methods.
The following table summarizes the inputs used to value the Fund’s assets measured at fair value as of March 31, 2011:
| | | | | | | | |
| Valuation Inputs of Assets | | Level 1 | | Level 2 | | Level 3 | | Total |
| Common Stock, including ADRs | | $4,630,839 | | $0 | | $0 | | $4,630,839 |
| Money Market Funds | | 149,929 | | 0 | | 0 | | 149,929 |
| Total | | $4,780,768 | | $0 | | $0 | | $4,780,768 |
Refer to the Fund’s Schedule of Investments for a listing of securities by industry. The Fund did not hold any Level 3 assets during the fiscal year ended March 31, 2011. There were no transfers into or out of level 1 and level 2 during the fiscal year ended March 31, 2011. It is the Fund’s policy to consider transfers into or out of level 1 and level 2 as of the end of the reporting period.
4.) INVESTMENT ADVISORY AGREEMENT
Value Trend Capital Management, LP (the “Adviser”), manages the investment portfolio of the Fund, subject to policies adopted by the Trust's Trustees. Under the Investment Advisory Agreement, the Adviser, at its own expense and without reimbursement from the Trust, furnishes office space and all necessary office facilities, equipment and executive personnel necessary for managing the Fund. The Adviser also pays the salaries and fees of all officers and trustees of the Trust who are also officers, partners, or employees of the Adviser. The Adviser pays all operating expenses of the Fund, with the exception of taxes, interest, borrowing expenses (such as (a) interest and (b) dividends on short sales), brokerage commissions and extraordinary expenses. For its services, the Adviser receives a fee of 1.95% per year of the average daily net assets of the Fund. As a result of the above calculation, for the fiscal year ended March 31, 2011, the Adviser received management fees totaling $100,944. At March 31, 2011, the Fund owed $7,952 to the Adviser.
5.) RELATED PARTY TRANSACTIONS
Control persons of Value Trend Capital Management, LP. also serve as directors/officers of the Fund. These individuals receive benefits from the Adviser resulting from management fees paid to the Adviser of the Fund. The Trustees who are not interested persons of the Fund were paid $500 each in Trustees’ fees for the fiscal year ended March 31, 2011 by the Adviser.
2011 Annual Report 11
Notes to the Financial Statements - continued
6.) CAPITAL STOCK
The Trust is authorized to issue an unlimited number of shares without par value. Paid in capital at March 31, 2011 was $9,760,296 representing 812,209 shares outstanding.
7.) INVESTMENT TRANSACTIONS
For the fiscal year ended March 31, 2011, purchases and sales of investment securities other than U.S. Government obligations and short-term investments aggregated $626,847 and $2,061,001, respectively. Purchases and sales of U.S. Government obligations aggregated $0 and $0, respectively.
For federal income tax purposes, the cost of investments owned at March 31, 2011 was $3,517,879. At March 31, 2011, the composition of unrealized appreciation (the excess of value over tax cost) and depreciation (the excess of tax cost over value) on a tax basis was as follows:
| | Appreciation | | (Depreciation) | | | Net Appreciation (Depreciation) |
| | $1,520,208 | | ($257,319) | | | $1,262,889 |
There were no differences between book basis and tax basis unrealized appreciation.
8.) LOSS CARRYFORWARDS
At March 31, 2011, the Fund had available for federal tax purposes an unused capital loss carryforward of $6,261,273, of which $375,757 expires in 2012, $2,851,410 expires in 2013, $2,154,763 expires in 2014, $711,985 expires in 2017 and $167,358 expires in 2018. Capital loss carryforwards are available to offset future realized capital gains. To the extent that these carryforwards are used to offset future capital gains, it is probable that the amount, which is offset, will not be distributed to shareholders. Capital loss carryforwards in the amount of $649,719 expired during the year ended March 31, 2011.
9.) DISTRIBUTIONS TO SHAREHOLDERS
There were no distributions paid during the fiscal years 2011 and 2010.
As of March 31, 2011 the components of distributable earnings / (accumulated losses) on a tax basis were as follows:
| | | |
| Undistributed accumulated losses | | $ (6,261,273 | ) |
| Unrealized appreciation - Net | | 1,262,889 | |
| | | $ (4,998,384 | ) |
2011 Annual Report 12
ADDITIONAL INFORMATION - WIRELESS FUND
March 31, 2011
(UNAUDITED)
1.) APPROVAL OF INVESTMENT ADVISORY AGREEMENT
On March 8, 2011, the Trustees for the Wireless Fund met to consider the renewal of the Management Agreement (the "Agreement"). In renewing the Agreement, the Trustees considered and evaluated the following factors: (i) the investment performance of the Fund and the Adviser; (ii) the nature, extent and quality of the services provided by the Adviser to the Fund; (iii) the cost of the services to be provided and the profits to be realized by the Adviser and its affiliates from the relationship with the Fund; (iv) the extent to which economies of scale will be realized as the Fund grows; and (v) whether the fee levels reflect these economies of scale to the benefit of shareholders.
The Trustees met with the Adviser to discuss the terms of the Agreement. The Trustees reviewed the history of the Adviser, including background and investment management experience. The representatives of the Adviser summarized the information provided to the Trustees regarding matters such as the Adviser's financial condition, the Adviser's performance, as well as Fund performance, management fees and expenses, and investment personnel of the Adviser. They also discussed the Adviser's background and investment management experience. Furthermore, they discussed the nature, extent, profitability and quality of the services to be provided by the Adviser and the firm's ability to meet its obligations under the Agreement. As to the performance of the Fund, the Adviser provided information regarding the performance of the Fund compared to a group of funds of similar size, style and objective, categorized by Morningstar (the "Peer Group"). All performance data was through the period ended December 31, 2010. The Trustees noted that the Fund posted a 12 month total return of 13.78% which underperformed the Peer Group average of 18.41%, but was within the range of its Peer Group. The Trustees also noted that the Fund posted a 6.80% average annualized return for the 5 year period ended December 31, 2010 which outperformed the Peer Group average of 4.47% . As to the costs of the services to be provided, the Trustees reviewed the fees under the Agreement compared to other mutual funds with similar investment objectives and asset levels and noted that the expense ratio of 1.95% was above the category average but within the range of its Peer Group. The Trustees then reviewed the management fee ratio of the Fund compared its Peer Group and noted that the management fee ratio of 1.95% was above the category average of 0.67% . The Trustees recognized the expense ratio was within the range of its Peer Group and the management fee was at the top end of the Peer Group; however, they also recognized that the Fund's Adviser is responsible under the Agreement for paying all but a very small fraction of the Fund's expenses out of the management fee. The Trustees also reviewed a profit and loss analysis prepared by the Adviser that detailed the expenses paid by the Adviser on behalf of the Fund, and the total revenue derived by the Adviser from the Fund, and concluded that the Adviser was not overly profitable. The Trustees further discussed the fact that the Adviser may consider a reduction in management fees as the assets of the Fund increase and that the shareholders may benefit from fee reductions as the Fund grows. They concluded that the expense ratio was reasonable. The representatives of the Adviser reviewed and discussed with the Trustees the history of the Adviser, the Adviser's ADV, the 17j-1 certifications, and descriptions of the background and investment management experience of the Adviser's professional staff. The representatives of the Adviser also reviewed and discussed with the Trustees a report comparing the historical performance of the Fund to similar funds. Lastly, the Trustees took time to review the Fund's annual commission summary/brokerage allocation report for the calendar period ended December 31, 2010. The Trustees noted that trades were executed based on best price and execution. The Trustees then reviewed the terms of the Agreement.
After reviewing all of the information presented, the Independent Trustees met in executive session. The Trustees discussed the performance of the Fund and the Adviser's compensation. Based upon the information provided, it was the Trustees' consensus that the fee to be paid to the Adviser pursuant to the Agreement was reasonable, that the overall arrangement provided under the terms of the Agreement was a reasonable business arrangement, and that the renewal of the Agreement was in the best interest of the Fund's shareholders.
2011 Annual Report 13
| |
Cohen Fund Audit Services, Ltd.
Certified Public Accountants | 800 Westpoint Pkwy, Ste 1100
Westlake, Ohio 44145
Phone: (440) 835-8500
Fax: (440) 835-1093
www.cohenfund.com |
REPORT OF INDEPENDENT REGISTERED PUBLIC ACCOUNTING FIRM
To the Shareholders and Board of Trustees
Wireless Fund
(PFS Funds)
We have audited the accompanying statement of assets and liabilities, including the schedule of investments, of Wireless Fund (the "Fund"), a series of the PFS Funds, as of March 31, 2011, and the related statement of operations for the year then ended, the statements of changes in net assets for each of the two years in the period then ended, and the financial highlights for each of the five years in the period then ended. These financial statements and financial highlights are the responsibility of Fund management. Our responsibility is to express an opinion on these financial statements and financial highlights based on our audit.
We conducted our audit in accordance with the standards of the Public Company Accounting Oversight Board (United States). Those standards require that we plan and perform the audit to obtain reasonable assurance about whether the financial statements and financial highlights are free of material misstatement. An audit includes examining, on a test basis, evidence supporting the amounts and disclosures in the financial statements. Our procedures included confirmation of securities owned as of March 31, 2011 by correspondence with the custodian. An audit also includes assessing the accounting principles used and significant estimates made by management, as well as evaluating the overall financial statement presentation. We believe that our audit provides a reasonable basis for our opinion.
In our opinion, the financial statements and financial highlights referred to above present fairly, in all material respects, the financial position of Wireless Fund as of March 31, 2011, the results of its operations for the year then ended, the changes in its net assets for each of the two years in the period then ended, and the financial highlights for each of the five years in the period then ended, in conformity with accounting principles generally accepted in the United States of America.

COHEN FUND AUDIT SERVICES, LTD.
Westlake, Ohio
May 31, 2011 |
2011 Annual Report 14
| This page intentionally left blank. |
2011 Annual Report 15
| This page intentionally left blank. |
2011 Annual Report 16
TRUSTEES AND OFFICERS
Unaudited
The Board of Trustees supervises the business activities of the Trust. The names of the Trustees and executive officers of the Trust are shown below. For more information regarding the Trustees, please refer to the Statement of Additional Information, which is available upon request by calling 1-800-590-0898. Each Trustee serves until the Trustee sooner dies, resigns, retires or is removed.
The Trustees and Officers of the Trust and their principal business activities during the past five years are:
Interested Trustees and Officers
| | | | | Number of | Other |
| | | | Principal | Portfolios In | Directorships |
Name, | Position(s) | Term of Office | Occupation(s) | Fund | Held By |
Address(1), | Held With | and Length of | During | Complex | Trustee or |
| and Year of Birth | the Trust | Time Served | Past 5 Years | Overseen By | Officer During |
| | | | | Trustee | Past 5 Years |
| |
| Ross C. Provence(2), | Trustee | Indefinite Term; | General Partner and Portfolio | 4 | Blue Chip |
| Year of Birth: 1938 | and | Since 2000 | Manager for Value Trend Capital | | Investor Funds |
| | President | | Management, LP (1995 to current). | | |
| | | | Estate planning attorney (1963 to | | |
| current). |
| |
| Jeffrey R. Provence(2), | Trustee, | Indefinite Term; | General Partner and Portfolio | 4 | Blue Chip |
| Year of Birth:1969 | Secretary | Since 2000 | Manager for Value Trend Capital | | Investor Funds, |
| | and | | Management, LP (1995 to current). | | Sycuan Funds, |
| | Treasurer | | CEO, Premier Fund Solutions, Inc. | | Private Asset |
| | | | (2001 to current). | | Management |
| | | | | | Fund |
(1) The address of each trustee and officer is c/o PFS Funds, 1939 Friendship Drive, Suite C, El Cajon, California 92020.
(2) Trustees who are considered "interested persons" as defined in Section 2(a)(19) of the Investment Company Act of 1940 by virtue of their affiliation with the Investment Adviser.
Independent Trustees
| | | | | Number of | Other |
| | | | Principal | Portfolios In | Directorships |
| Name, | Position | Term of Office | Occupation(s) | Fund | Held By |
| Address(1), | Held With | and Length of | During | Complex | Trustee or |
| and Year of Birth | the Trust | Time Served | Past 5 Years | Overseen By | Officer During |
| | | | | Trustee | Past 5 Years |
| | | | | | |
| Thomas H. Addis III, | Independent | Indefinite Term; | Executive Director/CEO, Southern | 4 | None |
| Year of Birth: 1945 | Trustee | Since 2000 | California PGA (2006 to current). | | |
| | | | President, Medallion Golf | | |
| | | | Management (1999 to 2006). | | |
| | | | | | Blue Chip |
| Allen C. Brown, | Independent | Indefinite Term; | Co-owner of Stebleton & Brown | 4 | Investor Funds, |
| Year of Birth: 1943 | Trustee | Since 2000 | (1994 to Current). Estate planning | | Sycuan Funds |
| | | | and business attorney (1970 to cur- | | |
| rent). |
| | | | | | Blue Chip |
| George Cossolias, CPA, | Independent | Indefinite Term; | Owner of George Cossolias & | 4 | Investor Funds, |
| Year of Birth: 1935 | Trustee | Since 2000 | Company, CPAs (1972 to current). | | Sycuan Funds, |
| | | | President of Lubrication Specialists, | | Temecula |
| | | | Inc. (1996 to current). | | Valley Bank |
(1) The address of each trustee and officer is c/o PFS Funds, 1939 Friendship Drive, Suite C, El Cajon, California 92020.
2011 Annual Report 17
Investment Adviser
Value Trend Capital Management, LP
1939 Friendship Drive, Suite C
El Cajon, CA 92020
Dividend Paying Agent,
Shareholders' Servicing Agent,
Transfer Agent
Mutual Shareholder Services, LLC
8000 Town Centre Dr., Ste 400
Broadview Hts, OH 44147
Distributor
Rafferty Capital Markets, LLC
59 Hilton Avenue, Suite 101
Garden City, NY 11530
Custodian
U.S. Bank, NA
425 Walnut Street
P.O. Box 1118
Cincinnati, OH 45201
Independent Registered Public Accounting Firm
Cohen Fund Audit Services, Ltd.
800 Westpoint Pkwy., Ste 1100
Westlake, OH 44145-1594 |
This report is provided for the general information of the shareholders of the Wireless
Fund. This report is not intended for distribution to prospective investors in the funds,
unless preceded or accompanied by an effective prospectus. |
Item 2. Code of Ethics.
The registrant has adopted a code of ethics that applies to the registrant’s principal executive officer and the principal financial officer. The registrant has not made any amendments to its code of ethics during the covered period. The registrant has not granted any waivers from any provisions of the code of ethics during the covered period. A copy of the registrant’s Code of Ethics is filed herewith.
Item 3. Audit Committee Financial Expert.
The registrant’s Board of Trustees has determined that George Cossolias is an audit committee finical expert. Mr. Cossolias is independent for purposes of this Item 3.
Item 4. Principal Accountant Fees and Services.
(a-d) The following table details the aggregate fees billed for each of the last two fiscal years for audit fees, audit-related fees, tax fees and other fees by the principal accountant to the registrant. The principal accountant has provided no services to the adviser or any entity controlled by, or under common control with the adviser that provides ongoing services to the registrant.
| | | | |
| | | FYE 3/31/11 | | FYE 3/31/10 |
| Audit Fees | | $8,731 | | $8,700 |
| Audit-Related Fees | | $0 | | $0 |
| Tax Fees | | $1,600 | | $1,600 |
| All Other Fees | | $600 | | $600 |
Nature of Tax Fees: preparation of Excise Tax Statement and 1120 RIC. Nature of All Other Fees: Review of Semi-Annual Report.
(e) (1) The audit committee approves all audit and non-audit related services and, therefore, has not adopted pre-approval policies and procedures described in paragraph (c)(7) of Rule 2-01 of Regulation S-X.
(e) (2) None of the services described in paragraph (b) through (d) of this Item were approved by the audit committee pursuant to paragraph (c)(7)(i)(C) of Rule 2-01 of Regulation S-X.
(f) All of the principal accountant’s hours spent on auditing the registrant’s financial statements were attributed to work performed by full-time permanent employees of the principal accountant.
(g) The following table indicates the aggregate non-audit fees billed by the registrant’s principal accountant for services to the registrant , the registrant’s investment adviser (not sub-adviser), and any entity controlling, controlled by, or under common control with the adviser that provides ongoing services to the registrant, for the last two years.
| | | | |
| Non-Audit Fees | | FYE 3/31/11 | | FYE 3/31/10 |
| Registrant | | $2,200 | | $2,200 |
| Registrant’s Investment Adviser | | $0 | | $0 |
(h) The principal accountant provided no services to the investment adviser or any entity controlling, controlled by, or under common control with the adviser that provides ongoing services to the registrant.
Item 5. Audit Committee of Listed Companies. Not applicable.
Item 6. Schedule of Investments. Schedule filed with Item 1.
Item 7. Disclosure of Proxy Voting Policies and Procedures for Closed-End Management Investment Companies. Not applicable.
Item 8. Portfolio Managers of Closed End Management Investment Companies. Not applicable.
Item 9. Purchases of Equity Securities by Closed-End Management Investment Companies and Affiliated Purchasers. Not applicable.
Item 10. Submission of Matters to a Vote of Security Holders.
The registrant has not adopted procedures by which shareholders may recommend nominees to the registrant’s board of trustees.
Item 11. Controls and Procedures.
(a) The registrant’s president and chief financial officer concluded that the disclosure controls and procedures (as defined in Rule 30a-3(c) under the Investment Company Act of 1940 (the “Act”)) were effective as of a date within 90 days of the filing date of this report, based on the evaluation of these controls and procedures required by Rule 30a-3(b) under the Act.
(b) There were no changes in the registrant’s internal control over financial reporting (as defined in Rule 30a-3(d) under the Act) that occurred during the registrant’s second fiscal quarter of the period covered by this report that have materially affected, or are reasonably likely to materially affect, the registrant’s internal control over financial reporting.
Item 12. Exhibits.
(a)(1) Code of Ethics. Filed herewith.
(a)(2) Certifications pursuant to Section 302 of the Sarbanes-Oxley Act of 2002. Filed herewith.
(b) Certification pursuant to Section 906 Certification of the Sarbanes-Oxley Act of 2002. Filed herewith.
Pursuant to the requirements of the Securities Exchange Act of 1934 and the Investment Company Act of 1940, the registrant has duly caused this report to be signed on its behalf by the undersigned, thereunto duly authorized.
| | By: /s/ Ross C. Provence
Ross C. Provence
President |
Pursuant to the requirements of the Securities Exchange Act of 1934 and the Investment Company Act of 1940, this report has been signed below by the following persons on behalf of the registrant and in the capacities and on the dates indicated.
| | By: /s/ Ross C. Provence
Ross C. Provence
President |
| | By: /s/ Jeffrey R. Provence
Jeffrey R. Provence
Chief Financial Officer |