UNITED STATES
SECURITIES AND EXCHANGE COMMISSION
WASHINGTON, D.C. 20549
FORM N-CSR
CERTIFIED SHAREHOLDER REPORT OF REGISTERED MANAGEMENT
INVESTMENT COMPANIES
Investment Company Act file number 811-09781
PFS Funds
(Exact name of registrant as specified in charter)
1939 Friendship Drive, Suite C, El Cajon, CA 92020
(Address of principal executive offices) (Zip code)
CT Corporation System
155 Federal St., Suite 700, Boston, MA 02110
(Name and address of agent for service)
Registrant's telephone number, including area code: (619) 588-9700
Date of fiscal year end: June 30
Date of reporting period: June 30, 2011
Form N-CSR is to be used by management investment companies to file reports with the Commission not later than 10 days after the transmission to stockholders of any report that is required to be transmitted to stockholders under Rule 30e-1 under the Investment Company Act of 1940 (17 CFR 270.30e -1). The Commission may use the information provided on Form N-CSR in its regulatory, disclosure review, inspection and policymaking roles.
A registrant is required to disclose the information specified by Form N-CSR, and the Commission will make this information public. A registrant is not required to respond to the collection of information contained in Form N-CSR unless the Form displays a currently valid Office of Management and Budget ("OMB") control number. Please direct comments concerning the accuracy of the information collection burden estimate and any suggestions for reducing the burden to Secretary, Securities and Exchange Commission, 450 Fifth Street, NW, Washington, DC 20549-0609. The OMB has reviewed this collection of information under the clearance requirements of 44 U.S.C. § 3507.
Item 1. Reports to Stockholders.


For Investors Seeking Long-Term Capital Appreciation
Annual Report
June 30, 2011 |
| | Dear Fellow Shareholders: |
We formed Castle Investment Management to bring a money manager with a strong track record to mutual fund investors. Over the first year of the Fund, our performance was strong on an absolute basis as the Fund returned 16.34% . Relative performance is less important to us as we believe trying to keep up with the market in all environments promotes poor decisions. As you'll read in our Sub-Adviser's letter, we are pleased with the fact that we participated sensibly over the past year, and are well-positioned to take advantage of market pullbacks with our cash position.
Our process for selecting the sub-adviser to the Fund included both qualitative and quantitative aspects. From a quantitative standpoint, we looked at several factors, all of which boil down to this: Has the manager been able to lose less during periods of severe market declines and produce strong returns over a full market cycle? Qualitatively, we were seeking a manager who was a good communicator and would share their thoughts on the market with you, our shareholders. We sought out a manager who would take a contrarian approach and ignore the group-think mentality of Wall Street. We selected St. James Investment Company as the Sub-Adviser to the Castle Focus Fund because their investment philosophy aligns with ours.
We are pleased to present you with the Annual Report for the Castle Focus Fund. We are grateful for your investments in the Fund and we look forward to managing your assets in the future.
Sincerely,

Caeli Andrews
Co-Founder, Managing Director
Castle Investment Management | Andrew Welle
Co-Founder, Managing Director
Castle Investment Management |
2011 Annual Report 1
| Dear Castle Focus Fund Shareholder: |
We are pleased to report the results of our first year of sub-advising the Castle Focus Fund. For the year ended June 30, 2011, the Investor Class shares of the Castle Focus Fund (the “Fund”) returned 16.34% .
The primary factors that contributed to the performance of the Fund were the strong returns of the equity market over the past year as well as the Fund's significant cash position throughout the year. The Fund trailed its benchmark (the S&P 500) as we would expect in a risk-on environment such as this past year. This does not surprise us as our approach to equities can best be described as both contrarian and conservative.
Our strategy focuses on long-term investment results. We attempt to achieve these favorable long-term results by participating sensibly in upward moving markets and losing less when markets pull back. An important part of our strategy is to be prepared for market pullbacks as we believe that the entry point on the purchase of a stock plays a critical role in the ultimate return of that investment. We believe that the Fed's quantitative easing programs played a major role in the recent advance of the stock market. Therefore, as equity markets moved up on non-traditional factors over the past 12 months, we saw valuations become less attractive. As such, our net cash* position increased over the year and as of June 30, 2011 was 32.25% of the Fund's net assets. Our cash position has not allowed us to participate fully when the market has moved up swiftly over the past year. We like the optionality of cash as it allows us the opportunity to take advantage of market pullbacks. When we see markets pull back, fear increase, and valuations improve, we will be more inclined to put our cash to work. A portfolio that holds little to no cash cannot buy great companies at great prices because they tend to have little to no cash on hand when they need it: when great companies are on sale.
Kind Regards,

| Robert J. Mark | Larry J. Redell |
| Partner, Portfolio Manager | Partner |
| St. James Investment Company | St. James Investment Company |
*Net Cash represents cash equivalents and other assets less liabilities.
2011 Annual Report 2
CASTLE FOCUS FUND (Unaudited)
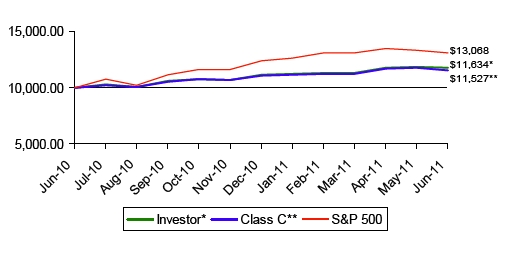
The Value of a $10,000 Investment in the
Castle Focus Fund
From July 1, 2010 to June 30, 2011
as Compared to the Standard & Poor's 500 Index
CASTLE FOCUS FUND PERFORMANCE INFORMATION
TOTAL RETURNS AS OF JUNE 30, 2011.
| | |
| | Since | |
| | Inception(A) | |
| Investor Class | 16.34% | |
| CLASS C (without CDSC)** | 15.27% | |
| CLASS C (with CDSC)** | 14.27% | |
| S&P 500 Index (B) | 30.68% | |
The Fund's Total Annual Expense Ratios (from 06/30/10 Prospectus): Investor Class - 1.63%
Class C - 2.63%
(A) Since Inception returns include change in share prices and in each case includes reinvestment of any dividends and capital gain distributions. The Castle Focus Fund commenced operations on July 1, 2010.
(B) The S&P 500 is an unmanaged index comprised of the stocks of large capitalization issues in the United States and it is considered representative of the U.S. equity markets as a whole.
** Class C shares of the Fund are offered at their NAV without sales charge. However, Class C shares are subject to a contingent deferred sales charge (“CDSC”) of 1% if redeemed within one year of the original purchase date. No CDSC will be charged if redeemed after one year of the purchase date.
PAST PERFORMANCE DOES NOT GUARANTEE FUTURE RESULTS. INVESTMENT RETURN AND PRINCIPAL VALUE WILL FLUCTUATE SO THAT SHARES, WHEN REDEEMED, MAY BE WORTH MORE OR LESS THAN THEIR ORIGINAL COST. RETURNS DO NOT REFLECT THE DEDUCTION OF TAXES THAT A SHAREHOLDER WOULD PAY ON FUND DISTRIBUTIONS OR THE REDEMPTION OF FUND SHARES. CURRENT PERFORMANCE MAY BE LOWER OR HIGHER THAN THE PERFORMANCE DATA QUOTED. TO OBTAIN PERFORMANCE DATA CURRENT TO THE MOST RECENT MONTH END, PLEASE CALL 1-703-260-1921. AN INVESTMENT IN THE FUND IS SUBJECT TO INVESTMENT RISKS, INCLUDING THE POSSIBLE LOSS OF THE PRINCIPAL AMOUNT INVESTED. THE FUND'S DISTRIBUTOR IS RAFFERTY CAPITAL MARKETS, LLC.
2011 Annual Report 3
| | CASTLE FOCUS FUND (Unaudited) |
Castle Focus Fund
by Sectors (as a percentage of Net Assets)

*Net Cash represents cash equivalents and other assets less liabilities.
Availability of Quarterly Schedule of Investments
The Fund files its complete schedule of portfolio holdings with the Securities and Exchange Commission (“SEC”) for the first and third quarters of each fiscal year on Form N-Q. The Fund’s Form N-Q is available on the SEC's website at http://www.sec.gov. The Fund’s Form N-Q may also be reviewed and copied at the SEC's Public Reference Room in Washington, DC. Information on the operation of the Public Reference Room may be obtained by calling 1-800-SEC-0330.
Proxy Voting Guidelines
The Adviser is responsible for exercising the voting rights associated with the securities held by the Fund. A description of the policies and procedures used by the Adviser in fulfilling this responsibility is available without charge by calling 703-260-1921. It is also included in the Fund’s Statement of Additional Information, which is available on the SEC’s website at http://www.sec.gov.
Information regarding how the Fund voted proxies, Form N-PX, relating to portfolio securities during the most recent 12-month period ended June 30, is available without charge, upon request, by calling 703-260-1921. This information is also available on the SEC’s website at http://www.sec.gov.
2011 Annual Report 4
Disclosure of Expenses (Unaudited)
As a shareholder of the Fund, you incur two types of costs: (1) transaction costs, including sales charges (loads) on purchase payments; and (2) ongoing costs, including management fees; distribution and/or service (12b-1) fees; and other Fund expenses. This Example is intended to help you understand your ongoing costs (in dollars) of investing in the Fund and to compare these costs with the ongoing costs of investing in other mutual funds. If Fund shares are redeemed within 90 days of purchase from the Fund, the shares are subject to a 2% redemption fee.
The Example is based on an investment of $1,000 invested at the beginning of the period and held for the period, January 1, 2011 through June 30, 2011.
Actual Expenses
The first line of the table below provides information about actual account values and actual expenses. You may use the information in this line, together with the amount you invested, to estimate the expenses that you paid over the period. Simply divide your account value by $1,000 (for example, an $8,600 account value divided by $1,000 = 8.6), then multiply the result by the number in the first line under the heading entitled "Expenses Paid During Period" to estimate the expenses you paid on your account during this period.
Hypothetical Example for Comparison Purposes
The second line of the table below provides information about hypothetical account values and hypothetical expenses based on the Fund's actual expense ratio and an assumed rate of return of 5% per year before expenses, which is not the Fund's actual return. The hypothetical account values and expenses may not be used to estimate the actual ending account balance or expenses you paid for the period. You may use this information to compare the ongoing costs of investing in this Fund and other funds. To do so, compare this 5% hypothetical example with the 5% hypothetical examples that appear in the shareholder reports of the other funds.
Please note that the expenses shown in the table are meant to highlight your ongoing costs only and do not reflect any transactional costs, such as sales charges (loads). Therefore, the second line of the table is useful in comparing ongoing costs only, and will not help you determine the relative cost of owning different funds. In addition, if these transactional costs were included, your cost could have been higher.
| | | | | | |
| Investor Shares | | | | | | |
| | | | | | | Expenses Paid |
| | | Beginning | | Ending | | During the Period* |
| | | Account Value | | Account Value | | January 1, 2011 |
| | | January 1, 2011 | | June 30, 2011 | | to June 30, 2011 |
| |
| Actual | | $1,000.00 | | $1,048.08 | | $8.02 |
| |
| Hypothetical | | $1,000.00 | | $1,016.96 | | $7.90 |
| (5% annual return | | | | | | |
| before expenses) | | | | | | |
* Expenses are equal to the Fund’s annualized expense ratio of 1.58% for Investor Shares, multiplied
by the average account value over the period, multiplied by 181/365 (to reflect the one-half year
period). |
| | | | | | |
| Class C | | | | | | |
| | | | | | | Expenses Paid |
| | | Beginning | | Ending | | During the Period* |
| | | Account Value | | Account Value | | January 1, 2011 |
| | | January 1, 2011 | | June 30, 2011 | | to June 30, 2011 |
| |
| Actual | | $1,000.00 | | $1,042.19 | | $13.06 |
| |
| Hypothetical | | $1,000.00 | | $1,012.00 | | $12.87 |
| (5% annual return | | | | | | |
| before expenses) | | | | | | |
* Expenses are equal to the Fund’s annualized expense ratio of 2.58% for Class C, multiplied by the
average account value over the period, multiplied by 181/365 (to reflect the one-half year period). |
2011 Annual Report 5
| | | | |
| Castle Focus Fund |
| |
| | | Schedule of Investments |
| | | June 30, 2011 |
| Shares/Principal Amount | Fair Value | % of Net Assets |
| COMMON STOCKS | | | |
| Business Services, NEC | | | |
| 42,000 | Western Union Co. | $841,260 | 2.88 | % |
| Crude Petroleum & Natural Gas | | | |
| 30,000 | EnCana Corp. (Canada) | 923,700 | 3.16 | % |
| Electric & Other Services Combined | | | |
| 35,000 | Exelon Corp. | 1,499,400 | 5.13 | % |
| Electromedical & Electrotherapeutic Apparatus | | | |
| 30,000 | Medtronic, Inc. | 1,155,900 | 3.96 | % |
| Engineering, Accounting, Research, Management | | | |
| 30,000 | Paychex Inc. | 921,600 | 3.15 | % |
| Fire, Marine & Casualty Insurance | | | |
| 25,000 | W.R. Berkley Corporation | 811,000 | 2.77 | % |
| Food and Kindred Products | | | |
| 20,000 | Kraft Foods Inc. | 704,600 | 2.41 | % |
| Groceries & Related Products | | | |
| 35,000 | Sysco Corp. | 1,091,300 | 3.73 | % |
| Natural Gas Transmission & Distrbution | | | |
| 10,000 | TransCanada Corp. (Canada) | 438,400 | 1.50 | % |
| Malt Beverages | | | |
| 21,000 | Molson Coors Brewing Company Class B | 939,540 | 3.22 | % |
| Petroleum Refining | | | |
| 5,000 | Exxon Mobil Corp. | 406,900 | 1.39 | % |
| Pharmaceutical Preparations | | | |
| 20,000 | Johnson & Johnson | 1,330,400 | | |
| 18,000 | Novartis AG ** | 1,099,980 | | |
| | | 2,430,380 | 8.31 | % |
| Prepackaged Software | | | |
| 70,000 | Microsoft Corporation | 1,820,000 | 6.23 | % |
| Soap, Detergent, Cleaning Preparations, Perfumes, Cosmetics | | | |
| 23,500 | Procter & Gamble Co. | 1,493,895 | 5.11 | % |
| Surgical & Medical Instruments & Apparatus | | | |
| 9,000 | Becton, Dickinson and Company | 775,530 | 2.65 | % |
| Variety Stores | | | | |
| 26,500 | Wal-Mart Stores Inc. | 1,408,210 | 4.82 | % |
| Total for Common Stock (Cost - $17,135,611) | $17,661,615 | 60.42 | % |
| EXCHANGE TRADED FUNDS | | | |
| 10,000 | SPDR Gold Shares * | 1,460,010 | 5.00 | % |
| (Cost - $1,306,945) | | | |
| ROYALTY TRUSTS | | | |
| 30,000 | Hugoton Royalty Trust | 682,200 | 2.33 | % |
| (Cost - $621,467) | | | |
| MONEY MARKET FUNDS | | | |
| 8,998,259 | Invesco Treasury Portfolio 0.03% *** | 8,998,259 | 30.78 | % |
| (Cost - $8,998,259) | | | |
| | Total Investments | 28,802,084 | 98.53 | % |
| | (Cost - $28,062,282) | | | |
| | Other Assets in Excess of Liabilities | 429,613 | 1.47 | % |
| | Net Assets | $29,231,697 | 100.00 | % |
* Non-Income Producing Security.
** ADR - American Depository Receipt
*** Variable Rate Security; The Yield Rate shown represents
the 7-day yield at June 30, 2011.
The accompanying notes are an integral part of these
financial statements. |
2011 Annual Report 6
| |
| Castle Focus Fund |
| |
| Statement of Assets and Liabilities | |
| June 30, 2011 | |
| Assets: | |
| Investment Securities at Fair Value | $ 28,802,084 |
| (Cost - $28,062,282) | |
| Cash | 346,135 |
| Receivables: | |
| Dividends and Interest | 31,079 |
| Shareholder Purchases | 94,670 |
| Total Assets | 29,273,968 |
| Liabilities: | |
| Accrued Advisory Fees | 23,149 |
| Accrued Service Fees | 13,426 |
| Accrued Distribution and Service (12b-1) Fees | 5,696 |
| Total Liabilities | 42,271 |
| Net Assets | $ 29,231,697 |
| Net Assets Consist of: | |
| Paid In Capital | 28,033,579 |
| Accumulated Undistributed Net Investment Income/(Loss) | 92,869 |
| Accumulated Undistributed Realized Gain (Loss) on Investments - Net | 365,447 |
| Unrealized Appreciation (Depreciation) in Value | |
| of Investments Based on Identified Cost - Net | 739,802 |
| Net Assets, for 1,677,638 Shares Outstanding | $ 29,231,697 |
| |
| Investor Shares | |
| Net Assets | $ 26,623,540 |
| Shares of beneficial interest outstanding | |
| (Unlimited number of shares authorized without par value) | 1,526,818 |
| Net Asset Value and Offering Price Per Share | $ 17.44 |
| Minimum Redemption Price Per Share ($17.44x0.98)* | $ 17.09 |
| |
| Class C | |
| Net Assets | $ 2,608,157 |
| Shares of beneficial interest outstanding | |
| (Unlimited number of shares authorized without par value) | 150,820 |
| Net Asset Value and Offering Price Per Share | $ 17.29 |
| Minimum Redemption Price Per Share with CDSC fee ($17.29x0.99)** | $ 17.12 |
| Minimum Redemption Price Per Share ($17.29x0.98)* | $ 16.94 |
| |
| Statement of Operations | |
| For the fiscal year ended June 30, 2011 | |
| Investment Income: | |
| Dividends (Net of foreign withholding tax and fees of $4,201) | $ 300,342 |
| Interest | 5,054 |
| Total Investment Income | 305,396 |
| Expenses: | |
| Advisory Fees | 125,138 |
| Service Fees | 72,580 |
| Distribution and Service (12b-1) Fees - Class C | 11,194 |
| Total Expenses | 208,912 |
| |
| Net Investment Income | 96,484 |
| Realized and Unrealized Gain/(Loss) on Investments: | |
| Realized Gain/(Loss) on Investments | 365,641 |
| Change In Unrealized Appreciation/(Depreciation) on Investments | 739,802 |
| Net Realized and Unrealized Gain/(Loss) on Investments | 1,105,443 |
| |
| Net Increase in Net Assets from Operations | $ 1,201,927 |
* Reflects a 2% redemption fee if shares are redeemed within 90 days of purchase.
** A contingent deferred sales charge ("CDSC") of 1% may be charged on shares redeemed within one year of
purchase. Redemption price per share is equal to net asset value less any redemption and/or CDSC fees. An addi-
tional 2% redemption fee may be applied if shares are redeemed within 90 days of purchase for a maximum
charge of 3%. |
The accompanying notes are an integral part of these
financial statements. |
2011 Annual Report 7
| | |
| Castle Focus Fund |
| |
| Statement of Changes in Net Assets | | |
| | 7/1/2010* | |
| | to | |
| | 6/30/2011 | |
| From Operations: | | |
| Net Investment Income | $ 96,484 | |
| Net Realized Gain on Investments | 365,641 | |
| Change in Net Unrealized Appreciation on Investments | 739,802 | |
| Increase/(Decrease) in Net Assets from Operations | 1,201,927 | |
| From Distributions to Shareholders: | | |
| Net Investment Income | | |
| Investor Shares | (3,615 | ) |
| Class C | - | |
| Net Realized Gain from Security Transactions | | |
| Investor Shares | (169 | ) |
| Class C | (25 | ) |
| Change in Net Assets from Distributions | (3,809 | ) |
| From Capital Share Transactions: | | |
| Proceeds From Sale of Shares | | |
| Investor Shares | 26,752,883 | |
| Class C | 2,572,690 | |
| Proceeds From Redemption Fees (Note 2) | | |
| Investor Shares | 1,306 | |
| Class C | - | |
| Shares Issued on Reinvestment of Dividends | | |
| Investor Shares | 3,754 | |
| Class C | 25 | |
| Cost of Shares Redeemed | | |
| Investor Shares | (1,227,116 | ) |
| Class C | (69,963 | ) |
| Net Increase (Decrease) from Shareholder Activity | 28,033,579 | |
| Net Increase (Decrease) in Net Assets | 29,231,697 | |
| Net Assets at Beginning of Period | - | |
| Net Assets at End of Period (Including Accumulated | $ 29,231,697 | |
| Undistributed Net Investment Income of $92,869) | | |
| Share Transactions: | | |
| Issued | | |
| Investor Shares | 1,597,633 | |
| Class C | 154,930 | |
| Reinvested | | |
| Investor Shares | 226 | |
| Class C | 1 | |
| Redeemed | | |
| Investor Shares | (71,041 | ) |
| Class C | (4,111 | ) |
| Net Increase (Decrease) in Shares | 1,677,638 | |
| Shares Outstanding at Beginning of Period | - | |
| Shares Outstanding at End of Period | 1,677,638 | |
* Commencement of operations.
The accompanying notes are an integral part of these
financial statements. |
2011 Annual Report 8
| | | | | |
| Castle Focus Fund |
| |
| Financial Highlights | Investor Shares | | | Class C | |
| Selected data for a share outstanding throughout the period: | 7/1/2010* | | | 7/1/2010* | |
| | to | | | to | |
| | 6/30/2011 | | | 6/30/2011 | |
| Net Asset Value - | | | | | |
| Beginning of Period | $ 15.00 | | | $ 15.00 | |
| Net Investment Income/(Loss) (a) | 0.15 | | | (0.03 | ) |
| Net Gains or Losses on Securities | | | | | |
| (realized and unrealized) | 2.30 | | | 2.32 | |
| Total from Investment Operations | 2.45 | | | 2.29 | |
| Proceeds from Redemption Fees | - | | + | - | |
| Distributions (From Net Investment Income) | (0.01 | ) | | - | |
| Distributions (From Capital Gains) | - | | + | - | + |
| Total Distributions | (0.01 | ) | | - | |
| Net Asset Value - | | | | | |
| End of Period | $ 17.44 | | | $ 17.29 | |
| Total Return (b) | 16.34% | | | 15.27% | |
| Ratios/Supplemental Data | | | | | |
| Net Assets - End of Period (Thousands) | $ 26,624 | | | $ 2,608 | |
| Ratio of Expenses to Average Net Assets | 1.58% | | | 2.58% | |
| Ratio of Net Investment Income (Loss) to Average Net Assets | 0.86% | | | -0.19% | |
| |
| Portfolio Turnover Rate | 39.80% | | | 39.80% | |
* Commencement of operations.
+ Amount was less than $0.005 per share.
(a) Based on Average Shares Outstanding.
(b) Total return in the above table represents the rate that the investor would have earned or lost on an
investment in the Fund assuming reinvestment of dividends. |
The accompanying notes are an integral part of these
financial statements. |
2011 Annual Report 9
NOTES TO THE FINANCIAL STATEMENTS
CASTLE FOCUS FUND
June 30, 2011
1.) ORGANIZATION:
Castle Focus Fund (the “Fund”) was organized as a non-diversified series of the PFS Funds (the “Trust”) on June 28, 2010. The Trust was established under the laws of Massachusetts by an Agreement and Declaration of Trust dated January 13, 2000. Prior to March 5, 2010, the Trust was named Wireless Fund. The Trust is registered as an open-end investment company under the Investment Company Act of 1940, as amended (the “1940 Act”). The Trust may offer an unlimited number of shares of beneficial interest in a number of separate series, each series representing a distinct fund with its own investment objectives and policies. As of June 30, 2011, there were five series authorized by the Trust. The Fund commenced operations on July 1, 2010. The Fund currently offers Investor shares and Class C shares. The classes differ principally in their respective distribution expenses and arrangements as well as their respective sales charge structure. All classes of shares have identical rights to earnings, assets and voting privileges, except for class specific expenses and exclusive rights to vote on matters affecting only individual classes. Investor shares of the Fund are sold at the net asset value (the “NAV”) without an initial sales charge and are not subject to 12b-1 distribution fees. Class C shares are subject to a contingent deferred sales charge (“CDSC”) for redemptions made within twelve months of purchase, in accordance with the Fund’s Prospectus. The CDSC is 1.00% of the lesser of the original purchase price or the value of shares being redeemed. The Fund's investment objective is to seek long-term capital appreciation. The Investment Adviser to the Fund is Castle Investment Management, LLC (the “Adviser”) and the Sub-Adviser to the Fund is St. James Investment Company, LLC (the “Sub-Adviser”). Significant accounting policies of the Fund are presented below:
2.) SIGNIFICANT ACCOUNTING POLICIES:
SECURITY VALUATION:
All investments in securities are recorded at their estimated fair value, as described in Note 3.
SHARE VALUATION:
The NAV is generally calculated as of the close of trading on the New York Stock Exchange (normally 4:00 p.m. Eastern time) every day the Exchange is open. The NAV is calculated by taking the total value of the Fund’s assets, subtracting its liabilities, and then dividing by the total number of shares outstanding, rounded to the nearest cent. The offering price and redemption price per share is equal to the net asset value per share, except that shares of the Fund are subject to a redemption fee of 2% if redeemed within 90 days of purchase. During the fiscal year ended June 30, 2011, proceeds from redemption fees were $1,306 and $0 for Investor Shares and Class C, respectively. Class C shares are also subject to a CDSC for redemptions made within twelve months of purchase. The CDSC is 1.00% of the lesser of the original purchase price or the value of shares being redeemed.
FEDERAL INCOME TAXES:
The Fund’s policy is to continue to comply with the requirements of the Internal Revenue Code that are applicable to regulated investment companies and to distribute all of its taxable income to shareholders. Therefore, no federal income tax provision is required. It is the Fund’s policy to distribute annually, prior to the end of the calendar year, dividends sufficient to satisfy excise tax requirements of the Internal Revenue Code. This Internal Revenue Code requirement may cause an excess of distributions over the book year-end accumulated income. In addition, it is the Fund’s policy to distribute annually, after the end of the fiscal year, any remaining net investment income and net realized capital gains.
The Fund recognizes the tax benefits of certain tax positions only where the position is “more likely than not” to be sustained assuming examination by tax authorities. Management has analyzed the Fund’s tax positions, and has concluded that no liability for unrecognized tax benefits should be recorded related to uncertain tax positions expected to be taken in the Fund’s tax returns. The Fund identifies its major tax jurisdictions as U.S. Federal and State tax authorities; however the Fund is not aware of any tax positions for which it is reasonably possible that the total amounts of unrecognized tax benefits will change materially in the next twelve months. The Fund recognizes interest and penalties, if any, related to unrecognized tax benefits as income tax expense in the statement of operations. During the fiscal year ended June 30, 2011, the Fund did not incur any interest or penalties.
2011 Annual Report 10
Notes to the Financial Statements - continued
DISTRIBUTIONS TO SHAREHOLDERS:
Distributions to shareholders, which are determined in accordance with income tax regulations, are recorded on the ex-dividend date.
The treatment for financial reporting purposes of distributions made to shareholders during the period from net investment income or net realized capital gains may differ from their ultimate treatment for federal income tax purposes. These differences are caused primarily by differences in the timing of the recognition of certain components of income, expense, or realized capital gain for federal income tax purposes. Where such differences are permanent in nature, they are reclassified in the components of the net assets based on their ultimate characterization for federal income tax purposes. Any such reclassifications will have no effect on net assets, results of operations, or net asset value per share of the Fund.
USE OF ESTIMATES:
The preparation of financial statements in conformity with accounting principles generally accepted in the United States (“GAAP”) requires management to make estimates and assumptions that affect the reported amounts of assets and liabilities and disclosure of contingent assets and liabilities at the date of the financial statements and the reported amounts of increases and decreases in net assets from operations during the reporting period. Actual results could differ from those estimates.
OTHER:
The Fund records security transactions based on a trade date. Dividend income is recognized on the ex-dividend date, and interest income is recognized on an accrual basis. Discounts and premiums on securities purchases are amortized over the lives of the respective securities. Withholding taxes on foreign dividends have been provided for in accordance with the Fund’s understanding of the applicable country’s tax rules and rates.
3.) SECURITIES VALUATIONS
The Fund utilizes various methods to measure the fair value of most of its investments on a recurring basis. GAAP establishes a hierarchy that prioritizes inputs to valuation methods. The three levels of inputs are:
Level 1 - Unadjusted quoted prices in active markets for identical assets or liabilities that the Fund has the ability to access.
Level 2 - Inputs other than quoted prices included in level 1 that are observable for the asset or liability, either directly or indirectly. These inputs may include quoted prices for the identical instrument on an inactive market, prices for similar instruments, interest rates, prepayment speeds, credit risk, yield curves, default rates and similar data.
Level 3 - Unobservable inputs for the asset or liability, to the extent relevant observable inputs are not available, representing the Fund’s own assumptions about the assumptions a market participant would use in valuating the asset or liability, and would be based on the best information available.
The availability of observable inputs can vary from security to security and is affected by a wide variety of factors, including, for example, the type of security, whether the security is new and not yet established in the marketplace, the liquidity of markets, and other characteristics particular to the security. To the extent that valuation is based on models or inputs that are less observable or unobservable in the market, the determination of fair value requires more judgment. Accordingly, the degree of judgment exercised in determining fair value is greatest for instruments categorized in level 3.
The inputs used to measure fair value may fall into different levels of the fair value hierarchy. In such cases, for disclosure purposes, the level in the fair value hierarchy within which the fair value measurement falls in its entirety, is determined based on the lowest level input that is significant to the fair value measurement in its entirety.
FAIR VALUE MEASUREMENTS
A description of the valuation techniques applied to the Fund’s major categories of assets and liabilities measured at fair value on a recurring basis follows.
Equity securities (common stocks, exchange traded funds, royalty trusts and real estate investment trusts). Equity securities that are traded on any exchange or on the NASDAQ over-the-
2011 Annual Report 11
Notes to the Financial Statements - continued
counter market are valued at the last quoted sale price. Lacking a last sale price, a long security is valued at its last bid price except when, in the Adviser's opinion, the last bid price does not accurately reflect the current value of the long security. To the extent these securities are actively traded and valuation adjustments are not applied, they are classified in level 1 of the fair value hierarchy. When market quotations are not readily available, when the Adviser determines the last bid price does not accurately reflect the current value or when restricted securities are being valued, such securities are valued as determined in good faith by the Adviser, in conformity with guidelines adopted by and subject to review of the Board of Trustees (the “Trustees”) and are categorized in level 2 or level 3, when appropriate.
Money markets. Money market securities are valued at a net asset value of $1.00 and are classified in level 1 of the fair value hierarchy.
In accordance with the Trust's good faith pricing guidelines, the Adviser is required to consider all appropriate factors relevant to the value of securities for which it has determined other pricing sources are not available or reliable as described above. There is no single standard for determining fair value controls, since fair value depends upon the circumstances of each individual case. As a general principle, the current fair value of an issue of securities being valued by the Adviser would appear to be the amount which the owner might reasonably expect to receive for them upon their current sale. Methods which are in accordance with this principle may, for example, be based on (i) a multiple of earnings; (ii) a discount from market of a similar freely traded security (including a derivative security or a basket of securities traded on other markets, exchanges or among dealers); or (iii) yield to maturity with respect to debt issues, or a combination of these and other methods.
The following table summarizes the inputs used to value the Fund’s assets measured at fair value as of June 30, 2011:
| | | | |
| Valuation Inputs of Assets | Level 1 | Level 2 | Level 3 | Total |
| Common Stocks | $17,661,615 | $0 | $0 | $17,661,615 |
| Exchange Traded Funds | 1,460,010 | 0 | 0 | 1,460,010 |
| Royalty Trusts | 682,200 | 0 | 0 | 682,200 |
| Money Market Funds | 8,998,259 | 0 | 0 | 8,998,259 |
| Total | $28,802,084 | $0 | $0 | $28,802,084 |
Refer to the Fund’s Schedule of Investments for a listing of securities by industry. The Fund did not hold any Level 3 assets during the fiscal year ended June 30, 2011. There were no transfers into or out of level 1 and level 2 during the fiscal year ended June 30, 2011. It is the Fund’s policy to consider transfers into or out of level 1 and level 2 as of the end of the reporting period.
4.) INVESTMENT ADVISORY AGREEMENT AND SERVICES AGREEMENT
The Fund entered into an Investment Management Agreement with Castle Investment Management, LLC as the investment adviser of the Fund. Under the terms of the Investment Management Agreement, the Adviser manages the investment portfolio of the Fund, subject to policies adopted by the Trust’s Trustees. The Adviser, at its own expense and without reimbursement from the Fund, furnishes office space and all necessary office facilities, equipment and executive personnel necessary for managing the assets of the Fund. The Adviser also pays the salaries and fees of all of its officers and employees that serve as officers and trustees of the Trust. For its services, the Adviser receives a fee of 1.00% per year of the average daily net assets of the Fund. The Sub-Adviser of the Fund has responsibility for providing investment ideas and recommendations for the assets of the Fund, subject to the supervision of the Adviser. As full compensation for all services rendered, including investment ideas and recommendations for the assets of the Fund, the Adviser pays the Sub-Adviser a sub-advisor fee. For the fiscal year ended June 30, 2011, the Adviser and Sub-Adviser received management fees totaling $125,138. At June 30, 2011, the Fund owed $23,149 to the Adviser.
The Fund also has a Services Agreement with the Adviser (the "Services Agreement"), under which the Fund pays the Adviser. Under the Services Agreement, the Adviser provides administrative and supervisory services as well as the services of a Chief Compliance Officer; and assumes all Fund operating expenses other than the management fee, brokerage fees and commissions, taxes, 12b-1 fees, borrowing costs (such as (a) interest and (b) dividend expenses on securities sold short), fees and expenses of acquired funds, and extraordinary or non recurring expenses. For its services, the Adviser receives a service fee equal to 0.58% of the average daily net assets of the Fund. For the fiscal year ended June 30, 2011, the Adviser earned service fees of $72,580. At June 30, 2011 the Fund owed the Adviser service fees of $13,426.
2011 Annual Report 12
Notes to the Financial Statements - continued
5.) DISTRIBUTION AND SHAREHOLDER SERVICING PLAN
The Fund has adopted a Distribution Plan in accordance with Rule 12b-1 under the 1940 Act (the “Plan”) with respect to the Class C shares of the Fund. Pursuant to the Distribution Plan, the Fund compensates the Distributor for services rendered and expenses borne in connection with activities primarily intended to result in the sale of the Fund's Class C shares. This Plan provides that the Fund will pay the annual rate of 1.00% of the average daily net assets of the Fund's Class C Shares for activities primarily intended to result in the sale of those shares. These activities include payment to entities for providing distribution and shareholder servicing with respect to the Fund's shares. The 1.00% for the Class C Shares is comprised of a 0.25% service fee and a 0.75% distribution fee. The Fund incurred distribution and service (12b-1) fees of $11,194 for Class C Shares, during the fiscal year ended June 30, 2011. At June 30, 2011 the Fund owed distribution and service (12b-1) fees of $5,696 for Class C Shares.
During the fiscal year ended June 30, 2011, the Adviser received $700 resulting from CDSC fees incurred by Class C shareholders.
6.) RELATED PARTY TRANSACTIONS
A control person of Premier Fund Solutions, Inc. (the “Administrator”) also serves as trustee/officer of the Fund. This individual receives benefits from the Administrator resulting from administration fees paid to the Administrator by the Adviser.
The Trustees who are not interested persons of the Fund were paid a total of $2,500 in Trustees’ fees for the fiscal year ended June 30, 2011 by the Adviser.
7.) INVESTMENT TRANSACTIONS
For the fiscal year ended June 30, 2011, purchases and sales of investment securities other than U.S. Government obligations and short-term investments aggregated $22,427,489 and $3,729,107, respectively. Purchases and sales of U.S. Government obligations aggregated $0 and $0, respectively.
For Federal income tax purposes, the cost of securities owned at June 30, 2011 was $28,036,998.
At June 30, 2011, the composition of gross unrealized appreciation (the excess of value over tax cost) and depreciation (the excess of tax cost over value) of investments on a tax basis was as follows:
| | Appreciation | | (Depreciation) | | | Net Appreciation (Depreciation) |
| | $1,002,347 | | ($0237,261) | | | $765,086 |
The differences between book basis and tax basis unrealized appreciation are attributable to the tax treatment of grantor trusts.
8.) CONTROL OWNERSHIP
The beneficial ownership, either directly or indirectly, of more than 25% of the voting securities of a fund creates a presumption of control of the Fund, under Section 2(a)(9) of the Investment Company Act of 1940. As of June 30, 2011, Charles Schwab & Co. Inc., for the benefit of its customers, owned, in the aggregate, 51.59% of Investor Class shares. The Trust does not know whether the foregoing entity or any of the underlying beneficial holders owned or controlled 25% or more of the voting securities of the Fund.
9.) DISTRIBUTIONS TO SHAREHOLDERS
There were distributions paid on December 22, 2010 of which $0.00942 per share was paid from net investment income and $0.00044 per share was paid from short term capital gain on the Investor Shares.
| | |
| Investor Shares distributions paid from: | | |
| | | Fiscal Year Ended |
| | | June 30, 2011 |
| Ordinary Income | | $ 3,615 |
| Short-term Capital Gain | | 169 |
| Long-term Capital Gain | | 0 |
| | | $ 3,784 |
2011 Annual Report 13
Notes to the Financial Statements - continued
Class C also paid distributions on December 22, 2010 of which $0.00044 per share was paid from short term capital gain.
| | |
| Class C distributions paid from: | | |
| | | Fiscal Year Ended |
| | | June 30, 2011 |
| Ordinary Income | | $ 0 |
| Short-term Capital Gain | | 25 |
| Long-term Capital Gain | | 0 |
| | | $ 25 |
As of June 30, 2011, the components of distributable earnings on a tax basis were as follows:
| | |
| Undistributed ordinary income | | $ 433,032 |
| Undistributed long-term capital gain/(accumulated losses) | | 0 |
| Unrealized appreciation/(depreciation) - net | | 765,086 |
| | | $ 1,198,118 |
2011 Annual Report 14
| |
Cohen Fund Audit Services, Ltd.
Certified Public Accountants | 800 Westpoint Pkwy, Ste 1100
Westlake, Ohio 44145
Phone: (440) 835-8500
Fax: (440) 835-1093
www.cohenfund.com |
REPORT OF INDEPENDENT REGISTERED PUBLIC ACCOUNTING FIRM
To the Shareholders and Board of Trustees
Castle Focus Fund
(a series of PFS Funds)
We have audited the accompanying statement of assets and liabilities, including the schedule of investments, of Castle Focus Fund (the "Fund"), a series of PFS Funds, as of June 30, 2011, and the related statement of operations, the statement of changes in net assets, and the financial highlights for the year ended June 30, 2011. These financial statements and financial highlights are the responsibility of Fund management. Our responsibility is to express an opinion on these financial statements and financial highlights based on our audit.
We conducted our audit in accordance with the standards of the Public Company Accounting Oversight Board (United States). Those standards require that we plan and perform the audit to obtain reasonable assurance about whether the financial statements and financial highlights are free of material misstatement. An audit includes examining, on a test basis, evidence supporting the amounts and disclosures in the financial statements. Our procedures included confirmation of securities owned as of June 30, 2011 by correspondence with the custodian. An audit also includes assessing the accounting principles used and significant estimates made by management, as well as evaluating the overall financial statement presentation. We believe that our audit provides a reasonable basis for our opinion.
In our opinion, the financial statements and financial highlights referred to above present fairly, in all material respects, the financial position of Castle Focus Fund as of June 30, 2011, the results of its operations, the changes in its net assets, and the financial highlights for the year ended June 30, 2011, in conformity with accounting principles generally accepted in the United States of America.

| | COHEN FUND AUDIT SERVICES, LTD.
Westlake, Ohio
August 25, 2011 |
2011 Annual Report 15
This page intentionally left blank.
2011 Annual Report 16
TRUSTEES AND OFFICERS
Unaudited
The Board of Trustees supervises the business activities of the Trust. The names of the Trustees and executive officers of the Trust are shown below. For more information regarding the Trustees, please refer to the Statement of Additional Information, which is available upon request by calling 703-260-1921. Each Trustee serves until the Trustee sooner dies, resigns, retires or is removed.
The Trustees and Officers of the Trust and their principal business activities during the past five years are:
| Interested Trustees and Officers |
| | | | | Number of | Other |
| | | | Principal | Portfolios In | Directorships |
| Name, | Position(s) | Term of Office | Occupation(s) | Fund | Held By |
| Address(1), | Held With | and Length of | During | Complex | Trustee or |
| and Year of Birth | the Trust | Time Served | Past 5 Years | Overseen By | Officer During |
| | | | | Trustee | Past 5 Years |
| |
| Ross C. Provence(2), | Trustee | Indefinite Term; | General Partner and Portfolio | 5 | Blue Chip |
| Year of Birth: 1938 | and | Since 2000 | Manager for Value Trend Capital | | Investor Funds |
| | President | | Management, LP (1995 to current). | | |
| | | | Estate planning attorney (1963 to | | |
| current). |
| |
| Jeffrey R. Provence(2), | Trustee, | Indefinite Term; | General Partner and Portfolio | 5 | Blue Chip |
| Year of Birth:1969 | Secretary | Since 2000 | Manager for Value Trend Capital | | Investor Funds, |
| | and | | Management, LP (1995 to current). | | Sycuan Funds, |
| | Treasurer | | CEO, Premier Fund Solutions, Inc. | | Private Asset |
| | | | (2001 to current). | | Management |
| | | | | | Fund |
| | (1) The address of each trustee and officer is c/o PFS Funds, 1939 Friendship Drive, Suite C, El Cajon, California 92020.
(2) Trustees who are considered "interested persons" as defined in Section 2(a)(19) of the Investment Company Act of 1940 by virtue
of their affiliation with the Investment Adviser.
Independent Trustees |
| | | | | Number of | Other |
| | | | Principal | Portfolios In | Directorships |
| Name, | Position | Term of Office | Occupation(s) | Fund | Held By |
| Address(1), | Held With | and Length of | During | Complex | Trustee or |
| and Year of Birth | the Trust | Time Served | Past 5 Years | Overseen By | Officer During |
| | | | | Trustee | Past 5 Years |
| |
| Thomas H. Addis III, | Independent | Indefinite Term; | Executive Director/CEO, Southern | 5 | None |
| Year of Birth: 1945 | Trustee | Since 2000 | California PGA (2006 to current). | | |
| | | | President, Medallion Golf | | |
| | | | Management (1999 to 2006). | | |
| | | | | | Blue Chip |
| Allen C. Brown, | Independent | Indefinite Term; | Co-owner of Stebleton & Brown | 5 | Investor Funds, |
| Year of Birth: 1943 | Trustee | Since 2000 | (1994 to Current). Estate planning | | Sycuan Funds |
| | | | and business attorney (1970 to cur- | | |
| rent). |
| | | | | | Blue Chip |
| George Cossolias, CPA, | Independent | Indefinite Term; | Owner of George Cossolias & | 5 | Investor Funds, |
| Year of Birth: 1935 | Trustee | Since 2000 | Company, CPAs (1972 to current). | | Sycuan Funds, |
| | | | President of Lubrication Specialists, | | Temecula |
| | | | Inc. (1996 to current). | | Valley Bank |
(1) The address of each trustee and officer is c/o PFS Funds, 1939 Friendship Drive, Suite C, El Cajon, California 92020.
2011 Annual Report 17
Investment Adviser
Castle Investment Management, LLC
Sub-Adviser
St. James Investment Company, LLC
Legal Counsel
The Law Offices of John H. Lively & Associates, Inc.
A Member Firm of The 1940 Act
Custodian
US Bank N.A.
Distributor
Rafferty Capital Markets, LLC
Dividend Paying Agent,
Shareholders' Servicing Agent,
Transfer Agent
Mutual Shareholder Services, LLC
Fund Administrator
Premier Fund Solutions, Inc.
Independent Registered Public Accounting Firm
Cohen Fund Audit Services, Ltd. |
This report is provided for the general information of the shareholders of the Castle
Focus Fund. This report is not intended for distribution to prospective investors in the
Fund, unless preceded or accompanied by an effective prospectus. |
Castle Focus Fund
7105 Marine Drive
Alexandria, Virginia 22307
www.castleim.com
703-260-1921 |
Item 2. Code of Ethics.
The registrant has adopted a code of ethics that applies to the registrant’s principal executive officer and the principal financial officer. The registrant has not made any amendments to its code of ethics during the covered period. The registrant has not granted any waivers from any provisions of the code of ethics during the covered period. A copy of the registrant’s Code of Ethics is filed herewith.
Item 3. Audit Committee Financial Expert.
The registrant’s Board of Trustees has determined that George Cossolias is an audit committee finical expert. Mr. Cossolias is independent for purposes of this Item 3.
Item 4. Principal Accountant Fees and Services.
(a-d) The following table details the aggregate fees billed for each of the last two fiscal years for audit fees, audit-related fees, tax fees and other fees by the principal accountant to the registrant. The principal accountant has provided no services to the adviser or any entity controlled by, or under common control with the adviser that provides ongoing services to the registrant.
| | |
| | | FYE 6/30/11 |
| Audit Fees | | $11,203 |
| Audit-Related Fees | | $0 |
| Tax Fees | | $2,000 |
| All Other Fees | | $850 |
Nature of Tax Fees: preparation of Excise Tax Statement and 1120 RIC.
All Other Fees: Semi-Annual Report Review
(e) (1) The audit committee approves all audit and non-audit related services and, therefore, has not adopted pre-approval policies and procedures described in paragraph (c)(7) of Rule 2-01 of Regulation S-X.
(e) (2) None of the services described in paragraph (b) through (d) of this Item were approved by the audit committee pursuant to paragraph (c)(7)(i)(C) of Rule 2-01 of Regulation S-X.
(f) All of the principal accountant’s hours spent on auditing the registrant’s financial statements were attributed to work performed by full-time permanent employees of the principal accountant.
(g) The following table indicates the aggregate non-audit fees billed by the registrant’s principal accountant for services to the registrant , the registrant’s investment adviser (not sub-adviser), and any entity controlling, controlled by, or under common control with the adviser that provides ongoing services to the registrant, for the last two years.
| | |
| Non-Audit Fees | | FYE 6/30/11 |
| Registrant | | $2,850 |
| Registrant’s Investment Adviser | | $0 |
(h) The principal accountant provided no services to the investment adviser or any entity controlling, controlled by, or under common control with the adviser that provides ongoing services to the registrant.
Item 5. Audit Committee of Listed Companies. Not applicable.
Item 6. Schedule of Investments. Schedule filed with Item 1.
Item 7. Disclosure of Proxy Voting Policies and Procedures for Closed-End Management Investment Companies. Not applicable.
Item 8. Portfolio Managers of Closed End Management Investment Companies. Not applicable.
Item 9. Purchases of Equity Securities by Closed-End Management Investment Companies and Affiliated Purchasers. Not applicable.
Item 10. Submission of Matters to a Vote of Security Holders.
The registrant has not adopted procedures by which shareholders may recommend nominees to the registrant’s board of trustees.
Item 11. Controls and Procedures.
(a) The registrant’s president and chief financial officer concluded that the disclosure controls and procedures (as defined in Rule 30a-3(c) under the Investment Company Act of 1940 (the “Act”)) were effective as of a date within 90 days of the filing date of this report, based on the evaluation of these controls and procedures required by Rule 30a-3(b) under the Act.
(b) There were no changes in the registrant’s internal control over financial reporting (as defined in Rule 30a-3(d) under the Act) that occurred during the registrant’s second fiscal quarter of the period covered by this report that have materially affected, or are reasonably likely to materially affect, the registrant’s internal control over financial reporting.
Item 12. Exhibits.
(a)(1) Code of Ethics. Filed herewith.
(a)(2) Certifications pursuant to Section 302 of the Sarbanes-Oxley Act of 2002. Filed herewith.
(b) Certification pursuant to Section 906 Certification of the Sarbanes-Oxley Act of 2002. Filed herewith.
Pursuant to the requirements of the Securities Exchange Act of 1934 and the Investment Company Act of 1940, the registrant has duly caused this report to be signed on its behalf by the undersigned, thereunto duly authorized.
| | By: /s/Ross C. Provence
Ross C. Provence
President |
Pursuant to the requirements of the Securities Exchange Act of 1934 and the Investment Company Act of 1940, this report has been signed below by the following persons on behalf of the registrant and in the capacities and on the dates indicated.
| | By: /s/Ross C. Provence
Ross C. Provence
President |
| | By: /s/Jeffrey R. Provence
Jeffrey R. Provence
Chief Financial Officer |