UNITED STATES
SECURITIES AND EXCHANGE COMMISSION
WASHINGTON, D.C. 20549
FORM N-CSR
CERTIFIED SHAREHOLDER REPORT OF REGISTERED MANAGEMENT
INVESTMENT COMPANIES
Investment Company Act file number 811-09781
PFS Funds
(Exact name of registrant as specified in charter)
1939 Friendship Drive, Suite C, El Cajon, CA 92020
(Address of principal executive offices) (Zip code)
CT Corporation System.
155 Federal St., Suite 700, Boston, MA 02110
(Name and address of agent for service)
Registrant's telephone number, including area code: (619) 588-9700
Date of fiscal year end: December 31
Date of reporting period: December 31, 2011
Form N-CSR is to be used by management investment companies to file reports with the Commission not later than 10 days after the transmission to stockholders of any report that is required to be transmitted to stockholders under Rule 30e-1 under the Investment Company Act of 1940 (17 CFR 270.30e -1). The Commission may use the information provided on Form N-CSR in its regulatory, disclosure review, inspection and policymaking roles.
A registrant is required to disclose the information specified by Form N-CSR, and the Commission will make this information public. A registrant is not required to respond to the collection of information contained in Form N-CSR unless the Form displays a currently valid Office of Management and Budget ("OMB") control number. Please direct comments concerning the accuracy of the information collection burden estimate and any suggestions for reducing the burden to Secretary, Securities and Exchange Commission, 450 Fifth Street, NW, Washington, DC 20549-0609. The OMB has reviewed this collection of information under the clearance requirements of 44 U.S.C. § 3507.
Item 1. Reports to Stockholders.

Annual Report
December 31, 2011
BRTNX
February 27, 2012
Dear Fellow Shareholders:
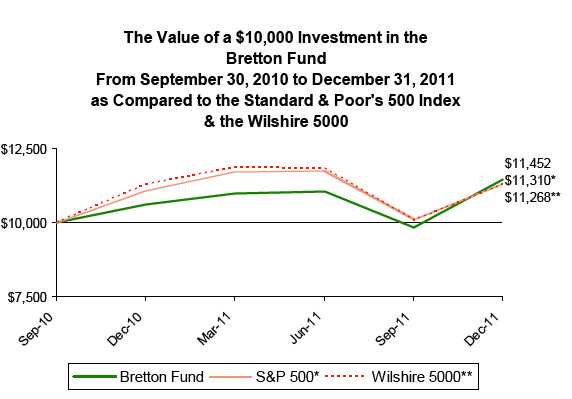
The Bretton Fund’s net asset value per share (NAV) as of December 31, 2011, was $16.98. For the quarter ended December 31, 2011, the fund’s total return was 16.39%, compared to 11.82% for the S&P 500 and 12.02% for the Wilshire 5000. For the full year, the fund’s total return was 7.90%, while the S&P 500 and Wilshire 5000 returned 2.11% and 0.98%, respectively.
The year’s performance put the fund in the top 2% of all mutual funds classified by Lipper as having a value strategy investing in companies of all sizes (“multi-cap value”), the average of which returned -3.00% . While I’m relatively pleased with the fund’s performance, the goal of the fund is not to outperform benchmarks in every calendar year; the goal is to compound value over many years at an attractive rate. There will be years the Bretton Fund lags materially behind its peers.
| Total Returns as of December 31, 2011 | | | |
| | | | Since Inception - | |
| | 4th Quarter | 1Year | Annualized(A) | |
| Bretton Fund | 16.39% | 7.90% | 11.44% | |
| S&P 500 Index(B) | 11.82% | 2.11% | 10.33% | |
| Wilshire 5000 Total Market Index(C) | 12.02% | 0.98% | 10.00% | |
| |
| Calendar Year Total Returns | | | | |
| | | | Wilshire 5000 Total | |
| | Bretton Fund | S&P 500 Index(B) | Market Index(C) | |
| 2011 | 7.90% | 2.11% | 0.98% | |
| 9/30/10–12/31/10 | 6.13% | 10.76% | 11.59% | |
| Cumulative Since Inception(A) | 14.52% | 13.10% | 12.68% | |
(A)Since Inception returns include change in share prices, and in each case, include reinvestment of any dividends and capital gain distributions. The inception date of the Bretton Fund was September 30, 2010.
(B)The S&P 500 is a broad, market-weighted average dominated by blue-chip stocks and is an unmanaged group of stocks whose composition is different from the Fund.
(C)The Wilshire 5000 Total Market Index is a market-capitalization-weighted index of the market value of all stocks actively traded in the United States.
Performance data quoted represents past performance. Past performance does not guarantee future results. The investment return and principal value of an investment will fluctuate so that an investor's shares, when redeemed, may be worth more or less than their original cost. All returns include change in share prices, and reinvestment of any dividends and capital gains distributions. Current performance may be lower or higher than the performance data quoted. Indices shown are broad-based, unmanaged indices commonly used to measure performance of US stocks. These indices do not incur expenses and are not available for investment. You may obtain performance data current to the most recent month-end by calling 800.231.2901. The fund's expense ratio is 1.50% . An investment in the fund is subject to investment risks, including the possible loss of the principal amount invested. The fund's distributor is Rafferty Capital Markets, LLC.
1
4th Quarter
For the quarter, the largest contributor to the fund’s performance was Apollo Group, increasing the NAV by 48¢, followed by the three railroad investments, which together contributed 40¢. The fund added Wells Fargo to its portfolio during the quarter and did not sell any securities.
Contributors to Performance
For the year, the biggest positive contributors were Ross Stores, Apollo Group, and Carter’s, adding to the NAV by 65¢, 47¢, and 26¢, respectively. The main detractor was Aflac, which had a negative impact of 40¢.
| Portfolio | | |
| |
| Security | % of Net Assets | |
| Ross Stores, Inc. | 11.4% | |
| Apollo Group, Inc. | 10.8% | |
| The Gap, Inc. | 9.4% | |
| Aflac, Inc. | 9.4% | |
| Carter’s, Inc. | 5.8% | |
| New Resource Bank | 4.7% | |
| Union Pacific Corp. | 4.6% | |
| CSX Corp. | 4.6% | |
| JP Morgan Chase & Co. | 4.6% | |
| Wells Fargo & Company | 4.5% | |
| CapitalSource, Inc. | 4.4% | |
| Norfolk Southern Corp. | 4.2% | |
| American Express Co. | 4.1% | |
| Peoples Federal Bancshares, Inc. | 3.4% | |
| Standard Financial Corp. | 3.3% | |
| SI Financial Group, Inc. | 3.2% | |
| Cash* | 7.6% | |
| |
| Total | 100.0% | |
*Cash represents cash less liabilities in excess of other assets.
How the fund’s companies fared during the year:
- Ross Stores: By opening new stores, increasing each stores’ sales, reducing relative costs, and buying back stock, Ross increased its earnings per share by about 22% over the past year. Its stores have great economics, and it has plenty of room to expand. Investors have caught on a bit to Ross’s success: Its share price increased 50% during the year.
- Apollo Group: Regulatory changes and negative news muted demand for Apollo Group’s universities. Excluding certain one-time items, earnings per share declined 8%, but its share price increased 38% since things didn’t turn out to be as bad as investors thought they would.
- The Gap: As discussed in the semiannual report, Gap’s earnings are being hindered by abnormally high cotton prices, which peaked close to four times its historical average before receding. In recent years, Gap has used its excess cash to purchase enormous amounts of its own stock, reducing its total shares outstanding by 50%. Think of it as buying out your business partner at a low price. The compounding
2
effect of a company buying back a lot of stock can be significant: In 2010, during the days of normal cotton prices, Gap made $1.2 billion, which resulted in earnings per average outstanding share at the time of $1.88. If Gap earned the same $1.2 billion today, it would be spread over much fewer shares, resulting in earnings of about $2.50 per share. This dynamic will continue as Gap plans to keep using its excess cash flow for share repurchases, and I expect earnings to at least come close to 2010 levels when cotton costs normalize. While its eponymous brand is struggling sartorially, revenue is flat due to international expansion and the relative health of its other brands. Gap’s shares ended the year around the same price for which the fund acquired its shares.
- Aflac: Aflac’s underlying business continues to perform well, but this was obscured by losses on its investments in European bank debt. Net of currency fluctuations and investment losses, its core earnings per share increased 8%. While not immaterial, its European investments remain manageable and a declining portion of assets. The key is that Aflac’s earnings stream—its business of selling supplemental health insurance in Japan and the US—remains unimpaired by anything happening in Europe and will accrue to investors over time. Its stock price declined 24% during the year.
- Carter’s: Similar to Gap, high cotton prices dragged down Carter’s earnings per share by 29% over the first nine months of the year, while revenue increased 20% from opening new stores, improving sales per store, and a successful launch of its new website, which now allows it to sell directly to customers. Its stock price increased 31% during the year.
- American Express: As fewer cardholders became delinquent and the affluent consumers that tend to make up American Express’s customers spent more, earnings per share increased 22%. American Express has many elements I look for in an investment: a long runway (cards are replacing cash and checks worldwide), a defensible business, management that thoughtfully pays out its earnings to shareholders, and a reasonable valuation. Its share price increased 10% during the year.
- Small Banks: Peoples Federal Bancshares, SI Financial Group, and Standard Financial Corp. are small community banks that recently converted from mutual savings banks, a corporate structure in which the depositors technically own the bank. The conversion process left them with excess cash that they’re now returning to shareholders through buybacks and dividends, and they trade below their liquidation value despite having virtually no bad loans. New Resource Bank is a tiny, relatively new bank focused on environmentally sustainable loans. After running into problems years ago, the bank has since turned around under the guidance of a new management team, who improved loan quality and made it profitable. Its shares sell for only slightly more than half its liquidation value. As CapitalSource continued to reduce its problem loans and build up excess cash, it began to return capital to shareholders through share repurchases, which reduced total shares outstanding by 15% in the third quarter alone. The stock prices of these banks were relatively flat during the year.
- Railroads: CSX, Norfolk Southern, and Union Pacific continued to experience outstanding economics: Rail volumes increased only 3–5%, but earnings per share increased 20–35% through price increases, operating leverage, and large share buybacks. I expect greater increases in volumes over the next few years and the
3
same attractive economics. The stock prices of Union Pacific and Norfolk Southern increased about 16% during the year, while CSX was flat.
- Large Banks: JP Morgan and Wells Fargo are the two newest companies in the fund, acquired last fall when stock prices of large banks fell precipitously. Banks, and especially large banks, are opaque, and it’s difficult for an outside investor—or even the bank’s CEO—to know with precision if loans are being accurately valued. No one knows for sure who’s going to pay back their loans and who won’t. Yet there are solid indicators that JP Morgan and Wells Fargo will be able to earn through bumps in the road: Loan metrics like delinquencies have steadily improved the past two years and capital levels, the cushion against losses, are close to all-time highs. Both companies have highly competent management teams who have worked their way through downturns before, and both have the structural ability to make profitable loans across wide portions of the US economy while funding those loans with low-cost deposits. This is inherently a sound business model, and their shares are priced so low that the return potential is attractive even if a lot goes wrong. Wells Fargo’s share price ended the year 14% higher than the fund’s average cost, while JP Morgan’s was lower by 4%. I expect their stock prices to be volatile over the near term.
The Difference Between Knowing and Doing
I’m always struck by how often I’ll notice a young investor reading a copy of The Intelligent Investor by Benjamin Graham on a plane or a subway. It’s not surprising that it’s widely read; it is, after all, the original manifesto for value investing and referred to with near-biblical reverence by well-known investors. What strikes me is the disconnect between how many people have read the book and how few seem to implement its principles. The main premise is simple enough: The price of a stock is eventually determined by its value. Yet funds that invest with this simple truism form only a minority of all funds. I suspect the majority of mutual fund managers would readily agree Warren Buffett is one of the greatest investors of all time, but despite how well publicized and documented his strategy is, only a few dozen out of the thousands of mutual funds operating today invest with the same long-term, concentrated, value approach. It’s basically a secret hiding in plain sight.
There’s a significant disconnect between what investors say is the right approach and how they invest in reality. Many funds claim to be long-term, but the average holding period for the average stock mutual fund is only 10 months. Part of the reason for this dissonance is the incentive for fund managers to invest a particular way to attract institutions, who often want low variances to market movements, not necessarily maximum returns. The desire to collect assets can cause a divergence of interests between fund shareholders and fund managers. This often leads funds to take on restrictions that, while now commonplace, are major disadvantages to performance: limiting investments to a certain asset class or within a narrow mandate, matching sector weightings to a specified index, or being fully invested at all times.
But I think the bigger reason for the disconnect between knowing and doing is human nature. This disparity exists in all areas of human activity. Weight-loss books need only three lines: “Eat better food. Less of it. Exercise more.” That there are thousands of books in the genre, and certain to be thousands more written, is because this knowledge-action gap exists. This is exacerbated by our tendency to justify our actions. It’s easy to forget the investor maxim “Be greedy when others are fearful” when things do indeed
4
become scary and instead justify it with something like, “It seems prudent to reduce our equity exposure given increased market volatility.” Investors don’t like to admit, even to themselves, “There are loads of great investments around, but we are too scared to do anything about it.”
People tend to see what they want to see. And they often seem more motivated to be proven right than to understand reality. Bridging the gap between knowledge and action means doing things that are uncomfortable, like changing one’s mind and admitting mistakes. No one is right about everything the first time around. It means analyzing past mistakes, thinking about personal shortcomings. In a 1999 New Yorker article, Malcolm Gladwell interviews Charles Bosk, a sociologist who developed a system to evaluate the differences between unsuccessful surgeons and successful ones. It boiled down to one thing: “He [Bosk] concluded that, far more than technical skills or intelligence, what was necessary for success was... a practical-minded obsession with the possibility and the consequences of failure.” Bosk elaborates:
In my interviewing, I began to develop what I thought was an indicator of whether someone was going to be a good surgeon or not. It was a couple of simple questions: Have you ever made a mistake? And, if so, what was your worst mistake? The people who said, “Gee, I haven’t really had one,” or “I’ve had a couple of bad outcomes, but they were due to things outside my control”—invariably those were the worst candidates. And the residents who said, “I make mistakes all the time. There was this horrible thing that happened just yesterday and here’s what it was.” They were the best. They had the ability to rethink everything that they’d done and imagine how they might have done it differently.
This type of introspection isn’t fun to do; that’s why few people do it. The difference between great investors and average investors is often behavioral, not informational. Buffett doesn’t have a team of 200 analysts who cover the entire investment universe, attending conferences and flying to management meetings. He attributes much of his success to just being more patient than the next guy. It’s an enormous advantage to be able to do nothing when the current opportunity set is meager, and there were years when Buffett made only minor changes to his portfolio. Many large fund firms are structurally incapable of doing this simply because it is extremely difficult for any group of 200 highly motivated, high-IQ people to do nothing for long periods of time, even when it’s the best course of action.
The vagaries of human nature is one of the main reasons investment opportunities exist. Informationally, markets are trending toward greater efficiency, but behaviorally, I believe they’re becoming less so. Technology and cultural changes have enabled the more schizophrenic elements of our nature and make it harder to have a long attention span. Patience is a major competitive advantage, possibly one of increasing value.
2011 Reading
One of my favorite business/economics books I read this past year was the The Rational Optimist by Matt Ridley, which was excellent. He illustrates, in an economically attuned and wonderfully conversational manner, how human ingenuity and the ability for people to exchange goods, as well as ideas, has led to exponential increases in well-being over tens of thousands of years. Ridley also picks apart the Malthusian tendency for current generations to believe that process will suddenly stop with them. On the dramatic improvements in our world:
5
Today, of Americans officially designated as “poor,” 99% have electricity, running water, flush toilets, and a refrigerator; 95% have a television, 88% a telephone, 71% a car, and 70% air conditioning. Cornelius Vanderbilt had none of these
This is what prosperity is: the increase in the amount of goods or services you can earn with the same amount of work. As late as the mid-1800s, a stagecoach journey from Paris to Bordeaux cost the equivalent of a clerk’s monthly wages; today the journey costs a day or so and is 50 times as fast. A half-gallon of milk cost the the average American 10 minutes of work in 1970, but only seven minutes in 1997. A three-minute phone call from New York to Los Angeles cost 90 hours of work at the average wage in 1920; today it costs less than two minutes.
How we got here:
The cumulative accretion of knowledge by specialists that allows us each to consume more and more different things by each producing fewer and fewer is, I submit, the central story of humanity. Innovation changes the world but only because it aids the elaboration of the division of labor and encourages the division of time.
Another favorite of mine was Where Good Ideas Come From by Steven Johnson. Inventors and great thinkers, often contrary to their own explanations, develop their best ideas slowly over time, in semiconscious “slow hunches,” and in environments where diverse ideas are able to bounce around with and borrow from each other.
Keeping a slow hunch alive poses challenges on multiple scales.... Most slow hunches never last long enough to turn into something useful, because they pass in and out of our memory too quickly, precisely because they possess a certain murkiness.... So part of the secret of hunch cultivation is simple: Write everything down.... Darwin was constantly rereading his notes, discovering new implications.
Thank You
Feel free to e-mail me at stephen.dodson@brettonfund.com if you have questions about the fund.
As always, thank you for being an investor.
Stephen J. Dodson
President
Bretton Capital Management
6
Bretton Fund by Sectors
(as a percentage of Net Assets)
(Unaudited)
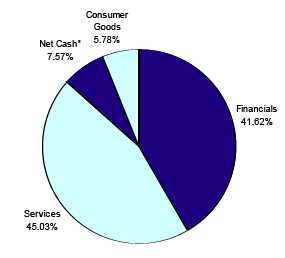
* Net Cash represents cash and other assets less liabilities.
7
| Bretton Fund |
| |
| | | | | | Schedule of Investments |
| | | | | | December 31, 2011 |
| Shares/Principal Amount | | Cost | | Fair Value | | % of Net Assets |
| COMMON STOCKS | | | | | | | |
| Accident & Health Insurance | | | | | | | |
| 6,000 | Aflac Inc. | | $ 320,765 | | $ 259,560 | | 9.43 | % |
| Apparel & Other Finished Products of Fabrics & Similar Material | | | | | | | |
| 4,000 | Carter's, Inc. * | | 108,740 | | 159,240 | | 5.78 | % |
| Finance Services | | | | | | | |
| 2,400 | American Express Company | | 98,773 | | 113,208 | | 4.11 | % |
| Miscellaneous Business Credit Institution | | | | | | | |
| 18,000 | CapitalSource, Inc. | | 108,965 | | 120,600 | | 4.38 | % |
| National Commercial Banks | | | | | | | |
| 3,800 | JPMorgan Chase & Co. | | 132,067 | | 126,350 | | | |
| 4,500 | Wells Fargo & Company | | 109,222 | | 124,020 | | | |
| | | | 241,289 | | 250,370 | | 9.09 | % |
| Railroad, Line-Haul Operating | | | | | | | |
| 6,000 | CSX Corp. | | 125,177 | | 126,360 | | | |
| 1,600 | Norfolk Southern Corp. | | 96,459 | | 116,576 | | | |
| 1,200 | Union Pacific Corporation | | 98,516 | | 127,128 | | | |
| | | | 320,152 | | 370,064 | | 13.44 | % |
| Regional - Pacific Banks | | | | | | | |
| 41,800 | New Resource Bank * (a) (b) | | 132,150 | | 129,580 | | 4.71 | % |
| Retail - Family Clothing Stores | | | | | | | |
| 14,000 | The Gap, Inc. | | 261,675 | | 259,700 | | | |
| 6,600 | Ross Stores Inc. | | 190,516 | | 313,698 | | | |
| | | | 452,191 | | 573,398 | | 20.83 | % |
| Saving Institution, Federally Chartered | | | | | | | |
| 8,800 | SI Financial Group Inc. (b) | | 84,112 | | 86,680 | | 3.15 | % |
| Saving Institution, Not Federally Chartered | | | | | | | |
| 6,600 | Peoples Federal Bancshares, Inc. * (b) | | 89,362 | | 94,050 | | 3.42 | % |
| Services - Educational Services | | | | | | | |
| 5,500 | Apollo Group Inc. Class A * | | 242,040 | | 296,285 | | 10.76 | % |
| State Commercial Banks | | | | | | | |
| 6,000 | Standard Financial Corp. (b) | | 86,373 | | 91,800 | | 3.33 | % |
| Total for Common Stock | | $ 2,284,912 | | $ 2,544,835 | | 92.43 | % |
| Total Investment Securities | | $ 2,284,912 | | $ 2,544,835 | | 92.43 | % |
| Other Assets in Excess of Liabilities | | | | $ 208,433 | | 7.57 | % |
| Net Assets | | | | | $ 2,753,268 | | 100.00 | % |
| | * Non-Income Producing Securities.
(a) Illiquid security. See Note 3.
(b) Level 2 investment.
The accompanying notes are an integral part of these
financial statements. 8 |
| Bretton Fund |
| |
| |
| Statement of Assets and Liabilities | | | |
| December 31, 2011 | | | |
| |
| Assets: | | | |
| Investment Securities at Fair Value | | $ 2,544,835 | |
| (Cost $2,284,912) | | | |
| Cash | | 209,575 | |
| Dividend Receivable | | 2,295 | |
| Total Assets | | 2,756,705 | |
| Liabilities: | | | |
| Payable to Adviser (Note 4) | | 3,437 | |
| Total Liabilities | | 3,437 | |
| Net Assets | | $ 2,753,268 | |
| |
| Net Assets Consist of: | | | |
| Paid In Capital (Note 5) | | $ 2,493,345 | |
| Unrealized Appreciation in Value of Investments | | | |
| Based on Identified Cost - Net | | 259,923 | |
| Net Assets, for 162,171 Shares Outstanding | | $ 2,753,268 | |
| (Unlimited shares authorized) | | | |
| Net Asset Value, Offering Price and Redemption Price Per Share | | | |
| ($2,753,268/162,171 shares) | | $ 16.98 | |
| |
| Statement of Operations | | | |
| For the fiscal year ended December 31, 2011 | | | |
| |
| Investment Income: | | | |
| Dividends | | $ 25,475 | |
| Interest | | 2 | |
| Total Investment Income | | 25,477 | |
| Expenses: | | | |
| Management Fees (Note 4) | | 35,038 | |
| Total Expenses | | 35,038 | |
| |
| Net Investment Loss | | (9,561 | ) |
| |
| Realized and Unrealized Gain on Investments: | | | |
| Realized Gain on Investments | | 40,539 | |
| Net Change in Unrealized Appreciation on Investments | | 159,156 | |
| Net Realized and Unrealized Gain on Investments | | 199,695 | |
| |
| Net Increase in Net Assets from Operations | | $ 190,134 | |
The accompanying notes are an integral part of these
financial statements. 9 |
| Bretton Fund |
| |
| |
| Statements of Changes in Net Assets | | | | |
| | 1/1/2011 | | 9/30/2010* | |
| | to | | to | |
| | 12/31/2011 | | 12/31/2010 | |
| From Operations: | | | | |
| Net Investment Loss | $ (9,561 | ) | $ (2,163 | ) |
| Net Realized Gain/(Loss) on Investments | 40,539 | | - | |
| Change in Net Unrealized Appreciation | 159,156 | | 100,767 | |
| Increase/(Decrease) in Net Assets from Operations | 190,134 | | 98,604 | |
| From Distributions to Shareholders: | | | | |
| Net Investment Income | - | | - | |
| Net Realized Gain from Security Transactions | (30,978 | ) | - | |
| Return of Capital | (454 | ) | - | |
| Change in Net Assets from Distributions | (31,432 | ) | - | |
| From Capital Share Transactions: | | | | |
| Proceeds From Sale of Shares | 717,167 | | 1,747,363 | |
| Shares Issued on Reinvestment of Distributions | 31,432 | | - | |
| Cost of Shares Redeemed | - | | - | |
| Net Increase (Decrease) from Shareholder Activity | 748,599 | | 1,747,363 | |
| |
| Net Increase (Decrease) in Net Assets | 907,301 | | 1,845,967 | |
| |
| Net Assets at Beginning of Period | 1,845,967 | | - | |
| Net Assets at End of Period (Including Accumulated Undistributed | | | | |
| Net Investment Income of $0 and $0, respectively) | $ 2,753,268 | | $ 1,845,967 | |
| |
| Share Transactions: | | | | |
| Issued | 44,353 | | 115,945 | |
| Reinvested | 1,873 | | - | |
| Redeemed | - | | - | |
| Net Increase in Shares | 46,226 | | 115,945 | |
| Shares Outstanding Beginning of Period | 115,945 | | - | |
| Shares Outstanding End of Period | 162,171 | | 115,945 | |
| |
| Financial Highlights | | | | |
| Selected data for a share outstanding throughout the period: | | | | |
| | 1/1/2011 | | 9/30/2010* | |
| | to | | to | |
| | 12/31/2011 | | 12/31/2010 | |
| Net Asset Value - | | | | |
| Beginning of Period | $ 15.92 | | $ 15.00 | |
| Net Investment Loss (a) | (0.07 | ) | (0.02 | ) |
| Net Gain (Loss) on Securities | | | | |
| (Realized and Unrealized) | 1.33 | | 0.94 | |
| Total from Investment Operations | 1.26 | | 0.92 | |
| |
| Distributions (From Net Investment Income) | - | | - | |
| Distributions (From Realized Capital Gains) | (0.20 | ) | - | |
| Distributions (From Return of Capital) | - | (b) | - | |
| Total Distributions | (0.20 | ) | - | |
| |
| Net Asset Value - | | | | |
| End of Period | $ 16.98 | | $ 15.92 | |
| Total Return (c) | 7.90% | | 6.13% | *** |
| Ratios/Supplemental Data | | | | |
| Net Assets - End of Period (Thousands) | $ 2,753 | | $ 1,846 | |
| Ratio of Expenses to Average Net Assets | 1.50% | | 1.50% | ** |
| Ratio of Net Investment Income (Loss) to Average Net Assets | (0.41)% | | (0.56)% | ** |
| Portfolio Turnover Rate | 13.14% | | 0.00% | *** |
* Commencement of Operations. ** Annualized. *** Not Annualized.
(a) Per share amounts were calculated using the average shares method.
(b) Less than $0.005 per share.
(c) Total return in the above table represents the rate that the investor would have earned
or lost on an investment in the Fund assuming reinvestment of dividends and distributions.
The accompanying notes are an integral part of these financial statements. |
10
Notes to Financial Statements
Bretton Fund
December 31, 2011
1.) ORGANIZATION:
Bretton Fund (the “Fund”) was organized as a non-diversified series of the PFS Funds (the “Trust”) on September 21, 2010. The Trust was established under the laws of Massachusetts by an Agreement and Declaration of Trust dated January 13, 2000. Prior to March 5, 2010, the Trust was named Wireless Fund. The Fund is registered as an open-end investment company under the Investment Company Act of 1940, as amended. The Trust may offer an unlimited number of shares of beneficial interest in a number of separate series, each series representing a distinct fund with its own investment objectives and policies. As of December 31, 2011, there were eight series authorized by the Trust. The Fund commenced operations on September 30, 2010. The Fund's investment objective is to seek long-term capital appreciation. The investment adviser to the Fund is Bretton Capital Management, LLC (the “Adviser”).
2.) SIGNIFICANT ACCOUNTING POLICIES
SECURITY VALUATION:
All investments in securities are recorded at their estimated fair value, as described in Note 3.
FEDERAL INCOME TAXES:
The Fund’s policy is to continue to comply with the requirements of the Internal Revenue Code that are applicable to regulated investment companies and to distribute all of its taxable income to shareholders. Therefore, no federal income tax provision is required. It is the Fund’s policy to distribute annually, prior to the end of the calendar year, dividends sufficient to satisfy excise tax requirements of the Internal Revenue Code. This Internal Revenue Code requirement may cause an excess of distributions over the book year-end accumulated income. In addition, it is the Fund’s policy to distribute annually, after the end of the fiscal year, any remaining net investment income and net realized capital gains.
The Fund recognizes the tax benefits of certain tax positions only where the position is “more likely than not” to be sustained assuming examination by tax authorities. Management has analyzed the Fund’s tax positions, and has concluded that no liability for unrecognized tax benefits should be recorded related to uncertain tax positions taken on returns filed for open tax year (2010), or expected to be taken in the Fund’s 2011 tax returns. The Fund identifies its major tax jurisdictions as U.S. Federal tax authorities; however, the Fund is not aware of any tax positions for which it is reasonably possible that the total amounts of unrecognized tax benefits will change materially in the next 12 months.
DISTRIBUTIONS TO SHAREHOLDERS:
Distributions to shareholders, which are determined in accordance with income tax regulations, are recorded on the ex-dividend date.
The treatment for financial reporting purposes of distributions made to shareholders during the period from net investment income or net realized capital gains may differ from their ultimate treatment for federal income tax purposes. These differences are caused primarily by differences in the timing of the recognition of certain components of income, expense, or realized capital gain for federal income tax purposes. Where such differences are permanent in nature, they are reclassified in the components of the net assets based on their ultimate characterization for federal income tax purposes. Any such reclassifications will have no effect on net assets, results of operations, or net asset value per share of the Fund. For the year ended December 31, 2011, $9,561 of net investment loss was reclassified to net realized accumulated capital gains.
USE OF ESTIMATES:
The preparation of financial statements in conformity with accounting principles generally accepted in the United States of America (“GAAP”) requires management to make estimates and assumptions that affect the reported amounts of assets and liabilities and disclosure of contingent assets and liabilities at the date of the financial statements and the reported amounts of increases and decreases in net assets from operations during the reporting period. Actual results could differ from those estimates.
OTHER:
The Fund records security transactions based on the trade date. Dividend income is recognized on the ex-dividend date. Interest income is recognized on an accrual basis. The Fund uses the
11
Notes to Financial Statements - continued
specific identification method in computing gain or loss on sales of investment securities. Discounts and premiums on securities purchased are accreted and amortized over the life of the respective securities. Withholding taxes on foreign dividends have been provided for in accordance with the Fund’s understanding of the applicable country’s tax rules and rates.
3.) SECURITIES VALUATIONS
As described in Note 2, the Fund utilizes various methods to measure the fair value of most of its investments on a recurring basis. GAAP establishes a hierarchy that prioritizes inputs to valuation methods. The three levels of inputs are:
Level 1 - Unadjusted quoted prices in active markets for identical assets or liabilities that the Fund has the ability to access.
Level 2 - Observable inputs other than quoted prices included in level 1 that are observable for the asset or liability, either directly or indirectly. These inputs may include quoted prices for the identical instrument in an inactive market, prices for similar instruments, interest rates, prepayment speeds, credit risk, yield curves, default rates, and similar data.
Level 3 - Unobservable inputs for the asset or liability, to the extent relevant observable inputs are not available, representing the Fund’s own assumptions about the assumptions a market participant would use in valuating the asset or liability, and would be based on the best information available.
The availability of observable inputs can vary from security to security and is affected by a wide variety of factors, including, for example, the type of security, whether the security is new and not yet established in the marketplace, the liquidity of markets, and other characteristics particular to the security. To the extent that valuation is based on models or inputs that are less observable or unobservable in the market, the determination of fair value requires more judgment. Accordingly, the degree of judgment exercised in determining fair value is greatest for instruments categorized in level 3.
The inputs used to measure fair value may fall into different levels of the fair value hierarchy. In such cases, for disclosure purposes, the level in the fair value hierarchy within which the fair value measurement falls in its entirety, is determined based on the lowest level input that is significant to the fair value measurement in its entirety.
FAIR VALUE MEASUREMENTS
A description of the valuation techniques applied to the Fund’s major categories of assets and liabilities measured at fair value on a recurring basis follows.
Equity securities (common stock). Equity securities generally are valued by using market quotations, but may be valued on the basis of prices furnished by a pricing service when the Adviser believes such prices more accurately reflect the fair value of such securities. Securities that are traded on any stock exchange or on the NASDAQ over-the-counter market are generally valued by the pricing service at the last quoted sale price. Lacking a last sale price, an equity security is generally valued by the pricing service at its last bid price. To the extent these securities are actively traded and valuation adjustments are not applied, they are classified in level 1 of the fair value hierarchy. When market quotations are not readily available, when the Adviser determines that the market quotation or the price provided by the pricing service does not accurately reflect the current fair value, or when restricted or illiquid securities are being valued, such securities are valued as determined in good faith by the Adviser, in conformity with guidelines adopted by and subject to review of the Board of Trustees of the Trust, and are categorized in level 2 or level 3, when appropriate.
Illiquid securities. A security may be considered to be illiquid if it has a limited trading market. Securities are generally considered to be liquid if they can be sold or disposed of in the ordinary course of business within seven days at approximately the price at which the security is valued by the Fund. These securities are valued at fair value as described above. The Fund intends to hold no more than 15% of its net assets in illiquid securities. As of December 31, 2011 illiquid securities as identified on the Schedule of Investments represented 4.7% of net assets.
Fixed income securities. Fixed income securities generally are valued by using market quotations, but may be valued on the basis of prices furnished by a pricing service when the Adviser believes such prices accurately reflect the fair market value of such securities. A pricing service utilizes electronic data processing techniques based on yield spreads relating to
12
Notes to Financial Statements - continued
securities with similar characteristics to determine prices for normal institutional-size trading units of debt securities without regard to sale or bid prices. If the Adviser decides that a price provided by the pricing service does not accurately reflect the fair value of the securities, when prices are not readily available from a pricing service, or when restricted or illiquid securities are being valued, securities are valued at fair value as determined in good faith by the Adviser, subject to review of the Board of Trustees. Short term investments in fixed income securities with maturities of less than 60 days when acquired, or which subsequently are within 60 days of maturity, are valued by using the amortized cost method of valuation, which the Board has determined will represent fair value. Generally, fixed income securities are categorized as level 2.
In accordance with the Trust's good faith pricing guidelines, the Adviser is required to consider all appropriate factors relevant to the value of securities for which it has determined other pricing sources are not available or reliable as described above. There is no single standard for determining fair value controls, since fair value depends upon the circumstances of each individual case. As a general principle, the current fair value of an issue of securities being valued by the Adviser would appear to be the amount which the owner might reasonably expect to receive for them upon their current sale. Methods which are in accordance with this principle may, for example, be based on (i) a multiple of earnings; (ii) a discount from market of a similar freely traded security (including a derivative security or a basket of securities traded on other markets, exchanges or among dealers); or (iii) yield to maturity with respect to debt issues, or a combination of these and other methods.
The following table summarizes the inputs used to value the Fund’s assets measured at fair value as of December 31, 2011:
| Valuation Inputs of Assets | Level 1 | Level 2 | Level 3 | Total |
| Common Stock | $2,142,725 | $402,110 | $0 | $2,544,835 |
| Total | $2,142,725 | $402,110 | $0 | $2,544,835 |
Refer to the Fund’s Schedule of Investments for a listing of securities by industry.
It is the Fund’s policy to consider transfers into or out of level 1 and level 2 as of the end of the reporting period. The following table shows the transfers between Level 1 and Level 2 of the fair value hierarchy:
| Transfers In | Transfers Out |
| Level 1 | Level 2 | Level 1 | Level 2 |
| $- | $91,800 | $91,800 | $- |
The asset was transferred from Level 1 to Level 2 as the associated position was considered to be held in inactive markets as of December 31, 2011. The Fund’s assets assigned to Level 2 input category are generally valued using a market approach, in which a security’s value is determined through its correlation to prices and information from observable market transactions for similar or identical assets. The Fund did not hold any level 3 assets during the fiscal year ended December 31, 2011.
4.) INVESTMENT ADVISORY AGREEMENT AND RELATED PARTY TRANSACTIONS
The Fund has entered into an investment advisory agreement (“Management Agreement”) with the Adviser. The Adviser manages the investment portfolio of the Fund, subject to policies adopted by the Trust's Board of Trustees, and, at its own expense and without reimbursement from the Fund, furnishes office space and all necessary office facilities, equipment, and executive personnel necessary for managing the Fund. The Adviser pays the expenses of the Fund except for all brokerage fees and commissions, taxes, borrowing costs (such as (a) interest and (b) dividend expenses on securities sold short), fees and expenses of acquired funds, extraordinary or non-recurring expenses as may arise, including litigation to which the Fund may be a party and indemnification of the Trust’s Trustees and officers with respect thereto. For its services, the Adviser receives an investment management fee equal to 1.50% of the average daily net assets of the Fund.
For the fiscal year ended December 31, 2011, the Adviser earned management fees totaling $35,038, of which $3,437 was due to the Adviser at December 31, 2011.
5.) CAPITAL SHARES
The Trust is authorized to issue an unlimited number of shares of beneficial interest. Paid-in capital at December 31, 2011, was $2,493,345 representing 162,171 shares outstanding.
13
Notes to Financial Statements - continued
6.) RELATED PARTY TRANSACTIONS
A control person of Premier Fund Solutions, Inc. (the “Administrator”) also serves as trustee/ officer of the Fund. This individual receives benefits from the Administrator resulting from administration fees paid to the Administrator of the Fund by the Adviser. Mr. Ross C. Provence is the father of Mr. Jeffrey R. Provence.
The Trustees who are not interested persons of the Fund received a total of $3,500 in Trustees’ fees plus travel and related expenses for the fiscal year ended December 31, 2011. Under the Management Agreement, the Adviser pays these fees.
7.) PURCHASES AND SALES OF SECURITIES
For the fiscal year ended December 31, 2011, purchases and sales of investment securities other than U.S. Government obligations and short-term investments aggregated $1,248,246 and $266,104, respectively. Purchases and sales of U.S. Government obligations aggregated $0 and $0, respectively.
8.) SECURITY TRANSACTIONS
For Federal income tax purposes, the cost of investments owned at December 31, 2011, was $2,284,912. At December 31, 2011, the composition of unrealized appreciation (the excess of value over tax cost) and depreciation (the excess of tax cost over value) was as follows:
| | Appreciation | | (Depreciation) | | | Net Appreciation (Depreciation) |
| | $340,555 | | ($80,632) | | | $259,923 |
There were no differences between book basis and tax basis unrealized appreciation.
9.) CONTROL OWNERSHIP
The beneficial ownership, either directly or indirectly, of more than 25% of the voting shares of a fund creates a presumption of control of the Fund, under Section 2(a)(9) of the Investment Company Act of 1940. As of December 31, 2011, Stephen Dodson and family members, located at 338 Spear Street, San Francisco, California 94105, beneficially held, in aggregate, approximately 79% of the Fund and therefore, may be deemed to control the Fund. Stephen Dodson is the control person of the Adviser.
10.) DISTRIBUTIONS TO SHAREHOLDERS
There was a distribution from short term capital gain of $0.1933 per share and a return of capital distribution of $0.0028 per share paid on December 22, 2011. There were no distributions paid during the period September 30, 2010, through December 31, 2010.
| Distributions paid from: | | | | | |
| | | | | September 30, 2010 thru | |
| | | 2011 | | December 31, 2010 | |
| Ordinary Income . | | $ 30,978 | | $ -0- | |
| Return of Capital | | 454 | | -0- | |
| Long-Term Capital Gain | | -0- | | -0- | |
| | | $ 31,432 | | $ -0- | |
As of December 31, 2011, the components of distributable earnings (accumulated losses) on a tax basis were as follows:
| Undistributed ordinary income/(accumulated losses) | $ 0 |
| Undistributed long-term capital gain/(accumulated losses) | 0 |
| Unrealized appreciation/(depreciation) | 259,923 |
| | $ 259,923 |
There were no differences between book basis and tax basis unrealized appreciation.
11.) RECENT TAX LAW
Under the recently enacted Regulated Investment Company Modernization Act of 2010, funds will be permitted to carry forward capital losses incurred in taxable years beginning after December 22, 2010 for an unlimited period. However, any losses incurred during those future taxable years will be required to be utilized prior to the losses incurred in pre-enactment taxable years. As a result of this pre-enactment capital loss carryforwards may be more likely to expire unused. Additionally, post-enactment capital losses that are carried forward will retain their character as
14
Notes to Financial Statements - continued
either short-term or long-term capital losses rather than being considered all short-term as under previous law.
12.) ACCOUNTING PRONOUNCEMENT
In May 2011, FASB issued Accounting Standards Update ("ASU") 2011-04. The amendments in this update are the results of the work of FASB and the International Accounting Standards Board to develop common requirements for measuring fair value and for disclosing information about fair value measurements, which are effective during interim and annual periods beginning after December 15, 2011. Consequently, these amendments improve the comparability of fair value measurements presented and disclosed in the financial statements prepared in accordance with GAAP and International Financial Reporting Standards. At this time, the Fund's management is evaluating the implications of ASU 2011-04.
15
Additional Information
December 31, 2011
(Unaudited)
1.) AVAILABILITY OF QUARTERLY SCHEDULE OF INVESTMENTS
The Fund files its complete schedule of portfolio holdings with the Securities and Exchange Commission ("SEC") for the first and third quarters of each fiscal year on Form N-Q. The Fund’s Form N-Q is available on the SEC's website at http://www.sec.gov. The Fund’s Form N-Q may also be reviewed and copied at the SEC's Public Reference Room in Washington, DC. Information on the operation of the Public Reference Room may be obtained by calling 800.SEC.0330.
2.) PROXY VOTING GUIDELINES
Bretton Capital Management, LLC, the Fund’s investment adviser (“Adviser”), is responsible for exercising the voting rights associated with the securities held by the Fund. A description of the policies and procedures used by the Adviser in fulfilling this responsibility is available without charge by calling our toll free number (800.231.2901) . It is also included in the Fund’s Statement of Additional Information, which is available on the SEC’s website at http://www.sec.gov.
Information regarding how the Fund voted proxies, Form N-PX, relating to portfolio securities during the most recent 12-month period ended June 30, is available without charge, upon request, by calling our toll free number (800.231.2901) . This information is also available on the SEC’s website at http://www.sec.gov.
3.) DISCLOSURE OF EXPENSES
As a shareholder of the Fund, you incur ongoing expenses consisting solely of management fees. This Example is intended to help you understand your ongoing costs (in dollars) of investing in the Fund and to compare these costs with the ongoing costs of investing in other mutual funds.
The Example is based on an investment of $1,000 invested in the Fund on July 1, 2011, and held through December 31, 2011.
Actual Expenses
The first line of the table below provides information about actual account values and actual expenses. You may use the information in this line, together with the amount you invested, to estimate the expenses that you paid over the period. Simply divide your account value by $1,000(for example, an $8,600 account value divided by $1,000 = 8.6), then multiply the result by the number in the first line under the heading entitled "Expenses Paid During Period" to estimate the expenses you paid on your account during this period.
Hypothetical Example for Comparison Purposes
The second line of the table below provides information about hypothetical account values and hypothetical expenses based on the Fund's actual expense ratio and an assumed rate of return of 5% per year before expenses, which is not the Fund's actual return. The hypothetical account values and expenses may not be used to estimate the actual ending account balance or expenses you paid for the period. You may use this information to compare the ongoing costs of investing in this Fund and other funds. To do so, compare this 5% hypothetical example with the 5% hypothetical examples that appear in the shareholder reports of the other funds.
Please note that the expenses shown in the table are meant to highlight your ongoing costs only and do not reflect any transactional costs, such as sales charges (loads). Therefore, the second line of the table is useful in comparing ongoing costs only, and will not help you determine the relative cost of owning different funds. In addition, if these transactional costs were included, your cost could have been higher.
| | | | | | | Expenses Paid |
| | | Beginning | | Ending | | During the Period* |
| | | Account Value | | Account Value | | July 1, 2011 to |
| | | July 1, 2011 | | December 31, 2011 | | December 31, 2011 |
| |
| Actual | | $1,000.00 | | $1,037.97 | | $7.71 |
| |
| Hypothetical | | $1,000.00 | | $1,017.64 | | $7.63 |
| (5% annual return | | | | | | |
| before expenses) | | | | | | |
* Expenses are equal to the Fund’s annualized expense ratio of 1.50%, multiplied by the average
account value over the period, multiplied by 184/365 (to reflect the one-half year period ended
December 31, 2011). |
16
Cohen Fund Audit Services, Ltd.
Certified Public Accountants | 800 Westpoint Pkwy, Ste 1100
Westlake, Ohio 44145
Phone: (440) 835-8500
Fax: (440) 835-1093
www.cohenfund.com |
REPORT OF INDEPENDENT REGISTERED PUBLIC ACCOUNTING FIRM
To the Shareholders and Board of Trustees
Bretton Fund (a series of PFS Funds)
We have audited the accompanying statement of assets and liabilities, including the schedule of investments, of Bretton Fund, (the "Fund"), a series of PFS Funds, as of December 31, 2011, and the related statement of operations for the year then ended, and the statements of changes in net assets and the financial highlights for each of the two periods in the period then ended. These financial statements and financial highlights are the responsibility of Fund management. Our responsibility is to express an opinion on these financial statements and financial highlights based on our audits.
We conducted our audits in accordance with the standards of the Public Company Accounting Oversight Board (United States). Those standards require that we plan and perform the audit to obtain reasonable assurance about whether the financial statements and financial highlights are free of material misstatement. An audit includes examining, on a test basis, evidence supporting the amounts and disclosures in the financial statements. Our procedures included confirmation of securities owned as of December 31, 2011 by correspondence with the custodian. An audit also includes assessing the accounting principles used and significant estimates made by management, as well as evaluating the overall financial statement presentation. We believe that our audit provides a reasonable basis for our opinion.
In our opinion, the financial statements and financial highlights referred to above present fairly, in all material respects, the financial position of Bretton Fund as of December 31, 2011, the results of its operations for the year then ended, and the changes in its net assets and the financial highlights for each of the two periods in the period then ended, in conformity with accounting principles generally accepted in the United States of America.

COHEN FUND AUDIT SERVICES, LTD.
Westlake, Ohio
February 27, 2012
17
Trustees and Officers
(Unaudited)
The Board of Trustees supervises the business activities of the Trust. The names of the Trustees and executive officers of the Trust are shown below. For more information regarding the Trustees, please refer to the Statement of Additional Information, which is available upon request by calling 800.590.0898. Each Trustee serves until the Trustee sooner dies, resigns, retires, or is removed.
The Trustees and Officers of the Trust and their principal business activities during the past five years are:
Interested Trustees and Officers
| | | | | Number of | Other |
| | | | Principal | Portfolios In | Directorships |
| Name, | Position(s) | Term of Office | Occupation(s) | Fund | Held By |
| Address(1), | Held With | and Length of | During | Complex | Trustee or |
| and Year of Birth | the Trust | Time Served | Past 5 Years | Overseen By | Officer |
| | | | | Trustee | |
| |
| Ross C. Provence(2), | Trustee | Indefinite Term; | General Partner and Portfolio | 8 | Blue Chip |
| Year of Birth: 1938 | and | Since 2000 | Manager for Value Trend Capital | | Investor Funds |
| | President | | Management, LP (1995 to current). | | |
| | | | Estate planning attorney (1963 to | | |
| current). |
|
| Jeffrey R. Provence(2), | Trustee, | Indefinite Term; | General Partner and Portfolio | 8 | Blue Chip |
| Year of Birth:1969 | Secretary | Since 2000 | Manager for Value Trend Capital | | Investor Funds, |
| | and | | Management, LP (1995 to current). | | Sycuan Funds, |
| | Treasurer | | CEO, Premier Fund Solutions, Inc. | | Private Asset |
| | | | (2001 to current). | | Management |
| | | | | | Fund |
| Julian G. Winters, | Chief | Chief | Managing Member, Watermark | | |
| Year of Birth: 1968 | Compliance | Compliance | Solutions LLC (investment compli- | N/A | N/A |
| | Officer | Officer Since | ance and consulting) since 3/07; | | |
| | | 2010 | previously, Vice President of | | |
| | | | Compliance Administration, The | | |
| | | | Nottingham Company (investment | | |
| | | | company administrator and fund | | |
| | | | accountant), 3/98-3/07. | | |
(1) The address of each trustee and officer is c/o PFS Funds, 1939 Friendship Drive, Suite C, El Cajon, California 92020.
(2) Trustees who are considered "interested persons" as defined in Section 2(a)(19) of the Investment Company Act of 1940 by virtue of their affiliation with the Investment Adviser.
Independent Trustees
| | | | | Number of | Other |
| | | | Principal | Portfolios In | Directorships |
| Name, | Position | Term of Office | Occupation(s) | Fund | Held By |
| Address(1), | Held With | and Length of | During | Complex | Trustee or |
| and Year of Birth | the Trust | Time Served | Past 5 Years | Overseen By | Officer |
| | | | | Trustee | |
| |
| Thomas H. Addis III, | Independent | Indefinite Term; | Executive Director/CEO, Southern | 8 | None |
| Year of Birth: 1945 | Trustee | Since 2000 | California PGA (2006 to current). | | |
| | | | President, Medallion Golf | | |
| | | | Management (1999 to 2006). | | |
| | | | | | Blue Chip |
| Allen C. Brown, | Independent | Indefinite Term; | Co-owner of Stebleton & Brown | 8 | Investor Funds, |
| Year of Birth: 1943 | Trustee | Since 2000 | (1994 to Current). Estate planning | | Sycuan Funds |
| | | | and business attorney (1970 to cur- | | |
| rent). |
| | | | | | Blue Chip |
| George Cossolias, CPA, | Independent | Indefinite Term; | Owner of George Cossolias & | 8 | Investor Funds, |
| Year of Birth: 1935 | Trustee | Since 2000 | Company, CPAs (1972 to current). | | Sycuan Funds, |
| | | | President of Lubrication Specialists, | | Temecula |
| | | | Inc. (1996 to current). | | Valley Bank |
(1) The address of each trustee and officer is c/o PFS Funds, 1939 Friendship Drive, Suite C, El Cajon, California 92020.
18

Investment Adviser
Bretton Capital Management, LLC
Legal Counsel
The Law Offices of John H. Lively
A member firm of The 1940 Act Law GroupTM
Custodian
US Bank N.A.
Dividend Paying Agent,
Shareholders' Servicing Agent,
Transfer Agent
Mutual Shareholder Services, LLC
Fund Administrator
Premier Fund Solutions, Inc.
Independent Registered Public Accounting Firm
Cohen Fund Audit Services, Ltd. |
This report is provided for the general information of the shareholders of the Bretton
Fund. This report is not intended for distribution to prospective investors in the Fund,
unless preceded or accompanied by an effective prospectus. |
Item 2. Code of Ethics.
The registrant has adopted a code of ethics that applies to the registrant’s principal executive officer and the principal financial officer. The registrant has not made any amendments to its code of ethics during the covered period. The registrant has not granted any waivers from any provisions of the code of ethics during the covered period. A copy of the registrant’s Code of Ethics is filed herewith.
Item 3. Audit Committee Financial Expert.
The registrant’s Board of Trustees has determined that George Cossolias is an audit committee finical expert. Mr. Cossolias is independent for purposes of this Item 3.
Item 4. Principal Accountant Fees and Services.
(a-d) The following table details the aggregate fees billed for each of the last two fiscal years for audit fees, audit-related fees, tax fees and other fees by the principal accountant to the registrant. The principal accountant has provided no services to the adviser or any entity controlled by, or under common control with the adviser that provides ongoing services to the registrant.
| | | FYE 12/31/11 | | FYE 12/31/10 |
| Audit Fees | | $13,250 | | $10,000 |
| Audit-Related Fees | | $0 | | $0 |
| Tax Fees | | $2,000 | | $2,000 |
| All Other Fees | | $750 | | $0 |
Nature of Tax Fees: preparation of Excise Tax Statement and 1120 RIC.
Nature of All Other Fees: Review of Semi-Annual Report.
(e) (1) The audit committee approves all audit and non-audit related services and, therefore, has not adopted pre-approval policies and procedures described in paragraph (c)(7) of Rule 2-01 of Regulation S-X.
(e) (2) None of the services described in paragraph (b) through (d) of this Item were approved by the audit committee pursuant to paragraph (c)(7)(i)(C) of Rule 2-01 of Regulation S-X.
(f) All of the principal accountant’s hours spent on auditing the registrant’s financial statements were attributed to work performed by full-time permanent employees of the principal accountant.
(g) The following table indicates the aggregate non-audit fees billed by the registrant’s principal accountant for services to the registrant , the registrant’s investment adviser (not sub-adviser), and any entity controlling, controlled by, or under common control with the adviser that provides ongoing services to the registrant, for the last two years.
| Non-Audit Fees | | FYE 12/31/11 | | FYE 12/31/10 |
| Registrant | | $2,750 | | $2,000 |
| Registrant’s Investment Adviser | | $0 | | $0 |
(h) The principal accountant provided no services to the investment adviser or any entity controlling, controlled by, or under common control with the adviser that provides ongoing services to the registrant.
Item 5. Audit Committee of Listed Companies. Not applicable.
Item 6. Schedule of Investments. Schedule filed with Item 1.
Item 7. Disclosure of Proxy Voting Policies and Procedures for Closed-End Management Investment Companies. Not applicable.
Item 8. Portfolio Managers of Closed End Management Investment Companies. Not applicable.
Item 9. Purchases of Equity Securities by Closed-End Management Investment Companies and Affiliated Purchasers. Not applicable.
Item 10. Submission of Matters to a Vote of Security Holders.
The registrant has not adopted procedures by which shareholders may recommend nominees to the registrant’s board of trustees.
Item 11. Controls and Procedures.
(a) The registrant’s president and chief financial officer concluded that the disclosure controls and procedures (as defined in Rule 30a-3(c) under the Investment Company Act of 1940 (the “Act”)) were effective as of a date within 90 days of the filing date of this report, based on the evaluation of these controls and procedures required by Rule 30a-3(b) under the Act.
(b) There were no changes in the registrant’s internal control over financial reporting (as defined in Rule 30a-3(d) under the Act) that occurred during the registrant’s second fiscal quarter of the period covered by this report that have materially affected, or are reasonably likely to materially affect, the registrant’s internal control over financial reporting.
Item 12. Exhibits.
(a)(1) Code of Ethics. Filed herewith.
(a)(2) Certifications pursuant to Section 302 of the Sarbanes-Oxley Act of 2002. Filed herewith.
(b) Certification pursuant to Section 906 Certification of the Sarbanes-Oxley Act of 2002. Filed herewith.
SIGNATURES
Pursuant to the requirements of the Securities Exchange Act of 1934 and the Investment Company Act of 1940, the registrant has duly caused this report to be signed on its behalf by the undersigned, thereunto duly authorized.
By: /s/Ross C. Provence
Ross C. Provence
President
Date: 3/7/12
Pursuant to the requirements of the Securities Exchange Act of 1934 and the Investment Company Act of 1940, this report has been signed below by the following persons on behalf of the registrant and in the capacities and on the dates indicated.
By: /s/Ross C. Provence
Ross C. Provence
President
Date: 3/7/12
By: /s/Jeffrey R. Provence
Jeffrey R. Provence
Chief Financial Officer
Date: 3/7/12