UNITED STATES
SECURITIES AND EXCHANGE COMMISSION
WASHINGTON, D.C. 20549
FORM N-CSR
CERTIFIED SHAREHOLDER REPORT OF REGISTERED MANAGEMENT INVESTMENT COMPANIES
Investment Company Act file number 811-09781
PFS FUNDS
(Exact name of registrant as specified in charter)
| 1939 Friendship Drive, Suite C | |
| El Cajon, CA | 92020 |
| (Address of principal executive offices) | (Zip code) |
CT Corporation System
155 Federal St., Suite 700,
Boston, MA 02110
(Name and address of agent for service)
Registrant's telephone number, including area code: (619) 588-9700
Date of fiscal year end: May 31
Date of reporting period: May 31, 2012
Form N-CSR is to be used by management investment companies to file reports with the Commission not later than 10 days after the transmission to stockholders of any report that is required to be transmitted to stockholders under Rule 30e-1 under the Investment Company Act of 1940 (17 CFR 270.30e -1). The Commission may use the information provided on Form N-CSR in its regulatory, disclosure review, inspection and policymaking roles.
A registrant is required to disclose the information specified by Form N-CSR, and the Commission will make this information public. A registrant is not required to respond to the collection of information contained in Form N-CSR unless the Form displays a currently valid Office of Management and Budget ("OMB") control number. Please direct comments concerning the accuracy of the information collection burden estimate and any suggestions for reducing the burden to Secretary, Securities and Exchange Commission, 450 Fifth Street, NW, Washington, DC 20549-0609. The OMB has reviewed this collection of information under the clearance requirements of 44 U.S.C. § 3507.
Item 1. Reports to Stockholders.

Annual Report
May 31, 2012
July 16, 2012
Dear Fellow Shareholder,
The HNP Growth and Preservation Fund (HNPKX) (the "Fund") was launched on June 1, 2011. Our investment strategy is one that is a rules-based, quantitative model, the primary intent of which is to capture growth while being cognizant of the downside risks in investments. HNP Capital Fund Management Group, LLC, the investment adviser to the Fund, manages the Fund to achieve this objective by attempting to identify when a single asset class index either enters or exits a sustainable price trend.
During the fiscal year ended May 31, 2012 the Fund returned -7.40% compared to -0.43% for the S&P 500® Index (Total Return) and -2.72% for the Dow Jones Global Moderate IndexSM. Since the launch of the Fund, the markets have seen a fair degree of volatility, as well as what we perceive to be a lack of any sustainable trend. At the launch, the Fund model was targeting a full investment strategy in all of the asset classes that we follow. The seven diversified asset classes that we follow (Domestic Equities, International Developed Equities, Emerging Markets, Real Estate Investment Trusts, Commodities, Gold & Treasuries) do not tend to correlate a majority of the time, therefore it is not typical for our portfolio to be fully invested.
Nonetheless, we are rules-based managers, and as such, the timing of the Fund's launch was rather unfortunate - the markets we track (roughly 10 days after the Fund's launch) started to greatly diverge from their up trends, and a violent selloff quickly ensued. Although the Fund was exposed to this sell off, we outperformed the S&P 500® Index (Total Return) and the Dow Jones Global Moderate IndexSM as the markets declined through September 2011. This was primarily due to our model getting sell signals across almost all asset classes during the months of August and September. As the markets rebounded subsequent to the selloff through September 2011, the same factors that helped us outperform in the downtrend, held our performance back when the markets began to rally in October of 2011.
While we can't control the markets, we can control costs. To that end, the Adviser doesn't accept any soft dollar arrangements and trades for between $0.0075 and $0.01 per share. Also, effective February 16, 2012 the Adviser reduced the Total Annual Fund Operating Expenses from 1.70% to 1.20% by implementing a fee waiver of 0.50% .
Our investment strategy is one that is a rules-based, quantitative model. This eliminates what we believe to be the pitfalls of subjectivity and prediction that are far too common in today's investing world. If our quantitative, proprietary model gives us buy signals to be fully invested across all asset classes, we obey our signals and execute the appropriate trades. This mathematical discipline ensures that our emotions and biases are always kept in check. It is important to note that our signals are not generated daily. We built longer intervals into our model specifically to mitigate whipsaws in volatile, sideways markets such as June 2011 through the end of September of 2011. Whipsaws are unavoidable from time to time, but being thoughtful in one's approach helps keep them to a minimum.
From the onset of the Fund's launch, the markets began a steady and volatile move down due to fears coming out of the Eurozone. By the end of September our model was almost entirely in cash, with the exception of gold and treasuries. At that point in time, there was tremendous fear that an encore of the 2008 Subprime Meltdown was under way. Only this time the fear was derived from concerns based in Europe. By October 3, 2011 the market created a V bottom and resulted in a record rally by the end of October. We held cash, due to our model signals, and missed a good portion of the October run. We eventually bought back into the domestic stock index, REIT Index, and eventually the Emerging Markets Index.
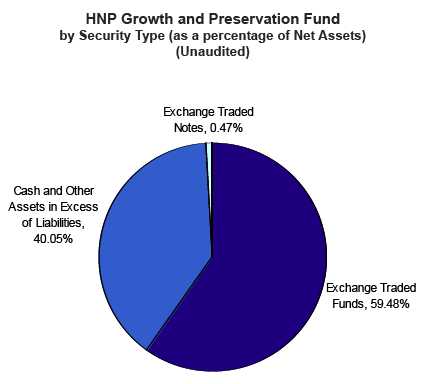
As of May 31, 2012, the Fund was invested in the following:
- Vanguard Total Stock Market ETF — 19.14%
- Vanguard REIT Index ETF — 18.99%
- iShares Barclays 7-10 Year Treasury — 9.97%
- SPDR Gold Shares — 4.96%
2012 Annual Report 1
- SPDR S&P 500 — 2.93%
- ProShares Short 20+ Year Treasury — 2.15%
- SPDR Dow Jones Industrial Average — 0.92%
- PowerShares DB Gold Short ETN — 0.47%
- Financial Select Sector SPDR ETF — 0.42%
- Cash — 40.12%
The Fund's year-to-date return was 1.09% .
The Fund's 1 year (since inception) return was -7.40% .
It is important to understand that our investment outlook for the Fund is one of long term. We believe greatly in our strategy of asset class diversification and discipline. The managers strongly believe that over the long term, our results will be very respectable while simultaneously being achieved with substantially less volatility to the Fund's price action.
We thank you for placing your trust and confidence in the HNP Capital Fund Management Group. We will continue to manage your wealth, along with ours, in a flexible, disciplined fashion with both growth and preservation as our top priorities. We are confident that you'll be rewarded by our long term, diversified, and disciplined approach.
Warm regards,
HNP Capital Fund Management Group, LLC
2012 Annual Report 2
HNP GROWTH AND PRESERVATION FUND (Unaudited)
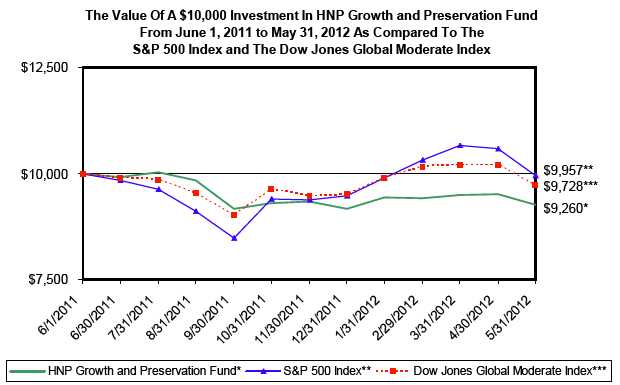
| PERFORMANCE INFORMATION - May 31, 2012 NAV $9.26 | |
| TOTAL RETURNS FOR THE PERIOD ENDED MAY 31, 2012. | | |
| | Since | |
| | Inception(A) | |
| HNP Growth and Preservation Fund | -7.40% | |
| S&P 500 Index (B) | -0.43% | |
| Dow Jones Global Moderate Index (C) | -2.72% | |
Annual Fund Operating Expense Ratio (from Supplement to Prospectus dated 2/16/12): Gross - 1.70%, Net - 1.20%
The Annual Fund Operating Expense Ratio reported above will not correlate to the expense ratio in the Fund’s financial highlights because (a) the financial highlights include only the direct operating expenses incurred by the Fund, not the indirect costs of investing in acquired funds; and (b) the Annual Fund Operating Expense Ratio - Net is reflective of the waiver of service fees which was not effective until February 16, 2012. See Note 4 for additional information regarding the contractual waiver of service fees.
(A) Since Inception returns include change in share prices and in each case includes reinvestment of any dividends and capital gain distributions. The HNP Growth and Preservation Fund commenced operations on June 1, 2011.
(B)The S&P 500® Index is a widely recognized unmanaged index of equity prices and is representative of a broader market and range of securities than is found in the Fund’s portfolio. The Index is an unmanaged benchmark that assumes reinvestment of all distributions and excludes the effect of taxes and fees. Individuals cannot invest directly in this Index; however, an individual can invest in exchange traded funds or other investment vehicles that attempt to track the performance of a benchmark index.
(C)The Dow Jones Moderate Portfolio IndexSM is a Dow Jones Relative Risk IndexSM that tracks three Composite Major Asset Classes (CMACs) - stocks, bonds and cash. The CMAC risk level of the Dow Jones Moderate Portfolio IndexSM is based on a 60% weighting in stocks.
PAST PERFORMANCE DOES NOT GUARANTEE FUTURE RESULTS. INVESTMENT RETURN AND PRINCIPAL VALUE WILL FLUCTUATE SO THAT SHARES, WHEN REDEEMED, MAY BE WORTH MORE OR LESS THAN THEIR ORIGINAL COST. RETURNS DO NOT REFLECT THE DEDUCTION OF TAXES THAT A SHAREHOLDER WOULD PAY ON FUND DISTRIBUTIONS OR THE REDEMPTION OF FUND SHARES. CURRENT PERFORMANCE MAY BE LOWER OR HIGHER THAN THE PERFORMANCE DATA QUOTED. TO OBTAIN PERFORMANCE DATA CURRENT TO THE MOST RECENT MONTH END, PLEASE CALL 1-866-694-6672. AN INVESTMENT IN THE FUND IS SUBJECT TO INVESTMENT RISKS, INCLUDING THE POSSIBLE LOSS OF THE PRINCIPAL AMOUNT INVESTED. THE FUND'S DISTRIBUTOR IS RAFFERTY CAPITAL MARKETS, LLC.
2012 Annual Report 3
HNP GROWTH AND PRESERVATION FUND
Availability of Quarterly Schedule of Investments
(Unaudited)
The Fund files its complete schedule of portfolio holdings with the Securities and Exchange Commission (“SEC”) for the first and third quarters of each fiscal year on Form N-Q. The Fund’s Form N-Q is available on the SEC's website at http://www.sec.gov. The Fund’s Form N-Q may also be reviewed and copied at the SEC's Public Reference Room in Washington, DC. Information on the operation of the Public Reference Room may be obtained by calling 1-800-SEC-0330.
Proxy Voting Guidelines
(Unaudited)
The Adviser is responsible for exercising the voting rights associated with the securities held by the Fund. A description of the policies and procedures used by the Adviser in fulfilling this responsibility is available without charge by calling 1-866-694-6672. It is also included in the Fund’s Statement of Additional Information, which is available on the SEC’s website at http://www.sec.gov.
Information regarding how the Fund voted proxies, Form N-PX, relating to portfolio securities during the most recent 12-month period ended June 30, is available without charge, upon request, by calling 1-866-694-6672. This information is also available on the SEC’s website at http://www.sec.gov.
2012 Annual Report 4
Expense Example
(Unaudited)
Shareholders of this Fund incur ongoing costs consisting of management fees and service fees. Although the Fund charges no sales loads or transaction fees, you will be assessed fees for outgoing wire transfers, returned checks and stop payment orders at prevailing rates charged by Mutual Shareholder Services, LLC, the Fund’s transfer agent. IRA accounts will be charged an $8.00 annual maintenance fee. If shares are redeemed within 90 days of purchase from the Fund, the shares are subject to a 2% redemption fee. The following example is intended to help you understand your ongoing costs of investing in the Fund and to compare these costs with similar costs of investing in other mutual funds. The example is based on an investment of $1,000 invested in the Fund on December 1, 2011 and held through May 31, 2012.
The first line of the table below provides information about actual account values and actual expenses. In order to estimate the expenses a shareholder paid during the period covered by this report, shareholders can divide their account value by $1,000 (for example, an $8,600 account value divided by $1,000 = 8.6) and then multiply the result by the number in the first line under the heading entitled "Expenses Paid During the Period."
The second line of the table below provides information about hypothetical account values and hypothetical expenses based on the Fund's actual expense ratio and an assumed rate of return of 5% per year before expenses, which is not the Fund’s actual return. The hypothetical account values and expenses may not be used to estimate the actual ending account balance or expenses paid by a shareholder for the period. Shareholders may use this information to compare the ongoing costs of investing in this Fund and other funds. To do so, compare this 5% hypothetical example with the 5% hypothetical examples that appear in other funds' shareholder reports.
| | | | | | | Expenses Paid |
| | | Beginning | | Ending | | During the Period* |
| | | Account Value | | Account Value | | December 1, 2011 |
| | | December 1, 2011 | | May 31, 2012 | | to May 31, 2012 |
| |
| Actual | | $1,000.00 | | $991.43 | | $5.82 |
| |
| Hypothetical | | $1,000.00 | | $1,019.15 | | $5.91 |
| (5% annual return | | | | | | |
| before expenses) | | | | | | |
* Expenses are equal to the Fund’s annualized expense ratio of 1.17%, multiplied
by the average account value over the period, multiplied by 183/366 (to reflect
the half year period). |
Please note that the expenses shown in the table are meant to highlight your ongoing costs only and do not reflect any transactional costs, such as redemption fees or the charges assessed by Mutual Shareholder Services, LLC as described above. Therefore, the second line of the table is useful in comparing ongoing costs only, and will not help you determine the relative total costs of owning different funds. In addition, if these transactional costs were included, your costs would have been higher.
2012 Annual Report 5
| HNP Growth and Preservation Fund |
| |
| | | | Schedule of Investments |
| | | | | | May 31, 2012 |
| Shares/Principal Amount | | Fair Value | | % of Net Assets |
| EXCHANGE TRADED FUNDS | | | | | |
| 2,000 | Financial Select Sector SPDR® Fund | $ | 28,020 | | | |
| 6,170 | iShares Barclays 7-10 Year Treasury Bond Fund | | 669,754 | | | |
| 5,000 | ProShares Short 20+ Year Treasury * | | 144,500 | | | |
| 500 | SPDR® Dow Jones Industrial AverageSM ETF Trust | | 61,850 | | | |
| 2,200 | SPDR® Gold Trust * | | 333,564 | | | |
| 1,500 | SPDR® S&P 500® ETF Trust | | 197,205 | | | |
| 20,420 | Vanguard REIT Index Fund ETF Shares | | 1,276,658 | | | |
| 19,100 | Vanguard Total Stock Market Index Fund ETF Shares | | 1,286,003 | | | |
| Total for Exchange Traded Funds (Cost - $4,006,836) | | 3,997,554 | | 59.48 | % |
| EXCHANGE TRADED NOTES | | | | | |
| 2,500 | PowerShares DB Gold Short ETN * | | 31,800 | | 0.47 | % |
| Total for Exchange Traded Notes (Cost - $29,460) | | | | | |
| Total Investments (Cost - $4,036,296) | | 4,029,354 | | 59.95 | % |
| Other Assets In Excess of Liabilities | | 2,691,813 | | 40.05 | % |
| Net Assets | | $ | 6,721,167 | | 100.00 | % |
* Non-Income Producing Security.
The accompanying notes are an integral part of these
financial statements. |
2012 Annual Report 6
| HNP Growth and Preservation Fund |
| |
| Statement of Assets and Liabilities | | | |
| May 31, 2012 | | | |
| |
| Assets: | | | |
| Investment Securities at Fair Value | $ | 4,029,354 | |
| (Cost - $4,036,296) | | | |
| Cash | | 2,696,607 | |
| Receivables: | | | |
| Dividends | | 213 | |
| Total Assets | | 6,726,174 | |
| Liabilities: | | | |
| Due to Adviser | | 5,007 | |
| Total Liabilities | | 5,007 | |
| Net Assets | $ | 6,721,167 | |
| |
| Net Assets Consist of: | | | |
| Paid In Capital | $ | 6,834,502 | |
| Accumulated Realized Gain/(Loss) on Investments - Net | | (106,393 | ) |
| Unrealized Appreciation/(Depreciation) in Value of Investments | | | |
| Based on Identified Cost - Net | | (6,942 | ) |
| Net Assets, for 725,822 Shares Outstanding | $ | 6,721,167 | |
| (Unlimited shares authorized, without par value) | | | |
| Net Asset Value and Offering Price Per Share | | | |
| ($6,721,167/725,822 shares) | $ | 9.26 | |
| Redemption Price * ($9.26 x 0.98) (Note 2) | $ | 9.07 | |
| |
| Statement of Operations | | | |
| For the fiscal year ended May 31, 2012 | | | |
| |
| Investment Income: | | | |
| Dividends and Interest | $ | 17,168 | |
| Total Investment Income | | 17,168 | |
| Expenses: | | | |
| Management Fees (Note 4) | | 25,953 | |
| Service Fees (Note 4) | | 12,977 | |
| Total Expenses | | 38,930 | |
| Less: Expenses Waived (Note 4) | | (6,548 | ) |
| Net Expenses | | 32,382 | |
| |
| Net Investment Income/(Loss) | | (15,214 | ) |
| |
| Realized and Unrealized Gain/(Loss) on Investments: | | | |
| Realized Gain/(Loss) on Investments | | (107,007 | ) |
| Net Change in Unrealized Appreciation/(Depreciation) on Investments | | (6,942 | ) |
| Net Realized and Unrealized Gain/(Loss) on Investments | | (113,949 | ) |
| |
| Net Increase/(Decrease) in Net Assets from Operations | $ | (129,163 | ) |
| * Reflects a 2% redemption fee if shares are redeemed within 90 days of purchase. |
The accompanying notes are an integral part of these
financial statements. |
2012 Annual Report 7
| HNP Growth and Preservation Fund |
| |
| Statement of Changes in Net Assets | | | |
| | | 6/1/2011* | |
| | | to | |
| | | 5/31/2012 | |
| From Operations: | | | |
| Net Investment Income/(Loss) | $ | (15,214 | ) |
| Net Realized Gain/(Loss) on Investments | | (107,007 | ) |
| Change in Net Unrealized Appreciation/(Depreciation) | | (6,942 | ) |
| Increase/(Decrease) in Net Assets from Operations | | (129,163 | ) |
| From Distributions to Shareholders: | | | |
| Net Investment Income | | - | |
| Net Realized Gain from Security Transactions | | - | |
| Change in Net Assets from Distributions | | - | |
| From Capital Share Transactions: | | | |
| Proceeds From Sale of Shares | | 7,315,714 | |
| Proceeds From Redemption Fees (Note 2) | | 849 | |
| Shares Issued on Reinvestment of Dividends | | - | |
| Cost of Shares Redeemed | | (466,233 | ) |
| Net Increase/(Decrease) from Shareholder Activity | | 6,850,330 | |
| Net Increase/(Decrease) in Net Assets | | 6,721,167 | |
| Net Assets at Beginning of Period | | - | |
| Net Assets at End of Period (Including Accumulated Net Investment | | | |
| Income of $0) | $ | 6,721,167 | |
| Share Transactions: | | | |
| Issued | | 775,188 | |
| Reinvested | | - | |
| Redeemed | | (49,366 | ) |
| Net Increase in Shares | | 725,822 | |
| Shares Outstanding Beginning of Period | | - | |
| Shares Outstanding End of Period | | 725,822 | |
| |
| Financial Highlights | | | |
| Selected data for a share outstanding throughout the period: | | 6/1/2011* | |
| | | to | |
| | | 5/31/2012 | |
| Net Asset Value - | | | |
| Beginning of Period | $ | 10.00 | |
| Net Investment Loss (a) (d) | | (0.05 | ) |
| Net Gain/(Loss) on Securities | | | |
| (Realized and Unrealized) | | (0.69 | ) |
| Total from Investment Operations | | (0.74 | ) |
| Distributions (From Net Investment Income) | | - | |
| Distributions (From Realized Capital Gains) | | - | |
| Total Distributions | | - | |
| Proceeds from Redemption Fee (Note 2) | | - | + |
| Net Asset Value - | | | |
| End of Period | $ | 9.26 | |
| Total Return(b) | | (7.40 | )% |
| Ratios/Supplemental Data | | | |
| Net Assets - End of Period (Thousands) | $ | 6,721 | |
| Before Reimbursement | | | |
| Ratio of Expenses to Average Net Assets (c) | | 1.50 | % |
| Ratio of Net Investment Income/(Loss) to Average Net Assets (c) (d) | | (0.84 | )% |
| After Reimbursement | | | |
| Ratio of Expenses to Average Net Assets (c) | | 1.24 | % |
| Ratio of Net Investment Income/(Loss) to Average Net Assets (c) (d) | | (0.58 | )% |
| Portfolio Turnover Rate | | 240.79 | % |
* Commencement of Operations. + Amount calculated is less than $0.005.
(a) Per share amounts were calculated using the average shares method. (b) Total return in the above
table represents the rate that the investor would have earned or lost on an investment in the Fund assum-
ing reinvestment of dividends and distributions. (c) These ratios exclude the impact of expenses of
the underlying security holdings listed in the Schedule of Investments. (d) Recognition of net invest-
ment income/(loss) by the Fund is affected by the timing of the declaration of dividends by the underlying
security holdings listed on the Schedule of Investments. |
The accompanying notes are an integral part of these
financial statements. |
2012 Annual Report 8
NOTES TO FINANCIAL STATEMENTS
HNP GROWTH AND PRESERVATION FUND
May 31, 2012
1.) ORGANIZATION:
HNP Growth and Preservation Fund (the “Fund”) was organized as a non-diversified series of the PFS Funds (the “Trust”) on May 24, 2011. The Trust was established under the laws of Massachusetts by an Agreement and Declaration of Trust dated January 13, 2000, which was amended and restated as of January 20, 2011. Prior to March 5, 2010, the Trust was named Wireless Fund. The Trust is registered as an open-end investment company under the Investment Company Act of 1940, as amended (the “1940 Act”). The Trust may offer an unlimited number of shares of beneficial interest in a number of separate series, each series representing a distinct fund with its own investment objectives and policies. As of May 31, 2012, there were nine series authorized by the Trust. The Fund commenced operations on June 1, 2011. The Fund's investment objective is to seek long-term capital appreciation, with a secondary emphasis on capital preservation. The investment adviser to the Fund is HNP Capital Fund Management Group, LLC (the “Adviser”). Significant accounting policies of the Fund are presented in Note 2 below.
2.) SIGNIFICANT ACCOUNTING POLICIES:
SECURITY VALUATION:
All investments in securities are recorded at their estimated fair value, as described in Note 3.
SHARE VALUATION:
The net asset value (the “NAV”) is generally calculated as of the close of trading on the New York Stock Exchange (normally 4:00 p.m. Eastern time) every day the Exchange is open. The NAV is calculated by taking the total value of the Fund’s assets, subtracting its liabilities, and then dividing by the total number of shares outstanding, rounded to the nearest cent. The offering price and redemption price per share is equal to the net asset value per share, except that shares of the Fund are subject to a redemption fee of 2% if redeemed within 90 days of purchase. During the fiscal year ended May 31, 2012, proceeds from redemption fees were $849.
FEDERAL INCOME TAXES:
The Fund’s policy is to continue to comply with the requirements of the Internal Revenue Code that are applicable to regulated investment companies and to distribute all of its taxable income to shareholders. The Fund also intends to distribute sufficient net investment income and net capital gains, if any, so that it will not be subject to excise tax on undistributed income and gains. Therefore, no federal income tax or excise provision is required. The Fund initially elected a tax year end of November 30. Beginning with the current period ended May 31, 2012, the Fund has changed its election so that the tax year end is May 31.
The Fund recognizes the tax benefits of certain tax positions only where the position is “more likely than not” to be sustained assuming examination by tax authorities. Management has analyzed the Fund’s tax positions, and has concluded that no liability for unrecognized tax benefits should be recorded related to uncertain tax positions taken or expected to be taken in the Fund’s 2011 tax returns. The Fund identifies its major tax jurisdictions as U.S. Federal tax authorities; however the Fund is not aware of any tax positions for which it is reasonably possible that the total amounts of unrecognized tax benefits will change materially in the next twelve months. The Fund recognizes interest and penalties, if any, related to unrecognized tax benefits as income tax expense in the Statement of Operations. During the fiscal year ended May 31, 2012, the Fund did not incur any interest or penalties.
DISTRIBUTIONS TO SHAREHOLDERS:
Distributions to shareholders, which are determined in accordance with income tax regulations, are recorded on the ex-dividend date.
The treatment for financial reporting purposes of distributions made to shareholders during the year from net investment income or net realized capital gains may differ from their ultimate treatment for federal income tax purposes. These differences are caused primarily by differences in the timing of the recognition of certain components of income, expense, or realized capital gain for federal income tax purposes. Where such differences are permanent in nature, they are reclassified in the components of the net assets based on their ultimate characterization for federal income tax purposes. Any such reclassifications will have no effect on net assets, results of operations, or net asset value per share of the Fund. At November 30, 2011 (the Fund’s previously elected tax year end), the net impact of permanent book to tax adjustments resulted in net investment loss in the amount of $5,757 to be reclassified to paid-in capital. At May 31, 2012 (the
2012 Annual Report 9
Notes to Financial Statements - continued
Fund’s currently elected tax year end), the net impact of permanent book to tax adjustments resulted in an increase to net investment loss of $9,457, an increase to net accumulated realized gain/(loss) on investments of $614, and a decrease to paid in capital of $10,071. The reclassifications were primarily related to the reclassification of net investment loss and tax treatment related to grantor trusts.
USE OF ESTIMATES:
The preparation of financial statements in conformity with accounting principles generally accepted in the United States (“GAAP”) requires management to make estimates and assumptions that affect the reported amounts of assets and liabilities and disclosure of contingent assets and liabilities at the date of the financial statements and the reported amounts of increases and decreases in net assets from operations during the reporting period. Actual results could differ from those estimates.
EXPENSES:
Expenses incurred by the Trust that do not relate to a specific fund of the Trust are allocated to the individual funds based on each fund’s relative net assets or another appropriate basis.
OTHER:
The Fund records security transactions based on a trade date. Dividend income is recognized on the ex-dividend date, and interest income is recognized on an accrual basis. Discounts and premiums on securities purchased are accreted and amortized over the lives of the respective securities. Withholding taxes on foreign dividends have been provided for in accordance with the Fund’s understanding of the applicable country’s tax rules and rates.
3.) INVESTMENT SECURITIES VALUATION
The Fund utilizes various methods to measure the fair value of most of its investments on a recurring basis. GAAP establishes a hierarchy that prioritizes inputs to valuation methods. The three levels of inputs are:
Level 1 - Unadjusted quoted prices in active markets for identical assets or liabilities that the Fund has the ability to access.
Level 2 - Inputs other than quoted prices included in level 1 that are observable for the asset or liability, either directly or indirectly. These inputs may include quoted prices for the identical instrument on an inactive market, prices for similar instruments, interest rates, prepayment speeds, credit risk, yield curves, default rates and similar data.
Level 3 - Unobservable inputs for the asset or liability, to the extent relevant observable inputs are not available, representing the Fund’s own assumptions about the assumptions a market participant would use in valuating the asset or liability, and would be based on the best information available.
The availability of observable inputs can vary from security to security and is affected by a wide variety of factors, including, for example, the type of security, whether the security is new and not yet established in the marketplace, the liquidity of markets, and other characteristics particular to the security. To the extent that valuation is based on models or inputs that are less observable or unobservable in the market, the determination of fair value requires more judgment. Accordingly, the degree of judgment exercised in determining fair value is greatest for instruments categorized in level 3.
The inputs used to measure fair value may fall into different levels of the fair value hierarchy. In such cases, for disclosure purposes, the level in the fair value hierarchy within which the fair value measurement falls in its entirety, is determined based on the lowest level input that is significant to the fair value measurement in its entirety.
FAIR VALUE MEASUREMENTS
A description of the valuation techniques applied to the Fund’s major categories of assets and liabilities measured at fair value on a recurring basis follows:
Equity securities (exchange traded funds and exchange traded notes). Equity securities that are traded on any exchange or on the NASDAQ over-the-counter market are valued at the last quoted sale price. Lacking a last sale price, a long security is valued at its last bid price except when, in the Adviser's opinion, the last bid price does not accurately reflect the current value of the long security. To the extent these securities are actively traded and valuation adjustments are not
2012 Annual Report 10
Notes to Financial Statements - continued
applied, they are classified in level 1 of the fair value hierarchy. When market quotations are not readily available, when the Adviser determines the last bid price does not accurately reflect the current value or when restricted securities are being valued, such securities are valued as determined in good faith by the Adviser, in conformity with guidelines adopted by and subject to review of the Board of Trustees (the “Trustees”) and are categorized in level 2 or level 3, when appropriate.
In accordance with the Trust's good faith pricing guidelines, the Adviser is required to consider all appropriate factors relevant to the value of securities for which it has determined other pricing sources are not available or reliable as described above. There is no single standard for determining fair value, since fair value depends upon the circumstances of each individual case. As a general principle, the current fair value of an issue of securities being valued by the Adviser would appear to be the amount which the owner might reasonably expect to receive for them upon their current sale. Methods which are in accordance with this principle may, for example, be based on (i) a multiple of earnings; (ii) a discount from market of a similar freely traded security (including a derivative security or a basket of securities traded on other markets, exchanges or among dealers); or (iii) yield to maturity with respect to debt issues, or a combination of these and other methods.
The following table summarizes the inputs used to value the Fund’s assets measured at fair value as of May 31, 2012:
| Valuation Inputs of Assets | | Level 1 | | Level 2 | | Level 3 | | Total |
| Exchange Traded Funds | | $3,997,554 | | $0 | | $0 | | $3,997,554 |
| Exchange Traded Notes | | 31,800 | | 0 | | 0 | | 31,800 |
| Total | | $4,029,354 | | $0 | | $0 | | $4,029,354 |
The Fund did not hold any Level 3 assets during the fiscal year ended May 31, 2012. There were no transfers into or out of the levels during the fiscal year ended May 31, 2012. It is the Fund’s policy to consider transfers into or out of the levels as of the end of the reporting period.
The Fund did not invest in derivative instruments during the fiscal year ended May 31, 2012.
4.) INVESTMENT ADVISORY AGREEMENT AND SERVICES AGREEMENT
The Fund has entered into an investment advisory agreement (“Management Agreement”) with the Adviser. The Adviser manages the investment portfolio of the Fund, subject to policies adopted by the Trust's Board of Trustees, and, at its own expense and without reimbursement from the Trust, furnishes office space and all necessary office facilities, equipment and executive personnel necessary for managing the Fund. For its services, the Adviser received an investment management fee equal to 1.00% of the average daily net assets of the Fund.
Under the terms of the Services Agreement between the Trust and the Adviser (the "Services Agreement"), the Adviser renders administrative and supervisory services to the Fund, provides the services of a chief compliance officer and assumes and pays all ordinary expenses of the Fund, excluding management fees, brokerage fees and commissions, taxes, borrowing costs (such as (a) interest and (b) dividend expenses on securities sold short), acquired fund fees and expenses, extraordinary or non-recurring expenses. For its services, the Adviser receives a service fee equal to 0.50% of the average daily net assets of the Fund. Effective February 16, 2012, the Adviser has contractually agreed to waive the 0.50% fees payable to it under the Services Agreement until September 30, 2013. The Services Agreement fee waiver will automatically terminate on September 30, 2013 unless it is renewed. The Adviser may not terminate the fee waiver before September 30, 2013.
For the fiscal year ended May 31, 2012, the Adviser earned management fees totaling $25,953. For the same period, the Adviser earned Services Agreement fees of $12,977 before the waiver of Services Agreement fees described above, which amounted to $6,548 for the fiscal year ended May 31, 2012. At May 31, 2012, $5,007 was due to the Adviser as a result of fees earned under the Management Agreement and Services Agreement, net of the waiver.
5.) RELATED PARTY TRANSACTIONS
A control person of Premier Fund Solutions, Inc. (the “Administrator”) also serves as trustee/officer of the Fund. This individual receives benefits from the Administrator resulting from administration fees paid to the Administrator of the Fund by the Adviser. Mr. Ross C. Provence is the father of Mr. Jeffrey R. Provence.
2012 Annual Report 11
Notes to Financial Statements - continued
The Trustees who are not interested persons of the Fund were paid a total of $2,250 in Trustees’ fees for the fiscal year ended May 31, 2012 by the Adviser.
6.) INVESTMENT TRANSACTIONS
For the fiscal year ended May 31, 2012, purchases and sales of investment securities other than U.S. Government obligations and short-term investments aggregated $7,684,531 and $3,541,228, respectively. Purchases and sales of U.S. Government obligations aggregated $0 and $0, respectively.
7.) CAPITAL SHARES
The Trust is authorized to issue an unlimited number of shares. Paid in capital at May 31, 2012 was $6,834,502, representing 725,822 shares outstanding.
8.) DISTRIBUTIONS TO SHAREHOLDERS
There were no distributions paid during the fiscal year ended May 31, 2012.
9.) FEDERAL TAX INFORMATION
For Federal income tax purposes, the cost of securities owned at May 31, 2012 was $4,073,003.
At May 31, 2012, the composition of gross unrealized appreciation (the excess of value over tax cost) and depreciation (the excess of tax cost over value) of investments on a tax basis was as follows:
| | Appreciation | | (Depreciation) | | Net Appreciation (Depreciation) | |
| | $85,791 | | ($129,440) | | ($43,649) | |
As of May 31, 2012, the components of distributable earnings/(accumulated losses) on a tax basis were as follows:
| Accumulated losses | $ | (69,686 | ) |
| Unrealized appreciation/(depreciation) - net | | (43,649 | ) |
| | $ | (113,335 | ) |
The differences between book basis unrealized appreciation are primarily attributable to the tax deferral of losses on wash sales and grantor trusts, as well as the tax deferral of post-October losses of $25,724.
As of May 31, 2012, the Fund’s tax year end, the Fund had available for federal purposes an unused short-term capital loss carryforward of $69,686, which may be used to offset future short-term capital gains and has no expiration. To the extent these carryforwards are used to offset future capital gains, it is probable that the amount that is offset will not be distributed to shareholders.
2012 Annual Report 12
Cohen Fund Audit Services, Ltd.
Certified Public Accountants | 800 Westpoint Pkwy, Ste 1100
Westlake, Ohio 44145
Phone: (440) 835-8500
Fax: (440) 835-1093
www.cohenfund.com |
REPORT OF INDEPENDENT REGISTERED PUBLIC ACCOUNTING FIRM
To the Shareholders and Board of Trustees
HNP Growth and Preservation Fund
(a series of PFS Funds)
We have audited the accompanying statement of assets and liabilities, including the schedule of investments, of HNP Growth and Preservation Fund (the "Fund"), a series of PFS Funds, as of May 31, 2012, and the related statements of operations and changes in net assets, and the financial highlights for the year then ended. These financial statements and financial highlights are the responsibility of Fund management. Our responsibility is to express an opinion on these financial statements and financial highlights based on our audit.
We conducted our audit in accordance with the standards of the Public Company Accounting Oversight Board (United States). Those standards require that we plan and perform the audit to obtain reasonable assurance about whether the financial statements and financial highlights are free of material misstatement. An audit includes examining, on a test basis, evidence supporting the amounts and disclosures in the financial statements. Our procedures included confirmation of securities owned as of May 31, 2012, by correspondence with the custodian. An audit also includes assessing the accounting principles used and significant estimates made by management, as well as evaluating the overall financial statement presentation. We believe that our audit provides a reasonable basis for our opinion.
In our opinion, the financial statements and financial highlights referred to above present fairly, in all material respects, the financial position of HNP Growth and Preservation Fund as of May 31, 2012, the results of its operations, the changes in its net assets, and the financial highlights for the year ended May 31, 2012, in conformity with accounting principles generally accepted in the United States of America.

COHEN FUND AUDIT SERVICES, LTD.
Westlake, Ohio
July 27, 2012
2012 Annual Report 13
Trustees and Officers
(Unaudited)
The Board of Trustees supervises the business activities of the Trust. The names of the Trustees and executive officers of the Trust are shown below. For more information regarding the Trustees, please refer to the Statement of Additional Information, which is available upon request by calling 800.590.0898. Each Trustee serves until the Trustee sooner dies, resigns, retires, or is removed.
The Trustees and Officers of the Trust and their principal business activities during the past five years are:
Interested Trustees and Officers
| | | | | Number of | Other |
| | | | Principal | Portfolios In | Directorships |
| Name, | Position(s) | Term of Office | Occupation(s) | Fund | Held By |
| Address(1), | Held With | and Length of | During | Complex | Trustee or |
| and Year of Birth | the Trust | Time Served | Past 5 Years | Overseen By | Officer |
| | | | | Trustee | |
| |
| Ross C. Provence(2), | Trustee | Indefinite Term; | General Partner and Portfolio | 9 | Blue Chip |
| Year of Birth: 1938 | and | Since 2000 | Manager for Value Trend Capital | | Investor Funds |
| | President | | Management, LP (1995 to current). | | |
| | | | Estate planning attorney (1963 to | | |
| current). |
| |
| Jeffrey R. Provence(2), | Trustee, | Indefinite Term; | General Partner and Portfolio | 9 | Blue Chip |
| Year of Birth:1969 | Secretary | Since 2000 | Manager for Value Trend Capital | | Investor Funds, |
| | and | | Management, LP (1995 to current). | | Sycuan Funds, |
| | Treasurer | | CEO, Premier Fund Solutions, Inc. | | Private Asset |
| | | | (2001 to current). | | Management |
| | | | | | Fund |
| Julian G. Winters, | Chief | Chief | Managing Member, Watermark | | |
| Year of Birth: 1968 | Compliance | Compliance | Solutions LLC (investment compli- | N/A | N/A |
| | Officer | Officer Since | ance and consulting) since 3/07; | | |
| | | 2010 | previously, Vice President of | | |
| | | | Compliance Administration, The | | |
| | | | Nottingham Company (investment | | |
| | | | company administrator and fund | | |
| | | | accountant), 3/98-3/07. | | |
(1) The address of each trustee and officer is c/o PFS Funds, 1939 Friendship Drive, Suite C, El Cajon, California 92020.
(2) Trustees who are considered "interested persons" as defined in Section 2(a)(19) of the Investment Company Act of 1940 by virtue of their affiliation with the Investment Adviser.
Independent Trustees
| | | | | Number of | Other |
| | | | Principal | Portfolios In | Directorships |
| Name, | Position | Term of Office | Occupation(s) | Fund | Held By |
| Address(1), | Held With | and Length of | During | Complex | Trustee or |
| and Year of Birth | the Trust | Time Served | Past 5 Years | Overseen By | Officer |
| | | | | Trustee | |
| |
| Thomas H. Addis III, | Independent | Indefinite Term; | Executive Director/CEO, Southern | 9 | None |
| Year of Birth: 1945 | Trustee | Since 2000 | California PGA (2006 to current). | | |
| |
| Allen C. Brown, | Independent | Indefinite Term; | Co-owner of Stebleton & Brown | 9 | Blue Chip |
| Year of Birth: 1943 | Trustee | Since 2010 | (1994 to Current). Estate planning | | Investor Funds,�� |
| | | | and business attorney (1970 to cur- | | Sycuan Funds |
| rent). |
| |
| George Cossolias, CPA, | Independent | Indefinite Term; | Owner of George Cossolias & | 9 | Blue Chip |
| Year of Birth: 1935 | Trustee | Since 2000 | Company, CPAs (1972 to current). | | Investor Funds, |
| | | | President of Lubrication Specialists, | | Sycuan Funds, |
| | | | Inc. (1996 to current). | | Temecula |
| | | | | | Valley Bank |
(1) The address of each trustee and officer is c/o PFS Funds, 1939 Friendship Drive, Suite C, El Cajon, California 92020.
2012 Annual Report 14
Investment Adviser
HNP Capital Fund Management Group, LLC
Legal Counsel
The Law Offices of John H. Lively & Associates, Inc.
A member firm of The 1940 Act Law GroupTM
Custodian
US Bank, N.A.
Distributor
Rafferty Capital Markets, LLC
Dividend Paying Agent,
Shareholders' Servicing Agent,
Transfer Agent
Mutual Shareholder Services, LLC
Fund Administrator
Premier Fund Solutions, Inc.
Independent Registered Public Accounting Firm
Cohen Fund Audit Services, Ltd. |
This report is provided for the general information of the shareholders of the HNP
Growth and Preservation Fund. This report is not intended for distribution to prospective
investors in the Fund, unless preceded or accompanied by an effective prospectus. |
HNP Growth and Preservation Fund
150 Allens Creek Road
Rochester, New York 14618
www.hnpcapitalfmg.com
1-866-694-6672
Item 2. Code of Ethics.
The registrant has adopted a code of ethics that applies to the registrant’s principal executive officer and the principal financial officer. The registrant has not made any amendments to its code of ethics during the covered period. The registrant has not granted any waivers from any provisions of the code of ethics during the covered period. A copy of the registrant’s Code of Ethics is filed herewith.
Item 3. Audit Committee Financial Expert.
The registrant’s Board of Trustees has determined that George Cossolias is an audit committee finical expert. Mr. Cossolias is independent for purposes of this Item 3.
Item 4. Principal Accountant Fees and Services.
(a-d) The following table details the aggregate fees billed for each of the last two fiscal years for audit fees, audit-related fees, tax fees and other fees by the principal accountant to the registrant. The principal accountant has provided no services to the adviser or any entity controlled by, or under common control with the adviser that provides ongoing services to the registrant.
| | | FYE 5/31/12 |
| Audit Fees | | $12,500 |
| Audit-Related Fees | | $0 |
| Tax Fees | | $4,000 |
| All Other Fees | | $750 |
Nature of Tax Fees: preparation of Excise Tax Statement and 1120 RIC. Nature of All Other Fees: Review of Semi-Annual Report.
(e) (1) The audit committee approves all audit and non-audit related services and, therefore, has not adopted pre-approval policies and procedures described in paragraph (c)(7) of Rule 2-01 of Regulation S-X.
(e) (2) None of the services described in paragraph (b) through (d) of this Item were approved by the audit committee pursuant to paragraph (c)(7)(i)(C) of Rule 2-01 of Regulation S-X.
(f) All of the principal accountant’s hours spent on auditing the registrant’s financial statements were attributed to work performed by full-time permanent employees of the principal accountant.
(g) The following table indicates the aggregate non-audit fees billed by the registrant’s principal accountant for services to the registrant , the registrant’s investment adviser (not sub-adviser), and any entity controlling, controlled by, or under common control with the adviser that provides ongoing services to the registrant, for the last two years.
| Non-Audit Fees | | FYE 5/31/12 |
| Registrant | | $4,750 |
| Registrant’s Investment Adviser | | $0 |
(h) The principal accountant provided no services to the investment adviser or any entity controlling, controlled by, or under common control with the adviser that provides ongoing services to the registrant.
Item 5. Audit Committee of Listed Companies. Not applicable.
Item 6. Schedule of Investments. Schedule filed with Item 1.
Item 7. Disclosure of Proxy Voting Policies and Procedures for Closed-End Management Investment Companies. Not applicable.
Item 8. Portfolio Managers of Closed End Management Investment Companies. Not applicable.
Item 9. Purchases of Equity Securities by Closed-End Management Investment Companies and Affiliated Purchasers. Not applicable.
Item 10. Submission of Matters to a Vote of Security Holders.
The registrant has not adopted procedures by which shareholders may recommend nominees to the registrant’s board of trustees.
Item 11. Controls and Procedures.
(a) The registrant’s president and chief financial officer concluded that the disclosure controls and procedures (as defined in Rule 30a-3(c) under the Investment Company Act of 1940 (the “Act”)) were effective as of a date within 90 days of the filing date of this report, based on the evaluation of these controls and procedures required by Rule 30a-3(b) under the Act.
(b) There were no changes in the registrant’s internal control over financial reporting (as defined in Rule 30a-3(d) under the Act) that occurred during the registrant’s second fiscal quarter of the period covered by this report that have materially affected, or are reasonably likely to materially affect, the registrant’s internal control over financial reporting.
Item 12. Exhibits.
(a)(1) Code of Ethics. Filed herewith.
(a)(2) Certifications pursuant to Section 302 of the Sarbanes-Oxley Act of 2002. Filed herewith.
(b) Certification pursuant to Section 906 Certification of the Sarbanes-Oxley Act of 2002. Filed herewith.
SIGNATURES
Pursuant to the requirements of the Securities Exchange Act of 1934 and the Investment Company Act of 1940, the registrant has duly caused this report to be signed on its behalf by the undersigned, thereunto duly authorized.
| | By: /s/Ross C. Provence
Ross C. Provence
President |
Pursuant to the requirements of the Securities Exchange Act of 1934 and the Investment Company Act of 1940, this report has been signed below by the following persons on behalf of the registrant and in the capacities and on the dates indicated.
| | By: /s/Ross C. Provence
Ross C. Provence
President |
| | By: /s/Jeffrey R. Provence
Jeffrey R. Provence
Chief Financial Officer |