UNITED STATES
SECURITIES AND EXCHANGE COMMISSION
WASHINGTON, D.C. 20549
FORM N-CSR
CERTIFIED SHAREHOLDER REPORT OF REGISTERED MANAGEMENT
INVESTMENT COMPANIES
Investment Company Act file number 811-09781
PFS FUNDS
(Exact name of registrant as specified in charter)
| 1939 Friendship Drive, Suite C | |
| El Cajon, CA | 92020 |
| (Address of principal executive offices) | (Zip code) |
CT Corporation System
155 Federal St., Suite 700,
Boston, MA 02110
(Name and address of agent for service)
Registrant's telephone number, including area code: (619) 588-9700
Date of fiscal year end: November 30
Date of reporting period: November 30, 2012
Form N-CSR is to be used by management investment companies to file reports with the Commission not later than 10 days after the transmission to stockholders of any report that is required to be transmitted to stockholders under Rule 30e-1 under the Investment Company Act of 1940 (17 CFR 270.30e -1). The Commission may use the information provided on Form N-CSR in its regulatory, disclosure review, inspection and policymaking roles.
A registrant is required to disclose the information specified by Form N-CSR, and the Commission will make this information public. A registrant is not required to respond to the collection of information contained in Form N-CSR unless the Form displays a currently valid Office of Management and Budget ("OMB") control number. Please direct comments concerning the accuracy of the information collection burden estimate and any suggestions for reducing the burden to Secretary, Securities and Exchange Commission, 450 Fifth Street, NW, Washington, DC 20549-0609. The OMB has reviewed this collection of information under the clearance requirements of 44 U.S.C. § 3507.
Item 1. Reports to Stockholders.
Christopher Weil & Company Core Investment Fund
Ticker CWCFX
Christopher Weil & Company Global Dividend Fund
Ticker CWGDX
For Investors Seeking Long-Term Capital Appreciation
ANNUAL REPORT
November 30, 2012
| Table of Contents |
| |
| |
| |
| CHRISTOPHER WEIL & COMPANY FUNDS | |
| |
| Letters to Shareholders | 2 |
| Sector Allocation | 6 |
| Performance Information | 7 |
| Schedules of Investments | 9 |
| Statements of Assets and Liabilities | 14 |
| Statements of Operations | 14 |
| Statements of Changes in Net Assets | 15 |
| Financial Highlights | 16 |
| NOTES TO FINANCIAL STATEMENTS | 17 |
| DISCLOSURE OF EXPENSES | 24 |
| ADDITIONAL INFORMATION | 26 |
| REPORT OF INDEPENDENT REGISTERED PUBLIC ACCOUNTING FIRM | 27 |
| TRUSTEES & OFFICERS | 28 |
2012 Annual Report 1
Christopher Weil & Company Core Investment Fund
Market and Investment Commentary for 2012
Investment Summary
Our portfolio underperformed the S&P 500 in 2012 due to a variety of factors. The use of hedging strategies, cash drag, and underweighting asset classes were the primary reasons for our underperformance. We purchased S&P 500 put options to protect the portfolio against declines in June as we were concerned markets may continue to react negatively to problems in Europe and China. However the option protection was ultimately unnecessary as the market did not decline enough at any point in the year to profit from the put options. We sold call options against positions and sectors we felt were vulnerable to downside risk due to potential short-term earnings disappointments or whose stock prices we believed were temporarily over-priced when compared to fundamental metrics we follow. The call options provided some dampening of volatility for the fund but ultimately provided little profit. There were times when we were not fully invested in the fund throughout the year. As the fund's assets were growing quickly at the beginning of the year, we chose to deploy new investments at a slow and measured pace. In retrospect this was not optimal as the U.S. markets in the first quarter of the year were robust. Finally, we were underweight the financial sector the entire year, specifically U.S. banks and insurance companies, which turned out to be one of year's strongest sectors.
Themes of 2012
2012 was characterized as a year of tension and uncertainty as we saw the European debt crisis continue to unfold, and a seemingly endless period of political gridlock took hold in the U.S. Yet, at the same time, we saw a positive turn in the housing market, helped by accommodative monetary policy and by an improving economy. As the year began, the markets were in a process of recovering from the high volatility of 2011, and those that had been hardest hit, particularly financials and consumer discretionary, tended to outperform. Stocks in the materials segment tended to underperform due to decreased emerging market demand. Energy and utilities performed the worst.
Economic Growth and Uncertainty
The absolute performance of the portfolio corresponds highly with strength in both the U.S. economy as well as the global economy. The economy has been showing signs of improvement despite the uncertainties surrounding the "Fiscal Cliff" (really "Fiscal Cliffs" as additional cliffs must be faced in 2013) and the recession in Europe. Employment has been growing, albeit slowly, and the housing market is showing many signs of strength both in housing prices and homebuilding. Somewhat lower gasoline prices and low mortgage interest rates have helped put more money in the consumer's pocket. The Federal Reserve has clearly shown that it will continue with quantitative easing until it sees signs of economic improvement and/or inflation. Employment could drop, however if the government does not resolve the ongoing budget crisis in a timely manner or if Europe continues to worsen. Even in those negative scenarios, however, the Fed's bond buying has pushed interest rates low enough that the housing sector should remain strong even if unemployment rises slightly, and we believe strength from this sector has provided a boost to the overall economy.
European Crisis
Europe continues to be an area of great concern. The European financial crisis has had a large, negative effect on equities markets. When selecting stocks, we did weigh negative exposure to Europe. The recession may last well into next year in many countries, and the pain will be experienced to at least some degree throughout the European Union and not just the PIIGS (Portugal, Ireland, Italy, Greece and Spain) economies. There appears to be a slight shift in consensus away from harsh austerity policies, but there is not really a foreseeable end to Europe's woes as long as the rift between Germany and the peripheral countries remains so large. This situation is not positive for U.S. markets, but it may not be devastating either as the U.S. does not rely very heavily on European imports. Should this crisis turn into a banking crisis caused by sovereign defaults, U.S. financial firms could also be hurt, but they are less vulnerable than they were in 2008.
China
China has been a large driver of the global economy. Companies, including many of those in the fund, have derived large amounts of revenue growth from there. The days of double digit growth in China may be coming to an end, but the country's economy still appears vibrant. A shift to consumption could benefit U.S. exporters, and less emphasis on infrastructure could dampen demand for commodities (bad for some firms, but good for the U.S. in general). China
2012 Annual Report 2
may have begun to exhaust its supply of cheap, rural labor, and many low wage industries may now look towards Vietnam and India as alternatives. In fact, even developed countries such as the U.S. are seeing jobs come back from China (as shown by Apple now building computers in the U.S.).
Oil
The price of oil has a direct positive effect on energy stocks and an indirect negative effect on the stocks of companies that consume it or rely on those who do. Therefore, we watch it closely and have aimed to mitigate the effect of a price shock. The European slump and Chinese slowdown have helped keep oil prices from rising too high in the face of Iranian sanctions. Gasoline prices have decreased in the past few months, but they have still risen much more rapidly than inflation over the past decade. North America is increasing production due to new techniques applicable to harvesting shale oil and oil sands. There will continue to be great battles between environmentalists and oil producers over development of these resources.
Investment Summary
Despite uncertainties and slowing earnings growth, we believe equities are still attractively priced. With bond yields for both investment grade and high yield at such low levels, the equity risk to reward calculation is favorable for investors who can tolerate short to medium term volatility. Corporations have been cautiously improving their balance sheets and are much more able to handle shocks than in times past. We continue to believe that well managed companies will continue to lead their industries, take market share, and grow earnings. Investors in well run companies should continue to profit over the longer term. We seek to buy companies that we hope will deliver outsized positive returns over the long term. We may employ some hedging strategies if necessary to weather more volatile times. While we do look to macro trends for guidance, we should note that our methodology is fundamentally bottom up. We rigorously screen through the investable universe for stocks that have strong balance sheets and income statements along with positive track records and likely potential for growth. The search for good value remains a top priority as we believe that even a great company can trade for too high a price, and even a mediocre one might trade below its intrinsic value. We look for stocks that will outperform over the next few years and mostly shun short term plays, maintaining a mix of stocks of varied sectors, market capitalization, and anticipated volatility.
Christopher Weil, Chairman & John Wells, President/CEO
Christopher Weil & Company, Inc., Investment Advisor
2012 Annual Report 3
Christopher Weil & Co. Global Dividend Fund
Market and Investment Commentary for 2012
The Christopher Weil & Co. Global Dividend Fund (the "Fund") had a total return of 10.5% from inception on December 21, 2011 to November 30, 2012, compared to 15.8% for the MSCI ACWI Index. On November 30th, the Fund had net assets of $24.5 million with a net cash position of 7.3% .
The Market Commentary
During the 12-month period ending November 30, 2012, the MSCI ACWI Index rose 14.0% with the S&P 500 also exhibiting strong growth by climbing 16.1% . The primary equity markets of Germany, France, and Hong Kong continued their strong run for the year, up 27%, 22%, and 25% respectively. Spain dragged with -3% return while Japan trailed the strong performers with an 8% return.
Equity valuations have declined to low levels: MSCI EAFE, the international benchmark, traded at 12 times trailing earnings on September 30, 2012, while the S&P 500 traded at 14 times, and the Dow Jones Euro at 10 times. Low valuations have historically been associated with attractive subsequent long-term returns.
Investment Strategy
Our longstanding approach to investing remains unchanged. Soledad Investment Management, the sub-adviser to the Fund, utilizes a long-term oriented buy-and-hold value philosophy in picking stocks for the Fund. We are a bottom-up manager, looking first at the fundamentals of a company. As such, we are typically suspicious of sensational headlines, and we see market turmoil and declines in investor sentiment as opportunities to invest in established businesses at attractive valuations.
Though general investor sentiment is outside of our control, selecting companies with reasonable income generation capability is absolutely within our focus. Given the current low bond yield environment, combined with the retiring Boomer generation (2012 marks the first wave of Boomer retirement), we strongly believe global dividends will play a key role in investor portfolios going forward. Investing outside of the U.S. allows investors to access a large universe of stocks. Also, the IMF projected global GDP growth to 2016 will primarily come from outside of the U.S. Furthermore, investing in dividend-paying stocks has many benefits. Not only do dividends provide income, dividend-paying stocks also have the potential to retain their value better than other stocks during downturns, as investors flock to them to seek attractive yields. In fact, for the last 80 years, dividends accounted for roughly 45% of the S&P 500's total return. Lastly, dividend-paying stocks can be attractive during low yield environments, especially as the Baby Boomers start retiring.
We have assembled a diversified portfolio of compelling investments trading below our estimate of their intrinsic value while paying healthy dividends. We remain confident in the long-run outlook for the Fund.
Our assessment of some leading contributors to and leading detractors from the Fund's 12-month performance follows.
Strong Performers: Diageo, PLC and Huaneng Power International
Diageo, PLC (2.1% of the Fund on November 30th) and Huaneng Power International (1.7%) helped the Fund's result in the year.
Diageo, the world's premier spirits company with a distribution network that spans 180 countries, ended the year up 45%. The Company has a long record of growth with strong market share positions in the emerging markets like China. It is poised to continue to grow along with the rise of disposable income of the emerging markets.
Huaneng Power International, one of the largest independent power producers in China, rose 63% during the period. Huaneng Power International is primarily a thermal coal power producer and, with the collapse of global coal prices this year, has enjoyed an increase in profit margin. During the period, we pared back our allocation to Huaneng to take advantage of other opportunities.
2012 Annual Report 4
Weak Performers: Telefonica and France Telecom
Telefonica (3.1% of the Fund on November 30) and France Telecom (1.9%) both hurt results during the period. Telefonica, one of the largest telecom companies in the world and the dominant provider in Spain and Czech Republic, was down 21%. It is also the second largest provider in the U.K. and has a substantial operation in Latin America. France Telecom, France's incumbent telephone service provider, was down 29%. While both companies' operating results were dragged down by the ongoing European economic slowdown, we believe the firms are well positioned for eventual recovery. In addition, both are trading at or near historic lows while also providing strong dividend yields.
Summary
We believe the global economic environment will continue to be mired in ambiguity and volatility as policymakers struggle to move the global recovery forward. Patient long-term investors should be able to take advantage of the volatility to find compelling investments. Global equity markets are trading at compelling valuations as concerns about the course of the world economy weigh on investors. That said, we note that many of our holdings are in better shape today than several years ago. We believe this will allow our portfolio companies to withstand an uncertain environment and opportunistically take advantage of unique situations to build long-term value. As the macro economic conditions seek direction, we will continue to keep our focus on finding undervalued companies with strong fundamentals and above market dividend yield, while being cognizant of the macro uncertainties. Given the low valuations of equity markets, we continue to believe that now is a compelling time to invest in equities.
Thank you for your continued confidence in our firm. As always, we welcome your comments and questions.
Louie Nguyen, Managing Member/Chief Investment Officer
Soledad Investment Management, Sub-Advisor
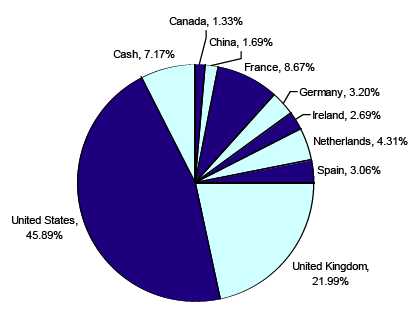
Christopher Weil & Company Global Dividend Fund
Country Diversification as of November 30, 2012
(UNAUDITED)
2012 Annual Report 5
Christopher Weil & Company Funds
CHRISTOPHER WEIL & COMPANY CORE INVESTMENT FUND
Sector Allocation (Unaudited)
(As a Percentage of Net Assets)
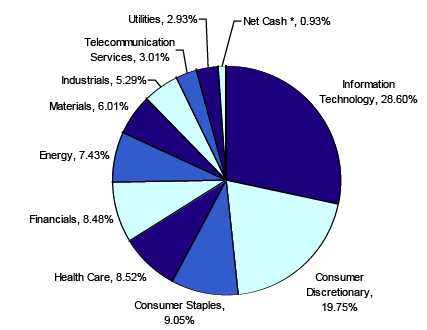
*Net Cash represents cash equivalents and liabilities in excess of other assets.
CHRISTOPHER WEIL & COMPANY GLOBAL DIVIDEND FUND
Sector Allocation (Unaudited)
(As a Percentage of Net Assets)
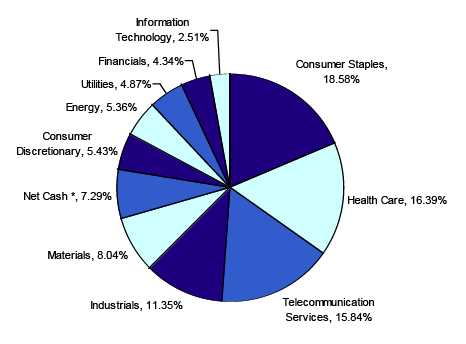
*Net Cash represents cash equivalents and other assets less liabilities.
2012 Annual Report 6
Christopher Weil & Company Core Investment Fund (Unaudited)
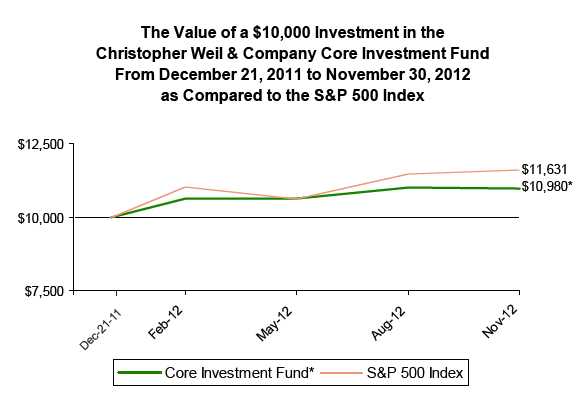
PERFORMANCE INFORMATION (Unaudited)
Total Returns for the Period Ended November 30, 2012.
November 30, 2012 NAV $10.98
| | Since | |
| | Inception(A) | |
| Christopher Weil & Company Core Investment Fund | 9.80% | |
| S&P 500® Index (B) | 16.31% | |
Annual Fund Operating Expense Ratio (from Prospectus dated 12/21/11): 1.52%
The Annual Fund Operating Expense Ratio reported above will not correlate to the expense ratio in the Fund’s financial highlights because the financial highlights include only the direct operating expenses incurred by the Fund, not the indirect costs of investing in acquired funds.
(A) Since Inception returns include change in share prices and in each case includes reinvestment of any dividends and capital gain distributions. The inception date of the Christopher Weil & Company Core Investment Fund was December 21, 2011.
(B) The S&P 500® Index is a widely recognized unmanaged index of equity prices and is representative of a broader market and range of securities than is found in the Fund’s portfolio. The Index is an unmanaged benchmark that assumes reinvestment of all distributions and excludes the effect of taxes and fees. Individuals cannot invest directly in this Index; however, an individual can invest in exchange traded funds or other investment vehicles that attempt to track the performance of a benchmark index.
PAST PERFORMANCE DOES NOT GUARANTEE FUTURE RESULTS. INVESTMENT RETURN AND PRINCIPAL VALUE WILL FLUCTUATE SO THAT SHARES, WHEN REDEEMED, MAY BE WORTH MORE OR LESS THAN THEIR ORIGINAL COST. RETURNS DO NOT REFLECT THE DEDUCTION OF TAXES THAT A SHAREHOLDER WOULD PAY ON FUND DISTRIBUTIONS OR THE REDEMPTION OF FUND SHARES. CURRENT PERFORMANCE MAY BE LOWER OR HIGHER THAN THE PERFORMANCE DATA QUOTED. TO OBTAIN PERFORMANCE DATA CURRENT TO THE MOST RECENT MONTH END, PLEASE CALL 1-888-550-9266 OR VISIT OUR WEBSITE AT www.cweil.com. THE FUND'S DISTRIBUTOR IS RAFFERTY CAPITAL MARKETS, LLC.
2012 Annual Report 7
Christopher Weil & Company Global Dividend Fund (Unaudited)
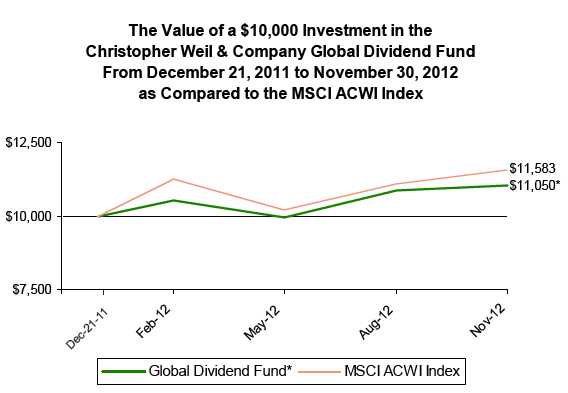
PERFORMANCE INFORMATION (Unaudited)
Total Returns for the Period Ended November 30, 2012.
November 30, 2012 NAV $11.05
| | Since | |
| | Inception(A) | |
| Christopher Weil & Company Global Dividend Fund | 10.50% | |
| MSCI ACWI Index (B) | 15.83% | |
Annual Fund Operating Expense Ratio (from Prospectus dated 12/21/11): 1.76%
The Annual Fund Operating Expense Ratio reported above will not correlate to the expense ratio in the Fund’s financial highlights because the financial highlights include only the direct operating expenses incurred by the Fund, not the indirect costs of investing in acquired funds.
(A) Since Inception returns include change in share prices and in each case includes reinvestment of any dividends and capital gain distributions. The inception date of the Christopher Weil & Company Global Dividend Fund was December 21, 2011.
(B) The MSCI ACWI Index is a free float-adjusted market capitalization weighted index that is designed to measure the equity market performance of developed and emerging markets. The MSCI ACWI consists of 45 country indices comprising 24 developed and 21 emerging market country indices.
PAST PERFORMANCE DOES NOT GUARANTEE FUTURE RESULTS. INVESTMENT RETURN AND PRINCIPAL VALUE WILL FLUCTUATE SO THAT SHARES, WHEN REDEEMED, MAY BE WORTH MORE OR LESS THAN THEIR ORIGINAL COST. RETURNS DO NOT REFLECT THE DEDUCTION OF TAXES THAT A SHAREHOLDER WOULD PAY ON FUND DISTRIBUTIONS OR THE REDEMPTION OF FUND SHARES. CURRENT PERFORMANCE MAY BE LOWER OR HIGHER THAN THE PERFORMANCE DATA QUOTED. TO OBTAIN PERFORMANCE DATA CURRENT TO THE MOST RECENT MONTH END, PLEASE CALL 1-888-550-9266 OR VISIT OUR WEBSITE AT www.cweil.com. THE FUND'S DISTRIBUTOR IS RAFFERTY CAPITAL MARKETS, LLC.
2012 Annual Report 8
| Christopher Weil & Company Core Investment Fund |
| |
| | | | Schedule of Investments |
| | | | November 30, 2012 |
| Shares/Principal Amount | | Fair Value | % of Net Assets |
| COMMON STOCKS | | | | |
| CONSUMER DISCRETIONARY | | | | |
| Cable & Other Pay Television Services | | | | |
| 10,350 | The Walt Disney Company | $ | 513,981 | | |
| General Building Contractors - Residential Buildings | | | | |
| 18,664 | Lennar Corporation Class A | | 709,979 | | |
| Men's & Boys' Furnishings, Work Clothing, & Allied Garments | | | | |
| 1,635 | Ralph Lauren Corporation | | 256,842 | | |
| Retail - Building Materials, Hardware, Garden Supply | | | | |
| 2,945 | Tractor Supply Company | | 263,931 | | |
| Retail - Eating Places | | | | |
| 3,015 | Panera Bread Company Class A * | | 483,908 | | |
| 5,201 | Yum! Brands, Inc. | | 348,883 | | |
| | | | 832,791 | | |
| Retail - Miscellaneous Shopping Goods Stores | | | | |
| 10,563 | HSN, Inc. | | 558,677 | | |
| Retail - Variety Stores | | | | |
| 10,350 | Target Corporation | | 653,396 | | |
| Rubber & Plastics Footwear | | | | |
| 5,118 | NIKE, Inc. Class B | | 498,903 | | |
| Television Broadcasting Stations | | | | |
| 11,250 | CBS Corporation Class B | | 404,775 | | |
| Wholesale - Motor Vehicles & Motor Vehicle Parts & Supplies | | | | |
| 10,662 | LKQ Corporation * | | 233,498 | | |
| Total for Consumer Discretionary | | 4,926,773 | 19.75 | % |
| CONSUMER STAPLES | | | | |
| Canned, Fruits, Vegetables, Preserves, Jams & Jellies | | | | |
| 4,953 | The J.M. Smucker Company | | 438,142 | | |
| Miscellaneous Chemical Products | | | | |
| 6,528 | WD-40 Company | | 308,383 | | |
| Perfumes, Cosmetics & Other Toilet Preparations | | | | |
| 4,461 | Colgate-Palmolive Company | | 484,019 | | |
| Retail - Variety Stores | | | | |
| 9,157 | Wal-Mart Stores, Inc. | | 659,487 | | |
| Soap, Detergents, Cleaning Preparations, Perfumes, Cosmetics | | | | |
| 5,293 | The Procter & Gamble Company | | 369,610 | | |
| Total for Consumer Staples | | 2,259,641 | 9.05 | % |
| ENERGY | | | | | |
| Crude Petroleum & Natural Gas | | | | |
| 6,851 | Noble Energy, Inc. | | 669,685 | | |
| Petroleum Refining | | | | |
| 5,415 | Chevron Corporation | | 572,311 | | |
| 10,760 | ConocoPhillips | | 612,674 | | |
| | | | 1,184,985 | | |
| Total for Energy | | 1,854,670 | 7.43 | % |
* Non-Income Producing Securities.
The accompanying notes are an integral part of these
financial statements. |
2012 Annual Report 9
| Christopher Weil & Company Core Investment Fund |
| |
| | | | Schedule of Investments |
| | | | November 30, 2012 |
| Shares/Principal Amount | | Fair Value | % of Net Assets |
| COMMON STOCKS | | | | |
| |
| FINANCIALS | | | | | |
| National Commercial Banks | | | | |
| 6,880 | The PNC Financial Services Group, Inc. | $ | 386,243 | | |
| 26,706 | U.S. Bancorp | | 861,536 | | |
| 26,305 | Wells Fargo & Company | | 868,328 | | |
| | | | 2,116,107 | | |
| Total for Financials | | 2,116,107 | 8.48 | % |
| HEALTH CARE | | | | | |
| Orthopedic, Prosthetic & Surgical Appliances & Supplies | | | | |
| 959 | Intuitive Surgical, Inc. * | | 507,311 | | |
| Pharmaceutical Preparations | | | | |
| 7,465 | Abbott Laboratories | | 485,225 | | |
| 5,350 | Allergan, Inc. | | 496,213 | | |
| 19,573 | Bristol-Myers Squibb Company | | 638,667 | | |
| | | | 1,620,105 | | |
| Total for Health Care | | 2,127,416 | 8.52 | % |
| INDUSTRIALS | | | | | |
| Railroads, Line-Haul Operating | | | | |
| 9,172 | Kansas City Southern | | 716,792 | | |
| 4,921 | Union Pacific Corporation | | 604,200 | | |
| | | | 1,320,992 | | |
| Total for Industrials | | 1,320,992 | 5.29 | % |
| INFORMATION TECHNOLOGY | | | | |
| Computer & Office Equipment | | | | |
| 3,763 | International Business Machines Corporation | | 715,233 | | |
| Computer Communications Equipment | | | | |
| 5,150 | F5 Networks, Inc. * | | 482,452 | | |
| Computer Storage Devices | | | | |
| 13,583 | EMC Corporation * | | 337,130 | | |
| Electronic Computers | | | | |
| 1,923 | Apple Inc. | | 1,125,493 | | |
| Radio & TV Broadcasting & Communications Equipment | | | | |
| 12,291 | QUALCOMM Incorporated | | 781,953 | | |
| Retail - Retail Stores, NEC | | | | |
| 9,900 | IAC/InterActiveCorp | | 466,785 | | |
| Services - Business Services, NEC | | | | |
| 10,475 | eBay Inc. * | | 553,290 | | |
| 8,895 | FleetCor Technologies, Inc. * | | 464,230 | | |
| 1,150 | MasterCard Incorporated | | 561,982 | | |
| | | | 1,579,502 | | |
| Services - Computer Programming, Data Processing, Etc. | | | | |
| 1,314 | Google Inc. Class A * | | 917,658 | | |
| Services - Prepackaged Software | | | | |
| 12,155 | Intuit Inc. | | 728,206 | | |
| Total for Information Technology | | 7,134,412 | 28.60 | % |
* Non-Income Producing Securities.
The accompanying notes are an integral part of these
financial statements. |
2012 Annual Report 10
| Christopher Weil & Company Core Investment Fund |
| |
| | | Schedule of Investments |
| | | November 30, 2012 |
| Shares/Principal Amount | | Fair Value | | % of Net Assets |
| COMMON STOCKS | | | | | |
| MATERIALS | | | | | |
| Industrial Inorganic Chemicals | | | | | |
| 3,707 | Praxair, Inc. | $ | 397,428 | | | |
| Paints, Varnishes, Lacquers, Enamels & Allied Products | | | | | |
| 5,705 | PPG Industries, Inc. | | 708,960 | | | |
| Soap, Detergents, Cleaning Preparations, Perfumes, Cosmetics | | | | | |
| 5,458 | Ecolab Inc. | | 393,413 | | | |
| Total for Materials | | 1,499,801 | | 6.01 | % |
| TELECOMMUNICATION SERVICES | | | | | |
| Telephone Communications (No Radiotelephone) | | | | | |
| 17,761 | BCE Inc. (Canada) | | 751,290 | | | |
| Total for Telecommunication Services | | 751,290 | | 3.01 | % |
| UTILITIES | | | | | |
| Electric & Other Services Combined | | | | | |
| 11,470 | Duke Energy Corporation | | 732,015 | | | |
| Total for Utilities | | 732,015 | | 2.93 | % |
| Total for Common Stock (Cost $22,722,448) | $ | 24,723,117 | | 99.07 | % |
| MONEY MARKET FUNDS | | | | | |
| 267,834 | Invesco Short Term Investments Treasury Class I 0.02%*** | | 267,834 | | 1.07 | % |
| (Cost $267,834) | | | | | |
| Total Investment Securities | | 24,990,951 | | 100.14 | % |
| (Cost $22,990,282) | | | | | |
| Liabilities In Excess of Other Assets | | (35,031 | ) | -0.14 | % |
| Net Assets | $ | 24,955,920 | | 100.00 | % |
* Non-Income Producing Securities.
*** Variable Rate Security; the rate shown was the 7-day yield at
November 30, 2012.
The accompanying notes are an integral part of these
financial statements. |
2012 Annual Report 11
| Christopher Weil & Company Global Dividend Fund |
| |
| | | | Schedule of Investments |
| | | | November 30, 2012 |
| Shares/Principal Amount | | Fair Value | % of Net Assets |
| COMMON STOCKS | | | | |
| |
| CONSUMER DISCRETIONARY | | | | |
| Games, Toys & Children's Vehicles (No Dolls & Bicycles) | | | | |
| 21,730 | Hasbro, Inc. | $ | 835,736 | | |
| Retail - Miscellaneous Shopping Goods Stores | | | | |
| 42,200 | Staples, Inc. | | 493,740 | | |
| Total for Consumer Discretionary | | 1,329,476 | 5.43 | % |
| CONSUMER STAPLES | | | | |
| Beverages | | | | | |
| 4,326 | Diageo plc ** | | 517,260 | | |
| 10,320 | PepsiCo, Inc. | | 724,567 | | |
| | | | 1,241,827 | | |
| Cigarettes | | | | | |
| 12,895 | Altria Group, Inc. | | 435,980 | | |
| Converted Paper & Paperboard Products (No Containers/Boxes) | | | | |
| 7,256 | Kimberly-Clark Corporation | | 621,984 | | |
| Food And Kindred Products | | | | |
| 5,403 | Kraft Foods Inc. | | 244,432 | | |
| 16,210 | Mondelez International, Inc. | | 419,677 | | |
| 25,782 | Unilever plc ** | | 988,740 | | |
| | | | 1,652,849 | | |
| Malt Beverages | | | | |
| 14,350 | Molson Coors Brewing Company Class B | | 594,951 | | |
| Total for Consumer Staples | | 4,547,591 | 18.58 | % |
| ENERGY | | | | | |
| Crude Petroleum & Natural Gas | | | | |
| 18,651 | TOTAL S.A. ** | | 935,534 | | |
| Petroleum Refining | | | | |
| 3,562 | Chevron Corporation | | 376,468 | | |
| Total for Energy | | 1,312,002 | 5.36 | % |
| FINANCIALS | | | | | |
| Savings Institution, Federally Chartered | | | | |
| 20,792 | HSBC Holdings plc ** | | 1,063,095 | | |
| Total for Financials | | 1,063,095 | 4.34 | % |
| HEALTH CARE | | | | | |
| Pharmaceutical Preparations | | | | |
| 13,605 | AstraZeneca plc ** | | 646,782 | | |
| 15,253 | Bristol-Myers Squibb Company | | 497,705 | | |
| 16,392 | GlaxoSmithKline plc ** | | 705,020 | | |
| 16,243 | Merck & Co., Inc. | | 719,565 | | |
| 28,533 | Pfizer Inc. | | 713,895 | | |
| 16,309 | Sanofi S.A. ** | | 727,708 | | |
| | | | 4,010,675 | | |
| Total for Health Care | | 4,010,675 | 16.39 | % |
| INDUSTRIALS | | | | | |
| Converted Paper & Paperboard Products (No Containers/Boxes) | | | | |
| 23,831 | Avery Dennison Corporation | | 797,147 | | |
| Electronic & Other Electrical Equipment (No Computer Equip) | | | | |
| 43,867 | General Electric Company | | 926,910 | | |
| 40,687 | Koninklijke Philips Electronics N.V. ** | | 1,052,980 | | |
| | | | 1,979,890 | | |
| Total for Industrials | | 2,777,037 | 11.35 | % |
**ADR - American Depository Receipt.
The accompanying notes are an integral part of these
financial statements. |
2012 Annual Report 12
| Christopher Weil & Company Global Dividend Fund |
| |
| | | | Schedule of Investments |
| | | | November 30, 2012 |
| Shares/Principal Amount | | Fair Value | | % of Net Assets |
| COMMON STOCKS | | | | | |
| INFORMATION TECHNOLOGY | | | | | |
| Semiconductors & Related Devices | | | | | |
| 31,341 | Intel Corporation | $ | 613,187 | | | |
| Total for Information Technology | | 613,187 | | 2.51 | % |
| MATERIALS | | | | | | |
| Cement, Hydraulic | | | | | |
| 35,804 | CRH plc ** | | 657,719 | | | |
| Chemicals - Diversified | | | | | |
| 8,693 | BASF Aktiengesellschaft ** | | 781,414 | | | |
| 12,266 | E.I. du Pont de Nemours and Company | | 529,155 | | | |
| | | | 1,310,569 | | | |
| Total for Materials | | 1,968,288 | | 8.04 | % |
| TELECOMMUNICATION SERVICES | | | | | |
| Radiotelephone Communications | | | | | |
| 29,748 | Vodafone Group plc ** | | 767,350 | | | |
| Telephone Communications (No Radiotelephone) | | | | | |
| 12,932 | AT&T Inc. | | 441,369 | | | |
| 7,689 | BCE Inc. (Canada) | | 325,245 | | | |
| 18,336 | BT Group plc ** | | 685,583 | | | |
| 42,568 | France Telecom S.A. ** | | 455,903 | | | |
| 57,437 | Telefonica S.A. ** | | 748,404 | | | |
| 10,177 | Verizon Communications Inc. | | 449,009 | | | |
| | | | 3,105,513 | | | |
| Total for Telecommunication Services | | 3,872,863 | | 15.84 | % |
| UTILITIES | | | | | | |
| Electric Services | | | | | |
| 12,139 | Huaneng Power International, Inc. ** | | 413,818 | | | |
| 26,539 | PPL Corporation | | 778,920 | | | |
| | | | 1,192,738 | | | |
| Total for Utilities | | 1,192,738 | | 4.87 | % |
| Total for Common Stock (Cost $21,372,188) | $ | 22,686,952 | | 92.71 | % |
| MONEY MARKET FUNDS | | | | | |
| 1,751,574 | Invesco Short Term Investments Treasury Class I 0.02%*** | | 1,751,574 | | 7.16 | % |
| | (Cost $1,751,574) | | | | | |
| Total Investment Securities | | 24,438,526 | | 99.87 | % |
| | (Cost $23,123,762) | | | | | |
| Other Assets In Excess of Liabilities | | 33,305 | | 0.13 | % |
| Net Assets | | $ | 24,471,831 | | 100.00 | % |
**ADR - American Depository Receipt.
*** Variable Rate Security; the rate shown was the 7-day yield at
November 30, 2012.
The accompanying notes are an integral part of these
financial statements. |
2012 Annual Report 13
| Christopher Weil & Company Funds |
| |
| |
| Statements of Assets and Liabilities | | Core Investment | | | Global Dividend | |
| November 30, 2012 | | Fund | | | Fund | |
| |
| Assets: | | | | | | |
| Investment Securities at Fair Value* | $ | 24,990,951 | | $ | 24,438,526 | |
| Cash | | 12,014 | | | - | |
| Dividends Receivable | | 45,812 | | | 67,869 | |
| Interest Receivable | | 5 | | | 31 | |
| Receivable for Securities Sold | | 558,716 | | | - | |
| Receivable for Shareholder Purchases | | 6,100 | | | - | |
| Total Assets | | 25,613,598 | | | 24,506,426 | |
| Liabilities: | | | | | | |
| Payable for Securities Purchased | | 627,190 | | | - | |
| Payable for Shareholder Redemptions | | 250 | | | - | |
| Payable for Advisor Fees | | 20,159 | | | 24,711 | |
| Payable for Services Fees | | 10,079 | | | 9,884 | |
| Total Liabilities | | 657,678 | | | 34,595 | |
| Net Assets | $ | 24,955,920 | | $ | 24,471,831 | |
| Net Assets Consist of: | | | | | | |
| Paid In Capital | $ | 23,462,692 | | $ | 22,764,763 | |
| Accumulated Undistributed Net Investment Income | | 60,978 | | | 400,004 | |
| Accumulated Realized Gain (Loss) on Investments - Net | | (568,419 | ) | | (7,700 | ) |
| Unrealized Appreciation (Depreciation) in Value of Investments - Net | | 2,000,669 | | | 1,314,764 | |
| Net Assets | $ | 24,955,920 | | $ | 24,471,831 | |
| |
| Net Asset Value and Offering Price (Note 2) | $ | 10.98 | | $ | 11.05 | |
| Minimum Redemption Price (Note 2) | $ | 10.76 | | $ | 10.83 | |
| |
| * Investments at Identified Cost | $ | 22,990,282 | | $ | 23,123,762 | |
| |
| Shares Outstanding (Unlimited number of shares | | 2,272,394 | | | 2,215,025 | |
| authorized without par value) | | | | | | |
| |
| Statements of Operations | | | | | | |
| For the period December 21, 2011(a) through November 30, 2012 | | | | | | |
| |
| Investment Income: | | | | | | |
| Dividends *** | $ | 365,276 | | $ | 740,401 | |
| Interest | | 187 | | | 373 | |
| Total Investment Income | | 365,463 | | | 740,774 | |
| Expenses: | | | | | | |
| Investment Advisor Fees | | 202,990 | | | 243,407 | |
| Services Fees | | 101,495 | | | 97,363 | |
| Total Expenses | | 304,485 | | | 340,770 | |
| |
| Net Investment Income (Loss) | | 60,978 | | | 400,004 | |
| |
| Realized and Unrealized Gain (Loss) on Investments: | | | | | | |
| Net Realized Gain (Loss) on Investments | | (13,560 | ) | | (7,700 | ) |
| Net Realized Gain (Loss) on Options Purchased | | (565,375 | ) | | - | |
| Net Realized Gain (Loss) on Options Written | | 10,516 | | | - | |
| Net Change in Unrealized Appreciation (Depreciation) on Investments | | 2,000,669 | | | 1,314,764 | |
| Net Realized and Unrealized Gain (Loss) on Investments | | 1,432,250 | | | 1,307,064 | |
| |
| Net Increase (Decrease) in Net Assets from Operations | $ | 1,493,228 | | $ | 1,707,068 | |
| |
| *** Net of Foreign Withholding Taxes and ADR Fees | $ | 7,080 | | $ | 65,692 | |
(a) Commencement of Operations.
The accompanying notes are an integral part of these
financial statements. |
2012 Annual Report 14
| Christopher Weil & Company Funds |
| |
| |
| Statements of Changes in Net Assets | | Core Investment Fund | | | Global Dividend Fund | |
| |
| | | 12/21/2011* | | | 12/21/2011* | |
| | | to | | | to | |
| | | 11/30/2012 | | | 11/30/2012 | |
| From Operations: | | | | | | |
| Net Investment Income (Loss) | $ | 60,978 | | $ | 400,004 | |
| Net Realized Gain (Loss) | | (568,419 | ) | | (7,700 | ) |
| Change in Net Unrealized Appreciation (Depreciation) | | 2,000,669 | | | 1,314,764 | |
| Increase (Decrease) in Net Assets from Operations | | 1,493,228 | | | 1,707,068 | |
| From Distributions to Shareholders: | | | | | | |
| Net Investment Income | | - | | | - | |
| Net Realized Gain from Security Transactions | | - | | | - | |
| Total Distributions to Shareholders | | - | | | - | |
| From Capital Share Transactions: | | | | | | |
| Proceeds From Sale of Shares | | 24,422,459 | | | 23,759,887 | |
| Proceeds from Redemption Fees (Note 2) | | - | | | - | |
| Shares Issued on Reinvestment of Dividends | | - | | | - | |
| Cost of Shares Redeemed | | (959,767 | ) | | (995,124 | ) |
| Net Increase (Decrease) from Shareholder Activity | | 23,462,692 | | | 22,764,763 | |
| Net Increase (Decrease) in Net Assets | | 24,955,920 | | | 24,471,831 | |
| |
| Net Assets at Beginning of Period | | - | | | - | |
| |
| Net Assets at End of Period | $ | 24,955,920 | | $ | 24,471,831 | |
| |
| Accumulated Undistributed Net Investment Income | $ | 60,978 | | $ | 400,004 | |
| |
| |
| Share Transactions: | | | | | | |
| Issued | | 2,359,730 | | | 2,307,058 | |
| Reinvested | | - | | | - | |
| Redeemed | | (87,336 | ) | | (92,033 | ) |
| Net Increase (Decrease) in Shares | | 2,272,394 | | | 2,215,025 | |
| Shares Outstanding Beginning of Period | | - | | | - | |
| Shares Outstanding End of Period | | 2,272,394 | | | 2,215,025 | |
* Commencement of Operations.
The accompanying notes are an integral part of these
financial statements. |
2012 Annual Report 15
| Christopher Weil & Company Core Investment Fund |
| |
| |
| Financial Highlights | | | |
| |
| Selected data for a share outstanding throughout the period: | | 12/21/2011* | |
| | | to | |
| | | 11/30/2012 | |
| Net Asset Value - Beginning of Period | $ | 10.00 | |
| Net Investment Income (Loss) (a) | | 0.03 | |
| Net Gains (Loss) on Investments (Realized and Unrealized) | | 0.95 | (c) |
| Total from Investment Operations | | 0.98 | |
| Distributions (From Net Investment Income) | | - | |
| Distributions (From Capital Gains) | | - | |
| Total Distributions | | - | |
| Proceeds from Redemption Fee (Note 2) | | - | |
| Net Asset Value - End of Period | $ | 10.98 | |
| Total Return (b) | | 9.80% | |
| Ratios/Supplemental Data | | | |
| Net Assets - End of Period (Thousands) | $ | 24,956 | |
| Ratio of Expenses to Average Net Assets | | 1.50% | ** |
| Ratio of Net Investment Income (Loss) to Average Net Assets | | 0.30% | ** |
| Portfolio Turnover Rate | | 59.33% | |
| |
| |
| Christopher Weil & Company Global Dividend Fund | |
| |
| |
| Financial Highlights | | | |
| |
| Selected data for a share outstanding throughout the period: | | 12/21/2011* | |
| | | to | |
| | | 11/30/2012 | |
| Net Asset Value - Beginning of Period | $ | 10.00 | |
| Net Investment Income (Loss) (a) | | 0.21 | |
| Net Gains (Loss) on Investments (Realized and Unrealized) | | 0.84 | (c) |
| Total from Investment Operations | | 1.05 | |
| Distributions (From Net Investment Income) | | - | |
| Distributions (From Capital Gains) | | - | |
| Total Distributions | | - | |
| Proceeds from Redemption Fee (Note 2) | | - | |
| Net Asset Value - End of Period | $ | 11.05 | |
| Total Return (b) | | 10.50% | |
| Ratios/Supplemental Data | | | |
| Net Assets - End of Period (Thousands) | $ | 24,472 | |
| Ratio of Expenses to Average Net Assets | | 1.75% | ** |
| Ratio of Net Investment Income (Loss) to Average Net Assets | | 2.05% | ** |
| Portfolio Turnover Rate | | 4.91% | |
* Commencement of Operations.
** Annualized.
(a) Per share amount calculated using the average shares method.
(b) Total return in the above table represents the rate that the investor would have earned or lost on an investment in the Fund
assuming reinvestment of dividends. Returns do not reflect the deduction of taxes a shareholder would pay on Fund
distributions or redemption of Fund shares.
(c) Realized and unrealized gains and losses per share in this caption are balancing amounts necessary to reconcile the
change in net asset value for the period, and may not reconcile with the aggregate gains and losses in the Statement of
Operations due to share transactions for the period. |
The accompanying notes are an integral part of these
financial statements. |
2012 Annual Report 16
NOTES TO FINANCIAL STATEMENTS
CHRISTOPHER WEIL & COMPANY CORE INVESTMENT FUND
CHRISTOPHER WEIL & COMPANY GLOBAL DIVIDEND FUND
November 30, 2012
1.) ORGANIZATION
Christopher Weil & Company Core Investment Fund (“Core Investment”) and Christopher Weil & Company Global Dividend Fund (“Global Dividend”) (collectively, the “Funds” or the “CWC Funds”) were each organized as a diversified series of the PFS Funds (the “Trust”) on December 16, 2011. The Trust was established under the laws of Massachusetts by an Agreement and Declaration of Trust dated January 13, 2000, which was amended and restated as of January 20, 2011. Prior to March 5, 2010, the Trust was named Wireless Fund. The Trust is registered as an open-end investment company under the Investment Company Act of 1940, as amended (the “1940 Act”). The Trust may offer an unlimited number of shares of beneficial interest in a number of separate series, each series representing a distinct fund with its own investment objectives and policies. As of November 30, 2012, there were nine series authorized by the Trust. The advisor to Core Investment and Global Dividend is Christopher Weil & Company, Inc. (the “Advisor” or “CWC”). The Funds commenced operations on December 21, 2011. The Funds’ investment objective is to seek long-term capital appreciation. Significant accounting policies of the Funds are presented in Note 2 below.
2.) SIGNIFICANT ACCOUNTING POLICIES
SECURITY VALUATION: All investments in securities are recorded at their estimated fair value, as described in Note 3.
SHARE VALUATION: The net asset value (the “NAV”) is generally calculated as of the close of trading on the New York Stock Exchange (“Exchange”) (normally 4:00 p.m. Eastern time) every day the Exchange is open. The NAV for each Fund is calculated by taking the total value of each Fund’s assets, subtracting its liabilities, and then dividing by the total number of shares outstanding, rounded to the nearest cent. The offering price and redemption price per share is equal to the net asset value per share, except that shares of each Fund are subject to a redemption fee of 2% if redeemed within 90 days of purchase. During the period December 21, 2011 through November 30, 2012, proceeds from redemption fees were $0 and $0 for Core Investment and Global Dividend, respectively.
SHORT SALES: Each Fund may sell a security it does not own in anticipation of a decline in the fair value of the security. When a Fund sells a security short, it must borrow the security sold short and deliver it to the broker-dealer through which it made the short sale. A gain, limited to the price at which a Fund sold the security short, or a loss, unlimited in size, will be recognized upon the termination of a short sale.
OPTIONS: The purchase and writing of options requires additional skills and techniques beyond normal portfolio management, and involves certain risks. The purchase of options limits a Fund’s potential loss to the amount of the premium paid and can afford a Fund the opportunity to profit from favorable movements in the price of the underlying security to a greater extent than if the transaction were effected directly. When a Fund writes an option, an amount equal to the premium received by the Fund is recorded as a liability and is subsequently adjusted to the current fair value of the option written. Premiums received from writing options that expire unexercised are treated by a Fund on the expiration date as realized gains from investments. The difference between the premium and the amount paid on effecting a closing purchase transaction, including brokerage commissions, is also treated as a realized gain, or, if the premium is less than the amount paid for the closing purchase transaction, as a realized loss. If a written call option is exercised, the premium is added to the proceeds from the sale of the underlying security or currency in determining whether a Fund has realized a gain or a loss. If a written put option is exercised, the premium reduces the cost basis of the securities purchased by the Fund. A Fund, as writer of an option, bears the market risk of an unfavorable change in the price of the security underlying the written option. See Note 6 for additional information.
INCOME TAXES: The Funds’ policy is to continue to comply with the requirements of the Internal Revenue Code that are applicable to regulated investment companies and to distribute all of their taxable income to shareholders. Therefore, no federal income tax provision is required. It is the Funds’ policy to distribute annually, prior to the end of the calendar year, dividends sufficient to satisfy excise tax requirements of the Internal Revenue Code. This Internal Revenue Code requirement may cause an excess of distributions over the book year-end accumulated income. In addition, it is the Funds’ policy to distribute annually, after the end of the fiscal year, any remaining net investment income and net realized capital gains.
2012 Annual Report 17
Notes to Financial Statements - continued
The Funds recognize the tax benefits of certain tax positions only where the position is “more likely than not” to be sustained assuming examination by tax authorities. Management has analyzed the Funds’ tax positions, and has concluded that no liability for unrecognized tax benefits should be recorded related to uncertain tax positions expected to be taken in the Funds’ 2011 tax returns. The Funds identify their major tax jurisdictions as U.S. Federal tax authorities; however the Funds are not aware of any tax positions for which they are reasonably possible that the total amounts of unrecognized tax benefits will change materially in the next twelve months. The Funds recognize interest and penalties, if any, related to unrecognized tax benefits as income tax expense in the statements of operations. During the period December 21, 2011 through November 30, 2012, the Funds did not incur any interest or penalties.
USE OF ESTIMATES: The preparation of financial statements in conformity with accounting principles generally accepted in the United States (“GAAP”) requires management to make estimates and assumptions that affect the reported amounts of assets and liabilities and disclosure of contingent assets and liabilities at the date of the financial statements and the reported amounts of increases and decreases in net assets from operations during the reporting period. Actual results could differ from those estimates.
DISTRIBUTIONS TO SHAREHOLDERS: Distributions to shareholders, which are determined in accordance with income tax regulations, are recorded on the ex-dividend date. The treatment for financial reporting purposes of distributions made to shareholders during the year from net investment income or net realized capital gains may differ from their ultimate treatment for federal income tax purposes. These differences are caused primarily by differences in the timing of recognition of certain components of income, expense or realized capital gain for federal income tax purposes. Where such differences are permanent in nature, they are reclassified in the components of the net assets based on their ultimate characterization for federal income tax purposes. Any such reclassification will have no effect on net assets, results of operations or net asset values per share of any Fund.
ORGANIZATIONAL & OFFERING EXPENSES: All costs incurred by the Funds in connection with the organization, offering and initial registration of the Funds, principally professional fees, were paid on behalf of the Funds by the Advisor and will not be borne by the Funds.
EXPENSES: Expenses incurred by the Trust that do not relate to a specific fund of the Trust are allocated to the individual fund based on each fund’s relative net assets or another appropriate basis.
OTHER: Each Fund records security transactions based on a trade date. Dividend income is recognized on the ex-dividend date, and interest income is recognized on an accrual basis. Discounts and premiums on securities purchased are accreted and amortized over the lives of the respective securities. Withholding taxes on foreign dividends have been provided for in accordance with each Fund’s understanding of the applicable country’s tax rules and rates.
3.) SECURITY VALUATIONS
The Funds utilize various methods to measure the fair value of their investments on a recurring basis. GAAP establishes a hierarchy that prioritizes inputs to valuation methods. The three levels of inputs are:
Level 1 - Unadjusted quoted prices in active markets for identical assets or liabilities that the Funds have the ability to access.
Level 2 - Observable inputs other than quoted prices included in level 1 that are observable for the asset or liability, either directly or indirectly. These inputs may include quoted prices for the identical instrument on an inactive market, prices for similar instruments, interest rates, prepayment speeds, credit risk, yield curves, default rates and similar data.
Level 3 - Unobservable inputs for the asset or liability, to the extent relevant observable inputs are not available, representing the Funds’ own assumptions about the assumptions a market participant would use in valuating the assets or liabilities, and would be based on the best information available.
The availability of observable inputs can vary from security to security and is affected by a wide variety of factors, including, for example, the type of security, whether the security is new and not yet established in the marketplace, the liquidity of markets, and other characteristics particular to the security. To the extent that valuation is based on models or inputs that are less observable or unobservable in the market, the determination of fair value requires more judgment. Accordingly, the
2012 Annual Report 18
Notes to Financial Statements - continued
degree of judgment exercised in determining fair value is greatest for instruments categorized in level 3.
The inputs used to measure fair value may fall into different levels of the fair value hierarchy. In such cases, for disclosure purposes, the level in the fair value hierarchy within which the fair value measurement falls in its entirety, is determined based on the lowest level input that is significant to the fair value measurement in its entirety.
FAIR VALUE MEASUREMENTS
A description of the valuation techniques applied to the Funds’ major categories of assets and liabilities measured at fair value on a recurring basis follows:
Equity securities (common stock). Equity securities are carried at fair value. The market quotation used for equity securities, including those listed on the NASDAQ National Market System, is the last sale price on the date on which the valuation is made or, in the absence of sales, at the closing bid price. Over-the-counter securities will be valued on the basis of the bid price at the close of each business day. Generally, if the security is traded in an active market and is valued at the last sale price, the security is categorized as a level 1 security. When the security position is not considered to be part of an active market or when the security is valued at the bid price, the position is generally categorized as level 2. When market quotations are not readily available, when the Advisor determines the last bid price does not accurately reflect the current value or when restricted securities are being valued, such securities are valued as determined in good faith by the Advisor, in conformity with guidelines adopted by and subject to review of the Board of Trustees (the “Trustees”) and are categorized in level 2 or level 3, when appropriate.
Money market funds. Money market funds are valued at a net asset value of $1.00 and are classified in level 1 of the fair value hierarchy.
Options. Option positions that are traded on any exchange or on the NASDAQ over-the-counter market are valued at the last quoted sale price. To the extent these option positions are actively traded and valuation adjustments are not applied, they are classified in level 1 of the fair value hierarchy. Lacking a last sale price, a purchased option position is valued at its last bid price except when, in the Advisor’s opinion, the last bid price does not accurately reflect the current value of the option position. Lacking a last sale price, a written option position is valued at its last ask price except when, in the Advisor’s opinion, the last ask price does not accurately reflect the current value of the option position. When such bid or ask prices are used for valuation or when the security is not actively traded, those securities are generally categorized in level 2 or level 3 of the fair value hierarchy.
Fixed income securities. Fixed income securities generally are valued by using market quotations, but may be valued on the basis of prices furnished by a pricing service when the Advisor believes such prices accurately reflect the fair value of such securities. A pricing service utilizes electronic data processing techniques based on yield spreads relating to securities with similar characteristics to determine prices for normal institutional-size trading units of debt securities without regard to sale or bid prices. When prices are not readily available from a pricing service, or when restricted or illiquid securities are being valued, securities are valued at fair value as determined in good faith by the Advisor, subject to review of the Trustees. Short-term investments in fixed income securities with maturities of less than 60 days when acquired, or which subsequently are within 60 days of maturity, are valued by using the amortized cost method of valuation. Generally, fixed income securities are categorized as level 2.
In accordance with the Trust's good faith pricing guidelines, the Advisor is required to consider all appropriate factors relevant to the value of securities for which it has determined other pricing sources are not available or reliable as described above. There is no single standard for determining fair value, since fair value depends upon the circumstances of each individual case. As a general principle, the current fair value of an issue of securities being valued by the Advisor would appear to be the amount which the owner might reasonably expect to receive for them upon their current sale. Methods which are in accordance with this principle may, for example, be based on (i) a multiple of earnings; (ii) a discount from market of a similar freely traded security (including a derivative security or a basket of securities traded on other markets, exchanges or among dealers); or (iii) yield to maturity with respect to debt issues, or a combination of these and other methods.
The following tables summarize the inputs used to value the Funds’ assets measured at fair value as of November 30, 2012:
2012 Annual Report 19
| Notes to Financial Statements - continued | | | | | | |
| |
| Core Investment: | | | | | | | | |
| Valuation Inputs of Assets | | Level 1 | | Level 2 | | Level 3 | | Total |
| Common Stock | | $24,723,117 | | $0 | | $0 | | $24,723,117 |
| Money Market Funds | | 267,834 | | 0 | | 0 | | 267,834 |
| Total | | $24,990,951 | | $0 | | $0 | | $24,990,951 |
| |
| Global Dividend: | | | | | | | | |
| Valuation Inputs of Assets | | Level 1 | | Level 2 | | Level 3 | | Total |
| Common Stock | | $22,686,952 | | $0 | | $0 | | $22,686,952 |
| Money Market Funds | | 1,751,574 | | 0 | | 0 | | 1,751,574 |
| Total | | $24,438,526 | | $0 | | $0 | | $24,438,526 |
Refer to each Fund’s Schedule of Investments for a listing of securities by industry. The Funds did not hold any level 3 assets during the period December 21, 2011 through November 30, 2012. There were no transfers into or out of the levels during the period December 21, 2011 through November 30, 2012. It is the Funds’ policy to consider transfers into or out of the levels as of the end of the reporting period.
4.) INVESTMENT ADVISORY AGREEMENTS AND SERVICES AGREEMENTS
Each of the Funds has an investment advisory agreement (collectively the "Management Agreements") with the Advisor. Under the Management Agreements, the Advisor, at its own expense and without reimbursement from the Funds, furnishes office space and all necessary office facilities, equipment and executive personnel necessary for managing the assets of the Funds. For its services the Advisor receives an investment management fee equal to 1.00% of the average daily net assets of Core Investment and an investment management fee equal to 1.25% of the average daily net assets of Global Dividend. Soledad Investment Management, LLC (the "Sub-Advisor") serves as the sub-advisor of Global Dividend and is paid by the Advisor, not the Fund. Core Investment does not have a Sub-Advisor. For the period December 21, 2011 through November 30, 2012, the Advisor earned management fees of $202,990 and $243,407 for Core Investment and Global Dividend, respectively. At November 30, 2012 Core Investment and Global Dividend owed the Advisor management fees of $20,159 and $24,711, respectively.
Additionally, the Funds each have a Services Agreement with the Advisor (the “Services Agreements”). Under the Services Agreements the Advisor receives an additional fee of 0.50% per Fund and is obligated to pay the operating expenses of the Funds excluding, as applicable, management fees and sub-advisory fees, brokerage fees and commissions, 12b-1 fees, taxes, borrowing costs (such as (a) interest and (b) dividend expenses on securities sold short), ADR fees, the cost of acquired funds and extraordinary expenses. For the period December 21, 2011 through November 30, 2012, the Advisor earned services fees of $101,495 and $97,363 for Core Investment and Global Dividend, respectively. At November 30, 2012 the Funds owed the Advisor services fees of $10,079 and $9,884 for Core Investment and Global Dividend, respectively.
5.) RELATED PARTY TRANSACTIONS
A control person of Premier Fund Solutions, Inc. (the “Administrator”) also serves as trustee/officer of the Funds. This individual receives benefits from the Administrator resulting from administration fees paid to the Administrator of the Funds by the Advisor. Mr. Ross C. Provence is the father of Mr. Jeffrey R. Provence.
The Trustees who are not interested persons of the Funds were each paid a total of $750 in Trustees’ fees per Fund for the period December 21, 2011 through November 30, 2012 by the Advisor.
6.) DERIVATIVES
Core Investment invested in derivatives during the period December 21, 2011 through November 30, 2012. Global Dividend did not invest in derivatives during the period December 21, 2011 through November 30, 2012. The following information summarizes Core Investment’s (defined as the “Fund” for Note 6) use of derivatives:
Transactions in written call options during the period December 21, 2011 through November 30, 2012 were as follows:
2012 Annual Report 20
| Notes to Financial Statements - continued | | | | |
| |
| | Number of | | Premiums | |
| | Contracts | | Received | |
| Options outstanding at December 21, 2011 | 0 | | $0 | |
| Options written | 97 | | 10,516 | |
| Options terminated in closing purchase transactions | 0 | | 0 | |
| Options expired | (97 | ) | (10,516 | ) |
| Options exercised | 0 | | 0 | |
| Options outstanding at November 30, 2012 | 0 | | $0 | |
Transactions in purchased put options during the period December 21, 2011 through November 30, 2012 were as follows:
| | Number of | | | Premiums | |
| | Contracts | | | Paid | |
| Options outstanding at December 21, 2011 | 0 | | | $0 | |
| Options purchased | 571 | | | 732,536 | |
| Options terminated in closing sale transactions | (571 | ) | | (732,536 | ) |
| Options expired | 0 | | | 0 | |
| Options exercised | 0 | | | 0 | |
| Options outstanding at November 30, 2012 | 0 | | | $0 | |
The locations on the statement of assets and liabilities of the Fund's derivative positions, which are not accounted for as hedging instruments under GAAP, are as follows:
| | | Asset | | | Liability |
| | | Derivatives | | | Derivatives |
| Options purchased: | | | Written Options at | | |
| Included In Investments in | | $0 | Fair Value | | $0 |
| Securities at Fair Value | | | | | |
Realized and unrealized gains and losses on derivatives contracts entered into during the period December 21, 2011 through November 30, 2012 by the Fund are recorded in the following locations in the Statement of Operations:
| | | | Realized | | | | Unrealized |
| Equity Contracts | Location | | Gain/(Loss) | | Location | | Gain/(Loss) |
| Put Options | Net Realized | | | | Change In Unrealized | | |
| Purchased | Gain (Loss) on | | ($565,375) | | Appreciation (Depreciation) | | $0 |
| Options Purchased | | | | on Options Purchased | | |
| |
| Call Options | Net Realized | | | | Change In Unrealized | | |
| Written | Gain (Loss) on | | $10,516 | | Appreciation (Depreciation) | | $0 |
| | Options Written | | | | on Options Written | | |
The Fund engages in option transactions involving individual securities and stock indexes. An option involves either: (a) the right or the obligation to buy or sell a specific instrument at a specific price until the expiration date of the option; or (b) the right to receive payments or the obligation to make payments representing the difference between the closing price of a stock index and the exercise price of the option expressed in dollars times a specified multiple until the expiration date of the option. The Fund may purchase and write options. Options are sold (written) on securities and stock indexes. The purchaser of an option on a security pays the seller (the writer) a premium for the right granted but is not obligated to buy or sell the underlying security. The purchaser of an option on a stock index pays the seller a premium for the right granted, and in return the seller of such an option is obligated to make the payment. A writer of an option may terminate the obligation prior to expiration of the option by making an offsetting purchase of an identical option. Options are traded on organized exchanges and in the over-the-counter market. To cover the potential obligations involved in writing options, a Fund will either: (a) own the underlying security, or in the case of an option on a market index, will hold a portfolio of stocks substantially replicating the movement of the index; or (b) the Fund will segregate with the custodian high grade liquid assets sufficient to purchase the underlying security or equal to the market value of the stock index option, marked to market daily.
The purchase of options limits a Fund's potential loss to the amount of the premium paid and can afford the Fund the opportunity to profit from favorable movements in the price of an underlying security to a greater extent than if transactions were effected in the security directly. However, the pur-
2012 Annual Report 21
Notes to Financial Statements - continued
chase of an option could result in the Fund losing a greater percentage of its investment than if the transaction were effected directly. When the Fund writes a call option, it will receive a premium, but it will give up the opportunity to profit from a price increase in the underlying security above the exercise price as long as its obligation as a writer continues, and it will retain the risk of loss should the price of the security decline. When the Fund writes a put option, it will assume the risk that the price of the underlying security or instrument will fall below the exercise price, in which case the Fund may be required to purchase the security or instrument at a higher price than the market price of the security or instrument. In addition, there can be no assurance that the Fund can effect a closing transaction on a particular option it has written. Further, the total premium paid for any option may be lost if the Fund does not exercise the option.
The Fund engages in option transactions involving securities and stock indices in order to gain exposure to particular securities or markets, in connection with hedging transactions, or to try to enhance returns. Options require additional skills and techniques beyond normal portfolio management. The Fund's use of options involves risk that such instruments may not work as intended due to unanticipated developments, especially in abnormal market conditions, or if the Advisor makes an error in judgment, or other causes. The use of options may magnify the increase or decrease in the performance of the Fund, and may also subject the Fund to higher price volatility.
The premiums paid for the options represent the cost of the investment and the options are valued daily at their closing price. The Fund recognizes a realized gain or loss when the option is sold or expired. Option holdings within the Fund, which may include put options and call options, are subject to loss of value with the passage of time, and may experience a total loss of value upon expiration. With options, there is minimal counterparty risk to the Fund since they are exchange traded.
7.) INVESTMENTS
For the period December 21, 2011 through November 30, 2012, purchases and sales of investment securities other than U.S. Government obligations and short-term investments were as follows:
| | | Core Investment | | Global Dividend |
| Purchases | | $33,912,732 | | $22,233,468 |
| Sales | | $11,176,724 | | $853,581 |
There were no purchases or sales of U.S. Government obligations.
For federal income tax purposes, at November 30, 2012 the cost of securities on a tax basis and the composition of gross unrealized appreciation (the excess of value over tax cost) and depreciation (the excess of tax cost over value) were as follows:
| | | Core Investment | | | Global Dividend | |
| Cost of Investments | | $22,990,282 | | | $23,123,765 | |
| |
| Gross Unrealized Appreciation | | $2,275,463 | | | $2,142,488 | |
| Gross Unrealized Depreciation | | ($274,794 | ) | | ($827,727 | ) |
| Net Unrealized Appreciation | | | | | | |
| (Depreciation) on Investments | | $2,000,669 | | | $1,314,761 | |
Differences between book basis and tax basis unrealized appreciation/(depreciation) are attributable to the tax deferral on wash sales.
8.) CAPITAL SHARES
At November 30, 2012, the Trust was authorized to issue an unlimited number of shares of beneficial interest. The following are the shares issued and paid in capital outstanding for the Funds at November 30, 2012:
| | | Core Investment | | Global Dividend |
| Shares Issued | | | | |
| and Outstanding | | 2,272,394 | | 2,215,025 |
| Paid in Capital | | $23,462,692 | | $22,764,763 |
9.) DISTRIBUTIONS TO SHAREHOLDERS
There were no distributions paid during the period December 21, 2011 through November 30, 2012.
2012 Annual Report 22
Notes to Financial Statements - continued
Subsequent to November 30, 2012, there was a distribution paid on December 26, 2012 for the Funds to the shareholders of record on December 24, 2012. Core Investment paid a distribution of $0.0310 per share from net investment income. Also, Global Dividend paid a distribution of $0.2079 per share from net investment income.
As of November 30, 2012, the components of distributable earnings / (accumulated losses) on a tax basis were as follows for the Funds:
| Core Investment: | | | |
| |
| Undistributed ordinary income/(accumulated losses) | | $ 60,978 | |
| Undistributed long-term capital gain/(accumulated losses) | | (568,419 | ) |
| Unrealized appreciation/(depreciation) - net | | 2,000,669 | |
| | | $ 1,493,228 | |
| |
| Global Dividend: | | | |
| |
| Undistributed ordinary income/(accumulated losses) | | $ 400,004 | |
| Undistributed long-term capital gain/(accumulated losses) | | (7,697 | ) |
| Unrealized appreciation/(depreciation) - net | | 1,314,761 | |
| | | $ 1,707,068 | |
Income and capital gains are determined in accordance with income tax regulations that may differ from GAAP. These differences are due to differing treatments for items such as the tax treatment of options on indexes and the deferral of wash sale losses.
10.) CONTROL OWNERSHIP
The beneficial ownership, either directly or indirectly, of more than 25% of the voting shares of a fund creates a presumption of control of the fund, under section 2(a)(9) of the Investment Company Act of 1940. At November 30, 2012, National Financial Services, LLC, located at 200 Liberty Street, New York, New York 10281, held for the benefit of its customers, in aggregate, 99.95% of the Core Investment Fund shares. National Financial Services, LLC, located at 200 Liberty Street, New York, New York 10281, held for the benefit of its customers, in aggregate, 99.86% of Global Dividend Fund shares. The Trust does not know whether National Financial Services, LLC or any of the accounts having a beneficial interest in accounts held of record by National Financial Services, Inc. (the "Underlying Accounts") hold beneficially 25% or more of the outstanding voting securities of the Funds. Accordingly, it is not known whether National Financial Services, Inc. or any of the Underlying Accounts could be deemed to control the Funds.
11.) LOSS CARRYFORWARDS
As of November 30, 2012, Core Investment had available for federal tax purposes an unused capital loss carryforward of $568,419, of which $273,266 is characterized as short-term and has no expiration and $295,153 is characterized as long-term and has no expiration. Also, at November 30, 2012, Global Dividend had available for federal tax purposes an unused capital loss carryforward of $7,697, which is characterized as short-term and has no expiration. Capital loss carryforwards are available to offset future capital gains. To the extent that these carryforwards are used to offset future capital gains, it is probable that the amount that is offset will not be distributed to shareholders.
2012 Annual Report 23
DISCLOSURE OF EXPENSES
(Unaudited)
As a shareholder of the Funds, you incur two types of costs: (1) transaction costs, including sales charges (loads) on purchase payments; and (2) ongoing costs, including management fees; and other Fund expenses. This Example is intended to help you understand your ongoing costs (in dollars) of investing in the Funds and to compare these costs with the ongoing costs of investing in other mutual funds. If Fund shares are redeemed within 90 days of purchase from the Funds, the shares are subject to a 2% redemption fee.
The Example is based on an investment of $1,000 invested in the Funds on June 1, 2012, and held through November 30, 2012.
Actual Expenses
The first line of the table below provides information about actual account values and actual expenses. You may use the information in this line, together with the amount you invested, to estimate the expenses that you paid over the period. Simply divide your account value by $1,000 (for example, an $8,600 account value divided by $1,000 = 8.6), then multiply the result by the number in the first line under the heading entitled "Expenses Paid During Period" to estimate the expenses you paid on your account during this period.
Hypothetical Example for Comparison Purposes
The second line of the table below provides information about hypothetical account values and hypothetical expenses based on the Funds’ actual expense ratio and an assumed rate of return of 5% per year before expenses, which is not the Funds’ actual return. The hypothetical account values and expenses may not be used to estimate the actual ending account balance or expenses you paid for the period. You may use this information to compare the ongoing costs of investing in these Funds and other funds. To do so, compare this 5% hypothetical example with the 5% hypothetical examples that appear in the shareholder reports of the other funds.
Please note that the expenses shown in the table are meant to highlight your ongoing costs only and do not reflect any transactional costs, such as sales charges (loads). Therefore, the second line of the table is useful in comparing ongoing costs only, and will not help you determine the relative cost of owning different funds. In addition, if these transactional costs were included, your cost could have been higher.
| CORE INVESTMENT | | | | | | |
| |
| | | | | | | Expenses Paid |
| | | Beginning | | Ending | | During the Period* |
| | | Account Value | | Account Value | | June 1, 2012 to |
| | | June 1, 2012 | | November 30, 2012 | | November 30, 2012 |
| |
| |
| Actual | | $1,000.00 | | $1,033.90 | | $7.65 |
| |
| Hypothetical | | $1,000.00 | | $1,017.55 | | $7.59 |
| (5% annual return | | | | | | |
| before expenses) | | | | | | |
* Expenses are equal to the Fund’s annualized expense ratio of 1.50%, multiplied by the average
account value over the period, multiplied by 183/365 (to reflect the one-half year period). |
2012 Annual Report 24
| Disclosure of Expenses (Unaudited) - continued | | |
| |
| |
| GLOBAL DIVIDEND | | | | | | |
| |
| | | | | | | Expenses Paid |
| | | Beginning | | Ending | | During the Period* |
| | | Account Value | | Account Value | | June 1, 2012 to |
| | | June 1, 2012 | | November 30, 2012 | | November 30, 2012 |
| |
| Actual | | $1,000.00 | | $1,110.55 | | $9.26 |
| |
| Hypothetical | | $1,000.00 | | $1,016.29 | | $8.85 |
| (5% annual return | | | | | | |
| before expenses) | | | | | | |
* Expenses are equal to the Fund’s annualized expense ratio of 1.75%, multiplied by the average
account value over the period, multiplied by 183/365 (to reflect the one-half year period). |
2012 Annual Report 25
ADDITIONAL INFORMATION
November 30, 2012
AVAILABILITY OF QUARTERLY SCHEDULE OF INVESTMENTS
(Unaudited)
The Funds file their complete schedules of portfolio holdings with the Securities and Exchange Commission ("SEC") for the first and third quarters of each fiscal year on Form N-Q. The Funds’ Forms N-Q are available on the SEC's website at http://www.sec.gov. The Funds’ Forms N-Q may also be reviewed and copied at the SEC's Public Reference Room in Washington, DC. Information on the operation of the Public Reference Room may be obtained by calling 1-800-SEC-0330.
PROXY VOTING GUIDELINES
(Unaudited)
Christopher Weil & Company, Inc., the Funds’ Advisor, is responsible for exercising the voting rights associated with the securities held by the Funds. A description of the policies and procedures used by the Advisor in fulfilling this responsibility is available without charge on the Funds’ web site at www.cweil.com. It is also included in the Funds’ Statement of Additional Information, which is available on the Securities and Exchange Commission’s website at http://www.sec.gov. Information regarding how the Funds voted proxies, Form N-PX, relating to portfolio securities during the most recent 12-month period ended June 30 is available without charge, upon request, by calling our toll free number(1-888-550-9266). This information is also available on the Securities and Exchange Commission’s web site at http://www.sec.gov.
ADDITIONAL INFORMATION
You will find more information about the Funds at www.cweil.com. For shareholder inquiries, please call toll-free in the U.S. at 1-888-550-9266.
2012 Annual Report 26
Cohen Fund Audit Services, Ltd.
Certified Public Accountants | 1350 Euclid Ave., Ste 800
Cleveland, Ohio 44115
Phone: (440) 835-8500
Fax: (440) 835-1093
www.cohenfund.com |
REPORT OF INDEPENDENT REGISTERED PUBLIC ACCOUNTING FIRM
To the Shareholders and Board of Trustees
Christopher Weil & Company Core Investment Fund
Christopher Weil & Company Global Dividend Fund
(PFS Funds)
We have audited the accompanying statements of assets and liabilities of Christopher Weil & Company Core Investment Fund and Christopher Weil & Company Global Dividend Fund (the "Funds"), each a series of PFS Funds, including the schedules of investments, as of November 30, 2012, and the related statements of operations, changes in net assets and the financial highlights for the period December 21, 2011 (commencement of operations) through November 30, 2012. These financial statements and financial highlights are the responsibility of the Funds' management. Our responsibility is to express an opinion on these financial statements and financial highlights based on our audit.
We conducted our audit in accordance with the standards of the Public Company Accounting Oversight Board (United States). Those standards require that we plan and perform the audit to obtain reasonable assurance about whether the financial statements and financial highlights are free of material misstatement. An audit includes examining, on a test basis, evidence supporting the amounts and disclosures in the financial statements. Our procedures included confirmation of securities owned as of November 30, 2012, by correspondence with the custodian and broker or by other appropriate auditing procedures where the reply from the broker was not received. An audit also includes assessing the accounting principles used and significant estimates made by management, as well as evaluating the overall financial statement presentation. We believe that our audit provides a reasonable basis for our opinion.
In our opinion, the financial statements and financial highlights referred to above present fairly, in all material respects, the financial position of each of the Funds as of November 30, 2012, the results of their operations, the changes in their net assets and their financial highlights for the period December 21, 2011 (commencement of operations), through November 30, 2012, in conformity with accounting principles generally accepted in the United States of America.

COHEN FUND AUDIT SERVICES, LTD.
Cleveland, Ohio
January 25, 2013
2012 Annual Report 27
Trustees and Officers
(Unaudited)
The Board of Trustees supervises the business activities of the Trust. The names of the Trustees and executive officers of the Trust are shown below. For more information regarding the Trustees, please refer to the Statement of Additional Information, which is available upon request by calling 1-888-550-9266. Each Trustee serves until the Trustee sooner dies, resigns, retires, or is removed.
The Trustees and Officers of the Trust and their principal business activities during the past five years are:
Interested Trustees and Officers
| | | | | Number of | Other |
| | | | Principal | Portfolios In | Directorships |
| Name, | Position(s) | Term of Office | Occupation(s) | Fund | Held By |
| Address(1), | Held With | and Length of | During | Complex | Trustee or |
| and Year of Birth | the Trust | Time Served | Past 5 Years | Overseen By | Officer |
| | | | | Trustee | |
| |
| Ross C. Provence(2), | Trustee | Indefinite Term; | General Partner and Portfolio | 9 | Blue Chip |
| Year of Birth: 1938 | and | Since 2000 | Manager for Value Trend Capital | | Investor Funds |
| | President | | Management, LP (1995 to current). | | |
| | | | Estate planning attorney (1963 to | | |
| current). |
| |
| Jeffrey R. Provence(2), | Trustee, | Indefinite Term; | General Partner and Portfolio | 9 | Blue Chip |
| Year of Birth:1969 | Secretary | Since 2000 | Manager for Value Trend Capital | | Investor Funds, |
| | and | | Management, LP (1995 to current). | | Sycuan Funds |
| | Treasurer | | CEO, Premier Fund Solutions, Inc. | | |
| | | | (2001 to current). | | |
| |
| Julian G. Winters, | Chief | Chief | Managing Member, Watermark | | |
| Year of Birth: 1968 | Compliance | Compliance | Solutions LLC (investment compli- | N/A | N/A |
| | Officer | Officer Since | ance and consulting) since 3/07; | | |
| | | 2010 | previously, Vice President of | | |
| | | | Compliance Administration, The | | |
| | | | Nottingham Company (investment | | |
| | | | company administrator and fund | | |
| | | | accountant), 3/98-3/07. | | |
(1) The address of each trustee and officer is c/o PFS Funds, 1939 Friendship Drive, Suite C, El Cajon, California 92020.
(2) Trustees who are considered "interested persons" as defined in Section 2(a)(19) of the Investment Company Act of 1940 by virtue of their affiliation with the Investment Adviser.
Independent Trustees
| | | | | Number of | Other |
| | | | Principal | Portfolios In | Directorships |
| Name, | Position | Term of Office | Occupation(s) | Fund | Held By |
| Address(1), | Held With | and Length of | During | Complex | Trustee or |
| and Year of Birth | the Trust | Time Served | Past 5 Years | Overseen By | Officer |
| | | | | Trustee | |
| |
| Thomas H. Addis III, | Independent | Indefinite Term; | Executive Director/CEO, Southern | 9 | None |
| Year of Birth: 1945 | Trustee | Since 2000 | California PGA (2006 to current). | | |
| |
| Allen C. Brown, | Independent | Indefinite Term; | Co-owner of Stebleton & Brown | 9 | Blue Chip |
| Year of Birth: 1943 | Trustee | Since 2010 | (1994 to Current). Estate planning | | Investor Funds, |
| | | | and business attorney (1970 to cur- | | Sycuan Funds |
| rent). |
| |
| George Cossolias, CPA, | Independent | Indefinite Term; | Owner of George Cossolias & | 9 | Blue Chip |
| Year of Birth: 1935 | Trustee | Since 2000 | Company, CPAs (1972 to current). | | Investor Funds, |
| | | | President of Lubrication Specialists, | | Sycuan Funds, |
| | | | Inc. (1996 to current). | | Temecula |
| | | | | | Valley Bank |
(1) The address of each trustee and officer is c/o PFS Funds, 1939 Friendship Drive, Suite C, El Cajon, California 92020.
2012 Annual Report 28
Investment Advisor
Christopher Weil & Company, Inc.
Sub-Advisor
Soledad Investment Management, LLC
(Christopher Weil & Company Global Dividend Fund only)
Custodian
US Bank N.A.
Distributor
Rafferty Capital Markets, LLC
Fund Administrator
Premier Fund Solutions, Inc.
Independent Registered
Public Accounting Firm
Cohen Fund Audit Services, Ltd.
Legal Counsel
The Law Offices of John H. Lively & Associates, Inc.
A member firm of The 1940 Act Law GroupTM
Transfer Agent
Mutual Shareholder Services, L.L.C. |
This report is provided for the general information of the shareholders of the Christopher
Weil & Company Core Investment Fund and the Christopher Weil & Company Global
Dividend Fund. This report is not intended for distribution to prospective investors in the
Funds, unless preceded or accompanied by an effective prospectus. |
Christopher Weil & Company Funds
12555 High Bluff Drive, Suite 180
San Diego, California 92130
1-888-550-9266 OR 1-800-355-9345
www.cweil.com
Item 2. Code of Ethics.
The registrant has adopted a code of ethics that applies to the registrant’s principal executive officer and the principal financial officer. The registrant has not made any amendments to its code of ethics during the covered period. The registrant has not granted any waivers from any provisions of the code of ethics during the covered period. A copy of the registrant’s Code of Ethics is filed herewith.
Item 3. Audit Committee Financial Expert.
The registrant’s Board of Trustees has determined that George Cossolias is an audit committee finical expert. Mr. Cossolias is independent for purposes of this Item 3.
Item 4. Principal Accountant Fees and Services.
(a-d) The following table details the aggregate fees billed for each of the last two fiscal years for audit fees, audit-related fees, tax fees and other fees by the principal accountant to the registrant. The principal accountant has provided no services to the adviser or any entity controlled by, or under common control with the adviser that provides ongoing services to the registrant.
| | | FYE 11/30/12 |
| Audit Fees | | $20,450 |
| Audit-Related Fees | | $0 |
| Tax Fees | | $5,000 |
| All Other Fees | | $1,200 |
Nature of Tax Fees: Preparation of Excise Tax Statement and 1120 RIC. Nature of All Other Fees: Review of Semi-Annual Report.
(e) (1) The audit committee approves all audit and non-audit related services and, therefore, has not adopted pre-approval policies and procedures described in paragraph (c)(7) of Rule 2-01 of Regulation S-X.
(e) (2) None of the services described in paragraph (b) through (d) of this Item were approved by the audit committee pursuant to paragraph (c)(7)(i)(C) of Rule 2-01 of Regulation S-X.
(f) All of the principal accountant’s hours spent on auditing the registrant’s financial statements were attributed to work performed by full-time permanent employees of the principal accountant.
(g) The following table indicates the aggregate non-audit fees billed by the registrant’s principal accountant for services to the registrant , the registrant’s investment adviser (not sub-adviser), and any entity controlling, controlled by, or under common control with the adviser that provides ongoing services to the registrant, for the last two years.
| Non-Audit Fees | | FYE 11/30/12 |
| Registrant | | $6,200 |
| Registrant’s Investment Adviser | | $0 |
(h) The principal accountant provided no services to the investment adviser or any entity controlling, controlled by, or under common control with the adviser that provides ongoing services to the registrant.
Item 5. Audit Committee of Listed Companies. Not applicable.
Item 6. Schedule of Investments. Schedule filed with Item 1.
Item 7. Disclosure of Proxy Voting Policies and Procedures for Closed-End Management Investment Companies. Not applicable.
Item 8. Portfolio Managers of Closed End Management Investment Companies. Not applicable.
Item 9. Purchases of Equity Securities by Closed-End Management Investment Companies and Affiliated Purchasers. Not applicable.
Item 10. Submission of Matters to a Vote of Security Holders.
The registrant has not adopted procedures by which shareholders may recommend nominees to the registrant’s board of trustees.
Item 11. Controls and Procedures.
(a) The registrant’s president and chief financial officer concluded that the disclosure controls and procedures (as defined in Rule 30a-3(c) under the Investment Company Act of 1940 (the “Act”)) were effective as of a date within 90 days of the filing date of this report, based on the evaluation of these controls and procedures required by Rule 30a-3(b) under the Act.
(b) There were no changes in the registrant’s internal control over financial reporting (as defined in Rule 30a-3(d) under the Act) that occurred during the registrant’s second fiscal quarter of the period covered by this report that have materially affected, or are reasonably likely to materially affect, the registrant’s internal control over financial reporting.
Item 12. Exhibits.
(a)(1) Code of Ethics. Filed herewith.
(a)(2) Certifications pursuant to Section 302 of the Sarbanes-Oxley Act of 2002. Filed herewith.
(b) Certification pursuant to Section 906 Certification of the Sarbanes-Oxley Act of 2002. Filed herewith.
SIGNATURES
Pursuant to the requirements of the Securities Exchange Act of 1934 and the Investment Company Act of 1940, the registrant has duly caused this report to be signed on its behalf by the undersigned, thereunto duly authorized.
| | By: /s/Ross C. Provence
Ross C. Provence
President |
Pursuant to the requirements of the Securities Exchange Act of 1934 and the Investment Company Act of 1940, this report has been signed below by the following persons on behalf of the registrant and in the capacities and on the dates indicated.
| | By: /s/Ross C. Provence
Ross C. Provence
President |
| | By: /s/Jeffrey R. Provence
Jeffrey R. Provence
Chief Financial Officer |