UNITED STATES
SECURITIES AND EXCHANGE COMMISSION
WASHINGTON, D.C. 20549 |
CERTIFIED SHAREHOLDER REPORT OF REGISTERED MANAGEMENT
INVESTMENT COMPANIES |
Investment Company Act file number 811-09781
PFS Funds
(Exact name of registrant as specified in charter)
1939 Friendship Drive, Suite C, El Cajon, CA 92020
(Address of principal executive offices) (Zip code)
CT Corporation System.
155 Federal St., Suite 700, Boston, MA 02110
(Name and address of agent for service) |
Registrant's telephone number, including area code: (619) 588-9700
Date of fiscal year end: December 31
Date of reporting period: December 31, 2012 |
Form N-CSR is to be used by management investment companies to file reports with the Commission not later than 10 days after the transmission to stockholders of any report that is required to be transmitted to stockholders under Rule 30e-1 under the Investment Company Act of 1940 (17 CFR 270.30e -1). The Commission may use the information provided on Form N-CSR in its regulatory, disclosure review, inspection and policymaking roles.
A registrant is required to disclose the information specified by Form N-CSR, and the Commission will make this information public. A registrant is not required to respond to the collection of information contained in Form N-CSR unless the Form displays a currently valid Office of Management and Budget ("OMB") control number. Please direct comments concerning the accuracy of the information collection burden estimate and any suggestions for reducing the burden to Secretary, Securities and Exchange Commission, 450 Fifth Street, NW, Washington, DC 20549-0609. The OMB has reviewed this collection of information under the clearance requirements of 44 U.S.C. § 3507.
Item 1. Reports to Stockholders.

Annual Report
December 31, 2012
BRTNX |
February 19, 2013
Dear Fellow Shareholders:
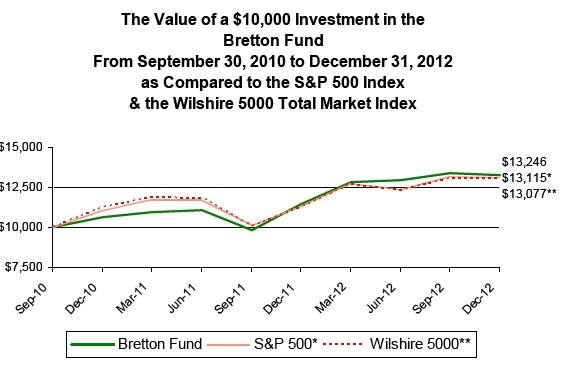
The Bretton Fund’s net asset value per share (NAV) as of December 31, 2012, was $18.84. For the quarter ended December 31, 2012, the fund’s total return was -1.06%, compared to -0.38% for the S&P 500 and 0.10% for the Wilshire 5000. For the full calendar year, the fund’s total return was 15.66%, while the S&P 500 and Wilshire 5000 returned 16.00% and 16.06%, respectively. The Bretton Fund’s returns include a long-term capital gain distribution of $0.7939 per share made on December 26, 2012.
The year’s performance put the fund in the 58th percentile of all mutual funds classified in Lipper’s “multi-cap core” category (778 funds) based on total return during 2012. The average fund in the category returned 15.05% .
| | | | | | | |
| Total Returns as of December 31, 2012 | | | | | | |
| | | | Since Inception - | |
| | 4th Quarter | 1 Year | Annualized(A) | |
| Bretton Fund | -1.06% | 15.66% | 13.29% |
| S&P 500® Index(B) | -0.38% | 16.00% | 12.78% |
| Wilshire 5000 Total Market Index(C) | 0.10% | 16.06% | 12.63% |
| |
| Calendar Year Total Returns | | | | | | | |
| |
| | | | | | | Wilshire 5000 Total |
| | Bretton Fund | S&P 500 Index(B) | Market Index(C) |
| 2012 | 15.66% | 16.00 | % | | 16.06% |
| 2011 | 7.90% | 2.11 | % | | 0.98% |
| 9/30/10–12/31/10 | 6.13% | 10.76 | % | | 11.59% |
| Cumulative Since Inception(A) | 32.46% | 31.15 | % | | 30.77% |
(A) Since Inception returns include change in share prices and, in each case, include reinvestment of any dividends and capital gain distributions. The inception date of the Bretton Fund was September 30, 2010.
(B) The S&P 500® is a broad, market-weighted average dominated by blue-chip stocks and is an unmanaged group of stocks whose composition is different from the Fund.
(C) The Wilshire 5000 Total Market Index is a market-capitalization-weighted index of the market value of all stocks actively traded in the United States.
Performance data quoted represents past performance. Past performance does not guarantee future results. The investment return and principal value of an investment will fluctuate so that an investor’s shares, when redeemed, may be worth more or less than their original cost. All returns include change in share prices, and reinvestment of any dividends and capital gains distributions. Current performance may be lower or higher than the performance data quoted. Indices shown are broad-based, unmanaged indices commonly used to measure performance of US stocks. These indices do not incur expenses and are not available for investment. You may obtain performance data current to the most recent month-end by calling 800.231.2901. The fund’s expense ratio is 1.50% . An investment in the fund is subject to investment risks, including the possible loss of the principal amount invested. The fund’s principal underwriter is Rafferty Capital Markets, LLC.
4th Quarter
The largest impact to the fund during the quarter, taking 1.5% off the NAV, was Ross Stores, whose stock price declined 16% in the quarter despite nothing about its business changing. It continues to build stores and sell more merchandise, and I believe it continues to be attractively valued. The largest positive contributors were New Resource Bank and Aflac, which contributed 0.8% and 0.9% to the fund’s NAV, respectively.
The fund did not initiate or eliminate any investments during the quarter.
1
Contributors to Performance for 2012
By far the largest contributor to the fund’s performance for the full year was The Gap, adding 6.5% to the fund’s returns. Other positive contributors were Aflac, Carter’s, and JPMorgan, each adding roughly 2% to the fund. Ross added 1.5% .
The main detractor from the fund’s performance was Apollo Group, which reduced the fund’s NAV by 2%. The two eastern railroads, CSX and Norfolk Southern, together negatively impacted the fund by 1.3% .
Portfolio
| | |
| Security | % of Net Assets |
| America’s Car-Mart, Inc. | 7.7 | % |
| Ross Stores, Inc. | 7.4 | % |
| Aflac, Inc. | 7.1 | % |
| Wells Fargo & Company | 7.1 | % |
| CSX Corp. | 5.5 | % |
| JPMorgan Chase & Co. | 5.1 | % |
| American Express Co. | 4.9 | % |
| Union Pacific Corp. | 4.4 | % |
| The Gap, Inc. | 3.8 | % |
| Carter’s, Inc. | 3.8 | % |
| New Resource Bank | 3.4 | % |
| Norfolk Southern Corp. | 3.3 | % |
| CapitalSource, Inc. | 2.8 | % |
| Standard Financial Corp. | 2.1 | % |
| SI Financial Group, Inc. | 1.8 | % |
| Apollo Group, Inc. | 1.1 | % |
| Cash* | 28.7 | % |
*Cash represents cash and other assets in excess of liabilities.
Portfolio Discussion
America’s Car-Mart
The fund’s most recent addition—and only new investment in 2012—continued to open dealerships, expanding into Georgia. As the only provider of size at the low end of the used-car market, it has a long runway to expand its dealerships. The company has been able to return significant capital to shareholders through large stock buybacks, while also growing rapidly, something few companies can do. The company’s share price ended the year 6% below the fund’s average cost and trades for an attractive price.
Ross Stores
Ross continued executing on its game plan superbly: Its stores increased in popularity, and it opened up new stores. It estimates that its earnings per share, which haven’t been released yet, increased 23% in 2012, which is on top of a 22% increase the year prior.
The stock’s total return during 2012 was 15%. It’s no longer as cheap as it was two years ago, but it remains well below what I believe the company will eventually be worth. Shoppers are increasingly enjoying the bargain-hunting experience of finding brand names at discounted prices. Ross and its main competitor, TJX (operator of T.J.Maxx and Marshalls), are the only firms that have the size required by apparel makers to buy their excess clothes quickly and in one order. Ross estimates it could eventually double the number of stores it has now, and if the new stores look anything like its current ones, which have returns on capital well over 50%, shareholders are likely to benefit nicely.
Aflac
Aflac’s core business of providing supplemental health insurance in Japan and the US performed well again, with its earnings per share from operations increasing 5%. Aflac
2
was also helped by lower investment losses, as the European banking crisis stabilized, and its overall earnings per share, including its investment results, increased 48%. The stock returned 26%.
Aflac is a great, defensible business trading for a low price, though there are risks to the investment. Its investments in European banks, while reduced and manageable, are not insignificant, and the Japanese yen, where three-quarters of its business comes from, has been weakening compared to the US dollar. The price of Aflac’s stock is so low and its business is so solid that I believe its growing earnings will more than surmount these potential challenges.
Wells Fargo
Wells Fargo increased its earnings per share by 19% as losses from the real estate crisis continued to recede in 2012. Its stock returned 27% during the year. The bank’s new challenges are low interest rates and weak loan demand, but it has significant advantages that will help in the long run as those difficulties dissipate. Its deposit franchise, which I believe to be the best in the US, is a structural competitive advantage, providing it with a cheaper source of capital to fund loans. I also believe Wells Fargo is the best bank at offering multiple financials products to its customers, meaning that if you take out a mortgage from Wells Fargo, there’s a good chance you’ll also open a credit card and checking account with Wells. It has done this exceptionally well in its historical footprint of the western US, and since it acquired Wachovia (for a low-ball price during the financial crisis, I’ll note), its new East Coast customers are looking increasingly like their western counterparts by using Wells for more of their financial needs.
Wells Fargo has plenty of room to grow and has been steadily gaining market share by offering banking services that people want (lots of branches and ATMs, online access with all the bells and whistles, integrated financial services). Despite all this, and a capital cushion near all-time highs, Wells Fargo still trades at a low price compared to its earnings.
JPMorgan Chase
Like Wells Fargo, JPMorgan continued to benefit from lower losses on its real estate loans. Despite large trading losses that have become known as the “London Whale” fiasco, JPMorgan’s earnings per share rose 16%, and the stock returned 36% in 2012.
Our investment in JPMorgan benefits from the same economic forces driving Wells Fargo: lots of potential customers in a new geography (JPMorgan acquired its West Coast presence by buying Washington Mutual out of FDIC receivership during the crisis), a low-cost deposit base, and increasing demand for services like financial advice and asset management. While I’m not wild about the opacity and complexity of its trading operations, the low price of its shares provides us a margin of safety, and I continue to believe management is highly capable and shareholder-centric.
American Express
American Express’s business fundamentals were solid in 2012: Cardholders continued to increase the amount they charge to their AmEx cards, the company added more cardholders, defaults were very low, and it was able to return more capital to shareholders. The stock’s total return was 24%. The company did incur some significant charges near the end of the year, and its earnings per share declined 5% from 2011. Net of these charges (which include the cost of laying off call-center employees in its travel business as travelers more frequently book online), earnings per share increased 8%.
I wrote about our American Express investment last year: “American Express has many elements I look for in an investment: a long runway, a defensible business, management that thoughtfully pays out its earnings to shareholders, and a reasonable valuation.” Nothing’s changed.
3
The Gap
Gap estimates its earnings per share increased 43% during 2012, which was a result of cotton prices falling down to normal levels, reduced shares outstanding due to stock buybacks, and prescient fashion calls. Apparently, colored pants are “in.” The stock’s total return was 70%.
Carter’s
Carter’s also benefited from lower/normal cotton prices. It estimates its 2012 earnings per share, once finalized, increased 33% net of some special charges. The stock’s total return was 40%. Carter’s sells its baby clothes through traditional retailers like Macy’s and Target, but has been increasingly selling its clothes directly to consumers through its own stores and website. It recently acquired a company that, as a franchisee, operated Carter’s stores in Canada, and it’s been successfully expanding its north-of-the-border presence since. The company just introduced international shipping from its website and found a lot of pent-up demand from surprising locales—surprising to me, at least—like Russia and Hong Kong.
Apollo Group
Not all the fund’s investments performed well in 2012. The performance of Apollo’s stock price was abysmal: It declined 61% during the year. I did not anticipate how much enrollment would fall at its universities as a result of regulatory changes and tougher competition from traditional colleges, as well as how cyclical demand is. In its most recent fiscal year, student enrollment dropped by 14%, revenue by 10%, and earnings per share (net of special gains and charges) by 27%. The fund was fortunate (read: lucky) to sell half of its stake early in the year before the decline. While the company is likely not worth what I initially thought it was, the price it’s trading for now undervalues the company.
Small Banks
Like Wells Fargo and JPMorgan, the fund’s small banks also have rebounded from the financial crisis and have performed well. The bank stocks’ total returns during 2012: New Resource Bank 29%, CapitalSource 21%, Standard Financial 15%, SI Financial 18%.
Railroads
The railroads were a mixed bag. Much of the cargo that makes up trains’ volumes is coal, which is primarily used for making electricity and steel. Coal use has been on the wane, but the railroads’ pricing power and market share gains from trucks have usually more than made up the difference. Until 2012. The main alternative to coal in the North American power grid is natural gas, and with so much cheap natural gas flooding the market from fracking and other drilling advancements, coal use dropped sharply. The eastern railroads CSX and Norfolk Southern derive about 30% of their revenue from coal and were the hardest hit. Coal volume dropped roughly 15%. CSX managed to improve its earnings per share by 7%, and its stock returned -4%. Norfolk Southern’s earning per share declined 1%, and its stock’s total return was -12%. Despite their near-term challenges, there remains no cheaper way, by far, to move large goods over long distances than rail, and it’s essentially impossible to construct a large railroad from scratch in the US today. The rails, even with less coal, will be moving a significant portion of America’s goods for decades to come.
Union Pacific, which only gets 20% of its revenue from coal, fared much better and demonstrated how good railroads’ economics can be even with flat volume. Carloads were down slightly, but revenue increased 7% and earnings per share by 23%. Its stock’s total return was 21%.
|
| Investments Initiated in 2012 |
| America’s Car-Mart |
4
| | |
| Investments Exited During 2012 | | |
| Investment | Internal Rate of Return (Annualized Return) | |
| Peoples Federal Bancshares | 16% |
Investment Environment
After four straight years of positive returns, the market hasn’t left a lot of easy money lying around. An investor with both the ability and the nerve to put money to work during the financial crisis of 2008–2009 was effectively trying to pick out investments that would yield 30%+ annually over the next few years from a field of merely 15%/year opportunities. These days, it feels more like hunting for 10–12% returns in a 6–8% world. Interest rates are artificially low and the pain of the financial crisis has ebbed, which together have pushed up asset prices to almost fair value in the case of stocks, and in the case of bonds, to egregious values. I come across slews of mediocre, slow-growing companies selling for excessively high prices simply because they pay a decent dividend, as income-seeking investors have crept into dividend stocks, viewing them as bond alternatives.
Bonds themselves are dangerously priced. A refresher on bond math: The value of a 10-year bond with a 2% coupon and yield would see its value fall by 9% from a mere 1% increase in its interest rate. The yield on a 10-year US Treasury bond, now around 2%, was north of 5% as recently as 2007. Bond returns have been excellent; investors have received their interest payments and their bonds’ values have increased as rates have approached zero. But at 2%, there’s not a lot of room left for rates to go lower. They will go up eventually. And when they do, investors in long-term bonds will see their principal values plummet.
Don’t bond investors understand this? Maybe. Interest rates fluctuate in response to bond investors and Federal Reserve fiat, but overall bull and bear bond cycles tend to span decades. Our current bull bond market started three decades ago in 1981. When its bear predecessor started, which is the last time we were in a similar situation with bonds yields this low, Harry S. Truman was in the first year of his presidency. There aren’t a lot of bond investors today who were investing then. There’s a real difference between conceptually knowing how interest rates affect bond values and viscerally understanding how a mere 3% increase in rates can destroy a significant portion of your accumulated wealth. I’ve heard the argument that one could “get out” in time before rates rise. I heard similar arguments about dot-com stocks in 2000 and Las Vegas condos in 2006.
The fund’s struggle to find compelling returns with low risk has manifested itself in a high cash balance (close to 30% of assets) and only one new investment made during the year. The amount of cash dragged down performance; on the portion of the fund that was invested, the fund’s investments materially outperformed the market. The Bretton Fund does not have a mandate, explicit or implicit, to be fully invested in stocks at all times, which is unlike the large majority of other stock mutual funds. The fund’s overall mandate is to make attractive investments for capital that has a long and indefinite time horizon; it’s not a fund “product” that’s designed to be allocated to and from depending on the level of the market.
This difference can be a disadvantage in the short run when markets appreciate rapidly, but I believe it’s a huge advantage over a multiyear period. The opportunity set available today is not likely to be the same range of opportunities that will be available six months or a year from now. Renowned investor Seth Klarman puts it this way: “Limiting your opportunity set to the one immediately at hand would be like limiting your spouse to the students you met in high school.” If your investment horizon were only a year, you’d put what you have to work pretty much right away. But if you had a five-, ten-year investment horizon, or longer, you’d probably be a little more patient and more willing to wait for the higher return, no-brainer opportunities.
I assure investors that the goal of the fund is not to constantly hold high levels of cash. The goal is to put substantially all of the fund’s capital to work in high-return/low-risk
5
investments; there just aren’t very many of those around right now. I continue to diligently evaluate the current opportunity set, and I’m finding the more intriguing situations in the smaller regions of the public company universe that are too small for larger funds. It’s a competitive advantage the Bretton Fund has, at least at its current size. The market doesn’t need to go down per se for the fund to put more of its capital to work; only a handful of opportunities need to present themselves.
2012 Reading
My favorite business/economics book I read in 2012 was Race Against the Machine, an e-book by Erik Brynjolfsson and Andrew McAfee. The authors, an economics professor and a research scientist, respectively, at the MIT Sloan School of Management, posit that as the speed of technological progress accelerates, the relative value that an unskilled worker provides, in comparison to capital and highly skilled labor, gets smaller and smaller.
As they note, the prospect of machines replacing people is nothing new:
At least since the followers of Ned Ludd smashed mechanized looms in 1811, workers have worried about automation destroying jobs. Economists have reassured them that new jobs would be created as old ones were eliminated. For over 200 years, the economists were right…. [But there] is no economic law that says everyone, or even most people, automatically benefit from technological progress.
Technology progresses, and workers try to keep up with those advances, a dynamic Harvard economists Claudia Goldin and Lawrence Katz call a “race between education and technology.” Brynjolfsson and McAfee are concerned that while gains from education are linear, technological changes are exponential. Since the 1970s, per capita GDP has increased quite significantly, but median income hasn't.
Technology has advanced rapidly, and the good news is that this has radically increased the economy’s productive capacity. However, technological progress does not automatically benefit everyone in a society. In particular, incomes have become more uneven, as have employment opportunities. Recent technological advances have favored some skill groups over others, particularly “superstars” in many fields, and probably also increased the overall share of GDP accruing to capital relative to labor.
The stagnation in median income is not because of technological progress. On the contrary, the problem is that our skills and institutions have not kept up with the rapid changes in technology.
A nice pairing with the book is an essay in The Atlantic by Adam Davidson that gives human texture to the abstract phenomenon. Davidson, who also cohosts the Planet Money podcast for NPR and writes a weekly column for the The New York Times Magazine, spent time at an auto parts factory in South Carolina following two workers: Maddie, an entry-level employee, and Luke, a highly skilled technician.
It’s hard to imagine what set of circumstances would reverse recent trends and bring large numbers of jobs for unskilled laborers back to the US. Our efforts might be more fruitfully focused on getting Maddie the education she needs for a better shot at a decent living in the years to come…. I came to realize, though, that Maddie represents a large population: people who, for whatever reason, are not going to be able to leave the workforce long enough to get the skills they need. Luke doesn’t have children, and his parents could afford to support him while he was in school. Those with the right ability and circumstances will, most likely, make the right adjustments, get the right skills, and eventually thrive. But I fear that those who are challenged now will only fall further behind.
It might be tempting to see this as a result of government policy—and to pick a politician to blame—but the phenomenon has been occurring across the world for a while, in
6
places with different taxes, regulations, and safety nets. While not an overt investing theme of the fund, stagnant median income and a divergent middle class do impact our companies.
Bretton in the News
In October, mutual fund columnist and podcaster Chuck Jaffe interviewed me on his show, MoneyLife. You can find a link to the iTunes recording (on which I spoke a little too fast and mumbled too often) on the Bretton Fund website, along with, helpfully, a transcript. An excerpt:
Chuck Jaffe: So the question becomes, when you talk about being a value manager, are you looking to be able to buy a dollar for a quarter, for 50 cents, for 75 cents, or we are looking for pennies?
Stephen Dodson: A lot of that depends on what’s currently available in the market. The sort of ideal company you can find is what I call—and other investors use the same term—are “compounders.” They’re dollars that next year are going to be worth $1.10, the year after that are going to be worth $1.20, then the year after that are going to be worth $1.35, and so on. If you can acquire those at $0.75, that’s a great investment. And you can just sort of sit back and let those companies do all the work for you and compound value.
We diligently continue our search for cheap compounders, the holy grail of returns.
Thank You
As always, I appreciate your being an investor in the fund,
Stephen J. Dodson
President
Bretton Capital Management |
7
Bretton Fund by Sectors
(as a percentage of Net Assets)
(Unaudited) |
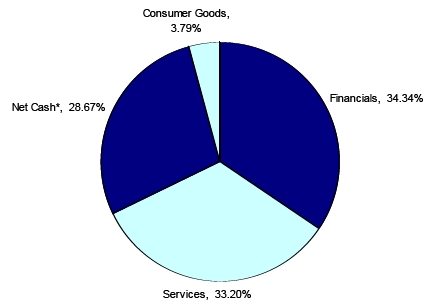
* Net Cash represents cash and other assets less liabilities.
8
| | | | | | | | |
| Bretton Fund | | | | | | | |
| |
| | | | | | Schedule of Investments | |
| | | | | | December 31, 2012 | |
| Shares/Principal Amount | | Cost | | Fair Value | | % of Net Assets | |
| COMMON STOCKS | | | | | | | |
| Accident & Health Insurance | | | | | | | |
| 6,500 | Aflac Inc. | $ | 343,550 | $ | 345,280 | | 7.12 | % |
| Apparel & Other Finished Products of Fabrics & Similar Material | | | | | | | |
| 3,300 | Carter's, Inc. * | | 90,589 | | 183,645 | | 3.79 | % |
| Finance Services | | | | | | | |
| 4,100 | American Express Company | | 191,768 | | 235,668 | | 4.86 | % |
| Miscellaneous Business Credit Institution | | | | | | | |
| 18,000 | CapitalSource, Inc. | | 108,452 | | 136,440 | | 2.82 | % |
| National Commercial Banks | | | | | | | |
| 5,600 | JPMorgan Chase & Co. | | 196,510 | | 246,227 | | | |
| 10,000 | Wells Fargo & Company | | 294,831 | | 341,800 | | | |
| | | | 491,341 | | 588,027 | | 12.14 | % |
| Railroad, Line-Haul Operating | | | | | | | |
| 13,500 | CSX Corp. | | 291,771 | | 266,355 | | | |
| 2,600 | Norfolk Southern Corp. | | 165,393 | | 160,784 | | | |
| 1,700 | Union Pacific Corporation | | 161,186 | | 213,724 | | | |
| | | | 618,350 | | 640,863 | | 13.23 | % |
| Regional - Pacific Banks | | | | | | | |
| 41,800 | New Resource Bank * (a) (b) | | 132,150 | | 167,200 | | 3.45 | % |
| Retail - Auto Dealers & Gasoline Stations | | | | | | | |
| 9,200 | America's Car-Mart, Inc. * | | 398,481 | | 372,784 | | 7.69 | % |
| Retail - Family Clothing Stores | | | | | | | |
| 6,000 | The Gap, Inc. | | 114,760 | | 186,240 | | | |
| 6,600 | Ross Stores Inc. | | 190,516 | | 356,994 | | | |
| | | | 305,276 | | 543,234 | | 11.21 | % |
| Saving Institution, Federally Chartered | | | | | | | |
| 7,526 | SI Financial Group Inc. | | 71,994 | | 86,549 | | 1.79 | % |
| Services - Educational Services | | | | | | | |
| 2,500 | Apollo Group Inc. Class A * | | 97,525 | | 52,300 | | 1.08 | % |
| State Commercial Banks | | | | | | | |
| 6,000 | Standard Financial Corp. (b) | | 86,372 | | 104,520 | | 2.15 | % |
| Total for Common Stocks | $ | 2,935,848 | $ | 3,456,510 | | 71.33 | % |
| Total Investment Securities | $ | 2,935,848 | $ | 3,456,510 | | 71.33 | % |
| Other Assets in Excess of Liabilities | | | $ | 1,389,200 | | 28.67 | % |
| Net Assets | | | | $ | 4,845,710 | | 100.00 | % |
* Non-Income Producing Securities.
(a) Illiquid security. See Note 3.
(b) Level 2 investment.
The accompanying notes are an integral part of these
financial statements.
9
| | | |
| Bretton Fund | | | |
| |
| |
| Statement of Assets and Liabilities | | | |
| December 31, 2012 | | | |
| |
| Assets: | | | |
| Investment Securities at Fair Value | $ | 3,456,510 | |
| (Cost $2,935,848) | | | |
| Cash | | 1,393,581 | |
| Dividend Receivable | | 1,578 | |
| Total Assets | | 4,851,669 | |
| Liabilities: | | | |
| Payable to Adviser (Note 4) | | 5,959 | |
| Total Liabilities | | 5,959 | |
| Net Assets | $ | 4,845,710 | |
| |
| Net Assets Consist of: | | | |
| Paid In Capital (Note 5) | $ | 4,325,048 | |
| Unrealized Appreciation (Depreciation) in Value of Investments | | | |
| Based on Identified Cost - Net | | 520,662 | |
| Net Assets, for 257,265 Shares Outstanding | $ | 4,845,710 | |
| (Unlimited shares authorized) | | | |
| Net Asset Value, Offering Price and Redemption Price Per Share | | | |
| ($4,845,710/257,265 shares) | $ | 18.84 | |
| |
| Statement of Operations | | | |
| For the fiscal year ended December 31, 2012 | | | |
| |
| Investment Income: | | | |
| Dividends | $ | 55,882 | |
| Interest | | 9 | |
| Total Investment Income | | 55,891 | |
| Expenses: | | | |
| Management Fees (Note 4) | | 56,035 | |
| Total Expenses | | 56,035 | |
| |
| Net Investment Income (Loss) | | (144 | ) |
| |
| Realized and Unrealized Gain (Loss) on Investments: | | | |
| Realized Gain (Loss) on Investments | | 195,526 | |
| Net Change in Unrealized Appreciation (Depreciation) on Investments | | 260,739 | |
| Net Realized and Unrealized Gain (Loss) on Investments | | 456,265 | |
| |
| Net Increase (Decrease) in Net Assets from Operations | $ | 456,121 | |
The accompanying notes are an integral part of these
financial statements.
10
| | | | | | |
| Bretton Fund | | | | | | |
| |
| |
| Statements of Changes in Net Assets | | | | | | |
| | | 1/1/2012 | | | 1/1/2011 | |
| | | to | | | to | |
| | | 12/31/2012 | | | 12/31/2011 | |
| From Operations: | | | | | | |
| Net Investment Income (Loss) | $ | (144 | ) | $ | (9,561 | ) |
| Net Realized Gain (Loss) on Investments | | 195,526 | | | 40,539 | |
| Change in Net Unrealized Appreciation (Depreciation) | | 260,739 | | | 159,156 | |
| Increase (Decrease) in Net Assets from Operations | | 456,121 | | | 190,134 | |
| From Distributions to Shareholders: | | | | | | |
| Net Investment Income | | - | | | - | |
| Net Realized Gain from Security Transactions | | (195,522 | ) | | (30,978 | ) |
| Return of Capital | | - | | | (454 | ) |
| Change in Net Assets from Distributions | | (195,522 | ) | | (31,432 | ) |
| From Capital Share Transactions: | | | | | | |
| Proceeds From Sale of Shares | | 1,760,737 | | | 717,167 | |
| Shares Issued on Reinvestment of Distributions | | 195,522 | | | 31,432 | |
| Cost of Shares Redeemed | | (124,416 | ) | | - | |
| Net Increase (Decrease) from Shareholder Activity | | 1,831,843 | | | 748,599 | |
| |
| Net Increase (Decrease) in Net Assets | | 2,092,442 | | | 907,301 | |
| |
| Net Assets at Beginning of Period | | 2,753,268 | | | 1,845,967 | |
| Net Assets at End of Period (Including Accumulated Undistributed | | | | | | |
| Net Investment Income of $0 and $0, respectively) | $ | 4,845,710 | | $ | 2,753,268 | |
| |
| Share Transactions: | | | | | | |
| Issued | | 90,945 | | | 44,353 | |
| Reinvested | | 10,450 | | | 1,873 | |
| Redeemed | | (6,301 | ) | | - | |
| Net Increase in Shares | | 95,094 | | | 46,226 | |
| Shares Outstanding Beginning of Period | | 162,171 | | | 115,945 | |
| Shares Outstanding End of Period | | 257,265 | | | 162,171 | |
| | | | | | | | | |
| Financial Highlights | | | | | | | | | |
| Selected data for a share outstanding throughout the period: | | | | | | | | | |
| | | 1/1/2012 | | | 1/1/2011 | | | 9/30/2010* | |
| | | to | | | to | | | to | |
| | | 12/31/2012 | | | 12/31/2011 | | | 12/31/2010 | |
| Net Asset Value - | | | | | | | | | |
| Beginning of Period | $ | 16.98 | | $ | 15.92 | | $ | 15.00 | |
| Net Investment Income (Loss) (a) | | 0.00 | (b) | | (0.07 | ) | | (0.02 | ) |
| Net Gain (Loss) on Securities | | | | | | | | | |
| (Realized and Unrealized) | | 2.65 | | | 1.33 | | | 0.94 | |
| Total from Investment Operations | | 2.65 | | | 1.26 | | | 0.92 | |
| |
| Distributions (From Net Investment Income) | | - | | | - | | | - | |
| Distributions (From Realized Capital Gains) | | (0.79 | ) | | (0.20 | ) | | - | |
| Distributions (From Return of Capital) | | - | | | - | (b) | | - | |
| Total Distributions | | (0.79 | ) | | (0.20 | ) | | - | |
| |
| Net Asset Value - | | | | | | | | | |
| End of Period | $ | 18.84 | | $ | 16.98 | | $ | 15.92 | |
| Total Return (c) | | 15.66 | % | | 7.90 | % | | 6.13 | % *** |
| Ratios/Supplemental Data | | | | | | | | | |
| Net Assets - End of Period (Thousands) | $ | 4,846 | | $ | 2,753 | | $ | 1,846 | |
| Ratio of Expenses to Average Net Assets | | 1.50 | % | | 1.50 | % | | 1.50 | % ** |
| Ratio of Net Investment Income (Loss) to Average Net Assets | | 0.00 | % | | (0.41 | )% | | (0.56 | )% ** |
| Portfolio Turnover Rate | | 20.14 | % | | 13.14 | % | | 0.00 | % *** |
* Commencement of Operations. ** Annualized. *** Not Annualized.
(a) Per share amounts were calculated using the average shares method.
(b) Less than $0.005 per share.
(c) Total return in the above table represents the rate that the investor would have earned
or lost on an investment in the Fund assuming reinvestment of dividends and distributions.
The accompanying notes are an integral part of these financial statements.
11
Notes to Financial Statements
Bretton Fund
December 31, 2012
1.) ORGANIZATION:
Bretton Fund (the “Fund”) was organized as a non-diversified series of the PFS Funds (the “Trust”) on September 21, 2010. The Trust was established under the laws of Massachusetts by an Agreement and Declaration of Trust dated January 13, 2000, which was amended and restated January 20, 2011. Prior to March 5, 2010, the Trust was named Wireless Fund. The Fund is registered as an open-end investment company under the Investment Company Act of 1940, as amended. The Trust may offer an unlimited number of shares of beneficial interest in a number of separate series, each series representing a distinct fund with its own investment objectives and policies. As of December 31, 2012, there were nine series authorized by the Trust. The Fund commenced operations on September 30, 2010. The Fund's investment objective is to seek long-term capital appreciation. The investment adviser to the Fund is Bretton Capital Management, LLC (the “Adviser”).
2.) SIGNIFICANT ACCOUNTING POLICIES
SECURITY VALUATION:
All investments in securities are recorded at their estimated fair value, as described in Note 3.
FEDERAL INCOME TAXES:
The Fund’s policy is to continue to comply with the requirements of the Internal Revenue Code that are applicable to regulated investment companies and to distribute all of its taxable income to shareholders. Therefore, no federal income tax provision is required. It is the Fund’s policy to distribute annually, prior to the end of the calendar year, dividends sufficient to satisfy excise tax requirements of the Internal Revenue Code. This Internal Revenue Code requirement may cause an excess of distributions over the book year-end accumulated income. In addition, it is the Fund’s policy to distribute annually, after the end of the fiscal year, any remaining net investment income and net realized capital gains.
The Fund recognizes the tax benefits of certain tax positions only where the position is “more likely than not” to be sustained assuming examination by tax authorities. Management has analyzed the Fund’s tax positions, and has concluded that no liability for unrecognized tax benefits should be recorded related to uncertain tax positions taken on returns filed for open tax years (2010-2011), or expected to be taken in the Fund’s 2012 tax returns. The Fund identifies its major tax jurisdictions as U.S. Federal tax authorities; however, the Fund is not aware of any tax positions for which it is reasonably possible that the total amounts of unrecognized tax benefits will change materially in the next 12 months. The Fund recognizes interest and penalties, if any, related to unrecognized tax benefits as income tax expense in the Statement of Operations. During the fiscal year ended December 31, 2012, the Fund did not incur any interest or penalties.
DISTRIBUTIONS TO SHAREHOLDERS:
Distributions to shareholders, which are determined in accordance with income tax regulations, are recorded on the ex-dividend date.
The treatment for financial reporting purposes of distributions made to shareholders during the period from net investment income or net realized capital gains may differ from their ultimate treatment for federal income tax purposes. These differences are caused primarily by differences in the timing of the recognition of certain components of income, expense, or realized capital gain for federal income tax purposes. Where such differences are permanent in nature, they are reclassified in the components of the net assets based on their ultimate characterization for federal income tax purposes. Any such reclassifications will have no effect on net assets, results of operations, or net asset value per share of the Fund. As of December 31, 2012, the Fund reclassified $144 of net investment loss to paid in capital.
USE OF ESTIMATES:
The preparation of financial statements in conformity with accounting principles generally accepted in the United States of America (“GAAP”) requires management to make estimates and assumptions that affect the reported amounts of assets and liabilities and disclosure of contingent assets and liabilities at the date of the financial statements and the reported amounts of increases and decreases in net assets from operations during the reporting period. Actual results could differ from those estimates.
12
Notes to Financial Statements - continued
EXPENSES:
Expenses incurred by the Trust that do not relate to a specific fund of the Trust are allocated to the individual funds based on each fund’s relative net assets or another appropriate basis.
OTHER:
The Fund records security transactions based on the trade date. Dividend income is recognized on the ex-dividend date. Interest income is recognized on an accrual basis. The Fund uses the specific identification method in computing gain or loss on sales of investment securities. Discounts and premiums on securities purchased are accreted and amortized over the life of the respective securities. Withholding taxes on foreign dividends have been provided for in accordance with the Fund’s understanding of the applicable country’s tax rules and rates.
3.) SECURITIES VALUATIONS
As described in Note 2, the Fund utilizes various methods to measure the fair value of most of its investments on a recurring basis. GAAP establishes a hierarchy that prioritizes inputs to valuation methods. The three levels of inputs are:
Level 1 - Unadjusted quoted prices in active markets for identical assets or liabilities that the Fund has the ability to access.
Level 2 - Observable inputs other than quoted prices included in level 1 that are observable for the asset or liability, either directly or indirectly. These inputs may include quoted prices for the identical instrument in an inactive market, prices for similar instruments, interest rates, prepayment speeds, credit risk, yield curves, default rates, and similar data.
Level 3 - Unobservable inputs for the asset or liability, to the extent relevant observable inputs are not available, representing the Fund’s own assumptions about the assumptions a market participant would use in valuing the asset or liability, and would be based on the best information available.
The availability of observable inputs can vary from security to security and is affected by a wide variety of factors, including, for example, the type of security, whether the security is new and not yet established in the marketplace, the liquidity of markets, and other characteristics particular to the security. To the extent that valuation is based on models or inputs that are less observable or unobservable in the market, the determination of fair value requires more judgment. Accordingly, the degree of judgment exercised in determining fair value is greatest for instruments categorized in level 3.
The inputs used to measure fair value may fall into different levels of the fair value hierarchy. In such cases, for disclosure purposes, the level in the fair value hierarchy within which the fair value measurement falls in its entirety, is determined based on the lowest level input that is significant to the fair value measurement in its entirety.
FAIR VALUE MEASUREMENTS
A description of the valuation techniques applied to the Fund’s major categories of assets and liabilities measured at fair value on a recurring basis follows.
Equity securities (common stock). Equity securities generally are valued by using market quotations, but may be valued on the basis of prices furnished by a pricing service when the Adviser believes such prices more accurately reflect the fair value of such securities. Securities that are traded on any stock exchange or on the NASDAQ over-the-counter market are generally valued by the pricing service at the last quoted sale price. Lacking a last sale price, an equity security is generally valued by the pricing service at its last bid price. To the extent these securities are actively traded and valuation adjustments are not applied, they are classified in level 1 of the fair value hierarchy. When market quotations are not readily available, when the Adviser determines that the market quotation or the price provided by the pricing service does not accurately reflect the current fair value, or when restricted or illiquid securities are being valued, such securities are valued as determined in good faith by the Adviser, in conformity with guidelines adopted by and subject to review of the Board of Trustees of the Trust, and are categorized in level 2 or level 3, when appropriate.
Illiquid securities. A security may be considered to be illiquid if it has a limited trading market. Securities are generally considered to be liquid if they can be sold or disposed of in the ordinary course of business within seven days at approximately the price at which the security is valued by the Fund. These securities are valued at fair value as described above. The Fund intends to hold
13
Notes to Financial Statements - continued
no more than 15% of its net assets in illiquid securities. As of December 31, 2012 illiquid securities as identified on the Schedule of Investments represented 3.45% of net assets.
Fixed income securities. Fixed income securities generally are valued by using market quotations, but may be valued on the basis of prices furnished by a pricing service when the Adviser believes such prices accurately reflect the fair market value of such securities. A pricing service utilizes electronic data processing techniques based on yield spreads relating to securities with similar characteristics to determine prices for normal institutional-size trading units of debt securities without regard to sale or bid prices. If the Adviser decides that a price provided by the pricing service does not accurately reflect the fair value of the securities, when prices are not readily available from a pricing service, or when restricted or illiquid securities are being valued, securities are valued at fair value as determined in good faith by the Adviser, subject to review of the Board of Trustees. Short-term investments in fixed income securities with maturities of less than 60 days when acquired, or which subsequently are within 60 days of maturity, are valued by using the amortized cost method of valuation, which the Board has determined will represent fair value. Generally, fixed income securities are categorized as level 2.
In accordance with the Trust's good faith pricing guidelines, the Adviser is required to consider all appropriate factors relevant to the value of securities for which it has determined other pricing sources are not available or reliable as described above. There is no single standard for determining fair value controls, since fair value depends upon the circumstances of each individual case. As a general principle, the current fair value of an issue of securities being valued by the Adviser would appear to be the amount which the owner might reasonably expect to receive for them upon their current sale. Methods which are in accordance with this principle may, for example, be based on (i) a multiple of earnings; (ii) a discount from market of a similar freely traded security (including a derivative security or a basket of securities traded on other markets, exchanges or among dealers); or (iii) yield to maturity with respect to debt issues, or a combination of these and other methods.
The following table summarizes the inputs used to value the Fund’s assets measured at fair value as of December 31, 2012:
| | | | | | | | |
| Valuation Inputs of Assets | | Level 1 | | Level 2 | | Level 3 | | Total |
| Common Stock | | $3,184,790 | | $271,720 | | $0 | | $3,456,510 |
| Total | | $3,184,790 | | $271,720 | | $0 | | $3,456,510 |
Refer to the Fund’s Schedule of Investments for a listing of securities by industry. The Fund did not hold any level 3 assets during the fiscal year ended December 31, 2012. The Fund did not hold any derivative instruments during the fiscal year ended December 31, 2012.
The following table shows transfers between level 1 and level 2 of the fair value hierarchy:
| | | | | |
| | Transfers In | Transfers Out |
| | Level 1 | Level 2 | Level 1 | | Level 2 |
| | $86,549 | - | - | | $86,549 |
Financial assets were transferred from level 2 to level 1 when the underlying positions began to trade more frequently on the open market.
4.) INVESTMENT ADVISORY AGREEMENT AND RELATED PARTY TRANSACTIONS
The Fund has entered into an investment advisory agreement (“Management Agreement”) with the Adviser. The Adviser manages the investment portfolio of the Fund, subject to policies adopted by the Trust's Board of Trustees, and, at its own expense and without reimbursement from the Fund, furnishes office space and all necessary office facilities, equipment, and executive personnel necessary for managing the Fund. The Adviser pays the expenses of the Fund except for the management fee, all brokerage fees and commissions, taxes, borrowing costs (such as (a) interest and (b) dividend expenses on securities sold short), fees and expenses of acquired funds, extraordinary or non-recurring expenses as may arise, including litigation to which the Fund may be a party and indemnification of the Trust’s Trustees and officers with respect thereto. For its services, the Adviser receives an investment management fee equal to 1.50% of the average daily net assets of the Fund.
For the fiscal year ended December 31, 2012, the Adviser earned management fees totaling $56,035, of which $5,959 was due to the Adviser at December 31, 2012.
14
Notes to Financial Statements - continued
5.) CAPITAL SHARES
The Trust is authorized to issue an unlimited number of shares of beneficial interest. Paid-in capital at December 31, 2012, was $4,325,048 representing 257,265 shares outstanding.
6.) RELATED PARTY TRANSACTIONS
A control person, Mr. Jeffrey R. Provence, of Premier Fund Solutions, Inc. (the “Administrator”) also serves as trustee/officer of the Fund. This individual receives benefits from the Administrator resulting from administration fees paid to the Administrator of the Fund by the Adviser. Mr. Ross C. Provence, another trustee of the Trust, is the father of Mr. Jeffrey R. Provence.
The Trustees who are not interested persons of the Trust received a total of $2,250 in Trustees’ fees plus travel and related expenses related to the Bretton Fund for the fiscal year ended December 31, 2012. Under the Management Agreement, the Adviser pays these fees.
7.) PURCHASES AND SALES OF SECURITIES
For the fiscal year ended December 31, 2012, purchases and sales of investment securities other than U.S. Government obligations and short-term investments aggregated $1,062,511 and $606,588, respectively. Purchases and sales of U.S. Government obligations aggregated $0 and $0, respectively.
8.) SECURITY TRANSACTIONS
For Federal income tax purposes, the cost of investments owned at December 31, 2012, was $2,935,848. At December 31, 2012, the composition of unrealized appreciation (the excess of value over tax cost) and depreciation (the excess of tax cost over value) was as follows:
| | | | | | |
| | Appreciation | | (Depreciation) | | | Net Appreciation (Depreciation) |
| | $637,833 | | ($117,171) | | | $520,662 |
There were no differences between book basis and tax basis unrealized appreciation.
9.) CONTROL OWNERSHIP
The beneficial ownership, either directly or indirectly, of more than 25% of the voting shares of a fund creates a presumption of control of the Fund, under Section 2(a)(9) of the Investment Company Act of 1940. As of December 31, 2012, Stephen Dodson and family members, located at 338 Spear Street, San Francisco, California 94105, beneficially held, in aggregate, approximately 69.67% of the Fund and therefore, may be deemed to control the Fund. Stephen Dodson is the control person of the Adviser.
10.) DISTRIBUTIONS TO SHAREHOLDERS
There was a distribution from long term capital gain of $0.7939 per share paid on December 26, 2012 to the shareholders of record on December 24, 2012.
| | | | | |
| Distributions paid from: | | | | | |
| |
| | | 2012 | | | 2011 |
| Ordinary Income . | | $ -0 | - | | $30,978 |
| Return of Capital | | -0 | - | | 454 |
| Long-Term Capital Gain | | 195,522 | | | -0- |
| | | $195,522 | | | $31,432 |
As of December 31, 2012, the components of distributable earnings (accumulated losses) on a tax basis were as follows:
| | | |
| Undistributed ordinary income/(accumulated losses) | | $-0 | - |
| Undistributed long-term capital gain/(accumulated losses) | | -0 | - |
| Unrealized appreciation/(depreciation) | | 520,662 | |
| | | $520,662 | |
There were no differences between book basis and tax basis unrealized appreciation.
15
This page was intentionally left blank.
16
Additional Information
December 31, 2012
(Unaudited) |
1.) AVAILABILITY OF QUARTERLY SCHEDULE OF INVESTMENTS
The Fund files its complete schedule of portfolio holdings with the Securities and Exchange Commission ("SEC") for the first and third quarters of each fiscal year on Form N-Q. The Fund’s Form N-Q is available on the SEC's website at http://www.sec.gov. The Fund’s Form N-Q may also be reviewed and copied at the SEC's Public Reference Room in Washington, DC. Information on the operation of the Public Reference Room may be obtained by calling 800.SEC.0330.
2.) PROXY VOTING GUIDELINES
Bretton Capital Management, LLC, the Fund’s investment adviser (“Adviser”), is responsible for exercising the voting rights associated with the securities held by the Fund. A description of the policies and procedures used by the Adviser in fulfilling this responsibility is available without charge by calling our toll free number (800.231.2901) . It is also included in the Fund’s Statement of Additional Information, which is available on the SEC’s website at http://www.sec.gov.
Information regarding how the Fund voted proxies, Form N-PX, relating to portfolio securities during the most recent 12-month period ended June 30, is available without charge, upon request, by calling our toll free number (800.231.2901) . This information is also available on the SEC’s website at http://www.sec.gov.
3.) APPROVAL OF INVESTMENT ADVISORY AGREEMENT AGREEMENT
On September 21, 2012, the Board of Trustees (the "Board") considered the approval of the continuation of the Investment Advisory Agreement (the "Agreement") between the Trust and Bretton Capital Management, LLC (the "Adviser") on behalf of the Bretton Fund (the "Fund").
In approving the Agreement, the Board of Trustees considered and evaluated the following factors: (i) the nature, extent and quality of the services provided by the Adviser to the Fund; (ii) the investment performance of the Fund and the Adviser; (iii) the cost of the services to be provided and the profits to be realized by the Adviser from the relationship with the Fund; (iv) the extent to which economies of scale will be realized as the Fund grows and whether the fee levels reflect these economies of scale to the benefit of shareholders; and (v) the Adviser's practices regarding possible conflicts of interest.
In assessing these factors and reaching its decisions, the Board took into consideration information furnished for the Board's review and consideration throughout the year at regular Board meetings, as well as information specifically prepared and/or presented in connection with the annual renewal process, including information presented at the Meeting. The Board requested and was provided with information and reports relevant to the annual renewal of the Agreement, including: (i) reports regarding the services and support provided to the Fund and its shareholders by the Adviser; (ii) assessments of the investment performance of the Fund by personnel of the Adviser; (iii) commentary on the reasons for the performance; (iv) presentations addressing the Adviser's investment philosophy, investment strategy, personnel and operations; (v) compliance and audit reports concerning the Fund and the Adviser; (vi) disclosure information contained in the registration statement of the Trust and the Form ADV of the Adviser; (vii) information on relevant developments in the mutual fund industry and how the Fund and/or the Adviser are responding to them; and (viii) a memorandum from Legal Counsel that summarized the fiduciary duties and responsibilities of the Board in reviewing and approving the Agreement, including the material factors set forth above and the types of information included in each factor that should be considered by the Board in order to make an informed decision. The Board also requested and received various informational materials including, without limitation: (i) documents containing information about the Adviser, including financial information, a description of personnel and the services provided to the Fund, information on investment advice, performance, summaries of Fund expenses, compliance program, current legal matters, and other general information; (ii) comparative expense and performance information for other mutual funds with strategies similar to the Fund; (iii) the anticipated effect of size on the Fund's performance and expenses; and (iv) benefits to be realized by the Adviser from its relationship with the Fund. The Board did not identify any particular information that was most relevant to its consideration to approve the Agreement and each Trustee may have afforded different weight to the various factors.
1. Nature, Extent and Quality of the Services Provided by the Adviser
In considering the nature, extent, and quality of the services provided by the Adviser, the Trustees
17
Additional Information (Unaudited) - continued
reviewed the responsibilities of the Adviser under the Agreement. The Trustees reviewed the services being provided by the Adviser including, without limitation: the quality of investment advisory services (including research and recommendations with respect to portfolio securities); the process for formulating investment recommendations and assuring compliance with the Fund's investment objective, strategies, and limitations, as well as for ensuring compliance with regulatory requirements. The Trustees considered the coordination of services for the Fund among the Adviser and the service providers and the Independent Trustees; and the efforts of the Adviser to promote the Fund and grow its assets. The Trustees noted the quality of the Adviser's personnel and the commitment to enhance its resources and systems; and the continued cooperation with the Independent Trustees and Legal Counsel for the Fund. The Trustees evaluated the Adviser's personnel, including the education and experience of its personnel. After reviewing the foregoing information and further information in the materials provided by the Adviser (including the Adviser's Form ADV), the Board concluded that, in light of all the facts and circumstances, the nature, extent, and quality of the services provided by the Adviser were satisfactory and adequate for the Fund.
2. Investment Performance of the Fund and the Adviser
In considering the investment performance of the Fund and the Adviser, the Trustees compared the short-term and since inception performance of the Fund with the performance of funds with similar objectives managed by other investment advisers, as well as with aggregated peer group data. As to the performance of the Fund, the Report included information regarding the performance of the Fund compared to a group of funds of similar size, style and objective, categorized by Morningstar (the "Peer Group"). All performance data was through the period ended June 30, 2012. The Trustees noted that for the 12 month period ended June 30, 2012 the Fund outperformed its benchmark index and its Peer Group average, and also outperformed its Index since inception. After reviewing and discussing the investment performance of the Fund further, the Adviser's experience managing the Fund, and other relevant factors, the Board concluded, in light of all the facts and circumstances, that the investment performance of the Fund and the Adviser was satisfactory.
3. Costs of the Services to be provided and profits to be realized by the Adviser
In considering the costs of the services to be provided and profits to be realized by the Adviser from the relationship with the Fund, the Trustees considered: (1) the Adviser's financial condition and the level of commitment to the Fund and the Adviser by the principal of the Adviser; (2) the asset level of the Fund; (3) the overall expenses of the Fund; and (4) the nature and frequency of advisory fee payments. The Trustees reviewed information provided by the Adviser regarding its profits associated with managing the Fund. The Trustees also considered potential benefits for the Adviser in managing the Fund. The Trustees then compared the fees and expenses of the Fund (including the management fee) to other comparable mutual funds. The Trustees reviewed the fees under the Agreement compared to other mutual funds with similar investment objectives and asset levels and noted that the expense ratio was approximately 32 basis points lower than its Peer Group average. The Trustees also reviewed the management fee of 1.50% noting that it was at the high end of the Peer Group. The Trustees also recognized that the Adviser was obligated to pay certain expenses of the Fund out of its management fee, and that after paying those expenses, the Adviser's relationship with the Fund was not profitable due to the Fund's current asset level. Based on the foregoing, the Board concluded that the fees to be paid to the Adviser and the profits to be realized by the Adviser, in light of all the facts and circumstances, were fair and reasonable in relation to the nature and quality of the services provided by the Adviser.
4. Economies of Scale
The Trustees next considered the impact of economies of scale on the Fund's size and whether advisory fee levels reflect those economies of scale for the benefit of the Fund's investors. The Trustees considered that while the management fee remained the same at all asset levels, the Fund's shareholders had experienced benefits from the fact that the Adviser was obligated to pay certain of the Fund's operating expenses which had the effect of limiting the overall fees paid by the Fund. In light of its ongoing consideration of the Fund's asset levels, expectations for growth in the Fund, and fee levels, the Board determined that the Fund's fee arrangements, in light of all the facts and circumstances, were fair and reasonable in relation to the nature and quality of the services provided by the Adviser.
5. The Adviser's Practices Regarding Possible Conflicts of Interest
In considering the Adviser's practices regarding conflicts of interest, the Trustees evaluated the
18
Additional Information (Unaudited) - continued
potential for conflicts of interest and considered such matters as the experience and ability of the advisory personnel assigned to the Fund; the basis of decisions to buy or sell securities for the Fund; and the substance and administration of the Adviser's code of ethics. The Trustees also considered disclosure in the registration statement of the Trust related to the Adviser's potential conflicts of interest. Based on the foregoing, the Board determined that the Adviser's standards and practices relating to the identification and mitigation of possible conflicts of interest were satisfactory.
The Board then reflected on its in-person discussion with a representative of the Adviser earlier in the Meeting. Next, the Independent Trustees met in executive session to discuss the continuation of the Agreement. The officers of the Trust were excused during this discussion. Upon reconvening, it was the Board's consensus (including a majority of the independent Trustees) that the fees to be paid to the Adviser, pursuant to the Agreement, were reasonable, that the overall arrangements provided under the terms of the Agreement were reasonable and within a range of what could have been negotiated at arms-length in light of all surrounding circumstances, including such services to be rendered and such other matters as the Trustees considered to be relevant in the exercise of their reasonable business judgment.
4.) DISCLOSURE OF EXPENSES
As a shareholder of the Fund, you incur ongoing expenses consisting solely of management fees. This Example is intended to help you understand your ongoing costs (in dollars) of investing in the Fund and to compare these costs with the ongoing costs of investing in other mutual funds.
The Example is based on an investment of $1,000 invested in the Fund on July 1, 2012, and held through December 31, 2012.
Actual Expenses
The first line of the table below provides information about actual account values and actual expenses. You may use the information in this line, together with the amount you invested, to estimate the expenses that you paid over the period. Simply divide your account value by $1,000 (for example, an $8,600 account value divided by $1,000 = 8.6), then multiply the result by the number in the first line under the heading entitled "Expenses Paid During Period" to estimate the expenses you paid on your account during this period.
Hypothetical Example for Comparison Purposes
The second line of the table below provides information about hypothetical account values and hypothetical expenses based on the Fund's actual expense ratio and an assumed rate of return of 5% per year before expenses, which is not the Fund's actual return. The hypothetical account values and expenses may not be used to estimate the actual ending account balance or expenses you paid for the period. You may use this information to compare the ongoing costs of investing in this Fund and other funds. To do so, compare this 5% hypothetical example with the 5% hypothetical examples that appear in the shareholder reports of the other funds.
Please note that the expenses shown in the table are meant to highlight your ongoing costs only and do not reflect any transactional costs, such as sales charges (loads). Therefore, the second line of the table is useful in comparing ongoing costs only, and will not help you determine the relative cost of owning different funds. In addition, if these transactional costs were included, your cost could have been higher.
| | | | | | |
| | | | | | | Expenses Paid |
| | | Beginning | | Ending | | During the Period* |
| | | Account Value | | Account Value | | July 1, 2012 to |
| | | July 1, 2012 | | December 31, 2012 | | December 31, 2012 |
| |
| Actual | | $1,000.00 | | $1,023.42 | | $7.65 |
| |
| Hypothetical | | $1,000.00 | | $1,017.64 | | $7.63 |
| (5% annual return | | | | | | |
| before expenses) | | | | | | |
* Expenses are equal to the Fund’s annualized expense ratio of 1.50%, multiplied by the
average account value over the period, multiplied by 184/365 (to reflect the one-half year
period ended December 31, 2012). |
| |
19
This page was intentionally left blank.
20
| |
| Cohen Fund Audit Services, Ltd. | 1350 Euclid Ave., Ste 800 |
| Certified Public Accountants | Cleveland, Ohio 44115 |
| | Phone: (440) 835-8500 |
| | Fax: (440) 835-1093 |
| | www.cohenfund.com |
REPORT OF INDEPENDENT REGISTERED PUBLIC ACCOUNTING FIRM
To the Shareholders and Board of Trustees
Bretton Fund (a series of PFS Funds)
We have audited the accompanying statement of assets and liabilities of Bretton Fund, a series of PFS Funds (the "Fund"), including the schedule of investments, as of December 31, 2012, and the related statement of operations for the year then ended, the statements of changes in net assets for each of the two years in the period then ended, and the financial highlights for each of the three periods in the period then ended. These financial statements and financial highlights are the responsibility of the Fund's management. Our responsibility is to express an opinion on these financial statements and financial highlights based on our audits.
We conducted our audits in accordance with the standards of the Public Company Accounting Oversight Board (United States). Those standards require that we plan and perform the audit to obtain reasonable assurance about whether the financial statements and financial highlights are free of material misstatement. An audit includes examining, on a test basis, evidence supporting the amounts and disclosures in the financial statements. Our procedures included confirmation of securities owned as of December 31, 2012, by correspondence with the custodian. An audit also includes assessing the accounting principles used and significant estimates made by management, as well as evaluating the overall financial statement presentation. We believe that our audits provide a reasonable basis for our opinion.
In our opinion, the financial statements and financial highlights referred to above present fairly, in all material respects, the financial position of Bretton Fund as of December 31, 2012, the results of its operations for the year then ended, the changes in its net assets for each of the two years in the period then ended, and the financial highlights for each of the three periods in the period then ended, in conformity with accounting principles generally accepted in the United States of America.

COHEN FUND AUDIT SERVICES, LTD.
Cleveland, Ohio
February 19, 2013 |
21
Trustees and Officers
(Unaudited) |
The Board of Trustees supervises the business activities of the Trust. The names of the Trustees and executive officers of the Trust are shown below. For more information regarding the Trustees, please refer to the Statement of Additional Information, which is available upon request by calling 800.231.2901. Each Trustee serves until the Trustee sooner dies, resigns, retires, or is removed.
The Trustees and Officers of the Trust and their principal business activities during the past five years are:
| | | | | |
| Interested Trustees and Officers | | | | |
| |
| | | | | Number of | Other |
| | | | Principal | Portfolios In Directorships |
| Name, | Position(s) Term of Office | Occupation(s) | Fund | Held By |
| Address(1), | Held With | and Length of | During | Complex | Trustee or |
| and Year of Birth | the Trust | Time Served | Past 5 Years | Overseen By | Officer |
| | | | | Trustee | |
| |
| Ross C. Provence(2), | Trustee | Indefinite Term; | General Partner and Portfolio | 9 | Blue Chip |
| Year of Birth: 1938 | and | Since 2000 | Manager for Value Trend Capital | | Investor Funds |
| | President | | Management, LP (1995 to current). | | |
| | | | Estate planning attorney (1963 to | | |
| current). |
| |
| Jeffrey R. Provence(2), | Trustee, | Indefinite Term; | General Partner and Portfolio | 9 | Blue Chip |
| Year of Birth:1969 | Secretary | Since 2000 | Manager for Value Trend Capital | | Investor Funds, |
| | and | | Management, LP (1995 to current). | | Sycuan Funds |
| | Treasurer | | CEO, Premier Fund Solutions, Inc. | | |
| | | | (2001 to current). | | |
| |
| Julian G. Winters, | Chief | Chief | Managing Member, Watermark | N/A | N/A |
| Year of Birth: 1968 | Compliance | Compliance | Solutions LLC (investment compli- | | |
| | Officer | Officer Since | ance and consulting) since 3/07; | | |
| | | 2010 | previously, Vice President of | | |
| | | | Compliance Administration, The | | |
| | | | Nottingham Company (investment | | |
| | | | company administrator and fund | | |
| | | | accountant), 3/98-3/07. | | |
(1) The address of each trustee and officer is c/o PFS Funds, 1939 Friendship Drive, Suite C, El Cajon, California 92020.
(2) Trustees who are considered "interested persons" as defined in Section 2(a)(19) of the Investment Company Act of 1940 by virtue
of their affiliation with the Investment Adviser.
| | | | | |
| Independent Trustees | | | | | |
| |
| | | | | Number of | Other |
| | | | Principal | Portfolios In Directorships |
| Name, | Position | Term of Office | Occupation(s) | Fund | Held By |
| Address(1), | Held With | and Length of | During | Complex | Trustee or |
| and Year of Birth | the Trust | Time Served | Past 5 Years | Overseen By | Officer |
| | | | | Trustee | |
| |
| Thomas H. Addis III, | Independent | Indefinite Term; | Executive Director/CEO, Southern | 9 | None |
| Year of Birth: 1945 | Trustee | Since 2000 | California PGA (2006 to current). | | |
| |
| Allen C. Brown, | Independent | Indefinite Term; | Co-owner of Stebleton & Brown | 9 | Blue Chip |
| Year of Birth: 1943 | Trustee | Since 2010 | (1994 to Current). Estate planning | | Investor Funds, |
| | | | and business attorney (1970 to cur- | | Sycuan Funds |
| rent). |
| |
| George Cossolias, CPA, | Independent | Indefinite Term; | Owner of George Cossolias & | 9 | Blue Chip |
| Year of Birth: 1935 | Trustee | Since 2000 | Company, CPAs (1972 to current). | | Investor Funds, |
| | | | President of Lubrication Specialists, | | Sycuan Funds, |
| | | | Inc. (1996 to current). | | Temecula |
| | | | | | Valley Bank |
(1) The address of each trustee and officer is c/o PFS Funds, 1939 Friendship Drive, Suite C, El Cajon, California 92020.
22

Investment Adviser
Bretton Capital Management, LLC
Legal Counsel
The Law Offices of John H. Lively
A member firm of The 1940 Act Law GroupTM
Custodian
US Bank N.A.
Dividend Paying Agent,
Shareholders' Servicing Agent,
Transfer Agent
Mutual Shareholder Services, LLC
Fund Administrator
Premier Fund Solutions, Inc.
Independent Registered Public Accounting Firm
Cohen Fund Audit Services, Ltd. |
This report is provided for the general information of the shareholders of the Bretton
Fund. This report is not intended for distribution to prospective investors in the Fund,
unless preceded or accompanied by an effective prospectus. |
Item 2. Code of Ethics.
The registrant has adopted a code of ethics that applies to the registrant’s principal executive officer and the principal financial officer. The registrant has not made any amendments to its code of ethics during the covered period. The registrant has not granted any waivers from any provisions of the code of ethics during the covered period. A copy of the registrant’s Code of Ethics is filed herewith.
Item 3. Audit Committee Financial Expert.
The registrant’s Board of Trustees has determined that George Cossolias is an audit committee finical expert. Mr. Cossolias is independent for purposes of this Item 3.
Item 4. Principal Accountant Fees and Services.
(a-d) The following table details the aggregate fees billed for each of the last two fiscal years for audit fees, audit-related fees, tax fees and other fees by the principal accountant to the registrant. The principal accountant has provided no services to the adviser or any entity controlled by, or under common control with the adviser that provides ongoing services to the registrant.
| | | | |
| | | FYE 12/31/12 | | FYE 12/31/11 |
| Audit Fees | | $13,250 | | $13,250 |
| Audit-Related Fees | | $0 | | $0 |
| Tax Fees | | $2,500 | | $2,000 |
| All Other Fees | | $750 | | $750 |
Nature of Tax Fees: preparation of Excise Tax Statement and 1120 RIC. Nature of All Other Fees: Review of Semi-Annual Report.
(e) (1) The audit committee approves all audit and non-audit related services and, therefore, has not adopted pre-approval policies and procedures described in paragraph (c)(7) of Rule 2-01 of Regulation S-X.
(e) (2) None of the services described in paragraph (b) through (d) of this Item were approved by the audit committee pursuant to paragraph (c)(7)(i)(C) of Rule 2-01 of Regulation S-X.
(f) All of the principal accountant’s hours spent on auditing the registrant’s financial statements were attributed to work performed by full-time permanent employees of the principal accountant.
(g) The following table indicates the aggregate non-audit fees billed by the registrant’s principal accountant for services to the registrant , the registrant’s investment adviser (not sub-adviser), and any entity controlling, controlled by, or under common control with the adviser that provides ongoing services to the registrant, for the last two years.
| | | | |
| Non-Audit Fees | | FYE 12/31/12 | | FYE 12/31/11 |
| Registrant | | $3,250 | | $2,750 |
| Registrant’s Investment Adviser | | $0 | | $0 |
(h) The principal accountant provided no services to the investment adviser or any entity controlling, controlled by, or under common control with the adviser that provides ongoing services to the registrant.
Item 5. Audit Committee of Listed Companies. Not applicable.
Item 6. Schedule of Investments. Schedule filed with Item 1.
Item 7. Disclosure of Proxy Voting Policies and Procedures for Closed-End Management Investment Companies. Not applicable.
Item 8. Portfolio Managers of Closed End Management Investment Companies. Not applicable.
Item 9. Purchases of Equity Securities by Closed-End Management Investment Companies and Affiliated Purchasers. Not applicable.
Item 10. Submission of Matters to a Vote of Security Holders.
The registrant has not adopted procedures by which shareholders may recommend nominees to the registrant’s board of trustees.
Item 11. Controls and Procedures.
(a) The registrant’s president and chief financial officer concluded that the disclosure controls and procedures (as defined in Rule 30a-3(c) under the Investment Company Act of 1940 (the “Act”)) were effective as of a date within 90 days of the filing date of this report, based on the evaluation of these controls and procedures required by Rule 30a-3(b) under the Act.
(b) There were no changes in the registrant’s internal control over financial reporting (as defined in Rule 30a-3(d) under the Act) that occurred during the registrant’s second fiscal quarter of the period covered by this report that have materially affected, or are reasonably likely to materially affect, the registrant’s internal control over financial reporting.
Item 12. Exhibits.
| (a) (1) Code of Ethics. Filed herewith. |
| |
| (a) (2) Certifications pursuant to Section 302 of the Sarbanes-Oxley Act of 2002. Filed herewith. |
| |
| (b) Certification pursuant to Section 906 Certification of the Sarbanes-Oxley Act of 2002. Filed herewith. |
| |
Pursuant to the requirements of the Securities Exchange Act of 1934 and the Investment Company Act of 1940, the registrant has duly caused this report to be signed on its behalf by the undersigned, thereunto duly authorized.
By: /s/ Ross C. Provence
Ross C. Provence
President
Date: 2/22/13
Pursuant to the requirements of the Securities Exchange Act of 1934 and the Investment Company Act of 1940, this report has been signed below by the following persons on behalf of the registrant and in the capacities and on the dates indicated.
By: /s/ Ross C. Provence
Ross C. Provence
President
Date: 2/22/13
By: /s/ Jeffrey R. Provence
Jeffrey R. Provence
Chief Financial Officer
Date: 2/22/13