UNITED STATES
SECURITIES AND EXCHANGE COMMISSION
WASHINGTON, D.C. 20549
FORM N-CSR
CERTIFIED SHAREHOLDER REPORT OF REGISTERED MANAGEMENT
INVESTMENT COMPANIES
Investment Company Act file number: 811-09781
PFS Funds
(Exact name of registrant as specified in charter)
| 1939 Friendship Drive. | |
| Suite C | |
| El Cajon, CA | 92020 |
| (Address of principal executive offices) | (Zip code) |
CT Corporation System
155 Federal St., Suite 700,
Boston, MA 02110
(Name and address of agent for service)
Registrant's telephone number, including area code: (619) 588-9700
Date of fiscal year end: March 31
Date of reporting period: March 31, 2013
Form N-CSR is to be used by management investment companies to file reports with the Commission not later than 10 days after the transmission to stockholders of any report that is required to be transmitted to stockholders under Rule 30e-1 under the Investment Company Act of 1940 (17 CFR 270.30e -1). The Commission may use the information provided on Form N-CSR in its regulatory, disclosure review, inspection and policymaking roles.
A registrant is required to disclose the information specified by Form N-CSR, and the Commission will make this information public. A registrant is not required to respond to the collection of information contained in Form N-CSR unless the Form displays a currently valid Office of Management and Budget ("OMB") control number. Please direct comments concerning the accuracy of the information collection burden estimate and any suggestions for reducing the burden to Secretary, Securities and Exchange Commission, 450 Fifth Street, NW, Washington, DC 20549-0609. The OMB has reviewed this collection of information under the clearance requirements of 44 U.S.C. § 3507.
Item 1. Reports to Stockholders.
Wireless Fund
Annual Report
March 31, 2013
Letter To Shareholders, May 2013
There is no question that Steve Jobs was one of the greatest technology innovators of the 21st century. Steve Jobs’ creativity, brilliance, passion and energy drove him to create incredible innovations beyond our wildest dreams! The iPhone and iPad are just a few examples of his innovative products that have enhanced our daily lives.
Fund Discussion
For the twelve month period ended March 31, 2013, the Wireless Fund posted a total return of 3.27% . For comparative purposes, the Standard & Poor's 500 Index ("S&P 500") was up 13.96% and the NASDAQ Composite Index ("NASDAQ") rose by 7.04%, for the same period. When looking at the performance against the S&P 500 and the NASDAQ, the Fund underper-formed.
The generally strong market helped the Fund generate positive returns during the fiscal period. Additionally, several of the Fund’s holdings produced positive returns during the fiscal period. Sprint Nextel Corp. (NYSE: S) and Texas Instruments Inc. (NYSE: TXN) rebounded during the Fund's fiscal period ended March 31, 2013. Holdings in the Communications Services sector were strong. These holdings included American Tower Corporation (NYSE: AMT), Crown Castle International Corp. (NYSE:CCI) and SBA Communications Corp. (NYSE: SBAC). Although the Fund did generate positive results, it did not keep pace with the broad market indices. One of the factors that contributed to the Fund's performance during the fiscal year was the pullback of several of the Fund's holdings. Apple Inc. (NASDAQ: AAPL) - the Fund's second largest holding at 8.45% of net assets closed at over $700 a share in September 2012 and subsequently sold off to approximately $442 a share as of March 31, 2013. After Steve Jobs left us in October 2012 the stock started to retreat. Yet the company continues to produce incredible products and has what we believe to be solid fundamentals. Nokia Corporation (NYSE:NOK) had a difficult stretch during the Fund's fiscal year as well, as several other of the Fund's holdings.
The Telephone Communications (No Radio Telephone) sector represented the largest percentage of the net assets at 22.77% . Sprint Nextel Corp. (NYSE: S) and China Mobile Limited (NYSE: CHL) were the two largest holdings in the Telephone Communications (No Radio Telephone) sector. Sprint Nextel Corp., through its subsidiaries, offers a range of wireless and wireline communications products and services to individual consumers, businesses, government subscribers, and resellers in the United States, Puerto Rico, and the U.S. Virgin Islands. The Wireless segment provides wireless data transmission services, including mobile productivity applications, such as Internet access, messaging, and email services; wireless photo and video offerings; location-based capabilities comprising asset and fleet management, dispatch services, and navigation tools; mobile entertainment applications; and local and long distance wireless voice services, as well as voicemail, call waiting, three-way calling, caller identification, directory assistance, and call forwarding services. China Mobile Limited provides mobile
2013 Annual Report 1
telecommunications and related services primarily in Mainland China and Hong Kong. It offers voice services comprising local calls, domestic long distance calls, international long distance calls, intra-provincial roaming, inter-provincial roaming, and international roaming. The company also provides voice value-added services, including caller identity display, caller restrictions, call waiting, call forwarding, call holding, voice mail, and conference calls; and data services, which primarily include short messaging services, multimedia messaging services, wireless data traffic services, and applications and information services, such as mobile music, mobile paper, mobile reading, mobile video, mobile gaming, mobile mailbox, and mobile market. As of December 31, 2012, it served approximately 710 million customers.
The Radio & TV Broadcasting & Communications Equipment sector represented the second largest percentage of the Fund's net assets at 16.42% . QUALCOMM Inc. (NASDAQ: QCOM) - the Fund's largest holding at 10.65% of net assets, designs, develops, manufactures, and markets digital telecommunications products and services. It operates in four segments: QCT, QTL, QWI, and QSI. The QCT segment develops and supplies integrated circuits and system software based on code division multiple access (CDMA), orthogonal frequency division multiple access (OFDMA), and other technologies for use in voice and data communications, networking, application processing, multimedia, and global positioning systems. The QTL segment grants licenses to use portions of its intellectual property portfolio, which includes patent rights useful in the manufacture and sale of various wireless products, such as products implementing CDMA2000, WCDMA, CDMA TDD, GSM/GPRS/EDGE, and OFDMA standards, as well as their derivatives. The QWI segment provides fleet management, satellite- and terrestrial-based two-way wireless information and position reporting, and other services; software and hardware to transportation and logistics companies; content enablement services for the wireless industry; push-to-talk and other software products and services for wireless network operators; and development, and other services and related products of wireless communications technologies to government agencies and their contractors, as well as builds and manages software applications that enable certain mobile commerce services. The QSI segment invests in early-stage companies that support the design and introduction of new products and services, as well as holds a wireless spectrum license. The company operates primarily in China, South Korea, Taiwan, and the United States.
As always, we appreciate your participation in the Wireless Fund.
Sincerely,
Jeffrey R. Provence
Past performance does not guarantee future results. The investment return and principal value of an investment will fluctuate so that an investor's shares, when redeemed, may be worth more or less than their original cost. Current performance may be lower or higher than the performance data quoted. You may obtain performance data current to the most recent month-end by calling toll free1-800-590-0898. Investors should consider the investment objectives, risks, and charges and expenses of the Fund carefully before investing. The prospectus contains this and other information about the Fund. You may obtain a prospectus on our website www.wire-less-fund.com or by calling toll free 1-800-590-0898.
2013 Annual Report 2
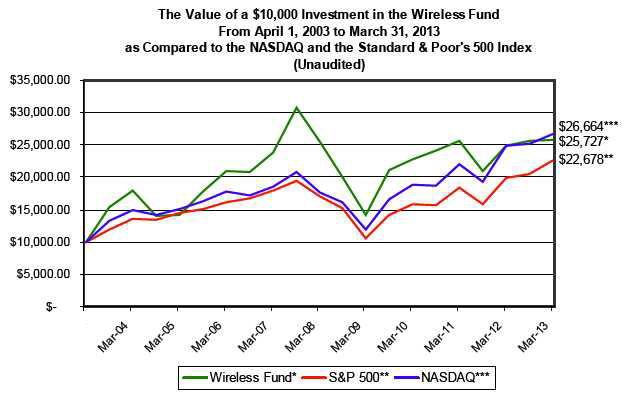
Average annual total returns for the periods ended 3/31/13 (Unaudited)
3/31/13 NAV $5.86
| | 1 Year* | | 3 Year* | | 5 Year* | | 10 Year* | |
| Wireless Fund | 3.27% | | 4.03% | | 0.19% | | 9.91% | |
| NASDAQ** | 7.04% | | 12.25% | | 8.70% | | 10.30% | |
| Standard & Poor’s 500 Index*** | 13.96% | | 12.67% | | 5.81% | | 8.53% | |
Total Annual Fund Operating Expense Ratio (from 08/01/12 Prospectus): 1.95%
The Fund's expense ratio for the period ended March 31, 2013 can be found in the financial highlights included within this report.
*1 Year, 3 Year, 5 Year and 10 Year returns include change in share prices and in each case includes reinvestment of any dividends and capital gain distributions. The returns shown do not reflect the deduction of taxes that a shareholder would pay on Fund distributions or the redemption of Fund shares.
**The NASDAQ Composite (NASDAQ) is a capitalization-weighted index of all common stocks listed on NASDAQ and is an unmanaged group of stocks whose composition is different from the Fund.
***The Standard & Poor’s 500 Index (S&P 500) is a broad market-weighted average dominated by blue-chip stocks and is an unmanaged group of stocks whose composition is different from the Fund.
PAST PERFORMANCE DOES NOT GUARANTEE FUTURE RESULTS. INVESTMENT RETURN AND PRINCIPAL VALUE WILL FLUCTUATE SO THAT SHARES, WHEN REDEEMED, MAY BE WORTH MORE OR LESS THAN THEIR ORIGINAL COST. CURRENT PERFORMANCE MAY BE LOWER OR HIGHER THAN THE PERFORMANCE DATA QUOTED. TO OBTAIN PERFORMANCE DATA CURRENT TO THE MOST RECENT MONTH END, PLEASE CALL 1-800-590-0898.
2013 Annual Report 3
Wireless Fund Sector Distribution (Unaudited)
(As a Percentage of Net Assets)
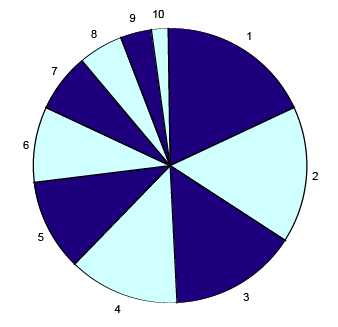
| Industry Sector | Percentage of Net Assets |
| 1. Telephone Communications (No Radio Telephone) | | 22.77% | |
| 2. Radio & TV Broadcasting & Communications Equipment | | 16.42% | |
| 3. Communications Services | | 15.96% | |
| 4. Radiotelephone Communications | | 12.30% | |
| 5. Electronic Computers | | 8.45% | |
| 6. Semiconductors and Related Devices | | 7.64% | |
| 7. Services - Computer Programming, Data Processing, Etc. | | 5.56% | |
| 8. Cash Equivalents Less Liabilities in Excess of Other Assets | 4.33% | |
| 9. Computer Communications Equipment | | 3.32% | |
| 10. Cable & Other Pay Television Services | | 3.25% | |
PROXY VOTING GUIDELINES
(Unaudited)
Value Trend Capital Management, LP, the Fund’s Adviser, is responsible for exercising the voting rights associated with the securities held by the Fund. A description of the policies and procedures used by the Adviser in fulfilling this responsibility is available without charge on the Fund’s website at www.wireless-fund.com. It is also included in the Fund’s Statement of Additional Information, which is available on the Securities and Exchange Commission’s website at http://www.sec.gov.
Information regarding how the Fund voted proxies, Form N-PX, relating to portfolio securities during the most recent 12-month period ended June 30 is available without charge, upon request, by calling our toll free number (1-800-590-0898). This information is also available on the Securities and Exchange Commission’s website at http://www.sec.gov.
2013 Annual Report 4
Availability of Quarterly Schedule of Investments
(Unaudited)
The Fund files its complete schedule of portfolio holdings with the Securities and Exchange Commission ("SEC") for the first and third quarters of each fiscal year on Form N-Q. The Fund’s Forms N-Q are available on the SEC's Web site at http://www.sec.gov. The Fund’s Forms N-Q may also be reviewed and copied at the SEC's Public Reference Room in Washington, DC. Information on the operation of the Public Reference Room may be obtained by calling 1-800-SEC-0330.
Disclosure of Expenses
(Unaudited)
Shareholders of this Fund incur ongoing operating expenses consisting of management fees. The following example is intended to help you understand your ongoing expenses of investing in the Fund and to compare these expenses with similar costs of investing in other mutual funds. The example is based on an investment of $1,000 (for example, an $8,600 account value divided by $1,000 = 8.6) invested in the Fund on October 1, 2012 and held through March 31, 2013.
The first line of the table below provides information about actual account values and actual expenses. In order to estimate the expenses a shareholder paid during the period covered by this report, shareholders can divide their account value by $1,000 and then multiply the result by the number in the first line under the heading entitled "Expenses Paid During the Period."
The second line of the table below provides information about hypothetical account values and hypothetical expenses based on the Fund's actual expense ratio and an assumed rate of return of 5% per year before expenses, which is not the Fund’s actual return. The hypothetical account values and expenses may not be used to estimate the actual ending account balance or expenses paid by a shareholder for the period. In order to assist shareholders in comparing the ongoing expenses of investing in this Fund and other funds, compare the 5% hypothetical example with the 5% hypothetical examples that appear in other funds' shareholder reports.
| | | | | | | Expenses Paid |
| | | Beginning | | Ending | | During the Period* |
| | | Account Value | | Account Value | | October 1, 2012 |
| | | October 1, 2012 | | March 31, 2013 | | to March 31, 2013 |
| |
| Actual | | $1,000 | | $1,004.40 | | $9.74 |
| |
| Hypothetical | | $1,000 | | $1,015.21 | | $9.80 |
| (5% annual return | | | | | | |
| before expenses) | | | | | | |
* Expenses are equal to the Fund’s annualized expense ratio of 1.95%, multiplied
by the average account value over the period, multiplied by 182/365 (to reflect the
one-half year period). |
2013 Annual Report 5
| SCHEDULE OF INVESTMENTS - WIRELESS FUND |
| |
| |
| MARCH 31, 2013 |
| |
| |
| Shares/Principal Amount | | Fair Value | | % of Net Assets |
| COMMON STOCKS | | | | | |
| Cable & Other Pay Television Services | | | | | |
| 2,000 | Rogers Communications Inc. | $ | 102,120 | | 3.25 | % |
| Communications Services | | | | | |
| 2,000 | American Tower Corp. | | 153,840 | | | |
| 2,100 | Crown Castle International Corp. * | | 146,244 | | | |
| 2,800 | SBA Communications Corp. Class A * | | 201,600 | | | |
| | | | 501,684 | | 15.96 | % |
| Computer Communications Equipment | | | | | |
| 5,000 | Cisco Systems, Inc. | | 104,475 | | 3.32 | % |
| Electronic Computers | | | | | |
| 600 | Apple Inc. | | 265,596 | | 8.45 | % |
| Radio Telephone Communications | | | | | |
| 11,000 | VimpelCom Ltd. ** | | 130,790 | | | |
| 9,000 | Vodafone Group PLC ** | | 255,600 | | | |
| | | | 386,390 | | 12.30 | % |
| Radio & TV Broadcasting & Communications Equipment | | | | | |
| 1,500 | Motorola Solutions, Inc. | | 96,045 | | | |
| 26,000 | Nokia Corporation ** | | 85,280 | | | |
| 5,000 | QUALCOMM Inc. | | 334,700 | | | |
| | | | 516,025 | | 16.42 | % |
| Semiconductors and Related Devices | | | | | |
| 4,300 | Skyworks Solutions Inc. * | | 94,708 | | | |
| 4,100 | Texas Instruments Inc. | | 145,468 | | | |
| | | | 240,176 | | 7.64 | % |
| Services - Computer Programming, Data Processing, Etc. | | | | | |
| 220 | Google Inc. Class A * | | 174,721 | | 5.56 | % |
| Telephone Communications (No Radio Telephone) | | | | | |
| 6,100 | America Movil SA de CV ** | | 127,856 | | | |
| 2,500 | AT&T Inc. | | 91,725 | | | |
| 2,650 | China Mobile Limited ** | | 140,795 | | | |
| 35,000 | Sprint Nextel Corp. * | | 217,350 | | | |
| 2,800 | Verizon Communications Inc. | | 137,620 | | | |
| | | | 715,346 | | 22.77 | % |
| Total for Common Stock (Cost $1,881,814) | | 3,006,533 | | 95.67 | % |
| Money Market Funds | | | | | |
| 199,084 | First American Treasury Obligation Fund Cl Y Rate 0.00% *** | | 199,084 | | 6.34 | % |
| | (Cost - $199,084) | | | | | |
| | Total Investments | | | | | |
| | (Cost - $2,080,898) | | 3,205,617 | | 102.01 | % |
| | Liabilities In Excess of Other Assets | | (63,123 | ) | -2.01 | % |
| | Net Assets | $ | 3,142,494 | | 100.00 | % |
* Non-Income producing securities.
** ADR - American Depositary Receipt.
*** Variable rate security; the yield rate shown represents
the rate at March 31, 2013.
The accompanying notes are an integral part of the financial
statements. |
2013 Annual Report 6
| WIRELESS FUND |
| |
| Statement of Assets and Liabilities | | | |
| March 31, 2013 | | | |
| |
| Assets: | | | |
| Investment Securities at Fair Value | $ | 3,205,617 | |
| (Cost - $2,080,898) | | | |
| Receivables: | | | |
| Securities Sold | | 137,798 | |
| Total Assets | | 3,343,415 | |
| Liabilities: | | | |
| Payables: | | | |
| Securities Purchased | | 195,662 | |
| Advisory Fees | | 5,259 | |
| Total Liabilities | | 200,921 | |
| |
| Net Assets | $ | 3,142,494 | |
| Net Assets Consist of: | | | |
| Paid In Capital | $ | 5,046,894 | |
| Accumulated Undistributed Net Investment Income | | 4,987 | |
| Accumulated Realized Gain (Loss) on Investments - Net | | (3,034,106 | ) |
| Unrealized Appreciation (Depreciation) in Value | | | |
| of Investments Based on Identified Cost - Net | | 1,124,719 | |
| Net Assets, for 536,591 Shares Outstanding | $ | 3,142,494 | |
| (Unlimited number of shares authorized without par value) | | | |
| Net Asset Value and Offering Price | | | |
| Per Share ($3,142,494/536,591 shares) | $ | 5.86 | |
| Minimum Redemption Price Per Share ($5.86 * 0.98) | $ | 5.74 | |
| |
| |
| Statement of Operations | | | |
| For the fiscal year ended March 31, 2013 | | | |
| Investment Income: | | | |
| Dividends (Net of foreign withholding tax and fees of $6,054) | $ | 72,007 | |
| Interest | | 19 | |
| Total Investment Income | | 72,026 | |
| Expenses: | | | |
| Management Fees | | 67,039 | |
| Total Expenses | | 67,039 | |
| |
| Net Investment Income (Loss) | | 4,987 | |
| |
| Realized and Unrealized Gain (Loss) on Investments: | | | |
| Realized Gain (Loss) on Investments | | 97,701 | |
| Change In Unrealized Appreciation (Depreciation) on Investments | | (5,167 | ) |
| Net Realized and Unrealized Gain (Loss) on Investments | | 92,534 | |
| |
| Net Increase (Decrease) in Net Assets from Operations | $ | 97,521 | |
The accompanying notes are an integral part of the financial
statements. |
2013 Annual Report 7
| WIRELESS FUND |
| | | | | | |
| | | | | | |
| Statements of Changes in Net Assets | | | | | | |
| | | 4/1/2012 | | | 4/1/2011 | |
| | | to | | | to | |
| | | 3/31/2013 | | | 3/31/2012 | |
| From Operations: | | | | | | |
| Net Investment Income (Loss) | $ | 4,987 | | $ | 3,276 | |
| Net Realized Gain (Loss) on Investments | | 97,701 | | | (61,181 | ) |
| Change In Net Unrealized Appreciation (Depreciation) | | (5,167 | ) | | (133,002 | ) |
| Increase (Decrease) in Net Assets from Operations | | 97,521 | | | (190,907 | ) |
| From Distributions to Shareholders: | | | | | | |
| Net Investment Income | | (3,273 | ) | | - | |
| Net Realized Gain from Security Transactions | | - | | | - | |
| Change in Net Assets from Distributions | | (3,273 | ) | | - | |
| From Capital Share Transactions: | | | | | | |
| Proceeds From Sale of Shares | | 161,421 | | | 170,584 | |
| Proceeds From Redemption Fees (Note 2) | | 359 | | | 3 | |
| Shares Issued on Reinvestment of Dividends | | 3,059 | | | - | |
| Cost of Shares Redeemed | | (903,287 | ) | | (954,898 | ) |
| Net Increase (Decrease) from Shareholder Activity | | (738,448 | ) | | (784,311 | ) |
| |
| Net Increase (Decrease) in Net Assets | | (644,200 | ) | | (975,218 | ) |
| |
| Net Assets at Beginning of Period | | 3,786,694 | | | 4,761,912 | |
| Net Assets at End of Period (Including Accumulated Undistributed | $ | 3,142,494 | | $ | 3,786,694 | |
| Net Investment Income of $4,987 and $3,276, respectively) | | | | | | |
| |
| Share Transactions: | | | | | | |
| Issued | | 28,869 | | | 31,305 | |
| Reinvested | | 538 | | | - | |
| Redeemed | | (159,118 | ) | | (177,212 | ) |
| Net Increase (Decrease) in Shares | | (129,711 | ) | | (145,907 | ) |
| Shares Outstanding, Beginning of Period | | 666,302 | | | 812,209 | |
| Shares Outstanding, End of Period | | 536,591 | | | 666,302 | |
| Financial Highlights | | | | | | | | | | | | | | | |
| Selected data for a share outstanding | | 4/1/2012 | | | 4/1/2011 | | | 4/1/2010 | | | 4/1/2009 | | | 4/1/2008 | |
| throughout the period: | | to | | | to | | | to | | | to | | | to | |
| | | 3/31/2013 | | | 3/31/2012 | | | 3/31/2011 | | | 3/31/2010 | | | 3/31/2009 | |
| Net Asset Value - | | | | | | | | | | | | | | | |
| Beginning of Period | $ | 5.68 | | $ | 5.86 | | $ | 5.21 | | $ | 3.23 | | $ | 5.81 | |
| Net Investment Income (Loss) (a) | | 0.01 | | | - | * | | - | * | | (0.02 | ) | | (0.01 | ) |
| Net Gains or Losses on Investments | | | | | | | | | | | | | | | |
| (realized and unrealized) (b) | | 0.18 | | | (0.18 | ) | | 0.65 | | | 2.00 | | | (2.57 | ) |
| Total from Investment Operations | | 0.19 | | | (0.18 | ) | | 0.65 | | | 1.98 | | | (2.58 | ) |
| Proceeds from Redemption Fees | | - | * | | - | * | | - | * | | - | * | | - | * |
| Distributions (From Net Investment Income) | | (0.01 | ) | | - | | | - | | | - | | | - | |
| Distributions (From Realized Capital Gains) | | - | | | - | | | - | | | - | | | - | |
| Total Distributions | | (0.01 | ) | | - | | | - | | | - | | | - | |
| Net Asset Value - | | | | | | | | | | | | | | | |
| End of Period | $ | 5.86 | | $ | 5.68 | | $ | 5.86 | | $ | 5.21 | | $ | 3.23 | |
| Total Return (c) | | 3.27 | % | | (3.07 | )% | | 12.48 | % | | 61.30 | % | | (44.41 | )% |
| Ratios/Supplemental Data | | | | | | | | | | | | | | | |
| Net Assets - End of Period (Thousands) | $ | 3,142 | | $ | 3,787 | | $ | 4,762 | | $ | 5,528 | | $ | 3,599 | |
| |
| Ratio of Expenses to Average Net Assets | | 1.95 | % | | 1.95 | % | | 1.95 | % | | 1.95 | % | | 1.95 | % |
| Ratio of Net Investment Income (Loss) to | | | | | | | | | | | | | | | |
| Average Net Assets | | 0.15 | % | | 0.08 | % | | -0.01 | % | | -0.36 | % | | -0.12 | % |
| Portfolio Turnover Rate | | 16.05 | % | | 9.16 | % | | 12.60 | % | | 25.29 | % | | 12.02 | % |
* Amounts were less than +/- $0.005 per share.
(a) Per Share amounts calculated using Average Shares Outstanding method.
(b) Realized and unrealized gains and losses per share in this caption are balancing amounts necessary to reconcile the
change in net asset value per share for the period, and may not reconcile with the aggregate gains and losses in the Statement
of Operations due to share transactions for the period.
(c) Total Returns in the above table represent the rate that the investor would have earned or lost on an investment in the Fund
assuming reinvestment of dividends. Total return calculation does not reflect redemption fee. |
| | The accompanying notes are an integral part of the financial
statements. |
2013 Annual Report 8
NOTES TO FINANCIAL STATEMENTS - WIRELESS FUND
March 31, 2013
1.) ORGANIZATION
Wireless Fund (the "Fund") is a non-diversified series of the PFS Funds (the "Trust"), an open-ended management investment company. Prior to March 5, 2010 the Trust was named Wireless Fund. The Trust was organized in Massachusetts as a business trust on January 13, 2000 and may offer shares of beneficial interest in a number of separate series, each series representing a distinct fund with its own investment objectives and policies. As of March 31, 2013, there were nine series operating in the Trust. The Fund's primary investment objective is to seek long-term growth of capital. Significant accounting policies of the Fund are presented below:
2.) SIGNIFICANT ACCOUNTING POLICIES
SECURITY VALUATION:
The Fund, under normal market conditions, invests at least 80% of its assets in the securities of companies engaged in the development, production, or distribution of wireless related products or services. All investments in securities are recorded at their estimated fair value, as described in Note 3.
SHARE VALUATION:
The net asset value (the “NAV”) is generally calculated as of the close of trading on the New York Stock Exchange (normally 4:00 p.m. Eastern time) every day the Exchange is open. The NAV is calculated by taking the total value of the Fund’s assets, subtracting its liabilities, and then dividing by the total number of shares outstanding, rounded to the nearest cent. The offering price and redemption price per share is equal to the net asset value per share, except that shares of the Fund are subject to a redemption fee of 2% if redeemed within 90 days of purchase. During the fiscal year ended March 31, 2013, proceeds from redemption fees were $359.
DISTRIBUTIONS TO SHAREHOLDERS:
Distributions to shareholders, which are determined in accordance with income tax regulations, are recorded on the ex-dividend date. The treatment for financial reporting purposes of distributions made to shareholders during the year from net investment income or net realized capital gains may differ from their ultimate treatment for federal income tax purposes. These differences are caused primarily by differences in the timing of the recognition of certain components of income, expense, or realized capital gain for federal income tax purposes. Where such differences are permanent in nature, they are reclassified in the components of the net assets based on their ultimate characterization for federal income tax purposes. Any such reclassifications will have no effect on net assets, results of operations, or net asset values per share of the Fund. For the fiscal year ended March 31, 2013, $2,814,890 was reclassified from net accumulated realized loss to paid in capital due to the expiration of capital loss carry-forwards.
FEDERAL INCOME TAXES:
The Fund’s policy is to continue to comply with the requirements of the Internal Revenue Code that are applicable to regulated investment companies and to distribute all of its taxable income to shareholders. Therefore, no federal income tax provision is required. It is the Fund’s policy to distribute annually, prior to the end of the calendar year, dividends sufficient to satisfy excise tax requirements of the Internal Revenue Code. This Internal Revenue Code requirement may cause an excess of distributions over the book year-end accumulated income. In addition, it is the Fund’s policy to distribute annually, after the end of the fiscal year, any remaining net investment income and net realized capital gains.
The Fund recognizes the tax benefits of certain tax positions only where the position is “more likely than not” to be sustained assuming examination by tax authorities. Management has analyzed the Fund’s tax positions, and has concluded that no liability for unrecognized tax benefits should be recorded related to uncertain tax positions taken on returns filed for open tax years (2009-2011), or expected to be taken on the Fund’s 2012 tax return. The Fund identifies its major tax jurisdictions as U.S. Federal and State tax authorities; however the Fund is not aware of any tax positions for which it is reasonably possible that the total amounts of unrecognized tax benefits will change materially in the next twelve months. The Fund recognizes interest and penalties, if any, related to unrecognized tax benefits as income tax expense in the Statement of Operations. During the fiscal year ended March 31, 2013, the Fund did not incur any interest or penalties.
2013 Annual Report 9
Notes to Financial Statements - continued
USE OF ESTIMATES:
The preparation of financial statements in conformity with accounting principles generally accepted in the United States of America (“GAAP”) requires management to make estimates and assumptions that affect the reported amounts of assets and liabilities and disclosure of contingent assets and liabilities at the date of the financial statements and the reported amounts of increases and decreases in net assets from operations during the reporting period. Actual results could differ from those estimates.
OTHER:
The Fund records security transactions based on a trade date. Dividend income is recognized on the ex-dividend date, and interest income is recognized on an accrual basis. Discounts and premiums on securities purchased are amortized, over the lives of the respective securities. Withholding taxes on foreign dividends have been provided for in accordance with the Fund’s understanding of the applicable country’s tax rules and rates.
3.) SECURITIES VALUATIONS
The Fund utilizes various methods to measure the fair value of most of its investments on a recurring basis. GAAP establishes a hierarchy that prioritizes inputs to valuation methods. The three levels of inputs are:
Level 1 - Unadjusted quoted prices in active markets for identical assets or liabilities that the Fund has the ability to access.
Level 2 - Observable inputs other than quoted prices in active markets included in level 1 that are observable for the asset or liability, either directly or indirectly. These inputs may include quoted prices for the identical instrument on an inactive market, prices for similar instruments, interest rates, prepayment speeds, credit risk, yield curves, default rates and similar data.
Level 3 - Unobservable inputs for the asset or liability, to the extent relevant observable inputs are not available, representing the Fund’s own assumptions about the assumptions a market participant would use in valuing the asset or liability, and would be based on the best information available.
The availability of observable inputs can vary from security to security and is affected by a wide variety of factors, including, for example, the type of security, whether the security is new and not yet established in the marketplace, the liquidity of markets, and other characteristics particular to the security. To the extent that valuation is based on models or inputs that are less observable or unobservable in the market, the determination of fair value requires more judgment. Accordingly, the degree of judgment exercised in determining fair value is greatest for instruments categorized in level 3.
The inputs used to measure fair value may fall into different levels of the fair value hierarchy. In such cases, for disclosure purposes, the level in the fair value hierarchy within which the fair value measurement falls in its entirety, is determined based on the lowest level input that is significant to the fair value measurement in its entirety.
FAIR VALUE MEASUREMENTS
A description of the valuation techniques applied to the Fund’s major categories of assets and liabilities measured at fair value on a recurring basis follows.
Equity securities (common stocks, including ADRs). Equity securities are generally valued by using market quotations. The market quotation used for common stocks, including those listed on the NASDAQ National Market System, is the last sale price on the date on which the valuation is made or, in the absence of sales, at the closing bid price. Over-the-counter securities will be valued on the basis of the bid price at the close of each business day. Generally, if the security is traded in an active market and is valued at the last sale price, the security is categorized as a level 1 security. When the security position is not considered to be part of an active market or when the security is valued at the bid price, the position is generally categorized as level 2. When market quotations are not readily available, when the Adviser determines the last bid price does not accurately reflect the current value or when restricted securities are being valued, such securities are valued as determined in good faith by the Adviser, in conformity with guidelines adopted by and subject to review of the Board of Trustees (the “Trustees”) and are categorized in level 2 or level 3, when appropriate.
2013 Annual Report 10
Notes to Financial Statements - continued
Money market funds. Shares of money market funds are valued at a net asset value of $1.00 and are classified in level 1 of the fair value hierarchy.
Fixed income securities. Fixed income securities generally are valued by using market quotations, but may be valued on the basis of prices furnished by a pricing service when the Adviser believes such prices accurately reflect the fair market value of such securities. A pricing service utilizes electronic data processing techniques based on yield spreads relating to securities with similar characteristics to determine prices for normal institutional-size trading units of debt securities without regard to sale or bid prices. When prices are not readily available from a pricing service, or when restricted or illiquid securities are being valued, securities are valued at fair value as determined in good faith by the Adviser, subject to review of the Trustees. Short-term investments in fixed income securities with maturities of less than 60 days when acquired, or which subsequently are within 60 days of maturity, are valued by using the amortized cost method of valuation. Generally, fixed income securities are categorized as level 2.
In accordance with the Trust's good faith pricing guidelines, the Adviser is required to consider all appropriate factors relevant to the value of securities for which it has determined other pricing sources are not available or reliable as described above. There is no standard procedure for determining fair value, since fair value depends upon the circumstances of each individual case. As a general principle, the current fair value of an issue of securities being valued by the Adviser would appear to be the amount which the owner might reasonably expect to receive for them upon their current sale. Methods which are in accordance with this principle may, for example, be based on (i) a multiple of earnings; (ii) a discount from market of a similar freely traded security (including a derivative security or a basket of securities traded on other markets, exchanges or among dealers); or (iii) yield to maturity with respect to debt issues, or a combination of these and other methods.
The following table summarizes the inputs used to value the Fund’s assets measured at fair value as of March 31, 2013:
| Valuation Inputs of Assets | | Level 1 | | Level 2 | | Level 3 | | Total |
| Common Stock, including ADRs | | $3,006,533 | | $0 | | $0 | | $3,006,533 |
| Money Market Funds | | 199,084 | | 0 | | 0 | | 199,084 |
| Total | | $3,205,617 | | $0 | | $0 | | $3,205,617 |
Refer to the Fund’s Schedule of Investments for a listing of securities by industry. The Fund did not hold any Level 3 assets during the fiscal year ended March 31, 2013. There were no transfers into or out of the levels during the fiscal year ended March 31, 2013. It is the Fund’s policy to consider transfers into or out of the levels as of the end of the reporting period.
The Fund did not invest in any derivative instruments during the fiscal year ended March 31, 2013.
4.) INVESTMENT ADVISORY AGREEMENT
Value Trend Capital Management, LP (the “Adviser”), manages the investment portfolio of the Fund, subject to policies adopted by the Trust's Trustees. Under the Investment Advisory Agreement, the Adviser, at its own expense and without reimbursement from the Trust, furnishes office space and all necessary office facilities, equipment and executive personnel necessary for managing the Fund. The Adviser also pays the salaries and fees of all officers and trustees of the Trust who are also officers, partners, or employees of the Adviser. The Adviser pays all operating expenses of the Fund, with the exception of taxes, interest, borrowing expenses (such as (a) interest and (b) dividends on short sales), brokerage commissions and extraordinary expenses. For its services, the Adviser receives a fee of 1.95% per year of the average daily net assets of the Fund. As a result of the above calculation, for the fiscal year ended March 31, 2013, the Adviser received management fees totaling $67,039. At March 31, 2013, the Fund owed $5,259 to the Adviser.
5.) RELATED PARTY TRANSACTIONS
A control person, Jeffrey R. Provence, of Premier Fund Solutions, Inc. (the “Administrator”) also serves as trustee/officer of the Fund. Also, control persons of Value Trend Capital Management, LP also serve as trustees/officers of the Fund. These individuals receive benefits from the Adviser resulting from management fees paid to the Adviser of the Fund. Mr. Ross C. Provence is the father of Mr. Jeffrey R. Provence. For the fiscal year ended March
2013 Annual Report 11
Notes to Financial Statements - continued
31, 2013, the Trustees who are not interested persons of the Fund received Trustees’ fees totaling $1,000 each plus travel expenses from the Adviser of the Fund. Under the Management Agreement, the Adviser pays these fees.
6.) CAPITAL STOCK
The Trust is authorized to issue an unlimited number of shares without par value. Paid in capital at March 31, 2013 was $5,046,894 representing 536,591 shares outstanding.
7.) INVESTMENT TRANSACTIONS
For the fiscal year ended March 31, 2013, purchases and sales of investment securities other than U.S. Government obligations and short-term investments aggregated $529,038 and $1,378,115, respectively. Purchases and sales of U.S. Government obligations aggregated $0 and $0, respectively.
For federal income tax purposes, the cost of investments owned at March 31, 2013 was $2,080,898. At March 31, 2013, the composition of unrealized appreciation (the excess of value over tax cost) and depreciation (the excess of tax cost over value) on a tax basis was as follows:
| | Appreciation | | (Depreciation) | | Net Appreciation (Depreciation) |
| | $1,267,143 | | ($142,424) | | $1,124,719 |
As of March 31, 2013, there were no differences between book basis and tax basis net unrealized appreciation.
8.) DISTRIBUTIONS TO SHAREHOLDERS
The tax character of distributions was as follows:
| Distributions paid from: | | | | |
| | | Year ended | | Year ended |
| | | March 31, 2013 | | March 31, 2012 |
| Ordinary Income: | | $ 3,273 | | $ 0 |
| Short-term Capital Gain: | | 0 | | 0 |
| Long-term Capital Gain: | | 0 | | 0 |
| | | $ 3,273 | | $ 0 |
As of March 31, 2013 the components of distributable earnings / (accumulated losses) on a tax basis were as follows:
| Ordinary income | | $ 4,987 | |
| Accumulated net realized losses | | (3,034,106 | ) |
| Unrealized appreciation - net | | 1,124,719 | |
| | | $(1,904,400 | ) |
9.) LOSS CARRYFORWARDS
At March 31, 2013, the Fund had available for federal tax purposes an unused capital loss carryforward of $3,034,106, of which $2,154,763 expires in 2014; $711,985 expires in 2017; and $167,358 expires in 2018. To the extent that these capital loss carryforwards are used to offset future capital gains, it is probable that the amount, which is offset, will not be distributed to shareholders. Capital loss carryforwards in the amount of $97,701 were utilized in the fiscal year ended March 31, 2013, and capital loss carryforwards in the amount of $2,814,890 expired during the fiscal year ended March 31, 2013.
2013 Annual Report 12
ADDITIONAL INFORMATION - WIRELESS FUND
March 31, 2013
(UNAUDITED)
On March 14, 2013 the Board of Trustees (the “Board” or “Trustees”) for the Wireless Fund (the “Fund”) met to consider the renewal of the Management Agreement (the "Agreement"). The Trustees considered and evaluated the following factors: (i) the nature, extent and quality of the services provided by the investment adviser, Value Trend Capital Management, L.P. ("Value Trend") to the Wireless Fund; (ii) the investment performance of the Wireless Fund; (iii) the cost of the services to be provided and the profits to be realized by Value Trend and its affiliates from the relationship with the Wireless Fund; (iv) the extent to which economies of scale will be realized as the Wireless Fund grows and whether the fee levels reflect these economies of scale to the benefit of shareholders; and (v) Value Trend's practices regarding possible conflicts of interest.
In assessing these factors and reaching its decisions, the Board took into consideration information furnished for the Board's review and consideration throughout the year at regular Board meetings, as well as information specifically prepared and/or presented in connection with the annual renewal process, including information presented at the Meeting. The Board requested and was provided with information and reports relevant to the annual renewal of the Agreement, including: (i) reports regarding the services and support provided to the Fund and its shareholders by Value Trend; (ii) assessments of the investment performance of the Fund by Value Trend; (iii) commentary on the reasons for the performance; (iv) presentations addressing Value Trend's investment philosophy, investment strategy, personnel and operations; (v) compliance and audit reports concerning the Fund and Value Trend; (vi) disclosure information contained in the registration statement of the Trust and the Form ADV of Value Trend; (vii) information on relevant developments in the mutual fund industry and how the Fund and/or Value Trend are responding to them; and (viii) a memorandum from Counsel, that summarized the fiduciary duties and responsibilities of the Board in reviewing and approving the Agreement, including the material factors set forth above and the types of information included in each factor that should be considered by the Board in order to make an informed decision. The Board also requested and received various informational materials including, without limitation: (i) documents containing information about Value Trend, including financial information, a description of personnel and the services provided to the Fund, information on investment advice, performance, summaries of Fund expenses, compliance program, current legal matters, and other general information; (ii) comparative expense and performance information for other mutual funds with strategies similar to the Fund; and (iii) benefits to be realized by Value Trend from its relationship with the Fund. The Board did not identify any particular information that was most relevant to its consideration to approve the Agreement and each Trustee may have afforded different weight to the various factors.
1. Nature, Extent and Quality of the Services Provided by Value Trend
In considering the nature, extent, and quality of the services provided by Value Trend, the Trustees reviewed the responsibilities of Value Trend under the Agreement. The Trustees reviewed the services being provided by Value Trend to the Fund including, without limitation: the quality of its investment advisory services (including research and recommendations with respect to portfolio securities); its process for formulating investment recommendations and assuring compliance with the Fund's investment objective, strategies, and limitations, as well as for ensuring compliance with regulatory requirements; its coordination of services for the Fund among the service providers and the Independent Trustees; its efforts to promote the Fund and grow its assets; and its provision of a Chief Compliance Officer to the Fund. The Trustees noted Value Trend's continuity of, and commitment to retain, qualified personnel and its commitment to maintain its resources and systems; the commitment of Value Trend to finding alternatives and options that allow the Fund to maintain its goals; and Value Trend's continued cooperation with the Independent Trustees and Counsel for the Fund. The Trustees evaluated Value Trend's personnel, including the education and experience of its personnel. After reviewing the foregoing information and further information in the materials provided by Value Trend (including Value Trend's Form ADV), the Board concluded that, in light of all the facts and circumstances, the nature, extent, and quality of the services provided by Value Trend were satisfactory and adequate for the Fund.
2013 Annual Report 13
Additional Information (Unaudited) - continued
2. Investment Performance of the Fund and Value Trend
In considering the investment performance of the Fund and Value Trend, the Trustees compared the short and long-term performance of the Fund with the performance of funds with similar objectives managed by other investment advisers, as well as with aggregated peer group data and category averages. As to the performance of the Fund, the Report included information regarding the performance of the Fund compared to a group of funds of similar size, style and objective, categorized by Morningstar (the "Peer Group"). Although not the determining factor in the Trustees' considerations, this information assisted the Trustees in concluding to approve the Agreement by a measure of how the Fund compares to other similar products. Generally, the performance data from the Peer Group was for periods ending December 31, 2012. The Trustees noted that for the 12 month period ended December 31, 2012, the Fund outperformed its Peer Group average and was slightly below the Communications category performance. It was noted that the Fund underperformed the Peer Group and Communications category average performance over the 3- and 5- year periods and outperformed the Peer Group and Communications category average over the 10-year period. The Fund outperformed the Dow Jones Global Telecommunications Index for the 1-, 3- and 10-year periods, but underperformed for the 5-year period. It was also noted that the Fund generally underperformed the specific broad based indices for the chosen period. After reviewing and discussing the investment performance of the Fund further, Value Trend's experience managing the Fund, and other relevant factors, the Board concluded, in light of all the facts and circumstances, that the investment performance of the Fund and Value Trend was satisfactory.
3. Costs of the Services to be provided and profits to be realized by Value Trend
In considering the costs of the services to be provided and profits to be realized by Value Trend from the relationship with the Fund, the Trustees considered: (1) Value Trend's financial condition and the level of commitment to the Fund by Value Trend; (2) the asset level of the Fund; (3) the overall expenses of the Fund; and (4) the nature and frequency of advisory fee payments. The Trustees noted that Value Trend operated at a loss for its most recent fiscal year. The Trustees reviewed information provided by Value Trend regarding its profits associated with managing the Fund. The Trustees also considered potential benefits for Value Trend in managing the Fund. The Trustees then compared the fees and expenses of the Fund (including the management fee) to other comparable mutual funds in the Peer Group. Although not the determining factor in the Trustees' considerations, this information assisted the Trustees in concluding to approve the Agreement by a measure of how the Fund compares to other similar products. The Trustees reviewed the fees under the Agreement compared to other mutual funds with similar investment objectives and asset levels and noted that the expense ratio of 1.95% was above the Peer Group and Communications category average of net expenses, but within the range of it Peer Group. The Trustees noted that the Communications category average had a larger asset base than the Fund. The Trustees then reviewed the management fee ratio of the Fund compared to its Peer Group and noted that the management fee ratio of 1.95% was the highest in the Peer Group. The Trustees recognized the expense ratio was within the range of its Peer Group and the management fee was the highest of the Peer Group; however, they also recognized that Value Trend is responsible under the Agreement for paying for most of the operating expenses of the Wireless Fund's expenses from the management fee. Based on the foregoing, the Board concluded that the fees to be paid to Value Trend by the Fund and the profits to be realized by Value Trend, in light of all the facts and circumstances, were fair and reasonable in relation to the nature and quality of the services provided by Value Trend.
4. Economies of Scale
The Trustees next considered the impact of economies of scale on the Fund's size and whether advisory fee levels reflect those economies of scale for the benefit of the Fund's investors. The Trustees considered that while the management fee remained the same at all asset levels, the Fund's shareholders had experienced benefits from the fact that Value Trend was obligated to pay certain of the Fund's operating expenses which had the effect of limiting the overall fees paid by the Fund. In light of its ongoing consideration of the Fund's asset levels, expectations for growth in the Fund, and fee levels, the Board determined that the Fund's fee arrangements, in light of all the facts and circumstances, were fair and reasonable in relation to the nature and quality of the services provided by Value Trend.
2013 Annual Report 14
Additional Information (Unaudited) - continued
5. Value Trend's Practices Regarding Possible Conflicts of Interest
In considering Value Trend's practices regarding conflicts of interest, the Trustees evaluated the potential for conflicts of interest and considered such matters as the experience and ability of the advisory personnel assigned to the Fund; the basis of decisions to buy or sell securities for the Fund; and the substance and administration of Value Trend's code of ethics. The Trustees also considered disclosure in the registration statement of the Trust related to Value Trend's potential conflicts of interest. The Trustees noted that an affiliate of Value Trend provides administrative services to the Fund, as well as the other series portfolios of the Trust and that the principals of Value Trend derived benefits from that relationship with the Trust -the Trustees concluded that the principals of Value Trend had demonstrated a history of openness and complete disclosure regarding this relationship. Based on the foregoing, the Board determined that Value Trend's standards and practices relating to the identification and mitigation of possible conflicts of interest were satisfactory.
The Independent Trustees met in executive session to discuss the continuation of the Agreement. It was the Trustees' consensus that the fee to be paid to Value Trend pursuant to the Agreement was reasonable, that the overall arrangement provided under the terms of the Agreement was a reasonable business arrangement, and that the renewal of the Agreement was in the best interest of the Fund's shareholders.
2013 Annual Report 15
Cohen Fund Audit Services, Ltd.
1350 Euclid Avenue, Ste 800
Cleveland, Ohio 44115 www.cohenfund.com | 216.649.1700
216.579.0111 fax |
REPORT OF INDEPENDENT REGISTERED PUBLIC ACCOUNTING FIRM
To the Shareholders and Board of Trustees
Wireless Fund (a series of PFS Funds)
We have audited the accompanying statement of assets and liabilities, including the schedule of investments of Wireless Fund (the "Fund"), a series of PFS Funds, as of March 31, 2013, and the related statement of operations for the year then ended, the statements of changes in net assets for each of the two years in the period then ended, and the financial highlights for each of the five years in the period then ended. These financial statements and financial highlights are the responsibility of the Fund's management. Our responsibility is to express an opinion on these financial statements and financial highlights based on our audits.
We conducted our audits in accordance with the standards of the Public Company Accounting Oversight Board (United States). Those standards require that we plan and perform the audit to obtain reasonable assurance about whether the financial statements and financial highlights are free of material misstatement. An audit includes examining, on a test basis, evidence supporting the amounts and disclosures in the financial statements. Our procedures included confirmation of securities owned as of March 31, 2013, by correspondence with the custodian and broker. An audit also includes assessing the accounting principles used and significant estimates made by management, as well as evaluating the overall financial statement presentation. We believe that our audits provide a reasonable basis for our opinion.
In our opinion, the financial statements and financial highlights referred to above present fairly, in all material respects, the financial position of Wireless Fund as of March 31, 2013, the results of its operations for the year then ended, the changes in its net assets for each of the two years in the period then ended, and the financial highlights for each of the five years in the period then ended, in conformity with accounting principles generally accepted in the United States of America.

COHEN FUND AUDIT SERVICES, LTD.
Cleveland, Ohio
May 28, 2013
2013 Annual Report 16
Trustees and Officers
(Unaudited)
The Board of Trustees supervises the business activities of the Trust. The names of the Trustees and executive officers of the Trust are shown below. For more information regarding the Trustees, please refer to the Statement of Additional Information, which is available upon request by calling 1-800-590-0898. Each Trustee serves until the Trustee sooner dies, resigns, retires, or is removed.
The Trustees and Officers of the Trust and their principal business activities during the past five years are:
Interested Trustees and Officers
| | | | | Number of | Other |
| | | | Principal | Portfolios In | Directorships |
| Name, | Position(s) | Term of Office | Occupation(s) | Fund | Held By |
| Address(1), | Held With | and Length of | During | Complex | Trustee or |
| and Year of Birth | the Trust | Time Served | Past 5 Years | Overseen By | Officer |
| | | | | Trustee | |
| |
| Ross C. Provence(2)(3), | Trustee | Indefinite Term; | General Partner and Portfolio | 9 | Blue Chip |
| Year of Birth: 1938 | and | Since 2000 | Manager for Value Trend Capital | | Investor Funds |
| | President | | Management, LP (1995 to current). | | |
| | | | Estate planning attorney (1963 to | | |
| current). |
| |
| Jeffrey R. Provence(2), | Trustee, | Indefinite Term; | General Partner and Portfolio | 9 | Blue Chip |
| Year of Birth:1969 | Secretary | Since 2000 | Manager for Value Trend Capital | | Investor Funds, |
| | Treasurer | | Management, LP (1995 to current). | | Sycuan Funds |
| | and Chief | | CEO, Premier Fund Solutions, Inc. | | |
| | Compliance | | (2001 to current). | | |
| | Officer | | | | |
(1) The address of each trustee and officer is c/o PFS Funds, 1939 Friendship Drive, Suite C, El Cajon, California 92020.
(2) Trustees who are considered "interested persons" as defined in Section 2(a)(19) of the Investment Company Act of 1940 by virtue of their affiliation with the Investment Adviser.
(3) Ross C. Provence resigned from the Board of Trustees on May 17, 2013.
Independent Trustees
| | | | | Number of | Other |
| | | | Principal | Portfolios In | Directorships |
| Name, | Position | Term of Office | Occupation(s) | Fund | Held By |
| Address(1), | Held With | and Length of | During | Complex | Trustee or |
| and Year of Birth | the Trust | Time Served | Past 5 Years | Overseen By | Officer |
| | | | | Trustee | |
| |
| Thomas H. Addis III, | Independent | Indefinite Term; | Executive Director/CEO, Southern | 9 | None |
| Year of Birth: 1945 | Trustee | Since 2000 | California PGA (2006 to current). | | |
| |
| Allen C. Brown, | Independent | Indefinite Term; | Co-owner of Stebleton & Brown | 9 | Blue Chip |
| Year of Birth: 1943 | Trustee | Since 2010 | (1994 to Current). Estate planning | | Investor Funds, |
| | | | and business attorney (1970 to cur- | | Sycuan Funds |
| rent). |
| |
| George Cossolias, CPA, | Independent | Indefinite Term; | Owner of George Cossolias & | 9 | Blue Chip |
| Year of Birth: 1935 | Trustee | Since 2000 | Company, CPAs (1972 to current). | | Investor Funds, |
| | | | President of Lubrication Specialists, | | Sycuan Funds, |
| | | | Inc. (1996 to current). | | Temecula |
| | | | | | Valley Bank |
(1) The address of each trustee and officer is c/o PFS Funds, 1939 Friendship Drive, Suite C, El Cajon, California 92020.
2013 Annual Report 17
Investment Adviser
Value Trend Capital Management, LP
1939 Friendship Drive, Suite C
El Cajon, CA 92020
Dividend Paying Agent,
Shareholders' Servicing Agent,
Transfer Agent
Mutual Shareholder Services, LLC
8000 Town Centre Dr., Ste 400
Broadview Hts, OH 44147
Distributor
Rafferty Capital Markets, LLC
59 Hilton Avenue, Suite 101
Garden City, NY 11530
Custodian
U.S. Bank, NA
425 Walnut Street
P.O. Box 1118
Cincinnati, OH 45201
Independent Registered Public Accounting Firm
Cohen Fund Audit Services, Ltd.
1350 Euclid Avenue, Ste 800
Cleveland, OH 44115
|
This report is provided for the general information of the shareholders of the Wireless
Fund. This report is not intended for distribution to prospective investors in the funds,
unless preceded or accompanied by an effective prospectus. |
Item 2. Code of Ethics.
The registrant has adopted a code of ethics that applies to the registrant’s principal executive officer and the principal financial officer. The registrant has not made any amendments to its code of ethics during the covered period. The registrant has not granted any waivers from any provisions of the code of ethics during the covered period. A copy of the registrant’s Code of Ethics is filed herewith.
Item 3. Audit Committee Financial Expert.
The registrant’s Board of Trustees has determined that George Cossolias is an audit committee finical expert. Mr. Cossolias is independent for purposes of this Item 3.
Item 4. Principal Accountant Fees and Services.
(a-d) The following table details the aggregate fees billed for each of the last two fiscal years for audit fees, audit-related fees, tax fees and other fees by the principal accountant to the registrant. The principal accountant has provided no services to the adviser or any entity controlled by, or under common control with the adviser that provides ongoing services to the registrant.
| | | FYE 3/31/13 | | FYE 3/31/12 |
| Audit Fees | | $10,600 | | $10,500 |
| Audit-Related Fees | | $0 | | $0 |
| Tax Fees | | $1,600 | | $1,600 |
| All Other Fees | | $600 | | $600 |
Nature of Tax Fees: preparation of Excise Tax Statement and 1120 RIC.
Nature of All Other Fees: Review of Semi-Annual Report.
(e) (1) The audit committee approves all audit and non-audit related services and, therefore, has not adopted pre-approval policies and procedures described in paragraph (c)(7) of Rule 2-01 of Regulation S-X.
(e) (2) None of the services described in paragraph (b) through (d) of this Item were approved by the audit committee pursuant to paragraph (c)(7)(i)(C) of Rule 2-01 of Regulation S-X.
(f) All of the principal accountant’s hours spent on auditing the registrant’s financial statements were attributed to work performed by full-time permanent employees of the principal accountant.
(g) The following table indicates the aggregate non-audit fees billed by the registrant’s principal accountant for services to the registrant , the registrant’s investment adviser (not sub-adviser), and any entity controlling, controlled by, or under common control with the adviser that provides ongoing services to the registrant, for the last two years.
| Non-Audit Fees | | FYE 3/31/13 | | FYE 3/31/12 |
| Registrant | | $2,200 | | $2,200 |
| Registrant’s Investment Adviser | | $0 | | $0 |
(h) The principal accountant provided no services to the investment adviser or any entity controlling, controlled by, or under common control with the adviser that provides ongoing services to the registrant.
Item 5. Audit Committee of Listed Companies. Not applicable.
Item 6. Schedule of Investments. Schedule filed with Item 1.
Item 7. Disclosure of Proxy Voting Policies and Procedures for Closed-End Management Investment Companies. Not applicable.
Item 8. Portfolio Managers of Closed End Management Investment Companies. Not applicable.
Item 9. Purchases of Equity Securities by Closed-End Management Investment Companies and Affiliated Purchasers. Not applicable.
Item 10. Submission of Matters to a Vote of Security Holders.
The registrant has not adopted procedures by which shareholders may recommend nominees to the registrant’s board of trustees.
Item 11. Controls and Procedures.
(a) The registrant’s president and chief financial officer concluded that the disclosure controls and procedures (as defined in Rule 30a-3(c) under the Investment Company Act of 1940 (the “Act”)) were effective as of a date within 90 days of the filing date of this report, based on the evaluation of these controls and procedures required by Rule 30a-3(b) under the Act.
(b) There were no changes in the registrant’s internal control over financial reporting (as defined in Rule 30a-3(d) under the Act) that occurred during the registrant’s second fiscal quarter of the period covered by this report that have materially affected, or are reasonably likely to materially affect, the registrant’s internal control over financial reporting.
Item 12. Exhibits.
(a)(1) Code of Ethics. Filed herewith.
(a)(2) Certifications pursuant to Section 302 of the Sarbanes-Oxley Act of 2002. Filed herewith.
(b) Certification pursuant to Section 906 Certification of the Sarbanes-Oxley Act of 2002. Filed herewith.
Pursuant to the requirements of the Securities Exchange Act of 1934 and the Investment Company Act of 1940, the registrant has duly caused this report to be signed on its behalf by the undersigned, thereunto duly authorized.
| | By: /s/Ross C. Provence
Ross C. Provence
President |
Pursuant to the requirements of the Securities Exchange Act of 1934 and the Investment Company Act of 1940, this report has been signed below by the following persons on behalf of the registrant and in the capacities and on the dates indicated.
| | By: /s/Ross C. Provence
Ross C. Provence
President |
| | By: /s/Jeffrey R. Provence
Jeffrey R. Provence
Chief Financial Officer |