UNITED STATES
SECURITIES AND EXCHANGE COMMISSION
WASHINGTON, D.C. 20549
FORM N-CSR
CERTIFIED SHAREHOLDER REPORT OF REGISTERED MANAGEMENT
INVESTMENT COMPANIES
Investment Company Act file number: 811-09781
PFS Funds
(Exact name of registrant as specified in charter)
| 1939 Friendship Drive. | |
| Suite C | |
| El Cajon, CA | 92020 |
| (Address of principal executive offices) | (Zip code) |
CT Corporation System
155 Federal St., Suite 700,
Boston, MA 02110
(Name and address of agent for service)
Registrant's telephone number, including area code: (619) 588-9700
Date of fiscal year end: March 31
Date of reporting period: March 31, 2013
Form N-CSR is to be used by management investment companies to file reports with the Commission not later than 10 days after the transmission to stockholders of any report that is required to be transmitted to stockholders under Rule 30e-1 under the Investment Company Act of 1940 (17 CFR 270.30e -1). The Commission may use the information provided on Form N-CSR in its regulatory, disclosure review, inspection and policymaking roles.
A registrant is required to disclose the information specified by Form N-CSR, and the Commission will make this information public. A registrant is not required to respond to the collection of information contained in Form N-CSR unless the Form displays a currently valid Office of Management and Budget ("OMB") control number. Please direct comments concerning the accuracy of the information collection burden estimate and any suggestions for reducing the burden to Secretary, Securities and Exchange Commission, 450 Fifth Street, NW, Washington, DC 20549-0609. The OMB has reviewed this collection of information under the clearance requirements of 44 U.S.C. § 3507.
Item 1. Reports to Stockholders.
ROCKY PEAK SMALL CAP VALUE FUND
ANNUAL REPORT
March 31, 2013
May 23, 2013
Dear Fellow Shareholders:
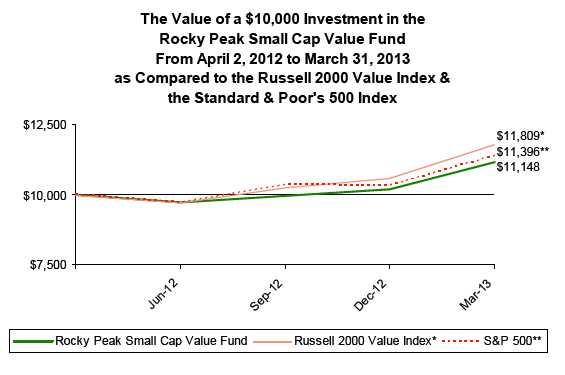
The net asset value ("NAV") of the Rocky Peak Small Cap Value Fund (the "Fund") as of March 31, 2013, was $11.07. For the fiscal period from April 2, 2012 (the Fund's inception date) to March 31, 2013, the Fund's total return was 11.48% compared to 18.09% for the Russell 2000® Value index and 13.96% for the S&P 500 Index. The Fund's total return includes a dividend distribution of $0.0712 per share made on December 21, 2012. Given what we believe to be a conservative risk profile of the Fund, we were very pleased with the results. These results were even more satisfactory when recognizing that the long-term value strategy utilized by the Fund often takes quite a bit of time to show good performance due to the investment process in which low-cost positions in stocks are built slowly over time and the realization of expected intrinsic values may take several years. Even in light of these solid results, we believe the Fund's portfolio's overall price-to-value discount as of March 31, 2013, remains attractive and we look forward to the next 1 year, 2 years and even 10 years as we strive to be competitive in rising markets while outperforming in down markets.
| Total Returns as of March 31, 2013 | | | | |
| |
| | Total Return | | Quarter ended | |
| | Since Inception | | 3/31/2013 | |
| Rocky Peak Small Cap Value Fund(A) | 11.48% | | 9.39% | |
| Russell 2000 Value Index(B) | 18.09% | | 11.63% | |
| S&P 500 Index(C) | 13.96% | | 10.61% | |
(A)Since Inception returns include change in share prices and in each case includes reinvestment of any dividends and capital gain distributions. The Rocky Peak Small Cap Value Fund commenced operations on April 2, 2012.
(B)The Russell 2000 Value Index (whose composition is different from the Fund) is an unmanaged index of small-capitalization stocks with lower price-to-book ratios and lower forecasted growth values than the total population of small-capitalization stocks.
(C)The S&P 500 Index is a broad, market-weighted average dominated by blue-chip stocks and is an unmanaged group of stocks whose composition is different from the Fund.
Performance data quoted represents past performance. Past performance does not guarantee future results. The investment return and principal value of an investment will fluctuate so that an investor's shares, when redeemed, may be worth more or less than their original cost. All returns include change in share prices, reinvestment of any dividends, and capital gains distributions. You may obtain performance data current to the most recent month-end by calling 1-888-505-0865. The Fund's total expense ratio is 1.50% .
Contributors to Performance
Two of the Fund's largest holdings, Duff & Phelps and WMS Industries, were acquired during the reporting period at significant premiums. Duff & Phelps, a business services company with a specialty in valuation advisory, announced a going private transaction while WMS, a leading manufacturer of gaming devices (slot machines), was acquired by a competitor. M&A activity, whether it be mergers or private equity transactions, are often a mixed blessing for long-term value investors. A substantial premium is often realized above the existing stock price, which can help performance, but these types of transactions are usually done at a price well below a reasonable calculation of intrinsic value (as in these cases). Also, the Fund is often deprived of a good company than can grow and compound value over the next 3-5 years (as in these cases). We have been "fortunate" to have many of these types of situations over the years as buying quality companies that we believe to be undervalued does not only look attractive to us, but often they look enticing to private equity firms and strategic or corporate buyers as well.
Another strong contributor for the period was Radio Shack, which increased 41.8% above our average cost basis. Radio Shack has had its challenges in a world rapidly turning to e-commerce, as well as its own internal mistakes related to its cell phone offerings. Yet buying the company when it was selling well below 50% of tangible book value seemed to offer a prudent long-term opportunity. With an improving liquidity situation and a new CEO (as of February 2013) who has significant retail experience, we believe the company is now well prepared to adapt its strategy for the new retail environment it faces. The company's stores have relatively short-term lease schedules in which approximately 20% of the leases
2013 Annual Report 1
expire every year, giving it much flexibility to reduce its store base if they do not prove to be economically viable. Although growth rates for predominantly brick and mortar retailers will never reach the levels of the past or obviously never come close to Amazon type growth rates, a sensible strategy of focusing on high margin product segments will enable them to generate sizable amounts of free cash flow. As a result, we expect the prudent capital allocation of this free cash flow is likely to provide reasonable shareholder returns over time.
A large detractor during the period involved one of the Fund's energy related holdings, Callon Petroleum, a small cap E&P company. This company's stock declined 24.8% from our average cost as their 2012 year-end financial results highlighted production misses, poor initial exploration drilling results and a 2013 guidance that was lower than most investors expected. The company possesses valuable land holdings and a very large net operating loss carryforward that will shield it from taxes for many years. The company's Net Asset Value per share remains substantially higher than its current stock price - even at lower commodity prices. The Fund's other energy holdings performed substantially better with impressive gains for the year and included Bill Barrett, EXCO Resources, and Flotek Industries.
The Fund's natural resource exposure at year-end totaled 14.2% of the portfolio. This portion of the Fund's portfolio includes investments in energy related companies, as well as an initial foray into the gold sector with the small purchase of two North American gold mining companies late in the fiscal period. Gold related stocks have been out of favor since the Fall of 2012 and the stock prices of many of these companies have declined substantially, despite solid balance sheets and consistent profitability. Although volatility will likely ensue in the short term, it is hard to believe that the massive monetary expansion from the world's central banks in recent years will not result in above average inflation at some point. The phrase "it's different this time" has rarely, if ever, been proven to be a reliable investment strategy.
| Portfolio - Top 15 Holdings as of March 31, 2013 | | |
| |
| Security | % of Net Assets | |
| Green Dot Corporation | 3.25% | |
| CallonPetroleum Company | 2.72% | |
| Westell Technologies, Inc. | 2.71% | |
| Hallmark Financial Services, Inc. | 2.68% | |
| INTL FCStone Inc. | 2.65% | |
| Allied Nevada Gold Corp. | 2.63% | |
| ManTech International Corporation | 2.61% | |
| Global Ship Lease, Inc. | 2.58% | |
| Bill Barrett Corporation | 2.55% | |
| DreamWorks Animation | 2.52% | |
| Omega Protein Corporation | 2.52% | |
| Avid Technology, Inc. | 2.45% | |
| Harte-Hanks, Inc. | 2.41% | |
| Federated Investors, Inc. | 2.35% | |
| JAKKS Pacific, Inc. | 2.34% | |
Commentary
As we have learned from the recent Apple cash debate, there are not many things a company can do with high cash balances. They can do nothing and let it gather on the balance sheet; re-invest it in the company through higher operating expenses, R&D or capital expenditures; make acquisitions; or return it to shareholders. Letting it sit on the balance sheet earning .01% is probably the worst option as it greatly diminishes the overall company returns on capital and assets.
Two Fund holdings are currently facing this cash dilemma. Although they do business in different product categories and end markets, Westell Technologies and Richardson Electronics, actually have a few things in common. Their corporate headquarters are located about 20 minutes apart from each other in the Chicago suburbs. They are relatively small companies with market capitalizations under $200 million. And they both have long operating histories going back over 30 years. But most importantly, they have both recently sold business units that have left them cash rich, particularly when compared to their market caps.
2013 Annual Report 2
Both of these companies are spending adequately on capital and R&D related expenses. Westell has been active on the acquisition front having recently bought a cell site optimization product company in May 2012 and has indicated that M&A will be a focus in order to meet their $100 million in revenue run rate goal. On March 18, 2013, Westell moved toward that goal even further by acquiring Kentrox, an Ohio based company that specializes in cell tower site management solutions and products. The acquisition utilized $30 million of their large cash position and will add over $30 million in high margin revenues to Westell. Richardson has indicated that acquisitions are a possible use of cash but has not been active in recent years. Returning it to shareholders through share buybacks is usually a worthwhile option but it all depends on the price one pays to determine if its accretive. The track record of accretive share buy-backs in corporate America has not been good. But both Richardson and Westell have been buying back shares recently at prices usually below tangible book value, which is almost always a good idea.
So is the best that can be said of cash rich, safe companies is that they won't go bankrupt? While certainly true in both cases here with no outstanding debt and loads of cash, we believe each has carved out some unique industry niches that will allow them to grow their businesses from the current low base they have created, even in sustained difficult economic environments. But what it all boils down to in cases like these is it becomes a management and board of directors story and how they allocate capital for the benefit of shareholders. So it certainly pays to be conservative in troubling times like we are in, yet it does nothing good for shareholders to watch your company's returns being driven down because the vast majority of your asset base is earning a return of less than 1%.
Other Items
The first fiscal period of operations of the Fund has been personally rewarding and exciting, and we appreciate all the support from shareholders, the Fund's service providers and other interested parties. The investment process and philosophy remains consistent and steadfast with always a sharp lookout for elements that will fine tune the process and improve investment returns over time. When reiterating the investment philosophy to shareholders, sometimes it is best to liberally borrow thoughts from other great investment managers. I summarize these collective thoughts below:
At Rocky Peak Capital Management, we aspire to protect capital, before seeking a return on it. We change our mind, not casually, but when presented with convincing evidence. Despite our best efforts, we are sometimes wrong. We take our mea culpa and move on, hopefully learning from our mistakes. We question our conclusions constantly. We do this with the hard earned capital clients have entrusted us to manage. As the author Malcolm Gladwell once said, "Incompetence is the disease of idiots. Overconfidence is the mistake of experts.... Incompetence irritates me. Overconfidence terrifies me."
We appreciate your interest and as always, please feel to contact us with any questions or concerns.
Tom Kerr, CFA
Portfolio Manager
May 23, 2013
Disclaimer: The opinions expressed herein are those of Rocky Peak Capital Management and are subject to change without notice. Past performance is not a guarantee or indicator of future results. You should not consider the information in this letter a recommendation to buy or sell any particular security.
Securities mentioned may not be in the Fund by the time you receive this report. The investment return and principal value of an investment will fluctuate so that an investor's shares, when redeemed, may be worth more or less than their original cost.
An investment in the Fund is subject to investment risks, including the possible loss of the principal amount invested. Investments in the Fund are also subject to market risk, investment style risk, investment advisor risk, market sector risk, equity securities risk, portfolio turnover risk, and small company risk. Investors should consider the investment objectives, risks, and charges and expenses of the Fund carefully before investing. The prospectus contains this and other information about the fund. You may obtain a prospectus by calling toll-free at 1-888-505-0865. The prospectus should be read carefully before investing.
The Fund's distributor is Rafferty Capital Markets, LLC, which is not affiliated with the Fund or the adviser.
2013 Annual Report 3
ROCKY PEAK SMALL CAP VALUE FUND (Unaudited)
ROCKY PEAK SMALL CAP VALUE FUND
by Sectors (as a percentage of Net Assets)
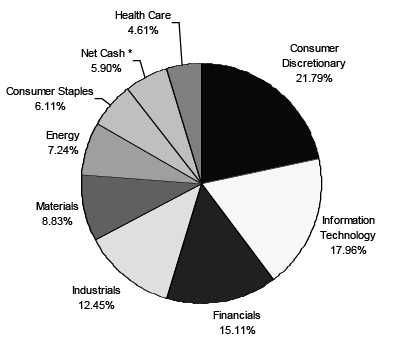
* Net Cash represents cash equivalents and liabilities in excess of other assets.
2013 Annual Report 4
Disclosure of Expenses
(Unaudited)
Shareholders of this Fund incur ongoing costs, consisting of management fees and other Fund expenses. The following example is intended to help you understand your ongoing costs of investing in the Fund and to compare these costs with similar costs of investing in other mutual funds. If shares are redeemed within 90 days of purchase from the Fund, the shares are subject to a 2% redemption fee. The example is based on an investment of $1,000 invested at the beginning of the period and held for the entire period from October 1, 2012 to March 31, 2013.
The first line of the table below provides information about actual account values and actual expenses. In order to estimate the expenses a shareholder paid during the period covered by this report, shareholders can divide their account value by $1,000 (for example, an $8,600 account value divided by $1,000 = 8.6) and then multiply the result by the number in the first line under the heading entitled "Expenses Paid During the Period." The second line of the table below provides information about hypothetical account values and hypothetical expenses based on the Fund's actual expense ratio and an assumed rate of return of 5% per year before expenses, which is not the Fund’s actual return. The hypothetical account values and expenses may not be used to estimate the actual ending account balance or expenses paid by a shareholder for the period. You may use this information to compare the ongoing costs of investing in the Fund and other funds. To do so, compare the 5% hypothetical example with the 5% hypothetical examples that appear in other funds' shareholder reports.
| | | | | | | Expenses Paid |
| | | Beginning | | Ending | | During the Period* |
| | | Account Value | | Account Value | | October 1, 2012 |
| | | October 1, 2012 | | March 31, 2013 | | to March 31, 2013 |
| |
| Actual | | $1,000.00 | | $1,120.43 | | $7.82 |
| |
| Hypothetical** | | $1,000.00 | | $1,017.55 | | $7.44 |
| (5% annual return | | | | | | |
| before expenses) | | | | | | |
* Expenses are equal to the Fund’s annualized expense ratio of 1.48%, multiplied by
the average account value over the period, multiplied by 182/365 (to reflect the one-
half year period). |
Availability of Quarterly Schedule of Investments
(Unaudited)
The Fund files its complete schedule of portfolio holdings with the Securities and Exchange Commission ("SEC") for the first and third quarters of each fiscal year on Form N-Q. The Fund’s Form N-Q is available on the SEC's Web site at http://www.sec.gov. The Fund’s Form N-Q may also be reviewed and copied at the SEC's Public Reference Room in Washington, DC. Information on the operation of the Public Reference Room may be obtained by calling 1-800-SEC-0330.
Proxy Voting Guidelines
(Unaudited)
Rocky Peak Capital Management, LLC, the Fund’s investment advisor (“Advisor”), is responsible for exercising the voting rights associated with the securities held by the Fund. A description of the policies and procedures used by the Advisor in fulfilling this responsibility is available without charge on the Fund’s website at www.rockypeakfunds.com. It is also included in the Fund’s Statement of Additional Information, which is available on the SEC’s website at http://www.sec.gov.
Information regarding how the Fund voted proxies, Form N-PX, relating to portfolio securities during the most recent period ended June 30th, is available without charge, upon request, by calling our toll free number (1-888-505-0865). This information is also available on the SEC’s website at http://www.sec.gov.
2013 Annual Report 5
| Rocky Peak Small Cap Value Fund |
| |
| | | | Schedule of Investments |
| | | | March 31, 2013 |
| Shares/Principal Amount | | Fair Value | | % of Net Assets |
| COMMON STOCKS | | | | | |
| Aircraft | | | | | | |
| 3,665 | AeroVironment, Inc. * | $ | 66,446 | | 2.02 | % |
| Commercial Printing | | | | | |
| 5,805 | R.R. Donnelley & Sons Company | | 69,950 | | 2.13 | % |
| Crude Petroleum & Natural Gas | | | | | |
| 4,135 | Bill Barrett Corporation * | | 83,816 | | | |
| 24,225 | Callon Petroleum Company * | | 89,633 | | | |
| 9,050 | EXCO Resources, Inc. | | 64,526 | | | |
| | | | 237,975 | | 7.24 | % |
| Deep Sea Foreign Transportation of Freight | | | | | |
| 18,900 | Global Ship Lease, Inc. Class A * (United Kingdom) | | 85,050 | | 2.58 | % |
| Electronic Components & Accessories | | | | | |
| 6,315 | AVX Corporation | | 75,148 | | 2.28 | % |
| Engines & Turbines | | | | | |
| 2,480 | Briggs & Stratton Corporation | | 61,504 | | 1.87 | % |
| Fabricated Structural Metal Products | | | | | |
| 2,615 | Harsco Corporation | | 64,774 | | 1.97 | % |
| Fats & Oils | | | | | | |
| 7,725 | Omega Protein Corporation * | | 83,044 | | 2.52 | % |
| Finance Services | | | | | |
| 6,400 | Green Dot Corporation Class A * | | 106,944 | | 3.25 | % |
| Games, Toys & Children's Vehicles (No Dolls & Bicycles) | | | | | |
| 7,325 | JAKKS Pacific, Inc. | | 76,839 | | 2.34 | % |
| Gold and Silver Ores | | | | | |
| 5,250 | Allied Nevada Gold Corp. * | | 86,415 | | | |
| 10,050 | AuRico Gold Inc. * (Canada) | | 63,215 | | | |
| | | | 149,630 | | 4.55 | % |
| Household Audio & Video Equipment | | | | | |
| 12,350 | Skullcandy, Inc. * | | 65,208 | | 1.98 | % |
| Insurance Carriers, NEC | | | | | |
| 9,800 | Hallmark Financial Services, Inc. * | | 88,200 | | 2.68 | % |
| Investment Advice | | | | | |
| 3,270 | Federated Investors, Inc. | | 77,401 | | 2.35 | % |
| Life Insurance | | | | | | |
| 5,380 | Symetra Financial Corporation | | 72,146 | | 2.19 | % |
| Miscellaneous Electrical Machinery, Equipment & Supplies | | | | | |
| 26,000 | Exide Technologies * | | 70,200 | | 2.13 | % |
| Miscellaneous Food Preparations & Kindred Products | | | | | |
| 3,580 | Diamond Foods, Inc. * | | 60,359 | | 1.83 | % |
| Motor Vehicle Parts & Accessories | | | | | |
| 16,250 | LoJack Corporation * | | 50,700 | | | |
| 2,100 | Superior Industries International, Inc. | | 39,228 | | | |
| | | | 89,928 | | 2.73 | % |
| Oil & Gas Field Exploration Services | | | | | |
| 4,450 | Flotek Industries, Inc. * | | 72,758 | | 2.21 | % |
| Photographic Equipment & Supplies | | | | | |
| 12,850 | Avid Technology, Inc. * | | 80,570 | | 2.45 | % |
| Printed Circuit Boards | | | | | |
| 12,125 | IEC Electronics Corp. * | | 69,719 | | 2.12 | % |
| Retail - Radio, TV & Consumer Electronics Stores | | | | | |
| 19,775 | RadioShack Corporation | | 66,444 | | 2.02 | % |
* Non-Income Producing Securities.
The accompanying notes are an integral part of these
financial statements. |
2013 Annual Report 6
| Rocky Peak Small Cap Value Fund |
| |
| | | | Schedule of Investments |
| | | | March 31, 2013 |
| Shares/Principal Amount | | Fair Value | | % of Net Assets |
| COMMON STOCKS | | | | | |
| Retail - Variety Stores | | | | | |
| 1,750 | Big Lots, Inc. * | $ | 61,722 | | 1.88 | % |
| Security Brokers, Dealers & Flotation Companies | | | | | |
| 5,000 | INTL FCStone Inc. * | | 87,050 | | 2.65 | % |
| Services - Business Services, NEC | | | | | |
| 4,110 | Sykes Enterprises, Incorporated * | | 65,596 | | 1.99 | % |
| Services - Computer Integrated Systems Design | | | | | |
| 3,200 | ManTech International Corporation Class A | | 85,984 | | 2.61 | % |
| Services - Direct Mail Advertising Services | | | | | |
| 10,175 | Harte-Hanks, Inc. | | 79,263 | | 2.41 | % |
| Services - Educational Services | | | | | |
| 10,350 | Lincoln Educational Services Corporation | | 60,651 | | | |
| 134 | The Washington Post Company Class B | | 59,898 | | | |
| | | | 120,549 | | 3.67 | % |
| Services - Motion Picture & Video Tape Production | | | | | |
| 4,380 | DreamWorks Animation SKG Inc. Class A * | | 83,045 | | | |
| 7,125 | World Wrestling Entertainment, Inc. | | 62,842 | | | |
| | | | 145,887 | | 4.44 | % |
| Sporting & Athletic Goods, NEC | | | | | |
| 10,650 | Callaway Golf Company | | 70,503 | | 2.14 | % |
| Telephone & Telegraph Apparatus | | | | | |
| 44,375 | Westell Technologies, Inc. Class A * | | 89,194 | | 2.71 | % |
| Truck & Bus Bodies | | | | | |
| 3,860 | Miller Industries, Inc. | | 61,953 | | 1.88 | % |
| Wholesale - Electronic Parts & Equipment, NEC | | | | | |
| 6,280 | Richardson Electronics, Ltd. | | 74,481 | | 2.26 | % |
| Wholesale - Medical, Dental & Hospital Equipment & Supplies | | | | | |
| 2,225 | Owens & Minor, Inc. | | 72,446 | | 2.20 | % |
| Wholesale - Miscellaneous Nondurable Goods | | | | | |
| 7,015 | Central Garden & Pet Company Class A * | | 57,663 | | | |
| 1,575 | The Scotts Miracle-Gro Company | | 68,103 | | | |
| | | | 125,766 | | 3.83 | % |
| Total for Common Stock (Cost $2,930,636) | | 3,030,631 | | 92.11 | % |
| REAL ESTATE INVESTMENT FUNDS | | | | | |
| 1,430 | Potlatch Corporation | | 65,580 | | 1.99 | % |
| | (Cost $57,098) | | | | | |
| MONEY MARKET FUNDS | | | | | |
| 153,329 | Fidelity Governmental Fund 57 0.01% ** | | 153,329 | | 4.66 | % |
| | (Cost $153,329) | | | | | |
| Total Investment Securities | | 3,249,540 | | 98.76 | % |
| | (Cost $3,141,063) | | | | | |
| Other Assets In Excess of Liabilities | | 40,844 | | 1.24 | % |
| Net Assets | | $ | 3,290,384 | | 100.00 | % |
* Non-Income Producing Securities.
** Variable Rate Security; The Yield Rate shown represents the 7-day
yield at March 31, 2013.
The accompanying notes are an integral part of these
financial statements. |
2013 Annual Report 7
| Rocky Peak Small Cap Value Fund |
| |
| Statement of Assets and Liabilities | | |
| March 31, 2013 | | |
| |
| Assets: | | |
| Investment Securities at Fair Value | $ | 3,249,540 |
| (Cost $3,141,063) | | |
| Cash | | 2,360 |
| Receivable for: | | |
| Dividends and Interest Receivable | | 863 |
| Investments Sold | | 134,584 |
| Total Assets | | 3,387,347 |
| Liabilities: | | |
| Payable for Investments Purchased | | 93,260 |
| Management Fees Payable | | 2,502 |
| Service Fees Payable | | 1,201 |
| Total Liabilities | | 96,963 |
| Net Assets | $ | 3,290,384 |
| |
| Net Assets Consist of: | | |
| Paid In Capital | $ | 3,113,018 |
| Accumulated Undistributed Net Investment Income | | 492 |
| Accumulated Undistributed Realized Gain/(Loss) on Investments - Net | | 68,397 |
| Unrealized Appreciation/(Depreciation) in Value of Investments | | |
| Based on Identified Cost - Net | | 108,477 |
| Net Assets, for 297,206 Shares Outstanding | $ | 3,290,384 |
| (Unlimited shares authorized) | | |
| Net Asset Value and Offering Price Per Share | | |
| ($3,290,384/297,206 shares) | $ | 11.07 |
| Redemption Price ($11.07 x 0.98) (Note 2) | $ | 10.85 |
| |
| Statement of Operations | | |
| For the period April 2, 2012* through March 31, 2013 | | |
| |
| Investment Income: | | |
| Dividends | $ | 17,337 |
| Interest | | 10 |
| Total Investment Income | | 17,347 |
| Expenses: | | |
| Management Fees (Note 4) | | 8,457 |
| Service Fees (Note 4) | | 4,059 |
| Total Expenses | | 12,516 |
| |
| Net Investment Income/(Loss) | | 4,831 |
| |
| Realized and Unrealized Gain/(Loss) on Investments: | | |
| Realized Gain/(Loss) on Investments | | 68,397 |
| Net Change in Unrealized Appreciation/(Depreciation) on Investments | | 108,477 |
| Net Realized and Unrealized Gain/(Loss) on Investments | | 176,874 |
| |
| Net Increase/(Decrease) in Net Assets from Operations | $ | 181,705 |
* The Fund commenced operations on April 2, 2012.
The accompanying notes are an integral part of these
financial statements. |
2013 Annual Report 8
| Rocky Peak Small Cap Value Fund |
| |
| Statement of Changes in Net Assets | | | |
| | | 4/2/2012* | |
| | | to | |
| | | 3/31/2013 | |
| From Operations: | | | |
| Net Investment Income/(Loss) | $ | 4,831 | |
| Net Realized Gain/(Loss) on Investments | | 68,397 | |
| Change in Net Unrealized Appreciation/(Depreciation) | | 108,477 | |
| Increase/(Decrease) in Net Assets from Operations | | 181,705 | |
| From Distributions to Shareholders: | | | |
| Net Investment Income | | (4,339 | ) |
| Net Realized Gain from Security Transactions | | - | |
| Change in Net Assets from Distributions | | (4,339 | ) |
| From Capital Share Transactions: | | | |
| Proceeds From Sale of Shares | | 3,202,058 | |
| Proceeds From Redemption Fees (Note 2) | | 219 | |
| Shares Issued on Reinvestment of Dividends | | 3,948 | |
| Cost of Shares Redeemed | | (93,207 | ) |
| Net Increase/(Decrease) from Shareholder Activity | | 3,113,018 | |
| Net Increase/(Decrease) in Net Assets | | 3,290,384 | |
| Net Assets at Beginning of Period | | - | |
| Net Assets at End of Period (Including Accumulated Undistributed Net | | | |
| Investment Income of $492) | $ | 3,290,384 | |
| Share Transactions: | | | |
| Issued | | 305,475 | |
| Reinvested | | 392 | |
| Redeemed | | (8,661 | ) |
| Net Increase in Shares | | 297,206 | |
| Shares Outstanding Beginning of Period | | - | |
| Shares Outstanding End of Period | | 297,206 | |
| |
| Financial Highlights | | | |
| Selected data for a share outstanding throughout the period: | | 4/2/2012* | |
| | | to | |
| | | 3/31/2013 | |
| Net Asset Value - | | | |
| Beginning of Period | $ | 10.00 | |
| Net Investment Income/(Loss) (a) | | 0.06 | |
| Net Gain/(Loss) on Securities (b) | | | |
| (Realized and Unrealized) | | 1.08 | |
| Total from Investment Operations | | 1.14 | |
| Distributions (From Net Investment Income) | | (0.07 | ) |
| Distributions (From Realized Capital Gains) | | - | |
| Total Distributions | | (0.07 | ) |
| Proceeds from Redemption Fee (Note 2) | | - | (d) |
| Net Asset Value - | | | |
| End of Period | $ | 11.07 | |
| Total Return (c) | | 11.48% | ** |
| Ratios/Supplemental Data | | | |
| Net Assets - End of Period (Thousands) | $ | 3,290 | |
| Ratio of Expenses to Average Net Assets | | 1.48% | *** |
| Ratio of Net Investment Income/(Loss) to Average Net Assets | | 0.57% | *** |
| Portfolio Turnover Rate | | 77.72% | ** |
* Commencement of Operations. ** Not Annualized. *** Annualized.
(a) Per share amounts were calculated using the average shares method.
(b) Realized and unrealized gains and losses per share in this caption are balancing amounts
necessary to reconcile the change in net asset value for the period, and may not reconcile
with the aggregate gains and losses in the Statement of Operations due to share transactions
for the period.
(c) Total return in the above table represents the rate that the investor would have earned
or lost on an investment in the Fund assuming reinvestment of dividends and distributions.
(d) Less than $0.005 per share. |
The accompanying notes are an integral part of these
financial statements. |
2013 Annual Report 9
NOTES TO FINANCIAL STATEMENTS
ROCKY PEAK SMALL CAP VALUE FUND
March 31, 2013
1.) ORGANIZATION:
Rocky Peak Small Cap Value Fund (the "Fund") was organized as a non-diversified series of the PFS Funds (the "Trust") on March 9, 2012. The Trust was established under the laws of Massachusetts by an Agreement and Declaration of Trust dated January 13, 2000, which was amended and restated January 20, 2011. Prior to March 5, 2010, the Trust was named Wireless Fund. The Trust is registered as an open-end investment company under the Investment Company Act of 1940, as amended (the “1940 Act”). The Trust may offer an unlimited number of shares of beneficial interest in a number of separate series, each series representing a distinct fund with its own investment objectives and policies. As of March 31, 2013, there were nine series authorized by the Trust. The Fund commenced operations on April 2, 2012. The investment advisor to the Fund is Rocky Peak Capital Management, LLC (the “Advisor”). The Fund’s investment objective is to seek long-term capital appreciation.
2.) SIGNIFICANT ACCOUNTING POLICIES:
SECURITY VALUATION:
All investments in securities are recorded at their estimated fair value, as described in Note 3.
FEDERAL INCOME TAXES:
The Fund’s policy is to continue to comply with the requirements of the Internal Revenue Code that are applicable to regulated investment companies and to distribute all of its taxable income to shareholders. Therefore, no federal income tax provision is required. It is the Fund’s policy to distribute annually, prior to the end of the calendar year, dividends sufficient to satisfy excise tax requirements of the Internal Revenue Code. This Internal Revenue Code requirement may cause an excess of distributions over the book year-end accumulated income. In addition, it is the Fund’s policy to distribute annually, after the end of the fiscal year, any remaining net investment income and net realized capital gains.
The Fund recognizes the tax benefits of certain tax positions only where the position is “more likely than not” to be sustained assuming examination by tax authorities. Management has analyzed the Fund’s tax positions, and has concluded that no liability for unrecognized tax benefits should be recorded related to uncertain tax positions expected to be taken in the Fund’s initial tax return. The Fund identifies its major tax jurisdictions as U.S. Federal tax authorities; however, the Fund is not aware of any tax positions for which it is reasonably possible that the total amounts of unrecognized tax benefits will change materially in the next twelve months. The Fund recognizes interest and penalties, if any, related to unrecognized tax benefits as income tax expense in the statement of operations. During the period April 2, 2012 through March 31, 2013, the Fund did not incur any interest or penalties.
SHARE VALUATION:
The net asset value per share of the Fund is calculated daily by dividing the total value of the Fund’s assets, less liabilities, by the number of shares outstanding, rounded to the nearest cent. The offering and redemption price per share is equal to the net asset value per share, except that shares of the Fund are subject to a redemption fee of 2% if redeemed after holding them for 90 days or less. During the period April 2, 2012 through March 31, 2013, proceeds from redemption fees amounted to $219.
DISTRIBUTIONS TO SHAREHOLDERS:
Distributions to shareholders, which are determined in accordance with income tax regulations, are recorded on the ex-dividend date.
The treatment for financial reporting purposes of distributions made to shareholders during the year from net investment income or net realized capital gains may differ from their ultimate treatment for federal income tax purposes. These differences are caused primarily by differences in the timing of the recognition of certain components of income, expense, or realized capital gain for federal income tax purposes. Where such differences are permanent in nature, they are reclassified in the components of the net assets based on their ultimate characterization for federal income tax purposes. Any such reclassifications will have no effect on net assets, results of operations, or net asset value per share of the Fund.
USE OF ESTIMATES:
The preparation of financial statements in conformity with accounting principles generally accepted in the United States of America (“GAAP”) requires management to make estimates and assumptions that affect the reported amounts of assets and liabilities and disclosure of contingent assets and liabilities at the date of the financial statements and the reported amounts of increases and decreases in net assets from operations during the reporting period. Actual results could differ from those estimates.
2013 Annual Report 10
Notes to Financial Statements - continued
OTHER:
The Fund records security transactions based on the trade date. Dividend income is recognized on the ex-dividend date. Interest income is recognized on an accrual basis. The Fund uses the specific identification method in computing gain or loss on the sale of investment securities. Discounts and premiums on securities purchased are accreted and amortized over the life of the respective securities. The ability of issuers of debt securities held by the Fund to meet their obligations may be affected by economic and political developments in a specific country or region. Withholding taxes on foreign dividends have been provided for in accordance with the Fund’s understanding of the applicable country’s tax rules and rates.
ORGANIZATIONAL & OFFERING EXPENSES:
All costs incurred by the Fund in connection with the organization, offering and initial registration of the Fund, principally professional fees, were paid on behalf of the Fund by the Advisor and will not be borne by the Fund.
EXPENSES:
Expenses incurred by the Trust that do not relate to a specific fund of the Trust are allocated to the individual funds based on each fund’s relative net assets or another appropriate basis.
3.) SECURITIES VALUATIONS:
The Fund utilizes various methods to measure the fair value of its investments on a recurring basis. GAAP establishes a hierarchy that prioritizes inputs to valuation methods. The three levels of inputs are:
Level 1 - Unadjusted quoted prices in active markets for identical assets or liabilities that the Fund has the ability to access.
Level 2 - Observable inputs other than quoted prices included in level 1 that are observable for the asset or liability, either directly or indirectly. These inputs may include quoted prices for the identical instrument on an inactive market, prices for similar instruments, interest rates, prepayment speeds, credit risk, yield curves, default rates and similar data.
Level 3 - Unobservable inputs for the asset or liability, to the extent relevant observable inputs are not available, representing the Fund’s own assumptions about the assumptions a market participant would use in valuing the asset or liability, and would be based on the best information available.
The availability of observable inputs can vary from security to security and is affected by a wide variety of factors, including, for example, the type of security, whether the security is new and not yet established in the marketplace, the liquidity of markets, and other characteristics particular to the security. To the extent that valuation is based on models or inputs that are less observable or unobservable in the market, the determination of fair value requires more judgment. Accordingly, the degree of judgment exercised in determining fair value is greatest for instruments categorized in level 3.
The inputs used to measure fair value may fall into different levels of the fair value hierarchy. In such cases, for disclosure purposes, the level in the fair value hierarchy within which the fair value measurement falls in its entirety, is determined based on the lowest level input that is significant to the fair value measurement in its entirety.
FAIR VALUE MEASUREMENTS
A description of the valuation techniques applied to the Fund’s major categories of assets and liabilities measured at fair value on a recurring basis follows.
Equity securities (including common stocks and real estate investment funds). Equity securities are carried at fair value. The market quotation used for common stocks, including those listed on the NASDAQ National Market System, is the last sale price on the date on which the valuation is made or, in the absence of sales, at the closing bid price. Over-the-counter securities will be valued on the basis of the bid price at the close of each business day. Generally, if the security is traded in an active market and is valued at the last sale price, the security is categorized as a level 1 security. When the security position is not considered to be part of an active market or when the security is valued at the bid price, the position is generally categorized as level 2. When market quotations are not readily available, when the Advisor determines the last bid price does not accurately reflect the current value or when restricted securities are being valued, such securities are valued as determined in good faith by the Advisor, in conformity with guidelines adopted by and subject to review of the Board of Trustees (the “Trustees”) and are categorized in level 2 or level 3, when appropriate.
2013 Annual Report 11
Notes to Financial Statements - continued
Money market funds. Shares of money market funds are valued at a net asset value of $1.00 and are classified in level 1 of the fair value hierarchy.
Fixed income securities. Fixed income securities generally are valued by using market quotations, but may be valued on the basis of prices furnished by a pricing service when the Advisor believes such prices accurately reflect the fair value of such securities. A pricing service utilizes electronic data processing techniques based on yield spreads relating to securities with similar characteristics to determine prices for normal institutional-size trading units of debt securities without regard to sale or bid prices. When prices are not readily available from a pricing service, or when restricted or illiquid securities are being valued, securities are valued at fair value as determined in good faith by the Advisor, subject to review of the Trustees. Short-term investments in fixed income securities with maturities of less than 60 days when acquired, or which subsequently are within 60 days of maturity, are valued by using the amortized cost method of valuation. Generally, fixed income securities are categorized as level 2.
In accordance with the Trust's good faith pricing guidelines, the Advisor is required to consider all appropriate factors relevant to the value of securities for which it has determined other pricing sources are not available or reliable as described above. There is no standard procedure for determining fair value, since fair value depends upon the circumstances of each individual case. As a general principle, the current fair value of an issue of securities being valued by the Advisor would appear to be the amount which the owner might reasonably expect to receive for them upon their current sale. Methods which are in accordance with this principle may, for example, be based on (i) a multiple of earnings; (ii) a discount from market of a similar freely traded security (including a derivative security or a basket of securities traded on other markets, exchanges or among dealers); or (iii) yield to maturity with respect to debt issues, or a combination of these and other methods.
The following table summarizes the inputs used to value the Fund’s assets measured at fair value as of March 31, 2013:
| Valuation Inputs of Assets | | Level 1 | | Level 2 | | Level 3 | | Total |
| Common Stocks | | $3,030,631 | | $0 | | $0 | | $3,030,631 |
| Real Estate Investment Funds | | 65,580 | | 0 | | 0 | | 65,580 |
| Money Market Funds | | 153,329 | | 0 | | 0 | | 153,329 |
| Total | | $3,249,540 | | $0 | | $0 | | $3,249,540 |
Refer to the Fund’s Schedule of Investments for a listing of securities by industry. The Fund did not hold any Level 3 assets during the period April 2, 2012 through March 31, 2013. There were no transfers into or out of the levels during the period April 2, 2012 through March 31, 2013. It is the Fund’s policy to consider transfers into or out of the levels as of the end of the reporting period.
The Fund did not invest in derivative instruments during the period April 2, 2012 through March 31, 2013.
4.) INVESTMENT ADVISORY AGREEMENT AND SERVICES AGREEMENT:
The Fund has entered into an investment advisory agreement (“Management Agreement”) with the Advisor. The Advisor manages the investment portfolio of the Fund, subject to policies adopted by the Trust's Board of Trustees. Under the Management Agreement, the Advisor, at its own expense and without reimbursement from the Trust, furnishes office space and all necessary office facilities, equipment and executive personnel necessary for managing the assets of the Fund. For its services the Advisor receives an investment management fee equal to 1.00% of the average daily net assets of the Fund.
Under the Services Agreement the Advisor receives an additional fee of 0.48% and is obligated to pay the operating expenses of the Fund excluding management fees, brokerage fees and commissions, taxes, borrowing costs (such as (a) interest and (b) dividend expenses on securities sold short), ADR fees, the cost of acquired funds and extraordinary expenses.
For the period April 2, 2012 through March 31, 2013, the Advisor earned management fees totaling $8,457 and service fees totaling $4,059. As a result of the advisory fees and services fees, as of March 31, 2013, the Fund owed the Advisor $2,502 in advisory fees and $1,201 in services fees.
5.) RELATED PARTY TRANSACTIONS:
A control person, Jeffrey R. Provence, of Premier Fund Solutions, Inc. (the “Administrator”) also serves as trustee/officer of the Fund. This individual receives benefits from the Administrator resulting from administration fees paid to the Administrator by the Advisor. Mr. Ross C. Provence, another Trustee of the Trust, is the father of Mr. Jeffrey R. Provence.
2013 Annual Report 12
Notes to Financial Statements - continued
The Trustees who are not interested persons of the Fund were each paid a total of $1,000 in Trustee fees plus travel and related expenses for the period April 2, 2012 through March 31, 2013 for the Fund. Under the Services Agreement, the Advisor pays these fees.
6.) CAPITAL SHARES:
The Trust is authorized to issue an unlimited number of shares of beneficial interest for the Fund. Paid in capital for the Fund at March 31, 2013 was $3,113,018 representing 297,206 shares outstanding.
7.) PURCHASES AND SALES OF SECURITIES:
For the period April 2, 2012 through March 31, 2013, purchases and sales of investment securities other than U.S. Government obligations and short-term investments aggregated $3,543,273 and $623,936, respectively. Purchases and sales of U.S. Government obligations aggregated $0 and $0, respectively.
8.) SECURITY TRANSACTIONS:
For Federal income tax purposes, the cost of investments owned at March 31, 2013 was $3,141,063. At March 31, 2013, the composition of unrealized appreciation (the excess of value over tax cost) and depreciation (the excess of tax cost over value) was as follows:
| | Appreciation | | (Depreciation) | | Net Appreciation (Depreciation) |
| | $227,206 | | ($118,729) | | $108,477 |
As of March 31, 2013, there were no differences between book basis and tax basis unrealized appreciation.
9.) CONTROL OWNERSHIP:
The beneficial ownership, either directly or indirectly, of more than 25% of the voting securities of a fund creates a presumption of control of a fund, under Section 2(a)(9) of the Investment Company Act of 1940. As of March 31, 2013, Ameritrade Inc. located in Omaha, Nebraska, beneficially held, in aggregate, for the benefit of others, 80.30% of the Fund and therefore may be deemed to control the Fund.
10.) DISTRIBUTIONS TO SHAREHOLDERS
There were distributions paid on December 21, 2012 to the shareholders of record on December 20, 2012 of which $0.0712 per share was from net investment income.
The tax character of distributions was as follows:
| Distributions paid: | | |
| | | Period April 2, 2012 |
| | | through March 31, 2013 |
| Ordinary Income: | | $4,339 |
| Long-term Capital Gain: | | -0- |
| | | $4,339 |
As of March 31, 2013, the components of distributable earnings/(accumulated losses) on a tax basis were as follows:
| Undistributed ordinary income | | $ 68,889 |
| Undistributed long-term capital gain (accumulated losses) | | -0- |
| Unrealized appreciation (depreciation) - net | | 108,477 |
| | | $ 177,366 |
2013 Annual Report 13
This page was intentionally left blank.
2013 Annual Report 14
This page was intentionally left blank.
2013 Annual Report 15
Cohen Fund Audit Services, Ltd.
1350 Euclid Avenue, Ste 800
Cleveland, Ohio 44115 www.cohenfund.com | 216.649.1700
216.579.0111 fax |
REPORT OF INDEPENDENT REGISTERED PUBLIC ACCOUNTING FIRM
To the Shareholders and Board of Trustees
Rocky Peak Small Cap Value Fund (a series of PFS Funds)
We have audited the accompanying statement of assets and liabilities, including the schedule of investments of Rocky Peak Small Cap Value Fund (the "Fund"), a series of PFS Funds, as of March 31, 2013, and the related statements of operations and changes in net assets, and the financial highlights for the period April 2, 2012 (commencement of operations) through March 31, 2013. These financial statements and financial highlights are the responsibility of the Fund's management. Our responsibility is to express an opinion on these financial statements and financial highlights based on our audit.
We conducted our audit in accordance with the standards of the Public Company Accounting Oversight Board (United States). Those standards require that we plan and perform the audit to obtain reasonable assurance about whether the financial statements and financial highlights are free of material misstatement. An audit includes examining, on a test basis, evidence supporting the amounts and disclosures in the financial statements. Our procedures included confirmation of securities owned as of March 31, 2013, by correspondence with the custodian and broker. An audit also includes assessing the accounting principles used and significant estimates made by management, as well as evaluating the overall financial statement presentation. We believe that our audit provides a reasonable basis for our opinion.
In our opinion, the financial statements and financial highlights referred to above present fairly, in all material respects, the financial position of Rocky Peak Small Cap Value Fund as of March 31, 2013 and the results of its operations, the changes in its net assets, and the financial highlights for the period April 2, 2012 (commencement of operations) through March 31, 2013, in conformity with accounting principles generally accepted in the United States of America.

COHEN FUND AUDIT SERVICES, LTD.
Cleveland, Ohio
May 28, 2013
2013 Annual Report 16
Trustees and Officers
(Unaudited)
The Board of Trustees supervises the business activities of the Trust. The names of the Trustees and executive officers of the Trust are shown below. For more information regarding the Trustees, please refer to the Statement of Additional Information, which is available upon request by calling 1-888-450-4517. Each Trustee serves until the Trustee sooner dies, resigns, retires, or is removed.
The Trustees and Officers of the Trust and their principal business activities during the past five years are:
Interested Trustees and Officers
| | | | | Number of | Other |
| | | | Principal | Portfolios In | Directorships |
| Name, | Position(s) | Term of Office | Occupation(s) | Fund | Held By |
| Address(1), | Held With | and Length of | During | Complex | Trustee or |
| and Year of Birth | the Trust | Time Served | Past 5 Years | Overseen By | Officer |
| | | | | Trustee | |
| |
| Ross C. Provence(2)(3), | Trustee | Indefinite Term; | General Partner and Portfolio | 9 | Blue Chip |
| Year of Birth: 1938 | and | Since 2000 | Manager for Value Trend Capital | | Investor Funds |
| | President | | Management, LP (1995 to current). | | |
| | | | Estate planning attorney (1963 to | | |
| current). |
| |
| Jeffrey R. Provence(2), | Trustee, | Indefinite Term; | General Partner and Portfolio | 9 | Blue Chip |
| Year of Birth:1969 | Secretary | Since 2000 | Manager for Value Trend Capital | | Investor Funds, |
| | and | | Management, LP (1995 to current). | | Sycuan Funds |
| | Treasurer | | CEO, Premier Fund Solutions, Inc. | | |
| | | | (2001 to current). | | |
| |
| Julian G. Winters, | Chief | Chief | Managing Member, Watermark | N/A | N/A |
| Year of Birth: 1968 | Compliance | Compliance | Solutions LLC (investment compli- | | |
| | Officer | Officer Since | ance and consulting) since March | | |
| | | 2010 | 2007. | | |
(1) The address of each trustee and officer is c/o PFS Funds, 1939 Friendship Drive, Suite C, El Cajon, California 92020.
(2) Trustees who are considered "interested persons" as defined in Section 2(a)(19) of the Investment Company Act of 1940 by virtue of their position with the Trust. Mr. Ross C. Provence is the father of Mr. Jeffrey R. Provence.
(3) Ross C. Provence resigned from the Board of Trustees on May 17, 2013.
Independent Trustees
| | | | | Number of | Other |
| | | | Principal | Portfolios In | Directorships |
| Name, | Position | Term of Office | Occupation(s) | Fund | Held By |
| Address(1), | Held With | and Length of | During | Complex | Trustee or |
| and Year of Birth | the Trust | Time Served | Past 5 Years | Overseen By | Officer |
| | | | | Trustee | |
| |
| Thomas H. Addis III, | Independent | Indefinite Term; | Executive Director/CEO, Southern | 9 | None |
| Year of Birth: 1945 | Trustee | Since 2000 | California PGA (2006 to current). | | |
| |
| Allen C. Brown, | Independent | Indefinite Term; | Co-owner of Stebleton & Brown | 9 | Blue Chip |
| Year of Birth: 1943 | Trustee | Since 2010 | (1994 to Current). Estate planning | | Investor Funds, |
| | | | and business attorney (1970 to cur- | | Sycuan Funds |
| rent). |
| |
| George Cossolias, CPA, | Independent | Indefinite Term; | Owner of George Cossolias & | 9 | Blue Chip |
| Year of Birth: 1935 | Trustee | Since 2000 | Company, CPAs (1972 to current). | | Investor Funds, |
| | | | President of Lubrication Specialists, | | Sycuan Funds, |
| | | | Inc. (1996 to current). | | Temecula |
| | | | | | Valley Bank |
(1) The address of each trustee and officer is c/o PFS Funds, 1939 Friendship Drive, Suite C, El Cajon, California 92020.
2013 Annual Report 17
Board of Trustees
Thomas H. Addis III
Allen C. Brown
George Cossolias, CPA
Jeffrey R. Provence
Investment Advisor
Rocky Peak Capital Management, LLC
Legal Counsel
The Law Offices of John H. Lively & Associates, Inc.
A member of The 1940 Act Law GroupTM
Custodian
US Bank N.A.
Dividend Paying Agent,
Shareholders' Servicing Agent,
Transfer Agent
Mutual Shareholder Services, LLC
Administrator
Premier Fund Solutions, Inc.
Independent Registered Public Accounting Firm
Cohen Fund Audit Services, Ltd.
Distributor
Rafferty Capital Markets, LLC |
This report is provided for the general information of the shareholders of the Rocky
Peak Small Cap Value Fund. This report is not intended for distribution to prospective
investors in the Fund, unless preceded or accompanied by an effective prospectus.
|
ROCKY PEAK SMALL CAP VALUE FUND
3935 Poppyseed Place
Calabasas, California 91302
Item 2. Code of Ethics.
The registrant has adopted a code of ethics that applies to the registrant’s principal executive officer and the principal financial officer. The registrant has not made any amendments to its code of ethics during the covered period. The registrant has not granted any waivers from any provisions of the code of ethics during the covered period. A copy of the registrant’s Code of Ethics is filed herewith.
Item 3. Audit Committee Financial Expert.
The registrant’s Board of Trustees has determined that George Cossolias is an audit committee finical expert. Mr. Cossolias is independent for purposes of this Item 3.
Item 4. Principal Accountant Fees and Services.
(a-d) The following table details the aggregate fees billed for each of the last two fiscal years for audit fees, audit-related fees, tax fees and other fees by the principal accountant to the registrant. The principal accountant has provided no services to the adviser or any entity controlled by, or under common control with the adviser that provides ongoing services to the registrant.
| | | FYE 3/31/13 |
| Audit Fees | | $12,950 |
| Audit-Related Fees | | $0 |
| Tax Fees | | $2,500 |
| All Other Fees | | $600 |
Nature of Tax Fees: preparation of Excise Tax Statement and 1120 RIC.
Nature of All Other Fees: Review of Semi-Annual Report.
(e) (1) The audit committee approves all audit and non-audit related services and, therefore, has not adopted pre-approval policies and procedures described in paragraph (c)(7) of Rule 2-01 of Regulation S-X.
(e) (2) None of the services described in paragraph (b) through (d) of this Item were approved by the audit committee pursuant to paragraph (c)(7)(i)(C) of Rule 2-01 of Regulation S-X.
(f) All of the principal accountant’s hours spent on auditing the registrant’s financial statements were attributed to work performed by full-time permanent employees of the principal accountant.
(g) The following table indicates the aggregate non-audit fees billed by the registrant’s principal accountant for services to the registrant , the registrant’s investment adviser (not sub-adviser), and any entity controlling, controlled by, or under common control with the adviser that provides ongoing services to the registrant, for the last two years.
| Non-Audit Fees | | FYE 3/31/13 |
| Registrant | | $3,100 |
| Registrant’s Investment Adviser | | $0 |
(h) The principal accountant provided no services to the investment adviser or any entity controlling, controlled by, or under common control with the adviser that provides ongoing services to the registrant.
Item 5. Audit Committee of Listed Companies. Not applicable.
Item 6. Schedule of Investments. Schedule filed with Item 1.
Item 7. Disclosure of Proxy Voting Policies and Procedures for Closed-End Management Investment Companies. Not applicable.
Item 8. Portfolio Managers of Closed End Management Investment Companies. Not applicable.
Item 9. Purchases of Equity Securities by Closed-End Management Investment Companies and Affiliated Purchasers. Not applicable.
Item 10. Submission of Matters to a Vote of Security Holders.
The registrant has not adopted procedures by which shareholders may recommend nominees to the registrant’s board of trustees.
Item 11. Controls and Procedures.
(a) The registrant’s president and chief financial officer concluded that the disclosure controls and procedures (as defined in Rule 30a-3(c) under the Investment Company Act of 1940 (the “Act”)) were effective as of a date within 90 days of the filing date of this report, based on the evaluation of these controls and procedures required by Rule 30a-3(b) under the Act.
(b) There were no changes in the registrant’s internal control over financial reporting (as defined in Rule 30a-3(d) under the Act) that occurred during the registrant’s second fiscal quarter of the period covered by this report that have materially affected, or are reasonably likely to materially affect, the registrant’s internal control over financial reporting.
Item 12. Exhibits.
(a)(1) Code of Ethics. Filed herewith.
(a)(2) Certifications pursuant to Section 302 of the Sarbanes-Oxley Act of 2002. Filed herewith.
(b) Certification pursuant to Section 906 Certification of the Sarbanes-Oxley Act of 2002. Filed herewith.
SIGNATURES
Pursuant to the requirements of the Securities Exchange Act of 1934 and the Investment Company Act of 1940, the registrant has duly caused this report to be signed on its behalf by the undersigned, thereunto duly authorized.
| | By: /s/Ross C. Provence
Ross C. Provence
President |
Pursuant to the requirements of the Securities Exchange Act of 1934 and the Investment Company Act of 1940, this report has been signed below by the following persons on behalf of the registrant and in the capacities and on the dates indicated.
| | By: /s/Ross C. Provence
Ross C. Provence
President |
| | By: /s/Jeffrey R. Provence
Jeffrey R. Provence
Chief Financial Officer |