UNITED STATES
SECURITIES AND EXCHANGE COMMISSION
WASHINGTON, D.C. 20549
FORM N-CSR
CERTIFIED SHAREHOLDER REPORT OF REGISTERED MANAGEMENT
INVESTMENT COMPANIES
Investment Company Act file number 811-09781
PFS FUNDS
(Exact name of registrant as specified in charter)
| 1939 Friendship Drive, Suite C | |
| El Cajon, CA | 92020 |
| (Address of principal executive offices) | (Zip code) |
CT Corporation System
155 Federal St., Suite 700,
Boston, MA 02110
(Name and address of agent for service)
Registrant's telephone number, including area code: (619) 588-9700
Date of fiscal year end: November 30
Date of reporting period: May 31, 2024
Item 1. Report to Stockholders.

SEMI-ANNUAL REPORT
|
Taylor Frigon Core Growth Fund (Unaudited)
PERFORMANCE INFORMATION May 31, 2024 NAV $17.24
Average Annual Total Returns for the Periods ended May 31, 2024
| Since | ||||||||
| 1 Year(A) | 3 Years(A) | 5 Years(A) | Inception(A) | |||||
| Taylor Frigon Core Growth Fund | 15.24% | -11.71% | 7.48% | 10.32% | ||||
| S&P Mid Cap 400® Index (B) | 25.97% | 4.67% | 12.26% | 9.76% | ||||
| S&P 500® Index (C) | 28.19% | 9.57% | 15.80% | 14.04% |
Annual Fund Operating Expense Ratio (from 3/28/2024 Prospectus): 1.45%
The Fund’s expense ratio for the six month period ended May 31, 2024, can be found in the financial highlights included within this report.
(A) 1 Year, 3 Years, 5 Years and Since Inception returns include change in share prices and in each case includes reinvestment of any dividends and capital gain distributions. The Taylor Frigon Core Growth Fund commenced operations on December 27, 2016.
(B) The S&P Mid Cap 400® Index measures the performance of the midcapitalization segment of the U.S. equity universe. The Index is a capitalization weighted index composed of 400 domestic common stocks.
(C) The S&P 500® Index is a widely recognized unmanaged index of equity prices and is representative of a broader market and range of securities than is found in the Fund’s portfolio. The Index is an unmanaged benchmark that assumes reinvestment of all distributions and excludes the effect of taxes and fees.
PAST PERFORMANCE DOES NOT GUARANTEE FUTURE RESULTS. INVESTMENT RETURN AND PRINCIPAL VALUE WILL FLUCTUATE SO THAT SHARES, WHEN REDEEMED, MAY BE WORTH MORE OR LESS THAN THEIR ORIGINAL COST. RETURNS DO NOT REFLECT THE DEDUCTION OF TAXES THAT A SHAREHOLDER WOULD PAY ON FUND DISTRIBUTIONS OR THE REDEMPTION OF FUND SHARES. CURRENT PERFORMANCE MAY BE LOWER OR HIGHER THAN THE PERFORMANCE DATA QUOTED. TO OBTAIN PERFORMANCE DATA CURRENT TO THE MOST RECENT MONTH END, PLEASE CALL 1-888-897-4821. AN INVESTMENT IN THE FUND IS SUBJECT TO INVESTMENT RISKS, INCLUDING THE POSSIBLE LOSS OF THE PRINCIPAL AMOUNT INVESTED. THE FUND'S DISTRIBUTOR IS ARBOR COURT CAPITAL, LLC.
2024 Semi-Annual Report 1
Taylor Frigon Core Growth Fund (Unaudited)
| Taylor Frigon Core Growth Fund by Sectors (as a percentage of Net Assets) May 31, 2024 |
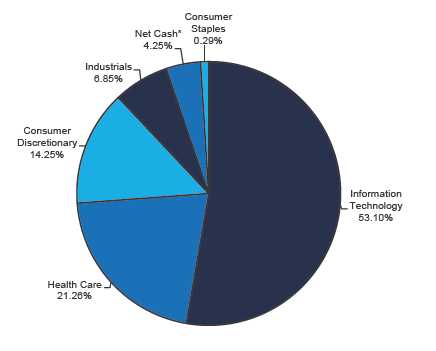
* Net Cash represents cash and liabilities in excess of other assets.
Availability of Quarterly Schedule of Investments
The Fund publicly files its complete schedule of portfolio holdings with the Securities and Exchange Commission (“SEC”) for the first and third quarters of each fiscal year on Form N-PORT. The Fund’s Form N-PORT is available on the SEC’s website at http://www.sec.gov.
| Proxy Voting Guidelines |
Taylor Frigon Capital Management, LLC, the Fund’s investment adviser (“Adviser”), is responsible for exercising the voting rights associated with the securities held by the Fund. A description of the policies and procedures used by the Adviser in fulfilling this responsibility is available without charge on the Fund’s website at www.taylorfrigonfunds.com. It is also included in the Fund’s Statement of Additional Information, which is available on the SEC’s website at http://www.sec.gov.
Form N-PX provides information regarding how the Fund voted proxies with regards to portfolio securities held during the most recent 12-month period ended June 30th and is available without charge, upon request, by calling our toll free number (1-888-897-4821). This information is also available on the SEC’s website at http://www.sec.gov.
2024 Semi-Annual Report 2
| Expense Example (Unaudited) |
Shareholders of this Fund incur ongoing costs consisting of management and service fees. Although the Fund charges no sales loads or transaction fees, you will be assessed fees for outgoing wire transfers, returned checks and stop payment orders at prevailing rates charged by Mutual Shareholder Services, LLC, the Fund’s transfer agent. IRA accounts will be charged an $8.00 annual maintenance fee. If shares are redeemed within 90 days or less of purchase from the Fund, the shares are subject to a 2% redemption fee. Additionally, your account will be indirectly subject to the expenses of any underlying funds. The following example is intended to help you understand your ongoing costs of investing in the Fund and to compare these costs with similar costs of investing in other mutual funds. The example is based on an investment of $1,000 invested in the Fund on December 1, 2023, and held through May 31, 2024.
| Actual Expenses |
The first line of the table below provides information about actual account values and actual expenses. In order to estimate the expenses a shareholder paid during the period covered by this report, shareholders can divide their account value by $1,000 (for example, an $8,600 account value divided by $1,000 = 8.6) and then multiply the result by the number in the first line under the heading entitled “Expenses Paid During the Period.”
Hypothetical Example for Comparison Purposes
The second line of the table below provides information about hypothetical account values and hypothetical expenses based on the Fund’s actual expense ratio and an assumed rate of return of 5% per year before expenses, which is not the Fund’s actual return. The hypothetical account values and expenses may not be used to estimate the actual ending account balance or expenses paid by a shareholder for the period. Shareholders may use this information to compare the ongoing costs of investing in this Fund and other funds. To do so, compare this 5% hypothetical example with the 5% hypothetical examples that appear in other funds’ shareholder reports.
Please note that the expenses shown in the table are meant to highlight your ongoing costs only and do not reflect any transactional costs, such as redemption fees or the charges assessed by Mutual Shareholder Services, LLC as described above and expenses of any underlying funds. Therefore, the second line of the table is useful in comparing ongoing costs only, and will not help you determine the relative total costs of owning different funds. In addition, if these transactional costs were included, your costs would have been higher.
| Expenses Paid | ||||||
| Beginning | Ending | During the Period* | ||||
| Account Value | Account Value | December 1, 2023 | ||||
| December 1, 2023 | May 31, 2024 | May 31, 2024 | ||||
| Actual | $1,000.00 | $1,184.88 | $7.92 | |||
| Hypothetical | $1,000.00 | $1,017.75 | $7.31 | |||
| (5% annual return | ||||||
| before expenses) | ||||||
| * | Expenses are equal to the Fund’s annualized expense ratio of 1.45%, multiplied by the average account value over the period, multiplied by 183/366 (to reflect the one-half year period). |
2024 Semi-Annual Report 3
| Taylor Frigon Core Growth Fund | |||||
| Schedule of Investments | |||||
| May 31, 2024 (Unaudited) | |||||
| Shares | Fair Value | % of Net Assets | |||
| COMMON STOCKS | |||||
| Biological Products (No Diagnostic Substances) | |||||
| 242,969 | Compugen Ltd. * (Israel) | $ | 527,243 | 1.69 | % |
| Communications Equipment, NEC | |||||
| 17,786 | Napco Security Technologies, Inc. | 883,075 | 2.84 | % | |
| Computer Storage Devices | |||||
| 18,919 | Pure Storage, Inc. - Class A * | 1,140,627 | 3.67 | % | |
| Electromedical & Electrotherapeutic Apparatus | |||||
| 24,102 | InMode Ltd. * (Israel) | 461,071 | 1.48 | % | |
| Electronic Components, NEC | |||||
| 5,074 | Impinj, Inc. * | 830,462 | 2.67 | % | |
| Food and Kindred Products | |||||
| 176,360 | Real Good Food Company, Inc. - Class A * | 91,884 | 0.29 | % | |
| General Industrial Machinery & Equipment, NEC | |||||
| 15,697 | Symbotic Inc. * | 621,130 | 2.00 | % | |
| In Vitro & In Vivo Diagnostic Substances | |||||
| 1,371 | IDEXX Laboratories, Inc. * | 681,318 | 2.19 | % | |
| IT Services | |||||
| 10,739 | CloudFlare, Inc. - Class A * | 726,923 | |||
| 64,404 | Grid Dynamics Holdings, Inc. - Class A * | 611,838 | |||
| 2,248 | MongoDB, Inc. - Class A * | 530,663 | |||
| 3,896 | NICE Ltd. ** | 715,189 | |||
| 2,584,613 | 8.31 | % | |||
| Orthopedic, Prosthetic & Surgical Appliances & Supplies | |||||
| 7,462 | Edwards Lifesciences Corporation * | 648,373 | 2.08 | % | |
| Printed Circuit Boards | |||||
| 134,027 | Nano Dimension Ltd. ** | 364,553 | 1.17 | % | |
| Printing Trades Machinery & Equipment | |||||
| 50,840 | Kornit Digital Ltd. * (Israel) | 722,945 | 2.32 | % | |
| Radio & TV Broadcasting & Communications Equipment | |||||
| 71,155 | Vuzix Corporation * | 95,348 | 0.31 | % | |
| Retail - Auto Dealers & Gasoline Stations | |||||
| 9,462 | Carvana Co. - Class A * | 946,011 | 3.04 | % | |
| Retail - Eating & Drinking Places | |||||
| 29,444 | Dutch Bros. Inc. - Class A * | 1,042,023 | 3.35 | % | |
| Retail - Shoe Stores | |||||
| 7,393 | Boot Barn Holdings, Inc. * | 879,249 | 2.83 | % | |
| Semiconductors & Related Devices | |||||
| 1,989 | Monolithic Power Systems, Inc. | 1,463,168 | |||
| 66,600 | QuickLogic Corporation * | 862,470 | |||
| 21,723 | Tower Semiconductor * (Israel) | 815,481 | |||
| 3,141,119 | 10.10 | % | |||
| Services - Amusement & Recreation Services | |||||
| 66,922 | Bowlero Corp. Class A * | 833,179 | 2.68 | % | |
| Services - Business Services, NEC | |||||
| 25,196 | Fiverr International Ltd. * (Israel) | 635,695 | 2.04 | % | |
| 79,432 | Repay Holdings Corporation - Class A * | 773,668 | 2.49 | % | |
| 1,409,363 | 4.53 | % | |||
| Services - Computer Integrated Systems Design | |||||
| 56,163 | Ebix, Inc. | 24,712 | 0.08 | % | |
| Services - Computer Programming Services | |||||
| 2,935 | EPAM Systems, Inc. * | 522,225 | 1.68 | % | |
| Services - Computer Programming, Data Processing, Etc. | |||||
| 7,749 | Wix.com Ltd. * (Israel) | 1,248,364 | 4.01 | % | |
| * Non-Income Producing Security. ** ADR - American Depositary Receipt. The accompanying notes are an integral part of these financial statements. |
2024 Semi-Annual Report 4
| Taylor Frigon Core Growth Fund | |||||||
| Schedule of Investments | |||||||
| May 31, 2024 (Unaudited) | |||||||
| Shares | Fair Value | % of Net Assets | |||||
| COMMON STOCKS | |||||||
| Services - Miscellaneous Business Services | |||||||
| 7,991 | NV5 Global, Inc. * | $ | 750,994 | 2.41 | % | ||
| Services - Prepackaged Software | |||||||
| 8,974 | Bill.com Holdings, Inc. * | 467,097 | |||||
| 4,247 | CyberArk Software Ltd. * (Israel) | 973,625 | |||||
| 29,796 | Mobileye Global Inc. Class - A * (Israel) | 764,565 | |||||
| 12,670 | Procore Technologies, Inc. * | 850,537 | |||||
| 81,161 | Zuora, Inc. - Class A * | 823,784 | |||||
| 3,879,608 | 12.47 | % | |||||
| Special Industry Machinery, NEC | |||||||
| 249,765 | Velo3D, Inc. * | 37,465 | 0.12 | % | |||
| Surgical & Medical Instruments & Apparatus | |||||||
| 132,282 | Apyx Medical Corporation * | 218,265 | |||||
| 88,829 | ClearPoint Neuro, Inc. * | 482,341 | |||||
| 4,973 | DexCom, Inc. * | 590,643 | |||||
| 8,311 | Glaukos Corporation * | 936,816 | |||||
| 26,912 | NovoCure Limited * (Jersey) | 592,333 | |||||
| 18,736 | PROCEPT BioRobotics Corporation | 1,244,070 | |||||
| 49,359 | Vapotherm, Inc. * | 37,365 | |||||
| 4,101,833 | 13.18 | % | |||||
| Telephone & Telegraph Apparatus | |||||||
| 849,187 | Akoustis Technologies, Inc. * | 182,575 | |||||
| 94,806 | AudioCodes Ltd. (Israel) | 947,112 | |||||
| 1,129,687 | 3.63 | % | |||||
| X-Ray Apparatus & Tubes & Related Irradiation Apparatus | |||||||
| 23,234 | Nano-X Imaging Ltd. * (Israel) | 194,236 | 0.62 | % | |||
| Total for Common Stocks (Cost $28,425,169) | 29,792,710 | 95.75 | % | ||||
| WARRANTS | |||||||
| 29,761 | Vapotherm, Inc. Warrant | ||||||
| (Expires 2/10/2028; Exercise Price $9.36) * | - | 0.00 | % | ||||
| Total for Warrants (Cost $14,286) | |||||||
| MONEY MARKET FUNDS | |||||||
| 1,349,230 | Federated Hermes Government Obligations Money | ||||||
| Market Fund Class Institutional Shares 5.19% *** | 1,349,230 | 4.34 | % | ||||
| (Cost $1,349,230) | |||||||
| Total Investment Securities | 31,141,940 | 100.09 | % | ||||
| (Cost $29,788,685) | |||||||
| Liabilities in Excess of Other Assets | (28,265 | ) | -0.09 | % | |||
| Net Assets | $ | 31,113,675 | 100.00 | % | |||
| * Non-Income Producing Security. *** The rate shown represents the 7-day yield at May 31, 2024. The accompanying notes are an integral part of these financial statements. |
2024 Semi-Annual Report 5
| Taylor Frigon Core Growth Fund | |||
| Statement of Assets and Liabilities (Unaudited) | |||
| May 31, 2024 | |||
| Assets: | |||
| Investment Securities at Fair Value | $ | 31,141,940 | |
| (Cost $29,788,685) | |||
| Cash | 500 | ||
| Dividends Receivable | 10,336 | ||
| Total Assets | 31,152,776 | ||
| Liabilities: | |||
| Management Fees Payable | 26,966 | ||
| Service Fees Payable | 12,135 | ||
| Total Liabilities | 39,101 | ||
| Net Assets | $ | 31,113,675 | |
| Net Assets Consist of: | |||
| Paid In Capital | $ | 30,369,805 | |
| Total Distributable Earnings/(Accumulated Deficit) | 743,870 | ||
| Net Assets, for 1,805,038 Shares Outstanding | $ | 31,113,675 | |
| (Unlimited shares authorized) | |||
| Net Asset Value and Offering Price Per Share | |||
| ($31,113,675/1,805,038 shares) | $ | 17.24 | |
| Redemption Price * ($17.24 x 0.98) (Note 2) | $ | 16.90 | |
| Statement of Operations (Unaudited) | |||
| For the six month period ended May 31, 2024 | |||
| Investment Income: | |||
| Dividends (Net of Foreign Withholding Taxes of $4,902) | $ | 27,318 | |
| Total Investment Income | 27,318 | ||
| Expenses: | |||
| Management Fees (Note 4) | 156,090 | ||
| Service Fees (Note 4) | 70,240 | ||
| Total Expenses | 226,330 | ||
| Net Investment Income/(Loss) | (199,012 | ) | |
| Net Realized and Unrealized Gain/(Loss) on Investments: | |||
| Net Realized Gain/(Loss) on Investments | 2,358,804 | ||
| Net Change in Unrealized Appreciation/(Depreciation) on Investments | 2,881,494 | ||
| Net Realized and Unrealized Gain/(Loss) on Investments | 5,240,298 | ||
| Net Increase/(Decrease) in Net Assets from Operations | $ | 5,041,286 | |
| * Reflects a 2% redemption fee if shares are redeemed within 90 days or less of purchase. |
| The accompanying notes are an integral part of these financial statements. |
2024 Semi-Annual Report 6
| Taylor Frigon Core Growth Fund | ||||||||
| Statements of Changes in Net Assets | (Unaudited) | |||||||
| 12/1/2023 | 12/1/2022 | |||||||
| to | to | |||||||
| 5/31/2024 | 11/30/2023 | |||||||
| From Operations: | ||||||||
| Net Investment Income/(Loss) | $ | (199,012 | ) | $ | (426,221 | ) | ||
| Net Realized Gain/(Loss) on Investments | 2,358,804 | (1,829,731 | ) | |||||
| Net Change in Unrealized Appreciation/(Depreciation) on Investments | 2,881,494 | 2,144,473 | ||||||
| Net Increase/(Decrease) in Net Assets from Operations | 5,041,286 | (111,479 | ) | |||||
| From Distributions to Shareholders: | - | - | ||||||
| From Capital Share Transactions: | ||||||||
| Proceeds From Sale of Shares | 673,606 | 2,197,602 | ||||||
| Proceeds From Redemption Fees (Note 2) | 902 | 1,676 | ||||||
| Shares Issued on Reinvestment of Dividends | - | - | ||||||
| Cost of Shares Redeemed | (2,551,497 | ) | (7,499,662 | ) | ||||
| Net Increase/(Decrease) from Shareholder Activity | (1,876,989 | ) | (5,300,384 | ) | ||||
| Net Increase/(Decrease) in Net Assets | 3,164,297 | (5,411,863 | ) | |||||
| Net Assets at Beginning of Period | 27,949,378 | 33,361,241 | ||||||
| Net Assets at End of Period | $ | 31,113,675 | $ | 27,949,378 | ||||
| Share Transactions: | ||||||||
| Issued | 38,651 | 147,078 | ||||||
| Reinvested | - | - | ||||||
| Redeemed | (154,368 | ) | (496,048 | ) | ||||
| Net Increase/(Decrease) in Shares | (115,717 | ) | (348,970 | ) | ||||
| Shares Outstanding Beginning of Period | 1,920,755 | 2,269,725 | ||||||
| Shares Outstanding End of Period | 1,805,038 | 1,920,755 | ||||||
| Financial Highlights | (Unaudited) | |||||||||||||||||||||||
| Selected data for a share outstanding | 12/1/2023 | 12/1/2022 | 12/1/2021 | 12/1/2020 | 12/1/2019 | 12/1/2018 | ||||||||||||||||||
| throughout each period: | to | to | to | to | to | to | ||||||||||||||||||
| 5/31/2024 | 11/30/2023 | 11/30/2022 | 11/30/2021 | 11/30/2020 | 11/30/2019 | |||||||||||||||||||
| Net Asset Value - | ||||||||||||||||||||||||
| Beginning of Period | $ | 14.55 | $ | 14.70 | $ | 30.30 | $ | 25.38 | $ | 15.65 | $ | 13.83 | ||||||||||||
| Net Investment Income/(Loss) (a) | (0.11 | ) | (0.20 | ) | (0.25 | ) | (0.40 | ) | (0.25 | ) | (0.18 | ) | ||||||||||||
| Net Gain/(Loss) on Securities (b) | ||||||||||||||||||||||||
| (Realized and Unrealized) | 2.80 | 0.05 | (12.63 | ) | 6.65 | 10.23 | 2.22 | |||||||||||||||||
| Total from Investment Operations | 2.69 | (0.15 | ) | (12.88 | ) | 6.25 | 9.98 | 2.04 | ||||||||||||||||
| Distributions (From Net Investment Income) | - | - | - | - | - | - | ||||||||||||||||||
| Distributions (From Realized Capital Gains) | - | - | (2.72 | ) | (1.34 | ) | (0.26 | ) | (0.22 | ) | ||||||||||||||
| Total Distributions | - | - | (2.72 | ) | (1.34 | ) | (0.26 | ) | (0.22 | ) | ||||||||||||||
| Proceeds from Redemption Fee (Note 2) | - | + | - | + | - | + | 0.01 | 0.01 | - | + | ||||||||||||||
| Net Asset Value - | ||||||||||||||||||||||||
| End of Period | $ | 17.24 | $ | 14.55 | $ | 14.70 | $ | 30.30 | $ | 25.38 | $ | 15.65 | ||||||||||||
| Total Return (c) | 18.49 | % | * | (1.02 | )% | (46.51 | )% | 25.54 | % | 64.93 | % | 15.43 | % | |||||||||||
| Ratios/Supplemental Data | ||||||||||||||||||||||||
| Net Assets - End of Period (Thousands) | $ | 31,114 | $ | 27,949 | $ | 33,361 | $ | 60,856 | $ | 44,432 | $ | 19,639 | ||||||||||||
| Ratio of Expenses to Average Net Assets | 1.45 | % | ** | 1.45 | % | 1.45 | % | 1.45 | % | 1.45 | % | 1.45 | % | |||||||||||
| Ratio of Net Investment Income/(Loss) to | ||||||||||||||||||||||||
| Average Net Assets | (1.28 | )% | ** | (1.36 | )% | (1.37 | )% | (1.34 | )% | (1.34 | )% | (1.27 | )% | |||||||||||
| Portfolio Turnover Rate | 10.60 | % | * | 27.35 | % | 27.53 | % | 17.06 | % | 28.92 | % | 14.73 | % |
| * Not Annualized. ** Annualized. + Less than $0.005. (a) Per share amounts were calculated using the average shares method. (b) Realized and unrealized gains and losses per share in this caption are balancing amounts necessary to reconcile the change in net asset value for the period, and may not reconcile with the aggregate gains and losses in the Statement of Operations due to share transactions for the period. (c) Total return represents the rate that the investor would have earned or lost on an investment in the Fund assuming reinvestment of dividends. Returns do not reflect the deduction of taxes a shareholder would pay on Fund distributions or redemption of Fund shares. |
| The accompanying notes are an integral part of these financial statements. |
2024 Semi-Annual Report 7
NOTES TO THE FINANCIAL STATEMENTS
TAYLOR FRIGON CORE GROWTH FUND
May 31, 2024
(Unaudited)
1.) ORGANIZATION
The Taylor Frigon Core Growth Fund (the “Fund”) was organized as a diversified series of PFS Funds (the “Trust”) on December 7, 2016 and commenced operations on December 27, 2016. The Trust was established under the laws of Massachusetts by an Agreement and Declaration of Trust dated January 13, 2000, which was amended and restated as of January 20, 2011. The Trust is registered as an open-end investment company under the Investment Company Act of 1940, as amended (the “1940 Act”). The Trust may offer an unlimited number of shares of beneficial interest in a number of separate series, each series representing a distinct fund with its own investment objectives and policies. As of May 31, 2024, there were twelve series authorized by the Trust. The Fund’s objective is to seek long-term capital appreciation. The investment adviser to the Fund is Taylor Frigon Capital Management, LLC (the “Adviser”).
2.) SIGNIFICANT ACCOUNTING POLICIES
The Fund is an investment company and accordingly follows the investment company accounting and reporting guidance of the Financial Accounting Standards Board (“FASB”) Accounting Standards Codification Topic 946 Financial Services - Investment Companies. The financial statements are prepared in conformity with accounting principles generally accepted in the United States of America (“GAAP”). The Fund follows the significant accounting policies described in this section.
SECURITY VALUATION
All investments in securities are valued as described in Note 3. The Trust’s Board of Trustees (“Board”) has designated the Adviser as “Valuation Designee” pursuant to Rule 2a-5 under the 1940 Act.
SHARE VALUATION
The net asset value (the “NAV”) is generally calculated as of the close of trading on the New York Stock Exchange (the “Exchange”) (normally 4:00 p.m. Eastern time) every day the Exchange is open. The NAV is calculated by taking the total value of the Fund’s assets, subtracting its liabilities, and then dividing by the total number of shares outstanding, rounded to the nearest cent. The offering price and redemption price per share is equal to the NAV per share, except that shares of the Fund are subject to a redemption fee of 2% if redeemed within 90 days or less of purchase. During the six month period ended May 31, 2024, proceeds from redemption fees were $902.
FEDERAL INCOME TAXES
The Fund’s policy is to continue to comply with the requirements of the Internal Revenue Code that are applicable to regulated investment companies and to distribute all of its taxable income to shareholders. Therefore, no federal income tax provision is required. It is the Fund’s policy to distribute annually, prior to the end of the calendar year, dividends sufficient to satisfy excise tax requirements of the Internal Revenue Code. This Internal Revenue Code requirement may cause an excess of distributions over the book year-end accumulated income. In addition, it is the Fund’s policy to distribute annually, after the end of the fiscal year, any remaining net investment income and net realized capital gains.
The Fund recognizes the tax benefits of certain tax positions only where the position is “more likely than not” to be sustained assuming examination by tax authorities. Management has analyzed the Fund’s tax positions, and has concluded that no liability for unrecognized tax benefits should be recorded related to uncertain tax positions taken on returns filed for open tax years. The Fund identifies its major tax jurisdictions as U.S. Federal and State tax authorities; however, the Fund is not aware of any tax positions for which it is reasonably possible that the total amounts of unrecognized tax benefits will change materially in the next twelve months. The Fund recognizes interest and penalties, if any, related to unrecognized tax benefits as income tax expense in the Statement of Operations. During the six month period ended May 31, 2024, the Fund did not incur any interest or penalties.
DISTRIBUTIONS TO SHAREHOLDERS
Distributions to shareholders, which are determined in accordance with income tax regulations, are recorded on the ex-dividend date.
The treatment for financial reporting purposes of distributions made to shareholders during the year from net investment income or net realized capital gains may differ from their ultimate treatment for federal income tax purposes. The differences between book and tax basis are caused
2024 Semi-Annual Report 8
Notes to the Financial Statements (Unaudited) - continued
primarily by differences in the timing of the recognition of certain components of income, expense, or realized capital gain for federal income tax purposes. Where such differences are permanent in nature, they are reclassified in the components of the net assets based on their ultimate characterization for federal income tax purposes. Any such reclassifications will have no effect on net assets, result of operations, or NAV per share of the Fund.
USE OF ESTIMATES
The financial statements are prepared in accordance with GAAP, which requires management to make estimates and assumptions that affect the reported amounts of assets and liabilities and disclosure of contingent assets and liabilities at the date of the financial statements and the reported amounts of increases and decreases in net assets from operations during the reporting period. Actual results could differ from those estimates.
EXPENSES
Expenses incurred by the Trust that do not relate to a specific fund of the Trust are allocated to the individual funds based on each fund’s relative net assets or another appropriate basis.
OTHER
The Fund records security transactions based on a trade date for financial reporting purposes. Dividend income is recognized on the ex-dividend date, and interest income, if any, is recognized on an accrual basis. The Fund uses the specific identification method in computing gain or loss on the sale of investment securities. Withholding taxes on foreign dividends have been provided for in accordance with the Fund’s understanding of the applicable country’s tax rules and rates.
3.) INVESTMENT SECURITIES VALUATIONS
The Fund utilizes various methods to measure the fair value of its investments on a recurring basis. GAAP establishes a hierarchy that prioritizes inputs to valuation methods. The three levels of inputs are:
Level 1 - Unadjusted quoted prices in active markets for identical assets or liabilities that the Fund has the ability to access.
Level 2 - Observable inputs other than quoted prices in active markets included in level 1 that are observable for the asset or liability, either directly or indirectly. These inputs may include quoted prices for the identical instrument on an inactive market, prices for similar instruments, interest rates, prepayment speeds, credit risk, yield curves, default rates and similar data.
Level 3 - Unobservable inputs for the asset or liability, to the extent relevant observable inputs are not available, representing the Fund’s own assumptions about the assumptions a market participant would use in valuing the asset or liability, and would be based on the best information available.
The availability of observable inputs can vary from security to security and is affected by a wide variety of factors, including, for example, the type of security, whether the security is new and not yet established in the marketplace, the liquidity of markets, and other characteristics particular to the security. To the extent that valuation is based on models or inputs that are less observable or unobservable in the market, the determination of fair value requires more judgment. Accordingly, the degree of judgment exercised in determining fair value is greatest for instruments categorized in level 3.
The inputs used to measure fair value may fall into different levels of the fair value hierarchy. In such cases, for disclosure purposes, the level in the fair value hierarchy within which the fair value measurement falls in its entirety, is determined based on the lowest level input that is significant to the fair value measurement in its entirety.
VALUATION OF FUND ASSETS
A description of the valuation techniques applied to the Fund’s major categories of assets and liabilities measured at fair value on a recurring basis follows.
Equity securities (common stocks, including ADRs). Equity securities generally are valued by using market quotations, but may be valued on the basis of prices furnished by a pricing service when the Valuation Designee believes such prices accurately reflect the fair value of such securities. Securities that are traded on any stock exchange or on the NASDAQ over-the-counter market are generally valued by the pricing service at the last quoted sale price. Lacking a last sale price, an equity security is generally valued by the pricing service at its last bid price. Generally, if the security is traded in an active market and is valued at the last sale price, the security is categorized as a level 1 security, and if an equity security is valued by the pricing service at its last
2024 Semi-Annual Report 9
Notes to the Financial Statements (Unaudited) - continued
bid, it is generally categorized as a level 2 security. When market quotations are not readily available, when the Valuation Designee determines that the market quotation or the price provided by the pricing service does not accurately reflect the current fair value, or when restricted securities are being valued, such securities are valued as determined in good faith by the Valuation Designee, subject to review of the Board, and are categorized in level 2 or level 3, when appropriate.
Money market funds. Money market funds are valued at NAV provided by the underlying fund and are classified in level 1 of the fair value hierarchy.
In accordance with the Trust’s good faith pricing guidelines, the Valuation Designee is required to consider all appropriate factors relevant to the value of securities for which it has determined other pricing sources are not available or reliable as described above. There is no standard procedure for determining fair value, since fair value depends upon the circumstances of each individual case. As a general principle, the current fair value of an issue of securities being valued by the Valuation Designee would appear to be the amount which the owner might reasonably expect to receive for them upon their current sale. Methods which are in accordance with this principle may, for example, be based on (i) a multiple of earnings; (ii) a discount from market of a similar freely traded security (including a derivative security or a basket of securities traded on other markets, exchanges or among dealers); or (iii) yield to maturity with respect to debt issues, or a combination of these and other methods. The Board maintains responsibilities for the fair value determinations under Rule 2a-5 under the 1940 Act and oversees the Valuation Designee.
The following table summarizes the inputs used to value the Fund’s assets measured at fair value as of May 31, 2024:
| Valuation Inputs of Assets | Level 1 | Level 2 | Level 3 | Total | |
| Common Stocks | $29,792,710 | $– | $– | $29,792,710 | |
| Warrants | – | – | – | – | |
| Money Market Funds | 1,349,230 | – | – | 1,349,230 | |
| Total | $31,141,940 | $– | $– | $31,141,940 |
The Fund did not hold any Level 3 assets during the six month period ended May 31, 2024.
The Fund did not invest in derivative instruments during the six month period ended May 31, 2024.
4.) INVESTMENT ADVISORY AGREEMENT
The Fund has entered into an investment advisory agreement (“Management Agreement”) with the Adviser. The Adviser manages the investment portfolio of the Fund, subject to policies adopted by the Trust’s Board of Trustees. Under the Management Agreement, the Adviser, at its own expense and without reimbursement from the Trust, furnishes office space and all necessary office facilities, equipment, and executive personnel necessary for managing the Fund and pays the operating expenses of the Fund excluding management fees, brokerage fees and commissions, taxes, borrowing costs (such as (a) interest and (b) dividend expenses on securities sold short), ADR fees, fees and expenses of acquired funds, fees pursuant to Rule 12b-1 distribution plans, and extraordinary or non-recurring expenses. For its services, the Adviser receives an investment management fee equal to 1.00% of the average daily net assets of the Fund.
As a result of the above calculation, for the six month period ended May 31, 2024, the Adviser earned management fees totaling $156,090. At May 31, 2024, the Fund owed the Adviser management fees of $26,966.
Additionally, the Fund has a Services Agreement with the Adviser (the “Services Agreement”). Under the Services Agreement the Adviser receives an additional fee of 0.45% of the average daily net assets up to $100 million, and 0.25% of such assets in excess of $100 million and is obligated to pay the operating expenses of the Fund excluding management fees, brokerage fees and commissions, 12b-1 fees (if any), taxes, borrowing costs (such as (a) interest and (b) dividend expenses on securities sold short), ADR fees, the cost of acquired funds and extraordinary expenses.
For the six month period ended May 31, 2024, the Adviser earned services fees of $70,240. At May 31, 2024, the Fund owed the Adviser services fees of $12,135.
5.) RELATED PARTY TRANSACTIONS
Certain officers and a Trustee of the Trust are also officers of Premier Fund Solutions, Inc. (the “Administrator”). These individuals receive benefits from the Administrator resulting from administration fees paid to the Administrator of the Fund by the Adviser.
2024 Semi-Annual Report 10
Notes to the Financial Statements (Unaudited) - continued
The Trustees who are not interested persons of the Fund were each paid $750, for a total of $3,000, in Trustees’ fees for the six month period ended May 31, 2024. These fees were paid by the Adviser.
6.) PURCHASES AND SALES OF SECURITIES
For the six month period ended May 31, 2024, purchases and sales of investment securities other than short-term investments and U.S. Government obligations aggregated $3,144,759 and $6,048,178, respectively.
7.) CONTROL OWNERSHIP
The beneficial ownership, either directly or indirectly, of more than 25% of the voting securities of a fund creates a presumption of control of that fund, under Section 2(a)(9) of the 1940 Act. As of May 31, 2024, Charles Schwab & Co., Inc. (“Schwab”), for the benefit of its customers, held, in aggregate, 93.25% of the shares in the Fund. The Trust does not know whether any underlying accounts held at Schwab, owned or controlled 25% or more of the voting securities of the Fund.
8.) TAX MATTERS
For Federal income tax purposes, the cost of securities owned at May 31, 2024 was $29,788,685. At May 31, 2024, the composition of unrealized appreciation (the excess of value over tax cost) and depreciation (the excess of tax cost over value) on a tax basis was as follows:
| Appreciation | (Depreciation) | Net Appreciation/(Depreciation) | |||
| $11,102,798 | ($9,749,543) | $1,353,255 |
The tax character of distributions was as follows:
| Six Months Ended | Fiscal Year Ended | |
| May 31, 2024 | November 30, 2023 | |
| Ordinary Income | $ – | $ – |
| Long-term Capital Gain | – | – |
| $ – | $ – |
9.) CONCENTRATION OF SECTOR RISK
If a Fund has significant investments in the securities of issuers in industries within a particular sector, any development affecting that sector will have a greater impact on the value of the net assets of the Fund than would be the case if the Fund did not have significant investments in that sector. In addition, this may increase the risk of loss of an investment in the Fund and increase the volatility of the Fund’s NAV per share. From time to time, circumstances may affect a particular sector and the companies within such sector. For instance, economic or market factors, regulation or deregulation, and technological or other developments may negatively impact all companies in a particular sector and therefore the value of a Fund’s portfolio will be adversely affected. As of May 31, 2024, the Fund had 53.10% of the value of its net assets invested in stocks within the Information Technology sector.
10.) SUBSEQUENT EVENTS
Subsequent events after the date of the Statement of Assets and Liabilities have been evaluated through the date the financial statements were issued. Management has concluded that there are no items requiring adjustment to or disclosure in the financial statements.
2024 Semi-Annual Report 11
ADDITIONAL INFORMATION
May 31, 2024
(Unaudited)
1.) APPROVAL OF CONTINUATION OF MANAGEMENT AGREEMENT FOR THE TAYLOR FRIGON CORE GROWTH FUND
On December 7, 2023, the Board of Trustees (the “Board” or the “Trustees”) considered the renewal of the Management Agreement (the “Agreement”) between Taylor Frigon Capital Management, LLC (“TFCM”) and the Trust with respect to the Taylor Frigon Core Growth Fund (the “Fund”). In approving the Agreement, the Board of Trustees considered and evaluated the following factors: (i) the nature, extent and quality of the services provided by TFCM to the Fund; (ii) the investment performance of the Fund and TFCM; (iii) the cost of the services to be provided and the profits to be realized by TFCM from the relationship with the Fund; (iv) the extent to which economies of scale will be realized as the Fund grows and whether the fee levels reflect these economies of scale to the benefit of shareholders; and (v) TFCM’s practices regarding possible conflicts of interest and other benefits to be realized by TFCM.
In assessing these factors and reaching its decisions, the Board took into consideration information furnished for the Board’s review and consideration throughout the year at regular Board meetings, as well as information specifically prepared and/or presented in connection with the annual renewal process, including information presented at the Meeting by a representative of TFCM. The Board requested and was provided with information and reports relevant to the annual renewal of the Agreement, including: (i) information regarding the services and support provided to the Fund and its shareholders by TFCM; (ii) assessments of the investment performance of the Fund by TFCM; (iii) commentary on the reasons for the performance; (iv) presentations addressing TFCM’s investment philosophy, investment strategy, personnel and operations; (v) compliance and audit related information concerning the Fund and TFCM; (vi) disclosure information contained in the registration statement of the Trust and the Form ADV of TFCM; and (vii) a memorandum from Counsel that summarized the fiduciary duties and responsibilities of the Board in reviewing and approving the continuation of the Agreement, including the material factors set forth above and the types of information included in each factor that should be considered by the Board in order to make an informed decision. The Board also requested and received various materials including, without limitation: (i) documents containing information about TFCM, including financial information, a description of personnel and the services provided to the Fund, information on investment advice, performance, summaries of fund expenses, compliance program, current legal matters, and other general information; (ii) comparative expense and performance information for other mutual funds with strategies similar to the Fund; (iii) the anticipated effect of size on the Fund’s performance and expenses; and (iv) benefits to be realized by TFCM from its relationship with the Fund. The Board did not identify any particular information that was most relevant to its consideration to approve the Agreement and each Trustee may have afforded different weight to the various factors.
1. Nature, Extent and Quality of the Services Provided by TFCM
In considering the nature, extent, and quality of the services provided by TFCM, the Trustees reviewed the responsibilities of TFCM under the Agreement. The Trustees reviewed the services being provided by TFCM including, without limitation: the quality of investment advisory services (including research and recommendations with respect to portfolio securities); the process for formulating investment recommendations and assuring compliance with the Fund’s investment objective, strategies, and limitations, as well as for ensuring compliance with regulatory requirements. The Trustees considered the coordination of services for the Fund among TFCM and the service providers and the Independent Trustees; and the efforts of TFCM to promote the Fund and grow assets. The Trustees discussed the quality of TFCM’s principals and the commitment to grow the firm’s business. The Trustees evaluated TFCM’s management team, including their education and experience. After reviewing the foregoing information and further information in the materials provided by TFCM, the Board concluded that the nature, extent, and quality of the services provided by TFCM was satisfactory and adequate for the Fund.
2. Investment Performance of the Fund and TFCM
In considering the investment performance of the Fund and TFCM, the Trustees compared the performance of the Fund with the performance of the S&P Mid Cap 400®Index, the Fund’s primary benchmark (the “Benchmark”) and to the funds included in Morningstar’s Small Growth Category, the category in which Morningstar has placed the Fund (the “Category”). The Trustees also compared the Fund’s performance to a sub- set of the Category that included funds with asset levels ranging from $10 million to $85 million (the “Peer Group”). The Trustees noted that for the 1-, 3- and 5-year periods period ended September 30, 2023, the Fund underperformed compared to the Benchmark, and the Category and the Peer Group averages. They compared the Fund’s performance to the separate accounts managed by TFCM with a similar strategy, noting that the performance was comparable. After reviewing all the relevant information, the Board
2024 Semi-Annual Report 12
Additional Information (Unaudited) - continued
concluded that the investment performance of the Fund and TFCM was satisfactory, but noted that it would continue to monitor the Fund’s performance.
3. Costs of the Services to be provided and profits to be realized by TFCM
In considering the costs of the services to be provided and profits to be realized by TFCM from its relationship with the Fund, the Trustees considered: (1) TFCM’s financial condition and the level of commitment to the Fund and TFCM by its principals; (2) the asset level of the Fund; (3) the overall expenses of the Fund; and (4) the nature and frequency of advisory fee payments. The Trustees considered the information provided by TFCM demonstrating that it is currently in a net profit as it relates to its overall services to the Fund. They noted that TFCM has confirmed its commitment to growing the Fund and has demonstrated its commitment by seeking assistance from the other service providers on ways to improve awareness of the Fund. The Trustees also considered potential benefits for TFCM in managing the Fund, noting the public performance record. The Trustees then compared the fees and expenses of the Fund (including the management fee) to other comparable mutual funds. It was noted that the Fund’s management fee was higher than the average management fee for the Category and Peer Group. The Trustees then compared the Fund’s expense ratio (as reported in the Fund’s prospectus) to the Category and Peer Group averages, noting that the Fund’s expense ratio was higher than both the Category and Peer Group averages. The Trustees discussed the management fees charged by TFCM to its separately managed accounts, noting that the fee structures are the same. The Trustees recognized that under the Agreement and services agreement with the Fund, TFCM is capping the Fund’s total operating expenses at 1.45% per annum. They reviewed the fees and expenses of the Fund being paid by TFCM pursuant to the services agreement. The Trustees noted that, overall (management fees plus service fees), the Fund is profitable to TFCM. Based on the foregoing, the Board concluded that the fees to be paid to TFCM were fair and reasonable in relation to the nature and quality of the services provided by TFCM.
4. Economies of Scale
The Trustees next considered the impact of economies of scale on the Fund’s size and whether advisory fee levels reflect those economies of scale for the benefit of the Fund’s investors. The Trustees considered that while the management fee remained the same at all asset levels, the Fund’s shareholders had experienced benefits from the fact that TFCM was obligated under a services agreement to pay certain of the Fund’s operating expenses, which had the effect of limiting the overall fees paid by the Fund. It was noted that TFCM has agreed to continue the services agreement for another year, which results in the Fund’s expenses being capped at no greater than 1.45% per annum. In light of its ongoing consideration of the Fund’s asset levels, expectations for growth in the Fund, and fee levels, the Board determined that the Fund’s fee arrangements, were fair and reasonable in relation to the nature and quality of the services provided by TFCM.
5. Possible conflicts of interest and benefits to TFCM
In considering TFCM’s practices regarding conflicts of interest, the Trustees evaluated the potential for conflicts of interest and considered such matters as the experience and ability of the principals of TFCM; the basis of decisions to buy or sell securities for the Fund; and the substance and administration of TFCM’s code of ethics. The Trustees also considered disclosure in the registration statement of the Trust related to TFCM’s potential conflicts of interest. Based on the foregoing, the Board determined that TFCM’s standards and practices relating to the identification and mitigation of possible conflicts of interest were satisfactory. The Board considered the fee assessment practices of TFCM with respect to separate account clients that invest in the Fund, noting that their clients only pay one management fee to TFCM. TFCM noted that it may experience certain cost savings by having the Fund within the Trust, which is made up of other series in which it may share certain expenses. Based on the foregoing, the Board concluded that the practices of TFCM with respect to possible conflicts of interest were acceptable.
The Board then reflected on its discussion with a representative of TFCM earlier in the Meeting. Next, the Independent Trustees and Counsel met in executive session to discuss the continuation of the Agreement. The officers of the Trust and others present at the Meeting were excused during this discussion.
After further review and discussion, the Board determined that the best interests of the Fund’s shareholders were served by the renewal of the Agreement.
2.) LIQUIDITY RISK MANAGEMENT PROGRAM
During the six month period ended May 31, 2024, the Board reviewed the Fund’s liquidity risk management program, adopted pursuant to Rule 22e-4 under the Investment Company Act. The program is overseen by the Adviser, who has delegated certain responsibilities for managing the
2024 Semi-Annual Report 13
Additional Information (Unaudited) - continued
program to a liquidity program administrator (the “LPA”). The LPA reported that it had assessed, managed and reviewed the program for the Fund taking into consideration several factors including the liquidity of the Fund’s portfolio investments and the market, trading or investment specific considerations that may reasonably affect a security’s classification as a liquid investment. The LPA certified that the program was adequate, effectively implemented and needed no changes at that time.
2024 Semi-Annual Report 14
Investment Adviser
|
| This report is provided for the general information of the shareholders of the Taylor Frigon Core Growth Fund. This report is not intended for distribution to prospective investors in the Fund, unless preceded or accompanied by an effective prospectus. |
| Taylor Frigon Core Growth Fund www.taylorfrigonfunds.com 1-888-897-4821 |
(b) Not applicable.
Item 2. Code of Ethics. Not applicable.
Item 3. Audit Committee Financial Expert. Not applicable.
Item 4. Principal Accountant Fees and Services. Not applicable.
Item 5. Audit Committee of Listed Companies. Not applicable.
Item 6. Investments.
(a) Not applicable. Schedule filed with Item 1.
(b) Not applicable.
Item 7. Disclosure of Proxy Voting Policies and Procedures for Closed-End Management Investment Companies. Not applicable.
Item 8. Portfolio Managers of Closed End Management Investment Companies. Not applicable.
Item 9. Purchases of Equity Securities by Closed-End Management Investment Companies and Affiliated Purchasers. Not applicable.
Item 10. Submission of Matters to a Vote of Security Holders.
The registrant has not adopted procedures by which shareholders may recommend nominees to the registrant’s board of trustees.
Item 11. Controls and Procedures.
(a) The Registrant’s president and chief financial officer concluded that the disclosure controls and procedures (as defined in Rule 30a-3(c) under the Act (17 CFR 270.30a -3(c))) as of a date within 90 days of the filing date of the report that includes the disclosure required by this paragraph, based on the evaluation of these controls and procedures required by Rule 30a-3(b) under the Act (17 CFR 270.30a -3(b)) and Rules 13a-15(b) or 15d-15(b) under the Exchange Act (17 CFR 240.13a -15(b) or 240.15d -15(b)).
(b) There were no changes in the registrant’s internal control over financial reporting (as defined in Rule 30a-3(d) under the Act (17 CFR 270.30a -3(d)) that occurred during the period covered by this report that has materially affected, or is reasonably likely to materially affect, the registrant’s internal control over financial reporting.
Item 12. Disclosure of Securities Lending Activities for Closed-End Management Investment Companies.
Not applicable.
Item 13. Exhibits.
(a)(1) Code of Ethics. Not applicable.
(a)(2) Certifications pursuant to Section 302 of the Sarbanes-Oxley Act of 2002. Filed herewith.
(a)(3) Not applicable.
(a)(4) Not applicable.
(b) Certification pursuant to Section 906 of the Sarbanes-Oxley Act of 2002. Filed herewith.
| SIGNATURES |
Pursuant to the requirements of the Securities Exchange Act of 1934 and the Investment Company Act of 1940, the registrant has duly caused this report to be signed on its behalf by the undersigned, thereunto duly authorized.
| PFS Funds |
| By: /s/James Craft James Craft President |
| Date: 7/19/2024 |
Pursuant to the requirements of the Securities Exchange Act of 1934 and the Investment Company Act of 1940, this report has been signed below by the following persons on behalf of the registrant and in the capacities and on the dates indicated.
| By: /s/James Craft James Craft President |
| Date: 7/19/2024 |
By: /s/Jeffrey R. Provence |
| Date: 7/19/2024 |