UNITED STATES
SECURITIES AND EXCHANGE COMMISSION
Washington, D.C. 20549
FORM N-CSR
CERTIFIED SHAREHOLDER REPORT OF REGISTERED
MANAGEMENT INVESTMENT COMPANIES
Investment Company Act file number | 811-09815 | |||||||
| ||||||||
THE ARBITRAGE FUNDS | ||||||||
(Exact name of registrant as specified in charter) | ||||||||
| ||||||||
41 Madison Avenue, 42nd Floor, New York, |
| NY 10010 | ||||||
(Address of principal executive offices) |
| (Zip code) | ||||||
| ||||||||
John S. Orrico Water Island Capital, LLC 41 Madison Avenue 42nd Floor New York, NY 10010 | ||||||||
(Name and address of agent for service) | ||||||||
| ||||||||
Registrant’s telephone number, including area code: | 800-295-4485 |
| ||||||
| ||||||||
Date of fiscal year end: | May 31 |
| ||||||
| ||||||||
Date of reporting period: | November 30, 2019 |
| ||||||
Item 1. Reports to Stockholders.

Semi-Annual Report
November 30, 2019
Arbitrage Fund
Water Island Diversified Event-Driven Fund
Water Island Credit Opportunities Fund
Water Island Long/Short Fund
Paper copies of The Arbitrage Funds' shareholder reports will no longer be sent by mail, unless you specifically request paper copies of the reports from The Arbitrage Funds or from your financial intermediary, such as a broker — dealer or bank. Instead, the reports will be made available on a website (https://artbitragefunds.com/restricted/content/downloads.html) and you will be notified by mail each time a report is posted and provided with a website link to access the report.
If you have already elected to receive your shareholder reports electronically, you will not be affected by this change and you need not take any action. You may elect to receive shareholder reports and other communications from The Arbitrage Funds electronically by sending a request in writing to: Arbitrage Funds, PO Box 219842, Kansas City MO 64121-9842 or by calling 1-800-295-4485.
You may also elect to receive all future reports in paper free of charge. You can inform The Arbitrage Funds [or your financial intermediary] that you wish to continue receiving paper copies of your shareholder reports by sending a request in writing to: Arbitrage Funds, PO Box 219842, Kansas City MO 64121-9842 or by calling 1-800-295-4485. Your election to receive reports in paper will apply to all Arbitrage Funds you hold directly in an account with The Arbitrage Funds. You must provide separate instructions to each of your financial intermediaries.

TABLE OF CONTENTS
Arbitrage Fund | |||||||
Portfolio Information | 1 | ||||||
Portfolio of Investments | 3 | ||||||
Water Island Diversified Event-Driven Fund | |||||||
Portfolio Information | 14 | ||||||
Portfolio of Investments | 16 | ||||||
Water Island Credit Opportunities Fund | |||||||
Portfolio Information | 27 | ||||||
Portfolio of Investments | 29 | ||||||
Water Island Long/Short Fund | |||||||
Portfolio Information | 36 | ||||||
Portfolio of Investments | 38 | ||||||
Statements of Assets and Liabilities | 46 | ||||||
Statements of Operations | 50 | ||||||
Statements of Changes in Net Assets | 54 | ||||||
Financial Highlights | |||||||
Arbitrage Fund - Class R | 58 | ||||||
Arbitrage Fund - Class I | 60 | ||||||
Arbitrage Fund - Class C | 62 | ||||||
Arbitrage Fund - Class A | 64 | ||||||
Water Island Diversified Event-Driven Fund - Class R | 66 | ||||||
Water Island Diversified Event-Driven Fund - Class I | 68 | ||||||
Water Island Diversified Event-Driven Fund - Class C | 70 | ||||||
Water Island Diversified Event-Driven Fund - Class A | 72 | ||||||
Water Island Credit Opportunities Fund - Class R | 74 | ||||||
Water Island Credit Opportunities Fund - Class I | 76 | ||||||
Water Island Credit Opportunities Fund - Class C | 78 | ||||||
Water Island Credit Opportunities Fund - Class A | 80 | ||||||
Water Island Long/Short Fund - Class R | 82 | ||||||
Water Island Long/Short Fund - Class I | 84 | ||||||
Notes to Financial Statements | 86 | ||||||
Disclosure of Fund Expenses | 113 | ||||||
Additional Information | 116 | ||||||
Arbitrage Fund Portfolio Information
November 30, 2019 (Unaudited)
Performance (annualized returns as of November 30, 2019)
| One Year | Five Year | Ten Year | Since Inception* | ||||||||||||||||
Arbitrage Fund, Class R | 3.77 | % | 2.56 | % | 2.11 | % | 3.95 | % | |||||||||||
Arbitrage Fund, Class I | 4.01 | % | 2.78 | % | 2.36 | % | 3.03 | % | |||||||||||
Arbitrage Fund, Class C** | 3.00 | % | 1.78 | % | N/A | 1.23 | % | ||||||||||||
Arbitrage Fund, Class A*** | 3.74 | % | 2.53 | % | N/A | 2.22 | % | ||||||||||||
| ICE BofA Merrill Lynch U.S. 3-Month Treasury Bill Index**** | 2.32 | % | 1.05 | % | 0.57 | % | 1.62 | % | |||||||||||
S&P 500® Index | 16.11 | % | 10.98 | % | 13.44 | % | 6.12 | % | |||||||||||
Current performance may be higher or lower than performance quoted above. Any performance data quoted represents past performance and the investment return and principal value of an investment in the Fund will fluctuate so that an investor's shares, when redeemed, may be worth more or less than their original cost. Past performance is no guarantee of future results. Returns shown above include the reinvestment of all dividends and capital gains. Performance results do not include adjustments made for financial reporting purposes in accordance with U.S. generally accepted accounting principles and may differ from the amount reported in the Financial Highlights. You can obtain performance data current to the most recent month end by calling 1-800-295-4485 or going to www.arbitragefunds.com.
* Class R inception: 9/18/00; Class I inception: 10/17/03; Class C inception: 6/1/12; Class A inception: 6/1/13. The "Since Inception" returns for securities indices are for the inception date of Class R shares.
** Class C shares are subject to a 1.00% contingent deferred sales charge on all purchases redeemed within 12 months of purchase.
*** Class A shares are subject to a maximum front-end sales load of 2.50% on purchases up to $250,000. The shares are also subject to a deferred sales charge of up to 1.00% on purchases of $250,000 or more purchased without a front-end sales charge and redeemed within 18 months of purchase.
**** Merger arbitrage and event-driven investing are market neutral investment strategies, which typically exhibit low betas and low correlations to broad equity and credit market indices. As such, the adviser has determined that a more appropriate benchmark for Arbitrage Fund is a measure of the risk-free rate, in this case the ICE Bank of America (BofA) Merrill Lynch U.S. 3-Month Treasury Bill Index.
The Total Annual Fund Operating Expenses for Class R, Class I, Class C and Class A are 1.99%, 1.74%, 2.74% and 1.99%, respectively. These expense ratios are as stated in the current prospectus and may differ from the expense ratios disclosed in the financial highlights in this report.
The ICE BofA Merrill Lynch U.S. 3-Month Treasury Bill Index tracks the performance of the U.S. dollar denominated U.S. Treasury Bills publicly issued in the U.S. domestic market with a remaining term to final maturity of less than 3 months.
The S&P 500® Index is an unmanaged index consisting of 500 stocks.
An investor may not invest directly in an index.
Semi-Annual Report | November 30, 2019
1
Arbitrage Fund Portfolio Information (continued)
November 30, 2019 (Unaudited)
Growth of $10,000 Investment
The chart represents historical performance of a hypothetical investment of $10,000 in the Class R shares of the Fund. Past performance does not guarantee future results. This chart does not reflect the deduction of taxes that a shareholder would pay on Fund distributions or the redemption of Fund shares.

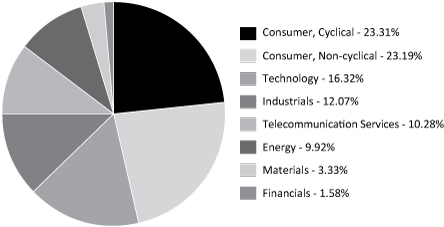
Sector Weighting
The following chart shows the sector weightings of the Arbitrage Fund's investments (including short sales and excluding derivatives) as of the report date.
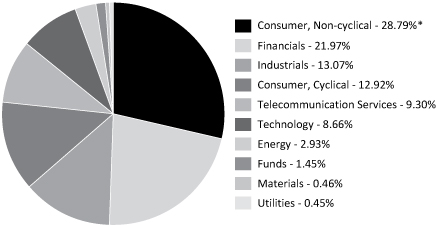
* Concentration Risk: The Fund may invest a large proportion of the Fund's assets in securities of issuers in a single sector over a given time. During such a period of concentration, the Fund may be subject to greater volatility with respect to its portfolio securities than a fund that is more broadly diversified.
www.arbitragefunds.com | 1-800-295-4485
2
Arbitrage Fund Portfolio of Investments
November 30, 2019 (Unaudited)
Shares | Value | ||||||||||
COMMON STOCKS - 83.60% | |||||||||||
Aerospace & Defense - 1.21% | |||||||||||
Cobham Plc | 9,810,885 | $ | 20,073,849 | ||||||||
Apparel - 0.11% | |||||||||||
Perry Ellis International, Inc.(a)(b) | 828,485 | 1,781,243 | |||||||||
Auto Parts & Equipment - 3.09% | |||||||||||
WABCO Holdings, Inc.(a)(c) | 381,948 | 51,467,493 | |||||||||
Banks - 8.67% | |||||||||||
IBERIABANK Corp.(c) | 22,733 | 1,659,282 | |||||||||
SunTrust Banks, Inc. | 1,883,538 | 133,429,832 | |||||||||
WesBanco, Inc. | 253,055 | 9,231,428 | |||||||||
144,320,542 | |||||||||||
Biotechnology - 2.71% | |||||||||||
Cambrex Corp.(a)(c) | 174,764 | 10,480,597 | |||||||||
Medicines Co.(a) | 246,201 | 20,730,124 | |||||||||
Pacific Biosciences of California, Inc.(a)(c) | 2,709,726 | 13,927,992 | |||||||||
45,138,713 | |||||||||||
Chemicals - 0.49% | |||||||||||
Innophos Holdings, Inc.(c) | 256,177 | 8,172,046 | |||||||||
Commercial Services - 1.05% | |||||||||||
Cramo Oyj | 163,874 | 2,412,015 | |||||||||
Nord Anglia Education, Inc.(a)(b) | 200,078 | 960,374 | |||||||||
Sotheby's(a)(b) | 247,097 | 14,084,529 | |||||||||
17,456,918 | |||||||||||
Computers & Computer Services - 2.34% | |||||||||||
Carbonite, Inc.(a)(c) | 927,022 | 21,321,506 | |||||||||
Presidio, Inc. | 347,107 | 5,730,737 | |||||||||
Sophos Group Plc(d) | 1,624,124 | 11,868,167 | |||||||||
38,920,410 | |||||||||||
Construction Materials - 0.71% | |||||||||||
Continental Building Products, Inc.(a)(c) | 322,390 | 11,860,728 | |||||||||
Distribution/Wholesale - 0.73% | |||||||||||
Anixter International, Inc.(a)(c) | 140,802 | 12,086,444 | |||||||||
Diversified Financial Services - 1.28% | |||||||||||
Aircastle Ltd.(c) | 615,276 | 19,682,679 | |||||||||
Bolsas y Mercados Espanoles SHMSF SA | 42,709 | 1,671,305 | |||||||||
21,353,984 | |||||||||||
See Notes to Financial Statements.
Semi-Annual Report | November 30, 2019
3
Arbitrage Fund Portfolio of Investments (continued)
November 30, 2019 (Unaudited)
Shares | Value | ||||||||||
COMMON STOCKS - 83.60% (Continued) | |||||||||||
Electronics - 1.26% | |||||||||||
Fitbit, Inc., Class A(a)(c) | 670,508 | $ | 4,666,736 | ||||||||
Tech Data Corp.(a)(c) | 112,613 | 16,316,497 | |||||||||
20,983,233 | |||||||||||
Energy - Alternate Sources - 0.61% | |||||||||||
Pattern Energy Group, Inc., Class A(c) | 370,681 | 10,201,141 | |||||||||
Engineering & Construction - 0.74% | |||||||||||
Altran Technologies SA | 368,120 | 5,746,755 | |||||||||
Koninklijke Volkerwessels NV | 273,026 | 6,602,401 | |||||||||
12,349,156 | |||||||||||
Entertainment - 4.64% | |||||||||||
Entertainment One Ltd. | 4,707,306 | 33,850,356 | |||||||||
International Speedway Corp., Class A(a)(b) | 792,042 | 35,641,893 | |||||||||
Stars Group, Inc.(a)(c) | 321,096 | 7,799,422 | |||||||||
77,291,671 | |||||||||||
Environmental Control - 5.25% | |||||||||||
Advanced Disposal Services, Inc.(a)(c) | 2,653,628 | 87,437,043 | |||||||||
Food - 1.57% | |||||||||||
Pioneer Foods Group Ltd. | 3,557,869 | 26,153,663 | |||||||||
Gas - 0.48% | |||||||||||
AltaGas Canada, Inc. | 316,774 | 7,977,182 | |||||||||
Healthcare - Products - 1.15% | |||||||||||
Consort Medical Plc | 123,325 | 1,666,800 | |||||||||
Wright Medical Group NV(a)(c) | 586,147 | 17,449,596 | |||||||||
19,116,396 | |||||||||||
Healthcare - Services - 10.23% | |||||||||||
WellCare Health Plans, Inc.(a)(c) | 528,636 | 170,257,797 | |||||||||
Home Builders - 0.40% | |||||||||||
William Lyon Homes, Class A(a)(c) | 315,274 | 6,582,921 | |||||||||
Insurance - 0.28% | |||||||||||
TOWER Ltd.(a) | 9,485,696 | 4,626,818 | |||||||||
Internet - 2.36% | |||||||||||
Shutterfly, Inc.(a)(b) | 769,876 | 39,263,676 | |||||||||
Lodging - 1.05% | |||||||||||
Caesars Entertainment Corp.(a)(c) | 1,344,156 | 17,527,794 | |||||||||
Media - 2.63% | |||||||||||
Axel Springer SE(a) | 637,092 | 43,867,772 | |||||||||
See Notes to Financial Statements.
www.arbitragefunds.com | 1-800-295-4485
4
Arbitrage Fund Portfolio of Investments (continued)
November 30, 2019 (Unaudited)
Shares | Value | ||||||||||
COMMON STOCKS - 83.60% (Continued) | |||||||||||
Miscellaneous Manufacturing - 0.52% | |||||||||||
Hillenbrand, Inc. | 272,603 | $ | 8,619,694 | ||||||||
Oil & Gas - 0.41% | |||||||||||
Eland Oil & Gas Plc | 3,247,050 | 6,878,898 | |||||||||
Pharmaceuticals - 5.33% | |||||||||||
Allergan Plc(c) | 279,886 | 51,762,117 | |||||||||
Bristol-Myers Squibb Co. | 650,993 | 37,067,541 | |||||||||
88,829,658 | |||||||||||
Pipelines - 1.23% | |||||||||||
SemGroup Corp., Class A | 1,334,452 | 20,510,527 | |||||||||
Real Estate - 0.26% | |||||||||||
Hembla AB, Class B(a) | 193,067 | 4,323,682 | |||||||||
Real Estate Investment Trusts - 2.17% | |||||||||||
Liberty Property Trust(c) | 585,383 | 36,071,300 | |||||||||
Retail - 2.99% | |||||||||||
EI Group Plc(a) | 3,910,019 | 14,250,689 | |||||||||
GrandVision NV(d) | 167,972 | 5,089,006 | |||||||||
Tiffany & Co. | 206,354 | 27,610,165 | |||||||||
Vitamin Shoppe, Inc.(a) | 441,328 | 2,859,806 | |||||||||
49,809,666 | |||||||||||
Semiconductors - 3.30% | |||||||||||
Mellanox Technologies Ltd.(a)(c)(e) | 478,777 | 55,011,477 | |||||||||
Software - 3.63% | |||||||||||
Cision Ltd.(a)(c) | 1,052,610 | 10,462,943 | |||||||||
InterXion Holding NV(a)(c) | 110,469 | 9,394,284 | |||||||||
MINDBODY, Inc., Class A(a)(b) | 843,793 | 30,798,445 | |||||||||
Onemarket Ltd.(a) | 111,800 | 73,353 | |||||||||
Pivotal Software, Inc., Class A(a)(c) | 644,502 | 9,680,420 | |||||||||
60,409,445 | |||||||||||
Telecommunications - 4.95% | |||||||||||
Inmarsat Plc | 1,305,059 | 9,168,661 | |||||||||
Zayo Group Holdings, Inc.(a)(c)(e) | 2,140,520 | 73,291,405 | |||||||||
82,460,066 | |||||||||||
Transportation - 3.77% | |||||||||||
Genesee & Wyoming, Inc., Class A(a) | 563,758 | 62,830,829 | |||||||||
| TOTAL COMMON STOCKS (Cost $1,346,075,624) | 1,392,023,875 | ||||||||||
See Notes to Financial Statements.
Semi-Annual Report | November 30, 2019
5
Arbitrage Fund Portfolio of Investments (continued)
November 30, 2019 (Unaudited)
Shares | Value | ||||||||||
LIMITED PARTNERSHIPS - 0.02% | |||||||||||
Pipelines - 0.02% | |||||||||||
Energy Transfer Equity LP | 30,829 | $ | 364,090 | ||||||||
| TOTAL LIMITED PARTNERSHIPS (Cost $364,016) | 364,090 | ||||||||||
RIGHTS - 0.15% | |||||||||||
A Schulman, Inc. CVR(b) | 173,468 | 164,309 | |||||||||
Bristol-Myers Squibb Co. | 650,993 | 1,399,635 | |||||||||
Corium International, Inc. CVR(b) | 920,694 | 182,390 | |||||||||
Elanco Animal Health, Inc. CVR(b) | 1,124,589 | — | |||||||||
Media General, Inc. CVR(b) | 613,589 | — | |||||||||
NewStar Financial, Inc. CVR(b) | 1,514,945 | 801,254 | |||||||||
| TOTAL RIGHTS (Cost $2,021,549) | 2,547,588 | ||||||||||
| Maturity Date | Rate | Principal Amount | Value | ||||||||||||||||
CORPORATE BONDS - 0.78% | |||||||||||||||||||
Pipelines - 0.78% | |||||||||||||||||||
| SemGroup Corp. / Rose Rock Finance Corp. | 11/15/2023 | 5.625 | % | $ | 12,713,000 | $ | 13,030,825 | ||||||||||||
| TOTAL CORPORATE BONDS (Cost $13,088,530) | 13,030,825 | ||||||||||||||||||
Shares | Value | ||||||||||
MUTUAL FUNDS - 1.55% | |||||||||||
Water Island Diversified Event-Driven Fund, Class I(f) | 2,657,765 | $ | 25,780,318 | ||||||||
| TOTAL MUTUAL FUNDS (Cost $25,340,129) | 25,780,318 | ||||||||||
| Expiration Date | Exercise Price | Notional Amount | Contracts | Value | |||||||||||||||||||
PURCHASED OPTIONS(a) - 0.00%(g) | |||||||||||||||||||||||
Put Options Purchased - 0.00%(g) | |||||||||||||||||||||||
| Mellanox Technologies, Ltd. | 12/2019 | $ | 100.00 | $ | 18,475,920 | 1,608 | $ | 36,180 | |||||||||||||||
12/2019 | 105.00 | 8,422,170 | 733 | 16,493 | |||||||||||||||||||
| Zayo Group Holdings, Inc. | 12/2019 | 32.50 | 3,516,448 | 1,027 | 5,135 | ||||||||||||||||||
| TOTAL PUT OPTIONS PURCHASED (Cost $729,129) | 57,808 | ||||||||||||||||||||||
| TOTAL PURCHASED OPTIONS (Cost $729,129) | 57,808 | ||||||||||||||||||||||
See Notes to Financial Statements.
www.arbitragefunds.com | 1-800-295-4485
6
Arbitrage Fund Portfolio of Investments (continued)
November 30, 2019 (Unaudited)
Yield | Shares | Value | |||||||||||||
SHORT-TERM INVESTMENTS - 13.35% | |||||||||||||||
Money Market Funds | |||||||||||||||
| Morgan Stanley Institutional Liquidity Fund Government Portfolio, Institutional Class | 1.550 | %(h) | 111,092,620 | $ | 111,092,620 | ||||||||||
| State Street Institutional U.S. Government Money Market Fund, Premium Class | 1.590 | %(h) | 111,092,620 | 111,092,620 | |||||||||||
222,185,240 | |||||||||||||||
| TOTAL SHORT-TERM INVESTMENTS (Cost $222,185,240) | 222,185,240 | ||||||||||||||
| Total Investments - 99.45% (Cost $1,609,804,217) | 1,655,989,744 | ||||||||||||||
Other Assets in Excess of Liabilities - 0.55%(i) | 9,092,450 | ||||||||||||||
NET ASSETS - 100.00% | $ | 1,665,082,194 | |||||||||||||
Portfolio Footnotes
(a) Non-income-producing security.
(b) Security fair valued using significant unobservable inputs and classified as a Level 3 security. As of November 30, 2019, the total fair market value of these securities was $123,678,113, representing 7.43% of net assets.
(c) Security, or a portion of security, is being held as collateral for short sales, written option contracts or forward foreign currency exchange contracts. At November 30, 2019, the aggregate fair market value of those securities was $507,411,362, representing 30.47% of net assets.
(d) Security exempt from registration under Rule 144A of the Securities Act of 1933. These securities may be resold in transactions exempt from registration, normally to qualified institutional buyers. As of November 30, 2019, these securities had a total value of $16,957,173 or 1.02% of net assets.
(e) Underlying security for a written/purchased call/put option.
(f) Affiliated investment.
(g) Less than 0.005% of net assets.
(h) Rate shown is the 7-day effective yield as of November 30, 2019.
(i) Includes cash held as collateral for short sales and written option contracts.
SCHEDULE OF SECURITIES SOLD SHORT | Shares | Value | |||||||||
COMMON STOCKS - (20.97%) | |||||||||||
Banks - (8.10%) | |||||||||||
First Horizon National Corp. | (103,964 | ) | $ | (1,671,741 | ) | ||||||
Truist Financial Corp. | (2,435,391 | ) | (133,264,596 | ) | |||||||
(134,936,337 | ) | ||||||||||
Distribution/Wholesale - (0.08%) | |||||||||||
WESCO International, Inc. | (24,151 | ) | (1,270,826 | ) | |||||||
See Notes to Financial Statements.
Semi-Annual Report | November 30, 2019
7
Arbitrage Fund Portfolio of Investments (continued)
November 30, 2019 (Unaudited)
Shares | Value | ||||||||||
COMMON STOCKS - (20.97%) (Continued) | |||||||||||
Entertainment - (0.39%) | |||||||||||
Eldorado Resorts, Inc. | (120,840 | ) | $ | (6,466,148 | ) | ||||||
Healthcare - Services - (6.49%) | |||||||||||
Centene Corp. | (1,786,919 | ) | (108,054,992 | ) | |||||||
Home Builders - (0.35%) | |||||||||||
Taylor Morrison Home Corp., Class A | (251,891 | ) | (5,848,909 | ) | |||||||
Miscellaneous Manufacturing - (0.52%) | |||||||||||
Hillenbrand, Inc. | (273,457 | ) | (8,646,710 | ) | |||||||
Pharmaceuticals - (2.26%) | |||||||||||
AbbVie, Inc. | (7,222 | ) | (633,586 | ) | |||||||
Bristol-Myers Squibb Co. | (650,966 | ) | (37,066,004 | ) | |||||||
(37,699,590 | ) | ||||||||||
Pipelines - (0.04%) | |||||||||||
SemGroup Corp., Class A | (42,377 | ) | (651,334 | ) | |||||||
Real Estate Investment Trusts - (2.74%) | |||||||||||
Digital Realty Trust, Inc. | (78,065 | ) | (9,441,962 | ) | |||||||
Prologis, Inc. | (395,127 | ) | (36,173,877 | ) | |||||||
(45,615,839 | ) | ||||||||||
| TOTAL COMMON STOCKS (Proceeds $327,318,198) | (349,190,685 | ) | |||||||||
LIMITED PARTNERSHIPS - (0.04%) | |||||||||||
Pipelines - (0.04%) | |||||||||||
Energy Transfer Equity LP | (54,758 | ) | (646,692 | ) | |||||||
| TOTAL LIMITED PARTNERSHIPS (Proceeds $654,262) | (646,692 | ) | |||||||||
RIGHTS - (0.08%) | |||||||||||
Pharmaceuticals - (0.08%) | |||||||||||
Bristol-Myers Squibb Co. | (650,993 | ) | (1,399,637 | ) | |||||||
| TOTAL RIGHTS (Proceeds $1,431,604) | (1,399,637 | ) | |||||||||
| TOTAL SECURITIES SOLD SHORT (Proceeds $329,404,064) | $ | (351,237,014 | ) | ||||||||
See Notes to Financial Statements.
www.arbitragefunds.com | 1-800-295-4485
8
Arbitrage Fund Portfolio of Investments (continued)
November 30, 2019 (Unaudited)
WRITTEN OPTIONS | Expiration Date | Exercise Price | Notional Amount | Contracts | Value | ||||||||||||||||||
Written Call Options | |||||||||||||||||||||||
| Anixter International, Inc. | 12/2019 | $ | 85.00 | $ | (1,639,544 | ) | (191 | ) | $ | (33,903 | ) | ||||||||||||
| TOTAL WRITTEN CALL OPTIONS (Premiums received $44,248) | (33,903 | ) | |||||||||||||||||||||
| TOTAL WRITTEN OPTIONS (Premiums received $44,248) | $ | (33,903 | ) | ||||||||||||||||||||
EQUITY SWAP CONTRACTS
Swap | Reference | Rate | Termination | Upfront | Upfront | Market | Notional | Unrealized | |||||||||||||||||||||||||||
Morgan | AbbVie, | Received |
| $ | — | $ | — | $ | — | $ | 20,630,587 | $ | — | ||||||||||||||||||||||
Morgan | Energy | Received |
| — | — | — | 10,809,776 | — | |||||||||||||||||||||||||||
Morgan | WesBanco, | Received |
| — | — | — | 9,231,410 | — | |||||||||||||||||||||||||||
Morgan | Cobham | Paid |
| — | — | — |
| — | |||||||||||||||||||||||||||
See Notes to Financial Statements.
Semi-Annual Report | November 30, 2019
9
Arbitrage Fund Portfolio of Investments (continued)
November 30, 2019 (Unaudited)
Swap | Reference | Rate | Termination | Upfront | Upfront | Market | Notional | Unrealized | |||||||||||||||||||||||||||
Morgan | Flutter | Received |
| $ | — | $ | — | $ | — | GBP | $ | — | |||||||||||||||||||||||
Morgan | Just Eat | Paid |
| $ | 486 | $ | — | $ | 21,096 | GBP | $ | 21,582 | |||||||||||||||||||||||
|
|
|
|
|
| $ | 21,096 |
| $ | 21,582 | |||||||||||||||||||||||||
OUTSTANDING FORWARD FOREIGN CURRENCY EXCHANGE CONTRACTS
| Currency Purchased | Currency Sold | Counterparty | Settlement Date | Unrealized Appreciation | |||||||||||||||
AUD | 3,500 | USD | 2,361 | Goldman Sachs & Co. | 12/16/2019 | $ | 7 | ||||||||||||
USD | 87,360 | AUD | 127,300 | Goldman Sachs & Co. | 12/16/2019 | 1,224 | |||||||||||||
CAD | 12,531,100 | USD | 9,416,180 | Goldman Sachs & Co. | 12/16/2019 | 18,802 | |||||||||||||
USD | 28,893,810 | CAD | 38,052,200 | Goldman Sachs & Co. | 12/16/2019 | 243,343 | |||||||||||||
EUR | 3,612,800 | USD | 3,977,275 | Goldman Sachs & Co. | 12/16/2019 | 6,683 | |||||||||||||
USD | 84,598,009 | EUR | 76,403,000 | Goldman Sachs & Co. | 12/16/2019 | 345,804 | |||||||||||||
GBP | 72,202,300 | USD | 92,522,734 | Goldman Sachs & Co. | 12/16/2019 | 906,464 | |||||||||||||
USD | 12,238,882 | GBP | 9,418,600 | Goldman Sachs & Co. | 12/16/2019 | 51,290 | |||||||||||||
NZD | 1,862,300 | USD | 1,179,832 | Goldman Sachs & Co. | 12/16/2019 | 15,658 | |||||||||||||
USD | 4,366,244 | NZD | 6,789,900 | Goldman Sachs & Co. | 12/16/2019 | 7,518 | |||||||||||||
USD | 259,892 | ZAR | 3,804,000 | Goldman Sachs & Co. | 12/13/2019 | 739 | |||||||||||||
$ | 1,597,532 | ||||||||||||||||||
| Currency Purchased | Currency Sold | Counterparty | Settlement Date | Unrealized Depreciation | |||||||||||||||
AUD | 19,900 | USD | 13,630 | Goldman Sachs & Co. | 12/16/2019 | $ | (160 | ) | |||||||||||
USD | 806 | AUD | 1,200 | Goldman Sachs & Co. | 12/16/2019 | (6 | ) | ||||||||||||
CAD | 15,037,000 | USD | 11,360,059 | Goldman Sachs & Co. | 12/16/2019 | (38,321 | ) | ||||||||||||
USD | 117,643 | CAD | 156,300 | Goldman Sachs & Co. | 12/16/2019 | (40 | ) | ||||||||||||
EUR | 22,419,100 | USD | 24,894,075 | Goldman Sachs & Co. | 12/16/2019 | (171,765 | ) | ||||||||||||
USD | 9,352,746 | EUR | 8,491,100 | Goldman Sachs & Co. | 12/16/2019 | (10,681 | ) | ||||||||||||
USD | 160,421,766 | GBP | 128,353,300 | Goldman Sachs & Co. | 12/16/2019 | (5,666,378 | ) | ||||||||||||
NZD | 544,000 | USD | 349,618 | Goldman Sachs & Co. | 12/16/2019 | (401 | ) | ||||||||||||
USD | 1,634,267 | NZD | 2,588,400 | Goldman Sachs & Co. | 12/16/2019 | (27,336 | ) | ||||||||||||
USD | 4,312,599 | SEK | 41,509,400 | Goldman Sachs & Co. | 12/16/2019 | (24,770 | ) | ||||||||||||
USD | 26,376,124 | ZAR | 394,122,100 | Goldman Sachs & Co. | 12/13/2019 | (473,982 | ) | ||||||||||||
$ | (6,413,840 | ) | |||||||||||||||||
See Notes to Financial Statements.
www.arbitragefunds.com | 1-800-295-4485
10
Arbitrage Fund Portfolio of Investments (continued)
November 30, 2019 (Unaudited)
The following is a summary of investments classified by country exposure:
Country | % of Net Assets(a) | ||||||
United Kingdom | 3.84 | % | |||||
Israel | 3.30 | % | |||||
Canada | 2.98 | % | |||||
Germany | 2.63 | % | |||||
Netherlands | 2.31 | % | |||||
South Africa | 1.57 | % | |||||
France | 0.34 | % | |||||
New Zealand | 0.28 | % | |||||
Sweden | 0.26 | % | |||||
Finland | 0.14 | % | |||||
Spain | 0.10 | % | |||||
Hong Kong | 0.06 | % | |||||
Australia | 0.01 | % | |||||
United States | 81.63 | % | |||||
Other Assets in Excess of Liabilities | 0.55 | % | |||||
100.00 | % | ||||||
(a) These percentages represent long positions only and are not net of short positions.
Abbreviations:
AB - Aktiebolag is the Swedish term for a limited company.
AUD - Australian dollar
bps - Basis Points. 100 Basis Points is equal to 1 percentage point.
CAD - Canadian dollar
CVR - Contingent Value Rights
EUR - Euro
GBP - British pound
LIBOR - London Interbank Offered Rate
LP - Limited Partnership
Ltd. - Limited
N.V. - Naamloze Vennootschap is the Dutch term for a public limited liability corporation.
NZD - New Zealand dollar
Plc - Public Limited Company
SA - Generally designates corporations in various countries, mostly those employing civil law. This translates literally in all languages mentioned as anonymous company.
SE - SE Regulation. A European Company which can operate on a Europe-wide basis and be governed by Community law directly applicable in all Member States
SEK - Swedish krona
SONIA - Sterling OverNight Index Average
USD - United States Dollar
ZAR - South African rand
See Notes to Financial Statements.
Semi-Annual Report | November 30, 2019
11
Arbitrage Fund Portfolio of Investments (continued)
November 30, 2019 (Unaudited)
The following table summarizes Arbitrage Fund's investments and derivative financial instruments categorized in the disclosure hierarchy as of November 30, 2019:
Investments in Securities at Value* | Level 1 | Level 2 | Level 3 | Total | |||||||||||||||
Assets | |||||||||||||||||||
Common Stocks | |||||||||||||||||||
Aerospace & Defense | $ | 20,073,849 | $ | — | $ | — | $ | 20,073,849 | |||||||||||
Apparel | — | — | 1,781,243 | 1,781,243 | |||||||||||||||
Auto Parts & Equipment | 51,467,493 | — | — | 51,467,493 | |||||||||||||||
Banks | 144,320,542 | — | — | 144,320,542 | |||||||||||||||
Biotechnology | 45,138,713 | — | — | 45,138,713 | |||||||||||||||
Chemicals | 8,172,046 | — | — | 8,172,046 | |||||||||||||||
Commercial Services | 2,412,015 | — | 15,044,903 | 17,456,918 | |||||||||||||||
| Computers & Computer Services | 38,920,410 | — | — | 38,920,410 | |||||||||||||||
Construction Materials | 11,860,728 | — | — | 11,860,728 | |||||||||||||||
Distribution/Wholesale | 12,086,444 | — | — | 12,086,444 | |||||||||||||||
Diversified Financial Services | 21,353,984 | — | — | 21,353,984 | |||||||||||||||
Electronics | 20,983,233 | — | — | 20,983,233 | |||||||||||||||
Energy - Alternate Sources | 10,201,141 | — | — | 10,201,141 | |||||||||||||||
Engineering & Construction | 12,349,156 | — | — | 12,349,156 | |||||||||||||||
Entertainment | 41,649,778 | — | 35,641,893 | 77,291,671 | |||||||||||||||
Environmental Control | 87,437,043 | — | — | 87,437,043 | |||||||||||||||
Food | 26,153,663 | — | — | 26,153,663 | |||||||||||||||
Gas | 7,977,182 | — | — | 7,977,182 | |||||||||||||||
Healthcare - Products | 19,116,396 | — | — | 19,116,396 | |||||||||||||||
Healthcare - Services | 170,257,797 | — | — | 170,257,797 | |||||||||||||||
Home Builders | 6,582,921 | — | — | 6,582,921 | |||||||||||||||
Insurance | 4,626,818 | — | — | 4,626,818 | |||||||||||||||
Internet | — | — | 39,263,676 | 39,263,676 | |||||||||||||||
Lodging | 17,527,794 | — | — | 17,527,794 | |||||||||||||||
Media | 43,867,772 | — | — | 43,867,772 | |||||||||||||||
Miscellaneous Manufacturing | 8,619,694 | — | — | 8,619,694 | |||||||||||||||
Oil & Gas | 6,878,898 | — | — | 6,878,898 | |||||||||||||||
Pharmaceuticals | 88,829,658 | — | — | 88,829,658 | |||||||||||||||
Pipelines | 20,510,527 | — | — | 20,510,527 | |||||||||||||||
Real Estate | 4,323,682 | — | — | 4,323,682 | |||||||||||||||
Real Estate Investment Trusts | 36,071,300 | — | — | 36,071,300 | |||||||||||||||
Retail | 49,809,666 | — | — | 49,809,666 | |||||||||||||||
Semiconductors | 55,011,477 | — | — | 55,011,477 | |||||||||||||||
Software | 29,611,000 | — | 30,798,445 | 60,409,445 | |||||||||||||||
Telecommunications | 82,460,066 | — | — | 82,460,066 | |||||||||||||||
Transportation | 62,830,829 | — | — | 62,830,829 | |||||||||||||||
Limited Partnerships | 364,090 | — | — | 364,090 | |||||||||||||||
Rights | 1,399,635 | — | 1,147,953 | 2,547,588 | |||||||||||||||
Corporate Bonds** | — | 13,030,825 | — | 13,030,825 | |||||||||||||||
Mutual Funds | 25,780,318 | — | — | 25,780,318 | |||||||||||||||
Purchased Options | 57,808 | — | — | 57,808 | |||||||||||||||
Short-Term Investments | 222,185,240 | — | — | 222,185,240 | |||||||||||||||
TOTAL | $ | 1,519,280,806 | $ | 13,030,825 | $ | 123,678,113 | $ | 1,655,989,744 | |||||||||||
See Notes to Financial Statements.
www.arbitragefunds.com | 1-800-295-4485
12
Arbitrage Fund Portfolio of Investments (continued)
November 30, 2019 (Unaudited)
Other Financial Instruments*** | Level 1 | Level 2 | Level 3 | Total | |||||||||||||||
Assets | |||||||||||||||||||
| Forward Foreign Currency Exchange Contracts | $ | — | $ | 1,597,532 | $ | — | $ | 1,597,532 | |||||||||||
Equity Swaps | 21,096 | — | — | 21,096 | |||||||||||||||
Liabilities | |||||||||||||||||||
Common Stocks** | (349,190,685 | ) | — | — | (349,190,685 | ) | |||||||||||||
Limited Partnerships | (646,692 | ) | — | — | (646,692 | ) | |||||||||||||
Rights | (1,399,637 | ) | — | — | (1,399,637 | ) | |||||||||||||
Written Options | (33,903 | ) | — | — | (33,903 | ) | |||||||||||||
| Forward Foreign Currency Exchange Contracts | — | (6,413,840 | ) | — | (6,413,840 | ) | |||||||||||||
TOTAL | $ | (351,249,821 | ) | $ | (4,816,308 | ) | $ | — | $ | (356,066,129 | ) | ||||||||
* Refer to footnote 2 where leveling hierarchy is defined.
** Refer to Portfolio of Investments for sector information.
*** Other financial instruments are instruments such as written options, securities sold short, equity swaps and forward foreign currency exchange contracts.
The following is a reconciliation of the fair valuations using significant unobservable inputs (Level 3) for the Fund's assets and liabilities during the period ended November 30, 2019:
| Investments in Securities | Balance as of May 31, 2019 | Realized Gain (Loss) | Change in Unrealized Appreciation (Depreciation) | Purchases | Sales Proceeds | Transfers into Level 3 | Transfers out of Level 3 | Balance as of November 30, 2019 | Net change in Unrealized (Depreciation) included in the Statement of Operations attributable to Level 3 investments held at November 30, 2019 | ||||||||||||||||||||||||||||||
| Common Stocks | $ | 33,540,061 | $ | 174,028 | $ | 582,078 | $ | 86,928,539 | $ | (16,434,325 | ) | $ | 17,739,780 | $ | — | $ | 122,530,160 | $ | 582,078 | ||||||||||||||||||||
Rights | 1,125,511 | — | 21,549 | 28,314 | (27,421 | ) | — | — | 1,147,953 | 21,549 | |||||||||||||||||||||||||||||
Total | $ | 34,665,572 | $ | 174,028 | $ | 603,626 | $ | 86,956,853 | $ | (16,461,745 | ) | $ | 17,739,780 | $ | — | $ | 123,678,113 | $ | 603,626 | ||||||||||||||||||||
See Notes to Financial Statements.
Semi-Annual Report | November 30, 2019
13
Water Island Diversified Event-Driven Fund Portfolio Information
November 30, 2019 (Unaudited)
Performance (annualized returns as of November 30, 2019)
| One Year | Five Year | Ten Year | Since Inception* | ||||||||||||||||
Water Island Diversified Event-Driven Fund, Class R | 3.10 | % | 0.49 | % | N/A | 1.46 | % | ||||||||||||
Water Island Diversified Event-Driven Fund, Class I | 3.26 | % | 0.71 | % | N/A | 1.70 | % | ||||||||||||
Water Island Diversified Event-Driven Fund, Class C** | 2.33 | % | -0.27 | % | N/A | 0.37 | % | ||||||||||||
Water Island Diversified Event-Driven Fund, Class A*** | 3.06 | % | 0.47 | % | N/A | 0.83 | % | ||||||||||||
ICE BofA Merrill Lynch U.S. 3-Month Treasury Bill Index**** | 2.32 | % | 1.05 | % | N/A | 0.61 | % | ||||||||||||
Bloomberg Barclays U.S. Aggregate Bond Index | 10.79 | % | 3.08 | % | N/A | 3.24 | % | ||||||||||||
Current performance may be higher or lower than performance quoted above. Any performance data quoted represents past performance, and the investment return and principal value of an investment in the Fund will fluctuate so that an investor's shares, when redeemed, may be worth more or less than their original cost. Past performance is no guarantee of future results. Returns shown above include the reinvestment of all dividends and capital gains. Performance results do not include adjustments made for financial reporting purposes in accordance with U.S. generally accepted accounting principles and may differ from the amount reported in the Financial Highlights. Contractual fee waivers are currently in effect. Without such fee waivers, performance numbers would be reduced. You can obtain performance data current to the most recent month end by calling 1-800-295-4485 or going to www.arbitragefunds.com.
* Class R and Class I inception: 10/1/10; Class C inception: 6/1/12; Class A inception: 6/1/13. The "Since Inception" returns for securities indices are for the inception date of Class R and Class I shares.
** Class C shares are subject to a 1.00% contingent deferred sales charge on all purchases redeemed within 12 months of purchase.
*** Class A shares are subject to a maximum front-end sales load of 3.25% of the offering price and are also subject to a 1.00% contingent deferred sales load on purchases at or above $250,000 purchased without a front-end sales charge and redeemed within 18 months of purchase.
**** Merger arbitrage and event-driven investing are market neutral investment strategies, which typically exhibit low betas and low correlations to broad equity and credit market indices. As such, the adviser has determined that a more appropriate benchmark for Water Island Diversified Event-Driven Fund is a measure of the risk-free rate, in this case the ICE Bank of America (BofA) Merrill Lynch U.S. 3-Month Treasury Bill Index.
The Total Annual Fund Operating Expenses for Class R, Class I, Class C and Class A are 2.62%, 2.37%, 3.37% and 2.62%, respectively. The Adviser has agreed to waive fees (not including the effects of interest, dividends on short positions, brokerage commissions, acquired fund fees and expenses, taxes, or other extraordinary expenses) in excess of 1.69%, 1.44%, 2.44% and 1.69% for Class R, Class I, Class C and Class A, respectively, until at least September 30, 2020. These expense ratios are as stated in the current prospectus and may differ from the expense ratios disclosed in the financial highlights in this report.
The ICE BofA Merrill Lynch U.S. 3-Month Treasury Bill Index tracks the performance of the U.S. dollar denominated U.S. Treasury Bills publicly issued in the U.S. domestic market with a remaining term to final maturity of less than 3 months.
The Bloomberg Barclays U.S. Aggregate Bond Index is a market value-weighted index of investment-grade fixed-rated debt issues, including government, corporate, asset-backed and mortgage-backed securities with a maturity of one year or more.
An investor may not invest directly in an index.
www.arbitragefunds.com | 1-800-295-4485
14
Water Island Diversified Event-Driven Fund Portfolio Information (continued)
November 30, 2019 (Unaudited)
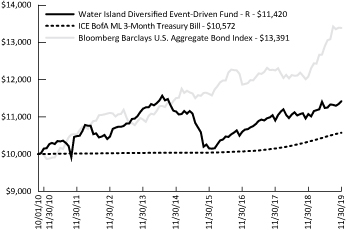
Growth of $10,000 Investment
The chart represents historical performance of a hypothetical investment of $10,000 in the Class R shares of the Fund since inception. Past performance does not guarantee future results. This chart does not reflect the deduction of taxes that a shareholder would pay on Fund distributions or the redemption of Fund shares.
Sector Weighting
The following chart shows the sector weightings of the Water Island Diversified Event-Driven Fund's investments (including short sales and excluding derivatives) as of the report date.
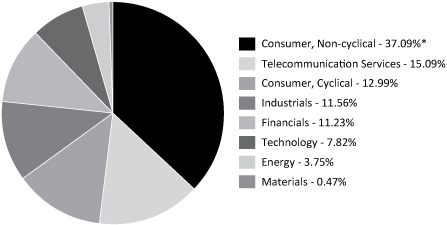
* Concentration Risk: The Fund may invest a large proportion of the Fund's assets in securities of issuers in a single sector over a given time. During such a period of concentration, the Fund may be subject to greater volatility with respect to its portfolio securities than a fund that is more broadly diversified.
Semi-Annual Report | November 30, 2019
15
Water Island Diversified Event-Driven Fund Portfolio of Investments
November 30, 2019 (Unaudited)
Shares | Value | ||||||||||
COMMON STOCKS - 84.28% | |||||||||||
Aerospace & Defense - 2.47% | |||||||||||
Cobham Plc | 1,578,942 | $ | 3,230,641 | ||||||||
Auto Parts & Equipment - 3.08% | |||||||||||
WABCO Holdings, Inc.(a)(b) | 29,912 | 4,030,642 | |||||||||
Banks - 6.27% | |||||||||||
SunTrust Banks, Inc. | 115,830 | 8,205,397 | |||||||||
Biotechnology - 5.42% | |||||||||||
Cambrex Corp.(a) | 27,413 | 1,643,957 | |||||||||
Medicines Co.(a) | 38,765 | 3,264,013 | |||||||||
Pacific Biosciences of California, Inc.(a)(b) | 424,869 | 2,183,827 | |||||||||
7,091,797 | |||||||||||
Chemicals - 0.27% | |||||||||||
Axalta Coating Systems Ltd.(a) | 12,405 | 353,170 | |||||||||
Commercial Services - 1.80% | |||||||||||
Herc Holdings, Inc.(a) | 3,572 | 167,027 | |||||||||
Sotheby's(a)(c) | 38,478 | 2,193,246 | |||||||||
2,360,273 | |||||||||||
Computers & Computer Services - 1.28% | |||||||||||
HP, Inc. | 27,874 | 559,710 | |||||||||
Presidio, Inc. | 26,796 | 442,402 | |||||||||
Sophos Group Plc(d) | 91,504 | 668,659 | |||||||||
1,670,771 | |||||||||||
Construction Materials - 0.49% | |||||||||||
Masco Corp.(b) | 13,663 | 636,013 | |||||||||
Distribution/Wholesale - 0.99% | |||||||||||
Anixter International, Inc.(a)(b) | 11,084 | 951,451 | |||||||||
HD Supply Holdings, Inc.(a)(b) | 8,671 | 345,279 | |||||||||
1,296,730 | |||||||||||
Energy - Alternate Sources - 0.61% | |||||||||||
Pattern Energy Group, Inc., Class A(b) | 29,013 | 798,438 | |||||||||
Engineering & Construction - 0.50% | |||||||||||
Altran Technologies SA | 42,401 | 661,926 | |||||||||
Entertainment - 2.36% | |||||||||||
Entertainment One Ltd. | 46,225 | 332,405 | |||||||||
International Speedway Corp., Class A(a)(c) | 61,256 | 2,756,520 | |||||||||
3,088,925 | |||||||||||
See Notes to Financial Statements.
www.arbitragefunds.com | 1-800-295-4485
16
Water Island Diversified Event-Driven Fund Portfolio of Investments (continued)
November 30, 2019 (Unaudited)
Shares | Value | ||||||||||
COMMON STOCKS - 84.28% (Continued) | |||||||||||
Environmental Control - 4.35% | |||||||||||
Advanced Disposal Services, Inc.(a) | 172,691 | $ | 5,690,168 | ||||||||
Food - 0.91% | |||||||||||
Pioneer Foods Group Ltd. | 161,717 | 1,188,771 | |||||||||
Healthcare - Products - 1.05% | |||||||||||
Wright Medical Group NV(a)(b) | 46,122 | 1,373,052 | |||||||||
Healthcare - Services - 10.20% | |||||||||||
WellCare Health Plans, Inc.(a)(b) | 41,484 | 13,360,752 | |||||||||
Internet - 3.69% | |||||||||||
NortonLifeLock, Inc.(b)(e) | 25,755 | 641,299 | |||||||||
Shutterfly, Inc.(a)(c) | 82,270 | 4,195,770 | |||||||||
4,837,069 | |||||||||||
Media - 1.95% | |||||||||||
Discovery, Inc., Class C(a)(b) | 9,765 | 298,028 | |||||||||
Axel Springer SE(a) | 32,666 | 2,249,258 | |||||||||
2,547,286 | |||||||||||
Pharmaceuticals - 9.77% | |||||||||||
Allergan Plc(b) | 47,041 | 8,699,763 | |||||||||
Bristol-Myers Squibb Co. | 69,054 | 3,931,935 | |||||||||
Paratek Pharmaceuticals, Inc.(a)(f) | 52,781 | 154,648 | |||||||||
12,786,346 | |||||||||||
Pipelines - 2.45% | |||||||||||
SemGroup Corp., Class A | 208,891 | 3,210,655 | |||||||||
Retail - 3.62% | |||||||||||
GrandVision NV(d) | 13,220 | 400,523 | |||||||||
Tiffany & Co.(b)(e) | 32,475 | 4,345,155 | |||||||||
4,745,678 | |||||||||||
Semiconductors - 5.41% | |||||||||||
Mellanox Technologies Ltd.(a)(b)(e) | 61,658 | 7,084,504 | |||||||||
Software - 1.93% | |||||||||||
MINDBODY, Inc., Class A(a)(c) | 48,463 | 1,768,899 | |||||||||
Pivotal Software, Inc., Class A(a)(b) | 50,745 | 762,190 | |||||||||
2,531,089 | |||||||||||
Telecommunications - 9.17% | |||||||||||
Inmarsat Plc | 102,738 | 721,784 | |||||||||
Zayo Group Holdings, Inc.(a)(b) | 329,518 | 11,282,696 | |||||||||
12,004,480 | |||||||||||
See Notes to Financial Statements.
Semi-Annual Report | November 30, 2019
17
Water Island Diversified Event-Driven Fund Portfolio of Investments (continued)
November 30, 2019 (Unaudited)
Shares | Value | ||||||||||
COMMON STOCKS - 84.28% (Continued) | |||||||||||
Transportation - 4.24% | |||||||||||
Genesee & Wyoming, Inc., Class A(a) | 49,809 | $ | 5,551,213 | ||||||||
| TOTAL COMMON STOCKS (Cost $107,944,468) | 110,335,786 | ||||||||||
LIMITED PARTNERSHIPS - 0.03% | |||||||||||
Pipelines - 0.03% | |||||||||||
Energy Transfer Equity LP | 2,998 | 35,406 | |||||||||
| TOTAL LIMITED PARTNERSHIPS (Cost $36,159) | 35,406 | ||||||||||
RIGHTS - 0.11% | |||||||||||
Bristol-Myers Squibb Co.(a) | 69,054 | 148,466 | |||||||||
| TOTAL RIGHTS (Cost $147,085) | 148,466 | ||||||||||
| Maturity Date | Rate | Principal Amount | Value | ||||||||||||||||
CORPORATE BONDS - 9.82% | |||||||||||||||||||
Commercial Services - 1.65% | |||||||||||||||||||
| Nielsen Co. Luxembourg SARL (The)(b)(d) | 10/01/2021 | 5.500 | % | $ | 2,158,000 | $ | 2,160,697 | ||||||||||||
Entertainment - 1.31% | |||||||||||||||||||
| Stars Group Holdings B.V. / Stars Group US Co-Borrower LLC(d) | 07/15/2026 | 7.000 | % | 1,585,000 | 1,711,800 | ||||||||||||||
Household Products - 0.71% | |||||||||||||||||||
| Avon International Operations, Inc.(d) | 08/15/2022 | 7.875 | % | 892,000 | 928,795 | ||||||||||||||
Internet - 1.67% | |||||||||||||||||||
| Zayo Group LLC / Zayo Capital, Inc. | 04/01/2023 | 6.000 | % | 1,339,000 | 1,372,505 | ||||||||||||||
| Zayo Group LLC / Zayo Capital, Inc.(d) | 01/15/2027 | 5.750 | % | 791,000 | 806,820 | ||||||||||||||
2,179,325 | |||||||||||||||||||
Lodging - 1.81% | |||||||||||||||||||
| Jack Ohio Finance LLC / Jack Ohio Finance 1 Corp.(d) | 11/15/2021 | 6.750 | % | 2,329,000 | 2,375,580 | ||||||||||||||
Machinery - Construction & Mining - 0.65% | |||||||||||||||||||
Vertiv Group Corp.(d) | 10/15/2024 | 9.250 | % | 872,000 | 856,740 | ||||||||||||||
See Notes to Financial Statements.
www.arbitragefunds.com | 1-800-295-4485
18
Water Island Diversified Event-Driven Fund Portfolio of Investments (continued)
November 30, 2019 (Unaudited)
| Maturity Date | Rate | Principal Amount | Value | ||||||||||||||||
CORPORATE BONDS - 9.82% (Continued) | |||||||||||||||||||
Pipelines - 0.98% | |||||||||||||||||||
| SemGroup Corp. / Rose Rock Finance Corp. | |||||||||||||||||||
07/15/2022 | 5.625 | % | $ | 437,000 | $ | 440,551 | |||||||||||||
11/15/2023 | 5.625 | % | 817,000 | 837,425 | |||||||||||||||
1,277,976 | |||||||||||||||||||
Toys/Games/Hobbies - 1.04% | |||||||||||||||||||
Mattel, Inc. | 08/15/2021 | 2.350 | % | 1,353,000 | 1,363,148 | ||||||||||||||
| TOTAL CORPORATE BONDS (Cost $12,870,207) | 12,854,061 | ||||||||||||||||||
Shares | Value | ||||||||||||||||||
WARRANTS - 0.01% | |||||||||||||||||||
Telecommunications - 0.01% | |||||||||||||||||||
| Avaya Holdings Corp., Exercise Price $25.55, Expires 12/15/2022(a)(g) | 5,548 | $ | 8,489 | ||||||||||||||||
| TOTAL WARRANTS (Cost $0) | 8,489 | ||||||||||||||||||
| Expiration Date | Exercise Price | Notional Amount | Contracts | Value | |||||||||||||||||||
PURCHASED OPTIONS(a) - 0.04% | |||||||||||||||||||||||
Call Options Purchased - 0.03% | |||||||||||||||||||||||
Emerson Electric Co. | 01/2020 | $ | 70.00 | $ | 81,246 | 11 | $ | 5,445 | |||||||||||||||
Stars Group, Inc. | 02/2020 | 22.50 | 97,160 | 40 | 8,900 | ||||||||||||||||||
| Xerox Holdings Corp. | 01/2020 | 40.00 | 1,039,431 | 267 | 31,506 | ||||||||||||||||||
| TOTAL CALL OPTIONS PURCHASED (Cost $42,977) | 45,851 | ||||||||||||||||||||||
Put Options Purchased - 0.01% | |||||||||||||||||||||||
| Avaya Holdings Corp. | 12/2019 | 10.00 | 936,041 | 733 | 1,833 | ||||||||||||||||||
| iShares Russell 2000 ETF | |||||||||||||||||||||||
12/2019 | 145.00 | 550,018 | 34 | 340 | |||||||||||||||||||
12/2019 | 147.00 | 550,018 | 34 | 459 | |||||||||||||||||||
12/2019 | 149.00 | 582,372 | 36 | 666 | |||||||||||||||||||
| Lowe's Companies, Inc. | 01/2020 | 100.00 | 434,047 | 37 | 1,018 | ||||||||||||||||||
See Notes to Financial Statements.
Semi-Annual Report | November 30, 2019
19
Water Island Diversified Event-Driven Fund Portfolio of Investments (continued)
November 30, 2019 (Unaudited)
| Expiration Date | Exercise Price | Notional Amount | Contracts | Value | |||||||||||||||||||
PURCHASED OPTIONS(a) - 0.04% (Continued) | |||||||||||||||||||||||
Put Options Purchased - 0.01% (Continued) | |||||||||||||||||||||||
| Mellanox Technologies, Ltd. | |||||||||||||||||||||||
12/2019 | $ | 100.00 | $ | 1,574,130 | 137 | $ | 3,082 | ||||||||||||||||
12/2019 | 105.00 | 1,309,860 | 114 | 2,565 | |||||||||||||||||||
| NortonLifeLock, Inc. | 01/2020 | 20.00 | 126,990 | 51 | 306 | ||||||||||||||||||
Tiffany & Co. | 02/2020 | 110.00 | 294,360 | 22 | 4,961 | ||||||||||||||||||
| TOTAL PUT OPTIONS PURCHASED (Cost $208,076) | 15,230 | ||||||||||||||||||||||
| TOTAL PURCHASED OPTIONS (Cost $251,053) | 61,081 | ||||||||||||||||||||||
Yield | Shares | Value | |||||||||||||
SHORT-TERM INVESTMENTS - 0.02% | |||||||||||||||
Money Market Fund | |||||||||||||||
| State Street Institutional U.S. Government Money Market Fund, Premier Class(h) | 1.590 | %(i) | 24,313 | $ | 24,313 | ||||||||||
| TOTAL SHORT-TERM INVESTMENTS (Cost $24,313) | 24,313 | ||||||||||||||
| Total Investments - 94.31% (Cost $121,273,285) | 123,467,602 | ||||||||||||||
Other Assets in Excess of Liabilities - 5.69%(j) | 7,452,015 | ||||||||||||||
NET ASSETS - 100.00% | $ | 130,919,617 | |||||||||||||
Portfolio Footnotes
(a) Non-income-producing security.
(b) Security, or a portion of security, is being held as collateral for short sales, written option contracts or forward foreign currency exchange contracts. At November 30, 2019, the aggregate fair market value of those securities was $44,062,072, representing 33.66% of net assets.
(c) Security fair valued using significant unobservable inputs and classified as a Level 3 security. As of November 30, 2019, the total fair market value of these securities was $10,914,435, representing 8.34% of net assets.
(d) Security exempt from registration under Rule 144A of the Securities Act of 1933. These securities may be resold in transactions exempt from registration, normally to qualified institutional buyers. As of November 30, 2019, these securities had a total value of $9,909,614 or 7.57% of net assets.
(e) Underlying security for a written/purchased call/put option.
See Notes to Financial Statements.
www.arbitragefunds.com | 1-800-295-4485
20
Water Island Diversified Event-Driven Fund Portfolio of Investments (continued)
November 30, 2019 (Unaudited)
(f) All or a portion of this security is out on loan.
(g) Security in default on interest payments.
(h) Represents an investment of securities lending cash collateral.
(i) Rate shown is the 7-day effective yield as of November 30, 2019.
(j) Includes cash held as collateral for short sales and written option contracts.
SCHEDULE OF SECURITIES SOLD SHORT | Shares | Value | |||||||||
COMMON STOCKS - (17.45%) | |||||||||||
Banks - (6.27%) | |||||||||||
Truist Financial Corp. | (149,958 | ) | $ | (8,205,702 | ) | ||||||
Chemicals - (0.25%) | |||||||||||
PPG Industries, Inc. | (1,354 | ) | (174,449 | ) | |||||||
RPM International, Inc. | (1,005 | ) | (74,099 | ) | |||||||
Sherwin-Williams Co. (The) | (136 | ) | (79,306 | ) | |||||||
(327,854 | ) | ||||||||||
Commercial Services - (0.11%) | |||||||||||
Nielsen Holdings Plc | (4,117 | ) | (80,487 | ) | |||||||
United Rentals, Inc. | (396 | ) | (60,608 | ) | |||||||
(141,095 | ) | ||||||||||
Construction Materials - (0.14%) | |||||||||||
Builders FirstSource, Inc. | (568 | ) | (14,433 | ) | |||||||
Fortune Brands Home & Security, Inc. | (988 | ) | (62,501 | ) | |||||||
JELD-WEN Holding, Inc. | (2,135 | ) | (48,571 | ) | |||||||
Masonite International Corp. | (818 | ) | (58,732 | ) | |||||||
(184,237 | ) | ||||||||||
Distribution/Wholesale - (0.20%) | |||||||||||
Fastenal Co. | (1,349 | ) | (47,917 | ) | |||||||
Watsco, Inc. | (269 | ) | (47,874 | ) | |||||||
WESCO International, Inc. | (2,199 | ) | (115,711 | ) | |||||||
WW Grainger, Inc. | (155 | ) | (49,127 | ) | |||||||
(260,629 | ) | ||||||||||
Electrical Components & Equipment - (0.06%) | |||||||||||
Emerson Electric Co. | (1,100 | ) | (81,246 | ) | |||||||
Entertainment - (0.07%) | |||||||||||
Stars Group, Inc. (The) | (3,993 | ) | (96,990 | ) | |||||||
Healthcare - Services - (6.48%) | |||||||||||
Centene Corp. | (140,222 | ) | (8,479,224 | ) | |||||||
Household Products - (0.04%) | |||||||||||
Avon Products, Inc. | (12,250 | ) | (56,227 | ) | |||||||
See Notes to Financial Statements.
Semi-Annual Report | November 30, 2019
21
Water Island Diversified Event-Driven Fund Portfolio of Investments (continued)
November 30, 2019 (Unaudited)
SCHEDULE OF SECURITIES SOLD SHORT | Shares | Value | |||||||||
COMMON STOCKS - (17.45%) (Continued) | |||||||||||
Media - (0.23%) | |||||||||||
Discovery, Inc., Class A | (8,981 | ) | $ | (295,834 | ) | ||||||
Office/Business Equip - (0.11%) | |||||||||||
Xerox Holdings Corp. | (3,819 | ) | (148,674 | ) | |||||||
Pharmaceuticals - (3.28%) | |||||||||||
AbbVie, Inc. | (4,072 | ) | (357,237 | ) | |||||||
Bristol-Myers Squibb Co. | (69,051 | ) | (3,931,764 | ) | |||||||
(4,289,001 | ) | ||||||||||
Pipelines - (0.04%) | |||||||||||
SemGroup Corp., Class A | (3,641 | ) | (55,962 | ) | |||||||
Retail - (0.02%) | |||||||||||
Beacon Roofing Supply, Inc. | (296 | ) | (8,776 | ) | |||||||
MSC Industrial Direct Co., Inc., Class A | (167 | ) | (12,260 | ) | |||||||
(21,036 | ) | ||||||||||
Telecommunications - (0.15%) | |||||||||||
Zayo Group Holdings, Inc. | (5,720 | ) | (195,853 | ) | |||||||
| TOTAL COMMON STOCKS (Proceeds $21,508,629) | (22,839,564 | ) | |||||||||
LIMITED PARTNERSHIPS - (0.08%) | |||||||||||
Pipelines - (0.08%) | |||||||||||
Energy Transfer Equity LP | (8,638 | ) | (102,015 | ) | |||||||
| TOTAL LIMITED PARTNERSHIPS (Proceeds $103,375) | (102,015 | ) | |||||||||
RIGHTS - (0.11%) | |||||||||||
Pharmaceuticals - (0.11%) | |||||||||||
Bristol-Myers Squibb Co. | (69,054 | ) | (148,466 | ) | |||||||
| TOTAL RIGHTS (Proceeds $154,836) | (148,466 | ) | |||||||||
| TOTAL SECURITIES SOLD SHORT (Proceeds $21,766,840) | $ | (23,090,045 | ) | ||||||||
See Notes to Financial Statements.
www.arbitragefunds.com | 1-800-295-4485
22
Water Island Diversified Event-Driven Fund Portfolio of Investments (continued)
November 30, 2019 (Unaudited)
WRITTEN OPTIONS | Expiration Date | Exercise Price | Notional Amount | Contracts | Value | ||||||||||||||||||
Written Put Options | |||||||||||||||||||||||
iShares Russell 2000 ETF | |||||||||||||||||||||||
12/2019 | $ | 135.00 | $ | (550,018 | ) | (34 | ) | $ | (102 | ) | |||||||||||||
12/2019 | 137.00 | (550,018 | ) | (34 | ) | (119 | ) | ||||||||||||||||
12/2019 | 139.00 | (582,372 | ) | (36 | ) | (162 | ) | ||||||||||||||||
| TOTAL WRITTEN PUT OPTIONS (Premiums received $29,209) | (383 | ) | |||||||||||||||||||||
| TOTAL WRITTEN OPTIONS (Premiums received $29,209) | $ | (383 | ) | ||||||||||||||||||||
EQUITY SWAP CONTRACTS
| Swap Counterparty/ Payment Frequency | Reference Obligation | Rate Paid/ Received by the Fund | Termination Date | Upfront Payments Paid | Upfront Payments Received | Market Value | Notional Amount | Unrealized Appreciation | |||||||||||||||||||||||||||
| Morgan Stanley & Co./ Monthly | AbbVie, Inc. | Received 1 Month- Federal Rate Minus 40 bps (1.150%) | 08/19/2021 | $ | — | $ | — | $ | — | $ | 3,216,708 | $ | — | ||||||||||||||||||||||
| Morgan Stanley & Co./ Monthly | Energy Transfer LP | Received 1 Month- Federal Rate Minus 40 bps (1.150%) | 08/19/2021 | — | — | — | 1,691,345 | — | |||||||||||||||||||||||||||
| Morgan Stanley & Co./ Monthly | Cobham Plc | Paid 1 Month- SONIA plus 90 bps (1.609%) | 10/21/2021 | — | — | — | GBP | (1,076,019 | ) | — | |||||||||||||||||||||||||
| Morgan Stanley & Co./ Monthly | Just Eat Plc | Paid 1 Month SONIA plus 90 bps (1.609%) | 10/21/2021 | — | — | 1,660 | GBP | (649,460 | ) | 1,660 | |||||||||||||||||||||||||
$ | 1,660 | $ | 1,660 | ||||||||||||||||||||||||||||||||
See Notes to Financial Statements.
Semi-Annual Report | November 30, 2019
23
Water Island Diversified Event-Driven Fund Portfolio of Investments (continued)
November 30, 2019 (Unaudited)
OUTSTANDING FORWARD FOREIGN CURRENCY EXCHANGE CONTRACTS
| Currency Purchased | Currency Sold | Counterparty | Settlement Date | Unrealized Appreciation | |||||||||||||||
EUR | 238,800 | USD | 262,964 | Goldman Sachs & Co. | 12/16/2019 | $ | 368 | ||||||||||||
USD | 4,434,334 | EUR | 4,004,300 | Goldman Sachs & Co. | 12/16/2019 | 18,656 | |||||||||||||
GBP | 1,373,500 | USD | 1,772,857 | Goldman Sachs & Co. | 12/16/2019 | 4,441 | |||||||||||||
USD | 258,912 | GBP | 199,200 | Goldman Sachs & Co. | 12/16/2019 | 1,149 | |||||||||||||
$ | 24,614 | ||||||||||||||||||
| Currency Purchased | Currency Sold | Counterparty | Settlement Date | Unrealized Depreciation | |||||||||||||||
EUR | 774,100 | USD | 862,042 | Goldman Sachs & Co. | 12/16/2019 | $ | (8,416 | ) | |||||||||||
USD | 33,666 | EUR | 30,600 | Goldman Sachs & Co. | 12/16/2019 | (77 | ) | ||||||||||||
USD | 5,028,641 | GBP | 4,032,100 | Goldman Sachs & Co. | 12/16/2019 | (188,864 | ) | ||||||||||||
USD | 1,208,214 | ZAR | 18,089,900 | Goldman Sachs & Co. | 12/13/2019 | (24,185 | ) | ||||||||||||
$ | (221,542 | ) | |||||||||||||||||
The following is a summary of investments classified by country exposure:
Country | % of Net Assets(a) | ||||||
Israel | 5.41 | % | |||||
United Kingdom | 3.53 | % | |||||
Netherlands | 2.66 | % | |||||
Germany | 1.72 | % | |||||
Luxembourg | 1.65 | % | |||||
South Africa | 0.91 | % | |||||
France | 0.50 | % | |||||
Canada | 0.25 | % | |||||
United States | 77.68 | % | |||||
Other Assets in Excess of Liabilities | 5.69 | % | |||||
100.00 | % | ||||||
(a) These percentages represent long positions only and are not net of short positions.
Abbreviations:
bps - Basis Points. 100 Basis Points is equal to 1 percentage point.
ETF - Exchange-Traded Fund
EUR - Euro
GBP - British pound
LLC - Limited Liability Company
LP - Limited Partnership
Ltd. - Limited
N.V. - Naamloze Vennootschap is the Dutch term for a public limited liability corporation.
Plc - Public Limited Company
SARL - Société Anonyme à Responsabilité Limitée is the French term for limited liability company.
See Notes to Financial Statements.
www.arbitragefunds.com | 1-800-295-4485
24
Water Island Diversified Event-Driven Fund Portfolio of Investments (continued)
November 30, 2019 (Unaudited)
SE - SE Regulation. A European Company which can operate on a Europe-wide basis and be governed by Community law directly applicable in all Member States
SONIA - Sterling OverNight Index Average
USD - United States Dollar
ZAR - South African rand
The following table summarizes Water Island Diversified Event-Driven Fund's investments and derivative financial instruments categorized in the disclosure hierarchy as of November 30, 2019:
Investments in Securities at Value* | Level 1 | Level 2 | Level 3 | Total | |||||||||||||||
Assets | |||||||||||||||||||
Common Stocks | |||||||||||||||||||
Aerospace & Defense | $ | 3,230,641 | $ | — | $ | — | $ | 3,230,641 | |||||||||||
Auto Parts & Equipment | 4,030,642 | — | — | 4,030,642 | |||||||||||||||
Banks | 8,205,397 | — | — | 8,205,397 | |||||||||||||||
Biotechnology | 7,091,797 | — | — | 7,091,797 | |||||||||||||||
Chemicals | 353,170 | — | — | 353,170 | |||||||||||||||
Commercial Services | 167,027 | — | 2,193,246 | 2,360,273 | |||||||||||||||
Computers & Computer Services | 1,670,771 | — | — | 1,670,771 | |||||||||||||||
Construction Materials | 636,013 | — | — | 636,013 | |||||||||||||||
Distribution/Wholesale | 1,296,730 | — | — | 1,296,730 | |||||||||||||||
Energy - Alternate Sources | 798,438 | — | — | 798,438 | |||||||||||||||
Engineering & Construction | 661,926 | — | — | 661,926 | |||||||||||||||
Entertainment | 332,405 | — | 2,756,520 | 3,088,925 | |||||||||||||||
Environmental Control | 5,690,168 | — | — | 5,690,168 | |||||||||||||||
Food | 1,188,771 | — | — | 1,188,771 | |||||||||||||||
Healthcare - Products | 1,373,052 | — | — | 1,373,052 | |||||||||||||||
Healthcare - Services | 13,360,752 | — | — | 13,360,752 | |||||||||||||||
Internet | 641,299 | — | 4,195,770 | 4,837,069 | |||||||||||||||
Media | 2,547,286 | — | — | 2,547,286 | |||||||||||||||
Pharmaceuticals | 12,786,346 | — | — | 12,786,346 | |||||||||||||||
Pipelines | 3,210,655 | — | — | 3,210,655 | |||||||||||||||
Retail | 4,745,678 | — | — | 4,745,678 | |||||||||||||||
Semiconductors | 7,084,504 | — | — | 7,084,504 | |||||||||||||||
Software | 762,190 | — | 1,768,899 | 2,531,089 | |||||||||||||||
Telecommunications | 12,004,480 | — | — | 12,004,480 | |||||||||||||||
Transportation | 5,551,213 | — | — | 5,551,213 | |||||||||||||||
Limited Partnerships | 35,406 | — | — | 35,406 | |||||||||||||||
Rights | 148,466 | — | — | 148,466 | |||||||||||||||
Corporate Bonds** | — | 12,854,061 | — | 12,854,061 | |||||||||||||||
Warrants | — | 8,489 | — | 8,489 | |||||||||||||||
Purchased Options | 61,081 | — | — | 61,081 | |||||||||||||||
Short-Term Investments | 24,313 | — | — | 24,313 | |||||||||||||||
TOTAL | $ | 99,690,617 | $ | 12,862,550 | $ | 10,914,435 | $ | 123,467,602 | |||||||||||
See Notes to Financial Statements.
Semi-Annual Report | November 30, 2019
25
Water Island Diversified Event-Driven Fund Portfolio of Investments (continued)
November 30, 2019 (Unaudited)
Other Financial Instruments*** | Level 1 | Level 2 | Level 3 | Total | |||||||||||||||
Assets | |||||||||||||||||||
| Forward Foreign Currency Exchange Contracts | $ | — | $ | 24,614 | $ | — | $ | 24,614 | |||||||||||
Equity Swaps | 1,660 | — | — | 1,660 | |||||||||||||||
Liabilities | |||||||||||||||||||
Common Stocks** | (22,839,564 | ) | — | — | (22,839,564 | ) | |||||||||||||
Limited Partnerships | (102,015 | ) | — | — | (102,015 | ) | |||||||||||||
Rights | (148,466 | ) | — | — | (148,466 | ) | |||||||||||||
Written Options | (383 | ) | — | — | (383 | ) | |||||||||||||
| Forward Foreign Currency Exchange Contracts | — | (221,542 | ) | — | (221,542 | ) | |||||||||||||
TOTAL | $ | (23,088,768 | ) | $ | (196,928 | ) | $ | — | $ | (23,285,696 | ) | ||||||||
* Refer to footnote 2 where leveling hierarchy is defined.
** Refer to Portfolio of Investments for sector information.
*** Other financial instruments are instruments such as written options, securities sold short, equity swaps and forward foreign currency exchange contracts.
The following is a reconciliation of the fair valuations using significant unobservable inputs (Level 3) for the Fund's assets and liabilities during the period ended November 30, 2019:
| Investments in Securities | Balance as of May 31, 2019 | Realized Gain (Loss) | Change in Unrealized Appreciation (Depreciation) | Purchases | Sales Proceeds | Transfers into Level 3 | Transfers out of Level 3 | Balance as of November 30, 2019 | Net change in Unrealized (Depreciation) included in the Statement of Operations attributable to Level 3 investments held at November 30, 2019 | ||||||||||||||||||||||||||||||
| Corporate Bonds | $ | 0 | $ | 7 | $ | — | $ | — | $ | 7 | $ | — | $ | — | $ | 0 | $ | — | |||||||||||||||||||||
| Common Stock | 1,768,900 | 27,719 | 43,060 | 10,204,146 | 2,399,007 | 1,269,617 | — | 10,914,435 | 43,060 | ||||||||||||||||||||||||||||||
Total | $ | 1,768,900 | $ | 27,726 | $ | 43,060 | $ | 10,204,146 | $ | 2,399,014 | $ | 1,269,617 | $ | — | $ | 10,914,435 | $ | 43,060 | |||||||||||||||||||||
See Notes to Financial Statements.
www.arbitragefunds.com | 1-800-295-4485
26
Water Island Credit Opportunities Fund Portfolio Information
November 30, 2019 (Unaudited)
Performance (annualized returns as of November 30, 2019)
| One Year | Five Year | Ten Year | Since Inception* | ||||||||||||||||
Water Island Credit Opportunities Fund, Class R | 4.16 | % | 1.99 | % | N/A | 2.42 | % | ||||||||||||
Water Island Credit Opportunities Fund, Class I | 4.31 | % | 2.23 | % | N/A | 2.64 | % | ||||||||||||
Water Island Credit Opportunities Fund, Class C** | 3.28 | % | 1.23 | % | N/A | 1.68 | % | ||||||||||||
Water Island Credit Opportunities Fund, Class A*** | 4.05 | % | 1.95 | % | N/A | 2.27 | % | ||||||||||||
Bloomberg Barclays Capital U.S. Aggregate Bond Index | 10.79 | % | 3.08 | % | N/A | 2.69 | % | ||||||||||||
ICE BofA Merrill Lynch U.S. 3-Month Treasury Bill Index | 2.32 | % | 1.05 | % | N/A | 0.75 | % | ||||||||||||
Current performance may be higher or lower than performance quoted above. Any performance data quoted represents past performance and the investment return and principal value of an investment in the Fund will fluctuate so that an investor's shares, when redeemed, may be worth more or less than their original cost. Past performance is no guarantee of future results. Returns shown above include the reinvestment of all dividends and capital gains. Performance results do not include adjustments made for financial reporting purposes in accordance with U.S. generally accepted accounting principles and may differ from the amount reported in the Financial Highlights. Contractual fee waivers are currently in effect. Without such fee waivers, performance numbers would be reduced. You can obtain performance data current to the most recent month end by calling 1-800-295-4485 or going to www.arbitragefunds.com.
* Class R, Class I and Class C inception: 10/1/12; Class A inception: 6/1/13. The "Since Inception" returns for securities indices are for the inception date of Class R, Class I and Class C shares.
** Class C shares are subject to a 1.00% contingent deferred sales charge on all purchases redeemed in 12 months of purchase.
*** Class A shares are subject to a maximum front-end sales load of 3.25% of the offering price and are also subject to a 1.00% contingent deferred sales load on purchases at or above $250,000 purchased without a front-end sales charge and redeemed within 18 months of purchase.
The Total Annual Fund Operating Expenses for Class R, Class I, Class C and Class A are 2.11%, 1.86%, 2.86% and 2.11%, respectively. The Adviser has agreed to waive fees (not including the effects of interest, dividends on short positions, brokerage commissions, acquired fund fees and expenses, taxes, or other extraordinary expenses) in excess of 1.23%, 0.98%, 1.98% and 1.23% for Class R, Class I, Class C and Class A, respectively, until at least September 30, 2020. These expense ratios are as stated in the current prospectus and may differ from the expense ratios disclosed in the financial highlights in this report.
The Bloomberg Barclays Capital U.S. Aggregate Bond Index is a market value-weighted index of investment grade fixed-rated debt issues, including government, corporate, asset-backed and mortgage-backed securities with a maturity of one year or more.
The ICE Bank of America (BofA) Merrill Lynch U.S. 3-Month Treasury Bill Index tracks the performance of the U.S. dollar denominated U.S. Treasury Bills publicly issued in the U.S. domestic market with a remaining term to final maturity of less than 3 months.
An investor may not invest directly in an index.
Semi-Annual Report | November 30, 2019
27
Water Island Credit Opportunities Fund Portfolio Information (continued)
November 30, 2019 (Unaudited)
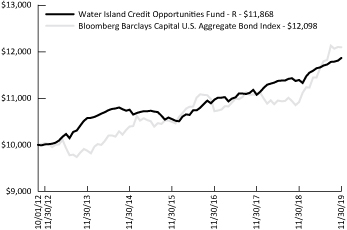
Growth of $10,000 Investment
The chart represents historical performance of a hypothetical investment of $10,000 in the Class R shares of the Fund since inception. Past performance does not guarantee future results. This chart does not reflect the deduction of taxes that a shareholder would pay on Fund distributions or the redemption of Fund shares.
Sector Weighting
The following chart shows the sector weightings of the Water Island Credit Opportunities Fund investments (including short sales and excluding derivatives) as of the report date.
www.arbitragefunds.com | 1-800-295-4485
28
Water Island Credit Opportunities Fund Portfolio of Investments
November 30, 2019 (Unaudited)
Shares | Value | ||||||||||
COMMON STOCKS - 0.04% | |||||||||||
Entertainment - 0.04% | |||||||||||
Eldorado Resorts, Inc.(a) | 405 | $ | 21,671 | ||||||||
| TOTAL COMMON STOCKS (Cost $16,341) | 21,671 | ||||||||||
LIMITED PARTNERSHIPS - 0.29% | |||||||||||
Pipelines - 0.29% | |||||||||||
Energy Transfer Equity LP | 14,774 | 174,481 | |||||||||
| TOTAL LIMITED PARTNERSHIPS (Cost $196,774) | 174,481 | ||||||||||
| Maturity Date | Rate | Principal Amount | Value | ||||||||||||||||
BANK LOAN - 1.71% | |||||||||||||||||||
Commercial Services - 1.71% | |||||||||||||||||||
| Refinitiv US Holdings, Inc., 2018 USD Term Loan B, Variable Rate (1 mo. USD LIBOR plus 3.750%) | 10/01/2025 | 5.452 | % | $ | 1,000,000 | $ | 1,007,360 | ||||||||||||
| TOTAL BANK LOANS (Cost $1,006,243) | 1,007,360 | ||||||||||||||||||
CORPORATE BONDS - 81.10% | |||||||||||||||||||
Aerospace & Defense - 6.84% | |||||||||||||||||||
Arconic, Inc.(b) | 08/15/2020 | 6.150 | % | 1,298,000 | 1,331,617 | ||||||||||||||
| Pioneer Holdings LLC / Pioneer Finance Corp.(c) | 11/01/2022 | 9.000 | % | 1,500,000 | 1,560,000 | ||||||||||||||
Triumph Group, Inc. | 06/01/2022 | 5.250 | % | 1,135,000 | 1,135,000 | ||||||||||||||
4,026,617 | |||||||||||||||||||
Banks - 1.60% | |||||||||||||||||||
SunTrust Capital III | 03/15/2028 | 2.769 | % | 1,000,000 | 942,500 | ||||||||||||||
Commercial Services - 5.50% | |||||||||||||||||||
| Nielsen Co. Luxembourg SARL (The)(b)(c) | 10/01/2021 | 5.500 | % | 1,844,000 | 1,846,305 | ||||||||||||||
| Prime Security Services Borrower LLC / Prime Finance, Inc.(b)(c) | 05/15/2023 | 9.250 | % | 804,000 | 845,205 | ||||||||||||||
Refinitiv US Holdings, Inc.(c) | 05/15/2026 | 6.250 | % | 500,000 | 545,000 | ||||||||||||||
3,236,510 | |||||||||||||||||||
Computers & Computer Services - 3.70% | |||||||||||||||||||
Everi Payments, Inc.(c) | 12/15/2025 | 7.500 | % | 263,000 | 277,465 | ||||||||||||||
NCR Corp. | 07/15/2022 | 5.000 | % | 1,882,000 | 1,900,349 | ||||||||||||||
2,177,814 | |||||||||||||||||||
See Notes to Financial Statements.
Semi-Annual Report | November 30, 2019
29
Water Island Credit Opportunities Fund Portfolio of Investments (continued)
November 30, 2019 (Unaudited)
| Maturity Date | Rate | Principal Amount | Value | ||||||||||||||||
CORPORATE BONDS - 81.10% (Continued) | |||||||||||||||||||
Electronics - 1.25% | |||||||||||||||||||
APX Group, Inc. | 12/01/2020 | 8.750 | % | $ | 750,000 | $ | 734,063 | ||||||||||||
Entertainment - 14.01% | |||||||||||||||||||
Eldorado Resorts, Inc.(b) | |||||||||||||||||||
08/01/2023 | 7.000 | % | 1,329,000 | 1,388,805 | |||||||||||||||
04/01/2025 | 6.000 | % | 1,180,000 | 1,241,950 | |||||||||||||||
Scientific Games International, Inc. | 12/01/2022 | 10.000 | % | 3,039,000 | 3,119,533 | ||||||||||||||
| Stars Group Holdings B.V. / Stars Group US Co-Borrower LLC(c) | 07/15/2026 | 7.000 | % | 2,316,000 | 2,501,280 | ||||||||||||||
8,251,568 | |||||||||||||||||||
Environmental Control - 1.77% | |||||||||||||||||||
Advanced Disposal Services, Inc.(c) | 11/15/2024 | 5.625 | % | 1,000,000 | 1,043,750 | ||||||||||||||
Food - 2.17% | |||||||||||||||||||
TreeHouse Foods, Inc.(b) | 03/15/2022 | 4.875 | % | 1,270,000 | 1,276,350 | ||||||||||||||
Food Service - 2.88% | |||||||||||||||||||
Aramark Services, Inc.(b) | 01/15/2024 | 5.125 | % | 1,650,000 | 1,697,438 | ||||||||||||||
Household Products - 4.82% | |||||||||||||||||||
Avon International Operations, Inc.(b)(c) | 08/15/2022 | 7.875 | % | 1,249,000 | 1,300,521 | ||||||||||||||
Edgewell Personal Care Co. | 05/19/2021 | 4.700 | % | 1,500,000 | 1,535,250 | ||||||||||||||
2,835,771 | |||||||||||||||||||
Internet - 4.24% | |||||||||||||||||||
Zayo Group LLC / Zayo Capital, Inc.(b) | 04/01/2023 | 6.000 | % | 1,500,000 | 1,537,534 | ||||||||||||||
Zayo Group LLC / Zayo Capital, Inc.(c) | 01/15/2027 | 5.750 | % | 941,000 | 959,820 | ||||||||||||||
2,497,354 | |||||||||||||||||||
Lodging - 2.81% | |||||||||||||||||||
| Jack Ohio Finance LLC / Jack Ohio Finance 1 Corp.(c) | 11/15/2021 | 6.750 | % | 1,623,000 | 1,655,460 | ||||||||||||||
Machinery - Construction & Mining - 1.78% | |||||||||||||||||||
Vertiv Group Corp.(c) | 10/15/2024 | 9.250 | % | 1,067,000 | 1,048,328 | ||||||||||||||
Media - 1.37% | |||||||||||||||||||
TEGNA, Inc. | 07/15/2020 | 5.125 | % | 802,000 | 804,005 | ||||||||||||||
Mining - 3.38% | |||||||||||||||||||
Aleris International, Inc.(b)(c) | 07/15/2023 | 10.750 | % | 1,901,000 | 1,988,921 | ||||||||||||||
Oil & Gas - 3.40% | |||||||||||||||||||
QEP Resources, Inc. | 03/01/2021 | 6.875 | % | 1,975,000 | 2,003,045 | ||||||||||||||
See Notes to Financial Statements.
www.arbitragefunds.com | 1-800-295-4485
30
Water Island Credit Opportunities Fund Portfolio of Investments (continued)
November 30, 2019 (Unaudited)
| Maturity Date | Rate | Principal Amount | Value | ||||||||||||||||
CORPORATE BONDS - 81.10% (Continued) | |||||||||||||||||||
Pharmaceuticals - 2.61% | |||||||||||||||||||
Bausch Health Companies, Inc.(c) | 03/15/2022 | 6.500 | % | $ | 1,500,000 | $ | 1,539,375 | ||||||||||||
Pipelines - 5.97% | |||||||||||||||||||
NuStar Logistics LP | 09/01/2020 | 4.800 | % | 1,492,000 | 1,502,724 | ||||||||||||||
| SemGroup Corp. / Rose Rock Finance Corp. | |||||||||||||||||||
07/15/2022 | 5.625 | % | 1,000,000 | 1,008,126 | |||||||||||||||
11/15/2023 | 5.625 | % | 979,000 | 1,003,475 | |||||||||||||||
3,514,325 | |||||||||||||||||||
Software - 3.51% | |||||||||||||||||||
TIBCO Software, Inc.(c) | 12/01/2021 | 11.375 | % | 2,000,000 | 2,065,000 | ||||||||||||||
Telecommunications - 4.44% | |||||||||||||||||||
T-Mobile USA, Inc. | 03/01/2023 | 6.000 | % | 2,568,000 | 2,612,683 | ||||||||||||||
Toys/Games/Hobbies - 3.05% | |||||||||||||||||||
Mattel, Inc. | 08/15/2021 | 2.350 | % | 1,785,000 | 1,798,387 | ||||||||||||||
| TOTAL CORPORATE BONDS (Cost $47,720,171) | 47,749,264 | ||||||||||||||||||
CONVERTIBLE CORPORATE BONDS - 11.57% | |||||||||||||||||||
Biotechnology - 2.93% | |||||||||||||||||||
Medicines Co. | 07/15/2023 | 2.750 | % | 1,000,000 | 1,727,535 | ||||||||||||||
Pharmaceuticals - 2.62% | |||||||||||||||||||
Jazz Investments I Ltd. | 08/15/2021 | 1.875 | % | 1,500,000 | 1,540,343 | ||||||||||||||
Semiconductors - 4.33% | |||||||||||||||||||
Rovi Corp.(b) | 03/01/2020 | 0.500 | % | 1,000,000 | 993,243 | ||||||||||||||
Synaptics, Inc.(b) | 06/15/2022 | 0.500 | % | 1,500,000 | 1,558,332 | ||||||||||||||
2,551,575 | |||||||||||||||||||
Software - 1.69% | |||||||||||||||||||
Nuance Communications, Inc.(b) | 12/15/2035 | 1.000 | % | 1,000,000 | 992,781 | ||||||||||||||
| TOTAL CONVERTIBLE CORPORATE BONDS (Cost $6,659,737) | 6,812,234 | ||||||||||||||||||
Shares | Value | ||||||||||||||||||
WARRANTS - 0.01% | |||||||||||||||||||
Telecommunications - 0.01% | |||||||||||||||||||
Avaya Holdings Corp., Exercise Price $25.55, Expires 12/15/2022(a)(d) | 3,017 | $ | 4,616 | ||||||||||||||||
| TOTAL WARRANTS (Cost $0) | 4,616 | ||||||||||||||||||
See Notes to Financial Statements.
Semi-Annual Report | November 30, 2019
31
Water Island Credit Opportunities Fund Portfolio of Investments (continued)
November 30, 2019 (Unaudited)
| Expiration Date | Exercise Price | Notional Amount | Contracts | Value | |||||||||||||||||||
PURCHASED OPTIONS(a) - 0.13% | |||||||||||||||||||||||
Call Options Purchased - 0.13% | |||||||||||||||||||||||
Aramark | 12/2019 | $ | 45.00 | $ | 344,756 | 79 | $ | 2,765 | |||||||||||||||
Edgewell Personal Care Co. | 02/2020 | 35.00 | 74,784 | 24 | 2,280 | ||||||||||||||||||
Emerson Electric Co. | 01/2020 | 70.00 | 96,018 | 13 | 6,435 | ||||||||||||||||||
Everi Holdings, Inc. | 03/2020 | 12.50 | 44,451 | 33 | 5,610 | ||||||||||||||||||
NCR Corp. | 01/2020 | 30.00 | 160,867 | 49 | 16,415 | ||||||||||||||||||
Northern Oil and Gas, Inc. | 01/2020 | 2.00 | 106,800 | 600 | 4,500 | ||||||||||||||||||
Paratek Pharmaceuticals, Inc. | 12/2019 | 5.00 | 14,650 | 50 | 375 | ||||||||||||||||||
QEP Resources, Inc. | 01/2020 | 4.00 | 101,370 | 310 | 3,875 | ||||||||||||||||||
Stars Group, Inc. | 02/2020 | 22.50 | 140,882 | 58 | 12,905 | ||||||||||||||||||
Triumph Group, Inc. | 12/2019 | 25.00 | 207,825 | 75 | 23,063 | ||||||||||||||||||
| TOTAL CALL OPTIONS PURCHASED (Cost $84,028) | 78,223 | ||||||||||||||||||||||
| TOTAL PURCHASED OPTIONS (Cost $84,028) | 78,223 | ||||||||||||||||||||||
| Total Investments - 94.85% (Cost $55,683,294) | 55,847,849 | ||||||||||||||||||||||
Other Assets in Excess of Liabilities - 5.15%(e) | 3,031,467 | ||||||||||||||||||||||
NET ASSETS - 100.00% | $ | 58,879,316 | |||||||||||||||||||||
Portfolio Footnotes
(a) Non-income-producing security.
(b) Security, or a portion of security, is being held as collateral for short sales, written option contracts or forward foreign currency exchange contracts. At November 30, 2019, the aggregate fair market value of those securities was $16,453,254, representing 27.94% of net assets.
(c) Security exempt from registration under Rule 144A of the Securities Act of 1933. These securities may be resold in transactions exempt from registration, normally to qualified institutional buyers. As of November 30, 2019, these securities had a total value of $19,176,430 or 32.57% of net assets.
(d) Security in default on interest payments.
(e) Includes cash held as collateral for short sales and written option contracts.
SCHEDULE OF SECURITIES SOLD SHORT | Shares | Value | |||||||||
COMMON STOCKS - (6.75%) | |||||||||||
Aerospace & Defense - (0.35%) | |||||||||||
Triumph Group, Inc. | (7,475 | ) | $ | (207,132 | ) | ||||||
Biotechnology - (2.19%) | |||||||||||
Medicines Co. | (15,300 | ) | (1,288,260 | ) | |||||||
See Notes to Financial Statements.
www.arbitragefunds.com | 1-800-295-4485
32
Water Island Credit Opportunities Fund Portfolio of Investments (continued)
November 30, 2019 (Unaudited)
SCHEDULE OF SECURITIES SOLD SHORT | Shares | Value | |||||||||
COMMON STOCKS - (6.75%) (Continued) | |||||||||||
Computers & Computer Services - (0.27%) | |||||||||||
NCR Corp. | (4,900 | ) | $ | (160,867 | ) | ||||||
Electrical Components & Equipment - (0.16%) | |||||||||||
Emerson Electric Co. | (1,300 | ) | (96,018 | ) | |||||||
Entertainment - (0.32%) | |||||||||||
Everi Holdings, Inc. | (3,300 | ) | (44,451 | ) | |||||||
Stars Group, Inc. (The) | (5,836 | ) | (141,757 | ) | |||||||
(186,208 | ) | ||||||||||
Environmental Control - (0.09%) | |||||||||||
Advanced Disposal Services, Inc. | (1,634 | ) | (53,840 | ) | |||||||
Food Service - (0.43%) | |||||||||||
Aramark | (5,850 | ) | (255,294 | ) | |||||||
Household Products - (0.24%) | |||||||||||
Avon Products, Inc. | (17,152 | ) | (78,728 | ) | |||||||
Edgewell Personal Care Co. | (1,900 | ) | (59,204 | ) | |||||||
(137,932 | ) | ||||||||||
Lodging - (0.10%) | |||||||||||
Caesars Entertainment Corp. | (4,500 | ) | (58,680 | ) | |||||||
Oil & Gas - (0.26%) | |||||||||||
Northern Oil and Gas, Inc. | (40,000 | ) | (71,200 | ) | |||||||
QEP Resources, Inc. | (25,000 | ) | (81,750 | ) | |||||||
(152,950 | ) | ||||||||||
Pharmaceuticals - (0.46%) | |||||||||||
Jazz Pharmaceuticals Plc | (1,800 | ) | (272,016 | ) | |||||||
Pipelines - (0.14%) | |||||||||||
SemGroup Corp., Class A | (5,463 | ) | (83,966 | ) | |||||||
Semiconductors - (0.85%) | |||||||||||
Synaptics, Inc. | (8,700 | ) | (497,292 | ) | |||||||
Software - (0.50%) | |||||||||||
Nuance Communications, Inc. | (16,500 | ) | (295,845 | ) | |||||||
Telecommunications - (0.39%) | |||||||||||
Zayo Group Holdings, Inc. | (6,607 | ) | (226,224 | ) | |||||||
| TOTAL COMMON STOCKS (Proceeds $3,809,280) | (3,972,524 | ) | |||||||||
| TOTAL SECURITIES SOLD SHORT (Proceeds $3,809,280) | $ | (3,972,524 | ) | ||||||||
See Notes to Financial Statements.
Semi-Annual Report | November 30, 2019
33
Water Island Credit Opportunities Fund Portfolio of Investments (continued)
November 30, 2019 (Unaudited)
EQUITY SWAP CONTRACTS
| Swap Counterparty/ Payment Frequency | Reference Obligation | Rate Paid/ Received by the Fund | Termination Date | Upfront Payments Paid | Upfront Payments Received | Market Value | Notional Amount | Unrealized Appreciation | |||||||||||||||||||||||||||
| Morgan Stanley & Co./ Monthly | SPDR Bloomberg Barclays High Yield Bond ETF | Received 1 Month- Federal Rate Minus 113 Bps (1.150%) | 08/19/2021 | $ | — | $ | — | $ | — | $ | 2,347,294 | $ | — | ||||||||||||||||||||||
| Morgan Stanley & Co./ Monthly | SemGroup Corp., Class A | Received 1 Month- Federal Rate Minus 40 Bps (1.150%) | 08/19/2021 | — | — | — | 138,330 | — | |||||||||||||||||||||||||||
$ | — | $ | 2,485,624 | $ | — | ||||||||||||||||||||||||||||||
The following is a summary of investments classified by country exposure:
Country | % of Net Assets(a) | ||||||
Netherlands | 4.24 | % | |||||
Luxembourg | 3.14 | % | |||||
Ireland | 2.62 | % | |||||
United States | 84.85 | % | |||||
Other Assets in Excess of Liabilities | 5.15 | % | |||||
100.00 | % | ||||||
(a) These percentages represent long positions only and are not net of short positions.
Abbreviations:
bps - Basis Points. 100 Basis Points is equal to 1 percentage point.
ETF - Exchange-Traded Fund
LIBOR - London Interbank Offered Rate
LLC - Limited Liability Company
LP - Limited Partnership
Ltd. - Limited
Plc - Public Limited Company
SARL - Société Anonyme à Responsabilité Limitée is the French term for limited liability company.
SPDR - Standard & Poor's Depositary Receipt
USD - United States Dollar
See Notes to Financial Statements.
www.arbitragefunds.com | 1-800-295-4485
34
Water Island Credit Opportunities Fund Portfolio of Investments (continued)
November 30, 2019 (Unaudited)
The following table summarizes Water Island Credit Opportunities Fund's investments and derivative financial instruments categorized in the disclosure hierarchy as of November 30, 2019:
Investments in Securities at Value* | Level 1 | Level 2 | Level 3 | Total | |||||||||||||||
Assets | |||||||||||||||||||
Common Stocks** | $ | 21,671 | $ | — | $ | — | $ | 21,671 | |||||||||||
Limited Partnerships | 174,481 | — | — | 174,481 | |||||||||||||||
Bank Loans | — | 1,007,360 | — | 1,007,360 | |||||||||||||||
Corporate Bonds** | — | 47,749,264 | — | 47,749,264 | |||||||||||||||
Convertible Corporate Bonds** | — | 6,812,234 | — | 6,812,234 | |||||||||||||||
Warrants | — | 4,616 | — | 4,616 | |||||||||||||||
Purchased Options | 78,223 | — | — | 78,223 | |||||||||||||||
TOTAL | $ | 274,375 | $ | 55,573,474 | $ | — | $ | 55,847,849 | |||||||||||
Other Financial Instruments*** | |||||||||||||||||||
Liabilities | |||||||||||||||||||
Common Stocks** | (3,972,524 | ) | — | — | (3,972,524 | ) | |||||||||||||
TOTAL | $ | (3,972,524 | ) | $ | — | $ | — | $ | (3,972,524 | ) | |||||||||
* Refer to footnote 2 where leveling hierarchy is defined.
** Refer to Portfolio of Investments for sector information.
*** Other financial instruments are instruments such as written options, securities sold short and equity swaps.
The following is a reconciliation of the fair valuations using significant unobservable inputs (Level 3) for the Fund's assets and liabilities during the period ended November 30, 2019:
| Investments in Securities | Balance as of May 31, 2019 | Change in Unrealized (Depreciation) | Purchases | Sales Proceeds | Amortization Premium/ Discount | Transfers into Level 3 | Transfers out of Level 3 | Balance as of November 30, 2019 | Net change in Unrealized (Depreciation) included in the Statement of Operations attributable to Level 3 investments held at November 30, 2019 | ||||||||||||||||||||||||||||||
| Corporate Bonds | $ | 0 | $ | 4 | $ | — | $ | 4 | $ | — | $ | — | $ | — | $ | — | $ | — | |||||||||||||||||||||
Total | $ | 0 | $ | 4 | $ | — | $ | 4 | $ | — | $ | — | $ | — | $ | — | $ | — | |||||||||||||||||||||
See Notes to Financial Statements.
Semi-Annual Report | November 30, 2019
35
Water Island Long/Short Fund Portfolio Information
November 30, 2019 (Unaudited)
Performance (annualized returns as of November 30, 2019)
| One Year | Five Year | Ten Year | Since Inception* | ||||||||||||||||
Water Island Long/Short Fund, Class R | 4.74 | % | N/A | N/A | 0.75 | % | |||||||||||||
Water Island Long/Short Fund, Class I | 4.74 | % | N/A | N/A | 0.75 | % | |||||||||||||
S&P 500® Index | 16.11 | % | N/A | N/A | 10.99 | % | |||||||||||||
ICE BofA Merrill Lynch U.S. 3-Month Treasury Bill Index | 2.32 | % | N/A | N/A | 1.06 | % | |||||||||||||
Current performance may be higher or lower than performance quoted above. Any performance data quoted represents past performance and the investment return and principal value of an investment in the Fund will fluctuate so that an investor's shares, when redeemed, may be worth more or less than their original cost. Past performance is no guarantee of future results. Returns shown above include the reinvestment of all dividends and capital gains. Performance results do not include adjustments made for financial reporting purposes in accordance with U.S. generally accepted accounting principles and may differ from the amount reported in the Financial Highlights. Contractual fee waivers are currently in effect. Without such fee waivers, performance numbers would be reduced. You can obtain performance data current to the most recent month end by calling 1-800-295-4485 or going to www.arbitragefunds.com.
* Class R and Class I inception: 12/31/14. The "Since Inception" returns for securities indices are for the inception date of Class R and Class I shares.
The Total Annual Fund Operating Expenses for Class R and Class I are 11.80%, 11.55%, respectively. The Adviser has agreed to waive fees (not including the effects of interest, dividends on short positions, brokerage commissions, acquired fund fees and expenses, taxes, or other extraordinary expenses) in excess of 1.69%, 1.44%, for Class R and Class I, respectively, until at least September 30, 2020. These expense ratios are as stated in the current prospectus and may differ from the expense ratios disclosed in the financial highlights in this report.
The S&P 500® Index is an unmanaged index consisting of 500 stocks.
The ICE Bank of America (BofA) Merrill Lynch U.S. 3-Month Treasury Bill Index tracks the performance of the U.S. dollar denominated U.S. Treasury Bills publicly issued in the U.S. domestic market with a remaining term to final maturity of less than 3 months.
An investor may not invest directly in an index.
www.arbitragefunds.com | 1-800-295-4485
36
Water Island Long/Short Fund Portfolio Information (continued)
November 30, 2019 (Unaudited)
Growth of $10,000 Investment
The chart represents historical performance of a hypothetical investment of $10,000 in the Class R shares of the Fund since inception. Past performance does not guarantee future results. This chart does not reflect the deduction of taxes that a shareholder would pay on Fund distributions or the redemption of Fund shares.

Sector Weighting
The following chart shows the sector weightings of the Water Island Long/Short Fund's investments (including short sales and excluding derivatives) as of the report date.
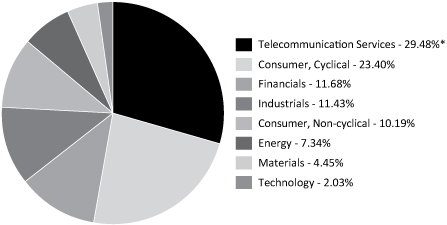
* Concentration Risk: The Fund may invest a large proportion of the Fund's assets in securities of issuers in a single sector over a given time. During such a period of concentration, the Fund may be subject to greater volatility with respect to its portfolio securities than a fund that is more broadly diversified.
Semi-Annual Report | November 30, 2019
37
Water Island Long/Short Fund Portfolio of Investments
November 30, 2019 (Unaudited)
Shares | Value | ||||||||||
COMMON STOCKS - 65.41% | |||||||||||
Chemicals - 2.53% | |||||||||||
Axalta Coating Systems Ltd.(a)(b) | 698 | $ | 19,872 | ||||||||
Ferro Corp.(a) | 1,911 | 27,557 | |||||||||
47,429 | |||||||||||
Commercial Services - 1.26% | |||||||||||
Global Payments, Inc.(b) | 67 | 12,134 | |||||||||
Herc Holdings, Inc.(a)(b) | 244 | 11,409 | |||||||||
23,543 | |||||||||||
Computers & Computer Services - 1.34% | |||||||||||
HP, Inc.(b) | 1,249 | 25,080 | |||||||||
Construction Materials - 3.13% | |||||||||||
Masco Corp.(b) | 1,257 | 58,513 | |||||||||
Distribution/Wholesale - 5.13% | |||||||||||
Anixter International, Inc.(a)(b) | 789 | 67,728 | |||||||||
HD Supply Holdings, Inc.(a)(b) | 713 | 28,391 | |||||||||
96,119 | |||||||||||
Diversified Financial Services - 3.42% | |||||||||||
Aircastle Ltd.(b) | 2,000 | 63,980 | |||||||||
Electronics - 3.06% | |||||||||||
Tech Data Corp.(a)(c) | 395 | 57,231 | |||||||||
Energy - Alternate Sources - 1.94% | |||||||||||
Pattern Energy Group, Inc., Class A(b) | 1,323 | 36,409 | |||||||||
Insurance - 3.49% | |||||||||||
American Equity Investment Life Holding Co.(b) | 2,200 | 65,384 | |||||||||
Internet - 4.23% | |||||||||||
NortonLifeLock, Inc.(b)(c) | 3,181 | 79,207 | |||||||||
Lodging - 3.95% | |||||||||||
Hilton Grand Vacations, Inc.(a)(b) | 800 | 27,704 | |||||||||
Wyndham Hotels & Resorts, Inc.(b) | 800 | 46,344 | |||||||||
74,048 | |||||||||||
Media - 10.87% | |||||||||||
Discovery, Inc., Class C(a)(b) | 1,379 | 42,087 | |||||||||
Kabel Deutschland Holding AG(b) | 553 | 62,752 | |||||||||
Liberty Broadband Corp., Class A(a) | 835 | 98,789 | |||||||||
203,628 | |||||||||||
See Notes to Financial Statements.
www.arbitragefunds.com | 1-800-295-4485
38
Water Island Long/Short Fund Portfolio of Investments (continued)
November 30, 2019 (Unaudited)
Shares | Value | ||||||||||
COMMON STOCKS - 65.41% (Continued) | |||||||||||
Miscellaneous Manufacturing - 1.31% | |||||||||||
Ingersoll-Rand Plc(b) | 187 | $ | 24,518 | ||||||||
Oil & Gas - 2.91% | |||||||||||
Marathon Petroleum Corp.(b)(c) | 900 | 54,576 | |||||||||
Pharmaceuticals - 5.97% | |||||||||||
McKesson Europe AG(b) | 2,223 | 64,166 | |||||||||
Paratek Pharmaceuticals, Inc.(b) | 1,575 | 4,615 | |||||||||
Recro Pharma, Inc.(a)(b) | 2,600 | 43,004 | |||||||||
111,785 | |||||||||||
Retail - 8.29% | |||||||||||
Tiffany & Co.(c) | 1,160 | 155,208 | |||||||||
Telecommunications - 2.58% | |||||||||||
LogMeIn, Inc.(c) | 620 | 48,348 | |||||||||
| TOTAL COMMON STOCKS (Cost $1,172,730) | 1,225,006 | ||||||||||
WARRANTS - 0.51% | |||||||||||
Leisure Time - 0.51% | |||||||||||
| OneSpaWorld Holdings Ltd., Exercise Price $11.50, Expires 03/19/2024(a)(b) | 1,750 | 9,607 | |||||||||
| TOTAL WARRANTS (Cost $7,884) | 9,607 | ||||||||||
| Expiration Date | Exercise Price | Notional Amount | Contracts | Value | |||||||||||||||||||
PURCHASED OPTIONS(a) - 0.55% | |||||||||||||||||||||||
Call Options Purchased - 0.46% | |||||||||||||||||||||||
| ServiceMaster Global Holdings, Inc. | 05/2020 | $ | 40.00 | $ | 70,542 | 18 | $ | 7,110 | |||||||||||||||
Xerox Holdings Corp. | 01/2020 | 40.00 | 46,716 | 12 | 1,416 | ||||||||||||||||||
| TOTAL CALL OPTIONS PURCHASED (Cost $5,854) | 8,526 | ||||||||||||||||||||||
Put Options Purchased - 0.09% | |||||||||||||||||||||||
Avaya Holdings Corp. | 12/2019 | 10.00 | 51,080 | 40 | 100 | ||||||||||||||||||
DXC Technology Co. | 12/2019 | 27.50 | 55,995 | 15 | 75 | ||||||||||||||||||
Everi Holdings, Inc. | 12/2019 | 7.50 | 70,044 | 52 | 260 | ||||||||||||||||||
iShares Russell 2000 ETF | 12/2019 | 140.00 | 404,425 | 25 | 125 | ||||||||||||||||||
LogMeIn, Inc. | 12/2019 | 70.00 | 62,384 | 8 | 460 | ||||||||||||||||||
Lowe's Companies, Inc. | 01/2020 | 100.00 | 35,193 | 3 | 83 | ||||||||||||||||||
Marathon Petroleum Corp. | 12/2019 | 59.00 | 18,192 | 3 | 342 | ||||||||||||||||||
NortonLifeLock, Inc. | 01/2020 | 20.00 | 17,430 | 7 | 42 | ||||||||||||||||||
See Notes to Financial Statements.
Semi-Annual Report | November 30, 2019
39
Water Island Long/Short Fund Portfolio of Investments (continued)
November 30, 2019 (Unaudited)
| Expiration Date | Exercise Price | Notional Amount | Contracts | Value | |||||||||||||||||||
PURCHASED OPTIONS(a) - 0.55% (Continued) | |||||||||||||||||||||||
Put Options Purchased - 0.09% (Continued) | |||||||||||||||||||||||
Tech Data Corp. | 12/2019 | $ | 110.00 | $ | 43,467 | 3 | $ | 8 | |||||||||||||||
Tiffany & Co. | 02/2020 | 110.00 | 13,380 | 1 | 225 | ||||||||||||||||||
| TOTAL PUT OPTIONS PURCHASED (Cost $22,012) | 1,720 | ||||||||||||||||||||||
| TOTAL PURCHASED OPTIONS (Cost $27,866) | 10,246 | ||||||||||||||||||||||
Yield | Shares | Value | |||||||||||||
SHORT-TERM INVESTMENTS - 35.70% | |||||||||||||||
Money Market Funds | |||||||||||||||
| Morgan Stanley Institutional Liquidity Fund Government Portfolio, Institutional Class | 1.570 | %(d) | 334,266 | $ | 334,266 | ||||||||||
| State Street Institutional U.S. Government Money Market Fund, Premium Class | 1.590 | %(d) | 334,266 | 334,266 | |||||||||||
668,532 | |||||||||||||||
| TOTAL SHORT-TERM INVESTMENTS (Cost $668,532) | 668,532 | ||||||||||||||
| Total Investments - 102.17% (Cost $1,877,012) | 1,913,391 | ||||||||||||||
Liabilities in Excess of Other Assets - (2.17)%(e) | (40,646 | ) | |||||||||||||
NET ASSETS - 100.00% | $ | 1,872,745 | |||||||||||||
Portfolio Footnotes
(a) Non-income-producing security.
(b) Security, or a portion of security, is being held as collateral for short sales, written option contracts or forward foreign currency exchange contracts. At November 30, 2019, the aggregate fair market value of those securities was $677,376, representing 36.17% of net assets.
(c) Underlying security for a written/purchased call/put option.
(d) Rate shown is the 7-day effective yield as of November 30, 2019.
(e) Includes cash held as collateral for short sales and written option contracts.
SCHEDULE OF SECURITIES SOLD SHORT | Shares | Value | |||||||||
COMMON STOCKS - (18.15%) | |||||||||||
Chemicals - (1.19%) | |||||||||||
PPG Industries, Inc. | (104 | ) | $ | (13,399 | ) | ||||||
RPM International, Inc. | (57 | ) | (4,203 | ) | |||||||
Sherwin-Williams Co. (The) | (8 | ) | (4,665 | ) | |||||||
(22,267 | ) | ||||||||||
See Notes to Financial Statements.
www.arbitragefunds.com | 1-800-295-4485
40
Water Island Long/Short Fund Portfolio of Investments (continued)
November 30, 2019 (Unaudited)
Shares | Value | ||||||||||
COMMON STOCKS - (18.15%) (Continued) | |||||||||||
Commercial Services - (0.22%) | |||||||||||
United Rentals, Inc. | (27 | ) | $ | (4,132 | ) | ||||||
Construction Materials - (0.90%) | |||||||||||
Builders FirstSource, Inc. | (47 | ) | (1,194 | ) | |||||||
Fortune Brands Home & Security, Inc. | (91 | ) | (5,757 | ) | |||||||
JELD-WEN Holding, Inc. | (196 | ) | (4,459 | ) | |||||||
Masonite International Corp.(a) | (75 | ) | (5,385 | ) | |||||||
(16,795 | ) | ||||||||||
Distribution/Wholesale - (1.08%) | |||||||||||
Fastenal Co. | (111 | ) | (3,943 | ) | |||||||
Watsco, Inc. | (22 | ) | (3,915 | ) | |||||||
WESCO International, Inc. | (156 | ) | (8,209 | ) | |||||||
WW Grainger, Inc. | (13 | ) | (4,120 | ) | |||||||
(20,187 | ) | ||||||||||
Food Service - (0.46%) | |||||||||||
Aramark | (198 | ) | (8,641 | ) | |||||||
Healthcare - Services - (1.06%) | |||||||||||
Pennant Group, Inc. | (850 | ) | (19,907 | ) | |||||||
Insurance - (2.40%) | |||||||||||
Athene Holding Ltd., Class A | (255 | ) | (11,480 | ) | |||||||
Lincoln National Corp. | (178 | ) | (10,511 | ) | |||||||
Manulife Financial Corp. | (594 | ) | (11,690 | ) | |||||||
Unum Group | (366 | ) | (11,251 | ) | |||||||
(44,932 | ) | ||||||||||
Leisure Time - (0.55%) | |||||||||||
OneSpaWorld Holdings Ltd. | (629 | ) | (10,272 | ) | |||||||
Machinery - Diversified - (1.16%) | |||||||||||
Gardner Denver Holdings, Inc. | (644 | ) | (21,812 | ) | |||||||
Media - (6.95%) | |||||||||||
Charter Communications, Inc., Class A | (188 | ) | (88,362 | ) | |||||||
Discovery, Inc., Class A | (1,270 | ) | (41,802 | ) | |||||||
(130,164 | ) | ||||||||||
Office/Business Equip - (0.36%) | |||||||||||
Xerox Holdings Corp. | (171 | ) | (6,657 | ) | |||||||
See Notes to Financial Statements.
Semi-Annual Report | November 30, 2019
41
Water Island Long/Short Fund Portfolio of Investments (continued)
November 30, 2019 (Unaudited)
Shares | Value | ||||||||||
COMMON STOCKS - (18.15%) (Continued) | |||||||||||
Oil & Gas - (1.28%) | |||||||||||
HollyFrontier Corp. | (170 | ) | $ | (8,763 | ) | ||||||
Murphy USA, Inc. | (43 | ) | (5,054 | ) | |||||||
Valero Energy Corp. | (106 | ) | (10,122 | ) | |||||||
(23,939 | ) | ||||||||||
Real Estate Investment Trusts - (0.45%) | |||||||||||
Uniti Group, Inc. | (1,250 | ) | (8,400 | ) | |||||||
Retail - (0.09%) | |||||||||||
Beacon Roofing Supply, Inc. | (24 | ) | (711 | ) | |||||||
MSC Industrial Direct Co., Inc., Class A | (14 | ) | (1,028 | ) | |||||||
(1,739 | ) | ||||||||||
| TOTAL COMMON STOCKS (Proceeds $329,410) | (339,844 | ) | |||||||||
| TOTAL SECURITIES SOLD SHORT (Proceeds $329,410) | $ | (339,844 | ) | ||||||||
WRITTEN OPTIONS | Expiration Date | Exercise Price | Notional Amount | Contracts | Value | ||||||||||||||||||
Written Call Options | |||||||||||||||||||||||
Marathon Petroleum Corp. | 12/2019 | $ | 65.00 | $ | (18,192 | ) | (3 | ) | $ | (119 | ) | ||||||||||||
| TOTAL WRITTEN CALL OPTIONS (Premiums received $223) | (119 | ) | |||||||||||||||||||||
Written Put Options | |||||||||||||||||||||||
Envista Holdings Corp. | 12/2019 | 35.00 | (42,180 | ) | (15 | ) | (11,100 | ) | |||||||||||||||
iShares Russell 2000 ETF | 12/2019 | 130.00 | (404,425 | ) | (25 | ) | (50 | ) | |||||||||||||||
| TOTAL WRITTEN PUT OPTIONS (Premiums received $18,679) | (11,150 | ) | |||||||||||||||||||||
| TOTAL WRITTEN OPTIONS (Premiums received $18,902) | $ | (11,269 | ) | ||||||||||||||||||||
See Notes to Financial Statements.
www.arbitragefunds.com | 1-800-295-4485
42
Water Island Long/Short Fund Portfolio of Investments (continued)
November 30, 2019 (Unaudited)
EQUITY SWAP CONTRACTS
| Swap Counterparty/ Payment Frequency | Reference Obligation | Rate Paid/ Received by the Fund | Termination Date | Upfront Payments Paid | Upfront Payments Received | Market Value | Notional Amount | Unrealized Appreciation | |||||||||||||||||||||||||||
| Morgan Stanley & Co./Monthly | MPLX LP | Received 1- Month FED minus 40 bps (1.150%) | 10/28/2021 | $ | — | $ | — | $ | — | $ | 13,433 | $ | — | ||||||||||||||||||||||
OUTSTANDING FORWARD FOREIGN CURRENCY EXCHANGE CONTRACTS
| Currency Purchased | Currency Sold | Counterparty | Settlement Date | Unrealized Appreciation | |||||||||||||||
USD | 132,941 | EUR | 120,070 | Goldman Sachs & Co. | 12/16/2019 | $ | 536 | ||||||||||||
| Currency Purchased | Currency Sold | Counterparty | Settlement Date | Unrealized Depreciation | |||||||||||||||
EUR | 4,320 | USD | 4,764 | Goldman Sachs & Co. | 12/16/2019 | $ | (1 | ) | |||||||||||
The following is a summary of investments classified by country exposure:
Country | % of Net Assets(a) | ||||||
Germany | 6.77 | % | |||||
Bahamas | 0.51 | % | |||||
United States | 94.89 | % | |||||
Liabilities in Excess of Other Assets | (2.17 | )% | |||||
100.00 | % | ||||||
(a) These percentages represent long positions only and are not net of short positions.
Abbreviations:
AG - Aktiengesellschaft is a German term that refers to a corporation that is limited by shares, i.e., owned by shareholders.
bps - Basis Points. 100 Basis Points is equal to 1 percentage point.
ETF - Exchange-Traded Fund
EUR - Euro
LP - Limited Partnership
Ltd. - Limited
Plc - Public Limited Company
USD - United States Dollar
See Notes to Financial Statements.
Semi-Annual Report | November 30, 2019
43
Water Island Long/Short Fund Portfolio of Investments (continued)
November 30, 2019 (Unaudited)
The following table summarizes Water Island Long/Short Fund's investments and derivative financial instruments categorized in the disclosure hierarchy as of November 30, 2019:
Investments in Securities at Value* | Level 1 | Level 2 | Level 3 | Total | |||||||||||||||
Assets | |||||||||||||||||||
Common Stocks** | $ | 1,225,006 | $ | — | $ | — | $ | 1,225,006 | |||||||||||
Warrants | 9,607 | — | — | 9,607 | |||||||||||||||
Purchased Options | 10,246 | — | — | 10,246 | |||||||||||||||
Short-Term Investments | 668,532 | — | — | 668,532 | |||||||||||||||
TOTAL | $ | 1,913,391 | $ | — | $ | — | $ | 1,913,391 | |||||||||||
Other Financial Instruments*** | |||||||||||||||||||
Assets | |||||||||||||||||||
Forward Foreign Currency Exchange Contracts | $ | — | $ | 536 | $ | — | $ | 536 | |||||||||||
Liabilities | |||||||||||||||||||
Common Stocks** | (339,844 | ) | — | — | (339,844 | ) | |||||||||||||
Written Options | (11,269 | ) | — | — | (11,269 | ) | |||||||||||||
Forward Foreign Currency Exchange Contracts | — | (1 | ) | — | (1 | ) | |||||||||||||
TOTAL | $ | (351,113 | ) | $ | 535 | $ | — | $ | (350,578 | ) | |||||||||
* Refer to footnote 2 where leveling hierarchy is defined.
** Refer to Portfolio of Investments for sector information.
*** Other financial instruments are instruments such as written options, securities sold short and forward foreign currency exchange contracts.
See Notes to Financial Statements.
www.arbitragefunds.com | 1-800-295-4485
44
This Page Intentionally Left Blank
The Arbitrage Funds
Arbitrage Fund | Water Island Diversified Event-Driven Fund | ||||||||||
ASSETS | |||||||||||
Investments: | |||||||||||
At cost of unaffiliated investments | $ | 1,584,464,088 | $ | 121,273,285 | |||||||
At cost of affiliated investments | $ | 25,340,129 | $ | — | |||||||
At fair value of unaffiliated investments (Note 2)(a) | $ | 1,630,209,426 | $ | 123,467,602 | |||||||
At fair value of affiliated investments (Note 2) | $ | 25,780,318 | $ | — | |||||||
Cash | — | 6,465,852 | |||||||||
Cash denominated in foreign currency (Cost $592, $8,964, $0 and $0) | 592 | 8,964 | |||||||||
Deposits with brokers for securities sold short (Note 2) | 352,551,159 | 22,900,279 | |||||||||
Segregated cash for swaps (Note 2) | 24,480,000 | 4,310,000 | |||||||||
Receivable for investment securities sold | 3,959,279 | 562,583 | |||||||||
Receivable for capital shares sold | 963,490 | 46,804 | |||||||||
Unrealized appreciation on forward foreign currency exchange contracts (Note 8) | 1,597,532 | 24,614 | |||||||||
Unrealized appreciation on swap contracts | 21,582 | 1,660 | |||||||||
Receivable for swap contract payments | 19,923,554 | — | |||||||||
Dividends and interest receivable | 1,129,165 | 217,087 | |||||||||
Receivable due from Adviser (Note 5) | — | — | |||||||||
Prepaid expenses and other assets | 882,184 | 57,022 | |||||||||
Total Assets | 2,061,498,281 | 158,062,467 | |||||||||
LIABILITIES | |||||||||||
| Securities sold short, at value (Note 2) (proceeds $329,404,064, $21,766,840, $3,809,280 and $329,410) | 351,237,014 | 23,090,045 | |||||||||
Due to bank | 88,113 | — | |||||||||
Written options, at value (Note 2) (premiums received $44,248, $29,209, $0 and $18,902) | 33,903 | 383 | |||||||||
Line of credit payable (Note 4) | — | 500,000 | |||||||||
Collateral for securities loaned | — | 24,313 | |||||||||
Payable for investment securities purchased | 14,551,510 | 2,982,402 | |||||||||
Unrealized depreciation on forward foreign currency exchange contracts (Note 8) | 6,413,840 | 221,542 | |||||||||
Payable for capital shares redeemed | 1,264,164 | 48,855 | |||||||||
Payable to Adviser (Note 5) | 1,417,959 | 93,451 | |||||||||
Dividends payable on securities sold short | — | 2,082 | |||||||||
Payable to Distributor (Note 5) | 50,211 | 7,084 | |||||||||
Payable to Administrator (Note 5) | 93,161 | 16,906 | |||||||||
Payable to Transfer Agent (Note 5) | 134,038 | 38,897 | |||||||||
Payable to Custodian | 69,538 | 23,110 | |||||||||
Income distribution payable | — | — | |||||||||
Interest expense payable | — | — | |||||||||
Interest payable on swap contracts | 18,185 | 2,523 | |||||||||
Dividend payable on swap contracts | 20,895,540 | 47,131 | |||||||||
Audit and legal fees payable | 55,220 | 17,190 | |||||||||
Payable to Trustees | 23,634 | 14,658 | |||||||||
Chief Compliance Officer Fees payable (Note 5) | 50,837 | 3,487 | |||||||||
Chief Financial Officer Fees payable (Note 5) | 5,308 | 984 | |||||||||
Other accrued expenses and liabilities | 13,912 | 7,807 | |||||||||
Total Liabilities | 396,416,087 | 27,142,850 | |||||||||
NET ASSETS | $ | 1,665,082,194 | $ | 130,919,617 | |||||||
NET ASSETS CONSIST OF: | |||||||||||
Paid-in capital | $ | 1,594,217,638 | $ | 187,564,635 | |||||||
Distributable earnings (Accumulated loss) | 70,864,556 | (56,645,018 | ) | ||||||||
NET ASSETS | $ | 1,665,082,194 | $ | 130,919,617 | |||||||
(a) Includes market value of securities on loan: | $ | — | $ | 21,919 | |||||||
See Notes to Financial Statements.
www.arbitragefunds.com | 1-800-295-4485
46
Statement of Assets and Liabilities
November 30, 2019 (Unaudited)
| Water Island Credit Opportunities Fund | Water Island Long/Short Fund | ||||||||||
ASSETS | |||||||||||
Investments: | |||||||||||
At cost of unaffiliated investments | $ | 55,683,294 | $ | 1,877,012 | |||||||
At cost of affiliated investments | $ | — | $ | — | |||||||
At fair value of unaffiliated investments (Note 2)(a) | $ | 55,847,849 | $ | 1,913,391 | |||||||
At fair value of affiliated investments (Note 2) | $ | — | $ | — | |||||||
Cash | 963,850 | — | |||||||||
Cash denominated in foreign currency (Cost $592, $8,964, $0 and $0) | — | — | |||||||||
Deposits with brokers for securities sold short (Note 2) | 3,980,076 | 342,811 | |||||||||
Segregated cash for swaps (Note 2) | 1,240,000 | — | |||||||||
Receivable for investment securities sold | 490,421 | 1,545 | |||||||||
Receivable for capital shares sold | 44,547 | — | |||||||||
Unrealized appreciation on forward foreign currency exchange contracts (Note 8) | — | 536 | |||||||||
Unrealized appreciation on swap contracts | — | — | |||||||||
Receivable for swap contract payments | — | — | |||||||||
Dividends and interest receivable | 947,723 | 3,197 | |||||||||
Receivable due from Adviser (Note 5) | — | 20,517 | |||||||||
Prepaid expenses and other assets | 38,906 | 27,134 | |||||||||
Total Assets | 63,553,372 | 2,309,131 | |||||||||
LIABILITIES | |||||||||||
| Securities sold short, at value (Note 2) (proceeds $329,404,064, $21,766,840, $3,809,280 and $329,410) | 3,972,524 | 339,844 | |||||||||
Due to bank | — | — | |||||||||
Written options, at value (Note 2) (premiums received $44,248, $29,209, $0 and $18,902) | — | 11,269 | |||||||||
Line of credit payable (Note 4) | 500,000 | — | |||||||||
Collateral for securities loaned | — | — | |||||||||
Payable for investment securities purchased | 28,441 | 34,498 | |||||||||
Unrealized depreciation on forward foreign currency exchange contracts (Note 8) | — | 1 | |||||||||
Payable for capital shares redeemed | 95,223 | — | |||||||||
Payable to Adviser (Note 5) | 17,642 | — | |||||||||
Dividends payable on securities sold short | 2,213 | 420 | |||||||||
Payable to Distributor (Note 5) | 2,047 | 2 | |||||||||
Payable to Administrator (Note 5) | 11,141 | 6,842 | |||||||||
Payable to Transfer Agent (Note 5) | 4,880 | 385 | |||||||||
Payable to Custodian | 3,761 | 8,356 | |||||||||
Income distribution payable | 1,217 | — | |||||||||
Interest expense payable | 404 | — | |||||||||
Interest payable on swap contracts | — | — | |||||||||
Dividend payable on swap contracts | — | — | |||||||||
Audit and legal fees payable | 15,024 | 13,801 | |||||||||
Payable to Trustees | 14,223 | 13,919 | |||||||||
Chief Compliance Officer Fees payable (Note 5) | 1,881 | 67 | |||||||||
Chief Financial Officer Fees payable (Note 5) | 716 | 590 | |||||||||
Other accrued expenses and liabilities | 2,719 | 6,392 | |||||||||
Total Liabilities | 4,674,056 | 436,386 | |||||||||
NET ASSETS | $ | 58,879,316 | $ | 1,872,745 | |||||||
NET ASSETS CONSIST OF: | |||||||||||
Paid-in capital | $ | 61,840,040 | $ | 1,871,041 | |||||||
Distributable earnings (Accumulated loss) | (2,960,724 | ) | 1,704 | ||||||||
NET ASSETS | $ | 58,879,316 | $ | 1,872,745 | |||||||
(a) Includes market value of securities on loan: | $ | — | $ | — | |||||||
Semi-Annual Report | November 30, 2019
47
The Arbitrage Funds
Arbitrage Fund | Water Island Diversified Event-Driven Fund | ||||||||||
PRICING OF SHARES: | |||||||||||
CLASS R SHARES: | |||||||||||
Net assets applicable to Class R shares | $ | 146,026,614 | $ | 30,933,114 | |||||||
Shares of beneficial interest outstanding (unlimited number of shares authorized, no par value) | 11,097,447 | 3,216,547 | |||||||||
Net asset value and offering price per share | $ | 13.16 | $ | 9.62 | |||||||
CLASS I SHARES: | |||||||||||
Net assets applicable to Class I shares | $ | 1,481,059,492 | $ | 98,491,780 | |||||||
Shares of beneficial interest outstanding (unlimited number of shares authorized, no par value) | 109,104,435 | 10,149,759 | |||||||||
Net asset value and offering price per share | $ | 13.57 | $ | 9.70 | |||||||
CLASS C SHARES: | |||||||||||
Net assets applicable to Class C shares | $ | 19,939,024 | $ | 689,262 | |||||||
Shares of beneficial interest outstanding (unlimited number of shares authorized, no par value) | 1,593,040 | 73,344 | |||||||||
Net asset value and offering price per share(a) | $ | 12.52 | $ | 9.40 | |||||||
CLASS A SHARES: | |||||||||||
Net assets applicable to Class A shares | $ | 18,057,064 | $ | 805,461 | |||||||
Shares of beneficial interest outstanding (unlimited number of shares authorized, no par value) | 1,374,664 | 83,793 | |||||||||
Net asset value and offering price per share(a) | $ | 13.14 | $ | 9.61 | |||||||
Maximum offering price per share (NAV/(100% — maximum sales charge)) | $ | 13.48 | $ | 9.93 | |||||||
Maximum sales charge | 2.50 | % | 3.25 | % | |||||||
(a) Redemption price varies based on length of time held (Note 1).
See Notes to Financial Statements.
www.arbitragefunds.com | 1-800-295-4485
48
Statement of Assets and Liabilities
November 30, 2019 (Unaudited)
| Water Island Credit Opportunities Fund | Water Island Long/Short Fund | ||||||||||
PRICING OF SHARES: | |||||||||||
CLASS R SHARES: | |||||||||||
Net assets applicable to Class R shares | $ | 8,440,831 | $ | 10,372 | |||||||
Shares of beneficial interest outstanding (unlimited number of shares authorized, no par value) | 869,566 | 1,031 | |||||||||
Net asset value and offering price per share | $ | 9.71 | $ | 10.06 | |||||||
CLASS I SHARES: | |||||||||||
Net assets applicable to Class I shares | $ | 49,676,922 | $ | 1,862,373 | |||||||
Shares of beneficial interest outstanding (unlimited number of shares authorized, no par value) | 5,141,504 | 185,139 | |||||||||
Net asset value and offering price per share | $ | 9.66 | $ | 10.06 | |||||||
CLASS C SHARES: | |||||||||||
Net assets applicable to Class C shares | $ | 355,990 | $ | — | |||||||
Shares of beneficial interest outstanding (unlimited number of shares authorized, no par value) | 36,807 | — | |||||||||
Net asset value and offering price per share(a) | $ | 9.67 | $ | — | |||||||
CLASS A SHARES: | |||||||||||
Net assets applicable to Class A shares | $ | 405,573 | $ | — | |||||||
Shares of beneficial interest outstanding (unlimited number of shares authorized, no par value) | 41,991 | — | |||||||||
Net asset value and offering price per share(a) | $ | 9.66 | $ | — | |||||||
Maximum offering price per share (NAV/(100% — maximum sales charge)) | $ | 9.98 | $ | — | |||||||
Maximum sales charge | 3.25 | % | — | ||||||||
Semi-Annual Report | November 30, 2019
49
The Arbitrage Funds
Arbitrage Fund | Water Island Diversified Event-Driven Fund | ||||||||||
INVESTMENT INCOME | |||||||||||
Dividend income | $ | 10,277,418 | $ | 597,713 | |||||||
Foreign taxes withheld on dividends | (67,421 | ) | (3,898 | ) | |||||||
Interest income | 3,650,129 | 546,266 | |||||||||
Securities lending income | — | 299 | |||||||||
Total Investment Income | 13,860,126 | 1,140,380 | |||||||||
EXPENSES | |||||||||||
Investment advisory fees (Note 5) | 9,047,947 | 806,291 | |||||||||
Distribution and service fees (Note 5) | |||||||||||
Class R | 192,073 | 38,629 | |||||||||
Class C | 96,636 | 4,131 | |||||||||
Class A | 23,114 | 993 | |||||||||
Administrative fees (Note 5) | 187,292 | 31,353 | |||||||||
Chief Compliance Officer fees (Note 5) | 89,852 | 7,137 | |||||||||
Trustees' fees | 57,439 | 41,649 | |||||||||
Dividend expense | 2,433,047 | 149,688 | |||||||||
Interest rebate expense | 11,711 | 3,395 | |||||||||
Transfer agent fees (Note 5) | 662,941 | 177,706 | |||||||||
Custodian and bank service fees | 190,400 | 43,066 | |||||||||
Registration and filing fees | 49,254 | 30,443 | |||||||||
Printing of shareholder reports | 78,762 | 16,003 | |||||||||
Professional fees | 122,925 | 17,139 | |||||||||
Line of credit interest expense (Note 4) | 97,046 | 3,103 | |||||||||
Insurance expense | 36,046 | 2,880 | |||||||||
Chief Financial Officer fees (Note 5) | 31,257 | 5,656 | |||||||||
Other expenses | 42,274 | 9,262 | |||||||||
Total Expenses | 13,450,016 | 1,388,524 | |||||||||
Fees waived by the Adviser, Class R (Note 5) | (13,326 | ) | (56,627 | ) | |||||||
Fees waived by the Adviser, Class I (Note 5) | (132,869 | ) | (181,587 | ) | |||||||
Fees waived by the Adviser, Class C (Note 5) | (1,688 | ) | (1,514 | ) | |||||||
Fees waived by the Adviser, Class A (Note 5) | (1,612 | ) | (1,455 | ) | |||||||
Net Expenses | 13,300,521 | 1,147,341 | |||||||||
NET INVESTMENT INCOME (LOSS) | 559,605 | (6,961 | ) | ||||||||
See Notes to Financial Statements.
www.arbitragefunds.com | 1-800-295-4485
50
Statement of Operations
For the Six Months Ended November 30, 2019 (Unaudited)
| Water Island Credit Opportunities Fund | Water Island Long/Short Fund | ||||||||||
INVESTMENT INCOME | |||||||||||
Dividend income | $ | 76,149 | $ | 25,530 | |||||||
Foreign taxes withheld on dividends | — | (310 | ) | ||||||||
Interest income | 1,071,129 | 5,256 | |||||||||
Securities lending income | — | — | |||||||||
Total Investment Income | 1,147,278 | 30,476 | |||||||||
EXPENSES | |||||||||||
Investment advisory fees (Note 5) | 276,288 | 13,310 | |||||||||
Distribution and service fees (Note 5) | |||||||||||
Class R | 10,278 | 13 | |||||||||
Class C | 1,971 | 17 | |||||||||
Class A | 172 | 4 | |||||||||
Administrative fees (Note 5) | 22,990 | 14,408 | |||||||||
Chief Compliance Officer fees (Note 5) | 2,938 | 111 | |||||||||
Trustees' fees | 40,883 | 40,334 | |||||||||
Dividend expense | 40,945 | 2,467 | |||||||||
Interest rebate expense | 1,314 | 233 | |||||||||
Transfer agent fees (Note 5) | 30,013 | 3,935 | |||||||||
Custodian and bank service fees | 11,487 | 16,784 | |||||||||
Registration and filing fees | 31,112 | 20,439 | |||||||||
Printing of shareholder reports | 3,956 | 2,535 | |||||||||
Professional fees | 12,067 | 8,420 | |||||||||
Line of credit interest expense (Note 4) | 1,315 | — | |||||||||
Insurance expense | 1,144 | 44 | |||||||||
Chief Financial Officer fees (Note 5) | 4,410 | 3,535 | |||||||||
Other expenses | 7,887 | 5,736 | |||||||||
Total Expenses | 501,170 | 132,325 | |||||||||
Fees waived by the Adviser, Class R (Note 5) | (22,641 | ) | (548 | ) | |||||||
Fees waived by the Adviser, Class I (Note 5) | (136,059 | ) | (113,407 | ) | |||||||
Fees waived by the Adviser, Class C (Note 5) | (1,085 | ) | (152 | ) | |||||||
Fees waived by the Adviser, Class A (Note 5) | (378 | ) | (152 | ) | |||||||
Net Expenses | 341,007 | 18,066 | |||||||||
NET INVESTMENT INCOME (LOSS) | 806,271 | 12,410 | |||||||||
Semi-Annual Report | November 30, 2019
51
The Arbitrage Funds
Arbitrage Fund | Water Island Diversified Event-Driven Fund | ||||||||||
REALIZED AND UNREALIZED GAINS (LOSSES) ON INVESTMENTS AND FOREIGN CURRENCIES | |||||||||||
Net realized gains (losses) from: | |||||||||||
Unaffiliated investments | $ | 101,507,616 | $ | 5,751,893 | |||||||
Purchased option contracts | (4,203,681 | ) | (382,615 | ) | |||||||
Swap contracts | (32,066,848 | ) | (1,520,938 | ) | |||||||
Securities sold short | (52,569,928 | ) | (2,284,979 | ) | |||||||
Written option contracts | 265,283 | 152,246 | |||||||||
Forward currency contracts | 6,426,654 | 287,886 | |||||||||
Foreign currency transactions (Note 8) | 3,150,164 | (34,257 | ) | ||||||||
Net change in unrealized appreciation (depreciation) on: | |||||||||||
Unaffiliated investment | 32,637,919 | 2,427,860 | |||||||||
Affiliated investments | 404,321 | — | |||||||||
Purchased option contracts | (418,655 | ) | (170,620 | ) | |||||||
Swap contracts | 21,582 | 1,660 | |||||||||
Securities sold short | (13,041,105 | ) | (1,688,793 | ) | |||||||
Written option contracts | (15,256 | ) | 23,870 | ||||||||
Forward currency contracts | (9,926,891 | ) | (367,960 | ) | |||||||
Foreign currency transactions (Note 8) | (1,837 | ) | 3,366 | ||||||||
NET REALIZED AND UNREALIZED GAIN/(LSS) | 32,169,338 | 2,198,619 | |||||||||
NET INCREASE IN NET ASSETS RESULTING FROM OPERATIONS | $ | 32,728,943 | $ | 2,191,658 | |||||||
See Notes to Financial Statements.
www.arbitragefunds.com | 1-800-295-4485
52
Statement of Operations
For the Six Months Ended November 30, 2019 (Unaudited)
| Water Island Credit Opportunities Fund | Water Island Long/Short Fund | ||||||||||
REALIZED AND UNREALIZED GAINS (LOSSES) ON INVESTMENTS AND FOREIGN CURRENCIES | |||||||||||
Net realized gains (losses) from: | |||||||||||
Unaffiliated investments | $ | 309,622 | $ | (6,393 | ) | ||||||
Purchased option contracts | (50,063 | ) | (12,117 | ) | |||||||
Swap contracts | (125,291 | ) | 2,236 | ||||||||
Securities sold short | 19,984 | (3,529 | ) | ||||||||
Written option contracts | 10,087 | 7,471 | |||||||||
Forward currency contracts | — | 4,828 | |||||||||
Foreign currency transactions (Note 8) | — | (68 | ) | ||||||||
Net change in unrealized appreciation (depreciation) on: | |||||||||||
Unaffiliated investment | 518,002 | 90,661 | |||||||||
Affiliated investments | — | — | |||||||||
Purchased option contracts | (24,880 | ) | (27,347 | ) | |||||||
Swap contracts | — | — | |||||||||
Securities sold short | (406,058 | ) | (41,613 | ) | |||||||
Written option contracts | (1,180 | ) | 9,174 | ||||||||
Forward currency contracts | — | (565 | ) | ||||||||
Foreign currency transactions (Note 8) | — | (5 | ) | ||||||||
NET REALIZED AND UNREALIZED GAIN/(LSS) | 250,223 | 22,733 | |||||||||
NET INCREASE IN NET ASSETS RESULTING FROM OPERATIONS | $ | 1,056,494 | $ | 35,143 | |||||||
Semi-Annual Report | November 30, 2019
53
The Arbitrage Funds
Arbitrage Fund | |||||||||||
| Six Months Ended November 30, 2019 (Unaudited) | Year Ended May 31, 2019 | ||||||||||
FROM OPERATIONS: | |||||||||||
Net investment income (loss) | $ | 559,605 | $ | 273,818 | |||||||
Net realized gains (losses) from: | |||||||||||
Unaffiliated Investments | 101,507,616 | 18,263,290 | |||||||||
Purchased option contracts | (4,203,681 | ) | (9,906,367 | ) | |||||||
Swap contracts | (32,066,848 | ) | 6,330,396 | ||||||||
Securities sold short | (52,569,928 | ) | 54,909,157 | ||||||||
Written option contracts | 265,283 | 7,785,695 | |||||||||
Forward currency contracts | 6,426,654 | 20,593,887 | |||||||||
Foreign currency transactions | 3,150,164 | 836,947 | |||||||||
Net change in unrealized appreciation (depreciation) on: | |||||||||||
Unaffiliated Investments | 32,637,919 | (11,301,841 | ) | ||||||||
Affiliated investments | 404,321 | 4,775 | |||||||||
Purchased option contracts | (418,655 | ) | (869,661 | ) | |||||||
Swap contracts | 21,582 | (19,040 | ) | ||||||||
Securities sold short | (13,041,105 | ) | (3,373,640 | ) | |||||||
Written option contracts | (15,256 | ) | (21,922 | ) | |||||||
Forward currency contracts | (9,926,891 | ) | (12,510,293 | ) | |||||||
Foreign currency transactions | (1,837 | ) | (353,986 | ) | |||||||
Net increase (decrease) in net assets resulting from operations | 32,728,943 | 70,641,215 | |||||||||
FROM DIVIDENDS AND DISTRIBUTIONS TO SHAREHOLDERS: | |||||||||||
Distributions, Class R | — | (3,337,705 | ) | ||||||||
Distributions, Class I | — | (28,493,325 | ) | ||||||||
Distributions, Class C | — | (258,793 | ) | ||||||||
Distributions, Class A | — | (312,255 | ) | ||||||||
Decrease in net assets from distributions to shareholders | — | (32,402,078 | ) | ||||||||
FROM CAPITAL SHARE TRANSACTIONS (NOTE 7): | |||||||||||
Proceeds from shares sold | 144,146,101 | 573,691,155 | |||||||||
Shares issued in reinvestment of distributions | — | 25,056,881 | |||||||||
Payments for shares redeemed | (259,074,072 | ) | (662,269,228 | ) | |||||||
Net increase (decrease) in net assets from capital share transactions | (114,927,971 | ) | (63,521,192 | ) | |||||||
TOTAL INCREASE (DECREASE) IN NET ASSETS | (82,199,028 | ) | (25,282,055 | ) | |||||||
NET ASSETS: | |||||||||||
Beginning of period | 1,747,281,222 | 1,772,563,277 | |||||||||
End of period | $ | 1,665,082,194 | $ | 1,747,281,222 | |||||||
See Notes to Financial Statements.
www.arbitragefunds.com | 1-800-295-4485
54
Statement of Changes in Net Assets
| Water Island Diversified Event-Driven Fund | |||||||||||
| Six Months Ended November 30, 2019 (Unaudited) | Year Ended May 31, 2019 | ||||||||||
FROM OPERATIONS: | |||||||||||
Net investment income (loss) | $ | (6,961 | ) | $ | 1,185,159 | ||||||
Net realized gains (losses) from: | |||||||||||
Unaffiliated Investments | 5,751,893 | 2,456,816 | |||||||||
Purchased option contracts | (382,615 | ) | (1,475,621 | ) | |||||||
Swap contracts | (1,520,938 | ) | 347,357 | ||||||||
Securities sold short | (2,284,979 | ) | (413,048 | ) | |||||||
Written option contracts | 152,246 | 872,256 | |||||||||
Forward currency contracts | 287,886 | 918,981 | |||||||||
Foreign currency transactions | (34,257 | ) | 37,222 | ||||||||
Net change in unrealized appreciation (depreciation) on: | |||||||||||
Unaffiliated Investments | 2,427,860 | (1,942,929 | ) | ||||||||
Affiliated investments | — | — | |||||||||
Purchased option contracts | (170,620 | ) | 19,748 | ||||||||
Swap contracts | 1,660 | — | |||||||||
Securities sold short | (1,688,793 | ) | 963,822 | ||||||||
Written option contracts | 23,870 | (107,896 | ) | ||||||||
Forward currency contracts | (367,960 | ) | (556,649 | ) | |||||||
Foreign currency transactions | 3,366 | (302 | ) | ||||||||
Net increase (decrease) in net assets resulting from operations | 2,191,658 | 2,304,916 | |||||||||
FROM DIVIDENDS AND DISTRIBUTIONS TO SHAREHOLDERS: | |||||||||||
Distributions, Class R | — | (546,554 | ) | ||||||||
Distributions, Class I | — | (1,734,805 | ) | ||||||||
Distributions, Class C | — | (5,311 | ) | ||||||||
Distributions, Class A | — | (13,015 | ) | ||||||||
Decrease in net assets from distributions to shareholders | — | (2,299,685 | ) | ||||||||
FROM CAPITAL SHARE TRANSACTIONS (NOTE 7): | |||||||||||
Proceeds from shares sold | 17,219,433 | 18,462,931 | |||||||||
Shares issued in reinvestment of distributions | — | 1,993,650 | |||||||||
Payments for shares redeemed | (13,217,916 | ) | (45,994,464 | ) | |||||||
Net increase (decrease) in net assets from capital share transactions | 4,001,517 | (25,537,883 | ) | ||||||||
TOTAL INCREASE (DECREASE) IN NET ASSETS | 6,193,175 | (25,532,652 | ) | ||||||||
NET ASSETS: | |||||||||||
Beginning of period | 124,726,442 | 150,259,094 | |||||||||
End of period | $ | 130,919,617 | $ | 124,726,442 | |||||||
Semi-Annual Report | November 30, 2019
55
The Arbitrage Funds
| Water Island Credit Opportunities Fund | |||||||||||
| Six Months Ended November 30, 2019 (Unaudited) | Year Ended May 31, 2019 | ||||||||||
FROM OPERATIONS: | |||||||||||
Net investment income (loss) | $ | 806,271 | $ | 1,857,606 | |||||||
Net realized gains (losses) from: | |||||||||||
Unaffiliated Investments | 309,622 | (136,053 | ) | ||||||||
Purchased option contracts | (50,063 | ) | (2,246 | ) | |||||||
Swap contracts | (125,291 | ) | — | ||||||||
Securities sold short | 19,984 | 154,774 | |||||||||
Written option contracts | 10,087 | 65,984 | |||||||||
Forward currency contracts | — | 73,267 | |||||||||
Foreign currency transactions | — | (2,445 | ) | ||||||||
Net change in unrealized appreciation (depreciation) on: | |||||||||||
Unaffiliated Investments | 518,002 | (653,777 | ) | ||||||||
Purchased option contracts | (24,880 | ) | 19,075 | ||||||||
Securities sold short | (406,058 | ) | 163,621 | ||||||||
Written option contracts | (1,180 | ) | (26,152 | ) | |||||||
Forward currency contracts | — | (55,745 | ) | ||||||||
Foreign currency transactions | — | 384 | |||||||||
Net increase (decrease) in net assets resulting from operations | 1,056,494 | 1,458,293 | |||||||||
FROM DIVIDENDS AND DISTRIBUTIONS TO SHAREHOLDERS: | |||||||||||
Distributions, Class R | (133,696 | ) | (223,168 | ) | |||||||
Distributions, Class I | (864,425 | ) | (1,623,472 | ) | |||||||
Distributions, Class C | (4,910 | ) | (12,522 | ) | |||||||
Distributions, Class A | (2,225 | ) | (4,639 | ) | |||||||
Decrease in net assets from distributions to shareholders | (1,005,256 | ) | (1,863,801 | ) | |||||||
FROM CAPITAL SHARE TRANSACTIONS (NOTE 7): | |||||||||||
Proceeds from shares sold | 8,637,576 | 31,563,229 | |||||||||
Shares issued in reinvestment of distributions | 998,439 | 1,841,724 | |||||||||
Payments for shares redeemed | (9,036,979 | ) | (21,303,781 | ) | |||||||
Net increase (decrease) in net assets from capital share transactions | 599,036 | 12,101,172 | |||||||||
TOTAL INCREASE (DECREASE) IN NET ASSETS | 650,274 | 11,695,664 | |||||||||
NET ASSETS: | |||||||||||
Beginning of period | 58,229,042 | 46,533,378 | |||||||||
End of period | $ | 58,879,316 | $ | 58,229,042 | |||||||
See Notes to Financial Statements.
www.arbitragefunds.com | 1-800-295-4485
56
Statement of Changes in Net Assets
Water Island Long/Short Fund | |||||||||||
| Six Months Ended November 30, 2019 (Unaudited) | Year Ended May 31, 2019 | ||||||||||
FROM OPERATIONS: | |||||||||||
Net investment income (loss) | $ | 12,410 | $ | 2,601 | |||||||
Net realized gains (losses) from: | |||||||||||
Unaffiliated Investments | (6,393 | ) | 200,171 | ||||||||
Purchased option contracts | (12,117 | ) | (60,947 | ) | |||||||
Swap contracts | 2,236 | (11,587 | ) | ||||||||
Securities sold short | (3,529 | ) | (132,947 | ) | |||||||
Written option contracts | 7,471 | 17,583 | |||||||||
Forward currency contracts | 4,828 | 11,557 | |||||||||
Foreign currency transactions | (68 | ) | (193 | ) | |||||||
Net change in unrealized appreciation (depreciation) on: | |||||||||||
Unaffiliated Investments | 90,661 | (86,799 | ) | ||||||||
Purchased option contracts | (27,347 | ) | 11,438 | ||||||||
Securities sold short | (41,613 | ) | 45,404 | ||||||||
Written option contracts | 9,174 | (1,628 | ) | ||||||||
Forward currency contracts | (565 | ) | (5,741 | ) | |||||||
Foreign currency transactions | (5 | ) | (1 | ) | |||||||
Net increase (decrease) in net assets resulting from operations | 35,143 | (11,089 | ) | ||||||||
FROM DIVIDENDS AND DISTRIBUTIONS TO SHAREHOLDERS: | |||||||||||
Distributions, Class R | — | (206 | ) | ||||||||
Distributions, Class I | — | (43,718 | ) | ||||||||
Distributions, Class C | — | (206 | ) | ||||||||
Distributions, Class A | — | (206 | ) | ||||||||
Decrease in net assets from distributions to shareholders | — | (44,336 | ) | ||||||||
FROM CAPITAL SHARE TRANSACTIONS (NOTE 7): | |||||||||||
Proceeds from shares sold | 39,224 | 366,929 | |||||||||
Shares issued in reinvestment of distributions | — | 44,336 | |||||||||
Payments for shares redeemed | (575,778 | ) | (189,524 | ) | |||||||
Net increase (decrease) in net assets from capital share transactions | (536,554 | ) | 221,741 | ||||||||
TOTAL INCREASE (DECREASE) IN NET ASSETS | (501,411 | ) | 166,316 | ||||||||
NET ASSETS: | |||||||||||
Beginning of period | 2,374,156 | 2,207,840 | |||||||||
End of period | $ | 1,872,745 | $ | 2,374,156 | |||||||
Semi-Annual Report | November 30, 2019
57
Arbitrage Fund – Class R
Selected Per Share Data and Ratios for a Share Outstanding Throughout the Periods Presented:
| Six Months Ended November 30, 2019 | Year Ended May 31, | ||||||||||||||||||||||||||
(Unaudited) | 2019 | 2018 | 2017 | 2016 | 2015 | ||||||||||||||||||||||
| Net asset value, beginning of period | $ | 12.92 | $ | 12.65 | $ | 13.06 | $ | 12.78 | $ | 12.97 | $ | 12.58 | |||||||||||||||
| Income (loss) from investment operations | |||||||||||||||||||||||||||
| Net investment income (loss)(a) | (0.01 | )(c) | (0.03 | )(c) | 0.05 | (0.13 | )(b) | (0.06 | ) | (0.11 | ) | ||||||||||||||||
| Net realized and unrealized gains (losses) on investments and foreign currencies | 0.25 | 0.52 | (0.01 | )(c) | 0.53 | (d) | 0.17 | 0.53 | |||||||||||||||||||
| Total from investment operations | 0.24 | 0.49 | 0.04 | 0.40 | 0.11 | 0.42 | |||||||||||||||||||||
Less distributions | |||||||||||||||||||||||||||
| From net investment income | – | (0.06 | ) | (0.09 | ) | – | – | – | |||||||||||||||||||
| From net realized gains | – | (0.16 | ) | (0.36 | ) | (0.12 | ) | (0.30 | ) | (0.03 | ) | ||||||||||||||||
Total distributions | – | (0.22 | ) | (0.45 | ) | (0.12 | ) | (0.30 | ) | (0.03 | ) | ||||||||||||||||
| Proceeds from redemption fees collected | – | – | 0.00 | (e) | 0.00 | (e) | 0.00 | (e) | 0.00 | (e) | |||||||||||||||||
| Net asset value, end of period | $ | 13.16 | $ | 12.92 | $ | 12.65 | $ | 13.06 | $ | 12.78 | $ | 12.97 | |||||||||||||||
Total return(f) | 1.86 | %(g) | 3.89 | % | 0.31 | % | 3.17 | % | 0.87 | % | 3.35 | % | |||||||||||||||
| Net assets, end of period (in 000s) | $ | 146,027 | $ | 163,349 | $ | 222,309 | $ | 340,353 | $ | 433,936 | $ | 500,440 | |||||||||||||||
| RATIOS TO AVERAGE NET ASSETS: | |||||||||||||||||||||||||||
Gross expenses(h) | 1.78 | %(i) | 1.94 | % | 1.91 | % | 1.87 | %(b) | 1.88 | % | 2.31 | % | |||||||||||||||
| Net expenses after advisory fees waived and expenses reimbursed(h)(j) | 1.76 | %(i) | 1.93 | % | 1.90 | % | 1.87 | %(b) | 1.88 | % | 2.31 | % | |||||||||||||||
| Net investment income (loss) | (0.14 | %)(c)(i) | (0.20 | %)(c) | 0.41 | % | (1.00 | %)(b) | (0.51 | %) | (0.87 | %) | |||||||||||||||
| Portfolio turnover rate | 121 | %(g) | 419 | % | 362 | % | 363 | % | 321 | % | 514 | % | |||||||||||||||
See Notes to Financial Statements.
www.arbitragefunds.com | 1-800-295-4485
58
Financial Highlights
(a) Per share amounts were calculated using average shares outstanding for the period.
(b) Includes a non-recurring refund by the custodian for overbilling of prior years' out-of-pocket fees. This amounted to less than $0.01 per share and is less than 0.005% of average net assets.
(c) The amount shown for a share outstanding throughout the period may not correlate with the Statement of Operations for the period due to timing of sales and redemptions of Fund shares in relation to income earned and/or fluctuating market value of the investments of the Fund.
(d) Includes estimated proceeds from the Fund's participation in a class action lawsuit. This represents a non-recurring gain in the amount of $0.01 per share.
(e) Amount rounds to less than $0.01 per share.
(f) Total return is a measure of the change in the value of an investment in the Fund over the periods covered, which assumes any dividends or capital gains distributions are reinvested in shares of the Fund. Returns shown do not reflect the deduction of taxes a shareholder would pay on Fund distributions or the redemption of Fund shares.
(g) Not annualized.
(h) Dividend expense totaled 0.28% (annualized), 0.46%, 0.42%, 0.36%, 0.34% and 0.68% of average net assets for the six months ended November 30, 2019, and the years ended May 31, 2019, 2018, 2017, 2016 and 2015, respectively. Interest rebate expense and line of credit interest expense totaled 0.01% (annualized), 0.00%, 0.01%, 0.03%, 0.07% and 0.18% of average net assets for the six months ended November 30, 2019, and the years ended May 31, 2019, 2018, 2017, 2016 and 2015, respectively.
(i) Annualized.
(j) Excluding dividend and interest expenses, the Fund's net expenses after advisory fees waived and expenses reimbursed would have been 1.47% (annualized), 1.47%, 1.47%, 1.48%, 1.47% and 1.45% of average net assets for the six months ended November 30, 2019 and the years ended May 31, 2019, 2018, 2017, 2016 and 2015, respectively.
See Notes to Financial Statements.
Semi-Annual Report | November 30, 2019
59
Arbitrage Fund – Class I
Selected Per Share Data and Ratios for a Share Outstanding Throughout the Periods Presented:
| Six Months Ended November 30, 2019 | Year Ended May 31, | ||||||||||||||||||||||||||
(Unaudited) | 2019 | 2018 | 2017 | 2016 | 2015 | ||||||||||||||||||||||
| Net asset value, beginning of period | $ | 13.32 | $ | 13.03 | $ | 13.46 | $ | 13.13 | $ | 13.28 | $ | 12.86 | |||||||||||||||
| Income (loss) from investment operations | |||||||||||||||||||||||||||
| Net investment income (loss)(a) | 0.01 | 0.01 | 0.05 | (0.10 | )(b) | (0.03 | ) | (0.09 | ) | ||||||||||||||||||
| Net realized and unrealized gains on investments and foreign currencies | 0.24 | 0.54 | 0.01 | 0.55 | (c) | 0.18 | 0.54 | ||||||||||||||||||||
| Total from investment operations | 0.25 | 0.55 | 0.06 | 0.45 | 0.15 | 0.45 | |||||||||||||||||||||
Less distributions | |||||||||||||||||||||||||||
| From net investment income | – | (0.10 | ) | (0.13 | ) | – | – | – | |||||||||||||||||||
| From net realized gains | – | (0.16 | ) | (0.36 | ) | (0.12 | ) | (0.30 | ) | (0.03 | ) | ||||||||||||||||
Total distributions | – | (0.26 | ) | (0.49 | ) | (0.12 | ) | (0.30 | ) | (0.03 | ) | ||||||||||||||||
| Proceeds from redemption fees collected | – | – | 0.00 | (d) | 0.00 | (d) | 0.00 | (d) | 0.00 | (d) | |||||||||||||||||
| Net asset value, end of period | $ | 13.57 | $ | 13.32 | $ | 13.03 | $ | 13.46 | $ | 13.13 | $ | 13.28 | |||||||||||||||
Total return(e) | 1.95 | %(f) | 4.21 | % | 0.50 | % | 3.47 | % | 1.16 | % | 3.51 | % | |||||||||||||||
| Net assets, end of period (in 000s) | $ | 1,481,059 | $ | 1,546,542 | $ | 1,510,598 | $ | 1,492,094 | $ | 1,395,178 | $ | 1,514,685 | |||||||||||||||
| RATIOS TO AVERAGE NET ASSETS: | |||||||||||||||||||||||||||
Gross expenses(g) | 1.53 | %(h) | 1.69 | % | 1.66 | % | 1.62 | %(b) | 1.63 | % | 2.06 | % | |||||||||||||||
| Net expenses after advisory fees waived and expenses reimbursed(g)(i) | 1.51 | %(h) | 1.68 | % | 1.65 | % | 1.62 | %(b) | 1.63 | % | 2.06 | % | |||||||||||||||
| Net investment income (loss) | 0.10 | %(h) | 0.06 | % | 0.35 | % | (0.76 | %)(b) | (0.24 | %) | (0.65 | %) | |||||||||||||||
| Portfolio turnover rate | 121 | %(f) | 419 | % | 362 | % | 363 | % | 321 | % | 514 | % | |||||||||||||||
See Notes to Financial Statements.
www.arbitragefunds.com | 1-800-295-4485
60
Financial Highlights
(a) Per share amounts were calculated using average shares outstanding for the period.
(b) Includes a non-recurring refund by the custodian for overbilling of prior years' out-of-pocket fees. This amounted to less than $0.01 per share and is less than 0.005% of average net assets.
(c) Includes estimated proceeds from the Fund's participation in a class action lawsuit. This represents a non-recurring gain in the amount of $0.01 per share.
(d) Amount rounds to less than $0.01 per share.
(e) Total return is a measure of the change in the value of an investment in the Fund over the periods covered, which assumes any dividends or capital gains distributions are reinvested in shares of the Fund. Returns shown do not reflect the deduction of taxes a shareholder would pay on Fund distributions or the redemption of Fund shares.
(f) Not annualized.
(g) Dividend expense totaled 0.28% (annualized), 0.46%, 0.42%, 0.36%, 0.34% and 0.68% of average net assets for the six months ended November 30, 2019, and the years ended May 31, 2019, 2018, 2017, 2016 and 2015, respectively. Interest rebate expense and line of credit interest expense totaled 0.01% (annualized), 0.00%, 0.01%, 0.03%, 0.07% and 0.18% of average net assets for the six months ended November 30, 2019, and the years ended May 31, 2019, 2018, 2017, 2016 and 2015, respectively.
(h) Annualized.
(i) Excluding dividend and interest expenses, the Fund's net expenses after advisory fees waived and expenses reimbursed would have been 1.22% (annualized), 1.22%, 1.22%, 1.23%, 1.22% and 1.20% of average net assets for the six months ended November 30, 2019, and the years ended May 31, 2019, 2018, 2017, 2016 and 2015, respectively.
See Notes to Financial Statements.
Semi-Annual Report | November 30, 2019
61
Arbitrage Fund – Class C
Selected Per Share Data and Ratios for a Share Outstanding Throughout the Periods Presented:
| Six Months Ended November 30, 2019 | Year Ended May 31, | ||||||||||||||||||||||||||
(Unaudited) | 2019 | 2018 | 2017 | 2016 | 2015 | ||||||||||||||||||||||
| Net asset value, beginning of period | $ | 12.34 | $ | 12.12 | $ | 12.54 | $ | 12.37 | $ | 12.65 | $ | 12.37 | |||||||||||||||
| Income (loss) from investment operations | |||||||||||||||||||||||||||
| Net investment loss(a) | (0.06 | )(b) | (0.12 | )(b) | (0.07 | )(b) | (0.22 | )(c) | (0.16 | ) | (0.20 | ) | |||||||||||||||
| Net realized and unrealized gains on investments and foreign currencies | 0.24 | 0.50 | 0.01 | 0.51 | (d) | 0.18 | 0.51 | ||||||||||||||||||||
| Total from investment operations | 0.18 | 0.38 | (0.06 | ) | 0.29 | 0.02 | 0.31 | ||||||||||||||||||||
Less distributions | |||||||||||||||||||||||||||
| From net investment income | – | – | (0.00 | )(e) | – | – | – | ||||||||||||||||||||
| From net realized gains | – | (0.16 | ) | (0.36 | ) | (0.12 | ) | (0.30 | ) | (0.03 | ) | ||||||||||||||||
Total distributions | – | (0.16 | ) | (0.36 | ) | (0.12 | ) | (0.30 | ) | (0.03 | ) | ||||||||||||||||
| Proceeds from redemption fees collected | – | – | – | – | – | – | |||||||||||||||||||||
| Net asset value, end of period | $ | 12.52 | $ | 12.34 | $ | 12.12 | $ | 12.54 | $ | 12.37 | $ | 12.65 | |||||||||||||||
Total return(f)(h) | 1.46 | %(g) | 3.11 | % | (0.45 | %) | 2.38 | % | 0.18 | % | 2.52 | % | |||||||||||||||
| Net assets, end of period (in 000s) | $ | 19,939 | $ | 19,050 | $ | 22,917 | $ | 26,900 | $ | 30,814 | $ | 32,958 | |||||||||||||||
| RATIOS TO AVERAGE NET ASSETS: | |||||||||||||||||||||||||||
Gross expenses(i) | 2.53 | %(j) | 2.69 | % | 2.66 | % | 2.62 | %(c) | 2.63 | % | 3.06 | % | |||||||||||||||
| Net expenses after advisory fees waived and expenses reimbursed(i)(k) | 2.51 | %(j) | 2.68 | % | 2.65 | % | 2.62 | %(c) | 2.63 | % | 3.06 | % | |||||||||||||||
| Net investment loss | (0.91 | %)(b)(j) | (0.94 | %)(b) | (0.56 | %) | (1.76 | %)(c) | (1.28 | %) | (1.60 | %) | |||||||||||||||
| Portfolio turnover rate | 121 | %(g) | 419 | % | 362 | % | 363 | % | 321 | % | 514 | % | |||||||||||||||
See Notes to Financial Statements.
www.arbitragefunds.com | 1-800-295-4485
62
Financial Highlights
(a) Per share amounts were calculated using average shares outstanding for the period.
(b) The amount shown for a share outstanding throughout the period may not correlate with the Statement of Operations for the period due to timing of sales and redemptions of Fund shares in relation to income earned and/or fluctuating market value of the investments of the Fund.
(c) Includes a non-recurring refund by the custodian for overbilling of prior years' out-of-pocket fees. This amounted to less than $0.01 per share and is less than 0.005% of average net assets.
(d) Includes estimated proceeds from the Fund's participation in a class action lawsuit. This represents a non-recurring gain in the amount of $0.01 per share.
(e) Amount rounds to less than $0.01 per share.
(f) Total return is a measure of the change in the value of an investment in the Fund over the periods covered, which assumes any dividends or capital gains distributions are reinvested in shares of the Fund. Returns shown do not reflect the deduction of taxes a shareholder would pay on Fund distributions or the redemption of Fund shares.
(g) Not annualized.
(h) Total return excludes sales charges, if any, and would be lower for the period presented if it reflected these charges.
(i) Dividend expense totaled 0.28% (annualized), 0.46%, 0.42%, 0.36%, 0.34% and 0.68% of average net assets for the six months ended November 30, 2019, and the years ended May 31, 2019, 2018, 2017, 2016 and 2015, respectively. Interest rebate expense and line of credit interest expense totaled 0.01% (annualized), 0.00%, 0.01%, 0.03%, 0.07% and 0.18% of average net assets for the six months ended November 30, 2019, and the years ended May 31, 2019, 2018, 2017, 2016 and 2015, respectively.
(j) Annualized.
(k) Excluding dividend and interest expenses, the Fund's net expenses after advisory fees waived and expenses reimbursed would have been 2.22% (annualized), 2.22%, 2.22%, 2.23%, 2.22% and 2.20% of average net assets for the six months ended November 30, 2019, and the years ended May 31, 2019, 2018, 2017, 2016 and 2015, respectively.
See Notes to Financial Statements.
Semi-Annual Report | November 30, 2019
63
Arbitrage Fund – Class A
Selected Per Share Data and Ratios for a Share Outstanding Throughout the Periods Presented:
| Six Months Ended November 30, 2019 | Year Ended May 31, | ||||||||||||||||||||||||||
(Unaudited) | 2019 | 2018 | 2017 | 2016 | 2015 | ||||||||||||||||||||||
| Net asset value, beginning of period | $ | 12.90 | $ | 12.63 | $ | 13.07 | $ | 12.79 | $ | 12.97 | $ | 12.59 | |||||||||||||||
| Income (loss) from investment operations | |||||||||||||||||||||||||||
| Net investment income (loss)(a) | (0.01 | )(d) | (0.02 | )(d) | – | (b) | (0.13 | )(c) | (0.07 | ) | (0.09 | ) | |||||||||||||||
| Net realized and unrealized gains on investments and foreign currencies | 0.25 | 0.52 | 0.02 | 0.53 | (e) | 0.19 | 0.50 | ||||||||||||||||||||
| Total from investment operations | 0.24 | 0.50 | 0.02 | 0.40 | 0.12 | 0.41 | |||||||||||||||||||||
Less distributions | |||||||||||||||||||||||||||
| From net investment income | – | (0.07 | ) | (0.10 | ) | – | – | – | |||||||||||||||||||
| From net realized gains | – | (0.16 | ) | (0.36 | ) | (0.12 | ) | (0.30 | ) | (0.03 | ) | ||||||||||||||||
Total distributions | – | (0.23 | ) | (0.46 | ) | (0.12 | ) | (0.30 | ) | (0.03 | ) | ||||||||||||||||
| Proceeds from redemption fees collected | – | – | – | – | – | – | |||||||||||||||||||||
| Net asset value, end of period | $ | 13.14 | $ | 12.90 | $ | 12.63 | $ | 13.07 | $ | 12.79 | $ | 12.97 | |||||||||||||||
Total return(f)(h) | 1.78 | %(g) | 3.94 | % | 0.21 | % | 3.17 | % | 0.95 | % | 3.27 | % | |||||||||||||||
| Net assets, end of period (in 000s) | $ | 18,057 | $ | 18,341 | $ | 16,740 | $ | 10,012 | $ | 8,421 | $ | 17,458 | |||||||||||||||
| RATIOS TO AVERAGE NET ASSETS: | |||||||||||||||||||||||||||
Gross expenses(i) | 1.78 | %(j) | 1.94 | % | 1.91 | % | 1.87 | %(c) | 1.87 | % | 2.31 | % | |||||||||||||||
| Net expenses after advisory fees waived and expenses reimbursed(i)(k) | 1.76 | %(j) | 1.93 | % | 1.90 | % | 1.87 | %(c) | 1.87 | % | 2.31 | % | |||||||||||||||
| Net investment loss | (0.16 | %)(d)(j) | (0.19 | %)(d) | (0.01 | %) | (1.02 | %)(c) | (0.56 | %) | (0.70 | %) | |||||||||||||||
| Portfolio turnover rate | 121 | %(g) | 419 | % | 362 | % | 363 | % | 321 | % | 514 | % | |||||||||||||||
See Notes to Financial Statements.
www.arbitragefunds.com | 1-800-295-4485
64
Financial Highlights
(a) Per share amounts were calculated using average shares outstanding for the period.
(b) Amount rounds to less than $0.01 per share.
(c) Includes a non-recurring refund by the custodian for overbilling of prior years' out-of-pocket fees. This amounted to less than $0.01 per share and is less than 0.005% of average net assets.
(d) The amount shown for a share outstanding throughout the period may not correlate with the Statement of Operations for the period due to timing of sales and redemptions of Fund shares in relation to income earned and/or fluctuating market value of the investments of the Fund.
(e) Includes estimated proceeds from the Fund's participation in a class action lawsuit. This represents a non-recurring gain in the amount of $0.01 per share.
(f) Total return is a measure of the change in the value of an investment in the Fund over the periods covered, which assumes any dividends or capital gains distributions are reinvested in shares of the Fund. Returns shown do not reflect the deduction of taxes a shareholder would pay on Fund distributions or the redemption of Fund shares.
(g) Not annualized.
(h) Total return excludes sales charges, if any, and would be lower for the period presented if it reflected these charges.
(i) Dividend expense totaled 0.28% (annualized), 0.46%, 0.42%, 0.36%, 0.33% and 0.68% of average net assets for six months ended November 30, 2019, and the years ended May 31, 2019, 2018, 2017, 2016 and 2015, respectively. Interest rebate expense and line of credit interest expense totaled 0.01% (annualized), 0.00%, 0.01%, 0.03%, 0.07% and 0.18% of average net assets for the six months ended November 30, 2019, and the years ended May 31, 2019, 2018, 2017, 2016 and 2015, respectively.
(j) Annualized.
(k) Excluding dividend and interest expenses, the Fund's net expenses after advisory fees waived and expenses reimbursed would have been 1.47% (annualized), 1.47%, 1.47%, 1.48%, 1.47% and 1.45% of average net assets for the six months ended November 30, 2019, the years ended May 31, 2019, 2018, 2017, 2016 and 2015, respectively.
See Notes to Financial Statements.
Semi-Annual Report | November 30, 2019
65
Water Island Diversified Event-Driven Fund – Class R
Selected Per Share Data and Ratios for a Share Outstanding Throughout the Periods Presented:
| Six Months Ended November 30, 2019 | Year Ended May 31, | ||||||||||||||||||||||||||
(Unaudited) | 2019 | 2018 | 2017 | 2016 | 2015 | ||||||||||||||||||||||
| Net asset value, beginning of period | $ | 9.47 | $ | 9.46 | $ | 9.34 | $ | 8.98 | $ | 9.73 | $ | 10.29 | |||||||||||||||
| Income (loss) from investment operations | |||||||||||||||||||||||||||
| Net investment income (loss)(a) | (0.01 | ) | 0.07 | 0.06 | (0.04 | )(b) | (0.02 | ) | 0.04 | ||||||||||||||||||
| Net realized and unrealized gains (losses) on investments and foreign currencies | 0.16 | 0.08 | 0.09 | 0.40 | (c) | (0.53 | ) | (0.36 | ) | ||||||||||||||||||
| Total from investment operations | 0.15 | 0.15 | 0.15 | 0.36 | (0.55 | ) | (0.32 | ) | |||||||||||||||||||
Less distributions | |||||||||||||||||||||||||||
| From net investment income | – | (0.14 | ) | (0.03 | ) | – | (0.20 | ) | (0.08 | ) | |||||||||||||||||
| From net realized gains | – | – | – | – | (0.00 | )(d) | (0.16 | ) | |||||||||||||||||||
Total distributions | – | (0.14 | ) | (0.03 | ) | – | (0.20 | ) | (0.24 | ) | |||||||||||||||||
| Proceeds from redemption fees collected | – | – | 0.00 | (d) | 0.00 | (d) | 0.00 | (d) | 0.00 | (d) | |||||||||||||||||
| Net asset value, end of period | $ | 9.62 | $ | 9.47 | $ | 9.46 | $ | 9.34 | $ | 8.98 | $ | 9.73 | |||||||||||||||
Total return(e) | 1.58 | %(f) | 1.60 | % | 1.56 | % | 4.01 | % | (5.55 | %) | (3.12 | %) | |||||||||||||||
| Net assets, end of period (in 000s) | $ | 30,933 | $ | 30,423 | $ | 45,383 | $ | 70,277 | $ | 80,114 | $ | 195,014 | |||||||||||||||
| RATIOS TO AVERAGE NET ASSETS: | |||||||||||||||||||||||||||
Gross expenses(g) | 2.30 | %(h) | 2.58 | % | 2.59 | % | 2.56 | %(b) | 2.62 | % | 2.52 | % | |||||||||||||||
| Net expenses after advisory fees waived and expenses reimbursed(g)(i) | 1.93 | %(h) | 2.18 | % | 2.16 | % | 2.26 | % | 2.46 | % | 2.50 | % | |||||||||||||||
| Net investment income (loss) | (0.19 | %)(h) | 0.70 | % | 0.58 | % | (0.45 | %)(b) | (0.27 | %) | 0.37 | % | |||||||||||||||
| Portfolio turnover rate | 175 | %(f) | 504 | % | 421 | % | 409 | % | 350 | % | 451 | % | |||||||||||||||
See Notes to Financial Statements.
www.arbitragefunds.com | 1-800-295-4485
66
Financial Highlights
(a) Per share amounts were calculated using average shares outstanding for the period.
(b) Includes a non-recurring refund by the custodian for overbilling of prior years' out-of-pocket fees. This amounted to less than $0.01 per share and 0.01% of average net assets.
(c) Includes estimated proceeds from the Fund's participation in a class action lawsuit. This represents a non-recurring gain in the amount of less than $0.005 per share.
(d) Amount rounds to less than $0.01 per share.
(e) Total return is a measure of the change in the value of an investment in the Fund over the periods covered, which assumes any dividends or capital gains distributions are reinvested in shares of the Fund. Returns shown do not reflect the deduction of taxes a shareholder would pay on Fund distributions or the redemption of Fund shares.
(f) Not annualized.
(g) Dividend expense totaled 0.23% (annualized), 0.46%, 0.44%, 0.53%, 0.58% and 0.55% of average net assets for the six months ended November 30, 2019, and the years ended May 31, 2019, 2018, 2017, 2016 and 2015, respectively. Interest rebate expense and line of credit interest expense totaled 0.01% (annualized), 0.03%, 0.03%, 0.04%, 0.19% and 0.26% of average net assets for the six months ended November 30, 2019, and the years ended May 31, 2019, 2018, 2017, 2016 and 2015, respectively.
(h) Annualized.
(i) Excluding dividend and interest expenses, the Fund's net expenses after advisory fees waived and expenses reimbursed would have been 1.69% (annualized), 1.69%, 1.69%, 1.69%, 1.69% and 1.69% of average net assets for the six months ended November 30, 2019 and the years ended May 31, 2019, 2018, 2017, 2016 and 2015, respectively.
See Notes to Financial Statements.
Semi-Annual Report | November 30, 2019
67
Water Island Diversified Event-Driven Fund – Class I
Selected Per Share Data and Ratios for a Share Outstanding Throughout the Periods Presented:
| Six Months Ended November 30, 2019 | Year Ended May 31, | ||||||||||||||||||||||||||
(Unaudited) | 2019 | 2018 | 2017 | 2016 | 2015 | ||||||||||||||||||||||
| Net asset value, beginning of period | $ | 9.54 | $ | 9.53 | $ | 9.43 | $ | 9.04 | $ | 9.81 | $ | 10.37 | |||||||||||||||
| Income (loss) from investment operations | |||||||||||||||||||||||||||
| Net investment income (loss)(a) | 0.00 | (d) | 0.09 | 0.04 | (0.02 | )(b) | (0.02 | ) | 0.06 | ||||||||||||||||||
| Net realized and unrealized gains (losses) on investments and foreign currencies | 0.16 | 0.09 | 0.12 | 0.41 | (c) | (0.51 | ) | (0.37 | ) | ||||||||||||||||||
| Total from investment operations | 0.16 | 0.18 | 0.16 | 0.39 | (0.53 | ) | (0.31 | ) | |||||||||||||||||||
Less distributions | |||||||||||||||||||||||||||
| From net investment income | – | (0.17 | ) | (0.06 | ) | – | (0.24 | ) | (0.09 | ) | |||||||||||||||||
| From net realized gains | – | – | – | – | (0.00 | )(d) | (0.16 | ) | |||||||||||||||||||
Total distributions | – | (0.17 | ) | (0.06 | ) | – | (0.24 | ) | (0.25 | ) | |||||||||||||||||
| Proceeds from redemption fees collected | – | – | 0.00 | (d) | 0.00 | (d) | 0.00 | (d) | 0.00 | (d) | |||||||||||||||||
| Net asset value, end of period | $ | 9.70 | $ | 9.54 | $ | 9.53 | $ | 9.43 | $ | 9.04 | $ | 9.81 | |||||||||||||||
Total return(e) | 1.68 | %(f) | 1.88 | % | 1.69 | % | 4.31 | % | (5.27 | %) | (2.96 | %) | |||||||||||||||
| Net assets, end of period (in 000s) | $ | 98,492 | $ | 92,710 | $ | 103,001 | $ | 68,272 | $ | 95,155 | $ | 390,102 | |||||||||||||||
| RATIOS TO AVERAGE NET ASSETS: | |||||||||||||||||||||||||||
Gross expenses(g) | 2.05 | %(h) | 2.33 | % | 2.34 | % | 2.31 | %(b) | 2.37 | % | 2.27 | % | |||||||||||||||
| Net expenses after advisory fees waived and expenses reimbursed(g)(i) | 1.68 | %(h) | 1.93 | % | 1.91 | % | 2.01 | % | 2.21 | % | 2.25 | % | |||||||||||||||
| Net investment income (loss) | 0.06 | %(h) | 0.92 | % | 0.46 | % | (0.22 | %)(b) | (0.26 | %) | 0.62 | % | |||||||||||||||
| Portfolio turnover rate | 175 | %(f) | 504 | % | 421 | % | 409 | % | 350 | % | 451 | % | |||||||||||||||
See Notes to Financial Statements.
www.arbitragefunds.com | 1-800-295-4485
68
Financial Highlights
(a) Per share amounts were calculated using average shares outstanding for the period.
(b) Includes a non-recurring refund by the custodian for overbilling of prior years' out-of-pocket fees. This amounted to less than $0.01 per share and 0.01% of average net assets.
(c) Includes estimated proceeds from the Fund's participation in a class action lawsuit. This represents a non-recurring gain in the amount of less than $0.005 per share.
(d) Amount rounds to less than $0.01 per share.
(e) Total return is a measure of the change in the value of an investment in the Fund over the periods covered, which assumes any dividends or capital gains distributions are reinvested in shares of the Fund. Returns shown do not reflect the deduction of taxes a shareholder would pay on Fund distributions or the redemption of Fund shares.
(f) Not annualized.
(g) Dividend expense totaled 0.23% (annualized), 0.46%, 0.44%, 0.53%, 0.58% and 0.55% of average net assets for the six months ended November 30, 2019, and the years ended May 31, 2019, 2018, 2017, 2016 and 2015, respectively. Interest rebate expense and line of credit interest expense totaled 0.01% (annualized), 0.03%, 0.03%, 0.04%, 0.19% and 0.26% of average net assets for the six months ended November 30, 2019, and the years ended May 31, 2019, 2018, 2017, 2016 and 2015, respectively.
(h) Annualized.
(i) Excluding dividend and interest expenses, the Fund's net expenses after advisory fees waived and expenses reimbursed would have been 1.44% (annualized), 1.44%, 1.44%, 1.44%, 1.44% and 1.44% of average net assets for the six months ended November 30, 2019, and the years ended May 31, 2019, 2018, 2017, 2016 and 2015, respectively.
See Notes to Financial Statements.
Semi-Annual Report | November 30, 2019
69
Water Island Diversified Event-Driven Fund – Class C
Selected Per Share Data and Ratios for a Share Outstanding Throughout the Periods Presented:
| Six Months Ended November 30, 2019 | Year Ended May 31, | ||||||||||||||||||||||||||
(Unaudited) | 2019 | 2018 | 2017 | 2016 | 2015 | ||||||||||||||||||||||
| Net asset value, beginning of period | $ | 9.29 | $ | 9.26 | $ | 9.19 | $ | 8.91 | $ | 9.62 | $ | 10.22 | |||||||||||||||
| Income (loss) from investment operations | |||||||||||||||||||||||||||
| Net investment loss(a) | (0.04 | ) | (0.01 | ) | (0.03 | )(b) | (0.11 | )(c) | (0.09 | ) | (0.04 | ) | |||||||||||||||
| Net realized and unrealized gains (losses) on investments and foreign currencies | 0.15 | 0.09 | 0.10 | 0.39 | (d) | (0.50 | ) | (0.36 | ) | ||||||||||||||||||
| Total from investment operations | 0.11 | 0.08 | 0.07 | 0.28 | (0.59 | ) | (0.40 | ) | |||||||||||||||||||
Less distributions | |||||||||||||||||||||||||||
| From net investment income | – | (0.05 | ) | – | – | (0.12 | ) | (0.04 | ) | ||||||||||||||||||
| From net realized gains | – | – | – | – | (0.00 | )(e) | (0.16 | ) | |||||||||||||||||||
Total distributions | – | (0.05 | ) | – | – | (0.12 | ) | (0.20 | ) | ||||||||||||||||||
| Net asset value, end of period | $ | 9.40 | $ | 9.29 | $ | 9.26 | $ | 9.19 | $ | 8.91 | $ | 9.62 | |||||||||||||||
Total return(f)(h) | 1.18 | %(g) | 0.91 | % | 0.76 | % | 3.14 | % | (6.14 | %) | (3.95 | %) | |||||||||||||||
| Net assets, end of period (in 000s) | $ | 689 | $ | 794 | $ | 1,175 | $ | 1,567 | $ | 2,538 | $ | 5,020 | |||||||||||||||
| RATIOS TO AVERAGE NET ASSETS: | |||||||||||||||||||||||||||
Gross expenses(j) | 3.05 | %(i) | 3.33 | % | 3.34 | % | 3.31 | %(c) | 3.37 | % | 3.27 | % | |||||||||||||||
| Net expenses after advisory fees waived and expenses reimbursed(j)(k) | 2.68 | %(i) | 2.93 | % | 2.91 | % | 3.01 | % | 3.21 | % | 3.25 | % | |||||||||||||||
| Net investment loss | (0.95 | %)(i) | (0.06 | %) | (0.34 | %) | (1.26 | %)(c) | (0.95 | %) | (0.37 | %) | |||||||||||||||
| Portfolio turnover rate | 175 | %(g) | 504 | % | 421 | % | 409 | % | 350 | % | 451 | % | |||||||||||||||
See Notes to Financial Statements.
www.arbitragefunds.com | 1-800-295-4485
70
Financial Highlights
(a) Per share amounts were calculated using average shares outstanding for the period.
(b) The amount shown for a share outstanding throughout the period may not correlate with the Statement of Operations for the period due to timing of sales and redemptions of Fund shares in relation to income earned and/or fluctuating market value of the investments of the Fund.
(c) Includes a non-recurring refund by the custodian for overbilling of prior years' out-of-pocket fees. This amounted to less than $0.01 per share and 0.01% of average net assets.
(d) Includes estimated proceeds from the Fund's participation in a class action lawsuit. This represents a non-recurring gain in the amount of less than $0.005 per share.
(e) Amount rounds to less than $0.01 per share.
(f) Total return is a measure of the change in the value of an investment in the Fund over the periods covered, which assumes any dividends or capital gains distributions are reinvested in shares of the Fund. Returns shown do not reflect the deduction of taxes a shareholder would pay on Fund distributions or the redemption of Fund shares.
(g) Not annualized.
(h) Total return excludes sales charges, if any, and would be lower for the period presented if it reflected these charges.
(i) Annualized.
(j) Dividend expense totaled 0.23% (annualized), 0.46%, 0.44%, 0.53%, 0.59% and 0.55% of average net assets for the six months ended November 30, 2019, and the years ended May 31, 2019, 2018, 2017, 2016 and 2015, respectively. Interest rebate expense and line of credit interest expense totaled 0.01% (annualized), 0.03%, 0.03%, 0.04%, 0.18% and 0.26% of average net assets for the six months ended November 30, 2019, and the years ended May 31, 2019, 2018, 2017, 2016 and 2015, respectively.
(k) Excluding dividend and interest expenses, the Fund's net expenses after advisory fees waived and expenses reimbursed would have been 2.44% (annualized), 2.44%, 2.44%, 2.44%, 2.44% and 2.44% of average net assets for the six months ended November 30, 2019, and the years ended May 31, 2019, 2018, 2017, 2016 and 2015, respectively.
See Notes to Financial Statements.
Semi-Annual Report | November 30, 2019
71
Water Island Diversified Event-Driven Fund – Class A
Selected Per Share Data and Ratios for a Share Outstanding Throughout the Periods Presented:
| Six Months Ended November 30, 2019 | Year Ended May 31, | ||||||||||||||||||||||||||
(Unaudited) | 2019 | 2018 | 2017 | 2016 | 2015 | ||||||||||||||||||||||
| Net asset value, beginning of period | $ | 9.46 | $ | 9.46 | $ | 9.35 | $ | 8.98 | $ | 9.73 | $ | 10.30 | |||||||||||||||
| Income (loss) from investment operations | |||||||||||||||||||||||||||
| Net investment income (loss)(a) | (0.01 | ) | 0.06 | 0.04 | (0.05 | )(b) | (0.03 | ) | 0.03 | ||||||||||||||||||
| Net realized and unrealized gains (losses) on investments and foreign currencies | 0.16 | 0.08 | 0.10 | 0.42 | (c) | (0.52 | ) | (0.36 | ) | ||||||||||||||||||
| Total from investment operations | 0.15 | 0.14 | 0.14 | 0.37 | (0.55 | ) | (0.33 | ) | |||||||||||||||||||
Less distributions | |||||||||||||||||||||||||||
| From net investment income | – | (0.14 | ) | (0.03 | ) | – | (0.20 | ) | (0.08 | ) | |||||||||||||||||
| From net realized gains | – | – | – | – | (0.00 | )(d) | (0.16 | ) | |||||||||||||||||||
Total distributions | – | (0.14 | ) | (0.03 | ) | – | (0.20 | ) | (0.24 | ) | |||||||||||||||||
| Proceeds from redemption fees collected | – | – | – | – | – | – | |||||||||||||||||||||
| Net asset value, end of period | $ | 9.61 | $ | 9.46 | $ | 9.46 | $ | 9.35 | $ | 8.98 | $ | 9.73 | |||||||||||||||
Total return(e)(g) | 1.59 | %(f) | 1.56 | % | 1.49 | % | 4.12 | % | (5.54 | %) | (3.22 | %) | |||||||||||||||
| Net assets, end of period (in 000s) | $ | 805 | $ | 799 | $ | 701 | $ | 810 | $ | 2,062 | $ | 5,341 | |||||||||||||||
| RATIOS TO AVERAGE NET ASSETS: | |||||||||||||||||||||||||||
Gross expenses(h) | 2.30 | %(i) | 2.58 | % | 2.59 | % | 2.56 | %(b) | 2.63 | % | 2.52 | % | |||||||||||||||
| Net expenses after advisory fees waived and expenses reimbursed(h)(j) | 1.93 | %(i) | 2.18 | % | 2.16 | % | 2.26 | % | 2.47 | % | 2.50 | % | |||||||||||||||
| Net investment income (loss) | (0.20 | %)(i) | 0.65 | % | 0.41 | % | (0.53 | %)(b) | (0.28 | %) | 0.35 | % | |||||||||||||||
| Portfolio turnover rate | 175 | %(f) | 504 | % | 421 | % | 409 | % | 350 | % | 451 | % | |||||||||||||||
See Notes to Financial Statements.
www.arbitragefunds.com | 1-800-295-4485
72
Financial Highlights
(a) Per share amounts were calculated using average shares outstanding for the period.
(b) Includes a non-recurring refund by the custodian for overbilling of prior years' out-of-pocket fees. This amounted to less than $0.01 per share and 0.01% of average net assets.
(c) Includes estimated proceeds from the Fund's participation in a class action lawsuit. This represents a non-recurring gain in the amount of less than $0.005 per share.
(d) Amount rounds to less than $0.01 per share.
(e) Total return excludes sales charges, if any, and would be lower for the period presented if it reflected these charges.
(f) Not annualized.
(g) Total return is a measure of the change in the value of an investment in the Fund over the periods covered, which assumes any dividends or capital gains distributions are reinvested in shares of the Fund. Returns shown do not reflect the deduction of taxes a shareholder would pay on Fund distributions or the redemption of Fund shares or the imposition of any sales load.
(h) Dividend expense totaled 0.23% (annualized), 0.46%, 0.44%, 0.53%, 0.59% and 0.55% of average net assets for six months ended November 30, 2019, and the years ended May 31, 2019, 2018, 2017, 2016 and 2015, respectively. Interest rebate expense and line of credit interest expense totaled 0.01% (annualized), 0.03%, 0.03%, 0.04%, 0.19% and 0.26% of average net assets for the six months ended November 30, 2019, and the years ended May 31, 2019, 2018, 2017, 2016 and 2015, respectively.
(i) Annualized.
(j) Excluding dividend and interest expenses, the Fund's net expenses after advisory fees waived and expenses reimbursed would have been 1.69% (annualized), 1.69%, 1.69%, 1.69%, 1.69% and 1.69% of average net assets for the six months ended November 30, 2019, the years ended May 31, 2019, 2018, 2017, 2016 and 2015, respectively.
See Notes to Financial Statements.
Semi-Annual Report | November 30, 2019
73
Water Island Credit Opportunities Fund – Class R
Selected Per Share Data and Ratios for a Share Outstanding Throughout the Periods Presented:
| Six Months Ended November 30, 2019 | Year Ended May 31, | ||||||||||||||||||||||||||
(Unaudited) | 2019 | 2018 | 2017 | 2016 | 2015 | ||||||||||||||||||||||
| Net asset value, beginning of period | $ | 9.70 | $ | 9.77 | $ | 9.67 | $ | 9.69 | $ | 9.95 | $ | 10.28 | |||||||||||||||
| Income (loss) from investment operations | |||||||||||||||||||||||||||
| Net investment income(a) | 0.12 | 0.31 | 0.20 | 0.23 | (b) | 0.25 | 0.28 | ||||||||||||||||||||
| Net realized and unrealized gains (losses) on investments and foreign currencies | 0.05 | (0.07 | ) | 0.12 | 0.01 | (0.24 | ) | (0.29 | ) | ||||||||||||||||||
| Total from investment operations | 0.17 | 0.24 | 0.32 | 0.24 | 0.01 | (0.01 | ) | ||||||||||||||||||||
Less distributions | |||||||||||||||||||||||||||
| From net investment income | (0.16 | ) | (0.31 | ) | (0.22 | ) | (0.26 | ) | (0.27 | ) | (0.32 | ) | |||||||||||||||
Total distributions | (0.16 | ) | (0.31 | ) | (0.22 | ) | (0.26 | ) | (0.27 | ) | (0.32 | ) | |||||||||||||||
| Proceeds from redemption fees collected | – | – | – | 0.00 | (c) | – | 0.00 | (c) | |||||||||||||||||||
| Net asset value, end of period | $ | 9.71 | $ | 9.70 | $ | 9.77 | $ | 9.67 | $ | 9.69 | $ | 9.95 | |||||||||||||||
Total return(d) | 1.74 | %(e) | 2.55 | % | 3.21 | % | 2.58 | % | 0.10 | % | (0.10 | %) | |||||||||||||||
| Net assets, end of period (in 000s) | $ | 8,441 | $ | 7,845 | $ | 9,533 | $ | 11,935 | $ | 12,426 | $ | 22,728 | |||||||||||||||
| RATIOS TO AVERAGE NET ASSETS: | |||||||||||||||||||||||||||
Gross expenses(f) | 1.93 | %(g) | 2.10 | %(h) | 2.27 | % | 1.96 | %(b) | 1.92 | % | 2.27 | % | |||||||||||||||
| Net expenses after advisory fees waived and expenses reimbursed(f)(i) | 1.38 | %(g) | 1.59 | %(h) | 1.95 | % | 1.66 | % | 1.67 | % | 2.03 | % | |||||||||||||||
| Net investment income | 2.57 | %(g) | 3.18 | %(h) | 2.09 | % | 2.34 | %(b) | 2.62 | % | 2.84 | % | |||||||||||||||
| Portfolio turnover rate | 96 | %(e) | 221 | % | 314 | % | 211 | % | 181 | % | 191 | % | |||||||||||||||
See Notes to Financial Statements.
www.arbitragefunds.com | 1-800-295-4485
74
Financial Highlights
(a) Per share amounts were calculated using average shares outstanding for the period.
(b) Includes a non-recurring refund by the custodian for overbilling of prior years' out-of-pocket fees. This amounted to less than $0.01 per share and is less than 0.005% of average net assets.
(c) Amount rounds to less than $0.01 per share.
(d) Total return is a measure of the change in the value of an investment in the Fund over the periods covered, which assumes any dividends or capital gains distributions are reinvested in shares of the Fund. Returns shown do not reflect the deduction of taxes a shareholder would pay on Fund distributions or the redemption of Fund shares.
(e) Not annualized.
(f) Dividend expense totaled 0.14% (annualized), 0.29%, 0.42%, 0.16%, 0.03% and 0.06% of average net assets for the six months ended November 30, 2019, and the years ended May 31, 2019, 2018, 2017, 2016 and 2015, respectively. Interest rebate expense and line of credit interest expense totaled 0.01% (annualized), 0.01%, 0.03% , 0.00%, 0.14% and 0.47% of average net assets for the six months ended November 30, 2019, and the years ended May 31, 2019, 2018, 2017, 2016 and 2015, respectively.
(g) Annualized.
(h) Effective August 6, 2018, the investment adviser reduced the advisory fee paid by the Fund and agreed to increase the expense reimbursements it provides to the Fund by contractually limiting the Fund's total expenses (other than certain expenses noted in the Notes to Financial Statements) to 1.23% for Class R shares. Prior to August 6, 2018, the expense limitation had been 1.50%
(i) Excluding dividend and interest expenses, the Fund's net expenses after advisory fees waived and expenses reimbursed would have been 1.23% (annualized), 1.29%, 1.50%, 1.50%, 1.50% and 1.50% of average net assets for the six months ended November 30, 2019 and the years ended May 31, 2019, 2018, 2017, 2016 and 2015, respectively.
See Notes to Financial Statements.
Semi-Annual Report | November 30, 2019
75
Water Island Credit Opportunities Fund – Class I
Selected Per Share Data and Ratios for a Share Outstanding Throughout the Periods Presented:
| Six Months Ended November 30, 2019 | Year Ended May 31, | ||||||||||||||||||||||||||
(Unaudited) | 2019 | 2018 | 2017 | 2016 | 2015 | ||||||||||||||||||||||
| Net asset value, beginning of period | $ | 9.65 | $ | 9.73 | $ | 9.65 | $ | 9.67 | $ | 9.93 | $ | 10.25 | |||||||||||||||
| Income (loss) from investment operations | |||||||||||||||||||||||||||
| Net investment income(a) | 0.14 | 0.34 | 0.23 | 0.25 | (b) | 0.27 | 0.33 | ||||||||||||||||||||
| Net realized and unrealized gains (losses) on investments and foreign currencies | 0.04 | (0.08 | ) | 0.11 | 0.02 | (0.24 | ) | (0.31 | ) | ||||||||||||||||||
| Total from investment operations | 0.18 | 0.26 | 0.34 | 0.27 | 0.03 | 0.02 | |||||||||||||||||||||
Less distributions | |||||||||||||||||||||||||||
| From net investment income | (0.17 | ) | (0.34 | ) | (0.26 | ) | (0.29 | ) | (0.29 | ) | (0.34 | ) | |||||||||||||||
Total distributions | (0.17 | ) | (0.34 | ) | (0.26 | ) | (0.29 | ) | (0.29 | ) | (0.34 | ) | |||||||||||||||
| Proceeds from redemption fees collected | – | – | – | – | – | 0.00 | (c) | ||||||||||||||||||||
| Net asset value, end of period | $ | 9.66 | $ | 9.65 | $ | 9.73 | $ | 9.65 | $ | 9.67 | $ | 9.93 | |||||||||||||||
Total return(d) | 1.87 | %(e) | 2.70 | % | 3.61 | % | 2.78 | % | 0.30 | % | 0.16 | % | |||||||||||||||
| Net assets, end of period (in 000s) | $ | 49,677 | $ | 49,795 | $ | 36,207 | $ | 44,159 | $ | 41,992 | $ | 46,118 | |||||||||||||||
| RATIOS TO AVERAGE NET ASSETS: | |||||||||||||||||||||||||||
Gross expenses(f) | 1.68 | %(g) | 1.85 | %(h) | 2.02 | % | 1.71 | %(b) | 1.68 | % | 2.04 | % | |||||||||||||||
| Net expenses after advisory fees waived and expenses reimbursed(f)(i) | 1.13 | %(g) | 1.32 | %(h) | 1.70 | % | 1.41 | % | 1.43 | % | 1.78 | % | |||||||||||||||
| Net investment income | 2.81 | %(g) | 3.51 | %(h) | 2.34 | % | 2.62 | %(b) | 2.84 | % | 3.28 | % | |||||||||||||||
| Portfolio turnover rate | 96 | %(e) | 221 | % | 314 | % | 211 | % | 181 | % | 191 | % | |||||||||||||||
See Notes to Financial Statements.
www.arbitragefunds.com | 1-800-295-4485
76
Financial Highlights
(a) Per share amounts were calculated using average shares outstanding for the period.
(b) Includes a non-recurring refund by the custodian for overbilling of prior years' out-of-pocket fees. This amounted to less than $0.01 per share and is less than 0.005% of average net assets.
(c) Amount rounds to less than $0.01 per share.
(d) Total return is a measure of the change in the value of an investment in the Fund over the periods covered, which assumes any dividends or capital gains distributions are reinvested in shares of the Fund. Returns shown do not reflect the deduction of taxes a shareholder would pay on Fund distributions or the redemption of Fund shares.
(e) Not annualized.
(f) Dividend expense totaled 0.14% (annualized), 0.29%, 0.42% 0.16%, 0.04% and 0.06% of average net assets for the six months ended November 30, 2019, and the years ended May 31, 2019, 2018, 2017, 2016 and 2015, respectively. Interest rebate expense and line of credit interest expense totaled 0.01% (annualized), 0.01%, 0.03%, 0.00%, 0.14% and 0.47% of average net assets for the six months ended November 30, 2019, and the years ended May 31, 2019, 2018, 2017, 2016 and 2015, respectively.
(g) Annualized.
(h) Effective August 6, 2018, the investment adviser reduced the advisory fee paid by the Fund and agreed to increase the expense reimbursements it provides to the Fund by contractually limiting the Fund's total expenses (other than certain expenses noted in the Notes to Financial Statements) to 0.98% for Class I shares. Prior to August 6, 2018, the expense limitation had been 1.25%
(i) Excluding dividend and interest expenses, the Fund's net expenses after advisory fees waived and expenses reimbursed would have been 0.98% (annualized), 1.02%, 1.25%, 1.25%, 1.25%and 1.25% of average net assets for the six months ended November 30, 2019, and the years ended May 31, 2019, 2018, 2017, 2016 and 2015, respectively.
See Notes to Financial Statements.
Semi-Annual Report | November 30, 2019
77
Water Island Credit Opportunities Fund – Class C
Selected Per Share Data and Ratios for a Share Outstanding Throughout the Periods Presented:
| Six Months Ended November 30, 2019 | Year Ended May 31, | ||||||||||||||||||||||||||
(Unaudited) | 2019 | 2018 | 2017 | 2016 | 2015 | ||||||||||||||||||||||
| Net asset value, beginning of period | $ | 9.67 | $ | 9.74 | $ | 9.62 | $ | 9.61 | $ | 9.89 | $ | 10.23 | |||||||||||||||
| Income (loss) from investment operations | |||||||||||||||||||||||||||
| Net investment income(a) | 0.09 | 0.24 | 0.13 | 0.16 | (b) | 0.18 | 0.22 | ||||||||||||||||||||
| Net realized and unrealized gains (losses) on investments and foreign currencies | 0.03 | (0.07 | ) | 0.11 | 0.02 | (0.25 | ) | (0.30 | ) | ||||||||||||||||||
| Total from investment operations | 0.12 | 0.17 | 0.24 | 0.18 | (0.07 | ) | (0.08 | ) | |||||||||||||||||||
Less distributions | |||||||||||||||||||||||||||
| From net investment income | (0.12 | ) | (0.24 | ) | (0.12 | ) | (0.17 | ) | (0.21 | ) | (0.26 | ) | |||||||||||||||
Total distributions | (0.12 | ) | (0.24 | ) | (0.12 | ) | (0.17 | ) | (0.21 | ) | (0.26 | ) | |||||||||||||||
| Net asset value, end of period | $ | 9.67 | $ | 9.67 | $ | 9.74 | $ | 9.62 | $ | 9.61 | $ | 9.89 | |||||||||||||||
Total return(c)(e) | 1.26 | %(d) | 1.79 | % | 2.53 | % | 1.83 | % | (0.72 | %) | (0.76 | %) | |||||||||||||||
| Net assets, end of period (in 000s) | $ | 356 | $ | 468 | $ | 640 | $ | 1,053 | $ | 1,220 | $ | 2,020 | |||||||||||||||
| RATIOS TO AVERAGE NET ASSETS: | |||||||||||||||||||||||||||
Gross expenses(f) | 2.68 | %(g) | 2.86 | %(h) | 3.02 | % | 2.71 | %(b) | 2.68 | % | 3.05 | % | |||||||||||||||
| Net expenses after advisory fees waived and expenses reimbursed(f)(i) | 2.13 | %(g) | 2.34 | %(h) | 2.70 | % | 2.41 | % | 2.43 | % | 2.78 | % | |||||||||||||||
| Net investment income | 1.81 | %(g) | 2.46 | %(h) | 1.38 | % | 1.69 | %(b) | 1.92 | % | 2.24 | % | |||||||||||||||
| Portfolio turnover rate | 96 | %(d) | 221 | % | 314 | % | 211 | % | 181 | % | 191 | % | |||||||||||||||
See Notes to Financial Statements.
www.arbitragefunds.com | 1-800-295-4485
78
Financial Highlights
(a) Per share amounts were calculated using average shares outstanding for the period.
(b) Includes a non-recurring refund by the custodian for overbilling of prior years' out-of-pocket fees. This amounted to less than $0.01 per share and is less than 0.005% of average net assets.
(c) Total return is a measure of the change in the value of an investment in the Fund over the periods covered, which assumes any dividends or capital gains distributions are reinvested in shares of the Fund. Returns shown do not reflect the deduction of taxes a shareholder would pay on Fund distributions or the redemption of Fund shares.
(d) Not annualized.
(e) Total return excludes sales charges, if any, and would be lower for the period presented if it reflected these charges.
(f) Dividend expense totaled 0.14% (annualized), 0.29%, 0.42%, 0.16%, 0.04% and 0.06% of average net assets for the six months ended November 30, 2019, and the years ended May 31, 2019, 2018, 2017, 2016 and 2015, respectively. Interest rebate expense and line of credit interest expense totaled 0.01% (annualized), 0.01%, 0.03%, 0.00%, 0.14% and 0.47% of average net assets for the six months ended November 30, 2019, and the years ended May 31, 2019, 2018, 2017, 2016 and 2015, respectively.
(g) Annualized.
(h) Effective August 6, 2018, the investment adviser reduced the advisory fee paid by the Fund and agreed to increase the expense reimbursements it provides to the Fund by contractually limiting the Fund's total expenses (other than certain expenses noted in the Notes to Financial Statements) to 1.98% for Class C shares. Prior to August 6, 2018, the expense limitation had been 2.25%.
(i) Excluding dividend and interest expenses, the Fund's net expenses after advisory fees waived and expenses reimbursed would have been 1.98% (annualized), 2.04%, 2.25%, 2.25%, 2.25% and 2.25% of average net assets for the six months ended November 30, 2019, and the years ended May 31, 2019, 2018, 2017, 2016 and 2015, respectively.
See Notes to Financial Statements.
Semi-Annual Report | November 30, 2019
79
Water Island Credit Opportunities Fund – Class A
Selected Per Share Data and Ratios for a Share Outstanding Throughout the Periods Presented:
| Six Months Ended November 30, 2019 | Year Ended May 31, | ||||||||||||||||||||||||||
(Unaudited) | 2019 | 2018 | 2017 | 2016 | 2015 | ||||||||||||||||||||||
| Net asset value, beginning of period | $ | 9.65 | $ | 9.73 | $ | 9.66 | $ | 9.67 | $ | 9.93 | $ | 10.25 | |||||||||||||||
| Income (loss) from investment operations | |||||||||||||||||||||||||||
| Net investment income(a) | 0.12 | 0.31 | 0.17 | 0.23 | (b) | 0.25 | 0.29 | ||||||||||||||||||||
| Net realized and unrealized gains (losses) on investments and foreign currencies | 0.05 | (0.08 | ) | 0.14 | 0.02 | (0.25 | ) | (0.29 | ) | ||||||||||||||||||
| Total from investment operations | 0.17 | 0.23 | 0.31 | 0.25 | – | – | |||||||||||||||||||||
Less distributions | |||||||||||||||||||||||||||
| From net investment income | (0.16 | ) | (0.31 | ) | (0.24 | ) | (0.26 | ) | (0.26 | ) | (0.32 | ) | |||||||||||||||
Total distributions | (0.16 | ) | (0.31 | ) | (0.24 | ) | (0.26 | ) | (0.26 | ) | (0.32 | ) | |||||||||||||||
| Net asset value, end of period | $ | 9.66 | $ | 9.65 | $ | 9.73 | $ | 9.66 | $ | 9.67 | $ | 9.93 | |||||||||||||||
Total return(c)(d) | 1.74 | %(e) | 2.45 | % | 3.10 | % | 2.58 | % | 0.02 | % | (0.01 | %) | |||||||||||||||
| Net assets, end of period (in 000s) | $ | 406 | $ | 121 | $ | 153 | $ | 107 | $ | 104 | $ | 630 | |||||||||||||||
| RATIOS TO AVERAGE NET ASSETS: | |||||||||||||||||||||||||||
Gross expenses(f) | 1.93 | %(g) | 2.10 | %(h) | 2.27 | % | 1.96 | %(b) | 1.91 | % | 2.29 | % | |||||||||||||||
| Net expenses after advisory fees waived and expenses reimbursed(f)(i) | 1.38 | %(g) | 1.58 | %(h) | 1.95 | % | 1.66 | % | 1.66 | % | 2.03 | % | |||||||||||||||
| Net investment income | 2.55 | %(g) | 3.24 | %(h) | 1.81 | % | 2.35 | %(b) | 2.62 | % | 2.95 | % | |||||||||||||||
| Portfolio turnover rate | 96 | %(e) | 221 | % | 314 | % | 211 | % | 181 | % | 191 | % | |||||||||||||||
See Notes to Financial Statements.
www.arbitragefunds.com | 1-800-295-4485
80
Financial Highlights
(a) Per share amounts were calculated using average shares outstanding for the period.
(b) Includes a non-recurring refund by the custodian for overbilling of prior years' out-of-pocket fees. This amounted to less than $0.01 per share and is less than 0.005% of average net assets.
(c) Total return is a measure of the change in the value of an investment in the Fund over the periods covered, which assumes any dividends or capital gains distributions are reinvested in shares of the Fund. Returns shown do not reflect the deduction of taxes a shareholder would pay on Fund distributions or the redemption of Fund shares or the imposition of any sales load.
(d) Total return excludes sales charges, if any, and would be lower for the period presented if it reflected these charges.
(e) Not annualized.
(f) Dividend expense totaled 0.14% (annualized), 0.29%, 0.42%, 0.16%, 0.02% and 0.06% of average net assets for six months ended November 30, 2019, and the years ended May 31, 2019, 2018, 2017, 2016 and 2015, respectively. Interest rebate expense and line of credit interest expense totaled 0.01% (annualized), 0.01%, 0.03%, 0.00%, 0.14% and 0.47% of average net assets for the six months ended November 30, 2019, and the years ended May 31, 2019, 2018, 2017, 2016 and 2015, respectively.
(g) Annualized.
(h) Effective August 6, 2018, the investment adviser reduced the advisory fee paid by the Fund and agreed to increase the expense reimbursements it provides to the Fund by contractually limiting the Fund's total expenses (other than certain expenses noted in the Notes to Financial Statements) to 1.23% for Class A shares. Prior to August 6, 2018, the expense limitation had been 1.50%
(i) Excluding dividend and interest expenses, the Fund's net expenses after advisory fees waived and expenses reimbursed would have been 1.23% (annualized), 1.28%, 1.50%, 1.50%, 1.50% and 1.50% of average net assets for the six months ended November 30, 2019, the years ended May 31, 2019, 2018, 2017, 2016 and 2015, respectively.
See Notes to Financial Statements.
Semi-Annual Report | November 30, 2019
81
Water Island Long/Short Fund – Class R
Selected Per Share Data and Ratios for a Share Outstanding Throughout the Periods Presented:
| Six Months Ended November 30, 2019 | Year Ended May 31, | ||||||||||||||||||||||||||
(Unaudited) | 2019 | 2018 | 2017 | 2016 | 2015(a) | ||||||||||||||||||||||
| Net asset value, beginning of period | $ | 9.88 | $ | 10.12 | $ | 9.99 | $ | 9.31 | $ | 10.12 | $ | 10.00 | |||||||||||||||
| Income (loss) from investment operations | |||||||||||||||||||||||||||
| Net investment income (loss)(b) | 0.04 | (0.01 | )(d) | (0.05 | ) | (0.20 | )(c) | (0.03 | ) | (0.10 | ) | ||||||||||||||||
| Net realized and unrealized gains (losses) on investments and foreign currencies | 0.14 | (0.03 | ) | 0.18 | 0.88 | (0.69 | ) | 0.22 | |||||||||||||||||||
| Total from investment operations | 0.18 | (0.04 | ) | 0.13 | 0.68 | (0.72 | ) | 0.12 | |||||||||||||||||||
Less distributions | |||||||||||||||||||||||||||
| From net realized gains | – | (0.20 | ) | – | – | (0.09 | ) | – | |||||||||||||||||||
Total distributions | – | (0.20 | ) | – | – | (0.09 | ) | – | |||||||||||||||||||
| Net asset value, end of period | $ | 10.06 | $ | 9.88 | $ | 10.12 | $ | 9.99 | $ | 9.31 | $ | 10.12 | |||||||||||||||
Total return(e) | 1.82 | %(f) | (0.29 | %) | 1.30 | % | 7.30 | % | (7.12 | %) | 1.20 | %(f) | |||||||||||||||
| Net assets, end of period (in 000s) | $ | 10 | $ | 10 | $ | 10 | $ | 10 | $ | 9 | $ | 10 | |||||||||||||||
| RATIOS TO AVERAGE NET ASSETS: | |||||||||||||||||||||||||||
Gross expenses(g) | 12.68 | %(h) | 11.69 | % | 12.52 | % | 15.85 | %(c) | 20.24 | % | 44.48 | %(h) | |||||||||||||||
| Net expenses after advisory fees waived and expenses reimbursed(g)(i) | 1.94 | %(h) | 2.43 | % | 2.35 | % | 2.66 | % | 2.62 | % | 2.85 | %(h) | |||||||||||||||
| Net investment income (loss) | 0.88 | %(h) | (0.15 | %) | (0.47 | %) | (2.14 | %)(c) | (0.34 | %) | (2.35 | %)(h) | |||||||||||||||
| Portfolio turnover rate | 335 | %(f) | 528 | % | 520 | % | 449 | % | 416 | % | 235 | %(f) | |||||||||||||||
See Notes to Financial Statements.
www.arbitragefunds.com | 1-800-295-4485
82
Financial Highlights
(a) Commenced operations on January 2, 2015.
(b) Per share amounts were calculated using average shares outstanding for the period.
(c) Includes a non-recurring refund by the custodian for overbilling of prior years' out-of-pocket fees. This amounted to $0.01 per share and 0.08% of average net assets.
(d) The amount shown for a share outstanding throughout the period may not correlate with the Statement of Operations for the period due to timing of sales and redemptions of Fund shares in relation to income earned and/or fluctuating market value of the investments of the Fund.
(e) Total return is a measure of the change in the value of an investment in the Fund over the periods covered, which assumes any dividends or capital gains distributions are reinvested in shares of the Fund. Returns shown do not reflect the deduction of taxes a shareholder would pay on Fund distributions or the redemption of Fund shares.
(f) Not annualized.
(g) Dividend expense totaled 0.23% (annualized), 0.74%, 0.66%, 0.84%, 0.70% and 1.01% (annualized) of average net assets for the six months ended November 30, 2019, the years ended May 31, 2019, 2018, 2017 and 2016, and the period ended May 31, 2015, respectively. Interest rebate expense and line of credit interest expense totaled 0.02% (annualized), 0.00%, 0.00%, 0.13%, 0.23% and 0.15% (annualized) of average net assets for the six months ended November 30, 2019, the years ended May 31, 2019, 2018, 2017 and 2016, and the period ended May 31, 2015, respectively.
(h) Annualized.
(i) Excluding dividend and interest expenses, the Fund's net expenses after advisory fees waived and expenses reimbursed would have been 1.69% (annualized), 1.69%, 1.69%, 1.69%, 1.69% and 1.69% (annualized) of average net assets for the six months ended November 30, 2019, years ended May 31, 2019, 2018, 2017 and 2016, and the period ended May 31, 2015, respectively.
See Notes to Financial Statements.
Semi-Annual Report | November 30, 2019
83
Water Island Long/Short Fund – Class I
Selected Per Share Data and Ratios for a Share Outstanding Throughout the Periods Presented:
| Six Months Ended November 30, 2019 | Year Ended May 31, | ||||||||||||||||||||||||||
(Unaudited) | 2019 | 2018 | 2017 | 2016 | 2015(a) | ||||||||||||||||||||||
| Net asset value, beginning of period | $ | 9.88 | $ | 10.12 | $ | 9.99 | $ | 9.31 | $ | 10.12 | $ | 10.00 | |||||||||||||||
| Income (loss) from investment operations | |||||||||||||||||||||||||||
| Net investment income (loss)(b) | 0.06 | 0.01 | (0.02 | ) | (0.18 | )(c) | (0.04 | ) | (0.09 | ) | |||||||||||||||||
| Net realized and unrealized gains (losses) on investments and foreign currencies | 0.12 | (0.05 | ) | 0.15 | 0.86 | (0.68 | ) | 0.21 | |||||||||||||||||||
| Total from investment operations | 0.18 | (0.04 | ) | 0.13 | 0.68 | (0.72 | ) | 0.12 | |||||||||||||||||||
Less distributions | |||||||||||||||||||||||||||
| From net realized gains | – | (0.20 | ) | – | – | (0.09 | ) | – | |||||||||||||||||||
Total distributions | – | (0.20 | ) | – | – | (0.09 | ) | – | |||||||||||||||||||
| Net asset value, end of period | $ | 10.06 | $ | 9.88 | $ | 10.12 | $ | 9.99 | $ | 9.31 | $ | 10.12 | |||||||||||||||
Total return(d) | 1.82 | %(e) | (0.29 | %) | 1.30 | % | 7.30 | % | (7.12 | %) | 1.20 | %(e) | |||||||||||||||
| Net assets, end of period (in 000s) | $ | 1,862 | $ | 2,344 | $ | 2,177 | $ | 2,048 | $ | 1,302 | $ | 1,386 | |||||||||||||||
| RATIOS TO AVERAGE NET ASSETS: | |||||||||||||||||||||||||||
Gross expenses(f) | 12.43 | %(g) | 11.44 | % | 12.27 | % | 15.60 | %(c) | 20.02 | % | 28.08 | %(g) | |||||||||||||||
| Net expenses after advisory fees waived and expenses reimbursed(f)(h) | 1.69 | %(g) | 2.18 | % | 2.10 | % | 2.41 | % | 2.40 | % | 2.60 | %(g) | |||||||||||||||
| Net investment income (loss) | 1.16 | %(g) | 0.12 | % | (0.22 | %) | (1.88 | %)(c) | (0.47 | %) | (2.15 | %)(g) | |||||||||||||||
| Portfolio turnover rate | 335 | %(e) | 528 | % | 520 | % | 449 | % | 416 | % | 235 | %(e) | |||||||||||||||
See Notes to Financial Statements.
www.arbitragefunds.com | 1-800-295-4485
84
Financial Highlights
(a) Commenced operations on January 2, 2015.
(b) Per share amounts were calculated using average shares outstanding for the period.
(c) Includes a non-recurring refund by the custodian for overbilling of prior years' out-of-pocket fees. This amounted to $0.01 per share and 0.08% of average net assets.
(d) Total return is a measure of the change in the value of an investment in the Fund over the periods covered, which assumes any dividends or capital gains distributions are reinvested in shares of the Fund. Returns shown do not reflect the deduction of taxes a shareholder would pay on Fund distributions or the redemption of Fund shares.
(e) Not annualized.
(f) Dividend expense totaled 0.23% (annualized), 0.74%, 0.66%, 0.84%, 0.72% and 1.01% of average net assets for the six months ended November 30, 2019, and the years ended May 31, 2019, 2018, 2017 and 2016, and the period ended May 31, 2015, respectively. Interest rebate expense and line of credit interest expense totaled 0.02% (annualized), 0.00%, 0.00%, 0.13%, 0.24% and 0.15% of average net assets for the six months ended November 30, 2019, and the years ended May 31, 2019, 2018, 2017 and 2016, and the period ended May 31, 2015, respectively.
(g) Annualized.
(h) Excluding dividend and interest expenses, the Fund's net expenses after advisory fees waived and expenses reimbursed would have been 1.44% (annualized), 1.44%, 1.44%, 1.44%, 1.44% and 1.44% (annualized) of average net assets for the six months ended November 30, 2019, and the years ended May 31, 2019, 2018, 2017 and 2016, and the period ended May 31, 2015, respectively.
See Notes to Financial Statements.
Semi-Annual Report | November 30, 2019
85
The Arbitrage Funds Notes to Financial Statements
November 30, 2019 (Unaudited)
1. ORGANIZATION
The Arbitrage Funds (the "Trust") is a Delaware statutory trust, which was organized on December 22, 1999 and is registered under the Investment Company Act of 1940, as amended (the "1940 Act"), as an open-end management investment company issuing its shares in series. Each series represents a distinct portfolio with its own investment objective and policies. The four series presently authorized are the Arbitrage Fund (the "Arbitrage Fund"), the Water Island Diversified Event-Driven Fund (the "Diversified Event-Driven Fund"), the Water Island Credit Opportunities Fund (the "Credit Opportunities Fund") and the Water Island Long/Short Fund (the "Long/Short Fund"), each a "Fund" and collectively the "Funds". Effective August 5, 2019, Arbitrage Event-Driven Fund changed its name to Water Island Diversified Event-Driven Fund. Arbitrage Event-Driven Fund's portfolio manager, investment objective and investment strategies did not change. The Arbitrage Fund, the Diversified Event-Driven Fund and the Credit Opportunities Fund are each a diversified series of the Trust. The Long/Short Fund is a non-diversified series of the Trust. The Funds' investments are managed by Water Island Capital, LLC (the "Adviser").
Commencement of Operations | |||||||||||||||||||
Fund | Class R shares | Class I shares | Class C shares | Class A shares | |||||||||||||||
Arbitrage Fund | September 18, 2000 | October 17, 2003 | June 1, 2012 | June 1, 2013 | |||||||||||||||
| Diversified Event-Driven Fund | October 1, 2010 | October 1, 2010 | June 1, 2012 | June 1, 2013 | |||||||||||||||
| Credit Opportunities Fund | October 1, 2012 | October 1, 2012 | October 1, 2012 | June 1, 2013 | |||||||||||||||
Long/Short Fund | January 2, 2015 | January 2, 2015 | January 2, 2015(1) | January 2, 2015(1) | |||||||||||||||
(1) Effective July 31, 2019, Class A and Class C shares of the Long/Short Fund were liquidated.
The investment objective of the Arbitrage Fund is to seek to achieve capital growth by engaging in merger arbitrage. The investment objective of the Diversified Event-Driven Fund is to seek to achieve capital growth by investing in companies that are impacted by corporate events such as mergers, acquisitions, restructurings, recapitalizations, refinancings, reorganizations and other special situations. The investment objective of the Credit Opportunities Fund is to seek to provide current income and capital growth by investing in debt securities impacted by events such as reorganizations, restructurings, recapitalizations, debt maturities, refinancings, mergers, acquisitions, regulatory changes and other special situations. The investment objective of the Long/Short Fund is to seek to achieve capital appreciation over a full market cycle with lower volatility than the broad equity market.
The Arbitrage Fund, Water Island Diversified Event-Driven Fund and Water Island Credit Opportunities Fund's four classes of shares, Class R, Class I, Class C and Class A, and the Water Island Long/Short Fund's two classes of shares, Class R and Class I, represent interests in the same portfolio of investments and have the same rights, but differ primarily in the expenses to which they are subject and the investment eligibility requirements. Class R shares, Class C shares and Class A shares are subject to an annual distribution and servicing fee of up to 0.25%, 1.00% and 0.25%, respectively, of each Fund's average daily net assets attributable to Class R shares, Class C shares and Class A shares, respectively, whereas Class I shares are not subject to any distribution and servicing fees. Class C shares are also subject to a 1.00% contingent deferred sales charge on all purchases redeemed within 12 months of purchase. Class A shares of the Arbitrage Fund are sold subject to a maximum front-end sales load equal to 2.50% of the offering price and are also subject to a 1.00% contingent deferred sales load on purchases at or above $250,000, purchased
www.arbitragefunds.com | 1-800-295-4485
86
The Arbitrage Funds Notes to Financial Statements (continued)
November 30, 2019 (Unaudited)
without a front-end sales charge and redeemed within 18 months of purchase. Class A shares of the Diversified Event-Driven Fund and the Credit Opportunities Fund are sold subject to a maximum front-end sales load equal to 3.25% of the offering price and are also subject to a 1.00% contingent deferred sales load on purchases at or above $250,000 purchased without a front-end sales charge and redeemed within 18 months of purchase. Effective July 31, 2019, Class A and Class C shares of the Long/Short Fund were liquidated.
2. SIGNIFICANT ACCOUNTING POLICIES
The following is a summary of significant accounting policies followed by the Funds. These policies are in conformity with U.S. generally accepted accounting principles ("GAAP"). The Funds are considered investment companies for financial reporting purposes under GAAP and Accounting Standards Codification Topic 946 — Financial Services — Investment Companies.
The Funds have adopted Financial Accounting Standards Board Accounting Standards Update ("ASU") No. 2017-08 "Premium Amortization on Purchased Callable Debt Securities", which amends the accounting standards to shorten the amortization period of certain purchased callable debt securities held at a premium to the earliest call date. The ASU is effective for annual and interim periods beginning after December 15, 2018. In accordance with the transition provisions of the standard, the Funds applied the amendments on a modified retrospective basis beginning with the fiscal year ended May 31, 2020. The cost basis of securities at May 31, 2019 has been adjusted to $130,328,230 and $59,114,148 for Diversified Event-Driven Fund and Credit Opportunities Fund, respectively, with no adjustment necessary for the remaining funds. The change in accounting policy has been made to comply with the newly issued accounting standard and had no impact on total accumulated earnings (loss) or the net asset value of the Funds' financial statements.
Use of Estimates — The preparation of financial statements in conformity with GAAP requires management to make estimates and assumptions that affect the reported amounts of assets and liabilities at the date of the financial statements and the reported amounts of increases and decreases in net assets from operations during the reporting period. Actual results could differ from those estimates.
Valuation of Investments — The Funds' portfolio securities are valued as of the close of trading of the New York Stock Exchange ("NYSE") (normally 4:00 p.m., Eastern standard time). Common stocks, mutual funds and other securities, including open short positions that are traded on a securities exchange, are valued at the last quoted sales price at the close of regular trading on the day the valuation is made. Securities which are quoted by NASDAQ are valued at the NASDAQ Official Closing Price. Price information on listed stocks is taken from the exchange where the security is primarily traded. Redeemable securities issued by open-end investment companies are valued at the investment company's respective net asset value, with the exception of exchange-traded open-end investment companies, which are priced as common stocks. Market quotations of foreign securities from the principal markets in which they trade may not be reliable if events or circumstances that may affect the value of portfolio securities occur between the time of the market quotation and the close of trading on the NYSE. If a significant event that affects the valuation of a foreign security occurs between the close of a foreign security's primary exchange and the time the Funds calculate their net asset value ("NAV"), the Funds will fair value the foreign security to account for this discrepancy. Securities which are listed on an exchange but which are not traded on the valuation date are valued at the mean of the most recent bid and ask prices. Put and call options and securities traded in the over-the-counter market are valued at the mean of the most recent bid and ask prices. When there is no bid price available, put
Semi-Annual Report | November 30, 2019
87
The Arbitrage Funds Notes to Financial Statements (continued)
November 30, 2019 (Unaudited)
and call options will be valued using the average of the last ask price and zero. Foreign currency forward contracts are valued at the current day's interpolated foreign exchange rate, as calculated using the current day's spot rate, and the thirty, sixty, ninety and one-hundred eighty day forward rates provided by an independent source.
If available, debt securities are priced based upon an evaluated bid provided by independent, third-party pricing agents. The third-party pricing agents may also value debt securities at an evaluated bid price by employing methodologies that utilize actual market transactions, broker-supplied valuations, or other methodologies designed to identify the market value for such securities. Unlisted securities for which market quotations are readily available are valued at the latest quoted bid price. Swap contracts that are listed or traded on a national securities exchange, commodities exchange, contract market or comparable over-the-counter market, and that are freely transferable, are valued at their closing settlement price on the exchange on which they are primarily traded or based upon the current settlement price for a like instrument acquired on the day on which the instrument is being valued. Over-the-counter swap contracts for which market quotations are readily available are valued based on quotes received from independent pricing services or one or more dealers that make markets in such securities.
Other assets and securities for which no quotations are readily available are valued at fair value using methods determined in good faith by the Pricing Committee, which is under the supervision of the Board of Trustees of the Trust. Some of the more common reasons that may necessitate that a security be valued at fair value include: the security's trading has been halted or suspended; the security has been delisted from a national exchange; the security's primary trading market is temporarily closed at a time when under normal conditions it would be open; the security has been acquired through completion of a merger/tender or the security's primary pricing source is not able or willing to provide a price. Such methods of fair valuation may include, but are not limited to: multiple of earnings, multiple of book value, discount from market of a similar freely traded security, purchase price of a security, subsequent private transactions in the security or related securities, or a combination of these and other factors. Foreign securities are translated from the local currency into U.S. dollars using currency exchange rates supplied by a quotation service.
Fair Value Measurements — In accordance with the authoritative guidance on fair value measurements under GAAP, the Funds disclose fair value of their investments in a hierarchy that prioritizes the inputs to valuation techniques used to measure the fair value. The objective of a fair value measurement is to determine the price that would be received to sell an asset or paid to transfer a liability in an orderly transaction between market participants at the measurement date (an exit price). Accordingly, the fair value hierarchy gives the highest priority to quoted prices (unadjusted) in active markets for identical assets or liabilities (Level 1) and the lowest priority to unobservable inputs (Level 3). The guidance establishes three levels of the fair value hierarchy as follows:
Level 1 — Unadjusted quoted prices in active markets for identical, unrestricted assets or liabilities that the Funds have the ability to access at the measurement date;
Level 2 — Observable inputs other than quoted prices included in Level 1 that are observable (either directly or indirectly) for substantially the full term of the asset or liability; and
Level 3 — Unobservable inputs for the asset or liability, to the extent relevant observable inputs are not available, representing each Fund's own assumption about the assumptions a market participant would use in valuing the asset or liability, and would be based on the best information available.
www.arbitragefunds.com | 1-800-295-4485
88
The Arbitrage Funds Notes to Financial Statements (continued)
November 30, 2019 (Unaudited)
Investments are classified within the level of the lowest significant input considered in determining fair value. Investments classified within Level 3, whose fair value measurement considers several inputs, may include Level 1 or Level 2 inputs as components of the overall fair value measurement. The inputs or methodology used for valuing securities are not necessarily an indication of the risk associated with investing in those securities.
For the six months ended November 30, 2019, there were no significant changes to the Funds' fair value methodologies. Transfers for Level 3 securities, if any, are shown as part of the leveling table in each Fund's Portfolio of Investments.
Share Valuation and Redemption Fees — The net asset value per share of each class of shares of the Funds is calculated daily by dividing the total value of a Fund's assets attributable to that class, less liabilities attributable to that class, by the number of shares of that class outstanding. The offering price and redemption price per share of each class of each Fund is equal to the net asset value per share. Effective September 30, 2017, the Trust no longer imposes a redemption fee for shares of the Fund sold within a certain number of days of purchase. Prior to September 30, 2017, Class R, Class I and Class A shares of the Arbitrage Fund, Diversified Event-Driven Fund and Long/Short Fund were subject to a redemption fee of 2% if redeemed within 30 days of purchase and Class R, Class I and Class A shares of the Credit Opportunities Fund were subject to a redemption fee of 2% if redeemed within 60 days of purchase. The Class A redemption fee did not apply for purchases over $250,000 in the Arbitrage Fund and purchases over $500,000 in the Diversified Event-Driven Fund, Credit Opportunities Fund and Long/Short Fund, as these purchases are subject to a contingent deferred sales charge. Class C shares were not subject to a redemption fee. The redemption fee is paid directly to each Fund rather than the Adviser and is allocated pro-rata to the shareholders based on net assets attributed to each class.
Security Transactions — Security transactions are accounted for on trade date. Gains and losses on securities sold are determined on a specific identification basis.
Short Positions — The Funds may sell securities short for economic hedging purposes. Subsequent fluctuations in the market prices of securities sold short may require purchasing the securities at prices which may differ from the market value reflected on the Portfolio of Investments. The Funds are liable for any dividends and interest payable on securities while those securities are in a short position. As collateral for their short positions, the Funds are required under the 1940 Act to maintain assets consisting of cash, cash equivalents or liquid securities. The amount of the collateral is required to be adjusted daily to reflect changes in the value of the securities sold short. The Funds are charged an interest rebate expense by the prime broker on securities sold short. The interest rebate expense is charged for the duration of time that a security is sold short and is shown on the Statements of Operations.
Derivative Instruments and Hedging Activities — The following discloses the Funds' use of derivative instruments and hedging activities.
The Funds' investment objectives not only permit the Funds to purchase investment securities, but they also allow certain Funds to enter into various types of derivative contracts, including, but not limited to, swap contracts, forward foreign currency exchange contracts, and purchased and written option contracts. In doing so, the Funds will employ strategies in differing combinations to permit them to increase, decrease, or change the level or types of exposure to market factors. Central to those strategies are features inherent to derivatives that make them more attractive for this purpose than equity or debt securities: they require little or no initial cash investment; they can focus exposure on only certain selected risk factors; and they may not
Semi-Annual Report | November 30, 2019
89
The Arbitrage Funds Notes to Financial Statements (continued)
November 30, 2019 (Unaudited)
require the ultimate receipt or delivery of the underlying security (or securities) to satisfy the contract. This may allow the Funds to pursue their objectives more quickly and efficiently than if they were to make direct purchases or sales of securities capable of effecting a similar response to market factors. The Funds may, but are not required to, seek to reduce their currency risk by hedging part or all of their exposure to various foreign currencies.
Market Risk Factors: In pursuit of their investment objectives, the Funds may seek to use derivatives to increase or decrease their exposure to the following market risk factors:
Equity Risk: Equity risk relates to the change in value of equity securities as they relate to increases or decreases in the general market. Investments in securities issued by small and medium capitalization companies tend to be less liquid and more volatile than stocks of companies with relatively large market capitalizations. To the extent a Fund invests in securities of small and medium capitalization companies, it may be more vulnerable to adverse business events than larger, more established companies.
Interest Rate Risk: Interest rate risk refers to the fluctuations in value of fixed-income securities resulting from the inverse relationship between price and yield. For example, an increase in general interest rates will tend to reduce the market value of fixed income investments, and a decline in general interest rates will tend to increase the value of such investments. In addition, debt securities with longer maturities, which tend to have higher yields, are subject to potentially greater fluctuations in value from changes in interest rates than obligations with shorter maturities.
Foreign Exchange Rate Risk: Foreign exchange rate risk relates to the change in the U.S. dollar value of a security held that is denominated in a foreign currency. The value of a foreign currency denominated security will decrease as the dollar appreciates against the currency, while the value of the foreign currency denominated security will increase as the dollar depreciates against the currency. Adverse changes in exchange rates may erode or reverse any gains produced by foreign currency denominated investments and may widen any losses.
Credit Risk: Credit risk relates to the ability of the issuer to meet interest and principal payments, or both, as they come due. In general, lower-grade, higher-yield bonds are subject to credit risk to a greater extent than lower-yield, higher-quality bonds.
Risk of Investing in Derivatives: The Funds' use of derivatives can result in losses due to unanticipated changes in the market risk factors and the overall market. In instances where the Funds are using derivatives to decrease or hedge exposures to market risk factors for securities held by the Funds, there are also risks that those derivatives may not perform as expected, resulting in losses for the combined or hedged positions.
Derivatives may have little or no initial cash investment relative to their market value exposure and therefore can produce significant gains or losses in excess of their cost. This use of embedded leverage allows the Funds to increase their market value exposure relative to their net assets and can substantially increase the volatility of the Funds' performance.
Additional associated risks from investing in derivatives also exist and potentially could have significant effects on the valuation of the derivative instruments and the Funds. Typically, the associated risks are not the risks that the Funds are attempting to increase or decrease exposure to, per their investment objectives, but are the additional risks from investing in derivatives.
www.arbitragefunds.com | 1-800-295-4485
90
The Arbitrage Funds Notes to Financial Statements (continued)
November 30, 2019 (Unaudited)
Examples of these associated risks are liquidity risk, which is the risk that the Funds will not be able to sell the derivative in the open market in a timely manner, and counterparty credit risk, which is the risk that the counterparty to a transaction will not fulfill its obligation to the Funds. Associated risks can be different for each type of derivative and are discussed by derivative type in the notes that follow.
Option Writing/Purchasing: Certain Funds may write or purchase option contracts to adjust risk and return of their overall investment positions. When a Fund writes or purchases an option, an amount equal to the premium received or paid by the Fund is recorded as a liability or an asset and is subsequently adjusted to the current market value of the option written or purchased. Premiums received or paid from writing or purchasing options that expire unexercised are treated by the Fund on the expiration date as realized gains or losses. The difference between the premium and the amount paid or received on effecting a closing purchase or sale transaction, including brokerage commissions, is also treated as a realized gain or loss. If an option is exercised, the premium paid or received is added to the cost of the purchase or proceeds from the sale in determining whether the Fund has realized a gain or loss on investment transactions. Risks from entering into option transactions arise from the potential inability of counterparties to meet the terms of the contracts, the potential inability to enter into closing transactions because of an illiquid secondary market and from unexpected movements in security values.
Options held by the Funds at November 30, 2019 are disclosed in the Portfolio of Investments.
During the period ended November 30, 2019, the Funds engaged in option writing/purchasing to limit volatility and correlation, and to create income and optionality.
Foreign Currency Exchange Contracts: The Funds may enter into forward foreign currency exchange contracts as a way of managing foreign exchange rate risk. The Funds may enter into these contracts for the purchase or sale of a specific foreign currency at a fixed price on a future date as a hedge or cross-hedge against either specific transactions or portfolio positions. The objective of the Funds' foreign currency hedging transactions is to reduce risk that the U.S. dollar value of the Funds' securities denominated in foreign currency will decline in value due to changes in foreign currency exchange rates.
Foreign currency exchange contracts held by the Funds at November 30, 2019 are disclosed in the Portfolio of Investments.
During the period ended November 30, 2019, the Funds entered into foreign currency exchange contracts to hedge currency risk.
Warrants/Rights: Each Fund may purchase or otherwise receive warrants or rights. Warrants and rights generally give the holder the right to receive, upon exercise, a security of the issuer at a set price. The Funds typically use warrants and rights in a manner similar to their use of purchased options on securities, as described in the Options Writing/Purchasing section above. Risks associated with the use of warrants and rights are generally similar to risks associated with the use of purchased options. However, warrants and rights often do not have standardized terms, and may have longer maturities and may be less liquid than exchange-traded options. In addition, the terms of warrants or rights may limit each Fund's ability to exercise the warrants or rights at such times and in such quantities as each Fund would otherwise wish. Warrants and rights generally pay no dividends and confer no voting or other rights other than to purchase the underlying security.
Semi-Annual Report | November 30, 2019
91
The Arbitrage Funds Notes to Financial Statements (continued)
November 30, 2019 (Unaudited)
Warrants/rights held by the Funds at November 30, 2019 are disclosed in the Portfolio of Investments.
During the period ended November 30, 2019, the Funds held warrants/rights as a result of receiving them from completed deals.
Swaps: Certain Funds may enter into interest rate, index, equity, total return and credit default swap agreements, for hedging and non-hedging purposes. These transactions would be entered into in an attempt to obtain a particular return when it is considered desirable to do so, possibly at a lower cost to a Fund than if the Fund had invested directly in the asset that yielded the desired return. Swap agreements may be executed in a multilateral or other trade facility program, such as a registered exchange ("centrally cleared swaps") or may be privately negotiated in the over-the-counter market. The duration of a swap agreement typically ranges from a few weeks to more than one year. In a standard swap transaction, two parties agree to exchange the returns (or differentials in rates of return) earned or realized on particular predetermined investments or instruments, which may be adjusted for an interest factor. The gross returns to be exchanged or "swapped" between the parties are generally calculated with respect to a "notional amount" (i.e., the return on or increase in value of a particular dollar amount invested at a particular interest rate, in a particular foreign currency, or in a "basket" of securities representing a particular index). In a centrally cleared swap, immediately following execution of the swap agreement, the swap agreement is novated to a central counterparty (the "CCP") and the Fund's counterparty on the swap agreement becomes the CCP.
Forms of swap agreements include interest rate caps, under which, in return for a premium, one party agrees to make payments to the other to the extent that interest rates exceed a specified rate, or "cap"; interest rate floors, under which, in return for a premium, one party agrees to make payments to the other to the extent that interest rates fall below a specified level, or "floor"; and interest rate collars, under which a party sells a cap and purchases a floor, or vice versa, in an attempt to protect itself against interest rate movements exceeding given minimum or maximum levels.
Credit default swaps are a type of swap agreement in which the protection "buyer" is generally obligated to pay the protection "seller" an upfront and/or a periodic stream of payments over the term of the contract provided that no credit event, such as a default, on a reference obligation has occurred. The credit default swap agreement may have as reference obligations one or more securities that are not currently held by a Fund. If a credit event occurs, the seller generally must pay the buyer the "par value" (full notional value) of the swap in exchange for an equal face amount of deliverable obligations of the reference entity described in the swap, or the seller may be required to deliver the related net cash amount if the swap is cash settled. A Fund may be either the buyer or seller in the transaction. If a Fund is a buyer and no credit event occurs, the Fund may recover nothing if the swap is held through its termination date. However, if a credit event occurs, the buyer generally may elect to receive the full notional value of the swap in exchange for an equal face amount of deliverable obligations of the reference entity whose value may have significantly decreased. As a seller, a Fund generally receives an upfront payment and/or a fixed rate of income throughout the term of the swap provided that there is no credit event. As the seller, a Fund would effectively add leverage to its portfolio because, in addition to its total net assets, the Fund would be subject to investment exposure on the notional amount of the swap. Credit default swap agreements involve greater risks than if a Fund had invested in the reference obligation directly since, in addition to general market risks, credit default swaps are subject to illiquidity risk, counterparty risk and credit risk. A Fund will enter into credit default
www.arbitragefunds.com | 1-800-295-4485
92
The Arbitrage Funds Notes to Financial Statements (continued)
November 30, 2019 (Unaudited)
swap agreements only with counterparties that meet certain standards of creditworthiness or that are centrally cleared.
Total return swap agreements are contracts in which one party agrees to make periodic payments based on the change in market value of underlying assets, which may include a specified security, basket of securities, defined portfolios of bonds, loans and mortgages, or securities indexes during the specified period in return for periodic payments based on a fixed or variable interest rate or the total return from other underlying assets or indices. Total return swap agreements may be used to obtain exposure to a security or market index without owning or taking physical custody of such security or component securities of a market index. Total return swap agreements may effectively add leverage to a Fund's portfolio because, in addition to its total net assets, the Fund would be subject to investment exposure on the notional amount of the swap. Total return swaps are a mechanism for the user to accept the economic benefits of asset ownership without utilizing the balance sheet. The other leg of the swap, usually the London Interbank Offered Rate (LIBOR), is spread to reflect the non-balance sheet nature of the product. Total return swaps can be designed with any underlying asset agreed upon between two parties. Typically no notional amounts are exchanged with total return swaps. Total return swap agreements entail the risk that a party will default on its payment obligations to a Fund thereunder. Swap agreements also entail the risk that a Fund will not be able to meet its obligation to the counterparty. Generally, a Fund will enter into total return swaps on a net basis (i.e., the two payment streams are netted out with the Fund receiving or paying, as the case may be, only the net amount of the two payments).
Most swap agreements entered into by a Fund calculate the obligations of the parties to the agreement on a "net basis." Consequently, a Fund's current obligations (or rights) under a swap agreement will generally be equal only to the net present value of amounts to be paid or received under the agreement based on the relative values of the positions held by each party to the agreement (the "net amount"). A Fund's current obligations under a swap agreement will be accrued daily (offset against amounts owed to the Fund), and any accrued but unpaid net amounts owed to a swap counterparty will be covered in accordance with applicable regulatory requirements to limit any potential leveraging of a Fund's portfolio. Any net amount accrued but not yet paid to a Fund by the counterparty under a swap agreement (i.e., the Fund's current rights under the swap agreement) is recorded as unrealized appreciation until the amount is paid to the Fund. The Fund's maximum risk of loss from counterparty credit risk is generally limited to the net payment to be received by the Fund and/or the termination value at the end of the contract. Obligations under swap agreements so covered will not be construed to be "senior securities" for purposes of the Funds' investment restriction concerning senior securities.
Whether a Fund's use of swap agreements will be successful in furthering its investment objective will depend on Management's ability to correctly predict whether certain types of investments are likely to produce greater returns than other investments. Swap agreements that cannot be terminated or sold within seven days may be considered to be illiquid investments. Moreover, a Fund bears the risk of loss of the amount expected to be received under a swap agreement in the event of the default or bankruptcy of a swap agreement counterparty. Although centrally cleared swaps typically present less counterparty risk than non-centrally cleared swaps, a Fund that has entered into centrally cleared swaps is subject to the risk of the failure of the CCP. A Fund will enter into swap agreements only with counterparties that meet certain standards for creditworthiness (generally, such counterparties would have to be eligible counterparties under the terms of the Fund's repurchase agreement guidelines) or that are centrally cleared. Certain restrictions imposed on the Funds by the Internal Revenue Code of 1986, as amended (the "Code"), may limit a Fund's ability to use swap agreements. It is possible that developments in
Semi-Annual Report | November 30, 2019
93
The Arbitrage Funds Notes to Financial Statements (continued)
November 30, 2019 (Unaudited)
the swap market, including additional government regulation, could adversely affect a Fund's ability to terminate existing swap agreements or to realize amounts to be received under such agreements.
International Swaps and Derivatives Association, Inc. Master Agreements ("ISDA Master Agreements") govern over-the-counter financial derivative transactions entered into by a Fund and counterparty. The ISDA Master Agreements maintain provisions for general obligations, representations, agreements, collateral and events of default or termination. Events of termination include conditions that may entitle counterparties to elect to terminate early and cause settlement of all outstanding transactions under the applicable ISDA Master Agreement. Any election to terminate early could be material to the financial statements.
Swap agreements held by the Funds at November 30, 2019 are disclosed in the Portfolio of Investments.
During the period ended November 30, 2019, the Arbitrage Fund, Diversified Event-Driven Fund and Long/Short Fund entered into swap agreements to invest outside the US more efficiently.
Fair Value of Derivative Instruments — Fair values of derivatives presented in the financial statements are not netted with the fair value of other derivatives or with any collateral amounts posted by the Funds or any counterparty on the Statement of Assets and Liabilities. The fair value of derivative instruments for the Funds as of the six months ended November 30, 2019, was as follows:
| Derivatives Not Accounted For As Hedging Instruments | Asset Derivatives Statement of Assets and Liabilities Location | Fair Value | Liability Derivatives Statement of Assets and Liabilities Location | Fair Value | |||||||||||||||
Arbitrage Fund | |||||||||||||||||||
| Foreign Currency Contracts | Unrealized appreciation on forward foreign currency exchange contracts | $ | 1,597,532 | Unrealized depreciation on forward foreign currency exchange contracts | $ | 6,413,840 | |||||||||||||
| Equity Contracts (swap contracts) | Unrealized appreciation on swap contracts | 21,582 | Unrealized depreciation on swap contracts | — | |||||||||||||||
| Equity Contracts (purchased option contracts) | Investments: at fair value of unaffiliated investments | 57,808 | |||||||||||||||||
| Equity Contracts (written option contracts) | Written options, at value | 33,903 | |||||||||||||||||
$ | 1,676,922 | $ | 6,447,743 | ||||||||||||||||
www.arbitragefunds.com | 1-800-295-4485
94
The Arbitrage Funds Notes to Financial Statements (continued)
November 30, 2019 (Unaudited)
| Derivatives Not Accounted For As Hedging Instruments | Asset Derivatives Statement of Assets and Liabilities Location | Fair Value | Liability Derivatives Statement of Assets and Liabilities Location | Fair Value | |||||||||||||||
Diversified Event-Driven Fund | |||||||||||||||||||
| Foreign Currency Contracts | Unrealized appreciation on forward foreign currency exchange contracts | $ | 24,614 | Unrealized depreciation on forward foreign currency exchange contracts | $ | 221,542 | |||||||||||||
| Equity Contracts (swap contracts) | Unrealized appreciation on swap contracts | 1,660 | Unrealized depreciation on swap contracts | — | |||||||||||||||
| Equity Contracts (purchased option contracts) | Investments: at fair value of unaffiliated investments | 61,081 | |||||||||||||||||
| Equity Contracts (written option contracts) | Written options, at value | 383 | |||||||||||||||||
$ | 87,355 | $ | 221,925 | ||||||||||||||||
| Derivatives Not Accounted For As Hedging Instruments | Asset Derivatives Statement of Assets and Liabilities Location | Fair Value | Liability Derivatives Statement of Assets and Liabilities Location | Fair Value | |||||||||||||||
Credit Opportunities Fund | |||||||||||||||||||
| Equity Contracts (purchased option contracts) | Investments: at fair value of unaffiliated investments | $ | 78,223 | $ | — | ||||||||||||||
$ | 78,223 | $ | — | ||||||||||||||||
Semi-Annual Report | November 30, 2019
95
The Arbitrage Funds Notes to Financial Statements (continued)
November 30, 2019 (Unaudited)
| Derivatives Not Accounted For As Hedging Instruments | Asset Derivatives Statement of Assets and Liabilities Location | Fair Value | Liability Derivatives Statement of Assets and Liabilities Location | Fair Value | |||||||||||||||
Long/Short Fund | |||||||||||||||||||
| Foreign Currency Contracts | Unrealized appreciation on forward foreign currency exchange contracts | $ | 536 | Unrealized depreciation on forward foreign currency exchange contracts | $ | 1 | |||||||||||||
| Equity Contracts (purchased option contracts) | Investments: at fair value of unaffiliated investments | 10,246 | |||||||||||||||||
| Equity Contracts (written option contracts) | Written options, at value | 11,269 | |||||||||||||||||
$ | 10,782 | $ | 11,270 | ||||||||||||||||
www.arbitragefunds.com | 1-800-295-4485
96
The Arbitrage Funds Notes to Financial Statements (continued)
November 30, 2019 (Unaudited)
The effect of derivative instruments on the Funds' Statement of Operations for the six months ended November 30, 2019, was as follows:
| Derivatives Not Accounted For As Hedging Instruments | Location Of Gains/(Loss) On Derivatives Recognized In Income | Realized Gain/(Loss) On Derivatives Recognized In Income | Change in Unrealized Gain/(Loss) On Derivatives Recognized In Income | ||||||||||||
Arbitrage Fund | |||||||||||||||
| Foreign Currency Contracts | Net realized gains (losses) from: Forward currency contracts / Net change in unrealized appreciation (depreciation) on: Forward currency contracts | $ | 6,426,654 | $ | (9,926,891 | ) | |||||||||
| Equity Contracts (swap contracts) | Net realized gains (losses) from: Swap contracts / Net change in unrealized appreciation (depreciation) on: Swap contracts | (32,066,848 | ) | 21,582 | |||||||||||
| Equity Contracts (purchased option contracts) | Net realized gains (losses) from: Purchased option contracts / Net change in unrealized appreciation (depreciation) on: Purchased option contracts | (4,203,681 | ) | (418,655 | ) | ||||||||||
| Equity Contracts (written option contracts) | Net realized gains (losses) from: Written option contracts / Net change in unrealized appreciation (depreciation) on: Written option contracts | 265,283 | (15,256 | ) | |||||||||||
$ | (29,578,592 | ) | $ | (10,339,220 | ) | ||||||||||
Semi-Annual Report | November 30, 2019
97
The Arbitrage Funds Notes to Financial Statements (continued)
November 30, 2019 (Unaudited)
| Derivatives Not Accounted For As Hedging Instruments | Location Of Gains/(Loss) On Derivatives Recognized In Income | Realized Gain/(Loss) On Derivatives Recognized In Income | Change in Unrealized Gain/(Loss) On Derivatives Recognized In Income | ||||||||||||
Diversified Event-Driven Fund | |||||||||||||||
| Foreign Currency Contracts | Net realized gains (losses) from: Forward currency contracts / Net change in unrealized appreciation (depreciation) on: Forward currency contracts | $ | 287,886 | $ | (367,960 | ) | |||||||||
| Equity Contracts (swap contracts) | Net realized gains (losses) from: Swap contracts / Net change in unrealized appreciation (depreciation) on: Swap contracts | (1,520,938 | ) | 1,660 | |||||||||||
| Equity Contracts (purchased option contracts) | Net realized gains (losses) from: Purchased option contracts / Net change in unrealized appreciation (depreciation) on: Purchased option contracts | (382,615 | ) | (170,620 | ) | ||||||||||
| Equity Contracts (written option contracts) | Net realized gains (losses) from: Written option contracts / Net change in unrealized appreciation (depreciation) on: Written option contracts | 152,246 | 23,870 | ||||||||||||
$ | (1,463,421 | ) | $ | (513,050 | ) | ||||||||||
| Derivatives Not Accounted For As Hedging Instruments | Location Of Gains/(Loss) On Derivatives Recognized In Income | Realized Gain/(Loss) On Derivatives Recognized In Income | Change in Unrealized Gain/(Loss) On Derivatives Recognized In Income | ||||||||||||
Credit Opportunities Fund | |||||||||||||||
| Equity Contracts (swap contracts) | Net realized gains (losses) from: Swap contracts / Net change in unrealized appreciation (depreciation) on: Swap contracts | $ | (125,291 | ) | $ | — | |||||||||
| Equity Contracts (purchased option contracts) �� | Net realized gains (losses) from: Purchased option contracts / Net change in unrealized appreciation (depreciation) on: Purchased option contracts | (50,063 | ) | (24,880 | ) | ||||||||||
| Equity Contracts (written option contracts) | Net realized gains (losses) from: Written option contracts / Net change in unrealized appreciation (depreciation) on: Written option contracts | 10,087 | (1,180 | ) | |||||||||||
$ | (165,267 | ) | $ | (26,060 | ) | ||||||||||
www.arbitragefunds.com | 1-800-295-4485
98
The Arbitrage Funds Notes to Financial Statements (continued)
November 30, 2019 (Unaudited)
| Derivatives Not Accounted For As Hedging Instruments | Location Of Gains/(Loss) On Derivatives Recognized In Income | Realized Gain/(Loss) On Derivatives Recognized In Income | Change in Unrealized Gain/(Loss) On Derivatives Recognized In Income | ||||||||||||
Long/Short Fund | |||||||||||||||
| Foreign Currency Contracts | Net realized gains (losses) from: Forward currency contracts / Net change in unrealized appreciation (depreciation) on: Forward currency contracts | $ | 4,828 | $ | (565 | ) | |||||||||
| Equity Contracts (swap contracts) | Net realized gains (losses) from: Swap contracts / Net change in unrealized appreciation (depreciation) on: Swap contracts | 2,236 | — | ||||||||||||
| Equity Contracts (purchased option contracts) | Net realized gains (losses) from: Purchased option contracts / Net change in unrealized appreciation (depreciation) on: Purchased option contracts | (12,117 | ) | (27,347 | ) | ||||||||||
| Equity Contracts (written option contracts) | Net realized gains (losses) from: Written option contracts / Net change in unrealized appreciation (depreciation) on: Written option contracts | 7,471 | 9,174 | ||||||||||||
$ | 2,418 | $ | (18,738 | ) | |||||||||||
Volume of derivative instruments held by the Funds during the six months ended November 30, 2019, was as follows:
Derivative Type | Unit of Measurement | Monthly Average | |||||||||
Arbitrage Fund | |||||||||||
Swap Contracts | Notional Quantity | 115,160,362 | |||||||||
| Forward Foreign Currency Exchange Contracts | Net Contracts to Deliver/(Receive) | (192,951,103 | ) | ||||||||
Purchased Option Contracts | Contracts | 12,146 | |||||||||
Written Option Contracts | Contracts | (366 | ) | ||||||||
Derivative Type | Unit of Measurement | Monthly Average | |||||||||
Diversified Event-Driven Fund | |||||||||||
Swap Contracts | Notional Quantity | 6,021,237 | |||||||||
| Forward Foreign Currency Exchange Contracts | Net Contracts to Deliver/(Receive) | (7,538,047 | ) | ||||||||
Purchased Option Contracts | Contracts | 2,681 | |||||||||
Written Option Contracts | Contracts | (412 | ) | ||||||||
Derivative Type | Unit of Measurement | Monthly Average | |||||||||
Credit Opportunities Fund | |||||||||||
Swap Contracts | Notional Quantity | 2,015,206 | |||||||||
Purchased Option Contracts | Contracts | 797 | |||||||||
Written Option Contracts | Contracts | (45 | ) | ||||||||
Semi-Annual Report | November 30, 2019
99
The Arbitrage Funds Notes to Financial Statements (continued)
November 30, 2019 (Unaudited)
Derivative Type | Unit of Measurement | Monthly Average | |||||||||
Long/Short Fund | |||||||||||
Swap Contracts | Notional Quantity | 4,761 | |||||||||
| Forward Foreign Currency Exchange Contracts | Net Contracts to Deliver/(Receive) | (119,950 | ) | ||||||||
Purchased Option Contracts | Contracts | 245 | |||||||||
Written Option Contracts | Contracts | (49 | ) | ||||||||
Certain derivative contracts are executed under either standardized netting agreements or, for exchange-traded derivatives, the relevant contracts for a particular exchange which contain enforceable netting provisions. A derivative netting arrangement creates an enforceable right of set-off that becomes effective, and affects the realization of settlement on individual assets, liabilities and collateral amounts, only following a specified event of default or early termination. Default events may include the failure to make payments or deliver securities timely, material adverse changes in financial condition or insolvency, the breach of minimum regulatory capital requirements, or loss of license, charter or other legal authorization necessary to perform under the contract.
The Funds held financial instruments such as Equity Swaps that are subject to enforceable netting arrangements or other similar agreements as of November 30, 2019. At November 30, 2019, there was no unrealized appreciation or depreciation on these instruments held by the Credit Opportunities Fund and the Long/Short Fund.
The following table presents financial instruments held by the Arbitrage Fund and Diversified Event-Driven Fund that are subject to enforceable netting arrangements or other similar agreements as of November 30, 2019:
Arbitrage Fund
Gross | Gross Amounts Offset in | Net Amounts Presented in | Gross Amounts Not Offset in the Statement of Assets and Liabilities | ||||||||||||||||||||||||
Description | Amounts of Recognized Assets | the Statements of Assets and Liabilities | the Statement of Assets and Liabilities | Financial Instruments | Cash Collateral Received | Net Amount | |||||||||||||||||||||
Equity Swaps | $ | 21,582 | $ | — | $ | 21,582 | $ | — | $ | — | $ | 21,582 | |||||||||||||||
Total | $ | 21,582 | $ | — | $ | 21,582 | $ | — | $ | — | $ | 21,582 | |||||||||||||||
Diversified Event-Driven Fund
Gross | Gross Amounts Offset in | Net Amounts Presented in | Gross Amounts Not Offset in the Statement of Assets and Liabilities | ||||||||||||||||||||||||
Description | Amounts of Recognized Assets | the Statements of Assets and Liabilities | the Statement of Assets and Liabilities | Financial Instruments | Cash Collateral Received | Net Amount | |||||||||||||||||||||
Equity Swaps | $ | 1,660 | $ | — | $ | 1,660 | $ | — | $ | — | $ | 1,660 | |||||||||||||||
Total | $ | 1,660 | $ | — | $ | 1,660 | $ | — | $ | — | $ | 1,660 | |||||||||||||||
Investment Income — Interest income, adjusted for amortization of premium and accretion of discount, is recorded on the accrual basis. Dividend income is recorded on the ex-dividend date, net of any non-reclaimable tax withholdings. Payment-in-kind securities have the option at each interest payment date of making interest payments in cash or additional debt securities. Any
www.arbitragefunds.com | 1-800-295-4485
100
The Arbitrage Funds Notes to Financial Statements (continued)
November 30, 2019 (Unaudited)
interest accrued on payment-in-kind securities is recorded as interest income. Distributions from REITs may be characterized as ordinary income, net capital gain, or a return of capital to the Funds. The proper characterization of REIT distributions is generally not known until after the end of each calendar year. As such, estimates are used in reporting the character of income and distributions for financial statement purposes when information is not available.
Dividends and Distributions to Shareholders — Dividends arising from net investment income and net capital gain distributions, if any, are declared and paid at least annually to shareholders of the Arbitrage Fund, Diversified Event-Driven Fund and Long/Short Fund. Dividends arising from net investment income, if any, are declared daily and paid monthly, and net capital gain distributions, if any, are declared and paid at least annually to shareholders of the Credit Opportunities Fund.
Allocation Between Classes — Investment income earned, realized capital gains and losses, and unrealized appreciation and depreciation are allocated daily to each class of shares based upon the proportionate shares of total net assets of each Fund. Class-specific expenses are charged directly to the class incurring the expense. Common expenses which are not attributable to a specific class are allocated daily to each class of shares based upon the proportionate share of total net assets of each Fund.
Federal Income Tax — It is the Funds' policy to continue to comply with the special provisions of Subchapter M of the Code, as amended, applicable to regulated investment companies. As provided therein, in any fiscal year in which a fund so qualifies and distributes at least 90% of its taxable net income, a fund (but not the shareholders) will be relieved of Federal income tax on the income distributed. Accordingly, no provision for income taxes has been made.
As of and during the six months ended November 30, 2019, the Funds did not have a liability for any unrecognized tax benefits. The Funds recognize interest and, if applicable, penalties for any uncertain tax positions. Interest and penalty expense will be recorded as a component of interest or other tax expense. No interest or penalties were recorded during the six months ended November 30, 2019. The Funds file U.S. federal, state, and local tax returns as required. The Funds' tax returns are subject to examination by the relevant tax authorities until expiration of the applicable statute of limitations which is generally three years after the filing of the tax return. Tax returns for open years have incorporated no uncertain tax positions that require a provision for income taxes.
3. INVESTMENT TRANSACTIONS
During the six months ended November 30, 2019, cost of purchases and proceeds from sales and maturities of investment securities, excluding short-term investments, U.S. government securities, equity swap contracts, purchased and written option contracts and securities sold short, were as follows:
Arbitrage Fund | Diversified Event-Driven Fund | Credit Opportunities Fund | Long/Short Fund | ||||||||||||||||
Purchases | $ | 2,205,294,691 | $ | 223,847,662 | $ | 54,419,990 | $ | 4,151,080 | |||||||||||
Sales and Maturities | 1,881,870,542 | 213,003,770 | 47,868,984 | 4,061,981 | |||||||||||||||
4. LINE OF CREDIT
The Trust, on behalf of the Funds, entered into an agreement which enables the Arbitrage Fund, the Diversified Event-Driven Fund, the Credit Opportunities Fund and the Long/Short Fund to participate in a $100,000,000 unsecured committed revolving line of credit (the "Committed
Semi-Annual Report | November 30, 2019
101
The Arbitrage Funds Notes to Financial Statements (continued)
November 30, 2019 (Unaudited)
Line") and a $100,000,000 unsecured uncommitted revolving line of credit (the "Uncommitted Line," together with the Committed Line, the "Credit Agreement") with State Street Bank and Trust Company (the "Custodian"). Borrowings are made solely to temporarily finance the purchase or sale of securities or to finance the redemption of the shares of an investor of the Funds. Interest is charged to the Funds based on their borrowings at a rate per annum of the higher of the LIBOR rate plus 1.25% and the overnight federal funds rate plus 1.25%. The Committed Line has a commitment fee of 0.25% per annum on the unused portion of the Committed Line and is payable quarterly. The Uncommitted Line has an upfront fee of $25,000, is held available on a discretionary demand basis and may be terminated by the Custodian or the Trust at any time for any or no reason. On December 3, 2019 the Trust reduced the amount on the Uncommited Line to $50,000,000. The Trust accrues, on behalf of each of the Funds, the commitment fee on the unused portion of the Committed Line. Such fees are included in the custodian and bank service fees on the Statement of Operations.
For the six months ended November 30, 2019, the Arbitrage Fund, the Diversified Event-Driven Fund and the Credit Opportunities Fund had average borrowings of $39,958,333, $1,288,000 and $1,071,429, respectively, over a period of 24 days, 25 days and 14 days, respectively, at a weighted average interest rate of 3.58%, 3.35% and 3.12%, respectively. Interest expense on the line of credit for the Arbitrage Fund, the Diversified Event-Driven Fund and the Credit Opportunities Fund during the six months ended November 30, 2019, is shown as line of credit interest expense on the Statements of Operations. The Arbitrage Fund had no outstanding borrowings at November 30, 2019. The Diversified Event-Driven Fund and the Credit Opportunities Fund had outstanding borrowings of $500,000 and $500,000, respectively, at November 30, 2019.
5. ADVISORY FEES, ADMINISTRATION FEES AND OTHER AGREEMENTS
Investment Advisory Agreement
The Funds' investments are managed by the Adviser according to the terms of Investment Advisory Agreements. Under the Investment Advisory Agreement between the Adviser and the Arbitrage Fund, as amended and restated on October 1, 2007, the Arbitrage Fund pays the Adviser an annual fee, which is computed and accrued daily and paid monthly, of 1.25% on the first $250 million, 1.20% on the next $50 million, 1.15% on the next $50 million, 1.10% on the next $75 million, 1.05% on the next $75 million and 1.00% for amounts over $500 million, based on the Arbitrage Fund's average daily net assets. Effective November 1, 2019, the Diversified Event-Driven Fund reduced the annual investment advisory fee to 1.10% based on the Diversified Event-Driven Fund's average daily net assets. Prior to November 1, 2019, under the Investment Advisory Agreement between the Adviser and the Diversified Event-Driven Fund dated September 27, 2010, the Diversified Event-Driven Fund paid the Adviser an annual fee, which was computed and accrued daily and paid monthly, of 1.25% based on the Diversified Event-Driven Fund's average daily net assets. Effective August 6, 2018, the Credit Opportunities Fund reduced the annual investment advisory fee to 0.95% on the first $250 million of its average daily net assets, 0.90% on the next $500 million of its average daily net assets and 0.85% on its average daily net assets in excess of $750 million. Prior to August 6, 2018, the Credit Opportunities Fund paid an average annual fee of 1.00% on the amount of the Credit Opportunities Fund's average daily net assets. Under the Investment Advisory Agreement between the Adviser and the Long/Short Fund dated December 22, 2014, the Long/Short Fund pays the Adviser an annual fee, which is computed and accrued daily and paid monthly, of 1.25% based on the Long/Short Fund's average daily net assets.
The Adviser has contractually agreed, at least until September 30, 2020 for the Arbitrage Fund, the Diversified Event-Driven Fund, the Credit Opportunities Fund, and Classes R and I of the
www.arbitragefunds.com | 1-800-295-4485
102
The Arbitrage Funds Notes to Financial Statements (continued)
November 30, 2019 (Unaudited)
Long/Short Fund, to waive its advisory fee and/or reimburse the Funds' other expenses to the extent that total operating expenses (exclusive of taxes, interest, dividends on short positions, brokerage commissions, acquired fund fees and expenses and other costs incurred in connection with the purchase or sale of portfolio securities) exceed the annual rate of the Funds' average daily net assets attributable to each share class as shown in the table below:
Arbitrage Fund | Diversified Event-Driven Fund | Credit Opportunities Fund | Long/Short Fund | ||||||||||||||||
Class R | 1.69 | % | 1.69 | % | 1.23 | % | 1.69 | % | |||||||||||
Class I | 1.44 | % | 1.44 | % | 0.98 | % | 1.44 | % | |||||||||||
Class C | 2.44 | % | 2.44 | % | 1.98 | % | 2.44 | % | |||||||||||
Class A | 1.69 | % | 1.69 | % | 1.23 | % | 1.69 | % | |||||||||||
Effective August 6, 2018, the Adviser has contractually agreed to provide additional expense reimbursements to the Credit Opportunities Fund by lowering the contractual expense limitation, not including taxes, interest, dividends on short positions, brokerage commissions, acquired fund fees and expenses and other costs incurred in connection with the purchase or sale of portfolio securities, to the amounts in the table above. Prior to August 6, 2018, the expense limitation was 1.50% of the Credit Opportunities Fund's average daily net assets allocable to the Class R shares, 1.25% of the Credit Opportunities Fund's average daily net assets allocable to the Class I shares, 2.25% of the Credit Opportunities Fund's average daily net assets allocable to the Class C shares, and 1.50% of the Credit Opportunities Fund's average daily net assets allocable to the Class A shares.
During the six months ended November 30, 2019, the Arbitrage Fund invested in the Diversified Event-Driven Fund. The Adviser has agreed to waive the advisory fee paid by the Arbitrage Fund on the Arbitrage Fund's assets that are invested in the Diversified Event-Driven Fund.
As of November 30, 2019, the Long/Short Fund had $20,517 receivable from the Adviser due to an advisory fee reimbursement.
For the six months ended November 30, 2019, the aggregate net fee paid to the Adviser as a percentage of average net assets for the Arbitrage Fund, Diversified Event-Driven Fund, Credit Opportunities Fund and Long/Short Fund was 1.04%, 0.86%, 0.40% and 0.00%, respectively.
The Adviser is permitted to recapture fees waived and expenses reimbursed to the extent actual fees and expenses for a period are less than the expense limitation of each class, provided, however, that the Adviser shall only be entitled to recapture such amounts for a period of three years after the year in which the expense was waived. The Adviser can recapture, with the exception of the advisory fees waived related to Arbitrage Fund's investment in the Diversified Event-Driven Fund, any fees it has waived within three fiscal years of the year in which the fees were waived subject to the applicable annual rate of: 1.69% for Class R shares, 1.44% for Class I shares, 2.44% for Class C shares and 1.69% for Class A shares of the Arbitrage Fund and Diversified Event-Driven Fund. The Adviser can recapture any fees it has waived within three fiscal years of the year in which the fees were waived subject to the applicable annual rate of: 1.69% for Class R shares, 1.44% for Class I shares, 2.44% of the Long/Short Fund. The Advisor can recapture any fees it has waived within three years of the date of the expense waiver for the Credit Opportunities Fund subject to the applicable annual rate of 1.23% for Class R shares, 0.98% for Class I shares, 1.98% for Class C shares and 1.23% for Class A shares of the Credit Opportunities Fund for fees waived after August 6, 2018. Prior to August 6, 2018, the Adviser can recapture any fees it has waived within three years after the year in which the expense was waived subject to
Semi-Annual Report | November 30, 2019
103
The Arbitrage Funds Notes to Financial Statements (continued)
November 30, 2019 (Unaudited)
the applicable annual rate of 1.50% for Class R shares, 1.25% for Class I shares, 2.25% for Class C shares and 1.50% for Class A shares of the Credit Opportunities Fund provided that such recapture would not cause the expense ratio of the Credit Opportunities Fund to exceed the limit in effect at the time such fees were recaptured.
As of November 30, 2019, the balances of future fee and expense recaptures for each Fund were as follows:
| Expiring May 31, 2020 | Expiring May 31, 2021 | Expiring May 31, 2022 | Total | ||||||||||||||||
Diversified Event-Driven Fund | |||||||||||||||||||
Class R | $ | 222,866 | $ | 212,683 | $ | 150,425 | $ | 585,974 | |||||||||||
| Class I | 236,150 | 390,120 | 392,244 | 1,018,514 | |||||||||||||||
| Class C | 5,997 | 5,981 | 3,752 | 15,730 | |||||||||||||||
| Class A | 3,680 | 3,178 | 3,225 | 10,083 | |||||||||||||||
Credit Opportunities Fund | |||||||||||||||||||
Class R | $ | 37,259 | $ | 42,333 | $ | 35,953 | $ | 115,545 | |||||||||||
| Class I | 129,977 | 126,190 | 244,066 | 500,233 | |||||||||||||||
| Class C | 2,984 | 2,587 | 2,613 | 8,184 | |||||||||||||||
| Class A | 330 | 655 | 740 | 1,725 | |||||||||||||||
Long/Short Fund | |||||||||||||||||||
Class R | $ | 1,275 | $ | 1,030 | $ | 938 | $ | 3,243 | |||||||||||
| Class I | 213,108 | 215,161 | 201,824 | 630,093 | |||||||||||||||
There were no amounts recaptured during the six months ended November 30, 2019, from the Funds.
Administration Agreement
State Street Bank & Trust Company serves as the Trust's administrator pursuant to an Administration Agreement with the Trust.
Distribution Agreement
ALPS Distributors, Inc. (the "Distributor") serves as the Funds' distributor. The Distributor acts as an agent for the Funds and the distributor of their shares. The Funds have adopted, with respect to their Class R, Class C shares and Class A shares, a plan of distribution pursuant to Rule 12b-1 under the 1940 Act which permits each Fund to pay for expenses incurred in the distribution and promotion of the Funds' Class R shares, Class C shares and Class A shares and for services provided to shareholders. The Plan is a "reimbursement" plan. This means that a Fund's Class R shares, Class C shares and Class A shares only pay a particular 12b-1 fee to the extent that the Adviser, the Distributor or others have incurred expenses in the promotion and distribution of the shares, including but not limited to, the printing of prospectuses and reports used for sales purposes, expenses of preparation of sales literature and related expenses, advertisements, and other distribution-related expenses, as well as any distribution fees paid to securities dealers or others. Under the distribution plan, a Fund may pay compensation to any broker-dealer with whom the Distributor or the Funds has entered into a contract to distribute Class R shares, Class C shares or Class A shares, or to any other qualified financial services firm, for distribution and/or shareholder-related services with respect to shares held or purchased by their respective customers or in connection with the purchase of shares attributable to their efforts. The amount of payments under the Plan in any year shall not exceed 0.25% for Class R shares, 0.75% for Class C shares and 0.25% for Class A shares, respectively, of the average daily net assets allocable to a Fund's Class R shares, Class C shares and Class A shares, respectively. In addition, the Plan permits
www.arbitragefunds.com | 1-800-295-4485
104
The Arbitrage Funds Notes to Financial Statements (continued)
November 30, 2019 (Unaudited)
each Fund to make payments at an annual rate of up to 0.25% of the Fund's Class C shares for expenses incurred in connection with the provision of shareholder support or administrative services for the Fund's Class C shares.
During the six months ended November 30, 2019, the Arbitrage Fund's Class R shares incurred $192,073, Class C shares incurred $96,636 and Class A shares incurred $23,114, respectively, in distribution expenses for Class R shares and Class A shares and distribution and shareholder support expenses for Class C shares, all of which was used to compensate broker-dealers. With respect to the Diversified Event-Driven Fund, during the six months ended November 30, 2019, the Diversified Event-Driven Fund's Class R shares incurred $38,629, Class C shares incurred $4,131 and Class A shares incurred $993, respectively, in distribution expenses for Class R shares and Class A shares and distribution and shareholder support expenses for Class C shares, all of which was used to compensate broker-dealers. With respect to the Credit Opportunities Fund, during the six months ended November 30, 2019, the Credit Opportunities Fund's Class R shares incurred $10,278, Class C shares incurred $1,971 and Class A shares incurred $172, respectively, in distribution expenses for Class R shares and Class A shares and distribution and shareholder support expenses for Class C shares, all of which was used to compensate broker-dealers. With respect to the Long/Short Fund, during the six months ended November 30, 2019, the Long/Short Fund's Class R shares incurred $13, Class C shares incurred $17 and Class A shares incurred $4, respectively, in distribution expenses for Class R shares and Class A shares and distribution and shareholder support expenses for Class C shares, all of which was used to compensate broker-dealers. Effective July 31, 2019, Class A and Class C shares of the Long/Short Fund were liquidated.
Chief Compliance Officer
Certain officers of the Trust are also officers of the Adviser. The Chief Compliance Officer ("CCO") of the Trust also serves as the CCO of the Adviser. The Funds currently pay the Adviser 50% of the CCO's salary for the CCO's provision of services to the Funds.
Chief Financial Officer
Foreside Management Services, LLC provides Chief Financial Officer ("CFO") services to the Trust. Foreside Management Services, LLC is compensated by the Trust under a Fund CFO/Treasurer Agreement.
Transfer Agent And Shareholder Services Agreement
DST Systems, Inc. ("DST") is the Funds' transfer agent, and per an agency agreement, maintains the records of each shareholder's account, answers shareholders' inquiries concerning their accounts, processes purchases and redemptions of the Funds shares, acts as dividend and distribution disbursing agent and performs other shareholder service functions.
6. AFFILIATED ISSUER TRANSACTIONS
A summary of affiliated transactions for the Arbitrage Fund for the six months ended November 30, 2019 follows:
| Affiliated Issuer | Beginning Value as of May 31, 2019 | Purchases at Cost | Proceeds from Sales | Net Realized Gain/ (Loss) on Sales | Change in Unrealized Appreciation/ Depreciation | Ending Value as of November 30, 2019 | Shares as of November 30, 2019 | Dividend Income | Capital Gain Distributions | ||||||||||||||||||||||||||||||
| Diversified Event-Driven Fund | $ | 15,375,997 | $ | 10,000,000 | $ | — | $ | — | $ | 404,321 | $ | 25,780,318 | 2,657,765 | $ | — | $ | — | ||||||||||||||||||||||
Semi-Annual Report | November 30, 2019
105
The Arbitrage Funds Notes to Financial Statements (continued)
November 30, 2019 (Unaudited)
7. CAPITAL SHARE TRANSACTIONS
Proceeds and payments on capital shares as shown in the Statement of Changes in Net Assets are the result of the following capital share transactions for the periods shown:
| Six Months Ended November 30, 2019 (Unaudited) | Year Ended May 31, 2019 | ||||||||||||||||||
Arbitrage Fund - Class R | Shares | Value | Shares | Value | |||||||||||||||
Proceeds from shares sold | 600,253 | $ | 7,820,352 | 3,793,525 | $ | 48,440,688 | |||||||||||||
| Shares issued in reinvestment of distributions | — | — | 258,687 | 3,287,911 | |||||||||||||||
Payments for shares redeemed | (2,142,625 | ) | (27,906,845 | ) | (8,983,994 | ) | (114,767,511 | ) | |||||||||||
Net decrease | (1,542,372 | ) | $ | (20,086,493 | ) | (4,931,782 | ) | $ | (63,038,912 | ) | |||||||||
Arbitrage Fund - Class I | |||||||||||||||||||
Proceeds from shares sold | 9,629,961 | $ | 129,298,714 | 39,434,735 | $ | 518,934,600 | |||||||||||||
| Shares issued in reinvestment of distributions | — | — | 1,630,790 | 21,330,733 | |||||||||||||||
Payments for shares redeemed | (16,671,140 | ) | (224,134,486 | ) | (40,852,721 | ) | (537,722,663 | ) | |||||||||||
Net increase/(decrease) | (7,041,179 | ) | $ | (94,835,772 | ) | 212,804 | $ | 2,542,670 | |||||||||||
Arbitrage Fund - Class C | |||||||||||||||||||
Proceeds from shares sold | 220,690 | $ | 2,742,534 | 97,547 | $ | 1,191,257 | |||||||||||||
| Shares issued in reinvestment of distributions | — | — | 15,160 | 184,649 | |||||||||||||||
Payments for shares redeemed | (171,528 | ) | (2,129,633 | ) | (460,138 | ) | (5,623,667 | ) | |||||||||||
Net increase/(decrease) | 49,162 | $ | 612,901 | (347,431 | ) | $ | (4,247,761 | ) | |||||||||||
Arbitrage Fund - Class A | |||||||||||||||||||
Proceeds from shares sold | 328,701 | $ | 4,284,501 | 402,219 | $ | 5,124,610 | |||||||||||||
| Shares issued in reinvestment of distributions | — | — | 19,983 | 253,588 | |||||||||||||||
Payments for shares redeemed | (375,725 | ) | (4,903,108 | ) | (325,498 | ) | (4,155,387 | ) | |||||||||||
Net increase/(decrease) | (47,024 | ) | $ | (618,607 | ) | 96,704 | $ | 1,222,811 | |||||||||||
www.arbitragefunds.com | 1-800-295-4485
106
The Arbitrage Funds Notes to Financial Statements (continued)
November 30, 2019 (Unaudited)
| Six Months Ended November 30, 2019 (Unaudited) | Year Ended May 31, 2019 | ||||||||||||||||||
| Diversified Event-Driven Fund - Class R | Shares | Value | Shares | Value | |||||||||||||||
Proceeds from shares sold | 372,347 | $ | 3,548,560 | 572,854 | $ | 5,382,416 | |||||||||||||
| Shares issued in reinvestment of distributions | — | — | 37,998 | 353,763 | |||||||||||||||
Payments for shares redeemed | (369,416 | ) | (3,524,128 | ) | (2,196,314 | ) | (20,654,136 | ) | |||||||||||
Net increase/(decrease) | 2,931 | $ | 24,432 | (1,585,462 | ) | $ | (14,917,957 | ) | |||||||||||
Diversified Event-Driven Fund - Class I | |||||||||||||||||||
Proceeds from shares sold | 1,411,350 | $ | 13,512,815 | 1,337,752 | $ | 12,728,183 | |||||||||||||
| Shares issued in reinvestment of distributions | — | — | 173,194 | 1,622,831 | |||||||||||||||
Payments for shares redeemed | (979,094 | ) | (9,415,322 | ) | (2,596,458 | ) | (24,686,089 | ) | |||||||||||
Net increase/(decrease) | 432,256 | $ | 4,097,493 | (1,085,512 | ) | $ | (10,335,075 | ) | |||||||||||
Diversified Event-Driven Fund - Class C | |||||||||||||||||||
Proceeds from shares sold | 10,805 | $ | 100,600 | 119 | $ | 1,100 | |||||||||||||
| Shares issued in reinvestment of distributions | — | — | 441 | 4,041 | |||||||||||||||
Payments for shares redeemed | (22,985 | ) | (214,938 | ) | (41,879 | ) | (387,752 | ) | |||||||||||
Net decrease | (12,180 | ) | $ | (114,338 | ) | (41,319 | ) | $ | (382,611 | ) | |||||||||
Diversified Event-Driven Fund - Class A | |||||||||||||||||||
Proceeds from shares sold | 5,984 | $ | 57,458 | 37,148 | $ | 351,232 | |||||||||||||
| Shares issued in reinvestment of distributions | — | — | 1,399 | 13,015 | |||||||||||||||
Payments for shares redeemed | (6,638 | ) | (63,528 | ) | (28,180 | ) | (266,487 | ) | |||||||||||
Net increase/(decrease) | (654 | ) | $ | (6,070 | ) | 10,367 | $ | 97,760 | |||||||||||
Semi-Annual Report | November 30, 2019
107
The Arbitrage Funds Notes to Financial Statements (continued)
November 30, 2019 (Unaudited)
| Six Months Ended November 30, 2019 (Unaudited) | Year Ended May 31, 2019 | ||||||||||||||||||
Credit Opportunities Fund - Class R | Shares | Value | Shares | Value | |||||||||||||||
Proceeds from shares sold | 191,942 | $ | 1,862,961 | 565,549 | $ | 5,466,164 | |||||||||||||
| Shares issued in reinvestment of distributions | 13,763 | 133,571 | 23,032 | 223,098 | |||||||||||||||
Payments for shares redeemed | (144,976 | ) | (1,407,408 | ) | (755,201 | ) | (7,333,975 | ) | |||||||||||
Net increase/(decrease) | 60,729 | $ | 589,124 | (166,620 | ) | $ | (1,644,713 | ) | |||||||||||
Credit Opportunities Fund - Class I | |||||||||||||||||||
Proceeds from shares sold | 670,537 | $ | 6,477,337 | 2,701,830 | $ | 26,082,551 | |||||||||||||
| Shares issued in reinvestment of distributions | 88,803 | 857,974 | 166,340 | 1,601,817 | |||||||||||||||
Payments for shares redeemed | (776,157 | ) | (7,497,532 | ) | (1,431,809 | ) | (13,740,602 | ) | |||||||||||
Net increase/(decrease) | (16,817 | ) | $ | (162,221 | ) | 1,436,361 | $ | 13,943,766 | |||||||||||
Credit Opportunities Fund - Class C | |||||||||||||||||||
| Shares issued in reinvestment of distributions | 491 | 4,746 | 1,278 | 12,324 | |||||||||||||||
Payments for shares redeemed | (12,123 | ) | (117,229 | ) | (18,575 | ) | (180,135 | ) | |||||||||||
Net decrease | (11,632 | ) | $ | (112,483 | ) | (17,297 | ) | $ | (167,811 | ) | |||||||||
Credit Opportunities Fund - Class A | |||||||||||||||||||
Proceeds from shares sold | 30,785 | $ | 297,278 | 1,501 | $ | 14,514 | |||||||||||||
| Shares issued in reinvestment of distributions | 222 | 2,148 | 466 | 4,485 | |||||||||||||||
Payments for shares redeemed | (1,535 | ) | (14,810 | ) | (5,171 | ) | (49,069 | ) | |||||||||||
Net increase/(decrease) | 29,472 | $ | 284,616 | (3,204 | ) | $ | (30,070 | ) | |||||||||||
www.arbitragefunds.com | 1-800-295-4485
108
The Arbitrage Funds Notes to Financial Statements (continued)
November 30, 2019 (Unaudited)
| Six Months Ended November 30, 2019 (Unaudited) | Year Ended May 31, 2019 | ||||||||||||||||||
Long/Short Fund - Class R | Shares | Value | Shares | Value | |||||||||||||||
| Shares issued in reinvestment of distributions | — | — | 21 | 206 | |||||||||||||||
Net increase | — | $ | — | 21 | $ | 206 | |||||||||||||
Long/Short Fund - Class I | |||||||||||||||||||
Proceeds from shares sold | 3,952 | $ | 39,224 | 36,793 | $ | 366,929 | |||||||||||||
| Shares issued in reinvestment of distributions | — | — | 4,583 | 43,718 | |||||||||||||||
Payments for shares redeemed | (56,097 | ) | (555,175 | ) | (19,151 | ) | (189,524 | ) | |||||||||||
Net increase/(decrease) | (52,145 | ) | $ | (515,951 | ) | 22,225 | $ | 221,123 | |||||||||||
Long/Short Fund - Class C(2) | |||||||||||||||||||
| Shares issued in reinvestment of distributions | — | — | 21 | 206 | |||||||||||||||
Payments for shares redeemed | (1,031 | ) | (10,300 | ) | — | — | |||||||||||||
Net increase/(decrease) | (1,031 | ) | $ | (10,300 | ) | 21 | $ | 206 | |||||||||||
Long/Short Fund - Class A(2) | |||||||||||||||||||
| Shares issued in reinvestment of distributions | — | — | 22 | 206 | |||||||||||||||
Payments for shares redeemed | (1,031 | ) | (10,303 | ) | — | — | |||||||||||||
Net increase/(decrease) | (1,031 | ) | $ | (10,303 | ) | 22 | $ | 206 | |||||||||||
(2) Effective July 31, 2019, Class A and Class C shares of the Long/Short Fund were liquidated.
8. FOREIGN CURRENCY TRANSLATION
Amounts denominated in or expected to settle in foreign currencies are translated to U.S. dollars based on exchange rates on the basis outlined below:
A. The market values of investment securities and other assets and liabilities are translated at the closing rate of exchange each day.
B. Purchases and sales of investment securities and income and expenses are translated at the rate of exchange prevailing on the respective dates of such transactions.
C. The Funds do not isolate that portion of the results of operations caused by changes in foreign exchange rates on investments from those caused by changes in market prices of securities held. Such fluctuations are included with the net realized and unrealized gains or losses on investments. Reported net realized foreign exchange gains or losses arise from 1) purchases and sales of foreign currencies; 2) currency gains or losses realized between the trade and settlement dates on security transactions; and 3) the difference between the amounts of dividends, interest and foreign withholding taxes recorded on the Funds' books, and the U.S. dollar equivalent of the amounts actually received or paid. Reported net unrealized foreign exchange gains and losses arise from changes in the value of assets and liabilities, other than investment securities, resulting from changes in exchange rates.
Semi-Annual Report | November 30, 2019
109
The Arbitrage Funds Notes to Financial Statements (continued)
November 30, 2019 (Unaudited)
9. CONTINGENCIES AND COMMITMENTS
The Funds indemnify the Trust's officers and trustees for certain liabilities that might arise from their performance of their duties to the Funds. Additionally, in the normal course of business, the Funds enter into contracts that contain a variety of representations and warranties and which provide general indemnifications. The Funds' maximum exposure under these arrangements is unknown, as this would involve future claims that may be made against the Funds that have not yet occurred. However, based on experience, the Funds expect the risk of loss to be remote.
10. SECURITIES LENDING
To generate additional income, the Funds may, from time to time, lend portfolio securities to broker-dealers, banks or institutional borrowers of securities. At the time of the loan, the Funds must receive from the borrower 102% collateral in the form of cash or U.S. government securities. This collateral must be valued daily and, should the market value of the loaned securities increase, the borrower must furnish additional collateral to the Funds. During the time portfolio securities are on loan, the borrower pays the Funds any dividends or interest paid on such securities.
Loans are subject to termination by the Funds or the borrower at any time. While the Funds do not have the right to vote securities on loan, they have the right to terminate the loan and regain the right to vote if that is considered important with respect to the investment. In the event the borrower defaults in its obligation to the Fund, the Funds bear the risk of delay in the recovery of portfolio securities and the risk of loss of rights in the collateral.
The Funds may participate in a securities lending program under which the Funds' custodian, State Street Bank and Trust Company (the "Custodian") acting as securities lending agent, is authorized to lend Fund portfolio securities to qualified brokers/dealers and financial institutions that post appropriate collateral. The value of securities loaned will not exceed one-third of the value of the total assets of the Fund making the loan. The Custodian has agreed to indemnify the Fund in case of default of any security borrower.
Securities on loan are fully collateralized and the collateral was equal to or exceeded the securities on loan. Cash collateral is invested in the State Street Institutional U.S. Government Money Market Fund, Premier Class. The Custodian receives a portion of the interest earned on any reinvested collateral. Income received by the Funds in securities lending transactions during the year ended November 30, 2019, if any, is reflected as securities lending income in the Statement of Operations. The market value of securities on loan to borrowers and the value of collateral held by the Funds with respect to such loans at November 30, 2019 were as follows:
| Market Value of Loaned Securities | Value of Cash Collateral | Value of Non-Cash Collateral | |||||||||||||
Diversified Event-Driven Fund | $ | 21,919 | $ | 24,313 | $ | — | |||||||||
11. FEDERAL TAX INFORMATION
In order to avoid imposition of the excise tax applicable to regulated investment companies, it is the Funds' intention to declare as dividends in each calendar year at least 98.0% of its net investment income (earned during the calendar year) and 98.2% of its net realized capital gains (earned during the twelve months ended October 31) plus undistributed amounts from prior years.
The amount of distributions from net investment income and net realized gains, if any, are determined in accordance with Federal income tax regulations which may differ from accounting principles generally accepted in the United States of America. These "book/tax" differences are either temporary or permanent in nature and permanent differences are charged or credited to
www.arbitragefunds.com | 1-800-295-4485
110
The Arbitrage Funds Notes to Financial Statements (continued)
November 30, 2019 (Unaudited)
undistributed net investment income (loss), accumulated net realized gain (loss) or paid-in capital as appropriate in the period that the differences arise.
Permanent differences between the Funds' financial statement and income tax reporting requirements are primarily attributable to gains and losses on certain foreign currency related transactions, short sale related dividend expense, investments in passive foreign investment companies, investments in swaps, ordinary loss netting to reduce short-term capital gains, convertible bonds, corporate actions, non-deductible excise tax activity and partnership basis adjustments. These have no effect on the Funds' net assets or net asset value per share.
Fund | Distributable Earnings (Accumulated Loss) | Paid-in Capital | |||||||||
Arbitrage Fund | $ | 5,122 | $ | (5,122 | ) | ||||||
Diversified Event-Driven Fund | 2,531 | (2,531 | ) | ||||||||
Credit Opportunities Fund | 1 | (1 | ) | ||||||||
Long/Short Fund | 48 | (48 | ) | ||||||||
The tax character of dividends and distributions declared and paid during the years ended May 31, 2019 and May 31, 2018 was as follows:
Fund | Year Ended | Ordinary Income | Long-Term Capital Gains* | Total Distributions | |||||||||||||||
Arbitrage Fund | 5/31/2019 | $ | 29,608,804 | $ | 2,793,274 | $ | 32,402,078 | ||||||||||||
5/31/2018 | 55,974,429 | 11,622,718 | 67,597,147 | ||||||||||||||||
Diversified Event-Driven Fund | 5/31/2019 | $ | 2,299,685 | $ | — | $ | 2,299,685 | ||||||||||||
5/31/2018 | 730,268 | — | 730,268 | ||||||||||||||||
Credit Opportunities Fund | 5/31/2019 | $ | 1,863,801 | $ | — | $ | 1,863,801 | ||||||||||||
5/31/2018 | 1,400,663 | — | 1,400,663 | ||||||||||||||||
Long/Short Fund | 5/31/2019 | $ | 39,986 | $ | 4,350 | $ | 44,336 | ||||||||||||
5/31/2018 | — | — | — | ||||||||||||||||
* The Funds designate these distributions as long-term capital gains dividends per IRC code section 852(b)(3)(C).
As of May 31, 2019, the components of distributable earnings on a tax basis were as follows:
| Arbitrage Fund | Diversified Event-Driven Fund | Credit Opportunities Fund | Long/Short Fund | ||||||||||||||||
| Undistributed ordinary income | $ | 21,843,269 | $ | 519,952 | $ | 66,269 | $ | 14,061 | |||||||||||
| Accumulated capital gains/losses | 12,763,361 | — | — | 22,300 | |||||||||||||||
| Unrealized appreciation/ (depreciation) | 3,528,983 | (1,306,291 | ) | (161,966 | ) | (69,800 | ) | ||||||||||||
Capital loss carryover | — | (58,050,337 | ) | (2,916,265 | ) | — | |||||||||||||
| Total distributable earnings (accumulated loss) | $ | 38,135,613 | $ | (58,836,676 | ) | $ | (3,011,962 | ) | $ | (33,439 | ) | ||||||||
Semi-Annual Report | November 30, 2019
111
The Arbitrage Funds Notes to Financial Statements (continued)
November 30, 2019 (Unaudited)
The following information is computed on a tax basis for each item as of November 30, 2019:
Fund | Gross Appreciation (excess of value over tax cost) | Gross Depreciation (excess of tax cost over value) | Net Unrealized Appreciation (Depreciation) | Aggregate Cost of Investments for Income Tax Purposes | |||||||||||||||
Arbitrage Fund | $ | 57,236,202 | $ | (37,668,006 | ) | $ | 19,568,196 | $ | 1,280,355,905 | ||||||||||
Diversified Event-Driven Fund | 3,828,731 | (3,152,072 | ) | 676,659 | 99,505,247 | ||||||||||||||
Credit Opportunities Fund | 376,609 | (540,958 | ) | (164,349 | ) | 52,039,674 | |||||||||||||
Long/Short Fund | 91,721 | (57,608 | ) | 34,113 | 1,528,700 | ||||||||||||||
The differences between book-basis and tax-basis net unrealized appreciation/(depreciation) for the Funds are attributable to constructive sales, dividends related to short securities, swap mark to market, wash sales, convertible bonds, straddle loss deferrals, partnership basis adjustments, forward contracts mark to market and unsettled short sales.
Capital Losses
As of May 31, 2019, the Diversified Event-Driven Fund had $49,145,252 of short term and $8,905,085 of long term capital loss carryforwards and the Credit Opportunities Fund had $1,802,859 of short term and $1,113,406 of long term capital loss carryforwards which may reduce the Funds' taxable income arising from future net realized gains on investments, if any, to the extent permitted by the Code and thus may reduce the amount of the distributions to shareholders which would otherwise be necessary to relieve the Funds of any liability for federal tax.
The Diversified Event-Driven Fund utilized $1,313,446 of capital loss carryforwards, and the Credit Opportunities Fund utilized $190,353 of capital loss carryforwards during the year ended May 31, 2019.
12. SUBSEQUENT EVENTS
Management has evaluated subsequent events for the Funds through the date the financial statements were issued, and has concluded that there are no recognized or non-recognized subsequent events relevant for financial statement disclosure.
www.arbitragefunds.com | 1-800-295-4485
112
The Arbitrage Funds Disclosure of Fund Expenses
November 30, 2019 (Unaudited)
All mutual funds have operating expenses. As a shareholder of a mutual fund, your investment is affected by these ongoing costs, which include (among others) costs for portfolio management, administrative services, distribution (12b-1) expenses, redemption fees and shareholder reports like this one. It is important for you to understand the impact of these costs on your investment returns.
Operating expenses such as these are deducted from a mutual fund's gross income and directly reduce its final investment return. These expenses are expressed as a percentage of a mutual fund's average net assets; this percentage is known as a mutual fund's expense ratio.
The following examples use the expense ratio and are intended to help you understand the ongoing costs (in dollars) of investing in your Fund and to compare these costs with those of other mutual funds. The examples are based on an investment of $1,000 made at the beginning of the period shown and held for the entire period.
The table on the following page illustrates your Fund's cost in two ways:
Actual Fund Return. The section helps you to estimate the actual expenses after fee waivers that your Fund incurred over the period. The "Expenses Paid During Period" column shows the actual dollar expense cost incurred by a $1,000 investment in the Fund, and the "Ending Account Value" number is derived from deducting that expense cost from the Fund's gross investment return.
You can use this information, together with the actual amount you invested in the Fund, to estimate the expenses you paid over that period. Simply divide your actual account value by $1,000 to arrive at a ratio (for example, an $8,600 account value divided by $1,000 = 8.6), then multiply that ratio by the number shown for your Fund under "Expenses Paid During Period."
Hypothetical 5% Return. This section helps you compare your Fund's costs with those of other mutual funds. It assumes that the Fund had an annual 5% return before expenses during the period, but that expense ratio (Column 3) for the period is unchanged. This example is useful in making comparisons because the Securities and Exchange Commission requires all mutual funds to make this 5% calculation. You can assess your Fund's comparative cost by comparing the hypothetical result for your Fund in the "Expenses Paid During Period" column with those that appear in the same charts in the shareholder reports for other mutual funds.
Note: Because the return is set at 5% for comparison purposes – NOT your Fund's actual return – the account values shown may not apply to your specific investment.
Semi-Annual Report | November 30, 2019
113
The Arbitrage Funds Disclosure of Fund Expenses (continued)
November 30, 2019 (Unaudited)
| Beginning Account Value 06/01/2019 | Ending Account Value 11/30/2019 | Expense Ratio(a) | Expenses Paid During Period(b) | ||||||||||||||||
Arbitrage Fund | |||||||||||||||||||
Class R | |||||||||||||||||||
Actual | $ | 1,000.00 | $ | 1,018.60 | 1.76 | % | $ | 8.88 | |||||||||||
| Hypothetical (5% return before expenses) | $ | 1,000.00 | $ | 1,016.20 | 1.76 | % | $ | 8.87 | |||||||||||
Class I | |||||||||||||||||||
Actual | $ | 1,000.00 | $ | 1,019.50 | 1.51 | % | $ | 7.62 | |||||||||||
| Hypothetical (5% return before expenses) | $ | 1,000.00 | $ | 1,017.45 | 1.51 | % | $ | 7.62 | |||||||||||
Class C | |||||||||||||||||||
Actual | $ | 1,000.00 | $ | 1,014.60 | 2.51 | % | $ | 12.64 | |||||||||||
| Hypothetical (5% return before expenses) | $ | 1,000.00 | $ | 1,012.45 | 2.51 | % | $ | 12.63 | |||||||||||
Class A | |||||||||||||||||||
Actual | $ | 1,000.00 | $ | 1,017.80 | 1.76 | % | $ | 8.88 | |||||||||||
| Hypothetical (5% return before expenses) | $ | 1,000.00 | $ | 1,016.20 | 1.76 | % | $ | 8.87 | |||||||||||
(a) Annualized, based on the Fund's most recent fiscal half-year expenses.
(b) Expenses, are equal to the Fund's annualized ratio multiplied by the average account value over the period, multiplied by the number of days in the most recent fiscal half year (183), divided by 366.
| Beginning Account Value 06/01/2019 | Ending Account Value 11/30/2019 | Expense Ratio(a) | Expenses Paid During Period(b) | ||||||||||||||||
Water Island Diversified Event-Driven Fund | |||||||||||||||||||
Class R | |||||||||||||||||||
Actual | $ | 1,000.00 | $ | 1,015.80 | 1.93 | % | $ | 9.73 | |||||||||||
| Hypothetical (5% return before expenses) | $ | 1,000.00 | $ | 1,015.35 | 1.93 | % | $ | 9.72 | |||||||||||
Class I | |||||||||||||||||||
Actual | $ | 1,000.00 | $ | 1,016.80 | 1.68 | % | $ | 8.47 | |||||||||||
| Hypothetical (5% return before expenses) | $ | 1,000.00 | $ | 1,016.60 | 1.68 | % | $ | 8.47 | |||||||||||
Class C | |||||||||||||||||||
Actual | $ | 1,000.00 | $ | 1,011.80 | 2.68 | % | $ | 13.48 | |||||||||||
| Hypothetical (5% return before expenses) | $ | 1,000.00 | $ | 1,011.60 | 2.68 | % | $ | 13.48 | |||||||||||
Class A | |||||||||||||||||||
Actual | $ | 1,000.00 | $ | 1,015.90 | 1.93 | % | $ | 9.73 | |||||||||||
| Hypothetical (5% return before expenses) | $ | 1,000.00 | $ | 1,015.35 | 1.93 | % | $ | 9.72 | |||||||||||
(a) Annualized, based on the Fund's most recent fiscal half-year expenses.
(b) Expenses, are equal to the Fund's annualized ratio multiplied by the average account value over the period, multiplied by the number of days in the most recent fiscal half year (183), divided by 366.
www.arbitragefunds.com | 1-800-295-4485
114
The Arbitrage Funds Disclosure of Fund Expenses (continued)
November 30, 2019 (Unaudited)
| Beginning Account Value 06/01/2019 | Ending Account Value 11/30/2019 | Expense Ratio(a) | Expenses Paid During Period(b) | ||||||||||||||||
Water Island Credit Opportunities Fund | |||||||||||||||||||
Class R | |||||||||||||||||||
Actual | $ | 1,000.00 | $ | 1,017.40 | 1.38 | % | $ | 6.96 | |||||||||||
| Hypothetical (5% return before expenses) | $ | 1,000.00 | $ | 1,018.10 | 1.38 | % | $ | 6.96 | |||||||||||
Class I | |||||||||||||||||||
Actual | $ | 1,000.00 | $ | 1,018.70 | 1.13 | % | $ | 5.70 | |||||||||||
| Hypothetical (5% return before expenses) | $ | 1,000.00 | $ | 1,019.35 | 1.13 | % | $ | 5.70 | |||||||||||
Class C | |||||||||||||||||||
Actual | $ | 1,000.00 | $ | 1,012.60 | 2.13 | % | $ | 10.72 | |||||||||||
| Hypothetical (5% return before expenses) | $ | 1,000.00 | $ | 1,014.35 | 2.13 | % | $ | 10.73 | |||||||||||
Class A | |||||||||||||||||||
Actual | $ | 1,000.00 | $ | 1,017.40 | 1.38 | % | $ | 6.96 | |||||||||||
| Hypothetical (5% return before expenses) | $ | 1,000.00 | $ | 1,018.10 | 1.38 | % | $ | 6.96 | |||||||||||
(a) Annualized, based on the Fund's most recent fiscal half-year expenses.
(b) Expenses, are equal to the Fund's annualized ratio multiplied by the average account value over the period, multiplied by the number of days in the most recent fiscal half year (183), divided by 366.
| Beginning Account Value 06/01/2019 | Ending Account Value 11/30/2019 | Expense Ratio(a) | Expenses Paid During Period(b) | ||||||||||||||||
Water Island Long/Short Fund | |||||||||||||||||||
Class R | |||||||||||||||||||
Actual | $ | 1,000.00 | $ | 1,018.20 | 1.94 | % | $ | 9.79 | |||||||||||
| Hypothetical (5% return before expenses) | $ | 1,000.00 | $ | 1,015.30 | 1.94 | % | $ | 9.77 | |||||||||||
Class I | |||||||||||||||||||
Actual | $ | 1,000.00 | $ | 1,018.20 | 1.69 | % | $ | 8.53 | |||||||||||
| Hypothetical (5% return before expenses) | $ | 1,000.00 | $ | 1,016.55 | 1.69 | % | $ | 8.52 | |||||||||||
(a) Annualized, based on the Fund's most recent fiscal half-year expenses.
(b) Expenses, are equal to the Fund's annualized ratio multiplied by the average account value over the period, multiplied by the number of days in the most recent fiscal half year (183), divided by 366.
Semi-Annual Report | November 30, 2019
115
The Arbitrage Funds Additional Information
November 30, 2019 (Unaudited)
1. PROXY VOTING POLICIES AND VOTING RECORD
A description of the policies and procedures that the Funds use to vote proxies relating to portfolio securities during the most recent 12-month period ended June 30 is available without charge upon request by calling toll-free 1-800-295-4485, or on the Securities and Exchange Commission's ("SEC") website at http://www.sec.gov. Information regarding how the Funds voted proxies will be available without charge upon request by calling toll-free 1-800-295-4485, or on the SEC's website at http://www.sec.gov.
2. QUARTERLY PORTFOLIO HOLDINGS
The Funds file a complete listing of their portfolio holdings with the SEC as of the first and third quarters of each fiscal year on Form N-PORT. The filings are available upon request by calling 1-800-295-4485. Furthermore, you may obtain a copy of the filing on the SEC's website at http://www.sec.gov. The Funds' Forms N-PORT may also be reviewed and copied at the SEC's Public Reference Room in Washington, D.C., and information on the operation of the Public Reference Room may be obtained by calling 1-800-SEC-0330.
www.arbitragefunds.com | 1-800-295-4485
116

Arbitrage Fund
Water Island Diversified Event-Driven Fund
Water Island Credit Opportunities Fund
Water Island Long/Short Fund
800-295-4485
www.arbitragefunds.com
Adviser
Water Island Capital, LLC
41 Madison Avenue, 42nd Floor
New York, NY 10010
Distributor
ALPS Distributors, Inc.
1290 Broadway, Suite 1100
Denver, CO 80203
Transfer Agent
DST Systems, Inc.
P.O. Box 219842
Kansas City, MO 64121-9842
Custodian
State Street Bank & Trust
225 Liberty Street
New York, NY 10281
This material must be preceded or accompanied by a prospectus. Please read it carefully before investing.
Item 2. Code of Ethics.
Not applicable to semi-annual report.
Item 3. Audit Committee Financial Expert.
Not applicable to semi-annual report.
Item 4. Principal Accountant Fees and Services.
Not applicable to semi-annual report.
Item 5. Audit Committee of Listed Registrants.
Not applicable.
Item 6. Schedule of Investments.
The Schedule of Investments is included as part of the Report to Stockholders filed under Item 1 of this form.
Item 7. Disclosure of Proxy Voting Policies and Procedures for Closed-End Management Investment Companies.
Not applicable.
Item 8. Portfolio Managers of Closed-End Management Investment Companies.
Not applicable.
Item 9. Purchases of Equity Securities by Closed-End Management Investment Company and Affiliated Purchasers.
Not applicable.
Item 10. Submission of Matters to Vote of Security Holders.
There have been no material changes to the procedures by which shareholders may recommend nominees to the registrant’s Board of Trustees.
Item 11. Controls and Procedures.
(a) The registrant’s principal executive officer and principal financial officer have evaluated the registrant’s disclosure controls and procedures (as defined in Rule 30a-3(c) under the Investment Company Act of 1940, as amended) within 90 days of this filing and have concluded that the registrant’s disclosure controls and procedures were effective, as of that date.
(b) There was no change in the registrant’s internal control over financial reporting (as defined in Rule 30a-3(d) under the Investment Company Act of 1940, as amended) during the period covered by this report that has materially affected, or is reasonably likely to materially affect, the registrant’s internal control over financial reporting.
Item 12. Disclosure of Securities Lending Activities for Closed-End Management Investment Companies
Not applicable.
Item 13. Exhibits.
(a)(1) Not applicable to semi-annual report.
(a)(2) A separate certification for the principal executive officer and the principal financial officer of the registrant as required by Rule 30a-2(a) under the Investment Company Act of 1940, as amended (17 CFR 270.30a-2(a)), are attached hereto as exhibit Ex-99.CERT.
(a)(3) Not applicable.
(a)(4) Not applicable.
(b) The certifications by the registrant’s principal executive officer and principal financial officer, as required by Rule 30a-2(b) of the Investment Company Act of 1940, as amended, and Section 906 of the Sarbanes-Oxley Act of 2002 are attached hereto as Ex-99.906CERT.
SIGNATURES
Pursuant to the requirements of the Securities Exchange Act of 1934 and the Investment Company Act of 1940, the registrant has duly caused this report to be signed on its behalf by the undersigned, thereunto duly authorized.
THE ARBITRAGE FUNDS
By: | /s/ John S. Orrico |
|
| John S. Orrico |
|
| President (Principal Executive Officer) |
|
|
| |
Date: | February 5, 2020 |
|
Pursuant to the requirements of the Securities Exchange Act of 1934 and the Investment Company Act of 1940, this report has been signed below by the following persons on behalf of the registrant and in the capacities and on the dates indicated.
By: | /s/ John S. Orrico |
|
| John S. Orrico |
|
| President (Principal Executive Officer) |
|
|
|
|
Date: | February 5, 2020 |
|
By: | /s/ Monique Labbe |
|
| Monique Labbe |
|
| Chief Financial Officer (Principal Financial Officer) |
|
|
|
|
Date: | February 5, 2020 |
|