UNITED STATES
SECURITIES AND EXCHANGE COMMISSION
Washington, D.C. 20549
FORM N-CSR
CERTIFIED SHAREHOLDER REPORT OF REGISTERED
MANAGEMENT INVESTMENT COMPANIES
Investment Company Act file number: 811-09815
THE ARBITRAGE FUNDS
(exact name of registrant as specified in charter)
41 Madison Avenue, 42nd Floor, New York, NY 10010
(Address of principal executive offices) (Zip code)
John S. Orrico
Water Island Capital, LLC
41 Madison Avenue
42nd Floor
New York, NY 10010
(Name and address of agent for service)
Registrant’s telephone number, including area code: 800-295-4485
Date of fiscal year end: May 31
Date of reporting period: May 31, 2024
Item 1. Reports to Stockholders.
Class R: AEDFX
Water Island Event-Driven Fund

Annual Shareholder Report
May 31, 2024
Fund Overview
This annual shareholder report contains important information about Water Island Event-Driven Fund for the period of June 1, 2023 to May 31, 2024. You can find additional information about the Fund at www.arbitragefunds.com/water-island-event-driven. You can also request this information by contacting us at 1-800-295-4485.
What were the Fund costs for the last year?
Annual Fund Operating Expenses
(based on a hypothetical $10,000 investment)
| Class Name | Cost of a $10,000 investment | Costs paid as a percentage of a $10,000 investment |
|---|---|---|
| Class R | $178 | 1.72% |
How did the Fund perform last year and what affected its performance?
The Fund’s performance for the fiscal year was driven by the outcomes of the idiosyncratic corporate catalysts in which the Fund invested. Returns were sourced predominantly from the Fund’s merger arbitrage sleeve, which notably included several high-profile deals that experienced favorable outcomes despite regulatory challenges. Most of the Fund’s performance was generated by investments in US-based catalysts. Information technology and health care were the top performing sectors, while consumer discretionary and materials detracted the most from returns. Top contributors included the acquisition of VMware by Broadcom, Microsoft’s acquisition of Activision Blizzard, and the acquisition of Horizon Therapeutics by Amgen. Top detractors included the merger of Capri Holdings and Tapestry, the acquisition of United States Steel by Nippon Steel, and the failed acquisition of PNM Resources by Avangrid.
Fund Performance
The chart below reflects a hypothetical $10,000 investment in the Fund, and assumes reinvestment of dividends and capital gains. Performance shown is for the previous 10 years. Performance reflects fee waivers and/or expense reimbursements and any recoupment of waived fees. If fee waivers had not been in place, performance would have been lower.
Total Return Based on $10,000 Investment*
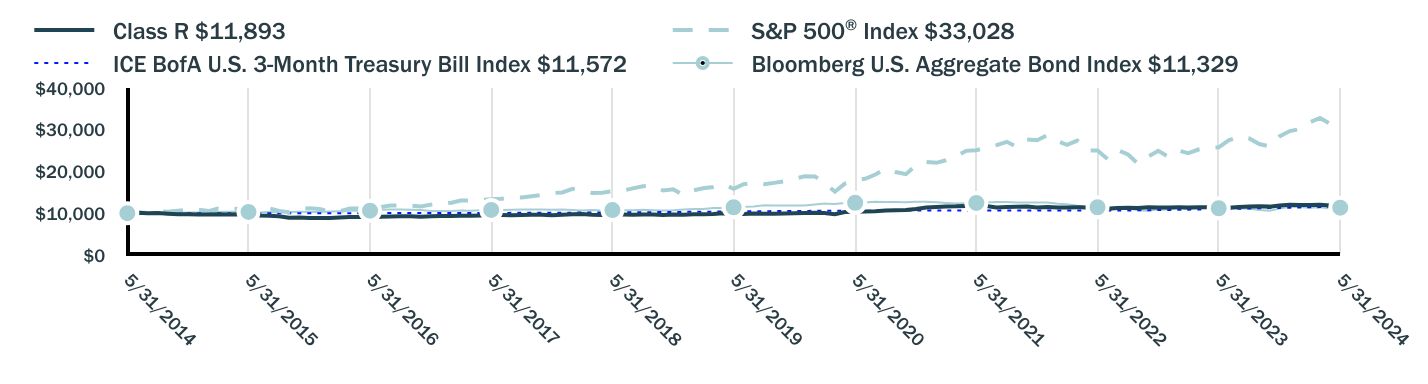
| Class R $11,893 | S&P 500® Index $33,028 | ICE BofA U.S. 3-Month Treasury Bill Index $11,572 | Bloomberg U.S. Aggregate Bond Index $11,329 | |
|---|---|---|---|---|
| 5/31/2014 | $10,000 | $10,000 | $10,000 | $10,000 |
| 6/30/2014 | $10,107 | $10,207 | $10,000 | $10,005 |
| 7/31/2014 | $10,000 | $10,066 | $10,001 | $9,980 |
| 8/31/2014 | $10,029 | $10,469 | $10,001 | $10,090 |
| 9/30/2014 | $9,883 | $10,322 | $10,001 | $10,022 |
| 10/31/2014 | $9,757 | $10,574 | $10,002 | $10,120 |
| 11/30/2014 | $9,738 | $10,858 | $10,002 | $10,192 |
| 12/31/2014 | $9,668 | $10,831 | $10,002 | $10,202 |
| 1/31/2015 | $9,678 | $10,506 | $10,002 | $10,415 |
| 2/28/2015 | $9,748 | $11,109 | $10,002 | $10,318 |
| 3/31/2015 | $9,688 | $10,934 | $10,002 | $10,365 |
| 4/30/2015 | $9,748 | $11,039 | $10,002 | $10,328 |
| 5/31/2015 | $9,688 | $11,181 | $10,002 | $10,303 |
| 6/30/2015 | $9,469 | $10,964 | $10,003 | $10,191 |
| 7/31/2015 | $9,360 | $11,194 | $10,002 | $10,262 |
| 8/31/2015 | $9,250 | $10,519 | $10,004 | $10,247 |
| 9/30/2015 | $8,912 | $10,258 | $10,004 | $10,316 |
| 10/31/2015 | $8,962 | $11,124 | $10,003 | $10,318 |
| 11/30/2015 | $8,872 | $11,157 | $10,004 | $10,291 |
| 12/31/2015 | $8,865 | $10,981 | $10,007 | $10,258 |
| 1/31/2016 | $8,876 | $10,436 | $10,007 | $10,399 |
| 2/29/2016 | $8,967 | $10,422 | $10,010 | $10,473 |
| 3/31/2016 | $9,059 | $11,129 | $10,015 | $10,569 |
| 4/30/2016 | $9,079 | $11,172 | $10,017 | $10,609 |
| 5/31/2016 | $9,151 | $11,372 | $10,018 | $10,612 |
| 6/30/2016 | $9,140 | $11,402 | $10,022 | $10,803 |
| 7/31/2016 | $9,202 | $11,822 | $10,025 | $10,871 |
| 8/31/2016 | $9,242 | $11,839 | $10,026 | $10,859 |
| 9/30/2016 | $9,293 | $11,841 | $10,031 | $10,852 |
| 10/31/2016 | $9,171 | $11,625 | $10,034 | $10,769 |
| 11/30/2016 | $9,263 | $12,056 | $10,036 | $10,514 |
| 12/31/2016 | $9,314 | $12,294 | $10,040 | $10,529 |
| 1/31/2017 | $9,324 | $12,527 | $10,044 | $10,550 |
| 2/28/2017 | $9,365 | $13,025 | $10,048 | $10,621 |
| 3/31/2017 | $9,395 | $13,040 | $10,050 | $10,615 |
| 4/30/2017 | $9,446 | $13,174 | $10,057 | $10,697 |
| 5/31/2017 | $9,517 | $13,359 | $10,062 | $10,779 |
| 6/30/2017 | $9,548 | $13,442 | $10,070 | $10,769 |
| 7/31/2017 | $9,528 | $13,719 | $10,079 | $10,815 |
| 8/31/2017 | $9,579 | $13,761 | $10,088 | $10,912 |
| 9/30/2017 | $9,599 | $14,045 | $10,097 | $10,860 |
| 10/31/2017 | $9,650 | $14,372 | $10,106 | $10,866 |
| 11/30/2017 | $9,528 | $14,813 | $10,115 | $10,852 |
| 12/31/2017 | $9,656 | $14,978 | $10,125 | $10,902 |
| 1/31/2018 | $9,738 | $15,836 | $10,138 | $10,777 |
| 2/28/2018 | $9,789 | $15,252 | $10,147 | $10,674 |
| 3/31/2018 | $9,656 | $14,864 | $10,161 | $10,743 |
| 4/30/2018 | $9,585 | $14,921 | $10,175 | $10,663 |
| 5/31/2018 | $9,666 | $15,281 | $10,191 | $10,739 |
| 6/30/2018 | $9,717 | $15,375 | $10,207 | $10,726 |
| 7/31/2018 | $9,646 | $15,947 | $10,224 | $10,728 |
| 8/31/2018 | $9,676 | $16,466 | $10,242 | $10,797 |
| 9/30/2018 | $9,697 | $16,560 | $10,257 | $10,728 |
| 10/31/2018 | $9,574 | $15,428 | $10,276 | $10,643 |
| 11/30/2018 | $9,676 | $15,743 | $10,297 | $10,707 |
| 12/31/2018 | $9,624 | $14,321 | $10,316 | $10,903 |
| 1/31/2019 | $9,748 | $15,469 | $10,336 | $11,019 |
| 2/28/2019 | $9,769 | $15,966 | $10,354 | $11,013 |
| 3/31/2019 | $9,790 | $16,276 | $10,377 | $11,224 |
| 4/30/2019 | $9,966 | $16,935 | $10,397 | $11,227 |
| 5/31/2019 | $9,821 | $15,859 | $10,421 | $11,426 |
| 6/30/2019 | $9,831 | $16,976 | $10,443 | $11,570 |
| 7/31/2019 | $9,904 | $17,220 | $10,463 | $11,595 |
| 8/31/2019 | $9,893 | $16,948 | $10,484 | $11,896 |
| 9/30/2019 | $9,872 | $17,265 | $10,503 | $11,833 |
| 10/31/2019 | $9,914 | $17,639 | $10,523 | $11,868 |
| 11/30/2019 | $9,976 | $18,279 | $10,536 | $11,862 |
| 12/31/2019 | $10,058 | $18,831 | $10,551 | $11,854 |
| 1/31/2020 | $10,089 | $18,823 | $10,565 | $12,082 |
| 2/29/2020 | $10,037 | $17,274 | $10,581 | $12,299 |
| 3/31/2020 | $9,767 | $15,140 | $10,611 | $12,227 |
| 4/30/2020 | $10,276 | $17,081 | $10,612 | $12,444 |
| 5/31/2020 | $10,360 | $17,895 | $10,612 | $12,502 |
| 6/30/2020 | $10,391 | $18,250 | $10,614 | $12,581 |
| 7/31/2020 | $10,463 | $19,279 | $10,616 | $12,769 |
| 8/31/2020 | $10,619 | $20,665 | $10,617 | $12,666 |
| 9/30/2020 | $10,692 | $19,880 | $10,618 | $12,659 |
| 10/31/2020 | $10,744 | $19,351 | $10,619 | $12,602 |
| 11/30/2020 | $11,014 | $21,470 | $10,620 | $12,726 |
| 12/31/2020 | $11,367 | $22,295 | $10,621 | $12,744 |
| 1/31/2021 | $11,513 | $22,070 | $10,622 | $12,652 |
| 2/28/2021 | $11,586 | $22,679 | $10,623 | $12,470 |
| 3/31/2021 | $11,638 | $23,672 | $10,624 | $12,314 |
| 4/30/2021 | $11,752 | $24,935 | $10,624 | $12,411 |
| 5/31/2021 | $11,825 | $25,109 | $10,624 | $12,452 |
| 6/30/2021 | $11,710 | $25,696 | $10,624 | $12,539 |
| 7/31/2021 | $11,388 | $26,306 | $10,624 | $12,679 |
| 8/31/2021 | $11,471 | $27,106 | $10,625 | $12,655 |
| 9/30/2021 | $11,523 | $25,845 | $10,625 | $12,546 |
| 10/31/2021 | $11,586 | $27,656 | $10,625 | $12,542 |
| 11/30/2021 | $11,347 | $27,464 | $10,626 | $12,579 |
| 12/31/2021 | $11,471 | $28,695 | $10,627 | $12,547 |
| 1/31/2022 | $11,347 | $27,210 | $10,626 | $12,277 |
| 2/28/2022 | $11,367 | $26,395 | $10,627 | $12,140 |
| 3/31/2022 | $11,451 | $27,375 | $10,631 | $11,803 |
| 4/30/2022 | $11,357 | $24,988 | $10,632 | $11,355 |
| 5/31/2022 | $11,264 | $25,034 | $10,639 | $11,428 |
| 6/30/2022 | $11,056 | $22,968 | $10,642 | $11,249 |
| 7/31/2022 | $11,253 | $25,085 | $10,647 | $11,523 |
| 8/31/2022 | $11,295 | $24,062 | $10,664 | $11,198 |
| 9/30/2022 | $11,222 | $21,846 | $10,691 | $10,714 |
| 10/31/2022 | $11,430 | $23,615 | $10,708 | $10,575 |
| 11/30/2022 | $11,336 | $24,935 | $10,742 | $10,964 |
| 12/31/2022 | $11,378 | $23,498 | $10,781 | $10,915 |
| 1/31/2023 | $11,399 | $24,975 | $10,815 | $11,251 |
| 2/28/2023 | $11,388 | $24,365 | $10,850 | $10,960 |
| 3/31/2023 | $11,419 | $25,260 | $10,897 | $11,238 |
| 4/30/2023 | $11,430 | $25,654 | $10,931 | $11,306 |
| 5/31/2023 | $11,139 | $25,766 | $10,974 | $11,183 |
| 6/30/2023 | $11,316 | $27,468 | $11,024 | $11,143 |
| 7/31/2023 | $11,503 | $28,350 | $11,068 | $11,135 |
| 8/31/2023 | $11,627 | $27,899 | $11,118 | $11,064 |
| 9/30/2023 | $11,658 | $26,569 | $11,169 | $10,783 |
| 10/31/2023 | $11,575 | $26,010 | $11,219 | $10,613 |
| 11/30/2023 | $11,866 | $28,386 | $11,269 | $11,094 |
| 12/31/2023 | $12,018 | $29,675 | $11,322 | $11,518 |
| 1/31/2024 | $11,935 | $30,174 | $11,370 | $11,487 |
| 2/29/2024 | $11,935 | $31,785 | $11,417 | $11,324 |
| 3/31/2024 | $12,018 | $32,808 | $11,468 | $11,429 |
| 4/30/2024 | $11,851 | $31,468 | $11,517 | $11,140 |
| 5/31/2024 | $11,893 | $33,028 | $11,572 | $11,329 |
* Past performance is not a good predictor of how the Fund will perform in the future. The chart does not reflect the deduction of taxes that a shareholder would pay on fund distributions or redemption of fund shares.
The indexes are unmanaged and, therefore, have no expenses. Investors cannot invest directly in an index.
Average Annual Total Returns (%)Footnote Reference*
| 1 Year | 5 Years | 10 Years | |
|---|---|---|---|
| Class R | 6.77% | 3.90% | 1.75% |
S&P 500® Index | 28.19% | 15.80% | 12.69% |
| ICE BofA U.S. 3-Month Treasury Bill Index | 5.45% | 2.12% | 1.47% |
| Bloomberg U.S. Aggregate Bond Index | 1.31% | -0.17% | 1.26% |
| Footnote | Description |
Footnote* | Past performance is not a good predictor of how the Fund will perform in the future. The table does not reflect the deduction of taxes that a shareholder would pay on fund distributions or redemption of fund shares. Returns shown above include the reinvestment of all dividends and capital gains. Performance reflects fee waivers and/or expense reimbursements and any recoupment of waived fees. If fee waivers had not been in place, performance would have been lower. |
Key Fund Statistics
| Total Net Assets | $80,324,009 |
| Number of Portfolio Holdings | 125 |
| Total Advisory Fees Paid | $1,181,245 |
| Portfolio Turnover Rate | 305% |
What did the Fund invest in?
The Fund invested primarily in the equity and credit securities of companies involved in announced corporate events or companies expected to undergo a corporate event.
Sector Weighting (%)

| Value | Value |
|---|---|
| Consumer, Non-cyclical | 34.50% |
| Technology | 16.88% |
| Energy | 16.28% |
| Consumer, Cyclical | 10.24% |
| Telecommunication Services | 10.17% |
| Financials | 6.33% |
| Materials | 3.18% |
| Utilities | 1.22% |
| Industrials | 1.20% |
Region Weighting (%)

| Value | Value |
|---|---|
| Americas | 90.26% |
| EMEA | 9.74% |
Material Fund Changes
There were no material changes to the Fund since May 31, 2023.
Additional Information
For additional information about the Fund, including its prospectus, financial information, holdings, and proxy voting, scan the QR code or visit www.arbitragefunds.com/water-island-event-driven.
Householding
To reduce Fund expenses, only one copy of most shareholder documents may be mailed to shareholders with multiple accounts at the same address (Householding). If you would prefer that your Fund documents not be householded, please contact us at 1-800-295-4485, or contact your financial intermediary.
The Water Island Event-Driven Fund is distributed by ALPS Distributors, Inc, which is not affiliated with Water Island Capital LLC or any of its affiliates.


Class R:
AEDFX
Water Island Event-Driven Fund
Annual Shareholder Report
May 31, 2024
Class A: AGEAX
Water Island Event-Driven Fund

Annual Shareholder Report
May 31, 2024
Fund Overview
This annual shareholder report contains important information about Water Island Event-Driven Fund for the period of June 1, 2023 to May 31, 2024. You can find additional information about the Fund at www.arbitragefunds.com/water-island-event-driven. You can also request this information by contacting us at 1-800-295-4485.
What were the Fund costs for the last year?
Annual Fund Operating Expenses
(based on a hypothetical $10,000 investment)
| Class Name | Cost of a $10,000 investment | Costs paid as a percentage of a $10,000 investment |
|---|---|---|
| Class A | $178 | 1.72% |
How did the Fund perform last year and what affected its performance?
The Fund’s performance for the fiscal year was driven by the outcomes of the idiosyncratic corporate catalysts in which the Fund invested. Returns were sourced predominantly from the Fund’s merger arbitrage sleeve, which notably included several high-profile deals that experienced favorable outcomes despite regulatory challenges. Most of the Fund’s performance was generated by investments in US-based catalysts. Information technology and health care were the top performing sectors, while consumer discretionary and materials detracted the most from returns. Top contributors included the acquisition of VMware by Broadcom, Microsoft’s acquisition of Activision Blizzard, and the acquisition of Horizon Therapeutics by Amgen. Top detractors included the merger of Capri Holdings and Tapestry, the acquisition of United States Steel by Nippon Steel, and the failed acquisition of PNM Resources by Avangrid.
Fund Performance
The chart below reflects a hypothetical $10,000 investment in the Fund, and assumes reinvestment of dividends and capital gains. Performance shown is for the previous 10 years. Performance reflects fee waivers and/or expense reimbursements and any recoupment of waived fees. If fee waivers had not been in place, performance would have been lower.
Total Return Based on $10,000 Investment*
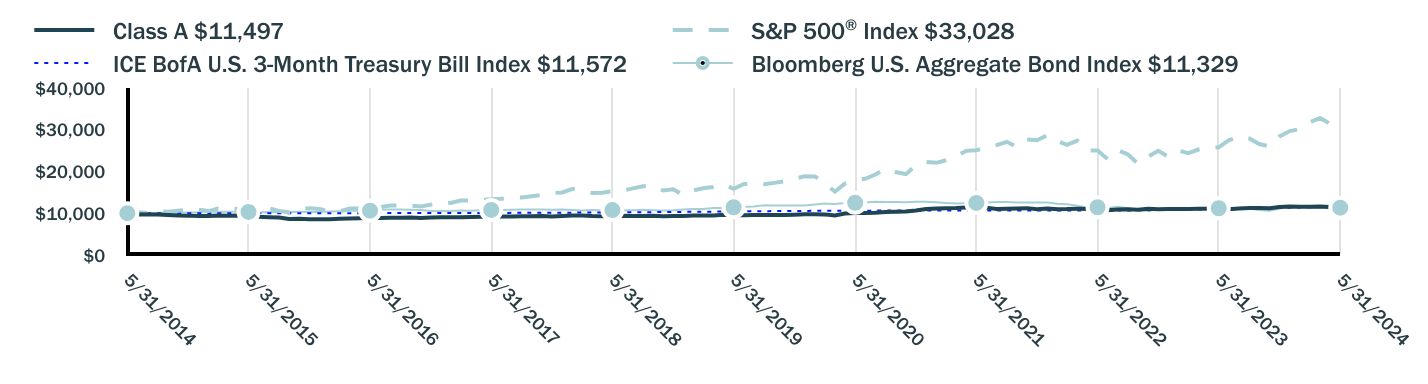
| Class A $11,497 | S&P 500® Index $33,028 | ICE BofA U.S. 3-Month Treasury Bill Index $11,572 | Bloomberg U.S. Aggregate Bond Index $11,329 | |
|---|---|---|---|---|
| 5/31/2014 | $9,671 | $10,000 | $10,000 | $10,000 |
| 6/30/2014 | $9,775 | $10,207 | $10,000 | $10,005 |
| 7/31/2014 | $9,662 | $10,066 | $10,001 | $9,980 |
| 8/31/2014 | $9,690 | $10,469 | $10,001 | $10,090 |
| 9/30/2014 | $9,549 | $10,322 | $10,001 | $10,022 |
| 10/31/2014 | $9,437 | $10,574 | $10,002 | $10,120 |
| 11/30/2014 | $9,418 | $10,858 | $10,002 | $10,192 |
| 12/31/2014 | $9,341 | $10,831 | $10,002 | $10,202 |
| 1/31/2015 | $9,350 | $10,506 | $10,002 | $10,415 |
| 2/28/2015 | $9,427 | $11,109 | $10,002 | $10,318 |
| 3/31/2015 | $9,360 | $10,934 | $10,002 | $10,365 |
| 4/30/2015 | $9,418 | $11,039 | $10,002 | $10,328 |
| 5/31/2015 | $9,360 | $11,181 | $10,002 | $10,303 |
| 6/30/2015 | $9,148 | $10,964 | $10,003 | $10,191 |
| 7/31/2015 | $9,052 | $11,194 | $10,002 | $10,262 |
| 8/31/2015 | $8,946 | $10,519 | $10,004 | $10,247 |
| 9/30/2015 | $8,610 | $10,258 | $10,004 | $10,316 |
| 10/31/2015 | $8,658 | $11,124 | $10,003 | $10,318 |
| 11/30/2015 | $8,571 | $11,157 | $10,004 | $10,291 |
| 12/31/2015 | $8,566 | $10,981 | $10,007 | $10,258 |
| 1/31/2016 | $8,576 | $10,436 | $10,007 | $10,399 |
| 2/29/2016 | $8,665 | $10,422 | $10,010 | $10,473 |
| 3/31/2016 | $8,753 | $11,129 | $10,015 | $10,569 |
| 4/30/2016 | $8,773 | $11,172 | $10,017 | $10,609 |
| 5/31/2016 | $8,842 | $11,372 | $10,018 | $10,612 |
| 6/30/2016 | $8,832 | $11,402 | $10,022 | $10,803 |
| 7/31/2016 | $8,891 | $11,822 | $10,025 | $10,871 |
| 8/31/2016 | $8,930 | $11,839 | $10,026 | $10,859 |
| 9/30/2016 | $8,980 | $11,841 | $10,031 | $10,852 |
| 10/31/2016 | $8,862 | $11,625 | $10,034 | $10,769 |
| 11/30/2016 | $8,950 | $12,056 | $10,036 | $10,514 |
| 12/31/2016 | $9,009 | $12,294 | $10,040 | $10,529 |
| 1/31/2017 | $9,019 | $12,527 | $10,044 | $10,550 |
| 2/28/2017 | $9,058 | $13,025 | $10,048 | $10,621 |
| 3/31/2017 | $9,078 | $13,040 | $10,050 | $10,615 |
| 4/30/2017 | $9,127 | $13,174 | $10,057 | $10,697 |
| 5/31/2017 | $9,206 | $13,359 | $10,062 | $10,779 |
| 6/30/2017 | $9,236 | $13,442 | $10,070 | $10,769 |
| 7/31/2017 | $9,216 | $13,719 | $10,079 | $10,815 |
| 8/31/2017 | $9,265 | $13,761 | $10,088 | $10,912 |
| 9/30/2017 | $9,285 | $14,045 | $10,097 | $10,860 |
| 10/31/2017 | $9,334 | $14,372 | $10,106 | $10,866 |
| 11/30/2017 | $9,216 | $14,813 | $10,115 | $10,852 |
| 12/31/2017 | $9,333 | $14,978 | $10,125 | $10,902 |
| 1/31/2018 | $9,422 | $15,836 | $10,138 | $10,777 |
| 2/28/2018 | $9,462 | $15,252 | $10,147 | $10,674 |
| 3/31/2018 | $9,333 | $14,864 | $10,161 | $10,743 |
| 4/30/2018 | $9,274 | $14,921 | $10,175 | $10,663 |
| 5/31/2018 | $9,343 | $15,281 | $10,191 | $10,739 |
| 6/30/2018 | $9,402 | $15,375 | $10,207 | $10,726 |
| 7/31/2018 | $9,333 | $15,947 | $10,224 | $10,728 |
| 8/31/2018 | $9,353 | $16,466 | $10,242 | $10,797 |
| 9/30/2018 | $9,373 | $16,560 | $10,257 | $10,728 |
| 10/31/2018 | $9,264 | $15,428 | $10,276 | $10,643 |
| 11/30/2018 | $9,353 | $15,743 | $10,297 | $10,707 |
| 12/31/2018 | $9,308 | $14,321 | $10,316 | $10,903 |
| 1/31/2019 | $9,428 | $15,469 | $10,336 | $11,019 |
| 2/28/2019 | $9,449 | $15,966 | $10,354 | $11,013 |
| 3/31/2019 | $9,469 | $16,276 | $10,377 | $11,224 |
| 4/30/2019 | $9,629 | $16,935 | $10,397 | $11,227 |
| 5/31/2019 | $9,489 | $15,859 | $10,421 | $11,426 |
| 6/30/2019 | $9,499 | $16,976 | $10,443 | $11,570 |
| 7/31/2019 | $9,569 | $17,220 | $10,463 | $11,595 |
| 8/31/2019 | $9,569 | $16,948 | $10,484 | $11,896 |
| 9/30/2019 | $9,549 | $17,265 | $10,503 | $11,833 |
| 10/31/2019 | $9,589 | $17,639 | $10,523 | $11,868 |
| 11/30/2019 | $9,639 | $18,279 | $10,536 | $11,862 |
| 12/31/2019 | $9,720 | $18,831 | $10,551 | $11,854 |
| 1/31/2020 | $9,750 | $18,823 | $10,565 | $12,082 |
| 2/29/2020 | $9,700 | $17,274 | $10,581 | $12,299 |
| 3/31/2020 | $9,439 | $15,140 | $10,611 | $12,227 |
| 4/30/2020 | $9,941 | $17,081 | $10,612 | $12,444 |
| 5/31/2020 | $10,022 | $17,895 | $10,612 | $12,502 |
| 6/30/2020 | $10,042 | $18,250 | $10,614 | $12,581 |
| 7/31/2020 | $10,122 | $19,279 | $10,616 | $12,769 |
| 8/31/2020 | $10,273 | $20,665 | $10,617 | $12,666 |
| 9/30/2020 | $10,343 | $19,880 | $10,618 | $12,659 |
| 10/31/2020 | $10,394 | $19,351 | $10,619 | $12,602 |
| 11/30/2020 | $10,655 | $21,470 | $10,620 | $12,726 |
| 12/31/2020 | $10,992 | $22,295 | $10,621 | $12,744 |
| 1/31/2021 | $11,132 | $22,070 | $10,622 | $12,652 |
| 2/28/2021 | $11,203 | $22,679 | $10,623 | $12,470 |
| 3/31/2021 | $11,253 | $23,672 | $10,624 | $12,314 |
| 4/30/2021 | $11,374 | $24,935 | $10,624 | $12,411 |
| 5/31/2021 | $11,444 | $25,109 | $10,624 | $12,452 |
| 6/30/2021 | $11,334 | $25,696 | $10,624 | $12,539 |
| 7/31/2021 | $11,012 | $26,306 | $10,624 | $12,679 |
| 8/31/2021 | $11,092 | $27,106 | $10,625 | $12,655 |
| 9/30/2021 | $11,153 | $25,845 | $10,625 | $12,546 |
| 10/31/2021 | $11,213 | $27,656 | $10,625 | $12,542 |
| 11/30/2021 | $10,971 | $27,464 | $10,626 | $12,579 |
| 12/31/2021 | $11,102 | $28,695 | $10,627 | $12,547 |
| 1/31/2022 | $10,971 | $27,210 | $10,626 | $12,277 |
| 2/28/2022 | $10,992 | $26,395 | $10,627 | $12,140 |
| 3/31/2022 | $11,082 | $27,375 | $10,631 | $11,803 |
| 4/30/2022 | $10,992 | $24,988 | $10,632 | $11,355 |
| 5/31/2022 | $10,901 | $25,034 | $10,639 | $11,428 |
| 6/30/2022 | $10,690 | $22,968 | $10,642 | $11,249 |
| 7/31/2022 | $10,871 | $25,085 | $10,647 | $11,523 |
| 8/31/2022 | $10,921 | $24,062 | $10,664 | $11,198 |
| 9/30/2022 | $10,851 | $21,846 | $10,691 | $10,714 |
| 10/31/2022 | $11,052 | $23,615 | $10,708 | $10,575 |
| 11/30/2022 | $10,951 | $24,935 | $10,742 | $10,964 |
| 12/31/2022 | $11,002 | $23,498 | $10,781 | $10,915 |
| 1/31/2023 | $11,022 | $24,975 | $10,815 | $11,251 |
| 2/28/2023 | $11,012 | $24,365 | $10,850 | $10,960 |
| 3/31/2023 | $11,042 | $25,260 | $10,897 | $11,238 |
| 4/30/2023 | $11,052 | $25,654 | $10,931 | $11,306 |
| 5/31/2023 | $10,770 | $25,766 | $10,974 | $11,183 |
| 6/30/2023 | $10,941 | $27,468 | $11,024 | $11,143 |
| 7/31/2023 | $11,112 | $28,350 | $11,068 | $11,135 |
| 8/31/2023 | $11,233 | $27,899 | $11,118 | $11,064 |
| 9/30/2023 | $11,273 | $26,569 | $11,169 | $10,783 |
| 10/31/2023 | $11,183 | $26,010 | $11,219 | $10,613 |
| 11/30/2023 | $11,475 | $28,386 | $11,269 | $11,094 |
| 12/31/2023 | $11,618 | $29,675 | $11,322 | $11,518 |
| 1/31/2024 | $11,537 | $30,174 | $11,370 | $11,487 |
| 2/29/2024 | $11,537 | $31,785 | $11,417 | $11,324 |
| 3/31/2024 | $11,618 | $32,808 | $11,468 | $11,429 |
| 4/30/2024 | $11,456 | $31,468 | $11,517 | $11,140 |
| 5/31/2024 | $11,497 | $33,028 | $11,572 | $11,329 |
* Past performance is not a good predictor of how the Fund will perform in the future. The chart does not reflect the deduction of taxes that a shareholder would pay on fund distributions or redemption of fund shares.
The indexes are unmanaged and, therefore, have no expenses. Investors cannot invest directly in an index.
Average Annual Total Returns (%)Footnote Reference*
| 1 Year | 5 Years | 10 Years | |
|---|---|---|---|
| Class A | 6.75% | 3.91% | 1.74% |
| Class A (After Sales Charges) | 3.27% | 3.23% | 1.40% |
S&P 500® Index | 28.19% | 15.80% | 12.69% |
| ICE BofA U.S. 3-Month Treasury Bill Index | 5.45% | 2.12% | 1.47% |
| Bloomberg U.S. Aggregate Bond Index | 1.31% | -0.17% | 1.26% |
| Footnote | Description |
Footnote* | Past performance is not a good predictor of how the Fund will perform in the future. The table does not reflect the deduction of taxes that a shareholder would pay on fund distributions or redemption of fund shares. Returns shown above include the reinvestment of all dividends and capital gains. Performance reflects fee waivers and/or expense reimbursements and any recoupment of waived fees. If fee waivers had not been in place, performance would have been lower. |
Key Fund Statistics
| Total Net Assets | $80,324,009 |
| Number of Portfolio Holdings | 125 |
| Total Advisory Fees Paid | $1,181,245 |
| Portfolio Turnover Rate | 305% |
What did the Fund invest in?
The Fund invested primarily in the equity and credit securities of companies involved in announced corporate events or companies expected to undergo a corporate event.
Sector Weighting (%)

| Value | Value |
|---|---|
| Consumer, Non-cyclical | 34.50% |
| Technology | 16.88% |
| Energy | 16.28% |
| Consumer, Cyclical | 10.24% |
| Telecommunication Services | 10.17% |
| Financials | 6.33% |
| Materials | 3.18% |
| Utilities | 1.22% |
| Industrials | 1.20% |
Region Weighting (%)

| Value | Value |
|---|---|
| Americas | 90.26% |
| EMEA | 9.74% |
Material Fund Changes
There were no material changes to the Fund since May 31, 2023.
Additional Information
For additional information about the Fund, including its prospectus, financial information, holdings, and proxy voting, scan the QR code or visit www.arbitragefunds.com/water-island-event-driven.
Householding
To reduce Fund expenses, only one copy of most shareholder documents may be mailed to shareholders with multiple accounts at the same address (Householding). If you would prefer that your Fund documents not be householded, please contact us at 1-800-295-4485, or contact your financial intermediary.
The Water Island Event-Driven Fund is distributed by ALPS Distributors, Inc, which is not affiliated with Water Island Capital LLC or any of its affiliates.


Class A:
AGEAX
Water Island Event-Driven Fund
Annual Shareholder Report
May 31, 2024
Class I: ACFIX
Water Island Credit Opportunities Fund

Annual Shareholder Report
May 31, 2024
Fund Overview
This annual shareholder report contains important information about Water Island Credit Opportunities Fund for the period of June 1, 2023 to May 31, 2024. You can find additional information about the Fund at www.arbitragefunds.com/water-island-credit-opportunities. You can also request this information by contacting us at 1-800-295-4485.
What were the Fund costs for the last year?
Annual Fund Operating Expenses
(based on a hypothetical $10,000 investment)
| Class Name | Cost of a $10,000 investment | Costs paid as a percentage of a $10,000 investment |
|---|---|---|
| Class I | $107 | 1.04% |
How did the Fund perform last year and what affected its performance?
The Fund’s performance for the fiscal year was driven by the outcomes of the idiosyncratic corporate catalysts in which the Fund invested. Performance was sourced largely from credit special situations investments, though merger-related credit also contributed to returns. Most of the Fund’s performance was generated by investments in US-based catalysts. Information technology and health care were the top performing sectors, while utilities and real estate detracted the most from returns. Top contributors included the Fund’s investments in UpHealth bonds, Getty Images bonds, and Kaleyra bonds. Top detractors included the Fund’s investments in Lightning eMotors bonds, broad credit market hedges, and Altice France bonds.
Fund Performance
The chart below reflects a hypothetical $100,000 investment in the Fund, and assumes reinvestment of dividends and capital gains. Performance shown is for the previous 10 years. Performance reflects fee waivers and/or expense reimbursements. If fee waivers had not been in place, performance would have been lower.
Total Return Based on $100,000 Investment*
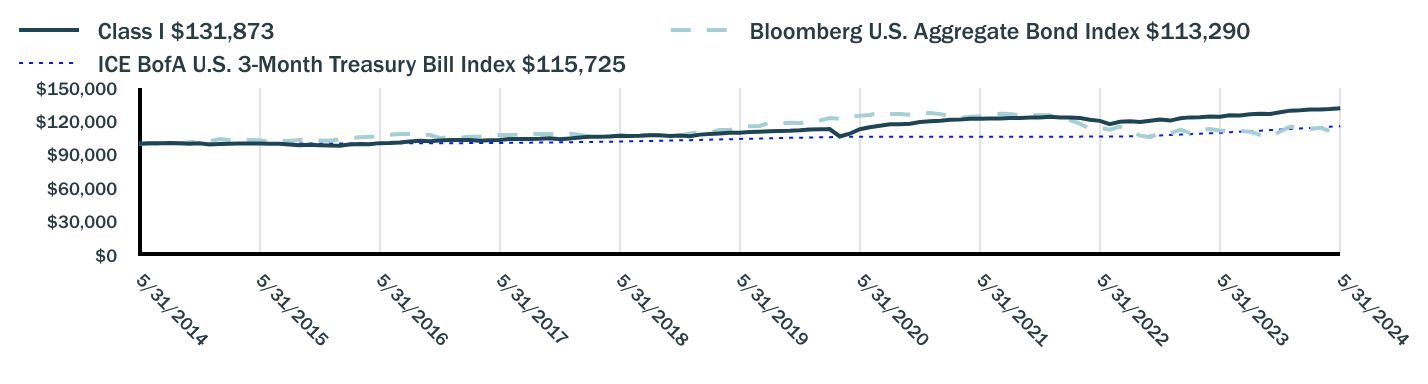
| Class I $131,873 | Bloomberg U.S. Aggregate Bond Index $113,290 | ICE BofA U.S. 3-Month Treasury Bill Index $115,725 | |
|---|---|---|---|
| 5/31/2014 | $100,000 | $100,000 | $100,000 |
| 6/30/2014 | $100,264 | $100,052 | $100,004 |
| 7/31/2014 | $100,362 | $99,801 | $100,007 |
| 8/31/2014 | $100,560 | $100,902 | $100,012 |
| 9/30/2014 | $100,357 | $100,217 | $100,015 |
| 10/31/2014 | $99,959 | $101,202 | $100,016 |
| 11/30/2014 | $100,257 | $101,921 | $100,017 |
| 12/31/2014 | $99,264 | $102,016 | $100,019 |
| 1/31/2015 | $99,666 | $104,155 | $100,022 |
| 2/28/2015 | $99,867 | $103,176 | $100,022 |
| 3/31/2015 | $100,061 | $103,655 | $100,022 |
| 4/30/2015 | $100,061 | $103,283 | $100,023 |
| 5/31/2015 | $100,161 | $103,034 | $100,025 |
| 6/30/2015 | $100,007 | $101,910 | $100,028 |
| 7/31/2015 | $99,906 | $102,619 | $100,022 |
| 8/31/2015 | $99,295 | $102,471 | $100,038 |
| 9/30/2015 | $98,561 | $103,165 | $100,039 |
| 10/31/2015 | $98,971 | $103,182 | $100,032 |
| 11/30/2015 | $98,663 | $102,909 | $100,038 |
| 12/31/2015 | $98,294 | $102,577 | $100,071 |
| 1/31/2016 | $98,191 | $103,988 | $100,074 |
| 2/29/2016 | $99,225 | $104,726 | $100,099 |
| 3/31/2016 | $99,631 | $105,687 | $100,145 |
| 4/30/2016 | $99,527 | $106,093 | $100,171 |
| 5/31/2016 | $100,462 | $106,120 | $100,180 |
| 6/30/2016 | $100,519 | $108,027 | $100,218 |
| 7/31/2016 | $101,041 | $108,710 | $100,245 |
| 8/31/2016 | $101,876 | $108,585 | $100,264 |
| 9/30/2016 | $102,522 | $108,521 | $100,313 |
| 10/31/2016 | $102,102 | $107,691 | $100,338 |
| 11/30/2016 | $102,731 | $105,144 | $100,355 |
| 12/31/2016 | $103,209 | $105,292 | $100,397 |
| 1/31/2017 | $103,209 | $105,499 | $100,442 |
| 2/28/2017 | $103,315 | $106,208 | $100,484 |
| 3/31/2017 | $102,523 | $106,152 | $100,502 |
| 4/30/2017 | $103,098 | $106,972 | $100,566 |
| 5/31/2017 | $103,258 | $107,795 | $100,621 |
| 6/30/2017 | $104,080 | $107,687 | $100,705 |
| 7/31/2017 | $104,183 | $108,150 | $100,790 |
| 8/31/2017 | $104,119 | $109,120 | $100,885 |
| 9/30/2017 | $104,362 | $108,600 | $100,972 |
| 10/31/2017 | $104,874 | $108,663 | $101,062 |
| 11/30/2017 | $104,034 | $108,524 | $101,146 |
| 12/31/2017 | $104,697 | $109,022 | $101,254 |
| 1/31/2018 | $105,535 | $107,766 | $101,379 |
| 2/28/2018 | $106,156 | $106,745 | $101,475 |
| 3/31/2018 | $106,296 | $107,429 | $101,611 |
| 4/30/2018 | $106,517 | $106,630 | $101,750 |
| 5/31/2018 | $106,988 | $107,391 | $101,906 |
| 6/30/2018 | $106,965 | $107,259 | $102,074 |
| 7/31/2018 | $106,985 | $107,284 | $102,236 |
| 8/31/2018 | $107,468 | $107,975 | $102,420 |
| 9/30/2018 | $107,505 | $107,280 | $102,571 |
| 10/31/2018 | $106,972 | $106,432 | $102,755 |
| 11/30/2018 | $107,302 | $107,067 | $102,967 |
| 12/31/2018 | $106,611 | $109,034 | $103,156 |
| 1/31/2019 | $108,100 | $110,192 | $103,359 |
| 2/28/2019 | $108,749 | $110,128 | $103,543 |
| 3/31/2019 | $109,159 | $112,243 | $103,766 |
| 4/30/2019 | $109,689 | $112,272 | $103,969 |
| 5/31/2019 | $109,876 | $114,265 | $104,207 |
| 6/30/2019 | $110,404 | $115,699 | $104,430 |
| 7/31/2019 | $110,632 | $115,954 | $104,628 |
| 8/31/2019 | $111,060 | $118,959 | $104,839 |
| 9/30/2019 | $111,258 | $118,325 | $105,025 |
| 10/31/2019 | $111,478 | $118,682 | $105,227 |
| 11/30/2019 | $111,930 | $118,621 | $105,356 |
| 12/31/2019 | $112,651 | $118,538 | $105,508 |
| 1/31/2020 | $112,991 | $120,820 | $105,650 |
| 2/29/2020 | $113,053 | $122,994 | $105,805 |
| 3/31/2020 | $106,435 | $122,270 | $106,114 |
| 4/30/2020 | $108,911 | $124,444 | $106,123 |
| 5/31/2020 | $112,979 | $125,023 | $106,124 |
| 6/30/2020 | $114,744 | $125,811 | $106,139 |
| 7/31/2020 | $116,057 | $127,690 | $106,159 |
| 8/31/2020 | $117,326 | $126,659 | $106,168 |
| 9/30/2020 | $117,375 | $126,590 | $106,179 |
| 10/31/2020 | $117,863 | $126,025 | $106,191 |
| 11/30/2020 | $119,457 | $127,261 | $106,201 |
| 12/31/2020 | $120,207 | $127,436 | $106,213 |
| 1/31/2021 | $120,615 | $126,523 | $106,222 |
| 2/28/2021 | $121,441 | $124,696 | $106,232 |
| 3/31/2021 | $121,581 | $123,139 | $106,239 |
| 4/30/2021 | $122,373 | $124,111 | $106,240 |
| 5/31/2021 | $122,344 | $124,517 | $106,243 |
| 6/30/2021 | $122,667 | $125,392 | $106,239 |
| 7/31/2021 | $122,622 | $126,794 | $106,245 |
| 8/31/2021 | $122,971 | $126,553 | $106,249 |
| 9/30/2021 | $123,032 | $125,457 | $106,255 |
| 10/31/2021 | $123,464 | $125,422 | $106,251 |
| 11/30/2021 | $123,435 | $125,793 | $106,256 |
| 12/31/2021 | $124,080 | $125,472 | $106,265 |
| 1/31/2022 | $123,442 | $122,768 | $106,259 |
| 2/28/2022 | $123,439 | $121,399 | $106,274 |
| 3/31/2022 | $123,130 | $118,026 | $106,306 |
| 4/30/2022 | $121,550 | $113,547 | $106,322 |
| 5/31/2022 | $120,493 | $114,279 | $106,394 |
| 6/30/2022 | $117,455 | $112,486 | $106,417 |
| 7/31/2022 | $119,668 | $115,235 | $106,472 |
| 8/31/2022 | $120,070 | $111,979 | $106,644 |
| 9/30/2022 | $119,511 | $107,141 | $106,909 |
| 10/31/2022 | $120,540 | $105,753 | $107,077 |
| 11/30/2022 | $121,591 | $109,642 | $107,422 |
| 12/31/2022 | $120,708 | $109,147 | $107,811 |
| 1/31/2023 | $122,865 | $112,505 | $108,149 |
| 2/28/2023 | $123,603 | $109,597 | $108,501 |
| 3/31/2023 | $123,673 | $112,380 | $108,968 |
| 4/30/2023 | $124,438 | $113,062 | $109,312 |
| 5/31/2023 | $124,141 | $111,830 | $109,740 |
| 6/30/2023 | $125,516 | $111,431 | $110,242 |
| 7/31/2023 | $125,222 | $111,354 | $110,681 |
| 8/31/2023 | $126,368 | $110,643 | $111,180 |
| 9/30/2023 | $126,868 | $107,831 | $111,690 |
| 10/31/2023 | $126,616 | $106,129 | $112,189 |
| 11/30/2023 | $128,155 | $110,935 | $112,693 |
| 12/31/2023 | $129,647 | $115,182 | $113,218 |
| 1/31/2024 | $130,059 | $114,866 | $113,702 |
| 2/29/2024 | $130,750 | $113,243 | $114,167 |
| 3/31/2024 | $130,702 | $114,289 | $114,681 |
| 4/30/2024 | $131,069 | $111,402 | $115,172 |
| 5/31/2024 | $131,873 | $113,290 | $115,725 |
* Past performance is not a good predictor of how the Fund will perform in the future. The chart does not reflect the deduction of taxes that a shareholder would pay on fund distributions or redemption of fund shares.
The indexes are unmanaged and, therefore, have no expenses. Investors cannot invest directly in an index.
Average Annual Total Returns (%)Footnote Reference*
| 1 Year | 5 Years | 10 Years | |
|---|---|---|---|
| Class I | 6.23% | 3.72% | 2.81% |
| Bloomberg U.S. Aggregate Bond Index | 1.31% | - 0.17% | 1.26% |
| ICE BofA U.S. 3-Month Treasury Bill Index | 5.45% | 2.12% | 1.47% |
| Footnote | Description |
Footnote* | Past performance is not a good predictor of how the Fund will perform in the future. The table does not reflect the deduction of taxes that a shareholder would pay on fund distributions or redemption of fund shares. Returns shown above include the reinvestment of all dividends and capital gains. Performance reflects fee waivers and/or expense reimbursements. If fee waivers had not been in place, performance would have been lower. |
Key Fund Statistics
| Total Net Assets | $143,238,533 |
| Number of Portfolio Holdings | 103 |
| Total Advisory Fees Paid | $768,351 |
| Portfolio Turnover Rate | 117% |
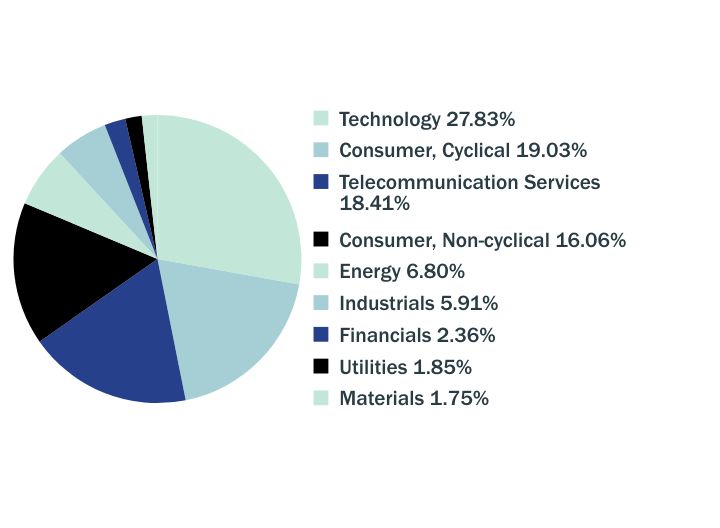
What did the Fund invest in?
The Fund invested primarily in the credit securities of companies involved in announced corporate events or companies expected to undergo a corporate event.
Sector Weighting (%)

| Value | Value |
|---|---|
| Technology | 27.83% |
| Consumer, Cyclical | 19.03% |
| Telecommunication Services | 18.41% |
| Consumer, Non-cyclical | 16.06% |
| Energy | 6.80% |
| Industrials | 5.91% |
| Financials | 2.36% |
| Utilities | 1.85% |
| Materials | 1.75% |
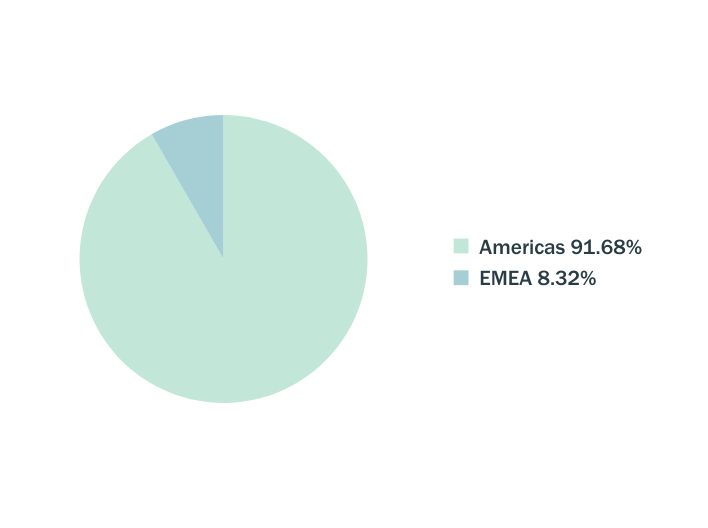
Region Weighting (%)

| Value | Value |
|---|---|
| Americas | 91.68% |
| EMEA | 8.32% |
Material Fund Changes
There were no material changes to the Fund since May 31, 2023.
Additional Information
For additional information about the Fund, including its prospectus, financial information, holdings, and proxy voting, scan the QR code or visit www.arbitragefunds.com/water-island-credit-opportunities.
Householding
To reduce Fund expenses, only one copy of most shareholder documents may be mailed to shareholders with multiple accounts at the same address (Householding). If you would prefer that your Fund documents not be householded, please contact us at 1-800-295-4485, or contact your financial intermediary.
The Water Island Credit Opportunities Fund is distributed by ALPS Distributors, Inc, which is not affiliated with Water Island Capital LLC or any of its affiliates.


Class I:
ACFIX
Water Island Credit Opportunities Fund
Annual Shareholder Report
May 31, 2024
Class C: ARBCX
Arbitrage Fund

Annual Shareholder Report
May 31, 2024
Fund Overview
This annual shareholder report contains important information about Arbitrage Fund for the period of June 1, 2023 to May 31, 2024. You can find additional information about the Fund at www.arbitragefunds.com/arbitrage. You can also request this information by contacting us at 1-800-295-4485.
What were the Fund costs for the last year?
Annual Fund Operating Expenses
(based on a hypothetical $10,000 investment)
| Class Name | Cost of a $10,000 investment | Costs paid as a percentage of a $10,000 investment |
|---|---|---|
| Class C | $239 | 2.31% |
How did the Fund perform last year and what affected its performance?
The Fund’s performance for the fiscal year was driven by the outcomes of the idiosyncratic mergers and acquisitions transactions in which the Fund invested, notably including several high-profile deals that experienced favorable outcomes despite regulatory challenges. Returns were sourced predominantly from US-target transactions. Information technology and health care were the top performing sectors, while consumer discretionary and materials detracted the most from returns. Top contributors included the acquisition of VMware by Broadcom, Microsoft’s acquisition of Activision Blizzard, and the acquisition of Horizon Therapeutics by Amgen. Top detractors included the merger of Capri Holdings and Tapestry, the acquisition of United States Steel by Nippon Steel, and the failed acquisition of PNM Resources by Avangrid.
Fund Performance
The chart below reflects a hypothetical $10,000 investment in the Fund, and assumes reinvestment of dividends and capital gains. Performance shown is for the previous 10 years.
Total Return Based on $10,000 Investment*
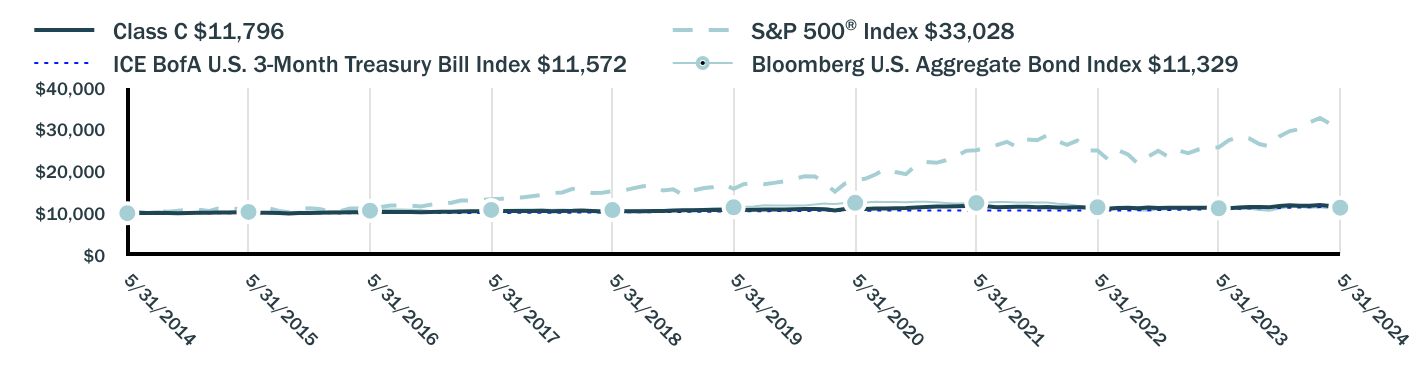
| Class C $11,796 | S&P 500® Index $33,028 | ICE BofA U.S. 3-Month Treasury Bill Index $11,572 | Bloomberg U.S. Aggregate Bond Index $11,329 | |
|---|---|---|---|---|
| 5/31/2014 | $10,000 | $10,000 | $10,000 | $10,000 |
| 6/30/2014 | $10,081 | $10,207 | $10,000 | $10,005 |
| 7/31/2014 | $10,073 | $10,066 | $10,001 | $9,980 |
| 8/31/2014 | $10,081 | $10,469 | $10,001 | $10,090 |
| 9/30/2014 | $10,032 | $10,322 | $10,001 | $10,022 |
| 10/31/2014 | $9,960 | $10,574 | $10,002 | $10,120 |
| 11/30/2014 | $10,024 | $10,858 | $10,002 | $10,192 |
| 12/31/2014 | $10,106 | $10,831 | $10,002 | $10,202 |
| 1/31/2015 | $10,130 | $10,506 | $10,002 | $10,415 |
| 2/28/2015 | $10,154 | $11,109 | $10,002 | $10,318 |
| 3/31/2015 | $10,195 | $10,934 | $10,002 | $10,365 |
| 4/30/2015 | $10,235 | $11,039 | $10,002 | $10,328 |
| 5/31/2015 | $10,252 | $11,181 | $10,002 | $10,303 |
| 6/30/2015 | $10,114 | $10,964 | $10,003 | $10,191 |
| 7/31/2015 | $10,098 | $11,194 | $10,002 | $10,262 |
| 8/31/2015 | $10,065 | $10,519 | $10,004 | $10,247 |
| 9/30/2015 | $9,944 | $10,258 | $10,004 | $10,316 |
| 10/31/2015 | $10,033 | $11,124 | $10,003 | $10,318 |
| 11/30/2015 | $10,049 | $11,157 | $10,004 | $10,291 |
| 12/31/2015 | $10,095 | $10,981 | $10,007 | $10,258 |
| 1/31/2016 | $10,145 | $10,436 | $10,007 | $10,399 |
| 2/29/2016 | $10,187 | $10,422 | $10,010 | $10,473 |
| 3/31/2016 | $10,236 | $11,129 | $10,015 | $10,569 |
| 4/30/2016 | $10,212 | $11,172 | $10,017 | $10,609 |
| 5/31/2016 | $10,270 | $11,372 | $10,018 | $10,612 |
| 6/30/2016 | $10,261 | $11,402 | $10,022 | $10,803 |
| 7/31/2016 | $10,261 | $11,822 | $10,025 | $10,871 |
| 8/31/2016 | $10,270 | $11,839 | $10,026 | $10,859 |
| 9/30/2016 | $10,311 | $11,841 | $10,031 | $10,852 |
| 10/31/2016 | $10,220 | $11,625 | $10,034 | $10,769 |
| 11/30/2016 | $10,311 | $12,056 | $10,036 | $10,514 |
| 12/31/2016 | $10,355 | $12,294 | $10,040 | $10,529 |
| 1/31/2017 | $10,363 | $12,527 | $10,044 | $10,550 |
| 2/28/2017 | $10,397 | $13,025 | $10,048 | $10,621 |
| 3/31/2017 | $10,439 | $13,040 | $10,050 | $10,615 |
| 4/30/2017 | $10,473 | $13,174 | $10,057 | $10,697 |
| 5/31/2017 | $10,514 | $13,359 | $10,062 | $10,779 |
| 6/30/2017 | $10,548 | $13,442 | $10,070 | $10,769 |
| 7/31/2017 | $10,540 | $13,719 | $10,079 | $10,815 |
| 8/31/2017 | $10,556 | $13,761 | $10,088 | $10,912 |
| 9/30/2017 | $10,556 | $14,045 | $10,097 | $10,860 |
| 10/31/2017 | $10,598 | $14,372 | $10,106 | $10,866 |
| 11/30/2017 | $10,481 | $14,813 | $10,115 | $10,852 |
| 12/31/2017 | $10,545 | $14,978 | $10,125 | $10,902 |
| 1/31/2018 | $10,571 | $15,836 | $10,138 | $10,777 |
| 2/28/2018 | $10,648 | $15,252 | $10,147 | $10,674 |
| 3/31/2018 | $10,519 | $14,864 | $10,161 | $10,743 |
| 4/30/2018 | $10,407 | $14,921 | $10,175 | $10,663 |
| 5/31/2018 | $10,467 | $15,281 | $10,191 | $10,739 |
| 6/30/2018 | $10,493 | $15,375 | $10,207 | $10,726 |
| 7/31/2018 | $10,458 | $15,947 | $10,224 | $10,728 |
| 8/31/2018 | $10,467 | $16,466 | $10,242 | $10,797 |
| 9/30/2018 | $10,519 | $16,560 | $10,257 | $10,728 |
| 10/31/2018 | $10,528 | $15,428 | $10,276 | $10,643 |
| 11/30/2018 | $10,631 | $15,743 | $10,297 | $10,707 |
| 12/31/2018 | $10,688 | $14,321 | $10,316 | $10,903 |
| 1/31/2019 | $10,723 | $15,469 | $10,336 | $11,019 |
| 2/28/2019 | $10,740 | $15,966 | $10,354 | $11,013 |
| 3/31/2019 | $10,758 | $16,276 | $10,377 | $11,224 |
| 4/30/2019 | $10,854 | $16,935 | $10,397 | $11,227 |
| 5/31/2019 | $10,793 | $15,859 | $10,421 | $11,426 |
| 6/30/2019 | $10,784 | $16,976 | $10,443 | $11,570 |
| 7/31/2019 | $10,854 | $17,220 | $10,463 | $11,595 |
| 8/31/2019 | $10,863 | $16,948 | $10,484 | $11,896 |
| 9/30/2019 | $10,863 | $17,265 | $10,503 | $11,833 |
| 10/31/2019 | $10,907 | $17,639 | $10,523 | $11,868 |
| 11/30/2019 | $10,950 | $18,279 | $10,536 | $11,862 |
| 12/31/2019 | $10,981 | $18,831 | $10,551 | $11,854 |
| 1/31/2020 | $11,016 | $18,823 | $10,565 | $12,082 |
| 2/29/2020 | $10,963 | $17,274 | $10,581 | $12,299 |
| 3/31/2020 | $10,650 | $15,140 | $10,611 | $12,227 |
| 4/30/2020 | $11,016 | $17,081 | $10,612 | $12,444 |
| 5/31/2020 | $11,034 | $17,895 | $10,612 | $12,502 |
| 6/30/2020 | $11,016 | $18,250 | $10,614 | $12,581 |
| 7/31/2020 | $11,097 | $19,279 | $10,616 | $12,769 |
| 8/31/2020 | $11,150 | $20,665 | $10,617 | $12,666 |
| 9/30/2020 | $11,168 | $19,880 | $10,618 | $12,659 |
| 10/31/2020 | $11,231 | $19,351 | $10,619 | $12,602 |
| 11/30/2020 | $11,347 | $21,470 | $10,620 | $12,726 |
| 12/31/2020 | $11,493 | $22,295 | $10,621 | $12,744 |
| 1/31/2021 | $11,589 | $22,070 | $10,622 | $12,652 |
| 2/28/2021 | $11,589 | $22,679 | $10,623 | $12,470 |
| 3/31/2021 | $11,646 | $23,672 | $10,624 | $12,314 |
| 4/30/2021 | $11,742 | $24,935 | $10,624 | $12,411 |
| 5/31/2021 | $11,781 | $25,109 | $10,624 | $12,452 |
| 6/30/2021 | $11,685 | $25,696 | $10,624 | $12,539 |
| 7/31/2021 | $11,435 | $26,306 | $10,624 | $12,679 |
| 8/31/2021 | $11,493 | $27,106 | $10,625 | $12,655 |
| 9/30/2021 | $11,550 | $25,845 | $10,625 | $12,546 |
| 10/31/2021 | $11,570 | $27,656 | $10,625 | $12,542 |
| 11/30/2021 | $11,406 | $27,464 | $10,626 | $12,579 |
| 12/31/2021 | $11,501 | $28,695 | $10,627 | $12,547 |
| 1/31/2022 | $11,356 | $27,210 | $10,626 | $12,277 |
| 2/28/2022 | $11,375 | $26,395 | $10,627 | $12,140 |
| 3/31/2022 | $11,443 | $27,375 | $10,631 | $11,803 |
| 4/30/2022 | $11,356 | $24,988 | $10,632 | $11,355 |
| 5/31/2022 | $11,250 | $25,034 | $10,639 | $11,428 |
| 6/30/2022 | $11,085 | $22,968 | $10,642 | $11,249 |
| 7/31/2022 | $11,240 | $25,085 | $10,647 | $11,523 |
| 8/31/2022 | $11,288 | $24,062 | $10,664 | $11,198 |
| 9/30/2022 | $11,192 | $21,846 | $10,691 | $10,714 |
| 10/31/2022 | $11,375 | $23,615 | $10,708 | $10,575 |
| 11/30/2022 | $11,250 | $24,935 | $10,742 | $10,964 |
| 12/31/2022 | $11,304 | $23,498 | $10,781 | $10,915 |
| 1/31/2023 | $11,314 | $24,975 | $10,815 | $11,251 |
| 2/28/2023 | $11,294 | $24,365 | $10,850 | $10,960 |
| 3/31/2023 | $11,314 | $25,260 | $10,897 | $11,238 |
| 4/30/2023 | $11,314 | $25,654 | $10,931 | $11,306 |
| 5/31/2023 | $11,055 | $25,766 | $10,974 | $11,183 |
| 6/30/2023 | $11,214 | $27,468 | $11,024 | $11,143 |
| 7/31/2023 | $11,384 | $28,350 | $11,068 | $11,135 |
| 8/31/2023 | $11,493 | $27,899 | $11,118 | $11,064 |
| 9/30/2023 | $11,513 | $26,569 | $11,169 | $10,783 |
| 10/31/2023 | $11,453 | $26,010 | $11,219 | $10,613 |
| 11/30/2023 | $11,733 | $28,386 | $11,269 | $11,094 |
| 12/31/2023 | $11,877 | $29,675 | $11,322 | $11,518 |
| 1/31/2024 | $11,806 | $30,174 | $11,370 | $11,487 |
| 2/29/2024 | $11,806 | $31,785 | $11,417 | $11,324 |
| 3/31/2024 | $11,979 | $32,808 | $11,468 | $11,429 |
| 4/30/2024 | $11,745 | $31,468 | $11,517 | $11,140 |
| 5/31/2024 | $11,796 | $33,028 | $11,572 | $11,329 |
* Past performance is not a good predictor of how the Fund will perform in the future. The chart does not reflect the deduction of taxes that a shareholder would pay on fund distributions or redemption of fund shares.
The indexes are unmanaged and, therefore, have no expenses. Investors cannot invest directly in an index.
Average Annual Total Returns (%)Footnote Reference*
| 1 Year | 5 Years | 10 Years | |
|---|---|---|---|
| Class C | 6.70% | 1.79% | 1.67% |
| Class C (After Sales Charges) | 5.70% | 1.79% | 1.67% |
S&P 500® Index | 28.19% | 15.80% | 12.69% |
| ICE BofA U.S. 3-Month Treasury Bill Index | 5.45% | 2.12% | 1.47% |
| Bloomberg U.S. Aggregate Bond Index | 1.31% | -0.17% | 1.26% |
| Footnote | Description |
Footnote* | Past performance is not a good predictor of how the Fund will perform in the future. The table does not reflect the deduction of taxes that a shareholder would pay on fund distributions or redemption of fund shares. Returns shown above include the reinvestment of all dividends and capital gains. |
Key Fund Statistics
| Total Net Assets | $938,998,873 |
| Number of Portfolio Holdings | 99 |
| Total Advisory Fees Paid | $10,257,507 |
| Portfolio Turnover Rate | 230% |
What did the Fund invest in?
The Fund invested primarily in the equity securities of companies involved in publicly announced mergers and acquisitions.
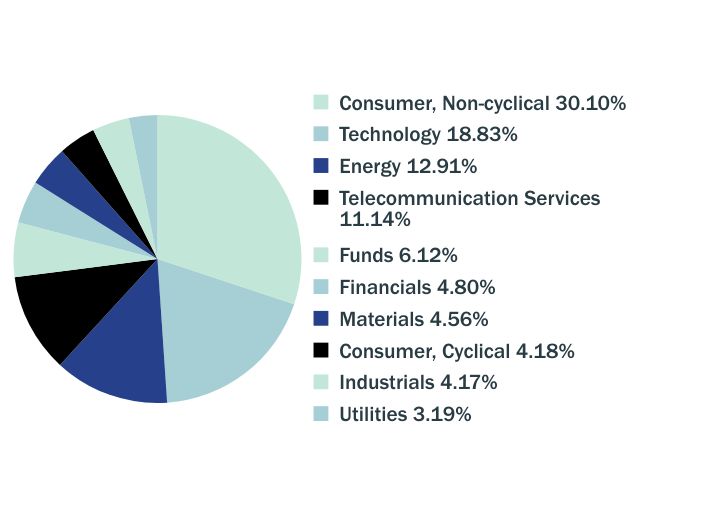
Sector Weighting (%)

| Value | Value |
|---|---|
| Consumer, Non-cyclical | 30.10% |
| Technology | 18.83% |
| Energy | 12.91% |
| Telecommunication Services | 11.14% |
| Funds | 6.12% |
| Financials | 4.80% |
| Materials | 4.56% |
| Consumer, Cyclical | 4.18% |
| Industrials | 4.17% |
| Utilities | 3.19% |
Region Weighting (%)
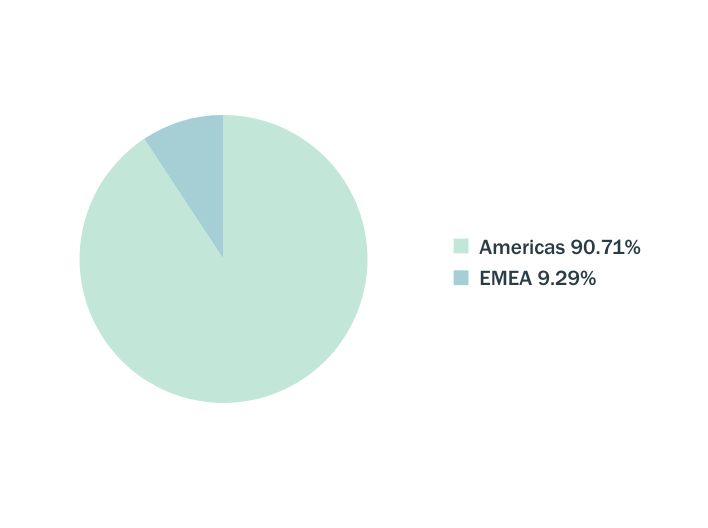
| Value | Value |
|---|---|
| Americas | 90.71% |
| EMEA | 9.29% |
Material Fund Changes
There were no material changes to the Fund since May 31, 2023.
Additional Information
For additional information about the Fund, including its prospectus, financial information, holdings, and proxy voting, scan the QR code or visit www.arbitragefunds.com/arbitrage.
Householding
To reduce Fund expenses, only one copy of most shareholder documents may be mailed to shareholders with multiple accounts at the same address (Householding). If you would prefer that your Fund documents not be householded, please contact us at 1-800-295-4485, or contact your financial intermediary.
The Arbitrage Fund is distributed by ALPS Distributors, Inc, which is not affiliated with Water Island Capital LLC or any of its affiliates.


Class C:
ARBCX
Arbitrage Fund
Annual Shareholder Report
May 31, 2024
Class R: ARBFX
Arbitrage Fund

Annual Shareholder Report
May 31, 2024
Fund Overview
This annual shareholder report contains important information about Arbitrage Fund for the period of June 1, 2023 to May 31, 2024. You can find additional information about the Fund at www.arbitragefunds.com/arbitrage. You can also request this information by contacting us at 1-800-295-4485.
What were the Fund costs for the last year?
Annual Fund Operating Expenses
(based on a hypothetical $10,000 investment)
| Class Name | Cost of a $10,000 investment | Costs paid as a percentage of a $10,000 investment |
|---|---|---|
| Class R | $162 | 1.56% |
How did the Fund perform last year and what affected its performance?
The Fund’s performance for the fiscal year was driven by the outcomes of the idiosyncratic mergers and acquisitions transactions in which the Fund invested, notably including several high-profile deals that experienced favorable outcomes despite regulatory challenges. Returns were sourced predominantly from US-target transactions. Information technology and health care were the top performing sectors, while consumer discretionary and materials detracted the most from returns. Top contributors included the acquisition of VMware by Broadcom, Microsoft’s acquisition of Activision Blizzard, and the acquisition of Horizon Therapeutics by Amgen. Top detractors included the merger of Capri Holdings and Tapestry, the acquisition of United States Steel by Nippon Steel, and the failed acquisition of PNM Resources by Avangrid.
Fund Performance
The chart below reflects a hypothetical $10,000 investment in the Fund, and assumes reinvestment of dividends and capital gains. Performance shown is for the previous 10 years.
Total Return Based on $10,000 Investment*
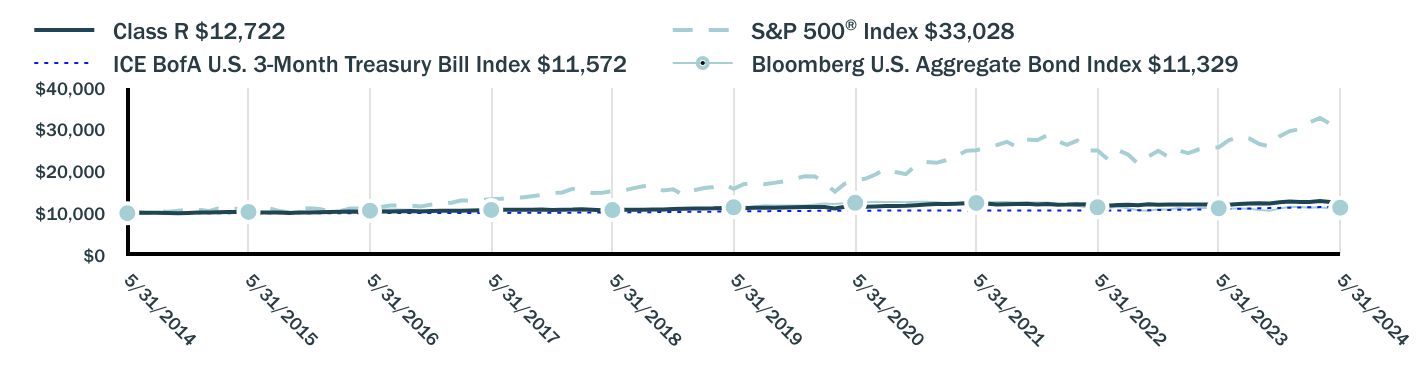
| Class R $12,722 | S&P 500® Index $33,028 | ICE BofA U.S. 3-Month Treasury Bill Index $11,572 | Bloomberg U.S. Aggregate Bond Index $11,329 | |
|---|---|---|---|---|
| 5/31/2014 | $10,000 | $10,000 | $10,000 | $10,000 |
| 6/30/2014 | $10,095 | $10,207 | $10,000 | $10,005 |
| 7/31/2014 | $10,087 | $10,066 | $10,001 | $9,980 |
| 8/31/2014 | $10,103 | $10,469 | $10,001 | $10,090 |
| 9/30/2014 | $10,064 | $10,322 | $10,001 | $10,022 |
| 10/31/2014 | $10,000 | $10,574 | $10,002 | $10,120 |
| 11/30/2014 | $10,064 | $10,858 | $10,002 | $10,192 |
| 12/31/2014 | $10,160 | $10,831 | $10,002 | $10,202 |
| 1/31/2015 | $10,183 | $10,506 | $10,002 | $10,415 |
| 2/28/2015 | $10,207 | $11,109 | $10,002 | $10,318 |
| 3/31/2015 | $10,263 | $10,934 | $10,002 | $10,365 |
| 4/30/2015 | $10,311 | $11,039 | $10,002 | $10,328 |
| 5/31/2015 | $10,335 | $11,181 | $10,002 | $10,303 |
| 6/30/2015 | $10,191 | $10,964 | $10,003 | $10,191 |
| 7/31/2015 | $10,183 | $11,194 | $10,002 | $10,262 |
| 8/31/2015 | $10,168 | $10,519 | $10,004 | $10,247 |
| 9/30/2015 | $10,048 | $10,258 | $10,004 | $10,316 |
| 10/31/2015 | $10,144 | $11,124 | $10,003 | $10,318 |
| 11/30/2015 | $10,168 | $11,157 | $10,004 | $10,291 |
| 12/31/2015 | $10,221 | $10,981 | $10,007 | $10,258 |
| 1/31/2016 | $10,278 | $10,436 | $10,007 | $10,399 |
| 2/29/2016 | $10,327 | $10,422 | $10,010 | $10,473 |
| 3/31/2016 | $10,384 | $11,129 | $10,015 | $10,569 |
| 4/30/2016 | $10,368 | $11,172 | $10,017 | $10,609 |
| 5/31/2016 | $10,425 | $11,372 | $10,018 | $10,612 |
| 6/30/2016 | $10,425 | $11,402 | $10,022 | $10,803 |
| 7/31/2016 | $10,433 | $11,822 | $10,025 | $10,871 |
| 8/31/2016 | $10,442 | $11,839 | $10,026 | $10,859 |
| 9/30/2016 | $10,499 | $11,841 | $10,031 | $10,852 |
| 10/31/2016 | $10,409 | $11,625 | $10,034 | $10,769 |
| 11/30/2016 | $10,507 | $12,056 | $10,036 | $10,514 |
| 12/31/2016 | $10,566 | $12,294 | $10,040 | $10,529 |
| 1/31/2017 | $10,575 | $12,527 | $10,044 | $10,550 |
| 2/28/2017 | $10,616 | $13,025 | $10,048 | $10,621 |
| 3/31/2017 | $10,665 | $13,040 | $10,050 | $10,615 |
| 4/30/2017 | $10,715 | $13,174 | $10,057 | $10,697 |
| 5/31/2017 | $10,756 | $13,359 | $10,062 | $10,779 |
| 6/30/2017 | $10,805 | $13,442 | $10,070 | $10,769 |
| 7/31/2017 | $10,797 | $13,719 | $10,079 | $10,815 |
| 8/31/2017 | $10,822 | $13,761 | $10,088 | $10,912 |
| 9/30/2017 | $10,830 | $14,045 | $10,097 | $10,860 |
| 10/31/2017 | $10,879 | $14,372 | $10,106 | $10,866 |
| 11/30/2017 | $10,764 | $14,813 | $10,115 | $10,852 |
| 12/31/2017 | $10,841 | $14,978 | $10,125 | $10,902 |
| 1/31/2018 | $10,875 | $15,836 | $10,138 | $10,777 |
| 2/28/2018 | $10,960 | $15,252 | $10,147 | $10,674 |
| 3/31/2018 | $10,832 | $14,864 | $10,161 | $10,743 |
| 4/30/2018 | $10,721 | $14,921 | $10,175 | $10,663 |
| 5/31/2018 | $10,789 | $15,281 | $10,191 | $10,739 |
| 6/30/2018 | $10,832 | $15,375 | $10,207 | $10,726 |
| 7/31/2018 | $10,798 | $15,947 | $10,224 | $10,728 |
| 8/31/2018 | $10,815 | $16,466 | $10,242 | $10,797 |
| 9/30/2018 | $10,875 | $16,560 | $10,257 | $10,728 |
| 10/31/2018 | $10,892 | $15,428 | $10,276 | $10,643 |
| 11/30/2018 | $11,003 | $15,743 | $10,297 | $10,707 |
| 12/31/2018 | $11,070 | $14,321 | $10,316 | $10,903 |
| 1/31/2019 | $11,113 | $15,469 | $10,336 | $11,019 |
| 2/28/2019 | $11,131 | $15,966 | $10,354 | $11,013 |
| 3/31/2019 | $11,166 | $16,276 | $10,377 | $11,224 |
| 4/30/2019 | $11,270 | $16,935 | $10,397 | $11,227 |
| 5/31/2019 | $11,209 | $15,859 | $10,421 | $11,426 |
| 6/30/2019 | $11,209 | $16,976 | $10,443 | $11,570 |
| 7/31/2019 | $11,287 | $17,220 | $10,463 | $11,595 |
| 8/31/2019 | $11,313 | $16,948 | $10,484 | $11,896 |
| 9/30/2019 | $11,313 | $17,265 | $10,503 | $11,833 |
| 10/31/2019 | $11,365 | $17,639 | $10,523 | $11,868 |
| 11/30/2019 | $11,417 | $18,279 | $10,536 | $11,862 |
| 12/31/2019 | $11,465 | $18,831 | $10,551 | $11,854 |
| 1/31/2020 | $11,500 | $18,823 | $10,565 | $12,082 |
| 2/29/2020 | $11,456 | $17,274 | $10,581 | $12,299 |
| 3/31/2020 | $11,137 | $15,140 | $10,611 | $12,227 |
| 4/30/2020 | $11,518 | $17,081 | $10,612 | $12,444 |
| 5/31/2020 | $11,553 | $17,895 | $10,612 | $12,502 |
| 6/30/2020 | $11,544 | $18,250 | $10,614 | $12,581 |
| 7/31/2020 | $11,633 | $19,279 | $10,616 | $12,769 |
| 8/31/2020 | $11,695 | $20,665 | $10,617 | $12,666 |
| 9/30/2020 | $11,722 | $19,880 | $10,618 | $12,659 |
| 10/31/2020 | $11,793 | $19,351 | $10,619 | $12,602 |
| 11/30/2020 | $11,925 | $21,470 | $10,620 | $12,726 |
| 12/31/2020 | $12,087 | $22,295 | $10,621 | $12,744 |
| 1/31/2021 | $12,201 | $22,070 | $10,622 | $12,652 |
| 2/28/2021 | $12,201 | $22,679 | $10,623 | $12,470 |
| 3/31/2021 | $12,268 | $23,672 | $10,624 | $12,314 |
| 4/30/2021 | $12,381 | $24,935 | $10,624 | $12,411 |
| 5/31/2021 | $12,429 | $25,109 | $10,624 | $12,452 |
| 6/30/2021 | $12,334 | $25,696 | $10,624 | $12,539 |
| 7/31/2021 | $12,078 | $26,306 | $10,624 | $12,679 |
| 8/31/2021 | $12,144 | $27,106 | $10,625 | $12,655 |
| 9/30/2021 | $12,211 | $25,845 | $10,625 | $12,546 |
| 10/31/2021 | $12,239 | $27,656 | $10,625 | $12,542 |
| 11/30/2021 | $12,078 | $27,464 | $10,626 | $12,579 |
| 12/31/2021 | $12,191 | $28,695 | $10,627 | $12,547 |
| 1/31/2022 | $12,048 | $27,210 | $10,626 | $12,277 |
| 2/28/2022 | $12,057 | $26,395 | $10,627 | $12,140 |
| 3/31/2022 | $12,143 | $27,375 | $10,631 | $11,803 |
| 4/30/2022 | $12,067 | $24,988 | $10,632 | $11,355 |
| 5/31/2022 | $11,952 | $25,034 | $10,639 | $11,428 |
| 6/30/2022 | $11,790 | $22,968 | $10,642 | $11,249 |
| 7/31/2022 | $11,962 | $25,085 | $10,647 | $11,523 |
| 8/31/2022 | $12,019 | $24,062 | $10,664 | $11,198 |
| 9/30/2022 | $11,924 | $21,846 | $10,691 | $10,714 |
| 10/31/2022 | $12,124 | $23,615 | $10,708 | $10,575 |
| 11/30/2022 | $12,009 | $24,935 | $10,742 | $10,964 |
| 12/31/2022 | $12,066 | $23,498 | $10,781 | $10,915 |
| 1/31/2023 | $12,086 | $24,975 | $10,815 | $11,251 |
| 2/28/2023 | $12,066 | $24,365 | $10,850 | $10,960 |
| 3/31/2023 | $12,096 | $25,260 | $10,897 | $11,238 |
| 4/30/2023 | $12,106 | $25,654 | $10,931 | $11,306 |
| 5/31/2023 | $11,829 | $25,766 | $10,974 | $11,183 |
| 6/30/2023 | $12,017 | $27,468 | $11,024 | $11,143 |
| 7/31/2023 | $12,205 | $28,350 | $11,068 | $11,135 |
| 8/31/2023 | $12,333 | $27,899 | $11,118 | $11,064 |
| 9/30/2023 | $12,363 | $26,569 | $11,169 | $10,783 |
| 10/31/2023 | $12,304 | $26,010 | $11,219 | $10,613 |
| 11/30/2023 | $12,600 | $28,386 | $11,269 | $11,094 |
| 12/31/2023 | $12,783 | $29,675 | $11,322 | $11,518 |
| 1/31/2024 | $12,712 | $30,174 | $11,370 | $11,487 |
| 2/29/2024 | $12,712 | $31,785 | $11,417 | $11,324 |
| 3/31/2024 | $12,904 | $32,808 | $11,468 | $11,429 |
| 4/30/2024 | $12,662 | $31,468 | $11,517 | $11,140 |
| 5/31/2024 | $12,722 | $33,028 | $11,572 | $11,329 |
* Past performance is not a good predictor of how the Fund will perform in the future. The chart does not reflect the deduction of taxes that a shareholder would pay on fund distributions or redemption of fund shares.
The indexes are unmanaged and, therefore, have no expenses. Investors cannot invest directly in an index.
Average Annual Total Returns (%)Footnote Reference*
| 1 Year | 5 Years | 10 Years | |
|---|---|---|---|
| Class R | 7.55% | 2.57% | 2.44% |
S&P 500® Index | 28.19% | 15.80% | 12.69% |
| ICE BofA U.S. 3-Month Treasury Bill Index | 5.45% | 2.12% | 1.47% |
| Bloomberg U.S. Aggregate Bond Index | 1.31% | -0.17% | 1.26% |
| Footnote | Description |
Footnote* | Past performance is not a good predictor of how the Fund will perform in the future. The table does not reflect the deduction of taxes that a shareholder would pay on fund distributions or redemption of fund shares. Returns shown above include the reinvestment of all dividends and capital gains. |
Key Fund Statistics
| Total Net Assets | $938,998,873 |
| Number of Portfolio Holdings | 99 |
| Total Advisory Fees Paid | $10,257,507 |
| Portfolio Turnover Rate | 230% |
What did the Fund invest in?
The Fund invested primarily in the equity securities of companies involved in publicly announced mergers and acquisitions.
Sector Weighting (%)
| Value | Value |
|---|---|
| Consumer, Non-cyclical | 30.10% |
| Technology | 18.83% |
| Energy | 12.91% |
| Telecommunication Services | 11.14% |
| Funds | 6.12% |
| Financials | 4.80% |
| Materials | 4.56% |
| Consumer, Cyclical | 4.18% |
| Industrials | 4.17% |
| Utilities | 3.19% |
Region Weighting (%)

| Value | Value |
|---|---|
| Americas | 90.71% |
| EMEA | 9.29% |
Material Fund Changes
There were no material changes to the Fund since May 31, 2023.
Additional Information
For additional information about the Fund, including its prospectus, financial information, holdings, and proxy voting, scan the QR code or visit www.arbitragefunds.com/arbitrage.
Householding
To reduce Fund expenses, only one copy of most shareholder documents may be mailed to shareholders with multiple accounts at the same address (Householding). If you would prefer that your Fund documents not be householded, please contact us at 1-800-295-4485, or contact your financial intermediary.
The Arbitrage Fund is distributed by ALPS Distributors, Inc, which is not affiliated with Water Island Capital LLC or any of its affiliates.


Class R:
ARBFX
Arbitrage Fund
Annual Shareholder Report
May 31, 2024
Class R: ARCFX
Water Island Credit Opportunities Fund

Annual Shareholder Report
May 31, 2024
Fund Overview
This annual shareholder report contains important information about Water Island Credit Opportunities Fund for the period of June 1, 2023 to May 31, 2024. You can find additional information about the Fund at www.arbitragefunds.com/water-island-credit-opportunities. You can also request this information by contacting us at 1-800-295-4485.
What were the Fund costs for the last year?
Annual Fund Operating Expenses
(based on a hypothetical $10,000 investment)
| Class Name | Cost of a $10,000 investment | Costs paid as a percentage of a $10,000 investment |
|---|---|---|
| Class R | $133 | 1.29% |
How did the Fund perform last year and what affected its performance?
The Fund’s performance for the fiscal year was driven by the outcomes of the idiosyncratic corporate catalysts in which the Fund invested. Performance was sourced largely from credit special situations investments, though merger-related credit also contributed to returns. Most of the Fund’s performance was generated by investments in US-based catalysts. Information technology and health care were the top performing sectors, while utilities and real estate detracted the most from returns. Top contributors included the Fund’s investments in UpHealth bonds, Getty Images bonds, and Kaleyra bonds. Top detractors included the Fund’s investments in Lightning eMotors bonds, broad credit market hedges, and Altice France bonds.
Fund Performance
The chart below reflects a hypothetical $10,000 investment in the Fund, and assumes reinvestment of dividends and capital gains. Performance shown is for the previous 10 years. Performance reflects fee waivers and/or expense reimbursements. If fee waivers had not been in place, performance would have been lower.
Total Return Based on $10,000 Investment*
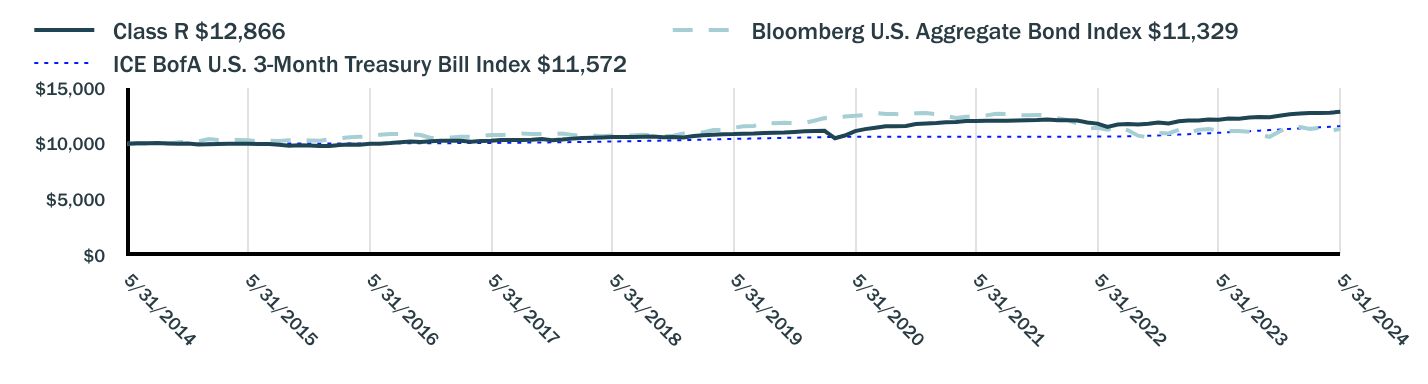
| Class R $12,866 | Bloomberg U.S. Aggregate Bond Index $11,329 | ICE BofA U.S. 3-Month Treasury Bill Index $11,572 | |
|---|---|---|---|
| 5/31/2014 | $10,000 | $10,000 | $10,000 |
| 6/30/2014 | $10,025 | $10,005 | $10,000 |
| 7/31/2014 | $10,035 | $9,980 | $10,001 |
| 8/31/2014 | $10,055 | $10,090 | $10,001 |
| 9/30/2014 | $10,020 | $10,022 | $10,001 |
| 10/31/2014 | $9,990 | $10,120 | $10,002 |
| 11/30/2014 | $10,010 | $10,192 | $10,002 |
| 12/31/2014 | $9,914 | $10,202 | $10,002 |
| 1/31/2015 | $9,944 | $10,415 | $10,002 |
| 2/28/2015 | $9,964 | $10,318 | $10,002 |
| 3/31/2015 | $9,980 | $10,365 | $10,002 |
| 4/30/2015 | $9,980 | $10,328 | $10,002 |
| 5/31/2015 | $9,990 | $10,303 | $10,002 |
| 6/30/2015 | $9,973 | $10,191 | $10,003 |
| 7/31/2015 | $9,963 | $10,262 | $10,002 |
| 8/31/2015 | $9,892 | $10,247 | $10,004 |
| 9/30/2015 | $9,813 | $10,316 | $10,004 |
| 10/31/2015 | $9,853 | $10,318 | $10,003 |
| 11/30/2015 | $9,823 | $10,291 | $10,004 |
| 12/31/2015 | $9,789 | $10,258 | $10,007 |
| 1/31/2016 | $9,779 | $10,399 | $10,007 |
| 2/29/2016 | $9,871 | $10,473 | $10,010 |
| 3/31/2016 | $9,917 | $10,569 | $10,015 |
| 4/30/2016 | $9,906 | $10,609 | $10,017 |
| 5/31/2016 | $9,999 | $10,612 | $10,018 |
| 6/30/2016 | $9,998 | $10,803 | $10,022 |
| 7/31/2016 | $10,050 | $10,871 | $10,025 |
| 8/31/2016 | $10,123 | $10,859 | $10,026 |
| 9/30/2016 | $10,191 | $10,852 | $10,031 |
| 10/31/2016 | $10,139 | $10,769 | $10,034 |
| 11/30/2016 | $10,212 | $10,514 | $10,036 |
| 12/31/2016 | $10,252 | $10,529 | $10,040 |
| 1/31/2017 | $10,252 | $10,550 | $10,044 |
| 2/28/2017 | $10,262 | $10,621 | $10,048 |
| 3/31/2017 | $10,177 | $10,615 | $10,050 |
| 4/30/2017 | $10,232 | $10,697 | $10,057 |
| 5/31/2017 | $10,257 | $10,779 | $10,062 |
| 6/30/2017 | $10,336 | $10,769 | $10,070 |
| 7/31/2017 | $10,333 | $10,815 | $10,079 |
| 8/31/2017 | $10,325 | $10,912 | $10,088 |
| 9/30/2017 | $10,347 | $10,860 | $10,097 |
| 10/31/2017 | $10,406 | $10,866 | $10,106 |
| 11/30/2017 | $10,310 | $10,852 | $10,115 |
| 12/31/2017 | $10,370 | $10,902 | $10,125 |
| 1/31/2018 | $10,451 | $10,777 | $10,138 |
| 2/28/2018 | $10,510 | $10,674 | $10,147 |
| 3/31/2018 | $10,533 | $10,743 | $10,161 |
| 4/30/2018 | $10,552 | $10,663 | $10,175 |
| 5/31/2018 | $10,586 | $10,739 | $10,191 |
| 6/30/2018 | $10,593 | $10,726 | $10,207 |
| 7/31/2018 | $10,593 | $10,728 | $10,224 |
| 8/31/2018 | $10,627 | $10,797 | $10,242 |
| 9/30/2018 | $10,640 | $10,728 | $10,257 |
| 10/31/2018 | $10,585 | $10,643 | $10,276 |
| 11/30/2018 | $10,605 | $10,707 | $10,297 |
| 12/31/2018 | $10,546 | $10,903 | $10,316 |
| 1/31/2019 | $10,679 | $11,019 | $10,336 |
| 2/28/2019 | $10,752 | $11,013 | $10,354 |
| 3/31/2019 | $10,790 | $11,224 | $10,377 |
| 4/30/2019 | $10,840 | $11,227 | $10,397 |
| 5/31/2019 | $10,857 | $11,426 | $10,421 |
| 6/30/2019 | $10,895 | $11,570 | $10,443 |
| 7/31/2019 | $10,915 | $11,595 | $10,463 |
| 8/31/2019 | $10,967 | $11,896 | $10,484 |
| 9/30/2019 | $10,973 | $11,833 | $10,503 |
| 10/31/2019 | $10,992 | $11,868 | $10,523 |
| 11/30/2019 | $11,046 | $11,862 | $10,536 |
| 12/31/2019 | $11,103 | $11,854 | $10,551 |
| 1/31/2020 | $11,134 | $12,082 | $10,565 |
| 2/29/2020 | $11,149 | $12,299 | $10,581 |
| 3/31/2020 | $10,486 | $12,227 | $10,611 |
| 4/30/2020 | $10,727 | $12,444 | $10,612 |
| 5/31/2020 | $11,123 | $12,502 | $10,612 |
| 6/30/2020 | $11,305 | $12,581 | $10,614 |
| 7/31/2020 | $11,420 | $12,769 | $10,616 |
| 8/31/2020 | $11,554 | $12,666 | $10,617 |
| 9/30/2020 | $11,557 | $12,659 | $10,618 |
| 10/31/2020 | $11,590 | $12,602 | $10,619 |
| 11/30/2020 | $11,756 | $12,726 | $10,620 |
| 12/31/2020 | $11,815 | $12,744 | $10,621 |
| 1/31/2021 | $11,852 | $12,652 | $10,622 |
| 2/28/2021 | $11,931 | $12,470 | $10,623 |
| 3/31/2021 | $11,942 | $12,314 | $10,624 |
| 4/30/2021 | $12,029 | $12,411 | $10,624 |
| 5/31/2021 | $12,024 | $12,452 | $10,624 |
| 6/30/2021 | $12,053 | $12,539 | $10,624 |
| 7/31/2021 | $12,046 | $12,679 | $10,624 |
| 8/31/2021 | $12,066 | $12,655 | $10,625 |
| 9/30/2021 | $12,081 | $12,546 | $10,625 |
| 10/31/2021 | $12,109 | $12,542 | $10,625 |
| 11/30/2021 | $12,116 | $12,579 | $10,626 |
| 12/31/2021 | $12,177 | $12,547 | $10,627 |
| 1/31/2022 | $12,100 | $12,277 | $10,626 |
| 2/28/2022 | $12,109 | $12,140 | $10,627 |
| 3/31/2022 | $12,077 | $11,803 | $10,631 |
| 4/30/2022 | $11,908 | $11,355 | $10,632 |
| 5/31/2022 | $11,802 | $11,428 | $10,639 |
| 6/30/2022 | $11,504 | $11,249 | $10,642 |
| 7/31/2022 | $11,717 | $11,523 | $10,647 |
| 8/31/2022 | $11,754 | $11,198 | $10,664 |
| 9/30/2022 | $11,710 | $10,714 | $10,691 |
| 10/31/2022 | $11,795 | $10,575 | $10,708 |
| 11/30/2022 | $11,908 | $10,964 | $10,742 |
| 12/31/2022 | $11,820 | $10,915 | $10,781 |
| 1/31/2023 | $12,015 | $11,251 | $10,815 |
| 2/28/2023 | $12,085 | $10,960 | $10,850 |
| 3/31/2023 | $12,089 | $11,238 | $10,897 |
| 4/30/2023 | $12,161 | $11,306 | $10,931 |
| 5/31/2023 | $12,143 | $11,183 | $10,974 |
| 6/30/2023 | $12,262 | $11,143 | $11,024 |
| 7/31/2023 | $12,243 | $11,135 | $11,068 |
| 8/31/2023 | $12,339 | $11,064 | $11,118 |
| 9/30/2023 | $12,399 | $10,783 | $11,169 |
| 10/31/2023 | $12,372 | $10,613 | $11,219 |
| 11/30/2023 | $12,506 | $11,094 | $11,269 |
| 12/31/2023 | $12,649 | $11,518 | $11,322 |
| 1/31/2024 | $12,699 | $11,487 | $11,370 |
| 2/29/2024 | $12,751 | $11,324 | $11,417 |
| 3/31/2024 | $12,744 | $11,429 | $11,468 |
| 4/30/2024 | $12,777 | $11,140 | $11,517 |
| 5/31/2024 | $12,866 | $11,329 | $11,572 |
* Past performance is not a good predictor of how the Fund will perform in the future. The chart does not reflect the deduction of taxes that a shareholder would pay on fund distributions or redemption of fund shares.
The indexes are unmanaged and, therefore, have no expenses. Investors cannot invest directly in an index.
Average Annual Total Returns (%)Footnote Reference*
| 1 Year | 5 Years | 10 Years | |
|---|---|---|---|
| Class R | 5.96% | 3.45% | 2.55% |
| Bloomberg U.S. Aggregate Bond Index | 1.31% | - 0.17% | 1.26% |
| ICE BofA U.S. 3-Month Treasury Bill Index | 5.45% | 2.12% | 1.47% |
| Footnote | Description |
Footnote* | Past performance is not a good predictor of how the Fund will perform in the future. The table does not reflect the deduction of taxes that a shareholder would pay on fund distributions or redemption of fund shares. Returns shown above include the reinvestment of all dividends and capital gains. Performance reflects fee waivers and/or expense reimbursements. If fee waivers had not been in place, performance would have been lower. |
Key Fund Statistics
| Total Net Assets | $143,238,533 |
| Number of Portfolio Holdings | 103 |
| Total Advisory Fees Paid | $768,351 |
| Portfolio Turnover Rate | 117% |
What did the Fund invest in?
The Fund invested primarily in the credit securities of companies involved in announced corporate events or companies expected to undergo a corporate event.
Sector Weighting (%)
| Value | Value |
|---|---|
| Technology | 27.83% |
| Consumer, Cyclical | 19.03% |
| Telecommunication Services | 18.41% |
| Consumer, Non-cyclical | 16.06% |
| Energy | 6.80% |
| Industrials | 5.91% |
| Financials | 2.36% |
| Utilities | 1.85% |
| Materials | 1.75% |
Region Weighting (%)
| Value | Value |
|---|---|
| Americas | 91.68% |
| EMEA | 8.32% |
Material Fund Changes
There were no material changes to the Fund since May 31, 2023.
Additional Information
For additional information about the Fund, including its prospectus, financial information, holdings, and proxy voting, scan the QR code or visit www.arbitragefunds.com/water-island-credit-opportunities.
Householding
To reduce Fund expenses, only one copy of most shareholder documents may be mailed to shareholders with multiple accounts at the same address (Householding). If you would prefer that your Fund documents not be householded, please contact us at 1-800-295-4485, or contact your financial intermediary.
The Water Island Credit Opportunities Fund is distributed by ALPS Distributors, Inc, which is not affiliated with Water Island Capital LLC or any of its affiliates.


Class R:
ARCFX
Water Island Credit Opportunities Fund
Annual Shareholder Report
May 31, 2024
Class I: AEDNX
Water Island Event-Driven Fund

Annual Shareholder Report
May 31, 2024
Fund Overview
This annual shareholder report contains important information about Water Island Event-Driven Fund for the period of June 1, 2023 to May 31, 2024. You can find additional information about the Fund at www.arbitragefunds.com/water-island-event-driven. You can also request this information by contacting us at 1-800-295-4485.
What were the Fund costs for the last year?
Annual Fund Operating Expenses
(based on a hypothetical $10,000 investment)
| Class Name | Cost of a $10,000 investment | Costs paid as a percentage of a $10,000 investment |
|---|---|---|
| Class I | $152 | 1.47% |
How did the Fund perform last year and what affected its performance?
The Fund’s performance for the fiscal year was driven by the outcomes of the idiosyncratic corporate catalysts in which the Fund invested. Returns were sourced predominantly from the Fund’s merger arbitrage sleeve, which notably included several high-profile deals that experienced favorable outcomes despite regulatory challenges. Most of the Fund’s performance was generated by investments in US-based catalysts. Information technology and health care were the top performing sectors, while consumer discretionary and materials detracted the most from returns. Top contributors included the acquisition of VMware by Broadcom, Microsoft’s acquisition of Activision Blizzard, and the acquisition of Horizon Therapeutics by Amgen. Top detractors included the merger of Capri Holdings and Tapestry, the acquisition of United States Steel by Nippon Steel, and the failed acquisition of PNM Resources by Avangrid.
Fund Performance
The chart below reflects a hypothetical $100,000 investment in the Fund, and assumes reinvestment of dividends and capital gains. Performance shown is for the previous 10 years. Performance reflects fee waivers and/or expense reimbursements and any recoupment of waived fees. If fee waivers had not been in place, performance would have been lower.
Total Return Based on $100,000 Investment*
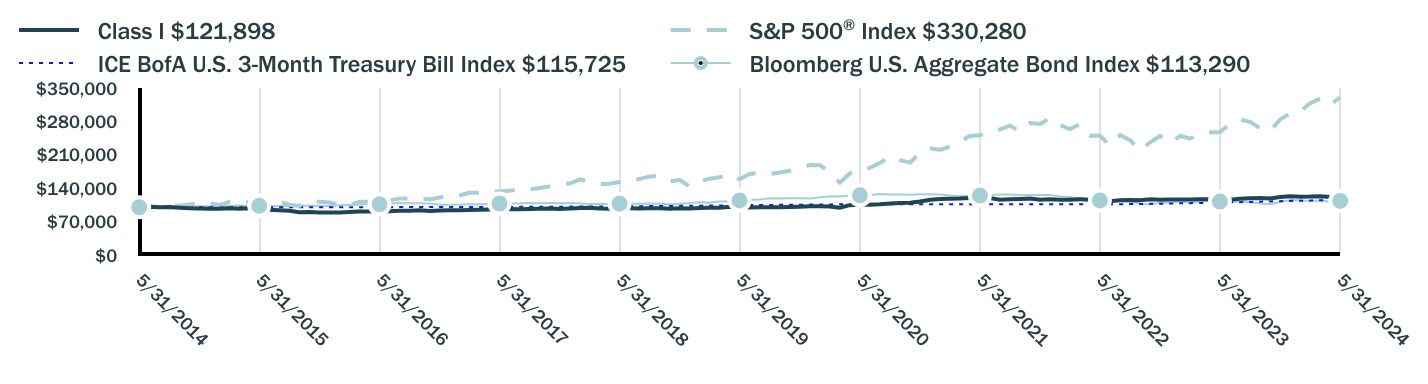
| Class I $121,898 | S&P 500® Index $330,280 | ICE BofA U.S. 3-Month Treasury Bill Index $115,725 | Bloomberg U.S. Aggregate Bond Index $113,290 | |
|---|---|---|---|---|
| 5/31/2014 | $100,000 | $100,000 | $100,000 | $100,000 |
| 6/30/2014 | $101,061 | $102,066 | $100,004 | $100,052 |
| 7/31/2014 | $100,000 | $100,658 | $100,007 | $99,801 |
| 8/31/2014 | $100,289 | $104,685 | $100,012 | $100,902 |
| 9/30/2014 | $98,843 | $103,217 | $100,015 | $100,217 |
| 10/31/2014 | $97,686 | $105,738 | $100,016 | $101,202 |
| 11/30/2014 | $97,493 | $108,582 | $100,017 | $101,921 |
| 12/31/2014 | $96,748 | $108,308 | $100,019 | $102,016 |
| 1/31/2015 | $96,847 | $105,057 | $100,022 | $104,155 |
| 2/28/2015 | $97,638 | $111,095 | $100,022 | $103,176 |
| 3/31/2015 | $97,044 | $109,338 | $100,022 | $103,655 |
| 4/30/2015 | $97,638 | $110,387 | $100,023 | $103,283 |
| 5/31/2015 | $97,044 | $111,806 | $100,025 | $103,034 |
| 6/30/2015 | $94,967 | $109,642 | $100,028 | $101,910 |
| 7/31/2015 | $93,879 | $111,939 | $100,022 | $102,619 |
| 8/31/2015 | $92,791 | $105,185 | $100,038 | $102,471 |
| 9/30/2015 | $89,328 | $102,583 | $100,039 | $103,165 |
| 10/31/2015 | $89,823 | $111,236 | $100,032 | $103,182 |
| 11/30/2015 | $89,032 | $111,567 | $100,038 | $102,909 |
| 12/31/2015 | $88,982 | $109,807 | $100,071 | $102,577 |
| 1/31/2016 | $89,083 | $104,358 | $100,074 | $103,988 |
| 2/29/2016 | $89,999 | $104,217 | $100,099 | $104,726 |
| 3/31/2016 | $90,914 | $111,287 | $100,145 | $105,687 |
| 4/30/2016 | $91,219 | $111,719 | $100,171 | $106,093 |
| 5/31/2016 | $91,931 | $113,725 | $100,180 | $106,120 |
| 6/30/2016 | $91,829 | $114,019 | $100,218 | $108,027 |
| 7/31/2016 | $92,439 | $118,223 | $100,245 | $108,710 |
| 8/31/2016 | $92,846 | $118,389 | $100,264 | $108,585 |
| 9/30/2016 | $93,456 | $118,412 | $100,313 | $108,521 |
| 10/31/2016 | $92,236 | $116,252 | $100,338 | $107,691 |
| 11/30/2016 | $93,151 | $120,557 | $100,355 | $105,144 |
| 12/31/2016 | $93,761 | $122,940 | $100,397 | $105,292 |
| 1/31/2017 | $93,863 | $125,272 | $100,442 | $105,499 |
| 2/28/2017 | $94,270 | $130,246 | $100,484 | $106,208 |
| 3/31/2017 | $94,575 | $130,398 | $100,502 | $106,152 |
| 4/30/2017 | $95,083 | $131,737 | $100,566 | $106,972 |
| 5/31/2017 | $95,897 | $133,591 | $100,621 | $107,795 |
| 6/30/2017 | $96,202 | $134,425 | $100,705 | $107,687 |
| 7/31/2017 | $95,998 | $137,189 | $100,790 | $108,150 |
| 8/31/2017 | $96,507 | $137,609 | $100,885 | $109,120 |
| 9/30/2017 | $96,710 | $140,447 | $100,972 | $108,600 |
| 10/31/2017 | $97,320 | $143,725 | $101,062 | $108,663 |
| 11/30/2017 | $96,100 | $148,133 | $101,146 | $108,524 |
| 12/31/2017 | $97,414 | $149,780 | $101,254 | $109,022 |
| 1/31/2018 | $98,335 | $158,355 | $101,379 | $107,766 |
| 2/28/2018 | $98,744 | $152,519 | $101,475 | $106,745 |
| 3/31/2018 | $97,414 | $148,643 | $101,611 | $107,429 |
| 4/30/2018 | $96,800 | $149,213 | $101,750 | $106,630 |
| 5/31/2018 | $97,618 | $152,806 | $101,906 | $107,391 |
| 6/30/2018 | $98,130 | $153,747 | $102,074 | $107,259 |
| 7/31/2018 | $97,414 | $159,468 | $102,236 | $107,284 |
| 8/31/2018 | $97,721 | $164,665 | $102,420 | $107,975 |
| 9/30/2018 | $97,925 | $165,602 | $102,571 | $107,280 |
| 10/31/2018 | $96,800 | $154,283 | $102,755 | $106,432 |
| 11/30/2018 | $97,823 | $157,427 | $102,967 | $107,067 |
| 12/31/2018 | $97,267 | $143,213 | $103,156 | $109,034 |
| 1/31/2019 | $98,621 | $154,689 | $103,359 | $110,192 |
| 2/28/2019 | $98,829 | $159,656 | $103,543 | $110,128 |
| 3/31/2019 | $99,142 | $162,758 | $103,766 | $112,243 |
| 4/30/2019 | $100,808 | $169,348 | $103,969 | $112,272 |
| 5/31/2019 | $99,350 | $158,587 | $104,207 | $114,265 |
| 6/30/2019 | $99,454 | $169,763 | $104,430 | $115,699 |
| 7/31/2019 | $100,183 | $172,203 | $104,628 | $115,954 |
| 8/31/2019 | $100,183 | $169,475 | $104,839 | $118,959 |
| 9/30/2019 | $100,079 | $172,646 | $105,025 | $118,325 |
| 10/31/2019 | $100,495 | $176,386 | $105,227 | $118,682 |
| 11/30/2019 | $101,016 | $182,788 | $105,356 | $118,621 |
| 12/31/2019 | $101,900 | $188,305 | $105,508 | $118,538 |
| 1/31/2020 | $102,214 | $188,232 | $105,650 | $120,820 |
| 2/29/2020 | $101,691 | $172,736 | $105,805 | $122,994 |
| 3/31/2020 | $99,075 | $151,401 | $106,114 | $122,270 |
| 4/30/2020 | $104,306 | $170,810 | $106,123 | $124,444 |
| 5/31/2020 | $105,143 | $178,945 | $106,124 | $125,023 |
| 6/30/2020 | $105,457 | $182,504 | $106,139 | $125,811 |
| 7/31/2020 | $106,294 | $192,795 | $106,159 | $127,690 |
| 8/31/2020 | $107,863 | $206,653 | $106,168 | $126,659 |
| 9/30/2020 | $108,700 | $198,801 | $106,179 | $126,590 |
| 10/31/2020 | $109,223 | $193,514 | $106,191 | $126,025 |
| 11/30/2020 | $111,944 | $214,697 | $106,201 | $127,261 |
| 12/31/2020 | $115,571 | $222,951 | $106,213 | $127,436 |
| 1/31/2021 | $117,039 | $220,700 | $106,222 | $126,523 |
| 2/28/2021 | $117,878 | $226,786 | $106,232 | $124,696 |
| 3/31/2021 | $118,298 | $236,718 | $106,239 | $123,139 |
| 4/30/2021 | $119,556 | $249,352 | $106,240 | $124,111 |
| 5/31/2021 | $120,395 | $251,093 | $106,243 | $124,517 |
| 6/30/2021 | $119,242 | $256,955 | $106,239 | $125,392 |
| 7/31/2021 | $115,886 | $263,059 | $106,245 | $126,794 |
| 8/31/2021 | $116,830 | $271,058 | $106,249 | $126,553 |
| 9/30/2021 | $117,459 | $258,451 | $106,255 | $125,457 |
| 10/31/2021 | $118,088 | $276,558 | $106,251 | $125,422 |
| 11/30/2021 | $115,571 | $274,642 | $106,256 | $125,793 |
| 12/31/2021 | $116,934 | $286,950 | $106,265 | $125,472 |
| 1/31/2022 | $115,676 | $272,102 | $106,259 | $122,768 |
| 2/28/2022 | $115,886 | $263,954 | $106,274 | $121,399 |
| 3/31/2022 | $116,830 | $273,755 | $106,306 | $118,026 |
| 4/30/2022 | $115,886 | $249,883 | $106,322 | $113,547 |
| 5/31/2022 | $114,942 | $250,341 | $106,394 | $114,279 |
| 6/30/2022 | $112,739 | $229,677 | $106,417 | $112,486 |
| 7/31/2022 | $114,732 | $250,855 | $106,472 | $115,235 |
| 8/31/2022 | $115,256 | $240,624 | $106,644 | $111,979 |
| 9/30/2022 | $114,627 | $218,463 | $106,909 | $107,141 |
| 10/31/2022 | $116,725 | $236,150 | $107,077 | $105,753 |
| 11/30/2022 | $115,781 | $249,347 | $107,422 | $109,642 |
| 12/31/2022 | $116,200 | $234,981 | $107,811 | $109,147 |
| 1/31/2023 | $116,410 | $249,746 | $108,149 | $112,505 |
| 2/28/2023 | $116,410 | $243,652 | $108,501 | $109,597 |
| 3/31/2023 | $116,725 | $252,598 | $108,968 | $112,380 |
| 4/30/2023 | $116,830 | $256,541 | $109,312 | $113,062 |
| 5/31/2023 | $113,893 | $257,656 | $109,740 | $111,830 |
| 6/30/2023 | $115,781 | $274,680 | $110,242 | $111,431 |
| 7/31/2023 | $117,669 | $283,504 | $110,681 | $111,354 |
| 8/31/2023 | $118,927 | $278,991 | $111,180 | $110,643 |
| 9/30/2023 | $119,242 | $265,689 | $111,690 | $107,831 |
| 10/31/2023 | $118,403 | $260,102 | $112,189 | $106,129 |
| 11/30/2023 | $121,549 | $283,856 | $112,693 | $110,935 |
| 12/31/2023 | $123,059 | $296,752 | $113,218 | $115,182 |
| 1/31/2024 | $122,214 | $301,739 | $113,702 | $114,866 |
| 2/29/2024 | $122,320 | $317,850 | $114,167 | $113,243 |
| 3/31/2024 | $123,165 | $328,077 | $114,681 | $114,289 |
| 4/30/2024 | $121,475 | $314,677 | $115,172 | $111,402 |
| 5/31/2024 | $121,898 | $330,280 | $115,725 | $113,290 |
* Past performance is not a good predictor of how the Fund will perform in the future. The chart does not reflect the deduction of taxes that a shareholder would pay on fund distributions or redemption of fund shares.
The indexes are unmanaged and, therefore, have no expenses. Investors cannot invest directly in an index.
Average Annual Total Returns (%)Footnote Reference*
| 1 Year | 5 Years | 10 Years | |
|---|---|---|---|
| Class I | 7.03% | 4.18% | 2.00% |
S&P 500® Index | 28.19% | 15.80% | 12.69% |
| ICE BofA U.S. 3-Month Treasury Bill Index | 5.45% | 2.12% | 1.47% |
| Bloomberg U.S. Aggregate Bond Index | 1.31% | -0.17% | 1.26% |
| Footnote | Description |
Footnote* | Past performance is not a good predictor of how the Fund will perform in the future. The table does not reflect the deduction of taxes that a shareholder would pay on fund distributions or redemption of fund shares. Returns shown above include the reinvestment of all dividends and capital gains. Performance reflects fee waivers and/or expense reimbursements and any recoupment of waived fees. If fee waivers had not been in place, performance would have been lower. |
Key Fund Statistics
| Total Net Assets | $80,324,009 |
| Number of Portfolio Holdings | 125 |
| Total Advisory Fees Paid | $1,181,245 |
| Portfolio Turnover Rate | 305% |
What did the Fund invest in?
The Fund invested primarily in the equity and credit securities of companies involved in announced corporate events or companies expected to undergo a corporate event.
Sector Weighting (%)
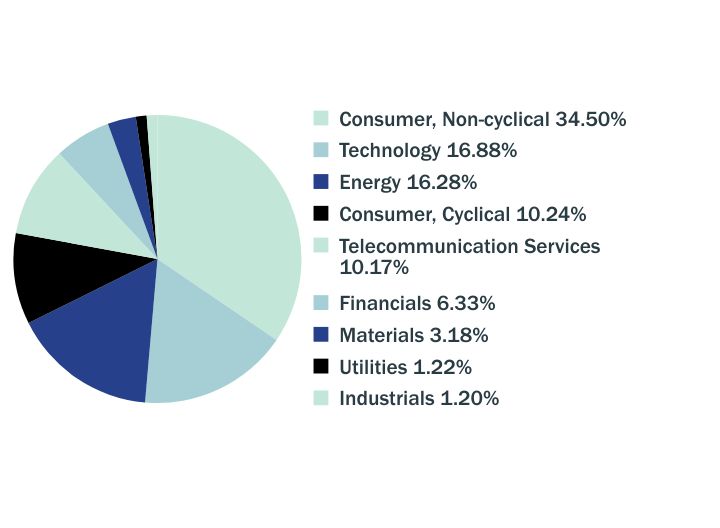
| Value | Value |
|---|---|
| Consumer, Non-cyclical | 34.50% |
| Technology | 16.88% |
| Energy | 16.28% |
| Consumer, Cyclical | 10.24% |
| Telecommunication Services | 10.17% |
| Financials | 6.33% |
| Materials | 3.18% |
| Utilities | 1.22% |
| Industrials | 1.20% |
Region Weighting (%)

| Value | Value |
|---|---|
| Americas | 90.26% |
| EMEA | 9.74% |
Material Fund Changes
There were no material changes to the Fund since May 31, 2023.
Additional Information
For additional information about the Fund, including its prospectus, financial information, holdings, and proxy voting, scan the QR code or visit www.arbitragefunds.com/water-island-event-driven.
Householding
To reduce Fund expenses, only one copy of most shareholder documents may be mailed to shareholders with multiple accounts at the same address (Householding). If you would prefer that your Fund documents not be householded, please contact us at 1-800-295-4485, or contact your financial intermediary.
The Water Island Event-Driven Fund is distributed by ALPS Distributors, Inc, which is not affiliated with Water Island Capital LLC or any of its affiliates.


Class I:
AEDNX
Water Island Event-Driven Fund
Annual Shareholder Report
May 31, 2024
Class A: AGCAX
Water Island Credit Opportunities Fund

Annual Shareholder Report
May 31, 2024
Fund Overview
This annual shareholder report contains important information about Water Island Credit Opportunities Fund for the period of June 1, 2023 to May 31, 2024. You can find additional information about the Fund at www.arbitragefunds.com/water-island-credit-opportunities. You can also request this information by contacting us at 1-800-295-4485.
What were the Fund costs for the last year?
Annual Fund Operating Expenses
(based on a hypothetical $10,000 investment)
| Class Name | Cost of a $10,000 investment | Costs paid as a percentage of a $10,000 investment |
|---|---|---|
| Class A | $134 | 1.30% |
How did the Fund perform last year and what affected its performance?
The Fund’s performance for the fiscal year was driven by the outcomes of the idiosyncratic corporate catalysts in which the Fund invested. Performance was sourced largely from credit special situations investments, though merger-related credit also contributed to returns. Most of the Fund’s performance was generated by investments in US-based catalysts. Information technology and health care were the top performing sectors, while utilities and real estate detracted the most from returns. Top contributors included the Fund’s investments in UpHealth bonds, Getty Images bonds, and Kaleyra bonds. Top detractors included the Fund’s investments in Lightning eMotors bonds, broad credit market hedges, and Altice France bonds.
Fund Performance
The chart below reflects a hypothetical $10,000 investment in the Fund, and assumes reinvestment of dividends and capital gains. Performance shown is for the previous 10 years. Performance reflects fee waivers and/or expense reimbursements. If fee waivers had not been in place, performance would have been lower.
Total Return Based on $10,000 Investment*
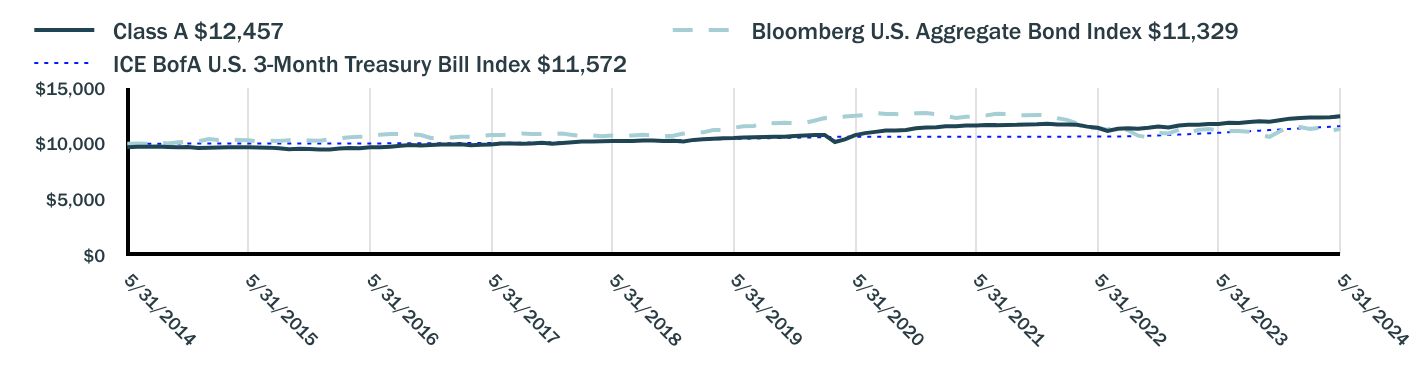
| Class A $12,457 | Bloomberg U.S. Aggregate Bond Index $11,329 | ICE BofA U.S. 3-Month Treasury Bill Index $11,572 | |
|---|---|---|---|
| 5/31/2014 | $9,679 | $10,000 | $10,000 |
| 6/30/2014 | $9,713 | $10,005 | $10,000 |
| 7/31/2014 | $9,723 | $9,980 | $10,001 |
| 8/31/2014 | $9,732 | $10,090 | $10,001 |
| 9/30/2014 | $9,707 | $10,022 | $10,001 |
| 10/31/2014 | $9,669 | $10,120 | $10,002 |
| 11/30/2014 | $9,698 | $10,192 | $10,002 |
| 12/31/2014 | $9,605 | $10,202 | $10,002 |
| 1/31/2015 | $9,634 | $10,415 | $10,002 |
| 2/28/2015 | $9,653 | $10,318 | $10,002 |
| 3/31/2015 | $9,668 | $10,365 | $10,002 |
| 4/30/2015 | $9,668 | $10,328 | $10,002 |
| 5/31/2015 | $9,678 | $10,303 | $10,002 |
| 6/30/2015 | $9,662 | $10,191 | $10,003 |
| 7/31/2015 | $9,642 | $10,262 | $10,002 |
| 8/31/2015 | $9,583 | $10,247 | $10,004 |
| 9/30/2015 | $9,506 | $10,316 | $10,004 |
| 10/31/2015 | $9,546 | $10,318 | $10,003 |
| 11/30/2015 | $9,516 | $10,291 | $10,004 |
| 12/31/2015 | $9,484 | $10,258 | $10,007 |
| 1/31/2016 | $9,464 | $10,399 | $10,007 |
| 2/29/2016 | $9,563 | $10,473 | $10,010 |
| 3/31/2016 | $9,600 | $10,569 | $10,015 |
| 4/30/2016 | $9,590 | $10,609 | $10,017 |
| 5/31/2016 | $9,680 | $10,612 | $10,018 |
| 6/30/2016 | $9,680 | $10,803 | $10,022 |
| 7/31/2016 | $9,730 | $10,871 | $10,025 |
| 8/31/2016 | $9,800 | $10,859 | $10,026 |
| 9/30/2016 | $9,867 | $10,852 | $10,031 |
| 10/31/2016 | $9,826 | $10,769 | $10,034 |
| 11/30/2016 | $9,887 | $10,514 | $10,036 |
| 12/31/2016 | $9,926 | $10,529 | $10,040 |
| 1/31/2017 | $9,926 | $10,550 | $10,044 |
| 2/28/2017 | $9,936 | $10,621 | $10,048 |
| 3/31/2017 | $9,853 | $10,615 | $10,050 |
| 4/30/2017 | $9,907 | $10,697 | $10,057 |
| 5/31/2017 | $9,930 | $10,779 | $10,062 |
| 6/30/2017 | $10,007 | $10,769 | $10,070 |
| 7/31/2017 | $10,005 | $10,815 | $10,079 |
| 8/31/2017 | $9,996 | $10,912 | $10,088 |
| 9/30/2017 | $10,018 | $10,860 | $10,097 |
| 10/31/2017 | $10,075 | $10,866 | $10,106 |
| 11/30/2017 | $9,982 | $10,852 | $10,115 |
| 12/31/2017 | $10,052 | $10,902 | $10,125 |
| 1/31/2018 | $10,127 | $10,777 | $10,138 |
| 2/28/2018 | $10,185 | $10,674 | $10,147 |
| 3/31/2018 | $10,196 | $10,743 | $10,161 |
| 4/30/2018 | $10,215 | $10,663 | $10,175 |
| 5/31/2018 | $10,238 | $10,739 | $10,191 |
| 6/30/2018 | $10,244 | $10,726 | $10,207 |
| 7/31/2018 | $10,244 | $10,728 | $10,224 |
| 8/31/2018 | $10,277 | $10,797 | $10,242 |
| 9/30/2018 | $10,289 | $10,728 | $10,257 |
| 10/31/2018 | $10,236 | $10,643 | $10,276 |
| 11/30/2018 | $10,266 | $10,707 | $10,297 |
| 12/31/2018 | $10,197 | $10,903 | $10,316 |
| 1/31/2019 | $10,338 | $11,019 | $10,336 |
| 2/28/2019 | $10,398 | $11,013 | $10,354 |
| 3/31/2019 | $10,435 | $11,224 | $10,377 |
| 4/30/2019 | $10,483 | $11,227 | $10,397 |
| 5/31/2019 | $10,499 | $11,426 | $10,421 |
| 6/30/2019 | $10,547 | $11,570 | $10,443 |
| 7/31/2019 | $10,567 | $11,595 | $10,463 |
| 8/31/2019 | $10,605 | $11,896 | $10,484 |
| 9/30/2019 | $10,622 | $11,833 | $10,503 |
| 10/31/2019 | $10,630 | $11,868 | $10,523 |
| 11/30/2019 | $10,681 | $11,862 | $10,536 |
| 12/31/2019 | $10,737 | $11,854 | $10,551 |
| 1/31/2020 | $10,767 | $12,082 | $10,565 |
| 2/29/2020 | $10,782 | $12,299 | $10,581 |
| 3/31/2020 | $10,148 | $12,227 | $10,611 |
| 4/30/2020 | $10,382 | $12,444 | $10,612 |
| 5/31/2020 | $10,768 | $12,502 | $10,612 |
| 6/30/2020 | $10,945 | $12,581 | $10,614 |
| 7/31/2020 | $11,057 | $12,769 | $10,616 |
| 8/31/2020 | $11,187 | $12,666 | $10,617 |
| 9/30/2020 | $11,178 | $12,659 | $10,618 |
| 10/31/2020 | $11,222 | $12,602 | $10,619 |
| 11/30/2020 | $11,383 | $12,726 | $10,620 |
| 12/31/2020 | $11,440 | $12,744 | $10,621 |
| 1/31/2021 | $11,476 | $12,652 | $10,622 |
| 2/28/2021 | $11,553 | $12,470 | $10,623 |
| 3/31/2021 | $11,563 | $12,314 | $10,624 |
| 4/30/2021 | $11,636 | $12,411 | $10,624 |
| 5/31/2021 | $11,631 | $12,452 | $10,624 |
| 6/30/2021 | $11,671 | $12,539 | $10,624 |
| 7/31/2021 | $11,664 | $12,679 | $10,624 |
| 8/31/2021 | $11,683 | $12,655 | $10,625 |
| 9/30/2021 | $11,687 | $12,546 | $10,625 |
| 10/31/2021 | $11,725 | $12,542 | $10,625 |
| 11/30/2021 | $11,732 | $12,579 | $10,626 |
| 12/31/2021 | $11,791 | $12,547 | $10,627 |
| 1/31/2022 | $11,716 | $12,277 | $10,626 |
| 2/28/2022 | $11,725 | $12,140 | $10,627 |
| 3/31/2022 | $11,693 | $11,803 | $10,631 |
| 4/30/2022 | $11,529 | $11,355 | $10,632 |
| 5/31/2022 | $11,427 | $11,428 | $10,639 |
| 6/30/2022 | $11,136 | $11,249 | $10,642 |
| 7/31/2022 | $11,344 | $11,523 | $10,647 |
| 8/31/2022 | $11,380 | $11,198 | $10,664 |
| 9/30/2022 | $11,336 | $10,714 | $10,691 |
| 10/31/2022 | $11,419 | $10,575 | $10,708 |
| 11/30/2022 | $11,529 | $10,964 | $10,742 |
| 12/31/2022 | $11,443 | $10,915 | $10,781 |
| 1/31/2023 | $11,632 | $11,251 | $10,815 |
| 2/28/2023 | $11,700 | $10,960 | $10,850 |
| 3/31/2023 | $11,704 | $11,238 | $10,897 |
| 4/30/2023 | $11,774 | $11,306 | $10,931 |
| 5/31/2023 | $11,756 | $11,183 | $10,974 |
| 6/30/2023 | $11,871 | $11,143 | $11,024 |
| 7/31/2023 | $11,853 | $11,135 | $11,068 |
| 8/31/2023 | $11,947 | $11,064 | $11,118 |
| 9/30/2023 | $12,004 | $10,783 | $11,169 |
| 10/31/2023 | $11,978 | $10,613 | $11,219 |
| 11/30/2023 | $12,108 | $11,094 | $11,269 |
| 12/31/2023 | $12,247 | $11,518 | $11,322 |
| 1/31/2024 | $12,296 | $11,487 | $11,370 |
| 2/29/2024 | $12,346 | $11,324 | $11,417 |
| 3/31/2024 | $12,339 | $11,429 | $11,468 |
| 4/30/2024 | $12,371 | $11,140 | $11,517 |
| 5/31/2024 | $12,457 | $11,329 | $11,572 |
* Past performance is not a good predictor of how the Fund will perform in the future. The chart does not reflect the deduction of taxes that a shareholder would pay on fund distributions or redemption of fund shares.
The indexes are unmanaged and, therefore, have no expenses. Investors cannot invest directly in an index.
Average Annual Total Returns (%)Footnote Reference*
| 1 Year | 5 Years | 10 Years | |
|---|---|---|---|
| Class A | 5.96% | 3.48% | 2.56% |
| Class A (After Sales Charges) | 2.54% | 2.81% | 2.22% |
| Bloomberg U.S. Aggregate Bond Index | 1.31% | - 0.17% | 1.26% |
| ICE BofA U.S. 3-Month Treasury Bill Index | 5.45% | 2.12% | 1.47% |
| Footnote | Description |
Footnote* | Past performance is not a good predictor of how the Fund will perform in the future. The table does not reflect the deduction of taxes that a shareholder would pay on fund distributions or redemption of fund shares. Returns shown above include the reinvestment of all dividends and capital gains. Performance reflects fee waivers and/or expense reimbursements. If fee waivers had not been in place, performance would have been lower. |
Key Fund Statistics
| Total Net Assets | $143,238,533 |
| Number of Portfolio Holdings | 103 |
| Total Advisory Fees Paid | $768,351 |
| Portfolio Turnover Rate | 117% |
What did the Fund invest in?
The Fund invested primarily in the credit securities of companies involved in announced corporate events or companies expected to undergo a corporate event.
Sector Weighting (%)

| Value | Value |
|---|---|
| Technology | 27.83% |
| Consumer, Cyclical | 19.03% |
| Telecommunication Services | 18.41% |
| Consumer, Non-cyclical | 16.06% |
| Energy | 6.80% |
| Industrials | 5.91% |
| Financials | 2.36% |
| Utilities | 1.85% |
| Materials | 1.75% |
Region Weighting (%)

| Value | Value |
|---|---|
| Americas | 91.68% |
| EMEA | 8.32% |
Material Fund Changes
There were no material changes to the Fund since May 31, 2023.
Additional Information
For additional information about the Fund, including its prospectus, financial information, holdings, and proxy voting, scan the QR code or visit www.arbitragefunds.com/water-island-credit-opportunities.
Householding
To reduce Fund expenses, only one copy of most shareholder documents may be mailed to shareholders with multiple accounts at the same address (Householding). If you would prefer that your Fund documents not be householded, please contact us at 1-800-295-4485, or contact your financial intermediary.
The Water Island Credit Opportunities Fund is distributed by ALPS Distributors, Inc, which is not affiliated with Water Island Capital LLC or any of its affiliates.


Class A:
AGCAX
Water Island Credit Opportunities Fund
Annual Shareholder Report
May 31, 2024
Class I: ARBNX
Arbitrage Fund

Annual Shareholder Report
May 31, 2024
Fund Overview
This annual shareholder report contains important information about Arbitrage Fund for the period of June 1, 2023 to May 31, 2024. You can find additional information about the Fund at www.arbitragefunds.com/arbitrage. You can also request this information by contacting us at 1-800-295-4485.
What were the Fund costs for the last year?
Annual Fund Operating Expenses
(based on a hypothetical $10,000 investment)
| Class Name | Cost of a $10,000 investment | Costs paid as a percentage of a $10,000 investment |
|---|---|---|
| Class I | $136 | 1.31% |
How did the Fund perform last year and what affected its performance?
The Fund’s performance for the fiscal year was driven by the outcomes of the idiosyncratic mergers and acquisitions transactions in which the Fund invested, notably including several high-profile deals that experienced favorable outcomes despite regulatory challenges. Returns were sourced predominantly from US-target transactions. Information technology and health care were the top performing sectors, while consumer discretionary and materials detracted the most from returns. Top contributors included the acquisition of VMware by Broadcom, Microsoft’s acquisition of Activision Blizzard, and the acquisition of Horizon Therapeutics by Amgen. Top detractors included the merger of Capri Holdings and Tapestry, the acquisition of United States Steel by Nippon Steel, and the failed acquisition of PNM Resources by Avangrid.
Fund Performance
The chart below reflects a hypothetical $100,000 investment in the Fund, and assumes reinvestment of dividends and capital gains. Performance shown is for the previous 10 years.
Total Return Based on $100,000 Investment*
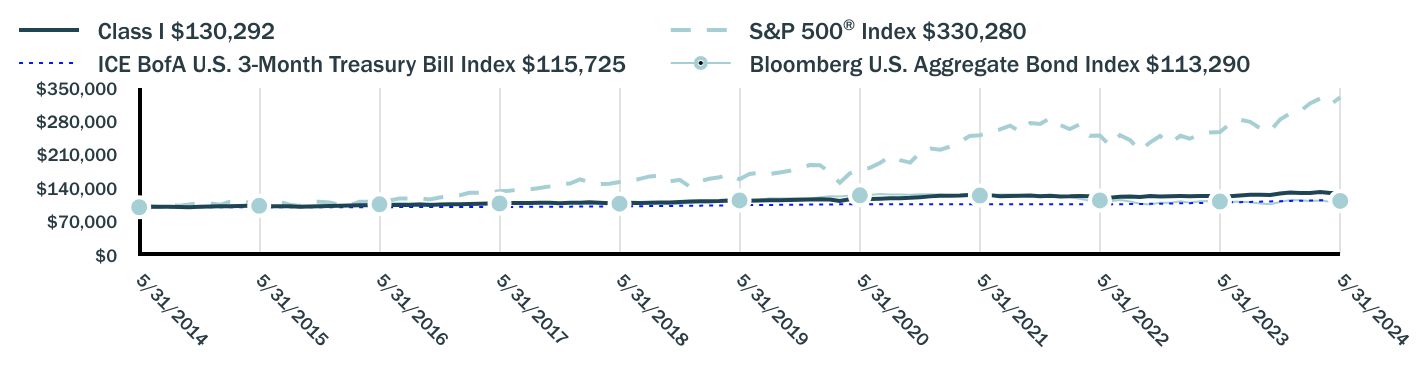
| Class I $130,292 | S&P 500® Index $330,280 | ICE BofA U.S. 3-Month Treasury Bill Index $115,725 | Bloomberg U.S. Aggregate Bond Index $113,290 | |
|---|---|---|---|---|
| 5/31/2014 | $100,000 | $100,000 | $100,000 | $100,000 |
| 6/30/2014 | $100,855 | $102,066 | $100,004 | $100,052 |
| 7/31/2014 | $100,933 | $100,658 | $100,007 | $99,801 |
| 8/31/2014 | $101,089 | $104,685 | $100,012 | $100,902 |
| 9/30/2014 | $100,622 | $103,217 | $100,015 | $100,217 |
| 10/31/2014 | $100,000 | $105,738 | $100,016 | $101,202 |
| 11/30/2014 | $100,778 | $108,582 | $100,017 | $101,921 |
| 12/31/2014 | $101,639 | $108,308 | $100,019 | $102,016 |
| 1/31/2015 | $101,950 | $105,057 | $100,022 | $104,155 |
| 2/28/2015 | $102,262 | $111,095 | $100,022 | $103,176 |
| 3/31/2015 | $102,808 | $109,338 | $100,022 | $103,655 |
| 4/30/2015 | $103,275 | $110,387 | $100,023 | $103,283 |
| 5/31/2015 | $103,509 | $111,806 | $100,025 | $103,034 |
| 6/30/2015 | $102,184 | $109,642 | $100,028 | $101,910 |
| 7/31/2015 | $102,106 | $111,939 | $100,022 | $102,619 |
| 8/31/2015 | $101,950 | $105,185 | $100,038 | $102,471 |
| 9/30/2015 | $100,781 | $102,583 | $100,039 | $103,165 |
| 10/31/2015 | $101,717 | $111,236 | $100,032 | $103,182 |
| 11/30/2015 | $101,950 | $111,567 | $100,038 | $102,909 |
| 12/31/2015 | $102,554 | $109,807 | $100,071 | $102,577 |
| 1/31/2016 | $103,192 | $104,358 | $100,074 | $103,988 |
| 2/29/2016 | $103,670 | $104,217 | $100,099 | $104,726 |
| 3/31/2016 | $104,228 | $111,287 | $100,145 | $105,687 |
| 4/30/2016 | $104,069 | $111,719 | $100,171 | $106,093 |
| 5/31/2016 | $104,707 | $113,725 | $100,180 | $106,120 |
| 6/30/2016 | $104,707 | $114,019 | $100,218 | $108,027 |
| 7/31/2016 | $104,787 | $118,223 | $100,245 | $108,710 |
| 8/31/2016 | $104,946 | $118,389 | $100,264 | $108,585 |
| 9/30/2016 | $105,504 | $118,412 | $100,313 | $108,521 |
| 10/31/2016 | $104,707 | $116,252 | $100,338 | $107,691 |
| 11/30/2016 | $105,664 | $120,557 | $100,355 | $105,144 |
| 12/31/2016 | $106,246 | $122,940 | $100,397 | $105,292 |
| 1/31/2017 | $106,407 | $125,272 | $100,442 | $105,499 |
| 2/28/2017 | $106,890 | $130,246 | $100,484 | $106,208 |
| 3/31/2017 | $107,373 | $130,398 | $100,502 | $106,152 |
| 4/30/2017 | $107,856 | $131,737 | $100,566 | $106,972 |
| 5/31/2017 | $108,339 | $133,591 | $100,621 | $107,795 |
| 6/30/2017 | $108,741 | $134,425 | $100,705 | $107,687 |
| 7/31/2017 | $108,741 | $137,189 | $100,790 | $108,150 |
| 8/31/2017 | $109,063 | $137,609 | $100,885 | $109,120 |
| 9/30/2017 | $109,144 | $140,447 | $100,972 | $108,600 |
| 10/31/2017 | $109,627 | $143,725 | $101,062 | $108,663 |
| 11/30/2017 | $108,500 | $148,133 | $101,146 | $108,524 |
| 12/31/2017 | $109,295 | $149,780 | $101,254 | $109,022 |
| 1/31/2018 | $109,629 | $158,355 | $101,379 | $107,766 |
| 2/28/2018 | $110,549 | $152,519 | $101,475 | $106,745 |
| 3/31/2018 | $109,295 | $148,643 | $101,611 | $107,429 |
| 4/30/2018 | $108,209 | $149,213 | $101,750 | $106,630 |
| 5/31/2018 | $108,877 | $152,806 | $101,906 | $107,391 |
| 6/30/2018 | $109,295 | $153,747 | $102,074 | $107,259 |
| 7/31/2018 | $108,961 | $159,468 | $102,236 | $107,284 |
| 8/31/2018 | $109,212 | $164,665 | $102,420 | $107,975 |
| 9/30/2018 | $109,880 | $165,602 | $102,571 | $107,280 |
| 10/31/2018 | $110,047 | $154,283 | $102,755 | $106,432 |
| 11/30/2018 | $111,134 | $157,427 | $102,967 | $107,067 |
| 12/31/2018 | $111,839 | $143,213 | $103,156 | $109,034 |
| 1/31/2019 | $112,350 | $154,689 | $103,359 | $110,192 |
| 2/28/2019 | $112,521 | $159,656 | $103,543 | $110,128 |
| 3/31/2019 | $112,861 | $162,758 | $103,766 | $112,243 |
| 4/30/2019 | $113,969 | $169,348 | $103,969 | $112,272 |
| 5/31/2019 | $113,372 | $158,587 | $104,207 | $114,265 |
| 6/30/2019 | $113,372 | $169,763 | $104,430 | $115,699 |
| 7/31/2019 | $114,224 | $172,203 | $104,628 | $115,954 |
| 8/31/2019 | $114,480 | $169,475 | $104,839 | $118,959 |
| 9/30/2019 | $114,565 | $172,646 | $105,025 | $118,325 |
| 10/31/2019 | $115,076 | $176,386 | $105,227 | $118,682 |
| 11/30/2019 | $115,587 | $182,788 | $105,356 | $118,621 |
| 12/31/2019 | $116,126 | $188,305 | $105,508 | $118,538 |
| 1/31/2020 | $116,561 | $188,232 | $105,650 | $120,820 |
| 2/29/2020 | $116,126 | $172,736 | $105,805 | $122,994 |
| 3/31/2020 | $112,908 | $151,401 | $106,114 | $122,270 |
| 4/30/2020 | $116,822 | $170,810 | $106,123 | $124,444 |
| 5/31/2020 | $117,170 | $178,945 | $106,124 | $125,023 |
| 6/30/2020 | $117,083 | $182,504 | $106,139 | $125,811 |
| 7/31/2020 | $118,040 | $192,795 | $106,159 | $127,690 |
| 8/31/2020 | $118,649 | $206,653 | $106,168 | $126,659 |
| 9/30/2020 | $118,997 | $198,801 | $106,179 | $126,590 |
| 10/31/2020 | $119,692 | $193,514 | $106,191 | $126,025 |
| 11/30/2020 | $121,084 | $214,697 | $106,201 | $127,261 |
| 12/31/2020 | $122,766 | $222,951 | $106,213 | $127,436 |
| 1/31/2021 | $123,880 | $220,700 | $106,222 | $126,523 |
| 2/28/2021 | $123,973 | $226,786 | $106,232 | $124,696 |
| 3/31/2021 | $124,623 | $236,718 | $106,239 | $123,139 |
| 4/30/2021 | $125,831 | $249,352 | $106,240 | $124,111 |
| 5/31/2021 | $126,388 | $251,093 | $106,243 | $124,517 |
| 6/30/2021 | $125,366 | $256,955 | $106,239 | $125,392 |
| 7/31/2021 | $122,859 | $263,059 | $106,245 | $126,794 |
| 8/31/2021 | $123,602 | $271,058 | $106,249 | $126,553 |
| 9/30/2021 | $124,252 | $258,451 | $106,255 | $125,457 |
| 10/31/2021 | $124,623 | $276,558 | $106,251 | $125,422 |
| 11/30/2021 | $122,952 | $274,642 | $106,256 | $125,793 |
| 12/31/2021 | $124,054 | $286,950 | $106,265 | $125,472 |
| 1/31/2022 | $122,653 | $272,102 | $106,259 | $122,768 |
| 2/28/2022 | $122,840 | $263,954 | $106,274 | $121,399 |
| 3/31/2022 | $123,680 | $273,755 | $106,306 | $118,026 |
| 4/30/2022 | $122,933 | $249,883 | $106,322 | $113,547 |
| 5/31/2022 | $121,813 | $250,341 | $106,394 | $114,279 |
| 6/30/2022 | $120,133 | $229,677 | $106,417 | $112,486 |
| 7/31/2022 | $122,000 | $250,855 | $106,472 | $115,235 |
| 8/31/2022 | $122,560 | $240,624 | $106,644 | $111,979 |
| 9/30/2022 | $121,627 | $218,463 | $106,909 | $107,141 |
| 10/31/2022 | $123,680 | $236,150 | $107,077 | $105,753 |
| 11/30/2022 | $122,467 | $249,347 | $107,422 | $109,642 |
| 12/31/2022 | $123,232 | $234,981 | $107,811 | $109,147 |
| 1/31/2023 | $123,426 | $249,746 | $108,149 | $112,505 |
| 2/28/2023 | $123,232 | $243,652 | $108,501 | $109,597 |
| 3/31/2023 | $123,523 | $252,598 | $108,968 | $112,380 |
| 4/30/2023 | $123,620 | $256,541 | $109,312 | $113,062 |
| 5/31/2023 | $120,905 | $257,656 | $109,740 | $111,830 |
| 6/30/2023 | $122,844 | $274,680 | $110,242 | $111,431 |
| 7/31/2023 | $124,686 | $283,504 | $110,681 | $111,354 |
| 8/31/2023 | $126,044 | $278,991 | $111,180 | $110,643 |
| 9/30/2023 | $126,432 | $265,689 | $111,690 | $107,831 |
| 10/31/2023 | $125,850 | $260,102 | $112,189 | $106,129 |
| 11/30/2023 | $128,953 | $283,856 | $112,693 | $110,935 |
| 12/31/2023 | $130,688 | $296,752 | $113,218 | $115,182 |
| 1/31/2024 | $130,094 | $301,739 | $113,702 | $114,866 |
| 2/29/2024 | $130,094 | $317,850 | $114,167 | $113,243 |
| 3/31/2024 | $132,074 | $328,077 | $114,681 | $114,289 |
| 4/30/2024 | $129,698 | $314,677 | $115,172 | $111,402 |
| 5/31/2024 | $130,292 | $330,280 | $115,725 | $113,290 |
* Past performance is not a good predictor of how the Fund will perform in the future. The chart does not reflect the deduction of taxes that a shareholder would pay on fund distributions or redemption of fund shares.
The indexes are unmanaged and, therefore, have no expenses. Investors cannot invest directly in an index.
Average Annual Total Returns (%)Footnote Reference*
| 1 Year | 5 Years | 10 Years | |
|---|---|---|---|
| Class I | 7.76% | 2.82% | 2.68% |
S&P 500® Index | 28.19% | 15.80% | 12.69% |
| ICE BofA U.S. 3-Month Treasury Bill Index | 5.45% | 2.12% | 1.47% |
| Bloomberg U.S. Aggregate Bond Index | 1.31% | -0.17% | 1.26% |
| Footnote | Description |
Footnote* | Past performance is not a good predictor of how the Fund will perform in the future. The table does not reflect the deduction of taxes that a shareholder would pay on fund distributions or redemption of fund shares. Returns shown above include the reinvestment of all dividends and capital gains. |
Key Fund Statistics
| Total Net Assets | $938,998,873 |
| Number of Portfolio Holdings | 99 |
| Total Advisory Fees Paid | $10,257,507 |
| Portfolio Turnover Rate | 230% |
What did the Fund invest in?
The Fund invested primarily in the equity securities of companies involved in publicly announced mergers and acquisitions.
Sector Weighting (%)

| Value | Value |
|---|---|
| Consumer, Non-cyclical | 30.10% |
| Technology | 18.83% |
| Energy | 12.91% |
| Telecommunication Services | 11.14% |
| Funds | 6.12% |
| Financials | 4.80% |
| Materials | 4.56% |
| Consumer, Cyclical | 4.18% |
| Industrials | 4.17% |
| Utilities | 3.19% |
Region Weighting (%)

| Value | Value |
|---|---|
| Americas | 90.71% |
| EMEA | 9.29% |
Material Fund Changes
There were no material changes to the Fund since May 31, 2023.
Additional Information
For additional information about the Fund, including its prospectus, financial information, holdings, and proxy voting, scan the QR code or visit www.arbitragefunds.com/arbitrage.
Householding
To reduce Fund expenses, only one copy of most shareholder documents may be mailed to shareholders with multiple accounts at the same address (Householding). If you would prefer that your Fund documents not be householded, please contact us at 1-800-295-4485, or contact your financial intermediary.
The Arbitrage Fund is distributed by ALPS Distributors, Inc, which is not affiliated with Water Island Capital LLC or any of its affiliates.


Class I:
ARBNX
Arbitrage Fund
Annual Shareholder Report
May 31, 2024
Class A: ARGAX
Arbitrage Fund

Annual Shareholder Report
May 31, 2024
Fund Overview
This annual shareholder report contains important information about Arbitrage Fund for the period of June 1, 2023 to May 31, 2024. You can find additional information about the Fund at www.arbitragefunds.com/arbitrage. You can also request this information by contacting us at 1-800-295-4485.
What were the Fund costs for the last year?
Annual Fund Operating Expenses
(based on a hypothetical $10,000 investment)
| Class Name | Cost of a $10,000 investment | Costs paid as a percentage of a $10,000 investment |
|---|---|---|
| Class A | $162 | 1.56% |
How did the Fund perform last year and what affected its performance?
The Fund’s performance for the fiscal year was driven by the outcomes of the idiosyncratic mergers and acquisitions transactions in which the Fund invested, notably including several high-profile deals that experienced favorable outcomes despite regulatory challenges. Returns were sourced predominantly from US-target transactions. Information technology and health care were the top performing sectors, while consumer discretionary and materials detracted the most from returns. Top contributors included the acquisition of VMware by Broadcom, Microsoft’s acquisition of Activision Blizzard, and the acquisition of Horizon Therapeutics by Amgen. Top detractors included the merger of Capri Holdings and Tapestry, the acquisition of United States Steel by Nippon Steel, and the failed acquisition of PNM Resources by Avangrid.
Fund Performance
The chart below reflects a hypothetical $10,000 investment in the Fund, and assumes reinvestment of dividends and capital gains. Performance shown is for the previous 10 years.
Total Return Based on $10,000 Investment*
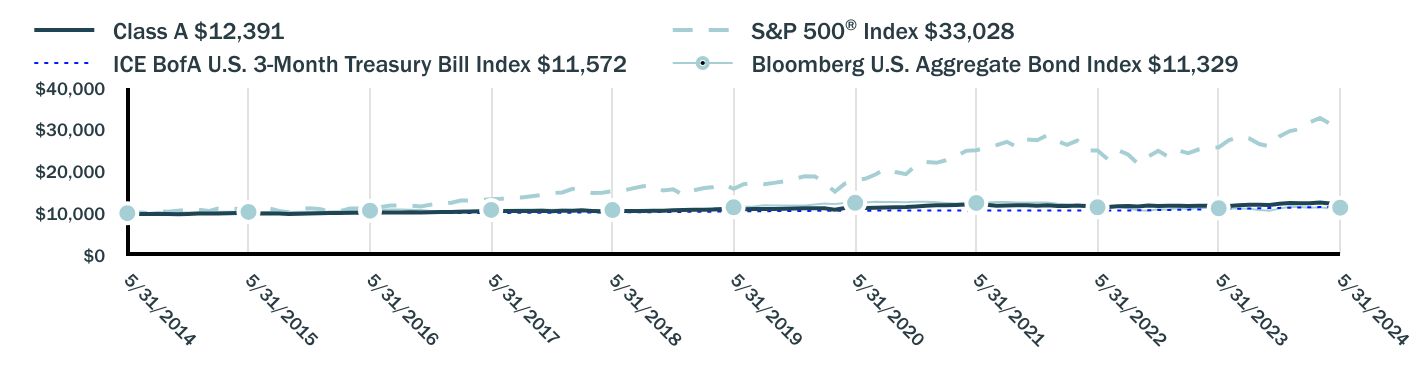
| Class A $12,391 | S&P 500® Index $33,028 | ICE BofA U.S. 3-Month Treasury Bill Index $11,572 | Bloomberg U.S. Aggregate Bond Index $11,329 | |
|---|---|---|---|---|
| 5/31/2014 | $9,752 | $10,000 | $10,000 | $10,000 |
| 6/30/2014 | $9,837 | $10,207 | $10,000 | $10,005 |
| 7/31/2014 | $9,837 | $10,066 | $10,001 | $9,980 |
| 8/31/2014 | $9,853 | $10,469 | $10,001 | $10,090 |
| 9/30/2014 | $9,814 | $10,322 | $10,001 | $10,022 |
| 10/31/2014 | $9,744 | $10,574 | $10,002 | $10,120 |
| 11/30/2014 | $9,814 | $10,858 | $10,002 | $10,192 |
| 12/31/2014 | $9,900 | $10,831 | $10,002 | $10,202 |
| 1/31/2015 | $9,931 | $10,506 | $10,002 | $10,415 |
| 2/28/2015 | $9,954 | $11,109 | $10,002 | $10,318 |
| 3/31/2015 | $10,009 | $10,934 | $10,002 | $10,365 |
| 4/30/2015 | $10,047 | $11,039 | $10,002 | $10,328 |
| 5/31/2015 | $10,071 | $11,181 | $10,002 | $10,303 |
| 6/30/2015 | $9,939 | $10,964 | $10,003 | $10,191 |
| 7/31/2015 | $9,931 | $11,194 | $10,002 | $10,262 |
| 8/31/2015 | $9,915 | $10,519 | $10,004 | $10,247 |
| 9/30/2015 | $9,799 | $10,258 | $10,004 | $10,316 |
| 10/31/2015 | $9,892 | $11,124 | $10,003 | $10,318 |
| 11/30/2015 | $9,908 | $11,157 | $10,004 | $10,291 |
| 12/31/2015 | $9,968 | $10,981 | $10,007 | $10,258 |
| 1/31/2016 | $10,023 | $10,436 | $10,007 | $10,399 |
| 2/29/2016 | $10,071 | $10,422 | $10,010 | $10,473 |
| 3/31/2016 | $10,127 | $11,129 | $10,015 | $10,569 |
| 4/30/2016 | $10,103 | $11,172 | $10,017 | $10,609 |
| 5/31/2016 | $10,166 | $11,372 | $10,018 | $10,612 |
| 6/30/2016 | $10,159 | $11,402 | $10,022 | $10,803 |
| 7/31/2016 | $10,166 | $11,822 | $10,025 | $10,871 |
| 8/31/2016 | $10,182 | $11,839 | $10,026 | $10,859 |
| 9/30/2016 | $10,238 | $11,841 | $10,031 | $10,852 |
| 10/31/2016 | $10,151 | $11,625 | $10,034 | $10,769 |
| 11/30/2016 | $10,238 | $12,056 | $10,036 | $10,514 |
| 12/31/2016 | $10,296 | $12,294 | $10,040 | $10,529 |
| 1/31/2017 | $10,312 | $12,527 | $10,044 | $10,550 |
| 2/28/2017 | $10,352 | $13,025 | $10,048 | $10,621 |
| 3/31/2017 | $10,400 | $13,040 | $10,050 | $10,615 |
| 4/30/2017 | $10,441 | $13,174 | $10,057 | $10,697 |
| 5/31/2017 | $10,489 | $13,359 | $10,062 | $10,779 |
| 6/30/2017 | $10,529 | $13,442 | $10,070 | $10,769 |
| 7/31/2017 | $10,521 | $13,719 | $10,079 | $10,815 |
| 8/31/2017 | $10,553 | $13,761 | $10,088 | $10,912 |
| 9/30/2017 | $10,553 | $14,045 | $10,097 | $10,860 |
| 10/31/2017 | $10,609 | $14,372 | $10,106 | $10,866 |
| 11/30/2017 | $10,489 | $14,813 | $10,115 | $10,852 |
| 12/31/2017 | $10,561 | $14,978 | $10,125 | $10,902 |
| 1/31/2018 | $10,602 | $15,836 | $10,138 | $10,777 |
| 2/28/2018 | $10,677 | $15,252 | $10,147 | $10,674 |
| 3/31/2018 | $10,553 | $14,864 | $10,161 | $10,743 |
| 4/30/2018 | $10,453 | $14,921 | $10,175 | $10,663 |
| 5/31/2018 | $10,511 | $15,281 | $10,191 | $10,739 |
| 6/30/2018 | $10,553 | $15,375 | $10,207 | $10,726 |
| 7/31/2018 | $10,519 | $15,947 | $10,224 | $10,728 |
| 8/31/2018 | $10,536 | $16,466 | $10,242 | $10,797 |
| 9/30/2018 | $10,594 | $16,560 | $10,257 | $10,728 |
| 10/31/2018 | $10,611 | $15,428 | $10,276 | $10,643 |
| 11/30/2018 | $10,719 | $15,743 | $10,297 | $10,707 |
| 12/31/2018 | $10,781 | $14,321 | $10,316 | $10,903 |
| 1/31/2019 | $10,832 | $15,469 | $10,336 | $11,019 |
| 2/28/2019 | $10,849 | $15,966 | $10,354 | $11,013 |
| 3/31/2019 | $10,883 | $16,276 | $10,377 | $11,224 |
| 4/30/2019 | $10,976 | $16,935 | $10,397 | $11,227 |
| 5/31/2019 | $10,925 | $15,859 | $10,421 | $11,426 |
| 6/30/2019 | $10,916 | $16,976 | $10,443 | $11,570 |
| 7/31/2019 | $11,001 | $17,220 | $10,463 | $11,595 |
| 8/31/2019 | $11,018 | $16,948 | $10,484 | $11,896 |
| 9/30/2019 | $11,027 | $17,265 | $10,503 | $11,833 |
| 10/31/2019 | $11,077 | $17,639 | $10,523 | $11,868 |
| 11/30/2019 | $11,120 | $18,279 | $10,536 | $11,862 |
| 12/31/2019 | $11,166 | $18,831 | $10,551 | $11,854 |
| 1/31/2020 | $11,209 | $18,823 | $10,565 | $12,082 |
| 2/29/2020 | $11,166 | $17,274 | $10,581 | $12,299 |
| 3/31/2020 | $10,846 | $15,140 | $10,611 | $12,227 |
| 4/30/2020 | $11,226 | $17,081 | $10,612 | $12,444 |
| 5/31/2020 | $11,252 | $17,895 | $10,612 | $12,502 |
| 6/30/2020 | $11,244 | $18,250 | $10,614 | $12,581 |
| 7/31/2020 | $11,330 | $19,279 | $10,616 | $12,769 |
| 8/31/2020 | $11,391 | $20,665 | $10,617 | $12,666 |
| 9/30/2020 | $11,417 | $19,880 | $10,618 | $12,659 |
| 10/31/2020 | $11,486 | $19,351 | $10,619 | $12,602 |
| 11/30/2020 | $11,616 | $21,470 | $10,620 | $12,726 |
| 12/31/2020 | $11,774 | $22,295 | $10,621 | $12,744 |
| 1/31/2021 | $11,885 | $22,070 | $10,622 | $12,652 |
| 2/28/2021 | $11,885 | $22,679 | $10,623 | $12,470 |
| 3/31/2021 | $11,950 | $23,672 | $10,624 | $12,314 |
| 4/30/2021 | $12,061 | $24,935 | $10,624 | $12,411 |
| 5/31/2021 | $12,107 | $25,109 | $10,624 | $12,452 |
| 6/30/2021 | $12,015 | $25,696 | $10,624 | $12,539 |
| 7/31/2021 | $11,765 | $26,306 | $10,624 | $12,679 |
| 8/31/2021 | $11,839 | $27,106 | $10,625 | $12,655 |
| 9/30/2021 | $11,894 | $25,845 | $10,625 | $12,546 |
| 10/31/2021 | $11,931 | $27,656 | $10,625 | $12,542 |
| 11/30/2021 | $11,765 | $27,464 | $10,626 | $12,579 |
| 12/31/2021 | $11,875 | $28,695 | $10,627 | $12,547 |
| 1/31/2022 | $11,735 | $27,210 | $10,626 | $12,277 |
| 2/28/2022 | $11,754 | $26,395 | $10,627 | $12,140 |
| 3/31/2022 | $11,828 | $27,375 | $10,631 | $11,803 |
| 4/30/2022 | $11,754 | $24,988 | $10,632 | $11,355 |
| 5/31/2022 | $11,651 | $25,034 | $10,639 | $11,428 |
| 6/30/2022 | $11,484 | $22,968 | $10,642 | $11,249 |
| 7/31/2022 | $11,651 | $25,085 | $10,647 | $11,523 |
| 8/31/2022 | $11,707 | $24,062 | $10,664 | $11,198 |
| 9/30/2022 | $11,614 | $21,846 | $10,691 | $10,714 |
| 10/31/2022 | $11,819 | $23,615 | $10,708 | $10,575 |
| 11/30/2022 | $11,698 | $24,935 | $10,742 | $10,964 |
| 12/31/2022 | $11,759 | $23,498 | $10,781 | $10,915 |
| 1/31/2023 | $11,779 | $24,975 | $10,815 | $11,251 |
| 2/28/2023 | $11,750 | $24,365 | $10,850 | $10,960 |
| 3/31/2023 | $11,779 | $25,260 | $10,897 | $11,238 |
| 4/30/2023 | $11,788 | $25,654 | $10,931 | $11,306 |
| 5/31/2023 | $11,528 | $25,766 | $10,974 | $11,183 |
| 6/30/2023 | $11,711 | $27,468 | $11,024 | $11,143 |
| 7/31/2023 | $11,885 | $28,350 | $11,068 | $11,135 |
| 8/31/2023 | $12,011 | $27,899 | $11,118 | $11,064 |
| 9/30/2023 | $12,039 | $26,569 | $11,169 | $10,783 |
| 10/31/2023 | $11,982 | $26,010 | $11,219 | $10,613 |
| 11/30/2023 | $12,281 | $28,386 | $11,269 | $11,094 |
| 12/31/2023 | $12,450 | $29,675 | $11,322 | $11,518 |
| 1/31/2024 | $12,381 | $30,174 | $11,370 | $11,487 |
| 2/29/2024 | $12,381 | $31,785 | $11,417 | $11,324 |
| 3/31/2024 | $12,568 | $32,808 | $11,468 | $11,429 |
| 4/30/2024 | $12,342 | $31,468 | $11,517 | $11,140 |
| 5/31/2024 | $12,391 | $33,028 | $11,572 | $11,329 |
* Past performance is not a good predictor of how the Fund will perform in the future. The chart does not reflect the deduction of taxes that a shareholder would pay on fund distributions or redemption of fund shares.
The indexes are unmanaged and, therefore, have no expenses. Investors cannot invest directly in an index.
Average Annual Total Returns (%)Footnote Reference*
| 1 Year | 5 Years | 10 Years | |
|---|---|---|---|
| Class A | 7.49% | 2.55% | 2.42% |
| Class A (After Sales Charges) | 4.51% | 2.03% | 2.17% |
S&P 500® Index | 28.19% | 15.80% | 12.69% |
| ICE BofA U.S. 3-Month Treasury Bill Index | 5.45% | 2.12% | 1.47% |
| Bloomberg U.S. Aggregate Bond Index | 1.31% | -0.17% | 1.26% |
| Footnote | Description |
Footnote* | Past performance is not a good predictor of how the Fund will perform in the future. The table does not reflect the deduction of taxes that a shareholder would pay on fund distributions or redemption of fund shares. Returns shown above include the reinvestment of all dividends and capital gains. |
Key Fund Statistics
| Total Net Assets | $938,998,873 |
| Number of Portfolio Holdings | 99 |
| Total Advisory Fees Paid | $10,257,507 |
| Portfolio Turnover Rate | 230% |
What did the Fund invest in?
The Fund invested primarily in the equity securities of companies involved in publicly announced mergers and acquisitions.
Sector Weighting (%)

| Value | Value |
|---|---|
| Consumer, Non-cyclical | 30.10% |
| Technology | 18.83% |
| Energy | 12.91% |
| Telecommunication Services | 11.14% |
| Funds | 6.12% |
| Financials | 4.80% |
| Materials | 4.56% |
| Consumer, Cyclical | 4.18% |
| Industrials | 4.17% |
| Utilities | 3.19% |
Region Weighting (%)

| Value | Value |
|---|---|
| Americas | 90.71% |
| EMEA | 9.29% |
Material Fund Changes
There were no material changes to the Fund since May 31, 2023.
Additional Information
For additional information about the Fund, including its prospectus, financial information, holdings, and proxy voting, scan the QR code or visit www.arbitragefunds.com/arbitrage.
Householding
To reduce Fund expenses, only one copy of most shareholder documents may be mailed to shareholders with multiple accounts at the same address (Householding). If you would prefer that your Fund documents not be householded, please contact us at 1-800-295-4485, or contact your financial intermediary.
The Arbitrage Fund is distributed by ALPS Distributors, Inc, which is not affiliated with Water Island Capital LLC or any of its affiliates.


Class A:
ARGAX
Arbitrage Fund
Annual Shareholder Report
May 31, 2024
| (b) | Not applicable. |
Item 2. Code of Ethics.
| (a) | The Registrant, as of the end of the period covered by the report, has adopted a code of ethics that applies to the Registrant's principal executive officer, principal financial officer, principal accounting officer or controller or any persons performing similar functions on behalf of the Registrant. |
| (b) | Not applicable. |
| (c) | During the period covered by this report, no amendments were made to the provisions of the code of ethics adopted in 2(a) above. |
| (d) | During the period covered by this report, no implicit or explicit waivers to the provisions of the code of ethics adopted in 2(a) above were granted. |
| (e) | Not applicable. |
| (f) | The Registrant's Code of Ethics is attached as an Exhibit hereto. |
Item 3. Audit Committee Financial Expert.
| (a)(1) | The Registrant’s board of trustees has determined that the Registrant has at least one audit committee financial expert serving on the audit committee |
| (a)(2) | The audit committee financial experts are John C. Alvarado and Francis X. Tracy, who are each independent as defined in Form N-CSR Item 3(a)(2). |
Item 4. Principal Accountant Fees and Services.
| (a) | Audit Fees: For the Registrant’s fiscal years ended May 31, 2024 and May 31, 2023, the aggregate fees billed for professional services rendered by the principal accountant for the audit of the Registrant’s annual financial statements were $109,000 and $100,000, respectively. |
| (b) | Audit-Related Fees: For the Registrant’s fiscal years ended May 31, 2024 and May 31, 2023, the aggregate fees billed for assurance and related services by the principal accountant that are reasonably related to the performance of the audit of the Registrant’s financial statements and are not reported under paragraph (a) of this Item were $0 and $0, respectively. |
| (c) | Tax Fees: For the Registrant’s fiscal years ended May 31, 2024 and May 31, 2023, aggregate fees of $27,922 and $27,400, respectively, were billed for professional services rendered by the principal accountant for tax compliance, tax advice, and tax planning. Services for which fees in the Tax Fees category are billed include Ernst & Young LLP’s (“E&Y”) review of the registrant’s U.S. federal income tax returns and the required state corporate income tax returns, as well as E&Y’s review of excise tax distribution calculations and identification and analyzation of the passive foreign investment company status of foreign corporate equities. |
| (d) | All Other Fees: For the Registrant’s fiscal years ended May 31, 2024 and May 31, 2023, no fees were billed to the Registrant by the principal accountant for services other than the services reported in paragraphs (a) through (c) of this item. |
| (e)(1) | Audit Committee’s Pre-Approval Policies and Procedures: All services to be performed by the Registrant's principal auditors must be pre-approved by the Registrant's audit committee. |
| (e)(2) | No services described in paragraphs (b) through (d) were approved pursuant to paragraph (c)(7)(i)(C) of Rule 2-01 of Regulation S-X. |
| (f) | Not applicable. |
| (g) | The aggregate non-audit fees billed by the Registrant’s principal accountant for the fiscal years ended May 31, 2024 and May 31, 2023 were $27,922 and $27,400, respectively. |
| (h) | Not applicable. |
| (i) | Not applicable. |
| (j) | Not applicable. |
Item 5. Audit Committee of Listed Registrants.
Not applicable.
Item 6. Investments.
The Schedule of Investments is included as part of the Report to Stockholders filed under Item 7(a) of this Form.
Item 7. Financial Statements and Financial Highlights for Open-End Management Investment Companies.
| (a) | The registrant’s Financial Statements are attached herewith. |
| (b) | The registrant’s Financial Highlights are included as part of the Financial Statements filed under Item 7(a) of this Form. |

Annual Report
May 31, 2024
Arbitrage Fund
Water Island Event-Driven Fund
Water Island Credit Opportunities Fund

TABLE OF CONTENTS
1 | |||||||
Arbitrage Fund | |||||||
3 | |||||||
6 | |||||||
8 | |||||||
Water Island Event-Driven Fund | |||||||
17 | |||||||
20 | |||||||
22 | |||||||
Water Island Credit Opportunities Fund | |||||||
31 | |||||||
33 | |||||||
35 | |||||||
44 | |||||||
48 | |||||||
52 | |||||||
Financial Highlights | |||||||
55 | |||||||
56 | |||||||
57 | |||||||
58 | |||||||
59 | |||||||
60 | |||||||
61 | |||||||
62 | |||||||
63 | |||||||
64 | |||||||
65 | |||||||
89 | |||||||
90 | |||||||
93 | |||||||
94 | |||||||
May 31, 2024 (Unaudited)
Dear Fellow Shareholders,
We are pleased to present The Arbitrage Funds' annual report for the fiscal year ending May 31, 2024.
In our letter one year ago, we noted the difficult year that both event-driven strategies and broader equity and credit markets had just experienced. Although several of the same macro challenges we have discussed in recent shareholder letters remain relevant today, the past 12 months was a markedly different period in terms of returns for many investors. Equity markets have been notching all-time highs with the S&P 500 index returning more than 28% for the funds' fiscal year, driven in part by exuberance over emerging technologies such as artificial intelligence ("AI"), while event-driven strategies delivered a strong year on the back of favorable regulatory developments in multiple high-profile mergers and acquisitions ("M&A") transactions.
For our own merger-related strategies, antitrust review remains a primary concern. Competition regulators, especially the Federal Trade Commission (FTC) and Department of Justice (DOJ) in the US, continue to espouse novel theories of antitrust law in their attempts to impede transactions that do not fit their views of fair competition, despite numerous failures when such cases are taken to trial. During the fiscal year, the most notable instance was perhaps Microsoft's victory in its pursuit to acquire video game developer Activision. As Microsoft and others have increasingly succeeded in challenging attempted regulatory blocks, we have seen a considerable segment of acquirers become more confident in pursuing transactions they may otherwise have avoided: after two years of lagging consolidation activity, deal flow is once again on the rise. According to Dealogic, for example, in the first five calendar months of 2024, 371 transactions worth $647 billion were announced. This compares to 318 transactions worth $441 billion in the year-ago period, representing increases of 17% in deal volume and an impressive 47% in total deal value. Yet despite these positive trends, the risk of unpredictable or extended regulatory reviews in this still-fraught regulatory environment may be holding potential deals back. We believe this indicates potential for even more growth in M&A activity as dealmakers continue to adjust to the current regulatory environment. As deal flow has improved, merger arbitrage deal spreads continue to remain compelling. While last fiscal year-end we had seen spreads more than double from the prior period, as of May 31, 2024, the average spread in Arbitrage Fund – our pure-play, diversified merger arbitrage strategy – had further increased by nearly 10% compared to the year-ago period.
Looking ahead, we anticipate healthy levels of deal flow to continue. The general availability of financing in the market and current macroeconomic outlook has strategic acquirers well-positioned to continue to seek growth via M&A. The private equity landscape, where buyers remain flush with cash waiting to be deployed, has displayed considerable strength in the face of elevated interest rates. Recent Barclays research suggests that M&A could continue to accelerate in the latter half of the year, with total deal volume for calendar year 2024 potentially increasing as much as 20% year-over-year. In the catalyst-driven credit space, in addition to merger-related investments, refinancing activity has been robust, which we expect to continue as companies seek to extend maturities. Lastly, we also see opportunities for softer catalyst investments in our broader event-driven strategies, particularly in spin-offs. The S&P US Spin-Off index returned 36% for the funds' fiscal year, and a flurry of new spin-offs are anticipated for the second half of 2024. At the same time, while we seldom attempt to predict what the future holds for broader markets, we can't help but raise an eyebrow at some of the fervor surrounding a rally that seems largely AI-driven. At this point, at least one interest rate cut by the Federal Reserve before the end of 2024 seems all but certain, which could further bolster markets, but it feels like we've been here before. Additionally, the outcome of the upcoming US presidential election is highly uncertain.
Annual Report | May 31, 2024
1
The Arbitrage Funds Shareholder Letter (continued)
May 31, 2024 (Unaudited)
For now, equity markets continue to trade at highs, seemingly full of vigor – so much so that one might wonder whether it makes sense to invest in non-correlated alternative strategies such as event driven. Yet we are reminded that this is a common refrain in these scenarios – one we have heard before. Before the COVID-19 pandemic, before the global financial crisis of 2007-2008, before the burst of the dot-com bubble. Diversification, it appears, may matter most when common opinion deems it least necessary.
Sincerely,
The Investment Team
Water Island Capital
The discussion of market trends and companies throughout this commentary are not intended as advice to any person regarding the advisability of investing in any particular security. Some of our comments are based on current management expectations and are considered "forward-looking statements." Actual future results, however, may prove to be different from our expectations. Our views are a reflection of our best judgment at the time of the commentary and are subject to change any time based on market and other conditions, and we have no obligation to update them.
Glossary
Deal Flow: The volume of announced mergers and acquisitions activity.
Deal Spread (also "merger spread" or "spread"): The difference between the price at which a target company's shares currently trade and the price an acquiring company has agreed to pay, which forms the rate of return in a merger arbitrage investment.
Hard Catalysts: Situations with more defined potential outcomes and higher probabilities of reaching a successful conclusion.
Soft Catalysts: Situations with less defined potential outcomes and relatively lower probabilities of reaching a successful conclusion.
Basis Point: An amount equal to 1/100 of 1%.
S&P US Spin-Off index: An index designed to measure the performance of public US companies that have been spun off from a parent company within the last four years and have a market cap of at least $1 billion.
www.arbitragefunds.com | 1-800-295-4485
2
May 31, 2024 (Unaudited)
Arbitrage Fund | Tickers: ARBNX, ARBFX, ARBCX, ARGAX
The Fund's Goal and Main Investments
The Fund seeks to achieve capital growth by engaging in merger arbitrage. Merger arbitrage is a sub-set of a broader event-driven investment strategy, which seeks to profit from investing in securities that are involved in corporate events such as mergers and acquisitions. Typically, merger arbitrage is a low volatility strategy pursued by absolute-return-minded investors. At Water Island Capital, our goal is to capture a return stream with a low correlation to the overall markets.
Investment Strategy
The strategy's focus is to capture returns from corporate events, generate market neutral capital growth, preserve capital, generate consistent and positive returns, and achieve low correlation and low volatility. The Fund generally engages in active and frequent trading of portfolio securities to achieve its principal investment objective. In attempting to achieve its investment strategy, the Fund plans to invest at least 80% of its net assets in equity securities of companies (both U.S. and foreign) that are involved in publicly announced mergers, takeovers, tender offers, leveraged buyouts, spin-offs, liquidations, and other corporate reorganizations. The Fund's investment adviser uses investment strategies designed to minimize market exposure, including short selling along with purchasing and selling options. The most common merger arbitrage activity, and the approach generally used by the Fund, involves purchasing the shares of an announced acquisition target company at a discount to their expected value upon the acquisition's completion. That difference, or "spread," is the primary driver of returns for this investment strategy. There is no limit to the number of stocks the Fund can hold; however, the Fund typically invests in 40 to 80 deals at any given time. Each deal will have one, or perhaps two, equity positions (a long and short position in a stock-for-stock deal) and, in many cases, associated derivative positions for hedging purposes.
Fiscal Year Highlights
Arbitrage Fund Class I (ARBNX) returned 7.76% for the fiscal year ended May 31, 2024. Investments in both the Americas and European regions contributed to returns, while the Asia-Pacific region detracted from returns slightly. Information technology and health care were the top performing sectors, while consumer discretionary and materials detracted the most from returns.
The Fund may utilize derivatives for several purposes, primarily to implement position-level hedges, portfolio-level hedges, or currency hedges. During the fiscal year, the Fund's investments in derivative instruments detracted from returns. Derivative performance was in line with expectations given prevailing market conditions over the period.
The Fund's top contributor for the period was its investment in the acquisition of VMware by Broadcom. In May 2022, VMware – a US-based software company specializing in cloud computing and virtualization technology – agreed to be acquired by Broadcom – a US-based semiconductor manufacturer focused on telecommunications and storage products – for $61.4 billion in cash and stock. The companies previously extended the termination date of this deal, as investigations from multiple global antitrust regulators caused lengthy delays in receiving clearances in several jurisdictions. We maintained our exposure throughout the deal given our conviction that it did not violate any competition laws. Despite the in-depth reviews, the deal ultimately received all required regulatory approvals and closed in November 2023, leading to gains for the Fund.
The second-largest contributor for the fiscal year was the Fund's position in the acquisition of Activision Blizzard by Microsoft. In January 2022, Microsoft Corp reached an agreement to acquire Activision Blizzard, a US-based developer and publisher of video game software, for $75.1 billion
Annual Report | May 31, 2024
3
Arbitrage Fund Manager Commentary (continued)
May 31, 2024 (Unaudited)
in cash. The deal was met not just with objections from competitors, including Sony, but also wariness amongst antitrust regulators, which caused ongoing volatility in the deal spread. During calendar Q1 2023, the UK Competition and Markets Authority ("CMA") initially signaled a favorable assessment of certain aspects of the transaction, only to block the deal early in calendar Q2 2023 based on concerns about competition in the nascent cloud gaming market – a decision which Microsoft appealed. Furthermore, the Federal Trade Commission ("FTC") took Microsoft to court seeking to block the acquisition in the US. However, not only did the FTC ultimately fail to persuade the judge that the deal would curtail competition, but it also saw its attempt to appeal the court's decision denied, clearing a path toward approval in the US. With the deal already having received approval in the EU, the CMA agreed to revisit its review and reopen discussions with Microsoft about potential remedies that could satisfy its concerns. In October 2023, the CMA and Microsoft agreed to remedies which addressed the CMA's previous concerns, included divesting Activision's rights to cloud gaming in the UK to competitor Ubisoft for at least 15 years, and the deal subsequently closed, leading to gains for the Fund.
The third-largest contributor for the period was the Fund's position in the acquisition of Horizon Therapeutics by Amgen. In December 2022, Amgen – a multinational biopharmaceutical company and one of the largest independent biotech companies in the world – reached an agreement to acquire Horizon Therapeutics – a biopharmaceutical company focused on treatments for rare, autoimmune diseases – for approximately $27.8 billion in cash. Despite there being no significant overlap in the companies' drug portfolios, the FTC sued to block the transaction based on concerns about the practice of "bundling" (i.e., offering rebates or discounts for ordering multiple products) – a justification that heretofore has never been used to block a merger. While the deal spread widened on the news, we viewed the FTC's case as extremely weak, especially considering bundling actually benefits consumers by lowering prices and the products that the FTC was concerned would be discounted do not even have any competitors currently on the market that could be disadvantaged by such a practice. For its part, Amgen stated the FTC's case "defies logic and precedent" and vowed to take the fight to court. Ultimately, the FTC reconsidered its aggressive stance by withdrawing its request for a hearing – perhaps suggesting it realized the weakness in its own case – and entered into a consent agreement with Amgen, effectively clearing the path for deal completion in the US. The spread narrowed on the news, leading to gains for the Fund, and the transaction closed successfully in calendar Q4 2023.
Conversely, the top detractor in the portfolio was the Fund's position in the merger of Capri Holdings and Tapestry. Capri Holdings is a multinational fashion holding company that owns leading luxury goods, apparel, and footwear brands such as Michael Kors, Versace, and Jimmy Choo. In August 2023, the company agreed to be acquired by Tapestry – a multinational fashion holding company which owns brands such as Kate Spade and Coach – in an all-cash transaction valued at $10 billion. Post deal announcement, the companies' share prices suffered amidst a softening luxury goods market, and the deal spread experienced further volatility stemming from a second request by the FTC, which extended the timeline for regulatory review. While the transaction is still pending, we ultimately opted to exit our position to focus on opportunities with greater risk/reward potential.
The second-largest detractor for the period was the Fund's position in the acquisition of United States Steel by Nippon Steel. In December 2023, United States Steel – a US-based steel producer – reached a definitive agreement to be acquired by Nippon Steel of Japan for $13.4 billion in cash. The transaction has been met with stiff pushback from steelworkers and politicians based primarily on concerns about its potential impact to jobs and national security, including from President Biden, who has expressed a desire for United States Steel to remain a domestically
www.arbitragefunds.com | 1-800-295-4485
4
Arbitrage Fund Manager Commentary (continued)
May 31, 2024 (Unaudited)
owned American firm. Nippon Steel, for its part, has emphasized its deep roots in the US and said its purchase of United States Steel would strengthen the US's supply chains and economic defenses against China. While the deal appears to have been caught up in the fray of election year politics, on its merits, we believe it meets all regulatory requirements. The transaction has already received shareholder approval and regulatory approval from all required jurisdictions outside the US, and the companies continue to guide toward expected completion in the second half of 2024. We continue to maintain our exposure as we monitor this situation closely.
The third-largest detractor for the fiscal year was the Fund's position in the failed acquisition of PNM Resources by Avangrid. In October 2020, PNM Resources – a US-based electric utility company primarily serving New Mexico and Texas – agreed to be acquired by Avangrid – a local peer serving New England and New York – for $4.0 billion in cash. The deal required several regulatory approvals at both the state and federal level – all but one of which had signed off by December 2021, when the Public Regulation Commission ("PRC") of New Mexico rejected the merger. As there was still a path for the companies to move forward and gain PRC approval, in January 2022 Avangrid filed an appeal and extended the date of the merger agreement to 2023. The deal spread experienced volatility at various points during the course of calendar 2023 as investors feared Avangrid would walk away as the extended termination date neared, despite public statements from Avangrid reaffirming its commitment to the transaction. Ultimately, these fears proved prescient – at the start of the New Year, with no clear timing in the receipt of any decision on their appeal of the PRC denial, Avangrid capitulated and finally exercised its right to terminate the merger.
Annual Report | May 31, 2024
5
May 31, 2024 (Unaudited)
Performance (annualized returns as of May 31, 2024)
| One Year | Five Year | Ten Year | Since Inception* | ||||||||||||||||
Arbitrage Fund, Class R | 7.55 | % | 2.57 | % | 2.44 | % | 3.66 | % | |||||||||||
Arbitrage Fund, Class I | 7.76 | % | 2.82 | % | 2.68 | % | 2.96 | % | |||||||||||
Arbitrage Fund, Class C** | 5.70 | % | 1.79 | % | 1.67 | % | 1.39 | % | |||||||||||
Arbitrage Fund, Class A*** | 4.51 | % | 2.03 | % | 2.17 | % | 2.07 | % | |||||||||||
S&P 500® Index | 28.19 | % | 15.80 | % | 12.69 | % | 7.58 | % | |||||||||||
ICE BofA U.S. 3-Month Treasury Bill Index | 5.45 | % | 2.12 | % | 1.47 | % | 1.72 | % | |||||||||||
Bloomberg U.S. Aggregate Bond Index | 1.31 | % | -0.17 | % | 1.26 | % | 3.76 | % | |||||||||||
Current performance may be higher or lower than performance quoted above. Any performance data quoted represents past performance and the investment return and principal value of an investment in the Fund will fluctuate so that an investor's shares, when redeemed, may be worth more or less than their original cost. Past performance is no guarantee of future results. Returns shown above include the reinvestment of all dividends and capital gains. Performance results do not include adjustments made for financial reporting purposes in accordance with U.S. generally accepted accounting principles and may differ from the amount reported in the Financial Highlights. You can obtain performance data current to the most recent month end by calling 1-800-295-4485 or going to www.arbitragefunds.com/arbitrage. This table does not reflect the deduction of taxes that a shareholder would pay on Fund distributions or the redemption of Fund shares.
* Class R inception: 9/18/00; Class I inception: 10/17/03; Class C inception: 6/1/12; Class A inception: 6/1/13. The "Since Inception" returns for securities indices are for the inception date of Class R shares.
** Class C One Year return includes load. Shares are subject to a 1.00% contingent deferred sales charge on all purchases redeemed within 12 months of purchase.
*** After sales charge. Class A shares are subject to a maximum front-end sales load of 2.75% on purchases up to $250,000. The shares are also subject to a deferred sales charge of up to 1.00% on purchases of $250,000 or more purchased without a front-end sales charge and redeemed within 18 months of purchase.
The Total Annual Fund Operating Expenses for Class R, Class I, Class C and Class A are 1.60%, 1.35%, 2.35% and 1.60%, respectively. These expense ratios are as stated in the current prospectus and may differ from the expense ratios disclosed in the financial highlights in this report.
The Standard and Poor's 500, or simply the S&P 500, is a stock market index tracking the performance of 500 large companies listed on stock exchanges in the United States.
The ICE BofA U.S. 3-Month Treasury Bill Index tracks the performance of the U.S. dollar denominated U.S. Treasury Bills publicly issued in the U.S. domestic market with a remaining term to final maturity of less than 3 months.
The Bloomberg U.S. Aggregate Bond Index is a market value-weighted index of investment grade fixed-rated debt issues, including government, corporate, asset-backed and mortgage-backed securities with a maturity of one year or more.
The indexes shown are not intended to, and do not, parallel the risk or investment style of the Fund's investment strategy. An investor may not invest directly in an index.
www.arbitragefunds.com | 1-800-295-4485
6
Arbitrage Fund Portfolio Information (continued)
May 31, 2024 (Unaudited)
Growth of $10,000 Investment
The chart represents historical performance of a hypothetical investment of $10,000 in the Class R shares of the Fund over ten years. Past performance does not guarantee future results. This chart does not reflect the deduction of taxes that a shareholder would pay on Fund distributions or the redemption of Fund shares.
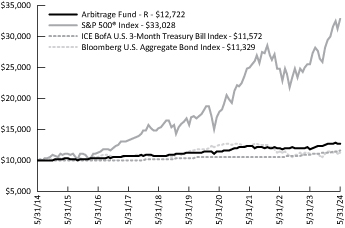
Sector Weighting
The following chart shows the sector weightings of Arbitrage Fund's investments in common stock and convertible corporate bonds as of the report date.
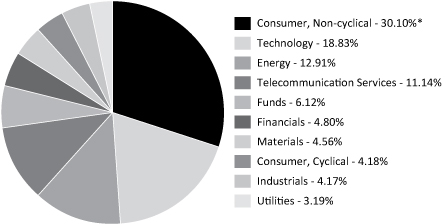
* Concentration Risk: If a large percentage of mergers or event-driven investment opportunities taking place within the U.S. are within one industry over a given period of time, the Fund may invest a large portion of its assets in securities of issuers in a single industry for that period of time. During such a period of concentration, the Fund may be subject to greater volatility with respect to its portfolio securities than a fund that is more broadly diversified.
Annual Report | May 31, 2024
7
May 31, 2024
Shares | Value | ||||||||||
COMMON STOCKS - 78.07% | |||||||||||
Biotechnology - 5.73% | |||||||||||
Cerevel Therapeutics Holdings, Inc.(a) | 473,467 | $ | 19,289,046 | ||||||||
Deciphera Pharmaceuticals, Inc.(a) | 379,976 | 9,704,587 | |||||||||
Olink Holding AB, ADR(a) | 1,035,589 | 24,802,356 | |||||||||
53,795,989 | |||||||||||
Commercial Services - 2.14% | |||||||||||
Applus Services SA | 700,986 | 9,674,889 | |||||||||
Network International Holdings PLC(a)(b) | 2,073,373 | 10,383,047 | |||||||||
20,057,936 | |||||||||||
Computers & Computer Services - 1.04% | |||||||||||
PlayAGS, Inc.(a)(c) | 845,000 | 9,759,750 | |||||||||
Electric - 2.97% | |||||||||||
ALLETE, Inc. | 166,958 | 10,543,398 | |||||||||
Atlantica Sustainable Infrastructure PLC | 393,339 | 8,645,591 | |||||||||
PNM Resources, Inc. | 227,098 | 8,706,937 | |||||||||
27,895,926 | |||||||||||
Electrical Components & Equipment - 1.57% | |||||||||||
Encore Wire Corp. | 51,170 | 14,774,314 | |||||||||
Food - 3.45% | |||||||||||
Albertsons Cos., Inc., Class A(c) | 1,568,503 | 32,373,902 | |||||||||
Healthcare - Products - 7.56% | |||||||||||
Axonics, Inc.(a)(c) | 471,594 | 31,639,242 | |||||||||
Shockwave Medical, Inc.(a) | 117,426 | 39,337,710 | |||||||||
70,976,952 | |||||||||||
Healthcare - Services - 7.42% | |||||||||||
Amedisys, Inc.(a) | 532,236 | 48,513,311 | |||||||||
Catalent, Inc.(a) | 394,010 | 21,193,798 | |||||||||
69,707,109 | |||||||||||
Home Furnishings - 2.87% | |||||||||||
Vizio Holding Corp., Class A(a) | 2,508,594 | 26,942,300 | |||||||||
Internet - 5.14% | |||||||||||
Perficient, Inc.(a) | 194,829 | 14,446,570 | |||||||||
Squarespace, Inc., Class A(a)(c) | 768,268 | 33,803,792 | |||||||||
48,250,362 | |||||||||||
Iron/Steel - 3.10% | |||||||||||
U.S. Steel Corp.(c)(d) | 759,848 | 29,140,171 | |||||||||
See Notes to Financial Statements.
www.arbitragefunds.com | 1-800-295-4485
8
Arbitrage Fund Portfolio of Investments (continued)
May 31, 2024
Shares | Value | ||||||||||
COMMON STOCKS - 78.07% (Continued) | |||||||||||
Media - 2.15% | |||||||||||
Endeavor Group Holdings, Inc., Class A(c) | 753,507 | $ | 20,216,593 | ||||||||
Oil & Gas - 6.98% | |||||||||||
Hess Corp. | 313,743 | 48,347,796 | |||||||||
Marathon Oil Corp. | 595,026 | 17,231,953 | |||||||||
65,579,749 | |||||||||||
Oil & Gas Services - 3.15% | |||||||||||
ChampionX Corp.(c) | 760,997 | 24,823,722 | |||||||||
U.S. Silica Holdings, Inc.(a)(d) | 307,000 | 4,755,430 | |||||||||
29,579,152 | |||||||||||
Packaging & Containers - 1.35% | |||||||||||
DS Smith PLC | 2,600,000 | 12,622,726 | |||||||||
Real Estate - 2.36% | |||||||||||
McGrath RentCorp | 202,985 | 22,121,305 | |||||||||
Real Estate Investment Trusts - 2.11% | |||||||||||
Apartment Income REIT Corp. | 511,737 | 19,829,809 | |||||||||
Retail - 1.02% | |||||||||||
Hibbett, Inc. | 111,000 | 9,610,380 | |||||||||
Semiconductors - 3.27% | |||||||||||
Broadcom, Inc. | 12,600 | 16,739,730 | |||||||||
Silicon Motion Technology Corp., ADR(d) | 178,553 | 13,943,204 | |||||||||
30,682,934 | |||||||||||
Software - 9.61% | |||||||||||
ANSYS, Inc.(a) | 88,951 | 28,237,495 | |||||||||
HashiCorp, Inc., Class A(a)(c) | 799,142 | 26,835,189 | |||||||||
Matterport, Inc.(a)(c) | 2,400,000 | 10,560,000 | |||||||||
Model N, Inc.(a) | 823,226 | 24,606,225 | |||||||||
90,238,909 | |||||||||||
Telecommunications - 3.08% | |||||||||||
GCI Liberty, Inc.(a)(e) | 660,966 | — | |||||||||
Juniper Networks, Inc.(c) | 554,172 | 19,767,315 | |||||||||
Spirent Communications PLC | 3,900,000 | 9,124,144 | |||||||||
28,891,459 | |||||||||||
| TOTAL COMMON STOCKS (Cost $743,826,526) | 733,047,727 | ||||||||||
See Notes to Financial Statements.
Annual Report | May 31, 2024
9
Arbitrage Fund Portfolio of Investments (continued)
May 31, 2024
Shares | Value | ||||||||||
RIGHTS(a) - 0.74% | |||||||||||
Bristol-Myers Squibb Co. CVR(e)(f) | 857,631 | $ | 1,157,802 | ||||||||
| Concert Pharmaceuticals, Inc. CVR, Expires 12/31/2029(e)(f) | 1,669,338 | 694,945 | |||||||||
Contra Abiomed, Inc. CVR, Expires 12/31/2030(e)(f) | 163,650 | 286,387 | |||||||||
| Contra Adamas Pharmaceuticals, Inc. CVR, Expires 12/31/2024(e)(f) | 1,150,652 | 87,795 | |||||||||
| Contra Adamas Pharmaceuticals, Inc. CVR, Expires 12/31/2025(e)(f) | 1,150,652 | 87,795 | |||||||||
Contra Albireo Pharma, Inc. CVR, Expires 12/31/2027(e)(f) | 313,065 | 757,836 | |||||||||
Contra CinCor Pharma, Inc. CVR, Expires 12/31/2027(e)(f) | 339,795 | 1,173,516 | |||||||||
Contra Resolute Forest Products, Inc. CVR(e)(f) | 803,806 | 1,285,447 | |||||||||
Flexion Therapy CVR, Expires 12/31/2030(e)(f) | 1,411,000 | 1,113,702 | |||||||||
Icosavax, Inc. CVR, Expires 02/19/2030(e)(f) | 802,494 | 255,354 | |||||||||
| TOTAL RIGHTS (Cost $6,086,303) | 6,900,579 | ||||||||||
| Maturity Date | Rate | Principal Amount | Value | ||||||||||||||||
CONVERTIBLE CORPORATE BONDS - 0.31% | |||||||||||||||||||
Healthcare - Services - 0.31% | |||||||||||||||||||
| UpHealth, Inc., Variable Rate, (SOFR plus 9.00%)(b) | 12/15/2025 | 14.330 | % | $ | 1,756,000 | $ | 1,742,830 | ||||||||||||
UpHealth, Inc.(b) | 06/15/2026 | 6.250 | % | 1,275,000 | 1,177,845 | ||||||||||||||
| TOTAL CONVERTIBLE CORPORATE BONDS (Cost $3,031,000) | 2,920,675 | ||||||||||||||||||
Shares | Value | ||||||||||
MUTUAL FUNDS(g) - 5.69% | |||||||||||
Water Island Event Driven Fund, Class I | 4,633,812 | $ | 53,474,188 | ||||||||
| TOTAL MUTUAL FUNDS (Cost $41,780,589) | 53,474,188 | ||||||||||
| Expiration Date | Exercise Price | Notional Amount | Contracts | Value | |||||||||||||||||||
PURCHASED OPTIONS(a) - 0.15% | |||||||||||||||||||||||
Call Options Purchased - 0.05% | |||||||||||||||||||||||
Capri Holdings Ltd. | 06/2024 | $ | 37.50 | $ | 8,637,500 | 2,500 | $ | 37,500 | |||||||||||||||
International Paper Co. | 06/2024 | 40.00 | 3,476,439 | 771 | 375,477 | ||||||||||||||||||
Nuvei Corp. | 09/2024 | 35.00 | 14,812,000 | 4,600 | 23,000 | ||||||||||||||||||
U.S. Silica Holdings, Inc. | 06/2024 | 16.00 | 6,196,000 | 4,000 | 40,000 | ||||||||||||||||||
| TOTAL CALL OPTIONS PURCHASED (Cost $401,485) | 475,977 | ||||||||||||||||||||||
See Notes to Financial Statements.
www.arbitragefunds.com | 1-800-295-4485
10
Arbitrage Fund Portfolio of Investments (continued)
May 31, 2024
| Expiration Date | Exercise Price | Notional Amount | Contracts | Value | |||||||||||||||||||
PURCHASED OPTIONS(a) - 0.15% (Continued) | |||||||||||||||||||||||
Put Options Purchased - 0.10% | |||||||||||||||||||||||
CoStar Group, Inc. | 10/2024 | $ | 80.00 | $ | 2,775,035 | 355 | $ | 205,900 | |||||||||||||||
| Silicon Motion Technology Corp. | 06/2024 | 67.50 | 13,954,683 | 1,787 | 82,202 | ||||||||||||||||||
U.S. Steel Corp. | 06/2024 | 45.00 | 4,103,450 | 1,070 | 658,050 | ||||||||||||||||||
| TOTAL PUT OPTIONS PURCHASED (Cost $718,598) | 946,152 | ||||||||||||||||||||||
| TOTAL PURCHASED OPTIONS (Cost $1,120,083) | 1,422,129 | ||||||||||||||||||||||
Yield | Shares | Value | |||||||||||||
SHORT-TERM INVESTMENTS - 17.22% | |||||||||||||||
Money Market Funds | |||||||||||||||
| Morgan Stanley Institutional Liquidity Fund - Government Portfolio | 5.232 | %(h) | 80,833,628 | $ | 80,833,628 | ||||||||||
| State Street Institutional U.S. Government Money Market Fund, Premier Class | 5.375 | %(h) | 80,833,628 | 80,833,628 | |||||||||||
161,667,256 | |||||||||||||||
| TOTAL SHORT-TERM INVESTMENTS (Cost $161,667,256) | 161,667,256 | ||||||||||||||
| Total Investments - 102.18% (Cost $957,511,757) | 959,432,554 | ||||||||||||||
Liabilities in Excess of Other Assets - (2.18%)(i) | (20,433,681 | ) | |||||||||||||
NET ASSETS - 100.00% | $ | 938,998,873 | |||||||||||||
Portfolio Footnotes
(a) Non-income-producing security.
(b) Security exempt from registration under Rule 144A of the Securities Act of 1933. These securities may be resold in transactions exempt from registration, normally to qualified institutional buyers. As of May 31, 2024, these securities had a total value of $13,303,722 or 1.42% of net assets.
(c) Security, or a portion of security, is being held as collateral for swaps, short sales or forward foreign currency exchange contracts. At May 31, 2024, the aggregate fair market value of those securities was $131,295,850, representing 13.98% of net assets.
(d) Underlying security for a written/purchased call/put option.
(e) Security fair valued using significant unobservable inputs and classified as a Level 3 security. As of May 31, 2024, the total fair market value of these securities was $6,900,579, representing 0.74% of net assets.
See Notes to Financial Statements.
Annual Report | May 31, 2024
11
Arbitrage Fund Portfolio of Investments (continued)
May 31, 2024
(f) Restricted securities (including private placements) - The Fund may own investment securities that have other legal or contractual limitations. At the end of the period, the value of restricted securities (excluding 144A issues) amounted to $6,900,579 or 0.74% of net assets.
Restricted Security | Acquisition Date | Acquisition Cost | |||||||||
Bristol-Myers Squibb Co. CVR | 11/20/2020 | $ | 1,185,787 | ||||||||
Concert Pharmaceuticals, Inc. CVR, Expires 12/31/2029 | 03/07/2023 | 617,655 | |||||||||
Contra Abiomed, Inc. CVR, Expires 12/31/2030 | 12/21/2022 | 166,923 | |||||||||
Contra Adamas Pharmaceuticals, Inc. CVR, Expires 12/31/2024 | 11/23/2021 | 69,039 | |||||||||
Contra Adamas Pharmaceuticals, Inc. CVR, Expires 12/31/2025 | 11/23/2021 | 69,039 | |||||||||
Contra Albireo Pharma, Inc. CVR, Expires 12/31/2027 | 03/03/2023 | 673,090 | |||||||||
Contra CinCor Pharma, Inc. CVR, Expires 12/31/2027 | 02/23/2023 | 1,039,773 | |||||||||
Contra Resolute Forest Products, Inc. CVR | 03/01/2023 | 1,141,404 | |||||||||
Flexion Therapy CVR, Expires 12/31/2030 | 11/22/2021 | 874,820 | |||||||||
Icosavax, Inc. CVR, Expires 02/19/2030 | 02/21/2024 | 248,773 | |||||||||
Total | $ | 6,086,303 | |||||||||
(g) Affiliated investment.
(h) Rate shown is the 7-day effective yield as of May 31, 2024.
(i) Includes cash held as collateral for short sales.
SCHEDULE OF SECURITIES SOLD SHORT | Shares | Value | |||||||||
COMMON STOCKS SOLD SHORT - (9.02%) | |||||||||||
Commercial Services - (2.38%) | |||||||||||
CoStar Group, Inc. | (43,962 | ) | $ | (3,436,509 | ) | ||||||
Nuvei Corp. | (307,000 | ) | (9,885,400 | ) | |||||||
WillScot Mobile Mini Holdings Corp. | (229,048 | ) | (9,031,363 | ) | |||||||
(22,353,272 | ) | ||||||||||
Forest Products & Paper - (1.15%) | |||||||||||
Mondi PLC | (540,000 | ) | (10,741,168 | ) | |||||||
Oil & Gas - (1.88%) | |||||||||||
ConocoPhillips | (151,732 | ) | (17,673,743 | ) | |||||||
Semiconductors - (1.78%) | |||||||||||
Broadcom, Inc. | (12,600 | ) | (16,739,730 | ) | |||||||
Software - (1.83%) | |||||||||||
Synopsys, Inc. | (30,688 | ) | (17,209,831 | ) | |||||||
| TOTAL SECURITIES SOLD SHORT (Proceeds $78,451,038) | $ | (84,717,744 | ) | ||||||||
See Notes to Financial Statements.
www.arbitragefunds.com | 1-800-295-4485
12
Arbitrage Fund Portfolio of Investments (continued)
May 31, 2024
WRITTEN OPTIONS | Expiration Date | Exercise Price | Notional Amount | Contracts | Value | ||||||||||||||||||
Written Call Options | |||||||||||||||||||||||
| Silicon Motion Technology Corp. | 06/2024 | $ | 82.50 | $ | (13,954,683 | ) | (1,787 | ) | $ | (160,830 | ) | ||||||||||||
| TOTAL WRITTEN CALL OPTIONS (Premiums received $166,308) | (160,830 | ) | |||||||||||||||||||||
EQUITY SWAP CONTRACTS
| Swap Counterparty/ Payment Frequency | Reference Obligation | Rate Paid/ Received by the Fund | Termination Date | Upfront Payments Made | Upfront Payments Received | Market Value | Notional Amount | Unrealized Appreciation | |||||||||||||||||||||||||||
| Morgan Stanley & Co./ Upon Termination | Schlumberger NV | Received 1 Month- Federal Rate Minus 40bps (4.930%) | 10/29/2024 | $ | — | $ | — | $ | 358,327 | USD | 26,051,542 | $ | 358,327 | ||||||||||||||||||||||
| Swap Counterparty/ Payment Frequency | Reference Obligation | Rate Paid/ Received by the Fund | Termination Date | Upfront Payments Made | Upfront Payments Received | Market Value | Notional Amount | Unrealized Depreciation | |||||||||||||||||||||||||||
| Morgan Stanley & Co./ Upon Termination | Chevron Corp. | Received 1 Month- Federal Rate Minus 40bps (4.930%) | 10/29/2024 | $ | — | $ | — | $ | (3,049,974 | ) | USD | 49,142,622 | $ | (3,049,974 | ) | ||||||||||||||||||||
| Morgan Stanley & Co./ Upon Termination | International Paper Co. | Received 1 Month- Federal Rate Minus 40bps (4.930%) | 10/29/2024 | — | — | (246,720 | ) | USD | 3,229,719 | (246,720 | ) | ||||||||||||||||||||||||
$ | (3,296,694 | ) | $ | (3,296,694 | ) | ||||||||||||||||||||||||||||||
See Notes to Financial Statements.
Annual Report | May 31, 2024
13
Arbitrage Fund Portfolio of Investments (continued)
May 31, 2024
OUTSTANDING FORWARD FOREIGN CURRENCY EXCHANGE CONTRACTS
| Currency Purchased | Currency Sold | Counterparty | Settlement Date | Unrealized Appreciation | |||||||||||||||
EUR | 6,624,900 | USD | 7,189,983 | Morgan Stanley & Co. | 06/17/2024 | $ | 2,252 | ||||||||||||
USD | 13,519,238 | EUR | 12,352,900 | Morgan Stanley & Co. | 06/17/2024 | 108,478 | |||||||||||||
GBP | 10,583,000 | USD | 13,329,084 | Morgan Stanley & Co. | 06/17/2024 | 157,185 | |||||||||||||
USD | 20,582,013 | GBP | 16,109,500 | Morgan Stanley & Co. | 06/17/2024 | 53,140 | |||||||||||||
NOK | 173,232,600 | USD | 16,485,673 | Morgan Stanley & Co. | 06/17/2024 | 23,779 | |||||||||||||
$ | 344,834 | ||||||||||||||||||
| Currency Purchased | Currency Sold | Counterparty | Settlement Date | Unrealized Depreciation | |||||||||||||||
USD | 3,462,956 | EUR | 3,216,600 | Morgan Stanley & Co. | 06/17/2024 | $ | (29,103 | ) | |||||||||||
GBP | 259,800 | USD | 331,091 | Morgan Stanley & Co. | 06/17/2024 | (19 | ) | ||||||||||||
USD | 11,599,660 | GBP | 9,187,300 | Morgan Stanley & Co. | 06/17/2024 | (108,023 | ) | ||||||||||||
USD | 16,502,926 | NOK | 173,232,600 | Morgan Stanley & Co. | 06/17/2024 | (6,527 | ) | ||||||||||||
$ | (143,672 | ) | |||||||||||||||||
The following is a summary of investments classified by country exposure:
Country | % of Net Assets(a) | ||||||
United States | 92.67 | % | |||||
United Kingdom | 4.35 | % | |||||
Sweden | 2.64 | % | |||||
Cayman Islands | 1.49 | % | |||||
Spain | 1.03 | % | |||||
Liabilities in Excess of Other Assets | (2.18 | )% | |||||
100.00 | % | ||||||
(a) These percentages represent long positions only and are not net of short positions.
Abbreviations:
AB - Aktiebolag is the Swedish term for a limited company.
ADR - American Depositary Receipt
bps - Basis Points. 100 Basis Points is equal to 1 percentage point.
CVR - Contingent Value Rights
EUR - Euro
GBP - British pound
Ltd. - Limited
NOK - Norwegian krone
NV - Naamloze Vennootschap is the Dutch term for a public limited liability corporation.
PLC - Public Limited Company
REIT - Real Estate Investment Trust
See Notes to Financial Statements.
www.arbitragefunds.com | 1-800-295-4485
14
Arbitrage Fund Portfolio of Investments (continued)
May 31, 2024
SA - Generally designates corporations in various countries, mostly those employing civil law. This translates literally in all languages mentioned as anonymous company.
SOFR - Secured Overnight Financing Rate
USD - United States Dollar
The following table summarizes the Arbitrage Fund's investments and derivative financial instruments categorized in the fair value hierarchy as of May 31, 2024:
Investments in Securities at Fair Value* | Level 1 | Level 2 | Level 3 | Total | |||||||||||||||
Assets | |||||||||||||||||||
Common Stocks | |||||||||||||||||||
Biotechnology | $ | 53,795,989 | $ | — | $ | — | $ | 53,795,989 | |||||||||||
Commercial Services | 20,057,936 | — | — | 20,057,936 | |||||||||||||||
Computers & Computer Services | 9,759,750 | — | — | 9,759,750 | |||||||||||||||
Electric | 27,895,926 | — | — | 27,895,926 | |||||||||||||||
Electrical Components & Equipment | 14,774,314 | — | — | 14,774,314 | |||||||||||||||
Food | 32,373,902 | — | — | 32,373,902 | |||||||||||||||
Healthcare - Products | 31,639,242 | 39,337,710 | — | 70,976,952 | |||||||||||||||
Healthcare - Services | 69,707,109 | — | — | 69,707,109 | |||||||||||||||
Home Furnishings | 26,942,300 | — | — | 26,942,300 | |||||||||||||||
Internet | 48,250,362 | — | — | 48,250,362 | |||||||||||||||
Iron/Steel | 29,140,171 | — | — | 29,140,171 | |||||||||||||||
Media | 20,216,593 | — | — | 20,216,593 | |||||||||||||||
Oil & Gas | 65,579,749 | — | — | 65,579,749 | |||||||||||||||
Oil & Gas Services | 29,579,152 | — | — | 29,579,152 | |||||||||||||||
Packaging & Containers | 12,622,726 | — | — | 12,622,726 | |||||||||||||||
Real Estate | 22,121,305 | — | — | 22,121,305 | |||||||||||||||
Real Estate Investment Trusts | 19,829,809 | — | — | 19,829,809 | |||||||||||||||
Retail | 9,610,380 | — | — | 9,610,380 | |||||||||||||||
Semiconductors | 30,682,934 | — | — | 30,682,934 | |||||||||||||||
Software | 90,238,909 | — | — | 90,238,909 | |||||||||||||||
Telecommunications | 28,891,459 | — | 0 | 28,891,459 | |||||||||||||||
Rights | — | — | 6,900,579 | 6,900,579 | |||||||||||||||
Convertible Corporate Bonds** | — | 2,920,675 | — | 2,920,675 | |||||||||||||||
Mutual Funds | 53,474,188 | — | — | 53,474,188 | |||||||||||||||
Purchased Options | 1,422,129 | — | — | 1,422,129 | |||||||||||||||
Short-Term Investments | 161,667,256 | — | — | 161,667,256 | |||||||||||||||
TOTAL | $ | 910,273,590 | $ | 42,258,385 | $ | 6,900,579 | $ | 959,432,554 | |||||||||||
See Notes to Financial Statements.
Annual Report | May 31, 2024
15
Arbitrage Fund Portfolio of Investments (continued)
May 31, 2024
Other Financial Instruments*** | Level 1 | Level 2 | Level 3 | Total | |||||||||||||||
Assets | |||||||||||||||||||
| Forward Foreign Currency Exchange Contracts | $ | — | $ | 344,834 | $ | — | $ | 344,834 | |||||||||||
Equity Swaps | 358,327 | — | — | 358,327 | |||||||||||||||
Liabilities | |||||||||||||||||||
Common Stocks** | (84,717,744 | ) | — | — | (84,717,744 | ) | |||||||||||||
Written Options | (160,830 | ) | — | — | (160,830 | ) | |||||||||||||
| Forward Foreign Currency Exchange Contracts | — | (143,672 | ) | — | (143,672 | ) | |||||||||||||
Equity Swaps | (3,296,694 | ) | — | — | (3,296,694 | ) | |||||||||||||
TOTAL | $ | (87,816,941 | ) | $ | 201,162 | $ | — | $ | (87,615,779 | ) | |||||||||
* Refer to Note 2 where leveling hierarchy is defined.
** Refer to Portfolio of Investments for sector information.
*** Other financial instruments are instruments such as written options, securities sold short, equity swaps and forward foreign currency exchange contracts.
The following is a reconciliation of the fair valuations using significant unobservable inputs (Level 3) for the Fund's assets and liabilities during the period ended May 31, 2024:
| Investments in Securities | Balance as of May 31, 2023 | Realized Gain (Loss) | Change in Unrealized Appreciation (Depreciation) | Purchases | Sales Proceeds | Transfers into Level 3 | Transfers out of Level 3 | Balance as of May 31, 2024 | Net change in Unrealized Appreciation (Depreciation) from investments still held as of May 31, 2024 | ||||||||||||||||||||||||||||||
| Common Stocks | $ | 82,025,339 | $ | 3,323,373 | $ | (3,323,473 | ) | $ | — | $ | (82,025,239 | ) | $ | — | $ | — | $ | 0 | $ | — | |||||||||||||||||||
Rights | 4,823,685 | 1,059,948 | 501,704 | 248,773 | (1,177,720 | ) | 1,444,189 | — | 6,900,579 | 779,545 | |||||||||||||||||||||||||||||
| Private Investments | 581,400 | 26,445 | (280,614 | ) | — | (327,231 | ) | — | — | — | — | ||||||||||||||||||||||||||||
Total | $ | 87,430,424 | $ | 4,409,766 | $ | (3,102,383 | ) | $ | 248,773 | $ | (83,530,190 | ) | $ | 1,444,189 | $ | — | $ | 6,900,579 | $ | 779,545 | |||||||||||||||||||
The following table summarizes the quantitative inputs used for investments categorized as Level 3 of the fair value hierarchy as of May 31, 2024:
| Investments in Securities | Fair Value at May 31, 2024 | Valuation Technique | Unobservable Input | Range of Values | Weighted Average | ||||||||||||||||||
Common Stocks | $ | 0 | Worthless | N/A | N/A | N/A | |||||||||||||||||
| Rights | 6,900,579 | Discounted, probability adjusted value, Broker Quote | Discount Rate, Probability, Broker Quote | 10%, 18.48%-65%, $1.35-$1.75 | 10%,38.26%, $1.43 | ||||||||||||||||||
See Notes to Financial Statements.
www.arbitragefunds.com | 1-800-295-4485
16
May 31, 2024 (Unaudited)
Water Island Event-Driven Fund | Tickers: AEDNX, AEDFX, AGEAX
The Fund's Goal and Main Investments
The Fund seeks to provide capital growth by investing in credit and equity securities involved in specific corporate events, with a focus on low volatility and low correlation relative to the broader capital markets.
Investment Strategy
The Fund's investment process follows a disciplined, fundamental approach that values risk mitigation while identifying compelling risk/reward opportunities available to us as we screen catalyst-driven corporate events, such as mergers and acquisitions, restructurings, refinancings, recapitalizations, spin-offs, litigation, regulatory changes, and bankruptcy. We may invest in both hard and soft catalysts, analyzing events through three core approaches: merger arbitrage, equity special situations, and credit opportunities. We seek to generate investment returns that have low volatility and low correlation compared to the broader capital markets. We do not manage against any particular benchmark and believe that capital preservation in difficult markets is as important as generating positive returns within our low correlated, low volatility event-driven investment strategy. This process and approach have been an integral part of the culture at Water Island Capital since the firm's inception.
Fiscal Year Highlights
Water Island Event-Driven Fund Class I (AEDNX) returned 7.03% for the fiscal year ended May 31, 2024. All three sub-strategy sleeves – merger arbitrage, credit opportunities, and equity special situations – contributed positively to returns. Investments in both the Americas and European regions contributed to returns, while the Asia-Pacific region detracted from returns slightly. Information technology and health care were the top performing sectors, while consumer discretionary and materials detracted the most from returns.
The Fund may utilize derivatives for several purposes, primarily to implement position-level hedges, portfolio-level hedges, or currency hedges. During the fiscal year, the Fund's investments in derivative instruments detracted from returns. Derivative performance was in line with expectations given prevailing market conditions over the period.
The Fund's top contributor for the period was its investment in the acquisition of VMware by Broadcom. In May 2022, VMware – a US-based software company specializing in cloud computing and virtualization technology – agreed to be acquired by Broadcom – a US-based semiconductor manufacturer focused on telecommunications and storage products – for $61.4 billion in cash and stock. The companies previously extended the termination date of this deal, as investigations from multiple global antitrust regulators caused lengthy delays in receiving clearances in several jurisdictions. We maintained our exposure throughout the deal given our conviction that it did not violate any competition laws. Despite the in-depth reviews, the deal ultimately received all required regulatory approvals and closed in November 2023, leading to gains for the Fund.
The second-largest contributor for the fiscal year was the Fund's position in the acquisition of Activision Blizzard by Microsoft. In January 2022, Microsoft Corp reached an agreement to acquire Activision Blizzard, a US-based developer and publisher of video game software, for $75.1 billion in cash. The deal was met not just with objections from competitors, including Sony, but also wariness amongst antitrust regulators, which caused ongoing volatility in the deal spread. During calendar Q1 2023, the UK Competition and Markets Authority ("CMA") initially signaled a favorable assessment of certain aspects of the transaction, only to block the deal early in calendar Q2 2023 based on concerns about competition in the nascent cloud gaming market – a decision
Annual Report | May 31, 2024
17
Water Island Event-Driven Fund Manager Commentary (continued)
May 31, 2024 (Unaudited)
which Microsoft appealed. Furthermore, the Federal Trade Commission ("FTC") took Microsoft to court seeking to block the acquisition in the US. However, not only did the FTC ultimately fail to persuade the judge that the deal would curtail competition, but it also saw its attempt to appeal the court's decision denied, clearing a path toward approval in the US. With the deal already having received approval in the EU, the CMA agreed to revisit its review and reopen discussions with Microsoft about potential remedies that could satisfy its concerns. In October 2023, the CMA and Microsoft agreed to remedies which addressed the CMA's previous concerns, included divesting Activision's rights to cloud gaming in the UK to competitor Ubisoft for at least 15 years, and the deal subsequently closed, leading to gains for the Fund.
The third-largest contributor for the period was the Fund's position in the acquisition of Horizon Therapeutics by Amgen. In December 2022, Amgen – a multinational biopharmaceutical company and one of the largest independent biotech companies in the world – reached an agreement to acquire Horizon Therapeutics – a biopharmaceutical company focused on treatments for rare, autoimmune diseases – for approximately $27.8 billion in cash. Despite there being no significant overlap in the companies' drug portfolios, the FTC sued to block the transaction based on concerns about the practice of "bundling" (i.e., offering rebates or discounts for ordering multiple products) – a justification that heretofore has never been used to block a merger. While the deal spread widened on the news, we viewed the FTC's case as extremely weak, especially considering bundling actually benefits consumers by lowering prices and the products that the FTC was concerned would be discounted do not even have any competitors currently on the market that could be disadvantaged by such a practice. For its part, Amgen stated the FTC's case "defies logic and precedent" and vowed to take the fight to court. Ultimately, the FTC reconsidered its aggressive stance by withdrawing its request for a hearing – perhaps suggesting it realized the weakness in its own case – and entered into a consent agreement with Amgen, effectively clearing the path for deal completion in the US. The spread narrowed on the news, leading to gains for the Fund, and the transaction closed successfully in calendar Q4 2023.
Conversely, the top detractor in the portfolio was the Fund's position in the merger of Capri Holdings and Tapestry. Capri Holdings is a multinational fashion holding company that owns leading luxury goods, apparel, and footwear brands such as Michael Kors, Versace, and Jimmy Choo. In August 2023, the company agreed to be acquired by Tapestry – a multinational fashion holding company which owns brands such as Kate Spade and Coach – in an all-cash transaction valued at $10 billion. Post deal announcement, the companies' share prices suffered amidst a softening luxury goods market, and the deal spread experienced further volatility stemming from a second request by the FTC, which extended the timeline for regulatory review. While the transaction is still pending, we ultimately opted to exit our position to focus on opportunities with greater risk/reward potential.
The second-largest detractor for the period was the Fund's position in the acquisition of United States Steel by Nippon Steel. In December 2023, United States Steel – a US-based steel producer – reached a definitive agreement to be acquired by Nippon Steel of Japan for $13.4 billion in cash. The transaction has been met with stiff pushback from steelworkers and politicians based primarily on concerns about its potential impact to jobs and national security, including from President Biden, who has expressed a desire for United States Steel to remain a domestically owned American firm. Nippon Steel, for its part, has emphasized its deep roots in the US and said its purchase of United States Steel would strengthen the US's supply chains and economic defenses against China. While the deal appears to have been caught up in the fray of election year politics, on its merits, we believe it meets all regulatory requirements. The transaction has
www.arbitragefunds.com | 1-800-295-4485
18
Water Island Event-Driven Fund Manager Commentary (continued)
May 31, 2024 (Unaudited)
already received shareholder approval and regulatory approval from all required jurisdictions outside the US, and the companies continue to guide toward expected completion in the second half of 2024. We continue to maintain our exposure as we monitor this situation closely.
The third-largest detractor for the fiscal year was the Fund's position in the failed acquisition of PNM Resources by Avangrid. In October 2020, PNM Resources – a US-based electric utility company primarily serving New Mexico and Texas – agreed to be acquired by Avangrid – a local peer serving New England and New York – for $4.0 billion in cash. The deal required several regulatory approvals at both the state and federal level – all but one of which had signed off by December 2021, when the Public Regulation Commission ("PRC") of New Mexico rejected the merger. As there was still a path for the companies to move forward and gain PRC approval, in January 2022 Avangrid filed an appeal and extended the date of the merger agreement to 2023. The deal spread experienced volatility at various points during the course of calendar 2023 as investors feared Avangrid would walk away as the extended termination date neared, despite public statements from Avangrid reaffirming its commitment to the transaction. Ultimately, these fears proved prescient – at the start of the New Year, with no clear timing in the receipt of any decision on their appeal of the PRC denial, Avangrid capitulated and finally exercised its right to terminate the merger.
Annual Report | May 31, 2024
19
May 31, 2024 (Unaudited)
Performance (annualized returns as of May 31, 2024)
| One Year | Five Year | Ten Year | Since Inception* | ||||||||||||||||
Water Island Event-Driven Fund, Class R | 6.77 | % | 3.90 | % | 1.75 | % | 2.28 | % | |||||||||||
Water Island Event-Driven Fund, Class I | 7.03 | % | 4.18 | % | 2.00 | % | 2.54 | % | |||||||||||
Water Island Event-Driven Fund, Class A** | 3.27 | % | 3.23 | % | 1.40 | % | 1.80 | % | |||||||||||
S&P 500® Index | 28.19 | % | 15.80 | % | 12.69 | % | 14.04 | % | |||||||||||
ICE BofA U.S. 3-Month Treasury Bill Index | 5.45 | % | 2.12 | % | 1.47 | % | 1.10 | % | |||||||||||
Bloomberg U.S. Aggregate Bond Index | 1.31 | % | -0.17 | % | 1.26 | % | 1.82 | % | |||||||||||
Current performance may be higher or lower than performance quoted above. Any performance data quoted represents past performance, and the investment return and principal value of an investment in the Fund will fluctuate so that an investor's shares, when redeemed, may be worth more or less than their original cost. Past performance is no guarantee of future results. Returns shown above include the reinvestment of all dividends and capital gains. Performance results do not include adjustments made for financial reporting purposes in accordance with U.S. generally accepted accounting principles and may differ from the amount reported in the Financial Highlights. Performance numbers reflect fee waivers and/or expense reimbursements by the Adviser and any recoupment by the Adviser of waived fees. Absent any applicable waivers and/or expense reimbursements, performance numbers would be reduced. You can obtain performance data current to the most recent month end by calling 1-800-295-4485 or going to www.arbitragefunds.com/water-island-event-driven. This table does not reflect the deduction of taxes that a shareholder would pay on Fund distributions or the redemption of Fund shares.
* Class R and Class I inception: 10/1/10; Class A inception: 6/1/13. The "Since Inception" returns for securities indices are for the inception date of Class R and Class I shares.
** After sales charge. Class A shares are subject to a maximum front-end sales load of 2.75% on purchases up to $250,000. The shares are also subject to a deferred sales charge of up to 1.00% on purchases of $250,000 or more purchased without a front-end sales charge and redeemed within 18 months of purchase.
The Total Annual Fund Operating Expenses for Class R, Class I and Class A are 1.71%, 1.46% and 1.71%, respectively. The Adviser has contractually agreed to limit the total annual operating expenses of the Fund, not including taxes, interest, dividends on short positions, brokerage commissions, acquired fund fees and expenses, and other costs incurred in connection with the purchase or sale of portfolio securities, so they do not exceed 1.69%, 1.44% and 1.69% for Class R, Class I and Class A, respectively. The agreement remains in effect until September 30, 2024, unless terminated earlier by the Board of Trustees. These expense ratios are as stated in the current prospectus and may differ from the expense ratios disclosed in the financial highlights in this report.
The Standard and Poor's 500, or simply the S&P 500, is a stock market index tracking the performance of 500 large companies listed on stock exchanges in the United States.
The ICE BofA U.S. 3-Month Treasury Bill Index tracks the performance of the U.S. dollar denominated U.S. Treasury Bills publicly issued in the U.S. domestic market with a remaining term to final maturity of less than 3 months.
The Bloomberg U.S. Aggregate Bond Index is a market value-weighted index of investment grade fixed-rated debt issues, including government, corporate, asset-backed and mortgage-backed securities with a maturity of one year or more.
The indexes shown are not intended to, and do not, parallel the risk or investment style of the Fund's investment strategy. An investor may not invest directly in an index.
www.arbitragefunds.com | 1-800-295-4485
20
Water Island Event-Driven Fund Portfolio Information (continued)
May 31, 2024 (Unaudited)
Growth of $10,000 Investment
The chart represents historical performance of a hypothetical investment of $10,000 in the Class R shares of the Fund over ten years. Past performance does not guarantee future results. This chart does not reflect the deduction of taxes that a shareholder would pay on Fund distributions or the redemption of Fund shares.

Sector Weighting
The following chart shows the sector weightings of Water Island Event-Driven Fund's investments in common stock, corporate bonds and convertible corporate bonds as of the report date.
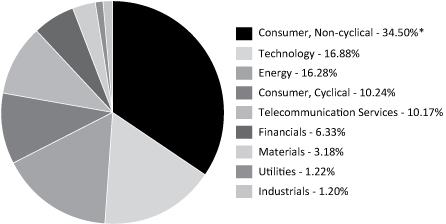
* Concentration Risk: If a large percentage of mergers or event-driven investment opportunities taking place within the U.S. are within one industry over a given period of time, the Fund may invest a large portion of its assets in securities of issuers in a single industry for that period of time. During such a period of concentration, the Fund may be subject to greater volatility with respect to its portfolio securities than a fund that is more broadly diversified.
Annual Report | May 31, 2024
21
May 31, 2024
Shares | Value | ||||||||||
COMMON STOCKS - 74.97% | |||||||||||
Biotechnology - 10.13% | |||||||||||
Cerevel Therapeutics Holdings, Inc.(a) | 73,172 | $ | 2,981,027 | ||||||||
Deciphera Pharmaceuticals, Inc.(a) | 60,514 | 1,545,528 | |||||||||
Olink Holding AB, ADR(a) | 150,555 | 3,605,792 | |||||||||
8,132,347 | |||||||||||
Commercial Services - 2.86% | |||||||||||
Applus Services SA | 55,151 | 761,185 | |||||||||
Network International Holdings PLC(a)(b) | 306,419 | 1,534,486 | |||||||||
2,295,671 | |||||||||||
Electric - 1.22% | |||||||||||
PNM Resources, Inc.(c) | 25,501 | 977,708 | |||||||||
Entertainment - 0.72% | |||||||||||
Cineplex, Inc.(a) | 101,193 | 576,888 | |||||||||
Food - 2.56% | |||||||||||
Albertsons Cos., Inc., Class A(c) | 99,773 | 2,059,315 | |||||||||
Healthcare - Products - 10.23% | |||||||||||
Axonics, Inc.(a)(c) | 54,588 | 3,662,309 | |||||||||
Shockwave Medical, Inc.(a) | 13,598 | 4,555,330 | |||||||||
8,217,639 | |||||||||||
Healthcare - Services - 7.53% | |||||||||||
Amedisys, Inc.(a) | 47,563 | 4,335,367 | |||||||||
Catalent, Inc.(a) | 31,848 | 1,713,104 | |||||||||
6,048,471 | |||||||||||
Home Furnishings - 2.14% | |||||||||||
Vizio Holding Corp., Class A(a)(c) | 159,835 | 1,716,628 | |||||||||
Insurance - 1.12% | |||||||||||
National Western Life Group, Inc., Class A | 1,839 | 902,030 | |||||||||
Internet - 2.41% | |||||||||||
Perficient, Inc.(a) | 15,686 | 1,163,117 | |||||||||
Squarespace, Inc., Class A(a) | 17,638 | 776,072 | |||||||||
1,939,189 | |||||||||||
Iron/Steel - 3.16% | |||||||||||
U.S. Steel Corp.(c) | 66,184 | 2,538,157 | |||||||||
Media - 2.45% | |||||||||||
Endeavor Group Holdings, Inc., Class A(c) | 73,339 | 1,967,685 | |||||||||
See Notes to Financial Statements.
www.arbitragefunds.com | 1-800-295-4485
22
Water Island Event-Driven Fund Portfolio of Investments (continued)
May 31, 2024
Shares | Value | ||||||||||
COMMON STOCKS - 74.97% (Continued) | |||||||||||
Oil & Gas - 6.42% | |||||||||||
Hess Corp. | 29,776 | $ | 4,588,482 | ||||||||
Marathon Oil Corp. | 19,498 | 564,662 | |||||||||
5,153,144 | |||||||||||
Oil & Gas Services - 3.11% | |||||||||||
ChampionX Corp.(c) | 76,658 | 2,500,584 | |||||||||
Pharmaceuticals - 0.48% | |||||||||||
Bayer AG | 12,589 | 385,750 | |||||||||
Real Estate - 2.91% | |||||||||||
McGrath RentCorp | 21,446 | 2,337,185 | |||||||||
Real Estate Investment Trusts - 2.26% | |||||||||||
Apartment Income REIT Corp. | 40,061 | 1,552,364 | |||||||||
Crown Castle, Inc.(c) | 2,579 | 264,347 | |||||||||
1,816,711 | |||||||||||
Semiconductors - 2.63% | |||||||||||
Broadcom, Inc. | 416 | 552,677 | |||||||||
Silicon Motion Technology Corp., ADR(c)(d) | 20,017 | 1,563,127 | |||||||||
2,115,804 | |||||||||||
Software - 7.01% | |||||||||||
ANSYS, Inc.(a) | 6,169 | 1,958,349 | |||||||||
HashiCorp, Inc., Class A(a)(c) | 63,519 | 2,132,968 | |||||||||
Model N, Inc.(a) | 51,543 | 1,540,620 | |||||||||
5,631,937 | |||||||||||
Telecommunications - 3.62% | |||||||||||
Juniper Networks, Inc.(c) | 81,402 | 2,903,609 | |||||||||
| TOTAL COMMON STOCKS (Cost $61,694,714) | 60,216,452 | ||||||||||
RIGHTS(a) - 0.63% | |||||||||||
Bristol-Myers Squibb Co. CVR(e)(f) | 67,803 | 91,534 | |||||||||
Concert Pharmaceuticals, Inc. CVR, Expires 12/31/2029(e)(f) | 154,954 | 64,507 | |||||||||
Contra Abiomed, Inc. CVR, Expires 12/31/2030(e)(f) | 13,890 | 24,308 | |||||||||
Contra Albireo Pharma, Inc. CVR, Expires 12/31/2027(e)(f) | 34,047 | 82,418 | |||||||||
Contra CinCor Pharma, Inc. CVR, Expires 12/31/2027(e)(f) | 39,632 | 136,873 | |||||||||
Contra Resolute Forest Products, Inc. CVR(e)(f) | 68,936 | 110,242 | |||||||||
| TOTAL RIGHTS (Cost $474,646) | 509,882 | ||||||||||
See Notes to Financial Statements.
Annual Report | May 31, 2024
23
Water Island Event-Driven Fund Portfolio of Investments (continued)
May 31, 2024
| Maturity Date | Rate | Principal Amount | Value | ||||||||||||||||
CORPORATE BONDS - 15.99% | |||||||||||||||||||
Entertainment - 2.97% | |||||||||||||||||||
Everi Holdings, Inc.(b) | 07/15/2029 | 5.000 | % | $ | 2,461,000 | $ | 2,389,212 | ||||||||||||
Leisure Time - 1.16% | |||||||||||||||||||
Vista Outdoor, Inc.(b) | 03/15/2029 | 4.500 | % | 945,000 | 928,507 | ||||||||||||||
Oil & Gas - 5.94% | |||||||||||||||||||
| CrownRock LP/CrownRock Finance, Inc.(b) | 10/15/2025 | 5.625 | % | 3,964,000 | 3,954,006 | ||||||||||||||
| Endeavor Energy Resources LP/EER Finance, Inc.(b) | 01/30/2028 | 5.750 | % | 807,000 | 814,797 | ||||||||||||||
4,768,803 | |||||||||||||||||||
Retail - 2.90% | |||||||||||||||||||
Carrols Restaurant Group, Inc.(b) | 07/01/2029 | 5.875 | % | 1,030,000 | 1,063,756 | ||||||||||||||
SRS Distribution, Inc.(b) | 07/01/2028 | 4.625 | % | 1,277,000 | 1,269,652 | ||||||||||||||
2,333,408 | |||||||||||||||||||
Software - 3.02% | |||||||||||||||||||
Alteryx, Inc.(b) | 03/15/2028 | 8.750 | % | 2,361,000 | 2,422,412 | ||||||||||||||
| TOTAL CORPORATE BONDS (Cost $12,898,051) | 12,842,342 | ||||||||||||||||||
CONVERTIBLE CORPORATE BONDS - 4.34% | |||||||||||||||||||
Entertainment - 0.26% | |||||||||||||||||||
Cineplex, Inc.(b) | 03/01/2030 | 7.750 | % | 268,000 | 212,117 | ||||||||||||||
Healthcare - Services - 0.50% | |||||||||||||||||||
| UpHealth, Inc., Variable Rate, (SOFR plus 9.00%)(b) | 12/15/2025 | 14.330 | % | 205,000 | 203,462 | ||||||||||||||
UpHealth, Inc.(b) | 06/15/2026 | 6.250 | % | 217,000 | 200,465 | ||||||||||||||
403,927 | |||||||||||||||||||
Internet - 1.64% | |||||||||||||||||||
TechTarget, Inc.(g) | 12/15/2026 | 0.000 | % | 1,371,000 | 1,312,733 | ||||||||||||||
Software - 1.94% | |||||||||||||||||||
BlackLine, Inc. | 08/01/2024 | 0.125 | % | 1,574,000 | 1,557,473 | ||||||||||||||
| TOTAL CONVERTIBLE CORPORATE BONDS (Cost $3,484,461) | 3,486,250 | ||||||||||||||||||
See Notes to Financial Statements.
www.arbitragefunds.com | 1-800-295-4485
24
Water Island Event-Driven Fund Portfolio of Investments (continued)
May 31, 2024
| Expiration Date | Exercise Price | Notional Amount | Contracts | Value | |||||||||||||||||||
PURCHASED OPTIONS(a) - 0.01% | |||||||||||||||||||||||
Put Options Purchased - 0.01% | |||||||||||||||||||||||
| Silicon Motion Technology Corp. | 06/2024 | $ | 67.50 | $ | 1,561,800 | 200 | $ | 9,200 | |||||||||||||||
| TOTAL PURCHASED OPTIONS (Cost $37,140) | 9,200 | ||||||||||||||||||||||
Yield | Shares | Value | |||||||||||||
SHORT-TERM INVESTMENTS - 4.39% | |||||||||||||||
Money Market Funds | |||||||||||||||
| Morgan Stanley Institutional Liquidity Fund - Government Portfolio | 5.232 | %(h) | 1,761,343 | $ | 1,761,343 | ||||||||||
| State Street Institutional U.S. Government Money Market Fund, Premier Class | 5.375 | %(h) | 1,761,343 | 1,761,343 | |||||||||||
3,522,686 | |||||||||||||||
| TOTAL SHORT-TERM INVESTMENTS (Cost $3,522,686) | 3,522,686 | ||||||||||||||
| Total Investments - 100.33% (Cost $82,111,698) | 80,586,812 | ||||||||||||||
Liabilities in Excess of Other Assets - (0.33%)(i) | (262,803 | ) | |||||||||||||
NET ASSETS - 100.00% | $ | 80,324,009 | |||||||||||||
Portfolio Footnotes
(a) Non-income-producing security.
(b) Security exempt from registration under Rule 144A of the Securities Act of 1933. These securities may be resold in transactions exempt from registration, normally to qualified institutional buyers. As of May 31, 2024, these securities had a total value of $14,992,872 or 18.67% of net assets.
(c) Security, or a portion of security, is being held as collateral for swaps, short sales or forward foreign currency exchange contracts. At May 31, 2024, the aggregate fair market value of those securities was $13,698,370, representing 17.05% of net assets.
(d) Underlying security for a written/purchased call/put option.
(e) Restricted securities (including private placements) - The Fund may own investment securities that have other legal or contractual limitations. At the end of the period, the value of restricted securities (excluding 144A issues) amounted to $509,882 or 0.63% of net assets.
See Notes to Financial Statements.
Annual Report | May 31, 2024
25
Water Island Event-Driven Fund Portfolio of Investments (continued)
May 31, 2024
Restricted Security | Acquisition Date | Acquisition Cost | |||||||||
Bristol-Myers Squibb Co. CVR | 11/20/2020 | $ | 110,781 | ||||||||
Concert Pharmaceuticals, Inc. CVR, Expires 12/31/2029 | 03/07/2023 | 57,333 | |||||||||
Contra Abiomed, Inc. CVR, Expires 12/31/2030 | 12/21/2022 | 14,168 | |||||||||
Contra Albireo Pharma, Inc. CVR, Expires 12/31/2027 | 03/03/2023 | 73,201 | |||||||||
Contra CinCor Pharma, Inc. CVR, Expires 12/31/2027 | 02/23/2023 | 121,274 | |||||||||
Contra Resolute Forest Products, Inc. CVR | 03/01/2023 | 97,889 | |||||||||
Total | $ | 474,646 | |||||||||
(f) Security fair valued using significant unobservable inputs and classified as a Level 3 security. As of May 31, 2024, the total fair market value of these securities was $509,882, representing 0.63% of net assets.
(g) Represents a zero coupon bond.
(h) Rate shown is the 7-day effective yield as of May 31, 2024.
(i) Includes cash held as collateral for short sales.
SCHEDULE OF SECURITIES SOLD SHORT | Shares | Value | |||||||||
COMMON STOCKS SOLD SHORT - (4.11%) | |||||||||||
Commercial Services - (1.19%) | |||||||||||
WillScot Mobile Mini Holdings Corp. | (24,201 | ) | $ | (954,245 | ) | ||||||
Entertainment - (0.02%) | |||||||||||
Cineplex, Inc. | (3,228 | ) | (18,402 | ) | |||||||
Oil & Gas - (0.72%) | |||||||||||
ConocoPhillips | (4,972 | ) | (579,139 | ) | |||||||
Semiconductors - (0.69%) | |||||||||||
Broadcom, Inc. | (416 | ) | (552,677 | ) | |||||||
Software - (1.49%) | |||||||||||
Synopsys, Inc. | (2,131 | ) | (1,195,065 | ) | |||||||
| TOTAL SECURITIES SOLD SHORT (Proceeds $3,231,051) | $ | (3,299,528 | ) | ||||||||
WRITTEN OPTIONS | Expiration Date | Exercise Price | Notional Amount | Contracts | Value | ||||||||||||||||||
Written Call Options | |||||||||||||||||||||||
| Silicon Motion Technology Corp. | 06/2024 | $ | 82.50 | $ | (1,561,800 | ) | (200 | ) | $ | (18,000 | ) | ||||||||||||
| TOTAL WRITTEN OPTIONS (Premiums received $18,616) | $ | (18,000 | ) | ||||||||||||||||||||
See Notes to Financial Statements.
www.arbitragefunds.com | 1-800-295-4485
26
Water Island Event-Driven Fund Portfolio of Investments (continued)
May 31, 2024
EQUITY SWAP CONTRACTS
| Swap Counterparty/ Payment Frequency | Reference Obligation | Rate Paid/ Received by the Fund | Termination Date | Upfront Payments Made | Upfront Payments Received | Market Value | Notional Amount | Unrealized Appreciation | |||||||||||||||||||||||||||
| Morgan Stanley & Co./ Upon Termination | Schlumberger NV | Received 1 Month- Federal Rate Minus 40bps (4.930%) | 10/29/2024 | $ | — | $ | — | $ | 36,111 | USD | 2,625,362 | $ | 36,111 | ||||||||||||||||||||||
| Swap Counterparty/ Payment Frequency | Reference Obligation | Rate Paid/ Received by the Fund | Termination Date | Upfront Payments Made | Upfront Payments Received | Market Value | Notional Amount | Unrealized Depreciation | |||||||||||||||||||||||||||
| Morgan Stanley & Co./ Upon Termination | Chevron Corp. | Received 1 Month- Federal Rate Minus 40bps (4.930%) | 10/29/2024 | $ | — | $ | — | $ | (183,311 | ) | USD | 4,770,572 | $ | (183,311 | ) | ||||||||||||||||||||
OUTSTANDING FORWARD FOREIGN CURRENCY EXCHANGE CONTRACTS
| Currency Purchased | Currency Sold | Counterparty | Settlement Date | Unrealized Appreciation | |||||||||||||||
CAD | 250,400 | USD | 183,069 | Morgan Stanley & Co. | 06/17/2024 | $ | 699 | ||||||||||||
USD | 936,284 | CAD | 1,262,600 | Morgan Stanley & Co. | 06/17/2024 | 9,664 | |||||||||||||
EUR | 184,800 | USD | 199,443 | Morgan Stanley & Co. | 06/17/2024 | 1,183 | |||||||||||||
USD | 1,179,699 | EUR | 1,078,500 | Morgan Stanley & Co. | 06/17/2024 | 8,840 | |||||||||||||
GBP | 1,421,000 | USD | 1,796,044 | Morgan Stanley & Co. | 06/17/2024 | 14,784 | |||||||||||||
USD | 3,499,562 | GBP | 2,739,100 | Morgan Stanley & Co. | 06/17/2024 | 9,035 | |||||||||||||
NOK | 37,868,100 | USD | 3,603,716 | Morgan Stanley & Co. | 06/17/2024 | 5,198 | |||||||||||||
$ | 49,403 | ||||||||||||||||||
See Notes to Financial Statements.
Annual Report | May 31, 2024
27
Water Island Event-Driven Fund Portfolio of Investments (continued)
May 31, 2024
| Currency Purchased | Currency Sold | Counterparty | Settlement Date | Unrealized Depreciation | |||||||||||||||
CAD | 199,800 | USD | 147,991 | Morgan Stanley & Co. | 06/17/2024 | $ | (1,357 | ) | |||||||||||
USD | 179,072 | CAD | 245,300 | Morgan Stanley & Co. | 06/17/2024 | (954 | ) | ||||||||||||
EUR | 122,400 | USD | 133,292 | Morgan Stanley & Co. | 06/17/2024 | (411 | ) | ||||||||||||
USD | 306,975 | EUR | 284,900 | Morgan Stanley & Co. | 06/17/2024 | (2,323 | ) | ||||||||||||
GBP | 92,400 | USD | 117,761 | Morgan Stanley & Co. | 06/17/2024 | (13 | ) | ||||||||||||
USD | 3,607,487 | NOK | 37,868,100 | Morgan Stanley & Co. | 06/17/2024 | (1,427 | ) | ||||||||||||
$ | (6,485 | ) | |||||||||||||||||
The following is a summary of investments classified by country exposure:
Country | % of Net Assets(a) | ||||||
United States | 89.58 | % | |||||
Sweden | 4.49 | % | |||||
Cayman Islands | 1.94 | % | |||||
United Kingdom | 1.91 | % | |||||
Canada | 0.98 | % | |||||
Spain | 0.95 | % | |||||
Germany | 0.48 | % | |||||
Liabilities in Excess of Other Assets | (0.33 | )% | |||||
100.00 | % | ||||||
(a) These percentages represent long positions only and are not net of short positions.
Abbreviations:
AB - Aktiebolag is the Swedish term for a limited company.
ADR - American Depositary Receipt
AG - Aktiengesellschaft is a German term that refers to a corporation that is limited by shares, i.e., owned by shareholders.
bps - Basis Points. 100 Basis Points is equal to 1 percentage point.
CAD - Canadian dollar
CVR - Contingent Value Rights
EUR - Euro
GBP - British pound
LP - Limited Partnership
NOK - Norwegian krone
NV - Naamloze Vennootschap is the Dutch term for a public limited liability corporation.
PLC - Public Limited Company
REIT - Real Estate Investment Trust
SA - Generally designates corporations in various countries, mostly those employing civil law. This translates literally in all languages mentioned as anonymous company.
SOFR - Secured Overnight Financing Rate
USD - United States Dollar
See Notes to Financial Statements.
www.arbitragefunds.com | 1-800-295-4485
28
Water Island Event-Driven Fund Portfolio of Investments (continued)
May 31, 2024
The following table summarizes the Water Island Event-Driven Fund's investments and derivative financial instruments categorized in the fair value hierarchy as of May 31, 2024:
Investments in Securities at Fair Value* | Level 1 | Level 2 | Level 3 | Total | |||||||||||||||
Assets | |||||||||||||||||||
Common Stocks | |||||||||||||||||||
Biotechnology | $ | 8,132,347 | $ | — | $ | — | $ | 8,132,347 | |||||||||||
Commercial Services | 2,295,671 | — | — | 2,295,671 | |||||||||||||||
Electric | 977,708 | — | — | 977,708 | |||||||||||||||
Entertainment | 576,888 | — | — | 576,888 | |||||||||||||||
Food | 2,059,315 | — | — | 2,059,315 | |||||||||||||||
Healthcare - Products | 3,662,309 | 4,555,330 | — | 8,217,639 | |||||||||||||||
Healthcare - Services | 6,048,471 | — | — | 6,048,471 | |||||||||||||||
Home Furnishings | 1,716,628 | — | — | 1,716,628 | |||||||||||||||
Insurance | 902,030 | — | — | 902,030 | |||||||||||||||
Internet | 1,939,189 | — | — | 1,939,189 | |||||||||||||||
Iron/Steel | 2,538,157 | — | — | 2,538,157 | |||||||||||||||
Media | 1,967,685 | — | — | 1,967,685 | |||||||||||||||
Oil & Gas | 5,153,144 | — | — | 5,153,144 | |||||||||||||||
Oil & Gas Services | 2,500,584 | — | — | 2,500,584 | |||||||||||||||
Pharmaceuticals | 385,750 | — | — | 385,750 | |||||||||||||||
Real Estate | 2,337,185 | — | — | 2,337,185 | |||||||||||||||
Real Estate Investment Trusts | 1,816,711 | — | — | 1,816,711 | |||||||||||||||
Semiconductors | 2,115,804 | — | — | 2,115,804 | |||||||||||||||
Software | 5,631,937 | — | — | 5,631,937 | |||||||||||||||
Telecommunications | 2,903,609 | — | — | 2,903,609 | |||||||||||||||
Rights | — | — | 509,882 | 509,882 | |||||||||||||||
Corporate Bonds** | — | 12,842,342 | — | 12,842,342 | |||||||||||||||
Convertible Corporate Bonds** | — | 3,486,250 | — | 3,486,250 | |||||||||||||||
Purchased Options | 9,200 | — | — | 9,200 | |||||||||||||||
Short-Term Investments | 3,522,686 | — | — | 3,522,686 | |||||||||||||||
TOTAL | $ | 59,193,008 | $ | 20,883,922 | $ | 509,882 | $ | 80,586,812 | |||||||||||
Other Financial Instruments*** | |||||||||||||||||||
Assets | |||||||||||||||||||
| Forward Foreign Currency Exchange Contracts | $ | — | $ | 49,403 | $ | — | $ | 49,403 | |||||||||||
Equity Swaps | 36,111 | — | — | 36,111 | |||||||||||||||
Liabilities | |||||||||||||||||||
Common Stocks** | (3,299,528 | ) | — | — | (3,299,528 | ) | |||||||||||||
Written Options | (18,000 | ) | — | — | (18,000 | ) | |||||||||||||
| Forward Foreign Currency Exchange Contracts | — | (6,485 | ) | — | (6,485 | ) | |||||||||||||
Equity Swaps | (183,311 | ) | — | — | (183,311 | ) | |||||||||||||
TOTAL | $ | (3,464,728 | ) | $ | 42,918 | $ | — | $ | (3,421,810 | ) | |||||||||
* Refer to Note 2 where leveling hierarchy is defined.
See Notes to Financial Statements.
Annual Report | May 31, 2024
29
Water Island Event-Driven Fund Portfolio of Investments (continued)
May 31, 2024
** Refer to Portfolio of Investments for sector information.
*** Other financial instruments are instruments such as written options, securities sold short, equity swaps and forward foreign currency exchange contracts.
The following is a reconciliation of the fair valuations using significant unobservable inputs (Level 3) for the Fund's assets and liabilities during the period ended May 31, 2024:
| Investments in Securities | Balance as of May 31, 2023 | Realized Gain (Loss) | Change in Unrealized Appreciation (Depreciation) | Purchases | Sales Proceeds | Transfers into Level 3 | Transfers out of Level 3 | Balance as of May 31, 2024 | Net change in Unrealized Appreciation (Depreciation) from investments still held as of May 31, 2024 | ||||||||||||||||||||||||||||||
| Common Stocks | $ | 6,889,128 | $ | 285,151 | $ | (285,251 | ) | $ | — | $ | (6,889,028 | ) | $ | — | $ | — | $ | — | $ | — | |||||||||||||||||||
Rights | 366,494 | 91,928 | 37,761 | — | (102,143 | ) | 115,842 | — | 509,882 | 59,555 | |||||||||||||||||||||||||||||
| Private Investments | 45,600 | 2,074 | (22,009 | ) | — | (25,665 | ) | — | — | — | — | ||||||||||||||||||||||||||||
Total | $ | 7,301,222 | $ | 379,153 | $ | (269,499 | ) | $ | — | $ | (7,016,836 | ) | $ | 115,842 | $ | — | $ | 509,882 | $ | 59,555 | |||||||||||||||||||
The following table summarizes the quantitative inputs used for investments categorized as Level 3 of the fair value hierarchy as of May 31, 2024:
| Investments in Securities | Fair Value at May 31, 2024 | Valuation Technique | Unobservable Input | Range of Values | Weighted Average | ||||||||||||||||||
| Rights | $ | 509,882 | Discounted, probability adjusted value, Broker Quote | Discount Rate, Probability, Broker Quote | 10%, 20.25%-65%, $1.35-$1.75 | 10%, 45.51%, $1.43 | |||||||||||||||||
See Notes to Financial Statements.
www.arbitragefunds.com | 1-800-295-4485
30
May 31, 2024 (Unaudited)
Water Island Credit Opportunities Fund | Tickers: ACFIX, ARCFX, AGCAX
The Fund's Goal and Main Investments
The Fund seeks to provide current income and capital growth by focusing on company-specific catalysts and events in order to generate returns that are more correlated to the outcomes and timelines of those events, rather than on overall market direction or changes in interest rates.
Investment Strategy
The Fund employs a fundamentally driven investment approach. The investment team screens catalyst-driven investments such as mergers, acquisitions, asset sales, spin-offs, refinancings, recapitalizations, corporate reorganizations, litigation, and regulatory changes. From this universe the team selects investments based on factors such as risk/reward profile, potential downside, and security liquidity. The team generates returns by holding outright long and short positions and by utilizing capital structure arbitrage, merger arbitrage, and convertible arbitrage techniques to exploit security mispricing or inefficiencies. This portfolio offers a pure-play credit implementation of Water Island Capital's broader event-driven style.
Fiscal Year Highlights
Water Island Credit Opportunities Fund Class I (ACFIX) returned 6.23% for the fiscal year ended May 31, 2024. Investments in both the Americas and European regions contributed to returns. Information technology and health care were the top performing sectors, while utilities and real estate detracted the most from returns.
The Fund may utilize derivatives for several purposes, primarily to implement position-level hedges, portfolio-level hedges, or currency hedges. During the fiscal year, the Fund's investments in derivative instruments were essentially flat (detracting less than one basis point). Derivative performance was in line with expectations given prevailing market conditions over the period.
The Fund's top contributor for the fiscal year was its investment in UpHealth bonds. UpHealth is a company that was formed in 2021 via the roll-up of several digital health services businesses in a transaction with a special purpose acquisition company. In March, the company completed the sale of subsidiary Cloudbreak Health to private equity firm GTCR for $180 million in cash, which had been previously announced in calendar Q4 2023. The company plans to use net proceeds to retire a significant portion of its outstanding convertible bonds, and the news pushed prices higher. The repurchases completed successfully during calendar Q2 2024, leading to gains for the Fund.
The second-largest contributor for the fiscal year was the Fund's position in Getty Images bonds. Getty Images is a world-renowned leader in visual media content providing stock images, editorial photography, and digital media for businesses and consumers. The company's bonds rose during the period as yield spreads tightened along with news that the company's debt had been upgraded by Moody's ratings agency and that the company may be moving toward redeeming its bonds in the near-term. We continue to believe Getty bonds are an attractive short-term yield investment that is supported by a high coupon, a variable cost structure, and management's desire to reduce debt.
The third-largest contributor for the period was the Fund's position in Kaleyra bonds. Kaleyra offers cloud communications platforms for building SMS, voice, and messaging applications. In 2022, we joined a group of investors to help fund Kaleyra's acquisition of Mgage LLC via a convertible bond offering. We believed the bonds offered attractive yields along with strong optionality via multiple potential catalysts, and during calendar Q2 2023 Kaleyra announced it
Annual Report | May 31, 2024
31
Water Island Credit Opportunities Fund Manager Commentary (continued)
May 31, 2024 (Unaudited)
had reached an agreement to be acquired by Tata Communications for $248 million in cash. Tata completed the acquisition of Kaleyra in calendar Q4 2023, leading to gains for the Fund.
Conversely, the top detractor in the portfolio was the Fund's position in Lightning eMotors bonds. Lightning eMotors produces electric fleet medium- and heavy-duty vehicles, including delivery trucks, passenger vans, and school, shuttle, and city transit buses. Since the 2020 pandemic, the company struggled to address supply shortages of batteries and chassis. Lacking additional funding, in December 2023, the company filed in the state of Colorado to appoint a receiver who will be responsible for selling and distributing the proceeds of the company's assets to creditors. We had exited most of our position in the company over the prior 18 months, leaving a small amount of exposure predicated on potential optionality as we await updates from the court and any subsequent asset sales and distributions to creditors.
The second-largest detractor for the period stemmed from the Fund's broad credit market hedges. From time to time, in addition to various issuer-specific hedges, we may choose to implement broader market hedges in the portfolio. These hedges may include a combination of credit, interest rate, equity, and exchange-traded fund (ETF) securities designed to help dampen portfolio volatility and to assist hedging of softer catalyst events. During the period, these positions have behaved as expected – while they detracted from returns somewhat, their performance was offset by overall gains in the positions they were meant to hedge.
The third-largest detractor for the fiscal year was the Fund's position in Altice France bonds. Altice France is a European broadband internet and cable television service provider. Our long-term holding of the company's bonds turned direction quickly in March after management reversed course on plans to reduce debt, instead announcing on its earnings call that the company would ask creditors for "haircuts" on their bonds to effectively de-lever the company's balance sheet. The news caught the market with extreme surprise as the company had several years until its larger maturity wall, and a series of assets sales had been announced which not only built investor confidence but were also consistent with billionaire owner Patrick Drahi's guidance last year stating that the company would follow the same plan as it had in years past by doing "everything" to de-lever including asset sales, equity infusions, and discount market purchases. While we had taken some profits in the bonds during calendar Q4 2023, heavy selling by investors pushed bond prices lower, leading to mark-to-market losses during calendar Q1 2024. With bond prices now stabilizing and slowly reversing, the situation has entered a period where large, sophisticated investors are preparing for negotiations to establish a more agreeable capital structure for the company.
www.arbitragefunds.com | 1-800-295-4485
32
May 31, 2024 (Unaudited)
Performance (annualized returns as of May 31, 2024)
| One Year | Five Year | Ten Year | Since Inception* | ||||||||||||||||
Water Island Credit Opportunities Fund, Class R | 5.96 | % | 3.45 | % | 2.55 | % | 2.82 | % | |||||||||||
Water Island Credit Opportunities Fund, Class I | 6.23 | % | 3.72 | % | 2.81 | % | 3.05 | % | |||||||||||
Water Island Credit Opportunities Fund, Class A** | 2.54 | % | 2.81 | % | 2.22 | % | 2.46 | % | |||||||||||
Bloomberg U.S. Aggregate Bond Index | 1.31 | % | -0.17 | % | 1.26 | % | 1.25 | % | |||||||||||
ICE BofA U.S. 3-Month Treasury Bill Index | 5.45 | % | 2.12 | % | 1.47 | % | 1.27 | % | |||||||||||
Current performance may be higher or lower than performance quoted above. Any performance data quoted represents past performance and the investment return and principal value of an investment in the Fund will fluctuate so that an investor's shares, when redeemed, may be worth more or less than their original cost. Past performance is no guarantee of future results. Returns shown above include the reinvestment of all dividends and capital gains. Performance results do not include adjustments made for financial reporting purposes in accordance with U.S. generally accepted accounting principles and may differ from the amount reported in the Financial Highlights. Contractual fee waivers are currently in effect. Without such fee waivers, performance numbers would be reduced. You can obtain performance data current to the most recent month end by calling 1-800-295-4485 or going to www.arbitragefunds.com/water-island-credit-opportunities. This table does not reflect the deduction of taxes that a shareholder would pay on Fund distributions or the redemption of Fund shares.
* Class R and Class I inception: 10/1/12; Class A inception: 6/1/13. The "Since Inception" returns for securities indices are for the inception date of Class R and Class I shares.
** After sales charge. Class A shares are subject to a maximum front-end sales load of 2.75% on purchases up to $250,000. The shares are also subject to a deferred sales charge of up to 1.00% on purchases of $250,000 or more purchased without a front-end sales charge and redeemed within 18 months of purchase.
The Total Annual Fund Operating Expenses for Class R, Class I and Class A are 1.63%, 1.38% and 1.63%, respectively. The Adviser has contractually agreed to limit the total annual operating expenses of the Fund, not including taxes, interest, dividends on short positions, brokerage commissions, acquired fund fees and expenses and other costs incurred in connection with the purchase or sale of portfolio securities, so they do not exceed 1.23%, 0.98% and 1.23% for Class R, Class I and Class A, respectively. The agreement remains in effect until September 30, 2024, unless terminated earlier by the Board of Trustees. These expense ratios are as stated in the current prospectus and may differ from the expense ratios disclosed in the financial highlights in this report.
The Bloomberg U.S. Aggregate Bond Index is a market value-weighted index of investment grade fixed-rated debt issues, including government, corporate, asset-backed and mortgage-backed securities with a maturity of one year or more.
The ICE BofA U.S. 3-Month Treasury Bill Index tracks the performance of the U.S. dollar denominated U.S. Treasury Bills publicly issued in the U.S. domestic market with a remaining term to final maturity of less than 3 months.
The indexes shown are not intended to, and do not, parallel the risk or investment style of the Fund's investment strategy. An investor may not invest directly in an index.
Annual Report | May 31, 2024
33
Water Island Credit Opportunities Fund Portfolio Information (continued)
May 31, 2024 (Unaudited)
Growth of $10,000 Investment
The chart represents historical performance of a hypothetical investment of $10,000 in the Class R shares of the Fund since inception. Past performance does not guarantee future results. This chart does not reflect the deduction of taxes that a shareholder would pay on Fund distributions or the redemption of Fund shares.

Sector Weighting
The following chart shows the sector weightings of Water Island Credit Opportunities Fund's investments in common stock, corporate bonds and convertible corporate bonds as of the report date.

* Concentration Risk: From time to time, based on market or economic conditions or investment opportunities, the Fund may have significant investments in one or more sectors of the market. During such a period of concentration, the Fund may be subject to greater volatility with respect to its portfolio securities than a fund that is more broadly diversified.
www.arbitragefunds.com | 1-800-295-4485
34
May 31, 2024
| Maturity Date | Rate | Principal Amount | Value | ||||||||||||||||
BANK LOANS - 4.91% | |||||||||||||||||||
Aerospace & Defense - 1.40% | |||||||||||||||||||
| Spirit Aerosystems, Inc., 2022 Term Loan, Variable Rate, (3 mo. USD SOFR plus 4.25%) | 01/15/2027 | 9.580 | % | $ | 1,994,937 | $ | 2,009,649 | ||||||||||||
Commercial Services - 3.51% | |||||||||||||||||||
| Nuvei Technologies Corp., Term Loan B(j) | 12/19/2030 | TBD | 5,000,000 | 5,028,575 | |||||||||||||||
| TOTAL BANK LOANS (Cost $7,013,072) | 7,038,224 | ||||||||||||||||||
CORPORATE BONDS - 54.25% | |||||||||||||||||||
Aerospace & Defense - 0.24% | |||||||||||||||||||
Howmet Aerospace, Inc. | 10/01/2024 | 5.125 | % | 340,000 | 339,753 | ||||||||||||||
Apparel - 2.41% | |||||||||||||||||||
Michael Kors USA, Inc.(a)(b) | 11/01/2024 | 4.250 | % | 3,500,000 | 3,459,023 | ||||||||||||||
Auto Manufacturers - 2.36% | |||||||||||||||||||
Ford Motor Credit Co. LLC(b) | 09/08/2024 | 3.664 | % | 3,400,000 | 3,379,445 | ||||||||||||||
Auto Parts & Equipment - 2.59% | |||||||||||||||||||
Goodyear Tire & Rubber Co.(b) | 05/31/2025 | 9.500 | % | 3,700,000 | 3,709,246 | ||||||||||||||
Banks - 0.67% | |||||||||||||||||||
| Truist Financial Corp., Variable Rate, (3 mo. USD SOFR plus 0.91%)(b) | 03/15/2028 | 6.241 | % | 1,000,000 | 956,890 | ||||||||||||||
Commercial Services - 2.79% | |||||||||||||||||||
| Triton Container International Ltd.(a) | 06/07/2024 | 1.150 | % | 4,000,000 | 3,997,160 | ||||||||||||||
Electric - 1.70% | |||||||||||||||||||
| Atlantica Sustainable Infrastructure PLC(a) | 06/15/2028 | 4.125 | % | 2,500,000 | 2,440,344 | ||||||||||||||
Electrical Components & Equipment - 2.77% | |||||||||||||||||||
WESCO Distribution, Inc.(a) | 06/15/2025 | 7.125 | % | 3,965,000 | 3,963,315 | ||||||||||||||
Entertainment - 3.72% | |||||||||||||||||||
Everi Holdings, Inc.(a)(b) | 07/15/2029 | 5.000 | % | 3,195,000 | 3,101,801 | ||||||||||||||
| International Game Technology PLC(a)(b) | 02/15/2025 | 6.500 | % | 2,220,000 | 2,224,576 | ||||||||||||||
5,326,377 | |||||||||||||||||||
See Notes to Financial Statements.
Annual Report | May 31, 2024
35
Water Island Credit Opportunities Fund Portfolio of Investments (continued)
May 31, 2024
| Maturity Date | Rate | Principal Amount | Value | ||||||||||||||||
CORPORATE BONDS - 54.25% (Continued) | |||||||||||||||||||
Healthcare - Services - 3.32% | |||||||||||||||||||
Catalent Pharma Solutions, Inc.(a)(b) | 04/01/2030 | 3.500 | % | $ | 5,000,000 | $ | 4,752,751 | ||||||||||||
Internet - 5.85% | |||||||||||||||||||
Gen Digital, Inc.(a)(b) | 04/15/2025 | 5.000 | % | 2,907,000 | 2,881,500 | ||||||||||||||
Getty Images, Inc.(a) | 03/01/2027 | 9.750 | % | 5,500,000 | 5,491,017 | ||||||||||||||
8,372,517 | |||||||||||||||||||
Iron/Steel - 1.61% | |||||||||||||||||||
U.S. Steel Corp. | 03/01/2029 | 6.875 | % | 2,300,000 | 2,300,011 | ||||||||||||||
Leisure Time - 1.37% | |||||||||||||||||||
Vista Outdoor, Inc.(a) | 03/15/2029 | 4.500 | % | 2,000,000 | 1,965,095 | ||||||||||||||
Miscellaneous Manufacturing - 1.03% | |||||||||||||||||||
Hillenbrand, Inc.(b) | 06/15/2025 | 5.750 | % | 1,475,000 | 1,468,428 | ||||||||||||||
Office/Business Equip - 2.63% | |||||||||||||||||||
Xerox Holdings Corp.(a)(b) | 08/15/2025 | 5.000 | % | 3,852,000 | 3,771,983 | ||||||||||||||
Oil & Gas - 5.11% | |||||||||||||||||||
| CrownRock LP/CrownRock Finance, Inc.(a)(b) | 10/15/2025 | 5.625 | % | 6,000,000 | 5,984,873 | ||||||||||||||
| Endeavor Energy Resources LP/EER Finance, Inc.(a) | 01/30/2028 | 5.750 | % | 1,295,000 | 1,307,511 | ||||||||||||||
Occidental Petroleum Corp. | 09/01/2025 | 5.875 | % | 30,000 | 29,994 | ||||||||||||||
7,322,378 | |||||||||||||||||||
Retail - 4.67% | |||||||||||||||||||
| Abercrombie & Fitch Management Co.(a)(b) | 07/15/2025 | 8.750 | % | 2,215,000 | 2,214,110 | ||||||||||||||
Carrols Restaurant Group, Inc.(a) | 07/01/2029 | 5.875 | % | 1,275,000 | 1,316,785 | ||||||||||||||
Dave & Buster's, Inc.(a)(b) | 11/01/2025 | 7.625 | % | 1,500,000 | 1,507,902 | ||||||||||||||
SRS Distribution, Inc.(a)(b) | 07/01/2028 | 4.625 | % | 1,657,000 | 1,647,465 | ||||||||||||||
6,686,262 | |||||||||||||||||||
Software - 6.51% | |||||||||||||||||||
ACI Worldwide, Inc.(a) | 08/15/2026 | 5.750 | % | 1,064,000 | 1,054,350 | ||||||||||||||
Alteryx, Inc.(a) | 03/15/2028 | 8.750 | % | 4,194,000 | 4,303,091 | ||||||||||||||
Boxer Parent Co., Inc.(a)(b) | 10/02/2025 | 7.125 | % | 3,215,000 | 3,223,320 | ||||||||||||||
PTC, Inc.(a)(b) | 02/15/2025 | 3.625 | % | 750,000 | 737,477 | ||||||||||||||
9,318,238 | |||||||||||||||||||
See Notes to Financial Statements.
www.arbitragefunds.com | 1-800-295-4485
36
Water Island Credit Opportunities Fund Portfolio of Investments (continued)
May 31, 2024
| Maturity Date | Rate | Principal Amount | Value | ||||||||||||||||
CORPORATE BONDS - 54.25% (Continued) | |||||||||||||||||||
Telecommunications - 2.90% | |||||||||||||||||||
Altice France Holding SA(a) | 05/15/2027 | 10.500 | % | $ | 1,550,000 | $ | 573,488 | ||||||||||||
Sprint LLC | 06/15/2024 | 7.125 | % | 2,500,000 | 2,500,403 | ||||||||||||||
U.S. Cellular Corp. | 12/15/2033 | 6.700 | % | 1,030,000 | 1,084,153 | ||||||||||||||
4,158,044 | |||||||||||||||||||
| TOTAL CORPORATE BONDS (Cost $78,919,324) | 77,687,260 | ||||||||||||||||||
CONVERTIBLE CORPORATE BONDS - 26.67% | |||||||||||||||||||
Auto Manufacturers - 0.02% | |||||||||||||||||||
Lightning eMotors, Inc.(a)(c) | 05/15/2024 | 7.500 | % | 973,000 | 29,190 | ||||||||||||||
Diversified Financial Services - 1.12% | |||||||||||||||||||
WisdomTree, Inc. | 06/15/2026 | 3.250 | % | 1,500,000 | 1,606,442 | ||||||||||||||
Entertainment - 0.21% | |||||||||||||||||||
Cineplex, Inc.(a) | 03/01/2030 | 7.750 | % | 388,000 | 307,095 | ||||||||||||||
Healthcare - Services - 0.77% | |||||||||||||||||||
| UpHealth, Inc., Variable Rate, (SOFR plus 9.00%)(a) | 12/15/2025 | 14.330 | % | 470,000 | 466,475 | ||||||||||||||
UpHealth, Inc.(a) | 06/15/2026 | 6.250 | % | 689,000 | 636,498 | ||||||||||||||
1,102,973 | |||||||||||||||||||
Internet - 6.81% | |||||||||||||||||||
Perficient, Inc.(b) | 11/15/2026 | 0.125 | % | 4,750,000 | 4,557,625 | ||||||||||||||
Spotify USA, Inc.(d) | 03/15/2026 | 0.000 | % | 3,500,000 | 3,279,525 | ||||||||||||||
TechTarget, Inc.(b)(d) | 12/15/2026 | 0.000 | % | 2,000,000 | 1,915,000 | ||||||||||||||
9,752,150 | |||||||||||||||||||
Pharmaceuticals - 2.07% | |||||||||||||||||||
Jazz Investments I Ltd.(b) | 08/15/2024 | 1.500 | % | 3,000,000 | 2,968,500 | ||||||||||||||
Software - 15.67% | |||||||||||||||||||
Bentley Systems, Inc.(b) | 07/01/2027 | 0.375 | % | 2,500,000 | 2,226,250 | ||||||||||||||
BlackLine, Inc. | 08/01/2024 | 0.125 | % | 4,474,000 | 4,427,023 | ||||||||||||||
BlackLine, Inc.(d) | 03/15/2026 | 0.000 | % | 3,071,000 | 2,763,900 | ||||||||||||||
Everbridge, Inc.(d) | 03/15/2026 | 0.000 | % | 2,500,000 | 2,456,250 | ||||||||||||||
Model N, Inc. | 03/15/2028 | 1.875 | % | 5,000,000 | 4,915,000 | ||||||||||||||
RingCentral, Inc.(b)(d) | 03/01/2025 | 0.000 | % | 3,105,000 | 2,928,015 | ||||||||||||||
Verint Systems, Inc. | 04/15/2026 | 0.250 | % | 3,000,000 | 2,718,000 | ||||||||||||||
22,434,438 | |||||||||||||||||||
| TOTAL CONVERTIBLE CORPORATE BONDS (Cost $39,043,318) | 38,200,788 | ||||||||||||||||||
See Notes to Financial Statements.
Annual Report | May 31, 2024
37
Water Island Credit Opportunities Fund Portfolio of Investments (continued)
May 31, 2024
Shares | Value | ||||||||||
WARRANTS(e) - 0.00%(f) | |||||||||||
Auto Manufacturers - 0.00%(f) | |||||||||||
| Lightning eMotors, Inc., Exercise Price $11.50, Expires 05/18/2025(g) | 53,913 | $ | 32 | ||||||||
| TOTAL WARRANTS (Cost $0) | 32 | ||||||||||
| Maturity Date | Rate | Shares | Value | ||||||||||||||||
PREFERRED STOCKS - 1.14% | |||||||||||||||||||
Pipelines - 1.14% | |||||||||||||||||||
| NuStar Energy LP, Series A, Variable Rate, (3 mo. USD SOFR plus 7.03%) | 06/03/2024 | 12.357 | % | 33,072 | $ | 826,470 | |||||||||||||
| NuStar Energy LP, Series B, Variable Rate, (3 mo. USD SOFR plus 5.90%) | 06/03/2024 | 11.234 | % | 31,989 | 799,405 | ||||||||||||||
1,625,875 | |||||||||||||||||||
| TOTAL PREFERRED STOCKS (Cost $1,669,115) | 1,625,875 | ||||||||||||||||||
| Expiration Date | Exercise Price | Notional Amount | Contracts | Value | |||||||||||||||||||
PURCHASED OPTIONS(e) - 0.05% | |||||||||||||||||||||||
Call Options Purchased - 0.02% | |||||||||||||||||||||||
| Dave & Buster's Entertainment, Inc. | 06/2024 | $ | 60.00 | $ | 408,720 | 80 | $ | 5,280 | |||||||||||||||
Gen Digital, Inc. | 09/2024 | 27.00 | 744,900 | 300 | 19,500 | ||||||||||||||||||
Nuvei Corp. | 09/2024 | 35.00 | 2,415,000 | 750 | 3,750 | ||||||||||||||||||
Xerox Holdings Corp. | |||||||||||||||||||||||
07/2024 | 15.00 | 140,600 | 100 | 1,700 | |||||||||||||||||||
07/2024 | 17.00 | 506,160 | 360 | 0 | |||||||||||||||||||
Put Options Purchased - 0.03% | |||||||||||||||||||||||
| iShares iBoxx $ High Yield Corporate Bond ETF | 08/2024 | 75.00 | 10,689,000 | 1,000 | 31,000 | ||||||||||||||||||
| iShares iBoxx $ Investment Grade Corporate Bond ETF | 07/2024 | 104.00 | 3,856,500 | 500 | 16,500 | ||||||||||||||||||
Vista Outdoor, Inc. | 06/2024 | 30.00 | 348,800 | 100 | 500 | ||||||||||||||||||
| TOTAL PURCHASED OPTIONS (Cost $156,868) | 78,230 | ||||||||||||||||||||||
See Notes to Financial Statements.
www.arbitragefunds.com | 1-800-295-4485
38
Water Island Credit Opportunities Fund Portfolio of Investments (continued)
May 31, 2024
Yield | Shares | Value | |||||||||||||
SHORT-TERM INVESTMENTS - 15.67% | |||||||||||||||
Money Market Funds | |||||||||||||||
| Morgan Stanley Institutional Liquidity Fund - Government Portfolio | 5.232 | %(h) | 11,220,343 | $ | 11,220,343 | ||||||||||
| State Street Institutional U.S. Government Money Market Fund, Premier Class | 5.375 | %(h) | 11,220,342 | 11,220,342 | |||||||||||
22,440,685 | |||||||||||||||
| TOTAL SHORT-TERM INVESTMENTS (Cost $22,440,685) | 22,440,685 | ||||||
| Total Investments - 102.68% (Cost $149,242,382) | 147,071,094 | ||||||
| Liabilities in Excess of Other Assets - (2.68%)(i) | (3,832,561 | ) | |||||
| NET ASSETS - 100.00% | $ | 143,238,533 | |||||
Portfolio Footnotes
(a) Security exempt from registration under Rule 144A of the Securities Act of 1933. These securities may be resold in transactions exempt from registration, normally to qualified institutional buyers. As of May 31, 2024, these securities had a total value of $63,358,195 or 44.23% of net assets.
(b) Security, or a portion of security, is being held as collateral for short sales, or forward foreign currency exchange contracts. At May 31, 2024, the aggregate fair market value of those securities was $56,062,115, representing 39.14% of net assets.
(c) Security in default on interest payments.
(d) Represents a zero coupon bond.
(e) Non-income-producing security.
(f) Less than 0.005% of net assets.
(g) Restricted securities (including private placements) - The Fund may own investment securities that have other legal or contractual limitations. At the end of the period, the value of restricted securities (excluding 144A issues) amounted to $32 or 0.0% of net assets.
Restricted Security | Acquisition Date | Acquisition Cost | |||||||||
Lightning eMotors, Inc., Exercise Price $11.50, Expires 05/18/2025 | 04/28/2021 | $ | — | ||||||||
Total | $ | — | |||||||||
(h) Rate shown is the 7-day effective yield as of May 31, 2024.
(i) Includes cash held as collateral for short sales.
(j) This position represents an unsettled loan commitment at period end. Certain details associated with this purchase are not known prior to the settlement date, including coupon rate, which will be adjusted on settlement date.
See Notes to Financial Statements.
Annual Report | May 31, 2024
39
Water Island Credit Opportunities Fund Portfolio of Investments (continued)
May 31, 2024
SCHEDULE OF SECURITIES SOLD SHORT | Shares | Value | |||||||||
COMMON STOCKS SOLD SHORT - (4.91%) | |||||||||||
Commercial Services - (1.69%) | |||||||||||
Nuvei Corp. | (75,000 | ) | $ | (2,415,000 | ) | ||||||
Diversified Financial Services - (0.38%) | |||||||||||
WisdomTree, Inc. | (54,400 | ) | (542,368 | ) | |||||||
Entertainment - (0.07%) | |||||||||||
Cineplex, Inc. | (18,000 | ) | (102,616 | ) | |||||||
Healthcare - Services - (0.60%) | |||||||||||
Catalent, Inc. | (16,000 | ) | (860,640 | ) | |||||||
Internet - (1.36%) | |||||||||||
Perficient, Inc. | (18,600 | ) | (1,379,190 | ) | |||||||
Spotify Technology SA | (1,900 | ) | (563,882 | ) | |||||||
(1,943,072 | ) | ||||||||||
Office/Business Equip - (0.07%) | |||||||||||
Xerox Holdings Corp. | (7,500 | ) | (105,450 | ) | |||||||
Retail - (0.05%) | |||||||||||
Dave & Buster's Entertainment, Inc. | (1,400 | ) | (71,526 | ) | |||||||
Software - (0.69%) | |||||||||||
Bentley Systems, Inc., Class B | (12,000 | ) | (602,880 | ) | |||||||
BlackLine, Inc. | (1,800 | ) | (85,896 | ) | |||||||
RingCentral, Inc., Class A | (300 | ) | (10,260 | ) | |||||||
Verint Systems, Inc. | (9,700 | ) | (287,702 | ) | |||||||
(986,738 | ) | ||||||||||
| TOTAL SECURITIES SOLD SHORT (Proceeds $7,106,057) | $ | (7,027,410 | ) | ||||||||
EQUITY SWAP CONTRACTS
| Swap Counterparty/ Payment Frequency | Reference Obligation | Rate Paid/ Received by the Fund | Termination Date | Upfront Payments Made | Upfront Payments Received | Market Value | Notional Amount | Unrealized Appreciation | |||||||||||||||||||||||||||
| Morgan Stanley & Co./ Upon Termination | Atlantica Sustainable Infrastructure PLC | Received 1 Month- Federal Rate Minus 40bps (4.930%) | 10/29/2024 | $ | — | $ | — | $ | 1,487 | USD | 111,387 | $ | 1,487 | ||||||||||||||||||||||
See Notes to Financial Statements.
www.arbitragefunds.com | 1-800-295-4485
40
Water Island Credit Opportunities Fund Portfolio of Investments (continued)
May 31, 2024
| Swap Counterparty/ Payment Frequency | Reference Obligation | Rate Paid/ Received by the Fund | Termination Date | Upfront Payments Made | Upfront Payments Received | Market Value | Notional Amount | Unrealized Depreciation | |||||||||||||||||||||||||||
| Morgan Stanley & Co./ Upon Termination | Gen Digital, Inc. | Received 1 Month- Federal Rate Minus 40bps (4.930%) | 10/29/2024 | $ | — | $ | — | $ | (9,452 | ) | USD | 263,678 | $ | (9,452 | ) | ||||||||||||||||||||
| Morgan Stanley & Co./ Upon Termination | iShares iBoxx High Yield Corporate Bond ETF | Received 1 Month- Federal Rate Minus 43bps (4.900%) | 10/29/2024 | — | — | (74,250 | ) | USD | 1,854,000 | (74,250 | ) | ||||||||||||||||||||||||
| Morgan Stanley & Co./ Upon Termination | SPDR Bloomberg High Yield Bond ETF | Received 1 Month- Federal Rate Minus 103bps (4.300%) | 10/29/2024 | — | — | (59,770 | ) | USD | 1,251,695 | (59,770 | ) | ||||||||||||||||||||||||
$ | (143,472 | ) | $ | (143,472 | ) | ||||||||||||||||||||||||||||||
OUTSTANDING FORWARD FOREIGN CURRENCY EXCHANGE CONTRACTS
| Currency Purchased | Currency Sold | Counterparty | Settlement Date | Unrealized Appreciation | |||||||||||||||
CAD | 28,400 | USD | 20,744 | Morgan Stanley & Co. | 06/17/2024 | $ | 99 | ||||||||||||
USD | 343,042 | CAD | 462,400 | Morgan Stanley & Co. | 06/17/2024 | 3,687 | |||||||||||||
$ | 3,786 | ||||||||||||||||||
| Currency Purchased | Currency Sold | Counterparty | Settlement Date | Unrealized Depreciation | |||||||||||||||
CAD | 195,700 | USD | 145,084 | Morgan Stanley & Co. | 06/17/2024 | $ | (1,460 | ) | |||||||||||
USD | 34,502 | CAD | 47,200 | Morgan Stanley & Co. | 06/17/2024 | (138 | ) | ||||||||||||
$ | (1,598 | ) | |||||||||||||||||
See Notes to Financial Statements.
Annual Report | May 31, 2024
41
Water Island Credit Opportunities Fund Portfolio of Investments (continued)
May 31, 2024
The following is a summary of investments classified by country exposure:
Country | % of Net Assets(a) | ||||||
United States | 90.44 | % | |||||
Bermuda | 4.86 | % | |||||
Canada | 3.73 | % | |||||
United Kingdom | 3.25 | % | |||||
Luxembourg | 0.40 | % | |||||
Liabilities in Excess of Other Assets | (2.68 | %) | |||||
100.00 | % | ||||||
(a) These percentages represent long positions only and are not net of short positions.
Abbreviations:
bps - Basis Points. 100 Basis Points is equal to 1 percentage point.
CAD - Canadian dollar
ETF - Exchange-Traded Fund
LLC - Limited Liability Company
LP - Limited Partnership
Ltd. - Limited
PLC - Public Limited Company
SA - Generally designates corporations in various countries, mostly those employing civil law. This translates literally in all languages mentioned as anonymous company.
SOFR - Secured Overnight Financing Rate
SPDR - Standard & Poor's Depositary Receipt
TBD - To be determined
USD - United States Dollar
The following table summarizes the Water Island Credit Opportunities Fund's investments and derivative financial instruments categorized in the fair value hierarchy as of May 31, 2024:
Investments in Securities at Fair Value* | Level 1 | Level 2 | Level 3 | Total | |||||||||||||||
Assets | |||||||||||||||||||
Bank Loans | $ | — | $ | 7,038,224 | $ | — | $ | 7,038,224 | |||||||||||
Corporate Bonds** | — | 77,687,260 | — | 77,687,260 | |||||||||||||||
Convertible Corporate Bonds** | — | 38,200,788 | — | 38,200,788 | |||||||||||||||
Warrants** | 32 | — | — | 32 | |||||||||||||||
Preferred Stocks** | 1,625,875 | — | — | 1,625,875 | |||||||||||||||
Purchased Options | 78,230 | — | — | 78,230 | |||||||||||||||
Short-Term Investments | 22,440,685 | — | — | 22,440,685 | |||||||||||||||
TOTAL | $ | 24,144,822 | $ | 122,926,272 | $ | — | $ | 147,071,094 | |||||||||||
See Notes to Financial Statements.
www.arbitragefunds.com | 1-800-295-4485
42
Water Island Credit Opportunities Fund Portfolio of Investments (continued)
May 31, 2024
Other Financial Instruments*** | Level 1 | Level 2 | Level 3 | Total | |||||||||||||||
Assets | |||||||||||||||||||
| Forward Foreign Currency Exchange Contracts | $ | — | $ | 3,786 | $ | — | $ | 3,786 | |||||||||||
Equity Swaps | 1,487 | — | — | 1,487 | |||||||||||||||
Liabilities | |||||||||||||||||||
Common Stocks** | (7,027,410 | ) | — | — | (7,027,410 | ) | |||||||||||||
| Forward Foreign Currency Exchange Contracts | — | (1,598 | ) | — | (1,598 | ) | |||||||||||||
Equity Swaps | (143,472 | ) | — | — | (143,472 | ) | |||||||||||||
TOTAL | $ | (7,169,395 | ) | $ | 2,188 | $ | — | $ | (7,167,207 | ) | |||||||||
* Refer to Note 2 where leveling hierarchy is defined.
** Refer to Portfolio of Investments for sector information.
*** Other financial instruments are instruments such as securities sold short, equity swaps and forward foreign currency exchange contracts.
See Notes to Financial Statements.
Annual Report | May 31, 2024
43
Arbitrage Fund | Water Island Event-Driven Fund | ||||||||||
ASSETS | |||||||||||
Investments: | |||||||||||
At cost of unaffiliated investments | $ | 915,731,168 | $ | 82,111,698 | |||||||
At cost of affiliated investments | 41,780,589 | — | |||||||||
| At fair value of unaffiliated investments (Note 2) | 905,958,366 | 80,586,812 | |||||||||
At fair value of affiliated investments (Note 2) | 53,474,188 | — | |||||||||
Cash | 399 | 265 | |||||||||
Cash denominated in foreign currency (Cost $1, $0 and $0) | 1 | — | |||||||||
Deposits with brokers for securities sold short (Note 2) | 65,882,851 | 2,654,504 | |||||||||
Segregated cash for collateral (Note 2) | — | — | |||||||||
Receivable for investment securities sold | 2,647,034 | 258,894 | |||||||||
Receivable for capital shares sold | 1,063,365 | 10,657 | |||||||||
Unrealized appreciation on forward foreign currency exchange contracts (Note 10) | 344,834 | 49,403 | |||||||||
Unrealized appreciation on swap contracts | 358,327 | 36,111 | |||||||||
Dividends and interest receivable | 2,416,008 | 336,028 | |||||||||
Miscellaneous receivable | 2,559,880 | 212,197 | |||||||||
Prepaid expenses | 68,208 | 23,389 | |||||||||
Total Assets | 1,034,773,461 | 84,168,260 | |||||||||
LIABILITIES | |||||||||||
Securities sold short, at value (Note 2) (proceeds $78,451,038, $3,231,051 and $7,106,057) | 84,717,744 | 3,299,528 | |||||||||
Foreign currency due to bank (Cost $0, $1 and $0) | — | 1 | |||||||||
Written options, at value (Note 2) (premiums received $166,308, $18,616 and $0) | 160,830 | 18,000 | |||||||||
Payable for investment securities purchased | 4,885,495 | 84,946 | |||||||||
Unrealized depreciation on forward foreign currency exchange contracts (Note 10) | 143,672 | 6,485 | |||||||||
Unrealized depreciation on swap contracts | 3,296,694 | 183,311 | |||||||||
Payable for capital shares redeemed | 407,141 | 39,886 | |||||||||
Payable to Adviser (Note 5) | 817,560 | 74,606 | |||||||||
Dividends payable on securities sold short | 305,456 | — | |||||||||
Payable to Distributor (Note 5) | 17,987 | 1,299 | |||||||||
Payable to Administrator (Note 5) | 43,523 | 8,999 | |||||||||
Payable to Transfer Agent (Note 5) | 66,246 | 8,049 | |||||||||
Payable to Custodian | 29,636 | 8,453 | |||||||||
Income distribution payable | — | — | |||||||||
Interest expense payable | — | 93 | |||||||||
Payable for swap dividends | 559,836 | 54,802 | |||||||||
Audit and legal fees payable | 110,072 | 25,842 | |||||||||
Payable to Trustees | 82,736 | 10,340 | |||||||||
Chief Compliance Officer Fees payable (Note 5) | 76,657 | 6,489 | |||||||||
Chief Financial Officer Fees payable (Note 5) | 5,435 | 1,062 | |||||||||
Other accrued expenses and liabilities | 47,868 | 12,060 | |||||||||
Total Liabilities | 95,774,588 | 3,844,251 | |||||||||
Commitments and contingent liabilities (Note 5) | |||||||||||
NET ASSETS | $ | 938,998,873 | $ | 80,324,009 | |||||||
NET ASSETS CONSIST OF: | |||||||||||
Paid-in capital | $ | 948,948,463 | $ | 115,652,516 | |||||||
Distributable earnings (Accumulated loss) | (9,949,590 | ) | (35,328,507 | ) | |||||||
NET ASSETS | $ | 938,998,873 | $ | 80,324,009 | |||||||
See Notes to Financial Statements.
www.arbitragefunds.com | 1-800-295-4485
44
Statements of Assets and Liabilities
| Water Island Credit Opportunities Fund | |||||||
ASSETS | |||||||
Investments: | |||||||
At cost of unaffiliated investments | $ | 149,242,382 | |||||
At cost of affiliated investments | — | ||||||
| At fair value of unaffiliated investments (Note 2) | 147,071,094 | ||||||
At fair value of affiliated investments (Note 2) | — | ||||||
Cash | 169 | ||||||
Cash denominated in foreign currency (Cost $1, $0 and $0) | — | ||||||
Deposits with brokers for securities sold short (Note 2) | 7,023,653 | ||||||
Segregated cash for collateral (Note 2) | 1,280,000 | ||||||
Receivable for investment securities sold | — | ||||||
Receivable for capital shares sold | 132,589 | ||||||
Unrealized appreciation on forward foreign currency exchange contracts (Note 10) | 3,786 | ||||||
Unrealized appreciation on swap contracts | 1,487 | ||||||
Dividends and interest receivable | 1,712,159 | ||||||
Miscellaneous receivable | — | ||||||
Prepaid expenses | 25,771 | ||||||
Total Assets | 157,250,708 | ||||||
LIABILITIES | |||||||
Securities sold short, at value (Note 2) (proceeds $78,451,038, $3,231,051 and $7,106,057) | 7,027,410 | ||||||
Foreign currency due to bank (Cost $0, $1 and $0) | — | ||||||
Written options, at value (Note 2) (premiums received $166,308, $18,616 and $0) | — | ||||||
Payable for investment securities purchased | 6,329,818 | ||||||
Unrealized depreciation on forward foreign currency exchange contracts (Note 10) | 1,598 | ||||||
Unrealized depreciation on swap contracts | 143,472 | ||||||
Payable for capital shares redeemed | 155,027 | ||||||
Payable to Adviser (Note 5) | 52,242 | ||||||
Dividends payable on securities sold short | 30,493 | ||||||
Payable to Distributor (Note 5) | 1,430 | ||||||
Payable to Administrator (Note 5) | 16,554 | ||||||
Payable to Transfer Agent (Note 5) | 14,928 | ||||||
Payable to Custodian | 3,733 | ||||||
Income distribution payable | 163,317 | ||||||
Interest expense payable | — | ||||||
Payable for swap dividends | — | ||||||
Audit and legal fees payable | 28,685 | ||||||
Payable to Trustees | 11,791 | ||||||
Chief Compliance Officer Fees payable (Note 5) | 13,488 | ||||||
Chief Financial Officer Fees payable (Note 5) | 1,303 | ||||||
Other accrued expenses and liabilities | 16,886 | ||||||
Total Liabilities | 14,012,175 | ||||||
Commitments and contingent liabilities (Note 5) | |||||||
NET ASSETS | $ | 143,238,533 | |||||
NET ASSETS CONSIST OF: | |||||||
Paid-in capital | $ | 149,495,105 | |||||
Distributable earnings (Accumulated loss) | (6,256,572 | ) | |||||
NET ASSETS | $ | 143,238,533 | |||||
May 31, 2024
Annual Report | May 31, 2024
45
The Arbitrage Funds
Arbitrage Fund | Water Island Event-Driven Fund | ||||||||||
PRICING OF SHARES: | |||||||||||
CLASS R SHARES: | |||||||||||
Net assets applicable to Class R shares | $ | 33,860,236 | $ | 4,505,644 | |||||||
Shares of beneficial interest outstanding (unlimited number of shares authorized, no par value) | 2,680,410 | 395,512 | |||||||||
Net asset value and offering price per share | $ | 12.63 | $ | 11.39 | |||||||
CLASS I SHARES: | |||||||||||
Net assets applicable to Class I shares | $ | 874,556,355 | $ | 74,217,277 | |||||||
Shares of beneficial interest outstanding (unlimited number of shares authorized, no par value) | 66,434,578 | 6,430,387 | |||||||||
Net asset value and offering price per share | $ | 13.16 | $ | 11.54 | |||||||
CLASS C SHARES: | |||||||||||
Net assets applicable to Class C shares | $ | 6,433,675 | $ | — | |||||||
Shares of beneficial interest outstanding (unlimited number of shares authorized, no par value) | 555,087 | — | |||||||||
Net asset value and offering price per share(a) | $ | 11.59 | $ | — | |||||||
CLASS A SHARES: | |||||||||||
Net assets applicable to Class A shares | $ | 24,148,607 | $ | 1,601,088 | |||||||
Shares of beneficial interest outstanding (unlimited number of shares authorized, no par value) | 1,917,375 | 140,789 | |||||||||
Net asset value and offering price per share(a) | $ | 12.59 | $ | 11.37 | |||||||
Maximum offering price per share (NAV/(100% — maximum sales charge)) | $ | 12.95 | $ | 11.75 | |||||||
Maximum sales charge | 2.75 | % | 3.25 | % | |||||||
(a) Redemption price varies based on length of time held (Note 1).
See Notes to Financial Statements.
www.arbitragefunds.com | 1-800-295-4485
46
Statements of Assets and Liabilities (continued)
| Water Island Credit Opportunities Fund | |||||||
PRICING OF SHARES: | |||||||
CLASS R SHARES: | |||||||
Net assets applicable to Class R shares | $ | 6,857,029 | |||||
Shares of beneficial interest outstanding (unlimited number of shares authorized, no par value) | 705,494 | ||||||
Net asset value and offering price per share | $ | 9.72 | |||||
CLASS I SHARES: | |||||||
Net assets applicable to Class I shares | $ | 136,310,444 | |||||
Shares of beneficial interest outstanding (unlimited number of shares authorized, no par value) | 14,089,853 | ||||||
Net asset value and offering price per share | $ | 9.67 | |||||
CLASS C SHARES: | |||||||
Net assets applicable to Class C shares | $ | — | |||||
Shares of beneficial interest outstanding (unlimited number of shares authorized, no par value) | — | ||||||
Net asset value and offering price per share(a) | $ | — | |||||
CLASS A SHARES: | |||||||
Net assets applicable to Class A shares | $ | 71,060 | |||||
Shares of beneficial interest outstanding (unlimited number of shares authorized, no par value) | 7,342 | ||||||
Net asset value and offering price per share(a) | $ | 9.68 | |||||
Maximum offering price per share (NAV/(100% — maximum sales charge)) | $ | 10.01 | |||||
Maximum sales charge | 3.25 | % | |||||
May 31, 2024
Annual Report | May 31, 2024
47
Arbitrage Fund | Water Island Event-Driven Fund | ||||||||||
INVESTMENT INCOME | |||||||||||
Dividend income | $ | 15,687,377 | $ | 1,470,718 | |||||||
Dividend income from affiliated investments | 553,814 | — | |||||||||
Foreign taxes withheld on dividends | (92,573 | ) | (9,826 | ) | |||||||
Interest income | 1,111,552 | 405,625 | |||||||||
Rebates on short sales, net of fees | 3,105,205 | 341,183 | |||||||||
Total Investment Income | 20,365,375 | 2,207,700 | |||||||||
EXPENSES | |||||||||||
Investment advisory fees (Note 5) | 11,186,745 | 1,201,648 | |||||||||
Distribution and service fees (Note 5) | |||||||||||
Class R | 99,840 | 10,563 | |||||||||
Class C | 72,973 | — | |||||||||
Class A | 63,812 | 4,321 | |||||||||
Administrative fees | 250,299 | 50,987 | |||||||||
Chief Compliance Officer fees | 171,151 | 15,162 | |||||||||
Trustees' fees | 308,200 | 40,095 | |||||||||
Dividend expense | 816,401 | 34,093 | |||||||||
Transfer agent fees | 840,119 | 95,560 | |||||||||
Custodian and bank service fees | 154,381 | 45,786 | |||||||||
Registration and filing fees | 82,932 | 50,553 | |||||||||
Printing of shareholder reports | 153,364 | 10,861 | |||||||||
Professional fees | 198,549 | 35,578 | |||||||||
Line of credit interest expense | — | 93 | |||||||||
Insurance expense | 51,791 | 4,738 | |||||||||
Chief Financial Officer fees | 56,498 | 12,269 | |||||||||
Other expenses | 76,273 | 30,232 | |||||||||
Total Expenses | 14,583,328 | 1,642,539 | |||||||||
Fees waived or reimbursed by the Adviser, Class R (Note 5) | (36,128 | ) | (800 | ) | |||||||
Fees waived or reimbursed by the Adviser, Class I (Note 5) | (863,430 | ) | (19,280 | ) | |||||||
Fees waived or reimbursed by the Adviser, Class C (Note 5) | (6,592 | ) | — | ||||||||
Fees waived or reimbursed by the Adviser, Class A (Note 5) | (23,088 | ) | (323 | ) | |||||||
Net Expenses | 13,654,090 | 1,622,136 | |||||||||
NET INVESTMENT INCOME | 6,711,285 | 585,564 | |||||||||
REALIZED AND UNREALIZED GAINS (LOSSES) ON INVESTMENTS AND FOREIGN CURRENCIES | |||||||||||
Net realized gains (losses) from: | |||||||||||
Unaffiliated investments | 30,053,880 | 3,061,020 | |||||||||
Affiliated investments | 3,878,451 | — | |||||||||
Purchased option contracts | (4,749,546 | ) | (473,300 | ) | |||||||
Swap contracts | (30,125,272 | ) | (3,053,356 | ) | |||||||
Securities sold short | 1,581,485 | 228,138 | |||||||||
Written option contracts | 390,210 | 43,199 | |||||||||
Forward currency contracts | 926,403 | 3,747 | |||||||||
Foreign currency transactions (Note 10) | 252,337 | 194,037 | |||||||||
See Notes to Financial Statements.
www.arbitragefunds.com | 1-800-295-4485
48
Statements of Operations
| Water Island Credit Opportunities Fund | |||||||
INVESTMENT INCOME | |||||||
Dividend income | $ | 686,744 | |||||
Dividend income from affiliated investments | — | ||||||
Foreign taxes withheld on dividends | (1,426 | ) | |||||
Interest income | 6,454,696 | ||||||
Rebates on short sales, net of fees | 225,476 | ||||||
Total Investment Income | 7,365,490 | ||||||
EXPENSES | |||||||
Investment advisory fees (Note 5) | 1,229,385 | ||||||
Distribution and service fees (Note 5) | |||||||
Class R | 14,458 | ||||||
Class C | — | ||||||
Class A | 173 | ||||||
Administrative fees | 92,478 | ||||||
Chief Compliance Officer fees | 23,700 | ||||||
Trustees' fees | 44,044 | ||||||
Dividend expense | 79,001 | ||||||
Transfer agent fees | 157,225 | ||||||
Custodian and bank service fees | 24,892 | ||||||
Registration and filing fees | 48,900 | ||||||
Printing of shareholder reports | 18,150 | ||||||
Professional fees | 39,657 | ||||||
Line of credit interest expense | 1,113 | ||||||
Insurance expense | 5,174 | ||||||
Chief Financial Officer fees | 13,274 | ||||||
Other expenses | 32,364 | ||||||
Total Expenses | 1,823,988 | ||||||
Fees waived or reimbursed by the Adviser, Class R (Note 5) | (20,681 | ) | |||||
Fees waived or reimbursed by the Adviser, Class I (Note 5) | (440,108 | ) | |||||
Fees waived or reimbursed by the Adviser, Class C (Note 5) | — | ||||||
Fees waived or reimbursed by the Adviser, Class A (Note 5) | (245 | ) | |||||
Net Expenses | 1,362,954 | ||||||
NET INVESTMENT INCOME | 6,002,536 | ||||||
REALIZED AND UNREALIZED GAINS (LOSSES) ON INVESTMENTS AND FOREIGN CURRENCIES | |||||||
Net realized gains (losses) from: | |||||||
Unaffiliated investments | (1,077,702 | ) | |||||
Affiliated investments | — | ||||||
Purchased option contracts | (442,576 | ) | |||||
Swap contracts | 1,479 | ||||||
Securities sold short | 555,407 | ||||||
Written option contracts | 23,529 | ||||||
Forward currency contracts | (2,666 | ) | |||||
Foreign currency transactions (Note 10) | (319 | ) | |||||
For the Year Ended May 31, 2024
Annual Report | May 31, 2024
49
The Arbitrage Funds
Arbitrage Fund | Water Island Event-Driven Fund | ||||||||||
Net change in unrealized appreciation (depreciation) on: | |||||||||||
Unaffiliated investments | $ | 68,352,613 | $ | 6,223,417 | |||||||
Affiliated investments | 591,976 | — | |||||||||
Securities sold short | (9,186,856 | ) | (331,535 | ) | |||||||
Foreign currency transactions (Note 10) | (120,353 | ) | (171,003 | ) | |||||||
Purchased option contracts | 777,524 | 65,923 | |||||||||
Written option contracts | 5,478 | (5,529 | ) | ||||||||
Swap contracts | 10,961,616 | 1,016,029 | |||||||||
Forward currency contracts | 99,997 | 72,496 | |||||||||
NET REALIZED AND UNREALIZED GAINS ON INVESTMENTS AND FOREIGN CURRENCIES | 73,689,943 | 6,873,283 | |||||||||
NET INCREASE IN NET ASSETS RESULTING FROM OPERATIONS | $ | 80,401,228 | $ | 7,458,847 | |||||||
See Notes to Financial Statements.
www.arbitragefunds.com | 1-800-295-4485
50
Statements of Operations (continued)
| Water Island Credit Opportunities Fund | |||||||
Net change in unrealized appreciation (depreciation) on: | |||||||
Unaffiliated investments | $ | 3,648,147 | |||||
Affiliated investments | — | ||||||
Securities sold short | (913,243 | ) | |||||
Foreign currency transactions (Note 10) | 32 | ||||||
Purchased option contracts | 34,943 | ||||||
Written option contracts | — | ||||||
Swap contracts | (119,154 | ) | |||||
Forward currency contracts | 4,041 | ||||||
NET REALIZED AND UNREALIZED GAINS ON INVESTMENTS AND FOREIGN CURRENCIES | 1,711,918 | ||||||
NET INCREASE IN NET ASSETS RESULTING FROM OPERATIONS | $ | 7,714,454 | |||||
For the Year Ended May 31, 2024
Annual Report | May 31, 2024
51
Arbitrage Fund | |||||||||||
| Year Ended May 31, 2024 | Year Ended May 31, 2023 | ||||||||||
FROM OPERATIONS: | |||||||||||
Net investment income | $ | 6,711,285 | $ | 5,307,920 | |||||||
Net realized gains (losses) from: | |||||||||||
Unaffiliated investments | 30,053,880 | 21,303,485 | |||||||||
Affiliated investments | 3,878,451 | — | |||||||||
Purchased option contracts | (4,749,546 | ) | (3,753,338 | ) | |||||||
Swap contracts | (30,125,272 | ) | 5,016,744 | ||||||||
Securities sold short | 1,581,485 | 7,701,552 | |||||||||
Written option contracts | 390,210 | (794,457 | ) | ||||||||
Forward currency contracts | 926,403 | 9,455,080 | |||||||||
Foreign currency transactions | 252,337 | 126,724 | |||||||||
Net change in unrealized appreciation (depreciation) on: | |||||||||||
Unaffiliated investments | 68,352,613 | (33,173,752 | ) | ||||||||
Affiliated investments | 591,976 | (660,536 | ) | ||||||||
Securities sold short | (9,186,856 | ) | (316,732 | ) | |||||||
Foreign currency transactions | (120,353 | ) | 121,839 | ||||||||
Purchased option contracts | 777,524 | (512,810 | ) | ||||||||
Written option contracts | 5,478 | (10,186 | ) | ||||||||
Swap contracts | 10,961,616 | (13,900,131 | ) | ||||||||
Forward currency contracts | 99,997 | (3,276,363 | ) | ||||||||
Net increase (decrease) in net assets resulting from operations | 80,401,228 | (7,364,961 | ) | ||||||||
FROM DIVIDENDS AND DISTRIBUTIONS TO SHAREHOLDERS: | |||||||||||
Distributions from distributable earnings, Class R | (754,585 | ) | (2,052,959 | ) | |||||||
Distributions from distributable earnings, Class I | (19,265,022 | ) | (48,583,107 | ) | |||||||
Distributions from distributable earnings, Class C | (148,836 | ) | (308,280 | ) | |||||||
Distributions from distributable earnings, Class A | (477,887 | ) | (1,345,088 | ) | |||||||
Decrease in net assets from distributions to shareholders | (20,646,330 | ) | (52,289,434 | ) | |||||||
FROM CAPITAL SHARE TRANSACTIONS (NOTE 9): | |||||||||||
Proceeds from shares sold | 212,385,783 | 291,944,330 | |||||||||
Shares issued in reinvestment of distributions | 17,237,234 | 43,054,678 | |||||||||
Payments for shares redeemed | (493,571,434 | ) | (724,701,012 | ) | |||||||
Net increase (decrease) in net assets from capital share transactions | (263,948,417 | ) | (389,702,004 | ) | |||||||
TOTAL INCREASE (DECREASE) IN NET ASSETS | (204,193,519 | ) | (449,356,399 | ) | |||||||
NET ASSETS: | |||||||||||
Beginning of year | 1,143,192,392 | 1,592,548,791 | |||||||||
End of year | $ | 938,998,873 | $ | 1,143,192,392 | |||||||
See Notes to Financial Statements.
www.arbitragefunds.com | 1-800-295-4485
52
Statements of Changes in Net Assets
Water Island Event-Driven Fund | |||||||||||
| Year Ended May 31, 2024 | Year Ended May 31, 2023 | ||||||||||
FROM OPERATIONS: | |||||||||||
Net investment income | $ | 585,564 | $ | 270,720 | |||||||
Net realized gains (losses) from: | |||||||||||
Unaffiliated investments | 3,061,020 | 2,421,410 | |||||||||
Affiliated investments | — | — | |||||||||
Purchased option contracts | (473,300 | ) | (340,066 | ) | |||||||
Swap contracts | (3,053,356 | ) | 399,115 | ||||||||
Securities sold short | 228,138 | 629,133 | |||||||||
Written option contracts | 43,199 | (59,394 | ) | ||||||||
Forward currency contracts | 3,747 | 379,573 | |||||||||
Foreign currency transactions | 194,037 | 29,855 | |||||||||
Net change in unrealized appreciation (depreciation) on: | |||||||||||
Unaffiliated investments | 6,223,417 | (3,546,003 | ) | ||||||||
Affiliated investments | — | — | |||||||||
Securities sold short | (331,535 | ) | 34,754 | ||||||||
Foreign currency transactions | (171,003 | ) | 171,309 | ||||||||
Purchased option contracts | 65,923 | (96,014 | ) | ||||||||
Written option contracts | (5,529 | ) | 5,284 | ||||||||
Swap contracts | 1,016,029 | (1,163,229 | ) | ||||||||
Forward currency contracts | 72,496 | (177,226 | ) | ||||||||
Net increase (decrease) in net assets resulting from operations | 7,458,847 | (1,040,779 | ) | ||||||||
FROM DIVIDENDS AND DISTRIBUTIONS TO SHAREHOLDERS: | |||||||||||
Distributions from distributable earnings, Class R | (21,021 | ) | — | ||||||||
Distributions from distributable earnings, Class I | (763,039 | ) | — | ||||||||
Distributions from distributable earnings, Class C | — | — | |||||||||
Distributions from distributable earnings, Class A | (7,976 | ) | — | ||||||||
Decrease in net assets from distributions to shareholders | (792,036 | ) | — | ||||||||
FROM CAPITAL SHARE TRANSACTIONS (NOTE 9): | |||||||||||
Proceeds from shares sold | 2,230,323 | 21,857,379 | |||||||||
Shares issued in reinvestment of distributions | 788,639 | — | |||||||||
Payments for shares redeemed | (43,901,589 | ) | (20,118,517 | ) | |||||||
Net increase (decrease) in net assets from capital share transactions | (40,882,627 | ) | 1,738,862 | ||||||||
TOTAL INCREASE (DECREASE) IN NET ASSETS | (34,215,816 | ) | 698,083 | ||||||||
NET ASSETS: | |||||||||||
Beginning of year | 114,539,825 | 113,841,742 | |||||||||
End of year | $ | 80,324,009 | $ | 114,539,825 | |||||||
Annual Report | May 31, 2024
53
The Arbitrage Funds Statements of Changes in Net Assets (continued)
| Water Island Credit Opportunities Fund | |||||||||||
| Year Ended May 31, 2024 | Year Ended May 31, 2023 | ||||||||||
FROM OPERATIONS: | |||||||||||
Net investment income | $ | 6,002,536 | $ | 4,805,374 | |||||||
Net realized gains (losses) from: | |||||||||||
Investments | (1,077,702 | ) | (2,307,637 | ) | |||||||
Purchased option contracts | (442,576 | ) | (61,807 | ) | |||||||
Swap contracts | 1,479 | 182,088 | |||||||||
Securities sold short | 555,407 | 1,379,050 | |||||||||
Written option contracts | 23,529 | 87,999 | |||||||||
Forward currency contracts | (2,666 | ) | (1,255 | ) | |||||||
Foreign currency transactions | (319 | ) | 811 | ||||||||
Net change in unrealized appreciation (depreciation) on: | |||||||||||
Investments | 3,648,147 | 1,258,163 | |||||||||
Securities sold short | (913,243 | ) | (1,775,332 | ) | |||||||
Foreign currency transactions | 32 | 248 | |||||||||
Purchased option contracts | 34,943 | (87,699 | ) | ||||||||
Written option contracts | — | 240 | |||||||||
Swap contracts | (119,154 | ) | (22,831 | ) | |||||||
Forward currency contracts | 4,041 | 220 | |||||||||
Net increase (decrease) in net assets resulting from operations | 7,714,454 | 3,457,632 | |||||||||
FROM DIVIDENDS AND DISTRIBUTIONS TO SHAREHOLDERS: | |||||||||||
Distributions from distributable earnings, Class R | (268,716 | ) | (350,840 | ) | |||||||
Distributions from distributable earnings, Class I | (6,059,018 | ) | (4,888,340 | ) | |||||||
Distributions from distributable earnings, Class A | (3,217 | ) | (3,044 | ) | |||||||
Decrease in net assets from distributions to shareholders | (6,330,951 | ) | (5,242,224 | ) | |||||||
FROM CAPITAL SHARE TRANSACTIONS (NOTE 9): | |||||||||||
Proceeds from shares sold | 52,054,317 | 18,148,503 | |||||||||
Shares issued in reinvestment of distributions | 4,292,211 | 3,406,172 | |||||||||
Payments for shares redeemed | (30,788,536 | ) | (38,354,970 | ) | |||||||
| Net increase (decrease) in net assets from capital share transactions | 25,557,992 | (16,800,295 | ) | ||||||||
TOTAL INCREASE (DECREASE) IN NET ASSETS | 26,941,495 | (18,584,887 | ) | ||||||||
NET ASSETS: | |||||||||||
Beginning of year | 116,297,038 | 134,881,925 | |||||||||
End of year | $ | 143,238,533 | $ | 116,297,038 | |||||||
See Notes to Financial Statements.
www.arbitragefunds.com | 1-800-295-4485
54
Selected Per Share Data and Ratios for a Share Outstanding Throughout the Periods Presented:
Year Ended May 31, | |||||||||||||||||||||||
2024 | 2023 | 2022 | 2021 | 2020 | |||||||||||||||||||
| Net asset value, beginning of period | $ | 11.97 | $ | 12.54 | $ | 13.11 | $ | 13.04 | $ | 12.92 | |||||||||||||
| Income (loss) from investment operations | |||||||||||||||||||||||
Net investment income (loss)(a) | 0.05 | 0.02 | (0.08 | ) | (0.01 | )(b) | (0.05 | ) | |||||||||||||||
| Net realized and unrealized gains (losses) on investments and foreign currencies | 0.85 | (0.15 | ) | (0.42 | ) | 0.97 | 0.44 | ||||||||||||||||
| Total from investment operations | 0.90 | (0.13 | ) | (0.50 | ) | 0.96 | 0.39 | ||||||||||||||||
Less distributions | |||||||||||||||||||||||
From net investment income | — | (0.09 | ) | — | — | — | |||||||||||||||||
From net realized gains | (0.24 | ) | (0.35 | ) | (0.07 | ) | (0.89 | ) | (0.27 | ) | |||||||||||||
Total distributions | (0.24 | ) | (0.44 | ) | (0.07 | ) | (0.89 | ) | (0.27 | ) | |||||||||||||
Net asset value, end of period | $ | 12.63 | $ | 11.97 | $ | 12.54 | $ | 13.11 | $ | 13.04 | |||||||||||||
Total return(c) | 7.55 | % | (1.03 | %) | (3.83 | %) | 7.58 | % | 3.07 | % | |||||||||||||
| Net assets, end of period (in 000s) | $ | 33,860 | $ | 44,250 | $ | 77,866 | $ | 97,909 | $ | 98,715 | |||||||||||||
| RATIOS TO AVERAGE NET ASSETS: | |||||||||||||||||||||||
Gross expenses(d) | 1.65 | % | 1.51 | % | 1.55 | % | 1.64 | % | 1.66 | % | |||||||||||||
| Net expenses after advisory fees waived and expenses reimbursed(d)(e) | 1.56 | % | 1.45 | % | 1.49 | % | 1.58 | % | 1.63 | % | |||||||||||||
Net investment income (loss) | 0.43 | % | 0.13 | % | (0.61 | %) | (0.08 | %)(b) | (0.36 | %) | |||||||||||||
Portfolio turnover rate | 230 | % | 197 | % | 206 | % | 300 | % | 273 | % | |||||||||||||
(a) Per share amounts were calculated using average shares outstanding for the year.
(b) The amount shown for a share outstanding throughout the period may not correlate with the Statements of Operations for the period due to timing of sales and redemptions of Fund shares in relation to income earned, allocation of class specific expenses and/or fluctuating market value of the investments of the Fund.
(c) Total return is a measure of the change in the value of an investment in the Fund over the years covered, which assumes any dividends or capital gains distributions are reinvested in shares of the Fund. Returns shown do not reflect the deduction of taxes a shareholder would pay on Fund distributions or the redemption of Fund shares.
(d) Dividend expense totaled 0.08%, 0.01%, 0.01%, 0.00% and 0.15% of average net assets for the years ended May 31, 2024, 2023, 2022, 2021 and 2020, respectively. Interest rebate expense and line of credit interest expense totaled 0.00%, 0.00%, 0.05%, 0.11% and 0.01% of average net assets for the years ended May 31, 2024, 2023, 2022, 2021 and 2020, respectively.
(e) Excluding dividend and interest expenses, the Fund's net expenses after advisory fees waived and expenses reimbursed would have been 1.48%, 1.44%, 1.43%, 1.47% and 1.47% of average net assets for the years ended May 31, 2024, 2023, 2022, 2021 and 2020, respectively.
See Notes to Financial Statements.
Annual Report | May 31, 2024
55
Selected Per Share Data and Ratios for a Share Outstanding Throughout the Periods Presented:
Year Ended May 31, | |||||||||||||||||||||||
2024 | 2023 | 2022 | 2021 | 2020 | |||||||||||||||||||
| Net asset value, beginning of period | $ | 12.47 | $ | 13.05 | $ | 13.60 | $ | 13.47 | $ | 13.32 | |||||||||||||
| Income (loss) from investment operations | |||||||||||||||||||||||
Net investment income (loss)(a) | 0.09 | 0.05 | (0.05 | ) | 0.02 | (0.02 | ) | ||||||||||||||||
| Net realized and unrealized gains (losses) on investments and foreign currencies | 0.87 | (0.15 | ) | (0.43 | ) | 1.00 | 0.45 | ||||||||||||||||
| Total from investment operations | 0.96 | (0.10 | ) | (0.48 | ) | 1.02 | 0.43 | ||||||||||||||||
Less distributions | |||||||||||||||||||||||
From net investment income | (0.03 | ) | (0.13 | ) | — | — | (0.01 | ) | |||||||||||||||
From net realized gains | (0.24 | ) | (0.35 | ) | (0.07 | ) | (0.89 | ) | (0.27 | ) | |||||||||||||
Total distributions | (0.27 | ) | (0.48 | ) | (0.07 | ) | (0.89 | ) | (0.28 | ) | |||||||||||||
Net asset value, end of period | $ | 13.16 | $ | 12.47 | $ | 13.05 | $ | 13.60 | $ | 13.47 | |||||||||||||
Total return(b) | 7.76 | % | (0.75 | %) | (3.55 | %) | 7.87 | % | 3.27 | % | |||||||||||||
| Net assets, end of period (in 000s) | $ | 874,556 | $ | 1,062,907 | $ | 1,459,176 | $ | 1,449,309 | $ | 1,243,838 | |||||||||||||
| RATIOS TO AVERAGE NET ASSETS: | |||||||||||||||||||||||
Gross expenses(c) | 1.40 | % | 1.26 | % | 1.30 | % | 1.39 | % | 1.41 | % | |||||||||||||
| Net expenses after advisory fees waived and expenses reimbursed(c)(d) | 1.31 | % | 1.20 | % | 1.24 | % | 1.33 | % | 1.38 | % | |||||||||||||
Net investment income (loss) | 0.68 | % | 0.40 | % | (0.41 | %) | 0.16 | % | (0.13 | %) | |||||||||||||
Portfolio turnover rate | 230 | % | 197 | % | 206 | % | 300 | % | 273 | % | |||||||||||||
(a) Per share amounts were calculated using average shares outstanding for the year.
(b) Total return is a measure of the change in the value of an investment in the Fund over the years covered, which assumes any dividends or capital gains distributions are reinvested in shares of the Fund. Returns shown do not reflect the deduction of taxes a shareholder would pay on Fund distributions or the redemption of Fund shares.
(c) Dividend expense totaled 0.08%, 0.01%, 0.01%, 0.00% and 0.15% of average net assets for the years ended May 31, 2024, 2023, 2022, 2021 and 2020, respectively. Interest rebate expense and line of credit interest expense totaled 0.00%, 0.00%, 0.05%, 0.11% and 0.01% of average net assets for the years ended May 31, 2024, 2023, 2022, 2021 and 2020, respectively.
(d) Excluding dividend and interest expenses, the Fund's net expenses after advisory fees waived and expenses reimbursed would have been 1.23%, 1.19%, 1.18%, 1.22% and 1.22% of average net assets for the years ended May 31, 2024, 2023, 2022, 2021 and 2020, respectively.
See Notes to Financial Statements.
www.arbitragefunds.com | 1-800-295-4485
56
Selected Per Share Data and Ratios for a Share Outstanding Throughout the Periods Presented:
Year Ended May 31, | |||||||||||||||||||||||
2024 | 2023 | 2022 | 2021 | 2020 | |||||||||||||||||||
| Net asset value, beginning of period | $ | 11.09 | $ | 11.64 | $ | 12.26 | $ | 12.34 | $ | 12.34 | |||||||||||||
| Income (loss) from investment operations | |||||||||||||||||||||||
Net investment loss(a) | (0.04 | )(b) | (0.07 | )(b) | (0.16 | ) | (0.10 | )(b) | (0.14 | ) | |||||||||||||
| Net realized and unrealized gains (losses) on investments and foreign currencies | 0.78 | (0.13 | ) | (0.39 | ) | 0.91 | 0.41 | ||||||||||||||||
| Total from investment operations | 0.74 | (0.20 | ) | (0.55 | ) | 0.81 | 0.27 | ||||||||||||||||
Less distributions | |||||||||||||||||||||||
From net realized gains | (0.24 | ) | (0.35 | ) | (0.07 | ) | (0.89 | ) | (0.27 | ) | |||||||||||||
Total distributions | (0.24 | ) | (0.35 | ) | (0.07 | ) | (0.89 | ) | (0.27 | ) | |||||||||||||
Net asset value, end of period | $ | 11.59 | $ | 11.09 | $ | 11.64 | $ | 12.26 | $ | 12.34 | |||||||||||||
Total return(c)(d) | 6.70 | % | (1.73 | %) | (4.51 | %) | 6.77 | % | 2.24 | % | |||||||||||||
| Net assets, end of period (in 000s) | $ | 6,434 | $ | 8,398 | $ | 13,467 | $ | 18,043 | $ | 19,860 | |||||||||||||
| RATIOS TO AVERAGE NET ASSETS: | |||||||||||||||||||||||
Gross expenses(e) | 2.40 | % | 2.26 | % | 2.30 | % | 2.39 | % | 2.41 | % | |||||||||||||
| Net expenses after advisory fees waived and expenses reimbursed(e)(f) | 2.31 | % | 2.20 | % | 2.24 | % | 2.33 | % | 2.38 | % | |||||||||||||
Net investment loss | (0.32 | %) | (0.61 | %) | (1.35 | %) | (0.85 | %)(b) | (1.16 | %) | |||||||||||||
Portfolio turnover rate | 230 | % | 197 | % | 206 | % | 300 | % | 273 | % | |||||||||||||
(a) Per share amounts were calculated using average shares outstanding for the year.
(b) The amount shown for a share outstanding throughout the period may not correlate with the Statements of Operations for the period due to timing of sales and redemptions of Fund shares in relation to income earned, allocation of class specific expenses and/or fluctuating market value of the investments of the Fund.
(c) Total return is a measure of the change in the value of an investment in the Fund over the years covered, which assumes any dividends or capital gains distributions are reinvested in shares of the Fund. Returns shown do not reflect the deduction of taxes a shareholder would pay on Fund distributions or the redemption of Fund shares.
(d) Total return excludes sales charges, if any, and would be lower for the period presented if it reflected these charges.
(e) Dividend expense totaled 0.08%, 0.01%, 0.01%, 0.00% and 0.15% of average net assets for the years ended May 31, 2024, 2023, 2022, 2021 and 2020, respectively. Interest rebate expense and line of credit interest expense totaled 0.00%, 0.00%, 0.05%, 0.11% and 0.01% of average net assets for the years ended May 31, 2024, 2023, 2022, 2021 and 2020, respectively.
(f) Excluding dividend and interest expenses, the Fund's net expenses after advisory fees waived and expenses reimbursed would have been 2.23%, 2.19%, 2.18%, 2.22% and 2.22% of average net assets for the years ended May 31, 2024, 2023, 2022, 2021 and 2020, respectively.
See Notes to Financial Statements.
Annual Report | May 31, 2024
57
Selected Per Share Data and Ratios for a Share Outstanding Throughout the Periods Presented:
Year Ended May 31, | |||||||||||||||||||||||
2024 | 2023 | 2022 | 2021 | 2020 | |||||||||||||||||||
| Net asset value, beginning of period | $ | 11.94 | $ | 12.52 | $ | 13.08 | $ | 13.01 | $ | 12.90 | |||||||||||||
| Income (loss) from investment operations | |||||||||||||||||||||||
Net investment income (loss)(a) | 0.05 | 0.02 | (0.09 | ) | 0.00 | (b) | (0.05 | ) | |||||||||||||||
| Net realized and unrealized gains (losses) on investments and foreign currencies | 0.84 | (0.15 | ) | (0.40 | ) | 0.96 | 0.43 | ||||||||||||||||
| Total from investment operations | 0.89 | (0.13 | ) | (0.49 | ) | 0.96 | 0.38 | ||||||||||||||||
Less distributions | |||||||||||||||||||||||
From net investment income | — | (0.10 | ) | — | — | — | |||||||||||||||||
From net realized gains | (0.24 | ) | (0.35 | ) | (0.07 | ) | (0.89 | ) | (0.27 | ) | |||||||||||||
Total distributions | (0.24 | ) | (0.45 | ) | (0.07 | ) | (0.89 | ) | (0.27 | ) | |||||||||||||
Net asset value, end of period | $ | 12.59 | $ | 11.94 | $ | 12.52 | $ | 13.08 | $ | 13.01 | |||||||||||||
Total return(c)(d) | 7.49 | % | (1.06 | %) | (3.77 | %) | 7.60 | % | 3.00 | % | |||||||||||||
| Net assets, end of period (in 000s) | $ | 24,149 | $ | 27,637 | $ | 42,040 | $ | 32,624 | $ | 17,762 | |||||||||||||
| RATIOS TO AVERAGE NET ASSETS: | |||||||||||||||||||||||
Gross expenses(e) | 1.65 | % | 1.51 | % | 1.55 | % | 1.64 | % | 1.66 | % | |||||||||||||
| Net expenses after advisory fees waived and expenses reimbursed(e)(f) | 1.56 | % | 1.45 | % | 1.49 | % | 1.58 | % | 1.63 | % | |||||||||||||
Net investment income (loss) | 0.43 | % | 0.16 | % | (0.74 | %) | (0.03 | %)(g) | (0.40 | %) | |||||||||||||
Portfolio turnover rate | 230 | % | 197 | % | 206 | % | 300 | % | 273 | % | |||||||||||||
(a) Per share amounts were calculated using average shares outstanding for the year.
(b) Amount rounds to less than $0.01 per share.
(c) Total return is a measure of the change in the value of an investment in the Fund over the years covered, which assumes any dividends or capital gains distributions are reinvested in shares of the Fund. Returns shown do not reflect the deduction of taxes a shareholder would pay on Fund distributions or the redemption of Fund shares.
(d) Total return excludes sales charges, if any, and would be lower for the period presented if it reflected these charges.
(e) Dividend expense totaled 0.08%, 0.01%, 0.01%, 0.00% and 0.15% of average net assets for the years ended May 31, 2024, 2023, 2022, 2021 and 2020, respectively. Interest rebate expense and line of credit interest expense totaled 0.00%, 0.00%, 0.05%, 0.11% and 0.01% of average net assets for the years ended May 31, 2024, 2023, 2022, 2021 and 2020, respectively.
(f) Excluding dividend and interest expenses, the Fund's net expenses after advisory fees waived and expenses reimbursed would have been 1.48%, 1.44%, 1.43%, 1.47% and 1.47% of average net assets for the years ended May 31, 2024, 2023, 2022, 2021 and 2020, respectively.
(g) The amount shown for a share outstanding throughout the period may not correlate with the Statements of Operations for the period due to timing of sales and redemptions of Fund shares in relation to income earned, allocation of class specific expenses and/or fluctuating market value of the investments of the Fund.
See Notes to Financial Statements.
www.arbitragefunds.com | 1-800-295-4485
58
Selected Per Share Data and Ratios for a Share Outstanding Throughout the Periods Presented:
Year Ended May 31, | |||||||||||||||||||||||
2024 | 2023 | 2022 | 2021 | 2020 | |||||||||||||||||||
| Net asset value, beginning of period | $ | 10.72 | $ | 10.84 | $ | 11.38 | $ | 9.97 | $ | 9.47 | |||||||||||||
| Income (loss) from investment operations | |||||||||||||||||||||||
Net investment income (loss)(a) | 0.03 | (0.00 | )(b)(c) | (0.12 | ) | (0.05 | ) | 0.01 | |||||||||||||||
| Net realized and unrealized gains (losses) on investments and foreign currencies | 0.70 | (0.12 | ) | (0.42 | ) | 1.46 | 0.51 | ||||||||||||||||
| Total from investment operations | 0.73 | (0.12 | ) | (0.54 | ) | 1.41 | 0.52 | ||||||||||||||||
Less distributions | |||||||||||||||||||||||
From net investment income | (0.06 | ) | — | — | — | (0.02 | ) | ||||||||||||||||
Total distributions | (0.06 | ) | — | — | — | (0.02 | ) | ||||||||||||||||
Net asset value, end of period | $ | 11.39 | $ | 10.72 | $ | 10.84 | $ | 11.38 | $ | 9.97 | |||||||||||||
Total return(d) | 6.77 | % | (1.11 | %) | (4.75 | %) | 14.14 | % | 5.49 | % | |||||||||||||
| Net assets, end of period (in 000s) | $ | 4,506 | $ | 3,990 | $ | 4,502 | $ | 10,116 | $ | 7,694 | |||||||||||||
| RATIOS TO AVERAGE NET ASSETS: | |||||||||||||||||||||||
Gross expenses(e) | 1.74 | % | 1.67 | % | 1.78 | % | 1.98 | % | 2.11 | % | |||||||||||||
| Net expenses after advisory fees waived and expenses reimbursed(e)(f) | 1.72 | % | 1.70 | % | 1.80 | % | 1.89 | % | 1.83 | % | |||||||||||||
Net investment income (loss) | 0.29 | % | (0.00 | %)(g) | (1.08 | %) | (0.51 | %) | 0.09 | % | |||||||||||||
Portfolio turnover rate | 305 | % | 216 | % | 217 | % | 320 | % | 397 | % | |||||||||||||
(a) Per share amounts were calculated using average shares outstanding for the year.
(b) Amount rounds to less than $0.01 per share.
(c) The amount shown for a share outstanding throughout the period may not correlate with the Statements of Operations for the period due to timing of sales and redemptions of Fund shares in relation to income earned, allocation of class specific expenses and/or fluctuating market value of the investments of the Fund.
(d) Total return is a measure of the change in the value of an investment in the Fund over the years covered, which assumes any dividends or capital gains distributions are reinvested in shares of the Fund. Returns shown do not reflect the deduction of taxes a shareholder would pay on Fund distributions or the redemption of Fund shares.
(e) Dividend expense totaled 0.03%, 0.01%, 0.01%, 0.01% and 0.13% of average net assets for the years ended May 31, 2024, 2023, 2022, 2021 and 2020, respectively. Interest rebate expense and line of credit interest expense totaled 0.00%, 0.00%, 0.10%, 0.19% and 0.01% of average net assets for the years ended May 31, 2024, 2023, 2022, 2021 and 2020, respectively.
(f) Excluding dividend and interest expenses, the Fund's net expenses after advisory fees waived and expenses reimbursed would have been 1.69%, 1.69%, 1.69%, 1.69% and 1.69% of average net assets for the years ended May 31, 2024, 2023, 2022, 2021 and 2020, respectively.
(g) Amount rounds to less than 0.01% per share.
See Notes to Financial Statements.
Annual Report | May 31, 2024
59
Selected Per Share Data and Ratios for a Share Outstanding Throughout the Periods Presented:
Year Ended May 31, | |||||||||||||||||||||||
2024 | 2023 | 2022 | 2021 | 2020 | |||||||||||||||||||
| Net asset value, beginning of period | $ | 10.86 | $ | 10.95 | $ | 11.47 | $ | 10.05 | $ | 9.54 | |||||||||||||
| Income (loss) from investment operations | |||||||||||||||||||||||
Net investment income (loss)(a) | 0.06 | 0.03 | (0.10 | ) | (0.03 | ) | 0.02 | ||||||||||||||||
| Net realized and unrealized gains (losses) on investments and foreign currencies | 0.70 | (0.12 | ) | (0.42 | ) | 1.48 | 0.53 | ||||||||||||||||
| Total from investment operations | 0.76 | (0.09 | ) | (0.52 | ) | 1.45 | 0.55 | ||||||||||||||||
Less distributions | |||||||||||||||||||||||
From net investment income | (0.08 | ) | — | — | (0.03 | ) | (0.04 | ) | |||||||||||||||
Total distributions | (0.08 | ) | — | — | (0.03 | ) | (0.04 | ) | |||||||||||||||
Net asset value, end of period | $ | 11.54 | $ | 10.86 | $ | 10.95 | $ | 11.47 | $ | 10.05 | |||||||||||||
Total return(b) | 7.03 | % | (0.82 | %) | (4.53 | %) | 14.51 | % | 5.83 | % | |||||||||||||
| Net assets, end of period (in 000s) | $ | 74,217 | $ | 108,674 | $ | 107,038 | $ | 125,093 | $ | 99,069 | |||||||||||||
| RATIOS TO AVERAGE NET ASSETS: | |||||||||||||||||||||||
Gross expenses(c) | 1.49 | % | 1.42 | % | 1.53 | % | 1.73 | % | 1.86 | % | |||||||||||||
| Net expenses after advisory fees waived and expenses reimbursed(c)(d) | 1.47 | % | 1.45 | % | 1.55 | % | 1.64 | % | 1.58 | % | |||||||||||||
Net investment income (loss) | 0.55 | % | 0.25 | % | (0.86 | %) | (0.24 | %) | 0.20 | % | |||||||||||||
Portfolio turnover rate | 305 | % | 216 | % | 217 | % | 320 | % | 397 | % | |||||||||||||
(a) Per share amounts were calculated using average shares outstanding for the year.
(b) Total return is a measure of the change in the value of an investment in the Fund over the years covered, which assumes any dividends or capital gains distributions are reinvested in shares of the Fund. Returns shown do not reflect the deduction of taxes a shareholder would pay on Fund distributions or the redemption of Fund shares.
(c) Dividend expense totaled 0.03%, 0.01%, 0.01%, 0.01% and 0.13% of average net assets for the years ended May 31, 2024, 2023, 2022, 2021 and 2020, respectively. Interest rebate expense and line of credit interest expense totaled 0.00%, 0.00%, 0.10%, 0.19% and 0.01% of average net assets for the years ended May 31, 2024, 2023, 2022, 2021 and 2020, respectively.
(d) Excluding dividend and interest expenses, the Fund's net expenses after advisory fees waived and expenses reimbursed would have been 1.44%, 1.44%, 1.44%, 1.44% and 1.44% of average net assets for the years ended May 31, 2024, 2023, 2022, 2021 and 2020, respectively.
See Notes to Financial Statements.
www.arbitragefunds.com | 1-800-295-4485
60
Selected Per Share Data and Ratios for a Share Outstanding Throughout the Periods Presented:
Year Ended May 31, | |||||||||||||||||||||||
2024 | 2023 | 2022 | 2021 | 2020 | |||||||||||||||||||
| Net asset value, beginning of period | $ | 10.70 | $ | 10.82 | $ | 11.36 | $ | 9.97 | $ | 9.46 | |||||||||||||
| Income (loss) from investment operations | |||||||||||||||||||||||
Net investment income (loss)(a) | 0.03 | (0.00 | )(b)(c) | (0.15 | ) | (0.06 | ) | (0.00 | )(b) | ||||||||||||||
| Net realized and unrealized gains (losses) on investments and foreign currencies | 0.69 | (0.12 | ) | (0.39 | ) | 1.46 | 0.53 | ||||||||||||||||
| Total from investment operations | 0.72 | (0.12 | ) | (0.54 | ) | 1.40 | 0.53 | ||||||||||||||||
Less distributions | |||||||||||||||||||||||
From net investment income | (0.05 | ) | — | — | (0.01 | ) | (0.02 | ) | |||||||||||||||
Total distributions | (0.05 | ) | — | — | (0.01 | ) | (0.02 | ) | |||||||||||||||
Net asset value, end of period | $ | 11.37 | $ | 10.70 | $ | 10.82 | $ | 11.36 | $ | 9.97 | |||||||||||||
Total return(d)(e) | 6.75 | % | (1.11 | %) | (4.75 | %) | 14.20 | % | 5.62 | % | |||||||||||||
| Net assets, end of period (in 000s) | $ | 1,601 | $ | 1,876 | $ | 2,301 | $ | 1,384 | $ | 347 | |||||||||||||
| RATIOS TO AVERAGE NET ASSETS: | |||||||||||||||||||||||
Gross expenses(f) | 1.74 | % | 1.67 | % | 1.77 | % | 2.00 | % | 2.11 | % | |||||||||||||
| Net expenses after advisory fees waived and expenses reimbursed(f)(g) | 1.72 | % | 1.70 | % | 1.79 | % | 1.91 | % | 1.83 | % | |||||||||||||
Net investment income (loss) | 0.29 | % | (0.01 | %) | (1.35 | %) | (0.59 | %) | 0.02 | % | |||||||||||||
Portfolio turnover rate | 305 | % | 216 | % | 217 | % | 320 | % | 397 | % | |||||||||||||
(a) Per share amounts were calculated using average shares outstanding for the year.
(b) Amount rounds to less than $0.01 per share.
(c) The amount shown for a share outstanding throughout the period may not correlate with the Statements of Operations for the period due to timing of sales and redemptions of Fund shares in relation to income earned, allocation of class specific expenses and/or fluctuating market value of the investments of the Fund.
(d) Total return excludes sales charges, if any, and would be lower for the period presented if it reflected these charges.
(e) Total return is a measure of the change in the value of an investment in the Fund over the years covered, which assumes any dividends or capital gains distributions are reinvested in shares of the Fund. Returns shown do not reflect the deduction of taxes a shareholder would pay on Fund distributions or the redemption of Fund shares or the imposition of any sales load.
(f) Dividend expense totaled 0.03%, 0.01%, 0.00%, 0.01% and 0.13% of average net assets for the years ended May 31, 2024, 2023, 2022, 2021 and 2020, respectively. Interest rebate expense and line of credit interest expense totaled 0.00%, 0.00%, 0.10%, 0.21% and 0.01% of average net assets for the years ended May 31, 2024, 2023, 2022, 2021 and 2020, respectively.
(g) Excluding dividend and interest expenses, the Fund's net expenses after advisory fees waived and expenses reimbursed would have been 1.69%, 1.69%, 1.69%, 1.69% and 1.69% of average net assets for the years ended May 31, 2024, 2023, 2022, 2021 and 2020, respectively.
See Notes to Financial Statements.
Annual Report | May 31, 2024
61
Selected Per Share Data and Ratios for a Share Outstanding Throughout the Periods Presented:
Year Ended May 31, | |||||||||||||||||||||||
2024 | 2023 | 2022 | 2021 | 2020 | |||||||||||||||||||
| Net asset value, beginning of period | $ | 9.61 | $ | 9.73 | $ | 10.16 | $ | 9.64 | $ | 9.70 | |||||||||||||
| Income (loss) from investment operations | |||||||||||||||||||||||
Net investment income(a) | 0.43 | 0.36 | 0.16 | 0.22 | 0.24 | ||||||||||||||||||
| Net realized and unrealized gains (losses) on investments and foreign currencies | 0.13 | (0.09 | ) | (0.33 | ) | 0.54 | (0.01 | ) | |||||||||||||||
| Total from investment operations | 0.56 | 0.27 | (0.17 | ) | 0.76 | 0.23 | |||||||||||||||||
Less distributions | |||||||||||||||||||||||
From net investment income | (0.45 | ) | (0.39 | ) | (0.26 | ) | (0.24 | ) | (0.29 | ) | |||||||||||||
Total distributions | (0.45 | ) | (0.39 | ) | (0.26 | ) | (0.24 | ) | (0.29 | ) | |||||||||||||
Net asset value, end of period | $ | 9.72 | $ | 9.61 | $ | 9.73 | $ | 10.16 | $ | 9.64 | |||||||||||||
Total return(b) | 5.96 | % | 2.88 | % | (1.74 | %) | 8.09 | % | 2.46 | % | |||||||||||||
| Net assets, end of period (in 000s) | $ | 6,857 | $ | 6,742 | $ | 9,072 | $ | 7,553 | $ | 3,673 | |||||||||||||
| RATIOS TO AVERAGE NET ASSETS: | |||||||||||||||||||||||
Gross expenses(c) | 1.65 | % | 1.62 | % | 1.62 | % | 1.77 | % | 1.96 | % | |||||||||||||
| Net expenses after advisory fees waived and expenses reimbursed(c)(d) | 1.29 | % | 1.30 | % | 1.32 | % | 1.32 | % | 1.35 | % | |||||||||||||
Net investment income | 4.39 | % | 3.70 | % | 1.58 | % | 2.20 | % | 2.48 | % | |||||||||||||
Portfolio turnover rate | 117 | % | 127 | % | 148 | % | 147 | % | 175 | % | |||||||||||||
(a) Per share amounts were calculated using average shares outstanding for the year.
(b) Total return is a measure of the change in the value of an investment in the Fund over the years covered, which assumes any dividends or capital gains distributions are reinvested in shares of the Fund. Returns shown do not reflect the deduction of taxes a shareholder would pay on Fund distributions or the redemption of Fund shares.
(c) Dividend expense totaled 0.06%, 0.05%, 0.01%, 0.01% and 0.07% of average net assets for the years ended May 31, 2024, 2023, 2022, 2021 and 2020, respectively. Interest rebate expense and line of credit interest expense totaled 0.00%, 0.02%, 0.08%, 0.08% and 0.05% of average net assets for the years ended May 31, 2024, 2023, 2022, 2021 and 2020, respectively.
(d) Excluding dividend and interest expenses, the Fund's net expenses after advisory fees waived and expenses reimbursed would have been 1.23%, 1.23%, 1.23%, 1.23% and 1.23% of average net assets for the years ended May 31, 2024, 2023, 2022, 2021 and 2020, respectively.
See Notes to Financial Statements.
www.arbitragefunds.com | 1-800-295-4485
62
Selected Per Share Data and Ratios for a Share Outstanding Throughout the Periods Presented:
Year Ended May 31, | |||||||||||||||||||||||
2024 | 2023 | 2022 | 2021 | 2020 | |||||||||||||||||||
| Net asset value, beginning of period | $ | 9.56 | $ | 9.69 | $ | 10.12 | $ | 9.60 | $ | 9.65 | |||||||||||||
| Income (loss) from investment operations | |||||||||||||||||||||||
Net investment income(a) | 0.45 | 0.38 | 0.18 | 0.24 | 0.26 | ||||||||||||||||||
| Net realized and unrealized gains (losses) on investments and foreign currencies | 0.13 | (0.10 | ) | (0.33 | ) | 0.55 | 0.01 | (b) | |||||||||||||||
| Total from investment operations | 0.58 | 0.28 | (0.15 | ) | 0.79 | 0.27 | |||||||||||||||||
Less distributions | |||||||||||||||||||||||
From net investment income | (0.47 | ) | (0.41 | ) | (0.28 | ) | (0.27 | ) | (0.32 | ) | |||||||||||||
Total distributions | (0.47 | ) | (0.41 | ) | (0.28 | ) | (0.27 | ) | (0.32 | ) | |||||||||||||
Net asset value, end of period | $ | 9.67 | $ | 9.56 | $ | 9.69 | $ | 10.12 | $ | 9.60 | |||||||||||||
Total return(c) | 6.23 | % | 3.03 | % | (1.51 | %) | 8.29 | % | 2.82 | % | |||||||||||||
| Net assets, end of period (in 000s) | $ | 136,310 | $ | 109,488 | $ | 125,705 | $ | 98,777 | $ | 56,869 | |||||||||||||
| RATIOS TO AVERAGE NET ASSETS: | |||||||||||||||||||||||
Gross expenses(d) | 1.40 | % | 1.37 | % | 1.37 | % | 1.52 | % | 1.71 | % | |||||||||||||
| Net expenses after advisory fees waived and expenses reimbursed(d)(e) | 1.04 | % | 1.05 | % | 1.07 | % | 1.07 | % | 1.10 | % | |||||||||||||
Net investment income | 4.65 | % | 3.94 | % | 1.84 | % | 2.44 | % | 2.73 | % | |||||||||||||
Portfolio turnover rate | 117 | % | 127 | % | 148 | % | 147 | % | 175 | % | |||||||||||||
(a) Per share amounts were calculated using average shares outstanding for the year.
(b) The amount shown for a share outstanding throughout the period may not correlate with the Statements of Operations for the period due to timing of sales and redemptions of Fund shares in relation to income earned, allocation of class specific expenses and/or fluctuating market value of the investments of the Fund.
(c) Total return is a measure of the change in the value of an investment in the Fund over the years covered, which assumes any dividends or capital gains distributions are reinvested in shares of the Fund. Returns shown do not reflect the deduction of taxes a shareholder would pay on Fund distributions or the redemption of Fund shares.
(d) Dividend expense totaled 0.06%, 0.05%, 0.01%, 0.01% and 0.07% of average net assets for the and the years ended May 31, 2024, 2023, 2022, 2021 and 2020, respectively. Interest rebate expense and line of credit interest expense totaled 0.00%, 0.02%, 0.08%, 0.08% and 0.05% of average net assets for the years ended May 31, 2024, 2023, 2022, 2021 and 2020, respectively.
(e) Excluding dividend and interest expenses, the Fund's net expenses after advisory fees waived and expenses reimbursed would have been 0.98%, 0.98%, 0.98%, 0.98% and 0.98% of average net assets for the years ended May 31, 2024, 2023, 2022, 2021 and 2020, respectively.
See Notes to Financial Statements.
Annual Report | May 31, 2024
63
Selected Per Share Data and Ratios for a Share Outstanding Throughout the Periods Presented:
Year Ended May 31, | |||||||||||||||||||||||
2024 | 2023 | 2022 | 2021 | 2020 | |||||||||||||||||||
| Net asset value, beginning of period | $ | 9.57 | $ | 9.69 | $ | 10.12 | $ | 9.60 | $ | 9.65 | |||||||||||||
| Income (loss) from investment operations | |||||||||||||||||||||||
Net investment income(a) | 0.42 | 0.35 | 0.16 | 0.22 | 0.23 | ||||||||||||||||||
| Net realized and unrealized gains (losses) on investments and foreign currencies | 0.14 | (0.08 | ) | (0.33 | ) | 0.54 | 0.01 | (b) | |||||||||||||||
| Total from investment operations | 0.56 | 0.27 | (0.17 | ) | 0.76 | 0.24 | |||||||||||||||||
Less distributions | |||||||||||||||||||||||
From net investment income | (0.45 | ) | (0.39 | ) | (0.26 | ) | (0.24 | ) | (0.29 | ) | |||||||||||||
Total distributions | (0.45 | ) | (0.39 | ) | (0.26 | ) | (0.24 | ) | (0.29 | ) | |||||||||||||
Net asset value, end of period | $ | 9.68 | $ | 9.57 | $ | 9.69 | $ | 10.12 | $ | 9.60 | |||||||||||||
Total return(c)(d) | 5.96 | % | 2.88 | % | (1.76 | %) | 8.02 | % | 2.56 | % | |||||||||||||
| Net assets, end of period (in 000s) | $ | 71 | $ | 67 | $ | 105 | $ | 97 | $ | 88 | |||||||||||||
| RATIOS TO AVERAGE NET ASSETS: | |||||||||||||||||||||||
Gross expenses(e) | 1.65 | % | 1.61 | % | 1.62 | % | 1.77 | % | 1.96 | % | |||||||||||||
| Net expenses after advisory fees waived and expenses reimbursed(e)(f) | 1.30 | % | 1.30 | % | 1.32 | % | 1.32 | % | 1.35 | % | |||||||||||||
Net investment income | 4.40 | % | 3.64 | % | 1.59 | % | 2.21 | % | 2.37 | % | |||||||||||||
Portfolio turnover rate | 117 | % | 127 | % | 148 | % | 147 | % | 175 | % | |||||||||||||
(a) Per share amounts were calculated using average shares outstanding for the year.
(b) The amount shown for a share outstanding throughout the period may not correlate with the Statements of Operations for the period due to timing of sales and redemptions of Fund shares in relation to income earned, allocation of class specific expenses and/or fluctuating market value of the investments of the Fund.
(c) Total return excludes sales charges, if any, and would be lower for the period presented if it reflected these charges.
(d) Total return is a measure of the change in the value of an investment in the Fund over the years covered, which assumes any dividends or capital gains distributions are reinvested in shares of the Fund. Returns shown do not reflect the deduction of taxes a shareholder would pay on Fund distributions or the redemption of Fund shares or the imposition of any sales load.
(e) Dividend expense totaled 0.06%, 0.05%, 0.01%, 0.01% and 0.07% of average net assets for the years ended May 31, 2024, 2023, 2022, 2021 and 2020, respectively. Interest rebate expense and line of credit interest expense totaled 0.00%, 0.02%, 0.08%, 0.08% and 0.05% of average net assets for the years ended May 31, 2024, 2023, 2022, 2021 and 2020, respectively.
(f) Excluding dividend and interest expenses, the Fund's net expenses after advisory fees waived and expenses reimbursed would have been 1.23%, 1.23%, 1.23%, 1.23% and 1.23% of average net assets for the years ended May 31, 2024, 2023, 2022, 2021 and 2020, respectively.
See Notes to Financial Statements.
www.arbitragefunds.com | 1-800-295-4485
64
May 31, 2024
1. ORGANIZATION
The Arbitrage Funds (the "Trust") is a Delaware statutory trust, which was organized on December 22, 1999 and is registered under the Investment Company Act of 1940, as amended (the "1940 Act"), as an open-end management investment company issuing its shares in series. Each series represents a distinct portfolio with its own investment objective and policies. The three series presently authorized are the Arbitrage Fund (the "Arbitrage Fund"), the Water Island Event-Driven Fund (the "Event-Driven Fund") and the Water Island Credit Opportunities Fund (the "Credit Opportunities Fund"), each a "Fund" and collectively the "Funds." The Arbitrage Fund and the Credit Opportunities Fund are each a diversified series of the Trust. The Event-Driven Fund is a non-diversified series of the Trust. Water Island Capital, LLC acts as the Funds' investment adviser (the "Adviser"). The Adviser is responsible for overseeing the management and business affairs of the Funds, and has discretion to purchase and sell securities in accordance with the Funds' objectives, policies, and restrictions, subject to the authority of and supervision by the Trust's Board of Trustees (the "Board"). The Adviser continuously reviews, supervises, and administers the Funds' investment programs. The Funds, together with the series of AltShares Trust, an open-end management investment company also advised by the Adviser, are part of a family of investment companies referred to as the Water Island Capital-Advised Funds.
Commencement of Operations | |||||||||||||||||||
Fund | Class R shares | Class I shares | Class C shares | Class A shares | |||||||||||||||
Arbitrage Fund | September 18, 2000 | October 17, 2003 | June 1, 2012 | June 1, 2013 | |||||||||||||||
Event-Driven Fund | October 1, 2010 | October 1, 2010 | N/A | June 1, 2013 | |||||||||||||||
| Credit Opportunities Fund | October 1, 2012 | October 1, 2012 | N/A | June 1, 2013 | |||||||||||||||
The investment objective of the Arbitrage Fund is to seek to achieve capital growth by engaging in merger arbitrage. The investment objective of the Event-Driven Fund is to seek to achieve capital growth by investing in companies that are impacted by corporate events such as mergers, acquisitions, asset sales, restructurings, refinancings, recapitalizations, reorganizations, or other special situations. The investment objective of the Credit Opportunities Fund is to seek to provide current income and capital growth by investing primarily in debt securities impacted by catalysts and events such as mergers, acquisitions, debt maturities, refinancings, regulatory changes, recapitalizations, reorganizations, restructurings, and other special situations.
The Arbitrage Fund's four classes of shares, Class R, Class I, Class C and Class A, and the Event-Driven Fund's and Credit Opportunities Fund's three classes of shares, Class R, Class I and Class A, represent interests in the same portfolio of investments and have the same rights, but differ primarily in the expenses to which they are subject and the investment eligibility requirements. Class R shares, Class C shares and Class A shares are subject to an annual distribution and servicing fee of up to 0.25%, 1.00% and 0.25%, respectively, of each Fund's average daily net assets attributable to Class R shares, Class C shares and Class A shares, respectively, whereas Class I shares are not subject to any distribution and servicing fees. Class C shares are also subject to a 1.00% contingent deferred sales charge on all purchases redeemed within 12 months of purchase. Class A shares of the Arbitrage Fund are sold subject to a maximum front-end sales load equal to 2.75% of the offering price and are also subject to a 1.00% contingent deferred sales load on purchases at or above $250,000, purchased without a front-end sales charge and redeemed within 18 months of purchase. Class A shares of the Event-Driven Fund and the Credit Opportunities Fund are sold subject to a maximum front-end sales load equal to 3.25% of the offering price and are also subject to a 1.00% contingent deferred sales load on purchases at or above $250,000 purchased without a front-end sales charge and redeemed within 18 months of purchase.
Annual Report | May 31, 2024
65
The Arbitrage Funds Notes to Financial Statements (continued)
May 31, 2024
2. SIGNIFICANT ACCOUNTING POLICIES
The following is a summary of significant accounting policies followed by the Funds. These policies are in conformity with U.S. generally accepted accounting principles ("GAAP"). The Funds are considered investment companies for financial reporting purposes under GAAP and Accounting Standards Codification Topic 946 — Financial Services — Investment Companies.
Use of Estimates — The preparation of financial statements in conformity with GAAP required management to make estimates and assumptions that affected the reported amounts of assets and liabilities at the date of the financial statements and the reported amounts of increases and decreases in net assets from operations during the reporting period. Actual results could differ from those estimates.
Valuation of Investments — The Funds' portfolio securities are valued as of the close of trading of the New York Stock Exchange ("NYSE") (normally 4:00 p.m., Eastern standard time). Common stocks, mutual funds and other securities, including open short positions that are traded on a securities exchange, are valued at the last quoted sales price at the close of regular trading on the day the valuation is made. Securities which are quoted by NASDAQ are valued at the NASDAQ Official Closing Price. Price information on listed stocks is taken from the exchange where the security is primarily traded. Redeemable securities issued by open-end investment companies are valued at the investment company's respective net asset value, with the exception of exchange-traded open-end investment companies, which are priced as common stocks. Market quotations of foreign securities from the principal markets in which they trade may not be reliable if events or circumstances that may affect the value of portfolio securities occur between the time of the market quotation and the close of trading on the NYSE. If a significant event that affects the valuation of a foreign security occurs between the close of a foreign security's primary exchange and the time the Funds calculate their net asset value ("NAV"), the Funds will fair value the foreign security to account for this discrepancy. Securities which are listed on an exchange but which are not traded on the valuation date will be valued at last bid if held long, and last ask if held short. All other equity securities for which over-the-counter (OTC) market quotations are readily available generally are valued at the mean of the current bid and asked prices. Exchange traded options are priced at the last traded price on the exchange in which they are traded. If a sales price is unavailable, then an exchange traded option would be priced at its bid price if held long or at its ask price if sold short. When there is no bid price available, options will typically be valued at zero. Foreign currency forward contracts are valued at the current day's interpolated foreign exchange rate, as calculated using the current day's spot rate, and the thirty, sixty, ninety and one-hundred eighty day forward rates provided by an independent source.
Debt securities are normally priced based upon an evaluated bid provided by independent, third-party pricing services, if available. Evaluated bids are market-based measurements that represent the third-party pricing service's good faith opinion as to what the holder would receive in an orderly transaction (typically in an institutional round lot position) under current market conditions. The third-party pricing services may use a variety of inputs in arriving at an evaluated bid price, including actual market transactions, quotations from dealers and trading systems, or other inputs and methodologies designed to identify the market value for such securities. Bank loans are valued at the mean of the current bid and ask prices. Single name swap agreements are valued using a market-based price based on the underlying terms of the agreement obtained from a third-party pricing service or broker-dealer. Other swap agreements (such as baskets of securities) are valued based on the terms of the swap agreement as provided by an independent third party. If a third-party valuation is not available, these other swap agreements are valued based on the valuation provided by the counterparty.
www.arbitragefunds.com | 1-800-295-4485
66
The Arbitrage Funds Notes to Financial Statements (continued)
May 31, 2024
Other assets and securities for which no quotations are readily available are valued at fair value using methods determined in good faith by the Adviser, whom the Board designated as each Fund's valuation designee. Some of the more common reasons that may necessitate that a security be valued at fair value include: the security's trading has been halted or suspended; the security has been delisted from a national exchange; the security's primary trading market is temporarily closed at a time when under normal conditions it would be open; the security has been acquired through completion of a merger/tender or the security's primary pricing source is not able or willing to provide a price. Common methods of fair valuation include the purchase price of a security or the terms of a deal that has closed. For non-routine fair valuations, the Adviser considers various factors in determining the fair value of a portfolio security or asset, such as fundamental business data relating to the issuer, borrower, or counterparty; the type, size, and cost of the investment; information regarding any transactions in or offers for the investment; the price and extent of public trading in other securities of the issuer or comparable companies; coupon payments, yield or cash flow data; business prospects of the issuer, borrower, or counterparty or of the industry of the issuer, borrower, or counterparty; or other relevant factors including, but not limited to, deal value. Foreign securities are translated from the local currency into U.S. dollars using currency exchange rates supplied by a quotation service.
Fair Value Measurements — In accordance with the authoritative guidance on fair value measurements under GAAP, the Funds disclose fair value of their investments in a hierarchy that prioritizes the inputs to valuation techniques used to measure the fair value. The objective of a fair value measurement is to determine the price that would be received to sell an asset or paid to transfer a liability in an orderly transaction between market participants at the measurement date (an exit price). Accordingly, the fair value hierarchy gives the highest priority to quoted prices (unadjusted) in active markets for identical assets or liabilities (Level 1) and the lowest priority to unobservable inputs (Level 3). The guidance establishes three levels of the fair value hierarchy as follows:
Level 1 — Unadjusted quoted prices in active markets for identical, unrestricted assets or liabilities that the Funds have the ability to access at the measurement date;
Level 2 — Observable inputs other than quoted prices included in Level 1 that are observable (either directly or indirectly) for substantially the full term of the asset or liability; and
Level 3 — Unobservable inputs for the asset or liability, to the extent relevant observable inputs are not available, representing each Fund's own assumption about the assumptions a market participant would use in valuing the asset or liability, and would be based on the best information available.
Investments are classified within the level of the lowest significant input considered in determining fair value. Investments classified within Level 3, whose fair value measurement considers several inputs, may include Level 1 or Level 2 inputs as components of the overall fair value measurement. The inputs or methodology used for valuing securities are not necessarily an indication of the risk associated with investing in those securities.
For the year ended May 31, 2024, there were no significant changes to the Funds' fair value methodologies. Transfers for Level 3 securities, if any, are shown as part of the leveling table in each Fund's Portfolio of Investments.
The availability of observable inputs can vary from security to security and is affected by a wide variety of factors, including, but not limited to, the type of security, whether the security is new and not yet established in the marketplace, the liquidity of markets, and other characteristics
Annual Report | May 31, 2024
67
The Arbitrage Funds Notes to Financial Statements (continued)
May 31, 2024
particular to the security. To the extent that valuation is based on models or inputs that are less observable or unobservable in the market, the determination of fair value requires more judgment. Accordingly, the degree of judgment exercised in determining fair value is generally greatest for instruments categorized in Level 3. Due to the inherent uncertainty of valuation, the determination of values may differ significantly from values that would have been realized had a ready market for investments existed, and the differences could be material.
Share Valuation — The net asset value per share of each class of shares of the Funds is calculated daily by dividing the total value of a Fund's assets attributable to that class, less liabilities attributable to that class, by the number of shares of that class outstanding.
Security Transactions — Security transactions are accounted for on trade date. Gains and losses on securities sold are determined on a specific identification basis.
Short Positions — The Funds may sell securities short for investment or hedging purposes. Subsequent fluctuations in the market prices of securities sold short may require purchasing the securities at prices which may differ from the market value reflected on the Portfolio of Investments. The Funds are liable for any dividends and interest payable on securities while those securities are in a short position. As collateral for their short positions, the Funds maintain assets consisting of cash, cash equivalents or liquid securities. The amount of collateral is required to be adjusted daily to reflect changes in the value of the securities sold short. The Funds may receive rebate income or be charged a fee on borrowed securities. Such income or fee is calculated on a daily basis based upon the market value of each borrowed security and a variable rate that is dependent upon the availability of such security. The dividends on short sales and rebate income/fees are shown on the Statements of Operations.
Collateral — The Funds maintain a margin account with a broker that is used to hold proceeds received from short sales as well as daily mark-to-market adjustments. The balance is shown in the Statements of Assets and Liabilities as 'Deposits with brokers for securities sold short'. Further, short sales, swap, and forward contracts require the Funds to maintain additional collateral with the broker/counterparty and to pledge assets or cash which is held in a segregated triparty account. Securities pledged as collateral are designated in the Schedule of Investments and cash collateral as 'Segregated cash for collateral' in the Statements of Assets and Liabilities.
Derivative Instruments and Hedging Activities — The following discloses the Funds' use of derivative instruments and hedging activities.
Each Fund may enter into various types of derivative contracts, including, but not limited to, swap contracts, forward foreign currency exchange contracts, and purchased and written option contracts. In doing so, the Funds will employ strategies in differing combinations to permit them to increase, decrease, or change the level or types of exposure to market factors. Central to those strategies are features inherent to derivatives that make them more attractive for this purpose than equity or debt securities: they require little or no initial cash investment; they can focus exposure on only certain selected risk factors; and they may not require the ultimate receipt or delivery of the underlying security (or securities) to satisfy the contract. This may allow the Funds to pursue their objectives more quickly and efficiently than if they were to make direct purchases or sales of securities capable of effecting a similar response to market factors. The Funds may, but are not required to, seek to reduce their currency risk by hedging part or all of their exposure to various foreign currencies.
www.arbitragefunds.com | 1-800-295-4485
68
The Arbitrage Funds Notes to Financial Statements (continued)
May 31, 2024
Risk of Investing in Derivatives: In pursuit of their investment objectives, the Funds may use derivatives which may increase or decrease their exposure to the following market risk factors:
Equity Risk: Equity risk relates to the change in value of equity securities as they relate to increases or decreases in the general market. Investments in securities issued by small and medium capitalization companies tend to be less liquid and more volatile than stocks of companies with relatively large market capitalizations. To the extent a Fund invests in securities of small and medium capitalization companies, it may be more vulnerable to adverse business events than larger, more established companies.
Interest Rate Risk: Interest rate risk refers to the fluctuations in value of fixed-income securities resulting from the inverse relationship between price and yield. For example, an increase in general interest rates will tend to reduce the market value of fixed-income investments, and a decline in general interest rates will tend to increase the value of such investments. In addition, debt securities with longer maturities, which tend to have higher yields, are subject to potentially greater fluctuations in value from changes in interest rates than obligations with shorter maturities.
Foreign Exchange Rate Risk: Foreign exchange rate risk relates to the change in the U.S. dollar value of a security held that is denominated in a foreign currency. The value of a foreign currency denominated security will decrease as the dollar appreciates against the currency, while the value of the foreign currency denominated security will increase as the dollar depreciates against the currency. Adverse changes in exchange rates may erode or reverse any gains produced by foreign currency denominated investments and may widen any losses.
Credit Risk: Credit risk relates to the ability of the issuer to meet interest and principal payments, or both, as they come due. In general, lower-grade, higher-yield bonds are subject to credit risk to a greater extent than lower-yield, higher-quality bonds.
The Funds' use of derivatives can result in losses due to unanticipated changes in the market risk factors and the overall market. In instances where the Funds are using derivatives to decrease or hedge exposures to market risk factors for securities held by the Funds, there are also risks that those derivatives may not perform as expected, resulting in losses for the combined or hedged positions.
Derivatives may have little or no initial cash investment relative to their market value exposure and therefore can produce significant gains or losses in excess of their cost. This use of embedded leverage allows the Funds to increase their market value exposure relative to their net assets and can substantially increase the volatility of the Funds' performance.
Additional associated risks from investing in derivatives also exist and potentially could have significant effects on the valuation of the derivative instruments and the Funds. Typically, the associated risks are not the risks that the Funds are attempting to increase or decrease exposure to, per their investment objectives, but are the additional risks from investing in derivatives.
Examples of these associated risks are liquidity risk, which is the risk that the Funds will not be able to sell the derivative in the open market in a timely manner, and counterparty credit risk, which is the risk that the counterparty to a transaction will not fulfill its obligation to the Funds. Associated risks can be different for each type of derivative and are discussed by derivative type in the notes that follow.
Annual Report | May 31, 2024
69
The Arbitrage Funds Notes to Financial Statements (continued)
May 31, 2024
Option Writing/Purchasing: The Funds may write or purchase option contracts to adjust risk and return of their overall investment positions. When a Fund writes or purchases an option, an amount equal to the premium received or paid by the Fund is recorded as a liability or an asset and is subsequently adjusted to the current market value of the option written or purchased. Premiums received or paid from writing or purchasing options that expire unexercised are treated by the Fund on the expiration date as realized gains or losses. The difference between the premium and the amount paid or received on effecting a closing purchase or sale transaction, including brokerage commissions, is also treated as a realized gain or loss. If an option is exercised, the premium paid or received is added to the cost of the purchase or proceeds from the sale in determining whether the Fund has realized a gain or loss on investment transactions. Risks from entering into option transactions arise from the potential inability of counterparties to meet the terms of the contracts, the potential inability to enter into closing transactions because of an illiquid secondary market and from unexpected movements in security values.
Options held by the Funds at May 31, 2024 are disclosed in the Portfolio of Investments.
During the year ended May 31, 2024, the Funds engaged in option writing/purchasing to limit volatility and correlation and to create income and optionality. The maximum potential amount of future payments (undiscounted) that a fund as a writer of put options could be required to make is equal to the notional amount multiplied by the exercise price as shown in the Portfolio of Investments.
Foreign Currency Exchange Contracts: The Funds may enter into forward foreign currency exchange contracts as a way of managing foreign exchange rate risk. The Funds may enter into these contracts for the purchase or sale of a specific foreign currency at a fixed price on a future date as a hedge or cross-hedge against either specific transactions or portfolio positions. The objective of the Funds' foreign currency hedging transactions is to reduce risk that the U.S. dollar value of the Funds' securities denominated in foreign currency will decline in value due to changes in foreign currency exchange rates.
Foreign currency exchange contracts held by the Funds at May 31, 2024 are disclosed in the Portfolio of Investments.
During the year ended May 31, 2024, the Funds entered into foreign currency exchange contracts to hedge currency risk.
Warrants/Rights: Each Fund may purchase or otherwise receive warrants or rights. Warrants and rights generally give the holder the right to receive, upon exercise, a security of the issuer at a set price. The Funds typically use warrants and rights in a manner similar to their use of purchased options on securities, as described in the Options Writing/Purchasing section above. Risks associated with the use of warrants and rights are generally similar to risks associated with the use of purchased options. However, warrants and rights often do not have standardized terms, and may have longer maturities and may be less liquid than exchange-traded options. In addition, the terms of warrants or rights may limit each Fund's ability to exercise the warrants or rights at such times and in such quantities as each Fund would otherwise wish. Warrants and rights generally pay no dividends and confer no voting or other rights other than to purchase the underlying security.
Warrants/rights held by the Funds at May 31, 2024 are disclosed in the Portfolio of Investments.
During the year ended May 31, 2024, the Funds held warrants/rights as a result of receiving them from completed deals, and to participate in investment opportunities.
www.arbitragefunds.com | 1-800-295-4485
70
The Arbitrage Funds Notes to Financial Statements (continued)
May 31, 2024
Swaps: The Funds may enter into swap transactions, such as interest rate, index, equity, total return and credit default swap agreements, for hedging and non-hedging purposes. These transactions would be entered into in an attempt to obtain a particular return when it is considered desirable to do so, possibly at a lower cost to a Fund than if the Fund had invested directly in the asset that yielded the desired return. Swap agreements may be executed in a multilateral or other trade facility program, such as a registered exchange ("centrally cleared swaps") or may be privately negotiated in the over-the-counter market. The duration of a swap agreement typically ranges from a few weeks to more than one year. In a standard swap transaction, two parties agree to exchange the returns (or differentials in rates of return) earned or realized on particular predetermined investments or instruments, which may be adjusted for an interest factor. The gross returns to be exchanged or "swapped" between the parties are generally calculated with respect to a "notional amount" (i.e., the return on or increase in value of a particular dollar amount invested at a particular interest rate, a particular security, in a particular foreign currency, or in a "basket" of securities representing a particular index). In a centrally cleared swap, immediately following execution of the swap agreement, the swap agreement is novated to a central counterparty (the "CCP") and the Fund's counterparty on the swap agreement becomes the CCP.
Total return swap agreements are contracts in which one party agrees to make periodic payments based on the change in market value of underlying assets, which may include a specified security, basket of securities, defined portfolios of bonds, loans and mortgages, or securities indexes during the specified period in return for periodic payments based on a fixed or variable interest rate or the total return from other underlying assets or indices. Total return swap agreements may be used to obtain exposure to a security or market index without owning or taking physical custody of such security or component securities of a market index. Total return swap agreements may effectively add leverage to a Fund's portfolio because, in addition to its total net assets, the Fund would be subject to investment exposure on the notional amount of the swap. Total return swaps are a mechanism for the user to accept the economic benefits of asset ownership without utilizing the balance sheet. The other leg of the swap, usually an identified reference rate such as the SOFR (Secured Overnight Financing Rate) or the federal funds rate, is spread to reflect the non-balance sheet nature of the product. Total return swaps can be designed with any underlying asset agreed upon between two parties. Typically no notional amounts are exchanged with total return swaps. Total return swap agreements entail the risk that a party will default on its payment obligations to a Fund thereunder. Swap agreements also entail the risk that a Fund will not be able to meet its obligation to the counterparty. Generally, a Fund will enter into total return swaps on a net basis (i.e., the two payment streams are netted out with the Fund receiving or paying, as the case may be, only the net amount of the two payments). The Funds will typically enter into agreements based on either long or short exposure to underlying equities.
Most swap agreements entered into by a Fund calculate the obligations of the parties to the agreement on a "net basis." Consequently, a Fund's current obligations (or rights) under a swap agreement will generally be equal only to the net present value of amounts to be paid or received under the agreement based on the relative values of the positions held by each party to the agreement (the "net amount"). A Fund's current obligations under a swap agreement will be accrued daily (offset against amounts owed to the Fund). Any net amount accrued but not yet paid to a Fund by the counterparty under a swap agreement (i.e., the Fund's current rights under the swap agreement) is recorded as unrealized appreciation until the amount is paid to the Fund.
Annual Report | May 31, 2024
71
The Arbitrage Funds Notes to Financial Statements (continued)
May 31, 2024
The Fund's maximum risk of loss from counterparty credit risk is generally limited to the net payment to be received by the Fund and/or the termination value at the end of the contract.
Whether a Fund's use of swap agreements will be successful in furthering its investment objective will depend on management's ability to correctly predict whether certain types of investments are likely to produce greater returns than other investments. Swap agreements that cannot be terminated or sold within seven days may be considered to be illiquid investments. Moreover, a Fund bears the risk of loss of the amount expected to be received under a swap agreement in the event of the default or bankruptcy of a swap agreement counterparty. Although centrally cleared swaps typically present less counterparty risk than non-centrally cleared swaps, a Fund that has entered into centrally cleared swaps is subject to the risk of the failure of the CCP. A Fund will enter into swap agreements only with counterparties that meet certain standards for creditworthiness (generally, such counterparties would have to be eligible counterparties under the terms of the Fund's repurchase agreement guidelines) or that are centrally cleared. Certain restrictions imposed on the Funds by the Internal Revenue Code of 1986, as amended (the "Code"), may limit a Fund's ability to use swap agreements. It is possible that developments in the swap market, including additional government regulation, could adversely affect a Fund's ability to terminate existing swap agreements or to realize amounts to be received under such agreements.
International Swaps and Derivatives Association, Inc. Master Agreements ("ISDA Master Agreements") govern over-the-counter financial derivative transactions entered into by a Fund and counterparty. The ISDA Master Agreements maintain provisions for general obligations, representations, agreements, collateral and events of default or termination. Events of termination include conditions that may entitle counterparties to elect to terminate early and cause settlement of all outstanding transactions under the applicable ISDA Master Agreement. Any election to terminate early could be material to the financial statements.
Swap agreements held by the Funds at May 31, 2024 are disclosed in the Portfolio of Investments.
During the year ended May 31, 2024, the Funds entered into swap agreements to gain efficient exposure to underlying equities.
Fair Value of Derivative Instruments — Fair values of derivatives presented in the financial statements are not netted with the fair value of other derivatives or with any collateral amounts
www.arbitragefunds.com | 1-800-295-4485
72
The Arbitrage Funds Notes to Financial Statements (continued)
May 31, 2024
posted by the Funds or any counterparty on the Statements of Assets and Liabilities. The fair value of derivative instruments for the Funds as of May 31, 2024, was as follows:
| Derivatives Not Accounted For As Hedging Instruments | Asset Derivatives Statements of Assets and Liabilities Location | Fair Value | Liability Derivatives Statements of Assets and Liabilities Location | Fair Value | |||||||||||||||
Arbitrage Fund | |||||||||||||||||||
| Forward Foreign Currency Exchange Contracts | Unrealized appreciation on forward foreign currency exchange contracts | $ | 344,834 | Unrealized depreciation on forward foreign currency exchange contracts | $ | 143,672 | |||||||||||||
| Equity Contracts (swap contracts) | Unrealized appreciation on swap contracts | 358,327 | Unrealized depreciation on swap contracts | 3,296,694 | |||||||||||||||
| Equity Contracts (purchased option contracts) | Investments: at fair value of unaffiliated investments | 1,422,129 | — | ||||||||||||||||
| Equity Contracts (written option contracts) | — | Written options, at value | 160,830 | ||||||||||||||||
$ | 2,125,290 | $ | 3,601,196 | ||||||||||||||||
Annual Report | May 31, 2024
73
The Arbitrage Funds Notes to Financial Statements (continued)
May 31, 2024
| Derivatives Not Accounted For As Hedging Instruments | Asset Derivatives Statements of Assets and Liabilities Location | Fair Value | Liability Derivatives Statements of Assets and Liabilities Location | Fair Value | |||||||||||||||
Event-Driven Fund | |||||||||||||||||||
| Forward Foreign Currency Exchange Contracts | Unrealized appreciation on forward foreign currency exchange contracts | $ | 49,403 | Unrealized depreciation on forward foreign currency exchange contracts | $ | 6,485 | |||||||||||||
| Equity Contracts (swap contracts) | Unrealized appreciation on swap contracts | 36,111 | Unrealized depreciation on swap contracts | 183,311 | |||||||||||||||
| Equity Contracts (purchased option contracts) | Investments: at fair value of unaffiliated investments | 9,200 | — | ||||||||||||||||
| Equity Contracts (written option contracts) | — | Written options, at value | 18,000 | ||||||||||||||||
$ | 94,714 | $ | 207,796 | ||||||||||||||||
| Derivatives Not Accounted For As Hedging Instruments | Asset Derivatives Statements of Assets and Liabilities Location | Fair Value | Liability Derivatives Statements of Assets and Liabilities Location | Fair Value | |||||||||||||||
Credit Opportunities Fund | |||||||||||||||||||
| Forward Foreign Currency Exchange Contracts | Unrealized appreciation on forward foreign currency exchange contracts | $ | 3,786 | Unrealized depreciation on forward foreign currency exchange contracts | $ | 1,598 | |||||||||||||
| Equity Contracts (swap contracts) | Unrealized appreciation on swap contracts | 1,487 | Unrealized depreciation on swap contracts | 143,472 | |||||||||||||||
| Equity Contracts (purchased option contracts) | Investments: at fair value of unaffiliated investments | 78,230 | — | ||||||||||||||||
$ | 83,503 | $ | 145,070 | ||||||||||||||||
www.arbitragefunds.com | 1-800-295-4485
74
The Arbitrage Funds Notes to Financial Statements (continued)
May 31, 2024
The effect of derivative instruments on the Funds' Statements of Operations for the year ended May 31, 2024, was as follows:
| Derivatives Not Accounted For As Hedging Instruments | Location Of Gains/(Loss) On Derivatives Recognized In Income | Realized Gain/(Loss) On Derivatives Recognized In Income | Change in Unrealized Gain/(Loss) On Derivatives Recognized In Income | ||||||||||||
Arbitrage Fund | |||||||||||||||
| Forward Foreign Currency Exchange Contracts | Net realized gains (losses) from: Forward currency contracts / Net change in unrealized appreciation (depreciation) on: Forward currency contracts | $ | 926,403 | $ | 99,997 | ||||||||||
| Swap Contracts | Net realized gains (losses) from: Swap contracts / Net change in unrealized appreciation (depreciation) on: Swap contracts | (30,125,272 | ) | 10,961,616 | |||||||||||
| Equity Contracts (purchased option contracts) | Net realized gains (losses) from: Purchased option contracts / Net change in unrealized appreciation (depreciation) on: Purchased option contracts | (4,749,546 | ) | 777,524 | |||||||||||
| Equity Contracts (written option contracts) | Net realized gains (losses) from: Written option contracts / Net change in unrealized appreciation (depreciation) on: Written option contracts | 390,210 | 5,478 | ||||||||||||
$ | (33,558,205 | ) | $ | 11,844,615 | |||||||||||
Annual Report | May 31, 2024
75
The Arbitrage Funds Notes to Financial Statements (continued)
May 31, 2024
| Derivatives Not Accounted For As Hedging Instruments | Location Of Gains/(Loss) On Derivatives Recognized In Income | Realized Gain/(Loss) On Derivatives Recognized In Income | Change in Unrealized Gain/(Loss) On Derivatives Recognized In Income | ||||||||||||
Event-Driven Fund | |||||||||||||||
| Forward Foreign Currency Exchange Contracts | Net realized gains (losses) from: Forward currency contracts / Net change in unrealized appreciation (depreciation) on: Forward currency contracts | $ | 3,747 | $ | 72,496 | ||||||||||
| Swap Contracts | Net realized gains (losses) from: Swap contracts / Net change in unrealized appreciation (depreciation) on: Swap contracts | (3,053,356 | ) | 1,016,029 | |||||||||||
| Equity Contracts (purchased option contracts) | Net realized gains (losses) from: Purchased option contracts / Net change in unrealized appreciation (depreciation) on: Purchased option contracts | (473,300 | ) | 65,923 | |||||||||||
| Equity Contracts (written option contracts) | Net realized gains (losses) from: Written option contracts / Net change in unrealized appreciation (depreciation) on: Written option contracts | 43,199 | (5,529 | ) | |||||||||||
$ | (3,479,710 | ) | $ | 1,148,919 | |||||||||||
www.arbitragefunds.com | 1-800-295-4485
76
The Arbitrage Funds Notes to Financial Statements (continued)
May 31, 2024
| Derivatives Not Accounted For As Hedging Instruments | Location Of Gains/(Loss) On Derivatives Recognized In Income | Realized Gain/(Loss) On Derivatives Recognized In Income | Change in Unrealized Gain/(Loss) On Derivatives Recognized In Income | ||||||||||||
Credit Opportunities Fund | |||||||||||||||
| Forward Foreign Currency Exchange Contracts | Net realized gains (losses) from: Forward currency contracts / Net change in unrealized appreciation (depreciation) on: Forward currency contracts | $ | (2,666 | ) | $ | 4,041 | |||||||||
| Swap Contracts | Net realized gains (losses) from: Swap contracts / Net change in unrealized appreciation (depreciation) on: Swap contracts | 1,479 | (119,154 | ) | |||||||||||
| Equity Contracts (purchased option contracts) | Net realized gains (losses) from: Purchased option contracts / Net change in unrealized appreciation (depreciation) on: Purchased option contracts | (442,576 | ) | 34,943 | |||||||||||
| Equity Contracts (written option contracts) | Net realized gains (losses) from: Written option contracts / Net change in unrealized appreciation (depreciation) on: Written option contracts | 23,529 | — | ||||||||||||
$ | (420,234 | ) | $ | (80,170 | ) | ||||||||||
Volume of derivative instruments held by the Funds during the year ended May 31, 2024, was as follows:
Derivative Type | Unit of Measurement | Monthly Average | |||||||||
Arbitrage Fund | |||||||||||
Swap Contracts | Notional Quantity | $ | 152,983,984 | ||||||||
| Forward Foreign Currency Exchange Contracts | Net Contracts to Deliver/(Receive) | (88,435,923) | |||||||||
Purchased Option Contracts | Contracts | 11,774 | |||||||||
Written Option Contracts | Contracts | (895 | ) | ||||||||
Derivative Type | Unit of Measurement | Monthly Average | |||||||||
Event-Driven Fund | |||||||||||
Swap Contracts | Notional Quantity | $ | 16,244,362 | ||||||||
| Forward Foreign Currency Exchange Contracts | Net Contracts to Deliver/(Receive) | (10,286,629) | |||||||||
Purchased Option Contracts | Contracts | 566 | |||||||||
Written Option Contracts | Contracts | (82 | ) | ||||||||
Annual Report | May 31, 2024
77
The Arbitrage Funds Notes to Financial Statements (continued)
May 31, 2024
Derivative Type | Unit of Measurement | Monthly Average | |||||||||
Credit Opportunities Fund | |||||||||||
Swap Contracts | Notional Quantity | $ | 7,408,259 | ||||||||
| Forward Foreign Currency Exchange Contracts | Net Contracts to Deliver/(Receive) | (250,029) | |||||||||
Purchased Option Contracts | Contracts | 2,632 | |||||||||
Written Option Contracts | Contracts | (202 | ) | ||||||||
Certain derivative contracts are executed under either standardized netting agreements or, for exchange-traded derivatives, the relevant contracts for a particular exchange which contain enforceable netting provisions. A derivative netting arrangement creates an enforceable right of set-off that becomes effective, and affects the realization of settlement on individual assets, liabilities and collateral amounts, only following a specified event of default or early termination. Default events may include the failure to make payments or deliver securities timely, material adverse changes in financial condition or insolvency, the breach of minimum regulatory capital requirements, or loss of license, charter or other legal authorization necessary to perform under the contract.
The Funds held financial instruments such as equity swaps that are subject to enforceable netting arrangements or other similar agreements as of May 31, 2024. All other derivative contracts held by the Funds were not subject to netting agreements.
The following tables present financial instruments held by the Funds that are subject to enforceable netting arrangements or other similar agreements as of May 31, 2024:
Arbitrage Fund
Gross | Gross Amounts Offset in | Net Amounts Presented in | Gross Amounts Not Offset in the Statements of Assets and Liabilities | ||||||||||||||||||||||||
Description | Amounts of Recognized Assets | the Statements of Assets and Liabilities | the Statements of Assets and Liabilities | Financial Instruments | Cash Collateral Received | Net Amount | |||||||||||||||||||||
Equity Swaps | $ | 358,327 | $ | (358,327 | ) | $ | — | $ | — | $ | — | $ | — | ||||||||||||||
Total | $ | 358,327 | $ | (358,327 | ) | $ | — | $ | — | $ | — | $ | — | ||||||||||||||
Gross | Gross Amounts Offset in | Net Amounts Presented in | Gross Amounts Not Offset in the Statements of Assets and Liabilities | ||||||||||||||||||||||||
Description | Amounts of Recognized Liabilities | the Statements of Assets and Liabilities | the Statements of Assets and Liabilities | Financial Instruments | Cash Collateral Pledged | Net Amount | |||||||||||||||||||||
Equity Swaps | $ | 3,296,694 | $ | (358,327 | ) | $ | 2,938,367 | $ | (2,938,367 | ) | $ | — | $ | — | |||||||||||||
Total | $ | 3,296,694 | $ | (358,327 | ) | $ | 2,938,367 | $ | (2,938,367 | ) | $ | — | $ | — | |||||||||||||
www.arbitragefunds.com | 1-800-295-4485
78
The Arbitrage Funds Notes to Financial Statements (continued)
May 31, 2024
Event-Driven Fund
Gross | Gross Amounts Offset in | Net Amounts Presented in | Gross Amounts Not Offset in the Statements of Assets and Liabilities | ||||||||||||||||||||||||
Description | Amounts of Recognized Assets | the Statements of Assets and Liabilities | the Statements of Assets and Liabilities | Financial Instruments | Cash Collateral Received | Net Amount | |||||||||||||||||||||
Equity Swaps | $ | 36,111 | $ | (36,111 | ) | $ | — | $ | — | $ | — | $ | — | ||||||||||||||
Total | $ | 36,111 | $ | (36,111 | ) | $ | — | $ | — | $ | — | $ | — | ||||||||||||||
Gross | Gross Amounts Offset in | Net Amounts Presented in | Gross Amounts Not Offset in the Statements of Assets and Liabilities | ||||||||||||||||||||||||
Description | Amounts of Recognized Liabilities | the Statements of Assets and Liabilities | the Statements of Assets and Liabilities | Financial Instruments | Cash Collateral Pledged | Net Amount | |||||||||||||||||||||
Equity Swaps | $ | 183,311 | $ | (36,111 | ) | $ | 147,200 | $ | (147,200 | ) | $ | — | $ | — | |||||||||||||
Total | $ | 183,311 | $ | (36,111 | ) | $ | 147,200 | $ | (147,200 | ) | $ | — | $ | — | |||||||||||||
Credit Opportunities Fund
Gross | Gross Amounts Offset in | Net Amounts Presented in | Gross Amounts Not Offset in the Statements of Assets and Liabilities | ||||||||||||||||||||||||
Description | Amounts of Recognized Assets | the Statements of Assets and Liabilities | the Statements of Assets and Liabilities | Financial Instruments | Cash Collateral Received | Net Amount | |||||||||||||||||||||
Equity Swaps | $ | 1,487 | $ | (1,487 | ) | $ | — | $ | — | $ | — | $ | — | ||||||||||||||
Total | $ | 1,487 | $ | (1,487 | ) | $ | — | $ | — | $ | — | $ | — | ||||||||||||||
Gross | Gross Amounts Offset in | Net Amounts Presented in | Gross Amounts Not Offset in the Statements of Assets and Liabilities | ||||||||||||||||||||||||
Description | Amounts of Recognized Liabilities | the Statements of Assets and Liabilities | the Statements of Assets and Liabilities | Financial Instruments | Cash Collateral Pledged | Net Amount | |||||||||||||||||||||
Equity Swaps | $ | 143,472 | $ | (1,487 | ) | $ | 141,985 | $ | — | $ | (141,985 | ) | $ | — | |||||||||||||
Total | $ | 143,472 | $ | (1,487 | ) | $ | 141,985 | $ | — | $ | (141,985 | ) | $ | — | |||||||||||||
Investment Income — Interest income, adjusted for amortization of premium and accretion of discount, is recorded on the accrual basis. Dividend income is recorded on the ex-dividend date, net of any non-reclaimable tax withholdings. Payment-in-kind securities have the option at each interest payment date of making interest payments in cash or additional debt securities. Any interest accrued on payment-in-kind securities is recorded as interest income on an accrual basis. Distributions from real estate investment trusts ("REITs") may be characterized as ordinary income, net capital gain, or a return of capital to the Funds. The proper characterization of REIT distributions is generally not known until after the end of each calendar year. As such, estimates are used in reporting the character of income and distributions for financial statement purposes when information is not available.
Annual Report | May 31, 2024
79
The Arbitrage Funds Notes to Financial Statements (continued)
May 31, 2024
Dividends and Distributions to Shareholders — Dividends arising from net investment income and net capital gain distributions, if any, are declared and paid at least annually to shareholders of the Arbitrage Fund and Event-Driven Fund. Dividends arising from net investment income, if any, are declared daily and paid monthly, and net capital gain distributions, if any, are declared and paid at least annually to shareholders of the Credit Opportunities Fund.
Cash — The Funds may invest a portion of their assets in cash or cash items. These cash items and other high-quality debt securities may include money market instruments, such as securities issued by the U.S. Government and its agencies, bankers' acceptances, commercial paper, bank certificates of deposit and investment companies that invest primarily in such instruments. As of May 31, 2024, cash held by the Funds represented cash held at a third-party custodian.
Allocation Between Classes — Investment income earned, realized capital gains and losses, and unrealized appreciation and depreciation are allocated daily to each class of shares based upon the proportionate shares of total net assets of each Fund. Class-specific expenses are charged directly to the class incurring the expense. Common expenses which are not attributable to a specific class are allocated daily to each class of shares based upon the proportionate share of total net assets of each Fund.
Federal Income Tax — It is the Funds' policy to continue to comply with the special provisions of Subchapter M of the Code, as amended, applicable to regulated investment companies. As provided therein, in any fiscal year in which a fund so qualifies and distributes at least 90% of its taxable net income, a fund (but not the shareholders) will be relieved of Federal income tax on the income distributed. Accordingly, no provision for income taxes has been made.
As of and during the year ended May 31, 2024, the Funds did not have a liability for any unrecognized tax benefits. The Funds recognize interest and, if applicable, penalties for any uncertain tax positions. Interest and penalty expense will be recorded as a component of interest or other tax expense. No interest or penalties were recorded during the year ended May 31, 2024. The Funds file U.S. federal, state, and local tax returns as required. The Funds' tax returns are subject to examination by the relevant tax authorities until expiration of the applicable statute of limitations which is generally three years after the filing of the tax return. Tax returns for open years have incorporated no uncertain tax positions that require a provision for income taxes.
3. INVESTMENT TRANSACTIONS
During the year ended May 31, 2024, cost of purchases and proceeds from sales and maturities of investment securities, excluding short-term investments, U.S. government securities, equity swap contracts, purchased and written option contracts and securities sold short, were as follows:
Arbitrage Fund | Event-Driven Fund | Credit Opportunities Fund | |||||||||||||
Purchases | $ | 2,051,997,530 | $ | 292,055,507 | $ | 141,312,143 | |||||||||
Sales and Maturities | 2,349,420,198 | 324,443,709 | 125,903,050 | ||||||||||||
4. LINE OF CREDIT
The Trust, on behalf of the Funds, has entered into an agreement which enables the Funds to participate in a $100,000,000 unsecured uncommitted revolving line of credit (the "Uncommitted Line") with State Street Bank and Trust Company (the "Custodian"). Borrowings under the Uncommitted Line are made solely to temporarily finance the purchase or sale of securities or to finance the redemption of the shares of an investor of the Funds. The Uncommitted Line has an upfront fee of $30,000, is held available on a discretionary demand basis and may be terminated by the Custodian or the Trust at any time for any or no reason. Such fees are included in the
www.arbitragefunds.com | 1-800-295-4485
80
The Arbitrage Funds Notes to Financial Statements (continued)
May 31, 2024
custodian bank and service fees on the Statements of Operations. Interest on the Uncommitted Line is charged to the Funds based on their borrowing at a rate equal to the higher of (a) the federal funds rate plus 1.35% and (b) the overnight bank funding rate plus 1.35%. For purposes of calculating the effective interest rate, if the federal funds rate or the overnight bank funding rate shall be less than zero, then such rate shall be deemed to be zero.
For the year ended May 31, 2024, the Event-Driven Fund and the Credit Opportunities Fund had average borrowings of $500,000 and $3,000,000, respectively, over a period of 1 day and 2 days, respectively, at a weighted average interest rate of 6.68% and 6.68%, respectively. Interest expense on the line of credit for the Event-Driven Fund and the Credit Opportunities Fund during the year ended May 31, 2024 is shown as line of credit interest expense on the Statements of Operations. The Funds had no outstanding borrowings at May 31, 2024.
5. ADVISORY FEES, ADMINISTRATION FEES AND OTHER AGREEMENTS
Investment Advisory Agreement
The Funds' investments are managed by the Adviser according to the terms of Investment Advisory Agreements. Under each of the Investment Advisory Agreements, fees are computed and accrued daily and paid monthly. Under the Investment Advisory Agreement between the Adviser and the Arbitrage Fund, as amended and restated on October 1, 2007, the Arbitrage Fund pays the Adviser an annual fee, of 1.25% on the first $250 million, 1.20% on the next $50 million, 1.15% on the next $50 million, 1.10% on the next $75 million, 1.05% on the next $75 million, and 1.00% on its average daily net assets in excess of $500 million. Effective November 1, 2019, the Event-Driven Fund pays the Adviser an annual fee of 1.10% based on the Event-Driven Fund's average daily net assets. Effective August 6, 2018, the Credit Opportunities Fund pays the Adviser an annual fee of 0.95% on the first $250 million, 0.90% on the next $500 million, and 0.85% on its average daily net assets in excess of $750 million.
Under an Amended and Restated Expense Waiver and Reimbursement Agreement for each of the Funds, the Adviser has contractually agreed to waive its advisory fee and/or reimburse the Funds' other expenses to the extent that total operating expenses (exclusive of taxes, interest, dividends on short positions, brokerage commissions, acquired fund fees and expenses and other costs incurred in connection with the purchase or sale of portfolio securities) exceed the annual rate of the Funds' average daily net assets attributable to each share class as shown in the table below. The agreement remains in effect until September 30, 2024, unless terminated earlier by the Board.
Arbitrage Fund | Event-Driven Fund | Credit Opportunities Fund | |||||||||||||
Class R | 1.69 | % | 1.69 | % | 1.23 | % | |||||||||
Class I | 1.44 | % | 1.44 | % | 0.98 | % | |||||||||
Class C | 2.44 | % | N/A | N/A | |||||||||||
Class A | 1.69 | % | 1.69 | % | 1.23 | % | |||||||||
The Adviser agreed not to charge the Arbitrage Fund an advisory fee on the portion of its assets invested in the Event-Driven Fund. This resulted in $929,238 of advisory fees being waived during the year ended May 31, 2024.
For the year ended May 31, 2024, the aggregate net fee paid to the Adviser as a percentage of average net assets for the Arbitrage Fund, Event-Driven Fund and Credit Opportunities Fund was 1.00%, 1.08% and 0.59%, respectively.
Annual Report | May 31, 2024
81
The Arbitrage Funds Notes to Financial Statements (continued)
May 31, 2024
The Adviser can recapture, with the exception of the advisory fees waived related to Arbitrage Fund's investment in the Event-Driven Fund, any waived amount from a Fund pursuant to the Amended and Restated Expense Waiver and Reimbursement Agreements if such recapture does not cause the Fund to exceed the expense limitations in effect at the time the amounts were waived, the recapture does not cause the Fund to exceed the current expense limitation, and the recapture is done within three years after the date on which the expense was waived. There were no amounts recaptured during the year ended May 31, 2024 for the Funds.
As of May 31, 2024, the balances of waived expenses that are eligible for potential recapture for each Fund are as follows:
| Expiring May 31, 2025 | Expiring May 31, 2026 | Expiring May 31, 2027 | Total | ||||||||||||||||
Event-Driven Fund | |||||||||||||||||||
Class R | $ | — | $ | — | $ | 800 | $ | 800 | |||||||||||
Class I | — | — | 19,280 | 19,280 | |||||||||||||||
Class A | — | — | 323 | 323 | |||||||||||||||
Credit Opportunities Fund | |||||||||||||||||||
Class R | $ | 27,491 | $ | 27,239 | $ | 20,681 | $ | 75,411 | |||||||||||
Class I | 360,709 | 360,425 | 440,108 | 1,161,242 | |||||||||||||||
Class A | 309 | 241 | 245 | 795 | |||||||||||||||
Administration Agreement
State Street Bank and Trust Company serves as the Trust's administrator pursuant to an Administration Agreement with the Trust.
Distribution Agreement
ALPS Distributors, Inc. (the "Distributor") serves as the Funds' distributor. The Distributor acts as an agent for the Funds and the distributor of their shares. The Funds have adopted, with respect to their Class R, Class C shares and Class A shares, as applicable, a plan of distribution pursuant to Rule 12b-1 under the 1940 Act which permits each Fund to pay for expenses incurred in the distribution and promotion of the Funds' Class R shares, Class C shares and Class A shares and for services provided to shareholders. The Plan is a "reimbursement" plan. This means that a Fund's Class R shares, Class C shares and Class A shares only pay the 12b-1 fee to the extent that the Adviser, the Distributor or others have incurred expenses in the promotion and distribution of the shares, including but not limited to, the printing of prospectuses and reports used for sales purposes, expenses of preparation of sales literature and related expenses, advertisements, and other distribution-related expenses, as well as any distribution fees paid to securities dealers or others. Under the distribution plan, a Fund may pay compensation to any broker-dealer with whom the Distributor or the Funds has entered into a contract to distribute Class R shares, Class C shares or Class A shares, or to any other qualified financial services firm, for distribution and/or shareholder-related services with respect to shares held or purchased by their respective customers or in connection with the purchase of shares attributable to their efforts. The amount of payments under the Plan in any year shall not exceed 0.25% for Class R shares, 0.75% for Class C shares and 0.25% for Class A shares, respectively, of the average daily net assets allocable to a Fund's Class R shares, Class C shares and Class A shares, respectively. In addition, the Plan permits each Fund to make payments at an annual rate of up to 0.25% of the Fund's Class C shares for expenses incurred in connection with the provision of shareholder support or administrative services for the Fund's Class C shares.
www.arbitragefunds.com | 1-800-295-4485
82
The Arbitrage Funds Notes to Financial Statements (continued)
May 31, 2024
During the year ended May 31, 2024, the Arbitrage Fund's Class R shares and Class A shares incurred $99,840 and $63,812 in distribution expenses, respectively, and Class C shares incurred $72,973 in distribution and shareholder support expenses, all of which were used to compensate broker-dealers. During the year ended May 31, 2024, the Event-Driven Fund's Class R shares and Class A shares incurred $10,563 and $4,321 in distribution expenses, respectively, all of which were used to compensate broker-dealers. During the year ended May 31, 2024, the Credit Opportunities Fund's Class R shares and Class A shares incurred $14,458 and $173 in distribution expenses, respectively, all of which were used to compensate broker-dealers.
Chief Compliance Officer
The Chief Compliance Officer ("CCO") of the Trust also serves as the CCO of the Adviser. The Trust pays a portion of the CCO's compensation as approved by the Board of Trustees. Information related to the CCO Fees can be found in the Funds' Statements of Operations.
Chief Financial Officer
Foreside Management Services, LLC ("Foreside", d/b/a ACA Group) provides Chief Financial Officer ("CFO") services to the Trust. Foreside is compensated by the Trust under a Fund CFO/Treasurer Agreement.
Transfer Agent and Shareholder Services Agreement
SS&C Global Investor and Distribution Solutions, Inc. ("SS&C GIDS," formerly known as DST Systems, Inc.) is the Funds' transfer agent, and per an agency agreement, maintains the records of each shareholder's account, answers shareholders' inquiries concerning their accounts, processes purchases and redemptions of the Funds shares, acts as dividend and distribution disbursing agent and performs other shareholder service functions.
6. RELATED PARTIES
The Adviser is a related party of the Funds and certain officers of the Trust are also officers of the Adviser. Fees payable to related parties are disclosed in Note 5 and accrued amounts are disclosed in the Statements of Operations.
7. AFFILIATED ISSUER TRANSACTIONS
A summary of affiliated transactions for the Arbitrage Fund for the year ended May 31, 2024 follows:
| Affiliated Issuer | Beginning Value as of May 31, 2023 | Purchases at Cost | Proceeds from Sales | Net Realized Gain/ (Loss) on Sales | Change in Unrealized Appreciation/ Depreciation | Ending Value as of May 31, 2024 | Shares as of May 31, 2024 | Dividend Income | Capital Gain Distributions | ||||||||||||||||||||||||||||||
| Water Island Event-Driven Fund | $ | 71,734,267 | $ | 553,967 | $ | 23,284,473 | $ | 3,878,451 | $ | 591,976 | $ | 53,474,188 | 4,633,812 | $ | 553,814 | $ | — | ||||||||||||||||||||||
At May 31, 2024, Arbitrage Fund, an affiliated fund, owned 66.51% of Event-Driven Fund's shares.
8. CONTINGENCIES AND COMMITMENTS
The Funds indemnify the Trust's officers and trustees for certain liabilities that might arise from their performance of their duties to the Funds. Additionally, in the normal course of business, the Funds enter into contracts that contain a variety of representations and warranties and which provide general indemnifications. The Funds' maximum exposure under these arrangements is
Annual Report | May 31, 2024
83
The Arbitrage Funds Notes to Financial Statements (continued)
May 31, 2024
unknown, as this would involve future claims that may be made against the Funds that have not yet occurred. However, based on experience, the Funds expect the risk of loss to be remote.
9. CAPITAL SHARE TRANSACTIONS
Proceeds and payments on capital shares as shown in the Statements of Changes in Net Assets are the result of the following capital share transactions for the periods shown:
| Year Ended May 31, 2024 | Year Ended May 31, 2023 | ||||||||||||||||||
Arbitrage Fund - Class R | Shares | Value | Shares | Value | |||||||||||||||
Proceeds from shares sold | 283,484 | $ | 3,555,982 | 875,065 | $ | 10,878,888 | |||||||||||||
| Shares issued in reinvestment of distributions | 58,539 | 739,936 | 164,500 | 2,001,965 | |||||||||||||||
Payments for shares redeemed | (1,357,571 | ) | (16,994,319 | ) | (3,550,659 | ) | (44,018,561 | ) | |||||||||||
Net decrease | (1,015,548 | ) | $ | (12,698,401 | ) | (2,511,094 | ) | $ | (31,137,708 | ) | |||||||||
Arbitrage Fund - Class I | |||||||||||||||||||
Proceeds from shares sold | 15,180,809 | $ | 198,164,737 | 21,230,187 | $ | 273,656,279 | |||||||||||||
| Shares issued in reinvestment of distributions | 1,223,226 | 16,085,423 | 3,154,548 | 39,905,031 | |||||||||||||||
Payments for shares redeemed | (35,227,115 | ) | (458,249,117 | ) | (50,906,547 | ) | (654,658,365 | ) | |||||||||||
Net decrease | (18,823,080 | ) | $ | (243,998,957 | ) | (26,521,812 | ) | $ | (341,097,055 | ) | |||||||||
Arbitrage Fund - Class C | |||||||||||||||||||
Proceeds from shares sold | 14,050 | $ | 163,939 | 13,835 | $ | 158,817 | |||||||||||||
| Shares issued in reinvestment of distributions | 9,197 | 106,962 | 21,082 | 238,233 | |||||||||||||||
Payments for shares redeemed | (225,727 | ) | (2,599,979 | ) | (434,130 | ) | (5,001,828 | ) | |||||||||||
Net decrease | (202,480 | ) | $ | (2,329,078 | ) | (399,213 | ) | $ | (4,604,778 | ) | |||||||||
Arbitrage Fund - Class A | |||||||||||||||||||
Proceeds from shares sold | 839,930 | $ | 10,501,125 | 588,071 | $ | 7,250,346 | |||||||||||||
| Shares issued in reinvestment of distributions | 24,199 | 304,913 | 74,975 | 909,449 | |||||||||||||||
Payments for shares redeemed | (1,261,830 | ) | (15,728,019 | ) | (1,706,721 | ) | (21,022,258 | ) | |||||||||||
Net decrease | (397,701 | ) | $ | (4,921,981 | ) | (1,043,675 | ) | $ | (12,862,463 | ) | |||||||||
Event-Driven Fund - Class R | |||||||||||||||||||
Proceeds from shares sold | 70,755 | $ | 808,984 | 25,875 | $ | 281,636 | |||||||||||||
| Shares issued in reinvestment of distributions | 1,796 | 20,620 | — | — | |||||||||||||||
Payments for shares redeemed | (49,051 | ) | (557,112 | ) | (69,180 | ) | (753,009 | ) | |||||||||||
Net increase/(decrease) | 23,500 | $ | 272,492 | (43,305 | ) | $ | (471,373 | ) | |||||||||||
Event-Driven Fund - Class I | |||||||||||||||||||
Proceeds from shares sold | 120,366 | $ | 1,365,136 | 1,846,566 | $ | 20,365,124 | |||||||||||||
| Shares issued in reinvestment of distributions | 65,408 | 760,043 | — | — | |||||||||||||||
Payments for shares redeemed | (3,757,845 | ) | (42,899,230 | ) | (1,614,916 | ) | (17,754,925 | ) | |||||||||||
Net increase/(decrease) | (3,572,071 | ) | $ | (40,774,051 | ) | 231,650 | $ | 2,610,199 | |||||||||||
www.arbitragefunds.com | 1-800-295-4485
84
The Arbitrage Funds Notes to Financial Statements (continued)
May 31, 2024
| Year Ended May 31, 2024 | Year Ended May 31, 2023 | ||||||||||||||||||
Event-Driven Fund - Class A | Shares | Value | Shares | Value | |||||||||||||||
Proceeds from shares sold | 5,183 | $ | 56,203 | 110,667 | $ | 1,210,619 | |||||||||||||
| Shares issued in reinvestment of distributions | 696 | 7,976 | — | — | |||||||||||||||
Payments for shares redeemed | (40,378 | ) | (445,247 | ) | (148,105 | ) | (1,610,583 | ) | |||||||||||
Net decrease | (34,499 | ) | $ | (381,068 | ) | (37,438 | ) | $ | (399,964 | ) | |||||||||
Credit Opportunities Fund - Class R | |||||||||||||||||||
Proceeds from shares sold | 272,082 | $ | 2,636,514 | 135,130 | $ | 1,297,962 | |||||||||||||
| Shares issued in reinvestment of distributions | 27,730 | 268,650 | 36,521 | 350,831 | |||||||||||||||
Payments for shares redeemed | (296,040 | ) | (2,862,710 | ) | (402,198 | ) | (3,872,353 | ) | |||||||||||
Net increase/(decrease) | 3,772 | $ | 42,454 | (230,547 | ) | $ | (2,223,560 | ) | |||||||||||
Credit Opportunities Fund - Class I | |||||||||||||||||||
Proceeds from shares sold | 5,117,751 | $ | 49,417,803 | 1,762,330 | $ | 16,850,541 | |||||||||||||
| Shares issued in reinvestment of distributions | 416,781 | 4,020,344 | 319,282 | 3,052,297 | |||||||||||||||
Payments for shares redeemed | (2,893,543 | ) | (27,925,826 | ) | (3,610,686 | ) | (34,442,728 | ) | |||||||||||
Net increase/(decrease) | 2,640,989 | $ | 25,512,321 | (1,529,074 | ) | $ | (14,539,890 | ) | |||||||||||
Credit Opportunities Fund - Class A | |||||||||||||||||||
| Shares issued in reinvestment of distributions | 333 | $ | 3,217 | 318 | $ | 3,044 | |||||||||||||
Payments for shares redeemed | — | — | (4,161 | ) | (39,889 | ) | |||||||||||||
Net increase/(decrease) | 333 | $ | 3,217 | (3,843 | ) | $ | (36,845 | ) | |||||||||||
10. FOREIGN CURRENCY TRANSLATION
Amounts denominated in or expected to settle in foreign currencies are translated to U.S. dollars based on exchange rates on the basis outlined below:
A. The market values of investment securities and other assets and liabilities are translated at the closing rate of exchange each day.
B. Purchases and sales of investment securities and income and expenses are translated at the rate of exchange prevailing on the respective dates of such transactions.
C. The Funds do not isolate that portion of the results of operations caused by changes in foreign exchange rates on investments from those caused by changes in market prices of securities held. Such fluctuations are included with the net realized and unrealized gains or losses on investments. Reported net realized foreign exchange gains or losses arise from 1) purchases and sales of foreign currencies; 2) currency gains or losses realized between the trade and settlement dates on security transactions; and 3) the difference between the amounts of dividends, interest and foreign withholding taxes recorded on the Funds' books, and the U.S. dollar equivalent of the amounts actually received or paid. Reported net unrealized foreign exchange gains and losses arise from changes in the value of assets and liabilities, other than investment securities, resulting from changes in exchange rates.
Annual Report | May 31, 2024
85
The Arbitrage Funds Notes to Financial Statements (continued)
May 31, 2024
11. SECURITIES LENDING
To generate additional income, the Funds may, from time to time, lend portfolio securities to broker-dealers, banks or institutional borrowers of securities. At the time of the loan, the Funds must receive from the borrower collateral equal in value to 102% of the securities on loan in the form of cash or U.S. government securities. This collateral must be valued daily and, should the market value of the loaned securities increase, the borrower must furnish additional collateral to the Funds. During the time portfolio securities are on loan, the borrower pays the Funds any dividends or interest paid on such securities.
Loans are subject to termination by the Funds or the borrower at any time. While the Funds do not have the right to vote securities on loan, they have the right to terminate the loan and regain the right to vote if that is considered important with respect to the investment. In the event the borrower defaults in its obligation to the Fund, the Funds bear the risk of delay in the recovery of portfolio securities and the risk of loss of rights in the collateral.
The Funds may participate in a securities lending program under which the Funds' custodian, State Street Bank and Trust Company (the "Custodian") acting as securities lending agent, is authorized to lend Fund portfolio securities to qualified brokers/dealers and financial institutions that post appropriate collateral. The value of securities loaned will not exceed one-third of the value of the total assets of the Fund making the loan. The Custodian has agreed to indemnify the Fund in case of default of any security borrower.
The securities lending agent monitors to ensure that securities on loan, if any, are fully collateralized and the collateral is equal to or exceeds the securities on loan. Cash collateral is invested in the State Street Institutional U.S. Government Money Market Fund, Premier Class. The Custodian receives a portion of the interest earned on any reinvested collateral. Income received by the Funds in securities lending transactions during the year ended May 31, 2024, if any, is net of fees retained by the securities lending agent and is reflected as securities lending income in the Statements of Operations. There were no securities loaned during the year ended May 31, 2024.
12. FEDERAL TAX INFORMATION
In order to avoid imposition of the excise tax applicable to regulated investment companies, it is each Fund's intention to declare as dividends in each calendar year at least 98.0% of its net investment income (earned during the calendar year) and 98.2% of its net realized capital gains (earned during the twelve months ended October 31), plus undistributed amounts from prior years.
The amount of distributions from net investment income and net realized gains, if any, are determined in accordance with Federal income tax regulations which may differ from accounting principles generally accepted in the United States of America. These "book/tax" differences are either temporary or permanent in nature and permanent differences are charged or credited to undistributed net investment income (loss), accumulated net realized gain (loss) or paid-in capital as appropriate in the period that the differences arise.
Permanent differences between the Funds' financial statements and income tax reporting requirements are primarily attributable to gains and losses on certain foreign currency related transactions, short sale related dividend expense, investments in passive foreign investment companies, investments in swaps, premium amortization, net operating losses, convertible bonds, non-deductible excise tax activity and partnership basis adjustments. Certain Funds claimed a portion of the payments made to redeeming shareholders as a distribution for income tax purposes. These have no effect on the Funds' net assets or net asset value per share.
www.arbitragefunds.com | 1-800-295-4485
86
The Arbitrage Funds Notes to Financial Statements (continued)
May 31, 2024
Fund | Distributable Earnings (Accumulated Loss) | Paid-in Capital | |||||||||
Arbitrage Fund | $ | (3,235,222 | ) | $ | 3,235,222 | ||||||
Event-Driven Fund | 170 | (170 | ) | ||||||||
Credit Opportunities Fund | — | — | |||||||||
The tax character of dividends and distributions declared and paid during the years ended May 31, 2024 and May 31, 2023 was as follows:
Fund | Year Ended | Ordinary Income | Long-Term Capital Gains* | Total Distributions | |||||||||||||||
Arbitrage Fund | 5/31/2024 | $ | 20,646,330 | $ | — | $ | 20,646,330 | ||||||||||||
5/31/2023 | 21,948,812 | 30,340,622 | 52,289,434 | ||||||||||||||||
Event-Driven Fund | 5/31/2024 | $ | 792,036 | $ | — | $ | 792,036 | ||||||||||||
5/31/2023 | — | — | — | ||||||||||||||||
Credit Opportunities Fund | 5/31/2024 | $ | 6,330,951 | $ | — | $ | 6,330,951 | ||||||||||||
5/31/2023 | 5,242,224 | — | 5,242,224 | ||||||||||||||||
* The Funds designate these distributions as long-term capital gains dividends per IRC code section 852(b)(3)(C).
As of May 31, 2024, the components of distributable earnings on a tax basis were as follows:
| Arbitrage Fund | Event-Driven Fund | Credit Opportunities Fund | |||||||||||||
Undistributed ordinary income | $ | 10,668,198 | $ | 121,332 | $ | 201,932 | |||||||||
Accumulated capital gains/losses | — | — | — | ||||||||||||
Unrealized appreciation/(depreciation) | (20,617,788 | ) | (2,278,286 | ) | (2,683,992 | ) | |||||||||
| Capital loss carryover and late year ordinary loss deferrals | — | (33,171,553 | ) | (3,611,195 | ) | ||||||||||
| Total distributable earnings (accumulated loss) | $ | (9,949,590 | ) | $ | (35,328,507 | ) | $ | (6,093,255 | ) | ||||||
As of May 31, 2024, the cost and aggregate gross unrealized appreciation/(depreciation) of long security positions, short security positions and derivative instruments for federal income tax purposes were as follows:
Fund | Gross Appreciation (excess of value over tax cost) | Gross Depreciation (excess of tax cost over value) | Net Unrealized Depreciation | Aggregate Cost of Investments for Income Tax Purposes | |||||||||||||||
Arbitrage Fund | $ | 24,504,026 | $ | (39,818,375 | ) | $ | (15,314,349 | ) | $ | 974,746,903 | |||||||||
Event-Driven Fund | 1,074,650 | (3,178,663 | ) | (2,104,013 | ) | 82,690,825 | |||||||||||||
Credit Opportunities Fund | 597,581 | (3,281,883 | ) | (2,684,302 | ) | 149,755,396 | |||||||||||||
The differences between book-basis and tax-basis net unrealized appreciation/(depreciation) for the Funds are attributable to dividends related to non-real estate investment trust adjustments, passive foreign investment companies, wash sales, straddle loss deferrals, premium amortization, constructive gains and constructive sales adjustments, partnership basis adjustments and forward contracts mark to market.
Annual Report | May 31, 2024
87
The Arbitrage Funds Notes to Financial Statements (continued)
May 31, 2024
Capital Losses
As of May 31, 2024, the Event-Driven Fund had $24,485,194 of short term and $8,686,359 of long term capital loss carryforwards and the Credit Opportunities Fund had $3,611,195 of long term capital loss carryforwards which may reduce the Funds' taxable income arising from future net realized gains on investments, if any, to the extent permitted by the Code and thus may reduce the amount of the distributions to shareholders which would otherwise be necessary to relieve the Funds of any liability for federal tax.
The Event-Driven Fund and Credit Opportunities Fund utilized $2,958,008 and $ 158,334 of capital loss carryforwards during the year ended May 31, 2024 respectively.
13. SUBSEQUENT EVENTS
Management has evaluated subsequent events for the Funds through the date the financial statements were issued, and has concluded that there are no recognized or non-recognized subsequent events relevant for financial statements disclosure.
www.arbitragefunds.com | 1-800-295-4485
88
To the Shareholders and the Board of Trustees of
The Arbitrage Funds
Opinion on the Financial Statements
We have audited the accompanying statements of assets and liabilities of The Arbitrage Funds (the Trust) (comprising Arbitrage Fund, Water Island Event-Driven Fund, and Water Island Credit Opportunities Fund, (collectively referred to as the "Funds")), including the schedules of investments, as of May 31, 2024, and the related statements of operations for the year then ended, the statements of changes in net assets for each of the two years in the period then ended, the financial highlights for each of the five years in the period then ended and the related notes (collectively referred to as the "financial statements"). In our opinion, the financial statements present fairly, in all material respects, the financial position of each of the Funds comprising the Trust at May 31, 2024, the results of their operations for the year then ended, changes in their net assets for each of the two years in the period then ended and their financial highlights for each of the five years in the period then ended, in conformity with U.S. generally accepted accounting principles.
Basis for Opinion
These financial statements are the responsibility of the Trust's management. Our responsibility is to express an opinion on each of the Funds' financial statements based on our audits. We are a public accounting firm registered with the Public Company Accounting Oversight Board (United States) ("PCAOB") and are required to be independent with respect to the Trust in accordance with the U.S. federal securities laws and the applicable rules and regulations of the Securities and Exchange Commission and the PCAOB.
We conducted our audits in accordance with the standards of the PCAOB. Those standards require that we plan and perform the audit to obtain reasonable assurance about whether the financial statements are free of material misstatement, whether due to error or fraud. The Trust is not required to have, nor were we engaged to perform, an audit of the Trust's internal control over financial reporting. As part of our audits, we are required to obtain an understanding of internal control over financial reporting, but not for the purpose of expressing an opinion on the effectiveness of the Trust's internal control over financial reporting. Accordingly, we express no such opinion.
Our audits included performing procedures to assess the risks of material misstatement of the financial statements, whether due to error or fraud, and performing procedures that respond to those risks. Such procedures included examining, on a test basis, evidence regarding the amounts and disclosures in the financial statements. Our procedures included confirmation of securities owned as of May 31, 2024, by correspondence with the custodians, agent banks, and brokers or by other appropriate auditing procedures where replies from agent banks and brokers were not received. Our audits also included evaluating the accounting principles used and significant estimates made by management, as well as evaluating the overall presentation of the financial statements. We believe that our audits provide a reasonable basis for our opinion.
We have served as the auditor of one or more of the Water Island Capital investment companies since 2012.
Minneapolis, Minnesota
July 30, 2024
Annual Report | May 31, 2024
89
May 31, 2024 (Unaudited)
As a shareholder of a mutual fund you incur two types of costs: transaction costs, including sales charges (loads) on some share classes, and operating expenses. Your investment is affected by these ongoing costs, which include (among others) costs for portfolio management, administrative services, distribution (12b-1) expenses, redemption fees and shareholder reports like this one. It is important for you to understand the impact of these costs on your investment returns.
Operating expenses such as these are deducted from a mutual fund's gross income and directly reduce its final investment return. These expenses are expressed as a percentage of a mutual fund's average net assets; this percentage is known as a mutual fund's expense ratio.
The following examples use the expense ratio and are intended to help you understand the ongoing costs (in dollars) of investing in your Fund and to compare these costs with those of other mutual funds. The examples are based on an investment of $1,000 made at the beginning of the period shown and held for the entire period.
The table on the following page illustrates your Fund's cost in two ways:
Actual Fund Return. The section helps you to estimate the actual expenses after fee waivers that your Fund incurred over the period. The "Expenses Paid During Period" column shows the actual dollar expense cost incurred by a $1,000 investment in the Fund, and the "Ending Account Value" number is derived from deducting that expense cost from the Fund's gross investment return.
You can use this information, together with the actual amount you invested in the Fund, to estimate the expenses you paid over that period. Simply divide your actual account value by $1,000 to arrive at a ratio (for example, an $8,600 account value divided by $1,000 = 8.6), then multiply that ratio by the number shown for your Fund under "Expenses Paid During Period."
Hypothetical 5% Return. This section helps you compare your Fund's costs with those of other mutual funds. It assumes that the Fund had an annual 5% return before expenses during the period, but that expense ratio (Column 3) for the period is unchanged. This example is useful in making comparisons because the Securities and Exchange Commission requires all mutual funds to make this 5% calculation. You can assess your Fund's comparative cost by comparing the hypothetical result for your Fund in the "Expenses Paid During Period" column with those that appear in the same charts in the shareholder reports for other mutual funds.
Note: Because the return is set at 5% for comparison purposes — NOT your Fund's actual return — the account values shown may not apply to your specific investment.
www.arbitragefunds.com | 1-800-295-4485
90
The Arbitrage Funds Disclosure of Fund Expenses (continued)
May 31, 2024 (Unaudited)
| Beginning Account Value 12/01/2023 | Ending Account Value 05/31/2024 | Expense Ratio(a) | Expenses Paid During Period(b) | ||||||||||||||||
Arbitrage Fund | |||||||||||||||||||
Class R | |||||||||||||||||||
Actual | $ | 1,000.00 | $ | 1,009.70 | 1.61 | % | $ | 8.09 | |||||||||||
| Hypothetical (5% return before expenses) | $ | 1,000.00 | $ | 1,016.95 | 1.61 | % | $ | 8.12 | |||||||||||
Class I | |||||||||||||||||||
Actual | $ | 1,000.00 | $ | 1,010.40 | 1.36 | % | $ | 6.84 | |||||||||||
| Hypothetical (5% return before expenses) | $ | 1,000.00 | $ | 1,018.20 | 1.36 | % | $ | 6.86 | |||||||||||
Class C | |||||||||||||||||||
Actual | $ | 1,000.00 | $ | 1,005.40 | 2.37 | % | $ | 11.88 | |||||||||||
| Hypothetical (5% return before expenses) | $ | 1,000.00 | $ | 1,013.15 | 2.37 | % | $ | 11.93 | |||||||||||
Class A | |||||||||||||||||||
Actual | $ | 1,000.00 | $ | 1,009.00 | 1.61 | % | $ | 8.09 | |||||||||||
| Hypothetical (5% return before expenses) | $ | 1,000.00 | $ | 1,016.95 | 1.61 | % | $ | 8.12 | |||||||||||
(a) Annualized, based on the Fund's most recent fiscal half-year expenses.
(b) Expenses are equal to the Fund's annualized ratio multiplied by the average account value over the period multiplied by the number of days in the most recent fiscal half year (183) divided by 366.
| Beginning Account Value 12/01/2023 | Ending Account Value 05/31/2024 | Expense Ratio(a) | Expenses Paid During Period(b) | ||||||||||||||||
Water Island Event-Driven Fund | |||||||||||||||||||
Class R | |||||||||||||||||||
Actual | $ | 1,000.00 | $ | 1,002.30 | 1.74 | % | $ | 8.71 | |||||||||||
| Hypothetical (5% return before expenses) | $ | 1,000.00 | $ | 1,016.30 | 1.74 | % | $ | 8.77 | |||||||||||
Class I | |||||||||||||||||||
Actual | $ | 1,000.00 | $ | 1,002.90 | 1.50 | % | $ | 7.51 | |||||||||||
| Hypothetical (5% return before expenses) | $ | 1,000.00 | $ | 1,017.50 | 1.50 | % | $ | 7.57 | |||||||||||
Class A | |||||||||||||||||||
Actual | $ | 1,000.00 | $ | 1,001.90 | 1.75 | % | $ | 8.76 | |||||||||||
| Hypothetical (5% return before expenses) | $ | 1,000.00 | $ | 1,016.25 | 1.75 | % | $ | 8.82 | |||||||||||
(a) Annualized, based on the Fund's most recent fiscal half-year expenses.
(b) Expenses are equal to the Fund's annualized ratio multiplied by the average account value over the period multiplied by the number of days in the most recent fiscal half year (183) divided by 366.
Annual Report | May 31, 2024
91
The Arbitrage Funds Disclosure of Fund Expenses (continued)
May 31, 2024 (Unaudited)
| Beginning Account Value 12/01/2023 | Ending Account Value 05/31/2024 | Expense Ratio(a) | Expenses Paid During Period(b) | ||||||||||||||||
Water Island Credit Opportunities Fund | |||||||||||||||||||
Class R | |||||||||||||||||||
Actual | $ | 1,000.00 | $ | 1,028.80 | 1.26 | % | $ | 6.39 | |||||||||||
| Hypothetical (5% return before expenses) | $ | 1,000.00 | $ | 1,018.70 | 1.26 | % | $ | 6.36 | |||||||||||
Class I | |||||||||||||||||||
Actual | $ | 1,000.00 | $ | 1,029.00 | 1.01 | % | $ | 5.12 | |||||||||||
| Hypothetical (5% return before expenses) | $ | 1,000.00 | $ | 1,019.95 | 1.01 | % | $ | 5.10 | |||||||||||
Class A | |||||||||||||||||||
Actual | $ | 1,000.00 | $ | 1,028.80 | 1.27 | % | $ | 6.44 | |||||||||||
| Hypothetical (5% return before expenses) | $ | 1,000.00 | $ | 1,018.65 | 1.27 | % | $ | 6.41 | |||||||||||
(a) Annualized, based on the Fund's most recent fiscal half-year expenses.
(b) Expenses are equal to the Fund's annualized ratio multiplied by the average account value over the period multiplied by the number of days in the most recent fiscal half year (183) divided by 366.
www.arbitragefunds.com | 1-800-295-4485
92
May 31, 2024 (Unaudited)
1. PROXY VOTING POLICIES AND VOTING RECORD
A description of the policies and procedures that the Funds use to determine how to vote proxies relating to portfolio securities is available without charge, upon request, by calling 1-800-295-4485 or on the Securities and Exchange Commission's ("SEC") website at http://www.sec.gov.
Information regarding how the Funds voted proxies relating to portfolio securities during the most recent 12-month period ended June 30 is available without charge upon request by calling 1-800-295-4485 or on the SEC's website at http://www.sec.gov.
2. QUARTERLY PORTFOLIO HOLDINGS
The Funds file a complete listing of their portfolio holdings with the SEC as of the first and third quarters of each fiscal year on Form N-PORT. The filings are available on the Funds' website at www.arbitragefunds.com/resources or upon request by calling 1-800-295-4485. Furthermore, you may obtain a copy of the filing on the SEC's website at http://www.sec.gov.
Annual Report | May 31, 2024
93
May 31, 2024 (Unaudited)
As required under the Investment Company Act of 1940 (the "1940 Act"), the Board of Trustees (the "Board") of The Arbitrage Funds (the "Trust"), which is comprised of Arbitrage Fund, Water Island Event-Driven Fund and Water Island Credit Opportunities Fund (each, a "Fund" and, collectively, the "Funds"), determines annually whether to continue each Fund's investment advisory agreement with Water Island Capital, LLC, the investment adviser to each Fund (the "Adviser"). In considering the renewal of the agreements, the Board, including a majority of those Trustees who are not "interested persons" of the Funds (the "Independent Trustees"), as defined in the 1940 Act, met with representatives of the Adviser on May 13, 2024 and May 21, 2024 and in separate executive sessions in advance of and at the May 21, 2024 meeting (the "Meetings") and approved the continuation of the agreements after concluding that the continuation of the agreements was in the best interests of each Fund and its shareholders.
The Board requested and received materials relating to the agreements in advance of the Meetings. Among other things, the Board considered expense and performance comparisons with other mutual funds in each Fund's peer group as determined by Broadridge Financial Solutions Inc. ("Broadridge"), an independent provider of mutual fund industry data, as well as additional substantial material prepared by the Funds' management. The Independent Trustees reviewed in detail the Broadridge report, as well as written materials prepared by the Adviser at the Independent Trustees' request, at the May 13, 2024 meeting, and engaged in discussions with management regarding the report and materials. The additional material prepared by management generally included Fund by Fund information including each Fund's average net assets; management fees; expense limitation arrangements; investment performance and risk metrics (in addition to the performance information prepared by Broadridge); information about services provided by the Adviser and profitability information. The Board also considered that it had reviewed the Funds' performance against comparable mutual funds as provided by the Adviser at the Meetings and at the Board's other meetings throughout the year, in addition to other information requested by the Independent Trustees and provided by the Adviser and other service providers at the Meetings and throughout the year. The Trustees were also continually aware of information provided by the Adviser and other service providers in response to the Board's requests, including from previous contract renewal periods, as well as certain information available to the Trustees from various other sources such as the Investment Company Institute, the Independent Directors Council and the Mutual Fund Directors Forum, among others.
In evaluating the agreements, the Board, including the Independent Trustees advised by independent legal counsel, considered the factors it deemed relevant, including the nature, quality and extent of services provided, the performance of each Fund, the profitability of the Adviser, expenses and fees, the potential for economies of scale that may be shared with each Fund and its shareholders as each Fund's assets grow, and any other benefits derived by the Adviser from its relationship with the Funds. In their deliberations, the Trustees did not identify any single factor which alone was responsible for the Board's decision to approve the agreement with respect to each Fund, and each Trustee may have given different weights to different factors and, thus, each Trustee may have had a different basis for his or her decision. In connection with its deliberations, the Board considered information provided by the Adviser throughout the year at regular Board meetings and between Board meetings, presentations from portfolio managers, as well as other information furnished at or in advance of the Meetings.
Nature, Extent and Quality of the Services under the Advisory Agreements
Based on the written and oral reports received by the Board prior to and at the Meetings, including in executive session, the Board considered the nature, quality, and extent of the services provided to each Fund by the Adviser under the advisory agreement for such Fund. The Board also noted
www.arbitragefunds.com | 1-800-295-4485
94
The Arbitrage Funds Approval of Investment Advisory Agreements (continued)
May 31, 2024 (Unaudited)
information received at regular meetings and at other times throughout the year related to the services rendered by the Adviser. The Board reviewed information regarding the overall organization and business functions of the Adviser and considered the background and experience of the Adviser's senior management. The Board also reviewed the qualifications, backgrounds and responsibilities of the portfolio managers primarily responsible for the day-to-day portfolio management of the Funds and the extent of the resources devoted to research and analysis of actual and potential investments. The Board considered that the Adviser provides a number of additional services to each Fund, including oversight of Fund service providers, duties with respect to the Fund's valuations, and operation of the Fund's compliance program. The Board considered the steps that the Adviser had taken during the past year to improve performance, including, without limitation, changes in personnel, enhancements in technology, and the Adviser's focus on evaluating risk and performance for the Funds. The Board also received and considered available information about the nature, extent and quality of services and fee rates offered to other clients of the Adviser for advisory services. The Trustees and the Adviser discussed the differences between an adviser's duties and its risks incurred in offering a sponsored mutual fund versus the more limited duties and risks involved in acting as a sub-adviser to a mutual fund, and also in comparing a sponsor adviser's duties and risks incurred in offering a sponsored mutual fund versus the much more limited duties and risks incurred managing an institutional separate account. The Board also considered that the Adviser bears and assumes significant ongoing risks, including investment, operational, enterprise, litigation, regulatory and compliance risks, with respect to all the Funds.
Adviser Profitability
The Board was provided with information on the Adviser's profitability in serving as the investment adviser to each Fund. The Board recognized that it is difficult to make comparisons of profitability from fund management contracts because comparative information is not generally publicly available and is affected by numerous factors, including the structure of the particular adviser, the types of funds it manages, its business mix, numerous assumptions regarding allocations of expenses and the adviser's capital structure and cost of capital. Taking these factors into account, the Board concluded that the Adviser's profitability in relation to the services rendered was reasonable and that it was believed to be sufficient to continue to support investments and to enhance services to the Funds and their shareholders.
Economies of Scale
The Board considered information regarding potential economies of scale with respect to the management of each Fund, whether the Fund has appropriately benefited from any economies of scale, and whether there is potential for realization of any further economies of scale. With respect to Arbitrage Fund, the Board noted that the management fee schedule for the Fund includes breakpoints, which have the effect of decreasing the fee rate as assets increase, and that at its current level of assets the Fund's effective fee rate reflected those rate reductions. The Board took note that the Fund's fee structure currently results in benefits to Fund shareholders whether or not the Adviser realizes any economies of scale. The Board noted that the advisory fee schedule for Water Island Event-Driven Fund does not contain breakpoints that would reduce the fee rate on assets above specified levels. The Board noted that the advisory fee for the Water Island Event-Driven Fund had been reduced effective November 1, 2019. The Board determined that, while fee breakpoints were not currently necessary for the Water Island Event-Driven Fund given the Fund's relatively smaller size, it would continue to review whether breakpoints should be incorporated as part of the fee structure. With respect to Water Island Credit Opportunities Fund, the Board noted that the Fund's management fee schedule includes breakpoints. The Independent Trustees also recognized that potential economies of scale may be shared acceptably with a Fund in many different manners such
Annual Report | May 31, 2024
95
The Arbitrage Funds Approval of Investment Advisory Agreements (continued)
May 31, 2024 (Unaudited)
as fee breakpoints, fee waivers or caps, reinvestments in the Adviser's business above contractual levels, additional new product offerings, and pricing to scale from inception, among others. The Trustees noted that each Fund is party to an expense limitation agreement with the Adviser, pursuant to which the Adviser has agreed to waive or reimburse expenses should they exceed certain contractually specified levels. The Independent Trustees recognized that is it extremely difficult to determine whether potential economies of scale in fact exist for any fund, or for a fund complex, and, or, at what point any potential economies of scale may begin to be reduced at some asset level, or possibly reverse and become diseconomies of scale. Thus, the Trustees were aware that they needed to use their business judgment and experience in evaluating whether any potential economies of scale might be equitably shared with the Funds.
Other Benefits to the Adviser
The Board considered other benefits received by the Adviser as a result of its relationship with the Funds. The Board concluded that the potential benefits to be derived by the Adviser included the ability to use soft dollar credits as well as the potential benefits consistent with those generally resulting from an increase in assets under management, specifically, potential access to additional research resources and benefits to its reputation. The Board concluded that the benefits derived by the Adviser were consistent with the types of benefits generally derived by investment advisers to mutual funds. The Board considered the standards applied in seeking best execution and reviewed the Adviser's method for and policies with respect to allocating portfolio investment opportunities among its advisory clients, including the Funds. The Independent Trustees considered these and any other potential fallout benefits and generally determined these to be not material to the consideration of the management and other fees and to the Adviser's profitability generally.
Other Factors and Broader Review
As discussed above, the Board considered detailed materials received from the Adviser as part of the annual review and at quarterly meetings throughout the year and over previous years. The Board also reviews and assesses the quality of the services that the Funds receive throughout the year. In this regard, the Board reviews reports of the Adviser at least quarterly, which include, among other things, detailed portfolio and market reviews, detailed Fund performance and risk reports and compliance reports along with various reports and information evaluating the Adviser's supervisory oversight of third party service providers to the Funds.
Investment Advisory Fee Rates and Expenses and Performance
The Board reviewed and considered the contractual advisory fee rates for each Fund in light of the nature, extent and quality of the advisory services provided by the Adviser. The Board also reviewed and considered the expense limitation agreements currently in place for each Fund. The Board received and considered information on the contractual advisory fee rate and gross and net total operating expense ratios for each Fund in comparison to those of a group of funds within the Fund's Morningstar category selected independently by Broadridge (the "Peer Group") as well as to a larger group of funds selected by Broadridge in the same Morningstar category (the "Category"). For each Fund, the Board considered information provided by Broadridge on the Fund's effective advisory fee rate — that is, the Fund's contractual advisory fee in comparison with the contractual advisory fee that would have been charged by other funds within a Peer Group and Category assuming the other funds were similar in size to the Fund. The contractual advisory fee analysis does not take into account any fee waivers or expense reimbursements. The comparisons placed each Fund in various quartiles, with the first quartile being the lowest cost mutual funds. The Broadridge expense data was based upon historical information taken from each Fund's audited annual report for the period ended May 31, 2023. Broadridge provided expense data for Class I shares of each Fund.
www.arbitragefunds.com | 1-800-295-4485
96
The Arbitrage Funds Approval of Investment Advisory Agreements (continued)
May 31, 2024 (Unaudited)
The performance of each Fund for the periods ended March 31, 2024, was compared to the performance of the funds within the same Morningstar Category, regardless of asset size or primary channel of distribution ("Performance Category"). The comparisons placed each Fund in various quartiles, with the first quartile being the best performing funds. The Board also received and considered additional information provided by the Adviser on comparisons of the performance of each Fund to its prospectus benchmark and to additional securities indices that the Adviser deemed relevant to the Board's considerations. The Independent Trustees also reviewed performance in relation to certain measures of the degree of investment risk undertaken by the portfolio managers. The Independent Trustees also noted that they regularly engage in discussions with the Adviser and counsel with regard to the portfolio benchmark comparisons for each Fund.
In evaluating the Funds' performance, the Board generally considered long-term performance to be more important than short-term performance and also took into account factors including general market conditions, as well as particular market and regulatory conditions that impact the Funds' investment strategies; the "style" in which the Funds are managed, as applicable, and whether that style is in or out of favor in the market; the relative sizes of the Funds; and fund cash flows. In this regard, the Board also noted how changes in time periods for performance calculations (for example, whether a one-year period is from December-to-December or March-to-March) can significantly impact a Fund's returns and peer ranking on a relative basis. The Board also considered that variations in performance among a Fund's operating classes reflect variations in class expenses, which result in lower performance for higher expense classes.
The Board received a description of Broadridge's methodology for determining peer groups, and factored into its evaluation of each Fund's performance, fees and expenses the limitations inherent in the methodology for constructing peer groups and determining, from year to year, which mutual funds should be included in which peer groups, among other things. The Board recognized these inherent limitations and, taking into account commentary and information from management, also recognized that comparisons between a Fund and other mutual funds in a peer category may not be as relevant in certain circumstances, given that in some cases a Fund may notably differ (for example, in its management techniques or relative size) when compared to other mutual funds in the peer group. The Board also noted that the number of mutual funds included in a peer group may be relatively small and constituent mutual funds included in a peer group may differ from year to year, which, among other factors, can limit the relevance of the comparisons. While recognizing these inherent limitations, the Board believed the analysis conducted by Broadridge provided a useful measure of comparative performance.
Arbitrage Fund
The Fund's performance (Class I Shares, net of fees) was compared to that of funds comprising the Morningstar Event Driven Category. The Fund's net total return ranked in the first quartile of the Performance Category for the one-year period, the second quartile for the three-year period, the third quartile for the five-year period, and the second quartile for the ten-year period. The Fund's performance was also compared to its prospectus benchmark index, the ICE BofA U.S. 3 Month Treasury Bill Index. The Fund outperformed the index for the one-, five- and ten-year periods and since inception, and underperformed the index for the three-year period. The Fund's effective advisory fee was in the second quartile of its Category and third quartile of its Peer Group, and the Fund's net total operating expense ratio (i.e., the Fund's total operating expenses, net of any waivers/reimbursements) was in the first quartile for the Category and the Peer Group. It was noted that the Adviser had entered into an expense waiver and reimbursement agreement to limit fees through September 30, 2025, although the Fund's expenses did not currently reach a level to require the Adviser to waive fees or reimburse expenses.
Annual Report | May 31, 2024
97
The Arbitrage Funds Approval of Investment Advisory Agreements (continued)
May 31, 2024 (Unaudited)
The Board determined that, given all of the factors provided, it would be in the best interests of the Fund and its shareholders to continue the advisory agreement. The Fund's fee structure was considered reasonable.
Water Island Event-Driven Fund
The Fund's performance (Class I Shares, net of fees) was compared to that of funds comprising the Morningstar Event Driven Category. The Fund's net total return ranked in the third quartile of the Performance Category for the one-year period, in the first quartile for the five-year period, and in the fourth quartile for the three- and ten-year periods. The Fund's performance was also compared to its prospectus benchmark index, the ICE BofA U.S. 3-Month Treasury Bill Index. The Fund outperformed the index for the one-, five- and ten-year periods and since inception, and underperformed the index for the three-year period. The Fund's effective advisory fee was in the second quartile of its Category and Peer Group (at the median for both Category and Peer Group) and the Fund's net total operating expense ratio (i.e., the Fund's total operating expenses, net of waivers/reimbursements) was in the second quartile of its Category and Peer Group. The Board considered that the Fund's contractual advisory fee rate had been reduced effective November 1, 2019 from 1.25% to 1.10%. It was further noted that the Adviser had entered into an expense waiver and reimbursement agreement to limit fund fees and expenses through September 30, 2025.
The Board determined that, given all of the factors provided, it would be in the best interests of the Fund and its shareholders to continue the advisory agreement. In light of the Fund's current size and fee rate, the Board concluded that the fee structure was reasonable and that the absence of breakpoints in the Fund's fee schedule was acceptable at this time, although the Board would continue to monitor whether breakpoints should be implemented for the Fund.
Water Island Credit Opportunities Fund
The Fund's performance (Class I Shares, net of fees) was compared to that of funds comprising the Morningstar Nontraditional Bond Category. The Fund's net total return ranked in the third quartile of the Performance Category for the one-year period, in the first quartile for the three- and five-year periods and in the second quartile for the ten-year period. The Fund outperformed its prospectus benchmark, the ICE BofA U.S. 3 Month Treasury Bill Index, for the one-, five- and ten-year periods and since inception, and slightly underperformed the index for the three-year period. The Fund outperformed its supplemental benchmark, the Bloomberg U.S. Aggregate Bond Index, for the one-, three-, five- and ten-year periods and since inception. The Fund's effective advisory fee was in third quartile of its Category and in the second quartile of its Peer Group, and the Fund's net total operating expense ratio (i.e., the Fund's total operating expenses, net of waivers/reimbursements) was in the third quartile for the Category and Peer Group. It was noted that the median average net asset size of the funds in the Category and Peer Group was significantly larger than that of the Fund and that many of those funds appear to benefit from economies of scale. It was further noted that the Adviser had lowered the Fund's management fee and instituted a breakpoint to the Fund's management fee schedule in 2018 and had entered into an expense waiver and reimbursement agreement to further limit fund fees and expenses through September 30, 2025.
The Board determined, given all of the factors provided, that it would be in the best interests of the Fund and its shareholders to continue the advisory agreement. In light of the Fund's current size and fee rate, the Board concluded that the fee structure was reasonable.
www.arbitragefunds.com | 1-800-295-4485
98

Arbitrage Fund
Water Island Event-Driven Fund
Water Island Credit Opportunities Fund
800-295-4485
www.arbitragefunds.com
Adviser
Water Island Capital, LLC
41 Madison Avenue, 42nd Floor
New York, NY 10010
Distributor
ALPS Distributors, Inc.
1290 Broadway, Suite 1100
Denver, CO 80203
Transfer Agent
SS&C GIDS
1055 Broadway
Kansas City, MO 64105
Custodian
State Street Bank and
Trust Company
One Congress Building,
One Congress Street, Suite 1
Boston, MA 02114-2016
This material must be preceded or accompanied by a prospectus. Please read it carefully before investing.
Item 8. Changes in and Disagreements with Accountants for Open-End Management Investment Companies.
Not applicable.
Item 9. Proxy Disclosures for Open-End Management Investment Companies.
Not applicable.
Item 10. Remuneration Paid to Directors, Officers, and Others of Open-End Management Investment Companies.
Renumeration Paid to Directors, Officers, and Others of Open-End Investment Companies is included as part of the Financial Statements filed under Item 7(a) of this Form.
Item 11. Statement Regarding Basis for Approval of Investment Advisory Contract.
The registrant’s Statement Regarding Basis for Approval of Investment Advisory Contract is included as part of the Financial Statements filed under Item 7(a) of this Form.
Item 12. Disclosure of Proxy Voting Policies and Procedures for Closed-End Management Investment Companies.
Not applicable to this registrant.
Item 13. Portfolio Managers of Closed-End Management Investment Companies.
Not applicable to this registrant.
Item 14. Purchases of Equity Securities by Closed-End Management Investment Company and Affiliated Purchasers.
Not applicable to this registrant.
Item 15. Submission of Matters to a Vote of Security Holders.
There have been no material changes to the procedures by which shareholders may recommend nominees to the registrant’s Board of Trustees.
Item 16. Controls and Procedures.
| (a) | The registrant’s principal executive officer and principal financial officer have evaluated the registrant’s disclosure controls and procedures (as defined in Rule 30a-3(c) under the Investment Company Act of 1940, as amended) within the most recent fiscal half-year of the filing date and have concluded that the registrant’s disclosure controls and procedures were effective, as of that date. |
| (b) | There was no change in the registrant’s internal control over financial reporting (as defined in Rule 30a-3(d) under the Investment Company Act of 1940, as amended) during the period covered by this report that has materially affected, or is reasonably likely to materially affect, the registrant’s internal control over financial reporting. |
Item 17. Disclosure of Securities Lending Activities for Closed-End Management Investment Companies
Not applicable to this registrant.
Item 18. Recovery of Erroneously Awarded Compensation.
Not applicable.
Item 19. Exhibits.
| (a)(1) | The code of ethics that applies to the registrant's principal executive officer and principal financial officer is attached hereto as EX-19.A.1. |
| (a)(2) | Not applicable. |
| (a)(4) | Not applicable. |
| (a)(5) | Not applicable. |
SIGNATURES
Pursuant to the requirements of the Securities Exchange Act of 1934 and the Investment Company Act of 1940, the registrant has duly caused this report to be signed on its behalf by the undersigned, thereunto duly authorized.
THE ARBITRAGE FUNDS
| By: | /s/ John S. Orrico | |
| John S. Orrico | ||
| President (Principal Executive Officer) | ||
| Date: | August 7, 2024 |
Pursuant to the requirements of the Securities Exchange Act of 1934 and the Investment Company Act of 1940, this report has been signed below by the following persons on behalf of the registrant and in the capacities and on the dates indicated.
| By: | /s/ John S. Orrico | |
| John S. Orrico | ||
| President (Principal Executive Officer) | ||
| Date: | August 7, 2024 |
| By: | /s/ Monique Labbe | |
| Monique Labbe | ||
| Chief Financial Officer (Principal Financial Officer) | ||
| Date: | August 7, 2024 |