UNITED STATES
SECURITIES AND EXCHANGE COMMISSION
Washington, D.C. 20549
FORM N-CSR
CERTIFIED SHAREHOLDER REPORT OF REGISTERED
MANAGEMENT INVESTMENT COMPANIES
Investment Company Act file number: 811-09819
STATE STREET INSTITUTIONAL INVESTMENT TRUST
(Exact name of registrant as specified in charter)
One Iron Street, Boston, Massachusetts 02210
(Address of principal executive offices)(Zip code)
| (Name and Address of Agent for Service) | Copy to: | |
Sean O’Malley, Esq. Senior Vice President and Deputy General Counsel c/o SSGA Funds Management, Inc. One Iron Street Boston, Massachusetts 02210 | Timothy W. Diggins, Esq. Ropes & Gray LLP Prudential Tower, 800 Boylston Street Boston, Massachusetts 02199-3600 | |
Registrant’s telephone number, including area code: (617) 664-1465
Date of fiscal year end: September 30
Date of reporting period: September 30, 2021
Item 1. Reports to Stockholders.
(a) The Report to Shareholders is attached herewith.
| State Street Institutional Investment Trust |
| State Street U.S. Core Equity Fund |
| State Street Income Fund |

| Page | |
| 1 | |
| Manager Reviews and Schedules of Investments | |
| 2 | |
| 10 | |
| Financial Statements | |
| 38 | |
| 40 | |
| 41 | |
| 42 | |
| 44 | |
| 54 | |
| 55 |
| Notes to Performance | 1 |
| 2 | State Street U.S. Core Equity Fund |
| Sector Allocation |
| Portfolio Composition as a % of Fair Value of $6,800,681 (in thousands) as of September 30, 2021 (a) |

| Top Ten Largest Holdings | |
| as of September 30, 2021 (as a % of Fair Value) (a) | |
| Microsoft Corp. | 6.17% |
| Apple Inc. | 4.89% |
| Amazon.com Inc. | 4.83% |
| Alphabet Inc., Class A | 3.71% |
| Visa Inc., Class A | 2.77% |
| Facebook Inc., Class A | 2.75% |
| JPMorgan Chase & Co. | 2.62% |
| UnitedHealth Group Inc. | 1.96% |
| Lowe's Companies Inc. | 1.77% |
| Alphabet Inc., Class C | 1.76% |
| (a) | The securities information regarding holdings, allocations and other characteristics is presented to illustrate examples of securities that the Fund has bought and the diversity of areas in which the Fund may invest as of a particular date. It may not be representative of the Fund’s current or future investments and should not be construed as a recommendation to purchase or sell a particular security. |
| State Street U.S. Core Equity Fund | 3 |
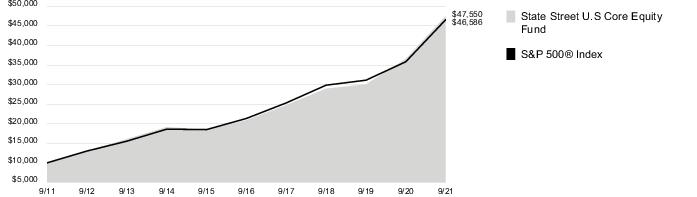
| Average Annual Total Return for the periods ended September 30, 2021 | |||||||||
| Inception date: 1/1/80 | |||||||||
| Nine Month | One Year | Five Year | Ten Year | Ending Value of a $10,000 Investment | |||||
| State Street U.S. Core Equity Fund | 15.73% | 30.02% | 17.85% | 16.87% | $47,550 | ||||
| S&P 500® Index | 15.92% | 30.00% | 16.90% | 16.64% | $46,586 | ||||
| 4 | State Street U.S. Core Equity Fund |
| Actual Fund Return | Hypothetical 5% Return (2.5% for the period) | ||
| Actual Fund Return | |||
| Beginning Account Value April 1, 2021 | $1,000.00 | $1,000.00 | |
| Ending Account Value September 30, 2021 | $1,090.40 | $1,024.30 | |
| Expenses Paid During Period | $ 0.84 | $ 0.81 |
| State Street U.S. Core Equity Fund | 5 |
| Number of Shares | Fair Value | |
| Common Stock - 98.7% † | ||
| Aerospace & Defense - 0.6% | ||
| Raytheon Technologies Corp. (a) | 457,893 | $ 39,360,482 |
| Apparel Retail - 1.3% | ||
| Ross Stores Inc. | 815,293 | 88,744,643 |
| Application Software - 3.3% | ||
| Adobe Inc. (b) | 80,902 | 46,576,899 |
| Intuit Inc. | 29,143 | 15,722,940 |
| salesforce.com Inc. (b) | 389,125 | 105,538,483 |
| Splunk Inc. (b) | 372,484 | 53,902,160 |
| 221,740,482 | ||
| Asset Management & Custody Banks - 0.2% | ||
| Blackstone Inc. | 140,755 | 16,375,437 |
| Auto Parts & Equipment - 0.7% | ||
| Magna International Inc. | 638,189 | 48,017,340 |
| Automotive Retail - 0.6% | ||
| O'Reilly Automotive Inc. (b) | 67,682 | 41,357,763 |
| Biotechnology - 1.5% | ||
| Biogen Inc. (b) | 53,480 | 15,134,305 |
| BioMarin Pharmaceutical Inc. (b) | 304,418 | 23,528,467 |
| Vertex Pharmaceuticals Inc. (b) | 340,051 | 61,681,851 |
| 100,344,623 | ||
| Building Products - 0.9% | ||
| Allegion PLC | 149,986 | 19,825,149 |
| Trane Technologies PLC | 236,207 | 40,781,139 |
| 60,606,288 | ||
| Cable & Satellite - 1.6% | ||
| Charter Communications Inc., Class A (b) | 37,694 | 27,424,647 |
| Comcast Corp., Class A | 1,483,230 | 82,957,054 |
| 110,381,701 | ||
| Communications Equipment - 0.2% | ||
| Cisco Systems Inc. | 270,098 | 14,701,434 |
| Construction Materials - 0.3% | ||
| Martin Marietta Materials Inc. | 56,853 | 19,425,533 |
| Number of Shares | Fair Value | |
| Data Processing & Outsourced Services - 5.7% | ||
| Fidelity National Information Services Inc. | 672,607 | $ 81,842,820 |
| Mastercard Inc., Class A | 213,755 | 74,318,338 |
| PayPal Holdings Inc. (b) | 170,462 | 44,355,917 |
| Visa Inc., Class A | 846,128 | 188,475,012 |
| 388,992,087 | ||
| Diversified Banks - 2.6% | ||
| JPMorgan Chase & Co. | 1,088,747 | 178,216,996 |
| Diversified Support Services - 1.0% | ||
| Cintas Corp. | 76,280 | 29,036,745 |
| IAA Inc. (b) | 727,163 | 39,681,285 |
| 68,718,030 | ||
| Electric Utilities - 0.9% | ||
| NextEra Energy Inc. | 763,652 | 59,961,955 |
| Electronic Components - 2.2% | ||
| Amphenol Corp., Class A | 896,227 | 65,630,703 |
| Corning Inc. | 2,308,416 | 84,234,100 |
| 149,864,803 | ||
| Environmental & Facilities Services - 1.0% | ||
| Waste Management Inc. | 448,789 | 67,031,125 |
| Financial Exchanges & Data - 1.1% | ||
| CME Group Inc. | 129,773 | 25,095,502 |
| MSCI Inc. | 23,964 | 14,578,260 |
| S&P Global Inc. | 65,065 | 27,645,468 |
| Tradeweb Markets Inc., Class A | 104,895 | 8,473,418 |
| 75,792,648 | ||
| Footwear - 0.4% | ||
| NIKE Inc., Class B | 182,910 | 26,564,019 |
| Healthcare Equipment - 3.4% | ||
| Becton Dickinson & Co. | 140,264 | 34,479,696 |
| Boston Scientific Corp. (b) | 1,916,447 | 83,154,635 |
| Edwards Lifesciences Corp. (b) | 200,785 | 22,730,870 |
| Medtronic PLC | 399,854 | 50,121,699 |
| Zimmer Biomet Holdings Inc. | 284,449 | 41,631,956 |
| 232,118,856 | ||
| Healthcare Services - 0.7% | ||
| Cigna Corp. | 220,586 | 44,152,494 |
| 6 | State Street U.S. Core Equity Fund |
| Number of Shares | Fair Value | |
| Home Improvement Retail - 2.1% | ||
| Lowe's Companies Inc. | 591,935 | $ 120,079,934 |
| The Home Depot Inc. | 67,384 | 22,119,472 |
| 142,199,406 | ||
| Hotels, Resorts & Cruise Lines - 1.1% | ||
| Marriott International Inc., Class A (b) | 498,152 | 73,771,330 |
| Household Products - 1.3% | ||
| Colgate-Palmolive Co. | 306,930 | 23,197,769 |
| The Procter & Gamble Co. | 480,846 | 67,222,271 |
| 90,420,040 | ||
| Hypermarkets & Super Centers - 0.4% | ||
| Walmart Inc. | 174,574 | 24,332,124 |
| Industrial Conglomerates - 1.5% | ||
| Honeywell International Inc. | 491,428 | 104,320,336 |
| Industrial Gases - 1.4% | ||
| Air Products & Chemicals Inc. | 361,499 | 92,583,509 |
| Industrial Machinery - 1.5% | ||
| Parker-Hannifin Corp. | 271,302 | 75,861,465 |
| Xylem Inc. | 199,947 | 24,729,445 |
| 100,590,910 | ||
| Insurance Brokers - 0.3% | ||
| Marsh & McLennan Companies Inc. | 122,288 | 18,518,072 |
| Integrated Oil & Gas - 0.8% | ||
| Chevron Corp. | 327,100 | 33,184,295 |
| Exxon Mobil Corp. | 400,938 | 23,583,173 |
| 56,767,468 | ||
| Interactive Home Entertainment - 0.2% | ||
| Activision Blizzard Inc. | 212,633 | 16,455,668 |
| Interactive Media & Services - 8.2% | ||
| Alphabet Inc., Class C (b) | 44,878 | 119,613,782 |
| Alphabet Inc., Class A (b) | 94,309 | 252,136,998 |
| Facebook Inc., Class A (b) | 552,545 | 187,528,247 |
| 559,279,027 | ||
| Internet & Direct Marketing Retail - 4.8% | ||
| Amazon.com Inc. (b) | 100,015 | 328,553,276 |
| Number of Shares | Fair Value | |
| Investment Banking & Brokerage - 0.7% | ||
| The Charles Schwab Corp. | 628,062 | $ 45,748,036 |
| IT Consulting & Other Services - 0.4% | ||
| Accenture PLC, Class A | 79,246 | 25,352,380 |
| Life & Health Insurance - 0.2% | ||
| Lincoln National Corp. | 154,000 | 10,587,500 |
| Life Sciences Tools & Services - 0.6% | ||
| IQVIA Holdings Inc. (b) | 184,013 | 44,078,474 |
| Managed Healthcare - 2.6% | ||
| Humana Inc. | 108,960 | 42,401,784 |
| UnitedHealth Group Inc. | 340,108 | 132,893,800 |
| 175,295,584 | ||
| Movies & Entertainment - 2.3% | ||
| Netflix Inc. (b) | 106,786 | 65,175,767 |
| The Walt Disney Co. (b) | 557,954 | 94,389,078 |
| 159,564,845 | ||
| Multi-Line Insurance - 0.3% | ||
| American International Group Inc. | 371,637 | 20,399,155 |
| Multi-Sector Holdings - 1.1% | ||
| Berkshire Hathaway Inc., Class B (b) | 281,318 | 76,782,935 |
| Multi-Utilities - 1.4% | ||
| Sempra Energy | 770,061 | 97,412,717 |
| Oil & Gas Equipment & Services - 0.3% | ||
| Schlumberger N.V. | 589,641 | 17,476,959 |
| Oil & Gas Exploration & Production - 1.6% | ||
| ConocoPhillips | 1,211,335 | 82,092,173 |
| Pioneer Natural Resources Co. | 142,084 | 23,658,407 |
| 105,750,580 | ||
| Packaged Foods & Meats - 1.4% | ||
| Mondelez International Inc., Class A | 1,658,314 | 96,480,709 |
| Personal Products - 0.4% | ||
| The Estee Lauder Companies Inc., Class A | 95,847 | 28,747,391 |
| State Street U.S. Core Equity Fund | 7 |
| Number of Shares | Fair Value | |
| Pharmaceuticals - 3.7% | ||
| Bristol-Myers Squibb Co. | 767,788 | $ 45,430,016 |
| Elanco Animal Health Inc. (b) | 355,300 | 11,330,517 |
| Johnson & Johnson | 358,313 | 57,867,549 |
| Merck & Company Inc. | 1,446,196 | 108,623,782 |
| Viatris Inc. (a) | 1,956,829 | 26,515,033 |
| 249,766,897 | ||
| Property & Casualty Insurance - 1.2% | ||
| Chubb Ltd. | 454,070 | 78,772,064 |
| Railroads - 0.5% | ||
| Union Pacific Corp. | 189,150 | 37,075,292 |
| Regional Banks - 3.5% | ||
| First Republic Bank | 394,326 | 76,057,599 |
| Regions Financial Corp. | 5,042,196 | 107,449,197 |
| SVB Financial Group (b) | 81,446 | 52,685,788 |
| 236,192,584 | ||
| Restaurants - 0.6% | ||
| McDonald's Corp. | 174,370 | 42,042,351 |
| Semiconductor Equipment - 1.3% | ||
| Applied Materials Inc. | 689,600 | 88,772,208 |
| Semiconductors - 4.9% | ||
| Advanced Micro Devices Inc. (b) | 335,597 | 34,532,931 |
| NVIDIA Corp. | 387,586 | 80,292,316 |
| QUALCOMM Inc. (a) | 847,702 | 109,336,604 |
| Texas Instruments Inc. | 557,568 | 107,170,145 |
| 331,331,996 | ||
| Soft Drinks - 0.8% | ||
| PepsiCo Inc. | 375,967 | 56,549,196 |
| Specialized REITs - 1.1% | ||
| American Tower Corp. | 272,491 | 72,321,836 |
| Number of Shares | Fair Value | |
| Specialty Chemicals - 0.5% | ||
| DuPont de Nemours Inc. | 229,566 | $ 15,608,193 |
| Ecolab Inc. | 42,707 | 8,909,534 |
| PPG Industries Inc. (a) | 76,902 | 10,997,755 |
| 35,515,482 | ||
| Systems Software - 7.0% | ||
| Microsoft Corp. | 1,488,326 | 419,588,866 |
| Oracle Corp. | 299,632 | 26,106,936 |
| ServiceNow Inc. (b) | 51,560 | 32,084,241 |
| 477,780,043 | ||
| Technology Hardware, Storage & Peripherals - 4.9% | ||
| Apple Inc. | 2,350,685 | 332,621,927 |
| Trading Companies & Distributors - 1.2% | ||
| United Rentals Inc. (b) | 227,204 | 79,732,700 |
| Trucking - 0.1% | ||
| Lyft Inc., Class A (b) | 88,604 | 4,748,288 |
| Wireless Telecommunication Services - 0.3% | ||
| T-Mobile US Inc. (b) | 147,785 | 18,881,012 |
| Total Common Stock (Cost $4,046,292,980) | 6,706,041,046 | |
| Short-Term Investments - 1.4% | ||
| State Street Institutional U.S. Government Money Market Fund - Class G Shares 0.03% (c)(d) (Cost $94,639,589) | 94,639,589 | 94,639,589 |
| Total Investments (Cost $4,140,932,569) | 6,800,680,635 | |
| Liabilities in Excess of Other Assets, net - (0.1)% | (4,997,030) | |
| NET ASSETS - 100.0% | $ 6,795,683,605 | |
| The Fund had the following long futures contracts open at September 30, 2021: |
| Description | Expiration Date | Number of Contracts | Notional Amount | Value | Unrealized Appreciation (Depreciation) |
| S&P 500 E-Mini Index Futures | December 2021 | 163 | $ 36,337,004 | $ 35,026,662 | $ (1,310,342) |
| 8 | State Street U.S. Core Equity Fund |
| (a) | At September 30, 2021, all or a portion of this security was pledged to cover collateral requirements for futures, swaps and/or TBAs. |
| (b) | Non-income producing security. |
| (c) | Sponsored by SSGA Funds Management, Inc., the Fund’s investment adviser and administrator, and an affiliate of State Street Bank & Trust Co., the Fund’s sub-administrator, custodian and accounting agent. |
| (d) | Coupon amount represents effective yield. |
| † | Percentages are based on net assets as of September 30, 2021. |
| Abbreviations: |
| REIT - Real Estate Investment Trust |
| Investments | Level 1 | Level 2 | Level 3 | Total | |||
| Investments in Securities | |||||||
| Common Stock | $ 6,706,041,046 | $ — | $ — | $ 6,706,041,046 | |||
| Short-Term Investments | 94,639,589 | — | — | 94,639,589 | |||
| Total Investments in Securities | $ 6,800,680,635 | $ — | $ — | $ 6,800,680,635 | |||
| Other Financial Instruments | |||||||
| Long Futures Contracts - Unrealized Depreciation | $ (1,310,342) | $ — | $ — | $ (1,310,342) | |||
| Total Other Financial Instruments | $ (1,310,342) | $ — | $ — | $ (1,310,342) |
| Affiliate Table |
| Number of Shares Held at 12/31/20 | Value at 12/31/20 | Cost of Purchases | Proceeds from Shares Sold | Realized Gain (Loss) | Change in Unrealized Appreciation (Depreciation) | Number of Shares Held at 9/30/21 | Value at 9/30/21 | Dividend Income | |
| State Street Institutional U.S. Government Money Market Fund - Class G Shares | — | $— | $254,748,376 | $160,108,787 | $— | $— | 94,639,589 | $94,639,589 | $3,799 |
| State Street U.S. Core Equity Fund | 9 |
| 10 | State Street Income Fund |
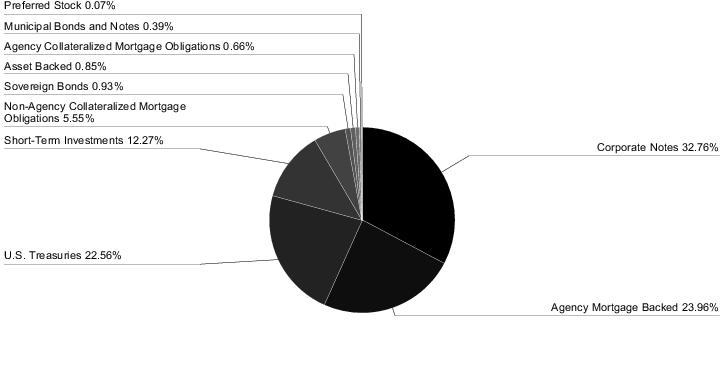
| Sector Allocation |
| Portfolio Composition as a % of Fair Value of $2,100,594 (in thousands) as of September 30, 2021 (a) |
| Quality Ratings | ||
| as of September 30, 2021 as a % of Fair Value (a)* | ||
| Moody’s / S&P / Rating | Percentage of Fair Value | |
| Aaa / AAA | 17.08% | |
| Aa / AA | 48.54% | |
| A / A | 6.91% | |
| Baa / BBB | 23.57% | |
| Ba / BB and lower | 3.25% | |
| NR / Other | 0.65% | |
| 100.00% | ||
| (a) | The securities information regarding holdings, allocations and other characteristics is presented to illustrate examples of securities that the Fund has bought and the diversity of areas in which the Fund may invest as of a particular date. It may not be representative of the Fund’s current or future investments and should not be construed as a recommendation to purchase or sell a particular security. |
| * | Moody’s Investors Services, Inc. (“Moody’s”) and S&P Global Ratings (“S&P”) are nationally recognized statistical rating organizations. The quality ratings represent the lower of Moody’s or S&P credit ratings. When a rating from only one of the rating agencies is available, that rating is used. Securities not rated by Moody’s or S&P are categorized as not rated. Credit quality measures a bond issuer’s ability to repay interest and principal in a timely manner. Credit quality ratings assigned by a rating agency are subject to change periodically and are not absolute standard of quality. In formulating investment decisions for the Fund, SSGA Funds Management, Inc. (“SSGA FM”) develops its own analysis of the credit quality and risks associated with individual debt instruments, rather than relying exclusively on rating agency ratings. |
| State Street Income Fund | 11 |
| Average Annual Total Return for the periods ended September 30, 2021 | |||||||||
| Inception date: 1/3/80 | |||||||||
| Nine Month | One Year | Five Year | Ten Year | Ending Value of a $10,000 Investment | |||||
| State Street Income Fund | (0.93)% | 0.79% | 3.32% | 3.57% | $14,199 | ||||
| Bloomberg U.S. Aggregate Bond Index | (1.55)% | (0.90)% | 2.94% | 3.01% | $13,455 | ||||

| 12 | State Street Income Fund |
| Actual Fund Return | Hypothetical 5% Return (2.5% for the period) | ||
| Actual Fund Return | |||
| Beginning Account Value April 1, 2021 | $1,000.00 | $1,000.00 | |
| Ending Account Value September 30, 2021 | $1,022.10 | $1,024.10 | |
| Expenses Paid During Period | $ 0.96 | $ 0.96 |
| State Street Income Fund | 13 |
| Principal Amount | Fair Value | |
| Bonds and Notes - 96.5% † | ||
| U.S. Treasuries - 24.9% | ||
| U.S. Treasury Bonds | ||
| 1.13%, 05/15/40 (a) | $ 31,243,000 | $ 27,010,550 |
| 1.25%, 05/15/50 (a) | 4,846,000 | 3,965,391 |
| 2.25%, 08/15/46 (a) | 14,668,000 | 15,151,586 |
| 3.00%, 08/15/48 (a) | 32,000,000 | 38,140,000 |
| U.S. Treasury Notes | ||
| 0.13%, 12/15/23 (a) | 19,226,000 | 19,138,882 |
| 0.25%, 07/31/25 (a) | 57,423,000 | 56,332,860 |
| 0.75%, 04/30/26 - 01/31/28 (a) | 191,361,000 | 186,944,492 |
| 1.38%, 01/31/22 (a) | 58,061,000 | 58,312,749 |
| 1.63%, 05/15/31 (a) | 56,119,000 | 56,785,413 |
| 2.63%, 02/15/29 (a) | 11,129,000 | 12,137,566 |
| 473,919,489 | ||
| Agency Mortgage Backed - 26.4% | ||
| Federal Home Loan Mortgage Corp. | ||
| 3.00%, 04/01/43 - 10/01/49 (a) | 50,587,955 | 53,661,060 |
| 4.50%, 06/01/33 - 02/01/35 (a) | 47,242 | 52,597 |
| 5.00%, 07/01/35 (a) | 434,578 | 494,584 |
| 5.50%, 01/01/38 - 04/01/39 (a) | 773,022 | 892,199 |
| 6.00%, 06/01/33 - 11/01/37 (a) | 1,593,031 | 1,841,914 |
| 6.50%, 07/01/29 (a) | 12,806 | 13,787 |
| 7.00%, 01/01/27 - 08/01/36 (a) | 362,629 | 419,712 |
| 7.50%, 01/01/28 - 09/01/33 (a) | 28,199 | 30,948 |
| 8.00%, 11/01/30 (a) | 2,267 | 2,555 |
| 8.50%, 04/01/30 (a) | 4,919 | 6,159 |
| Federal National Mortgage Assoc. | ||
| 2.50%, 02/01/51 - 03/01/51 (a) | 82,952,271 | 85,983,606 |
| 3.00%, 03/01/50 (a) | 9,979,529 | 10,433,084 |
| 3.50%, 08/01/45 - 01/01/48 (a) | 21,035,184 | 22,647,995 |
| 4.00%, 01/01/41 - 01/01/50 (a) | 26,905,227 | 29,288,032 |
| 4.50%, 07/01/33 - 12/01/48 (a) | 12,860,543 | 14,222,855 |
| 5.00%, 03/01/34 - 05/01/39 (a) | 1,139,901 | 1,296,667 |
| 5.50%, 12/01/32 - 01/01/39 (a) | 3,929,843 | 4,500,474 |
| Principal Amount | Fair Value | |
| 6.00%, 02/01/33 - 05/01/41 (a) | $ 7,346,566 | $ 8,520,697 |
| 6.50%, 10/01/28 - 08/01/36 (a) | 254,786 | 283,709 |
| 7.00%, 10/01/32 - 02/01/34 (a) | 38,563 | 42,689 |
| 7.50%, 11/01/22 - 03/01/33 (a) | 133,398 | 149,945 |
| 8.00%, 06/01/24 - 10/01/31 (a) | 52,691 | 57,088 |
| 8.50%, 04/01/30 (a) | 11,232 | 13,473 |
| 9.00%, 03/01/22 - 12/01/22 (a) | 1,681 | 1,687 |
| Federal National Mortgage Assoc. 1.60% + 12 month USD LIBOR | ||
| 1.85%, 04/01/37 (a)(b) | 14,549 | 14,901 |
| Federal National Mortgage Assoc. TBA | ||
| 2.00%, 10/01/36 - 10/01/51 (c) | 54,421,457 | 55,073,340 |
| 3.00%, 10/01/51 (c) | 85,747,998 | 89,714,700 |
| Government National Mortgage Assoc. | ||
| 3.00%, 12/20/42 - 05/20/45 (a) | 53,313,908 | 56,563,488 |
| 3.50%, 08/20/48 (a) | 9,539,508 | 10,098,321 |
| 4.00%, 01/20/41 - 04/20/43 (a) | 6,548,778 | 7,210,623 |
| 4.50%, 08/15/33 - 03/20/41 (a) | 2,575,531 | 2,885,989 |
| 5.00%, 08/15/33 (a) | 140,888 | 156,512 |
| 6.00%, 04/15/27 - 04/15/35 (a) | 500,247 | 573,532 |
| 6.50%, 01/15/24 - 09/15/36 (a) | 350,919 | 389,189 |
| 7.00%, 03/15/26 - 10/15/36 (a) | 248,621 | 278,431 |
| 7.50%, 11/15/22 - 10/15/28 (a) | 78,813 | 82,840 |
| 8.00%, 12/15/29 - 05/15/30 (a) | 1,046 | 1,165 |
| Government National Mortgage Assoc. 1.50% + 1 year CMT | ||
| 1.88%, 04/20/24 (a)(b) | 445 | 450 |
| 2.00%, 01/20/24 - 03/20/24 (a)(b) | 565 | 571 |
| 2.13%, 11/20/21 - 10/20/25 (a)(b) | 3,259 | 3,293 |
| 2.25%, 08/20/23 - 09/20/24 (a)(b) | 946 | 953 |
| 14 | State Street Income Fund |
| Principal Amount | Fair Value | |
| Government National Mortgage Assoc. TBA | ||
| 2.50%, 10/01/51 (c) | $ 23,737,000 | $ 24,498,720 |
| 3.00%, 10/01/51 (c) | 20,029,653 | 20,925,780 |
| 503,330,314 | ||
| Agency Collateralized Mortgage Obligations - 0.7% | ||
| Federal Home Loan Mortgage Corp. | ||
| 0.08%, 09/25/43 (a)(b)(d) | 4,141,069 | 17,623 |
| 2.51%, 07/25/29 (a) | 6,504,000 | 6,934,091 |
| 4.05%, 09/25/28 (a)(b) | 2,313,000 | 2,690,434 |
| Federal Home Loan Mortgage Corp. REMIC | ||
| 3.50%, 11/15/30 (a)(d) | 397,609 | 10,156 |
| 5.50%, 06/15/33 (a)(d) | 136,335 | 21,472 |
| 7.50%, 07/15/27 (a)(d) | 5,258 | 768 |
| Federal Home Loan Mortgage Corp. REMIC 6.60% - 1 month USD LIBOR | ||
| 6.50%, 08/15/25 (a)(b)(d)** | 16,668 | — |
| Federal Home Loan Mortgage Corp. STRIPS | ||
| 0.00%, 08/01/27 (a)(e) | 3,752 | 3,578 |
| 8.00%, 02/01/23 - 07/01/24 (a)(d) | 6,815 | 525 |
| Federal National Mortgage Assoc. REMIC | ||
| 1.10%, 12/25/42 (a)(b)(d) | 596,601 | 19,078 |
| 5.00%, 02/25/40 - 09/25/40 (a)(d) | 388,588 | 42,190 |
| 8.00%, 05/25/22 (a)(d) | 1 | 3 |
| Federal National Mortgage Assoc. REMIC 6.00% - 1 month USD LIBOR | ||
| 5.91%, 07/25/38 (a)(b)(d) | 172,085 | 22,713 |
| Federal National Mortgage Assoc. REMIC 6.55% - 1 month USD LIBOR | ||
| 6.46%, 11/25/41 (a)(b)(d) | 19,869,823 | 3,906,553 |
| Federal National Mortgage Assoc. STRIPS | ||
| 0.01%, 12/25/34 (a)(e) | 126,187 | 113,444 |
| 4.50%, 08/25/35 - 01/25/36 (a)(d) | 294,667 | 38,778 |
| 5.00%, 03/25/38 - 05/25/38 (a)(d) | 181,736 | 33,379 |
| 5.50%, 12/25/33 (a)(d) | 51,198 | 10,069 |
| 6.00%, 01/25/35 (a)(d) | 203,959 | 32,253 |
| 7.50%, 11/25/23 (a)(d) | 17,858 | 929 |
| Principal Amount | Fair Value | |
| 8.00%, 08/25/23 - 07/25/24 (a)(d) | $ 12,953 | $ 1,031 |
| 8.50%, 07/25/22 (a)(d) | 494 | 7 |
| 9.00%, 05/25/22 (a)(d)** | 67 | — |
| 13,899,074 | ||
| Asset Backed - 0.9% | ||
| CarMax Auto Owner Trust 2018-3 | ||
| 3.13%, 06/15/23 (a) | 365,386 | 367,582 |
| Chase Funding Trust 2004-1 | ||
| 4.99%, 11/25/33 (a)(f) | 372,099 | 372,098 |
| Enterprise Fleet Financing 2019-1 LLC | ||
| 3.07%, 10/20/24 (a)(g) | 4,214,000 | 4,266,675 |
| Ford Credit Auto Owner Trust 2020-B | ||
| 0.56%, 10/15/24 (a) | 8,079,000 | 8,101,331 |
| Santander Retail Auto Lease Trust 2019-B | ||
| 2.30%, 01/20/23 (a)(g) | 4,612,115 | 4,632,611 |
| 17,740,297 | ||
| Corporate Notes - 36.1% | ||
| 3M Co. | ||
| 3.13%, 09/19/46 (a) | 765,000 | 790,214 |
| 7-Eleven Inc. | ||
| 0.95%, 02/10/26 (a)(g) | 2,685,000 | 2,630,924 |
| Abbott Laboratories | ||
| 3.75%, 11/30/26 (a) | 569,000 | 638,088 |
| 4.90%, 11/30/46 (a) | 463,000 | 626,768 |
| AbbVie Inc. | ||
| 2.60%, 11/21/24 (a) | 1,094,000 | 1,149,980 |
| 2.95%, 11/21/26 (a) | 1,081,000 | 1,158,291 |
| 3.20%, 05/14/26 - 11/21/29 (a) | 1,583,000 | 1,706,002 |
| 3.25%, 10/01/22 (a) | 746,000 | 762,226 |
| 3.45%, 03/15/22 (a) | 1,638,000 | 1,652,709 |
| 4.05%, 11/21/39 (a) | 450,000 | 516,920 |
| 4.25%, 11/21/49 (a) | 670,000 | 793,267 |
| 4.63%, 10/01/42 (a) | 84,000 | 101,406 |
| 4.70%, 05/14/45 (a) | 157,000 | 193,799 |
| 4.88%, 11/14/48 (a) | 149,000 | 190,960 |
| Advance Auto Parts Inc. | ||
| 3.90%, 04/15/30 (a) | 1,810,000 | 2,002,150 |
| AEP Texas Inc. | ||
| 3.45%, 05/15/51 (a) | 1,167,000 | 1,213,330 |
| Aetna Inc. | ||
| 3.50%, 11/15/24 (a) | 568,000 | 610,753 |
| State Street Income Fund | 15 |
| Principal Amount | Fair Value | |
| Aircastle Ltd. | ||
| 4.25%, 06/15/26 (a) | $ 796,000 | $ 869,630 |
| Alcoa Nederland Holding BV | ||
| 5.50%, 12/15/27 (a)(g) | 1,047,000 | 1,123,975 |
| Alcon Finance Corp. | ||
| 2.60%, 05/27/30 (a)(g) | 358,000 | 366,259 |
| 3.80%, 09/23/49 (a)(g) | 200,000 | 221,900 |
| Alexandria Real Estate Equities Inc. | ||
| 1.88%, 02/01/33 (a) | 456,000 | 430,049 |
| 4.70%, 07/01/30 (a) | 275,000 | 326,200 |
| Alibaba Group Holding Ltd. | ||
| 3.40%, 12/06/27 (a) | 300,000 | 321,741 |
| 4.00%, 12/06/37 (a) | 450,000 | 490,361 |
| 4.20%, 12/06/47 (a) | 339,000 | 373,734 |
| Ally Financial Inc. | ||
| 5.75%, 11/20/25 (a) | 426,000 | 486,973 |
| Altria Group Inc. | ||
| 3.40%, 05/06/30 - 02/04/41 (a) | 596,000 | 584,115 |
| 4.00%, 02/04/61 (a) | 225,000 | 216,477 |
| 4.25%, 08/09/42 (a) | 62,000 | 64,480 |
| 4.45%, 05/06/50 (a) | 299,000 | 315,188 |
| 4.50%, 05/02/43 (a) | 209,000 | 224,140 |
| Amazon.com Inc. | ||
| 1.50%, 06/03/30 (a) | 336,000 | 326,619 |
| 2.50%, 06/03/50 (a) | 414,000 | 388,560 |
| 2.70%, 06/03/60 (a) | 321,000 | 302,000 |
| 2.88%, 05/12/41 (a) | 704,000 | 724,585 |
| 3.25%, 05/12/61 (a) | 527,000 | 559,621 |
| 4.25%, 08/22/57 (a) | 136,000 | 172,764 |
| Ameren Corp. | ||
| 2.50%, 09/15/24 (a) | 1,616,000 | 1,688,623 |
| 3.65%, 02/15/26 (a) | 351,000 | 381,474 |
| America Movil SAB de C.V. | ||
| 3.13%, 07/16/22 (a) | 1,469,000 | 1,499,922 |
| 4.38%, 04/22/49 (a) | 300,000 | 367,455 |
| American Campus Communities Operating Partnership LP | ||
| 4.13%, 07/01/24 (a) | 331,000 | 359,241 |
| American Electric Power Company Inc. | ||
| 2.30%, 03/01/30 (a) | 385,000 | 383,506 |
| 3.25%, 03/01/50 (a) | 321,000 | 320,961 |
| American International Group Inc. | ||
| 4.25%, 03/15/29 (a) | 476,000 | 544,901 |
| 4.50%, 07/16/44 (a) | 455,000 | 555,550 |
| Principal Amount | Fair Value | |
| American International Group Inc. (5.75% fixed rate until 04/01/28; 2.87% + 3 month USD LIBOR thereafter) | ||
| 5.75%, 04/01/48 (a)(b) | $ 138,000 | $ 158,410 |
| American Tower Corp. | ||
| 1.50%, 01/31/28 (a) | 1,306,000 | 1,266,637 |
| 2.90%, 01/15/30 (a) | 459,000 | 477,732 |
| 3.70%, 10/15/49 (a) | 260,000 | 280,912 |
| 3.80%, 08/15/29 (a) | 565,000 | 625,636 |
| American Water Capital Corp. | ||
| 2.95%, 09/01/27 (a) | 415,000 | 446,382 |
| Amgen Inc. | ||
| 2.00%, 01/15/32 | 2,416,000 | 2,329,386 |
| 2.45%, 02/21/30 (a) | 191,000 | 195,189 |
| 3.00%, 01/15/52 | 805,000 | 777,380 |
| 3.15%, 02/21/40 (a) | 771,000 | 785,927 |
| 3.38%, 02/21/50 (a) | 210,000 | 217,241 |
| 4.56%, 06/15/48 (a) | 378,000 | 467,076 |
| 4.66%, 06/15/51 (a) | 157,000 | 198,186 |
| Anheuser-Busch Companies LLC/Anheuser-Busch InBev Worldwide Inc. | ||
| 3.65%, 02/01/26 (a) | 934,000 | 1,024,888 |
| 4.70%, 02/01/36 (a) | 232,000 | 280,453 |
| 4.90%, 02/01/46 (a) | 508,000 | 630,870 |
| Anheuser-Busch InBev Worldwide Inc. | ||
| 3.50%, 06/01/30 (a) | 515,000 | 564,260 |
| 4.00%, 04/13/28 (a) | 165,000 | 186,204 |
| 4.35%, 06/01/40 (a) | 501,000 | 584,001 |
| 4.38%, 04/15/38 (a) | 812,000 | 947,945 |
| 4.50%, 06/01/50 (a) | 397,000 | 474,995 |
| 4.60%, 04/15/48 (a) | 293,000 | 350,753 |
| 4.75%, 04/15/58 (a) | 229,000 | 281,079 |
| 5.55%, 01/23/49 (a) | 533,000 | 721,623 |
| Anthem Inc. | ||
| 2.88%, 09/15/29 (a) | 257,000 | 270,611 |
| 3.30%, 01/15/23 (a) | 532,000 | 551,849 |
| 3.60%, 03/15/51 (a) | 282,000 | 307,983 |
| 3.70%, 09/15/49 (a) | 257,000 | 282,633 |
| ANZ New Zealand International Ltd. | ||
| 3.45%, 01/21/28 (a)(g) | 887,000 | 976,738 |
| Aon Corp./Aon Global Holdings PLC | ||
| 2.90%, 08/23/51 | 806,000 | 777,798 |
| 16 | State Street Income Fund |
| Principal Amount | Fair Value | |
| Apollo Management Holdings LP | ||
| 2.65%, 06/05/30 (a)(g) | $ 389,000 | $ 392,820 |
| Apollo Management Holdings LP (4.95% fixed rate until 12/17/24; 3.27% + 5 year CMT Rate thereafter) | ||
| 4.95%, 01/14/50 (a)(b)(g) | 476,000 | 496,301 |
| Apple Inc. | ||
| 2.20%, 09/11/29 (a) | 513,000 | 528,077 |
| 2.65%, 02/08/51 (a) | 787,000 | 757,259 |
| 2.80%, 02/08/61 (a) | 562,000 | 540,425 |
| 2.95%, 09/11/49 (a) | 339,000 | 344,438 |
| 3.35%, 02/09/27 (a) | 248,000 | 273,328 |
| 3.45%, 02/09/45 (a) | 862,000 | 952,484 |
| 3.85%, 08/04/46 (a) | 775,000 | 904,720 |
| Applied Materials Inc. | ||
| 4.35%, 04/01/47 (a) | 293,000 | 365,066 |
| Aptiv PLC | ||
| 4.40%, 10/01/46 (a) | 351,000 | 414,506 |
| Archer-Daniels-Midland Co. | ||
| 2.50%, 08/11/26 (a) | 303,000 | 322,404 |
| Ares Capital Corp. | ||
| 2.88%, 06/15/28 (a) | 1,759,000 | 1,785,666 |
| 3.25%, 07/15/25 (a) | 3,612,000 | 3,794,550 |
| Arthur J Gallagher & Co. | ||
| 3.50%, 05/20/51 (a) | 881,000 | 936,767 |
| Ascension Health | ||
| 4.85%, 11/15/53 (a) | 574,000 | 815,907 |
| Ashtead Capital Inc. | ||
| 1.50%, 08/12/26 (g) | 600,000 | 593,202 |
| Astrazeneca Finance LLC | ||
| 1.75%, 05/28/28 (a) | 1,132,000 | 1,138,701 |
| AstraZeneca PLC | ||
| 3.00%, 05/28/51 (a) | 534,000 | 550,394 |
| 4.00%, 01/17/29 (a) | 235,000 | 268,398 |
| 4.38%, 08/17/48 (a) | 128,000 | 162,085 |
| AT&T Inc. | ||
| 1.70%, 03/25/26 (a) | 3,255,000 | 3,297,152 |
| 2.30%, 06/01/27 (a) | 811,000 | 840,018 |
| 2.75%, 06/01/31 (a) | 1,622,000 | 1,665,762 |
| 3.30%, 02/01/52 (a) | 1,754,000 | 1,689,155 |
| 3.85%, 06/01/60 (a) | 757,000 | 783,381 |
| 4.35%, 03/01/29 (a) | 779,000 | 893,256 |
| 4.50%, 05/15/35 (a) | 556,000 | 650,470 |
| 4.55%, 03/09/49 (a) | 301,000 | 350,277 |
| 4.75%, 05/15/46 (a) | 178,000 | 212,619 |
| 4.80%, 06/15/44 (a) | 376,000 | 447,869 |
| 4.85%, 03/01/39 (a) | 725,000 | 868,775 |
| 5.25%, 03/01/37 (a) | 377,000 | 466,756 |
| Principal Amount | Fair Value | |
| 5.35%, 12/15/43 (a) | $ 415,000 | $ 514,820 |
| 5.45%, 03/01/47 (a) | 362,000 | 472,338 |
| Athene Holding Ltd. | ||
| 4.13%, 01/12/28 (a) | 397,000 | 440,924 |
| 6.15%, 04/03/30 (a) | 775,000 | 976,484 |
| Avangrid Inc. | ||
| 3.15%, 12/01/24 (a) | 959,000 | 1,021,853 |
| Baidu, Inc. | ||
| 2.38%, 10/09/30 (a) | 765,000 | 750,893 |
| Bain Capital Specialty Finance Inc. | ||
| 2.95%, 03/10/26 (a) | 1,172,000 | 1,194,760 |
| Bank of America Corp. | ||
| 3.25%, 10/21/27 (a) | 286,000 | 308,708 |
| 4.18%, 11/25/27 (a) | 977,000 | 1,088,515 |
| 4.25%, 10/22/26 (a) | 965,000 | 1,086,715 |
| Bank of America Corp. (2.09% fixed rate until 06/14/28; 1.06% + SOFR thereafter) | ||
| 2.09%, 06/14/29 (a)(b) | 1,759,000 | 1,757,487 |
| Bank of America Corp. (2.59% fixed rate until 04/29/30; 2.15% + SOFR thereafter) | ||
| 2.59%, 04/29/31 (a)(b) | 2,192,000 | 2,235,928 |
| Bank of America Corp. (3.12% fixed rate until 01/20/22; 1.16% + 3 month USD LIBOR thereafter) | ||
| 3.12%, 01/20/23 (a)(b) | 600,000 | 604,956 |
| Bank of America Corp. (3.37% fixed rate until 01/23/25; 0.81% + 3 month USD LIBOR thereafter) | ||
| 3.37%, 01/23/26 (a)(b) | 415,000 | 443,432 |
| Bank of America Corp. (3.42% fixed rate until 12/20/27; 1.04% + 3 month USD LIBOR thereafter) | ||
| 3.42%, 12/20/28 (a)(b) | 468,000 | 507,635 |
| Bank of America Corp. (3.56% fixed rate until 04/23/26; 1.06% + 3 month USD LIBOR thereafter) | ||
| 3.56%, 04/23/27 (a)(b) | 767,000 | 834,312 |
| Bank of America Corp. (3.71% fixed rate until 04/24/27; 1.51% + 3 month USD LIBOR thereafter) | ||
| 3.71%, 04/24/28 (a)(b) | 1,035,000 | 1,137,330 |
| State Street Income Fund | 17 |
| Principal Amount | Fair Value | |
| Bank of America Corp. (3.95% fixed rate until 01/23/48; 1.19% + 3 month USD LIBOR thereafter) | ||
| 3.95%, 01/23/49 (a)(b) | $ 622,000 | $ 722,260 |
| Bank of America Corp. (4.24% fixed rate until 04/24/37; 1.81% + 3 month USD LIBOR thereafter) | ||
| 4.24%, 04/24/38 (a)(b) | 646,000 | 754,851 |
| Bank of America Corp. (4.27% fixed rate until 07/23/28; 1.31% + 3 month USD LIBOR thereafter) | ||
| 4.27%, 07/23/29 (a)(b) | 232,000 | 263,067 |
| Bank of America Corp. (4.30% fixed rate until 01/28/25; 2.66% + 3 month USD LIBOR thereafter) | ||
| 4.30%, 12/31/99 (a)(b) | 1,031,000 | 1,053,991 |
| Barclays PLC | ||
| 4.38%, 01/12/26 (a) | 911,000 | 1,016,093 |
| 4.84%, 05/09/28 (a) | 276,000 | 312,322 |
| Barclays PLC (2.65% fixed rate until 06/24/30; 1.90% + 1 year CMT Rate thereafter) | ||
| 2.65%, 06/24/31 (a)(b) | 1,414,000 | 1,424,732 |
| Barclays PLC (2.85% fixed rate until 05/07/25; 2.71% + SOFR thereafter) | ||
| 2.85%, 05/07/26 (a)(b) | 1,320,000 | 1,385,300 |
| Barclays PLC (4.97% fixed rate until 05/16/28; 1.90% + 3 month USD LIBOR thereafter) | ||
| 4.97%, 05/16/29 (a)(b) | 507,000 | 589,707 |
| Barrick North America Finance LLC | ||
| 5.70%, 05/30/41 (a) | 87,000 | 117,683 |
| BAT Capital Corp. | ||
| 2.73%, 03/25/31 (a) | 784,000 | 772,703 |
| 4.39%, 08/15/37 (a) | 578,000 | 617,240 |
| 4.54%, 08/15/47 (a) | 261,000 | 271,925 |
| 4.70%, 04/02/27 (a) | 492,000 | 555,532 |
| 4.91%, 04/02/30 (a) | 515,000 | 590,350 |
| BAT International Finance PLC | ||
| 1.67%, 03/25/26 (a) | 501,000 | 501,251 |
| Bayer US Finance II LLC | ||
| 3.88%, 12/15/23 (a)(g) | 608,000 | 646,748 |
| Baylor Scott & White Holdings | ||
| 2.84%, 11/15/50 (a) | 122,000 | 120,804 |
| Principal Amount | Fair Value | |
| Becton Dickinson & Co. | ||
| 3.70%, 06/06/27 (a) | $ 447,000 | $ 494,199 |
| 3.73%, 12/15/24 | 9,000 | 9,730 |
| 4.67%, 06/06/47 (a) | 58,000 | 72,222 |
| 4.69%, 12/15/44 (a) | 67,000 | 83,153 |
| Berkshire Hathaway Energy Co. | ||
| 3.25%, 04/15/28 (a) | 255,000 | 277,978 |
| 3.70%, 07/15/30 (a) | 576,000 | 648,420 |
| 3.80%, 07/15/48 (a) | 225,000 | 253,962 |
| 4.25%, 10/15/50 (a) | 491,000 | 594,267 |
| 6.13%, 04/01/36 (a) | 229,000 | 317,012 |
| Berkshire Hathaway Finance Corp. | ||
| 1.45%, 10/15/30 (a) | 521,000 | 501,541 |
| 2.85%, 10/15/50 (a) | 387,000 | 380,088 |
| 4.25%, 01/15/49 (a) | 331,000 | 406,322 |
| Berry Global Inc. | ||
| 4.88%, 07/15/26 (a)(g) | 1,462,000 | 1,534,559 |
| BHP Billiton Finance USA Ltd. | ||
| 5.00%, 09/30/43 (a) | 135,000 | 179,657 |
| Biogen Inc. | ||
| 2.25%, 05/01/30 (a) | 244,000 | 242,368 |
| 3.15%, 05/01/50 (a) | 158,000 | 151,737 |
| Block Financial LLC | ||
| 2.50%, 07/15/28 (a) | 750,000 | 759,315 |
| 3.88%, 08/15/30 (a) | 239,000 | 259,960 |
| BNP Paribas S.A. (2.82% fixed rate until 11/19/24; 1.11% + 3 month USD LIBOR thereafter) | ||
| 2.82%, 11/19/25 (a)(b)(g) | 1,007,000 | 1,054,722 |
| BNP Paribas S.A. (5.13% fixed rate until 11/15/27; 2.84% + USD 5 year Swap Rate thereafter) | ||
| 5.13%, 12/31/99 (a)(b)(g) | 600,000 | 638,406 |
| Boardwalk Pipelines LP | ||
| 4.80%, 05/03/29 (a) | 506,000 | 578,920 |
| Boston Scientific Corp. | ||
| 4.70%, 03/01/49 (a) | 218,000 | 277,867 |
| BP Capital Markets America Inc. | ||
| 3.00%, 02/24/50 (a) | 620,000 | 597,010 |
| 3.02%, 01/16/27 (a) | 1,271,000 | 1,365,728 |
| 3.38%, 02/08/61 (a) | 1,055,000 | 1,049,619 |
| BP Capital Markets PLC (4.38% fixed rate until 06/22/25; 4.04% + 5 year CMT Rate thereafter) | ||
| 4.38%, 12/31/99 (a)(b) | 1,086,000 | 1,158,154 |
| 18 | State Street Income Fund |
| Principal Amount | Fair Value | |
| BP Capital Markets PLC (4.88% fixed rate until 03/22/30; 4.40% + 5 year CMT Rate thereafter) | ||
| 4.88%, 12/31/99 (a)(b) | $ 774,000 | $ 849,852 |
| Bristol-Myers Squibb Co. | ||
| 1.45%, 11/13/30 (a) | 558,000 | 534,648 |
| 2.35%, 11/13/40 (a) | 309,000 | 293,420 |
| 3.20%, 06/15/26 (a) | 412,000 | 449,199 |
| 3.40%, 07/26/29 (a) | 491,000 | 544,146 |
| 3.45%, 11/15/27 (a) | 32,000 | 35,519 |
| 4.13%, 06/15/39 (a) | 402,000 | 480,205 |
| 4.25%, 10/26/49 (a) | 402,000 | 498,794 |
| 4.35%, 11/15/47 (a) | 54,000 | 67,241 |
| 4.55%, 02/20/48 (a) | 141,000 | 180,903 |
| 5.00%, 08/15/45 (a) | 101,000 | 135,735 |
| Brixmor Operating Partnership LP | ||
| 2.25%, 04/01/28 (a) | 1,054,000 | 1,063,518 |
| 3.90%, 03/15/27 (a) | 210,000 | 229,925 |
| Broadcom Inc. | ||
| 3.14%, 11/15/35 | 303,000 | 302,047 |
| 3.19%, 11/15/36 | 40,000 | 39,942 |
| 3.42%, 04/15/33 (a)(g) | 732,000 | 758,586 |
| 3.47%, 04/15/34 (a)(g) | 36,000 | 37,228 |
| 4.15%, 11/15/30 (a) | 738,000 | 818,405 |
| 4.30%, 11/15/32 (a) | 516,000 | 577,574 |
| Brown-Forman Corp. | ||
| 4.00%, 04/15/38 (a) | 129,000 | 150,482 |
| Brunswick Corp. | ||
| 2.40%, 08/18/31 | 2,480,000 | 2,390,670 |
| Bunge Limited Finance Corp. | ||
| 3.75%, 09/25/27 (a) | 183,000 | 202,081 |
| Burlington Northern Santa Fe LLC | ||
| 4.15%, 12/15/48 (a) | 455,000 | 552,966 |
| 4.55%, 09/01/44 (a) | 686,000 | 863,715 |
| Cameron LNG LLC | ||
| 3.30%, 01/15/35 (a)(g) | 251,000 | 267,820 |
| Canadian Natural Resources Ltd. | ||
| 3.85%, 06/01/27 (a) | 568,000 | 621,880 |
| 4.95%, 06/01/47 (a) | 111,000 | 137,465 |
| Cantor Fitzgerald LP | ||
| 4.88%, 05/01/24 (a)(g) | 1,731,000 | 1,884,886 |
| Capital One Financial Corp. | ||
| 3.75%, 07/28/26 (a) | 961,000 | 1,054,919 |
| Cardinal Health Inc. | ||
| 3.08%, 06/15/24 (a) | 280,000 | 295,772 |
| Principal Amount | Fair Value | |
| Carlisle Cos. Inc. | ||
| 2.20%, 03/01/32 | $ 2,010,000 | $ 1,952,514 |
| Carrier Global Corp. | ||
| 2.72%, 02/15/30 (a) | 488,000 | 504,558 |
| 3.58%, 04/05/50 (a) | 488,000 | 518,056 |
| Caterpillar Inc. | ||
| 3.25%, 09/19/49 - 04/09/50 (a) | 747,000 | 809,758 |
| Celulosa Arauco y Constitucion S.A. | ||
| 4.20%, 01/29/30 (a)(g) | 541,000 | 583,918 |
| Cenovus Energy Inc. | ||
| 2.65%, 01/15/32 | 535,000 | 525,386 |
| 3.75%, 02/15/52 | 620,000 | 604,624 |
| Centene Corp. | ||
| 3.38%, 02/15/30 (a) | 1,097,000 | 1,135,439 |
| 4.25%, 12/15/27 (a) | 3,230,000 | 3,380,389 |
| CenterPoint Energy Inc. | ||
| 2.65%, 06/01/31 (a) | 811,000 | 828,566 |
| Charter Communications Operating LLC/Charter Communications Operating Capital | ||
| 3.50%, 06/01/41 (a) | 704,000 | 692,891 |
| 3.70%, 04/01/51 (a) | 1,055,000 | 1,021,398 |
| 4.80%, 03/01/50 (a) | 1,063,000 | 1,197,395 |
| 4.91%, 07/23/25 (a) | 214,000 | 240,557 |
| 5.05%, 03/30/29 (a) | 899,000 | 1,049,906 |
| 5.75%, 04/01/48 (a) | 280,000 | 354,158 |
| Cheniere Corpus Christi Holdings LLC | ||
| 5.88%, 03/31/25 (a) | 1,415,000 | 1,598,200 |
| 7.00%, 06/30/24 (a) | 2,333,000 | 2,635,987 |
| Chevron Corp. | ||
| 2.24%, 05/11/30 (a) | 268,000 | 274,778 |
| 2.98%, 05/11/40 (a) | 378,000 | 390,194 |
| 3.08%, 05/11/50 (a) | 256,000 | 265,116 |
| Chevron USA Inc. | ||
| 3.85%, 01/15/28 (a) | 938,000 | 1,059,340 |
| 3.90%, 11/15/24 (a) | 322,000 | 351,647 |
| 4.20%, 10/15/49 (a) | 259,000 | 315,037 |
| 5.05%, 11/15/44 (a) | 101,000 | 134,791 |
| Choice Hotels International Inc. | ||
| 3.70%, 01/15/31 (a) | 571,000 | 611,570 |
| Chubb INA Holdings Inc. | ||
| 4.35%, 11/03/45 (a) | 364,000 | 457,624 |
| Cigna Corp. | ||
| 2.40%, 03/15/30 (a) | 485,000 | 493,163 |
| 3.25%, 04/15/25 (a) | 438,000 | 468,235 |
| State Street Income Fund | 19 |
| Principal Amount | Fair Value | |
| 3.40%, 03/01/27 - 03/15/51 (a) | $ 736,000 | $ 779,871 |
| 3.75%, 07/15/23 (a) | 187,000 | 197,644 |
| 3.88%, 10/15/47 (a) | 135,000 | 149,270 |
| 4.13%, 11/15/25 (a) | 783,000 | 869,764 |
| 4.38%, 10/15/28 (a) | 245,000 | 283,147 |
| 4.80%, 08/15/38 (a) | 215,000 | 263,126 |
| 4.90%, 12/15/48 (a) | 109,000 | 139,120 |
| Cisco Systems Inc. | ||
| 5.90%, 02/15/39 (a) | 269,000 | 388,831 |
| Citadel Finance LLC | ||
| 3.38%, 03/09/26 (a)(g) | 3,500,000 | 3,547,600 |
| Citigroup Inc. | ||
| 4.13%, 07/25/28 (a) | 2,310,000 | 2,579,923 |
| 4.45%, 09/29/27 (a) | 572,000 | 650,541 |
| 4.65%, 07/23/48 (a) | 682,000 | 881,246 |
| Citigroup Inc. (0.98% fixed rate until 05/01/24; 0.67% + SOFR thereafter) | ||
| 0.98%, 05/01/25 (a)(b) | 775,000 | 777,961 |
| Citigroup Inc. (1.68% fixed rate until 05/15/23; 1.67% + SOFR thereafter) | ||
| 1.68%, 05/15/24 (a)(b) | 3,628,000 | 3,699,073 |
| Citigroup Inc. (2.56% fixed rate until 05/01/31; 1.17% + SOFR thereafter) | ||
| 2.56%, 05/01/32 (a)(b) | 781,000 | 789,950 |
| Citigroup Inc. (2.88% fixed rate until 07/24/22; 0.95% + 3 month USD LIBOR thereafter) | ||
| 2.88%, 07/24/23 (a)(b) | 231,000 | 235,505 |
| Citigroup Inc. (2.98% fixed rate until 11/05/29; 1.42% + SOFR thereafter) | ||
| 2.98%, 11/05/30 (a)(b) | 476,000 | 500,662 |
| Citigroup Inc. (3.88% fixed rate until 01/24/38; 1.17% + 3 month USD LIBOR thereafter) | ||
| 3.88%, 01/24/39 (a)(b) | 225,000 | 257,274 |
| Citigroup Inc. (4.70% fixed rate until 01/30/25; 3.23% + SOFR thereafter) | ||
| 4.70%, 12/31/99 (a)(b) | 856,000 | 877,785 |
| CME Group Inc. | ||
| 3.75%, 06/15/28 (a) | 282,000 | 318,981 |
| CMS Energy Corp. | ||
| 4.88%, 03/01/44 (a) | 762,000 | 976,206 |
| Principal Amount | Fair Value | |
| CNA Financial Corp. | ||
| 3.45%, 08/15/27 (a) | $ 212,000 | $ 232,770 |
| 3.90%, 05/01/29 (a) | 501,000 | 559,081 |
| CNH Industrial Capital LLC | ||
| 1.95%, 07/02/23 (a) | 1,168,000 | 1,194,257 |
| CNOOC Finance 2014 ULC | ||
| 4.25%, 04/30/24 (a) | 2,095,000 | 2,262,139 |
| CNOOC Petroleum North America ULC | ||
| 6.40%, 05/15/37 (a) | 540,000 | 719,032 |
| Comcast Corp. | ||
| 2.65%, 08/15/62 (a) | 381,000 | 337,128 |
| 2.80%, 01/15/51 (a) | 432,000 | 408,283 |
| 2.94%, 11/01/56 (g) | 339,000 | 321,745 |
| 2.99%, 11/01/63 (g) | 322,000 | 301,869 |
| 3.10%, 04/01/25 (a) | 605,000 | 647,241 |
| 3.20%, 07/15/36 (a) | 470,000 | 500,357 |
| 3.25%, 11/01/39 (a) | 755,000 | 798,397 |
| 3.45%, 02/01/50 (a) | 368,000 | 391,015 |
| 3.97%, 11/01/47 (a) | 523,000 | 596,246 |
| 4.15%, 10/15/28 (a) | 515,000 | 592,647 |
| CommonSpirit Health | ||
| 4.35%, 11/01/42 | 1,029,000 | 1,178,431 |
| Conagra Brands Inc. | ||
| 5.30%, 11/01/38 (a) | 235,000 | 298,676 |
| 5.40%, 11/01/48 (a) | 205,000 | 274,493 |
| ConocoPhillips | ||
| 3.75%, 10/01/27 (a)(g) | 148,000 | 165,087 |
| 4.30%, 08/15/28 (a)(g) | 497,000 | 571,953 |
| 4.88%, 10/01/47 (a)(g) | 248,000 | 321,681 |
| ConocoPhillips Co. | ||
| 4.30%, 11/15/44 (a) | 474,000 | 568,667 |
| Consolidated Edison Company of New York Inc. | ||
| 2.90%, 12/01/26 (a) | 578,000 | 611,576 |
| 3.35%, 04/01/30 (a) | 221,000 | 241,825 |
| 3.88%, 06/15/47 (a) | 265,000 | 295,025 |
| 3.95%, 04/01/50 (a) | 369,000 | 421,926 |
| Constellation Brands Inc. | ||
| 3.15%, 08/01/29 (a) | 1,060,000 | 1,134,560 |
| 3.70%, 12/06/26 (a) | 495,000 | 546,822 |
| 4.50%, 05/09/47 (a) | 382,000 | 455,814 |
| Continental Resources Inc. | ||
| 3.80%, 06/01/24 (a) | 4,052,000 | 4,258,895 |
| 4.50%, 04/15/23 (a) | 2,697,000 | 2,792,501 |
| Corning Inc. | ||
| 4.38%, 11/15/57 (a) | 258,000 | 310,498 |
| 20 | State Street Income Fund |
| Principal Amount | Fair Value | |
| Corporate Nacional del Cobre de Chile | ||
| 3.15%, 01/15/51 (a)(g) | $ 1,200,000 | $ 1,105,512 |
| Corporate Office Properties LP | ||
| 2.00%, 01/15/29 | 860,000 | 842,267 |
| 2.25%, 03/15/26 (a) | 712,000 | 728,967 |
| 2.75%, 04/15/31 (a) | 443,000 | 447,802 |
| Credit Suisse AG | ||
| 2.95%, 04/09/25 (a) | 1,080,000 | 1,144,973 |
| Credit Suisse Group AG | ||
| 3.80%, 06/09/23 (a) | 937,000 | 986,605 |
| 4.28%, 01/09/28 (a)(g) | 593,000 | 658,491 |
| Crown Castle International Corp. | ||
| 3.30%, 07/01/30 (a) | 1,421,000 | 1,514,928 |
| 4.15%, 07/01/50 (a) | 215,000 | 244,083 |
| 5.20%, 02/15/49 (a) | 333,000 | 431,195 |
| CSX Corp. | ||
| 4.50%, 03/15/49 - 08/01/54 (a) | 757,000 | 948,100 |
| CubeSmart LP | ||
| 4.38%, 02/15/29 (a) | 765,000 | 871,633 |
| Cummins Inc. | ||
| 1.50%, 09/01/30 (a) | 525,000 | 501,344 |
| 2.60%, 09/01/50 (a) | 525,000 | 490,061 |
| CVS Health Corp. | ||
| 3.00%, 08/15/26 (a) | 538,000 | 577,532 |
| 3.25%, 08/15/29 (a) | 445,000 | 478,513 |
| 3.63%, 04/01/27 (a) | 505,000 | 557,081 |
| 3.75%, 04/01/30 (a) | 368,000 | 408,944 |
| 3.88%, 07/20/25 (a) | 312,000 | 341,652 |
| 4.25%, 04/01/50 (a) | 269,000 | 318,254 |
| 4.30%, 03/25/28 (a) | 44,000 | 50,172 |
| 4.78%, 03/25/38 (a) | 329,000 | 402,703 |
| 5.00%, 12/01/24 (a) | 723,000 | 807,699 |
| 5.13%, 07/20/45 (a) | 320,000 | 412,182 |
| 5.30%, 12/05/43 (a) | 541,000 | 710,685 |
| Dell International LLC/EMC Corp. | ||
| 4.00%, 07/15/24 (a) | 925,000 | 1,000,730 |
| 5.45%, 06/15/23 (a) | 479,000 | 514,106 |
| 6.02%, 06/15/26 (a) | 157,000 | 187,248 |
| 8.35%, 07/15/46 (a) | 148,000 | 241,681 |
| Deutsche Bank AG | ||
| 3.30%, 11/16/22 (a) | 875,000 | 902,204 |
| 3.70%, 05/30/24 (a) | 347,000 | 369,722 |
| Deutsche Telekom AG | ||
| 3.63%, 01/21/50 (a)(g) | 309,000 | 329,162 |
| Principal Amount | Fair Value | |
| Deutsche Telekom International Finance BV | ||
| 2.49%, 09/19/23 (a)(g) | $ 758,000 | $ 784,280 |
| Devon Energy Corp. | ||
| 5.00%, 06/15/45 (a) | 169,000 | 198,308 |
| DH Europe Finance II Sarl | ||
| 2.60%, 11/15/29 (a) | 461,000 | 480,689 |
| 3.25%, 11/15/39 (a) | 262,000 | 279,855 |
| 3.40%, 11/15/49 (a) | 132,000 | 142,759 |
| Diamondback Energy Inc. | ||
| 2.88%, 12/01/24 (a) | 884,000 | 927,413 |
| 3.13%, 03/24/31 (a) | 704,000 | 729,971 |
| 3.25%, 12/01/26 (a) | 441,000 | 471,380 |
| 3.50%, 12/01/29 (a) | 378,000 | 404,377 |
| 4.40%, 03/24/51 (a) | 348,000 | 394,594 |
| Digital Realty Trust LP | ||
| 3.60%, 07/01/29 (a) | 825,000 | 904,274 |
| Discover Bank | ||
| 2.70%, 02/06/30 (a) | 535,000 | 554,822 |
| Discovery Communications LLC | ||
| 2.95%, 03/20/23 (a) | 948,000 | 980,611 |
| 3.95%, 03/20/28 (a) | 370,000 | 410,001 |
| 4.95%, 05/15/42 (a) | 132,000 | 155,953 |
| 5.00%, 09/20/37 (a) | 169,000 | 203,047 |
| Dollar General Corp. | ||
| 3.50%, 04/03/30 (a) | 301,000 | 331,157 |
| 4.13%, 04/03/50 (a) | 447,000 | 521,694 |
| Dollar Tree Inc. | ||
| 4.00%, 05/15/25 (a) | 596,000 | 651,589 |
| Dominion Energy Inc. | ||
| 3.07%, 08/15/24 (a)(f) | 650,000 | 687,453 |
| 3.38%, 04/01/30 (a) | 758,000 | 821,536 |
| Dover Corp. | ||
| 2.95%, 11/04/29 (a) | 518,000 | 550,784 |
| DTE Energy Co. | ||
| 2.85%, 10/01/26 (a) | 243,000 | 257,420 |
| Duke Energy Carolinas LLC | ||
| 3.95%, 03/15/48 (a) | 302,000 | 348,668 |
| Duke Energy Corp. | ||
| 2.55%, 06/15/31 (a) | 1,162,000 | 1,180,255 |
| 3.30%, 06/15/41 (a) | 1,055,000 | 1,078,484 |
| 3.50%, 06/15/51 (a) | 1,055,000 | 1,088,697 |
| 3.75%, 09/01/46 (a) | 1,611,000 | 1,719,952 |
| Duke Energy Corp. (4.88% fixed rate until 09/16/24; 3.39% + 5 year CMT Rate thereafter) | ||
| 4.88%, 12/31/99 (a)(b) | 1,119,000 | 1,195,114 |
| State Street Income Fund | 21 |
| Principal Amount | Fair Value | |
| Duke Energy Progress LLC | ||
| 4.15%, 12/01/44 (a) | $ 287,000 | $ 339,624 |
| Duke Realty LP | ||
| 3.05%, 03/01/50 (a) | 228,000 | 224,195 |
| 3.25%, 06/30/26 (a) | 301,000 | 324,421 |
| DuPont de Nemours Inc. | ||
| 5.42%, 11/15/48 (a) | 189,000 | 259,229 |
| Duquesne Light Holdings Inc. | ||
| 3.62%, 08/01/27 (a)(g) | 795,000 | 859,268 |
| Eastman Chemical Co. | ||
| 4.65%, 10/15/44 (a) | 514,000 | 615,942 |
| Eaton Corp. | ||
| 3.10%, 09/15/27 (a) | 319,000 | 345,633 |
| Ecolab Inc. | ||
| 1.30%, 01/30/31 (a) | 527,000 | 495,607 |
| Edison International | ||
| 4.95%, 04/15/25 (a) | 1,209,000 | 1,333,225 |
| 5.75%, 06/15/27 (a) | 151,000 | 173,899 |
| EI du Pont de Nemours & Co. | ||
| 2.30%, 07/15/30 (a) | 389,000 | 395,683 |
| Electronic Arts Inc. | ||
| 1.85%, 02/15/31 (a) | 652,000 | 630,471 |
| Emera US Finance LP | ||
| 2.64%, 06/15/31 (a)(g) | 1,172,000 | 1,177,626 |
| Emerson Electric Co. | ||
| 1.80%, 10/15/27 (a) | 339,000 | 344,865 |
| 2.75%, 10/15/50 (a) | 259,000 | 251,717 |
| Empower Finance 2020 LP | ||
| 1.36%, 09/17/27 (a)(g) | 781,000 | 766,872 |
| 1.78%, 03/17/31 (a)(g) | 602,000 | 578,281 |
| Enbridge Energy Partners LP | ||
| 5.50%, 09/15/40 (a) | 72,000 | 92,161 |
| Enbridge Inc. | ||
| 1.60%, 10/04/26 | 2,165,000 | 2,174,071 |
| Enbridge Inc. (5.75% fixed rate until 04/15/30; 5.31% + 5 year CMT Rate thereafter) | ||
| 5.75%, 07/15/80 (a)(b) | 1,311,000 | 1,480,788 |
| Enel Finance International N.V. | ||
| 3.63%, 05/25/27 (a)(g) | 795,000 | 879,604 |
| Energy Transfer LP | ||
| 4.25%, 03/15/23 (a) | 697,000 | 726,372 |
| 4.50%, 04/15/24 (a) | 555,000 | 600,527 |
| 4.95%, 06/15/28 (a) | 168,000 | 192,958 |
| 5.30%, 04/01/44 - 04/15/47 (a) | 856,000 | 998,181 |
| 5.35%, 05/15/45 (a) | 704,000 | 821,617 |
| 6.13%, 12/15/45 (a) | 138,000 | 175,631 |
| 6.50%, 02/01/42 (a) | 396,000 | 515,596 |
| Principal Amount | Fair Value | |
| Energy Transfer LP (6.75% fixed rate until 05/15/25; 5.13% + 5 year CMT Rate thereafter) | ||
| 6.75%, 12/31/99 (a)(b) | $ 2,488,000 | $ 2,554,007 |
| Energy Transfer LP/Regency Energy Finance Corp. | ||
| 4.50%, 11/01/23 (a) | 354,000 | 376,989 |
| Enstar Group Ltd. | ||
| 3.10%, 09/01/31 | 750,000 | 738,705 |
| Enterprise Products Operating LLC | ||
| 4.25%, 02/15/48 (a) | 741,000 | 839,531 |
| Enterprise Products Operating LLC (5.25% fixed rate until 08/16/27; 3.03% + 3 month USD LIBOR thereafter) | ||
| 5.25%, 08/16/77 (a)(b) | 241,000 | 251,934 |
| EOG Resources Inc. | ||
| 4.15%, 01/15/26 (a) | 333,000 | 371,621 |
| 4.38%, 04/15/30 (a) | 576,000 | 672,480 |
| 4.95%, 04/15/50 (a) | 261,000 | 345,212 |
| 5.10%, 01/15/36 (a) | 210,000 | 257,477 |
| Equinix Inc. | ||
| 1.25%, 07/15/25 (a) | 974,000 | 970,971 |
| 2.15%, 07/15/30 (a) | 735,000 | 718,977 |
| Equinor ASA | ||
| 3.25%, 11/18/49 (a) | 435,000 | 458,494 |
| ERP Operating LP | ||
| 4.50%, 07/01/44 (a) | 174,000 | 217,926 |
| Everest Reinsurance Holdings Inc. | ||
| 3.13%, 10/15/52 | 2,012,000 | 1,965,301 |
| Eversource Energy | ||
| 3.45%, 01/15/50 (a) | 513,000 | 537,778 |
| Exelon Corp. | ||
| 3.50%, 06/01/22 (a) | 575,000 | 585,063 |
| 4.05%, 04/15/30 (a) | 775,000 | 877,292 |
| 4.45%, 04/15/46 (a) | 483,000 | 583,744 |
| 4.70%, 04/15/50 | 516,000 | 651,378 |
| Exxon Mobil Corp. | ||
| 2.61%, 10/15/30 (a) | 1,552,000 | 1,625,534 |
| 3.45%, 04/15/51 (a) | 807,000 | 863,095 |
| FedEx Corp. | ||
| 4.10%, 02/01/45 (a) | 1,138,000 | 1,275,675 |
| Fidelity National Financial Inc. | ||
| 3.20%, 09/17/51 | 1,255,000 | 1,197,283 |
| 22 | State Street Income Fund |
| Principal Amount | Fair Value | |
| Fidelity National Information Services Inc. | ||
| 1.15%, 03/01/26 (a) | $ 657,000 | $ 651,389 |
| 1.65%, 03/01/28 (a) | 594,000 | 586,230 |
| 3.10%, 03/01/41 (a) | 138,000 | 139,674 |
| FirstEnergy Transmission LLC | ||
| 4.55%, 04/01/49 (a)(g) | 741,000 | 866,385 |
| Fiserv Inc. | ||
| 3.50%, 07/01/29 (a) | 345,000 | 375,726 |
| 4.40%, 07/01/49 (a) | 205,000 | 244,963 |
| Florida Power & Light Co. | ||
| 2.85%, 04/01/25 (a) | 1,303,000 | 1,382,952 |
| 4.13%, 02/01/42 (a) | 283,000 | 341,179 |
| Flowers Foods Inc. | ||
| 2.40%, 03/15/31 (a) | 631,000 | 629,290 |
| Flowserve Corp. | ||
| 2.80%, 01/15/32 | 1,235,000 | 1,222,773 |
| Ford Motor Co. | ||
| 4.35%, 12/08/26 (a) | 525,000 | 559,886 |
| Ford Motor Credit Company LLC | ||
| 3.10%, 05/04/23 (a) | 1,436,000 | 1,460,670 |
| 3.22%, 01/09/22 (a) | 354,000 | 355,713 |
| 3.34%, 03/28/22 (a) | 1,106,000 | 1,114,085 |
| 3.81%, 01/09/24 (a) | 945,000 | 974,928 |
| Fox Corp. | ||
| 3.50%, 04/08/30 (a) | 524,000 | 570,825 |
| GA Global Funding Trust | ||
| 1.63%, 01/15/26 (a)(g) | 949,000 | 955,273 |
| General Dynamics Corp. | ||
| 4.25%, 04/01/50 (a) | 395,000 | 499,110 |
| General Mills Inc. | ||
| 3.00%, 02/01/51 (a)(g) | 412,000 | 411,431 |
| General Motors Co. | ||
| 5.20%, 04/01/45 (a) | 76,000 | 92,348 |
| 5.40%, 10/02/23 - 04/01/48 (a) | 379,000 | 441,040 |
| 6.13%, 10/01/25 (a) | 990,000 | 1,160,349 |
| 6.80%, 10/01/27 (a) | 417,000 | 520,879 |
| General Motors Financial Company Inc. | ||
| 1.25%, 01/08/26 (a) | 1,176,000 | 1,161,853 |
| 2.35%, 01/08/31 (a) | 517,000 | 506,696 |
| 3.45%, 01/14/22 - 04/10/22 (a) | 2,450,000 | 2,469,530 |
| 4.20%, 11/06/21 (a) | 2,704,000 | 2,713,112 |
| 5.25%, 03/01/26 (a) | 408,000 | 466,218 |
| Georgia-Pacific LLC | ||
| 1.75%, 09/30/25 (a)(g) | 1,317,000 | 1,347,238 |
| 3.60%, 03/01/25 (a)(g) | 2,312,000 | 2,494,925 |
| Principal Amount | Fair Value | |
| Gilead Sciences Inc. | ||
| 1.65%, 10/01/30 (a) | $ 305,000 | $ 293,142 |
| 2.60%, 10/01/40 (a) | 394,000 | 375,112 |
| 2.80%, 10/01/50 (a) | 569,000 | 539,150 |
| 2.95%, 03/01/27 (a) | 87,000 | 93,498 |
| 3.50%, 02/01/25 (a) | 315,000 | 338,946 |
| 3.65%, 03/01/26 (a) | 287,000 | 314,345 |
| 4.15%, 03/01/47 (a) | 191,000 | 223,758 |
| GlaxoSmithKline Capital Inc. | ||
| 3.38%, 05/15/23 (a) | 698,000 | 732,118 |
| 3.63%, 05/15/25 (a) | 660,000 | 720,944 |
| GlaxoSmithKline Capital PLC | ||
| 3.38%, 06/01/29 (a) | 588,000 | 646,953 |
| Glencore Finance Canada Ltd. | ||
| 4.25%, 10/25/22 (a)(g) | 1,403,000 | 1,457,156 |
| 4.95%, 11/15/21 (a)(g) | 556,000 | 558,763 |
| Glencore Funding LLC | ||
| 3.88%, 04/27/51 (a)(g) | 651,000 | 679,729 |
| Graphic Packaging International LLC | ||
| 1.51%, 04/15/26 (a)(g) | 1,163,000 | 1,162,221 |
| Gray Oak Pipeline LLC | ||
| 2.00%, 09/15/23 (a)(g) | 1,827,000 | 1,863,284 |
| 2.60%, 10/15/25 (a)(g) | 1,194,000 | 1,225,390 |
| Grupo Televisa SAB | ||
| 5.00%, 05/13/45 (a) | 382,000 | 458,404 |
| Halliburton Co. | ||
| 3.80%, 11/15/25 (a) | 21,000 | 22,995 |
| 5.00%, 11/15/45 (a) | 228,000 | 272,927 |
| HCA Inc. | ||
| 3.50%, 09/01/30 - 07/15/51 (a) | 2,814,000 | 2,926,821 |
| 5.38%, 02/01/25 (a) | 1,610,000 | 1,798,837 |
| Health Care Service Corp. | ||
| 2.20%, 06/01/30 (a)(g) | 717,000 | 716,821 |
| 3.20%, 06/01/50 (a)(g) | 260,000 | 267,574 |
| Healthcare Trust of America Holdings LP | ||
| 2.00%, 03/15/31 (a) | 424,000 | 407,366 |
| Helmerich & Payne Inc. | ||
| 2.90%, 09/29/31 (g) | 430,000 | 431,243 |
| Hess Corp. | ||
| 5.60%, 02/15/41 (a) | 111,000 | 137,976 |
| 5.80%, 04/01/47 (a) | 71,000 | 92,328 |
| Hewlett Packard Enterprise Co. | ||
| 6.35%, 10/15/45 (a) | 122,000 | 164,327 |
| Highwoods Realty LP | ||
| 4.13%, 03/15/28 (a) | 311,000 | 346,706 |
| 4.20%, 04/15/29 (a) | 755,000 | 845,509 |
| State Street Income Fund | 23 |
| Principal Amount | Fair Value | |
| Honeywell International Inc. | ||
| 1.75%, 09/01/31 | $ 1,132,000 | $ 1,102,149 |
| 2.70%, 08/15/29 (a) | 590,000 | 626,610 |
| Hormel Foods Corp. | ||
| 1.80%, 06/11/30 (a) | 1,049,000 | 1,032,468 |
| HSBC Holdings PLC (2.01% fixed rate until 09/22/27; 1.73% + SOFR thereafter) | ||
| 2.01%, 09/22/28 (a)(b) | 1,938,000 | 1,936,760 |
| HSBC Holdings PLC (4.00% fixed rate until 03/09/26; 3.22% + 5 year CMT Rate thereafter) | ||
| 4.00%, 12/31/99 (a)(b) | 924,000 | 922,392 |
| HSBC Holdings PLC (4.29% fixed rate until 09/12/25; 1.35% + 3 month USD LIBOR thereafter) | ||
| 4.29%, 09/12/26 (a)(b) | 1,372,000 | 1,512,603 |
| HSBC Holdings PLC (6.00% fixed rate until 05/22/27; 3.75% + USD 5 year Mid-Market Swap Rate thereafter) | ||
| 6.00%, 12/31/99 (a)(b) | 801,000 | 879,033 |
| HSBC Holdings PLC (6.50% fixed rate until 03/23/28; 3.61% + USD 5 year Mid-Market Swap Rate thereafter) | ||
| 6.50%, 12/31/99 (a)(b) | 1,024,000 | 1,154,755 |
| Humana Inc. | ||
| 1.35%, 02/03/27 | 1,295,000 | 1,276,896 |
| 2.15%, 02/03/32 | 650,000 | 634,621 |
| Huntington Bancshares Inc. | ||
| 2.55%, 02/04/30 (a) | 1,029,000 | 1,063,616 |
| Huntington Ingalls Industries Inc. | ||
| 2.04%, 08/16/28 (g) | 2,012,000 | 1,985,683 |
| Hyundai Capital America | ||
| 1.30%, 01/08/26 (a)(g) | 1,979,000 | 1,947,415 |
| 3.10%, 04/05/22 (a)(g) | 485,000 | 491,106 |
| Imperial Brands Finance PLC | ||
| 3.13%, 07/26/24 (a)(g) | 844,000 | 886,976 |
| 3.50%, 02/11/23 - 07/26/26 (a)(g) | 2,689,000 | 2,786,028 |
| Indiana Michigan Power Co. | ||
| 3.25%, 05/01/51 (a) | 525,000 | 547,418 |
| ING Groep N.V. | ||
| 4.10%, 10/02/23 (a) | 2,303,000 | 2,465,131 |
| Principal Amount | Fair Value | |
| ING Groep N.V. (1.06% fixed rate until 04/01/26; 1.01% + SOFR thereafter) | ||
| 1.06%, 04/01/27 (b) | $ 836,000 | $ 844,870 |
| Ingredion Inc. | ||
| 3.90%, 06/01/50 (a) | 262,000 | 295,392 |
| Intel Corp. | ||
| 2.00%, 08/12/31 | 804,000 | 798,951 |
| 2.45%, 11/15/29 (a) | 992,000 | 1,033,793 |
| 2.60%, 05/19/26 (a) | 677,000 | 721,208 |
| 2.80%, 08/12/41 | 930,000 | 926,968 |
| 2.88%, 05/11/24 (a) | 423,000 | 447,416 |
| 3.10%, 02/15/60 (a) | 472,000 | 463,716 |
| 3.20%, 08/12/61 | 401,000 | 405,403 |
| Intercontinental Exchange Inc. | ||
| 1.85%, 09/15/32 (a) | 262,000 | 247,624 |
| 2.65%, 09/15/40 (a) | 176,000 | 168,450 |
| International Business Machines Corp. | ||
| 3.45%, 02/19/26 (a) | 704,000 | 770,986 |
| 4.15%, 05/15/39 (a) | 470,000 | 554,036 |
| 4.25%, 05/15/49 (a) | 227,000 | 275,176 |
| International Paper Co. | ||
| 4.40%, 08/15/47 (a) | 381,000 | 464,058 |
| Interstate Power & Light Co. | ||
| 3.40%, 08/15/25 (a) | 2,014,000 | 2,157,820 |
| ITC Holdings Corp. | ||
| 2.95%, 05/14/30 (a)(g) | 1,295,000 | 1,360,281 |
| JAB HOLDINGS BV | ||
| 2.20%, 11/23/30 (a)(g) | 498,000 | 488,020 |
| Jabil Inc. | ||
| 3.95%, 01/12/28 (a) | 401,000 | 441,882 |
| Jefferies Group LLC | ||
| 5.13%, 01/20/23 (a) | 422,000 | 446,290 |
| John Deere Capital Corp. | ||
| 2.45%, 01/09/30 (a) | 1,263,000 | 1,313,583 |
| Johnson & Johnson | ||
| 3.63%, 03/03/37 (a) | 259,000 | 298,453 |
| Johnson Controls International PLC | ||
| 4.50%, 02/15/47 (a) | 164,000 | 202,000 |
| JPMorgan Chase & Co. (1.58% fixed rate until 04/22/26; 0.89% + SOFR thereafter) | ||
| 1.58%, 04/22/27 (a)(b) | 1,460,000 | 1,462,701 |
| 24 | State Street Income Fund |
| Principal Amount | Fair Value | |
| JPMorgan Chase & Co. (2.96% fixed rate until 05/13/30; 2.52% + SOFR thereafter) | ||
| 2.96%, 05/13/31 (a)(b) | $ 845,000 | $ 879,915 |
| JPMorgan Chase & Co. (3.16% fixed rate until 04/22/41; 1.46% + SOFR thereafter) | ||
| 3.16%, 04/22/42 (a)(b) | 704,000 | 731,125 |
| JPMorgan Chase & Co. (3.88% fixed rate until 07/24/37; 1.36% + 3 month USD LIBOR thereafter) | ||
| 3.88%, 07/24/38 (a)(b) | 556,000 | 635,397 |
| JPMorgan Chase & Co. (3.90% fixed rate until 01/23/48; 1.22% + 3 month USD LIBOR thereafter) | ||
| 3.90%, 01/23/49 (a)(b) | 563,000 | 648,148 |
| JPMorgan Chase & Co. (3.96% fixed rate until 01/29/26; 1.25% + 3 month USD LIBOR thereafter) | ||
| 3.96%, 01/29/27 (a)(b) | 928,000 | 1,024,438 |
| JPMorgan Chase & Co. (4.01% fixed rate until 04/23/28; 1.12% + 3 month USD LIBOR thereafter) | ||
| 4.01%, 04/23/29 (a)(b) | 383,000 | 428,454 |
| JPMorgan Chase & Co. (4.03% fixed rate until 07/24/47; 1.46% + 3 month USD LIBOR thereafter) | ||
| 4.03%, 07/24/48 (a)(b) | 372,000 | 433,309 |
| JPMorgan Chase & Co. (4.49% fixed rate until 03/24/30; 3.79% + SOFR thereafter) | ||
| 4.49%, 03/24/31 (a)(b) | 1,286,000 | 1,501,109 |
| JPMorgan Chase & Co. (4.60% fixed rate until 02/01/25; 3.13% + SOFR thereafter) | ||
| 4.60%, 12/31/99 (a)(b) | 1,446,000 | 1,479,215 |
| JPMorgan Chase & Co. (6.10% fixed rate until 10/01/24; 3.33% + 3 month USD LIBOR thereafter) | ||
| 6.10%, 10/29/49 (a)(b) | 1,231,000 | 1,337,715 |
| Kaiser Foundation Hospitals | ||
| 3.00%, 06/01/51 (a) | 721,000 | 736,393 |
| 3.27%, 11/01/49 (a) | 693,000 | 739,660 |
| Principal Amount | Fair Value | |
| Kansas City Southern | ||
| 3.50%, 05/01/50 | $ 402,000 | $ 421,746 |
| Keurig Dr Pepper Inc. | ||
| 3.20%, 05/01/30 (a) | 578,000 | 621,344 |
| 3.80%, 05/01/50 (a) | 437,000 | 491,712 |
| 4.50%, 11/15/45 (a) | 223,000 | 270,724 |
| 4.60%, 05/25/28 (a) | 114,000 | 132,261 |
| Kinder Morgan Energy Partners LP | ||
| 4.70%, 11/01/42 (a) | 95,000 | 108,573 |
| 5.00%, 03/01/43 (a) | 200,000 | 237,704 |
| 6.38%, 03/01/41 (a) | 169,000 | 231,062 |
| Kinder Morgan Inc. | ||
| 5.05%, 02/15/46 (a) | 158,000 | 191,106 |
| KLA Corp. | ||
| 3.30%, 03/01/50 (a) | 514,000 | 541,710 |
| 4.65%, 11/01/24 (a) | 703,000 | 776,028 |
| Kohl's Corp. | ||
| 3.38%, 05/01/31 (a) | 1,295,000 | 1,335,637 |
| 5.55%, 07/17/45 (a) | 506,000 | 602,337 |
| Kreditanstalt fuer Wiederaufbau | ||
| 2.00%, 10/04/22 (a) | 1,948,000 | 1,984,096 |
| L3Harris Technologies Inc. | ||
| 3.85%, 12/15/26 (a) | 417,000 | 462,174 |
| Lear Corp. | ||
| 4.25%, 05/15/29 (a) | 343,000 | 383,337 |
| Leidos Inc. | ||
| 2.95%, 05/15/23 (a) | 1,447,000 | 1,498,007 |
| 3.63%, 05/15/25 (a) | 428,000 | 462,107 |
| 4.38%, 05/15/30 (a) | 1,074,000 | 1,215,704 |
| Liberty Mutual Group Inc. | ||
| 3.95%, 05/15/60 (a)(g) | 261,000 | 289,470 |
| Life Storage LP | ||
| 2.20%, 10/15/30 (a) | 730,000 | 723,109 |
| Lincoln National Corp. | ||
| 4.35%, 03/01/48 (a) | 281,000 | 334,598 |
| Lloyds Banking Group PLC | ||
| 3.75%, 01/11/27 (a) | 372,000 | 409,107 |
| Lloyds Banking Group PLC (2.44% fixed rate until 02/05/25; 1.00% + 1 year CMT Rate thereafter) | ||
| 2.44%, 02/05/26 (a)(b) | 800,000 | 829,680 |
| Lloyds Banking Group PLC (2.91% fixed rate until 11/07/22; 0.81% + 3 month USD LIBOR thereafter) | ||
| 2.91%, 11/07/23 (a)(b) | 982,000 | 1,007,503 |
| State Street Income Fund | 25 |
| Principal Amount | Fair Value | |
| Lockheed Martin Corp. | ||
| 3.55%, 01/15/26 (a) | $ 371,000 | $ 407,640 |
| 3.80%, 03/01/45 (a) | 146,000 | 168,900 |
| 4.50%, 05/15/36 (a) | 472,000 | 584,095 |
| Lowe's Companies Inc. | ||
| 1.30%, 04/15/28 (a) | 343,000 | 333,032 |
| 1.70%, 10/15/30 (a) | 262,000 | 250,695 |
| 3.00%, 10/15/50 (a) | 523,000 | 509,449 |
| 3.50%, 04/01/51 (a) | 584,000 | 621,265 |
| 3.70%, 04/15/46 (a) | 187,000 | 203,877 |
| 4.05%, 05/03/47 (a) | 343,000 | 392,258 |
| Lowe's Cos. Inc. | ||
| 1.70%, 09/15/28 | 1,605,000 | 1,591,149 |
| LYB International Finance II BV | ||
| 3.50%, 03/02/27 (a) | 119,000 | 129,723 |
| LYB International Finance III LLC | ||
| 1.25%, 10/01/25 (a) | 412,000 | 411,217 |
| 3.63%, 04/01/51 (a) | 262,000 | 273,704 |
| 3.80%, 10/01/60 (a) | 261,000 | 271,881 |
| Marvell Technology Inc. | ||
| 1.65%, 04/15/26 (a)(g) | 1,549,000 | 1,551,618 |
| 2.45%, 04/15/28 (a)(g) | 1,176,000 | 1,198,744 |
| 2.95%, 04/15/31 (a)(g) | 621,000 | 636,215 |
| Masco Corp. | ||
| 3.50%, 11/15/27 (a) | 149,000 | 162,507 |
| McCormick & Company Inc. | ||
| 1.85%, 02/15/31 (a) | 372,000 | 359,307 |
| 3.25%, 11/15/25 (a) | 3,735,000 | 4,013,071 |
| McDonald's Corp. | ||
| 3.60%, 07/01/30 (a) | 774,000 | 860,998 |
| 3.63%, 09/01/49 (a) | 314,000 | 342,831 |
| Medtronic Inc. | ||
| 4.63%, 03/15/45 (a) | 61,000 | 79,568 |
| Memorial Sloan-Kettering Cancer Center | ||
| 4.13%, 07/01/52 (a) | 781,000 | 975,984 |
| Merck & Company Inc. | ||
| 2.45%, 06/24/50 (a) | 645,000 | 599,560 |
| 2.75%, 02/10/25 (a) | 822,000 | 870,013 |
| 4.00%, 03/07/49 (a) | 174,000 | 208,551 |
| MetLife Inc. | ||
| 4.72%, 12/15/44 (a) | 297,000 | 382,673 |
| Microchip Technology Inc. | ||
| 2.67%, 09/01/23 (a) | 3,618,000 | 3,751,938 |
| Micron Technology Inc. | ||
| 2.50%, 04/24/23 (a) | 1,036,000 | 1,066,541 |
| Principal Amount | Fair Value | |
| Microsoft Corp. | ||
| 2.40%, 08/08/26 (a) | $ 368,000 | $ 391,004 |
| 2.68%, 06/01/60 (a) | 212,000 | 205,983 |
| 2.92%, 03/17/52 (a) | 1,571,000 | 1,634,374 |
| 3.04%, 03/17/62 (a) | 396,000 | 416,810 |
| 3.45%, 08/08/36 (a) | 136,000 | 155,863 |
| 3.50%, 02/12/35 (a) | 373,000 | 429,983 |
| Mid-America Apartments LP | ||
| 2.88%, 09/15/51 | 800,000 | 768,520 |
| Mitsubishi UFJ Financial Group Inc. | ||
| 2.80%, 07/18/24 (a) | 2,310,000 | 2,433,354 |
| Mizuho Financial Group Inc. (3.92% fixed rate until 09/11/23; 1.00% + 3 month USD LIBOR thereafter) | ||
| 3.92%, 09/11/24 (a)(b) | 1,310,000 | 1,391,351 |
| Molson Coors Beverage Co. | ||
| 4.20%, 07/15/46 (a) | 166,000 | 183,719 |
| Morgan Stanley | ||
| 3.63%, 01/20/27 (a) | 367,000 | 404,504 |
| 3.95%, 04/23/27 (a) | 728,000 | 809,667 |
| 4.35%, 09/08/26 (a) | 1,038,000 | 1,170,490 |
| 4.38%, 01/22/47 (a) | 389,000 | 483,698 |
| 5.00%, 11/24/25 (a) | 2,967,000 | 3,390,302 |
| Morgan Stanley (2.48% fixed rate until 09/16/31; 1.36% + SOFR thereafter) | ||
| 2.48%, 09/16/36 (b) | 3,215,000 | 3,144,688 |
| Morgan Stanley (2.80% fixed rate until 01/25/51; 1.43% + SOFR thereafter) | ||
| 2.80%, 01/25/52 (a)(b) | 692,000 | 670,666 |
| Morgan Stanley (3.62% fixed rate until 04/01/30; 3.12% + SOFR thereafter) | ||
| 3.62%, 04/01/31 (a)(b) | 645,000 | 710,971 |
| Morgan Stanley (3.97% fixed rate until 07/22/37; 1.46% + 3 month USD LIBOR thereafter) | ||
| 3.97%, 07/22/38 (a)(b) | 347,000 | 399,303 |
| MPLX LP | ||
| 2.65%, 08/15/30 (a) | 598,000 | 600,787 |
| 3.38%, 03/15/23 (a) | 342,000 | 354,975 |
| 5.20%, 12/01/47 (a) | 183,000 | 220,919 |
| Mylan Inc. | ||
| 5.20%, 04/15/48 (a) | 236,000 | 288,770 |
| National Retail Properties Inc. | ||
| 4.00%, 11/15/25 (a) | 484,000 | 533,920 |
| 26 | State Street Income Fund |
| Principal Amount | Fair Value | |
| Natwest Group PLC (3.75% fixed rate until 11/01/24; 2.10% + 5 year CMT Rate thereafter) | ||
| 3.75%, 11/01/29 (a)(b) | $ 575,000 | $ 613,226 |
| Natwest Group PLC (4.52% fixed rate until 06/25/23; 1.55% + 3 month USD LIBOR thereafter) | ||
| 4.52%, 06/25/24 (a)(b) | 953,000 | 1,014,383 |
| NewMarket Corp. | ||
| 2.70%, 03/18/31 (a) | 533,000 | 533,432 |
| Newmont Corp. | ||
| 4.88%, 03/15/42 (a) | 299,000 | 374,557 |
| NextEra Energy Capital Holdings Inc. | ||
| 3.25%, 04/01/26 (a) | 896,000 | 962,510 |
| NextEra Energy Capital Holdings Inc. (5.65% fixed rate until 05/01/29; 3.16% + 3 month USD LIBOR thereafter) | ||
| 5.65%, 05/01/79 (a)(b) | 471,000 | 550,839 |
| NGPL PipeCo LLC | ||
| 3.25%, 07/15/31 (a)(g) | 833,000 | 855,616 |
| NIKE Inc. | ||
| 3.38%, 03/27/50 (a) | 255,000 | 285,411 |
| Nippon Life Insurance Co. (3.40% fixed rate until 01/23/30; 2.61% + 5 year CMT Rate thereafter) | ||
| 3.40%, 01/23/50 (a)(b)(g) | 786,000 | 812,897 |
| NiSource Inc. | ||
| 3.60%, 05/01/30 (a) | 528,000 | 579,459 |
| 3.95%, 03/30/48 (a) | 153,000 | 174,025 |
| Nordstrom Inc. | ||
| 4.00%, 03/15/27 (a) | 1,757,000 | 1,813,452 |
| Norfolk Southern Corp. | ||
| 3.95%, 10/01/42 (a) | 325,000 | 373,708 |
| NOV Inc. | ||
| 3.60%, 12/01/29 (a) | 772,000 | 812,414 |
| Novant Health Inc. | ||
| 3.32%, 11/01/61 (a) | 503,000 | 530,937 |
| Novartis Capital Corp. | ||
| 2.20%, 08/14/30 (a) | 771,000 | 790,984 |
| 3.00%, 11/20/25 (a) | 65,000 | 69,891 |
| Nucor Corp. | ||
| 3.95%, 05/01/28 (a) | 449,000 | 504,398 |
| Nutrien Ltd. | ||
| 4.90%, 06/01/43 (a) | 323,000 | 406,247 |
| Principal Amount | Fair Value | |
| NVIDIA Corp. | ||
| 2.85%, 04/01/30 (a) | $ 261,000 | $ 279,688 |
| 3.50%, 04/01/50 (a) | 343,000 | 381,786 |
| NXP BV/NXP Funding LLC/NXP USA Inc. | ||
| 2.50%, 05/11/31 (a)(g) | 527,000 | 531,116 |
| 2.70%, 05/01/25 (a)(g) | 725,000 | 758,009 |
| 3.25%, 05/11/41 (a)(g) | 390,000 | 403,588 |
| Occidental Petroleum Corp. | ||
| 2.90%, 08/15/24 (a) | 481,000 | 489,836 |
| Oklahoma Gas & Electric Co. | ||
| 3.25%, 04/01/30 (a) | 432,000 | 466,815 |
| Oncor Electric Delivery Company LLC | ||
| 3.80%, 09/30/47 (a) | 172,000 | 199,071 |
| ONEOK Inc. | ||
| 4.35%, 03/15/29 (a) | 480,000 | 540,922 |
| Oracle Corp. | ||
| 1.65%, 03/25/26 (a) | 959,000 | 972,541 |
| 2.30%, 03/25/28 (a) | 354,000 | 362,163 |
| 2.40%, 09/15/23 (a) | 301,000 | 311,436 |
| 2.65%, 07/15/26 (a) | 537,000 | 566,245 |
| 2.88%, 03/25/31 (a) | 512,000 | 527,626 |
| 2.95%, 04/01/30 (a) | 775,000 | 810,666 |
| 3.60%, 04/01/50 (a) | 516,000 | 516,552 |
| 3.65%, 03/25/41 (a) | 564,000 | 586,334 |
| 3.80%, 11/15/37 (a) | 162,000 | 173,941 |
| 3.95%, 03/25/51 (a) | 569,000 | 602,799 |
| 4.00%, 07/15/46 - 11/15/47 (a) | 775,000 | 822,384 |
| 4.10%, 03/25/61 (a) | 669,000 | 715,776 |
| Otis Worldwide Corp. | ||
| 2.06%, 04/05/25 (a) | 894,000 | 923,332 |
| 2.57%, 02/15/30 (a) | 318,000 | 326,411 |
| 3.36%, 02/15/50 (a) | 302,000 | 316,097 |
| Ovintiv Exploration Inc. | ||
| 5.63%, 07/01/24 (a) | 4,004,000 | 4,437,433 |
| Owens Corning | ||
| 4.40%, 01/30/48 (a) | 222,000 | 259,511 |
| Pacific Gas & Electric Co. | ||
| 2.10%, 08/01/27 (a) | 432,000 | 421,533 |
| 2.50%, 02/01/31 (a) | 774,000 | 736,252 |
| 3.00%, 06/15/28 (a) | 732,000 | 738,332 |
| 3.30%, 08/01/40 (a) | 774,000 | 714,278 |
| 3.50%, 08/01/50 (a) | 337,000 | 306,262 |
| 4.30%, 03/15/45 (a) | 517,000 | 509,958 |
| PacifiCorp | ||
| 2.70%, 09/15/30 (a) | 470,000 | 489,881 |
| 2.90%, 06/15/52 (a) | 1,167,000 | 1,132,585 |
| State Street Income Fund | 27 |
| Principal Amount | Fair Value | |
| 6.25%, 10/15/37 (a) | $ 732,000 | $ 1,036,614 |
| Packaging Corp. of America | ||
| 3.05%, 10/01/51 | 700,000 | 691,145 |
| Parker-Hannifin Corp. | ||
| 3.25%, 06/14/29 (a) | 464,000 | 499,000 |
| PartnerRe Finance B LLC (4.50% fixed rate until 04/01/30; 3.82% + 5 year CMT Rate thereafter) | ||
| 4.50%, 10/01/50 (a)(b) | 1,048,000 | 1,102,182 |
| PayPal Holdings Inc. | ||
| 2.65%, 10/01/26 (a) | 682,000 | 728,697 |
| 3.25%, 06/01/50 (a) | 390,000 | 419,106 |
| PepsiCo Inc. | ||
| 1.63%, 05/01/30 (a) | 497,000 | 487,716 |
| 2.63%, 07/29/29 (a) | 667,000 | 707,500 |
| 3.45%, 10/06/46 (a) | 169,000 | 186,738 |
| Petroleos Mexicanos | ||
| 5.35%, 02/12/28 (a) | 434,000 | 427,885 |
| 5.63%, 01/23/46 (a) | 293,000 | 235,613 |
| 6.35%, 02/12/48 (a) | 471,000 | 396,342 |
| 6.49%, 01/23/27 (a) | 490,000 | 517,989 |
| 6.50%, 03/13/27 (a) | 1,170,000 | 1,234,947 |
| 7.69%, 01/23/50 (a) | 879,000 | 831,499 |
| Pfizer Inc. | ||
| 2.70%, 05/28/50 (a) | 917,000 | 903,337 |
| 3.45%, 03/15/29 (a) | 256,000 | 284,536 |
| 3.60%, 09/15/28 (a) | 590,000 | 662,948 |
| 3.90%, 03/15/39 (a) | 291,000 | 340,278 |
| 4.13%, 12/15/46 (a) | 199,000 | 242,432 |
| 4.40%, 05/15/44 (a) | 118,000 | 147,591 |
| Philip Morris International Inc. | ||
| 1.50%, 05/01/25 (a) | 549,000 | 557,065 |
| 2.10%, 05/01/30 (a) | 263,000 | 261,709 |
| 3.38%, 08/15/29 (a) | 383,000 | 419,757 |
| 4.13%, 03/04/43 (a) | 148,000 | 165,578 |
| Phillips 66 | ||
| 2.15%, 12/15/30 (a) | 2,702,000 | 2,637,395 |
| Phillips 66 Partners LP | ||
| 3.15%, 12/15/29 (a) | 1,464,000 | 1,526,981 |
| 3.75%, 03/01/28 (a) | 199,000 | 215,808 |
| 4.68%, 02/15/45 (a) | 280,000 | 322,725 |
| Pioneer Natural Resources Co. | ||
| 1.13%, 01/15/26 (a) | 1,543,000 | 1,524,129 |
| 2.15%, 01/15/31 (a) | 450,000 | 437,004 |
| Plains All American Pipeline LP/PAA Finance Corp. | ||
| 3.55%, 12/15/29 (a) | 748,000 | 786,694 |
| Principal Amount | Fair Value | |
| 3.65%, 06/01/22 (a) | $ 1,021,000 | $ 1,034,559 |
| PPL Capital Funding Inc. | ||
| 3.10%, 05/15/26 (a) | 571,000 | 608,452 |
| Precision Castparts Corp. | ||
| 4.38%, 06/15/45 (a) | 301,000 | 365,143 |
| Prospect Capital Corp. | ||
| 3.36%, 11/15/26 (a) | 942,000 | 956,592 |
| Prudential Financial Inc. | ||
| 3.94%, 12/07/49 (a) | 524,000 | 616,145 |
| Prudential Financial Inc. (5.70% fixed rate until 09/15/28; 2.67% + 3 month USD LIBOR thereafter) | ||
| 5.70%, 09/15/48 (a)(b) | 608,000 | 709,572 |
| Public Service Company of Colorado | ||
| 3.70%, 06/15/28 (a) | 551,000 | 614,944 |
| Public Service Electric & Gas Co. | ||
| 2.38%, 05/15/23 (a) | 1,155,000 | 1,186,797 |
| PVH Corp. | ||
| 4.63%, 07/10/25 (a) | 1,498,000 | 1,649,043 |
| QUALCOMM Inc. | ||
| 1.30%, 05/20/28 (a) | 204,000 | 199,428 |
| 4.30%, 05/20/47 (a) | 90,000 | 111,860 |
| Quanta Services Inc. | ||
| 2.35%, 01/15/32 | 865,000 | 846,939 |
| 3.05%, 10/01/41 | 935,000 | 903,930 |
| Quest Diagnostics Inc. | ||
| 2.95%, 06/30/30 (a) | 190,000 | 200,693 |
| Ralph Lauren Corp. | ||
| 1.70%, 06/15/22 (a) | 257,000 | 259,555 |
| Raytheon Technologies Corp. | ||
| 1.90%, 09/01/31 | 1,020,000 | 990,134 |
| 2.82%, 09/01/51 | 1,209,000 | 1,152,999 |
| 3.13%, 05/04/27 (a) | 779,000 | 845,277 |
| 3.50%, 03/15/27 (a) | 403,000 | 442,474 |
| 3.95%, 08/16/25 (a) | 329,000 | 362,403 |
| 4.15%, 05/15/45 (a) | 315,000 | 368,096 |
| 4.45%, 11/16/38 (a) | 248,000 | 300,283 |
| Realty Income Corp. | ||
| 3.00%, 01/15/27 (a) | 148,000 | 158,471 |
| 3.25%, 01/15/31 (a) | 497,000 | 539,210 |
| Regeneron Pharmaceuticals Inc. | ||
| 1.75%, 09/15/30 (a) | 918,000 | 872,357 |
| Regions Financial Corp. | ||
| 1.80%, 08/12/28 | 2,012,000 | 1,989,445 |
| 28 | State Street Income Fund |
| Principal Amount | Fair Value | |
| Reliance Steel & Aluminum Co. | ||
| 2.15%, 08/15/30 (a) | $ 473,000 | $ 462,334 |
| Reynolds American Inc. | ||
| 4.45%, 06/12/25 (a) | 35,000 | 38,585 |
| Rio Tinto Finance USA PLC | ||
| 4.13%, 08/21/42 (a) | 192,000 | 231,613 |
| Rockwell Automation Inc. | ||
| 2.80%, 08/15/61 | 280,000 | 267,226 |
| 4.20%, 03/01/49 (a) | 358,000 | 442,044 |
| Rogers Communications Inc. | ||
| 5.00%, 03/15/44 (a) | 138,000 | 170,079 |
| Roper Technologies Inc. | ||
| 2.95%, 09/15/29 (a) | 542,000 | 574,580 |
| Ross Stores Inc. | ||
| 4.70%, 04/15/27 (a) | 198,000 | 227,476 |
| Royalty Pharma PLC | ||
| 0.75%, 09/02/23 | 591,000 | 592,885 |
| 1.20%, 09/02/25 | 787,000 | 781,538 |
| 1.75%, 09/02/27 | 395,000 | 393,167 |
| 2.15%, 09/02/31 (a) | 670,000 | 645,183 |
| 2.20%, 09/02/30 | 169,000 | 165,525 |
| 3.30%, 09/02/40 | 99,000 | 98,948 |
| 3.35%, 09/02/51 (a) | 710,000 | 673,130 |
| RPM International Inc. | ||
| 3.75%, 03/15/27 (a) | 285,000 | 311,813 |
| Ryder System Inc. | ||
| 2.90%, 12/01/26 (a) | 1,320,000 | 1,404,493 |
| Sabine Pass Liquefaction LLC | ||
| 4.20%, 03/15/28 (a) | 258,000 | 288,230 |
| 4.50%, 05/15/30 (a) | 295,000 | 340,312 |
| 5.00%, 03/15/27 (a) | 150,000 | 172,646 |
| 5.88%, 06/30/26 (a) | 979,000 | 1,151,284 |
| Salesforce.com Inc. | ||
| 1.95%, 07/15/31 (a) | 1,167,000 | 1,162,659 |
| 2.70%, 07/15/41 (a) | 876,000 | 872,873 |
| 2.90%, 07/15/51 (a) | 805,000 | 805,547 |
| Santander UK Group Holdings PLC | ||
| 4.75%, 09/15/25 (a)(g) | 1,003,000 | 1,116,289 |
| Saudi Arabian Oil Co. | ||
| 3.50%, 04/16/29 (a)(g) | 1,243,000 | 1,339,158 |
| 4.38%, 04/16/49 (a)(g) | 256,000 | 291,492 |
| Schlumberger Holdings Corp. | ||
| 3.90%, 05/17/28 (a)(g) | 585,000 | 645,980 |
| Sealed Air Corp. | ||
| 1.57%, 10/15/26 (g) | 3,750,000 | 3,730,800 |
| Principal Amount | Fair Value | |
| Selective Insurance Group Inc. | ||
| 5.38%, 03/01/49 (a) | $ 226,000 | $ 289,400 |
| Sempra Energy | ||
| 3.80%, 02/01/38 (a) | 196,000 | 216,956 |
| 4.00%, 02/01/48 (a) | 213,000 | 237,987 |
| Shell International Finance BV | ||
| 2.38%, 08/21/22 (a) | 962,000 | 980,740 |
| 3.13%, 11/07/49 (a) | 870,000 | 904,765 |
| 3.75%, 09/12/46 (a) | 149,000 | 169,210 |
| 4.13%, 05/11/35 (a) | 210,000 | 247,304 |
| Shire Acquisitions Investments Ireland DAC | ||
| 2.88%, 09/23/23 (a) | 510,000 | 531,685 |
| 3.20%, 09/23/26 (a) | 142,000 | 153,337 |
| Simon Property Group LP | ||
| 3.38%, 06/15/27 (a) | 358,000 | 390,847 |
| South Jersey Industries Inc. | ||
| 5.02%, 04/15/31 (a) | 1,407,000 | 1,533,897 |
| Southern California Edison Co. | ||
| 2.40%, 02/01/22 (a) | 807,000 | 809,590 |
| 4.00%, 04/01/47 (a) | 931,000 | 995,947 |
| 4.20%, 03/01/29 (a) | 707,000 | 794,930 |
| Southern Company Gas Capital Corp. | ||
| 3.95%, 10/01/46 (a) | 506,000 | 561,721 |
| 4.40%, 05/30/47 (a) | 81,000 | 95,347 |
| Southern Copper Corp. | ||
| 5.88%, 04/23/45 (a) | 525,000 | 709,291 |
| Southwest Airlines Co. | ||
| 2.63%, 02/10/30 (a) | 776,000 | 787,314 |
| Southwestern Electric Power Co. | ||
| 2.75%, 10/01/26 (a) | 403,000 | 424,202 |
| Spectra Energy Partners LP | ||
| 3.38%, 10/15/26 (a) | 109,000 | 118,098 |
| 4.50%, 03/15/45 (a) | 82,000 | 95,871 |
| Spirit Realty LP | ||
| 4.00%, 07/15/29 (a) | 602,000 | 666,932 |
| Standard Chartered PLC (2.68% fixed rate until 06/29/31; 1.20% + 1 year CMT Rate thereafter) | ||
| 2.68%, 06/29/32 (a)(b)(g) | 1,843,000 | 1,833,619 |
| Standard Chartered PLC (2.82% fixed rate until 01/30/25; 1.21% + 3 month USD LIBOR thereafter) | ||
| 2.82%, 01/30/26 (a)(b)(g) | 1,510,000 | 1,570,747 |
| State Street Income Fund | 29 |
| Principal Amount | Fair Value | |
| Starbucks Corp. | ||
| 4.00%, 11/15/28 (a) | $ 310,000 | $ 352,603 |
| STERIS Irish FinCo UnLtd Co. | ||
| 2.70%, 03/15/31 (a) | 1,563,000 | 1,597,292 |
| 3.75%, 03/15/51 (a) | 640,000 | 691,194 |
| Stryker Corp. | ||
| 1.95%, 06/15/30 (a) | 1,081,000 | 1,067,196 |
| 2.90%, 06/15/50 (a) | 492,000 | 490,829 |
| Sumitomo Mitsui Financial Group Inc. | ||
| 4.44%, 04/02/24 (a)(g) | 3,830,000 | 4,138,047 |
| Sumitomo Mitsui Trust Bank Ltd. | ||
| 1.35%, 09/16/26 (g) | 4,014,000 | 4,004,728 |
| Suncor Energy Inc. | ||
| 4.00%, 11/15/47 (a) | 118,000 | 130,908 |
| Svenska Handelsbanken AB (1.42% fixed rate until 06/11/26; 0.63% + 1 year CMT Rate thereafter) | ||
| 1.42%, 06/11/27 (a)(b)(g) | 1,744,000 | 1,737,233 |
| Sysco Corp. | ||
| 3.25%, 07/15/27 (a) | 304,000 | 328,588 |
| 5.95%, 04/01/30 (a) | 101,000 | 128,550 |
| 6.60%, 04/01/50 (a) | 117,000 | 184,418 |
| Takeda Pharmaceutical Company Ltd. | ||
| 2.05%, 03/31/30 (a) | 200,000 | 196,934 |
| 3.03%, 07/09/40 (a) | 300,000 | 303,759 |
| 3.18%, 07/09/50 (a) | 300,000 | 304,731 |
| 3.38%, 07/09/60 (a) | 300,000 | 315,351 |
| Tampa Electric Co. | ||
| 2.40%, 03/15/31 (a) | 977,000 | 993,287 |
| 3.45%, 03/15/51 | 704,000 | 759,595 |
| 4.35%, 05/15/44 (a) | 610,000 | 735,745 |
| Tapestry Inc. | ||
| 4.13%, 07/15/27 (a) | 348,000 | 380,719 |
| 4.25%, 04/01/25 (a) | 4,066,000 | 4,400,591 |
| Target Corp. | ||
| 2.50%, 04/15/26 (a) | 319,000 | 340,580 |
| Teck Resources Ltd. | ||
| 3.90%, 07/15/30 (a) | 1,496,000 | 1,624,791 |
| 5.40%, 02/01/43 (a) | 311,000 | 381,787 |
| Telefonica Emisiones S.A. | ||
| 4.10%, 03/08/27 (a) | 639,000 | 717,776 |
| Texas Instruments Inc. | ||
| 3.88%, 03/15/39 (a) | 400,000 | 471,652 |
| The Allstate Corp. | ||
| 4.20%, 12/15/46 (a) | 184,000 | 225,321 |
| Principal Amount | Fair Value | |
| The Allstate Corp. (5.75% fixed rate until 08/15/23; 2.94% + 3 month USD LIBOR thereafter) | ||
| 5.75%, 08/15/53 (a)(b) | $ 951,000 | $ 1,026,899 |
| The Bank of New York Mellon Corp. (4.63% fixed rate until 09/20/26; 3.13% + 3 month USD LIBOR thereafter) | ||
| 4.63%, 12/29/49 (a)(b) | 837,000 | 907,994 |
| The Bank of Nova Scotia (4.65% fixed rate until 10/12/22; 2.65% + 3 month USD LIBOR thereafter) | ||
| 4.65%, 12/31/99 (a)(b) | 921,000 | 923,063 |
| The Boeing Co. | ||
| 2.20%, 02/04/26 (a) | 2,237,000 | 2,254,762 |
| 2.70%, 02/01/27 (a) | 1,227,000 | 1,271,111 |
| 2.95%, 02/01/30 (a) | 313,000 | 318,891 |
| 3.25%, 03/01/28 (a) | 157,000 | 164,277 |
| 3.55%, 03/01/38 (a) | 212,000 | 214,883 |
| 3.75%, 02/01/50 (a) | 278,000 | 281,850 |
| 5.04%, 05/01/27 (a) | 1,804,000 | 2,073,482 |
| 5.15%, 05/01/30 (a) | 1,019,000 | 1,196,388 |
| 5.81%, 05/01/50 (a) | 630,000 | 842,096 |
| The Charles Schwab Corp. (4.00% fixed rate until 12/01/30; 3.08% + 10 year CMT Rate thereafter) | ||
| 4.00%, 12/31/99 (b) | 1,306,000 | 1,340,883 |
| The Cleveland Electric Illuminating Co. | ||
| 4.55%, 11/15/30 (a)(g) | 1,247,000 | 1,447,792 |
| The Clorox Co. | ||
| 1.80%, 05/15/30 (a) | 724,000 | 707,066 |
| The Coca-Cola Co. | ||
| 2.60%, 06/01/50 (a) | 517,000 | 495,038 |
| 2.75%, 06/01/60 (a) | 398,000 | 384,747 |
| The Dow Chemical Co. | ||
| 2.10%, 11/15/30 (a) | 396,000 | 392,258 |
| 3.60%, 11/15/50 (a) | 396,000 | 420,992 |
| 4.25%, 10/01/34 (a) | 246,000 | 282,324 |
| 5.55%, 11/30/48 (a) | 283,000 | 388,412 |
| The Estee Lauder Companies Inc. | ||
| 2.38%, 12/01/29 (a) | 401,000 | 416,230 |
| The George Washington University | ||
| 4.13%, 09/15/48 | 905,000 | 1,103,783 |
| 30 | State Street Income Fund |
| Principal Amount | Fair Value | |
| The Goldman Sachs Group Inc. | ||
| 3.50%, 04/01/25 - 11/16/26 (a) | $ 1,966,000 | $ 2,122,709 |
| 3.85%, 01/26/27 (a) | 2,549,000 | 2,800,484 |
| 4.25%, 10/21/25 (a) | 661,000 | 732,329 |
| 5.15%, 05/22/45 (a) | 201,000 | 263,195 |
| The Goldman Sachs Group Inc. (1.54% fixed rate until 09/10/26; 0.82% + SOFR thereafter) | ||
| 1.54%, 09/10/27 (a)(b) | 956,000 | 953,189 |
| The Goldman Sachs Group Inc. (1.99% fixed rate until 01/27/31; 1.09% + SOFR thereafter) | ||
| 1.99%, 01/27/32 (a)(b) | 1,210,000 | 1,165,702 |
| The Goldman Sachs Group Inc. (2.38% fixed rate until 07/21/31; 1.25% + SOFR thereafter) | ||
| 2.38%, 07/21/32 (a)(b) | 522,000 | 517,088 |
| The Goldman Sachs Group Inc. (2.91% fixed rate until 06/05/22; 1.05% + 3 month USD LIBOR thereafter) | ||
| 2.91%, 06/05/23 (a)(b) | 1,075,000 | 1,092,458 |
| The Goldman Sachs Group Inc. (2.91% fixed rate until 07/21/41; 1.47% + SOFR thereafter) | ||
| 2.91%, 07/21/42 (a)(b) | 423,000 | 418,097 |
| The Goldman Sachs Group Inc. (3.21% fixed rate until 04/22/41; 1.51% + SOFR thereafter) | ||
| 3.21%, 04/22/42 (a)(b) | 647,000 | 668,920 |
| The Goldman Sachs Group Inc. (3.81% fixed rate until 04/23/28; 1.16% + 3 month USD LIBOR thereafter) | ||
| 3.81%, 04/23/29 (a)(b) | 299,000 | 330,643 |
| The Goldman Sachs Group Inc. (4.02% fixed rate until 10/31/37; 1.37% + 3 month USD LIBOR thereafter) | ||
| 4.02%, 10/31/38 (a)(b) | 311,000 | 357,355 |
| Principal Amount | Fair Value | |
| The Goldman Sachs Group Inc. (4.22% fixed rate until 05/01/28; 1.30% + 3 month USD LIBOR thereafter) | ||
| 4.22%, 05/01/29 (a)(b) | $ 495,000 | $ 559,994 |
| The Hartford Financial Services Group Inc. | ||
| 2.80%, 08/19/29 (a) | 1,118,000 | 1,167,840 |
| The Hartford Financial Services Group Inc. (2.25% fixed rate until 11/01/21; 2.13% + 3 month USD LIBOR thereafter) | ||
| 2.25%, 02/12/67 (a)(b)(g) | 683,000 | 656,254 |
| The Home Depot Inc. | ||
| 2.70%, 04/15/30 (a) | 297,000 | 314,294 |
| 3.35%, 04/15/50 (a) | 515,000 | 557,266 |
| 3.50%, 09/15/56 (a) | 283,000 | 315,972 |
| 3.90%, 12/06/28 - 06/15/47 (a) | 587,000 | 679,991 |
| 4.50%, 12/06/48 (a) | 230,000 | 295,458 |
| The Kroger Co. | ||
| 2.20%, 05/01/30 (a) | 466,000 | 467,612 |
| 2.95%, 11/01/21 (a) | 1,192,000 | 1,194,348 |
| 4.65%, 01/15/48 (a) | 196,000 | 240,712 |
| The Northwestern Mutual Life Insurance Co. | ||
| 3.45%, 03/30/51 (a)(g) | 705,000 | 756,634 |
| The Southern Co. | ||
| 3.25%, 07/01/26 (a) | 182,000 | 195,905 |
| The Toronto-Dominion Bank (3.63% fixed rate until 09/15/26; 2.21% + USD 5 year Swap Rate thereafter) | ||
| 3.63%, 09/15/31 (a)(b) | 701,000 | 768,864 |
| The Travelers Companies Inc. | ||
| 2.55%, 04/27/50 (a) | 730,000 | 695,376 |
| The Walt Disney Co. | ||
| 2.65%, 01/13/31 (a) | 758,000 | 792,262 |
| 3.38%, 11/15/26 (a) | 116,000 | 127,194 |
| 3.60%, 01/13/51 (a) | 498,000 | 556,565 |
| 4.75%, 11/15/46 (a) | 77,000 | 100,065 |
| 6.65%, 11/15/37 (a) | 504,000 | 750,884 |
| The Williams Companies Inc. | ||
| 3.75%, 06/15/27 (a) | 125,000 | 137,803 |
| 4.85%, 03/01/48 (a) | 258,000 | 315,343 |
| 4.90%, 01/15/45 (a) | 605,000 | 726,230 |
| 5.40%, 03/04/44 (a) | 87,000 | 109,827 |
| Thermo Fisher Scientific Inc. | ||
| 2.80%, 10/15/41 | 570,000 | 568,398 |
| State Street Income Fund | 31 |
| Principal Amount | Fair Value | |
| 4.13%, 03/25/25 (a) | $ 38,000 | $ 41,829 |
| 4.50%, 03/25/30 (a) | 181,000 | 213,918 |
| Time Warner Cable LLC | ||
| 6.55%, 05/01/37 (a) | 228,000 | 308,249 |
| T-Mobile USA Inc. | ||
| 3.50%, 04/15/25 (a) | 934,000 | 1,005,460 |
| 3.75%, 04/15/27 (a) | 1,163,000 | 1,281,347 |
| 3.88%, 04/15/30 (a) | 318,000 | 351,326 |
| 4.50%, 04/15/50 (a) | 151,000 | 176,371 |
| Total Capital International S.A. | ||
| 3.46%, 02/19/29 (a) | 998,000 | 1,103,908 |
| Trane Technologies Luxembourg Finance S.A. | ||
| 3.55%, 11/01/24 (a) | 538,000 | 578,033 |
| 3.80%, 03/21/29 (a) | 707,000 | 790,030 |
| TransCanada PipeLines Ltd. | ||
| 4.25%, 05/15/28 (a) | 717,000 | 816,441 |
| 4.88%, 01/15/26 (a) | 162,000 | 184,960 |
| Transcanada Trust (5.63% fixed rate until 05/20/25; 3.53% + 3 month USD LIBOR thereafter) | ||
| 5.63%, 05/20/75 (a)(b) | 1,417,000 | 1,528,490 |
| Transcontinental Gas Pipe Line Company LLC | ||
| 4.00%, 03/15/28 (a) | 337,000 | 376,335 |
| Truist Financial Corp. (4.80% fixed rate until 09/01/24; 3.00% + 5 year CMT Rate thereafter) | ||
| 4.80%, 12/31/99 (a)(b) | 1,954,000 | 2,074,073 |
| TSMC Global Ltd. | ||
| 0.75%, 09/28/25 (a)(g) | 1,849,000 | 1,807,231 |
| TWDC Enterprises 18 Corp. | ||
| 4.13%, 06/01/44 (a) | 164,000 | 195,149 |
| Tyco Electronics Group S.A. | ||
| 3.13%, 08/15/27 (a) | 343,000 | 375,691 |
| Tyson Foods Inc. | ||
| 4.00%, 03/01/26 (a) | 1,268,000 | 1,409,762 |
| 4.55%, 06/02/47 (a) | 96,000 | 117,497 |
| UBS Group AG (2.86% fixed rate until 08/15/22; 0.95% + 3 month USD LIBOR thereafter) | ||
| 2.86%, 08/15/23 (a)(b)(g) | 890,000 | 908,503 |
| UBS Group AG (3.13% fixed rate until 08/13/29; 1.47% + 3 month USD LIBOR thereafter) | ||
| 3.13%, 08/13/30 (a)(b)(g) | 1,015,000 | 1,078,529 |
| Principal Amount | Fair Value | |
| UDR Inc. | ||
| 2.10%, 08/01/32 (a) | $ 655,000 | $ 630,379 |
| 3.00%, 08/15/31 (a) | 417,000 | 436,595 |
| UniCredit S.p.A. (2.57% fixed rate until 09/22/25; 2.30% + 1 year CMT Rate thereafter) | ||
| 2.57%, 09/22/26 (a)(b)(g) | 1,783,000 | 1,810,226 |
| Union Pacific Corp. | ||
| 3.55%, 05/20/61 | 604,000 | 653,419 |
| 3.60%, 09/15/37 (a) | 109,000 | 121,231 |
| 3.80%, 04/06/71 (a)(g) | 278,000 | 313,114 |
| 4.10%, 09/15/67 (a) | 191,000 | 225,531 |
| UnitedHealth Group Inc. | ||
| 2.00%, 05/15/30 (a) | 814,000 | 816,434 |
| 4.45%, 12/15/48 (a) | 558,000 | 706,852 |
| 4.75%, 07/15/45 (a) | 482,000 | 631,372 |
| Utah Acquisition Sub Inc. | ||
| 3.95%, 06/15/26 (a) | 104,000 | 114,546 |
| Vale S.A. | ||
| 5.63%, 09/11/42 (a) | 235,000 | 288,829 |
| Valero Energy Corp. | ||
| 2.85%, 04/15/25 (a) | 728,000 | 766,708 |
| 4.00%, 04/01/29 (a) | 686,000 | 754,689 |
| Ventas Realty LP | ||
| 3.25%, 10/15/26 (a) | 389,000 | 416,568 |
| VEREIT Operating Partnership LP | ||
| 2.85%, 12/15/32 (a) | 488,000 | 506,847 |
| Verizon Communications Inc. | ||
| 2.10%, 03/22/28 (a) | 1,054,000 | 1,070,031 |
| 2.36%, 03/15/32 (g) | 1,408,000 | 1,394,019 |
| 2.55%, 03/21/31 (a) | 977,000 | 991,176 |
| 3.00%, 03/22/27 (a) | 1,808,000 | 1,940,544 |
| 3.40%, 03/22/41 (a) | 704,000 | 734,624 |
| 3.55%, 03/22/51 (a) | 532,000 | 560,148 |
| 3.70%, 03/22/61 (a) | 664,000 | 701,894 |
| 4.40%, 11/01/34 (a) | 811,000 | 960,451 |
| 4.52%, 09/15/48 (a) | 315,000 | 385,576 |
| 4.67%, 03/15/55 (a) | 262,000 | 328,878 |
| 4.86%, 08/21/46 (a) | 1,060,000 | 1,349,634 |
| 5.25%, 03/16/37 (a) | 254,000 | 329,321 |
| ViacomCBS Inc. | ||
| 2.90%, 01/15/27 (a) | 242,000 | 256,859 |
| 3.70%, 06/01/28 (a) | 235,000 | 260,154 |
| 5.25%, 04/01/44 (a) | 87,000 | 109,202 |
| Virginia Electric & Power Co. | ||
| 4.00%, 11/15/46 (a) | 515,000 | 602,741 |
| Visa Inc. | ||
| 2.00%, 08/15/50 (a) | 381,000 | 329,466 |
| 32 | State Street Income Fund |
| Principal Amount | Fair Value | |
| 2.05%, 04/15/30 (a) | $ 492,000 | $ 500,280 |
| 2.70%, 04/15/40 (a) | 535,000 | 545,149 |
| Vistra Operations Company LLC | ||
| 3.55%, 07/15/24 (a)(g) | 1,814,000 | 1,904,609 |
| Viterra Finance BV | ||
| 2.00%, 04/21/26 (a)(g) | 712,000 | 717,105 |
| 3.20%, 04/21/31 (a)(g) | 1,000,000 | 1,013,030 |
| VMware Inc. | ||
| 2.20%, 08/15/31 (a) | 731,000 | 715,612 |
| Vodafone Group PLC | ||
| 4.38%, 05/30/28 (a) | 357,000 | 410,093 |
| 5.25%, 05/30/48 (a) | 186,000 | 240,996 |
| Volkswagen Group of America Finance LLC | ||
| 1.63%, 11/24/27 (a)(g) | 1,420,000 | 1,405,601 |
| Vontier Corp. | ||
| 2.40%, 04/01/28 (a)(g) | 1,384,000 | 1,368,984 |
| 2.95%, 04/01/31 (a)(g) | 1,064,000 | 1,058,648 |
| Vornado Realty LP | ||
| 2.15%, 06/01/26 (a) | 1,250,000 | 1,270,637 |
| 3.40%, 06/01/31 (a) | 468,000 | 484,403 |
| 3.50%, 01/15/25 (a) | 332,000 | 353,261 |
| Vulcan Materials Co. | ||
| 3.90%, 04/01/27 (a) | 155,000 | 173,733 |
| Walgreens Boots Alliance Inc. | ||
| 4.10%, 04/15/50 (a) | 57,000 | 63,321 |
| Walmart Inc. | ||
| 1.80%, 09/22/31 | 670,000 | 663,816 |
| 2.50%, 09/22/41 | 670,000 | 667,608 |
| 2.65%, 09/22/51 | 315,000 | 313,551 |
| Waste Connections Inc. | ||
| 2.20%, 01/15/32 | 920,000 | 907,230 |
| 2.95%, 01/15/52 | 920,000 | 900,708 |
| WEC Energy Group Inc. | ||
| 3.55%, 06/15/25 (a) | 409,000 | 442,485 |
| Wells Fargo & Co. | ||
| 4.15%, 01/24/29 (a) | 958,000 | 1,087,560 |
| 4.75%, 12/07/46 (a) | 1,080,000 | 1,350,994 |
| Wells Fargo & Co. (1.65% fixed rate until 06/02/23; 1.60% + SOFR thereafter) | ||
| 1.65%, 06/02/24 | 942,000 | 942,000 |
| Wells Fargo & Co. (2.19% fixed rate until 04/30/25; 2.00% + SOFR thereafter) | ||
| 2.19%, 04/30/26 (a)(b) | 1,130,000 | 1,166,770 |
| Principal Amount | Fair Value | |
| Wells Fargo & Co. (2.39% fixed rate until 06/02/27; 2.10% + SOFR thereafter) | ||
| 2.39%, 06/02/28 (a)(b) | $ 4,349,000 | $ 4,485,515 |
| Wells Fargo & Co. (3.07% fixed rate until 04/30/40; 2.53% + SOFR thereafter) | ||
| 3.07%, 04/30/41 (a)(b) | 1,080,000 | 1,111,612 |
| Wells Fargo & Co. (3.20% fixed rate until 06/17/26; 1.17% + 3 month USD LIBOR thereafter) | ||
| 3.20%, 06/17/27 (a)(b) | 2,529,000 | 2,715,615 |
| Wells Fargo & Co. (5.88% fixed rate until 06/15/25; 3.99% + 3 month USD LIBOR thereafter) | ||
| 5.88%, 12/29/49 (a)(b) | 696,000 | 778,031 |
| Westlake Chemical Corp. | ||
| 2.88%, 08/15/41 | 360,000 | 343,400 |
| 3.13%, 08/15/51 | 399,000 | 376,329 |
| 3.38%, 08/15/61 | 603,000 | 566,808 |
| Westpac Banking Corp. (2.89% fixed rate until 02/04/25; 1.35% + 5 year CMT Rate thereafter) | ||
| 2.89%, 02/04/30 (a)(b) | 796,000 | 824,234 |
| Westpac Banking Corp. (4.11% fixed rate until 07/24/29; 2.00% + 5 year CMT Rate thereafter) | ||
| 4.11%, 07/24/34 (a)(b) | 578,000 | 627,853 |
| Willis North America Inc. | ||
| 3.60%, 05/15/24 (a) | 533,000 | 568,359 |
| 3.88%, 09/15/49 (a) | 522,000 | 579,394 |
| WPP Finance 2010 | ||
| 3.75%, 09/19/24 (a) | 311,000 | 337,472 |
| WRKCo Inc. | ||
| 3.00%, 09/15/24 (a) | 451,000 | 477,460 |
| Xcel Energy Inc. | ||
| 3.40%, 06/01/30 (a) | 645,000 | 704,688 |
| Yamana Gold Inc. | ||
| 2.63%, 08/15/31 (g) | 1,057,000 | 1,030,120 |
| Zoetis Inc. | ||
| 3.00%, 09/12/27 (a) | 149,000 | 160,334 |
| 3.90%, 08/20/28 (a) | 354,000 | 397,875 |
| 688,243,035 | ||
| Non-Agency Collateralized Mortgage Obligations - 6.1% | ||
| BANK 2017-BNK7 | ||
| 3.18%, 09/15/60 (a) | 20,509,000 | 22,053,679 |
| State Street Income Fund | 33 |
| Principal Amount | Fair Value | |
| BANK 2018-BNK15 | ||
| 4.41%, 11/15/61 (a)(b) | $ 8,550,000 | $ 9,895,809 |
| BX Commercial Mortgage Trust 2018-IND 0.75% + 1 month USD LIBOR | ||
| 0.83%, 11/15/35 (a)(b)(g) | 952,308 | 952,592 |
| Cantor Commercial Real Estate Lending 2019-CF3 | ||
| 3.01%, 01/15/53 (a) | 4,022,000 | 4,297,156 |
| CD 2019-CD8 Mortgage Trust | ||
| 2.91%, 08/15/57 (a) | 7,323,000 | 7,759,715 |
| Citigroup Commercial Mortgage Trust 2015-GC35 | ||
| 4.61%, 11/10/48 (a)(b) | 4,118,000 | 4,012,714 |
| Citigroup Commercial Mortgage Trust 2016-P6 | ||
| 4.03%, 12/10/49 (a)(b) | 2,942,926 | 3,187,192 |
| COMM 2012-CCRE3 Mortgage Trust | ||
| 3.92%, 10/15/45 (a)(g) | 1,602,000 | 1,580,865 |
| COMM 2013-LC13 Mortgage Trust | ||
| 4.56%, 08/10/46 (a)(b)(g) | 1,375,000 | 1,462,215 |
| COMM 2014-CR14 Mortgage Trust | ||
| 4.53%, 02/10/47 (a)(b) | 1,940,000 | 2,083,378 |
| GS Mortgage Securities Trust 2012-GCJ9 | ||
| 2.08%, 11/10/45 (a)(b)(d) | 5,202,867 | 65,384 |
| GS Mortgage Securities Trust 2014-GC22 | ||
| 4.85%, 06/10/47 (a)(b) | 2,433,000 | 2,533,305 |
| GS Mortgage Securities Trust 2015-GS1 | ||
| 4.57%, 11/10/48 (a)(b) | 3,270,000 | 2,883,451 |
| GS Mortgage Securities Trust 2018-GS9 | ||
| 4.14%, 03/10/51 (a)(b) | 2,609,000 | 2,917,740 |
| GS Mortgage Securities Trust 2019-GC42 | ||
| 2.75%, 09/01/52 (a) | 13,110,000 | 13,661,816 |
| GS Mortgage Securities Trust 2019-GSA1 | ||
| 3.05%, 11/10/52 (a) | 6,397,000 | 6,835,708 |
| Impac CMB Trust 2004-5 (0.80% fixed rate until 10/25/21; 0.72% + 1 month USD LIBOR thereafter) | ||
| 0.81%, 10/25/34 (a)(b) | 206,886 | 203,563 |
| Principal Amount | Fair Value | |
| JP Morgan Chase Commercial Mortgage Securities Trust 2012-LC9 | ||
| 1.54%, 12/15/47 (a)(b)(d) | $ 3,708,707 | $ 44,211 |
| JPMBB Commercial Mortgage Securities Trust 2013-C12 | ||
| 4.17%, 07/15/45 (a)(b) | 1,010,000 | 1,056,553 |
| JPMBB Commercial Mortgage Securities Trust 2015-C32 | ||
| 4.80%, 11/15/48 (a)(b) | 2,174,000 | 1,799,145 |
| MASTR Alternative Loan Trust 2003-5 | ||
| 5.00%, 08/25/18 (a)(d) | 9,344 | 98 |
| Morgan Stanley Bank of America Merrill Lynch Trust 2013-C7 | ||
| 4.26%, 02/15/46 (a)(b) | 3,391,000 | 3,285,712 |
| Morgan Stanley Bank of America Merrill Lynch Trust 2015-C21 | ||
| 1.01%, 03/15/48 (a)(b)(d) | 27,404,404 | 644,820 |
| UBS-Barclays Commercial Mortgage Trust 2013-C6 | ||
| 3.88%, 04/10/46 (a)(b)(g) | 8,161,000 | 8,266,757 |
| Wells Fargo Commercial Mortgage Trust 2014-LC16 | ||
| 4.32%, 08/15/50 (a) | 8,162,000 | 7,636,120 |
| Wells Fargo Commercial Mortgage Trust 2015-C26 | ||
| 1.35%, 02/15/48 (a)(b)(d) | 21,105,798 | 710,484 |
| WFRBS Commercial Mortgage Trust 2013-C17 | ||
| 4.26%, 12/15/46 (a) | 1,880,000 | 2,004,257 |
| WFRBS Commercial Mortgage Trust 2014-LC14 | ||
| 4.35%, 03/15/47 (a)(b) | 4,333,000 | 4,637,879 |
| 116,472,318 | ||
| Sovereign Bonds - 1.0% | ||
| Government of Chile | ||
| 2.55%, 01/27/32 (a) | 2,507,000 | 2,489,100 |
| 3.63%, 10/30/42 (a) | 150,000 | 156,606 |
| 3.86%, 06/21/47 (a) | 860,000 | 924,715 |
| Government of Indonesia | ||
| 3.50%, 01/11/28 (a) | 578,000 | 627,974 |
| 4.35%, 01/11/48 (a) | 232,000 | 258,360 |
| Government of Mexico | ||
| 3.60%, 01/30/25 (a) | 1,402,000 | 1,526,427 |
| 4.00%, 10/02/23 (a) | 122,000 | 130,419 |
| 4.60%, 02/10/48 (a) | 972,000 | 1,005,427 |
| 4.75%, 03/08/44 (a) | 2,068,000 | 2,209,017 |
| 34 | State Street Income Fund |
| Principal Amount | Fair Value | |
| Government of Panama | ||
| 3.16%, 01/23/30 (a) | $ 1,217,000 | $ 1,254,544 |
| 3.87%, 07/23/60 (a) | 826,000 | 807,622 |
| 4.50%, 05/15/47 (a) | 530,000 | 580,472 |
| Government of Peru | ||
| 1.86%, 12/01/32 (a) | 1,230,000 | 1,122,461 |
| 2.78%, 12/01/60 (a) | 2,055,000 | 1,737,605 |
| 5.63%, 11/18/50 (a) | 884,000 | 1,201,851 |
| Government of Philippines | ||
| 3.95%, 01/20/40 (a) | 835,000 | 911,461 |
| Government of Qatar | ||
| 3.38%, 03/14/24 (a)(g) | 1,045,000 | 1,111,389 |
| 4.82%, 03/14/49 (a)(g) | 275,000 | 353,931 |
| Government of Uruguay | ||
| 5.10%, 06/18/50 (a) | 884,133 | 1,126,403 |
| 19,535,784 | ||
| Municipal Bonds and Notes - 0.4% | ||
| American Municipal Power Inc. | ||
| 6.27%, 02/15/50 | 1,070,000 | 1,513,221 |
| Board of Regents of the University of Texas System | ||
| 3.35%, 08/15/47 | 1,025,000 | 1,175,751 |
| Port Authority of New York & New Jersey | ||
| 4.46%, 10/01/62 | 1,870,000 | 2,517,934 |
| State of California | ||
| 4.60%, 04/01/38 | 1,840,000 | 2,132,620 |
| State of Illinois | ||
| 5.10%, 06/01/33 | 745,000 | 868,332 |
| 8,207,858 | ||
| Principal Amount | Fair Value | |
| FNMA (TBA) - 0.0% * | ||
| Lehman TBA | ||
| 5.50%, (c)(h) | $ 1,140,372 | $ 29,307 |
| 29,307 | ||
| Total Bonds and Notes (Cost $1,788,728,794) | 1,841,377,476 | |
| Number of Shares | ||
| Domestic Equity - 0.1% | ||
| Preferred Stock - 0.1% | ||
| Wells Fargo & Co. 5.85%, 3.09% + 3 month USD LIBOR (Cost $1,375,850) (b) | 55,034 | 1,505,180 |
| Total Investments in Securities (Cost $1,790,104,644) | 1,842,882,656 | |
| Short-Term Investments - 13.5% | ||
| State Street Institutional U.S. Government Money Market Fund - Class G Shares 0.03% (i)(j) (Cost $257,710,916) | 257,710,916 | 257,710,916 |
| Total Investments (Cost $2,047,815,560) | 2,100,593,572 | |
| Liabilities in Excess of Other Assets, net - (10.1)% | (192,182,687) | |
| NET ASSETS - 100.0% | $ 1,908,410,885 | |
| Centrally Cleared Credit Default Swaps |
| Reference Entity | Counterparty | Notional Amount (000s omitted) | Contract Annual Fixed Rate/ Payment Frequency | Termination Date | Market Value | Unamortized Upfront Payments Received (Paid) | Unrealized Appreciation (Depreciation) |
| Sell Protection | |||||||
| Markit CDX North America High Yield Index | Intercontinental Exchange | $40,995 | 5.00%/ Quarterly | 06/20/26 | $3,803,950 | $3,975,790 | $(171,840) |
| State Street Income Fund | 35 |
| The Fund had the following long futures contracts open at September 30, 2021: |
| Description | Expiration Date | Number of Contracts | Notional Amount | Value | Unrealized Appreciation (Depreciation) |
| U.S. Long Bond Futures | December 2021 | 197 | $ 32,194,369 | $ 31,366,094 | $ (828,275) |
| Ultra Long-Term U.S. Treasury Bond Futures | December 2021 | 207 | 41,065,094 | 39,549,938 | (1,515,156) |
| 2 Yr. U.S. Treasury Notes Futures | December 2021 | 1,004 | 221,080,922 | 220,934,907 | (146,015) |
| 5 Yr. U.S. Treasury Notes Futures | December 2021 | 738 | 90,661,578 | 90,583,734 | (77,844) |
| $ (2,567,290) |
| The Fund had the following short futures contracts open at September 30, 2021: |
| Description | Expiration date | Number of Contracts | Notional Amount | Value | Unrealized Appreciation (Depreciation) |
| 10 Yr. U.S. Treasury Ultra Futures | December 2021 | 370 | (54,793,005) | (53,742,500) | $ 1,050,505 |
| 10 Yr. U.S. Treasury Notes Futures | December 2021 | 508 | (67,698,180) | (66,857,563) | 840,617 |
| $ 1,891,122 | |||||
| $ (676,168) |
| During the period ended September 30, 2021, average notional values related to derivative contracts were as follows: | ||||||||
| Purchased Put Options | Purchased Call Options | Written Put Options | Written Call Options | Long Futures Contracts | Short Futures Contracts | Credit Default Swap Contracts | Interest Rate Swap Contracts | |
| Average Notional Value | $— | $— | $— | $— | $299,841,791 | $205,559,733 | $40,521,054 | $— |
| (a) | At September 30, 2021, all or a portion of this security was pledged to cover collateral requirements for futures, swaps and/or TBAs. |
| (b) | Variable Rate Security - Interest rate shown is rate in effect at September 30, 2021. For securities based on a published reference rate and spread, the reference rate and spread are indicated in the description above. |
| (c) | Settlement is on a delayed delivery or when-issued basis with final maturity to be announced ("TBA") in the future. |
| (d) | Interest only security. These securities represent the right to receive the monthly interest payments on an underlying pool of mortgages. Payments of principal on the pool reduce the value of the "interest only" holding. |
| (e) | Principal only security. These securities represent the right to receive the monthly principal payments on an underlying pool of mortgages. No payments of interest on the pool are passed through to the "principal only" holder. |
| (f) | Step coupon bond. |
| (g) | Pursuant to Rule 144A of the Securities Act of 1933, as amended, these securities may be resold in transactions exempt from registration, normally to qualified institutional buyers. At September 30, 2021, these securities amounted to $119,703,765 or 6.27% of the net assets of the State Street Income Fund. These securities have been determined to be liquid using procedures established by the Fund's Board of Trustees. |
| (h) | Security is fair valued by the Valuation Committee, in accordance with the procedures approved by the Fund's Board of Trustees. Security value is determined based on level 3 inputs. |
| (i) | Sponsored by SSGA Funds Management, Inc., the Fund’s investment adviser and administrator, and an affiliate of State Street Bank & Trust Co., the Fund’s sub-administrator, custodian and accounting agent. |
| (j) | Coupon amount represents effective yield. |
| † | Percentages are based on net assets as of September 30, 2021. |
| ** | Amount is less than $0.50. |
| 36 | State Street Income Fund |
| * | Less than 0.05%. |
| Abbreviations: |
| CMT - Constant Maturity Treasury |
| LIBOR - London Interbank Offered Rate |
| REMIC - Real Estate Mortgage Investment Conduit |
| SOFR - Secured Overnight Financing Rate |
| STRIPS - Separate Trading of Registered Interest and Principal of Security |
| TBA - To Be Announced |
| Investments | Level 1 | Level 2 | Level 3 | Total | |||
| Investments in Securities | |||||||
| U.S. Treasuries | $ — | $ 473,919,489 | $ — | $ 473,919,489 | |||
| Agency Mortgage Backed | — | 503,330,314 | — | 503,330,314 | |||
| Agency Collateralized Mortgage Obligations | — | 13,899,074 | — | 13,899,074 | |||
| Asset Backed | — | 17,740,297 | — | 17,740,297 | |||
| Corporate Notes | — | 688,243,035 | — | 688,243,035 | |||
| Non-Agency Collateralized Mortgage Obligations | — | 116,472,318 | — | 116,472,318 | |||
| Sovereign Bonds | — | 19,535,784 | — | 19,535,784 | |||
| Municipal Bonds and Notes | — | 8,207,858 | — | 8,207,858 | |||
| FNMA (TBA) | — | — | 29,307 | 29,307 | |||
| Preferred Stock | 1,505,180 | — | — | 1,505,180 | |||
| Short-Term Investments | 257,710,916 | — | — | 257,710,916 | |||
| Total Investments in Securities | $ 259,216,096 | $ 1,841,348,169 | $ 29,307 | $ 2,100,593,572 | |||
| Other Financial Instruments | |||||||
| Credit Default Swap Contracts - Unrealized Depreciation | $ — | $ (171,840) | $ — | $ (171,840) | |||
| Long Futures Contracts - Unrealized Depreciation | (2,567,290) | — | — | (2,567,290) | |||
| Short Futures Contracts - Unrealized Appreciation | 1,891,122 | — | — | 1,891,122 | |||
| Total Other Financial Instruments | $ (676,168) | $ (171,840) | $ — | $ (848,008) |
| Affiliate Table |
| Number of Shares Held at 12/31/20 | Value at 12/31/20 | Cost of Purchases | Proceeds from Shares Sold | Realized Gain (Loss) | Change in Unrealized Appreciation (Depreciation) | Number of Shares Held at 9/30/21 | Value at 9/30/21 | Dividend Income | |
| State Street Institutional U.S. Government Money Market Fund - Class G Shares | — | $— | $412,091,233 | $154,380,317 | $— | $— | 257,710,916 | $257,710,916 | $11,232 |
| State Street Income Fund | 37 |
| Period Ended 9/30/21(a)(b) | Year Ended 12/31/20(a) | Year Ended 12/31/19(a) | Year Ended 12/31/18(a) | Year Ended 12/31/17(a) | Year Ended 12/31/16(a) | ||||||
| Net asset value, beginning of period | $ 66.39 | $ 57.30 | $ 46.05 | $ 52.45 | $ 49.27 | $ 47.59 | |||||
| Income/(loss) from investment operations: | |||||||||||
| Net investment income | 0.54 (c) | 0.77 (c) | 0.78 (c) | 0.77 (c) | 0.76 (c) | 0.92 | |||||
| Net realized and unrealized gains/(losses) on investments | 9.90 | 12.86 | 14.07 | (2.41) | 9.35 | 3.92 | |||||
| Total income/(loss) from investment operations | 10.44 | 13.63 | 14.85 | (1.64) | 10.11 | 4.84 | |||||
| Less distributions from: | |||||||||||
| Net investment income | — | 0.81 | 0.77 | 0.81 | 0.81 | 0.91 | |||||
| Net realized gains | — | 3.73 | 2.83 | 3.95 | 6.12 | 2.25 | |||||
| Total distributions | — | 4.54 | 3.60 | 4.76 | 6.93 | 3.16 | |||||
| Net asset value, end of period | $ 76.83 | $ 66.39 | $ 57.30 | $ 46.05 | $ 52.45 | $ 49.27 | |||||
| Total Return(d) | 15.73% (e) | 23.82% | 32.22% | (3.05)% | 20.50% | 10.13% | |||||
| Ratios/Supplemental Data: | |||||||||||
| Net assets, end of period (in thousands) | $6,795,684 | $6,229,783 | $5,541,415 | $4,700,274 | $5,435,513 | $4,914,567 | |||||
| Ratios to average net assets: | |||||||||||
| Net expenses | 0.15% (f) | 0.14% | 0.14% | 0.14% | 0.14% | 0.16% | |||||
| Gross expenses | 0.15% (f) | 0.14% | 0.14% | 0.14% | 0.14% | 0.16% | |||||
| Net investment income | 0.99% (f) | 1.29% | 1.44% | 1.41% | 1.39% | 1.79% | |||||
| Portfolio turnover rate | 27% (e) | 37% | 31% | 40% | 77% | 38% |
| Notes to Financial Highlights | |
| (a) | Financial information from January 1, 2016 until May 24, 2021 is for the GE RSP U.S. Equity Fund, which was reorganized into the State Street U.S. Core Equity Fund effective May 24, 2021. See Note 1 in the accompanying Notes to Financial Statements. |
| (b) | The Board of Trustees approved a change in fiscal year end for the Fund from December 31 to September 30. |
| (c) | Per share values have been calculated using the average share method. |
| (d) | Total returns are historical and assume changes in share price, reinvestment of dividends and capital gains distributions. Past performance does not guarantee future results. |
| (e) | Not annualized. |
| (f) | Annualized for periods less than one year. |
| 38 | Financial Highlights |
| Period Ended 9/30/21(a)(b) | Year Ended 12/31/20(a) | Year Ended 12/31/19(a) | Year Ended 12/31/18(a) | Year Ended 12/31/17(a) | Year Ended 12/31/16(a) | ||||||
| Net asset value, beginning of period | $ 12.42 | $ 11.85 | $ 11.14 | $ 11.55 | $ 11.38 | $ 11.36 | |||||
| Income/(loss) from investment operations: | |||||||||||
| Net investment income | 0.17 (c) | 0.26 (c) | 0.31 (c) | 0.32 (c) | 0.29 (c) | 0.31 | |||||
| Net realized and unrealized gains/(losses) on investments | (0.29) | 0.69 | 0.72 | (0.40) | 0.16 | 0.09 | |||||
| Total income/(loss) from investment operations | (0.12) | 0.95 | 1.03 | (0.08) | 0.45 | 0.40 | |||||
| Less distributions from: | |||||||||||
| Net investment income | 0.22 | 0.34 | 0.32 | 0.33 | 0.28 | 0.29 | |||||
| Net realized gains | — | 0.04 | — | — | — | 0.09 | |||||
| Total distributions | 0.22 | 0.38 | 0.32 | 0.33 | 0.28 | 0.38 | |||||
| Net asset value, end of period | $ 12.08 | $ 12.42 | $ 11.85 | $ 11.14 | $ 11.55 | $ 11.38 | |||||
| Total Return(d) | (0.93)% (e) | 8.20% | 9.38% | (0.75)% | 3.99% | 3.50% | |||||
| Ratios/Supplemental Data: | |||||||||||
| Net assets, end of period (in thousands) | $1,908,411 | $2,084,815 | $2,024,704 | $1,992,169 | $2,329,674 | $2,427,975 | |||||
| Ratios to average net assets: | |||||||||||
| Net expenses | 0.19% (f) | 0.17% | 0.17% | 0.17% | 0.16% | 0.21% | |||||
| Gross expenses | 0.19% (f) | 0.17% | 0.17% | 0.17% | 0.16% | 0.21% | |||||
| Net investment income | 1.85% (f) | 2.16% | 2.67% | 2.86% | 2.55% | 2.66% | |||||
| Portfolio turnover rate | 59% (e)(g) | 110% (g) | 422% | 223% | 297% | 242% |
| Notes to Financial Highlights | |
| (a) | Financial information from January 1, 2016 until May 24, 2021 is for the GE RSP Income Fund, which was reorganized into the State Street Income Fund effective May 24, 2021. See Note 1 in the accompanying Notes to Financial Statements. |
| (b) | The Board of Trustees approved a change in fiscal year end for the Fund from December 31 to September 30. |
| (c) | Per share values have been calculated using the average share method. |
| (d) | Total returns are historical and assume changes in share price, reinvestment of dividends and capital gains distributions. Past performance does not guarantee future results. |
| (e) | Not annualized. |
| (f) | Annualized for periods less than one year. |
| (g) | The portfolio turnover calculated for the periods ended 9/30/21 and 12/31/20 did not include To-Be-Announced transactions and, if it had, the portfolio turnover would have been 134% and 304%, respectively. |
| Financial Highlights | 39 |
| State Street U.S. Core Equity Fund | State Street Income Fund | ||
| Assets | |||
| Investments in securities, at fair value (cost $4,046,292,980 and $1,790,104,644, respectively) | $ 6,706,041,046 | $ 1,842,882,656 | |
| Short-term affiliated investments, at fair value (cost $94,639,589 and $257,710,916, respectively) | 94,639,589 | 257,710,916 | |
| Cash | 193,357 | — | |
| Net cash collateral on deposit with broker for future contracts | 2,807,336 | 610,994 | |
| Receivable for investments sold | 36,116,824 | 45,663 | |
| Income receivables | 5,445,141 | 8,470,889 | |
| Receivable for fund shares sold | — | 3,532 | |
| Income receivable from affiliated investments | 2,089 | 4,885 | |
| Receivable for accumulated variation margin on swap contracts | — | 3,863,199 | |
| Other assets | 17,824 | 4,971 | |
| Total assets | 6,845,263,206 | 2,113,597,705 | |
| Liabilities | |||
| Distribution payable to shareholders | — | 109,193 | |
| Due to custodian | — | 693,280 | |
| Net cash collateral on swap contracts due to broker | — | 3,840,554 | |
| Payable for investments purchased | 44,436,081 | 198,676,201 | |
| Payable for fund shares redeemed | 2,252,128 | 597,589 | |
| Payable for accumulated variation margin on futures contracts | 1,309,963 | 670,824 | |
| Payable to the Adviser | 695,751 | 205,892 | |
| Payable for custody, fund accounting and sub-administration fees | 92,378 | 36,848 | |
| Accrued other expenses | 793,300 | 356,439 | |
| Total liabilities | 49,579,601 | 205,186,820 | |
| Net Assets | $ 6,795,683,605 | $ 1,908,410,885 | |
| Net Assets Consist of: | |||
| Capital paid in | $ 3,371,866,347 | $ 1,818,835,132 | |
| Total distributable earnings (loss) | 3,423,817,258 | 89,575,753 | |
| Net Assets | $ 6,795,683,605 | $ 1,908,410,885 | |
| Shares outstanding ($25.00 and $10.00 par value, respectively; unlimited shares authorized) | 88,448,955 | 157,944,469 | |
| Net asset value per share | $ 76.83 | $ 12.08 | |
| 40 | Statements of Assets and Liabilities |
| State Street U.S. Core Equity Fund | State Street Income Fund | ||||||
| Period Ended 9/30/21(a) | Year Ended 12/31/20 | Period Ended 9/30/21(a) | Year Ended 12/31/20 | ||||
| Investment Income | |||||||
| Income | |||||||
| Dividend | $ 57,080,007 | $ 77,666,037 | $ 53,618 | $ — | |||
| Interest | — | 56,934 | 29,904,886 | 47,977,847 | |||
| Income from affiliated investments | 3,799 | — | 11,232 | — | |||
| Less: Foreign taxes withheld | (41,762) | (1,376) | — | (75) | |||
| Total income | 57,042,044 | 77,721,595 | 29,969,736 | 47,977,772 | |||
| Expenses | |||||||
| Advisory and administration fees | 6,018,611 | 6,523,574 | 1,917,142 | 2,675,312 | |||
| Transfer agent fees | 381,429 | 517,929 | 350,403 | 478,304 | |||
| Trustees' fees | 11,438 | — | 6,570 | — | |||
| Custody, fund accounting and sub-administration fees | 376,315 | 340,023 | 203,841 | 286,272 | |||
| Professional fees | 147,840 | 17,452 | 69,098 | 33,784 | |||
| Registration fees | 438,577 | — | 126,849 | — | |||
| Other expenses | 231,156 | 139,336 | 78,132 | 39,536 | |||
| Total expenses | 7,605,366 | 7,538,314 | 2,752,035 | 3,513,208 | |||
| Net investment income | $ 49,436,678 | $ 70,183,281 | $ 27,217,701 | $ 44,464,564 | |||
| Net Realized and Unrealized Gain (Loss) on Investments | |||||||
| Realized gain (loss) on: | |||||||
| Unaffiliated investments | $ 740,909,803 | $ 328,591,241 | $ 22,016,657 | $ 67,651,614 | |||
| Futures | 2,664,335 | — | 2,492,700 | (2,465,063) | |||
| Swap contracts | — | — | 8,494,183 | (18,558,979) | |||
| Foreign currency transactions | — | (34) | — | — | |||
| Increase (decrease) in unrealized appreciation/depreciation on: | |||||||
| Unaffiliated investments | 168,434,096 | 799,903,293 | (72,537,853) | 60,489,495 | |||
| Futures | (1,310,342) | — | (83,267) | (1,233,001) | |||
| Swap contracts | — | — | (7,202,563) | 9,163,864 | |||
| Net realized and unrealized gain (loss) on investments | 910,697,892 | 1,128,494,500 | (46,820,143) | 115,047,930 | |||
| Net Increase (Decrease) in Net Assets Resulting from Operations | $ 960,134,570 | $ 1,198,677,781 | $ (19,602,442) | $ 159,512,494 |
| (a) | The Board of Trustees approved a change in fiscal year end for the Fund from December 31 to September 30. |
| Statements of Operations | 41 |
| State Street U.S. Core Equity Fund | |||||
| Period Ended 9/30/21(a) | Year Ended 12/31/20 | Year Ended 12/31/19 | |||
| Increase (Decrease) in Net Assets | |||||
| Operations: | |||||
| Net investment income | $ 49,436,678 | $ 70,183,281 | $ 75,533,364 | ||
| Net realized gain (loss) on investments, futures and foreign currency related transactions | 743,574,138 | 328,591,207 | 246,992,970 | ||
| Net increase (decrease) in unrealized appreciation/depreciation on investments and futures | 167,123,754 | 799,903,293 | 1,122,037,278 | ||
| Net increase (decrease) from operations | 960,134,570 | 1,198,677,781 | 1,444,563,612 | ||
| Distributions to shareholders: | |||||
| Total distributions | — | (400,316,279) | (328,895,329) | ||
| Increase (decrease) in assets from operations and distributions | 960,134,570 | 798,361,502 | 1,115,668,283 | ||
| Share transactions: | |||||
| Proceeds from sale of shares | 15,549,302 | 55,418,614 | 20,879,021 | ||
| Value of distributions reinvested | — | 379,700,260 | 311,798,754 | ||
| Cost of shares redeemed | (409,783,514) | (545,111,984) | (607,205,188) | ||
| Net increase (decrease) from share transactions | (394,234,212) | (109,993,110) | (274,527,413) | ||
| Total increase (decrease) in net assets | 565,900,358 | 688,368,392 | 841,140,870 | ||
| Net Assets | |||||
| Beginning of period | 6,229,783,247 | 5,541,414,855 | 4,700,273,985 | ||
| End of period | $ 6,795,683,605 | $ 6,229,783,247 | $ 5,541,414,855 | ||
| Changes in Fund Shares | |||||
| Shares sold | 216,103 | 914,306 | 404,270 | ||
| Issued for distributions reinvested | — | 5,739,128 | 5,422,709 | ||
| Shares redeemed | (5,605,458) | (9,524,851) | (11,183,222) | ||
| Net decrease in fund shares | (5,389,355) | (2,871,417) | (5,356,243) | ||
| (a) | The Board of Trustees approved a change in fiscal year end for the Fund from December 31 to September 30. |
| 42 | Statements of Changes in Net Assets |
| State Street Income Fund | |||||
| Period Ended 9/30/21(a) | Year Ended 12/31/20 | Year Ended 12/31/19 | |||
| Increase (Decrease) in Net Assets | |||||
| Operations: | |||||
| Net investment income | $ 27,217,701 | $ 44,464,564 | $ 54,095,486 | ||
| Net realized gain (loss) on investments, futures, options contracts and swap contracts | 33,003,540 | 46,627,572 | 51,428,998 | ||
| Net increase (decrease) in unrealized appreciation/depreciation on investments, futures and swap contracts | (79,823,683) | 68,420,358 | 75,572,625 | ||
| Net increase (decrease) from operations | (19,602,442) | 159,512,494 | 181,097,109 | ||
| Distributions to shareholders: | |||||
| Total distributions | (36,235,960) | (64,080,587) | (56,663,793) | ||
| Increase (decrease) in assets from operations and distributions | (55,838,402) | 95,431,907 | 124,433,316 | ||
| Share transactions: | |||||
| Proceeds from sale of shares | 14,393,778 | 48,154,654 | 34,357,470 | ||
| Value of distributions reinvested | 32,110,035 | 61,957,884 | 54,586,248 | ||
| Cost of shares redeemed | (167,069,788) | (145,433,304) | (180,842,366) | ||
| Net increase (decrease) from share transactions | (120,565,975) | (35,320,766) | (91,898,648) | ||
| Total increase (decrease) in net assets | (176,404,377) | 60,111,141 | 32,534,668 | ||
| Net Assets | |||||
| Beginning of period | 2,084,815,262 | 2,024,704,121 | 1,992,169,453 | ||
| End of period | $ 1,908,410,885 | $ 2,084,815,262 | $ 2,024,704,121 | ||
| Changes in Fund Shares | |||||
| Shares sold | 1,431,692 | 3,948,098 | 2,956,246 | ||
| Issued for distributions reinvested | 2,646,451 | 5,055,918 | 4,688,763 | ||
| Shares redeemed | (14,031,749) | (12,024,475) | (15,628,926) | ||
| Net decrease in fund shares | (9,953,606) | (3,020,459) | (7,983,917) | ||
| (a) | The Board of Trustees approved a change in fiscal year end for the Fund from December 31 to September 30. |
| Statements of Changes in Net Assets | 43 |
| Fund | Predecessor Fund |
| State Street U.S. Core Equity Fund | GE RSP U.S. Equity Fund |
| State Street Income Fund | GE RSP Income Fund |
| • | Equity investments (including preferred stocks and registered investment companies that are exchange-traded funds) traded on a recognized securities exchange for which market quotations are readily available are valued |
| 44 | Notes to Financial Statements |
| at the last sale price or official closing price, as applicable, on the primary market or exchange on which they trade. Equity investments traded on a recognized exchange for which there were no sales on that day are valued at the last published sale price or at fair value. | |
| • | Government and municipal fixed income securities are generally valued using quotations from independent pricing services or brokers. Certain government inflation-indexed securities may require a calculated fair valuation as the cumulative inflation is contained within the price provided by the pricing service or broker. For these securities, the inflation component of the price is “cleaned” from the pricing service or broker price utilizing the published inflation factors in order to ensure proper accrual of income. |
| • | Debt obligations (including short term investments and convertible debt securities) are valued using quotations from independent pricing services or brokers or are generally valued at the last reported evaluated prices. |
| • | Exchange-traded futures contracts are valued at the closing settlement price on the primary market on which they are traded most extensively. Exchange-traded futures contracts traded on a recognized exchange for which there were no sales on that day are valued at the last reported sale price obtained from independent pricing services or brokers or at fair value. |
| • | Swap agreements are valued daily based upon prices supplied by Board approved pricing vendors or through brokers. Depending on the product and terms of the transaction, the value of agreements is determined using a series of techniques including valuation models that incorporate a number of market data factors, such as discounted cash flows, yields, curves, trades and values of the underlying reference instruments. In the event SSGA Funds Management, Inc. (the “Adviser” or “SSGA FM”) is unable to obtain an independent, third-party valuation the agreements will be fair valued. |
| • | Options on futures are priced at their last sale price on the principal market on which they are traded on the valuation date. If there were no sales on that day, options on futures are valued at either the last reported sale or official closing price on their primary exchange determined in accordance with the valuation policy and procedures approved by the Board. |
| • | Level 1 — Unadjusted quoted prices in active markets for an identical asset or liability; |
| • | Level 2 — Inputs other than quoted prices included within Level 1 that are observable for the asset or liability either directly or indirectly, including quoted prices for similar assets or liabilities in active markets, quoted prices for identical or similar assets or liabilities in markets that are not considered to be active, inputs other than quoted prices that are observable for the asset or liability (such as exchange rates, financing terms, interest rates, yield curves, volatilities, prepayment speeds, loss severities, credit risks and default rates) or other market-corroborated inputs; and |
| • | Level 3 — Unobservable inputs for the asset or liability, including the Committee’s assumptions used in determining the fair value of investments. |
| Notes to Financial Statements | 45 |
| 46 | Notes to Financial Statements |
| Notes to Financial Statements | 47 |
| Asset Derivatives | ||||||
| Interest Rate Contracts Risk | Foreign Exchange Contracts Risk | Credit Contracts Risk | Equity Contracts Risk | Commodity Contracts Risk | Total | |
| State Street Income Fund | ||||||
| Swap Contracts | $ — | $ — | 3,863,199 | $ — | $ — | $ 3,863,199 |
| 48 | Notes to Financial Statements |
| Liability Derivatives | ||||||
| Interest Rate Contracts Risk | Foreign Exchange Contracts Risk | Credit Contracts Risk | Equity Contracts Risk | Commodity Contracts Risk | Total | |
| State Street U.S. Core Equity Fund | ||||||
| Futures Contracts | $ — | $ — | $ — | 1,309,963 | $ — | $ 1,309,963 |
| State Street Income Fund | ||||||
| Futures Contracts | $ 670,824 | $ — | $ — | $ — | $ — | $ 670,824 |
| Realized Gain/Loss | ||||||
| Interest Rate Contracts Risk | Foreign Exchange Contracts Risk | Credit Contracts Risk | Equity Contracts Risk | Commodity Contracts Risk | Total | |
| State Street U.S. Core Equity Fund | ||||||
| Futures Contracts | $ — | $ — | $ — | 2,664,335 | $ — | $ 2,664,335 |
| State Street Income Fund | ||||||
| Futures Contracts | $ 2,492,700 | $ — | $ — | $ — | $ — | $ 2,492,700 |
| Swap Contracts | — | — | 8,494,183 | — | — | 8,494,183 |
| Net Change in Unrealized Appreciation (Depreciation) | ||||||
| Interest Rate Contracts Risk | Foreign Exchange Contracts Risk | Credit Contracts Risk | Equity Contracts Risk | Commodity Contracts Risk | Total | |
| State Street U.S. Core Equity Fund | ||||||
| Futures Contracts | $ — | $ — | $ — | (1,310,342) | $ — | $ (1,310,342) |
| State Street Income Fund | ||||||
| Futures Contracts | $ (83,267) | $ — | $ — | $ — | $ — | $ (83,267) |
| Swap Contracts | — | — | (7,202,563) | — | — | (7,202,563) |
| Fund | Average Daily Net Assets of the Fund | Management Fee |
| State Street U.S. Core Equity Fund | All Assets | 0.12% |
| State Street Income Fund | All Assets | 0.13% |
| Notes to Financial Statements | 49 |
| U.S. Government Obligations | Other Securities | ||||
| Fund | Purchases | Sales | Purchases | Sales | |
| State Street U.S. Core Equity Fund | $ — | $ — | $1,808,953,526 | $2,184,753,309 | |
| State Street Income Fund | 669,054,314 | 477,868,609 | 332,995,458 | 590,824,131 | |
| Fund | Ordinary Income | Long-Term Capital Gains | Total |
| State Street Income Fund | $36,235,960 | $— | $36,235,960 |
| 50 | Notes to Financial Statements |
| Fund | Ordinary Income | Long-Term Capital Gains | Total |
| State Street U.S. Core Equity Fund | $96,916,006 | $303,400,273 | $400,316,279 |
| State Street Income Fund | 59,629,980 | 4,450,607 | 64,080,587 |
| Fund | Ordinary Income | Long-Term Capital Gains | Total |
| State Street U.S. Core Equity Fund | $74,112,841 | $254,782,488 | $328,895,329 |
| State Street Income Fund | 56,663,793 | — | 56,663,793 |
| Fund | Undistributed Ordinary Income | Tax Exempt Income | Capital Loss Carryforwards | Undistributed long term gain | Net Unrealized Gains (Losses) | Qualified Late-Year Losses | Total |
| State Street U.S. Core Equity Fund | $117,273,292 | $— | $— | $670,967,990 | $2,635,575,976 | $— | $3,423,817,258 |
| State Street Income Fund | 32,790,199 | — | — | 17,648,379 | 39,137,175 | — | 89,575,753 |
| Fund | Tax Cost | Gross Unrealized Appreciation | Gross Unrealized Depreciation | Net Unrealized Appreciation (Depreciation) |
| State Street U.S. Core Equity Fund | $4,163,794,317 | $2,686,684,905 | $51,108,929 | $2,635,575,976 |
| State Street Income Fund | 2,061,324,448 | 50,673,003 | 11,535,828 | 39,137,175 |
| Notes to Financial Statements | 51 |
| Fund | Predecessor Name | Aggregate Net Asset Value | Shares |
| State Street U.S. Core Equity Fund | GE RSP U.S. Equity Fund | $6,729,291,756 | 90,684,798 |
| State Street Income Fund | GE RSP Income Fund | $1,938,602,965 | 161,204,455 |
| 52 | Notes to Financial Statements |
| Notes to Financial Statements | 53 |


| 54 | Report of Independent Registered Public Accounting Firm |
| Other Information | 55 |
| • | A comparison of each New Fund’s estimated expense ratio (with detail of component expenses) to the expense ratios of a group of comparable mutual funds selected by the independentthird-party data provider (the “Expense Group” and/or “Expense Universe”); |
| • | A comparison of each New Fund’s contractual and estimated actual management fees to the contractual and actual management fees of the Expense Group and Expense Universe; |
| • | Comparative information concerning the fees charged by the Adviser for managing comparable funds and/or other accounts, as applicable, using investment strategies and techniques similar to those to be used in managing each New Fund; and |
| 56 | Other Information |
| • | Profitability analyses for (a) the Adviser with respect to Other Funds and (b) affiliates of the Adviser that provide services to the Other Funds. |
| • | Descriptions of the investment management services to be provided by the Adviser to the New Funds as well as services provided to the Other Funds, including its investment strategies and processes; |
| • | Information concerning the allocation of brokerage; and |
| • | Information regarding the procedures and processes to be used to value the assets of the New Funds. |
| • | Reports detailing the financial results and condition of the Adviser and its affiliates; |
| • | Descriptions of the qualifications, education and experience of the individual investment professionals who will be responsible for managing the New Funds; |
| • | Information relating to compliance with and the administration of the Code of Ethics adopted by the Adviser; |
| • | Information about the Adviser’s proxy voting policies and procedures and information regarding the Adviser’s practices for overseeing proxy vendors; |
| • | Information concerning the resources to be devoted by the Adviser to overseeing compliance by the New Funds and their service providers, including the Adviser’s record of compliance with investment policies and restrictions and other operating policies of the Other Funds; |
| • | A description of the adequacy and sophistication of the Adviser’s technology and systems with respect to investment and administrative matters and a description of any material improvements or changes in technology or systems in the past year; |
| • | A description of the business continuity and disaster recovery plans of the Adviser; and |
| • | Information regarding the Adviser’s cybersecurity and risk management processes. |
| • | Information concerning the nature, extent, quality and cost of various services to be provided to the New Funds by SSGA FM in its capacity as administrator; |
| • | Information concerning the nature, extent, quality and cost of various non-investment management services to be provided to the New Funds by affiliates of SSGA FM, including the custodian, sub-administrator and fund accountant of the New Funds, and the role of SSGA FM in managing the New Funds’ relationships with these service providers; |
| • | Copies of the Advisory Agreement and agreements with other service providers of the New Funds; |
| • | Responses to a letter from Independent Counsel requesting specific information regarding the Other Funds, certain of which was applicable to the New Funds, from each of: |
| ○ | SSGA FM, in its capacity as the Other Funds’ Adviser and Administrator, with respect to its operations relating to the Other Funds and its approximate profit margins before taxes from such operations for the calendar year ended December 31, 2019; and the relevant operations of other affiliated service providers to the Other Funds, together with their approximate profit margins from such relevant operations for the calendar year ended December 31, 2019; |
| ○ | State Street Bank and Trust Company (“State Street”), the sub-administrator, custodian, and fund accountant for the Other Funds with respect to its operations relating to the Other Funds; and |
| ○ | State Street Global Advisors Funds Distributors, LLC, the principal underwriter and distributor of the shares of the Other Funds (the “Distributor”), with respect to its operations relating to the Other Funds. |
| Other Information | 57 |
| 58 | Other Information |
| Other Information | 59 |
| Name, Address, and Year of Birth | Position(s) Held with Trust | Term of Office and Length of Time Served | Principal Occupation During Past Five Years and Relevant Experience | Number of Funds in Fund Complex Overseen by Trustee† | Other Directorships Held by Trustee During Past Five Years |
| INDEPENDENT TRUSTEES | |||||
| Michael F. Holland c/o SSGA Funds Management, Inc. One Iron Street Boston, MA 02210 YOB: 1944 | Trustee and Co-Chairperson of the Board | Term: Indefinate Elected: 7/99 | Chairman, Holland & Company L.L.C. (investment adviser) (1995 – present). | 62 | Director, the Holland Series Fund, Inc.; Director, The China Fund, Inc. (1992 – 2017); Director, The Taiwan Fund, Inc. (2007 – 2017); Director, Reaves Utility Income Fund, Inc.; and Director, Blackstone/ GSO Loans (and Real Estate) Funds. |
| Patrick J. Riley c/o SSGA Funds Management, Inc. One Iron Street Boston, MA 02210 YOB: 1948 | Trustee and Co-Chairperson of the Board | Term: Indefinate Elected: 1/14 | 2002 to May 2010, Associate Justice of the Superior Court, Commonwealth of Massachusetts; 1985 to 2002, Partner, Riley, Burke & Donahue, L.L.P. (law firm); 1998 to present, Independent Director, State Street Global Advisers Ireland, Ltd. (investment company); 1998 to present, Independent Director, SSGA Liquidity plc (formerly, SSGA Cash Management Fund plc); January 2009 to present, Independent Director, SSGA Fixed Income plc; and January 2009 – 2019, Independent Director, SSGA Qualified Funds PLC. | 62 | Board Director and Chairman, SPDR Europe 1PLC Board (2011 – present); Board Director and Chairman, SPDR Europe II, PLC (2013 – present). |
| John R. Costantino c/o SSGA Funds Management, Inc. One Iron Street Boston, MA 02210 YOB: 1946 | Trustee and Chairperson of the Qualified Legal Compliance Committee | Term: Indefinate Elected: 12/18 | Senior Advisor to NGN Capital LLC (January 2019 – present); Managing General Partner, NGN Capital LLC (2006 – December 2019). | 62 | Director of Kleinfeld Bridal Corp. (January 2016 – present); Trustee of Neuroscience Research Institute (1986 – 2017); Trustee of Fordham University (1989 – 1995 and 2001 – 2007) and Trustee Emeritus (2007 – present); Trustee and Independent Chairperson of GE Funds (1993 – February 2011); Director, Muscular Dystrophy Association (since 2019); and Trustee of Gregorian University Foundation (1992 – 2007). |
| 60 | Other Information |
| Name, Address, and Year of Birth | Position(s) Held with Trust | Term of Office and Length of Time Served | Principal Occupation During Past Five Years and Relevant Experience | Number of Funds in Fund Complex Overseen by Trustee† | Other Directorships Held by Trustee During Past Five Years |
| INDEPENDENT TRUSTEES (continued) | |||||
| Donna M. Rapaccioli c/o SSGA Funds Management, Inc. One Iron Street Boston, MA 02210 YOB: 1962 | Trustee and Chairperson of the Audit Committee | Term: Indefinate Elected: 12/18 | Dean of the Gabelli School of Business (2007 – present) and Accounting Professor (1987 – present) at Fordham University. | 62 | Director- Graduate Management Admissions Council (2015 – present); Trustee of Emmanuel College (2010 – 2019). |
| Richard D. Shirk c/o SSGA Funds Management, Inc. One Iron Street Boston, MA 02210 YOB: 1945 | Trustee and Chairperson of the Nominating Committee Chairperson of the Governance Committee | Term: Indefinate Elected: 1/14 | March 2001 to April 2002, Chairman (1996 to March 2001, President and Chief Executive Officer), Cerulean Companies, Inc. (holding company) (Retired); 1992 to March 2001, President and Chief Executive Officer, Blue Cross Blue Shield of Georgia (health insurer, managed healthcare). | 62 | 1998 to December 2008, Chairman, Board Member and December 2008 to present, Investment Committee Member, Healthcare Georgia Foundation (private foundation); September 2002 to 2012, Lead Director and Board Member, Amerigroup Corp. (managed health care); 1999 to 2013, Board Member and (2001-2017) Investment Committee Member, Woodruff Arts Center; and 2003 to 2009, Trustee, Gettysburg College; Board member, Aerocare Holdings, Regenesis Biomedical Inc. |
| Bruce D. Taber c/o SSGA Funds Management, Inc. One Iron Street Boston, MA 02210 YOB: 1943 | Trustee and Co-Chairperson of the Valuation Committee, Chairperson of the Nominating Committee and Chairperson of the Governance Committee | Term: Indefinate Elected: 1/14 | Retired; 1999 to 2016, Partner, Zenergy LLC (a technology company providing Computer Modeling and System Analysis to the General Electric Power Generation Division); Until December 2008, Independent Director, SSGA Cash Management Fund plc; Until December 2008, Independent Director, State Street Global Advisers Ireland, Ltd. (investment companies). | 44 | None. |
| Michael A. Jessee c/o SSGA Funds Management, Inc. One Iron Street Boston, MA 02210 YOB: 1946 | Trustee and Chairperson of the Valuation Committee | Term: Indefinate Appointed: 7/16 Elected: 12/18 | Retired; formerly, President and Chief Executive Officer of the Federal Home Loan Bank of Boston (1989 – 2009); Trustee, Randolph-Macon College (2004 – 2016). | 62 | None. |
| Other Information | 61 |
| Name, Address, and Year of Birth | Position(s) Held with Trust | Term of Office and Length of Time Served | Principal Occupation During Past Five Years and Relevant Experience | Number of Funds in Fund Complex Overseen by Trustee† | Other Directorships Held by Trustee During Past Five Years |
| INTERESTED TRUSTEES(1) | |||||
| Ellen M. Needham(2) SSGA Funds Management, Inc. One Iron Street Boston, MA 02210 YOB: 1967 | Trustee and President | Term: Indefinate Elected: 12/18 | Chairman, SSGA Funds Management, Inc. (March 2020 – present); President and Director, SSGA Funds Management, Inc. (2001 – present)*; Senior Managing Director, State Street Global Advisors (1992 – present)*; Manager, State Street Global Advisors Funds Distributors, LLC (May 2017 – present). | 62 | Board Director, SSGA SPDR ETFs Europe 1 plc (May 2020 – present); Board Director, SSGA SPDR ETFs Europe II plc (May 2020 – present). |
| (1) | The individual listed above is a Trustee who is an “interested person,” as defined in the 1940 Act, of the Trust (“Interested Trustee”). |
| (2) | Ms. Needham is an Interested Trustee because of her employment by SSGA FM, an affiliate of the Trust. |
| * | Served in various capacities and/or with various affiliated entities during noted time period. |
| † | For the purpose of determining the number of portfolios overseen by the Trustees, “Fund Complex” comprises registered investment companies for which SSGA FM serves as investment adviser. |
| Name, Address, and Year of Birth | Position(s) Held with Trust | Term of Office and Length of Time Served | Principal Occupation During Past Five Years |
| OFFICERS: | |||
| Ellen M. Needham SSGA Funds Management, Inc. One Iron Street Boston, MA 02210 YOB: 1967 | President and Trustee | Term: Indefinite Elected: 10/12 | Chairman, SSGA Funds Management, Inc. (March 2020 – present); President and Director, SSGA Funds Management, Inc. (2001 – present)*; Senior Managing Director, State Street Global Advisors (1992 – present)*; Manager, State Street Global Advisors Funds Distributors, LLC (May 2017 – present). |
| Bruce S. Rosenberg SSGA Funds Management, Inc. One Iron Street Boston, MA 02210 YOB: 1961 | Treasurer | Term: Indefinite Elected: 2/16 | Managing Director, State Street Global Advisors and SSGA Funds Management, Inc. (July 2015 – present); Director, Credit Suisse (April 2008 – July 2015). |
| Ann M. Carpenter SSGA Funds Management, Inc. One Iron Street Boston, MA 02210 YOB: 1966 | Vice President and Deputy Treasurer | Term: Indefinite Elected: 10/12 Term: Indefinate Elected: 2/16 | Chief Operating Officer, SSGA Funds Management, Inc. (April 2005 – present)*; Managing Director, State Street Global Advisors (2005 – present).* |
| Chad C. Hallett SSGA Funds Management, Inc. One Iron Street Boston, MA 02210 YOB: 1969 | Deputy Treasurer | Term: Indefinite Elected: 2/16 | Vice President, State Street Global Advisors and SSGA Funds Management, Inc. (November 2014 – present); Vice President, State Street Bank and Trust Company (2001 – November 2014).* |
| 62 | Other Information |
| Name, Address, and Year of Birth | Position(s) Held with Trust | Term of Office and Length of Time Served | Principal Occupation During Past Five Years |
| OFFICERS: (continued) | |||
| Darlene Anderson-Vasquez SSGA Funds Management, Inc. One Iron Street Boston, MA 02210 YOB: 1968 | Deputy Treasurer | Term: Indefinite Elected: 11/16 | Managing Director, State Street Global Advisors and SSGA Funds Management, Inc. (May 2016 – present); Senior Vice President, John Hancock Investments (September 2007 – May 2016). |
| Arthur A. Jensen SSGA Funds Management, Inc. 1600 Summer Street Stamford, CT 06905 YOB: 1966 | Deputy Treasurer | Term: Indefinite Elected: 11/16 | Vice President, State Street Global Advisors and SSGA Funds Management, Inc. (July 2016 – present); Mutual Funds Controller of GE Asset Management Incorporated (April 2011 – July 2016). |
| David K. Lancaster SSGA Funds Management, Inc. One Iron Street Boston, MA 02210 YOB: 1971 | Assistant Treasurer | Term: Indefinite Elected: 11/20 | Vice President, State Street Global Advisors and SSGA Funds Management, Inc. (July 2017 – present); Assistant Vice President, State Street Bank and Trust Company (November 2011 – July 2017). |
| Brian Harris SSGA Funds Management, Inc. One Iron Street Boston, MA 02210 YOB: 1973 | Chief Compliance Officer, Anti-Money Laundering Officer and Code of Ethics Compliance Officer | Term: Indefinite Elected: 11/13 Term: Indefinite Elected: 9/16 | Managing Director, State Street Global Advisors and SSGA Funds Management, Inc. (June 2013 – Present).* |
| Sean O’Malley SSGA Funds Management, Inc. One Iron Street Boston, MA 02210 YOB: 1969 | Chief Legal Officer | Term: Indefinite Elected: 8/19 | Senior Vice President and Deputy General Counsel, State Street Global Advisors (November 2013 – present). |
| David Barr SSGA Funds Management, Inc. One Iron Street Boston, MA 02210 YOB: 1974 | Secretary | Term: Indefinite Elected: 9/20 | Vice President and Senior Counsel, State Street Global Advisors (October 2019 – present); Vice President at Eaton Vance Corp. (October 2010 – October 2019). |
| Timothy Collins SSGA Funds Management, Inc. One Iron Street Boston, MA 02210 YOB: 1967 | Assistant Secretary | Term: Indefinite Elected: 9/21 | Vice President and Senior Counsel, State Street Global Advisors (August 2021 - present); Vice President and Managing Counsel, State Street Corporation (March 2020 - August 2021); Vice President and Senior Counsel (April 2018 - March 2020); Counsel, Sutton Place Investments (January 2010-March 2018). |
| Other Information | 63 |
| Name, Address, and Year of Birth | Position(s) Held with Trust | Term of Office and Length of Time Served | Principal Occupation During Past Five Years |
| OFFICERS: (continued) | |||
| David Urman SSGA Funds Management, Inc. One Iron Street Boston, MA 02210 YOB: 1985 | Assistant Secretary | Term: Indefinite Elected: 8/19 | Vice President and Senior Counsel, State Street Global Advisors (April 2019 – present); Vice President and Counsel, State Street Global Advisors (August 2015 – April 2019); Associate, Ropes & Gray LLP (November 2012 – August 2015). |
| * | Served in various capacities and/or with various affiliated entities during noted time period. |
| 64 | Other Information |
or visit OneHR.ge.com > Retirement (or RSP) > My GE RSP
or visit www.ssga.com
| 66 | Shareholder Services |
(b) Not Applicable.
Item 2. Code of Ethics.
As of the end of the period covered by this report, State Street Institutional Investment Trust (the “Trust” or “Registrant”) has adopted a code of ethics, as defined in Item 2(b) of Form N-CSR, that applies to the Registrant’s principal executive officer, principal financial officer, principal accounting officer or controller, or persons performing similar functions, regardless of whether these individuals are employed by the Registrant or a third party (the “Code”). That Code comprises written standards that are reasonably designed to deter wrongdoing and to promote: (1) honest and ethical conduct, including the ethical handling of actual or apparent conflicts of interest between personal and professional relationships; (2) full, fair, accurate, timely and understandable disclosure in reports and documents that the Registrant files with, or submits to, the U.S. Securities Exchange Commission (the “SEC”) and in other public communications made by the Registrant; (3) compliance with applicable laws and governmental rules and regulations; (4) the prompt internal reporting to an appropriate person or persons identified in the Code of violations of the Code; and (5) accountability for adherence to the Code. For the period covered by the report, the Code was combined with other mutual funds advised by SSGA Funds Management, Inc. (“SSGA FM” or the “Adviser”). The Registrant has not made any amendments to the Code that relates to any element of the code of ethics definition set forth in Item 2(b) of Form N-CSR during the covered period. The Registrant has not granted any waivers from any provisions of the Code during the covered period. A copy of the Code is filed as Exhibit 13(a)(1) to this Form N-CSR.
Item 3. Audit Committee Financial Expert.
The Trust’s Board of Trustees (the “Board”) has determined that the Trust has the following “audit committee financial experts” as defined in Item 3(b) of Form N-CSR serving on its audit committee (the “Audit Committee”): Messrs. Michael F. Holland, Richard D. Shirk and John R. Costantino and Ms. Donna M. Rapaccioli. Each of the “audit committee financial experts” is “independent” as that term is defined in Item 3(a)(2) of Form N-CSR.
An “audit committee financial expert” is not an “expert” for any purpose, including for purposes of Section 11 of the Securities Act of 1933, as amended, as a result of being designated as an “audit committee financial expert.” Further, the designation of a person as an “audit committee financial expert” does not mean that the person has any greater duties, obligations, or liability than those imposed on the person without the “audit committee financial expert” designation. Similarly, the designation of a person as an “audit committee financial expert” does not affect the duties, obligations, or liability of any other member of the Audit Committee or the Board.
Item 4. Principal Accountant Fees and Services.
| (a) | Audit Fees |
For the fiscal period ended September 30, 2021, the aggregate audit fees billed for professional services rendered by BBD LLP (“BBD”), the Trust’s principal accountant, for the audit of the Trust’s annual financial statements or services normally provided by BBD in connection with the Trust’s statutory and regulatory filings and engagements were $45,500.
| (b) | Audit-Related Fees |
For the fiscal period ended September 30, 2021, there were no fees for assurance and related services by BBD reasonably related to the performance of the audit of the Trust’s financial statements that were not reported under paragraph (a) of this Item.
| (c) | Tax Fees |
For the fiscal period ended September 30, 2021, the aggregate tax fees billed for professional services rendered by BBD for tax compliance, tax advice, and tax planning in the form of preparation of excise filings and income tax returns were $0.
| (d) | All Other Fees |
For the fiscal period ended September 30, 2021, there were no fees billed for professional services rendered by BBD for products and services provided by BBD to the Trust, other than the services reported in paragraphs (a) through (c).
For the fiscal period ended September 30, 2021, the aggregate fees for professional services rendered by BBD for products and services provided by BBD to the Adviser and any entity controlling, controlled by, or under common control with the Adviser that provides ongoing services to the Trust that (i) relate directly to the operations and financial reporting of the Trust and (ii) were pre-approved by the Audit Committee were approximately $0.
| (e)(1) | Audit Committee Pre-Approval Policies and Procedures |
The Trust’s Audit Committee Charter states the following with respect to pre-approval procedures:
The Audit Committee shall have the following duties and powers:
| • | To pre-approve engagements by a Trust’s independent auditor for non-audit services to be rendered to the Fund’s investment adviser (not including any sub-adviser whose role is primarily portfolio management and is subcontracted with or overseen by another investment adviser), and any entity controlling, controlled by, or under common control with the investment adviser that provides ongoing services to the Fund, if the engagement relates directly to the operations and financial reporting of the Fund; |
| • | To establish, if deemed necessary or appropriate as an alternative to Audit Committee pre-approval of services to be provided by the independent auditor as required by paragraph (b) above, policies and procedures to permit such services to be pre-approved by other means, such as by action of a designated member or members of the Audit Committee, subject to the requirement that the decision of any member to whom authority is delegated to pre-approve an activity shall be presented to the full Audit Committee at its next scheduled meeting; |
Alternate Pre-Approval Procedure:
| • | The Chairperson, or a Co-Chairperson, of the Audit Committee is authorized to pre-approve any engagement involving the Trust’s independent auditors to the same extent as the Audit Committee. Any pre-approval decision by the Chairperson, or a Co-Chairperson, under the foregoing authority shall be presented to the Audit Committee at its next scheduled meeting. |
| (e)(2) | Percentages of Services |
None of the services described in paragraphs (b) through (d) of this Item were performed in reliance on paragraph (c)(7)(i)(C) of Rule 2-01 of Regulation S-X during the period of time for which such rule was effective.
| (f) | Not applicable. |
| (g) | Total Fees Paid by Adviser and Certain Affiliates |
For the fiscal period ended September 30, 2021, the aggregate non-audit fees billed by BBD for services rendered to the Trust and the Adviser and any entity controlling, controlled by, or under common control with the Adviser that provided ongoing services to the Trust were approximately $0.
| (h) | BBD notified the Trust’s Audit Committee of all non-audit services that were rendered by BBD to the Adviser and any entity controlling, controlled by, or under common control with the Adviser that provides services to the Trust, which services were not required to be pre-approved pursuant to paragraph (c)(7)(ii) of Rule 2-01 of Regulation S-X, allowing the Trust’s Audit Committee to consider whether such services were compatible with maintaining BBD’s independence. |
| (i) | Not applicable. |
| (j) | Not applicable. |
Item 5. Audit Committee of Listed Registrants.
Not applicable to the Registrant.
Item 6. Investments.
(a) Schedules of Investments are included as part of the reports to shareholders filed under Item 1 of this Form N-CSR.
(b) Not applicable to the Registrant.
Item 7. Disclosure of Proxy Voting Policies and Procedures for Closed-End Management Investment Companies.
Not applicable to the Registrant.
Item 8. Portfolio Managers of Closed-End Management Investment Companies.
Not applicable to the Registrant.
Item 9. Purchases of Equity Securities by Closed-End Management Investment Company and Affiliated Purchasers.
Not applicable to the Registrant.
Item 10. Submission of Matters to a Vote of Security Holders.
There were no material changes to the procedures by which shareholders may recommend nominees to the Registrant’s Board of Trustees.
Item 11. Controls and Procedures.
(a) The Trust’s principal executive officer and principal financial officer have concluded that the Trust’s disclosure controls and procedures (as defined in Rule 30a-3(c) under the Investment Company Act of 1940, as amended (the “1940 Act”)) are effective to provide reasonable assurance that information required to be disclosed by the Registrant on Form N-CSR is recorded, processed, summarized and reported as of a date within 90 days of the filing date of this report, based on their evaluation of these controls and procedures required by Rule 30a-3(b) under the 1940 Act and Rules 13a-15(b) or 15d-15(b) under the Securities Exchange Act of 1934, as amended.
(b) There were no changes in the Trust’s internal control over financial reporting (as defined in Rule 30a-3(d) under the 1940 Act) that occurred during the period covered by this report that have materially affected, or are reasonably likely to materially affect, the Trust’s internal control over financial reporting.
Item 12. Disclosure of Securities Lending Activities for Closed-End Management Investment Companies.
(a) Not applicable to the Registrant.
(b) Not applicable to the Registrant.
Item 13. Exhibits.
SIGNATURES
Pursuant to the requirements of the Securities Exchange Act of 1934, as amended, and the Investment Company Act of 1940, as amended, the Registrant has duly caused this report to be signed on its behalf by the undersigned, thereunto duly authorized.
Registrant: STATE STREET INSTITUTIONAL INVESTMENT TRUST
| By: | /s/ Ellen M. Needham | |
| Ellen M. Needham | ||
| President |
Date: December 3, 2021
Pursuant to the requirements of the Securities Exchange Act of 1934, as amended, and the Investment Company Act of 1940, as amended, this report has been signed below by the following persons on behalf of the Registrant and in the capacities and on the dates indicated.
| By: | /s/ Ellen M. Needham | |
| Ellen M. Needham | ||
| President (Principal Executive Officer) |
Date: December 3, 2021
| By: | /s/ Bruce S. Rosenberg | |
| Bruce S. Rosenberg | ||
| Treasurer (Principal Financial and Accounting Officer) |
Date: December 3, 2021