UNITED STATES
SECURITIES AND EXCHANGE COMMISSION
Washington, D.C. 20549
FORM N-CSR
CERTIFIED SHAREHOLDER REPORT OF REGISTERED
MANAGEMENT INVESTMENT COMPANIES
Investment Company Act file number: 811-09819
STATE STREET INSTITUTIONAL INVESTMENT TRUST
(Exact name of registrant as specified in charter)
One Iron Street, Boston, Massachusetts 02210
(Address of principal executive offices)(Zip code)
| (Name and Address of Agent for Service) | Copy to: | |
Sean O’Malley, Esq. Senior Vice President and General Counsel c/o SSGA Funds Management, Inc. One Iron Street Boston, Massachusetts 02210 | Timothy W. Diggins, Esq. Ropes & Gray LLP Prudential Tower, 800 Boylston Street Boston, Massachusetts 02199-3600 | |
Registrant’s telephone number, including area code: (617) 664-1465
Date of fiscal year end: September 30
Date of reporting period: September 30, 2022
Item 1. Reports to Stockholders.
| (a) | The Report to Shareholders is attached herewith. |
| State Street Institutional Investment Trust |
| State Street U.S. Core Equity Fund |
| State Street Income Fund |

| Page | |
| 1 | |
| Management’s Discussion of Fund Performance, Performance Summary, Understanding Your Fund’s Expenses and Schedules of Investments | |
| 2 | |
| 10 | |
| Financial Statements | |
| 38 | |
| 40 | |
| 41 | |
| 42 | |
| 44 | |
| 54 | |
| 55 |
| Notes to Performance | 1 |
| 2 | State Street U.S. Core Equity Fund |
| Sector Allocation |
| Portfolio composition as a % of Fair Value of $5,200,030 (in thousands) as of September 30, 2022 (a) |

| Top Ten Largest Holdings | |
| as of September 30, 2022 (as a % of Fair Value) (a) | |
| Microsoft Corp. | 6.40% |
| Apple Inc. | 5.92% |
| Amazon.com Inc. | 4.49% |
| Alphabet Inc., Class A | 3.90% |
| Johnson & Johnson | 2.64% |
| ConocoPhillips | 2.47% |
| UnitedHealth Group Inc. | 2.43% |
| Merck & Company Inc. | 1.91% |
| Mastercard Inc., Class A | 1.86% |
| NextEra Energy Inc. | 1.77% |
| (a) | The securities information regarding holdings, allocations and other characteristics is presented to illustrate examples of securities that the Fund has bought and the diversity of areas in which the Fund may invest as of a particular date. It may not be representative of the Fund’s current or future investments and should not be construed as a recommendation to purchase or sell a particular security. |
| State Street U.S. Core Equity Fund | 3 |
| Average Annual Total Return for the periods ended September 30, 2022 | |||||||
| Inception date 1/1/80 | |||||||
| One Year | Five Year | Ten Year | Ending Value of a $10,000 Investment | ||||
| State Street U.S. Core Equity Fund | (16.76)% | 9.84% | 11.76% | $30,409 | |||
| S&P 500® Index | (15.47)% | 9.24% | 11.70% | $30,244 | |||

| 4 | State Street U.S. Core Equity Fund |
| Actual Fund Return | Hypothetical 5% Return (2.5% for the period) | ||
| Beginning Account Value April 1, 2022 | $1,000.00 | $1,000.00 | |
| Ending Account value September 30, 2022 | $ 804.40 | $1,024.30 | |
| Expenses Paid During Period* | $ 0.72 | $ 0.81 |
| * | Expenses are equal to the Fund's annualized expense ratio of 0.16% (for the period April 1, 2022 - September 30, 2022), multiplied by the average account value over the period, multiplied by 183/365 (to reflect the one-half year period). |
| State Street U.S. Core Equity Fund | 5 |
| Number of Shares | Fair Value | |
| Common Stock - 99.6% † | ||
| Aerospace & Defense - 0.7% | ||
| Raytheon Technologies Corp. | 426,064 | $ 34,877,599 |
| Apparel Retail - 1.1% | ||
| Ross Stores Inc. | 673,194 | 56,730,058 |
| Application Software - 2.5% | ||
| Adobe Inc. (a) | 77,384 | 21,296,077 |
| Intuit Inc. | 29,973 | 11,609,142 |
| Salesforce Inc. (a) | 625,298 | 89,942,864 |
| Splunk Inc. (a) | 64,425 | 4,844,760 |
| 127,692,843 | ||
| Auto Parts & Equipment - 0.6% | ||
| Magna International Inc. | 615,605 | 29,191,989 |
| Automobile Manufacturers - 1.2% | ||
| Ford Motor Co. | 2,486,039 | 27,843,637 |
| Tesla Inc. (a) | 121,431 | 32,209,573 |
| 60,053,210 | ||
| Automotive Retail - 0.9% | ||
| O'Reilly Automotive Inc. (a) | 69,630 | 48,974,260 |
| Biotechnology - 1.9% | ||
| BioMarin Pharmaceutical Inc. (a) | 287,378 | 24,361,033 |
| Seagen Inc. (a) | 18,871 | 2,582,119 |
| Vertex Pharmaceuticals Inc. (a) | 240,142 | 69,530,715 |
| 96,473,867 | ||
| Building Products - 0.9% | ||
| Allegion PLC | 139,560 | 12,515,741 |
| Trane Technologies PLC | 228,618 | 33,106,172 |
| 45,621,913 | ||
| Cable & Satellite - 0.6% | ||
| Charter Communications Inc., Class A (a) | 33,994 | 10,312,080 |
| Comcast Corp., Class A | 673,034 | 19,740,087 |
| 30,052,167 | ||
| Communications Equipment - 0.1% | ||
| Cisco Systems Inc. | 183,520 | 7,340,800 |
| Construction Materials - 0.4% | ||
| Martin Marietta Materials Inc. | 59,039 | 19,015,872 |
| Number of Shares | Fair Value | |
| Data Processing & Outsourced Services - 5.0% | ||
| Fidelity National Information Services Inc. | 717,829 | $ 54,246,337 |
| Mastercard Inc., Class A | 339,908 | 96,649,441 |
| PayPal Holdings Inc. (a) | 288,685 | 24,847,118 |
| Visa Inc., Class A | 476,401 | 84,632,638 |
| 260,375,534 | ||
| Diversified Banks - 0.8% | ||
| JPMorgan Chase & Co. | 413,349 | 43,194,971 |
| Diversified Support Services - 0.5% | ||
| Cintas Corp. | 63,202 | 24,534,384 |
| Electric Utilities - 2.2% | ||
| American Electric Power Company Inc. | 229,633 | 19,851,773 |
| NextEra Energy Inc. | 1,169,634 | 91,711,002 |
| 111,562,775 | ||
| Electrical Components & Equipment - 0.1% | ||
| Generac Holdings Inc. (a) | 41,289 | 7,355,222 |
| Electronic Components - 1.4% | ||
| Amphenol Corp., Class A | 810,432 | 54,266,527 |
| Corning Inc. | 603,319 | 17,508,317 |
| 71,774,844 | ||
| Environmental & Facilities Services - 0.6% | ||
| Waste Management Inc. | 202,280 | 32,407,279 |
| Financial Exchanges & Data - 2.8% | ||
| CME Group Inc. | 195,074 | 34,553,458 |
| MSCI Inc. | 58,737 | 24,774,679 |
| S&P Global Inc. | 278,340 | 84,991,119 |
| 144,319,256 | ||
| Footwear - 0.1% | ||
| NIKE Inc., Class B | 49,632 | 4,125,412 |
| Healthcare Equipment - 3.9% | ||
| Becton Dickinson & Co. | 83,613 | 18,631,485 |
| Boston Scientific Corp. (a) | 1,857,135 | 71,926,839 |
| IDEXX Laboratories Inc. (a) | 78,684 | 25,635,247 |
| Medtronic PLC | 491,514 | 39,689,756 |
| Stryker Corp. | 123,693 | 25,052,780 |
| Teleflex Inc. | 110,890 | 22,339,899 |
| 203,276,006 | ||
| 6 | State Street U.S. Core Equity Fund |
| Number of Shares | Fair Value | |
| Healthcare Services - 0.3% | ||
| Cigna Corp. | 63,064 | $ 17,498,368 |
| Home Improvement Retail - 1.5% | ||
| Lowe's Companies Inc. | 318,938 | 59,899,746 |
| The Home Depot Inc. | 62,700 | 17,301,438 |
| 77,201,184 | ||
| Hotels, Resorts & Cruise Lines - 0.4% | ||
| Marriott International Inc., Class A | 150,523 | 21,094,293 |
| Household Products - 1.3% | ||
| Colgate-Palmolive Co. | 285,595 | 20,063,049 |
| The Procter & Gamble Co. | 392,749 | 49,584,561 |
| 69,647,610 | ||
| Hypermarkets & Super Centers - 1.2% | ||
| Costco Wholesale Corp. | 39,101 | 18,466,229 |
| Walmart Inc. | 356,150 | 46,192,655 |
| 64,658,884 | ||
| Industrial Conglomerates - 1.5% | ||
| Honeywell International Inc. | 457,268 | 76,350,038 |
| Industrial Gases - 1.1% | ||
| Air Products & Chemicals Inc. (b) | 255,067 | 59,361,743 |
| Industrial Machinery - 1.3% | ||
| Parker-Hannifin Corp. | 275,960 | 66,867,868 |
| Insurance Brokers - 0.3% | ||
| Marsh & McLennan Companies Inc. | 109,989 | 16,420,258 |
| Integrated Oil & Gas - 0.9% | ||
| Chevron Corp. | 323,408 | 46,464,027 |
| Interactive Home Entertainment - 0.3% | ||
| Activision Blizzard Inc. (b) | 228,155 | 16,961,043 |
| Interactive Media & Services - 5.8% | ||
| Alphabet Inc., Class C (a) | 317,260 | 30,504,549 |
| Alphabet Inc., Class A (a) | 2,119,743 | 202,753,418 |
| Meta Platforms Inc., Class A (a) | 516,332 | 70,055,926 |
| 303,313,893 | ||
| Number of Shares | Fair Value | |
| Internet & Direct Marketing Retail - 4.5% | ||
| Amazon.com Inc. (a)(b) | 2,065,583 | $ 233,410,879 |
| Investment Banking & Brokerage - 1.7% | ||
| The Charles Schwab Corp. | 1,239,536 | 89,085,452 |
| IT Consulting & Other Services - 0.4% | ||
| Accenture PLC, Class A | 75,800 | 19,503,340 |
| Life & Health Insurance - 0.1% | ||
| Lincoln National Corp. | 143,295 | 6,292,083 |
| Life Sciences Tools & Services - 1.2% | ||
| IQVIA Holdings Inc. (a) | 352,998 | 63,942,058 |
| Managed Healthcare - 2.9% | ||
| Humana Inc. | 53,653 | 26,031,899 |
| UnitedHealth Group Inc. | 250,308 | 126,415,552 |
| 152,447,451 | ||
| Movies & Entertainment - 0.5% | ||
| The Walt Disney Co. (a) | 269,815 | 25,451,649 |
| Multi-Line Insurance - 0.3% | ||
| American International Group Inc. | 334,927 | 15,902,334 |
| Multi-Sector Holdings - 1.3% | ||
| Berkshire Hathaway Inc., Class B (a) | 260,281 | 69,500,233 |
| Multi-Utilities - 1.0% | ||
| Sempra Energy | 337,840 | 50,655,730 |
| Oil & Gas Equipment & Services - 0.8% | ||
| Schlumberger N.V. | 1,164,642 | 41,810,648 |
| Oil & Gas Exploration & Production - 3.2% | ||
| ConocoPhillips | 1,257,359 | 128,678,120 |
| Pioneer Natural Resources Co. | 167,983 | 36,373,359 |
| 165,051,479 | ||
| Packaged Foods & Meats - 0.7% | ||
| Mondelez International Inc., Class A | 644,946 | 35,362,389 |
| Personal Products - 0.4% | ||
| The Estee Lauder Companies Inc., Class A | 91,283 | 19,708,000 |
| State Street U.S. Core Equity Fund | 7 |
| Number of Shares | Fair Value | |
| Pharmaceuticals - 5.8% | ||
| AstraZeneca PLC ADR | 374,139 | $ 20,517,783 |
| Bristol-Myers Squibb Co. | 532,309 | 37,841,847 |
| Elanco Animal Health Inc. (a) | 452,332 | 5,613,440 |
| Johnson & Johnson | 840,197 | 137,254,582 |
| Merck & Company Inc. | 1,155,693 | 99,528,281 |
| 300,755,933 | ||
| Property & Casualty Insurance - 1.3% | ||
| Chubb Ltd. | 371,048 | 67,486,210 |
| Railroads - 0.7% | ||
| Union Pacific Corp. | 180,962 | 35,255,017 |
| Regional Banks - 2.6% | ||
| First Republic Bank | 587,459 | 76,692,772 |
| SVB Financial Group (a) | 179,724 | 60,347,725 |
| 137,040,497 | ||
| Restaurants - 0.7% | ||
| McDonald's Corp. | 162,250 | 37,437,565 |
| Semiconductor Equipment - 1.3% | ||
| Applied Materials Inc. | 804,218 | 65,889,581 |
| Semiconductors - 4.6% | ||
| Advanced Micro Devices Inc. (a) | 1,206,427 | 76,439,215 |
| NVIDIA Corp. | 325,973 | 39,569,862 |
| QUALCOMM Inc. | 803,916 | 90,826,430 |
| Texas Instruments Inc. | 221,998 | 34,360,850 |
| 241,196,357 | ||
| Soft Drinks - 1.3% | ||
| Monster Beverage Corp. (a) | 200,106 | 17,401,218 |
| PepsiCo Inc. | 298,956 | 48,807,556 |
| 66,208,774 | ||
| Specialized REITs - 1.5% | ||
| American Tower Corp. | 363,022 | 77,940,823 |
| Number of Shares | Fair Value | |
| Specialty Chemicals - 0.5% | ||
| DuPont de Nemours Inc. | 276,891 | $ 13,955,306 |
| Ecolab Inc. | 76,521 | 11,051,163 |
| 25,006,469 | ||
| Systems Software - 7.6% | ||
| Microsoft Corp. | 1,427,680 | 332,506,672 |
| Oracle Corp. | 309,636 | 18,909,471 |
| ServiceNow Inc. (a) | 114,209 | 43,126,460 |
| 394,542,603 | ||
| Technology Hardware, Storage & Peripherals - 5.9% | ||
| Apple Inc. | 2,228,367 | 307,960,319 |
| Trading Companies & Distributors - 1.4% | ||
| United Rentals Inc. (a) | 271,785 | 73,414,564 |
| Trucking - 0.0%* | ||
| Lyft Inc., Class A (a) | 177,456 | 2,337,096 |
| Wireless Telecommunication Services - 1.2% | ||
| T-Mobile US Inc. (a) | 461,080 | 61,863,104 |
| Total Common Stock (Cost $4,061,882,158) | 5,177,248,107 | |
| Short-Term Investments - 0.4% | ||
| State Street Institutional U.S. Government Money Market Fund - Class G Shares 2.98% (c)(d) (Cost $22,781,784) | 22,781,784 | 22,781,784 |
| Total Investments (Cost $4,084,663,942) | 5,200,029,891 | |
| Liabilities in Excess of Other Assets, net - (0.0)%* | (1,404,604) | |
| NET ASSETS - 100.0% | $ 5,198,625,287 | |
| The Fund had the following short futures contracts open at September 30, 2022: |
| Description | Expiration date | Number of Contracts | Notional Amount | Value | Unrealized Appreciation (Depreciation) |
| S&P 500 E-mini Index Futures | December 2022 | 247 | (48,704,082) | (44,478,525) | $ 4,225,557 |
| 8 | State Street U.S. Core Equity Fund |
| (a) | Non-income producing security. |
| (b) | At September 30, 2022, all or a portion of this security was pledged to cover collateral requirements for futures contracts. |
| (c) | Sponsored by SSGA Funds Management, Inc., the Fund’s investment adviser and administrator, and an affiliate of State Street Bank & Trust Co., the Fund’s sub-administrator, custodian and accounting agent. |
| (d) | Coupon amount represents effective yield. |
| † | Percentages are based on net assets as of September 30, 2022. |
| * | Less than 0.05%. |
| Abbreviations: |
| ADR - American Depositary Receipt |
| REIT - Real Estate Investment Trust |
| Investments | Level 1 | Level 2 | Level 3 | Total | |||
| Investments in Securities | |||||||
| Common Stock | $ 5,177,248,107 | $ — | $ — | $ 5,177,248,107 | |||
| Short-Term Investments | 22,781,784 | — | — | 22,781,784 | |||
| Total Investments in Securities | $ 5,200,029,891 | $ — | $ — | $ 5,200,029,891 | |||
| Other Financial Instruments | |||||||
| Short Futures Contracts - Unrealized Appreciation | $ 4,225,557 | $ — | $ — | $ 4,225,557 | |||
| Total Other Financial Instruments | $ 4,225,557 | $ — | $ — | $ 4,225,557 |
| Affiliate Table |
| Number of Shares Held at 9/30/21 | Value at 9/30/21 | Cost of Purchases | Proceeds from Shares Sold | Realized Gain (Loss) | Change in Unrealized Appreciation (Depreciation) | Number of Shares Held at 9/30/22 | Value at 9/30/22 | Dividend Income | |
| State Street Institutional U.S. Government Money Market Fund - Class G Shares | 94,639,589 | $94,639,589 | $893,629,651 | $965,487,456 | $— | $— | 22,781,784 | $22,781,784 | $640,540 |
| State Street U.S. Core Equity Fund | 9 |
| 10 | State Street Income Fund |
| Sector Allocation |
| Portfolio composition as a % of Fair Value of $1,555,038 (in thousands) as of September 30, 2022 (a) |

| Quality Ratings | ||
| as of September 30, 2022 as a % of Fair Value (a)* | ||
| Moody’s / S&P / Rating | Percentage of Fair Value | |
| Aaa / AAA | 4.95% | |
| Aa / AA | 52.08% | |
| A / A | 7.07% | |
| Baa / BBB | 20.84% | |
| Ba / BB and lower | 2.10% | |
| NR / Other | 12.96% | |
| 100.00% | ||
| (a) | The securities information regarding holdings, allocations and other characteristics is presented to illustrate examples of securities that the Fund has bought and the diversity of areas in which the Fund may invest as of a particular date. It may not be representative of the Fund’s current or future investments and should not be construed as a recommendation to purchase or sell a particular security. |
| * | Moody’s Investors Services, Inc. (“Moody’s”) and S&P Global Ratings (“S&P”) are nationally recognized statistical rating organizations. The quality ratings represent the lower of Moody’s or S&P credit ratings. When a rating from only one of the rating agencies is available, that rating is used. Securities not rated by Moody’s or S&P are categorized as not rated. Credit quality measures a bond issuer’s ability to repay interest and principal in a timely manner. Credit quality ratings assigned by a rating agency are subject to change periodically and are not absolute standard of quality. In formulating investment decisions for the Fund, SSGA Funds Management, Inc. (“SSGA FM”) develops its own analysis of the credit quality and risks associated with individual debt instruments, rather than relying exclusively on rating agency ratings. |
| State Street Income Fund | 11 |
| Average Annual Total Return for the periods ended September 30, 2022 | |||||||
| Inception date 1/3/80 | |||||||
| One Year | Five Year | Ten Year | Ending Value of a $10,000 Investment | ||||
| State Street Income Fund | (15.48)% | (0.27)% | 1.12% | $11,174 | |||
| Bloomberg U.S. Aggregate Bond Index | (14.60)% | (0.27)% | 0.89% | $10,927 | |||

| 12 | State Street Income Fund |
| Actual Fund Return | Hypothetical 5% Return (2.5% for the period) | ||
| Beginning Account Value April 1, 2022 | $1,000.00 | $1,000.00 | |
| Ending Account value September 30, 2022 | $ 902.90 | $1,024.10 | |
| Expenses Paid During Period* | $ 0.95 | $ 1.01 |
| * | Expenses are equal to the Fund's annualized expense ratio of 0.20% (for the period April 1, 2022 - September 30, 2022), multiplied by the average account value over the period, multiplied by 183/365 (to reflect the one-half year period). |
| State Street Income Fund | 13 |
| Principal Amount | Fair Value | |
| Bonds and Notes - 94.8% † | ||
| U.S. Treasuries - 32.2% | ||
| U.S. Treasury Bonds | ||
| 1.88%, 02/15/41 - 02/15/51 | $ 42,775,000 | $ 29,669,021 |
| 2.25%, 08/15/46 (a) | 14,576,000 | 10,490,165 |
| 2.38%, 02/15/42 | 8,248,000 | 6,320,030 |
| 3.00%, 08/15/48 (a) | 31,799,000 | 26,875,124 |
| U.S. Treasury Notes | ||
| 0.25%, 07/31/25 (a) | 57,738,000 | 51,598,827 |
| 0.63%, 10/15/24 (a) | 16,223,000 | 15,078,518 |
| 0.75%, 12/31/23 - 01/31/28 (a) | 172,511,000 | 152,019,774 |
| 1.13%, 01/15/25 (a) | 29,962,000 | 27,909,135 |
| 1.25%, 11/30/26 (a) | 28,947,000 | 25,762,830 |
| 1.50%, 02/29/24 (a) | 19,853,000 | 19,089,125 |
| 1.63%, 05/15/31 (a) | 58,861,000 | 49,415,649 |
| 1.75%, 01/31/29 (a) | 13,892,000 | 12,131,623 |
| 2.63%, 02/15/29 (a) | 11,059,000 | 10,188,968 |
| 2.88%, 05/15/32 (a) | 8,792,000 | 8,133,974 |
| 3.00%, 06/30/24 (a) | 16,400,000 | 16,041,250 |
| 460,724,013 | ||
| Agency Mortgage Backed - 22.4% | ||
| Federal Home Loan Mortgage Corp. | ||
| 3.00%, 04/01/43 - 10/01/49 (a) | 40,685,878 | 35,925,408 |
| 4.50%, 06/01/33 - 02/01/35 (a) | 39,080 | 38,286 |
| 5.00%, 07/01/35 (a) | 342,170 | 343,110 |
| 5.50%, 01/01/38 - 04/01/39 (a) | 585,221 | 600,190 |
| 6.00%, 06/01/33 - 11/01/37 (a) | 1,210,889 | 1,263,635 |
| 6.50%, 07/01/29 (a) | 10,508 | 10,704 |
| 7.00%, 01/01/27 - 08/01/36 (a) | 292,655 | 308,963 |
| 7.50%, 01/01/28 - 09/01/33 (a) | 24,650 | 25,524 |
| 8.00%, 11/01/30 (a) | 1,855 | 1,950 |
| 8.50%, 04/01/30 (a) | 4,154 | 4,611 |
| Federal National Mortgage Assoc. | ||
| 2.50%, 02/01/51 - 03/01/51 (a) | 50,986,258 | 42,956,438 |
| 3.00%, 03/01/50 (a) | 7,134,389 | 6,260,122 |
| 3.50%, 08/01/45 - 01/01/48 (a) | 16,177,662 | 14,789,961 |
| 4.00%, 01/01/41 - 01/01/50 (a) | 18,859,432 | 17,785,484 |
| Principal Amount | Fair Value | |
| 4.50%, 07/01/33 - 12/01/48 (a) | $ 9,421,075 | $ 9,134,897 |
| 5.00%, 03/01/34 - 05/01/39 (a) | 854,026 | 856,758 |
| 5.50%, 12/01/32 - 01/01/39 (a) | 3,033,788 | 3,104,752 |
| 6.00%, 02/01/33 - 05/01/41 (a) | 5,616,226 | 5,855,172 |
| 6.50%, 02/01/29 - 08/01/36 (a) | 182,487 | 189,252 |
| 7.00%, 10/01/32 - 02/01/34 (a) | 36,251 | 37,620 |
| 7.50%, 11/01/22 - 03/01/33 (a) | 99,872 | 105,003 |
| 8.00%, 06/01/24 - 10/01/31 (a) | 33,822 | 34,673 |
| 8.50%, 04/01/30 (a) | 8,362 | 9,031 |
| Federal National Mortgage Assoc. 1.60% + 3 month USD LIBOR | ||
| 2.97%, 04/01/37 (a)(b) | 12,967 | 12,823 |
| Federal National Mortgage Assoc. TBA | ||
| 2.00%, 10/01/37 - 10/01/52 (c) | 55,686,067 | 45,631,237 |
| 2.50%, 10/01/52 (c) | 19,268,125 | 16,166,651 |
| 3.00%, 10/01/52 (c) | 8,160,439 | 7,089,390 |
| 3.50%, 10/01/52 (c) | 15,024,987 | 13,503,136 |
| 4.00%, 10/01/52 (c) | 8,550,933 | 7,924,945 |
| 4.50%, 10/01/52 (c) | 5,237,141 | 4,983,375 |
| 5.00%, 10/01/52 (c) | 2,140,903 | 2,085,559 |
| Government National Mortgage Assoc. | ||
| 3.00%, 12/20/42 - 05/20/45 (a) | 40,297,117 | 36,277,254 |
| 3.50%, 08/20/48 (a) | 6,394,342 | 5,892,534 |
| 4.00%, 01/20/41 - 04/20/43 (a) | 5,002,597 | 4,794,589 |
| 4.50%, 08/15/33 - 03/20/41 (a) | 2,033,954 | 2,000,573 |
| 5.00%, 08/15/33 (a) | 109,220 | 111,044 |
| 6.00%, 04/15/27 - 04/15/35 (a) | 421,808 | 440,905 |
| 6.50%, 01/15/24 - 09/15/36 (a) | 281,114 | 293,199 |
| 7.00%, 03/15/26 - 10/15/36 (a) | 221,786 | 232,503 |
| 7.50%, 11/15/22 - 10/15/28 (a) | 58,854 | 59,825 |
| 8.00%, 12/15/29 - 05/15/30 (a) | 953 | 999 |
| 14 | State Street Income Fund |
| Principal Amount | Fair Value | |
| Government National Mortgage Assoc. 1.50% + 1 year CMT Rate | ||
| 1.63%, 08/20/23 - 09/20/24 (a)(b) | $ 342 | $ 337 |
| 1.75%, 10/20/24 - 10/20/25 (a)(b) | 528 | 512 |
| 2.63%, 01/20/24 - 03/20/24 (a)(b) | 283 | 278 |
| 2.88%, 04/20/24 (a)(b) | 217 | 214 |
| Government National Mortgage Assoc. TBA | ||
| 2.00%, 10/01/52 (c) | 21,407,952 | 17,778,897 |
| 2.50%, 10/01/52 (c) | 12,849,028 | 11,012,671 |
| 4.00%, 10/01/52 (c) | 5,142,447 | 4,795,579 |
| 320,730,573 | ||
| Agency Collateralized Mortgage Obligations - 0.7% | ||
| Federal Home Loan Mortgage Corp. | ||
| 0.08%, 09/25/43 (a)(b)(d) | 3,615,937 | 10,828 |
| 2.51%, 07/25/29 (a) | 6,504,000 | 5,748,675 |
| 4.05%, 09/25/28 (a)(b) | 1,713,000 | 1,666,625 |
| Federal Home Loan Mortgage Corp. REMIC | ||
| 3.50%, 11/15/30 (a)(d) | 132,096 | 1,694 |
| 5.50%, 06/15/33 (a)(d) | 101,020 | 16,769 |
| 7.50%, 07/15/27 (a)(d) | 3,511 | 361 |
| Federal Home Loan Mortgage Corp. STRIPS | ||
| 0.00%, 08/01/27 (a)(e) | 2,781 | 2,578 |
| 8.00%, 02/01/23 - 07/01/24 (a)(d) | 2,868 | 152 |
| Federal National Mortgage Assoc. REMIC | ||
| 1.15%, 12/25/42 (a)(b)(d) | 514,311 | 18,001 |
| 5.00%, 02/25/40 - 09/25/40 (a)(d) | 260,300 | 28,763 |
| Federal National Mortgage Assoc. REMIC 6.00% - 3 month USD LIBOR | ||
| 2.92%, 07/25/38 (a)(b)(d) | 130,051 | 11,364 |
| Federal National Mortgage Assoc. REMIC 6.55% - 3 month USD LIBOR | ||
| 3.47%, 11/25/41 (a)(b)(d) | 15,855,768 | 1,895,459 |
| Federal National Mortgage Assoc. STRIPS | ||
| 0.00%, 12/25/34 (a)(e) | 99,437 | 77,490 |
| 4.50%, 08/25/35 - 01/25/36 (a)(d) | 222,241 | 28,815 |
| Principal Amount | Fair Value | |
| 5.00%, 03/25/38 - 05/25/38 (a)(d) | $ 135,993 | $ 20,938 |
| 5.50%, 12/25/33 (a)(d) | 39,500 | 7,473 |
| 6.00%, 01/25/35 (a)(d) | 162,618 | 28,830 |
| 7.50%, 11/25/23 (a)(d) | 5,219 | 119 |
| 8.00%, 08/25/23 - 07/25/24 (a)(d) | 5,814 | 303 |
| 9,565,237 | ||
| Asset Backed - 0.4% | ||
| Chase Funding Trust 2004-1 | ||
| 4.99%, 11/25/33 (f) | 280,767 | 276,808 |
| Enterprise Fleet Financing 2019-1 LLC | ||
| 3.07%, 10/20/24 (g) | 2,263,520 | 2,262,962 |
| Ford Credit Auto Owner Trust 2020-B | ||
| 0.56%, 10/15/24 | 3,385,565 | 3,343,087 |
| 5,882,857 | ||
| Corporate Notes - 32.1% | ||
| 3M Co. | ||
| 3.13%, 09/19/46 (a) | 422,000 | 279,111 |
| 7-Eleven Inc. | ||
| 0.95%, 02/10/26 (a)(g) | 2,113,000 | 1,822,822 |
| Abbott Laboratories | ||
| 3.75%, 11/30/26 (a) | 569,000 | 552,493 |
| 4.90%, 11/30/46 (a) | 463,000 | 445,341 |
| AbbVie Inc. | ||
| 2.60%, 11/21/24 (a) | 861,000 | 820,163 |
| 2.95%, 11/21/26 (a) | 851,000 | 778,554 |
| 3.20%, 05/14/26 - 11/21/29 (a) | 1,245,000 | 1,120,602 |
| 4.05%, 11/21/39 (a) | 355,000 | 287,497 |
| 4.25%, 11/21/49 (a) | 697,000 | 559,287 |
| 4.40%, 11/06/42 (a) | 289,000 | 239,936 |
| 4.63%, 10/01/42 (a) | 68,000 | 57,787 |
| 4.70%, 05/14/45 (a) | 124,000 | 105,343 |
| 4.88%, 11/14/48 (a) | 117,000 | 102,738 |
| Advance Auto Parts Inc. | ||
| 3.90%, 04/15/30 (a) | 1,424,000 | 1,225,267 |
| Advanced Micro Devices Inc. | ||
| 4.39%, 06/01/52 (a) | 590,000 | 499,701 |
| AEP Texas Inc. | ||
| 3.45%, 05/15/51 (a) | 919,000 | 639,284 |
| Aetna Inc. | ||
| 3.50%, 11/15/24 (a) | 446,000 | 433,673 |
| Aircastle Ltd. | ||
| 4.25%, 06/15/26 (a) | 627,000 | 562,275 |
| State Street Income Fund | 15 |
| Principal Amount | Fair Value | |
| Alcoa Nederland Holding BV | ||
| 5.50%, 12/15/27 (a)(g) | $ 1,047,000 | $ 975,856 |
| Alcon Finance Corp. | ||
| 2.60%, 05/27/30 (a)(g) | 358,000 | 288,423 |
| 3.80%, 09/23/49 (a)(g) | 200,000 | 144,102 |
| Alexandria Real Estate Equities Inc. | ||
| 1.88%, 02/01/33 (a) | 360,000 | 253,422 |
| 2.95%, 03/15/34 (a) | 633,000 | 489,682 |
| 3.55%, 03/15/52 (a) | 532,000 | 362,484 |
| 4.70%, 07/01/30 (a) | 216,000 | 201,867 |
| Ally Financial Inc. | ||
| 2.20%, 11/02/28 (a) | 791,000 | 611,759 |
| Altria Group Inc. | ||
| 3.40%, 05/06/30 - 02/04/41 (a) | 468,000 | 321,116 |
| 4.00%, 02/04/61 (a) | 176,000 | 107,990 |
| 4.25%, 08/09/42 (a) | 50,000 | 34,179 |
| 4.45%, 05/06/50 (a) | 236,000 | 157,672 |
| 4.50%, 05/02/43 (a) | 163,000 | 114,825 |
| Amazon.com Inc. | ||
| 1.50%, 06/03/30 (a) | 264,000 | 208,370 |
| 2.50%, 06/03/50 (a) | 327,000 | 203,966 |
| 2.70%, 06/03/60 (a) | 252,000 | 149,302 |
| 2.88%, 05/12/41 (a) | 555,000 | 404,823 |
| 3.25%, 05/12/61 (a) | 414,000 | 278,734 |
| 4.25%, 08/22/57 (a) | 109,000 | 91,031 |
| Ameren Corp. | ||
| 2.50%, 09/15/24 (a) | 1,271,000 | 1,206,751 |
| 3.65%, 02/15/26 (a) | 277,000 | 263,020 |
| American Electric Power Company Inc. | ||
| 2.30%, 03/01/30 (a) | 303,000 | 242,009 |
| 3.25%, 03/01/50 (a) | 252,000 | 162,280 |
| American International Group Inc. (5.75% fixed rate until 04/01/28; 2.87% + 3 month USD LIBOR thereafter) | ||
| 5.75%, 04/01/48 (a)(b) | 110,000 | 101,750 |
| American Tower Corp. | ||
| 1.50%, 01/31/28 (a) | 1,027,000 | 822,606 |
| 2.90%, 01/15/30 (a) | 363,000 | 297,998 |
| 3.70%, 10/15/49 (a) | 212,000 | 144,921 |
| 3.80%, 08/15/29 (a) | 445,000 | 390,968 |
| American Water Capital Corp. | ||
| 2.95%, 09/01/27 (a) | 328,000 | 297,729 |
| Amgen Inc. | ||
| 2.00%, 01/15/32 (a) | 565,000 | 431,971 |
| 2.45%, 02/21/30 (a) | 149,000 | 122,989 |
| Principal Amount | Fair Value | |
| 3.00%, 01/15/52 (a) | $ 345,000 | $ 217,788 |
| 3.15%, 02/21/40 (a) | 608,000 | 438,435 |
| 3.38%, 02/21/50 (a) | 164,000 | 112,015 |
| 4.66%, 06/15/51 (a) | 124,000 | 104,804 |
| AngloGold Ashanti Holdings PLC | ||
| 3.38%, 11/01/28 (a) | 1,145,000 | 930,393 |
| Anheuser-Busch Companies LLC/Anheuser-Busch InBev Worldwide Inc. | ||
| 3.65%, 02/01/26 (a) | 735,000 | 706,695 |
| 4.70%, 02/01/36 (a) | 181,000 | 163,179 |
| 4.90%, 02/01/46 (a) | 400,000 | 346,676 |
| Anheuser-Busch InBev Worldwide Inc. | ||
| 3.50%, 06/01/30 (a) | 406,000 | 362,249 |
| 4.00%, 04/13/28 (a) | 129,000 | 122,528 |
| 4.35%, 06/01/40 (a) | 395,000 | 334,292 |
| 4.38%, 04/15/38 (a) | 639,000 | 546,230 |
| 4.50%, 06/01/50 (a) | 313,000 | 257,364 |
| 4.60%, 04/15/48 (a) | 230,000 | 190,659 |
| 4.75%, 04/15/58 (a) | 178,000 | 144,899 |
| 5.55%, 01/23/49 (a) | 419,000 | 394,149 |
| ANZ Bank New Zealand Ltd. (5.55% fixed rate until 08/11/27; 3.00% + 5 year CMT Rate thereafter) | ||
| 5.55%, 08/11/32 (b)(g) | 1,791,000 | 1,737,570 |
| Aon Corp./Aon Global Holdings PLC | ||
| 2.90%, 08/23/51 (a) | 634,000 | 393,790 |
| Apollo Management Holdings LP | ||
| 2.65%, 06/05/30 (a)(g) | 307,000 | 245,760 |
| Apollo Management Holdings LP (4.95% fixed rate until 12/17/24; 3.27% + 5 year CMT Rate thereafter) | ||
| 4.95%, 01/14/50 (a)(b)(g) | 374,000 | 320,810 |
| Apple Inc. | ||
| 2.20%, 09/11/29 (a) | 404,000 | 344,325 |
| 2.65%, 02/08/51 (a) | 395,000 | 259,191 |
| 2.80%, 02/08/61 (a) | 442,000 | 276,988 |
| 2.95%, 09/11/49 (a) | 266,000 | 187,756 |
| 3.35%, 02/09/27 (a) | 194,000 | 185,287 |
| 3.45%, 02/09/45 (a) | 678,000 | 534,156 |
| 3.85%, 08/04/46 (a) | 611,000 | 506,110 |
| 3.95%, 08/08/52 | 535,000 | 446,046 |
| Applied Materials Inc. | ||
| 4.35%, 04/01/47 (a) | 230,000 | 198,460 |
| 16 | State Street Income Fund |
| Principal Amount | Fair Value | |
| Aptiv PLC | ||
| 4.40%, 10/01/46 (a) | $ 277,000 | $ 199,410 |
| Archer-Daniels-Midland Co. | ||
| 2.50%, 08/11/26 (a) | 239,000 | 219,799 |
| Ares Capital Corp. | ||
| 2.88%, 06/15/28 (a) | 1,384,000 | 1,089,028 |
| 3.25%, 07/15/25 (a) | 2,842,000 | 2,597,304 |
| Arthur J Gallagher & Co. | ||
| 3.50%, 05/20/51 (a) | 694,000 | 472,024 |
| Ascension Health | ||
| 4.85%, 11/15/53 (a) | 450,000 | 439,056 |
| Ashtead Capital Inc. | ||
| 1.50%, 08/12/26 (a)(g) | 600,000 | 502,092 |
| Astrazeneca Finance LLC | ||
| 1.75%, 05/28/28 (a) | 890,000 | 749,994 |
| AstraZeneca PLC | ||
| 3.00%, 05/28/51 (a) | 420,000 | 290,359 |
| 4.00%, 01/17/29 (a) | 184,000 | 174,496 |
| 4.38%, 08/17/48 (a) | 102,000 | 89,429 |
| AT&T Inc. | ||
| 1.70%, 03/25/26 (a) | 2,563,000 | 2,278,507 |
| 2.30%, 06/01/27 (a) | 638,000 | 558,767 |
| 2.75%, 06/01/31 (a) | 1,277,000 | 1,023,962 |
| 3.85%, 06/01/60 (a) | 596,000 | 400,953 |
| 4.35%, 03/01/29 (a) | 613,000 | 573,222 |
| 4.50%, 05/15/35 (a) | 436,000 | 377,450 |
| 4.55%, 03/09/49 (a) | 237,000 | 189,145 |
| 4.75%, 05/15/46 (a) | 140,000 | 117,292 |
| 4.85%, 03/01/39 (a) | 571,000 | 495,188 |
| Athene Holding Ltd. | ||
| 4.13%, 01/12/28 (a) | 313,000 | 281,716 |
| 6.15%, 04/03/30 (a) | 611,000 | 588,527 |
| Avangrid Inc. | ||
| 3.15%, 12/01/24 (a) | 755,000 | 721,501 |
| Bain Capital Specialty Finance Inc. | ||
| 2.95%, 03/10/26 (a) | 923,000 | 796,355 |
| Bank of America Corp. | ||
| 3.25%, 10/21/27 (a) | 654,000 | 586,749 |
| 4.18%, 11/25/27 (a) | 768,000 | 711,590 |
| 4.25%, 10/22/26 (a) | 759,000 | 721,915 |
| Bank of America Corp. (2.09% fixed rate until 06/14/28; 1.06% + SOFR thereafter) | ||
| 2.09%, 06/14/29 (a)(b) | 1,384,000 | 1,123,683 |
| Bank of America Corp. (2.97% fixed rate until 02/04/32; 1.33% + SOFR thereafter) | ||
| 2.97%, 02/04/33 (b) | 4,000,000 | 3,133,600 |
| Principal Amount | Fair Value | |
| Bank of America Corp. (2.97% fixed rate until 07/21/51; 1.56% + SOFR thereafter) | ||
| 2.97%, 07/21/52 (a)(b) | $ 1,062,000 | $ 650,103 |
| Bank of America Corp. (3.37% fixed rate until 01/23/25; 0.81% + 3 month USD LIBOR thereafter) | ||
| 3.37%, 01/23/26 (a)(b) | 328,000 | 310,455 |
| Bank of America Corp. (3.42% fixed rate until 12/20/27; 1.04% + 3 month USD LIBOR thereafter) | ||
| 3.42%, 12/20/28 (a)(b) | 368,000 | 326,434 |
| Bank of America Corp. (3.56% fixed rate until 04/23/26; 1.06% + 3 month USD LIBOR thereafter) | ||
| 3.56%, 04/23/27 (a)(b) | 604,000 | 557,522 |
| Bank of America Corp. (3.71% fixed rate until 04/24/27; 1.51% + 3 month USD LIBOR thereafter) | ||
| 3.71%, 04/24/28 (a)(b) | 815,000 | 741,756 |
| Bank of America Corp. (3.85% fixed rate until 03/08/32; 2.00% + 5 year CMT Rate thereafter) | ||
| 3.85%, 03/08/37 (a)(b) | 857,000 | 692,516 |
| Bank of America Corp. (3.95% fixed rate until 01/23/48; 1.19% + 3 month USD LIBOR thereafter) | ||
| 3.95%, 01/23/49 (a)(b) | 489,000 | 359,821 |
| Bank of America Corp. (4.24% fixed rate until 04/24/37; 1.81% + 3 month USD LIBOR thereafter) | ||
| 4.24%, 04/24/38 (a)(b) | 509,000 | 419,665 |
| Bank of America Corp. (4.27% fixed rate until 07/23/28; 1.31% + 3 month USD LIBOR thereafter) | ||
| 4.27%, 07/23/29 (a)(b) | 181,000 | 165,128 |
| Bank of America Corp. (4.30% fixed rate until 01/28/25; 2.66% + 3 month USD LIBOR thereafter) | ||
| 4.30%, 12/31/99 (a)(b) | 812,000 | 670,363 |
| Barclays PLC | ||
| 4.38%, 01/12/26 (a) | 911,000 | 860,786 |
| 4.84%, 05/09/28 (a) | 276,000 | 244,362 |
| State Street Income Fund | 17 |
| Principal Amount | Fair Value | |
| Barclays PLC (2.65% fixed rate until 06/24/30; 1.90% + 1 year CMT Rate thereafter) | ||
| 2.65%, 06/24/31 (a)(b) | $ 1,414,000 | $ 1,052,016 |
| Barclays PLC (2.85% fixed rate until 05/07/25; 2.71% + SOFR thereafter) | ||
| 2.85%, 05/07/26 (a)(b) | 1,320,000 | 1,199,365 |
| Barclays PLC (4.97% fixed rate until 05/16/28; 1.90% + 3 month USD LIBOR thereafter) | ||
| 4.97%, 05/16/29 (a)(b) | 507,000 | 457,360 |
| Barrick North America Finance LLC | ||
| 5.70%, 05/30/41 (a) | 69,000 | 65,614 |
| BAT Capital Corp. | ||
| 2.73%, 03/25/31 (a) | 616,000 | 455,267 |
| 4.39%, 08/15/37 (a) | 454,000 | 324,342 |
| 4.54%, 08/15/47 (a) | 204,000 | 135,886 |
| 4.70%, 04/02/27 (a) | 387,000 | 361,443 |
| 4.91%, 04/02/30 (a) | 406,000 | 357,670 |
| BAT International Finance PLC | ||
| 1.67%, 03/25/26 (a) | 395,000 | 341,205 |
| Baxter International Inc. | ||
| 1.92%, 02/01/27 (a) | 2,014,000 | 1,747,769 |
| 2.27%, 12/01/28 (a) | 1,214,000 | 1,003,237 |
| 2.54%, 02/01/32 (a) | 570,000 | 443,392 |
| Bayer US Finance II LLC | ||
| 3.88%, 12/15/23 (a)(g) | 608,000 | 597,336 |
| Baylor Scott & White Holdings | ||
| 2.84%, 11/15/50 (a) | 97,000 | 63,021 |
| Becton Dickinson & Co. | ||
| 3.70%, 06/06/27 (a) | 352,000 | 327,786 |
| 3.73%, 12/15/24 (a) | 7,000 | 6,800 |
| 4.67%, 06/06/47 (a) | 46,000 | 39,583 |
| 4.69%, 12/15/44 (a) | 54,000 | 46,213 |
| Berkshire Hathaway Energy Co. | ||
| 3.25%, 04/15/28 (a) | 200,000 | 181,342 |
| 3.70%, 07/15/30 (a) | 452,000 | 407,094 |
| 3.80%, 07/15/48 (a) | 176,000 | 131,805 |
| 4.25%, 10/15/50 (a) | 386,000 | 311,606 |
| 6.13%, 04/01/36 (a) | 178,000 | 180,547 |
| Berkshire Hathaway Finance Corp. | ||
| 1.45%, 10/15/30 (a) | 410,000 | 315,507 |
| 2.85%, 10/15/50 (a) | 1,164,000 | 749,965 |
| 3.85%, 03/15/52 (a) | 856,000 | 657,305 |
| Principal Amount | Fair Value | |
| 4.25%, 01/15/49 (a) | $ 260,000 | $ 217,610 |
| Berry Global Inc. | ||
| 4.88%, 07/15/26 (a)(g) | 1,151,000 | 1,081,802 |
| BHP Billiton Finance USA Ltd. | ||
| 5.00%, 09/30/43 (a) | 108,000 | 102,151 |
| Biogen Inc. | ||
| 2.25%, 05/01/30 (a) | 191,000 | 150,974 |
| Block Financial LLC | ||
| 2.50%, 07/15/28 (a) | 591,000 | 489,265 |
| 3.88%, 08/15/30 (a) | 188,000 | 160,445 |
| BNP Paribas S.A. (2.82% fixed rate until 11/19/24; 1.11% + 3 month USD LIBOR thereafter) | ||
| 2.82%, 11/19/25 (a)(b)(g) | 1,007,000 | 939,541 |
| BNP Paribas S.A. (5.13% fixed rate until 11/15/27; 2.24% + USD 5 year Swap Rate thereafter) | ||
| 5.13%, 12/31/99 (a)(b)(g) | 600,000 | 449,454 |
| Boardwalk Pipelines LP | ||
| 4.80%, 05/03/29 (a) | 399,000 | 367,004 |
| Boston Scientific Corp. | ||
| 4.70%, 03/01/49 (a) | 57,000 | 49,902 |
| BP Capital Markets America Inc. | ||
| 3.00%, 02/24/50 (a) | 488,000 | 316,907 |
| 3.38%, 02/08/61 (a) | 561,000 | 366,585 |
| BP Capital Markets PLC (4.38% fixed rate until 09/22/25; 4.04% + 5 year CMT Rate thereafter) | ||
| 4.38%, 12/31/99 (a)(b) | 855,000 | 785,813 |
| BP Capital Markets PLC (4.88% fixed rate until 06/22/30; 4.40% + 5 year CMT Rate thereafter) | ||
| 4.88%, 12/31/99 (a)(b) | 610,000 | 526,766 |
| Bristol-Myers Squibb Co. | ||
| 1.45%, 11/13/30 (a) | 438,000 | 337,948 |
| 2.35%, 11/13/40 (a) | 243,000 | 162,326 |
| 2.95%, 03/15/32 (a) | 570,000 | 489,305 |
| 3.20%, 06/15/26 (a) | 214,000 | 202,754 |
| 3.40%, 07/26/29 (a) | 120,000 | 109,021 |
| 3.55%, 03/15/42 (a) | 235,000 | 184,388 |
| 4.13%, 06/15/39 (a) | 317,000 | 276,820 |
| 4.25%, 10/26/49 (a) | 317,000 | 265,579 |
| 4.35%, 11/15/47 (a) | 43,000 | 36,774 |
| 4.55%, 02/20/48 (a) | 88,000 | 77,310 |
| 18 | State Street Income Fund |
| Principal Amount | Fair Value | |
| Brixmor Operating Partnership LP | ||
| 2.25%, 04/01/28 (a) | $ 829,000 | $ 671,017 |
| 3.90%, 03/15/27 (a) | 164,000 | 149,117 |
| Broadcom Inc. | ||
| 3.14%, 11/15/35 (a)(g) | 239,000 | 167,570 |
| 3.19%, 11/15/36 (a)(g) | 31,000 | 21,227 |
| 3.42%, 04/15/33 (a)(g) | 576,000 | 441,930 |
| 3.47%, 04/15/34 (a)(g) | 28,000 | 21,058 |
| 4.15%, 11/15/30 (a) | 247,000 | 213,487 |
| 4.30%, 11/15/32 (a) | 406,000 | 341,998 |
| 4.93%, 05/15/37 (a)(g) | 333,000 | 275,481 |
| Brooklyn Union Gas Co. | ||
| 4.87%, 08/05/32 (g) | 1,719,000 | 1,571,424 |
| Brown-Forman Corp. | ||
| 4.00%, 04/15/38 (a) | 103,000 | 86,284 |
| Brunswick Corp. | ||
| 2.40%, 08/18/31 (a) | 1,952,000 | 1,359,314 |
| Bunge Limited Finance Corp. | ||
| 3.75%, 09/25/27 (a) | 143,000 | 131,310 |
| Burlington Northern Santa Fe LLC | ||
| 4.15%, 12/15/48 (a) | 359,000 | 297,970 |
| 4.55%, 09/01/44 (a) | 540,000 | 471,701 |
| Cameron LNG LLC | ||
| 3.30%, 01/15/35 (a)(g) | 197,000 | 155,514 |
| Canadian Natural Resources Ltd. | ||
| 3.85%, 06/01/27 (a) | 446,000 | 411,480 |
| 4.95%, 06/01/47 (a) | 269,000 | 228,779 |
| Canadian Pacific Railway Co. | ||
| 1.75%, 12/02/26 (a) | 843,000 | 738,645 |
| 2.45%, 12/02/31 (a) | 721,000 | 577,867 |
| 3.00%, 12/02/41 (a) | 310,000 | 221,452 |
| 3.10%, 12/02/51 (a) | 278,000 | 183,349 |
| Cantor Fitzgerald LP | ||
| 4.88%, 05/01/24 (a)(g) | 1,361,000 | 1,334,066 |
| Capital One Financial Corp. | ||
| 3.75%, 07/28/26 (a) | 756,000 | 699,360 |
| Cardinal Health Inc. | ||
| 3.08%, 06/15/24 (a) | 219,000 | 211,692 |
| Carlisle Companies Inc. | ||
| 2.20%, 03/01/32 (a) | 1,134,000 | 839,750 |
| Carrier Global Corp. | ||
| 2.72%, 02/15/30 (a) | 385,000 | 317,767 |
| 3.58%, 04/05/50 (a) | 385,000 | 266,077 |
| Caterpillar Inc. | ||
| 3.25%, 09/19/49 - 04/09/50 (a) | 587,000 | 433,146 |
| Principal Amount | Fair Value | |
| Cenovus Energy Inc. | ||
| 2.65%, 01/15/32 (a) | $ 421,000 | $ 325,353 |
| 3.75%, 02/15/52 (a) | 488,000 | 330,688 |
| Centene Corp. | ||
| 3.00%, 10/15/30 (a) | 403,000 | 318,942 |
| 3.38%, 02/15/30 (a) | 1,902,000 | 1,554,961 |
| 4.25%, 12/15/27 (a) | 3,230,000 | 2,952,478 |
| CenterPoint Energy Inc. | ||
| 2.65%, 06/01/31 (a) | 638,000 | 509,596 |
| Charter Communications Operating LLC/Charter Communications Operating Capital | ||
| 3.50%, 06/01/41 (a) | 555,000 | 354,578 |
| 3.70%, 04/01/51 (a) | 830,000 | 504,217 |
| 4.80%, 03/01/50 (a) | 837,000 | 598,639 |
| 4.91%, 07/23/25 (a) | 167,000 | 162,965 |
| 5.05%, 03/30/29 (a) | 707,000 | 649,457 |
| 5.75%, 04/01/48 (a) | 219,000 | 177,086 |
| Cheniere Corpus Christi Holdings LLC | ||
| 5.88%, 03/31/25 (a) | 1,113,000 | 1,115,727 |
| 7.00%, 06/30/24 (a) | 1,824,000 | 1,853,695 |
| Chevron Corp. | ||
| 2.24%, 05/11/30 (a) | 210,000 | 174,804 |
| 3.08%, 05/11/50 (a) | 201,000 | 142,762 |
| Chevron USA Inc. | ||
| 3.85%, 01/15/28 (a) | 737,000 | 700,968 |
| 3.90%, 11/15/24 (a) | 255,000 | 251,333 |
| Choice Hotels International Inc. | ||
| 3.70%, 01/15/31 (a) | 447,000 | 368,552 |
| Chubb INA Holdings Inc. | ||
| 4.35%, 11/03/45 (a) | 287,000 | 242,954 |
| Church & Dwight Company Inc. | ||
| 2.30%, 12/15/31 (a) | 452,000 | 355,507 |
| Cigna Corp. | ||
| 2.40%, 03/15/30 (a) | 382,000 | 311,842 |
| 3.25%, 04/15/25 (a) | 345,000 | 330,041 |
| 3.40%, 03/01/27 - 03/15/51 (a) | 578,000 | 456,440 |
| 3.75%, 07/15/23 (a) | 145,000 | 143,824 |
| 3.88%, 10/15/47 (a) | 108,000 | 78,784 |
| 4.13%, 11/15/25 (a) | 615,000 | 597,110 |
| 4.38%, 10/15/28 (a) | 192,000 | 181,319 |
| 4.80%, 08/15/38 (a) | 168,000 | 149,080 |
| 4.90%, 12/15/48 (a) | 87,000 | 75,354 |
| Cintas Corp. No 2 | ||
| 4.00%, 05/01/32 (a) | 1,285,000 | 1,183,357 |
| State Street Income Fund | 19 |
| Principal Amount | Fair Value | |
| Cisco Systems Inc. | ||
| 5.90%, 02/15/39 (a) | $ 211,000 | $ 219,455 |
| Citadel Finance LLC | ||
| 3.38%, 03/09/26 (a)(g) | 3,500,000 | 3,103,065 |
| Citigroup Inc. | ||
| 4.45%, 09/29/27 (a) | 448,000 | 415,592 |
| 4.65%, 07/23/48 (a) | 966,000 | 784,498 |
| Citigroup Inc. (1.68% fixed rate until 05/15/23; 1.67% + SOFR thereafter) | ||
| 1.68%, 05/15/24 (a)(b) | 1,959,000 | 1,917,567 |
| Citigroup Inc. (2.56% fixed rate until 05/01/31; 1.17% + SOFR thereafter) | ||
| 2.56%, 05/01/32 (a)(b) | 614,000 | 471,613 |
| Citigroup Inc. (2.98% fixed rate until 11/05/29; 1.42% + SOFR thereafter) | ||
| 2.98%, 11/05/30 (a)(b) | 374,000 | 307,301 |
| Citigroup Inc. (3.79% fixed rate until 03/17/32; 1.94% + SOFR thereafter) | ||
| 3.79%, 03/17/33 (b) | 3,000,000 | 2,516,490 |
| Citigroup Inc. (3.88% fixed rate until 01/24/38; 1.17% + 3 month USD LIBOR thereafter) | ||
| 3.88%, 01/24/39 (a)(b) | 176,000 | 141,974 |
| Citigroup Inc. (4.70% fixed rate until 01/30/25; 3.23% + SOFR thereafter) | ||
| 4.70%, 12/31/99 (a)(b) | 856,000 | 687,933 |
| CME Group Inc. | ||
| 2.65%, 03/15/32 (a) | 460,000 | 378,092 |
| 3.75%, 06/15/28 (a) | 221,000 | 208,511 |
| CMS Energy Corp. | ||
| 4.88%, 03/01/44 (a) | 600,000 | 516,054 |
| CNH Industrial Capital LLC | ||
| 1.95%, 07/02/23 (a) | 919,000 | 898,920 |
| CNOOC Finance 2014 ULC | ||
| 4.25%, 04/30/24 (a) | 2,095,000 | 2,077,088 |
| CNOOC Petroleum North America ULC | ||
| 6.40%, 05/15/37 (a) | 540,000 | 551,059 |
| Comcast Corp. | ||
| 2.65%, 08/15/62 (a) | 301,000 | 162,435 |
| 2.80%, 01/15/51 (a) | 341,000 | 207,400 |
| 2.89%, 11/01/51 (a) | 317,000 | 198,005 |
| 2.94%, 11/01/56 (a) | 266,000 | 158,799 |
| 2.99%, 11/01/63 (a) | 253,000 | 146,765 |
| 3.20%, 07/15/36 (a) | 370,000 | 286,469 |
| Principal Amount | Fair Value | |
| 3.25%, 11/01/39 (a) | $ 595,000 | $ 437,563 |
| 3.97%, 11/01/47 (a) | 411,000 | 314,357 |
| 4.15%, 10/15/28 (a) | 406,000 | 383,451 |
| CommonSpirit Health | ||
| 4.35%, 11/01/42 | 1,029,000 | 804,843 |
| Commonwealth Bank of Australia | ||
| 3.78%, 03/14/32 (a)(g) | 800,000 | 638,736 |
| Conagra Brands Inc. | ||
| 5.30%, 11/01/38 (a) | 184,000 | 161,375 |
| 5.40%, 11/01/48 (a) | 159,000 | 138,845 |
| ConocoPhillips Co. | ||
| 4.30%, 11/15/44 (a) | 373,000 | 309,967 |
| Consolidated Edison Company of New York Inc. | ||
| 2.90%, 12/01/26 (a) | 454,000 | 413,603 |
| 3.35%, 04/01/30 (a) | 174,000 | 153,304 |
| 3.88%, 06/15/47 (a) | 208,000 | 157,275 |
| 3.95%, 04/01/50 (a) | 291,000 | 224,719 |
| Constellation Brands Inc. | ||
| 3.15%, 08/01/29 (a) | 834,000 | 717,774 |
| 3.70%, 12/06/26 (a) | 389,000 | 366,142 |
| 4.50%, 05/09/47 (a) | 301,000 | 243,349 |
| Continental Resources Inc. | ||
| 2.88%, 04/01/32 (a)(g) | 665,000 | 485,829 |
| 3.80%, 06/01/24 (a) | 3,189,000 | 3,092,692 |
| 4.50%, 04/15/23 (a) | 2,123,000 | 2,111,408 |
| Corebridge Financial Inc. | ||
| 3.90%, 04/05/32 (a)(g) | 1,980,000 | 1,670,922 |
| Corning Inc. | ||
| 4.38%, 11/15/57 (a) | 202,000 | 150,583 |
| Corporate Office Properties LP | ||
| 2.00%, 01/15/29 (a) | 677,000 | 510,675 |
| 2.25%, 03/15/26 (a) | 561,000 | 490,376 |
| 2.75%, 04/15/31 (a) | 349,000 | 258,323 |
| Credit Suisse AG | ||
| 2.95%, 04/09/25 (a) | 1,080,000 | 992,293 |
| Credit Suisse Group AG | ||
| 3.80%, 06/09/23 (a) | 937,000 | 919,872 |
| 4.28%, 01/09/28 (a)(g) | 593,000 | 505,811 |
| Crown Castle Inc. | ||
| 2.90%, 03/15/27 (a) | 1,430,000 | 1,271,470 |
| 3.30%, 07/01/30 (a) | 1,118,000 | 936,940 |
| 4.15%, 07/01/50 (a) | 168,000 | 124,550 |
| 5.20%, 02/15/49 (a) | 262,000 | 226,250 |
| CSL Finance PLC | ||
| 4.25%, 04/27/32 (a)(g) | 856,000 | 780,235 |
| 20 | State Street Income Fund |
| Principal Amount | Fair Value | |
| CSX Corp. | ||
| 4.50%, 03/15/49 - 08/01/54 (a) | $ 595,000 | $ 501,023 |
| CubeSmart LP | ||
| 2.50%, 02/15/32 (a) | 807,000 | 606,582 |
| 4.38%, 02/15/29 (a) | 602,000 | 556,615 |
| Cummins Inc. | ||
| 1.50%, 09/01/30 (a) | 412,000 | 317,302 |
| 2.60%, 09/01/50 (a) | 412,000 | 256,985 |
| CVS Health Corp. | ||
| 3.00%, 08/15/26 (a) | 423,000 | 391,055 |
| 3.25%, 08/15/29 (a) | 350,000 | 306,383 |
| 3.63%, 04/01/27 (a) | 398,000 | 372,667 |
| 3.75%, 04/01/30 (a) | 290,000 | 258,332 |
| 3.88%, 07/20/25 (a) | 245,000 | 237,655 |
| 4.25%, 04/01/50 (a) | 211,000 | 165,158 |
| 4.30%, 03/25/28 (a) | 35,000 | 33,104 |
| 4.78%, 03/25/38 (a) | 260,000 | 227,872 |
| 5.00%, 12/01/24 (a) | 570,000 | 566,728 |
| 5.13%, 07/20/45 (a) | 252,000 | 220,553 |
| 5.30%, 12/05/43 (a) | 426,000 | 382,407 |
| Daimler Trucks Finance North America LLC | ||
| 2.00%, 12/14/26 (a)(g) | 1,580,000 | 1,362,213 |
| 2.38%, 12/14/28 (a)(g) | 845,000 | 689,951 |
| 2.50%, 12/14/31 (a)(g) | 845,000 | 639,902 |
| Danaher Corp. | ||
| 2.80%, 12/10/51 (a) | 1,084,000 | 691,234 |
| Dell International LLC/EMC Corp. | ||
| 4.00%, 07/15/24 (a) | 728,000 | 713,768 |
| 5.45%, 06/15/23 (a) | 101,000 | 101,248 |
| 6.02%, 06/15/26 (a) | 124,000 | 124,496 |
| 8.35%, 07/15/46 (a) | 29,000 | 31,402 |
| Deutsche Bank AG | ||
| 3.30%, 11/16/22 (a) | 772,000 | 770,634 |
| 3.70%, 05/30/24 (a) | 327,000 | 315,539 |
| Deutsche Bank AG (2.31% fixed rate until 11/16/26; 1.22% + SOFR thereafter) | ||
| 2.31%, 11/16/27 (a)(b) | 2,227,000 | 1,808,391 |
| Deutsche Bank AG (3.74% fixed rate until 01/07/32; 2.26% + SOFR thereafter) | ||
| 3.74%, 01/07/33 (a)(b) | 1,000,000 | 658,810 |
| Deutsche Telekom AG | ||
| 3.63%, 01/21/50 (a)(g) | 309,000 | 211,544 |
| Deutsche Telekom International Finance BV | ||
| 2.49%, 09/19/23 (a)(g) | 758,000 | 739,474 |
| Principal Amount | Fair Value | |
| Devon Energy Corp. | ||
| 5.00%, 06/15/45 (a) | $ 133,000 | $ 110,822 |
| DH Europe Finance II Sarl | ||
| 2.60%, 11/15/29 (a) | 363,000 | 310,125 |
| 3.25%, 11/15/39 (a) | 205,000 | 155,716 |
| 3.40%, 11/15/49 (a) | 106,000 | 75,407 |
| Diamondback Energy Inc. | ||
| 3.13%, 03/24/31 (a) | 555,000 | 450,210 |
| 3.25%, 12/01/26 (a) | 347,000 | 320,149 |
| 3.50%, 12/01/29 (a) | 298,000 | 257,260 |
| 4.40%, 03/24/51 (a) | 275,000 | 207,686 |
| Digital Realty Trust LP | ||
| 3.60%, 07/01/29 (a) | 649,000 | 568,479 |
| Discover Bank | ||
| 2.70%, 02/06/30 (a) | 535,000 | 419,365 |
| Discovery Communications LLC | ||
| 2.95%, 03/20/23 (a) | 746,000 | 740,062 |
| 3.95%, 03/20/28 (a) | 292,000 | 256,399 |
| 4.95%, 05/15/42 (a) | 106,000 | 78,242 |
| 5.00%, 09/20/37 (a) | 133,000 | 105,413 |
| Dollar General Corp. | ||
| 3.50%, 04/03/30 (a) | 237,000 | 207,892 |
| 4.13%, 04/03/50 (a) | 352,000 | 274,725 |
| Dollar Tree Inc. | ||
| 4.00%, 05/15/25 (a) | 468,000 | 453,600 |
| Dominion Energy Inc. | ||
| 3.07%, 08/15/24 (a)(f) | 511,000 | 489,957 |
| 3.38%, 04/01/30 (a) | 597,000 | 514,477 |
| Dover Corp. | ||
| 2.95%, 11/04/29 (a) | 407,000 | 349,971 |
| DTE Energy Co. | ||
| 2.85%, 10/01/26 (a) | 190,000 | 173,293 |
| Duke Energy Carolinas LLC | ||
| 3.95%, 03/15/48 (a) | 238,000 | 186,604 |
| Duke Energy Corp. | ||
| 2.55%, 06/15/31 (a) | 915,000 | 716,418 |
| 3.30%, 06/15/41 (a) | 830,000 | 578,668 |
| 3.50%, 06/15/51 (a) | 830,000 | 559,810 |
| 3.75%, 09/01/46 (a) | 1,269,000 | 899,290 |
| Duke Energy Corp. (4.88% fixed rate until 09/16/24; 3.39% + 5 year CMT Rate thereafter) | ||
| 4.88%, 12/31/99 (a)(b) | 1,119,000 | 1,015,862 |
| Duke Energy Progress LLC | ||
| 4.15%, 12/01/44 (a) | 226,000 | 182,244 |
| Duke Realty LP | ||
| 3.05%, 03/01/50 (a) | 177,000 | 118,608 |
| 3.25%, 06/30/26 (a) | 237,000 | 218,874 |
| State Street Income Fund | 21 |
| Principal Amount | Fair Value | |
| DuPont de Nemours Inc. | ||
| 5.42%, 11/15/48 (a) | $ 147,000 | $ 132,096 |
| Duquesne Light Holdings Inc. | ||
| 3.62%, 08/01/27 (a)(g) | 626,000 | 553,196 |
| Eastman Chemical Co. | ||
| 4.65%, 10/15/44 (a) | 405,000 | 318,946 |
| Eaton Corp. | ||
| 3.10%, 09/15/27 (a) | 251,000 | 229,989 |
| Ecolab Inc. | ||
| 1.30%, 01/30/31 (a) | 414,000 | 311,220 |
| Edison International | ||
| 4.95%, 04/15/25 (a) | 950,000 | 931,703 |
| 5.75%, 06/15/27 (a) | 119,000 | 116,664 |
| EI du Pont de Nemours & Co. | ||
| 2.30%, 07/15/30 (a) | 307,000 | 250,976 |
| Electronic Arts Inc. | ||
| 1.85%, 02/15/31 (a) | 513,000 | 395,697 |
| Elevance Health Inc. | ||
| 2.88%, 09/15/29 (a) | 202,000 | 172,514 |
| 3.30%, 01/15/23 (a) | 418,000 | 416,729 |
| 3.60%, 03/15/51 (a) | 221,000 | 158,970 |
| 3.70%, 09/15/49 (a) | 202,000 | 147,715 |
| Emera US Finance LP | ||
| 2.64%, 06/15/31 (a) | 923,000 | 720,069 |
| Emerson Electric Co. | ||
| 1.80%, 10/15/27 (a) | 266,000 | 230,077 |
| 2.75%, 10/15/50 (a) | 203,000 | 130,996 |
| Empower Finance 2020 LP | ||
| 1.36%, 09/17/27 (a)(g) | 614,000 | 503,081 |
| 1.78%, 03/17/31 (a)(g) | 473,000 | 352,546 |
| Enbridge Energy Partners LP | ||
| 5.50%, 09/15/40 (a) | 57,000 | 52,057 |
| Enbridge Inc. | ||
| 1.60%, 10/04/26 (a) | 1,704,000 | 1,475,136 |
| Enbridge Inc. (5.75% fixed rate until 07/15/30; 5.31% + 5 year CMT Rate thereafter) | ||
| 5.75%, 07/15/80 (a)(b) | 1,031,000 | 922,745 |
| Energy Transfer LP | ||
| 4.25%, 03/15/23 (a) | 549,000 | 546,480 |
| 4.50%, 04/15/24 (a) | 435,000 | 428,962 |
| 4.95%, 06/15/28 (a) | 132,000 | 123,370 |
| 5.30%, 04/01/44 - 04/15/47 (a) | 673,000 | 537,920 |
| 5.35%, 05/15/45 (a) | 555,000 | 447,685 |
| 6.13%, 12/15/45 (a) | 110,000 | 96,127 |
| 6.50%, 02/01/42 (a) | 312,000 | 290,188 |
| Principal Amount | Fair Value | |
| Energy Transfer LP (6.75% fixed rate until 05/15/25; 5.13% + 5 year CMT Rate thereafter) | ||
| 6.75%, 12/31/99 (a)(b) | $ 2,488,000 | $ 2,148,488 |
| Energy Transfer LP/Regency Energy Finance Corp. | ||
| 4.50%, 11/01/23 (a) | 279,000 | 276,553 |
| Enterprise Products Operating LLC | ||
| 4.25%, 02/15/48 (a) | 583,000 | 450,793 |
| Enterprise Products Operating LLC (5.25% fixed rate until 08/16/27; 3.03% + 3 month USD LIBOR thereafter) | ||
| 5.25%, 08/16/77 (a)(b) | 190,000 | 159,651 |
| EOG Resources Inc. | ||
| 4.15%, 01/15/26 (a) | 262,000 | 255,440 |
| 4.95%, 04/15/50 (a) | 204,000 | 190,665 |
| 5.10%, 01/15/36 (a) | 164,000 | 152,654 |
| Equinix Inc. | ||
| 1.25%, 07/15/25 (a) | 767,000 | 686,020 |
| 2.15%, 07/15/30 (a) | 579,000 | 443,856 |
| Equinor ASA | ||
| 3.25%, 11/18/49 (a) | 435,000 | 311,678 |
| ERP Operating LP | ||
| 4.50%, 07/01/44 (a) | 136,000 | 115,071 |
| Everest Reinsurance Holdings Inc. | ||
| 3.13%, 10/15/52 (a) | 676,000 | 419,857 |
| Eversource Energy | ||
| 3.45%, 01/15/50 (a) | 404,000 | 281,095 |
| Exelon Corp. | ||
| 4.05%, 04/15/30 (a) | 611,000 | 553,768 |
| 4.45%, 04/15/46 (a) | 380,000 | 310,969 |
| 4.70%, 04/15/50 (a) | 406,000 | 340,277 |
| Extra Space Storage LP | ||
| 3.90%, 04/01/29 (a) | 375,000 | 332,839 |
| Exxon Mobil Corp. | ||
| 2.61%, 10/15/30 (a) | 1,221,000 | 1,036,470 |
| 3.45%, 04/15/51 (a) | 634,000 | 471,423 |
| FedEx Corp. | ||
| 4.10%, 02/01/45 (a) | 896,000 | 647,620 |
| Fidelity National Financial Inc. | ||
| 3.20%, 09/17/51 (a) | 633,000 | 362,253 |
| Fidelity National Information Services Inc. | ||
| 1.15%, 03/01/26 (a) | 517,000 | 446,972 |
| 1.65%, 03/01/28 (a) | 467,000 | 382,543 |
| 22 | State Street Income Fund |
| Principal Amount | Fair Value | |
| 3.10%, 03/01/41 (a) | $ 110,000 | $ 73,151 |
| FirstEnergy Transmission LLC | �� | |
| 4.55%, 04/01/49 (a)(g) | 741,000 | 575,535 |
| Fiserv Inc. | ||
| 3.50%, 07/01/29 (a) | 272,000 | 237,021 |
| 4.40%, 07/01/49 (a) | 159,000 | 123,249 |
| Florida Power & Light Co. | ||
| 2.85%, 04/01/25 (a) | 1,025,000 | 980,577 |
| 4.13%, 02/01/42 (a) | 222,000 | 185,850 |
| Flowers Foods Inc. | ||
| 2.40%, 03/15/31 (a) | 496,000 | 389,296 |
| Flowserve Corp. | ||
| 2.80%, 01/15/32 (a) | 631,000 | 451,891 |
| Ford Motor Co. | ||
| 4.35%, 12/08/26 (a) | 525,000 | 484,313 |
| Ford Motor credit Company LLC | ||
| 2.90%, 02/10/29 (a) | 1,600,000 | 1,215,952 |
| Ford Motor Credit Company LLC | ||
| 3.10%, 05/04/23 (a) | 1,436,000 | 1,410,798 |
| 3.81%, 01/09/24 (a) | 945,000 | 913,853 |
| Fox Corp. | ||
| 3.50%, 04/08/30 (a) | 411,000 | 352,301 |
| Freeport-McMoRan Inc. | ||
| 4.25%, 03/01/30 (a) | 721,000 | 618,084 |
| GA Global Funding Trust | ||
| 1.63%, 01/15/26 (a)(g) | 747,000 | 655,358 |
| General Dynamics Corp. | ||
| 4.25%, 04/01/50 (a) | 312,000 | 269,799 |
| General Mills Inc. | ||
| 3.00%, 02/01/51 (a) | 326,000 | 213,393 |
| General Motors Co. | ||
| 5.20%, 04/01/45 (a) | 60,000 | 45,959 |
| 5.40%, 10/02/23 - 04/01/48 (a) | 296,000 | 265,772 |
| 6.13%, 10/01/25 (a) | 780,000 | 781,747 |
| 6.80%, 10/01/27 (a) | 328,000 | 331,529 |
| General Motors Financial Company Inc. | ||
| 1.25%, 01/08/26 (a) | 926,000 | 796,110 |
| 2.35%, 01/08/31 (a) | 406,000 | 295,328 |
| 5.25%, 03/01/26 (a) | 322,000 | 313,718 |
| Genuine Parts Co. | ||
| 2.75%, 02/01/32 (a) | 427,000 | 331,309 |
| Georgia-Pacific LLC | ||
| 1.75%, 09/30/25 (a)(g) | 1,036,000 | 941,527 |
| 3.60%, 03/01/25 (a)(g) | 1,820,000 | 1,755,299 |
| Gilead Sciences Inc. | ||
| 2.60%, 10/01/40 (a) | 311,000 | 206,286 |
| Principal Amount | Fair Value | |
| 2.80%, 10/01/50 (a) | $ 447,000 | $ 275,611 |
| 2.95%, 03/01/27 (a) | 69,000 | 62,867 |
| 3.50%, 02/01/25 (a) | 248,000 | 239,637 |
| 3.65%, 03/01/26 (a) | 226,000 | 215,025 |
| 4.15%, 03/01/47 (a) | 149,000 | 117,810 |
| GlaxoSmithKline Capital Inc. | ||
| 3.63%, 05/15/25 (a) | 520,000 | 505,664 |
| GlaxoSmithKline Capital PLC | ||
| 3.38%, 06/01/29 (a) | 462,000 | 419,427 |
| Glencore Finance Canada Ltd. | ||
| 4.25%, 10/25/22 (a)(g) | 1,103,000 | 1,103,033 |
| Glencore Funding LLC | ||
| 3.88%, 04/27/51 (a)(g) | 512,000 | 346,460 |
| Graphic Packaging International LLC | ||
| 1.51%, 04/15/26 (a)(g) | 628,000 | 542,466 |
| Gray Oak Pipeline LLC | ||
| 2.00%, 09/15/23 (a)(g) | 1,438,000 | 1,388,749 |
| 2.60%, 10/15/25 (a)(g) | 940,000 | 844,336 |
| GSK Consumer Healthcare Capital US LLC | ||
| 3.38%, 03/24/27 (a)(g) | 1,465,000 | 1,331,289 |
| 3.63%, 03/24/32 (a)(g) | 610,000 | 516,694 |
| 4.00%, 03/24/52 (a)(g) | 250,000 | 184,143 |
| Halliburton Co. | ||
| 3.80%, 11/15/25 (a) | 3,000 | 2,897 |
| 5.00%, 11/15/45 (a) | 177,000 | 147,280 |
| HCA Inc. | ||
| 3.13%, 03/15/27 (a)(g) | 1,200,000 | 1,059,552 |
| 3.50%, 09/01/30 (a) | 427,000 | 352,843 |
| 3.63%, 03/15/32 (a)(g) | 640,000 | 518,509 |
| 4.63%, 03/15/52 (a)(g) | 215,000 | 161,760 |
| 5.38%, 02/01/25 (a) | 3,221,000 | 3,183,089 |
| Health Care Service Corp. | ||
| 2.20%, 06/01/30 (a)(g) | 564,000 | 443,665 |
| 3.20%, 06/01/50 (a)(g) | 204,000 | 137,914 |
| Healthcare Realty Holdings LP | ||
| 2.00%, 03/15/31 (a) | 335,000 | 247,093 |
| Helmerich & Payne Inc. | ||
| 2.90%, 09/29/31 (a) | 339,000 | 264,895 |
| Hess Corp. | ||
| 5.60%, 02/15/41 | 89,000 | 78,005 |
| 5.80%, 04/01/47 (a) | 56,000 | 50,275 |
| Hewlett Packard Enterprise Co. | ||
| 6.35%, 10/15/45 (a) | 97,000 | 88,302 |
| Highwoods Realty LP | ||
| 4.13%, 03/15/28 (a) | 244,000 | 221,291 |
| 4.20%, 04/15/29 (a) | 595,000 | 519,364 |
| State Street Income Fund | 23 |
| Principal Amount | Fair Value | |
| Honeywell International Inc. | ||
| 1.75%, 09/01/31 (a) | $ 636,000 | $ 496,640 |
| 2.70%, 08/15/29 (a) | 463,000 | 406,847 |
| Hormel Foods Corp. | ||
| 1.80%, 06/11/30 (a) | 826,000 | 659,355 |
| HSBC Holdings PLC (2.01% fixed rate until 09/22/27; 1.73% + SOFR thereafter) | ||
| 2.01%, 09/22/28 (a)(b) | 1,527,000 | 1,228,594 |
| HSBC Holdings PLC (2.25% fixed rate until 11/22/26; 1.10% + SOFR thereafter) | ||
| 2.25%, 11/22/27 (a)(b) | 1,250,000 | 1,050,000 |
| HSBC Holdings PLC (2.87% fixed rate until 11/22/31; 1.41% + SOFR thereafter) | ||
| 2.87%, 11/22/32 (a)(b) | 520,000 | 379,189 |
| HSBC Holdings PLC (3.00% fixed rate until 03/10/25; 1.43% + SOFR thereafter) | ||
| 3.00%, 03/10/26 (a)(b) | 1,095,000 | 1,012,404 |
| HSBC Holdings PLC (4.00% fixed rate until 09/09/26; 3.22% + 5 year CMT Rate thereafter) | ||
| 4.00%, 12/31/99 (a)(b) | 924,000 | 735,486 |
| HSBC Holdings PLC (4.29% fixed rate until 09/12/25; 1.35% + 3 month USD LIBOR thereafter) | ||
| 4.29%, 09/12/26 (a)(b) | 1,372,000 | 1,294,509 |
| HSBC Holdings PLC (6.00% fixed rate until 05/22/27; 3.74% + USD 5 year Mid-Market Swap Rate thereafter) | ||
| 6.00%, 12/31/99 (a)(b) | 801,000 | 660,921 |
| HSBC Holdings PLC (6.50% fixed rate until 03/23/27; 3.60% + USD 5 year Mid-Market Swap Rate thereafter) | ||
| 6.50%, 12/31/99 (a)(b) | 1,024,000 | 858,409 |
| Humana Inc. | ||
| 1.35%, 02/03/27 (a) | 1,018,000 | 857,746 |
| 2.15%, 02/03/32 (a) | 511,000 | 388,391 |
| Huntington Bancshares Inc. | ||
| 2.55%, 02/04/30 (a) | 810,000 | 656,416 |
| Huntington Ingalls Industries Inc. | ||
| 2.04%, 08/16/28 (a) | 1,107,000 | 898,308 |
| Principal Amount | Fair Value | |
| Huntsman International LLC | ||
| 4.50%, 05/01/29 | $ 859,000 | $ 756,882 |
| Hyundai Capital America | ||
| 1.30%, 01/08/26 (a)(g) | 1,557,000 | 1,342,819 |
| Imperial Brands Finance PLC | ||
| 3.13%, 07/26/24 (a)(g) | 844,000 | 805,725 |
| 3.50%, 02/11/23 - 07/26/26 (a)(g) | 2,068,000 | 2,019,808 |
| Indiana Michigan Power Co. | ||
| 3.25%, 05/01/51 (a) | 412,000 | 278,842 |
| ING Groep N.V. | ||
| 4.10%, 10/02/23 (a) | 1,682,000 | 1,660,033 |
| ING Groep N.V. 1.01% + SOFR | ||
| 3.98%, 04/01/27 (a)(b) | 836,000 | 793,105 |
| Ingredion Inc. | ||
| 3.90%, 06/01/50 (a) | 205,000 | 147,042 |
| Intel Corp. | ||
| 2.00%, 08/12/31 (a) | 632,000 | 490,053 |
| 2.45%, 11/15/29 (a) | 781,000 | 652,721 |
| 2.60%, 05/19/26 (a) | 533,000 | 495,338 |
| 2.80%, 08/12/41 (a) | 731,000 | 492,650 |
| 2.88%, 05/11/24 (a) | 334,000 | 325,403 |
| 3.10%, 02/15/60 (a) | 372,000 | 224,628 |
| Intercontinental Exchange Inc. | ||
| 1.85%, 09/15/32 (a) | 205,000 | 149,664 |
| 2.65%, 09/15/40 (a) | 138,000 | 92,471 |
| International Business Machines Corp. | ||
| 3.45%, 02/19/26 (a) | 704,000 | 671,602 |
| 4.15%, 05/15/39 (a) | 470,000 | 387,435 |
| 4.25%, 05/15/49 (a) | 227,000 | 179,425 |
| International Paper Co. | ||
| 4.40%, 08/15/47 (a) | 301,000 | 240,993 |
| Interstate Power & Light Co. | ||
| 3.40%, 08/15/25 (a) | 1,587,000 | 1,504,174 |
| ITC Holdings Corp. | ||
| 2.95%, 05/14/30 (a)(g) | 1,018,000 | 836,918 |
| JAB HOLDINGS BV | ||
| 2.20%, 11/23/30 (a)(g) | 498,000 | 368,147 |
| Jabil Inc. | ||
| 3.95%, 01/12/28 (a) | 316,000 | 286,786 |
| 4.25%, 05/15/27 (a) | 1,710,000 | 1,595,071 |
| John Deere Capital Corp. | ||
| 2.45%, 01/09/30 (a) | 726,000 | 610,188 |
| 3.90%, 06/07/32 (a) | 345,000 | 316,510 |
| Johnson & Johnson | ||
| 3.63%, 03/03/37 (a) | 203,000 | 175,603 |
| 24 | State Street Income Fund |
| Principal Amount | Fair Value | |
| Johnson Controls International PLC | ||
| 4.50%, 02/15/47 (a) | $ 129,000 | $ 102,883 |
| JPMorgan Chase & Co. (1.58% fixed rate until 04/22/26; 0.89% + SOFR thereafter) | ||
| 1.58%, 04/22/27 (a)(b) | 1,149,000 | 993,219 |
| JPMorgan Chase & Co. (2.96% fixed rate until 01/25/32; 1.26% + SOFR thereafter) | ||
| 2.96%, 01/25/33 (b) | 4,000,000 | 3,150,560 |
| JPMorgan Chase & Co. (2.96% fixed rate until 05/13/30; 2.52% + SOFR thereafter) | ||
| 2.96%, 05/13/31 (a)(b) | 665,000 | 528,542 |
| JPMorgan Chase & Co. (3.16% fixed rate until 04/22/41; 1.46% + SOFR thereafter) | ||
| 3.16%, 04/22/42 (a)(b) | 555,000 | 380,025 |
| JPMorgan Chase & Co. (3.88% fixed rate until 07/24/37; 1.36% + 3 month USD LIBOR thereafter) | ||
| 3.88%, 07/24/38 (a)(b) | 436,000 | 342,055 |
| JPMorgan Chase & Co. (3.90% fixed rate until 01/23/48; 1.22% + 3 month USD LIBOR thereafter) | ||
| 3.90%, 01/23/49 (a)(b) | 1,302,000 | 965,641 |
| JPMorgan Chase & Co. (3.96% fixed rate until 01/29/26; 1.25% + 3 month USD LIBOR thereafter) | ||
| 3.96%, 01/29/27 (a)(b) | 731,000 | 689,735 |
| JPMorgan Chase & Co. (4.01% fixed rate until 04/23/28; 1.12% + 3 month USD LIBOR thereafter) | ||
| 4.01%, 04/23/29 (a)(b) | 301,000 | 272,251 |
| JPMorgan Chase & Co. (4.03% fixed rate until 07/24/47; 1.46% + 3 month USD LIBOR thereafter) | ||
| 4.03%, 07/24/48 (a)(b) | 294,000 | 222,784 |
| JPMorgan Chase & Co. (4.49% fixed rate until 03/24/30; 3.79% + SOFR thereafter) | ||
| 4.49%, 03/24/31 (a)(b) | 1,012,000 | 922,276 |
| Principal Amount | Fair Value | |
| JPMorgan Chase & Co. (4.60% fixed rate until 02/01/25; 3.13% + SOFR thereafter) | ||
| 4.60%, 12/31/99 (a)(b) | $ 1,137,000 | $ 989,065 |
| Kaiser Foundation Hospitals | ||
| 3.00%, 06/01/51 (a) | 568,000 | 375,312 |
| 3.27%, 11/01/49 (a) | 693,000 | 491,067 |
| Kansas City Southern/old | ||
| 3.50%, 05/01/50 (a) | 317,000 | 221,773 |
| Keurig Dr Pepper Inc. | ||
| 3.20%, 05/01/30 (a) | 454,000 | 387,421 |
| 3.80%, 05/01/50 (a) | 344,000 | 244,536 |
| KeyBank NA | ||
| 4.90%, 08/08/32 | 1,000,000 | 899,470 |
| Kinder Morgan Energy Partners LP | ||
| 4.70%, 11/01/42 (a) | 76,000 | 59,404 |
| 5.00%, 03/01/43 (a) | 156,000 | 126,402 |
| 6.38%, 03/01/41 (a) | 133,000 | 123,771 |
| Kinder Morgan Inc. | ||
| 1.75%, 11/15/26 (a) | 1,980,000 | 1,716,284 |
| 5.05%, 02/15/46 (a) | 125,000 | 102,349 |
| KLA Corp. | ||
| 3.30%, 03/01/50 (a) | 405,000 | 284,699 |
| 4.65%, 11/01/24 (a) | 161,000 | 160,583 |
| Kraft Heinz Foods Co. | ||
| 5.20%, 07/15/45 (a) | 643,000 | 559,076 |
| Kreditanstalt fuer Wiederaufbau | ||
| 2.00%, 10/04/22 (a) | 1,948,000 | 1,948,000 |
| Kyndryl Holdings Inc. | ||
| 2.05%, 10/15/26 | 791,000 | 635,814 |
| 2.70%, 10/15/28 | 1,361,000 | 1,001,097 |
| L3Harris Technologies Inc. | ||
| 3.85%, 12/15/26 (a) | 328,000 | 309,327 |
| Lear Corp. | ||
| 4.25%, 05/15/29 (a) | 270,000 | 237,900 |
| Leidos Inc. | ||
| 2.95%, 05/15/23 (a) | 1,138,000 | 1,123,343 |
| 3.63%, 05/15/25 (a) | 339,000 | 324,548 |
| 4.38%, 05/15/30 (a) | 1,480,000 | 1,294,896 |
| Liberty Mutual Group Inc. | ||
| 3.95%, 05/15/60 (a)(g) | 204,000 | 129,275 |
| Life Storage LP | ||
| 2.20%, 10/15/30 (a) | 574,000 | 436,963 |
| Lincoln National Corp. | ||
| 4.35%, 03/01/48 (a) | 649,000 | 511,470 |
| Lloyds Banking Group PLC | ||
| 3.75%, 01/11/27 (a) | 372,000 | 340,462 |
| State Street Income Fund | 25 |
| Principal Amount | Fair Value | |
| Lloyds Banking Group PLC (2.44% fixed rate until 02/05/25; 1.00% + 1 year CMT Rate thereafter) | ||
| 2.44%, 02/05/26 (a)(b) | $ 800,000 | $ 735,592 |
| Lloyds Banking Group PLC (2.91% fixed rate until 11/07/22; 0.81% + 3 month USD LIBOR thereafter) | ||
| 2.91%, 11/07/23 (a)(b) | 982,000 | 979,496 |
| Lockheed Martin Corp. | ||
| 3.55%, 01/15/26 (a) | 146,000 | 141,129 |
| 3.80%, 03/01/45 (a) | 115,000 | 91,534 |
| 4.50%, 05/15/36 (a) | 372,000 | 342,463 |
| Lowe's Companies Inc. | ||
| 1.30%, 04/15/28 (a) | 270,000 | 218,835 |
| 1.70%, 09/15/28 - 10/15/30 (a) | 840,000 | 673,242 |
| 3.00%, 10/15/50 (a) | 411,000 | 251,327 |
| 3.70%, 04/15/46 (a) | 145,000 | 103,808 |
| 4.05%, 05/03/47 (a) | 343,000 | 257,734 |
| 5.63%, 04/15/53 | 644,000 | 595,294 |
| LYB International Finance III LLC | ||
| 1.25%, 10/01/25 (a) | 321,000 | 282,695 |
| 3.63%, 04/01/51 (a) | 205,000 | 134,072 |
| 3.80%, 10/01/60 (a) | 204,000 | 127,988 |
| Marsh & McLennan Companies Inc. | ||
| 2.90%, 12/15/51 (a) | 399,000 | 250,205 |
| Masco Corp. | ||
| 3.50%, 11/15/27 (a) | 117,000 | 105,694 |
| McCormick & Company Inc. | ||
| 1.85%, 02/15/31 (a) | 294,000 | 218,798 |
| 3.25%, 11/15/25 (a) | 2,940,000 | 2,763,747 |
| McDonald's Corp. | ||
| 3.60%, 07/01/30 (a) | 610,000 | 549,293 |
| 3.63%, 09/01/49 (a) | 247,000 | 180,070 |
| Medtronic Inc. | ||
| 4.63%, 03/15/45 (a) | 49,000 | 44,290 |
| Memorial Sloan-Kettering Cancer Center | ||
| 4.13%, 07/01/52 (a) | 646,000 | 537,052 |
| Merck & Company Inc. | ||
| 1.90%, 12/10/28 (a) | 1,081,000 | 906,667 |
| 2.45%, 06/24/50 (a) | 509,000 | 314,114 |
| 2.75%, 02/10/25 - 12/10/51 (a) | 1,007,000 | 855,156 |
| 2.90%, 12/10/61 (a) | 201,000 | 125,531 |
| 4.00%, 03/07/49 (a) | 136,000 | 112,222 |
| Principal Amount | Fair Value | |
| Meta Platforms Inc. | ||
| 3.85%, 08/15/32 (g) | $ 1,509,000 | $ 1,329,565 |
| 4.45%, 08/15/52 (g) | 1,509,000 | 1,232,717 |
| MetLife Inc. | ||
| 4.72%, 12/15/44 (a) | 234,000 | 201,029 |
| Microchip Technology Inc. | ||
| 2.67%, 09/01/23 (a) | 2,847,000 | 2,773,234 |
| Micron Technology Inc. | ||
| 3.37%, 11/01/41 (a) | 528,000 | 338,242 |
| 3.48%, 11/01/51 (a) | 739,000 | 437,458 |
| Microsoft Corp. | ||
| 2.40%, 08/08/26 (a) | 290,000 | 268,511 |
| 2.68%, 06/01/60 (a) | 165,000 | 104,508 |
| 2.92%, 03/17/52 (a) | 1,236,000 | 873,914 |
| 3.45%, 08/08/36 (a) | 109,000 | 95,262 |
| 3.50%, 02/12/35 (a) | 295,000 | 265,358 |
| Mid-America Apartments LP | ||
| 2.88%, 09/15/51 (a) | 631,000 | 394,659 |
| Mitsubishi UFJ Financial Group Inc. | ||
| 2.80%, 07/18/24 (a) | 1,396,000 | 1,339,378 |
| Mizuho Financial Group Inc. (3.92% fixed rate until 09/11/23; 1.00% + 3 month USD LIBOR thereafter) | ||
| 3.92%, 09/11/24 (a)(b) | 1,310,000 | 1,286,250 |
| Molson Coors Beverage Co. | ||
| 4.20%, 07/15/46 (a) | 130,000 | 96,750 |
| Morgan Stanley | ||
| 3.63%, 01/20/27 (a) | 289,000 | 269,206 |
| 4.35%, 09/08/26 (a) | 816,000 | 779,256 |
| 4.38%, 01/22/47 (a) | 307,000 | 245,486 |
| Morgan Stanley (1.51% fixed rate until 07/20/26; 0.86% + SOFR thereafter) | ||
| 1.51%, 07/20/27 (a)(b) | 633,000 | 539,791 |
| Morgan Stanley (2.48% fixed rate until 09/16/31; 1.36% + SOFR thereafter) | ||
| 2.48%, 09/16/36 (a)(b) | 2,531,000 | 1,813,639 |
| Morgan Stanley (2.80% fixed rate until 01/25/51; 1.43% + SOFR thereafter) | ||
| 2.80%, 01/25/52 (a)(b) | 1,405,000 | 847,060 |
| Morgan Stanley (2.94% fixed rate until 01/21/32; 1.29% + SOFR thereafter) | ||
| 2.94%, 01/21/33 (b) | 2,000,000 | 1,580,740 |
| 26 | State Street Income Fund |
| Principal Amount | Fair Value | |
| Morgan Stanley (3.97% fixed rate until 07/22/37; 1.46% + 3 month USD LIBOR thereafter) | ||
| 3.97%, 07/22/38 (a)(b) | $ 274,000 | $ 218,540 |
| MPLX LP | ||
| 2.65%, 08/15/30 (a) | 470,000 | 369,476 |
| 5.20%, 12/01/47 (a) | 143,000 | 116,586 |
| Mylan Inc. | ||
| 5.20%, 04/15/48 (a) | 185,000 | 127,556 |
| National Australia Bank Ltd. (3.35% fixed rate until 01/12/32; 1.70% + 5 year CMT Rate thereafter) | ||
| 3.35%, 01/12/37 (a)(b)(g) | 1,246,000 | 961,389 |
| National Retail Properties Inc. | ||
| 4.00%, 11/15/25 (a) | 381,000 | 364,625 |
| Natwest Group PLC (3.75% fixed rate until 11/01/24; 2.10% + 5 year CMT Rate thereafter) | ||
| 3.75%, 11/01/29 (a)(b) | 575,000 | 532,381 |
| Natwest Group PLC (4.52% fixed rate until 06/25/23; 1.55% + 3 month USD LIBOR thereafter) | ||
| 4.52%, 06/25/24 (a)(b) | 953,000 | 941,859 |
| NewMarket Corp. | ||
| 2.70%, 03/18/31 (a) | 419,000 | 318,976 |
| Newmont Corp. | ||
| 4.88%, 03/15/42 (a) | 236,000 | 205,228 |
| NextEra Energy Capital Holdings Inc. (5.65% fixed rate until 05/01/29; 3.16% + 3 month USD LIBOR thereafter) | ||
| 5.65%, 05/01/79 (a)(b) | 371,000 | 324,562 |
| NGPL PipeCo LLC | ||
| 3.25%, 07/15/31 (a)(g) | 656,000 | 514,514 |
| NIKE Inc. | ||
| 3.38%, 03/27/50 (a) | 200,000 | 148,054 |
| Nippon Life Insurance Co. (3.40% fixed rate until 01/23/30; 2.61% + 5 year CMT Rate thereafter) | ||
| 3.40%, 01/23/50 (a)(b)(g) | 786,000 | 660,334 |
| NiSource Inc. | ||
| 3.60%, 05/01/30 (a) | 415,000 | 361,042 |
| 3.95%, 03/30/48 (a) | 121,000 | 89,853 |
| Norfolk Southern Corp. | ||
| 3.95%, 10/01/42 (a) | 256,000 | 207,665 |
| Principal Amount | Fair Value | |
| NOV Inc. | ||
| 3.60%, 12/01/29 (a) | $ 608,000 | $ 513,888 |
| Novant Health Inc. | ||
| 3.32%, 11/01/61 (a) | 396,000 | 265,724 |
| Novartis Capital Corp. | ||
| 2.20%, 08/14/30 (a) | 608,000 | 508,039 |
| 3.00%, 11/20/25 (a) | 52,000 | 49,529 |
| Nutrien Ltd. | ||
| 4.90%, 06/01/43 (a) | 254,000 | 221,013 |
| NVIDIA Corp. | ||
| 2.85%, 04/01/30 (a) | 204,000 | 174,918 |
| 3.50%, 04/01/50 (a) | 270,000 | 198,736 |
| NXP BV/NXP Funding LLC/NXP USA Inc. | ||
| 3.25%, 11/30/51 (a) | 880,000 | 528,739 |
| Oklahoma Gas & Electric Co. | ||
| 3.25%, 04/01/30 (a) | 341,000 | 295,163 |
| Oncor Electric Delivery Company LLC | ||
| 3.80%, 09/30/47 (a) | 136,000 | 107,836 |
| ONEOK Inc. | ||
| 4.35%, 03/15/29 (a) | 378,000 | 337,429 |
| Oracle Corp. | ||
| 1.65%, 03/25/26 (a) | 755,000 | 662,112 |
| 2.30%, 03/25/28 (a) | 279,000 | 232,873 |
| 2.40%, 09/15/23 (a) | 237,000 | 231,165 |
| 2.65%, 07/15/26 (a) | 423,000 | 380,637 |
| 2.88%, 03/25/31 (a) | 403,000 | 317,463 |
| 2.95%, 04/01/30 (a) | 611,000 | 493,077 |
| 3.60%, 04/01/50 (a) | 406,000 | 254,018 |
| 3.65%, 03/25/41 (a) | 444,000 | 301,387 |
| 3.80%, 11/15/37 (a) | 128,000 | 93,231 |
| 3.95%, 03/25/51 (a) | 447,000 | 296,750 |
| 4.00%, 07/15/46 - 11/15/47 (a) | 609,000 | 410,106 |
| 4.10%, 03/25/61 (a) | 527,000 | 333,570 |
| Otis Worldwide Corp. | ||
| 2.06%, 04/05/25 (a) | 704,000 | 652,143 |
| 2.57%, 02/15/30 (a) | 251,000 | 205,333 |
| 3.36%, 02/15/50 (a) | 238,000 | 160,710 |
| Owens Corning | ||
| 4.40%, 01/30/48 (a) | 174,000 | 130,157 |
| Pacific Gas & Electric Co. | ||
| 2.10%, 08/01/27 (a) | 341,000 | 276,425 |
| 2.50%, 02/01/31 (a) | 610,000 | 444,129 |
| 3.00%, 06/15/28 (a) | 576,000 | 474,924 |
| 3.30%, 08/01/40 (a) | 610,000 | 391,699 |
| 3.50%, 08/01/50 (a) | 265,000 | 161,502 |
| 4.30%, 03/15/45 (a) | 406,000 | 271,468 |
| State Street Income Fund | 27 |
| Principal Amount | Fair Value | |
| PacifiCorp | ||
| 2.70%, 09/15/30 (a) | $ 370,000 | $ 308,562 |
| 2.90%, 06/15/52 (a) | 919,000 | 586,864 |
| 6.25%, 10/15/37 (a) | 576,000 | 587,578 |
| Packaging Corp. of America | ||
| 3.05%, 10/01/51 (a) | 551,000 | 347,091 |
| Paramount Global | ||
| 2.90%, 01/15/27 (a) | 190,000 | 169,001 |
| 3.70%, 06/01/28 (a) | 184,000 | 164,573 |
| 5.25%, 04/01/44 (a) | 69,000 | 50,651 |
| Parker-Hannifin Corp. | ||
| 3.25%, 06/14/29 (a) | 365,000 | 321,861 |
| 4.50%, 09/15/29 (a) | 645,000 | 610,505 |
| PartnerRe Finance B LLC (4.50% fixed rate until 10/01/30; 3.82% + 5 year CMT Rate thereafter) | ||
| 4.50%, 10/01/50 (a)(b) | 328,000 | 279,751 |
| PayPal Holdings Inc. | ||
| 2.65%, 10/01/26 (a) | 537,000 | 493,149 |
| 3.25%, 06/01/50 (a) | 308,000 | 208,245 |
| PepsiCo Inc. | ||
| 1.63%, 05/01/30 (a) | 391,000 | 313,316 |
| 2.63%, 07/29/29 (a) | 525,000 | 456,944 |
| 2.75%, 10/21/51 (a) | 972,000 | 656,013 |
| Petroleos Mexicanos | ||
| 6.70%, 02/16/32 | 1,516,000 | 1,066,400 |
| 7.69%, 01/23/50 (a) | 879,000 | 537,491 |
| Pfizer Inc. | ||
| 2.70%, 05/28/50 (a) | 721,000 | 487,410 |
| 3.45%, 03/15/29 (a) | 201,000 | 185,153 |
| 3.60%, 09/15/28 (a) | 463,000 | 435,452 |
| 3.90%, 03/15/39 (a) | 228,000 | 195,360 |
| 4.13%, 12/15/46 (a) | 155,000 | 134,636 |
| 4.40%, 05/15/44 (a) | 94,000 | 83,876 |
| Philip Morris International Inc. | ||
| 1.50%, 05/01/25 (a) | 432,000 | 395,945 |
| 2.10%, 05/01/30 (a) | 206,000 | 156,486 |
| 3.38%, 08/15/29 (a) | 301,000 | 257,346 |
| 4.13%, 03/04/43 (a) | 117,000 | 81,282 |
| Phillips 66 Co. | ||
| 2.15%, 12/15/30 (a) | 2,250,000 | 1,736,347 |
| 3.15%, 12/15/29 (a)(g) | 1,152,000 | 970,583 |
| 3.30%, 03/15/52 (a) | 670,000 | 439,835 |
| 3.75%, 03/01/28 (a)(g) | 155,000 | 140,835 |
| 4.68%, 02/15/45 (a)(g) | 219,000 | 181,301 |
| Pioneer Natural Resources Co. | ||
| 1.13%, 01/15/26 (a) | 1,216,000 | 1,061,921 |
| 2.15%, 01/15/31 (a) | 355,000 | 273,620 |
| Principal Amount | Fair Value | |
| Plains All American Pipeline LP/PAA Finance Corp. | ||
| 3.55%, 12/15/29 (a) | $ 589,000 | $ 491,338 |
| PPL Capital Funding Inc. | ||
| 3.10%, 05/15/26 (a) | 447,000 | 410,632 |
| Precision Castparts Corp. | ||
| 4.38%, 06/15/45 (a) | 237,000 | 201,362 |
| Prospect Capital Corp. | ||
| 3.36%, 11/15/26 (a) | 741,000 | 613,155 |
| Prudential Financial Inc. | ||
| 3.94%, 12/07/49 (a) | 411,000 | 314,090 |
| Prudential Financial Inc. (5.70% fixed rate until 09/15/28; 2.67% + 3 month USD LIBOR thereafter) | ||
| 5.70%, 09/15/48 (a)(b) | 479,000 | 449,661 |
| Public Service Company of Colorado | ||
| 3.70%, 06/15/28 (a) | 433,000 | 404,444 |
| Public Service Electric & Gas Co. | ||
| 2.38%, 05/15/23 (a) | 909,000 | 897,319 |
| PVH Corp. | ||
| 4.63%, 07/10/25 (a) | 1,179,000 | 1,130,413 |
| QUALCOMM Inc. | ||
| 1.30%, 05/20/28 (a) | 159,000 | 131,347 |
| 4.30%, 05/20/47 (a) | 72,000 | 61,221 |
| Quanta Services Inc. | ||
| 2.35%, 01/15/32 (a) | 680,000 | 500,983 |
| 3.05%, 10/01/41 (a) | 736,000 | 466,455 |
| Quest Diagnostics Inc. | ||
| 2.95%, 06/30/30 (a) | 148,000 | 123,675 |
| Raytheon Technologies Corp. | ||
| 1.90%, 09/01/31 (a) | 802,000 | 612,896 |
| 2.82%, 09/01/51 (a) | 476,000 | 299,076 |
| 3.13%, 05/04/27 (a) | 613,000 | 563,525 |
| 3.50%, 03/15/27 (a) | 318,000 | 297,724 |
| 3.95%, 08/16/25 (a) | 260,000 | 253,581 |
| 4.15%, 05/15/45 (a) | 248,000 | 198,579 |
| 4.45%, 11/16/38 (a) | 206,000 | 179,506 |
| Realty Income Corp. | ||
| 2.85%, 12/15/32 (a) | 385,000 | 308,624 |
| 3.00%, 01/15/27 (a) | 117,000 | 106,491 |
| 3.25%, 01/15/31 (a) | 391,000 | 332,045 |
| Regeneron Pharmaceuticals Inc. | ||
| 1.75%, 09/15/30 (a) | 722,000 | 546,431 |
| Regions Financial Corp. | ||
| 1.80%, 08/12/28 (a) | 1,585,000 | 1,302,268 |
| 28 | State Street Income Fund |
| Principal Amount | Fair Value | |
| Reliance Industries Ltd. | ||
| 3.63%, 01/12/52 (a)(g) | $ 1,000,000 | $ 658,940 |
| Republic Services Inc. | ||
| 2.38%, 03/15/33 (a) | 1,111,000 | 852,704 |
| Reynolds American Inc. | ||
| 4.45%, 06/12/25 (a) | 27,000 | 26,114 |
| Rio Tinto Finance USA Ltd. | ||
| 2.75%, 11/02/51 (a) | 597,000 | 385,978 |
| Rio Tinto Finance USA PLC | ||
| 4.13%, 08/21/42 | 150,000 | 126,351 |
| Rockwell Automation Inc. | ||
| 2.80%, 08/15/61 (a) | 219,000 | 128,943 |
| 4.20%, 03/01/49 (a) | 281,000 | 237,942 |
| Rogers Communications Inc. | ||
| 5.00%, 03/15/44 (a) | 110,000 | 90,071 |
| Roper Technologies Inc. | ||
| 2.95%, 09/15/29 (a) | 426,000 | 359,250 |
| Ross Stores Inc. | ||
| 4.70%, 04/15/27 (a) | 155,000 | 151,365 |
| Royalty Pharma PLC | ||
| 0.75%, 09/02/23 (a) | 464,000 | 444,354 |
| 1.20%, 09/02/25 (a) | 619,000 | 547,741 |
| 1.75%, 09/02/27 (a) | 312,000 | 257,375 |
| 2.15%, 09/02/31 (a) | 528,000 | 389,727 |
| 2.20%, 09/02/30 (a) | 133,000 | 101,661 |
| 3.30%, 09/02/40 (a) | 79,000 | 53,387 |
| RPM International Inc. | ||
| 3.75%, 03/15/27 (a) | 224,000 | 206,783 |
| Ryder System Inc. | ||
| 2.90%, 12/01/26 (a) | 1,038,000 | 937,729 |
| Sabine Pass Liquefaction LLC | ||
| 4.20%, 03/15/28 (a) | 202,000 | 184,426 |
| 4.50%, 05/15/30 (a) | 232,000 | 211,415 |
| 5.00%, 03/15/27 (a) | 118,000 | 113,331 |
| 5.88%, 06/30/26 (a) | 770,000 | 769,592 |
| Salesforce Inc. | ||
| 1.95%, 07/15/31 (a) | 695,000 | 548,049 |
| 2.70%, 07/15/41 (a) | 690,000 | 475,665 |
| Santander UK Group Holdings PLC | ||
| 4.75%, 09/15/25 (a)(g) | 1,003,000 | 945,548 |
| Saudi Arabian Oil Co. | ||
| 3.50%, 04/16/29 (a)(g) | 1,243,000 | 1,121,360 |
| 4.38%, 04/16/49 (a)(g) | 256,000 | 212,106 |
| Schlumberger Holdings Corp. | ||
| 3.90%, 05/17/28 (a)(g) | 460,000 | 415,877 |
| Sealed Air Corp. | ||
| 1.57%, 10/15/26 (a)(g) | 2,504,000 | 2,102,108 |
| Principal Amount | Fair Value | |
| Selective Insurance Group Inc. | ||
| 5.38%, 03/01/49 (a) | $ 176,000 | $ 151,221 |
| Sempra Energy | ||
| 3.80%, 02/01/38 (a) | 153,000 | 119,400 |
| 4.00%, 02/01/48 (a) | 166,000 | 124,103 |
| Sempra Energy (4.13% fixed rate until 04/01/27; 2.87% + 5 year CMT Rate thereafter) | ||
| 4.13%, 04/01/52 (a)(b) | 1,014,000 | 806,941 |
| Shell International Finance BV | ||
| 3.13%, 11/07/49 (a) | 684,000 | 470,134 |
| 3.75%, 09/12/46 (a) | 117,000 | 89,337 |
| Shire Acquisitions Investments Ireland DAC | ||
| 2.88%, 09/23/23 (a) | 133,000 | 130,078 |
| 3.20%, 09/23/26 (a) | 114,000 | 105,235 |
| Simon Property Group LP | ||
| 3.38%, 06/15/27 (a) | 281,000 | 257,761 |
| Sonoco Products Co. | ||
| 2.85%, 02/01/32 (a) | 776,000 | 616,400 |
| Southern California Edison Co. | ||
| 4.00%, 04/01/47 (a) | 732,000 | 535,011 |
| 4.20%, 03/01/29 (a) | 557,000 | 515,075 |
| Southern Company Gas Capital Corp. | ||
| 3.95%, 10/01/46 (a) | 399,000 | 296,126 |
| 4.40%, 05/30/47 (a) | 65,000 | 50,949 |
| Southwest Airlines Co. | ||
| 2.63%, 02/10/30 (a) | 611,000 | 490,829 |
| Southwestern Electric Power Co. | ||
| 2.75%, 10/01/26 (a) | 318,000 | 288,207 |
| Spectra Energy Partners LP | ||
| 3.38%, 10/15/26 (a) | 87,000 | 80,233 |
| 4.50%, 03/15/45 (a) | 66,000 | 52,397 |
| Spirit Realty LP | ||
| 4.00%, 07/15/29 (a) | 473,000 | 408,710 |
| Standard Chartered PLC (2.68% fixed rate until 06/29/31; 1.20% + 1 year CMT Rate thereafter) | ||
| 2.68%, 06/29/32 (a)(b)(g) | 1,297,000 | 947,549 |
| Standard Chartered PLC (2.82% fixed rate until 01/30/25; 1.21% + 3 month USD LIBOR thereafter) | ||
| 2.82%, 01/30/26 (a)(b)(g) | 1,304,000 | 1,199,458 |
| Stanley Black & Decker Inc. | ||
| 3.00%, 05/15/32 (a) | 916,000 | 750,580 |
| State Street Income Fund | 29 |
| Principal Amount | Fair Value | |
| Starbucks Corp. | ||
| 4.00%, 11/15/28 (a) | $ 243,000 | $ 228,257 |
| STERIS Irish FinCo UnLtd Co. | ||
| 2.70%, 03/15/31 (a) | 1,474,000 | 1,155,557 |
| 3.75%, 03/15/51 (a) | 604,000 | 412,544 |
| Stryker Corp. | ||
| 1.95%, 06/15/30 (a) | 851,000 | 673,796 |
| Sumitomo Mitsui Financial Group Inc. | ||
| 4.44%, 04/02/24 (a)(g) | 2,981,000 | 2,938,431 |
| Sumitomo Mitsui Trust Bank Ltd. | ||
| 1.35%, 09/16/26 (a)(g) | 3,099,000 | 2,666,906 |
| Suncor Energy Inc. | ||
| 4.00%, 11/15/47 (a) | 94,000 | 70,675 |
| Svenska Handelsbanken AB (1.42% fixed rate until 06/11/26; 0.63% + 1 year CMT Rate thereafter) | ||
| 1.42%, 06/11/27 (a)(b)(g) | 1,744,000 | 1,502,735 |
| Sysco Corp. | ||
| 3.25%, 07/15/27 (a) | 239,000 | 217,796 |
| 5.95%, 04/01/30 (a) | 80,000 | 80,978 |
| 6.60%, 04/01/50 (a) | 94,000 | 98,429 |
| Takeda Pharmaceutical Company Ltd. | ||
| 2.05%, 03/31/30 (a) | 200,000 | 158,482 |
| 3.03%, 07/09/40 (a) | 300,000 | 212,142 |
| 3.18%, 07/09/50 (a) | 300,000 | 199,596 |
| 3.38%, 07/09/60 (a) | 300,000 | 194,268 |
| Take-Two Interactive Software Inc. | ||
| 3.70%, 04/14/27 (a) | 1,945,000 | 1,806,594 |
| 4.00%, 04/14/32 (a) | 430,000 | 373,339 |
| Tampa Electric Co. | ||
| 2.40%, 03/15/31 (a) | 768,000 | 622,579 |
| 3.45%, 03/15/51 (a) | 555,000 | 389,088 |
| 4.35%, 05/15/44 (a) | 479,000 | 394,270 |
| Tapestry Inc. | ||
| 4.13%, 07/15/27 (a) | 69,000 | 63,270 |
| Targa Resources Partners LP/Targa Resources Partners Finance Corp. | ||
| 5.00%, 01/15/28 (a) | 1,940,000 | 1,795,392 |
| Target Corp. | ||
| 2.50%, 04/15/26 (a) | 251,000 | 232,878 |
| Teck Resources Ltd. | ||
| 5.40%, 02/01/43 (a) | 244,000 | 201,500 |
| Principal Amount | Fair Value | |
| Telefonica Emisiones S.A. | ||
| 4.10%, 03/08/27 (a) | $ 639,000 | $ 589,931 |
| Texas Instruments Inc. | ||
| 3.88%, 03/15/39 (a) | 315,000 | 272,236 |
| The Allstate Corp. | ||
| 4.20%, 12/15/46 (a) | 571,000 | 475,323 |
| The Allstate Corp. (5.75% fixed rate until 08/15/23; 2.94% + 3 month USD LIBOR thereafter) | ||
| 5.75%, 08/15/53 (a)(b) | 748,000 | 689,162 |
| The Bank of New York Mellon Corp. (4.63% fixed rate until 09/20/26; 3.13% + 3 month USD LIBOR thereafter) | ||
| 4.63%, 12/29/49 (a)(b) | 659,000 | 583,373 |
| The Bank of Nova Scotia (4.65% fixed rate until 10/12/22; 2.65% + 3 month USD LIBOR thereafter) | ||
| 4.65%, 12/31/99 (a)(b) | 724,000 | 626,260 |
| The Boeing Co. | ||
| 2.20%, 02/04/26 (a) | 1,126,000 | 999,629 |
| 2.70%, 02/01/27 (a) | 966,000 | 839,860 |
| 2.95%, 02/01/30 (a) | 246,000 | 198,015 |
| 3.25%, 03/01/28 (a) | 124,000 | 107,525 |
| 3.55%, 03/01/38 (a) | 165,000 | 112,860 |
| 3.75%, 02/01/50 (a) | 218,000 | 140,806 |
| 5.04%, 05/01/27 (a) | 1,421,000 | 1,368,437 |
| 5.15%, 05/01/30 (a) | 801,000 | 741,718 |
| 5.81%, 05/01/50 (a) | 496,000 | 431,619 |
| The Charles Schwab Corp. | ||
| 2.45%, 03/03/27 (a) | 1,070,000 | 962,636 |
| 2.90%, 03/03/32 (a) | 355,000 | 293,170 |
| The Charles Schwab Corp. (4.00% fixed rate until 12/01/30; 3.08% + 10 year CMT Rate thereafter) | ||
| 4.00%, 12/31/99 (a)(b) | 1,027,000 | 759,980 |
| The Cleveland Electric Illuminating Co. | ||
| 4.55%, 11/15/30 (a)(g) | 982,000 | 914,291 |
| The Clorox Co. | ||
| 1.80%, 05/15/30 (a) | 570,000 | 439,858 |
| The Coca-Cola Co. | ||
| 2.60%, 06/01/50 (a) | 406,000 | 261,147 |
| 2.75%, 06/01/60 (a) | 314,000 | 195,974 |
| The Dow Chemical Co. | ||
| 2.10%, 11/15/30 (a) | 312,000 | 239,716 |
| 3.60%, 11/15/50 (a) | 312,000 | 212,494 |
| 4.25%, 10/01/34 (a) | 193,000 | 162,676 |
| 30 | State Street Income Fund |
| Principal Amount | Fair Value | |
| 5.55%, 11/30/48 (a) | $ 222,000 | $ 201,414 |
| The Estee Lauder Companies Inc. | ||
| 2.38%, 12/01/29 (a) | 316,000 | 266,909 |
| The George Washington University | ||
| 4.13%, 09/15/48 | 905,000 | 737,828 |
| The Goldman Sachs Group Inc. | ||
| 3.85%, 01/26/27 (a) | 2,007,000 | 1,871,046 |
| 4.25%, 10/21/25 (a) | 521,000 | 502,280 |
| 5.15%, 05/22/45 (a) | 157,000 | 130,935 |
| The Goldman Sachs Group Inc. (1.54% fixed rate until 09/10/26; 0.82% + SOFR thereafter) | ||
| 1.54%, 09/10/27 (a)(b) | 752,000 | 636,139 |
| The Goldman Sachs Group Inc. (2.38% fixed rate until 07/21/31; 1.25% + SOFR thereafter) | ||
| 2.38%, 07/21/32 (a)(b) | 410,000 | 309,710 |
| The Goldman Sachs Group Inc. (2.91% fixed rate until 07/21/41; 1.47% + SOFR thereafter) | ||
| 2.91%, 07/21/42 (a)(b) | 334,000 | 214,689 |
| The Goldman Sachs Group Inc. (3.21% fixed rate until 04/22/41; 1.51% + SOFR thereafter) | ||
| 3.21%, 04/22/42 (a)(b) | 509,000 | 343,870 |
| The Goldman Sachs Group Inc. (3.44% fixed rate until 02/24/42; 1.63% + SOFR thereafter) | ||
| 3.44%, 02/24/43 (b) | 859,000 | 595,046 |
| The Goldman Sachs Group Inc. (3.81% fixed rate until 04/23/28; 1.16% + 3 month USD LIBOR thereafter) | ||
| 3.81%, 04/23/29 (a)(b) | 236,000 | 209,835 |
| The Goldman Sachs Group Inc. (4.02% fixed rate until 10/31/37; 1.37% + 3 month USD LIBOR thereafter) | ||
| 4.02%, 10/31/38 (a)(b) | 244,000 | 193,487 |
| Principal Amount | Fair Value | |
| The Goldman Sachs Group Inc. (4.22% fixed rate until 05/01/28; 1.30% + 3 month USD LIBOR thereafter) | ||
| 4.22%, 05/01/29 (a)(b) | $ 389,000 | $ 354,235 |
| The Hartford Financial Services Group Inc. | ||
| 2.80%, 08/19/29 (a) | 880,000 | 742,579 |
| The Hartford Financial Services Group Inc. 2.13% + 3 month USD LIBOR | ||
| 5.03%, 02/12/67 (a)(b)(g) | 566,000 | 464,239 |
| The Home Depot Inc. | ||
| 2.70%, 04/15/30 (a) | 234,000 | 200,051 |
| 3.35%, 04/15/50 (a) | 406,000 | 291,431 |
| 3.50%, 09/15/56 (a) | 222,000 | 157,607 |
| 3.90%, 12/06/28 - 06/15/47 (a) | 461,000 | 400,550 |
| 4.50%, 12/06/48 (a) | 179,000 | 156,605 |
| 4.95%, 09/15/52 | 260,000 | 243,747 |
| The Kroger Co. | ||
| 2.20%, 05/01/30 (a) | 366,000 | 290,681 |
| 4.65%, 01/15/48 (a) | 153,000 | 129,182 |
| The Northwestern Mutual Life Insurance Co. | ||
| 3.45%, 03/30/51 (a)(g) | 987,000 | 681,948 |
| The Progressive Corp. | ||
| 3.00%, 03/15/32 (a) | 1,284,000 | 1,080,281 |
| 3.70%, 03/15/52 (a) | 145,000 | 110,589 |
| The Southern Co. | ||
| 3.25%, 07/01/26 (a) | 142,000 | 131,682 |
| The Toronto-Dominion Bank | ||
| 3.20%, 03/10/32 (a) | 1,713,000 | 1,407,641 |
| 4.46%, 06/08/32 (a) | 905,000 | 825,803 |
| The Travelers Companies Inc. | ||
| 2.55%, 04/27/50 (a) | 730,000 | 451,936 |
| The Walt Disney Co. | ||
| 2.65%, 01/13/31 (a) | 597,000 | 493,283 |
| 3.38%, 11/15/26 (a) | 94,000 | 88,535 |
| 3.60%, 01/13/51 (a) | 392,000 | 291,946 |
| 4.75%, 11/15/46 (a) | 61,000 | 54,267 |
| 6.65%, 11/15/37 (a) | 397,000 | 434,175 |
| The Williams Companies Inc. | ||
| 3.75%, 06/15/27 (a) | 100,000 | 92,044 |
| 4.85%, 03/01/48 (a) | 202,000 | 167,090 |
| 4.90%, 01/15/45 (a) | 476,000 | 386,488 |
| 5.40%, 03/04/44 (a) | 69,000 | 60,280 |
| The Williams Cos. Inc. | ||
| 5.30%, 08/15/52 | 350,000 | 306,625 |
| State Street Income Fund | 31 |
| Principal Amount | Fair Value | |
| Thermo Fisher Scientific Inc. | ||
| 2.80%, 10/15/41 (a) | $ 447,000 | $ 313,687 |
| Time Warner Cable LLC | ||
| 6.55%, 05/01/37 | 177,000 | 160,546 |
| T-Mobile USA Inc. | ||
| 3.50%, 04/15/25 (a) | 735,000 | 703,145 |
| 3.75%, 04/15/27 (a) | 916,000 | 846,659 |
| 3.88%, 04/15/30 (a) | 251,000 | 222,436 |
| 4.50%, 04/15/50 (a) | 119,000 | 95,709 |
| TotalEnergies Capital International S.A. | ||
| 3.46%, 02/19/29 (a) | 785,000 | 716,430 |
| Trane Technologies Luxembourg Finance S.A. | ||
| 3.55%, 11/01/24 (a) | 423,000 | 409,709 |
| 3.80%, 03/21/29 (a) | 557,000 | 500,609 |
| TransCanada PipeLines Ltd. | ||
| 4.25%, 05/15/28 (a) | 564,000 | 522,918 |
| 4.88%, 01/15/26 (a) | 128,000 | 125,755 |
| Transcanada Trust (5.63% fixed rate until 05/20/25; 3.53% + 3 month USD LIBOR thereafter) | ||
| 5.63%, 05/20/75 (a)(b) | 1,115,000 | 1,037,652 |
| Transcontinental Gas Pipe Line Company LLC | ||
| 4.00%, 03/15/28 (a) | 265,000 | 242,687 |
| Truist Financial Corp. (4.80% fixed rate until 09/01/24; 3.00% + 5 year CMT Rate thereafter) | ||
| 4.80%, 12/31/99 (a)(b) | 1,539,000 | 1,387,147 |
| TWDC Enterprises 18 Corp. | ||
| 4.13%, 06/01/44 (a) | 129,000 | 105,321 |
| Tyco Electronics Group S.A. | ||
| 3.13%, 08/15/27 (a) | 270,000 | 247,766 |
| Tyson Foods Inc. | ||
| 4.00%, 03/01/26 (a) | 999,000 | 958,141 |
| UBS Group AG (3.13% fixed rate until 08/13/29; 1.47% + 3 month USD LIBOR thereafter) | ||
| 3.13%, 08/13/30 (a)(b)(g) | 1,015,000 | 833,406 |
| UDR Inc. | ||
| 2.10%, 08/01/32 (a) | 515,000 | 373,226 |
| 3.00%, 08/15/31 (a) | 328,000 | 262,498 |
| UniCredit S.p.A. (2.57% fixed rate until 09/22/25; 2.30% + 1 year CMT Rate thereafter) | ||
| 2.57%, 09/22/26 (a)(b)(g) | 1,783,000 | 1,527,015 |
| Principal Amount | Fair Value | |
| Union Pacific Corp. | ||
| 3.55%, 05/20/61 (a) | $ 475,000 | $ 330,230 |
| 3.60%, 09/15/37 (a) | 87,000 | 70,688 |
| 3.80%, 04/06/71 (a) | 218,000 | 153,864 |
| 4.10%, 09/15/67 (a) | 149,000 | 112,605 |
| UnitedHealth Group Inc. | ||
| 2.00%, 05/15/30 (a) | 641,000 | 517,120 |
| 4.20%, 05/15/32 (a) | 670,000 | 622,946 |
| 4.45%, 12/15/48 (a) | 438,000 | 370,785 |
| 4.75%, 07/15/45 - 05/15/52 (a) | 1,023,000 | 917,105 |
| Utah Acquisition Sub Inc. | ||
| 3.95%, 06/15/26 (a) | 83,000 | 75,606 |
| Ventas Realty LP | ||
| 3.25%, 10/15/26 (a) | 307,000 | 281,924 |
| Verizon Communications Inc. | ||
| 2.10%, 03/22/28 (a) | 829,000 | 699,527 |
| 2.36%, 03/15/32 (a) | 1,108,000 | 852,063 |
| 2.55%, 03/21/31 (a) | 768,000 | 613,133 |
| 3.00%, 03/22/27 (a) | 1,423,000 | 1,295,869 |
| 3.40%, 03/22/41 (a) | 555,000 | 406,266 |
| 3.55%, 03/22/51 (a) | 418,000 | 295,154 |
| 3.70%, 03/22/61 (a) | 523,000 | 355,902 |
| 4.40%, 11/01/34 (a) | 638,000 | 558,014 |
| 4.86%, 08/21/46 (a) | 834,000 | 723,829 |
| Virginia Electric & Power Co. | ||
| 4.00%, 11/15/46 (a) | 406,000 | 322,445 |
| Visa Inc. | ||
| 2.70%, 04/15/40 (a) | 421,000 | 304,690 |
| Vistra Operations Company LLC | ||
| 3.55%, 07/15/24 (a)(g) | 1,428,000 | 1,360,241 |
| Viterra Finance BV | ||
| 2.00%, 04/21/26 (a)(g) | 712,000 | 603,100 |
| 3.20%, 04/21/31 (a)(g) | 1,000,000 | 748,800 |
| Vodafone Group PLC | ||
| 4.38%, 05/30/28 (a) | 281,000 | 264,798 |
| 5.25%, 05/30/48 (a) | 144,000 | 118,555 |
| Volkswagen Group of America Finance LLC | ||
| 1.63%, 11/24/27 (a)(g) | 1,420,000 | 1,155,781 |
| Vontier Corp. | ||
| 2.40%, 04/01/28 (a) | 640,000 | 499,136 |
| 2.95%, 04/01/31 (a) | 838,000 | 602,396 |
| Vornado Realty LP | ||
| 2.15%, 06/01/26 (a) | 984,000 | 832,366 |
| 3.50%, 01/15/25 (a) | 261,000 | 243,698 |
| Vulcan Materials Co. | ||
| 3.90%, 04/01/27 (a) | 123,000 | 116,027 |
| 32 | State Street Income Fund |
| Principal Amount | Fair Value | |
| Walgreens Boots Alliance Inc. | ||
| 4.10%, 04/15/50 (a) | $ 45,000 | $ 32,189 |
| Walmart Inc. | ||
| 1.80%, 09/22/31 (a) | 528,000 | 420,726 |
| 2.50%, 09/22/41 (a) | 528,000 | 368,211 |
| 2.65%, 09/22/51 (a) | 248,000 | 167,274 |
| Warnermedia Holdings Inc. | ||
| 5.05%, 03/15/42 (a)(g) | 225,000 | 168,410 |
| 5.14%, 03/15/52 (a)(g) | 220,000 | 159,865 |
| 5.39%, 03/15/62 (a)(g) | 220,000 | 159,474 |
| Waste Connections Inc. | ||
| 2.20%, 01/15/32 (a) | 723,000 | 561,684 |
| 2.95%, 01/15/52 (a) | 723,000 | 469,415 |
| WEC Energy Group Inc. | ||
| 3.55%, 06/15/25 (a) | 86,000 | 81,698 |
| Wells Fargo & Co. | ||
| 4.15%, 01/24/29 (a) | 754,000 | 693,650 |
| 4.75%, 12/07/46 (a) | 850,000 | 679,907 |
| Wells Fargo & Co. (1.65% fixed rate until 06/02/23; 1.60% + SOFR thereafter) | ||
| 1.65%, 06/02/24 (a)(b) | 741,000 | 723,490 |
| Wells Fargo & Co. (2.19% fixed rate until 04/30/25; 2.00% + SOFR thereafter) | ||
| 2.19%, 04/30/26 (a)(b) | 889,000 | 812,706 |
| Wells Fargo & Co. (2.39% fixed rate until 06/02/27; 2.10% + SOFR thereafter) | ||
| 2.39%, 06/02/28 (a)(b) | 1,705,000 | 1,461,867 |
| Wells Fargo & Co. (3.07% fixed rate until 04/30/40; 2.53% + SOFR thereafter) | ||
| 3.07%, 04/30/41 (a)(b) | 850,000 | 584,494 |
| Wells Fargo & Co. (3.20% fixed rate until 06/17/26; 1.17% + 3 month USD LIBOR thereafter) | ||
| 3.20%, 06/17/27 (a)(b) | 1,991,000 | 1,812,348 |
| Wells Fargo & Co. (3.35% fixed rate until 03/02/32; 1.50% + SOFR thereafter) | ||
| 3.35%, 03/02/33 (b) | 1,000,000 | 812,750 |
| Wells Fargo & Co. (5.88% fixed rate until 06/15/25; 3.99% + 3 month USD LIBOR thereafter) | ||
| 5.88%, 12/29/49 (a)(b) | 1,407,000 | 1,344,895 |
| Westlake Corp. | ||
| 2.88%, 08/15/41 (a) | 283,000 | 179,111 |
| 3.13%, 08/15/51 (a) | 314,000 | 193,625 |
| Principal Amount | Fair Value | |
| 3.38%, 08/15/61 (a) | $ 317,000 | $ 182,896 |
| Westpac Banking Corp. (2.89% fixed rate until 02/04/25; 1.35% + 5 year CMT Rate thereafter) | ||
| 2.89%, 02/04/30 (a)(b) | 627,000 | 577,348 |
| Westpac Banking Corp. (4.11% fixed rate until 07/24/29; 2.00% + 5 year CMT Rate thereafter) | ||
| 4.11%, 07/24/34 (a)(b) | 454,000 | 386,554 |
| Weyerhaeuser Co. | ||
| 4.00%, 03/09/52 (a) | 565,000 | 414,360 |
| Willis North America Inc. | ||
| 3.88%, 09/15/49 (a) | 410,000 | 286,422 |
| Workday Inc. | ||
| 3.50%, 04/01/27 (a) | 715,000 | 662,083 |
| 3.70%, 04/01/29 (a) | 1,430,000 | 1,282,510 |
| WPP Finance 2010 | ||
| 3.75%, 09/19/24 (a) | 244,000 | 236,358 |
| Xcel Energy Inc. | ||
| 3.40%, 06/01/30 (a) | 509,000 | 442,993 |
| Yamana Gold Inc. | ||
| 2.63%, 08/15/31 (a) | 832,000 | 615,331 |
| Zoetis Inc. | ||
| 3.00%, 09/12/27 (a) | 117,000 | 105,253 |
| 3.90%, 08/20/28 (a) | 279,000 | 258,580 |
| 460,607,774 | ||
| Non-Agency Collateralized Mortgage Obligations - 5.7% | ||
| BANK 2017-BNK7 | ||
| 3.18%, 09/15/60 (a) | 20,509,000 | 18,622,975 |
| BANK 2018-BNK15 | ||
| 4.41%, 11/15/61 (a)(b) | 8,550,000 | 8,142,864 |
| BPR Trust 2022-OANA 1.90% + 1-month Term SOFR | ||
| 4.74%, 04/15/37 (a)(b)(g) | 3,084,865 | 3,063,681 |
| Cantor Commercial Real Estate Lending 2019-CF3 | ||
| 3.01%, 01/15/53 (a) | 4,022,000 | 3,460,597 |
| CD 2019-CD8 Mortgage Trust | ||
| 2.91%, 08/15/57 (a) | 7,323,000 | 6,284,950 |
| Citigroup Commercial Mortgage Trust 2016-P6 | ||
| 4.03%, 12/10/49 (a)(b) | 2,942,926 | 2,709,440 |
| COMM 2012-CCRE3 Mortgage Trust | ||
| 3.92%, 10/15/45 (a)(g) | 1,602,000 | 1,533,230 |
| State Street Income Fund | 33 |
| Principal Amount | Fair Value | |
| COMM 2013-LC13 Mortgage Trust | ��� | |
| 4.56%, 08/10/46 (a)(b)(g) | $ 1,375,000 | $ 1,363,905 |
| COMM 2014-CR14 Mortgage Trust | ||
| 4.53%, 02/10/47 (a)(b) | 1,940,000 | 1,904,016 |
| GS Mortgage Securities Trust 2012-GCJ9 | ||
| 1.94%, 11/10/45 (a)(b)(d) | 836,878 | 33 |
| GS Mortgage Securities Trust 2015-GS1 | ||
| 4.57%, 11/10/48 (a)(b) | 3,270,000 | 2,605,051 |
| GS Mortgage Securities Trust 2018-GS9 | ||
| 4.14%, 03/10/51 (a)(b) | 2,609,000 | 2,371,657 |
| GS Mortgage Securities Trust 2019-GC42 | ||
| 2.75%, 09/01/52 (a) | 13,110,000 | 11,156,160 |
| GS Mortgage Securities Trust 2019-GSA1 | ||
| 3.05%, 11/10/52 (a) | 6,397,000 | 5,508,893 |
| Impac CMB Trust 2004-5 0.72% + 3 month USD LIBOR | ||
| 3.80%, 10/25/34 (a)(b) | 161,025 | 157,547 |
| JP Morgan Chase Commercial Mortgage Securities Trust 2012-LC9 | ||
| 1.31%, 12/15/47 (b)(d) | 1,602,263 | 63 |
| JPMBB Commercial Mortgage Securities Trust 2013-C12 | ||
| 4.17%, 07/15/45 (a)(b) | 1,010,000 | 995,438 |
| JPMBB Commercial Mortgage Securities Trust 2015-C32 | ||
| 4.81%, 11/15/48 (a)(b) | 2,174,000 | 1,676,630 |
| MASTR Alternative Loan Trust 2003-5 | ||
| 5.00%, 10/25/22 (a)(d) | 9,284 | 1,161 |
| Morgan Stanley Bank of America Merrill Lynch Trust 2015-C21 | ||
| 0.99%, 03/15/48 (a)(b)(d) | 25,672,556 | 389,510 |
| Wells Fargo Commercial Mortgage Trust 2014-LC16 | ||
| 4.32%, 08/15/50 (a) | 4,152,195 | 3,574,210 |
| Wells Fargo Commercial Mortgage Trust 2015-C26 | ||
| 1.34%, 02/15/48 (b)(d) | 20,431,511 | 454,781 |
| WFRBS Commercial Mortgage Trust 2013-C17 | ||
| 4.26%, 12/15/46 (a) | 1,880,000 | 1,852,017 |
| Principal Amount | Fair Value | |
| WFRBS Commercial Mortgage Trust 2014-LC14 | ||
| 4.35%, 03/15/47 (a)(b) | $ 4,333,000 | $ 4,237,522 |
| 82,066,331 | ||
| Sovereign Bonds - 0.9% | ||
| Government of Chile | ||
| 2.55%, 01/27/32 (a) | 2,507,000 | 1,969,223 |
| 3.63%, 10/30/42 (a) | 150,000 | 107,246 |
| 3.86%, 06/21/47 (a) | 860,000 | 630,638 |
| Government of Indonesia | ||
| 3.50%, 01/11/28 (a) | 578,000 | 528,350 |
| 4.35%, 01/11/48 (a) | 232,000 | 183,394 |
| Government of Mexico | ||
| 4.60%, 02/10/48 (a) | 972,000 | 709,706 |
| 4.75%, 03/08/44 (a) | 2,068,000 | 1,590,974 |
| Government of Panama | ||
| 3.16%, 01/23/30 (a) | 1,217,000 | 993,169 |
| 3.87%, 07/23/60 (a) | 826,000 | 488,777 |
| 4.50%, 05/15/47 (a) | 530,000 | 376,311 |
| Government of Peru | ||
| 1.86%, 12/01/32 (a) | 1,230,000 | 867,162 |
| 2.78%, 12/01/60 (a) | 2,055,000 | 1,110,728 |
| 5.63%, 11/18/50 (a) | 884,000 | 830,500 |
| Government of Philippines | ||
| 3.95%, 01/20/40 (a) | 835,000 | 664,769 |
| Government of Qatar | ||
| 3.38%, 03/14/24 (a)(g) | 1,045,000 | 1,023,065 |
| 4.82%, 03/14/49 (a)(g) | 275,000 | 254,372 |
| Government of Uruguay | ||
| 5.10%, 06/18/50 (a) | 884,133 | 806,188 |
| 13,134,572 | ||
| Municipal Bonds and Notes - 0.4% | ||
| American Municipal Power Inc. | ||
| 6.27%, 02/15/50 | 1,040,000 | 1,106,207 |
| Board of Regents of the University of Texas System | ||
| 3.35%, 08/15/47 | 1,025,000 | 778,760 |
| Port Authority of New York & New Jersey | ||
| 4.46%, 10/01/62 | 1,870,000 | 1,633,814 |
| State of California | ||
| 4.60%, 04/01/38 | 1,840,000 | 1,719,375 |
| 34 | State Street Income Fund |
| Principal Amount | Fair Value | |
| State of Illinois | ||
| 5.10%, 06/01/33 | $ 745,000 | $ 709,658 |
| 5,947,814 | ||
| Total Bonds and Notes (Cost $1,552,612,908) | 1,358,659,171 | |
| Number of Shares | ||
| Domestic Equity - 0.1% | ||
| Preferred Stock - 0.1% | ||
| Wells Fargo & Co. 5.85%, (5.85% fixed rate until 09/15/23; 3.09% + 3 month USD LIBOR thereafter) (Cost $1,375,850) (b) | 55,034 | 1,235,513 |
| Total Investments in Securities (Cost $1,553,988,758) | 1,359,894,684 | |
| Number of Shares | Fair Value | |
| Short-Term Investments - 13.6% | ||
| State Street Institutional U.S. Government Money Market Fund - Class G Shares 2.98% (h)(i) (Cost $195,143,093) | 195,143,093 | $ 195,143,093 |
| Total Investments (Cost $1,749,131,851) | 1,555,037,777 | |
| Liabilities in Excess of Other Assets, net - (8.5)% | (122,298,576) | |
| NET ASSETS - 100.0% | $ 1,432,739,201 | |
| Centrally Cleared Credit Default Swaps |
| Reference Entity | Counterparty | Notional Amount (000s omitted) | Contract Annual Fixed Rate/ Payment Frequency | Termination Date | Market Value | Unamortized Upfront Payments Received (Paid) | Unrealized Appreciation (Depreciation) |
| Buy Protection | |||||||
| Markit CDX North America High Yield Index | Intercontinental Exchange | $96,165 | 5.00%/ Quarterly | 12/20/27 | $(3,956,709) | $(3,956,665) | $(44) |
| The Fund had the following long futures contracts open at September 30, 2022: |
| Description | Expiration Date | Number of Contracts | Notional Amount | Value | Unrealized Appreciation (Depreciation) |
| U.S. Long Bond Futures | December 2022 | 131 | $ 17,780,180 | $ 16,559,219 | $ (1,220,961) |
| U.S. Ultra Long-Term Treasury Bond Futures | December 2022 | 151 | 22,219,187 | 20,687,000 | (1,532,187) |
| 2 Yr. U.S. Treasury Notes Futures | December 2022 | 699 | 145,994,527 | 143,568,047 | (2,426,480) |
| $ (5,179,628) |
| State Street Income Fund | 35 |
| The Fund had the following short futures contracts open at September 30, 2022: |
| Description | Expiration date | Number of Contracts | Notional Amount | Value | Unrealized Appreciation (Depreciation) |
| 10 Yr. U.S. Treasury Notes Futures | December 2022 | 324 | (37,724,150) | (36,308,250) | $ 1,415,900 |
| 10 Yr. U.S. Treasury Ultra Futures | December 2022 | 196 | (24,079,286) | (23,222,937) | 856,349 |
| 5 Yr. U.S. Treasury Notes Futures | December 2022 | 386 | (42,871,840) | (41,498,016) | 1,373,824 |
| $ 3,646,073 |
| During the period ended September 30, 2022, average notional values related to derivative contracts were as follows: | |||
| Long Futures Contracts | Short Futures Contracts | Credit Default Swap Contracts | |
| Average Notional Value | $273,920,431 | $140,656,446 | $54,631,826 |
| (a) | At September 30, 2022, all or a portion of this security was pledged to cover collateral requirements for futures swaps and/or TBAs. |
| (b) | Variable Rate Security - Interest rate shown is rate in effect at September 30, 2022. For securities based on a published reference rate and spread, the reference rate and spread are indicated in the description above. |
| (c) | Settlement is on a delayed delivery or when-issued basis with final maturity to be announced ("TBA") in the future. |
| (d) | Interest only security. These securities represent the right to receive the monthly interest payments on an underlying pool of mortgages. Payments of principal on the pool reduce the value of the "interest only" holding. |
| (e) | Principal only security. These securities represent the right to receive the monthly principal payments on an underlying pool of mortgages. No payments of interest on the pool are passed through to the "principal only" holder. |
| (f) | Step coupon bond. |
| (g) | Pursuant to Rule 144A of the Securities Act of 1933, as amended, these securities may be resold in transactions exempt from registration, normally to qualified institutional buyers. At September 30, 2022, these securities amounted to $82,319,365 or 5.75% of the net assets of the State Street Income Fund. These securities have been determined to be liquid using procedures established by the Fund's Board of Trustees. |
| (h) | Sponsored by SSGA Funds Management, Inc., the Fund’s investment adviser and administrator, and an affiliate of State Street Bank & Trust Co., the Fund’s sub-administrator, custodian and accounting agent. |
| (i) | Coupon amount represents effective yield. |
| † | Percentages are based on net assets as of September 30, 2022. |
| Abbreviations: |
| CMT - Constant Maturity Treasury |
| LIBOR - London Interbank Offered Rate |
| REMIC - Real Estate Mortgage Investment Conduit |
| SOFR - Secured Overnight Financing Rate |
| STRIPS - Separate Trading of Registered Interest and Principal of Security |
| TBA - To Be Announced |
| 36 | State Street Income Fund |
| Investments | Level 1 | Level 2 | Level 3 | Total | |||
| Investments in Securities | |||||||
| U.S. Treasuries | $ — | $ 460,724,013 | $ — | $ 460,724,013 | |||
| Agency Mortgage Backed | — | 320,730,573 | — | 320,730,573 | |||
| Agency Collateralized Mortgage Obligations | — | 9,565,237 | — | 9,565,237 | |||
| Asset Backed | — | 5,882,857 | — | 5,882,857 | |||
| Corporate Notes | — | 460,607,774 | — | 460,607,774 | |||
| Non-Agency Collateralized Mortgage Obligations | — | 82,066,331 | — | 82,066,331 | |||
| Sovereign Bonds | — | 13,134,572 | — | 13,134,572 | |||
| Municipal Bonds and Notes | — | 5,947,814 | — | 5,947,814 | |||
| Preferred Stock | 1,235,513 | — | — | 1,235,513 | |||
| Short-Term Investments | 195,143,093 | — | — | 195,143,093 | |||
| Total Investments in Securities | $ 196,378,606 | $ 1,358,659,171 | $ — | $ 1,555,037,777 | |||
| Other Financial Instruments | |||||||
| Credit Default Swap Contracts - Unrealized Depreciation | $ — | $ (44) | $ — | $ (44) | |||
| Long Futures Contracts - Unrealized Depreciation | (5,179,628) | — | — | (5,179,628) | |||
| Short Futures Contracts - Unrealized Appreciation | 3,646,073 | — | — | 3,646,073 | |||
| Total Other Financial Instruments | $ (1,533,555) | $ (44) | $ — | $ (1,533,599) |
| Affiliate Table |
| Number of Shares Held at 9/30/21 | Value at 9/30/21 | Cost of Purchases | Proceeds from Shares Sold | Realized Gain (Loss) | Change in Unrealized Appreciation (Depreciation) | Number of Shares Held at 9/30/22 | Value at 9/30/22 | Dividend Income | |
| State Street Institutional U.S. Government Money Market Fund - Class G Shares | 257,710,916 | $257,710,916 | $542,697,594 | $605,265,417 | $— | $— | 195,143,093 | $195,143,093 | $921,251 |
| State Street Income Fund | 37 |
| Year Ended 9/30/22 | Period Ended 9/30/21(a)(b)(c) | Year Ended 12/31/20(a)(b) | Year Ended 12/31/19(a)(b) | Year Ended 12/31/18(a)(b) | Year Ended 12/31/17(a)(b) | ||||||
| Net asset value, beginning of period | $ 76.83 | $ 66.39 | $ 57.30 | $ 46.05 | $ 52.45 | $ 49.27 | |||||
| Income/(loss) from investment operations: | |||||||||||
| Net investment income | 0.77 (d) | 0.54 (d) | 0.77 (d) | 0.78 (d) | 0.77 (d) | 0.76 (d) | |||||
| Net realized and unrealized gains/(losses) on investments | (11.27) | 9.90 | 12.86 | 14.07 | (2.41) | 9.35 | |||||
| Total income/(loss) from investment operations | (10.50) | 10.44 | 13.63 | 14.85 | (1.64) | 10.11 | |||||
| Less distributions from: | |||||||||||
| Net investment income | 0.77 | — | 0.81 | 0.77 | 0.81 | 0.81 | |||||
| Net realized gains | 9.03 | — | 3.73 | 2.83 | 3.95 | 6.12 | |||||
| Total distributions | 9.80 | — | 4.54 | 3.60 | 4.76 | 6.93 | |||||
| Net asset value, end of period | $ 56.53 | $ 76.83 | $ 66.39 | $ 57.30 | $ 46.05 | $ 52.45 | |||||
| Total Return(e) | (16.76)% | 15.73% (f) | 23.82% | 32.22% | (3.05)% | 20.50% | |||||
| Ratios/Supplemental Data: | |||||||||||
| Net assets, end of period (in thousands) | $5,198,625 | $6,795,684 | $6,229,783 | $5,541,415 | $4,700,274 | $5,435,513 | |||||
| Ratios to average net assets: | |||||||||||
| Net expenses | 0.16% | 0.15% (g) | 0.14% | 0.14% | 0.14% | 0.14% | |||||
| Gross expenses | 0.16% | 0.15% (g) | 0.14% | 0.14% | 0.14% | 0.14% | |||||
| Net investment income | 1.11% | 0.99% (g) | 1.29% | 1.44% | 1.41% | 1.39% | |||||
| Portfolio turnover rate | 30% | 27% (f) | 37% | 31% | 40% | 77% |
| Notes to Financial Highlights | |
| (a) | Beginning with the year ended September 30, 2022, the Fund was audited by Ernst & Young LLP. The previous periods were audited by another independent registered public accounting firm. |
| (b) | Financial information from January 1, 2016 until May 24, 2021 is for the GE RSP U.S. Equity Fund, which was reorganized into the State Street U.S. Core Equity Fund effective May 24, 2021. See Note 1 in the accompanying Notes to Financial Statements. |
| (c) | Effective 4/13/2021, the Board of Trustees approved a change in fiscal year end for the Fund from December 31 to September 30. |
| (d) | Per share values have been calculated using the average shares method. |
| (e) | Total returns are historical and assume changes in share price, reinvestment of dividends and capital gains distributions. Past performance does not guarantee future results. |
| (f) | Not annualized. |
| (g) | Annualized for periods less than one year. |
| 38 | Financial Highlights |
| Year Ended 9/30/22 | Period Ended 9/30/21(a)(b)(c) | Year Ended 12/31/20(a)(b) | Year Ended 12/31/19(a)(b) | Year Ended 12/31/18(a)(b) | Year Ended 12/31/17(a)(b) | ||||||
| Net asset value, beginning of period | $ 12.08 | $ 12.42 | $ 11.85 | $ 11.14 | $ 11.55 | $ 11.38 | |||||
| Income/(loss) from investment operations: | |||||||||||
| Net investment income | 0.23 (d) | 0.17 (d) | 0.26 (d) | 0.31 (d) | 0.32 (d) | 0.29 (d) | |||||
| Net realized and unrealized gains/(losses) on investments | (2.02) | (0.29) | 0.69 | 0.72 | (0.40) | 0.16 | |||||
| Total income/(loss) from investment operations | (1.79) | (0.12) | 0.95 | 1.03 | (0.08) | 0.45 | |||||
| Less distributions from: | |||||||||||
| Net investment income | 0.27 | 0.22 | 0.34 | 0.32 | 0.33 | 0.28 | |||||
| Net realized gains | 0.33 | — | 0.04 | — | — | — | |||||
| Total distributions | 0.60 | 0.22 | 0.38 | 0.32 | 0.33 | 0.28 | |||||
| Net asset value, end of period | $ 9.69 | $ 12.08 | $ 12.42 | $ 11.85 | $ 11.14 | $ 11.55 | |||||
| Total Return(e) | (15.48)% | (0.93)% (f) | 8.20% | 9.38% | (0.75)% | 3.99% | |||||
| Ratios/Supplemental Data: | |||||||||||
| Net assets, end of period (in thousands) | $1,432,739 | $1,908,411 | $2,084,815 | $2,024,704 | $1,992,169 | $2,329,674 | |||||
| Ratios to average net assets: | |||||||||||
| Net expenses | 0.20% | 0.19% (g) | 0.17% | 0.17% | 0.17% | 0.16% | |||||
| Gross expenses | 0.20% | 0.19% (g) | 0.17% | 0.17% | 0.17% | 0.16% | |||||
| Net investment income | 2.07% | 1.85% (g) | 2.16% | 2.67% | 2.86% | 2.55% | |||||
| Portfolio turnover rate | 48% (h) | 59% (f)(h) | 110% (h) | 422% | 223% | 297% |
| Notes to Financial Highlights | |
| (a) | Beginning with the year ended September 30, 2022, the Fund was audited by Ernst & Young LLP. The previous periods were audited by another independent registered public accounting firm. |
| (b) | Financial information from January 1, 2016 until May 24, 2021 is for the GE RSP Income Fund, which was reorganized into the State Street Income Fund effective May 24, 2021. See Note 1 in the accompanying Notes to Financial Statements. |
| (c) | Effective 4/13/2021, the Board of Trustees approved a change in fiscal year end for the Fund from December 31 to September 30. |
| (d) | Per share values have been calculated using the average shares method. |
| (e) | Total returns are historical and assume changes in share price, reinvestment of dividends and capital gains distributions. Past performance does not guarantee future results. |
| (f) | Not annualized. |
| (g) | Annualized for periods less than one year. |
| (h) | The portfolio turnover calculated for the periods ended, 9/30/22, 9/30/21 and 12/31/20 did not include To-Be-Announced transactions and, if it had, the portfolio turnover would have been 163%, 134% and 304%, respectively. |
| Financial Highlights | 39 |
| State Street U.S. Core Equity Fund | State Street Income Fund | ||
| Assets | |||
| Investments in securities, at fair value (cost $4,061,882,158 and $1,553,988,758, respectively) | $ 5,177,248,107 | $ 1,359,894,684 | |
| Short-term affiliated investments, at fair value (cost $22,781,784 and $195,143,093 respectively) | 22,781,784 | 195,143,093 | |
| Cash | 153,182 | 2,075,692 | |
| Net cash collateral on deposit with broker for future contracts and TBAs | — | 7,076,825 | |
| Net cash collateral on deposit with broker for swap contracts | — | 2,524,878 | |
| Receivable for investments sold | 14,064,255 | — | |
| Income receivables | 5,002,789 | 7,358,846 | |
| Receivable for fund shares sold | — | 2,413 | |
| Income receivable from affiliated investments | 97,793 | 258,103 | |
| Receivable for accumulated variation margin on futures contracts | 4,226,113 | — | |
| Other assets | 13,359 | 3,579 | |
| Total assets | 5,223,587,382 | 1,574,338,113 | |
| Liabilities | |||
| Distribution payable to shareholders | 38,820 | 376,187 | |
| Net cash collateral on futures contracts due to broker | 1,189,644 | — | |
| Payable for investments purchased | 20,590,092 | 134,988,901 | |
| Payable for fund shares redeemed | 1,555,382 | 404,775 | |
| Payable for accumulated variation margin on swap contracts | — | 3,799,301 | |
| Payable for accumulated variation margin on futures contracts | — | 1,450,832 | |
| Payable to the Adviser | 556,078 | 168,156 | |
| Payable for custody, fund accounting and sub-administration fees | 206,722 | 93,924 | |
| Accrued other expenses | 825,357 | 316,836 | |
| Total liabilities | 24,962,095 | 141,598,912 | |
| Net Assets | $ 5,198,625,287 | $ 1,432,739,201 | |
| Net Assets Consist of: | |||
| Capital paid in | $ 3,672,339,262 | $ 1,709,458,789 | |
| Total distributable earnings (loss) | 1,526,286,025 | (276,719,588) | |
| Net Assets | $ 5,198,625,287 | $ 1,432,739,201 | |
| Shares outstanding ($25.00 and $10.00 par value, respectively; unlimited shares authorized) | 91,968,681 | 147,906,571 | |
| Net asset value per share | $ 56.53 | $ 9.69 | |
| 40 | Statements of Assets and Liabilities |
| State Street U.S. Core Equity Fund | State Street Income Fund | ||
| Investment Income | |||
| Income | |||
| Dividend | $ 80,791,895 | $ — | |
| Interest | — | 37,161,811 | |
| Income from affiliated investments | 640,540 | 921,251 | |
| Less: Foreign taxes withheld | (202,462) | — | |
| Total income | 81,229,973 | 38,083,062 | |
| Expenses | |||
| Advisory and administration fees | 7,730,909 | 2,197,285 | |
| Transfer agent fees | 495,986 | 443,031 | |
| Trustees' fees | 51,997 | 28,910 | |
| Custody, fund accounting and sub-administration fees | 539,845 | 254,466 | |
| Professional fees | 69,981 | 21,095 | |
| Registration fees | 771,382 | 215,214 | |
| Other expenses | 327,964 | 164,474 | |
| Total expenses | 9,988,064 | 3,324,475 | |
| Net investment income | $ 71,241,909 | $ 34,758,587 | |
| Net Realized and Unrealized Gain (Loss) on Investments | |||
| Realized gain (loss) on: | |||
| Unaffiliated investments | $ 421,924,091 | $ (52,122,585) | |
| Futures | (3,562,381) | (5,806,128) | |
| Swap contracts | — | (4,362,923) | |
| Increase (decrease) in unrealized appreciation/depreciation on: | |||
| Unaffiliated investments | (1,544,382,117) | (246,872,086) | |
| Futures | 5,535,899 | (857,387) | |
| Swap contracts | — | 171,840 | |
| Net realized and unrealized gain (loss) on investments | (1,120,484,508) | (309,849,269) | |
| Net Decrease in Net Assets Resulting from Operations | $(1,049,242,599) | $ (275,090,682) |
| Statements of Operations | 41 |
| State Street U.S. Core Equity Fund | |||||
| Year Ended 9/30/22 | Period Ended 9/30/21(a)(b) | Year Ended 12/31/20(a) | |||
| Increase (Decrease) in Net Assets | |||||
| Operations: | |||||
| Net investment income | $ 71,241,909 | $ 49,436,678 | $ 70,183,281 | ||
| Net realized gain (loss) on investments and futures | 418,361,710 | 743,574,138 | 328,591,207 | ||
| Net increase (decrease) in unrealized appreciation/depreciation on investments and futures | (1,538,846,218) | 167,123,754 | 799,903,293 | ||
| Net increase (decrease) from operations | (1,049,242,599) | 960,134,570 | 1,198,677,781 | ||
| Distributions to shareholders: | |||||
| Total distributions | (848,288,634) | — | (400,316,279) | ||
| Increase (decrease) in assets from operations and distributions | (1,897,531,233) | 960,134,570 | 798,361,502 | ||
| Share transactions: | |||||
| Proceeds from sale of shares | 42,400,917 | 15,549,302 | 55,418,614 | ||
| Value of distributions reinvested | 805,523,319 | — | 379,700,260 | ||
| Cost of shares redeemed | (547,451,321) | (409,783,514) | (545,111,984) | ||
| Net increase (decrease) from share transactions | 300,472,915 | (394,234,212) | (109,993,110) | ||
| Total increase (decrease) in net assets | (1,597,058,318) | 565,900,358 | 688,368,392 | ||
| Net Assets | |||||
| Beginning of period | 6,795,683,605 | 6,229,783,247 | 5,541,414,855 | ||
| End of period | $ 5,198,625,287 | $ 6,795,683,605 | $ 6,229,783,247 | ||
| Changes in Fund Shares | |||||
| Shares sold | 610,238 | 216,103 | 914,306 | ||
| Issued for distributions reinvested | 10,796,453 | — | 5,739,128 | ||
| Shares redeemed | (7,886,965) | (5,605,458) | (9,524,851) | ||
| Net increase (decrease) in fund shares | 3,519,726 | (5,389,355) | (2,871,417) | ||
| (a) | Beginning with the year ended September 30, 2022, the Fund was audited by Ernst & Young LLP. The previous periods were audited by another independent registered public accounting firm. |
| (b) | Effective 4/13/2021, the Board of Trustees approved a change in fiscal year end for the Fund from December 31 to September 30. |
| 42 | Statements of Changes in Net Assets |
| State Street Income Fund | |||||
| Year Ended 9/30/22 | Period Ended 9/30/21(a)(b) | Year Ended 12/31/20(a) | |||
| Increase (Decrease) in Net Assets | |||||
| Operations: | |||||
| Net investment income | $ 34,758,587 | $ 27,217,701 | $ 44,464,564 | ||
| Net realized gain (loss) on investments, futures and swap contracts | (62,291,636) | 33,003,540 | 46,627,572 | ||
| Net increase (decrease) in unrealized appreciation/depreciation on investments, futures and swap contracts | (247,557,633) | (79,823,683) | 68,420,358 | ||
| Net increase (decrease) from operations | (275,090,682) | (19,602,442) | 159,512,494 | ||
| Distributions to shareholders: | |||||
| Total distributions | (91,204,659) | (36,235,960) | (64,080,587) | ||
| Increase (decrease) in assets from operations and distributions | (366,295,341) | (55,838,402) | 95,431,907 | ||
| Share transactions: | |||||
| Proceeds from sale of shares | 11,422,739 | 14,393,778 | 48,154,654 | ||
| Value of distributions reinvested | 88,373,222 | 32,110,035 | 61,957,884 | ||
| Cost of shares redeemed | (209,172,304) | (167,069,788) | (145,433,304) | ||
| Net increase (decrease) from share transactions | (109,376,343) | (120,565,975) | (35,320,766) | ||
| Total increase (decrease) in net assets | (475,671,684) | (176,404,377) | 60,111,141 | ||
| Net Assets | |||||
| Beginning of period | 1,908,410,885 | 2,084,815,262 | 2,024,704,121 | ||
| End of period | $ 1,432,739,201 | $ 1,908,410,885 | $ 2,084,815,262 | ||
| Changes in Fund Shares | |||||
| Shares sold | 1,028,378 | 1,431,692 | 3,948,098 | ||
| Issued for distributions reinvested | 7,836,577 | 2,646,451 | 5,055,918 | ||
| Shares redeemed | (18,902,853) | (14,031,749) | (12,024,475) | ||
| Net decrease in fund shares | (10,037,898) | (9,953,606) | (3,020,459) | ||
| (a) | Beginning with the year ended September 30, 2022, the Fund was audited by Ernst & Young LLP. The previous periods were audited by another independent registered public accounting firm. |
| (b) | Effective 4/13/2021, the Board of Trustees approved a change in fiscal year end for the Fund from December 31 to September 30. |
| Statements of Changes in Net Assets | 43 |
| Fund | Predecessor Fund |
| State Street U.S. Core Equity Fund | GE RSP U.S. Equity Fund |
| State Street Income Fund | GE RSP Income Fund |
| • | Equity investments (including preferred stocks and registered investment companies that are exchange-traded funds) traded on a recognized securities exchange for which market quotations are readily available are valued |
| 44 | Notes to Financial Statements |
| at the last sale price or official closing price, as applicable, on the primary market or exchange on which they trade. Equity investments traded on a recognized exchange for which there were no sales on that day are valued at the last published sale price or at fair value. | |
| • | Government and municipal fixed income securities are generally valued using quotations from independent pricing services or brokers. Certain government inflation-indexed securities may require a calculated fair valuation as the cumulative inflation is contained within the price provided by the pricing service or broker. For these securities, the inflation component of the price is “cleaned” from the pricing service or broker price utilizing the published inflation factors in order to ensure proper accrual of income. |
| • | Debt obligations (including short term investments and convertible debt securities) are valued using quotations from independent pricing services or brokers or are generally valued at the last reported evaluated prices. |
| • | Exchange-traded futures contracts are valued at the closing settlement price on the primary market on which they are traded most extensively. Exchange-traded futures contracts traded on a recognized exchange for which there were no sales on that day are valued at the last reported sale price obtained from independent pricing services or brokers or at fair value. |
| • | Swap agreements are valued daily based upon prices supplied by Board approved pricing vendors or through brokers. Depending on the product and terms of the transaction, the value of agreements is determined using a series of techniques including valuation models that incorporate a number of market data factors, such as discounted cash flows, yields, curves, trades and values of the underlying reference instruments. In the event SSGA Funds Management, Inc. (the “Adviser” or “SSGA FM”) is unable to obtain an independent, third-party valuation the agreements will be fair valued. |
| • | Level 1 — Unadjusted quoted prices in active markets for an identical asset or liability; |
| • | Level 2 — Inputs other than quoted prices included within Level 1 that are observable for the asset or liability either directly or indirectly, including quoted prices for similar assets or liabilities in active markets, quoted prices for identical or similar assets or liabilities in markets that are not considered to be active, inputs other than quoted prices that are observable for the asset or liability (such as exchange rates, financing terms, interest rates, yield curves, volatilities, prepayment speeds, loss severities, credit risks and default rates) or other market-corroborated inputs; and |
| • | Level 3 — Unobservable inputs for the asset or liability, including the Committee’s assumptions used in determining the fair value of investments. |
| Notes to Financial Statements | 45 |
| 46 | Notes to Financial Statements |
| Notes to Financial Statements | 47 |
| Asset Derivatives | ||||||
| Interest Rate Risk | Foreign Exchange Risk | Credit Risk | Equity Risk | Commodity Risk | Total | |
| State Street U.S. Core Equity Fund | ||||||
| Futures Contracts | $ — | $ — | $ — | 4,226,113 | $ — | $ 4,226,113 |
| Liability Derivatives | ||||||
| Interest Rate Risk | Foreign Exchange Risk | Credit Risk | Equity Risk | Commodity Risk | Total | |
| State Street Income Fund | ||||||
| Futures Contracts | $ 1,450,832 | $ — | $ — | $ — | $ — | $ 1,450,832 |
| Swap Contracts | — | — | 3,799,301 | — | — | 3,799,301 |
| Realized Gain/Loss | ||||||
| Interest Rate Risk | Foreign Exchange Risk | Credit Risk | Equity Risk | Commodity Risk | Total | |
| State Street U.S. Core Equity Fund | ||||||
| Futures Contracts | $ — | $ — | $ — | (3,562,381) | $ — | $ (3,562,381) |
| State Street Income Fund | ||||||
| Futures Contracts | $ (5,806,128) | $ — | $ — | $ — | $ — | $ (5,806,128) |
| Swap Contracts | — | — | (4,362,923) | — | — | (4,362,923) |
| Net Change in Unrealized Appreciation (Depreciation) | ||||||
| Interest Rate Risk | Foreign Exchange Risk | Credit Risk | Equity Risk | Commodity Risk | Total | |
| State Street U.S. Core Equity Fund | ||||||
| Futures Contracts | $ — | $ — | $ — | 5,535,899 | $ — | $ 5,535,899 |
| State Street Income Fund | ||||||
| Futures Contracts | $ (857,387) | $ — | $ — | $ — | $ — | $ (857,387) |
| Swap Contracts | — | — | 171,840 | — | — | 171,840 |
| 48 | Notes to Financial Statements |
| Fund | Management Fee |
| State Street U.S. Core Equity Fund | 0.12% |
| State Street Income Fund | 0.13% |
| U.S. Government Obligations | Other Securities | ||||
| Fund | Purchases | Sales | Purchases | Sales | |
| State Street U.S. Core Equity Fund | $ — | $ — | $1,878,720,898 | $2,284,658,099 | |
| State Street Income Fund | 565,528,812 | 509,491,073 | 143,939,134 | 207,960,688 | |
| Notes to Financial Statements | 49 |
| Fund | Ordinary Income | Long-Term Capital Gains | Total |
| State Street U.S. Core Equity Fund | $130,189,250 | $718,099,384 | $848,288,634 |
| State Street Income Fund | 73,556,280 | 17,648,379 | 91,204,659 |
| Fund | Ordinary Income | Long-Term Capital Gains | Total |
| State Street Income Fund | $36,235,960 | $— | $36,235,960 |
| Fund | Ordinary Income | Long-Term Capital Gains | Total |
| State Street U.S. Core Equity Fund | $96,916,006 | $303,400,273 | $400,316,279 |
| State Street Income Fund | 59,629,980 | 4,450,607 | 64,080,587 |
| Fund | Undistributed Ordinary Income | Tax Exempt Income | Capital Loss Carryforwards | Undistributed long term gain | Net Unrealized Gains (Losses) | Qualified Late-Year Losses | Total |
| State Street U.S. Core Equity Fund | $58,140,756 | $— | $ — | $375,222,486 | $1,092,922,783 | $— | $1,526,286,025 |
| State Street Income Fund | 433,293 | — | (77,774,795) | — | (199,001,899) | — | (276,343,401) |
| Fund | Non-Expiring Short Term | Non-Expiring Long Term |
| State Street Income Fund | $40,872,370 | $36,902,425 |
| 50 | Notes to Financial Statements |
| Fund | Tax Cost | Gross Unrealized Appreciation | Gross Unrealized Depreciation | Net Unrealized Appreciation (Depreciation) |
| State Street U.S. Core Equity Fund | $4,111,332,665 | $1,409,766,129 | $316,843,346 | $1,092,922,783 |
| State Street Income Fund | 1,752,506,121 | 361,051 | 199,362,950 | (199,001,899) |
| Notes to Financial Statements | 51 |
| Fund | Predecessor Name | Aggregate Net Asset Value | Shares |
| State Street U.S. Core Equity Fund | GE RSP U.S. Equity Fund | $6,729,291,756 | 90,684,798 |
| State Street Income Fund | GE RSP Income Fund | $1,938,602,965 | 161,204,455 |
| 52 | Notes to Financial Statements |
| Notes to Financial Statements | 53 |

| 54 | Report of Independent Registered Public Accounting Firm |
| Amount | |
| State Street U.S. Core Equity Fund | $718,099,384 |
| State Street Income Fund | 17,648,379 |
| Other Information | 55 |
| • | Comparisons of the Fund’s performance over the past one-, three-, five- and ten-year periods ended December 31, 2021, to the performance of an appropriate benchmark constructed by Broadridge Financial Solutions, Inc. (“Broadridge”) for the Fund (the “Lipper Index”) and a universe of other mutual funds with similar investment objectives and policies (the “Performance Group” and/or the “Performance Universe”); |
| • | Comparisons of the Fund’s expense ratio (with detail of component expenses) to the expense ratios of a group of comparable mutual funds selected by the independent third-party data provider (the “Expense Group” and/or “Expense Universe”); |
| 56 | Other Information |
| • | A chart showing the Fund’s historical average net assets relative to its total expenses, management fees, and non-management expenses over the past five calendar years; and |
| • | Comparisons of the Fund’s contractual management fee to the contractual management fees of comparable mutual funds at different asset levels. |
| • | Descriptions of the investment management services provided by the Adviser, including its investment strategies and processes; |
| • | Information concerning the allocation of brokerage; and |
| • | Information regarding the procedures and processes used to value the assets of the Funds. |
| • | Reports detailing the financial results and condition of the Adviser and its affiliates; |
| • | Descriptions of the qualifications, education and experience of the individual investment and other professionals responsible for managing the portfolios of the Funds and for Fund operations; |
| • | Information relating to compliance with and the administration of the Code of Ethics adopted by the Adviser; |
| • | Information about the Adviser’s proxy voting policies and procedures and information regarding the Adviser’s practices for overseeing proxy vendors; |
| • | Information concerning the resources devoted by the Adviser to overseeing compliance by the Funds and their service providers, including information concerning compliance with investment policies and restrictions and other operating policies of the Funds; |
| • | A description of the adequacy and sophistication of the Adviser’s technology and systems with respect to investment and administrative matters and a description of any material improvements or changes in technology or systems in the past year; |
| • | A description of the business continuity and disaster recovery plans of the Adviser; and |
| • | Information regarding the Adviser’s risk management processes. |
| • | Information concerning the nature, extent, quality and cost of services provided to the Funds by SSGA FM in its capacity as the Funds’ administrator (the “Administrator”); |
| • | Information concerning the nature, extent, quality and cost of various non-investment management services provided to the Funds by affiliates of the Adviser, including the custodian, sub-administrator, fund accountant and securities lending agent of the Funds, as applicable, and the role of the Adviser in managing the Funds’ relationship with these service providers; |
| • | Copies of the Advisory Agreement and agreements with other service providers of the Funds; |
| • | Responses to a request for information reviewed prior to the April 6, 2022 and May 11-12, 2022 meetings by Independent Counsel, requesting specific information from each of: |
| Other Information | 57 |
| ○ | SSGA FM, in its capacity as the Funds’ Adviser and Administrator, with respect to its operations relating to the Funds and its approximate profit margins from such operations for the calendar year ended December 31, 2021; and the relevant operations of other Affiliated Service Providers to the Funds, together with their approximate profit margins from such relevant operations for the calendar year ended December 31, 2021; |
| ○ | State Street Bank and Trust Company (“State Street”), the sub-administrator, custodian and securities lending agent for the Funds, with respect to its operations relating to the Funds; and |
| ○ | State Street Global Advisors Funds Distributors, LLC, the principal underwriter and distributor of the shares of the Funds (the “Distributor”), with respect to its operations relating to the Funds, together with the Funds’ related distribution plans and arrangements under Rule 12b-1 of the 1940 Act; |
| • | Information from SSGA FM, State Street and the Distributor with respect to the Trust providing any material changes to the previous information supplied in response to the letter from Independent Counsel prior to the executive session of the Board on May 11-12, 2022; and |
| • | Materials provided by Broadridge, circulated to the Independent Trustees and to Independent Counsel. |
| 58 | Other Information |
| Other Information | 59 |
| 60 | Other Information |
| Name, Address and Year of Birth | Position(s) Held with Trust | Term of Office and Length of Time Served | Principal Occupation During the Past Five Years and Relevant Experience | Number of Funds in Fund Complex Overseen by Trustee† | Other Directorships Held by Trustee During the Past Five Years |
| Trustees | |||||
| Independent Trustees | |||||
| Michael F. Holland c/o SSGA Funds Management, Inc. One Iron Street Boston, MA 02210 YOB: 1944 | Trustee and Co- Chairperson of the Board | Term: Indefinite Elected: 7/99 | Chairman, Holland & Company L.L.C. (investment adviser) (1995 - present). | 57 | Director, the Holland Series Fund, Inc.; Director, The China Fund, Inc. (1992 - 2017); Director, The Taiwan Fund, Inc. (2007 - 2017); Director, Reaves Utility Income Fund, Inc.; and Director, Blackstone/GSO Loans (and Real Estate) Funds. |
| Patrick J. Riley c/o SSGA Funds Management, Inc. One Iron Street Boston, MA 02210 YOB: 1948 | Trustee and Co- Chairperson of the Board | Term: Indefinite Elected: 1/14 | 2002 to May 2010, Associate Justice of the Superior Court, Commonwealth of Massachusetts; 1985 to 2002, Partner, Riley, Burke & Donahue, L.L.P. (law firm); 1998 to Present, Independent Director, State Street Global Advisers Europe Limited (investment company); 1998 to Present, Independent Director, SSGA Liquidity plc (formerly, SSGA Cash Management Fund plc); January 2009 to Present, Independent Director, SSGA Fixed Income plc; and January 2009 - 2019, Independent Director, SSGA Qualified Funds PLC. | 57 | Board Director and Chairman, SPDR Europe 1PLC Board (2011 - present); Board Director and Chairman, SPDR Europe II, PLC (2013 - present). |
| John R. Costantino c/o SSGA Funds Management, Inc. One Iron Street Boston, MA 02210 YOB: 1946 | Trustee and Chairperson of the Qualified Legal Compliance Committee | Term: Indefinite Elected: 12/18 | Senior Advisor to NGN Capital LLC (January 2020 - present); Managing General Partner, NGN Capital LLC (2006 - December 2019). | 57 | Director, Kleinfeld Bridal Corp. (January 2016 - present); Trustee of Neuroscience Research Institute (1986 - 2017); Trustee of Fordham University (1989 - 1995 and 2001 - 2007) and Trustee Emeritus (2007 - present); Trustee and Independent Chairperson of GE Funds (1993 - February 2011); Director, Muscular Dystrophy Association (since 2019); Trustee of Gregorian University Foundation (1992 - 2007); Chairman of the Board of Directors, Vivaldi Biosciences Inc. (May 2017 - present); Chairman of the Supervisory Board, Vivaldi Biosciences AG. (May 2017 - present); Trustee, Gallim Dance (December 2021 - present). |
| Other Information | 61 |
| Name, Address and Year of Birth | Position(s) Held with Trust | Term of Office and Length of Time Served | Principal Occupation During the Past Five Years and Relevant Experience | Number of Funds in Fund Complex Overseen by Trustee† | Other Directorships Held by Trustee During the Past Five Years |
| Richard D. Shirk c/o SSGA Funds Management, Inc. One Iron Street Boston, MA 02210 YOB: 1945 | Trustee and Chairperson of the Nominating Committee and Chairperson of the Governance Committee | Term: Indefinite Elected: 1/14 | March 2001 to April 2002, Chairman (1996 to March 2001, President and Chief Executive Officer), Cerulean Companies, Inc. (holding company) (Retired); 1992 to March 2001, President and Chief Executive Officer, Blue Cross Blue Shield of Georgia (health insurer, managed healthcare). | 57 | 1998 to December 2008, Chairman, Board Member and December 2008 to present, Investment Committee Member, Healthcare Georgia Foundation (private foundation); September 2002 to 2012, Lead Director and Board Member, Amerigroup Corp. (managed health care); 1999 to 2013, Board Member and (2001 - 2017) Investment Committee Member, Woodruff Arts Center; and 2003 to 2009, Trustee, Gettysburg College; Board member, Aerocare Holdings (2003 - January 2021), Regenesis Biomedical Inc. (April 2012 - present). |
| Michael A. Jessee c/o SSGA Funds Management, Inc. One Iron Street Boston, MA 02210 YOB: 1946 | Trustee and Chairperson of the Valuation Committee | Term: Indefinite Appointed: 7/16 Elected: 12/18 | Retired; formerly, President and Chief Executive Officer of the Federal Home Loan Bank of Boston (1989 - 2009); Trustee, Randolph-Macon College (2004 - 2016). | 57 | None. |
| Donna M. Rapaccioli c/o SSGA Funds Management, Inc. One Iron Street Boston, MA 02210 YOB: 1962 | Trustee and Chairperson of the Audit Committee | Term: Indefinite Elected: 12/18 | Dean of the Gabelli School of Business (2007 - June 2022) and Accounting Professor (1987 - present) at Fordham University. | 57 | Director- Graduate Management Admissions Council (2015 - present); Trustee of Emmanuel College (2010 - 2019). |
| Margaret McLaughlin c/o SSGA Funds Management, Inc. One Iron Street Boston, MA 02210 YOB: 1967 | Trustee | Term: Indefinite Appointed: 9/22 | Consultant (since 2020) Bates Group (consultants); Consultant (2019 - 2020) Madison Dearborn Partners (private equity); General Counsel/CCO (2011 - 2019) Kramer Van Kirk Credit Strategies L.P./Mariana Systems LLC (Investment Adviser/SaaS Technology). | 57 | Director, Manning & Napier Fund Inc. (2021 - present). |
| George Pereira c/o SSGA Funds Management, Inc. One Iron Street Boston, MA 02210 YOB: 1964 | Trustee | Term: Indefinite Appointed: 9/22 | Chief Operating Officer (January 2011 - September 2020) and Chief Financial Officer (November 2004 – September 2020), Charles Schwab Investment Management. | 57 | Director, Pacific Premier Bancorp, Pacific Premier Bank (2021 - present); Director, Charles Schwab Asset Management (Ireland) Ltd., & Charles Schwab Worldwide Funds plc. (2005 - 2020); Director, Rotaplast International, Inc. (non-profit providing free medical services to children worldwide) (2012 - 2018). |
| 62 | Other Information |
| Interested Trustee(1) | |||||
| Ellen M. Needham(2) SSGA Funds Management, Inc. One Iron Street Boston, MA 02210 YOB: 1967 | Trustee and President | Term: Indefinite Elected 12/18 | Chairman, SSGA Funds Management, Inc. (March 2020 - present); President and Director, SSGA Funds Management, Inc. (2001 - present)*; Senior Managing Director, State Street Global Advisors (1992 - present)*; Manager, State Street Global Advisors Funds Distributors, LLC (May 2017 - present). | 57 | Board Director, SSGA SPDR ETFs Europe 1 plc (May 2020 - present); Board Director, SSGA SPDR ETFs Europe II plc (May 2020 - present). |
| (1) | The individual listed above is a Director who is an “interested person,” as defined in the 1940 Act, of the Company (“Interested Director”). |
| (2) | Ms. Needham is an Interested Director because of her employment by SSGA FM, an affiliate of the Company. |
| * | Served in various capacities and/or with various affiliated entities during noted time period. |
| † | For the purpose of determining the number of portfolios overseen by the Trustees, “Fund Complex” comprises registered investment companies for which SSGA FM serves as Adviser. |
| Name, Address, and Year of Birth | Position(s) Held with Trust | Term of Office and Length of Time Served | Principal Occupation During Past Five Years |
| OFFICERS: | |||
| Ellen M. Needham SSGA Funds Management, Inc. One Iron Street Boston, MA 02210 YOB: 1967 | President and Trustee | Term: Indefinite Elected: 4/20 | Chairman, SSGA Funds Management, Inc. (March 2020 - present); President and Director, SSGA Funds Management, Inc. (2001 - present)*; Senior Managing Director, State Street Global Advisors (1992 - present)*; Manager, State Street Global Advisors Funds Distributors, LLC (May 2017 - present).* |
| Bruce S. Rosenberg SSGA Funds Management, Inc. One Iron Street Boston, MA 02210 YOB: 1961 | Treasurer | Term: Indefinite Elected: 4/19 | Managing Director, State Street Global Advisors and SSGA Funds Management, Inc. (July 2015 - present); Director, Credit Suisse (April 2008 - July 2015). |
| Ann M. Carpenter SSGA Funds Management, Inc. One Iron Street Boston, MA 02210 YOB: 1966 | Vice President and Deputy Treasurer | Term: Indefinite Elected: 4/19 | Chief Operating Officer, SSGA Funds Management, Inc. (April 2005 - present)*; Managing Director, State Street Global Advisors (2005 - present).* |
| Chad C. Hallett SSGA Funds Management, Inc. One Iron Street Boston, MA 02210 YOB: 1969 | Deputy Treasurer | Term: Indefinite Elected: 4/19 | Vice President, State Street Global Advisors and SSGA Funds Management, Inc. (November 2014 - present); Vice President, State Street Bank and Trust Company (2001 - November 2014).* |
| Other Information | 63 |
| Name, Address, and Year of Birth | Position(s) Held with Trust | Term of Office and Length of Time Served | Principal Occupation During Past Five Years |
| OFFICERS: (continued) | |||
| Darlene Anderson-Vasquez SSGA Funds Management, Inc. One Iron Street Boston, MA 02210 YOB: 1968 | Deputy Treasurer | Term: Indefinite Elected: 4/19 | Managing Director, State Street Global Advisors and SSGA Funds Management, Inc. (May 2016 - present); Senior Vice President, John Hancock Investments (September 2007 - May 2016). |
| Arthur A. Jensen SSGA Funds Management, Inc. 1600 Summer Street Stamford, CT 06905 YOB: 1966 | Deputy Treasurer | Term: Indefinite Elected: 4/19 | Vice President, State Street Global Advisors and SSGA Funds Management, Inc. (July 2016 - present); Mutual Funds Controller, GE Asset Management Incorporated (April 2011 - July 2016). |
| David K. Lancaster SSGA Funds Management, Inc. One Iron Street Boston, MA 02210 YOB: 1971 | Assistant Treasurer | Term: Indefinite Elected: 11/20 | Vice President, State Street Global Advisors and SSGA Funds Management, Inc. (July 2017 - present); Assistant Vice President, State Street Bank and Trust Company (November 2011 - July 2017). |
| Ryan Hill SSGA Funds Management, Inc. One Iron Street, Boston, MA 02210 YOB:1982 | Assistant Treasurer | Term: Indefinite Elected: 5/22 | Vice President, State Street Global Advisors and SSGA Funds Management, Inc. (May 2017 - present); Assistant Vice President, State Street Bank and Trust Company (May 2014 - May 2017). |
| John Bettencourt SSGA Funds Management, Inc. One Iron Street, Boston, MA 02210 YOB:1976 | Assistant Treasurer | Term: Indefinite Elected: 5/22 | Vice President, State Street Global Advisors and SSGA Funds Management, Inc. (March 2020 - present); Assistant Vice President, State Street Global Advisors (June 2007 - March 2020). |
| Brian Harris SSGA Funds Management, Inc. One Iron Street Boston, MA 02210 YOB: 1973 | Chief Compliance Officer, Anti-Money Laundering Officer and Code of Ethics Compliance Officer | Term: Indefinite Elected: 6/16 Term: Indefinite Elected: 4/19 | Managing Director, State Street Global Advisors and SSGA Funds Management, Inc. (June 2013 - Present).* |
| Sean O’Malley SSGA Funds Management, Inc. One Iron Street Boston, MA 02210 YOB: 1969 | Chief Legal Officer | Term: Indefinite Elected: 8/19 | Senior Vice President and General Counsel, State Street Global Advisors (May 2022 – present); Senior Vice President and Deputy General Counsel, State Street Global Advisors (November 2013 – May 2022). |
| David Barr SSGA Funds Management, Inc. One Iron Street Boston, MA 02210 YOB: 1974 | Secretary | Term: Indefinite Elected: 9/20 | Vice President and Senior Counsel, State Street Global Advisors (October 2019 - present); Vice President and Counsel Eaton Vance Corp. (October 2010 - October 2019). |
| 64 | Other Information |
| Name, Address, and Year of Birth | Position(s) Held with Trust | Term of Office and Length of Time Served | Principal Occupation During Past Five Years |
| OFFICERS: (continued) | |||
| David Urman SSGA Funds Management, Inc. One Iron Street Boston, MA 02210 YOB: 1985 | Assistant Secretary | Term: Indefinite Elected: 8/19 | Vice President and Senior Counsel, State Street Global Advisors (April 2019 - present); Vice President and Counsel, State Street Global Advisors (August 2015 - April 2019); Associate, Ropes & Gray LLP (November 2012 - August 2015). |
| * | Served in various capacities and/or with various affiliated entities during noted time period. |
| Other Information | 65 |
or visit OneHR.ge.com > Retirement (or RSP) > My GE RSP
or visit www.ssga.com
| Shareholder Services | 67 |
| State Street Diversified Income Fund |

| 1 | |
| 4 | |
| 15 | |
| 16 | |
| 17 | |
| 18 | |
| 19 | |
| 27 | |
| 28 |
(Based on Net Asset Value)
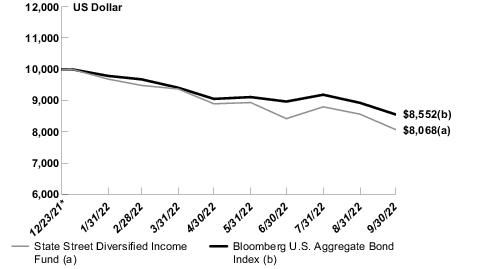
Total Return Inception Date to September 30, 2022* | |
| State Street Diversified Income Fund Class K | (19.32%) |
| Bloomberg U.S. Aggregate Bond Index (1) | (14.48%) |
| * | Inception date is December 22, 2021. |
| (1) | The Bloomberg U.S. Aggregate Bond Index provides a measure of the performance of the U.S. dollar denominated investment grade bond market, which includes investment grade (must be Baa3/BBB- or higher using the middle rating of Moody's Investor Service, Inc., Standard & Poor's, and Fitch Inc.) government bonds, investment grade corporate bonds, mortgage pass through securities, commercial mortgage backed securities and asset backed securities that are publicly for sale in the United States. The securities in the Bloomberg U.S. Aggregate Bond Index must have at least 1 year remaining to maturity and must have $300 million or more of outstanding face value. Asset backed securities must have a minimum deal size of $500 million and a minimum tranche size of $25 million. For commercial mortgage backed securities, the original aggregate transaction must have a minimum deal size of $500 million, and a minimum tranche size of $25 million; the aggregate outstanding transaction sizes must be at least $300 million to remain in the index. In addition, the securities must be U.S. dollar denominated, fixed rate, non convertible, and taxable. Certain types of securities, such as flower bonds, TINs, and state and local government series bonds are excluded from the Bloomberg U.S. Aggregate Bond Index. Also excluded from the Bloomberg U.S. Aggregate Bond Index are structured notes with embedded swaps or other special features, private placements, floating rate securities and Eurobonds. The Bloomberg U.S. Aggregate Bond Index is market capitalization weighted and the securities in the Index are updated on the last business day of each month. |
| Description | % of Net Assets | ||
| SPDR Blackstone Senior Loan ETF | 3.0% | ||
| SPDR Bloomberg Convertible Securities ETF | 3.0 | ||
| Federal National Mortgage Association 2.00% 10/15/2052 | 2.9 | ||
| Federal National Mortgage Association 2.50% 10/15/2052 | 2.4 | ||
| SPDR ICE Preferred Securities ETF | 2.0 | ||
| TOTAL | 13.3% |
| % of Net Assets | |||
| Corporate Bonds & Notes | 54.3% | ||
| Foreign Government Obligations | 17.0 | ||
| U.S. Government Agency Obligations | 14.6 | ||
| Mutual Funds and Exchange Traded Products | 10.0 | ||
| Asset-Backed Securities | 2.6 | ||
| Commercial Mortgage Backed Securities | 2.0 | ||
| Short-Term Investment | 11.9 | ||
| Liabilities in Excess of Other Assets | (12.4) | ||
| TOTAL | 100.0% |
| Security Description | Principal Amount | Value | ||||
| CORPORATE BONDS & NOTES — 54.3% | ||||||
| ADVERTISING — 0.2% | ||||||
Clear Channel Outdoor Holdings, Inc. 5.13%, 8/15/2027 (a) | $ 50,000 | $ 42,378 | ||||
| AEROSPACE & DEFENSE — 1.5% | ||||||
| Boeing Co.: | ||||||
5.04%, 5/1/2027 | 75,000 | 72,226 | ||||
5.71%, 5/1/2040 | 50,000 | 43,647 | ||||
Bombardier, Inc. 7.50%, 3/15/2025 (a) | 43,000 | 41,821 | ||||
Howmet Aerospace, Inc. 3.00%, 1/15/2029 | 50,000 | 40,875 | ||||
Spirit AeroSystems, Inc. 7.50%, 4/15/2025 (a) | 50,000 | 47,148 | ||||
TransDigm, Inc. 4.63%, 1/15/2029 | 50,000 | 40,371 | ||||
| 286,088 | ||||||
| AGRICULTURE — 0.7% | ||||||
Altria Group, Inc. 3.40%, 2/4/2041 | 50,000 | 31,525 | ||||
BAT Capital Corp. 3.73%, 9/25/2040 | 50,000 | 32,090 | ||||
BAT International Finance PLC 1.67%, 3/25/2026 | 50,000 | 43,190 | ||||
Darling Ingredients, Inc. 6.00%, 6/15/2030 (a) | 20,000 | 19,090 | ||||
| 125,895 | ||||||
| AIRLINES — 1.0% | ||||||
| American Airlines, Inc./AAdvantage Loyalty IP, Ltd.: | ||||||
5.50%, 4/20/2026 (a) | 50,000 | 46,988 | ||||
5.75%, 4/20/2029 (a) | 50,000 | 43,636 | ||||
Delta Air Lines, Inc. 2.90%, 10/28/2024 | 50,000 | 46,625 | ||||
United Airlines, Inc. 4.38%, 4/15/2026 (a) | 50,000 | 44,611 | ||||
| 181,860 | ||||||
| AUTO MANUFACTURERS — 1.5% | ||||||
Ford Motor Co. 3.25%, 2/12/2032 | 100,000 | 72,026 | ||||
Ford Motor Credit Co. LLC 2.70%, 8/10/2026 | 100,000 | 82,840 | ||||
| General Motors Financial Co., Inc.: | ||||||
1.25%, 1/8/2026 | 50,000 | 42,986 | ||||
2.70%, 6/10/2031 | 50,000 | 36,826 | ||||
Jaguar Land Rover Automotive PLC 5.63%, 2/1/2023 (a) | 50,000 | 48,875 | ||||
| 283,553 | ||||||
| Security Description | Principal Amount | Value | ||||
| AUTO PARTS & EQUIPMENT — 0.2% | ||||||
Goodyear Tire & Rubber Co. 5.00%, 7/15/2029 | $ 50,000 | $ 40,961 | ||||
| BANKS — 3.7% | ||||||
Bank of America Corp. 5 Year CMT + 1.20%, 2.48%, 9/21/2036 (b) | 100,000 | 72,350 | ||||
Barclays PLC 5 Year CMT + 2.90%, 3.56%, 9/23/2035 (b) | 100,000 | 74,066 | ||||
Citigroup, Inc. 4.40%, 6/10/2025 | 100,000 | 97,233 | ||||
| Deutsche Bank AG: | ||||||
SOFR + 2.58%, 3.96%, 11/26/2025 (b) | 50,000 | 46,659 | ||||
SOFR + 2.76%, 3.73%, 1/14/2032 (b) | 50,000 | 34,083 | ||||
First-Citizens Bank & Trust Co. 3 Month SOFR + 3.83%, 3.93%, 6/19/2024 (b) | 50,000 | 49,316 | ||||
Freedom Mortgage Corp. 6.63%, 1/15/2027 (a) | 50,000 | 35,675 | ||||
Goldman Sachs Group, Inc. 6.75%, 10/1/2037 | 50,000 | 49,960 | ||||
HSBC Holdings PLC 6.50%, 9/15/2037 | 50,000 | 46,701 | ||||
Intesa Sanpaolo SpA 1 year CMT + 2.60%, 4.20%, 6/1/2032 (a) (b) | 50,000 | 33,811 | ||||
Morgan Stanley SOFR + 1.36%, 2.48%, 9/16/2036 (b) | 50,000 | 35,828 | ||||
Natwest Group PLC 5 Year CMT + 2.35%, 3.03%, 11/28/2035 (b) | 50,000 | 35,519 | ||||
UniCredit SpA 5 Year CMT + 4.75%, 5.46%, 6/30/2035 (a) (b) | 50,000 | 37,179 | ||||
Westpac Banking Corp. 5 Year CMT + 1.35%, 2.89%, 2/4/2030 (b) | 50,000 | 46,040 | ||||
| 694,420 | ||||||
| BEVERAGES — 1.2% | ||||||
Anheuser-Busch Cos. LLC/Anheuser-Busch InBev Worldwide, Inc. 4.70%, 2/1/2036 | 100,000 | 90,154 | ||||
Constellation Brands, Inc. 2.25%, 8/1/2031 | 50,000 | 38,359 | ||||
Keurig Dr Pepper, Inc. 3.95%, 4/15/2029 | 100,000 | 91,323 | ||||
| 219,836 | ||||||
| BUILDING MATERIALS — 0.4% | ||||||
Carrier Global Corp. 2.72%, 2/15/2030 | 50,000 | 41,269 | ||||
| Security Description | Principal Amount | Value | ||||
Standard Industries, Inc. 3.38%, 1/15/2031 (a) | $ 50,000 | $ 35,291 | ||||
| 76,560 | ||||||
| CHEMICALS — 1.3% | ||||||
Chemours Co. 4.63%, 11/15/2029 (a) | 50,000 | 37,191 | ||||
Dow Chemical Co. 3.60%, 11/15/2050 | 50,000 | 34,053 | ||||
DuPont de Nemours, Inc. 5.32%, 11/15/2038 | 50,000 | 45,502 | ||||
LYB International Finance III LLC 3.63%, 4/1/2051 | 50,000 | 32,701 | ||||
Methanex Corp. 5.13%, 10/15/2027 | 50,000 | 42,140 | ||||
WR Grace Holdings LLC 4.88%, 6/15/2027 (a) | 50,000 | 43,076 | ||||
| 234,663 | ||||||
| COMMERCIAL SERVICES — 2.0% | ||||||
ADT Security Corp. 4.13%, 8/1/2029 (a) | 50,000 | 41,449 | ||||
Allied Universal Holdco LLC/Allied Universal Finance Corp./Atlas Luxco 4 S.a.r.l 4.63%, 6/1/2028 (a) | 50,000 | 38,499 | ||||
Block, Inc. 2.75%, 6/1/2026 | 50,000 | 42,969 | ||||
Gartner, Inc. 3.63%, 6/15/2029 (a) | 50,000 | 41,891 | ||||
MPH Acquisition Holdings LLC 5.50%, 9/1/2028 (a) | 50,000 | 41,305 | ||||
Nielsen Finance LLC/Nielsen Finance Co. 4.50%, 7/15/2029 (a) | 50,000 | 49,960 | ||||
Prime Security Services Borrower LLC/Prime Finance, Inc. 3.38%, 8/31/2027 (a) | 50,000 | 42,058 | ||||
Service Corp. International 3.38%, 8/15/2030 | 50,000 | 39,201 | ||||
United Rentals North America, Inc. 3.75%, 1/15/2032 | 50,000 | 39,258 | ||||
| 376,590 | ||||||
| COMPUTERS — 0.6% | ||||||
Dell International LLC/EMC Corp. 5.30%, 10/1/2029 | 50,000 | 46,583 | ||||
NCR Corp. 5.13%, 4/15/2029 (a) | 50,000 | 37,474 | ||||
Seagate HDD Cayman 3.13%, 7/15/2029 | 50,000 | 36,777 | ||||
| 120,834 | ||||||
| COSMETICS/PERSONAL CARE — 0.3% | ||||||
Coty, Inc. 5.00%, 4/15/2026 (a) | 50,000 | 45,798 | ||||
| Security Description | Principal Amount | Value | ||||
| DIVERSIFIED FINANCIAL SERVICES — 2.0% | ||||||
AerCap Ireland Capital DAC/AerCap Global Aviation Trust 1.65%, 10/29/2024 | $ 50,000 | $ 45,663 | ||||
Air Lease Corp. 1.88%, 8/15/2026 | 50,000 | 42,373 | ||||
Capital One Financial Corp. SOFR + 0.86%, 1.88%, 11/2/2027 (b) | 50,000 | 42,579 | ||||
Nationstar Mortgage Holdings, Inc. 5.75%, 11/15/2031 (a) | 50,000 | 36,964 | ||||
Navient Corp. 5.50%, 3/15/2029 | 50,000 | 38,056 | ||||
NFP Corp. 4.88%, 8/15/2028 (a) | 50,000 | 42,684 | ||||
Nomura Holdings, Inc. 2.61%, 7/14/2031 | 50,000 | 37,094 | ||||
OneMain Finance Corp. 3.50%, 1/15/2027 | 50,000 | 39,037 | ||||
Rocket Mortgage LLC/Rocket Mortgage Co-Issuer, Inc. 2.88%, 10/15/2026 (a) | 50,000 | 41,252 | ||||
| 365,702 | ||||||
| ELECTRIC — 1.6% | ||||||
Calpine Corp. 5.13%, 3/15/2028 (a) | 50,000 | 43,237 | ||||
Dominion Energy, Inc. Series C, 2.25%, 8/15/2031 | 50,000 | 38,991 | ||||
Duke Energy Corp. 2.55%, 6/15/2031 | 50,000 | 39,149 | ||||
FirstEnergy Corp. Series B, 4.40%, 7/15/2027 | 75,000 | 69,497 | ||||
NRG Energy, Inc. 3.88%, 2/15/2032 (a) | 50,000 | 39,093 | ||||
Pacific Gas & Electric Co. 2.50%, 2/1/2031 | 50,000 | 36,404 | ||||
Vistra Operations Co. LLC 4.38%, 5/1/2029 (a) | 50,000 | 41,790 | ||||
| 308,161 | ||||||
| ELECTRICAL COMPONENTS & EQUIPMENT — 0.3% | ||||||
WESCO Distribution, Inc. 7.13%, 6/15/2025 (a) | 50,000 | 50,002 | ||||
| ELECTRONICS — 0.2% | ||||||
Sensata Technologies, Inc. 3.75%, 2/15/2031 (a) | 50,000 | 39,444 | ||||
| ENTERTAINMENT — 0.5% | ||||||
Caesars Entertainment, Inc. 6.25%, 7/1/2025 (a) | 50,000 | 48,187 | ||||
Live Nation Entertainment, Inc. 3.75%, 1/15/2028 (a) | 50,000 | 42,392 | ||||
| 90,579 | ||||||
| Security Description | Principal Amount | Value | ||||
| ENVIRONMENTAL CONTROL — 0.2% | ||||||
GFL Environmental, Inc. 4.00%, 8/1/2028 (a) | $ 50,000 | $ 41,677 | ||||
| FOOD — 1.1% | ||||||
Albertsons Cos., Inc./Safeway, Inc./New Albertsons L.P./Albertsons LLC 3.50%, 3/15/2029 (a) | 50,000 | 40,375 | ||||
Lamb Weston Holdings, Inc. 4.13%, 1/31/2030 (a) | 50,000 | 42,279 | ||||
Performance Food Group, Inc. 4.25%, 8/1/2029 (a) | 50,000 | 41,629 | ||||
Post Holdings, Inc. 4.50%, 9/15/2031 (a) | 50,000 | 40,250 | ||||
US Foods, Inc. 6.25%, 4/15/2025 (a) | 50,000 | 49,263 | ||||
| 213,796 | ||||||
| FOOD SERVICE — 0.2% | ||||||
Aramark Services, Inc. 5.00%, 2/1/2028 (a) | 50,000 | 44,198 | ||||
| FOREST PRODUCTS & PAPER — 0.2% | ||||||
Suzano Austria GmbH Series DM3N, 3.13%, 1/15/2032 | 50,000 | 35,811 | ||||
| GAS — 0.2% | ||||||
Southern Co. Gas Capital Corp. Series 20-A, 1.75%, 1/15/2031 | 50,000 | 37,005 | ||||
| HEALTH CARE PRODUCTS — 0.4% | ||||||
Avantor Funding, Inc. 3.88%, 11/1/2029 (a) | 50,000 | 40,620 | ||||
Medline Borrower LP 3.88%, 4/1/2029 (a) | 50,000 | 40,152 | ||||
| 80,772 | ||||||
| HEALTH CARE SERVICES — 2.1% | ||||||
Centene Corp. 2.50%, 3/1/2031 | 75,000 | 56,809 | ||||
CHS/Community Health Systems, Inc. 4.75%, 2/15/2031 (a) | 75,000 | 50,434 | ||||
DaVita, Inc. 3.75%, 2/15/2031 (a) | 50,000 | 35,635 | ||||
Encompass Health Corp. 4.63%, 4/1/2031 | 50,000 | 39,543 | ||||
HCA, Inc. 2.38%, 7/15/2031 | 50,000 | 37,045 | ||||
IQVIA, Inc. 5.00%, 5/15/2027 (a) | 50,000 | 47,038 | ||||
Legacy LifePoint Health LLC 6.75%, 4/15/2025 (a) | 50,000 | 47,320 | ||||
| Tenet Healthcare Corp.: | ||||||
4.38%, 1/15/2030 (a) | 50,000 | 41,702 | ||||
6.25%, 2/1/2027 (a) | 50,000 | 46,666 | ||||
| 402,192 | ||||||
| Security Description | Principal Amount | Value | ||||
| HOUSEWARES — 0.3% | ||||||
Newell Brands, Inc. 4.45%, 4/1/2026 | $ 50,000 | $ 46,002 | ||||
| INSURANCE — 0.4% | ||||||
Acrisure LLC/Acrisure Finance, Inc. 4.25%, 2/15/2029 (a) | 50,000 | 39,455 | ||||
HUB International, Ltd. 5.63%, 12/1/2029 (a) | 50,000 | 41,758 | ||||
| 81,213 | ||||||
| INTERNET — 0.3% | ||||||
Uber Technologies, Inc. 7.50%, 9/15/2027 (a) | 50,000 | 49,002 | ||||
| INVESTMENT COMPANY SECURITY — 0.5% | ||||||
Blackstone Secured Lending Fund 2.85%, 9/30/2028 | 50,000 | 37,920 | ||||
Icahn Enterprises L.P./Icahn Enterprises Finance Corp. 4.75%, 9/15/2024 | 50,000 | 46,874 | ||||
| 84,794 | ||||||
| IRON/STEEL — 0.5% | ||||||
Cleveland-Cliffs, Inc. 6.75%, 3/15/2026 (a) | 50,000 | 49,183 | ||||
Vale Overseas, Ltd. 3.75%, 7/8/2030 | 50,000 | 40,423 | ||||
| 89,606 | ||||||
| LEISURE TIME — 0.9% | ||||||
Carnival Corp. 5.75%, 3/1/2027 (a) | 75,000 | 52,587 | ||||
NCL Corp., Ltd. 3.63%, 12/15/2024 (a) | 50,000 | 42,486 | ||||
Royal Caribbean Cruises, Ltd. 4.25%, 7/1/2026 (a) | 50,000 | 36,913 | ||||
Viking Cruises, Ltd. 6.25%, 5/15/2025 (a) | 50,000 | 43,439 | ||||
| 175,425 | ||||||
| LODGING — 1.2% | ||||||
Hilton Domestic Operating Co., Inc. 3.63%, 2/15/2032 (a) | 50,000 | 38,340 | ||||
Melco Resorts Finance, Ltd. Series REGS, 4.88%, 6/6/2025 | 50,000 | 37,325 | ||||
MGM China Holdings, Ltd. 5.38%, 5/15/2024 (a) | 50,000 | 43,978 | ||||
MGM Resorts International 4.75%, 10/15/2028 | 50,000 | 42,328 | ||||
Travel & Leisure Co. 4.50%, 12/1/2029 (a) | 50,000 | 38,792 | ||||
Wynn Macau, Ltd. 5.13%, 12/15/2029 (a) | 50,000 | 32,768 | ||||
| 233,531 | ||||||
| Security Description | Principal Amount | Value | ||||
| MEDIA — 3.3% | ||||||
CCO Holdings LLC/CCO Holdings Capital Corp. 4.25%, 1/15/2034 (a) | $ 100,000 | $ 72,210 | ||||
| Charter Communications Operating LLC/Charter Communications Operating Capital: | ||||||
3.50%, 3/1/2042 | 50,000 | 31,642 | ||||
3.85%, 4/1/2061 | 50,000 | 29,290 | ||||
| CSC Holdings LLC: | ||||||
3.38%, 2/15/2031 (a) | 50,000 | 35,243 | ||||
5.75%, 1/15/2030 (a) | 50,000 | 35,556 | ||||
Directv Financing LLC/Directv Financing Co-Obligor, Inc. 5.88%, 8/15/2027 (a) | 50,000 | 43,203 | ||||
| DISH DBS Corp.: | ||||||
5.75%, 12/1/2028 (a) | 50,000 | 37,697 | ||||
5.88%, 11/15/2024 | 50,000 | 44,722 | ||||
Gray Television, Inc. 4.75%, 10/15/2030 (a) | 50,000 | 37,510 | ||||
iHeartCommunications, Inc. 4.75%, 1/15/2028 (a) | 50,000 | 41,670 | ||||
Paramount Global 4.95%, 1/15/2031 | 50,000 | 44,117 | ||||
Sirius XM Radio, Inc. 3.13%, 9/1/2026 (a) | 50,000 | 43,916 | ||||
Univision Communications, Inc. 5.13%, 2/15/2025 (a) | 50,000 | 47,444 | ||||
Virgin Media Finance PLC 5.00%, 7/15/2030 (a) | 50,000 | 37,437 | ||||
Ziggo B.V. 4.88%, 1/15/2030 (a) | 50,000 | 39,535 | ||||
| 621,192 | ||||||
| METAL FABRICATE & HARDWARE — 0.3% | ||||||
Advanced Drainage Systems, Inc. 6.38%, 6/15/2030 (a) | 62,000 | 60,080 | ||||
| MINING — 1.0% | ||||||
Corp. Nacional del Cobre de Chile 3.70%, 1/30/2050 (a) | 100,000 | 66,353 | ||||
FMG Resources August 2006 Pty, Ltd. 4.38%, 4/1/2031 (a) | 50,000 | 38,730 | ||||
Novelis Corp. 3.88%, 8/15/2031 (a) | 50,000 | 37,317 | ||||
Southern Copper Corp. 5.88%, 4/23/2045 | 50,000 | 46,814 | ||||
| 189,214 | ||||||
| MISCELLANEOUS MANUFACTURER — 0.2% | ||||||
GE Capital International Funding Co. Unlimited Co. 4.42%, 11/15/2035 | 50,000 | 44,852 | ||||
| Security Description | Principal Amount | Value | ||||
| OIL & GAS — 2.4% | ||||||
KazMunayGas National Co. JSC Series REGS, 3.50%, 4/14/2033 | $ 200,000 | $ 131,548 | ||||
Murphy Oil Corp. 6.13%, 12/1/2042 | 50,000 | 39,749 | ||||
Parkland Corp. 4.50%, 10/1/2029 (a) | 50,000 | 40,621 | ||||
| Petroleos Mexicanos: | ||||||
6.50%, 3/13/2027 | 100,000 | 83,786 | ||||
6.75%, 9/21/2047 | 50,000 | 27,850 | ||||
Range Resources Corp. 4.88%, 5/15/2025 | 50,000 | 47,134 | ||||
Southwestern Energy Co. 5.38%, 3/15/2030 | 50,000 | 44,939 | ||||
Sunoco L.P./Sunoco Finance Corp. 4.50%, 5/15/2029 | 50,000 | 41,518 | ||||
| 457,145 | ||||||
| PACKAGING & CONTAINERS — 1.3% | ||||||
Ardagh Packaging Finance PLC/Ardagh Holdings USA, Inc. 5.25%, 8/15/2027 (a) | 50,000 | 31,119 | ||||
Ball Corp. 2.88%, 8/15/2030 | 50,000 | 38,453 | ||||
Graphic Packaging International LLC 3.75%, 2/1/2030 (a) | 50,000 | 41,559 | ||||
LABL, Inc. 6.75%, 7/15/2026 (a) | 50,000 | 45,317 | ||||
Mauser Packaging Solutions Holding Co. 5.50%, 4/15/2024 (a) | 50,000 | 47,440 | ||||
OI European Group B.V. 4.75%, 2/15/2030 (a) | 50,000 | 39,803 | ||||
| 243,691 | ||||||
| PHARMACEUTICALS — 2.6% | ||||||
AbbVie, Inc. 4.55%, 3/15/2035 | 100,000 | 89,846 | ||||
Bausch Health Cos., Inc. 7.00%, 1/15/2028 (a) | 100,000 | 38,366 | ||||
CVS Health Corp. 4.78%, 3/25/2038 | 75,000 | 65,732 | ||||
EMBECTA Corp. 6.75%, 2/15/2030 (a) | 100,000 | 93,018 | ||||
Endo Dac/Endo Finance LLC/Endo Finco, Inc. 5.88%, 10/15/2024 (a) | 50,000 | 40,955 | ||||
Organon & Co./Organon Foreign Debt Co-Issuer BV 4.13%, 4/30/2028 (a) | 50,000 | 42,746 | ||||
Perrigo Finance Unlimited Co. 4.40%, 6/15/2030 | 50,000 | 40,930 | ||||
Takeda Pharmaceutical Co., Ltd. 2.05%, 3/31/2030 | 50,000 | 39,621 | ||||
| Security Description | Principal Amount | Value | ||||
Viatris, Inc. 2.70%, 6/22/2030 | $ 50,000 | $ 37,150 | ||||
| 488,364 | ||||||
| PIPELINES — 4.7% | ||||||
Buckeye Partners L.P. 4.50%, 3/1/2028 (a) | 50,000 | 42,512 | ||||
Cheniere Energy Partners L.P. COR, 3.25%, 1/31/2032 | 50,000 | 38,407 | ||||
DCP Midstream Operating L.P. 5.38%, 7/15/2025 | 50,000 | 48,614 | ||||
Enbridge, Inc. 2.50%, 8/1/2033 | 50,000 | 37,601 | ||||
| Energy Transfer L.P.: | ||||||
4.25%, 3/15/2023 | 50,000 | 49,770 | ||||
5.00%, 5/15/2050 | 50,000 | 39,071 | ||||
Enterprise Products Operating LLC 3.20%, 2/15/2052 | 50,000 | 31,990 | ||||
EQM Midstream Partners L.P. 4.75%, 1/15/2031 (a) | 50,000 | 39,685 | ||||
Genesis Energy L.P./Genesis Energy Finance Corp. 6.25%, 5/15/2026 | 50,000 | 43,490 | ||||
Hess Midstream Operations L.P. 4.25%, 2/15/2030 (a) | 50,000 | 40,526 | ||||
| Kinder Morgan, Inc.: | ||||||
1.75%, 11/15/2026 | 50,000 | 43,340 | ||||
3.60%, 2/15/2051 | 50,000 | 33,056 | ||||
MPLX L.P. 1.75%, 3/1/2026 | 50,000 | 43,817 | ||||
New Fortress Energy, Inc. 6.75%, 9/15/2025 (a) | 50,000 | 47,346 | ||||
NGL Energy Operating LLC/NGL Energy Finance Corp. 7.50%, 2/1/2026 (a) | 50,000 | 44,508 | ||||
ONEOK, Inc. 5.20%, 7/15/2048 | 50,000 | 40,069 | ||||
Tallgrass Energy Partners L.P./Tallgrass Energy Finance Corp. 6.00%, 12/31/2030 (a) | 50,000 | 42,494 | ||||
TransCanada PipeLines, Ltd. 2.50%, 10/12/2031 | 50,000 | 38,422 | ||||
Venture Global Calcasieu Pass LLC 3.88%, 8/15/2029 (a) | 50,000 | 42,978 | ||||
Western Midstream Operating L.P. 3.35%, 2/1/2025 | 50,000 | 46,539 | ||||
Williams Cos., Inc. 2.60%, 3/15/2031 | 50,000 | 39,259 | ||||
| 873,494 | ||||||
| REAL ESTATE — 0.2% | ||||||
Realogy Group LLC/Realogy Co-Issuer Corp. 5.75%, 1/15/2029 (a) | 50,000 | 36,067 | ||||
| Security Description | Principal Amount | Value | ||||
| REAL ESTATE INVESTMENT TRUSTS — 2.1% | ||||||
American Tower Corp. 3.38%, 10/15/2026 | $ 50,000 | $ 45,795 | ||||
Boston Properties L.P. 2.45%, 10/1/2033 | 50,000 | 35,428 | ||||
Crown Castle, Inc. 2.10%, 4/1/2031 | 50,000 | 37,447 | ||||
Diversified Healthcare Trust 4.38%, 3/1/2031 | 50,000 | 32,341 | ||||
Equinix, Inc. 2.15%, 7/15/2030 | 50,000 | 38,330 | ||||
Iron Mountain, Inc. REIT, 4.50%, 2/15/2031 (a) | 50,000 | 38,705 | ||||
Kimco Realty Corp. 3.70%, 10/1/2049 | 50,000 | 34,493 | ||||
Omega Healthcare Investors, Inc. 3.25%, 4/15/2033 | 50,000 | 35,431 | ||||
Service Properties Trust 4.35%, 10/1/2024 | 50,000 | 44,060 | ||||
Uniti Group L.P./Uniti Fiber Holdings, Inc./CSL Capital LLC 7.88%, 2/15/2025 (a) | 50,000 | 48,713 | ||||
| 390,743 | ||||||
| RETAIL — 1.9% | ||||||
1011778 BC ULC/New Red Finance, Inc. 4.00%, 10/15/2030 (a) | 50,000 | 39,365 | ||||
Carvana Co. 4.88%, 9/1/2029 (a) | 50,000 | 24,377 | ||||
Lowe's Cos., Inc. 1.70%, 10/15/2030 | 50,000 | 37,737 | ||||
McDonald's Corp. Series MTN, 4.88%, 12/9/2045 | 50,000 | 44,357 | ||||
Nordstrom, Inc. 2.30%, 4/8/2024 | 50,000 | 46,640 | ||||
PetSmart, Inc./PetSmart Finance Corp. 4.75%, 2/15/2028 (a) | 50,000 | 43,033 | ||||
QVC, Inc. 4.38%, 9/1/2028 | 50,000 | 34,123 | ||||
Staples, Inc. 7.50%, 4/15/2026 (a) | 50,000 | 41,978 | ||||
Yum! Brands, Inc. 3.63%, 3/15/2031 | 50,000 | 39,851 | ||||
| 351,461 | ||||||
| SEMICONDUCTORS — 0.4% | ||||||
Broadcom Corp./Broadcom Cayman Finance, Ltd. 3.88%, 1/15/2027 | 50,000 | 46,084 | ||||
Broadcom, Inc. 3.19%, 11/15/2036 (a) | 50,000 | 34,237 | ||||
| 80,321 | ||||||
| Security Description | Principal Amount | Value | ||||
| SOFTWARE — 1.4% | ||||||
Clarivate Science Holdings Corp. 3.88%, 7/1/2028 (a) | $ 50,000 | $ 41,327 | ||||
Fiserv, Inc. 3.50%, 7/1/2029 | 50,000 | 43,570 | ||||
Open Text Corp. 3.88%, 2/15/2028 (a) | 50,000 | 41,171 | ||||
| Oracle Corp.: | ||||||
3.80%, 11/15/2037 | 50,000 | 36,419 | ||||
3.85%, 4/1/2060 | 50,000 | 30,219 | ||||
Take-Two Interactive Software, Inc. 3.55%, 4/14/2025 | 40,000 | 38,375 | ||||
VMware, Inc. 2.20%, 8/15/2031 | 50,000 | 36,503 | ||||
| 267,584 | ||||||
| TELECOMMUNICATIONS — 4.2% | ||||||
Altice France SA 5.50%, 1/15/2028 (a) | 50,000 | 39,586 | ||||
| AT&T, Inc.: | ||||||
2.55%, 12/1/2033 | 100,000 | 74,417 | ||||
3.55%, 9/15/2055 | 100,000 | 65,668 | ||||
CommScope Technologies LLC 6.00%, 6/15/2025 (a) | 50,000 | 44,383 | ||||
Frontier Communications Holdings LLC 5.00%, 5/1/2028 (a) | 50,000 | 42,888 | ||||
Level 3 Financing, Inc. 4.25%, 7/1/2028 (a) | 50,000 | 39,066 | ||||
Lumen Technologies, Inc. 5.38%, 6/15/2029 (a) | 50,000 | 37,174 | ||||
Sprint Corp. 7.88%, 9/15/2023 | 75,000 | 76,047 | ||||
Telecom Italia SpA 5.30%, 5/30/2024 (a) | 50,000 | 47,191 | ||||
| T-Mobile USA, Inc.: | ||||||
2.25%, 2/15/2026 | 50,000 | 44,785 | ||||
2.55%, 2/15/2031 | 100,000 | 79,219 | ||||
VEON Holdings B.V. 3.38%, 11/25/2027 (a) | 50,000 | 25,172 | ||||
| Verizon Communications, Inc.: | ||||||
2.65%, 11/20/2040 | 100,000 | 64,859 | ||||
3.00%, 11/20/2060 | 50,000 | 29,092 | ||||
| Vodafone Group PLC: | ||||||
4.38%, 5/30/2028 | 50,000 | 47,117 | ||||
5 Year CMT + 2.77%, 4.13%, 6/4/2081 (b) | 50,000 | 34,728 | ||||
| 791,392 | ||||||
| TRANSPORTATION — 0.2% | ||||||
FedEx Corp. 3.25%, 5/15/2041 | 50,000 | 34,398 | ||||
| TRUCKING & LEASING — 0.2% | ||||||
Fortress Transportation and Infrastructure Investors LLC 5.50%, 5/1/2028 (a) | 50,000 | 40,116 | ||||
| Security Description | Principal Amount | Value | ||||
| WATER — 0.2% | ||||||
American Water Capital Corp. 3.25%, 6/1/2051 | $ 50,000 | $ 34,936 | ||||
TOTAL CORPORATE BONDS & NOTES (Cost $12,878,510) | 10,203,398 | |||||
| ASSET-BACKED SECURITIES — 2.6% | ||||||
| AUTOMOBILE — 1.8% | ||||||
Carmax Auto Owner Trust Series 2019-3, Class B, 2.50%, 4/15/2025 | 200,000 | 196,133 | ||||
Foursight Capital Automobile Receivables Trust Series 2021-1, Class C, 1.02%, 9/15/2026 (a) | 160,000 | 150,894 | ||||
| 347,027 | ||||||
| CREDIT CARD — 0.8% | ||||||
Citibank Credit Card Issuance Trust Series 2017-A6, Class A6, 1 Month USD LIBOR + 0.77%, 3.55%, 5/14/2029 (b) | 150,000 | 147,739 | ||||
TOTAL ASSET-BACKED SECURITIES (Cost $514,837) | 494,766 | |||||
| FOREIGN GOVERNMENT OBLIGATIONS — 17.0% | ||||||
| ANGOLA — 0.4% | ||||||
Angolan Government International Bond Series 144A, 8.00%, 11/26/2029 (a) | 100,000 | 75,253 | ||||
| ARGENTINA — 0.2% | ||||||
Argentine Republic Government International Bond 1.50%, 7/9/2035 (c) | 200,000 | 36,350 | ||||
| BAHRAIN — 0.8% | ||||||
Bahrain Government International Bond Series 144A, 5.63%, 5/18/2034 (a) | 200,000 | 156,944 | ||||
| BOLIVIA — 0.2% | ||||||
Bolivian Government International Bond Series REGS, 4.50%, 3/20/2028 | 50,000 | 39,281 | ||||
| BRAZIL — 1.0% | ||||||
| Brazilian Government International Bond: | ||||||
3.75%, 09/12/2031 | 200,000 | 161,966 | ||||
4.75%, 01/14/2050 | 50,000 | 34,316 | ||||
| 196,282 | ||||||
| Security Description | Principal Amount | Value | |||
| COLOMBIA — 0.7% | |||||
Colombia Government International Bond 3.25%, 4/22/2032 | $ 200,000 | $ 135,354 | |||
| COSTA RICA — 0.5% | |||||
Costa Rica Government International Bond Series REGS, 6.13%, 2/19/2031 | 100,000 | 92,009 | |||
| DOMINICAN REPUBLIC — 0.5% | |||||
Dominican Republic International Bond Series REGS, 5.30%, 1/21/2041 | 150,000 | 101,502 | |||
| ECUADOR — 0.3% | |||||
Ecuador Government International Bond Series REGS, 2.50%, 7/31/2035 (c) | 150,000 | 49,365 | |||
| EGYPT — 0.6% | |||||
Egypt Government International Bond Series 144A, 5.88%, 2/16/2031 (a) | 200,000 | 116,302 | |||
| EL SALVADOR — 0.1% | |||||
El Salvador Government International Bond Series REGS, 5.88%, 1/30/2025 | 50,000 | 27,071 | |||
| GHANA — 0.5% | |||||
Ghana Government International Bond Series REGS, Zero Coupon, 4/7/2025 | 200,000 | 84,210 | |||
| GUATEMALA — 0.2% | |||||
Guatemala Government Bond Series 144A, 3.70%, 10/7/2033 (a) | 50,000 | 36,729 | |||
| HUNGARY — 1.2% | |||||
| Hungary Government International Bond: | |||||
7.63%, 03/29/2041 | 50,000 | 49,346 | |||
Series 144A, 5.25%, 06/16/2029 (a) | 200,000 | 181,996 | |||
| 231,342 | |||||
| INDIA — 0.4% | |||||
Export-Import Bank of India Series REGS, 2.25%, 1/13/2031 | 100,000 | 74,543 | |||
| JAMAICA — 0.3% | |||||
Jamaica Government International Bond 6.75%, 4/28/2028 | 50,000 | 52,069 |
| Security Description | Principal Amount | Value | |||
| JORDAN — 0.4% | |||||
Jordan Government International Bond Series 144A, 5.85%, 7/7/2030 (a) | $ 100,000 | $ 80,818 | |||
| KENYA — 0.3% | |||||
Republic of Kenya Government International Bond Series 144A, 6.30%, 1/23/2034 (a) | 100,000 | 61,126 | |||
| LEBANON — 0.0% (d) | |||||
Lebanon Government International Bond Series EMTN, 6.10%, 10/4/2022 (e) | 100,000 | 5,650 | |||
| MEXICO — 0.6% | |||||
| Mexico Government International Bond: | |||||
3.50%, 02/12/2034 | 50,000 | 38,193 | |||
5.00%, 04/27/2051 | 100,000 | 76,950 | |||
| 115,143 | |||||
| MONGOLIA — 0.2% | |||||
Mongolia Government International Bond Series REGS, 3.50%, 7/7/2027 | 50,000 | 35,239 | |||
| MOROCCO — 0.4% | |||||
Morocco Government International Bond Series 144A, 3.00%, 12/15/2032 (a) | 100,000 | 70,068 | |||
| NIGERIA — 0.7% | |||||
Nigeria Government International Bond Series REGS, 6.13%, 9/28/2028 | 200,000 | 132,260 | |||
| OMAN — 1.0% | |||||
Oman Government International Bond Series REGS, 4.75%, 6/15/2026 | 200,000 | 186,250 | |||
| PAKISTAN — 0.2% | |||||
Pakistan Government International Bond Series 144A, 6.00%, 4/8/2026 (a) | 100,000 | 38,614 | |||
| PANAMA — 0.7% | |||||
| Panama Government International Bond: | |||||
3.87%, 07/23/2060 | 50,000 | 29,587 | |||
6.70%, 01/26/2036 | 100,000 | 97,871 | |||
| 127,458 |
| Security Description | Principal Amount | Value | |||
| PARAGUAY — 0.4% | |||||
Paraguay Government International Bond Series 144A, 5.40%, 3/30/2050 (a) | $ 100,000 | $ 73,675 | |||
| ROMANIA — 1.1% | |||||
| Romanian Government International Bond: | |||||
Series 144A, 3.00%, 02/27/2027 (a) | 200,000 | 168,846 | |||
Series REGS, 4.00%, 02/14/2051 | 50,000 | 27,752 | |||
| 196,598 | |||||
| SOUTH AFRICA — 0.7% | |||||
Republic of South Africa Government International Bond 5.75%, 9/30/2049 | 200,000 | 127,628 | |||
| SRI LANKA — 0.3% | |||||
Sri Lanka Government International Bond Series REGS, 7.55%, 3/28/2030 | 200,000 | 49,528 | |||
| TRINIDAD AND TOBAGO — 0.3% | |||||
Trinidad & Tobago Government International Bond Series REGS, 4.50%, 8/4/2026 | 50,000 | 48,146 | |||
| TURKEY — 1.3% | |||||
| Turkey Government International Bond: | |||||
4.25%, 03/13/2025 | 200,000 | 176,070 | |||
4.88%, 04/16/2043 | 50,000 | 28,079 | |||
5.13%, 02/17/2028 | 50,000 | 38,709 | |||
| 242,858 | |||||
| UKRAINE — 0.1% | |||||
Ukraine Government International Bond Series REGS, 7.75%, 9/1/2025 | 100,000 | 23,390 | |||
| UZBEKISTAN — 0.4% | |||||
Republic of Uzbekistan International Bond Series 144A, 3.90%, 10/19/2031 (a) | 100,000 | 70,037 | |||
TOTAL FOREIGN GOVERNMENT OBLIGATIONS (Cost $4,374,376) | 3,189,092 |
| Security Description | Principal Amount | Value | |||
| U.S. GOVERNMENT AGENCY OBLIGATIONS — 14.6% | |||||
| Federal National Mortgage Association: | |||||
TBA, 2.00%, 10/15/2037 (f) | $ 300,000 | $ 263,986 | |||
TBA, 2.00%, 10/15/2052 (f) | 675,000 | 545,694 | |||
TBA, 2.50%, 10/18/2037 (f) | 250,000 | 226,186 | |||
TBA, 2.50%, 10/15/2052 (f) | 525,000 | 440,494 | |||
TBA, 3.00%, 10/15/2052 (f) | 350,000 | 304,063 | |||
TBA, 3.50%, 10/15/2052 (f) | 200,000 | 179,742 | |||
TBA, 4.00%, 10/15/2052 (f) | 200,000 | 185,359 | |||
TBA, 4.50%, 10/15/2052 (f) | 100,000 | 95,155 | |||
| Government National Mortgage Association: | |||||
TBA, 2.00%, 10/20/2052 (f) | 100,000 | 83,048 | |||
TBA, 2.50%, 10/20/2052 (f) | 100,000 | 85,708 | |||
TBA, 3.00%, 10/20/2052 (f) | 125,000 | 110,226 | |||
TBA, 3.50%, 10/20/2052 (f) | 90,000 | 81,653 | |||
TBA, 4.00%, 10/20/2052 (f) | 150,000 | 139,882 | |||
TOTAL U.S. GOVERNMENT AGENCY OBLIGATIONS (Cost $2,857,117) | 2,741,196 | ||||
| COMMERCIAL MORTGAGE BACKED SECURITIES — 2.0% | |||||
BANK Series 2021-BN33, Class A5, 2.56%, 5/15/2064 | 75,000 | 61,228 | |||
Benchmark Mortgage Trust Series 2021-B31, Class A5, 2.67%, 12/15/2054 | 100,000 | 81,468 | |||
GS Mortgage Securities Trust Series 2018-GS9, Class AS, 4.14%, 3/10/2051 (b) | 99,000 | 89,994 | |||
JPMBB Commercial Mortgage Securities Trust Series 2013-C12, Class AS, 4.17%, 7/15/2045 (b) | 60,000 | 59,135 | |||
Morgan Stanley Capital I Trust Series 2016-UB12, Class A3, 3.34%, 12/15/2049 | 98,350 | 91,259 | |||
TOTAL COMMERCIAL MORTGAGE BACKED SECURITIES (Cost $455,758) | 383,084 | ||||
| MUTUAL FUNDS AND EXCHANGE TRADED PRODUCTS — 10.0% | |||||
| DOMESTIC EQUITY — 2.0% | |||||
SPDR ICE Preferred Securities ETF (g) | 10,850 | 378,231 | |||
| DOMESTIC FIXED INCOME — 6.0% | |||||
SPDR Blackstone Senior Loan ETF (g) | 14,000 | 572,180 |
| Security Description | Principal Amount | Value | |||
SPDR Bloomberg Convertible Securities ETF (g) | $ 8,850 | $ 560,205 | |||
| 1,132,385 | |||||
| INTERNATIONAL FIXED INCOME — 2.0% | |||||
SPDR Bloomberg Emerging Markets Local Bond ETF (g) | 19,100 | 362,327 | |||
TOTAL MUTUAL FUNDS AND EXCHANGE TRADED PRODUCTS (Cost $2,287,690) | 1,872,943 |
| Shares | |||
| SHORT-TERM INVESTMENT — 11.9% | |||
State Street Institutional U.S. Government Money Market Fund, Class G Shares 2.98% (h) (i) (Cost $2,225,579) | 2,225,579 | 2,225,579 | |
TOTAL INVESTMENTS — 112.4% (Cost $25,593,867) | 21,110,058 | ||
LIABILITIES IN EXCESS OF OTHER ASSETS — (12.4)% | (2,324,300) | ||
NET ASSETS — 100.0% | $ 18,785,758 | ||
| (a) | Securities purchased pursuant to Rule 144A of the Securities Act of 1933, as amended. These securities, which represent 31.4% of net assets as of September 30, 2022, are considered liquid and may be resold in transactions exempt from registration, normally to qualified institutional buyers. |
| (b) | Variable Rate Security - Interest rate shown is rate in effect at September 30, 2022. For securities based on a published reference rate and spread, the reference rate and spread are indicated in the description above. |
| (c) | Step-up bond - Coupon rate increases in increments to maturity. Rate shown as of September 30, 2022. Maturity date shown is the final maturity. |
| (d) | Amount is less than 0.05% of net assets. |
| (e) | Security is currently in default and/or issuer is in bankruptcy. |
| (f) | Security, or a portion of the security has been designated as collateral for TBA securities. |
| (g) | Affiliated fund managed by SSGA Funds Management, Inc. Amounts related to these transactions during the period ended September 30, 2022 are shown in the Affiliate Table below. |
| (h) | The Fund invested in certain money market funds managed by SSGA Funds Management, Inc. Amounts related to these transactions during the period ended September 30, 2022 are shown in the Affiliate Table below. |
| (i) | The rate shown is the annualized seven-day yield at September 30, 2022. |
| CMT | Constant Maturity Treasury |
| EMTN | Euro Medium Term Note |
| LIBOR | London Interbank Offered Rate |
| MTN | Medium Term Note |
| REIT | Real Estate Investment Trust |
| SOFR | Secured Overnight Financing Rate |
| TBA | To Be Announced |
| Description | Number of Contracts | Expiration Date | Notional Amount | Value | Unrealized Appreciation (Depreciation) | |||||
| Ultra 10 Yr. U.S. Treasury Futures (short) | (13) | 12/20/2022 | $(1,636,688) | $(1,540,317) | $ 96,371 | |||||
| U.S. Treasury Long Bond Futures (long) | 1 | 12/20/2022 | 137,258 | 126,406 | (10,852) | |||||
| Ultra U.S. Treasury Bond Futures (long) | 5 | 12/20/2022 | 750,547 | 685,000 | (65,547) | |||||
| 5 Yr. U.S. Treasury Note Futures (long) | 8 | 12/30/2022 | 891,287 | 860,063 | (31,224) | |||||
| $ (11,252) |
| Reference Entity | Counterparty | Notional Amount (000s Omitted) | Contract Annual Fixed Rate/ Payment Frequency | Termination Date | Market Value | Unamortized Upfront Payments Received (Paid) | Unrealized Appreciation (Depreciation) | |||||||
| Sell Protection | ||||||||||||||
| Markit CDX North America High Yield Index | Intercontinental Exchange, Inc. | 2,500 | 1.00%/ Quarterly | 12/20/27 | $(248,542) | $(201,931) | $ (46,611) | |||||||
| Markit CDX North America High Yield Index | Intercontinental Exchange, Inc. | 250 | 1.00%/ Quarterly | 12/20/27 | 905 | 459 | 1,364 | |||||||
| $(45,247) |
| Description | Level 1 – Quoted Prices | Level 2 – Other Significant Observable Inputs | Level 3 – Significant Unobservable Inputs | Total | ||||
| ASSETS: | ||||||||
| INVESTMENTS: | ||||||||
Corporate Bonds & Notes | $ — | $10,203,398 | $— | $10,203,398 | ||||
Asset-Backed Securities | — | 494,766 | — | 494,766 | ||||
Foreign Government Obligations | — | 3,189,092 | — | 3,189,092 | ||||
U.S. Government Agency Obligations | — | 2,741,196 | — | 2,741,196 | ||||
Commercial Mortgage Backed Securities | — | 383,084 | — | 383,084 | ||||
Mutual Funds and Exchange Traded Products | 1,872,943 | — | — | 1,872,943 | ||||
Short-Term Investment | 2,225,579 | — | — | 2,225,579 | ||||
TOTAL INVESTMENTS | $4,098,522 | $ 17,011,536 | $— | $ 21,110,058 | ||||
| OTHER FINANCIAL INSTRUMENTS: | ||||||||
Credit Default Swaps(a) | — | 1,364 | — | 1,364 | ||||
Futures Contracts(b) | $ 96,371 | $ — | $— | $ 96,371 | ||||
TOTAL OTHER FINANCIAL INSTRUMENTS: | $ 96,371 | $ 1,364 | $— | $ 97,735 | ||||
TOTAL INVESTMENTS AND OTHER FINANCIAL INSTRUMENTS | $4,194,893 | $17,012,900 | $— | $21,207,793 |
| Description | Level 1 – Quoted Prices | Level 2 – Other Significant Observable Inputs | Level 3 – Significant Unobservable Inputs | Total | ||||
| LIABILITIES: | ||||||||
| OTHER FINANCIAL INSTRUMENTS: | ||||||||
Credit Default Swaps(a) | $ — | $ (46,611) | $— | $ (46,611) | ||||
Futures Contracts(b) | (107,623) | — | — | (107,623) | ||||
TOTAL OTHER FINANCIAL INSTRUMENTS: | $ (107,623) | $ (46,611) | $— | $ (154,234) |
| (a) | Credit Default Swaps are valued at unrealized appreciation (depreciation). |
| (b) | Futures Contracts are valued at unrealized appreciation (depreciation). |
| Number of Shares Held at 12/23/2021* | Value at 12/23/2021* | Cost of Purchases | Proceeds from Shares Sold | Realized Gain (Loss) | Change in Unrealized Appreciation/ Depreciation | Number of Shares Held at 9/30/22 | Value at 9/30/22 | Dividend Income | |||||||||
SPDR Blackstone Senior Loan ETF | — | $— | $ 696,620 | $ 58,553 | $ (762) | $ (65,125) | 14,000 | $ 572,180 | $20,043 | ||||||||
SPDR Bloomberg Convertible Securities ETF | — | — | 737,476 | 10,333 | (2,040) | (164,898) | 8,850 | 560,205 | 6,518 | ||||||||
SPDR Bloomberg Emerging Markets Local Bond ETF | — | — | 487,009 | 19,138 | (2,798) | (102,746) | 19,100 | 362,327 | 12,063 | ||||||||
SPDR ICE Preferred Securities ETF | — | — | 487,812 | 23,927 | (3,676) | (81,978) | 10,850 | 378,231 | 16,146 | ||||||||
State Street Institutional U.S. Government Money Market Fund, Class G Shares | — | — | 26,996,986 | 24,771,407 | — | — | 2,225,579 | 2,225,579 | 19,065 | ||||||||
Total | $— | $29,405,903 | $24,883,358 | $(9,276) | $(414,747) | $4,098,522 | $73,835 |
| * | Commencement of operations. |
| ASSETS | |
Investments in unaffiliated issuers, at value | $ 17,011,536 |
Investments in affiliated issuers, at value | 4,098,522 |
Total Investments | 21,110,058 |
Foreign currency, at value | 94 |
Net cash at broker | 687,942 |
Cash | 8 |
Dividends receivable — affiliated issuers | 5,045 |
Interest receivable — unaffiliated issuers | 193,929 |
Receivable for foreign taxes recoverable | 593 |
Prepaid expenses and other assets | 51 |
TOTAL ASSETS | 21,997,720 |
| LIABILITIES | |
Payable for investments purchased | 2,860,501 |
Payable for accumulated variation margin on open futures contracts | 11,232 |
Payable for accumulated variation margin on swap contracts | 245,838 |
Advisory fee payable | 25,774 |
Custodian fees payable | 13,409 |
Administration fees payable | 812 |
Transfer agent fees payable | 5,568 |
Registration and filing fees payable | 11,117 |
Professional fees payable | 37,070 |
Printing and postage fees payable | 43 |
Accrued expenses and other liabilities | 598 |
TOTAL LIABILITIES | 3,211,962 |
NET ASSETS | $18,785,758 |
| NET ASSETS CONSIST OF: | |
Paid-in Capital | $23,987,390 |
Total distributable earnings (loss) | (5,201,632) |
NET ASSETS | $18,785,758 |
| Class K | |
Net Assets | $18,785,758 |
Shares Outstanding | 2,400,000 |
Net asset value, offering and redemption price per share | $ 7.83 |
| COST OF INVESTMENTS: | |
Investments in unaffiliated issuers | $21,080,598 |
Investments in affiliated issuers | 4,513,269 |
Total cost of investments | $25,593,867 |
Foreign currency, at cost | $ 94 |
| INVESTMENT INCOME | |
Interest income — unaffiliated issuers | $ 682,800 |
Dividend income — affiliated issuers | 73,835 |
TOTAL INVESTMENT INCOME (LOSS) | 756,635 |
| EXPENSES | |
Advisory fee | 41,476 |
Administration fees | 8,295 |
Custodian fees | 29,025 |
Trustees’ fees and expenses | 15,837 |
Transfer agent fees | 7,177 |
Registration and filing fees | 11,163 |
Professional fees and expenses | 37,127 |
Printing and postage fees | 4,815 |
Insurance expense | 13 |
Miscellaneous expenses | 1,510 |
TOTAL EXPENSES | 156,438 |
Expenses waived/reimbursed by the Adviser | (40,297) |
NET EXPENSES | 116,141 |
NET INVESTMENT INCOME (LOSS) | $ 640,494 |
| REALIZED AND UNREALIZED GAIN (LOSS) | |
| Net realized gain (loss) on: | |
Investments — unaffiliated issuers | (522,589) |
Investments — affiliated issuers | (9,276) |
Futures contracts | (196,578) |
Swaps Contracts | 26,495 |
Net realized gain (loss) | (701,948) |
| Net change in unrealized appreciation/depreciation on: | |
Investments — unaffiliated issuers | (4,069,062) |
Investments — affiliated issuers | (414,747) |
Futures contracts | (11,252) |
Swap contracts | (45,247) |
Net change in unrealized appreciation/depreciation | (4,540,308) |
NET REALIZED AND UNREALIZED GAIN (LOSS) | (5,242,256) |
NET INCREASE (DECREASE) IN NET ASSETS FROM OPERATIONS | $(4,601,762) |
| (a) For the period December 23, 2021 (commencement of operations) through September 30, 2022. |
| For the Period 12/23/21*- 9/30/22 | |
| INCREASE (DECREASE) IN NET ASSETS FROM OPERATIONS: | |
Net investment income (loss) | $ 640,494 |
Net realized gain (loss) | (701,948) |
Net change in unrealized appreciation/depreciation | (4,540,308) |
Net increase (decrease) in net assets resulting from operations | (4,601,762) |
| DISTRIBUTIONS TO SHAREHOLDERS: | |
Class K | (612,480) |
| FROM BENEFICIAL INTEREST TRANSACTIONS: | |
| Class K | |
Proceeds from sale of shares sold | 24,000,000 |
Net increase (decrease) in net assets from beneficial interest transactions | 24,000,000 |
Net increase (decrease) in net assets during the period | 18,785,758 |
Net assets at beginning of period | — |
NET ASSETS AT END OF PERIOD | $18,785,758 |
| SHARES OF BENEFICIAL INTEREST: | |
| Class K | |
Shares sold | 2,400,000 |
Net increase (decrease) from share transactions | 2,400,000 |
| * | Commencement of operations. |
| For the Period 12/23/21*- 9/30/22 | |
Net asset value, beginning of period | $ 10.00 |
| Income (loss) from investment operations: | |
Net investment income (loss) (a) | 0.27 |
Net realized and unrealized gain (loss) (b) | (2.18) |
Total from investment operations | (1.91) |
| Distributions to shareholders from: | |
Net investment income | (0.26) |
Net asset value, end of period | $ 7.83 |
Total return (c) | (19.32)% |
| Ratios and Supplemental Data: | |
Net assets, end of period (in 000s) | $18,786 |
| Ratios to average net assets: | |
Total expenses | 0.94%(d) |
Net expenses | 0.70%(d) |
Net investment income (loss) | 3.86%(d) |
Portfolio turnover rate | 8%(e)(f) |
| * | Commencement of operations. |
| (a) | Per share numbers have been calculated using average shares outstanding, which more appropriately presents the per share data for the year. |
| (b) | Amounts shown in this caption for a share outstanding may not accord with the change in aggregate gains and losses in securities for the fiscal period because of the timing of sales and repurchases of Fund shares in relation to fluctuating market values for the Fund. |
| (c) | Total return is calculated assuming a purchase of shares at net asset value on the first day and a sale at net asset value on the last day of each period reported. Distributions are assumed, for the purpose of this calculation, to be reinvested at net asset value per share on the respective payment dates of the Fund. Total return for periods of less than one year are not annualized. Results represent past performance and are not indicative of future results. |
| (d) | Annualized. |
| (e) | Not annualized. |
| (f) | The portfolio turnover calculated did not include "To-Be-Announced" transactions and, if it had, the portfolio turnover would have been 180%. |
| Fund | Classes | Commencement of Operations | Diversification Classification |
| State Street Diversified Income Fund | Class K | December 23, 2021 | Diversified |
these securities, the inflation component of the price is “cleaned” from the pricing service or broker price utilizing the published inflation factors in order to ensure proper accrual of income.
| Liability Derivatives | |||||||||||
| Interest Rate Risk | Foreign Exchange Risk | Credit Risk | Equity Risk | Commodity Risk | Total | ||||||
Futures Contracts | $11,232 | $— | $ — | $— | $— | $ 11,232 | |||||
Swap Contracts | — | — | 245,838 | — | — | 245,838 | |||||
| Net Realized Gain (Loss) | |||||||||||
| Interest Rate Risk | Foreign Exchange Risk | Credit Risk | Equity Risk | Commodity Risk | Total | ||||||
Futures Contracts | $(196,578) | $— | $ — | $— | $— | $(196,578) | |||||
Swap Contracts | — | — | 26,495 | — | — | 26,495 | |||||
| Net Change in Unrealized Appreciation (Depreciation) | |||||||||||
| Interest Rate Risk | Foreign Exchange Risk | Credit Risk | Equity Risk | Commodity Risk | Total | ||||||
Futures Contracts | $(11,252) | $— | $ — | $— | $— | $ (11,252) | |||||
Swap Contracts | — | — | (45,247) | — | — | (45,247) | |||||
| Fund | Number of 10% Affiliated Account Holders | Percentage of Affiliated Ownership | ||
State Street Diversified Income Fund | 1 | 100% |
| U.S. Government Obligations | Other Securities | ||||||
| Purchases | Sales | Purchases | Sales | ||||
State Street Diversified Income Fund | $40,554,489 | $37,283,864 | $21,996,917 | $1,466,985 | |||
| Ordinary Income | Long-Term Capital Gains | Total | |||
State Street Diversified Income Fund | $612,480 | $— | $612,480 |
| Undistributed Ordinary Income | Capital Loss Carryforwards | Undistributed Long-Term Capital Gains | Net Unrealized Gains (Losses) | Total | |||||
State Street Diversified Income Fund | $— | $(706,593) | $— | $(4,495,039) | $(5,201,632) |
| Non-Expiring Short Term | Non-Expiring Long Term | ||
State Street Diversified Income Fund | $581,921 | $124,672 |
and other financial instruments based on cost for federal income tax purposes were as follows:
| Tax Cost | Gross Unrealized Appreciation | Gross Unrealized Depreciation | Net Unrealized Appreciation (Depreciation) | ||||
State Street Diversified Income Fund | $25,548,598 | $548 | $4,495,587 | $(4,495,039) |

November 23, 2022
| Actual | Hypothetical (assuming a 5% return before expenses) | ||||||||
| Annualized Expense Ratio | Ending Account Value | Expenses Paid During Period(a) | Ending Account Value | Expenses Paid During Period(a) | |||||
State Street Diversified Income Fund | 0.70% | $861.40 | $3.27 | $1,021.60 | $3.55 | ||||
| (a) | Expenses are equal to the Fund's annualized net expense ratio multiplied by the average account value of the period, multiplied by 183, then divided by 365. |
| Name, Address and Year of Birth | Position(s) Held with Trust | Term of Office and Length of Time Served | Principal Occupation During the Past Five Years and Relevant Experience | Number of Funds in Fund Complex Overseen by Trustee† | Other Directorships Held by Trustee During the Past Five Years | |||||
| Trustees | ||||||||||
| Independent Trustees | ||||||||||
| Michael F. Holland c/o SSGA Funds Management, Inc. One Iron Street Boston, MA 02210 YOB: 1944 | Trustee and Co- Chairperson of the Board | Term: Indefinite Elected: 7/99 | Chairman, Holland & Company L.L.C. (investment adviser) (1995 - present). | 57 | Director, the Holland Series Fund, Inc.; Director, The China Fund, Inc. (1992 - 2017); Director, The Taiwan Fund, Inc. (2007 - 2017); Director, Reaves Utility Income Fund, Inc.; and Director, Blackstone/GSO Loans (and Real Estate) Funds. | |||||
| Patrick J. Riley c/o SSGA Funds Management, Inc. One Iron Street Boston, MA 02210 YOB: 1948 | Trustee and Co- Chairperson of the Board | Term: Indefinite Elected: 1/14 | 2002 to May 2010, Associate Justice of the Superior Court, Commonwealth of Massachusetts; 1985 to 2002, Partner, Riley, Burke & Donahue, L.L.P. (law firm); 1998 to Present, Independent Director, State Street Global Advisers Europe Limited (investment company); 1998 to Present, Independent Director, SSGA Liquidity plc (formerly, SSGA Cash Management Fund plc); January 2009 to Present, Independent Director, SSGA Fixed Income plc; and January 2009 - 2019, Independent Director, SSGA Qualified Funds PLC. | 57 | Board Director and Chairman, SPDR Europe 1PLC Board (2011 - present); Board Director and Chairman, SPDR Europe II, PLC (2013 - present). | |||||
| John R. Costantino c/o SSGA Funds Management, Inc. One Iron Street Boston, MA 02210 YOB: 1946 | Trustee and Chairperson of the Qualified Legal Compliance Committee | Term: Indefinite Elected: 12/18 | Senior Advisor to NGN Capital LLC (January 2020 - present); Managing General Partner, NGN Capital LLC (2006 - December 2019). | 57 | Director, Kleinfeld Bridal Corp. (January 2016 - present); Trustee of Neuroscience Research Institute (1986 - 2017); Trustee of Fordham University (1989 - 1995 and 2001 - 2007) and Trustee Emeritus (2007 - present); Trustee and Independent Chairperson of GE Funds (1993 - February 2011); Director, Muscular Dystrophy Association (since 2019); Trustee of Gregorian University Foundation (1992 - 2007); Chairman of the Board of Directors, Vivaldi Biosciences Inc. (May 2017 - present); Chairman of the Supervisory Board, Vivaldi Biosciences AG. (May 2017 - present); Trustee, Gallim Dance (December 2021 - present). | |||||
| Richard D. Shirk c/o SSGA Funds Management, Inc. One Iron Street Boston, MA 02210 YOB: 1945 | Trustee and Chairperson of the Nominating Committee and Chairperson of the Governance Committee | Term: Indefinite Elected: 1/14 | March 2001 to April 2002, Chairman (1996 to March 2001, President and Chief Executive Officer), Cerulean Companies, Inc. (holding company) (Retired); 1992 to March 2001, President and Chief Executive Officer, Blue Cross Blue Shield of Georgia (health insurer, managed healthcare). | 57 | 1998 to December 2008, Chairman, Board Member and December 2008 to present, Investment Committee Member, Healthcare Georgia Foundation (private foundation); September 2002 to 2012, Lead Director and Board Member, Amerigroup Corp. (managed health care); 1999 to 2013, Board Member and (2001 - 2017) Investment Committee Member, Woodruff Arts Center; and 2003 to 2009, Trustee, Gettysburg College; Board member, Aerocare Holdings (2003 - January 2021), Regenesis Biomedical Inc. (April 2012 - present). | |||||
| Michael A. Jessee c/o SSGA Funds Management, Inc. One Iron Street Boston, MA 02210 YOB: 1946 | Trustee and Chairperson of the Valuation Committee | Term: Indefinite Appointed: 7/16 Elected: 12/18 | Retired; formerly, President and Chief Executive Officer of the Federal Home Loan Bank of Boston (1989 - 2009); Trustee, Randolph-Macon College (2004 - 2016). | 57 | None. |
| Name, Address and Year of Birth | Position(s) Held with Trust | Term of Office and Length of Time Served | Principal Occupation During the Past Five Years and Relevant Experience | Number of Funds in Fund Complex Overseen by Trustee† | Other Directorships Held by Trustee During the Past Five Years | |||||
| Donna M. Rapaccioli c/o SSGA Funds Management, Inc. One Iron Street Boston, MA 02210 YOB: 1962 | Trustee and Chairperson of the Audit Committee | Term: Indefinite Elected: 12/18 | Dean of the Gabelli School of Business (2007 - June 2022) and Accounting Professor (1987 - present) at Fordham University. | 57 | Director- Graduate Management Admissions Council (2015 - present); Trustee of Emmanuel College (2010 - 2019). | |||||
| Margaret McLaughlin c/o SSGA Funds Management, Inc. One Iron Street Boston, MA 02210 YOB: 1967 | Trustee | Term: Indefinite Appointed: 9/22 | Consultant (since 2020) Bates Group (consultants); Consultant (2019 - 2020) Madison Dearborn Partners (private equity); General Counsel/CCO (2011 - 2019) Kramer Van Kirk Credit Strategies L.P./Mariana Systems LLC (Investment Adviser/SaaS Technology). | 57 | Director, Manning & Napier Fund Inc. (2021 - present). | |||||
| George Pereira c/o SSGA Funds Management, Inc. One Iron Street Boston, MA 02210 YOB: 1964 | Trustee | Term: Indefinite Appointed: 9/22 | Chief Operating Officer (January 2011 - September 2020) and Chief Financial Officer (November 2004 – September 2020), Charles Schwab Investment Management. | 57 | Director, Pacific Premier Bancorp, Pacific Premier Bank (2021 - present); Director, Charles Schwab Asset Management (Ireland) Ltd., & Charles Schwab Worldwide Funds plc. (2005 - 2020); Director, Rotaplast International, Inc. (non-profit providing free medical services to children worldwide) (2012 - 2018). |
| Interested Trustee(1) | |||||
| Ellen M. Needham(2) SSGA Funds Management, Inc. One Iron Street Boston, MA 02210 YOB: 1967 | Trustee and President | Term: Indefinite Elected 12/18 | Chairman, SSGA Funds Management, Inc. (March 2020 - present); President and Director, SSGA Funds Management, Inc. (2001 - present)*; Senior Managing Director, State Street Global Advisors (1992 - present)*; Manager, State Street Global Advisors Funds Distributors, LLC (May 2017 - present). | 57 | Board Director, SSGA SPDR ETFs Europe 1 plc (May 2020 - present); Board Director, SSGA SPDR ETFs Europe II plc (May 2020 - present). |
| † For the purpose of determining the number of portfolios overseen by the Trustees, “Fund Complex” comprises registered investment companies for which SSGA Funds Management, Inc. serves as investment adviser. | |||||
| (1) The individual listed below is a Trustee who is an “interested person,” as defined in the 1940 Act, of the Trust (“Interested Trustee”). | |||||
| (2) Ms. Needham is an Interested Trustee because of her employment by SSGA FM, an affiliate of the Trust. | |||||
| * Served in various capacities and/or with various affiliated entities during noted time period. | |||||
| The following lists the principal officers for the Trust, as well as their mailing addresses and ages, positions with the Trust and length of time served, and present and principal occupations: | |||
| Name, Address and Year of Birth | Position(s) Held with Trust | Term of Office and Length of Time Served | Principal Occupation(s) During the Past 5 Years |
| Officers | |||
| ELLEN M. NEEDHAM SSGA Funds Management, Inc. One Iron Street Boston, MA 02210 YOB: 1967 | President, Trustee | Term: Indefinite Elected: 10/12 | Chairman, SSGA Funds Management, Inc. (March 2020 - present); President and Director, SSGA Funds Management, Inc. (2001 - present)*; Senior Managing Director, State Street Global Advisors (1992 - present)*; Manager, State Street Global Advisors Funds Distributors, LLC (May 2017 - present). |
| BRUCE S. ROSENBERG SSGA Funds Management, Inc. One Iron Street Boston, MA 02210 YOB: 1961 | Treasurer | Term: Indefinite Elected: 2/16 | Managing Director, State Street Global Advisors and SSGA Funds Management, Inc. (July 2015 - present); Director, Credit Suisse (April 2008 - July 2015). |
| ANN M. CARPENTER SSGA Funds Management, Inc. One Iron Street Boston, MA 02210 YOB: 1966 | Vice President and Deputy Treasurer | Term: Indefinite Elected: 10/12 Term: Indefinite Elected: 2/16 | Chief Operating Officer, SSGA Funds Management, Inc. (April 2005 - present)*; Managing Director, State Street Global Advisors. (April 2005 - present).* |
| CHAD C. HALLETT SSGA Funds Management, Inc. One Iron Street Boston, MA 02210 YOB: 1969 | Deputy Treasurer | Term: Indefinite Elected: 2/16 | Vice President, State Street Global Advisors and SSGA Funds Management, Inc. (November 2014 - present); Vice President, State Street Bank and Trust Company (2001 - November 2014).* |
| DARLENE ANDERSON-VASQUEZ SSGA Funds Management, Inc. One Iron Street Boston, MA 02210 YOB: 1968 | Deputy Treasurer | Term: Indefinite Elected: 11/16 | Managing Director, State Street Global Advisors and SSGA Funds Management, Inc. (May 2016 - present); Senior Vice President, John Hancock Investments (September 2007 - May 2016). |
| ARTHUR A. JENSEN SSGA Funds Management, Inc. 1600 Summer Street Stamford, CT 06905 YOB: 1966 | Deputy Treasurer | Term: Indefinite Elected: 11/16 | Vice President, State Street Global Advisors and SSGA Funds Management, Inc. (July 2016 - present); Mutual Funds Controller, GE Asset Management Incorporated (April 2011 - July 2016). |
| DAVID LANCASTER SSGA Funds Management, Inc. One Iron Street Boston, MA 02210 YOB: 1971 | Assistant Treasurer | Term: Indefinite Elected: 11/20 | Vice President, State Street Global Advisors and SSGA Funds Management, Inc. (July 2017 - present); Assistant Vice President, State Street Bank and Trust Company (November 2011 - July 2017).* |
| Ryan Hill SSGA Funds Management, Inc. One Iron Street, Boston, MA 02210 YOB:1982 | Assistant Treasurer | Term: Indefinite Elected: 5/22 | Vice President, State Street Global Advisors and SSGA Funds Management, Inc. (May 2017 - present); Assistant Vice President, State Street Bank and Trust Company (May 2014 - May 2017). |
| John Bettencourt SSGA Funds Management, Inc. One Iron Street, Boston, MA 02210 YOB:1976 | Assistant Treasurer | Term: Indefinite Elected: 5/22 | Vice President, State Street Global Advisors and SSGA Funds Management, Inc. (March 2020 - present); Assistant Vice President, State Street Global Advisors (June 2007 - March 2020). |
| BRIAN HARRIS SSGA Funds Management, Inc. One Iron Street Boston, MA 02210 YOB: 1973 | Chief Compliance Officer, Anti-Money Laundering Officer and Code of Ethics Compliance Officer | Term: Indefinite Elected: 7/16 | Managing Director, State Street Global Advisors and SSGA Funds Management, Inc. (June 2013 - present).* |
| SEAN O'MALLEY SSGA Funds Management, Inc. One Iron Street Boston, MA 02210 YOB: 1969 | Chief Legal Officer | Term: Indefinite Elected: 8/19 | Senior Vice President and General Counsel, State Street Global Advisors (May 2022 - present); Senior Vice President and Deputy General Counsel, State Street Global Advisors (November 2013 - May 2022). |
| DAVID BARR SSGA Funds Management, Inc. One Iron Street Boston, MA 02210 YOB: 1974 | Secretary | Term: Indefinite Elected: 9/20 | Vice President and Senior Counsel, State Street Global Advisors (October 2019 - present); Vice President and Counsel, Eaton Vance Corp. (October 2010 - October 2019). |
| DAVID URMAN SSGA Funds Management, Inc. One Iron Street Boston, MA 02210 YOB: 1985 | Assistant Secretary | Term: Indefinite Elected: 8/19 | Vice President and Senior Counsel, State Street Global Advisors (April 2019 - present); Vice President and Counsel, State Street Global Advisors (August 2015 - April 2019); Associate, Ropes & Gray LLP (November 2012 - August 2015). |
| * Served in various capacities and/or with various affiliated entities during noted time period. | |||
| Statement of Additional Information (SAI) includes additional information about the Fund's Trustees and officers and is available, without charge, upon request and by calling 1-877-521-4083. | |||
One Iron Street
Boston, MA 02210
State Street Financial Center
One Lincoln Street
Boston, MA 02111
200 Clarendon Street
Boston, MA 02116
800 Boylston Street
Boston, MA 02199
State Street Global Advisors
P.O. Box 219737
Kansas City, MO 64121-9737
One Iron Street
Boston, MA 02210
State Street Bank and Trust Company
P.O. Box 5049
Boston, MA 02206
| (b) | Not Applicable. |
Item 2. Code of Ethics.
As of the end of the period covered by this report, State Street Institutional Investment Trust (the “Trust” or “Registrant”) has adopted a code of ethics, as defined in Item 2(b) of Form N-CSR, that applies to the Registrant’s principal executive officer, principal financial officer, principal accounting officer or controller, or persons performing similar functions, regardless of whether these individuals are employed by the Registrant or a third party (the “Code”). That Code comprises written standards that are reasonably designed to deter wrongdoing and to promote: (1) honest and ethical conduct, including the ethical handling of actual or apparent conflicts of interest between personal and professional relationships; (2) full, fair, accurate, timely and understandable disclosure in reports and documents that the Registrant files with, or submits to, the U.S. Securities Exchange Commission (the “SEC”) and in other public communications made by the Registrant; (3) compliance with applicable laws and governmental rules and regulations; (4) the prompt internal reporting to an appropriate person or persons identified in the Code of violations of the Code; and (5) accountability for adherence to the Code. For the period covered by the report, the Code was combined with other mutual funds advised by SSGA Funds Management, Inc. (“SSGA FM” or the “Adviser”). The Registrant has not made any amendments to the Code that relates to any element of the code of ethics definition set forth in Item 2(b) of Form N-CSR during the covered period. The Registrant has not granted any waivers from any provisions of the Code during the covered period. A copy of the Code is filed as Exhibit 13(a)(1) to this Form N-CSR.
Item 3. Audit Committee Financial Expert.
The Trust’s Board of Trustees (the “Board”) has determined that the Trust has the following “audit committee financial experts” as defined in Item 3(b) of Form N-CSR serving on its audit committee (the “Audit Committee”): Messrs. Michael F. Holland, Richard D. Shirk and John R. Costantino and Ms. Donna M. Rapaccioli. Each of the “audit committee financial experts” is “independent” as that term is defined in Item 3(a)(2) of Form N-CSR.
An “audit committee financial expert” is not an “expert” for any purpose, including for purposes of Section 11 of the Securities Act of 1933, as amended, as a result of being designated as an “audit committee financial expert.” Further, the designation of a person as an “audit committee financial expert” does not mean that the person has any greater duties, obligations, or liability than those imposed on the person without the “audit committee financial expert” designation. Similarly, the designation of a person as an “audit committee financial expert” does not affect the duties, obligations, or liability of any other member of the Audit Committee or the Board.
Item 4. Principal Accountant Fees and Services.
| (a) | Audit Fees |
For the fiscal period ended September 30, 2022, the aggregate audit fees billed for professional services rendered by Ernst & Young LLP (“EY”), the Trust’s principal accountant, for the audit of the Trust’s annual financial statements or services normally provided by EY in connection with the Trust’s statutory and regulatory filings and engagements were $95,130.
For the fiscal year ending September 30, 2021, the aggregate audit fees billed for professional services rendered by BBD LLP (“BBD”), the Trust’s prior principal accountant, for the audit of the Trust’s annual financial statements or services normally provided by BBD in connection with the Trust’s statutory and regulatory filings and engagements were $45,500.
| (b) | Audit-Related Fees |
For the fiscal periods ended September 30, 2022 and September 30, 2021, there were no fees for assurance and related services by EY or BBD, respectively, reasonably related to the performance of the audit of the Trust’s financial statements that were not reported under paragraph (a) of this Item.
| (c) | Tax Fees |
For the fiscal period ended September 30, 2022, the aggregate tax fees billed for services related to the review of year-end distribution requirements were $8,220.
For the fiscal year ended September 30, 2021, the aggregate tax fees billed for professional services rendered by BBD for tax compliance, tax advice, and tax planning in the form of preparation of excise filings and income tax returns were $0.
| (d) | All Other Fees |
For the fiscal period ended September 30, 2022, there were no fees billed for professional services rendered by EY for products and services provided by EY to the Trust, other than the services reported in paragraphs (a) through (c).
For the fiscal period ended September 30, 2022, the aggregate fees for professional services rendered by EY for products and services provided by EY to the Adviser and any entity controlling, controlled by, or under common control with the Adviser that provides ongoing services to the Trust that (i) relate directly to the operations and financial reporting of the Trust and (ii) were pre-approved by the Audit Committee were approximately $9,327,125.
For the fiscal year ended September 30, 2021, the aggregate fees billed for professional services rendered by BBD for products and services provided by BBD to the Adviser and any entity controlling, controlled by, or under common control with the Adviser that provides ongoing services to the Trust that (i) relate directly to the operations and financial reporting of the Trust and (ii) were pre-approved by the Audit Committee, were $0.
| (e)(1) | Audit Committee Pre-Approval Policies and Procedures |
The Trust’s Audit Committee Charter states the following with respect to pre-approval procedures:
The Audit Committee shall have the following duties and powers:
| • | To pre-approve engagements by a Fund Entity’s independent auditor for non-audit services to be rendered to the Adviser (not including any subadviser whose role is primarily portfolio management and is subcontracted with or overseen by another investment adviser), and any entity controlling, controlled by, or under common control with the Adviser that provides ongoing services to the Fund, if the engagement relates directly to the operations and financial reporting of the Fund; |
| • | To establish, if deemed necessary or appropriate as an alternative to Committee pre-approval of services to be provided by the independent auditor as required by paragraph (ii) above, policies and procedures to permit such services to be pre-approved by other means, such as by action of a designated member or members of the Committee, subject to the requirement that the decision of any member to whom authority is delegated to pre-approve an activity shall be presented to the full Committee at its next scheduled meeting; |
Alternate Pre-Approval Procedure:
| • | The Chairperson, or a Co-Chairperson, of the Committee is authorized to pre-approve any engagement involving the Fund Entity’s independent auditors to the same extent as the Committee. Any pre-approval decision by the Chairperson, or a Co-Chairperson, under the foregoing authority shall be presented to the Committee at its next scheduled meeting. |
| (e)(2) | Percentages of Services |
None of the services described in paragraphs (b) through (d) of this Item were performed in reliance on paragraph (c)(7)(i)(C) of Rule 2-01 of Regulation S-X during the period of time for which such rule was effective.
| (f) | Not applicable. |
| (g) | Total Fees Paid by Adviser and Certain Affiliates |
For the fiscal period ended September 30, 2022, the aggregate non-audit fees billed by EY for services rendered to the Trust and the Adviser and any entity controlling, controlled by, or under common control with the Adviser that provided ongoing services to the Trust were as follows:
| FY 2022 (in millions) | ||||
Non audit services billed to: | ||||
Registrant: | See Item 4 | (c) | ||
Investment Adviser: | — | |||
Other entities in the Investment Company Complex (1)(2): | ||||
Audit Related Fees | $ | 18.1 | ||
Tax Fees | $ | 5.4 | ||
All Other Fees | $ | 14.5 | ||
| (1) | Information is for the calendar year 2022. |
| (2) | Services under the caption Audit-Related Fees consisted principally of reports on the processing of transactions by servicing organizations, audits of employee benefit plan, non-statutory audits and due diligence procedures. Services under the caption Tax Fees consisted principally of expatriate, compliance and corporate tax advisory services. Services under the caption All Other Fees primarily related to statutory and financial statement audits and the requirement to opine on the design and operating effectiveness of internal control over financial reporting. |
For the fiscal period ended September 30, 2021, the aggregate non-audit fees billed by BBD for services rendered to the Trust and the Adviser and any entity controlling, controlled by, or under common control with the Adviser that provided ongoing services to the Trust were $0.
| (h) | EY notified the Trust’s Audit Committee of all non-audit services that were rendered by EY to the Adviser and any entity controlling, controlled by, or under common control with the Adviser that provides services to the Trust, which services were not required to be pre-approved pursuant to paragraph (c)(7)(ii) of Rule 2-01 of Regulation S-X, allowing the Trust’s Audit Committee to consider whether such services were compatible with maintaining EY’s independence. |
| (i) | Not applicable. |
| (j) | Not applicable. |
Item 5. Audit Committee of Listed Registrants.
Not applicable to the Registrant.
Item 6. Investments.
(a) Schedules of Investments are included as part of the reports to shareholders filed under Item 1 of this Form N-CSR.
(b) Not applicable to the Registrant.
Item 7. Disclosure of Proxy Voting Policies and Procedures for Closed-End Management Investment Companies.
Not applicable to the Registrant.
Item 8. Portfolio Managers of Closed-End Management Investment Companies.
Not applicable to the Registrant.
Item 9. Purchases of Equity Securities by Closed-End Management Investment Company and Affiliated Purchasers.
Not applicable to the Registrant.
Item 10. Submission of Matters to a Vote of Security Holders.
There were no material changes to the procedures by which shareholders may recommend nominees to the Board.
Item 11. Controls and Procedures.
(a) The Trust’s principal executive officer and principal financial officer have concluded that the Trust’s disclosure controls and procedures (as defined in Rule 30a-3(c) under the Investment Company Act of 1940, as amended (the “1940 Act”)) are effective to provide reasonable assurance that information required to be disclosed by the Registrant on Form N-CSR is recorded, processed, summarized and reported as of a date within 90 days of the filing date of this report, based on their evaluation of these controls and procedures required by Rule 30a-3(b) under the 1940 Act and Rules 13a-15(b) or 15d-15(b) under the Securities Exchange Act of 1934, as amended.
(b) There were no changes in the Trust’s internal control over financial reporting (as defined in Rule 30a-3(d) under the 1940 Act) that occurred during the period covered by this report that have materially affected, or are reasonably likely to materially affect, the Trust’s internal control over financial reporting.
Item 12. Disclosure of Securities Lending Activities for Closed-End Management Investment Companies.
(a) Not applicable to the Registrant.
(b) Not applicable to the Registrant.
Item 13. Exhibits.
| (a)(1) | Code of Ethics pursuant to Item 2 of Form N-CSR is attached hereto. |
| (a)(2) |
| (a)(3) | Not applicable to the Registrant. |
| (a)(4) | Not applicable to the Registrant. |
| (b) |
SIGNATURES
Pursuant to the requirements of the Securities Exchange Act of 1934, as amended, and the Investment Company Act of 1940, as amended, the Registrant has duly caused this report to be signed on its behalf by the undersigned, thereunto duly authorized.
| Registrant: | STATE STREET INSTITUTIONAL INVESTMENT TRUST |
| By: | /s/ Ellen M. Needham | |
| Ellen M. Needham | ||
| President | ||
| Date: | December 7, 2022 | |
Pursuant to the requirements of the Securities Exchange Act of 1934, as amended, and the Investment Company Act of 1940, as amended, this report has been signed below by the following persons on behalf of the Registrant and in the capacities and on the dates indicated.
| By: | /s/ Ellen M. Needham | |
| Ellen M. Needham | ||
| President (Principal Executive Officer) | ||
| Date: | December 7, 2022 | |
| By: | /s/ Bruce S. Rosenberg | |
| Bruce S. Rosenberg | ||
| Treasurer (Principal Financial and Accounting Officer) | ||
| Date: | December 7, 2022 | |