 Earnings Conference Call 2 nd Quarter 2015 July 29, 2015 Exhibit 99.2 |
 2 Q2 2015 Earnings Release Slides Cautionary Statements Regarding Forward-Looking Information This presentation contains certain forward-looking statements within the meaning of the Private Securities Litigation Reform Act of 1995, that are subject to risks and uncertainties. The factors that could cause actual results to differ materially from the forward-looking statements made by Exelon Corporation, Commonwealth Edison Company, PECO Energy Company, Baltimore Gas and Electric Company and Exelon Generation Company, LLC (Registrants) include those factors discussed herein, as well as the items discussed in (1) Exelon’s 2014 Annual Report on Form 10-K in (a) ITEM 1A. Risk Factors, (b) ITEM 7. Management’s Discussion and Analysis of Financial Condition and Results of Operations and (c) ITEM 8. Financial Statements and Supplementary Data: Note 22; (2) Exelon’s Second Quarter 2015 Quarterly Report on Form 10-Q (to be filed on July 29, 2015) in (a) Part II, Other Information, ITEM 1A. Risk Factors; (b) Part 1, Financial Information, ITEM 2. Management’s Discussion and Analysis of Financial Condition and Results of Operations and (c) Part I, Financial Information, ITEM 1. Financial Statements: Note 19; and (3) other factors discussed in filings with the SEC by the Registrants. Readers are cautioned not to place undue reliance on these forward-looking statements, which apply only as of the date of this presentation. None of the Registrants undertakes any obligation to publicly release any revision to its forward-looking statements to reflect events or circumstances after the date of this presentation. |
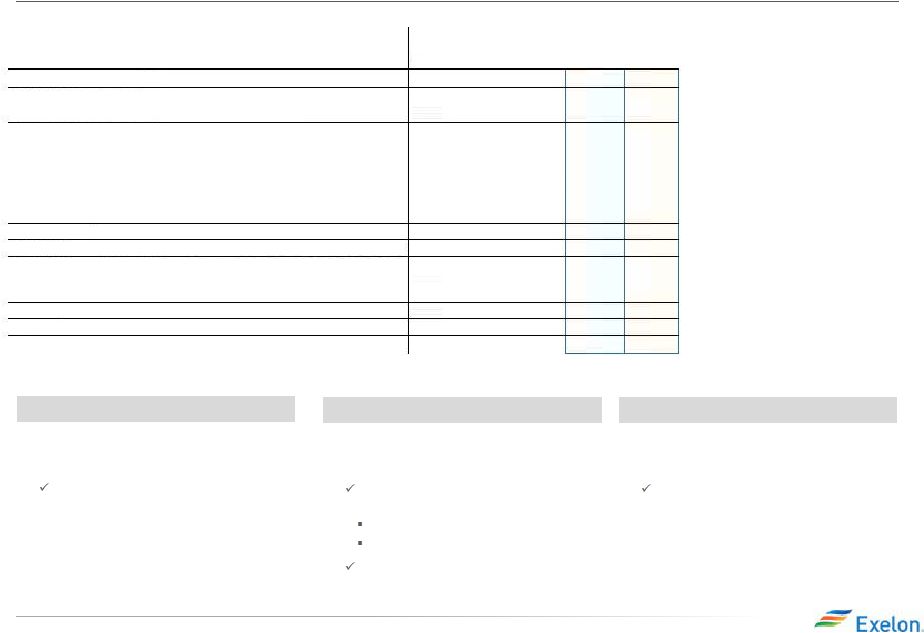
 3 Q2 2015 Earnings Release Slides • Pepco Holdings Merger o Received regulatory approval in Maryland and Delaware • Nuclear capacity factor of 93.1% (2) • Power dispatch match of 99.2% and renewables energy capture of 96.1% • 1 st quartile Customer Satisfaction Index (CSI) scores across all utilities • Capacity Performance • Illinois Low Carbon Portfolio Standard legislation • EPA Clean Power Plan • PECO and ComEd rate cases • Delivered Q2 adjusted operating earnings of $0.59 per share, exceeding our guidance range (1) Q2 2015 in Review (1) Represents adjusted (non-GAAP) operating EPS. Refer to the Earnings Release Attachments for additional details and to the Appendix for a reconciliation of adjusted (non-GAAP) operating EPS to GAAP EPS. (2) Exelon operated plants at ownership, excluding Salem Delivered another strong quarter of financial results and operational performance across the company Financial Discipline Operational Excellence Regulatory and Policy Efforts Opportunistic Growth |
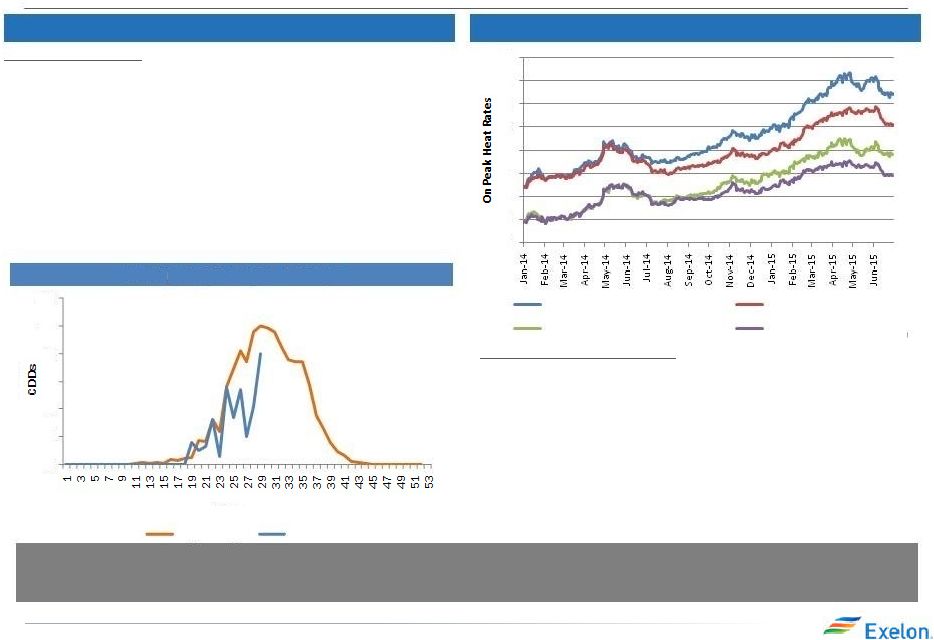 4 Q2 2015 Earnings Release Slides Forward Market Outlook Q2 2015 Lower Volatility and Lower Prices Forward Markets Reacted To Spot Prices Impacts on Forward Markets • While forward natural gas prices stayed relatively flat during the quarter, we saw a significant decrease in power prices and subsequently heat rates in 2016 and 2017 • The lack of liquidity in the forward power markets has exacerbated the drops in forward power prices and heat rates Spot Market Update • The spot power market in 2015 has been less volatile compared to 2014 • Spot market conditions are driving weaker prices: • Cooling degree days this summer have been below the 30-year average in Chicago and near normal on the East Coast • NYMEX gas prices averaged $2.72 in Q2 2015, while gas prices in Q2 2014 averaged $4.64, a $1.92 MMBtu difference year over year • TETCo M3 basis prices continue to stay weak with Q2 2015 averaging a $1.05 discount to NYMEX Cool weather in the Midwest has pressured power prices across the region. Our fundamental view is that gas and power prices will be stronger in the forward years. 8 9 10 11 12 13 14 15 16 PJMW_HR_2016 PJMW_HR_2017 PJMNiHub_HR_2016 PJMNiHub_HR_2017 Cooling Degree Days - Chicago 0 2 4 6 8 10 12 30-yr Average 2015 Week Number |
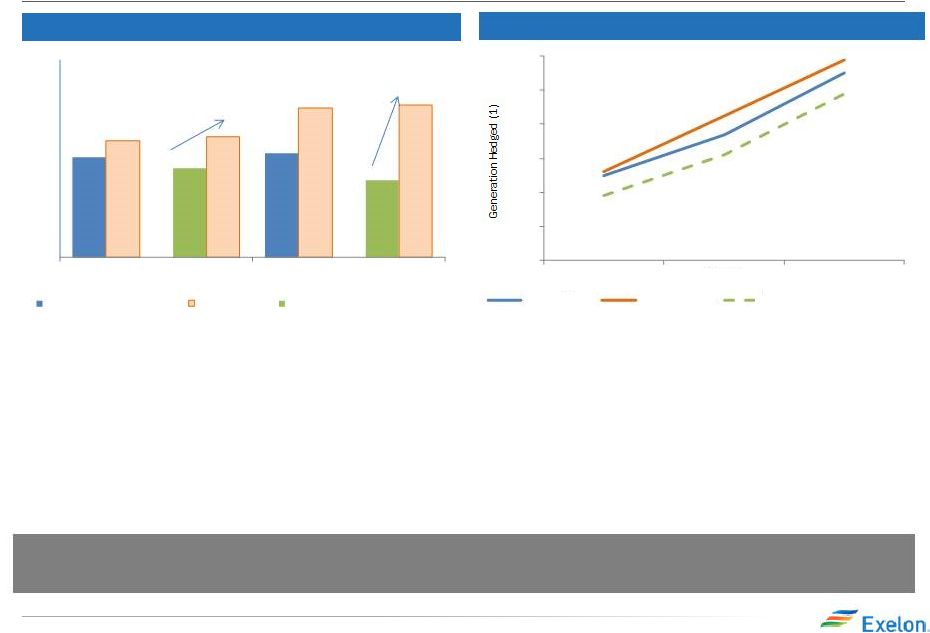 5 Q2 2015 Earnings Release Slides Forward Markets and Hedging Activity (1) Mid-point of disclosed total portfolio hedge % range was used • Our fundamental view remains relatively unchanged • We expect further upside in NiHub forward market based on our fundamental forecast given current natural gas prices, expected retirements, new generation resources, and load assumptions We are deploying a behind ratable strategy and a cross–commodity position to broaden exposure to power upside • We align our hedging strategies with our fundamental views by leaving portfolio exposure to power price upside • We have left a significant amount of our portfolio open to moves in the power market, when considering our behind ratable and cross commodity strategies • Generation 54-56% open in 2017 • 7-8% behind ratable NiHub Market versus Fundamental View 2017: Maintaining a More Open Position (1) $/MWh 27.00 28.00 29.00 30.00 31.00 32.00 33.00 34.00 35.00 2016 2017 Market as of 3/31/2015 Internal View Market as of 6/30/2015 Approximately $1.00/MWh upside Approximately $3.00/MWh upside 20% 25% 30% 35% 40% 45% 50% Q4-14 Q1-15 Q2-15 2017 - Actual 2017 - Ratable 2017 - Actual (excl NG hedges) |
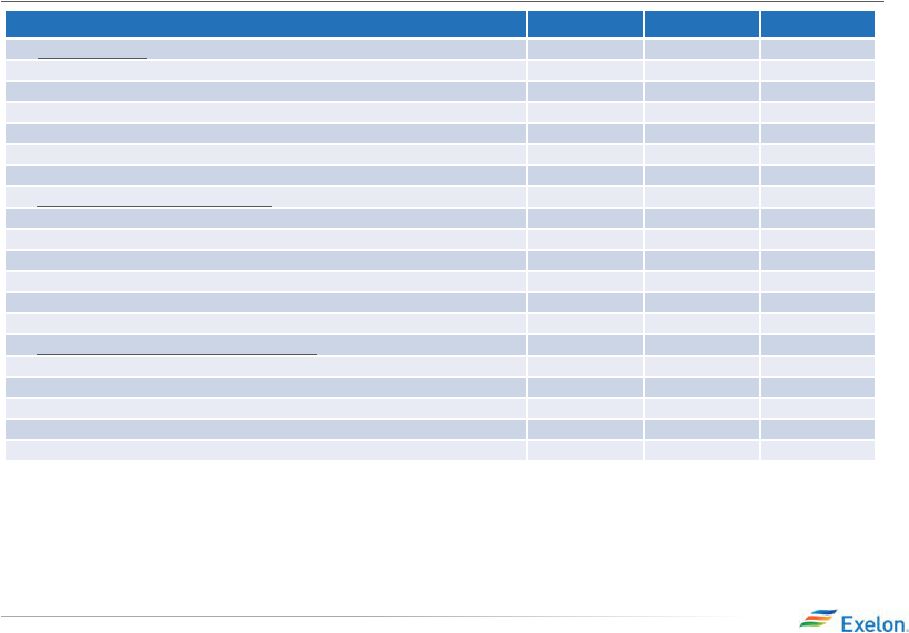
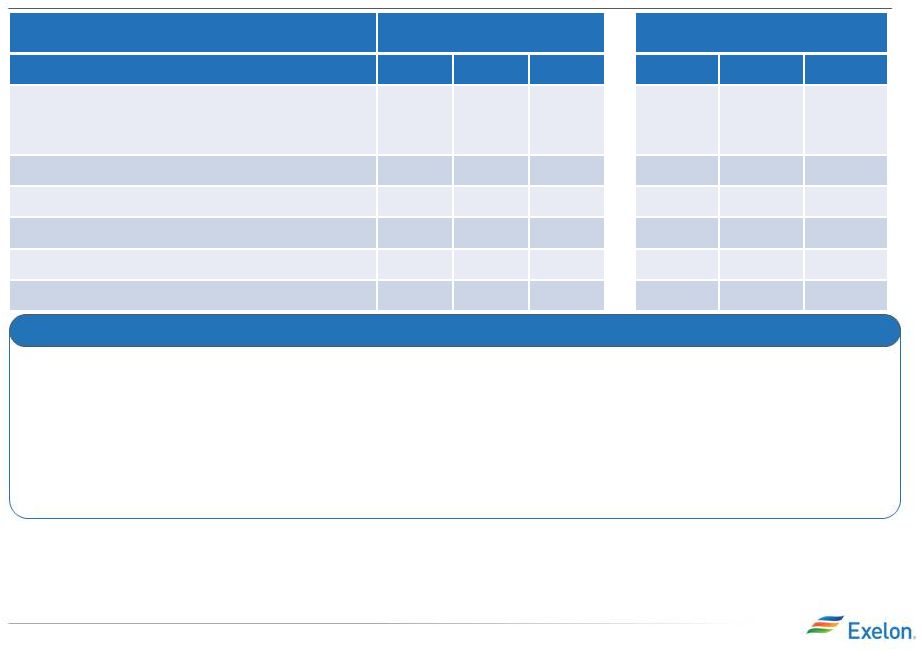 6 Q2 2015 Earnings Release Slides Exelon Generation: Gross Margin Update 1) Gross margin categories rounded to nearest $50M 2) Total Gross Margin (Non-GAAP) is defined as operating revenues less purchased power and fuel expense, excluding revenue related to decommissioning, gross receipts tax, Exelon Nuclear Partners, operating services agreement with Fort Calhoun and variable interest entities. Total Gross Margin is also net of direct cost of sales for certain Constellation businesses. See Slide 29 for a Non-GAAP to GAAP reconciliation of Total Gross Margin. 3) Excludes EDF’s equity ownership share of the CENG Joint Venture 4) Mark-to-Market of Hedges assumes mid-point of hedge percentages • Load serving business had a strong quarter driven by our generation to load matching strategy • Power prices declined, natural gas prices were relatively flat, and heat rates contracted during the quarter • Behind ratable reflecting the fundamental upside we see in power prices in 2016 and 2017 Recent Developments Gross Margin Category ($M) (1) 2015 2016 2017 2015 2016 2017 Open Gross Margin (3) (including South, West, Canada hedged gross margin) $5,250 $5,700 $5,750 $(350) $(200) $(300) Mark-to-Market of Hedges (3,4) $1,850 $900 $500 $550 $300 $150 Power New Business / To Go $100 $450 $900 $(150) $(50) $100 Non-Power Margins Executed $350 $200 $100 $50 $50 $50 Non-Power New Business / To Go $100 $250 $350 $(50) $(50) $(50) Total Gross Margin (2) $7,650 $7,500 $7,600 $50 $50 $(50) June 30, 2015 Change from Mar 31, 2015 |
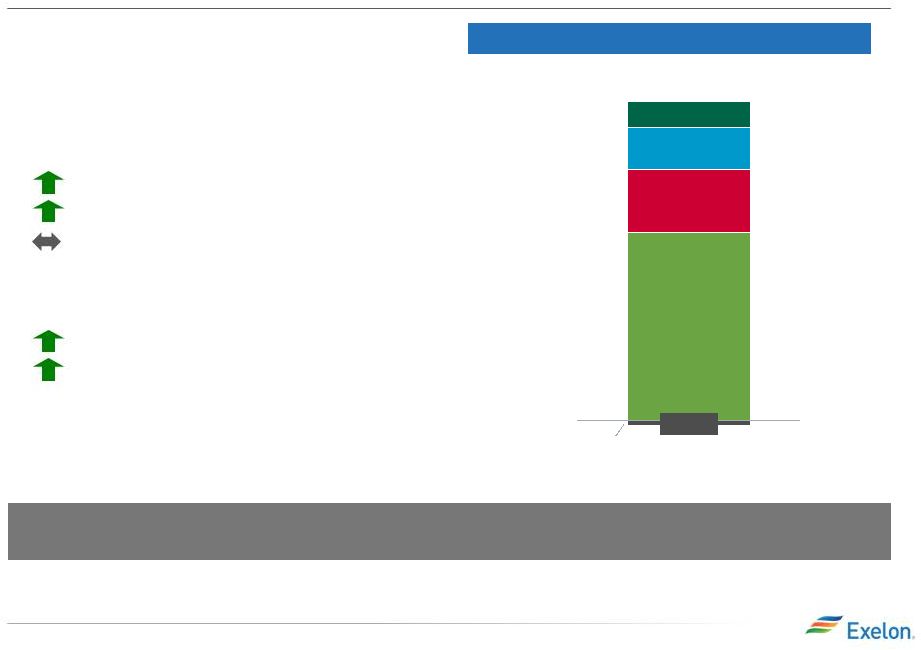 7 Q2 2015 Earnings Release Slides Key Financial Messages Expect Q3 2015 earnings of $0.65 - $0.75/share and narrowing full-year guidance range from $2.25 - $2.55/share to $2.35 - $2.55/share (3,4) (1) (2) Amounts may not add due to rounding (3) ComEd ROE based on 30 Year average Treasury yield of 2.94% as of 6/30/15. 25 basis point move in 30 Year Treasury Rate equates to +/-$0.01 impact to EPS. (4) 2015 earnings guidance based on expected average outstanding shares of ~892M. Refer to Appendix for a reconciliation of adjusted non-GAAP operating EPS guidance to GAAP EPS. HoldCo BGE ExGen ComEd PECO Q2 2015 $0.59 -$0.01 $0.36 $0.12 $0.08 $0.05 Adjusted Operating EPS Results (1,2) • Delivered adjusted (non-GAAP) operating earnings in Q2 of $0.59/share exceeding our guidance range of $0.45-$0.55/share • Utilities Increased distribution revenues Lower uncollectible expense at BGE Net neutral weather impacts • ExGen Lower costs to serve load Strong portfolio management Refer to the Earnings Release Attachments for additional details and to the Appendix for a reconciliation of adjusted (non-GAAP) operating EPS to GAAP EPS |
 8 Q2 2015 Earnings Release Slides 2015 Projected Sources and Uses of Cash (1) All amounts rounded to the nearest $25M. (2) Excludes counterparty collateral activity. (3) Adjusted Cash Flow from Operations (non-GAAP) primarily includes net cash flows from operating activities and net cash flows from investing activities excluding capital expenditures at ownership. (4) Other Financing primarily includes expected changes in short-term debt and tax-exempt bond issuance at ExGen. (5) Dividends are subject to declaration by the Board of Directors. (6) Includes cash flow activity from Holding Company, eliminations, and other corporate entities. Consistent and reliable free cash flows Enable growth & value creation Supported by a strong balance sheet Strong balance sheet enables flexibility to raise and deploy capital for growth Completed financing for PHI Acquisition including: $4.2B Long-term debt issuance $1.9B Equity issuance HoldCo: Retired $0.8B LTD note at maturity in June Operational excellence and financial discipline drives free cash flow reliability Generating ~$4B of free cash flow in 2015, including $0.9B at ExGen and $3.3B at the Utilities Creating value for customers, communities and shareholders Investing $4.7B, with $3.7B at the Utilities and $1B at ExGen ($ in millions) (1) BGE ComEd PECO Total Utilities ExGen Corp (6) Exelon 2015E Cash Balance 3,575 Adjusted Cash Flow from Operations (3) 600 2,000 675 3,300 3,275 25 6,600 Base CapEx and Nuclear Fuel 0 0 0 0 (2,375) (50) (2,450) Free Cash Flow 600 2,000 675 3,300 900 (25) 4,175 Net Financing (excluding items below) (75) 500 350 775 200 3,400 4,375 Project Financing n/a n/a n/a n/a (50) n/a (50) Equity Issuance 0 0 0 0 0 1,875 1,875 Contribution from Parent 0 100 0 100 0 (100) 0 Other Financing (4) 300 75 0 350 1,125 300 1,800 Financing 225 675 350 1,225 1,275 5,475 7,975 825 2,675 1,025 4,525 2,175 5,425 12,150 Utility Investment (700) (2,400) (600) (3,700) 0 0 (3,700) ExGen Growth 0 0 0 0 (1,050) 0 (1,050) Dividend (5) (1,100) Other CapEx and Dividend (700) (2,400) (600) (3,700) (1,050) 0 (5,850) Total Cash Flow 125 275 450 825 1,125 5,425 6,300 Ending Cash Balance 9,850 Total Free Cash Flow and Financing Growth Beginning Cash Balance (2) (2) |
 9 Q2 2015 Earnings Release Slides Exelon Generation Disclosures June 30, 2015 |
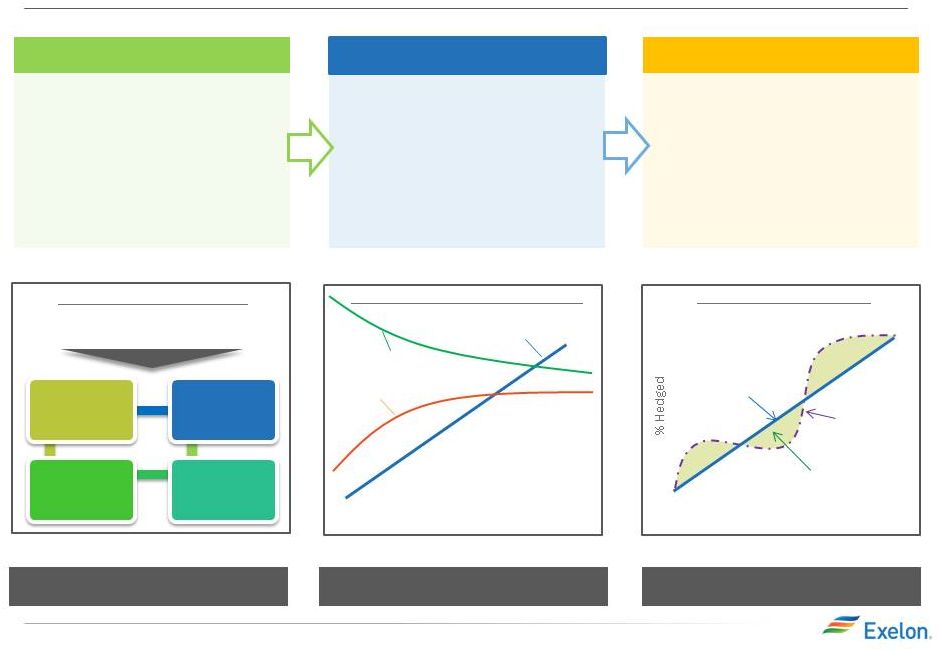 10 Q2 2015 Earnings Release Slides Portfolio Management Strategy Protect Balance Sheet Ensure Earnings Stability Create Value Exercising Market Views Purely ratable Actual hedge % Market views on timing, product allocation and regional spreads reflected in actual hedge % High End of Profit Low End of Profit % Hedged Open Generation with LT Contracts Portfolio Management & Optimization Portfolio Management Over Time Align Hedging & Financials Establishing Minimum Hedge Targets Strategic Policy Alignment •Aligns hedging program with financial policies and financial outlook •Establish minimum hedge targets to meet financial objectives of the company (dividend, credit rating) •Hedge enough commodity risk to meet future cash requirements under a stress scenario Three-Year Ratable Hedging •Ensure stability in near-term cash flows and earnings •Disciplined approach to hedging •Tenor aligns with customer preferences and market liquidity •Multiple channels to market that allow us to maximize margins •Large open position in outer years to benefit from price upside Bull / Bear Program •Ability to exercise fundamental market views to create value within the ratable framework •Modified timing of hedges versus purely ratable •Cross-commodity hedging (heat rate positions, options, etc.) •Delivery locations, regional and zonal spread relationships Credit Rating Capital & Operating Expenditure Dividend Capital Structure |
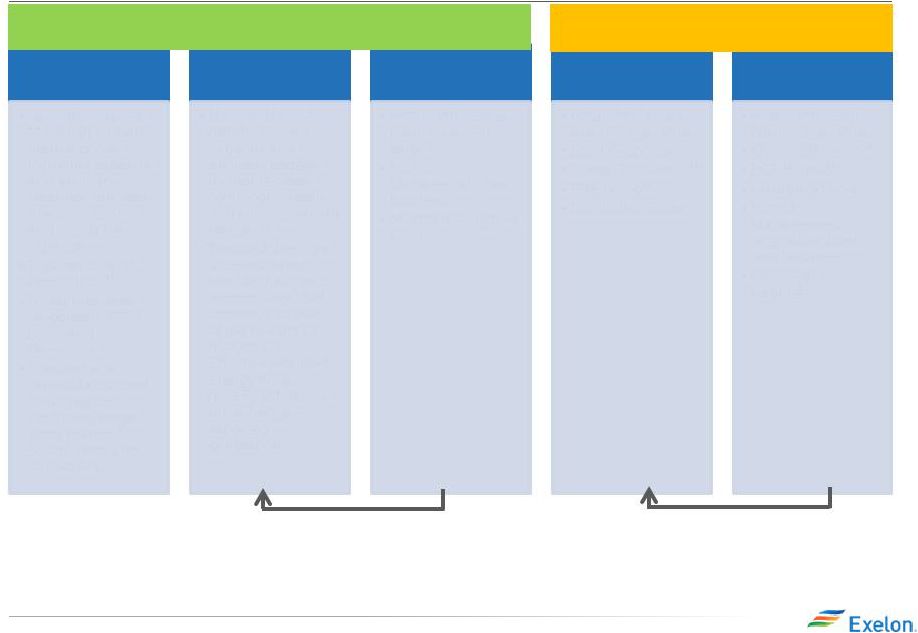 11 Q2 2015 Earnings Release Slides Components of Gross Margin Categories Open Gross Margin •Generation Gross Margin at current market prices, including capacity and ancillary revenues, nuclear fuel amortization and fossils fuels expense •Exploration and Production (4) •Power Purchase Agreement (PPA) Costs and Revenues •Provided at a consolidated level for all regions (includes hedged gross margin for South, West and Canada (1) ) MtM of Hedges (2) •Mark-to-Market (MtM) of power, capacity and ancillary hedges, including cross commodity, retail and wholesale load transactions •Provided directly at a consolidated level for five major regions. Provided indirectly for each of the five major regions via Effective Realized Energy Price (EREP), reference price, hedge %, expected generation “Power” New Business •Retail, Wholesale planned electric sales •Portfolio Management new business •Mid marketing new business “Non Power” Executed •Retail, Wholesale executed gas sales •Load Response •Energy Efficiency (4) •BGE Home (4) •Distributed Solar “Non Power” New Business •Retail, Wholesale planned gas sales •Energy Efficiency (4) •BGE Home (4) •Distributed Solar •Portfolio Management / origination fuels new business •Proprietary trading (3) Margins move from new business to MtM of hedges over the course of the year as sales are executed (5) Margins move from “Non power new business” to “Non power executed” over the course of the year Gross margin linked to power production and sales Gross margin from other business activities (1) Hedged gross margins for South, West & Canada region will be included with Open Gross Margin, and no expected generation, hedge %, EREP or reference prices provided for this region (2) MtM of hedges provided directly for the five larger regions; MtM of hedges is not provided directly at the regional level but can be easily estimated using EREP, reference price and hedged MWh (3) Proprietary trading gross margins will generally remain within “Non Power” New Business category and only move to “Non Power” Executed category upon management discretion (4) Gross margin for these businesses are net of direct “cost of sales” (5) Margins for South, West & Canada regions and optimization of fuel and PPA activities captured in Open Gross Margin |
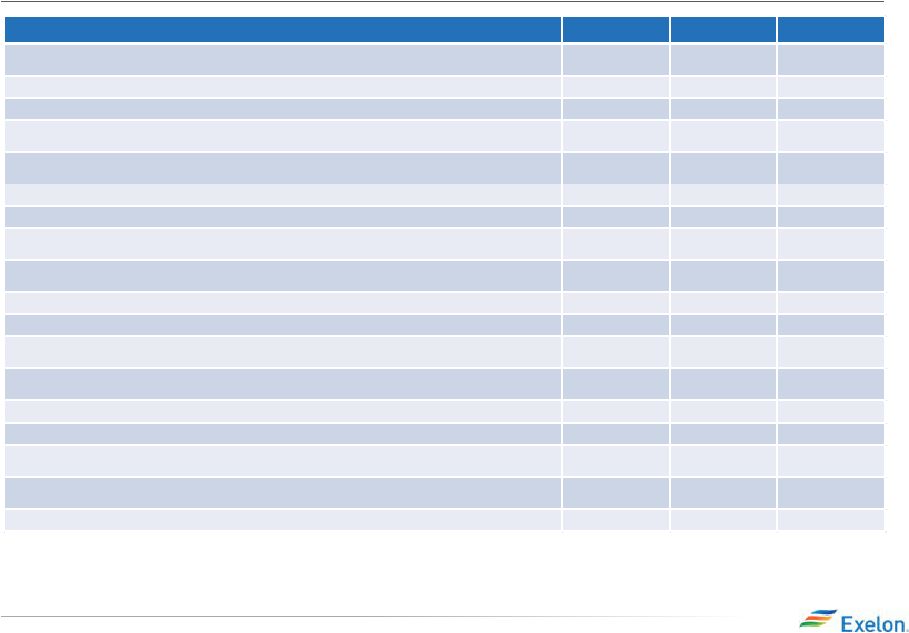
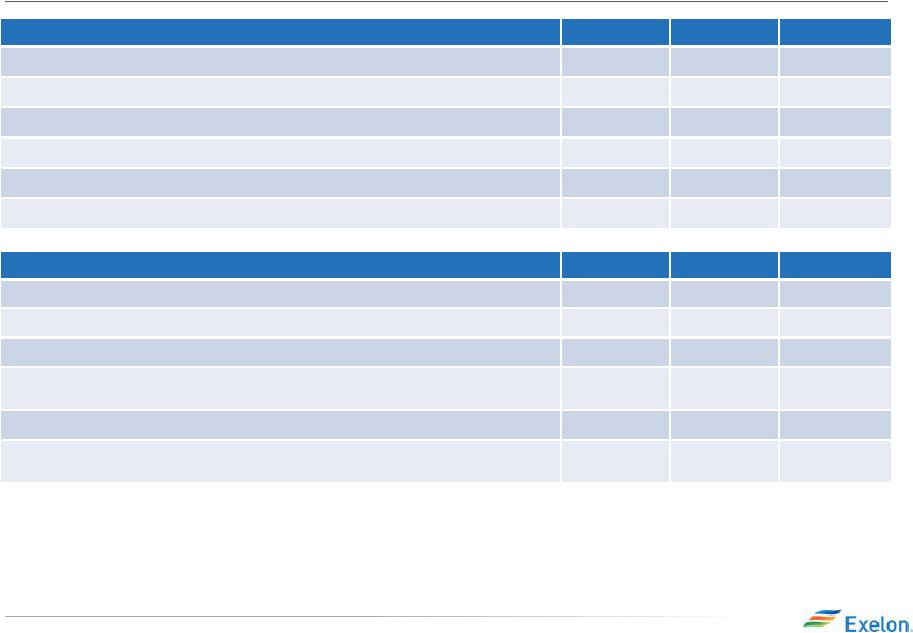 12 Q2 2015 Earnings Release Slides ExGen Disclosures (1) Gross margin categories rounded to nearest $50M (2) Total Gross Margin (Non-GAAP) is defined as operating revenues less purchased power and fuel expense, excluding revenue related to decommissioning, gross receipts tax, Exelon Nuclear Partners, operating services agreement with Fort Calhoun and variable interest entities. Total Gross Margin is also net of direct cost of sales for certain Constellation businesses. See Slide 29 for a Non-GAAP to GAAP reconciliation of Total Gross Margin. (3) Excludes EDF’s equity ownership share of the CENG Joint Venture (4) Mark-to-Market of Hedges assumes mid-point of hedge percentages (5) Based on June 30, 2015 market conditions Gross Margin Category ($M) (1) 2015 2016 2017 Open Gross Margin (including South, West & Canada hedged GM) (3) $5,250 $5,700 $5,750 Mark-to-Market of Hedges (3,4) $1,850 $900 $500 Power New Business / To Go $100 $450 $900 Non-Power Margins Executed $350 $200 $100 Non-Power New Business / To Go $100 $250 $350 Total Gross Margin (2) $7,650 $7,500 $7,600 Reference Prices (5) 2015 2016 2017 Henry Hub Natural Gas ($/MMbtu) $2.86 $3.17 $3.36 Midwest: NiHub ATC prices ($/MWh) $28.75 $30.65 $30.17 Mid-Atlantic: PJM-W ATC prices ($/MWh) $37.89 $38.27 $36.99 ERCOT-N ATC Spark Spread ($/MWh) HSC Gas, 7.2HR, $2.50 VOM $3.43 $3.82 $4.06 New York: NY Zone A ($/MWh) $33.12 $34.03 $33.52 New England: Mass Hub ATC Spark Spread($/MWh) ALQN Gas, 7.5HR, $0.50 VOM $4.85 $8.77 $9.87 |
 13 Q2 2015 Earnings Release Slides ExGen Disclosures Generation and Hedges 2015 2016 2017 Exp. Gen (GWh) (1) 190,300 198,500 204,200 Midwest 96,500 97,300 95,900 Mid-Atlantic (2) 61,700 63,000 61,000 ERCOT 12,700 16,300 25,300 New York (2) 9,300 9,300 9,300 New England 10,100 12,600 12,700 % of Expected Generation Hedged (3) 77%-80% 46%-49% Midwest 97%-100% 72%-75% 38%-41% Mid-Atlantic (2) 100%-103% 82%-85% 55%-58% ERCOT 99%-102% 93%-96% 60%-63% New York (2) 94%-97% 76%-79% 48%-51% New England 99%-102% 67%-70% 28%-31% Effective Realized Energy Price ($/MWh) (4) Midwest $35.00 $34.00 $34.00 Mid-Atlantic (2) $49.50 $45.50 $44.50 ERCOT (5) $19.50 $10.00 $7.00 New York (2) $46.50 $41.50 $39.00 New England (5) $32.50 $19.00 $17.00 (1) Expected generation is the volume of energy that best represents our commodity position in energy markets from owned or contracted for capacity based upon a simulated dispatch model that makes assumptions regarding future market conditions, which are calibrated to market quotes for power, fuel, load following products, and options. Expected generation assumes 14 refueling outages in 2015, 12 in 2016, and 15 in 2017 at Exelon-operated nuclear plants, and Salem. Expected generation assumes capacity factors of 93.3%, 94.1% and 93.4% in 2015 , 2016 and 2017 respectively at Exelon-operated nuclear plants, at ownership. These estimates of expected generation in 2016 and 2017 do not represent guidance or a forecast of future results as Exelon has not completed its planning or optimization processes for those years. (2) Excludes EDF’s equity ownership share of CENG Joint Venture. (3) Percent of expected generation hedged is the amount of equivalent sales divided by expected generation. Includes all hedging products, such as wholesale and retail sales of power, options and swaps. (4) Effective realized energy price is representative of an all-in hedged price, on a per MWh basis, at which expected generation has been hedged. It is developed by considering the energy revenues and costs associated with our hedges and by considering the fossil fuel that has been purchased to lock in margin. It excludes uranium costs and RPM capacity revenue, but includes the mark-to-market value of capacity contracted at prices other than RPM clearing prices including our load obligations. It can be compared with the reference prices used to calculate open gross margin in order to determine the mark-to-market value of Exelon Generation's energy hedges. (5) Spark spreads shown for ERCOT and New England. 98%-101% |
 14 Q2 2015 Earnings Release Slides ExGen Hedged Gross Margin Sensitivities (1) Based on June 30, 2015 market conditions and hedged position; Gas price sensitivities are based on an assumed gas-power relationship derived from an internal model that is updated periodically; Power prices sensitivities are derived by adjusting the power price assumption while keeping all other prices inputs constant; Due to correlation of the various assumptions, the hedged gross margin impact calculated by aggregating individual sensitivities may not be equal to the hedged gross margin impact calculated when correlations between the various assumptions are also considered; Sensitivities based on commodity exposure which includes open generation and all committed transactions; Excludes EDF’s equity share of CENG Joint Venture Gross Margin Sensitivities (With Existing Hedges) (1) 2015 2016 2017 Henry Hub Natural Gas ($/Mmbtu) + $1/Mmbtu $(80) $140 $400 - $1/Mmbtu $90 $(135) $(385) NiHub ATC Energy Price + $5/MWh - $135 $305 - $5/MWh - $(135) $(305) PJM-W ATC Energy Price + $5/MWh $(10) $60 $145 - $5/MWh $10 $(55) $(140) NYPP Zone A ATC Energy Price + $5/MWh - $5 $20 - $5/MWh - $(10) $(20) Nuclear Capacity Factor +/- 1% +/- $20 +/- $45 +/- $40 |
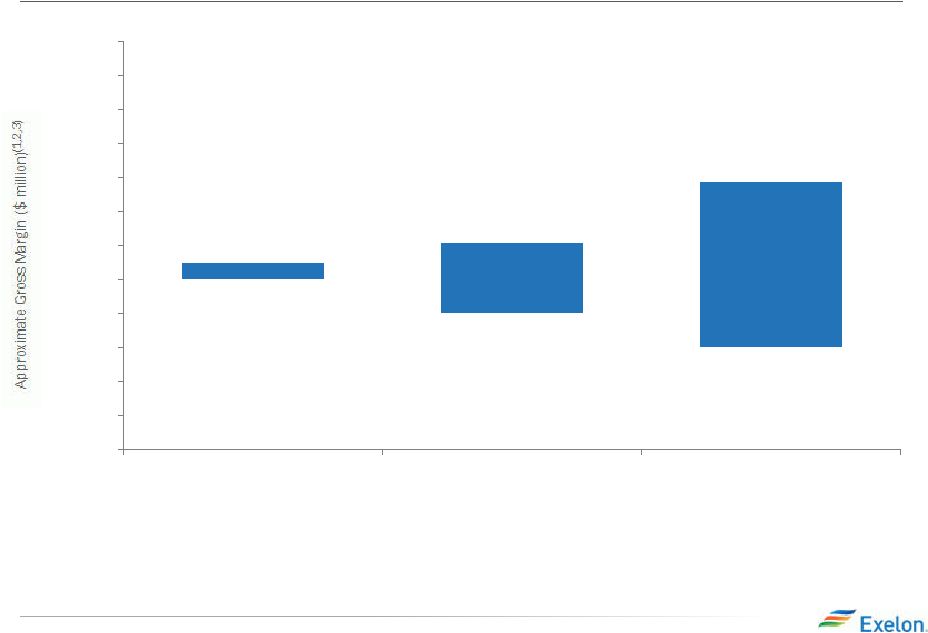 15 Q2 2015 Earnings Release Slides ExGen Hedged Gross Margin Upside/Risk 5,000 5,500 6,000 6,500 7,000 7,500 8,000 8,500 9,000 9,500 10,000 10,500 11,000 2015 2016 2017 $8,950 $6,500 $7,750 $7,500 $8,050 $7,000 (1) Represents an approximate range of expected gross margin, taking into account hedges in place, between the 5th and 95th percent confidence levels assuming all unhedged supply is sold into the spot market; Approximate gross margin ranges are based upon an internal simulation model and are subject to change based upon market inputs, future transactions and potential modeling changes; These ranges of approximate gross margin in 2016 and 2017 do not represent earnings guidance or a forecast of future results as Exelon has not completed its planning or optimization processes for those years; The price distributions that generate this range are calibrated to market quotes for power, fuel, load following products, and options as of June 30, 2015 (2) Gross Margin Upside/Risk based on commodity exposure which includes open generation and all committed transactions (3) Gross Margin (Non-GAAP) is defined as operating revenues less purchased power and fuel expense, excluding revenue related to decommissioning, gross receipts tax, Exelon Nuclear Partners, operating services agreement with Fort Calhoun and variable interest entities. Total Gross Margin is also net of direct cost of sales for certain Constellation businesses. See Slide 29 for a Non-GAAP to GAAP reconciliation of Total Gross Margin Excludes EDF’s equity ownership share of the CENG Joint Venture. |
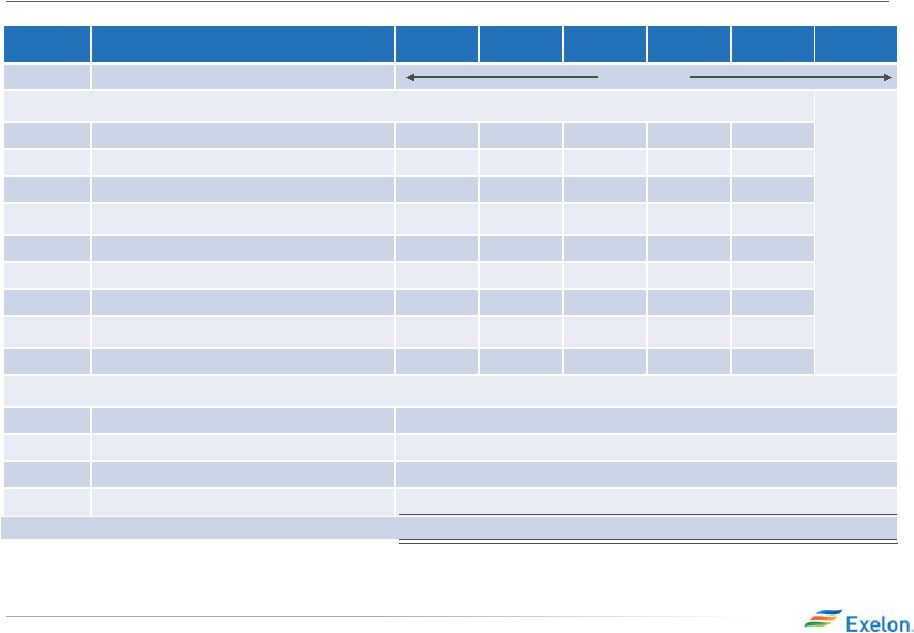 16 Q2 2015 Earnings Release Slides Illustrative Example of Modeling Exelon Generation 2016 Gross Margin (1) Mark-to-market rounded to the nearest $5 million (2) Total Gross Margin (Non-GAAP) is defined as operating revenues less purchased power and fuel expense, excluding revenue related to decommissioning, gross receipts tax, Exelon Nuclear Partners operating services agreement with Fort Calhoun and variable interest entities. Total Gross Margin is also net of direct cost of sales for certain Constellation businesses. See Slide 29 for a Non-GAAP to GAAP reconciliation of Total Gross Margin. Row Item Midwest Mid-Atlantic ERCOT New York New England South, West & Canada (A) (B) 97.3 63.0 16.3 9.3 12.6 (C) 73.5% 83.5% 94.5% 77.5% 68.5% (D=B*C) 71.5 52.6 15.4 7.2 8.6 (E) $34.00 $45.50 $10.00 $41.50 $19.00 (F) $30.65 $38.27 $3.82 $34.03 $8.77 (G=E-F) $3.35 $7.23 $6.18 $7.47 $10.23 (H=D*G) $240 $380 $95 $55 $90 (I=A+H) (J) (K) (L) Start with fleet-wide open gross margin Expected Generation (TWh) Hedge % (assuming mid-point of range) Hedged Volume (TWh) Effective Realized Energy Price ($/MWh) Reference Price ($/MWh) Difference ($/MWh) Mark-to-market value of hedges ($ million) (1) Hedged Gross Margin ($ million) Power New Business / To Go ($ million) Non-Power Margins Executed ($ million) Non-Power New Business / To Go ($ million) $200 $250 $5.7 billion $6,600 $450 (N=I+J+K+L) Total Gross Margin (2) $7,500 million |
 17 Q2 2015 Earnings Release Slides Additional Disclosures |
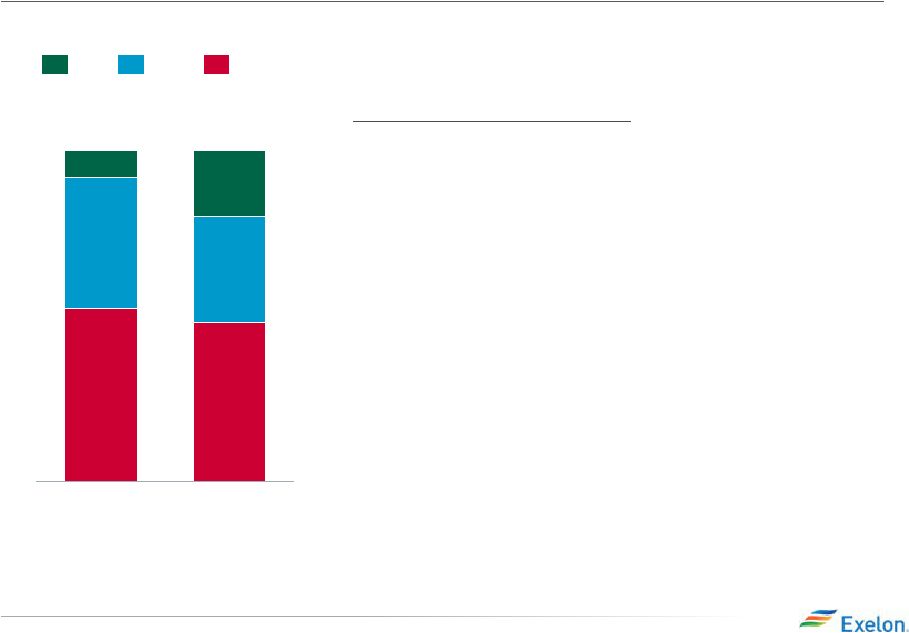 18 Q2 2015 Earnings Release Slides Exelon Utilities Adjusted Operating EPS Contribution (1) Key Drivers – 2Q15 vs. 2Q14 : BGE (+0.03): • Decreased uncollectible expense: $0.02 • Increased distribution revenue due to increased rates: $0.01 PECO (-0.02): • Increased storm costs: ($0.01) ComEd (-0.01): • Unfavorable weather (2) : $(0.01) • Increased distribution (2) earnings due to increased capital investments: $0.01 2Q 2015 $0.25 $0.12 $0.08 $0.05 2Q 2014 $0.25 $0.13 $0.10 $0.02 BGE ComEd Numbers may not add due to rounding. (1) Refer to the Earnings Release Attachments for additional details and to the Appendix for a reconciliation of adjusted (non-GAAP) operating EPS to GAAP EPS. PECO (2) Due to the distribution formula rate, changes in ComEd’s earnings are driven primarily by changes in 30-year U.S. Treasury rates (inclusive of ROE), rate base and capital structure in addition to weather, load and changes in customer mix. |
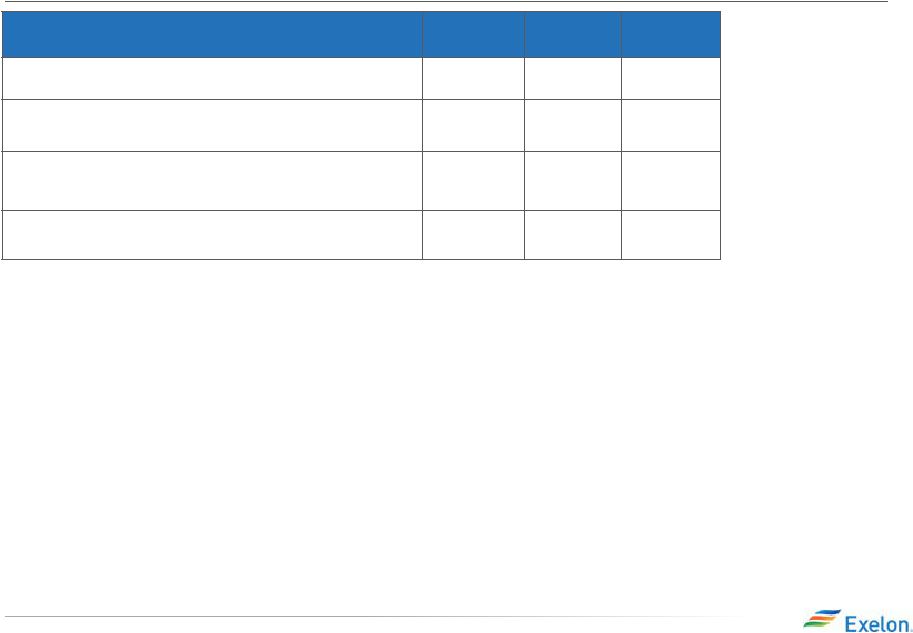
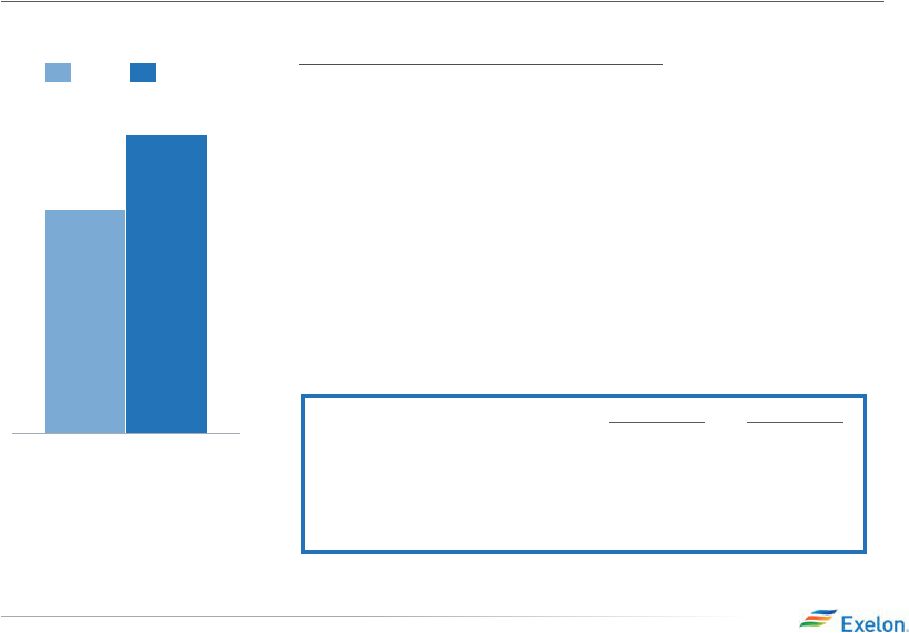 19 Q2 2015 Earnings Release Slides ExGen Adjusted Operating EPS Contribution (1) $0.36 Q2 $0.27 2015 2014 Numbers may not add due to rounding (1) Refer to the Earnings Release Attachments for additional details and to the Appendix for a reconciliation of adjusted (non-GAAP) operating EPS to GAAP EPS. (excludes Salem) Q2 2014 Actual Q2 2015 Actual Planned Refueling Outage Days 108 71 Non-refueling Outage Days 44 18 Nuclear Capacity Factor 91.8% 93.1% Key Drivers – Q2 2015 vs. Q2 2014 ExGen (+0.09) • Increased RNF: $0.10 • Increased nuclear output in 2015, primarily due to a reduction in outage days: $0.07 • Favorability from portfolio management optimization activities, partially offset by the absence of various generating units sold in 2014 and 2015: $0.02 • Increased capacity revenue: $0.01 • Higher realized NTDF gains: $0.03 • Increased income tax expense due to decreased domestic production activities deduction: ($0.03) • Increased interest expense: ($0.01) |
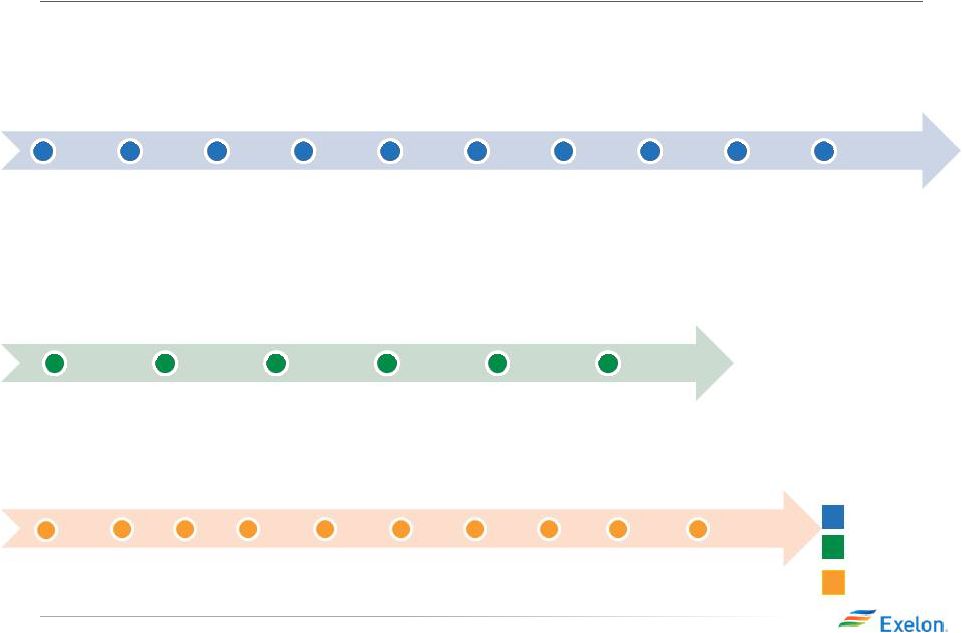 20 Q2 2015 Earnings Release Slides 2015 Regulatory and Legislative Timelines Settlement Filed in New Jersey (Jan 14) New Jersey Approval (Feb 11) Settlement filed in Delaware (Feb 13) Multi-party Settlement filed in Maryland (March 16) Maryland Settlement Hearings (April 15-21) DC Initial Briefs Due (May 13) Maryland PSC Approval (May 15) DC Reply Briefs Due (May 27) Delaware Approval (June 2) Expected Transaction Close (Q3) Illinois Legislative Session Begins (Jan 14) IL Senate Committee approves LCPS & ComEd legislation (March 27) MATS Rule in Effect (April) Supreme Court decision on cert in EPSA v. FERC (Demand Response) (May) Illinois Regular Legislative Session Ends (May 31) Supreme Court Decision in Michigan vs. EPA (MATS) (June) FERC Approves Capacity Performance (June 9) PJM BRA Auction Results (Aug. 21) Final Clean Power Rule (111d) Issued (Aug/Sept) Illinois Legislative Veto Session (TBD Oct/Nov) ExGen Exelon Utilities PHI Acquisition PECO Electric Rate Case and LTIIP Filing (March 27) ComEd Formula Rate Filing (April15) BGE Electric and Gas Rate Case Filing (TBD) MD PSC Ruling Expected 7 Months after Filing PaPUC Ruling Expected on LTIIP Filing (Q3) PaPUC Ruling Expected on PECO Electric Rate Case (Dec) ICC Rules on ComEd Formula Rate Filing (Dec) |
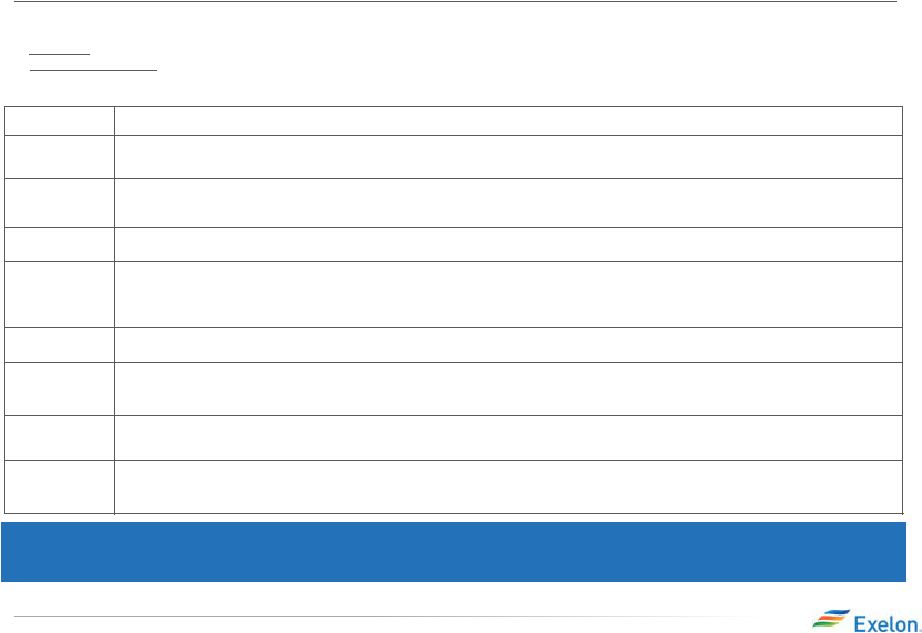 21 Q2 2015 Earnings Release Slides ComEd April 2015 Distribution Formula Rate Amounts represent ComEd’s position filed in rebuttal testimony on July 22, 2015. Note: Disallowance of any items in the 2015 distribution formula rate filing could impact 2015 earnings in the form of a regulatory asset adjustment. Given the retroactive ratemaking provision in the Energy Infrastructure Modernization Act (EIMA) legislation, ComEd net income during the year will be based on actual costs with a regulatory asset/liability recorded to reflect any under/over recovery reflected in rates. Revenue Requirement in rate filings impacts cash flow. (1) Docket # 15-0287 Filing Year 2014 Calendar Year Actual Costs and 2015 Projected Net Plant Additions are used to set the rates for calendar year 2016. Rates currently in effect (docket 14-0312) for calendar year 2015 were based on 2013 actual costs and 2014 projected net plant additions Reconciliation Year Reconciles Revenue Requirement reflected in rates during 2014 to 2014 Actual Costs Incurred. Revenue requirement for 2014 is based on docket 13-0318 (2012 actual costs and 2013 projected net plant additions) approved in December 2013 and reflects the impacts of PA 98-0015 (SB9) Common Equity Ratio ~ 46% for both the filing and reconciliation year ROE 9.14% for the filing year (2014 30-yr Treasury Yield of 3.34% + 580 basis point risk premium) and 9.09% for the reconciliation year (2014 30-yr Treasury Yield of 3.34% + 580 basis point risk premium – 5 basis points performance metrics penalty). For 2015 and 2016, the actual allowed ROE reflected in net income will ultimately be based on the average of the 30-year Treasury Yield during the respective years plus 580 basis point spread, absent any metric penalties Requested Rate of Return ~ 7% for both the filing and reconciliation years $8,277 million–Filing year (represents projected year-end rate base using 2014 actual plus 2015 projected capital additions). 2015 and 2016 earnings will reflect 2015 and 2016 year-end rate base respectively. $7,082 million - Reconciliation year (represents year-end rate base for 2014) $54M decrease ($145M decrease due to the 2014 reconciliation offset by a $91M increase related to the filing year). The 2014 reconciliation impact on net income was recorded in 2014 as a regulatory asset. Timeline • 04/15/15 Filing Date • 240 Day Proceeding • ICC order expected to be issued by December 11, 2015 The 2015 distribution formula rate filing establishes the net revenue requirement used to set the rates that will take effect in January 2016 after the Illinois Commerce Commission's (ICC’s) review. There are two components to the annual distribution formula rate filing: • Filing Year: Based on prior year costs (2014) and current year (2015) projected plant additions. • Annual Reconciliation: For the prior calendar year (2014), this amount reconciles the revenue requirement reflected in rates during the prior year (2014) in effect to the actual costs for that year. The annual reconciliation impacts cash flow in the following year (2016) but the earnings impact has been recorded in the prior year (2014) as a regulatory asset. Revenue Requirement Decrease Rate Base (1) (1) |
 22 Q2 2015 Earnings Release Slides PECO Electric Distribution Rate Case Docket # R-2015-2468981 Fully Projected Future Test Year 2016 Common Equity Ratio 53% 10.95% Overall Rate of Return 8.2% Proposed Rate Base $4.1B $190M System Average Increase as % of overall bill 4.4% Timeline • 3/27/15 – PECO filed electric distribution rate case with PaPUC • 8/11/15 – 8/14/15 – Evidentiary Hearings • October 2015 – ALJ Recommended Decision • December 2015 – PUC Decision • Increased rates effective on January 1, 2016 Basis for Rate Case • Since last rate case (2010): – Electric Distribution Rate base increased by one third (approximately $1B) – Sales declined by 0.6% – Operating expenses were essentially flat (less than 1% annually) • Proposed investment maintains strong reliability performance with targeted investment to address pockets with reliability issues First Electric Distribution Rate Case since 2010 Requested Return on Equity Revenue Requirement Increase Ask |
 23 Q2 2015 Earnings Release Slides PECO Electric LTIIP - System 2020 • PECO filed its Electric Long Term Infrastructure Improvement Plan (“LTIIP”) along with its associated recovery mechanism the Distribution System Improvement Charge (“DSIC”) on March 27, 2015 (with Electric Distribution Rate Case) o LTIIP includes $275 million in incremental capital spending from 2016-2020 focusing on the following areas: Cable Replacement Storm Hardening Programs Substation replacement and upgrades o DSIC mechanism will allow recovery of eligible LTIIP spend between rate cases if the electric distribution ROE falls below the DSIC ROE established by PaPUC. The current Electric DSIC ROE is 10.0%. o Expected approval in 3Q15 • PECO also proposed the concept of constructing one or more pilot microgrid projects as part of a future LTIIP update ($50-$100M). The objective is to evaluate and test emerging microgrid technologies that could enhance reliability and resiliency by replacing obsolete infrastructure as an alternative to traditional solutions. |
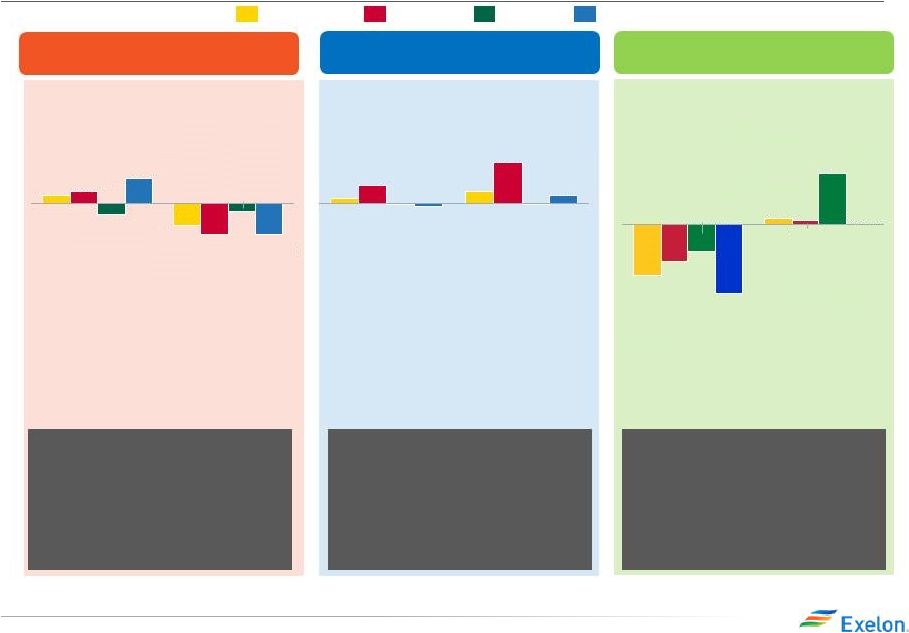 24 Q2 2015 Earnings Release Slides Exelon Utilities Load 2015E 2014 PECO 2015 load growth is driven by modest economic growth coupled with solid residential customer growth, partially offset by energy efficiency Philadelphia GMP 1.7% Philadelphia Unemployment 5.3% Notes: Data is not adjusted for leap year. Source of economic outlook data is IHS (June 2015) and Bureau of Economic Analysis. Assumes 2015 GDP of 2.1% and U.S. unemployment of 5.3%. ComEd has the ROE collar as part of the distribution formula rate and BGE is decoupled which mitigates the load risk. QTD and YTD actual data can be found in earnings release tables. 2015E 2014 Large C&I Small C&I Residential All Customers ComEd 2015 load growth is lower than 2014 (impacts of energy efficiency partially offset by slowly improving economy) with Residential and Large C&I trending downward Chicago GMP 1.7% Chicago Unemployment 6.2% BGE 2015 load growth is greater than 2014, attributable to slowly improving economic conditions and moderate customer growth, partially offset by energy efficiency Baltimore GMP 1.3% Baltimore Unemployment 5.6% 2015E 2014 0.3% 0.1% 1.1% 0.5% 0.0% 0.0% 0.2% -0.1% (0.6%) 0.2% (0.9%) 0.3% (0.2%) (0.3%) (0.9%) 0.7% -1.2% 0.1% -0.8% 0.1% 1.1% -0.6% 0.0% -1.6% |
 25 Q2 2015 Earnings Release Slides Appendix Reconciliation of Non-GAAP Measures |
 26 Q2 2015 Earnings Release Slides Three Months Ended June 30, 2015 ExGen ComEd PECO BGE Other Exelon 2015 Adjusted (non-GAAP) Operating Earnings (Loss) Per Share $0.36 $0.12 $0.08 $0.05 $(0.01) $0.59 Mark-to-market impact of economic hedging activities 0.16 - - - - 0.16 Unrealized losses related to NDT fund investments (0.06) - - - - (0.06) Merger and integration costs (0.01) - - - (0.01) (0.02) Mark-to-market impact of PHI merger related interest rate swaps - - - - 0.08 0.08 Amortization of commodity contract intangibles (0.01) - - - - (0.01) Long-lived asset impairment - - - - (0.02) (0.02) CENG Non-Controlling Interest 0.02 - - - - 0.02 2Q 2015 GAAP Earnings Per Share $0.46 $0.12 $0.08 $0.05 $0.04 $0.74 NOTE: All amounts shown are per Exelon share and represent contributions to Exelon's EPS. Amounts may not add due to rounding. Three Months Ended June 30, 2014 ExGen ComEd PECO BGE Other Exelon 2014 Adjusted (non-GAAP) Operating Earnings Per Share $0.27 $0.13 $0.10 $0.02 $- $0.51 Mark-to-market impact of economic hedging activities (0.01) - - - - (0.01) Unrealized gains related to NDT fund investments 0.09 - - - - 0.09 Merger and integration costs (0.02) - - - (0.01) (0.03) Amortization of commodity contract intangibles (0.03) - - - - (0.03) Long-lived asset impairment (0.06) - - - (0.02) (0.08) Gain on CENG integration 0.18 - - - - 0.18 CENG Non-Controlling Interest (0.03) - - - - (0.03) 2Q 2014 GAAP Earnings Per Share $0.39 $0.13 $0.10 $0.02 $- $0.60 2Q GAAP EPS Reconciliation |
 27 Q2 2015 Earnings Release Slides 2Q YTD GAAP EPS Reconciliation Six Months Ended June 30, 2015 ExGen ComEd PECO BGE Other Exelon 2015 Adjusted (non-GAAP) Operating Earnings (Loss) Per Share $0.71 $0.22 $0.24 $0.18 $(0.05) $1.30 Mark-to-market impact of economic hedging activities 0.27 - - - - 0.27 Unrealized losses related to NDT fund investments (0.04) - - - - (0.04) Merger and integration costs (0.01) - - - (0.03) (0.04) Mark-to-market impact of PHI merger related interest rate swaps - - - - 0.03 0.03 Amortization of commodity contract intangibles 0.02 - - - - 0.02 Long-lived asset impairment - - - - (0.02) (0.02) Midwest Generation bankruptcy recoveries 0.01 - - - - 0.01 CENG Non-Controlling Interest 0.01 - - - - 0.01 2Q 2015 GAAP Earnings (Loss) Per Share $0.97 $0.22 $0.24 $0.18 $(0.07) $1.54 NOTE: All amounts shown are per Exelon share and represent contributions to Exelon's EPS. Amounts may not add due to rounding. Six Months Ended June 30, 2014 ExGen ComEd PECO BGE Other Exelon 2014 Adjusted (non-GAAP) Operating Earnings (Loss) Per Share $0.57 $0.24 $0.20 $0.12 $(0.01) $1.12 Mark-to-market impact of economic hedging activities (0.52) - - - - (0.52) Unrealized gains related to NDT fund investments 0.10 - - - - 0.10 Merger and integration costs (0.03) - - - (0.01) (0.04) Amortization of commodity contract intangibles (0.06) - - - - (0.06) Long-lived asset impairment (0.06) - - - (0.02) (0.08) Tax settlements 0.04 - - - - 0.04 Gain on CENG integration 0.18 - - - - 0.18 CENG Non-Controlling Interest (0.03) - - - - (0.03) 2Q 2014 GAAP Earnings (Loss) Per Share $0.18 $0.24 $0.20 $0.12 $(0.04) $0.71 |
 28 Q2 2015 Earnings Release Slides GAAP to Operating Adjustments NOTE: All amounts shown are per Exelon share and represent contributions to Exelon's EPS. Amounts may not add due to rounding. • Exelon’s 2015 adjusted (non-GAAP) operating earnings excludes the earnings effects of the following: Mark-to-market adjustments from economic hedging activities Unrealized gains and losses from NDT fund investments to the extent not offset by contractual accounting as described in the notes to the consolidated financial statements Certain costs incurred associated with the Integrys and pending Pepco Holdings, Inc. acquisitions Mark-to-market adjustments from forward-starting interest rate swaps related to the financing for the pending PHI acquisition Non-cash amortization of intangible assets, net, related to commodity contracts recorded at fair value at the date of acquisition of Integrys in 2014 Impairment of investment in long-term generating leases Generation’s non-controlling interest related to CENG exclusion items Other unusual items |
 29 Q2 2015 Earnings Release Slides ExGen Total Gross Margin Reconciliation to GAAP Total Gross Margin Reconciliation (in $M) (4) 2015 2016 2017 Revenue Net of Purchased Power and Fuel Expense (1)(5) $8,200 $8,100 $8,300 Other revenues (2) $(250) $(250) $(250) Direct cost of sales incurred to generate revenues for certain Constellation businesses (3) $(300) $(350) $(450) Total Gross Margin (Non-GAAP, as shown on slide (6) $7,650 $7,500 $7,600 (1) Revenue net of purchased power and fuel expense (RNF), a non-GAAP measure, is calculated as the GAAP measure of operating revenue less the GAAP measure of purchased power and fuel expense. ExGen does not forecast the GAAP components of RNF separately. RNF also includes the RNF of our proportionate ownership share of CENG (2) Reflects revenues from operating services agreement with Fort Calhoun, variable interest entities, funds collected through revenues for decommissioning the former PECO nuclear plants through regulated rates and gross receipts tax revenues (3) Reflects the cost of sales and depreciation expense of certain Constellation businesses of Generation (4) All amounts rounded to the nearest $50M (5) Excludes the impact of the operating exclusion for mark-to-market due to the volatility and unpredictability of the future changes to power prices |