EXHIBIT 99.11
Alliance Capital
Third Quarter 2001 Review
Bruce W. Calvert |
| John D. Carifa |
| Lewis A. Sanders |
|
|
|
|
|
CEO and Chairman |
| President and COO |
| CIO and Vice Chairman |
|
|
|
|
|
|
|
|
|
|
|
| November 1, 2001 |
|
|
Introduction
The SEC adopted Regulation FD in October 2000. In light of Regulation FD, Management will be limited in responding to inquiries from investors or analysts in a non-public forum. You are encouraged to ask all questions of a material nature on this conference call.
Forward-Looking Statements
Certain statements provided by Alliance Capital Management L.P. (“Alliance Capital”) and Alliance Capital Management Holding L.P. (“Alliance Holding”) in this report are “forward-looking statements” within the meaning of the Private Securities Litigation Reform Act of 1995. Such forward-looking statements are subject to risks, uncertainties and other factors which could cause actual results to differ materially from future results expressed or implied by such forward-looking statements. The most significant of such factors include, but are not limited to, the following: the performance of financial markets, the investment performance of Alliance Capital’s sponsored investment products and separately managed accounts, general economic conditions, future acquisitions, competitive conditions, and government regulations, including changes in tax rates. Alliance Capital and Alliance Holding caution readers to carefully consider such factors. Further, such forward-looking statements speak only as of the date on which such statements are made; Alliance Capital and Alliance Holding undertake no obligation to update any forward-looking statements to reflect events or circumstances after the date of such statements.
Brief History of Alliance Capital
1962 Investment management department of Donaldson, Lufkin & Jenrette(DLJ) is founded to specialize in management of pension fund assets.
1971 DLJ’s investment management department is merged with Moody’s Investors Services investment advisory business to form AllianceCapital Management Corporation.
1985 Alliance Capital and DLJ are acquired by the Equitable Life Assurance Society of the United States.*
1988 Alliance Capital “goes public” as a master limited partnership and is listed on the New York Stock Exchange.
1992 Equitable is acquired by AXA and subsequently renamed AXA Financial (1999).
2000 Alliance Capital acquires Sanford C. Bernstein & Co. Inc., a premier global value franchise. Provides entry into the private client and institutional research business, and scale and product breadth for international expansion.
*Equitable Companies Incorporated, an indirect parent of The Equitable Life Assurance Society of the United States, changed its name to AXA Financial, Inc. in September 1999
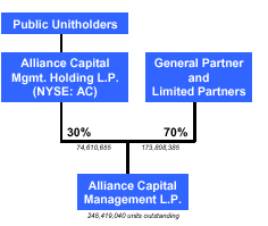
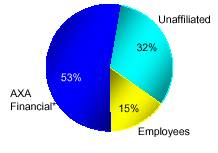
Alliance Capital Ownership Structure
Unit Ownership |
| Alliance Capital |
|
|
|
|
|
|
| ||
|
| |
| If all unexercised options are included, | |
|
| |
| . | |
|
| |
| * AXA Financial ownership includes General Partnership interests. Employee ownership percentage includes restricted unit awards. | |
Investment Considerations
Alliance Capital (The Operating Partnership) |
|
|
|
|
|
|
|
|
|
• Assets Under Management: |
|
|
| $421 billion |
• Value (1): |
|
|
| $12.0 billion |
|
|
|
|
|
Alliance Holding (The Publicly Traded Partnership) |
|
|
|
|
|
|
|
|
|
• NYSE |
|
|
| Ticker: AC |
• AC: Market Capitalization (public) |
|
|
| $3.6 billion |
• Current Price: |
|
|
| $48.00 |
• Trailing Twelve Month Yield |
|
|
| 5.9% |
• 10 year DPU (2) Growth Rate |
|
|
| 19% |
• 5 year DPU (2) Growth Rate |
|
|
| 22% |
(1) Value of operating partnership is based upon price of Alliance Holding units as of 10/30/01 and total outstanding Alliance Capital units as of 9/30/01.
(2) Distributions per Unit.
Current price, value, market capitalization, and yield as of 10/30/01. AUM as of 9/30/01.
AUM by Investment and Client Orientation
| $421 Billion |
| |
|
| ||
|
| ||
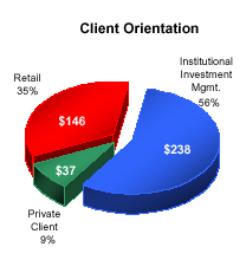
AUM by Client Orientation
$421 Billion |
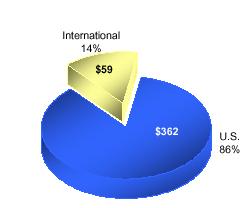
(1) Assets are categorized by country domicile of client accounts. Amounts in $ billions.
Mission
To be the premier
global research and investment management organization
through superior performance
across a broad range of investment disciplines
for a diverse group of clients
Global Platform
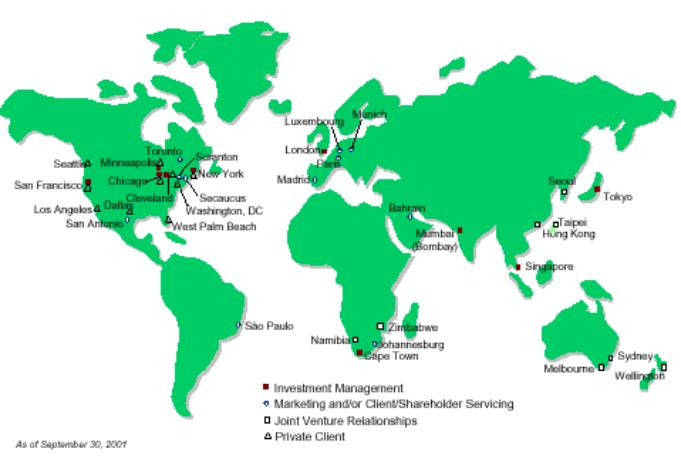
Resourced to Provide Superior Performance
|
|
|
| Fixed |
|
|
|
|
|
|
| Equity |
| Income |
| Other |
| Total |
|
Buy-Side Analysts |
| 170 |
| 69 |
| – |
| 239 |
|
|
|
|
|
|
|
|
|
|
|
Sell-Side Analysts |
| 87 |
| – |
| – |
| 87 |
|
|
|
|
|
|
|
|
|
|
|
Portfolio Managers |
| 142 |
| 74 |
| 3 |
| 219 |
|
|
|
|
|
|
|
|
|
|
|
Traders |
|
|
|
|
|
|
|
|
|
Buy-Side |
| 27 |
| 10 |
| – |
| 37 |
|
Sell-Side |
| 30 |
| – |
| – |
| 30 |
|
Floor |
| 23 |
| – |
| – |
| 23 |
|
|
|
|
|
|
|
|
|
|
|
Corporate Finance/Other |
| – |
| – |
| 11 |
| 11 |
|
|
|
|
|
|
|
|
|
|
|
TOTAL |
| 479 |
| 153 |
| 14 |
| 646 |
|
As of September 30, 2001
Includes investment professionals and analysts from joint venture affiliates and non-key investment locations.
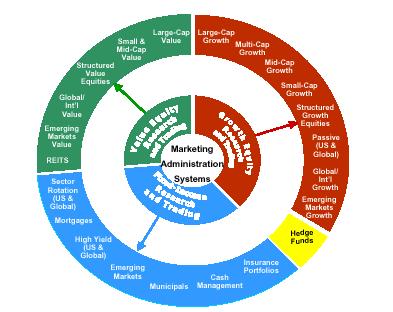
Broad Range of Investment Disciplines
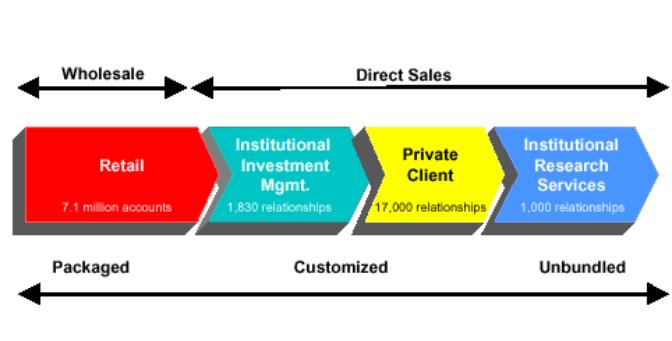
Diverse Group of Clients
Delivering Superior Investor Returns
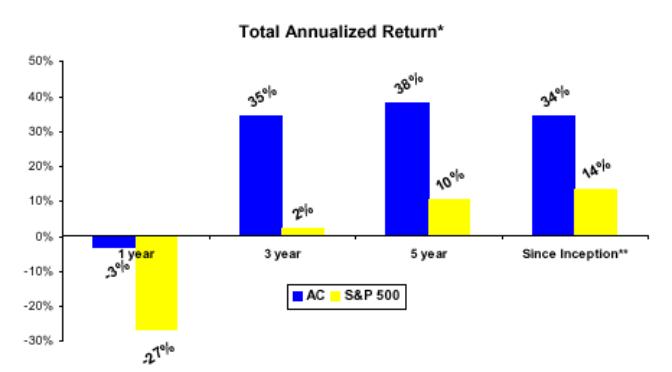
*As of 9/30/01. AC and S&P returns include reinvestment of cash distributions and dividends, respectively.
**Since IPO 4/88.
Steady Flow of Cash Distributions
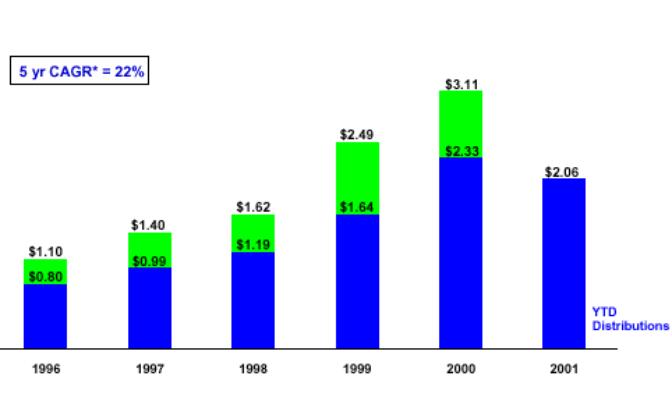
Distributions per Unit are adjusted for two-for-one Unit split in 1998.
*Based on LTM distributions for periods from3Q96 through 3Q01.
Third Quarter Highlights
All information compared to Second Quarter 2001
· AUM declined $44 billion, or 9%, to $421 billion
- Market depreciation of $50 billion
- Net flows of $6 billion
· Average AUM down 1% to $449 billion
· Relative performance remains competitive
· Net new business positive in all three major channels – retail, institutional investment management and private client
· Wrap business – on hold in most programs; net outflows of $2.1 billion
· Revenues down 5%
- Market depreciation and mix change to lower fee products contributed to the decline
· Cost-reduction activities partially offset decrease in revenue
Market Environment Remains Difficult
|
| 3Q |
| YTD |
|
S&P 500 |
| (14.7 | )% | (20.4 | )% |
|
|
|
|
|
|
Russell 1000 Growth |
| (19.4 | ) | (30.9 | ) |
|
|
|
|
|
|
Russell 1000 Value |
| (11.0 | ) | (12.1 | ) |
|
|
|
|
|
|
Lehman Aggregate Bond |
| 4.6 |
| 8.4 |
|
Market Depreciation Causes AUM Decline
|
|
|
|
|
|
|
|
|
|
| ||||
|
|
| Institutional |
| Private |
|
|
| ||||||
|
| Retail |
| Inv Mgmt |
| Client |
| Total |
| |||||
|
|
|
|
|
|
|
|
|
| |||||
• June 2001 AUM* |
| $ | 164 |
| $ | 262 |
| $ | 39 |
| $ | 465 |
| |
|
|
|
|
|
|
|
|
|
| |||||
• Net New Business** |
| 1 |
| 3 |
| 1 |
| 4 |
| |||||
|
|
|
|
|
|
|
|
|
| |||||
• Wrap Net Redemptions |
| (2 | ) | – |
| – |
| (2 | ) | |||||
|
|
|
|
|
|
|
|
|
| |||||
• Cash Management |
| 2 |
| 2 |
| – |
| 4 |
| |||||
|
|
|
|
|
|
|
|
|
| |||||
• Market Depreciation |
| (19 | ) | (29 | ) | (2 | ) | (50 | ) | |||||
|
|
|
|
|
|
|
|
|
| |||||
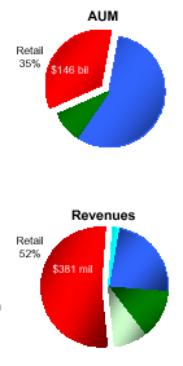
• Sept 2001 AUM |
| $ | 146 |
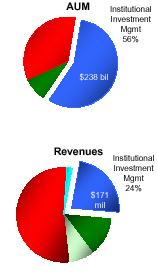
| $ | 238 |
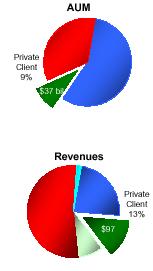
| $ | 37 |
| $ | 421 |
| |
Net New Business in Every Major Distribution Channel for Third Consecutive Quarter
* June 30, 2001 assets under management have been reclassified.
** Excluding wrap and cash management.
In $ billions.
Note: table may not add due to rounding.
Net New Business Strengthened by Product Diversity
|
| Growth |
| Value |
| Fixed |
|
|
|
|
|
| |||||
|
| Equity |
| Equity |
| Income |
| Passive |
| Total |
| ||||||
|
|
|
|
|
|
|
|
|
|
|
| ||||||
• June 2001 AUM* |
| $ | 195 |
| $ | 96 |
| $ | 141 |
| $ | 33 |
| $ | 465 |
| |
|
|
|
|
|
|
|
|
|
|
|
| ||||||
•Net New Business |
| (2 | ) | 2 |
| 6 |
| – |
| 6 |
| ||||||
|
|
|
|
|
|
|
|
|
|
|
| ||||||
• Market Apprec/(Deprec) |
| (36 | ) | (10 | ) | 1 |
| (5 | ) | (50 | ) | ||||||
|
|
|
|
|
|
|
|
|
|
|
| ||||||
• Sept 2001 AUM |
| $ | 157 |
| $ | 88 |
| $ | 148 |
| $ | 28 |
| $ | 421 |
| |
June 30, 2001 assets under management have been reclassified.
In $ billions
Return Premium (1) – Institutional Inv Mgmt Services
Institutional Equity Composites vs. Benchmarks
Growth Oriented Services
|
| Large Cap |
| Disciplined |
| Multi Cap |
| Small Cap |
| Intl Lg Cap |
| Emerging Market |
|
|
| Growth (2) |
| Growth(2) |
| Growth(3) |
| Growth(4) |
| Growth(5) |
| Growth(6) |
|
QTR |
| +2.0 |
| -2.0 |
| -2.6 |
| +0.4 |
| +1.1 |
| -2.7 |
|
|
|
|
|
|
|
|
|
|
|
|
|
|
|
YTD |
| +3.8 |
| -0.4 |
| -3.1 |
| -0.7 |
| +2.6 |
| -5.8 |
|
|
|
|
|
|
|
|
|
|
|
|
|
|
|
1yr |
| +8.2 |
| +3.4 |
| +1.1 |
| +3.2 |
| +4.0 |
| -6.5 |
|
|
|
|
|
|
|
|
|
|
|
|
|
|
|
3yr |
| +4.5 |
| +1.4 |
| +2.2 |
| +10.6 |
| +7.2 |
| +4.5 |
|
|
|
|
|
|
|
|
|
|
|
|
|
|
|
5yr |
| +6.2 |
| +2.0 |
| +1.5 |
| +7.3 |
| +4.8 |
| +3.2 |
|
|
|
|
|
|
|
|
|
|
|
|
|
|
|
10yr |
| +3.3 |
| +0.9 |
| +0.9 |
| +6.5 |
| +3.8 |
| +1.6 |
|
(1) Investment performance of composites are after investment management fees.
(2) vs. Russell 1000 Growth
(3) vs. Russell 3000 Growth
(4) vs. Russell 2000 Growth
(5) vs. MSCI EAFE Growth
(6) vs. MSCI Emerging Markets Free Composite and benchmark data through 9/30/01.
See Performance Disclosure
Return Premium (1) – Institutional Inv Mgmt Services
Institutional Equity Composites vs. Benchmarks
Value Oriented Services
|
| Strategic |
| Diversified |
| Relative |
| Small Cap |
| International |
| Emerging Market |
|
|
| Value(2) |
| Value(3) |
| Value(2) |
| Value(4) |
| Value(5) |
| Value(6) |
|
QTR |
| +2.8 |
| +5.6 |
| -3.5 |
| +1.3 |
| -1.9 |
| +3.4 |
|
|
|
|
|
|
|
|
|
|
|
|
|
|
|
YTD |
| +10.2 |
| +13.7 |
| -0.1 |
| +1.1 |
| +5.4 |
| +7.1 |
|
|
|
|
|
|
|
|
|
|
|
|
|
|
|
1yr |
| +22.0 |
| +23.6 |
| -1.1 |
| -1.1 |
| +4.8 |
| +9.7 |
|
|
|
|
|
|
|
|
|
|
|
|
|
|
|
3yr |
| +1.3 |
| +5.2 |
| +5.9 |
| +0.8 |
| -0.3 |
| +7.5 |
|
|
|
|
|
|
|
|
|
|
|
|
|
|
|
5yr |
| -0.7 |
| +1.8 |
| +2.5 |
| 0.0 |
| +2.6 |
| +2.2 |
|
|
|
|
|
|
|
|
|
|
|
|
|
|
|
10yr |
| +1.7 |
| +1.5 |
| – |
| -1.1 |
| – |
| – |
|
(1) Investment performance of composites are after investment management fees.
(2) vs. Russell 1000 Value
(3) vs. S&P 500
(4) vs. Russell 2000 Value
(5) vs. MSCI EAFE Value
(6) vs. MSCI Emerging Markets Free Composite and benchmark data through 9/30/01.
See Performance Disclosure
Return Premium – Retail Services
Retail Mutual Funds vs. Lipper Averages
|
| Premier |
|
|
| Growth & |
| AB Disc |
| Global Growth |
| North Amer |
|
|
| Growth(1) |
| Technology(2) |
| Income(3) |
| Value(3) |
| Trends(4) |
| Govt Trust(5) |
|
QTR |
| +0.3 |
| +3.6 |
| -1.4 |
| -4.8 |
| -0.1 |
| -4.0 |
|
|
|
|
|
|
|
|
|
|
|
|
|
|
|
YTD |
| +1.4 |
| +8.9 |
| -0.2 |
| +6.3 |
| +2.4 |
| +1.6 |
|
|
|
|
|
|
|
|
|
|
|
|
|
|
|
1yr |
| +1.6 |
| +9.6 |
| -2.3 |
| +7.7 |
| -0.9 |
| +3.3 |
|
|
|
|
|
|
|
|
|
|
|
|
|
|
|
3yr |
| -1.5 |
| -0.6 |
| +4.1 |
| – |
| +10.4 |
| +10.4 |
|
|
|
|
|
|
|
|
|
|
|
|
|
|
|
5yr |
| +3.7 |
| +0.9 |
| +4.7 |
| – |
| +6.4 |
| +8.5 |
|
|
|
|
|
|
|
|
|
|
|
|
|
|
|
10yr |
| – |
| +1.2 |
| +1.0 |
| – |
| – |
| – |
|
(1) vs. Large Cap Growth average
(2) vs. Science and Technology average
(3) vs. Multi-Cap Value average
(4) vs. Global Growth average
(5) vs. Global Income average
Mutual fund performance and Lipper data through 9/30/01.
Expenses Decline 4.5% from Second Quarter
· Staff increases limited to strategic initiatives
· Lower incentive compensation and other benefits in line with lower earnings
· Expense management resulted in 5.3% decline in non-compensation related categories
· Excluding additional costs associated with the acquisition of Bernstein, future expenses are expected to rise in line with organic business growth
Operating Partnership Financial Highlights
|
| 3Q01 |
| 2Q01 |
| % chg |
| ||
•Revenues: |
|
|
|
|
|
|
| ||
Base Fee & Other |
| $ | 716 |
| $ | 744 |
| -4 | % |
Performance Fee |
| 9 |
| 16 |
| -44 |
| ||
|
| 725 |
| 760 |
| -5 |
| ||
|
|
|
|
|
|
|
| ||
•Expenses |
| (531 | ) | (556 | ) | -5 |
| ||
|
|
|
|
|
|
|
| ||
•Net Operating Earnings |
| $ | 194 |
| $ | 204 |
| -5 | % |
|
|
|
|
|
|
|
| ||
•Base Fee Earnings |
| $ | 187 |
| $ | 192 |
| -2 | % |
|
|
|
|
|
|
|
| ||
•Performance Fee Earnings |
| 7 |
| 12 |
| -43 |
| ||
|
|
|
|
|
|
|
| ||
•Net Operating Earnings |
| $ | 194 |
| $ | 204 |
| -5 | % |
In $ millions
Alliance Holding Per Unit Financial Highlights
|
| 3Q01 |
| 2Q01 |
| % chg |
| ||
•Diluted Net Income |
| $ | 0.51 |
| $ | 0.56 |
| -9 | % |
•Amortization of Intangible Assets |
| 0.17 |
| 0.16 |
| + 6 |
| ||
|
|
|
|
|
|
|
| ||
•Net Operating Earnings |
| $ | 0.68 |
| $ | 0.72 |
| -6 | % |
|
|
|
|
|
|
|
| ||
|
|
|
|
|
|
|
| ||
•Base Fee Earnings |
| $ | 0.66 |
| $ | 0.68 |
| -3 | % |
•Performance Fee Earnings |
| 0.02 |
| 0.04 |
| -50 |
| ||
•Net Operating Earnings |
| $ | 0.68 |
| $ | 0.72 |
| -6 | % |
|
|
|
|
|
|
|
| ||
|
|
|
|
|
|
|
| ||
•Distribution |
| $ | 0.67 |
| $ | 0.71 |
| -6 | % |
Per Unit amounts
Retail Highlights
• AUM down 11% from June 30 |
|
|
|
| |
• Revenues down 5% from 2Q |
| |
|
| |
Mix shift to lower fee equity, fixed income and cash management products |
| |
|
| |
• Total net sales $1.6 billion, down 6% from 2Q |
| |
|
| |
• Net U.S. long-term fund sales: $1.1 billion, compared to $1.7 billion in 2Q |
| |
|
| |
— CollegeBoundfund –currently AUM exceeds $1 billion; $445 million net sales in 3Q |
| |
|
| |
— Improving market share on a gross and net basis* |
| |
|
| |
• Net non-U.S. long-term fund sales: $0.7 billion, up 16% from 2Q |
| |
|
| |
• Cash management net sales of $1.8 billion |
| |
|
| |
• Wrap –$2.1 billion in net redemptions |
| |
|
| |
• AllianceBernstein value funds –$545 million in AUM and $194 million in 3Q net sales |
| |
|
| |
• Continuing investment in e-wholesaling and client relationship management tools to increase productivity |
|
* Based on U.S. long-term sales in non-proprietary channel.
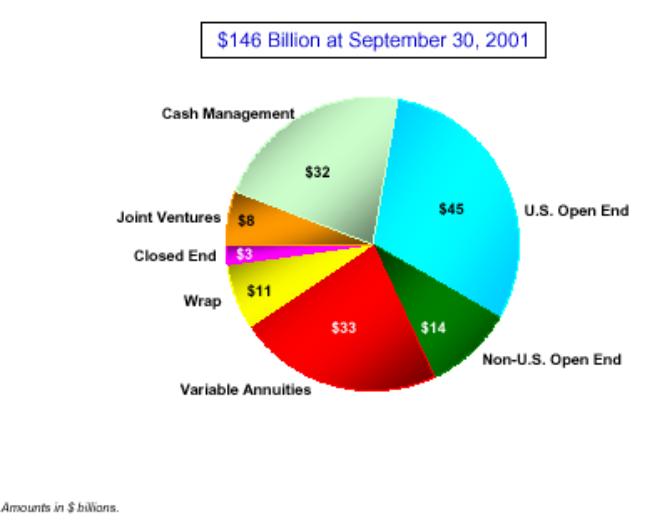
Changes in Retail AUM by Product
|
| U.S. |
| Non-U.S. |
| Variable |
|
|
|
|
| |||||
|
| Funds |
| Funds |
| Annuity |
| Wrap |
| Total |
| |||||
• June 2001 AUM* |
| $ | 86 |
| $ | 24 |
| $ | 39 |
| $ | 15 |
| $ | 164 |
|
|
|
|
|
|
|
|
|
|
|
|
| |||||
•Long-Term Product Net Sales |
| 1 |
| 1 |
| – |
| (2 | ) | – |
| |||||
|
|
|
|
|
|
|
|
|
|
|
| |||||
•Cash Management Net Sales |
| 2 |
| – |
| – |
| – |
| 2 |
| |||||
|
|
|
|
|
|
|
|
|
|
|
| |||||
•Cash Flow/Unreinvested Dividends |
| (1 | ) | – |
| – |
| – |
| (1 | ) | |||||
|
|
|
|
|
|
|
|
|
|
|
| |||||
•Net New Business |
| 2 |
| 1 |
| – |
| (2 | ) | 1 |
| |||||
|
|
|
|
|
|
|
|
|
|
|
| |||||
•Market Depreciation |
| (9 | ) | (2 | ) | (6 | ) | (2 | ) | (19 | ) | |||||
|
|
|
|
|
|
|
|
|
|
|
| |||||
•Sept 2001 AUM |
| $ | 79 |
| $ | 23 |
| $ | 33 |
| $ | 11 |
| $ | 146 |
|
* June 30, 2001 assets under management have been reclassified.
Assets reflect 100% of the assets managed by the Joint Venture companies.
Amounts in $ billions.
Changes in Retail AUM by Investment Orientation
|
| Growth |
| Value |
| Fixed |
| Cash |
|
|
| ||||||
|
| Equity |
| Equity |
| Income |
| Mgmt. |
| Total |
| ||||||
•June 2001 AUM* |
| $ | 90 |
| $ | 16 |
| $ | 28 |
| $ | 30 |
| $ | 164 |
| |
|
|
|
|
|
|
|
|
|
|
|
| ||||||
•Long-Term Product Net Sales |
| (3 | ) | 1 |
| 2 |
| – |
| – |
| ||||||
|
|
|
|
|
|
|
|
|
|
|
| ||||||
•Cash Management Net Sales |
| – |
| – |
| – |
| 2 |
| 2 |
| ||||||
|
|
|
|
|
|
|
|
|
|
|
| ||||||
•Cash Flow/Unreinvested Dividends |
| (1 | ) | – |
| – |
| – |
| (1 | ) | ||||||
|
|
|
|
|
|
|
|
|
|
|
| ||||||
•Net New Business |
| (4 | ) | 1 |
| 2 |
| 2 |
| 1 |
| ||||||
|
|
|
|
|
|
|
|
|
|
|
| ||||||
•Market Depreciation |
| (18 | ) | (1 | ) | – |
| – |
| (19 | ) | ||||||
|
|
|
|
|
|
|
|
|
|
|
| ||||||
•Sept 2001 AUM |
| $ | 68 |
| $ | 16 |
| $ | 30 |
| $ | 32 |
| $ | 146 |
| |
* June 30, 2001 assets under management have been reclassified.
Assets reflect 100% of the assets managed by the Joint Venture companies.
Amounts in $ billions.
Average Global Daily Gross Sales
AllianceBernstein Institutional Investment Mgmt Highlights
• AUM down 9% from June 30 |
|
|
• Revenues down 4% from 2Q |
| |
|
| |
• 58 new separate account wins totaled $4.2 billion in AUM; year-to-date account wins totaled $27.2 billion |
| |
|
| |
• Net new inflows were $4.6 billion, $3.7 billion over 2Q (excluding Vanguard mandate of $12.5 billion) |
| |
|
| |
• Selective expansion of UK/Europe sales force |
| |
|
| |
• Continued focus on cross-selling initiatives |
|
Changes in Institutional Investment Management AUM by Investment Orientation
|
| Growth |
| Value |
| Fixed |
|
|
|
|
| |||||
|
| Equity |
| Equity |
| Income |
| Passive |
| Total |
| |||||
• June 2001 AUM* |
| $ | 105 |
| $ | 54 |
| $ | 74 |
| $ | 29 |
| $ | 262 |
|
|
|
|
|
|
|
|
|
|
|
|
| |||||
•Long-Term Net Sales |
| 2 |
| 1 |
| – |
| – |
| 3 |
| |||||
|
|
|
|
|
|
|
|
|
|
|
| |||||
•Cash Management Net Sales |
| – |
| – |
| 2 |
| – |
| 2 |
| |||||
|
|
|
|
|
|
|
|
|
|
|
| |||||
•Net New Business |
| 2 |
| 1 |
| 2 |
| – |
| 5 |
| |||||
|
|
|
|
|
|
|
|
|
|
|
| |||||
•Market Depreciation |
| (19 | ) | (6 | ) | – |
| (4 | ) | (29 | ) | |||||
|
|
|
|
|
|
|
|
|
|
|
| |||||
•Sept 2001 AUM |
| $ | 88 |
| $ | 49 |
| $ | 76 |
| $ | 25 |
| $ | 238 |
|
* June 30, 2001 assets under management have been reclassified.
Assets reflect 100% of the assets managed by the Joint Venture companies.
Amounts in $ billions.
Balanced Mix of Separately Managed Account Wins
58 New Accounts
$4.2 Billion in AUM
21 Investment Disciplines
|
| New |
|
| New |
| |
Growth Equity Products |
| Accounts |
| Fixed Income Products |
| Accounts |
|
Large Cap Growth |
| 15 |
| Insurance |
| 2 |
|
Disciplined Growth |
| 2 |
| Mortgage |
| 2 |
|
Small Cap Growth |
| 2 |
| Canadian Fixed Income |
| 1 |
|
Global Large Cap Growth |
| 2 |
| Intermediate Duration |
| 1 |
|
European Growth |
| 1 |
| High Yield |
| 1 |
|
Japan Growth |
| 1 |
| Global High Yield |
| 1 |
|
Emerging Markets Growth |
| 1 |
| Other |
| 2 |
|
|
| 24 |
|
|
| 10 |
|
|
|
|
|
|
|
|
|
Value Equity Products |
|
|
| Passive |
| 1 |
|
Diversified Value |
| 7 |
|
|
|
| |
Strategic Value |
| 5 |
|
|
|
|
|
International Value |
| 4 |
|
|
|
| |
Relative Value |
| 3 |
|
|
|
|
|
Global Value |
| 2 |
|
|
|
| |
Canadian Value |
| 2 |
|
|
|
|
|
|
| 23 |
|
|
|
| |
Private Client Highlights
Bernstein Investment Research & Management
• AUM down 4% from June 30 |
|
($ in Millions) |
• Revenues up 2% from 2Q |
| |
|
| |
• Net new flows of $846 million |
| |
|
| |
• Positive inflows every month this year |
| |
|
| |
• Established office in Minneapolis in 3Q; Miami and Houston offices scheduled to open in early 2002 |
| |
|
| |
• Increased number of financial advisors 20% through September 2001; plan to maintain current financial advisor level through 2002 |
|
Institutional Research Services Highlights
• Revenues down 11% from 2Q |
|
($ in Millions) |
|
| |
• Down 1% excluding 2Q one-time syndication revenues |
| |
|
| |
• Three consecutive quarters of NYSE market share growth |
| |
|
| |
• Leverage well-positioned institutional research services |
| |
|
| |
• 8 new product launches year-to-date; additional product launches planned in 2002 |
| |
|
| |
• London trading operation to open in December; expansion of research product and client base |
|
Positioned For Growth
· Worldwide research and investment capabilities
· Unique with strengths in both growth and value investing
· Broad array of fixed income services
· Highly regarded marketing and client service teams
· Well-positioned in retail, institutional and private client channels
· Continued underlying business strength
· Strong financials
· Cogent strategy

Performance Disclosure
Alliance Capital Management L.P.
Alliance Capital Management L.P. (“ACMLP”), is a registered investment advisor. ACMLP had $421 billion in assets under management as of September 30, 2001. Performance figures in this report have been presented net of investment management fees. Net performance figures have been calculated by deducting the highest fee charged to an account in a composite from inception of the composite to December 2000. The annual fees used were: 1.00% for Small Cap Growth, 0.90% for Large Cap Growth and Disciplined Growth from 1/1/00 to 12/31/00 and 0.75% from 1/1/78 to 12/31/99, 0.75% for International Large Cap Growth, Relative Value, and Multi-Cap Growth. From January 2001 forward, the composite’s net of fee return is based upon a weighted average of the actual fee rates charged to each account in the composite. The average fees applied were: 0.88% for Small Cap Growth, 0.32% for Large Cap Growth, 0.34% for Disciplined Growth, 0.30% for International Large Cap Growth, 0.21% for Relative Value, 0.63% for Multi-Cap Growth. Both fee structures exclude accounts with performance based fee arrangements. Net of fee performance figures reflect the compounding effect of such fees.
No representation is made that the performance of these investment accounts are indicative of future performance. Performance figures for each account are calculated monthly on a trade-date basis using an internal rate of return calculation. Monthly market values include income accruals and reflect the daily weighting of cash flows. The composite results are asset-weighted on a monthly basis. Quarterly and annual composite performance figures are computed by linking monthly returns resulting in a time-weighted rate of return.
The Composites include discretionary tax-exempt accounts with assets over $10 million which are not subject to significant investment restrictions imposed by clients, except for the European Growth Composite which consists of one taxable account.
Composites used for performance reporting purposes represent the following:
|
|
|
|
|
| % of Total Firm |
|
Strategy |
| Number of Accounts |
| Assets ($mm) |
| Assets |
|
Large Cap Growth |
| 296 |
| 27,684 |
| 7 | % |
Disciplined Growth |
| 118 |
| 7,819 |
| 2 |
|
Small Cap Growth |
| 11 |
| 499 |
| <1 |
|
Multi Cap Growth |
| 12 |
| 686 |
| <1 |
|
Relative Value |
| 11 |
| 1,786 |
| <1 |
|
International Large Cap Growth |
| 5 |
| 1,792 |
| <1 |
|
Emerging Markets Growth |
| 3 |
| 558 |
| <1 |
|
Alliance Capital Management L.P. – Bernstein Inverstment Research & Management Unit
Performance Statistics Are Not Financial Statements - There are various methods of compiling or reporting performance statistics. The standards of performance measurement used in compiling this data are in accordance with the methods set forth by the Notes below. Past performance statistics may not be indicative of future results and may differ for different time periods.
Total Return - Performance results of accounts and comparisons are made on a total-return basis which includes all dividends, interest and accrued interest, and realized and unrealized gains or losses. Securities are included in accounts on a trade date basis. Performance results are after deductions of all transaction charges and fees.
Rate of Return - Investment results are computed on a "time-weighted" rate-of-return basis. Assuming dividends and interest are reinvested, the growth in dollars of an investment in a period can be computed using these rates of return. In computing the “time-weighted rate of return”, if an account’s net monthly cash flow exceeds 10% of its beginning market value, the cash flows are weighted on a daily basis. When an account’s net monthly cash flows are less than 10% of its beginning market value, the cash flows are weighted by the “end of the month” assumption. Beginning 2001, all cashflows are daily-weighted using the modified Dietz method.
Preparation of Data - Investment results on a quarterly basis for all accounts in the cited category under the discretionary management of Bernstein's Investment Policy Group for the entire quarter were added together and the sum divided by the total number of accounts in each quarter through 1992; beginning in 1993 quarterly performance was for all accounts weighted by their market value. These quarterly performance figures were then linked to produce a continuous-performance index. The continuous-performance index from inception was used to create point-to-point comparisons. Closed accounts are included for each full quarter prior to their closing. From inception, returns for Diversified Value optimized against the Russell 1000 Value Index exclude certain accounts with special restrictions imposed by clients. Strategic Value returns include all accounts offered from 1974-1982 and, from 1983-1999, all Strategic Value accounts with $5 million or more in assets. Beginning January 1, 2000, results exclude accounts with a client-directed margin balance of 20% or more of market value at any month end. From July 1993 quarterly results were those of GDP-weighted, half-hedged International Value accounts separately managed in US dollars.
Investment Management Performance Statistics and Dispersion - Performance statistics and dispersion are shown after the deduction of investment management fees. Dispersion, or standard deviation, measures the variability of account returns within a composite. In a normal distribution, approximately two-thirds of the account returns will fall within the range of one standard deviation above and below the equal-weighted mean return. Beginning in 1993, performance is weighted by account size, therefore dispersion is calculated from the asset-weighted mean. Dispersion of performance for accounts under management are: Diversified Value (Russell 1000 Value) - 1999: 1.7%; 2000: 1.9; 2001: N/A; Strategic Value -1974: 29.1; 1975: 26.5; 1976: 17.6; 1977: 8.3; 1978: 11.5; 1979: 9.0; 1980: 8.7; 1981: 5.6; 1982: 5.5; 1983: 2.9; 1984: 1.6; 1985:1.6; 1986: 1.1; 1987: 1.7; 1988: 1.7; 1989: 1.3; 1990: 1.2; 1991: 2.0; 1992: 1.4; 1993: 1.2; 1994: 1.2; 1995: 1.3; 1996: 1.2; 1997: 1.5; 1998: 2.5; 1999: 2.5; 2000: 2.6; 2001: N/A; Small-Cap Value - 1991: 1.3; 1992: 1.3; 1993: 1.5; 1994: 1.6; 1995: 1.6; 1996: 1.2; 1997: 1.0; 1998: 1.8; 1999: 1.6; 2000: 1.7; 2001: N/A; International Value (GDP-Weighted, Half-Hedged) 1993:2H: 0.5; 1994: 0.9; 1995: 1.1; 1996: 1.0; 1997: 1.3; 1998: 1.6; 1999: 1.8; 2000: 1.6; 2001:N/A.
Investment Management Fees and Notice to Financial Consultants - Bernstein has published investment management fee schedules for varying sizes of accounts, which are described in our Form ADV. The following before-fee and after-fee cumulative annualized rates of return illustrate the cumulative effects of the deduction of fees: Diversified Value (Russell 1000 Value) - 2000: 13.7%, 13.2%; 2 yrs 1999:2Q-2001:1Q: 6.9%, 6.5%; Strategic Value -2000: 10.6%, 10.1%; 5 yrs 1996-00: 14.3%, 13.8%; 27-1/4 yrs 1974-2001:1Q:16.1%, 15.6%; Small-Cap Value - 2000: 20.6%, 19.7%; 5 yrs 1996-2000: 12.2%, 11.4%; 10-1/4 yrs 1991-2001:1Q: 16.9%, 16.1%; International Value (GDP-Weighted, Half-Hedged): 2000: (2.0%), (2.6%); 5 yrs 1996-2000: 12.5%, 11.8%; 8-3/4 yrs 1992:3Q-2001:1Q: 11.5%, 10.7%. The following are the account after-fee annual rates of return: Diversified Value (Russell 1000 Value) –1999:2Q-4Q: 2.0%; 2000: 13.2%; 2001:1Q: (1.8%); Strategic Value - 1983: 26.5%; 1984: 11.9%; 1985: 27.9%; 1986: 8.3%; 1987: 12.7%; 1988: 20.3%; 1989: 20.4%; 1990: (23.3%); 1991: 31.7%; 1992: 26.1%; 1993: 26.8%; 1994: 0.7%; 1995: 37.2%; 1996: 24.0%; 1997: 27.2%; 1998: 9.9%; 1999: (0.2%); 2000:10.1%; 2001:1Q: 0.2%; Small-Cap Value - 1991: 49.7%; 1992: 25.2%; 1993: 11.6%; 1994: 2.0%; 1995: 26.4%; 1996: 15.2%; 1997: 30.5%; 1998: (3.7%); 1999: (1.1%); 2000: 19.7%; 2001:1Q: (0.4%); International Value (GDP-weighted, half-hedged):1992:2H: (5.0%); 1993: 35.9%; 1994: 5.3%; 1995: 8.8%; 1996: 18.2%; 1997: 10.0%; 1998: 13.5%; 1999: 21.6%; 2000: (2.6%); 2001:1Q: (5.9%).
Composites used for reporting purposes represent the following:
Strategy |
| Number of Accounts |
| Assets ($mm) |
| % of Total Firm Assets |
|
Strategic Value (accts. over $5 million) |
| 377 |
| 15,388 |
| 4 | % |
Diversified Value (opt to Russell 1000 Value) |
| 37 |
| 1,017 |
| <1 |
|
Small Cap Value |
| 58 |
| 1,521 |
| <1 |
|
International Value (half-hedged, GDP wtd) |
| 58 |
| 980 |
| <1 |
|
Emerging Markets Value |
| 5 |
| 1,230 |
| <1 |
|
APPENDIX
Alliance Capital (The Operating Partnership)
Consolidated Balance Sheet
|
| 9/30/01 |
| 12/31/00 |
| ||
Assets |
|
|
|
|
| ||
Cash and investments |
| $ | 678,316 |
| $ | 556,569 |
|
Cash and securities |
| 1,093,478 |
| 1,306,334 |
| ||
Receivables |
| 1,151,856 |
| 1,906,248 |
| ||
Intangible assets, net |
| 3,308,626 |
| 3,430,708 |
| ||
Deferred sales commissions, net |
| 667,826 |
| 715,692 |
| ||
Other |
| 380,058 |
| 355,211 |
| ||
Total Assets |
| $ | 7,280,160 |
| $ | 8,270,762 |
|
|
|
|
|
|
| ||
Liabilities and Partners' Capital |
|
|
|
|
| ||
Liabilites: |
|
|
|
|
| ||
Payables |
| $ | 2,006,756 |
| $ | 2,798,694 |
|
Accounts payable and accrued expenses |
| 184,845 |
| 238,640 |
| ||
Accrued compensation and benefits |
| 482,831 |
| 313,426 |
| ||
Debt |
| 577,377 |
| 782,232 |
| ||
Other |
| 7,135 |
| 4,093 |
| ||
Total Liabilities |
| 3,258,944 |
| 4,137,085 |
| ||
|
|
|
|
|
| ||
Partners' Capital |
| 4,021,216 |
| 4,133,677 |
| ||
Total Liabilities and Partners' Capital |
| $ | 7,280,160 |
| $ | 8,270,762 |
|
Amounts in $ thousands.
Unaudited
Alliance Capital (The Operating Partnership)
Consolidated Cash Flow
|
| Nine Months Ended |
| ||||
|
| 9/30/01 |
| 9/30/00 |
| ||
Cash Flows From Operating Activities: |
|
|
|
|
| ||
Net income |
| $ | 463,832 |
| $ | 520,491 |
|
Non-cash items: |
|
|
|
|
| ||
Amortization and depreciation |
| 334,394 |
| 189,121 |
| ||
Non-recurring item |
| - |
| (23,853 | ) | ||
Other, net |
| 45,632 |
| 29,118 |
| ||
Changes in assets and liabilities |
| 162,880 |
| 40,191 |
| ||
Net cash provided from operating activities |
| 1,006,738 |
| 755,068 |
| ||
|
|
|
|
|
| ||
Cash Flows From Investing Activities: |
|
|
|
|
| ||
Purchase of investments, net |
| (164,234 | ) | (1,770,595 | ) | ||
Additions to furniture, equipment and leaseholds, net |
| (63,322 | ) | (44,934 | ) | ||
Other |
| (6,779 | ) | - |
| ||
Net cash (used in) investing actvities |
| (234,335 | ) | (1,815,529 | ) | ||
|
|
|
|
|
| ||
Cash Flows From Financing Activities: |
|
|
|
|
| ||
Increase (decrease) in debt, net |
| (222,621 | ) | 115,657 |
| ||
Distributions to partners |
| (597,620 | ) | (446,672 | ) | ||
Proceeds from issuance of Units to ELAS and AXF |
| - |
| 1,629,525 |
| ||
Other |
| 8,427 |
| (160,112 | ) | ||
Net cash provided from (used in) financing activities |
| (811,814 | ) | 1,138,398 |
| ||
|
|
|
|
|
| ||
Effect of exchange rate change |
| (433 | ) | (1,991 | ) | ||
|
|
|
|
|
| ||
Net increase (decrease) in cash |
| (39,844 | ) | 75,946 |
| ||
Cash at the beginning of period |
| 216,251 |
| 80,185 |
| ||
Cash at the end of period |
| $ | 176,407 |
| $ | 156,131 |
|
Amounts in $ thousands.
Unaudited
Changes in AUM by Client
Three Months Ended September 30, 2001
|
|
|
| Institutional |
|
|
|
|
|
|
|
|
| Investment |
| Private |
|
|
|
|
| Retail |
| Management |
| Client |
| Total |
|
Beginning of Period |
| $164,258 |
| $262,396 |
| $38,717 |
| $465,371 |
|
|
|
|
|
|
|
|
|
|
|
Sales/New accounts |
| 9,471 |
| 4,267 |
| 1,288 |
| 15,026 |
|
Redemptions/Terminations |
| (9,752 | ) | (2,041 | ) | (510 | ) | (12,303 | ) |
Net cash management sales |
| 1,856 |
| 1,755 |
| 91 |
| 3,702 |
|
Cash flow |
| (739 | ) | 650 |
| 20 |
| (69 | ) |
Unreinvested dividends |
| (265 | ) | (9 | ) | (43 | ) | (317 | ) |
Net new business |
| 571 |
| 4,622 |
| 846 |
| 6,039 |
|
|
|
|
|
|
|
|
|
|
|
Market depreciation |
| (18,457 | ) | (29,240 | ) | (2,311 | ) | (50,008 | ) |
End of Period |
| $146,372 |
| $237,778 |
| $37,252 |
| $421,402 |
|
Note: June 30, 2001 assets under management have been reclassified.
Assets reflect 100% of the assets managed by the Joint Ventures.
Amounts in $ millions.
Changes in AUM by Investment Orientation
Three Months Ended September 30, 2001
|
| Growth |
| Value |
| Fixed |
|
|
|
|
| |||||
|
| Equity |
| Equity |
| Income |
| Passive |
| Total |
| |||||
Beginning of Period |
| $ | 194,820 |
| $ | 96,212 |
| $ | 141,248 |
| $ | 33,091 |
| $ | 465,371 |
|
|
|
|
|
|
|
|
|
|
|
|
| |||||
Sales/New accounts |
| 5,646 |
| 3,106 |
| 5,768 |
| 506 |
| 15,026 |
| |||||
Redemptions/Terminations |
| (6,283 | ) | (1,083 | ) | (4,403 | ) | (534 | ) | (12,303 | ) | |||||
Net cash management sales |
| - |
| - |
| 3,702 |
| - |
| 3,702 |
| |||||
Cash flow |
| (1,003 | ) | (407 | ) | 1,240 |
| 101 |
| (69 | ) | |||||
Unreinvested dividends |
| (4 | ) | 5 |
| (318 | ) | - |
| (317 | ) | |||||
Net new business |
| (1,644 | ) | 1,621 |
| 5,989 |
| 73 |
| 6,039 |
| |||||
|
|
|
|
|
|
|
|
|
|
|
| |||||
Market depreciation |
| (36,387 | ) | (9,443 | ) | 526 |
| (4,704 | ) | (50,008 | ) | |||||
|
|
|
|
|
|
|
|
|
|
|
| |||||
End Of Period |
| $ | 156,789 |
| $ | 88,390 |
| $ | 147,763 |
| $ | 28,460 |
| $ | 421,402 |
|
Note: June 30, 2001 assets under management have been reclassified.
Assets reflect 100% of the assets managed by the Joint Ventures.
Amounts in $ millions.
Market Share of U.S.-Based Mutual Fund Gross Sales In Key Advisor-Assisted Channels
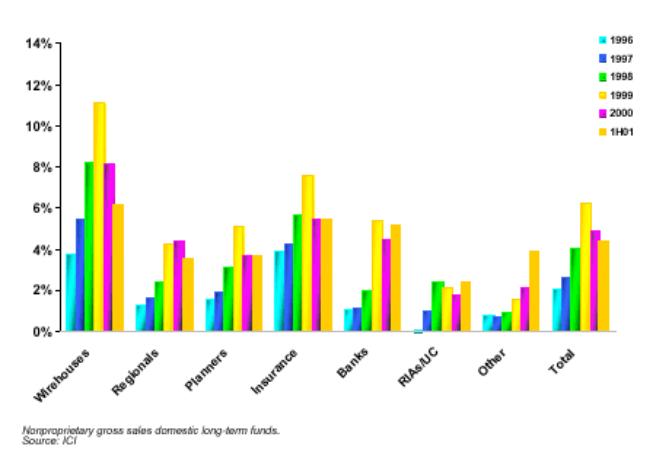
A Diverse Retail Mix
Alliance Capital (The Operating Partnership)
Retail AUM and Net Flows
|
|
|
| Quarters |
| ||||||||
|
| AUM |
| Net Flows |
| Net Flows |
| Net Flows |
| ||||
|
| 9/30/01 |
| 3Q 2001 |
| 2Q 2001 |
| 3Q 2000 |
| ||||
U.S. Based Mutual Funds |
| $ | 47,511 |
| $ | 335 |
| $ | 869 |
| $ | 2,113 |
|
Non-U.S. Based Mutual Funds: |
|
|
|
|
|
|
|
|
| ||||
Luxembourg Funds |
| 7,262 |
| 181 |
| 547 |
| 900 |
| ||||
EPTA Funds |
| 2,633 |
| (241 | ) | (466 | ) | (415 | ) | ||||
India |
| 601 |
| 18 |
| 13 |
| 146 |
| ||||
Japan ITM |
| 3,020 |
| 80 |
| 140 |
| 39 |
| ||||
Other Funds |
| 876 |
| (9 | ) | 313 |
| (1 | ) | ||||
Joint Venture Funds |
| 8,300 |
| 590 |
| (26 | ) | 388 |
| ||||
Total Non-U.S. |
| 22,691 |
| 619 |
| 521 |
| 1,057 |
| ||||
|
|
|
|
|
|
|
|
|
| ||||
Wrap |
| 10,698 |
| (2,107 | ) | 579 |
| 1,231 |
| ||||
Variable Annuity |
| 33,348 |
| (132 | ) | 794 |
| 676 |
| ||||
Total Long-Term |
| 114,248 |
| (1,285 | ) | 2,763 |
| 5,077 |
| ||||
|
|
|
|
|
|
|
|
|
| ||||
Cash Management |
| 32,124 |
| 1,856 |
| (1,172 | ) | 2,219 |
| ||||
|
|
|
|
|
|
|
|
|
| ||||
Total |
| $ | 146,372 |
| $ | 571 |
| $ | 1,591 |
| $ | 7,296 |
|
Note: June 30, 2001 assets under management have been reclassified.
Alliance Capital (The Operating Partnership)
Institutional Investment Management AUM and Net Flows
|
|
|
| Quarters |
| |||||||||||
|
| AUM |
| Net Flows |
| Net Flows |
| Net Flows |
| |||||||
|
| 9/30/01 |
| 3Q 2001 |
| 2Q 2001 |
| 3Q 2000 |
| |||||||
Mutual Funds |
|
|
|
|
|
|
|
|
| |||||||
U.S. Based |
| $ | 876 |
| $ | (56 | ) | $ | 177 |
| $ | 60 |
| |||
|
|
|
|
|
|
|
|
|
| |||||||
Non-U.S. Based: |
|
|
|
|
|
|
|
|
| |||||||
Luxembourg |
| - |
| - |
| - |
| - |
| |||||||
Structured Products |
| - |
| (288 | ) | (274 | ) | (988 | ) | |||||||
Other |
| 3,607 |
| - |
| (1 | ) | (1 | ) | |||||||
Total Non-U.S. |
| 3,607 |
| (288 | ) | (275 | ) | (989 | ) | |||||||
|
|
|
|
|
|
|
|
|
| |||||||
Separate Accounts |
| 221,310 |
| 3,211 |
| 15,320 |
| (915 | ) | |||||||
|
|
|
|
|
|
|
|
|
| |||||||
Total Long-Term |
| 225,793 |
| 2,867 |
| 15,222 |
| (1,844 | ) | |||||||
|
|
|
|
|
|
|
|
|
| |||||||
Cash Management |
| 11,986 |
| 1,755 |
| (1,061 | ) | 2,821 |
| |||||||
|
|
|
|
|
|
|
|
|
| |||||||
Total |
| $ | 237,778 |
| $ | 4,622 |
| $ | 14,161 |
| $ | 977 |
| |||
Note: June 30, 2001 assets under management have been reclassified.
Alliance Capital (The Operating Partnership)
Private Client AUM and Net Flows
|
|
|
| Quarters |
| ||||||||
|
| AUM |
| Net Flows |
| Net Flows |
| Net Flows |
| ||||
|
| 9/30/01 |
| 3Q 2001 |
| 2Q 2001 |
| 3Q 2000 |
| ||||
Mutual Funds |
| $ | 10,897 |
| $ | 86 |
| $ | (111 | ) | $ | 78 |
|
Separate Accounts |
| 26,146 |
| 669 |
| 478 |
| 40 |
| ||||
Total Long-Term |
| 37,043 |
| 755 |
| 367 |
| 118 |
| ||||
|
|
|
|
|
|
|
|
|
| ||||
Cash Management |
| 209 |
| 91 |
| - |
| - |
| ||||
|
|
|
|
|
|
|
|
|
| ||||
Total |
| $ | 37,252 |
| $ | 846 |
| $ | 367 |
| $ | 118 |
|
Note: June 30, 2001 assets under management have been reclassified.
Alliance Capital Investment Management Services
Alliance Capital provides diversified investment management and related services globally to a broad range of clients:
1. |
| Retail Services consists of investment management products and services distributed to individual investors through financial intermediaries, such as brokers and financial planners by means of: | |
|
| • | mutual funds sponsored by Alliance Capital and affiliated joint venture companies, |
|
| • | cash management products such as money market funds and deposit accounts, |
|
| • | mutual fund sub-advisory relationships resulting from the efforts of the mutual fund marketing department, and |
• | “managed money” products; | ||
2. |
| Institutional Investment Management Services consists of investment management services to unaffiliated parties such as corporate and public employee pension funds, endowment funds, domestic and foreign institutions and governments, and affiliates such as AXA and its insurance company subsidiaries by means of: | |
|
| • | separate accounts, |
|
| • | mutual fund shares and classes sold principally to institutional investors and high net worth individuals, |
|
| • | sub-advisory relationships resulting from the efforts of the institutional marketing department, |
|
| • | hedge funds, |
|
| • | structured products, and |
|
| • | group trusts; |
3. |
| Private Client Services consists of investment management services provided to high net worth individuals, trusts and estates, charitable foundations, partnerships, private and family corporations and other entities by means of: | |
|
| • | separate accounts, |
|
| • | hedge funds and |
|
| • | certain other vehicles; and |
4. |
| Institutional Research Services to institutional clients by means of: | |
|
| • | in-depth research, |
|
| • | portfolio strategy, |
|
| • | trading and |
|
| • | brokerage-related services. |