EXHIBIT 99.20
Alliance Capital and Alliance Holding
First Quarter 2002 Review
Bruce W. Calvert |
| John D. Carifa |
| Lewis A. Sanders |
Chairman and CEO |
| President and COO |
| Vice Chairman and CIO |
May 2, 2002
Introduction
The SEC adopted Regulation FD in October 2000. In light of Regulation FD, Management will be limited in responding to inquiries from investors or analysts in a non-public forum. You are encouraged to ask all questions of a material nature on this conference call.
Forward-Looking Statements
Certain statements provided by Alliance Capital Management L.P. (“Alliance Capital”) and Alliance Capital Management Holding L.P. (“Alliance Holding”) inthis report are “forward-looking statements” within the meaning of the Private Securities Litigation Reform Act of 1995. Such forward-looking statements are subject to risks, uncertainties and otherfactors which could cause actual results to differ materially from future results expressed or implied by such forward-looking statements. The most significant of such factors include, but are not limited to, the following: the performance of financial markets, the investment performance of Alliance Capital’s sponsored investment products and separately managed accounts, general economic conditions, future acquisitions, competitive conditions, and government regulations, including changes in tax rates. Alliance Capital and Alliance Holding caution readers to carefully consider such factors. Further, such forward-looking statements speak only as of the date on which such statements are made; Alliance Capital and Alliance Holding undertake no obligation to update any forward-looking statements to reflect events or circumstances after the date of such statements.
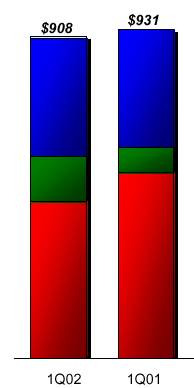
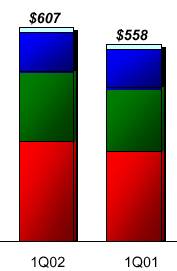
First Quarter Financial Highlights
| Alliance Capital | 1Q02 vs. 1Q01 |
|
|
|
• | AUM | $452 bn vs. $429 bn, up 5.4% |
|
|
|
• | Average AUM | $448 bn vs. $451 bn, down 0.7% |
|
|
|
• | Twelve Month Market Performance | S & P 500 up 0.3% |
|
|
|
• | Net new business | $5 bn in 1Q02 |
|
|
|
• | Revenues | $721 mm vs. $742 mm, down 3.0% |
|
|
|
• | Expenses | $539 mm vs. $537 mm, up 0.3% |
|
|
|
|
|
|
| Alliance Holding |
|
|
|
|
• | NOE per Unit | $0.60 vs. $0.69, down 13.0% |
|
|
|
• | Distributions per Unit | $0.59 vs. $0.68, down 13.2% |
Alliance Capital First Quarter Financial Highlights
|
| 1Q02 |
| 1Q01 |
| % chg | ||
• | Revenues |
|
|
|
|
| ||
| Base Fee & Other | $ | 586 |
| 598 |
| -2 | |
| Performance Fee | 6 |
| 4 |
| +50 | ||
| Distribution | 129 |
| 140 |
| -8 | ||
|
| 721 |
| 742 |
| -3 | ||
• | Expenses |
|
|
|
|
| ||
| Compensation | 236 |
| 220 |
| +7 | ||
| Distribution (1) | 176 |
| 182 |
| -3 | ||
| Other | 136 |
| 145 |
| -7 | ||
|
| 548 |
| 547 |
| – | ||
• | Net Operating Earnings | $ | 173 |
| $ | 195 |
| -11 |
|
|
|
|
|
|
| ||
• | Base Fee Earnings | $ | 169 |
| $ | 192 |
| -12 |
• | Performance Fee Earnings | 4 |
| 3 |
| +33 | ||
• | Net Operating Earnings | $ | 173 |
| $ | 195 |
| -11 |
(1) Distribution plan payments and amortization of deferred sales commissions.
In $ millions
Lower Discretionary Expenses
|
| 1Q02 |
| 1Q01 |
| ||||||||
|
| Discretionary |
| Non-Disc. |
| Discretionary |
| Non-Disc. |
| ||||
• Employee Comp. & Benefits |
| $ | 97 |
| $ | 139 |
| $ | 100 |
| $ | 120 |
|
|
|
|
|
|
|
|
|
|
| ||||
• Distribution |
| – |
| 176 |
| – |
| 182 |
| ||||
|
|
|
|
|
|
|
|
|
| ||||
• Promotion and Svcg. |
| 28 |
| 10 |
| 38 |
| 8 |
| ||||
|
|
|
|
|
|
|
|
|
| ||||
• General & Admin |
| 44 |
| 37 |
| 43 |
| 33 |
| ||||
|
|
|
|
|
|
|
|
|
| ||||
• Interest |
| – |
| 8 |
| – |
| 13 |
| ||||
|
|
|
|
|
|
|
|
|
| ||||
• Total Expenses |
| $ | 169 |
| $ | 370 |
| $ | 181 |
| $ | 356 |
|
|
|
|
|
|
|
|
|
|
| ||||
• % Change |
| -6.6 | % | +3.9 | % |
|
|
|
| ||||
Alliance Capital Pre-tax Operating Margin
|
| 1Q02 |
| % of |
| 1Q01 |
| % of |
| ||
• Base Fee Earnings, Net |
| $ | 214 |
| 36.2 | % | $ | 235 |
| 39.0 | % |
|
|
|
|
|
|
|
|
|
| ||
• Distribution Expense, Net (2) |
| (36 | ) | -6.1 |
| (33 | ) | -5.5 |
| ||
|
|
|
|
|
|
|
|
|
| ||
• Performance Fee Earnings, Net |
| 4 |
| 0.7 |
| 3 |
| 0.6 |
| ||
|
|
|
|
|
|
|
|
|
| ||
• Pre-tax Operating Earnings |
| $ | 182 |
| 30.8 | % | $ | 205 |
| 34.1 | % |
• Lower average AUM
• Continuing revenue mix shift
• Acquisition-related expenses
(1) Excludes distribution revenues.
(2) Distribution expense, net includes allocation of incentive compensation.
Alliance Holding First Quarter Financial Highlights
|
| 1Q01 |
| 1Q02 |
| % chg |
| 4Q01 |
| % chg |
| |||
• Diluted Net Income |
| $ | 0.58 |
| $ | 0.52 |
| +12 |
| $ | 0.51 |
| +14 |
|
|
|
|
|
|
|
|
|
|
|
|
| |||
• Amort. of Intangibles & Goodwill |
| 0.02 |
| 0.17 |
| -88 |
| 0.17 |
| -88 |
| |||
|
|
|
|
|
|
|
|
|
|
|
| |||
• Net Operating Earnings |
| $ | 0.60 |
| $ | 0.69 |
| -13 |
| $ | 0.68 |
| -12 |
|
|
|
|
|
|
|
|
|
|
|
|
| |||
|
|
|
|
|
|
|
|
|
|
|
| |||
• Base Fee Earnings |
| $ | 0.59 |
| $ | 0.68 |
| -13 |
| $ | 0.59 |
| – |
|
|
|
|
|
|
|
|
|
|
|
|
| |||
• Performance Fee Earnings |
| 0.01 |
| 0.01 |
| – |
| 0.09 |
| -89 |
| |||
|
|
|
|
|
|
|
|
|
|
|
| |||
• Net Operating Earnings |
| $ | 0.60 |
| $ | 0.69 |
| -13 |
| $ | 0.68 |
| -12 |
|
|
|
|
|
|
|
|
|
|
|
|
| |||
• Distribution |
| $ | 0.59 |
| $ | 0.68 |
| -13 |
| $ | 0.67 |
| -12 |
|
Per Unit amounts
Alliance Capital Operating Highlights
Operating Highlights
• Challenging market environment
• Recent performance results mixed
• Very competitive long-term investment results
• Net new business remains positive
• Modest adverse changes in fee mix from continued under-performance of growth equities
Challenging Market Environment
|
| 1Q02 |
| 1 Year |
| 2 Year |
|
• S&P 500 |
| 0.3 | % | 0.3 | % | -21.5 | % |
|
|
|
|
|
|
|
|
• Russell 1000 Growth |
| -2.6 | % | -2.0 | % | -43.9 | % |
|
|
|
|
|
|
|
|
• Russell 1000 Value |
| 4.1 | % | 4.4 | % | 4.7 | % |
|
|
|
|
|
|
|
|
• NASDAQ Composite |
| -5.4 | % | 0.3 | % | -59.4 | % |
|
|
|
|
|
|
|
|
• Lehman Aggregate Bond |
| 0.1 | % | 5.4 | % | 18.6 | % |
Cumulative returns through March 31, 2002
Relative Performance (1) – Institutional Inv Mgmt Services
Institutional Equity Composites vs. Benchmarks
Growth Oriented Services
|
| Large Cap |
| Disciplined |
| Multi Cap |
| Small Cap |
| Intl Lg Cap |
| Emerging |
|
QTR |
| -2.4 |
| -3.3 |
| -0.7 |
| +0.7 |
| +1.3 |
| +1.6 |
|
|
|
|
|
|
|
|
|
|
|
|
|
|
|
1yr |
| -3.8 |
| -3.2 |
| -1.2 |
| +3.9 |
| +6.9 |
| +1.3 |
|
|
|
|
|
|
|
|
|
|
|
|
|
|
|
3yr |
| +0.8 |
| -0.9 |
| +1.9 |
| +13.9 |
| +7.9 |
| +8.1 |
|
|
|
|
|
|
|
|
|
|
|
|
|
|
|
5yr |
| +4.4 |
| +1.0 |
| +1.6 |
| +6.3 |
| +5.2 |
| +4.2 |
|
|
|
|
|
|
|
|
|
|
|
|
|
|
|
10yr |
| +2.6 |
| +1.0 |
| +1.0 |
| +7.1 |
| +3.6 |
| +3.0 |
|
(1) Investment performance of composites are after investment management fees.
(2) vs. Russell 1000 Growth (3) vs. Russell 3000 Growth (4) vs. Russell 2000 Growth (5) vs. MSCI EAFE Growth (6) vs. MSCI Emerging Markets Free
Composite and benchmark data through 3/31/02.
See Performance Disclosure
Relative Performance (1) – Institutional Inv Mgmt Services
Institutional Equity Composites vs. Benchmarks
Value Oriented Services
|
| Strategic Value(2) |
| Diversified Value(3) |
| Relative Value(2) |
| Small- Mid Cap Value(4) |
| International Value(5)* |
| Emerging Market Value(6)* |
|
QTR |
| -0.7 |
| +3.0 |
| -2.6 |
| +2.8 |
| +1.9 |
| +1.9 |
|
|
|
|
|
|
|
|
|
|
|
|
|
|
|
1yr |
| +8.7 |
| +9.1 |
| -0.7 |
| +14.3 |
| +4.7 |
| -2.7 |
|
|
|
|
|
|
|
|
|
|
|
|
|
|
|
3yr |
| +4.9 |
| +8.3 |
| +3.5 |
| – |
| +3.2 |
| +3.1 |
|
|
|
|
|
|
|
|
|
|
|
|
|
|
|
5yr |
| -0.3 |
| +1.6 |
| +2.7 |
| – |
| +2.0 |
| +0.4 |
|
|
|
|
|
|
|
|
|
|
|
|
|
|
|
10yr |
| +1.3 |
| +1.3 |
| – |
| – |
| – |
| – |
|
(1) Investment performance of composites are after investment management fees.
(2) vs. Russell 1000 Value (3) vs. S&P 500 (4) vs. Russell 2500 Value (5) vs. MSCI EAFE Value (6) vs. MSCI Emerging Markets Free
* Preliminary returns
Composite and benchmark data through 3/31/02.
See Performance Disclosure
Relative Performance – Retail Services
Retail Mutual Funds vs. Lipper Averages
|
| Premier |
| Technology(2) |
| Growth & |
| AB |
| Global Growth |
| Americas Govt |
|
QTR |
| -3.4 |
| +1.2 |
| -1.3 |
| +2.1 |
| +1.5 |
| +1.5 |
|
|
|
|
|
|
|
|
|
|
|
|
|
|
|
1yr |
| -6.9 |
| +7.1 |
| +0.8 |
| +4.1 |
| +4.1 |
| -1.9 |
|
|
|
|
|
|
|
|
|
|
|
|
|
|
|
3yr |
| -5.2 |
| +2.5 |
| +3.8 |
| – |
| +8.9 |
| +5.9 |
|
|
|
|
|
|
|
|
|
|
|
|
|
|
|
5yr |
| +0.3 |
| +1.5 |
| +4.9 |
| – |
| +8.5 |
| +6.3 |
|
|
|
|
|
|
|
|
|
|
|
|
|
|
|
10yr |
| – |
| +1.8 |
| +2.0 |
| – |
| +6.8 |
| +3.4 |
|
(1) vs. Large Cap Growth average (2) vs. Science and Technology average (3) vs. Large Cap Value average (4) vs. Multi-Cap Value average (5) vs. Global Growth average (6) vs. Global Income average. (7) Formerly known as North American Government Income Trust. Mutual fund performance and Lipper data through 3/31/02.
Relative Performance (1) – Private Client
Private Client Equity Composites vs. Benchmarks
|
| Strategic |
| Strategic |
| 50% Strategic |
| Advanced |
|
|
|
|
|
|
|
|
|
|
|
QTR |
| +2.1 |
| -9.3 |
| -3.6 |
| +4.3 |
|
|
|
|
|
|
|
|
|
|
|
1yr |
| +11.0 |
| -9.1 |
| +0.7 |
| +6.6 |
|
|
|
|
|
|
|
|
|
|
|
3yr |
| +10.0 |
| – |
| +1.8 |
| +21.0 |
|
|
|
|
|
|
|
|
|
|
|
5yr |
| +0.2 |
| – |
| +1.1 |
| – |
|
|
|
|
|
|
|
|
|
|
|
10yr |
| +1.4 |
| – |
| +1.0 |
| – |
|
(1) Investment performance of composites are after investment management fees.
(2) vs. S&P 500 (3) vs. S&P 500; simulated results
Composite and benchmark data through 3/31/02.
See Performance Disclosure
Positive Net New Business in All Channels
AUM by Channel: Three Months Ended March 31, 2002
|
| Retail |
| Institutional |
| Private |
| Total |
| ||||
• December 2001* |
| $ | 171 |
| $ | 242 |
| $ | 39 |
| $ | 452 |
|
|
|
|
|
|
|
|
|
|
| ||||
• Net Long-Term Sales |
| 3 |
| 3 |
| 1 |
| 7 |
| ||||
|
|
|
|
|
|
|
|
|
| ||||
• Cash Management, Net |
| (2 | ) | – |
| – |
| (2 | ) | ||||
|
|
|
|
|
|
|
|
|
| ||||
• Net New Business |
| 1 |
| 3 |
| 1 |
| 5 |
| ||||
|
|
|
|
|
|
|
|
|
| ||||
• Apprec/(Deprec) |
| (3 | ) | (3 | ) | 1 |
| (5 | ) | ||||
|
|
|
|
|
|
|
|
|
| ||||
• March 2002 |
| $ | 169 |
| $ | 242 |
| $ | 41 |
| $ | 452 |
|
*AUM previously reported as of each date prior to March 31, 2002, have been restated to conform to the March 31, 2002 presentation. AUM now reflects the reclassification of institutional cash management and sub-advised variable annuity accounts from Institutional Investment Management to Retail and certain Private Client accounts to Retail and Institutional Investment Management. AUM now also excludes AUM from unconsolidated affiliates.
In $ billions.
Mix Shift Toward Value and Fixed Income
AUM by Investment Orientation: Three Months Ended March 31, 2002
|
| Growth |
| Value |
| Fixed |
| Passive |
| Total |
| |||||
• December 2001* |
| $ | 173 |
| $ | 101 |
| $ | 146 |
| $ | 32 |
| $ | 452 |
|
|
|
|
|
|
|
|
|
|
|
|
| |||||
• Net Long-Term Sales |
| – |
| 4 |
| 3 |
| – |
| 7 |
| |||||
|
|
|
|
|
|
|
|
|
|
|
| |||||
• Cash Mgmt, Net |
| – |
| – |
| (2 | ) | – |
| (2 | ) | |||||
|
|
|
|
|
|
|
|
|
|
|
| |||||
• Net New Business |
| – |
| 4 |
| 1 |
| – |
| 5 |
| |||||
|
|
|
|
|
|
|
|
|
|
|
| |||||
• Apprec/(Deprec) |
| (8 | ) | 3 |
| – |
| – |
| (5 | ) | |||||
|
|
|
|
|
|
|
|
|
|
|
| |||||
• March 2002 |
| $ | 165 |
| $ | 108 |
| $ | 147 |
| $ | 32 |
| $ | 452 |
|
*AUM previously reported as of each date prior to March 31, 2002, have been restated to conform to the March 31, 2002 presentation. AUM now reflects the reclassification of institutional cash management and sub-advised variable annuity accounts from Institutional Investment Management to Retail and certain Private Client accounts to Retail and Institutional Investment Management. AUM now also excludes AUM from unconsolidated affiliates.
In $ billions.
Net New Business Exceeds Market Depreciation
AUM by Channel: Twelve Months Ended March 31, 2002
|
| Retail |
| Institutional |
| Private |
| Total |
| ||||
• March 2001* |
| $ | 172 |
| $ | 221 |
| $ | 36 |
| $ | 429 |
|
|
|
|
|
|
|
|
|
|
| ||||
• Net Long-Term Sales |
| 5 |
| 24 |
| 3 |
| 32 |
| ||||
|
|
|
|
|
|
|
|
|
| ||||
• Cash Management, Net |
| (3 | ) | – |
| – |
| (3 | ) | ||||
|
|
|
|
|
|
|
|
|
| ||||
• Net New Business |
| 2 |
| 24 |
| 3 |
| 29 |
| ||||
|
|
|
|
|
|
|
|
|
| ||||
• Transfers |
| 1 |
| (1 | ) | – |
| – |
| ||||
|
|
|
|
|
|
|
|
|
| ||||
• Apprec/(Deprec) |
| (6 | ) | (2 | ) | 2 |
| (6 | ) | ||||
|
|
|
|
|
|
|
|
|
| ||||
• March 2002 |
| $ | 169 |
| $ | 242 |
| $ | 41 |
| $ | 452 |
|
*AUM previously reported as of each date prior to March 31, 2002, have been restated to conform to the March 31, 2002 presentation. AUM now reflects the reclassification of institutional cash management and sub-advised variable annuity accounts from Institutional Investment Management to Retail and certain Private Client accounts to Retail and Institutional Investment Management. AUM now also excludes AUM from unconsolidated affiliates.
In $ billions.
Diversification Contributes to Asset Gains
AUM by Investment Orientation: Twelve Months Ended March 31, 2002
|
| Growth Equity |
| Value Equity |
| Fixed Income |
| Passive |
| Total |
| |||||
• March 2001* |
| $ | 168 |
| $ | 90 |
| $ | 140 |
| $ | 31 |
| $ | 429 |
|
|
|
|
|
|
|
|
|
|
|
|
| |||||
• Net Long-Term Sales |
| 13 |
| 12 |
| 7 |
| – |
| 32 |
| |||||
|
|
|
|
|
|
|
|
|
|
|
| |||||
• Cash Management, Net |
| – |
| – |
| (3 | ) | – |
| (3 | ) | |||||
|
|
|
|
|
|
|
|
|
|
|
| |||||
• Net New Business |
| 13 |
| 12 |
| 4 |
| – |
| 29 |
| |||||
|
|
|
|
|
|
|
|
|
|
|
| |||||
• Apprec/(Deprec) |
| (15 | ) | 7 |
| 2 |
| – |
| (6 | ) | |||||
|
|
|
|
|
|
|
|
|
|
|
| |||||
• March 2002 |
| $ | 166 |
| $ | 109 |
| $ | 146 |
| $ | 31 |
| $ | 452 |
|
*AUM previously reported as of each date prior to March 31, 2002, have been restated to conform to the March 31, 2002 presentation. AUM now reflects the reclassification of institutional cash management and sub-advised variable annuity accounts from Institutional Investment Management to Retail and certain Private Client accounts to Retail and Institutional Investment Management. AUM now also excludes AUM from unconsolidated affiliates.
In $ billions.
Annualized Fee Base (1) – Mix Shift Toward Value and Fixed Income
AFB by Channel and Investment Orientation
|
|
| Average Basis Points |
|
| |||||||
|
| 1Q02 | 1Q01 |
| 1Q02 | 1Q01 | ||||||
| Retail | 53.6 | 54.1 |
| $1,850 mil | $1,783 mil | ||||||
|
| |||||||||||
Retail | Institutional | Private Client | ||||||||||
|
|
| Average Basis Points |
|
| |||||||
|
| 1Q02 | 1Q01 |
| 1Q02 | 1Q01 | ||||||
| Retail | 53.6 | 54.1 |
| $1,850 mil | $1,783 mil | ||||||
|
| |||||||||||
Retail | Institutional | Private Client | ||||||||||


(1) Annualized Fee Base is defined as period end AUM times contractual annual fee rates; assumes no change in AUM or fee rates for one year.
In $ millions
Alliance Capital Distribution Highlights
First Quarter Distribution Channel Highlights
• Retail
• Luxembourg fund net sales up 20% over 1Q01
• Launched 3 new closed-end municipal funds which raised $804 million in AUM
• CollegeBoundfund: largest 529 plan in the country with over $2 billion in AUM
• Reinstated Regent managed account product in key wirehouses
• Institutional Investment Management
• 63 account wins total $6.3 billion in AUM
• 60% of sales are from non-U.S. clients
• Private Client
• One of the strongest quarters in net new flows
• Opened Miami and Houston offices
• Added new hedge fund product
• Institutional Research Services
• Increased market share partially attributed to investments in research, sales and trading
• Launched coverage on 3 industries
• Began trading in London
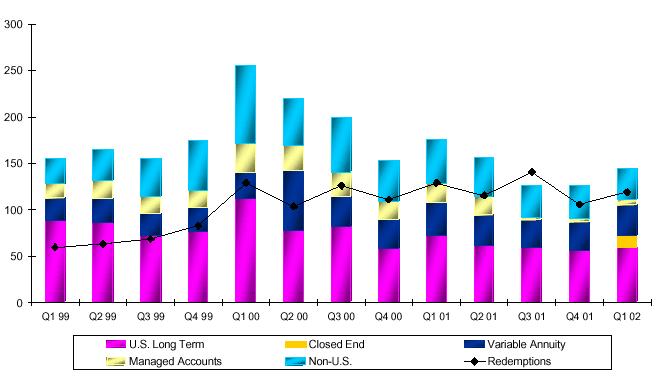
Retail Net Sales
|
| 1Q01 |
| 1Q02 |
| % chg |
| 4Q01 |
| % chg |
| |||
• U.S. |
| $ | 1,456 |
| $ | 887 |
| +64 |
| 714 |
| +104 |
| |
|
|
|
|
|
|
|
|
|
|
|
| |||
• Non-U.S. |
| 614 |
| 620 |
| -1 |
| 690 |
| -11 |
| |||
|
|
|
|
|
|
|
|
|
|
|
| |||
• Variable Annuity |
| 576 |
| 778 |
| -26 |
| 791 |
| -27 |
| |||
|
|
|
|
|
|
|
|
|
|
|
| |||
• Managed Accounts |
| (290 | ) | 583 |
| -150 |
| (702 | ) | -59 |
| |||
|
|
|
|
|
|
|
|
|
|
|
| |||
• Total Long-term |
| 2,356 |
| 2,868 |
| -18 |
| 1,493 |
| +58 |
| |||
|
|
|
|
|
|
|
|
|
|
|
| |||
• Cash Management |
| (1,540 | ) | 4,985 |
| -131 |
| (2,529 | ) | -39 |
| |||
|
|
|
|
|
|
|
|
|
|
|
| |||
• Total |
| $ | 816 |
| $ | 7,853 |
| -90 |
| $ | (1,036 | ) | -179 |
|
• Strength in Luxembourg fund sales offset by other non-U.S. products
• U.S. sales strengthened by closed-end fund launches in 1Q02
• Outflows in cash management products offset long-term sales
AUM previously reported as of each date prior to March 31, 2002, have been restated to conform to the March 31, 2002 presentation. AUM now reflects the reclassification of institutional cash management and sub-advised variable annuity accounts from Institutional Investment Management to Retail and certain Private Client accounts to Retail and Institutional Investment Management. AUM now also excludes AUM from unconsolidated affiliates.
In $ millions. Excludes unreinvested dividends and net cash flow.
Non-U.S. Institutional Sales Gaining Momentum
Investment |
| Account Wins |
|
| ||||
Discipline |
| U.S. |
| Non-U.S. |
| Total |
| |
Growth Equity |
| 6 |
| 10 |
| 16 |
| |
Value Equity |
| 18 |
| 11 |
| 29 |
| |
Fixed Income Equity |
| 2 |
| 16 |
| 18 |
| |
|
|
|
|
|
|
|
| |
Total |
| 26 |
| 37 |
| 63 |
| |
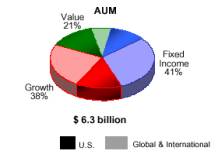
Investment |
| AUM by Client Domicile |
| | |||||||
Discipline |
| U.S. |
| Non-U.S. |
| Total |
| ||||
Growth Equity |
| $ | 0.9 |
| $ | 1.5 |
| $ | 2.4 |
| |
Value Equity |
| 0.9 |
| 0.4 |
| 1.3 |
| ||||
Fixed Income Equity |
| 0.7 |
| 1.9 |
| 2.6 |
| ||||
|
|
|
|
|
|
|
| ||||
Total |
| $ | 2.5 |
| $ | 3.8 |
| $ | 6.3 |
| |

AUM in $ billions.
Continuing Initiatives
• Investment Management Platform
Adding Japan value equity capabilities
• Retail
Relaunch of AllianceBernstein value series
Continued emphasis on CollegeBoundfund
Emphasis on managed account sales
Focus on non-U.S. sales
• Institutional Investment Management
Build on international momentum
Pursue cross-selling initiatives to existing clients
Marketing of blend services
• Private Client
Raise productivity of Financial Advisors
Increase fee realization through introduction of premium-priced products
• Institutional Research Services
U.S.
• Expand and upgrade U.S. analysts and industry research coverage
• Cross-sell non-U.S. research to U.S. clients
• Add Nasdaq trading
Outside the U.S.
• Expand European research analysts and coverage
• Cross-sell U.S. research to non-U.S. clients
Positioned For Growth
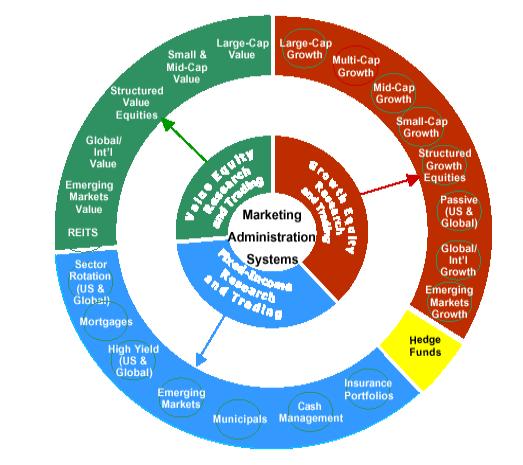
• Worldwide research and investment capabilities
• Unique with strengths in both growth and value investing
• Broad array of fixed income services
• Highly regarded marketing and client service teams
• Well-positioned in retail, institutional and private client channels
• Continued underlying business strength
• Strong financials
• Cogent strategy
Performance Disclosure – Growth Composites
Net of Fee
Alliance Capital Management L.P. (“ACMLP”), is a registered investment advisor. ACMLP had US$452.2 billion in assets under management as of March 31, 2002. US$40.6 billion in assets are managed by our private client services group, which does not present its performance composites in strict accordance with AIMR standards.
1) TOTAL RETURN METHODOLOGY AND FEE STRUCTURE - Performance figures in this report have been presented net of investment management fees. Net performance figures have been calculated by deducting the highest fee charged to an account in the composite from inception of the composite to December 2000. The annual fees used were: 0.90% for the Disciplined Growth Composite from January 2000 to December 2000 and 0.75% from inception to December 1999, 0.75% for the Relative Value Composite, 1.00% for the Emerging Markets Growth Composite, 0.90% for the International Large Cap Growth Composite from October 2000 to December 2000 and 0.75% from inception to September 2000, 0.90% for the Large Cap Growth Composite from January 2000 to December 2000 and 0.75% from inception to December 1999, 1.00% for the Multi Capitalization Growth Composite, and 1.00% for the Small Cap Growth Composite. From January 2001 forward, the Composites’ net of fee returns are based upon a weighted average of the actual fee rates charged to each account in the Composites. The average fees applied were: 0.37% for the Disciplined Growth Composite; 0.42% for the Relative Value Composite; 0.57% for the Emerging Markets Growth Composite; 0.35% for the International Large Cap Growth Composite; 0.33% for the Large Cap Growth Composite; 0.62% for the Multi Capitalization Growth Composite; and 0.87% for the Small Cap Growth Composite. Both fee structures exclude accounts with performance-based fee arrangements. Net-of-fee performance figures reflect the compounding effect of such fees.
2) RATE OF RETURN - No representation is made that the performance shown in this presentation is indicative of future performance. A portfolio could suffer losses as well as gains. Performance figures for each account are calculated monthly on a trade-date basis using an internal rate-of-return calculation. Monthly market values include income accruals and reflect the daily weighting of cash flows. The composite results are asset weighted on a monthly basis. Quarterly and annual composite performance figures are computed by linking monthly returns, resulting in a "time-weighted" rate of return. Performance results include the reinvestment of dividends and other earnings. Returns are calculated in US dollar.
3) COMPOSITE STRUCTURE - As of March 31, 2002 the Composites include fee-paying discretionary accounts with assets over US$10 million, which are not subject to significant investment restrictions imposed by clients. As of March 31, 2002, the Emerging Markets Growth Composite had 5.30% of its assets invested in countries or regions outside of the benchmark, and the International Large Cap Growth Composite had 6.40% of its assets invested in countries or regions outside of the benchmark. The Relative Value Composite has been restated to reflect a material change in the investment process during the fourth quarter of 1994. The nature of the restatement has resulted in a change in the inception of the composite from January 1, 1992 to January 1, 1995. No other changes occurred as a result of this restatement. The primary portfolio manager responsible for managing the Small Cap Strategy, who had been in place since June of 1994, left the firm in January of 1999. A new team responsible for managing the Small Cap Strategy was put in place during January of 1999.
The number of accounts in each composite, the market value, and percentage of composite assets in relation to the total assets under management are included in the following table.
|
| Number of |
| Asset Value |
| % of Total |
| Minimum |
|
Large Cap Growth Composite |
| 295 |
| 29,020 |
| 6 |
| 10 |
|
Disciplined Growth Composite |
| 116 | �� | 7,470 |
| 2 |
| 10 |
|
Small Cap Growth Composite |
| 12 |
| 648 |
| <1 |
| 10 |
|
Multi Cap Growth Composite |
| 9 |
| 708 |
| <1 |
| 10 |
|
Relative Value Composite |
| 13 |
| 988 |
| <1 |
| 10 |
|
International Large Cap Growth Composite |
| 6 |
| 1502 |
| <1 |
| 10 |
|
Emerging Markets Growth Composite |
| 5 |
| 518 |
| <1 |
| 10 |
|
Performance Disclosure – Growth Composites: Net of Fee
The Large Cap and Disciplined Growth Composites include the equity segment of balanced accounts. In these portfolios, the asset allocation mix is generally determined by client guidelines and cash flows are allocated in accordance with these guidelines. The remainder of the Composites do not include the equity segments of balanced accounts.
The withholding tax basis of the International Large Cap Growth and Emerging Markets Growth Composites are consistent with the benchmark, which is Luxembourg.
4) DISPERSION - The dispersion of annual returns was calculated based on the asset-weighted standard deviation. Dispersion of performance for the Composites is as follows: Disciplined Growth: 1993: 1.10; 1994: 0.68; 1995: 1.05; 1996: 1.09; 1997: 1.64; 1998: 0.88; 1999: 1.36; 2000: 1.68; 2001: 1.75; 2002 (YTD): 0.56.
Relative Value: 1994(Q4): 0.53; 1995: 2.72; 1996: 0.39; 1997: 0.23; 1998: 0.54; 1999: 0.76; 2000: 0.24; 2001: 0.50; 2002 (YTD): 0.88. Emerging Markets Growth: 1993: N/M*; 1994: 2.56; 1995: 1.00; 1996: 0.57; 1997: 0.31; 1998: 0.04; 1999: N/M*; 2000: N/M*; 2001: N/M*; 2002 (YTD): 0.35. International Large Cap Growth: 1993: 2.22; 1994: 0.49; 1995: 1.18; 1996: 0.24; 1997: 0.90; 1998: 3.06; 1999: 5.77; 2000: 2.58; 2001: 0.69; 2002 (YTD): 0.56. Large Cap Growth: 1993: 1.61; 1994: 1.22; 1995: 1.86; 1996: 1.29; 1997: 4.97; 1998: 2.43; 1999: 3.23; 2000: 2.11; 2001: 3.56; 2002 (YTD): 0.79. Multi Capitalization Growth: 1993: 1.86; 1994: 0.46; 1995: 0.39; 1996: 1.18; 1997: 0.71; 1998: 0.34; 1999: 1.13; 2000: 0.25; 2001: 0.27; 2002 (YTD): 0.21. Small Cap Growth: 1994(Q2-Q4): 1.65; 1995: 0.19; 1996: 0.09; 1997: 0.14; 1998: 0.29; 1999: 0.55; 2000: 0.79; 2001: 0.28; 2002 (YTD): 0.07.
Alliance Capital has prepared and presented this report in compliance with the Performance Presentation Standards of the Association for Investment Management and Research (AIMR-PPSR), the US and Canadian versions of the Global Investment Performance Standards (GIPSR). AIMR has not been involved in the preparation or review of this report. Alliance Capital received Level 1 and 2 AIMR Verification from KPMG LLP for 1992, 1993, 1994, 1995, 1996, 1997, 1998 and 1999. KPMG LLP is currently auditing 2000 and 2001. This verification is available upon request.
*N/M represents not meaningful. N/M coding indicates that only one account, or no accounts, are in the Composite for the full year. Dispersion is only shown for accounts included in each quarter of each year presented.
Performance Disclosure – Value Composites: Net of Fee
1) Performance Statistics Are Not Financial Statements - There are various methods of compiling or reporting performance statistics. The standards of performance measurement used in compiling this data are in accordance with the methods set forth below. Past performance statistics are not indicative of future results.
2) Total Return - Performance results of accounts and comparisons are made on a total-return basis, which includes all dividends, interest and accrued interest, and realized and unrealized gains or losses. Securities are included in accounts on a trade-date basis. Performance results are after deductions of all transaction charges and fees.
3) Rate of Return - Investment results are computed on a “time-weighted” rate-of-return basis. Assuming dividends and interest are reinvested, the growth in dollars of an investment in a period can be computed using these rates of return. In computing the time-weighted rate of return, if an account’s net monthly cash flow exceeds 10% of its beginning market value, the cash flows are weighted on a daily basis. When an account’s net monthly cash flows are less than 10% of its beginning market value, the cash flows are weighted by the “end-of-the-month” assumption. Beginning 2001, all cash flows are daily-weighted using the Modified Dietz Method.
4) Preparation of Data - Investment results for Strategic Value accounts for the entire quarter were added together and the sum divided by the total number of accounts in each quarter through 1992; beginning in 1993, and since inception for all the other cited composites, quarterly performance was for all accounts weighted by their market value. These quarterly performance figures were then linked to produce a continuous-performance index. The continuous-performance index from inception was used to create point-to-point comparisons. Closed accounts are included for each full quarter prior to their closing. From inception, returns for Diversified Value optimized against the Russell 1000 Value Index exclude certain accounts with special restrictions imposed by clients. Strategic Value returns include all accounts offered from 1974-1982 and, from 1983, all Strategic Value accounts with $5 million or more in assets. Beginning January 1, 2000, results exclude accounts with a client-directed margin balance of 20% or more of market value at any month end. From July 1993 quarterly results were those of GDP-weighted, half-hedged International Value accounts separately managed in US dollars. The minimum account size for Emerging Market Value accounts (including commingled accounts) included in performance is $5 million or more in assets.
5) Dispersion - The dispersion factor is a measure around the average account performance. The dispersion factor is calculated as the standard deviation of the equal-weighted returns from the asset-weighted mean. Specifically, it is the standard deviation around the performance for accounts managed during each period and indicates the range from average performance of approximately two-thirds of the accounts included in each period. Dispersion of performance for accounts under management are: Diversified Value (Russell 1000 Value) – 1999: 2Q-4Q: 1.8; 2000: 1.9; 2001: 1.0; 2002: N/A; Strategic Value - 1974: 29.1; 1975: 26.5; 1976: 17.6; 1977: 8.3; 1978: 11.5; 1979: 9.0; 1980: 8.7; 1981: 5.6; 1982: 5.5; 1983: 2.9; 1984: 1.6; 1985: 1.6; 1986: 1.1; 1987: 1.7; 1988: 1.7; 1989: 1.4; 1990: 1.2; 1991: 2.0; 1992: 1.4; 1993: 1.2; 1994: 1.2; 1995: 1.3; 1996: 1.3; 1997: 1.6; 1998: 2.5; 1999: 2.5; 2000: 2.6; 2001: 2.1; 2002: N/A. Dispersion of performance for Small & Mid-Cap Value composite is currently not available. International Value (GDP-weighted, half-hedged) - 1993:2H: 0.5; 1994: 0.9; 1995: 1.1; 1996: 1.0; 1997: 1.3; 1998: 1.6; 1999: 1.8; 2000: 1.6; 2001: 0.9; 2002: N/A; Emerging Markets Value - 1996: 0.0; 1997: 3.8; 1998: 2.7; 1999: 2.8; 2000: 2.0; 2001: 2.1; 2002: N/A.
Performance Disclosure – Value Composites and Private
Client Simulation: Net of Fee
6) Financial Securities Environment - Various indices are used to indicate the type of investment environment existing during the time periods shown.
Composites used for reporting purposes represent the following:
Strategy |
| Number of |
| Assets ($mm) |
| % of Total |
|
Strategic Value (accts. over $5 million) |
| 176 |
| 14,414 |
| 3 | % |
Diversified Value (opt to S&P 500) |
| 66 |
| 5,696 |
| 1 |
|
Small-Mid Cap Value |
| 3 |
| 158 |
| <1 |
|
International Value (half-hedged, GDP wtd) |
| 23 |
| 1,522 |
| <1 |
|
Emerging Markets Value |
| 3 |
| 433 |
| <1 |
|
Strategic Value and Large Cap/Strategic Growth 50/50 Simulation
The 50/50 Simulation results were calculated quarterly by summing after-fee returns of the Alliance Large Cap Growth composite through 12/31/00 and thereafter the actual Strategic Growth composite after-fee returns with the actual Bernstein All Strategic Value composite after-fee returns in a 50/50 percentage ratio. These quarterly performance figures were then linked to produce a continuous-performance index. This index from inception was used to create point-to-point comparisons. Net-of-fee performance figures for Alliance Large Cap Growth have been calculated as follows: from 1979-1982, 0.75%, the highest annual fee charged to an Alliance Large Cap Growth account for that period (excluding accounts with performance-based fee arrangements), was deducted from the composite’s gross-of-fee returns. From 1983 through 2000, the actual average quarterly fee charged by Bernstein for the All Strategic Value service was deducted. Alliance Large Cap Growth differs from Strategic Growth, which is offered exclusively to Bernstein clients, in that, among other things, Strategic Growth offers tax management and may contain fewer stocks. Simulated portfolio conditions are static; actual balanced portfolios may employ tactical asset allocation and additional rebalancing techniques. The 50/50 Simulation results are before deduction of transaction charges involved in periodic rebalancing. Simulated results do not represent actual trading using client assets, but (i) were achieved by means of the retroactive application of a model designed with the benefit of hindsight; and (ii) do not reflect the impact that material economic factors may have had on our decision-making. Simulation statistics are not indicative of future results; there is always the potential for loss as well as for profit.
APPENDIX |
About Alliance Capital |
Consolidated Financial Information |
Retail Highlights and Supplemental Financial Information |
Institutional Investment Management Highlights and |
Private Client Highlights and Supplemental Financial Information |
Institutional Research Services Highlights |
About Alliance Capital
Brief History of Alliance Capital
1962 Investment management department of Donaldson, Lufkin & Jenrette (DLJ) is founded to specialize in management of pension fund assets.
1971 DLJ’s investment management department is merged with Moody’s Investors Services investment advisory business to form Alliance Capital Management Corporation.
1985 Alliance Capital and DLJ are acquired by the Equitable Life Assurance Society of the United States.
1988 Alliance Capital “goes public” as a master limited partnership and is listed on the New York Stock Exchange.
1992 Equitable is acquired by AXA and subsequently renamed AXA Financial (1999).*
2000 Alliance Capital acquires Sanford C. Bernstein & Co. Inc., a premier global value franchise. Provides entry into the private client and institutional research business, and scale and product breadth for international expansion.
*Equitable Companies Incorporated, an indirect parent of The Equitable Life Assurance Society of the United States, changed its name to AXA Financial, Inc. in September 1999
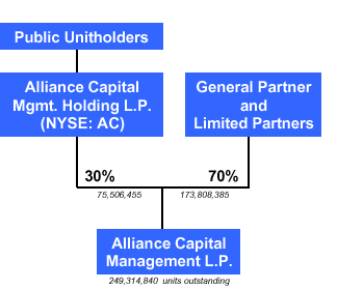
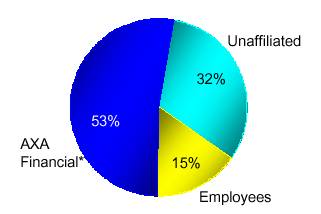
About Alliance Capital – Ownership Structure
Unit Ownership |
| Alliance Capital |
|
|
|
|
|
|
|
|
|
|
|
| |
| If all unexercised options are included, Alliance employee ownership is 20%. |
| |
|
|
| |
| * AXA Financial ownership includes General Partnership interests. Employee ownership percentage includes restricted unit awards. |
|
About Alliance Capital – Investment Considerations
Alliance Capital (The Operating Partnership) |
|
|
|
|
|
|
|
|
|
|
|
• Assets Under Management: |
|
|
| $452 billion |
|
|
|
|
|
|
|
• Value (1): |
|
|
| $11.6 billion |
|
|
|
|
|
|
|
Alliance Holding (The Publicly Traded Partnership) |
|
|
|
|
|
|
|
|
|
|
|
• NYSE |
|
|
| Ticker: AC |
|
|
|
|
|
|
|
• AC: Market Capitalization (public) |
|
|
| $3.5 billion |
|
|
|
|
|
|
|
• Current Price: |
|
|
| $46.01 |
|
|
|
|
|
|
|
• Trailing Twelve Month Yield |
|
|
| 5.7 | % |
|
|
|
|
|
|
• 10 year DPU (2) Growth Rate |
|
|
| 17 | % |
|
|
|
|
|
|
• 5 year DPU (2) Growth Rate |
|
|
| 18 | % |
(1) Value of operating partnership is based upon price of Alliance Holding units as of 4/30/02 and total outstanding Alliance Capital units as of 3/31/02. (2) Distributions per Unit.
Current price, value, market capitalization, and yield as of 4/30/02. AUM as of 3/31/02.
About Alliance Capital – AUM by Investment and Client Orientation
$452 Billion
at March 31, 2002
Investment Orientation |
| Client Orientation |
|
|
|
|
|
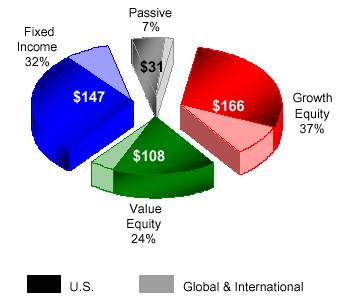
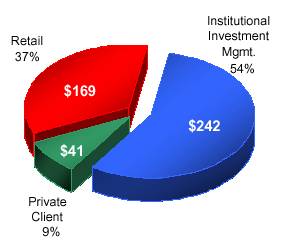
Amounts in $ billions.
Equity includes balanced portfolios AUM.
About Alliance Capital – AUM by Client Orientation
$452 Billion
at March 31, 2002
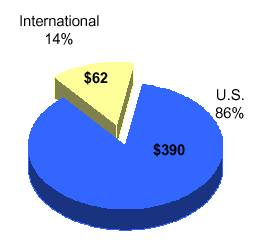
(1) Assets are categorized by country domicile of client accounts.
Amounts in $ billions.
Our Mission
To be the premier
global research and investment management organization
through superior performance
across a broad range of investment disciplines
for a diverse group of clients
A Global Platform

As of March 31, 2002
Resourced to Provide Superior Performance
|
| Equity |
| Fixed |
| Other |
| Total |
|
Buy-Side Analysts |
| 160 |
| 64 |
| – |
| 224 |
|
|
|
|
|
|
|
|
|
|
|
Sell-Side Analysts |
| 92 |
| – |
| – |
| 92 |
|
|
|
|
|
|
|
|
|
|
|
Portfolio Managers |
| 144 |
| 70 |
| 2 |
| 216 |
|
|
|
|
|
|
|
|
|
|
|
Traders |
|
|
|
|
|
|
|
|
|
Buy-Side |
| 28 |
| 10 |
| – |
| 38 |
|
Floor |
| 24 |
| – |
| – |
| 24 |
|
|
|
|
|
|
|
|
|
|
|
Corporate Finance/Other |
| – |
| – |
| 11 |
| 11 |
|
|
|
|
|
|
|
|
|
|
|
TOTAL |
| 448 |
| 144 |
| 13 |
| 605 |
|
As of March 31, 2002
Includes investment professionals and analysts from joint venture affiliates and non-key investment locations.
Broad Range of Investment Disciplines
Diverse Group of Clients

• 7.6 million accounts |
| • 2,440 client relationships* |
| • 18,000 client relationships |
| • 1,000 client relationships |
|
|
|
| |||
• 130+ U.S. mutual funds |
|
|
|
|
|
|
| • Ranked #8** in assets worldwide by |
| • 12 client offices in U.S. |
| • 45 senior analysts | |
|
|
|
|
| ||
• 200+ non-U.S. mutual funds |
|
|
|
| • Independent | |
|
|
|
| |||
|
|
|
|
|
|
|
• CollegeBoundfund: |
| • 45 of Fortune 100 companies |
|
|
|
|
|
|
|
|
| ||
|
|
|
|
|
|
|
|
| • Public pension funds across 43 states |
|
|
|
|
|
|
|
|
|
|
As of March 31, 2002.
*Increased number of account relationships is partially attributed to the reclassification of certain Private Client accounts to Institutional Investment Management.
**Based on assets as of December 31, 2001.
Delivering Superior Investor Returns
Total Annualized Return*
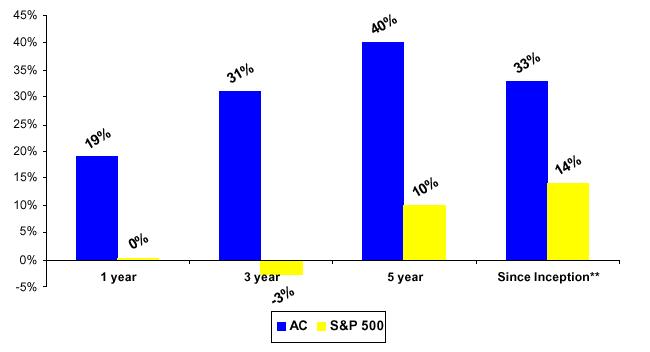
*As of 3/31/02. AC and S&P returns include reinvestment of cash distributions and dividends, respectively.
**Since IPO 4/88.
Steady Flow of Cash Distributions
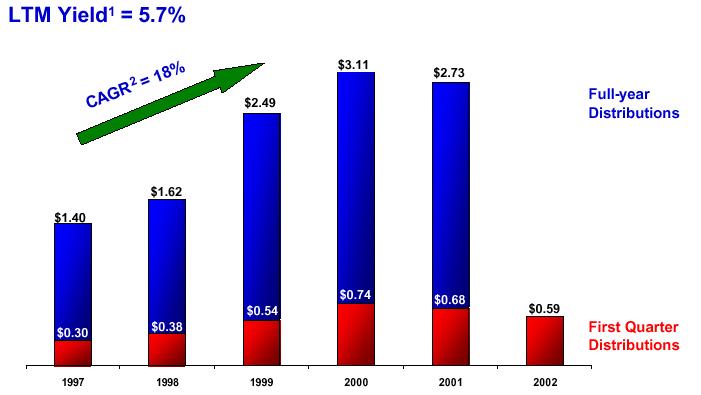
Distributions per Unit are adjusted for two-for-one in1998.
1 LTM yield based upon price of Alliance Holding units as of 4/30/02.
2 Based on last twelve months ended 1Q97 and 1Q02.
Consolidated Financial Information
Changes in AUM by Client
Three Months Ended March 31, 2002
|
| Retail |
| Institutional |
| Private |
| Total |
| ||||
|
|
|
|
|
|
|
|
|
| ||||
Beginning of Period |
| $ | 171,496 |
| $ | 241,491 |
| $ | 39,169 |
| $ | 452,156 |
|
|
|
|
|
|
|
|
|
|
| ||||
Sales/New accounts |
| 9,274 |
| 6,318 |
| 1,885 |
| 17,477 |
| ||||
Redemptions/Terminations |
| (6,918 | ) | (3,231 | ) | (675 | ) | (10,824 | ) | ||||
Net cash management sales |
| (1,540 | ) | - |
| - |
| (1,540 | ) | ||||
Cash flow |
| 77 |
| 433 |
| (222 | ) | 288 |
| ||||
Unreinvested dividends |
| (210 | ) | (1 | ) | (39 | ) | (250 | ) | ||||
Net new business |
| 683 |
| 3,519 |
| 949 |
| 5,151 |
| ||||
|
|
|
|
|
|
|
|
|
| ||||
Appreciation (depreciation) |
| (2,724 | ) | (2,913 | ) | 526 |
| (5,111 | ) | ||||
|
|
|
|
|
|
|
|
|
| ||||
End of Period |
| $ | 169,455 |
| $ | 242,097 |
| $ | 40,644 |
| $ | 452,196 |
|
AUM previously reported as of each date prior to March 31, 2002, have been restated to conform to the March 31, 2002 presentation. AUM now reflects the reclassification of institutional cash management and sub-advised variable annuity accounts from Institutional Investment Management to Retail and certain Private Client accounts to Retail and Institutional Investment Management. AUM now also excludes AUM from unconsolidated affiliates.
Amounts in $ millions.
Changes in AUM by Client
Twelve Months Ended March 31, 2002
|
| Retail |
| Institutional |
| Private |
| Total |
| ||||
|
|
|
|
|
|
|
|
|
| ||||
Beginning of Period |
| $ | 172,087 |
| $ | 220,892 |
| $ | 35,989 |
| $ | 428,968 |
|
|
|
|
|
|
|
|
|
|
| ||||
Sales/New accounts |
| 34,056 |
| 33,844 |
| 5,793 |
| 73,693 |
| ||||
Redemptions/Terminations |
| (28,467 | ) | (13,057 | ) | (2,175 | ) | (43,699 | ) | ||||
Net cash management sales |
| (2,600 | ) | - |
| - |
| (2,600 | ) | ||||
Cash flow |
| 168 |
| 3,207 |
| (632 | ) | 2,743 |
| ||||
Unreinvested dividends |
| (896 | ) | (12 | ) | (213 | ) | (1,121 | ) | ||||
Net new business |
| 2,261 |
| 23,982 |
| 2,773 |
| 29,016 |
| ||||
|
|
|
|
|
|
|
|
|
| ||||
Transfers |
| 749 |
| (749 | ) | - |
| - |
| ||||
|
|
|
|
|
|
|
|
|
| ||||
Appreciation (depreciation) |
| (5,642 | ) | (2,028 | ) | 1,882 |
| (5,788 | ) | ||||
|
|
|
|
|
|
|
|
|
| ||||
End of Period |
| $ | 169,455 |
| $ | 242,097 |
| $ | 40,644 |
| $ | 452,196 |
|
AUM previously reported as of each date prior to March 31, 2002, have been restated to conform to the March 31, 2002 presentation. AUM now reflects the reclassification of institutional cash management and sub-advised variable annuity accounts from Institutional Investment Management to Retail and certain Private Client accounts to Retail and Institutional Investment Management. AUM now also excludes AUM from unconsolidated affiliates.
Amounts in $ millions.
Changes in AUM by Investment Orientation
Three Months Ended March 31, 2002
|
| Growth |
| Value |
| Fixed |
| Passive |
| Total |
| |||||
|
|
|
|
|
|
|
|
|
|
|
| |||||
Beginning of Period |
| $ | 173,362 |
| $ | 101,410 |
| $ | 145,428 |
| $ | 31,956 |
| $ | 452,156 |
|
|
|
|
|
|
|
|
|
|
|
|
| |||||
Sales/New accounts |
| 5,678 |
| 4,568 |
| 6,992 |
| 239 |
| 17,477 |
| |||||
Redemptions/Terminations |
| (4,909 | ) | (1,350 | ) | (3,939 | ) | (626 | ) | (10,824 | ) | |||||
Net cash management sales |
| - |
| - |
| (1,540 | ) | - |
| (1,540 | ) | |||||
Cash flow |
| (545 | ) | 697 |
| 230 |
| (94 | ) | 288 |
| |||||
Unreinvested dividends |
| (3 | ) | (3 | ) | (244 | ) | - |
| (250 | ) | |||||
Net new business |
| 221 |
| 3,912 |
| 1,499 |
| (481 | ) | 5,151 |
| |||||
|
|
|
|
|
|
|
|
|
|
|
| |||||
Appreciation (depreciation) |
| (7,925 | ) | 2,885 |
| (38 | ) | (33 | ) | (5,111 | ) | |||||
|
|
|
|
|
|
|
|
|
|
|
| |||||
End Of Period |
| $ | 165,658 |
| $ | 108,207 |
| $ | 146,889 |
| $ | 31,442 |
| $ | 452,196 |
|
AUM previously reported as of each date prior to March 31, 2002, have been restated to conform to the March 31, 2002 presentation. AUM now reflects the reclassification of institutional cash management and sub-advised variable annuity accounts from Institutional Investment Management to Retail and certain Private Client accounts to Retail and Institutional Investment Management. AUM now also excludes AUM from unconsolidated affiliates.
Amounts in $ millions.
Changes in AUM by Investment Orientation
Twelve Months Ended March 31, 2002
|
| Growth |
| Value |
| Fixed |
| Passive |
| Total |
| |||||
|
|
|
|
|
|
|
|
|
|
|
| |||||
Beginning of Period |
| $ | 167,448 |
| $ | 89,792 |
| $ | 140,418 |
| $ | 31,310 |
| $ | 428,968 |
|
|
|
|
|
|
|
|
|
|
|
|
| |||||
Sales/New accounts |
| 36,284 |
| 14,311 |
| 21,379 |
| 1,719 |
| 73,693 |
| |||||
Redemptions/Terminations |
| (24,534 | ) | (4,989 | ) | (12,720 | ) | (1,456 | ) | (43,699 | ) | |||||
Net cash management sales |
| - |
| - |
| (2,600 | ) | - |
| (2,600 | ) | |||||
Cash flow |
| 1,353 |
| 2,468 |
| (510 | ) | (568 | ) | 2,743 |
| |||||
Unreinvested dividends |
| (8 | ) | (73 | ) | (1,040 | ) | - |
| (1,121 | ) | |||||
Net new business |
| 13,095 |
| 11,717 |
| 4,509 |
| (305 | ) | 29,016 |
| |||||
|
|
|
|
|
|
|
|
|
|
|
| |||||
Appreciation (depreciation) |
| (14,885 | ) | 6,698 |
| 1,962 |
| 437 |
| (5,788 | ) | |||||
|
|
|
|
|
|
|
|
|
|
|
| |||||
End Of Period |
| $ | 165,658 |
| $ | 108,207 |
| $ | 146,889 |
| $ | 31,442 |
| $ | 452,196 |
|
AUM previously reported as of each date prior to March 31, 2002, have been restated to conform to the March 31, 2002 presentation. AUM now reflects the reclassification of institutional cash management and sub-advised variable annuity accounts from Institutional Investment Management to Retail and certain Private Client accounts to Retail and Institutional Investment Management. AUM now also excludes AUM from unconsolidated affiliates.
Amounts in $ millions.
Annualized Fee Base (1) – Mix Shift Toward Value and Fixed Income
AFB by Channel and Investment Orientation
|
|
| Average Basis Points |
|
| ||
|
| 1Q02 | 1Q01 |
| 1Q02 | 1Q01 | |
| Retail | 53.6 | 54.1 |
| $1,850 mil | $1,783 mil | |
|
| ||||||
Retail | Institutional | Private Client | |||||


(1) Annualized Fee Base is defined as period end AUM times contractual annual fee rates; assumes no change in AUM or fee rates for one year.
In $ millions
Alliance Capital (The Operating Partnership)
Consolidated Balance Sheet
|
| 3/31/02 |
| 12/31/01 |
| ||
Assets |
|
|
|
|
| ||
Cash and investments |
| $ | 464,848 |
| $ | 501,845 |
|
Cash and securities, segregated |
| 1,098,184 |
| 1,415,158 |
| ||
Receivables |
| 2,085,363 |
| 1,954,582 |
| ||
Goodwill, net |
| 2,876,657 |
| 2,876,657 |
| ||
Intangible assets, net |
| 382,950 |
| 388,125 |
| ||
Deferred sales commissions, net |
| 626,235 |
| 648,244 |
| ||
Other |
| 379,773 |
| 390,782 |
| ||
Total Assets |
| $ | 7,914,010 |
| $ | 8,175,393 |
|
|
|
|
|
|
| ||
Liabilities and Partners' Capital |
|
|
|
|
| ||
Liabilites: |
|
|
|
|
| ||
Payables |
| $ | 2,733,816 |
| $ | 3,029,983 |
|
Accounts payable and accrued expenses |
| 187,758 |
| 194,538 |
| ||
Accrued compensation and benefits |
| 347,482 |
| 328,077 |
| ||
Debt |
| 718,997 |
| 627,609 |
| ||
Other |
| 7,318 |
| 7,026 |
| ||
Total Liabilities |
| 3,995,371 |
| 4,187,233 |
| ||
|
|
|
|
|
| ||
Partners' Capital |
| 3,918,639 |
| 3,988,160 |
| ||
Total Liabilities and Partners' Capital |
| $ | 7,914,010 |
| $ | 8,175,393 |
|
Amounts in $ thousands. Unaudited
Alliance Capital (The Operating Partnership)
Consolidated Cash Flow
|
| Three Months Ended |
| ||||
|
| 3/31/02 |
| 3/31/01 |
| ||
Cash Flows From Operating Activities: |
|
|
|
|
| ||
Net income |
| $ | 167,888 |
| $ | 152,274 |
|
Non-cash items: |
|
|
|
|
| ||
Amortization and depreciation |
| 73,944 |
| 111,578 |
| ||
Other, net |
| 23,979 |
| 18,740 |
| ||
Changes in assets and liabilities |
| (123,428 | ) | 46,453 |
| ||
Net cash provided from operating activities |
| 142,383 |
| 329,045 |
| ||
|
|
|
|
|
| ||
Cash Flows From Investing Activities: |
|
|
|
|
| ||
Sales of investments, net |
| 15,212 |
| 4,582 |
| ||
Additions to furniture, equipment and leaseholds, net |
| (14,651 | ) | (15,346 | ) | ||
Net cash provided from (used in) investing actvities |
| 561 |
| (10,764 | ) | ||
|
|
|
|
|
| ||
Cash Flows From Financing Activities: |
|
|
|
|
| ||
Increase (decrease) in debt, net |
| 90,322 |
| (120,394 | ) | ||
Distributions to partners |
| (187,696 | ) | (214,843 | ) | ||
Other |
| (66,545 | ) | 172 |
| ||
Net cash (used in) financing activities |
| (163,919 | ) | (335,065 | ) | ||
|
|
|
|
|
| ||
Effect of exchange rate change on cash |
| (1,141 | ) | (1,372 | ) | ||
|
|
|
|
|
| ||
Net decrease in cash |
| (22,116 | ) | (18,156 | ) | ||
Cash at the beginning of period |
| 220,127 |
| 216,251 |
| ||
Cash at the end of period |
| $ | 198,011 |
| $ | 198,095 |
|
Amounts in $ thousands. Unaudited
Retail Highlights and
Supplemental Financial Information
Retail 1Q02 Highlights
| 1Q02 vs. 1Q01 |
|
|
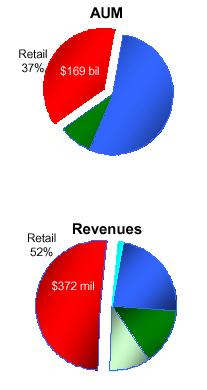
| |
• AUM | $169 bn vs. $172 bn, down 1.5% | |
|
| |
• Net new business | $683 mm vs. $7 bn, down $6 bn | |
|
| |
• Revenues | $372 mm vs. $417 mm, down 10.8% | |
| ||
| ||
• Total net sales $0.8 billion, down from $7.8 billion in 1Q01 | ||
| ||
U.S. long-term net sales was $1.7 billion down 22.5% from 1Q01 | ||
| ||
Non-U.S. net sales were $0.6 billion, down 1% from 1Q01 | ||
| ||
• Regent managed account product reinstated in key wirehouses | ||
| ||
• Launched 3 new closed-end municipal funds which raised $804 in AUM | ||
| ||
• CollegeBoundfund: leader in 529 college savings program with over $2 billion in assets and $0.6 billion in net sales | ||
| ||
• Launched 4 new customized managed account products | ||
Changes in Retail AUM by Investment Orientation
Three Months Ended March 31, 2002
|
| Growth |
| Value |
| Fixed |
| Cash |
| Total |
| |||||
|
|
|
|
|
|
|
|
|
|
|
| |||||
Beginning Of Period |
| $ | 79,047 |
| $ | 21,282 |
| $ | 29,323 |
| $ | 41,844 |
| $ | 171,496 |
|
|
|
|
|
|
|
|
|
|
|
|
| |||||
Sales |
| 3,151 |
| 2,662 |
| 3,461 |
| - |
| 9,274 |
| |||||
Redemptions |
| (3,932 | ) | (830 | ) | (2,156 | ) | - |
| (6,918 | ) | |||||
Net cash management sales |
| - |
| - |
| - |
| (1,540 | ) | (1,540 | ) | |||||
Cash Flow |
| (167 | ) | 597 |
| (353 | ) | - |
| 77 |
| |||||
Unreinvested Dividends |
| (3 | ) | (3 | ) | (204 | ) | - |
| (210 | ) | |||||
Net new business |
| (951 | ) | 2,426 |
| 748 |
| (1,540 | ) | 683 |
| |||||
|
|
|
|
|
|
|
|
|
|
|
| |||||
Appreciation (depreciation) |
| (3,629 | ) | 356 |
| 549 |
| - |
| (2,724 | ) | |||||
|
|
|
|
|
|
|
|
|
|
|
| |||||
End Of Period |
| $ | 74,467 |
| $ | 24,064 |
| $ | 30,620 |
| $ | 40,304 |
| $ | 169,455 |
|
AUM previously reported as of each date prior to March 31, 2002, have been restated to conform to the March 31, 2002 presentation. AUM now reflects the reclassification of institutional cash management and sub-advised variable annuity accounts from Institutional Investment Management to Retail and certain Private Client accounts to Retail and Institutional Investment Management. AUM now also excludes AUM from unconsolidated affiliates.
Amounts in $ millions.
Changes in Retail AUM by Product
Three Months Ended March 31, 2002
|
| U.S. |
| Non-U.S. |
| Variable |
| Managed |
| Total |
| |||||
|
|
|
|
|
|
|
|
|
|
|
| |||||
Beginning Of Period |
| $ | 95,603 |
| $ | 20,330 |
| $ | 44,505 |
| $ | 11,058 |
| $ | 171,496 |
|
|
|
|
|
|
|
|
|
|
|
|
| |||||
Sales |
| 4,529 |
| 2,446 |
| 1,982 |
| 317 |
| 9,274 |
| |||||
Redemptions |
| (3,072 | ) | (1,833 | ) | (1,406 | ) | (607 | ) | (6,918 | ) | |||||
Net cash management sales |
| (1,540 | ) | - |
| - |
| - |
| (1,540 | ) | |||||
Cash flow |
| 199 |
| 25 |
| (147 | ) | - |
| 77 |
| |||||
Unreinvested dividends |
| (162 | ) | (48 | ) | - |
| - |
| (210 | ) | |||||
Net new business |
| (46 | ) | 590 |
| 429 |
| (290 | ) | 683 |
| |||||
|
|
|
|
|
|
|
|
|
|
|
| |||||
Appreciation (depreciation) |
| (1,364 | ) | 530 |
| (1,466 | ) | (424 | ) | (2,724 | ) | |||||
|
|
|
|
|
|
|
|
|
|
|
| |||||
End Of Period |
| $ | 94,193 |
| $ | 21,450 |
| $ | 43,468 |
| $ | 10,344 |
| $ | 169,455 |
|
AUM previously reported as of each date prior to March 31, 2002, have been restated to conform to the March 31, 2002 presentation. AUM now reflects the reclassification of institutional cash management and sub-advised variable annuity accounts from Institutional Investment Management to Retail and certain Private Client accounts to Retail and Institutional Investment Management. AUM now also excludes AUM from unconsolidated affiliates.
Amounts in $ millions.
Average Global Daily Gross Sales
Excludes sales of unconsolidated affiliates.
Amounts in $ millions.
Retail Sales Activity
|
| 1Q 2002 |
| 1Q 2002 |
| 1Q 2001 |
| 1Q 2001 |
| ||||
|
|
|
|
|
|
|
|
|
| ||||
Long-Term Mutual Funds |
| $ | 6,974 |
| $ | 2,069 |
| $ | 7,105 |
| $ | 1,507 |
|
Managed Accounts |
| 317 |
| (290 | ) | 1,219 |
| 583 |
| ||||
Variable Annuity Products |
| 1,983 |
| 577 |
| 2,226 |
| 778 |
| ||||
|
| 9,274 |
| 2,356 |
| 10,550 |
| 2,868 |
| ||||
|
|
|
|
|
|
|
|
|
| ||||
Cash Management Mutual Funds, Net |
| (1,540 | ) | (1,540 | ) | 4,985 |
| 4,985 |
| ||||
Total |
| $ | 7,734 |
| $ | 816 |
| $ | 15,535 |
| $ | 7,853 |
|
AUM previously reported as of each date prior to March 31, 2002, have been restated to conform to the March 31, 2002 presentation. AUM now reflects the reclassification of institutional cash management and sub-advised variable annuity accounts from Institutional Investment Management to Retail and certain Private Client accounts to Retail and Institutional Investment Management. AUM now also excludes AUM from unconsolidated affiliates.
Amounts in $ millions.
Retail AUM and Net Flows
|
|
|
| Quarters |
| ||||||||
|
| AUM |
| Net Flows |
| Net Flows |
| Net Flows |
| ||||
U.S. Based Mutual Funds |
| $ | 53,889 |
| $ | 1,493 |
| $ | 1,073 |
| $ | 727 |
|
Non-U.S. Based Mutual Funds: |
|
|
|
|
|
|
|
|
| ||||
Luxembourg Funds |
| 9,419 |
| 662 |
| 860 |
| 571 |
| ||||
EPTA Funds |
| 2,729 |
| (25 | ) | (110 | ) | 1 |
| ||||
India |
| 635 |
| (41 | ) | 8 |
| (165 | ) | ||||
Japan ITM |
| 3,042 |
| 10 |
| (8 | ) | 147 |
| ||||
Other Funds |
| 5,625 |
| (15 | ) | (95 | ) | 5,415 |
| ||||
Total Non-U.S. |
| 21,450 |
| 591 |
| 655 |
| 5,969 |
| ||||
|
|
|
|
|
|
|
|
|
| ||||
Managed Accounts |
| 10,344 |
| (290 | ) | (701 | ) | 582 |
| ||||
Variable Annuity |
| 43,468 |
| 429 |
| 1,018 |
| 747 |
| ||||
|
|
|
|
|
|
|
|
|
| ||||
Total Long-Term |
| 129,151 |
| 2,223 |
| 2,045 |
| 8,025 |
| ||||
|
|
|
|
|
|
|
|
|
| ||||
Cash Management |
| 40,304 |
| (1,540 | ) | (2,495 | ) | 4,965 |
| ||||
|
|
|
|
|
|
|
|
|
| ||||
Total |
| $ | 169,455 |
| $ | 683 |
| $ | (450 | ) | $ | 12,990 |
|
AUM previously reported as of each date prior to March 31, 2002, have been restated to conform to the March 31, 2002 presentation. AUM now reflects the reclassification of institutional cash management and sub-advised variable annuity accounts from Institutional Investment Management to Retail and certain Private Client accounts to Retail and Institutional Investment Management. AUM now also excludes AUM from unconsolidated affiliates.
Amounts in $ millions.
Market Share of U.S.-Based Mutual Fund Gross Sales In
Key Advisor-Assisted Channels
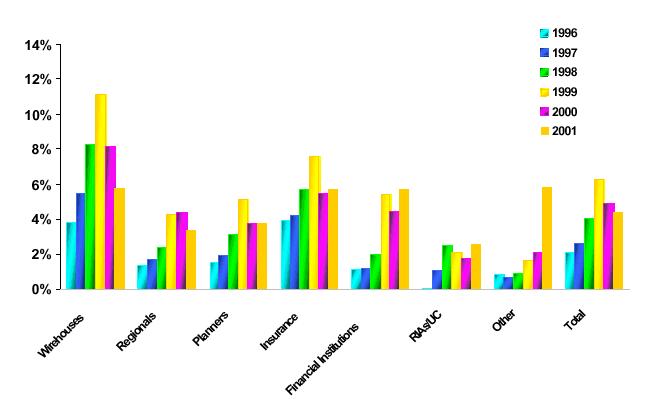
Nonproprietary gross sales domestic long-term funds.
Source: ICI
Institutional Investment Management Highlights and
Supplemental Financial Information
AllianceBernstein Institutional Investment Mgmt 1Q02 Highlights
| 1Q02 vs. 1Q01 |
|
|
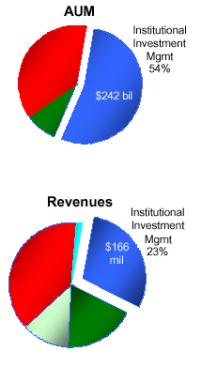
| |
• AUM | $242 bn vs. $221 bn, up 9.6% | |
|
| |
• Net new business | $3.5 bn vs. $1.8 bn, up 91.0% | |
|
| |
• Revenues | $166 mm vs. $160 mm, up 3.5% | |
| ||
| ||
• 63 new separate account wins totaled $6.3 billion in AUM | ||
| ||
• 60% of sales are from non-U.S. clients | ||
| ||
| ||
| ||
| ||
| ||
| ||
| ||
| ||
| ||
| ||
Non-U.S. Institutional Sales Gaining Momentum
63 New Accounts
$6.3 Billion in AUM
26 Investment Disciplines
Growth Equity Products |
| New Accounts |
| Fixed Income Products |
| New Accounts |
|
|
|
|
|
|
|
|
|
Large Cap Growth |
| 5 |
| Insurance |
| 2 |
|
Disciplined Growth |
| 2 |
| Mortgage |
| 2 |
|
Emerging Markets Growth |
| 3 |
| Canadian Fixed Income |
| 1 |
|
Japan Growth |
| 2 |
| Corporate Bond |
| 2 |
|
Global Large Cap Growth |
| 1 |
| Intermediate Duration |
| 1 |
|
Strategic Growth |
| 2 |
| Global Sector Rotation |
| 4 |
|
Global Ex-Japan |
| 2 |
| Global High Yield |
| 1 |
|
|
| 17 |
| Specialist Active Bond |
| 1 |
|
Value Equity Products |
|
|
| Whittingdale |
| 3 |
|
Diversified Value |
| 7 |
| Passive Australian |
| 1 |
|
Strategic Value |
| 8 |
|
|
| 18 |
|
Global Value |
| 2 |
| Other Products |
|
|
|
International Value |
| 3 |
| Lg. Cap Equity Regent |
| 1 |
|
Relative Value |
| 2 |
|
|
| 1 |
|
UK Value |
| 2 |
|
|
|
|
|
Small Cap Value |
| 1 |
|
|
|
|
|
Global Strategic Value |
| 2 |
|
|
|
|
|
|
| 27 |
|
|
|
|
|
Changes in Institutional Investment Management AUM by Investment Orientation
Three Months Ended March 31, 2002
|
| Growth |
| Value |
| Fixed |
| Passive |
| Total |
| |||||
|
|
|
|
|
|
|
|
|
|
|
| |||||
Beginning Of Period |
| $ | 95,218 |
| $ | 52,749 |
| $ | 65,056 |
| $ | 28,468 |
| $ | 241,491 |
|
|
|
|
|
|
|
|
|
|
|
|
| |||||
Sales/New accounts |
| 2,365 |
| 1,301 |
| 2,636 |
| 16 |
| 6,318 |
| |||||
Redemptions/Terminations |
| (977 | ) | (247 | ) | (1,584 | ) | (423 | ) | (3,231 | ) | |||||
Cash Management Sales, Net |
| - |
| - |
| - |
| - |
| - |
| |||||
Cash flow |
| (528 | ) | 246 |
| 841 |
| (126 | ) | 433 |
| |||||
Unreinvested dividends |
| - |
| - |
| (1 | ) | - |
| (1 | ) | |||||
Net new business |
| 860 |
| 1,300 |
| 1,892 |
| (533 | ) | 3,519 |
| |||||
|
|
|
|
|
|
|
|
|
|
|
| |||||
Appreciation (depreciation) |
| (4,082 | ) | 1,919 |
| (696 | ) | (54 | ) | (2,913 | ) | |||||
|
|
|
|
|
|
|
|
|
|
|
| |||||
End Of Period |
| $ | 91,996 |
| $ | 55,968 |
| $ | 66,252 |
| $ | 27,881 |
| $ | 242,097 |
|
AUM previously reported as of each date prior to March 31, 2002, have been restated to conform to the March 31, 2002 presentation. AUM now reflects the reclassification of institutional cash management and sub-advised variable annuity accounts from Institutional Investment Management to Retail and certain Private Client accounts to Retail and Institutional Investment Management. AUM now also excludes AUM from unconsolidated affiliates.
Amounts in $ millions.
Institutional Investment Management AUM and Net Flows
|
|
|
| Quarters |
| ||||||||
|
| AUM |
| Net Flows |
| Net Flows |
| Net Flows |
| ||||
Mutual Funds |
|
|
|
|
|
|
|
|
| ||||
U.S. Based |
| $ | 717 |
| $ | (14 | ) | $ | (22 | ) | $ | (88 | ) |
|
|
|
|
|
|
|
|
|
| ||||
Non-U.S. Based: |
|
|
|
|
|
|
|
|
| ||||
Luxembourg |
| - |
| - |
| - |
| - |
| ||||
Structured Products |
| 3,758 |
| (145 | ) | (296 | ) | (67 | ) | ||||
Other |
| - |
| - |
| - |
| - |
| ||||
Total Non-U.S. |
| 3,758 |
| (145 | ) | (296 | ) | (67 | ) | ||||
|
|
|
|
|
|
|
|
|
| ||||
Separate Accounts |
| 237,622 |
| 3,678 |
| 2,208 |
| 5,149 |
| ||||
|
|
|
|
|
|
|
|
|
| ||||
Total |
| $ | 242,097 |
| $ | 3,519 |
| $ | 1,890 |
| $ | 4,994 |
|
AUM previously reported as of each date prior to March 31, 2002, have been restated to conform to the March 31, 2002 presentation. AUM now reflects the reclassification of institutional cash management and sub-advised variable annuity accounts from Institutional Investment Management to Retail and certain Private Client accounts to Retail and Institutional Investment Management. AUM now also excludes AUM from unconsolidated affiliates.
Amounts in $ millions.
Private Client Highlights and
Supplemental Financial Information
Private Client 1Q02 Highlights
Bernstein Investment Research & Management
| 1Q02 vs. 1Q01 |
|
|
| |
• AUM | $41 bn vs. $36 bn, up 12.9% | |
|
| |
• Net new business | $949 mm vs. $704 mm, up 34.8% | |
|
| |
• Revenues | $103 mm vs. $84 mm, up 22.4% | |
| ||
| ||
• One of strongest quarters in net new business flows | ||
| ||
• Houston and Miami offices opened | ||
| ||
• Launched new hedge fund | ||
| ||
| ||
| ||
| ||
| ||
| ||
| ||
| ||
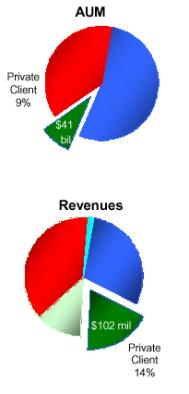
Private Client AUM and Net Flows
|
|
|
| Quarters |
| ||||||||
|
| AUM |
| Net Flows |
| Net Flows |
| Net Flows |
| ||||
Mutual Funds |
| $ | 11,476 |
| $ | 227 |
| $ | 104 |
| $ | (144 | ) |
Separate Accounts |
| 29,168 |
| 722 |
| 455 |
| 848 |
| ||||
|
|
|
|
|
|
|
|
|
| ||||
Total |
| $ | 40,644 |
| $ | 949 |
| $ | 559 |
| $ | 704 |
|
AUM previously reported as of each date prior to March 31, 2002, have been restated to conform to the March 31, 2002 presentation. AUM now reflects the reclassification of institutional cash management and sub-advised variable annuity accounts from Institutional Investment Management to Retail and certain Private Client accounts to Retail and Institutional Investment Management. AUM now also excludes AUM from unconsolidated affiliates.
Amounts in $ millions.
Institutional Research Services Highlights and
Supplemental Financial Information
Institutional Research Services 1Q02 Highlights
| 1Q02 vs. 1Q01 |
|
|
| |
• Revenues | $72 mm vs. $64 mm, up 11.5% | |
|
| |
• Market Share | 0.15% increase in market share | |
| ||
| ||
• Launched coverage of three industries | ||
| ||
• Began trading in London | ||
| ||
| ||
| ||
| ||
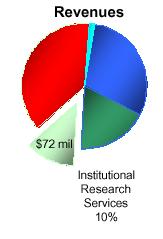
Alliance Capital Investment Management Services
Alliance Capital provides diversified investment management and related services globally to a broad range of clients:
1. Retail Services consists of investment management products and services distributed to individual investors through financial intermediaries, such as brokers and financial planners by means of:
• mutual funds sponsored by Alliance Capital and consolidated joint venture companies,
• cash management products such as money market funds and deposit accounts,
• mutual fund sub-advisory relationships resulting from the efforts of the mutual fund marketing department, and
• “managed account” products;
2. Institutional Investment Management Services consists of investment management services to unaffiliated parties such as corporate and public employee pension funds, endowment funds, domestic and foreign institutions and governments, and affiliates such as AXA and its insurance company subsidiaries by means of:
• separate accounts,
• mutual fund shares sold exclusively to institutional investors and high net worth individuals,
• sub-advisory relationships resulting from the efforts of the institutional marketing department,
• hedge funds,
• structured products, and
• group trusts;
3. Private Client Services consists of investment management services provided to high net worth individuals, trusts and estates, charitable foundations, partnerships, private and family corporations and other entities by means of:
• separate accounts,
• hedge funds and
• certain other vehicles; and
4. Institutional Research Services provided to institutional clients by means of:
• in-depth research,
• portfolio strategy,
• trading and
• brokerage-related services.