UNITED STATES
SECURITIES AND EXCHANGE COMMISSION
Washington, D.C. 20549
_________________
FORM 6-K
REPORT OF FOREIGN PRIVATE ISSUER
PURSUANT TO RULE 13a-16 OR 15d-16 UNDER
THE SECURITIES EXCHANGE ACT OF 1934
Date: August 23, 2024
UBS Group AG
(Registrant's Name)
Bahnhofstrasse 45, 8001 Zurich, Switzerland
(Address of principal executive office)
Commission File Number: 1-36764
UBS AG
(Registrant's Name)
Bahnhofstrasse 45, 8001 Zurich, Switzerland
Aeschenvorstadt 1, 4051 Basel, Switzerland
(Address of principal executive offices)
Commission File Number: 1-15060
Indicate by check mark whether the registrants file or will file annual reports under cover of Form 20-F or Form
40-
F.
Form 20-F
☒
☐
This Form 6-K consists of the 30 June 2024 Pillar 3 Report of UBS Group and significant regulated subsidiaries and
sub-groups, which appears immediately following this page.

Terms used in this report, unless the context requires otherwise
“UBS,” “UBS Group,” “UBS Group AG consolidated,” “Group,” “the Group,” “we,” “us” and “our”
UBS Group AG and its consolidated subsidiaries
“UBS Group excluding the Credit Suisse AG sub-group”
All UBS Group entities, excluding the Credit Suisse AG sub-group
before the merger with UBS AG
“UBS AG” and “UBS AG consolidated”
UBS AG and its consolidated subsidiaries
“Credit Suisse AG” and “Credit Suisse AG consolidated”
Credit Suisse AG and its consolidated subsidiaries before the merger
with UBS AG
“Credit Suisse Group“ and “Credit Suisse Group AG consolidated”
Pre-acquisition Credit Suisse Group
”Credit Suisse”
Credit Suisse AG and its consolidated subsidiaries before the merger
with UBS AG, Credit Suisse Services AG and other small former
Credit Suisse Group entities now directly held by UBS Group AG
“UBS Group AG” and “UBS Group AG standalone”
UBS Group AG on a standalone basis
“Credit Suisse Group AG” and “Credit Suisse Group AG standalone”
Credit Suisse Group AG on a standalone basis
“UBS AG standalone”
UBS AG on a standalone basis
“Credit Suisse AG standalone”
Credit Suisse AG before the merger with UBS AG on a standalone
basis
“UBS Switzerland AG” and “UBS Switzerland AG standalone”
UBS Switzerland AG on a standalone basis
“UBS Europe SE consolidated”
UBS Europe SE and its consolidated subsidiaries
“UBS Americas Holding LLC” and “UBS Americas Holding LLC consolidated”
UBS Americas Holding LLC and its consolidated subsidiaries
“1m”
One million, i.e., 1,000,000
“1bn”
One billion, i.e., 1,000,000,000
“1trn”
One trillion, i.e., 1,000,000,000,000
In this report, unless the context requires otherwise, references to any gender shall apply to all genders.
Table of contents
UBS Group
2
Section 1
4
Section 2
6
Section 3
8
Section 4
19
Section 5
25
Section 6
29
Section 7
33
Section 8
39
Section 9
Total loss-absorbing capacity
41
Section 10
43
Section 11
46
Section 12
Significant regulated subsidiaries and sub-groups
47
Section 1
48
Section 2
52
Section 3
56
Section 4
62
Section 5
63
Section 6
65
Section 7
69
Section 8
73
Section 9
Appendix
75
77
Contacts
Switchboards
For all general inquiries.
ubs.com/contact
Zurich +41-44-234 1111
London +44-207-567 8000
New York +1-212-821 3000
Hong Kong SAR +852-2971 8888
Singapore +65-6495 8000
Investor Relations
UBS’s Investor Relations team
manages relationships with
institutional investors, research
analysts and credit rating agencies.
ubs.com/investors
Zurich +41-44-234 4100
New York +1-212-882 5734
Media Relations
UBS’s Media Relations team
manages relationships with global
media and journalists.
ubs.com/media
Zurich +41-44-234 8500
mediarelations@ubs.com
London +44-20-7567 4714
ubs-media-relations@ubs.com
New York +1-212-882 5858
mediarelations@ubs.com
Hong Kong SAR +852-2971 8200
sh-mediarelations-ap@ubs.com
Office of the Group Company
Secretary
The Group Company Secretary
handles inquiries directed to the
Chairman or to other members
of the Board of Directors.
UBS Group AG, Office of the
Group Company Secretary
PO Box, CH-8098 Zurich, Switzerland
sh-company-secretary@ubs.com
Zurich +41-44-235 6652
Shareholder Services
UBS’s Shareholder Services team,
a unit of the Group Company
Secretary’s office, manages
relationships with shareholders and
the registration of UBS Group AG
registered shares.
UBS Group AG, Shareholder Services
PO Box, CH-8098 Zurich, Switzerland
sh-shareholder-services@ubs.com
Zurich +41-44-235 6652
US Transfer Agent
For global registered share-related
inquiries in the US.
Computershare Trust Company NA
PO Box 43006
Providence, RI, 02940-3006, USA
Shareholder online inquiries:
www.computershare.com/us/
investor-inquiries
Shareholder website:
computershare.com/investor
Calls from the US
+1-866-305-9566
Calls from outside the US
+1-781-575-2623
TDD for hearing impaired
+1-800-231-5469
TDD for foreign shareholders
+1-201-680-6610
Imprint
Publisher: UBS Group AG, Zurich, Switzerland | ubs.com
Language: English
© UBS 2024. The key symbol and UBS are among the registered and
unregistered trademarks of UBS. All rights reserved.
30 June 2024 Pillar 3 Report |
UBS Group | Introduction and basis for preparation 2
UBS Group
Introduction and basis for preparation
Scope of Basel III Pillar 3 disclosures
The Basel Committee on Banking Supervision (the BCBS) Basel III capital adequacy framework consists of three
complementary pillars. Pillar 1 provides a framework for measuring minimum capital requirements for the credit, market,
operational and non-counterparty-related risks faced by banks. Pillar 2 addresses the principles of the supervisory review
process, emphasizing the need for a qualitative approach to supervising banks. Pillar 3 requires banks to publish a range
of disclosures, mainly covering risk, capital, leverage, liquidity and remuneration.
This report provides Pillar 3 disclosures for the UBS Group, including the acquired Credit Suisse Group, and prudential
key figures and regulatory information for UBS AG consolidated and standalone, UBS Switzerland AG standalone,
UBS Europe SE consolidated, and UBS Americas Holding LLC consolidated, as well as Credit Suisse (Schweiz) AG
consolidated and standalone, and Credit Suisse International standalone in the respective sections under “Significant
regulated subsidiaries and sub-groups.”
This Pillar 3 Report has been prepared in accordance with Swiss Financial Market Supervisory Authority (FINMA) Pillar 3
disclosure requirements (FINMA Circular 2016/1 “Disclosure – banks”) as revised on 8 December 2021, the underlying
BCBS guidance “Revised Pillar 3 disclosure requirements” issued in January 2015, the “Frequently asked questions on
the revised Pillar 3 disclosure requirements” issued in August 2016, the “Pillar 3 disclosure requirements – consolidated
and enhanced framework” issued in March 2017 and the subsequent “Technical Amendment – Pillar 3 disclosure
requirements – regulatory treatment of accounting provisions” issued in August 2018.
As UBS is considered a systemically relevant bank (an SRB) under Swiss banking law, UBS Group AG, UBS AG and Credit
Suisse (Schweiz) AG are required to comply with regulations based on the Basel III framework as applicable to Swiss SRBs
on a consolidated basis.
Local regulators may also require the publication of Pillar 3 information at a subsidiary or sub-group level. Where
applicable, these local disclosures are provided under “Holding company and significant regulated subsidiaries and sub-
groups” at
ubs.com/investors
.
Acquisition of the Credit Suisse Group
Impact of our acquisition of the Credit Suisse Group on Basel III Pillar 3 disclosures
We completed the merger of UBS AG and Credit Suisse AG on 31 May 2024 and the transition to a single US
intermediate holding company on 7 June 2024. These changes have been reflected in the significant regulated
subsidiaries and sub-groups section of this report.
›
Refer to the “UBS AG consolidated,” “UBS AG standalone” and “UBS Americas Holding LLC consolidated” sections of this report
for more information about the newly merged entities
›
Refer to “Integration of Credit Suisse” in the “Recent developments” section of the UBS Group second quarter 2024 report,
available under “Quarterly reporting” at
ubs.com/investors
, for more information about the integration of Credit Suisse
›
Refer to “Note 2 Accounting for the merger of UBS AG and Credit Suisse AG” in the “Consolidated financial statements” section of
the UBS AG second quarter 2024 report, available under “Quarterly reporting” at
ubs.com/investors
, for more information about
the merger of UBS AG and Credit Suisse AG
Finalization of IFRS 3 measurement period adjustments for the acquisition of the Credit Suisse Group
In the second quarter of 2024, in light of the additional information about circumstances existing on the acquisition date
that became available to management, IFRS 3 measurement period adjustments totaling USD 0.5bn were made. The
adjustments reflect our final conclusions on critical assumptions and judgments, which are within a range of reasonably
possible outcomes, relating to significant uncertainties that existed on the acquisition date. With the measurement period
adjustments effected in the second quarter of 2024, the accounting for the acquisition of the Credit Suisse Group is
complete. Comparative periods for common equity tier 1 capital information have been revised accordingly. We have
applied the amended measurement for leverage ratio denominator, risk-weighted assets and net stable funding ratio
calculation purposes prospectively from the second quarter of 2024.
›
Refer to “Note 2 Accounting for the acquisition of the Credit Suisse Group” in the “Consolidated financial statements” section of
the UBS Group second quarter 2024 report, available under “Quarterly reporting” at
ubs.com/investors
, for more information
about the IFRS 3 measurement period adjustments
30 June 2024 Pillar 3 Report |
UBS Group | Introduction and basis for preparation 3
Significant regulatory developments, disclosure requirements and other changes
Developments related to the final Basel III implementation
In June 2024, the Swiss Federal Council confirmed that the amendments to the Capital Adequacy Ordinance that will
incorporate the final Basel III standards into Swiss law will enter into force on 1 January 2025. Also in June 2024, the
European Commission confirmed its intention to implement the final Basel III requirements as of 1 January 2025, except
for the market risk capital requirements , the implementation of which will be delayed until at least 1 January 2026. The
implementation timeline to incorporate the final Basel III standards in the US is expected to be delayed beyond July 2025,
as banking agencies continue to discuss amendments to their proposals. The UK has previously stated its intention to
implement the final Basel III standards by 1 July 2025; however, it has delayed the publication of its final rules until the
autumn of 2024.
We expect that the adoption of the final Basel III standards in January 2025 will lead to an increase of around 5% in UBS
Group risk-weighted assets, driven mainly by the Fundamental Review of the Trading Book. This estimate is based on our
current understanding of the relevant standards. We are in an active dialogue with FINMA regarding various aspects of
the final rules. Our estimate does not take into account mitigating actions, nor does it reflect the impact of the output
floor, which is to be phased in over time.
Frequency and comparability of Pillar 3 disclosures
FINMA has specified the reporting frequency for each disclosure, as outlined in the “Introduction and basis for
preparation” section of the 31 December 2023 Pillar 3 Report, available under “Pillar 3 disclosures” at
ubs.com/investors
.
In line with the FINMA-specified disclosure frequency and requirements for disclosure with regard to comparative periods,
we provide quantitative comparative information as of 31 March 2024 for disclosures required on a quarterly basis and
as of 31 December 2023 for disclosures required on a semi-annual basis. Where specifically required by FINMA and / or
the BCBS, we disclose comparative information for additional reporting dates.
Where required, movement commentary is aligned with the corresponding disclosure frequency required by FINMA and
always refers to the latest comparative period. Throughout this report, signposts are displayed at the beginning of a
section, table or chart –
Semi-annual |
Quarterly |
triangle symbol –
p
p
›
Refer to the 31 March 2024 Pillar 3 Report, available under “Pillar 3 disclosures” at
ubs.com/investors
, for more information about
previously published quarterly movement commentary
›
Refer to the 31 December 2023 Pillar 3 Report, available under “Pillar 3 disclosures” at
ubs.com/investors
, for more information
about previously published semi-annual movement commentary
30 June 2024 Pillar 3 Report |
UBS Group | Key metrics 4
Key metrics
Key metrics for the second quarter of 2024
Quarterly |
The KM1 and KM2 tables below are based on Basel Committee on Banking Supervision Basel III rules. The KM2
table includes a reference to the total loss-absorbing capacity (TLAC) term sheet, published by the Financial Stability Board
(the FSB). The FSB provides this term sheet at
fsb.org/2015/11/total-loss-absorbing-capacity-tlac-principles-and-term-
sheet
.
Our capital ratios increased , reflecting a decrease in risk-weighted assets (RWA), partly offset by a decrease in our tier 1
capital. Our leverage ratio increased, reflecting a decrease in the leverage ratio denominator (the LRD), partly offset by
the decrease in our tier 1 capital.
Our common equity tier 1 (CET1) capital decreased by USD 1.6bn to USD 76.1bn, mainly as the operating profit before
tax of USD 1.5bn and an increase in eligible deferred tax assets recognized for temporary differences of USD 0.1bn were
more than offset by a net share repurchase effect of USD 1.0bn, a negative effect from compensation- and own-share-
related capital components of USD 1.0bn, dividend accruals of USD 0.6bn, current tax expenses of USD 0.3bn, and
amortization of transitional CET1 capital purchase price allocation (PPA) adjustments (interest rate and own credit) of
USD 0.3bn (net of tax). The net share repurchase effect of USD 1.0bn reflects actual share repurchases of USD 0.15bn
under our new, 2024 share repurchase program and the establishing of a USD 0.85bn capital reserve for potential share
repurchases.
As agreed with the Swiss Financial Market Supervisory Authority (FINMA), as part of the acquisition of the Credit Suisse
Group in 2023, a transitional CET1 capital treatment has been applied for certain PPA fair value adjustments required
under IFRS 3,
Business Combinations
, due to the substantially temporary nature of these IFRS-3-accounting-driven effects
related to interest rate and own credit. As such, equity reductions under IFRS Accounting Standards of USD 5.9bn (before
tax) and USD 5.0bn (net of tax) as of the acquisition date have been neutralized for CET1 capital calculation purposes, of
which USD 1.0bn (net of tax) related to own-credit-related fair value adjustments. The transitional treatment is subject
to linear amortization and will be reduced to nil by 30 June 2027. The amortization of transitional CET1 capital PPA
adjustments since the acquisition date totaled USD 1.3bn (net of tax) as of 30 June 2024, an increase of USD 0.3bn (net
of tax) in the second quarter of 2024.
Our tier 1 capital decreased by USD 1.2bn to USD 91.8bn, reflecting the aforementioned decrease in CET1 capital, partly
offset by an increase in additional tier 1 (AT1) capital of USD 0.4bn. The AT1 capital increase was mainly driven by the
issuance of one AT1 capital instrument equivalent to USD 0.4bn.
The TLAC available as of 30 June 2024 included CET1 capital, AT1 capital and non-regulatory capital elements of TLAC.
Under the Swiss systemically relevant bank framework, including transitional arrangements, TLAC excludes 45% of the
gross unrealized gains on debt instruments measured at fair value through other comprehensive income for accounting
purposes, which for regulatory capital purposes are measured at the lower of cost or market value. This amount was
negligible as of 30 June 2024 but is included as available TLAC in the KM2 table in this section.
Our available TLAC increased by USD 0.7bn to USD 197.7bn, driven by a USD 1.9bn increase in TLAC-eligible senior
unsecured debt, partly offset by the aforementioned decrease in tier 1 capital. The increase in TLAC-eligible senior
unsecured debt was mainly due to new issuances totaling USD 2.3bn equivalent of TLAC-eligible senior unsecured debt
instruments, partly offset by a USD 0.1bn equivalent TLAC-eligible senior unsecured debt instrument that ceased to be
eligible as gone concern capital as it entered the final year before maturity, and negative impacts from interest rate risk
hedge, foreign currency translation and other effects.
During the second quarter of 2024, RWA decreased by USD 15.1bn to USD 511.4bn, mainly driven by decreases of
USD 11.1bn in credit risk RWA and USD 1.9bn in market risk RWA. The remaining variance was spread across other risk
types.
The LRD decreased by USD 35.4bn to USD 1,564.2bn, driven by asset size and other movements of USD 33.4bn, as well
as currency effects of USD 2.1bn.
30 June 2024 Pillar 3 Report |
UBS Group | Key metrics 5
The quarterly average liquidity coverage ratio (the LCR) of the UBS Group decreased 8.2 percentage points to 212.0%,
remaining above the prudential requirement communicated by FINMA. The movement in the quarterly average LCR was
primarily driven by a decrease in high-quality liquid assets of USD 44.4bn to USD 378.2bn, mainly due to the repayment
of the remaining funding drawn under the Swiss National Bank Emergency Liquidity Assistance facility and an increase in
trading assets. The average net cash outflows decreased by USD 13.7bn to USD 178.5bn, reflecting lower outflows from
deposits and loan commitments and higher net inflows from securities financing transactions.
As of 30 June 2024, the net stable funding ratio of the UBS Group increased 1.6 percentage points to 128.0%, remaining
above the prudential requirement communicated by FINMA. Available stable funding decreased by USD 4.8bn to
USD 882.3bn, mainly driven by lower customer deposits, partly offset by higher debt issued measured at amortized cost.
Required stable funding decreased by USD 12.5bn to USD 689.0bn, predominantly reflecting lower lending assets and
derivative balances, partly offset by higher trading assets and securities financing transactions.
KM1: Key metrics
USD m, except where indicated
30.6.24
31.3.24
1
31.12.23
1
30.9.23
1
30.6.23
1
Available capital (amounts)
1
Common Equity Tier 1 (CET1)
76,104
77,663
78,002
76,926
78,597
2
Tier 1
91,804
92,983
91,894
89,885
91,626
3
Total capital
91,804
92,984
91,895
89,886
91,626
Risk-weighted assets (amounts)
4
Total risk-weighted assets (RWA)
511,376
526,437
546,505
546,491
556,603
4a
Minimum capital requirement
2
40,910
42,115
43,720
43,719
44,528
Risk-based capital ratios as a percentage of RWA
5
CET1 ratio (%)
14.88
14.75
14.27
14.08
14.12
6
Tier 1 ratio (%)
17.95
17.66
16.81
16.45
16.46
7
Total capital ratio (%)
17.95
17.66
16.81
16.45
16.46
Additional CET1 buffer requirements as a percentage of RWA
8
Capital conservation buffer requirement (%)
2.50
2.50
2.50
2.50
2.50
9
Countercyclical buffer requirement (%)
0.16
0.15
0.14
0.15
0.11
9a
Additional countercyclical buffer for Swiss mortgage loans (%)
0.33
0.32
0.33
0.31
0.30
10
Bank G-SIB and / or D-SIB additional requirements (%)
1.00
1.00
1.00
1.00
1.00
11
Total of bank CET1 specific buffer requirements (%)
3
3.66
3.65
3.64
3.65
3.61
12
CET1 available after meeting the bank’s minimum capital requirements (%)
4
9.95
9.66
8.81
8.45
8.46
Basel III leverage ratio
13
Total Basel III leverage ratio exposure measure
1,564,201
1,599,646
1,695,403
1,615,817
1,677,877
14
Basel III leverage ratio (%)
5.87
5.81
5.42
5.56
5.46
Liquidity coverage ratio (LCR)
5
15
Total high-quality liquid assets (HQLA)
378,235
422,617
415,594
367,518
257,107
16
Total net cash outflow
178,452
192,106
192,760
187,256
144,973
16a
of which: cash outflows
342,383
348,693
342,096
344,862
275,298
16b
of which: cash inflows
163,931
156,588
149,336
157,606
130,325
17
LCR (%)
211.99
220.21
215.66
196.53
175.24
Net stable funding ratio (NSFR)
18
Total available stable funding
882,282
887,037
926,424
19
Total required stable funding
689,025
701,560
743,159
20
NSFR (%)
128.05
126.44
124.66
1 Comparative-period information has been revised. Refer to “Note 2 Accounting for the acquisition of the Credit Suisse Group” in the “Consolidated financial statements” section of the UBS Group second quarter
2024 report, available under "Quarterly reporting" at ubs.com/investors, for more information. 2 Calculated as 8% of total RWA, based on total capital minimum requirements, excluding CET1 buffer requirements.
3 Excludes non-BCBS capital buffer requirements for risk-weighted positions that are directly or indirectly backed by residential properties in Switzerland. 4 Represents the CET1 ratio that is available to meet buffer
requirements. Calculated as the CET1 ratio minus the BCBS CET1 capital requirement and, where applicable, minus the BCBS tier 2 capital requirement met with CET1 capital. 5 Calculated after the application of
haircuts, inflow and outflow rates, as well as, where applicable, caps on Level 2 assets and cash inflows. Calculated based on an average of 61 data points in the second quarter of 2024 and 61 data points in the
first quarter of 2024. For the prior-quarter data points, refer to the respective Pillar 3 Report, available under “Pillar 3 disclosures” at ubs.com/investors, for more information.
KM2: Key metrics – TLAC requirements (at resolution group level)
1
USD m, except where indicated
30.6.24
31.3.24
2
31.12.23
2
30.9.23
2
30.6.23
2
1
Total loss-absorbing capacity (TLAC) available
2
Total RWA at the level of the resolution group
3
TLAC as a percentage of RWA (%)
4
Leverage ratio exposure measure at the level of the resolution group
5
TLAC as a percentage of leverage ratio exposure measure (%)
6a
Does the subordination exemption in the antepenultimate paragraph of
Section 11 of the FSB TLAC Term Sheet apply?
No
6b
Does the subordination exemption in the penultimate paragraph of
Section 11 of the FSB TLAC Term Sheet apply?
No
6c
If the capped subordination exemption applies, the amount of funding
issued that ranks pari passu with excluded liabilities and that is
recognized as external TLAC, divided by funding issued that ranks pari
passu with excluded liabilities and that would be recognized as external
TLAC if no cap was applied (%)
N/A – Refer to our response to 6b.
1 Resolution group level is defined as the UBS Group AG consolidated level. 2 Comparative-period information has been revised. Refer to “Note 2 Accounting for the acquisition of the Credit Suisse Group” in the
“Consolidated financial statements” section of the UBS Group second quarter 2024 report, available under "Quarterly reporting" at ubs.com/investors, for more information.
p
30 June 2024 Pillar 3 Report |
UBS Group | Overview of risk-weighted assets 6
Overview of risk-weighted assets
Overview of RWA and capital requirements
Quarterly |
The OV1 table below provides an overview of our risk-weighted assets (RWA) and the related minimum capital
requirements by risk type. The table presented is based on the respective Swiss Financial Market Supervisory Authority
(FINMA) template and empty rows indicate current non-applicability to UBS.
During the second quarter of 2024, RWA decreased by USD 15.1bn to USD 511.4bn, mainly driven by decreases of
USD 11.1bn in credit risk RWA and USD 1.9bn in market risk RWA. The remaining variance was spread across other risk
types.
Credit risk RWA decreased by USD 11.1bn, mainly driven by decreases of USD 8.2bn related to asset size and other
movements and USD 3.0bn related to model updates and methodology changes. Asset size and other movements
decreased by USD 8.2bn, mainly driven by a reduction of RWA in the Non-core and Legacy portfolio, driven by our actions
to actively unwind the portfolio, in addition to the natural roll-off. The decrease was also driven by decreases in loan
balances in Personal & Corporate Banking and Global Wealth Management. Model updates and methodology changes
resulted in a decrease of USD 3.0bn, mainly reflecting a decrease in RWA of USD 1.6bn related to the recalibration of
certain multipliers as a result of model improvements and a decrease in RWA of USD 0.8bn from methodology changes
related to commercial real estate and large corporate loans.
Market risk RWA decreased by USD 1.9bn, mainly driven by a decrease related to asset size and other movements that
reflected updates from the monthly risks-not-in-VaR assessments.
The flow tables for credit risk, counterparty credit risk and market risk RWA in the respective sections of this report provide
further details regarding the movements in RWA in the second quarter of 2024.
›
Refer to the “Introduction and basis for preparation” section of this report for more information about the regulatory standards
applied
›
Refer to the “Capital management” section of the UBS Group second quarter 2024 report, available under
Quarterly reporting”
at
ubs.com/investors
, for more information about capital management and RWA, including details regarding movements in RWA
during the second quarter of 2024
30 June 2024 Pillar 3 Report |
UBS Group | Overview of risk-weighted assets 7
OV1: Overview of RWA
Section or table
reference
Minimum
capital
requirements
1
USD m
30.6.24
31.3.24
31.12.23
30.6.24
1
Credit risk (excluding counterparty credit risk)
2
of which: standardized approach (SA)
CR4
2a
of which: non-counterparty-related risk
CR4
3
of which: foundation internal ratings-based (F-IRB) approach
4
of which: supervisory slotting approach
CR10
5
of which: advanced internal ratings-based (A-IRB) approach
CR6
6
Counterparty credit risk
2
5, CCR1, CCR8
7
of which: SA for counterparty credit risk (SA-CCR)
8
of which: internal model method (IMM)
CCR7
8a
of which: value-at-risk (VaR)
CCR7
9
of which: other CCR
10
Credit valuation adjustment (CVA)
5, CCR2
11
Equity positions under the simple risk-weight approach
4, CR10
12
Equity investments in funds – look-through approach
13
Equity investments in funds – mandate-based approach
14
Equity investments in funds – fallback approach
15
Settlement risk
16
Securitization exposures in banking book
17
of which: securitization internal ratings-based approach (SEC-IRBA)
18
of which: securitization external ratings-based approach (SEC-ERBA), including internal assessment
approach (IAA)
19
of which: securitization standardized approach (SEC-SA)
20
Market Risk
6,7
21
of which: standardized approach (SA)
MR1
22
of which: internal models approach (IMA)
MR2
23
Capital charge for switch between trading book and banking book
3
24
Operational risk
25
Amounts below thresholds for deduction (250% risk weight)
4
25a
26
Floor adjustment
27
Total
1 Calculated based on 8% of RWA. 2 Excludes settlement risk, which is separately reported in line 15 “Settlement risk.” Includes RWA with central counterparties. The split between the sub-components of
counterparty credit risk refers to the calculation of the exposure measure. 3 Not applicable until the implementation of the final rules on the minimum capital requirements for market risk (the Fundamental Review
of the Trading Book). 4 Includes items subject to threshold deduction treatment that do not exceed their respective threshold and are risk-weighted at 250%. Items subject to threshold deduction treatment include
significant investments in common shares of non-consolidated financial institutions (banks, insurance and other financial entities), deferred tax assets arising from temporary differences, and mortgage servicing rights.
p
30 June 2024 Pillar 3 Report |
UBS Group | Credit risk 8
Credit risk
Introduction
Semi-annual |
The parameters applied under the advanced internal ratings-based (A-IRB) approach are generally based on the
same methodologies, data and systems we use for internal credit risk quantification, except where certain treatments are
specified by regulatory requirements. These include, for example, the application of regulatory prescribed floors and
multipliers, and differences with respect to eligibility criteria and exposure definitions. The exposure information presented
in this section may thus differ from our internal management view disclosed in the “Risk management and control”
sections of the quarterly and annual reports. Similarly, the regulatory capital prescribed measure of credit risk exposure
also differs from how it is defined under IFRS Accounting Standards.
p
Credit quality of assets
Semi-annual |
The CR1 table below provides a breakdown of defaulted and non-defaulted loans, debt securities and off-
balance sheet exposures. The table includes a split of expected credit loss accounting provisions based on the standardized
approach and the internal ratings-based approach.
Compared with 31 December 2023, the net carrying values of loans, including balances at central banks, decreased by
USD 111.5bn to USD 875.5bn, mainly due to the repayment of funding from the Swiss National Bank, including the
repayment of the remaining funding drawn under the Emergency Liquidity Assistance (ELA) facility, active unwinds in
Non-core and Legacy, and currency effects. The net carrying value of off-balance sheet exposures decreased by
USD 18.4bn to USD 99.3bn, primarily driven by decreases in loan commitments and guarantees across businesses.
›
Refer to the “CR3: Credit risk mitigation techniques – overview” table in this section for more information about the net value
movements related to Loans and Debt securities shown in the table below
›
Refer to “Credit risk” in the “Risk management and control” section of the UBS Group Annual Report 2023, available under
”Annual reporting” at
ubs.com/investors
, for more information about the definitions of default and credit impairment and to
“Credit risk exposure categories” in the “Credit risk” section of the 31 December 2023 Pillar 3 Report, available under “Pillar 3
disclosures” at
ubs.com/investors
, for more information about the classification of loans and debt securities
CR1: Credit quality of assets
Gross carrying amounts of:
Allowances /
impairments
2
Of which: ECL accounting provisions
for credit losses on SA exposures
Of which: ECL
accounting
provisions for
credit losses on
IRB exposures
Net values
USD m
Defaulted
exposures
1
Non-defaulted
exposures
Allocated in
regulatory
category of
Specific
3
Allocated in
regulatory
category of
General
3
30.6.24
1
Loans
4
2
Debt securities
3
Off-balance sheet exposures
5
4
Total
31.12.23
1
Loans
4
2
Debt securities
3
Off-balance sheet exposures
5
4
Total
1 Defaulted exposures include stage 3 and defaulted purchased credit-impaired (PCI) assets under IFRS 9. Refer to “Note 9 Expected credit loss measurement” in the “Consolidated financial statements” section of
the UBS Group second quarter 2024 report, available under “Quarterly reporting” at ubs.com/investors, for more information about IFRS 9. 2 Expected credit loss (ECL) allowances and provisions amounted to USD
2,258m as of 30 June 2024, as disclosed in “Note 9 Expected credit loss measurement” in the “Consolidated financial statements” section of the UBS Group second quarter 2024 report, available under “Quarterly
reporting” at ubs.com/investors. This Pillar 3 table excludes ECL on securitization on- and off- balance sheet exposures (30 June 2024: USD 122m; 31 December 2023: USD 143m), ECL on revocable off-balance sheet
exposures (30 June 2024: USD 80m; 31 December 2023: USD 95m), ECL on exposures subject to counterparty credit risk (30 June 2024: USD 5m; 31 December 2023: USD 5m) and ECL on irrevocable committed
prolongation of loans that do not give rise to additional credit exposures (30 June 2024: USD 2m; 31 December 2023: USD 3m). 3 Specific provisions include stage 3 ECL allowances and additional ECL allowances
on defaulted PCI assets. General provisions include stage 1 and 2 ECL allowances and additional ECL allowances on non-defaulted PCI assets. 4 Loan exposure is reported in line with the Pillar 3 definition. Refer
to “Credit risk exposure categories” in the “Credit risk“ section of the 31 December 2023 Pillar 3 Report, available under “Pillar 3 disclosures” at ubs.com/investors, for more information about the classification of
loans and debt securities. 5 Off-balance sheet exposures include unutilized credit facilities, guarantees provided and forward starting loan commitments but exclude prolongations of loans that do not increase the
initially committed loan amount. Unutilized credit facilities exclude unconditionally revocable as well as uncommitted credit facilities, even if they attract RWA.
p
30 June 2024 Pillar 3 Report |
UBS Group | Credit risk 9
Semi-annual |
exposures for the first half of 2024. The total amount of defaulted loans and debt securities was USD 6.2bn as of 30 June
2024, a decrease of USD 0.3bn compared with 31 December 2023.
CR2: Changes in stock of defaulted loans, debt securities and off-balance sheet exposures
USD m
For the half year
ended 30.6.24
1
For the half year
ended 31.12.23
1
1
Defaulted loans, debt securities and off-balance sheet exposures as of the beginning of the half year
2
Loans and debt securities that have defaulted since the last reporting period
3
Returned to non-defaulted status
4
Amounts written off
5
Other changes
2
6
Defaulted loans, debt securities and off-balance sheet exposures as of the end of the half year
1 Off-balance sheet exposures include unutilized credit facilities, guarantees provided and forward starting loan commitments, but exclude prolongations of loans that do not increase the initially committed loan
amount. Unutilized credit facilities exclude unconditionally revocable and uncommitted credit facilities, even if they attract RWA. 2 Includes primarily partial or full repayments, as well as currency effects.
p
Credit risk mitigation
Semi-annual |
secured exposures, with additional information about the security type.
Compared with 31 December 2023, the carrying amount of unsecured loans, including balances at central banks,
decreased by USD 72.0bn to USD 326.3bn, mainly due to the repayment of funding from the Swiss National Bank,
including the repayment of the remaining funding drawn under the ELA facility and currency effects.
The carrying amount of partially or fully secured loans decreased by USD 39.5bn to USD 549.2bn, primarily driven by
currency effects and decreases in Non-core and Legacy, mainly resulting from our actions to actively unwind the portfolio,
in addition to the natural roll-off.
CR3: Credit risk mitigation techniques – overview
1
Secured portion of exposures partially or fully secured:
USD m
Exposures fully
unsecured: carrying
amount
Exposures partially
or fully secured:
carrying amount
Total: carrying
amount
Exposures secured
by collateral
Exposures secured
by financial
guarantees
Exposures secured
by credit derivatives
30.6.24
1
Loans
2
1a
of which: cash and balances at central
banks
2
Debt securities
3
Total
4
of which: defaulted
3
31.12.23
1
Loans
2
1a
of which: cash and balances at central
banks
2
Debt securities
3
Total
4
of which: defaulted
3
1 Exposures in this table represent carrying amounts in accordance with the regulatory scope of consolidation. 2 Loan exposure is reported in line with the Pillar 3 definition. Refer to “Credit risk exposure categories”
in the “Credit risk“ section of the 31 December 2023 Pillar 3 Report, available under “Pillar 3 disclosures” at ubs.com/investors for more information about the classification of loans and debt securities. 3 Includes
purchased credit-impaired assets when defaulted.
p
30 June 2024 Pillar 3 Report |
UBS Group | Credit risk 10
Credit risk under the standardized approach
Introduction
The standardized approach is generally applied where using the A-IRB approach is not feasible. Under the standardized
approach we use, where possible, credit ratings from external credit assessment institutions to determine the risk
weightings applied to rated counterparties.
Credit risk exposure and credit risk mitigation effects
Semi-annual |
The CR4 table below illustrates the credit risk exposure and effect of credit risk mitigation (CRM) on the
calculation of capital requirements under the standardized approach.
Compared with 31 December 2023, exposures before credit conversion factors (CCFs) and CRM in the Central
governments and central banks asset class decreased by USD 28.0bn to USD 60.4bn, mainly due to a decrease in cash
and central bank balances, including the repayment of the remaining funding drawn under the Swiss National Bank ELA
facility.
Exposures before CCFs and CRM in the Corporates asset class decreased by USD 10.3bn to USD 58.4bn and exposures
after CCFs and CRM decreased by USD 8.4bn to USD 43.2bn and RWA decreased by USD 7.1bn to USD 29.3bn, primarily
driven by decreases in Non-core and Legacy, mainly driven by our actions to actively unwind the portfolio, in addition to
the natural roll-off, and a methodology change related to the establishing of a new model for commercial real estate,
which resulted in a transition of these exposures from the standardized approach to the A-IRB approach.
CR4: Standardized approach – credit risk exposure and credit risk mitigation (CRM) effects
Exposures
before CCF and CRM
Exposures
post-CCF and post-CRM
RWA and RWA density
USD m, except where indicated
On-balance
sheet
amount
Off-balance
sheet
amount
Total
On-balance
sheet
amount
Off-balance
sheet
amount
Total
RWA
RWA density
in %
30.6.24
Asset classes
1
Central governments and central banks
2
Banks and securities dealers
3
Public-sector entities and multi-lateral development banks
4
Corporates
5
Retail
6
Equity
7
Other assets
7a
of which: non-counterparty related assets
7b
of which: others
8
Total
31.12.23
Asset classes
1
Central governments and central banks
2
Banks and securities dealers
3
Public-sector entities and multi-lateral development banks
4
Corporates
5
Retail
6
Equity
7
Other assets
7a
of which: non-counterparty related assets
7b
of which: others
8
Total
p
30 June 2024 Pillar 3 Report |
UBS Group | Credit risk 11
Exposures by asset classes and risk weight
Semi-annual |
weights applied.
CR5: Standardized approach – exposures by asset classes and risk weights
USD m
Risk weight
0%
10%
20%
35%
50%
75%
100%
150%
Others
Total credit
exposures amount
(post-CCF and
post-CRM)
30.6.24
Asset classes
1
Central governments and central banks
2
Banks and securities dealers
3
Public-sector entities and multi-lateral development banks
4
Corporates
1
5
Retail
6
Equity
7
Other assets
7a
of which: non-counterparty related assets
7b
of which: others
8
Total
9
of which: secured by real estate
10
of which: past due
31.12.23
Asset classes
1
Central governments and central banks
2
Banks and securities dealers
3
Public-sector entities and multi-lateral development banks
4
Corporates
1
5
Retail
6
Equity
7
Other assets
7a
of which: non-counterparty related assets
7b
of which: others
8
Total
9
of which: secured by real estate
10
of which: past due
1 Includes exposures secured by credit derivatives cleared through central counterparties risk-weighted at 2% or 4%. 2 Includes both residential mortgages and claims secured by other properties, such as commercial
real estate. 3 Includes exposure to defaulted counterparties and purchased credit-impaired assets.
p
30 June 2024 Pillar 3 Report |
UBS Group | Credit risk 12
Credit risk under the advanced internal ratings-based approach
Introduction
Under the A-IRB approach, the required capital for credit risk is quantified through empirical models that we have
developed to estimate the probability of default (PD), loss given default (LGD), exposure at default (EAD) and other
parameters, subject to FINMA approval.
Credit risk exposures by portfolio and probability of default range
Semi-annual |
The CR6 table below provides information about credit risk exposures under the A-IRB approach, including a
breakdown of the main parameters used in A-IRB models to calculate the capital requirements, presented by portfolio
and PD range across FINMA-defined asset classes. EAD in the following comments represents exposure at default after
credit conversion factors and credit risk mitigation.
Compared with 31 December 2023, EAD decreased by USD 91.9bn to USD 965.9bn, and RWA decreased by USD 16.9bn
to USD 190.0bn across various asset classes.
In the Central governments and central banks asset class, EAD decreased by USD 37.8bn to USD 243.6bn, and RWA
remained broadly unchanged at USD 4.7bn. EAD decreased mainly due to a decrease in cash and balances at central
banks, including the repayment of the remaining funding drawn under the Swiss National Bank ELA facility and currency
effects.
In the Banks and securities dealers asset class both EAD (at USD 16.4bn) and RWA (at USD 7.1bn) remained broadly
unchanged in the first half of 2024.
In the Public-sector entities and multi-lateral development banks asset class both EAD (at USD 7.9bn) and RWA (at
USD 0.9bn) remained broadly unchanged in the first half of 2024.
In the Corporates: specialized lending asset class, EAD decreased by USD 5.3bn to USD 57.6bn, and RWA decreased by
USD 1.5bn to USD 25.9bn. The decreases mainly reflected currency effects and decreases in loan balances in Personal &
Corporate Banking and Global Wealth Management, partly offset by a methodology change related to the establishing
of a new model for commercial real estate, which resulted in a transition of these exposures from the standardized
approach to the A-IRB approach.
In the Corporates: other lending asset class, EAD decreased by USD 18.2bn to USD 110.9bn, and RWA decreased by
USD 10.9bn to USD 65.0bn. The decreases were primarily driven by decreases in Non-core and Legacy, mainly due to our
actions to actively unwind the portfolio, in addition to the natural roll-off, a decrease due to a model update related to
small and medium-sized enterprises in Personal & Corporate Banking, and a decrease in loan balances in Global Wealth
Management, as well as currency effects. A further reduction in RWA was related to the recalibration of certain multipliers
as a result of improvements to models, primarily in the Investment Bank.
In the Retail: residential mortgages asset class, EAD decreased by USD 21.2bn to USD 290.4bn, and RWA decreased by
USD 4.9bn to USD 59.7bn. The decreases mainly reflected currency effects and decreases in loan balances in Global
Wealth Management and Personal & Corporate Banking. An additional reduction in RWA resulted from financial resource
optimization, mainly in Personal & Corporate Banking.
In the Retail: qualifying revolving retail exposures (QRRE) asset class both EAD (at USD 7.2bn) and RWA (at USD 1.3bn)
remained broadly unchanged in the first half of 2024.
In the Retail: other retail asset class, EAD decreased by USD 8.6bn to USD 231.8bn, and RWA remained broadly
unchanged at USD 25.4bn. The decrease in EAD mainly reflected currency effects and a decrease in Lombard loans in
Global Wealth Management and Personal & Corporate Banking, partly offset by a model update related to small and
medium-sized enterprises.
›
Refer to the “CR8: RWA flow statements of credit risk exposures under IRB” table in this section for more information about the
movement of credit risk exposures under the A-IRB approach for the second quarter of 2024
30 June 2024 Pillar 3 Report |
UBS Group | Credit risk 13
CR6: IRB – Credit risk exposures by portfolio and PD range
USD m, except where indicated
Original on-
balance sheet
gross exposure
Off-balance
sheet exposures
pre-CCF
Total
exposures
pre-CCF
Average CCF
in %
EAD post-CCF
and post-CRM
Average PD
in %
Number of
obligors (in
thousands)
1
Average LGD
in %
2
Average
maturity in
years
2
RWA
RWA density
in %
EL
Provisions
3
Central governments and central banks as of 30.6.24
0.00 to <0.15
<0.1
0.15 to <0.25
<0.1
0.25 to <0.50
<0.1
0.50 to <0.75
<0.1
0.75 to <2.50
<0.1
2.50 to <10.00
<0.1
10.00 to <100.00
<0.1
100.00 (default)
4
<0.1
Subtotal
Central governments and central banks as of 31.12.23
0.00 to <0.15
<0.1
0.15 to <0.25
<0.1
0.25 to <0.50
<0.1
0.50 to <0.75
<0.1
0.75 to <2.50
<0.1
2.50 to <10.00
<0.1
10.00 to <100.00
<0.1
100.00 (default)
4
<0.1
Subtotal
Banks and securities dealers as of 30.6.24
0.00 to <0.15
0.15 to <0.25
0.25 to <0.50
0.50 to <0.75
<0.1
0.75 to <2.50
2.50 to <10.00
10.00 to <100.00
<0.1
100.00 (default)
4
<0.1
Subtotal
Banks and securities dealers as of 31.12.23
0.00 to <0.15
0.15 to <0.25
0.25 to <0.50
0.50 to <0.75
0.75 to <2.50
2.50 to <10.00
10.00 to <100.00
<0.1
100.00 (default)
4
<0.1
Subtotal
30 June 2024 Pillar 3 Report |
UBS Group | Credit risk 14
CR6: IRB – Credit risk exposures by portfolio and PD range (continued)
USD m, except where indicated
Original on-
balance sheet
gross exposure
Off-balance
sheet exposures
pre-CCF
Total
exposures
pre-CCF
Average CCF
in %
EAD post-CCF
and post-CRM
Average PD
in %
Number of
obligors (in
thousands)
1
Average LGD
in %
2
Average
maturity in
years
2
RWA
RWA density
in %
EL
Provisions
3
Public sector entities, multilateral developmental banks as of 30.6.24
0.00 to <0.15
0.15 to <0.25
0.25 to <0.50
0.50 to <0.75
<0.1
0.75 to <2.50
<0.1
2.50 to <10.00
<0.1
10.00 to <100.00
100.00 (default)
4
<0.1
Subtotal
Public sector entities, multilateral developmental banks as of 31.12.23
0.00 to <0.15
0.15 to <0.25
0.25 to <0.50
0.50 to <0.75
<0.1
0.75 to <2.50
<0.1
2.50 to <10.00
<0.1
10.00 to <100.00
100.00 (default)
4
Subtotal
Corporates: specialized lending as of 30.6.24
0.00 to <0.15
0.15 to <0.25
0.25 to <0.50
0.50 to <0.75
0.75 to <2.50
2.50 to <10.00
10.00 to <100.00
<0.1
100.00 (default)
4
<0.1
Subtotal
Corporates: specialized lending as of 31.12.23
0.00 to <0.15
0.15 to <0.25
0.25 to <0.50
0.50 to <0.75
0.75 to <2.50
2.50 to <10.00
10.00 to <100.00
<0.1
100.00 (default)
4
<0.1
Subtotal
30 June 2024 Pillar 3 Report |
UBS Group | Credit risk 15
CR6: IRB – Credit risk exposures by portfolio and PD range (continued)
USD m, except where indicated
Original on-
balance sheet
gross exposure
Off-balance
sheet exposures
pre-CCF
Total
exposures
pre-CCF
Average CCF
in %
EAD post-CCF
and post-CRM
Average PD
in %
Number of
obligors (in
thousands)
1
Average LGD
in %
2
Average
maturity in
years
2
RWA
RWA density
in %
EL
Provisions
3
Corporates: other lending as of 30.6.24
0.00 to <0.15
0.15 to <0.25
0.25 to <0.50
0.50 to <0.75
0.75 to <2.50
2.50 to <10.00
10.00 to <100.00
100.00 (default)
4
Subtotal
Corporates: other lending as of 31.12.23
0.00 to <0.15
0.15 to <0.25
0.25 to <0.50
0.50 to <0.75
0.75 to <2.50
2.50 to <10.00
10.00 to <100.00
100.00 (default)
4
Subtotal
Retail: residential mortgages as of 30.6.24
0.00 to <0.15
0.15 to <0.25
0.25 to <0.50
0.50 to <0.75
0.75 to <2.50
2.50 to <10.00
10.00 to <100.00
100.00 (default)
4
Subtotal
Retail: residential mortgages as of 31.12.23
0.00 to <0.15
0.15 to <0.25
0.25 to <0.50
0.50 to <0.75
0.75 to <2.50
2.50 to <10.00
10.00 to <100.00
100.00 (default)
4
Subtotal
30 June 2024 Pillar 3 Report |
UBS Group | Credit risk 16
CR6: IRB – Credit risk exposures by portfolio and PD range (continued)
USD m, except where indicated
Original on-
balance sheet
gross exposure
Off-balance
sheet exposures
pre-CCF
Total
exposures
pre-CCF
Average CCF
in %
EAD post-CCF
and post-CRM
Average PD
in %
Number of
obligors (in
thousands)
1
Average LGD
in %
2
Average
maturity in
years
2
RWA
RWA density
in %
EL
Provisions
3
Retail: qualifying revolving retail exposures (QRRE) as of 30.6.24
0.00 to <0.15
0.15 to <0.25
0.25 to <0.50
0.50 to <0.75
0.75 to <2.50
2.50 to <10.00
10.00 to <100.00
100.00 (default)
4
Subtotal
Retail: qualifying revolving retail exposures (QRRE) as of 31.12.23
0.00 to <0.15
0.15 to <0.25
0.25 to <0.50
0.50 to <0.75
0.75 to <2.50
2.50 to <10.00
10.00 to <100.00
100.00 (default)
4
Subtotal
Retail: other retail as of 30.6.24
0.00 to <0.15
0.15 to <0.25
0.25 to <0.50
0.50 to <0.75
0.75 to <2.50
2.50 to <10.00
10.00 to <100.00
100.00 (default)
4
Subtotal
Retail: other retail as of 31.12.23
0.00 to <0.15
0.15 to <0.25
0.25 to <0.50
0.50 to <0.75
0.75 to <2.50
2.50 to <10.00
10.00 to <100.00
100.00 (default)
4
Subtotal
Total 30.6.24
Total 31.12.23
1 Numbers of obligors represent an aggregation of the client relationships in the UBS Group excluding Credit Suisse along with the client relationships in Credit Suisse. RWA calculations are based on the applicable rules and models approved by FINMA for the respective legal entities. 2 Defaulted exposures disclosed
in the table are excluded from average loss given default (LGD) and average maturity information as not relevant for risk weighting. Furthermore, Retail asset classes are excluded from the average maturity, as maturity is not relevant for risk weighting. 3 In line with BCBS Pillar 3 disclosure requirements, provisions are
only provided for the sub-totals by asset class. Provisions reflect IFRS Accounting Standards Expected Credit Losses accounting provisions for credit losses on A-IRB exposures. 4 Includes defaulted purchased credit-impaired assets.
p
30 June 2024 Pillar 3 Report |
UBS Group | Credit risk 17
Credit derivatives used as credit risk mitigation techniques
Semi-annual |
Where credit derivatives are used as CRM techniques, the PD of the obligor is in general substituted with the
PD of the hedge provider. In addition, default correlation between the obligor and the hedge provider is taken into
account through the double default approach. The impact of credit derivatives used as CRM techniques on A-IRB credit
risk has been immaterial for past reporting periods and continued to be immaterial for this reporting period. Therefore,
we have discontinued the disclosure of the “CR7: IRB – effect on RWA of credit derivatives used as CRM techniques”
table, in line with FINMA Circular 2016/1, General principles of disclosure.
p
›
Refer to the “CCR6: Credit derivatives exposures” table in the “Counterparty credit risk” section of this report for notional and fair
value information about credit derivatives used as CRM techniques
Risk-weighted assets flow statements of credit risk exposures under the internal ratings-based approach
Quarterly |
movement categories defined by the Basel Committee on Banking Supervision (the BCBS).
Credit risk RWA under the internal ratings -based (IRB) approach decreased by USD 6.9bn to USD 191.6bn during the
second quarter of 2024. This balance includes credit risk under the A-IRB approach, as well as credit risk under the
supervisory slotting approach.
Movements in asset size drove a USD 5.6bn decrease in RWA, due to a decrease in loan balances in Global Wealth
Management and Personal & Corporate Banking, as well as reductions in Non-core and Legacy, mainly driven by our
actions to actively unwind the portfolio, in addition to the natural roll-off.
Movements in asset quality, including changes in risk density across the overall portfolio, decreased RWA by USD 1.0bn,
mainly resulting from financial resource optimization in Global Wealth Management and Personal & Corporate Banking.
Such decreases were partly offset by changes in risk density in other business divisions.
Model updates decreased RWA by USD 2.2bn, primarily related to the recalibration of certain multipliers as a result of
improvements to models, primarily in the Investment Bank and Personal & Corporate Banking.
Methodology and policy changes resulted in an RWA increase of USD 1.8bn, mainly related to the establishing of a new
model for commercial real estate, which resulted in a transition of these exposures from the standardized approach to
the A-IRB approach.
Currency effects, driven by the weakening of the US dollar against other major currencies, resulted in an RWA increase
of USD 0.2bn.
›
Refer to the “Definitions of credit risk and counterparty credit risk RWA movement table components for CR8 and CCR7” in the
“Credit risk” section of the 31 December 2023 Pillar 3 Report, available under “Pillar 3 disclosures” at
ubs.com/investors
, for
definitions of credit risk RWA movement table components
CR8: RWA flow statements of credit risk exposures under IRB
USD m
For the quarter
ended 30.6.24
For the quarter
ended 31.3.24
1
RWA as of the beginning of the quarter
2
Asset size
3
Asset quality
4
Model updates
5
Methodology and policy
5a
of which: regulatory add-ons
6
Acquisitions and disposals
7
Foreign exchange movements
8
Other
9
RWA as of the end of the quarter
p
30 June 2024 Pillar 3 Report |
UBS Group | Credit risk 18
Specialized lending
Semi-annual |
approach. Exposures related to specialized lending for the UBS Group excluding Credit Suisse are included in the “CR6:
IRB – Credit risk exposures by portfolio and PD range” table in this section.
CR10: Specialized lending
USD m, except where indicated
On-balance sheet
amount
Off-balance sheet
amount
Risk weight
in %
Exposure amount
1
RWA
EL
30.6.24
Other than high-volatility commercial real estate
Regulatory categories and remaining maturity
Strong
Less than 2.5 years
Equal to or more than 2.5 years
Good
Less than 2.5 years
Equal to or more than 2.5 years
Satisfactory
2
Weak
Default
Total
High-volatility commercial real estate
Regulatory categories and remaining maturity
Default
Total
31.12.23
Other than high-volatility commercial real estate
Regulatory categories and remaining maturity
Strong
Less than 2.5 years
Equal to or more than 2.5 years
Good
Less than 2.5 years
Equal to or more than 2.5 years
Satisfactory
2
Weak
Default
Total
High-volatility commercial real estate
Regulatory categories and remaining maturity
Default
Total
1 Exposure amounts in connection with income-producing real estate. 2 For a portion of the exposure, a risk weight of 120% is applied.
p
Equity exposures
Semi-annual |
The table below provides information about our equity exposures under the simple risk-weight method.
Compared with 31 December 2023, RWA from equity positions under the simple risk-weight approach increased by
USD 0.3bn to USD 5.8bn.
CR10: IRB (equities under the simple risk-weight method)
USD m, except where indicated
On-balance sheet
amount
Off-balance sheet
amount
Risk weight
in %
1
Exposure amount
2
RWA
1
30.6.24
Exchange-traded equity exposures
Other equity exposures
Total
31.12.23
Exchange-traded equity exposures
Other equity exposures
Total
1 RWA are calculated post-application of the A-IRB multiplier of 6%, therefore the respective risk weight is higher than 300% and 400%. 2 The exposure amount for equities in the banking book is based on the
net position.
p
30 June 2024 Pillar 3 Report |
UBS Group | Counterparty credit risk 19
Counterparty credit risk
Introduction
Semi-annual I
This section provides information about the exposures subject to the Basel III counterparty credit risk (CCR)
framework. CCR arises from over-the-counter (OTC) derivatives and exchange-traded derivatives (ETDs), securities
financing transactions (SFTs), and long settlement transactions. We determine the regulatory credit exposure on the
majority of our derivatives portfolio by applying the internal model method (IMM). For the remainder of the derivatives
portfolio we apply the standardized approach for counterparty credit risk (SA-CCR). For the majority of SFTs we determine
the regulatory credit exposure using the value-at-risk (VaR) approach. For the remainder of the SFTs portfolio we apply
the comprehensive approach for credit risk mitigation.
p
Counterparty credit risk exposure
Semi-annual I
The CCR1 table below presents the methods used to calculate CCR exposure. Compared with 31 December
2023, exposures on SFTs under the VaR approach decreased by USD 5.6bn to USD 37.3bn, mainly reflecting lower levels
of client activity. Derivative exposures subject to the IMM decreased by USD 2.2bn, primarily from decreases in Non-core
and Legacy, due to our actions to actively unwind the portfolio, in addition to the natural roll-off.
CCR1: Analysis of counterparty credit risk (CCR) exposure by approach
Replacement cost
Potential future
exposure
EEPE
Alpha used for
computing
regulatory EAD
EAD
post-CRM
RWA
30.6.24
1
SA-CCR (for derivatives)
2
Internal model method (for derivatives)
1
3
Simple approach for credit risk mitigation (for SFTs)
4
Comprehensive approach for credit risk mitigation (for SFTs)
5
VaR (for SFTs)
6
Total
31.12.23
1
SA-CCR (for derivatives)
2
Internal model method (for derivatives)
1
3
Simple approach for credit risk mitigation (for SFTs)
4
Comprehensive approach for credit risk mitigation (for SFTs)
5
VaR (for SFTs)
6
Total
1 A conservative treatment for the purpose of calculating exposure profiles is applied to material trades with wrong-way risk features, along with an alpha factor of 1.0.
p
30 June 2024 Pillar 3 Report |
UBS Group | Counterparty credit risk 20
Semi-annual |
The CCR2 table below presents the credit valuation adjustment (CVA) capital charge with a breakdown by
standardized and advanced approaches. In addition to the default risk capital requirements for CCR on derivatives, we
add a CVA capital charge to cover the risk of mark-to-market losses associated with the deterioration of counterparty
credit quality. The advanced CVA VaR approach has been used to calculate the CVA capital charge for the majority of
derivatives. Where this is not feasible, the standardized CVA approach has been used.
Compared with 31 December 2023, CVA risk-weighted assets (RWA) decreased by USD 1.5bn to USD 7.4bn, primarily
reflecting decreases in exposures on derivatives subject to the advanced CVA capital change within Non-core and Legacy.
During the first half of 2024, USD 1.5bn of RWA was reclassified from advanced CVA to standardized CVA, better aligning
the CVA capital treatment across the Group.
CCR2: Credit valuation adjustment (CVA) capital charge
30.6.24
31.12.23
USD m
EAD post-CRM
RWA
EAD post-CRM
RWA
Total portfolios subject to the advanced CVA capital charge
1
(i) VaR component (including the 3× multiplier)
2
(ii) Stressed VaR component (including the 3× multiplier)
3
All portfolios subject to the standardized CVA capital charge
4
Total subject to the CVA capital charge
p
Semi-annual |
We have discontinued the disclosure of the “CCR3: Standardized approach – CCR exposures by regulatory
portfolio and risk weights” table, starting with the 31 December 2022 Pillar 3 Report, on the grounds of materiality. The
majority of our CCR exposures are subject to advanced internal ratings-based (A-IRB) risk weights or disclosed separately
when related to central counterparties.
p
›
Refer to the “CCR4: IRB – CCR exposures by portfolio and PD scale” and the “CCR8: Exposures to central counterparties” tables in
this section for more information about CCR exposures subject to A-IRB risk weights and central counterparties, respectively
30 June 2024 Pillar 3 Report |
UBS Group | Counterparty credit risk 21
Semi-annual |
The CCR4 table below provides a breakdown of the key parameters used for the calculation of capital
requirements under the A-IRB approach across Swiss Financial Market Supervisory Authority (FINMA)-defined asset
classes. EAD in this section represents exposure at default after credit risk mitigation.
Compared with 31 December 2023, EAD decreased by USD 6.3bn to USD 111.1bn across the various asset classes, and
RWA decreased by USD 1.8bn to USD 34.3bn.
In the Central governments and central banks asset class, EAD decreased by USD 4.9bn to USD 7.8bn, mainly as a result
of decreased activity in SFTs in Group Treasury. RWA decreased by USD 0.2bn to USD 0.6bn.
In the Banks and securities dealers asset class, EAD decreased by USD 5.3bn to USD 25.9bn, and RWA decreased by
USD 1.5bn to USD 7.2bn, primarily driven by lower derivative exposures in the Investment Bank and Group Treasury.
In the Public-sector entities and multi-lateral development banks asset class, EAD decreased by USD 0.2bn to USD 0.9bn.
RWA remained unchanged at USD 0.1bn.
In the Corporates asset class, EAD increased by USD 1.2bn to USD 65.3bn, primarily due to exposure increases in SFTs in
the Investment Bank, partly offset by lower derivative exposures in Non-core and Legacy, driven by our actions to actively
unwind the portfolio, in addition to the natural roll-off. RWA decreased by USD 0.5bn to USD 25.2bn, primarily due to
the aforementioned exposure decrease in Non-core and Legacy.
In the Retail: other retail asset class, EAD increased by USD 3.0bn to USD 11.1bn, and RWA increased by USD 0.4bn to
USD 1.3bn, mainly due to an increase in derivative exposures in Global Wealth Management.
›
Refer to the “CCR7: RWA flow statements of CCR exposures under the internal model method (IMM) and value-at-risk (VaR)” table
in this section for more information about RWA, including details of movements in CCR RWA
CCR4: IRB – CCR exposures by portfolio and PD scale
USD m, except where indicated
EAD post-CRM
Average PD
in %
Number of obligors
(in thousands)
1
Average LGD
in %
2
Average maturity
in years
2
RWA
RWA density
in %
Central governments and central banks as of 30.6.24
0.00 to <0.15
0.15 to <0.25
< 0.1
0.25 to <0.50
< 0.1
0.50 to <0.75
< 0.1
0.75 to <2.50
< 0.1
2.50 to <10.00
10.00 to <100.00
100.00 (default)
Subtotal
Central governments and central banks as of 31.12.23
0.00 to <0.15
0.15 to <0.25
< 0.1
0.25 to <0.50
< 0.1
0.50 to <0.75
< 0.1
0.75 to <2.50
< 0.1
2.50 to <10.00
10.00 to <100.00
100.00 (default)
Subtotal
Banks and securities dealers as of 30.6.24
0.00 to <0.15
0.15 to <0.25
0.25 to <0.50
0.50 to <0.75
< 0.1
0.75 to <2.50
2.50 to <10.00
< 0.1
10.00 to <100.00
< 0.1
100.00 (default)
Subtotal
Banks and securities dealers as of 31.12.23
0.00 to <0.15
0.15 to <0.25
0.25 to <0.50
0.50 to <0.75
< 0.1
0.75 to <2.50
2.50 to <10.00
< 0.1
10.00 to <100.00
< 0.1
100.00 (default)
Subtotal
30 June 2024 Pillar 3 Report |
UBS Group | Counterparty credit risk 22
CCR4: IRB – CCR exposures by portfolio and PD scale (continued)
USD m, except where indicated
EAD post-CRM
Average PD
in %
Number of obligors
(in thousands)
1
Average LGD
in %
2
Average maturity
in years
2
RWA
RWA density
in %
Public-sector entities and multi-lateral development banks as of 30.6.24
0.00 to <0.15
< 0.1
0.15 to <0.25
< 0.1
0.25 to <0.50
< 0.1
0.50 to <0.75
0.75 to <2.50
< 0.1
2.50 to <10.00
10.00 to <100.00
100.00 (default)
Subtotal
< 0.1
Public-sector entities and multi-lateral development banks as of 31.12.23
0.00 to <0.15
< 0.1
0.15 to <0.25
< 0.1
0.25 to <0.50
< 0.1
0.50 to <0.75
0.75 to <2.50
< 0.1
2.50 to <10.00
10.00 to <100.00
100.00 (default)
Subtotal
< 0.1
Corporates as of 30.6.24
3
0.00 to <0.15
0.15 to <0.25
0.25 to <0.50
0.50 to <0.75
0.75 to <2.50
2.50 to <10.00
10.00 to <100.00
< 0.1
100.00 (default)
< 0.1
Subtotal
Corporates as of 31.12.23
3
0.00 to <0.15
0.15 to <0.25
0.25 to <0.50
0.50 to <0.75
0.75 to <2.50
2.50 to <10.00
10.00 to <100.00
< 0.1
100.00 (default)
< 0.1
Subtotal
Retail: other retail as of 30.6.24
0.00 to <0.15
0.15 to <0.25
0.25 to <0.50
0.50 to <0.75
0.75 to <2.50
2.50 to <10.00
10.00 to <100.00
< 0.1
100.00 (default)
< 0.1
Subtotal
Retail: other retail as of 31.12.23
0.00 to <0.15
0.15 to <0.25
0.25 to <0.50
0.50 to <0.75
0.75 to <2.50
2.50 to <10.00
10.00 to <100.00
< 0.1
100.00 (default)
< 0.1
Subtotal
Total 30.6.24
Total 31.12.23
1 Numbers of obligors represent an aggregation of the client relationships in the UBS Group excluding Credit Suisse along with the client relationships in Credit Suisse. RWA calculations are based on the applicable
rules and models approved by FINMA for the respective legal entities. 2 Defaulted exposures disclosed in the table are excluded from average loss given default (LGD) and average maturity information as not relevant
for risk weighting. Furthermore, Retail asset classes are excluded from the average maturity, as they are not subject to maturity treatment. 3 Includes exposures to managed funds.
p
30 June 2024 Pillar 3 Report |
UBS Group | Counterparty credit risk 23
Semi-annual |
The CCR5 table below presents a breakdown of collateral posted or received relating to CCR exposures from
derivative transactions and SFTs .
Compared with 31 December 2023, the fair value of collateral received for SFTs decreased by USD 14.5bn to
USD 686.3bn, and the fair value of collateral posted for SFTs decreased by USD 29.6bn to USD 535.1bn, mainly related
to decreases in sovereign and other debt securities, primarily from Non-core and Legacy, due to our actions to actively
unwind the portfolio, in addition to the natural roll-off. The decrease in the fair value of collateral received was partly
offset by an increase in equity securities received.
The fair value of collateral received for derivatives decreased by USD 6.8bn to USD 119.6bn, and the fair value of collateral
posted for derivatives decreased by USD 10.7bn to USD 85.8bn, primarily from decreases in Non-core and Legacy, due
to our actions to actively unwind the portfolio, in addition to the natural roll-off.
CCR5: Composition of collateral for CCR exposure
1
Collateral used in derivative transactions
Collateral used in SFTs
Fair value of collateral received
Fair value of posted collateral
Fair value of
collateral received
Fair value of
posted collateral
USD m
Segregated
Unsegregated
Total
Segregated
Unsegregated
Total
30.6.24
Cash – domestic currency
Cash – other currencies
Sovereign debt
Other debt securities
Equity securities
Other collateral
2
Total
31.12.23
Cash – domestic currency
Cash – other currencies
Sovereign debt
Other debt securities
Equity securities
Other collateral
2
Total
1 This table includes collateral received and posted with and without the right of rehypothecation but excludes securities placed with central banks related to undrawn credit lines and for payment, clearing and
settlement purposes for which there were no associated liabilities or contingent liabilities. 2 Includes fund investments, asset-backed securities, and mortgage-backed securities.
p
Semi-annual |
The CCR6 table below presents an overview of credit risk protection bought or sold through credit derivatives.
Compared with 31 December 2023, notionals for credit derivatives decreased by USD 35.6bn to USD 115.1bn for
protection bought and by USD 44.6bn to USD 88.2bn for protection sold, primarily driven by index credit default swaps
and single-name credit default swaps in Non-core and Legacy, mainly driven by our actions to actively unwind the
portfolio, in addition to the natural roll-off.
CCR6: Credit derivatives exposures
30.6.24
31.12.23
USD m
Protection
bought
Protection
sold
Protection
bought
Protection
sold
Notionals
1
Single-name credit default swaps
Index credit default swaps
Total return swaps
Credit options
Total notionals
Fair values
Positive fair value (asset)
Negative fair value (liability)
1 Includes notional amounts for client-cleared transactions.
p
30 June 2024 Pillar 3 Report |
UBS Group | Counterparty credit risk 24
Counterparty credit risk risk-weighted assets
Quarterly |
The CCR7 table below presents a flow statement explaining changes in CCR RWA determined under the internal
model method (the IMM) for derivatives and the VaR approach for SFTs.
CCR RWA on derivatives under the IMM increased by USD 0.5bn to USD 16.5bn during the second quarter of 2024.
Asset quality movements contributed to a USD 1.5bn increase in RWA, primarily due to changes in average risk density
in the Investment Bank. These increases were partly offset by asset size movements that contributed to a USD 0.7bn
decrease in RWA. That decrease was mainly due to a decrease in Non-core and Legacy, driven by our actions to actively
unwind the portfolio, in addition to the natural roll-off, and a decrease in the Investment Bank. Model updates resulted
in a decrease of USD 0.3bn, primarily related to the recalibration of certain multipliers as a result of improvements to
models.
CCR RWA on SFTs under the VaR approach remained stable at USD 9.7bn during the second quarter of 2024. Asset
quality movements contributed to a USD 1.0bn increase in RWA, primarily due to an increase in the risk profile in Group
Treasury. These increases were largely offset by a decrease of USD 0.9bn due to asset size movements, primarily in the
Investment Bank.
›
Refer to “Definitions of credit risk and counterparty credit risk RWA movement table components for CR8 and CCR7” in the
“Credit risk” section of the 31 December 2023 Pillar 3 Report, available under “Pillar 3 disclosures” at
ubs.com/investors
, for
definitions of CCR RWA movement table components
CCR7: RWA flow statements of CCR exposures under internal model method (IMM) and value-at-risk (VaR)
For the quarter ended 30.6.24
For the quarter ended 31.3.24
USD m
Derivatives
SFTs
Total
Derivatives
SFTs
Total
Subject to IMM
Subject to VaR
Subject to IMM
Subject to VaR
1
RWA as of the beginning of the quarter
2
Asset size
3
Credit quality of counterparties
4
Model updates
5
Methodology and policy
5a
of which: regulatory add-ons
6
Acquisitions and disposals
7
Foreign exchange movements
8
Other
9
RWA as of the end of the quarter
p
Semi-annual |
The CCR8 table below presents a breakdown of exposures to central counterparties and related RWA.
Compared with 31 December 2023, exposures to qualifying central counterparties decreased by USD 28.3bn to
USD 64.5bn, and related RWA decreased by USD 0.7bn to USD 2.3bn. This was primarily due to a reduction in Non-core
and Legacy, mainly driven by our actions to actively unwind the portfolio, in addition to the natural roll-off, as well
decreases in the Investment Bank.
CCR8: Exposures to central counterparties
30.6.24
31.12.23
USD m
EAD (post-CRM)
RWA
EAD (post-CRM)
RWA
1
Exposures to QCCPs (total)
1
2
Exposures for trades at QCCPs (excluding initial margin and default fund contributions); of which
3
(i) OTC derivatives
4
(ii) Exchange-traded derivatives
5
(iii) Securities financing transactions
6
(iv) Netting sets where cross-product netting has been approved
7
Segregated initial margin
8
Non-segregated initial margin
2
9
Pre-funded default fund contributions
10
Unfunded default fund contributions
11
Exposures to non-QCCPs (total)
12
Exposures for trades at non-QCCPs (excluding initial margin and default fund contributions); of which
13
(i) OTC derivatives
14
(ii) Exchange-traded derivatives
15
(iii) Securities financing transactions
16
(iv) Netting sets where cross-product netting has been approved
17
Segregated initial margin
18
Non-segregated initial margin
2
19
Pre-funded default fund contributions
20
Unfunded default fund contributions
3
1 Qualifying central counterparties (QCCPs) are entities licensed by regulators to operate as CCPs and meet the requirements outlined in FINMA Circular 2017/7 “Credit risks – banks”. 2 Exposures associated with
initial margin, where the exposures are measured under the IMM or the VaR approach, have been included within the exposures for trades (refer to line 2 for QCCPs and line 12 for non-QCCPs). The exposures for
non-segregated initial margin (refer to line 8 for QCCPs and line 18 for non-QCCPs), i.e., not bankruptcy-remote in accordance with FINMA Circular 2017/7, reflect the replacement costs under SA-CCR multiplied by
an alpha factor of 1.4. The RWA reflect the exposure multiplied by the applied risk weight of derivatives. Under SA-CCR, collateral posted to a segregated, bankruptcy-remote account does not increase the value of
replacement costs. 3 Excludes unfunded default fund contributions that are not subject to RWA calculations in line with regulatory guidance.
p
30 June 2024 Pillar 3 Report |
UBS Group | Securitizations 25
Securitizations
Introduction
Semi-annual |
books based on the Basel III securitization framework.
In a traditional securitization a pool of loans (or other debt obligations) is typically transferred to structured entities that
have been established to own the pool and to issue tranched securities to third-party investors referencing this pool of
loans. In a synthetic securitization legal ownership of securitized pools of assets is typically retained, but associated credit
risk is transferred to structured entities, typically through guarantees, credit derivatives or credit-linked notes. In both
traditional and synthetic securitizations risk is dependent on the seniority of the retained interest and the performance of
the underlying asset pool.
Regulatory capital treatment of securitization structures
For banking book securitizations, the regulatory capital requirements are calculated using the following hierarchy of
approaches: the securitization internal ratings-based approach, the securitization external ratings-based approach or the
securitization standardized approach. Otherwise, a 1,250% risk weight is applied as a fallback. External ratings used in
regulatory capital calculations for securitization risk exposures in the banking book are obtained from Fitch, Moody’s,
S&P or DBRS.
For trading book securitizations, the regulatory capital requirements are calculated using a ratings-based approach, the
supervisory formula approach or the weighted-average risk-weight approach.
p
Securitization exposures in the banking and trading books
Semi-annual |
The SEC1 and SEC2 tables show the balance sheet carrying values of securitization exposures in the banking
and trading books as of 30 June 2024 and 31 December 2023, respectively. For synthetic securitizations, the amounts
disclosed reflect the net exposure at default on retained positions. The securitization activity is further broken down by
role (originator, sponsor or investor) and by securitization type (traditional or synthetic). The SEC3 and SEC4 tables provide
the regulatory capital requirements associated with the banking book securitization exposures differentiated by our role
in the securitization.
Development of securitization exposures in the first half of 2024
Compared with 31 December 2023, securitization exposures in the banking book decreased by USD 19.5bn to
USD 37.2bn, mainly due to the unwinding of securitized products in Non-core and Legacy and the reduction of
securitization hedges.
30 June 2024 Pillar 3 Report |
UBS Group | Securitizations 26
SEC1: Securitization exposures in the banking book
Bank acts as originator
Bank acts as sponsor
Bank acts as investor
Total
USD m
Traditional
Synthetic
Subtotal
Traditional
Synthetic
Subtotal
Traditional
Synthetic
Subtotal
30.6.24
Asset classes
1
Retail (total)
2
of which: residential mortgage
3
of which: credit card receivables
4
of which: other retail exposures
1
5
Wholesale (total)
6
of which: loans to corporates or SME
7
of which: commercial mortgage
8
of which: lease and receivables
9
of which: other wholesale
10
Re-securitization
11
Total securitization / re-securitization
(including retail and wholesale)
31.12.23
Asset classes
1
Retail (total)
2
of which: residential mortgage
3
of which: credit card receivables
4
of which: other retail exposures
1
5
Wholesale (total)
6
of which: loans to corporates or SME
7
of which: commercial mortgage
8
of which: lease and receivables
9
of which: other wholesale
10
Re-securitization
11
Total securitization / re-securitization
(including retail and wholesale)
1 Includes unsecured consumer loans, solar leases and automobile loans.
SEC2: Securitization exposures in the trading book
Bank acts as originator
Bank acts as sponsor
Bank acts as investor
Total
USD m
Traditional
Synthetic
Subtotal
Traditional
Synthetic
Subtotal
Traditional
Synthetic
Subtotal
30.6.24
Asset classes
1
Retail (total)
2
of which: residential mortgage
4
of which: other retail exposures
5
Wholesale (total)
6
of which: loans to corporates or SME
7
of which: commercial mortgage
9
of which: other wholesale
10
Re-securitization
11
Total securitization / re-securitization
(including retail and wholesale)
31.12.23
Asset classes
1
Retail (total)
2
of which: residential mortgage
4
of which: other retail exposures
5
Wholesale (total)
6
of which: loans to corporates or SME
7
of which: commercial mortgage
9
of which: other wholesale
10
Re-securitization
11
Total securitization / re-securitization
(including retail and wholesale)
30 June 2024 Pillar 3 Report |
UBS Group | Securitizations 27
SEC3: Securitization exposures in the banking book and associated regulatory capital requirements – bank acting as originator or as sponsor
USD m
Total
exposure
values
Exposure values (by RW bands)
Exposure values (by regulatory approach)
Total
RWA
RWA (by regulatory approach)
Total capital
charge after
cap
Capital charge after cap
30.6.24
≤20% RW
>20% to
50% RW
>50% to
100% RW
>100% to
<1250% RW
1250% RW
SEC-
IRBA
SEC-
ERBA
SEC-SA
1250%
SEC-
IRBA
SEC-
ERBA
SEC-SA
1250%
SEC-
IRBA
SEC-
ERBA
SEC-SA
1250%
Asset classes
1
Total exposures
2
Traditional securitization
3
of which: securitization
4
of which: retail underlying
5
of which: wholesale
6
of which: re-securitization
7
of which: senior
8
of which: non-senior
9
Synthetic securitization
10
of which: securitization
11
of which: retail underlying
12
of which: wholesale
13
of which: re-securitization
14
of which: senior
15
of which: non-senior
31.12.23
Asset classes
1
Total exposures
2
Traditional securitization
3
of which: securitization
4
of which: retail underlying
5
of which: wholesale
6
of which: re-securitization
7
of which: senior
8
of which: non-senior
9
Synthetic securitization
10
of which: securitization
11
of which: retail underlying
12
of which: wholesale
13
of which: re-securitization
14
of which: senior
15
of which: non-senior
30 June 2024 Pillar 3 Report |
UBS Group | Securitizations 28
SEC4: Securitization exposures in the banking book and associated regulatory capital requirements – bank acting as investor
USD m
Total
exposure
values
Exposure values (by RW bands)
Exposure values (by regulatory approach)
Total
RWA
RWA (by regulatory approach)
Total capital
charge after
cap
Capital charge after cap
30.6.24
≤20% RW
>20% to
50% RW
>50% to
100% RW
>100% to
<1250% RW
1250% RW
SEC-
IRBA
SEC-
ERBA
SEC-SA
1250%
SEC-
IRBA
SEC-
ERBA
SEC-SA
1250%
SEC-
IRBA
SEC-
ERBA
SEC-SA
1250%
Asset classes
1
Total exposures
2
Traditional securitization
3
of which: securitization
4
of which: retail underlying
5
of which: wholesale
6
of which: re-securitization
7
of which: senior
8
of which: non-senior
9
Synthetic securitization
10
of which: securitization
11
of which: retail underlying
12
of which: wholesale
13
of which: re-securitization
14
of which: senior
15
of which: non-senior
31.12.23
Asset classes
1
Total exposures
2
Traditional securitization
3
of which: securitization
4
of which: retail underlying
5
of which: wholesale
6
of which: re-securitization
7
of which: senior
8
of which: non-senior
9
Synthetic securitization
10
of which: securitization
11
of which: retail underlying
12
of which: wholesale
13
of which: re-securitization
14
of which: senior
15
of which: non-senior
p
30 June 2024 Pillar 3 Report |
UBS Group | Market risk 29
Market risk
Overview
Semi-annual |
The amount of capital required to underpin market risk in the regulatory trading book is calculated using a
variety of methods approved by the Swiss Financial Market Supervisory Authority (FINMA). The components contributing
to market risk risk-weighted assets (RWA) are value-at-risk (VaR), stressed value-at-risk (SVaR), an add-on for risks that
are potentially not fully modeled in VaR (risks not in VaR, or RniV), the incremental risk charge (the IRC) and the
securitization framework for securitization positions in the trading book.
p
Securitization positions in the trading book
Semi-annual |
The MR1 table below shows the components of RWA under the standardized approach for market risk. In line
with regulatory requirements, the standardized approach for market risk is used for the specific risk on securitization
exposures.
Securitization exposures in the trading book is the only relevant disclosure component of market risk under the
standardized approach. Compared with 31 December 2023, securitization exposures subject to market risk RWA were
broadly unchanged.
›
Refer to the “Securitizations” section of this report for more information about the securitization exposures in the trading book
MR1: Market risk under standardized approach
RWA
USD m
30.6.24
31.12.23
Outright products
1
Interest rate risk (general and specific)
2
Equity risk (general and specific)
3
Foreign exchange risk
4
Commodity risk
Options
5
Simplified approach
6
Delta-plus method
7
Scenario approach
8
Securitization
9
Total
p
30 June 2024 Pillar 3 Report |
UBS Group | Market risk 30
Market risk risk-weighted assets
Market risk risk-weighted assets development in the second quarter of 2024
Quarterly |
The three main components that contribute to market risk RWA are regulatory VaR, SVaR and the IRC. The VaR
and SVaR components include the RWA charge for RniV.
The MR2 table below provides a breakdown of the movement in market risk RWA in the second quarter of 2024 under
an internal model approach across those components, pursuant to the movement categories defined by the Basel
Committee on Banking Supervision.
Market risk RWA decreased by USD 1.8bn to USD 22.1bn in the second quarter of 2024, driven by a decrease in asset
size and other movements that reflected updates from the monthly RniV assessments.
The FINMA VaR multiplier derived from backtesting exceptions for market risk RWA was unchanged compared with the
prior quarter, at 3.0, for both the UBS Group excluding certain legacy Credit Suisse components and the aforementioned
legacy Credit Suisse components.
›
Refer to “Definitions of market risk RWA movement table components for MR2” in the “Market risk” section of the 31 December
2023 Pillar 3 Report, available under “Pillar 3 disclosures” at
ubs.com/investors
, for definitions of market risk RWA movement
table components
MR2: RWA flow statements of market risk exposures under an IMA
1,2
USD m
VaR
Stressed VaR
IRC
CRM
Other
Total RWA
1
RWA as of 31.12.23
1a
Regulatory adjustment
1b
RWA at previous quarter-end (end of day)
2
Movement in risk levels
3
Model updates / changes
4
Methodology and policy
5
Acquisitions and disposals
6
Foreign exchange movements
7
Other
8a
RWA at the end of the reporting period (end of day)
8b
Regulatory adjustment
8c
RWA as of 31.3.24
1
RWA as of 31.3.24
1a
Regulatory adjustment
1b
RWA at previous quarter-end (end of day)
2
Movement in risk levels
3
Model updates / changes
4
Methodology and policy
5
Acquisitions and disposals
6
Foreign exchange movements
7
Other
8a
RWA at the end of the reporting period (end of day)
8b
Regulatory adjustment
8c
RWA as of 30.6.24
1 Components that describe movements in RWA are presented in italics. 2 The changes in RWA amounts over the reporting period for each of the key drivers are based on reasonable estimates of the relevant
figures and the approach used might differ for UBS Group excluding certain legacy Credit Suisse components and legacy Credit Suisse components.
p
30 June 2024 Pillar 3 Report |
UBS Group | Market risk 31
Regulatory calculation of market risk
Semi-annual |
The MR3 table below shows the minimum, maximum, average and period-end regulatory VaR, SVaR and IRC.
The comprehensive risk charge has not been applicable since 2019, which was the last time UBS had eligible correlation
trading positions.
During the first half of 2024, for the UBS Group excluding certain legacy Credit Suisse components, regulatory VaR, SVaR
and IRC were on average broadly unchanged.
For the legacy Credit Suisse components , regulatory VaR and SVaR decreased on average, mainly driven by continued
strategic migration of positions to UBS and reductions within Non-core and Legacy.
MR3: IMA values for trading portfolios
UBS Group excluding certain legacy Credit Suisse
components
Legacy Credit Suisse components
For the six-month period
ended 30.6.24
For the six-month period
ended 31.12.23
For the six-month period
ended 30.6.24
For the six-month period
ended 31.12.23
USD m
VaR (10-day 99%)
1
Maximum value
2
Average value
3
Minimum value
4
Period end
Stressed VaR (10-day 99%)
5
Maximum value
6
Average value
7
Minimum value
8
Period end
Incremental risk charge (99.9%)
9
Maximum value
10
Average value
11
Minimum value
12
Period end
p
MR4: Comparison of VaR estimates with gains / losses
Semi-annual |
VaR backtesting is a performance measurement process in which a 1-day VaR prediction is compared with the
realized 1-day profit or loss. We compute backtesting VaR using a 99% confidence level and 1-day holding period. Since
99% VaR at UBS is defined as a risk measure that operates on the lower tail of the profit-or-loss distribution, 99%
backtesting VaR is a negative number. Backtesting revenues exclude non-trading revenues, such as valuation reserves,
fees and commissions, and revenues from intraday trading, to provide for a like-for-like comparison. A backtesting
exception occurs when backtesting revenues are lower than the previous day’s backtesting VaR.
Statistically, given the 99% confidence level, two or three backtesting exceptions a year can be expected. More than four
exceptions could indicate that the VaR model is not performing appropriately, as could too few exceptions over a long
period. However, as noted under “VaR limitations” in the “Risk management and control” section of the UBS Group
Annual Report 2023, available under “Annual reporting” at
ubs.com/investors
, a sudden increase (or decrease) in market
volatility relative to the lookback window could lead to a higher (or lower) number of exceptions. Therefore, backtesting
exceptions are investigated, as are exceptionally positive backtesting revenues, with the results reported to senior business
management, the Group Chief Risk Officer and the Group Chief Market Risk Officer. Internal and external auditors and
relevant regulators are also informed of backtesting exceptions.
The “Development of regulatory backtesting revenues and actual trading revenues against backtesting VaR” charts below
show the development of backtesting VaR against the backtesting revenues and actual trading revenues for the first half
of 2024.
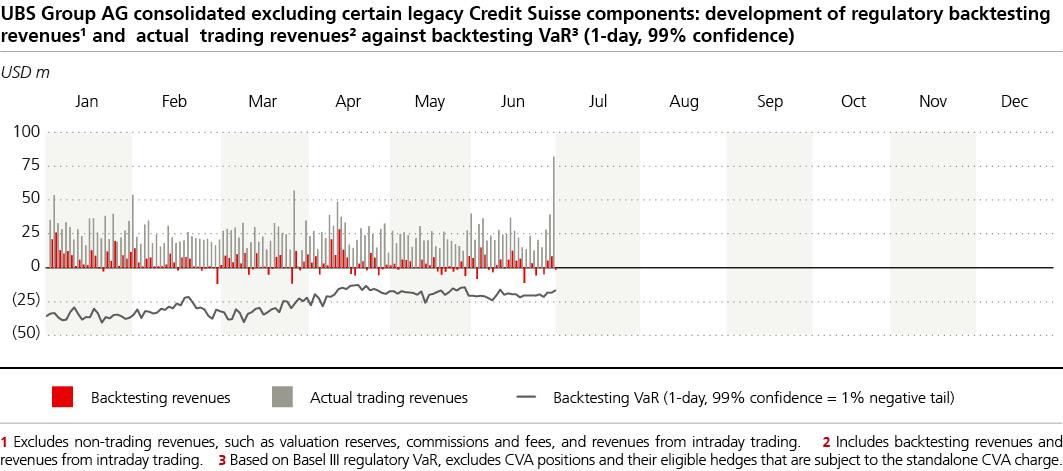
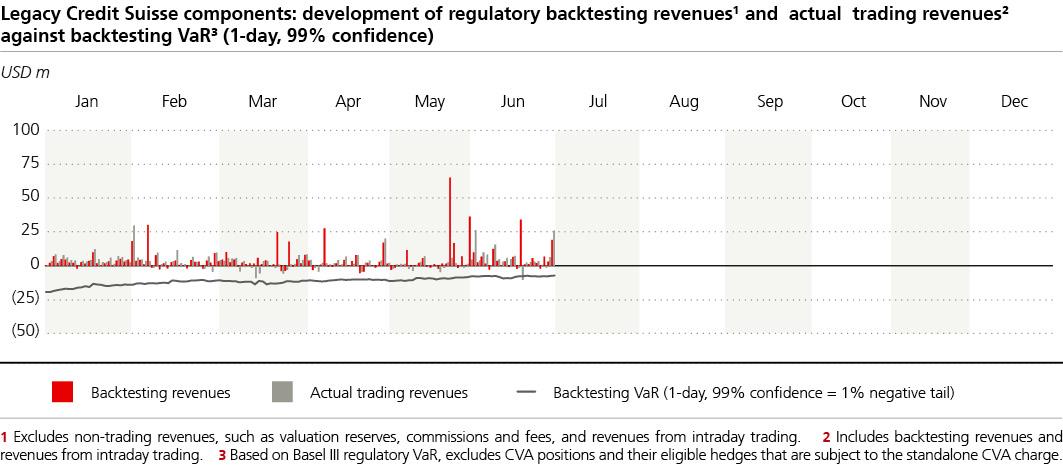
30 June 2024 Pillar 3 Report |
UBS Group | Market risk 32
The actual trading revenues include backtesting and intraday revenues.
For the UBS Group excluding certain legacy Credit Suisse components, there were no new VaR negative backtesting
exceptions in the first half of 2024, and the total number of negative backtesting exceptions within the most recent 250-
business-day window remained at zero. As these backtesting exceptions remained below five, the FINMA VaR multiplier
used to compute regulatory and stressed VaR RWA was unchanged at 3.0 throughout the first half of 2024.
For the legacy Credit Suisse components, there were no new negative backtesting exceptions in the first half of 2024,
and the total number of negative backtesting exceptions within the most recent 250-business-day window decreased to
one from three by the end of the first half of 2024. As these backtesting exceptions remained below five, the FINMA VaR
multiplier used to compute regulatory and stressed VaR RWA was unchanged at 3.0 throughout the first half of 2024.
p
30 June 2024 Pillar 3 Report |
UBS Group | Going and gone concern requirements and eligible capital 33
Going and gone concern requirements and eligible
capital
Quarterly |
The table below provides details of the Swiss systemically relevant bank (SRB) going and gone concern capital
requirements as required by the Swiss Financial Market Supervisory Authority (FINMA ).
›
Refer to the “Capital management” section of the UBS Group second quarter 2024 report, available under ”Quarterly reporting”
at
ubs.com/investors
, for more information about capital management
Swiss SRB going and gone concern requirements and information
As of 30.6.24
RWA
LRD
USD m, except where indicated
in %
in %
Required going concern capital
Total going concern capital
1
1
Common equity tier 1 capital
2
of which: minimum capital
of which: buffer capital
of which: countercyclical buffer
Maximum additional tier 1 capital
of which: additional tier 1 capital
of which: additional tier 1 buffer capital
Eligible going concern capital
Total going concern capital
Common equity tier 1 capital
Total loss-absorbing additional tier 1 capital
3
of which: high-trigger loss-absorbing additional tier 1 capital
of which: low-trigger loss-absorbing additional tier 1 capital
Required gone concern capital
Total gone concern loss-absorbing capacity
4,5,6
7
7
of which: base requirement including add-ons for market share and LRD
Eligible gone concern capital
Total gone concern loss-absorbing capacity
Total tier 2 capital
of which: non-Basel III-compliant tier 2 capital
TLAC-eligible senior unsecured debt
Total loss-absorbing capacity
Required total loss-absorbing capacity
Eligible total loss-absorbing capacity
Risk-weighted assets / leverage ratio denominator
Risk-weighted assets
Leverage ratio denominator
1 Includes applicable add-ons of 1.44% for risk-weighted assets (RWA) and 0.50% for leverage ratio denominator (LRD) 2 Our minimum CET1 leverage ratio requirement of 3.50% consists of a 1.5% base
requirement, a 1.5% base buffer capital requirement, a 0.25% LRD add-on requirement, a 0.25% market share add-on requirement based on our Swiss credit business 3 Includes outstanding low-trigger loss-
absorbing additional tier 1 capital instruments, which are available under the Swiss systemically relevant bank framework to meet the going concern requirements until their first call date. As of their first call date,
these instruments are eligible to meet the gone concern requirements. 4 A maximum of 25% of the gone concern requirements can be met with instruments that have a remaining maturity of between one and two
years. Once at least 75% of the minimum gone concern requirement has been met with instruments that have a remaining maturity of greater than two years, all instruments that have a remaining maturity of between
one and two years remain eligible to be included in the total gone concern capital. 5 From 1 January 2023, the resolvability discount on the gone concern capital requirements for systemically important banks (SIBs)
has been replaced with reduced base gone concern capital requirements equivalent to 75% of the total going concern requirements (excluding countercyclical buffer requirements). 6 As of July 2024, the Swiss
Financial Market Supervisory Authority (FINMA) has the authority to impose a surcharge of up to 25% of the total going concern capital requirements should obstacles to an SIB’s resolvability be identified in future
resolvability assessments. 7 Includes applicable add-ons of 1.08% for RWA and 0.38% for LRD.
p
30 June 2024 Pillar 3 Report |
UBS Group | Going and gone concern requirements and eligible capital 34
Semi-annual |
countercyclical capital buffer (the CCyB) requirement applicable to private-sector exposures in UBS Group
AG consolidated. In the first half of 2024, the CCyB for Belgium was set to 0.5%, effective from 1 April 2024, the CCyB
for South Korea was set to 1.0%, effective from 1 May 2024, and the CCyB for the Netherlands was increased to 2.0%
from 1.0%, effective from 31 May 2024. These updates increased our bank-specific CCyB requirement to 16 basis points
as of 30 June 2024.
›
Refer to the “Risk management and control” section of the UBS Group Annual Report 2023, available under ”Annual reporting” at
ubs.com/investors
, for more information about the methodology of geographical allocation used
CCyB1: Geographical distribution of credit exposures used in the countercyclical capital buffer
USD m, except where indicated
30.6.24
Geographical breakdown
Countercyclical capital
buffer rate, %
Risk-weighted assets
used in the computation
of the countercyclical
capital buffer
1
Bank-specific
countercyclical capital
buffer rate, %
Countercyclical amount
Hong Kong SAR
Luxembourg
United Kingdom
Sweden
Australia
Germany
France
Netherlands
Belgium
Korea
Sum
Total
1 Included private-sector exposures in the countries that are Basel Committee on Banking Supervision (BCBS)-member jurisdictions, under the following categories: “Credit risk,” “Counterparty credit risk,” “Equity
positions in the banking book,” “Settlement risk,” “Securitization exposures in the banking book” and “Amounts below thresholds for deduction,” as well as the corresponding trading book charges included under
“Market Risk.”
p
Explanation of the differences between the IFRS Accounting Standards and regulatory scopes of
consolidation
Semi-annual |
USD 17,071m; total equity on a standalone basis as of 30 June 2024: USD 30m) represented the most significant entity
that was included in the IFRS Accounting Standards scope of consolidation but not in the regulatory scope of
consolidation. This life insurance entity accounts for most of the difference between the “Balance sheet in accordance
with IFRS Accounting Standards scope of consolidation” and the “Balance sheet in accordance with regulatory scope of
consolidation” columns in the CC2 table. The difference is mainly related to financial assets at fair value not held for
trading and other financial liabilities designated at fair value. Further differences are mainly related to other entities that
are not active in the banking industry or the financial sector and therefore are not consolidated under the regulatory
scope of consolidation.
In the banking book, certain equity investments are not consolidated under either the IFRS Accounting Standards or
under the regulatory scopes. As of 30 June 2024, these investments mainly consisted of infrastructure holdings and joint
operations (e.g., settlement and clearing institutions, and stock and financial futures exchanges) and included our
participation in SIX Group. These investments are risk weighted based on applicable threshold rules.
›
Refer to our legal entity structure, available under “Holding company and significant regulated subsidiaries and sub-groups” at
ubs.com/investors
, for more information about the legal structure of the UBS Group and to “Note 1 Summary of material
accounting policies” in the “Consolidated financial statements” section of the UBS Group Annual Report 2023, available under
“Annual reporting” at
ubs.com/investors
, for more information about the IFRS Accounting Standards scope of consolidation
›
Refer to the “Linkage between financial statements and regulatory exposures” section of the 31 December 2023 Pillar 3 Report,
available under “Pillar 3 disclosures” at
ubs.com/investors
, for more information about differences between the IFRS Accounting
Standards and regulatory scopes of consolidation
p
30 June 2024 Pillar 3 Report |
UBS Group | Going and gone concern requirements and eligible capital 35
Semi-annual |
The CC2 table below provides a reconciliation of the balance sheet under IFRS Accounting Standards to the
balance sheet according to the regulatory scope of consolidation as defined by the Basel Committee on Banking
Supervision (the BCBS) and FINMA. Lines in the balance sheet under the regulatory scope of consolidation are expanded
and referenced where relevant to display all components that are used in the “CC1: Composition of regulatory capital”
table.
CC2: Reconciliation of accounting balance sheet to balance sheet under the regulatory scope of consolidation
As of 30.6.24
Balance sheet in
accordance with
IFRS Accounting
Standards scope
of consolidation
Effect of
deconsolidated,
proportionally
consolidated or
additional consolidated
entities for regulatory
consolidation
Balance sheet in
accordance with
regulatory scope of
consolidation
References
1
USD m
Assets
Cash and balances at central banks
Amounts due from banks
Receivables from securities financing transactions measured at amortized cost
Cash collateral receivables on derivative instruments
Loans and advances to customers
Other financial assets measured at amortized cost
Total financial assets measured at amortized cost
Financial assets at fair value held for trading
of which: assets pledged as collateral that may be sold or repledged by counterparties
Derivative financial instruments
Brokerage receivables
Financial assets at fair value not held for trading
Total financial assets measured at fair value through profit or loss
Financial assets measured at fair value through other comprehensive income
Investments in associates
of which: goodwill
Property, equipment and software
Goodwill and intangible assets
of which: goodwill
of which: intangible assets
Deferred tax assets
of which: deferred tax assets recognized for tax loss carry-forwards and unused tax credits
carried forward
of which: deferred tax assets on temporary differences
Other non-financial assets
of which: net defined benefit pension and other post-employment assets
Total assets
30 June 2024 Pillar 3 Report |
UBS Group | Going and gone concern requirements and eligible capital 36
CC2: Reconciliation of accounting balance sheet to balance sheet under the regulatory scope of consolidation
(continued)
As of 30.6.24
Balance sheet in
accordance with
IFRS Accounting
Standards scope
of consolidation
Effect of
deconsolidated,
proportionally
consolidated or
additional consolidated
entities for regulatory
consolidation
Balance sheet in
accordance with
regulatory scope of
consolidation
References
1
USD m
Liabilities
Amounts due to banks
Payables from securities financing transactions measured at amortized cost
Cash collateral payables on derivative instruments
Customer deposits
Debt issued measured at amortized cost
of which: amount eligible for high-trigger loss-absorbing additional tier 1 capital
of which: amount eligible for low-trigger loss-absorbing additional tier 1 capital
Other financial liabilities measured at amortized cost
Total financial liabilities measured at amortized cost
Financial liabilities at fair value held for trading
Derivative financial instruments
Brokerage payables designated at fair value
Debt issued designated at fair value
Other financial liabilities designated at fair value
Total financial liabilities measured at fair value through profit or loss
Provisions and contingent liabilities
Other non-financial liabilities
of which: amount eligible for high-trigger loss-absorbing capital (Deferred Contingent
Capital Plan (DCCP))
2
of which: deferred tax liabilities related to goodwill
of which: deferred tax liabilities related to other intangible assets
Total liabilities
Equity
Share capital
Share premium
Treasury shares
Retained earnings
Other comprehensive income recognized directly in equity, net of tax
of which: unrealized gains / (losses) from cash flow hedges
Equity attributable to shareholders
Equity attributable to non-controlling interests
Total equity
Total liabilities and equity
1 References link the lines of this table to the respective reference numbers provided in the “References” column in the “CC1: Composition of regulatory capital” table in this section. 2 The IFRS Accounting Standards
carrying amount of total DCCP liabilities was USD 1,701m as of 30 June 2024. Refer to the “Compensation” section of the UBS Group Annual Report 2023, available under ”Annual reporting” at ubs.com/investors,
for more information about the DCCP.
p
30 June 2024 Pillar 3 Report |
UBS Group | Going and gone concern requirements and eligible capital 37
Semi-annual |
The CC1 table below provides the composition of capital in the format prescribed by the BCBS and FINMA, and
is based on BCBS Basel III rules, unless stated otherwise. Reference is made to items reconciling to the balance sheet
under the regulatory scope of consolidation as disclosed in the “CC2: Reconciliation of accounting balance sheet to
balance sheet under the regulatory scope of consolidation” table in this section.
›
Refer to the documents titled “Capital and total loss-absorbing capacity instruments of UBS Group AG consolidated, UBS AG
consolidated and standalone – Key features” and “UBS Group AG consolidated capital instruments and TLAC-eligible senior
unsecured debt,” available under “Bondholder information” at
ubs.com/investors,
regulatory capital instruments, as well as the full terms and conditions
CC1: Composition of regulatory capital
As of 30.6.24
Amounts
References
1
USD m, except where indicated
Common Equity Tier 1 capital: instruments and reserves
1
Directly issued qualifying common share (and equivalent for non-joint stock companies) capital plus related stock surplus
2
Retained earnings
3
Accumulated other comprehensive income (and other reserves)
5
Common share capital issued by subsidiaries and held by third parties (amount allowed in group CET1)
6
Common Equity Tier 1 capital before regulatory adjustments
Common Equity Tier 1 capital: regulatory adjustments
7
Prudent valuation adjustments
8
Goodwill (net of related tax liability)
9
Other intangibles other than mortgage servicing rights (net of related tax liability)
10
Deferred tax assets that rely on future profitability, excluding those arising from temporary differences (net of related tax liability)
2
11
Cash flow hedge reserve
12
Shortfall of provisions to expected losses
13
Securitization gain on sale
14
Gains and losses due to changes in own credit risk on fair valued liabilities
15
Defined benefit pension fund net assets
16
Investments in own shares (if not already subtracted from paid-in capital on reported balance sheet)
3
17
Reciprocal cross-holdings in common equity
17a
Qualified holdings where a significant influence is exercised with other owners (CET1 instruments)
17b
Immaterial investments (CET1 items)
18
Investments in the capital of banking, financial and insurance entities that are outside the scope of regulatory consolidation, where the bank
does not own more than 10% of the issued share capital (amount above 10% threshold)
19
Significant investments in the common stock of banking, financial and insurance entities that are outside the scope of regulatory consolidation
(amount above 10% threshold)
20
Mortgage servicing rights (amount above 10% threshold)
21
Deferred tax assets arising from temporary differences (amount above 10% threshold, net of related tax liability)
22
Amount exceeding the 15% threshold
23
Of which: significant investments in the common stock of financials
24
Of which: mortgage servicing rights
25
Of which: deferred tax assets arising from temporary differences
26
Expected losses on equity investment under the PD / LGD approach
26a
Further adjustments to financial statements in accordance with a recognized international accounting standard
26b
Other adjustments
4,5
27
Regulatory adjustments applied to Common Equity Tier 1 due to insufficient Additional Tier 1 and Tier 2 to cover deductions
28
Total regulatory adjustments to Common Equity Tier 1
29
Common Equity Tier 1 capital (CET1)
30 June 2024 Pillar 3 Report |
UBS Group | Going and gone concern requirements and eligible capital 38
CC1: Composition of regulatory capital (continued)
As of 30.6.24
Amounts
References
1
USD m, except where indicated
Additional Tier 1 capital: instruments
30
Directly issued qualifying additional Tier 1 instruments plus related stock surplus
31
Of which: classified as equity under applicable accounting standards
32
Of which: classified as liabilities under applicable accounting standards
34
Additional Tier 1 instruments (and CET1 instruments not included in row 5) issued by subsidiaries and held by third parties (amount allowed in
group AT1)
36
Additional Tier 1 capital before regulatory adjustments
Additional Tier 1 capital: regulatory adjustments
37
Investments in own additional Tier 1 instruments
6
38
Reciprocal cross-holdings in additional Tier 1 instruments
38a
Qualified holdings where a significant influence is exercised with other owners (AT1 instruments)
38b
Immaterial investments (AT1 instruments)
39
Investments in the capital of banking, financial and insurance entities that are outside the scope of regulatory consolidation, where the bank
does not own more than 10% of the issued common share capital of the entity (amount above 10% threshold)
40
Significant investments in the capital of banking, financial and insurance entities that are outside the scope of regulatory consolidation
41
Other adjustments
42
Regulatory adjustments applied to additional Tier 1 due to insufficient Tier 2 to cover deductions
42a
Regulatory adjustments applied to CET1 capital due to insufficient additional Tier 1 to cover deductions
43
Total regulatory adjustments to additional Tier 1 capital
44
Additional Tier 1 capital (AT1)
45
Tier 1 capital (T1 = CET1 + AT1)
Tier 2 capital: instruments and provisions
46
Directly issued qualifying Tier 2 instruments plus related stock surplus
7
48
Tier 2 instruments (and CET1 and AT1 instruments not included in rows 5 or 34) issued by subsidiaries and held by third parties (amount
allowed in group Tier 2)
50
Provisions
51
Tier 2 capital before regulatory adjustments
Tier 2 capital: regulatory adjustments
52
Investments in own Tier 2 instruments
53
Reciprocal cross-holdings in Tier 2 instruments and other TLAC liabilities
53a
Qualified holdings where a significant influence is exercised with other owners (T2 instruments and other TLAC instruments)
53b
Immaterial investments (T2 instruments and other TLAC instruments)
54
Investments in the capital and other TLAC liabilities of banking, financial and insurance entities that are outside the scope of regulatory
consolidation, where the bank does not own more than 10% of the issued common share capital of the entity (amount above 10% threshold)
55
Significant investments in the capital and other TLAC liabilities of banking, financial and insurance entities that are outside the scope of
regulatory consolidation (net of eligible short positions)
56
Other adjustments
56a
Excess of the adjustments, which are allocated to the AT1 capital
57
Total regulatory adjustments to Tier 2 capital
58
Tier 2 capital (T2)
59
Total regulatory capital (TC = T1 + T2)
60
Total risk-weighted assets
Capital ratios and buffers
61
Common Equity Tier 1 (as a percentage of risk-weighted assets)
62
Tier 1 (as a percentage of risk-weighted assets)
63
Total capital (as a percentage of risk-weighted assets)
64
Institution-specific buffer requirement (capital conservation buffer plus countercyclical buffer requirements plus higher loss absorbency
requirement, expressed as a percentage of risk-weighted assets)
8
65
Of which: capital conservation buffer requirement
66
Of which: bank-specific countercyclical buffer requirement
67
Of which: higher loss absorbency requirement
68
Common Equity Tier 1 (as a percentage of risk-weighted assets) available after meeting the bank’s minimum capital requirements
Amounts below the thresholds for deduction (before risk weighting)
72
Non-significant investments in the capital and other TLAC liabilities of other financial entities
73
Significant investments in the common stock of financial entities
74
Mortgage servicing rights (net of related tax liability)
75
Deferred tax assets arising from temporary differences (net of related tax liability)
Applicable caps on the inclusion of provisions in Tier 2
76
Provisions eligible for inclusion in Tier 2 in respect of exposures subject to standardized approach (prior to application of cap)
77
Cap on inclusion of provisions in Tier 2 under standardized approach
78
Provisions eligible for inclusion in Tier 2 in respect of exposures subject to internal ratings-based approach (prior to application of cap)
79
Cap for inclusion of provisions in Tier 2 under internal ratings-based approach
1 References link the lines of this table to the respective reference numbers provided in the “References” column in the “CC2: Reconciliation of accounting balance sheet to balance sheet under the regulatory scope
of consolidation” table in this section. 2 IFRS Accounting Standards netting for deferred tax assets and liabilities is reversed for items deducted from CET1 capital. 3 Includes USD 850m capital reserves for potential
share repurchases. 4 Includes USD 917m in a compensation-related charge for regulatory capital purposes. 5 Includes USD 3,664m related to transitional CET1 capital purchase price allocation adjustments. Refer
to the “Key metrics” section of this report for more information. 6 Under IFRS Accounting Standards, debt issued and subsequently repurchased is treated as extinguished. 7 Consists of 45% of the gross unrealized
gains on debt instruments measured at fair value through other comprehensive income, which are measured at the lower of cost or market value for regulatory capital purposes. 8 BCBS requirements are exceeded
by our Swiss SRB requirements. Refer to the “Capital, liquidity and funding, and balance sheet“ section of the UBS Group Annual Report 2023, available under ”Annual reporting” at ubs.com/investors, for more
information about the Swiss SRB requirements.
p
30 June 2024 Pillar 3 Report |
UBS Group | Total loss-absorbing capacity 39
Total loss-absorbing capacity
Resolution group – composition of total loss-absorbing capacity
Semi-annual |
The TLAC1 table below is based on Basel Committee on Banking Supervision rules and only applicable to
UBS Group AG as the ultimate parent entity of the defined UBS resolution group, to which, in case of resolution,
resolution tools (e.g., a bail-in) are expected to be applied.
In the first half of 2024, our eligible additional tier 1 (AT1) instruments increased by USD 1.8bn, mainly driven by three
issuances of AT1 capital instruments equivalent to a total of USD 1.9bn, partly offset by negative impacts from interest
rate risk hedge, foreign currency translation and other effects.
Non-regulatory capital instruments decreased by USD 1.2bn, mainly reflecting the call of USD 4.0bn equivalent of TLAC-
eligible senior unsecured debt instruments, USD 2.5bn equivalent of TLAC -eligible senior unsecured debt instruments
that ceased to be eligible as gone concern capital as they entered the final year before maturity, as well as negative
impacts from interest rate risk hedge, foreign currency translation and other effects . These decreases were partly offset
by new issuances of USD 7.8bn equivalent of TLAC-eligible senior unsecured debt instruments.
TLAC1: TLAC composition for G-SIBs (at resolution group level)
30.6.24
31.12.23
1
USD m, except where indicated
Regulatory capital elements of TLAC and adjustments
1
Common Equity Tier 1 capital (CET1)
2
Additional Tier 1 capital (AT1) before TLAC adjustments
3
AT1 ineligible as TLAC as issued out of subsidiaries to third parties
4
Other adjustments
5
Total AT1 instruments eligible under the TLAC framework
6
Tier 2 capital (T2) before TLAC adjustments
7
Amortized portion of T2 instruments where remaining maturity > 1 year
8
T2 capital ineligible as TLAC as issued out of subsidiaries to third parties
9
Other adjustments
10
Total T2 instruments eligible under the TLAC framework
11
TLAC arising from regulatory capital
Non-regulatory capital elements of TLAC
12
External TLAC instruments issued directly by the bank and subordinated to excluded liabilities
13
External TLAC instruments issued directly by the bank which are not subordinated to excluded liabilities but meet all other TLAC term sheet
requirements
14
of which: amount eligible as TLAC after application of the caps
15
External TLAC instruments issued by funding vehicles prior to 1 January 2022
16
Eligible ex ante commitments to recapitalize a G-SIB in resolution
17
TLAC arising from non-regulatory capital instruments before adjustments
Non-regulatory capital elements of TLAC: adjustments
18
TLAC before deductions
19
Deductions of exposures between multiple-point-of-entry (MPE) resolution groups that correspond to items eligible for TLAC (not applicable to
SPE G-SIBs)
20
Deduction of investments in own other TLAC liabilities
2
21
Other adjustments to TLAC
22
TLAC after deductions
Risk-weighted assets and leverage exposure measure for TLAC purposes
23
Total risk-weighted assets adjusted as permitted under the TLAC regime
24
Leverage exposure measure
TLAC ratios and buffers
25
TLAC (as a percentage of risk-weighted assets adjusted as permitted under the TLAC regime)
26
TLAC (as a percentage of leverage exposure)
27
CET1 (as a percentage of risk-weighted assets) available after meeting the resolution group’s minimum capital and TLAC requirements
28
Institution-specific buffer requirement (capital conservation buffer plus countercyclical buffer requirements plus higher loss absorbency
requirement, expressed as a percentage of risk-weighted assets)
29
of which: capital conservation buffer requirement
30
of which: bank-specific countercyclical buffer requirement
31
of which: higher loss absorbency requirement
1 Comparative-period information has been revised. Refer to “Note 2 Accounting for the acquisition of the Credit Suisse Group” in the “Consolidated financial statements” section of the UBS Group second quarter
2024 report, available under "Quarterly reporting" at ubs.com/investors, for more information. 2 Under IFRS Accounting Standards, debt issued and subsequently repurchased is treated as extinguished.
p
30 June 2024 Pillar 3 Report |
UBS Group | Total loss-absorbing capacity 40
Resolution entity – creditor ranking at legal entity level
Semi-annual |
The TLAC3 table below provides an overview of the creditor ranking structure of the resolution entity,
UBS Group AG, on a standalone basis.
UBS Group AG issues loss-absorbing AT1 capital instruments and TLAC-eligible senior unsecured debt.
UBS Group AG grants Deferred Contingent Capital Plan (DCCP) awards to UBS Group employees, which qualify as
Basel III AT1 capital on a UBS Group consolidated basis and totaled USD 2,076m as of 30 June 2024 (31 December 2023:
USD 1,935m). The related liabilities of UBS Group AG on a standalone basis of USD 1,392m (31 December 2023:
USD 1,412m) are not included in the table below, as these do not give rise to any current claims until the awards are
legally vested.
As of 30 June 2024, the TLAC available on a UBS Group AG consolidated basis amounted to USD 197,690m
(31 December 2023: USD 199,001m).
›
Refer to “Holding company and significant regulated subsidiaries and sub-groups” at
ubs.com/investors
about UBS Group AG standalone for the six-month period ended 30 June 2024
›
Refer to “Bondholder information” at
ubs.com/investors
›
Refer to the “TLAC1: TLAC composition for G-SIBs (at resolution group level)” table in this section for more information about
TLAC for UBS Group AG consolidated
TLAC3: Creditor ranking at legal entity level for the resolution entity, UBS Group AG
As of 30.6.24
Creditor ranking
Total
USD m
1
2
3
1
Description of creditor ranking
Common shares
(most junior)
2
Additional Tier 1
Bail-in debt and
pari passu
liabilities
(most senior)
2
Total capital and liabilities net of credit risk mitigation
1
3
Subset of row 2 that are excluded liabilities
4
Total capital and liabilities less excluded liabilities (row 2 minus row 3)
3,4,5
6,7
5
Subset of row 4 that are potentially eligible as TLAC
8
6
Subset of row 5 with 1 year ≤ residual maturity < 2 years
9
7
Subset of row 5 with 2 years ≤ residual maturity < 5 years
8
Subset of row 5 with 5 years ≤ residual maturity < 10 years
9
Subset of row 5 with residual maturity ≥ 10 years, but excluding perpetual securities
10
Subset of row 5 that is perpetual securities
1 No credit risk mitigation is applied to capital and liabilities for UBS Group AG standalone. 2 Common shares including the associated reserves are equal to the equity of UBS Group AG standalone attributable to
shareholders. 3 Includes interest expense accrued on AT1 capital instruments, which is not eligible as TLAC. 4 An AT1 instrument in the amount of USD 2.5bn was redeemed and AT1 instruments in a total amount
of USD 1.8bn were issued during the six months ended 30 June 2024. 5 Includes two AT1 instruments in the total amount of USD 1bn, the call of which was announced on 10 July 2024 (call dates 27 August 2024
and 4 September 2024). 6 Includes interest expense accrued on bail-in debt, interest-bearing liabilities that consist of loans from UBS AG and UBS Switzerland AG, negative replacement values, and tax and other
liabilities that are not excluded liabilities under Swiss law and that rank pari passu to bail-in debt. 7 Bail-in debt of USD 4.8bn was redeemed and bail-in debt of USD 7.7bn was issued during the six months ended
30 June 2024. 8 Bail-in debt of USD 2.6bn has a residual maturity of less than one year and is not potentially eligible as TLAC. 9 Includes bail-in debt in the amount of USD 1.6bn, the call of which was announced
on 2 July 2024 (redemption date 17 July 2024) and USD 1.8bn, the call of which was announced on 16 July 2024 (redemption date 5 August 2024).
p
30 June 2024 Pillar 3 Report |
UBS Group | Leverage ratio 41
Leverage ratio
Basel III leverage ratio
Quarterly |
table in section 2 of this report, is calculated by dividing the period-end tier 1 capital by the period-end leverage ratio
denominator (the LRD).
The LRD consists of on-balance sheet assets and off-balance sheet items based on IFRS Accounting Standards. Derivative
exposures are adjusted for a number of items, including replacement values and eligible cash variation margin netting,
the current exposure method add-on for potential future exposure and net notional amounts for written credit derivatives.
The LRD also includes an additional charge for counterparty credit risk related to securities financing transactions (SFTs).
The table below shows the difference between IFRS Accounting Standards total assets as per the consolidation scope
under IFRS Accounting Standards and the BCBS total on-balance sheet exposures. Those exposures are the starting point
for calculating the BCBS LRD, as shown in the LR2 table in this section. The difference is due to the application of the
regulatory scope of consolidation for the purpose of the BCBS calculation. In addition, carrying amounts for derivative
financial instruments and SFTs are deducted from IFRS Accounting Standards total assets. They are measured differently
under BCBS leverage ratio rules and are therefore added back in separate exposure line items in the LR2 table.
Difference between the Swiss systemically relevant bank and BCBS leverage ratio
The LRD is the same under Swiss systemically relevant bank (SRB) and BCBS rules. However, there is a difference in the
capital numerator between the two frameworks. Under BCBS rules only common equity tier 1 and additional tier 1 capital
are included in the numerator. Under Swiss SRB rules UBS is required to meet going and gone concern leverage ratio
requirements. Therefore, depending on the requirement, the numerator includes tier 1 capital instruments, tier 2 capital
instruments and / or total loss-absorbing capacity-eligible senior unsecured debt.
Reconciliation of IFRS Accounting Standards total assets to BCBS Basel III total on-balance sheet exposures excluding
derivatives and securities financing transactions
USD m
30.6.24
31.3.24
31.12.23
On-balance sheet exposures
IFRS Accounting Standards total assets
1
1
Adjustment for investments in banking, financial, insurance or commercial entities that are consolidated for accounting purposes
but outside the scope of regulatory consolidation
Adjustment for investments in banking, financial, insurance or commercial entities that are outside the scope of consolidation for
accounting purposes but consolidated for regulatory purposes
Adjustment for fiduciary assets recognized on the balance sheet pursuant to the operative accounting framework but excluded from
the leverage ratio exposure measure
Less carrying amount of derivative financial instruments in IFRS Accounting Standards total assets
Less carrying amount of securities financing transactions in IFRS Accounting Standards total assets
Adjustments to accounting values
1
1
On-balance sheet items excluding derivatives and securities financing transactions, but including collateral
Asset amounts deducted in determining BCBS Basel III tier 1 capital
Transitional CET1 capital purchase price allocation adjustments
Total on-balance sheet exposures (excluding derivatives and securities financing transactions)
1,198,311
1,228,720
1,321,913
1 Comparative-period information for IFRS Accounting Standards total assets has been revised subsequent to the publication of the UBS Group first quarter 2024 report. Refer to “Note 2 Accounting for the acquisition
of the Credit Suisse Group” in the “Consolidated financial statements” section of the UBS Group second quarter 2024 report, available under “Quarterly reporting” at ubs.com/investors, for more information. Due
to materiality considerations, we have kept the leverage ratio denominator unchanged and reversed the impact in the “Adjustm ents to accounting values” line.
p
Quarterly |
During the second quarter of 2024, the LRD decreased by USD 35.4bn to USD 1,564.2bn. The decrease was
primarily driven by asset size and other movements of USD 33.4bn, as well as currency effects of USD 2.1bn.
On-balance sheet exposures (excluding derivatives and securities financing transactions) decreased by USD 30.4bn, mainly
due to asset size and other movements of USD 29.3bn and currency effects of USD 1.1bn. The asset size movement was
mainly driven by a decrease in cash and central bank balances driven by the repayment of the remaining funding drawn
under the Swiss National Bank Emergency Liquidity Assistance facility and lower lending balances. Furthermore, there
were also decreases in trading portfolio assets in Non-core and Legacy, driven by our actions to actively unwind the
portfolio, in addition to the natural roll-off. These decreases were partly offset by higher trading portfolio assets, driven
by higher inventory held to hedge client positions in the Investment Bank and purchases of high-quality liquid securities
in Group Treasury.
Derivative exposures decreased by USD 3.8bn, mainly due to asset size and other movements of USD 3.3bn and currency
effects of USD 0.5bn. The asset size movement was mainly driven by the continued reductions
i
n Non-core and Legacy,
as well as market-driven movements.
30 June 2024 Pillar 3 Report |
UBS Group | Leverage ratio 42
Securities financing transactions increased by USD 1.9bn, mainly due to asset size and other movements of USD 2.5bn,
partly offset by currency effects of USD 0.5bn. The asset size movement was primarily driven by higher levels of client
activity.
Off-balance sheet items decreased by USD 3.2bn, mainly due to asset size and other movements of USD 3.2bn, primarily
driven by lower irrevocable loan commitments.
›
Refer to “Leverage ratio denominator” in the “Risk, capital, liquidity and funding, and balance sheet” section of the UBS Group
second quarter 2024 report, available under “Quarterly reporting” at
ubs.com/investors
, for more information
LR1: BCBS Basel III leverage ratio summary comparison
USD m
30.6.24
31.3.24
31.12.23
1
Total consolidated assets as per published financial statements
1
1
2
Adjustment for investments in banking, financial, insurance or commercial entities that are consolidated for accounting
purposes but outside the scope of regulatory consolidation
2
3
Adjustment for fiduciary assets recognized on the balance sheet pursuant to the operative accounting framework but excluded
from the leverage ratio exposure measure
4
Adjustments for derivative financial instruments
5
Adjustment for securities financing transactions (i.e., repos and similar secured lending)
6
Adjustment for off-balance sheet items (i.e., conversion to credit equivalent amounts of off-balance sheet exposures)
7
Other adjustments
1
1
7a
of which: Transitional CET1 capital purchase price allocation adjustments
7b
of which: consolidated entities under the regulatory scope of consolidation
8
Leverage ratio exposure (leverage ratio denominator)
1 Comparative-period information for IFRS Accounting Standards total assets has been revised subsequent to the publication of the UBS Group first quarter 2024 report. Refer to “Note 2 Accounting for the acquisition
of the Credit Suisse Group” in the “Consolidated financial statements” section of the UBS Group second quarter 2024 report, available under “Quarterly reporting” at ubs.com/investors, for more information. Due
to materiality considerations, we have kept the leverage ratio denominator unchanged and reversed the impact in the “Other adjustments” line. 2 Includes assets that are deducted from tier 1 capital.
LR2: BCBS Basel III leverage ratio common disclosure
USD m, except where indicated
30.6.24
31.3.24
31.12.23
On-balance sheet exposures
1
On-balance sheet items (excluding derivatives and securities financing transactions (SFTs), but including collateral)
2
(Asset amounts deducted in determining Basel III Tier 1 capital)
2a
Transitional CET1 capital purchase price allocation adjustments
3
Total on-balance sheet exposures (excluding derivatives and SFTs)
Derivative exposures
4
Replacement cost associated with all derivatives transactions (i.e., net of eligible cash variation margin)
5
Add-on amounts for PFE associated with all derivatives transactions
6
Gross-up for derivatives collateral provided where deducted from the balance sheet assets pursuant to the operative
accounting framework
7
(Deductions of receivables assets for cash variation margin provided in derivatives transactions)
8
(Exempted QCCP leg of client-cleared trade exposures)
9
Adjusted effective notional amount of all written credit derivatives
1
10
(Adjusted effective notional offsets and add-on deductions for written credit derivatives)
2
11
Total derivative exposures
Securities financing transaction exposures
12
Gross SFT assets (with no recognition of netting), after adjusting for sale accounting transactions
13
(Netted amounts of cash payables and cash receivables of gross SFT assets)
14
CCR exposure for SFT assets
15
Agent transaction exposures
16
Total securities financing transaction exposures
Other off-balance sheet exposures
17
Off-balance sheet exposure at gross notional amount
18
(Adjustments for conversion to credit equivalent amounts)
19
Total off-balance sheet items
Total exposures (leverage ratio denominator)
Capital and total exposures (leverage ratio denominator)
20
Tier 1 capital
3
21
Total exposures (leverage ratio denominator)
Leverage ratio
22
Basel III leverage ratio (%)
3
3
1 Includes protection sold, including agency transactions. 2 Protection sold can be offset with protection bought on the same underlying reference entity, provided that the conditions according to the Basel III
leverage ratio framework and disclosure requirements are met. 3 Comparative-period information for IFRS Accounting Standards total assets has been revised subsequent to the publication of the UBS Group first
quarter 2024 report. Refer to “Note 2 Accounting for the acquisition of the Credit Suisse Group” in the “Consolidated financial statements” section of the UBS Group second quarter 2024 report, available under
“Quarterly reporting” at ubs.com/investors, for more information. Tier 1 capital information was restated for comparative periods. Due to materiality considerations, we have kept the leverage ratio denominator
unchanged.
p
30 June 2024 Pillar 3 Report |
UBS Group | Liquidity and funding 43
Liquidity and funding
Liquidity coverage ratio
Quarterly |
We monitor the liquidity coverage ratio (the LCR) in all significant currencies in order to manage any currency
mismatch between high-quality liquid assets (HQLA) and the net expected cash outflows in times of stress.
p
Pillar 3 disclosure requirement
Second quarter 2024 report section
Disclosure
Second quarter 2024 report page number
Concentration of funding sources
Balance sheet and off-balance sheet
Liabilities, by product and currency
54
High-quality liquid assets
Quarterly |
HQLA must be easily and immediately convertible into cash at little or no loss of value, especially during a period
of stress. HQLA are assets that are of low risk and are unencumbered. Other characteristics of HQLA are ease and certainty
of valuation, low correlation with risky assets, listing of the assets on a developed and recognized exchange, existence of
an active and sizable market for the assets, and low volatility. Our HQLA predominantly consist of assets that qualify as
Level 1 in the LCR framework, including cash, central bank reserves and government bonds. In the second quarter of
2024, our HQLA decreased by USD 44.4bn to USD 378.2bn, mainly due to the repayment of the remaining funding
drawn under the Swiss National Bank Emergency Liquidity Assistance (ELA) facility and an increase in trading assets .
High-quality liquid assets (HQLA)
Average 2Q24
1
Average 1Q24
1
USD bn, except where indicated
Level 1
weighted
liquidity
value
2
Level 2
weighted
liquidity
value
2
Total
weighted
liquidity
value
2
Level 1
weighted
liquidity
value
2
Level 2
weighted
liquidity
value
2
Total
weighted
liquidity
value
2
Cash balances
3
Securities (on- and off-balance sheet)
Total HQLA
4
1 Calculated based on an average of 61 data points in the second quarter of 2024 and 61 data points in the first quarter of 2024. 2 Calculated after the application of haircuts and, where applicable, caps on Level 2
assets. 3 Includes cash and balances with central banks and other eligible balances as prescribed by FINMA. 4 Calculated in accordance with FINMA requirements.
p
30 June 2024 Pillar 3 Report |
UBS Group | Liquidity and funding 44
Liquidity coverage ratio development during the second quarter of 2024
Quarterly |
The quarterly average LCR of the UBS Group decreased 8.2 percentage points to 212.0%, remaining above the
prudential requirement communicated by the Swiss Financial Market Supervisory Authority (FINMA). The movement in
the quarterly average LCR was primarily driven by a decrease in HQLA of USD 44.4bn to USD 378.2bn, mainly due to the
repayment of the remaining funding drawn under the Swiss National Bank ELA facility and an increase in trading assets.
The average net cash outflows decreased by USD 13.7bn to USD 178.5bn, reflecting lower outflows from deposits and
loan commitments and higher net inflows from securities financing transactions.
LIQ1: Liquidity coverage ratio (LCR)
Average 2Q24
1
Average 1Q24
1
USD bn, except where indicated
Unweighted
value
Weighted
value
2
Unweighted
value
Weighted
value
2
High-quality liquid assets (HQLA)
1
Total HQLA
Cash outflows
2
Retail deposits and deposits from small business customers
3
of which: stable deposits
4
of which: less stable deposits
5
Unsecured wholesale funding
6
of which: operational deposits (all counterparties)
7
of which: non-operational deposits (all counterparties)
8
of which: unsecured debt
9
Secured wholesale funding
10
Additional requirements:
11
of which: outflows related to derivatives and other transactions
12
of which: outflows related to loss of funding on debt products
3
13
of which: committed credit and liquidity facilities
14
Other contractual funding obligations
15
Other contingent funding obligations
16
Total cash outflows
Cash inflows
17
Secured lending
18
Inflows from fully performing exposures
19
Other cash inflows
20
Total cash inflows
Average 2Q24
1
Average 1Q24
1
USD bn, except where indicated
Total adjusted
value
4
Total adjusted
value
4
Liquidity coverage ratio (LCR)
21
Total HQLA
22
Net cash outflows
23
LCR (%)
1 Calculated based on an average of 61 data points in the second quarter of 2024 and 61 data points in the first quarter of 2024. 2 Calculated after the application of haircuts, inflow and outflow rates. 3 Includes
outflows related to loss of funding on asset-backed securities, covered bonds, other structured financing instruments, asset-backed commercial papers, structured entities (conduits), securities investment vehicles and
other such financing facilities. 4 Calculated after the application of haircuts, inflow and outflow rates, as well as, where applicable, caps on Level 2 assets and cash inflows.
p
30 June 2024 Pillar 3 Report |
UBS Group | Liquidity and funding 45
Net stable funding ratio
Net stable funding ratio development during the second quarter of 2024
Semi-annual |
remaining above the prudential requirement communicated by FINMA.
Available stable funding decreased by USD 4.8bn to USD 882.3bn, mainly driven by lower customer deposits, partly offset
by higher debt issued measured at amortized cost. Required stable funding decreased by USD 12.5bn to USD 689.0bn,
predominantly reflecting lower lending assets and derivative balances, partly offset by higher trading assets and securities
financing transactions.
LIQ2: Net stable funding ratio (NSFR)
30.6.24
31.3.24
Unweighted value by residual maturity
Unweighted value by residual maturity
USD bn
No Maturity
< 6 months
6 months to
< 1 year
≥ 1 year
Weighted
Value
No Maturity
< 6 months
6 months to
< 1 year
≥ 1 year
Weighted
Value
Available stable funding (ASF) item
1
Capital:
81.6
13.7
95.3
82.3
13.5
95.8
2
Regulatory Capital
81.6
13.2
94.8
82.3
12.9
95.2
3
Other Capital Instruments
0.5
0.5
0.5
0.5
4
Retail deposits and deposits from small business
customers:
385.5
15.6
16.2
378.8
387.3
17.6
16.7
382.7
5
Stable deposits
31.2
0.1
0.0
29.8
31.6
0.2
0.0
30.2
6
Less stable deposits
354.3
15.5
16.2
349.0
355.8
17.5
16.7
352.6
7
Wholesale Funding:
480.1
68.5
229.2
401.1
509.6
51.9
236.4
401.6
8
Operational Deposits
70.7
35.3
70.2
35.1
9
Other wholesale funding
409.4
68.5
229.2
365.8
439.4
51.9
236.4
366.5
10
Liabilities with matching interdependent assets
3.9
3.9
11
Other liabilities:
38.8
139.8
4.5
7.1
37.2
147.6
1.3
7.0
12
NSFR derivative liabilities
2.9
1
13
All other liabilities and equity not included in the
above categories
38.8
139.8
1.6
7.1
37.2
147.6
1.3
7.0
14
Total ASF
882.3
887.0
Required stable funding (RSF) item
15
Total NSFR high-quality liquid assets (HQLA)
40.4
38.2
16
Deposits held at other financial institutions for
operational purposes
14.9
7.7
14.7
7.6
17
Performing loans and securities:
45.7
294.4
58.8
454.4
517.9
43.2
291.2
55.3
472.0
526.9
18
Performing loans to financial institutions secured by
Level 1 HQLA or Level 2a HQLA
74.2
0.1
0.3
11.7
76.9
0.2
0.2
9.8
19
Performing loans to financial institutions secured by
Level 2b HQLA or non-HQLA and unsecured
performing loans to financial institutions
74.3
11.3
42.0
62.1
75.5
6.7
56.1
74.0
20
Performing loans to non-financial corporate clients,
loans to retail and small business customers, and
loans to sovereigns, central banks and PSEs, of which:
1.0
121.1
25.9
150.3
188.8
1.0
114.5
25.2
147.4
185.6
21
With a risk weight of less than or equal to 35%
under Basel II standardized approach for credit risk
1.0
17.3
0.3
4.0
4.4
1.0
10.2
0.2
4.0
4.4
22
Performing residential mortgages, of which:
22.2
18.3
241.8
197.1
21.1
20.4
245.5
199.1
23
With a risk weight of less than or equal to 35%
under Basel II standardized approach for credit risk
12.9
9.8
228.0
176.1
10.9
12.5
228.1
174.9
24
Securities that are not in default and do not qualify as
HQLA, including exchange-traded equities
44.7
2.7
3.3
20.0
58.2
42.2
3.2
2.8
22.8
58.5
25
Assets with matching interdependent liabilities
3.9
3.9
26
Other assets:
44.5
58.3
0.3
132.5
117.7
45.1
64.8
0.5
135.6
123.2
27
Physical traded commodities, including gold
1.8
1.5
2.4
2.0
28
Assets posted as initial margin for derivative contracts
and contributions to default funds of CCPs
38.9
1
33.1
40.9
1
34.8
29
NSFR derivative assets
3.7
1
3.7
30
NSFR derivative liabilities before deduction of variation
margin posted
73.3
1
14.7
69.6
1
13.9
31
All other assets not included in the above categories
42.7
58.3
0.3
20.3
68.5
42.7
64.8
0.5
21.3
68.8
32
Off-balance sheet items
20.9
7.9
89.0
5.4
21.3
8.7
95.2
5.7
33
Total RSF
689.0
701.6
34
Net stable funding ratio (%)
128.0
126.4
1 The ≥ 1 year maturity bucket includes balances for which differentiation by maturity is not required.
p
30 June 2024 Pillar 3 Report |
UBS Group | Requirements for global systemically important banks and related indicators 46
Requirements for global systemically important banks
and related indicators
Semi-annual |
The Financial Stability Board (the FSB) has determined that UBS is a global systemically important bank (a G-SIB),
using an indicator-based methodology adopted by the Basel Committee on Banking Supervision (the BCBS). Banks that
qualify as G-SIBs are required to disclose 13 high-level indicators annually for assessing the systemic importance of G-SIBs
as defined by the BCBS. These indicators are used for the G-SIB score calculation and cover five categories: size, cross-
jurisdictional activity, interconnectedness, substitutability / financial institution infrastructure, and complexity.
In November 2023, the FSB, in consultation with the BCBS and national authorities, published the 2023 list of G-SIBs,
and Credit Suisse had moved below the threshold for G-SIB designation, no longer being considered a G-SIB.
Based on the published indicators, G-SIBs are subject to additional common equity tier 1 (CET1) capital buffer
requirements in a range from 1.0% to 3.5%. In November 2023, the FSB confirmed that, based on the year-end 2022
indicators, the additional CET1 capital buffer requirement for the UBS Group will increase to 1.5%, from 1.0%, as of
1 January 2025. This increase follows the acquisition of the Credit Suisse Group in June 2023. As our Swiss systemically
relevant bank Basel III capital requirements remain above the BCBS requirements, including the increased G-SIB buffer,
we are not affected by these additional G-SIB requirements.
The BCBS introduced a leverage ratio buffer for G-SIBs as a part of the finalization of the Basel III framework announced
in December 2017. The leverage ratio buffer is set at 50% of risk-weighted higher-loss absorbency requirements.
Implementation of the final Basel III framework in Switzerland is expected to enter into force on 1 January 2025. We do
not expect these changes to increase our additional CET1 capital buffer requirement.
Our G-SIB indicators as of 31 December 2023 were published in July 2024 under “Pillar 3 disclosures” at
ubs.com/investors
.
p
30 June 2024 Pillar 3 Report |
Significant regulated subsidiaries and sub-groups | Introduction 47
Significant regulated subsidiaries
and sub-groups
Introduction
Scope of disclosures in this section
The sections below include capital and other regulatory information as of 30 June 2024 for UBS AG consolidated, UBS AG
standalone, UBS Switzerland AG standalone, UBS Europe SE consolidated, UBS Americas Holding LLC consolidated,
Credit Suisse (Schweiz) AG consolidated, Credit Suisse (Schweiz) AG standalone and Credit Suisse International
standalone. Capital information in the following sections is based on Pillar 1 capital requirements. Entities may be subject
to significant additional Pillar 2 requirements, which represent additional amounts of capital considered necessary and
are agreed with regulators based on the risk profile of the respective entity.
UBS Americas Holding LLC consolidated
Federal Reserve Board releases stress-test results
In June 2024, the Federal Reserve Board released the results of its 2024 Dodd–Frank Act Stress Test (DFAST). UBS’s US
intermediate holding company, UBS Americas Holding LLC, exceeded the minimum capital requirements under the
severely adverse scenario.
30 June 2024 Pillar 3 Report |
Significant regulated subsidiaries and sub-groups | UBS AG consolidated 48
UBS AG consolidated
Merger of UBS
AG and Credit Suisse AG
On 31 May 2024, the merger of UBS AG and Credit Suisse AG was completed, with UBS AG becoming the sole Swiss
parent entity, succeeding by operation of Swiss law to all assets and liabilities of Credit Suisse AG, and becoming the
direct or indirect shareholder of all of the former direct and indirect subsidiaries of Credit Suisse AG. UBS has accounted
for the acquisition as a business combination under common control accounting principles. As part of this method of
accounting, the assets and liabilities of Credit Suisse AG have been converted from US generally accepted accounting
principles to IFRS Accounting Standards. Prior periods have not been restated.
The merger of UBS AG and Credit Suisse AG resulted in a USD 190.0bn increase in risk-weighted assets (RWA) and a
USD 41.4bn increase in common equity tier 1 (CET1) capital as of the date of the merger . Both the liquidity coverage
ratio (the LCR) and the net stable funding ratio (the NSFR) of UBS AG consolidated increased in the second quarter of
2024, including the impact of the merger of UBS AG and Credit Suisse AG.
›
Refer to “Integration of Credit Suisse” in the “Recent developments” section of the UBS Group second quarter 2024 report,
available under “Quarterly reporting” at
ubs.com/investors
, for more information about the integration of Credit Suisse
›
Refer to “Note 2 Accounting for the merger of UBS AG and Credit Suisse AG” in the “Consolidated financial statements” section of
the UBS AG second quarter 2024 report, available under “Quarterly reporting” at
ubs.com/investors
, for more information about
the accounting for the merger of UBS AG and Credit Suisse AG
›
Refer to “Comparison between UBS AG consolidated and UBS Group AG consolidated” in the “Consolidated financial statements”
section of the UBS AG second quarter 2024 report, available under “Quarterly reporting” at
ubs.com/investors
, for a comparison
of selected financial information between UBS AG consolidated and UBS Group AG consolidated
Key metrics for the second quarter of 2024
Quarterly |
Standards.
During the second quarter of 2024, tier 1 capital increased by USD 40.1bn to USD 98.1bn. CET1 capital increased by
USD 39.1bn to USD 83.0bn, primarily due to the merger of UBS AG and Credit Suisse AG, which resulted in an increase
of USD 41.4bn as of the date of the merger, and an increase in eligible deferred tax assets recognized for temporary
differences of USD 1.6bn. These increases were partly offset by dividend accruals of USD 3.1bn, a current tax expense of
USD 0.3bn and an operating loss before tax of USD 0.2bn. Additional tier 1 (AT1) capital issued by the Group and on
lent to UBS AG increased by USD 0.9bn to USD 15.1bn, mainly reflecting two AT1 instruments totaling USD 0.6bn
recognized by UBS AG upon the merger of UBS AG and Credit Suisse AG, and the issuance of one AT1 capital instrument
of an equivalent of USD 0.4bn.
During the second quarter of 2024, RWA increased by USD 181.2bn to USD 510.0bn, predominantly due to the merger
of UBS AG and Credit Suisse AG, which resulted in a USD 190.0bn increase in RWA. Excluding that merger, RWA
decreased by USD 8.8bn, reflecting decreases of USD 5.9bn resulting from asset size and other movements, driven by
decreases in credit and counterparty credit risk RWA and to a lesser extent by market risk RWA, and USD 2.9bn resulting
from model updates and methodology changes.
During the second quarter of 2024, the leverage ratio denominator (the LRD) increased by USD 485.4bn to
USD 1,564.0bn, predominantly due to the merger of UBS AG and Credit Suisse AG, which resulted in a USD 516.4bn
increase in the LRD. Excluding that merger, the LRD decreased by USD 30.9bn, driven by USD 29.2bn resulting from asset
size and other movements, as well as USD 1.8bn from currency effects. The asset size and other movements were mainly
due to a decrease in cash and central bank balances driven by the repayment of the remaining funding drawn under the
Swiss National Bank Emergency Liquidity Assistance facility, as well as lower derivatives and off-balance sheet exposures,
partly offset by higher securities financing transaction exposures.
Correspondingly, the CET1 capital ratio of UBS AG consolidated increased to 16.3% from 13.3%, reflecting the increase
in CET1 capital, partly offset by the increase in RWA. The Basel III leverage ratio increased to 6.3% from 5.4%, reflecting
higher tier 1 capital, partly offset by the increase in the LRD .
30 June 2024 Pillar 3 Report |
Significant regulated subsidiaries and sub-groups | UBS AG consolidated 49
The quarterly average LCR of UBS AG consolidated increased 2.7 percentage points to 194.1%, remaining above the
prudential requirement communicated by the Swiss Financial Market Supervisory Authority (FINMA). The movement in
the quarterly average LCR was primarily driven by an increase in high-quality liquid assets (HQLA) of USD 29.3bn to
USD 280.3bn. This increase was substantially related to the contribution of Credit Suisse HQLA after the merger of
UBS AG and Credit Suisse AG. The increase in HQLA was partly offset by a USD 12.3bn increase in net cash outflows to
USD 143.6bn, predominantly attributable to Credit Suisse’s net cash outflows related to customer deposits, loan
commitments and derivatives. These outflows were partly offset by inflows from loans in Credit Suisse, as well as lower
outflows from deposits and higher net inflows from securities financing transactions of UBS AG consolidated excluding
Credit Suisse.
As of 30 June 2024, the NSFR increased 6.1 percentage points to 127.7%. Available stable funding increased by
USD 293.5bn to USD 882.8bn, predominantly driven by the contribution of Credit Suisse after the merger, mainly
reflecting deposit balances, debt securities issued and regulatory capital, as well as higher debt securities issued of UBS AG
excluding the contribution of Credit Suisse. Required stable funding increased by USD 206.7bn to USD 691.5bn,
predominantly driven by the contribution of Credit Suisse after the merger, mainly reflecting lending assets.
KM1: Key metrics
USD m, except where indicated
30.6.24
31.3.24
31.12.23
30.9.23
30.6.23
Available capital (amounts)
1
Common Equity Tier 1 (CET1)
2
Tier 1
3
Total capital
Risk-weighted assets (amounts)
4
Total risk-weighted assets (RWA)
4a
Minimum capital requirement
1
Risk-based capital ratios as a percentage of RWA
5
CET1 ratio (%)
6
Tier 1 ratio (%)
7
Total capital ratio (%)
Additional CET1 buffer requirements as a percentage of RWA
8
Capital conservation buffer requirement (%)
9
Countercyclical buffer requirement (%)
9a
Additional countercyclical buffer for Swiss mortgage loans (%)
10
Bank G-SIB and / or D-SIB additional requirements (%)
2
11
Total of bank CET1 specific buffer requirements (%)
3
12
CET1 available after meeting the bank’s minimum capital requirements (%)
4
Basel III leverage ratio
13
Total Basel III leverage ratio exposure measure
14
Basel III leverage ratio (%)
Liquidity coverage ratio (LCR)
5
15
Total high-quality liquid assets (HQLA)
16
Total net cash outflow
16a
of which: cash outflows
16b
of which: cash inflows
17
LCR (%)
194.12
191.38
189.71
176.56
170.94
Net stable funding ratio (NSFR)
18
Total available stable funding
882,760
19
Total required stable funding
691,477
20
NSFR (%)
127.66
1 Calculated as 8% of total RWA, based on total capital minimum requirements, excluding CET1 buffer requirements. 2 Swiss SRB going and gone concern requirements and information for UBS AG consolidated
are provided below in this section. 3 Excludes non-BCBS capital buffer requirements for risk-weighted positions that are directly or indirectly backed by residential properties in Switzerland. 4 Represents the CET1
ratio that is available to meet buffer requirements. Calculated as the CET1 ratio minus the BCBS CET1 capital requirement and, where applicable, minus the BCBS tier 2 capital requirement met with CET1 capital.
5 Calculated after the application of haircuts, inflow and outflow rates, as well as, where applicable, caps on Level 2 assets and cash inflows. Calculated based on an average of 61 data points in the second quarter
of 2024, of which 40 data points were before the merger (i.e., from 2 April 2024 until 30 May 2024), and 21 data points were after the merger (i.e., from 31 May 2024 until 30 June 2024) and 61 data points in the
first quarter of 2024. For the prior-quarter data points, refer to the respective Pillar 3 Report, av ailable under “Pillar 3 disclosures” at ubs.com/investors, for more information.
p
30 June 2024 Pillar 3 Report |
Significant regulated subsidiaries and sub-groups | UBS AG consolidated 50
Swiss systemically relevant bank going and gone concern requirements and information
Quarterly |
The tables below provide details of the Swiss systemically relevant bank RWA- and LRD-based going and gone
concern requirements and information as required by FINMA ; details regarding eligible gone concern instruments are
also provided below.
Outstanding high- and low-trigger loss-absorbing tier 2 capital instruments, non-Basel III-compliant tier 2 capital
instruments, and total loss-absorbing capacity-eligible unsecured debt instruments are eligible to meet gone concern
requirements until one year before maturity.
More information about the going and gone concern requirements and information is provided in the “Total loss-
absorbing capacity” section of the UBS AG Annual Report 2023, available under “Annual reporting” at
ubs.com/investors.
Swiss SRB going and gone concern requirements and information
As of 30.6.24
RWA
LRD
USD m, except where indicated
in %
in %
Required going concern capital
Total going concern capital
1
1
Common equity tier 1 capital
2
of which: minimum capital
of which: buffer capital
of which: countercyclical buffer
Maximum additional tier 1 capital
of which: additional tier 1 capital
of which: additional tier 1 buffer capital
Eligible going concern capital
Total going concern capital
Common equity tier 1 capital
Total loss-absorbing additional tier 1 capital
of which: high-trigger loss-absorbing additional tier 1 capital
of which: low-trigger loss-absorbing additional tier 1 capital
3
Required gone concern capital
Total gone concern loss-absorbing capacity
4,5,6
7
7
of which: base requirement including add-ons for market share and LRD
Eligible gone concern capital
Total gone concern loss-absorbing capacity
Total tier 2 capital
of which: non-Basel III-compliant tier 2 capital
TLAC-eligible unsecured debt
Total loss-absorbing capacity
Required total loss-absorbing capacity
Eligible total loss-absorbing capacity
Risk-weighted assets / leverage ratio denominator
Risk-weighted assets
Leverage ratio denominator
1 Includes applicable add-ons of 1.78% for risk-weighted assets (RWA) and 0.61% for leverage ratio denominator (LRD), of which 34 basis points for RWA and 11 basis points for LRD reflect the FINMA Pillar 2 capital
add-on of USD 1,728m related to the supply chain finance funds matter at Credit Suisse. 2 Our minimum CET1 leverage ratio requirement of 3.61% consists of a 1.5% base requirement, a 1.5% base buffer capital
requirement, a 0.25% LRD add-on requirement, a 0.25% market share add-on requirement based on our Swiss credit business and a 0.11% Pillar 2 capital add-on related to the supply chain finance funds matter at
Credit Suisse. 3 Existing outstanding low-trigger additional tier 1 capital instruments qualify as going concern capital at the UBS AG consolidated level, as agreed with FINMA, until their first call date. As of their
first call date, these instruments are eligible to meet the gone concern requirements. 4 A maximum of 25% of the gone concern requirements can be met with instruments that have a remaining maturity of between
one and two years. Once at least 75% of the minimum gone concern requirement has been met with instruments that have a remaining maturity of greater than two years, all instruments that have a remaining
maturity of between one and two years remain eligible to be included in the total gone concern capital. 5 From 1 January 2023, the resolvability discount on the gone concern capital requirements for systemically
important banks (SIBs) has been replaced with reduced base gone concern capital requirements equivalent to 75% of the total going concern requirements (excluding countercyclical buffer requirements). 6 As of
July 2024, FINMA has the authority to impose a surcharge of up to 25% of the total going concern capital requirements should obstacles to an SIB’s resolvability be identified in future resolvability assessments.
7 Includes applicable add-ons of 1.08% for RWA and 0.38% for LRD.
30 June 2024 Pillar 3 Report |
Significant regulated subsidiaries and sub-groups | UBS AG consolidated 51
Swiss SRB going and gone concern information
USD m, except where indicated
30.6.24
31.3.24
31.12.23
Eligible going concern capital
Total going concern capital
Total tier 1 capital
Common equity tier 1 capital
Total loss-absorbing additional tier 1 capital
of which: high-trigger loss-absorbing additional tier 1 capital
of which: low-trigger loss-absorbing additional tier 1 capital
Eligible gone concern capital
Total gone concern loss-absorbing capacity
Total tier 2 capital
of which: non-Basel III-compliant tier 2 capital
TLAC-eligible unsecured debt
Total loss-absorbing capacity
Total loss-absorbing capacity
Risk-weighted assets / leverage ratio denominator
Risk-weighted assets
Leverage ratio denominator
Capital and loss-absorbing capacity ratios (%)
Going concern capital ratio
of which: common equity tier 1 capital ratio
Gone concern loss-absorbing capacity ratio
Total loss-absorbing capacity ratio
Leverage ratios (%)
Going concern leverage ratio
of which: common equity tier 1 leverage ratio
Gone concern leverage ratio
Total loss-absorbing capacity leverage ratio
p
30 June 2024 Pillar 3 Report |
Significant regulated subsidiaries and sub-groups | UBS AG standalone 52
UBS AG standalone
Merger of UBS AG and Credit Suisse AG
On 31 May 2024, the merger of UBS AG and Credit Suisse AG was completed, with UBS AG becoming the sole Swiss
parent entity, succeeding by operation of Swiss law to all assets and liabilities of Credit Suisse AG, and becoming the
direct or indirect shareholder of all of the former direct and indirect subsidiaries of Credit Suisse AG. UBS has accounted
for the acquisition as a business combination under common control accounting principles. As part of this method of
accounting, the assets and liabilities of Credit Suisse AG have been converted from US generally accepted accounting
principles to IFRS Accounting Standards. Prior periods have not been restated.
In the second quarter of 2024, UBS AG (standalone) common equity tier 1 (CET1) capital increased by USD 30.4bn,
primarily due to a USD 29.8bn increase as a result of the merger of UBS AG and Credit Suisse AG as of the date of the
merger. That impact of the merger included a USD 6.9bn reduction in CET1 capital related to the removal of a regulatory
concession that had been granted to Credit Suisse AG standalone prior to the merger which allowed for the measurement
of investments in subsidiaries under the portfolio valuation method instead of under the individual valuation method.
The merger of UBS AG and Credit Suisse AG resulted in a USD 202.0bn increase in phase-in risk-weighted assets (RWA)
(fully applied: USD 222.6bn), including a USD 17.9bn RWA reduction related to the aforementioned regulatory
concession on investments in subsidiaries (fully applied: USD 20.6bn) . Intra-Group transactions with subsidiaries of the
former Credit Suisse AG are subject to higher risk weights based on the standardized approach as of 30 June 2024, which
contributed to a USD 7.2bn increase in RWA. Prior to the merger, UBS AG had applied the standardized approach for
intra-Group transactions with its subsidiaries, and Credit Suisse AG had applied generally lower risk weights using the
advanced internal ratings-based approach.
Both the liquidity coverage ratio (the LCR) and the net stable funding ratio (the NSFR) of UBS AG standalone increased in
the second quarter of 2024, including the impact of the merger of UBS AG and Credit Suisse AG, maintaining these
ratios well above the regulatory requirements.
›
Refer to “Integration of Credit Suisse” in the “Recent developments” section of the UBS Group second quarter 2024 report,
available under “Quarterly reporting” at
ubs.com/investors
, for more information about the integration of Credit Suisse
›
Refer to “Note 2 Accounting for the merger of UBS AG and Credit Suisse AG” in the “Consolidated financial statements” section of
the UBS AG second quarter 2024 report, available under “Quarterly reporting” at
ubs.com/investors
, for more information about
the accounting for the merger of UBS AG and Credit Suisse AG
Key metrics for the second quarter of 2024
Quarterly |
The table below is based on Basel Committee on Banking Supervision (BCBS) Basel III rules and IFRS Accounting
Standards.
During the second quarter of 2024, tier 1 capital increased by USD 31.3bn to USD 97.5bn. CET1 capital increased by
USD 30.4bn to USD 82.3bn, mainly due to the merger of UBS AG and Credit Suisse AG, which resulted in an increase of
USD 29.8bn as of the date of the merger, and an operating profit before tax of USD 3.4bn, partly offset by additional
accruals for capital returns to UBS Group AG of USD 3.1bn. Additional tier 1 (AT1) capital issued by the Group and on
lent to UBS AG increased by USD 0.9bn to USD 15.1bn, mainly reflecting two AT1 instruments in the total amount of
USD 0.6bn recognized by UBS AG as a result of the merger of UBS AG and Credit Suisse AG, and the issuance of one
AT1 capital instrument of an equivalent of USD 0.4bn.
Phase-in RWA increased by USD 197.7bn to USD 554.5bn during the second quarter of 2024, predominantly due to the
merger of UBS AG and Credit Suisse AG, which resulted in a USD 202.0bn increase in RWA. Excluding that merger, RWA
decreased by USD 4.3bn, mainly driven by lower participation RWA and to a lesser extent by lower market risk RWA,
partly offset by higher credit and counterparty credit risk RWA.
During the second quarter of 2024, the leverage ratio denominator (the LRD) increased by USD 280.5bn to USD 921.8bn,
predominantly due to the merger of UBS AG and Credit Suisse AG, which resulted in a USD 300.5bn increase in the LRD.
Excluding the impact of the merger, the LRD decreased by USD 20.0bn, driven by USD 16.8bn resulting from asset size
and other movements, as well as USD 3.3bn from currency effects. The asset size and other movements were mainly due
to a decrease in cash and central bank balances driven by the repayment of the remaining funding drawn under the
Swiss National Bank Emergency Liquidity Assistance facility, and lower securities financing transaction exposures, partly
offset by higher derivatives and off-balance sheet exposures .
Correspondingly, the phase-in CET1 capital ratio of UBS AG standalone increased to 14.8% from 14.6%, reflecting the
increase in CET1 capital, partly offset by the increase in phase-in RWA. The firm’s Basel III leverage ratio increased to
10.6% from 10.3%, reflecting the increase in tier 1 capital , partly offset by the aforementioned increase in the LRD.
30 June 2024 Pillar 3 Report |
Significant regulated subsidiaries and sub-groups | UBS AG standalone 53
The quarterly average LCR of UBS AG standalone increased 0.9 percentage points to 269.5%, remaining above the
prudential requirement communicated by the Swiss Financial Market Supervisory Authority (FINMA). The movement in
the average LCR was primarily driven by an increase in high-quality liquid assets (HQLA) of USD 13.3bn to USD 137.0bn.
This increase was substantially related to the contribution of Credit Suisse AG’s HQLA after the merger of UBS AG and
Credit Suisse AG. This increase in HQLA was partly offset by a USD 4.3bn increase in net cash outflows to USD 50.5bn,
predominantly due to Credit Suisse AG’s net cash outflows related to customer deposits and loan commitments, as well
as higher debt issued at fair value in UBS AG standalone excluding Credit Suisse AG. These outflows were partly offset
by inflows from loans in Credit Suisse AG, as well as lower outflows from deposits and higher net inflows from securities
financing transactions of UBS AG standalone excluding Credit Suisse AG.
As of 30 June 2024, the NSFR increased 7.2 percentage points to 102.5%. Available stable funding increased by
USD 173.4bn to USD 448.0bn, predominantly driven by the contribution of Credit Suisse after the merger, mainly
reflecting deposit balances, debt securities issued and regulatory capital, as well as higher debt securities issued of UBS AG
excluding the contribution of Credit Suisse. Required stable funding increased by USD 149.0bn to USD 437.3bn,
predominantly driven by the contribution of Credit Suisse after the merger, mainly reflecting lending assets and
investments in subsidiaries and associates.
KM1: Key metrics
USD m, except where indicated
30.6.24
31.3.24
31.12.23
30.9.23
30.6.23
Available capital (amounts)
1
Common Equity Tier 1 (CET1)
2
Tier 1
3
Total capital
Risk-weighted assets (amounts)
1
4
Total risk-weighted assets (RWA)
4a
Minimum capital requirement
2
Risk-based capital ratios as a percentage of RWA
1
5
CET1 ratio (%)
6
Tier 1 ratio (%)
7
Total capital ratio (%)
Additional CET1 buffer requirements as a percentage of RWA
8
Capital conservation buffer requirement (%)
9
Countercyclical buffer requirement (%)
9a
Additional countercyclical buffer for Swiss mortgage loans (%)
10
Bank G-SIB and / or D-SIB additional requirements (%)
3
11
Total of bank CET1 specific buffer requirements (%)
4
12
CET1 available after meeting the bank’s minimum capital requirements (%)
5
Basel III leverage ratio
13
Total Basel III leverage ratio exposure measure
14
Basel III leverage ratio (%)
Liquidity coverage ratio (LCR)
6
15
Total high-quality liquid assets (HQLA)
16
Total net cash outflow
16a
of which: cash outflows
16b
of which: cash inflows
17
LCR (%)
269.55
Net stable funding ratio (NSFR)
7
18
Total available stable funding
448,005
274,568
19
Total required stable funding
437,275
288,322
20
NSFR (%)
102.45
95.23
1 Based on phase-in rules for RWA. Refer to “Swiss systemically relevant bank going and gone concern requirements and information” below for more information. 2 Calculated as 8% of total RWA, based on total
capital minimum requirements, excluding CET1 buffer requirements. 3 Swiss SRB going and gone concern requirements and information for UBS AG standalone are provided below in this section. 4 Excludes non-
BCBS capital buffer requirements for risk-weighted positions that are directly or indirectly backed by residential properties in Switzerland. 5 Represents the CET1 ratio that is available to meet buffer requirements.
Calculated as the CET1 ratio minus the BCBS CET1 capital requirement and, where applicable, minus the BCBS tier 2 capital requirement met with CET1 capital. 6 Calculated after the application of haircuts, inflow
and outflow rates, as well as, where applicable, caps on Level 2 assets and cash inflows. Calculated based on an average of 61 data points in the second quarter of 2024, of which 40 data points were before the
merger (i.e., from 2 April 2024 until 30 May 2024), and 21 data points were after the merger (i.e., from 31 May 2024 until 30 June 2024) and 61 data points in the first quarter of 2024. For the prior-quarter data
points, refer to the respective Pillar 3 Report, available under “Pillar 3 disclosures” at ubs.com/investors, for more information. 7 In accordance with Art. 17h para. 3 and 4 of the Liquidity Ordinance, UBS AG
standalone is required to maintain a minimum NSFR of at least 80% without taking into account excess funding of UBS Switzerland AG and 100% after taking into account such excess funding.
p
30 June 2024 Pillar 3 Report |
Significant regulated subsidiaries and sub-groups | UBS AG standalone 54
Swiss systemically relevant bank going and gone concern requirements and information
Quarterly |
The tables below provide details of the Swiss SRB RWA- and LRD-based going and gone concern requirements
and information as required by FINMA; details regarding eligible gone concern instruments are also provided below .
UBS AG standalone is subject to a gone concern capital requirement based on the sum of: (i) the nominal value of the
gone concern instruments issued by UBS entities and held by the parent firm; (ii) 75% of the capital requirements resulting
from third-party exposure on a standalone basis; and (iii) a buffer requirement equal to 30% of the Group’s gone concern
capital requirement on UBS AG’s consolidated exposure. As of 1 January 2024, the buffer requirement has been fully
phased in. The gone concern capital coverage ratio reflects how much gone concern capital is available to meet the gone
concern requirement. Outstanding high- and low-trigger loss-absorbing tier 2 capital instruments, non-Basel III-compliant
tier 2 capital instruments, and total loss-absorbing capacity-eligible unsecured debt instruments are eligible to meet gone
concern requirements until one year before maturity.
More information about the going and gone concern requirements is provided in the “UBS AG Standalone” section of
the 31 December 2023 Pillar 3 Report, available under “Pillar 3 disclosures” at
ubs.com/investors.
Swiss SRB going and gone concern requirements and information
As of 30.6.24
RWA, phase-in
RWA, fully applied as of 1.1.28
LRD
USD m, except where indicated
in %
in %
in %
Required going concern capital
Total going concern capital
1
1
1
Common equity tier 1 capital
of which: minimum capital
of which: buffer capital
of which: countercyclical buffer
Maximum additional tier 1 capital
of which: additional tier 1 capital
of which: additional tier 1 buffer capital
Eligible going concern capital
Total going concern capital
Common equity tier 1 capital
Total loss-absorbing additional tier 1 capital
of which: high-trigger loss-absorbing additional tier 1 capital
of which: low-trigger loss-absorbing additional tier 1 capital
Risk-weighted assets / leverage ratio denominator
Risk-weighted assets
Leverage ratio denominator
Required gone concern capital
2
Higher of RWA- or LRD-based
Total gone concern loss-absorbing capacity
Eligible gone concern capital
Total gone concern loss-absorbing capacity
Gone concern capital coverage ratio
1 Includes applicable add-ons of 1.75% for risk-weighted assets (RWA, phase-in), 1,72% for risk-weighted assets (RWA, fully applied) and 0.69% for leverage ratio denominator (LRD), of which 31 basis points for
RWA phase-in, 28 basis points for RWA fully applied and 19 basis points for LRD reflect the FINMA Pillar 2 capital add-on of USD 1,728m related to the supply chain finance funds matter at Credit Suisse. 2 A
maximum of 25% of the gone concern requirements can be met with instruments that have a remaining maturity of between one and two years. Once at least 75% of the minimum gone concern requirement has
been met with instruments that have a remaining maturity of greater than two years, all instruments that have a remaining maturity of between one and two years remain eligible to be included in the total gone
concern capital.
30 June 2024 Pillar 3 Report |
Significant regulated subsidiaries and sub-groups | UBS AG standalone 55
Swiss SRB going and gone concern information
USD m, except where indicated
30.6.24
31.3.24
31.12.23
Eligible going concern capital
Total going concern capital
Total tier 1 capital
Common equity tier 1 capital
Total loss-absorbing additional tier 1 capital
of which: high-trigger loss-absorbing additional tier 1 capital
of which: low-trigger loss-absorbing additional tier 1 capital
Eligible gone concern capital
Total gone concern loss-absorbing capacity
Total tier 2 capital
of which: non-Basel III-compliant tier 2 capital
TLAC-eligible unsecured debt
Total loss-absorbing capacity
Total loss-absorbing capacity
Denominators for going and gone concern ratios
Risk-weighted assets, phase-in
of which: investments in Switzerland-domiciled subsidiaries
1
of which: investments in foreign-domiciled subsidiaries
1
Risk-weighted assets, fully applied as of 1.1.28
of which: investments in Switzerland-domiciled subsidiaries
1
of which: investments in foreign-domiciled subsidiaries
1
Leverage ratio denominator
Capital and loss-absorbing capacity ratios (%)
Going concern capital ratio, phase-in
of which: common equity tier 1 capital ratio, phase-in
Going concern capital ratio, fully applied as of 1.1.28
of which: common equity tier 1 capital ratio, fully applied as of 1.1.28
Leverage ratios (%)
Going concern leverage ratio
of which: common equity tier 1 leverage ratio
Capital coverage ratio (%)
Gone concern capital coverage ratio
1 Net exposures for direct and indirect investments including holding of regulatory capital instruments in Switzerland-domiciled subsidiaries and for direct and indirect investments including holding of regulatory capital
instruments in foreign-domiciled subsidiaries are risk-weighted at 230% and 320%, respectively, for the current year. Risk weights will gradually increase by 5 percentage points per year for Switzerland-domiciled
investments and 20 percentage points per year for foreign-domiciled investments until the fully applied risk weights of 250% and 400%, respectively, are applied.
p
30 June 2024 Pillar 3 Report |
Significant regulated subsidiaries and sub-groups | UBS Switzerland AG standalone 56
UBS Switzerland AG standalone
Key metrics for the second quarter of 2024
Quarterly |
The table below is based on Basel Committee on Banking Supervision (BCBS) Basel III rules and IFRS Accounting
Standards.
During the second quarter of 2024, common equity tier 1 capital was broadly unchanged at CHF 12.6bn, mainly driven
by operating profit, offset by additional dividend accruals.
Total risk-weighted assets (RWA) decreased by CHF 1.0bn to CHF 110.3bn, mainly due to lower credit risk RWA.
The leverage ratio denominator (the LRD) decreased by CHF 0.5bn to CHF 337.1bn, mainly due to a decrease in lending
balances and credit commitments.
The quarterly average liquidity coverage ratio of UBS Switzerland AG increased 3.4 percentage points to 145.9%,
remaining above the prudential requirement communicated by the Swiss Financial Market Supervisory Authority (FINMA).
Average high-quality liquid assets increased by CHF 0.7bn to CHF 78.1bn, due to proceeds from covered bonds issued
and securities financing transactions, partly offset by the dividend payment in April 2024. Average net cash outflows
decreased by CHF 0.8bn to CHF 53.6bn, mainly driven by lower outflows from intercompany deposits.
As of 30 June 2024, the net stable funding ratio increased 1.5 percentage points to 136.1%, remaining above the
prudential requirement communicated by FINMA. Required stable funding decreased by CHF 1.5bn to CHF 165.3bn,
predominantly driven by the lower weighting effect from changes in the residual tenors of lending assets. Available stable
funding remained largely stable at CHF 225.0bn, with higher debt securities issued and securities financing transactions
substantially offset by the lower weighting effect from changes in the residual tenors of customer deposits and regulatory
capital.
KM1: Key metrics
CHF m, except where indicated
30.6.24
31.3.24
31.12.23
30.9.23
30.6.23
Available capital (amounts)
1
Common Equity Tier 1 (CET1)
2
Tier 1
3
Total capital
Risk-weighted assets (amounts)
4
Total risk-weighted assets (RWA)
4a
Minimum capital requirement
1
4b
Total risk-weighted assets (pre-floor)
Risk-based capital ratios as a percentage of RWA
5
CET1 ratio (%)
6
Tier 1 ratio (%)
7
Total capital ratio (%)
Additional CET1 buffer requirements as a percentage of RWA
8
Capital conservation buffer requirement (%)
9
Countercyclical buffer requirement (%)
9a
Additional countercyclical buffer for Swiss mortgage loans (%)
10
Bank G-SIB and / or D-SIB additional requirements (%)
2
11
Total of bank CET1 specific buffer requirements (%)
3
12
CET1 available after meeting the bank’s minimum capital requirements (%)
4
Basel III leverage ratio
13
Total Basel III leverage ratio exposure measure
14
Basel III leverage ratio (%)
Liquidity coverage ratio (LCR)
5
15
Total high-quality liquid assets (HQLA)
16
Total net cash outflow
16a
of which: cash outflows
16b
of which: cash inflows
17
LCR (%)
Net stable funding ratio (NSFR)
6
18
Total available stable funding
224,953
224,591
222,709
221,883
219,728
19
Total required stable funding
165,291
166,818
166,100
165,543
163,021
20
NSFR (%)
136.10
134.63
134.08
134.03
134.79
1 Calculated as 8% of total RWA, based on total capital minimum requirements, excluding CET1 buffer requirements. 2 Swiss SRB going and gone concern requirements and information for UBS Switzerland AG are
provided below. 3 Excludes non-BCBS capital buffer requirements for risk-weighted positions that are directly or indirectly backed by residential properties in Switzerland. 4 Represents the CET1 ratio that is
available to meet buffer requirements. Calculated as the CET1 ratio minus the BCBS CET1 capital requirement and, where applicable, minus the BCBS tier 2 capital requirement met with CET1 capital. 5 Calculated
after the application of haircuts, inflow and outflow rates, as well as, where applicable, caps on Level 2 assets and cash inflows. Calculated based on an average of 61 data points in the second quarter of 2024 and
61 data points in the first quarter of 2024. For the prior-quarter data points, refer to the respective Pillar 3 Report, available under “Pillar 3 disclosures” at ubs.com/investors, for more information. 6 UBS Switzerland
AG is required to maintain a minimum NSFR of at least 100% on an ongoing basis, as set out in Art. 17h para. 1 of the Liquidity Ordinance. A portion of the excess funding is used to fulfill the NSFR requirement of
UBS AG standalone.
p
30 June 2024 Pillar 3 Report |
Significant regulated subsidiaries and sub-groups | UBS Switzerland AG standalone 57
Swiss systemically relevant bank going and gone concern requirements and information
Quarterly |
gone concern requirements and information as required by FINMA; details regarding eligible gone concern instruments
are also provided below.
UBS Switzerland AG is considered an SRB under Swiss banking law and is subject to capital regulations on a standalone
basis. As of 30 June 2024, the going concern capital and leverage ratio requirements for UBS Switzerland AG standalone
were 15.18% (including a countercyclical buffer of 0.88%) and 5.00%, respectively.
The Swiss SRB framework and going concern requirements applicable to UBS Switzerland AG standalone are the same
as those applicable to UBS Group AG consolidated. The gone concern requirement corresponds to 62% of the Group’s
going concern requirements, excluding the countercyclical buffer requirements.
The gone concern requirements were 8.87% for the RWA-based requirement and 3.10% for the LRD-based requirement.
›
Refer to “Capital and capital ratios of our significant regulated subsidiaries” in the “Capital, liquidity and funding, and balance
sheet” section of the UBS Group Annual Report 2023, available under “Annual reporting” at
ubs.com/investors
, for more
information about the joint liability of UBS AG and UBS Switzerland AG
Swiss SRB going and gone concern requirements and information
As of 30.6.24
RWA
LRD
CHF m, except where indicated
in %
in %
Required going concern capital
Total going concern capital
1
1
Common equity tier 1 capital
of which: minimum capital
of which: buffer capital
of which: countercyclical buffer
Maximum additional tier 1 capital
of which: additional tier 1 capital
of which: additional tier 1 buffer capital
Eligible going concern capital
Total going concern capital
Common equity tier 1 capital
Total loss-absorbing additional tier 1 capital
of which: high-trigger loss-absorbing additional tier 1 capital
Required gone concern capital
2
Total gone concern loss-absorbing capacity
3
3
of which: base requirement including add-ons for market share and LRD
Eligible gone concern capital
Total gone concern loss-absorbing capacity
TLAC-eligible unsecured debt
Total loss-absorbing capacity
Required total loss-absorbing capacity
Eligible total loss-absorbing capacity
Risk-weighted assets / leverage ratio denominator
Risk-weighted assets
Leverage ratio denominator
1 Includes applicable add-ons of 1.44% for risk-weighted assets (RWA) and 0.50% for leverage ratio denominator (LRD). 2 A maximum of 25% of the gone concern requirements can be met with instruments that
have a remaining maturity of between one and two years. Once at least 75% of the minimum gone concern requirement has been met with instruments that have a remaining maturity of greater than two years, all
instruments that have a remaining maturity of between one and two years remain eligible to be included in the total gone concern capital. 3 Includes applicable add-ons of 0.89% for RWA and 0.31% for LRD.
30 June 2024 Pillar 3 Report |
Significant regulated subsidiaries and sub-groups | UBS Switzerland AG standalone 58
Swiss SRB going and gone concern information
CHF m, except where indicated
30.6.24
31.3.24
31.12.23
Eligible going concern capital
Total going concern capital
Total tier 1 capital
Common equity tier 1 capital
Total loss-absorbing additional tier 1 capital
of which: high-trigger loss-absorbing additional tier 1 capital
Eligible gone concern capital
Total gone concern loss-absorbing capacity
TLAC-eligible unsecured debt
Total loss-absorbing capacity
Total loss-absorbing capacity
Risk-weighted assets / leverage ratio denominator
Risk-weighted assets
Leverage ratio denominator
Capital and loss-absorbing capacity ratios (%)
Going concern capital ratio
of which: common equity tier 1 capital ratio
Gone concern loss-absorbing capacity ratio
Total loss-absorbing capacity ratio
Leverage ratios (%)
Going concern leverage ratio
of which: common equity tier 1 leverage ratio
Gone concern leverage ratio
Total loss-absorbing capacity leverage ratio
p
30 June 2024 Pillar 3 Report |
Significant regulated subsidiaries and sub-groups | UBS Switzerland AG standalone 59
Capital instruments
Quarterly |
Capital instruments of UBS Switzerland AG – key features
Presented according to issuance date.
Share capital
Additional tier 1 capital
1
Issuer
UBS Switzerland AG, Switzerland
UBS Switzerland AG,
Switzerland
UBS Switzerland AG,
Switzerland
UBS Switzerland AG,
Switzerland
UBS Switzerland AG,
Switzerland
UBS Switzerland AG,
Switzerland
UBS Switzerland AG,
Switzerland
UBS Switzerland AG,
Switzerland
2
Unique identifier (e.g., CUSIP, ISIN or Bloomberg identifier for
private placement)
–
–
3
Governing law(s) of the instrument
Swiss
Swiss
3a
Means by which enforceability requirement of Section 13 of
the TLAC Term Sheet is achieved (for other TLAC-eligible
instruments governed by foreign law)
n/a
n/a
Regulatory treatment
4
Transitional Basel III rules
1
CET1 – going concern capital
Additional tier 1 capital
5
Post-transitional Basel III rules
2
CET1 – going concern capital
Additional tier 1 capital
6
Eligible at solo / group / group and solo
UBS Switzerland AG consolidated and
standalone
UBS Switzerland AG consolidated and standalone
7
Instrument type (types to be specified by each jurisdiction)
Ordinary shares
Loan
3
8
Amount recognized in regulatory capital (currency in million,
as of most recent reporting date)
1
CHF 10.0
CHF 1,000
CHF 825
CHF 475
CHF 500
CHF 700
CHF 675
CHF 825
9
Par value of instrument (currency in million)
CHF 10.0
CHF 1,000
CHF 825
CHF 475
CHF 500
CHF 700
CHF 675
CHF 825
10
Accounting classification
4
Equity attributable to UBS Switzerland AG
shareholders
Due to banks held at amortized cost
11
Original date of issuance
–
18 December 2017
12 December 2018
11 December 2019
29 October 2020
11 March 2021
2 June 2021
2 June 2021
12
Perpetual or dated
–
Perpetual
13
Original maturity date
–
–
14
Issuer call subject to prior supervisory approval
–
Yes
30 June 2024 Pillar 3 Report |
Significant regulated subsidiaries and sub-groups | UBS Switzerland AG standalone 60
Capital instruments of UBS Switzerland AG – key features (continued)
Presented according to issuance date.
Share capital
Additional tier 1 capital
15
Optional call date, contingent call dates and redemption
amount
–
First optional
repayment date:
18 December 2022
5
First optional
repayment date:
12 December 2023
5
First optional
repayment date:
11 December 2024
First optional
repayment date:
29 October 2025
First optional
repayment date:
11 March 2026
First optional
repayment date:
2 June 2026
First optional
repayment date:
2 June 2028
Repayable at any time after the first optional repayment date.
Repayment subject to FINMA approval. Optional repayment amount: principal amount, together with any
accrued and unpaid interest thereon.
Repayable on the
first optional
repayment date or
on any of every
second interest
payment date
thereafter.
Repayment subject
to FINMA approval.
Optional repayment
amount: principal
amount, together
with any accrued
and unpaid interest
thereon.
Repayable on the
first optional
repayment date or
on any interest
payment date
thereafter.
Repayment subject
to FINMA approval.
Optional repayment
amount: principal
amount, together
with any accrued
and unpaid interest
thereon.
16
Subsequent call dates, if applicable
–
Early repayment possible due to a tax or regulatory event. Repayment due to a tax event subject to FINMA approval.
Repayment amount: principal amount, together with accrued and unpaid interest.
30 June 2024 Pillar 3 Report |
Significant regulated subsidiaries and sub-groups | UBS Switzerland AG standalone 61
Capital instruments of UBS Switzerland AG – key features (continued)
Presented according to issuance date.
Share capital
Additional tier 1 capital
Coupons
17
Fixed or floating dividend / coupon
–
Floating
18
Coupon rate and any related index
–
3-month SARON
Compound
+ 250 bps
per annum quarterly
3-month SARON
Compound
+ 489 bps
per annum quarterly
3-month SARON
Compound
+ 433 bps
per annum quarterly
3-month SARON
Compound
+ 397 bps
per annum quarterly
3-month SARON
Compound
+ 337 bps
per annum quarterly
3-month SARON
Compound
+ 307 bps
per annum quarterly
3-month SARON
Compound
+ 308 bps
per annum quarterly
19
Existence of a dividend stopper
–
No
20
Fully discretionary, partially discretionary or mandatory
Fully discretionary
Fully discretionary
21
Existence of step-up or other incentive to redeem
–
No
22
Non-cumulative or cumulative
Non-cumulative
Non-cumulative
23
Convertible or non-convertible
–
Non-convertible
24
If convertible, conversion trigger(s)
–
–
25
If convertible, fully or partially
–
–
26
If convertible, conversion rate
–
–
27
If convertible, mandatory or optional conversion
–
–
28
If convertible, specify instrument type convertible into
–
–
29
If convertible, specify issuer of instrument it converts into
–
–
30
Write-down feature
–
Yes
31
If write-down, write-down trigger(s)
–
Trigger: CET1 ratio is less than 7%
FINMA determines a write-down necessary to ensure UBS Switzerland AG’s viability; or UBS Switzerland AG receives a commitment of governmental support
that FINMA determines necessary to ensure UBS Switzerland AG‘s viability. Subject to applicable conditions.
32
If write-down, fully or partially
–
Fully
33
If write-down, permanent or temporary
–
Permanent
34
If temporary write-down, description of write-up mechanism
–
–
34a
Type of subordination
Statutory
Contractual
35
Position in subordination hierarchy in liquidation (specify
instrument type immediately senior to instrument in the
insolvency creditor hierarchy of the legal entity concerned)
Unless otherwise stated in the articles of
association, once debts are paid back, the
assets of the liquidated company are
divided between the shareholders pro rata
based on their contributions and
considering the preferences attached to
certain categories of shares (Art. 745,
Swiss Code of Obligations)
Subject to any obligations that are mandatorily preferred by law, each obligation of UBS Switzerland AG that is unsubordinated or is subordinated and not
ranked junior (such as all classes of share capital) or at par (such as tier 1 instruments)
36
Non-compliant transitioned features
–
–
37
If yes, specify non-compliant features
–
–
1 Based on Swiss SRB (including transitional arrangement) requirements. 2 Based on Swiss SRB requirements applicable as of 1 January 2020. 3 Loans granted by UBS AG, Zurich Branch. 4 As applied in UBS Switzerland AG‘s financial statements under Swiss GAAP. 5 The entity decided not to trigger the call
option. There is no expected date for the repayment.
p
30 June 2024 Pillar 3 Report |
Significant regulated subsidiaries and sub-groups | UBS Europe SE consolidated 62
UBS Europe SE consolidated
Key metrics for the second quarter of 2024
Quarterly |
liquidity of UBS Europe SE consolidated based on Basel Committee on Banking Supervision Pillar 1 requirements and in
accordance with EU regulatory rules and IFRS Accounting Standards.
During the second quarter of 2024, available capital increased by EUR 0.1bn, driven by the recognition of the audited
financial results, which led to an increase in retained earnings and prudential filters, and risk-weighted assets decreased
by EUR 0.2bn to EUR 12.4bn, mainly driven by a decrease in Lombard loans. Leverage ratio exposure increased by
EUR 1.8bn to EUR 50.6bn, mainly reflecting the increase in securities financing transactions in line with the balance sheet
movement.
The average liquidity coverage ratio remained stable and well above the regulatory requirements of 100% at 148.3%,
with a EUR 1.0bn decrease in high-quality liquid assets and a EUR 0.7bn decrease in total net cash outflows. The net
stable funding ratio increased 7.0 percentage points to 129.6%. Available stable funding increased by EUR 1.5bn as a
result of an increase in intercompany funding. Required stable funding increased by EUR 0.5bn, mainly due to client-
driven Investment Bank activities in the Asian markets.
KM1: Key metrics
1
EUR m, except where indicated
30.6.24
31.3.24
2
31.12.23
30.9.23
2
30.6.23
Available capital (amounts)
1
Common Equity Tier 1 (CET1)
2
Tier 1
3
Total capital
Risk-weighted assets (amounts)
4
Total risk-weighted assets (RWA)
4a
Minimum capital requirement
3
Risk-based capital ratios as a percentage of RWA
5
CET1 ratio (%)
6
Tier 1 ratio (%)
7
Total capital ratio (%)
Additional CET1 buffer requirements as a percentage of RWA
8
Capital conservation buffer requirement (%)
9
Countercyclical buffer requirement (%)
10
Bank G-SIB and / or D-SIB additional requirements (%)
11
Total of bank CET1 specific buffer requirements (%)
12
CET1 available after meeting the bank’s minimum capital requirements (%)
4
Basel III leverage ratio
13
Total Basel III leverage ratio exposure measure
14
Basel III leverage ratio (%)
5
Liquidity coverage ratio (LCR)
6
15
Total high-quality liquid assets (HQLA)
16
Total net cash outflow
17
LCR (%)
Net stable funding ratio (NSFR)
18
Total available stable funding
19
Total required stable funding
20
NSFR (%)
1 Based on applicable EU regulatory rules. 2 Comparative figures have been restated to align with the regulatory reports as submitted to the European Central Bank. 3 Calculated as 8% of total RWA, based on
total capital minimum requirements, excluding CET1 buffer requirements. 4 Represents the CET1 ratio that is available for meeting buffer requirements. Calculated as the CET1 ratio minus 4.5% and after considering,
where applicable, CET1 capital that has been used to meet tier 1 and / or total capital ratio requirements under Pillar 1. 5 On the basis of tier 1 capital. 6 Figures are calculated on a 12
‑
month average.
p
30 June 2024 Pillar 3 Report |
Significant regulated subsidiaries and sub-groups | UBS Americas Holding LLC consolidated 63
UBS Americas Holding LLC consolidated
Reparenting of Credit Suisse Holdings (USA), Inc. to UBS Americas Holding LLC
On 7 June 2024, Credit Suisse Holdings (USA), Inc. was reparented to UBS Americas Holding LLC, which became the sole
intermediate holding company of UBS in the USA, succeeding by operation of US law to all assets and liabilities of Credit
Suisse Holdings (USA), Inc., and becoming the direct or indirect shareholder of all of the former direct and indirect
subsidiaries of Credit Suisse Holdings (USA), Inc. Prior periods have not been restated. UBS has accounted for the
acquisition as a business combination under common control accounting principles. As a result of that reparenting,
common equity tier 1 (CET1) capital and risk-weighted assets (RWA) increased by USD 7.5bn and USD 7.3bn respectively
for UBS Americas Holding LLC as of 30 June 2024.
Key metrics for the second quarter of 2024
Quarterly |
with US Basel III rules.
Effective 1 October 2023, and through 30 September 2024, UBS Americas Holding LLC is subject to a stress capital buffer
(an SCB) of 9.1%, in addition to the minimum capital requirements. The SCB was determined by the Federal Reserve
Board following the completion of the 2023 Comprehensive Capital Analysis and Review (the CCAR) based on Dodd–
Frank Act Stress Test (DFAST) results and planned future dividends. The SCB, which replaces the static capital conservation
buffer of 2.5%, is subject to change on an annual basis or as otherwise determined by the Federal Reserve Board.
During the second quarter of 2024, CET1 capital increased by USD 8.9bn to USD 23.0bn, driven by the reparenting of
Credit Suisse Holdings (USA), Inc. to UBS Americas Holding LLC in June 2024. RWA increased by USD 8.4bn to
USD 84.3bn, driven by the aforementioned USD 7.3bn increase resulting from the consolidation of Credit Suisse Holdings
(USA), Inc. assets, in addition to increases in deferred tax assets and loans. These increases were partly offset by decreases
in derivatives and market risk. Leverage ratio exposure, calculated on an average basis, increased by USD 22.0bn to
USD 205.7bn, primarily due to the consolidation of assets of Credit Suisse Holdings (USA), Inc. Pursuant to local regulatory
guidance, leverage ratio exposure was calculated as if the merger had taken place on 1 April 2024.
The average liquidity coverage ratio decreased 2.2 percentage points to 147.7%, driven by an increase in net cash
outflows, partly offset by an increase in high-quality liquid assets (HQLA) from the addition of Credit Suisse Holdings
(USA), Inc., following the reparenting in June 2024. The average net stable funding ratio increased 1.7 percentage points
to 135.4%. This was due to a USD 0.7bn decrease in required stable funding, which was primarily driven by a decrease
in non-HQLA securities held, and by a USD 0.5bn increase in available stable funding, primarily due to an increase in
regulatory capital from Credit Suisse Holdings (USA), Inc. offset by a reduction in deposits.
30 June 2024 Pillar 3 Report |
Significant regulated subsidiaries and sub-groups | UBS Americas Holding LLC consolidated 64
KM1: Key metrics
USD m, except where indicated
30.6.24
1
31.3.24
31.12.23
30.9.23
30.6.23
Available capital (amounts)
1
Common Equity Tier 1 (CET1)
2
Tier 1
3
Total capital
Risk-weighted assets (amounts)
4
Total risk-weighted assets (RWA)
4a
Minimum capital requirement
2
Risk-based capital ratios as a percentage of RWA
5
CET1 ratio (%)
6
Tier 1 ratio (%)
7
Total capital ratio (%)
Additional CET1 buffer requirements as a percentage of RWA
8
BCBS capital conservation buffer requirement (%)
8a
US stress capital buffer requirement (%)
9
Countercyclical buffer requirement (%)
10
Bank G-SIB and / or D-SIB additional requirements (%)
11
BCBS total of bank CET1 specific buffer requirements (%)
11a
US total bank specific capital buffer requirements (%)
12
CET1 available after meeting the bank’s minimum capital requirements (%)
3
Basel III leverage ratio
13
Total Basel III leverage ratio exposure measure
4
14
Basel III leverage ratio (%)
5
14a
Total Basel III supplementary leverage ratio exposure measure
4
14b
Basel III supplementary leverage ratio (%)
5
Liquidity coverage ratio (LCR)
6
15
Total high-quality liquid assets (HQLA)
16
Total net cash outflow
7
17
LCR (%)
Net stable funding ratio (NSFR)
6
18
Total available stable funding
8
8
19
Total required stable funding
7
8
8
20
NSFR (%)
8
8
1 Regulatory information for 30 June 2024 is inclusive of Credit Suisse Holdings (USA), Inc. following the reparenting of this entity under UBS Americas Holding LLC on 7 June 2024. Prior periods have not been
restated. 2 Calculated as 8% of total RWA, based on total minimum capital requirements, excluding CET1 buffer requirements. 3 Represents the CET1 ratio that is available to meet buffer requirements. Calculated
as the CET1 ratio minus the BCBS CET1 capital requirement and, where applicable, minus the BCBS additional tier 1 and tier 2 capital requirements met with CET1 capital. 4 Leverage exposure for 30 June 2024
has been calculated as if the reparenting of Credit Suisse Holdings (USA), Inc. occurred on the first day of the calendar quarter. 5 On the basis of tier 1 capital. 6 Figures are calculated on a simple daily average of
the quarter which included the business activity of Credit Suisse Holdings (USA), Inc. beginning on 7 June 2024. 7 Reflected at 85% of the full amount in accordance with the Federal Reserve tailoring rule.
8 Comparative information for 30 September 2023 and 30 June 2023 has been restated for revisions to available stable funding and required stable funding.
p
Material sub-group entity – creditor ranking at legal entity level
Semi-annual |
The TLAC2 table below provides an overview of the creditor ranking structure of UBS Americas Holding LLC on
a standalone basis.
As of 30 June 2024, UBS Americas Holding LLC had a total loss-absorbing capacity (TLAC) of USD 33.6bn after regulatory
capital deductions and adjustments. This amount included tier 1 capital of USD 25.8bn and USD 7.8bn of internal long-
term debt that is eligible as internal TLAC issued to UBS AG, a wholly owned subsidiary of the UBS Group AG resolution
entity.
TLAC2: Material sub-group entity – creditor ranking at legal entity level
As of 30.6.24
Creditor ranking
Total
USD m
1
2
3
4
1
Is the resolution entity the creditor / investor?
No
No
No
No
2
Description of creditor ranking
Common Equity
(most junior)
1
Preferred Shares
(additional tier 1)
Subordinated
debt
Unsecured loans and
other pari passu
liabilities (most senior)
3
Total capital and liabilities net of credit risk mitigation
4
Subset of row 3 that are excluded liabilities
5
Total capital and liabilities less excluded liabilities (row 3 minus row 4)
6
Subset of row 5 that are eligible as TLAC
7
Subset of row 6 with 1 year ≤ residual maturity < 2 years
8
Subset of row 6 with 2 years ≤ residual maturity < 5 years
9
Subset of row 6 with 5 years ≤ residual maturity < 10 years
10
Subset of row 6 with residual maturity ≥ 10 years, but excluded perpetual
securities
11
Subset of row 6 that is perpetual securities
1 Equity attributable to shareholders, which includes share premium and reserves.
p
30 June 2024 Pillar 3 Report |
Significant regulated subsidiaries and sub-groups | Credit Suisse (Schweiz) AG consolidated 65
Credit Suisse (Schweiz) AG consolidated
Key metrics for the second quarter of 2024
Quarterly |
The table below is based on Basel Committee on Banking Supervision (BCBS) Basel III rules.
During the second quarter of 2024, the common equity tier 1 (CET1) capital of Credit Suisse (Schweiz) AG consolidated
remained unchanged at CHF 11.0bn. Tier 1 capital remained unchanged at CHF 14.1bn.
Risk-weighted assets (RWA) decreased by CHF 5.5bn to CHF 76.7bn during the second quarter of 2024, primarily driven
by a decrease in credit risk RWA.
The leverage ratio denominator (the LRD) decreased by CHF 9.9bn to CHF 236.2bn, mainly driven by lower lending
balances.
Correspondingly, the CET1 capital ratio of Credit Suisse (Schweiz) AG consolidated increased to 14.4% from 13.4%,
reflecting the decrease in RWA. The Basel III leverage ratio increased to 6.0% from 5.7%, reflecting the decrease in the
LRD.
In the second quarter of 2024, the quarterly average liquidity coverage ratio (the LCR) of Credit Suisse (Schweiz) AG
consolidated decreased 0.5 percentage points to 150.8%, remaining above the prudential requirement communicated
by the Swiss Financial Market Supervisory Authority (FINMA). The movement in the quarterly average LCR was primarily
driven by a CHF 1.9bn decrease in high-quality liquid assets to CHF 55.0bn, mainly due to the repayment of the remaining
funding drawn under the Swiss National Bank Emergency Liquidity Assistance facility and lower customer deposits, partly
offset by more cash available from intercompany funding from UBS AG and lower loans to customers. Net cash outflows
decreased by CHF 1.2bn to CHF 36.5bn, mainly due to lower outflows from securities financing transactions and higher
cash inflows from loans and intercompany transactions.
As of 30 June 2024, the net stable funding ratio (the NSFR) of Credit Suisse (Schweiz) AG consolidated increased
17.2 percentage points to 131.4%, remaining above the prudential requirement communicated by FINMA. The
movement in the NSFR was predominantly driven by an increase of CHF 15.4bn in available stable funding to
CHF 148.9bn, mainly reflecting an increase in intercompany funding. Additionally, required stable funding decreased by
CHF 3.6bn to CHF 113.3bn, mainly attributable to a reduction of loans to customers.
30 June 2024 Pillar 3 Report |
Significant regulated subsidiaries and sub-groups | Credit Suisse (Schweiz) AG consolidated 66
KM1: Key metrics
CHF m, except where indicated
30.6.24
31.3.24
31.12.23
30.9.23
30.6.23
Available capital (amounts)
1
Common Equity Tier 1 (CET1)
1
2
Tier 1
1
3
Total capital
1
Risk-weighted assets (amounts)
4
Total risk-weighted assets (RWA)
4a
Minimum capital requirement
2
4b
Total risk-weighted assets (pre-floor)
Risk-based capital ratios as a percentage of RWA
5
CET1 ratio (%)
1
6
Tier 1 ratio (%)
1
7
Total capital ratio (%)
1
Additional CET1 buffer requirements as a percentage of RWA
8
Capital conservation buffer requirement (%)
9
Countercyclical buffer requirement (%)
9a
Additional countercyclical buffer for Swiss mortgage loans (%)
10
Bank G-SIB and / or D-SIB additional requirements (%)
3,4
11
Total of bank CET1 specific buffer requirements (%)
5
12
CET1 available after meeting the bank’s minimum capital requirements (%)
4,6
Basel III leverage ratio
13
Total Basel III leverage ratio exposure measure
14
Basel III leverage ratio (%)
1
Liquidity coverage ratio (LCR)
7
15
Total high-quality liquid assets (HQLA)
16
Total net cash outflow
16a
of which: cash outflows
16b
of which: cash inflows
17
LCR (%)
Net stable funding ratio (NSFR)
18
Total available stable funding
19
Total required stable funding
20
NSFR (%)
1 Credit Suisse had a transitional relief of recognizing CECL allowances and provisions in CET1 capital in accordance with FINMA Circular 2013/1 “Eligible capital – banks” until 30 June 2024. No transitional relief
was applied to CET1 and tier 1 capital in the second quarter of 2024 (CHF 2m in the first quarter of 2024 and CHF 3m in the fourth quarter of 2023). No transitional relief was applied for the other periods presented.
2 Calculated as 8% of total RWA, based on total capital minimum requirements, excluding CET1 buffer requirements. 3 Swiss SRB going and gone concern requirements and information for Credit Suisse (Schweiz)
AG consolidated are provided below in this section. 4 Credit Suisse (Schweiz) AG consolidated has aligned its minimum capital requirements to the UBS approach of applying the G-SIB buffer at the Group level only.
5 Excludes non-BCBS countercyclical capital buffer requirements for risk-weighted positions that are directly or indirectly backed by residential properties in Switzerland. 6 Represents the CET1 ratio that is available
to meet buffer requirements. Calculated as the CET1 ratio minus the BCBS CET1 capital requirement and, where applicable, minus the BCBS additional tier 1 and tier 2 capital requirements met with CET1 capital.
7 Calculated after the application of haircuts, inflow and outflow rates, as well as, where applicable, caps on Level 2 assets and cash inflows. Calculated based on an average of 61 data points in the second quarter
of 2024 and 62 data points in the first quarter of 2024. For the prior-quarter data points, refer to the respective Pillar 3 Report, available under “Pillar 3 disclosures” at ubs.com/investors, for more information.
p
30 June 2024 Pillar 3 Report |
Significant regulated subsidiaries and sub-groups | Credit Suisse (Schweiz) AG consolidated 67
Swiss systemically relevant bank going and gone concern requirements and information
Quarterly |
The tables below provide details of the Swiss systemically relevant bank (SRB) RWA- and LRD-based going and
gone concern requirements and information as required by FINMA; details regarding eligible gone concern instruments
are also provided below.
Credit Suisse (Schweiz) AG consolidated is considered an SRB under Swiss banking law and is subject to capital regulations
on a consolidated basis. As of 30 June 2024, the going concern capital and leverage ratio requirements for Credit Suisse
(Schweiz) AG consolidated were 15.09% (including a countercyclical buffer of 0.79%) and 5.00%, respectively.
The Swiss SRB framework and going concern requirements applicable to Credit Suisse (Schweiz) AG consolidated are the
same as those applicable to UBS Group AG consolidated. The gone concern requirement corresponds to 62% of the
UBS Group AG consolidated going concern requirements, excluding countercyclical buffer requirements.
The gone concern requirements were 8.87% for the RWA-based requirement and 3.10% for the LRD-based requirement.
Swiss SRB going and gone concern requirements and information
As of 30.6.24
RWA
LRD
CHF m, except where indicated
in %
in %
Required going concern capital
Total going concern capital
1
1
Common equity tier 1 capital
of which: minimum capital
of which: buffer capital
of which: countercyclical buffer
Maximum additional tier 1 capital
of which: additional tier 1 capital
of which: additional tier 1 buffer capital
Eligible going concern capital
Total going concern capital
Common equity tier 1 capital
Total loss-absorbing additional tier 1 capital
of which: high-trigger loss-absorbing additional tier 1 capital
Required gone concern capital
2
Total gone concern loss-absorbing capacity
of which: base requirement including add-ons for market share and LRD
Eligible gone concern capital
Total gone concern loss-absorbing capacity
TLAC-eligible unsecured debt
Total loss-absorbing capacity
Required total loss-absorbing capacity
Eligible total loss-absorbing capacity
Risk-weighted assets / leverage ratio denominator
Risk-weighted assets
Leverage ratio denominator
1 Includes applicable add-ons of 1.44% for risk-weighted assets (RWA) and 0.5% for leverage ratio denominator (LRD). 2 A maximum of 25% of the gone concern requirements can be met with instruments that
have a remaining maturity of between one and two years. Once at least 75% of the minimum gone concern requirement has been met with instruments that have a remaining maturity of greater than two years, all
instruments that have a remaining maturity of between one and two years remain eligible to be included in the total gone concern capital.
30 June 2024 Pillar 3 Report |
Significant regulated subsidiaries and sub-groups | Credit Suisse (Schweiz) AG consolidated 68
Swiss SRB going and gone concern information
CHF m, except where indicated
30.6.24
31.3.24
31.12.23
Eligible going concern capital
Total going concern capital
Total tier 1 capital
Common equity tier 1 capital
Total loss-absorbing additional tier 1 capital
of which: high-trigger loss-absorbing additional tier 1 capital
Eligible gone concern capital
Total gone concern loss-absorbing capacity
TLAC-eligible unsecured debt
Total loss-absorbing capacity
Total loss-absorbing capacity
Risk-weighted assets / leverage ratio denominator
Risk-weighted assets
Leverage ratio denominator
Capital and loss-absorbing capacity ratios (%)
Going concern capital ratio
of which: common equity tier 1 capital ratio
Gone concern loss-absorbing capacity ratio
Total loss-absorbing capacity ratio
Leverage ratios (%)
Going concern leverage ratio
of which: common equity tier 1 leverage ratio
Gone concern leverage ratio
Total loss-absorbing capacity leverage ratio
p
30 June 2024 Pillar 3 Report |
Significant regulated subsidiaries and sub-groups | Credit Suisse (Schweiz) AG standalone 69
Credit Suisse (Schweiz) AG standalone
Key metrics for the second quarter of 2024
Quarterly |
During the second quarter of 2024, the common equity tier 1 (CET1) capital of Credit Suisse (Schweiz) AG standalone
remained unchanged at CHF 10.4bn. Tier 1 capital remained unchanged at CHF 13.5bn.
Risk-weighted assets (RWA) decreased by CHF 4.1bn to CHF 77.4bn during the second quarter of 2024, primarily driven
by lower credit risk RWA.
The leverage ratio denominator (the LRD) decreased by CHF 9.3bn to CHF 234.6bn during the second quarter of 2024,
mainly driven by lower lending balances.
Correspondingly, the CET1 capital ratio of Credit Suisse (Schweiz) AG standalone increased to 13.4% from 12.8%,
reflecting the aforementioned decrease in RWA. The Basel III leverage ratio increased to 5.7% from 5.5%, reflecting the
decrease in the LRD.
In the second quarter of 2024, the quarterly average liquidity coverage ratio (the LCR) of Credit Suisse (Schweiz) AG
standalone decreased 0.4 percentage points to 149.1%, remaining above the prudential requirement communicated by
the Swiss Financial Market Supervisory Authority (FINMA). The movement in the quarterly average LCR was primarily
driven by a CHF 1.9bn decrease in high-quality liquid assets to CHF 54.9bn, mainly due to the repayment of the remaining
funding drawn under the Swiss National Bank Emergency Liquidity Assistance facility and lower customer deposits, partly
offset by more cash available from intercompany funding from UBS AG and lower loans to customers. Net cash outflows
decreased by CHF 1.2bn to CHF 36.8bn, mainly due to lower outflows from securities financing transactions and higher
cash inflows from loans and intercompany transactions.
As of 30 June 2024, the net stable funding ratio (the NSFR) of Credit Suisse (Schweiz) AG standalone increased
17.1 percentage points to 131.4%, remaining above the prudential requirement communicated by FINMA. The
movement in the NSFR was predominantly driven by an increase of CHF 16.1bn in available stable funding to
CHF 148.0bn, mainly reflecting an increase in intercompany funding. Additionally, required stable funding decreased by
CHF 2.8bn to CHF 112.7bn, mainly attributable to a reduction of loans to customers.
As of 30 June 2024, Credit Suisse (Schweiz) AG standalone held assets with a carrying value of CHF 909m that are
pledged under the UBS AG legacy international covered bonds program (previously the international covered bonds
program of Credit Suisse AG) and for which the related liabilities of CHF 559m as of 30 June 2024 are reported by
UBS AG. The liabilities were fully collateralized through cash deposits from UBS AG to Credit Suisse (Schweiz) AG.
30 June 2024 Pillar 3 Report |
Significant regulated subsidiaries and sub-groups | Credit Suisse (Schweiz) AG standalone 70
KM1: Key metrics
CHF m, except where indicated
30.6.24
31.3.24
31.12.23
30.9.23
30.6.23
Available capital (amounts)
1
Common Equity Tier 1 (CET1)
1
2
Tier 1
1
3
Total capital
1
Risk-weighted assets (amounts)
4
Total risk-weighted assets (RWA)
4a
Minimum capital requirement
2
4b
Total risk-weighted assets (pre-floor)
Risk-based capital ratios as a percentage of RWA
5
CET1 ratio (%)
1
6
Tier 1 ratio (%)
1
7
Total capital ratio (%)
1
Additional CET1 buffer requirements as a percentage of RWA
8
Capital conservation buffer requirement (%)
9
Countercyclical buffer requirement (%)
9a
Additional countercyclical buffer for Swiss mortgage loans (%)
10
Bank G-SIB and / or D-SIB additional requirements (%)
3,4
11
Total of bank CET1 specific buffer requirements (%)
5
12
CET1 available after meeting the bank’s minimum capital requirements (%)
4,6
Basel III leverage ratio
13
Total Basel III leverage ratio exposure measure
14
Basel III leverage ratio (%)
1
Liquidity coverage ratio (LCR)
7
15
Total high-quality liquid assets (HQLA)
16
Total net cash outflow
16a
of which: cash outflows
16b
of which: cash inflows
17
LCR (%)
Net stable funding ratio (NSFR)
8
18
Total available stable funding
19
Total required stable funding
20
NSFR (%)
1 Credit Suisse had a transitional relief of recognizing CECL allowances and provisions in CET1 capital in accordance with FINMA Circular 2013/1 “Eligible capital – banks” until 30 June 2024. No transitional relief
was applied to CET1 and tier 1 capital in the second quarter of 2024 (CHF 5m in the first quarter of 2024 and CHF 8m in the fourth quarter of 2023). No transitional relief was applied for the other periods presented.
2 Calculated as 8% of total RWA, based on total capital minimum requirements, excluding CET1 buffer requirements. 3 Swiss SRB going and gone concern requirements and information for Credit Suisse (Schweiz)
AG standalone are provided below in this section. 4 Credit Suisse (Schweiz) AG standalone has aligned its minimum capital requirements to the UBS approach of applying the G-SIB buffer at the Group level only.
5 Excludes non-BCBS countercyclical capital buffer requirements for risk-weighted positions that are directly or indirectly backed by residential properties in Switzerland. 6 Represents the CET1 ratio that is available
to meet buffer requirements. Calculated as the CET1 ratio minus the BCBS CET1 capital requirement and, where applicable, minus the BCBS additional tier 1 and tier 2 capital requirements met with CET1 capital.
7 Calculated after the application of haircuts, inflow and outflow rates, as well as, where applicable, caps on Level 2 assets and cash inflows. Calculated based on an averag e of 61 data points in the second quarter
of 2024 and 62 data points in the first quarter of 2024. For the prior-quarter data points, refer to the respective Pillar 3 Report, available under “Pillar 3 disclosures” at ubs.com/investors, for more information. 8 In
accordance with Art. 17h of the Liquidity Ordinance, Credit Suisse (Schweiz) AG must always have an NSFR of at least 100% on a standalone basis.
p
30 June 2024 Pillar 3 Report |
Significant regulated subsidiaries and sub-groups | Credit Suisse (Schweiz) AG standalone 71
Swiss systemically relevant bank going and gone concern requirements and information
Quarterly |
The tables below provide details of the Swiss systemically relevant bank (SRB) RWA- and LRD-based going and
gone concern requirements and information as required by FINMA; details regarding eligible gone concern instruments
are also provided below.
Credit Suisse (Schweiz) AG standalone is considered an SRB under Swiss banking law and is subject to capital regulations
on a standalone basis. As of 30 June 2024, the going concern capital and leverage ratio requirements for Credit Suisse
(Schweiz) AG standalone were 15.09% (including a countercyclical buffer of 0.79%) and 5.00%, respectively.
The Swiss SRB framework and going concern requirements applicable to Credit Suisse (Schweiz) AG standalone are the
same as those applicable to UBS Group AG consolidated. The gone concern requirement corresponds to 62% of the
UBS Group AG consolidated going concern requirements, excluding countercyclical buffer requirements.
The gone concern requirements were 8.87% for the RWA-based requirement and 3.10% for the LRD-based requirement.
Swiss SRB going and gone concern requirements and information
As of 30.6.24
RWA
LRD
CHF m, except where indicated
in %
in %
Required going concern capital
Total going concern capital
1
1
Common equity tier 1 capital
of which: minimum capital
of which: buffer capital
of which: countercyclical buffer
Maximum additional tier 1 capital
of which: additional tier 1 capital
of which: additional tier 1 buffer capital
Eligible going concern capital
Total going concern capital
Common equity tier 1 capital
Total loss-absorbing additional tier 1 capital
of which: high-trigger loss-absorbing additional tier 1 capital
Required gone concern capital
2
Total gone concern loss-absorbing capacity
of which: base requirement including add-ons for market share and LRD
Eligible gone concern capital
Total gone concern loss-absorbing capacity
TLAC-eligible unsecured debt
Total loss-absorbing capacity
Required total loss-absorbing capacity
Eligible total loss-absorbing capacity
Risk-weighted assets / leverage ratio denominator
Risk-weighted assets
Leverage ratio denominator
1 Includes applicable add-ons of 1.44% for risk-weighted assets (RWA) and 0.5% for leverage ratio denominator (LRD). 2 A maximum of 25% of the gone concern requirements can be met with instruments that
have a remaining maturity of between one and two years. Once at least 75% of the minimum gone concern requirement has been met with instruments that have a remaining maturity of greater than two years, all
instruments that have a remaining maturity of between one and two years remain eligible to be included in the total gone concern capital.
30 June 2024 Pillar 3 Report |
Significant regulated subsidiaries and sub-groups | Credit Suisse (Schweiz) AG standalone 72
Swiss SRB going and gone concern information
CHF m, except where indicated
30.6.24
31.3.24
31.12.23
Eligible going concern capital
Total going concern capital
Total tier 1 capital
Common equity tier 1 capital
Total loss-absorbing additional tier 1 capital
of which: high-trigger loss-absorbing additional tier 1 capital
Eligible gone concern capital
Total gone concern loss-absorbing capacity
TLAC-eligible unsecured debt
Total loss-absorbing capacity
Total loss-absorbing capacity
Risk-weighted assets / leverage ratio denominator
Risk-weighted assets
Leverage ratio denominator
Capital and loss-absorbing capacity ratios (%)
Going concern capital ratio
of which: common equity tier 1 capital ratio
Gone concern loss-absorbing capacity ratio
Total loss-absorbing capacity ratio
Leverage ratios (%)
Going concern leverage ratio
of which: common equity tier 1 leverage ratio
Gone concern leverage ratio
Total loss-absorbing capacity leverage ratio
p
30 June 2024 Pillar 3 Report |
Significant regulated subsidiaries and sub-groups | Credit Suisse International standalone 73
Credit Suisse International standalone
Key metrics for the second quarter of 2024
Quarterly |
accordance with UK Prudential Regulatory Authority regulations and IFRS Accounting Standards.
During the second quarter of 2024, the common equity tier 1 capital of Credit Suisse International standalone decreased
by USD 0.1bn to USD 12.8bn from USD 12.9bn, primarily due to a coupon payment on additional tier 1 capital that
reduced retained earnings, offset by a reduction in capital deductions. Total capital decreased by USD 0.1bn to
USD 14.0bn. Risk-weighted assets decreased by USD 8.4bn to USD 19.7bn, driven by a decrease across all risk types due
to a reduction in trading activity. Leverage ratio exposure decreased by USD 8.8bn to USD 58.2bn, mainly driven by a
decrease in the trading inventory.
The average liquidity coverage ratio was 345.3%, compared with 340.3% in the first quarter of 2024. The increase was
driven by a small decrease of USD 0.1bn in net cash outflows. High-quality liquid assets were stable at USD 14.6bn.
The net stable funding ratio (the NSFR) of Credit Suisse International standalone remained above the regulatory
requirement of 100%, at 150.8%, compared with 136.7% in the first quarter of 2024. The movement in the NSFR was
driven by a decrease of USD 3.5bn in required stable funding, mainly driven by a decrease in the trading inventory, net
derivative assets and initial margin posted. This was offset by a decrease of USD 3.3bn in available stable funding, mainly
driven by a decrease in long-term funding and capital.
KM1: Key metrics
USD m, except where indicated
30.6.24
31.3.24
31.12.23
1
30.9.23
30.6.23
Available capital (amounts)
1
Common Equity Tier 1 (CET1)
2
Tier 1
3
Total capital
Risk-weighted assets (amounts)
4
Total risk-weighted assets (RWA)
4a
Minimum capital requirement
2
Risk-based capital ratios as a percentage of RWA
5
CET1 ratio (%)
6
Tier 1 ratio (%)
7
Total capital ratio (%)
Additional CET1 buffer requirements as a percentage of RWA
8
BCBS capital conservation buffer requirement (%)
9
Countercyclical buffer requirement (%)
10
Bank G-SIB and / or D-SIB additional requirements (%)
11
BCBS total of bank CET1 specific buffer requirements (%)
12
CET1 available after meeting the bank’s minimum capital requirements (%)
3
Basel III leverage ratio
13
Total Basel III leverage ratio exposure measure
14
Basel III leverage ratio (%)
4
Liquidity coverage ratio (LCR)
5
15
Total high-quality liquid assets (HQLA)
16
Total net cash outflow
17
LCR (%)
Net stable funding ratio (NSFR)
18
Total available stable funding
19
Total required stable funding
20
NSFR (%)
1 Comparative information has been aligned with Credit Suisse International standalone’s final 2023 audited financial statements. 2 Calculated as 8% of total RWA, based on total minimum capital requirements,
excluding CET1 buffer requirements. 3 Represents the CET1 ratio that is available to meet buffer requirements. Calculated as the CET1 ratio minus the BCBS CET1 capital requirement and, where applicable, minus
the BCBS additional tier 1 and tier 2 capital requirements met with CET1 capital. 4 On the basis of tier 1 capital. 5 Based on Pillar 1 requirements; calculated using a 12-month average.
p
30 June 2024 Pillar 3 Report |
Significant regulated subsidiaries and sub-groups | Credit Suisse International standalone 74
Material sub-group entity – creditor ranking at legal entity level
Semi-annual |
a standalone basis.
As of 30 June 2024, Credit Suisse International had a total loss-absorbing capacity (TLAC) of USD 18.6bn after regulatory
capital deductions and adjustments. This amount included tier 1 capital, excluding minority interests, of USD 14.0bn and
USD 4.6bn of internal long-term debt that was eligible as internal TLAC issued to UBS AG, a wholly owned subsidiary of
the UBS Group AG resolution entity.
TLAC2: Material sub-group entity – creditor ranking at legal entity level
As of 30.6.24
Creditor ranking
Total
USD m
1
2
3
4
1
Is the resolution entity the creditor / investor?
No
No
No
No
2
Description of creditor ranking
Common Equity
(most junior)
1
Preferred Shares
(Additional tier 1)
Subordinated
debt
Unsecured loans and
other pari passu
liabilities (most senior)
3
Total capital and liabilities net of credit risk mitigation
4
Subset of row 3 that are excluded liabilities
5
Total capital and liabilities less excluded liabilities (row 3 minus row 4)
6
Subset of row 5 that are eligible as TLAC
7
Subset of row 6 with 1 year ≤ residual maturity < 2 years
8
Subset of row 6 with 2 years ≤ residual maturity < 5 years
9
Subset of row 6 with 5 years ≤ residual maturity < 10 years
10
Subset of row 6 with residual maturity ≥ 10 years, but excluded perpetual
securities
11
Subset of row 6 that is perpetual securities
1 Equity attributable to shareholders, which includes share premium and reserves.
p
30 June 2024 Pillar 3 Report |
Appendix 75
Appendix
Abbreviations frequently used in our financial reports
A
ABS asset-backed securities
AG Aktiengesellschaft
AGM Annual General Meeting of
shareholders
AI artificial intelligence
A-IRB advanced internal ratings-
based
AIV alternative investment
vehicle
ALCO Asset and Liability
Committee
AMA advanced measurement
approach
AML anti-money laundering
AoA Articles of Association
APM alternative performance
measure
ARR alternative reference rate
ARS auction rate securities
ASF available stable funding
AT1 additional tier 1
AuM assets under management
B
BCBS Basel Committee on
Banking Supervision
BIS Bank for International
Settlements
BoD Board of Directors
C
CAO Capital Adequacy
Ordinance
CCAR Comprehensive Capital
Analysis and Review
CCF credit conversion factor
CCP central counterparty
CCR counterparty credit risk
CCRC Corporate Culture and
Responsibility Committee
CDS credit default swap
CEA Commodity Exchange Act
CEO Chief Executive Officer
CET1 common equity tier 1
CFO Chief Financial Officer
CGU cash-generating unit
CHF Swiss franc
CIO Chief Investment Office
C&ORC Compliance & Operational
Risk Control
CRM credit risk mitigation (credit
risk) or comprehensive risk
measure (market risk)
CST combined stress test
CUSIP Committee on Uniform
Security Identification
Procedures
CVA credit valuation adjustment
D
DBO defined benefit obligation
DCCP Deferred Contingent
Capital Plan
DE&I diversity, equity and
inclusion
DFAST Dodd–Frank Act Stress Test
DM discount margin
DOJ US Department of Justice
DTA deferred tax asset
DVA debit valuation adjustment
E
EAD exposure at default
EB Executive Board
EC European Commission
ECB European Central Bank
ECL expected credit loss
EGM Extraordinary General
Meeting of shareholders
EIR effective interest rate
EL expected loss
EMEA Europe, Middle East and
Africa
EOP Equity Ownership Plan
EPS earnings per share
ESG environmental, social and
governance
ESR environmental and social
risk
ETD exchange-traded derivatives
ETF exchange-traded fund
EU European Union
EUR euro
EURIBOR Euro Interbank Offered Rate
EVE economic value of equity
EY Ernst & Young Ltd
F
FA financial advisor
FCA UK Financial Conduct
Authority
FDIC Federal Deposit Insurance
Corporation
FINMA Swiss Financial Market
Supervisory Authority
FMIA Swiss Financial Market
Infrastructure Act
FSB Financial Stability Board
FTA Swiss Federal Tax
Administration
FVA funding valuation
adjustment
FVOCI fair value through other
comprehensive income
FVTPL fair value through profit or
loss
FX foreign exchange
G
GAAP generally accepted
accounting principles
GBP pound sterling
GCRG Group Compliance,
Regulatory & Governance
GDP gross domestic product
GEB Group Executive Board
GHG greenhouse gas
GIA Group Internal Audit
GRI Global Reporting Initiative
G-SIB global systemically
important bank
H
HQLA
high-quality liquid assets
I
IAS International Accounting
Standards
IASB International Accounting
Standards Board
IBOR interbank offered rate
IFRIC International Financial
Reporting Interpretations
Committee
IFRS accounting standards
Accounting issued by the IASB
Standards
IRB internal ratings-based
IRRBB interest rate risk in the
banking book
ISDA International Swaps and
Derivatives Association
ISIN International Securities
Identification Number
30 June 2024 Pillar 3 Report |
Appendix 76
Abbreviations frequently used in our financial reports (continued)
K
KRT Key Risk Taker
L
LAS liquidity-adjusted stress
LCR liquidity coverage ratio
LGD loss given default
LIBOR London Interbank Offered
Rate
LLC limited liability company
LoD lines of defense
LRD leverage ratio denominator
LTIP Long-Term Incentive Plan
LTV loan-to-value
M
M&A mergers and acquisitions
MRT Material Risk Taker
N
NII net interest income
NSFR net stable funding ratio
NYSE New York Stock Exchange
O
OCA own credit adjustment
OCI other comprehensive
income
OECD Organisation for Economic
Co-operation and
Development
OTC over-the-counter
P
PCI purchased credit impaired
PD probability of default
PIT point in time
P&L profit or loss
PPA purchase price allocation
Q
QCCP qualifying central
counterparty
R
RBC risk-based capital
RbM risk-based monitoring
REIT real estate investment trust
RMBS residential mortgage-
backed securities
RniV risks not in VaR
RoCET1 return on CET1 capital
RoU right-of-use
rTSR relative total shareholder
return
RWA risk-weighted assets
S
SA standardized approach or
société anonyme
SA-CCR standardized approach for
counterparty credit risk
SAR Special Administrative
Region of the People’s
Republic of China
SDG Sustainable Development
Goal
SEC US Securities and Exchange
Commission
SFT securities financing
transaction
SI sustainable investing or
sustainable investment
SIBOR Singapore Interbank
Offered Rate
SICR significant increase in credit
risk
SIX SIX Swiss Exchange
SME small and medium-sized
entities
SMF Senior Management
Function
SNB Swiss National Bank
SOR Singapore Swap Offer Rate
SPPI solely payments of principal
and interest
SRB systemically relevant bank
SRM specific risk measure
SVaR stressed value-at-risk
T
TBTF too big to fail
TCFD Task Force on Climate-
related Financial Disclosures
TIBOR Tokyo Interbank Offered
Rate
TLAC total loss-absorbing capacity
TTC through the cycle
U
USD US dollar
V
VaR value-at-risk
VAT
value added tax
This is a general list of the abbreviations frequently used in our financial reporting. Not all of the listed abbreviations may
appear in this particular report.
30 June 2024 Pillar 3 Report |
Appendix 77
Cautionary statement |
of an offer to buy or sell any securities or other financial instruments in Switzerland, the United States or any other jurisdiction. No investment decision relating
to securities of or relating to UBS Group AG, UBS AG or their affiliates should be made on the basis of this report. Refer to UBS’s most recent annual report on
Form 20-
F,
quarterly reports and other information furnished to or filed with the US Securities and Exchange Commission (the SEC) on Form 6-K, available at
ubs.com/investors
, for additional information.
Rounding |
disclosed in text and tables are calculated on the basis of unrounded figures. Absolute changes between reporting periods disclosed in the text, which can be
derived from numbers presented in related tables, are calculated on a rounded basis.
Tables |
available as of the relevant date or for the relevant period. Zero values generally indicate that the respective figure is zero on an actual or rounded basis. Values
that are zero on a rounded basis can be either negative or positive on an actual basis.
Websites |
of any such websites into this report.

UBS Group AG
P.O. Box
CH-8098 Zurich
ubs.com
SIGNATURES
Pursuant to the requirements of the Securities Exchange Act of 1934, the registrants have duly caused this
report to be signed on their behalf by the undersigned, thereunto duly authorized.
UBS Group AG
By: _/s/ David Kelly _____________
Name: David Kelly
Title: Managing Director
By: _/s/ Ella Campi ______________
Name: Ella Campi
Title: Executive Director
UBS AG
By: _/s/ David Kelly _____________
Name: David Kelly
Title: Managing Director
By: _/s/ Ella Campi ______________
Name: Ella Campi
Title: Executive Director
Date: August 23, 2024